UNITED STATES
SECURITIES AND EXCHANGE COMMISSION
Washington, DC 20549
FORM N-CSRS
CERTIFIED SHAREHOLDER REPORT OF REGISTERED
MANAGEMENT INVESTMENT COMPANIES
Investment Company Act file number 811-04986
Franklin Investors Securities Trust
(Exact name of registrant as specified in charter)
One Franklin Parkway, San Mateo, CA 94403-1906
(Address of principal executive offices) (Zip code)
Craig S. Tyle, One Franklin Parkway, San Mateo, CA 94403-1906
(Name and address of agent for service)
Registrant’s telephone number, including area Code: (650) 312-2000
Date of fiscal year end: 10/31
Date of reporting period: 4/30/17
| Item 1. | Reports to Stockholders. |

Franklin Templeton Investments
Gain From Our Perspective®
At Franklin Templeton Investments, we’re dedicated to one goal: delivering exceptional asset management for our clients. By bringing together multiple, world-class investment teams in a single firm, we’re able to offer specialized expertise across styles and asset classes, all supported by the strength and resources of one of the world’s largest asset managers. This has helped us to become a trusted partner to individual and institutional investors across the globe.
Dear Shareholder:
During the six months ended April 30, 2017, mostly upbeat economic data, improved U.S. corporate earnings and supportive global monetary policies were positives for U.S. securities markets. After maintaining its target interest rate in the 0.25%–0.50% range for nearly a year, the U.S. Federal Reserve (Fed) increased its target range for the federal funds rate twice, in December 2016 and March 2017, to 0.75%–1.00%, noting improved employment and hints of higher inflation. The 10-year U.S. Treasury yield began the period at 1.84% and ended the period at 2.29%. In this environment, U.S. stocks, as measured by the Standard & Poor’s® 500 Index, generated a +13.32% total return for the six-month period.1 Investment-grade bonds, as measured by the Bloomberg Barclays U.S. Aggregate Bond Index, had a -0.67% total return.1
In all economic environments, we are committed to our long-term perspective and disciplined investment approach as we conduct a diligent, fundamental analysis of securities with a regular emphasis on investment risk management.
We believe active, professional investment management serves investors well. We also recognize the important role of financial advisors in today’s markets and encourage investors to continue to seek their advice. Amid changing markets and economic conditions, we are confident investors with a well-diversified portfolio and a patient, long-term outlook should be well positioned for the years ahead.
In addition, Franklin Investors Securities Trust’s semiannual report includes more detail about prevailing conditions and a discussion about investment decisions during the period. Please remember all securities markets fluctuate, as do mutual fund share prices.
We thank you for investing with Franklin Templeton, welcome your questions and comments, and look forward to serving your future investment needs.
Sincerely,

Rupert H. Johnson, Jr.
Chairman
Franklin Investors Securities Trust
This letter reflects our analysis and opinions as of April 30, 2017, unless otherwise indicated. The information is not a complete analysis of every aspect of any market, country, industry, security or fund. Statements of fact are from sources considered reliable.
1. Source: Morningstar.
See www.franklintempletondatasources.com for additional data provider information.
| | |
| | Not FDIC Insured | May Lose Value | No Bank Guarantee |
| | | | |
| | | |
franklintempleton.com | | Not part of the semiannual report | | 1 |
Contents
Visit franklintempleton.com for fund updates, to access your account, or to find helpful financial planning tools.
| | | | |
| | | |
2 | | Semiannual Report | | franklintempleton.com |
Semiannual Report
Economic and Market Overview
U.S. economic growth decelerated in 2017’s first quarter, largely due to declines in private inventory investment and government spending. However, an increase in exports and personal consumption, as well as residential and nonresidential fixed investment aided growth. The manufacturing sector generally expanded and the services sector also continued to grow. The unemployment rate decreased from 4.8% in October 2016 to 4.4% at period-end.1 Monthly retail sales were volatile, but grew for most of the period. Annual inflation, as measured by the Consumer Price Index, increased from 1.6% to 2.2% during the period.
At its December meeting, the U.S. Federal Reserve (Fed) raised its target range for the federal funds rate from 0.25%–0.50% to 0.50%–0.75%, as policymakers cited improved labor market conditions and higher inflation. The Fed kept its interest rate unchanged at its February meeting, but incoming economic data, along with statements by Fed officials in late February and early March, heightened many investors’ expectations for a March interest-rate hike. The Fed, at its March meeting, made the widely anticipated increase in its federal funds target rate to 0.75%–1.00%.
U.S. equity markets rose during the period, benefiting from mostly upbeat economic data, better U.S. corporate earnings and signs of improvement in the Chinese and European economies. The European Central Bank’s December announcement to extend its quantitative easing program beyond March 2017, investor optimism arising from pro-growth and pro-business policy plans in the U.S. and the results of the first round of presidential elections in France also helped U.S. equities. However, investor concerns about the terms of the U.K.’s exit from the European Union (also known as “Brexit”) and geopolitical tensions in the Middle East and the Korean peninsula weighed on market sentiment. The broad U.S. stock market, as measured by the Standard & Poor’s 500 Index, generated a +13.32% total return for the six-month period.2
The foregoing information reflects our analysis and opinions as of April 30, 2017. The information is not a complete analysis of every aspect of any market, country, industry, security or fund. Statements of fact are from sources considered reliable.
1. Source: Bureau of Labor Statistics.
2. Source: Morningstar.
See www.franklintempletondatasources.com for additional data provider information.
| | | | |
| | | |
franklintempleton.com | | Semiannual Report | | 3 |
Franklin Balanced Fund
This semiannual report for Franklin Balanced Fund covers the period ended April 30, 2017.
Your Fund’s Goal and Main Investments
The Fund seeks both income and capital appreciation by investing in a diversified portfolio of stocks (substantially dividend paying), convertible securities and debt securities. The Fund normally invests at least 25% of its total assets in equity securities, primarily common and preferred stock, and at least 25% of its total assets in debt securities, including bonds, notes, debentures and money market securities.
Portfolio Composition*
4/30/17
| | |
| | | % of Total
Net Assets |
Stocks | | 57.2% |
Common Stocks | | 44.2% |
Equity-Linked Securities | | 8.1% |
Convertible Preferred Stocks | | 3.7% |
Management Investment Companies | | 1.0% |
Preferred Stocks | | 0.2% |
Options Purchased | | 0.0%** |
Bonds | | 32.5% |
Corporate Bonds | | 32.0% |
Convertible Bonds | | 0.5% |
Short-Term Investments & Other Net Assets | | 10.3% |
*Percentages reflect certain derivatives held in the portfolio (or their underlying reference assets) and may not total 100% or may be negative due to rounding, use of derivatives, unsettled trades or other factors. The composition may not match the SOI.
**Rounds to less than 0.1% of net assets.
Performance Overview
For the six months under review, the Fund’s Class A shares delivered a cumulative total return of +6.24%. In comparison, the Fund’s equity benchmark, the Standard & Poor’s 500 Index (S&P 500®), which is a broad measure of U.S. stock performance, generated a +13.32% total return.1 The Fund’s fixed income benchmark, the Bloomberg Barclays U.S. Aggregate Bond Index, which tracks the U.S. investment-grade, taxable bond market, had a -0.67% total return.1 You can find the Fund’s long-term performance data in the Performance Summary beginning on page 9.
Performance data represent past performance, which does not guarantee future results. Investment return and principal value will fluctuate, and you may have a gain or loss when you sell your shares. Current performance may differ from figures shown. For most recent month-end performance, go to franklintempleton.com or call (800) 342-5236.
Investment Strategy
We apply a bottom-up approach to investing in individual securities. We will assess the market price of a company’s securities relative to our evaluation of the company’s long-term earnings, asset value and cash flow potential. We also consider a company’s price/earnings ratio, profit margins and liquidation value. In determining an optimal mix of equity and fixed income investments for the Fund, we assess changing economic, market and industry conditions. The Fund seeks income by investing in a combination of corporate, agency and government bonds issued in the U.S. and other countries, as well as common stocks and convertible securities. The Fund seeks capital appreciation by investing in equity securities and convertible securities of companies from a variety of industries. For purposes of pursuing the Fund’s investment goal, we may enter into various equity-related transactions involving derivative instruments. We may also invest in equity-linked notes, which are hybrid derivative-type instruments specially designed to combine the characteristics of one or more reference securities (usually a single stock, a stock index or a basket of stocks) and a related equity derivative, such as a put or call option.
|
|
What is an equity-linked note? An equity-linked note is a derivative instrument whose return is determined by the performance of a single equity security, a basket of equity securities, or an equity index. The purchase of equity-linked notes may involve investment in related equity derivatives, such as put and call options. |
Manager’s Discussion
Consistent with the Fund’s long-term strategy of investing across asset classes to seek to generate attractive income, while seeking opportunities for capital appreciation, performance was supported by healthy diversification and positive overall contributions from the Fund’s equity and fixed income
1. Source: Morningstar.
The indexes are unmanaged and include reinvestment of any income or distributions. They do not reflect any fees, expenses or sales charges. One cannot invest directly in an index, and an index is not representative of the Fund’s portfolio.
The dollar value, number of shares or principal amount, and names of all portfolio holdings are listed in the Fund’s Statement of Investments (SOI). The SOI begins on page 35.
| | | | |
| | | |
4 | | Semiannual Report | | franklintempleton.com |
FRANKLIN BALANCED FUND
|
|
What are put and call options? A put option is a contract giving the owner the right, but not the obligation, to sell a specified amount of an underlying security at a specified price within a specified time. Put options are most commonly used to protect against the decline of a stock price below a certain price. Conversely, a call option gives the holder the right to buy shares at a specified price within a specified time, regardless of the price in the future before the expiration date. If the stock price rises, the holder of the call option has the right to buy at the agreed-upon price, which could be lower. |
Distributions*
11/1/16–4/30/17
| | | | | | | | | | | | | | | | | | | | |
| | | Distributions per Share (cents) | |
| Month | | Class A | | | Class C | | | Class R | | | Class R6 | | | Advisor Class | |
November | | | 3.00 | | | | 2.27 | | | | 2.75 | | | | 3.34 | | | | 3.24 | |
December | | | 3.00 | | | | 2.28 | | | | 2.75 | | | | 3.36 | | | | 3.24 | |
January | | | 3.00 | | | | 2.28 | | | | 2.75 | | | | 3.36 | | | | 3.24 | |
February | | | 3.00 | | | | 2.28 | | | | 2.75 | | | | 3.36 | | | | 3.24 | |
March | | | 3.00 | | | | 2.26 | | | | 2.75 | | | | 3.33 | | | | 3.24 | |
April | | | 3.00 | | | | 2.26 | | | | 2.75 | | | | 3.33 | | | | 3.24 | |
Total | | | 18.00 | | | | 13.63 | | | | 16.50 | | | | 20.08 | | | | 19.44 | |
*The distribution amount is the sum of all distributions to shareholders for the period shown and includes only estimated tax-basis net investment income. All Fund distributions will vary depending upon current market conditions, and past distributions are not indicative of future trends.
positions. During the six months under review, our actions and movements in equity and fixed income markets resulted in a modest decline in equity holdings from 63.2% to 57.2% of total net assets, while fixed income holdings were relatively flat at 32.5%. Our cash position rose from 4.1% to 10.3% of total net assets. The flexibility to use market volatility to invest in different asset classes remains a core strategy of the Fund.
In the months following the U.S. presidential election, equity markets have performed well. The prospects of higher interest rates, an accelerating economy that could benefit from less regulation, the possibility of a large infrastructure bill and a focus on job creation all contributed to investor optimism and pushed equity values higher.
Among equities, the largest contributor during the period under review was the financials sector as the Federal Reserve (Fed) raised interest rates in December and inflation expectations rose in the fourth quarter. The Fund began to increase its weightings across the sector in early 2016 as we believed that fears of slower growth and deteriorating credit concerns would
dissipate and that financial companies would continue to grow book value. Our holdings in banking companies Wells Fargo, JPMorgan Chase and Bank of America were notable contributors to performance.2 Strong performance at Wells Fargo during the period was driven by mortgage-origination income, while JPMorgan reported strong performance helped by results within their fixed income currencies and commodities business and lower legal costs. Bank of America reported increased total loans, credit card spending, assets under management, and client fees across divisions. Earnings at all three companies benefited from improved net interest income, which resulted from the increase in long-term interest rates, while investor optimism about accelerating economic growth also supported share gains.
Top Five Equity Holdings
4/30/17
| | |
Company Sector/Industry | | % of Total
Net Assets |
Microsoft Corp. Information Technology | | 2.0% |
Texas Instruments Information Technology | | 1.8% |
Wells Fargo & Co. Financials | | 1.8% |
General Electric Co. Industrials | | 1.7% |
Raytheon Co. Industrials | | 1.6% |
The industrials sector contributed to Fund performance as companies benefited from anticipated prospects of an improvement in the economy, the potential for a large infrastructure spending measure and increased focus by the Trump administration on bringing manufacturing jobs to the U.S. All of the Fund’s industrials sector holdings benefited performance, led by Union Pacific. Union Pacific reported higher first quarter 2017 revenue resulting from transport volume increases in coal, agricultural products, and industrial products. Waste management company Republic Services grew revenue and earnings as it transitioned its annual contract price adjustments formerly based on the consumer price index to more favorable methods and advanced productivity and cost saving initiatives. Raytheon also fared well on the prospects of increased U.S. government defense spending.
In recent years, the Fund has seen an increasing number of opportunities in the information technology (IT) sector, which saw solid gains during the period. Microsoft was the largest
2. Banking companies are in financials in the equity section of the SOI.
| | | | |
| | | |
franklintempleton.com | | Semiannual Report | | 5 |
FRANKLIN BALANCED FUND
contributor as it posted two impressive quarters within the period, showing continued strong execution in the shift of enterprise customers to their Office 365 platform and robust growth in their cloud-computing solution Azure. Oracle advanced in the wake of the company’s inline quarterly revenue results and above-consensus earnings-per-share results.3 The company saw modest outperformance in its higher margin software and cloud segments, but this was offset somewhat by signs of weakness in its hardware business. Semiconductor manufacturer Texas Instruments continued to increase its market share while serving a broad array of end markets, and has lately shown improving profitability and financial metrics, underscored by better-than-expected results during the fourth-quarter 2016 earnings season.
All of our materials sector investments advanced on signs of stronger global demand that has helped diminish inventory overhangs and supply surpluses in key commodity markets, and on expectations of increased infrastructure spending under the new U.S. presidential administration. The sector was further supported by the inverse pricing correlation of a weaker trade-weighted U.S. dollar (which makes commodities less expensive for non-U.S. buyers) and ongoing cost-containment efforts. Contributions from the sector were led by strong results from chemical manufacturers Dow Chemical and BASF. Dow has shown consistently promising results in recent years and their pending merger with DuPont could drive additional value over time. Similarly, BASF continued to show healthy cash flow generation and a diversified portfolio across products and geographies, which enabled favorable product development. Despite lower market prices for phosphate and potash and lower year-over-year quarterly revenue during the period, the share price of Mosaic, an agricultural fertilizer producer, increased overall, helped by lower phosphate raw materials prices and effective expense management.
Within consumer staples, Kimberly-Clark and Philip Morris International also aided results. Kimberly-Clark, an American multinational personal goods manufacturer that produces mostly paper-based consumer goods, was driven by stronger-than expected earnings aided by effective cost savings, an equity valuation that was below its industry peer group average, and merger speculation among food and household product companies in recent months. Global tobacco producer Philip Morris International reported strong sales with favorable pricing in its legacy products, in addition to incremental returns from newer product platforms.
3. Not held at period-end.
Other individual contributors included Lowe’s in the consumer discretionary sector. Lowe’s reported a solid fourth quarter of 2016, with strong sales and good momentum heading into 2017, according to our analysis. Amgen in the health care sector benefited from positive data on its cholesterol drug as well as a favorable outcome in litigation over one of its other drugs.3 AstraZeneca rebounded after it posted better-than-expected earnings, and the company continued to be a highly successful sought-after partner for several of its pharmaceutical peers due to its focused developmental pipeline. In telecommunication services, Rogers Communications’ wireless business continued to perform well, with its cable business improving as investors become less concerned about business operations during the period prior to its new chief executive officer taking charge.
Although all equity sectors contributed to performance, the utilities, telecommunication services, real estate, energy and health care sectors contributed less to results. Individual detractors from performance included Verizon Communications, which reported weaker-than-anticipated results driven by increased competition within its wireless business. In the health care sector, Teva Pharmaceutical Industries had disappointing quarterly earnings and negative outcomes in regard to drug patent challenges that hurt its share price. Along with the wider energy sector, Occidental Petroleum was affected by rising U.S. onshore oil-rig counts and elevated global crude oil inventory levels pressured energy commodities and numerous related equities outside of the oilfield services industry. In addition to these factors, Occidental also suffered from near-term production disruptions.
Other individual equity positions that detracted from performance included QUALCOMM and Target. Computer chip manufacturer QUALCOMM in the IT sector was affected by Apple’s lawsuit in January regarding royalties previously paid by Apple’s mobile phone chip suppliers, which has significantly reduced QUALCOMM’s revenue. This also affected QUALCOMM’s 2017 earnings guidance, although the company’s earnings continued to increase during the period.3 In the consumer discretionary sector, Target announced that strong holiday season results, which started off with solid Black Friday sales, did not continue through year-end 2016. Target also offered weak guidance for 2017 that was emblematic of many brick-and-mortar retailers’ struggles in competing with online competitors.
| | | | |
| | | |
6 | | Semiannual Report | | franklintempleton.com |
FRANKLIN BALANCED FUND
The Fund used derivative instruments during the period, such as equity and equity index options. The goal of these instruments is to enhance Fund returns, to mitigate volatility, or to more efficiently enter and exit stock positions at prices the Fund deems attractive. These positions did not have a material impact on performance. We were comfortable with the Fund’s rising cash position during the period, as we believed it helped reduce volatility and enabled us to invest opportunistically at times when the markets retreated.
What many investors at the outset of 2017 thought was supposed to be the year of the bear market in bonds has thus far turned out to be just the opposite. The decline in longer term yields was largely a tailwind for corporate fixed income securities, which ended the period in positive territory despite flat results in March. Investors continued to migrate into higher yielding corporate bonds even as their yield spreads versus Treasuries have narrowed as prices reached recent highs. According to our analysis, high-yield corporate debt default rates continued to decline during the period as liquidity and access to capital remained favorable amid robust new issuance, particularly in March as issuers rushed to get ahead of the Fed’s latest interest-rate hike.
The Fund’s fixed income holdings contributed to performance, particularly in the financials sector, led by banks JPMorgan Chase and Bank of America, but also including Citigroup, Morgan Stanley and Wells Fargo. These companies are among several examples of how the Fund invests across the capital structure of companies we view positively. The Fund’s fixed income holdings in energy companies all added to Fund performance.4 Most of the Fund’s energy bonds fared better than related equities as many investors maintained confidence in these companies’ ability to pay down their long-term debt despite a lack of crude oil and natural gas pricing power so far in 2017. Moreover, green shoots of pricing power have emerged on the services side of the energy value chain, which has benefited Weatherford International in particular. Weatherford is also an example of the many situations where the Fund has worked closely with a company to help them solve potential financing needs such as reducing debt and extending maturities. These situations can lead to improved financial flexibility for companies, while allowing the Fund to participate in securities that have an attractive income and total return profile. For the six-month period, a more constructive commodity price environment that served as a tailwind for the
industry as a whole and the decision by the Organization of the Petroleum Exporting Countries to remove production from the market in November provided catalysts that helped bond prices.
Within the telecommunication services sector, Sprint bonds performed well as confidence in its operational turnaround continued to increase, bolstered by positive earnings performance in the September and December quarters. In addition, there was increased speculation that Sprint would be involved in an industry consolidation. Our positions in DISH DBS, a global provider of satellite communications, and broadcaster Sirius XM Radio, both in the consumer discretionary sector, also performed well.
Individual fixed income health care positions that significantly contributed to Fund performance included hospital and health care center operators like Community Health Systems, Tenet Healthcare and Hospital Corporation of America (HCA), which outperformed as hospital names rallied after concerns about the potential repeal of the Affordable Care Act receded. Community Health reported much better-than-expected fourth-quarter earnings and announced several asset sales at robust deleveraging multiples, leading to significant outperformance relative to the broader market. Tenet’s USPI and Conifer divisions both performed well.5 HCA expected increased first-quarter facility revenue to increase based on an increase in the total number of “same facility” admissions.
Top Five Fixed Income Holdings
4/30/17
| | |
Company Sector/Industry | | % of Total
Net Assets |
Morgan Stanley Financials | | 1.2% |
JPMorgan Chase & Co. Financials | | 1.1% |
Weatherford International Ltd. Energy | | 0.9% |
Kraft Heinz Foods Co. Consumer Staples | | 0.8% |
Bank of America Corp. Financials | | 0.8% |
Although all fixed income sectors contributed to Fund performance, among individual companies, some longer duration securities showed negative performance given the
4. Energy companies are in energy and utilities in the fixed income section of the SOI.
5. New position during the period.
See www.franklintempletondatasources.com for additional data provider information.
| | | | |
| | | |
franklintempleton.com | | Semiannual Report | | 7 |
FRANKLIN BALANCED FUND
backup in interest rates during the period, including Verizon Communications.3 In addition, some consumer and food-related issues did not have enough spread tightening to offset the backup in rates and posted slightly negative returns during the period. Kraft Heinz Foods, Mondelez International, Tyson Foods and Anheuser-Busch InBev Finance are all in this category.
Thank you for your continued participation in Franklin Balanced Fund. We look forward to serving your future investment needs.
| | |
 | | 
Edward D. Perks, CFA |
| | Alan E. Muschott, CFA Shawn Lyons, CFA Todd Brighton, CFA |
| |
| | Portfolio Management Team |
The foregoing information reflects our analysis, opinions and portfolio holdings as of April 30, 2017, the end of the reporting period. The way we implement our main investment strategies and the resulting portfolio holdings may change depending on factors such as market and economic conditions. These opinions may not be relied upon as investment advice or an offer for a particular security. The information is not a complete analysis of every aspect of any market, country, industry, security or the Fund. Statements of fact are from sources considered reliable, but the investment manager makes no representation or warranty as to their completeness or accuracy. Although historical performance is no guarantee of future results, these insights may help you understand our investment management philosophy.
CFA® is a trademark owned by CFA Institute.
| | | | |
| | | |
8 | | Semiannual Report | | franklintempleton.com |
FRANKLIN BALANCED FUND
Performance Summary as of April 30, 2017
The performance tables do not reflect any taxes that a shareholder would pay on Fund dividends, capital gain distributions, if any, or any realized gains on the sale of Fund shares. Total return reflects reinvestment of the Fund’s dividends and capital gain distributions, if any, and any unrealized gains or losses. Your dividend income will vary depending on dividends or interest paid by securities in the Fund’s portfolio, adjusted for operating expenses of each class. Capital gain distributions are net profits realized from the sale of portfolio securities.
Performance as of 4/30/171
Cumulative total return excludes sales charges. Average annual total return include maximum sales charges. Sales charges will vary depending on the size of the investment and the class of share purchased. The maximum is 5.75% and the minimum is 0%. Class A: 5.75% maximum initial sales charge; Advisor Class: no sales charges. For other share classes, visit franklintempleton.com.
| | | | |
Share Class | | Cumulative Total Return2 | | Average Annual Total Return3 |
| | |
A | | | | |
6-Month | | +6.24% | | +0.14% |
1-Year | | +10.17% | | +3.80% |
5-Year | | +43.14% | | +6.16% |
10-Year | | +65.87% | | +4.57% |
| | |
Advisor | | | | |
6-Month | | +6.44% | | +6.44% |
1-Year | | +10.50% | | +10.50% |
5-Year | | +45.20% | | +7.74% |
10-Year | | +70.96% | | +5.51% |
| | | | | | | | |
| Share Class | | Distribution Rate4 | | 30-Day Standardized Yield5 |
| | | (with waiver) | | | (without waiver) |
| | | |
A | | 2.82% | | | 2.01% | | | 1.98% |
Advisor | | 3.23% | | | 2.38% | | | 2.35% |
Performance data represent past performance, which does not guarantee future results. Investment return and principal value will fluctuate, and you may have a gain or loss when you sell your shares. Current performance may differ from figures shown. For most recent month-end performance, go to franklintempleton.com or call (800) 342-5236.
See page 10 for Performance Summary footnotes.
| | | | |
| | | |
franklintempleton.com | | Semiannual Report | | 9 |
FRANKLIN BALANCED FUND
PERFORMANCE SUMMARY
Net Asset Value
| | | | | | | | | | | | | | | | | | | | |
| Share Class (Symbol) | | 4/30/17 | | | | | | 10/31/16 | | | | | | Change | |
A (FBLAX) | | | $12.02 | | | | | | | | $11.65 | | | | | | | | +$0.37 | |
C (FBMCX) | | | $11.91 | | | | | | | | $11.55 | | | | | | | | +$0.36 | |
R (N/A) | | | $12.05 | | | | | | | | $11.67 | | | | | | | | +$0.38 | |
R6 (FBFRX) | | | $12.04 | | | | | | | | $11.67 | | | | | | | | +$0.37 | |
Advisor (FBFZX) | | | $12.04 | | | | | | | | $11.67 | | | | | | | | +$0.37 | |
| | | | | |
| Distributions (11/1/16–4/30/17) | | | | | | | | | | | | | | | | | | | | |
| Share Class | | Net Investment
Income | | | | | | Long-Term
Capital Gain | | | | | | Total | |
A | | | $0.1800 | | | | | | | | $0.1692 | | | | | | | | $0.3492 | |
C | | | $0.1363 | | | | | | | | $0.1692 | | | | | | | | $0.3055 | |
R | | | $0.1650 | | | | | | | | $0.1692 | | | | | | | | $0.3342 | |
R6 | | | $0.2008 | | | | | | | | $0.1692 | | | | | | | | $0.3700 | |
Advisor | | | $0.1944 | | | | | | | | $0.1692 | | | | | | | | $0.3636 | |
| | | | | | | | | | | | |
| | | |
| Total Annual Operating Expenses6 | | | | | | | | | | | | |
| | | |
| Share Class | | With Waiver | | | | | | Without Waiver | |
A | | | 1.02 | % | | | | | | | 1.03% | |
Advisor | | | 0.77 | % | | | | | | | 0.78% | |
Each class of shares is available to certain eligible investors and has different annual fees and expenses, as described in the prospectus.
All investments involve risks, including possible loss of principal. The Fund’s share price and yield will be affected by interest rate movements. Bond prices generally move in the opposite direction of interest rates. As the prices of bonds in the Fund adjust to a rise in interest rates, the Fund’s share price may decline. Stock prices fluctuate, sometimes rapidly and dramatically, due to factors affecting individual companies, particular industries or sectors, or general market conditions. The Fund is actively managed but there is no guarantee that the manager’s investment decisions will produce the desired results. The Fund’s prospectus also includes a description of the main investment risks.
1. The Fund has a fee waiver associated with any investment it makes in a Franklin Templeton money fund and/or other Franklin Templeton Fund, contractually guaranteed through 2/28/18. Fund investment results reflect the fee waiver; without this reduction, the results would have been lower.
2. Cumulative total return represents the change in value of an investment over the periods indicated.
3. Average annual total return represents the average annual change in value of an investment over the periods indicated. Return for less than one year, if any, has not been annualized.
4. Distribution rate is based on an annualization of the respective class’s April dividend and the maximum offering price (NAV for Advisor Class) per share on 4/30/17.
5. The Fund’s 30-day standardized yield is calculated over a trailing 30-day period using the yield to maturity on bonds and/or the dividends accrued on stocks. It may not equal the Fund’s actual income distribution rate, which reflects the Fund’s past dividends paid to shareholders.
6. Figures are as stated in the Fund’s current prospectus and may differ from the expense ratios disclosed in the Your Fund’s Expenses and Financial Highlights sections in this report. In periods of market volatility, assets may decline significantly, causing total annual Fund operating expenses to become higher than the figures shown.
| | | | |
| | | |
10 | | Semiannual Report | | franklintempleton.com |
FRANKLIN BALANCED FUND
Your Fund’s Expenses
As a Fund shareholder, you can incur two types of costs: (1) transaction costs, including sales charges (loads) on Fund purchases and redemptions; and (2) ongoing Fund costs, including management fees, distribution and service (12b-1) fees, and other Fund expenses. All mutual funds have ongoing costs, sometimes referred to as operating expenses. The table below shows ongoing costs of investing in the Fund and can help you understand these costs and compare them with those of other mutual funds. The table assumes a $1,000 investment held for the six months indicated.
Actual Fund Expenses
The table below provides information about actual account values and actual expenses in the columns under the heading “Actual.” In these columns the Fund’s actual return, which includes the effect of Fund expenses, is used to calculate the “Ending Account Value” for each class of shares. You can estimate the expenses you paid during the period by following these steps (of course, your account value and expenses will differ from those in this illustration): Divide your account value by $1,000 (if your account had an $8,600 value, then $8,600 ÷ $1,000 = 8.6). Then multiply the result by the number in the row for your class of shares under the headings “Actual” and “Expenses Paid During Period” (if Actual Expenses Paid During Period were $7.50, then 8.6 x $7.50 = $64.50). In this illustration, the actual expenses paid this period are $64.50.
Hypothetical Example for Comparison with Other Funds
Under the heading “Hypothetical” in the table, information is provided about hypothetical account values and hypothetical expenses based on the Fund’s actual expense ratio and an assumed rate of return of 5% per year before expenses, which is not the Fund’s actual return. This information may not be used to estimate the actual ending account balance or expenses you paid for the period, but it can help you compare ongoing costs of investing in the Fund with those of other funds. To do so, compare this 5% hypothetical example for the class of shares you hold with the 5% hypothetical examples that appear in the shareholder reports of other funds.
Please note that expenses shown in the table are meant to highlight ongoing costs and do not reflect any transactional costs. Therefore, information under the heading “Hypothetical” is useful in comparing ongoing costs only, and will not help you compare total costs of owning different funds. In addition, if transactional costs were included, your total costs would have been higher.
| | | | | | | | | | | | | | | | | | |
| | | | | | | Actual (actual return after expenses) | | | | Hypothetical (5% annual return before expenses) | | | | |
Share Class | | Beginning
Account
Value 11/1/16 | | | | Ending
Account
Value 4/30/17 | | Expenses Paid During
Period
11/1/16–4/30/171,2 | | | | Ending
Account
Value 4/30/17 | | Expenses Paid During
Period
11/1/16–4/30/171,2 | | | | Net Annualized Expense Ratio2 |
A | | $1,000 | | | | $1,062.40 | | $5.06 | | | | $1,019.89 | | $4.96 | | | | 0.99% |
C | | $1,000 | | | | $1,059.00 | | $8.88 | | | | $1,016.17 | | $8.70 | | | | 1.74% |
R | | $1,000 | | | | $1,061.80 | | $6.34 | | | | $1,018.65 | | $6.21 | | | | 1.24% |
R6 | | $1,000 | | | | $1,065.00 | | $3.28 | | | | $1,021.62 | | $3.21 | | | | 0.64% |
Advisor | | $1,000 | | | | $1,064.40 | | $3.79 | | | | $1,021.12 | | $3.71 | | | | 0.74% |
1. Expenses are equal to the annualized expense ratio for the six-month period as indicated above—in the far right column—multiplied by the simple average account value over the period indicated, and then multiplied by 181/365 to reflect the one-half year period.
2. Reflects expenses after fee waivers and expense reimbursements. Does not include acquired fund fees and expenses.
| | | | |
| | | |
franklintempleton.com | | Semiannual Report | | 11 |
Franklin Convertible Securities Fund
This semiannual report for Franklin Convertible Securities Fund covers the period ended April 30, 2017.
Your Fund’s Goal and Main Investments
The Fund seeks to maximize total return, consistent with reasonable risk, by seeking to optimize capital appreciation and high current income under varying market conditions and investing at least 80% of its net assets in convertible securities.
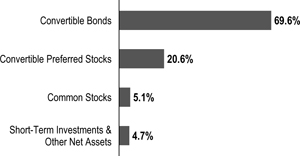
Portfolio Composition
Based on Total Net Assets as of 4/30/17
Performance Overview
For the six months under review, the Fund’s Class A shares delivered a +8.72% cumulative total return. In comparison, the Fund’s benchmark, the BofA Merrill Lynch (BofAML) All Total Return Alternatives U.S. Convertibles Index, which tracks the domestic convertible securities market, generated a +8.77% total return.1 You can find the Fund’s long-term performance data in the Performance Summary beginning on page 15.
Performance data represent past performance, which does not guarantee future results. Investment return and principal value will fluctuate, and you may have a gain or loss when you sell your shares. Current performance may differ from figures shown. For most recent month-end performance, go to franklintempleton.com or call (800) 342-5236.
Investment Strategy
When choosing convertible securities for the Fund, we attempt to maintain a balance in the portfolio between the equity and debt characteristics of convertible securities with an emphasis
on the equity features. We also consider the company’s long-term earnings, asset value and cash flow potential. Some of the convertible securities in which the Fund may invest have been structured to provide enhanced yield, increased equity exposure or enhanced downside protection. These securities typically provide a benefit to the issuer in exchange for the enhanced features, such as a conversion premium that is paid by the Fund. We may invest in convertible securities of companies of any capitalization size, but we generally seek to make the portfolio representative of the entire convertible securities market.
Manager’s Discussion
All the sectors the Fund invested in rose in value during the six months under review and supported performance. The information technology (IT), industrials and consumer discretionary sectors contributed most to Fund performance during the period. Within IT, the Fund’s holdings of convertible bonds issued by semiconductor processing systems manufacturer Novellus Systems (now owned by LAM Research), semiconductor manufacturer Micron Technology and interactive entertainment provider Take-Two Interactive Software aided performance. LAM Research benefited from a strong semiconductor environment, leading to increased demand for capital equipment. Flash memory chip manufacturers are converting to vertical chip architectures, which require more of LAM’s etch and deposition tools relative to prior versions. Large foundry customers like Taiwan Semiconductor Manufacturing are developing new leading-edge logic devices, a capital-intensive process.2 These factors have allowed LAM to grow at roughly twice the pace of the broader semiconductor equipment market, in our analysis. Micron’s shares rose amid firm pricing in both the dynamic random access memory and NAND flash memory markets. Pricing was strong due to constrained supply growth and solid demand from the personal computer, server and mobile phone markets, relative to expectations. In addition, Micron made good headway toward improving its 3-D NAND 64-layer product. Micron also reported significant upside to revenue and earnings-per-share expectations when it reported its February fiscal quarter. Take-Two’s share price increased significantly during the period, largely driven by a strong holiday season,
1. Source: BofA Merrill Lynch.
The index is unmanaged and includes reinvestment of any income or distributions. It does not reflect any fees, expenses or sales charges. One cannot invest directly in an index, and an index is not representative of the Fund’s portfolio.
2. Not a Fund holding.
See www.franklintempletondatasources.com for additional data provider information.
The dollar value, number of shares or principal amount, and names of all portfolio holdings are listed in the Fund’s Statement of Investments (SOI). The SOI begins on page 46.
| | | | |
| | | |
12 | | Semiannual Report | | franklintempleton.com |
FRANKLIN CONVERTIBLE SECURITIES FUND
continued growth in user engagement, and the successful launch of a highly anticipated title. In its most recent earnings call, management announced that the anticipated title Mafia III broke the company’s first-week sales record. Mafia III, along with strong user engagement in Grand Theft Auto Online and NBA 2K17, combined for an above expectations holiday season that achieved impressive growth in total sales.
Top 10 Holdings
4/30/17
| | |
Company Sector/Industry | | % of Total
Net Assets |
Liberty Media Corp. Consumer Discretionary | | 2.8% |
Microchip Technology Inc. Information Technology | | 2.4% |
Micron Technology Inc. Information Technology | | 2.2% |
Novellus Systems Inc. Information Technology | | 2.2% |
Mandatory Exchangeable Trust Information Technology | | 2.2% |
The Priceline Group Inc. Consumer Discretionary | | 2.2% |
Dish Network Corp. Consumer Discretionary | | 2.2% |
Post Holdings Inc. Consumer Staples | | 2.1% |
T-Mobile U.S. Inc. Telecommunication Services | | 2.1% |
Rexnord Corp. Industrials | | 2.0% |
In industrials, Arconic, a lightweight metals engineering and manufacturing company, and Stanley Black & Decker, a manufacturer of hand and power tools and electronic security systems, contributed to performance. Arconic, which separated from Alcoa2 at the start of the period, makes aluminum products for the aerospace, auto and other industries. Restructuring contributed to an operating loss in 2016’s last quarter, but better revenue and cost controls improved 2017’s first quarter. Shareholder activism leading to the replacement of Arconic’s chief executive officer (CEO) in April and a proxy vote in May about adding board members have investors watching closely. Stanley Black & Decker experienced increased sales helped by its acquisition of the Craftsman brand from Sears2 and the tools business of Newell Brands. Stanley also sold its struggling mechanical security business and increased its 2017 earnings guidance.
In the consumer discretionary sector, our convertibles in media company Liberty Interactive benefited performance. The
convertibles are exchangeable for common stock of Charter Communications, which provides TV, Internet and voice broadband communication services. The company benefited from strong growth in customer relationships, revenue and earnings that was helped by a number of acquisitions last year.
Elsewhere, the Fund’s positions in wireless telecommunications company T-Mobile U.S. contributed to performance in the telecommunication services sector, as did regional bank Wintrust Financial in the financials sector. T-Mobile has continued to gain market share, and the company’s shares were also boosted by speculation about potential merger-and-acquisition activity as the broadcaster auction came to a close at the end of April and would allow carriers like T-Mobile to start talking to one another without going against auction rules. Wintrust benefited from growth in loans, deposits and mortgage banking, as well as extremely good credit quality. In addition, rising short-term interest rates have helped most bank stock prices because investors believe that net interest margins will expand if short-term interest rates continue to rise. Corporate tax reform, if it happens, would also likely benefit bank stocks.
In contrast, several individual holdings detracted from the Fund’s absolute performance, including Frontier Communications in the telecommunication services sector, Palo Alto Networks in the information technology sector, and Teva Pharmaceutical Industries, Depomed and Novavax in the health care sector. Telecommunications company Frontier continued to have difficulty integrating the Verizon Communications2 assets it acquired in 2016. Frontier has not been able to stabilize the assets, which continued to lose subscribers and profitability. The inability of the company to stabilize the assets has put in question its dividend, which was eventually cut in the most recent quarter. Security solutions platform provider Palo Alto Networks struggled with sales execution during the October 2016 and January 2017 fiscal quarters after a large and ill-conceived sales reorganization during the October quarter. We believe the company is also struggling to move down market as Cisco Systems2 has improved its security portfolio and provided greater incentives to its channel. Although we remain confident that Palo Alto Networks is attractively valued, we have taken a more conservative view on how large this company can be in the future. Generic pharmaceuticals company Teva’s competitive dynamics worsened, as customer consolidation and new competition led to lower prices for generic drugs. The company’s acquisition of Actavis Generics from Allergan was a poor decision, in our view, as the transaction took longer than expected to close and was too expensive for the new realities of the generics industry. During
| | | | |
| | | |
franklintempleton.com | | Semiannual Report | | 13 |
FRANKLIN CONVERTIBLE SECURITIES FUND
the period, Teva’s three most senior executives resigned, which created significant uncertainty. Although specialty pharmaceutical company Depomed had record pain medicine sales in 2016, unrealized merger expectations, high debt, senior management changes and operating losses hinder the company. Vaccine developer Novavax experienced decreased revenue and a net loss for 2016, largely due to disappointing clinical trial results and increased research and development expenses. Tyson Foods, a food products manufacturer that hindered results in the consumer staples sector, announced the transition to a new CEO by the end of 2016. Although the company reported lower fiscal-year 2016 sales, earnings increased from the prior year and first-quarter 2017 sales and earnings also increased.
Thank you for your continued participation in Franklin Convertible Securities Fund. We look forward to serving your future investment needs.
The foregoing information reflects our analysis, opinions and portfolio holdings as of April 30, 2017, the end of the reporting period. The way we implement our main investment strategies and the resulting portfolio holdings may change depending on factors such as market and economic conditions. These opinions may not be relied upon as investment advice or an offer for a particular security. The information is not a complete analysis of every aspect of any market, country, industry, security or the Fund. Statements of fact are from sources considered reliable, but the investment manager makes no representation or warranty as to their completeness or accuracy. Although historical performance is no guarantee of future results, these insights may help you understand our investment management philosophy.
| | |
 | | 
Alan E. Muschott, CFA |
| | |
 | | 
Matthew D. Quinlan |
| |
| | Eric Webster, CFA |
| |
| | Portfolio Management Team |
| | | | |
| | | |
14 | | Semiannual Report | | franklintempleton.com |
FRANKLIN CONVERTIBLE SECURITIES FUND
Performance Summary as of April 30, 2017
The performance tables do not reflect any taxes that a shareholder would pay on Fund dividends, capital gain distributions, if any, or any realized gains on the sale of Fund shares. Total return reflects reinvestment of the Fund’s dividends and capital gain distributions, if any, and any unrealized gains or losses. Your dividend income will vary depending on dividends or interest paid by securities in the Fund’s portfolio, adjusted for operating expenses of each class. Capital gain distributions are net profits realized from the sale of portfolio securities.
Performance as of 4/30/171
Cumulative total return excludes sales charges. Average annual total return include maximum sales charges. Sales charges will vary depending on the size of the investment and the class of share purchased. The maximum is 5.75% and the minimum is 0%. Class A: 5.75% maximum initial sales charge; Advisor Class: no sales charges. For other share classes, visit franklintempleton.com.
| | | | |
| Share Class | | Cumulative Total Return2 | | Average Annual Total Return3 |
| | |
A | | | | |
6-Month | | +8.72% | | +2.48% |
1-Year | | +15.60% | | +8.95% |
5-Year | | +58.74% | | +8.39% |
10-Year | | +79.30% | | +5.38% |
| | |
Advisor4 | | | | |
6-Month | | +8.86% | | +8.86% |
1-Year | | +15.90% | | +15.90% |
5-Year | | +60.78% | | +9.96% |
10-Year | | +83.44% | | +6.25% |
| | | | | | | | | | | | |
| Share Class | | Distribution | | | 30-Day Standardized Yield6 | |
| | Rate5 | | | (with waiver) | | | (without waiver) | |
| | | |
A | | | 2.30% | | | | 1.33% | | | | 1.32% | |
Advisor | | | 2.68% | | | | 1.66% | | | | 1.64% | |
Performance data represent past performance, which does not guarantee future results. Investment return and principal value will fluctuate, and you may have a gain or loss when you sell your shares. Current performance may differ from figures shown. For most recent month-end performance, go to franklintempleton.com or call (800) 342-5236.
See page 16 for Performance Summary footnotes.
| | | | |
| | | |
franklintempleton.com | | Semiannual Report | | 15 |
FRANKLIN CONVERTIBLE SECURITIES FUND
PERFORMANCE SUMMARY
Distributions (11/1/16–4/30/17)
| | | | | | | | | | | | | | | | | | | | | | | | | | | | | | | | | | | | | | | | |
| Share Class | | Net Investment
Income | | | | | | | | | Short-Term
Capital Gain | | | | | | | | | Long-Term
Capital Gain | | | | | | | | | Total | |
A | | | $0.2588 | | | | | | | | | | | | $0.3076 | | | | | | | | | | | | $0.0334 | | | | | | | | | | | | $0.5998 | |
C | | | $0.1911 | | | | | | | | | | | | $0.3076 | | | | | | | | | | | | $0.0334 | | | | | | | | | | | | $0.5321 | |
R6 | | | $0.2930 | | | | | | | | | | | | $0.3076 | | | | | | | | | | | | $0.0334 | | | | | | | | | | | | $0.6340 | |
Advisor | | | $0.2827 | | | | | | | | | | | | $0.3076 | | | | | | | | | | | | $0.0334 | | | | | | | | | | | | $0.6237 | |
| | | | | | | |
Total Annual Operating Expenses7 | | | | | | | | | | | | | | | | | | | | | | | | | | | | | |
| | | | | | |
| Share Class | | With Waiver | | | Without Waiver |
A | | | 0.86% | | | 0.87% |
Advisor | | | 0.61% | | | 0.62% |
Each class of shares is available to certain eligible investors and has different annual fees and expenses, as described in the prospectus.
All investments involve risks, including possible loss of principal. Convertible securities are subject to the risks of stocks when the underlying stock price is high relative to the conversion price (because more of the security’s value resides in the conversion feature) and debt securities when the underlying stock price is low relative to the conversion price (because the conversion feature is less valuable). A convertible security is not as sensitive to interest rate changes as a similar non-convertible debt security, and generally has less potential for gain or loss than the underlying stock. The Fund may invest in high yielding, fixed income securities. High yields reflect the higher credit risk associated with these lower rated securities and, in some cases, the lower market prices for these instruments. Interest rate movements may affect the Fund’s share price and yield. Bond prices generally move in the opposite direction of interest rates. As prices of bonds in the Fund adjust to a rise in interest rates, the Fund’s share price may decline. The Fund may also invest in foreign securities, which involve special risks, including political uncertainty and currency volatility. The Fund is actively managed but there is no guarantee that the manager’s investment decisions will produce the desired results. The Fund’s prospectus also includes a description of the main investment risks.
1. The Fund has a fee waiver associated with any investment it makes in a Franklin Templeton money fund and/or other Franklin Templeton fund, contractually guaranteed through 2/28/18. Fund investment results reflect the fee waiver; without this waiver, the results would have been lower.
2. Cumulative total return represents the change in value of an investment over the periods indicated.
3. Average annual total return represents the average annual change in value of an investment over the periods indicated. Return for less than one year, if any, has not been annualized.
4. Effective 5/15/08, the Fund began offering Advisor Class shares, which do not have sales charges or a Rule 12b-1 plan. Performance quotations for this class reflect the following methods of calculation: (a) For periods prior to 5/15/08, a restated figure is used based upon the Fund’s Class A performance, excluding the effect of Class A’s maximum initial sales charge, but reflecting the effect of the Class A Rule 12b-1 fees; and (b) for periods after 5/15/08 actual Advisor Class performance is used reflecting all charges and fees applicable to that class. Since 5/15/08 (commencement of sales), the cumulative and average annual total returns of Advisor Class shares were +87.16% and +7.25%.
5. Distribution rate is based on the sum of the respective class’s past four quarterly dividends and the maximum offering price (NAV for Advisor Class) per share on 4/30/17.
6. The Fund’s 30-day standardized yield is calculated over a trailing 30-day period using the yield to maturity on bonds and/or the dividends accrued on stocks. It may not equal the Fund’s actual income distribution rate, which reflects the Fund’s past dividends paid to shareholders.
7. Figures are as stated in the Fund’s current prospectus and may differ from the expense ratios disclosed in the Your Fund’s Expenses and Financial Highlights sections in this report. In periods of market volatility, assets may decline significantly, causing total annual Fund operating expenses to become higher than the figures shown.
| | | | |
| | | |
16 | | Semiannual Report | | franklintempleton.com |
FRANKLIN CONVERTIBLE SECURITIES FUND
Your Fund’s Expenses
As a Fund shareholder, you can incur two types of costs: (1) transaction costs, including sales charges (loads) on Fund purchases and redemptions; and (2) ongoing Fund costs, including management fees, distribution and service (12b-1) fees, and other Fund expenses. All mutual funds have ongoing costs, sometimes referred to as operating expenses. The table below shows ongoing costs of investing in the Fund and can help you understand these costs and compare them with those of other mutual funds. The table assumes a $1,000 investment held for the six months indicated.
Actual Fund Expenses
The table below provides information about actual account values and actual expenses in the columns under the heading “Actual.” In these columns the Fund’s actual return, which includes the effect of Fund expenses, is used to calculate the “Ending Account Value” for each class of shares. You can estimate the expenses you paid during the period by following these steps (of course, your account value and expenses will differ from those in this illustration): Divide your account value by $1,000 (if your account had an $8,600 value, then $8,600 ÷ $1,000 = 8.6). Then multiply the result by the number in the row for your class of shares under the headings “Actual” and “Expenses Paid During Period” (if Actual Expenses Paid During Period were $7.50, then 8.6 x $7.50 = $64.50). In this illustration, the actual expenses paid this period are $64.50.
Hypothetical Example for Comparison with Other Funds
Under the heading “Hypothetical” in the table, information is provided about hypothetical account values and hypothetical expenses based on the Fund’s actual expense ratio and an assumed rate of return of 5% per year before expenses, which is not the Fund’s actual return. This information may not be used to estimate the actual ending account balance or expenses you paid for the period, but it can help you compare ongoing costs of investing in the Fund with those of other funds. To do so, compare this 5% hypothetical example for the class of shares you hold with the 5% hypothetical examples that appear in the shareholder reports of other funds.
Please note that expenses shown in the table are meant to highlight ongoing costs and do not reflect any transactional costs. Therefore, information under the heading “Hypothetical” is useful in comparing ongoing costs only, and will not help you compare total costs of owning different funds. In addition, if transactional costs were included, your total costs would have been higher.
| | | | | | | | | | | | | | | | | | |
| | | | | Actual (actual return after expenses) | | | | Hypothetical (5% annual return before expenses) | | | | |
Share
Class | | Beginning
Account
Value 11/1/16 | | | | Ending
Account
Value 4/30/17 | | Expenses Paid During
Period 11/1/16–4/30/171,2 | | | | Ending Account
Value 4/30/17 | | Expenses
Paid During
Period
11/1/16–4/30/171,2 | | | | Net Annualized Expense Ratio2 |
A | | $1,000 | | | | $1,087.20 | | $4.40 | | | | $1,020.58 | | $4.26 | | | | 0.85% |
C | | $1,000 | | | | $1,083.30 | | $8.26 | | | | $1,016.86 | | $8.00 | | | | 1.60% |
R6 | | $1,000 | | | | $1,089.30 | | $2.54 | | | | $1,022.36 | | $2.46 | | | | 0.49% |
Advisor | | $1,000 | | | | $1,088.60 | | $3.11 | | | | $1,021.82 | | $3.01 | | | | 0.60% |
1. Expenses are equal to the annualized expense ratio for the six-month period as indicated above–in the far right column–multiplied by the simple average account value over the period indicated, and then multiplied by 181/365 to reflect the one-half year period.
2. Reflects expenses after fee waivers and expense reimbursements. Does not include acquired fund fees and expenses.
| | | | |
| | | |
franklintempleton.com | | Semiannual Report | | 17 |
Franklin Equity Income Fund
This semiannual report for Franklin Equity Income Fund covers the period ended April 30, 2017.
Your Fund’s Goal and Main Investments
The Fund seeks to maximize total return, emphasizing high current income and long-term capital appreciation, consistent with reasonable risk, by investing at least 80% of its net assets in equity securities including securities convertible into common stocks. The Fund may invest up to 20% of its net assets in debt securities and may also invest in foreign securities, including emerging markets.
Performance Overview
For the six months under review, the Fund’s Class A shares delivered a +9.99% cumulative total return. In comparison, the Fund’s benchmark, the Standard & Poor’s 500 Index (S&P 500), which tracks the broad U.S. stock market, generated a +13.32% total return.1 The Fund’s peers, as measured by the Lipper Equity Income Funds Classification Average, which consists of funds chosen by Lipper that seek relatively high current income and growth of income by investing at least 60% of their portfolios in stocks, posted a +10.90% total return.2 You can find the Fund’s long-term performance data in the Performance Summary beginning on page 22.
Performance data represent past performance, which does not guarantee future results. Investment return and principal value will fluctuate, and you may have a gain or loss when you sell your shares. Current performance may differ from figures shown. For most recent month-end performance, go to franklintempleton.com or call (800) 342-5236.
Investment Strategy
We seek to invest in a broadly diversified portfolio of equity securities that we consider to be financially strong, with a focus on “blue chip” companies. We apply a bottom-up approach to investing in individual securities. We will assess the market price of a company’s securities relative to our evaluation of the company’s long-term earnings, asset value and cash flow potential. We also consider a company’s price/earnings ratio, profit margins, balance sheet and liquidation value. We consider dividend yield and the opportunity for dividend
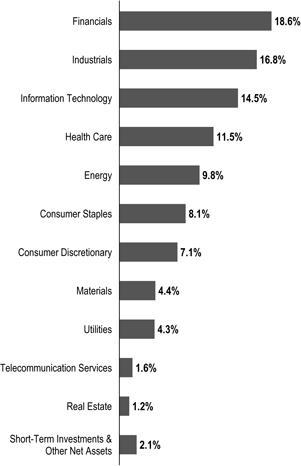
Portfolio Composition
Based on Total Net Assets as of 4/30/17
growth in selecting stocks for the Fund because we believe that, over time, dividend income can contribute significantly to total return and can be a more consistent source of investment return than capital appreciation. We seek to take advantage of price dislocations that result from the market’s short-term focus and choose to invest in those companies that, in our opinion, offer the best trade-off between growth opportunity, business and financial risk, and valuation.
Manager’s Discussion
All the sectors the Fund invested in rose in value during the six months under review and supported performance. The
1. Source: Morningstar.
2. Source: Lipper, a Thomson Reuters Company. For the 6-month period ended 4/30/17, this category consisted of 508 funds. Lipper calculations do not include sales charges, or expense subsidization by a fund’s manager. The Fund’s performance relative to the average may have differed if these and other factors had been considered.
The indexes are unmanaged and include reinvestment of any income or distributions. They do not include any fees, expenses or sales charges. One cannot invest directly in an index, and an index is not representative of the Fund’s portfolio.
The dollar value, number of shares or principal amount, and names of all portfolio holdings are listed in the Fund’s Statement of Investments (SOI). The SOI begins on page 55.
| | | | |
| | | |
18 | | Semiannual Report | | franklintempleton.com |
FRANKLIN EQUITY INCOME FUND
financials, industrials and information technology (IT) sectors contributed most to Fund returns during the period. Within financials, global banks JPMorgan Chase and Wells Fargo helped performance, as did capital markets firm Morgan Stanley. All three companies benefited as optimism increased that economic growth would improve, which could drive stronger loan growth and lower credit costs. The potential for higher interest rates and improved net interest income, due to higher inflation and stronger economic growth, also supported the shares, as did the potential for lower tax rates, which would benefit banks more than the broader market because of their relatively high tax rates and more domestic focus. In addition, investors believed the regulatory environment was likely to ease, thus reducing expenses, creating new revenue opportunities and freeing up capital to return to shareholders.
In industrials, Illinois Tool Works and Republic Services were notable contributors to results. Shares of industrial products and equipment manufacturer Illinois Tool Works performed well for the reporting period as the company reported another quarter well above analysts’ estimates and raised 2017 guidance. The company saw a nice turn upward in its core industrial businesses, in our view, and integration of its recent auto component supplier deal is going well. The company performed especially well amid increasing operating leverage driving significant earnings-per-share growth. Waste management company Republic Services grew revenue and earnings as it transitioned its annual contract price adjustments formerly based on the consumer price index to more favorable methods and advanced productivity and cost saving initiatives.
IT holdings that benefited the Fund’s performance included Microsoft and Apple. Microsoft, a software and IT services company, performed well during the period due to a more resilient personal computer spending environment, continued growth in enterprise Office 365 adoption, a rebound in growth of its legacy server business and sustained growth of its Azure cloud offering. We remain positive on Microsoft as the company transitions to the cloud and expands its share of IT spending. Technology hardware and software provider Apple performed well as the iPhone 7 cycle turned out to be better than expected. Additionally, Apple’s service revenue has continued to grow and investor anticipation of a strong iPhone 8 cycle is buoying sentiment toward the stock.
Elsewhere, contributors included Lowe’s in the consumer discretionary sector and International Paper in the materials sector. Home improvement retailer Lowe’s continued to benefit from strong demand for home improvement products. Paper and packaging firm International Paper delivered solid quarterly earnings during the period despite a challenging
Top 10 Holdings
4/30/17
| | |
Company Sector/Industry | | % of Total
Net Assets |
Microsoft Corp. Information Technology | | 3.8% |
JPMorgan Chase & Co. Financials | | 3.7% |
Wells Fargo & Co. Financials | | 2.9% |
U.S. Bancorp Financials | | 2.6% |
Chevron Corp. Energy | | 2.5% |
Apple Inc. Information Technology | | 2.5% |
PepsiCo Inc. Consumer Staples | | 2.4% |
General Electric Co. Industrials | | 2.4% |
Raytheon Co. Industrials | | 2.1% |
Medtronic PLC Health Care | | 2.0% |
operating environment including higher raw materials prices, maintenance outage expenses and an accident at its Pensacola mill. The company began to experience benefits from price increases and its December purchase of cellulose fiber pulp mills from Weyerhaeuser, and management expects improved results going forward resulting from several commercial and operational initiatives.
In contrast, several holdings in the consumer discretionary and telecommunication services sectors detracted from the Fund’s absolute performance during the six months under review. In consumer discretionary, detractors included toy maker Mattel, discount retailer Target and specialty retailer L Brands. Mattel suffered from an industry-wide challenge of lower-than-expected toy sales in the U.S. over the holiday season, which resulted in excess inventory coming into 2017, and these trends were exacerbated by unfavorable currency exchange dynamics. However, the company reported that its core brands continued to show solid growth and that momentum in high-growth markets like China was equally strong. Shares of Target were pressured after slow in-store sales during the holidays led to disappointing results. Target later sharply reduced its earnings outlook for 2017 as it planned to increase investment. L
| | | | |
| | | |
franklintempleton.com | | Semiannual Report | | 19 |
FRANKLIN EQUITY INCOME FUND
Brands3 experienced recent volatility, driven by a strategic initiative early last year to exit non-core categories at Victoria’s Secret. The initiative has driven negative comparable-store sales and a focus on core categories, with the goal of driving market share in the short run. This move has led to potential customer demand disruptions during a time when the environment has become more competitive and mall traffic continued to suffer. We have seen recovery in most segments of the company’s business. We continue to believe L Brands is a high-quality company that is going through a transition that has driven volatility but should benefit the business longer term.
In telecommunication services, wireless provider Verizon Communications hindered results. The company continued to face an increasingly competitive wireless environment as the industry moves to unlimited plans, which resulted in the company needing to reverse course on previous statements that such plans were unprofitable in the long run. Verizon also reported weak quarterly results that showed the financial impact of the competitive environment.
Elsewhere, notable detractors from the Fund’s performance included oil and gas exploration and production company Anadarko Petroleum, information and measurement company Nielsen Holdings,4 and retailer and pharmacy benefits manager CVS Health. Anadarko’s shares declined during the period following a 2016 rally capped by the decision in late November 2016 by the Organization of the Petroleum Exporting Countries (OPEC) to curtail production. Although the company sold several assets to increase cash to more than $6 billion, disappointing 2017 production guidance and uncertainty about how the company would deploy its large cash position weighed on the shares. In addition, crude oil prices failed to sustain positive momentum above $50 per barrel from the OPEC rally, as the OPEC supply cuts did not immediately translate into crude inventory declines, which pressured the industry in early 2017. Shares of CVS Health declined during the reporting period due to increasing scrutiny on the pharmacy benefit manager’s business model and uncertainty regarding the drug pricing environment. We believe the vertically integrated business model of CVS as a retailer and pharmacy benefits manager offers competitive advantages that could enable the company to capture an increasing share of health care spending in the long term. Nielsen’s consumer packaged goods measurement and data analytics business, particularly in the
U.S., has come under substantial pressure as customers are reducing costs to offset a combination of negligible market growth and eroding market share. The company’s shares declined amid disappointing quarterly results and outlook.
Thank you for your continued participation in Franklin Equity Income Fund. We look forward to serving your future investment needs.
| | |
| |
Matthew D. Quinlan |
| |
| |
Alan E. Muschott, CFA |
| |
| | Todd Brighton, CFA |
| |
| | Portfolio Management Team |
3. A new Fund holding.
4. Not held at period-end.
See www.franklintempletondatasources.com for additional data provider information.
| | | | |
| | | |
20 | | Semiannual Report | | franklintempleton.com |
FRANKLIN EQUITY INCOME FUND
The foregoing information reflects our analysis, opinions and portfolio holdings as of April 30, 2017, the end of the reporting period. The way we implement our main investment strategies and the resulting portfolio holdings may change depending on factors such as market and economic conditions. These opinions may not be relied upon as investment advice or an offer for a particular security. The information is not a complete analysis of every aspect of any market, country, industry, security or the Fund. Statements of fact are from sources considered reliable, but the investment manager makes no representation or warranty as to their completeness or accuracy. Although historical performance is no guarantee of future results, these insights may help you understand our investment management philosophy.
| | | | |
| | | |
franklintempleton.com | | Semiannual Report | | 21 |
FRANKLIN EQUITY INCOME FUND
Performance Summary as of April 30, 2017
The performance tables do not reflect any taxes that a shareholder would pay on Fund dividends, capital gain distributions, if any, or any realized gains on the sale of Fund shares. Total return reflects reinvestment of the Fund’s dividends and capital gain distributions, if any, and any unrealized gains or losses. Your dividend income will vary depending on dividends or interest paid by securities in the Fund’s portfolio, adjusted for operating expenses of each class. Capital gain distributions are net profits realized from the sale of portfolio securities.
Performance as of 4/30/171
Cumulative total return excludes sales charges. Average annual total return include maximum sales charges. Sales charges will vary depending on the size of the investment and the class of share purchased. The maximum is 5.75% and the minimum is 0%. Class A: 5.75% maximum initial sales charge; Advisor Class: no sales charges. For other share classes, visit franklintempleton.com.
| | | | |
Share Class | | Cumulative Total Return2 | | Average Annual Total Return3 |
| | |
A | | | | |
6-Month | | +9.99% | | +3.68% |
| | |
1-Year | | +13.70% | | +7.14% |
| | |
5-Year | | +68.09% | | +9.64% |
| | |
10-Year | | +59.75% | | +4.18% |
| | |
Advisor4 | | | | |
6-Month | | +10.17% | | +10.17% |
| | |
1-Year | | +13.97% | | +13.97% |
| | |
5-Year | | +70.30% | | +11.24% |
| | |
10-Year | | +63.51% | | +5.04% |
| | | | | | | | | | | | |
| | | Distribution | | | 30-Day Standardized Yield6 | |
| Share Class | | Rate5 | | | (with waiver) | | | (without waiver) | |
| | | |
A | | | 2.13% | | | | 1.62% | | | | 1.62% | |
| | | |
Advisor | | | 2.43% | | | | 1.97% | | | | 1.97% | |
Performance data represent past performance, which does not guarantee future results. Investment return and principal value will fluctuate, and you may have a gain or loss when you sell your shares. Current performance may differ from figures shown. For most recent month-end performance, go to franklintempleton.com or call (800) 342-5236.
See page 23 for Performance Summary footnotes.
| | | | |
| | | |
22 | | Semiannual Report | | franklintempleton.com |
FRANKLIN EQUITY INCOME FUND
PERFORMANCE SUMMARY
Distributions (11/1/16–4/30/17)
| | | | | | | | | | | | | | | | | | | | | | | | | | | | |
Share Class | | Net Investment
Income | | | | | | | | | Long-Term
Capital Gain | | | | | | | | | Total | |
A | | | $0.2923 | | | | | | | | | | | | $0.8885 | | | | | | | | | | | | $1.1808 | |
C | | | $0.2078 | | | | | | | | | | | | $0.8885 | | | | | | | | | | | | $1.0963 | |
R | | | $0.2683 | | | | | | | | | | | | $0.8885 | | | | | | | | | | | | $1.1568 | |
R6 | | | $0.3361 | | | | | | | | | | | | $0.8885 | | | | | | | | | | | | $1.2246 | |
Advisor | | | $0.3233 | | | | | | | | | | | | $0.8885 | | | | | | | | | | | | $1.2118 | |
Total Annual Operating Expenses7
| | |
| Share Class | | |
A | | 0.88% |
Advisor | | 0.63% |
Each class of shares is available to certain eligible investors and has different annual fees and expenses, as described in the prospectus.
All investments involve risks, including possible loss of principal. Stock prices fluctuate, sometimes rapidly and dramatically, due to factors affecting individual companies, particular industries or sectors, or general market conditions. Convertible securities are subject to the risks of stocks when the underlying stock price is high relative to the conversion price and debt securities when the underlying stock price is low relative to the conversion price. The Fund’s investment in foreign securities also involves special risks, including currency fluctuations and economic as well as political uncertainty. The Fund is actively managed but there is no guarantee that the manager’s investment decisions will produce the desired results. The Fund’s prospectus also includes a description of the main investment risks.
1. The Fund has a fee waiver associated with any investment it makes in a Franklin Templeton money fund and/or other Franklin Templeton Fund, contractually guaranteed through 2/28/18. Fund investment results reflect the fee waiver; without this waiver, the results would have been lower.
2. Cumulative total return represents the change in value of an investment over the periods indicated.
3. Average annual total return represents the average annual change in value of an investment over the periods indicated. Return for less than one year, if any, has not been annualized.
4. Effective 5/15/08, the Fund began offering Advisor Class shares, which do not have sales charges or a Rule 12b-1 plan. Performance quotations for this class reflect the following methods of calculation: (a) For periods prior to 5/15/08, a restated figure is used based upon the Fund’s Class A performance, excluding the effect of Class A’s maximum initial sales charge, but reflecting the effect of the Class A Rule 12b-1 fees; and (b) for periods after 5/15/08, actual Advisor Class performance is used reflecting all charges and fees applicable to that class. Since 5/15/08 (commencement of sales), the cumulative and average annual total returns of Advisor Class shares were +77.77% and +6.63%.
5. Distribution rate is based on an annualization of the respective class’s current quarterly dividend and the maximum offering price (NAV for Advisor Class) per share on 4/30/17.
6. The Fund’s 30-day standardized yield is calculated over a trailing 30-day period using the yield to maturity on bonds and/or the dividends accrued on stocks. It may not equal the Fund’s actual income distribution rate, which reflects the Fund’s past dividends paid to shareholders.
7. Figures are as stated in the Fund’s current prospectus and may differ from the expense ratios disclosed in the Your Fund’s Expenses and Financial Highlights sections in this report. In periods of market volatility, assets may decline significantly, causing total annual Fund operating expenses to become higher than the figures shown.
| | | | |
| | | |
franklintempleton.com | | Semiannual Report | | 23 |
FRANKLIN EQUITY INCOME FUND
Your Fund’s Expenses
As a Fund shareholder, you can incur two types of costs: (1) transaction costs, including sales charges (loads) on Fund purchases and redemptions; and (2) ongoing Fund costs, including management fees, distribution and service (12b-1) fees, and other Fund expenses. All mutual funds have ongoing costs, sometimes referred to as operating expenses. The table below shows ongoing costs of investing in the Fund and can help you understand these costs and compare them with those of other mutual funds. The table assumes a $1,000 investment held for the six months indicated.
Actual Fund Expenses
The table below provides information about actual account values and actual expenses in the columns under the heading “Actual.” In these columns the Fund’s actual return, which includes the effect of Fund expenses, is used to calculate the “Ending Account Value” for each class of shares. You can estimate the expenses you paid during the period by following these steps (of course, your account value and expenses will differ from those in this illustration): Divide your account value by $1,000 (if your account had an $8,600 value, then $8,600 ÷ $1,000 = 8.6). Then multiply the result by the number in the row for your class of shares under the headings “Actual” and “Expenses Paid During Period” (if Actual Expenses Paid During Period were $7.50, then 8.6 x $7.50 = $64.50). In this illustration, the actual expenses paid this period are $64.50.
Hypothetical Example for Comparison with Other Funds
Under the heading “Hypothetical” in the table, information is provided about hypothetical account values and hypothetical expenses based on the Fund’s actual expense ratio and an assumed rate of return of 5% per year before expenses, which is not the Fund’s actual return. This information may not be used to estimate the actual ending account balance or expenses you paid for the period, but it can help you compare ongoing costs of investing in the Fund with those of other funds. To do so, compare this 5% hypothetical example for the class of shares you hold with the 5% hypothetical examples that appear in the shareholder reports of other funds.
Please note that expenses shown in the table are meant to highlight ongoing costs and do not reflect any transactional costs. Therefore, information under the heading “Hypothetical” is useful in comparing ongoing costs only, and will not help you compare total costs of owning different funds. In addition, if transactional costs were included, your total costs would have been higher.
| | | | | | | | | | | | | | | | | | |
| | | | | | | Actual
(actual return after expenses) | | | | Hypothetical
(5% annual return before expenses) | | | | |
Share Class | | Beginning
Account Value 11/1/16 | | | | Ending Account Value 4/30/17 | | Expenses Paid During
Period 11/1/16–4/30/171,2 | | | | Ending
Account
Value 4/30/17 | | Expenses
Paid During
Period 11/1/16–4/30/171,2 | | | | Net Annualized Expense Ratio2 |
A | | $1,000 | | | | $1,099.90 | | $4.43 | | | | $1,020.58 | | $4.26 | | | | 0.85% |
C | | $1,000 | | | | $1,096.30 | | $8.32 | | | | $1,016.86 | | $8.00 | | | | 1.60% |
R | | $1,000 | | | | $1,098.80 | | $5.62 | | | | $1,019.44 | | $5.41 | | | | 1.08% |
R6 | | $1,000 | | | | $1,101.80 | | $2.50 | | | | $1,022.41 | | $2.41 | | | | 0.48% |
Advisor | | $1,000 | | | | $1,101.70 | | $3.13 | | | | $1,021.82 | | $3.01 | | | | 0.60% |
1. Expenses are equal to the annualized expense ratio for the six-month period as indicated above—in the far right column—multiplied by the simple average account value over the period indicated, and then multiplied by 181/365 to reflect the one-half year period.
2. Reflects expenses after fee waivers and expense reimbursements. Does not include acquired fund fees and expenses.
| | | | |
| | | |
24 | | Semiannual Report | | franklintempleton.com |
Franklin Real Return Fund
This semiannual report for Franklin Real Return Fund covers the period ended April 30, 2017.
Your Fund’s Goal and Main Investments
The Fund seeks total return that exceeds the rate of inflation over an economic cycle. Under normal market conditions, the Fund seeks to allocate assets among investments to achieve the highest level of real return (total return less the rate of inflation) consistent with an acceptable level of risk. The Fund shifts its investments among the following general asset classes: inflation-indexed securities and investment-grade and high yield fixed income securities issued by governments, corporations and municipal issuers; equity securities with high correlation to broad measures of inflation; and short-term non-dollar denominated debt securities.
Portfolio Composition*
Based on Total Net Assets as of 4/30/17
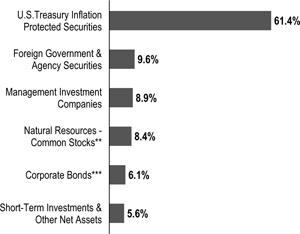
*Percentages reflect certain derivatives held in the portfolio (or their underlying reference assets) and may not total 100% or may be negative due to rounding, use of derivatives, unsettled trades or other factors.
**In the SOI, the natural resources sector comprises energy and materials. ***Includes Senior Floating Rate Interests.
Performance Overview
For the six months under review, the Fund’s Class A shares had a +0.98% cumulative total return. In comparison, the Barclays U.S. TIPS Index, which tracks the universe of inflation-protected notes issued by the U.S. Treasury that have at least
one year to final maturity, had a -0.19% total return.1 Also for comparison, the Consumer Price Index for All Urban Consumers - Non-Seasonally Adjusted (CPI-NSA), a measure of the average change in prices of all goods and services purchased for consumption by urban householders, rose 1.16% for the same period.2 You can find the Fund’s long-term performance data in the Performance Summary beginning on page 27.
Performance data represent past performance, which does not guarantee future results. Investment return and principal value will fluctuate, and you may have a gain or loss when you sell your shares. Current performance may differ from figures shown. For most recent month-end performance, go to franklintempleton.com or call (800) 342-5236.
Investment Strategy
Under normal market conditions, we will allocate the Fund’s assets among securities in various market sectors based on our assessment of changing economic, global market, industry and issuer conditions. When making our investment decisions, we use a “top-down” analysis of macroeconomic trends combined with a “bottom-up” fundamental analysis of market sectors, industries and issuers to try to take advantage of varying sector reactions to economic events. We will evaluate such criteria as country risk, business cycles, yield curves and values between and within markets.
|
|
What is the yield curve? The yield curve is a line that plots the interest rates, at a set point in time, of bonds having equal credit quality but differing maturity dates. The most frequently reported yield curve compares three-month, two-year and 30-year U.S. Treasury debt. |
Manager’s Discussion
U.S. economic indicators remained generally encouraging during the reporting period. Steady growth in manufacturing and services created jobs, boosting employment. The U.S. Federal Reserve increased its target rate twice, noting improved employment and higher inflation. Retail sales increased and home sales continued to grow but more slowly.
1. Source: Morningstar.
The indexes are unmanaged and include reinvestment of any income or distributions. They do not reflect any fees, expenses or sales charges. One cannot invest directly in an index, and an index is not representative of the Fund’s portfolio.
2. Source: Bureau of Labor Statistics, bls.gov/cpi.
See www.franklintempletondatasources.com for additional data provider information.
The dollar value, number of shares or principal amount, and names of all portfolio holdings are listed in the Fund’s Statement of Investments (SOI). The SOI begins on page 62.
| | | | |
| | | |
franklintempleton.com | | Semiannual Report | | 25 |
FRANKLIN REAL RETURN FUND
At period-end, more than half of total net assets were invested in Treasury Inflation Protected Securities (TIPS). For diversification, we also allocated the Fund’s assets to foreign government and agency securities, management investment companies, common stocks, repurchase agreements, corporate bonds, senior secured floating rate loans and short-term investments. We employed a non-U.S. dollar strategy to help hedge against potential U.S. dollar weakness versus certain currencies and concentrated our TIPS holdings in shorter maturities.
During the period, we increased the Fund’s allocations to TIPS and high yield corporate credit securities. In contrast, we decreased the Fund’s allocation to foreign government debt securities and senior secured floating rate loans. The Fund’s heaviest allocations were in TIPS and foreign government debt securities.
The Fund’s investments in foreign government bonds and TIPS helped results. In contrast, the Fund’s foreign currency exposure hindered Fund performance.
Thank you for your continued participation in Franklin Real Return Fund. We look forward to serving your future investment needs.
| | |
 | | 
T. Anthony Coffey, CFA |
| |
 | | 
Kent Burns, CFA |
| |
| | Portfolio Management Team |
The foregoing information reflects our analysis, opinions and portfolio holdings as of April 30, 2017, the end of the reporting period. The way we implement our main investment strategies and the resulting portfolio holdings may change depending on factors such as market and economic conditions. These opinions may not be relied upon as investment advice or an offer for a particular security. The information is not a complete analysis of every aspect of any market, country, industry, security or the Fund. Statements of fact are from sources considered reliable, but the investment manager makes no representation or warranty as to their completeness or accuracy. Although historical performance is no guarantee of future results, these insights may help you understand our investment management philosophy.
| | | | |
| | | |
26 | | Semiannual Report | | franklintempleton.com |
FRANKLIN REAL RETURN FUND
Performance Summary as of April 30, 2017
The performance tables do not reflect any taxes that a shareholder would pay on Fund dividends, capital gain distributions, if any, or any realized gains on the sale of Fund shares. Total return reflects reinvestment of the Fund’s dividends and capital gain distributions, if any, and any unrealized gains or losses. Your dividend income will vary depending on dividends or interest paid by securities in the Fund’s portfolio, adjusted for operating expenses of each class. Capital gain distributions are net profits realized from the sale of portfolio securities.
Performance as of 4/30/171
Cumulative total return excludes sales charges. Average annual total return include maximum sales charges. Sales charges will vary depending on the size of the investment and the class of share purchased. The maximum is 4.25% and the minimum is 0%. Class A: 4.25% maximum initial sales charge; Advisor Class: no sales charges. For other share classes, visit franklintempleton.com.
| | | | |
| Share Class | | Cumulative Total Return2 | | Average Annual Total Return3 |
| | |
A | | | | |
6-Month | | +0.98% | | -3.33% |
1-Year | | +2.19% | | -2.12% |
5-Year | | -0.33% | | -0.93% |
10-Year | | +23.24% | | +1.67% |
| | |
Advisor | | | | |
6-Month | | +1.11% | | +1.11% |
1-Year | | +2.42% | | +2.42% |
5-Year | | +0.84% | | +0.17% |
10-Year | | +26.36% | | +2.37% |
| | | | | | | | | | | | |
| | | Distribution | | | 30-Day Standardized Yield5 | |
| Share Class | | Rate4 | | | (with waiver) | | | (without waiver) | |
| | | |
A | | | 0.99% | | | | 1.58% | | | | 1.37% | |
| | | |
Advisor | | | 2.58% | | | | 1.91% | | | | 1.68% | |
Performance data represent past performance, which does not guarantee future results. Investment return and principal value will fluctuate, and you may have a gain or loss when you sell your shares. Current performance may differ from figures shown. For most recent month-end performance, go to franklintempleton.com or call (800) 342-5236.
See page 28 for Performance Summary footnotes.
| | | | |
| | | |
franklintempleton.com | | Semiannual Report | | 27 |
FRANKLIN REAL RETURN FUND
PERFORMANCE SUMMARY
Distributions (11/1/16–4/30/17)
| | | | |
| Share Class | | Net Investment
Income | |
A | | | $0.0088 | |
R6 | | | $0.0292 | |
Advisor | | | $0.0220 | |
Total Annual Operating Expenses6
| | | | | | |
| Share Class | | With Waiver | | | Without Waiver |
A | | | 0.93 | % | | 1.15% |
Advisor | | | 0.68 | % | | 0.90% |
Each class of shares is available to certain eligible investors and has different annual fees and expenses, as described in the prospectus.
All investments involve risks, including possible loss of principal. Interest rate movements will affect the Fund’s share price and yield. Bond prices generally move in the opposite direction of interest rates. As prices of bonds in a Fund adjust to a rise in interest rates, the Fund’s share price may decline. Foreign securities involve special risks, including currency fluctuations and economic and political uncertainties. Changes in the financial strength of a bond issuer or in a bond’s credit rating may affect its value. Stock prices fluctuate, sometimes rapidly and dramatically, due to factors affecting individual companies, particular industries or sectors, or general market conditions. The Fund is actively managed but there is no guarantee that the manager’s investment decisions will produce the desired results. The Fund’s prospectus also includes a description of the main investment risks.
1. The Fund has an expense reduction and a fee waiver associated with any investments it makes in a Franklin Templeton money fund and/or other Franklin Templeton fund, contractually guaranteed through 2/28/18. Fund investment results reflect the expense reduction and fee waiver; without these reductions, the results would have been lower.
2. Cumulative total return represents the change in value of an investment over the periods indicated.
3. Average annual total return represents the average annual change in value of an investment over the periods indicated. Return for less than one year, if any, has not been annualized.
4. Distribution rate is based on an annualization of the respective class’s April dividend and the maximum offering price (NAV for Advisor Class) per share on 4/30/17.
5. The Fund’s 30-day standardized yield is calculated over a trailing 30-day period using the yield to maturity on bonds and/or the dividends accrued on stocks. It may not equal the Fund’s actual income distribution rate, which reflects the Fund’s past dividends paid to shareholders.
6. Figures are as stated in the Fund’s current prospectus and may differ from the expense ratios disclosed in the Your Fund’s Expenses and Financial Highlights sections in this report. In periods of market volatility, assets may decline significantly, causing total annual Fund operating expenses to become higher than the figures shown.
| | | | |
| | | |
28 | | Semiannual Report | | franklintempleton.com |
FRANKLIN REAL RETURN FUND
Your Fund’s Expenses
As a Fund shareholder, you can incur two types of costs: (1) transaction costs, including sales charges (loads) on Fund purchases and redemptions; and (2) ongoing Fund costs, including management fees, distribution and service (12b-1) fees, and other Fund expenses. All mutual funds have ongoing costs, sometimes referred to as operating expenses. The table below shows ongoing costs of investing in the Fund and can help you understand these costs and compare them with those of other mutual funds. The table assumes a $1,000 investment held for the six months indicated.
Actual Fund Expenses
The table below provides information about actual account values and actual expenses in the columns under the heading “Actual.” In these columns the Fund’s actual return, which includes the effect of Fund expenses, is used to calculate the “Ending Account Value” for each class of shares. You can estimate the expenses you paid during the period by following these steps (of course, your account value and expenses will differ from those in this illustration): Divide your account value by $1,000 (if your account had an $8,600 value, then $8,600 ÷ $1,000 = 8.6). Then multiply the result by the number in the row for your class of shares under the headings “Actual” and “Expenses Paid During Period” (if Actual Expenses Paid During Period were $7.50, then 8.6 x $7.50 = $64.50). In this illustration, the actual expenses paid this period are $64.50.
Hypothetical Example for Comparison with Other Funds
Under the heading “Hypothetical” in the table, information is provided about hypothetical account values and hypothetical expenses based on the Fund’s actual expense ratio and an assumed rate of return of 5% per year before expenses, which is not the Fund’s actual return. This information may not be used to estimate the actual ending account balance or expenses you paid for the period, but it can help you compare ongoing costs of investing in the Fund with those of other funds. To do so, compare this 5% hypothetical example for the class of shares you hold with the 5% hypothetical examples that appear in the shareholder reports of other funds.
Please note that expenses shown in the table are meant to highlight ongoing costs and do not reflect any transactional costs. Therefore, information under the heading “Hypothetical” is useful in comparing ongoing costs only, and will not help you compare total costs of owning different funds. In addition, if transactional costs were included, your total costs would have been higher.
| | | | | | | | | | | | |
| | | | | Actual
(actual return after expenses) | | Hypothetical
(5% annual return before expenses) | | |
Share Class | | Beginning
Account
Value 11/1/16 | | Ending
Account
Value 4/30/17 | | Expenses Paid During
Period 11/1/16–4/30/171,2 | | Ending
Account
Value 4/30/17 | | Expenses Paid During
Period 11/1/16–4/30/171,2 | | Net Annualized
Expense Ratio2 |
| | | | | | |
A | | $1,000 | | $1,009.80 | | $4.48 | | $1,020.33 | | $4.51 | | 0.90% |
C | | $1,000 | | $1,008.00 | | $6.52 | | $1,018.30 | | $6.56 | | 1.31% |
R6 | | $1,000 | | $1,011.70 | | $2.44 | | $1,022.36 | | $2.46 | | 0.49% |
Advisor | | $1,000 | | $1,011.10 | | $3.24 | | $1,021.57 | | $3.26 | | 0.65% |
1. Expenses are equal to the annualized expense ratio for the six-month period as indicated above—in the far right column—multiplied by the simple average account value over the period indicated, and then multiplied by 181/365 to reflect the one-half year period.
2. Reflects expenses after fee waivers and expense reimbursements. Does not include acquired fund fees and expenses.
| | | | |
| | | |
franklintempleton.com | | Semiannual Report | | 29 |
FRANKLIN INVESTORS SECURITIES TRUST
Financial Highlights
Franklin Balanced Fund
| | | | | | | | | | | | | | | | | | | | | | | | |
| | | Six Months Ended April 30, 2017 (unaudited) | | | | | | | | | | | | | | | | |
| | | | Year Ended October 31, | |
| | | | 2016 | | | 2015 | | | 2014 | | | 2013 | | | 2012 | |
Class A | | | | | | | | | | | | | | | | | | | | | | | | |
| | | | | | |
Per share operating performance | | | | | | | | | | | | | | | | | | | | | | | | |
| | | | | | |
(for a share outstanding throughout the period) | | | | | | | | | | | | | | | | | | | | | | | | |
| | | | | | |
Net asset value, beginning of period | | | $11.65 | | | | $11.40 | | | | $11.86 | | | | $11.43 | | | | $10.64 | | | | $9.87 | |
| | | | | | |
Income from investment operationsa: | | | | | | | | | | | | | | | | | | | | | | | | |
| | | | | | |
Net investment incomeb | | | 0.14 | | | | 0.30 | | | | 0.30 | | | | 0.31 | c | | | 0.27 | | | | 0.30 | |
| | | | | | |
Net realized and unrealized gains (losses) | | | 0.58 | | | | 0.31 | | | | (0.24 | ) | | | 0.65 | | | | 1.02 | | | | 0.83 | |
| | | | | | |
Total from investment operations | | | 0.72 | | | | 0.61 | | | | 0.06 | | | | 0.96 | | | | 1.29 | | | | 1.13 | |
| | | | | | |
Less distributions from: | | | | | | | | | | | | | | | | | | | | | | | | |
| | | | | | |
Net investment income | | | (0.18 | ) | | | (0.36 | ) | | | (0.36 | ) | | | (0.36 | ) | | | (0.36 | ) | | | (0.36 | ) |
| | | | | | |
Net realized gains | | | (0.17 | ) | | | (— | )d | | | (0.16 | ) | | | (0.17 | ) | | | (0.14 | ) | | | (— | )d |
| | | | | | |
Total distributions | | | (0.35 | ) | | | (0.36 | ) | | | (0.52 | ) | | | (0.53 | ) | | | (0.50 | ) | | | (0.36 | ) |
| | | | | | |
Net asset value, end of period | | | $12.02 | | | | $11.65 | | | | $11.40 | | | | $11.86 | | | | $11.43 | | | | $10.64 | |
| | | | | | |
Total returne | | | 6.24% | | | | 5.54% | | | | 0.51% | | | | 8.66% | | | | 12.51% | | | | 11.70% | |
| | | | | | |
Ratios to average net assetsf | | | | | | | | | | | | | | | | | | | | | | | | |
| | | | | | |
Expenses before waiver and payments by affiliates | | | 1.01% | | | | 1.02% | | | | 1.06% | | | | 1.09% | | | | 1.12% | | | | 1.15% | |
| | | | | | |
Expenses net of waiver and payments by affiliates | | | 0.99% | g | | | 1.01% | g | | | 1.06% | g,h | | | 1.09% | g,h | | | 1.10% | g | | | 1.01% | |
| | | | | | |
Net investment income | | | 2.36% | | | | 2.62% | | | | 2.56% | | | | 2.64% | c | | | 2.51% | | | | 2.95% | |
| | | | | | |
Supplemental data | | | | | | | | | | | | | | | | | | | | | | | | |
| | | | | | |
Net assets, end of period (000’s) | | | $2,633,337 | | | | $2,532,459 | | | | $2,371,133 | | | | $2,053,623 | | | | $1,354,710 | | | | $627,287 | |
| | | | | | |
Portfolio turnover rate | | | 12.05% | | | | 46.03% | | | | 69.23% | | | | 40.54% | | | | 58.52% | | | | 58.59% | |
aThe amount shown for a share outstanding throughout the period may not correlate with the Statement of Operations for the period due to the timing of sales and repurchases of the Fund’s shares in relation to income earned and/or fluctuating fair value of the investments of the Fund.
bBased on average daily shares outstanding.
cNet investment income per share includes approximately $0.03 per share related to income received in the form of a special dividend in connection with certain Fund holdings. Excluding this amount, the ratio of net investment income to average net assets would have been 2.39%.
dAmount rounds to less than $0.01 per share.
eTotal return does not reflect sales commissions or contingent deferred sales charges, if applicable, and is not annualized for periods less than one year.
fRatios are annualized for periods less than one year.
gBenefit of expense reduction rounds to less than 0.01%.
hBenefit of waiver and payments by affiliates rounds to less than 0.01%.
| | | | |
| | | |
30 | | Semiannual Report | The accompanying notes are an integral part of these financial statements. | | franklintempleton.com |
FRANKLIN INVESTORS SECURITIES TRUST
FINANCIAL HIGHLIGHTS
Franklin Balanced Fund (continued)
| | | | | | | | | | | | | | | | | | | | | | | | |
| | | Six Months Ended April 30, 2017 (unaudited) | | | Year Ended October 31, | |
| | | | 2016 | | | 2015 | | | 2014 | | | 2013 | | | 2012 | |
Class C | | | | | | | | | | | | | | | | | | | | | | | | |
| | | | | | |
Per share operating performance | | | | | | | | | | | | | | | | | | | | | | | | |
| | | | | | |
(for a share outstanding throughout the period) | | | | | | | | | | | | | | | | | | | | | | | | |
| | | | | | |
Net asset value, beginning of period | | | $11.55 | | | | $11.31 | | | | $11.77 | | | | $11.34 | | | | $10.57 | | | | $9.81 | |
| | | | | | |
Income from investment operationsa: | | | | | | | | | | | | | | | | | | | | | | | | |
| | | | | | |
Net investment incomeb | | | 0.10 | | | | 0.21 | | | | 0.21 | | | | 0.23 | c | | | 0.20 | | | | 0.23 | |
| | | | | | |
Net realized and unrealized gains (losses) | | | 0.57 | | | | 0.31 | | | | (0.23 | ) | | | 0.65 | | | | 0.99 | | | | 0.82 | |
| | | | | | |
Total from investment operations | | | 0.67 | | | | 0.52 | | | | (0.02 | ) | | | 0.88 | | | | 1.19 | | | | 1.05 | |
| | | | | | |
Less distributions from: | | | | | | | | | | | | | | | | | | | | | | | | |
| | | | | | |
Net investment income | | | (0.14 | ) | | | (0.28 | ) | | | (0.28 | ) | | | (0.28 | ) | | | (0.28 | ) | | | (0.29 | ) |
| | | | | | |
Net realized gains | | | (0.17 | ) | | | (— | )d | | | (0.16 | ) | | | (0.17 | ) | | | (0.14 | ) | | | (— | )d |
| | | | | | |
Total distributions | | | (0.31 | ) | | | (0.28 | ) | | | (0.44 | ) | | | (0.45 | ) | | | (0.42 | ) | | | (0.29 | ) |
| | | | | | |
Net asset value, end of period | | | $11.91 | | | | $11.55 | | | | $11.31 | | | | $11.77 | | | | $11.34 | | | | $10.57 | |
| | | | | | |
Total returne | | | 5.90% | | | | 4.73% | | | | (0.20)% | | | | 7.97% | | | | 11.62% | | | | 10.91% | |
| | | | | | |
Ratios to average net assetsf | | | | | | | | | | | | | | | | | | | | | | | | |
| | | | | | |
Expenses before waiver and payments by affiliates | | | 1.76% | | | | 1.77% | | | | 1.77% | | | | 1.79% | | | | 1.82% | | | | 1.85% | |
| | | | | | |
Expenses net of waiver and payments by affiliates | | | 1.74% | g | | | 1.76% | g | | | 1.77% | g,h | | | 1.79% | g,h | | | 1.80% | g | | | 1.71% | |
| | | | | | |
Net investment income | | | 1.61% | | | | 1.87% | | | | 1.85% | | | | 1.94% | c | | | 1.81% | | | | 2.25% | |
| | | | | | |
Supplemental data | | | | | | | | | | | | | | | | | | | | | | | | |
| | | | | | |
Net assets, end of period (000’s) | | | $663,322 | | | | $630,110 | | | | $563,419 | | | | $492,514 | | | | $354,359 | | | | $187,991 | |
| | | | | | |
Portfolio turnover rate | | | 12.05% | | | | 46.03% | | | | 69.23% | | | | 40.54% | | | | 58.52% | | | | 58.59% | |
aThe amount shown for a share outstanding throughout the period may not correlate with the Statement of Operations for the period due to the timing of sales and repurchases of the Fund’s shares in relation to income earned and/or fluctuating fair value of the investments of the Fund.
bBased on average daily shares outstanding.
cNet investment income per share includes approximately $0.03 per share related to income received in the form of a special dividend in connection with certain Fund holdings. Excluding this amount, the ratio of net investment income to average net assets would have been 1.69%.
dAmount rounds to less than $0.01 per share.
eTotal return does not reflect sales commissions or contingent deferred sales charges, if applicable, and is not annualized for periods less than one year.
fRatios are annualized for periods less than one year.
gBenefit of expense reduction rounds to less than 0.01%.
hBenefit of waiver and payments by affiliates rounds to less than 0.01%.
| | | | |
| | | |
franklintempleton.com | | The accompanying notes are an integral part of these financial statements. | Semiannual Report | | 31 |
FRANKLIN INVESTORS SECURITIES TRUST
FINANCIAL HIGHLIGHTS
Franklin Balanced Fund (continued)
| | | | | | | | | | | | | | | | | | | | | | | | |
| | | Six Months Ended April 30, 2017 (unaudited) | | | Year Ended October 31, | |
| | | | 2016 | | | 2015 | | | 2014 | | | 2013 | | | 2012 | |
Class R | | | | | | | | | | | | | | | | | | | | | | | | |
| | | | | | |
Per share operating performance | | | | | | | | | | | | | | | | | | | | | | | | |
| | | | | | |
(for a share outstanding throughout the period) | | | | | | | | | | | | | | | | | | | | | | | | |
| | | | | | |
Net asset value, beginning of period | | | $11.67 | | | | $11.42 | | | | $11.89 | | | | $11.45 | | | | $10.66 | | | | $9.89 | |
| | | | | | |
Income from investment operationsa: | | | | | | | | | | | | | | | | | | | | | | | | |
| | | | | | |
Net investment incomeb | | | 0.12 | | | | 0.27 | | | | 0.27 | | | | 0.29 | c | | | 0.26 | | | | 0.29 | |
| | | | | | |
Net realized and unrealized gains (losses) | | | 0.60 | | | | 0.32 | | | | (0.24 | ) | | | 0.66 | | | | 1.01 | | | | 0.82 | |
| | | | | | |
Total from investment operations | | | 0.72 | | | | 0.59 | | | | 0.03 | | | | 0.95 | | | | 1.27 | | | | 1.11 | |
| | | | | | |
Less distributions from: | | | | | | | | | | | | | | | | | | | | | | | | |
| | | | | | |
Net investment income | | | (0.17 | ) | | | (0.34 | ) | | | (0.34 | ) | | | (0.34 | ) | | | (0.34 | ) | | | (0.34 | ) |
| | | | | | |
Net realized gains | | | (0.17 | ) | | | (— | )d | | | (0.16 | ) | | | (0.17 | ) | | | (0.14 | ) | | | (— | )d |
| | | | | | |
Total distributions | | | (0.34 | ) | | | (0.34 | ) | | | (0.50 | ) | | | (0.51 | ) | | | (0.48 | ) | | | (0.34 | ) |
| | | | | | |
Net asset value, end of period | | | $12.05 | | | | $11.67 | | | | $11.42 | | | | $11.89 | | | | $11.45 | | | | $10.66 | |
| | | | | | |
Total returne | | | 6.18% | | | | 5.28% | | | | 0.21% | | | | 8.51% | | | | 12.26% | | | | 11.46% | |
| | | | | | |
Ratios to average net assetsf | | | | | | | | | | | | | | | | | | | | | | | | |
| | | | | | |
Expenses before waiver and payments by affiliates | | | 1.26% | | | | 1.27% | | | | 1.27% | | | | 1.29% | | | | 1.32% | | | | 1.35% | |
| | | | | | |
Expenses net of waiver and payments by affiliates | | | 1.24% | g | | | 1.26% | g | | | 1.27% | g,h | | | 1.29% | g,h | | | 1.30% | g | | | 1.21% | |
| | | | | | |
Net investment income | | | 2.11% | | | | 2.39% | | | | 2.35% | | | | 2.44% | c | | | 2.31% | | | | 2.75% | |
| | | | | | |
Supplemental data | | | | | | | | | | | | | | | | | | | | | | | | |
| | | | | | |
Net assets, end of period (000’s) | | | $5,179 | | | | $4,482 | | | | $4,699 | | | | $3,598 | | | | $3,253 | | | | $2,378 | |
| | | | | | |
Portfolio turnover rate | | | 12.05% | | | | 46.03% | | | | 69.23% | | | | 40.54% | | | | 58.52% | | | | 58.59% | |
aThe amount shown for a share outstanding throughout the period may not correlate with the Statement of Operations for the period due to the timing of sales and repurchases of the Fund’s shares in relation to income earned and/or fluctuating fair value of the investments of the Fund.
bBased on average daily shares outstanding.
cNet investment income per share includes approximately $0.03 per share related to income received in the form of a special dividend in connection with certain Fund holdings. Excluding this amount, the ratio of net investment income to average net assets would have been 2.19%.
dAmount rounds to less than $0.01 per share.
eTotal return is not annualized for periods less than one year.
fRatios are annualized for periods less than one year.
gBenefit of expense reduction rounds to less than 0.01%.
hBenefit of waiver and payments by affiliates rounds to less than 0.01%.
| | | | |
| | | |
32 | | Semiannual Report | The accompanying notes are an integral part of these financial statements. | | franklintempleton.com |
FRANKLIN INVESTORS SECURITIES TRUST
FINANCIAL HIGHLIGHTS
Franklin Balanced Fund (continued)
| | | | | | | | | | | | | | | | | | | | |
| | | Six Months Ended April 30, 2017 (unaudited) | | | Year Ended October 31, | |
| | | | 2016 | | | 2015 | | | 2014 | | | 2013a | |
Class R6 | | | | | | | | | | | | | | | | | | | | |
| | | | | |
Per share operating performance | | | | | | | | | | | | | | | | | | | | |
| | | | | |
(for a share outstanding throughout the period) | | | | | | | | | | | | | | | | | | | | |
| | | | | |
Net asset value, beginning of period | | | $11.67 | | | | $11.42 | | | | $11.89 | | | | $11.45 | | | | $11.08 | |
| | | | | |
Income from investment operationsb: | | | | | | | | | | | | | | | | | | | | |
| | | | | |
Net investment incomec | | | 0.14 | | | | 0.34 | | | | 0.35 | | | | 0.37d | | | | 0.19 | |
| | | | | |
Net realized and unrealized gains (losses) | | | 0.60 | | | | 0.31 | | | | (0.25) | | | | 0.65 | | | | 0.38 | |
| | | | | |
Total from investment operations | | | 0.74 | | | | 0.65 | | | | 0.10 | | | | 1.02 | | | | 0.57 | |
| | | | | |
Less distributions from: | | | | | | | | | | | | | | | | | | | | |
| | | | | |
Net investment income | | | (0.20 | ) | | | (0.40 | ) | | | (0.41 | ) | | | (0.41 | ) | | | (0.20 | ) |
| | | | | |
Net realized gains | | | (0.17) | | | | (—)e | | | | (0.16) | | | | (0.17) | | | | — | |
| | | | | |
Total distributions | | | (0.37) | | | | (0.40) | | | | (0.57) | | | | (0.58) | | | | (0.20) | |
| | | | | |
Net asset value, end of period | | | $12.04 | | | | $11.67 | | | | $11.42 | | | | $11.89 | | | | $11.45 | |
| | | | | |
Total returnf | | | 6.50% | | | | 5.90% | | | | 0.81% | | | | 9.29% | | | | 5.15% | |
| | | | | |
Ratios to average net assetsg | | | | | | | | | | | | | | | | | | | | |
| | | | | |
Expenses before waiver and payments by affiliates | | | 0.70% | | | | 0.73% | | | | 0.70% | | | | 0.68% | | | | 1.82% | |
| | | | | |
Expenses net of waiver and payments by affiliatesh | | | 0.64% | | | | 0.66% | | | | 0.67% | | | | 0.68%i | | | | 0.70% | |
| | | | | |
Net investment income | | | 2.71% | | | | 2.99% | | | | 2.95% | | | | 3.05%d | | | | 2.91% | |
| | | | | |
Supplemental data | | | | | | | | | | | | | | | | | | | | |
| | | | | |
Net assets, end of period (000’s) | | | $608 | | | | $233 | | | | $221 | | | | $513 | | | | $5 | |
| | | | | |
Portfolio turnover rate | | | 12.05% | | | | 46.03% | | | | 69.23% | | | | 40.54% | | | | 58.52% | |
aFor the period May 1, 2013 (effective date) to October 31, 2013.
bThe amount shown for a share outstanding throughout the period may not correlate with the Statement of Operations for the period due to the timing of sales and repurchases of the Fund’s shares in relation to income earned and/or fluctuating fair value of the investments of the Fund.
cBased on average daily shares outstanding.
dNet investment income per share includes approximately $0.03 per share related to income received in the form of a special dividend in connection with certain Fund holdings. Excluding this amount, the ratio of net investment income to average net assets would have been 2.80%.
eAmount rounds to less than $0.01 per share.
fTotal return is not annualized for periods less than one year.
gRatios are annualized for periods less than one year.
hBenefit of expense reduction rounds to less than 0.01%.
iBenefit of waiver and payments by affiliates rounds to less than 0.01%.
| | | | |
| | | |
franklintempleton.com | | The accompanying notes are an integral part of these financial statements. | Semiannual Report | | 33 |
FRANKLIN INVESTORS SECURITIES TRUST
FINANCIAL HIGHLIGHTS
Franklin Balanced Fund (continued)
| | | | | | | | | | | | | | | | | | | | | | | | |
| | | Six Months Ended April 30, 2017 (unaudited) | | | Year Ended October 31, | |
| | | | 2016 | | | 2015 | | | 2014 | | | 2013 | | | 2012 | |
Advisor Class | | | | | | | | | | | | | | | | | | | | | | | | |
| | | | | | |
Per share operating performance | | | | | | | | | | | | | | | | | | | | | | | | |
| | | | | | |
(for a share outstanding throughout the period) | | | | | | | | | | | | | | | | | | | | | | | | |
| | | | | | |
Net asset value, beginning of period | | | $11.67 | | | | $11.42 | | | | $11.88 | | | | $11.45 | | | | $10.66 | | | | $9.89 | |
| | | | | | |
Income from investment operationsa: | | | | | | | | | | | | | | | | | | | | | | | | |
| | | | | | |
Net investment incomeb | | | 0.15 | | | | 0.29 | | | | 0.33 | | | | 0.35 | c | | | 0.30 | | | | 0.34 | |
| | | | | | |
Net realized and unrealized gains (losses) | | | 0.58 | | | | 0.35 | | | | (0.24 | ) | | | 0.65 | | | | 1.02 | | | | 0.82 | |
| | | | | | |
Total from investment operations | | | 0.73 | | | | 0.64 | | | | 0.09 | | | | 1.00 | | | | 1.32 | | | | 1.16 | |
| | | | | | |
Less distributions from: | | | | | | | | | | | | | | | | | | | | | | | | |
| | | | | | |
Net investment income | | | (0.19 | ) | | | (0.39 | ) | | | (0.39 | ) | | | (0.40 | ) | | | (0.39 | ) | | | (0.39 | ) |
| | | | | | |
Net realized gains | | | (0.17 | ) | | | (— | )d | | | (0.16 | ) | | | (0.17 | ) | | | (0.14 | ) | | | (— | )d |
| | | | | | |
Total distributions | | | (0.36 | ) | | | (0.39 | ) | | | (0.55 | ) | | | (0.57 | ) | | | (0.53 | ) | | | (0.39 | ) |
| | | | | | |
Net asset value, end of period | | | $12.04 | | | | $11.67 | | | | $11.42 | | | | $11.88 | | | | $11.45 | | | | $10.66 | |
| | | | | | |
Total returne | | | 6.44% | | | | 5.79% | | | | 0.81% | | | | 8.97% | | | | 12.82% | | | | 12.01% | |
| | | | | | |
Ratios to average net assetsf | | | | | | | | | | | | | | | | | | | | | | | | |
| | | | | | |
Expenses before waiver and payments by affiliates | | | 0.76% | | | | 0.77% | | | | 0.77% | | | | 0.79% | | | | 0.82% | | | | 0.85% | |
| | | | | | |
Expenses net of waiver and payments by affiliates | | | 0.74% | g | | | 0.76% | g | | | 0.77% | g,h | | | 0.79% | g,h | | | 0.80% | g | | | 0.71% | |
| | | | | | |
Net investment income | | | 2.61% | | | | 2.87% | | | | 2.85% | | | | 2.94% | c | | | 2.81% | | | | 3.25% | |
| | | | | | |
Supplemental data | | | | | | | | | | | | | | | | | | | | | | | | |
| | | | | | |
Net assets, end of period (000’s) | | | $201,900 | | | | $138,111 | | | | $54,881 | | | | $41,494 | | | | $68,201 | | | | $13,779 | |
| | | | | | |
Portfolio turnover rate | | | 12.05% | | | | 46.03% | | | | 69.23% | | | | 40.54% | | | | 58.52% | | | | 58.59% | |
aThe amount shown for a share outstanding throughout the period may not correlate with the Statement of Operations for the period due to the timing of sales and repurchases of the Fund’s shares in relation to income earned and/or fluctuating fair value of the investments of the Fund.
bBased on average daily shares outstanding.
cNet investment income per share includes approximately $0.03 per share related to income received in the form of a special dividend in connection with certain Fund holdings. Excluding this amount, the ratio of net investment income to average net assets would have been 2.69%.
dAmount rounds to less than $0.01 per share.
eTotal return is not annualized for periods less than one year.
fRatios are annualized for periods less than one year.
gBenefit of expense reduction rounds to less than 0.01%.
hBenefit of waiver and payments by affiliates rounds to less than 0.01%.
| | | | |
| | | |
34 | | Semiannual Report | The accompanying notes are an integral part of these financial statements. | | franklintempleton.com |
FRANKLIN INVESTORS SECURITIES TRUST
Statement of Investments, April 30, 2017 (unaudited)
| | | | | | | | | | | | |
Franklin Balanced Fund | | | | | | | | | | | | |
| | | Country | | | Shares | | | Value | |
Common Stocks 44.2% | | | | | | | | | | | | |
Consumer Discretionary 4.5% | | | | | | | | | | | | |
Ford Motor Co. | | | United States | | | | 3,500,000 | | | $ | 40,145,000 | |
General Motors Co. | | | United States | | | | 1,000,000 | | | | 34,640,000 | |
Lowe’s Cos. Inc. | | | United States | | | | 600,000 | | | | 50,928,000 | |
Nordstrom Inc. | | | United States | | | | 250,000 | | | | 12,067,500 | |
Target Corp. | | | United States | | | | 350,000 | | | | 19,547,500 | |
| | | | | | | | | | | | |
| | | | | | | | | | | 157,328,000 | |
| | | | | | | | | | | | |
Consumer Staples 5.7% | | | | | | | | | | | | |
Anheuser-Busch InBev SA/NV, ADR | | | Belgium | | | | 300,000 | | | | 33,972,000 | |
The Coca-Cola Co. | | | United States | | | | 1,200,000 | | | | 51,780,000 | |
Kimberly-Clark Corp. | | | United States | | | | 300,000 | �� | | | 38,925,000 | |
Philip Morris International Inc. | | | United States | | | | 300,000 | | | | 33,252,000 | |
Walgreens Boots Alliance Inc. | | | United States | | | | 500,000 | | | | 43,270,000 | |
| | | | | | | | | | | | |
| | | | | | | | | | | 201,199,000 | |
| | | | | | | | | | | | |
Energy 3.7% | | | | | | | | | | | | |
Chevron Corp. | | | United States | | | | 300,000 | | | | 32,010,000 | |
Exxon Mobil Corp. | | | United States | | | | 420,000 | | | | 34,293,000 | |
Occidental Petroleum Corp. | | | United States | | | | 400,000 | | | | 24,616,000 | |
Royal Dutch Shell PLC, A, ADR | | | United Kingdom | | | | 719,264 | | | | 37,538,388 | |
| | | | | | | | | | | | |
| | | | | | | | | | | 128,457,388 | |
| | | | | | | | | | | | |
Financials 7.3% | | | | | | | | | | | | |
Bank of America Corp. | | | United States | | | | 1,496,715 | | | | 34,933,328 | |
The Charles Schwab Corp. | | | United States | | | | 400,000 | | | | 15,540,000 | |
JPMorgan Chase & Co. | | | United States | | | | 450,000 | | | | 39,150,000 | |
T. Rowe Price Group Inc. | | | United States | | | | 400,000 | | | | 28,356,000 | |
The Toronto-Dominion Bank | | | Canada | | | | 750,000 | | | | 35,317,500 | |
U.S. Bancorp | | | United States | | | | 750,000 | | | | 38,460,000 | |
Wells Fargo & Co. | | | United States | | | | 1,200,000 | | | | 64,608,000 | |
| | | | | | | | | | | | |
| | | | | | | | | | | 256,364,828 | |
| | | | | | | | | | | | |
Health Care 4.1% | | | | | | | | | | | | |
AstraZeneca PLC, ADR | | | United Kingdom | | | | 985,000 | | | | 29,796,250 | |
Johnson & Johnson | | | United States | | | | 300,000 | | | | 37,041,000 | |
a Mylan NV | | | United States | | | | 355,800 | | | | 13,289,130 | |
Pfizer Inc | | | United States | | | | 1,250,000 | | | | 42,400,000 | |
Teva Pharmaceutical Industries Ltd., ADR | | | Israel | | | | 687,400 | | | | 21,708,092 | |
| | | | | | | | | | | | |
| | | | | | | | | | | 144,234,472 | |
| | | | | | | | | | | | |
Industrials 9.0% | | | | | | | | | | | | |
General Dynamics Corp. | | | United States | | | | 100,000 | | | | 19,379,000 | |
General Electric Co. | | | United States | | | | 2,000,000 | | | | 57,980,000 | |
Honeywell International Inc. | | | United States | | | | 225,000 | | | | 29,506,500 | |
Northrop Grumman Corp. | | | United States | | | | 125,000 | | | | 30,745,000 | |
Raytheon Co. | | | United States | | | | 360,000 | | | | 55,875,600 | |
Republic Services Inc. | | | United States | | | | 560,000 | | | | 35,274,400 | |
Union Pacific Corp. | | | United States | | | | 385,189 | | | | 43,125,761 | |
United Technologies Corp. | | | United States | | | | 353,592 | | | | 42,073,912 | |
| | | | | | | | | | | | |
| | | | | | | | | | | 313,960,173 | |
| | | | | | | | | | | | |
Information Technology 3.0% | | | | | | | | | | | | |
Microsoft Corp. | | | United States | | | | 1,000,000 | | | | 68,460,000 | |
Texas Instruments Inc. | | | United States | | | | 465,000 | | | | 36,818,700 | |
| | | | | | | | | | | | |
| | | | | | | | | | | 105,278,700 | |
| | | | | | | | | | | | |
| | | | |
| | | |
franklintempleton.com | | Semiannual Report | | 35 |
FRANKLIN INVESTORS SECURITIES TRUST
STATEMENT OF INVESTMENTS (UNAUDITED)
| | | | | | | | | | | | |
| Franklin Balanced Fund (continued) | | | | | | | | | | | | |
| | | Country | | | Shares | | | Value | |
Common Stocks (continued) | | | | | | | | | | | | |
Materials 3.0% | | | | | | | | | | | | |
BASF SE | | | Germany | | | | 400,000 | | | $ | 38,979,513 | |
The Dow Chemical Co. | | | United States | | | | 800,000 | | | | 50,240,000 | |
The Mosaic Co. | | | United States | | | | 560,000 | | | | 15,080,800 | |
| | | | | | | | | | | | |
| | | | | | | | | | | 104,300,313 | |
| | | | | | | | | | | | |
Real Estate 0.8% | | | | | | | | | | | | |
Host Hotels & Resorts Inc. | | | United States | | | | 1,500,000 | | | | 26,925,000 | |
| | | | | | | | | | | | |
Telecommunication Services 2.2% | | | | | | | | | | | | |
Rogers Communications Inc., B | | | Canada | | | | 790,000 | | | | 36,229,400 | |
Verizon Communications Inc. | | | United States | | | | 900,000 | | | | 41,319,000 | |
| | | | | | | | | | | | |
| | | | | | | | | | | 77,548,400 | |
| | | | | | | | | | | | |
Utilities 0.9% | | | | | | | | | | | | |
Dominion Resources Inc. | | | United States | | | | 100,000 | | | | 7,743,000 | |
Entergy Corp. | | | United States | | | | 118,400 | | | | 9,029,184 | |
The Southern Co. | | | United States | | | | 330,000 | | | | 16,434,000 | |
| | | | | | | | | | | | |
| | | | | | | | | | | 33,206,184 | |
| | | | | | | | | | | | |
Total Common Stocks (Cost $1,322,630,221) | | | | | | | | | | | 1,548,802,458 | |
| | | | | | | | | | | | |
| | | |
Management Investment Companies 1.0% | | | | | | | | | | | | |
Financials 1.0% | | | | | | | | | | | | |
b Franklin Liberty Investment Grade Corporate ETF. | | | United States | | | | 750,000 | | | | 18,262,500 | |
iShares Core U.S. Aggregate Bond ETF | | | United States | | | | 160,000 | | | | 17,480,000 | |
| | | | | | | | | | | | |
Total Management Investment Companies
(Cost $35,181,725) | | | | | | | | | | | 35,742,500 | |
| | | | | | | | | | | | |
c Equity-Linked Securities 8.1% | | | | | | | | | | | | |
Energy 2.8% | | | | | | | | | | | | |
d Credit Suisse New York into Schlumberger Ltd., 7.50%, 144A | | | United States | | | | 320,000 | | | | 23,478,176 | |
d Royal Bank of Canada into Anadarko Petroleum Corp., 7.50%, 144A | | | United States | | | | 475,000 | | | | 27,406,217 | |
d The Goldman Sachs Group Inc. into Anadarko Petroleum Corp., 7.00%, 144A | | | United States | | | | 340,000 | | | | 20,225,614 | |
d Wells Fargo Bank National Assn. into Halliburton Co., 8.00%, 144A | | | United States | | | | 550,000 | | | | 25,463,130 | |
| | | | | | | | | | | | |
| | | | | | | | | | | 96,573,137 | |
| | | | | | | | | | | | |
Industrials 1.1% | | | | | | | | | | | | |
d Wells Fargo Bank National Assn. into The Boeing Co., 7.00%, 144A | | | United States | | | | 275,000 | | | | 40,066,813 | |
| | | | | | | | | | | | |
Information Technology 3.2% | | | | | | | | | | | | |
d Citigroup Global Markets Holdings Inc. into Analog Devices Inc., 6.50%, 144A | | | United States | | | | 450,000 | | | | 34,875,765 | |
d Credit Suisse AG London into Apple Inc., 6.50%, 144A | | | United States | | | | 190,000 | | | | 25,312,180 | |
d Royal Bank of Canada into Texas Instruments Inc., 6.00%, 144A | | | United States | | | | 400,000 | | | | 27,825,440 | |
d UBS AG London into Intel Corp., 6.00%, 144A | | | United States | | | | 715,000 | | | | 25,705,680 | |
| | | | | | | | | | | | |
| | | | | | | | | | | 113,719,065 | |
| | | | | | | | | | | | |
Materials 1.0% | | | | | | | | | | | | |
d The Goldman Sachs Group Inc. into The Mosaic Co., 10.00%, 144A | | | United States | | | | 1,210,000 | | | | 33,396,968 | |
| | | | | | | | | | | | |
Total Equity-Linked Securities (Cost $274,579,050) | | | | | | | | | | | 283,755,983 | |
| | | | | | | | | | | | |
| | | |
Convertible Preferred Stocks 3.7% | | | | | | | | | | | | |
Energy 0.7% | | | | | | | | | | | | |
Hess Corp., 8.00%, cvt. pfd. | | | United States | | | | 400,000 | | | | 23,860,000 | |
| | | | | | | | | | | | |
Health Care 0.9% | | | | | | | | | | | | |
Allergan PLC, 5.50%, cvt. pfd. | | | United States | | | | 35,102 | | | | 30,390,610 | |
| | | | | | | | | | | | |
| | | | |
| | | |
36 | | Semiannual Report | | franklintempleton.com |
FRANKLIN INVESTORS SECURITIES TRUST
STATEMENT OF INVESTMENTS (UNAUDITED)
| | | | | | | | | | | | |
Franklin Balanced Fund (continued) | | | | | | | | | | | | |
| | | Country | | | Shares | | | Value | |
Convertible Preferred Stocks (continued) | | | | | | | | | | | | |
Real Estate 1.1% | | | | | | | | | | | | |
American Tower Corp., 5.50%, cvt. pfd. | | | United States | | | | 350,000 | | | $ | 40,348,875 | |
| | | | | | | | | | | | |
Utilities 1.0% | | | | | | | | | | | | |
Great Plains Energy Inc., 7.00%, cvt. pfd. | | | United States | | | | 324,000 | | | | 17,528,400 | |
NextEra Energy Inc., 6.371%, cvt. pfd. | | | United States | | | | 260,000 | | | | 16,034,200 | |
| | | | | | | | | | | | |
| | | | | | | | | | | 33,562,600 | |
| | | | | | | | | | | | |
Total Convertible Preferred Stocks (Cost $118,785,263) | | | | | | | | | | | 128,162,085 | |
| | | | | | | | | | | | |
Preferred Stocks (Cost $7,750,000) 0.2% | | | | | | | | | | | | |
Financials 0.2% | | | | | | | | | | | | |
Morgan Stanley, 6.375%, pfd., I | | | United States | | | | 310,000 | | | | 8,608,700 | |
| | | | | | | | | | | | |
| | | |
| | | | | | Principal
Amount* | | | | |
Convertible Bonds (Cost $15,000,000) 0.5% | | | | | | | | | | | | |
Energy 0.5% | | | | | | | | | | | | |
Weatherford International Ltd., cvt., senior note, 5.875%, 7/01/21 | | | United States | | | $ | 15,000,000 | | | | 17,868,750 | |
| | | | | | | | | | | | |
Corporate Bonds 32.0% | | | | | | | | | | | | |
Consumer Discretionary 4.1% | | | | | | | | | | | | |
Charter Communications Operating LLC/Charter Communications Operating Capital Corp., senior secured note, first lien, 4.908%, 7/23/25 | | | United States | | | | 20,000,000 | | | | 21,482,480 | |
DISH DBS Corp., | | | | | | | | | | | | |
senior note, 5.875%, 7/15/22 | | | United States | | | | 12,000,000 | | | | 12,741,480 | |
senior note, 7.75%, 7/01/26 | | | United States | | | | 10,000,000 | | | | 11,737,500 | |
Dollar General Corp., | | | | | | | | | | | | |
senior bond, 3.25%, 4/15/23 | | | United States | | | | 15,000,000 | | | | 15,203,490 | |
senior bond, 3.875%, 4/15/27 | | | United States | | | | 10,000,000 | | | | 10,141,190 | |
Ford Motor Credit Co. LLC, senior note, 2.551%, 10/05/18 | | | United States | | | | 5,000,000 | | | | 5,035,915 | |
NIKE Inc., senior bond, 2.375%, 11/01/26 | | | United States | | | | 20,000,000 | | | | 18,996,780 | |
d Sirius XM Radio Inc., senior bond, 144A, 5.375%, 4/15/25 | | | United States | | | | 15,000,000 | | | | 15,431,250 | |
Tiffany & Co., senior bond, 4.90%, 10/01/44 | | | United States | | | | 7,000,000 | | | | 6,586,797 | |
Trinity Acquisition PLC, senior note, 4.625%, 8/15/23 | | | United States | | | | 7,000,000 | | | | 7,423,150 | |
Yum! Brands Inc., senior bond, 3.875%, 11/01/23 | | | United States | | | | 17,950,000 | | | | 17,792,937 | |
| | | | | | | | | | | | |
| | | | | | | | | | | 142,572,969 | |
| | | | | | | | | | | | |
Consumer Staples 3.6% | | | | | | | | | | | | |
Anheuser-Busch InBev Finance Inc., senior bond, 4.90%, 2/01/46 | | | Belgium | | | | 15,000,000 | | | | 16,449,075 | |
CVS Health Corp., senior note, 3.875%, 7/20/25 | | | United States | | | | 10,000,000 | | | | 10,415,780 | |
Kraft Heinz Foods Co., | | | | | | | | | | | | |
senior bond, 3.50%, 6/06/22 | | | United States | | | | 10,000,000 | | | | 10,348,240 | |
senior bond, 3.00%, 6/01/26 | | | United States | | | | 20,000,000 | | | | 19,045,680 | |
Mondelez International Inc., senior bond, 4.00%, 2/01/24 | | | United States | | | | 15,000,000 | | | | 15,873,390 | |
Reynolds American Inc., | | | | | | | | | | | | |
senior note, 2.30%, 8/21/17 | | | United States | | | | 6,100,000 | | | | 6,113,853 | |
senior note, 4.45%, 6/12/25 | | | United States | | | | 15,000,000 | | | | 16,023,390 | |
Tyson Foods Inc., senior bond, 3.95%, 8/15/24 | | | United States | | | | 12,100,000 | | | | 12,469,171 | |
Whole Foods Market Inc., senior note, 5.20%, 12/03/25 | | | United States | | | | 20,000,000 | | | | 20,991,160 | |
| | | | | | | | | | | | |
| | | | | | | | | | | 127,729,739 | |
| | | | | | | | | | | | |
Energy 2.8% | | | | | | | | | | | | |
Anadarko Petroleum Corp., senior note, 8.70%, 3/15/19 | | | United States | | | | 7,215,000 | | | | 8,069,718 | |
Energy Transfer Partners LP, senior bond, 3.60%, 2/01/23 | | | United States | | | | 15,000,000 | | | | 15,138,990 | |
EOG Resources Inc., senior bond, 2.625%, 3/15/23 | | | United States | | | | 5,500,000 | | | | 5,431,475 | |
Ferrellgas LP/Ferrellgas Finance Corp., senior note, 6.75%, 6/15/23 | | | United States | | | | 18,800,000 | | | | 18,236,000 | |
| | | | |
| | | |
franklintempleton.com | | Semiannual Report | | 37 |
FRANKLIN INVESTORS SECURITIES TRUST
STATEMENT OF INVESTMENTS (UNAUDITED)
| | | | | | | | | | | | |
Franklin Balanced Fund (continued) | | | | | | | | | | | | |
| | | Country | | | Principal
Amount* | | | Value | |
Corporate Bonds (continued) | | | | | | | | | | | | |
Energy (continued) | | | | | | | | | | | | |
Oceaneering International Inc., senior note, 4.65%, 11/15/24 | | | United States | | | $ | 9,400,000 | | | $ | 9,540,925 | |
d Sabine Pass Liquefaction LLC, senior secured bond, 144A, 5.00%, 3/15/27 | | | United States | | | | 8,200,000 | | | | 8,671,049 | |
Weatherford International Ltd., | | | | | | | | | | | | |
senior bond, 5.95%, 4/15/42 | | | United States | | | | 4,000,000 | | | | 3,520,000 | |
senior note, 5.125%, 9/15/20 | | | United States | | | | 10,000,000 | | | | 10,107,000 | |
The Williams Cos. Inc., senior bond, 3.70%, 1/15/23 | | | United States | | | | 5,000,000 | | | | 4,950,000 | |
Williams Partners LP, senior note, 3.60%, 3/15/22 | | | United States | | | | 15,000,000 | | | | 15,368,850 | |
| | | | | | | | | | | | |
| | | | | | | | | | | 99,034,007 | |
| | | | | | | | | | | | |
Financials 8.1% | | | | | | | | | | | | |
e Bank of America Corp., | | | | | | | | | | | | |
junior sub. bond, AA, 6.10% to 3/17/25, FRN thereafter, Perpetual | | | United States | | | | 15,000,000 | | | | 16,087,500 | |
junior sub. bond, M, 8.125% to 5/15/18, FRN thereafter, Perpetual | | | United States | | | | 10,000,000 | | | | 10,487,500 | |
Capital One Bank USA NA, senior note, 2.30%, 6/05/19 | | | United States | | | | 10,000,000 | | | | 10,020,850 | |
f Capital One NA, FRN, 1.885%, 9/13/19 | | | United States | | | | 15,000,000 | | | | 15,082,590 | |
Citigroup Inc., | | | | | | | | | | | | |
ejunior sub. bond, P, 5.95% to 5/15/25, FRN thereafter, Perpetual | | | United States | | | | 15,000,000 | | | | 15,778,125 | |
sub. bond, 4.125%, 7/25/28 | | | United States | | | | 10,000,000 | | | | 10,016,180 | |
Compass Bank, sub. note, 3.875%, 4/10/25 | | | United States | | | | 15,000,000 | | | | 14,789,550 | |
JPMorgan Chase & Co., | | | | | | | | | | | | |
ejunior sub. bond, I, 7.90% to 4/30/19, FRN thereafter, Perpetual | | | United States | | | | 10,000,000 | | | | 10,462,500 | |
ejunior sub. bond, V, 5.00% to 7/30/19, FRN thereafter, Perpetual | | | United States | | | | 13,000,000 | | | | 13,255,580 | |
senior note, 2.295%, 8/15/21 | | | United States | | | | 15,000,000 | | | | 14,914,935 | |
d Liberty Mutual Group Inc., senior note, 144A, 4.95%, 5/01/22 | | | United States | | | | 7,100,000 | | | | 7,784,916 | |
d Mizuho Bank Ltd., senior note, 144A, 2.45%, 4/16/19 | | | Japan | | | | 12,000,000 | | | | 12,069,888 | |
Morgan Stanley, | | | | | | | | | | | | |
ejunior sub. bond, 5.55% to 7/15/20, FRN thereafter, Perpetual | | | United States | | | | 10,900,000 | | | | 11,424,562 | |
senior note, 2.50%, 4/21/21 | | | United States | | | | 15,000,000 | | | | 14,970,060 | |
senior sub. bond, 4.35%, 9/08/26 | | | United States | | | | 15,000,000 | | | | 15,542,265 | |
Navient Corp., senior note, 6.125%, 3/25/24 | | | United States | | | | 15,000,000 | | | | 14,925,000 | |
d Nippon Life Insurance Co., sub. bond, 144A, 5.10% to 10/16/24, FRN thereafter, 10/16/44 | | | Japan | | | | 15,000,000 | | | | 15,955,125 | |
e PNC Financial Services Group Inc., junior sub. note, 4.85% to 6/01/23, FRNthereafter, Perpetual | | | United States | | | | 12,000,000 | | | | 12,054,000 | |
Prudential Financial Inc., | | | | | | | | | | | | |
3.50%, 5/15/24 | | | United States | | | | 10,000,000 | | | | 10,403,100 | |
junior sub. bond, 5.875%, 9/15/42 | | | United States | | | | 5,000,000 | | | | 5,530,270 | |
Royal Bank of Scotland Group PLC, | | | | | | | | | | | | |
sub. note, 6.125%, 12/15/22 | | | United Kingdom | | | | 4,000,000 | | | | 4,319,340 | |
sub. note, 5.125%, 5/28/24 | | | United Kingdom | | | | 10,400,000 | | | | 10,696,868 | |
e Wells Fargo & Co., junior sub. bond, 5.875% to 6/15/25, FRN thereafter, Perpetual | | | United States | | | | 15,000,000 | | | | 16,293,750 | |
| | | | | | | | | | | | |
| | | | | | | | | | | 282,864,454 | |
| | | | | | | | | | | | |
Health Care 4.1% | | | | | | | | | | | | |
Actavis Funding SCS, senior bond, 4.75%, 3/15/45 | | | United States | | | | 12,000,000 | | | | 12,243,792 | |
d AMAG Pharmaceuticals Inc., senior note, 144A, 7.875%, 9/01/23 | | | United States | | | | 16,000,000 | | | | 15,280,000 | |
Baxalta Inc., senior note, 4.00%, 6/23/25 | | | United States | | | | 11,900,000 | | | | 12,260,058 | |
Biogen Inc., senior note, 3.625%, 9/15/22 | | | United States | | | | 10,000,000 | | | | 10,431,140 | |
Celgene Corp., senior bond, 4.00%, 8/15/23 | | | United States | | | | 10,000,000 | | | | 10,551,590 | |
CHS/Community Health Systems Inc., | | | | | | | | | | | | |
senior note, 8.00%, 11/15/19 | | | United States | | | | 10,000,000 | | | | 9,768,900 | |
senior secured note, first lien, 6.25%, 3/31/23 | | | United States | | | | 16,400,000 | | | | 16,748,500 | |
Edwards Lifesciences Corp., senior note, 2.875%, 10/15/18 | | | United States | | | | 10,000,000 | | | | 10,136,430 | |
| | | | |
| | | |
38 | | Semiannual Report | | franklintempleton.com |
FRANKLIN INVESTORS SECURITIES TRUST
STATEMENT OF INVESTMENTS (UNAUDITED)
| | | | | | | | | | | | |
Franklin Balanced Fund (continued) | | | | | | | | | | | | |
| | | Country | | | Principal
Amount* | | | Value | |
Corporate Bonds (continued) | | | | | | | | | | | | |
Health Care (continued) | | | | | | | | | | | | |
d Endo Finance LLC/Endo Finco Inc., senior note, 144A, 5.375%, 1/15/23 | | | United States | | | $ | 15,000,000 | | | $ | 12,937,500 | |
HCA Inc., senior secured note, first lien, 5.00%, 3/15/24 | | | United States | | | | 12,000,000 | | | | 12,765,000 | |
d Tenet Healthcare Corp., senior secured note, second lien, 144A, 7.50%, 1/01/22 | | | United States | | | | 9,200,000 | | | | 9,867,000 | |
d Valeant Pharmaceuticals International Inc., | | | | | | | | | | | | |
senior bond, 144A, 6.125%, 4/15/25 | | | United States | | | | 6,300,000 | | | | 4,674,600 | |
senior note, 144A, 5.875%, 5/15/23 | | | United States | | | | 8,300,000 | | | | 6,173,125 | |
| | | | | | | | | | | | |
| | | | | | | | | | | 143,837,635 | |
| | | | | | | | | | | | |
Industrials 1.0% | | | | | | | | | | | | |
d Air Canada 2013-1A Pass Through Trust, first lien, 144A, 4.125%, 11/15/26 | | | Canada | | | | 5,998,419 | | | | 6,258,151 | |
e General Electric Co., junior sub. bond, 5.00% to 1/21/21, FRN thereafter, Perpetual | | | United States | | | | 9,876,000 | | | | 10,429,056 | |
Lockheed Martin Corp., senior bond, 3.55%, 1/15/26 | | | United States | | | | 15,000,000 | | | | 15,507,030 | |
United Rentals North America Inc., senior bond, 5.875%, 9/15/26 | | | United States | | | | 4,300,000 | | | | 4,552,625 | |
| | | | | | | | | | | | |
| | | | | | | | | | | 36,746,862 | |
| | | | | | | | | | | | |
Information Technology 2.1% | | | | | | | | | | | | |
d CommScope Technologies LLC, senior bond, 144A, 5.00%, 3/15/27 | | | United States | | | | 10,000,000 | | | | 10,112,500 | |
d Diamond 1 Finance Corp./Diamond 2 Finance Corp., | | | | | | | | | | | | |
senior note, 144A, 5.875%, 6/15/21 | | | United States | | | | 2,700,000 | | | | 2,868,750 | |
senior note, 144A, 7.125%, 6/15/24 | | | United States | | | | 2,700,000 | | | | 2,985,852 | |
senior secured note, first lien, 144A, 4.42%, 6/15/21 | | | United States | | | | 18,000,000 | | | | 18,910,134 | |
d Microsemi Corp., senior note, 144A, 9.125%, 4/15/23 | | | United States | | | | 5,500,000 | | | | 6,352,500 | |
Oracle Corp., senior note, 2.50%, 10/15/22 | | | United States | | | | 10,000,000 | | | | 10,037,370 | |
d Western Digital Corp., senior secured note, 144A, 7.375%, 4/01/23 | | | United States | | | | 20,000,000 | | | | 21,950,000 | |
| | | | | | | | | | | | |
| | | | | | | | | | | 73,217,106 | |
| | | | | | | | | | | | |
Materials 1.0% | | | | | | | | | | | | |
Crown Americas LLC/Crown Americas Capital Corp. IV, senior bond, 4.50%, 1/15/23 | | | United States | | | | 5,000,000 | | | | 5,175,000 | |
EI du Pont de Nemours & Co., senior note, 2.20%, 5/01/20 | | | United States | | | | 3,600,000 | | | | 3,607,164 | |
d FMG Resources (August 2006) Pty. Ltd., senior secured note, 144A, 9.75%, 3/01/22 | | | Australia | | | | 12,500,000 | | | | 14,421,875 | |
Freeport-McMoRan Inc., senior bond, 3.875%, 3/15/23 | | | United States | | | | 7,000,000 | | | | 6,527,500 | |
Reliance Steel & Aluminum Co., senior note, 4.50%, 4/15/23 | | | United States | | | | 4,000,000 | | | | 4,194,776 | |
| | | | | | | | | | | | |
| | | | | | | | | | | 33,926,315 | |
| | | | | | | | | | | | |
Real Estate 1.9% | | | | | | | | | | | | |
HCP Inc., senior bond, 3.875%, 8/15/24 | | | United States | | | | 21,700,000 | | | | 21,962,071 | |
Healthcare Trust of America Holdings LP, senior note, 3.375%, 7/15/21 | | | United States | | | | 10,000,000 | | | | 10,237,940 | |
Prologis LP, senior note, 4.25%, 8/15/23 | | | United States | | | | 12,000,000 | | | | 12,861,648 | |
Realty Income Corp., senior bond, 3.875%, 7/15/24 | | | United States | | | | 15,000,000 | | | | 15,491,880 | |
Senior Housing Properties Trust, senior note, 6.75%, 12/15/21 | | | United States | | | | 7,000,000 | | | | 7,810,138 | |
| | | | | | | | | | | | |
| | | | | | | | | | | 68,363,677 | |
| | | | | | | | | | | | |
Telecommunication Services 1.0% | | | | | | | | | | | | |
AT&T Inc., senior note, 3.95%, 1/15/25 | | | United States | | | | 11,700,000 | | | | 11,866,877 | |
Sprint Corp., senior note, 7.625%, 2/15/25 | | | United States | | | | 10,000,000 | | | | 11,187,500 | |
Telefonica Emisiones S.A.U., senior note, 4.57%, 4/27/23 | | | Spain | | | | 10,000,000 | | | | 10,787,450 | |
| | | | | | | | | | | | |
| | | | | | | | | | | 33,841,827 | |
| | | | | | | | | | | | |
Utilities 2.3% | | | | | | | | | | | | |
Alabama Power Co., senior note, 2.80%, 4/01/25 | | | United States | | | | 7,000,000 | | | | 6,864,305 | |
d Calpine Corp., senior secured bond, 144A, 5.25%, 6/01/26 | | | United States | | | | 15,000,000 | | | | 15,168,750 | |
d,e EDF SA, sub. note, 144A, 5.25% to 1/29/23, FRN thereafter, Perpetual | | | France | | | | 10,000,000 | | | | 10,007,800 | |
d Enogex LLC, senior note, 144A, 6.25%, 3/15/20 | | | United States | | | | 5,000,000 | | | | 5,385,910 | |
d InterGen NV, secured bond, 144A, 7.00%, 6/30/23 | | | Netherlands | | | | 10,000,000 | | | | 9,350,000 | |
| | | | |
| | | |
franklintempleton.com | | Semiannual Report | | 39 |
FRANKLIN INVESTORS SECURITIES TRUST
STATEMENT OF INVESTMENTS (UNAUDITED)
| | | | | | | | | | | | |
Franklin Balanced Fund (continued) | | | | | | | | | | | | |
| | | Country | | | Principal
Amount* | | | Value | |
Corporate Bonds (continued) | | | | | | | | | | | | |
Utilities (continued) | | | | | | | | | | | | |
Kinder Morgan Energy Partners LP, senior note, 4.30%, 5/01/24 | | | United States | | | $ | 12,900,000 | | | $ | 13,387,375 | |
PSEG Power LLC, senior note, 3.00%, 6/15/21 | | | United States | | | | 20,000,000 | | | | 20,273,120 | |
| | | | | | | | | | | | |
| | | | | | | | | | | 80,437,260 | |
| | | | | | | | | | | | |
Total Corporate Bonds (Cost $1,086,189,376) | | | | | | | | | | | 1,122,571,851 | |
| | | | | | | | | | | | |
| | | |
| | | | | | Number of
Contracts | | | | |
Options Purchased (Cost $797,012) 0.0%† | | | | | | | | | | | | |
Calls - Exchange-Traded | | | | | | | | | | | | |
Financials 0.0%† | | | | | | | | | | | | |
CBOE SPX Volatility Index, May Strike Price $18, Expires 5/17/17 | | | | | | | 5,000 | | | | 100,000 | |
| | | | | | | | | | | | |
Total Investments before Short Term Investments
(Cost $2,860,912,647) | | | | | | | | | | | 3,145,612,327 | |
| | | | | | | | | | | | |
| | | |
| | | | | | Shares | | | | |
Short Term Investments (Cost $314,587,427) 9.0% | | | | | | | | | | | | |
Money Market Funds 9.0% | | | | | | | | | | | | |
b,g Institutional Fiduciary Trust Money Market Portfolio, 0.37% | | | United States | | | | 314,587,427 | | | | 314,587,427 | |
| | | | | | | | | | | | |
Total Investments (Cost $3,175,500,074) 98.7% | | | | | | | | | | | 3,460,199,754 | |
Options Written (0.0)%† | | | | | | | | | | | (25,000 | ) |
Other Assets, less Liabilities 1.3% | | | | | | | | | | | 44,170,378 | |
| | | | | | | | | | | | |
Net Assets 100.0% | | | | | | | | | | $ | 3,504,345,132 | |
| | | | | | | | | | | | |
| | | |
| | | | | | Number of
Contracts | | | | |
h Options Written (Premiums received $210,400) (0.0)%† | | | | | | | | | | | | |
Calls - Exchange-Traded | | | | | | | | | | | | |
Financials (0.0)%† | | | | | | | | | | | | |
CBOE SPX Volatility Index, May Strike Price $30, Expires 5/17/17 | | | | | | | 5,000 | | | | (25,000 | ) |
| | | | | | | | | | | | |
| | | | |
| | | |
40 | | Semiannual Report | | franklintempleton.com |
FRANKLIN INVESTORS SECURITIES TRUST
STATEMENT OF INVESTMENTS (UNAUDITED)
Franklin Balanced Fund (continued)
See Abbreviations on page 90.
†Rounds to less than 0.1% of net assets.
*The principal amount is stated in U.S. dollars unless otherwise indicated.
aNon-income producing.
bSee Note 3(f) regarding investments in affiliated management investment companies.
cSee Note 1(g) regarding equity-linked securities.
dSecurity was purchased pursuant to Rule 144A under the Securities Act of 1933 and may be sold in transactions exempt from registration only to qualified institutional buyers or in a public offering registered under the Securities Act of 1933. These securities have been deemed liquid under guidelines approved by the Trust’s Board of Trustees. At April 30, 2017, the aggregate value of these securities was $516,372,658, representing 14.7% of net assets.
ePerpetual security with no stated maturity date.
fThe coupon rate shown represents the rate at period end.
gThe rate shown is the annualized seven-day yield at period end.
hSee Note 1(e) regarding written options.
| | | | |
| | | |
franklintempleton.com | | Semiannual Report | | 41 |
FRANKLIN INVESTORS SECURITIES TRUST
Financial Highlights
Franklin Convertible Securities Fund
| | | | | | | | | | | | | | | | | | | | | | | | |
| | | Six Months Ended April 30, 2017 (unaudited) | | | | | | | | | | | |
| | | | Year Ended October 31, |
| | | | 2016 | | 2015 | | 2014 | | 2013 | | 2012 |
Class A | | | | | | | | | | | | | | | | | | | | | | | | |
| | | | | | |
Per share operating performance | | | | | | | | | | | | | | | | | | | | | | | | |
| | | | | | |
(for a share outstanding throughout the period) | | | | | | | | | | | | | | | | | | | | | | | | |
| | | | | | |
Net asset value, beginning of period | | | $18.24 | | | | $18.00 | | | | $18.97 | | | | $17.82 | | | | $14.93 | | | | $14.37 | |
| | | | | | |
Income from investment operationsa: | | | | | | | | | | | | | | | | | | | | | | | | |
| | | | | | |
Net investment incomeb | | | 0.12 | | | | 0.25 | | | | 0.24 | | | | 0.23 | | | | 0.37 | | | | 0.41 | |
| | | | | | |
Net realized and unrealized gains (losses) | | | 1.43 | | | | 0.85 | | | | (0.14) | | | | 1.32 | | | | 2.99 | | | | 0.67 | |
| | | | | | |
Total from investment operations | | | 1.55 | | | | 1.10 | | | | 0.10 | | | | 1.55 | | | | 3.36 | | | | 1.08 | |
| | | | | | |
Less distributions from: | | | | | | | | | | | | | | | | | | | | | | | | |
| | | | | | |
Net investment income | | | (0.26) | | | | (0.50) | | | | (0.39) | | | | (0.33) | | | | (0.47) | | | | (0.52) | |
| | | | | | |
Net realized gains | | | (0.34) | | | | (0.36) | | | | (0.68) | | | | (0.07) | | | | — | | | | — | |
| | | | | | |
Total distributions | | | (0.60) | | | | (0.86) | | | | (1.07) | | | | (0.40) | | | | (0.47) | | | | (0.52) | |
| | | | | | |
Net asset value, end of period | | | $19.19 | | | | $18.24 | | | | $18.00 | | | | $18.97 | | | | $17.82 | | | | $14.93 | |
| | | | | | |
Total returnc | | | 8.72% | | | | 6.41% | | | | 0.66% | | | | 8.85% | | | | 22.92% | | | | 7.66% | |
| | | | | | |
Ratios to average net assetsd | | | | | | | | | | | | | | | | | | | | | | | | |
| | | | | | |
Expenses before waiver and payments by affiliates | | | 0.86% | | | | 0.86% | | | | 0.86% | | | | 0.88% | | | | 0.88% | | | | 0.90% | |
| | | | | | |
Expenses net of waiver and payments by affiliates | | | 0.85%e | | | | 0.85%e | | | | 0.86%e,f | | | | 0.88%e,f | | | | 0.88%e | | | | 0.90% | |
| | | | | | |
Net investment income | | | 1.30% | | | | 1.44% | | | | 1.33% | | | | 1.23% | | | | 2.25% | | | | 2.84% | |
| | | | | | |
Supplemental data | | | | | | | | | | | | | | | | | | | | | | | | |
| | | | | | |
Net assets, end of period (000’s) | | | $745,901 | | | | $768,553 | | | | $818,082 | | | | $921,134 | | | | $844,498 | | | | $602,804 | |
| | | | | | |
Portfolio turnover rate | | | 13.02% | | | | 28.03% | | | | 17.30% | | | | 23.05% | | | | 34.69% | | | | 12.82% | |
aThe amount shown for a share outstanding throughout the period may not correlate with the Statement of Operations for the period due to the timing of sales and repurchases of the Fund’s shares in relation to income earned and/or fluctuating fair value of the investments of the Fund.
bBased on average daily shares outstanding.
cTotal return does not reflect sales commissions or contingent deferred sales charges, if applicable, and is not annualized for periods less than one year.
dRatios are annualized for periods less than one year.
eBenefit of expense reduction rounds to less than 0.01%.
fBenefit of waiver and payments by affiliates rounds to less than 0.01%.
| | | | |
| | | |
42 | | Semiannual Report | The accompanying notes are an integral part of these financial statements. | | franklintempleton.com |
FRANKLIN INVESTORS SECURITIES TRUST
FINANCIAL HIGHLIGHTS
Franklin Convertible Securities Fund (continued)
| | | | | | | | | | | | | | | | | | | | | | | | |
| | | Six Months Ended April 30, 2017 (unaudited) | | | | | | | | | | | |
| | | | Year Ended October 31, |
| | | | 2016 | | 2015 | | 2014 | | 2013 | | 2012 |
Class C | | | | | | | | | | | | | | | | | | | | | | | | |
| | | | | | |
Per share operating performance | | | | | | | | | | | | | | | | | | | | | | | | |
| | | | | | |
(for a share outstanding throughout the period) | | | | | | | | | | | | | | | | | | | | | | | | |
| | | | | | |
Net asset value, beginning of period | | | $17.98 | | | | $17.75 | | | | $18.73 | | | | $17.60 | | | | $14.75 | | | | $14.21 | |
| | | | | | |
Income from investment operationsa: | | | | | | | | | | | | | | | | | | | | | | | | |
| | | | | | |
Net investment incomeb | | | 0.05 | | | | 0.12 | | | | 0.11 | | | | 0.09 | | | | 0.24 | | | | 0.30 | |
| | | | | | |
Net realized and unrealized gains (losses) | | | 1.41 | | | | 0.84 | | | | (0.16) | | | | 1.31 | | | | 2.97 | | | | 0.65 | |
| | | | | | |
Total from investment operations | | | 1.46 | | | | 0.96 | | | | (0.05) | | | | 1.40 | | | | 3.21 | | | | 0.95 | |
| | | | | | |
Less distributions from: | | | | | | | | | | | | | | | | | | | | | | | | |
| | | | | | |
Net investment income | | | (0.19) | | | | (0.37) | | | | (0.25) | | | | (0.20) | | | | (0.36) | | | | (0.41) | |
| | | | | | |
Net realized gains | | | (0.34) | | | | (0.36) | | | | (0.68) | | | | (0.07) | | | | — | | | | — | |
| | | | | | |
Total distributions | | | (0.53) | | | | (0.73) | | | | (0.93) | | | | (0.27) | | | | (0.36) | | | | (0.41) | |
| | | | | | |
Net asset value, end of period | | | $18.91 | | | | $17.98 | | | | $17.75 | | | | $18.73 | | | | $17.60 | | | | $14.75 | |
| | | | | | |
Total returnc | | | 8.33% | | | | 5.65% | | | | (0.15)% | | | | 8.01% | | | | 22.11% | | | | 6.79% | |
| | | | | | |
Ratios to average net assetsd | | | | | | | | | | | | | | | | | | | | | | | | |
| | | | | | |
Expenses before waiver and payments by affiliates | | | 1.61% | | | | 1.61% | | | | 1.61% | | | | 1.63% | | | | 1.63% | | | | 1.65% | |
| | | | | | |
Expenses net of waiver and payments by affiliates | | | 1.60%e | | | | 1.60%e | | | | 1.61%e,f | | | | 1.63%e,f | | | | 1.63%e | | | | 1.65% | |
| | | | | | |
Net investment income | | | 0.55% | | | | 0.69% | | | | 0.58% | | | | 0.48% | | | | 1.50% | | | | 2.09% | |
| | | | | | |
Supplemental data | | | | | | | | | | | | | | | | | | | | | | | | |
| | | | | | |
Net assets, end of period (000’s) | | | $301,022 | | | | $293,038 | | | | $311,951 | | | | $333,034 | | | | $273,132 | | | | $211,630 | |
| | | | | | |
Portfolio turnover rate | | | 13.02% | | | | 28.03% | | | | 17.30% | | | | 23.05% | | | | 34.69% | | | | 12.82% | |
aThe amount shown for a share outstanding throughout the period may not correlate with the Statement of Operations for the period due to the timing of sales and repurchases of the Fund’s shares in relation to income earned and/or fluctuating fair value of the investments of the Fund.
bBased on average daily shares outstanding.
cTotal return does not reflect sales commissions or contingent deferred sales charges, if applicable, and is not annualized for periods less than one year.
dRatios are annualized for periods less than one year.
eBenefit of expense reduction rounds to less than 0.01%.
fBenefit of waiver and payments by affiliates rounds to less than 0.01%.
| | | | |
| | | |
franklintempleton.com | | The accompanying notes are an integral part of these financial statements. | Semiannual Report | | 43 |
FRANKLIN INVESTORS SECURITIES TRUST
FINANCIAL HIGHLIGHTS
Franklin Convertible Securities Fund (continued)
| | | | | | | | | | | | | | | | |
| | | Six Months Ended April 30, 2017 (unaudited) | | | | | | | | | | |
| | | | Year Ended October 31, | |
| | | | 2016 | | | 2015 | | | 2014a | |
Class R6 | | | | | | | | | | | | | | | | |
| | | | |
Per share operating performance | | | | | | | | | | | | | | | | |
| | | | |
(for a share outstanding throughout the period) | | | | | | | | | | | | | | | | |
| | | | |
Net asset value, beginning of period | | | $18.33 | | | | $18.09 | | | | $18.99 | | | | $19.21 | |
| | | | |
Income from investment operationsb: | | | | | | | | | | | | | | | | |
| | | | |
Net investment incomec | | | 0.15 | | | | 0.33 | | | | 0.30 | | | | 0.19 | |
| | | | |
Net realized and unrealized gains (losses) | | | 1.44 | | | | 0.84 | | | | (0.14) | | | | (0.17) | |
| | | | |
Total from investment operations | | | 1.59 | | | | 1.17 | | | | 0.16 | | | | 0.02 | |
| | | | |
Less distributions from: | | | | | | | | | | | | | | | | |
| | | | |
Net investment income | | | (0.29) | | | | (0.57) | | | | (0.38) | | | | (0.24) | |
| | | | |
Net realized gains | | | (0.34) | | | | (0.36) | | | | (0.68) | | | | — | |
| | | | |
Total distributions | | | (0.63) | | | | (0.93) | | | | (1.06) | | | | (0.24) | |
| | | | |
Net asset value, end of period | | | $19.29 | | | | $18.33 | | | | $18.09 | | | | $18.99 | |
| | | | |
Total returnd | | | 8.93% | | | | 6.78% | | | | 0.99% | | | | 0.11% | |
| | | | |
Ratios to average net assetse | | | | | | | | | | | | | | | | |
| | | | |
Expenses before waiver and payments by affiliates | | | 0.50% | | | | 0.50% | | | | 0.50% | | | | 0.51% | |
| | | | |
Expenses net of waiver and payments by affiliatesf | | | 0.49% | | | | 0.49% | | | | 0.50%g | | | | 0.51%g | |
| | | | |
Net investment income | | | 1.66% | | | | 1.80% | | | | 1.69% | | | | 1.60% | |
| | | | |
Supplemental data | | | | | | | | | | | | | | | | |
| | | | |
Net assets, end of period (000’s) | | | $11,706 | | | | $7,154 | | | | $5 | | | | $3,093 | |
| | | | |
Portfolio turnover rate | | | 13.02% | | | | 28.03% | | | | 17.30% | | | | 23.05% | |
aFor the period March 4, 2014 (effective date) to October 31, 2014.
bThe amount shown for a share outstanding throughout the period may not correlate with the Statement of Operations for the period due to the timing of sales and repurchases of the Fund’s shares in relation to income earned and/or fluctuating fair value of the investments of the Fund.
cBased on average daily shares outstanding.
dTotal return is not annualized for periods less than one year.
eRatios are annualized for periods less than one year.
fBenefit of expense reduction rounds to less than 0.01%.
gBenefit of waiver and payments by affiliates rounds to less than 0.01%.
| | | | |
| | | |
44 | | Semiannual Report | The accompanying notes are an integral part of these financial statements. | | franklintempleton.com |
FRANKLIN INVESTORS SECURITIES TRUST
FINANCIAL HIGHLIGHTS
Franklin Convertible Securities Fund (continued)
| | | | | | | | | | | | | | | | | | | | | | | | |
| | | Six Months Ended April 30, 2017 (unaudited) | | | | | | | | | | | |
| | | | Year Ended October 31, |
| | | | 2016 | | 2015 | | 2014 | | 2013 | | 2012 |
Advisor Class | | | | | | | | | | | | | | | | | | | | | | | | |
| | | | | | |
Per share operating performance | | | | | | | | | | | | | | | | | | | | | | | | |
| | | | | | |
(for a share outstanding throughout the period) | | | | | | | | | | | | | | | | | | | | | | | | |
| | | | | | |
Net asset value, beginning of period | | | $18.24 | | | | $18.00 | | | | $18.98 | | | | $17.83 | | | | $14.94 | | | | $14.38 | |
| | | | | | |
Income from investment operationsa: | | | | | | | | | | | | | | | | | | | | | | | | |
| | | | | | |
Net investment incomeb | | | 0.14 | | | | 0.30 | | | | 0.29 | | | | 0.28 | | | | 0.41 | | | | 0.45 | |
| | | | | | |
Net realized and unrealized gains (losses) | | | 1.43 | | | | 0.85 | | | | (0.15) | | | | 1.32 | | | | 2.99 | | | | 0.66 | |
| | | | | | |
Total from investment operations | | | 1.57 | | | | 1.15 | | | | 0.14 | | | | 1.60 | | | | 3.40 | | | | 1.11 | |
| | | | | | |
Less distributions from: | | | | | | | | | | | | | | | | | | | | | | | | |
| | | | | | |
Net investment income | | | (0.28) | | | | (0.55) | | | | (0.44) | | | | (0.38) | | | | (0.51) | | | | (0.55) | |
| | | | | | |
Net realized gains | | | (0.34) | | | | (0.36) | | | | (0.68) | | | | (0.07) | | | | — | | | | — | |
| | | | | | |
Total distributions | | | (0.62) | | | | (0.91) | | | | (1.12) | | | | (0.45) | | | | (0.51) | | | | (0.55) | |
| | | | | | |
Net asset value, end of period | | | $19.19 | | | | $18.24 | | | | $18.00 | | | | $18.98 | | | | $17.83 | | | | $14.94 | |
| | | | | | |
Total returnc | | | 8.86% | | | | 6.68% | | | | 0.87% | | | | 9.13% | | | | 23.21% | | | | 7.93% | |
| | | | | | |
Ratios to average net assetsd | | | | | | | | | | | | | | | | | | | | | | | | |
| | | | | | |
Expenses before waiver and payments by affiliates | | | 0.61% | | | | 0.61% | | | | 0.61% | | | | 0.63% | | | | 0.63% | | | | 0.65% | |
| | | | | | |
Expenses net of waiver and payments by affiliates | | | 0.60%e | | | | 0.60%e | | | | 0.61%e,f | | | | 0.63%e,f | | | | 0.63%e | | | | 0.65% | |
| | | | | | |
Net investment income | | | 1.55% | | | | 1.69% | | | | 1.58% | | | | 1.48% | | | | 2.50% | | | | 3.09% | |
| | | | | | |
Supplemental data | | | | | | | | | | | | | | | | | | | | | | | | |
| | | | | | |
Net assets, end of period (000’s) | | | $1,295,521 | | | | $1,080,346 | | | | $899,441 | | | | $877,190 | | | | $387,528 | | | | $196,765 | |
| | | | | | |
Portfolio turnover rate | | | 13.02% | | | | 28.03% | | | | 17.30% | | | | 23.05% | | | | 34.69% | | | | 12.82% | |
aThe amount shown for a share outstanding throughout the period may not correlate with the Statement of Operations for the period due to the timing of sales and repurchases of the Fund’s shares in relation to income earned and/or fluctuating fair value of the investments of the Fund.
bBased on average daily shares outstanding.
cTotal return is not annualized for periods less than one year.
dRatios are annualized for periods less than one year.
eBenefit of expense reduction rounds to less than 0.01%.
fBenefit of waiver and payments by affiliates rounds to less than 0.01%.
| | | | |
| | | |
franklintempleton.com | | The accompanying notes are an integral part of these financial statements. | Semiannual Report | | 45 |
FRANKLIN INVESTORS SECURITIES TRUST
Statement of Investments, April 30, 2017 (unaudited)
Franklin Convertible Securities Fund
| | | | | | | | | | |
| | | Country | | Shares | | | Value | |
Common Stocks 5.1% | | | | | | | | | | |
Consumer Discretionary 0.8% | | | | | | | | | | |
Newell Brands Inc. | | United States | | | 403,856 | | | $ | 19,280,085 | |
| | | | | | | | | | |
Energy 1.0% | | | | | | | | | | |
a McDermott International Inc. | | United States | | | 3,407,616 | | | | 22,285,809 | |
| | | | | | | | | | |
Financials 1.3% | | | | | | | | | | |
Wintrust Financial Corp. | | United States | | | 440,016 | | | | 31,179,534 | |
| | | | | | | | | | |
Industrials 2.0% | | | | | | | | | | |
Stanley Black & Decker Inc. | | United States | | | 346,021 | | | | 47,110,759 | |
| | | | | | | | | | |
Total Common Stocks (Cost $97,224,674) | | | | | | | 119,856,187 | |
| | | | | | | | | | |
| | | |
Convertible Preferred Stocks 20.6% | | | | | | | | | | |
Consumer Staples 3.9% | | | | | | | | | | |
Post Holdings Inc., 2.50%, cvt. pfd. | | United States | | | 231,200 | | | | 36,717,450 | |
Post Holdings Inc., 5.25%, cvt. pfd. | | United States | | | 95,200 | | | | 13,873,020 | |
Tyson Foods Inc., 4.75%, cvt. pfd. | | United States | | | 600,000 | | | | 41,610,000 | |
| | | | | | | | | | |
| | | | | | | | | 92,200,470 | |
| | | | | | | | | | |
Energy 0.4% | | | | | | | | | | |
Sanchez Energy Corp., 6.50%, cvt. pfd., B | | United States | | | 236,000 | | | | 7,979,160 | |
| | | | | | | | | | |
Health Care 2.7% | | | | | | | | | | |
Allergan PLC, 5.50%, cvt. pfd. | | United States | | | 45,500 | | | | 39,392,990 | |
Teva Pharmaceutical Industries Ltd., 7.00%, cvt. pfd. | | Israel | | | 42,500 | | | | 24,267,500 | |
| | | | | | | | | | |
| | | | | | | | | 63,660,490 | |
| | | | | | | | | | |
Industrials 4.6% | | | | | | | | | | |
Arconic Inc., 5.375%, cvt. pfd. | | United States | | | 750,000 | | | | 31,845,000 | |
Rexnord Corp., 5.75%, cvt. pfd. | | United States | | | 855,000 | | | | 48,179,250 | |
Stericycle Inc., 5.25%, cvt. pfd. | | United States | | | 380,000 | | | | 28,123,800 | |
| | | | | | | | | | |
| | | | | | | | | 108,148,050 | |
| | | | | | | | | | |
Information Technology 2.2% | | | | | | | | | | |
b Mandatory Exchangeable Trust, 5.75%, cvt. pfd., 144A | | China | | | 375,000 | | | | 51,605,625 | |
| | | | | | | | | | |
Telecommunication Services 2.6% | | | | | | | | | | |
Frontier Communications Corp., 11.125%, cvt. pfd. | | United States | | | 267,060 | | | | 11,841,440 | |
T-Mobile U.S. Inc., 5.50%, cvt. pfd. | | United States | | | 455,000 | | | | 49,922,600 | |
| | | | | | | | | | |
| | | | | | | | | 61,764,040 | |
| | | | | | | | | | |
Utilities 4.2% | | | | | | | | | | |
Black Hills Corp., 7.75%, cvt. pfd. | | United States | | | 606,000 | | | | 45,140,940 | |
Dominion Resources Inc., 6.375%, cvt. pfd., A | | United States | | | 185,200 | | | | 9,326,672 | |
Exelon Corp., 6.50%, cvt. pfd. | | United States | | | 500,000 | | | | 24,695,000 | |
Great Plains Energy Inc., 7.00%, cvt. pfd. | | United States | | | 370,000 | | | | 20,017,000 | |
| | | | | | | | | | |
| | | | | | | | | 99,179,612 | |
| | | | | | | | | | |
Total Convertible Preferred Stocks (Cost $447,405,496) | | | | | | | 484,537,447 | |
| | | | | | | | | | |
| | | | |
| | | |
46 | | Semiannual Report | | franklintempleton.com |
FRANKLIN INVESTORS SECURITIES TRUST
STATEMENT OF INVESTMENTS (UNAUDITED)
Franklin Convertible Securities Fund (continued)
| | | | | | | | | | | | |
| | | Country | | | Principal
Amount* | | | Value | |
| |
Convertible Bonds 69.6% | | | | | | | | | | | | |
Consumer Discretionary 12.8% | | | | | | | | | | | | |
Ctrip.com International Ltd., | | | | | | | | | | | | |
cvt., senior note, 1.25%, 10/15/18 | | | China | | | $ | 19,200,000 | | | $ | 25,632,768 | |
bcvt., senior note, 144A, 1.25%, 9/15/22 | | | China | | | | 20,000,000 | | | | 21,000,000 | |
b Dish Network Corp., cvt., senior bond, 144A, 3.375%, 8/15/26 | | | United States | | | | 41,250,000 | | | | 50,685,937 | |
GNC Holdings Inc., cvt., senior note, 1.50%, 8/15/20 | | | United States | | | | 5,000,000 | | | | 3,445,750 | |
b Liberty Interactive LLC, cvt., senior bond, 144A, 1.75%, 9/30/46 | | | United States | | | | 37,000,000 | | | | 43,429,120 | |
Liberty Media Corp., | | | | | | | | | | | | |
bcvt., senior bond, 144A, 2.25%, 9/30/46 | | | United States | | | | 39,000,000 | | | | 42,680,625 | |
cvt., senior note, 1.375%, 10/15/23 | | | United States | | | | 21,200,000 | | | | 23,995,750 | |
The Priceline Group Inc., cvt., senior note, 0.35%, 6/15/20 | | | United States | | | | 35,000,000 | | | | 51,209,375 | |
Shutterfly Inc., cvt., 0.25%, 5/15/18 | | | United States | | | | 37,465,000 | | | | 38,050,391 | |
| | | | | | | | | | | | |
| | | | | | | | | | | 300,129,716 | |
| | | | | | | | | | | | |
Energy 0.2% | | | | | | | | | | | | |
Cobalt International Energy Inc., cvt., senior bond, 3.125%, 5/15/24 | | | United States | | | | 15,200,000 | | | | 4,522,000 | |
| | | | | | | | | | | | |
Health Care 11.8% | | | | | | | | | | | | |
BioMarin Pharmaceutical Inc., cvt., senior sub. note, 1.50%, 10/15/20 | | | United States | | | | 28,200,000 | | | | 35,091,375 | |
Brookdale Senior Living Inc., cvt., senior note, 2.75%, 6/15/18 | | | United States | | | | 26,200,000 | | | | 25,970,750 | |
Depomed Inc., cvt., senior note, 2.50%, 9/01/21 | | | United States | | | | 16,000,000 | | | | 14,920,000 | |
Fluidigm Corp., cvt., senior bond, 2.75%, 2/01/34 | | | United States | | | | 14,418,000 | | | | 9,930,397 | |
Illumina Inc., cvt., senior note, 0.50%, 6/15/21 | | | United States | | | | 33,000,000 | | | | 35,330,625 | |
Impax Laboratories Inc., cvt., senior note, 2.00%, 6/15/22 | | | United States | | | | 45,000,000 | | | | 38,165,625 | |
Jazz Investments I Ltd., cvt., senior note, 1.875%, 8/15/21 | | | United States | | | | 35,000,000 | | | | 38,937,500 | |
b Neurocrine Biosciences Inc., cvt., senior note, 144A, 2.25%, 5/15/24 | | | United States | | | | 24,000,000 | | | | 24,960,000 | |
Novavax Inc., senior note, cvt., 3.75%, 2/01/23 | | | United States | | | | 34,000,000 | | | | 13,408,750 | |
Nuvasive Inc., cvt., 2.25%, 3/15/21 | | | United States | | | | 12,000,000 | | | | 16,027,500 | |
b Pacira Pharmaceuticals Inc., cvt., senior note, 144A, 2.375%, 4/01/22 | | | United States | | | | 6,000,000 | | | | 6,405,000 | |
Spectranetics Corp., cvt., senior note, 2.625%, 6/01/34 | | | United States | | | | 17,000,000 | | | | 19,411,875 | |
| | | | | | | | | | | | |
| | | | | | | | | | | 278,559,397 | |
| | | | | | | | | | | | |
Industrials 0.8% | | | | | | | | | | | | |
The keyW Holding Corp., cvt., senior note, 2.50%, 7/15/19 | | | United States | | | | 20,000,000 | | | | 19,462,500 | |
| | | | | | | | | | | | |
Information Technology 40.7% | | | | | | | | | | | | |
b Blackhawk Network Holdings Inc., cvt., senior note, 144A, 1.50%, 1/15/22 | | | United States | | | | 42,700,000 | | | | 46,489,625 | |
Bottomline Technologies (de) Inc., cvt., senior note, 1.50%, 12/01/17 | | | United States | | | | 21,400,000 | | | | 21,520,375 | |
Electronics for Imaging Inc., cvt., senior note, 0.75%, 9/01/19 | | | United States | | | | 22,000,000 | | | | 23,430,000 | |
b Inphi Corp., cvt., senior note, 144A, 0.75%, 9/01/21 | | | United States | | | | 9,600,000 | | | | 9,870,000 | |
Integrated Device Technology Inc., cvt., senior note, 0.875%, 11/15/22 | | | United States | | | | 4,700,000 | | | | 4,791,063 | |
Intel Corp., | | | | | | | | | | | | |
cvt., junior sub. bond, 3.25%, 8/01/39 | | | United States | | | | 8,000,000 | | | | 14,005,040 | |
bcvt., junior sub. bond, 144A, 2.95%, 12/15/35 | | | United States | | | | 19,000,000 | | | | 25,923,125 | |
cvt., junior sub. deb., 2.95%, 12/15/35 | | | United States | | | | 2,000,000 | | | | 2,728,750 | |
Mercadolibre Inc., cvt., 2.25%, 7/01/19 | | | Argentina | | | | 5,000,000 | | | | 9,346,450 | |
Microchip Technology Inc., | | | | | | | | | | | | |
bcvt., senior note, 144A, 1.625%, 2/15/27 | | | United States | | | | 38,750,000 | | | | 39,866,000 | |
cvt., senior sub. bond, 1.625%, 2/15/25 | | | United States | | | | 11,000,000 | | | | 16,135,625 | |
Micron Technology Inc., | | | | | | | | | | | | |
cvt., senior bond, 2.125%, 2/15/33 | | | United States | | | | 6,800,000 | | | | 17,493,000 | |
cvt., senior bond, G, 3.00%, 11/15/43 | | | United States | | | | 32,000,000 | | | | 34,720,000 | |
Novellus Systems Inc., cvt., senior note, 2.625%, 5/15/41 | | | United States | | | | 12,100,000 | | | | 51,840,937 | |
NXP Semiconductors NV, cvt., senior note, 1.00%, 12/01/19 | | | Netherlands | | | | 35,000,000 | | | | 40,971,875 | |
Palo Alto Networks Inc., cvt., zero cpn., 7/01/19 | | | United States | | | | 28,750,000 | | | | 33,673,438 | |
| | | | |
| | | |
franklintempleton.com | | Semiannual Report | | 47 |
FRANKLIN INVESTORS SECURITIES TRUST
STATEMENT OF INVESTMENTS (UNAUDITED)
Franklin Convertible Securities Fund (continued)
| | | | | | | | | | | | |
| | | Country | | | Principal
Amount* | | | Value | |
| |
Convertible Bonds (continued) | | | | | | | | | | | | |
Information Technology (continued) | | | | | | | | | | | | |
Proofpoint Inc., cvt., 0.75%, 6/15/20 | | | United States | | | $ | 39,100,000 | | | $ | 44,842,812 | |
Red Hat Inc., cvt., senior note, 0.25%, 10/01/19 | | | United States | | | | 29,250,000 | | | | 38,591,719 | |
Salesforce.com Inc., cvt., senior note, 0.25%, 4/01/18 | | | United States | | | | 35,200,000 | | | | 46,772,000 | |
ServiceNow Inc., cvt., zero cpn., 11/01/18 | | | United States | | | | 35,500,000 | | | | 47,925,000 | |
b Silicon Laboratories Inc., cvt., 144A, 1.375%, 3/01/22 | | | United States | | | | 38,700,000 | | | | 40,804,313 | |
b Square Inc., cvt., 144A, 0.375%, 3/01/22 | | | United States | | | | 43,000,000 | | | | 45,687,500 | |
Take-Two Interactive Software Inc., cvt., senior note, 1.00%, 7/01/18 | | | United States | | | | 16,400,000 | | | | 47,939,250 | |
Twitter Inc., cvt., senior note, 1.00%, 9/15/21 | | | United States | | | | 35,000,000 | | | | 32,331,250 | |
VeriSign Inc., cvt., junior sub. bond, 3.25%, 8/15/37 | | | United States | | | | 11,000,000 | | | | 28,710,000 | |
Viavi Solutions Inc., cvt., senior bond, 0.625%, 8/15/33 | | | United States | | | | 39,900,000 | | | | 43,515,937 | |
Workday Inc., cvt., senior note, 1.50%, 7/15/20 | | | United States | | | | 24,166,500 | | | | 30,298,749 | |
Xilinx Inc., cvt., senior note, 2.625%, 6/15/17 | | | United States | | | | 16,270,000 | | | | 35,875,350 | |
Yahoo! Inc., cvt., zero cpn., 12/01/18 | | | United States | | | | 35,100,000 | | | | 37,030,500 | |
b Zillow Group Inc., cvt., senior note, 144A, 2.00%, 12/01/21 | | | United States | | | | 43,500,000 | | | | 45,692,835 | |
| | | | | | | | | | | | |
| | | | | | | | | | | 958,822,518 | |
| | | | | | | | | | | | |
Materials 1.8% | | | | | | | | | | | | |
B2Gold Corp., cvt., senior sub. note, 3.25%, 10/01/18 | | | Canada | | | | 13,900,000 | | | | 14,534,188 | |
Cemex SAB de CV, cvt., sub. note, 3.75%, 3/15/18 | | | Mexico | | | | 24,000,000 | | | | 28,095,360 | |
| | | | | | | | | | | | |
| | | | | | | | | | | 42,629,548 | |
| | | | | | | | | | | | |
Real Estate 1.5% | | | | | | | | | | | | |
Forest City Enterprises Inc., | | | | | | | | | | | | |
cvt., senior note, 4.25%, 8/15/18 | | | United States | | | | 17,110,000 | | | | 19,494,707 | |
cvt., senior note, A, 3.625%, 8/15/20 | | | United States | | | | 15,250,000 | | | | 16,670,156 | |
| | | | | | | | | | | | |
| | | | | | | | | | | 36,164,863 | |
| | | | | | | | | | | | |
| | | |
Total Convertible Bonds (Cost $1,436,023,841) | | | | | | | | | | | 1,640,290,542 | |
| | | | | | | | | | | | |
| | | | | | Shares | | | | |
Escrows and Litigation Trusts (Cost $22,362) 0.0% | | | | | | | | | | | | |
a,c Motors Liquidation Co., Escrow Account | | | United States | | | | 376,200 | | | | — | |
| | | | | | | | | | | | |
Total Investments before Short Term Investments (Cost $1,980,676,373) | | | | | | | | | | | 2,244,684,176 | |
| | | | | | | | | | | | |
| | | |
Short Term Investments 5.4% | | | | | | | | | | | | |
Money Market Funds (Cost $118,070,432) 5.0% | | | | | | | | | | | | |
d,e Institutional Fiduciary Trust Money Market Portfolio, 0.37% | | | United States | | | | 118,070,432 | | | | 118,070,432 | |
| | | | | | | | | | | | |
| | | | |
| | | |
48 | | Semiannual Report | | franklintempleton.com |
FRANKLIN INVESTORS SECURITIES TRUST
STATEMENT OF INVESTMENTS (UNAUDITED)
Franklin Convertible Securities Fund (continued)
| | | | | | | | | | | | |
| | | Country | | | Principal
Amount* | | | Value | |
| |
Repurchase Agreements (Cost $8,702,266) 0.4% | | | | | | | | | | | | |
f Joint Repurchase Agreement, 0.797%, 5/01/17 (Maturity Value $8,702,844) | | | | | | | | | | | | |
BNP Paribas Securities Corp. (Maturity Value $3,498,021) | | | | | | | | | | | | |
Deutsche Bank Securities Inc. (Maturity Value $395,109) | | | | | | | | | | | | |
HSBC Securities (USA) Inc. (Maturity Value $3,498,021) | | | | | | | | | | | | |
Merrill Lynch, Pierce, Fenner & Smith Inc. (Maturity Value $1,311,693) | | | | | | | | | | | | |
Collateralized by U.S. Government Agency Securities, 0.75% - 2.375%, 4/09/18 - | | | | | | | | | | | | |
4/05/22; gU.S. Treasury Bill, 6/08/17 - 11/09/17; U.S. Treasury Note, 0.75% - | | | | | | | | | | | | |
2.125%, 7/15/19 - 8/15/21; and U.S. Treasury Note, Index Linked, 0.125%, | | | | | | | | | | | | |
4/15/19 (valued at $8,882,607) | | | United States | | | $ | 8,702,266 | | | $ | 8,702,266 | |
| | | | | | | | | | | | |
Total Investments (Cost $2,107,449,071) 100.7% | | | | | | | | | | | 2,371,456,874 | |
Other Assets, less Liabilities (0.7)% | | | | | | | | | | | (17,307,948 | ) |
| | | | | | | | | | | | |
Net Assets 100.0% | | | | | | | | | | $ | 2,354,148,926 | |
| | | | | | | | | | | | |
*The principal amount is stated in U.S. dollars unless otherwise indicated.
a Non-income producing.
bSecurity was purchased pursuant to Rule 144A under the Securities Act of 1933 and may be sold in transactions exempt from registration only to qualified institutional buyers or in a public offering registered under the Securities Act of 1933. These securities have been deemed liquid under guidelines approved by the Trust’s Board of Trustees. At April 30, 2017, the aggregate value of these securities was $495,099,705, representing 21.0% of net assets.
cSecurity has been deemed illiquid because it may not be able to be sold within seven days.
dSee Note 3(f) regarding investments in affiliated management investment companies.
eThe rate shown is the annualized seven-day yield at period end.
fSee Note 1(c) regarding joint repurchase agreement.
gThe security was issued on a discount basis with no stated coupon rate.
| | | | |
| | | |
franklintempleton.com | | The accompanying notes are an integral part of these financial statements. | Semiannual Report | | 49 |
FRANKLIN INVESTORS SECURITIES TRUST
Financial Highlights
Franklin Equity Income Fund
| | | | | | | | | | | | | | | | | | | | | | | | |
| | | Six Months Ended April 30, 2017 (unaudited) | | | | | | | | | | | |
| | | | Year Ended October 31, |
| | | | 2016 | | 2015 | | 2014 | | 2013 | | 2012 |
Class A | | | | | | | | | | | | | | | | | | | | | | | | |
| | | | | | |
Per share operating performance | | | | | | | | | | | | | | | | | | | | | | | | |
| | | | | | |
(for a share outstanding throughout the period) | | | | | | | | | | | | | | | | | | | | | | | | |
| | | | | | |
Net asset value, beginning of period | | | $22.50 | | | | $22.99 | | | | $23.93 | | | | $22.16 | | | | $18.01 | | | | $16.58 | |
| | | | | | |
Income from investment operationsa: | | | | | | | | | | | | | | | | | | | | | | | | |
| | | | | | |
Net investment incomeb | | | 0.21 | | | | 0.47 | | | | 0.55 | | | | 0.66c | | | | 0.44 | | | | 0.41 | |
| | | | | | |
Net realized and unrealized gains (losses) | | | 2.00 | | | | 0.24 | | | | 0.26 | | | | 1.73 | | | | 4.19 | | | | 1.46 | |
| | | | | | |
Total from investment operations | | | 2.21 | | | | 0.71 | | | | 0.81 | | | | 2.39 | | | | 4.63 | | | | 1.87 | |
| | | | | | |
Less distributions from: | | | | | | | | | | | | | | | | | | | | | | | | |
| | | | | | |
Net investment income | | | (0.29) | | | | (0.60) | | | | (0.69) | | | | (0.50) | | | | (0.48) | | | | (0.44) | |
| | | | | | |
Net realized gains | | | (0.89) | | | | (0.60) | | | | (1.06) | | | | (0.12) | | | | — | | | | — | |
| | | | | | |
Total distributions | | | (1.18) | | | | (1.20) | | | | (1.75) | | | | (0.62) | | | | (0.48) | | | | (0.44) | |
| | | | | | |
Net asset value, end of period | | | $23.53 | | | | $22.50 | | | | $22.99 | | | | $23.93 | | | | $22.16 | | | | $18.01 | |
| | | | | | |
Total returnd | | | 9.99% | | | | 3.31% | | | | 3.72% | | | | 10.99% | | | | 26.07% | | | | 11.43% | |
| | | | | | |
Ratios to average net assetse | | | | | | | | | | | | | | | | | | | | | | | | |
| | | | | | |
Expenses before waiver and payments by affiliates | | | 0.86% | | | | 0.87% | | | | 0.86% | | | | 0.87% | | | | 0.91% | | | | 0.95% | |
| | | | | | |
Expenses net of waiver and payments by affiliates | | | 0.85%f | | | | 0.87%f,g | | | | 0.86%f,g | | | | 0.87%f,g | | | | 0.91%f | | | | 0.95% | |
| | | | | | |
Net investment income | | | 1.80% | | | | 2.13% | | | | 2.37% | | | | 2.87%c | | | | 2.19% | | | | 2.36% | |
| | | | | | |
Supplemental data | | | | | | | | | | | | | | | | | | | | | | | | |
| | | | | | |
Net assets, end of period (000’s) | | | $1,742,039 | | | | $1,700,712 | | | | $1,790,392 | | | | $1,762,318 | | | | $1,637,089 | | | | $1,305,791 | |
| | | | | | |
Portfolio turnover rate | | | 12.63% | | | | 50.05% | | | | 34.09% | | | | 20.15% | | | | 33.18% | | | | 19.71% | |
aThe amount shown for a share outstanding throughout the period may not correlate with the Statement of Operations for the period due to the timing of sales and repurchases of the Fund’s shares in relation to income earned and/or fluctuating fair value of the investments of the Fund.
bBased on average daily shares outstanding.
cNet investment income per share includes approximately $0.17 per share related to income received in the form of a special dividend in connection with certain Fund holdings. Excluding this amount, the ratio of net investment income to average net assets would have been 2.15%.
dTotal return does not reflect sales commissions or contingent deferred sales charges, if applicable, and is not annualized for periods less than one year.
eRatios are annualized for periods less than one year.
fBenefit of expense reduction rounds to less than 0.01%.
gBenefit of waiver and payments by affiliates rounds to less than 0.01%.
| | | | |
| | | |
50 | | Semiannual Report | The accompanying notes are an integral part of these financial statements. | | franklintempleton.com |
FRANKLIN INVESTORS SECURITIES TRUST
FINANCIAL HIGHLIGHTS
Franklin Equity Income Fund (continued)
| | | | | | | | | | | | | | | | | | | | | | | | |
| | | Six Months Ended April 30, 2017 (unaudited) | | | | | | | | | | | |
| | | | Year Ended October 31, |
| | | | 2016 | | 2015 | | 2014 | | 2013 | | 2012 |
Class C | | | | | | | | | | | | | | | | | | | | | | | | |
| | | | | | |
Per share operating performance | | | | | | | | | | | | | | | | | | | | | | | | |
| | | | | | |
(for a share outstanding throughout the period) | | | | | | | | | | | | | | | | | | | | | | | | |
| | | | | | |
Net asset value, beginning of period | | | $22.32 | | | | $22.85 | | | | $23.79 | | | | $22.04 | | | | $17.91 | | | | $16.50 | |
| | | | | | |
Income from investment operationsa: | | | | | | | | | | | | | | | | | | | | | | | | |
| | | | | | |
Net investment incomeb | | | 0.12 | | | | 0.30 | | | | 0.37 | | | | 0.49c | | | | 0.28 | | | | 0.28 | |
| | | | | | |
Net realized and unrealized gains (losses) | | | 2.00 | | | | 0.23 | | | | 0.27 | | | | 1.71 | | | | 4.18 | | | | 1.45 | |
| | | | | | |
Total from investment operations | | | 2.12 | | | | 0.53 | | | | 0.64 | | | | 2.20 | | | | 4.46 | | | | 1.73 | |
| | | | | | |
Less distributions from: | | | | | | | | | | | | | | | | | | | | | | | | |
| | | | | | |
Net investment income | | | (0.21) | | | | (0.46) | | | | (0.52) | | | | (0.33) | | | | (0.33) | | | | (0.32) | |
| | | | | | |
Net realized gains | | | (0.89) | | | | (0.60) | | | | (1.06) | | | | (0.12) | | | | — | | | | — | |
| | | | | | |
Total distributions | | | (1.10) | | | | (1.06) | | | | (1.58) | | | | (0.45) | | | | (0.33) | | | | (0.32) | |
| | | | | | |
Net asset value, end of period | | | $23.34 | | | | $22.32 | | | | $22.85 | | | | $23.79 | | | | $22.04 | | | | $17.91 | |
| | | | | | |
Total returnd | | | 9.63% | | | | 2.51% | | | | 2.96% | | | | 10.14% | | | | 25.18% | | | | 10.56% | |
| | | | | | |
Ratios to average net assetse | | | | | | | | | | | | | | | | | | | | | | | | |
| | | | | | |
Expenses before waiver and payments by affiliates | | | 1.61% | | | | 1.62% | | | | 1.61% | | | | 1.62% | | | | 1.66% | | | | 1.70% | |
| | | | | | |
Expenses net of waiver and payments by affiliates | | | 1.60%f | | | | 1.62%f,g | | | | 1.61%f,g | | | | 1.62%f,g | | | | 1.66%f | | | | 1.70% | |
| | | | | | |
Net investment income | | | 1.05% | | | | 1.38% | | | | 1.62% | | | | 2.12%c | | | | 1.44% | | | | 1.61% | |
| | | | | | |
Supplemental data | | | | | | | | | | | | | | | | | | | | | | | | |
| | | | | | |
Net assets, end of period (000’s) | | | $271,578 | | | | $257,156 | | | | $250,347 | | | | $241,566 | | | | $208,325 | | | | $134,746 | |
| | | | | | |
Portfolio turnover rate | | | 12.63% | | | | 50.05% | | | | 34.09% | | | | 20.15% | | | | 33.18% | | | | 19.71% | |
aThe amount shown for a share outstanding throughout the period may not correlate with the Statement of Operations for the period due to the timing of sales and repurchases of the Fund’s shares in relation to income earned and/or fluctuating fair value of the investments of the Fund.
bBased on average daily shares outstanding.
cNet investment income per share includes approximately $0.17 per share related to income received in the form of a special dividend in connection with certain Fund holdings. Excluding this amount, the ratio of net investment income to average net assets would have been 1.40%.
dTotal return does not reflect sales commissions or contingent deferred sales charges, if applicable, and is not annualized for periods less than one year.
eRatios are annualized for periods less than one year.
fBenefit of expense reduction rounds to less than 0.01%.
gBenefit of waiver and payments by affiliates rounds to less than 0.01%.
| | | | |
| | | |
franklintempleton.com | | The accompanying notes are an integral part of these financial statements. | Semiannual Report | | 51 |
FRANKLIN INVESTORS SECURITIES TRUST
FINANCIAL HIGHLIGHTS
Franklin Equity Income Fund (continued)
| | | | | | | | | | | | | | | | | | | | | | | | |
| | | Six Months Ended April 30, 2017 (unaudited) | | | | | | | | | | | |
| | | | Year Ended October 31, |
| | | | 2016 | | 2015 | | 2014 | | 2013 | | 2012 |
Class R | | | | | | | | | | | | | | | | | | | | | | | | |
| | | | | | |
Per share operating performance | | | | | | | | | | | | | | | | | | | | | | | | |
| | | | | | |
(for a share outstanding throughout the period) | | | | | | | | | | | | | | | | | | | | | | | | |
| | | | | | |
Net asset value, beginning of period | | | $22.49 | | | | $22.99 | | | | $23.93 | | | | $22.17 | | | | $18.01 | | | | $16.58 | |
| | | | | | |
Income from investment operationsa: | | | | | | | | | | | | | | | | | | | | | | | | |
| | | | | | |
Net investment incomeb | | | 0.18 | | | | 0.41 | | | | 0.50 | | | | 0.61c | | | | 0.39 | | | | 0.37 | |
| | | | | | |
Net realized and unrealized gains (losses) | | | 2.01 | | | | 0.24 | | | | 0.25 | | | | 1.72 | | | | 4.20 | | | | 1.46 | |
| | | | | | |
Total from investment operations | | | 2.19 | | | | 0.65 | | | | 0.75 | | | | 2.33 | | | | 4.59 | | | | 1.83 | |
| | | | | | |
Less distributions from: | | | | | | | | | | | | | | | | | | | | | | | | |
| | | | | | |
Net investment income | | | (0.27) | | | | (0.55) | | | | (0.63) | | | | (0.45) | | | | (0.43) | | | | (0.40) | |
| | | | | | |
Net realized gains | | | (0.89) | | | | (0.60) | | | | (1.06) | | | | (0.12) | | | | — | | | | — | |
| | | | | | |
Total distributions | | | (1.16) | | | | (1.15) | | | | (1.69) | | | | (0.57) | | | | (0.43) | | | | (0.40) | |
| | | | | | |
Net asset value, end of period | | | $23.52 | | | | $22.49 | | | | $22.99 | | | | $23.93 | | | | $22.17 | | | | $18.01 | |
| | | | | | |
Total returnd | | | 9.88% | | | | 3.05% | | | | 3.45% | | | | 10.67% | | | | 25.81% | | | | 11.16% | |
| | | | | | |
Ratios to average net assetse | | | | | | | | | | | | | | | | | | | | | | | | |
| | | | | | |
Expenses before waiver and payments by affiliates | | | 1.09% | | | | 1.11% | | | | 1.11% | | | | 1.12% | | | | 1.16% | | | | 1.20% | |
| | | | | | |
Expenses net of waiver and payments by affiliates | | | 1.08%f | | | | 1.11%f,g | | | | 1.11%f,g | | | | 1.12%f,g | | �� | | 1.16%f | | | | 1.20% | |
| | | | | | |
Net investment income | | | 1.57% | | | | 1.89% | | | | 2.12% | | | | 2.62%c | | | | 1.94% | | | | 2.11% | |
| | | | | | |
Supplemental data | | | | | | | | | | | | | | | | | | | | | | | | |
| | | | | | |
Net assets, end of period (000’s) | | | $7,282 | | | | $6,395 | | | | $6,265 | | | | $7,305 | | | | $5,844 | | | | $4,940 | |
| | | | | | |
Portfolio turnover rate | | | 12.63% | | | | 50.05% | | | | 34.09% | | | | 20.15% | | | | 33.18% | | | | 19.71% | |
aThe amount shown for a share outstanding throughout the period may not correlate with the Statement of Operations for the period due to the timing of sales and repurchases of the Fund’s shares in relation to income earned and/or fluctuating fair value of the investments of the Fund.
bBased on average daily shares outstanding.
cNet investment income per share includes approximately $0.17 per share related to income received in the form of a special dividend in connection with certain Fund holdings. Excluding this amount, the ratio of net investment income to average net assets would have been 1.90%.
dTotal return is not annualized for periods less than one year.
eRatios are annualized for periods less than one year.
fBenefit of expense reduction rounds to less than 0.01%.
gBenefit of waiver and payments by affiliates rounds to less than 0.01%.
| | | | |
| | | |
52 | | Semiannual Report | The accompanying notes are an integral part of these financial statements. | | franklintempleton.com |
FRANKLIN INVESTORS SECURITIES TRUST
FINANCIAL HIGHLIGHTS
Franklin Equity Income Fund (continued)
| | | | | | | | | | | | | | | | | | | | |
| | | Six Months Ended April 30, 2017 (unaudited) | | | | | | | | | |
| | | | Year Ended October 31, |
| | | | 2016 | | 2015 | | 2014 | | 2013a |
Class R6 | | | | | | | | | | | | | | | | | | | | |
| | | | | |
Per share operating performance | | | | | | | | | | | | | | | | | | | | |
| | | | | |
(for a share outstanding throughout the period) | | | | | | | | | | | | | | | | | | | | |
| | | | | |
Net asset value, beginning of period | | | $22.54 | | | | $23.01 | | | | $23.95 | | | | $22.18 | | | | $20.00 | |
| | | | | |
Income from investment operationsb: | | | | | | | | | | | | | | | | | | | | |
| | | | | |
Net investment incomec | | | 0.25 | | | | 0.43 | | | | 0.63 | | | | 0.75d | | | | 0.26 | |
| | | | | |
Net realized and unrealized gains (losses) | | | 2.01 | | | | 0.37 | | | | 0.27 | | | | 1.73 | | | | 2.18 | |
| | | | | |
Total from investment operations | | | 2.26 | | | | 0.80 | | | | 0.90 | | | | 2.48 | | | | 2.44 | |
| | | | | |
Less distributions from: | | | | | | | | | | | | | | | | | | | | |
| | | | | |
Net investment income | | | (0.34) | | | | (0.67) | | | | (0.78) | | | | (0.59) | | | | (0.26) | |
| | | | | |
Net realized gains | | | (0.89) | | | | (0.60) | | | | (1.06) | | | | (0.12) | | | | — | |
| | | | | |
Total distributions | | | (1.23) | | | | (1.27) | | | | (1.84) | | | | (0.71) | | | | (0.26) | |
| | | | | |
Net asset value, end of period | | | $23.57 | | | | $22.54 | | | | $23.01 | | | | $23.95 | | | | $22.18 | |
| | | | | |
Total returne | | | 10.18% | | | | 3.72% | | | | 4.10% | | | | 11.38% | | | | 12.30% | |
| | | | | |
Ratios to average net assetsf | | | | | | | | | | | | | | | | | | | | |
| | | | | |
Expenses before waiver and payments by affiliates | | | 0.49% | | | | 0.49% | | | | 2.89% | | | | 1.78% | | | | 2.16% | |
| | | | | |
Expenses net of waiver and payments by affiliatesg | | | 0.48% | | | | 0.49%h | | | | 0.48% | | | | 0.50% | | | | 0.51% | |
| | | | | |
Net investment income | | | 2.17% | | | | 2.51% | | | | 2.75% | | | | 3.24%d | | | | 2.59% | |
| | | | | |
Supplemental data | | | | | | | | | | | | | | | | | | | | |
| | | | | |
Net assets, end of period (000’s) | | | $11,544 | | | | $10,537 | | | | $6 | | | | $6 | | | | $6 | |
| | | | | |
Portfolio turnover rate | | | 12.63% | | | | 50.05% | | | | 34.09% | | | | 20.15% | | | | 33.18% | |
aFor the period May 1, 2013 (effective date) to October 31, 2013.
bThe amount shown for a share outstanding throughout the period may not correlate with the Statement of Operations for the period due to the timing of sales and repurchases of the Fund’s shares in relation to income earned and/or fluctuating fair value of the investments of the Fund.
cBased on average daily shares outstanding.
dNet investment income per share includes approximately $0.17 per share related to income received in the form of a special dividend in connection with certain Fund holdings. Excluding this amount, the ratio of net investment income to average net assets would have been 2.51%.
eTotal return is not annualized for periods less than one year.
fRatios are annualized for periods less than one year.
gBenefit of expense reduction rounds to less than 0.01%.
hBenefit of waiver and payments by affiliates rounds to less than 0.01%.
| | | | |
| | | |
franklintempleton.com | | The accompanying notes are an integral part of these financial statements. | Semiannual Report | | 53 |
FRANKLIN INVESTORS SECURITIES TRUST
FINANCIAL HIGHLIGHTS
Franklin Equity Income Fund (continued)
| | | | | | | | | | | | | | | | | | | | | | | | |
| | | Six Months Ended April 30, 2017 (unaudited) | | | | | | | | | | | |
| | | | Year Ended October 31, |
| | | | 2016 | | 2015 | | 2014 | | 2013 | | 2012 |
Advisor Class | | | | | | | | | | | | | | | | | | | | | | | | |
| | | | | | |
Per share operating performance | | | | | | | | | | | | | | | | | | | | | | | | |
| | | | | | |
(for a share outstanding throughout the period) | | | | | | | | | | | | | | | | | | | | | | | | |
| | | | | | |
Net asset value, beginning of period | | | $22.53 | | | | $23.02 | | | | $23.96 | | | | $22.19 | | | | $18.02 | | | | $16.59 | |
| | | | | | |
Income from investment operationsa: | | | | | | | | | | | | | | | | | | | | | | | | |
| | | | | | |
Net investment incomeb | | | 0.22 | | | | 0.45 | | | | 0.60 | | | | 0.71c | | | | 0.48 | | | | 0.45 | |
| | | | | | |
Net realized and unrealized gains (losses) | | | 2.03 | | | | 0.31 | | | | 0.27 | | | | 1.74 | | | | 4.22 | | | | 1.46 | |
| | | | | | |
Total from investment operations | | | 2.25 | | | | 0.76 | | | | 0.87 | | | | 2.45 | | | | 4.70 | | | | 1.91 | |
| | | | | | |
Less distributions from: | | | | | | | | | | | | | | | | | | | | | | | | |
| | | | | | |
Net investment income | | | (0.32) | | | | (0.65) | | | | (0.75) | | | | (0.56) | | | | (0.53) | | | | (0.48) | |
| | | | | | |
Net realized gains | | | (0.89) | | | | (0.60) | | | | (1.06) | | | | (0.12) | | | | — | | | | — | |
| | | | | | |
Total distributions | | | (1.21) | | | | (1.25) | | | | (1.81) | | | | (0.68) | | | | (0.53) | | | | (0.48) | |
| | | | | | |
Net asset value, end of period | | | $23.57 | | | | $22.53 | | | | $23.02 | | | | $23.96 | | | | $22.19 | | | | $18.02 | |
| | | | | | |
Total returnd | | | 10.17% | | | | 3.53% | | | | 3.98% | | | | 11.25% | | | | 26.48% | | | | 11.69% | |
| | | | | | |
Ratios to average net assetse | | | | | | | | | | | | | | | | | | | | | | | | |
| | | | | | |
Expenses before waiver and payments by affiliates | | | 0.61% | | | | 0.62% | | | | 0.61% | | | | 0.62% | | | | 0.66% | | | | 0.70% | |
| | | | | | |
Expenses net of waiver and payments by affiliates | | | 0.60%f | | | | 0.62%f,g | | | | 0.61%f,g | | | | 0.62%f,g | | | | 0.66%f | | | | 0.70% | |
| | | | | | |
Net investment income | | | 2.05% | | | | 2.38% | | | | 2.62% | | | | 3.12%c | | | | 2.44% | | | | 2.61% | |
| | | | | | |
Supplemental data | | | | | | | | | | | | | | | | | | | | | | | | |
| | | | | | |
Net assets, end of period (000’s) | | | $117,357 | | | | $80,422 | | | | $34,577 | | | | $30,166 | | | | $17,534 | | | | $10,527 | |
| | | | | | |
Portfolio turnover rate | | | 12.63% | | | | 50.05% | | | | 34.09% | | | | 20.15% | | | | 33.18% | | | | 19.71% | |
aThe amount shown for a share outstanding throughout the period may not correlate with the Statement of Operations for the period due to the timing of sales and repurchases of the Fund’s shares in relation to income earned and/or fluctuating fair value of the investments of the Fund.
bBased on average daily shares outstanding.
cNet investment income per share includes approximately $0.17 per share related to income received in the form of a special dividend in connection with certain Fund holdings. Excluding this amount, the ratio of net investment income to average net assets would have been 2.40%.
dTotal return is not annualized for periods less than one year.
eRatios are annualized for periods less than one year.
fBenefit of expense reduction rounds to less than 0.01%.
gBenefit of waiver and payments by affiliates rounds to less than 0.01%.
| | | | |
| | | |
54 | | Semiannual Report | The accompanying notes are an integral part of these financial statements. | | franklintempleton.com |
FRANKLIN INVESTORS SECURITIES TRUST
Statement of Investments, April 30, 2017 (unaudited)
Franklin Equity Income Fund
| | | | | | | | | | |
| | | Country | | Shares | | | Value | |
Common Stocks 86.7% | | | | | | | | | | |
Consumer Discretionary 5.7% | | | | | | | | | | |
Ford Motor Co. | | United States | | | 1,236,700 | | | $ | 14,184,949 | |
L Brands Inc. | | United States | | | 230,000 | | | | 12,146,300 | |
Lowe’s Cos. Inc. | | United States | | | 440,000 | | | | 37,347,200 | |
Mattel Inc. | | United States | | | 550,000 | | | | 12,331,000 | |
Newell Brands Inc. | | United States | | | 570,000 | | | | 27,211,800 | |
Target Corp. | | United States | | | 348,900 | | | | 19,486,065 | |
| | | | | | | | | | |
| | | | | | | | | 122,707,314 | |
| | | | | | | | | | |
Consumer Staples 8.1% | | | | | | | | | | |
Anheuser-Busch InBev SA/NV, ADR | | Belgium | | | 201,100 | | | | 22,772,564 | |
CVS Health Corp. | | United States | | | 346,000 | | | | 28,524,240 | |
Kimberly-Clark Corp. | | United States | | | 114,000 | | | | 14,791,500 | |
The Kraft Heinz Co. | | United States | | | 369,100 | | | | 33,362,949 | |
PepsiCo Inc. | | United States | | | 460,500 | | | | 52,165,440 | |
Wal-Mart Stores Inc. | | United States | | | 285,000 | | | | 21,426,300 | |
| | | | | | | | | | |
| | | | | | | | | 173,042,993 | |
| | | | | | | | | | |
Energy 8.5% | | | | | | | | | | |
Anadarko Petroleum Corp. | | United States | | | 193,200 | | | | 11,016,264 | |
Baker Hughes Inc. | | United States | | | 225,000 | | | | 13,358,250 | |
BP PLC, ADR | | United Kingdom | | | 265,000 | | | | 9,094,800 | |
Chevron Corp. | | United States | | | 502,800 | | | | 53,648,760 | |
Exxon Mobil Corp. | | United States | | | 367,234 | | | | 29,984,656 | |
Royal Dutch Shell PLC, A, ADR | | United Kingdom | | | 385,900 | | | | 20,140,121 | |
Schlumberger Ltd. | | United States | | | 283,000 | | | | 20,542,970 | |
Suncor Energy Inc. | | Canada | | | 775,000 | | | | 24,304,000 | |
| | | | | | | | | | |
| | | | | | | | | 182,089,821 | |
| | | | | | | | | | |
Financials 17.0% | | | | | | | | | | |
Arthur J. Gallagher & Co. | | United States | | | 571,800 | | | | 31,912,158 | |
Bank of America Corp. | | United States | | | 937,200 | | | | 21,874,248 | |
BB&T Corp. | | United States | | | 720,000 | | | | 31,089,600 | |
BlackRock Inc. | | United States | | | 110,500 | | | | 42,494,985 | |
JPMorgan Chase & Co. | | United States | | | 922,800 | | | | 80,283,600 | |
Morgan Stanley | | United States | | | 956,000 | | | | 41,461,720 | |
U.S. Bancorp | | United States | | | 1,076,800 | | | | 55,218,304 | |
Wells Fargo & Co. | | United States | | | 1,145,000 | | | | 61,646,800 | |
| | | | | | | | | | |
| | | | | | | | | 365,981,415 | |
| | | | | | | | | | |
Health Care 8.9% | | | | | | | | | | |
AstraZeneca PLC, ADR | | United Kingdom | | | 298,800 | | | | 9,038,700 | |
Eli Lilly & Co. | | United States | | | 465,400 | | | | 38,190,724 | |
Johnson & Johnson | | United States | | | 144,000 | | | | 17,779,680 | |
Medtronic PLC | | United States | | | 523,000 | | | | 43,456,070 | |
Merck & Co. Inc. | | United States | | | 225,000 | | | | 14,024,250 | |
Pfizer Inc. | | United States | | | 1,174,300 | | | | 39,832,256 | |
UnitedHealth Group Inc. | | United States | | | 161,500 | | | | 28,243,120 | |
| | | | | | | | | | |
| | | | | | | | | 190,564,800 | |
| | | | | | | | | | |
Industrials 16.8% | | | | | | | | | | |
Cummins Inc. | | United States | | | 161,800 | | | | 24,422,092 | |
Deere & Co. | | United States | | | 186,500 | | | | 20,815,265 | |
General Electric Co. | | United States | | | 1,770,500 | | | | 51,326,795 | |
Illinois Tool Works Inc. | | United States | | | 225,400 | | | | 31,125,486 | |
Lockheed Martin Corp. | | United States | | | 122,600 | | | | 33,034,570 | |
| | | | |
| | | |
franklintempleton.com | | Semiannual Report | | 55 |
FRANKLIN INVESTORS SECURITIES TRUST
STATEMENT OF INVESTMENTS (UNAUDITED)
Franklin Equity Income Fund (continued)
| | | | | | | | | | |
| | | Country | | Shares | | | Value | |
| |
Common Stocks (continued) | | | | | | | | | | |
Industrials (continued) | | | | | | | | | | |
Norfolk Southern Corp. | | United States | | | 149,500 | | | $ | 17,564,755 | |
Raytheon Co. | | United States | | | 293,500 | | | | 45,554,135 | |
Republic Services Inc. | | United States | | | 643,500 | | | | 40,534,065 | |
Stanley Black & Decker Inc. | | United States | | | 258,380 | | | | 35,178,437 | |
United Parcel Service Inc., B | | United States | | | 266,600 | | | | 28,648,836 | |
United Technologies Corp. | | United States | | | 274,700 | | | | 32,686,553 | |
| | | | | | | | | | |
| | | | | | | | | 360,890,989 | |
| | | | | | | | | | |
Information Technology 11.8% | | | | | | | | | | |
Apple Inc. | | United States | | | 370,500 | | | | 53,222,325 | |
Automatic Data Processing Inc. | | United States | | | 80,000 | | | | 8,359,200 | |
Broadcom Ltd. | | United States | | | 53,500 | | | | 11,813,335 | |
Cisco Systems Inc. | | United States | | | 966,733 | | | | 32,936,593 | |
Intel Corp. | | United States | | | 311,518 | | | | 11,261,376 | |
Microsoft Corp. | | United States | | | 1,200,100 | | | | 82,158,846 | |
Oracle Corp. | | United States | | | 323,000 | | | | 14,522,080 | |
Texas Instruments Inc. | | United States | | | 493,000 | | | | 39,035,740 | |
| | | | | | | | | | |
| | | | | | | | | 253,309,495 | |
| | | | | | | | | | |
Materials 4.4% | | | | | | | | | | |
BASF SE | | Germany | | | 286,500 | | | | 27,919,077 | |
The Dow Chemical Co. | | United States | | | 525,400 | | | | 32,995,120 | |
International Paper Co. | | United States | | | 612,600 | | | | 33,062,022 | |
| | | | | | | | | | |
| | | | | | | | | 93,976,219 | |
| | | | | | | | | | |
Real Estate 1.2% | | | | | | | | | | |
Host Hotels & Resorts Inc. | | United States | | | 1,483,000 | | | | 26,619,850 | |
| | | | | | | | | | |
Telecommunication Services 1.6% | | | | | | | | | | |
Rogers Communications Inc., B | | Canada | | | 362,700 | | | | 16,633,422 | |
Verizon Communications Inc. | | United States | | | 408,000 | | | | 18,731,280 | |
| | | | | | | | | | |
| | | | | | | | | 35,364,702 | |
| | | | | | | | | | |
Utilities 2.7% | | | | | | | | | | |
Dominion Resources Inc. | | United States | | | 361,100 | | | | 27,959,973 | |
Xcel Energy Inc. | | United States | | | 673,500 | | | | 30,341,175 | |
| | | | | | | | | | |
| | | | | | | | | 58,301,148 | |
| | | | | | | | | | |
Total Common Stocks (Cost $1,379,149,162) | | | | | | | | | 1,862,848,746 | |
| | | | | | | | | | |
a Equity-Linked Securities 7.4% | | | | | | | | | | |
Consumer Discretionary 1.4% | | | | | | | | | | |
b Wells Fargo Bank National Assn. into Amazon.com Inc., 5.00%, 144A | | United States | | | 33,300 | | | | 29,027,710 | |
| | | | | | | | | | |
Energy 0.8% | | | | | | | | | | |
b Merrill Lynch International & Co. CV into Schlumberger Ltd., 7.00%, 144A | | United States | | | 126,000 | | | | 9,495,738 | |
b UBS AG London into Anadarko Petroleum Corp., 9.00%, 144A | | United States | | | 150,000 | | | | 8,761,455 | |
| | | | | | | | | | |
| | | | | | | | | 18,257,193 | |
| | | | | | | | | | |
Financials 1.6% | | | | | | | | | | |
b The Goldman Sachs Group Inc. into The Charles Schwab Corp., 7.00%, 144A | | United States | | | 1,000,000 | | | | 34,063,100 | |
| | | | | | | | | | |
Health Care 0.9% | | | | | | | | | | |
b Merrill Lynch International & Co. CV into Gilead Sciences Inc., 7.25%, 144A | | United States | | | 284,000 | | | | 19,909,082 | |
| | | | | | | | | | |
| | | | |
| | | |
56 | | Semiannual Report | | franklintempleton.com |
FRANKLIN INVESTORS SECURITIES TRUST
STATEMENT OF INVESTMENTS (UNAUDITED)
Franklin Equity Income Fund (continued)
| | | | | | | | | | |
| | | Country | | Shares | | | Value | |
| |
a Equity-Linked Securities (continued) | | | | | | | | | | |
Information Technology 2.7% | | | | | | | | | | |
b Barclays Bank PLC into Broadcom Ltd., 9.00%, 144A | | Singapore | | | 160,000 | | | $ | 27,695,920 | |
b UBS AG into Intel Corp., 7.00%, 144A | | United States | | | 845,000 | | | | 30,763,661 | |
| | | | | | | | | | |
| | | | | | | | | 58,459,581 | |
| | | | | | | | | | |
Total Equity-Linked Securities (Cost $154,316,208) | | | | | | | | | 159,716,666 | |
| | | | | | | | | | |
Convertible Preferred Stocks 3.8% | | | | | | | | | | |
Energy 0.5% | | | | | | | | | | |
Hess Corp., 8.00%, cvt. pfd. | | United States | | | 175,000 | | | | 10,438,750 | |
| | | | | | | | | | |
Health Care 1.7% | | | | | | | | | | |
Allergan PLC, 5.50%, cvt. pfd. | | United States | | | 41,700 | | | | 36,103,026 | |
| | | | | | | | | | |
Utilities 1.6% | | | | | | | | | | |
NextEra Energy Inc., 6.371%, cvt. pfd. | | United States | | | 575,000 | | | | 35,460,250 | |
| | | | | | | | | | |
Total Convertible Preferred Stocks (Cost $81,908,075) | | | | | | | | | 82,002,026 | |
| | | | | | | | | | |
Total Investments before Short Term Investments (Cost $1,615,373,445) | | | | | | | 2,104,567,438 | |
| | | | | | | | | | |
Short Term Investments (Cost $39,182,790) 1.8% | | | | | | | | | | |
Money Market Funds 1.8% | | | | | | | | | | |
c,d Institutional Fiduciary Trust Money Market Portfolio, 0.37% | | United States | | | 39,182,790 | | | | 39,182,790 | |
| | | | | | | | | | |
Total Investments (Cost $1,654,556,235) 99.7% | | | | | | | | | 2,143,750,228 | |
Other Assets, less Liabilities 0.3% | | | | | | | | | 6,050,760 | |
| | | | | | | | | | |
Net Assets 100.0% | | | | | | | | $ | 2,149,800,988 | |
| | | | | | | | | | |
See Abbreviations on page 90.
aSee Note 1(g) regarding equity-linked securities.
bSecurity was purchased pursuant to Rule 144A under the Securities Act of 1933 and may be sold in transactions exempt from registration only to qualified institutional buyers or in a public offering registered under the Securities Act of 1933. These securities have been deemed liquid under guidelines approved by the Trust’s Board of Trustees. At April 30, 2017, the aggregate value of these securities was $159,716,666, representing 7.4% of net assets.
cSee Note 3(f) regarding investments in affiliated management investment companies.
dThe rate shown is the annualized seven-day yield at period end.
| | | | |
| | | |
franklintempleton.com | | The accompanying notes are an integral part of these financial statements. | Semiannual Report | | 57 |
FRANKLIN INVESTORS SECURITIES TRUST
Financial Highlights
Franklin Real Return Fund
| | | | | | | | | | | | | | | | | | | | | | | | |
| | | Six Months Ended
April 30, 2017 (unaudited) | | | | | | | | | | | | | | | | |
| | | | Year Ended October 31, | |
| | | | 2016 | | | 2015 | | | 2014 | | | 2013 | | | 2012 | |
Class A | | | | | | | | | | | | | | | | | | | | | | | | |
| | | | | | |
Per share operating performance | | | | | | | | | | | | | | | | | | | | | | | | |
| | | | | | |
(for a share outstanding throughout the period) | | | | | | | | | | | | | | | | | | | | | | | | |
| | | | | | |
Net asset value, beginning of period | | | $10.09 | | | | $9.92 | | | | $10.66 | | | | $10.82 | | | | $10.94 | | | | $11.06 | |
| | | | | | |
Income from investment operationsa: | | | | | | | | | | | | | | | | | | | | | | | | |
| | | | | | |
Net investment incomeb | | | 0.10 | | | | 0.12 | | | | 0.05 | | | | 0.14 | | | | 0.15 | | | | 0.17 | |
| | | | | | |
Net realized and unrealized gains (losses) | | | —c | | | | 0.15 | | | | (0.72) | | | | (0.06) | | | | (0.01) | | | | 0.01 | |
| | | | | | |
Total from investment operations | | | 0.10 | | | | 0.27 | | | | (0.67) | | | | 0.08 | | | | 0.14 | | | | 0.18 | |
| | | | | | |
Less distributions from: | | | | | | | | | | | | | | | | | | | | | | | | |
| | | | | | |
Net investment income and net foreign currency gains | | | (0.01) | | | | (0.09) | | | | (0.07) | | | | (0.24) | | | | (0.26) | | | | (0.30) | |
| | | | | | |
Tax return of capital | | | — | | | | (0.01) | | | | — | | | | — | | | | — | | | | — | |
| | | | | | |
Total distributions | | | (0.01) | | | | (0.10) | | | | (0.07) | | | | (0.24) | | | | (0.26) | | | | (0.30) | |
| | | | | | |
Net asset value, end of period | | | $10.18 | | | | $10.09 | | | | $9.92 | | | | $10.66 | | | | $10.82 | | | | $10.94 | |
| | | | | | |
Total returnd | | | 0.98% | | | | 2.77% | | | | (6.32)% | | | | 0.75% | | | | 1.34% | | | | 1.67% | |
| | | | | | |
Ratios to average net assetse | | | | | | | | | | | | | | | | | | | | | | | | |
| | | | | | |
Expenses before waiver and payments by affiliates | | | 1.13% | | | | 1.12% | | | | 1.10% | | | | 1.10% | | | | 1.08% | | | | 1.06% | |
| | | | | | |
Expenses net of waiver and payments by affiliates | | | 0.90%f | | | | 0.90%f | | | | 0.90%f | | | | 0.90%f | | | | 0.90%f | | | | 0.90% | |
| | | | | | |
Net investment income | | | 1.92% | | | | 1.18% | | | | 0.43% | | | | 1.34% | | | | 1.35% | | | | 1.58% | |
| | | | | | |
Supplemental data | | | | | | | | | | | | | | | | | | | | | | | | |
| | | | | | |
Net assets, end of period (000’s) | | | $161,408 | | | | $161,541 | | | | $185,743 | | | | $248,313 | | | | $327,285 | | | | $411,419 | |
| | | | | | |
Portfolio turnover rate | | | 23.46% | | | | 31.82% | | | | 26.57% | | | | 33.02% | | | | 27.91% | | | | 18.64% | |
aThe amount shown for a share outstanding throughout the period may not correlate with the Statement of Operations for the period due to the timing of sales and repurchases of the Fund’s shares in relation to income earned, adjustments to interest income for the inflation-indexed bonds, and/or fluctuating fair value of the investments of the Fund.
bBased on average daily shares outstanding.
cAmount rounds to less than $0.01 per share.
dTotal return does not reflect sales commissions or contingent deferred sales charges, if applicable, and is not annualized for periods less than one year.
eRatios are annualized for periods less than one year.
fBenefit of expense reduction rounds to less than 0.01%.
| | | | |
| | | |
58 | | Semiannual Report | The accompanying notes are an integral part of these financial statements. | | franklintempleton.com |
FRANKLIN INVESTORS SECURITIES TRUST
FINANCIAL HIGHLIGHTS
Franklin Real Return Fund (continued)
| | | | | | | | | | | | | | | | | | | | | | | | |
| | | Six Months Ended April 30, 2017 (unaudited) | | | | | | | | | | | |
| | | | Year Ended October 31, |
| | | | 2016 | | 2015 | | 2014 | | 2013 | | 2012 |
Class C | | | | | | | | | | | | | | | | | | | | | | | | |
| | | | | | |
Per share operating performance | | | | | | | | | | | | | | | | | | | | | | | | |
| | | | | | |
(for a share outstanding throughout the period) | | | | | | | | | | | | | | | | | | | | | | | | |
| | | | | | |
Net asset value, beginning of period | | | $10.00 | | | | $9.82 | | | | $10.59 | | | | $10.76 | | | | $10.87 | | | | $11.00 | |
| | | | | | |
Income from investment operationsa: | | | | | | | | | | | | | | | | | | | | | | | | |
| | | | | | |
Net investment incomeb | | | 0.08 | | | | 0.08 | | | | —c | | | | 0.10 | | | | 0.10 | | | | 0.13 | |
| | | | | | |
Net realized and unrealized gains (losses) | | | —c | | | | 0.16 | | | | (0.71) | | | | (0.07) | | | | 0.01 | | | | —c | |
| | | | | | |
Total from investment operations | | | 0.08 | | | | 0.24 | | | | (0.71) | | | | 0.03 | | | | 0.11 | | | | 0.13 | |
| | | | | | |
Less distributions from: | | | | | | | | | | | | | | | | | | | | | | | | |
| | | | | | |
Net investment income and net foreign currency gains | | | — | | | | (0.05) | | | | (0.06) | | | | (0.20) | | | | (0.22) | | | | (0.26) | |
| | | | | | |
Tax return of capital | | | — | | | | (0.01) | | | | — | | | | — | | | | — | | | | — | |
| | | | | | |
Total distributions | | | — | | | | (0.06) | | | | (0.06) | | | | (0.20) | | | | (0.22) | | | | (0.26) | |
| | | | | | |
Net asset value, end of period | | | $10.08 | | | | $10.00 | | | | $9.82 | | | | $10.59 | | | | $10.76 | | | | $10.87 | |
| | | | | | |
Total returnd | | | 0.80% | | | | 2.44% | | | | (6.70)% | | | | 0.22% | | | | 1.03% | | | | 1.22% | |
| | | | | | |
Ratios to average net assetse | | | | | | | | | | | | | | | | | | | | | | | | |
| | | | | | |
Expenses before waiver and payments by affiliates | | | 1.54% | | | | 1.52% | | | | 1.50% | | | | 1.50% | | | | 1.48% | | | | 1.46% | |
| | | | | | |
Expenses net of waiver and payments by affiliates | | | 1.31%f | | | | 1.30%f | | | | 1.30%f | | | | 1.30%f | | | | 1.30%f | | | | 1.30% | |
| | | | | | |
Net investment income | | | 1.51% | | | | 0.78% | | | | 0.04% | | | | 0.94% | | | | 0.95% | | | | 1.18% | |
| | | | | | |
Supplemental data | | | | | | | | | | | | | | | | | | | | | | | | |
| | | | | | |
Net assets, end of period (000’s) | | | $38,617 | | | | $39,568 | | | | $48,084 | | | | $68,188 | | | | $83,666 | | | | $104,682 | |
| | | | | | |
Portfolio turnover rate | | | 23.46% | | | | 31.82% | | | | 26.57% | | | | 33.02% | | | | 27.91% | | | | 18.64% | |
aThe amount shown for a share outstanding throughout the period may not correlate with the Statement of Operations for the period due to the timing of sales and repurchases of the Fund’s shares in relation to income earned, adjustments to interest income for the inflation-indexed bonds, and/or fluctuating fair value of the investments of the Fund.
bBased on average daily shares outstanding.
cAmount rounds to less than $0.01 per share.
dTotal return does not reflect sales commissions or contingent deferred sales charges, if applicable, and is not annualized for periods less than one year.
eRatios are annualized for periods less than one year.
fBenefit of expense reduction rounds to less than 0.01%.
| | | | |
| | | |
franklintempleton.com | | The accompanying notes are an integral part of these financial statements. | Semiannual Report | | 59 |
FRANKLIN INVESTORS SECURITIES TRUST
FINANCIAL HIGHLIGHTS
Franklin Real Return Fund (continued)
| | | | | | | | | | | | | | | | | | | | |
| | | Six Months Ended April 30, 2017 (unaudited) | | | | | | | | | |
| | | | Year Ended October 31, |
| | | | 2016 | | 2015 | | 2014 | | 2013a |
Class R6 | | | | | | | | | | | | | | | | | | | | |
| | | | | |
Per share operating performance | | | | | | | | | | | | | | | | | | | | |
| | | | | |
(for a share outstanding throughout the period) | | | | | | | | | | | | | | | | | | | | |
| | | | | |
Net asset value, beginning of period | | | $10.15 | | | | $9.98 | | | | $10.68 | | | | $10.85 | | | | $11.01 | |
| | | | | |
Income from investment operationsb: | | | | | | | | | | | | | | | | | | | | |
| | | | | |
Net investment incomec | | | 0.12 | | | | 0.16 | | | | 0.10 | | | | 0.21 | | | | 0.09 | |
| | | | | |
Net realized and unrealized gains (losses) | | | —d | | | | 0.16 | | | | (0.72) | | | | (0.10) | | | | (0.10) | |
| | | | | |
Total from investment operations | | | 0.12 | | | | 0.32 | | | | (0.62) | | | | 0.11 | | | | (0.01) | |
| | | | | |
Less distributions from: | | | | | | | | | | | | | | | | | | | | |
| | | | | |
Net investment income and net foreign currency gains | | | (0.03) | | | | (0.14) | | | | (0.08) | | | | (0.28) | | | | (0.15) | |
| | | | | |
Tax return of capital | | | — | | | | (0.01) | | | | — | | | | — | | | | — | |
| | | | | |
Total distributions | | | (0.03) | | | | (0.15) | | | | (0.08) | | | | (0.28) | | | | (0.15) | |
| | | | | |
Net asset value, end of period | | | $10.24 | | | | $10.15 | | | | $9.98 | | | | $10.68 | | | | $10.85 | |
| | | | | |
Total returne | | | 1.17% | | | | 3.25% | | | | (5.87)% | | | | 1.04% | | | | (0.06)% | |
| | | | | |
Ratios to average net assetsf | | | | | | | | | | | | | | | | | | | | |
| | | | | |
Expenses before waiver and payments by affiliates | | | 0.70% | | | | 0.71% | | | | 0.71% | | | | 0.70% | | | | 2.43% | |
| | | | | |
Expenses net of waiver and payments by affiliatesg | | | 0.49% | | | | 0.50% | | | | 0.50% | | | | 0.52% | | | | 0.52% | |
| | | | | |
Net investment income | | | 2.33% | | | | 1.58% | | | | 0.83% | | | | 1.72% | | | | 1.73% | |
| | | | | |
Supplemental data | | | | | | | | | | | | | | | | | | | | |
| | | | | |
Net assets, end of period (000’s) | | | $6,006 | | | | $5,326 | | | | $1,730 | | | | $2,034 | | | | $5 | |
| | | | | |
Portfolio turnover rate | | | 23.46% | | | | 31.82% | | | | 26.57% | | | | 33.02% | | | | 27.91% | |
aFor the period May 1, 2013 (effective date) to October 31, 2013.
bThe amount shown for a share outstanding throughout the period may not correlate with the Statement of Operations for the period due to the timing of sales and repurchases of the Fund’s shares in relation to income earned, adjustments to interest income for the inflation-indexed bonds, and/or fluctuating fair value of the investments of the Fund.
cBased on average daily shares outstanding.
dAmount rounds to less than $0.01 per share.
eTotal return is not annualized for periods less than one year.
fRatios are annualized for periods less than one year.
gBenefit of expense reduction rounds to less than 0.01%.
| | | | |
| | | |
60 | | Semiannual Report | The accompanying notes are an integral part of these financial statements. | | franklintempleton.com |
FRANKLIN INVESTORS SECURITIES TRUST
FINANCIAL HIGHLIGHTS
Franklin Real Return Fund (continued)
| | | | | | | | | | | | | | | | | | | | | | | | |
| | | Six Months Ended April 30, 2017 (unaudited) | | | | | | | | | | | |
| | | | Year Ended October 31, |
| | | | 2016 | | 2015 | | 2014 | | 2013 | | 2012 |
Advisor Class | | | | | | | | | | | | | | | | | | | | | | | | |
| | | | | | |
Per share operating performance | | | | | | | | | | | | | | | | | | | | | | | | |
| | | | | | |
(for a share outstanding throughout the period) | | | | | | | | | | | | | | | | | | | | | | | | |
| | | | | | |
Net asset value, beginning of period | | | $10.13 | | | | $9.96 | | | | $10.68 | | | | $10.85 | | | | $10.97 | | | | $11.08 | |
| | | | | | |
Income from investment operationsa: | | | | | | | | | | | | | | | | | | | | | | | | |
| | | | | | |
Net investment incomeb | | | 0.11 | | | | 0.14 | | | | 0.05 | | | | 0.18 | | | | 0.18 | | | | 0.20 | |
| | | | | | |
Net realized and unrealized gains (losses) | | | 0.01 | | | | 0.16 | | | | (0.70) | | | | (0.08) | | | | (0.01) | | | | 0.01 | |
| | | | | | |
Total from investment operations | | | 0.12 | | | | 0.30 | | | | (0.65) | | | | 0.10 | | | | 0.17 | | | | 0.21 | |
| | | | | | |
Less distributions from: | | | | | | | | | | | | | | | | | | | | | | | | |
| | | | | | |
Net investment income and net foreign currency gains | | | (0.02) | | | | (0.12) | | | | (0.07) | | | | (0.27) | | | | (0.29) | | | | (0.32) | |
| | | | | | |
Tax return of capital | | | — | | | | (0.01) | | | | — | | | | — | | | | — | | | | — | |
| | | | | | |
Total distributions | | | (0.02) | | | | (0.13) | | | | (0.07) | | | | (0.27) | | | | (0.29) | | | | (0.32) | |
| | | | | | |
Net asset value, end of period | | | $10.23 | | | | $10.13 | | | | $9.96 | | | | $10.68 | | | | $10.85 | | | | $10.97 | |
| | | | | | |
Total returnc | | | 1.11% | | | | 3.04% | | | | (6.08)% | | | | 0.91% | | | | 1.60% | | | | 1.99% | |
| | | | | | |
Ratios to average net assetsd | | | | | | | | | | | | | | | | | | | | | | | | |
| | | | | | |
Expenses before waiver and payments by affiliates | | | 0.88% | | | | 0.87% | | | | 0.85% | | | | 0.85% | | | | 0.83% | | | | 0.81% | |
| | | | | | |
Expenses net of waiver and payments by affiliates | | | 0.65%e | | | | 0.65%e | | | | 0.65%e | | | | 0.65%e | | | | 0.65%e | | | | 0.65% | |
| | | | | | |
Net investment income | | | 2.17% | | | | 1.43% | | | | 0.68% | | | | 1.59% | | | | 1.60% | | | | 1.83% | |
| | | | | | |
Supplemental data | | | | | | | | | | | | | | | | | | | | | | | | |
| | | | | | |
Net assets, end of period (000’s) | | | $39,833 | | | | $35,215 | | | | $37,758 | | | | $65,958 | | | | $28,042 | | | | $35,362 | |
| | | | | | |
Portfolio turnover rate | | | 23.46% | | | | 31.82% | | | | 26.57% | | | | 33.02% | | | | 27.91% | | | | 18.64% | |
aThe amount shown for a share outstanding throughout the period may not correlate with the Statement of Operations for the period due to the timing of sales and repurchases of the Fund’s shares in relation to income earned, adjustments to interest income for the inflation-indexed bonds, and/or fluctuating fair value of the investments of the Fund.
bBased on average daily shares outstanding.
cTotal return is not annualized for periods less than one year.
dRatios are annualized for periods less than one year.
eBenefit of expense reduction rounds to less than 0.01%.
| | | | |
| | | |
franklintempleton.com | | The accompanying notes are an integral part of these financial statements. | Semiannual Report | | 61 |
FRANKLIN INVESTORS SECURITIES TRUST
Statement of Investments, April 30, 2017 (unaudited)
Franklin Real Return Fund
| | | | | | | | | | |
| | | Country | | Shares | | | Value | |
Common Stocks 8.4% | | | | | | | | | | |
Energy 5.2% | | | | | | | | | | |
Anadarko Petroleum Corp. | | United States | | | 23,700 | | | $ | 1,351,374 | |
Canadian Natural Resources Ltd. | | Canada | | | 33,700 | | | | 1,074,019 | |
Chevron Corp. | | United States | | | 13,700 | | | | 1,461,790 | |
Exxon Mobil Corp. | | United States | | | 15,277 | | | | 1,247,367 | |
Halliburton Co. | | United States | | | 33,300 | | | | 1,527,804 | |
Noble Energy Inc. | | United States | | | 27,400 | | | | 885,842 | |
Occidental Petroleum Corp. | | United States | | | 18,200 | | | | 1,120,028 | |
Pioneer Natural Resources Co. | | United States | | | 4,700 | | | | 813,053 | |
Royal Dutch Shell PLC, A, ADR | | United Kingdom | | | 19,800 | | | | 1,033,362 | |
Schlumberger Ltd. | | United States | | | 20,850 | | | | 1,513,502 | |
a Weatherford International PLC | | United States | | | 119,400 | | | | 688,938 | |
| | | | | | | | | | |
| | | | | | | | | 12,717,079 | |
| | | | | | | | | | |
Materials 3.2% | | | | | | | | | | |
Agrium Inc. | | Canada | | | 8,800 | | | | 826,584 | |
BHP Billiton PLC, ADR | | United Kingdom | | | 32,700 | | | | 1,004,871 | |
The Dow Chemical Co. | | United States | | | 26,600 | | | | 1,670,480 | |
a Freeport-McMoRan Inc. | | United States | | | 53,046 | | | | 676,336 | |
Goldcorp Inc. | | Canada | | | 101,600 | | | | 1,418,336 | |
Nucor Corp. | | United States | | | 21,000 | | | | 1,287,930 | |
Rio Tinto PLC, ADR | | United Kingdom | | | 27,700 | | | | 1,103,014 | |
| | | | | | | | | | |
| | | | | | | | | 7,987,551 | |
| | | | | | | | | | |
Total Common Stocks (Cost $21,881,836) | | | | | | | | | 20,704,630 | |
| | | | | | | | | | |
Management Investment Companies 8.9% | | | | | | | | | | |
Diversified Financials 1.7% | | | | | | | | | | |
b Franklin Lower Tier Floating Rate Fund | | United States | | | 292,284 | | | | 3,083,593 | |
b Franklin Middle Tier Floating Rate Fund | | United States | | | 108,877 | | | | 1,095,307 | |
| | | | | | | | | | |
| | | | | | | | | 4,178,900 | |
| | | | | | | | | | |
Real Estate 7.2% | | | | | | | | | | |
SPDR Dow Jones REIT ETF | | United States | | | 193,000 | | | | 17,773,370 | |
| | | | | | | | | | |
Total Management Investment Companies (Cost $13,334,958) | | | | | | | | | 21,952,270 | |
| | | | | | | | | | |
| | | |
| | | | | Principal
Amount* | | | | |
Corporate Bonds 4.1% | | | | | | | | | | |
Consumer Services 0.1% | | | | | | | | | | |
MGM Resorts International, senior note, 7.75%, 3/15/22 | | United States | | | 200,000 | | | | 233,500 | |
| | | | | | | | | | |
Energy 1.5% | | | | | | | | | | |
c Chesapeake Energy Corp., secured note, second lien, 144A, 8.00%, 12/15/22 | | United States | | | 425,000 | | | | 449,437 | |
CONSOL Energy Inc., | | | | | | | | | | |
senior note, 5.875%, 4/15/22 | | United States | | | 300,000 | | | | 294,000 | |
senior note, 8.00%, 4/01/23 | | United States | | | 600,000 | | | | 628,125 | |
Energy Transfer Equity LP, senior note, first lien, 7.50%, 10/15/20 | | United States | | | 1,000,000 | | | | 1,131,875 | |
Sabine Pass Liquefaction LLC, first lien, 5.625%, 2/01/21 | | United States | | | 1,000,000 | | | | 1,088,391 | |
| | | | | | | | | | |
| | | | | | | | | 3,591,828 | |
| | | | | | | | | | |
| | | | |
| | | |
62 | | Semiannual Report | | franklintempleton.com |
FRANKLIN INVESTORS SECURITIES TRUST
STATEMENT OF INVESTMENTS (UNAUDITED)
Franklin Real Return Fund (continued)
| | | | | | | | | | |
| | | Country | | Principal
Amount* | | | Value | |
| |
Corporate Bonds (continued) | | | | | | | | | | |
Health Care Equipment & Services 0.5% | | | | | | | | | | |
HCA Inc., senior secured bond, first lien, 5.875%, 3/15/22 | | United States | | | 1,000,000 | | | $ | 1,111,250 | |
| | | | | | | | | | |
Materials 0.3% | | | | | | | | | | |
c Novelis Corp., senior bond, 144A, 5.875%, 9/30/26 | | United States | | | 700,000 | | | | 721,000 | |
| | | | | | | | | | |
Media 0.6% | | | | | | | | | | |
c Altice U.S. Finance I Corp., senior secured bond, 144A, 5.50%, 5/15/26 | | United States | | | 300,000 | | | | 310,875 | |
CSC Holdings LLC, senior note, 6.75%, 11/15/21 | | United States | | | 1,000,000 | | | | 1,102,500 | |
| | | | | | | | | | |
| | | | | | | | | 1,413,375 | |
| | | | | | | | | | |
Pharmaceuticals, Biotechnology & Life Sciences 0.3% | | | | | | | | | | |
c Valeant Pharmaceuticals International Inc., senior note, 144A, 7.50%, 7/15/21 | | United States | | | 1,000,000 | | | | 832,500 | |
| | | | | | | | | | |
Telecommunication Services 0.8% | | | | | | | | | | |
Intelsat Jackson Holdings SA, senior note, 7.25%, 10/15/20 | | Luxembourg | | | 1,000,000 | | | | 941,200 | |
c Sprint Communications Inc., senior note, 144A, 7.00%, 3/01/20 | | United States | | | 1,000,000 | | | | 1,095,000 | |
| | | | | | | | | | |
| | | | | | | | | 2,036,200 | |
| | | | | | | | | | |
Total Corporate Bonds (Cost $9,768,590) | | | | | | | | | 9,939,653 | |
| | | | | | | | | | |
d,eSenior Floating Rate Interests 2.0% | | | | | | | | | | |
Automobiles & Components 0.1% | | | | | | | | | | |
The Goodyear Tire & Rubber Co., Second Lien Term Loan, 2.99%, 4/30/19 | | United States | | | 47,572 | | | | 48,147 | |
TI Group Automotive Systems LLC, Initial US Term Loan, 3.743%, 6/30/22 | | United States | | | 147,070 | | | | 148,173 | |
| | | | | | | | | | |
| | | | | | | | | 196,320 | |
| | | | | | | | | | |
Capital Goods 0.1% | | | | | | | | | | |
f Allison Transmission Inc., Term Loans, 2.99%, 9/23/22 | | United States | | | 86,520 | | | | 87,487 | |
Harsco Corp., Initial Term Loan, 6.00%, 11/02/23 | | United States | | | 29,299 | | | | 29,940 | |
Leidos (Abacus Innovations Corp.), B Term Loan, 3.25%, 8/16/23 | | United States | | | 22,692 | | | | 22,947 | |
| | | | | | | | | | |
| | | | | | | | | 140,374 | |
| | | | | | | | | | |
Commercial & Professional Services 0.0%† | | | | | | | | | | |
KAR Auction Services Inc., Tranche B-3 Term Loans, 4.50%, 3/09/23 | | United States | | | 91,257 | | | | 92,411 | |
| | | | | | | | | | |
Consumer Services 0.1% | | | | | | | | | | |
Aristocrat Technologies Inc., Tranche B-2 Loans, 3.406%, 10/20/21 | | United States | | | 16,979 | | | | 17,145 | |
f Caesars Entertainment Operating Co. LLC., Term B Loans, 5.75%, 8/31/24 | | United States | | | 15,167 | | | | 15,085 | |
f Greektown Holdings LLC, Initial Term Loan, 6.00%, 4/25/24 | | United States | | | 31,122 | | | | 31,193 | |
Prime Security Services Borrower LLC, 2016-2 Refinancing Term B-1 Loan, 4.25%, 5/02/22 | | United States | | | 99,203 | | | | 100,328 | |
| | | | | | | | | | |
| | | | | | | | | 163,751 | |
| | | | | | | | | | |
Diversified Financials 0.0%† | | | | | | | | | | |
First Eagle Investment Management LLC, Initial Term Loans, 4.656%, 12/01/22 | | United States | | | 46,333 | | | | 46,579 | |
Russell Investments US Institutional Holdco Inc., Initial Term Loan, 6.75%, 6/01/23 | | United States | | | 34,911 | | | | 35,261 | |
| | | | | | | | | | |
| | | | | | | | | 81,840 | |
| | | | | | | | | | |
| | | | |
| | | |
franklintempleton.com | | Semiannual Report | | 63 |
FRANKLIN INVESTORS SECURITIES TRUST
STATEMENT OF INVESTMENTS (UNAUDITED)
Franklin Real Return Fund (continued)
| | | | | | | | | | | | | | | | |
| | | Country | | | Principal
Amount* | | | | | | Value | |
| |
d,e Senior Floating Rate Interests (continued) | | | | | | | | | | | | | | | | |
Energy 0.2% | | | | | | | | | | | | | | | | |
Bowie Resource Holdings LLC, First Lien Initial Term Loan, 6.75%, 8/14/20 | | | United States | | | | 196,065 | | | | | | | $ | 190,837 | |
f Fieldwood Energy LLC, Loans, 3.875%, 10/01/18 | | | United States | | | | 404,913 | | | | | | | | 396,308 | |
McDermott Finance LLC, Term Loan, 8.397%, 4/16/19 | | | United States | | | | 10,050 | | | | | | | | 10,207 | |
| | | | | | | | | | | | | | | | |
| | | | | | | | | | | | | | | 597,352 | |
| | | | | | | | | | | | | | | | |
Food, Beverage & Tobacco 0.0%† | | | | | | | | | | | | | | | | |
JBS USA LUX SA, New Initial Term Loans, 3.483%, 10/30/22 | | | Brazil | | | | 21,300 | | | | | | | | 21,403 | |
Pinnacle Foods Finance LLC, Initial Term Loans, 2.983%, 2/03/24 | | | United States | | | | 17,532 | | | | | | | | 17,663 | |
| | | | | | | | | | | | | | | | |
| | | | | | | | | | | | | | | 39,066 | |
| | | | | | | | | | | | | | | | |
Health Care Equipment & Services 0.0%† | | | | | | | | | | | | | | | | |
Carestream Health Inc., Term Loan, 5.147%, 6/07/19 | | | United States | | | | 66,912 | | | | | | | | 66,514 | |
| | | | | | | | | | | | | | | | |
Household & Personal Products 0.1% | | | | | | | | | | | | | | | | |
FGI Operating Co. LLC (Freedom Group), Term B Loans, 5.50%, 4/19/19 | | | United States | | | | 359,062 | | | | | | | | 347,392 | |
Spectrum Brands Inc., Term Loans, 2.852% - 3.486%, 6/23/22 | | | United States | | | | 3,705 | | | | | | | | 3,740 | |
| | | | | | | | | | | | | | | | |
| | | | | | | | | | | | | | | 351,132 | |
| | | | | | | | | | | | | | | | |
Materials 0.2% | | | | | | | | | | | | | | | | |
Chemours Co., Tranche B-1 US Term Loans, 3.49%, 5/12/22 | | | United States | | | | 207,953 | | | | | | | | 209,350 | |
Cyanco Intermediate Corp., Initial Term Loan, 5.50%, 5/01/20 | | | United States | | | | 56,195 | | | | | | | | 56,512 | |
f FMG America Finance Inc. (Fortescue Metals Group), Loans, 3.75%, 6/30/19 | | | Australia | | | | 140,743 | | | | | | | | 141,782 | |
OCI Beaumont LLC, Term B-3 Loan, 8.025%, 8/20/19 | | | United States | | | | 124,626 | | | | | | | | 128,520 | |
| | | | | | | | | | | | | | | | |
| | | | | | | | | | | | | | | 536,164 | |
| | | | | | | | | | | | | | | | |
Media 0.2% | | | | | | | | | | | | | | | | |
Altice US Finance I Corp., March 2017 Refinancing TL Commitments, 3.241%, 7/28/25 | | | United States | | | | 25,126 | | | | | | | | 25,132 | |
AMC Entertainment Holdings Inc., | | | | | | | | | | | | | | | | |
2016 Incremental Term Commitments, 3.742%, 12/15/23 | | | United States | | | | 9,766 | | | | | | | | 9,848 | |
Initial Term Loans, 3.744%, 12/15/22 | | | United States | | | | 15,240 | | | | | | | | 15,348 | |
Charter Communications Operating LLC (CCO Safari), Term Loan A-1, 2.75%, 5/18/21 | | | United States | | | | 133,000 | | | | | | | | 133,047 | |
CSC Holdings LLC, March 2017 Incremental Term Loans, 3.244%, 7/17/25 | | | United States | | | | 121,086 | | | | | | | | 121,171 | |
Lions Gate Entertainment Corp., Term A Loan, 3.482%, 12/08/21 | | | United States | | | | 67,100 | | | | | | | | 67,478 | |
Live Nation Entertainment Inc., Term B-2 Loans, 3.50%, 10/31/23 | | | United States | | | | 9,742 | | | | | | | | 9,819 | |
UPC Financing Partnership, Facility AP, 3.744%, 4/15/25 | | | United States | | | | 30,895 | | | | | | | | 31,046 | |
| | | | | | | | | | | | | | | | |
| | | | | | | | | | | | | | | 412,889 | |
| | | | | | | | | | | | | | | | |
Pharmaceuticals, Biotechnology & Life Sciences 0.2%f | | | | | | | | | | | | | | | | |
f Endo Luxembourg Finance Co. I S.A.R.L and Endo LLC, Initial Term Loans, 7.25%, 4/27/24 | | | United States | | | | 198,748 | | | | | | | | 200,021 | |
Grifols Worldwide Operations USA Inc., Tranche B Term Loan, 3.195%, 1/31/25 | | | United States | | | | 197,579 | | | | | | | | 198,444 | |
RPI Finance Trust, Term A-2 Term Loan, 3.397%, 10/14/20 | | | United States | | | | 37,207 | | | | | | | | 37,276 | |
Valeant Pharmaceuticals International Inc., Series F Tranche B Term Loan, 5.74%, 4/01/22 | | | United States | | | | 145,109 | | | | | | | | 146,032 | |
| | | | | | | | | | | | | | | | |
| | | | | | | | | | | | | | | 581,773 | |
| | | | | | | | | | | | | | | | |
| | | | |
| | | |
64 | | Semiannual Report | | franklintempleton.com |
FRANKLIN INVESTORS SECURITIES TRUST
STATEMENT OF INVESTMENTS (UNAUDITED)
Franklin Real Return Fund (continued)
| | | | | | | | | | | | | | | | |
| | | Country | | | Principal
Amount* | | | | | | Value | |
d,e Senior Floating Rate Interests (continued) | | | | | | | | | | | | | | | | |
Retailing 0.2% | | | | | | | | | | | | | | | | |
Ascena Retail Group Inc., Tranche B Term Loan, 5.50%, 8/21/22 | | | United States | | | | 230,352 | | | | | | | $ | 208,756 | |
Dollar Tree Inc., Term A-1 Loans, 2.75%, 7/06/20 | | | United States | | | | 69,598 | | | | | | | | 69,402 | |
f PetSmart Inc., Tranche B-2 Loans, 4.02%, 3/11/22 | | | United States | | | | 200,798 | | | | | | | | 185,362 | |
| | | | | | | | | | | | | | | | |
| | | | | | | | | | | | | | | 463,520 | |
| | | | | | | | | | | | | | | | |
Semiconductors & Semiconductor Equipment 0.2% | | | | | | | | | | | | | | | | |
MACOM Technology Solutions Holdings Inc., Initial Term Loans, 3.989%, 5/07/21 | | | United States | | | | 120,690 | | | | | | | | 122,500 | |
MKS Instruments Inc., Tranche B-2 Term Loans, 3.743%, 5/01/23 | | | United States | | | | 49,260 | | | | | | | | 49,845 | |
ON Semiconductor Corp., 2017 Replacement Term Loans, 3.243%, 3/31/23 | | | United States | | | | 230,406 | | | | | | | | 232,011 | |
| | | | | | | | | | | | | | | | |
| | | | | | | | | | | | | | | 404,356 | |
| | | | | | | | | | | | | | | | |
Software & Services 0.1% | | | | | | | | | | | | | | | | |
Global Payments Inc., Delayed Draw Term Loan (A-2), 3.196%, 10/31/21 | | | United States | | | | 139,877 | | | | | | | | 140,139 | |
Rackspace Hosting Inc., 2016 Refinancing Term B Loan, 4.535%, 11/03/23 | | | United States | | | | 48,832 | | | | | | | | 49,234 | |
| | | | | | | | | | | | | | | | |
| | | | | | | | | | | | | | | 189,373 | |
| | | | | | | | | | | | | | | | |
Technology Hardware & Equipment 0.1% | | | | | | | | | | | | | | | | |
Ciena Corp., Refinancing Term Loan, 3.493%, 1/28/22 | | | United States | | | | 26,241 | | | | | | | | 26,454 | |
Dell International LLC, Term A-3 Loan, 3.00%, 12/31/18 | | | United States | | | | 104,098 | | | | | | | | 104,369 | |
Western Digital Corp., US Term B-2 Loan, 3.743%, 4/29/23 | | | United States | | | | 66,991 | | | | | | | | 67,611 | |
Zebra Technologies Corp., Second Amendment Refinancing Term Loan, 3.60%, 10/27/21 | | | United States | | | | 46,719 | | | | | | | | 47,230 | |
| | | | | | | | | | | | | | | | |
| | | | | | | | | | | | | | | 245,664 | |
| | | | | | | | | | | | | | | | |
Telecommunication Services 0.0%† | | | | | | | | | | | | | | | | |
Consolidated Communications Inc., Initial Term Loan, 4.00%, 10/05/23 | | | United States | | | | 24,445 | | | | | | | | 24,653 | |
Global Tel*Link Corp., Term Loan, 5.00%, 5/23/20 | | | United States | | | | 26,655 | | | | | | | | 26,655 | |
| | | | | | | | | | | | | | | | |
| | | | | | | | | | | | | | | 51,308 | |
| | | | | | | | | | | | | | | | |
Transportation 0.1% | | | | | | | | | | | | | | | | |
Air Canada, Term Loan, 3.90%, 10/06/23 | | | Canada | | | | 6,423 | | | | | | | | 6,474 | |
Navios Maritime Midstream Partners LP and Navios Maritime Midstream Partners Finance (US) Inc., Term Loan, 5.66%, 6/18/20 | | | Marshall Islands | | | | 85,486 | | | | | | | | 85,486 | |
United Air Lines Inc., Class B Term Loans, 3.422%, 4/01/24 | | | United States | | | | 32,482 | | | | | | | | 32,619 | |
XPO Logistics Inc., Loans, 3.405%, 11/01/21 | | | United States | | | | 89,706 | | | | | | | | 90,188 | |
| | | | | | | | | | | | | | | | |
| | | | | | | | | | | | | | | 214,767 | |
| | | | | | | | | | | | | | | | |
Utilities 0.1% | | | | | | | | | | | | | | | | |
EFS Cogen Holdings I LLC (Linden), Term B Advance, 4.65%, 6/28/23 | | | United States | | | | 15,864 | | | | | | | | 16,003 | |
NRG Energy Inc., Term Loans, 3.243%, 6/30/23 | | | United States | | | | 119,100 | | | | | | | | 119,757 | |
| | | | | | | | | | | | | | | | |
| | | | | | | | | | | | | | | 135,760 | |
| | | | | | | | | | | | | | | | |
Total Senior Floating Rate Interests (Cost $4,926,263) | | | | | | | | | | | | | | | 4,964,334 | |
| | | | | | | | | | | | | | | | |
Foreign Government and Agency Securities 9.6% | | | | | | | | | | | | | | | | |
Government of Hungary, senior note, 6.375%, 3/29/21 | | | Hungary | | | | 620,000 | | | | | | | | 701,933 | |
Government of Indonesia, senior bond, FR53, 8.25%, 7/15/21 | | | Indonesia | | | | 58,500,000,000 | | | | IDR | | | | 4,634,703 | |
Government of Malaysia, senior note, 3.58%, 9/28/18 | | | Malaysia | | | | 7,650,000 | | | | MYR | | | | 1,770,620 | |
Government of Mexico, | | | Mexico | | | | 1,124,000 | g | | | MXN | | | | 5,841,905 | |
M, 4.75%, 6/14/18 | | | | | | | | | | | | | | | | |
senior note, M, 5.00%, 6/15/17 | | | Mexico | | | | 750,000 | g | | | MXN | | | | 3,978,356 | |
| | | | |
| | | |
franklintempleton.com | | Semiannual Report | | 65 |
FRANKLIN INVESTORS SECURITIES TRUST
STATEMENT OF INVESTMENTS (UNDAUDITED)
Franklin Real Return Fund (continued)
| | | | | | | | | | | | | | | | |
| | | Country | | | Principal
Amount* | | | | | | Value | |
Foreign Government and Agency Securities (continued) | | | | | | | | | | | | | | | | |
Nota Do Tesouro Nacional, | | | | | | | | | | | | | | | | |
10.00%, 1/01/21 | | | Brazil | | | | 17,200 | h | | | BRL | | | $ | 5,433,831 | |
iIndex Linked, 6.00%, 8/15/18 | | | Brazil | | | | 1,270 | h | | | BRL | | | | 1,211,257 | |
| | | | | | | | | | | | | | | | |
Total Foreign Government and Agency Securities (Cost $22,950,368) | | | | | | | | | | | | | | | 23,572,605 | |
| | | | | | | | | | | | | | | | |
U.S. Government and Agency Securities 61.4% | | | | | | | | | | | | | | | | |
j U.S. Treasury Note, | | | | | | | | | | | | | | | | |
Index Linked, 2.625%, 7/15/17 | | | United States | | | | 15,278,216 | | | | | | | | 15,405,835 | |
Index Linked, 1.625%, 1/15/18 | | | United States | | | | 33,717,748 | | | | | | | | 34,199,810 | |
Index Linked, 1.375%, 7/15/18 | | | United States | | | | 982,714 | | | | | | | | 1,008,863 | |
Index Linked, 2.125%, 1/15/19 | | | United States | | | | 38,573,113 | | | | | | | | 40,312,644 | |
Index Linked, 0.125%, 4/15/19 | | | United States | | | | 22,037,602 | | | | | | | | 22,241,538 | |
Index Linked, 1.875%, 7/15/19 | | | United States | | | | 23,956,405 | | | | | | | | 25,304,001 | |
Index Linked, 1.375%, 1/15/20 | | | United States | | | | 2,365,420 | | | | | | | | 2,480,808 | |
Index Linked, 0.125%, 4/15/20 | | | United States | | | | 9,881,202 | | | | | | | | 9,997,751 | |
| | | | | | | | | | | | | | | | |
Total U.S. Government and Agency Securities (Cost $150,677,923) | | | | | | | | | | | | | | | 150,951,250 | |
| | | | | | | | | | | | | | | | |
Total Investments before Short Term Investments (Cost $223,539,938) | | | | | | | | | | | | | | | 232,084,742 | |
| | | | | | | | | | | | | | | | |
Short Term Investments (Cost $13,070,414) 5.3% | | | | | | | | | | | | | | | | |
Repurchase Agreements 5.3% | | | | | | | | | | | | | | | | |
kJoint Repurchase Agreement, 0.797%, 5/01/17 | | | | | | | | | | | | | | | | |
(Maturity Value $13,071,282) | | | | | | | | | | | | | | | | |
BNP Paribas Securities Corp. (Maturity Value $5,253,871) | | | | | | | | | | | | | | | | |
Deutsche Bank Securities Inc. (Maturity Value $593,436) | | | | | | | | | | | | | | | | |
HSBC Securities (USA) Inc. (Maturity Value $5,253,871) | | | | | | | | | | | | | | | | |
Merrill Lynch, Pierce, Fenner & Smith Inc. (Maturity Value $1,970,104) | | | | | | | | | | | | | | | | |
Collateralized by U.S. Government Agency Securities, 0.75% - 2.375%, 4/09/18 - 4/05/22; lU.S. Treasury Bill, 6/08/17 - 11/09/17; U.S. Treasury Note, 0.75% - 2.125%, 7/15/19 - 8/15/21; and U.S. Treasury Note, Index Linked, 0.125%, 4/15/19 (valued at $13,341,278) | | | United States | | | | 13,070,414 | | | | | | | | 13,070,414 | |
| | | | | | | | | | | | | | | | |
Total Investments (Cost $236,610,352) 99.7% | | | | | | | | | | | | | | | 245,155,156 | |
Other Assets, less Liabilities 0.3% | | | | | | | | | | | | | | | 708,736 | |
| | | | | | | | | | | | | | | | |
Net Assets 100.0% | | | | | | | | | | | | | | $ | 245,863,892 | |
| | | | | | | | | | | | | | | | |
| | | | |
| | | |
66 | | Semiannual Report | | franklintempleton.com |
FRANKLIN INVESTORS SECURITIES TRUST
STATEMENT OF INVESTMENTS (UNDAUDITED)
Franklin Real Return Fund (continued)
†Rounds to less than 0.1% of net assets.
*The principal amount is stated in U.S. dollars unless otherwise indicated.
aNon-income producing.
bSee Note 3(f) regarding investments in affiliated management investment companies.
cSecurity was purchased pursuant to Rule 144A under the Securities Act of 1933 and may be sold in transactions exempt from registration only to qualified institutional buyers or in a public offering registered under the Securities Act of 1933. These securities have been deemed liquid under guidelines approved by the Trust’s Board of Trustees. At April 30, 2017, the aggregate value of these securities was $3,408,812, representing 1.4% of net assets.
dThe coupon rate shown represents the rate at period end.
eSee Note 1(h) regarding senior floating rate interests.
fA portion or all of the security purchased on a delayed delivery basis. See Note 1(d).
gPrincipal amount is stated in 100 Mexican Peso Units.
hPrincipal amount is stated in 1,000 Brazilian Real Units.
iRedemption price at maturity is adjusted for inflation. See Note 1(j).
jPrincipal amount of security is adjusted for inflation. See Note 1(j).
kSee Note 1(c) regarding joint repurchase agreement.
lThe security was issued on a discount basis with no stated coupon rate.
At April 30, 2017, the Fund had the following forward exchange contracts outstanding. See Note 1(e).
Forward Exchange Contracts
| | | | | | | | | | | | | | | | | | | | | | | | | | | | |
| Currency | | Counterpartya | | | Type | | | Quantity | | | Contract
Amount | | | Settlement
Date | | | Unrealized
Appreciation | | | Unrealized
Depreciation | |
OTC Forward Exchange Contracts | | | | | | | | | | | | | | | | | | | | | | | | | | | | |
Chilean Peso | | | DBAB | | | | Buy | | | | 328,810,000 | | | | $487,849 | | | | 5/18/17 | | | | $ 4,778 | | | | $ — | |
Euro | | | DBAB | | | | Buy | | | | 3,072,361 | | | | 3,257,225 | | | | 5/18/17 | | | | 93,029 | | | | — | |
Euro | | | DBAB | | | | Sell | | | | 3,072,361 | | | | 3,448,664 | | | | 5/18/17 | | | | 98,409 | | | | — | |
Euro | | | JPHQ | | | | Buy | | | | 1,150,100 | | | | 1,218,979 | | | | 5/18/17 | | | | 35,146 | | | | — | |
Euro | | | JPHQ | | | | Sell | | | | 1,150,100 | | | | 1,276,369 | | | | 5/18/17 | | | | 22,244 | | | | — | |
Total Forward Exchange Contracts | | | | $253,606 | | | | $ — | |
Net unrealized appreciation (depreciation) | | | | $253,606 | | | | | |
aMay be comprised of multiple contracts with the same counterparty, currency and settlement date.
See Abbreviations on page 90.
| | | | |
| | | |
franklintempleton.com | The accompanying notes are an integral part of these financial statements. | | Semiannual Report | | 67 |
FRANKLIN INVESTORS SECURITIES TRUST
Financial Statements
Statements of Assets and Liabilities
April 30, 2017 (unaudited)
| | | | | | | | | | | | | | | | |
| | | Franklin Balanced Fund | | | Franklin Convertible Securities Fund | | | Franklin Equity
Income Fund | | | Franklin Real
Return Fund | |
Assets: | | | | | | | | | | | | | | | | |
Investments in securities: | | | | | | | | | | | | | | | | |
Cost - Unaffiliated issuers | | | $2,842,914,522 | | | | $1,980,676,373 | | | | $1,615,373,445 | | | | $219,566,358 | |
Cost - Controlled affiliates (Note 3f) | | | 17,998,125 | | | | — | | | | — | | | | — | |
Cost - Non-controlled affiliates (Note 3f) | | | 314,587,427 | | | | 118,070,432 | | | | 39,182,790 | | | | 3,973,580 | |
Cost - Repurchase agreements | | | — | | | | 8,702,266 | | | | — | | | | 13,070,414 | |
| | | | |
Total cost of investments | | | $3,175,500,074 | | | | $2,107,449,071 | | | | $1,654,556,235 | | | | $236,610,352 | |
| | | | |
Value - Unaffiliated issuers | | | $3,127,349,827 | | | | $2,244,684,176 | | | | $2,104,567,438 | | | | $227,905,842 | |
Value - Controlled affiliates (Note 3f) | | | 18,262,500 | | | | — | | | | — | | | | — | |
Value - Non-controlled affiliates (Note 3f) | | | 314,587,427 | | | | 118,070,432 | | | | 39,182,790 | | | | 4,178,900 | |
Value - Repurchase agreements | | | — | | | | 8,702,266 | | | | — | | | | 13,070,414 | |
| | | | |
Total value of investments | | | 3,460,199,754 | | | | 2,371,456,874 | | | | 2,143,750,228 | | | | 245,155,156 | |
Cash | | | — | | | | — | | | | — | | | | 912 | |
Restricted Cash (Note 1f) | | | — | | | | — | | | | — | | | | 230,000 | |
Foreign currency, at value (cost $—, $—, $— and $77,334, respectively) | | | — | | | | — | | | | — | | | | 77,392 | |
Receivables: | | | | | | | | | | | | | | | | |
Investment securities sold | | | 61,247,549 | | | | — | | | | 9,013,988 | | | | — | |
Capital shares sold | | | 5,567,000 | | | | 6,153,969 | | | | 2,501,212 | | | | 364,434 | |
Dividends and interest | | | 17,588,170 | | | | 6,930,786 | | | | 3,075,401 | | | | 1,324,849 | |
Affiliates | | | — | | | | — | | | | — | | | | 50,390 | |
Unrealized appreciation on OTC forward exchange contracts | | | — | | | | — | | | | — | | | | 253,606 | |
Other assets | | | 2,845 | | | | 1,842 | | | | 1,770 | | | | 203 | |
| | | | |
Total assets | | | 3,544,605,318 | | | | 2,384,543,471 | | | | 2,158,342,599 | | | | 247,456,942 | |
| | | | |
Liabilities: | | | | | | | | | | | | | | | | |
Payables: | | | | | | | | | | | | | | | | |
Investment securities purchased | | | 29,074,298 | | | | 24,000,000 | | | | 2,198,889 | | | | 314,283 | |
Capital shares redeemed | | | 7,313,218 | | | | 4,540,083 | | | | 4,393,594 | | | | 797,163 | |
Management fees | | | 1,735,292 | | | | 872,665 | | | | 817,187 | | | | 81,387 | |
Distribution fees | | | 1,087,997 | | | | 392,447 | | | | 579,301 | | | | 53,981 | |
Transfer agent fees | | | 570,695 | | | | 443,646 | | | | 405,355 | | | | 38,774 | |
Trustees’ fees and expenses | | | 1,411 | | | | 1,075 | | | | 1,321 | | | | 229 | |
Distributions to shareholders | | | — | | | | — | | | | — | | | | 12,741 | |
Funds advanced by custodian. | | | 190,468 | | | | — | | | | — | | | | — | |
Options written, at value (premiums received $210,400,
$—, $— and $—, respectively) | | | 25,000 | | | | — | | | | — | | | | — | |
Due to brokers | | | — | | | | — | | | | — | | | | 230,000 | |
Deferred tax | | | — | | | | — | | | | — | | | | 19,529 | |
Accrued expenses and other liabilities | | | 261,807 | | | | 144,629 | | | | 145,964 | | | | 44,963 | |
| | | | |
Total liabilities | | | 40,260,186 | | | | 30,394,545 | | | | 8,541,611 | | | | 1,593,050 | |
| | | | |
Net assets, at value | | | $3,504,345,132 | | | | $2,354,148,926 | | | | $2,149,800,988 | | | | $245,863,892 | |
| | | | |
Net assets consist of: | | | | | | | | | | | | | | | | |
Paid-in capital | | | $3,200,566,587 | | | | $2,031,834,953 | | | | $1,613,552,854 | | | | $268,163,766 | |
Distributions in excess of net investment income | | | (13,590,101 | ) | | | (30,653,721 | ) | | | (5,258,125 | ) | | | (2,523,465 | ) |
Net unrealized appreciation (depreciation) | | | 284,873,966 | | | | 264,007,803 | | | | 489,174,612 | | | | 8,785,902 | |
Accumulated net realized gain (loss) | | | 32,494,680 | | | | 88,959,891 | | | | 52,331,647 | | | | (28,562,311 | ) |
| | | | |
Net assets, at value | | | $3,504,345,132 | | | | $2,354,148,926 | | | | $2,149,800,988 | | | | $245,863,892 | |
| | | | |
| | | | |
| | | |
68 | | Semiannual Report | The accompanying notes are an integral part of these financial statements. | | franklintempleton.com |
FRANKLIN INVESTORS SECURITIES TRUST
FINANCIAL STATEMENTS
Statements of Assets and Liabilities (continued)
April 30, 2017 (unaudited)
| | | | | | | | | | | | | | | | |
| | | Franklin Balanced Fund | | | Franklin
Convertible
Securities Fund | | | Franklin Equity
Income Fund | | | Franklin Real
Return Fund | |
Class A: | | | | | | | | | | | | | | | | |
Net assets, at value | | $ | 2,633,336,723 | | | $ | 745,900,612 | | | $ | 1,742,039,324 | | | $ | 161,407,573 | |
| | | | |
Shares outstanding | | | 219,099,176 | | | | 38,874,415 | | | | 74,035,908 | | | | 15,848,199 | |
| | | | |
Net asset value per sharea | | $ | 12.02 | | | $ | 19.19 | | | $ | 23.53 | | | $ | 10.18 | |
| | | | |
Maximum offering price per share (net asset value pershare ÷ 94.25%, 94.25%, 94.25% and 95.75%,respectively) | | $ | 12.75 | | | $ | 20.36 | | | $ | 24.97 | | | $ | 10.63 | |
| | | | |
Class C: | | | | | | | | | | | | | | | | |
Net assets, at value | | $ | 663,321,659 | | | $ | 301,021,752 | | | $ | 271,577,917 | | | $ | 38,617,224 | |
| | | | |
Shares outstanding | | | 55,674,471 | | | | 15,921,220 | | | | 11,635,810 | | | | 3,829,889 | |
| | | | |
Net asset value and maximum offering price per sharea | | $ | 11.91 | | | $ | 18.91 | | | $ | 23.34 | | | $ | 10.08 | |
| | | | |
Class R: | | | | | | | | | | | | | | | | |
Net assets, at value | | $ | 5,179,426 | | | | | | | $ | 7,282,308 | | | | | |
| | | | | | | | | | | | | | | | |
Shares outstanding | | | 429,919 | | | | | | | | 309,588 | | | | | |
| | | | | | | | | | | | | | | | |
Net asset value and maximum offering price per share | | $ | 12.05 | | | | | | | $ | 23.52 | | | | | |
| | | | | | | | | | | | | | | | |
Class R6: | | | | | | | | | | | | | | | | |
Net assets, at value | | $ | 607,767 | | | $ | 11,705,964 | | | $ | 11,544,444 | | | $ | 6,005,873 | |
| | | | |
Shares outstanding | | | 50,466 | | | | 606,714 | | | | 489,698 | | | | 586,435 | |
| | | | |
Net asset value and maximum offering price per share | | $ | 12.04 | | | $ | 19.29 | | | $ | 23.57 | | | $ | 10.24 | |
| | | | |
Advisor Class: | | | | | | | | | | | | | | | | |
Net assets, at value | | $ | 201,899,557 | | | $ | 1,295,520,598 | | | $ | 117,356,995 | | | $ | 39,833,222 | |
| | | | |
Shares outstanding | | | 16,764,460 | | | | 67,504,471 | | | | 4,979,582 | | | | 3,895,550 | |
| | | | |
Net asset value and maximum offering price per share | | $ | 12.04 | | | $ | 19.19 | | | $ | 23.57 | | | $ | 10.23 | |
| | | | |
aRedemption price is equal to net asset value less contingent deferred sales charges, if applicable.
| | | | |
| | | |
franklintempleton.com | | The accompanying notes are an integral part of these financial statements. | Semiannual Report | | 69 |
FRANKLIN INVESTORS SECURITIES TRUST
FINANCIAL STATEMENTS
Statements of Operations
for the six months ended April 30, 2017 (unaudited)
| | | | | | | | | | | | | | | | |
| | | Franklin
Balanced Fund | | | Franklin
Convertible
Securities Fund | | | Franklin Equity
Income Fund | | | Franklin Real
Return Fund | |
Investment income: | | | | | | | | | | | | | | | | |
Dividends: | | | | | | | | | | | | | | | | |
Unaffiliated issuers | | | $ 30,488,644 | | | | $ 12,645,067 | | | | $ 28,193,757 | | | | $ 695,337 | |
Controlled affiliates (Note 3f) | | | 233,907 | | | | — | | | | — | | | | — | |
Non-controlled affiliates (Note 3f) | | | 200,023 | | | | 86,058 | | | | 37,356 | | | | 188,018 | |
Interest | | | 26,336,407 | | | | 10,912,337 | | | | — | | | | 943,533 | |
Inflation principal adjustments | | | — | | | | — | | | | — | | | | 1,601,611 | |
| | | | |
Total investment income | | | 57,258,981 | | | | 23,643,462 | | | | 28,231,113 | | | | 3,428,499 | |
| | | | |
Expenses: | | | | | | | | | | | | | | | | |
Management fees (Note 3a) | | | 10,766,473 | | | | 5,162,479 | | | | 4,956,752 | | | | 759,295 | |
Distribution fees: (Note 3c) | | | | | | | | | | | | | | | | |
Class A | | | 3,228,819 | | | | 922,953 | | | | 2,171,998 | | | | 203,670 | |
Class C | | | 3,265,689 | | | | 1,458,209 | | | | 1,342,455 | | | | 128,062 | |
Class R | | | 12,014 | | | | — | | | | 17,146 | | | | — | |
Transfer agent fees: (Note 3e) | | | | | | | | | | | | | | | | |
Class A | | | 1,418,651 | | | | 453,529 | | | | 1,085,149 | | | | 143,607 | |
Class C | | | 358,087 | | | | 179,041 | | | | 167,693 | | | | 34,694 | |
Class R | | | 2,647 | | | | — | | | | 4,423 | | | | — | |
Class R6 | | | 89 | | | | 360 | | | | 132 | | | | 85 | |
Advisor Class | | | 92,753 | | | | 711,632 | | | | 61,686 | | | | 32,904 | |
Custodian fees (Note 4) | | | 17,163 | | | | 8,746 | | | | 10,772 | | | | 8,113 | |
Reports to shareholders | | | 163,295 | | | | 91,300 | | | | 120,403 | | | | 19,682 | |
Registration and filing fees | | | 142,905 | | | | 73,576 | | | | 83,379 | | | | 33,295 | |
Professional fees | | | 33,169 | | | | 28,465 | | | | 29,230 | | | | 21,638 | |
Trustees’ fees and expenses | | | 17,932 | | | | 11,655 | | | | 11,741 | | | | 1,419 | |
Other | | | 36,577 | | | | 21,221 | | | | 22,095 | | | | 10,798 | |
| | | | |
Total expenses | | | 19,556,263 | | | | 9,123,166 | | | | 10,085,054 | | | | 1,397,262 | |
Expense reductions (Note 4) | | | (973 | ) | | | (593 | ) | | | (447 | ) | | | (81 | ) |
Expenses waived/paid by affiliates (Note 3f and 3g) | | | (357,457 | ) | | | (170,694 | ) | | | (95,084 | ) | | | (280,133 | ) |
| | | | |
Net expenses | | | 19,197,833 | | | | 8,951,879 | | | | 9,989,523 | | | | 1,117,048 | |
| | | | |
Net investment income | | | 38,061,148 | | | | 14,691,583 | | | | 18,241,590 | | | | 2,311,451 | |
| | | | |
Realized and unrealized gains (losses): | | | | | | | | | | | | | | | | |
Net realized gain (loss) from: | | | | | | | | | | | | | | | | |
Investments | | | 39,079,578 | | | | 88,851,626 | | | | 52,307,676 | | | | (1,708,141 | ) |
Written options | | | 3,741,673 | | | | — | | | | 72,846 | | | | — | |
Foreign currency transactions | | | (14,553 | ) | | | — | | | | (43,548 | ) | | | (34,480 | ) |
| | | | |
Net realized gain (loss) | | | 42,806,698 | | | | 88,851,626 | | | | 52,336,974 | | | | (1,742,621 | ) |
| | | | |
Net change in unrealized appreciation (depreciation) on: | | | | | | | | | | | | | | | | |
Investments | | | 123,266,424 | | | | 83,094,574 | | | | 131,099,904 | | | | 1,714,012 | |
Translation of other assets and liabilities denominated in foreign currencies | | | (1,719 | ) | | | — | | | | (569 | ) | | | 204,204 | |
Written options | | | 465,321 | | | | — | | | | — | | | | — | |
Change in deferred taxes on unrealized appreciation | | | — | | | | — | | | | — | | | | (528 | ) |
| | | | |
Net change in unrealized appreciation (depreciation) | | | 123,730,026 | | | | 83,094,574 | | | | 131,099,335 | | | | 1,917,688 | |
| | | | |
Net realized and unrealized gain (loss) | | | 166,536,724 | | | | 171,946,200 | | | | 183,436,309 | | | | 175,067 | |
| | | | |
Net increase (decrease) in net assets resulting from operations | | | $204,597,872 | | | | $186,637,783 | | | | $201,677,899 | | | | $2,486,518 | |
| | | | |
| | | | |
| | | |
70 | | Semiannual Report | The accompanying notes are an integral part of these financial statements. | | franklintempleton.com |
FRANKLIN INVESTORS SECURITIES TRUST
FINANCIAL STATEMENTS
Statements of Changes in Net Assets
| | | | | | | | | | | | | | | | |
| | | Franklin Balanced Fund | | | Franklin Convertible Securities Fund | |
| | | Six Months Ended
April 30, 2017
(unaudited) | | | Year Ended
October 31, 2016 | | | Six Months Ended
April 30, 2017
(unaudited) | | | Year Ended
October 31, 2016 | |
Increase (decrease) in net assets: | | | | | | | | | | | | | | | | |
Operations: | | | | | | | | | | | | | | | | |
Net investment income | | $ | 38,061,148 | | | $ | 78,519,243 | | | $ | 14,691,583 | | | $ | 29,650,370 | |
Net realized gain (loss) | | | 42,806,698 | | | | 70,229,504 | | | | 88,851,626 | | | | 70,272,718 | |
Net change in unrealized appreciation (depreciation) | | | 123,730,026 | | | | 22,673,744 | | | | 83,094,574 | | | | 35,403,730 | |
| | | | |
Net increase (decrease) in net assets resulting from operations | | | 204,597,872 | | | | 171,422,491 | | | | 186,637,783 | | | | 135,326,818 | |
| | | | |
Distributions to shareholders from: | | | | | | | | | | | | | | | | |
Net investment income: | | | | | | | | | | | | | | | | |
Class A | | | (39,266,813 | ) | | | (79,181,917 | ) | | | (10,424,839 | ) | | | (21,449,948 | ) |
Class C | | | (7,576,230 | ) | | | (15,011,956 | ) | | | (3,061,268 | ) | | | (6,322,161 | ) |
Class R | | | (66,862 | ) | | | (131,468 | ) | | | — | | | | — | |
Class R6 | | | (6,106 | ) | | | (8,352 | ) | | | (147,853 | ) | | | (89,054 | ) |
Advisor Class | | | (2,778,713 | ) | | | (2,775,337 | ) | | | (17,422,934 | ) | | | (28,889,795 | ) |
Net realized gains: | | | | | | | | | | | | | | | | |
Class A | | | (36,628,714 | ) | | | (196,452 | ) | | | (13,914,557 | ) | | | (15,784,677 | ) |
Class C | | | (9,315,546 | ) | | | (49,077 | ) | | | (5,462,741 | ) | | | (6,225,597 | ) |
Class R | | | (65,313 | ) | | | (340 | ) | | | — | | | | — | |
Class R6 | | | (3,395 | ) | | | (18 | ) | | | (160,359 | ) | | | (98 | ) |
Advisor Class | | | (2,130,727 | ) | | | (10,279 | ) | | | (20,367,792 | ) | | | (15,633,159 | ) |
| | | | |
Total distributions to shareholders | | | (97,838,419 | ) | | | (97,365,196 | ) | | | (70,962,343 | ) | | | (94,394,489 | ) |
| | | | |
Capital share transactions: (Note 2) | | | | | | | | | | | | | | | | |
Class A | | | 19,439,762 | | | | 102,305,345 | | | | (60,834,497 | ) | | | (54,566,518 | ) |
Class C | | | 12,920,859 | | | | 53,175,745 | | | | (7,085,443 | ) | | | (21,791,985 | ) |
Class R | | | 547,749 | | | | (287,996 | ) | | | — | | | | — | |
Class R6 | | | 364,124 | | | | 5,265 | | | | 3,953,303 | | | | 6,867,487 | |
Advisor Class | | | 58,918,267 | | | | 81,786,363 | | | | 153,348,732 | | | | 148,171,070 | |
| | | | |
Total capital share transactions | | | 92,190,761 | | | | 236,984,722 | | | | 89,382,095 | | | | 78,680,054 | |
| | | | |
Net increase (decrease) in net assets . | | | 198,950,214 | | | | 311,042,017 | | | | 205,057,535 | | | | 119,612,383 | |
Net assets: | | | | | | | | | | | | | | | | |
Beginning of period | | | 3,305,394,918 | | | | 2,994,352,901 | | | | 2,149,091,391 | | | | 2,029,479,008 | |
| | | | |
End of period | | $ | 3,504,345,132 | | | $ | 3,305,394,918 | | | $ | 2,354,148,926 | | | $ | 2,149,091,391 | |
| | | | |
Distributions in excess of net investment income included in net assets: | | | | | | | | | | | | | | | | |
End of period | | $ | (13,590,101) | | | $ | (1,700,359) | | | $ | (30,653,721) | | | $ | (14,288,410) | |
| | | | |
| | | | |
| | | |
franklintempleton.com | | The accompanying notes are an integral part of these financial statements. | Semiannual Report | | 71 |
FRANKLIN INVESTORS SECURITIES TRUST
FINANCIAL STATEMENTS
Statements of Changes in Net Assets (continued)
| | | | | | | | | | | | | | | | |
| | | Franklin Equity Income Fund | | | Franklin Real Return Fund | |
| | | Six Months Ended
April 30, 2017
(unaudited) | | | Year Ended
October 31, 2016 | | | Six Months Ended
April 30, 2017
(unaudited) | | | Year Ended
October 31, 2016 | |
Increase (decrease) in net assets: | | | | | | | | | | | | | | | | |
Operations: | | | | | | | | | | | | | | | | |
Net investment income | | $ | 18,241,590 | | | $ | 42,110,358 | | | $ | 2,311,451 | | | $ | 2,879,106 | |
Net realized gain (loss) | | | 52,336,974 | | | | 94,010,493 | | | | (1,742,621) | | | | (17,568,660) | |
Net change in unrealized appreciation (depreciation) | | | 131,099,335 | | | | (69,788,269) | | | | 1,917,688 | | | | 20,787,529 | |
| | | | |
Net increase (decrease) in net assets resulting from operations | | | 201,677,899 | | | | 66,332,582 | | | | 2,486,518 | | | | 6,097,975 | |
| | | | |
Distributions to shareholders from: | | | | | | | | | | | | | | | | |
Net investment income: | | | | | | | | | | | | | | | | |
Class A | | | (21,831,977) | | | | (47,097,269) | | | | (139,432) | | | | (1,562,108) | |
Class C | | | (2,420,028) | | | | (5,251,049) | | | | — | | | | (215,455) | |
Class R | | | (82,033) | | | | (152,076) | | | | — | | | | — | |
Class R6 | | | (155,792) | | | | (180,060) | | | | (17,050) | | | | (21,887) | |
Advisor Class | | | (1,349,299) | | | | (1,422,902) | | | | (85,725) | | | | (429,016) | |
Net realized gains: | | | | | | | | | | | | | | | | |
Class A | | | (66,065,657) | | | | (46,499,582) | | | | — | | | | — | |
Class C | | | (10,179,945) | | | | (6,537,589) | | | | — | | | | — | |
Class R | | | (270,558) | | | | (161,343) | | | | — | | | | — | |
Class R6 | | | (407,606) | | | | (149) | | | | — | | | | — | |
Advisor Class | | | (3,358,230) | | | | (889,611) | | | | — | | | | — | |
Tax return of capital: | | | | | | | | | | | | | | | | |
Class A | | | — | | | | — | | | | — | | | | (243,513) | |
Class C | | | — | | | | — | | | | — | | | | (62,428) | |
Class R6 | | | — | | | | — | | | | — | | | | (3,525) | |
Advisor Class | | | — | | | | — | | | | — | | | | (50,006) | |
| | | | |
Total distributions to shareholders | | | (106,121,125) | | | | (108,191,630) | | | | (242,207) | | | | (2,587,938) | |
| | | | |
Capital share transactions: (Note 2) | | | | | | | | | | | | | | | | |
Class A | | | (37,228,941) | | | | (53,673,051) | | | | (1,678,521) | | | | (26,641,058) | |
Class C | | | 2,516,798 | | | | 12,513,162 | | | | (1,271,732) | | | | (9,129,554) | |
Class R | | | 579,755 | | | | 252,727 | | | | — | | | | — | |
Class R6 | | | 513,291 | | | | 9,967,087 | | | | 623,310 | | | | 3,570,373 | |
Advisor Class | | | 32,642,150 | | | | 46,433,315 | | | | 4,296,185 | | | | (2,973,664) | |
| | | | |
Total capital share transactions | | | (976,947) | | | | 15,493,240 | | | | 1,969,242 | | | | (35,173,903) | |
| | | | |
Net increase (decrease) in net assets . | | | 94,579,827 | | | | (26,365,808) | | | | 4,213,553 | | | | (31,663,866) | |
Net assets: | | | | | | | | | | | | | | | | |
Beginning of period | | | 2,055,221,161 | | | | 2,081,586,969 | | | | 241,650,339 | | | | 273,314,205 | |
| | | | |
End of period | | $ | 2,149,800,988 | | | $ | 2,055,221,161 | | | $ | 245,863,892 | | | $ | 241,650,339 | |
| | | | |
Undistributed net investment income included in net assets: | | | | | | | | | | | | | | | | |
End of period | | $ | — | | | $ | 2,339,414 | | | $ | — | | | $ | — | |
| | | | |
Distributions in excess of net investment income included in net assets: | | | | | | | | | | | | | | | | |
End of period | | $ | (5,258,125) | | | $ | — | | | $ | (2,523,465) | | | $ | (4,592,709) | |
| | | | |
| | | | |
| | | |
72 | | Semiannual Report | The accompanying notes are an integral part of these financial statements. | | franklintempleton.com |
FRANKLIN INVESTORS SECURITIES TRUST
Notes to Financial Statements (unaudited)
1. Organization and Significant Accounting Policies
Franklin Investors Securities Trust (Trust) is registered under the Investment Company Act of 1940 (1940 Act) as an open-end management investment company, consisting of eight separate funds, four of which are included in this report (Funds) and applies the specialized accounting and reporting guidance in U.S. Generally Accepted Accounting Principles (U.S. GAAP). The financial statements of the remaining funds in the Trust are presented separately. The classes of shares offered within each of the Funds are indicated below. Each class of shares may differ by its initial sales load, contingent deferred sales charges, voting rights on matters affecting a single class, its exchange privilege and fees primarily due to differing arrangements for distribution and transfer agent fees.
|
| Class A, Class C, Class R, Class R6 & Advisor Class |
Franklin Balanced Fund |
Franklin Equity Income Fund |
|
| Class A, Class C, Class R6 & Advisor Class |
Franklin Convertible Securities Fund |
Franklin Real Return Fund |
The following summarizes the Funds’ significant accounting policies.
a. Financial Instrument Valuation
The Funds’ investments in financial instruments are carried at fair value daily. Fair value is the price that would be received to sell an asset or paid to transfer a liability in an orderly transaction between market participants on the measurement date. The Funds calculate the net asset value (NAV) per share as of 4 p.m. Eastern time each day the New York Stock Exchange (NYSE) is open for trading. Under compliance policies and procedures approved by the Trust’s Board of Trustees (the Board), the Funds’ administrator has responsibility for oversight of valuation, including leading the cross-functional Valuation Committee (VC). The VC provides administration and oversight of the Funds’ valuation policies and procedures, which are approved annually by the Board. Among other things, these procedures allow the Funds to utilize independent pricing services, quotations from securities and financial instrument dealers, and other market sources to determine fair value.
Equity securities, exchange traded funds, and derivative financial instruments listed on an exchange or on the NASDAQ National Market System are valued at the last quoted sale price or the official closing price of the day, respectively. Foreign equity securities are valued as of the close of trading on the foreign stock exchange on which the security is primarily traded, or as of 4 p.m. Eastern time. The value is then converted into its U.S. dollar equivalent at the foreign exchange rate in effect at 4 p.m. Eastern time on the day that the value of the security is determined. Over-the-counter (OTC) securities are valued within the range of the most recent quoted bid and ask prices. Securities that trade in multiple markets or on multiple exchanges are valued according to the broadest and most representative market. Certain equity securities are valued based upon fundamental characteristics or relationships to similar securities.
Debt and certain preferred securities generally trade in the OTC market rather than on a securities exchange. The Funds’ pricing services use multiple valuation techniques to determine fair value. In instances where sufficient market activity exists, the pricing services may utilize a market-based approach through which quotes from market makers are used to determine fair value. In instances where sufficient market activity may not exist or is limited, the pricing services also utilize proprietary valuation models which may consider market characteristics such as benchmark yield curves, credit spreads, estimated default rates, anticipated market interest rate volatility, coupon rates, anticipated timing of principal repayments, underlying collateral, and other unique security features in order to estimate the relevant cash flows, which are then discounted to calculate the fair value. Securities denominated in a foreign currency are converted into their U.S. dollar equivalent at the foreign exchange rate in effect at 4 p.m. Eastern time on the date that the values of the foreign debt securities are determined.
Investments in open-end mutual funds are valued at the closing NAV. Investments in repurchase agreements are valued at cost, which approximates fair value.
Certain derivative financial instruments trade in the OTC market. The Funds’ pricing services use various techniques including industry standard option pricing models and proprietary discounted cash flow models to determine the fair value of those instruments. The Funds’ net benefit or obligation under the derivative contract, as measured by the fair value of the contract, is included in net assets.
| | | | |
| | | |
franklintempleton.com | | Semiannual Report | | 73 |
FRANKLIN INVESTORS SECURITIES TRUST
NOTES TO FINANCIAL STATEMENTS (UNAUDITED)
1. Organization and Significant Accounting Policies (continued)
a. Financial Instrument Valuation (continued)
The Funds have procedures to determine the fair value of financial instruments for which market prices are not reliable or readily available. Under these procedures, the VC convenes on a regular basis to review such financial instruments and considers a number of factors, including significant unobservable valuation inputs, when arriving at fair value. The VC primarily employs a market-based approach which may use related or comparable assets or liabilities, recent transactions, market multiples, book values, and other relevant information for the investment to determine the fair value of the investment. An income-based valuation approach may also be used in which the anticipated future cash flows of the investment are discounted to calculate fair value. Discounts may also be applied due to the nature or duration of any restrictions on the disposition of the investments. Due to the inherent uncertainty of valuations of such investments, the fair values may differ significantly from the values that would have been used had an active market existed. The VC employs various methods for calibrating these valuation approaches including a regular review of key inputs and assumptions, transactional back-testing or disposition analysis, and reviews of any related market activity.
Trading in securities on foreign securities stock exchanges and OTC markets may be completed before 4 p.m. Eastern time. In addition, trading in certain foreign markets may not take place on every Funds’ business day. Occasionally, events occur between the time at which trading in a foreign security is completed and 4 p.m. Eastern time that might call into question the reliability of the value of a portfolio security held by the Fund. As a result, differences may arise between the value of the Funds’ portfolio securities as determined at the foreign market close and the latest indications of value at 4 p.m. Eastern time. In order to minimize the potential for these differences, the VC monitors price movements following the close of trading in foreign stock markets through a series of country specific market proxies (such as baskets of American Depositary Receipts, futures contracts and exchange traded funds). These price movements are measured against established trigger thresholds for each specific market proxy to assist in determining if an event has occurred that may call into question the reliability of the values of the foreign securities
held by the Funds. If such an event occurs, the securities may be valued using fair value procedures, which may include the use of independent pricing services.
When the last day of the reporting period is a non-business day, certain foreign markets may be open on those days that the Funds’ NAV is not calculated, which could result in differences between the value of the Funds’ portfolio securities on the last business day and the last calendar day of the reporting period. Any significant security valuation changes due to an open foreign market are adjusted and reflected by the Funds for financial reporting purposes.
b. Foreign Currency Translation
Portfolio securities and other assets and liabilities denominated in foreign currencies are translated into U.S. dollars based on the exchange rate of such currencies against U.S. dollars on the date of valuation. The Funds may enter into foreign currency exchange contracts to facilitate transactions denominated in a foreign currency. Purchases and sales of securities, income and expense items denominated in foreign currencies are translated into U.S. dollars at the exchange rate in effect on the transaction date. Portfolio securities and assets and liabilities denominated in foreign currencies contain risks that those currencies will decline in value relative to the U.S. dollar. Occasionally, events may impact the availability or reliability of foreign exchange rates used to convert the U.S. dollar equivalent value. If such an event occurs, the foreign exchange rate will be valued at fair value using procedures established and approved by the Board.
The Funds do not separately report the effect of changes in foreign exchange rates from changes in market prices on securities held. Such changes are included in net realized and unrealized gain or loss from investments in the Statements of Operations.
Realized foreign exchange gains or losses arise from sales of foreign currencies, currency gains or losses realized between the trade and settlement dates on securities transactions and the difference between the recorded amounts of dividends, interest, and foreign withholding taxes and the U.S. dollar equivalent of the amounts actually received or paid. Net unrealized foreign exchange gains and losses arise from changes in foreign exchange rates on foreign denominated assets and liabilities other than investments in securities held at the end of the reporting period.
| | | | |
| | | |
74 | | Semiannual Report | | franklintempleton.com |
FRANKLIN INVESTORS SECURITIES TRUST
NOTES TO FINANCIAL STATEMENTS (UNAUDITED)
c. Joint Repurchase Agreement
Certain or all Funds enter into a joint repurchase agreement whereby their uninvested cash balance is deposited into a joint cash account with other funds managed by the investment manager or an affiliate of the investment manager and is used to invest in one or more repurchase agreements. The value and face amount of the joint repurchase agreement are allocated to the funds based on their pro-rata interest. A repurchase agreement is accounted for as a loan by the Fund to the seller, collateralized by securities which are delivered to the Funds’ custodian. The fair value, including accrued interest, of the initial collateralization is required to be at least 102% of the dollar amount invested by the funds, with the value of the underlying securities marked to market daily to maintain coverage of at least 100%. Repurchase agreements are subject to the terms of Master Repurchase Agreements (MRAs) with approved counterparties (sellers). The MRAs contain various provisions, including but not limited to events of default and maintenance of collateral for repurchase agreements. In the event of default by either the seller or the Funds, certain MRAs may permit the non-defaulting party to net and close-out all transactions, if any, traded under such agreements. The Funds may sell securities it holds as collateral and apply the proceeds towards the repurchase price and any other amounts owed by the seller to the Funds in the event of default by the seller. This could involve costs or delays in addition to a loss on the securities if their value falls below the repurchase price owed by the seller. The joint repurchase agreement held by the Funds at period end, as indicated in the Statements of Investments, had been entered into on April 28, 2017.
d. Securities Purchased on a Delayed Delivery Basis
Certain or all Funds purchase securities on a delayed delivery basis, with payment and delivery scheduled for a future date. These transactions are subject to market fluctuations and are subject to the risk that the value at delivery may be more or less than the trade date purchase price. Although the Funds will generally purchase these securities with the intention of holding the securities, they may sell the securities before the settlement date. Sufficient assets have been segregated for these securities.
e. Derivative Financial Instruments
Certain or all Funds invested in derivative financial instruments in order to manage risk or gain exposure to various other investments or markets. Derivatives are financial contracts based on an underlying or notional amount, require no initial
investment or an initial net investment that is smaller than would normally be required to have a similar response to changes in market factors, and require or permit net settlement. Derivatives contain various risks including the potential inability of the counterparty to fulfill their obligations under the terms of the contract, the potential for an illiquid secondary market, and/or the potential for market movements which expose the Fund to gains or losses in excess of the amounts shown in the Statements of Assets and Liabilities. Realized gain and loss and unrealized appreciation and depreciation on these contracts for the period are included in the Statements of Operations.
Derivative counterparty credit risk is managed through a formal evaluation of the creditworthiness of all potential counter-parties. Certain or all Funds attempt to reduce their exposure to counterparty credit risk on OTC derivatives, whenever possible, by entering into International Swaps and Derivatives Association (ISDA) master agreements with certain counterparties. These agreements contain various provisions, including but not limited to collateral requirements, events of default, or early termination. Termination events applicable to the counterparty include certain deteriorations in the credit quality of the counterparty. Termination events applicable to the Funds include failure of the Funds to maintain certain net asset levels and/or limit the decline in net assets over various periods of time. In the event of default or early termination, the ISDA master agreement gives the non-defaulting party the right to net and close-out all transactions traded, whether or not arising under the ISDA agreement, to one net amount payable by one counterparty to the other. However, absent an event of default or early termination, OTC derivative assets and liabilities are presented gross and not offset in the Statements of Assets and Liabilities. Early termination by the counterparty may result in an immediate payment by the Funds of any net liability owed to that counterparty under the ISDA agreement. At April 30, 2017, Franklin Real Return Fund had no OTC derivatives in a net liability position for such contracts.
Collateral requirements differ by type of derivative. Collateral or initial margin requirements are set by the broker or exchange clearing house for exchange traded and centrally cleared derivatives. Initial margin deposited is held at the exchange and can be in the form of cash and/or securities. For OTC derivatives traded under an ISDA master agreement, posting of collateral is required by either the Fund or the applicable counterparty if the total net exposure of all OTC derivatives
| | | | |
| | | |
franklintempleton.com | | Semiannual Report | | 75 |
FRANKLIN INVESTORS SECURITIES TRUST
NOTES TO FINANCIAL STATEMENTS (UNAUDITED)
1. Organization and Significant Accounting Policies (continued)
e. Derivative Financial Instruments (continued)
with the applicable counterparty exceeds the minimum transfer amount, which typically ranges from $100,000 to $250,000, and can vary depending on the counterparty and the type of the agreement. Generally, collateral is determined at the close of Fund business each day and any additional collateral required due to changes in derivative values may be delivered by the Fund or the counterparty the next business day, or within a few business days. Collateral pledged and/or received by the Fund for OTC derivatives, if any, is held in segregated accounts with the Fund’s custodian/counterparty broker and can be in the form of cash and/or securities. Unrestricted cash may be invested according to the Funds’ investment objectives. To the extent that the amounts due to the Fund from its counterparties are not subject to collateralization or are not fully collateralized, the Fund bears the risk of loss from counterparty non-performance.
Certain or all Funds entered into OTC forward exchange contracts primarily to manage and/or gain exposure to certain foreign currencies. A forward exchange contract is an agreement between the Fund and a counterparty to buy or sell a foreign currency at a specific exchange rate on a future date.
Certain or all Funds purchased or wrote exchange traded option contracts primarily to manage and/or gain exposure to equity price risk. An option is a contract entitling the holder to purchase or sell a specific amount of shares or units of an asset or notional amount of a swap (swaption), at a specified price. When an option is purchased or written, an amount equal to the premium paid or received is recorded as an asset or liability, respectively. Upon exercise of an option, the acquisition cost or sales proceeds of the underlying investment is adjusted by any premium received or paid. Upon expiration of an option, any premium received or paid is recorded as a realized gain or loss. Upon closing an option other than through expiration or exercise, the difference between the premium received or paid and the cost to close the position is recorded as a realized gain or loss.
See Notes 6 and 8 regarding investment transactions and other derivative information, respectively.
f. Restricted Cash
At April 30, 2017, certain or all Funds held restricted cash in connection with investments in certain derivative securities. Restricted cash is held in a segregated account with the Fund’s custodian and is reflected in the Statements of Assets and Liabilities.
g. Equity-Linked Securities
Certain or all Funds invest in equity-linked securities. Equity-linked securities are hybrid financial instruments that generally combine both debt and equity characteristics into a single note form. Income received from equity-linked securities is recorded as realized gains in the Statements of Operations and may be based on the performance of an underlying equity security, an equity index, or an option position. The risks of investing in equity-linked securities include unfavorable price movements in the underlying security and the credit risk of the issuing financial institution. There may be no guarantee of a return of principal with equity-linked securities and the appreciation potential may be limited. Equity-linked securities may be more volatile and less liquid than other investments held by the Funds.
h. Senior Floating Rate Interests
Certain or all Funds invest in senior secured corporate loans that pay interest at rates which are periodically reset by reference to a base lending rate plus a spread. These base lending rates are generally the prime rate offered by a designated U.S. bank or the London InterBank Offered Rate (LIBOR). Senior secured corporate loans often require prepayment of principal from excess cash flows or at the discretion of the borrower. As a result, actual maturity may be substantially less than the stated maturity. Senior secured corporate loans in which the Funds invest are generally readily marketable, but may be subject to certain restrictions on resale.
i. Income and Deferred Taxes
It is each Fund’s policy to qualify as a regulated investment company under the Internal Revenue Code. Each Fund intends to distribute to shareholders substantially all of its taxable income and net realized gains to relieve it from federal income and excise taxes. As a result, no provision for U.S. federal income taxes is required.
| | | | |
| | | |
76 | | Semiannual Report | | franklintempleton.com |
FRANKLIN INVESTORS SECURITIES TRUST
NOTES TO FINANCIAL STATEMENTS (UNAUDITED)
The Funds may be subject to foreign taxation related to income received, capital gains on the sale of securities and certain foreign currency transactions in the foreign jurisdictions in which the Funds invest. Foreign taxes, if any, are recorded based on the tax regulations and rates that exist in the foreign markets in which the Funds invest. When a capital gain tax is determined to apply, certain or all Funds record an estimated deferred tax liability in an amount that would be payable if the securities were disposed of on the valuation date. As a result of several court cases, in certain countries across the European Union, certain or all Funds filed additional tax reclaims for previously withheld taxes on dividends earned in those countries (EU reclaims). These additional filings are subject to various administrative proceedings by the local jurisdictions’ tax authorities within the European Union, as well as a number of related judicial proceedings. Income recognized, if any, for EU reclaims is reflected as other income in the Statements of Operations and any related receivable, if any, is reflected as European Union tax reclaims in the Statements of Assets and Liabilities. When uncertainty exists as to the ultimate resolution of these proceedings, the likelihood of receipt of these EU reclaims, and the potential timing of payment, no amounts are reflected in the financial statements. For U.S. income tax purposes, EU reclaims received by the Funds, if any, reduce the amounts of foreign taxes Fund shareholders can use as tax credits in their individual income tax returns.
Each Fund may recognize an income tax liability related to its uncertain tax positions under U.S. GAAP when the uncertain tax position has a less than 50% probability that it will be sustained upon examination by the tax authorities based on its technical merits. As of April 30, 2017, each Fund has determined that no tax liability is required in its financial statements related to uncertain tax positions for any open tax years (or expected to be taken in future tax years). Open tax years are those that remain subject to examination and are based on each tax jurisdiction’s statute of limitation.
j. Security Transactions, Investment Income, Expenses and Distributions
Security transactions are accounted for on trade date. Realized gains and losses on security transactions are determined on a specific identification basis. Interest income and estimated expenses are accrued daily. Amortization of premium and accretion of discount on debt securities are included in interest income. Facility fees are recognized as income over the expected term of the loan. Dividend income is recorded on the
ex-dividend date except for certain dividends from securities where the dividend rate is not available. In such cases, the dividend is recorded as soon as the information is received by the Funds. Distributions to shareholders are recorded on the ex-dividend date and are determined according to income tax regulations (tax basis). Distributable earnings determined on a tax basis may differ from earnings recorded in accordance with U.S. GAAP. These differences may be permanent or temporary. Permanent differences are reclassified among capital accounts to reflect their tax character. These reclassifications have no impact on net assets or the results of operations. Temporary differences are not reclassified, as they may reverse in subsequent periods.
Common expenses incurred by the Trust are allocated among the Funds based on the ratio of net assets of each Fund to the combined net assets of the Trust. Fund specific expenses are charged directly to the Fund that incurred the expense.
Realized and unrealized gains and losses and net investment income, not including class specific expenses, are allocated daily to each class of shares based upon the relative proportion of net assets of each class. Differences in per share distributions, by class, are generally due to differences in class specific expenses.
Inflation-indexed bonds are adjusted for inflation through periodic increases or decreases in the security’s interest accruals, face amount, or principal redemption value, by amounts corresponding to the rate of inflation as measured by an index. Any increase or decrease in the face amount or principal redemption value will be included as inflation principal adjustments in the Statements of Operations.
k. Accounting Estimates
The preparation of financial statements in accordance with U.S. GAAP requires management to make estimates and assumptions that affect the reported amounts of assets and liabilities at the date of the financial statements and the amounts of income and expenses during the reporting period. Actual results could differ from those estimates.
l. Guarantees and Indemnifications
Under the Trust’s organizational documents, its officers and trustees are indemnified by the Trust against certain liabilities arising out of the performance of their duties to the Trust. Additionally, in the normal course of business, the Trust, on
| | | | |
| | | |
franklintempleton.com | | Semiannual Report | | 77 |
FRANKLIN INVESTORS SECURITIES TRUST
NOTES TO FINANCIAL STATEMENTS (UNAUDITED)
1. Organization and Significant Accounting Policies (continued)
l. Guarantees and Indemnifications (continued)
behalf of the Funds, enters into contracts with service providers that contain general indemnification clauses. The Trust’s
maximum exposure under these arrangements is unknown as this would involve future claims that may be made against the Trust that have not yet occurred. Currently, the Trust expects the risk of loss to be remote.
2. Shares of Beneficial Interest
At April 30, 2017, there were an unlimited number of shares authorized (without par value). Transactions in the Funds’ shares were as follows:
| | | | | | | | | | | | | | | | |
| | | Franklin Balanced Fund | | | Franklin Convertible Securities Fund | |
| | | | |
| | | Shares | | | Amount | | | Shares | | | Amount | |
Class A Shares: | | | | | | | | | | | | | | | | |
Six Months ended April 30, 2017 | | | | | | | | | | | | | | | | |
Shares sold | | | 25,133,296 | | | $ | 299,639,478 | | | | 4,811,945 | | | $ | 89,266,227 | |
Shares issued in reinvestment of distributions | | | 6,251,164 | | | | 74,202,629 | | | | 1,282,223 | | | | 23,132,849 | |
Shares redeemed | | | (29,754,455 | ) | | | (354,402,345 | ) | | | (9,366,391 | ) | | | (173,233,573 | ) |
| | | | |
Net increase (decrease) | | | 1,630,005 | | | $ | 19,439,762 | | | | (3,272,223 | ) | | $ | (60,834,497 | ) |
| | | | |
Year ended October 31, 2016 | | | | | | | | | | | | | | | | |
Shares sold | | | 59,288,525 | | | $ | 669,112,660 | | | | 9,476,768 | | | $ | 168,154,565 | |
Shares issued in reinvestment of distributions | | | 6,894,113 | | | | 77,791,246 | | | | 2,018,714 | | | | 35,174,653 | |
Shares redeemed | | | (56,715,686 | ) | | | (644,598,561 | ) | | | (14,805,915 | ) | | | (257,895,736 | ) |
| | | | |
Net increase (decrease) | | | 9,466,952 | | | $ | 102,305,345 | | | | (3,310,433 | ) | | $ | (54,566,518 | ) |
| | | | |
Class C Shares: | | | | | | | | | | | | | | | | |
Six Months ended April 30, 2017 | | | | | | | | | | | | | | | | |
Shares sold | | | 6,376,588 | | | $ | 75,309,891 | | | | 1,240,300 | | | $ | 22,622,246 | |
Shares issued in reinvestment of distributions | | | 1,331,012 | | | | 15,657,733 | | | | 391,944 | | | | 6,969,905 | |
Shares redeemed | | | (6,602,559 | ) | | | (78,046,765 | ) | | | (2,012,064 | ) | | | (36,677,594 | ) |
| | | | |
Net increase (decrease) | | | 1,105,041 | | | $ | 12,920,859 | | | | (379,820 | ) | | $ | (7,085,443 | ) |
| | | | |
Year ended October 31, 2016 | | | | | | | | | | | | | | | | |
Shares sold | | | 17,111,710 | | | $ | 191,037,224 | | | | 1,949,088 | | | $ | 33,909,433 | |
Shares issued in reinvestment of distributions | | | 1,240,417 | | | | 13,880,631 | | | | 589,732 | | | | 10,122,973 | |
Shares redeemed | | | (13,610,128 | ) | | | (151,742,110 | ) | | | (3,808,818 | ) | | | (65,824,391 | ) |
| | | | |
Net increase (decrease) | | | 4,741,999 | | | $ | 53,175,745 | | | | (1,269,998 | ) | | $ | (21,791,985 | ) |
| | | | |
Class R Shares: | | | | | | | | | | | | | | | | |
Six Months ended April 30, 2017 | | | | | | | | | | | | | | | | |
Shares sold | | | 68,709 | | | $ | 821,286 | | | | | | | | | |
Shares issued in reinvestment of distributions | | | 11,106 | | | | 132,176 | | | | | | | | | |
Shares redeemed | | | (33,882 | ) | | | (405,713 | ) | | | | | | | | |
| | | | |
Net increase (decrease) | | | 45,933 | | | $ | 547,749 | | | | | | | | | |
| | | | |
Year ended October 31, 2016 | | | | | | | | | | | | | | | | |
Shares sold | | | 132,632 | | | $ | 1,496,201 | | | | | | | | | |
Shares issued in reinvestment of distributions | | | 11,661 | | | | 131,808 | | | | | | | | | |
Shares redeemed | | | (171,599 | ) | | | (1,916,005 | ) | | | | | | | | |
| | | | |
Net increase (decrease) | | | (27,306 | ) | | $ | (287,996 | ) | | | | | | | | |
| | | | |
| | | |
78 | | Semiannual Report | | franklintempleton.com |
FRANKLIN INVESTORS SECURITIES TRUST
NOTES TO FINANCIAL STATEMENTS (UNAUDITED)
| | | | | | | | | | | | | | | | |
| | | Franklin Balanced Fund | | | Franklin Convertible Securities Fund | |
| | | | |
| | | Shares | | | Amount | | | Shares | | | Amount | |
Class R6 Shares: | | | | | | | | | | | | | | | | |
Six Months ended April 30, 2017 | | | | | | | | | | | | | | | | |
Shares sold | | | 29,716 | | | $ | 355,237 | | | | 255,574 | | | $ | 4,701,653 | |
Shares issued in reinvestment of distributions | | | 797 | | | | 9,500 | | | | 16,962 | | | | 308,064 | |
Shares redeemed | | | (51 | ) | | | (613 | ) | | | (56,009 | ) | | | (1,056,414 | ) |
| | | | |
Net increase (decrease) | | | 30,462 | | | $ | 364,124 | | | | 216,527 | | | $ | 3,953,303 | |
| | | | |
Year ended October 31, 2016 | | | | | | | | | | | | | | | | |
Shares sold | | | 3,047 | | | $ | 34,245 | | | | 788,664 | | | $ | 13,994,019 | |
Shares issued in reinvestment of distributions | | | 740 | | | | 8,369 | | | | 4,845 | | | | 88,899 | |
Shares redeemed | | | (3,180 | ) | | | (37,349 | ) | | | (403,594 | ) | | | (7,215,431 | ) |
| | | | |
Net increase (decrease) | | | 607 | | | $ | 5,265 | | | | 389,915 | | | $ | 6,867,487 | |
| | | | |
Advisor Class Shares: | | | | | | | | | | | | | | | | |
Six Months ended April 30, 2017 | | | | | | | | | | | | | | | | |
Shares sold | | | 9,400,656 | | | $ | 112,150,660 | | | | 15,042,282 | | | $ | 278,761,941 | |
Shares issued in reinvestment of distributions | | | 365,816 | | | | 4,354,164 | | | | 1,894,301 | | | | 34,195,606 | |
Shares redeemed | | | (4,838,898 | ) | | | (57,586,557 | ) | | | (8,660,608 | ) | | | (159,608,815 | ) |
| | | | |
Net increase (decrease) | | | 4,927,574 | | | $ | 58,918,267 | | | | 8,275,975 | | | $ | 153,348,732 | |
| | | | |
Year ended October 31, 2016 | | | | | | | | | | | | | | | | |
Shares sold | | | 14,391,414 | | | $ | 167,114,896 | | | | 44,182,146 | | | $ | 748,163,852 | |
Shares issued in reinvestment of distributions | | | 204,315 | | | | 2,323,814 | | | | 2,236,760 | | | | 39,111,889 | |
Shares redeemed | | | (7,564,701 | ) | | | (87,652,347 | ) | | | (37,152,701 | ) | | | (639,104,671 | ) |
| | | | |
Net increase (decrease) | | | 7,031,028 | | | $ | 81,786,363 | | | | 9,266,205 | | | $ | 148,171,070 | |
| | | | | | | | | | | | | | | | |
| | | Franklin Equity Income Fund | | | Franklin Real Return Fund | |
| | | | |
| | | Shares | | | Amount | | | Shares | | | Amount | |
Class A Shares: | | | | | | | | | | | | | | | | |
Six Months ended April 30, 2017 | | | | | | | | | | | | | | | | |
Shares sold | | | 5,184,824 | | | $ | 120,232,937 | | | | 2,330,684 | | | $ | 23,661,490 | |
Shares issued in reinvestment of distributions | | | 3,751,533 | | | | 86,001,149 | | | | 13,373 | | | | 136,140 | |
Shares redeemed | | | (10,502,097 | ) | | | (243,463,027 | ) | | | (2,506,897 | ) | | | (25,476,151 | ) |
| | | | |
Net increase (decrease) | | | (1,565,740 | ) | | $ | (37,228,941 | ) | | | (162,840 | ) | | $ | (1,678,521 | ) |
| | | | |
Year ended October 31, 2016 | | | | | | | | | | | | | | | | |
Shares sold | | | 10,955,507 | | | $ | 240,824,766 | | | | 2,920,637 | | | $ | 28,866,525 | |
Shares issued in reinvestment of distributions | | | 4,189,138 | | | | 91,549,334 | | | | 182,566 | | | | 1,756,283 | |
Shares redeemed | | | (17,422,052 | ) | | | (386,047,151 | ) | | | (5,823,642 | ) | | | (57,263,866 | ) |
| | | | |
Net increase (decrease) | | | (2,277,407 | ) | | $ | (53,673,051 | ) | | | (2,720,439 | ) | | $ | (26,641,058 | ) |
| | | | |
| | | |
franklintempleton.com | | Semiannual Report | | 79 |
FRANKLIN INVESTORS SECURITIES TRUST
NOTES TO FINANCIAL STATEMENTS (UNAUDITED)
2. Shares of Beneficial Interest (continued)
| | | | | | | | | | | | | | | | |
| | | Franklin
Equity Income Fund | | | Franklin
Real Return Fund | |
| | | | |
| | | Shares | | | Amount | | | Shares | | | Amount | |
Class C Shares: | | | | | | | | | | | | | | | | |
Six Months ended April 30, 2017 | | | | | | | | | | | | | | | | |
Shares sold | | | 1,097,405 | | | $ | 25,270,791 | | | | 531,448 | | | $ | 5,349,112 | |
Shares issued in reinvestment of distributions | | | 525,160 | | | | 11,957,583 | | | | — | | | | — | |
Shares redeemed | | | (1,506,065 | ) | | | (34,711,576 | ) | | | (658,289 | ) | | | (6,620,844 | ) |
| | | | |
Net increase (decrease) | | | 116,500 | | | $ | 2,516,798 | | | | (126,841 | ) | | $ | (1,271,732 | ) |
| | | | |
Year ended October 31, 2016 | | | | | | | | | | | | | | | | |
Shares sold | | | 2,665,652 | | | $ | 58,334,909 | | | | 625,724 | | | $ | 6,130,419 | |
Shares issued in reinvestment of distributions | | | 516,181 | | | | 11,198,526 | | | | 28,218 | | | | 269,761 | |
Shares redeemed | | | (2,617,595 | ) | | | (57,020,273 | ) | | | (1,591,824 | ) | | | (15,529,734 | ) |
| | | | |
Net increase (decrease) | | | 564,238 | | | $ | 12,513,162 | | | | (937,882 | ) | | $ | (9,129,554 | ) |
| | | | |
Class R Shares: | | | | | | | | | | | | | | | | |
Six Months ended April 30, 2017 | | | | | | | | | | | | | | | | |
Shares sold | | | 45,635 | | | $ | 1,060,416 | | | | | | | | | |
Shares issued in reinvestment of distributions | | | 13,383 | | | | 306,848 | | | | | | | | | |
Shares redeemed | | | (33,739 | ) | | | (787,509 | ) | | | | | | | | |
| | | | |
Net increase (decrease) | | | 25,279 | | | $ | 579,755 | | | | | | | | | |
| | | | |
Year ended October 31, 2016 | | | | | | | | | | | | | | | | |
Shares sold | | | 83,578 | | | $ | 1,810,529 | | | | | | | | | |
Shares issued in reinvestment of distributions | | | 12,662 | | | | 276,699 | | | | | | | | | |
Shares redeemed | | | (84,438 | ) | | | (1,834,501 | ) | | | | | | | | |
| | | | |
Net increase (decrease) | | | 11,802 | | | $ | 252,727 | | | | | | | | | |
| | | | |
Class R6 Shares: | | | | | | | | | | | | | | | | |
Six Months ended April 30, 2017 | | | | | | | | | | | | | | | | |
Shares sold | | | 133,844 | | | $ | 3,106,525 | | | | 197,797 | | | $ | 2,015,177 | |
Shares issued in reinvestment of distributions | | | 349 | | | | 8,012 | | | | 989 | | | | 10,122 | |
Shares redeemed | | | (112,032 | ) | | | (2,601,246 | ) | | | (137,285 | ) | | | (1,401,989 | ) |
| | | | |
Net increase (decrease) | | | 22,161 | | | $ | 513,291 | | | | 61,501 | | | $ | 623,310 | |
| | | | |
Year ended October 31, 2016 | | | | | | | | | | | | | | | | |
Shares sold | | | 537,262 | | | $ | 11,541,244 | | | | 414,897 | | | $ | 4,196,219 | |
Shares issued in reinvestment of distributions | | | 84 | | | | 1,876 | | | | 9 | | | | 93 | |
Shares redeemed | | | (70,059 | ) | | | (1,576,033 | ) | | | (63,409 | ) | | | (625,939 | ) |
| | | | |
Net increase (decrease) | | | 467,287 | | | $ | 9,967,087 | | | | 351,497 | | | $ | 3,570,373 | |
| | | | |
| | | |
80 | | Semiannual Report | | franklintempleton.com |
FRANKLIN INVESTORS SECURITIES TRUST
NOTES TO FINANCIAL STATEMENTS (UNAUDITED)
| | | | | | | | | | | | | | | | |
| | | Franklin Equity Income Fund | | | Franklin Real Return Fund | |
| | | | |
| | | Shares | | | Amount | | | Shares | | | Amount | |
Advisor Class Shares: | | | | | | | | | | | | | | | | |
Six Months ended April 30, 2017 | | | | | | | | | | | | | | | | |
Shares sold | | | 2,600,993 | | | $ | 60,295,727 | | | | 1,150,282 | | | $ | 11,758,592 | |
Shares issued in reinvestment of distributions | | | 192,701 | | | | 4,427,807 | | | | 8,141 | | | | 83,204 | |
Shares redeemed | | | (1,383,396 | ) | | | (32,081,384 | ) | | | (739,148 | ) | | | (7,545,611 | ) |
| | | | |
Net increase (decrease) | | | 1,410,298 | | | $ | 32,642,150 | | | | 419,275 | | | $ | 4,296,185 | |
| | | | |
Year ended October 31, 2016 | | | | | | | | | | | | | | | | |
Shares sold | | | 4,153,049 | | | $ | 93,471,028 | | | | 1,852,276 | | | $ | 18,341,311 | |
Shares issued in reinvestment of distributions | | | 95,903 | | | | 2,107,308 | | | | 47,451 | | | | 457,432 | |
Shares redeemed | | | (2,181,835 | ) | | | (49,145,021 | ) | | | (2,214,965 | ) | | | (21,772,407 | ) |
| | | | |
Net increase (decrease) | | | 2,067,117 | | | $ | 46,433,315 | | | | (315,238 | ) | | $ | (2,973,664 | ) |
3. Transactions with Affiliates
Franklin Resources, Inc. is the holding company for various subsidiaries that together are referred to as Franklin Templeton Investments. Certain officers and trustees of the Trust are also officers and/or directors of the following subsidiaries:
| | | | |
| Subsidiary | | Affiliation | | |
Franklin Advisers, Inc. (Advisers) | | Investment manager | | |
Franklin Templeton Services, LLC (FT Services) | | Administrative manager | | |
Franklin Templeton Distributors, Inc. (Distributors) | | Principal underwriter | | |
Franklin Templeton Investor Services, LLC (Investor Services) | | Transfer agent | | |
a. Management Fees
Franklin Balanced Fund pays an investment management fee to Advisers based on the average daily net assets of the Fund as follows:
| | | | |
| Annualized Fee Rate | | Net Assets | | |
0.700% | | Up to and including $250 million | | |
0.675% | | Over $250 million, up to and including $500 million | | |
0.650% | | Over $500 million, up to and including $1 billion | | |
0.625% | | Over $1 billion, up to and including $2.5 billion | | |
0.600% | | Over $2.5 billion, up to and including $5 billion | | |
0.575% | | Over $5 billion, up to and including $10 billion | | |
0.550% | | Over $10 billion, up to and including $15 billion | | |
0.525% | | Over $15 billion, up to and including $20 billion | | |
0.500% | | In excess of $20 billion | | |
| | | | |
| | | |
franklintempleton.com | | Semiannual Report | | 81 |
FRANKLIN INVESTORS SECURITIES TRUST
NOTES TO FINANCIAL STATEMENTS (UNAUDITED)
3. Transactions with Affiliates (continued)
a. Management Fees (continued)
Franklin Convertible Securities Fund and Franklin Equity Income Fund pay an investment management fee to Advisers based on the month-end net assets of each of the Funds as follows:
| | | | |
| Annualized Fee Rate | | Net Assets | | |
0.625% | | Up to and including $100 million | | |
0.500% | | Over $100 million, up to and including $250 million | | |
0.450% | | Over $250 million, up to and including $7.5 billion | | |
0.440% | | Over $7.5 billion, up to and including $10 billion | | |
0.430% | | Over $10 billion, up to and including $12.5 billion | | |
0.420% | | Over $12.5 billion, up to and including $15 billion | | |
0.400% | | Over $15 billion, up to and including $17.5 billion | | |
0.380% | | Over $17.5 billion, up to and including $20 billion | | |
0.360% | | Over $20 billion, up to and including $35 billion | | |
0.355% | | Over $35 billion, up to and including $50 billion | | |
0.350% | | In excess of $50 billion | | |
Franklin Real Return Fund pays an investment management fee to Advisers based on the average daily net assets of the Fund as follows:
| | | | |
| Annualized Fee Rate | | Net Assets | | |
0.625% | | Up to and including $500 million | | |
0.525% | | Over $500 million, up to and including $1 billion | | |
0.480% | | Over $1 billion, up to and including $1.5 billion | | |
0.435% | | Over $1.5 billion, up to and including $6.5 billion | | |
0.415% | | Over $6.5 billion, up to and including $11.5 billion | | |
0.400% | | Over $11.5 billion, up to and including $16.5 billion | | |
0.390% | | Over $16.5 billion, up to and including $19 billion | | |
0.380% | | Over $19 billion, up to and including $21.5 billion | | |
0.370% | | In excess of $21.5 billion | | |
For the period ended April 30, 2017, each Fund’s annualized effective investment management fee rate based on average daily net assets was as follows:
| | | | | | | | | | | | |
Franklin
Balanced Fund | | Franklin
Convertible
Securities Fund | | | Franklin Equity
Income Fund | | | Franklin Real
Return Fund | |
0.631% | | | 0.469% | | | | 0.466% | | | | 0.625% | |
b. Administrative Fees
Under an agreement with Advisers, FT Services provides administrative services to the Funds. The fee is paid by Advisers based on each of the Funds’ average daily net assets, and is not an additional expense of the Funds.
| | | | |
| | | |
82 | | Semiannual Report | | franklintempleton.com |
FRANKLIN INVESTORS SECURITIES TRUST
NOTES TO FINANCIAL STATEMENTS (UNAUDITED)
c. Distribution Fees
The Board has adopted distribution plans for each share class, with the exception of Class R6 and Advisor Class shares, pursuant to Rule 12b-1 under the 1940 Act. Under the Funds’ Class A reimbursement distribution plans, the Funds reimburse Distributors for costs incurred in connection with the servicing, sale and distribution of each Fund’s shares up to the maximum annual plan rate for each class. Under the Class A reimbursement distribution plans, costs exceeding the maximum for the current plan year cannot be reimbursed in subsequent periods. In addition, under the Funds’ Class C and R compensation distribution plans, the Funds pay Distributors for costs incurred in connection with the servicing, sale and distribution of each Fund’s shares up to the maximum annual plan rate for each class. The plan year, for purposes of monitoring compliance with the maximum annual plan rates, is February 1 through January 31 for each Fund.
The maximum annual plan rates, based on the average daily net assets, for each class, are as follows:
| | | | | | | | | | | | | | | | |
| | | Franklin
Balanced Fund | | | Franklin
Convertible
Securities Fund | | | Franklin Equity
Income Fund | | | Franklin Real
Return Fund | |
Reimbursement Plans: | | | | | | | | | | | | | | | | |
Class A | | | 0.35% | | | | 0.25% | | | | 0.25% | | | | 0.25% | |
Compensation Plans: | | | | | | | | | | | | | | | | |
Class C | | | 1.00% | | | | 1.00% | | | | 1.00% | | | | 0.65% | |
Class R | | | 0.50% | | | | — | | | | 0.50% | | | | — | |
For Franklin Balanced Fund, the Board has set the current rate at 0.25% per year for Class A shares until further notice and approval by the Board.
d. Sales Charges/Underwriting Agreements
Front-end sales charges and contingent deferred sales charges (CDSC) do not represent expenses of the Funds. These charges are deducted from the proceeds of sales of fund shares prior to investment or from redemption proceeds prior to remittance, as applicable. Distributors has advised the Funds of the following commission transactions related to the sales and redemptions of the Funds’ shares for the period:
| | | | | | | | | | | | | | | | |
| | | Franklin
Balanced Fund | | | Franklin
Convertible
Securities Fund | | | Franklin Equity
Income Fund | | | Franklin Real
Return Fund | |
Sales charges retained net of commissions paid to unaffiliated brokers/dealers | | | $708,129 | | | | $88,052 | | | | $281,283 | | | | $21,580 | |
CDSC retained | | | $ 44,483 | | | | $10,101 | | | | $ 10,866 | | | | $ 4,410 | |
e. Transfer Agent Fees
Each class of shares, except for Class R6, pays transfer agent fees to Investor Services for its performance of shareholder servicing obligations and reimburses Investor Services for out of pocket expenses incurred, including shareholder servicing fees paid to third parties. These fees are allocated daily based upon their relative proportion of such classes’ aggregate net assets. Class R6 pays Investor Services transfer agent fees specific to that class.
For the period ended April 30, 2017, the Funds paid transfer agent fees as noted in the Statements of Operations of which the following amounts were retained by Investor Services:
| | | | | | | | | | | | | | | | |
| | | Franklin
Balanced Fund | | | Franklin
Convertible
Securities Fund | | | Franklin Equity
Income Fund | | | Franklin Real
Return Fund | |
Transfer agent fees | | | $621,025 | | | | $407,879 | | | | $478,366 | | | | $89,919 | |
| | | | |
| | | |
franklintempleton.com | | Semiannual Report | | 83 |
FRANKLIN INVESTORS SECURITIES TRUST
NOTES TO FINANCIAL STATEMENTS (UNAUDITED)
3. Transactions with Affiliates (continued)
f. Investments in Affiliated Management Investment Companies
Certain or all Funds invest in one or more affiliated management investment companies for purposes other than exercising a controlling influence over the management or policies. Management fees paid by the Funds are waived on assets invested in the affiliated management investment companies, as noted in the Statements of Operations, in an amount not to exceed the management and administrative fees paid directly or indirectly by each affiliate. Prior to November 1, 2013, the waiver was accounted for as a reduction to management fees. During the period ended April 30, 2017, investments in affiliated management investment companies were as follows:
| | | | | | | | | | | | | | | | | | | | | | | | | | | | | | | | | | | | | | | | |
| | | Number of
Shares Held
at Beginning
of Period | | Gross
Additions | | Gross
Reductions | | Number of
Shares
Held at End
of Period | | Value
at End
of Period | | Investment
Income | | Realized
Gain (Loss) | | %of
Affiliated
Fund Shares
Outstanding
Held at End
of Period |
Franklin Balanced Fund | | | | | | | | | | | | | | | | | | | | | | | | | | | | | | | | | | | | | | | | |
Controlled Affiliates | | | | | | | | | | | | | | | | | | | | | | | | | | | | | | | | | | | | | | | | |
Franklin Liberty Investment Grade | | | | | | | | | | | | | | | | | | | | | | | | | | | | | | | | | | | | | | | | |
Corporate ETF | | | | — | | | | | 750,000 | | | | | — | | | | | 750,000 | | | | $ | 18,262,500 | | | | $ | 233,907 | | | | $ | — | | | | | 32.6% | |
| | | | | | | | | | | | | | | | | | | | | | | | | | | | | | |
| | | | | | | | |
Non-Controlled Affiliates | | | | | | | | | | | | | | | | | | | | | | | | | | | | | | | | | | | | | | | | |
Institutional Fiduciary Trust Money | | | | | | | | | | | | | | | | | | | | | | | | | | | | | | | | | | | | | | | | |
Market Portfolio, 0.37% | | | | 120,863,963 | | | | | 576,549,575 | | | | | (382,826,111 | ) | | | | 314,587,427 | | | | $ | 314,587,427 | | | | $ | 200,023 | | | | $ | — | | | | | 1.6% | |
| | | | | | | | | | | | | | | | | | | | | | | | | | | | | | |
Total | | | | | | | | | | | | | | | | | | | | | | | $ | 332,849,927 | | | | $ | 433,930 | | | | $ | — | | | | | | |
| | | | | | | | | | | | | | | | | | | | | | | | | | | | | | |
| | | | | | | | |
Franklin Convertible Securities Fund | | | | | | | | | | | | | | | | | | | | | | | | | | | | | | | | | | | | | | | | |
Non-Controlled Affiliates | | | | | | | | | | | | | | | | | | | | | | | | | | | | | | | | | | | | | | | | |
Institutional Fiduciary Trust Money Market Portfolio, 0.37% | | | | 98,515,365 | | | | | 182,180,531 | | | | | (162,625,464 | ) | | | | 118,070,432 | | | | $ | 118,070,432 | | | | $ | 86,058 | | | | $ | — | | | | | 0.6% | |
| | | | | | | | | | | | | | | | | | | | | | | | | | | | | | |
| | | | | | | | |
Franklin Equity Income Fund | | | | | | | | | | | | | | | | | | | | | | | | | | | | | | | | | | | | | | | | |
Non-Controlled Affiliates | | | | | | | | | | | | | | | | | | | | | | | | | | | | | | | | | | | | | | | | |
Institutional Fiduciary Trust Money Market Portfolio, 0.37% | | | | 50,191,472 | | | | | 197,665,543 | | | | | (208,674,225 | ) | | | | 39,182,790 | | | | $ | 39,182,790 | | | | $ | 37,356 | | | | $ | — | | | | | 0.2% | |
| | | | | | | | | | | | | | | | | | | | | | | | | | | | | | |
| | | | | | | | |
Franklin Real Return Fund | | | | | | | | | | | | | | | | | | | | | | | | | | | | | | | | | | | | | | | | |
Non-Controlled Affiliates | | | | | | | | | | | | | | | | | | | | | | | | | | | | | | | | | | | | | | | | |
Franklin Lower Tier Floating Rate Fund | | | | 280,073 | | | | | 12,211 | | | | | — | | | | | 292,284 | | | | $ | 3,083,593 | | | | $ | 145,517 | | | | $ | — | | | | | 1.0% | |
Franklin Middle Tier Floating Rate Fund | | | | 105,222 | | | | | 3,655 | | | | | — | | | | | 108,877 | | | | | 1,095,307 | | | | | 42,501 | | | | | — | | | | | 0.4% | |
| | | | | | | | | | | | | | | | | | | | | | | | | | | | | | |
Total | | | | | | | | | | | | | | | | | | | | | | | $ | 4,178,900 | | | | $ | 188,018 | | | | $ | — | | | | | | |
| | | | | | | | | | | | | | | | | | | | | | | | | | | | | | |
g. Waiver and Expense Reimbursements
Advisers and Investor Services have contractually agreed in advance to waive or limit their respective fees and to assume as their own expense certain expenses otherwise payable by Franklin Real Return Fund so that the expenses (excluding distribution fees, and acquired fund fees and expenses) for Class A, Class C, and Advisor Class of the Fund do not exceed 0.65%, and Class R6 does not exceed 0.49% based on the average net assets of each class (other than certain non-routine expenses or costs, including those relating to litigation, indemnification, reorganizations, and liquidations) until February 28, 2018. Total expenses waived or paid are not subject to recapture subsequent to the Fund’s fiscal year end. Prior to March 1, 2017, expenses for Class R6 were limited to 0.50%.
| | | | |
| | | |
84 | | Semiannual Report | | franklintempleton.com |
FRANKLIN INVESTORS SECURITIES TRUST
NOTES TO FINANCIAL STATEMENTS (UNAUDITED)
Additionally, Investor Services has contractually agreed in advance to waive or limit its fees so that the Class R6 transfer agent fees do not exceed 0.01% until February 28, 2018. For Franklin Convertible Securities Fund and Franklin Equity Income Fund, there were no Class R6 transfer agent fees waived during the period ended April 30, 2017.
4. Expense Offset Arrangement
The Funds have entered into an arrangement with their custodian whereby credits realized as a result of uninvested cash balances are used to reduce a portion of the Funds’ custodian expenses. During the period ended April 30, 2017, the custodian fees were reduced as noted in the Statements of Operations.
5. Income Taxes
For tax purposes, capital losses may be carried over to offset future capital gains. Capital loss carryforwards with no expiration, if any, must be fully utilized before those losses with expiration dates.
At October 31, 2016, the capital loss carryforwards were as follows:
| | | | |
| | | Franklin Real Return Fund | |
Capital loss carryforwards subject to expiration: | | | | |
2017 | | | $ 1,207,907 | |
2018 | | | 1,206,586 | |
Capital loss carryforwards not subject to expiration: | | | | |
Short term | | | 842,781 | |
Long term | | | 23,558,304 | |
| | | | |
Total capital loss carryforwards | | | $26,815,578 | |
| | | | |
At April 30, 2017, the cost of investments and net unrealized appreciation (depreciation) for income tax purposes were as follows:
| | | | | | | | | | | | | | | | |
| | | Franklin
Balanced Fund | | | Franklin
Convertible
Securities Fund | | | Franklin Equity
Income Fund | | | Franklin Real
Return Fund | |
Cost of investments | | | $3,187,831,006 | | | | $2,134,732,708 | | | | $1,654,730,289 | | | | $241,141,426 | |
| | | | |
Unrealized appreciation | | | $ 342,167,402 | | | | $ 379,993,731 | | | | $ 526,261,867 | | | | $ 14,536,311 | |
Unrealized depreciation | | | (69,798,654 | ) | | | (143,269,565 | ) | | | (37,241,928 | ) | | | (10,522,581 | ) |
Net unrealized appreciation (depreciation) | | | $ 272,368,748 | | | | $ 236,724,166 | | | | $ 489,019,939 | | | | $ 4,013,730 | |
Differences between income and/or capital gains as determined on a book basis and a tax basis are primarily due to differing treatments of foreign currency transactions, bond discounts and premiums and wash sales.
6. Investment Transactions
Purchases and sales of investments (excluding short term securities) for the period ended April 30, 2017, were as follows:
| | | | | | | | | | | | | | | | |
| | | Franklin
Balanced Fund | | | Franklin
Convertible
Securities Fund | | | Franklin Equity
Income Fund | | | Franklin Real
Return Fund | |
Purchases | | | $385,479,561 | | | | $300,488,159 | | | | $261,999,255 | | | | $61,252,254 | |
Sales | | | $547,156,583 | | | | $274,447,702 | | | | $315,644,034 | | | | $53,679,050 | |
| | | | |
| | | |
franklintempleton.com | | Semiannual Report | | 85 |
FRANKLIN INVESTORS SECURITIES TRUST
NOTES TO FINANCIAL STATEMENTS (UNAUDITED)
6. Investment Transactions (continued)
Transactions in options written during the period ended April 30, 2017, were as follows:
| | | | | | | | |
| | | Number of
Contracts | | | Premiums | |
Franklin Balanced Fund | | | | | | | | |
Options outstanding at October 31, 2016 | | | 44,478 | | | $ | 2,871,309 | |
Options written | | | 20,275 | | | | 3,307,441 | |
Options expired | | | (21,525 | ) | | | (1,992,485 | ) |
Options exercised | | | (17,750 | ) | | | (1,226,378 | ) |
Options closed | | | (20,478 | ) | | | (2,749,487 | ) |
Options outstanding at April 30, 2017 | | | 5,000 | | | $ | 210,400 | |
| | |
Franklin Equity Income Fund | | | | | | | | |
Options outstanding at October 31, 2016 | | | — | | | $ | — | |
Options written | | | 1,600 | | | | 72,846 | |
Options expired | | | (1,600 | ) | | | (72,846 | ) |
Options exercised | | | — | | | | — | |
Options closed | | | — | | | | — | |
Options outstanding at April 30, 2017 | | | — | | | $ | — | |
See Notes 1(e) and 8 regarding derivative financial instruments and other derivative information, respectively.
7. Credit Risk
At April 30, 2017, Franklin Balanced Fund, Franklin Convertible Securities Fund and Franklin Real Return Fund had 11.4%, 58.0% and 9.9%, respectively, of their portfolio invested in high yield securities, senior secured floating rate notes, or other securities rated below investment grade and unrated securities, if any. These securities may be more sensitive to economic conditions causing greater price volatility and are potentially subject to a greater risk of loss due to default than higher rated securities.
8. Other Derivative Information
At April 30, 2017, the Funds’ investments in derivative contracts are reflected in the Statements of Assets and Liabilities as follows:
| | | | | | | | | | | | | | |
| | | Asset Derivatives | | Liability Derivatives |
Derivative Contracts
Not Accounted for as
Hedging Instruments | | Statement of
Assets and Liabilities
Location | | Fair Value | | Statement of
Assets and Liabilities
Location | | Fair Value |
| | | | |
Franklin Balanced Fund | | | | | | | | | | | | | | |
Equity contracts | | Investments in securities, at value | | | | $100,000a | | | Options written, at value | | | | $25,000 | |
| | | | |
Franklin Real Return Fund | | | | | | | | | | | | | | |
Foreign exchange contracts | | Unrealized appreciation on OTC forward exchange contracts | | | | $253,606 | | | Unrealized depreciation on OTC forward exchange contracts | | | | $ — | |
aPurchased option contracts are included in investments in securities, at value in the Statement of Assets and Liabilities.
| | | | |
| | | |
86 | | Semiannual Report | | franklintempleton.com |
FRANKLIN INVESTORS SECURITIES TRUST
NOTES TO FINANCIAL STATEMENTS (UNAUDITED)
For the period ended April 30, 2017, the effect of derivative contracts in the Funds’ Statements of Operations was as follows:
| | | | | | | | | | | | | | |
Derivative
Contracts
Not Accounted for
as
Hedging
Instruments | | Statement of Operations Locations | | Net Realized
Gain (Loss) for
the Period | | Statement of
Operations Locations | | Net Change
in Unrealized
Appreciation
(Depreciation)
for the Period |
| | Net realized gain (loss) from: | | | | | | | Net change in unrealized appreciation (depreciation) on: | | | | | |
Franklin Balanced Fund | | | | | | | | | | | | | | |
Equity contracts | | Investments | | | $ | (2,400,750 | )a | | Investments | | | $ | (743,012 | )a |
| | Written options | | | | 3,741,673 | | | Written options | | | | 465,321 | |
| | | | |
Franklin Equity Income Fund | | | | | | | | | | | | | | |
Equity contracts | | Written options | | | $ | 72,846 | | | Written options | | | $ | — | |
| | | | |
Franklin Real | | | | | | | | | | | | | | |
Return Fund | | | | | | | | | | | | | | |
Foreign exchange contracts | | Foreign currency transactions | | | $ | — | | | Translation of other assets and liabilities denominated in foreign currencies | | | $ | 198,982 | b |
a Purchased option contracts are included in net realized gain (loss) from investments and net change in unrealized appreciation (depreciation) on investments in the Statements of Operations.
bForward exchange contracts are included in net realized gain (loss) from foreign currency transactions and net change in unrealized appreciation (depreciation) on translation of other assets and liabilities denominated in foreign currencies in the Statements of Operations.
For the period ended April 30, 2017, the average month end fair value of derivatives, as a percentage of average month end net assets, and the average month end number of open derivative contracts for the period were as follows:
| | | | | | |
| | | Franklin Balanced Fund | | Franklin Equity Income Fund | | Franklin Real Return Fund |
Average month end fair value of derivatives | | 0.1% | | 0.0%a | | 0.1% |
Average month end number of open derivatives | | 5 | | —b | | 4 |
| | |
aRounds to less than 0.1%.
bRounds to less than 1.
See Note 1(e) regarding derivative financial instruments.
9. Credit Facility
The Funds, together with other U.S. registered and foreign investment funds (collectively, Borrowers), managed by Franklin Templeton Investments, are borrowers in a joint syndicated senior unsecured credit facility totaling $2 billion (Global Credit Facility) which matures on February 9, 2018. This Global Credit Facility provides a source of funds to the Borrowers for temporary and emergency purposes, including the ability to meet future unanticipated or unusually large redemption requests.
Under the terms of the Global Credit Facility, the Funds shall, in addition to interest charged on any borrowings made by the Funds and other costs incurred by the Funds, pay their share of fees and expenses incurred in connection with the implementation and maintenance of the Global Credit Facility, based upon their relative share of the aggregate net assets of all of the Borrowers, including an annual commitment fee of 0.15% based upon the unused portion of the Global Credit Facility. These fees are reflected in other expenses in the Statements of Operations. During the period ended April 30, 2017, the Funds did not use the Global Credit Facility.
| | | | |
| | | |
franklintempleton.com | | Semiannual Report | | 87 |
FRANKLIN INVESTORS SECURITIES TRUST
NOTES TO FINANCIAL STATEMENTS (UNAUDITED)
10. Fair Value Measurements
The Funds follow a fair value hierarchy that distinguishes between market data obtained from independent sources (observable inputs) and the Funds’ own market assumptions (unobservable inputs). These inputs are used in determining the value of the Funds’ financial instruments and are summarized in the following fair value hierarchy:
| | • | | Level 1 – quoted prices in active markets for identical financial instruments |
| | • | | Level 2 – other significant observable inputs (including quoted prices for similar financial instruments, interest rates, prepayment speed, credit risk, etc.) |
| | • | | Level 3 – significant unobservable inputs (including the Funds’ own assumptions in determining the fair value of financial instruments) |
The input levels are not necessarily an indication of the risk or liquidity associated with financial instruments at that level.
For movements between the levels within the fair value hierarchy, the Funds have adopted a policy of recognizing the transfers as of the date of the underlying event which caused the movement.
A summary of inputs used as of April 30, 2017, in valuing the Funds’ assets and liabilities carried at fair value, is as follows:
| | | | | | | | | | | | | | | | |
| | | Level 1 | | | Level 2 | | | Level 3 | | | Total | |
Franklin Balanced Fund | | | | | | | | | | | | | | | | |
Assets: | | | | | | | | | | | | | | | | |
Investments in Securities: | | | | | | | | | | | | | | | | |
Equity Investmentsa,b | | $ | 1,721,315,743 | | | $ | — | | | $ | — | | | $ | 1,721,315,743 | |
Equity-Linked Securities | | | — | | | | 283,755,983 | | | | — | | | | 283,755,983 | |
Convertible Bonds | | | — | | | | 17,868,750 | | | | — | | | | 17,868,750 | |
Corporate Bonds | | | — | | | | 1,122,571,851 | | | | — | | | | 1,122,571,851 | |
Options Purchased | | | 100,000 | | | | — | | | | — | | | | 100,000 | |
Short Term Investments | | | 314,587,427 | | | | — | | | | — | | | | 314,587,427 | |
Total Investments in Securities | | $ | 2,036,003,170 | | | $ | 1,424,196,584 | | | $ | — | | | $ | 3,460,199,754 | |
| | | | |
Liabilities: | | | | | | | | | | | | | | | | |
Other Financial Instruments: | | | | | | | | | | | | | | | | |
Options Written | | $ | 25,000 | | | $ | — | | | $ | — | | | $ | 25,000 | |
| | | | |
Franklin Convertible Securities Fund | | | | | | | | | | | | | | | | |
Assets: | | | | | | | | | | | | | | | | |
Investments in Securities: | | | | | | | | | | | | | | | | |
Equity Investments:a | | | | | | | | | | | | | | | | |
Consumer Staples | | $ | 41,610,000 | | | $ | 50,590,470 | | | $ | — | | | $ | 92,200,470 | |
Energy | | | 22,285,809 | | | | 7,979,160 | | | | — | | | | 30,264,969 | |
Information Technology | | | — | | | | 51,605,625 | | | | — | | | | 51,605,625 | |
All Other Equity Investmentsb | | | 430,322,570 | | | | — | | | | — | | | | 430,322,570 | |
Convertible Bonds | | | — | | | | 1,640,290,542 | | | | — | | | | 1,640,290,542 | |
Escrows and Litigation Trusts | | | — | | | | — | | | | — | c | | | — | |
Short Term Investments | | | 118,070,432 | | | | 8,702,266 | | | | — | | | | 126,772,698 | |
Total Investments in Securities | | $ | 612,288,811 | | | $ | 1,759,168,063 | | | $ | — | | | $ | 2,371,456,874 | |
| | | | |
| | | |
88 | | Semiannual Report | | franklintempleton.com |
FRANKLIN INVESTORS SECURITIES TRUST
NOTES TO FINANCIAL STATEMENTS (UNAUDITED)
| | | | | | | | | | | | | | | | |
| | | Level 1 | | | Level 2 | | | Level 3 | | | Total | |
Franklin Equity Income Fund | | | | | | | | | | | | | | | | |
Assets: | | | | | | | | | | | | | | | | |
Investments in Securities: | | | | | | | | | | | | | | | | |
Equity Investmentsa,b | | $ | 1,944,850,772 | | | $ | — | | | $ | — | | | $ | 1,944,850,772 | |
Equity-Linked Securities | | | — | | | | 159,716,666 | | | | — | | | | 159,716,666 | |
Short Term Investments | | | 39,182,790 | | | | — | | | | — | | | | 39,182,790 | |
Total Investments in Securities | | $ | 1,984,033,562 | | | $ | 159,716,666 | | | $ | — | | | $ | 2,143,750,228 | |
| | | | |
Franklin Real Return Fund | | | | | | | | | | | | | | | | |
Assets: | | | | | | | | | | | | | | | | |
Investments in Securities: | | | | | | | | | | | | | | | | |
Equity Investmentsa,b | | $ | 42,656,900 | | | $ | — | | | $ | — | | | $ | 42,656,900 | |
Corporate Bonds | | | — | | | | 9,939,653 | | | | — | | | | 9,939,653 | |
Senior Floating Rate Interests | | | — | | | | 4,964,334 | | | | — | | | | 4,964,334 | |
Foreign Government and Agency Securities | | | — | | | | 23,572,605 | | | | — | | | | 23,572,605 | |
U.S. Government and Agency Securities | | | — | | | | 150,951,250 | | | | — | | | | 150,951,250 | |
Short Term Investments | | | — | | | | 13,070,414 | | | | — | | | | 13,070,414 | |
Total Investments in Securities | | $ | 42,656,900 | | | $ | 202,498,256 | | | $ | — | | | $ | 245,155,156 | |
| | | | |
Other Financial Instruments: | | | | | | | | | | | | | | | | |
Forward Exchange Contracts | | $ | — | | | $ | 253,606 | | | $ | — | | | $ | 253,606 | |
aIncludes common, preferred, convertible preferred stocks and management investment companies.
bFor detailed categories, see the accompanying Statement of Investments.
cIncludes securities determined to have no value at April 30, 2017.
11. New Accounting Pronouncements
In March 2017, the Financial Accounting Standards Board (FASB) issued Accounting Standards Update (ASU) No. 2017-08, Receivables—Nonrefundable Fees and Other Costs (Subtopic 310-20): Premium Amortization on Purchased Callable Debt Securities. The amendments in the ASU shorten the amortization period for certain callable debt securities, held at a premium, to be amortized to the earliest call date. The ASU does not require an accounting change for securities held at a discount; which continues to be amortized to maturity. The ASU is effective for fiscal years and interim periods within those fiscal years beginning after December 15, 2018. Management is currently evaluating the impact, if any, of applying this provision.
12. Investment Company Reporting Modernization
In October 2016, the U.S. Securities and Exchange Commission adopted new rules and amended existing rules (together, final rules) intended to modernize the reporting and disclosure of information by registered investment companies. In part, the final rules amend Regulation S-X and require standardized, enhanced disclosures about derivatives in investment company financial statements, as well as other amendments. The compliance date for the amendments to Regulation S-X is August 1, 2017. Management is currently evaluating the impact that the adoption of the amendments to Regulation S-X will have on the Funds’ financial statements and related disclosures.
13. Subsequent Events
The Funds have evaluated subsequent events through the issuance of the financial statements and determined that no events have occurred that require disclosure.
| | | | |
| | | |
franklintempleton.com | | Semiannual Report | | 89 |
FRANKLIN INVESTORS SECURITIES TRUST
NOTES TO FINANCIAL STATEMENTS (UNAUDITED)
Abbreviations
| | | | | | | | | | |
| Counterparty | | Currency | | Selected Portfolio |
DBAB | | Deutsche Bank AG | | BRL | | Brazilian Real | | ADR | | American Depositary Receipt |
JPHQ | | JP Morgan Chase & Co. | | IDR | | Indonesian Rupiah | | ETF | | Exchange Traded Fund |
| | | | MXN | | Mexican Peso | | FRN | | Floating Rate Note |
| | | | MYR | | Malaysian Ringgit | | REIT | | Real Estate Investment Trust |
| | | | | | | | SPDR | | S&P Depositary Receipt |
| | | | |
| | | |
90 | | Semiannual Report | | franklintempleton.com |
FRANKLIN INVESTORS SECURITIES TRUST
Shareholder Information
Board Approval of Investment Management Agreements
FRANKLIN INVESTORS SECURITIES TRUST
Franklin Balanced Fund
Franklin Convertible Securities Fund
Franklin Equity Income Fund
Franklin Real Return Fund
(each a Fund)
At an in-person meeting held on February 28, 2017 (Meeting), the Board of Trustees (Board) of Franklin Investors Securities Trust, including a majority of the trustees who are not “interested persons” as defined in the Investment Company Act of 1940 (Independent Trustees), reviewed and approved the continuance of the investment management agreement between Franklin Advisers, Inc. (Manager) and each Fund (each a Management Agreement) for an additional one-year period. The Independent Trustees received advice from and met separately with Independent Trustee counsel in considering whether to approve the continuation of each Management Agreement. Although the Management Agreements for the Funds were considered at the same Board meeting, the Board considered the information provided to it about the Funds together and with respect to each Fund separately as the Board deemed appropriate.
In considering the continuation of each Management Agreement, the Board reviewed and considered information provided by the Manager at the Meeting and throughout the year at meetings of the Board and its committees. The Board also reviewed and considered information provided in response to a detailed set of requests for information submitted to the Manager by Independent Trustee counsel on behalf of the Independent Trustees in connection with the annual contract renewal process. In addition, prior to the Meeting, the Independent Trustees held a telephonic contract renewal meeting at which the Independent Trustees conferred amongst themselves and Independent Trustee counsel about contract renewal matters. The Board reviewed and considered all of the factors it deemed relevant in approving the continuance of each Management Agreement, including, but not limited to: (i) the nature, extent, and quality of the services provided by the Manager; (ii) the investment performance of each Fund; (iii) the costs of the services provided and profits realized by the Manager and its affiliates from the relationship with each Fund; (iv) the extent to which economies of scale are realized as each Fund grows; and (v) whether fee levels reflect these economies of scale for the benefit of Fund investors.
In approving the continuance of each Management Agreement, the Board, including a majority of the Independent Trustees, determined that the existing management fees are fair and reasonable and that the continuance of such Management Agreement is in the interests of the applicable Fund and its shareholders. While attention was given to all information furnished, the following discusses some primary factors relevant to the Board’s determination.
Nature, Extent and Quality of Services
The Board reviewed and considered information regarding the nature, extent and quality of investment management services provided by the Manager and its affiliates to the Funds and their shareholders. This information included, among other things, the qualifications, background and experience of the senior management and investment personnel of the Manager; the structure of investment personnel compensation; oversight of third-party service providers; investment performance reports and related financial information for each Fund; reports on expenses, shareholder services, marketing support payments made to financial intermediaries and third party servicing arrangements; legal and compliance matters; risk controls; pricing and other services provided by the Manager and its affiliates; and management fees charged by the Manager and its affiliates to U.S. funds and other accounts, including management’s explanation of differences among accounts where relevant. The Board noted management’s continual efforts and expenditures in establishing effective business continuity plans and developing strategies to address areas of heightened concern in the mutual fund industry, such as cybersecurity, derivatives and liquidity risk management.
The Board also reviewed and considered the benefits provided to Fund shareholders of investing in a fund that is part of the Franklin Templeton family of funds. The Board noted the financial position of Franklin Resources, Inc. (FRI), the Manager’s parent, and its commitment to the mutual fund business as evidenced by its continued introduction of new funds, reassessment of the fund offerings in response to the market environment and project initiatives and capital investments relating to the services provided to the Funds by the Franklin Templeton Investments (FTI) organization.
Following consideration of such information, the Board was satisfied with the nature, extent and quality of services provided by the Manager and its affiliates to the Funds and their shareholders.
Fund Performance
The Board reviewed and considered the performance results of
| | | | |
| | | |
franklintempleton.com | | Semiannual Report | | 91 |
FRANKLIN INVESTORS SECURITIES TRUST
SHAREHOLDER INFORMATION
each Fund over various time periods ended December 31, 2016. The Board considered the performance returns for each Fund in comparison to the performance returns of mutual funds deemed comparable to the Fund included in a universe (Performance Universe) selected by Broadridge Financial Solutions, Inc. (Broadridge), an independent provider of investment company data. The Board received a description of the methodology used by Broadridge to select the mutual funds included in a Performance Universe. The Board also reviewed and considered Fund performance reports provided and discussions that occurred with portfolio managers at Board meetings throughout the year. A summary of each Fund’s performance results is below.
Franklin Balanced Fund - The Performance Universe for this Fund included the Fund and all retail and institutional mixed-asset target allocation moderate funds. The Board noted that the Fund’s annualized income return and annualized total return for the one-, three-, five- and 10-year periods were above the medians of its Performance Universe. The Board concluded that the Fund’s performance was satisfactory.
Franklin Convertible Securities Fund - The Performance Universe for this Fund included the Fund and all retail and institutional convertible securities funds. The Board noted that the Fund’s annualized income return and annualized total return for the one-, three-, five- and 10-year periods were above the medians of its Performance Universe. The Board concluded that the Fund’s performance was satisfactory.
Franklin Equity Income Fund - The Performance Universe for this Fund included the Fund and all retail and institutional equity income funds. The Board noted that the Fund’s annualized income return for the one-, three-, five- and 10-year periods was above the median of its Performance Universe. The Board also noted that the Fund’s annualized total return for the one-, three-, five- and 10-year periods was below the median of its Performance Universe. In discussing such performance, management explained that it reflected the Fund’s long-standing strategy of investing in securities with yields higher than the overall market and Broadridge peers. Given the Fund’s income-oriented investment objective and consistently good comparative income returns, the Board concluded that the Fund’s performance was acceptable. In doing so, the Board noted the changes in the Fund’s portfolio management team in 2015 and that the Fund’s annualized total return for each of the one-, three-, five- and 10-year periods, while below the median, exceeded 4.9%.
Franklin Real Return Fund - The Performance Universe for this Fund included the Fund and all retail and institutional inflation-protected bond funds. The Board noted that the Fund’s annualized income return for the one-year period was below the median of its Performance Universe, but for the three-, five- and 10-year periods was above the median of its Performance Universe. The Board also noted that the Fund’s annualized total return for the one-year period was above the median of its Performance Universe, but for the three-, five-and 10-year periods was below the median of its Performance Universe. In discussing such performance, management explained that the Performance Universe contained many funds that invested primarily in treasury inflation protected securities (TIPS) and held longer term TIPS that performed better during such periods than the Fund’s portfolio, which had a lesser weighting in TIPS with those being held of a shorter duration. Management further explained that the Fund is positioned correctly to protect investors from a rise in inflation. Given the Fund’s income-oriented investment objective, the Board concluded that the Fund’s performance was acceptable.
Comparative Fees and Expenses
The Board reviewed and considered information regarding each Fund’s actual total expense ratio and its various components, including, as applicable, management fees; transfer agent expenses; underlying fund expenses; Rule 12b-1 and non-Rule 12b-1 service fees; and other non-management fees. The Board also noted that at its February meeting each year, it receives an annual report on all marketing support payments made by FTI to financial intermediaries. The Board considered the actual total expense ratio and, separately, the contractual management fee rate, without the effect of fee waivers, if any (Management Rate) of each Fund, in comparison to the median ratio and median Management Rate, respectively, of other mutual funds deemed comparable to and with a similar expense structure as the Fund selected by Broadridge (Expense Group). Broadridge fee and expense data is based upon information taken from each fund’s most recent annual report, which reflects historical asset levels that may be quite different from those currently existing, particularly in a period of market volatility. While recognizing such inherent limitation and the fact that expense ratios and Management Rates generally increase as assets decline and decrease as assets grow, the Board believed the independent analysis conducted by Broadridge to be an appropriate measure of comparative fees and expenses. The Broadridge Management Rate includes administrative charges, and the actual total expense ratio, for comparative consistency, was shown for Class A shares for funds with multiple classes of shares. The Board received a
| | | | |
| | | |
92 | | Semiannual Report | | franklintempleton.com |
FRANKLIN INVESTORS SECURITIES TRUST
SHAREHOLDER INFORMATION
description of the methodology used by Broadridge to select the mutual funds included in an Expense Group.
Franklin Balanced Fund and Franklin Real Return Fund – The Expense Group for the Franklin Balanced Fund included the Fund and seven other mixed-asset target allocation moderate funds. The Expense Group for the Franklin Real Return Fund included the Fund and ten other inflation-protected bond funds. The Board noted that the Management Rates and actual total expense ratios for these Funds were above the medians of their respective Expense Groups. The Board concluded that the Management Rates charged to these Funds are fair and reasonable. In doing so, the Board noted that while the Management Rate and actual total expense ratio for the Franklin Balanced Fund were above the median, the Fund had very strong performance for the one-, three-, five- and 10-year periods ended December 31, 2016. The Board also noted management’s explanation that the Expense Group for the Franklin Real Return Fund consists of funds that predominantly invest in Treasury inflation protected securities as compared to the Fund which has a broader asset allocation and employs individual security selection among a variety of sectors, including equity sectors. The Board further noted that the Franklin Real Return Fund’s actual total expense ratio reflected a fee waiver from management.
Franklin Convertible Securities Fund and Franklin Equity Income Fund – The Expense Group for the Franklin Convertible Securities Fund included the Fund and eight other convertible securities funds. The Expense Group for the Franklin Equity Income Fund included the Fund and twelve other equity income funds. The Board noted that the Management Rates and actual total expense ratios for these Funds were below the medians of their Expense Groups. The Board concluded that the Management Rates charged to these Funds are fair and reasonable.
Profitability
The Board reviewed and considered information regarding the profits realized by the Manager and its affiliates in connection with the operation of each Fund. In this respect, the Board considered the Fund profitability analysis provided by the Manager that addresses the overall profitability of FTI’s U.S. fund business, as well as its profits in providing investment management and other services to each of the individual funds during the 12-month period ended September 30, 2016, being the most recent fiscal year-end for FRI. The Board noted that although management continually makes refinements to its methodologies used in calculating profitability in response to
organizational and product related changes, the overall methodology has remained consistent with that used in the Funds’ profitability report presentations from prior years. Additionally, the Funds’ independent registered public accounting firm has been engaged by the Manager to periodically review the reasonableness of the allocation methodologies to be used solely by the Funds’ Board with respect to the profitability analysis.
The Board noted management’s belief that costs incurred in establishing the infrastructure necessary for the type of mutual fund operations conducted by the Manager and its affiliates may not be fully reflected in the expenses allocated to each Fund in determining its profitability, as well as the fact that the level of profits, to a certain extent, reflected operational cost savings and efficiencies initiated by management. The Board also noted management’s expenditures in improving shareholder services provided to the Funds, as well as the need to implement systems and meet additional regulatory and compliance requirements resulting from recent SEC and other regulatory requirements.
The Board also considered the extent to which the Manager and its affiliates might derive ancillary benefits from fund operations, including revenues generated from transfer agent services, potential benefits resulting from personnel and systems enhancements necessitated by fund growth, as well as increased leverage with service providers and counterparties. Based upon its consideration of all these factors, the Board concluded that the level of profits realized by the Manager and its affiliates from providing services to each Fund was not excessive in view of the nature, quality and extent of services provided to each Fund.
Economies of Scale
The Board reviewed and considered the extent to which the Manager may realize economies of scale, if any, as each Fund grows larger and whether the Fund’s management fee structure reflects any economies of scale for the benefit of shareholders. With respect to possible economies of scale, the Board noted the existence of management fee breakpoints, which operate generally to share any economies of scale with a Fund’s shareholders by reducing the Fund’s effective management fees as the Fund grows in size. The Board considered the Manager’s view that any analyses of potential economies of scale in managing a particular fund are inherently limited in light of the joint and common costs and investments the Manager incurs across the Franklin Templeton family of funds as a whole. The Board concluded that to the extent economies of scale may be
| | | | |
| | | |
franklintempleton.com | | Semiannual Report | | 93 |
FRANKLIN INVESTORS SECURITIES TRUST
SHAREHOLDER INFORMATION
realized by the Manager and its affiliates, each Fund’s management fee structure provided a sharing of benefits with the Fund and its shareholders as the Fund grows.
Conclusion
Based on its review, consideration and evaluation of all factors it believed relevant, including the above-described factors and conclusions, the Board unanimously approved the continuation of each Management Agreement for an additional one-year period.
Proxy Voting Policies and Procedures
The Trust’s investment manager has established Proxy Voting Policies and Procedures (Policies) that the Trust uses to determine how to vote proxies relating to portfolio securities. Shareholders may view the Trust’s complete Policies online at franklintempleton.com. Alternatively, shareholders may request copies of the Policies free of charge by calling the Proxy Group collect at (954) 527-7678 or by sending a written request to: Franklin Templeton Companies, LLC, 300 S.E. 2nd Street, Fort Lauderdale, FL 33301, Attention: Proxy Group. Copies of the Trust’s proxy voting records are also made available online at franklintempleton.com and posted on the U.S. Securities and Exchange Commission’s website at sec.gov and reflect the most recent 12-month period ended June 30.
Quarterly Statement of Investments
The Trust files a complete statement of investments with the U.S. Securities and Exchange Commission for the first and third quarters for each fiscal year on Form N-Q. Shareholders may view the filed Form N-Q by visiting the Commission’s website at sec.gov. The filed form may also be viewed and copied at the Commission’s Public Reference Room in Washington, DC. Information regarding the operations of the Public Reference Room may be obtained by calling (800) SEC-0330.
| | | | |
| | | |
94 | | Semiannual Report | | franklintempleton.com |
This page intentionally left blank.
This page intentionally left blank.
| | |
| |

| | Semiannual Report and Shareholder Letter Franklin Investors Securities Trust |
| | Investment Manager Franklin Advisers, Inc. |
| |
| | Distributor Franklin Templeton Distributors, Inc. (800) DIAL BEN® / 342-5236 franklintempleton.com |
| |
| | Shareholder Services (800) 632-2301 |
Authorized for distribution only when accompanied or preceded by a summary prospectus and/or prospectus. Investors should carefully consider a fund’s investment goals, risks, charges and expenses before investing. A prospectus contains this and other information; please read it carefully before investing.
To help ensure we provide you with quality service, all calls to and from our service areas are monitored and/or recorded.
© 2017 Franklin Templeton Investments. All rights reserved.
FIST1 S 06/17

Franklin Templeton Investments
Gain From Our Perspective®
At Franklin Templeton Investments, we’re dedicated to one goal: delivering exceptional asset management for our clients. By bringing together multiple, world-class investment teams in a single firm, we’re able to offer specialized expertise across styles and asset classes, all supported by the strength and resources of one of the world’s largest asset managers. This has helped us to become a trusted partner to individual and institutional investors across the globe.
Dear Shareholder:
During the six months ended April 30, 2017, mostly upbeat economic data, improved U.S. corporate earnings and supportive global monetary policies were positives for U.S. securities markets. After maintaining its target interest rate in the 0.25%–0.50% range for nearly a year, the U.S. Federal Reserve (Fed) increased its target range for the federal funds rate twice, in December 2016 and March 2017, to 0.75%–1.00%, noting improved employment and hints of higher inflation. The 10-year U.S. Treasury yield began the period at 1.84% and ended the period at 2.29%. Investment-grade bonds, as measured by the Bloomberg Barclays U.S. Aggregate Bond Index, had a -0.67% total return.1
In all economic environments, we are committed to our long-term perspective and disciplined investment approach as we conduct a diligent, fundamental analysis of securities with a regular emphasis on investment risk management.
We believe active, professional investment management serves investors well. We also recognize the important role of financial advisors in today’s markets and encourage investors to continue to seek their advice. Amid changing markets and economic conditions, we are confident investors with a well-diversified portfolio and a patient, long-term outlook should be well positioned for the years ahead.
In addition, Franklin Investors Securities Trust’s semiannual report includes more detail about prevailing conditions and a discussion about investment decisions during the period. Please remember all securities markets fluctuate, as do mutual fund share prices.
We thank you for investing with Franklin Templeton, welcome your questions and comments, and look forward to serving your future investment needs.
Sincerely,

Rupert H. Johnson, Jr.
Chairman
Franklin Investors Securities Trust
This letter reflects our analysis and opinions as of April 30, 2017, unless otherwise indicated. The information is not a complete analysis of every aspect of any market, country, industry, security or fund. Statements of fact are from sources considered reliable.
1. Source: Morningstar.
See www.franklintempletondatasources.com for additional data provider information.
| | | | | | | | |
| | | | Not FDIC Insured | | | May loss value | | | No Bank Guarantee |
| | | | |
| | | |
franklintempleton.com | | Not part of the semiannual report | | 1 |
Contents
Visit franklintempleton.com for fund updates, to access your account, or to find helpful financial planning tools.
| | | | |
| | | |
2 | | Semiannual Report | | franklintempleton.com |
Semiannual Report
Economic and Market Overview
The U.S. economic growth decelerated in 2017’s first quarter, largely due to declines in private inventory investment and government spending. However, an increase in exports and personal consumption, as well as residential and nonresidential fixed investment aided growth. The manufacturing sector generally expanded and the services sector also continued to grow. The unemployment rate decreased from 4.8% in October 2016 to 4.4% at period-end.1 Monthly retail sales were volatile, but grew for most of the period. Annual inflation, as measured by the Consumer Price Index, increased from 1.1% to 2.2% during the period.
At its December meeting, the U.S. Federal Reserve (Fed) raised its target range for the federal funds rate from 0.25%–0.50% to 0.50%–0.75%, as policymakers cited improved labor market conditions and higher inflation. The Fed kept its interest rate unchanged at its February meeting, but incoming economic data, along with statements by Fed officials in late February and early March, heightened many investors’ expectations for a March interest-rate hike. The Fed, at its March meeting, made the widely anticipated increase in its federal funds target rate to 0.75%–1.00%.
The 10-year Treasury yield, which moves inversely to its price, shifted during the period. It increased in November and December, amid a bond market sell-off, based on investor expectations that possible expansionary fiscal policies under new U.S. President Donald Trump could lead to a stronger economy and higher inflation. Although toward period-end, geopolitical tensions in the Middle East and the Korean peninsula pushed the Treasury yield down. Overall, the U.S. Treasury yield rose from 1.84% on October 31, 2016, to 2.29% at period-end.
The foregoing information reflects our analysis and opinions as of April 30, 2017. The information is not a complete analysis of every aspect of any market, country, industry, security or fund. Statements of fact are from sources considered reliable.
1. Source: Bureau of Labor Statistics.
| | | | |
| | | |
franklintempleton.com | | Semiannual Report | | 3 |
Franklin Adjustable U.S. Government Securities Fund
This semiannual report for Franklin Adjustable U.S. Government Securities Fund covers the period ended April 30, 2017.
Your Fund’s Goal and Main Investments
The Fund seeks to provide a high level of current income while providing lower volatility of principal than a fund that invests in fixed-rate securities by investing at least 80% of its net assets in adjustable-rate U.S. government mortgage securities, which are issued or guaranteed by the U.S. government, its agencies or instrumentalities.1 The Fund’s investments may include securities issued by Ginnie Mae (GNMA) and government-sponsored entities, such as Fannie Mae (FNMA) and Freddie Mac (FHLMC).2
Performance Overview
The Fund’s Class A shares had a +0.04% cumulative total return for the six months under review. In comparison, the Fund’s benchmark, the Bloomberg Barclays U.S. Government Index: 1-2 Year Component, posted a +0.12% total return.3 The index measures public obligations of the U.S. Treasury with one to two years to final maturity and publicly issued debt of U.S. government agencies, quasi-federal corporations, and corporate or foreign debt guaranteed by the U.S. government. You can find the Fund’s long-term performance data in the Performance Summary beginning on page 6.
Performance data represent past performance, which does not guarantee future results. Investment return and principal value will fluctuate, and you may have a gain or loss when you sell your shares. Current performance may differ from figures shown. For most recent month-end performance, go to franklintempleton.com or call (800) 342-5236.
Investment Strategy
We employ a conservative investment strategy as we strive to produce solid performance in a variety of interest rate climates. We choose securities using a value-oriented approach, emphasizing the bonds’ economic fundamentals in relation to
Portfolio Composition
Based on Total Net Assets as of 4/30/17
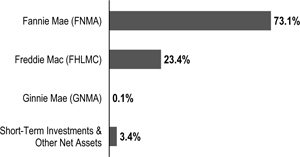
comparable securities as well as their historical prepayment performance.
Manager’s Discussion
U.S. economic indicators remained generally encouraging during the reporting period. Steady growth in manufacturing and services created jobs, boosting employment. The U.S. Federal Reserve increased its target rate twice, noting improved employment and higher inflation. Retail sales increased and home sales continued to grow but more slowly.
The Fund employed a conservative strategy that invested primarily in adjustable-rate mortgage securities (ARMs) that are either explicitly or implicitly backed by the U.S. government.1 During the period, the Fund invested predominantly in securities issued or guaranteed by FNMA and FHLMC. The Fund took a collateral-intensive research approach to analyze the prepayment behavior of individual ARMs to identify those with the most attractive prepayment profiles and focused on seasoned ARMs. Such securities have typically been through several interest-rate cycles and therefore tend to be less sensitive to changes in interest rates, compared to newer issued counterparts. We have found such securities historically to have experienced lower volatility than comparable maturity Treasuries and have provided more consistent income. We focused on seasoned, post-reset FNMA and FHLMC ARM positions with average coupons near 3%.
1. Securities owned by the Fund, but not shares of the Fund, are issued or guaranteed by the U.S. government, its agencies or instrumentalities, including government-sponsored entities, as to timely payment of principal and interest.
2. Although U.S. government-sponsored entities may be chartered by acts of Congress, their securities are neither issued nor guaranteed by the U.S. Government. Please see the Fund’s prospectus for a detailed discussion regarding various levels of credit support for government agency or instrumentality securities. The Fund’s yield and share price are not guaranteed and will vary with market conditions.
3. Source: Morningstar.
The index is unmanaged and includes reinvestment of any income or distributions. It does not reflect any fees, expenses or sales charges. One cannot invest directly in an index, and an index is not representative of the Fund’s portfolio.
The dollar value, number of shares or principal amount, and names of all portfolio holdings are listed in the Fund’s Statement of Investments (SOI). The SOI begins on page 33.
| | | | |
| | | |
4 | | Semiannual Report | | franklintempleton.com |
FRANKLIN ADJUSTABLE U.S. GOVERNMENT SECURITIES FUND
Distributions*
11/1/16–4/30/17
| | | | | | | | | | | | | | | | | | | | |
| | | Distributions per Share (cents) | |
Month | | Class A | | | Class A1 | | | Class C | | | Class R6 | | | Advisor Class | |
November | | | 1.1809 | | | | 1.2880 | | | | 0.9056 | | | | 1.4299 | | | | 1.3528 | |
December | | | 1.1900 | | | | 1.2460 | | | | 0.8638 | | | | 1.4020 | | | | 1.3136 | |
January | | | 1.1953 | | | | 1.3507 | | | | 0.9517 | | | | 1.5237 | | | | 1.4309 | |
February | | | 1.2951 | | | | 1.4037 | | | | 1.0381 | | | | 1.5379 | | | | 1.4580 | |
March | | | 1.2599 | | | | 1.3686 | | | | 0.9741 | | | | 1.5263 | | | | 1.4380 | |
April | | | 1.2118 | | | | 1.3112 | | | | 0.9599 | | | | 1.4503 | | | | 1.3707 | |
Total | | | 7.3330 | | | | 7.9682 | | | | 5.6932 | | | | 8.8701 | | | | 8.3640 | |
*The distribution amount is the sum of all distributions to shareholders for the period shown and includes only estimated tax-basis net investment income. Assumes shares were purchased and held for the entire accrual period. Since dividends accrue daily, your actual distributions will vary depending on the date you purchased your shares and any account activity. All Fund distributions will vary depending upon current market conditions, and past distributions are not indicative of future trends.
Although mortgage rates remained low, mortgage credit has remained constrained, and actual prepayment levels have been relatively low. The Fund’s London Interbank Offered Rate (LIBOR) indexed ARMs detracted from value, while ARMs indexed to U.S. Treasuries were generally additive.4
Thank you for your continued participation in Franklin Adjustable U.S. Government Securities Fund. We look forward to serving your future investment needs.
The foregoing information reflects our analysis, opinions and portfolio holdings as of April 30, 2017, the end of the reporting period. The way we implement our main investment strategies and the resulting portfolio holdings may change depending on factors such as market and economic conditions. These opinions may not be relied upon as investment advice or an offer for a particular security. The information is not a complete analysis of every aspect of any market, country, industry, security or the Fund. Statements of fact are from sources considered reliable, but the investment manager makes no representation or warranty as to their completeness or accuracy. Although historical performance is no guarantee of future results, these insights may help you understand our investment management philosophy.
| | |

| | 
Paul Varunok |
| |

| | 
Roger A. Bayston, CFA |
| |
| | Portfolio Management Team |
CFA® is a trademark owned by CFA Institute.
4. The London Interbank Offered Rate (LIBOR) is the interest rate banks charge each other for loans. LIBOR is a widely used benchmark for short-term interest rates. See www.franklintempletondatasources.com for additional data provider information.
| | | | |
| | | |
franklintempleton.com | | Semiannual Report | | 5 |
FRANKLIN ADJUSTABLE U.S. GOVERNMENT SECURITIES FUND
Performance Summary as of April 30, 2017
The performance tables do not reflect any taxes that a shareholder would pay on Fund dividends, capital gain distributions, if any, or any realized gains on the sale of Fund shares. Total return reflects reinvestment of the Fund’s dividends and capital gain distributions, if any, and any unrealized gains or losses. Your dividend income will vary depending on dividends or interest paid by securities in the Fund’s portfolio, adjusted for operating expenses of each class. Capital gain distributions are net profits realized from the sale of portfolio securities.
Performance as of 4/30/171
Cumulative total return excludes sales charges. Average annual total return include maximum sales charges. Sales charges will vary depending on the size of the investment and the class of share purchased. The maximum is 2.25% and the minimum is 0%. Class A: 2.25% maximum initial sales charge; Advisor Class: no sales charges. For other share classes, visit franklintempleton.com.
| | | | |
Share Class | | Cumulative Total Return2 | | Average Annual Total Return3 |
| | |
A | | | | |
6-Month | | +0.04% | | -2.17% |
1-Year | | +0.46% | | -1.76% |
5-Year | | +0.34% | | -0.38% |
10-Year | | +16.51% | | +1.31% |
| | |
Advisor4 | | | | |
6-Month | | +0.16% | | +0.16% |
1-Year | | +0.71% | | +0.71% |
5-Year | | +1.60% | | +0.32% |
10-Year | | +19.28% | | +1.78% |
| | | | | | |
| | | | | 30-Day Standardized Yield6 |
Share Class | | Distribution Rate5 | | (with waiver) | | (without waiver) |
A | | 1.86% | | 0.42% | | 0.42% |
Advisor | | 2.14% | | 0.67% | | 0.67% |
Performance data represent past performance, which does not guarantee future results. Investment return and principal value will fluctuate, and you may have a gain or loss when you sell your shares. Current performance may differ from figures shown. For most recent month-end performance, go to franklintempleton.com or call (800) 342-5236.
See page 7 for Performance Summary footnotes.
| | | | |
| | | |
6 | | Semiannual Report | | franklintempleton.com |
FRANKLIN ADJUSTABLE U.S. GOVERNMENT SECURITIES FUND
PERFORMANCE SUMMARY
Distributions
(11/1/16–4/30/17)
| | | | |
Share Class | | Net Investment Income | |
A | | | $0.073330 | |
A1 | | | $0.079682 | |
C | | | $0.056932 | |
R6 | | | $0.088701 | |
Advisor | | | $0.083640 | |
Total Annual Operating Expenses7
| | | | | | |
Share Class | | With Waiver | | | Without Waiver |
A | | | 0.91 | % | | 0.92% |
Advisor | | | 0.66 | % | | 0.67% |
Each class of shares is available to certain eligible investors and has different annual fees and expenses, as described in the prospectus.
All investments involve risks, including possible loss of principal. Interest rate movements, unscheduled mortgage prepayments and other risk factors will affect the Fund’s share price and yield. Bond prices generally move in the opposite direction of interest rates. As prices of bonds in the Fund adjust to a rise in interest rates, the Fund’s share price may decline. Changes in the financial strength of a bond issuer or in a bond’s credit rating may affect its value. The Fund is actively managed but there is no guarantee that the manager’s investment decisions will produce the desired results. The Fund’s prospectus also includes a description of the main investment risks.
1. The Fund has a fee waiver associated with any investment it makes in a Franklin Templeton money fund and/or other Franklin Templeton fund, contractually guaranteed through 2/28/18. Fund investment results reflect the fee waiver; without this waiver, the results would have been lower.
2. Cumulative total return represents the change in value of an investment over the periods indicated.
3. Average annual total return represents the average annual change in value of an investment over the periods indicated. Return for less than one year, if any, has not been annualized.
4. Effective 5/15/08, the Fund began offering Advisor Class shares, which do not have sales charges or a Rule 12b-1 plan. Performance quotations for this class reflect the following methods of calculation: (a) For periods prior to 5/15/08, a restated figure is used based upon the Fund’s Class A performance, excluding the effect of Class A’s maximum initial sales charge, but reflecting the effect of the Class A Rule 12b-1 fees; and (b) for periods after 5/15/08 actual Advisor Class performance is used reflecting all charges and fees applicable to that class. Since 5/15/08 (commencement of sales), the cumulative and average annual total returns of Advisor Class shares were +13.62% and +1.44%.
5. Distribution rate is based on an annualization of the sum of the respective class’s past 30 days’ daily distributions and the maximum offering price (NAV for Advisor Class) per share on 4/30/17.
6. The Fund’s 30-day standardized yield is calculated over a trailing 30-day period using the yield to maturity on bonds and/or the dividends accrued on stocks. It may not equal the Fund’s actual income distribution rate, which reflects the Fund’s past dividends paid to shareholders.
7. Figures are as stated in the Fund’s current prospectus and may differ from the expense ratios disclosed in the Your Fund’s Expenses and Financial Highlights sections in this report. In periods of market volatility, assets may decline significantly, causing total annual Fund operating expenses to become higher than the figures shown.
| | | | |
| | | |
franklintempleton.com | | Semiannual Report | | 7 |
FRANKLIN ADJUSTABLE U.S. GOVERNMENT SECURITIES FUND
Your Fund’s Expenses
As a Fund shareholder, you can incur two types of costs: (1) transaction costs, including sales charges (loads) on Fund purchases and redemptions; and (2) ongoing Fund costs, including management fees, distribution and service (12b-1) fees, and other Fund expenses. All mutual funds have ongoing costs, sometimes referred to as operating expenses. The table below shows ongoing costs of investing in the Fund and can help you understand these costs and compare them with those of other mutual funds. The table assumes a $1,000 investment held for the six months indicated.
Actual Fund Expenses
The table below provides information about actual account values and actual expenses in the columns under the heading “Actual.” In these columns the Fund’s actual return, which includes the effect of Fund expenses, is used to calculate the “Ending Account Value” for each class of shares. You can estimate the expenses you paid during the period by following these steps (of course, your account value and expenses will differ from those in this illustration): Divide your account value by $1,000 (if your account had an $8,600 value, then $8,600 ÷ $1,000 = 8.6). Then multiply the result by the number in the row for your class of shares under the headings “Actual” and “Expenses Paid During Period” (if Actual Expenses Paid During Period were $7.50, then 8.6 x $7.50 = $64.50). In this illustration, the actual expenses paid this period are $64.50.
Hypothetical Example for Comparison with Other Funds
Under the heading “Hypothetical” in the table, information is provided about hypothetical account values and hypothetical expenses based on the Fund’s actual expense ratio and an assumed rate of return of 5% per year before expenses, which is not the Fund’s actual return. This information may not be used to estimate the actual ending account balance or expenses you paid for the period, but it can help you compare ongoing costs of investing in the Fund with those of other funds. To do so, compare this 5% hypothetical example for the class of shares you hold with the 5% hypothetical examples that appear in the shareholder reports of other funds.
Please note that expenses shown in the table are meant to highlight ongoing costs and do not reflect any transactional costs. Therefore, information under the heading “Hypothetical” is useful in comparing ongoing costs only, and will not help you compare total costs of owning different funds. In addition, if transactional costs were included, your total costs would have been higher.
| | | | | | | | | | | | | | | | | | |
| | | | | | | Actual (actual return after expenses) | | | | Hypothetical (5% annual return before expenses) | | | | |
Share Class | | Beginning
Account Value 11/1/16 | | | | Ending
Account Value 4/30/17 | | Expenses Paid
During Period
11/1/16–4/30/171,2 | | | | Ending
Account Value 4/30/17 | | Expenses Paid During
Period 11/1/16–4/30/171,2 | | | | Net Annualized
Expense Ratio2 |
A | | $1,000 | | | | $1,000.40 | | $4.56 | | | | $1,020.23 | | $4.61 | | | | 0.92% |
A1 | | $1,000 | | | | $1,001.20 | | $3.77 | | | | $1,021.03 | | $3.81 | | | | 0.76% |
C | | $1,000 | | | | $ 997.20 | | $6.54 | | | | $1,018.25 | | $6.61 | | | | 1.32% |
R6 | | $1,000 | | | | $1,002.20 | | $2.73 | | | | $1,022.07 | | $2.76 | | | | 0.55% |
Advisor | | $1,000 | | | | $1,001.60 | | $3.33 | | | | $1,021.47 | | $3.36 | | | | 0.67% |
1. Expenses are equal to the annualized expense ratio for the six-month period as indicated above–in the far right column–multiplied by the simple average account value over the period indicated, and then multiplied by 181/365 to reflect the one-half year period.
2. Reflects expenses after fee waivers and expense reimbursements. Does not include acquired fund fees and expenses.
| | | | |
| | | |
8 | | Semiannual Report | | franklintempleton.com |
Franklin Floating Rate Daily Access Fund
This semiannual report for Franklin Floating Rate Daily Access Fund covers the period ended April 30, 2017.
Your Fund’s Goal and Main Investments
The Fund seeks to provide a high level of current income and, secondarily, preservation of capital by investing at least 80% of its net assets in income-producing floating interest-rate corporate loans and corporate debt securities made to or issued by U.S. companies, non-U.S. entities and U.S. subsidiaries of non-U.S. entities.
What are corporate loans?
Corporate loans are typically floating rate loans to corporate borrowers made by a group, or syndicate, of banks and other financial institutions. These loans provide capital to companies for varied purposes, such as merger and acquisition activity, leveraged buyouts or refinancings. These loans are typically syndicated to a group of investors.
Performance Overview
The Fund’s Class A shares delivered a +2.15% cumulative total return for the six months under review. In comparison, the Credit Suisse Leveraged Loan Index (CS LLI), which is designed to mirror the investable universe of the U.S. dollar-denominated leveraged loan market, posted a +3.14% total return.1 You can find more of the Fund’s performance data in the Performance Summary beginning on page 13.
Performance data represent past performance, which does not guarantee future results. Investment return and principal value will fluctuate, and you may have a gain or loss when you sell your shares. Current performance may differ from figures shown. For most recent month-end performance, go to franklintempleton.com or call (800) 342-5236.
Corporate Loan Market Overview
During the period under review, loan prices moved higher and spreads tightened further as net new supply remained slow to meet demand from market participants who received an influx of cash from retail investors and the repayment of existing loans. Inflows into loan mutual funds accelerated following the U.S. presidential election, further increases in the London Interbank Offered Rate (LIBOR), and the decision by the U.S.
Portfolio Composition*
Based on Total Net Assets as of 4/30/17
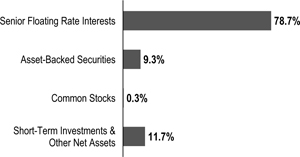
*Figures reflect certain derivatives held in the portfolio (or their underlying reference assets) and may not total 100% or may be negative due to rounding, use of any derivatives, unsettled trades or other factors.
Federal Reserve (Fed) to increase its benchmark rate in December 2016 and March 2017. Issuance of collateralized loan obligations (CLOs) compounded this increase in demand while net new supply remained slow, leading to strong demand for loans trading at steep discounts to par and those with relatively lower ratings.
Following the U.S. presidential election, U.S. Treasury yields increased significantly after some investors adjusted their expectations for expansionary fiscal policy, which resulted in increased interest in the asset class. Furthermore, the Fed’s rate hikes during the period, as well as expectations of further rate hikes in 2017, led investors to search for a possible hedge against further increases in interest rates and shorter duration investments. The LIBOR also continued to move higher and the rate ended the period higher than the average floor in the market, leading to a large portion of the market being based on a floating rate rather than a fixed floor. Toward the end of the period as U.S. Treasury yields declined and the yield curve flattened, demand for loans moderated, but loan retail vehicles continued to report positive flows.
As risk retention rules were scheduled to take effect toward the end of 2016, CLO issuance increased as managers attempted to launch deals prior to the regulations becoming effective. Spreads among the highest rated tranches also tightened significantly, which allowed managers to lower liability costs by refinancing CLO vehicles. The lower spreads on liability tranches helped to mitigate the challenging arbitrage due to
1. Source: Credit Suisse Group.
The index is unmanaged and includes reinvestment of any income or distributions. It does not reflect any fees, expenses or sales charges. One cannot invest directly in an index, and an index is not representative of the Fund’s portfolio.
See www.franklintempletondatasources.com for additional data provider information.
The dollar value, number of shares or principal amount, and names of all portfolio holdings are listed in the Fund’s Statement of Investments (SOI).
The SOI begins on page 40.
| | | | |
| | | |
franklintempleton.com | | Semiannual Report | | 9 |
FRANKLIN FLOATING RATE DAILY ACCESS FUND
robust repricing activity in the loan market. However, the lack of collateral in terms of new supply helped to restrain CLO volume later in the period, and most activity was related to refinancing.
Institutional issuance increased during the period, but a large portion of transactions continued to include repricing deals (refinancing transactions that cut spreads). Although repricing transactions eventually slowed down, the imbalance between supply and demand allowed issuers to reduce coupons by a meaningful amount, in our view. Furthermore, as volume from mergers-and-acquisition deals was relatively subdued, opportunistic issuance by issuers increased, including higher levels of dividend deals. In addition to the low net new supply, repayment activity increased during the period and included issuers that paid down loans through the issuance of high yield bonds.
Distributions*
11/1/16–4/30/17
| | | | | | | | | | | | | | | | |
| | | Distributions per Share (cents) | |
| Month | | Class A | | | Class C | | | Class R6 | | | Advisor
Class | |
November | | | 2.7383 | | | | 2.4487 | | | | 2.9840 | | | | 2.9195 | |
December | | | 2.8928 | | | | 2.6018 | | | | 3.1459 | | | | 3.0764 | |
January | | | 2.6851 | | | | 2.3739 | | | | 2.9523 | | | | 2.8811 | |
February | | | 2.1683 | | | | 1.8968 | | | | 2.3993 | | | | 2.3401 | |
March | | | 2.3615 | | | | 2.0603 | | | | 2.6114 | | | | 2.5512 | |
April | | | 2.0531 | | | | 1.7857 | | | | 2.2759 | | | | 2.2226 | |
Total | | | 14.8991 | | | | 13.1672 | | | | 16.3688 | | | | 15.9909 | |
*The distribution amount is the sum of all distributions to shareholders for the period shown and includes only estimated tax-basis net investment income. Assumes shares were purchased and held for the entire accrual period. Since dividends accrue daily, your actual distributions will vary depending on the date you purchased your shares and any account activity. All Fund distributions will vary depending upon current market conditions, and past distributions are not indicative of future trends.
The default rate declined during the period, as defaults from the prior year rolled off the calculation. The increase in refinancing and demand also helped to push impending maturities to later years. However, after the increase in commodity-related defaults from the previous year subsided, investor focus shifted to heightened stress within the retail space. The retail sector was a weak performer during the period amid concerns across brick-and-mortar stores and as more names within the industry traded to distressed levels.
Retail flows have decelerated in light of recent declines in U.S. Treasury yields and a flatter yield curve. Despite the moderation in demand, new supply remains scarce and repricing transactions have continued to tighten loan spreads. Furthermore, as a majority of
loans trade above par, the prospect for further repricing deals remains high, which we believe could possibly further deteriorate credit conditions. We have maintained our overweighted allocation in loans rated in the upper tier, including shorter tenor and non-institutional tranches, which we believe could protect against these conditions and potential future market volatility.
Investment Strategy
We use a detailed credit analysis process to select corporate loan and corporate debt securities that meet our criteria. We conduct ongoing credit monitoring of our investments. To help manage the credit risk associated with investing in securities rated below investment grade (or if unrated, of comparable quality), we seek to diversify the Fund by investing in a large number of loans of companies that we have identified as having attractive risk/reward profiles, favorable capital structures, strong asset coverage and dominant market shares. This diversification potentially reduces credit risk by spreading assets across many different industries.
In addition, we seek to exploit market inefficiencies by assigning forward-looking credit-risk tiers to issuers based upon our forward-looking analysis of the issuers’ prospects in the near term. This independent analysis enables us to express differences between backward-looking rating assignments of credit-risk tiers and our analysts’ forward-looking assessment of credit risk, thereby allowing us to potentially take advantage of credit risks the market may be overstating or avoid uncompensated credit risks the market may not have adequately identified.
Manager’s Discussion
During the six-month period under review, the Fund underperformed its benchmark, the CS LLI. The Fund maintained an overweighting in the upper tier of the market throughout the period, which detracted from performance as upper tiers loans in the index returned 1.95%, middle tier returned 2.90%, and lower tier returned 11.34%, according to the CS LLI. Furthermore, our selection in energy and service sectors detracted from relative performance compared to the index. However, the Fund’s overweighting in the metals and minerals sector contributed to performance.
The top contributors to performance included middle- and lower-tier rated names that began the period at steeper discounts to par, but traded higher following positive news and a favorable technical environment. The term loan of 99 Cents Only Stores, a regional value-based retailer, reported better-than-expected results for the fourth quarter and generated expectations that the company could take steps to address its
| | | | |
| | | |
10 | | Semiannual Report | | franklintempleton.com |
FRANKLIN FLOATING RATE DAILY ACCESS FUND
Top 10 Holdings
4/30/17
| | | | |
Company
Sector/Industry | | % of Total
Net Assets | |
Zayo Group LLC | | | 2.4% | |
Integrated Telecommunication Services | | | | |
Ascena Retail Group Inc. | | | 2.3% | |
Apparel Retail | | | | |
Fieldwood Energy LLC | | | 2.1% | |
Oil & Gas Exploration & Production | | | | |
PetSmart Inc. | | | 2.1% | |
Specialty Stores | | | | |
Dell International LLC | | | 2.0% | |
Technology Distributors | | | | |
NRG Energy Inc. | | | 2.0% | |
Independent Power Producers & Energy Traders | | | | |
Lions Gate Entertainment Corp. | | | 1.9% | |
Movies & Entertainment | | | | |
FGI Operating Co. LLC (Freedom Group) | | | 1.8% | |
Personal Products | | | | |
Sungard Availability Services Capital Inc. | | | 1.6% | |
IT Consulting & Other Services | | | | |
Delos Finance S.A.R.L. (ILFC) | | | 1.6% | |
Aerospace & Defense | | | | |
capital structure. Bowie Resource Holdings, a coal producer, also contributed to performance as the company executed an amendment that allowed its sponsor to provide additional equity support. Furthermore, Fieldwood Energy, a provider of oil and gas services, benefited from relatively higher oil prices.
The top detractors from performance included those that faced industry-specific challenges in the retail and commodities industries. PetSmart, a leading retailer in the pet market, detracted from performance amid concerns at brick-and-mortar stores about online competition. The term loan of Ascena Retail Group, a specialty retailer with multiple core brands, also declined after adjusting guidance downward amid a decline in sales due to weaker store traffic. Onsite Rental Group Operations, a specialized industrial equipment rental company in Australia, detracted from performance amid expectations of a possible restructuring as its natural resource segment faced continued weakness.
Purchases during the period focused on higher rated loans with relatively shorter years to maturity, which we believe would fare relatively better amid a period of increased credit risk as they would be closer to refinancing or repayment. Our weighting in the upper tier increased, while our weightings in the middle and lower tiers declined. The Fund also continued to increase its weighting in non-institutional loans such as Term Loan A, in addition to AAA-rated CLO tranches. Our largest
sells included positions that we believed had posed elevated credit risk, while we also opted not to participate in a handful of refinancing deals that extended maturities or tightened spreads to levels where we believed we were not being adequately compensated for the risk. The Fund also bought protection in HYCDX, an index of high-yield bond credit default swaps providing synthetic exposure to the high-yield bond market, to protect against potential volatility in the credit markets.
Thank you for your continued participation in Franklin Floating Rate Daily Access Fund. We look forward to serving your future investment needs.
| | |
 | | 
Mark Boyadjian, CFA |
| | |
 | | 
Madeline Lam |
| |
| | Justin Ma, CFA |
| |
| | Portfolio Management Team |
| | | | |
| | | |
franklintempleton.com | | Semiannual Report | | 11 |
FRANKLIN FLOATING RATE DAILY ACCESS FUND
The foregoing information reflects our analysis, opinions and portfolio holdings as of April 30, 2017, the end of the reporting period. The way we implement our main investment strategies and the resulting portfolio holdings may change depending on factors such as market and economic conditions. These opinions may not be relied upon as investment advice or an offer for a particular security. The information is not a complete analysis of every aspect of any market, country, industry, security or the Fund. Statements of fact are from sources considered reliable, but the investment manager makes no representation or warranty as to their completeness or accuracy. Although historical performance is no guarantee of future results, these insights may help you understand our investment management philosophy.
��
| | | | |
| | | |
12 | | Semiannual Report | | franklintempleton.com |
FRANKLIN FLOATING RATE DAILY ACCESS FUND
Performance Summary as of April 30, 2017
The performance tables do not reflect any taxes that a shareholder would pay on Fund dividends, capital gain distributions, if any, or any realized gains on the sale of Fund shares. Total return reflects reinvestment of the Fund’s dividends and capital gain distributions, if any, and any unrealized gains or losses. Your dividend income will vary depending on dividends or interest paid by securities in the Fund’s portfolio, adjusted for operating expenses of each class. Capital gain distributions are net profits realized from the sale of portfolio securities.
Performance as of 4/30/171
Cumulative total return excludes sales charges. Average annual total return include maximum sales charges. Sales charges will vary depending on the size of the investment and the class of share purchased. The maximum is 2.25% and the minimum is 0%. Class A: 2.25% maximum initial sales charge; Advisor Class: no sales charges. For other share classes, visit franklintempleton.com.
| | | | |
| Share Class | | Cumulative
Total Return2 | | Average Annual
Total Return3 |
| | |
A | | | | |
6-Month | | +2.15% | | -0.11% |
1-Year | | +8.64% | | +6.14% |
5-Year | | +19.80% | | +3.21% |
10-Year | | +36.04% | | +2.89% |
| | |
Advisor | | | | |
6-Month | | +2.16% | | +2.16% |
1-Year | | +8.91% | | +8.91% |
5-Year | | +21.31% | | +3.94% |
10-Year | | +39.47% | | +3.38% |
| | | | | | |
| | | Distribution
Rate4 | | 30-Day Standardized Yield5 |
| Share Class | | | (with waiver) | | (without waiver) |
A | | 3.01% | | 2.94% | | 2.88% |
Advisor | | 3.33% | | 3.24% | | 3.18% |
Performance data represent past performance, which does not guarantee future results. Investment return and principal value will fluctuate, and you may have a gain or loss when you sell your shares. Current performance may differ from figures shown. For most recent month-end performance, go to franklintempleton.com or call (800) 342-5236.
See page 14 for Performance Summary footnotes.
| | | | |
| | | |
franklintempleton.com | | Semiannual Report | | 13 |
FRANKLIN FLOATING RATE DAILY ACCESS FUND
PERFORMANCE SUMMARY
Distributions (11/1/16–4/30/17)
| | | | |
| Share Class | | Net Investment
Income | |
A | | $ | 0.148991 | |
C | | $ | 0.131672 | |
R6 | | $ | 0.163688 | |
Advisor | | $ | 0.159909 | |
Total Annual Operating Expenses6
| | | | | | |
| Share Class | | With Waiver | | | Without Waiver |
A | | | 0.87 | % | | 0.89% |
Advisor | | | 0.62 | % | | 0.64% |
Each class of shares is available to certain eligible investors and has different annual fees and expenses, as described in the prospectus
All investments involve risks, including possible loss of principal. Investors should be aware that the Fund’s share price and yield will fluctuate with market conditions. The Fund should not be considered an alternative to money market funds or certificates of deposit (CDs). The floating rate loans and debt securities in which the Fund invests tend to be rated below investment grade. Investing in higher yielding, lower rated, floating rate loans and debt securities involves greater risk of default, which could result in loss of principal—a risk that may be heightened in a slowing economy. Interest earned on floating rate loans varies with changes in prevailing interest rates. Therefore, while floating rate loans offer higher interest income when interest rates rise, they will also generate less income when interest rates decline. Changes in the financial strength of a bond issuer or in a bond’s credit rating may affect its value. The Fund is actively managed but there is no guarantee that the manager’s investment decisions will produce the desired results. The Fund’s prospectus also includes a description of the main investment risks.
1. The Fund has a fee waiver associated with any investment it makes in a Franklin Templeton money fund and/or other Franklin Templeton fund, contractually guaranteed through 2/28/18. Fund investment results reflect the fee waiver; without this waiver, the results would have been lower.
2. Cumulative total return represents the change in value of an investment over the periods indicated.
3. Average annual total return represents the average annual change in value of an investment over the periods indicated. Return for less than one year, if any, has not been annualized.
4. Distribution rate is based on an annualization of the sum of the respective class’s past 30 days’ daily distributions and the maximum offering price (NAV for Advisor Class) per share on 4/30/17.
5. The Fund’s 30-day standardized yield is calculated over a trailing 30-day period using the yield to maturity on bonds and/or the dividends accrued on stocks. It may not equal the Fund’s actual income distribution rate, which reflects the Fund’s past dividends paid to shareholders.
6. Figures are as stated in the Fund’s current prospectus and may differ from the expense ratios disclosed in the Your Fund’s Expenses and Financial Highlights sections in this report. In periods of market volatility, assets may decline significantly, causing total annual Fund operating expenses to become higher than the figures shown.
| | | | |
| | | |
14 | | Semiannual Report | | franklintempleton.com |
FRANKLIN FLOATING RATE DAILY ACCESS FUND
Your Fund’s Expenses
As a Fund shareholder, you can incur two types of costs: (1) transaction costs, including sales charges (loads) on Fund purchases and redemptions; and (2) ongoing Fund costs, including management fees, distribution and service (12b-1) fees, and other Fund expenses. All mutual funds have ongoing costs, sometimes referred to as operating expenses. The table below shows ongoing costs of investing in the Fund and can help you understand these costs and compare them with those of other mutual funds. The table assumes a $1,000 investment held for the six months indicated.
Actual Fund Expenses
The table below provides information about actual account values and actual expenses in the columns under the heading “Actual.” In these columns the Fund’s actual return, which includes the effect of Fund expenses, is used to calculate the “Ending Account Value” for each class of shares. You can estimate the expenses you paid during the period by following these steps (of course, your account value and expenses will differ from those in this illustration): Divide your account value by $1,000 (if your account had an $8,600 value, then $8,600 ÷ $1,000 = 8.6). Then multiply the result by the number in the row for your class of shares under the headings “Actual” and “Expenses Paid During Period” (if Actual Expenses Paid During Period were $7.50, then 8.6 x $7.50 = $64.50). In this illustration, the actual expenses paid this period are $64.50.
Hypothetical Example for Comparison with Other Funds
Under the heading “Hypothetical” in the table, information is provided about hypothetical account values and hypothetical expenses based on the Fund’s actual expense ratio and an assumed rate of return of 5% per year before expenses, which is not the Fund’s actual return. This information may not be used to estimate the actual ending account balance or expenses you paid for the period, but it can help you compare ongoing costs of investing in the Fund with those of other funds. To do so, compare this 5% hypothetical example for the class of shares you hold with the 5% hypothetical examples that appear in the shareholder reports of other funds.
Please note that expenses shown in the table are meant to highlight ongoing costs and do not reflect any transactional costs. Therefore, information under the heading “Hypothetical” is useful in comparing ongoing costs only, and will not help you compare total costs of owning different funds. In addition, if transactional costs were included, your total costs would have been higher.
| | | | | | | | | | | | | | | | | | |
| | | | | | | Actual
(actual return after expenses) | | | | Hypothetical
(5% annual return before expenses) | | | | |
Share
Class | | Beginning
Account
Value 11/1/16 | | | | Ending
Account
Value 4/30/17 | | Expenses
Paid During
Period
11/1/16–4/30/171,2 | | | | Ending
Account
Value 4/30/17 | | Expenses Paid During
Period
11/1/16–4/30/171,2 | | | | Net Annualized
Expense Ratio2 |
A | | $1,000 | | | | $1,021.50 | | $4.06 | | | | $1,020.78 | | $4.06 | | | | 0.81% |
C | | $1,000 | | | | $1,019.50 | | $6.06 | | | | $1,018.79 | | $6.06 | | | | 1.21% |
R6 | | $1,000 | | | | $1,023.20 | | $2.36 | | | | $1,022.46 | | $2.36 | | | | 0.47% |
Advisor | | $1,000 | | | | $1,021.60 | | $2.81 | | | | $1,022.02 | | $2.81 | | | | 0.56% |
1. Expenses are equal to the annualized expense ratio for the six-month period as indicated above–in the far right column–multiplied by the simple average account value over the period indicated, and then multiplied by 181/365 to reflect the one-half year period.
2. Reflects expenses after fee waivers and expense reimbursements. Does not include acquired fund fees and expenses.
| | | | |
| | | |
franklintempleton.com | | Semiannual Report | | 15 |
Franklin Low Duration Total Return Fund
We are pleased to bring you Franklin Low Duration Total Return Fund’s semiannual report for the period ended April 30, 2017.
Your Fund’s Goal and Main Investments
The Fund seeks a high level of current income as is consistent with prudent investing, while seeking capital preservation. The Fund invests primarily in investment-grade debt securities and investments, including government and corporate debt securities and mortgage- and asset-backed securities, targeting an estimated average portfolio duration of three years or less.
What is duration?
Duration is a measure of a bond’s price sensitivity to interest-rate changes. In general, a portfolio of securities with a lower duration can be expected to be less sensitive to interest-rate changes than a portfolio with a higher duration.
Performance Overview
The Fund’s Class A shares delivered a +1.02% cumulative total return for the six months under review. In comparison, the Fund’s benchmark, the Bloomberg Barclays U.S. Government/Credit Index: 1-3 Year Component, posted a +0.24% total return.1 The index measures public obligations of the U.S. Treasury with one to three years to final maturity and publicly issued debt of U.S. government agencies, quasi-federal corporations, and corporate or foreign debt guaranteed by the U.S. government. You can find more of the Fund’s performance data in the Performance Summary beginning on page 19.
Performance data represent past performance, which does not guarantee future results. Investment return and principal value will fluctuate, and you may have a gain or loss when you sell your shares. Current performance may differ from figures shown. For most recent month-end performance, go to franklintempleton.com or call (800) 342-5236.
Investment Strategy
We seek to invest in a combination of fixed income securities, primarily from across the investment-grade debt universe. We analyze securities using proprietary and nonproprietary research to help us identify attractive investment opportunities across the entire fixed income opportunity set, on a relative basis. When making investment decisions, we evaluate
Portfolio Composition*
Based on Total Net Assets as of 4/30/17
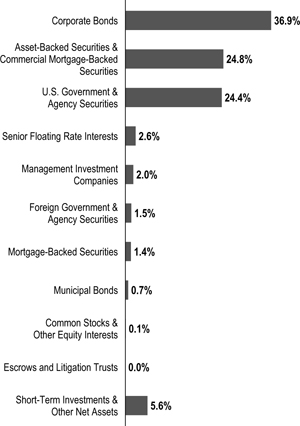
*Figures reflect certain derivatives held in the portfolio (or their underlying reference assets) and may not total 100% or may be negative due to rounding, use of derivatives, unsettled trades or other factors.
business cycles, yield curves, and values between and within markets. Through a low duration portfolio, we seek to position the Fund to be less affected by interest rate changes than a fund with a higher duration. In addition, we may use derivative transactions, such as forwards, futures contracts and swap agreements to obtain net long or short exposures to select currencies, interest rates, countries, duration or credit risks.
1. Source: Morningstar.
The index is unmanaged and includes reinvestment of any income or distributions. It does not reflect any fees, expenses or sales charges. One cannot invest directly in an index, and an index is not representative of the Fund’s portfolio.
See www.franklintempletondatasources.com for additional data provider information.
The dollar value, number of shares or principal amount, and names of all portfolio holdings are listed in the Fund’s Statement of Investments (SOI).
The SOI begins on page 52.
| | | | |
| | | |
16 | | Semiannual Report | | franklintempleton.com |
FRANKLIN LOW DURATION TOTAL RETURN FUND
What is the yield curve?
The yield curve is a line that plots the interest rates, at a set point in time, of bonds having equal credit quality but differing maturity dates. The most frequently reported yield curve compares three-month, two-year and 30-year U.S. Treasury debt.
What is a currency forward contract?
A currency forward contract is an agreement between the Fund and a counterparty to buy or sell a foreign currency in exchange for another currency at a specific exchange rate on a future date.
What is a futures contract?
A futures contract is an agreement between the Fund and a counterparty made through a U.S. or foreign futures exchange to buy or sell an underlying instrument or asset at a specific price on a future date.
What are swap agreements?
Swap agreements, such as interest rate, fixed income total return, currency, inflation index and credit default swaps, are contracts between the Fund and another party (the swap counterparty). In a basic swap transaction, the Fund agrees with the swap counterparty to exchange the returns (or differentials in rates of return) earned or realized on a particular “notional amount” of underlying instruments. The notional amount is the set amount selected by the parties as the basis on which to calculate the obligations that they have agreed to exchange. The parties typically do not actually exchange the notional amount. Instead, they agree to exchange the returns that would be earned or realized if the notional amount were invested in given instruments or at given interest rates.
Manager’s Discussion
U.S. economic indicators remained generally encouraging during the reporting period. Steady growth in manufacturing and services created jobs, boosting employment. The U.S. Federal Reserve increased its target rate twice, noting improved employment and higher inflation. Retail sales increased and home sales continued to grow but more slowly.
From a perspective of excess returns over Treasuries of similar duration, U.S. dollar-denominated high yield corporate credit performed well. Other major fixed income sectors that delivered notable positive excess returns, as measured by Bloomberg Barclays indexes, included emerging market bonds, senior secured floating rate loans and U.S. investment-grade corporate bonds. In contrast, agency mortgage-backed securities underperformed Treasuries.
During the period, the Fund’s non-agency residential mortgage-backed securities (RMBS) and senior secured floating rate loans exposure benefited performance. Our allocation to high yield corporate credit and foreign currency also contributed to results. In contrast, the Fund’s exposure to sovereign developed securities were a slight detractor from results.
Distributions*
11/1/16–4/30/17
| | | | | | | | | | | | | | | | |
| | | Distributions per Share (cents) | |
| Month | | Class A | | | Class C | | | Class R6 | | | Advisor
Class | |
November** | | | 3.1581 | | | | 2.8431 | | | | 3.4832 | | | | 3.3746 | |
December** | | | 4.1934 | | | | 3.8594 | | | | 4.5190 | | | | 4.3953 | |
January | | | 1.7447 | | | | 1.4062 | | | | 2.0721 | | | | 1.9612 | |
February | | | 0.9938 | | | | 0.7827 | | | | 1.1915 | | | | 1.1236 | |
March | | | 1.6942 | | | | 1.3801 | | | | 2.0365 | | | | 1.9003 | |
April | | | 1.2530 | | | | 1.0234 | | | | 1.5043 | | | | 1.4046 | |
Total | | | 13.0372 | | | | 11.2949 | | | | 14.8066 | | | | 14.1596 | |
*The distribution amount is the sum of all distributions to shareholders for the period shown and includes only estimated tax-basis net investment income. Assumes shares were purchased and held for the entire accrual period. Since dividends accrue daily, your actual distributions will vary depending on the date you purchased your shares and any account activity. All Fund distributions will vary depending upon current market conditions, and past distributions are not indicative of future trends.
**Includes additional income distributions made in order to meet excise tax requirements.
At period-end, we were overweighted relative to the benchmark in many spread sectors, including corporate credit and securitized products, based on our belief that valuations remained relatively attractive on a longer term basis. Over the period, we increased our exposure to non-agency RMBS. We decreased our exposures to investment-grade corporate debt, asset-backed securities and commercial mortgage-backed securities.
During the period, the portfolio utilized derivatives, including credit default and currency swaps, currency forwards, Treasury futures, interest rate swaps and credit default swap options, principally as a tool for efficient portfolio management and to manage overall portfolio risk. These derivative transactions may provide the same, or similar, net long or short exposure to select currencies, interest rates, countries, duration or credit risks in a less expensive way than by directly purchasing securities. In those markets where non-derivative securities are readily available, the cost difference in normal market conditions may be small.
| | | | |
| | | |
franklintempleton.com | | Semiannual Report | | 17 |
FRANKLIN LOW DURATION TOTAL RETURN FUND
Thank you for your continued participation in Franklin Low Duration Total Return Fund. We look forward to serving your future investment needs.
| | |

| |  Roger A. Bayston, CFA |

| | 
Kent Burns, CFA |
| |
| | Christopher J. Molumphy, CFA David Yuen, CFA, FRM |
| |
| | Portfolio Management Team |
The foregoing information reflects our analysis, opinions and portfolio holdings as of April 30, 2017, the end of the reporting period. The way we implement our main investment strategies and the resulting portfolio holdings may change depending on factors such as market and economic conditions. These opinions may not be relied upon as investment advice or an offer for a particular security. The information is not a complete analysis of every aspect of any market, country, industry, security or the Fund. Statements of fact are from sources considered reliable, but the investment manager makes no representation or warranty as to their completeness or accuracy. Although historical performance is no guarantee of future results, these insights may help you understand our investment management philosophy.
| | | | |
| | | |
18 | | Semiannual Report | | franklintempleton.com |
FRANKLIN LOW DURATION TOTAL RETURN FUND
Performance Summary as of April 30, 2017
The performance tables do not reflect any taxes that a shareholder would pay on Fund dividends, capital gain distributions, if any, or any realized gains on the sale of Fund shares. Total return reflects reinvestment of the Fund’s dividends and capital gain distributions, if any, and any unrealized gains or losses. Your dividend income will vary depending on dividends or interest paid by securities in the Fund’s portfolio, adjusted for operating expenses of each class. Capital gain distributions are net profits realized from the sale of portfolio securities.
Performance as of 4/30/171
Cumulative total return excludes sales charges. Average annual total return include maximum sales charges. Sales charges will vary depending on the size of the investment and the class of share purchased. The maximum is 2.25% and the minimum is 0%. Class A: 2.25% maximum initial sales charge; Advisor Class: no sales charges. For other share classes, visit franklintempleton.com.
| | | | |
Share Class | | Cumulative
Total Return2 | | Average Annual
Total Return3 |
| | |
A | | | | |
6-Month | | +1.02% | | -1.27% |
1-Year | | +2.52% | | +0.16% |
5-Year | | +7.19% | | +0.93% |
10-Year | | +32.76% | | +2.64% |
| | |
Advisor4 | | | | |
6-Month | | +1.13% | | +1.13% |
1-Year | | +2.80% | | +2.80% |
5-Year | | +8.69% | | +1.68% |
10-Year | | +35.97% | | +3.12% |
| | | | | | |
| | | | | 30-Day Standardized Yield6 |
Share Class | | Distribution Rate5 | | (with waiver) | | (without waiver) |
A | | 1.49% | | 1.52% | | 1.37% |
Advisor | | 1.70% | | 1.80% | | 1.64% |
Performance data represent past performance, which does not guarantee future results. Investment return and principal value will fluctuate, and you may have a gain or loss when you sell your shares. Current performance may differ from figures shown. For most recent month-end performance, go to franklintempleton.com or call (800) 342-5236.
See page 20 for Performance Summary footnotes.
| | | | |
| | | |
franklintempleton.com | | Semiannual Report | | 19 |
FRANKLIN LOW DURATION TOTAL RETURN FUND
PERFORMANCE SUMMARY
Distributions (11/1/16–4/30/17)
| | | | |
| Share Class | | Net Investment
Income | |
A | |
| $0.130372
|
|
C | |
| $0.112949
|
|
R6 | |
| $0.148066
|
|
Advisor | |
| $0.141596
|
|
Total Annual Operating Expenses7
| | | | | | |
Share Class | | With Waiver | | | Without Waiver |
A | | | 0.82 | % | | 0.97% |
Advisor | | | 0.57 | % | | 0.72% |
Each class of shares is available to certain eligible investors and has different annual fees and expenses, as described in the prospectus
All investments involve risks, including possible loss of principal. Investors should be aware that the Fund’s share price and yield will fluctuate with market conditions. The Fund should not be considered an alternative to money market funds or certificates of deposit (CDs). The floating rate loans and debt securities in which the Fund invests tend to be rated below investment grade. Investing in higher yielding, lower rated, floating rate loans and debt securities involves greater risk of default, which could result in loss of principal—a risk that may be heightened in a slowing economy. Interest earned on floating rate loans varies with changes in prevailing interest rates. Therefore, while floating rate loans offer higher interest income when interest rates rise, they will also generate less income when interest rates decline. Changes in the financial strength of a bond issuer or in a bond’s credit rating may affect its value. The Fund is actively managed but there is no guarantee that the manager’s investment decisions will produce the desired results. The Fund’s prospectus also includes a description of the main investment risks.
1. The Fund has an expense reduction and a fee waiver associated with any investments it makes in a Franklin Templeton money fund and/or other Franklin Templeton fund, contractually guaranteed through 2/28/18. Fund investment results reflect the expense reduction and fee waiver; without these reductions, the results would have been lower.
2. Cumulative total return represents the change in value of an investment over the periods indicated.
3. Average annual total return represents the average annual change in value of an investment over the periods indicated. Return for less than one year, if any, has not been annualized.
4. Effective 5/15/08, the Fund began offering Advisor class shares, which do not have sales charges or a Rule 12b-1 plan. Performance quotations for this class reflect the following methods of calculation: (a) For periods prior to 5/15/08, a restated figure is used based upon the Fund’s Class A performance, excluding the effect of Class A’s maximum initial sales charge, but reflecting the effect of the Class A Rule 12b-1 fees; and (b) for periods after 5/15/08 actual Advisor Class performance is used reflecting all charges and fees applicable to that class. Since 5/15/08 (commencement of sales), the cumulative and average annual total returns of Advisor Class shares were +28.63% and +2.85%.
5. Distribution rate is based on an annualization of the sum of the respective class’s past 30 days’ daily distributions and the maximum offering price (NAV for Advisor Class) per share on 4/30/17.
6. The Fund’s 30-day standardized yield is calculated over a trailing 30-day period using the yield to maturity on bonds and/or the dividends accrued on stocks. It may not equal the Fund’s actual income distribution rate, which reflects the Fund’s past dividends paid to shareholders.
7. Figures are as stated in the Fund’s current prospectus and may differ from the expense ratios disclosed in the Your Fund’s Expenses and Financial Highlights sections in this report. In periods of market volatility, assets may decline significantly, causing total annual Fund operating expenses to become higher than the figures shown.
| | | | |
| | | |
20 | | Semiannual Report | | franklintempleton.com |
FRANKLIN LOW DURATION TOTAL RETURN FUND
Your Fund’s Expenses
As a Fund shareholder, you can incur two types of costs: (1) transaction costs, including sales charges (loads) on Fund purchases and redemptions; and (2) ongoing Fund costs, including management fees, distribution and service (12b-1) fees, and other Fund expenses. All mutual funds have ongoing costs, sometimes referred to as operating expenses. The table below shows ongoing costs of investing in the Fund and can help you understand these costs and compare them with those of other mutual funds. The table assumes a $1,000 investment held for the six months indicated.
Actual Fund Expenses
The table below provides information about actual account values and actual expenses in the columns under the heading “Actual.” In these columns the Fund’s actual return, which includes the effect of Fund expenses, is used to calculate the “Ending Account Value” for each class of shares. You can estimate the expenses you paid during the period by following these steps (of course, your account value and expenses will differ from those in this illustration): Divide your account value by $1,000 (if your account had an $8,600 value, then $8,600 ÷ $1,000 = 8.6). Then multiply the result by the number in the row for your class of shares under the headings “Actual” and “Expenses Paid During Period” (if Actual Expenses Paid During Period were $7.50, then 8.6 x $7.50 = $64.50). In this illustration, the actual expenses paid this period are $64.50.
Hypothetical Example for Comparison with Other Funds
Under the heading “Hypothetical” in the table, information is provided about hypothetical account values and hypothetical expenses based on the Fund’s actual expense ratio and an assumed rate of return of 5% per year before expenses, which is not the Fund’s actual return. This information may not be used to estimate the actual ending account balance or expenses you paid for the period, but it can help you compare ongoing costs of investing in the Fund with those of other funds. To do so, compare this 5% hypothetical example for the class of shares you hold with the 5% hypothetical examples that appear in the shareholder reports of other funds.
Please note that expenses shown in the table are meant to highlight ongoing costs and do not reflect any transactional costs. Therefore, information under the heading “Hypothetical” is useful in comparing ongoing costs only, and will not help you compare total costs of owning different funds. In addition, if transactional costs were included, your total costs would have been higher.
| | | | | | | | | | | | | | | | | | |
| | | | | | | Actual (actual return after expenses) | | | | Hypothetical (5% annual return before expenses) | | | | |
Share Class | | Beginning
Account
Value 11/1/16 | | | | Ending
Account
Value 4/30/17 | | Expenses Paid During Period 11/1/16–4/30/171,2 | | | | Ending
Account
Value 4/30/17 | | Expenses Paid During Period 11/1/16–4/30/171,2 | | | | Net Annualized
Expense Ratio2 |
A | | $1,000 | | | | $1,010.20 | | $3.99 | | | | $1,020.83 | | $4.01 | | | | 0.80% |
C | | $1,000 | | | | $1,008.50 | | $5.93 | | | | $1,018.89 | | $5.96 | | | | 1.19% |
R6 | | $1,000 | | | | $1,013.00 | | $2.05 | | | | $1,022.76 | | $2.06 | | | | 0.41% |
Advisor | | $1,000 | | | | $1,011.30 | | $2.74 | | | | $1,022.07 | | $2.76 | | | | 0.55% |
1. Expenses are equal to the annualized expense ratio for the six-month period as indicated above–in the far right column–multiplied by the simple average account value over the period indicated, and then multiplied by 181/365 to reflect the one-half year period.
2. Reflects expenses after fee waivers and expense reimbursements. Does not include acquired fund fees and expenses.
| | | | |
| | | |
franklintempleton.com | | Semiannual Report | | 21 |
Franklin Total Return Fund
This semiannual report for Franklin Total Return Fund covers the period ended April 30, 2017.
Your Fund’s Goal and Main Investments
The Fund seeks to provide high current income, consistent with preservation of capital. Capital appreciation over the long term is a secondary goal. The Fund invests at least 80% of its assets in investment-grade debt securities and investments. The Fund currently focuses on government and corporate debt securities and mortgage- and asset-backed securities.
Performance Overview
The Fund’s Class A shares produced a -0.06% cumulative total return for the six months under review. In comparison, the Fund’s benchmark, the Bloomberg Barclays U.S. Aggregate Bond Index had a -0.67% total return.1 The index measures the U.S. investment-grade, fixed-rate, taxable bond market with index components for government and corporate, mortgage pass-through and asset-backed securities. You can find the Fund’s long-term performance data in the Performance Summary beginning on page 25.
Performance data represent past performance, which does not guarantee future results. Investment return and principal value will fluctuate, and you may have a gain or loss when you sell your shares. Current performance may differ from figures shown. For most recent month-end performance, go to franklintempleton.com or call (800) 342-5236.
Investment Strategy
We seek to invest in a combination of fixed income securities, predominantly from across the investment-grade debt universe. We analyze securities using proprietary and nonproprietary research to help us identify attractive investment opportunities, across the entire fixed income opportunity set, on a relative basis. The Fund may also invest up to 20% of its total assets in noninvestment-grade debt securities. In addition, we may use derivative transactions, such as currency and cross-currency forwards, futures contracts and swap agreements, to obtain net long or short exposures to select currencies, interest rates, countries, duration or credit risks.
Portfolio Composition*
Based on Total Net Assets as of 4/30/17
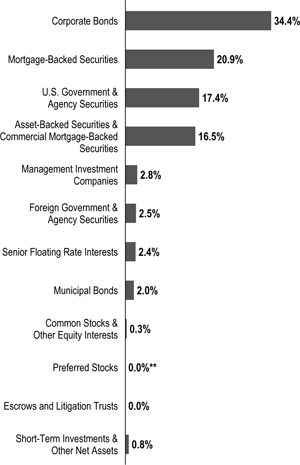
*Figures reflect certain derivatives held in the portfolio (or their underlying reference assets) and may not total 100% or may be negative due to roundings, use of derivatives, unsettled trades or other factors.
**Rounds to less than 0.1% of total net assets.
What is a currency forward contract?
A currency forward contract is an agreement between the Fund and a counterparty to buy or sell a foreign currency in exchange for another currency at a specific exchange rate on a future date.
Manager’s Discussion
U.S. economic indicators remained generally encouraging during the reporting period. Steady growth in manufacturing
1. Source: Morningstar.
The index is unmanaged and includes reinvestment of any income or distributions. It does not reflect any fees, expenses or sales charges. One cannot invest directly in an index, and an index is not representative of the Fund’s portfolio.
See www.franklintempletondatasources.com for additional data provider information.
The dollar value, number of shares or principal amount, and names of all portfolio holdings are listed in the Fund’s Consolidated Statement of Investments (SOI). The Consolidated SOI begins on page 78.
| | | | |
| | | |
22 | | Semiannual Report | | franklintempleton.com |
FRANKLIN TOTAL RETURN FUND
What is a futures contract?
A futures contract is an agreement between the Fund and a counterparty made through a U.S. or foreign futures exchange to buy or sell an underlying instrument or asset at a specific price on a future date.
What are swap agreements?
Swap agreements, such as interest rate, fixed income total return, currency, inflation index and credit default swaps, are contracts between the Fund and another party (the swap counterparty). In a basic swap transaction, the Fund agrees with the swap counterparty to exchange the returns (or differentials in rates of return) earned or realized on a particular “notional amount” of underlying instruments. The notional amount is the set amount selected by the parties as the basis on which to calculate the obligations that they have agreed to exchange. The parties typically do not actually exchange the notional amount. Instead, they agree to exchange the returns that would be earned or realized if the notional amount were invested in given instruments or at given interest rates.
and services created jobs, boosting employment. The U.S. Federal Reserve increased its target rate twice, noting improved employment and higher inflation. Retail sales increased and home sales continued to grow but more slowly.
From a perspective of excess returns over Treasuries of similar duration, U.S. dollar-denominated high yield corporate credit performed well. Other major fixed income sectors that delivered notable positive excess returns, as measured by Bloomberg Barclays indexes, included emerging markets bonds, senior secured floating rate loans and U.S. investment-grade corporate bonds. In contrast, agency mortgage-backed securities underperformed Treasuries.
During the period, the Fund’s exposure to foreign currencies benefited performance. The Fund’s exposure to non-agency residential mortgage-backed securities (RMBS) and high yield corporate credit were significant contributors to returns. Senior secured floating rate loans also aided results. In contrast, the Fund’s exposure to investment-grade corporate bonds and commercial mortgage-backed securities (CMBS) detracted from performance.
What is the yield curve?
The yield curve is a line that plots the interest rates, at a set point in time, of bonds having equal credit quality but differing maturity dates. The most frequently reported yield curve compares three-month, two-year and 30-year U.S. Treasury debt.
| | | | | | | | | | | | | | | | | | | | |
| Distributions* | | | | | | | | | | | | | | | |
11/1/16–4/30/17 | | | | | | | | | | | | | | | | | | | | |
| | | Distributions per Share (cents) | |
| Month | | Class A | | | Class C | | | Class R | | | Class R6 | | | Advisor
Class | |
November** | | | 4.1184 | | | | 3.7778 | | | | 3.9143 | | | | 4.4466 | | | | 4.3335 | |
December** | | | 5.0337 | | | | 4.6872 | | | | 4.8109 | | | | 5.3537 | | | | 5.2341 | |
January | | | 2.8305 | | | | 2.4798 | | | | 2.6116 | | | | 3.1871 | | | | 3.0563 | |
February | | | 1.2004 | | | | 0.9934 | | | | 1.0711 | | | | 1.4129 | | | | 1.3328 | |
March | | | 1.8946 | | | | 1.5896 | | | | 1.7042 | | | | 2.1959 | | | | 2.0902 | |
April | | | 2.0549 | | | | 1.7619 | | | | 1.8767 | | | | 2.3470 | | | | 2.2430 | |
Total | | | 17.1325 | | | | 15.2897 | | | | 15.9888 | | | | 18.9432 | | | | 18.2899 | |
*The distribution amount is the sum of all distributions to shareholders for the period shown and includes only estimated tax-basis net investment income. Assumes shares were purchased and held for the entire accrual period. Since dividends accrue daily, your actual distributions will vary depending on the date you purchased your shares and any account activity. All Fund distributions will vary depending upon current market conditions, and past distributions are not indicative of future trends.
**Includes additional income distributions made in order to meet excise tax requirements
At period-end, we were overweighted relative to the benchmark in many spread sectors, including corporate credit and securitized products, based on our belief that valuations remained relatively attractive on a longer term basis. Over the period, we increased our exposure to collateralized loan obligations, non-agency RMBS and high yield corporate credit. We decreased our exposure to investment-grade corporate credit, asset-backed securities and CMBS as we found better relative opportunities.
During the period, the portfolio utilized derivatives, including credit default and currency swaps, currency forwards, Treasury futures, inflation index swaps and credit default swap options, principally as a tool for efficient portfolio management and to manage overall portfolio risk. These derivative transactions may provide the same, or similar, net long or short exposure to select currencies, interest rates, countries, duration or credit risks in a less expensive way than by directly purchasing securities. In those markets where non-derivative securities are readily available, the cost difference in normal market conditions may be small.
What is an option?
An option is a contract to buy or sell a specific financial product known as the option’s underlying instrument at a specific price. The buyer of an option has the right, but not the obligation, to buy or sell the underlying instrument at or until a specified expiration date. Conversely, the seller (“writer”) of an option who opens a transaction is obligated to buy or sell the underlying instrument should the option holder exercise that right.
| | | | |
| | | |
franklintempleton.com | | Semiannual Report | | 23 |
FRANKLIN TOTAL RETURN FUND
Thank you for your continued participation in Franklin Total Return Fund. We look forward to serving your future investment needs.
| | |
| |
Roger A. Bayston, CFA |
| | |
| |
Kent Burns, CFA |
| |
| | Christopher J. Molumphy, CFA David Yuen, CFA, FRM Michael J. Materasso |
| |
| | Portfolio Management Team |
The foregoing information reflects our analysis, opinions and portfolio holdings as of April 30, 2017, the end of the reporting period. The way we implement our main investment strategies and the resulting portfolio holdings may change depending on factors such as market and economic conditions. These opinions may not be relied upon as investment advice or an offer for a particular security. The information is not a complete analysis of every aspect of any market, country, industry, security or the Fund. Statements of fact are from sources considered reliable, but the investment manager makes no representation or warranty as to their completeness or accuracy. Although historical performance is no guarantee of future results, these insights may help you understand our investment management philosophy.
| | | | |
| | | |
24 | | Semiannual Report | | franklintempleton.com |
FRANKLIN TOTAL RETURN FUND
Performance Summary as of April 30, 2017
The performance tables do not reflect any taxes that a shareholder would pay on Fund dividends, capital gain distributions, if any, or any realized gains on the sale of Fund shares. Total return reflects reinvestment of the Fund’s dividends and capital gain distributions, if any, and any unrealized gains or losses. Your dividend income will vary depending on dividends or interest paid by securities in the Fund’s portfolio, adjusted for operating expenses of each class. Capital gain distributions are net profits realized from the sale of portfolio securities.
Performance as of 4/30/171
Cumulative total return excludes sales charges. Average annual total return include maximum sales charges. Sales charges will vary depending on the size of the investment and the class of share purchased. The maximum is 4.25% and the minimum is 0%. Class A: 4.25% maximum initial sales charge; Advisor Class: no sales charges. For other share classes, visit franklintempleton.com.
| | | | |
| Share Class | | Cumulative Total Return2 | | Average Annual Total Return3 |
| | |
A | | | | |
6-Month | | -0.06% | | -4.30% |
1-Year | | +2.18% | | -2.13% |
5-Year | | +13.04% | | +1.59% |
10-Year | | +51.97% | | +3.83% |
| | |
Advisor | | | | |
6-Month | | +0.06% | | +0.06% |
1-Year | | +2.44% | | +2.44% |
5-Year | | +14.51% | | +2.75% |
10-Year | | +55.92% | | +4.54% |
| | | | | | |
| | | Distribution Rate4 | | 30-Day Standardized Yield5 |
| Share Class | | | (with waiver) | | (without waiver) |
A | | 2.42% | | 2.09% | | 2.07% |
Advisor | | 2.75% | | 2.44% | | 2.41% |
Performance data represent past performance, which does not guarantee future results. Investment return and principal value will fluctuate, and you may have a gain or loss when you sell your shares. Current performance may differ from figures shown. For most recent month-end performance, go to franklintempleton.com or call (800) 342-5236.
See page 26 for Performance Summary footnotes.
| | | | |
| | | |
franklintempleton.com | | Semiannual Report | | 25 |
FRANKLIN TOTAL RETURN FUND
PERFORMANCE SUMMARY
Distributions (11/1/16–4/30/17)
| | | | |
| Share Class | | Net Investment Income | |
A | | | $0.171325 | |
C | | | $0.152897 | |
R | | | $0.159888 | |
R6 | | | $0.189432 | |
Advisor | | | $0.182899 | |
Total Annual Operating Expenses6
| | | | | | |
| Share Class | | With Waiver | | | Without Waiver |
A | | | 0.91 | % | | 0.93% |
Advisor | | | 0.66 | % | | 0.68% |
Each class of shares is available to certain eligible investors and has different annual fees and expenses, as described in the prospectus.
All investments involve risks, including possible loss of principal. Interest rate movements and mortgage prepayments will affect the Fund’s share price and yield. Bond prices generally move in the opposite direction of interest rates. Thus, as prices of bonds in the Fund adjust to a rise in interest rates, the Fund’s share price may decline. Changes in the financial strength of a bond issuer or in a bond’s credit rating may affect its value. The risks associated with higher yielding, lower rated securities include higher risk of default and loss of principal. Investment in foreign securities also involves special risks, including currency fluctuations, and political and economic uncertainty. Derivatives, including currency management strategies, involve costs and can create economic leverage in the portfolio which may result in significant volatility and cause the Fund to participate in losses (as well as gains) on an amount that exceeds the Fund’s initial investment. The Fund may not achieve the anticipated benefits and may realize losses when a counterparty fails to perform as promised. The Fund is actively managed but there is no guarantee that the manager’s investment decisions will produce the desired results. The Fund’s prospectus also includes a description of the main investment risks.
1. The Fund has an expense reduction and a fee waiver associated with any investments it makes in a Franklin Templeton money fund and/or other Franklin Templeton fund, contractually guaranteed through 2/28/18. Fund investment results reflect the expense reduction and fee waiver; without these reductions, the results would have been lower.
2. Cumulative total return represents the change in value of an investment over the periods indicated.
3. Average annual total return represents the average annual change in value of an investment over the periods indicated. Return for less than one year, if any, has not been annualized.
4. Distribution rate is based on an annualization of the sum of the respective class’s past 30 days’ daily distributions and the maximum offering price (NAV for Advisor Class) per share on 4/30/17.
5. The Fund’s 30-day standardized yield is calculated over a trailing 30-day period using the yield to maturity on bonds and/or the dividends accrued on stocks. It may not equal the Fund’s actual income distribution rate, which reflects the Fund’s past dividends paid to shareholders.
6. Figures are as stated in the Fund’s current prospectus and may differ from the expense ratios disclosed in the Your Fund’s Expenses and Financial Highlights sections in this report. In periods of market volatility, assets may decline significantly, causing total annual Fund operating expenses to become higher than the figures shown.
| | | | |
| | | |
26 | | Semiannual Report | | franklintempleton.com |
FRANKLIN TOTAL RETURN FUND
Your Fund’s Expenses
As a Fund shareholder, you can incur two types of costs: (1) transaction costs, including sales charges (loads) on Fund purchases and redemptions; and (2) ongoing Fund costs, including management fees, distribution and service (12b-1) fees, and other Fund expenses. All mutual funds have ongoing costs, sometimes referred to as operating expenses. The table below shows ongoing costs of investing in the Fund and can help you understand these costs and compare them with those of other mutual funds. The table assumes a $1,000 investment held for the six months indicated.
Actual Fund Expenses
The table below provides information about actual account values and actual expenses in the columns under the heading “Actual.” In these columns the Fund’s actual return, which includes the effect of Fund expenses, is used to calculate the “Ending Account Value” for each class of shares. You can estimate the expenses you paid during the period by following these steps (of course, your account value and expenses will differ from those in this illustration): Divide your account value by $1,000 (if your account had an $8,600 value, then $8,600 ÷ $1,000 = 8.6). Then multiply the result by the number in the row for your class of shares under the headings “Actual” and “Expenses Paid During Period” (if Actual Expenses Paid During Period were $7.50, then 8.6 x $7.50 = $64.50). In this illustration, the actual expenses paid this period are $64.50.
Hypothetical Example for Comparison with Other Funds
Under the heading “Hypothetical” in the table, information is provided about hypothetical account values and hypothetical expenses based on the Fund’s actual expense ratio and an assumed rate of return of 5% per year before expenses, which is not the Fund’s actual return. This information may not be used to estimate the actual ending account balance or expenses you paid for the period, but it can help you compare ongoing costs of investing in the Fund with those of other funds. To do so, compare this 5% hypothetical example for the class of shares you hold with the 5% hypothetical examples that appear in the shareholder reports of other funds.
Please note that expenses shown in the table are meant to highlight ongoing costs and do not reflect any transactional costs. Therefore, information under the heading “Hypothetical” is useful in comparing ongoing costs only, and will not help you compare total costs of owning different funds. In addition, if transactional costs were included, your total costs would have been higher.
| | | | | | | | | | | | | | | | | | |
| | | | | | | Actual (actual return after expenses) | | | | Hypothetical (5% annual return before expenses) | | | | |
Share Class | | Beginning
Account Value
11/1/16 | | | | Ending Account Value 4/30/17 | | Expenses
Paid During
Period 11/1/16–4/30/171,2 | | | | Ending Account Value 4/30/17 | | Expenses Paid During
Period 11/1/16–4/30/171,2 | | | | Net Annualized
Expense Ratio2 |
A | | $1,000 | | | | $ 999.40 | | $4.31 | | | | $1,020.48 | | $4.36 | | | | 0.87% |
C | | $1,000 | | | | $ 997.50 | | $6.29 | | | | $1,018.50 | | $6.36 | | | | 1.27% |
R | | $1,000 | | | | $ 998.20 | | $5.55 | | | | $1,019.24 | | $5.61 | | | | 1.12% |
R6 | | $1,000 | | | | $1,001.20 | | $2.38 | | | | $1,022.41 | | $2.41 | | | | 0.48% |
Advisor | | $1,000 | | | | $1,000.60 | | $3.08 | | | | $1,021.72 | | $3.11 | | | | 0.62% |
1. Expenses are equal to the annualized expense ratio for the six-month period as indicated above–in the far right column–multiplied by the simple average account value over the period indicated, and then multiplied by 181/365 to reflect the one-half year period.
2. Reflects expenses after fee waivers and expense reimbursements. Does not include acquired fund fees and expenses.
| | | | |
| | | |
franklintempleton.com | | Semiannual Report | | 27 |
FRANKLIN INVESTORS SECURITIES TRUST
Financial Highlights
Franklin Adjustable U.S. Government Securities Fund
| | | | | | | | | | | | | | | | | | | | | | | | |
| | | Six Months Ended April 30, 2017 (unaudited) | | | | | | | | | | | | | | | | |
| | | | Year Ended October 31, | |
| | | | 2016 | | | 2015 | | | 2014 | | | 2013 | | | 2012 | |
Class A | | | | | | | | | | | | | | | | | | | | | | | | |
| | | | | | |
Per share operating performance | | | | | | | | | | | | | | | | | | | | | | | | |
| | | | | | |
(for a share outstanding throughout the period) | | | | | | | | | | | | | | | | | | | | | | | | |
| | | | | | |
Net asset value, beginning of period | | | $ 8.40 | | | | $ 8.55 | | | | $ 8.67 | | | | $ 8.72 | | | | $ 8.90 | | | | $ 8.84 | |
| | | | | | |
Income from investment operationsa: | | | | | | | | | | | | | | | | | | | | | | | | |
| | | | | | |
Net investment income | | | 0.018 | | | | 0.025 | | | | 0.019 | | | | 0.043 | | | | 0.048 | | | | 0.078 | |
| | | | | | |
Net realized and unrealized gains (losses) | | | (0.015) | | | | (0.053) | | | | (0.040) | | | | 0.006 | | | | (0.098) | | | | 0.117 | |
| | | | | | |
Total from investment operations | | | 0.003 | | | | (0.028) | | | | (0.021) | | | | 0.049 | | | | (0.050) | | | | 0.195 | |
| | | | | | |
Less distributions from net investment income | | | (0.073) | | | | (0.122) | | | | (0.099) | | | | (0.099) | | | | (0.130) | | | | (0.135) | |
| | | | | | |
Net asset value, end of period | | | $ 8.33 | | | | $ 8.40 | | | | $ 8.55 | | | | $ 8.67 | | | | $ 8.72 | | | | $ 8.90 | |
| | | | | | |
Total returnb | | | 0.04% | | | | (0.32)% | | | | (0.24)% | | | | 0.56% | | | | (0.56)% | | | | 2.22% | |
| | | | | | |
Ratios to average net assetsc | | | | | | | | | | | | | | | | | | | | | | | | |
| | | | | | |
Expenses before waiver and payments by affiliates | | | 0.93% | | | | 0.92% | | | | 0.91% | | | | 0.93% | | | | 0.87% | | | | 0.87% | |
| | | | | | |
Expenses net of waiver and payments by affiliates | | | 0.92%d | | | | 0.91%d | | | | 0.91% | d,e | | | 0.93% | d,e | | | 0.87% | | | | 0.87% | |
| | | | | | |
Net investment income | | | 0.52% | | | | 0.43% | | | | 0.39% | | | | 0.48% | | | | 0.63% | | | | 0.91% | |
| | | | | | |
Supplemental data | | | | | | | | | | | | | | | | | | | | | | | | |
| | | | | | |
Net assets, end of period (000’s) | | | $591,064 | | | | $667,671 | | | | $848,918 | | | | $1,058,838 | | | | $1,105,674 | | | | $1,308,971 | |
| | | | | | |
Portfolio turnover rate | | | 1.40% | | | | 11.49% | | | | 9.98% | | | | 14.18% | | | | 8.66% | | | | 9.69% | |
aThe amount shown for a share outstanding throughout the period may not correlate with the Statement of Operations for the period due to the timing of sales and repurchases of the Fund’s shares in relation to income earned and/or fluctuating fair value of the investments of the Fund.
bTotal return does not reflect sales commissions or contingent deferred sales charges, if applicable, and is not annualized for periods less than one year.
cRatios are annualized for periods less than one year.
dBenefit of expense reduction rounds to less than 0.01%.
eBenefit of waiver and payments by affiliates rounds to less than 0.01%.
| | | | |
| | | |
28 | | Semiannual Report | The accompanying notes are an integral part of these financial statements. | | franklintempleton.com |
FRANKLIN INVESTORS SECURITIES TRUST
FINANCIAL HIGHLIGHTS
Franklin Adjustable U.S. Government Securities Fund (continued)
| | | | | | | | | | | | | | | | |
| | | Six Months Ended April 30, 2017 (unaudited) | | | | | | | | | | |
| | | | Year Ended October 31, | |
| | | | 2016 | | | 2015 | | | 2014a | |
Class A1 | | | | | | | | | | | | | | | | |
| | | | |
Per share operating performance | | | | | | | | | | | | | | | | |
| | | | |
(for a share outstanding throughout the period) | | | | | | | | | | | | | | | | |
| | | | |
Net asset value, beginning of period | | | $ 8.40 | | | | $ 8.54 | | | | $ 8.67 | | | | $ 8.68 | |
| | | | |
Income from investment operationsb: | | | | | | | | | | | | | | | | |
| | | | |
Net investment income | | | 0.032 | | | | 0.049 | | | | 0.046 | | | | 0.018 | |
| | | | |
Net realized and unrealized gains (losses) | | | (0.022) | | | | (0.054) | | | | (0.062) | | | | 0.010 | |
| | | | |
Total from investment operations | | | 0.010 | | | | (0.005) | | | | (0.016) | | | | 0.028 | |
| | | | |
Less distributions from net investment income | | | (0.080) | | | | (0.135) | | | | (0.114) | | | | (0.038) | |
| | | | |
Net asset value, end of period | | | $ 8.33 | | | | $ 8.40 | | | | $ 8.54 | | | | $ 8.67 | |
| | | | |
Total returnc | | | 0.12% | | | | (0.05)% | | | | (0.19)% | | | | 0.32% | |
| | | | |
Ratios to average net assetsd | | | | | | | | | | | | | | | | |
| | | | |
Expenses before waiver and payments by affiliates | | | 0.77% | | | | 0.77% | | | | 0.75% | | | | 0.78% | |
| | | | |
Expenses net of waiver and payments by affiliates | | | 0.76%e | | | | 0.76%e | | | | 0.75% | e,f | | | 0.78% | e,f |
| | | | |
Net investment income | | | 0.68% | | | | 0.58% | | | | 0.55% | | | | 0.63% | |
| | | | |
Supplemental data | | | | | | | | | | | | | | | | |
| | | | |
Net assets, end of period (000’s) | | | $136,835 | | | | $160,469 | | | | $198,670 | | | | $253,021 | |
| | | | |
Portfolio turnover rate | | | 1.40% | | | | 11.49% | | | | 9.98% | | | | 14.18% | |
aFor the period June 18, 2014 (effective date) to October 31, 2014.
bThe amount shown for a share outstanding throughout the period may not correlate with the Statement of Operations for the period due to the timing of sales and repurchases of the Fund’s shares in relation to income earned and/or fluctuating fair value of the investments of the Fund.
cTotal return does not reflect sales commissions or contingent deferred sales charges, if applicable, and is not annualized for periods less than one year.
dRatios are annualized for periods less than one year.
eBenefit of expense reduction rounds to less than 0.01%.
fBenefit of waiver and payments by affiliates rounds to less than 0.01%.
| | | | |
| | | |
franklintempleton.com | | The accompanying notes are an integral part of these financial statements. | Semiannual Report | | 29 |
FRANKLIN INVESTORS SECURITIES TRUST
FINANCIAL HIGHLIGHTS
Franklin Adjustable U.S. Government Securities Fund (continued)
| | | | | | | | | | | | | | | | | | | | | | | | |
| | | Six Months Ended April 30, 2017 (unaudited) | | | | | | | | | | | | | | | | |
| | | | Year Ended October 31, | |
| | | | 2016 | | | 2015 | | | 2014 | | | 2013 | | | 2012 | |
Class C | | | | | | | | | | | | | | | | | | | | | | | | |
| | | | | | |
Per share operating performance | | | | | | | | | | | | | | | | | | | | | | | | |
| | | | | | |
(for a share outstanding throughout the period) | | | | | | | | | | | | | | | | | | | | | | | | |
| | | | | | |
Net asset value, beginning of period | | | $ 8.40 | | | | $ 8.54 | | | | $ 8.66 | | | | $ 8.71 | | | | $ 8.90 | | | | $ 8.83 | |
| | | | | | |
Income from investment operationsa: | | | | | | | | | | | | | | | | | | | | | | | | |
| | | | | | |
Net investment income (loss) | | | (0.003) | | | | (0.011) | | | | (0.013) | | | | (0.004) | | | | 0.006 | | | | 0.042 | |
| | | | | | |
Net realized and unrealized gains (losses) | | | (0.020) | | | | (0.041) | | | | (0.043) | | | | 0.018 | | | | (0.101) | | | | 0.128 | |
| | | | | | |
Total from investment operations | | | (0.023) | | | | (0.052) | | | | (0.056) | | | | 0.014 | | | | (0.095) | | | | 0.170 | |
| | | | | | |
Less distributions from net investment income | | | (0.057) | | | | (0.088) | | | | (0.064) | | | | (0.064) | | | | (0.095) | | | | (0.100) | |
| | | | | | |
Net asset value, end of period | | | $ 8.32 | | | | $ 8.40 | | | | $ 8.54 | | | | $ 8.66 | | | | $ 8.71 | | | | $ 8.90 | |
| | | | | | |
Total returnb | | | (0.28)% | | | | (0.61)% | | | | (0.65)% | | | | 0.16% | | | | (1.07)% | | | | 1.93% | |
| | | | | | |
Ratios to average net assetsc | | | | | | | | | | | | | | | | | | | | | | | | |
| | | | | | |
Expenses before waiver and payments by affiliates | | | 1.33% | | | | 1.32% | | | | 1.31% | | | | 1.33% | | | | 1.27% | | | | 1.27% | |
| | | | | | |
Expenses net of waiver and payments by affiliates | | | 1.32%d | | | | 1.31%d | | | | 1.31% | d,e | | | 1.33% | d,e | | | 1.27% | | | | 1.27% | |
| | | | | | |
Net investment income (loss) | | | 0.12% | | | | 0.03% | | | | (0.01)% | | | | 0.08% | | | | 0.23% | | | | 0.51% | |
| | | | | | |
Supplemental data | | | | | | | | | | | | | | | | | | | | | | | | |
| | | | | | |
Net assets, end of period (000’s) | | | $224,664 | | | | $266,186 | | | | $336,254 | | | | $428,031 | | | | $603,067 | | | | $794,201 | |
| | | | | | |
Portfolio turnover rate | | | 1.40% | | | | 11.49% | | | | 9.98% | | | | 14.18% | | | | 8.66% | | | | 9.69% | |
aThe amount shown for a share outstanding throughout the period may not correlate with the Statement of Operations for the period due to the timing of sales and repurchases of the Fund’s shares in relation to income earned and/or fluctuating fair value of the investments of the Fund.
bTotal return does not reflect sales commissions or contingent deferred sales charges, if applicable, and is not annualized for periods less than one year.
cRatios are annualized for periods less than one year.
dBenefit of expense reduction rounds to less than 0.01%.
eBenefit of waiver and payments by affiliates rounds to less than 0.01%.
| | | | |
| | | |
30 | | Semiannual Report | The accompanying notes are an integral part of these financial statements. | | franklintempleton.com |
FRANKLIN INVESTORS SECURITIES TRUST
FINANCIAL HIGHLIGHTS
|
Franklin Adjustable U.S. Government Securities Fund (continued) |
| | | | | | | | | | | | | | | | | | | | |
| | | Six Months Ended April 30, 2017 (unaudited) | | | | | | | | | | | | | |
| | | | Year Ended October 31, | |
| | | | 2016 | | | 2015 | | | 2014 | | | 2013a | |
Class R6 | | | | | | | | | | | | | | | | | | | | |
| | | | | |
Per share operating performance | | | | | | | | | | | | | | | | | | | | |
| | | | | |
(for a share outstanding throughout the period) | | | | | | | | | | | | | | | | | | | | |
| | | | | |
Net asset value, beginning of period | | | $ 8.41 | | | | $ 8.55 | | | | $ 8.68 | | | | $ 8.73 | | | | $ 8.72 | |
| | | | | |
Income from investment operationsb: | | | | | | | | | | | | | | | | | | | | |
| | | | | |
Net investment income | | | 0.038 | | | | 0.066 | | | | 0.013 | | | | 0.088c | | | | 0.008 | |
| | | | | |
Net realized and unrealized gains (losses) | | | (0.019) | | | | (0.053) | | | | (0.010) | | | | (0.009) | | | | 0.018 | |
| | | | | |
Total from investment operations | | | 0.019 | | | | 0.013 | | | | 0.003 | | | | 0.079 | | | | 0.026 | |
| | | | | |
Less distributions from net investment income | | | (0.089) | | | | (0.153) | | | | (0.133) | | | | (0.129) | | | | (0.016) | |
| | | | | |
Net asset value, end of period | | | $ 8.34 | | | | $ 8.41 | | | | $ 8.55 | | | | $ 8.68 | | | | $ 8.73 | |
| | | | | |
Total returnd | | | 0.22% | | | | 0.15% | | | | 0.03% | | | | 0.92% | | | | 0.30% | |
| | | | | |
Ratios to average net assetse | | | | | | | | | | | | | | | | | | | | |
| | | | | |
Expenses before waiver and payments by affiliates | | | 0.56% | | | | 0.56% | | | | 0.53% | | | | 0.56% | | | | 0.53% | |
| | | | | |
Expenses net of waiver and payments by affiliates | | | 0.55%f | | | | 0.55%f | | | | 0.53% | f,g | | | 0.56% | f,g | | | 0.53% | |
| | | | | |
Net investment income | | | 0.89% | | | | 0.79% | | | | 0.77% | | | | 0.85% | | | | 0.97% | |
| | | | | |
Supplemental data | | | | | | | | | | | | | | | | | | | | |
| | | | | |
Net assets, end of period (000’s) | | | $2,363 | | | | $2,374 | | | | $2,176 | | | | $7,193 | | | | $335 | |
| | | | | |
Portfolio turnover rate | | | 1.40% | | | | 11.49% | | | | 9.98% | | | | 14.18% | | | | 8.66% | |
aFor the period September 20, 2013 (effective date) to October 31, 2013.
bThe amount shown for a share outstanding throughout the period may not correlate with the Statement of Operations for the period due to the timing of sales and repurchases of the Fund’s shares in relation to income earned and/or fluctuating fair value of the investments of the Fund.
cBased on average daily shares outstanding.
dTotal return is not annualized for periods less than one year.
eRatios are annualized for periods less than one year.
fBenefit of expense reduction rounds to less than 0.01%.
gBenefit of waiver and payments by affiliates rounds to less than 0.01%.
| | | | |
| | | |
franklintempleton.com | | The accompanying notes are an integral part of these financial statements. | Semiannual Report | | 31 |
FRANKLIN INVESTORS SECURITIES TRUST
FINANCIAL HIGHLIGHTS
Franklin Adjustable U.S. Government Securities Fund (continued)
| | | | | | | | | | | | | | | | | | | | | | | | |
| | | Six Months Ended April 30, 2017 (unaudited) | | | | | | | | | | | | | | | | |
| | | | Year Ended October 31, | |
| | | | 2016 | | | 2015 | | | 2014 | | | 2013 | | | 2012 | |
Advisor Class | | | | | | | | | | | | | | | | | | | | | | | | |
| | | | | | |
Per share operating performance | | | | | | | | | | | | | | | | | | | | | | | | |
| | | | | | |
(for a share outstanding throughout the period) | | | | | | | | | | | | | | | | | | | | | | | | |
| | | | | | |
Net asset value, beginning of period | | | $ 8.41 | | | | $ 8.55 | | | | $ 8.68 | | | | $ 8.73 | | | | $ 8.91 | | | | $ 8.85 | |
| | | | | | |
Income from investment operationsa: | | | | | | | | | | | | | | | | | | | | | | | | |
| | | | | | |
Net investment income | | | 0.028 | | | | 0.046 | | | | 0.040 | | | | 0.068 | | | | 0.073 | | | | 0.107 | |
| | | | | | |
Net realized and unrealized gains (losses) | | | (0.014) | | | | (0.043) | | | | (0.049) | | | | 0.003 | | | | (0.101) | | | | 0.111 | |
| | | | | | |
Total from investment operations | | | 0.014 | | | | 0.003 | | | | (0.009) | | | | 0.071 | | | | (0.028) | | | | 0.218 | |
| | | | | | |
Less distributions from net investment income . | | | (0.084) | | | | (0.143) | | | | (0.121) | | | | (0.121) | | | | (0.152) | | | | (0.158) | |
| | | | | | |
Net asset value, end of period | | | $ 8.34 | | | | $ 8.41 | | | | $ 8.55 | | | | $ 8.68 | | | | $ 8.73 | | | | $ 8.91 | |
| | | | | | |
Total returnb | | | 0.16% | | | | 0.05% | | | | (0.11)% | | | | 0.82% | | | | (0.31)% | | | | 2.48% | |
| | | | | | |
Ratios to average net assetsc | | | | | | | | | | | | | | | | | | | | | | | | |
| | | | | | |
Expenses before waiver and payments by affiliates | | | 0.68% | | | | 0.67% | | | | 0.66% | | | | 0.68% | | | | 0.62% | | | | 0.62% | |
| | | | | | |
Expenses net of waiver and payments by affiliates | | | 0.67%d | | | | 0.66%d | | | | 0.66% | d,e | | | 0.68% | d,e | | | 0.62% | | | | 0.62% | |
| | | | | | |
Net investment income | | | 0.77% | | | | 0.68% | | | | 0.64% | | | | 0.73% | | | | 0.88% | | | | 1.16% | |
| | | | | | |
Supplemental data | | | | | | | | | | | | | | | | | | | | | | | | |
| | | | | | |
Net assets, end of period (000’s) | | | $204,947 | | | | $227,599 | | | | $308,683 | | | | $416,854 | | | | $411,228 | | | | $437,540 | |
| | | | | | |
Portfolio turnover rate | | | 1.40% | | | | 11.49% | | | | 9.98% | | | | 14.18% | | | | 8.66% | | | | 9.69% | |
aThe amount shown for a share outstanding throughout the period may not correlate with the Statement of Operations for the period due to the timing of sales and repurchases of the Fund’s shares in relation to income earned and/or fluctuating fair value of the investments of the Fund.
bTotal return is not annualized for periods less than one year.
cRatios are annualized for periods less than one year.
dBenefit of expense reduction rounds to less than 0.01%.
eBenefit of waiver and payments by affiliates rounds to less than 0.01%.
| | | | |
| | | |
32 | | Semiannual Report | The accompanying notes are an integral part of these financial statements. | | franklintempleton.com |
FRANKLIN INVESTORS SECURITIES TRUST
Statement of Investments, April 30, 2017 (unaudited)
Franklin Adjustable U.S. Government Securities Fund
| | | | | | | | |
| | | Principal
Amount | | | Value | |
Mortgage-Backed Securities 96.6% | | | | | | | | |
a Federal Home Loan Mortgage Corp. (FHLMC) Adjustable Rate 23.4% | | | | | | | | |
FHLMC, 2.594%, 9/01/35 | | $ | 10,013,341 | | | $ | 10,513,592 | |
FHLMC, 2.761%, 4/01/34 | | | 10,748,725 | | | | 11,395,828 | |
FHLMC, 1.849% - 2.806%, 2/01/18 - 4/01/37 | | | 10,528,318 | | | | 11,090,410 | |
FHLMC, 2.812%, 3/01/35 | | | 5,529,851 | | | | 5,828,671 | |
FHLMC, 2.845%, 12/01/35 | | | 5,416,671 | | | | 5,714,885 | |
FHLMC, 2.83% - 2.876%, 1/01/36 - 3/01/37 | | | 10,900,452 | | | | 11,485,570 | |
FHLMC, 2.899% - 3.005%, 1/01/36 - 12/01/37 | | | 10,731,660 | | | | 11,319,059 | |
FHLMC, 3.017% - 3.084%, 4/01/34 - 10/01/38 | | | 10,637,404 | | | | 11,275,861 | |
FHLMC, 3.104%, 1/01/36 | | | 5,373,043 | | | | 5,692,033 | |
FHLMC, 3.106% - 3.134%, 2/01/36 - 11/01/41 | | | 8,958,428 | | | | 9,451,926 | |
FHLMC, 3.138%, 11/01/37 | | | 6,420,948 | | | | 6,791,736 | |
FHLMC, 3.141% - 3.203%, 6/01/35 - 1/01/37 | | | 8,875,959 | | | | 9,369,582 | |
FHLMC, 3.211% - 3.215%, 4/01/37 - 11/01/37 | | | 7,643,720 | | | | 8,019,694 | |
FHLMC, 3.223%, 12/01/35 | | | 4,915,275 | | | | 5,162,824 | |
FHLMC, 3.225%, 9/01/37 | | | 33,085,546 | | | | 35,016,137 | |
FHLMC, 3.228%, 11/01/40 | | | 6,413,131 | | | | 6,765,140 | |
FHLMC, 3.229%, 9/01/38 | | | 6,619,165 | | | | 6,996,146 | |
FHLMC, 3.222% - 3.236%, 9/01/38 - 5/01/40 | | | 6,635,247 | | | | 6,995,727 | |
FHLMC, 3.259%, 7/01/35 | | | 13,060,284 | | | | 13,843,454 | |
FHLMC, 3.277%, 10/01/41 | | | 6,829,913 | | | | 7,146,463 | |
FHLMC, 3.257% - 3.295%, 11/01/35 - 12/01/37 | | | 10,908,787 | | | | 11,521,412 | |
FHLMC, 3.337%, 2/01/36 | | | 4,638,500 | | | | 4,916,174 | |
FHLMC, 3.299% - 3.388%, 8/01/34 - 3/01/38 | | | 8,242,415 | | | | 8,735,439 | |
FHLMC, 3.408%, 12/01/35 | | | 5,879,105 | | | | 6,209,105 | |
FHLMC, 3.418%, 6/01/37 | | | 12,382,163 | | | | 13,190,523 | |
FHLMC, 3.425%, 1/01/37 | | | 5,265,491 | | | | 5,636,790 | |
FHLMC, 3.415% - 3.482%, 11/01/36 - 4/01/40 | | | 8,142,604 | | | | 8,614,496 | |
FHLMC, 3.49% - 3.563%, 12/01/34 - 3/01/37 | | | 9,132,106 | | | | 9,714,163 | |
FHLMC, 4.141%, 8/01/34 | | | 2,770,433 | | | | 2,921,563 | |
| | | | | | | | |
| | | | | | | 271,334,403 | |
| | | | | | | | |
a Federal National Mortgage Association (FNMA) Adjustable Rate 73.1% | | | | | | | | |
FNMA, 1.528% - 2.057%, 7/01/17 - 11/01/44 | | | 11,239,279 | | | | 11,389,143 | |
FNMA, 2.062% - 2.434%, 7/01/17 - 2/01/43 | | | 10,985,377 | | | | 11,304,882 | |
FNMA, 2.436% - 2.542%, 6/01/17 - 5/01/38 | | | 11,183,151 | | | | 11,568,526 | |
FNMA, 2.543% - 2.622%, 11/01/17 - 11/01/37 | | | 8,377,154 | | | | 8,809,508 | |
FNMA, 2.622% - 2.663%, 1/01/19 - 8/01/36 | | | 9,218,352 | | | | 9,665,723 | |
FNMA, 2.663% - 2.677%, 10/01/18 - 1/01/37 | | | 10,983,123 | | | | 11,577,183 | |
FNMA, 2.68% - 2.723%, 4/01/18 - 1/01/37 | | | 10,656,070 | | | | 11,176,689 | |
FNMA, 2.723% - 2.748%, 9/01/17 - 9/01/38 | | | 10,943,082 | | | | 11,491,203 | |
FNMA, 2.748% - 2.777%, 12/01/17 - 2/01/39 | | | 10,228,807 | | | | 10,747,925 | |
FNMA, 2.788%, 12/01/34 | | | 9,253,278 | | | | 9,723,026 | |
FNMA, 2.777% - 2.798%, 10/01/18 - 8/01/37 | | | 10,910,072 | | | | 11,427,641 | |
FNMA, 2.799% - 2.819%, 1/01/18 - 9/01/39 | | | 11,109,893 | | | | 11,594,658 | |
FNMA, 2.819%, 6/01/36 | | | 6,380,219 | | | | 6,720,595 | |
FNMA, 2.822%, 3/01/38 | | | 6,495,609 | | | | 6,862,751 | |
FNMA, 2.835%, 1/01/38 | | | 7,928,465 | | | | 8,326,239 | |
FNMA, 2.842%, 5/01/36 | | | 26,066,321 | | | | 27,537,043 | |
FNMA, 2.843%, 10/01/35 | | | 5,127,506 | | | | 5,402,256 | |
FNMA, 2.82% - 2.845%, 12/01/18 - 7/01/40 | | | 11,005,457 | | | | 11,555,637 | |
FNMA, 2.845% - 2.86%, 3/01/18 - 9/01/39 | | | 10,840,623 | | | | 11,404,182 | |
FNMA, 2.86% - 2.873%, 8/01/22 - 9/01/39 | | | 10,675,965 | | | | 11,261,139 | |
| | | | |
| | | |
franklintempleton.com | | Semiannual Report | | 33 |
FRANKLIN INVESTORS SECURITIES TRUST
STATEMENT OF INVESTMENTS (UNAUDITED)
Franklin Adjustable U.S. Government Securities Fund (continued)
| | | | | | | | |
| | | Principal
Amount | | | Value | |
Mortgage-Backed Securities (continued) | | | | | | | | |
a Federal National Mortgage Association (FNMA) Adjustable Rate (continued) | | | | | | | | |
FNMA, 2.875%, 1/01/36 | | $ | 5,509,353 | | | $ | 5,755,081 | |
FNMA, 2.873% - 2.878%, 8/01/19 - 7/01/38 | | | 10,990,015 | | | | 11,569,435 | |
FNMA, 2.879% - 2.89%, 1/01/32 - 3/01/38 | | | 10,918,750 | | | | 11,414,316 | |
FNMA, 2.896%, 3/01/35 | | | 4,971,741 | | | | 5,220,783 | |
FNMA, 2.89% - 2.914%, 4/01/19 - 7/01/42 | | | 10,963,886 | | | | 11,494,870 | |
FNMA, 2.914%, 2/01/36 | | | 11,611,396 | | | | 12,197,768 | |
FNMA, 2.914% - 2.922%, 9/01/18 - 7/01/38 | | | 11,049,098 | | | | 11,541,365 | |
FNMA, 2.923%, 8/01/37 | | | 5,040,920 | | | | 5,329,230 | |
FNMA, 2.922% - 2.934%, 1/01/23 - 5/01/38 | | | 9,321,285 | | | | 9,757,044 | |
FNMA, 2.934% - 2.953%, 2/01/19 - 8/01/39 | | | 10,471,779 | | | | 10,986,862 | |
FNMA, 2.953% - 2.964%, 1/01/19 - 8/01/39 | | | 10,961,845 | | | | 11,499,482 | |
FNMA, 2.965% - 2.98%, 6/01/19 - 1/01/40 | | | 7,169,181 | | | | 7,536,971 | |
FNMA, 2.992%, 5/01/39 | | | 9,628,837 | | | | 10,110,218 | |
FNMA, 2.98% - 2.998%, 4/01/25 - 12/01/43 | | | 10,735,697 | | | | 11,349,482 | |
FNMA, 3.008%, 2/01/36 | | | 6,832,414 | | | | 7,205,431 | |
FNMA, 2.998% - 3.013%, 10/01/18 - 10/01/41 | | | 10,141,982 | | | | 10,680,187 | |
FNMA, 3.017%, 3/01/37 | | | 7,415,448 | | | | 7,828,065 | |
FNMA, 3.013% - 3.027%, 7/01/26 - 9/01/37 | | | 10,142,514 | | | | 10,662,973 | |
FNMA, 3.035%, 2/01/36 | | | 7,133,677 | | | | 7,546,669 | |
FNMA, 3.027% - 3.05%, 5/01/18 - 11/01/39 | | | 10,495,535 | | | | 11,074,737 | |
FNMA, 3.054%, 11/01/34 | | | 6,617,304 | | | | 6,985,791 | |
FNMA, 3.05% - 3.059%, 4/01/24 - 8/01/40 | | | 10,020,560 | | | | 10,572,862 | |
FNMA, 3.059% - 3.065%, 9/01/24 - 5/01/48 | | | 10,251,814 | | | | 10,830,226 | |
FNMA, 3.066% - 3.077%, 10/01/17 - 6/01/38 | | | 9,691,649 | | | | 10,202,544 | |
FNMA, 3.078% - 3.093%, 4/01/18 - 3/01/41 | | | 10,915,170 | | | | 11,496,138 | |
FNMA, 3.103%, 7/01/40 | | | 6,762,490 | | | | 7,178,169 | |
FNMA, 3.094% - 3.104%, 12/01/19 - 4/01/37 | | | 9,267,563 | | | | 9,741,823 | |
FNMA, 3.108%, 11/01/34 | | | 7,233,653 | | | | 7,650,040 | |
FNMA, 3.104% - 3.113%, 9/01/19 - 1/01/42 | | | 10,935,899 | | | | 11,559,101 | |
FNMA, 3.115% - 3.128%, 6/01/17 - 7/01/42 | | | 10,965,511 | | | | 11,575,225 | |
FNMA, 3.13%, 12/01/36 | | | 8,882,139 | | | | 9,342,832 | |
FNMA, 3.134%, 9/01/37 | | | 4,698,230 | | | | 4,974,012 | |
FNMA, 3.136%, 6/01/35 | | | 5,170,588 | | | | 5,488,013 | |
FNMA, 3.144%, 9/01/36 | | | 5,508,782 | | | | 5,791,407 | |
FNMA, 3.128% - 3.148%, 3/01/32 - 5/01/48 | | | 7,082,644 | | | | 7,488,459 | |
FNMA, 3.156%, 1/01/36 | | | 6,797,551 | | | | 7,224,753 | |
FNMA, 3.157%, 2/01/43 | | | 6,023,166 | | | | 6,371,257 | |
FNMA, 3.148% - 3.163%, 12/01/21 - 9/01/38 | | | 8,908,912 | | | | 9,393,442 | |
FNMA, 3.163% - 3.176%, 11/01/17 - 10/01/40 | | | 8,069,852 | | | | 8,528,655 | |
FNMA, 3.178% - 3.183%, 3/01/26 - 12/01/36 | | | 9,147,515 | | | | 9,665,758 | |
FNMA, 3.184%, 9/01/39 | | | 5,035,036 | | | | 5,326,985 | |
FNMA, 3.183% - 3.193%, 1/01/33 - 11/01/38 | | | 9,307,888 | | | | 9,798,621 | |
FNMA, 3.207%, 1/01/37 | | | 7,334,380 | | | | 7,788,537 | |
FNMA, 3.193% - 3.208%, 9/01/25 - 11/01/38 | | | 10,976,177 | | | | 11,592,549 | |
FNMA, 3.208% - 3.215%, 12/01/32 - 3/01/42 | | | 8,930,306 | | | | 9,406,716 | |
FNMA, 3.218% - 3.222%, 1/01/33 - 9/01/40 | | | 10,841,563 | | | | 11,448,938 | |
FNMA, 3.238%, 3/01/35 | | | 10,902,419 | | | | 11,516,328 | |
FNMA, 3.247%, 3/01/41 | | | 8,844,329 | | | | 9,348,810 | |
FNMA, 3.224% - 3.253%, 12/01/22 - 4/01/38 | | | 10,968,497 | | | | 11,565,218 | |
FNMA, 3.253% - 3.279%, 3/01/33 - 11/01/41 | | | 9,997,658 | | | | 10,530,186 | |
FNMA, 3.281% - 3.285%, 4/01/33 - 10/01/37 | | | 9,630,571 | | | | 10,184,007 | |
| | | | |
| | | |
34 | | Semiannual Report | | franklintempleton.com |
FRANKLIN INVESTORS SECURITIES TRUST
STATEMENT OF INVESTMENTS (UNAUDITED)
Franklin Adjustable U.S. Government Securities Fund (continued)
| | | | | | | | |
| | | Principal
Amount | | | Value | |
Mortgage-Backed Securities (continued) | | | | | | | | |
a Federal National Mortgage Association (FNMA) Adjustable Rate (continued) | | | | | | | | |
FNMA, 3.288%, 1/01/39 | | $ | 7,620,621 | | | $ | 8,047,145 | |
FNMA, 3.294%, 4/01/34 | | | 26,694,156 | | | | 28,092,497 | |
FNMA, 3.285% - 3.309%, 10/01/18 - 11/01/38 | | | 9,395,341 | | | | 9,926,380 | |
FNMA, 3.31%, 8/01/35 | | | 4,757,808 | | | | 5,037,016 | |
FNMA, 3.31% - 3.316%, 4/01/33 - 8/01/39 | | | 9,733,655 | | | | 10,269,037 | |
FNMA, 3.319% - 3.361%, 3/01/24 - 3/01/40 | | | 10,938,797 | | | | 11,564,019 | |
FNMA, 3.362% - 3.416%, 5/01/21 - 1/01/42 | | | 10,356,499 | | | | 10,911,135 | |
FNMA, 3.444%, 9/01/35 | | | 4,683,417 | | | | 4,959,343 | |
FNMA, 3.42% - 3.445%, 5/01/25 - 2/01/41 | | | 10,520,689 | | | | 11,105,677 | |
FNMA, 3.445%, 1/01/36 | | | 6,162,369 | | | | 6,486,077 | |
FNMA, 3.468%, 5/01/40 | | | 6,745,247 | | | | 7,128,453 | |
FNMA, 3.447% - 3.507%, 10/01/21 - 9/01/37 | | | 8,968,721 | | | | 9,488,025 | |
FNMA, 3.513% - 3.566%, 1/01/25 - 6/01/38 | | | 8,626,208 | | | | 9,133,539 | |
FNMA, 3.567% - 3.626%, 6/01/25 - 3/01/47 | | | 10,701,762 | | | | 11,332,963 | |
FNMA, 3.635% - 4.036%, 12/01/17 - 11/01/46 | | | 11,000,000 | | | | 11,570,356 | |
FNMA, 4.045% - 7.67%, 9/01/17 - 3/01/38 | | | 1,657,978 | | | | 1,693,777 | |
| | | | | | | | |
| | | | | | | 847,619,759 | |
| | | | | | | | |
a Government National Mortgage Association (GNMA) Adjustable Rate 0.1% | | | | | | | | |
GNMA, 2.00% - 2.25%, 9/20/33 - 5/20/36 | | | 1,428,079 | | | | 1,467,486 | |
| | | | | | | | |
Total Mortgage-Backed Securities (Cost $1,115,083,438) | | | | | | | 1,120,421,648 | |
| | | | | | | | |
| | | Shares | | | | |
Short Term Investments (Cost $30,179,621) 2.6% | | | | | | | | |
Money Market Funds 2.6% | | | 30,179,621 | | | | 30,179,621 | |
| | | | | | | | |
b,c Institutional Fiduciary Trust Money Market Portfolio, 0.37% | | | | | | | | |
Total Investments (Cost $1,145,263,059) 99.2% | | | | | | | 1,150,601,269 | |
Other Assets, less Liabilities 0.8% | | | | | | | 9,270,645 | |
| | | | | | | | |
Net Assets 100.0% | | | | | | $ | 1,159,871,914 | |
| | | | | | | | |
aThe coupon rate shown represents the rate at period end.
bSee Note 3(f) regarding investments in affiliated management investment companies.
cThe rate shown is the annualized seven-day yield at period end.
| | | | |
| | | |
franklintempleton.com | | The accompanying notes are an integral part of these financial statements. | Semiannual Report | | 35 |
FRANKLIN INVESTORS SECURITIES TRUST
Financial Highlights
Franklin Floating Rate Daily Access Fund
| | | | | | | | | | | | | | | | | | | | | | | | |
| | | Six Months Ended April 30, 2017 (unaudited) | | | | | | | | | | | |
| | | | Year Ended October 31, |
| | | | 2016 | | 2015 | | 2014 | | 2013 | | 2012 |
Class A | | | | | | | | | | | | | | | | | | | | | | | | |
| | | | | | |
Per share operating performance | | | | | | | | | | | | | | | | | | | | | | | | |
| | | | | | |
(for a share outstanding throughout the period) | | | | | | | | | | | | | | | | | | | | | | | | |
| | | | | | |
Net asset value, beginning of period | | | $ 8.84 | | | | $ 8.61 | | | | $ 9.04 | | | | $ 9.20 | | | | $ 9.11 | | | | $ 8.89 | |
| | | | | | |
Income from investment operationsa: | | | | | | | | | | | | | | | | | | | | | | | | |
| | | | | | |
Net investment income | | | 0.149 | | | | 0.401 | | | | 0.406 | | | | 0.335 | | | | 0.333 | | | | 0.403 | |
| | | | | | |
Net realized and unrealized gains (losses) | | | 0.040 | | | | 0.228 | | | | (0.434 | ) | | | (0.160 | ) | | | 0.088 | | | | 0.225 | |
| | | | | | |
Total from investment operations | | | 0.189 | | | | 0.629 | | | | (0.028 | ) | | | 0.175 | | | | 0.421 | | | | 0.628 | |
| | | | | | |
Less distributions from net investment income | | | (0.149 | ) | | | (0.399 | ) | | | (0.402 | ) | | | (0.335 | ) | | | (0.331 | ) | | | (0.408 | ) |
| | | | | | |
Net asset value, end of period | | | $ 8.88 | | | | $ 8.84 | | | | $ 8.61 | | | | $ 9.04 | | | | $ 9.20 | | | | $ 9.11 | |
| | | | | | |
Total returnb | | | 2.15% | | | | 7.60% | | | | (0.37)% | | | | 1.91% | | | | 4.69% | | | | 7.22% | |
| | | | | | |
Ratios to average net assetsc | | | | | | | | | | | | | | | | | | | | | | | | |
| | | | | | |
Expenses before waiver and payments by affiliates | | | 0.87% | | | | 0.88% | | | | 0.85% | | | | 0.84% | | | | 0.83% | | | | 0.90% | |
| | | | | | |
Expenses net of waiver and payments by affiliates | | | 0.81%d | | | | 0.86%d | | | | 0.84%d | | | | 0.82%d | | | | 0.83%d,e | | | | 0.90% | |
| | | | | | |
Net investment income | | | 3.37% | | | | 4.72% | | | | 4.55% | | | | 3.64% | | | | 3.60% | | | | 4.52% | |
| | | | | | |
Supplemental data | | | | | | | | | | | | | | | | | | | | | | | | |
| | | | | | |
Net assets, end of period (000’s) | | | $1,455,825 | | | | $1,359,862 | | | | $1,553,100 | | | | $1,874,867 | | | | $1,991,138 | | | | $1,295,166 | |
| | | | | | |
Portfolio turnover rate | | | 43.26% | | | | 34.10% | | | | 46.72% | | | | 83.93% | | | | 42.72% | | | | 80.88% | |
aThe amount shown for a share outstanding throughout the period may not correlate with the Statement of Operations for the period due to the timing of sales and repurchases of the Fund’s shares in relation to income earned and/or fluctuating fair value of the investments of the Fund.
bTotal return does not reflect sales commissions or contingent deferred sales charges, if applicable, and is not annualized for periods less than one year.
cRatios are annualized for periods less than one year.
dBenefit of expense reduction rounds to less than 0.01%.
eBenefit of waiver and payments by affiliates rounds to less than 0.01%.
| | | | |
| | | |
36 | | Semiannual Report | The accompanying notes are an integral part of these financial statements. | | franklintempleton.com |
FRANKLIN INVESTORS SECURITIES TRUST
FINANCIAL HIGHLIGHTS
Franklin Floating Rate Daily Access Fund (continued)
| | | | | | | | | | | | | | | | | | | | | | | | |
| | | Six Months Ended April 30, 2017 (unaudited) | | | | | | | | | | | |
| | | | Year Ended October 31, |
| | | | 2016 | | 2015 | | 2014 | | 2013 | | 2012 |
Class C | | | | | | | | | | | | | | | | | | | | | | | | |
Per share operating performance | | | | | | | | | | | | | | | | | | | | | | | | |
(for a share outstanding throughout the period) | | | | | | | | | | | | | | | | | | | | | | | | |
Net asset value, beginning of period | | | $ 8.84 | | | $ | 8.61 | | | $ | 9.05 | | | $ | 9.20 | | | $ | 9.11 | | | $ | 8.89 | |
Income from investment operationsa: | | | | | | | | | | | | | | | | | | | | | | | | |
Net investment income | | | 0.132 | | | | 0.366 | | | | 0.369 | | | | 0.298 | | | | 0.296 | | | | 0.368 | |
Net realized and unrealized gains (losses) | | | 0.040 | | | | 0.229 | | | | (0.443 | ) | | | (0.150 | ) | | | 0.088 | | | | 0.224 | |
Total from investment operations | | | 0.172 | | | | 0.595 | | | | (0.074 | ) | | | 0.148 | | | | 0.384 | | | | 0.592 | |
Less distributions from net investment income | | | (0.132 | ) | | | (0.365 | ) | | | (0.366 | ) | | | (0.298 | ) | | | (0.294 | ) | | | (0.372 | ) |
Net asset value, end of period | | | $ 8.88 | | | $ | 8.84 | | | $ | 8.61 | | | $ | 9.05 | | | $ | 9.20 | | | $ | 9.11 | |
Total returnb | | | 1.95 | % | | | 7.18 | % | | | (0.87 | )% | | | 1.62 | % | | | 4.28 | % | | | 6.79 | % |
| | | | | | |
Ratios to average net assetsc | | | | | | | | | | | | | | | | | | | | | | | | |
Expenses before waiver and payments by affiliates | | | 1.27 | % | | | 1.28 | % | | | 1.25 | % | | | 1.24 | % | | | 1.23 | % | | | 1.30 | % |
Expenses net of waiver and payments by affiliates | | | 1.21 | %d | | | 1.26 | %d | | | 1.24 | %d | | | 1.22 | %d | | | 1.23 | %d,e | | | 1.30 | % |
Net investment income | | | 2.97 | % | | | 4.32 | % | | | 4.15 | % | | | 3.24 | % | | | 3.20 | % | | | 4.12 | % |
| | | | | | |
Supplemental data | | | | | | | | | | | | | | | | | | | | | | | | |
Net assets, end of period (000’s) | | | $596,792 | | | $ | 551,726 | | | $ | 627,805 | | | $ | 742,602 | | | $ | 765,839 | | | $ | 431,818 | |
Portfolio turnover rate | | | 43.26 | % | | | 34.10 | % | | | 46.72 | % | | | 83.93 | % | | | 42.72 | % | | | 80.88 | % |
aThe amount shown for a share outstanding throughout the period may not correlate with the Statement of Operations for the period due to the timing of sales and repurchases of the Fund’s shares in relation to income earned and/or fluctuating fair value of the investments of the Fund.
bTotal return does not reflect sales commissions or contingent deferred sales charges, if applicable, and is not annualized for periods less than one year.
cRatios are annualized for periods less than one year.
dBenefit of expense reduction rounds to less than 0.01%.
eBenefit of waiver and payments by affiliates rounds to less than 0.01%.
| | | | |
| | | |
franklintempleton.com | | The accompanying notes are an integral part of these financial statements. | Semiannual Report | | 37 |
FRANKLIN INVESTORS SECURITIES TRUST
FINANCIAL HIGHLIGHTS
Franklin Floating Rate Daily Access Fund (continued)
| | | | | | | | | | | | | | | | | | | | |
| | | Six Months Ended April 30, 2017 (unaudited) | | | | |
| | | | Year Ended October 31, | |
| | | | 2016 | | | 2015 | | | 2014 | | | 2013a | |
Class R6 | | | | | | | | | | | | | | | | | | | | |
Per share operating performance | | | | | | | | | | | | | | | | | | | | |
(for a share outstanding throughout the period) | | | | | | | | | | | | | | | | | | | | |
Net asset value, beginning of period | | | $ 8.84 | | | | $ 8.60 | | | | $ 9.05 | | | | $ 9.21 | | | | $ 9.21 | |
Income from investment operationsb: | | | | | | | | | | | | | | | | | | | | |
Net investment income | | | 0.165 | | | | 0.422 | | | | 0.437 | | | | 0.364 | | | | 0.175 | |
Net realized and unrealized gains (losses) | | | 0.039 | | | | 0.245 | | | | (0.457 | ) | | | (0.159 | ) | | | (0.001 | ) |
Total from investment operations | | | 0.204 | | | | 0.667 | | | | (0.020 | ) | | | 0.205 | | | | 0.174 | |
Less distributions from net investment income | | | (0.164 | ) | | | (0.427 | ) | | | (0.430 | ) | | | (0.365 | ) | | | (0.174 | ) |
Net asset value, end of period | | | $ 8.88 | | | | $ 8.84 | | | | $8.60 | | | | $ 9.05 | | | | $ 9.21 | |
| | | | | |
Total returnc | | | 2.32% | | | | 7.96% | | | | (0.16)% | | | | 2.36% | | | | 1.80% | |
| | | | | |
Ratios to average net assetsd | | | | | | | | | | | | | | | | | | | | |
Expenses before waiver and payments by affiliates | | | 0.53% | | | | 0.53% | | | | 0.72% | | | | 0.52% | | | | 0.51% | |
Expenses net of waiver and payments by affiliates | | | 0.47% | e | | | 0.51% | e | | | 0.51% | e | | | 0.50% | e | | | 0.51% | e,f |
Net investment income | | | 3.71% | | | | 5.07% | | | | 4.88% | | | | 3.96% | | | | 3.92% | |
| | | | | |
Supplemental data | | | | | | | | | | | | | | | | | | | | |
Net assets, end of period (000’s) | | | $110,557 | | | | $12,333 | | | | $7 | | | | $465 | | | | $1,339 | |
Portfolio turnover rate | | | 43.26% | | | | 34.10% | | | | 46.72% | | | | 83.93% | | | | 42.72% | |
aFor the period May 1, 2013 (effective date) to October 31, 2013.
bThe amount shown for a share outstanding throughout the period may not correlate with the Statement of Operations for the period due to the timing of sales and repurchases of the Fund’s shares in relation to income earned and/or fluctuating fair value of the investments of the Fund.
cTotal return is not annualized for periods less than one year.
dRatios are annualized for periods less than one year.
eBenefit of expense reduction rounds to less than 0.01%.
fBenefit of waiver and payments by affiliates rounds to less than 0.01%.
| | | | |
| | | |
38 | | Semiannual Report | The accompanying notes are an integral part of these financial statements. | | franklintempleton.com |
FRANKLIN INVESTORS SECURITIES TRUST
FINANCIAL HIGHLIGHTS
Franklin Floating Rate Daily Access Fund (continued)
| | | | | | | | | | | | | | | | | | | | | | | | |
| | | Six Months Ended April 30, 2017 (unaudited) | | | | | | | | | | | |
| | | | Year Ended October 31, |
| | �� | | 2016 | | 2015 | | 2014 | | 2013 | | 2012 |
Advisor Class | | | | | | | | | | | | | | | | | | | | | | | | |
| | | | | | |
Per share operating performance | | | | | | | | | | | | | | | | | | | | | | | | |
| | | | | | |
(for a share outstanding throughout the period) | | | | | | | | | | | | | | | | | | | | | | | | |
| | | | | | |
Net asset value, beginning of period | | | $ 8.85 | | | | $ 8.61 | | | | $ 9.05 | | | | $ 9.20 | | | | $ 9.11 | | | | $ 8.89 | |
| | | | | | |
Income from investment operationsa: | | | | | | | | | | | | | | | | | | | | | | | | |
| | | | | | |
Net investment income | | | 0.159 | | | | 0.422 | | | | 0.427 | | | | 0.358 | | | | 0.355 | | | | 0.426 | |
| | | | | | |
Net realized and unrealized gains (losses) | | | 0.031 | | | | 0.239 | | | | (0.443 | ) | | | (0.150 | ) | | | 0.089 | | | | 0.225 | |
| | | | | | |
Total from investment operations | | | 0.190 | | | | 0.661 | | | | (0.016 | ) | | | 0.208 | | | | 0.444 | | | | 0.651 | |
| | | | | | |
Less distributions from net investment income . | | | (0.160 | ) | | | (0.421 | ) | | | (0.424 | ) | | | (0.358 | ) | | | (0.354 | ) | | | (0.431 | ) |
| | | | | | |
Net asset value, end of period | | | $ 8.88 | | | | $ 8.85 | | | | $ 8.61 | | | | $ 9.05 | | | | $ 9.20 | | | | $ 9.11 | |
| | | | | | |
Total returnb | | | 2.16% | | | | 8.00% | | | | (0.23)% | | | | 2.28% | | | | 4.95% | | | | 7.49% | |
| | | | | | |
Ratios to average net assetsc | | | | | | | | | | | | | | | | | | | | | | | | |
| | | | | | |
Expenses before waiver and paymentsby affiliates | | | 0.62% | | | | 0.63% | | | | 0.60% | | | | 0.59% | | | | 0.58% | | | | 0.65% | |
| | | | | | |
Expenses net of waiver and payments by affiliates | | | 0.56%d | | | | 0.61%d | | | | 0.59%d | | | | 0.57%d | | | | 0.58%d,e | | | | 0.65% | |
| | | | | | |
Net investment income | | | 3.62% | | | | 4.97% | | | | 4.80% | | | | 3.89% | | | | 3.85% | | | | 4.77% | |
| | | | | | |
Supplemental data | | | | | | | | | | | | | | | | | | | | | | | | |
| | | | | | |
Net assets, end of period (000’s) | | | $1,700,081 | | | | $1,108,692 | | | | $1,405,281 | | | | $2,019,477 | | | | $2,374,914 | | | | $739,974 | |
| | | | | | |
Portfolio turnover rate | | | 43.26% | | | | 34.10% | | | | 46.72% | | | | 83.93% | | | | 42.72% | | | | 80.88% | |
aThe amount shown for a share outstanding throughout the period may not correlate with the Statement of Operations for the period due to the timing of sales and repurchases of the Fund’s shares in relation to income earned and/or fluctuating fair value of the investments of the Fund.
bTotal return is not annualized for periods less than one year.
cRatios are annualized for periods less than one year.
dBenefit of expense reduction rounds to less than 0.01%.
eBenefit of waiver and payments by affiliates rounds to less than 0.01%.
| | | | |
| | | |
franklintempleton.com | | The accompanying notes are an integral part of these financial statements. | Semiannual Report | | 39 |
FRANKLIN INVESTORS SECURITIES TRUST
Statement of Investments, April 30, 2017 (unaudited)
Franklin Floating Rate Daily Access Fund
| | | | | | | | | | |
| | | Country | | Shares | | | Value | |
Common Stocks 0.3% | | | | | | | | | | |
Oil & Gas Exploration & Production 0.2% | | | | | | | | | | |
a Samson Resources II LLC | | United States | | | 432,778 | | | $ | 8,547,365 | |
| | | | | | | | | | |
Steel 0.1% | | | | | | | | | | |
a,b Warrior Met Coal Inc. | | United States | | | 96,129 | | | | 1,651,113 | |
| | | | | | | | | | |
| | |
Total Common Stocks (Cost $19,878,527) | | | | | | | 10,198,478 | |
| | | | | | | | | | |
| | | |
| | | | | Principal
Amount* | | | | |
c,d Senior Floating Rate Interests 78.7% | | | | | | | | | | |
Aerospace & Defense 3.2% | | | | | | | | | | |
Avolon TLB Borrower I, Initial Term B-1 Loans, 3.243%, 7/20/20 | | United States | | $ | 14,200,000 | | | | 14,372,431 | |
e Delos Finance S.A.R.L. (ILFC), New Loan, 3.397%, 10/06/23 | | Luxembourg | | | 59,610,818 | | | | 60,231,784 | |
Digitalglobe Inc., Term Loan B, 3.743%, 1/15/24 | | United States | | | 5,402,935 | | | | 5,432,203 | |
Doncasters U.S. Finance LLC, | | | | | | | | | | |
Second Lien Term Loan, 9.50%, 10/09/20 | | United States | | | 6,608,226 | | | | 6,404,474 | |
eTerm B Loans, 4.647%, 4/09/20 | | United States | | | 34,105,364 | | | | 33,451,667 | |
Leidos (Abacus Innovations Corp.), B Term Loan, 3.25%, 8/16/23 | | United States | | | 3,319,115 | | | | 3,356,455 | |
| | | | | | | | | | |
| | | |
| | | | | | | | | 123,249,014 | |
| | | | | | | | | | |
Agricultural Products 0.1% | | | | | | | | | | |
Allflex Holdings III Inc., Second Lien Initial Term Loan, 8.156%, 7/16/21 | | United States | | | 2,287,774 | | | | 2,294,924 | |
| | | | | | | | | | |
Air Freight & Logistics 0.3% | | | | | | | | | | |
XPO Logistics Inc., Loans, 3.405%, 11/01/21 | | United States | | | 10,923,643 | | | | 10,982,358 | |
| | | | | | | | | | |
Airlines 3.3% | | | | | | | | | | |
Air Canada, Term Loan, 3.90%, 10/06/23 | | Canada | | | 33,327,459 | | | | 33,591,313 | |
American Airlines Inc., | | | | | | | | | | |
2017 Replacement Term Loans, 2.993%, 6/27/20 | | United States | | | 9,985,738 | | | | 10,003,213 | |
Class B Term Loans, 3.493%, 4/28/23 | | United States | | | 14,621,025 | | | | 14,670,780 | |
Class B Term Loans, 3.494%, 12/14/23 | | United States | | | 33,022,636 | | | | 33,135,012 | |
e Flying Fortress Inc. (ILFC), New Loan, 3.397%, 10/30/22 | | United States | | | 30,062,918 | | | | 30,344,758 | |
United Air Lines Inc., Class B Term Loans, 3.422%, 4/01/24 | | United States | | | 4,784,343 | | | | 4,804,528 | |
| | | | | | | | | | |
| | | |
| | | | | | | | | 126,549,604 | |
| | | | | | | | | | |
Apparel Retail 2.4% | | | | | | | | | | |
e Ascena Retail Group Inc., Tranche B Term Loan, 5.50%, 8/21/22 | | United States | | | 96,448,452 | | | | 87,406,410 | |
The Men’s Wearhouse Inc., Tranche B Term Loan, 4.50% - 4.563%, 6/18/21 | | United States | | | 5,033,680 | | | | 4,844,917 | |
| | | | | | | | | | |
| | | |
| | | | | | | | | 92,251,327 | |
| | | | | | | | | | |
Auto Parts & Equipment 1.0% | | | | | | | | | | |
American Axle and Manufacturing Inc., Tranche B Term Loan, 3.24%, 4/06/24 | | United States | | | 3,958,745 | | | | 3,947,364 | |
TI Group Automotive Systems LLC, Initial US Term Loan, 3.743%, 6/30/22 | | United States | | | 36,339,238 | | | | 36,611,782 | |
| | | | | | | | | | |
| | | |
| | | | | | | | | 40,559,146 | |
| | | | | | | | | | |
Broadcasting 1.0% | | | | | | | | | | |
Gray Television Inc., Term B-2 Loan, 3.483%, 2/07/24 | | United States | | | 18,917,920 | | | | 19,111,829 | |
e Marshall Broadcasting Group Inc., Term A Loans, 5.00%, 6/28/18 | | United States | | | 553,440 | | | | 553,440 | |
Mission Broadcasting Inc., Term B Loans, 3.994%, 1/17/24 | | United States | | | 1,185,497 | | | | 1,194,944 | |
Nexstar Broadcasting Group Inc., Term B Loans, 3.994%, 1/17/24 | | United States | | | 12,227,994 | | | | 12,325,439 | |
e Nexstar Broadcasting Inc., Term A Loans, 5.50%, 1/17/22 | | United States | | | 3,170,680 | | | | 3,178,607 | |
Sinclair Television Group Inc., Tranche B Term Loans, 3.25%, 1/31/24 | | United States | | | 3,778,411 | | | | 3,792,172 | |
e WXXA-TV LLC and WLAJ-TV LLC, Term A Loans, 5.50%, 1/17/22 | | United States | | | 267,550 | | | | 264,540 | |
| | | | | | | | | | |
| | | |
| | | | | | | | | 40,420,971 | |
| | | | | | | | | | |
| | | | |
| | | |
40 | | Semiannual Report | | franklintempleton.com |
FRANKLIN INVESTORS SECURITIES TRUST
STATEMENT OF INVESTMENTS (UNAUDITED)
Franklin Floating Rate Daily Access Fund (continued)
| | | | | | | | | | | | |
| | | Country | | | Principal Amount* | | | Value | |
| |
c,d Senior Floating Rate Interests (continued) | | | | | | | | | | | | |
Cable & Satellite 3.2% | | | | | | | | | | | | |
Charter Communications Operating LLC (CCO Safari), Term Loan A-1, 2.75%, 5/18/21 | | | United States | | | $ | 29,296,655 | | | $ | 29,307,114 | |
CSC Holdings LLC, March 2017 Incremental Term Loans, 3.244%, 7/17/25 | | | United States | | | | 42,580,694 | | | | 42,610,628 | |
Mediacom LLC/US, Tranche K Term Loan, 3.20%, 2/15/24 | | | United States | | | | 9,056,123 | | | | 9,116,500 | |
UPC Financing Partnership, Facility AP, 3.744%, 4/15/25 | | | United States | | | | 17,720,000 | | | | 17,806,385 | |
Virgin Media Bristol LLC, I Facility, 3.744%, 1/31/25 | | | United States | | | | 24,326,188 | | | | 24,444,778 | |
| | | | | | | | | | | | |
| | | |
| | | | | | | | | | | 123,285,405 | |
| | | | | | | | | | | | |
Casinos & Gaming 1.6% | | | | | | | | | | | | |
Aristocrat Technologies Inc., Tranche B-2 Loans, 3.406%, 10/20/21 | | | United States | | | | 7,181,102 | | | | 7,251,255 | |
Boyd Gaming Corp., eRefinancing Term B Loans, 5.50%, 9/15/23 | | | United States | | | | 15,895,777 | | | | 15,990,866 | |
Term A Loan, 2.695%, 9/15/21 | | | United States | | | | 4,875,253 | | | | 4,881,347 | |
e Caesars Entertainment Operating Co. LLC., Term B Loans, 5.75%, 8/31/24 | | | United States | | | | 2,882,954 | | | | 2,867,337 | |
e Eldorado Resorts Inc., Initial Term Loan, 5.25%, 4/17/24 | | | United States | | | | 12,014,309 | | | | 12,029,327 | |
e Greektown Holdings LLC, Initial Term Loan, 6.00%, 4/25/24 | | | United States | | | | 15,504,386 | | | | 15,539,922 | |
Las Vegas Sands LLC, Term B Loans, 2.99%, 3/29/24 | | | United States | | | | 1,461,074 | | | | 1,464,041 | |
| | | | | | | | | | | | |
| | | |
| | | | | | | | | | | 60,024,095 | |
| | | | | | | | | | | | |
Coal & Consumable Fuels 2.1% | | | | | | | | | | | | |
Bowie Resource Holdings LLC, eFirst Lien Initial Term Loan, 6.75%, 8/14/20 | | | United States | | | | 30,057,858 | | | | 29,256,305 | |
Second Lien Initial Term Loan, 11.75%, 2/16/21 | | | United States | | | | 4,464,778 | | | | 4,120,990 | |
Foresight Energy LLC, Term Loans, 6.75%, 3/28/22 | | | United States | | | | 41,839,875 | | | | 40,676,224 | |
Westmoreland Coal Co., Term Loan, 7.647%, 12/16/20 | | | United States | | | | 7,939,963 | | | | 7,324,616 | |
| | | | | | | | | | | | |
| | | |
| | | | | | | | | | | 81,378,135 | |
| | | | | | | | | | | | |
Commodity Chemicals 1.9% | | | | | | | | | | | | |
Cyanco Intermediate Corp., Initial Term Loan, 5.50%, 5/01/20 | | | United States | | | | 56,293,579 | | | | 56,610,231 | |
e Ineos U.S. Finance LLC., 2024 Dollar Term Loan, 3.743%, 3/31/24 | | | United States | | | | 16,705,583 | | | | 16,828,268 | |
| | | | | | | | | | | | |
| | | |
| | | | | | | | | | | 73,438,499 | |
| | | | | | | | | | | | |
Communications Equipment 0.9% | | | | | | | | | | | | |
Ciena Corp., Refinancing Term Loan, 3.493%, 1/28/22 | | | United States | | | | 16,337,585 | | | | 16,470,328 | |
CommScope Inc., Tranche 5 Term Loans, 3.493%, 12/29/22 | | | United States | | | | 17,153,762 | | | | 17,289,414 | |
| | | | | | | | | | | | |
| | | |
| | | | | | | | | | | 33,759,742 | |
| | | | | | | | | | | | |
Construction Machinery & Heavy Trucks 1.0% | | | | | | | | | | | | |
e Allison Transmission Inc., Term Loans, 2.99%, 9/23/22 | | | United States | | | | 36,857,311 | | | | 37,269,412 | |
| | | | | | | | | | | | |
Data Processing & Outsourced Services 1.6% | | | | | | | | | | | | |
Global Payments Inc., Delayed Draw Term Loan (A-2), 3.196%, 10/31/21 | | | United States | | | | 36,057,214 | | | | 36,124,821 | |
MoneyGram International Inc., Term Loan, 4.397%, 3/27/20 | | | United States | | | | 23,123,614 | | | | 23,176,613 | |
e Neustar Inc., Term Loan B1, 6.25%, 9/01/19 | | | United States | | | | 720,000 | | | | 731,588 | |
| | | | | | | | | | | | |
| | | |
| | | | | | | | | | | 60,033,022 | |
| | | | | | | | | | | | |
Diversified Chemicals 1.8% | | | | | | | | | | | | |
e Chemours Co., Tranche B-1 US Term Loans, 3.49%, 5/12/22 | | | United States | | | | 37,812,879 | | | | 38,066,944 | |
e Huntsman International LLC, Term Loan B, 3.743%, 10/01/21 | | | United States | | | | 2,795,489 | | | | 2,826,046 | |
e OCI Beaumont LLC, Term B-3 Loan, 8.025%, 8/20/19 | | | United States | | | | 26,941,532 | | | | 27,783,455 | |
Unifrax I LLC, Initial Dollar Term Loans, 4.90%, 4/04/24 | | | United States | | | | 2,111,331 | | | | 2,121,007 | |
| | | | | | | | | | | | |
| | | |
| | | | | | | | | | | 70,797,452 | |
| | | | | | | | | | | | |
Diversified Metals & Mining 1.4% | | | | | | | | | | | | |
e FMG America Finance Inc. (Fortescue Metals Group), Loans, 3.75%, 6/30/19 | | | Australia | | | | 54,855,314 | | | | 55,260,037 | |
| | | | | | | | | | | | |
| | | | |
| | | |
franklintempleton.com | | Semiannual Report | | 41 |
FRANKLIN INVESTORS SECURITIES TRUST
STATEMENT OF INVESTMENTS (UNAUDITED)
Franklin Floating Rate Daily Access Fund (continued)
| | | | | | | | | | | | |
| | | Country | | | Principal
Amount* | | | Value | |
| |
c,d Senior Floating Rate Interests (continued) | | | | | | | | | | | | |
Diversified Real Estate Activities 0.3% | | | | | | | | | | | | |
Realogy Group LLC, Initial Term A Loans, 2.99%, 10/23/20 | | | United States | | | $ | 12,784,335 | | | $ | 12,808,305 | |
| | | | | | | | | | | | |
Diversified Support Services 0.2% | | | | | | | | | | | | |
Ventia Pty. Ltd., Term B Loans (USD), 4.662%, 5/21/22 | | | Australia | | | | 7,261,041 | | | | 7,333,652 | |
| | | | | | | | | | | | |
Electric Utilities 0.1% | | | | | | | | | | | | |
EFS Cogen Holdings I LLC (Linden), Term B Advance, 4.65%, 6/28/23 | | | United States | | | | 3,112,224 | | | | 3,139,456 | |
| | | | | | | | | | | | |
Electronic Equipment & Instruments 0.0%† | | | | | | | | | | | | |
Zebra Technologies Corp., Second Amendment Refinancing Term Loan, 3.60%, 10/27/21 | | | United States | | | | 1,756,570 | | | | 1,775,789 | |
| | | | | | | | | | | | |
Fertilizers & Agricultural Chemicals 0.1% | | | | | | | | | | | | |
e Mosaic Co., Term Loan A, 4.50%, 11/18/21 | | | United States | | | | 4,299,217 | | | | 4,272,347 | |
| | | | | | | | | | | | |
Food Distributors 0.3% | | | | | | | | | | | | |
e Aramark Corp., U.S. Term A Loan, 4.75%, 3/28/22 | | | United States | | | | 12,014,309 | | | | 12,055,615 | |
| | | | | | | | | | | | |
Forest Products 0.8% | | | | | | | | | | | | |
Appvion Inc., Term Loan, 7.75%, 6/28/19 | | | United States | | | | 30,211,103 | | | | 29,493,589 | |
| | | | | | | | | | | | |
General Merchandise Stores 2.6% | | | | | | | | | | | | |
e 99 Cents Only Stores, Tranche B-2 Loan, 4.554% - 4.647%, 1/11/19 | | | United States | | | | 42,904,848 | | | | 40,357,373 | |
Dollar Tree Inc., Term A-1 Loans, 2.75%, 7/06/20 | | | United States | | | | 10,220,707 | | | | 10,191,834 | |
e Evergreen AcqCo. 1 LP (Savers), Term Loan, 5.00%, 7/09/19 | | | United States | | | | 56,690,720 | | | | 51,942,872 | |
| | | | | | | | | | | | |
| | | |
| | | | | | | | | | | 102,492,079 | |
| | | | | | | | | | | | |
Health Care Distributors 0.4% | | | | | | | | | | | | |
Mallinckrodt International Finance SA/CB LLC, Extended Term Loan B, 3.897%, 9/24/24 | | | United States | | | | 15,850,000 | | | | 15,868,830 | |
| | | | | | | | | | | | |
Health Care Equipment 0.2% | | | | | | | | | | | | |
Carestream Health Inc., Term Loan, 5.147%, 6/07/19 | | | United States | | | | 6,504,659 | | | | 6,466,041 | |
| | | | | | | | | | | | |
Health Care Facilities 1.2% | | | | | | | | | | | | |
e Community Health Systems Inc., 2019 Term A Loans, 3.493% - 3.554%, 1/27/19 | | | United States | | | | 28,137,472 | | | | 28,168,254 | |
HCA Inc., Tranche A-5 Term Loan, 2.493%, 6/10/20 | | | United States | | | | 19,066,226 | | | | 19,104,359 | |
| | | | | | | | | | | | |
| | | |
| | | | | | | | | | | 47,272,613 | |
| | | | | | | | | | | | |
Health Care Services 0.8% | | | | | | | | | | | | |
DaVita Healthcare Partners Inc., Tranche A Term Loan, 2.993%, 6/24/19 | | | United States | | | | 15,038,420 | | | | 15,108,920 | |
Envision Healthcare Corp. (Emergency Medical), Initial Term Loans, 4.15%, 12/01/23 | | | United States | | | | 13,545,399 | | | | 13,694,615 | |
e US Renal Care Inc., Intial Term Loan, 7.25%, 12/31/22 | | | United States | | | | 2,708,744 | | | | 2,552,146 | |
| | | | | | | | | | | | |
| | | |
| | | | | | | | | | | 31,355,681 | |
| | | | | | | | | | | | |
Hotels, Resorts & Cruise Lines 0.7% | | | | | | | | | | | | |
Hilton Worldwide Finance LLC, Series B-2 Term Loans, 2.991%, 10/25/23 | | | United States | | | | 19,779,950 | | | | 19,977,749 | |
e Station Casinos LLC, Revolving Commitment, 5.50%, 6/08/21 | | | United States | | | | 8,232,000 | | | | 7,892,430 | |
| | | | | | | | | | | | |
| | | |
| | | | | | | | | | | 27,870,179 | |
| | | | | | | | | | | | |
Household Products 0.3% | | | | | | | | | | | | |
Spectrum Brands Inc., | | | | | | | | | | | | |
Term Loans, 2.852% - 3.486%, 6/23/22 | | | United States | | | | 9,029,242 | | | | 9,113,891 | |
eUSD Term Loans, 5.00%, 6/23/22 | | | United States | | | | 1,031,513 | | | | 1,039,106 | |
| | | | | | | | | | | | |
| | | |
| | | | | | | | | | | 10,152,997 | |
| | | | | | | | | | | | |
Independent Power Producers & Energy Traders 5.5% | | | | | | | | | | | | |
e Calpine Construction Finance Co. LP, Term B-1 Loan, 3.24%, 5/03/20 | | | United States | | | | 59,964,009 | | | | 60,188,874 | |
Calpine Corp., Term Loan (B5), 3.90%, 1/15/24 | | | United States | | | | 19,314,017 | | | | 19,404,561 | |
e Helix Gen Funding LLC, Term Loan B, 6.75%, 5/01/24 | | | United States | | | | 36,212,880 | | | | 36,674,594 | |
| | | | |
| | | |
42 | | Semiannual Report | | franklintempleton.com |
FRANKLIN INVESTORS SECURITIES TRUST
STATEMENT OF INVESTMENTS (UNAUDITED)
Franklin Floating Rate Daily Access Fund (continued)
| | | | | | | | | | | | |
| | | Country | | | Principal Amount* | | | Value | |
| |
c,d Senior Floating Rate Interests (continued) | | | | | | | | | | | | |
Independent Power Producers & Energy Traders (continued) | | | | | | | | | | | | |
Lightstone Holdco LLC, | | | | | | | | | | | | |
Initial Term B Loan, 5.539%, 1/30/24 | | | United States | | | $ | 16,742,167 | | | $ | 16,858,759 | |
Initial Term C Loan, 5.50%, 1/30/24 | | | United States | | | | 1,032,869 | | | | 1,040,062 | |
NRG Energy Inc., Term Loans, 3.243%, 6/30/23 | | | United States | | | | 76,117,771 | | | | 76,538,018 | |
| | | | | | | | | | | | |
| | | |
| | | | | | | | | | | 210,704,868 | |
| | | | | | | | | | | | |
Industrial Machinery 2.5% | | | | | | | | | | | | |
Harsco Corp., Initial Term Loan, 6.00%, 11/02/23 | | | United States | | | | 3,188,462 | | | | 3,258,209 | |
e Mueller Water Products Inc., Loans, 3.493% - 3.647%, 11/25/21 | | | United States | | | | 9,147,489 | | | | 9,265,647 | |
Navistar Inc., Tranche B Term Loans, 5.00%, 8/07/20 | | | United States | | | | 55,083,196 | | | | 55,863,560 | |
f Onsite Rental Group Operations Pty. Ltd., Term B Loan, 5.50%, 7/30/21 | | | Australia | | | | 40,657,849 | | | | 26,834,180 | |
| | | | | | | | | | | | |
| | | |
| | | | | | | | | | | 95,221,596 | |
| | | | | | | | | | | | |
Integrated Telecommunication Services 2.9% | | | | | | | | | | | | |
e Consolidated Communications Inc., Term Loan B-2, 6.00%, 10/05/23 | | | United States | | | | 4,278,791 | | | | 4,315,161 | |
Global Tel*Link Corp., | | | | | | | | | | | | |
eSecond Lien Term Loan, 9.00%, 11/20/20 | | | United States | | | | 6,033,937 | | | | 6,018,852 | |
Term Loan, 5.00%, 5/23/20 | | | United States | | | | 7,411,566 | | | | 7,411,566 | |
e Securus Technologies Holdings Inc., Second Lien Term Loan, 9.00%, 4/17/21 | | | United States | | | | 666,667 | | | | 666,042 | |
Zayo Group LLC, 2017 Incremental Refinancing B-1 Term Loan, 2.991%, 1/19/21 | | | United States | | | | 91,300,000 | | | | 91,927,687 | |
| | | | | | | | | | | | |
| | | |
| | | | | | | | | | | 110,339,308 | |
| | | | | | | | | | | | |
Internet Software & Services 0.1% | | | | | | | | | | | | |
Rackspace Hosting Inc., 2016 Refinancing Term B Loan, 4.535%, 11/03/23 | | | United States | | | | 5,314,103 | | | | 5,357,832 | |
| | | | | | | | | | | | |
IT Consulting & Other Services 1.7% | | | | | | | | | | | | |
Gartner Inc., Tranche A Term Loans, 2.993%, 3/21/22 | | | United States | | | | 3,140,605 | | | | 3,154,345 | |
Sungard Availability Services Capital Inc., Tranche B Term Loan, 6.00%, 3/29/19 | | | United States | | | | 63,973,532 | | | | 63,333,796 | |
| | | | | | | | | | | | |
| | | |
| | | | | | | | | | | 66,488,141 | |
| | | | | | | | | | | | |
Leisure Facilities 1.8% | | | | | | | | | | | | |
24 Hour Fitness Worldwide Inc., Term Loan, 4.897%, 5/28/21 | | | United States | | | | 30,556,178 | | | | 30,460,690 | |
e Fitness International LLC, Term A Loan, 4.243%, 4/01/20 | | | United States | | | | 40,107,694 | | | | 40,107,694 | |
| | | | | | | | | | | | |
| | | |
| | | | | | | | | | | 70,568,384 | |
| | | | | | | | | | | | |
Life Sciences Tools & Services 0.5% | | | | | | | | | | | | |
e Quintiles IMS Inc., Term Loan B, 5.00%, 3/02/24 | | | United States | | | | 18,952,500 | | | | 19,149,928 | |
| | | | | | | | | | | | |
Marine 0.4% | | | | | | | | | | | | |
Navios Maritime Partners LP, Initial Term Loan, 6.13%, 9/14/20 | | | Greece | | | | 15,000,000 | | | | 14,824,995 | |
| | | | | | | | | | | | |
Metal & Glass Containers 0.6% | | | | | | | | | | | | |
Owens-Brockway Glass Container Inc., Term A Loan, 2.695% - 2.742%, 4/22/20 | | | United States | | | | 22,287,953 | | | | 22,287,953 | |
| | | | | | | | | | | | |
Movies & Entertainment 2.6% | | | | | | | | | | | | |
AMC Entertainment Holdings Inc., 2016 Incremental Term Commitments, 3.742%, 12/15/23 | | | United States | | | | 3,358,489 | | | | 3,386,617 | |
Cinemark USA Inc., Amended Term Loan Facility, 3.24%, 5/08/22 | | | United States | | | | 1,227,095 | | | | 1,241,156 | |
e Lions Gate Entertainment Corp., Term A Loan, 3.482%, 12/08/21 | | | United States | | | | 72,061,115 | | | | 72,466,458 | |
Live Nation Entertainment Inc., Term B-2 Loans, 3.50%, 10/31/23 | | | United States | | | | 6,820,683 | | | | 6,874,996 | |
Regal Cinemas Corp., Term Loan, 3.493%, 4/01/22 | | | United States | | | | 15,619,549 | | | | 15,808,686 | |
| | | | | | | | | | | | |
| | | |
| | | | | | | | | | | 99,777,913 | |
| | | | | | | | | | | | |
Office Services & Supplies 0.2% | | | | | | | | | | | | |
Conduent Business Services LLC, Delayed Draw Term A Loan, 3.243%, 12/07/21 | | | United States | | | | 8,000,000 | | | | 7,985,000 | |
| | | | | | | | | | | | |
Oil & Gas Equipment & Services 0.3% | | | | | | | | | | | | |
McDermott Finance LLC, Term Loan, 8.397%, 4/16/19 | | | United States | | | | 11,490,217 | | | | 11,669,752 | |
| | | | | | | | | | | | |
| | | | |
| | | |
franklintempleton.com | | Semiannual Report | | 43 |
FRANKLIN INVESTORS SECURITIES TRUST
STATEMENT OF INVESTMENTS (UNAUDITED)
Franklin Floating Rate Daily Access Fund (continued)
| | | | | | | | | | | | |
| | | Country | | | Principal Amount* | | | Value | |
| |
c,d Senior Floating Rate Interests (continued) | | | | | | | | | | | | |
Oil & Gas Exploration & Production 3.2% | | | | | | | | | | | | |
e Fieldwood Energy LLC, Loans, 3.875%, 10/01/18 | | | United States | | | $ | 84,633,286 | | | $ | 82,834,828 | |
UTEX Industries Inc., First Lien Initial Term Loan, 5.00%, 5/21/21 | | | United States | | | | 42,235,679 | | | | 39,134,018 | |
| | | | | | | | | | | | |
| | | |
| | | | | | | | | | | 121,968,846 | |
| | | | | | | | | | | | |
Oil & Gas Storage & Transportation 1.5% | | | | | | | | | | | | |
Energy Transfer Equity LP, Loans, 3.733%, 2/02/24 | | | United States | | | | 17,571,354 | | | | 17,621,556 | |
International Seaways Inc., Initial Term Loan, 5.79%, 8/05/19 | | | United States | | | | 13,269,466 | | | | 13,258,412 | |
OSG Bulk Ships Inc., Initial Term Loan, 5.29%, 8/05/19 | | | United States | | | | 21,276,970 | | | | 20,975,539 | |
e Strike LLC, Term Loan, 9.291%, 11/10/22 | | | United States | | | | 6,122,500 | | | | 6,244,950 | |
| | | | | | | | | | | | |
| | | |
| | | | | | | | | | | 58,100,457 | |
| | | | | | | | | | | | |
Packaged Foods & Meats 1.6% | | | | | | | | | | | | |
e CSM Bakery Supplies LLC, | | | | | | | | | | | | |
Second Lien Term Loan, 8.90%, 7/03/21 | | | United States | | | | 15,590,519 | | | | 13,446,823 | |
Term Loans, 5.15%, 7/03/20 | | | United States | | | | 8,832,746 | | | | 8,265,975 | |
e JBS USA LUX SA, New Initial Term Loans, 3.483%, 10/30/22 | | | Brazil | | | | 37,674,706 | | | | 37,857,202 | |
Pinnacle Foods Finance LLC, Initial Term Loans, 2.983%, 2/03/24 | | | United States | | | | 2,309,445 | | | | 2,326,593 | |
| | | | | | | | | | | | |
| | | |
| | | | | | | | | | | 61,896,593 | |
| | | | | | | | | | | | |
Paper Packaging 0.6% | | | | | | | | | | | | |
Caraustar Industries Inc., Refinancing Term Loans, 6.647%, 3/14/22 | | | United States | | | | 23,223,978 | | | | 23,441,702 | |
| | | | | | | | | | | | |
Personal Products 2.7% | | | | | | | | | | | | |
Coty Inc., Term A Loan, 2.483%, 10/27/20 | | | United States | | | | 32,867,533 | | | | 32,840,154 | |
FGI Operating Co. LLC (Freedom Group), Term B Loans, 5.50%, 4/19/19 | | | United States | | | | 72,879,733 | | | | 70,511,142 | |
| | | | | | | | | | | | |
| | | |
| | | | | | | | | | | 103,351,296 | |
| | | | | | | | | | | | |
Pharmaceuticals 3.8% | | | | | | | | | | | | |
e Endo Luxembourg Finance Co. I S.A.R.L and Endo LLC, Initial Term Loans, 7.25%, 4/27/24 | | | United States | | | | 39,996,893 | | | | 40,253,113 | |
Grifols Worldwide Operations USA Inc., Tranche B Term Loan, 3.195%, 1/31/25 | | | United States | | | | 37,127,009 | | | | 37,289,514 | |
Horizon Pharma Inc., Second Amendment Refinancing Term Loans, 4.75%, 3/29/24 | | | United States | | | | 8,481,332 | | | | 8,544,942 | |
RPI Finance Trust, | | | | | | | | | | | | |
Term A-2 Term Loan, 3.397%, 10/14/20 | | | United States | | | | 9,139,976 | | | | 9,157,113 | |
Term B-6 Term Loan, 3.153%, 3/13/23 | | | United States | | | | 4,372,214 | | | | 4,394,758 | |
e Valeant Pharmaceuticals International Inc., Series F Tranche B Term Loan, 5.74%, 4/01/22 | | | United States | | | | 48,793,280 | | | | 49,103,313 | |
| | | | | | | | | | | | |
| | | |
| | | | | | | | | | | 148,742,753 | |
| | | | | | | | | | | | |
Restaurants 0.4% | | | | | | | | | | | | |
KFC Holding Co./Pizza Hut Holdings LLC/Taco Bell of America LLC, Term B Loans, 2.994%, 6/16/23 | | | United States | | | | 9,111,746 | | | | 9,172,494 | |
e NPC International Inc., Second Lien Initial Term Loan, 10.50%, 4/20/25 | | | United States | | | | 8,228,426 | | | | 8,346,710 | |
| | | | | | | | | | | | |
| | | |
| | | | | | | | | | | 17,519,204 | |
| | | | | | | | | | | | |
Retail REITs 0.2% | | | | | | | | | | | | |
Capital Automotive LP, Tranche B-2 Term Loan, 4.00%, 3/24/24 | | | United States | | | | 8,607,418 | | | | 8,689,903 | |
| | | | | | | | | | | | |
Semiconductor Equipment 0.1% | | | | | | | | | | | | |
MKS Instruments Inc., Tranche B-2 Term Loans, 3.743%, 5/01/23 | | | United States | | | | 3,050,402 | | | | 3,086,626 | |
| | | | | | | | | | | | |
Semiconductors 1.2% | | | | | | | | | | | | |
e MACOM Technology Solutions Holdings Inc., Initial Term Loans, 3.989%, 5/07/21 | | | United States | | | | 27,751,088 | | | | 28,167,355 | |
ON Semiconductor Corp., 2017 Replacement Term Loans, 3.243%, 3/31/23 | | | United States | | | | 18,831,093 | | | | 18,962,232 | |
| | | | | | | | | | | | |
| | | |
| | | | | | | | | | | 47,129,587 | |
| | | | | | | | | | | | |
| | | | |
| | | |
44 | | Semiannual Report | | franklintempleton.com |
FRANKLIN INVESTORS SECURITIES TRUST
STATEMENT OF INVESTMENTS (UNAUDITED)
Franklin Floating Rate Daily Access Fund (continued)
| | | | | | | | | | | | |
| | | Country | | | Principal Amount* | | | Value | |
| |
c,d Senior Floating Rate Interests (continued) | | | | | | | | | | | | |
Specialized Consumer Services 1.5% | | | | | | | | | | | | |
Avis Budget Car Rental LLC, Tranche B Term Loan, 3.15%, 3/15/22 | | | United States | | | $ | 23,041,125 | | | $ | 23,101,608 | |
NVA Holdings Inc., | | | | | | | | | | | | |
Second Lien Term Loan, 8.147%, 8/14/22 | | | United States | | | | 307,870 | | | | 311,077 | |
eTerm Loan B-2, 4.647%, 8/14/21 | | | United States | | | | 7,134,935 | | | | 7,208,518 | |
Sabre GLBL Inc., | | | | | | | | | | | | |
Incremental Term A Loan, 3.493%, 7/18/21 | | | United States | | | | 26,907,358 | | | | 27,013,857 | |
Term B Loan, 3.743%, 2/22/24 | | | United States | | | | 1,896,612 | | | | 1,916,763 | |
| | | | | | | | | | | | |
| | | |
| | | | | | | | | | | 59,551,823 | |
| | | | | | | | | | | | |
Specialty Chemicals 1.3% | | | | | | | | | | | | |
Axalta Coating Systems U.S. Holdings Inc., Term B-1 Dollar Loans, 3.647%, 2/01/23 | | | United States | | | | 11,028,720 | | | | 11,152,826 | |
Oxbow Carbon LLC, | | | | | | | | | | | | |
Second Lien Initial Term Loan, 8.00%, 1/17/20 | | | United States | | | | 26,864,314 | | | | 27,032,216 | |
Tranche B Term Loan, 6.25%, 7/19/19 | | | United States | | | | 3,531,637 | | | | 3,540,466 | |
Solenis International LP and Solenis Holdings 3 LLC, Second Lien Term Loan,
7.804%, 7/31/22 | | | United States | | | | 7,800,000 | | | | 7,753,200 | |
| | | | | | | | | | | | |
| | | |
| | | | | | | | | | | 49,478,708 | |
| | | | | | | | | | | | |
Specialty Stores 2.1% | | | | | | | | | | | | |
ePetSmart Inc., Tranche B-2 Loans, 4.02%, 3/11/22 | | | United States | | | | 86,599,569 | | | | 79,942,227 | |
| | | | | | | | | | | | |
Technology Distributors 2.0% | | | | | | | | | | | | |
Dell International LLC, | | | | | | | | | | | | |
Term A-1 Loan, 3.00%, 12/31/18 | | | United States | | | | 10,482,500 | | | | 10,497,574 | |
Term A-3 Loan, 3.00%, 12/31/18 | | | United States | | | | 67,306,123 | | | | 67,481,388 | |
| | | | | | | | | | | | |
| | | |
| | | | | | | | | | | 77,978,962 | |
| | | | | | | | | | | | |
Technology Hardware, Storage & Peripherals 0.7% | | | | | | | | | | | | |
Western Digital Corp., | | | | | | | | | | | | |
eTerm A Loan, 2.993%, 4/29/21 | | | United States | | | | 18,839,286 | | | | 18,988,437 | |
US Term B-2 Loan, 3.743%, 4/29/23 | | | United States | | | | 6,835,507 | | | | 6,898,735 | |
| | | | | | | | | | | | |
| | | |
| | | | | | | | | | | 25,887,172 | |
| | | | | | | | | | | | |
Tires & Rubber 0.3% | | | | | | | | | | | | |
The Goodyear Tire & Rubber Co., Second Lien Term Loan, 2.99%, 4/30/19 | | | United States | | | | 12,281,318 | | | | 12,429,713 | |
| | | | | | | | | | | | |
Trucking 1.6% | | | | | | | | | | | | |
The Hertz Corp., Tranche B-1 Term Loan, 3.743%, 6/30/23 | | | United States | | | | 46,168,213 | | | | 46,280,032 | |
Pilot Travel Centers LLC, Initial Tranche B Term Loans, 2.993%, 5/25/23 | | | United States | | | | 16,159,500 | | | | 16,287,435 | |
| | | | | | | | | | | | |
| | | |
| | | | | | | | | | | 62,567,467 | |
| | | | | | | | | | | | |
Total Senior Floating Rate Interests
(Cost $3,051,069,870) | | | | | | | | | | | 3,040,049,025 | |
| | | | | | | | | | | | |
Asset-Backed Securities 9.3% | | | | | | | | | | | | |
Other Diversified Financial Services 9.3% | | | | | | | | | | | | |
g Apidos CDO, 2013-14A, C2, 144A, 4.85%, 4/15/25 | | | United States | | | | 3,540,000 | | | | 3,556,496 | |
c,g Ballyrock CLO LLC, 2014-1A, BR, 144A, FRN, 3.256%, 10/20/26 | | | United States | | | | 5,200,000 | | | | 5,210,452 | |
c,g Birchwood Park CLO Ltd., 2014-1A, AR, 144A, FRN, 2.338%, 7/15/26 | | | United States | | | | 8,625,000 | | | | 8,641,129 | |
c,g Bluemountain CLO Ltd., 2012-2A, AR, 144A, FRN, 2.472%, 11/20/28 | | | United States | | | | 22,160,000 | | | | 22,339,939 | |
c,g Bristol Park CLO Ltd., 2016-1A, A, 144A, FRN, 2.578%, 4/15/29 | | | United States | | | | 45,000,000 | | | | 45,004,050 | |
c,g Carlyle Global Market Strategies CLO Ltd., | | | | | | | | | | | | |
2014-2A, AR, 144A, FRN, 2.289%,5/15/25 | | | United States | | | | 5,000,000 | | | | 5,001,250 | |
2015-2A, A1, 144A, FRN, 2.64%,4/27/27 | | | United States | | | | 16,535,000 | | | | 16,551,866 | |
| | | | |
| | | |
franklintempleton.com | | Semiannual Report | | 45 |
FRANKLIN INVESTORS SECURITIES TRUST
STATEMENT OF INVESTMENTS (UNAUDITED)
Franklin Floating Rate Daily Access Fund (continued)
| | | | | | | | | | | | |
| | | Country | | | Principal Amount* | | | Value | |
| |
Asset-Backed Securities (continued) | | | | | | | | | | | | |
Other Diversified Financial Services (continued) | | | | | | | | | | | | |
c,g Carlyle U.S. CLO Ltd., 2017-1A, A1A, 144A, FRN, 2.391%, 4/20/31 | | | United States | | | $ | 24,000,000 | | | $ | 24,087,600 | |
c,g Cent CLO LP, | | | | | | | | | | | | |
2013-17A, B, 144A, FRN, 4.039%,1/30/25 | | | United States | | | | 3,850,000 | | | | 3,859,086 | |
2014-22A, A1R, 144A, FRN, 2.444%,11/07/26 | | | United States | | | | 5,000,000 | | | | 5,020,050 | |
2014-22A, BR, 144A, FRN, 3.984%,11/07/26 | | | United States | | | | 7,400,000 | | | | 7,401,110 | |
c,g Eaton Vance CDO Ltd., 2014-1A, AR, 144A, FRN, 2.358%, 7/15/26 | | | United States | | | | 6,510,000 | | | | 6,512,995 | |
g Emerson Park CLO Ltd., 2013-1A, C2R, 144A, 4.055%, 7/15/25 | | | United States | | | | 3,600,000 | | | | 3,582,936 | |
c,g Flatiron CLO Ltd., 2014-1A, A1R, 144A, FRN, 2.338%, 7/17/26 | | | United States | | | | 16,400,000 | | | | 16,403,936 | |
g Highbridge Loan Management Ltd., 2013-2A, B2, 144A, 5.80%, 10/20/24 | | | United States | | | | 3,500,000 | | | | 3,532,375 | |
c,g LCM XXI LP, 21A, A, 144A, FRN, 2.706%, 4/20/28 | | | United States | | | | 30,320,000 | | | | 30,504,649 | |
c,g LCM XXIV Ltd., 24A, A, 144A, FRN, 2.546%, 3/20/30 | | | United States | | | | 52,000,000 | | | | 52,007,800 | |
c,g Madison Park Funding Ltd., 2016-21A, A1, 144A, FRN, 2.568%, 7/25/29 | | | United States | | | | 17,200,000 | | | | 17,251,944 | |
c,g Magnetite XIV Ltd., 2015-14A, A, 144A, FRN, 2.548%, 7/18/28 | | | United States | | | | 3,140,000 | | | | 3,165,434 | |
c,g Octagon Investment Partners 24 Ltd., 2015-1A, A1, 144A, FRN, 2.502%, 5/21/27 | | | United States | | | | 3,300,000 | | | | 3,314,718 | |
c,g Octagon Investment Partners 30 Ltd., 144A, FRN, 2.355%, 3/17/30 | | | United States | | | | 23,071,429 | | | | 23,129,338 | |
c,g Octagon Investment Partners XIX Ltd., 2014-14, AR, 144A, FRN, 2.258%, 4/15/26 | | | United States | | | | 5,600,000 | | | | 5,593,336 | |
c,g Octagon Investment Partners XVII Ltd., 2013-1A, A1, 144A, FRN, 2.486%, 10/25/25 | | | United States | | | | 6,820,000 | | | | 6,839,028 | |
c,g Venture XXIV CLO Ltd., 2016-24A, A1D, 144A, FRN, 2.576%, 10/20/28 | | | United States | | | | 34,000,000 | | | | 34,245,140 | |
c,g Voya CLO Ltd., 2015-1A, A1, 144A, FRN, 2.638%, 4/18/27 | | | United States | | | | 6,900,000 | | | | 6,920,700 | |
c,g Ziggurat CLO I Ltd., 2014-1A, C, 144A, FRN, 4.258%, 10/17/26 | | | United States | | | | 1,340,000 | | | | 1,344,247 | |
| | | | | | | | | | | | |
Total Asset-Backed Securities (Cost $360,314,012) | | | | | | | | | | | 361,021,604 | |
| | | | | | | | | | | | |
Total Investments before Short Term Investments
(Cost $3,431,262,409) | | | | | | | | | | | 3,411,269,107 | |
| | | | | | | | | | | | |
Short Term Investments 21.6% | | | | | | | | | | | | |
U.S. Government and Agency Securities (Cost $66,538,690) 1.7% | | | | | | | | | | | | |
h U.S. Treasury Bill, 6/22/17 | | | United States | | | | 66,600,000 | | | | 66,533,533 | |
| | | | | | | | | | | | |
| | | |
| | | | | | Shares | | | | |
Money Market Funds (Cost $766,726,003) 19.9% | | | | | | | | | | | | |
i,j Institutional Fiduciary Trust Money Market Portfolio, 0.37% | | | United States | | | | 766,726,003 | | | | 766,726,003 | |
| | | | | | | | | | | | |
Total Investments (Cost $4,264,527,102) 109.9% | | | | | | | | | | | 4,244,528,643 | |
Other Assets, less Liabilities (9.9)% | | | | | | | | | | | (381,272,890 | ) |
| | | | | | | | | | | | |
Net Assets 100.0% | | | | | | | | | | $ | 3,863,255,753 | |
| | | | | | | | | | | | |
| | | | |
| | | |
46 | | Semiannual Report | | franklintempleton.com |
FRANKLIN INVESTORS SECURITIES TRUST
STATEMENT OF INVESTMENTS (UNAUDITED)
Franklin Floating Rate Daily Access Fund (continued)
†Rounds to less than 0.1% of net assets.
*The principal amount is stated in U.S. dollars unless otherwise indicated.
aNon-income producing.
bSee Note 8 regarding restricted securities.
cThe coupon rate shown represents the rate at period end.
dSee Note 1(i) regarding senior floating rate interests.
eA portion or all of the security purchased on a delayed delivery basis. See Note 1(c).
fAt April 30, 2017, pursuant to the Fund’s policies and the requirements of applicable securities law, the Fund is restricted from trading these securities at period end.
gSecurity was purchased pursuant to Rule 144A under the Securities Act of 1933 and may be sold in transactions exempt from registration only to qualified institutional buyers or in a public offering registered under the Securities Act of 1933. These securities have been deemed liquid under guidelines approved by the Trust’s Board of Trustees.
hThe security was issued on a discount basis with no stated coupon rate.
i See Note 3(f) regarding investments in affiliated management investment companies.
jThe rate shown is the annualized seven-day yield at period end.
At April 30, 2017, the Fund had the following credit default swap contracts outstanding. See Note 1(d).
Credit Default Swap Contracts
| | | | | | | | | | | | | | | | | | | | | | | | | | | | | | | | | | | | |
| Description | | Periodic
Payment
Rate | | | Exchange | | | Notional
Amount | | | Expiration
Date | | | Unamortized
Upfront
Payments
(Receipts) | | | Unrealized
Appreciation | | | Unrealized
Depreciation | | | Value | | | Rating | |
Centrally Cleared Swap Contracts | | | | | | | | | | | | | | | | | | | | | | | | | |
Contracts to Buy Protection | | | | | | | | | | | | | | | | | | | | | | | | | |
Traded Index | | | | | | | | | | | | | | | | | | | | | | | | | | | | | | | | | | | | |
CDX.NA.HY.26 | | | 5.00 | % | | | ICE | | | $ | 50,688,000 | | | | 6/20/21 | | | $ | (3,950,810 | ) | | $ | — | | | $ | (783,852 | ) | | $ | (4,734,662 | ) | | | | |
| | | | | | | | | | | | | | | | | | | | | | | | |
See Note 10 regarding other derivative information.
See Abbreviations on page 131.
| | | | |
| | | |
franklintempleton.com | | The accompanying notes are an integral part of these financial statements. | Semiannual Report | | 47 |
FRANKLIN INVESTORS SECURITIES TRUST
Financial Highlights
Franklin Low Duration Total Return Fund
| | | | | | | | | | | | | | | | | | | | | | | | | | |
| | | Six Months Ended April 30, 2017 (unaudited) | | | | | | | | | | | | | | | | | | |
| | | | | Year Ended October 31, | |
| | | | | 2016 | | | 2015 | | | 2014 | | | 2013 | | | 2012 | |
| | | | | | | | |
Class A | | | | | | | | | | | | | | | | | | | | | | | | | | |
| | | | | | | |
Per share operating performance | | | | | | | | | | | | | | | | | | | | | | | | | | |
| | | | | | | |
(for a share outstanding throughout the period) | | | | | | | | | | | | | | | | | | | | | | | | | | |
| | | | | | | |
Net asset value, beginning of period | | | $ 9.89 | | | | | | $ 9.91 | | | | $ 10.11 | | | | $ 10.16 | | | | $ 10.29 | | | | $ 10.27 | |
| | | | | | | |
Income from investment operationsa: | | | | | | | | | | | | | | | | | | | | | | | | | | |
| | | | | | | |
Net investment income | | | 0.082 | | | | | | 0.151 | | | | 0.134 | | | | 0.144 | | | | 0.166 | | | | 0.169 | |
| | | | | | | |
Net realized and unrealized gains (losses) | | | 0.018 | | | | | | 0.031 | | | | (0.135 | ) | | | (0.011 | ) | | | (0.032 | ) | | | 0.158 | |
| | | | | | | |
Total from investment operations | | | 0.100 | | | | | | 0.182 | | | | (0.001 | ) | | | 0.133 | | | | 0.134 | | | | 0.327 | |
| | | | | | | |
Less distributions from net investment income and net foreign currency gains | | | (0.130 | ) | | | | | (0.202 | ) | | | (0.199 | ) | | | (0.183 | ) | | | (0.264 | ) | | | (0.307 | ) |
| | | | | | | |
Net asset value, end of period | | | $ 9.86 | | | | | | $ 9.89 | | | | $ 9.91 | | | | $ 10.11 | | | | $ 10.16 | | | | $ 10.29 | |
| | | | | | | |
Total returnb | | | 1.02% | | | | | | 1.88% | | | | (0.02)% | | | | 1.32% | | | | 1.32% | | | | 3.26% | |
| | | | | | | |
Ratios to average net assetsc | | | | | | | | | | | | | | | | | | | | | | | | | | |
| | | | | | | |
Expenses before waiver and payments by affiliates | | | 0.95% | | | | | | 0.95% | | | | 0.96% | | | | 0.93% | | | | 0.98% | | | | 1.01% | |
| | | | | | | |
Expenses net of waiver and payments by affiliates | | | 0.80% | d | | | | | 0.80% | d | | | 0.80% | d | | | 0.80% | d | | | 0.80% | d | | | 0.89% | |
| | | | | | | |
Net investment income | | | 1.74% | | | | | | 1.57% | | | | 1.27% | | | | 1.24% | | | | 1.25% | | | | 1.47% | |
| | | | | | | |
Supplemental data | | | | | | | | | | | | | | | | | | | | | | | | | | |
| | | | | | | |
Net assets, end of period (000’s) | | | $1,457,581 | | | | | | $1,524,437 | | | | $1,656,001 | | | | $1,589,854 | | | | $1,296,612 | | | | $904,878 | |
| | | | | | | |
Portfolio turnover rate | | | 20.40% | | | | | | 44.76% | | | | 41.28% | | | | 78.63% | | | | 64.86% | | | | 51.42% | |
aThe amount shown for a share outstanding throughout the period may not correlate with the Statement of Operations for the period due to the timing of sales and repurchases of the Fund’s shares in relation to income earned and/or fluctuating fair value of the investments of the Fund.
bTotal return does not reflect sales commissions or contingent deferred sales charges, if applicable, and is not annualized for periods less than one year.
cRatios are annualized for periods less than one year.
dBenefit of expense reduction rounds to less than 0.01%.
| | | | |
| | | |
48 | | Semiannual Report | The accompanying notes are an integral part of these financial statements. | | franklintempleton.com |
FRANKLIN INVESTORS SECURITIES TRUST
FINANCIAL HIGHLIGHTS
Franklin Low Duration Total Return Fund (continued)
| | | | | | | | | | | | | | | | | | | | | | | | | | |
| | | Six Months Ended April 30, 2017 (unaudited) | | | | | | | | | | | | | | | | | | |
| | | | | Year Ended October 31, | |
| | | | | 2016 | | | 2015 | | | 2014 | | | 2013 | | | 2012a | |
| | | | | | | | |
Class C | | | | | | | | | | | | | | | | | | | | | | | | | | |
| | | | | | | |
Per share operating performance | | | | | | | | | | | | | | | | | | | | | | | | | | |
| | | | | | | |
(for a share outstanding throughout the period) | | | | | | | | | | | | | | | | | | | | | | | | | | |
| | | | | | | |
Net asset value, beginning of period | | | $ 9.86 | | | | | | $ 9.90 | | | | $ 10.11 | | | | $ 10.16 | | | | $ 10.29 | | | | $ 10.29 | |
| | | | | | | |
Income from investment operationsb: | | | | | | | | | | | | | | | | | | | | | | | | | | |
| | | | | | | |
Net investment income | | | 0.061 | | | | | | 0.113 | | | | 0.104 | | | | 0.098 | | | | 0.189 | | | | 0.013 | |
| | | | | | | |
Net realized and unrealized gains (losses) | | | 0.022 | | | | | | 0.024 | | | | (0.145) | | | | (0.001) | | | | (0.090) | | | | 0.005 | |
| | | | | | | |
Total from investment operations | | | 0.083 | | | | | | 0.137 | | | | (0.041 | ) | | | 0.097 | | | | 0.099 | | | | 0.018 | |
| | | | | | | |
Less distributions from net investment income and net foreign currency gains | | | (0.113 | ) | | | | | (0.177 | ) | | | (0.169 | ) | | | (0.147 | ) | | | (0.229 | ) | | | (0.018 | ) |
| | | | | | | |
Net asset value, end of period | | | $ 9.83 | | | | | | $ 9.86 | | | | $ 9.90 | | | | $ 10.11 | | | | $ 10.16 | | | | $ 10.29 | |
| | | | | | | |
Total returnc | | | 0.85% | | | | | | 1.41% | | | | (0.41)% | | | | 0.96% | | | | 0.97% | | | | 0.17% | |
| | | | | | | |
Ratios to average net assetsd | | | | | | | | | | | | | | | | | | | | | | | | | | |
| | | | | | | |
Expenses before waiver and payments by affiliates | | | 1.34% | | | | | | 1.35% | | | | 1.36% | | | | 1.33% | | | | 1.38% | | | | 1.41% | |
| | | | | | | |
Expenses net of waiver and payments by affiliates | | | 1.19% | e | | | | | 1.20% | e | | | 1.20% | e | | | 1.20% | e | | | 1.20% | e | | | 1.29% | |
| | | | | | | |
Net investment income | | | 1.35% | | | | | | 1.17% | | | | 0.87% | | | | 0.84% | | | | 0.84% | | | | 1.07% | |
| | | | | | | |
Supplemental data | | | | | | | | | | | | | | | | | | | | | | | | | | |
| | | | | | | |
Net assets, end of period (000’s) | | | $ 198,093 | | | | | | $ 218,066 | | | | $ 211,354 | | | | $ 165,952 | | | | $ 114,200 | | | | $ 1,034 | |
| | | | | | | |
Portfolio turnover rate | | | 20.40% | | | | | | 44.76% | | | | 41.28% | | | | 78.63% | | | | 64.86% | | | | 51.42% | |
aFor the period October 1, 2012 (effective date) to October 31, 2012.
bThe amount shown for a share outstanding throughout the period may not correlate with the Statement of Operations for the period due to the timing of sales and repurchases of the Fund’s shares in relation to income earned and/or fluctuating fair value of the investments of the Fund.
cTotal return does not reflect sales commissions or contingent deferred sales charges, if applicable, and is not annualized for periods less than one year.
dRatios are annualized for periods less than one year.
eBenefit of expense reduction rounds to less than 0.01%.
| | | | |
| | | |
franklintempleton.com | | The accompanying notes are an integral part of these financial statements. | Semiannual Report | | 49 |
FRANKLIN INVESTORS SECURITIES TRUST
FINANCIAL HIGHLIGHTS
Franklin Low Duration Total Return Fund (continued)
| | | | | | | | | | | | | | | | | | | | | | |
| | | Six Months Ended April 30, 2017 (unaudited) | | | | | | | | | | | | | | | |
| | | | | Year Ended October 31, | |
| | | | | 2016 | | | 2015 | | | 2014 | | | 2013a | |
| | | | | | | |
Class R6 | | | | | | | | | | | | | | | | | | | | | | |
| | | | | | |
Per share operating performance | | | | | | | | | | | | | | | | | | | | | | |
| | | | | | |
(for a share outstanding throughout the period) | | | | | | | | | | | | | | | | | | | | | | |
| | | | | | |
Net asset value, beginning of period | | | $ 9.94 | | | | | | $ 9.95 | | | | $ 10.14 | | | | $ 10.19 | | | | $ 10.27 | |
| | | | | | |
Income from investment operationsb: | | | | | | | | | | | | | | | | | | | | | | |
| | | | | | |
Net investment income | | | 0.106 | | | | | | 0.195 | | | | 0.165 | | | | 0.164c | | | | 0.089 | |
| | | | | | |
Net realized and unrealized gains (losses) | | | 0.022 | | | | | | 0.021 | | | | (0.130 | ) | | | 0.003 | | | | (0.046 | ) |
| | | | | | |
Total from investment operations | | | 0.128 | | | | | | 0.216 | | | | 0.035 | | | | 0.167 | | | | 0.043 | |
| | | | | | |
Less distributions from net investment income and net foreign currency gains | | | (0.148 | ) | | | | | (0.226 | ) | | | (0.228 | ) | | | (0.217 | ) | | | (0.123 | ) |
| | | | | | |
Net asset value, end of period | | | $ 9.92 | | | | | | $ 9.94 | | | | $ 9.95 | | | | $ 10.14 | | | | $ 10.19 | |
| | | | | | |
Total returnd | | | 1.30% | | | | | | 2.22% | | | | 0.37% | | | | 1.66% | | | | 0.43% | |
| | | | | | |
Ratios to average net assetse | | | | | | | | | | | | | | | | | | | | | | |
| | | | | | |
Expenses before waiver and payments by affiliates | | | 0.53% | | | | | | 0.53% | | | | 0.54% | | | | 0.55% | | | | 0.62% | |
| | | | | | |
Expenses net of waiver and payments by affiliatesf | | | 0.41% | | | | | | 0.42% | | | | 0.42% | | | | 0.42% | | | | 0.43% | |
| | | | | | |
Net investment income | | | 2.13% | | | | | | 1.95% | | | | 1.65% | | | | 1.62% | | | | 1.61% | |
| | | | | | |
Supplemental data | | | | | | | | | | | | | | | | | | | | | | |
| | | | | | |
Net assets, end of period (000’s) | | | $586,401 | | | | | | $553,233 | | | | $508,675 | | | | $418,539 | | | | $943 | |
| | | | | | |
Portfolio turnover rate | | | 20.40% | | | | | | 44.76% | | | | 41.28% | | | | 78.63% | | | | 64.86% | |
aFor the period May 1, 2013 (effective date) to October 31, 2013.
bThe amount shown for a share outstanding throughout the period may not correlate with the Statement of Operations for the period due to the timing of sales and repurchases of the Fund’s shares in relation to income earned and/or fluctuating fair value of the investments of the Fund.
cBased on average daily shares outstanding.
dTotal return is not annualized for periods less than one year.
eRatios are annualized for periods less than one year.
fBenefit of expense reduction rounds to less than 0.01%.
| | | | |
| | | |
50 | | Semiannual Report | The accompanying notes are an integral part of these financial statements. | | franklintempleton.com |
FRANKLIN INVESTORS SECURITIES TRUST
FINANCIAL HIGHLIGHTS
Franklin Low Duration Total Return Fund (continued)
| | | | | | | | | | | | | | | | | | | | | | | | | | |
| | | Six Months Ended April 30, 2017 (unaudited) | | | | | | | | | | | | | | | | | | |
| | | | | Year Ended October 31, | |
| | | | | 2016 | | | 2015 | | | 2014 | | | 2013 | | | 2012 | |
| | | | | | | | |
Advisor Class | | | | | | | | | | | | | | | | | | | | | | | | | | |
| | | | | | | |
Per share operating performance | | | | | | | | | | | | | | | | | | | | | | | | | | |
| | | | | | | |
(for a share outstanding throughout the period) | | | | | | | | | | | | | | | | | | | | | | | | | | |
| | | | | | | |
Net asset value, beginning of period | | | $ 9.94 | | | | | | $ 9.95 | | | | $ 10.14 | | | | $ 10.19 | | | | $ 10.31 | | | | $ 10.29 | |
| | | | | | | |
Income from investment operationsa: | | | | | | | | | | | | | | | | | | | | | | | | | | |
| | | | | | | |
Net investment income | | | 0.108 | | | | | | 0.184 | | | | 0.134 | | | | 0.166 | | | | 0.231 | | | | 0.202 | |
| | | | | | | |
Net realized and unrealized gains (losses) | | | 0.004 | | | | | | 0.025 | | | | (0.106) | | | | (0.010) | | | | (0.064) | | | | 0.146 | |
| | | | | | | |
Total from investment operations | | | 0.112 | | | | | | 0.209 | | | | 0.028 | | | | 0.156 | | | | 0.167 | | | | 0.348 | |
| | | | | | | |
Less distributions from net investment income and net foreign currency gains | | | (0.142 | ) | | | | | (0.219 | ) | | | (0.218 | ) | | | (0.206 | ) | | | (0.287 | ) | | | (0.328 | ) |
| | | | | | | |
Net asset value, end of period | | | $ 9.91 | | | | | | $ 9.94 | | | | $ 9.95 | | | | $ 10.14 | | | | $ 10.19 | | | | $ 10.31 | |
| | | | | | | |
Total returnb | | | 1.13% | | | | | | 2.14% | | | | 0.27% | | | | 1.54% | | | | 1.64% | | | | 3.46% | |
| | | | | | | |
Ratios to average net assetsc | | | | | | | | | | | | | | | | | | | | | | | | | | |
| | | | | | | |
Expenses before waiver and payments by affiliates | | | 0.70% | | | | | | 0.70% | | | | 0.71% | | | | 0.68% | | | | 0.73% | | | | 0.76% | |
| | | | | | | |
Expenses net of waiver and payments by affiliates | | | 0.55% | d | | | | | 0.55% | d | | | 0.55% | d | | | 0.55% | d | | | 0.55% | d | | | 0.64% | |
| | | | | | | |
Net investment income | | | 1.99% | | | | | | 1.82% | | | | 1.52% | | | | 1.49% | | | | 1.50% | | | | 1.72% | |
| | | | | | | |
Supplemental data | | | | | | | | | | | | | | | | | | | | | | | | | | |
| | | | | | | |
Net assets, end of period (000’s) | | | $374,186 | | | | | | $224,887 | | | | $150,464 | | | | $198,694 | | | | $156,129 | | | | $70,442 | |
| | | | | | | |
Portfolio turnover rate | | | 20.40% | | | | | | 44.76% | | | | 41.28% | | | | 78.63% | | | | 64.86% | | | | 51.42% | |
aThe amount shown for a share outstanding throughout the period may not correlate with the Statement of Operations for the period due to the timing of sales and repurchases of the Fund’s shares in relation to income earned and/or fluctuating fair value of the investments of the Fund.
bTotal return is not annualized for periods less than one year.
cRatios are annualized for periods less than one year.
dBenefit of expense reduction rounds to less than 0.01%.
| | | | |
| | | |
franklintempleton.com | | The accompanying notes are an integral part of these financial statements. | Semiannual Report | | 51 |
FRANKLIN INVESTORS SECURITIES TRUST
Statement of Investments, April 30, 2017 (unaudited)
Franklin Low Duration Total Return Fund
| | | | | | | | | | | | | | | | |
| | | Country | | | Shares/
Warrants | | | | | | Value | |
Common Stocks and Other Equity Interests 0.1% | | | | | | | | | | | | | | | | |
Energy 0.1% | | | United States | | | | 57,719 | | | | | | | $ | 1,587,272 | |
a Energy XXI Gulf Coast Inc. | | | | | | | | | | | | | | | | |
a,b Halcon Resources Corp. | | | United States | | | | 98,168 | | | | | | | | 631,163 | |
a Halcon Resources Corp., wts., 9/09/20 | | | United States | | | | 8,753 | | | | | | | | 9,191 | |
a Linn Energy Inc. | | | United States | | | | 8,053 | | | | | | | | 225,725 | |
| | | | | | | | | | | | | | | | |
| | | | |
| | | | | | | | | | | | | | | 2,453,351 | |
| | | | | | | | | | | | | | | | |
Materials 0.0%† | | | | | | | | | | | | | | | | |
a Verso Corp., A | | | United States | | | | 1,387 | | | | | | | | 8,419 | |
a Verso Corp., wts., 7/25/23 | | | United States | | | | 146 | | | | | | | | 22 | |
| | | | | | | | | | | | | | | | |
| | | | |
| | | | | | | | | | | | | | | 8,441 | |
| | | | | | | | | | | | | | | | |
Retailing 0.0%† | | | | | | | | | | | | | | | | |
a,b Holdco 2, A | | | South Africa | | | | 12,326,925 | | | | | | | | 9,223 | |
a,b Holdco 2, B | | | South Africa | | | | 1,226,701 | | | | | | | | 918 | |
| | | | | | | | | | | | | | | | |
| | | | |
| | | | | | | | | | | | | | | 10,141 | |
| | | | | | | | | | | | | | | | |
Total Common Stocks and Other Equity Interests
(Cost $5,980,585) | | | | | | | | | | | | | | | 2,471,933 | |
| | | | | | | | | | | | | | | | |
| | | | |
Management Investment Companies 2.0% | | | | | | | | | | | | | | | | |
Diversified Financials 2.0% | | | | | | | | | | | | | | | | |
c Franklin Lower Tier Floating Rate Fund | | | United States | | | | 1,893,663 | | | | | | | | 19,978,147 | |
c Franklin Middle Tier Floating Rate Fund | | | United States | | | | 2,389,308 | | | | | | | | 24,036,434 | |
PowerShares Senior Loan Portfolio ETF | | | United States | | | | 380,000 | | | | | | | | 8,846,400 | |
| | | | | | | | | | | | | | | | |
Total Management Investment Companies
(Cost $50,273,822) | | | | | | | | | | | | | | | 52,860,981 | |
| | | | | | | | | | | | | | | | |
| | | | | | Principal
Amount* | | | | | | | |
Corporate Bonds 36.9% | | | | | | | | | | | | | | | | |
Automobiles & Components 1.2% | | | | | | | | | | | | | | | | |
Delphi Automotive PLC, senior note, 3.15%, 11/19/20 | | | United States | | | | 10,500,000 | | | | | | | | 10,675,350 | |
Fiat Chrysler Automobiles NV, senior note, 4.50%, 4/15/20 | | | United Kingdom | | | | 4,000,000 | | | | | | | | 4,135,000 | |
Ford Motor Credit Co. LLC, | | | | | | | | | | | | | | | | |
senior note, 2.597%, 11/04/19 | | | United States | | | | 4,000,000 | | | | | | | | 4,023,696 | |
senior note, 3.157%, 8/04/20 | | | United States | | | | 11,300,000 | | | | | | | | 11,507,863 | |
| | | | | | | | | | | | | | | | |
| | | | |
| | | | | | | | | | | | | | | 30,341,909 | |
| | | | | | | | | | | | | | | | |
Banks 9.7% | | | | | | | | | | | | | | | | |
d ANZ New Zealand International Ltd. of London, senior note, 144A, 2.85%, 8/06/20 | | | New Zealand | | | | 7,500,000 | | | | | | | | 7,607,850 | |
e Banca Monte dei Paschi di Siena SpA, secured note, Reg S, 2.875%, 4/16/21 | | | Italy | | | | 6,300,000 | | | | EUR | | | | 7,354,226 | |
Banco Comercial Portugues SA, secured note, 4.75%, 6/22/17 | | | Portugal | | | | 4,500,000 | | | | EUR | | | | 4,934,938 | |
e Banco Popular Espanol SA, secured note, Reg S, 1.00%, 3/03/22 | | | Spain | | | | 6,000,000 | | | | EUR | | | | 6,649,327 | |
Bank of America Corp., | | | | | | | | | | | | | | | | |
senior note, 2.65%, 4/01/19 | | | United States | | | | 9,300,000 | | | | | | | | 9,413,906 | |
fsenior note, FRN, 2.198%, 1/15/19 | | | United States | | | | 16,671,000 | | | | | | | | 16,858,982 | |
Barclays PLC, senior note, 3.25%, 1/12/21 | | | United Kingdom | | | | 7,000,000 | | | | | | | | 7,117,040 | |
| | | | |
| | | |
52 | | Semiannual Report | | franklintempleton.com |
FRANKLIN INVESTORS SECURITIES TRUST
STATEMENT OF INVESTMENTS (UNAUDITED)
Franklin Low Duration Total Return Fund (continued)
| | | | | | | | | | | | | | | | |
| | | Country | | | Principal Amount* | | | | | | Value | |
Corporate Bonds (continued) | | | | | | | | | | | | | | | | |
Banks (continued) | | | | | | | | | | | | | | | | |
BB&T Corp., | | | | | | | | | | | | | | | | |
senior note, 2.05%, 6/19/18 | | | United States | | | | 1,000,000 | | | | | | | $ | 1,004,526 | |
fsenior note, FRN, 1.694%, 2/01/19 | | | United States | | | | 2,000,000 | | | | | | | | 2,014,204 | |
Citigroup Inc., | | | | | | | | | | | | | | | | |
senior note, 2.40%, 2/18/20 | | | United States | | | | 11,300,000 | | | | | | | | 11,367,077 | |
fsenior note, FRN, 2.032%, 6/07/19 | | | United States | | | | 5,000,000 | | | | | | | | 5,034,760 | |
f Credit Suisse New York, senior note, FRN, 1.542%, 5/26/17 | | | Switzerland | | | | 5,400,000 | | | | | | | | 5,401,960 | |
Depfa ACS Bank, secured bond, 2.125%, 10/13/17 | | | Ireland | | | | 5,000,000 | | | | CHF | | | | 5,083,409 | |
HSBC Holdings PLC, senior note, 3.40%, 3/08/21 | | | United Kingdom | | | | 3,300,000 | | | | | | | | 3,392,945 | |
HSBC USA Inc., senior note, 2.00%, 8/07/18 | | | United States | | | | 7,500,000 | | | | | | | | 7,520,985 | |
Industrial and Commercial Bank of China Ltd./New York, 3.231%, 11/13/19 | | | China | | | | 5,400,000 | | | | | | | | 5,509,458 | |
d,f ING Bank NV, senior note, 144A, FRN, 1.838%, 10/01/19 | | | Netherlands | | | | 5,000,000 | | | | | | | | 5,016,500 | |
Intesa Sanpaolo SpA, | | | | | | | | | | | | | | | | |
senior note, 3.875%, 1/16/18 | | | Italy | | | | 5,900,000 | | | | | | | | 5,969,207 | |
senior note, 3.875%, 1/15/19 | | | Italy | | | | 10,100,000 | | | | | | | | 10,332,957 | |
e,fsenior note, Reg S, FRN, 0.00%, 5/18/17 | | | Italy | | | | 2,150,000 | | | | EUR | | | | 2,342,323 | |
JPMorgan Chase & Co., senior note, 1.85%, 3/22/19 | | | United States | | | | 8,000,000 | | | | | | | | 8,002,112 | |
senior note, 2.20%, 10/22/19 | | | United States | | | | 21,400,000 | | | | | | | | 21,502,506 | |
senior note, 2.40%, 6/07/21 | | | United States | | | | 2,600,000 | | | | | | | | 2,596,643 | |
National Australia Bank of New York, senior note, 1.875%, 7/23/18 | | | Australia | | | | 7,600,000 | | | | | | | | 7,610,997 | |
d Norddeutsche Landesbank Girozentrale, secured note, 144A, 2.00%, 2/05/19 | | | Germany | | | | 6,500,000 | | | | | | | | 6,526,585 | |
PHH Corp., senior note, 7.375%, 9/01/19 | | | United States | | | | 1,800,000 | | | | | | | | 1,957,500 | |
Regions Financial Corp., senior note, 2.00%, 5/15/18 | | | United States | | | | 4,500,000 | | | | | | | | 4,505,184 | |
Royal Bank of Canada, secured note, 2.10%, 10/14/20 | | | Canada | | | | 6,300,000 | | | | | | | | 6,301,625 | |
d The Toronto-Dominion Bank, secured note, 144A, 2.25%, 3/15/21 | | | Canada | | | | 12,700,000 | | | | | | | | 12,723,222 | |
e Unione di Banche Italiane SpA, senior note, Reg S, 2.875%, 2/18/19 | | | Italy | | | | 5,800,000 | | | | EUR | | | | 6,633,079 | |
Wells Fargo & Co., | | | | | | | | | | | | | | | | |
senior note, 2.50%, 3/04/21 | | | United States | | | | 2,600,000 | | | | | | | | 2,609,555 | |
fsenior note, FRN, 2.033%, 7/22/20 | | | United States | | | | 21,600,000 | | | | | | | | 21,878,942 | |
d Westpac Banking Corp., | | | | | | | | | | | | | | | | |
secured note, 144A, 2.10%, 2/25/22 | | | Australia | | | | 9,700,000 | | | | | | | | 9,656,738 | |
senior secured note, 144A, 2.25%, 11/09/20 | | | Australia | | | | 6,300,000 | | | | | | | | 6,317,420 | |
d Woori Bank, sub. note, 144A, 4.75%, 4/30/24 | | | South Korea | | | | 5,300,000 | | | | | | | | 5,489,926 | |
| | | | | | | | | | | | | | | | |
| | | | |
| | | | | | | | | | | | | | | 254,238,614 | |
| | | | | | | | | | | | | | | | |
Capital Goods 0.8% | | | | | | | | | | | | | | | | |
CNH Industrial Capital LLC, senior note, 3.875%, 10/15/21 | | | United States | | | | 2,800,000 | | | | | | | | 2,821,000 | |
John Deere Capital Corp., | | | | | | | | | | | | | | | | |
senior note, 1.30%, 3/12/18 | | | United States | | | | 1,700,000 | | | | | | | | 1,699,657 | |
senior note, 1.95%, 3/04/19 | | | United States | | | | 3,750,000 | | | | | | | | 3,768,776 | |
Lockheed Martin Corp., senior note, 1.85%, 11/23/18 | | | United States | | | | 4,200,000 | | | | | | | | 4,213,007 | |
United Technologies Corp., senior note, 4.50%, 4/15/20 | | | United States | | | | 7,500,000 | | | | | | | | 8,084,115 | |
| | | | | | | | | | | | | | | | |
| | | | |
| | | | | | | | | | | | | | | 20,586,555 | |
| | | | | | | | | | | | | | | | |
Commercial & Professional Services 0.0%† | | | | | | | | | | | | | | | | |
Republic Services Inc., senior note, 3.80%, 5/15/18 | | | United States | | | | 1,035,000 | | | | | | | | 1,056,193 | |
| | | | | | | | | | | | | | | | |
| | | | |
| | | |
franklintempleton.com | | Semiannual Report | | 53 |
FRANKLIN INVESTORS SECURITIES TRUST
STATEMENT OF INVESTMENTS (UNAUDITED)
Franklin Low Duration Total Return Fund (continued)
| | | | | | | | | | | | | | |
| | | Country | | | Principal Amount* | | | | | Value | |
Corporate Bonds (continued) | | | | | | | | | | | | | | |
Consumer Durables & Apparel 0.7% | | | | | | | | | | | | | | |
Beazer Homes USA Inc., senior note, 5.75%, 6/15/19 | | | United States | | | | 13,000,000 | | | | | $ | 13,666,250 | |
KB Home, senior note, 4.75%, 5/15/19 | | | United States | | | | 4,000,000 | | | | | | 4,155,000 | |
| | | | | | | | | | | | | | |
| | | | |
| | | | | | | | | | | | | 17,821,250 | |
| | | | | | | | | | | | | | |
Consumer Services 0.4% | | | | | | | | | | | | | | |
Marriott International Inc., senior note, 2.875%, 3/01/21 | | | United States | | | | 10,000,000 | | | | | | 10,150,710 | |
| | | | | | | | | | | | | | |
Diversified Financials 4.2% | | | | | | | | | | | | | | |
American Express Credit Corp., senior note, 1.55%, 9/22/17 | | | United States | | | | 4,600,000 | | | | | | 4,602,599 | |
f Bank of New York Mellon Corp., senior note, FRN, 1.912%, 8/17/20 | | | United States | | | | 6,400,000 | | | | | | 6,515,725 | |
Capital One Bank USA NA, senior note, 2.30%, 6/05/19 | | | United States | | | | 11,900,000 | | | | | | 11,924,811 | |
Capital One Financial Corp., senior note, 3.05%, 3/09/22 | | | United States | | | | 6,600,000 | | | | | | 6,626,261 | |
f Deutsche Bank AG, senior note, FRN, 2.362%, 8/20/20 | | | Germany | | | | 7,500,000 | | | | | | 7,527,038 | |
f The Goldman Sachs Group Inc., senior note, FRN, 2.331%, 9/15/20 | | | United States | | | | 20,000,000 | | | | | | 20,315,880 | |
d Hutchison Whampoa International 14 Ltd., 144A, 1.625%, 10/31/17 | | | Hong Kong | | | | 4,700,000 | | | | | | 4,697,979 | |
d Lincoln Finance Ltd., senior secured note, 144A, 7.375%, 4/15/21 | | | Netherlands | | | | 400,000 | | | | | | 428,000 | |
f Morgan Stanley, senior note, FRN, 2.31%, 1/27/20 | | | United States | | | | 22,400,000 | | | | | | 22,791,104 | |
Navient Corp., senior note, 5.50%, 1/15/19 | | | United States | | | | 3,400,000 | | | | | | 3,540,250 | |
d Park Aerospace Holdings Ltd., senior note, 144A, 5.25%, 8/15/22 | | | Ireland | | | | 3,100,000 | | | | | | 3,274,375 | |
d Pricoa Global Funding I, secured note, 144A, 2.55%, 11/24/20 | | | United States | | | | 5,600,000 | | | | | | 5,640,701 | |
d Protective Life Global Funding, | | | | | | | | | | | | | | |
secured note, 144A, 2.262%, 4/08/20 | | | United States | | | | 7,000,000 | | | | | | 7,007,791 | |
senior secured note, 144A, 1.722%, 4/15/19 | | | United States | | | | 4,300,000 | | | | | | 4,262,973 | |
d,f Seven and Seven Ltd., senior note, 144A, FRN, 2.43%, 9/11/19 | | | South Korea | | | | 1,000,000 | | | | | | 998,637 | |
| | | | | | | | | | | | | | |
| | | | |
| | | | | | | | | | | | | 110,154,124 | |
| | | | | | | | | | | | | | |
Energy 2.8% | | | | | | | | | | | | | | |
Anadarko Petroleum Corp., senior note, 4.85%, 3/15/21 | | | United States | | | | 2,300,000 | | | | | | 2,475,113 | |
d California Resources Corp., secured note, second lien, 144A, 8.00%, 12/15/22 | | | United States | | | | 1,656,000 | | | | | | 1,281,330 | |
d CNPC General Capital Ltd., | | | | | | | | | | | | | | |
senior note, 144A, 1.95%, 4/16/18 | | | China | | | | 1,500,000 | | | | | | 1,498,830 | |
fsenior note, 144A, FRN, 1.936%, 5/14/17 | | | China | | | | 7,500,000 | | | | | | 7,537,507 | |
Enable Midstream Partners LP, senior note, 2.40%, 5/15/19 | | | United States | | | | 3,700,000 | | | | | | 3,672,143 | |
Energy Transfer Partners LP, senior note, 4.15%, 10/01/20 | | | United States | | | | 2,600,000 | | | | | | 2,707,809 | |
EnLink Midstream Partners LP, senior note, 2.70%, 4/01/19 | | | United States | | | | 800,000 | | | | | | 801,409 | |
Enterprise Products Operating LLC, senior note, 2.55%, 10/15/19 | | | United States | | | | 7,500,000 | | | | | | 7,577,070 | |
d Kinder Morgan Finance Co. LLC, senior secured note, 144A, 6.00%, 1/15/18 | | | United States | | | | 2,500,000 | | | | | | 2,571,790 | |
Kinder Morgan Inc., senior note, 3.05%, 12/01/19 | | | United States | | | | 4,500,000 | | | | | | 4,590,945 | |
d Petrofac Ltd., senior note, 144A, 3.40%, 10/10/18 | | | United Kingdom | | | | 1,300,000 | | | | | | 1,313,822 | |
Sabine Pass Liquefaction LLC, first lien, 5.625%, 2/01/21 | | | United States | | | | 5,000,000 | | | | | | 5,441,955 | |
Sanchez Energy Corp., senior note, 7.75%, 6/15/21 | | | United States | | | | 1,900,000 | | | | | | 1,847,750 | |
d Sinopec Group Overseas Development 2015 Ltd., senior note, 144A, 2.50%, 4/28/20 | | | China | | | | 7,400,000 | | | | | | 7,387,790 | |
d Sinopec Group Overseas Development 2017 Ltd., senior note, 144A, 2.375%, 4/12/20 | | | China | | | | 5,100,000 | | | | | | 5,088,448 | |
f Statoil ASA, senior note, FRN, 1.498%, 11/08/18 | | | Norway | | | | 6,900,000 | | | | | | 6,935,190 | |
Transocean Inc., senior bond, 7.375%, 4/15/18 | | | United States | | | | 7,000,000 | | | | | | 7,210,000 | |
Williams Partners LP, senior note, 4.125%, 11/15/20 | | | United States | | | | 1,700,000 | | | | | | 1,781,940 | |
| | | | | | | | | | | | | | |
| | | | |
| | | | | | | | | | | | | 71,720,841 | |
| | | | | | | | | | | | | | |
| | | | |
| | | |
54 | | Semiannual Report | | franklintempleton.com |
FRANKLIN INVESTORS SECURITIES TRUST
STATEMENT OF INVESTMENTS (UNAUDITED)
Franklin Low Duration Total Return Fund (continued)
| | | | | | | | | | | | | | |
| | | Country | | | Principal Amount* | | | | | Value | |
Corporate Bonds (continued) | | | | | | | | | | | | | | |
Food & Staples Retailing 0.5% | | | | | | | | | | | | | | |
The Kroger Co., senior note, 2.60%, 2/01/21 | | | United States | | | | 7,500,000 | | | | | $ | 7,534,958 | |
Walgreens Boots Alliance Inc., senior note, 1.75%, 11/17/17 | | | United States | | | | 5,900,000 | | | | | | 5,910,372 | |
| | | | | | | | | | | | | | |
| | | | |
| | | | | | | | | | | | | 13,445,330 | |
| | | | | | | | | | | | | | |
Food, Beverage & Tobacco 1.8% | | | | | | | | | | | | | | |
Anheuser-Busch InBev Finance Inc., senior note, 2.65%, 2/01/21 | | | Belgium | | | | 6,500,000 | | | | | | 6,580,730 | |
Coca-Cola Femsa SAB de CV, senior note, 2.375%, 11/26/18 | | | Mexico | | | | 5,500,000 | | | | | | 5,514,795 | |
Constellation Brands Inc., senior note, 7.25%, 5/15/17 | | | United States | | | | 6,600,000 | | | | | | 6,612,659 | |
d Imperial Brands Finance PLC, senior note, 144A, 2.95%, 7/21/20 | | | United Kingdom | | | | 6,000,000 | | | | | | 6,107,793 | |
d JBS USA LLC/Finance Inc., senior note, 144A, 7.25%, 6/01/21 | | | United States | | | | 2,500,000 | | | | | | 2,581,250 | |
Kraft Heinz Foods Co., | | | | | | | | | | | | | | |
senior note, 2.25%, 6/05/17 | | | United States | | | | 7,000,000 | | | | | | 7,006,622 | |
senior note, 2.00%, 7/02/18 | | | United States | | | | 6,400,000 | | | | | | 6,418,298 | |
f Mondelez International Inc., senior note, FRN, 1.554%, 2/01/19 | | | United States | | | | 500,000 | | | | | | 502,197 | |
Reynolds American Inc., senior note, 2.30%, 6/12/18 | | | United States | | | | 6,200,000 | | | | | | 6,235,774 | |
| | | | | | | | | | | | | | |
| | | | |
| | | | | | | | | | | | | 47,560,118 | |
| | | | | | | | | | | | | | |
Health Care Equipment & Services 1.5% | | | | | | | | | | | | | | |
Aetna Inc., senior note, 1.50%, 11/15/17 | | | United States | | | | 1,000,000 | | | | | | 999,953 | |
CHS/Community Health Systems Inc., senior note, 7.125%, 7/15/20 | | | United States | | | | 2,000,000 | | | | | | 1,802,500 | |
Edwards Lifesciences Corp., senior note, 2.875%, 10/15/18 | | | United States | | | | 1,600,000 | | | | | | 1,621,829 | |
HCA Inc., senior secured note, first lien, 4.25%, 10/15/19 | | | United States | | | | 3,000,000 | | | | | | 3,116,250 | |
Stryker Corp., senior note, 2.00%, 3/08/19 | | | United States | | | | 10,100,000 | | �� | | | | 10,138,612 | |
Tenet Healthcare Corp., | | | | | | | | | | | | | | |
senior note, 5.00%, 3/01/19 | | | United States | | | | 10,600,000 | | | | | | 10,699,428 | |
senior note, 5.50%, 3/01/19 | | | United States | | | | 3,000,000 | | | | | | 3,045,000 | |
Zimmer Holdings Inc., senior note, 2.70%, 4/01/20 | | | United States | | | | 7,500,000 | | | | | | 7,587,683 | |
| | | | | | | | | | | | | | |
| | | | |
| | | | | | | | | | | | | 39,011,255 | |
| | | | | | | | | | | | | | |
Household & Personal Products 0.6% | | | | | | | | | | | | | | |
Avon Products Inc., senior note, 6.60%, 3/15/20 | | | United States | | | | 10,000,000 | | | | | | 10,212,500 | |
Colgate-Palmolive Co., senior note, 0.90%, 5/01/18 | | | United States | | | | 2,200,000 | | | | | | 2,191,081 | |
The Procter & Gamble Co., senior note, 1.70%, 11/03/21 | | | United States | | | | 3,200,000 | | | | | | 3,168,007 | |
| | | | | | | | | | | | | | |
| | | | | | | | | | | | | 15,571,588 | |
| | | | | | | | | | | | | | |
Insurance 1.5% | | | | | | | | | | | | | | |
d Jackson National Life Global Funding, secured note, 144A, 2.25%, 4/29/21 | | | United States | | | | 7,600,000 | | | | | | 7,527,625 | |
d Metropolitan Life Global Funding I, senior secured bond, 144A, 3.875%, 4/11/22 | | | United States | | | | 5,900,000 | | | | | | 6,249,492 | |
d New York Life Global Funding, | | | | | | | | | | | | | | |
secured note, 144A, 2.10%, 1/02/19 | | | United States | | | | 10,000,000 | | | | | | 10,070,610 | |
secured note, 144A, 2.15%, 6/18/19 | | | United States | | | | 6,400,000 | | | | | | 6,425,555 | |
f Prudential Financial Inc., senior note, FRN, 1.819%, 8/15/18 | | | United States | | | | 5,700,000 | | | | | | 5,733,716 | |
d TIAA Asset Management Finance LLC, senior note, 144A, 2.95%, 11/01/19 | | | United States | | | | 4,200,000 | | | | | | 4,270,577 | |
| | | | | | | | | | | | | | |
| | | | |
| | | | | | | | | | | | | 40,277,575 | |
| | | | | | | | | | | | | | |
Materials 0.3% | | | | | | | | | | | | | | |
d BlueScope Steel Ltd./BlueScope Steel Finance, senior note, 144A, 6.50%, 5/15/21 | | | Australia | | | | 3,500,000 | | | | | | 3,713,745 | |
EI du Pont de Nemours & Co., senior note, 2.20%, 5/01/20 | | | United States | | | | 1,400,000 | | | | | | 1,402,786 | |
Reynolds Group Holdings Inc., senior bond, 8.125%, 6/15/17 | | | United States | | | | 2,100,000 | | | | | | 2,121,000 | |
| | | | | | | | | | | | | | |
| | | | |
| | | | | | | | | | | | | 7,237,531 | |
| | | | | | | | | | | | | | |
| | | | |
| | | |
franklintempleton.com | | Semiannual Report | | 55 |
FRANKLIN INVESTORS SECURITIES TRUST
STATEMENT OF INVESTMENTS (UNAUDITED)
Franklin Low Duration Total Return Fund (continued)
| | | | | | | | | | | | | | |
| | | Country | | | Principal Amount* | | | | | Value | |
Corporate Bonds (continued) | | | | | | | | | | | | | | |
Media 1.3% | | | | | | | | | | | | | | |
CBS Corp., senior note, 2.30%, 8/15/19 | | | United States | | | | 11,437,000 | | | | | $ | 11,510,780 | |
CSC Holdings LLC, | | | | | | | | | | | | | | |
senior bond, 7.625%, 7/15/18 | | | United States | | | | 3,500,000 | | | | | | 3,714,375 | |
senior note, 8.625%, 2/15/19 | | | United States | | | | 3,000,000 | | | | | | 3,312,150 | |
d NBCUniversal Enterprise Inc., senior note, 144A, 1.974%, 4/15/19 | | | United States | | | | 10,000,000 | | | | | | 10,037,060 | |
Time Warner Inc., senior note, 2.10%, 6/01/19 | | | United States | | | | 4,500,000 | | | | | | 4,510,944 | |
| | | | | | | | | | | | | | |
| | | | |
| | | | | | | | | | | | | 33,085,309 | |
| | | | | | | | | | | | | | |
Pharmaceuticals, Biotechnology & Life Sciences 1.8% | | | | | | | | | | | | | | |
AbbVie Inc., senior note, 1.80%, 5/14/18 | | | United States | | | | 8,600,000 | | | | | | 8,614,319 | |
Actavis Funding SCS, senior note, 2.35%, 3/12/18 | | | United States | | | | 6,200,000 | | | | | | 6,227,763 | |
Amgen Inc., | | | | | | | | | | | | | | |
senior note, 2.125%, 5/15/17 | | | United States | | | | 2,500,000 | | | | | | 2,500,620 | |
fsenior note, FRN, 1.65%, 5/22/19 | | | United States | | | | 6,200,000 | | | | | | 6,251,119 | |
Baxalta Inc., senior note, 2.00%, 6/22/18 | | | United States | | | | 10,200,000 | | | | | | 10,222,338 | |
Biogen Inc., senior note, 2.90%, 9/15/20 | | | United States | | | | 7,500,000 | | | | | | 7,655,040 | |
Celgene Corp., senior note, 2.30%, 8/15/18 | | | United States | | | | 3,000,000 | | | | | | 3,019,023 | |
d Valeant Pharmaceuticals International Inc., senior note, 144A, 5.375%, 3/15/20 | | | United States | | | | 3,800,000 | | | | | | 3,268,000 | |
| | | | | | | | | | | | | | |
| | | | |
| | | | | | | | | | | | | 47,758,222 | |
| | | | | | | | | | | | | | |
Real Estate 0.3% | | | | | | | | | | | | | | |
American Tower Corp., senior note, 3.40%, 2/15/19 | | | United States | | | | 3,600,000 | | | | | | 3,679,254 | |
Prologis LP, senior note, 2.75%, 2/15/19 | | | United States | | | | 4,800,000 | | | | | | 4,868,453 | |
| | | | | | | | | | | | | | |
| | | | |
| | | | | | | | | | | | | 8,547,707 | |
| | | | | | | | | | | | | | |
Retailing 0.6% | | | | | | | | | | | | | | |
Dollar General Corp., senior note, 1.875%, 4/15/18 | | | United States | | | | 8,200,000 | | | | | | 8,213,973 | |
d Experian Finance PLC, 144A, 2.375%, 6/15/17 | | | United Kingdom | | | | 1,000,000 | | | | | | 1,001,040 | |
d,g K2016470219 South Africa Ltd., senior secured note, 144A, PIK, 3.00%, 12/31/22 | | | South Africa | | | | 909,211 | | | | | | 86,375 | |
d,g K2016740260 South Africa Ltd., senior secured note, 144A, PIK, 25.00%, 12/31/22 | | | South Africa | | | | 131,325 | | | | | | 177,945 | |
Toys R Us Inc., senior bond, 7.375%, 10/15/18 | | | United States | | | | 5,740,000 | | | | | | 5,424,300 | |
| | | | | | | | | | | | | | |
| | | | |
| | | | | | | | | | | | | 14,903,633 | |
| | | | | | | | | | | | | | |
Semiconductors & Semiconductor Equipment 0.2% | | | | | | | | | | | | | | |
Maxim Integrated Products Inc., senior note, 2.50%, 11/15/18 | | | United States | | | | 5,200,000 | | | | | | 5,244,304 | |
| | | | | | | | | | | | | | |
Software & Services 0.9% | | | | | | | | | | | | | | |
Alibaba Group Holding Ltd., senior note, 2.50%, 11/28/19 | | | China | | | | 11,900,000 | | | | | | 11,966,402 | |
Fiserv Inc., senior note, 2.70%, 6/01/20 | | | United States | | | | 11,300,000 | | | | | | 11,475,817 | |
| | | | | | | | | | | | | | |
| | | | |
| | | | | | | | | | | | | 23,442,219 | |
| | | | | | | | | | | | | | |
Technology Hardware & Equipment 1.8% | | | | | | | | | | | | | | |
f Apple Inc., senior note, FRN, 1.285%, 5/03/18 | | | United States | | | | 7,300,000 | | | | | | 7,317,221 | |
Cisco Systems Inc., senior note, 2.45%, 6/15/20 | | | United States | | | | 8,700,000 | | | | | | 8,860,437 | |
d Diamond 1 Finance Corp./Diamond 2 Finance Corp., senior secured note, | | | | | | | | | | | | | | |
first lien, 144A, 3.48%, 6/01/19 | | | United States | | | | 6,400,000 | | | | | | 6,549,728 | |
f Hewlett Packard Enterprise Co., senior note, FRN, 3.08%, 10/05/18 | | | United States | | | | 8,100,000 | | | | | | 8,258,622 | |
Juniper Networks Inc., | | | | | | | | | | | | | | |
senior note, 3.125%, 2/26/19 | | | United States | | | | 7,500,000 | | | | | | 7,651,252 | |
senior note, 3.30%, 6/15/20 | | | United States | | | | 500,000 | | | | | | 513,099 | |
| | | | |
| | | |
56 | | Semiannual Report | | franklintempleton.com |
FRANKLIN INVESTORS SECURITIES TRUST
STATEMENT OF INVESTMENTS (UNAUDITED)
Franklin Low Duration Total Return Fund (continued)
| | | | | | | | | | | | | | | | |
| | | Country | | | Principal Amount* | | | | | | Value | |
Corporate Bonds (continued) | | | | | | | | | | | | | | | | |
Technology Hardware & Equipment (continued) | | | | | | | | | | | | | | | | |
d Sanmina Corp., senior note, first lien, 144A, 4.375%, 6/01/19 | | | United States | | | | 6,500,000 | | | | | | | $ | 6,678,750 | |
| | | | | | | | | | | | | | | | |
| | | | |
| | | | | | | | | | | | | | | 45,829,109 | |
| | | | | | | | | | | | | | | | |
Telecommunication Services 1.3% | | | | | | | | | | | | | | | | |
AT&T Inc., senior note, 2.45%, 6/30/20 | | | United States | | | | 7,400,000 | | | | | | | | 7,417,005 | |
CenturyLink Inc., senior note, 5.625%, 4/01/20 | | | United States | | | | 3,400,000 | | | | | | | | 3,621,000 | |
Intelsat Jackson Holdings SA, senior note, 7.25%, 10/15/20 | | | Luxembourg | | | | 2,000,000 | | | | | | | | 1,882,400 | |
d Sprint Communications Inc., senior note, 144A, 9.00%, 11/15/18 | | | United States | | | | 1,000,000 | | | | | | | | 1,096,250 | |
d Sprint Spectrum Co. LLC/Sprint Spectrum Co. II LLC, 144A, 3.36%, 3/20/23 | | | United States | | | | 2,500,000 | | | | | | | | 2,523,025 | |
Telefonica Emisiones S.A.U., senior note, 3.192%, 4/27/18 | | | Spain | | | | 2,300,000 | | | | | | | | 2,330,762 | |
T-Mobile USA Inc., senior note, 4.00%, 4/15/22 | | | United States | | | | 1,800,000 | | | | | | | | 1,846,692 | |
Verizon Communications Inc., | | | | | | | | | | | | | | | | |
senior note, 2.625%, 2/21/20 | | | United States | | | | 8,824,000 | | | | | | | | 8,966,084 | |
fsenior note, FRN, 2.871%, 9/14/18 | | | United States | | | | 4,800,000 | | | | | | | | 4,898,986 | |
| | | | | | | | | | | | | | | | |
| | | | |
| | | | | | | | | | | | | | | 34,582,204 | |
| | | | | | | | | | | | | | | | |
Transportation 0.4% | | | | | | | | | | | | | | | | |
FedEx Corp., senior note, 0.50%, 4/09/20 | | | United States | | | | 7,100,000 | | | | EUR | | | | 7,812,183 | |
XPO CNW Inc., senior bond, 7.25%, 1/15/18 | | | United States | | | | 3,275,000 | | | | | | | | 3,389,625 | |
| | | | | | | | | | | | | | | | |
| | | | |
| | | | | | | | | | | | | | | 11,201,808 | |
| | | | | | | | | | | | | | | | |
Utilities 2.3% | | | | | | | | | | | | | | | | |
Dominion Resources Inc., senior note, 2.50%, 12/01/19 | | | United States | | | | 9,500,000 | | | | | | | | 9,601,830 | |
Duke Energy Corp., senior note, 2.10%, 6/15/18 | | | United States | | | | 5,100,000 | | | | | | | | 5,119,278 | |
d Engie SA, senior note, 144A, 1.625%, 10/10/17 | | | France | | | | 1,000,000 | | | | | | | | 1,000,025 | |
d Korea Western Power Co. Ltd., senior note, 144A, 3.125%, 5/10/17 | | | South Korea | | | | 5,200,000 | | | | | | | | 5,201,248 | |
PSEG Power LLC, senior note, 3.00%, 6/15/21 | | | United States | | | | 7,700,000 | | | | | | | | 7,805,151 | |
Sempra Energy, senior note, 2.85%, 11/15/20 | | | United States | | | | 9,600,000 | | | | | | | | 9,755,270 | |
The Southern Co., | | | | | | | | | | | | | | | | |
senior note, 2.45%, 9/01/18 | | | United States | | | | 7,000,000 | | | | | | | | 7,057,722 | |
senior note, 2.35%, 7/01/21 | | | United States | | | | 6,500,000 | | | | | | | | 6,420,850 | |
d State Grid Overseas Investment 2013 Ltd., senior note, 144A, 1.75%, 5/22/18 | | | China | | | | 2,000,000 | | | | | | | | 1,995,670 | |
d State Grid Overseas Investment 2014 Ltd., senior note, 144A, 2.75%, 5/07/19 | | | China | | | | 2,200,000 | | | | | | | | 2,225,355 | |
d Talen Energy Supply LLC, senior note, 144A, 9.50%, 7/15/22 | | | United States | | | | 1,900,000 | | | | | | | | 1,781,250 | |
e Veolia Environnement SA, senior bond, Reg S, 4.625%, 3/30/27 | | | France | | | | 1,000,000 | | | | EUR | | | | 1,438,067 | |
Virginia Electric & Power Co., senior note, 1.20%, 1/15/18 | | | United States | | | | 900,000 | | | | | | | | 897,338 | |
| | | | | | | | | | | | | | | | |
| | | | |
| | | | | | | | | | | | | | | 60,299,054 | |
| | | | | | | | | | | | | | | | |
Total Corporate Bonds (Cost $960,159,634) | | | | | | | | | | | | | | | 964,067,162 | |
| | | | | | | | | | | | | | | | |
f,h Senior Floating Rate Interests 2.6% | | | | | | | | | | | | | | | | |
Automobiles & Components 0.1% | | | | | | | | | | | | | | | | |
The Goodyear Tire & Rubber Co., Second Lien Term Loan, 2.99%, 4/30/19 | | | United States | | | | 178,394 | | | | | | | | 180,550 | |
TI Group Automotive Systems LLC, Initial US Term Loan, 3.743%, 6/30/22 | | | United States | | | | 1,597,095 | | | | | | | | 1,609,072 | |
| | | | | | | | | | | | | | | | |
| | | | |
| | | | | | | | | | | | | | | 1,789,622 | |
| | | | | | | | | | | | | | | | |
| | | | |
| | | |
franklintempleton.com | | Semiannual Report | | 57 |
FRANKLIN INVESTORS SECURITIES TRUST
STATEMENT OF INVESTMENTS (UNAUDITED)
Franklin Low Duration Total Return Fund (continued)
| | | | | | | | | | | | | | | | |
| | | Country | | | Principal Amount* | | | | | | Value | |
f,h Senior Floating Rate Interests (continued) | | | | | | | | | | | | | | | | |
Capital Goods 0.0%† | | | | | | | | | | | | | | | | |
i Allison Transmission Inc., Term Loans, 2.99%, 9/23/22 | | | United States | | | | 874,812 | | | | | | | $ | 884,593 | |
Harsco Corp., Initial Term Loan, 6.00%, 11/02/23 | | | United States | | | | 135,219 | | | | | | | | 138,177 | |
Leidos (Abacus Innovations Corp.), B Term Loan, 3.25%, 8/16/23 | | | United States | | | | 211,788 | | | | | | | | 214,171 | |
| | | | | | | | | | | | | | | | |
| | | | |
| | | | | | | | | | | | | | | 1,236,941 | |
| | | | | | | | | | | | | | | | |
Commercial & Professional Services 0.0%† | | | | | | | | | | | | | | | | |
KAR Auction Services Inc., Tranche B-3 Term Loans, 4.50%, 3/09/23 | | | United States | | | | 904,274 | | | | | | | | 915,713 | |
| | | | | | | | | | | | | | | | |
Consumer Services 0.3% | | | | | | | | | | | | | | | | |
Aristocrat Technologies Inc., Tranche B-2 Loans, 3.406%, 10/20/21 | | | United States | | | | 157,243 | | | | | | | | 158,779 | |
Avis Budget Car Rental LLC, Tranche B Term Loan, 3.15%, 3/15/22 | | | United States | | | | 1,559,572 | | | | | | | | 1,563,666 | |
i Caesars Entertainment Operating Co. LLC., Term B Loans, 5.75%, 8/31/24 | | | United States | | | | 166,833 | | | | | | | | 165,929 | |
Fitness International LLC, Term A Loan, 4.243%, 4/01/20 | | | United States | | | | 3,244,978 | | | | | | | | 3,244,978 | |
i Greektown Holdings LLC, Initial Term Loan, 6.00%, 4/25/24 | | | United States | | | | 684,685 | | | | | | | | 686,255 | |
Prime Security Services Borrower LLC, 2016-2 Refinancing Term B-1 Loan, 4.25%, 5/02/22 | | | United States | | | | 867,903 | | | | | | | | 877,744 | |
| | | | | | | | | | | | | | | | |
| | | | |
| | | | | | | | | | | | | | | 6,697,351 | |
| | | | | | | | | | | | | | | | |
Diversified Financials 0.1% | | | | | | | | | | | | | | | | |
First Eagle Investment Management LLC, Initial Term Loans, 4.656%, 12/01/22 | | | United States | | | | 890,242 | | | | | | | | 894,972 | |
Russell Investments US Institutional Holdco Inc., Initial Term Loan, 6.75%, 6/01/23 | | | United States | | | | 602,222 | | | | | | | | 608,244 | |
| | | | | | | | | | | | | | | | |
| | | | |
| | | | | | | | | | | | | | | 1,503,216 | |
| | | | | | | | | | | | | | | | |
Energy 0.4% | | | | | | | | | | | | | | | | |
Bowie Resource Holdings LLC, First Lien Initial Term Loan, 6.75%, 8/14/20 | | | United States | | | | 2,048,419 | | | | | | | | 1,993,793 | |
i Fieldwood Energy LLC, Loans, 3.875%, 10/01/18 | | | United States | | | | 5,036,382 | | | | | | | | 4,929,359 | |
International Seaways Inc., Initial Term Loan, 5.79%, 8/05/19 | | | United States | | | | 1,776,597 | | | | | | | | 1,775,117 | |
McDermott Finance LLC, Term Loan, 8.397%, 4/16/19 | | | United States | | | | 138,185 | | | | | | | | 140,344 | |
OSG Bulk Ships Inc., Initial Term Loan, 5.29%, 8/05/19 | | | United States | | | | 1,038,624 | | | | | | | | 1,023,910 | |
| | | | | | | | | | | | | | | | |
| | | | |
| | | | | | | | | | | | | | | 9,862,523 | |
| | | | | | | | | | | | | | | | |
Food & Staples Retailing 0.0%† | | | | | | | | | | | | | | | | |
i Aramark Corp., U.S. Term A Loan, 4.75%, 3/28/22 | | | United States | | | | 157,108 | | | | | | | | 157,648 | |
| | | | | | | | | | | | | | | | |
Food, Beverage & Tobacco 0.1% | | | | | | | | | | | | | | | | |
JBS USA LUX SA, New Initial Term Loans, 3.483%, 10/30/22 | | | Brazil | | | | 3,000,000 | | | | | | | | 3,014,532 | |
| | | | | | | | | | | | | | | | |
Health Care Equipment & Services 0.0%† | | | | | | | | | | | | | | | | |
Carestream Health Inc., Term Loan, 5.147%, 6/07/19 | | | United States | | | | 630,882 | | | | | | | | 627,137 | |
| | | | | | | | | | | | | | | | |
Household & Personal Products 0.1% | | | | | | | | | | | | | | | | |
FGI Operating Co. LLC (Freedom Group), Term B Loans, 5.50%, 4/19/19 | | | United States | | | | 3,650,460 | | | | | | | | 3,531,820 | |
Spectrum Brands Inc., Term Loans, 2.852% - 3.486%, 6/23/22 | | | United States | | | | 34,272 | | | | | | | | 34,593 | |
| | | | | | | | | | | | | | | | |
| | | | |
| | | | | | | | | | | | | | | 3,566,413 | |
| | | | | | | | | | | | | | | | |
Materials 0.2% | | | | | | | | | | | | | | | | |
Chemours Co., Tranche B-1 US Term Loans, 3.49%, 5/12/22 | | | United States | | | | 2,864,999 | | | | | | | | 2,884,249 | |
Cyanco Intermediate Corp., Initial Term Loan, 5.50%, 5/01/20 | | | United States | | | | 552,588 | | | | | | | | 555,696 | |
i FMG America Finance Inc. (Fortescue Metals Group), Loans, 3.75%, 6/30/19 | | | Australia | | | | 1,019,812 | | | | | | | | 1,027,336 | |
OCI Beaumont LLC, Term B-3 Loan, 8.025%, 8/20/19 | | | United States | | | | 824,833 | | | | | | | | 850,610 | |
| | | | | | | | | | | | | | | | |
| | | | |
| | | | | | | | | | | | | | | 5,317,891 | |
| | | | | | | | | | | | | | | | |
| | | | |
| | | |
58 | | Semiannual Report | | franklintempleton.com |
FRANKLIN INVESTORS SECURITIES TRUST
STATEMENT OF INVESTMENTS (UNAUDITED)
Franklin Low Duration Total Return Fund (continued)
| | | | | | | | | | | | | | |
| | | Country | | | Principal Amount* | | | | | Value | |
f,h Senior Floating Rate Interests (continued) | | | | | | | | | | | | | | |
Media 0.1% | | | | | | | | | | | | | | |
Altice US Finance I Corp., March 2017 Refinancing TL Commitments, 3.241%, 7/28/25 | | | United States | | | | 116,095 | | | | | $ | 116,124 | |
AMC Entertainment Holdings Inc., | | | | | | | | | | | | | | |
2016 Incremental Term Commitments, 3.742%, 12/15/23 | | | United States | | | | 45,073 | | | | | | 45,451 | |
Initial Term Loans, 3.744%, 12/15/22 | | | United States | | | | 70,333 | | | | | | 70,831 | |
Charter Communications Operating LLC (CCO Safari), Term Loan A-1, 2.75%, 5/18/21 | | | United States | | | | 1,273,000 | | | | | | 1,273,454 | |
CSC Holdings LLC, March 2017 Incremental Term Loans, 3.244%, 7/17/25 | | | United States | | | | 1,246,599 | | | | | | 1,247,476 | |
Lions Gate Entertainment Corp., Term A Loan, 3.482%, 12/08/21 | | | United States | | | | 310,428 | | | | | | 312,174 | |
Live Nation Entertainment Inc., Term B-2 Loans, 3.50%, 10/31/23 | | | United States | | | | 44,960 | | | | | | 45,318 | |
UPC Financing Partnership, Facility AP, 3.744%, 4/15/25 | | | United States | | | | 286,448 | | | | | | 287,844 | |
| | | | | | | | | | | | | | |
| | | | |
| | | | | | | | | | | | | 3,398,672 | |
| | | | | | | | | | | | | | |
Pharmaceuticals, Biotechnology & Life Sciences 0.2% | | | | | | | | | | | | | | |
i Endo Luxembourg Finance Co. I S.A.R.L and Endo LLC, Initial Term Loans, 7.25%, 4/27/24 | | | United States | | | | 2,687,915 | | | | | | 2,705,134 | |
Grifols Worldwide Operations USA Inc., Tranche B Term Loan, 3.195%, 1/31/25 | | | United States | | | | 1,456,927 | | | | | | 1,463,304 | |
RPI Finance Trust, Term A-2 Term Loan, 3.397%, 10/14/20 | | | United States | | | | 344,133 | | | | | | 344,778 | |
Valeant Pharmaceuticals International Inc., Series F Tranche B Term Loan, 5.74%, 4/01/22 | | | United States | | | | 1,222,869 | | | | | | 1,230,639 | |
| | | | | | | | | | | | | | |
| | | | |
| | | | | | | | | | | | | 5,743,855 | |
| | | | | | | | | | | | | | |
Retailing 0.3% | | | | | | | | | | | | | | |
Ascena Retail Group Inc., Tranche B Term Loan, 5.50%, 8/21/22 | | | United States | | | | 3,261,781 | | | | | | 2,955,989 | |
Dollar Tree Inc., Term A-1 Loans, 2.75%, 7/06/20 | | | United States | | | | 507,075 | | | | | | 505,642 | |
i PetSmart Inc., Tranche B-2 Loans, 4.02%, 3/11/22 | | | United States | | | | 3,711,517 | | | | | | 3,426,194 | |
| | | | | | | | | | | | | | |
| | | | |
| | | | | | | | | | | | | 6,887,825 | |
| | | | | | | | | | | | | | |
Semiconductors & Semiconductor Equipment 0.1% | | | | | | | | | | | | | | |
MACOM Technology Solutions Holdings Inc., Initial Term Loans, 3.989%, 5/07/21 | | | United States | | | | 843,601 | | | | | | 856,255 | |
MKS Instruments Inc., Tranche B-2 Term Loans, 3.743%, 5/01/23 | | | United States | | | | 185,539 | | | | | | 187,742 | |
ON Semiconductor Corp., 2017 Replacement Term Loans, 3.243%, 3/31/23 | | | United States | | | | 2,144,420 | | | | | | 2,159,354 | |
| | | | | | | | | | | | | | |
| | | | |
| | | | | | | | | | | | | 3,203,351 | |
| | | | | | | | | | | | | | |
Software & Services 0.2% | | | | | | | | | | | | | | |
Global Payments Inc., Delayed Draw Term Loan (A-2), 3.196%, 10/31/21 | | | United States | | | | 645,986 | | | | | | 647,197 | |
MoneyGram International Inc., Term Loan, 4.397%, 3/27/20 | | | United States | | | | 3,509,503 | | | | | | 3,517,547 | |
Rackspace Hosting Inc., 2016 Refinancing Term B Loan, 4.535%, 11/03/23 | | | United States | | | | 225,365 | | | | | | 227,220 | |
| | | | | | | | | | | | | | |
| | | | |
| | | | | | | | | | | | | 4,391,964 | |
| | | | | | | | | | | | | | |
Technology Hardware & Equipment 0.1% | | | | | | | | | | | | | | |
Ciena Corp., Refinancing Term Loan, 3.493%, 1/28/22 | | | United States | | | | 189,522 | | | | | | 191,062 | |
Dell International LLC, Term A-3 Loan, 3.00%, 12/31/18 | | | United States | | | | 923,168 | | | | | | 925,572 | |
Western Digital Corp., US Term B-2 Loan, 3.743%, 4/29/23 | | | United States | | | | 636,891 | | | | | | 642,782 | |
Zebra Technologies Corp., Second Amendment Refinancing Term Loan, 3.60%, 10/27/21 | | | United States | | | | 404,896 | | | | | | 409,326 | |
| | | | | | | | | | | | | | |
| | | | |
| | | | | | | | | | | | | 2,168,742 | |
| | | | | | | | | | | | | | |
| | | | |
| | | |
franklintempleton.com | | Semiannual Report | | 59 |
FRANKLIN INVESTORS SECURITIES TRUST
STATEMENT OF INVESTMENTS (UNAUDITED)
Franklin Low Duration Total Return Fund (continued)
| | | | | | | | | | | | | | |
| | | Country | | | Principal Amount* | | | | | Value | |
f,h Senior Floating Rate Interests (continued) | | | | | | | | | | | | | | |
Telecommunication Services 0.0%† | | | | | | | | | | | | | | |
Consolidated Communications Inc., Initial Term Loan, 4.00%, 10/05/23 | | | United States | | | | 226,143 | | | | | $ | 228,065 | |
Global Tel*Link Corp., Term Loan, 5.00%, 5/23/20 | | | United States | | | | 266,546 | | | | | | 266,546 | |
| | | | | | | | | | | | | | |
| | | | |
| | | | | | | | | | | | | 494,611 | |
| | | | | | | | | | | | | | |
Transportation 0.1% | | | | | | | | | | | | | | |
Air Canada, Term Loan, 3.90%, 10/06/23 | | | Canada | | | | 46,797 | | | | | | 47,168 | |
Navios Maritime Midstream Partners LP and Navios Maritime Midstream | | | | | | | | | | | | | | |
Partners Finance (US) Inc., Term Loan, 5.66%, 6/18/20 | | | Marshall Islands | | | | 1,215,807 | | | | | | 1,215,807 | |
Navios Maritime Partners LP, Initial Term Loan, 6.13%, 9/14/20 | | | Greece | | | | 2,250,000 | | | | | | 2,223,749 | |
United Air Lines Inc., Class B Term Loans, 3.422%, 4/01/24 | | | United States | | | | 357,297 | | | | | | 358,804 | |
XPO Logistics Inc., Loans, 3.405%, 11/01/21 | | | United States | | | | 88,294 | | | | | | 88,769 | |
| | | | | | | | | | | | | | |
| | | | |
| | | | | | | | | | | | | 3,934,297 | |
| | | | | | | | | | | | | | |
Utilities 0.2% | | | | | | | | | | | | | | |
Calpine Construction Finance Co. LP, Term B-1 Loan, 3.24%, 5/03/20 | | | United States | | | | 2,723,744 | | | | | | 2,733,958 | |
EFS Cogen Holdings I LLC (Linden), Term B Advance, 4.65%, 6/28/23 | | | United States | | | | 158,638 | | | | | | 160,026 | |
NRG Energy Inc., Term Loans, 3.243%, 6/30/23 | | | United States | | | | 1,141,375 | | | | | | 1,147,677 | |
| | | | | | | | | | | | | | |
| | | | |
| | | | | | | | | | | | | 4,041,661 | |
| | | | | | | | | | | | | | |
| | | | |
Total Senior Floating Rate Interests (Cost $68,635,341) | | | | | | | | | | | | | 68,953,965 | |
| | | | | | | | | | | | | | |
Foreign Government and Agency Securities 1.5% | | | | | | | | | | | | | | |
d The Export-Import Bank of China, senior note, 144A, 2.50%, 7/31/19 | | | China | | | | 8,000,000 | | | | | | 8,090,000 | |
The Export-Import Bank of Korea, senior note, 2.25%, 1/21/20 | | | South Korea | | | | 11,200,000 | | | | | | 11,186,504 | |
Government of Hungary, | | | | | | | | | | | | | | |
A, 6.75%, 11/24/17 | | | Hungary | | | | 3,910,000 | | | HUF | | | 14,110 | |
A, 5.50%, 12/20/18 | | | Hungary | | | | 428,710,000 | | | HUF | | | 1,620,411 | |
Government of Mexico, | | | | | | | | | | | | | | |
7.75%, 12/14/17 | | | Mexico | | | | 930,000 | j | | MXN | | | 4,973,938 | |
M, 4.75%, 6/14/18 | | | Mexico | | | | 720,000 | j | | MXN | | | 3,742,145 | |
senior note, 8.50%, 12/13/18 | | | Mexico | | | | 1,060,000 | j | | MXN | | | 5,776,736 | |
d Government of Serbia, senior note, 144A, 5.25%, 11/21/17 | | | Serbia | | | | 1,800,000 | | | | | | 1,834,407 | |
Nota Do Tesouro Nacional, | | | | | | | | | | | | | | |
10.00%, 1/01/21 | | | Brazil | | | | 2,350 | k | | BRL | | | 742,413 | |
lIndex Linked, 6.00%, 5/15/17 | | | Brazil | | | | 150 | k | | BRL | | | 141,040 | |
lIndex Linked, 6.00%, 8/15/18 | | | Brazil | | | | 1,810 | k | | BRL | | | 1,726,279 | |
| | | | | | | | | | | | | | |
Total Foreign Government and Agency Securities
(Cost $42,282,004) | | | | | | | | | | | | | 39,847,983 | |
| | | | | | | | | | | | | | |
U.S. Government and Agency Securities 24.4% | | | | | | | | | | | | | | |
m U.S. Treasury Bond, Index Linked, 0.125%, 7/15/22 | | | United States | | | | 14,405,159 | | | | | | 14,546,675 | |
U.S. Treasury Note, | | | | | | | | | | | | | | |
1.50%, 12/31/18 | | | United States | | | | 50,000,000 | | | | | | 50,216,800 | |
1.375%, 2/28/19 | | | United States | | | | 40,000,000 | | | | | | 40,092,960 | |
1.50%, 2/28/19 | | | United States | | | | 76,000,000 | | | | | | 76,347,320 | |
1.625%, 3/31/19 | | | United States | | | | 80,000,000 | | | | | | 80,573,440 | |
3.125%, 5/15/19 | | | United States | | | | 90,000,000 | | | | | | 93,324,060 | |
1.625%, 6/30/19 | | | United States | | | | 50,000,000 | | | | | | 50,354,500 | |
3.375%, 11/15/19 | | | United States | | | | 100,000,000 | | | | | | 105,025,400 | |
mIndex Linked, 1.875%, 7/15/19 | | | United States | | | | 24,230,192 | | | | | | 25,593,189 | |
mIndex Linked, 1.375%, 1/15/20 | | | United States | | | | 24,622,895 | | | | | | 25,824,024 | |
mIndex Linked, 0.125%, 1/15/22 | | | United States | | | | 38,742,577 | | | | | | 39,089,904 | |
mIndex Linked, 0.125%, 1/15/23 | | | United States | | | | 27,436,791 | | | | | | 27,508,072 | |
| | | | |
| | | |
60 | | Semiannual Report | | franklintempleton.com |
FRANKLIN INVESTORS SECURITIES TRUST
STATEMENT OF INVESTMENTS (UNAUDITED)
Franklin Low Duration Total Return Fund (continued)
| | | | | | | | | | | | | | |
| | | Country | | | Principal Amount* | | | | | Value | |
U.S. Government and Agency Securities (continued) | | | | | | | | | | | | | | |
U.S. Treasury Note, (continued) | | | | | | | | | | | | | | |
mIndex Linked, 0.125%, 7/15/24 | | | United States | | | | 10,258,231 | | | | | $ | 10,214,357 | |
| | | | | | | | | | | | | | |
Total U.S. Government and Agency Securities
(Cost $639,814,927) | | | | | | | | | | | | | 638,710,701 | |
| | | | | | | | | | | | | | |
Asset-Backed Securities and Commercial Mortgage-
Backed Securities 24.8% | | | | | | | | | | | | | | |
Automobiles & Components 0.0%† | | | | | | | | | | | | | | |
f Countrywide Asset-Backed Certificates, | | | | | | | | | | | | | | |
2001-BC3, A, FRN, 1.471%, 12/25/31 | | | United States | | | | 1,447 | | | | | | 1,087 | |
2002-3, 1A1, FRN, 1.731%, 5/25/32 | | | United States | | | | 1,619 | | | | | | 1,558 | |
| | | | | | | | | | | | | | |
| | | | |
| | | | | | | | | | | | | 2,645 | |
| | | | | | | | | | | | | | |
Banks 1.2% | | | | | | | | | | | | | | |
Banc of America Commercial Mortgage Trust, | | | | | | | | | | | | | | |
f2006-1, D, FRN, 5.648%, 9/10/45 | | | United States | | | | 1,776,000 | | | | | | 1,771,935 | |
2006-4, AJ, 5.695%, 7/10/46 | | | United States | | | | 2,045,886 | | | | | | 2,042,138 | |
Bear Stearns Commercial Mortgage Securities Trust, | | | | | | | | | | | | | | |
f2005-T20, E, FRN, 5.115%, 10/12/42 | | | United States | | | | 2,000,000 | | | | | | 1,969,875 | |
2006-PW13, AJ, 5.611%, 9/11/41 | | | United States | | | | 404,647 | | | | | | 404,401 | |
f2007-PW16, AM, FRN, 5.655%, 6/11/40 | | | United States | | | | 335,895 | | | | | | 335,837 | |
f CD Commercial Mortgage Trust, 2005-CD1, E, FRN, 5.259%, 7/15/44 | | | United States | | | | 1,383,186 | | | | | | 1,381,477 | |
Citigroup Commercial Mortgage Trust, | | | | | | | | | | | | | | |
2006-C5, AJ, 5.482%, 10/15/49 | | | United States | | | | 947,404 | | | | | | 898,488 | |
f2007-C6, AM, FRN, 5.701%, 12/10/49 | | | United States | | | | 5,200,000 | | | | | | 5,268,424 | |
f Commercial Mortgage Trust, 2006-GG7, AJ, FRN, 5.759%, 7/10/38 | | | United States | | | | 4,448,000 | | | | | | 3,771,555 | |
Credit Suisse First Boston Mortgage Securities Corp., 2004-6, 3A1, 5.00%, 9/25/19 | | | United States | | | | 635,818 | | | | | | 653,112 | |
f CWABS Asset-Backed Certificates Trust, 2004-7, MV3, FRN, 2.041%, 12/25/34 | | | United States | | | | 329,861 | | | | | | 330,568 | |
f CWABS Inc. Asset-Backed Certificates, 2004-1, M1, FRN, 1.741%, 3/25/34 | | | United States | | | | 283,978 | | | | | | 276,129 | |
f GE Capital Commercial Mortgage Corp. Trust, 2007-C1, AM, FRN, 5.606%, 12/10/49 | | | United States | | | | 2,200,000 | | | | | | 2,189,684 | |
f Greenwich Capital Commercial Funding Corp., 2006-GG7, AM, FRN, 5.759%, 7/10/38 | | | United States | | | | 278,307 | | | | | | 278,276 | |
f Impac Secured Assets CMN Owner Trust, 2004-4, M1, FRN, 1.756%, 2/25/35 | | | United States | | | | 1,120,000 | | | | | | 1,104,323 | |
f LB-UBS Commercial Mortgage Trust, 2006-C1, AJ, FRN, 5.276%, 2/15/41 | | | United States | | | | 1,572,251 | | | | | | 1,573,113 | |
f Merrill Lynch Mortgage Investors Trust, | | | | | | | | | | | | | | |
2003-A, 1A, FRN, 1.731%, 3/25/28 | | | United States | | | | 473,913 | | | | | | 452,272 | |
2005-1, 2A2, FRN, 3.027%, 4/25/35 | | | United States | | | | 398,693 | | | | | | 388,551 | |
2006-3, 2A1, FRN, 3.101%, 10/25/36 | | | United States | | | | 2,727,413 | | | | | | 2,675,633 | |
f Morgan Stanley ABS Capital I Inc. Trust, 2005-WMC, M2, FRN, 1.726%, 1/25/35 | | | United States | | | | 263,928 | | | | | | 260,783 | |
Morgan Stanley Capital I Trust, | | | | | | | | | | | | | | |
d2005-RR6, B, 144A, 5.306%, 5/24/43 | | | United States | | | | 306,683 | | | | | | 307,391 | |
f2006-HQ8, AJ, FRN, 5.45%, 3/12/44 | | | United States | | | | 1,165,861 | | | | | | 1,168,954 | |
| | | | |
| | | |
franklintempleton.com | | Semiannual Report | | 61 |
FRANKLIN INVESTORS SECURITIES TRUST
STATEMENT OF INVESTMENTS (UNAUDITED)
Franklin Low Duration Total Return Fund (continued)
| | | | | | | | | | | | |
| | | Country | | Principal Amount* | | | | | Value | |
Asset-Backed Securities and Commercial Mortgage- Backed Securities (continued) | | | | | | | | | | | | |
Banks (continued) | | | | | | | | | | | | |
d,f Wachovia Bank Commercial Mortgage Trust, 2003-C7, F, 144A, FRN, 5.93%, 10/15/35 | | United States | | | 437,246 | | | | | $ | 437,006 | |
f Wells Fargo Mortgage Backed Securities Trust, | | | | | | | | | | | | |
2005-AR, 1A1, FRN, 3.116%, 2/25/35 | | United States | | | 1,653,889 | | | | | | 1,682,785 | |
2005-AR9, 2A2, FRN, 3.068%, 10/25/33 | | United States | | | 173,182 | | | | | | 171,374 | |
| | | | | | | | | | | | |
| | | | |
| | | | | | | | | | | 31,794,084 | |
| | | | | | | | | | | | |
Diversified Financials 22.9% | | | | | | | | | | | | |
f American Express Credit Account Master Trust, | | | | | | | | | | | | |
2008-2, A, FRN, 2.254%, 9/15/20 | | United States | | | 2,900,000 | | | | | | 2,928,224 | |
2012-1, A, FRN, 1.264%, 1/15/20 | | United States | | | 11,890,000 | | | | | | 11,892,540 | |
f American Home Mortgage Investment Trust, | | | | | | | | | | | | |
2004-3, 4A, FRN, 2.861%, 10/25/34 | | United States | | | 2,881,927 | | | | | | 2,818,275 | |
2005-1, 6A, FRN, 3.428%, 6/25/45 | | United States | | | 1,434,812 | | | | | | 1,427,396 | |
f Ameriquest Mortgage Securities Inc. Asset-Backed Pass-Through Certificates, 2004-R4, M1, FRN, 1.816%, 6/25/34 | | United States | | | 1,008,564 | | | | | | 992,441 | |
d Apidos CDO, 2013-14A, C2, 144A, 4.85%, 4/15/25 | | United States | | | 1,900,000 | | | | | | 1,908,854 | |
d,f ARCap REIT Inc., 2004-RR3, A2, 144A, FRN, 5.751%, 9/21/45 | | United States | | | 1,414,591 | | | | | | 1,429,572 | |
f Argent Securities Inc. Asset-Backed Pass-Through Certificates, 2005-W2, A2C, FRN, 1.351%, 10/25/35 | | United States | | | 699,757 | | | | | | 687,910 | |
d,f Atrium X, 10A, A, 144A, FRN, 2.278%, 7/16/25 | | United States | | | 1,390,000 | | | | | | 1,389,013 | |
d,f Atrium XI, 11A, CR, 144A, FRN, 3.303%, 10/23/25 | | Cayman Islands | | | 6,750,000 | | | | | | 6,749,932 | |
f Bear Stearns ALT-A Trust, | | | | | | | | | | | | |
n2004-10, 1A3, FRN, 1.991%, 9/25/34 | | United States | | | 943,223 | | | | | | 938,688 | |
2004-13, A2, FRN, 1.871%, 11/25/34 | | United States | | | 91,436 | | | | | | 88,342 | |
d,f BlueMountain CLO Ltd., 2013-3A, A, 144A, FRN, 2.439%, 10/29/25 | | United States | | | 1,448,215 | | | | | | 1,448,983 | |
d,f Burnham Park CLO Ltd., 2016-1A, A, 144A, FRN, 2.586%, 10/20/29 | | Cayman Islands | | | 2,240,000 | | | | | | 2,240,650 | |
f Capital One Multi-Asset Execution Trust, 2007-A5, A5, FRN, 1.034%, 7/15/20 | | United States | | | 10,200,000 | | | | | | 10,199,438 | |
d,f Carlyle Global Market Strategies CLO Ltd., 2012-4A, AR, 144A, FRN, 2.606%, 1/20/29 | | United States | | | 2,800,000 | | | | | | 2,821,028 | |
d,f Carlyle U.S. CLO Ltd., 2017-1A, A1A, 144A, FRN, 2.391%, 4/20/31 | | United States | | | 1,000,000 | | | | | | 1,003,650 | |
d,f Catamaran CLO Ltd., 2014-2A, BR, 144A, FRN, 4.108%, 10/18/26 | | Cayman Islands | | | 3,011,300 | | | | | | 3,018,708 | |
d,f Cent CLO, 2013-17A, A1, 144A, FRN, 2.339%, 1/30/25 | | United States | | | 8,916,000 | | | | | | 8,933,565 | |
d,f Cent CLO 20 Ltd., 13-20A, AR, 144A, FRN, 2.256%, 1/25/26 | | Cayman Islands | | | 4,000,000 | | | | | | 4,000,000 | |
d,f Cent CLO LP, | | | | | | | | | | | | |
2014-22A, A1R, 144A, FRN, 2.444%, 11/07/26 | | United States | | | 2,800,000 | | | | | | 2,811,228 | |
2014-22A, BR, 144A, FRN, 3.984%, 11/07/26 | | United States | | | 4,050,000 | | | | | | 4,050,607 | |
d Centerline REIT Inc., 2004-RR3, B, 144A, 5.04%, 9/21/45 | | United States | | | 2,227,000 | | | | | | 2,058,750 | |
f Chase Funding Trust, 2004-2, 2A2, FRN, 1.491%, 2/26/35 | | United States | | | 12,255 | | | | | | 11,346 | |
Chase Issuance Trust, | | | | | | | | | | | | |
f2013-A3, A3, FRN, 1.274%, 4/15/20 | | United States | | | 6,147,000 | | | | | | 6,158,111 | |
f2014-A5, A5, FRN, 1.364%, 4/15/21 | | United States | | | 7,310,000 | | | | | | 7,349,856 | |
2015-A2, A2, 1.59%, 2/18/20 | | United States | | | 8,200,000 | | | | | | 8,211,301 | |
2015-A7, A7, 1.62%, 7/15/20 | | United States | | | 5,005,000 | | | | | | 5,012,123 | |
f COBALT CMBS Commercial Mortgage Trust, 2007-C2, AMFX, FRN, | | | | | | | | | | | | |
5.526%, 4/15/47 | | United States | | | 415,199 | | | | | | 418,509 | |
d,f Colony American Homes, | | | | | | | | | | | | |
2014-1A, A, 144A, FRN, 2.144%, 5/17/31 | | United States | | | 4,455,781 | | | | | | 4,462,850 | |
2014-1A, C, 144A, FRN, 2.844%, 5/17/31 | | United States | | | 700,000 | | | | | | 700,685 | |
| | | | |
| | | |
62 | | Semiannual Report | | franklintempleton.com |
FRANKLIN INVESTORS SECURITIES TRUST
STATEMENT OF INVESTMENTS (UNAUDITED)
Franklin Low Duration Total Return Fund (continued)
| | | | | | | | | | | | |
| | | Country | | Principal Amount* | | | | | Value | |
Asset-Backed Securities and Commercial Mortgage- Backed Securities (continued) | | | | | | | | | | | | |
Diversified Financials (continued) | | | | | | | | | | | | |
d,f Commercial Mortgage Trust, 2014-BBG, A, 144A, FRN, 1.794%, 3/15/29 | | United States | | | 6,600,000 | | | | | $ | 6,616,573 | |
f Conseco Finance Securitizations Corp., 2002-2, M1, FRN, 7.424%, 3/01/33 | | United States | | | 948,781 | | | | | | 1,050,761 | |
Conseco Financial Corp., | | | | | | | | | | | | |
f1997-3, A7, FRN, 7.64%, 3/15/28 | | United States | | | 939,060 | | | | | | 966,344 | |
1998-6, A8, 6.66%, 6/01/30 | | United States | | | 6,976,422 | | | | | | 7,449,814 | |
d Core Industrial Trust, 2015-CALW, A, 144A, 3.04%, 2/10/34 | | United States | | | 5,290,000 | | | | | | 5,436,989 | |
f Countrywide Home Loans, | | | | | | | | | | | | |
2004-6, 1A1, FRN, 3.056%, 5/25/34 | | United States | | | 2,098,163 | | | | | | 2,083,568 | |
2004-11, 2A1, FRN, 2.68%, 7/25/34 | | United States | | | 2,333,196 | | | | | | 2,333,582 | |
d,f CSMC Trust, 2014-IVR3, A1, 144A, FRN, 3.50%, 7/25/44 | | United States | | | 2,885,358 | | | | | | 2,921,931 | |
Discover Card Execution Note Trust, | | | | | | | | | | | | |
f2012-A4, A4, FRN, 1.359%, 11/15/19 | | United States | | | 10,500,000 | | | | | | 10,501,624 | |
f2013-A6, A6, FRN, 1.444%, 4/15/21 | | United States | | | 5,520,000 | | | | | | 5,546,157 | |
f2014-A1, A1, FRN, 1.424%, 7/15/21 | | United States | | | 7,690,000 | | | | | | 7,733,058 | |
2014-A5, A, 1.39%, 4/15/20 | | United States | | | 2,060,000 | | | | | | 2,060,951 | |
d,f Dryden 33 Senior Loan Fund, 2014-33A, AR, 144A, FRN, 2.588%, 10/15/28 | | Cayman Islands | | | 12,415,000 | | | | | | 12,501,781 | |
d,f Dryden 34 Senior Loan Fund, 14-34A, AR, 144A, FRN, 2.318%, 10/15/26 | | Cayman Islands | | | 3,000,000 | | | | | | 3,001,080 | |
d,f Dryden 38 Senior Loan Fund, 2015-38A, A, 144A, FRN, 2.588%, 7/15/27 | | Cayman Islands | | | 9,642,857 | | | | | | 9,700,136 | |
d,f Eaton Vance CDO Ltd., 2014-1A, AR, 144A, FRN, 2.358%, 7/15/26 | | United States | | | 5,266,000 | | | | | | 5,268,422 | |
f FHLMC Structured Agency Credit Risk Debt Notes, | | | | | | | | | | | | |
2014-DN1, M2, FRN, 3.191%, 2/25/24 | | United States | | | 360,000 | | | | | | 370,412 | |
2014-DN3, M2, FRN, 3.391%, 8/25/24 | | United States | | | 358,303 | | | | | | 359,878 | |
2014-DN3, M3, FRN, 4.991%, 8/25/24 | | United States | | | 1,270,000 | | | | | | 1,383,150 | |
2014-DN4, M2, FRN, 3.391%, 10/25/24 | | United States | | | 446,269 | | | | | | 447,081 | |
2014-HQ1, M2, FRN, 3.491%, 8/25/24 | | United States | | | 4,373,049 | | | | | | 4,446,915 | |
2014-HQ3, M2, FRN, 3.641%, 10/25/24 | | United States | | | 3,804,155 | | | | | | 3,840,765 | |
2015-DN1, M2, FRN, 3.391%, 1/25/25 | | United States | | | 3,184,218 | | | | | | 3,200,863 | |
2015-DN1, M3, FRN, 5.141%, 1/25/25 | | United States | | | 9,400,000 | | | | | | 10,235,197 | |
2015-DNA1, M2, FRN, 2.841%, 10/25/27 | | United States | | | 10,530,000 | | | | | | 10,785,633 | |
2015-DNA1, M3, FRN, 4.291%, 10/25/27 | | United States | | | 350,000 | | | | | | 380,134 | |
2015-DNA2, M2, FRN, 3.591%, 12/25/27 | | United States | | | 11,918,837 | | | | | | 12,234,405 | |
2015-DNA2, M3, FRN, 4.891%, 12/25/27 | | United States | | | 6,925,000 | | | | | | 7,684,602 | |
2015-DNA3, M2, FRN, 3.841%, 4/25/28 | | United States | | | 9,199,699 | | | | | | 9,557,106 | |
2015-HQ1, M2, FRN, 3.191%, 3/25/25 | | United States | | | 7,430,050 | | | | | | 7,533,339 | |
2015-HQ1, M3, FRN, 4.791%, 3/25/25 | | United States | | | 8,725,000 | | | | | | 9,474,528 | |
2015-HQA1, M2, FRN, 3.641%, 3/25/28 | | United States | | | 12,595,419 | | | | | | 12,935,566 | |
2015-HQA2, M2, FRN, 3.791%, 5/25/28 | | United States | | | 13,209,343 | | | | | | 13,660,721 | |
2016-DNA1, M2, FRN, 3.891%, 7/25/28 | | United States | | | 330,000 | | | | | | 344,284 | |
2016-DNA2, M2, FRN, 3.191%, 10/25/28 | | United States | | | 2,270,000 | | | | | | 2,322,442 | |
2016-HQ1, M1, FRN, 2.741%, 9/25/28 | | United States | | | 2,718,981 | | | | | | 2,736,338 | |
2016-HQA1, M2, FRN, 3.741%, 9/25/28 | | United States | | | 655,000 | | | | | | 681,995 | |
2016-HQA2, M2, FRN, 3.241%, 11/25/28 | | United States | | | 1,160,000 | | | | | | 1,199,788 | |
2016-HQA3, M2, FRN, 2.341%, 3/25/29 | | United States | | | 250,000 | | | | | | 252,933 | |
| | | | |
| | | |
franklintempleton.com | | Semiannual Report | | 63 |
FRANKLIN INVESTORS SECURITIES TRUST
STATEMENT OF INVESTMENTS (UNAUDITED)
Franklin Low Duration Total Return Fund (continued)
| | | | | | | | | | | | | | |
| | | Country | | | Principal Amount* | | | | | Value | |
Asset-Backed Securities and Commercial Mortgage- Backed Securities (continued) | | | | | | | | | | | | | | |
Diversified Financials (continued) | | | | | | | | | | | | | | |
f First Horizon Alternative Mortgage Securities Trust, 2004-AA5, 2A1, FRN, 2.759%, 12/25/34 | | | United States | | | | 1,473,843 | | | | | $ | 1,434,539 | |
d,f Flagship CLO VIII Ltd., 2014-8A, AR, 144A, FRN, 2.408%, 1/16/26 | | | Cayman Islands | | | | 5,545,000 | | | | | | 5,553,484 | |
f FNMA Connecticut Avenue Securities, | | | | | | | | | | | | | | |
2013-C01, M1, FRN, 2.991%, 10/25/23 | | | United States | | | | 3,198,812 | | | | | | 3,236,807 | |
2014-C02, 2M1, FRN, 1.941%, 5/25/24 | | | United States | | | | 282,173 | | | | | | 282,768 | |
2014-C03, 1M2, FRN, 3.991%, 7/25/24 | | | United States | | | | 12,579,000 | | | | | | 13,242,525 | |
2014-C03, 2M2, FRN, 3.891%, 7/25/24 | | | United States | | | | 3,395,000 | | | | | | 3,565,584 | |
2014-C04, 1M1, FRN, 5.891%, 11/25/24 | | | United States | | | | 287,000 | | | | | | 327,652 | |
2014-C04, 2M2, FRN, 5.991%, 11/25/24 | | | United States | | | | 4,213,651 | | | | | | 4,732,040 | |
2015-C01, 1M2, FRN, 5.291%, 2/25/25 | | | United States | | | | 2,512,039 | | | | | | 2,744,747 | |
2015-C01, 2M2, FRN, 5.541%, 2/25/25 | | | United States | | | | 11,856,235 | | | | | | 12,873,481 | |
2015-C02, 1M2, FRN, 4.991%, 5/25/25 | | | United States | | | | 2,957,554 | | | | | | 3,208,295 | |
2015-C02, 2M2, FRN, 4.991%, 5/25/25 | | | United States | | | | 5,121,193 | | | | | | 5,496,413 | |
2015-C03, 1M2, FRN, 5.991%, 7/25/25 | | | United States | | | | 3,689,966 | | | | | | 4,097,224 | |
2015-C03, 2M2, FRN, 5.991%, 7/25/25 | | | United States | | | | 5,627,000 | | | | | | 6,270,532 | |
2017-C01, 1M2, FRN, 4.541%, 7/25/29 | | | United States | | | | 6,805,000 | | | | | | 7,059,887 | |
d,f Galaxy CLO Ltd., 2014-17A, AR, 144A, FRN, 2.558%, 7/15/26 | | | Cayman Islands | | | | 1,710,000 | | | | | | 1,715,506 | |
d,f Galaxy XV CLO Ltd., 2013-15A, A, 144A, FRN, 2.408%, 4/15/25 | | | United States | | | | 10,063,000 | | | | | | 10,082,824 | |
d G-Force LLC, 2005-RRA, B, 144A, 5.09%, 8/22/36 | | | United States | | | | 195,248 | | | | | | 195,128 | |
n GMAC Commercial Mortgage Securities Inc. Trust, 2005-C1, B, 4.936%, 5/10/43 | | | United States | | | | 1,411,913 | | | | | | 74,054 | |
f Greenpoint Manufactured Housing, 1999-5, M1A, FRN, 8.30%, 10/15/26 | | | United States | | | | 856,561 | | | | | | 938,500 | |
f,o GS Mortgage Securities Corp. II, 2015-GC30, XA, IO, FRN, 0.895%, 5/10/50 | | | United States | | | | 7,998,399 | | | | | | 389,772 | |
f GSAA Home Equity Trust, | | | | | | | | | | | | | | |
2005-5, M3, FRN, 1.936%, 2/25/35 | | | United States | | | | 5,506,240 | | | | | | 5,349,167 | |
2005-6, A3, FRN, 1.361%, 6/25/35 | | | United States | | | | 341,138 | | | | | | 339,837 | |
f GSAMP Trust, 2005-HE3, M2, FRN, 1.996%, 6/25/35 | | | United States | | | | 806,529 | | | | | | 798,481 | |
f GSR Mortgage Loan Trust, 2005-AR1, 1A1, FRN, 3.489%, 1/25/35 | | | United States | | | | 505,468 | | | | | | 484,803 | |
d Highbridge Loan Management Ltd., 2013-2A, B2, 144A, 5.80%, 10/20/24 | | | United States | | | | 570,000 | | | | | | 575,273 | |
d,f Invitation Homes Trust, | | | | | | | | | | | | | | |
2014-SFR1, B, 144A, FRN, 2.494%, 6/17/31 | | | United States | | | | 490,089 | | | | | | 490,367 | |
2014-SFR2, A, 144A, FRN, 2.094%, 9/17/31 | | | United States | | | | 4,328,680 | | | | | | 4,332,256 | |
2014-SFR2, B, 144A, FRN, 2.594%, 9/17/31 | | | United States | | | | 8,500,000 | | | | | | 8,507,630 | |
2015-SFR1, A, 144A, FRN, 2.444%, 3/17/32 | | | United States | | | | 2,374,697 | | | | | | 2,381,454 | |
2015-SFR2, A, 144A, FRN, 2.344%, 6/17/32 | | | United States | | | | 7,945,589 | | | | | | 7,971,217 | |
2015-SFR3, A, 144A, FRN, 2.294%, 8/17/32 | | | United States | | | | 4,259,271 | | | | | | 4,284,554 | |
f IXIS Real Estate Capital Trust, 2005-HE4, A3, FRN, 1.671%, 2/25/36 | | | United States | | | | 2,730 | | | | | | 2,734 | |
d,f Jay Park CLO Ltd., 2016-1A, A2, 144A, FRN, 2.956%, 10/20/27 | | | United States | | | | 17,290,000 | | | | | | 17,298,126 | |
d,f Jefferies & Co., 2009-R2, 4A, 144A, FRN, 3.302%, 5/26/37 | | | United States | | | | 833,853 | | | | | | 838,569 | |
JP Morgan Chase Commercial Mortgage Securities Trust, | | | | | | | | | | | | | | |
2004-LN2, A2, 5.115%, 7/15/41 | | | United States | | | | 22,953 | | | | | | 22,917 | |
f2005-LPD5, F, FRN, 5.632%, 12/15/44 | | | United States | | | | 6,357,475 | | | | | | 6,342,465 | |
2006-CB17, AM, 5.464%, 12/12/43 | | | United States | | | | 136,615 | | | | | | 136,586 | |
| | | | |
| | | |
64 | | Semiannual Report | | franklintempleton.com |
FRANKLIN INVESTORS SECURITIES TRUST
STATEMENT OF INVESTMENTS (UNAUDITED)
Franklin Low Duration Total Return Fund (continued)
| | | | | | | | | | | | | | |
| | | Country | | | Principal Amount* | | | | | Value | |
Asset-Backed Securities and Commercial Mortgage- Backed Securities (continued) | | | | | | | | | | | | | | |
Diversified Financials (continued) | | | | | | | | | | | | | | |
f JP Morgan Mortgage Trust, 2004-A1, 5A1, FRN, 3.394%, 2/25/34 | | | United States | | | | 89,500 | | | | | $ | 88,662 | |
d,f,n LB-UBS Commercial Mortgage Trust, 2001-C3, E, 144A, FRN, 6.95%,
6/15/36 | | | United States | | | | 700,000 | | | | | | 687,053 | |
f Lehman XS Trust, 2005-4, 1A4, FRN, 1.551%, 10/25/35 | | | United States | | | | 841,961 | | | | | | 803,462 | |
d,f Mach One ULC, | | | | | | | | | | | | | | |
2004-1A, K, 144A, FRN, 5.45%, 5/28/40 | | | United States | | | | 4,293,400 | | | | | | 4,310,180 | |
2004-1A, L, 144A, FRN, 5.45%, 5/28/40 | | | United States | | | | 3,470,500 | | | | | | 3,500,623 | |
2004-1A, M, 144A, FRN, 5.45%, 5/28/40 | | | United States | | | | 640,000 | | | | | | 641,554 | |
f Madison Avenue Manufactured Housing Contract Trust, 2002-A, B1, FRN, 4.241%, 3/25/32 | | | United States | | | | 1,436,728 | | | | | | 1,452,879 | |
f Manufactured Housing Contract Trust Pass Through Certificates, 2001-1, IIM2, FRN, 2.443%, 4/20/32 | | | United States | | | | 6,960,435 | | | | | | 6,589,040 | |
MASTR Alternative Loan Trust, | | | | | | | | | | | | | | |
2003-1, 3A1, 5.00%, 2/25/18 | | | United States | | | | 127,250 | | | | | | 129,555 | |
2003-6, 2A1, 5.00%, 8/25/18 | | | United States | | | | 385,871 | | | | | | 389,478 | |
2003-9, 1A1, 5.50%, 12/25/18 | | | United States | | | | 166,744 | | | | | | 168,113 | |
2004-4, 5A1, 5.50%, 4/25/19 | | | United States | | | | 567,453 | | | | | | 576,607 | |
f2004-11, 2A1, FRN, 5.544%, 11/25/19 | | | United States | | | | 701,613 | | | | | | 715,130 | |
f Merrill Lynch Mortgage Investors Trust, | | | | | | | | | | | | | | |
2003-G, A2, FRN, 1.96%, 1/25/29 | | | United States | | | | 794,942 | | | | | | 752,159 | |
2005-A10, A, FRN, 1.201%, 2/25/36 | | | United States | | | | 3,368,922 | | | | | | 3,225,428 | |
f Merrill Lynch Mortgage Investors Trust Inc., 2003-E, A1, FRN, 1.611%, 10/25/28 | | | United States | | | | 854,290 | | | | | | 824,538 | |
f Merrill Lynch Mortgage Trust, 2005-CKI1, D, FRN, 5.361%, 11/12/37 | | | United States | | | | 990,779 | | | | | | 989,857 | |
d Multi Security Asset Trust LP Commercial Mortgage, | | | | | | | | | | | | | | |
2005-RR4A, J, 144A, 5.88%, 11/28/35 | | | United States | | | | 6,097,200 | | | | | | 6,231,186 | |
f2005-RR4A, K, 144A, FRN, 5.88%, 11/28/35 | | | United States | | | | 3,866,000 | | | | | | 3,958,417 | |
f New York Mortgage Trust, 2005-3, M1, FRN, 1.666%, 2/25/36 | | | United States | | | | 459,551 | | | | | | 410,371 | |
f Novastar Home Equity Loan, 2004-4, M4, FRN, 2.641%, 3/25/35 | | | United States | | | | 665,773 | | | | | | 664,469 | |
d,f NZCG Funding Ltd., 2015-2A, A1, 144A, FRN, 2.72%, 4/27/27 | | | United States | | | | 8,101,875 | | | | | | 8,114,271 | |
d OBP Depositor LLC Trust, 2010-OBP, A, 144A, 4.646%, 7/15/45 | | | United States | | | | 1,700,000 | | | | | | 1,817,062 | |
d,f Octagon Investment Partners XVII Ltd., 2013-1A, A1, 144A, FRN, 2.486%, 10/25/25 | | | United States | | | | 7,510,000 | | | | | | 7,530,953 | |
d,f,p Octagon Investment Partners XX Ltd., 2014-1A, AR, 144A, FRN, 0.00%, 8/12/26 | | | Cayman Islands | | | | 3,000,000 | | | | | | 3,000,000 | |
d,f Octagon Investment Partners XXIII Ltd., | | | | | | | | | | | | | | |
2015-1A, A1, 144A, FRN, 2.578%, 7/15/27 | | | United States | | | | 4,160,328 | | | | | | 4,172,809 | |
2015-1A, A2, 144A, FRN, 2.578%, 7/15/27 | | | United States | | | | 3,949,678 | | | | | | 3,961,527 | |
f Ownit Mortgage Loan Asset-Backed Certificates, 2005-2, M4, FRN, 1.921%, 3/25/36 | | | United States | | | | 705,343 | | | | | | 703,754 | |
f Park Place Securities Inc. Asset-Backed Pass-Through Certificates, 2004-WHQ2, M2, FRN, 1.936%, 2/25/35 | | | United States | | | | 704,983 | | | | | | 707,673 | |
f RAAC, 2004-SP1, AII, FRN, 1.691%, 3/25/34 | | | United States | | | | 532,011 | | | | | | 506,628 | |
f Residential Funding Mortgage Securities II, 2004-HI3, A5, FRN, 5.48%, 6/25/34 | | | United States | | | | 286,229 | | | | | | 295,822 | |
d,f Resource Capital Corp. Ltd., | | | | | | | | | | | | | | |
2014-CRE2, A, 144A, FRN, 2.044%, 4/15/32 | | | United States | | | | 465,959 | | | | | | 465,878 | |
2015-CRE4, A, 144A, FRN, 2.394%, 8/15/32 | | | United States | | | | 773,243 | | | | | | 774,401 | |
d,f Silver Bay Realty Trust, | | | | | | | | | | | | | | |
2014-1, A, 144A, FRN, 1.994%, 9/17/31 | | | United States | | | | 1,147,798 | | | | | | 1,149,703 | |
2014-1, B, 144A, FRN, 2.444%, 9/17/31 | | | United States | | | | 540,000 | | | | | | 536,584 | |
| | | | |
| | | |
franklintempleton.com | | Semiannual Report | | 65 |
FRANKLIN INVESTORS SECURITIES TRUST
STATEMENT OF INVESTMENTS (UNAUDITED)
Franklin Low Duration Total Return Fund (continued)
| | | | | | | | | | | | | | |
| | | Country | | | Principal Amount* | | | | | Value | |
Asset-Backed Securities and Commercial Mortgage- Backed Securities (continued) | | | | | | | | | | | | | | |
Diversified Financials (continued) | | | | | | | | | | | | | | |
f Structured ARM Loan Trust, 2004-12, 3A1, FRN, 3.314%, 9/25/34 | | | United States | | | | 3,286,456 | | | | | $ | 3,263,030 | |
f Structured Asset Investment Loan Trust, 2004-BNC2, A2, FRN, 2.031%, 12/25/34 | | | United States | | | | 755,022 | | | | | | 755,038 | |
f Structured Asset Mortgage Investments II Trust, 2004-AR6, A1A, FRN, 1.694%, 2/19/35 | | | United States | | | | 1,832,814 | | | | | | 1,713,282 | |
f Structured Asset Mortgage Investments Trust, | | | | | | | | | | | | | | |
2003-AR1, A1, FRN, 1.734%, 10/19/33 | | | United States | | | | 360,250 | | | | | | 338,061 | |
n2003-AR2, A1, FRN, 1.734%, 12/19/33 | | | United States | | | | 794,656 | | | | | | 765,997 | |
f Thornburg Mortgage Securities Trust, | | | | | | | | | | | | | | |
2003-4, A1, FRN, 1.631%, 9/25/43 | | | United States | | | | 2,234,099 | | | | | | 2,160,119 | |
2004-3, A, FRN, 1.731%, 9/25/44 | | | United States | | | | 1,113,999 | | | | | | 1,028,078 | |
2005-1, A3, FRN, 3.073%, 4/25/45 | | | United States | | | | 375,966 | | | | | | 376,214 | |
d Towd Point Mortgage Trust, | | | | | | | | | | | | | | |
f2015-3, A1B, 144A, FRN, 3.00%, 3/25/54 | | | United States | | | | 2,451,035 | | | | | | 2,479,731 | |
2016-1, A1, 144A, 3.50%, 2/25/55 | | | United States | | | | 10,109,064 | | | | | | 10,355,596 | |
f2016-5, A1, 144A, FRN, 2.50%, 10/25/56 | | | United States | | | | 6,156,911 | | | | | | 6,155,608 | |
f2017-1, A1, 144A, FRN, 2.75%, 10/25/56 | | | United States | | | | 5,819,324 | | | | | | 5,854,724 | |
d,f Voya CLO Ltd., | | | | | | | | | | | | | | |
2012-4A, A2R, 144A, FRN, 3.008%, 10/15/28 | | | Cayman Islands | | | | 7,660,000 | | | | | | 7,689,261 | |
2014-4A, A1, 144A, FRN, 2.658%, 10/14/26 | | | Cayman Islands | | | | 6,450,000 | | | | | | 6,457,740 | |
2015-1A, A1, 144A, FRN, 2.638%, 4/18/27 | | | United States | | | | 5,280,000 | | | | | | 5,295,840 | |
f WaMu Mortgage Pass-Through Certificates, | | | | | | | | | | | | | | |
2005-AR8, 1A1A, FRN, 1.281%, 7/25/45 | | | United States | | | | 1,343,444 | | | | | | 1,300,121 | |
2005-AR19, A1A1, FRN, 1.261%, 12/25/45 | | | United States | | | | 3,563,137 | | | | | | 3,405,700 | |
f,o Wells Fargo Commercial Mortgage Trust, 2016-NXS6, XA, IO, FRN, 1.66%, 11/15/49 | | | United States | | | | 54,357,682 | | | | | | 5,736,029 | |
f Wells Fargo Mortgage Backed Securities Trust, | | | | | | | | | | | | | | |
2004-W, A9, FRN, 3.004%, 11/25/34 | | | United States | | | | 131,026 | | | | | | 132,893 | |
2005-AR10, 2A3, FRN, 3.092%, 6/25/35 | | | United States | | | | 712,276 | | | | | | 711,225 | |
d,f West CLO Ltd., | | | | | | | | | | | | | | |
2014-1A, A2, 144A, FRN, 3.258%, 7/18/26 | | | United States | | | | 1,360,000 | | | | | | 1,367,358 | |
2014-1A, B, 144A, FRN, 4.008%, 7/18/26 | | | United States | | | | 3,590,000 | | | | | | 3,600,734 | |
| | | | | | | | | | | | | | |
| | | | |
| | | | | | | | | | | | | 598,869,824 | |
| | | | | | | | | | | | | | |
Real Estate 0.7% | | | | | | | | | | | | | | |
d BAMLL Commercial Mortgage Securities Trust, 2012-PARK, A, 144A, 2.959%, 12/10/30 | | | United States | | | | 3,200,000 | | | | | | 3,259,907 | |
d Colony MFM Trust, 2014-1, A, 144A, 2.543%, 4/20/50 | | | United States | | | | 3,538,544 | | | | | | 3,525,124 | |
d,f SWAY Residential Trust, 2014-1, A, 144A, FRN, 2.294%, 1/17/32 | | | United States | | | | 4,329,854 | | | | | | 4,353,024 | |
d,f Tricon American Homes Trust, 2015-SFR1, A, 144A, FRN, 2.244%, 5/17/32 | | | United States | | | | 7,213,743 | | | | | | 7,232,074 | |
| | | | | | | | | | | | | | |
| | | | | | | | | | | | | 18,370,129 | |
| | | | | | | | | | | | | | |
Total Asset-Backed Securities and Commercial Mortgage-Backed Securities (Cost $645,297,132) | | | | | | | | | | | | | 649,036,682 | |
| | | | | | | | | | | | | | |
Mortgage-Backed Securities 1.4% | | | | | | | | | | | | | | |
f Federal Home Loan Mortgage Corp. (FHLMC) Adjustable Rate 0.1% | | | | | | | | | | | | | | |
FHLMC, 3.324% - 3.418%, 10/01/36 - 6/01/37 | | | United States | | | | 3,020,051 | | | | | | 3,211,546 | |
| | | | | | | | | | | | | | |
| | | | |
| | | |
66 | | Semiannual Report | | franklintempleton.com |
FRANKLIN INVESTORS SECURITIES TRUST
STATEMENT OF INVESTMENTS (UNAUDITED)
Franklin Low Duration Total Return Fund (continued)
| | | | | | | | | | | | | | |
| | | Country | | | Principal Amount* | | | | | Value | |
Mortgage-Backed Securities (continued) | | | | | | | | | | | | | | |
Federal Home Loan Mortgage Corp. (FHLMC) Fixed Rate 0.0%† | | | | | | | | | | | | | | |
FHLMC Gold 15 Year, 5.00%, 10/01/23 | | | United States | | | | 151,729 | | | | | $ | 158,806 | |
FHLMC Gold 15 Year, 6.00%, 6/01/23 | | | United States | | | | 37,672 | | | | | | 39,857 | |
FHLMC Gold 30 Year, 5.00%, 1/01/39 | | | United States | | | | 171,472 | | | | | | 187,463 | |
| | | | | | | | | | | | | | |
| | | | |
| | | | | | | | | | | | | 386,126 | |
| | | | | | | | | | | | | | |
f Federal National Mortgage Association (FNMA) Adjustable Rate 1.1% | | | | | | | | | | | | | | |
FNMA, 1.841% - 3.51%, 7/01/17 - 10/01/44 | | | United States | | | | 21,986,014 | | | | | | 23,042,504 | |
FNMA, 3.513% - 5.89%, 8/01/19 - 4/01/38 | | | United States | | | | 5,547,570 | | | | | | 5,878,621 | |
| | | | | | | | | | | | | | |
| | | | |
| | | | | | | | | | | | | 28,921,125 | |
| | | | | | | | | | | | | | |
Federal National Mortgage Association (FNMA) Fixed Rate 0.2% | | | | | | | | | | | | | | |
FNMA 15 Year, 3.50%, 10/01/25 | | | United States | | | | 1,297,660 | | | | | | 1,357,750 | |
FNMA 15 Year, 4.00%, 12/01/25 | | | United States | | | | 1,960,654 | | | | | | 2,072,079 | |
FNMA 15 Year, 4.50%, 5/01/23 - 6/01/25 | | | United States | | | | 1,423,691 | | | | | | 1,504,102 | |
FNMA 30 Year, 5.00%, 3/01/38 | | | United States | | | | 38,721 | | | | | | 42,408 | |
| | | | | | | | | | | | | | |
| | | | |
| | | | | | | | | | | | | 4,976,339 | |
| | | | | | | | | | | | | | |
f Government National Mortgage Association (GNMA) Adjustable Rate 0.0%† | | | | | | | | | | | | | | |
GNMA, 2.125%, 4/20/26 - 9/20/26 | | | United States | | | | 26,621 | | | | | | 27,467 | |
| | | | | | | | | | | | | | |
| | | | |
Total Mortgage-Backed Securities (Cost $37,296,476) | | | | | | | | | | | | | 37,522,603 | |
| | | | | | | | | | | | | | |
Municipal Bonds 0.7% | | | | | | | | | | | | | | |
Industry Public Facilities Authority Tax Allocation Revenue, Transportation District, Industrial Redevelopment Project No. 2, Refunding, Series B, AGMC Insured, 3.389%, 1/01/20 | | | United States | | | | 5,900,000 | | | | | | 6,063,371 | |
Pennsylvania State GO, Refunding, Second Series, 5.00%, 1/15/20 | | | United States | | | | 6,500,000 | | | | | | 7,125,040 | |
Texas State GO, Transportation Commission-Highway Improvement, Series A, 5.00%, 4/01/21 | | | United States | | | | 2,685,000 | | | | | | 3,061,518 | |
f University of California Revenue, Series Y-2, Monthly FRN, 1.483%, 7/01/41 | | | United States | | | | 390,000 | | | | | | 390,000 | |
| | | | | | | | | | | | | | |
| | | | |
Total Municipal Bonds (Cost $16,380,424) | | | | | | | | | | | | | 16,639,929 | |
| | | | | | | | | | | | | | |
| | | | | | Shares | | | | | | |
Escrows and Litigation Trusts (Cost $—) 0.0% | | | | | | | | | | | | | | |
a,q NewPage Corp., Litigation Trust | | | United States | | | | 500,000 | | | | | | — | |
| | | | | | | | | | | | | | |
Total Investments before Short Term Investments (Cost $2,466,120,345) | | | | | | | | | | | | | 2,470,111,939 | |
| | | | | | | | | | | | | | |
Short Term Investments (Cost $137,532,020) 5.3% | | | | | | | | | | | | | | |
Money Market Funds 5.3% | | | | | | | | | | | | | | |
c,r Institutional Fiduciary Trust Money Market Portfolio, 0.37% | | | United States | | | | 137,532,020 | | | | | | 137,532,020 | |
| | | | | | | | | | | | | | |
Total Investments (Cost $2,603,652,365) 99.7% | | | | | | | | | | | | | 2,607,643,959 | |
Other Assets, less Liabilities 0.3% | | | | | | | | | | | | | 8,615,839 | |
| | | | | | | | | | | | | | |
| | | | |
Net Assets 100.0% | | | | | | | | | | | | $ | 2,616,259,798 | |
| | | | | | | | | | | | | | |
| | | | |
| | | |
franklintempleton.com | | Semiannual Report | | 67 |
FRANKLIN INVESTORS SECURITIES TRUST
STATEMENT OF INVESTMENTS (UNAUDITED)
Franklin Low Duration Total Return Fund (continued)
†Rounds to less than 0.1% of net assets.
*The principal amount is stated in U.S. dollars unless otherwise indicated.
aNon-income producing.
bSee Note 8 regarding restricted securities.
cSee Note 3(f) regarding investments in affiliated management investment companies.
dSecurity was purchased pursuant to Rule 144A under the Securities Act of 1933 and may be sold in transactions exempt from registration only to qualified institutional buyers or in a public offering registered under the Securities Act of 1933. These securities have been deemed liquid under guidelines approved by the Trust’s Board of Trustees. At April 30, 2017, the aggregate value of these securities was $484,745,683, representing 18.5% of net assets.
eSecurity was purchased pursuant to Regulation S under the Securities Act of 1933, which exempts from registration securities offered and sold outside of the United States. Such a security cannot be sold in the United States without either an effective registration statement filed pursuant to the Securities Act of 1933, or pursuant to an exemption from registration. These securities have been deemed liquid under guidelines approved by the Trust’s Board of Trustees. At April 30, 2017, the aggregate value of these securities was $24,417,022, representing 0.9% of net assets.
fThe coupon rate shown represents the rate at period end.
gIncome may be received in additional securities and/or cash.
hSee Note 1(i) regarding senior floating rate interests.
iA portion or all of the security purchased on a delayed delivery basis. See Note 1(c).
jPrincipal amount is stated in 100 Mexican Peso Units.
kPrincipal amount is stated in 1,000 Brazilian Real Units.
lRedemption price at maturity is adjusted for inflation. See Note 1(k).
mPrincipal amount of security is adjusted for inflation. See Note 1(k).
nThe bond pays interest and/or principal based upon the issuer’s ability to pay, which may be less than the stated interest rate or principal paydown.
oInvestment in an interest-only security entitles holders to receive only the interest payments on the underlying mortgages. The principal amount shown is the notional amount of the underlying mortgages. The rate represents the coupon rate.
pSecurity purchased on a when-issued basis. See Note 1(c).
qSecurity has been deemed illiquid because it may not be able to be sold within seven days.
rThe rate shown is the annualized seven-day yield at period end.
| | | | |
| | | |
68 | | Semiannual Report | | franklintempleton.com |
FRANKLIN INVESTORS SECURITIES TRUST
STATEMENT OF INVESTMENTS (UNAUDITED)
Franklin Low Duration Total Return Fund (continued)
At April 30, 2017, the Fund had the following futures contracts outstanding. See Note 1(d).
Futures Contracts
| | | | | | | | | | | | | | | | | | | | | | | | |
| Description | | Type | | | Number of
Contracts | | | Notional
Value | | | Expiration
Date | | | Unrealized
Appreciation | | | Unrealized
Depreciation | |
Interest Rate Contracts | | | | | | | | | | | | | | | | | | | | | | | | |
Canadian 10 Yr. Bond | | | Long | | | | 49 | | | | $ 5,010,213 | | | | 6/21/17 | | | | $112,255 | | | | $ — | |
CME Ultra Long Term U.S. Treasury Bond | | | Short | | | | 5 | | | | 814,688 | | | | 6/21/17 | | | | — | | | | (4,232 | ) |
U.S. Treasury 2 Yr. Note | | | Long | | | | 2,394 | | | | 518,562,844 | | | | 6/30/17 | | | | 661,781 | | | | — | |
U.S. Treasury 5 Yr. Note | | | Short | | | | 710 | | | | 84,068,437 | | | | 6/30/17 | | | | — | | | | (234,779 | ) |
U.S. Treasury 10 Yr. Note | | | Short | | | | 336 | | | | 42,241,500 | | | | 6/21/17 | | | | — | | | | (673,672 | ) |
| | | | | | | | | | | | | | | | | | | | |
Total Futures Contracts | | | | | | | | | | | | | | | | | | | $774,036 | | | | $(912,683) | |
| | | | | | | | | | | | | | | | | | | | |
Net unrealized appreciation (depreciation) | | | | | | | | | | | | | | | | $(138,647) | |
| | | | | | | | | | | | | | | | | | | | | | | | |
At April 30, 2017, the Fund had the following forward exchange contracts outstanding. See Note 1(d).
Forward Exchange Contracts
| | | | | | | | | | | | | | | | | | | | | | | | | | | | |
| Currency | | Counterpartya | | | Type | | | Quantity | | | Contract Amount* | | | Settlement
Date | | | Unrealized
Appreciation | | | Unrealized
Depreciation | |
OTC Forward Exchange Contracts | | | | | | | | | | | | | | | | | | | | | | | | | | | | |
Australian Dollar | | | DBAB | | | | Sell | | | | 3,360,000 | | | | 2,532,432 | | | | 5/18/17 | | | $ | 17,573 | | | $ | — | |
Australian Dollar | | | DBAB | | | | Sell | | | | 3,410,144 | | | | 2,529,781 | | | | 5/18/17 | | | | — | | | | (22,609 | ) |
Australian Dollar | | | JPHQ | | | | Sell | | | | 11,750,000 | | | | 8,908,850 | | | | 5/18/17 | | | | 114,328 | | | | — | |
Brazilian Real | | | JPHQ | | | | Buy | | | | 7,500,000 | | | | 2,202,643 | | | | 5/18/17 | | | | 145,914 | | | | — | |
British Pound | | | DBAB | | | | Sell | | | | 3,000,000 | | | | 3,750,600 | | | | 5/18/17 | | | | — | | | | (137,609 | ) |
Canadian Dollar | | | JPHQ | | | | Sell | | | | 1,350,000 | | | | 1,028,611 | | | | 5/18/17 | | | | 39,247 | | | | — | |
Euro | | | BZWS | | | | Sell | | | | 194,860 | | | | 218,055 | | | | 5/18/17 | | | | 5,571 | | | | — | |
Euro | | | CITI | | | | Sell | | | | 391,262 | | | | 439,112 | | | | 5/18/17 | | | | 12,460 | | | | — | |
Euro | | | DBAB | | | | Buy | | | | 558,065 | | | | 613,425 | | | | 5/18/17 | | | | — | | | | (4,883 | ) |
Euro | | | DBAB | | | | Buy | | | | 23,277,041 | | | | 24,843,575 | | | | 5/18/17 | | | | 538,860 | | | | — | |
Euro | | | DBAB | | | | Sell | | | | 22,799,965 | | | | 24,447,192 | | | | 5/18/17 | | | | — | | | | (415,016 | ) |
Euro | | | DBAB | | | | Sell | | | | 46,977,626 | | | | 52,731,446 | | | | 5/18/17 | | | | 1,504,722 | | | | — | |
Euro | | | GSCO | | | | Sell | | | | 420,000 | | | | 471,912 | | | | 5/18/17 | | | | 13,923 | | | | — | |
Euro | | | HSBK | | | | Sell | | | | 6,000 | | | | 6,659 | | | | 5/18/17 | | | | 117 | | | | — | |
Euro | | | JPHQ | | | | Sell | | | | 3,577,590 | | | | 3,834,998 | | | | 5/18/17 | | | | — | | | | (66,184 | ) |
Euro | | | JPHQ | | | | Sell | | | | 6,167,765 | | | | 6,862,323 | | | | 5/18/17 | | | | 136,687 | | | | — | |
Hungarian Forint | | | DBAB | | | | Buy | | | | 750,880,000 | | | | 2,554,535 | | | | 5/18/17 | | | | 58,903 | | | | — | |
Hungarian Forint | | | DBAB | | | | Sell | | | | 900,000,000 | | | | 3,220,266 | | | | 5/18/17 | | | | 87,816 | | | | — | |
Hungarian Forint | | | JPHQ | | | | Sell | | | | 430,000,000 | | | | 1,547,375 | | | | 5/18/17 | | | | 50,760 | | | | — | |
Indian Rupee | | | DBAB | | | | Buy | | | | 135,900,000 | | | | 1,955,396 | | | | 5/18/17 | | | | 153,652 | | | | — | |
Indian Rupee | | | JPHQ | | | | Buy | | | | 78,000,000 | | | | 1,130,435 | | | | 5/18/17 | | | | 80,056 | | | | — | |
Indonesian Rupiah | | | JPHQ | | | | Buy | | | | 41,430,000,000 | | | | 3,058,693 | | | | 5/18/17 | | | | 43,516 | | | | — | |
Japanese Yen | | | JPHQ | | | | Buy | | | | 860,000,000 | | | | 7,551,899 | | | | 5/18/17 | | | | 171,473 | | | | — | |
Japanese Yen | | | JPHQ | | | | Sell | | | | 863,000,000 | | | | 8,605,353 | | | | 5/18/17 | | | | 855,040 | | | | — | |
Japanese Yen | | | JPHQ | | | | Sell | | | | 1,400,000,000 | | | | 12,349,926 | | | | 5/18/17 | | | | — | | | | (223,004 | ) |
Mexican Peso | | | JPHQ | | | | Buy | | | | 214,700,000 | | | | 10,313,078 | | | | 5/18/17 | | | | 1,048,213 | | | | — | |
Mexican Peso | | | JPHQ | | | | Sell | | | | 63,000,000 | | | | 3,391,473 | | | | 5/18/17 | | | | 57,698 | | | | — | |
Mexican Peso | | | JPHQ | | | | Sell | | | | 70,500,000 | | | | 3,401,361 | | | | 5/18/17 | | | | — | | | | (329,293 | ) |
Philippine Peso | | | JPHQ | | | | Buy | | | | 94,860,000 | | | | 1,925,310 | | | | 5/18/17 | | | | — | | | | (38,318 | ) |
South Korean Won | | | JPHQ | | | | Buy | | | | 2,900,000,000 | | | | 2,533,083 | | | | 5/18/17 | | | | 17,078 | | | | — | |
South Korean Won | | | JPHQ | | | | Sell | | | | 2,900,000,000 | | | | 2,491,366 | | | | 5/18/17 | | | | — | | | | (58,794 | ) |
| | | | |
| | | |
franklintempleton.com | | Semiannual Report | | 69 |
FRANKLIN INVESTORS SECURITIES TRUST
STATEMENT OF INVESTMENTS (UNAUDITED)
Franklin Low Duration Total Return Fund (continued)
Forward Exchange Contracts (continued)
| | | | | | | | | | | | | | | | | | | | | | | | | | | | |
| Currency | | Counterpartya | | | Type | | | Quantity | | | Contract Amount* | | | Settlement
Date | | | Unrealized Appreciation | | | Unrealized
Depreciation | |
OTC Forward Exchange Contracts (continued) | | | | | | | | | | | | | | | | | | | | | | | | | |
British Pound | | | JPHQ | | | | Sell | | | | 1,900,000 | | | | 21,815,863 | SEK | | | 10/26/17 | | | $ | 13,332 | | | $ | — | |
| | | | | | | | | | | | | | | | | | | | | | | | |
Total Forward Exchange Contracts | | | | | | | | | | | | | | | $ | 5,166,939 | | | $ | (1,295,710) | |
| | | | | | | | | | | | | | | | | | | | | | | | |
Net unrealized appreciation (depreciation) | | | | | | | | | | | | | | | | | | | $ | 3,871,229 | | | | | |
| | | | | | | | | | | | | | | | | | | | | | | | | | | | |
*In U.S. dollars unless otherwise indicated.
aMay be comprised of multiple contracts with the same counterparty, currency and settlement date.
At April 30, 2017, the Fund had the following credit default swap contracts outstanding. See Note 1(d).
Credit Default Swap Contracts
| | | | | | | | | | | | | | | | | | | | | | | | | | | | | | | | | | | | |
| Description | | Periodic
Payment
Rate | | | Counter-
party/
Exchange | | | Notional Amounta | | | Expiration
Date | | | Unamortized
Upfront
Payments
(Receipts) | | | Unrealized
Appreciation | | | Unrealized
Depreciation | | | Value | | | Ratingb | |
Centrally Cleared Swap Contracts | | | | | | | | | | | | | | | | | | | | | | | | | | | | | | | | | |
Contracts to Buy Protection | | | | | | | | | | | | | | | | | | | | | | | | | | | | | | | | | | | | |
Single Name | | | | | | | | | | | | | | | | | | | | | | | | | | | | | | | | | | | | |
Olin Corp. | | | 1.00 | % | | | ICE | | | $ | 2,400,000 | | | | 12/20/21 | | | $ | 58,791 | | | $ | — | | | $ | (2,532 | ) | | $ | 56,259 | | | | | |
| | | | | | | | | | | | | | | | | | | | | | | | |
Contracts to Sell Protectionc | | | | | | | | | | | | | | | | | | | | | | | | | | | | | | | | | | | | |
Traded Index | | | | | | | | | | | | | | | | | | | | | | | | | | | | | | | | | | | | |
CDX.NA.IG.28 | | | 1.00 | % | | | ICE | | | | 31,500,000 | | | | 6/20/22 | | | | 553,339 | | | | 37,112 | | | | — | | | | 590,451 | | | | Investment | |
| | | | | | | | | | | | | | | | | | | | | | | | |
| | | | | | | | | | | | | | | | | | | | | | | | | | | | | | | | | | | Grade | |
Total Centrally Cleared Swap Contracts | | | | | | | | | | | | | | | | | | $ | 612,130 | | | $ | 37,112 | | | $ | (2,532 | ) | | $ | 646,710 | | | | | |
| | | | | | | | | | | | | | | | | | | | | | | | |
OTC Swap Contracts | | | | | | | | | | | | | | | | | | | | | | | | | | | | | | | | | | | | |
Contracts to Buy Protection | | | | | | | | | | | | | | | | | | | | | | | | | | | | | | | | | | | | |
Single Name | | | | | | | | | | | | | | | | | | | | | | | | | | | | | | | | | | | | |
The AES Corp. | | | 5.00 | % | | | JPHQ | | | $ | 7,400,000 | | | | 6/20/21 | | | $ | (681,449 | ) | | $ | — | | | $ | (340,221 | ) | | $ | (1,021,670 | ) | | | | |
The AES Corp. | | | 5.00 | % | | | JPHQ | | | | 7,600,000 | | | | 6/20/22 | | | | (1,057,648 | ) | | | — | | | | (33,621 | ) | | | (1,091,269 | ) | | | | |
Avon Products Inc. | | | 5.00 | % | | | GSCO | | | | 10,000,000 | | | | 3/20/20 | | | | 870,246 | | | | — | | | | (1,550,652 | ) | | | (680,406 | ) | | | | |
Beazer Homes USA Inc. | | | 5.00 | % | | | CITI | | | | 1,500,000 | | | | 6/20/19 | | | | (39,257 | ) | | | — | | | | (94,893 | ) | | | (134,150 | ) | | | | |
Beazer Homes USA Inc. | | | 5.00 | % | | | FBCO | | | | 8,500,000 | | | | 6/20/19 | | | | (734,520 | ) | | | — | | | | (25,662 | ) | | | (760,182 | ) | | | | |
Beazer Homes USA Inc. | | | 5.00 | % | | | GSCO | | | | 3,000,000 | | | | 6/20/19 | | | | (75,627 | ) | | | — | | | | (192,673 | ) | | | (268,300 | ) | | | | |
Best Buy Co. Inc. | | | 5.00 | % | | | CITI | | | | 1,500,000 | | | | 6/20/22 | | | | (242,560 | ) | | | — | | | | (25,020 | ) | | | (267,580 | ) | | | | |
Constellation Brands Inc. | | | 5.00 | % | | | DBAB | | | | 6,600,000 | | | | 6/20/17 | | | | (33,406 | ) | | | — | | | | (51,258 | ) | | | (84,664 | ) | | | | |
CSC Holdings LLC | | | 5.00 | % | | | GSCO | | | | 3,500,000 | | | | 9/20/18 | | | | (100,259 | ) | | | — | | | | (142,594 | ) | | | (242,853 | ) | | | | |
CSC Holdings LLC | | | 5.00 | % | | | GSCO | | | | 3,000,000 | | | | 3/20/19 | | | | (67,471 | ) | | | — | | | | (198,057 | ) | | | (265,528 | ) | | | | |
Olin Corp. | | | 1.00 | % | | | CITI | | | | 1,430,000 | | | | 6/20/21 | | | | 92,531 | | | | — | | | | (83,705 | ) | | | 8,826 | | | | | |
Olin Corp. | | | 1.00 | % | | | GSCO | | | | 3,570,000 | | | | 6/20/21 | | | | 237,516 | | | | — | | | | (215,483 | ) | | | 22,033 | | | | | |
Pactiv LLC | | | 5.00 | % | | | BZWS | | | | 2,100,000 | | | | 6/20/17 | | | | (6,983 | ) | | | — | | | | (18,876 | ) | | | (25,859 | ) | | | | |
PHH Corp. | | | 5.00 | % | | | GSCO | | | | 1,800,000 | | | | 9/20/19 | | | | 11,094 | | | | — | | | | (164,906 | ) | | | (153,812 | ) | | | | |
Sanmina Corp. | | | 5.00 | % | | | GSCO | | | | 6,500,000 | | | | 6/20/19 | | | | (611,612 | ) | | | — | | | | (73,389 | ) | | | (685,001 | ) | | | | |
Staples Inc. | | | 1.00 | % | | | CITI | | | | 1,500,000 | | | | 6/20/22 | | | | 92,313 | | | | — | | | | (12,951 | ) | | | 79,362 | | | | | |
Tenet Healthcare Corp. | | | 5.00 | % | | | DBAB | | | | 3,000,000 | | | | 3/20/19 | | | | (148,385 | ) | | | 2,222 | | | | — | | | | (146,163 | ) | | | | |
Tenet Healthcare Corp. | | | 5.00 | % | | | GSCO | | | | 9,100,000 | | | | 3/20/19 | | | | (491,089 | ) | | | 47,727 | | | | — | | | | (443,362 | ) | | | | |
| | | | |
| | | |
70 | | Semiannual Report | | franklintempleton.com |
FRANKLIN INVESTORS SECURITIES TRUST
STATEMENT OF INVESTMENTS (UNAUDITED)
Franklin Low Duration Total Return Fund (continued)
Credit Default Swap Contracts (continued)
| | | | | | | | | | | | | | | | | | | | | | | | | | | | | | | | | | | | |
| Description | | Periodic
Payment
Rate | | | Counter-
party/
Exchange | | | Notional Amounta | | | Expiration
Date | | | Unamortized
Upfront
Payments
(Receipts) | | | Unrealized
Appreciation | | | Unrealized
Depreciation | | | Value | | | Ratingb | |
OTC Swap Contracts (continued) | | | | | | | | | | | | | | | | | | | | | | | | | |
Contracts to Buy Protection (continued) | | | | | | | | | | | | | | | | | | | | | | | | | |
Single Name (continued) | | | | | | | | | | | | | | | | | | | | | | | | | |
Toys R Us Inc. | | | 5.00% | | | | CITI | | | $ | 2,000,000 | | | | 12/20/18 | | | $ | 220,850 | | | $ | — | | | $ | (40,830 | ) | | $ | 180,020 | | | | | |
Toys R Us Inc. | | | 5.00% | | | | DBAB | | | | 1,840,000 | | | | 12/20/18 | | | | 221,810 | | | | — | | | | (56,192 | ) | | | 165,618 | | | | | |
Toys R Us Inc. | | | 5.00% | | | | GSCO | | | | 1,900,000 | | | | 12/20/18 | | | | 315,998 | | | | — | | | | (144,979 | ) | | | 171,019 | | | | | |
Transocean Inc. | | | 5.00% | | | | MSCO | | | | 7,000,000 | | | | 6/20/18 | | | | (96,923 | ) | | | — | | | | (222,694 | ) | | | (319,617 | ) | | | | |
XPO CNW Inc. | | | 5.00% | | | | JPHQ | | | | 3,275,000 | | | | 3/20/18 | | | | (70,227 | ) | | | — | | | | (70,971 | ) | | | (141,198 | ) | | | | |
Contracts to Sell Protectionc | | | | | | | | | | | | | | | | | | | | | | | | | | | | | | | | | | | | |
Single Name | | | | | | | | | | | | | | | | | | | | | | | | | | | | | | | | | | | | |
American Tower Corp. | | | 1.00% | | | | GSCO | | | | 6,500,000 | | | | 3/20/21 | | | | (94,665 | ) | | | 5,601 | | | | — | | | | (89,064 | ) | | | BBB- | |
Calpine Corp. | | | 5.00% | | | | JPHQ | | | | 7,400,000 | | | | 6/20/21 | | | | 359,132 | | | | 422,306 | | | | — | | | | 781,438 | | | | B | |
Calpine Corp. | | | 5.00% | | | | JPHQ | | | | 7,600,000 | | | | 6/20/22 | | | | 562,686 | | | | 34,044 | | | | — | | | | 596,730 | | | | B | |
Enterprise Products | | | | | | | | | | | | | | | | | | | | | | | | | | | | | | | | | | | | |
Operating LLC | | | 1.00% | | | | MSCO | | | | 3,500,000 | | | | 12/20/19 | | | | (13,369 | ) | | | 59,604 | | | | — | | | | 46,235 | | | | BBB+ | |
Government of Mexico | | | 1.00% | | | | CITI | | | | 2,500,000 | | | | 6/20/20 | | | | (18,788 | ) | | | 49,895 | | | | — | | | | 31,107 | | | | BBB+ | |
Simon Property Group LP | | | 1.00% | | | | CITI | | | | 3,000,000 | | | | 6/20/22 | | | | 10,034 | | | | 1,989 | | | | — | | | | 12,023 | | | | A | |
Traded Index | | | | | | | | | | | | | | | | | | | | | | | | | | | | | | | | | | | | |
dCitibank Bespoke 58 IG/42 | | | | | | | | | | | | | | | | | | | | | | | | | | | | | | | | | | | | |
HY Equity Tranche 0-3% | | | | | | | | | | | | | | | | | | | | | | | | | | | | | | | | | | | | |
Index | | | 0.00% | | | | CITI | | | | 1,300,000 | | | | 6/20/19 | | | | (329,089 | ) | | | 67,945 | | | | — | | | | (261,144 | ) | | | Non- | |
| | | | | | | | | | | | | | | | | | | | | | | | | | | | | | | | | | | Investment | |
| | | | | | | | | | | | | | | | | | | | | | | | | | | | | | | | | | | Grade | |
dCitibank Bespoke Dec-18 | | | | | | | | | | | | | | | | | | | | | | | | | | | | | | | | | | | | |
Hong Kong Tranche Index | | | 1.00% | | | | CITI | | | | 7,000,000 | | | | 12/20/18 | | | | (245,879 | ) | | | 146,771 | | | | — | | | | (99,108 | ) | | | Non- | |
| | | | | | | | | | | | | | | | | | | | | | | | |
| | | | | | | | | | | | | | | | | | | | | | | | | | | | | | | | | | | Investment | |
| | | | | | | | | | | | | | | | | | | | | | | | | | | | | | | | | | | Grade | |
Total OTC Swap Contracts | | | $ | (2,164,996 | ) | | $ | 838,104 | | | $ | (3,759,627 | ) | | $ | (5,086,519 | ) | | | | |
| | | | | | | | | | | | | | | | | | | | | | | | |
Total Credit Default Swap Contracts | | | $ | (1,552,866 | ) | | $ | 875,216 | | | $ | (3,762,159 | ) | | $ | (4,439,809 | ) | | | | |
| | | | | | | | | | | | | | | | | | | | | | | | |
| | | |
Net unrealized appreciation (depreciation) | | | $ | (2,886,943 | ) | | | | | | | | |
| | | | | | | | | | | | | | | | | | | | | | | | | | | | | | | | | | | | |
aFor contracts to sell protection, the notional amount is equal to the maximum potential amount of the future payments and no recourse provisions have been entered into in association with the contracts.
bBased on Standard and Poor’s (S&P) Rating for single name swaps and internal ratings for index swaps. Internal ratings based on mapping into equivalent ratings from external vendors.
cThe Fund enters contracts to sell protection to create a long credit position. Performance triggers include default, bankruptcy or restructuring for single name swaps, and failure to pay or bankruptcy of the underlying securities for traded index swaps.
dRepresents a custom index comprised of a basket of underlying issuers.
| | | | |
| | | |
franklintempleton.com | | Semiannual Report | | 71 |
FRANKLIN INVESTORS SECURITIES TRUST
STATEMENT OF INVESTMENTS (UNAUDITED)
Franklin Low Duration Total Return Fund (continued)
At April 30, 2017, the Fund had the following cross-currency swap contracts outstanding. See Note 1(d).
Cross Currency Swap Contracts
| | | | | | | | | | | | | | | | | | | | |
| Description | | Counter-
party | | | Notional Amount | | | Expiration
Date | | | Unrealized
Appreciation | | | Unrealized
Depreciation | |
OTC Swap Contracts | | | | | | | | | | | | | | | | | | | | |
Receive Floating Quarterly 3-month USD BBA LIBOR + 2.18% | | | CITI | | | | 3,922,448 USD | | | | 10/13/17 | | | $ | 356,795 | | | $ | — | |
Pay Fixed Annual 2.125% | | | | | | | 3,500,000 CHF | | | | | | | | | | | | | |
Receive Floating Quarterly 3-month USD BBA LIBOR + 3.29% | | | JPHQ | | | | 1,562,500 USD | | | | 10/13/17 | | | | 41,884 | | | | — | |
Pay Fixed Annual 2.125% | | | | | | | 1,500,000 CHF | | | | | | | | | | | | | |
Receive Fixed Semi-Annual 2.393% | | | JPHQ | | | | 7,916,500 USD | | | | 4/09/20 | | | | 116,683 | | | | — | |
Pay Fixed Annual 0.50% | | | | | | | 7,100,000 EUR | | | | | | | | | | | | | |
| | | | | | | | | | | | | | | | |
Net unrealized appreciation (depreciation) | | | | | | | | | | | | | | $ | 515,362 | | | | | |
| | | | | | | | | | | | | | | | | | | | |
See Note 10 regarding other derivative information.
See Abbreviations on page 131.
| | | | |
| | | |
72 | | Semiannual Report | The accompanying notes are an integral part of these financial statements. | | franklintempleton.com |
FRANKLIN INVESTORS SECURITIES TRUST
Consolidated Financial Highlights
Franklin Total Return Fund
| | | | | | | | | | | | | | | | | | | | | | | | |
| | | Six Months Ended April 30, 2017 (unaudited) | | | | | | | | | | | | | | | | |
| | | | Year Ended October 31, | |
| | | | 2016 | | | 2015 | | | 2014 | | | 2013 | | | 2012 | |
Class A | | | | | | | | | | | | | | | | | | | | | | | | |
| | | | | | |
Per share operating performance | | | | | | | | | | | | | | | | | | | | | | | | |
| | | | | | |
(for a share outstanding throughout the period) | | | | | | | | | | | | | | | | | | | | | | | | |
| | | | | | |
Net asset value, beginning of period | | | $ 9.93 | | | | $ 9.87 | | | | $ 10.18 | | | | $ 10.05 | | | | $ 10.53 | | | | $ 10.32 | |
| | | | | | |
Income from investment operationsa: | | | | | | | | | | | | | | | | | | | | | | | | |
| | | | | | |
Net investment income | | | 0.125 | | | | 0.231 | | | | 0.217 | | | | 0.257 | | | | 0.236 | | | | 0.297 | |
| | | | | | |
Net realized and unrealized gains (losses) | | | (0.134 | ) | | | 0.107 | | | | (0.220 | ) | | | 0.214 | | | | (0.205 | ) | | | 0.472 | |
| | | | | | |
Total from investment operations | | | (0.009 | ) | | | 0.338 | | | | (0.003 | ) | | | 0.471 | | | | 0.031 | | | | 0.769 | |
| | | | | | |
Less distributions from: | | | | | | | | | | | | | | | | | | | | | | | | |
| | | | | | |
Net investment income and net foreign currency gains | | | (0.171 | ) | | | (0.278 | ) | | | (0.307 | ) | | | (0.341 | ) | | | (0.351 | ) | | | (0.447 | ) |
| | | | | | |
Net realized gains | | | — | | | | — | | | | — | | | | — | | | | (0.160 | ) | | | (0.112 | ) |
| | | | | | |
Total distributions | | | (0.171 | ) | | | (0.278 | ) | | | (0.307 | ) | | | (0.341 | ) | | | (0.511 | ) | | | (0.559 | ) |
| | | | | | |
Net asset value, end of period | | | $ 9.75 | | | | $ 9.93 | | | | $ 9.87 | | | | $ 10.18 | | | | $ 10.05 | | | | $ 10.53 | |
| | | | | | |
Total returnb | | | (0.06)% | | | | 3.53% | | | | (0.05)% | | | | 4.80% | | | | 0.30% | | | | 7.74% | |
| | | | | | |
Ratios to average net assetsc | | | | | | | | | | | | | | | | | | | | | | | | |
| | | | | | |
Expenses before waiver and payments by affiliates | | | 0.91% | | | | 0.90% | | | | 0.91% | | | | 0.93% | | | | 0.91% | | | | 0.92% | |
| | | | | | |
Expenses net of waiver and payments by affiliates | | | 0.87% | d | | | 0.85% | d | | | 0.87% | d | | | 0.88% | d | | | 0.88% | d | | | 0.88% | |
| | | | | | |
Net investment income | | | 2.70% | | | | 2.32% | | | | 2.08% | | | | 2.46% | | | | 2.36% | | | | 2.69% | |
| | | | | | |
Supplemental data | | | | | | | | | | | | | | | | | | | | | | | | |
| | | | | | |
Net assets, end of period (000’s) | | | $3,220,519 | | | | $3,623,035 | | | | $3,527,479 | | | | $3,213,446 | | | | $3,019,228 | | | | $3,134,211 | |
| | | | | | |
Portfolio turnover rate | | | 35.71% | | | | 287.38% | | | | 294.80% | | | | 273.96% | | | | 371.54% | | | | 314.62% | |
| | | | | | |
Portfolio turnover rate excluding mortgage dollar rollse | | | 30.75% | | | | 146.15% | | | | 95.06% | | | | 85.03% | | | | 156.49% | | | | 122.04% | |
aThe amount shown for a share outstanding throughout the period may not correlate with the Consolidated Statement of Operations for the period due to the timing of sales and repurchases of the Fund’s shares in relation to income earned and/or fluctuating fair value of the investments of the Fund.
bTotal return does not reflect sales commissions or contingent deferred sales charges, if applicable, and is not annualized for periods less than one year.
cRatios are annualized for periods less than one year.
dBenefit of expense reduction rounds to less than 0.01%.
eSee Note 1(h) regarding mortgage dollar rolls.
| | | | |
| | | |
franklintempleton.com | | The accompanying notes are an integral part of these financial statements. | Semiannual Report | | 73 |
FRANKLIN INVESTORS SECURITIES TRUST
CONSOLIDATED FINANCIAL HIGHLIGHTS
Franklin Total Return Fund (continued)
| | | | | | | | | | | | | | | | | | | | | | | | |
| | | Six Months Ended April 30, 2017 (unaudited) | | | | | | | | | | | | | | | | |
| | | | Year Ended October 31, | |
| | | | 2016 | | | 2015 | | | 2014 | | | 2013 | | | 2012 | |
Class C | | | | | | | | | | | | | | | | | | | | | | | | |
| | | | | | |
Per share operating performance | | | | | | | | | | | | | | | | | | | | | | | | |
| | | | | | |
(for a share outstanding throughout the period) | | | | | | | | | | | | | | | | | | | | | | | | |
| | | | | | |
Net asset value, beginning of period | | | $ 9.87 | | | | $ 9.84 | | | | $ 10.16 | | | | $ 10.03 | | | | $ 10.51 | | | | $ 10.31 | |
| | | | | | |
Income from investment operationsa: | | | | | | | | | | | | | | | | | | | | | | | | |
| | | | | | |
Net investment income | | | 0.098 | | | | 0.189 | | | | 0.172 | | | | 0.201 | | | | 0.174 | | | | 0.253 | |
| | | | | | |
Net realized and unrealized gains (losses) | | | (0.115 | ) | | | 0.100 | | | | (0.214 | ) | | | 0.232 | | | | (0.182 | ) | | | 0.467 | |
| | | | | | |
Total from investment operations | | | (0.017 | ) | | | 0.289 | | | | (0.042 | ) | | | 0.433 | | | | (0.008 | ) | | | 0.720 | |
| | | | | | |
Less distributions from: | | | | | | | | | | | | | | | | | | | | | | | | |
| | | | | | |
Net investment income and net foreign currency gains | | | (0.153 | ) | | | (0.259 | ) | | | (0.278 | ) | | | (0.303 | ) | | | (0.312 | ) | | | (0.408 | ) |
| | | | | | |
Net realized gains | | | — | | | | — | | | | — | | | | — | | | | (0.160 | ) | | | (0.112 | ) |
| | | | | | |
Total distributions | | | (0.153 | ) | | | (0.259 | ) | | | (0.278 | ) | | | (0.303 | ) | | | (0.472 | ) | | | (0.520 | ) |
| | | | | | |
Net asset value, end of period | | | $ 9.70 | | | | $ 9.87 | | | | $ 9.84 | | | | $ 10.16 | | | | $ 10.03 | | | | $ 10.51 | |
| | | | | | |
Total returnb | | | (0.25)% | | | | 3.13% | | | | (0.43)% | | | | 4.42% | | | | (0.08)% | | | | 7.25% | |
| | | | | | |
Ratios to average net assetsc | | | | | | | | | | | | | | | | | | | | | | | | |
| | | | | | |
Expenses before waiver and payments by affiliates | | | 1.31% | | | | 1.30% | | | | 1.31% | | | | 1.33% | | | | 1.31% | | | | 1.32% | |
| | | | | | |
Expenses net of waiver and payments by affiliates | | | 1.27% | d | | | 1.25% | d | | | 1.27% | d | | | 1.28% | d | | | 1.28% | d | | | 1.28% | |
| | | | | | |
Net investment income | | | 2.30% | | | | 1.92% | | | | 1.68% | | | | 2.06% | | | | 1.96% | | | | 2.29% | |
| | | | | | |
Supplemental data | | | | | | | | | | | | | | | | | | | | | | | | |
| | | | | | |
Net assets, end of period (000’s) | | | $394,867 | | | | $449,274 | | | | $444,253 | | | | $432,767 | | | | $455,720 | | | | $571,206 | |
| | | | | | |
Portfolio turnover rate | | | 35.71% | | | | 287.38% | | | | 294.80% | | | | 273.96% | | | | 371.54% | | | | 314.62% | |
| | | | | | |
Portfolio turnover rate excluding mortgage dollar rollse | | | 30.75% | | | | 146.15% | | | | 95.06% | | | | 85.03% | | | | 156.49% | | | | 122.04% | |
aThe amount shown for a share outstanding throughout the period may not correlate with the Consolidated Statement of Operations for the period due to the timing of sales and repurchases of the Fund’s shares in relation to income earned and/or fluctuating fair value of the investments of the Fund.
bTotal return does not reflect sales commissions or contingent deferred sales charges, if applicable, and is not annualized for periods less than one year.
cRatios are annualized for periods less than one year.
dBenefit of expense reduction rounds to less than 0.01%.
eSee Note 1(h) regarding mortgage dollar rolls.
| | | | |
| | | |
74 | | Semiannual Report | The accompanying notes are an integral part of these financial statements. | | franklintempleton.com |
FRANKLIN INVESTORS SECURITIES TRUST
CONSOLIDATED FINANCIAL HIGHLIGHTS
Franklin Total Return Fund (continued)
| | | | | | | | | | | | | | | | | | | | | | | | |
| | | Six Months Ended April 30, 2017 (unaudited) | | | | | | | | | | | | | | | | |
| | | | Year Ended October 31, | |
| | | | 2016 | | | 2015 | | | 2014 | | | 2013 | | | 2012 | |
Class R | | | | | | | | | | | | | | | | | | | | | | | | |
| | | | | | |
Per share operating performance | | | | | | | | | | | | | | | | | | | | | | | | |
| | | | | | |
(for a share outstanding throughout the period) | | | | | | | | | | | | | | | | | | | | | | | | |
| | | | | | |
Net asset value, beginning of period | | | $ 9.90 | | | | $ 9.85 | | | | $ 10.17 | | | | $ 10.04 | | | | $ 10.52 | | | | $ 10.32 | |
| | | | | | |
Income from investment operationsa: | | | | | | | | | | | | | | | | | | | | | | | | |
| | | | | | |
Net investment income | | | 0.102 | | | | 0.199 | | | | 0.198 | | | | 0.209 | | | | 0.204 | | | | 0.255 | |
| | | | | | |
Net realized and unrealized gains (losses) | | | (0.122 | ) | | | 0.117 | | | | (0.229 | ) | | | 0.238 | | | | (0.197 | ) | | | 0.480 | |
| | | | | | |
Total from investment operations | | | (0.020 | ) | | | 0.316 | | | | (0.031 | ) | | | 0.447 | | | | 0.007 | | | | 0.735 | |
| | | | | | |
Less distributions from: | | | | | | | | | | | | | | | | | | | | | | | | |
| | | | | | |
Net investment income and net foreign currency gains | | | (0.160 | ) | | | (0.266 | ) | | | (0.289 | ) | | | (0.317 | ) | | | (0.327 | ) | | | (0.423 | ) |
| | | | | | |
Net realized gains | | | — | | | | — | | | | — | | | | — | | | | (0.160 | ) | | | (0.112 | ) |
| | | | | | |
Total distributions | | | (0.160 | ) | | | (0.266 | ) | | | (0.289 | ) | | | (0.317 | ) | | | (0.487 | ) | | | (0.535 | ) |
| | | | | | |
Net asset value, end of period | | | $ 9.72 | | | | $ 9.90 | | | | $ 9.85 | | | | $ 10.17 | | | | $ 10.04 | | | | $ 10.52 | |
| | | | | | |
Total returnb | | | (0.18)% | | | | 3.31% | | | | (0.32)% | | | | 4.56% | | | | 0.06% | | | | 7.39% | |
| | | | | | |
Ratios to average net assetsc | | | | | | | | | | | | | | | | | | | | | | | | |
| | | | | | |
Expenses before waiver and payments by affiliates | | | 1.16% | | | | 1.15% | | | | 1.16% | | | | 1.18% | | | | 1.16% | | | | 1.17% | |
| | | | | | |
Expenses net of waiver and payments by affiliates | | | 1.12% | d | | | 1.10% | d | | | 1.12% | d | | | 1.13% | d | | | 1.13% | d | | | 1.13% | |
| | | | | | |
Net investment income | | | 2.45% | | | | 2.07% | | | | 1.83% | | | | 2.21% | | | | 2.11% | | | | 2.44% | |
| | | | | | |
Supplemental data | | | | | | | | | | | | | | | | | | | | | | | | |
| | | | | | |
Net assets, end of period (000’s) | | | $49,027 | | | | $58,715 | | | | $70,506 | | | | $59,307 | | | | $65,601 | | | | $87,235 | |
| | | | | | |
Portfolio turnover rate | | | 35.71% | | | | 287.38% | | | | 294.80% | | | | 273.96% | | | | 371.54% | | | | 314.62% | |
| | | | | | |
Portfolio turnover rate excluding mortgage dollar rollse | | | 30.75% | | | | 146.15% | | | | 95.06% | | | | 85.03% | | | | 156.49% | | | | 122.04% | |
aThe amount shown for a share outstanding throughout the period may not correlate with the Consolidated Statement of Operations for the period due to the timing of sales and repurchases of the Fund’s shares in relation to income earned and/or fluctuating fair value of the investments of the Fund.
bTotal return is not annualized for periods less than one year.
cRatios are annualized for periods less than one year.
dBenefit of expense reduction rounds to less than 0.01%.
eSee Note 1(h) regarding mortgage dollar rolls.
| | | | |
| | | |
franklintempleton.com | | The accompanying notes are an integral part of these financial statements. | Semiannual Report | | 75 |
FRANKLIN INVESTORS SECURITIES TRUST
CONSOLIDATED FINANCIAL HIGHLIGHTS
Franklin Total Return Fund (continued)
| | | | | | | | | | | | | | | | | | | | |
| | | Six Months Ended April 30, 2017 (unaudited) | | | | | | | | | | | | | |
| | | | Year Ended October 31, | |
| | | | 2016 | | | 2015 | | | 2014 | | | 2013a | |
Class R6 | | | | | | | | | | | | | | | | | | | | |
| | | | | |
Per share operating performance | | | | | | | | | | | | | | | | | | | | |
| | | | | |
(for a share outstanding throughout the period) | | | | | | | | | | | | | | | | | | | | |
| | | | | |
Net asset value, beginning of period | | | $ 9.98 | | | | $ 9.91 | | | | $ 10.20 | | | | $ 10.07 | | | | $ 10.44 | |
| | | | | |
Income from investment operationsb: | | | | | | | | | | | | | | | | | | | | |
| | | | | |
Net investment income | | | 0.124 | | | | 0.195 | | | | 0.255 | c | | | 0.317 | c | | | 0.145 | |
| | | | | |
Net realized and unrealized gains (losses) | | | (0.105 | ) | | | 0.173 | | | | (0.209 | ) | | | 0.191 | | | | (0.348 | ) |
| | | | | |
Total from investment operations | | | 0.019 | | | | 0.368 | | | | 0.046 | | | | 0.508 | | | | (0.203 | ) |
| | | | | |
Less distributions from net investment income and net foreign currency gains | | | (0.189 | ) | | | (0.298 | ) | | | (0.336 | ) | | | (0.378 | ) | | | (0.167 | ) |
| | | | | |
Net asset value, end of period | | | $ 9.81 | | | | $ 9.98 | | | | $ 9.91 | | | | $ 10.20 | | | | $ 10.07 | |
| | | | | |
Total returnd | | | 0.12% | | | | 3.94% | | | | 0.44% | | | | 5.18% | | | | (1.92)% | |
| | | | | |
Ratios to average net assetse | | | | | | | | | | | | | | | | | | | | |
| | | | | |
Expenses before waiver and payments by affiliates | | | 0.51% | | | | 0.51% | | | | 0.50% | | | | 0.50% | | | | 0.50% | |
| | | | | |
Expenses net of waiver and payments by affiliatesf | | | 0.48% | | | | 0.46% | | | | 0.46% | | | | 0.48% | | | | 0.49% | |
| | | | | |
Net investment income | | | 3.09% | | | | 2.71% | | | | 2.49% | | | | 2.86% | | | | 2.75% | |
| | | | | |
Supplemental data | | | | | | | | | | | | | | | | | | | | |
| | | | | |
Net assets, end of period (000’s) | | | $106,537 | | | | $93,892 | | | | $68,848 | | | | $26,123 | | | | $329,806 | |
| | | | | |
Portfolio turnover rate | | | 35.71% | | | | 287.38% | | | | 294.80% | | | | 273.96% | | | | 371.54% | |
| | | | | |
Portfolio turnover rate excluding mortgage dollar rollsg | | | 30.75% | | | | 146.15% | | | | 95.06% | | | | 85.03% | | | | 156.49% | |
aFor the period May 1, 2013 (effective date) to October 31, 2013.
bThe amount shown for a share outstanding throughout the period may not correlate with the Consolidated Statement of Operations for the period due to the timing of sales and repurchases of the Fund’s shares in relation to income earned and/or fluctuating fair value of the investments of the Fund.
cBased on average daily shares outstanding.
dTotal return is not annualized for periods less than one year.
eRatios are annualized for periods less than one year.
fBenefit of expense reduction rounds to less than 0.01%.
gSee Note 1(h) regarding mortgage dollar rolls.
| | | | |
| | | |
76 | | Semiannual Report | The accompanying notes are an integral part of these financial statements. | | franklintempleton.com |
FRANKLIN INVESTORS SECURITIES TRUST
CONSOLIDATED FINANCIAL HIGHLIGHTS
Franklin Total Return Fund (continued)
| | | | | | | | | | | | | | | | | | | | | | | | |
| | | Six Months Ended April 30, 2017
(unaudited) | | | | | | | | | | | | | | | | |
| | | | Year Ended October 31, | |
| | | | 2016 | | | 2015 | | | 2014 | | | 2013 | | | 2012 | |
Advisor Class | | | | | | | | | | | | | | | | | | | | | | | | |
| | | | | | |
Per share operating performance | | | | | | | | | | | | | | | | | | | | | | | | |
| | | | | | |
(for a share outstanding throughout the period) | | | | | | | | | | | | | | | | | | | | | | | | |
| | | | | | |
Net asset value, beginning of period | | | $ 9.98 | | | | $ 9.91 | | | | $ 10.20 | | | | $ 10.07 | | | | $ 10.55 | | | | $ 10.34 | |
| | | | | | |
Income from investment operationsa: | | | | | | | | | | | | | | | | | | | | | | | | |
| | | | | | |
Net investment income | | | 0.137 | | | | 0.218 | | | | 0.127 | | | | 0.288 | | | | 0.242 | | | | 0.319 | |
| | | | | | |
Net realized and unrealized gains (losses) | | | (0.134 | ) | | | 0.142 | | | | (0.092 | ) | | | 0.206 | | | | (0.186 | ) | | | 0.474 | |
| | | | | | |
Total from investment operations | | | 0.003 | | | | 0.360 | | | | 0.035 | | | | 0.494 | | | | 0.056 | | | | 0.793 | |
| | | | | | |
Less distributions from: | | | | | | | | | | | | | | | | | | | | | | | | |
| | | | | | |
Net investment income and net foreign currency gains | | | (0.183 | ) | | | (0.290 | ) | | | (0.325 | ) | | | (0.364 | ) | | | (0.376 | ) | | | (0.471 | ) |
| | | | | | |
Net realized gains | | | — | | | | — | | | | — | | | | — | | | | (0.160 | ) | | | (0.112 | ) |
| | | | | | |
Total distributions | | | (0.183 | ) | | | (0.290 | ) | | | (0.325 | ) | | | (0.364 | ) | | | (0.536 | ) | | | (0.583 | ) |
| | | | | | |
Net asset value, end of period | | | $ 9.80 | | | | $ 9.98 | | | | $ 9.91 | | | | $ 10.20 | | | | $ 10.07 | | | | $ 10.55 | |
| | | | | | |
Total returnb | | | 0.06% | | | | 3.75% | | | | 0.33% | | | | 5.03% | | | | 0.54% | | | | 7.98% | |
| | | | | | |
Ratios to average net assetsc | | | | | | | | | | | | | | | | | | | | | | | | |
| | | | | | |
Expenses before waiver and payments by affiliates | | | 0.66% | | | | 0.65% | | | | 0.66% | | | | 0.68% | | | | 0.66% | | | | 0.67% | |
| | | | | | |
Expenses net of waiver and payments by affiliates | | | 0.62% | d | | | 0.60% | d | | | 0.62% | d | | | 0.63% | d | | | 0.63% | d | | | 0.63% | |
| | | | | | |
Net investment income | | | 2.95% | | | | 2.57% | | | | 2.33% | | | | 2.71% | | | | 2.61% | | | | 2.94% | |
| | | | | | |
Supplemental data | | | | | | | | | | | | | | | | | | | | | | | | |
| | | | | | |
Net assets, end of period (000’s) | | | $854,540 | | | | $740,046 | | | | $526,749 | | | | $1,281,151 | | | | $1,148,451 | | | | $1,482,994 | |
| | | | | | |
Portfolio turnover rate | | | 35.71% | | | | 287.38% | | | | 294.80% | | | | 273.96% | | | | 371.54% | | | | 314.62% | |
| | | | | | |
Portfolio turnover rate excluding mortgage dollar rollse | | | 30.75% | | | | 146.15% | | | | 95.06% | | | | 85.03% | | | | 156.49% | | | | 122.04% | |
aThe amount shown for a share outstanding throughout the period may not correlate with the Consolidated Statement of Operations for the period due to the timing of sales and repurchases of the Fund’s shares in relation to income earned and/or fluctuating fair value of the investments of the Fund.
bTotal return is not annualized for periods less than one year.
cRatios are annualized for periods less than one year.
dBenefit of expense reduction rounds to less than 0.01%.
eSee Note 1(h) regarding mortgage dollar rolls.
| | | | |
| | | |
franklintempleton.com | | The accompanying notes are an integral part of these financial statements. | Semiannual Report | | 77 |
FRANKLIN INVESTORS SECURITIES TRUST
Consolidated Statement of Investments, April 30, 2017 (unaudited)
Franklin Total Return Fund
| | | | | | | | | | | | | | | | |
| | | Country | | | Shares/
Warrants | | | | | | Value | |
Common Stocks and Other Equity Interests 0.3% | | | | | | | | | |
Consumer Services 0.2% | | | | | | | | | | | | | | | | |
a,b,cTurtle Bay Resort | | | United States | | | | 1,550,567 | | | | | | | $ | 7,210,139 | |
| | | | | | | | | | | | | | | | |
Energy 0.1% | | | | | | | | | | | | | | | | |
aEnergy XXI Gulf Coast Inc. | | | United States | | | | 115,438 | | | | | | | | 3,174,545 | |
a,dHalcon Resources Corp. | | | United States | | | | 229,059 | | | | | | | | 1,472,715 | |
aHalcon Resources Corp., wts., 9/09/20 | | | United States | | | | 20,425 | | | | | | | | 21,446 | |
aLinn Energy Inc. | | | United States | | | | 35,793 | | | | | | | | 1,003,278 | |
| | | | | | | | | | | | | | | | |
| | | | | | | | | | | | | | | 5,671,984 | |
| | | | | | | | | | | | | | | | |
Materials 0.0%† | | | | | | | | | | | | | | | | |
aVerso Corp., A | | | United States | | | | 6,954 | | | | | | | | 42,211 | |
aVerso Corp., wts., 7/25/23 | | | United States | | | | 732 | | | | | | | | 110 | |
| | | | | | | | | | | | | | | | |
| | | | | | | | | | | | | | | 42,321 | |
| | | | | | | | | | | | | | | | |
Retailing 0.0%† | | | | | | | | | | | | | | | | |
a,dHoldco 2, A | | | South Africa | | | | 28,762,824 | | | | | | | | 21,519 | |
a,dHoldco 2, B | | | South Africa | | | | 2,862,311 | | | | | | | | 2,142 | |
| | | | | | | | | | | | | | | | |
| | | | | | | | | | | | | | | 23,661 | |
| | | | | | | | | | | | | | | | |
Total Common Stocks and Other Equity Interests (Cost $15,051,463) | | | | | | | | | | | | | | | 12,948,105 | |
| | | | | | | | | | | | | | | | |
| | | | |
Management Investment Companies 2.8% | | | | | | | | | | | | | | | | |
Diversified Financials 2.8% | | | | | | | | | | | | | | | | |
eFranklin Liberty Investment Grade Corporate ETF | | | United States | | | | 1,200,000 | | | | | | | | 29,220,000 | |
eFranklin Liberty Short Duration U.S. Government ETF | | | United States | | | | 500,000 | | | | | | | | 48,437,500 | |
eFranklin Lower Tier Floating Rate Fund | | | United States | | | | 997,589 | | | | | | | | 10,524,565 | |
eFranklin Middle Tier Floating Rate Fund | | | United States | | | | 1,889,310 | | | | | | | | 19,006,460 | |
PowerShares Senior Loan Portfolio ETF | | | United States | | | | 1,000,000 | | | | | | | | 23,280,000 | |
| | | | | | | | | | | | | | | | |
Total Management Investment Companies (Cost $129,948,810) | | | | | | | | | | | | | | | 130,468,525 | |
| | | | | | | | | | | | | | | | |
| | | | |
Preferred Stocks (Cost $2,325,000) 0.0%† | | | | | | | | | | | | | | | | |
Diversified Financials 0.0%† | | | | | | | | | | | | | | | | |
fCitigroup Capital XIII, 6.902%, pfd | | | United States | | | | 93,000 | | | | | | | | 2,440,320 | |
| | | | | | | | | | | | | | | | |
| | | | |
| | | | | | Principal
Amount* | | | | | | | |
Corporate Bonds 34.4% | | | | | | | | | | | | | | | | |
Automobiles & Components 0.6% | | | | | | | | | | | | | | | | |
Delphi Corp., senior bond, 4.15%, 3/15/24 | | | United Kingdom | | | | 5,100,000 | | | | | | | | 5,382,846 | |
Fiat Chrysler Automobiles NV, senior note, 4.50%, 4/15/20 | | | United Kingdom | | | | 4,000,000 | | | | | | | | 4,135,000 | |
Ford Motor Credit Co. LLC, senior note, 3.096%, 5/04/23 | | | United States | | | | 18,200,000 | | | | | | | | 17,935,390 | |
| | | | | | | | | | | | | | | | |
| | | | | | | | | | | | | | | 27,453,236 | |
| | | | | | | | | | | | | | | | |
Banks 7.0% | | | | | | | | | | | | | | | | |
Banco Comercial Portugues SA, secured note, 4.75%, 6/22/17 | | | Portugal | | | | 5,400,000 | | | | EUR | | | | 5,921,925 | |
Bank of America Corp., | | | | | | | | | | | | | | | | |
senior bond, 3.875%, 8/01/25 | | | United States | | | | 6,000,000 | | | | | | | | 6,148,392 | |
senior note, 3.50%, 4/19/26 | | | United States | | | | 20,400,000 | | | | | | | | 20,394,043 | |
| | | | |
| | | |
78 | | Semiannual Report | | franklintempleton.com |
FRANKLIN INVESTORS SECURITIES TRUST
CONSOLIDATED STATEMENT OF INVESTMENTS (UNAUDITED)
Franklin Total Return Fund (continued)
| | | | | | | | | | | | | | | | |
| | | Country | | | Principal Amount* | | | | | | Value | |
Corporate Bonds (continued) | | | | | | | | | | | | | | | | |
Banks (continued) | | | | | | | | | | | | | | | | |
gBarclays Bank PLC, senior sub. note, Reg S, 6.00%, 1/14/21 | | | United Kingdom | | | | 8,000,000 | | | | EUR | | | $ | 10,242,471 | |
Barclays PLC, sub. note, 4.375%, 9/11/24 | | | United Kingdom | | | | 500,000 | | | | | | | | 508,425 | |
CIT Group Inc., senior note, 5.00%, 8/15/22 | | | United States | | | | 3,000,000 | | | | | | | | 3,234,900 | |
Citigroup Inc., | | | | | | | | | | | | | | | | |
senior bond, 8.125%, 7/15/39 | | | United States | | | | 4,400,000 | | | | | | | | 6,493,498 | |
senior note, 3.40%, 5/01/26 | | | United States | | | | 20,000,000 | | | | | | | | 19,771,660 | |
Depfa ACS Bank, secured bond, 2.125%, 10/13/17 | | | Ireland | | | | 12,250,000 | | | | CHF | | | | 12,454,351 | |
HSBC Holdings PLC, | | | | | | | | | | | | | | | | |
senior note, 3.60%, 5/25/23 | | | United Kingdom | | | | 12,700,000 | | | | | | | | 13,040,678 | |
senior note, 4.30%, 3/08/26 | | | United Kingdom | | | | 14,800,000 | | | | | | | | 15,614,222 | |
Intesa Sanpaolo SpA, senior note, 3.875%, 1/16/18 | | | Italy | | | | 4,300,000 | | | | | | | | 4,350,439 | |
JPMorgan Chase & Co., | | | | | | | | | | | | | | | | |
hjunior sub. bond, X, 6.10% to 10/01/24, FRN thereafter, Perpetual | | | United States | | | | 10,400,000 | | | | | | | | 11,167,000 | |
senior bond, 3.30%, 4/01/26 | | | United States | | | | 22,000,000 | | | | | | | | 21,763,610 | |
senior bond, 3.20%, 6/15/26 | | | United States | | | | 10,800,000 | | | | | | | | 10,599,682 | |
senior note, 2.40%, 6/07/21 | | | United States | | | | 10,000,000 | | | | | | | | 9,987,090 | |
senior note, 3.25%, 9/23/22 | | | United States | | | | 11,400,000 | | | | | | | | 11,690,586 | |
iNorddeutsche Landesbank Girozentrale, secured note, 144A, 2.00%, 2/05/19 | | | Germany | | | | 7,000,000 | | | | | | | | 7,028,630 | |
PHH Corp., senior note, 7.375%, 9/01/19 | | | United States | | | | 5,400,000 | | | | | | | | 5,872,500 | |
Royal Bank of Canada, secured note, 2.10%, 10/14/20 | | | Canada | | | | 11,500,000 | | | | | | | | 11,502,967 | |
iShinhan Bank, senior note, 144A, 1.875%, 7/30/18 | | | South Korea | | | | 10,000,000 | | | | | | | | 9,978,650 | |
SVB Financial Group, senior note, 3.50%, 1/29/25 | | | United States | | | | 6,000,000 | | | | | | | | 5,912,166 | |
jUniCredit SpA, senior note, FRN, 1.672%, 10/31/17 | | | Italy | | | | 9,500,000 | | | | EUR | | | | 10,432,638 | |
gUnione di Banche Italiane SpA, senior note, Reg S, 2.875%, 2/18/19 | | | Italy | | | | 12,000,000 | | | | EUR | | | | 13,723,612 | |
Wells Fargo & Co., | | | | | | | | | | | | | | | | |
hjunior sub. bond, S, 5.90% to 6/15/24, FRN thereafter, Perpetual | | | United States | | | | 5,500,000 | | | | | | | | 5,836,875 | |
senior note, 2.50%, 3/04/21 | | | United States | | | | 10,000,000 | | | | | | | | 10,036,750 | |
senior note, 3.00%, 4/22/26 | | | United States | | | | 31,200,000 | | | | | | | | 30,215,484 | |
sub. bond, 4.65%, 11/04/44 | | | United States | | | | 10,000,000 | | | | | | | | 10,123,140 | |
iWestpac Banking Corp., senior secured note, 144A, 2.25%, 11/09/20 | | | Australia | | | | 10,800,000 | | | | | | | | 10,829,862 | |
iWoori Bank, sub. note, 144A, 4.75%, 4/30/24 | | | South Korea | | | | 9,750,000 | | | | | | | | 10,099,391 | |
| | | | | | | | | | | | | | | | |
| | | | | | | | | | | | | | | 324,975,637 | |
| | | | | | | | | | | | | | | | |
Capital Goods 1.5% | | | | | | | | | | | | | | | | |
Aircastle Ltd., senior note, 4.125%, 5/01/24 | | | United States | | | | 4,000,000 | | | | | | | | 4,078,000 | |
iAmcor Finance USA Inc., senior note, 144A, 3.625%, 4/28/26 | | | Australia | | | | 11,800,000 | | | | | | | | 11,800,177 | |
CNH Industrial Capital LLC, senior note, 3.875%, 10/15/21 | | | United States | | | | 3,400,000 | | | | | | | | 3,425,500 | |
iCortes NP Acquisition Corp., senior note, 144A, 9.25%, 10/15/24 | | | United States | | | | 4,100,000 | | | | | | | | 4,422,875 | |
General Electric Co., senior note, A, 8.50%, 4/06/18 | | | United States | | | | 135,000,000 | | | | MXN | | | | 7,233,928 | |
Lockheed Martin Corp., senior bond, 4.70%, 5/15/46 | | | United States | | | | 13,900,000 | | | | | | | | 15,333,493 | |
iSydney Airport Finance Co. Pty. Ltd., 144A, 3.90%, 3/22/23 | | | Australia | | | | 5,800,000 | | | | | | | | 6,027,650 | |
iTennant Co., senior note, 144A, 5.625%, 5/01/25 | | | United States | | | | 2,600,000 | | | | | | | | 2,713,750 | |
iTerex Corp., senior note, 144A, 5.625%, 2/01/25 | | | United States | | | | 1,100,000 | | | | | | | | 1,126,125 | |
United Technologies Corp., senior note, 1.125%, 12/15/21 | | | United States | | | | 10,500,000 | | | | EUR | | | | 11,865,018 | |
| | | | | | | | | | | | | | | | |
| | | | | | | | | | | | | | | 68,026,516 | |
| | | | | | | | | | | | | | | | |
Commercial & Professional Services 0.1% | | | | | | | | | | | | | | | | |
Republic Services Inc., senior note, 2.90%, 7/01/26 | | | United States | | | | 4,500,000 | | | | | | | | 4,411,728 | |
| | | | | | | | | | | | | | | | |
| | | | |
| | | |
franklintempleton.com | | Semiannual Report | | 79 |
FRANKLIN INVESTORS SECURITIES TRUST
CONSOLIDATED STATEMENT OF INVESTMENTS (UNAUDITED)
Franklin Total Return Fund (continued)
| | | | | | | | | | | | |
| | | Country | | | Principal Amount* | | | Value | |
Corporate Bonds (continued) | | | | | | | | | | | | |
Consumer Durables & Apparel 0.6% | | | | | | | | | | | | |
Beazer Homes USA Inc., senior note, 5.75%, 6/15/19 | | | United States | | | | 19,700,000 | | | $ | 20,709,625 | |
PulteGroup Inc., senior bond, 5.00%, 1/15/27 | | | United States | | | | 4,900,000 | | | | 4,979,625 | |
| | | | | | | | | | | | |
| | | | | | | | | | | 25,689,250 | |
| | | | | | | | | | | | |
Consumer Services 0.5% | | | | | | | | | | | | |
Marriott International Inc., senior bond, 3.75%, 10/01/25 | | | United States | | | | 18,400,000 | | | | 18,736,150 | |
Yum! Brands Inc., senior note, 5.30%, 9/15/19 | | | United States | | | | 3,000,000 | | | | 3,191,250 | |
| | | | | | | | | | | | |
| | | | | | | | | | | 21,927,400 | |
| | | | | | | | | | | | |
Diversified Financials 3.1% | | | | | | | | | | | | |
American Airlines Pass Through Trust, first lien, 2016-2, AA, 3.20%, 6/15/28 | | | United States | | | | 6,600,000 | | | | 6,476,250 | |
American Express Centurion Bank, senior note, 5.95%, 6/12/17 | | | United States | | | | 800,000 | | | | 804,018 | |
Capital One Bank USA NA, sub. bond, 3.375%, 2/15/23 | | | United States | | | | 6,000,000 | | | | 6,050,124 | |
Capital One Financial Corp., senior note, 3.20%, 2/05/25 | | | United States | | | | 9,700,000 | | | | 9,426,576 | |
Discover Financial Services, senior note, 3.85%, 11/21/22 | | | United States | | | | 3,052,000 | | | | 3,132,973 | |
GE Capital International Funding Co., senior bond, 3.373%, 11/15/25 | | | United States | | | | 17,000,000 | | | | 17,667,318 | |
The Goldman Sachs Group Inc., | | | | | | | | | | | | |
senior note, 3.75%, 5/22/25 | | | United States | | | | 7,700,000 | | | | 7,852,475 | |
senior note, 3.75%, 2/25/26 | | | United States | | | | 21,300,000 | | | | 21,678,778 | |
Morgan Stanley, | | | | | | | | | | | | |
senior bond, 4.30%, 1/27/45 | | | United States | | | | 10,000,000 | | | | 10,034,430 | |
senior note, 3.875%, 1/27/26 | | | United States | | | | 20,500,000 | | | | 20,996,654 | |
Navient Corp., senior note, 7.25%, 9/25/23 | | | United States | | | | 4,000,000 | | | | 4,200,000 | |
iPark Aerospace Holdings Ltd., | | | | | | | | | | | | |
senior note, 144A, 5.25%, 8/15/22 | | | Ireland | | | | 1,700,000 | | | | 1,795,625 | |
senior note, 144A, 5.50%, 2/15/24 | | | Ireland | | | | 1,800,000 | | | | 1,906,200 | |
Springleaf Finance Corp., senior note, 6.00%, 6/01/20 | | | United States | | | | 1,200,000 | | | | 1,233,000 | |
i,kTempo Acquisition LLC / Tempo Acquisition Finance Corp., senior note, 144A, 6.75%, 6/01/25 | | | United States | | | | 2,700,000 | | | | 2,781,000 | |
iThree Gorges Finance I Cayman Islands Ltd., senior note, 144A, 3.70%, 6/10/25 | | | China | | | | 12,800,000 | | | | 13,071,488 | |
iTransurban Finance Co. Pty. Ltd., senior secured bond, 144A, 4.125%, 2/02/26 | | | Australia | | | | 8,200,000 | | | | 8,446,164 | |
United Airlines Pass Through Trust, first lien, 2016-1, AA, 3.10%, 1/07/30 | | | United States | | | | 6,300,000 | | | | 6,229,125 | |
| | | | | | | | | | | | |
| | | | | | | | | | | 143,782,198 | |
| | | | | | | | | | | | |
Energy 3.8% | | | | | | | | | | | | |
Anadarko Petroleum Corp., senior note, 6.45%, 9/15/36 | | | United States | | | | 2,260,000 | | | | 2,685,845 | |
iCalifornia Resources Corp., secured note, second lien, 144A, 8.00%, 12/15/22 | | | United States | | | | 4,000,000 | | | | 3,095,000 | |
iCheniere Corpus Christi Holdings LLC, | | | | | | | | | | | | |
senior secured note, 144A, 7.00%, 6/30/24 | | | United States | | | | 2,300,000 | | | | 2,581,474 | |
senior secured note, first lien, 144A, 5.875%, 3/31/25 | | | United States | | | | 1,600,000 | | | | 1,710,000 | |
CNOOC Finance 2013 Ltd., senior note, 3.00%, 5/09/23 | | | China | | | | 14,000,000 | | | | 13,745,550 | |
Enable Midstream Partners LP, | | | | | | | | | | | | |
senior bond, 5.00%, 5/15/44 | | | United States | | | | 1,200,000 | | | | 1,110,083 | |
senior note, 3.90%, 5/15/24 | | | United States | | | | 3,600,000 | | | | 3,543,638 | |
Energy Transfer Partners LP, senior bond, 5.15%, 2/01/43 | | | United States | | | | 6,000,000 | | | | 5,805,054 | |
EnLink Midstream Partners LP, senior bond, 5.05%, 4/01/45 | | | United States | | | | 6,200,000 | | | | 5,890,180 | |
Ensco PLC, senior bond, 5.75%, 10/01/44 | | | United States | | | | 3,700,000 | | | | 2,713,580 | |
| | | | |
| | | |
80 | | Semiannual Report | | franklintempleton.com |
FRANKLIN INVESTORS SECURITIES TRUST
CONSOLIDATED STATEMENT OF INVESTMENTS (UNAUDITED)
Franklin Total Return Fund (continued)
| | | | | | | | | | | | |
| | | Country | | | Principal Amount* | | | Value | |
Corporate Bonds (continued) | | | | | | | | | | | | |
Energy (continued) | | | | | | | | | | | | |
Enterprise Products Operating LLC, senior bond, 4.45%, 2/15/43 | | | United States | | | | 6,000,000 | | | $ | 5,878,716 | |
Exxon Mobil Corp., senior note, 2.709%, 3/06/25 | | | United States | | | | 21,500,000 | | | | 21,349,500 | |
i,lGaz Capital SA, (OJSC Gazprom), loan participation, senior note, 144A, 3.85%, 2/06/20 | | | Russia | | | | 10,000,000 | | | | 10,183,000 | |
MPLX LP, senior bond, 4.00%, 2/15/25 | | | United States | | | | 4,600,000 | | | | 4,630,075 | |
Oceaneering International Inc., senior note, 4.65%, 11/15/24 | | | United States | | | | 7,900,000 | | | | 8,018,437 | |
iPetrofac Ltd., senior note, 144A, 3.40%, 10/10/18 | | | United Kingdom | | | | 7,600,000 | | | | 7,680,803 | |
iSabine Pass Liquefaction LLC, senior secured bond, 144A, 5.00%, 3/15/27 | | | United States | | | | 3,700,000 | | | | 3,912,547 | |
Sanchez Energy Corp., senior note, 6.125%, 1/15/23 | | | United States | | | | 3,000,000 | | | | 2,774,970 | |
iSinopec Group Overseas Development 2014 Ltd., senior note, 144A, 4.375%, 4/10/24 | | | China | | | | 9,300,000 | | | | 9,857,488 | |
iSinopec Group Overseas Development 2015 Ltd., senior note, 144A, 3.25%, 4/28/25 | | | China | | | | 16,400,000 | | | | 16,123,578 | |
Sunoco Logistics Partners Operations LP, senior note, 4.25%, 4/01/24 | | | United States | | | | 9,300,000 | | | | 9,567,059 | |
Transcontinental Gas Pipe Line Corp., senior note, 6.05%, 6/15/18 | | | United States | | | | 550,000 | | | | 574,256 | |
Transocean Inc., senior bond, 7.375%, 4/15/18 | | | United States | | | | 13,000,000 | | | | 13,390,000 | |
Valero Energy Corp., senior bond, 4.90%, 3/15/45 | | | United States | | | | 6,700,000 | | | | 6,731,838 | |
Weatherford International Ltd., | | | | | | | | | | | | |
senior note, 7.75%, 6/15/21 | | | United States | | | | 1,600,000 | | | | 1,712,000 | |
senior note, 8.25%, 6/15/23 | | | United States | | | | 2,000,000 | | | | 2,172,500 | |
iWoodside Finance Ltd., senior note, 144A, 3.70%, 9/15/26 | | | Australia | | | | 9,500,000 | | | | 9,385,145 | |
| | | | | | | | | | | | |
| | | | | | | | | | | 176,822,316 | |
| | | | | | | | | | | | |
Food & Staples Retailing 0.3% | | | | | | | | | | | | |
The Kroger Co., senior note, 4.00%, 2/01/24 | | | United States | | | | 15,400,000 | | | | 16,108,000 | |
| | | | | | | | | | | | |
Food, Beverage & Tobacco 1.5% | | | | | | | | | | | | |
Anheuser-Busch InBev Finance Inc., senior bond, 3.65%, 2/01/26 | | | Belgium | | | | 17,000,000 | | | | 17,416,075 | |
Bunge Ltd. Finance Corp., senior note, 3.25%, 8/15/26 | | | United States | | | | 12,000,000 | | | | 11,757,660 | |
Constellation Brands Inc., senior note, 7.25%, 5/15/17 | | | United States | | | | 5,000,000 | | | | 5,009,590 | |
Kraft Heinz Foods Co., senior note, 3.50%, 7/15/22 | | | United States | | | | 21,400,000 | | | | 22,077,920 | |
iLamb Weston Holdings Inc., | | | | | | | | | | | | |
senior note, 144A, 4.625%, 11/01/24 | | | United States | | | | 1,500,000 | | | | 1,552,500 | |
senior note, 144A, 4.875%, 11/01/26 | | | United States | | | | 1,600,000 | | | | 1,654,000 | |
Reynolds American Inc., senior bond, 5.70%, 8/15/35 | | | United States | | | | 9,300,000 | | | | 10,673,508 | |
| | | | | | | | | | | | |
| | | | | | | | | | | 70,141,253 | |
| | | | | | | | | | | | |
Health Care Equipment & Services 0.7% | | | | | | | | | | | | |
CHS/Community Health Systems Inc., senior secured note, first lien, 6.25%, 3/31/23 | | | United States | | | | 2,000,000 | | | | 2,042,500 | |
HCA Inc., senior bond, 5.875%, 5/01/23 | | | United States | | | | 4,000,000 | | | | 4,362,800 | |
Medco Health Solutions Inc., senior note, 4.125%, 9/15/20 | | | United States | | | | 3,500,000 | | | | 3,664,850 | |
iMPH Acquisition Holdings LLC, senior note, 144A, 7.125%, 6/01/24 | | | United States | | | | 1,000,000 | | | | 1,077,500 | |
Stryker Corp., senior bond, 3.50%, 3/15/26 | | | United States | | | | 3,000,000 | | | | 3,061,035 | |
Tenet Healthcare Corp., senior note, 5.50%, 3/01/19 | | | United States | | | | 15,835,000 | | | | 16,072,525 | |
| | | | | | | | | | | | |
| | | | | | | | | | | 30,281,210 | |
| | | | | | | | | | | | |
Household & Personal Products 0.7% | | | | | | | | | | | | |
Avon Products Inc., senior note, 6.60%, 3/15/20 | | | United States | | | | 18,500,000 | | | | 18,893,125 | |
The Procter & Gamble Co., senior note, 2.45%, 11/03/26 | | | United States | | | | 12,500,000 | | | | 12,122,187 | |
| | | | | | | | | | | | |
| | | | | | | | | | | 31,015,312 | |
| | | | | | | | | | | | |
| | | | |
| | | |
franklintempleton.com | | Semiannual Report | | 81 |
FRANKLIN INVESTORS SECURITIES TRUST
CONSOLIDATED STATEMENT OF INVESTMENTS (UNAUDITED)
Franklin Total Return Fund (continued)
| | | | | | | | | | | | | | | | |
| | | Country | | | Principal Amount* | | | | | | Value | |
Corporate Bonds (continued) | | | | | | | | | | | | | | | | |
Insurance 1.7% | | | | | | | | | | | | | | | | |
Aflac Inc., | | | | | | | | | | | | | | | | |
senior bond, 3.625%, 6/15/23 | | | United States | | | | 5,100,000 | | | | | | | $ | 5,355,653 | |
senior note, 0.932%, 1/25/27 | | | United States | | | | 1,400,000,000 | | | | JPY | | | | 12,698,497 | |
iLiberty Mutual Group Inc., senior note, 144A, 4.95%, 5/01/22 | | | United States | | | | 12,000,000 | | | | | | | | 13,157,604 | |
MetLife Inc., | | | | | | | | | | | | | | | | |
senior note, 3.60%, 4/10/24 | | | United States | | | | 9,600,000 | | | | | | | | 10,014,566 | |
senior note, 3.00%, 3/01/25 | | | United States | | | | 1,500,000 | | | | | | | | 1,494,714 | |
Prudential Financial Inc., junior sub. bond, 5.875%, 9/15/42 | | | United States | | | | 7,000,000 | | | | | | | | 7,742,378 | |
iTeachers Insurance & Annuity Assn. of America, sub. bond, 144A, 4.90%, 9/15/44 | | | United States | | | | 20,400,000 | | | | | | | | 22,482,412 | |
iTIAA Asset Management Finance LLC, senior note, 144A, 2.95%, 11/01/19 | | | United States | | | | 5,800,000 | | | | | | | | 5,897,463 | |
| | | | | | | | | | | | | | | | |
| | | | | | | | | | | | | | | 78,843,287 | |
| | | | | | | | | | | | | | | | |
Materials 1.5% | | | | | | | | | | | | | | | | |
ArcelorMittal, senior note, 6.25%, 3/01/21 | | | France | | | | 5,000,000 | | | | | | | | 5,469,500 | |
iArdagh Packaging Finance PLC/Ardagh MP Holdings USA Inc., senior note, 144A, 6.00%, 2/15/25 | | | Luxembourg | | | | 4,000,000 | | | | | | | | 4,070,000 | |
iBWAY Holding Co., senior note, 144A, 7.25%, 4/15/25 | | | United States | | | | 4,000,000 | | | | | | | | 4,005,000 | |
iCemex SAB de CV, first lien, 144A, 5.70%, 1/11/25 | | | Mexico | | | | 6,000,000 | | | | | | | | 6,312,990 | |
iFirst Quantum Minerals Ltd., senior note, 144A, 7.25%, 4/01/23 | | | Canada | | | | 2,800,000 | | | | | | | | 2,857,750 | |
iGlencore Finance Canada Ltd., senior bond, 144A, 4.95%, 11/15/21 | | | Switzerland | | | | 4,700,000 | | | | | | | | 5,055,527 | |
LYB International Finance BV, senior note, 4.00%, 7/15/23 | | | United States | | | | 18,400,000 | | | | | | | | 19,340,884 | |
Reliance Steel & Aluminum Co., senior note, 4.50%, 4/15/23 | | | United States | | | | 5,600,000 | | | | | | | | 5,872,686 | |
Reynolds Group Holdings Inc., senior bond, 8.125%, 6/15/17 | | | United States | | | | 12,000,000 | | | | | | | | 12,120,000 | |
iReynolds Group Issuer Inc./Reynolds Group Issuer LLC/Reynolds Group Issuer Luxembourg SA, | | | | | | | | | | | | | | | | |
first lien, 144A, 5.125%, 7/15/23 | | | United States | | | | 1,600,000 | | | | | | | | 1,670,000 | |
senior note, 144A, 7.00%, 7/15/24 | | | United States | | | | 800,000 | | | | | | | | 862,500 | |
| | | | | | | | | | | | | | | | |
| | | | | | | | | | | | | | | 67,636,837 | |
| | | | | | | | | | | | | | | | |
Media 1.1% | | | | | | | | | | | | | | | | |
21st Century Fox America Inc., | | | | | | | | | | | | | | | | |
senior bond, 6.90%, 8/15/39 | | | United States | | | | 1,800,000 | | | | | | | | 2,334,748 | |
senior bond, 7.90%, 12/01/95 | | | United States | | | | 500,000 | | | | | | | | 663,680 | |
senior note, 3.00%, 9/15/22 | | | United States | | | | 5,100,000 | | | | | | | | 5,173,782 | |
senior note, 3.70%, 10/15/25 | | | United States | | | | 2,300,000 | | | | | | | | 2,361,297 | |
iAltice U.S. Finance I Corp., senior secured bond, 144A, 5.50%, 5/15/26 | | | United States | | | | 4,500,000 | | | | | | | | 4,663,125 | |
iCCO Holdings LLC/CCO Holdings Capital Corp., senior bond, 144A, 5.375%, 5/01/25 | | | United States | | | | 4,000,000 | | | | | | | | 4,180,000 | |
CSC Holdings LLC, | | | | | | | | | | | | | | | | |
senior bond, 7.625%, 7/15/18 | | | United States | | | | 3,000,000 | | | | | | | | 3,183,749 | |
senior note, 8.625%, 2/15/19 | | | United States | | | | 9,000,000 | | | | | | | | 9,936,450 | |
NBCUniversal Media LLC, senior bond, 4.45%, 1/15/43 | | | United States | | | | 8,100,000 | | | | | | | | 8,238,761 | |
iNexstar Broadcasting Inc., senior note, 144A, 5.625%, 8/01/24 | | | United States | | | | 1,600,000 | | | | | | | | 1,644,000 | |
Time Warner Inc., senior bond, 6.10%, 7/15/40 | | | United States | | | | 8,600,000 | | | | | | | | 9,747,008 | |
| | | | | | | | | | | | | | | | |
| | | | | | | | | | | | | | | 52,126,600 | |
| | | | | | | | | | | | | | | | |
| | | | |
| | | |
82 | | Semiannual Report | | franklintempleton.com |
FRANKLIN INVESTORS SECURITIES TRUST
CONSOLIDATED STATEMENT OF INVESTMENTS (UNAUDITED)
Franklin Total Return Fund (continued)
| | | | | | | | | | | | |
| | | Country | | | Principal Amount* | | | Value | |
Corporate Bonds (continued) | | | | | | | | | | | | |
Pharmaceuticals, Biotechnology & Life Sciences 1.1% | | | | | | | | | | | | |
Actavis Funding SCS, senior bond, 4.55%, 3/15/35 | | | United States | | | | 13,400,000 | | | $ | 13,561,189 | |
Baxalta Inc., senior note, 3.60%, 6/23/22 | | | United States | | | | 8,300,000 | | | | 8,549,548 | |
Biogen Inc., senior bond, 5.20%, 9/15/45 | | | United States | | | | 9,200,000 | | | | 10,017,475 | |
PerkinElmer Inc., senior note, 5.00%, 11/15/21 | | | United States | | | | 13,200,000 | | | | 14,411,984 | |
iValeant Pharmaceuticals International Inc., | | | | | | | | | | | | |
senior bond, 144A, 6.125%, 4/15/25 | | | United States | | | | 4,800,000 | | | | 3,561,600 | |
senior note, 144A, 7.00%, 3/15/24 | | | United States | | | | 400,000 | | | | 409,000 | |
| | | | | | | | | | | | |
| | | | | | | | | | | 50,510,796 | |
| | | | | | | | | | | | |
Real Estate 1.4% | | | | | | | | | | | | |
American Tower Corp., | | | | | | | | | | | | |
senior bond, 3.50%, 1/31/23 | | | United States | | | | 12,700,000 | | | | 12,937,782 | |
senior bond, 4.40%, 2/15/26 | | | United States | | | | 9,400,000 | | | | 9,889,900 | |
ERP Operating LP, senior bond, 5.75%, 6/15/17 | | | United States | | | | 881,000 | | | | 885,301 | |
MPT Operating Partnership LP/MPT Finance Corp., senior bond, 5.25%, 8/01/26 | | | United States | | | | 1,100,000 | | | | 1,133,000 | |
Prologis LP, senior bond, 3.75%, 11/01/25 | | | United States | | | | 9,400,000 | | | | 9,724,826 | |
Realty Income Corp., senior bond, 4.125%, 10/15/26 | | | United States | | | | 12,500,000 | | | | 12,982,400 | |
Senior Housing Properties Trust, senior note, 6.75%, 12/15/21 | | | United States | | | | 14,500,000 | | | | 16,178,143 | |
| | | | | | | | | | | | |
| | | | | | | | | | | 63,731,352 | |
| | | | | | | | | | | | |
Retailing 1.2% | | | | | | | | | | | | |
Dollar General Corp., senior bond, 4.15%, 11/01/25 | | | United States | | | | 12,700,000 | | | | 13,259,308 | |
Home Depot Inc., senior note, 2.125%, 9/15/26 | | | United States | | | | 16,800,000 | | | | 15,786,691 | |
i,mK2016470219 South Africa Ltd., senior secured note, 144A, PIK, 3.00%, 12/31/22 | | | South Africa | | | | 2,121,493 | | | | 201,542 | |
i,mK2016740260 South Africa Ltd., senior secured note, 144A, PIK, 25.00%, 12/31/22 | | | South Africa | | | | 306,426 | | | | 415,207 | |
Tiffany & Co., senior bond, 4.90%, 10/01/44 | | | United States | | | | 10,300,000 | | | | 9,692,002 | |
Toys R Us Inc., senior bond, 7.375%, 10/15/18 | | | United States | | | | 17,225,000 | | | | 16,277,625 | |
| | | | | | | | | | | | |
| | | | | | | | | | | 55,632,375 | |
| | | | | | | | | | | | |
Semiconductors & Semiconductor Equipment 0.5% | | | | | | | | | | | | |
Maxim Integrated Products Inc., senior note, 3.375%, 3/15/23 | | | United States | | | | 22,000,000 | | | | 22,232,826 | |
| | | | | | | | | | | | |
Software & Services 0.5% | | | | | | | | | | | | |
Alibaba Group Holding Ltd., senior bond, 4.50%, 11/28/34 | | | China | | | | 10,000,000 | | | | 10,506,500 | |
iFirst Data Corp., secured note, first lien, 144A, 5.00%, 1/15/24 | | | United States | | | | 4,000,000 | | | | 4,106,000 | |
Fiserv Inc., senior bond, 3.85%, 6/01/25 | | | United States | | | | 9,300,000 | | | | 9,652,498 | |
| | | | | | | | | | | | |
| | | | | | | | | | | 24,264,998 | |
| | | | | | | | | | | | |
Technology Hardware & Equipment 1.1% | | | | | | | | | | | | |
Cisco Systems Inc., senior note, 2.60%, 2/28/23 | | | United States | | | | 12,000,000 | | | | 12,081,564 | |
iDiamond 1 Finance Corp./Diamond 2 Finance Corp., senior secured note, first lien, 144A, 3.48%, 6/01/19 | | | United States | | | | 12,000,000 | | | | 12,280,740 | |
Juniper Networks Inc., | | | | | | | | | | | | |
senior bond, 4.50%, 3/15/24 | | | United States | | | | 4,500,000 | | | | 4,744,618 | |
senior bond, 4.35%, 6/15/25 | | | United States | | | | 9,300,000 | | | | 9,674,622 | |
iSanmina Corp., senior note, first lien, 144A, 4.375%, 6/01/19 | | | United States | | | | 11,100,000 | | | | 11,405,250 | |
iWestern Digital Corp., senior secured note, 144A, 7.375%, 4/01/23 | | | United States | | | | 1,200,000 | | | | 1,317,000 | |
| | | | | | | | | | | | |
| | | | | | | | | | | 51,503,794 | |
| | | | | | | | | | | | |
| | | | |
| | | |
franklintempleton.com | | Semiannual Report | | 83 |
FRANKLIN INVESTORS SECURITIES TRUST
CONSOLIDATED STATEMENT OF INVESTMENTS (UNAUDITED)
Franklin Total Return Fund (continued)
| | | | | | | | | | | | | | | | |
| | | Country | | | Principal Amount* | | | | | | Value | |
Corporate Bonds (continued) | | | | | | | | | | | | | | | | |
Telecommunication Services 1.3% | | | | | | | | | | | | | | | | |
AT&T Inc., | | | | | | | | | | | | | | | | |
senior bond, 4.50%, 5/15/35 | | | United States | | | | 16,200,000 | | | | | | | $ | 15,387,521 | |
senior note, 3.95%, 1/15/25 | | | United States | | | | 7,400,000 | | | | | | | | 7,505,546 | |
iHughes Satellite Systems Corp., senior bond, 144A, 6.625%, 8/01/26 | | | United States | | | | 4,500,000 | | | | | | | | 4,635,000 | |
Sprint Communications Inc., senior note, 6.00%, 11/15/22 | | | United States | | | | 3,000,000 | | | | | | | | 3,133,125 | |
Telefonica Emisiones S.A.U., senior note, 4.57%, 4/27/23 | | | Spain | | | | 9,000,000 | | | | | | | | 9,708,705 | |
Verizon Communications Inc., | | | | | | | | | | | | | | | | |
senior bond, 4.522%, 9/15/48 | | | United States | | | | 10,700,000 | | | | | | | | 9,812,831 | |
isenior bond, 144A, 4.812%, 3/15/39 | | | United States | | | | 11,065,000 | | | | | | | | 10,888,104 | |
iWind Acquisition Finance SA, secured note, second lien, 144A, 7.375%, 4/23/21 | | | Italy | | | | 800,000 | | | | | | | | 833,776 | |
| | | | | | | | | | | | | | | | |
| | | | | | | | | | | | | | | 61,904,608 | |
| | | | | | | | | | | | | | | | |
Transportation 0.3% | | | | | | | | | | | | | | | | |
iAviation Capital Group Corp., senior bond, 144A, 7.125%, 10/15/20 | | | United States | | | | 6,000,000 | | | | | | | | 6,867,648 | |
Burlington Northern and Santa Fe 99-2 Trust, secured bond, 7.57%, 1/02/21 | | | United States | | | | 71,584 | | | | | | | | 77,311 | |
iDP World Ltd., senior bond, 144A, 6.85%, 7/02/37 | | | United Arab Emirates | | | | 3,700,000 | | | | | | | | 4,365,667 | |
Union Pacific Railroad Co. 2005 Pass Trust, 2005-1, 5.082%, 1/02/29 | | | United States | | | | 160,249 | | | | | | | | 175,736 | |
XPO CNW Inc., senior bond, 7.25%, 1/15/18 | | | United States | | | | 4,300,000 | | | | | | | | 4,450,500 | |
| | | | | | | | | | | | | | | | |
| | | | | | | | | | | | | | | 15,936,862 | |
| | | | | | | | | | | | | | | | |
Utilities 2.3% | | | | | | | | | | | | | | | | |
Commonwealth Edison Co., secured bond, 6.45%, 1/15/38 | | | United States | | | | 700,000 | | | | | | | | 927,002 | |
Dominion Resources Inc., senior bond, 3.90%, 10/01/25 | | | United States | | | | 12,200,000 | | | | | | | | 12,582,311 | |
iDynegy Inc., senior note, 144A, 8.00%, 1/15/25 | | | United States | | | | 4,400,000 | | | | | | | | 4,081,000 | |
h,iEDF SA, sub. note, 144A, 5.25% to 1/29/23, FRN thereafter, Perpetual | | | France | | | | 24,000,000 | | | | | | | | 24,018,720 | |
iEnogex LLC, senior note, 144A, 6.25%, 3/15/20 | | | United States | | | | 5,000,000 | | | | | | | | 5,385,910 | |
Georgia Power Co., senior bond, 4.30%, 3/15/42 | | | United States | | | | 9,000,000 | | | | | | | | 8,996,031 | |
Kinder Morgan Energy Partners LP, senior note, 6.85%, 2/15/20 | | | United States | | | | 1,000,000 | | | | | | | | 1,114,844 | |
Sempra Energy, senior note, 3.75%, 11/15/25 | | | United States | | | | 8,200,000 | | | | | | | | 8,429,936 | |
The Southern Co., senior bond, 3.25%, 7/01/26 | | | United States | | | | 14,350,000 | | | | | | | | 13,994,149 | |
iState Grid Overseas Invesments 2016 Ltd., senior note, 144A, 3.50%, 5/04/27 | | | China | | | | 10,700,000 | | | | | | | | 10,693,687 | |
iTalen Energy Supply LLC, senior note, 144A, 9.50%, 7/15/22 | | | United States | | | | 4,200,000 | | | | | | | | 3,937,500 | |
gVeolia Environnement SA, senior bond, Reg S, 4.625%, 3/30/27 | | | France | | | | 7,800,000 | | | | EUR | | | | 11,216,920 | |
| | | | | | | | | | | | | | | | |
| | | | | | | | | | | | | | | 105,378,010 | |
| | | | | | | | | | | | | | | | |
Total Corporate Bonds (Cost $1,575,252,311) | | | | | | | | | | | | | | | 1,590,336,401 | |
| | | | | | | | | | | | | | | | |
j,nSenior Floating Rate Interests 2.4% | | | | | | | | | | | | | | | | |
Automobiles & Components 0.1% | | | | | | | | | | | | | | | | |
The Goodyear Tire & Rubber Co., Second Lien Term Loan, 2.99%, 4/30/19 | | | United States | | | | 832,506 | | | | | | | | 842,565 | |
TI Group Automotive Systems LLC, Initial US Term Loan, 3.743%, 6/30/22 | | | United States | | | | 1,480,525 | | | | | | | | 1,491,629 | |
| | | | | | | | | | | | | | | | |
| | | | | | | | | | | | | | | 2,334,194 | |
| | | | | | | | | | | | | | | | |
| | | | |
| | | |
84 | | Semiannual Report | | franklintempleton.com |
FRANKLIN INVESTORS SECURITIES TRUST
CONSOLIDATED STATEMENT OF INVESTMENTS (UNAUDITED)
Franklin Total Return Fund (continued)
| | | | | | | | | | | | |
| | | Country | | | Principal Amount* | | | Value | |
j,nSenior Floating Rate Interests (continued) | | | | | | | | | | | | |
Capital Goods 0.1% | | | | | | | | | | | | |
oAllison Transmission Inc., Term Loans, 2.99%, 9/23/22 | | | United States | | | | 6,248,655 | | | $ | 6,318,521 | |
Harsco Corp., Initial Term Loan, 6.00%, 11/02/23 | | | United States | | | | 273,916 | | | | 279,907 | |
Leidos (Abacus Innovations Corp.), B Term Loan, 3.25%, 8/16/23 | | | United States | | | | 194,139 | | | | 196,324 | |
| | | | | | | | | | | | |
| | | | | | | | | | | 6,794,752 | |
| | | | | | | | | | | | |
Consumer Services 0.3% | | | | | | | | | | | | |
Aristocrat Technologies Inc., Tranche B-2 Loans, 3.406%, 10/20/21 | | | United States | | | | 158,005 | | | | 159,549 | |
Avis Budget Car Rental LLC, Tranche B Term Loan, 3.15%, 3/15/22 | | | United States | | | | 5,102,305 | | | | 5,115,699 | |
oCaesars Entertainment Operating Co. LLC., Term B Loans, 5.75%, 8/31/24 | | | United States | | | | 187,055 | | | | 186,041 | |
oEldorado Resorts Inc., Initial Term Loan, 5.25%, 4/17/24 | | | United States | | | | 5,028,937 | | | | 5,035,223 | |
Fitness International LLC, Term A Loan, 4.243%, 4/01/20 | | | United States | | | | 2,110,649 | | | | 2,110,649 | |
oGreektown Holdings LLC, Initial Term Loan, 6.00%, 4/25/24 | | | United States | | | | 381,245 | | | | 382,119 | |
Prime Security Services Borrower LLC, 2016-2 Refinancing Term B-1 Loan, 4.25%, 5/02/22 | | | United States | | | | 793,525 | | | | 802,523 | |
c,mTurtle Bay Holdings LLC, Term Loan B, PIK, 3.75%, 6/30/17 | | | United States | | | | 707,584 | | | | 697,855 | |
| | | | | | | | | | | | |
| | | | | | | | | | | 14,489,658 | |
| | | | | | | | | | | | |
Diversified Financials 0.0%† | | | | | | | | | | | | |
First Eagle Investment Management LLC, Initial Term Loans, 4.656%, 12/01/22 | | | United States | | | | 473,252 | | | | 475,766 | |
Russell Investments US Institutional Holdco Inc., Initial Term Loan, 6.75%, 6/01/23 | | | United States | | | | 322,931 | | | | 326,160 | |
| | | | | | | | | | | | |
| | | | | | | | | | | 801,926 | |
| | | | | | | | | | | | |
Energy 0.2% | | | | | | | | | | | | |
Bowie Resource Holdings LLC, | | | | | | | | | | | | |
oFirst Lien Initial Term Loan, 6.75%, 8/14/20 | | | United States | | | | 3,037,710 | | | | 2,956,703 | |
Second Lien Initial Term Loan, 11.75%, 2/16/21 | | | United States | | | | 592,359 | | | | 546,747 | |
oFieldwood Energy LLC, Loans, 3.875%, 10/01/18 | | | United States | | | | 6,287,342 | | | | 6,153,736 | |
McDermott Finance LLC, Term Loan, 8.397%, 4/16/19 | | | United States | | | | 140,697 | | | | 142,896 | |
| | | | | | | | | | | | |
| | | | | | | | | | | 9,800,082 | |
| | | | | | | | | | | | |
Food & Staples Retailing 0.1% | | | | | | | | | | | | |
oAramark Corp., U.S. Term A Loan, 4.75%, 3/28/22 | | | United States | | | | 3,142,154 | | | | 3,152,957 | |
| | | | | | | | | | | | |
Food, Beverage & Tobacco 0.1% | | | | | | | | | | | | |
JBS USA LUX SA, New Initial Term Loans, 3.483%, 10/30/22 | | | Brazil | | | | 4,210,869 | | | | 4,231,266 | |
Pinnacle Foods Finance LLC, Initial Term Loans, 2.983%, 2/03/24 | | | United States | | | | 186,112 | | | | 187,494 | |
| | | | | | | | | | | | |
| | | | | | | | | | | 4,418,760 | |
| | | | | | | | | | | | |
Health Care Equipment & Services 0.0%† | | | | | | | | | | | | |
Carestream Health Inc., Term Loan, 5.147%, 6/07/19 | | | United States | | | | 583,088 | | | | 579,626 | |
| | | | | | | | | | | | |
Household & Personal Products 0.0%† | | | | | | | | | | | | |
Spectrum Brands Inc., Term Loans, 2.852% - 3.486%, 6/23/22 | | | United States | | | | 34,576 | | | | 34,900 | |
| | | | | | | | | | | | |
Materials 0.2% | | | | | | | | | | | | |
Chemours Co., Tranche B-1 US Term Loans, 3.49%, 5/12/22 | | | United States | | | | 3,184,851 | | | | 3,206,250 | |
Cyanco Intermediate Corp., Initial Term Loan, 5.50%, 5/01/20 | | | United States | | | | 561,953 | | | | 565,114 | |
oFMG America Finance Inc. (Fortescue Metals Group), Loans, 3.75%, 6/30/19 | | | Australia | | | | 2,187,900 | | | | 2,204,043 | |
Huntsman International LLC, 2015 Extended Term B Dollar Loan, 3.993%, 4/19/19 | | | United States | | | | 470,218 | | | | 472,765 | |
OCI Beaumont LLC, Term B-3 Loan, 8.025%, 8/20/19 | | | United States | | | | 1,034,839 | | | | 1,067,178 | |
| | | | |
| | | |
franklintempleton.com | | Semiannual Report | | 85 |
FRANKLIN INVESTORS SECURITIES TRUST
CONSOLIDATED STATEMENT OF INVESTMENTS (UNAUDITED)
Franklin Total Return Fund (continued)
| | | | | | | | | | | | |
| | | Country | | | Principal Amount* | | | Value | |
j,nSenior Floating Rate Interests (continued) | | | | | | | | | | | | |
Materials (continued) | | | | | | | | | | | | |
oOxbow Carbon LLC, Tranche A Term Loan, 6.00%, 10/21/19 | | | United States | | | | 720,000 | | | $ | 720,900 | |
| | | | | | | | | | | | |
| | | | | | | | | | | 8,236,250 | |
| | | | | | | | | | | | |
Media 0.1% | | | | | | | | | | | | |
Altice US Finance I Corp., March 2017 Refinancing TL Commitments, 3.241%, 7/28/25 | | | United States | | | | 234,911 | | | | 234,969 | |
AMC Entertainment Holdings Inc., | | | | | | | | | | | | |
2016 Incremental Term Commitments, 3.742%, 12/15/23 | | | United States | | | | 91,305 | | | | 92,070 | |
Initial Term Loans, 3.744%, 12/15/22 | | | United States | | | | 142,475 | | | | 143,484 | |
CSC Holdings LLC, March 2017 Incremental Term Loans, 3.244%, 7/17/25 | | | United States | | | | 1,099,316 | | | | 1,100,089 | |
Lions Gate Entertainment Corp., Term A Loan, 3.482%, 12/08/21 | | | United States | | | | 3,491,518 | | | | 3,511,158 | |
Live Nation Entertainment Inc., Term B-2 Loans, 3.50%, 10/31/23 | | | United States | | | | 91,076 | | | | 91,801 | |
UPC Financing Partnership, Facility AP, 3.744%, 4/15/25 | | | United States | | | | 287,840 | | | | 289,244 | |
| | | | | | | | | | | | |
| | | | | | | | | | | 5,462,815 | |
| | | | | | | | | | | | |
Pharmaceuticals, Biotechnology & Life Sciences 0.2% | | | | | | | | | | | | |
oEndo Luxembourg Finance Co. I S.A.R.L and Endo LLC, Initial Term Loans, 7.25%, 4/27/24 | | | United States | | | | 3,038,956 | | | | 3,058,423 | |
Grifols Worldwide Operations USA Inc., Tranche B Term Loan, 3.195%, 1/31/25 | | | United States | | | | 2,446,842 | | | | 2,457,552 | |
RPI Finance Trust, Term A-2 Term Loan, 3.397%, 10/14/20 | | | United States | | | | 347,181 | | | | 347,832 | |
Valeant Pharmaceuticals International Inc., Series F Tranche B Term Loan, 5.74%, 4/01/22 | | | United States | | | | 1,499,535 | | | | 1,509,063 | |
| | | | | | | | | | | | |
| | | | | | | | | | | 7,372,870 | |
| | | | | | | | | | | | |
Retailing 0.2% | | | | | | | | | | | | |
Ascena Retail Group Inc., Tranche B Term Loan, 5.50%, 8/21/22 | | | United States | | | | 3,307,851 | | | | 2,997,740 | |
Dollar Tree Inc., Term A-1 Loans, 2.75%, 7/06/20 | | | United States | | | | 596,559 | | | | 594,874 | |
oPetSmart Inc., Tranche B-2 Loans, 4.02%, 3/11/22 | | | United States | | | | 7,217,357 | | | | 6,662,523 | |
| | | | | | | | | | | | |
| | | | | | | | | | | 10,255,137 | |
| | | | | | | | | | | | |
Semiconductors & Semiconductor Equipment 0.1% | | | | | | | | | | | | |
MACOM Technology Solutions Holdings Inc., Initial Term Loans, 3.989%, 5/07/21 | | | United States | | | | 240,813 | | | | 244,426 | |
MKS Instruments Inc., Tranche B-2 Term Loans, 3.743%, 5/01/23 | | | United States | | | | 169,047 | | | | 171,054 | |
ON Semiconductor Corp., 2017 Replacement Term Loans, 3.243%, 3/31/23 | | | United States | | | | 1,980,870 | | | | 1,994,665 | |
| | | | | | | | | | | | |
| | | | | | | | | | | 2,410,145 | |
| | | | | | | | | | | | |
Software & Services 0.1% | | | | | | | | | | | | |
Global Payments Inc., Delayed Draw Term Loan (A-2), 3.196%, 10/31/21 | | | United States | | | | 1,307,605 | | | | 1,310,057 | |
MoneyGram International Inc., Term Loan, 4.397%, 3/27/20 | | | United States | | | | 2,669,347 | | | | 2,675,465 | |
Rackspace Hosting Inc., 2016 Refinancing Term B Loan, 4.535%, 11/03/23 | | | United States | | | | 456,526 | | | | 460,282 | |
| | | | | | | | | | | | |
| | | | | | | | | | | 4,445,804 | |
| | | | | | | | | | | | |
Technology Hardware & Equipment 0.0%† | | | | | | | | | | | | |
Dell International LLC, Term A-3 Loan, 3.00%, 12/31/18 | | | United States | | | | 927,880 | | | | 930,297 | |
Western Digital Corp., US Term B-2 Loan, 3.743%, 4/29/23 | | | United States | | | | 578,155 | | | | 583,503 | |
Zebra Technologies Corp., Second Amendment Refinancing Term Loan, 3.60%, 10/27/21 | | | United States | | | | 365,964 | | | | 369,967 | |
| | | | | | | | | | | | |
| | | | | | | | | | | 1,883,767 | |
| | | | | | | | | | | | |
| | | | |
| | | |
86 | | Semiannual Report | | franklintempleton.com |
FRANKLIN INVESTORS SECURITIES TRUST
CONSOLIDATED STATEMENT OF INVESTMENTS (UNAUDITED)
Franklin Total Return Fund (continued)
| | | | | | | | | | | | | | | | |
| | | Country | | | Principal Amount* | | | | | | Value | |
j,nSenior Floating Rate Interests (continued) | | | | | | | | | | | | | | | | |
Telecommunication Services 0.0%† | | | | | | | | | | | | | | | | |
Consolidated Communications Inc., Initial Term Loan, 4.00%, 10/05/23 | | | United States | | | | 228,131 | | | | | | | $ | 230,070 | |
Global Tel*Link Corp., Term Loan, 5.00%, 5/23/20 | | | United States | | | | 266,546 | | | | | | | | 266,546 | |
| | | | | | | | | | | | | | | | |
| | | | | | | | | | | | | | | 496,616 | |
| | | | | | | | | | | | | | | | |
Transportation 0.3% | | | | | | | | | | | | | | | | |
Air Canada, Term Loan, 3.90%, 10/06/23 | | | Canada | | | | 55,056 | | | | | | | | 55,492 | |
The Hertz Corp., Tranche B-1 Term Loan, 3.743%, 6/30/23 | | | United States | | | | 3,989,950 | | | | | | | | 3,999,613 | |
Navios Maritime Midstream Partners LP and Navios Maritime | | | | | | | | | | | | | | | | |
Midstream Partners Finance (US) Inc., Term Loan, 5.66%, 6/18/20 | | | Marshall Islands | | | | 1,709,728 | | | | | | | | 1,709,728 | |
Navios Maritime Partners LP, Initial Term Loan, 6.13%, 9/14/20 | | | Greece | | | | 3,000,000 | | | | | | | | 2,964,999 | |
United Air Lines Inc., Class B Term Loans, 3.422%, 4/01/24 | | | United States | | | | 397,898 | | | | | | | | 399,577 | |
oXPO Logistics Inc., Loans, 3.405%, 11/01/21 | | | United States | | | | 2,375,250 | | | | | | | | 2,388,017 | |
| | | | | | | | | | | | | | | | |
| | | | | | | | | | | | | | | 11,517,426 | |
| | | | | | | | | | | | | | | | |
Utilities 0.3% | | | | | | | | | | | | | | | | |
Calpine Construction Finance Co. LP, Term B-1 Loan, 3.24%, 5/03/20 | | | United States | | | | 7,710,790 | | | | | | | | 7,739,706 | |
EFS Cogen Holdings I LLC (Linden), Term B Advance, 4.65%, 6/28/23 | | | United States | | | | 158,638 | | | | | | | | 160,026 | |
oLightstone Holdco LLC, | | | | | | | | | | | | | | | | |
Initial Term B Loan, 5.539%, 1/30/24 | | | United States | | | | 6,046,948 | | | | | | | | 6,089,059 | |
Initial Term C Loan, 5.50%, 1/30/24 | | | United States | | | | 373,053 | | | | | | | | 375,650 | |
NRG Energy Inc., Term Loans, 3.243%, 6/30/23 | | | United States | | | | 1,042,125 | | | | | | | | 1,047,879 | |
| | | | | | | | | | | | | | | | |
| | | | | | | | | | | | | | | 15,412,320 | |
| | | | | | | | | | | | | | | | |
Total Senior Floating Rate Interests
(Cost $109,999,992) | | | | | | | | | | | | | | | 109,900,005 | |
| | | | | | | | | | | | | | | | |
Foreign Government and Agency Securities 2.5% | | | | | | | | | | | | | | | | |
The Export-Import Bank of Korea, senior note, 2.25%, 1/21/20 | | | South Korea | | | | 18,800,000 | | | | | | | | 18,777,346 | |
Government of Hungary, | | | | | | | | | | | | | | | | |
6.00%, 1/11/19 | | | Hungary | | | | 1,820,000 | | | | EUR | | | | 2,189,056 | |
A, 6.75%, 11/24/17 | | | Hungary | | | | 1,457,960,000 | | | | HUF | | | | 5,261,153 | |
A, 5.50%, 12/20/18 | | | Hungary | | | | 205,390,000 | | | | HUF | | | | 776,320 | |
gsenior bond, Reg S, 3.875%, 2/24/20 | | | Hungary | | | | 285,000 | | | | EUR | | | | 343,203 | |
gsenior note, Reg S, 4.375%, 7/04/17 | | | Hungary | | | | 215,000 | | | | EUR | | | | 236,255 | |
gsenior note, Reg S, 5.75%, 6/11/18 | | | Hungary | | | | 695,000 | | | | EUR | | | | 809,112 | |
iGovernment of Lithuania, 144A, 7.375%, 2/11/20 | | | Lithuania | | | | 4,670,000 | | | | | | | | 5,322,142 | |
Government of Mexico, | | | | | | | | | | | | | | | | |
7.75%, 12/14/17 | | | Mexico | | | | 2,600,000 | p | | | MXN | | | | 13,905,633 | |
M, 4.75%, 6/14/18 | | | Mexico | | | | 2,940,000 | p | | | MXN | | | | 15,280,426 | |
senior note, 8.50%, 12/13/18 | | | Mexico | | | | 2,000,000 | p | | | MXN | | | | 10,899,503 | |
iGovernment of Serbia, senior note, 144A, 4.875%, 2/25/20 | | | Serbia | | | | 6,000,000 | | | | | | | | 6,264,030 | |
iGovernment of Spain, senior bond, 144A, 2.75%, 10/31/24 | | | Spain | | | | 5,700,000 | | | | EUR | | | | 6,911,963 | |
iGovernment of Ukraine, | | | | | | | | | | | | | | | | |
144A, 7.75%, 9/01/20 | | | Ukraine | | | | 292,000 | | | | | | | | 295,840 | |
144A, 7.75%, 9/01/21 | | | Ukraine | | | | 229,000 | | | | | | | | 229,149 | |
144A, 7.75%, 9/01/22 | | | Ukraine | | | | 229,000 | | | | | | | | 226,137 | |
144A, 7.75%, 9/01/23 | | | Ukraine | | | | 229,000 | | | | | | | | 222,565 | |
144A, 7.75%, 9/01/24 | | | Ukraine | | | | 229,000 | | | | | | | | 219,246 | |
144A, 7.75%, 9/01/25 | | | Ukraine | | | | 229,000 | | | | | | | | 217,972 | |
144A, 7.75%, 9/01/26 | | | Ukraine | | | | 229,000 | | | | | | | | 216,268 | |
| | | | |
| | | |
franklintempleton.com | | Semiannual Report | | 87 |
FRANKLIN INVESTORS SECURITIES TRUST
CONSOLIDATED STATEMENT OF INVESTMENTS (UNAUDITED)
Franklin Total Return Fund (continued)
| | | | | | | | | | | | | | | | |
| | | Country | | | Principal Amount* | | | | | | Value | |
Foreign Government and Agency Securities (continued) | | | | | | | | | | | | | | | | |
iGovernment of Ukraine, (continued) | | | | | | | | | | | | | | | | |
144A, 7.75%, 9/01/27 | | | Ukraine | | | | 229,000 | | | | | | | $ | 215,695 | |
a,q144A, VRI, GDP Linked Security, 5/31/40 | | | Ukraine | | | | 474,000 | | | | | | | | 167,872 | |
iGovernment of Vietnam, 144A, 6.75%, 1/29/20 | | | Vietnam | | | | 5,120,000 | | | | | | | | 5,606,400 | |
Italy Treasury Bond, 2.50%, 12/01/24 | | | Italy | | | | 6,000,000 | | | | EUR | | | | 6,849,944 | |
rNota Do Tesouro Nacional, Index Linked, 6.00%, 8/15/18 | | | Brazil | | | | 13,695 | s | | | BRL | | | | 13,061,546 | |
iPeru Enhanced Pass-Through Finance Ltd., senior secured bond, A-1, 144A, zero cpn., 5/31/18 | | | Peru | | | | 217,859 | | | | | | | | 213,804 | |
| | | | | | | | | | | | | | | | |
Total Foreign Government and Agency Securities (Cost $127,282,201) | | | | | | | | | | | | | | | 114,718,580 | |
| | | | | | | | | | | | | | | | |
U.S. Government and Agency Securities 17.4% | | | | | | | | | | | | | | | | |
U.S. Treasury Bond, | | | | | | | | | | | | | | | | |
6.25%, 8/15/23 | | | United States | | | | 66,000,000 | | | | | | | | 82,634,046 | |
4.75%, 2/15/37 | | | United States | | | | 21,000,000 | | | | | | | | 27,749,526 | |
2.875%, 5/15/43 | | | United States | | | | 27,000,000 | | | | | | | | 26,651,430 | |
2.875%, 8/15/45 | | | United States | | | | 5,000,000 | | | | | | | | 4,915,820 | |
2.50%, 2/15/46 | | | United States | | | | 50,000,000 | | | | | | | | 45,447,250 | |
2.50%, 5/15/46 | | | United States | | | | 60,000,000 | | | | | | | | 54,485,160 | |
2.25%, 8/15/46 | | | United States | | | | 55,000,000 | | | | | | | | 47,205,510 | |
tIndex Linked, 2.375%, 1/15/25 | | | United States | | | | 21,321,483 | | | | | | | | 24,685,758 | |
U.S. Treasury Note, | | | | | | | | | | | | | | | | |
1.375%, 12/31/18 | | | United States | | | | 50,000,000 | | | | | | | | 50,114,250 | |
3.625%, 2/15/21 | | | United States | | | | 25,000,000 | | | | | | | | 26,833,500 | |
3.125%, 5/15/21 | | | United States | | | | 90,000,000 | | | | | | | | 95,036,130 | |
2.125%, 6/30/21 | | | United States | | | | 50,000,000 | | | | | | | | 50,837,900 | |
2.00%, 8/31/21 | | | United States | | | | 30,000,000 | | | | | | | | 30,322,860 | |
2.125%, 12/31/21 | | | United States | | | | 23,000,000 | | | | | | | | 23,345,897 | |
2.00%, 11/30/22 | | | United States | | | | 36,900,000 | | | | | | | | 37,036,936 | |
2.125%, 12/31/22 | | | United States | | | | 55,500,000 | | | | | | | | 56,036,574 | |
2.125%, 3/31/24 | | | United States | | | | 35,200,000 | | | | | | | | 35,272,195 | |
2.00%, 11/15/26 | | | United States | | | | 10,000,000 | | | | | | | | 9,759,770 | |
tIndex Linked, 0.125%, 7/15/24 | | | United States | | | | 76,423,822 | | | | | | | | 76,096,957 | |
| | | | | | | | | | | | | | | | |
Total U.S. Government and Agency Securities
(Cost $812,683,257) | | | | | | | | | | | | | | | 804,467,469 | |
| | | | | | | | | | | | | | | | |
Asset-Backed Securities and Commercial Mortgage-Backed Securities 16.5% | | | | | | | | | | | | | | | | |
Banks 1.2% | | | | | | | | | | | | | | | | |
Banc of America Commercial Mortgage Trust, 2006-4, AJ, 5.695%, 7/10/46 | | | United States | | | | 3,805,088 | | | | | | | | 3,798,117 | |
Bear Stearns Commercial Mortgage Securities Trust, | | | | | | | | | | | | | | | | |
2006-PW13, AJ, 5.611%, 9/11/41 | | | United States | | | | 751,499 | | | | | | | | 751,041 | |
j2007-PW16, AM, FRN, 5.655%, 6/11/40 | | | United States | | | | 1,777,044 | | | | | | | | 1,776,738 | |
Citigroup Commercial Mortgage Trust, 2006-C5, AJ, 5.482%, 10/15/49 | | | United States | | | | 8,154,362 | | | | | | | | 7,733,336 | |
jCommercial Mortgage Trust, 2006-GG7, AJ, FRN, 5.759%, 7/10/38 | | | United States | | | | 8,491,000 | | | | | | | | 7,199,702 | |
Credit Suisse First Boston Mortgage Securities Corp., 2004-6, 3A1, 5.00%, 9/25/19 | | | United States | | | | 461,922 | | | | | | | | 474,486 | |
i,jCSMC, 2009-15R, 3A1, 144A, FRN, 3/26/36 | | | United States | | | | 3,071,398 | | | | | | | | 3,056,065 | |
jCWABS Inc. Asset-Backed Certificates, 2004-1, M1, FRN, 1.741%, 3/25/34 | | | United States | | | | 1,532,756 | | | | | | | | 1,490,395 | |
| | | | |
| | | |
88 | | Semiannual Report | | franklintempleton.com |
FRANKLIN INVESTORS SECURITIES TRUST
CONSOLIDATED STATEMENT OF INVESTMENTS (UNAUDITED)
Franklin Total Return Fund (continued)
| | | | | | | | | | | | |
| | | Country | | | Principal Amount* | | | Value | |
Asset-Backed Securities and Commercial Mortgage-Backed Securities (continued) | | | | | | | | | | | | |
Banks (continued) | | | | | | | | | | | | |
jFNMA, 2005-122, FN, FRN, 1.341%, 1/25/36 | | | United States | | | | 473,637 | | | $ | 474,412 | |
jGE Capital Commercial Mortgage Corp. Trust, 2007-C1, AM, FRN, 5.606%, 12/10/49 | | | United States | | | | 4,325,000 | | | | 4,304,719 | |
jGreenwich Capital Commercial Funding Corp., 2006-GG7, AM, FRN, 5.759%, 7/10/38 | | | United States | | | | 1,975,556 | | | | 1,975,340 | |
j,uJP Morgan Chase Commercial Mortgage Securities Trust, 2006-CB16, B, FRN, 5.672%, 5/12/45 | | | United States | | | | 6,745,000 | | | | 832,164 | |
jMerrill Lynch Mortgage Investors Trust, 2003-A, 1A, FRN, 1.731%, 3/25/28 | | | United States | | | | 1,378,917 | | | | 1,315,949 | |
jMorgan Stanley ABS Capital I Inc. Trust, 2005-WMC, M2, FRN, 1.726%, 1/25/35 | | | United States | | | | 1,583,570 | | | | 1,564,696 | |
jMorgan Stanley Capital I Trust, | | | | | | | | | | | | |
2006-HQ8, AJ, FRN, 5.45%, 3/12/44 | | | United States | | | | 2,490,945 | | | | 2,497,554 | |
2007-IQ16, AM, FRN, 6.11%, 12/12/49 | | | United States | | | | 16,470,000 | | | | 16,723,720 | |
vWeyerhaeuser Mortgage Co., 1984-A, 7.43%, 1/01/24 | | | United States | | | | 14,906 | | | | 14,906 | |
| | | | | | | | | | | | |
| | | | | | | | | | | 55,983,340 | |
| | | | | | | | | | | | |
Diversified Financials 15.0% | | | | | | | | | | | | |
jAmerican Home Mortgage Investment Trust, 2004-3, 4A, FRN, 2.861%, 10/25/34 | | | United States | | | | 1,694,848 | | | | 1,657,414 | |
jAmeriquest Mortgage Securities Inc. Asset-Backed Pass-Through | | | | | | | | | | | | |
Certificates, 2004-R4, M1, FRN, 1.816%, 6/25/34 | | | United States | | | | 5,431,149 | | | | 5,344,324 | |
iApidos CDO, 2013-14A, C2, 144A, 4.85%, 4/15/25 | | | United States | | | | 8,740,000 | | | | 8,780,728 | |
i,jARCap REIT Inc., 2004-RR3, A2, 144A, FRN, 5.751%, 9/21/45 | | | United States | | | | 2,932,172 | | | | 2,963,223 | |
i,jAres Enhanced Loan Investment Strategy IR Ltd., 2013-IRAR, BR, 144A, FRN, 4.053%, 7/23/25 | | | United States | | | | 900,000 | | | | 906,453 | |
jArgent Securities Inc. Asset-Backed Pass-Through Certificates, 2005-W2, A2C, FRN, 1.351%, 10/25/35 | | | United States | | | | 3,771,417 | | | | 3,707,565 | |
i,jAtrium X, | | | | | | | | | | | | |
10A, A, 144A, FRN, 2.278%, 7/16/25 | | | United States | | | | 3,890,000 | | | | 3,887,238 | |
10A, C, 144A, FRN, 3.758%, 7/16/25 | | | United States | | | | 4,650,000 | | | | 4,675,203 | |
i,jBallyrock CLO LLC, 2014-1A, BR, 144A, FRN, 3.256%, 10/20/26 | | | United States | | | | 10,000,000 | | | | 10,020,100 | |
jBear Stearns ALT-A Trust, 2004-13, A2, FRN, 1.871%, 11/25/34 | | | United States | | | | 840,364 | | | | 811,924 | |
i,jBluemountain CLO Ltd., 2014, CL 3A, 144A, FRN, 2.298%, 10/15/26 | | | Cayman Islands | | | | 8,100,000 | | | | 8,109,882 | |
i,jBlueMountain CLO Ltd., 2013-3A, A, 144A, FRN, 2.439%, 10/29/25 | | | United States | | | | 2,638,970 | | | | 2,640,369 | |
i,jCarlyle Global Market Strategies CLO Ltd., | | | | | | | | | | | | |
2012-4A, AR, 144A, FRN, 2.606%, 1/20/29 | | | United States | | | | 6,280,000 | | | | 6,327,163 | |
2014-3A, A1AR, 144A, FRN, 2.32%, 7/27/26 | | | Cayman Islands | | | | 1,250,000 | | | | 1,251,875 | |
i,jCarlyle U.S. CLO Ltd., 2017-1A, A1A, 144A, FRN, 2.391%, 4/20/31 | | | United States | | | | 18,800,000 | | | | 18,868,620 | |
i,jCatamaran CLO Ltd., 2014-2A, BR, 144A, FRN, 4.108%, 10/18/26 | | | Cayman Islands | | | | 6,401,000 | | | | 6,416,746 | |
i,jCent CDO Ltd., | | | | | | | | | | | | |
2007-15A, A2B, 144A, FRN, 1.46%, 3/11/21 | | | United States | | | | 5,686,824 | | | | 5,506,608 | |
2007-15A, B, 144A, FRN, 1.84%, 3/11/21 | | | United States | | | | 8,500,000 | | | | 8,252,905 | |
i,jCent CLO, 2013-17A, A1, 144A, FRN, 2.339%, 1/30/25 | | | United States | | | | 16,246,000 | | | | 16,278,005 | |
i,jCent CLO 20 Ltd., | | | | | | | | | | | | |
13-20A, AR, 144A, FRN, 2.256%, 1/25/26 | | | Cayman Islands | | | | 8,000,000 | | | | 8,000,000 | |
13-20A, CR, 144A, FRN, 3.506%, 1/25/26 | | | Cayman Islands | | | | 3,500,000 | | | | 3,500,000 | |
i,jCent CLO LP, | | | | | | | | | | | | |
2013-17A, B, 144A, FRN, 4.039%, 1/30/25 | | | United States | | | | 3,500,000 | | | | 3,508,260 | |
2014-22A, A1R, 144A, FRN, 2.444%, 11/07/26 | | | United States | | | | 6,280,000 | | | | 6,305,183 | |
| | | | |
| | | |
franklintempleton.com | | Semiannual Report | | 89 |
FRANKLIN INVESTORS SECURITIES TRUST
CONSOLIDATED STATEMENT OF INVESTMENTS (UNAUDITED)
Franklin Total Return Fund (continued)
| | | | | | | | | | | | |
| | | Country | | | Principal Amount* | | | Value | |
Asset-Backed Securities and Commercial | | | | | | | | | | | | |
Mortgage-Backed Securities (continued) | | | | | | | | | | | | |
Diversified Financials (continued) | | | | | | | | | | | | |
jChase Funding Trust, 2004-2, 2A2, FRN, 1.491%, 2/26/35 | | | United States | | | | 625,033 | | | $ | 578,634 | |
i,jCitigroup Mortgage Loan Trust, 2013-A, A, 144A, FRN, 3.00%, 5/25/42 | | | United States | | | | 2,500,046 | | | | 2,498,514 | |
i,jColony American Homes, | | | | | | | | | | | | |
2014-1A, A, 144A, FRN, 2.144%, 5/17/31 | | | United States | | | | 9,332,437 | | | | 9,347,243 | |
2014-2A, C, 144A, FRN, 2.884%, 7/17/31 | | | United States | | | | 10,105,000 | | | | 10,120,265 | |
Conseco Financial Corp., 1996-9, M1, 7.63%, 8/15/27 | | | United States | | | | 2,562,561 | | | | 2,781,702 | |
i,jDryden 31 Senior Loan Fund, 2014-31A, AR, 144A, FRN, 2.238%, 4/18/26 | | | Cayman Islands | | | | 1,200,000 | | | | 1,198,560 | |
i,jDryden 33 Senior Loan Fund, 2014-33A, AR, 144A, FRN, 2.588%, 10/15/28 | | | Cayman Islands | | | | 12,185,000 | | | | 12,270,173 | |
i,jDryden 34 Senior Loan Fund, 14-34A, AR, 144A, FRN, 2.318%, 10/15/26 | | | Cayman Islands | | | | 19,310,000 | | | | 19,316,952 | |
i,jDryden 38 Senior Loan Fund, 2015-38A, A, 144A, FRN, 2.588%, 7/15/27 | | | Cayman Islands | | | | 21,757,143 | | | | 21,886,380 | |
i,jEaton Vance CDO Ltd., 2014-1A, AR, 144A, FRN, 2.358%, 7/15/26 | | | United States | | | | 10,096,000 | | | | 10,100,644 | |
i,jEleven Madison Trust Mortgage Trust, 2015-11MD, A, 144A, FRN, 3.555%, 9/10/35 | | | United States | | | | 3,255,000 | | | | 3,388,677 | |
jFHLMC Structured Agency Credit Risk Debt Notes, | | | | | | | | | | | | |
2014-DN1, M2, FRN, 3.191%, 2/25/24 | | | United States | | | | 3,430,000 | | | | 3,529,201 | |
2014-DN3, M3, FRN, 4.991%, 8/25/24 | | | United States | | | | 10,978,000 | | | | 11,956,078 | |
2014-DN4, M3, FRN, 5.541%, 10/25/24 | | | United States | | | | 9,500,000 | | | | 10,480,731 | |
2015-DN1, M3, FRN, 5.141%, 1/25/25 | | | United States | | | | 14,610,000 | | | | 15,908,109 | |
2015-DNA2, M3, FRN, 4.891%, 12/25/27 | | | United States | | | | 15,000,000 | | | | 16,645,347 | |
2015-DNA3, M2, FRN, 3.841%, 4/25/28 | | | United States | | | | 25,272,791 | | | | 26,254,636 | |
2015-HQ1, M3, FRN, 4.791%, 3/25/25 | | | United States | | | | 23,111,666 | | | | 25,097,092 | |
2015-HQA1, M2, FRN, 3.641%, 3/25/28 | | | United States | | | | 29,969,642 | | | | 30,778,990 | |
2015-HQA2, M2, FRN, 3.791%, 5/25/28 | | | United States | | | | 3,718,356 | | | | 3,845,417 | |
2016-DNA1, M2, FRN, 3.891%, 7/25/28 | | | United States | | | | 6,800,000 | | | | 7,094,331 | |
2016-DNA2, M2, FRN, 3.191%, 10/25/28 | | | United States | | | | 35,270,000 | | | | 36,084,815 | |
2016-HQA1, M2, FRN, 3.741%, 9/25/28 | | | United States | | | | 13,900,000 | | | | 14,472,861 | |
2016-HQA2, M2, FRN, 3.241%, 11/25/28 | | | United States | | | | 22,018,000 | | | | 22,773,217 | |
2016-HQA3, M2, FRN, 2.341%, 3/25/29 | | | United States | | | | 2,250,000 | | | | 2,276,392 | |
jFNMA Connecticut Avenue Securities, | | | | | | | | | | | | |
2014-C02, 2M2, FRN, 3.591%, 5/25/24 | | | United States | | | | 3,830,000 | | | | 3,984,649 | |
2014-C03, 1M2, FRN, 3.991%, 7/25/24 | | | United States | | | | 9,960,000 | | | | 10,485,376 | |
2014-C04, 1M1, FRN, 5.891%, 11/25/24 | | | United States | | | | 7,079,000 | | | | 8,081,698 | |
2014-C04, 2M2, FRN, 5.991%, 11/25/24 | | | United States | | | | 4,166,394 | | | | 4,678,970 | |
2015-C01, 1M2, FRN, 5.291%, 2/25/25 | | | United States | | | | 4,899,366 | | | | 5,353,230 | |
2015-C01, 2M2, FRN, 5.541%, 2/25/25 | | | United States | | | | 22,049,478 | | | | 23,941,288 | |
2015-C02, 1M2, FRN, 4.991%, 5/25/25 | | | United States | | | | 9,216,434 | | | | 9,997,803 | |
2015-C02, 2M2, FRN, 4.991%, 5/25/25 | | | United States | | | | 4,886,634 | | | | 5,244,668 | |
2015-C03, 1M2, FRN, 5.991%, 7/25/25 | | | United States | | | | 9,946,001 | | | | 11,043,729 | |
2017-C01, 1B1, FRN, 6.741%, 7/25/29 | | | United States | | | | 5,375,000 | | | | 5,746,781 | |
i,jGalaxy XV CLO Ltd., 2013-15A, A, 144A, FRN, 2.408%, 4/15/25 | | | United States | | | | 15,465,000 | | | | 15,495,466 | |
iG-Force LLC, 2005-RRA, C, 144A, 5.20%, 8/22/36 | | | United States | | | | 9,275,000 | | | | 9,105,174 | |
uGMAC Commercial Mortgage Securities Inc. Trust, 2005-C1, B, 4.936%, 5/10/43 | | | United States | | | | 8,991,659 | | | | 471,605 | |
jGSAA Home Equity Trust, 2005-5, M3, FRN, 1.936%, 2/25/35 | | | United States | | | | 3,285,236 | | | | 3,191,520 | |
iHighbridge Loan Management Ltd., 2013-2A, B2, 144A, 5.80%, 10/20/24 | | | United States | | | | 2,620,000 | | | | 2,644,235 | |
| | | | |
| | | |
90 | | Semiannual Report | | franklintempleton.com |
FRANKLIN INVESTORS SECURITIES TRUST
CONSOLIDATED STATEMENT OF INVESTMENTS (UNAUDITED)
Franklin Total Return Fund (continued)
| | | | | | | | | | | | |
| | | Country | | | Principal Amount* | | | Value | |
Asset-Backed Securities and Commercial | | | | | | | | | | | | |
Mortgage-Backed Securities (continued) | | | | | | | | | | | | |
Diversified Financials (continued) | | | | | | | | | | | | |
jHome Equity Mortgage Trust, 2004-4, M3, FRN, 1.966%, 12/25/34 | | | United States | | | | 2,808,566 | | | $ | 2,705,290 | |
i,jInvitation Homes Trust, | | | | | | | | | | | | |
2014-SFR3, C, 144A, FRN, 3.494%, 12/17/31 | | | United States | | | | 1,250,000 | | | | 1,251,925 | |
2015-SFR1, B, 144A, FRN, 2.844%, 3/17/32 | | | United States | | | | 7,400,000 | | | | 7,421,406 | |
2015-SFR2, C, 144A, FRN, 2.994%, 6/17/32 | | | United States | | | | 2,340,000 | | | | 2,349,093 | |
2015-SFR3, C, 144A, FRN, 2.994%, 8/17/32 | | | United States | | | | 10,402,000 | | | | 10,444,433 | |
JP Morgan Chase Commercial Mortgage Securities Trust, 2006-CB17, AM, 5.464%, 12/12/43 | | | United States | | | | 801,669 | | | | 801,501 | |
i,jKatonah Ltd., 2007-IA, A2L, 144A, FRN, 2.653%, 4/23/22 | | | United States | | | | 5,416,684 | | | | 5,417,063 | |
jMerrill Lynch Mortgage Investors Trust, 2004-A1, M1, FRN, 2/25/34 | | | United States | | | | 1,487,050 | | | | 1,191,977 | |
i,jNZCG Funding Ltd., 2015-2A, A1, 144A, FRN, 2.72%, 4/27/27 | | | United States | | | | 18,215,625 | | | | 18,243,495 | |
i,jOctagon Investment Partners 24 Ltd., 2015-1A, A1, 144A, FRN, 2.502%, 5/21/27 | | | United States | | | | 10,530,000 | | | | 10,576,964 | |
i,j,kOctagon Investment Partners XX Ltd., 2014-1A, AR, 144A, FRN, 0.00%, 8/12/26 | | | Cayman Islands | | | | 4,000,000 | | | | 4,000,000 | |
i,jOctagon Investment Partners XXIII Ltd., | | | | | | | | | | | | |
2015-1A, A1, 144A, FRN, 2.578%, 7/15/27 | | | United States | | | | 7,581,042 | | | | 7,603,785 | |
2015-1A, A2, 144A, FRN, 2.578%, 7/15/27 | | | United States | | | | 7,197,192 | | | | 7,218,784 | |
jStructured Asset Securities Corp., 2002-1A, 2A1, FRN, 2.617%, 2/25/32 | | | United States | | | | 20,275 | | | | 18,557 | |
i,jTowd Point Mortgage Trust, 2017-1, A2, 144A, FRN, 3.50%, 10/25/56 | | | United States | | | | 8,862,000 | | | | 9,054,472 | |
i,jVoya CLO Ltd., | | | | | | | | | | | | |
2014-4A, A1, 144A, FRN, 2.658%, 10/14/26 | | | Cayman Islands | | | | 7,620,000 | | | | 7,629,144 | |
2015-1A, A1, 144A, FRN, 2.638%, 4/18/27 | | | United States | | | | 7,745,000 | | | | 7,768,235 | |
Wells Fargo Mortgage Backed Securities Trust, | | | | | | | | | | | | |
j2004-W, A9, FRN, 3.004%, 11/25/34 | | | United States | | | | 1,378,856 | | | | 1,398,503 | |
u2007-3, 3A1, 5.50%, 4/25/22 | | | United States | | | | 206,752 | | | | 211,605 | |
i,jWest CLO Ltd., | | | | | | | | | | | | |
2014-1A, A2, 144A, FRN, 3.258%, 7/18/26 | | | United States | | | | 2,860,000 | | | | 2,875,473 | |
2014-1A, B, 144A, FRN, 4.008%, 7/18/26 | | | United States | | | | 7,540,000 | | | | 7,562,545 | |
i,jWestchester CLO Ltd., 2007-1A, A1A, 144A, FRN, 1.259%, 8/01/22 | | | United States | | | | 170,649 | | | | 170,601 | |
i,jZiggurat CLO I Ltd., 2014-1A, C, 144A, FRN, 4.258%, 10/17/26 | | | United States | | | | 2,000,000 | | | | 2,006,340 | |
| | | | | | | | | | | | |
| | | | | | | | | | | 695,792,132 | |
| | | | | | | | | | | | |
Real Estate 0.3% | | | | | | | | | | | | |
iColony MFM Trust, 2014-1, A, 144A, 2.543%, 4/20/50 | | | United States | | | | 5,912,318 | | | | 5,889,894 | |
i,jTricon American Homes Trust, 2015-SFR1, C, 144A, FRN, 2.894%, 5/17/32 | | | United States | | | | 8,170,000 | | | | 8,157,890 | |
| | | | | | | | | | | | |
| | | | | | | | | | | 14,047,784 | |
| | | | | | | | | | | | |
Total Asset-Backed Securities and Commercial | | | | | | | | | | | | |
Mortgage-Backed Securities (Cost $765,636,711) | | | | | | | | | | | 765,823,256 | |
| | | | | | | | | | | | |
Mortgage-Backed Securities 20.9% | | | | | | | | | | | | |
jFederal Home Loan Mortgage Corp. (FHLMC) Adjustable Rate 0.1% | | | | | | | | | | | | |
FHLMC, 1.866%, 11/01/27 | | | United States | | | | 1,708,522 | | | | 1,721,095 | |
| | | | | | | | | | | | |
Federal Home Loan Mortgage Corp. (FHLMC) Fixed Rate 10.6% | | | | | | | | | | | | |
FHLMC 30 Year, 6.00%, 6/01/37 | | | United States | | | | 49,975 | | | | 56,650 | |
FHLMC 30 Year, 6.50%, 8/01/25 - 11/01/31 | | | United States | | | | 92,200 | | | | 102,500 | |
FHLMC 30 Year, 7.00%, 7/01/31 | | | United States | | | | 6,570 | | | | 6,928 | |
| | | | |
| | | |
franklintempleton.com | | Semiannual Report | | 91 |
FRANKLIN INVESTORS SECURITIES TRUST
CONSOLIDATED STATEMENT OF INVESTMENTS (UNAUDITED)
Franklin Total Return Fund (continued)
| | | | | | | | | | | | |
| | | Country | | | Principal Amount* | | | Value | |
Mortgage-Backed Securities (continued) | | | | | | | | | | | | |
Federal Home Loan Mortgage Corp. (FHLMC) Fixed Rate (continued) | | | | | | | | | | | | |
FHLMC 30 Year, 8.00%, 2/01/30 | | | United States | | | | 25,480 | | | $ | 30,020 | |
FHLMC 30 Year, 8.50%, 10/01/24 | | | United States | | | | 5,094 | | | | 5,729 | |
FHLMC Gold 15 Year, 5.00%, 10/01/17 - 9/01/18 | | | United States | | | | 16,100 | | | | 16,529 | |
FHLMC Gold 15 Year, 5.50%, 11/01/22 | | | United States | | | | 121,332 | | | | 126,760 | |
FHLMC Gold 15 Year, 6.00%, 10/01/21 - 9/01/22 | | | United States | | | | 378,080 | | | | 400,123 | |
FHLMC Gold 30 Year, 3.00%, 9/01/46 | | | United States | | | | 110,962,303 | | | | 110,929,713 | |
FHLMC Gold 30 Year, 3.50%, 8/01/46 | | | United States | | | | 79,699,231 | | | | 82,048,355 | |
FHLMC Gold 30 Year, 3.50%, 12/01/46 | | | United States | | | | 19,609,436 | | | | 20,187,421 | |
wFHLMC Gold 30 Year, 3.50%, 5/01/47 | | | United States | | | | 15,300,000 | | | | 15,733,365 | |
FHLMC Gold 30 Year, 4.00%, 3/01/47 | | | United States | | | | 224,296,091 | | | | 236,411,878 | |
FHLMC Gold 30 Year, 4.50%, 3/01/39 | | | United States | | | | 2,360,245 | | | | 2,546,223 | |
FHLMC Gold 30 Year, 5.00%, 8/01/33 - 2/01/39 | | | United States | | | | 13,858,918 | | | | 15,160,140 | |
FHLMC Gold 30 Year, 5.50%, 1/01/35 - 12/01/37 | | | United States | | | | 1,168,028 | | | | 1,296,375 | |
FHLMC Gold 30 Year, 6.00%, 5/01/33 - 4/01/38 | | | United States | | | | 1,521,689 | | | | 1,725,682 | |
FHLMC Gold 30 Year, 6.50%, 4/01/28 - 3/01/39 | | | United States | | | | 1,136,331 | | | | 1,279,807 | |
FHLMC Gold 30 Year, 7.00%, 1/01/28 - 7/01/32 | | | United States | | | | 86,219 | | | | 98,741 | |
FHLMC Gold 30 Year, 7.50%, 3/01/32 | | | United States | | | | 20,774 | | | | 24,451 | |
FHLMC Gold 30 Year, 8.50%, 8/01/30 | | | United States | | | | 3,780 | | | | 4,561 | |
FHLMC Gold 30 Year, 9.00%, 1/01/22 | | | United States | | | | 797 | | | | 805 | |
FHLMC Gold 30 Year, 10.00%, 10/01/30 | | �� | United States | | | | 9,189 | | | | 9,237 | |
| | | | | | | | | | | | |
| | | | | | | | | | | 488,201,993 | |
| | | | | | | | | | | | |
jFederal National Mortgage Association (FNMA) Adjustable Rate 0.1% | | | | | | | | | | | | |
FNMA, 1.869% - 4.107%, 12/01/24 - 3/01/37 | | | United States | | | | 5,844,416 | | | | 6,085,538 | |
| | | | | | | | | | | | |
Federal National Mortgage Association (FNMA) Fixed Rate 6.3% | | | | | | | | | | | | |
FNMA 15 Year, 4.50%, 3/01/19 - 6/01/19 | | | United States | | | | 64,854 | | | | 66,577 | |
FNMA 15 Year, 5.00%, 6/01/18 - 7/01/18 | | | United States | | | | 30,707 | | | | 31,539 | |
FNMA 15 Year, 5.50%, 9/01/17 - 12/01/23 | | | United States | | | | 157,595 | | | | 165,019 | |
FNMA 15 Year, 6.00%, 6/01/17 - 9/01/22 | | | United States | | | | 62,139 | | | | 64,474 | |
FNMA 30 Year, 3.00%, 8/01/46 | | | United States | | | | 109,757,655 | | | | 109,765,483 | |
FNMA 30 Year, 3.50%, 7/01/46 | | | United States | | | | 115,408,550 | | | | 118,818,280 | |
FNMA 30 Year, 3.50%, 12/01/46 | | | United States | | | | 18,664,463 | | | | 19,215,903 | |
wFNMA 30 Year, 3.50%, 5/01/47 | | | United States | | | | 10,000,000 | | | | 10,283,593 | |
wFNMA 30 Year, 4.00%, 5/01/47 | | | United States | | | | 10,000,000 | | | | 10,532,812 | |
FNMA 30 Year, 5.00%, 6/01/36 - 5/01/39 | | | United States | | | | 2,252,078 | | | | 2,468,332 | |
FNMA 30 Year, 5.50%, 6/01/33 - 8/01/37 | | | United States | | | | 7,648,742 | | | | 8,612,129 | |
FNMA 30 Year, 6.00%, 9/01/32 - 9/01/38 | | | United States | | | | 10,250,890 | | | | 11,629,028 | |
FNMA 30 Year, 6.50%, 8/01/28 - 5/01/37 | | | United States | | | | 271,547 | | | | 303,346 | |
FNMA 30 Year, 7.00%, 11/01/25 | | | United States | | | | 3,772 | | | | 3,813 | |
FNMA 30 Year, 7.50%, 1/01/30 | | | United States | | | | 14,487 | | | | 17,302 | |
FNMA 30 Year, 8.50%, 4/01/30 - 5/01/32 | | | United States | | | | 83,225 | | | | 101,947 | |
FNMA 30 Year, 9.00%, 11/01/26 - 5/01/27 | | | United States | | | | 103,425 | | | | 111,432 | |
| | | | | | | | | | | | |
| | | | | | | | | | | 292,191,009 | |
| | | | | | | | | | | | |
jGovernment National Mortgage Association (GNMA) Adjustable Rate 0.0%† | | | | | | | | | | | | |
GNMA, 2.00% - 2.25%, 1/20/23 - 10/20/26 | | | United States | | | | 45,983 | | | | 47,422 | |
| | | | | | | | | | | | |
| | | | |
| | | |
92 | | Semiannual Report | | franklintempleton.com |
FRANKLIN INVESTORS SECURITIES TRUST
CONSOLIDATED STATEMENT OF INVESTMENTS (UNAUDITED)
Franklin Total Return Fund (continued)
| | | | | | | | | | | | |
| | | Country | | | Principal Amount* | | | Value | |
Mortgage-Backed Securities (continued) | | | | | | | | | | | | |
Government National Mortgage Association (GNMA) Fixed Rate 3.8% | | | | | | | | | | | | |
GNMA I SF 30 Year, 6.00%, 1/15/39 | | | United States | | | | 229,145 | | | $ | 260,441 | |
GNMA I SF 30 Year, 6.50%, 10/15/31 - 7/15/38 | | | United States | | | | 40,249 | | | | 45,400 | |
GNMA I SF 30 Year, 7.00%, 10/15/27 - 6/15/31 | | | United States | | | | 37,705 | | | | 43,018 | |
GNMA I SF 30 Year, 7.50%, 1/15/22 - 5/15/26 | | | United States | | | | 92,206 | | | | 95,246 | |
GNMA I SF 30 Year, 9.00%, 9/15/25 - 1/15/31 | | | United States | | | | 1,606 | | | | 1,660 | |
GNMA II SF 30 Year, 3.00%, 8/20/46 | | | United States | | | | 76,217,962 | | | | 77,358,341 | |
GNMA II SF 30 Year, 3.50%, 2/20/47 | | | United States | | | | 85,967,419 | | | | 89,465,210 | |
wGNMA II SF 30 Year, 3.50%, 5/01/47 | | | United States | | | | 9,000,000 | | | | 9,351,211 | |
GNMA II SF 30 Year, 6.00%, 5/20/31 | | | United States | | | | 5,217 | | | | 6,025 | |
GNMA II SF 30 Year, 6.50%, 3/20/28 - 7/20/38 | | | United States | | | | 515,374 | | | | 594,056 | |
GNMA II SF 30 Year, 7.50%, 8/20/30 - 1/20/33 | | | United States | | | | 56,184 | | | | 66,134 | |
| | | | | | | | | | | | |
| | | | | | | | | | | 177,286,742 | |
| | | | | | | | | | | | |
Total Mortgage-Backed Securities
(Cost $977,446,313) | | | | | | | | | | | 965,533,799 | |
| | | | | | | | | | | | |
Municipal Bonds 2.0% | | | | | | | | | | | | |
California State GO, | | | | | | | | | | | | |
Refunding, 5.00%, 9/01/29 | | | United States | | | | 1,730,000 | | | | 2,063,976 | |
Various Purpose, 6.00%, 11/01/39 | | | United States | | | | 2,385,000 | | | | 2,674,921 | |
California Statewide CDA, PCR, Southern California Edison Co., Mandatory Put 12/01/23, Refunding, Series D, 2.625%, 11/01/33 | | | United States | | | | 400,000 | | | | 410,848 | |
Chicago Transit Authority Sales and Transfer Tax Receipts Revenue, Pension Funding, Series A, 6.899%, 12/01/40 | | | United States | | | | 800,000 | | | | 1,000,456 | |
Clark County School District GO, Refunding, Series D, 5.00%, 6/15/23 | | | United States | | | | 1,500,000 | | | | 1,768,245 | |
Connecticut State GO, Series B, 5.00%, 4/15/18 | | | United States | | | | 650,000 | | | | 674,011 | |
Denver City and County Airport System Revenue, Refunding, Series A, 5.00%, 11/15/25 | | | United States | | | | 215,000 | | | | 260,113 | |
Industry Public Facilities Authority Tax Allocation Revenue, Transportation District, Industrial Redevelopment Project No. 2, Refunding, Series B, AGMC Insured, 4.294%, 1/01/23 | | | United States | | | | 10,000,000 | | | | 10,308,000 | |
Minnesota State GO, | | | | | | | | | | | | |
Refunding, Series D, 5.00%, 8/01/25 | | | United States | | | | 860,000 | | | | 1,055,908 | |
Various Purpose, Refunding, Series F, 4.00%, 10/01/24 | | | United States | | | | 5,760,000 | | | | 6,490,483 | |
New Jersey EDA Revenue, School Facilities Construction, Refunding, Series NN, 5.00%, 3/01/30 | | | United States | | | | 3,300,000 | | | | 3,353,097 | |
New York State Dormitory Authority State Personal Income Tax Revenue, General Purpose, Refunding, Series A, 5.00%, 2/15/25 | | | United States | | | | 950,000 | | | | 1,133,236 | |
Port Authority of New York and New Jersey Revenue, | | | | | | | | | | | | |
Consolidated, One Hundred Ninety-First Series, 4.823%, 6/01/45 | | | United States | | | | 4,570,000 | | | | 4,829,896 | |
Consolidated, Refunding, One Hundred Ninety-Second Series, 4.81%, 10/15/65 | | | United States | | | | 15,000,000 | | | | 16,541,400 | |
Providence St. Joseph Health Obligated Group, 2.746%, 10/01/26 | | | United States | | | | 8,875,000 | | | | 8,503,031 | |
Puerto Rico Electric Power Authority Power Revenue, Series A, 6.75%, 7/01/36 | | | United States | | | | 12,000,000 | | | | 8,550,000 | |
Texas State GO, Transportation Commission-Highway Improvement, Series A, 5.00%, 4/01/26 | | | United States | | | | 8,215,000 | | | | 10,066,990 | |
University of California Revenue, Limited Project, Refunding, Series J, 4.131%, 5/15/45 | | | United States | | | | 10,750,000 | | | | 10,719,685 | |
| | | | |
| | | |
franklintempleton.com | | Semiannual Report | | 93 |
FRANKLIN INVESTORS SECURITIES TRUST
CONSOLIDATED STATEMENT OF INVESTMENTS (UNAUDITED)
Franklin Total Return Fund (continued)
| | | | | | | | | | | | |
| | | Country | | | Principal Amount* | | | Value | |
Municipal Bonds (continued) | | | | | | | | | | | | |
University of Texas Revenue, Series J, 5.00%, 8/15/25 | | | United States | | | | 1,000,000 | | | $ | 1,222,800 | |
| | | | | | | | | | | | |
Total Municipal Bonds (Cost $92,217,460) | | | | | | | | | | | 91,627,096 | |
| | | | | | | | | | | | |
| | | |
| | | | | | Shares | | | | |
Escrows and Litigation Trusts 0.0% | | | | | | | | | | | | |
a,vMotors Liquidation Co., Escrow Account, cvt. pfd., C | | | United States | | | | 43,500 | | | | — | |
a,vNewPage Corp., Litigation Trust | | | United States | | | | 2,500,000 | | | | — | |
| | | | | | | | | | | | |
Total Escrows and Litigation Trusts (Cost $2,307) | | | | | | | | | | | — | |
| | | | | | | | | | | | |
Total Investments before Short Term Investments (Cost $4,607,845,825) | | | | | | | | | | | 4,588,263,556 | |
| | | | | | | | | | | | |
Short Term Investments (Cost $70,776,511) 1.5% | | | | | | | | | | | | |
Money Market Funds 1.5% | | | | | | | | | | | | |
e,xInstitutional Fiduciary Trust Money Market Portfolio, 0.37% | | | United States | | | | 70,776,511 | | | | 70,776,511 | |
| | | | | | | | | | | | |
Total Investments (Cost $4,678,622,336) 100.7% | | | | | | | | | | | 4,659,040,067 | |
Other Assets, less Liabilities (0.7)% | | | | | | | | | | | (33,551,310 | ) |
| | | | | | | | | | | | |
Net Assets 100.0% | | | | | | | | | | $ | 4,625,488,757 | |
| | | | | | | | | | | | |
| | | | |
| | | |
94 | | Semiannual Report | | franklintempleton.com |
FRANKLIN INVESTORS SECURITIES TRUST
CONSOLIDATED STATEMENT OF INVESTMENTS (UNAUDITED)
Franklin Total Return Fund (continued)
†Rounds to less than 0.1% of net assets.
*The principal amount is stated in U.S. dollars unless otherwise indicated.
aNon-income producing.
bThe security is owned by FT Holdings Corporation I, a wholly-owned subsidiary of the Fund. See Note 1(g).
cAt April 30, 2017, pursuant to the Fund’s policies and the requirements of applicable securities law, the Fund is restricted from trading these securities at period end.
dSee Note 8 regarding restricted securities.
eSee Note 3(f) regarding investments in affiliated management investment companies.
fVariable rate security. The rate shown represents the yield at period end.
gSecurity was purchased pursuant to Regulation S under the Securities Act of 1933, which exempts from registration securities offered and sold outside of the United States. Such a security cannot be sold in the United States without either an effective registration statement filed pursuant to the Securities Act of 1933, or pursuant to an exemption from registration. These securities have been deemed liquid under guidelines approved by the Trust’s Board of Trustees. At April 30, 2017, the aggregate value of these securities was $36,571,573, representing 0.8% of net assets.
hPerpetual security with no stated maturity date.
iSecurity was purchased pursuant to Rule 144A under the Securities Act of 1933 and may be sold in transactions exempt from registration only to qualified institutional buyers or in a public offering registered under the Securities Act of 1933. These securities have been deemed liquid under guidelines approved by the Trust’s Board of Trustees. At April 30, 2017, the aggregate value of these securities was $745,699,878, representing 16.1% of net assets.
jThe coupon rate shown represents the rate at period end.
kSecurity purchased on a when-issued basis. See Note 1(c).
lSee Note 1(f) regarding loan participation notes.
mIncome may be received in additional securities and/or cash.
nSee Note 1(i) regarding senior floating rate interests.
oA portion or all of the security purchased on a delayed delivery basis. See Note 1(c).
pPrincipal amount is stated in 100 Mexican Peso Units.
qThe principal represents the notional amount. See Note 1(d) regarding value recovery instruments.
rRedemption price at maturity is adjusted for inflation. See Note 1(k).
sPrincipal amount is stated in 1,000 Brazilian Real Units.
tPrincipal amount of security is adjusted for inflation. See Note 1(k).
uThe bond pays interest and/or principal based upon the issuer’s ability to pay, which may be less than the stated interest rate or principal paydown.
vSecurity has been deemed illiquid because it may not be able to be sold within seven days. At April 30, 2017, the aggregate value of these securities was $14,906, representing less than 0.1% of net assets.
wSecurity purchased on a to-be-announced (TBA) basis. See Note 1(c).
xThe rate shown is the annualized seven-day yield at period end.
| | | | |
| | | |
franklintempleton.com | | Semiannual Report | | 95 |
FRANKLIN INVESTORS SECURITIES TRUST
CONSOLIDATED STATEMENT OF INVESTMENTS (UNAUDITED)
Franklin Total Return Fund (continued)
At April 30, 2017, the Fund had the following futures contracts outstanding. See Note 1(d).
Futures Contracts
| | | | | | | | | | | | | | | | | | | | | | | | |
| Description | | Type | | | Number of
Contracts | | | Notional
Value | | | Expiration
Date | | | Unrealized
Appreciation | | | Unrealized
Depreciation | |
Interest Rate Contracts | | | | | | | | | | | | | | | | | | | | | | | | |
Australian 10 Yr. Bond | | | Long | | | | 650 | | | | $ 63,132,692 | | | | 6/15/17 | | | | $1,857,084 | | | | $ — | |
Canadian 10 Yr. Bond | | | Long | | | | 207 | | | | 21,165,594 | | | | 6/21/17 | | | | 474,221 | | | | — | |
Euro-Bund | | | Short | | | | 120 | | | | 21,147,236 | | | | 6/08/17 | | | | — | | | | (62,997 | ) |
Long Gilt | | | Long | | | | 380 | | | | 63,136,292 | | | | 6/28/17 | | | | 1,082,299 | | | | — | |
U.S. Treasury 2 Yr. Note | | | Long | | | | 101 | | | | 21,877,547 | | | | 6/30/17 | | | | 31,262 | | | | — | |
U.S. Treasury 5 Yr. Note | | | Long | | | | 1,359 | | | | 160,914,094 | | | | 6/30/17 | | | | 1,300,082 | | | | — | |
U.S. Treasury 10 Yr. Ultra | | | Long | | | | 200 | | | | 27,090,625 | | | | 6/21/17 | | | | 691,658 | | | | — | |
U.S. Treasury 30 Yr. Bond | | | Long | | | | 960 | | | | 146,850,000 | | | | 6/21/17 | | | | 3,170,314 | | | | — | |
Total Futures Contracts | | | | | | | | | | | | | | | | | | | $8,606,920 | | | | $(62,997) | |
Net unrealized appreciation (depreciation) | | | | | | | | | | | | | | | | | | | $8,543,923 | | | | | |
At April 30, 2017, the Fund had the following forward exchange contracts outstanding. See Note 1(d).
Forward Exchange Contracts
| | | | | | | | | | | | | | | | | | | | | | | | | | | | |
| Currency | | Counterpartya | | | Type | | | Quantity | | | Contract Amount* | | | Settlement
Date | | | Unrealized
Appreciation | | | Unrealized
Depreciation | |
OTC Forward Exchange Contracts | | | | | | | | | | | | | | | | | | | | | | | | | | | | |
Australian Dollar | | | DBAB | | | | Sell | | | | 9,789,527 | | | | 7,262,263 | | | | 5/18/17 | | | $ | — | | | $ | (64,904 | ) |
Australian Dollar | | | DBAB | | | | Sell | | | | 33,150,000 | | | | 24,985,155 | | | | 5/18/17 | | | | 173,376 | | | | — | |
Australian Dollar | | | JPHQ | | | | Sell | | | | 36,198,000 | | | | 27,445,324 | | | | 5/18/17 | | | | 352,208 | | | | — | |
British Pound | | | DBAB | | | | Sell | | | | 15,900,000 | | | | 19,878,180 | | | | 5/18/17 | | | | — | | | | (729,330 | ) |
Canadian Dollar | | | JPHQ | | | | Sell | | | | 11,500,000 | | | | 8,655,000 | | | | 5/18/17 | | | | 227,087 | | | | — | |
Euro | | | BZWS | | | | Sell | | | | 4,446,931 | | | | 4,967,208 | | | | 5/18/17 | | | | 118,054 | | | | — | |
Euro | | | CITI | | | | Sell | | | | 3,200,070 | | | | 3,587,448 | | | | 5/18/17 | | | | 97,934 | | | | — | |
Euro | | | DBAB | | | | Buy | | | | 3,683,229 | | | | 4,048,606 | | | | 5/18/17 | | | | — | | | | (32,231 | ) |
Euro | | | DBAB | | | | Buy | | | | 85,572,473 | | | | 91,214,308 | | | | 5/18/17 | | | | 2,098,142 | | | | — | |
Euro | | | DBAB | | | | Sell | | | | 89,423,576 | | | | 95,649,576 | | | | 5/18/17 | | | | — | | | | (1,862,309 | ) |
Euro | | | DBAB | | | | Sell | | | | 108,263,979 | | | | 121,524,151 | | | | 5/18/17 | | | | 3,467,760 | | | | — | |
Euro | | | GSCO | | | | Sell | | | | 1,024,000 | | | | 1,150,566 | | | | 5/18/17 | | | | 33,946 | | | | — | |
Euro | | | HSBK | | | | Sell | | | | 267,000 | | | | 296,343 | | | | 5/18/17 | | | | 5,193 | | | | — | |
Euro | | | JPHQ | | | | Sell | | | | 6,587,940 | | | | 7,061,733 | | | | 5/18/17 | | | | — | | | | (122,082 | ) |
Euro | | | JPHQ | | | | Sell | | | | 30,245,583 | | | | 33,837,258 | | | | 5/18/17 | | | | 855,980 | | | | — | |
Hungarian Forint | | | DBAB | | | | Buy | | | | 3,092,050,000 | | | | 10,519,324 | | | | 5/18/17 | | | | 242,558 | | | | — | |
Hungarian Forint | | | DBAB | | | | Sell | | | | 4,332,000,000 | | | | 15,500,215 | | | | 5/18/17 | | | | 422,686 | | | | — | |
Hungarian Forint | | | JPHQ | | | | Sell | | | | 935,000,000 | | | | 3,364,641 | | | | 5/18/17 | | | | 110,373 | | | | — | |
Indian Rupee | | | DBAB | | | | Buy | | | | 631,935,000 | | | | 9,092,590 | | | | 5/18/17 | | | | 714,482 | | | | — | |
Indian Rupee | | | JPHQ | | | | Buy | | | | 260,000,000 | | | | 3,768,116 | | | | 5/18/17 | | | | 266,854 | | | | — | |
Indonesian Rupiah | | | DBAB | | | | Buy | | | | 139,844,100,000 | | | | 10,237,489 | | | | 5/18/17 | | | | 233,803 | | | | — | |
Japanese Yen | | | JPHQ | | | | Sell | | | | 852,000,000 | | | | 8,570,356 | | | | 5/18/17 | | | | 918,831 | | | | — | |
Japanese Yen | | | JPHQ | | | | Sell | | | | 900,000,000 | | | | 7,939,238 | | | | 5/18/17 | | | | — | | | | (143,360 | ) |
Mexican Peso | | | JPHQ | | | | Buy | | | | 783,000,000 | | | | 37,618,749 | | | | 5/18/17 | | | | 3,815,303 | | | | — | |
Mexican Peso | | | JPHQ | | | | Sell | | | | 195,000,000 | | | | 10,497,416 | | | | 5/18/17 | | | | 178,591 | | | | — | |
Mexican Peso | | | JPHQ | | | | Sell | | | | 245,000,000 | | | | 11,820,331 | | | | 5/18/17 | | | | — | | | | (1,144,347 | ) |
Philippine Peso | | | JPHQ | | | | Buy | | | | 177,480,000 | | | | 3,602,192 | | | | 5/18/17 | | | | — | | | | (71,692 | ) |
Singapore Dollar | | | JPHQ | | | | Sell | | | | 13,800,000 | | | | 9,805,315 | | | | 5/18/17 | | | | — | | | | (74,528 | ) |
| | | | |
| | | |
96 | | Semiannual Report | | franklintempleton.com |
FRANKLIN INVESTORS SECURITIES TRUST
CONSOLIDATED STATEMENT OF INVESTMENTS (UNAUDITED)
Franklin Total Return Fund (continued)
Forward Exchange Contracts (continued)
| | | | | | | | | | | | | | | | | | | | | | | | | | | | |
| Currency | | Counterpartya | | | Type | | | Quantity | | | Contract Amount* | | | Settlement
Date | | | Unrealized
Appreciation | | | Unrealized
Depreciation | |
OTC Forward Exchange Contracts (continued) | | | | | | | | | | | | | | | | | | | | | |
South Korean Won | | | JPHQ | | | | Sell | | | | 11,300,000,000 | | | | 9,677,143 | | | | 5/18/17 | | | $ | — | | | $ | (259,689 | ) |
Japanese Yen | | | DBAB | | | | Sell | | | | 1,515,000,000 | | | | 13,971,246 | | | | 10/23/17 | | | | 263,340 | | | | — | |
Japanese Yen | | | JPHQ | | | | Sell | | | | 3,740,000,000 | | | | 34,513,944 | | | | 10/23/17 | | | | 673,966 | | | | — | |
British Pound | | | JPHQ | | | | Sell | | | | 6,600,000 | | | | 75,781,420 | SEK | | | 10/26/17 | | | | 46,316 | | | | — | |
Japanese Yen | | | JPHQ | | | | Sell | | | | 1,400,000,000 | | | | 12,917,274 | | | | 1/23/19 | | | | — | | | | (88,995 | ) |
Total Forward Exchange Contracts | | | | | | | | | | | | | | | $ | 15,316,783 | | | $ | (4,593,467 | ) |
Net unrealized appreciation (depreciation) | | | | | | | | | | | $ | 10,723,316 | | | | | |
*In U.S. dollars unless otherwise indicated.
aMay be comprised of multiple contracts with the same counterparty, currency and settlement date.
At April 30, 2017, the Fund had the following credit default swap contracts outstanding. See Note 1(d).
Credit Default Swap Contracts
| | | | | | | | | | | | | | | | | | | | | | | | | | | | | | | | | | | | |
| Description | | Periodic
Payment
Rate | | | Counter-
party/
Exchange | | | Notional
Amounta | | | Expiration
Date | | | Unamortized
Upfront
Payments
(Receipts) | | | Unrealized
Appreciation | | | Unrealized
Depreciation | | | Value | | | Ratingb | |
Centrally Cleared Swap Contracts | | | | | | | | | | | | | | | | | | | | | | | | | | | | | |
Contracts to Buy Protection | | | | | | | | | | | | | | | | | | | | | | | | | | | | | |
Single Name | | | | | | | | | | | | | | | | | | | | | | | | | | | | | |
Olin Corp. | | | 1.00 | % | | | ICE | | | $ | 3,800,000 | | | | 12/20/21 | | | $ | 93,085 | | | $ | — | | | $ | (4,009 | ) | | $ | 89,076 | | | | | |
Contracts to Sell Protectionc | | | | | | | | | | | | | | | | | | | | | | | | | | | | | |
Traded Index | | | | | | | | | | | | | | | | | | | | | | | | | | | | | |
CDX.NA.IG.24 | | | 1.00 | % | | | ICE | | | | 25,000,000 | | | | 6/20/25 | | | | (47,676 | ) | | | 49,455 | | | | — | | | | 1,779 | | |
| Investment
Grade |
|
CDX.NA.IG.28 | | | 1.00 | % | | | ICE | | | | 32,400,000 | | | | 6/20/22 | | | | 569,149 | | | | 38,172 | | | | — | | | | 607,321 | | |
| Investment
Grade |
|
Total Centrally Cleared Swap Contracts | | | $ | 614,558 | | | $ | 87,627 | | | $ | (4,009 | ) | | $ | 698,176 | | | | | |
OTC Swap Contracts | | | | | | | | | | | | | | | | | | | | | | | | | | | | | |
Contracts to Buy Protection | | | | | | | | | | | | | | | | | | | | | | | | | | | | | |
Single Name | | | | | | | | | | | | | | | | | | | | | | | | | | | | | |
The AES Corp. | | | 5.00 | % | | | JPHQ | | | $ | 14,100,000 | | | | 6/20/21 | | | $ | (1,298,842 | ) | | $ | — | | | $ | (647,853 | ) | | $ | (1,946,695 | ) | | | | |
The AES Corp. | | | 5.00 | % | | | JPHQ | | | | 13,275,000 | | | | 6/20/22 | | | | (1,845,199 | ) | | | — | | | | (56,923 | ) | | | (1,902,122 | ) | | | | |
Avon Products Inc. | | | 5.00 | % | | | GSCO | | | | 18,500,000 | | | | 3/20/20 | | | | 1,754,401 | | | | — | | | | (3,013,153 | ) | | | (1,258,752 | ) | | | | |
Beazer Homes USA Inc. | | | 5.00 | % | | | CITI | | | | 4,000,000 | | | | 6/20/19 | | | | (100,738 | ) | | | — | | | | (256,995 | ) | | | (357,733 | ) | | | | |
Beazer Homes USA Inc. | | | 5.00 | % | | | FBCO | | | | 9,700,000 | | | | 6/20/19 | | | | (838,469 | ) | | | — | | | | (29,033 | ) | | | (867,502 | ) | | | | |
Beazer Homes USA Inc. | | | 5.00 | % | | | GSCO | | | | 5,000,000 | | | | 6/20/19 | | | | (132,889 | ) | | | — | | | | (314,277 | ) | | | (447,166 | ) | | | | |
Best Buy Co. Inc. | | | 5.00 | % | | | CITI | | | | 4,600,000 | | | | 6/20/22 | | | | (743,849 | ) | | | — | | | | (76,728 | ) | | | (820,577 | ) | | | | |
Constellation Brands Inc. | | | 5.00 | % | | | BZWS | | | | 3,000,000 | | | | 6/20/17 | | | | (12,816 | ) | | | — | | | | (25,668 | ) | | | (38,484 | ) | | | | |
Constellation Brands Inc. | | | 5.00 | % | | | DBAB | | | | 2,000,000 | | | | 6/20/17 | | | | (8,603 | ) | | | — | | | | (17,053 | ) | | | (25,656 | ) | | | | |
CSC Holdings LLC | | | 5.00 | % | | | GSCO | | | | 3,000,000 | | | | 9/20/18 | | | | (85,936 | ) | | | — | | | | (122,224 | ) | | | (208,160 | ) | | | | |
CSC Holdings LLC | | | 5.00 | % | | | GSCO | | | | 9,000,000 | | | | 3/20/19 | | | | (225,000 | ) | | | — | | | | (571,585 | ) | | | (796,585 | ) | | | | |
El Paso Corp. | | | 5.00 | % | | | GSCO | | | | 1,100,000 | | | | 6/20/17 | | | | (5,798 | ) | | | — | | | | (8,298 | ) | | | (14,096 | ) | | | | |
| | | | |
| | | |
franklintempleton.com | | Semiannual Report | | 97 |
FRANKLIN INVESTORS SECURITIES TRUST
CONSOLIDATED STATEMENT OF INVESTMENTS (UNAUDITED)
Franklin Total Return Fund (continued)
Credit Default Swap Contracts (continued)
| | | | | | | | | | | | | | | | | | | | | | | | | | | | | | | | | | | | |
| Description | | Periodic
Payment
Rate | | | Counter-
party/ Exchange | | | Notional
Amounta | | | Expiration
Date | | | Unamortized
Upfront
Payments
(Receipts) | | | Unrealized
Appreciation | | | Unrealized
Depreciation | | | Value | | | Ratingb | |
OTC Swap Contracts (continued) | | | | | | | | | | | | | | | | | | | | | | | | | | | | | |
Contracts to Buy Protection (continued) | | | | | | | | | | | | | | | | | | | | | | | | | | | | | |
Single Name (continued) | | | | | | | | | | | | | | | | | | | | | | | | | | | | | |
Kinder Morgan Energy Partners LP | | | 5.00 | % | | | CITI | | | $ | 1,000,000 | | | | 3/20/20 | | | $ | (125,550 | ) | | $ | — | | | $ | (13,108 | ) | | $ | (138,658 | ) | | | | |
Lennar Corp. | | | 5.00 | % | | | FBCO | | | | 4,500,000 | | | | 9/20/19 | | | | (314,856 | ) | | | — | | | | (174,720 | ) | | | (489,576 | ) | | | | |
Olin Corp. | | | 1.00 | % | | | FBCO | | | | 5,000,000 | | | | 6/20/21 | | | | 325,234 | | | | — | | | | (294,375 | ) | | | 30,859 | | | | | |
Olin Corp. | | | 1.00 | % | | | GSCO | | | | 5,000,000 | | | | 6/20/21 | | | | 322,186 | | | | — | | | | (291,327 | ) | | | 30,859 | | | | | |
Pactiv LLC | | | 5.00 | % | | | UBSW | | | | 12,000,000 | | | | 6/20/17 | | | | 24,480 | | | | — | | | | (172,243 | ) | | | (147,763 | ) | | | | |
PHH Corp. | | | 5.00 | % | | | GSCO | | | | 5,400,000 | | | | 9/20/19 | | | | 22,422 | | | | — | | | | (483,858 | ) | | | (461,436 | ) | | | | |
Sanmina Corp. | | | 5.00 | % | | | BZWS | | | | 3,600,000 | | | | 6/20/19 | | | | (343,011 | ) | | | — | | | | (36,374 | ) | | | (379,385 | ) | | | | |
Sanmina Corp. | | | 5.00 | % | | | GSCO | | | | 7,500,000 | | | | 6/20/19 | | | | (705,706 | ) | | | — | | | | (84,680 | ) | | | (790,386 | ) | | | | |
Springleaf Finance Corp. | | | 5.00 | % | | | GSCO | | | | 1,200,000 | | | | 6/20/20 | | | | (45,497 | ) | | | — | | | | (34,567 | ) | | | (80,064 | ) | | | | |
Staples Inc. | | | 1.00 | % | | | CITI | | | | 4,600,000 | | | | 6/20/22 | | | | 283,093 | | | | — | | | | (39,717 | ) | | | 243,376 | | | | | |
Tenet Healthcare Corp. | | | 5.00 | % | | | BZWS | | | | 4,500,000 | | | | 3/20/19 | | | | (189,798 | ) | | | — | | | | (29,447 | ) | | | (219,245 | ) | | | | |
Tenet Healthcare Corp. | | | 5.00 | % | | | DBAB | | | | 4,000,000 | | | | 3/20/19 | | | | (197,847 | ) | | | 2,963 | | | | — | | | | (194,884 | ) | | | | |
Tenet Healthcare Corp. | | | 5.00 | % | | | GSCO | | | | 7,335,000 | | | | 3/20/19 | | | | (284,926 | ) | | | — | | | | (72,443 | ) | | | (357,369 | ) | | | | |
Toys R Us Inc. | | | 5.00 | % | | | DBAB | | | | 11,750,000 | | | | 12/20/18 | | | | 1,421,682 | | | | — | | | | (364,065 | ) | | | 1,057,617 | | | | | |
Toys R Us Inc. | | | 5.00 | % | | | GSCO | | | | 5,475,000 | | | | 12/20/18 | | | | 816,770 | | | | — | | | | (323,965 | ) | | | 492,805 | | | | | |
Transocean Inc. | | | 5.00 | % | | | MSCO | | | | 13,000,000 | | | | 6/20/18 | | | | (180,000 | ) | | | — | | | | (413,575 | ) | | | (593,575 | ) | | | | |
XPO CNW Inc. | | | 5.00 | % | | | JPHQ | | | | 4,300,000 | | | | 3/20/18 | | | | (92,211 | ) | | | — | | | | (93,178 | ) | | | (185,389 | ) | | | | |
| | | | | | | | | |
Contracts to Sell Protectionc | | | | | | | | | | | | | | | | | | | | | | | | | | | | | | | | | | | | |
Single Name | | | | | | | | | | | | | | | | | | | | | | | | | | | | | | | | | | | | |
Calpine Corp. | | | 5.00 | % | | | JPHQ | | | | 14,100,000 | | | | 6/20/21 | | | | 685,106 | | | | 803,849 | | | | — | | | | 1,488,955 | | | | B | |
Calpine Corp. | | | 5.00 | % | | | JPHQ | | | | 13,275,000 | | | | 6/20/22 | | | | 985,146 | | | | 57,785 | | | | — | | | | 1,042,931 | | | | B | |
Freeport-McMoRan Inc. | | | 1.00 | % | | | DBAB | | | | 6,500,000 | | | | 3/20/23 | | | | (276,291 | ) | | | — | | | | (818,754 | ) | | | (1,095,045 | ) | | | BB- | |
Government of Mexico | | | 1.00 | % | | | CITI | | | | 8,400,000 | | | | 6/20/20 | | | | (63,126 | ) | | | 167,647 | | | | — | | | | 104,521 | | | | BBB+ | |
Prudential Financial Inc. | | | 1.00 | % | | | BOFA | | | | 8,800,000 | | | | 12/20/21 | | | | (120,806 | ) | | | 301,113 | | | | — | | | | 180,307 | | | | A | |
Simon Property Group LP | | | 1.00 | % | | | CITI | | | | 9,200,000 | | | | 6/20/22 | | | | 30,771 | | | | 6,098 | | | | — | | | | 36,869 | | | | A | |
| | | | | | | | | |
Traded Index | | | | | | | | | | | | | | | | | | | | | | | | | | | | | | | | | | | | |
dCitibank Bespoke 58 IG/42 HY Equity Tranche 0-3% Index | | | 0.00 | % | | | CITI | | | | 3,600,000 | | | | 6/20/19 | | | | (911,323 | ) | | | 188,156 | | | | — | | | | (723,167 | ) | |
| Non-
Investment
Grade |
|
dCitibank Bespoke Dec-18 | | | | | | | | | | | | | | | | | | | | | | | | | | | | | | | | | | | | |
Hong Kong Tranche Index | | | 1.00 | % | | | CITI | | | | 13,100,000 | | | | 12/20/18 | | | | (460,144 | ) | | | 274,671 | | | | — | | | | (185,473 | ) | |
| Non-Investment
Grade |
|
MCDX.NA.28 | | | 1.00 | % | | | CITI | | | | 6,160,000 | | | | 6/20/22 | | | | 97,183 | | | | 27,518 | | | | — | | | | 124,701 | | |
| Investment
Grade |
|
Total OTC Swap Contracts | | | $ | (2,840,757 | ) | | $ | 1,829,800 | | | $ | (8,880,186 | ) | | $ | (9,891,143 | ) | | | | |
Total Credit Default Swap Contracts | | | $ | (2,226,199 | ) | | $ | 1,917,427 | | | $ | (8,884,195 | ) | | $ | (9,192,967 | ) | | | | |
Net unrealized appreciation (depreciation) | | | | | | | | | | | $ | (6,966,768 | ) | | | | | | | | |
| | | | |
| | | |
98 | | Semiannual Report | | franklintempleton.com |
FRANKLIN INVESTORS SECURITIES TRUST
CONSOLIDATED STATEMENT OF INVESTMENTS (UNAUDITED)
Franklin Total Return Fund (continued)
Credit Default Swap Contracts (continued)
aFor contracts to sell protection, the notional amount is equal to the maximum potential amount of the future payments and no recourse provisions have been entered into in association with the contracts.
bBased on Standard and Poor’s (S&P) Rating for single name swaps and internal ratings for index swaps. Internal ratings based on mapping into equivalent ratings from external vendors.
cThe Fund enters contracts to sell protection to create a long credit position. Performance triggers include default, bankruptcy or restructuring for single name swaps, and failure to pay or bankruptcy of the underlying securities for traded index swaps.
dRepresents a custom index comprised of a basket of underlying issuers.
At April 30, 2017, the Fund had the following cross-currency swap contracts outstanding. See Note 1(d).
Cross Currency Swap Contracts
| | | | | | | | | | | | | | | | | | | | |
| Description | | Counter-
party | | | Notional
Amount | | | Expiration
Date | | | Unrealized
Appreciation | | | Unrealized
Depreciation | |
OTC Swap Contracts | | | | | | | | | | | | | | | | | | | | |
Receive Floating Quarterly 3-month USD BBA LIBOR + 3.29% | | | JPHQ | | | | 12,760,417 USD | | | | 10/13/17 | | | $ | 342,046 | | | $ | — | |
Pay Fixed Annual 2.125% | | | | | | | 12,250,000 CHF | | | | | | | | | | | | | |
Receive Fixed Semi-Annual 3.045% | | | CITI | | | | 11,760,000 USD | | | | 12/15/21 | | | | 227,684 | | | | — | |
Pay Fixed Annual 1.125% | | | | | | | 10,500,000 EUR | | | | | | | | | | | | | |
Net unrealized appreciation (depreciation) | | | | | | | | | | | | | | $ | 569,730 | | | | | |
At April 30, 2017, the Fund had the following inflation index swap contracts outstanding. See Note 1(d).
Inflation Index Swap Contracts
| | | | | | | | | | | | | | | | | | | | |
| Description | | Counterparty | | | Notional
Amount | | | Expiration
Date | | | Unrealized
Appreciation | | | Unrealized
Depreciation | |
OTC Swap Contracts | | | | | | | | | | | | | | | | | | | | |
Receive variable change in USA-CPI-U | | | | | | | | | | | | | | | | | | | | |
Pay fixed rate at maturity 1.782% | | | JPHQ | | | $ | 95,700,000 | | | | 5/27/24 | | | $ | 2,814,809 | | | $ | — | |
See Note 10 regarding other derivative information.
See Abbreviations on page 131.
| | | | |
| | | |
franklintempleton.com | | The accompanying notes are an integral part of these financial statements. | Semiannual Report | | 99 |
FRANKLIN INVESTORS SECURITIES TRUST
Financial Statements
Statements of Assets and Liabilities
April 30, 2017 (unaudited)
| | | | | | | | | | | | | | | | |
| | | Franklin
Adjustable
U.S. Government
Securities Fund | | | Franklin
Floating Rate
Daily Access
Fund | | | Franklin
Low Duration
Total Return
Fund | | | Franklin
Total Return
Funda | |
Assets: | | | | | | | | | | | | | | | | |
Investments in securities: | | | | | | | | | | | | | | | | |
Cost - Unaffiliated issuers | | $ | 1,115,083,438 | | | $ | 3,497,801,099 | | | $ | 2,424,669,173 | | | $ | 4,501,114,516 | |
Cost - Controlled affiliates (Note 3f) | | | — | | | | — | | | | — | | | | 78,742,350 | |
Cost - Non-controlled affiliates (Note 3f) | | | 30,179,621 | | | | 766,726,003 | | | | 178,983,192 | | | | 98,765,470 | |
Total cost of investments | | $ | 1,145,263,059 | | | $ | 4,264,527,102 | | | $ | 2,603,652,365 | | | $ | 4,678,622,336 | |
Value - Unaffiliated issuers | | $ | 1,120,421,648 | | | $ | 3,477,802,640 | | | $ | 2,426,097,358 | | | $ | 4,481,075,031 | |
Value - Controlled affiliates (Note 3f) | | | — | | | | — | | | | — | | | | 77,657,500 | |
Value - Non-controlled affiliates (Note 3f) | | | 30,179,621 | | | | 766,726,003 | | | | 181,546,601 | | | | 100,307,536 | |
Total value of investments | | | 1,150,601,269 | | | | 4,244,528,643 | | | | 2,607,643,959 | | | | 4,659,040,067 | |
Cash | | | — | | | | 2,997,481 | | | | 600,319 | | | | 768,461 | |
Restricted Cash (Note 1e) | | | — | | | | — | | | | 190,000 | | | | 2,331,000 | |
Foreign currency, at value (cost $—, $—, $5,566,782 and $3,072,812, respectively) | | | — | | | | — | | | | 5,572,667 | | | | 3,076,252 | |
Receivables: | | | | | | | | | | | | | | | | |
Investment securities sold | | | 8,604,181 | | | | 40,946 | | | | 10,273,215 | | | | 13,285,221 | |
Capital shares sold | | | 1,569,749 | | | | 9,998,323 | | | | 5,870,698 | | | | 8,006,522 | |
Dividends and interest | | | 3,325,796 | | | | 5,592,023 | | | | 12,987,068 | | | | 28,548,005 | |
Affiliates | | | — | | | | — | | | | 343,215 | | | | — | |
Due from brokers | | | — | | | | 1,151,759 | | | | 5,135,766 | | | | 17,829,585 | |
Variation margin | | | — | | | | — | | | | — | | | | 970,383 | |
OTC swap contracts (upfront payments $—, $—, $4,427,517 and $11,503,739) | | | — | | | | — | | | | 2,994,210 | | | | 6,768,474 | |
Unrealized appreciation on OTC forward exchange contracts | | | — | | | | — | | | | 5,166,939 | | | | 15,316,783 | |
Unrealized appreciation on OTC swap contracts | | | — | | | | — | | | | 1,353,466 | | | | 5,214,339 | |
Unrealized appreciation on unfunded loan commitments (Note 9) | | | — | | | | 880,912 | | | | 103,134 | | | | 231,571 | |
Other assets | | | 1,026 | | | | 2,893 | | | | 2,244 | | | | 7,891 | |
Total assets | | | 1,164,102,021 | | | | 4,265,192,980 | | | | 2,658,236,900 | | | | 4,761,394,554 | |
Liabilities: | | | | | | | | | | | | | | | | |
Payables: | | | | | | | | | | | | | | | | |
Investment securities purchased | | | — | | | | 387,304,682 | | | | 24,624,513 | | | | 92,837,114 | |
Capital shares redeemed | | | 2,979,839 | | | | 8,849,023 | | | | 5,131,763 | | | | 12,819,348 | |
Management fees | | | 476,663 | | | | 1,368,830 | | | | 721,482 | | | | 1,733,841 | |
Distribution fees | | | 250,869 | | | | 614,217 | | | | 398,899 | | | | 880,565 | |
Transfer agent fees | | | 256,940 | | | | 512,693 | | | | — | | | | 791,934 | |
Trustees’ fees and expenses | | | 1,713 | | | | 2,410 | | | | 5,923 | | | | 3,490 | |
Distributions to shareholders | | | 113,307 | | | | 2,449,130 | | | | 352,542 | | | | 633,404 | |
Variation margin | | | — | | | | 18,914 | | | | 19,879 | | | | — | |
OTC swap contracts (upfront receipts $—, $—, $7,719,642 and $12,952,288) | | | — | | | | — | | | | 5,159,206 | | | | 9,609,231 | |
Due to brokers | | | — | | | | — | | | | 190,000 | | | | 2,331,000 | |
Unrealized depreciation on OTC forward exchange contracts | | | — | | | | — | | | | 1,295,710 | | | | 4,593,467 | |
Unrealized depreciation on OTC swap contracts | | | — | | | | — | | | | 3,759,627 | | | | 8,880,186 | |
Accrued expenses and other liabilities | | | 150,776 | | | | 817,328 | | | | 317,558 | | | | 792,217 | |
| | | | |
| | | |
100 | | Semiannual Report | The accompanying notes are an integral part of these financial statements. | | franklintempleton.com |
FRANKLIN INVESTORS SECURITIES TRUST
FINANCIAL STATEMENTS
Statements of Assets and Liabilities (continued)
April 30, 2017 (unaudited)
| | | | | | | | | | | | | | | | |
| | | Franklin
Adjustable
U.S. Government
Securities Fund | | | Franklin
Floating Rate
Daily Access
Fund | | | Franklin
Low Duration
Total Return
Fund | | | Franklin
Total Return
Funda | |
Total liabilities | | $ | 4,230,107 | | | $ | 401,937,227 | | | $ | 41,977,102 | | | $ | 135,905,797 | |
Net assets, at value | | $ | 1,159,871,914 | | | $ | 3,863,255,753 | | | $ | 2,616,259,798 | | | $ | 4,625,488,757 | |
Net assets consist of: | | | | | | | | | | | | | | | | |
Paid-in capital | | $ | 1,320,244,165 | | | $ | 4,154,938,266 | | | $ | 2,694,695,764 | | | $ | 4,748,492,512 | |
Undistributed net investment income | | | — | | | | 2,527,413 | | | | — | | | | — | |
Distributions in excess of net investment income | | | (7,677,763 | ) | | | — | | | | (9,743,274 | ) | | | (17,210,594 | ) |
Net unrealized appreciation (depreciation) | | | 5,338,210 | | | | (20,190,040 | ) | | | 5,057,416 | | | | (4,359,937 | ) |
Accumulated net realized gain (loss) | | | (158,032,698 | ) | | | (274,019,886 | ) | | | (73,750,108 | ) | | | (101,433,224 | ) |
Net assets, at value | | $ | 1,159,871,914 | | | $ | 3,863,255,753 | | | $ | 2,616,259,798 | | | $ | 4,625,488,757 | |
Class A: | | | | | | | | | | | | | | | | |
Net assets, at value | | $ | 591,063,541 | | | $ | 1,455,825,235 | | | $ | 1,457,580,736 | | | $ | 3,220,518,564 | |
Shares outstanding | | | 70,965,235 | | | | 163,984,231 | | | | 147,777,057 | | | | 330,251,615 | |
Net asset value per shareb | | | $8.33 | | | | $8.88 | | | | $9.86 | | | | $9.75 | |
Maximum offering price per share (net asset value per share ÷ 97.75%, 97.75%, 97.75% and 95.75%, respectively) | | | $8.52 | | | | $9.08 | | | | $10.09 | | | | $10.18 | |
Class A1: | | | | | | | | | | | | | | | | |
Net assets, at value | | $ | 136,835,288 | | | | | | | | | | | | | |
Shares outstanding | | | 16,434,016 | | | | | | | | | | | | | |
Net asset value per shareb | | | $8.33 | | | | | | | | | | | | | |
Maximum offering price per share (net asset value per share ÷ 97.75%) | | | $8.52 | | | | | | | | | | | | | |
Class C: | | | | | | | | | | | | | | | | |
Net assets, at value | | $ | 224,663,780 | | | $ | 596,792,105 | | | $ | 198,092,631 | | | $ | 394,866,888 | |
Shares outstanding | | | 26,992,872 | | | | 67,209,450 | | | | 20,152,330 | | | | 40,722,246 | |
Net asset value and maximum offering price per shareb | | | $8.32 | | | | $8.88 | | | | $9.83 | | | | $9.70 | |
Class R: | | | | | | | | | | | | | | | | |
Net assets, at value | | | | | | | | | | | | | | $ | 49,026,819 | |
Shares outstanding | | | | | | | | | | | | | | | 5,043,313 | |
Net asset value and maximum offering price per share | | | | | | | | | | | | | | | $9.72 | |
Class R6: | | | | | | | | | | | | | | | | |
Net assets, at value | | $ | 2,362,620 | | | $ | 110,557,139 | | | $ | 586,400,754 | | | $ | 106,536,668 | |
Shares outstanding | | | 283,363 | | | | 12,451,035 | | | | 59,132,846 | | | | 10,861,878 | |
Net asset value and maximum offering price per share | | | $8.34 | | | | $8.88 | | | | $9.92 | | | | $9.81 | |
Advisor Class: | | | | | | | | | | | | | | | | |
Net assets, at value | | $ | 204,946,685 | | | $ | 1,700,081,274 | | | $ | 374,185,677 | | | $ | 854,539,818 | |
Shares outstanding | | | 24,582,636 | | | | 191,418,675 | | | | 37,760,240 | | | | 87,182,218 | |
Net asset value and maximum offering price per share | | | $8.34 | | | | $8.88 | | | | $9.91 | | | | $9.80 | |
aConsolidated financial statement. See Note 1(g).
bRedemption price is equal to net asset value less contingent deferred sales charges, if applicable.
| | | | |
| | | |
franklintempleton.com | | The accompanying notes are an integral part of these financial statements. | Semiannual Report | | 101 |
FRANKLIN INVESTORS SECURITIES TRUST
FINANCIAL STATEMENTS
Statements of Operations
for the six months ended April 30, 2017 (unaudited)
| | | | | | | | | | | | | | | | |
| | | Franklin
Adjustable
U.S. Government
Securities Fund | | | Franklin
Floating Rate
Daily Access
Fund | | | Franklin
Low Duration
Total Return
Fund | | | Franklin
Total Return
Funda | |
Investment income: | | | | | | | | | | | | | | | | |
Dividends: | | | | | | | | | | | | | | | | |
Unaffiliated issuers | | $ | — | | | $ | 340,697 | | | $ | 24,556 | | | $ | 629,379 | |
Controlled affiliates (Note 3f) | | | — | | | | — | | | | — | | | | 942,024 | |
Non-controlled affiliates (Note 3f) | | | 16,988 | | | | 531,665 | | | | 1,759,782 | | | | 1,162,121 | |
Interest | | | 16,678,354 | | | | 71,662,576 | | | | 29,692,474 | | | | 78,421,777 | |
Inflation principal adjustments | | | — | | | | — | | | | 1,618,591 | | | | 1,345,721 | |
Paydown gain (loss) | | | (7,806,115 | ) | | | — | | | | (1,761,764 | ) | | | 540,746 | |
Total investment income | | | 8,889,227 | | | | 72,534,938 | | | | 31,333,639 | | | | 83,041,768 | |
Expenses: | | | | | | | | | | | | | | | | |
Management fees (Note 3a) | | | 3,086,976 | | | | 8,661,717 | | | | 6,185,963 | | | | 10,936,928 | |
Distribution fees: (Note 3c) | | | | | | | | | | | | | | | | |
Class A | | | 778,928 | | | | 1,781,243 | | | | 1,824,878 | | | | 4,126,051 | |
Class A1 | | | 69,562 | | | | — | | | | — | | | | — | |
Class C | | | 790,091 | | | | 1,879,577 | | | | 666,177 | | | | 1,334,602 | |
Class R | | | — | | | | — | | | | — | | | | 133,363 | |
Transfer agent fees: (Note 3e) | | | | | | | | | | | | | | | | |
Class A | | | 414,640 | | | | 631,484 | | | | 1,218,867 | | | | 2,499,915 | |
Class A1 | | | 98,133 | | | | — | | | | — | | | | — | |
Class C | | | 161,721 | | | | 256,279 | | | | 172,262 | | | | 310,918 | |
Class R | | | — | | | | — | | | | — | | | | 40,526 | |
Class R6 | | | 165 | | | | 113 | | | | 207 | | | | 642 | |
Advisor Class | | | 143,586 | | | | 628,113 | | | | 247,182 | | | | 592,585 | |
Custodian fees (Note 4) | | | 5,176 | | | | 11,725 | | | | 27,404 | | | | 70,343 | |
Reports to shareholders | | | 75,847 | | | | 126,724 | | | | 121,876 | | | | 317,466 | |
Registration and filing fees | | | 56,622 | | | | 60,321 | | | | 95,604 | | | | 202,482 | |
Professional fees | | | 27,570 | | | | 249,810 | | | | 46,506 | | | | 70,609 | |
Trustees’ fees and expenses | | | 8,250 | | | | 17,294 | | | | 15,714 | | | | 27,617 | |
Other | | | 120,413 | | | | 41,639 | | | | 114,095 | | | | 236,319 | |
Total expenses | | | 5,837,680 | | | | 14,346,039 | | | | 10,736,735 | | | | 20,900,366 | |
Expense reductions (Note 4) | | | (156 | ) | | | (6,071 | ) | | | (8,845 | ) | | | (17,926 | ) |
Expenses waived/paid by affiliates (Note 3f and 3g) | | | (35,871 | ) | | | (972,408 | ) | | | (1,812,227 | ) | | | (881,659 | ) |
Net expenses | | | 5,801,653 | | | | 13,367,560 | | | | 8,915,663 | | | | 20,000,781 | |
Net investment income | | | 3,087,574 | | | | 59,167,378 | | | | 22,417,976 | | | | 63,040,987 | |
Realized and unrealized gains (losses): | | | | | | | | | | | | | | | | |
Net realized gain (loss) from: | | | | | | | | | | | | | | | | |
Investments | | | (30,187 | ) | | | (23,742,812 | ) | | | (5,400,462 | ) | | | (20,532,790 | ) |
Foreign currency transactions | | | — | | | | 2,687 | | | | 3,328,659 | | | | 15,883,456 | |
Futures contracts | | | — | | | | — | | | | 4,165,038 | | | | (28,246,165 | ) |
Swap contracts | | | — | | | | 95,162 | | | | 343,433 | | | | (6,453,413 | ) |
Net realized gain (loss) | | | (30,187 | ) | | | (23,644,963 | ) | | | 2,436,668 | | | | (39,348,912 | ) |
Net change in unrealized appreciation (depreciation) on: | | | | | | | | | | | | | | | | |
Investments | | | (3,176,160 | ) | | | 36,866,079 | | | | (54,419 | ) | | | (52,384,963 | ) |
Translation of other assets and liabilities denominated in foreign currencies | | | — | | | | — | | | | 2,350,380 | | | | 3,522,175 | |
Futures contracts | | | — | | | | — | | | | (1,105,738 | ) | | | 12,401,376 | |
Swap contracts | | | — | | | | (783,852 | ) | | | 873,632 | | | | 6,648,460 | |
Net change in unrealized appreciation (depreciation) | | | (3,176,160 | ) | | | 36,082,227 | | | | 2,063,855 | | | | (29,812,952 | ) |
| | | | |
| | | |
102 | | Semiannual Report | The accompanying notes are an integral part of these financial statements. | | franklintempleton.com |
FRANKLIN INVESTORS SECURITIES TRUST
FINANCIAL STATEMENTS
Statements of Operations (continued)
for the six months ended April 30, 2017 (unaudited)
| | | | | | | | | | | | | | | | |
| | | Franklin
Adjustable
U.S. Government
Securities Fund | | | Franklin
Floating Rate
Daily Access
Fund | | | Franklin
Low Duration
Total Return
Fund | | | Franklin
Total Return
Funda | |
Net realized and unrealized gain (loss) | | | $(3,206,347 | ) | | | $12,437,264 | | | | $ 4,500,523 | | | | $(69,161,864 | ) |
Net increase (decrease) in net assets resulting from operations | | | $ (118,773 | ) | | | $71,604,642 | | | | $26,918,499 | | | | $ (6,120,877 | ) |
aConsolidated financial statement. See Note 1(g).
| | | | |
| | | |
franklintempleton.com | | The accompanying notes are an integral part of these financial statements. | Semiannual Report | | 103 |
FRANKLIN INVESTORS SECURITIES TRUST
FINANCIAL STATEMENTS
Statements of Changes in Net Assets
| | | | | | | | | | | | | | | | |
| | | Franklin Adjustable U.S.
Government Securities Fund | | | Franklin Floating Rate
Daily Access Fund | |
| | | Six Months Ended
April 30, 2017
(unaudited) | | | Year Ended
October 31, 2016 | | | Six Months Ended
April 30, 2017
(unaudited) | | | Year Ended
October 31, 2016 | |
Increase (decrease) in net assets: | | | | | | | | | | | | | | | | |
Operations: | | | | | | | | | | | | | | | | |
Net investment income | | | $ 3,087,574 | | | | $ 6,177,925 | | | | $ 59,167,378 | | | | $ 142,862,698 | |
Net realized gain (loss) | | | (30,187 | ) | | | 617,606 | | | | (23,644,963 | ) | | | (60,596,568 | ) |
Net change in unrealized appreciation (depreciation) | | | (3,176,160 | ) | | | (11,522,082 | ) | | | 36,082,227 | | | | 119,213,445 | |
Net increase (decrease) in net assets resulting from operations | | | (118,773 | ) | | | (4,726,551 | ) | | | 71,604,642 | | | | 201,479,575 | |
Distributions to shareholders from: | | | | | | | | | | | | | | | | |
Net investment income: | | | | | | | | | | | | | | | | |
Class A | | | (5,513,417 | ) | | | (10,995,661 | ) | | | (24,128,920 | ) | | | (64,460,934 | ) |
Class A1 | | | (1,418,499 | ) | | | (2,862,431 | ) | | | — | | | | — | |
Class C | | | (1,670,229 | ) | | | (3,137,657 | ) | | | (8,642,590 | ) | | | (23,786,613 | ) |
Class R6 | | | (24,971 | ) | | | (41,661 | ) | | | (743,147 | ) | | | (285,466 | ) |
Advisor Class | | | (2,174,353 | ) | | | (4,223,137 | ) | | | (25,349,157 | ) | | | (54,321,011 | ) |
Total distributions to shareholders | | | (10,801,469 | ) | | | (21,260,547 | ) | | | (58,863,814 | ) | | | (142,854,024 | ) |
Capital share transactions: (Note 2) | | | | | | | | | | | | | | | | |
Class A | | | (71,076,618 | ) | | | (167,984,621 | ) | | | 90,116,578 | | | | (222,175,112 | ) |
Class A1 | | | (22,333,416 | ) | | | (35,100,623 | ) | | | — | | | | — | |
Class C | | | (39,373,562 | ) | | | (64,817,272 | ) | | | 42,750,617 | | | | (87,707,899 | ) |
Class R6 | | | 9,740 | | | | 236,438 | | | | 98,314,701 | | | | 11,857,272 | |
Advisor Class | | | (20,732,007 | ) | | | (76,748,790 | ) | | | 586,719,206 | | | | (314,178,543 | ) |
Total capital share transactions | | | (153,505,863 | ) | | | (344,414,868 | ) | | | 817,901,102 | | | | (612,204,282 | ) |
Net increase (decrease) in net assets . | | | (164,426,105 | ) | | | (370,401,966 | ) | | | 830,641,930 | | | | (553,578,731 | ) |
Net assets: | | | | | | | | | | | | | | | | |
Beginning of period | | | 1,324,298,019 | | | | 1,694,699,985 | | | | 3,032,613,823 | | | | 3,586,192,554 | |
End of period | | | $1,159,871,914 | | | | $1,324,298,019 | | | | $3,863,255,753 | | | | $3,032,613,823 | |
Undistributed net investment income included in net assets: | | | | | | | | | | | | | | | | |
End of period | | | $ — | | | | $ 36,132 | | | | $ 2,527,413 | | | | $ 2,223,849 | |
Distributions in excess of net investment income included in net assets: | | | | | | | | | | | | | | | | |
End of period | | | $ (7,677,763) | | | | $ — | | | | $ — | | | | $ — | |
| | | | |
| | | |
104 | | Semiannual Report | The accompanying notes are an integral part of these financial statements. | | franklintempleton.com |
FRANKLIN INVESTORS SECURITIES TRUST
FINANCIAL STATEMENTS
Statements of Changes in Net Assets (continued)
| | | | | | | | | | | | | | | | |
| | | Franklin Low Duration
Total Return Fund | | | Franklin Total
Return Funda | |
| | | Six Months Ended
April 30, 2017
(unaudited) | | | Year Ended
October 31, 2016 | | | Six Months Ended
April 30, 2017
(unaudited) | | | Year Ended
October 31, 2016 | |
Increase (decrease) in net assets: | | | | | | | | | | | | | | | | |
Operations: | | | | | | | | | | | | | | | | |
Net investment income | | | $ 22,417,976 | | | | $ 41,317,809 | | | | $ 63,040,987 | | | | $ 110,841,380 | |
Net realized gain (loss) | | | 2,436,668 | | | | (21,952,845 | ) | | | (39,348,912 | ) | | | (59,263,353 | ) |
Net change in unrealized appreciation (depreciation) | | | 2,063,855 | | | | 29,381,816 | | | | (29,812,952 | ) | | | 114,335,062 | |
Net increase (decrease) in net assets resulting from operations | | | 26,918,499 | | | | 48,746,780 | | | | (6,120,877 | ) | | | 165,913,089 | |
Distributions to shareholders from: | | | | | | | | | | | | | | | | |
Net investment income: | | | | | | | | | | | | | | | | |
Class A | | | (19,650,393 | ) | | | (33,131,709 | ) | | | (59,758,454 | ) | | | (101,527,245 | ) |
Class C | | | (2,435,536 | ) | | | (4,013,836 | ) | | | (6,676,604 | ) | | | (11,788,656 | ) |
Class R | | | — | | | | — | | | | (910,522 | ) | | | (1,861,369 | ) |
Class R6 | | | (7,740,893 | ) | | | (12,099,518 | ) | | | (1,937,130 | ) | | | (2,201,117 | ) |
Advisor Class | | | (3,991,480 | ) | | | (3,563,139 | ) | | | (14,605,873 | ) | | | (15,522,886 | ) |
Total distributions to shareholders | | | (33,818,302 | ) | | | (52,808,202 | ) | | | (83,888,583 | ) | | | (132,901,273 | ) |
Capital share transactions: (Note 2) | | | | | | | | | | | | | | | | |
Class A | | | (62,437,175 | ) | | | (127,311,300 | ) | | | (335,804,468 | ) | | | 66,617,965 | |
Class C | | | (19,266,344 | ) | | | 7,361,242 | | | | (46,015,199 | ) | | | 2,877,723 | |
Class R | | | — | | | | — | | | | (8,600,375 | ) | | | (12,019,056 | ) |
Class R6 | | | 34,667,600 | | | | 43,783,151 | | | | 14,179,336 | | | | 24,451,715 | |
Advisor Class | | | 149,573,459 | | | | 74,356,194 | | | | 126,775,869 | | | | 212,187,480 | |
Total capital share transactions | | | 102,537,540 | | | | (1,810,713 | ) | | | (249,464,837 | ) | | | 294,115,827 | |
Net increase (decrease) in net assets | | | 95,637,737 | | | | (5,872,135 | ) | | | (339,474,297 | ) | | | 327,127,643 | |
Net assets: | | | | | | | | | | | | | | | | |
Beginning of period | | | 2,520,622,061 | | | | 2,526,494,196 | | | | 4,964,963,054 | | | | 4,637,835,411 | |
End of period | | | $2,616,259,798 | | | | $2,520,622,061 | | | | $4,625,488,757 | | | | $4,964,963,054 | |
Undistributed net investment income included in net assets: | | | | | | | | | | | | | | | | |
End of period | | | $ — | | | | $ 1,657,052 | | | | $ — | | | | $ 3,637,002 | |
Distributions in excess of net investment income included in net assets: | | | | | | | | | | | | | | | | |
End of period | | | $ (9,743,274 | ) | | | $ — | | | | $ (17,210,594 | ) | | | $ — | |
aConsolidated financial statement. See Note 1(g).
| | | | |
| | | |
franklintempleton.com | | The accompanying notes are an integral part of these financial statements. | Semiannual Report | | 105 |
FRANKLIN INVESTORS SECURITIES TRUST
Notes to Financial Statements (unaudited)
1. Organization and Significant Accounting Policies
Franklin Investors Securities Trust (Trust) is registered under the Investment Company Act of 1940 (1940 Act) as an open-end management investment company, consisting of eight separate funds, four of which are included in this report (Funds) and applies the specialized accounting and reporting guidance in U.S. Generally Accepted Accounting Principles (U.S. GAAP). The financial statements of the remaining funds in the Trust are presented separately. The classes of shares offered within each of the Funds are indicated below. Each class of shares may differ by its initial sales load, contingent deferred sales charges, voting rights on matters affecting a single class, its exchange privilege and fees primarily due to differing arrangements for distribution and transfer agent fees.
Class A, Class A1, Class C, Class R6 & Advisor Class
Franklin Adjustable U.S. Government Securities Fund
Class A, Class C, Class R6 & Advisor Class
Franklin Floating Rate Daily Access Fund
Franklin Low Duration Total Return Fund
Class A, Class C, Class R, Class R6 & Advisor Class
Franklin Total Return Fund
The following summarizes the Funds’ significant accounting policies.
a. Financial Instrument Valuation
The Funds’ investments in financial instruments are carried at fair value daily. Fair value is the price that would be received to sell an asset or paid to transfer a liability in an orderly transaction between market participants on the measurement date. The Funds calculate the net asset value (NAV) per share as of 4 p.m. Eastern time each day the New York Stock Exchange (NYSE) is open for trading. Under compliance policies and procedures approved by the Trust’s Board of Trustees (the Board), the Funds’ administrator has responsibility for oversight of valuation, including leading the cross-functional Valuation Committee (VC). The VC provides administration and oversight of the Funds’ valuation policies and procedures, which are approved annually by the Board. Among other things, these procedures allow the Funds to utilize independent pricing services, quotations from securities and financial instrument dealers, and other market sources to determine fair value.
Equity securities, exchange traded funds, and derivative financial instruments listed on an exchange or on the NASDAQ National Market System are valued at the last quoted sale price or the official closing price of the day, respectively. Foreign equity securities are valued as of the close of trading on the foreign stock exchange on which the security is primarily traded, or as of 4 p.m. Eastern time. The value is then converted into its U.S. dollar equivalent at the foreign exchange rate in effect at 4 p.m. Eastern time on the day that the value of the security is determined. Over-the-counter (OTC) securities are valued within the range of the most recent quoted bid and ask prices. Securities that trade in multiple markets or on multiple exchanges are valued according to the broadest and most representative market. Certain equity securities are valued based upon fundamental characteristics or relationships to similar securities.
Debt securities generally trade in the OTC market rather than on a securities exchange. The Funds’ pricing services use multiple valuation techniques to determine fair value. In instances where sufficient market activity exists, the pricing services may utilize a market-based approach through which quotes from market makers are used to determine fair value. In instances where sufficient market activity may not exist or is limited, the pricing services also utilize proprietary valuation models which may consider market characteristics such as benchmark yield curves, credit spreads, estimated default rates, anticipated market interest rate volatility, coupon rates, anticipated timing of principal repayments, underlying collateral, and other unique security features in order to estimate the relevant cash flows, which are then discounted to calculate the fair value. Securities denominated in a foreign currency are converted into their U.S. dollar equivalent at the foreign exchange rate in effect at 4 p.m. Eastern time on the date that the values of the foreign debt securities are determined.
Investments in open-end mutual funds are valued at the closing NAV.
Certain derivative financial instruments are centrally cleared or traded in the OTC market. The Funds’ pricing services use various techniques including industry standard option pricing models and proprietary discounted cash flow models to determine the fair value of those instruments. The Funds’ net benefit or obligation under the derivative contract, as measured by the fair value of the contract, is included in net assets.
| | | | |
| | | |
106 | | Semiannual Report | | franklintempleton.com |
FRANKLIN INVESTORS SECURITIES TRUST
NOTES TO FINANCIAL STATEMENTS (UNAUDITED)
The Funds have procedures to determine the fair value of financial instruments for which market prices are not reliable or readily available. Under these procedures, the VC convenes on a regular basis to review such financial instruments and considers a number of factors, including significant unobservable valuation inputs, when arriving at fair value. The VC primarily employs a market-based approach which may use related or comparable assets or liabilities, recent transactions, market multiples, book values, and other relevant information for the investment to determine the fair value of the investment. An income-based valuation approach may also be used in which the anticipated future cash flows of the investment are discounted to calculate fair value. Discounts may also be applied due to the nature or duration of any restrictions on the disposition of the investments. Due to the inherent uncertainty of valuations of such investments, the fair values may differ significantly from the values that would have been used had an active market existed. The VC employs various methods for calibrating these valuation approaches including a regular review of key inputs and assumptions, transactional back-testing or disposition analysis, and reviews of any related market activity.
Trading in securities on foreign securities stock exchanges and OTC markets may be completed before 4 p.m. Eastern time. In addition, trading in certain foreign markets may not take place on every Funds’ business day. Occasionally, events occur between the time at which trading in a foreign security is completed and 4 p.m. Eastern time that might call into question the reliability of the value of a portfolio security held by the Fund. As a result, differences may arise between the value of the Funds’ portfolio securities as determined at the foreign market close and the latest indications of value at 4 p.m. Eastern time. In order to minimize the potential for these differences, the VC monitors price movements following the close of trading in foreign stock markets through a series of country specific market proxies (such as baskets of American Depositary Receipts, futures contracts and exchange traded funds). These price movements are measured against established trigger thresholds for each specific market proxy to assist in determining if an event has occurred that may call into question the reliability of the values of the foreign securities held by the Funds. If such an event occurs, the securities may be valued using fair value procedures, which may include the use of independent pricing services.
When the last day of the reporting period is a non-business day, certain foreign markets may be open on those days that the Funds’ NAV is not calculated, which could result in differences between the value of the Funds’ portfolio securities on the last business day and the last calendar day of the reporting period. Any significant security valuation changes due to an open foreign market are adjusted and reflected by the Funds for financial reporting purposes.
b. Foreign Currency Translation
Portfolio securities and other assets and liabilities denominated in foreign currencies are translated into U.S. dollars based on the exchange rate of such currencies against U.S. dollars on the date of valuation. The Funds may enter into foreign currency exchange contracts to facilitate transactions denominated in a foreign currency. Purchases and sales of securities, income and expense items denominated in foreign currencies are translated into U.S. dollars at the exchange rate in effect on the transaction date. Portfolio securities and assets and liabilities denominated in foreign currencies contain risks that those currencies will decline in value relative to the U.S. dollar. Occasionally, events may impact the availability or reliability of foreign exchange rates used to convert the U.S. dollar equivalent value. If such an event occurs, the foreign exchange rate will be valued at fair value using procedures established and approved by the Board.
The Funds do not separately report the effect of changes in foreign exchange rates from changes in market prices on securities held. Such changes are included in net realized and unrealized gain or loss from investments in the Statements of Operations.
Realized foreign exchange gains or losses arise from sales of foreign currencies, currency gains or losses realized between the trade and settlement dates on securities transactions and the difference between the recorded amounts of dividends, interest, and foreign withholding taxes and the U.S. dollar equivalent of the amounts actually received or paid. Net unrealized foreign exchange gains and losses arise from changes in foreign exchange rates on foreign denominated assets and liabilities other than investments in securities held at the end of the reporting period.
| | | | |
| | | |
franklintempleton.com | | Semiannual Report | | 107 |
FRANKLIN INVESTORS SECURITIES TRUST
NOTES TO FINANCIAL STATEMENTS (UNAUDITED)
1. Organization and Significant Accounting
Policies (continued)
c. Securities Purchased on a When-Issued, Delayed Delivery and TBA Basis
Certain or all Funds purchase securities on a when-issued or delayed delivery and to-be-announced (TBA) basis, with payment and delivery scheduled for a future date. These transactions are subject to market fluctuations and are subject to the risk that the value at delivery may be more or less than the trade date purchase price. Although the Funds will generally purchase these securities with the intention of holding the securities, they may sell the securities before the settlement date. Sufficient assets have been segregated for these securities and collateral has been pledged and/or received for open TBA trades.
d. Derivative Financial Instruments
Certain or all Funds invested in derivative financial instruments in order to manage risk or gain exposure to various other investments or markets. Derivatives are financial contracts based on an underlying or notional amount, require no initial investment or an initial net investment that is smaller than would normally be required to have a similar response to changes in market factors, and require or permit net settlement. Derivatives contain various risks including the potential inability of the counterparty to fulfill their obligations under the terms of the contract, the potential for an illiquid secondary market, and/or the potential for market movements which expose the Fund to gains or losses in excess of the amounts shown in the Statements of Assets and Liabilities. Realized gain and loss and unrealized appreciation and depreciation on these contracts for the period are included in the Statements of Operations.
Derivative counterparty credit risk is managed through a formal evaluation of the creditworthiness of all potential counter-parties. Certain or all Funds attempt to reduce their exposure to counterparty credit risk on OTC derivatives, whenever possible, by entering into International Swaps and Derivatives Association (ISDA) master agreements with certain counterparties. These agreements contain various provisions, including but not limited to collateral requirements, events of default, or early termination. Termination events applicable to the counterparty include certain deteriorations in the credit quality of the counterparty. Termination events applicable to the Funds include failure of the Funds to maintain certain net asset
levels and/or limit the decline in net assets over various periods of time. In the event of default or early termination, the ISDA master agreement gives the non-defaulting party the right to net and close-out all transactions traded, whether or not arising under the ISDA agreement, to one net amount payable by one counterparty to the other. However, absent an event of default or early termination, OTC derivative assets and liabilities are presented gross and not offset in the Statements of Assets and Liabilities. Early termination by the counterparty may result in an immediate payment by the Funds of any net liability owed to that counterparty under the ISDA agreement.
Collateral requirements differ by type of derivative. Collateral or initial margin requirements are set by the broker or exchange clearing house for exchange traded and centrally cleared derivatives. Initial margin deposited is held at the exchange and can be in the form of cash and/or securities. For OTC derivatives traded under an ISDA master agreement, posting of collateral is required by either the Fund or the applicable counterparty if the total net exposure of all OTC derivatives with the applicable counterparty exceeds the minimum transfer amount, which typically ranges from $100,000 to $250,000, and can vary depending on the counterparty and the type of the agreement. Generally, collateral is determined at the close of Fund business each day and any additional collateral required due to changes in derivative values may be delivered by the Fund or the counterparty the next business day, or within a few business days. Collateral pledged and/or received by the Fund for OTC derivatives, if any, is held in segregated accounts with the Fund’s custodian/counterparty broker and can be in the form of cash and/or securities. Unrestricted cash may be invested according to the Funds’ investment objectives. To the extent that the amounts due to the Fund from its counterparties are not subject to collateralization or are not fully collateralized, the Fund bears the risk of loss from counterparty non-performance.
Certain or all Funds entered into exchange traded futures contracts primarily to manage and/or gain exposure to interest rate risk. A futures contract is an agreement between the Fund and a counterparty to buy or sell an asset at a specified price on a future date. Required initial margins are pledged by the Fund, and the daily change in fair value is accounted for as a variation margin payable or receivable in the Statements of Assets and Liabilities.
| | | | |
| | | |
108 | | Semiannual Report | | franklintempleton.com |
FRANKLIN INVESTORS SECURITIES TRUST
NOTES TO FINANCIAL STATEMENTS (UNAUDITED)
Certain or all Funds entered into OTC forward exchange contracts primarily to manage and/or gain exposure to certain foreign currencies. A forward exchange contract is an agreement between the Fund and a counterparty to buy or sell a foreign currency at a specific exchange rate on a future date.
Certain or all Funds entered into credit default swap contracts primarily to manage and/or gain exposure to credit risk. A credit default swap is an agreement between the Fund and a counterparty whereby the buyer of the contract receives credit protection and the seller of the contract guarantees the credit worthiness of a referenced debt obligation. These agreements may be privately negotiated in the over-the-counter market (OTC credit default swaps) or may be executed in a multilateral trade facility platform, such as a registered exchange (centrally cleared credit default swaps). The underlying referenced debt obligation may be a single issuer of corporate or sovereign debt, a credit index, a basket of issuers or indices, or a tranche of a credit index or basket of issuers or indices. In the event of a default of the underlying referenced debt obligation, the buyer is entitled to receive the notional amount of the credit default swap contract from the seller in exchange for the referenced debt obligation, a net settlement amount equal to the notional amount of the credit default swap less the recovery value of the referenced debt obligation, or other agreed upon amount. For centrally cleared credit default swaps, required initial margins are pledged by the Fund, and the daily change in fair value is accounted for as a variation margin payable or receivable in the Statements of Assets and Liabilities. Over the term of the contract, the buyer pays the seller a periodic stream of payments, provided that no event of default has occurred. Such periodic payments are accrued daily as an unrealized appreciation or depreciation until the payments are made, at which time they are realized. Upfront payments and receipts are reflected in the Statements of Assets and Liabilities and represent compensating factors between stated terms of the credit default swap agreement and prevailing market conditions (credit spreads and other relevant factors). These upfront payments and receipts are amortized over the term of the contract as a realized gain or loss in the Statements of Operations.
Certain or all Funds entered into OTC cross currency swap contracts primarily to manage and/or gain exposure to interest rate risk and certain foreign currencies. A cross currency swap is an agreement between the Fund and a counterparty to exchange cash flows (determined using either a fixed or floating rate) based on the
notional amounts of two different currencies. The notional amounts are typically determined based on the spot exchange rates at the opening of the contract. Cross currency swaps may require the exchange of notional amounts at the opening and/or closing of the contract. Over the term of the contract, contractually required payments to be paid and to be received are accrued daily and recorded as unrealized depreciation and appreciation until the payments are made, at which time they are realized. Upfront payments and receipts are reflected in the Statements of Assets and Liabilities and represent compensating factors between stated terms of the cross currency swap contract and prevailing market conditions (interest rate spreads and other relevant factors). These upfront payments and receipts are amortized over the term of the contract as a realized gain or loss in the Statements of Operations.
Certain or all Funds entered into interest rate swap contracts primarily to manage interest rate risk. An interest rate swap is an agreement between the Fund and a counterparty to exchange cash flows based on the difference between two interest rates, applied to a notional amount. These agreements may be privately negotiated in the over-the-counter market (OTC interest rate swaps) or may be executed on a registered exchange (centrally cleared interest rate swaps). For centrally cleared interest rate swaps, required initial margins are pledged by the Fund, and the daily change in fair value is accounted for as a variation margin payable or receivable in the Statements of Assets and Liabilities. Over the term of the contract, contractually required payments to be paid and to be received are accrued daily and recorded as unrealized depreciation and appreciation until the payments are made, at which time they are realized.
Certain or all Funds purchased or wrote OTC option contracts primarily to manage and/or gain exposure to credit risk. An option is a contract entitling the holder to purchase or sell a specific amount of shares or units of an asset or notional amount of a swap (swaption), at a specified price. When an option is purchased or written, an amount equal to the premium paid or received is recorded as an asset or liability, respectively. Upon exercise of an option, the acquisition cost or sales proceeds of the underlying investment is adjusted by any premium received or paid. Upon expiration of an option, any premium received or paid is recorded as a realized gain or loss. Upon closing an
| | | | |
| | | |
franklintempleton.com | | Semiannual Report | | 109 |
FRANKLIN INVESTORS SECURITIES TRUST
NOTES TO FINANCIAL STATEMENTS (UNAUDITED)
1. Organization and Significant Accounting
Policies (continued)
d. Derivative Financial Instruments (continued)
option other than through expiration or exercise, the difference between the premium received or paid and the cost to close the position is recorded as a realized gain or loss.
Certain or all Funds entered into inflation index swap contracts primarily to manage inflation risk. An inflation index swap is an agreement between the Fund and a counterparty to exchange cash flows whereby one party makes payments based on the percentage change in an index that serves as a measure of inflation and the other party makes a regular payment based on a compounded fixed rate, applied to a notional amount. These agreements may be privately negotiated in the over-the-counter market (OTC inflation index swap) or may be executed on a registered exchange (centrally cleared inflation index swap). For centrally cleared inflation index swaps, required initial margins are pledged by the Fund, and the daily change in fair value is accounted for as a variation margin payable or receivable. Over the term of the contract, contractually required payments to be paid and to be received are accrued daily and recorded as unrealized depreciation and appreciation until the payments are made, at which time they are realized. Typically, an inflation index swap has payment obligations netted and exchanged upon maturity.
Certain or all Funds invest in value recovery instruments (VRI) primarily to gain exposure to growth risk. Periodic payments from VRI are dependent on established benchmarks for underlying variables. VRI has a notional amount, which is used to calculate amounts of payments to holders. Payments are recorded upon receipt as realized gains in the Statements of Operations. The risks of investing in VRI include growth risk, liquidity, and the potential loss of investment.
See Note 10 regarding other derivative information.
e. Restricted Cash
At April 30, 2017, certain or all Funds held restricted cash in connection with investments in certain derivative securities. Restricted cash is held in a segregated account with the Fund’s custodian and is reflected in the Statements of Assets and Liabilities.
f. Loan Participation Notes
Certain or all Funds invest in loan participation notes (Participations). Participations are loans originally issued to a borrower by one or more financial institutions (the Lender) and subsequently sold to other investors, such as the Funds. Participations typically result in the Fund having a contractual relationship only with the Lender and not with the borrower. The Funds have the right to receive from the Lender any payments of principal, interest and fees which the Lender received from the borrower. The Funds generally have no rights to either enforce compliance by the borrower with the terms of the loan agreement or to any collateral relating to the original loan. As a result, the Funds assume the credit risk of both the borrower and the Lender that is selling the Participation. The Participations may also involve interest rate risk and liquidity risk, including the potential default or insolvency of the borrower and/or the Lender.
g. Investments in FT Holdings Corporation I (FT Subsidiary)
Franklin Total Return Fund invests in certain financial instruments through its investment in the FT Subsidiary. The FT Subsidiary is a Delaware Corporation, is a wholly-owned Subsidiary of the Fund, and is able to invest in certain financial instruments consistent with the investment objective of the Fund. At April 30, 2017, the FT Subsidiary’s investment, Turtle Bay Resort, as well as any other assets and liabilities of the FT Subsidiary are reflected in the Fund’s Consolidated Statement of Investments and Consolidated Statement of Assets and Liabilities. The financial statements have been consolidated and include the accounts of the Fund and the FT Subsidiary. All intercompany transactions and balances have been eliminated. At April 30, 2017, the net assets of the FT Subsidiary were $7,352,929, representing 0.2% of the Fund’s consolidated net assets. The Fund’s investment in the FT Subsidiary is limited to 25% of consolidated assets.
h. Mortgage Dollar Rolls
Certain or all Funds enter into mortgage dollar rolls, typically on a TBA basis. Mortgage dollar rolls are agreements between the Fund and a financial institution where the Fund sells (or buys) mortgage-backed securities for delivery on a specified date and simultaneously contracts to repurchase (or sell) substantially similar (same type, coupon, and maturity) securities at a future date and at a predetermined price. Gains or losses are realized on the initial sale, and the difference between
| | | | |
| | | |
110 | | Semiannual Report | | franklintempleton.com |
FRANKLIN INVESTORS SECURITIES TRUST
NOTES TO FINANCIAL STATEMENTS (UNAUDITED)
the repurchase price and the sale price is recorded as an unrealized gain or loss to the Fund upon entering into the mortgage dollar roll. In addition, the Fund may invest the cash proceeds that are received from the initial sale. During the period between the sale and repurchase, the Fund is not entitled to principal and interest paid on the mortgage backed securities. Transactions in mortgage dollar rolls are accounted for as purchases and sales and may result in an increase to the Fund’s portfolio turnover rate. The risks of mortgage dollar roll transactions include the potential inability of the counterparty to fulfill its obligations.
i. Senior Floating Rate Interests
Certain or all Funds invest in senior secured corporate loans that pay interest at rates which are periodically reset by reference to a base lending rate plus a spread. These base lending rates are generally the prime rate offered by a designated U.S. bank or the London InterBank Offered Rate (LIBOR). Senior secured corporate loans often require prepayment of principal from excess cash flows or at the discretion of the borrower. As a result, actual maturity may be substantially less than the stated maturity. Senior secured corporate loans in which the Funds invest are generally readily marketable, but may be subject to certain restrictions on resale.
j. Income and Deferred Taxes
It is each Fund’s policy to qualify as a regulated investment company under the Internal Revenue Code. Each Fund intends to distribute to shareholders substantially all of its taxable income and net realized gains to relieve it from federal income and excise taxes. As a result, no provision for U.S. federal income taxes is required.
The Funds may be subject to foreign taxation related to income received, capital gains on the sale of securities and certain foreign currency transactions in the foreign jurisdictions in which the Funds invest. Foreign taxes, if any, are recorded based on the tax regulations and rates that exist in the foreign markets in which the Funds invest. When a capital gain tax is determined to apply, certain or all Funds record an estimated deferred tax liability in an amount that would be payable if the securities were disposed of on the valuation date.
Each Fund may recognize an income tax liability related to its uncertain tax positions under U.S. GAAP when the uncertain tax position has a less than 50% probability that it will be sustained upon examination by the tax authorities based on its technical
merits. As of April 30, 2017, each Fund has determined that no tax liability is required in its financial statements related to uncertain tax positions for any open tax years (or expected to be taken in future tax years). Open tax years are those that remain subject to examination and are based on each tax jurisdiction’s statute of limitation.
k. Security Transactions, Investment Income, Expenses and Distributions
Security transactions are accounted for on trade date. Realized gains and losses on security transactions are determined on a specific identification basis. Interest income and estimated expenses are accrued daily. Amortization of premium and accretion of discount on debt securities are included in interest income. Paydown gains and losses are recorded separately on the Statements of Operations. Facility fees are recognized as income over the expected term of the loan. Dividend income is recorded on the ex-dividend date except for certain dividends from securities where the dividend rate is not available. In such cases, the dividend is recorded as soon as the information is received by the Funds. Dividends from net investment income are normally declared daily; these dividends may be reinvested or paid monthly to shareholders. Distributions to shareholders are recorded on the ex-dividend date and are determined according to income tax regulations (tax basis). Distributable earnings determined on a tax basis may differ from earnings recorded in accordance with U.S. GAAP. These differences may be permanent or temporary. Permanent differences are reclassified among capital accounts to reflect their tax character. These reclassifications have no impact on net assets or the results of operations. Temporary differences are not reclassified, as they may reverse in subsequent periods.
Common expenses incurred by the Trust are allocated among the Funds based on the ratio of net assets of each Fund to the combined net assets of the Trust. Fund specific expenses are charged directly to the Fund that incurred the expense.
Net investment income, not including class specific expenses, is allocated daily to each class of shares based upon the relative value of the settled shares of each class. Realized and unrealized gains and losses are allocated daily to each class of shares based upon the relative proportion of net assets of each class. Differences in per share distributions, by class, are generally due to differences in class specific expenses.
| | | | |
| | | |
franklintempleton.com | | Semiannual Report | | 111 |
FRANKLIN INVESTORS SECURITIES TRUST
NOTES TO FINANCIAL STATEMENTS (UNAUDITED)
1. Organization and Significant Accounting
Policies (continued)
k. Security Transactions, Investment Income, Expenses and Distributions (continued)
Inflation-indexed bonds are adjusted for inflation through periodic increases or decreases in the security’s interest accruals, face amount, or principal redemption value, by amounts corresponding to the rate of inflation as measured by an index. Any increase or decrease in the face amount or principal redemption value will be included as inflation principal adjustments in the Statements of Operations.
l. Accounting Estimates
The preparation of financial statements in accordance with U.S. GAAP requires management to make estimates and assumptions that affect the reported amounts of assets and liabilities at the date
of the financial statements and the amounts of income and expenses during the reporting period. Actual results could differ from those estimates.
m. Guarantees and Indemnifications
Under the Trust’s organizational documents, its officers and trustees are indemnified by the Trust against certain liabilities arising out of the performance of their duties to the Trust. Additionally, in the normal course of business, the Trust, on behalf of the Funds, enter into contracts with service providers that contain general indemnification clauses. The Trust’s maximum exposure under these arrangements is unknown as this would involve future claims that may be made against the Trust that have not yet occurred. Currently, the Trust expects the risk of loss to be remote.
2. Shares of Beneficial Interest
At April 30, 2017, there were an unlimited number of shares authorized (without par value). Transactions in the Funds’ shares were as follows:
| | | | | | | | | | | | | | | | |
| | | Franklin Adjustable U.S.
Government Securities Fund | | | Franklin Floating Rate
Daily Access Fund | |
| | | Shares | | | Amount | | | Shares | | | Amount | |
Class A Shares: | | | | | | | | | | | | | | | | |
Six Months ended April 30, 2017 | | | | | | | | | | | | | | | | |
Shares sold | | | 9,372,200 | | | $ | 78,515,204 | | | | 32,788,504 | | | $ | 290,786,944 | |
Shares issued in reinvestment of distributions | | | 623,266 | | | | 5,214,944 | | | | 2,530,252 | | | | 22,459,469 | |
Shares redeemed | | | (18,481,904 | ) | | | (154,806,766 | ) | | | (25,138,976 | ) | | | (223,129,835 | ) |
Net increase (decrease) | | | (8,486,438 | ) | | $ | (71,076,618 | ) | | | 10,179,780 | | | $ | 90,116,578 | |
Year ended October 31, 2016 | | | | | | | | | | | | | | | | |
Shares sold | | | 21,965,175 | | | $ | 185,996,265 | | | | 24,811,623 | | | $ | 212,007,459 | |
Shares issued in reinvestment of distributions | | | 1,239,949 | | | | 10,469,739 | | | | 7,064,574 | | | | 59,950,762 | |
Shares redeemed | | | (43,095,113 | ) | | | (364,450,625 | ) | | | (58,463,296 | ) | | | (494,133,333 | ) |
Net increase (decrease) | | | (19,889,989 | ) | | $ | (167,984,621 | ) | | | (26,587,099 | ) | | $ | (222,175,112 | ) |
| | | | |
Class A1 Shares: | | | | | | | | | | | | | | | | |
Six Months ended April 30, 2017 | | | | | | | | | | | | | | | | |
Shares sold | | | 215,670 | | | $ | 1,806,256 | | | | | | | | | |
Shares issued in reinvestment of distributions | | | 160,697 | | | | 1,344,045 | | | | | | | | | |
Shares redeemed | | | (3,043,851 | ) | | | (25,483,717 | ) | | | | | | | | |
Net increase (decrease) | | | (2,667,484 | ) | | $ | (22,333,416 | ) | | | | | | | | |
Year ended October 31, 2016 | | | | | | | | | | | | | | | | |
Shares sold | | | 782,382 | | | $ | 6,611,320 | | | | | | | | | |
Shares issued in reinvestment of distributions | | | 321,531 | | | | 2,714,543 | | | | | | | | | |
Shares redeemed | | | (5,258,218 | ) | | | (44,426,486 | ) | | | | | | | | |
Net increase (decrease) | | | (4,154,305 | ) | | $ | (35,100,623 | ) | | | | | | | | |
| | | | |
| | | |
112 | | Semiannual Report | | franklintempleton.com |
FRANKLIN INVESTORS SECURITIES TRUST
NOTES TO FINANCIAL STATEMENTS (UNAUDITED)
| | | | | | | | | | | | | | | | |
| | | Franklin Adjustable U.S.
Government Securities Fund | | | Franklin Floating Rate
Daily Access Fund | |
| | | Shares | | | Amount | | | Shares | | | Amount | |
Class C Shares: | | | | | | | | | | | | | | | | |
Six Months ended April 30, 2017 | | | | | | | | | | | | | | | | |
Shares sold | | | 1,022,602 | | | $ | 8,561,902 | | | | 12,026,180 | | | $ | 106,690,314 | |
Shares issued in reinvestment of distributions | | | 184,858 | | | | 1,545,482 | | | | 886,780 | | | | 7,871,319 | |
Shares redeemed | | | (5,911,715 | ) | | | (49,480,946 | ) | | | (8,091,302 | ) | | | (71,811,016 | ) |
Net increase (decrease) | | | (4,704,255 | ) | | $ | (39,373,562 | ) | | | 4,821,658 | | | $ | 42,750,617 | |
Year ended October 31, 2016 | | | | | | | | | | | | | | | | |
Shares sold | | | 4,522,226 | | | $ | 38,281,353 | | | | 9,537,412 | | | $ | 81,449,034 | |
Shares issued in reinvestment of distributions | | | 342,782 | | | | 2,892,128 | | | | 2,536,642 | | | | 21,527,906 | |
Shares redeemed | | | (12,545,368 | ) | | | (105,990,753 | ) | | | (22,589,768 | ) | | | (190,684,839 | ) |
Net increase (decrease) | | | (7,680,360 | ) | | $ | (64,817,272 | ) | | | (10,515,714 | ) | | $ | (87,707,899 | ) |
| | | | |
Class R6 Shares: | | | | | | | | | | | | | | | | |
Six Months ended April 30, 2017 | | | | | | | | | | | | | | | | |
Shares sold | | | 27,660 | | | $ | 231,971 | | | | 11,527,268 | | | $ | 102,495,436 | |
Shares issued in reinvestment of distributions | | | 2,981 | | | | 24,971 | | | | 83,703 | | | | 743,141 | |
Shares redeemed | | | (29,471 | ) | | | (247,202 | ) | | | (554,716 | ) | | | (4,923,876 | ) |
Net increase (decrease) | | | 1,170 | �� | | $ | 9,740 | | | | 11,056,255 | | | $ | 98,314,701 | |
Year ended October 31, 2016 | | | | | | | | | | | | | | | | |
Shares sold | | | 59,418 | | | $ | 503,303 | | | | 1,447,506 | | | $ | 12,322,386 | |
Shares issued in reinvestment of distributions | | | 4,930 | | | | 41,660 | | | | 32,856 | | | | 285,282 | |
Shares redeemed | | | (36,505 | ) | | | (308,525 | ) | | | (86,396 | ) | | | (750,396 | ) |
Net increase (decrease) | | | 27,843 | | | $ | 236,438 | | | | 1,393,966 | | | $ | 11,857,272 | |
| | | | |
Advisor Class Shares: | | | | | | | | | | | | | | | | |
Six Months ended April 30, 2017 | | | | | | | | | | | | | | | | |
Shares sold | | | 6,164,437 | | | $ | 51,675,295 | | | | 94,121,932 | | | $ | 835,876,991 | |
Shares issued in reinvestment of distributions | | | 233,751 | | | | 1,957,290 | | | | 1,414,485 | | | | 12,557,780 | |
Shares redeemed | | | (8,874,376 | ) | | | (74,364,592 | ) | | | (29,463,358 | ) | | | (261,715,565 | ) |
Net increase (decrease) | | | (2,476,188 | ) | | $ | (20,732,007 | ) | | | 66,073,059 | | | $ | 586,719,206 | |
Year ended October 31, 2016 | | | | | | | | | | | | | | | | |
Shares sold | | | 13,280,439 | | | $ | 112,298,847 | | | | 43,401,930 | | | $ | 369,260,775 | |
Shares issued in reinvestment of distributions | | | 441,098 | | | | 3,728,635 | | | | 2,892,071 | | | | 24,565,655 | |
Shares redeemed | | | (22,751,797 | ) | | | (192,776,272 | ) | | | (84,100,921 | ) | | | (708,004,973 | ) |
Net increase (decrease) | | | (9,030,260 | ) | | $ | (76,748,790 | ) | | | (37,806,920 | ) | | $ | (314,178,543 | ) |
| | | | |
| | | |
franklintempleton.com | | Semiannual Report | | 113 |
FRANKLIN INVESTORS SECURITIES TRUST
NOTES TO FINANCIAL STATEMENTS (UNAUDITED)
2. Shares of Beneficial Interest (continued)
| | | | | | | | | | | | | | | | |
| | | Franklin Low Duration
Total Return Fund | | | Franklin Total
Return Fund | |
| | | Shares | | | Amount | | | Shares | | | Amount | |
Class A Shares: | | | | | | | | | | | | | | | | |
Six Months ended April 30, 2017 | | | | | | | | | | | | | | | | |
Shares sold | | | 29,910,062 | | | $ | 294,509,663 | | | | 32,603,205 | | | $ | 315,962,071 | |
Shares issued in reinvestment of distributions | | | 1,726,320 | | | | 16,991,595 | | | | 6,055,976 | | | | 58,602,876 | |
Shares redeemed | | | (37,977,485 | ) | | | (373,938,433 | ) | | | (73,334,720 | ) | | | (710,369,415 | ) |
Net increase (decrease) | | | (6,341,103 | ) | | $ | (62,437,175 | ) | | | (34,675,539 | ) | | $ | (335,804,468 | ) |
Year ended October 31, 2016 | | | | | | | | | | | | | | | | |
Shares sold | | | 47,047,322 | | | $ | 461,234,268 | | | | 93,822,994 | | | $ | 916,738,346 | |
Shares issued in reinvestment of distributions | | | 2,977,746 | | | | 29,135,231 | | | | 10,292,781 | | | | 99,324,788 | |
Shares redeemed | | | (62,936,182 | ) | | | (617,680,799 | ) | | | (96,558,711 | ) | | | (949,445,169 | ) |
Net increase (decrease) | | | (12,911,114 | ) | | $ | (127,311,300 | ) | | | 7,557,064 | | | $ | 66,617,965 | |
| | | | |
Class C Shares: | | | | | | | | | | | | | | | | |
Six Months ended April 30, 2017 | | | | | | | | | | | | | | | | |
Shares sold | | | 3,190,045 | | | $ | 31,317,932 | | | | 3,176,057 | | | $ | 30,600,455 | |
Shares issued in reinvestment of distributions | | | 200,551 | | | | 1,967,554 | | | | 636,235 | | | | 6,120,245 | |
Shares redeemed | | | (5,354,682 | ) | | | (52,551,830 | ) | | | (8,592,719 | ) | | | (82,735,899 | ) |
Net increase (decrease) | | | (1,964,086 | ) | | $ | (19,266,344 | ) | | | (4,780,427 | ) | | $ | (46,015,199 | ) |
Year ended October 31, 2016 | | | | | | | | | | | | | | | | |
Shares sold | | | 10,992,306 | | | $ | 107,389,119 | | | | 11,518,037 | | | $ | 111,836,091 | |
Shares issued in reinvestment of distributions | | | 344,793 | | | | 3,366,635 | | | | 1,118,125 | | | | 10,736,413 | |
Shares redeemed | | | (10,576,146 | ) | | | (103,394,512 | ) | | | (12,292,706 | ) | | | (119,694,781 | ) |
Net increase (decrease) | | | 760,953 | | | $ | 7,361,242 | | | | 343,456 | | | $ | 2,877,723 | |
| | | | |
Class R Shares: | | | | | | | | | | | | | | | | |
Six Months ended April 30, 2017 | | | | | | | | | | | | | | | | |
Shares sold | | | | | | | | | | | 542,058 | | | $ | 5,226,613 | |
Shares issued in reinvestment of distributions | | | | | | | | | | | 90,404 | | | | 872,024 | |
Shares redeemed | | | | | | | | | | | (1,521,044 | ) | | | (14,699,012 | ) |
Net increase (decrease) | | | | | | | | | | | (888,582 | ) | | $ | (8,600,375 | ) |
Year ended October 31, 2016 | | | | | | | | | | | | | | | | |
Shares sold | | | | | | | | | | | 1,331,922 | | | $ | 12,937,501 | |
Shares issued in reinvestment of distributions | | | | | | | | | | | 186,048 | | | | 1,789,731 | |
Shares redeemed | | | | | | | | | | | (2,741,401 | ) | | | (26,746,288 | ) |
Net increase (decrease) | | | | | | | | | | | (1,223,431 | ) | | $ | (12,019,056 | ) |
| | | | |
Class R6 Shares: | | | | | | | | | | | | | | | | |
Six Months ended April 30, 2017 | | | | | | | | | | | | | | | | |
Shares sold | | | 10,501,553 | | | $ | 104,140,101 | | | | 2,157,909 | | | $ | 21,007,832 | |
Shares issued in reinvestment of distributions | | | 777,160 | | | | 7,689,264 | | | | 13,439 | | | | 130,795 | |
Shares redeemed | | | (7,793,453 | ) | | | (77,161,765 | ) | | | (714,198 | ) | | | (6,959,291 | ) |
Net increase (decrease) | | | 3,485,260 | | | $ | 34,667,600 | | | | 1,457,150 | | | $ | 14,179,336 | |
Year ended October 31, 2016 | | | | | | | | | | | | | | | | |
Shares sold | | | 13,012,102 | | | $ | 127,680,026 | | | | 5,007,346 | | | $ | 49,666,379 | |
Shares issued in reinvestment of distributions | | | 1,225,030 | | | | 12,041,881 | | | | 8,309 | | | | 80,954 | |
Shares redeemed | | | (9,709,503 | ) | | | (95,938,756 | ) | | | (2,560,569 | ) | | | (25,295,618 | ) |
Net increase (decrease) | | | 4,527,629 | | | $ | 43,783,151 | | | | 2,455,086 | | | $ | 24,451,715 | |
| | | | |
| | | |
114 | | Semiannual Report | | franklintempleton.com |
FRANKLIN INVESTORS SECURITIES TRUST
NOTES TO FINANCIAL STATEMENTS (UNAUDITED)
| | | | | | | | | | | | | | | | |
| | | Franklin Low Duration
Total Return Fund | | | Franklin Total
Return Fund | |
| | | Shares | | | Amount | | | Shares | | | Amount | |
Advisor Class Shares: | | | | | | | | | | | | | | | | |
Six Months ended April 30, 2017 | | | | | | | | | | | | | | | | |
Shares sold | | | 23,350,987 | | | $ | 230,935,690 | | | | 28,116,273 | | | $ | 273,973,224 | |
Shares issued in reinvestment of distributions | | | 357,059 | | | | 3,530,051 | | | | 1,319,091 | | | | 12,832,191 | |
Shares redeemed | | | (8,582,221 | ) | | | (84,892,282 | ) | | | (16,425,394 | ) | | | (160,029,546 | ) |
Net increase (decrease) | | | 15,125,825 | | | $ | 149,573,459 | | | | 13,009,970 | | | $ | 126,775,869 | |
Year ended October 31, 2016 | | | | | | | | | | | | | | | | |
Shares sold | | | 18,882,422 | | | $ | 186,687,617 | | | | 48,174,526 | | | $ | 480,064,749 | |
Shares issued in reinvestment of distributions | | | 280,629 | | | | 2,760,337 | | | | 1,297,441 | | | | 12,575,671 | |
Shares redeemed | | | (11,651,331 | ) | | | (115,091,760 | ) | | | (28,473,005 | ) | | | (280,452,940 | ) |
Net increase (decrease) | | | 7,511,720 | | | $ | 74,356,194 | | | | 20,998,962 | | | $ | 212,187,480 | |
3. Transactions with Affiliates
Franklin Resources, Inc. is the holding company for various subsidiaries that together are referred to as Franklin Templeton Investments. Certain officers and trustees of the Trust are also officers and/or directors of the following subsidiaries:
| | |
| Subsidiary | | Affiliation |
Franklin Advisers, Inc. (Advisers) | | Investment manager |
Franklin Templeton Institutional, LLC (FT Institutional) | | Investment manager |
Franklin Templeton Services, LLC (FT Services) | | Administrative manager |
Franklin Templeton Distributors, Inc. (Distributors) | | Principal underwriter |
Franklin Templeton Investor Services, LLC (Investor Services) | | Transfer agent |
a. Management Fees
Franklin Adjustable U.S. Government Securities Fund pays an investment management fee to Advisers based on the average daily net assets of the Fund as follows:
| | |
| Annualized Fee Rate | | Net Assets |
0.500% | | Up to and including $5 billion |
0.440% | | Over $5 billion, up to and including $10 billion |
0.410% | | Over $10 billion, up to and including $15 billion |
0.380% | | In excess of $15 billion |
| | | | |
| | | |
franklintempleton.com | | Semiannual Report | | 115 |
FRANKLIN INVESTORS SECURITIES TRUST
NOTES TO FINANCIAL STATEMENTS (UNAUDITED)
3. Transactions with Affiliates (continued)
a. Management Fees (continued)
Franklin Floating Rate Daily Access Fund pays an investment management fee to Advisers based on the average daily net assets of the Fund as follows:
| | |
| Annualized Fee Rate | | Net Assets |
0.650% | | Up to and including $500 million |
0.550% | | Over $500 million, up to and including $1 billion |
0.500% | | Over $1 billion, up to and including $1.5 billion |
0.450% | | Over $1.5 billion, up to and including $6.5 billion |
0.425% | | Over $6.5 billion, up to and including $11.5 billion |
0.400% | | Over $11.5 billion, up to and including $16.5 billion |
0.390% | | Over $16.5 billion, up to and including $19 billion |
0.380% | | Over $19 billion, up to and including $21.5 billion |
0.370% | | In excess of $21.5 billion |
Franklin Low Duration Total Return Fund and Franklin Total Return Fund pay an investment management fee to Advisers based on the average daily net assets of each of the Funds as follows:
| | |
| Annualized Fee Rate | | Net Assets |
0.625% | | Up to and including $500 million |
0.525% | | Over $500 million, up to and including $1 billion |
0.480% | | Over $1 billion, up to and including $1.5 billion |
0.435% | | Over $1.5 billion, up to and including $6.5 billion |
0.415% | | Over $6.5 billion, up to and including $11.5 billion |
0.400% | | Over $11.5 billion, up to and including $16.5 billion |
0.390% | | Over $16.5 billion, up to and including $19 billion |
0.380% | | Over $19 billion, up to and including $21.5 billion |
0.370% | | In excess of $21.5 billion |
Under a subadvisory agreement, FT Institutional, an affiliate of Advisers, provides subadvisory services to Franklin Total Return Fund. The subadvisory fee is paid by Advisers based on the Fund’s average daily net assets, and is not an additional expense of the Fund.
For the period ended April 30, 2017, each Fund’s annualized effective investment management fee rate based on average daily net assets was as follows:
| | | | | | | | | | | | | | |
Franklin
Adjustable
U.S. Government
Securities Fund | | | Franklin
Floating Rate
Daily Access
Fund | | | Franklin
Low Duration
Total Return
Fund | | | Franklin
Total Return
Fund | |
| | 0.500% | | | | 0.499 | % | | �� | 0.500 | % | | | 0.470 | % |
b. Administrative Fees
Under an agreement with Advisers, FT Services provides administrative services to the Funds. The fee is paid by Advisers based on each of the Funds’ average daily net assets, and is not an additional expense of the Funds.
| | | | |
| | | |
116 | | Semiannual Report | | franklintempleton.com |
FRANKLIN INVESTORS SECURITIES TRUST
NOTES TO FINANCIAL STATEMENTS (UNAUDITED)
c. Distribution Fees
The Board has adopted distribution plans for each share class, with the exception of Class R6 and Advisor Class shares, pursuant to Rule 12b-1 under the 1940 Act. Under the Funds’ Class A and A1 reimbursement distribution plans, the Funds reimburse Distributors for costs incurred in connection with the servicing, sale and distribution of each Fund’s shares up to the maximum annual plan rate for each class. Under the Class A and A1 reimbursement distribution plans, costs exceeding the maximum for the current plan year cannot be reimbursed in subsequent periods. In addition, under the Funds’ Class C and R compensation distribution plans, the Funds pay Distributors for costs incurred in connection with the servicing, sale and distribution of each Fund’s shares up to the maximum annual plan rate for each class. The plan year, for purposes of monitoring compliance with the maximum annual plan rates, is February 1 through January 31 for each Fund.
The maximum annual plan rates, based on the average daily net assets, for each class, are as follows:
| | | | | | | | | | | | | | | | |
| | | Franklin
Adjustable
U.S. Government
Securities Fund | | | Franklin
Floating Rate
Daily Access
Fund | | | Franklin
Low Duration
Total Return
Fund | | | Franklin
Total Return
Fund | |
Reimbursement Plans: | | | | | | | | | | | | | | | | |
Class A | | | 0.25% | | | | 0.25% | | | | 0.25% | | | | 0.25% | |
Class A1 | | | 0.10% | | | | —% | | | | —% | | | | —% | |
Compensation Plans: | | | | | | | | | | | | | | | | |
Class C | | | 0.65% | | | | 0.65% | | | | 0.65% | | | | 0.65% | |
Class R | | | —% | | | | —% | | | | —% | | | | 0.50% | |
d. Sales Charges/Underwriting Agreements
Front-end sales charges and contingent deferred sales charges (CDSC) do not represent expenses of the Funds. These charges are deducted from the proceeds of sales of fund shares prior to investment or from redemption proceeds prior to remittance, as applicable. Distributors has advised the Funds of the following commission transactions related to the sales and redemptions of the Funds’ shares for the period:
| | | | | | | | | | | | | | | | |
| | | Franklin
Adjustable
U.S. Government
Securities Fund | | | Franklin
Floating Rate
Daily Access
Fund | | | Franklin
Low Duration
Total Return
Fund | | | Franklin
Total Return
Fund | |
Sales charges retained net of commissions paid to
unaffiliated brokers/dealers | | | $41,912 | | | | $111,815 | | | | $152,310 | | | | $560,096 | |
CDSC retained | | | $ 5,804 | | | | $ 25,370 | | | | $ 53,187 | | | | $ 60,907 | |
e. Transfer Agent Fees
Each class of shares, except for Class R6, pays transfer agent fees to Investor Services for its performance of shareholder servicing obligations and reimburses Investor Services for out of pocket expenses incurred, including shareholder servicing fees paid to third parties. These fees are allocated daily based upon their relative proportion of such classes’ aggregate net assets. Class R6 pays Investor Services transfer agent fees specific to that class.
For the period ended April 30, 2017, the Funds paid transfer agent fees as noted in the Statements of Operations of which the following amounts were retained by Investor Services:
| | | | | | | | | | | | | | | | |
| | | Franklin
Adjustable
U.S. Government
Securities Fund | | | Franklin
Floating Rate
Daily Access
Fund | | | Franklin
Low Duration
Total Return
Fund | | | Franklin
Total Return
Fund | |
Transfer agent fees | | | $325,416 | | | | $530,275 | | | | $626,407 | | | | $1,264,260 | |
| | | | |
| | | |
franklintempleton.com | | Semiannual Report | | 117 |
FRANKLIN INVESTORS SECURITIES TRUST
NOTES TO FINANCIAL STATEMENTS (UNAUDITED)
3. Transactions with Affiliates (continued)
f. Investments in Affiliated Management Investment Companies
Certain or all Funds invest in one or more affiliated management investment companies for purposes other than exercising a controlling influence over the management or policies. Management fees paid by the Funds are waived on assets invested in the affiliated management investment companies, as noted in the Statements of Operations, in an amount not to exceed the management and administrative fees paid directly or indirectly by each affiliate. Prior to November 1, 2013, the waiver was accounted for as a reduction to management fees. During the period ended April 30, 2017, investments in affiliated management investment companies were as follows:
| | | | | | | | | | | | | | | | | | | | | | | | | | | | | | | | |
| | | Number of
Shares Held
at Beginning
of Period | | | Gross
Additions | | | Gross
Reductions | | | Number of
Shares
Held at End
of Period | | | Value
at End
of Period | | | Investment
Income | | | Realized
Gain (Loss) | | | % of
Affiliated
Fund Shares
Outstanding
Held at End
of Period | |
Franklin Adjustable U.S. Government Securities Fund | |
Non-Controlled Affiliates | | | | | | | | | | | | | | | | | | | | | | | | | | | | | |
Institutional Fiduciary Trust | | | | | | | | | | | | | | | | | | | | | | | | | | | | | | | | |
Money Market Portfolio, 0.37% | | | 26,812,763 | | | | 186,525,004 | | | | (183,158,146 | ) | | | 30,179,621 | | | | $ 30,179,621 | | | | $ 16,988 | | | | $ — | | | | 0.2 | % |
Franklin Floating Rate Daily Access Fund | |
Non-Controlled Affiliates | | | | | | | | | | | | | | | | | | | | | | | | | | | | | | | | |
Institutional Fiduciary Trust | | | | | | | | | | | | | | | | | | | | | | | | | | | | | | | | |
Money Market Portfolio, 0.37% | | | 301,294,963 | | | | 1,512,997,350 | | | | (1,047,566,310 | ) | | | 766,726,003 | | | | $766,726,003 | | | | $ 531,665 | | | | $ — | | | | 4.0 | % |
Franklin Low Duration Total Return Fund | |
Non-Controlled Affiliates | | | | | | | | | | | | | | | | | | | | | | | | | |
Franklin Lower Tier Floating Rate Fund | | | 1,893,663 | | | | — | | | | — | | | | 1,893,663 | | | | $ 19,978,147 | | | | $848,999 | | | | $ — | | | | 6.2 | % |
Franklin Middle Tier Floating Rate Fund | | | 2,389,308 | | | | — | | | | — | | | | 2,389,308 | | | | 24,036,434 | | | | 825,721 | | | | — | | | | 8.5 | % |
Institutional Fiduciary Trust Money Market Portfolio, 0.37% | | | 89,753,463 | | | | 432,965,820 | | | | (385,187,263 | ) | | | 137,532,020 | | | | 137,532,020 | | | | 85,062 | | | | — | | | | 0.7 | % |
Total | | | | | | | | | | | | | | | | | | | $181,546,601 | | | | $ 1,759,782 | | | | $ — | | | | | |
Franklin Total Return Fund
Controlled Affiliates | |
Franklin Liberty Investment Grade Corporate ETF | | | 400,000 | | | | 800,000 | | | | — | | | | 1,200,000 | | | | $ 29,220,000 | | | | $418,674 | | | | $ — | | | | 52.2 | % |
Franklin Liberty Short Duration U.S. Government ETF | | | 500,000 | | | | — | | | | — | | | | 500,000 | | | | 48,437,500 | | | | 523,350 | | | | — | | | | 29.4 | % |
Non-Controlled Affiliates | |
Franklin Lower Tier Floating Rate Fund | | | 997,589 | | | | — | | | | — | | | | 997,589 | | | | 10,524,565 | | | | 447,256 | | | | — | | | | 3.3 | % |
Franklin Middle Tier Floating Rate Fund | | | 1,889,310 | | | | — | | | | — | | | | 1,889,310 | | | | 19,006,460 | | | | 652,927 | | | | — | | | | 6.7 | % |
Institutional Fiduciary Trust Money Market Portfolio, 0.37% | | | 104,199,665 | | | | 757,701,654 | | | | (791,124,808 | ) | | | 70,776,511 | | | | 70,776,511 | | | | 61,938 | | | | — | | | | 0.4 | % |
Total | | | | | | | | | | | | | | | | | | | $177,965,036 | | | | $ 2,104,145 | | | | $ — | | | | | |
g. Waiver and Expense Reimbursements
Advisers and Investor Services have contractually agreed in advance to waive or limit their respective fees and to assume as their own expense certain expenses otherwise payable by Franklin Low Duration Total Return Fund and Franklin Total Return Fund so that the expenses (excluding distribution fees and acquired fund fees and expenses) for Class A, Class C, Class R and Advisor Class
| | | | |
| | | |
118 | | Semiannual Report | | franklintempleton.com |
FRANKLIN INVESTORS SECURITIES TRUST
NOTES TO FINANCIAL STATEMENTS (UNAUDITED)
of the Funds do not exceed 0.55% and 0.63%, respectively, and Class R6 does not exceed 0.38% and 0.49%, respectively, based on the average net assets of each class (other than certain non-routine expenses or costs, including those relating to litigation, indemnification, reorganizations, and liquidations) until February 28, 2018. Total expenses waived or paid are not subject to recapture subsequent to the Funds’ fiscal year end.
Additionally, Investor Services has contractually agreed in advance to waive or limit its fees so that the Class R6 transfer agent fees do not exceed 0.01% until February 28, 2018. For Franklin Low Duration Total Return Fund and Franklin Total Return Fund, there were no Class R6 transfer agent fees waived during the period ended April 30, 2017.
h. Other Affiliated Transactions
At April 30, 2017, one or more of the funds in Franklin Fund Allocator Series owned a percentage of the following Funds’ outstanding shares:
| | | | | | |
Franklin
Floating Rate
Daily Access
Fund | | | | Franklin
Low Duration
Total Return
Fund | |
2.9% | | | | | 21.3% | |
i. Interfund Transactions
Certain or all Funds engaged in purchases and sales of investments with funds or other accounts that have common investment managers (or affiliated investment managers), directors, trustees or officers. Purchases and sales for the period ended April 30, 2017, were as follows:
| | | | | | | | |
| | | Franklin
Floating Rate
Daily Access
Fund | | | Franklin
Low Duration
Total Return
Fund | |
Purchases | | $ | 20,186,742 | | | $ | — | |
Sales | | $ | — | | | $ | 1,067,625 | |
4. Expense Offset Arrangement
The Funds have entered into an arrangement with their custodian whereby credits realized as a result of uninvested cash balances are used to reduce a portion of the Funds’ custodian expenses. During the period ended April 30, 2017, the custodian fees were reduced as noted in the Statements of Operations.
5. Income Taxes
For tax purposes, capital losses may be carried over to offset future capital gains. Capital loss carryforwards with no expiration, if any, must be fully utilized before those losses with expiration dates.
| | | | |
| | | |
franklintempleton.com | | Semiannual Report | | 119 |
FRANKLIN INVESTORS SECURITIES TRUST
NOTES TO FINANCIAL STATEMENTS (UNAUDITED)
5. Income Taxes (continued)
At October 31, 2016, the capital loss carryforwards were as follows:
| | | | | | | | | | | | | | | | |
| | | Franklin
Adjustable
U.S. Government
Securities Fund | | | Franklin
Floating
Rate Daily
Access Fund | | | Franklin
Low Duration
Total Return
Fund | | | Franklin
Total Return
Fund | |
Capital loss carryforwards subject to expiration: | | | | | | | | | | | | | | | | |
2017 | | | $ 4,398,245 | | | | $113,325,538 | | | | $ — | | | | $ — | |
2018 | | | 39,689,305 | | | | — | | | | — | | | | — | |
2019 | | | 21,934,756 | | | | 10,282,409 | | | | 5,327,487 | | | | — | |
Capital loss carryforwards not subject to expiration: | | | | | | | | | | | | | | | | |
Short term | | | 19,905,561 | | | | 21,809,899 | | | | 23,452,757 | | | | 21,117,357 | |
Long term | | | 72,074,646 | | | | 104,483,893 | | | | 44,282,224 | | | | 34,070,782 | |
| | | | |
Total capital loss carryforwards | | | $158,002,513 | | | | $249,901,739 | | | | $73,062,468 | | | | $55,188,139 | |
| | | | |
At April 30, 2017, the cost of investments and net unrealized appreciation (depreciation), for income tax purposes were as follows:
| | | | | | | | | | | | | | | | |
| | | Franklin
Adjustable
U.S. Government
Securities Fund | | | Franklin
Floating Rate
Daily Access
Fund | | | Franklin
Low Duration
Total Return
Fund | | | Franklin
Total Return
Fund | |
Cost of investments | | | $1,145,263,059 | | | | $4,263,821,148 | | | | $2,611,014,005 | | | | $4,694,573,640 | |
Unrealized appreciation | | | $ 9,426,306 | | | | $ 29,379,620 | | | | $ 23,176,735 | | | | $ 82,454,170 | |
Unrealized depreciation | | | (4,088,096 | ) | | | (48,672,125 | ) | | | (26,546,781 | ) | | | (117,987,743 | ) |
Net unrealized appreciation (depreciation) | | | $ 5,338,210 | | | | $ (19,292,505 | ) | | | $ (3,370,046 | ) | | | $ (35,533,573 | ) |
Differences between income and/or capital gains as determined on a book basis and a tax basis are primarily due to differing treatments of foreign currency transactions, paydown losses, bond discounts and premiums, swaps and wash sales.
6. Investment Transactions
Purchases and sales of investments (excluding short term securities) for the period ended April 30, 2017, were as follows:
| | | | | | | | | | | | | | | | |
| | | Franklin
Adjustable
U.S. Government
Securities Fund | | | Franklin
Floating Rate
Daily Access
Fund | | | Franklin
Low Duration
Total Return
Fund | | | Franklin
Total Return
Fund | |
Purchases | | | $ 16,952,758 | | | | $2,077,997,282 | | | | $541,572,424 | | | | $1,657,008,991 | |
Sales | | | $176,915,954 | | | | $1,352,593,974 | | | | $488,488,579 | | | | $1,950,924,972 | |
7. Credit Risk
At April 30, 2017, Franklin Floating Rate Daily Access Fund, Franklin Low Duration Total Return Fund and Franklin Total Return Fund had 64.0%, 15.7% and 16.0%, respectively, of their portfolio invested in high yield securities, senior secured floating rate notes, or other securities rated below investment grade and unrated securities, if any. These securities may be more sensitive to economic conditions causing greater price volatility and are potentially subject to a greater risk of loss due to default than higher rated securities.
| | | | |
| | | |
120 | | Semiannual Report | | franklintempleton.com |
FRANKLIN INVESTORS SECURITIES TRUST
NOTES TO FINANCIAL STATEMENTS (UNAUDITED)
8. Restricted Securities
Certain or all Funds invest in securities that are restricted under the Securities Act of 1933 (1933 Act) or which are subject to legal, contractual, or other agreed upon restrictions on resale. Restricted securities are often purchased in private placement transactions, and cannot be sold without prior registration unless the sale is pursuant to an exemption under the 1933 Act. Disposal of these securities may require greater effort and expense, and prompt sale at an acceptable price may be difficult. The Funds may have registration rights for restricted securities. The issuer generally incurs all registration costs.
At April 30, 2017, investments in restricted securities, excluding certain securities exempt from registration under the 1933 Act deemed to be liquid, were as follows:
| | | | | | | | | | | | | | | | |
| Shares | | | Issuer | | Acquisition
Date | | | Cost | | | Value | |
| | Franklin Floating Rate Daily Access Fund | | | | | |
| | 96,129 | | | Warrior Met Coal Inc.(Value is 0.1% of Net Assets) | | | 7/31/14 - 9/23/14 | | | | $13,170,468 | | | | $1,651,113 | |
| | | | | | | | | | | | |
| | Franklin Low Duration Total Return Fund | | | | | |
| | 98,168 | | | a Halcon Resources Corp. | | | 3/17/15 - 7/07/15 | | | | $ 1,880,354 | | | | $ 631,163 | |
| | 12,326,925 | | | Holdco 2, A | | | 4/15/13 - 2/01/17 | | | | 92,078 | | | | 9,223 | |
| | 1,226,701 | | | Holdco 2, B | | | 2/01/17 | | | | 911 | | | | 918 | |
| | | | | | | | | | | | |
| | | | Total Restricted Securities (Value is 0.0%† of Net Assets) | | | | | | | $ 1,973,343 | | | | $ 641,304 | |
| | | | | | | | | | | | |
| | Franklin Total Return Fund | | | | | |
| | 229,059 | | | b Halcon Resources Corp. | | | 3/17/15 - 7/07/15 | | | | $ 4,383,141 | | | | $1,472,715 | |
| | 28,762,824 | | | Holdco 2, A | | | 4/15/13 - 2/01/17 | | | | 221,469 | | | | 21,519 | |
| | 2,862,311 | | | Holdco 2, B | | | 2/01/17 | | | | 2,125 | | | | 2,142 | |
| | | | | | | | | | | | |
| | | | Total Restricted Securities (Value is 0.0%† of Net Assets) | | | | | | | $ 4,606,735 | | | | $1,496,376 | |
| | | | | | | | | | | | |
| † | Rounds to less than 0.1% of net assets. |
| a | The Fund also invests in unrestricted securities or other investments in the issuer, valued at $9,191 as of April 30, 2017. |
| b | The Fund also invests in unrestricted securities or other investments in the issuer, valued at $21,446 as of April 30, 2017. |
9. Unfunded Loan Commitments
Certain or all Funds enter into certain credit agreements, all or a portion of which may be unfunded. The Funds are obligated to fund these loan commitments at the borrowers’ discretion. Unfunded loan commitments and funded portions of credit agreements are marked to market daily and any unrealized appreciation or depreciation is included in the Statements of Assets and Liabilities and the Statements of Operations. Funded portions of credit agreements are presented in the Statements of Investments.
At April 30, 2017, unfunded commitments were as follows:
| | | | |
| Borrower | | Unfunded
Commitment | |
Franklin Floating Rate Daily Access Fund | | | | |
BMC Software Finance, Inc., Initial US Revolving Commitment | | | $20,723,252 | |
| |
Franklin Low Duration Total Return Fund | | | | |
BMC Software Finance, Inc., Initial US Revolving Commitment | | | $ 3,492,917 | |
| |
Franklin Total Return Fund | | | | |
BMC Software Finance, Inc., Initial US Revolving Commitment | | | $ 7,629,911 | |
Global Tel*Link Corp, Revolving Commitment | | | 211,174 | |
| | | $ 7,841,085 | |
| | | | |
| | | |
franklintempleton.com | | Semiannual Report | | 121 |
FRANKLIN INVESTORS SECURITIES TRUST
NOTES TO FINANCIAL STATEMENTS (UNAUDITED)
10. Other Derivative Information
At April 30, 2017, the Funds’ investments in derivative contracts are reflected in the Statements of Assets and Liabilities as follows:
| | | | | | | | | | | | |
| | | Asset Derivatives | | | | | Liability Derivatives | |
Derivative Contracts
Not Accounted for as
Hedging Instruments | | Statements of Assets and Liabilities Location | | Fair Value | | | Statements of Assets and Liabilities Location | | Fair Value | |
Franklin Floating Rate Daily Access Fund | | | | | | | | | | | | |
Credit contracts | | Variation margin | | $ | — | | | Variation margin | | $ | 783,852 | a |
| | | | |
Franklin Low Duration Total Return Fund | | | | | | | | | | | | |
Interest rate contracts | | Variation margin | | $ | 774,036 | a | | Variation margin | | $ | 912,683 | a |
| | | | |
| | Unrealized appreciation on OTC swap contracts | | | 515,362 | | | Unrealized depreciation on OTC
swap contracts | | | — | |
| | | | |
Foreign exchange contracts | | Unrealized appreciation on OTC forward exchange
contracts | | | 5,166,939 | | | Unrealized depreciation on OTC forward exchange
contracts | | | 1,295,710 | |
| | | | |
Credit contracts | | Variation margin | | | 37,112 | a | | Variation margin | | | 2,532 | a |
| | | | |
| | OTC swap contracts (Upfront payments) | | | 2,994,210 | | | OTC swap contracts (Upfront
receipts) | | | 5,159,206 | |
| | | | |
| | Unrealized appreciation on OTC swap contracts | | | 838,104 | | | Unrealized depreciation on OTC
swap contracts | | | 3,759,627 | |
| | | | | | | | | | | | |
Totals | | | | $ | 10,325,763 | | | | | $ | 11,129,758 | |
| | | | | | | | | | | | |
| | | | |
Franklin Total Return Fund | | | | | | | | | | | | |
Interest rate contracts | | Variation margin | | $ | 8,606,920 | a | | Variation margin | | $ | 62,997 | a |
| | | | |
| | Unrealized appreciation on OTC swap contracts | | | 569,730 | | | Unrealized depreciation on OTC
swap contracts | | | — | |
| | | | |
Foreign exchange contracts | | Unrealized appreciation on OTC forward exchange
contracts | | | 15,316,783 | | | Unrealized depreciation on OTC forward exchange
contracts | | | 4,593,467 | |
| | | | |
Credit contracts | | Variation margin | | | 87,627 | a | | Variation margin | | | 4,009 | a |
| | | | |
| | OTC swap contracts (Upfront payments) | | | 6,768,474 | | | OTC swap contracts (Upfront
receipts) | | | 9,609,231 | |
| | | | |
| | Unrealized appreciation on OTC swap contracts | | | 1,829,800 | | | Unrealized depreciation on OTC
swap contracts | | | 8,880,186 | |
| | | | |
Inflation contracts | | Unrealized appreciation on OTC swap contracts | | | 2,814,809 | | | Unrealized depreciation on OTC
swap contracts | | | — | |
| | | | |
Value recovery instruments | | Investments in securities, at value | | | 167,872 | | | Investments in securities, at value | | | — | |
| | | | | | | | | | | | |
Totals | | | | $ | 36,162,015 | | | | | $ | 23,149,890 | |
| | | | | | | | | | | | |
a This amount reflects the cumulative appreciation (depreciation) of futures contracts and centrally cleared swap contracts as reported in the Statement of Investments. Only the variation margin receivable/payable at period end is separately reported within the Statements of Assets and Liabilities. Prior variation margin movements were recorded to cash upon receipt or payment.
| | | | |
| | | |
122 | | Semiannual Report | | franklintempleton.com |
FRANKLIN INVESTORS SECURITIES TRUST
NOTES TO FINANCIAL STATEMENTS (UNAUDITED)
For the period ended April 30, 2017, the effect of derivative contracts in the Funds’ Statements of Operations was as follows:
| | | | | | | | | | | | |
Derivative Contracts
Not Accounted for as
Hedging Instruments | | Statements of
Operations Locations | | Net Realized
Gain (Loss) for
the Period | | | Statements of
Operations Locations | | Net Change
in Unrealized
Appreciation
(Depreciation)
for the Period | |
| | Net realized gain (loss) from: | | | | | | Net change in unrealized | | | | |
| | | | | | | | appreciation (depreciation) on: | | | | |
| | | | |
Franklin Floating Rate Daily Access Fund | | | | | | | | | | | | |
Credit contracts | | Swap contracts | | | $ 95,162 | | | Swap contracts | | | $ (783,852) | |
| | | | | | | | | | | | |
| | | | |
Franklin Low Duration Total Return Fund | | | | | | | | | | | | |
Interest rate contracts | | Futures contracts | | | $ 4,165,038 | | | Futures contracts | | | $(1,105,738) | |
| | | | |
| | Swap contracts | | | 2,396,017 | | | Swap contracts | | | (361,064) | |
| | | | |
Foreign exchange contracts | | Foreign currency transactions | | | 2,992,677a | | | Translation of other assets
and liabilities denominated in foreign currencies | | | 2,312,545a | |
| | | | |
Credit contracts | | Investments | | | (294,814) | b | | Investments | | | 148,822b | |
| | | | |
| | Swap contracts | | | (2,052,584) | | | Swap contracts | | | 1,234,696 | |
| | | | | | | | | | | | |
Totals | | | | | $ 7,206,334 | | | | | | $ 2,229,261 | |
| | | | | | | | | | | | |
| | | | |
Franklin Total Return Fund | | | | | | | | | | | | |
Interest rate contracts | | Futures contracts | | | $(28,246,165) | | | Futures contracts | | | $12,401,376 | |
| | | | |
| | Swap contracts | | | 348,752 | | | Swap contracts | | | (159,881) | |
| | | | |
Foreign exchange contracts | | Foreign currency transactions | | | 16,116,648a | | | Translation of other assets | | | 3,408,056a | |
| | | | | | | | and liabilities denominated | | | | |
| | | | | | | | in foreign currencies | | | | |
| | | | |
Credit contracts | | Investments | | | (859,360) | b | | Investments | | | 427,650b | |
| | | | |
| | Swap contracts | | | (6,802,165) | | | Swap contracts | | | 5,608,437 | |
| | | | |
Inflation contracts | | Swap contracts | | | — | | | Swap contracts | | | 1,199,904 | |
| | | | |
Value recovery instruments | | Investments | | | — | | | Investments | | | 15,581 | |
| | | | | | | | | | | | |
| | | | | | | | | | | | |
Totals | | | | | $(19,442,290) | | | | | | $22,901,123 | |
| | | | | | | | | | | | |
aForward exchange contracts are included in net realized gain (loss) from foreign currency transactions and net change in unrealized appreciation (depreciation) on translation of other assets and liabilities denominated in foreign currencies in the Statements of Operations.
bPurchased option contracts are included in net realized gain (loss) from investments and net change in unrealized appreciation (depreciation) on investments in the Statements of Operations.
For the period ended April 30, 2017, the average month end fair value of derivatives, as a percentage of average month end net assets, and the average month end number of open derivative contracts for the period were as follows:
| | | | | | | | | | | | |
| | | Franklin
Floating Rate
Daily Access Fund | | | Franklin
Low Duration
Total Return
Fund | | | Franklin
Total Return
Fund | |
Average month end fair value of derivatives | | | 0.0% | a | | | 0.4% | | | | 1.0% | |
Average month end number of open derivatives | | | 2 | | | | 115 | | | | 131 | |
| | | |
aRounds to less than 0.1%. | | | | | | | | | | | | |
| | | | |
| | | |
franklintempleton.com | | Semiannual Report | | 123 |
FRANKLIN INVESTORS SECURITIES TRUST
NOTES TO FINANCIAL STATEMENTS (UNAUDITED)
10. Other Derivative Information (continued)
At April 30, 2017, the Funds’ OTC derivative assets and liabilities are as follows:
| | | | | | | | |
| | | Gross Amounts of Assets and Liabilities Presented in the Statements of Assets and Liabilities | |
| | | Assetsa | | | Liabilitiesa | |
Derivatives | | | | | | | | |
Franklin Low Duration | | | | | | | | |
Total Return Fund | | | | | | | | |
Forward exchange contracts | | | $5,166,939 | | | | $ 1,295,710 | |
Swap contracts | | | 4,347,676 | | | | 8,918,833 | |
| | | | |
Total | | | $9,514,615 | | | | $10,214,543 | |
| | | | |
Franklin Total | | | | | | | | |
Return Fund | | | | | | | | |
Forward exchange contracts | | | $15,316,783 | | | | $ 4,593,467 | |
Swap contracts | | | 11,982,813 | | | | 18,489,417 | |
| | | | |
Total | | | $27,299,596 | | | | $23,082,884 | |
| | | | |
aAbsent an event of default or early termination, OTC derivative assets and liabilities are presented gross and not offset in the Statements of Assets and Liabilities.
At April 30, 2017, the Funds’ OTC derivative assets, which may be offset against the Funds’ OTC derivative liabilities and collateral received from the counterparty, are as follows:
| | | | | | | | | | | | | | | | | | | | |
| | | | | | Amounts Not Offset in the Statements of Assets and Liabilities | | | | |
| | | Gross Amounts of
Assets Presented in
the Statements of
Assets and Liabilities | | | Financial
Instruments
Available for
Offset | | | Financial
Instruments
Collateral
Receivedb,c | | | Cash
Collateral
Received | | | Net Amount
(Not less
than zero) | |
Franklin Low Duration Total Return Fund | | | | | | | | | | | | | | | | | | | | |
Counterparty | | | | | | | | | | | | | | | | | | | | |
BZWS | | | $ 5,571 | | | | $ (5,571) | | | | $ — | | | | $— | | | | $ — | |
CITI | | | 1,051,583 | | | | (1,051,583) | | | | — | | | | — | | | | — | |
DBAB | | | 2,585,558 | | | | (869,358) | | | | (1,526,200) | | | | (190,000) | | | | — | |
FBCO | | | — | | | | — | | | | — | | | | — | | | | — | |
GSCO | | | 1,502,105 | | | | (1,502,105) | | | | — | | | | — | | | | — | |
HSBK | | | 117 | | | | — | | | | — | | | | — | | | | 117 | |
JPHQ | | | 4,310,077 | | | | (2,969,730) | | | | (1,340,347) | | | | — | | | | — | |
MSCO | | | 59,604 | | | | (59,604) | | | | — | | | | — | | | | — | |
| | | | |
Total | | | $9,514,615 | | | | $(6,457,951) | | | | $(2,866,547) | | | | $(190,000) | | | | $ 117 | |
| | | | |
| | | | |
| | | |
124 | | Semiannual Report | | franklintempleton.com |
FRANKLIN INVESTORS SECURITIES TRUST
NOTES TO FINANCIAL STATEMENTS (UNAUDITED)
| | | | | | | | | | | | | | | | | | | | | | | | |
| | | | | | | | | Amounts Not Offset in the Statements of Assets and Liabilities | | | | |
| | | Gross Amounts of
Assets Presented in
the Statements of
Assets and Liabilities | | | | | | Financial
Instruments
Available for
Offset | | | Financial
Instruments
Collateral
Receivedb,c | | | Cash
Collateral
Received | | | Net Amount
(Not less
than zero) | |
Franklin Total Return Fund | | | | | | | | | | | | | | | | | | | | | | | | |
Counterparty | | | | | | | | | | | | | | | | | | | | | | | | |
BOFA | | | $ 301,113 | | | | | | | | $ (120,806) | | | | $ — | | | | $ (111,000) | | | | $69,307 | |
BZWS | | | 118,054 | | | | | | | | (118,054) | | | | — | | | | — | | | | — | |
CITI | | | 1,400,755 | | | | | | | | (1,400,755) | | | | — | | | | — | | | | — | |
DBAB | | | 9,040,792 | | | | | | | | (4,371,387) | | | | (4,179,409) | | | | (490,000) | | | | — | |
FBCO | | | 325,234 | | | | | | | | (325,234) | | | | — | | | | — | | | | — | |
GSCO | | | 2,949,725 | | | | | | | | (2,949,725) | | | | — | | | | — | | | | — | |
HSBK | | | 5,193 | | | | | | | | — | | | | — | | | | — | | | | 5,193 | |
JPHQ | | | 13,134,250 | | | | | | | | (5,938,899) | | | | (5,465,351) | | | | (1,730,000) | | | | — | |
MSCO | | | — | | | | | | | | — | | | | — | | | | — | | | | — | |
UBSW | | | 24,480 | | | | | | | | (24,480) | | | | — | | | | — | | | | — | |
| | | | |
Total | | | $27,299,596 | | | | | | | | $(15,249,340) | | | | $(9,644,756) | | | | $(2,331,000) | | | | $74,500 | |
| | | | |
At April 30, 2017, the Funds’ OTC derivative liabilities, which may be offset against the Funds’ OTC derivative assets and collateral pledged to the counterparty, are as follows:
| | | | | | | | | | | | | | | | | | | | | | | | |
| | | | | | | | | Amounts Not Offset in the Statement of Assets and Liabilities | | | | |
| | | Gross Amounts of
Liabilities Presented in
the Statement of
Assets and Liabilities | | | | | | Financial
Instruments
Available for
Offset | | | Financial
Instruments
Collateral
Pledged | | | Cash
Collateral
Pledgedc | | | Net Amount
(Not less
than zero) | |
Franklin Low Duration Total Return Fund | | | | | | | | | | | | | | | | | | | | | | | | |
Counterparty | | | | | | | | | | | | | | | | | | | | | | | | |
BZWS | | | $ 25,859 | | | | | | | | $ (5,571) | | | | $ — | | | | $ (20,288) | | | | $ — | |
CITI | | | 1,132,972 | | | | | | | | (1,051,583) | | | | — | | | | — | | | | 81,389 | |
DBAB | | | 869,358 | | | | | | | | (869,358) | | | | — | | | | — | | | | — | |
FBCO | | | 760,182 | | | | | | | | — | | | | — | | | | (760,000) | | | | 182 | |
GSCO | | | 4,123,456 | | | | | | | | (1,502,105) | | | | — | | | | (2,480,000) | | | | 141,351 | |
HSBK | | | — | | | | | | | | — | | | | — | | | | — | | | | — | |
JPHQ | | | 2,969,730 | | | | | | | | (2,969,730) | | | | — | | | | — | | | | — | |
MSCO | | | 332,986 | | | | | | | | (59,604) | | | | — | | | | (170,000) | | | | 103,382 | |
| | | | |
Total | | | $10,214,543 | | | | | | | | $(6,457,951) | | | | $ — | | | | $(3,430,288) | | | | $326,304 | |
| | | | |
| | | | |
| | | |
franklintempleton.com | | Semiannual Report | | 125 |
FRANKLIN INVESTORS SECURITIES TRUST
NOTES TO FINANCIAL STATEMENTS (UNAUDITED)
10. Other Derivative Information (continued)
| | | | | | | | | | | | | | | | | | | | | | | | |
| | | | | | | | | Amounts Not Offset in the Statements of Assets and Liabilities | | | | |
| | | Gross Amounts of
Liabilities Presented in
the Statements of
Assets and Liabilities | | | | | | Financial
Instruments
Available for
Offset | | | Financial
Instruments
Collateral
Pledged | | | Cash
Collateral
Pledgedc | | | Net Amount
(Not less
than zero) | |
Franklin Total Return Fund | | | | | | | | | | | | | | | | | | | | | | | | |
Counterparty | | | | | | | | | | | | | | | | | | | | | | | | |
BOFA | | | $ 120,806 | | | | | | | | $ (120,806) | | | | $ — | | | | $ — | | | | $ — | |
BZWS | | | 637,114 | | | | | | | | (118,054) | | | | — | | | | (490,000) | | | | 29,060 | |
CITI | | | 2,791,278 | | | | | | | | (1,400,755) | | | | — | | | | (1,360,000) | | | | 30,523 | |
DBAB | | | 4,371,387 | | | | | | | | (4,371,387) | | | | — | | | | — | | | | — | |
FBCO | | | 1,651,453 | | | | | | | | (325,234) | | | | — | | | | (1,326,219) | | | | — | |
GSCO | | | 6,806,129 | | | | | | | | (2,949,725) | | | | — | | | | (3,720,000) | | | | 136,404 | |
HSBK | | | — | | | | | | | | — | | | | — | | | | — | | | | — | |
JPHQ | | | 5,938,899 | | | | | | | | (5,938,899) | | | | — | | | | — | | | | — | |
MSCO | | | 593,575 | | | | | | | | — | | | | — | | | | (490,000) | | | | 103,575 | |
UBSW | | | 172,243 | | | | | | | | (24,480) | | | | — | | | | (147,763) | | | | — | |
| | | | |
| | | $23,082,884 | | | | | | | | $(15,249,340) | | | | $ — | | | | $(7,533,982) | | | | $299,562 | |
| | | | |
bAt April 30, 2017, the Fund received U.S. Government and Agency Securities as collateral for derivatives.
cIn some instances, the collateral amounts disclosed in the table above were adjusted due to the requirement to limit collateral amounts to avoid the effect of overcollateralization. Actual collateral received and/or pledged may be more than the amounts disclosed herein.
See Note 1(d) regarding derivative financial instruments.
See Abbreviations on page 131.
11. Credit Facility
The Funds, together with other U.S. registered and foreign investment funds (collectively, Borrowers), managed by Franklin Templeton Investments, are borrowers in a joint syndicated senior unsecured credit facility totaling $2 billion (Global Credit Facility) which matures on February 9, 2018. This Global Credit Facility provides a source of funds to the Borrowers for temporary and emergency purposes, including the ability to meet future unanticipated or unusually large redemption requests.
Under the terms of the Global Credit Facility, the Funds shall, in addition to interest charged on any borrowings made by the Funds and other costs incurred by the Funds, pay their share of fees and expenses incurred in connection with the implementation and maintenance of the Global Credit Facility, based upon their relative share of the aggregate net assets of all of the Borrowers, including an annual commitment fee of 0.15% based upon the unused portion of the Global Credit Facility. These fees are reflected in other expenses in the Statements of Operations. During the period ended April 30, 2017, the Funds did not use the Global Credit Facility.
12. Fair Value Measurements
The Funds follow a fair value hierarchy that distinguishes between market data obtained from independent sources (observable inputs) and the Funds’ own market assumptions (unobservable inputs). These inputs are used in determining the value of the Funds’ financial instruments and are summarized in the following fair value hierarchy:
| | • | | Level 1 – quoted prices in active markets for identical financial instruments |
| | | | |
| | | |
126 | | Semiannual Report | | franklintempleton.com |
FRANKLIN INVESTORS SECURITIES TRUST
NOTES TO FINANCIAL STATEMENTS (UNAUDITED)
| | • | | Level 2 – other significant observable inputs (including quoted prices for similar financial instruments, interest rates, prepayment speed, credit risk, etc.) |
| | • | | Level 3 – significant unobservable inputs (including the Funds’ own assumptions in determining the fair value of financial instruments) |
The input levels are not necessarily an indication of the risk or liquidity associated with financial instruments at that level.
For movements between the levels within the fair value hierarchy, the Funds have adopted a policy of recognizing the transfers as of the date of the underlying event which caused the movement.
A summary of inputs used as of April 30, 2017, in valuing the Funds’ assets and liabilities carried at fair value, is as follows:
| | | | | | | | | | | | | | | | |
| | | Level 1 | | | Level 2 | | | Level 3 | | | Total | |
Franklin Adjustable U.S. Government Securities
Fund | | | | | | | | | | | | | | | | |
Assets: | | | | | | | | | | | | | | | | |
Investments in Securities: | | | | | | | | | | | | | | | | |
Mortgage-Backed Securities | | $ | — | | | $ | 1,120,421,648 | | | $ | — | | | $ | 1,120,421,648 | |
Short Term Investments | | | 30,179,621 | | | | — | | | | — | | | | 30,179,621 | |
| | | | |
Total Investments in Securities | | $ | 30,179,621 | | | $ | 1,120,421,648 | | | $ | — | | | $ | 1,150,601,269 | |
| | | | |
Franklin Floating Rate Daily Access Fund | | | | | | | | | | | | | | | | |
Assets: | | | | | | | | | | | | | | | | |
Investments in Securities: | | | | | | | | | | | | | | | | |
Equity Investments: | | | | | | | | | | | | | | | | |
Oil & Gas Exploration & Production | | $ | — | | | $ | 8,547,365 | | | $ | — | | | $ | 8,547,365 | |
Steel | | | — | | | | — | | | | 1,651,113 | | | | 1,651,113 | |
Senior Floating Rate Interests | | | — | | �� | | 3,040,049,025 | | | | — | | | | 3,040,049,025 | |
Asset-Backed Securities | | | — | | | | 361,021,604 | | | | — | | | | 361,021,604 | |
Short Term Investments | | | 833,259,536 | | | | — | | | | — | | | | 833,259,536 | |
| | | | |
Total Investments in Securities | | $ | 833,259,536 | | | $ | 3,409,617,994 | | | $ | 1,651,113 | | | $ | 4,244,528,643 | |
| | | | |
Other Financial Instruments: | | | | | | | | | | | | | | | | |
Unfunded Loan Commitments | | $ | — | | | $ | 880,912 | | | $ | — | | | $ | 880,912 | |
| | | | |
Liabilities: | | | | | | | | | | | | | | | | |
Other Financial Instruments: | | | | | | | | | | | | | | | | |
Swap Contracts | | $ | — | | | $ | 783,852 | | | $ | — | | | $ | 783,852 | |
| | | | |
| | | | |
| | | |
franklintempleton.com | | Semiannual Report | | 127 |
FRANKLIN INVESTORS SECURITIES TRUST
NOTES TO FINANCIAL STATEMENTS (UNAUDITED)
12. Fair Value Measurements (continued)
| | | | | | | | | | | | | | | | |
| | | Level 1 | | | Level 2 | | | Level 3 | | | Total | |
Franklin Low Duration Total Return Fund | | | | | | | | | | | | | | | | |
Assets: | | | | | | | | | | | | | | | | |
Investments in Securities: | | | | | | | | | | | | | | | | |
Equity Investments:a | | | | | | | | | | | | | | | | |
Energy | | $ | 1,822,188 | | | $ | — | | | $ | 631,163 | | | $ | 2,453,351 | |
Retailing | | | — | | | | — | | | | 10,141 | | | | 10,141 | |
All Other Equity Investmentsb | | | 52,869,422 | | | | — | | | | — | | | | 52,869,422 | |
Corporate Bonds | | | — | | | | 964,067,162 | | | | — | | | | 964,067,162 | |
Senior Floating Rate Interests | | | — | | | | 68,953,965 | | | | — | | | | 68,953,965 | |
Foreign Government and Agency Securities | | | — | | | | 39,847,983 | | | | — | | | | 39,847,983 | |
U.S. Government and Agency Securities | | | — | | | | 638,710,701 | | | | — | | | | 638,710,701 | |
Asset-Backed Securities and Commercial
Mortgage-Backed Securities | | | — | | | | 649,036,682 | | | | — | | | | 649,036,682 | |
Mortgage-Backed Securities | | | — | | | | 37,522,603 | | | | — | | | | 37,522,603 | |
Municipal Bonds | | | — | | | | 16,639,929 | | | | — | | | | 16,639,929 | |
Escrows and Litigation Trusts | | | — | | | | — | | | | — | c | | | — | |
Short Term Investments | | | 137,532,020 | | | | — | | | | — | | | | 137,532,020 | |
| | | | |
Total Investments in Securities | | $ | 192,223,630 | | | $ | 2,414,779,025 | | | $ | 641,304 | | | $ | 2,607,643,959 | |
| | | | |
Other Financial Instruments: | | | | | | | | | | | | | | | | |
Futures Contracts | | $ | 774,036 | | | $ | — | | | $ | — | | | $ | 774,036 | |
Forward Exchange Contracts | | | — | | | | 5,166,939 | | | | — | | | | 5,166,939 | |
Swap Contracts | | | — | | | | 1,390,578 | | | | — | | | | 1,390,578 | |
Unfunded Loan Commitments | | | — | | | | 103,134 | | | | — | | | | 103,134 | |
| | | | |
Total Other Financial Instruments | | $ | 774,036 | | | $ | 6,660,651 | | | $ | — | | | $ | 7,434,687 | |
| | | | |
Liabilities: | | | | | | | | | | | | | | | | |
Other Financial Instruments: | | | | | | | | | | | | | | | | |
Futures Contracts | | $ | 912,683 | | | $ | — | | | $ | — | | | $ | 912,683 | |
Forward Exchange Contracts | | | — | | | | 1,295,710 | | | | — | | | | 1,295,710 | |
Swap Contracts | | | — | | | | 3,762,159 | | | | — | | | | 3,762,159 | |
| | | | |
Total Other Financial Instruments | | $ | 912,683 | | | $ | 5,057,869 | | | $ | — | | | $ | 5,970,552 | |
| | | | |
| | | | |
| | | |
128 | | Semiannual Report | | franklintempleton.com |
FRANKLIN INVESTORS SECURITIES TRUST
NOTES TO FINANCIAL STATEMENTS (UNAUDITED)
| | | | | | | | | | | | | | | | |
| | | Level 1 | | | Level 2 | | | Level 3 | | | Total | |
Franklin Total Return Fund | | | | | | | | | | | | | | | | |
Assets: | | | | | | | | | | | | | | | | |
Investments in Securities: | | | | | | | | | | | | | | | | |
Equity Investments:a | | | | | | | | | | | | | | | | |
Consumer Services | | $ | — | | | $ | — | | | $ | 7,210,139 | | | $ | 7,210,139 | |
Energy | | | 4,199,269 | | | | — | | | | 1,472,715 | | | | 5,671,984 | |
Retailing | | | — | | | | — | | | | 23,661 | | | | 23,661 | |
All Other Equity Investmentsb | | | 132,951,166 | | | | — | | | | — | | | | 132,951,166 | |
Corporate Bonds | | | — | | | | 1,590,336,401 | | | | — | | | | 1,590,336,401 | |
Senior Floating Rate Interests | | | — | | | | 109,900,005 | | | | — | | | | 109,900,005 | |
Foreign Government and Agency Securities | | | — | | | | 114,718,580 | | | | — | | | | 114,718,580 | |
U.S. Government and Agency Securities | | | — | | | | 804,467,469 | | | | — | | | | 804,467,469 | |
Asset-Backed Securities and Commercial
Mortgage-Backed Securities | | | — | | | | 765,808,350 | | | | 14,906 | | | | 765,823,256 | |
Mortgage-Backed Securities | | | — | | | | 965,533,799 | | | | — | | | | 965,533,799 | |
Municipal Bonds | | | — | | | | 91,627,096 | | | | — | | | | 91,627,096 | |
Escrows and Litigation Trusts | | | — | | | | — | | | | — | c | | | — | |
Short Term Investments | | | 70,776,511 | | | | — | | | | — | | | | 70,776,511 | |
| | | | |
Total Investments in Securities | | $ | 207,926,946 | | | $ | 4,442,391,700 | | | $ | 8,721,421 | | | $ | 4,659,040,067 | |
| | | | |
Other Financial Instruments: | | | | | | | | | | | | | | | | |
Futures Contracts | | $ | 8,606,920 | | | $ | — | | | $ | — | | | $ | 8,606,920 | |
Forward Exchange Contracts | | | — | | | | 15,316,783 | | | | — | | | | 15,316,783 | |
Swap Contracts | | | — | | | | 5,301,966 | | | | — | | | | 5,301,966 | |
Unfunded Loan Commitments | | | — | | | | 231,571 | | | | — | | | | 231,571 | |
| | | | |
Total Other Financial Instruments | | $ | 8,606,920 | | | $ | 20,850,320 | | | $ | — | | | $ | 29,457,240 | |
| | | | |
Liabilities: | | | | | | | | | | | | | | | | |
Other Financial Instruments: | | | | | | | | | | | | | | | | |
Futures Contracts | | $ | 62,997 | | | $ | — | | | $ | — | | | $ | 62,997 | |
Forward Exchange Contracts | | | — | | | | 4,593,467 | | | | — | | | | 4,593,467 | |
Swap Contracts | | | — | | | | 8,884,195 | | | | — | | | | 8,884,195 | |
| | | | |
Total Other Financial Instruments | | $ | 62,997 | | | $ | 13,477,662 | | | $ | — | | | $ | 13,540,659 | |
| | | | |
aIncludes common and preferred stocks, and management investment companies as well as other equity investments.
bFor detailed categories, see the accompanying Statement of Investments.
cIncludes securities determined to have no value at April 30, 2017.
A reconciliation of assets in which Level 3 inputs are used in determining fair value is presented when there are significant Level 3 financial insutruments at the end of the period.
13. New Accounting Pronouncements
In March 2017, the Financial Accounting Standards Board (FASB) issued Accounting Standards Update (ASU) No. 2017-08, Receivables—Nonrefundable Fees and Other Costs (Subtopic 310-20): Premium Amortization on Purchased Callable Debt Securities. The amendments in the ASU shorten the amortization period for certain callable debt securities, held at a premium, to be amortized to the earliest call date. The ASU does not require an accounting change for securities held at a discount; which continues to be amortized to maturity. The ASU is effective for fiscal years and interim periods within fiscal years beginning after December 15, 2018. Management is currently evaluating the impact, if any, of applying this provision.
| | | | |
| | | |
franklintempleton.com | | Semiannual Report | | 129 |
FRANKLIN INVESTORS SECURITIES TRUST
NOTES TO FINANCIAL STATEMENTS (UNAUDITED)
14. Investment Company Reporting Modernization
In October 2016, the U.S. Securities and Exchange Commission adopted new rules and amended existing rules (together, final rules) intended to modernize the reporting and disclosure of information by registered investment companies. In part, the final rules amend Regulation S-X and require standardized, enhanced disclosures about derivatives in investment company financial statements, as well as other amendments. The compliance date for the amendments to Regulation S-X is August 1, 2017. Management is currently evaluating the impact that the adoption of the amendments to Regulation S-X will have on the Funds’ financial statements and related disclosures.
15. Subsequent Events
The Funds have evaluated subsequent events through the issuance of the financial statements and determined that no events have occurred that require disclosure.
| | | | |
| | | |
| 130 | | Semiannual Report | | franklintempleton.com |
FRANKLIN INVESTORS SECURITIES TRUST
NOTES TO FINANCIAL STATEMENTS (UNAUDITED)
Abbreviations
| | | | | | | | | | |
| Counterparty/Exchange | | Currency | | Selected Portfolio |
BOFA | | Bank of America, N.A. | | BRL | | Brazilian Real | | AGMC | | Assured Guaranty Municipal Corp. |
BZWS | | Barclays Bank PLC | | CHF | | Swiss Franc | | ARM | | Adjustable Rate Mortgage |
CITI | | Citigroup, Inc. | | EUR | | Euro | | BBA | | British Bankers Association |
DBAB | | Deutsche Bank AG | | HUF | | Hungarian Forint | | CDA | | Community Development Authority/Agency |
FBCO | | Credit Suisse Group AG | | JPY | | Japanese Yen | | CDO | | Collateralized Debt Obligation |
GSCO | | The Goldman Sachs Group, Inc. | | MXN | | Mexican Peso | | CLO | | Collateralized Loan Obligation |
HSBK | | HSBC Bank PLC | | SEK | | Swedish Krona | | EDA | | Economic Development Authority |
ICE | | Intercontinental Exchange | | USD | | United States Dollar | | ETF | | Exchange Traded Fund |
JPHQ | | JP Morgan Chase & Co. | | | | | | FRN | | Floating Rate Note |
MSCO | | Morgan Stanley | | | | | | GDP | | Gross Domestic Product |
UBSW | | UBS AG | | | | | | GO | | General Obligation |
| | | | | | | | IO | | Interest Only |
| | | | | | | | LIBOR | | London InterBank Offered Rate |
| | | | | | | | MFM | | Multi-Family Mortgage |
| | | | | | | | PCR | | Pollution Control Revenue |
| | | | | | | | PIK | | Payment-In-Kind |
| | | | | | | | REIT | | Real Estate Investment Trust |
| | | | | | | | SF | | Single Family |
| | | | | | | | VRI | | Value Recovery Instruments |
| | |
| Index | | |
CDX.NA.HY.Series number | | CDX North America High Yield Index |
CDX.NA.IG.Series number | | CDX North America Investment Grade Index |
MCDX.NA.Series number | | MCDX North America Index |
| | | | |
| | | |
franklintempleton.com | | Semiannual Report | | 131 |
FRANKLIN INVESTORS SECURITIES TRUST
Shareholder Information
Board Approval of Investment Management Agreements
FRANKLIN INVESTORS SECURITIES TRUST
Franklin Adjustable U.S. Government Securities Fund
Franklin Floating Rate Daily Access Fund
Franklin Low Duration Total Return Fund
Franklin Total Return Fund
(each a Fund)
At an in-person meeting held on February 28, 2017 (Meeting), the Board of Trustees (Board) of Franklin Investors Securities Trust, including a majority of the trustees who are not “interested persons” as defined in the Investment Company Act of 1940 (Independent Trustees), reviewed and approved the continuance of the investment management agreement between Franklin Advisers, Inc. (Manager) and each Fund and the investment sub-advisory agreement between the Manager and Franklin Templeton Institutional, LLC (Sub-Adviser), an affiliate of the Manager, on behalf of the Franklin Total Return Fund (each a Management Agreement) for an additional one-year period. The Independent Trustees received advice from and met separately with Independent Trustee counsel in considering whether to approve the continuation of each Management Agreement. Although the Management Agreements for the Funds were considered at the same Board meeting, the Board considered the information provided to it about the Funds together and with respect to each Fund separately as the Board deemed appropriate.
In considering the continuation of each Management Agreement, the Board reviewed and considered information provided by the Manager at the Meeting and throughout the year at meetings of the Board and its committees. The Board also reviewed and considered information provided in response to a detailed set of requests for information submitted to the Manager by Independent Trustee counsel on behalf of the Independent Trustees in connection with the annual contract renewal process. In addition, prior to the Meeting, the Independent Trustees held a telephonic contract renewal meeting at which the Independent Trustees conferred amongst themselves and Independent Trustee counsel about contract renewal matters. The Board reviewed and considered all of the factors it deemed relevant in approving the continuance of each Management Agreement, including, but not limited to: (i) the nature, extent, and quality of the services provided by the Manager; (ii) the investment performance of each Fund; (iii) the costs of the services provided and profits realized by the Manager and its affiliates from the relationship with each Fund;
(iv) the extent to which economies of scale are realized as each Fund grows; and (v) whether fee levels reflect these economies of scale for the benefit of Fund investors.
In approving the continuance of each Management Agreement, the Board, including a majority of the Independent Trustees, determined that the existing management fees are fair and reasonable and that the continuance of such Management Agreement is in the interests of the applicable Fund and its shareholders. While attention was given to all information furnished, the following discusses some primary factors relevant to the Board’s determination.
Nature, Extent and Quality of Services
The Board reviewed and considered information regarding the nature, extent and quality of investment management services provided by the Manager and its affiliates to the Funds and their shareholders. This information included, among other things, the qualifications, background and experience of the senior management and investment personnel of the Manager; the structure of investment personnel compensation; oversight of third-party service providers; investment performance reports and related financial information for each Fund; reports on expenses, shareholder services, marketing support payments made to financial intermediaries and third party servicing arrangements; legal and compliance matters; risk controls; pricing and other services provided by the Manager and its affiliates; and management fees charged by the Manager and its affiliates to U.S. funds and other accounts, including management’s explanation of differences among accounts where relevant. The Board noted management’s continual efforts and expenditures in establishing effective business continuity plans and developing strategies to address areas of heightened concern in the mutual fund industry, such as cybersecurity, derivatives and liquidity risk management.
The Board also reviewed and considered the benefits provided to Fund shareholders of investing in a fund that is part of the Franklin Templeton family of funds. The Board noted the strong financial position of Franklin Resources, Inc. (FRI), the Manager’s parent, and its commitment to the mutual fund business as evidenced by its continued introduction of new funds, reassessment of the fund offerings in response to the market environment and project initiatives and capital investments relating to the services provided to the Funds by the Franklin Templeton Investments (FTI) organization.
Following consideration of such information, the Board was satisfied with the nature, extent and quality of services provided
| | | | |
| | | |
132 | | Semiannual Report | | franklintempleton.com |
FRANKLIN INVESTORS SECURITIES TRUST
SHAREHOLDER INFORMATION
by the Manager and its affiliates to the Funds and their shareholders.
Fund Performance
The Board reviewed and considered the performance results of each Fund over various time periods ended December 31, 2016. The Board considered the performance returns for each Fund in comparison to the performance returns of mutual funds deemed comparable to the Fund included in a universe (Performance Universe) selected by Broadridge Financial Solutions, Inc. (Broadridge), an independent provider of investment company data. The Board received a description of the methodology used by Broadridge to select the mutual funds included in a Performance Universe. The Board also reviewed and considered Fund performance reports provided and discussions that occurred with portfolio managers at Board meetings throughout the year. A summary of each Fund’s performance results is below.
Franklin Adjustable U.S. Government Securities Fund - The Performance Universe for this Fund included the Fund and all retail and institutional ultra-short obligation funds. The Board noted that the Fund’s annualized income return for the one-, three-, five- and 10-year periods was above the median of its Performance Universe. The Board also noted that the Fund’s annualized total return for the one-, three- and five-year periods was below the median of its Performance Universe, but for the 10-year period was above the median of its Performance Universe. Given the Fund’s income-oriented investment objective, the Board concluded that the Fund’s performance was acceptable.
Franklin Floating Rate Daily Access Fund - The Performance Universe for this Fund included the Fund and all retail and institutional loan participation funds. The Board noted that the Fund’s annualized income return and annualized total return for the one-, three- and five-year periods were above the medians of its Performance Universe, but for the 10-year period were below the medians of its Performance Universe. The Board concluded that the Fund’s performance was satisfactory.
Franklin Low Duration Total Return Fund - The Performance Universe for this Fund included the Fund and all retail and institutional short investment-grade debt funds. The Board noted that the Fund’s annualized income return and annualized total return for the one-, three-, five- and 10-year periods were above the medians of its Performance Universe. The Board concluded that the Fund’s performance was satisfactory.
Franklin Total Return Fund - The Performance Universe for this Fund included the Fund and all retail and institutional core plus bond funds. The Board noted that the Fund’s annualized income return for the one-year period was below the median of its Performance Universe, but for the three-, five- and 10-year periods was above the median of its Performance Universe. The Board also noted that the Fund’s annualized total return for the one-, three-, five- and 10-year periods was below the median of its Performance Universe. Given the Fund’s income-oriented investment objective, the Board concluded that the Fund’s performance was acceptable. In doing so, the Board noted that Fund’s annualized total return for each of the one-, three-, five- and 10-year periods, while below the median, exceeded 2.3%.
Comparative Fees and Expenses
The Board reviewed and considered information regarding each Fund’s actual total expense ratio and its various components, including management fees; transfer agent expenses; underlying fund expenses, if any; Rule 12b-1 and non-Rule 12b-1 service fees; and other non-management fees. The Board also noted that at its February meeting each year, it receives an annual report on all marketing support payments made by FTI to financial intermediaries. The Board considered the actual total expense ratio and, separately, the contractual management fee rate (Management Rate) of each Fund, in comparison to the median ratio and median Management Rate, respectively, of other mutual funds deemed comparable to and with a similar expense structure as the Fund selected by Broadridge (Expense Group). Broadridge fee and expense data is based upon information taken from each fund’s most recent annual report, which reflects historical asset levels that may be quite different from those currently existing, particularly in a period of market volatility. While recognizing such inherent limitation and the fact that expense ratios and Management Rates generally increase as assets decline and decrease as assets grow, the Board believed the independent analysis conducted by Broadridge to be an appropriate measure of comparative fees and expenses. The Broadridge Management Rate includes administrative charges, and the actual total expense ratio, for comparative consistency, was shown for Class A shares for funds with multiple classes of shares. The Board received a description of the methodology used by Broadridge to select the mutual funds included in an Expense Group.
Franklin Adjustable U.S. Government Securities Fund – The Expense Group for the Fund included the Fund and one other ultra-short obligation fund, one short U.S. government fund and one short-intermediate investment-grade debt fund. The Board noted the small size of the Expense Group and that the
| | | | |
| | | |
franklintempleton.com | | Semiannual Report | | 133 |
FRANKLIN INVESTORS SECURITIES TRUST
SHAREHOLDER INFORMATION
Management Rate and total expense ratio for the Fund were 8.4 and 8.1 basis points above the median of its Expense Group, respectively. The Board concluded that the Management Rate charged to the Fund is fair and reasonable.
Franklin Floating Rate Daily Access Fund – The Expense Group for the Fund included the Fund and 14 other loan participation funds. The Board noted that the Management Rate and actual total expense ratio for the Fund were below the median of its Expense Group. The Board concluded that the Management Rate charged to the Fund is fair and reasonable.
Franklin Low Duration Total Return Fund – The Expense Group for the Fund included the Fund and eight other short investment-grade debt funds. The Board noted that the Management Rate for the Fund was above the median of its Expense Group, but the actual total expense ratio for the Fund was equal to the median of its Expense Group. The Board concluded that the Management Rate charged to the Fund is fair and reasonable. In doing so, the Board noted that the Fund benefited from a fee waiver from management.
Franklin Total Return Fund – The Expense Group for the Fund included the Fund and eight other core plus bond funds. The Board noted that the Management Rate and actual total expense ratio for the Fund were 6.4 and 3.7 basis points above the median of its Expense Group, respectively. The Board concluded that the Management Rate charged to the Fund is fair and reasonable. In doing so, the Board noted that the Fund benefited from a fee waiver from management and that the Sub-Adviser was paid by the Manager out of the management fee the Manager received from the Fund.
Profitability
The Board reviewed and considered information regarding the profits realized by the Manager and its affiliates in connection with the operation of each Fund. In this respect, the Board considered the Fund profitability analysis provided by the Manager that addresses the overall profitability of FTI’s U.S. fund business, as well as its profits in providing investment management and other services to each of the individual funds during the 12-month period ended September 30, 2016, being the most recent fiscal year-end for FRI. The Board noted that although management continually makes refinements to its methodologies used in calculating profitability in response to organizational and product related changes, the overall methodology has remained consistent with that used in the Funds’ profitability report presentations from prior years. Additionally, the Funds’ independent registered public accounting firm has been engaged by the Manager to
periodically review the reasonableness of the allocation methodologies to be used solely by the Funds’ Board with respect to the profitability analysis.
The Board noted management’s belief that costs incurred in establishing the infrastructure necessary for the type of mutual fund operations conducted by the Manager and its affiliates may not be fully reflected in the expenses allocated to each Fund in determining its profitability, as well as the fact that the level of profits, to a certain extent, reflected operational cost savings and efficiencies initiated by management. The Board also noted management’s expenditures in improving shareholder services provided to the Funds, as well as the need to implement systems and meet additional regulatory and compliance requirements resulting from recent SEC and other regulatory requirements.
The Board also considered the extent to which the Manager and its affiliates might derive ancillary benefits from fund operations, including revenues generated from transfer agent services, potential benefits resulting from personnel and systems enhancements necessitated by fund growth, as well as increased leverage with service providers and counterparties. Based upon its consideration of all these factors, the Board concluded that the level of profits realized by the Manager and its affiliates from providing services to each Fund was not excessive in view of the nature, quality and extent of services provided to each Fund.
Economies of Scale
The Board reviewed and considered the extent to which the Manager may realize economies of scale, if any, as each Fund grows larger and whether the Fund’s management fee structure reflects any economies of scale for the benefit of shareholders. With respect to possible economies of scale, the Board noted the existence of management fee breakpoints, which operate generally to share any economies of scale with a Fund’s shareholders by reducing the Fund’s effective management fees as the Fund grows in size. The Board considered the Manager’s view that any analyses of potential economies of scale in managing a particular fund are inherently limited in light of the joint and common costs and investments the Manager incurs across the Franklin Templeton family of funds as a whole. The Board concluded that to the extent economies of scale may be realized by the Manager and its affiliates, each Fund’s management fee structure provided a sharing of benefits with the Fund and its shareholders as the Fund grows.
Conclusion
Based on its review, consideration and evaluation of all factors
| | | | |
| | | |
134 | | Semiannual Report | | franklintempleton.com |
FRANKLIN INVESTORS SECURITIES TRUST
SHAREHOLDER INFORMATION
it believed relevant, including the above-described factors and conclusions, the Board unanimously approved the continuation of each Management Agreement for an additional one-year period.
Proxy Voting Policies and Procedures
The Trust’s investment manager has established Proxy Voting Policies and Procedures (Policies) that the Trust uses to determine how to vote proxies relating to portfolio securities. Shareholders may view the Trust’s complete Policies online at franklintempleton.com. Alternatively, shareholders may request copies of the Policies free of charge by calling the Proxy Group collect at (954) 527-7678 or by sending a written request to: Franklin Templeton Companies, LLC, 300 S.E. 2nd Street, Fort Lauderdale, FL 33301, Attention: Proxy Group. Copies of the Trust’s proxy voting records are also made available online at franklintempleton.com and posted on the U.S. Securities and Exchange Commission’s website at sec.gov and reflect the most recent 12-month period ended June 30.
Quarterly Statement of Investments
The Trust files a complete statement of investments with the U.S. Securities and Exchange Commission for the first and third quarters for each fiscal year on Form N-Q. Shareholders may view the filed Form N-Q by visiting the Commission’s website at sec.gov. The filed form may also be viewed and copied at the Commission’s Public Reference Room in Washington, DC. Information regarding the operations of the Public Reference Room may be obtained by calling (800) SEC-0330.
| | | | |
| | | |
franklintempleton.com | | Semiannual Report | | 135 |
This page intentionally left blank.
| | |
| |
 | | Semiannual Report and Shareholder Letter
Franklin Investors Securities Trust |
| | Investment Manager Franklin Advisers, Inc. |
| |
| | Subadvisor |
| | Franklin Templeton Institutional, LLC |
| |
| | Distributor |
| | Franklin Templeton Distributors, Inc. (800) DIAL BEN® / 342-5236 franklintempleton.com |
| |
| | Shareholder Services |
| | (800) 632-2301 |
Authorized for distribution only when accompanied or preceded by a summary prospectus and/or prospectus. Investors should carefully consider a fund’s investment goals, risks, charges and expenses before investing. A prospectus contains this and other information; please read it carefully before investing.
To help ensure we provide you with quality service, all calls to and from our service areas are monitored and/or recorded.
| | | | |
© 2017 Franklin Templeton Investments. All rights reserved. | | | FIST2 S 06/17 | |
(a) The Registrant has adopted a code of ethics that applies to its principal executive officers and principal financial and accounting officer.
(f) Pursuant to Item 12(a)(1), the Registrant is attaching as an exhibit a copy of its code of ethics that applies to its principal executive officers and principal financial and accounting officer.
| Item 3. | Audit Committee Financial Expert. |
(a) (1) The Registrant has an audit committee financial expert serving on its audit committee.
(2) The audit committee financial expert is John B. Wilson and he is “independent” as defined under the relevant Securities and Exchange Commission Rules and Releases.
| | |
Item 4. Principal Accountant Fees and Services. | | N/A |
| | |
| |
Item 5. Audit Committee of Listed Registrants. | | N/A |
| |
Item 6. Schedule of Investments. | | N/A |
| |
Item 7. Disclosure of Proxy Voting Policies and Procedures for Closed-End Management Investment Companies. | | N/A |
| |
Item 8. Portfolio Managers of Closed-End Management Investment Companies. | | N/A |
| |
Item 9. Purchases of Equity Securities by Closed-End Management Investment Company and Affiliated Purchasers. | | N/A |
| Item 10. | Submission of Matters to a Vote of Security Holders. |
There have been no changes to the procedures by which shareholders may recommend nominees to the Registrant’s Board of Trustees that would require disclosure herein.
| Item 11. | Controls and Procedures. |
(a) Evaluation of Disclosure Controls and Procedures. The Registrant maintains disclosure controls and procedures that are designed to ensure that information required to be disclosed in the Registrant’s filings under the Securities Exchange Act of 1934 and the Investment Company Act of 1940 is recorded, processed, summarized and reported within the periods specified in the rules and forms of the Securities and Exchange Commission. Such information is accumulated and communicated to the Registrant’s management, including its principal executive officer and principal financial officer, as appropriate, to allow timely decisions regarding required disclosure. The Registrant’s management, including the principal executive officer and the principal financial officer, recognizes that any set of controls and procedures, no matter how well designed and operated, can provide only reasonable assurance of achieving the desired control objectives.
Within 90 days prior to the filing date of this Shareholder Report on Form N-CSR, the Registrant had carried out an evaluation, under the supervision and with the participation of the Registrant’s management, including the Registrant’s principal executive officer and the Registrant’s principal financial officer, of the effectiveness of the design and operation of the Registrant’s disclosure controls and procedures. Based on such evaluation, the Registrant’s principal executive officer and principal financial officer concluded that the Registrant’s disclosure controls and procedures are effective.
(b) Changes in Internal Controls. There have been no changes in the Registrant’s internal controls or in other factors that could materially affect the internal controls over financial reporting subsequent to the date of their evaluation in connection with the preparation of this Shareholder Report on Form N-CSR.
(a)(1) Code of Ethics
(a)(2) Certifications pursuant to Section 302 of the Sarbanes-Oxley Act of 2002 of Matthew T. Hinkle, Chief Executive Officer—Finance and Administration, and Gaston Gardey, Chief Financial Officer and Chief Accounting Officer
(b) Certifications pursuant to Section 906 of the Sarbanes-Oxley Act of 2002 of Matthew T. Hinkle, Chief Executive Officer—Finance and Administration, and Gaston Gardey, Chief Financial Officer and Chief Accounting Officer
SIGNATURES
Pursuant to the requirements of the Securities Exchange Act of 1934 and the Investment Company Act of 1940, the registrant has duly caused this report to be signed on its behalf by the undersigned, thereunto duly authorized.
| | |
| FRANKLIN INVESTORS SECURITIES TRUST |
| | |
| |
| By | | /S/ MATTHEW T. HINKLE |
| | Matthew T. Hinkle |
| | Chief Executive Officer – |
| | Finance and Administration |
| |
| Date | | June 26, 2017 |
Pursuant to the requirements of the Securities Exchange Act of 1934 and the Investment Company Act of 1940, this report has been signed below by the following persons on behalf of the registrant and in the capacities and on the dates indicated.
| | |
| By | | /S/ MATTHEW T. HINKLE |
| | Matthew T. Hinkle |
| | Chief Executive Officer – |
| | Finance and Administration |
| |
| Date | | June 26, 2017 |
| | |
| By | | /S/ GASTON GARDEY |
| | Gaston Gardey |
| | Chief Financial Officer and |
| | Chief Accounting Officer |
| |
| Date | | June 26, 2017 |