UNITED STATES
SECURITIES AND EXCHANGE COMMISSION
Washington, DC 20549
FORM N-CSRS
CERTIFIED SHAREHOLDER REPORT OF REGISTERED MANAGEMENT INVESTMENT COMPANIES
Investment Company Act file number 811-04986
Franklin Investors Securities Trust
(Exact name of registrant as specified in charter)
One Franklin Parkway, San Mateo, CA 94403-1906
(Address of principal executive offices) (Zip code)
Craig S. Tyle, One Franklin Parkway, San Mateo, CA 94403-1906
(Name and address of agent for service)
Registrant's telephone number, including area Code: (650) 312-2000
Date of fiscal year end: 10/31
Date of reporting period: 4/30/15
Item 1. Reports to Stockholders.

Franklin Templeton Investments
Gain From Our Perspective®
At Franklin Templeton Investments, we’re dedicated to one goal: delivering exceptional asset management for our clients. By bringing together multiple, world-class investment teams in a single firm, we’re able to offer specialized expertise across styles and asset classes, all supported by the strength and resources of one of the world’s largest asset managers. This has helped us to become a trusted partner to individual and institutional investors across the globe.
Focus on Investment Excellence
At the core of our firm, you’ll find multiple independent investment teams—each with a focused area of expertise—from traditional to alternative strategies and multi-asset solutions. And because our portfolio groups operate autonomously, their strategies can be combined to deliver true style and asset class diversification.
All of our investment teams share a common commitment to excellence grounded in rigorous, fundamental research and robust, disciplined risk management. Decade after decade, our consistent, research-driven processes have helped Franklin Templeton earn an impressive record of strong, long-term results.
Global Perspective Shaped by Local Expertise
In today’s complex and interconnected world, smart investing demands a global perspective. Franklin Templeton pioneered international investing over 60 years ago, and our expertise in emerging markets spans more than a quarter of a century. Today, our investment professionals are on the ground across the globe, spotting investment ideas and potential risks firsthand. These locally based teams bring in-depth understanding of local companies, economies and cultural nuances, and share their best thinking across our global research network.
Strength and Experience
Franklin Templeton is a global leader in asset management serving clients in over 150 countries.1 We run our business with the same prudence we apply to asset management, staying focused on delivering relevant investment solutions, strong long-term results and reliable, personal service. This approach, focused on putting clients first, has helped us to become one of the most trusted names in financial services.
1. As of 12/31/14. Clients are represented by the total number of shareholder accounts.
Not FDIC Insured | May Lose Value | No Bank Guarantee
| | |
| Contents | |
| |
| Semiannual Report | |
| Economic and Market Overview | 3 |
| Franklin Balanced Fund | 4 |
| Franklin Convertible | |
| Securities Fund | 12 |
| Franklin Equity Income Fund | 19 |
| Franklin Real Return Fund | 27 |
| Financial Highlights and | |
| Statements of Investments | 34 |
| Financial Statements | 73 |
| Notes to Financial Statements | 78 |
| Shareholder Information | 93 |
franklintempleton.com
1
Semiannual Report
Economic and Market Overview
U.S. economic growth moderated during the six-month period ended April 30, 2015. In the first half of the period, greater spending by consumers, businesses and state and local governments aided growth. However, economic activity slowed in 2015’s first quarter as low energy prices and U.S. dollar strength led exports to decline. In addition, harsh weather and labor disputes weighed on business spending. Housing market data improved, as home sales and prices rose, while mortgage rates fell. Retail sales remained mixed but increased toward period-end as auto sales surged. Inflation, as measured by the Consumer Price Index, remained subdued during the past six months but rose late in the period amid higher energy prices bouncing from recent lows. Manufacturing and non-manufacturing activities increased, and the unemployment rate declined to 5.4% in April 2015 from 5.7% in October 2014.1
Although the Federal Reserve Board (Fed) had repeatedly stated that it could be patient with regard to raising interest rates, in March, the Fed removed the word “patient” from its monetary policy guidance. It added, however, that it might keep interest rates lower than what it viewed as normal. In its April meeting, the Fed attributed the economy’s first-quarter slowdown to transitory factors. The Fed reiterated that it would raise interest rates when it saw further improvement in the labor market and was reasonably confident that inflation would move back to its 2% objective over the medium term.
Investor confidence grew as the Fed maintained its cautious tone on raising interest rates and China introduced more stimulus measures. The stock markets endured sell-offs when many investors reacted to the crisis in Ukraine, Greece’s debt negotiations and signs of relatively weak global economic growth, particularly in Europe and Japan, as well as less robust growth in China. U.S. stocks rose overall for the six months under review as the Standard & Poor’s® 500 Index and the Dow Jones Industrial Average reached all-time highs.
The foregoing information reflects our analysis and opinions as of April 30, 2015. The information is not a complete analysis of every aspect of any market, country, industry, security or fund. Statements of fact are from sources considered reliable.
1. Source: Bureau of Labor Statistics.
franklintempleton.com Semiannual Report | 3
Franklin Balanced Fund
This semiannual report for Franklin Balanced Fund covers the period ended April 30, 2015.
Your Fund’s Goal and Main Investments
The Fund seeks both income and capital appreciation by investing in a combination of stocks, convertible securities and debt securities. The Fund will normally invest at least 25% of its total assets in equity securities (primarily common and preferred stock) and at least 25% of its total assets in debt securities, including bonds, notes, debentures and money market securities.
| | | |
| Portfolio Breakdown* | | |
| 4/30/15 | | |
| | % of Total | |
| | Net Assets | |
| |
| Stocks | 58.0 | % |
| Common Stocks | 44.6 | % |
| Equity-Linked Securities | 8.3 | % |
| Convertible Preferred Stocks | 4.5 | % |
| Preferred Stocks | 0.6 | % |
| |
| Bonds | 30.9 | % |
| Corporate Bonds | 30.9 | % |
| |
| Short-Term Investments & Other Net Assets | 11.1 | % |
*Percentages reflect certain derivatives held in the portfolio (or their underlying
reference assets) and may not total 100% or may be negative due to rounding,
use of derivatives, unsettled trades or other factors.
Performance Overview
For the six months under review, the Fund’s Class A shares delivered a +3.11% cumulative total return. In comparison, the Fund’s equity benchmark, the Standard & Poor’s 500 Index (S&P 500®), which is a broad measure of U.S. stock performance, posted a total return of +4.40%.1 The Fund’s fixed income benchmark, the Barclays U.S. Aggregate Bond Index, which tracks the U.S. investment-grade, taxable bond market, returned +2.06%.1 You can find the Fund’s long-term performance data in the Performance Summary beginning on page 7.
Performance data represent past performance, which does not guarantee future results. Investment return and principal value will fluctuate, and you may have a gain or loss when you sell your shares. Current performance may differ from figures shown. Please visit franklintempleton.com or call (800) 342-5236 for most recent month-end performance.
| | | | | | |
| Dividend Distributions* | | | |
| 11/1/14–4/30/15 | | | | |
| | | Dividend per Share (cents) | |
| | | | | | Advisor |
| Month | Class A | Class C | Class R | Class R6 | Class |
| November | 3.00 | 2.29 | 2.80 | 3.43 | 3.31 |
| December | 3.00 | 2.30 | 2.80 | 3.42 | 3.30 |
| January | 3.00 | 2.30 | 2.80 | 3.42 | 3.30 |
| February | 3.00 | 2.30 | 2.80 | 3.42 | 3.30 |
| March | 3.00 | 2.33 | 2.80 | 3.38 | 3.30 |
| April | 3.00 | 2.33 | 2.80 | 3.38 | 3.30 |
| Total | 18.00 | 13.85 | 16.80 | 20.45 | 19.81 |
*All Fund distributions will vary depending upon current market conditions, and past
distributions are not indicative of future trends.
Investment Strategy
We apply a bottom-up approach to investing in individual securities. We will assess the market price of a company’s securities relative to our evaluation of the company’s long-term earnings, asset value and cash flow potential. We also consider a company’s price/earnings ratio, profit margins and liquidation value. In determining an optimal mix of equity and fixed income investments for the Fund, we assess changing economic, market and industry conditions. We may sell securities for a number of possible reasons, including the achievement of certain stock prices or credit spreads, changes in the fundamental outlook or risk/reward profile of a security, less attractive values relative to market peers, or broad economic conditions affecting certain fixed income sectors. For purposes of pursuing our investment goal, we may enter into various equity-related transactions involving derivative instruments. We may also invest in equity-linked notes, which are hybrid derivative-type instruments specially designed to combine the characteristics of one or more reference securities (usually a single stock, a stock index or a basket of stocks) and a related equity derivative, such as a put or call option.
What are put and call options?
A put option is a contract giving the owner the right, but not the obligation, to sell a specified amount of an underlying security at a specified price within a specified time. Put options are most commonly used to protect against the decline of a stock price below a certain price. Conversely, a call option gives the holder the right to buy shares at a specified price within a specified time, regardless of the price in the future before the expiration date. If the stock price rises, the holder of the call option has the right to buy at the agreed-upon price, which could be lower.
1. Source: Morningstar.
The indexes are unmanaged and include reinvestment of any income or distributions. One cannot invest directly in an index, and an index is not representative of the
Fund’s portfolio.
The dollar value, number of shares or principal amount, and names of all portfolio holdings are listed in the Fund’s Statement of Investments (SOI).
The SOI begins on page 39.
4 | Semiannual Report franklintempleton.com
FRANKLIN BALANCED FUND
Manager’s Discussion
During the six months under review, we continued to strategically shift the Fund’s asset mix seeking to manage risks, and our equity holdings declined while our fixed income holdings increased. The Fund’s equity weighting fell to 58.0% from 64.4% of total net assets, and the Fund’s fixed income weighting rose to 30.9% from 29.8%. Our cash position rose during the period to 11.1% from 5.8% of total net assets.
The Fund’s equity holdings performed in line with the S&P 500 during the period. The Fund’s equity information technology, consumer discretionary and consumer staples sector positions performed well. In contrast, our equity energy, materials and utilities sector positions were weak performers.
Our equity-linked security in computer and personal electronics maker Apple was a leading contributor in the equity information technology sector. The company experienced record revenues in its second fiscal quarter based on strong iPhone, Mac and App Store sales. Other notable sector contributors included Analog Devices, Cisco Systems and an equity-linked security in Freescale Semiconductor.
In the equity consumer discretionary sector, big-box retailer Target was able to overcome negative sentiment associated with the company’s disappointing expansion into Canada and the data breach it suffered in December 2013. Home improvement products retailer Lowe’s generated sales growth across all regions of the country in its first fiscal quarter.2 Auto manufacturer General Motors put a period of failed recalls and fatalities behind it by focusing on improving its operational efficiency and taking steps to build shareholder value.
Notable equity contributors from other sectors included Walgreens Boots Alliance, The Boeing Co. and an equity-linked security in LyondellBasell Industries.
The slowing global economy outside North America and growing production led to excess supply in oil, coal, copper and iron ore and contributed to an energy price decline in 2014’s fourth quarter. This collapse drove a substantial amount of the underperformance in the Fund’s equity energy and materials sectors and placed significant pressure on the Fund’s share price during the period.
| | | |
| Top Five Equity Holdings | | |
| 4/30/15 | | |
| Company | % of Total | |
| Sector/Industry | Net Assets | |
| |
| Schlumberger Ltd., ord. & equity linked | 1.4 | % |
| Energy | | |
| Target Corp. | 1.4 | % |
| Consumer Discretionary | | |
| Intel Corp., ord. & equity linked | 1.4 | % |
| Information Technology | | |
| General Electric Co., ord. & equity linked | 1.4 | % |
| Industrials | | |
| Cisco Systems Inc., ord. & equity linked | 1.3 | % |
| Information Technology | | |
Major equity energy detractors included exploration and production companies Rex Energy, Chesapeake Energy2 and Sanchez Energy and oilfield services companies Schlumberger and Halliburton. Falling copper and iron ore prices weighed on our equity materials sector positions, which included BHP Billiton and Rio Tinto and an equity-linked security in Freeport-McMoRan.
Notable equity detractors from other sectors included Caterpillar, QUALCOMM and Johnson & Johnson.
Within fixed income, we continued to focus on corporate bonds, which helped Fund performance. Although fixed income markets experienced volatility and credit spreads widened during the period, we believed the sector’s fundamentals remained solid. Leverage increased but did not reach levels associated with the end of the business cycle. Investment-grade corporate bonds, as measured by the Barclays U.S. Aggregate Bond Index, outperformed Treasuries, agencies, mortgage-backed securities and other securitized products during the period. In this environment, we found valuations that presented what we considered opportunities to add modest exposure at attractive prices. Our industry positioning and security selection within the corporate bond side of the portfolio benefited Fund results. Major fixed income contributors included the banking, consumer non-cyclical and real estate investment trust sectors.3 In contrast, the basic industry, finance companies and capital goods sectors weighed on performance.4
2. No longer held at period-end.
3. Banking holdings are in financials in the fixed income section of the SOI. Consumer non-cyclical holdings are in consumer staples and health care in the fixed income
section of the SOI. Real estate investment trust holdings are in financials in the fixed income section of the SOI.
4. Basic industry holdings are in energy and materials in the fixed income section of the SOI. Finance companies are in financials in the fixed income section of the SOI.
Capital goods holdings are in industrials and materials in the fixed income section of the SOI.
See www.franklintempletondatasources.com for additional data provider information.
franklintempleton.com Semiannual Report | 5
FRANKLIN BALANCED FUND
| | | |
| Top Five Bond Holdings | | |
| 4/30/15 | | |
| Company | % of Total | |
| Sector/Industry | Net Assets | |
| |
| Morgan Stanley | 0.9 | % |
| Financials | | |
| Bank of America Corp. | 0.9 | % |
| Financials | | |
| Citigroup Inc. | 0.9 | % |
| Financials | | |
| Valeant Pharmaceuticals International Inc. | 0.9 | % |
| Health Care | | |
| Energy Transfer Partners LP | 0.8 | % |
| Energy | | |
We continued to find what we considered opportunities in the fixed income banking sector during the period, as we believed the sector could benefit from potential interest rate changes that may result in higher margins. Financial services provider Citigroup benefited from growth in its loans and deposits and its focus on keeping expenses low. Other sector contributors included Wells Fargo & Co. and Royal Bank of Scotland Group.
One of the Fund’s new acquisitions during the period, medical device developer Medtronic, was a notable performer among fixed income consumer non-cyclicals. The company successfully integrated health care products company Covidien during the period. The merged company experienced revenue growth from its cardiac and vascular, minimally invasive therapies, restorative therapies and diabetes business lines. Other sector contributors included Mondelez International and Valeant Pharmaceuticals International.
Notable fixed income contributors from other sectors included Dollar General, Freescale Semiconductor and Nippon Life Insurance.
The commodity price collapse during the period also negatively impacted our fixed income results. Coal company Peabody Energy and copper and gold miner Freeport-McMoRan in basic industry detracted from Fund performance, as did oil and gas services companies Weatherford International and Chesapeake Energy in energy. We strategically introduced some new energy positions during the period as valuations became attractive in our view. At period-end, we viewed our energy holdings favorably, believing they should be more tied to recently stabilized energy prices rather than potential interest rate moves.
Among fixed income finance companies, Navient, which services and collects student loans, lost value. Airplane and train manufacturer Bombardier, in the capital goods sector, was another detractor.
The Fund used derivative instruments during the period, such as equity options. The goal of these instruments is to enhance Fund returns and more efficiently enter and exit stock positions at prices the Fund deems attractive. None of these positions had a material impact on performance. We were comfortable with the Fund’s rising cash position during the period, as we believed it helped reduce volatility and enabled us to invest opportunistically at times when the markets retreated.
Thank you for your continued participation in Franklin Balanced Fund. We look forward to serving your future investment needs.

The foregoing information reflects our analysis, opinions and portfolio holdings as of April 30, 2015, the end of the reporting period. The way we implement our main investment strategies and the resulting portfolio holdings may change depending on factors such as market and economic conditions. These opinions may not be relied upon as investment advice or an offer for a particular security. The information is not a complete analysis of every aspect of any market, country, industry, security or the Fund. Statements of fact are from sources considered reliable, but the investment manager makes no representation or warranty as to their completeness or accuracy. Although historical performance is no guarantee of future results, these insights may help you understand our investment management philosophy.
CFA® is a trademark owned by CFA Institute.
6 | Semiannual Report franklintempleton.com
FRANKLIN BALANCED FUND
Performance Summary as of April 30, 2015
Your dividend income will vary depending on dividends or interest paid by securities in the Fund’s portfolio, adjusted for operating expenses of each class. Capital gain distributions are net profits realized from the sale of portfolio securities. The performance tables do not reflect any taxes that a shareholder would pay on Fund dividends, capital gain distributions, if any, or any realized gains on the sale of Fund shares. Total return reflects reinvestment of the Fund’s dividends and capital gain distributions, if any, and any unrealized gains or losses.
| | | | | | | |
| Net Asset Value | | | | | | |
| Share Class (Symbol) | | 4/30/15 | | 10/31/14 | | Change |
| A (FBLAX) | $ | 11.88 | $ | 11.86 | +$ | 0.02 |
| C (FBMCX) | $ | 11.78 | $ | 11.77 | +$ | 0.01 |
| R (N/A) | $ | 11.90 | $ | 11.89 | +$ | 0.01 |
| R6 (FBFRX) | $ | 11.90 | $ | 11.89 | +$ | 0.01 |
| Advisor (FBFZX) | $ | 11.90 | $ | 11.88 | +$ | 0.02 |
| |
| |
| Distributions (11/1/14–4/30/15) | | | | | | |
| | | Dividend | | Long-Term | | |
| Share Class | | Income | | Capital Gain | | Total |
| A | $ | 0.1800 | $ | 0.1574 | $ | 0.3374 |
| C | $ | 0.1385 | $ | 0.1574 | $ | 0.2959 |
| R | $ | 0.1680 | $ | 0.1574 | $ | 0.3254 |
| R6 | $ | 0.2045 | $ | 0.1574 | $ | 0.3619 |
| Advisor | $ | 0.1981 | $ | 0.1574 | $ | 0.3555 |
franklintempleton.com
Semiannual Report | 7
FRANKLIN BALANCED FUND
PERFORMANCE SUMMARY
Performance as of 4/30/151
Cumulative total return excludes sales charges. Average annual total returns and value of $10,000 investment include maximum sales charges. Class A: 5.75% maximum initial sales charge; Class C: 1% contingent deferred sales charge in first year only;
Class R/R6/Advisor Class: no sales charges.
| | | | | | | | | | | |
| | Cumulative | | Average Annual | | | Value of | Average Annual | | Total Annual | |
| Share Class | Total Return2 | | Total Return3 | | $ | 10,000 Investment4 | Total Return (3/31/15)5 | | Operating Expenses6 | |
| A | | | | | | | | | 1.09 | % |
| 6-Month | +3.11 | % | -2.79 | % | $ | 9,721 | | | | |
| 1-Year | +5.67 | % | -0.43 | % | $ | 9,957 | +0.03 | % | | |
| 5-Year | +56.88 | % | +8.14 | % | $ | 14,789 | +8.39 | % | | |
| Since Inception (7/3/06) | +75.47 | % | +5.87 | % | $ | 16,538 | +5.80 | % | | |
| C | | | | | | | | | 1.79 | % |
| 6-Month | +2.68 | % | +1.68 | % | $ | 10,168 | | | | |
| 1-Year | +4.88 | % | +3.88 | % | $ | 10,388 | +4.35 | % | | |
| 5-Year | +51.42 | % | +8.65 | % | $ | 15,142 | +8.90 | % | | |
| Since Inception (7/3/06) | +65.01 | % | +5.84 | % | $ | 16,501 | +5.78 | % | | |
| R | | | | | | | | | 1.29 | % |
| 6-Month | +2.91 | % | +2.91 | % | $ | 10,291 | | | | |
| 1-Year | +5.36 | % | +5.36 | % | $ | 10,536 | +5.83 | % | | |
| 5-Year | +55.36 | % | +9.21 | % | $ | 15,536 | +9.44 | % | | |
| Since Inception (7/3/06) | +72.71 | % | +6.39 | % | $ | 17,271 | +6.33 | % | | |
| R6 | | | | | | | | | 0.68 | % |
| 6-Month | +3.23 | % | +3.23 | % | $ | 10,323 | | | | |
| 1-Year | +6.18 | % | +6.18 | % | $ | 10,618 | +6.57 | % | | |
| Since Inception (5/1/13) | +18.63 | % | +8.93 | % | $ | 11,863 | +8.74 | % | | |
| Advisor | | | | | | | | | 0.79 | % |
| 6-Month | +3.26 | % | +3.26 | % | $ | 10,326 | | | | |
| 1-Year | +5.98 | % | +5.98 | % | $ | 10,598 | +6.45 | % | | |
| 5-Year | +59.32 | % | +9.76 | % | $ | 15,932 | +10.01 | % | | |
| Since Inception (7/3/06) | +80.23 | % | +6.90 | % | $ | 18,023 | +6.84 | % | | |
| | | | | | | |
| | Distribution | | 30-Day Standardized Yield8 | |
| Share Class | Rate7 | | (with waiver) | | (without waiver) | |
| A | 2.86 | % | 1.85 | % | 1.84 | % |
| C | 2.37 | % | 1.27 | % | 1.26 | % |
| R | 2.82 | % | 1.77 | % | 1.75 | % |
| R6 | 3.41 | % | 2.37 | % | 2.36 | % |
| Advisor | 3.33 | % | 2.26 | % | 2.25 | % |
Performance data represent past performance, which does not guarantee future results. Investment return and principal value will fluctuate, and you may have a gain or loss when you sell your shares. Current performance may differ from figures shown. For most recent month-end performance, go to franklintempleton.com or call (800) 342-5236.
8 | Semiannual Report
franklintempleton.com
| |
| FRANKLIN BALANCED FUND |
| PERFORMANCE SUMMARY |
All investments involve risks, including possible loss of principal. The Fund’s share price and yield will be affected by interest rate movements. Bond prices generally move in the opposite direction of interest rates. As prices of bonds in the Fund adjust to a rise in interest rates, the Fund’s share price may decline. Stock prices fluctuate, sometimes rapidly and dramatically, due to factors affecting individual companies, particular industries or sectors, or general market conditions. The Fund is actively managed but there is no guarantee that the manager’s investment decisions will produce the desired results. The Fund’s prospectus also includes a description of the main investment risks.
| | |
| Class C: | These shares have higher annual fees and expenses than Class A shares. |
| Class R: | Shares are available to certain eligible investors as described in the prospectus. These shares have higher annual fees and expenses than Class A shares. |
| Class R6: | Shares are available to certain eligible investors as described in the prospectus. |
| Advisor Class: | Shares are available to certain eligible investors as described in the prospectus. |
1. The Fund has a fee waiver associated with its investments in a Franklin Templeton money fund, contractually guaranteed through at least its current fiscal year-end.
Class R6 has a fee waiver contractually guaranteed through at least 2/29/16. Fund investment results reflect the fee waivers, to the extent applicable; without these
reductions, the results would have been lower.
2. Cumulative total return represents the change in value of an investment over the periods indicated.
3. Average annual total return represents the average annual change in value of an investment over the periods indicated. Six-month return has not been annualized.
4. These figures represent the value of a hypothetical $10,000 investment in the Fund over the periods indicated.
5. In accordance with SEC rules, we provide standardized average annual total return information through the latest calendar quarter.
6. Figures are as stated in the Fund’s current prospectus. In periods of market volatility, assets may decline significantly, causing total annual Fund operating expenses to
become higher than the figures shown.
7. Distribution rate is based on an annualization of the respective class’s April dividend and the maximum offering price (NAV for Classes C, R, R6 and Advisor) per share
on 4/30/15.
8. The 30-day standardized yield for the 30 days ended 4/30/15 reflects an estimated yield to maturity (assuming all portfolio securities are held to maturity). It should be
regarded as an estimate of the Fund’s rate of investment income, and it may not equal the Fund’s actual income distribution rate (which reflects the Fund’s past dividends
paid to shareholders) or the income reported in the Fund’s financial statements.
franklintempleton.com Semiannual Report | 9
FRANKLIN BALANCED FUND
Your Fund’s Expenses
As a Fund shareholder, you can incur two types of costs:
- Transaction costs, including sales charges (loads) on Fund purchases; and
- Ongoing Fund costs, including management fees, distribu- tion and service (12b-1) fees, and other Fund expenses. All mutual funds have ongoing costs, sometimes referred to as operating expenses.
The following table shows ongoing costs of investing in the Fund and can help you understand these costs and compare them with those of other mutual funds. The table assumes a $1,000 investment held for the six months indicated.
Actual Fund Expenses
The first line (Actual) for each share class listed in the table provides actual account values and expenses. The “Ending Account Value” is derived from the Fund’s actual return, which includes the effect of Fund expenses.
You can estimate the expenses you paid during the period by following these steps. Of course, your account value and expenses will differ from those in this illustration:
| 1. | Divide your account value by $1,000. |
| | If an account had an $8,600 value, then $8,600 ÷ $1,000 = 8.6. |
| 2. | Multiply the result by the number under the heading “Expenses Paid During Period.” |
| | If Expenses Paid During Period were $7.50, then 8.6 x $7.50 = $64.50. |
In this illustration, the estimated expenses paid this period are $64.50.
Hypothetical Example for Comparison with Other Funds
Information in the second line (Hypothetical) for each class in the table can help you compare ongoing costs of investing in the Fund with those of other mutual funds. This information may not be used to estimate the actual ending account balance or expenses you paid during the period. The hypothetical “Ending Account Value” is based on the actual expense ratio for each class and an assumed 5% annual rate of return before expenses, which does not represent the Fund’s actual return. The figure under the heading “Expenses Paid During Period” shows the hypothetical expenses your account would have incurred under this scenario. You can compare this figure with the 5% hypothetical examples that appear in shareholder reports of other funds.
Please note that expenses shown in the table are meant to highlight ongoing costs and do not reflect any transaction costs, such as sales charges. Therefore, the second line for each class is useful in comparing ongoing costs only, and will not help you compare total costs of owning different funds. In addition, if transaction costs were included, your total costs would have been higher. Please refer to the Fund prospectus for additional information on operating expenses.
10 | Semiannual Report
franklintempleton.com
FRANKLIN BALANCED FUND
YOUR FUND’S EXPENSES
| | | | | | | |
| | | Beginning Account | | Ending Account | | Expenses Paid During |
| Share Class | | Value 11/1/14 | | Value 4/30/15 | | Period* 11/1/14–4/30/15 |
| A | | | | | | |
| Actual | $ | 1,000 | $ | 1,031.10 | $ | 5.34 |
| Hypothetical (5% return before expenses) | $ | 1,000 | $ | 1,019.54 | $ | 5.31 |
| C | | | | | | |
| Actual | $ | 1,000 | $ | 1,026.80 | $ | 8.84 |
| Hypothetical (5% return before expenses) | $ | 1,000 | $ | 1,016.07 | $ | 8.80 |
| R | | | | | | |
| Actual | $ | 1,000 | $ | 1,029.10 | $ | 6.34 |
| Hypothetical (5% return before expenses) | $ | 1,000 | $ | 1,018.55 | $ | 6.31 |
| R6 | | | | | | |
| Actual | $ | 1,000 | $ | 1,032.30 | $ | 3.33 |
| Hypothetical (5% return before expenses) | $ | 1,000 | $ | 1,021.52 | $ | 3.31 |
| Advisor | | | | | | |
| Actual | $ | 1,000 | $ | 1,032.60 | $ | 3.83 |
| Hypothetical (5% return before expenses) | $ | 1,000 | $ | 1,021.03 | $ | 3.81 |
*Expenses are calculated using the most recent six-month expense ratio, net of expense waivers, annualized for each class (A: 1.06%;
C: 1.76%; R: 1.26%; R6: 0.66%; and Advisor: 0.76%), multiplied by the average account value over the period, multiplied by 181/365 to
reflect the one-half year period.
franklintempleton.com
Semiannual Report | 11
Franklin Convertible Securities Fund
This semiannual report for Franklin Convertible Securities Fund covers the period ended April 30, 2015.
Your Fund’s Goal and Main Investments
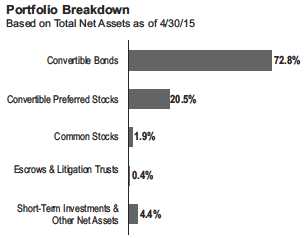
The Fund seeks to maximize total return, consistent with reasonable risk, by seeking to optimize capital appreciation and high current income under varying market conditions and investing at least 80% of its net assets in convertible securities.
Performance Overview
For the six months under review, the Fund’s Class A shares delivered a +2.48% cumulative total return. In comparison, the Fund’s benchmark, the BofA Merrill Lynch (BofAML) All Total Return Alternatives U.S. Convertibles Index, which tracks the domestic convertible securities market, posted a +4.18% total return.1 You can find the Fund’s long-term performance data in the Performance Summary beginning on page 14.
Performance data represent past performance, which does not guarantee future results. Investment return and principal value will fluctuate, and you may have a gain or loss when you sell your shares. Current performance may differ from figures shown. Please visit franklintempleton.com or call (800) 342-5236 for most recent month-end performance.
Investment Strategy
We follow a strategy of maintaining a balance in the portfolio between the equity and debt characteristics of convertible securities with an emphasis on the equity features. Convertible securities are attractive for two reasons: the opportunity to participate in common stocks’ potential growth with relatively reduced volatility, and the potential for current income with potential downside protection from bonds. Typically, we sell securities whose equity sensitivity becomes too high and no longer offers appropriate downside protection. Likewise, as securities become too bond-like — reducing their ability to appreciate with increases in the underlying common stock —we attempt to redeploy those assets into more balanced convertible securities and maintain the potential for the Fund’s upside participation. Our experienced team of analysts searches for investment opportunities among all economic sectors and considers a company’s long-term earnings, asset value and cash flow potential, to create a broadly diversified portfolio.
| | | |
| Top 10 Holdings | | |
| 4/30/15 | | |
| Company | % of Total | |
| Sector/Industry | Net Assets | |
| |
| Electronic Arts Inc. | 2.9 | % |
| Information Technology | | |
| Novellus Systems Inc. | 2.3 | % |
| Information Technology | | |
| Omnicare Inc. | 2.3 | % |
| Health Care | | |
| Forest City Enterprises Inc. | 2.2 | % |
| Financials | | |
| Palo Alto Networks Inc. | 2.1 | % |
| Information Technology | | |
| Jarden Corp. | 2.1 | % |
| Consumer Discretionary | | |
| Trulia Inc. | 2.1 | % |
| Information Technology | | |
| Salix Pharmaceuticals Ltd. | 2.1 | % |
| Health Care | | |
| Salesforce.com Inc. | 2.0 | % |
| Information Technology | | |
| ServiceNow Inc. | 2.0 | % |
| Information Technology | | |
1. Source: BofA Merrill Lynch.
The indexes are unmanaged and include reinvestment of any income or distributions. One cannot invest directly in an index, and an index is not representative of the
Fund’s portfolio.
The dollar value, number of shares or principal amount, and names of all portfolio holdings are listed in the Fund’s Statement of Investments (SOI).
The SOI begins on page 50.
12 | Semiannual Report franklintempleton.com
FRANKLIN CONVERTIBLE SECURITIES FUND
Manager’s Discussion
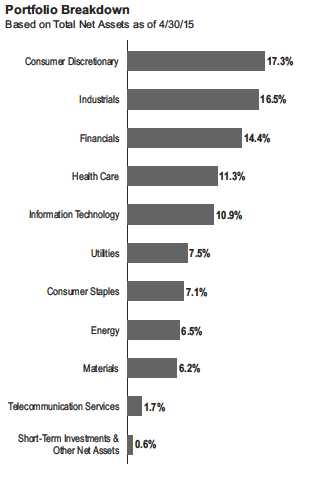
Most sectors the Fund invested in rose in value, as did the majority of the portfolio’s individual securities, supporting overall performance during the six months under review. Investments in the health care, information technology (IT), telecommunication services and consumer staples sectors accounted for the bulk of the Fund’s total return. Among health care sector holdings, pharmaceuticals firms BioMarin Pharmaceutical, Mylan and Salix Pharmaceuticals were top contributors. Within IT, the Fund’s holdings of convertible notes issued by video game company Electronic Arts, network security firm Palo Alto Networks and semiconductor manufacturer Microchip Technology2 enjoyed some of the largest gains. In the telecommunication services sector, a new position in convertible preferred shares of wireless network operator T-Mobile US was a top contributor. Post Holdings, which specializes in cereals and granola, was a key consumer staples contributor.
Despite the Fund’s positive results this reporting period, there were a few disappointments in the portfolio. By sector, energy, materials and consumer discretionary detracted from performance. The slowing global economy outside North America and growing production led to excess supply in oil, coal and iron ore and contributed to a decline in energy prices in 2014’s fourth quarter. This collapse drove a substantial amount of the underperformance in the Fund’s energy and materials sectors. On an individual security basis, key detractors included SandRidge Energy convertible preferred shares, Iconix Brand Group convertible notes and Rex Energy convertible preferred shares. Holdings of flash memory manufacturer Sandisk and Pacira Pharmaceuticals also hurt Fund performance.
Thank you for your continued participation in Franklin Convertible Securities Fund. We look forward to serving your future investment needs.

The foregoing information reflects our analysis, opinions and portfolio holdings as of April 30, 2015, the end of the reporting period. The way we implement our main investment strategies and the resulting portfolio holdings may change depending on factors such as market and economic conditions. These opinions may not be relied upon as investment advice or an offer for a particular security. The information is not a complete analysis of every aspect of any market, country, industry, security or the Fund. Statements of fact are from sources considered reliable, but the investment manager makes no representation or warranty as to their completeness or accuracy. Although historical performance is no guarantee of future results, these insights may help you understand our investment management philosophy.
2. One security sold and another purchased during the period.
See www.franklintempletondatasources.com for additional data provider information.
franklintempleton.com Semiannual Report | 13
FRANKLIN CONVERTIBLE SECURITIES FUND
Performance Summary as of April 30, 2015
Your dividend income will vary depending on dividends or interest paid by securities in the Fund’s portfolio, adjusted for operating expenses of each class. Capital gain distributions are net profits realized from the sale of portfolio securities. The performance tables do not reflect any taxes that a shareholder would pay on Fund dividends, capital gain distributions, if any, or any realized gains on the sale of Fund shares. Total return reflects reinvestment of the Fund’s dividends and capital gain distributions, if any, and any unrealized gains or losses.
| | | | | | | | | |
| Net Asset Value | | | | | | | | |
| Share Class (Symbol) | | 4/30/15 | | 10/31/14 | | Change | | |
| A (FISCX) | $ | 18.54 | $ | 18.97 | -$ | 0.43 | | |
| C (FROTX) | $ | 18.29 | $ | 18.73 | -$ | 0.44 | | |
| R6 (N/A) | $ | 18.55 | $ | 18.99 | -$ | 0.44 | | |
| Advisor (FCSZX) | $ | 18.54 | $ | 18.98 | -$ | 0.44 | | |
| |
| |
| Distributions (11/1/14–4/30/15) | | | | | | | | |
| | | Dividend | | Short-Term | | Long-Term | | |
| Share Class | | Income | | Capital Gain | | Capital Gain | | Total |
| A | $ | 0.1770 | $ | 0.1578 | $ | 0.5215 | $ | 0.8563 |
| C | $ | 0.1094 | $ | 0.1578 | $ | 0.5215 | $ | 0.7887 |
| R6 | $ | 0.2138 | $ | 0.1578 | $ | 0.5215 | $ | 0.8931 |
| Advisor | $ | 0.2016 | $ | 0.1578 | $ | 0.5215 | $ | 0.8809 |
14 | Semiannual Report
franklintempleton.com
FRANKLIN CONVERTIBLE SECURITIES FUND
PERFORMANCE SUMMARY
Performance as of 4/30/151
Cumulative total return excludes sales charges. Average annual total returns and value of $10,000 investment include maximum sales charges. Class A: 5.75% maximum initial sales charge; Class C: 1% contingent deferred sales charge in first year only;
Class R6/Advisor Class: no sales charges.
| | | | | | | | | | | |
| | Cumulative | | Average Annual | | | Value of | Average Annual | | Total Annual | |
| Share Class | Total Return2 | | Total Return3 | | $ | 10,000 Investment4 | Total Return (3/31/15)5 | | Operating Expenses6 | |
| A | | | | | | | | | 0.88 | % |
| 6-Month | +2.48 | % | -3.42 | % | $ | 9,658 | | | | |
| 1-Year | +5.20 | % | -0.87 | % | $ | 9,913 | -2.10 | % | | |
| 5-Year | +58.50 | % | +8.36 | % | $ | 14,938 | +8.91 | % | | |
| 10-Year | +111.16 | % | +7.13 | % | $ | 19,906 | +6.77 | % | | |
| C | | | | | | | | | 1.63 | % |
| 6-Month | +2.07 | % | +1.10 | % | $ | 10,110 | | | | |
| 1-Year | +4.38 | % | +3.39 | % | $ | 10,339 | +2.10 | % | | |
| 5-Year | +52.62 | % | +8.82 | % | $ | 15,262 | +9.37 | % | | |
| 10-Year | +95.91 | % | +6.96 | % | $ | 19,591 | +6.60 | % | | |
| R6 | | | | | | | | | 0.51 | % |
| 6-Month | +2.63 | % | +2.63 | % | $ | 10,263 | | | | |
| 1-Year | +5.55 | % | +5.55 | % | $ | 10,555 | +4.31 | % | | |
| Since Inception (3/4/14) | +2.74 | % | +2.37 | % | $ | 10,274 | +1.93 | % | | |
| Advisor7 | | | | | | | | | 0.63 | % |
| 6-Month | +2.56 | % | +2.56 | % | $ | 10,256 | | | | |
| 1-Year | +5.43 | % | +5.43 | % | $ | 10,543 | +4.13 | % | | |
| 5-Year | +60.41 | % | +9.91 | % | $ | 16,041 | +10.48 | % | | |
| 10-Year | +114.92 | % | +7.95 | % | $ | 21,492 | +7.60 | % | | |
| | | | | | | |
| | Distribution | | 30-Day Standardized Yield9 | |
| Share Class | Rate8 | | (with waiver) | | (without waiver) | |
| A | 1.64 | % | 1.40 | % | 1.40 | % |
| C | 1.02 | % | 0.75 | % | 0.75 | % |
| R6 | 2.12 | % | 1.86 | % | 1.86 | % |
| Advisor | 2.01 | % | 1.74 | % | 1.74 | % |
Performance data represent past performance, which does not guarantee future results. Investment return and principal value will fluctuate, and you may have a gain or loss when you sell your shares. Current performance may differ from figures shown. For most recent month-end performance, go to franklintempleton.com or call (800) 342-5236.
franklintempleton.com
Semiannual Report | 15
FRANKLIN CONVERTIBLE SECURITIES FUND
PERFORMANCE SUMMARY
All investments involve risks, including possible loss of principal. The Fund may invest in high yielding, fixed income securities. High yields reflect the higher credit risk associated with these lower rated securities and, in some cases, the lower market prices for these instruments. Interest rate movements may affect the Fund’s share price and yield. Bond prices generally move in the opposite direction of interest rates. As prices of bonds in the Fund adjust to a rise in interest rates, the Fund’s share price may decline. The Fund may also invest in foreign securities, which involve special risks, including political uncertainty and currency volatility. The Fund is actively managed but there is no guarantee that the manager’s investment decisions will produce the desired results. The Fund’s prospectus also includes a description of the main investment risks.
| | |
| Class C: | These shares have higher annual fees and expenses than Class A shares. |
| Class R6: | Shares are available to certain eligible investors as described in the prospectus. |
| Advisor Class: | Shares are available to certain eligible investors as described in the prospectus. |
1. The Fund has a fee waiver associated with its investments in a Franklin Templeton money fund, contractually guaranteed through at least its current fiscal year-end.
Class R6 has a fee waiver contractually guaranteed through at least 2/29/16. Fund investment results reflect the fee waivers, to the extent applicable; without these
reductions, the results would have been lower.
2. Cumulative total return represents the change in value of an investment over the periods indicated.
3. Average annual total return represents the average annual change in value of an investment over the periods indicated. Six-month return has not been annualized.
4. These figures represent the value of a hypothetical $10,000 investment in the Fund over the periods indicated.
5. In accordance with SEC rules, we provide standardized average annual total return information through the latest calendar quarter.
6. Figures are as stated in the Fund’s current prospectus. In periods of market volatility, assets may decline significantly, causing total annual Fund operating expenses to
become higher than the figures shown.
7. Effective 5/15/08, the Fund began offering Advisor Class shares, which do not have sales charges or a Rule 12b-1 plan. Performance quotations for this class reflect the
following methods of calculation: (a) For periods prior to 5/15/08, a restated figure is used based upon the Fund’s Class A performance, excluding the effect of Class A’s
maximum initial sales charge, but reflecting the effect of the Class A Rule 12b-1 fees; and (b) for periods after 5/15/08, actual Advisor Class performance is used reflecting
all charges and fees applicable to that class. Since 5/15/08 (commencement of sales), the cumulative and average annual total returns of Advisor Class shares were
+63.86% and +7.35%.
8. Distribution rate is based on the sum of the respective class’s past four quarterly dividends and the maximum offering price (NAV for Classes C, R6 and Advisor) per
share on 4/30/15.
9. The 30-day standardized yield for the 30 days ended 4/30/15 reflects an estimated yield to maturity (assuming all portfolio securities are held to maturity). It should be
regarded as an estimate of the Fund’s rate of investment income, and it may not equal the Fund’s actual income distribution rate (which reflects the Fund’s past dividends
paid to shareholders) or the income reported in the Fund’s financial statements.
16 | Semiannual Report franklintempleton.com
FRANKLIN CONVERTIBLE SECURITIES FUND
Your Fund’s Expenses
As a Fund shareholder, you can incur two types of costs:
- Transaction costs, including sales charges (loads) on Fund purchases; and
- Ongoing Fund costs, including management fees, distribu- tion and service (12b-1) fees, and other Fund expenses. All mutual funds have ongoing costs, sometimes referred to as operating expenses.
The following table shows ongoing costs of investing in the Fund and can help you understand these costs and compare them with those of other mutual funds. The table assumes a $1,000 investment held for the six months indicated.
Actual Fund Expenses
The first line (Actual) for each share class listed in the table provides actual account values and expenses. The “Ending Account Value” is derived from the Fund’s actual return, which includes the effect of Fund expenses.
You can estimate the expenses you paid during the period by following these steps. Of course, your account value and expenses will differ from those in this illustration:
| 1. | Divide your account value by $1,000. |
| | If an account had an $8,600 value, then $8,600 ÷ $1,000 = 8.6. |
| 2. | Multiply the result by the number under the heading “Expenses Paid During Period.” |
| | If Expenses Paid During Period were $7.50, then 8.6 x $7.50 = $64.50. |
In this illustration, the estimated expenses paid this period are $64.50.
Hypothetical Example for Comparison with Other Funds
Information in the second line (Hypothetical) for each class in the table can help you compare ongoing costs of investing in the Fund with those of other mutual funds. This information may not be used to estimate the actual ending account balance or expenses you paid during the period. The hypothetical “Ending Account Value” is based on the actual expense ratio for each class and an assumed 5% annual rate of return before expenses, which does not represent the Fund’s actual return. The figure under the heading “Expenses Paid During Period” shows the hypothetical expenses your account would have incurred under this scenario. You can compare this figure with the 5% hypothetical examples that appear in shareholder reports of other funds.
Please note that expenses shown in the table are meant to highlight ongoing costs and do not reflect any transaction costs, such as sales charges. Therefore, the second line for each class is useful in comparing ongoing costs only, and will not help you compare total costs of owning different funds. In addition, if transaction costs were included, your total costs would have been higher. Please refer to the Fund prospectus for additional information on operating expenses.
franklintempleton.com Semiannual Report | 17
| | | | | | | |
| FRANKLIN CONVERTIBLE SECURITIES FUND | | | | |
| YOUR FUND’S EXPENSES | | | | | | |
| |
| |
| |
| | | Beginning Account | | Ending Account | | Expenses Paid During |
| Share Class | | Value 11/1/14 | | Value 4/30/15 | | Period* 11/1/14–4/30/15 |
| A | | | | | | |
| Actual | $ | 1,000 | $ | 1,024.80 | $ | 4.32 |
| Hypothetical (5% return before expenses) | $ | 1,000 | $ | 1,020.53 | $ | 4.31 |
| C | | | | | | |
| Actual | $ | 1,000 | $ | 1,020.70 | $ | 8.07 |
| Hypothetical (5% return before expenses) | $ | 1,000 | $ | 1,016.81 | $ | 8.05 |
| R6 | | | | | | |
| Actual | $ | 1,000 | $ | 1,026.30 | $ | 2.51 |
| Hypothetical (5% return before expenses) | $ | 1,000 | $ | 1,022.32 | $ | 2.51 |
| Advisor | | | | | | |
| Actual | $ | 1,000 | $ | 1,025.60 | $ | 3.06 |
| Hypothetical (5% return before expenses) | $ | 1,000 | $ | 1,021.77 | $ | 3.06 |
*Expenses are calculated using the most recent six-month expense ratio, net of expense waivers, annualized for each class (A: 0.86%;
C: 1.61%; R6: 0.50%; and Advisor: 0.61%), multiplied by the average account value over the period, multiplied by 181/365 to reflect the
one-half year period.
18 | Semiannual Report franklintempleton.com
Franklin Equity Income Fund
This semiannual report for Franklin Equity Income Fund covers the period ended April 30, 2015.
Your Fund’s Goal and Main Investments
The Fund seeks to maximize total return, emphasizing high current income and long-term capital appreciation, consistent with reasonable risk, by investing at least 80% of its net assets in equity securities including securities convertible into common stocks.
Performance Overview
For the six months under review, the Fund’s Class A shares delivered a +3.50% cumulative total return. In comparison, the Fund’s benchmark, the Standard & Poor’s 500 Index (S&P 500), which tracks the broad U.S. stock market, generated a +4.40% total return.1 The Fund’s peers, as measured by the Lipper Equity Income Funds Classification Average, which consists of funds chosen by Lipper that seek relatively high current income and growth of income by investing at least 60% of their portfolios in stocks, posted a +2.96% total return.2 You can find the Fund’s long-term performance data in the Performance Summary beginning on page 22.
Performance data represent past performance, which does not guarantee future results. Investment return and principal value will fluctuate, and you may have a gain or loss when you sell your shares. Current performance may differ from figures shown. Please visit franklintempleton.com or call (800) 342-5236 for most recent month-end performance.
Investment Strategy
We seek to invest in a broadly diversified portfolio of equity securities that we consider to be financially strong, with a focus on “blue chip” companies. We apply a bottom-up approach to investing in individual securities. We will assess the market price of a company’s securities relative to our evaluation of the company’s long-term earnings, asset value and cash flow potential. We also consider a company’s price/earnings ratio,
profit margins, balance sheet and liquidation value. We consider dividend yield in selecting stocks for the Fund because we believe that, over time, dividend income can contribute significantly to total return and can be a more consistent source of investment return than capital appreciation. We seek to take advantage of price dislocations that result from the market’s short-term focus and choose to invest in those companies that, in our opinion, offer the best trade-off between growth opportunity, business and financial risk, and valuation.
1. Source: Morningstar.
2. Source: Lipper, a Thomson Reuters Company. For the six-month period ended 4/30/15, this category consisted of 514 funds. Lipper calculations do not include sales
charges, or expense subsidization by a fund’s manager. The Fund’s performance relative to the average may have differed if these and other factors had been considered.
The indexes are unmanaged and include reinvested dividends. One cannot invest directly in an index, and an index is not representative of the Fund’s portfolio.
The dollar value, number of shares or principal amount, and names of all portfolio holdings are listed in the Fund’s Statement of Investments (SOI).
The SOI begins on page 59.
franklintempleton.com Semiannual Report | 19
| | | | | | |
| FRANKLIN EQUITY INCOME FUND | | |
| |
| |
| Dividend Distributions* | | | |
| 11/1/14–4/30/15 | | | | |
| | | Dividend per Share (cents) | |
| | | | | | Advisor |
| Month | Class A | Class C | Class R | Class R6 | Class |
| November | 3.90 | 2.42 | 3.41 | 4.64 | 4.40 |
| December** | 26.44 | 24.92 | 25.94 | 27.17 | 26.94 |
| January | 3.90 | 2.38 | 3.40 | 4.63 | 4.40 |
| February | 3.90 | 2.38 | 3.40 | 4.63 | 4.40 |
| March | 3.90 | 2.52 | 3.43 | 4.59 | 4.37 |
| April | 3.90 | 2.52 | 3.43 | 4.59 | 4.37 |
| Total | 45.94 | 37.14 | 43.01 | 50.25 | 48.88 |
*All Fund distributions will vary depending upon current market conditions, and past
distributions are not indicative of future trends.
**Includes an additional 22.54 cent per share distribution to meet excise tax
requirements.
Manager’s Discussion
Most sectors the Fund invested in rose in value, as did the majority of the portfolio’s individual securities, supporting overall performance during the six months under review. Key contributing sectors included consumer discretionary, information technology (IT), industrials and health care.
Within the consumer discretionary sector, specialty retailer L Brands, multiline retailer Target and Internet retailer Amazon.com led results. Among IT holdings, communications equipment company Cisco Systems, semiconductor and semiconductor equipment maker Maxim Integrated Products and software firm CA were key contributors. Aerospace and defense firm The Boeing Co.3 and waste management company Republic Services were leading contributors in the industrials sector. Top-performing health care sector holdings included pharmaceuticals firms Pfizer and Eli Lilly & Co. Other standout performers included Starwood Hotels & Resorts Worldwide and investment manager BlackRock.
| | | |
| Top 10 Holdings | | |
| 4/30/15 | | |
| Company | % of Total | |
| Sector/Industry | Net Assets | |
| |
| Microsoft Corp. | 2.3 | % |
| Information Technology | | |
| Cisco Systems Inc. | 2.3 | % |
| Information Technology | | |
| Ford Motor Co. | 2.3 | % |
| Consumer Discretionary | | |
| BlackRock Inc. | 2.2 | % |
| Financials | | |
| L Brands Inc. | 2.2 | % |
| Consumer Discretionary | | |
| NIKE Inc., B | 2.1 | % |
| Consumer Discretionary | | |
| Target Corp. | 2.1 | % |
| Consumer Discretionary | | |
| Starwood Hotels & Resorts Worldwide Inc. | 2.1 | % |
| Consumer Discretionary | | |
| Sanofi, ADR (France) | 2.1 | % |
| Health Care | | |
| JPMorgan Chase & Co. | 2.1 | % |
| Financials | | |
The slowing global economy outside North America and growing production led to excess supply in oil, coal and iron ore and contributed to a decline in commodity prices in 2014’s fourth quarter. This collapse drove a substantial amount of the underperformance in the Fund’s energy and materials sectors. Copper and gold miner Freeport-McMoRan and aluminum producer Alcoa were notable detractors. Energy firms Royal Dutch Shell, Chesapeake Energy, Exxon Mobil and HollyFrontier also posted losses. Other key detractors included hotel and casino operator Wynn Resorts3 and heavy equipment manufacturer Caterpillar.
3. No longer held at period-end.
See www.franklintempletondatasources.com for additional data provider information.
20 | Semiannual Report franklintempleton.com
FRANKLIN EQUITY INCOME FUND
Thank you for your continued participation in Franklin Equity Income Fund. We look forward to serving your future investment needs.

The foregoing information reflects our analysis, opinions and portfolio holdings as of April 30, 2015, the end of the reporting period. The way we implement our main investment strategies and the resulting portfolio holdings may change depending on factors such as market and economic conditions. These opinions may not be relied upon as investment advice or an offer for a particular security. The information is not a complete analysis of every aspect of any market, country, industry, security or the Fund. Statements of fact are from sources considered reliable, but the investment manager makes no representation or warranty as to their completeness or accuracy. Although historical performance is no guarantee of future results, these insights may help you understand our investment management philosophy.
franklintempleton.com Semiannual Report | 21
FRANKLIN EQUITY INCOME FUND
Performance Summary as of April 30, 2015
Your dividend income will vary depending on dividends or interest paid by securities in the Fund’s portfolio, adjusted for operating expenses of each class. Capital gain distributions are net profits realized from the sale of portfolio securities. The performance tables do not reflect any taxes that a shareholder would pay on Fund dividends, capital gain distributions, if any, or any realized gains on the sale of Fund shares. Total return reflects reinvestment of the Fund’s dividends and capital gain distributions, if any, and any unrealized gains or losses.
| | | | | | | | | |
| Net Asset Value | | | | | | | | |
| Share Class (Symbol) | | 4/30/15 | | 10/31/14 | | Change | | |
| A (FISEX) | $ | 23.18 | $ | 23.93 | -$ | 0.75 | | |
| C (FRETX) | $ | 23.05 | $ | 23.79 | -$ | 0.74 | | |
| R (FREIX) | $ | 23.18 | $ | 23.93 | -$ | 0.75 | | |
| R6 (N/A) | $ | 23.20 | $ | 23.95 | -$ | 0.75 | | |
| Advisor (FEIFX) | $ | 23.21 | $ | 23.96 | -$ | 0.75 | | |
| |
| |
| Distributions (11/1/14–4/30/15) | | | | | | | | |
| | | Dividend | | Short-Term | | Long-Term | | |
| Share Class | | Income | | Capital Gain | | Capital Gain | | Total |
| A | $ | 0.4594 | $ | 0.2690 | $ | 0.7955 | $ | 1.5239 |
| C | $ | 0.3714 | $ | 0.2690 | $ | 0.7955 | $ | 1.4359 |
| R | $ | 0.4301 | $ | 0.2690 | $ | 0.7955 | $ | 1.4946 |
| R6 | $ | 0.5025 | $ | 0.2690 | $ | 0.7955 | $ | 1.5670 |
| Advisor | $ | 0.4888 | $ | 0.2690 | $ | 0.7955 | $ | 1.5533 |
22 | Semiannual Report
franklintempleton.com
FRANKLIN EQUITY INCOME FUND
PERFORMANCE SUMMARY
Performance as of 4/30/151
Cumulative total return excludes sales charges. Average annual total returns and value of $10,000 investment include maximum sales charges. Class A: 5.75% maximum initial sales charge; Class C: 1% contingent deferred sales charge in first year only;
Class R/R6/Advisor Class: no sales charges.
| | | | | | | | | | | | | |
| | | | | | | Value of | Average Annual | | | | | |
| | | | | | | | | | Total Annual Operating Expenses6 | |
| | Cumulative | | Average Annual | | $ | 10,000 | Total Return | | | | | |
| Share Class | Total Return2 | | Total Return3 | | | Investment4 | (3/31/15 | )5 | (with waiver) | | (without waiver) | |
| A | | | | | | | | | 0.87 | % | 0.87 | % |
| 6-Month | +3.50 | % | -2.45 | % | $ | 9,755 | | | | | | |
| 1-Year | +7.36 | % | +1.19 | % | $ | 10,119 | +0.88 | % | | | | |
| 5-Year | +76.99 | % | +10.78 | % | $ | 16,685 | +10.96 | % | | | | |
| 10-Year | +81.48 | % | +5.52 | % | $ | 17,106 | +5.27 | % | | | | |
| C | | | | | | | | | 1.62 | % | 1.62 | % |
| 6-Month | +3.18 | % | +2.21 | % | $ | 10,221 | | | | | | |
| 1-Year | +6.60 | % | +5.60 | % | $ | 10,560 | +5.27 | % | | | | |
| 5-Year | +70.49 | % | +11.26 | % | $ | 17,049 | +11.45 | % | | | | |
| 10-Year | +68.48 | % | +5.35 | % | $ | 16,848 | +5.11 | % | | | | |
| R | | | | | | | | | 1.12 | % | 1.12 | % |
| 6-Month | +3.37 | % | +3.37 | % | $ | 10,337 | | | | | | |
| 1-Year | +7.09 | % | +7.09 | % | $ | 10,709 | +6.76 | % | | | | |
| 5-Year | +74.66 | % | +11.80 | % | $ | 17,466 | +11.99 | % | | | | |
| 10-Year | +76.78 | % | +5.86 | % | $ | 17,678 | +5.62 | % | | | | |
| R6 | | | | | | | | | 0.50 | % | 1.78 | % |
| 6-Month | +3.69 | % | +3.69 | % | $ | 10,369 | | | | | | |
| 1-Year | +7.75 | % | +7.75 | % | $ | 10,775 | +7.41 | % | | | | |
| Since Inception (5/1/13) | +29.70 | % | +13.91 | % | $ | 12,970 | +13.89 | % | | | | |
| Advisor7 | | | | | | | | | 0.62 | % | 0.62 | % |
| 6-Month | +3.63 | % | +3.63 | % | $ | 10,363 | | | | | | |
| 1-Year | +7.63 | % | +7.63 | % | $ | 10,763 | +7.34 | % | | | | |
| 5-Year | +79.28 | % | +12.38 | % | $ | 17,928 | +12.58 | % | | | | |
| 10-Year | +84.82 | % | +6.33 | % | $ | 18,482 | +6.09 | % | | | | |
| | | | | | | |
| | | | 30-Day Standardized Yield9 | |
| | Distribution | | | | | |
| Share Class | Rate8 | | (with waiver) | | (without waiver) | |
| A | 1.90 | % | 2.10 | % | 2.10 | % |
| C | 1.31 | % | 1.49 | % | 1.49 | % |
| R | 1.78 | % | 1.98 | % | 1.98 | % |
| R6 | 2.37 | % | 2.60 | % | 2.60 | % |
| Advisor | 2.26 | % | 2.48 | % | 2.48 | % |
Performance data represent past performance, which does not guarantee future results. Investment return and principal value will fluctuate, and you may have a gain or loss when you sell your shares. Current performance may differ from figures shown. For most recent month-end performance, go to franklintempleton.com or call (800) 342-5236.
franklintempleton.com Semiannual Report | 23
FRANKLIN EQUITY INCOME FUND
PERFORMANCE SUMMARY
All investments involve risks, including possible loss of principal. Stock prices fluctuate, sometimes rapidly and dramatically, due to factors affecting individual companies, particular industries or sectors, or general market conditions. Convertible securities are subject to the risks of stocks when the underlying stock price is high relative to the conversion price and debt securities when the underlying stock price is low relative to the conversion price. The Fund’s investment in foreign securities also involves special risks, including currency fluctuations and economic as well as political uncertainty. The Fund is actively managed but there is no guarantee that the manager’s investment decisions will produce the desired results. The Fund’s prospectus also includes a description of the main investment risks.
| | |
| Class C: | These shares have higher annual fees and expenses than Class A shares. |
| Class R: | Shares are available to certain eligible investors as described in the prospectus. These shares have higher annual fees and expenses than Class A shares. |
| Class R6: | Shares are available to certain eligible investors as described in the prospectus. |
| Advisor Class: | Shares are available to certain eligible investors as described in the prospectus. |
1. The Fund has a fee waiver associated with its investments in a Franklin Templeton money fund, contractually guaranteed through at least its current fiscal year-end.
Class R6 has a fee waiver contractually guaranteed through at least 2/29/16. Fund investment results reflect the fee waivers, to the extent applicable; without these
reductions, the results would have been lower.
2. Cumulative total return represents the change in value of an investment over the periods indicated.
3. Average annual total return represents the average annual change in value of an investment over the periods indicated. Six-month return has not been annualized.
4. These figures represent the value of a hypothetical $10,000 investment in the Fund over the periods indicated.
5. In accordance with SEC rules, we provide standardized average annual total return information through the latest calendar quarter.
6. Figures are as stated in the Fund’s current prospectus. In periods of market volatility, assets may decline significantly, causing total annual Fund operating expenses to
become higher than the figures shown.
7. Effective 5/15/08, the Fund began offering Advisor Class shares, which do not have sales charges or a Rule 12b-1 plan. Performance quotations for this class reflect the
following methods of calculation: (a) For periods prior to 5/15/08, a restated figure is used based upon the Fund’s Class A performance, excluding the effect of Class A’s
maximum initial sales charge, but reflecting the effect of the Class A Rule 12b-1 fees; and (b) for periods after 5/15/08, actual Advisor Class performance is used reflecting
all charges and fees applicable to that class. Since 5/15/08 (commencement of sales), the cumulative and average annual total returns of Advisor Class shares were
+55.35% and +6.53%.
8. Distribution rate is based on an annualization of the respective class’s April dividend and the maximum offering price (NAV for Classes C, R, R6 and Advisor) per share
on 4/30/15.
9. The 30-day standardized yield for the 30 days ended 4/30/15 reflects an estimated yield to maturity (assuming all portfolio securities are held to maturity). It should be
regarded as an estimate of the Fund’s rate of investment income, and it may not equal the Fund’s actual income distribution rate (which reflects the Fund’s past dividends
paid to shareholders) or the income reported in the Fund’s financial statements.
24 | Semiannual Report franklintempleton.com
FRANKLIN EQUITY INCOME FUND
Your Fund’s Expenses
As a Fund shareholder, you can incur two types of costs:
- Transaction costs, including sales charges (loads) on Fund purchases; and
- Ongoing Fund costs, including management fees, distribu- tion and service (12b-1) fees, and other Fund expenses. All mutual funds have ongoing costs, sometimes referred to as operating expenses.
The following table shows ongoing costs of investing in the Fund and can help you understand these costs and compare them with those of other mutual funds. The table assumes a $1,000 investment held for the six months indicated.
Actual Fund Expenses
The first line (Actual) for each share class listed in the table provides actual account values and expenses. The “Ending Account Value” is derived from the Fund’s actual return, which includes the effect of Fund expenses.
You can estimate the expenses you paid during the period by following these steps. Of course, your account value and expenses will differ from those in this illustration:
| 1. | Divide your account value by $1,000. |
| | If an account had an $8,600 value, then $8,600 ÷ $1,000 = 8.6. |
| 2. | Multiply the result by the number under the heading “Expenses Paid During Period.” |
| | If Expenses Paid During Period were $7.50, then 8.6 x $7.50 = $64.50. |
In this illustration, the estimated expenses paid this period are $64.50.
Hypothetical Example for Comparison with Other Funds
Information in the second line (Hypothetical) for each class in the table can help you compare ongoing costs of investing in the Fund with those of other mutual funds. This information may not be used to estimate the actual ending account balance or expenses you paid during the period. The hypothetical “Ending Account Value” is based on the actual expense ratio for each class and an assumed 5% annual rate of return before expenses, which does not represent the Fund’s actual return. The figure under the heading “Expenses Paid During Period” shows the hypothetical expenses your account would have incurred under this scenario. You can compare this figure with the 5% hypothetical examples that appear in shareholder reports of other funds.
Please note that expenses shown in the table are meant to highlight ongoing costs and do not reflect any transaction costs, such as sales charges. Therefore, the second line for each class is useful in comparing ongoing costs only, and will not help you compare total costs of owning different funds. In addition, if transaction costs were included, your total costs would have been higher. Please refer to the Fund prospectus for additional information on operating expenses.
franklintempleton.com
Semiannual Report | 25
| | | | | | | |
| FRANKLIN EQUITY INCOME FUND | | | | | | |
| YOUR FUND’S EXPENSES | | | | | | |
| |
| |
| |
| | | Beginning Account | | Ending Account | | Expenses Paid During |
| Share Class | | Value 11/1/14 | | Value 4/30/15 | | Period* 11/1/14–4/30/15 |
| A | | | | | | |
| Actual | $ | 1,000 | $ | 1,035.00 | $ | 4.39 |
| Hypothetical (5% return before expenses) | $ | 1,000 | $ | 1,020.48 | $ | 4.36 |
| C | | | | | | |
| Actual | $ | 1,000 | $ | 1,031.80 | $ | 8.16 |
| Hypothetical (5% return before expenses) | $ | 1,000 | $ | 1,016.76 | $ | 8.10 |
| R | | | | | | |
| Actual | $ | 1,000 | $ | 1,033.70 | $ | 5.65 |
| Hypothetical (5% return before expenses) | $ | 1,000 | $ | 1,019.24 | $ | 5.61 |
| R6 | | | | | | |
| Actual | $ | 1,000 | $ | 1,036.90 | $ | 2.53 |
| Hypothetical (5% return before expenses) | $ | 1,000 | $ | 1,022.32 | $ | 2.51 |
| Advisor | | | | | | |
| Actual | $ | 1,000 | $ | 1,036.30 | $ | 3.13 |
| Hypothetical (5% return before expenses) | $ | 1,000 | $ | 1,021.72 | $ | 3.11 |
*Expenses are calculated using the most recent six-month expense ratio, net of expense waivers, annualized for each class (A: 0.87%;
C: 1.62%; R: 1.12%; R6: 0.50%; and Advisor: 0.62%), multiplied by the average account value over the period, multiplied by 181/365 to
reflect the one-half year period.
26 | Semiannual Report
franklintempleton.com
Franklin Real Return Fund
This semiannual report for Franklin Real Return Fund covers the period ended April 30, 2015.
Your Fund’s Goal and Main Investments
The Fund seeks to achieve total return that exceeds the rate of inflation over an economic cycle. The Fund will generally invest a substantial portion of its assets in inflation-protected securities. The managers also have the flexibility to invest in other sectors of the market to increase real return (total return less inflation) potential and offer greater diversification.
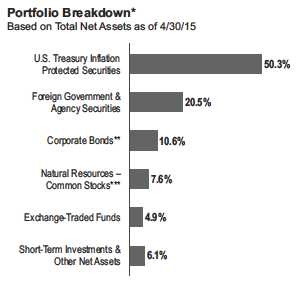
*Figures reflect certain derivatives held in the portfolio (or their underlying
reference assets) and may not total 100% or may be negative due to rounding,
use of any derivatives, unsettled trades or other factors.
**Includes Senior Floating Rate Interests.
***In the SOI, the natural resources sector comprises energy and materials.
Performance Overview
For the six months under review, the Fund’s Class A shares had a -1.69% cumulative total return. In comparison, the Barclays U.S. TIPS Index, which tracks the universe of inflation-protected notes issued by the U.S. Treasury that have at least one year to final maturity, posted a +1.28% total return.1 Also for comparison, the Consumer Price Index (CPI) for Urban Consumers (All Items) NSA (non-seasonally adjusted), a measure of the average change in prices of all goods and services purchased for consumption by urban householders, declined 0.35% for the same period.2 You can find more of the Fund’s performance data in the Performance Summary beginning on page 29.
Performance data represent past performance, which does not guarantee future results. Investment return and principal value will fluctuate, and you may have a gain or loss when you sell your shares. Current performance may differ from figures shown. Please visit franklintempleton.com or call (800) 342-5236 for most recent month-end performance.
Investment Strategy
We seek to allocate assets among investments to achieve the highest level of real return (total return less the rate of inflation) consistent with an acceptable level of risk. We will allocate the Fund’s assets among securities in various market sectors based on our assessment of changing economic, global market, industry and issuer conditions. When making our investment decisions, we use a “top-down” analysis of macroeconomic trends combined with a “bottom-up” fundamental analysis of market sectors, industries and issuers to try to take advantage of varying sector reactions to economic events. We will evaluate such criteria as country risk, business cycles, yield curves, and values between and within markets.
Manager’s Discussion
The economy grew slowly during the period. Growth in the fourth quarter of 2014 stemmed from greater spending by consumers, businesses, and state and local governments. Economic activity moderated in 2015’s first quarter, however, partly because of an ongoing energy price collapse, shrinking exports and weaker business spending. Despite the slowdown, home prices and sales increased while mortgage rates fell.
Near period-end, the Fed noted it expected economic activity would expand at a moderate pace with appropriate policy accommodation. The Fed also stated it would raise interest rates when inflation and employment data met its expectations.
1. Source: Morningstar.
The index is unmanaged and includes reinvestment of any income or distributions. One cannot invest directly in an index, and an index is not representative of the
Fund’s portfolio.
2. Source: Bureau of Labor Statistics, bls.gov/cpi.
See www.franklintempletondatasources.com for additional data provider information.
The dollar value, number of shares or principal amount, and names of all portfolio holdings are listed in the Fund’s Statement of Investments (SOI).
The SOI begins on page 66.
franklintempleton.com Semiannual Report | 27
| | | | | |
| FRANKLIN REAL RETURN FUND | | |
| |
| |
| Dividend Distributions* | | | |
| 11/1/14–4/30/15 | | | | |
| | | Dividend per Share (cents) | |
| | | | | Advisor |
| Month | Class A | Class C | Class R6 | Class |
| November | 1.34 | 1.03 | 1.64 | 1.54 |
| December | 5.64 | 5.31 | 6.01 | 5.88 |
| January** | — | — | — | — |
| February** | — | — | — | — |
| March** | — | — | — | — |
| April** | — | — | — | — |
| Total | 6.98 | 6.34 | 7.65 | 7.42 |
*All Fund distributions will vary depending upon current market conditions, and past
distributions are not indicative of future trends.
**The Fund paid no dividends due to negative inflation adjustments for TIPS, which
are the Fund’s primary investments.
We invested the Fund’s assets in the allowable sectors during the period under review. At period-end, half of total net assets were invested in Treasury Inflation Protected Securities (TIPS). For diversification, we also allocated the Fund’s assets to foreign government and agency securities, senior secured floating rate loans, natural resources, exchange-traded funds and short-term investments. We employed a non-U.S. dollar strategy to help hedge against potential U.S. dollar weakness versus certain currencies and concentrated our TIPS holdings in shorter maturities.
During the period, we increased the Fund’s allocations to foreign government debt securities and TIPS. In contrast, we decreased the Fund’s allocations in real estate investment trusts (REITs) and natural resources. Our allocations to high yield corporate credit and corporate loans remained about the same. The Fund’s heaviest allocations were in TIPS and foreign government debt securities.
The Fund’s investments in foreign government bonds and REITs helped results. In contrast, the Fund’s positions in non-U.S. dollar holdings, natural resources stocks and TIPS hindered Fund performance.
Thank you for your continued participation in Franklin Real Return Fund. We look forward to serving your future investment needs.

The foregoing information reflects our analysis, opinions and portfolio holdings as of April 30, 2015, the end of the reporting period. The way we implement our main investment strategies and the resulting portfolio holdings may change depending on factors such as market and economic conditions. These opinions may not be relied upon as investment advice or an offer for a particular security. The information is not a complete analysis of every aspect of any market, country, industry, security or the Fund. Statements of fact are from sources considered reliable, but the investment manager makes no representation or warranty as to their completeness or accuracy. Although historical performance is no guarantee of future results, these insights may help you understand our investment management philosophy.
28 | Semiannual Report franklintempleton.com
FRANKLIN REAL RETURN FUND
Performance Summary as of April 30, 2015
Your dividend income will vary depending on dividends or interest paid by securities in the Fund’s portfolio, adjusted for operating expenses of each class. Capital gain distributions are net profits realized from the sale of portfolio securities. The performance tables do not reflect any taxes that a shareholder would pay on Fund dividends, capital gain distributions, if any, or any realized gains on the sale of Fund shares. Total return reflects reinvestment of the Fund’s dividends and capital gain distributions, if any, and any unrealized gains or losses.
| | | | | | | |
| Net Asset Value | | | | | | |
| Share Class (Symbol) | | 4/30/15 | | 10/31/14 | | Change |
| A (FRRAX) | $ | 10.41 | $ | 10.66 | -$ | 0.25 |
| C (FRRCX) | $ | 10.33 | $ | 10.59 | -$ | 0.26 |
| R6 (FRRRX) | $ | 10.45 | $ | 10.68 | -$ | 0.23 |
| Advisor (FARRX) | $ | 10.44 | $ | 10.68 | -$ | 0.24 |
| | | |
| Distributions (11/1/14–4/30/15) | | |
| | | Dividend |
| Share Class | | Income |
| A | $ | 0.0698 |
| C | $ | 0.0634 |
| R6 | $ | 0.0765 |
| Advisor | $ | 0.0742 |
franklintempleton.com
Semiannual Report | 29
FRANKLIN REAL RETURN FUND
PERFORMANCE SUMMARY
Performance as of 4/30/151
Cumulative total return excludes sales charges. Average annual total returns include maximum sales charges. Class A: 4.25% maximum initial sales charge; Class C: 1% contingent deferred sales charge in first year only; Class R6/Advisor Class: no sales charges.
| | | | | | | | | | | |
| | Cumulative | | Average Annual | | Average Annual | | Total Annual Operating Expenses5 | |
| Share Class | Total Return2 | | Total Return3 | | Total Return (3/31/15)4 | | (with waiver) | | (without waiver) | |
| A | | | | | | | 0.92 | % | 1.12 | % |
| 6-Month | -1.69 | % | -5.84 | % | | | | | | |
| 1-Year | -2.55 | % | -6.66 | % | -6.84 | % | | | | |
| 5-Year | +7.85 | % | +0.64 | % | +0.63 | % | | | | |
| 10-Year | +40.92 | % | +3.04 | % | +3.01 | % | | | | |
| C | | | | | | | 1.32 | % | 1.52 | % |
| 6-Month | -1.86 | % | -2.83 | % | | | | | | |
| 1-Year | -3.04 | % | -3.99 | % | -4.14 | % | | | | |
| 5-Year | +5.72 | % | +1.12 | % | +1.09 | % | | | | |
| Since Inception (11/03/08) | +22.04 | % | +3.12 | % | +2.97 | % | | | | |
| R6 | | | | | | | 0.54 | % | 0.72 | % |
| 6-Month | -1.43 | % | -1.43 | % | | | | | | |
| 1-Year | -2.25 | % | -2.25 | % | -2.40 | % | | | | |
| Since Inception (5/1/13) | -0.46 | % | -0.23 | % | -0.89 | % | | | | |
| Advisor | | | | | | | 0.67 | % | 0.87 | % |
| 6-Month | -1.55 | % | -1.55 | % | | | | | | |
| 1-Year | -2.35 | % | -2.35 | % | -2.40 | % | | | | |
| 5-Year | +9.20 | % | +1.78 | % | +1.76 | % | | | | |
| 10-Year | +44.44 | % | +3.75 | % | +3.73 | % | | | | |
| | | | | | | |
| | | | 30-Day Standardized Yield7 | |
| | Distribution | | | | | |
| Share Class | Rate6 | | (with waiver) | | (without waiver) | |
| A | 0.00 | % | 0.96 | % | 0.75 | % |
| C | 0.00 | % | 0.61 | % | 0.39 | % |
| R6 | 0.00 | % | 1.38 | % | 1.20 | % |
| Advisor | 0.00 | % | 1.25 | % | 1.03 | % |
Performance data represent past performance, which does not guarantee future results. Investment return and principal value will fluctuate, and you may have a gain or loss when you sell your shares. Current performance may differ from figures shown. For most recent month-end performance, go to franklintempleton.com or call (800) 342-5236.
30 | Semiannual Report franklintempleton.com
FRANKLIN REAL RETURN FUND
PERFORMANCE SUMMARY
All investments involve risks, including possible loss of principal. Interest rate movements will affect the Fund’s share price and yield. Bond prices generally move in the opposite direction of interest rates. As the prices of bonds in the Fund adjust to a rise in interest rates, the Fund’s share price may decline. Foreign securities involve special risks, including currency fluctuations and economic and political uncertainties. Changes in the financial strength of a bond issuer or in a bond’s credit rating may affect its value. Stock prices fluctuate, sometimes rapidly and dramatically, due to factors affecting individual companies, particular industries or sectors, or general market conditions. The Fund is actively managed but there is no guarantee that the manager’s investment decisions will produce the desired results. The Fund’s prospectus also includes a description of the main investment risks.
| | |
| Class C: | These shares have higher annual fees and expenses than Class A shares. |
| Class R6: | Shares are available to certain eligible investors as described in the prospectus. |
| Advisor Class: | Shares are available to certain eligible investors as described in the prospectus. |
1. The Fund has an expense reduction contractually guaranteed through at least 2/29/16. Fund investment results reflect the expense reduction, to the extent applicable;
without this reduction, the results would have been lower.
2. Cumulative total return represents the change in value of an investment over the periods indicated.
3. Average annual total return represents the average annual change in value of an investment over the periods indicated. Six-month return has not been annualized.
4. In accordance with SEC rules, we provide standardized average annual total return information through the latest calendar quarter.
5. Figures are as stated in the Fund’s current prospectus. In periods of market volatility, assets may decline significantly, causing total annual Fund operating expenses to
become higher than the figures shown.
6. Distribution rate is based on an annualization of the respective class’s April dividend and the maximum offering price (NAV for Classes C, R6 and Advisor) per share
on 4/30/15.
7. The 30-day standardized yield for the 30 days ended 4/30/15 reflects an estimated yield to maturity (assuming all portfolio securities are held to maturity). It should be
regarded as an estimate of the Fund’s rate of investment income, and it may not equal the Fund’s actual income distribution rate (which reflects the Fund’s past dividends
paid to shareholders) or the income reported in the Fund’s financial statements.
franklintempleton.com
Semiannual Report | 31
FRANKLIN REAL RETURN FUND
Your Fund’s Expenses
As a Fund shareholder, you can incur two types of costs:
- Transaction costs, including sales charges (loads) on Fund purchases; and
- Ongoing Fund costs, including management fees, distribu- tion and service (12b-1) fees, and other Fund expenses. All mutual funds have ongoing costs, sometimes referred to as operating expenses.
The following table shows ongoing costs of investing in the Fund and can help you understand these costs and compare them with those of other mutual funds. The table assumes a $1,000 investment held for the six months indicated.
Actual Fund Expenses
The first line (Actual) for each share class listed in the table provides actual account values and expenses. The “Ending Account Value” is derived from the Fund’s actual return, which includes the effect of Fund expenses.
You can estimate the expenses you paid during the period by following these steps. Of course, your account value and expenses will differ from those in this illustration:
| 1. | Divide your account value by $1,000. |
| | If an account had an $8,600 value, then $8,600 ÷ $1,000 = 8.6. |
| 2. | Multiply the result by the number under the heading “Expenses Paid During Period.” |
| | If Expenses Paid During Period were $7.50, then 8.6 x $7.50 = $64.50. |
In this illustration, the estimated expenses paid this period are $64.50.
Hypothetical Example for Comparison with Other Funds
Information in the second line (Hypothetical) for each class in the table can help you compare ongoing costs of investing in the Fund with those of other mutual funds. This information may not be used to estimate the actual ending account balance or expenses you paid during the period. The hypothetical “Ending Account Value” is based on the actual expense ratio for each class and an assumed 5% annual rate of return before expenses, which does not represent the Fund’s actual return. The figure under the heading “Expenses Paid During Period” shows the hypothetical expenses your account would have incurred under this scenario. You can compare this figure with the 5% hypothetical examples that appear in shareholder reports of other funds.
Please note that expenses shown in the table are meant to highlight ongoing costs and do not reflect any transaction costs, such as sales charges. Therefore, the second line for each class is useful in comparing ongoing costs only, and will not help you compare total costs of owning different funds. In addition, if transaction costs were included, your total costs would have been higher. Please refer to the Fund prospectus for additional information on operating expenses.
32 | Semiannual Report
franklintempleton.com
FRANKLIN REAL RETURN FUND
YOUR FUND’S EXPENSES
| | | | | | | |
| | | Beginning Account | | Ending Account | | Expenses Paid During |
| Share Class | | Value 11/1/14 | | Value 4/30/15 | | Period* 11/1/14–4/30/15 |
| A | | | | | | |
| Actual | $ | 1,000 | $ | 983.10 | $ | 4.43 |
| Hypothetical (5% return before expenses) | $ | 1,000 | $ | 1,020.33 | $ | 4.51 |
| C | | | | | | |
| Actual | $ | 1,000 | $ | 981.40 | $ | 6.34 |
| Hypothetical (5% return before expenses) | $ | 1,000 | $ | 1,018.40 | $ | 6.46 |
| R6 | | | | | | |
| Actual | $ | 1,000 | $ | 985.70 | $ | 2.51 |
| Hypothetical (5% return before expenses) | $ | 1,000 | $ | 1,022.27 | $ | 2.56 |
| Advisor | | | | | | |
| Actual | $ | 1,000 | $ | 984.50 | $ | 3.20 |
| Hypothetical (5% return before expenses) | $ | 1,000 | $ | 1,021.57 | $ | 3.26 |
*Expenses are calculated using the most recent six-month expense ratio, net of expense waivers, annualized for each class (A: 0.90%;
C: 1.29%; R6: 0.51%; and Advisor: 0.65%), multiplied by the average account value over the period, multiplied by 181/365 to reflect the
one-half year period.
franklintempleton.com
Semiannual Report | 33
| | | | | | | | | | | | | | | | | | | |
| FRANKLIN INVESTORS SECURITIES TRUST | | | | | | | | | | | | | | | | |
| |
| |
| Financial Highlights | | | | | | | | | | | | | | | | | | |
| Franklin Balanced Fund | | | | | | | | | | | | | | | | | | |
| | | Six Months Ended | | | | | | | | | | | | | | | | |
| | | April 30, 2015 | | | | | | Year Ended October 31, | | | | |
| | | (unaudited) | | | 2014 | | | 2013 | | | 2012 | | | 2011 | | | 2010 | |
| Class A | | | | | | | | | | | | | | | | | | |
| Per share operating performance | | | | | | | | | | | | | | | | | | |
| (for a share outstanding throughout the period) | | | | | | | | | | | | | | | | | | |
| Net asset value, beginning of period | $ | 11.86 | �� | $ | 11.43 | | $ | 10.64 | | $ | 9.87 | | $ | 9.61 | | $ | 8.55 | |
| Income from investment operationsa: | | | | | | | | | | | | | | | | | | |
| Net investment incomeb | | 0.12 | | | 0.31 | c | | 0.27 | | | 0.30 | | | 0.32 | | | 0.31 | |
| Net realized and unrealized gains (losses) | | 0.24 | | | 0.65 | | | 1.02 | | | 0.83 | | | 0.30 | | | 1.11 | |
| Total from investment operations | | 0.36 | | | 0.96 | | | 1.29 | | | 1.13 | | | 0.62 | | | 1.42 | |
| Less distributions from: | | | | | | | | | | | | | | | | | | |
| Net investment income | | (0.18 | ) | | (0.36 | ) | | (0.36 | ) | | (0.36 | ) | | (0.36 | ) | | (0.36 | ) |
| Net realized gains | | (0.16 | ) | | (0.17 | ) | | (0.14 | ) | | (—)d | | | — | | | — | |
| Total distributions | | (0.34 | ) | | (0.53 | ) | | (0.50 | ) | | (0.36 | ) | | (0.36 | ) | | (0.36 | ) |
| Net asset value, end of period | $ | 11.88 | | $ | 11.86 | | $ | 11.43 | | $ | 10.64 | | $ | 9.87 | | $ | 9.61 | |
| |
| Total returne | | 3.11 | % | | 8.66 | % | | 12.51 | % | | 11.70 | % | | 6.51 | % | | 16.95 | % |
| |
| Ratios to average net assetsf | | | | | | | | | | | | | | | | | | |
| Expenses before waiver and payments by | | | | | | | | | | | | | | | | | | |
| affiliates | | 1.07 | % | | 1.09 | % | | 1.12 | % | | 1.15 | % | | 1.17 | % | | 1.23 | % |
| Expenses net of waiver and payments by | | | | | | | | | | | | | | | | | | |
| affiliates | | 1.06 | %g | | 1.09 | %g | | 1.10 | %g | | 1.01 | % | | 1.01 | % | | 1.02 | % |
| Net investment income | | 2.09 | % | | 2.64 | %c | | 2.51 | % | | 2.95 | % | | 3.27 | % | | 3.44 | % |
| |
| Supplemental data | | | | | | | | | | | | | | | | | | |
| Net assets, end of period (000’s) | $ | 2,365,438 | | $ | 2,053,623 | | $ | 1,354,710 | | $ | 627,287 | | $ | 218,625 | | $ | 146,699 | |
| Portfolio turnover rate | | 19.44 | % | | 40.54 | % | | 58.52 | % | | 58.59 | % | | 70.76 | % | | 54.12 | % |
aThe amount shown for a share outstanding throughout the period may not correlate with the Statement of Operations for the period due to the timing of sales and
repurchases of the Fund shares in relation to income earned and/or fluctuating fair value of the investments of the Fund.
bBased on average daily shares outstanding.
cNet investment income per share includes approximately $0.03 per share received in the form of a special dividend paid in connection with certain Fund holdings.
Excluding this amount, the ratio of net investment income to average net assets would have been 2.39%.
dAmount rounds to less than $0.01 per share.
eTotal return does not reflect sales commissions or contingent deferred sales charges, if applicable, and is not annualized for periods less than one year.
fRatios are annualized for periods less than one year.
gBenefit of expense reduction rounds to less than 0.01%.
34 | Semiannual Report | The accompanying notes are an integral part of these financial statements. franklintempleton.com
| | | | | | | | | | | | | | | | | | | |
| | | | | | | | | FRANKLIN INVESTORS SECURITIES TRUST | |
| | | | | | | | | | | | FINANCIAL HIGHLIGHTS | |
| |
| |
| |
| Franklin Balanced Fund (continued) | | | | | | | | | | | | | | | | | | |
| | | Six Months Ended | | | | | | | | | | | | | | | | |
| | | April 30, 2015 | | | | | | Year Ended October 31, | | | | |
| | | (unaudited) | | | 2014 | | | 2013 | | | 2012 | | | 2011 | | | 2010 | |
| Class C | | | | | | | | | | | | | | | | | | |
| Per share operating performance | | | | | | | | | | | | | | | | | | |
| (for a share outstanding throughout the period) | | | | | | | | | | | | | | | | | | |
| Net asset value, beginning of period | $ | 11.77 | | $ | 11.34 | | $ | 10.57 | | $ | 9.81 | | $ | 9.54 | | $ | 8.49 | |
| Income from investment operationsa: | | | | | | | | | | | | | | | | | | |
| Net investment incomeb | | 0.08 | | | 0.23 | c | | 0.20 | | | 0.23 | | | 0.25 | | | 0.24 | |
| Net realized and unrealized gains (losses) | | 0.23 | | | 0.65 | | | 0.99 | | | 0.82 | | | 0.31 | | | 1.11 | |
| Total from investment operations | | 0.31 | | | 0.88 | | | 1.19 | | | 1.05 | | | 0.56 | | | 1.35 | |
| Less distributions from: | | | | | | | | | | | | | | | | | | |
| Net investment income | | (0.14 | ) | | (0.28 | ) | | (0.28 | ) | | (0.29 | ) | | (0.29 | ) | | (0.30 | ) |
| Net realized gains | | (0.16 | ) | | (0.17 | ) | | (0.14 | ) | | (—)d | | | — | | | — | |
| Total distributions | | (0.30 | ) | | (0.45 | ) | | (0.42 | ) | | (0.29 | ) | | (0.29 | ) | | (0.30 | ) |
| Net asset value, end of period | $ | 11.78 | | $ | 11.77 | | $ | 11.34 | | $ | 10.57 | | $ | 9.81 | | $ | 9.54 | |
| |
| Total returne | | 2.68 | % | | 7.97 | % | | 11.62 | % | | 10.91 | % | | 5.91 | % | | 16.12 | % |
| |
| Ratios to average net assetsf | | | | | | | | | | | | | | | | | | |
| Expenses before waiver and payments by | | | | | | | | | | | | | | | | | | |
| affiliates | | 1.77 | % | | 1.79 | % | | 1.82 | % | | 1.85 | % | | 1.87 | % | | 1.92 | % |
| Expenses net of waiver and payments by | | | | | | | | | | | | | | | | | | |
| affiliates | | 1.76 | %g | | 1.79 | %g | | 1.80 | %g | | 1.71 | % | | 1.71 | % | | 1.71 | % |
| Net investment income | | 1.39 | % | | 1.94 | %c | | 1.81 | % | | 2.25 | % | | 2.57 | % | | 2.75 | % |
| |
| Supplemental data | | | | | | | | | | | | | | | | | | |
| Net assets, end of period (000’s) | $ | 581,361 | | $ | 492,514 | | $ | 354,359 | | $ | 187,991 | | $ | 85,302 | | $ | 47,219 | |
| Portfolio turnover rate | | 19.44 | % | | 40.54 | % | | 58.52 | % | | 58.59 | % | | 70.76 | % | | 54.12 | % |
aThe amount shown for a share outstanding throughout the period may not correlate with the Statement of Operations for the period due to the timing of sales and
repurchases of the Fund shares in relation to income earned and/or fluctuating fair value of the investments of the Fund.
bBased on average daily shares outstanding.
cNet investment income per share includes approximately $0.03 per share received in the form of a special dividend paid in connection with certain Fund holdings.
Excluding this amount, the ratio of net investment income to average net assets would have been 1.69%.
dAmount rounds to less than $0.01 per share.
eTotal return does not reflect sales commissions or contingent deferred sales charges, if applicable, and is not annualized for periods less than one year.
fRatios are annualized for periods less than one year.
gBenefit of expense reduction rounds to less than 0.01%.
franklintempleton.com The accompanying notes are an integral part of these financial statements. | Semiannual Report | 35
FRANKLIN INVESTORS SECURITIES TRUST
FINANCIAL HIGHLIGHTS
| | | | | | | | | | | | | | | | | | | |
| Franklin Balanced Fund (continued) | | | | | | | | | | | | | | | | | | |
| | | Six Months Ended | | | | | | | | | | | | | | | | |
| | | April 30, 2015 | | | | | | Year Ended October 31, | | | | |
| | | (unaudited) | | | 2014 | | | 2013 | | | 2012 | | | 2011 | | | 2010 | |
| Class R | | | | | | | | | | | | | | | | | | |
| Per share operating performance | | | | | | | | | | | | | | | | | | |
| (for a share outstanding throughout the period) | | | | | | | | | | | | | | | | | | |
| Net asset value, beginning of period | $ | 11.89 | | $ | 11.45 | | $ | 10.66 | | $ | 9.89 | | $ | 9.62 | | $ | 8.56 | |
| Income from investment operationsa: | | | | | | | | | | | | | | | | | | |
| Net investment incomeb | | 0.11 | | | 0.29 | c | | 0.26 | | | 0.29 | | | 0.31 | | | 0.28 | |
| Net realized and unrealized gains (losses) | | 0.23 | | | 0.66 | | | 1.01 | | | 0.82 | | | 0.30 | | | 1.12 | |
| Total from investment operations | | 0.34 | | | 0.95 | | | 1.27 | | | 1.11 | | | 0.61 | | | 1.40 | |
| Less distributions from: | | | | | | | | | | | | | | | | | | |
| Net investment income | | (0.17 | ) | | (0.34 | ) | | (0.34 | ) | | (0.34 | ) | | (0.34 | ) | | (0.34 | ) |
| Net realized gains | | (0.16 | ) | | (0.17 | ) | | (0.14 | ) | | (—)d | | | — | | | — | |
| Total distributions | | (0.33 | ) | | (0.51 | ) | | (0.48 | ) | | (0.34 | ) | | (0.34 | ) | | (0.34 | ) |
| Net asset value, end of period | $ | 11.90 | | $ | 11.89 | | $ | 11.45 | | $ | 10.66 | | $ | 9.89 | | $ | 9.62 | |
| |
| Total returne | | 2.91 | % | | 8.51 | % | | 12.26 | % | | 11.46 | % | | 6.39 | % | | 16.70 | % |
| |
| Ratios to average net assetsf | | | | | | | | | | | | | | | | | | |
| Expenses before waiver and payments by | | | | | | | | | | | | | | | | | | |
| affiliates | | 1.27 | % | | 1.29 | % | | 1.32 | % | | 1.35 | % | | 1.37 | % | | 1.42 | % |
| Expenses net of waiver and payments by | | | | | | | | | | | | | | | | | | |
| affiliates | | 1.26 | %g | | 1.29 | %g | | 1.30 | %g | | 1.21 | % | | 1.21 | % | | 1.21 | % |
| Net investment income | | 1.89 | % | | 2.44 | %c | | 2.31 | % | | 2.75 | % | | 3.07 | % | | 3.25 | % |
| |
| Supplemental data | | | | | | | | | | | | | | | | | | |
| Net assets, end of period (000’s) | $ | 4,728 | | $ | 3,598 | | $ | 3,253 | | $ | 2,378 | | $ | 1,928 | | $ | 677 | |
| Portfolio turnover rate | | 19.44 | % | | 40.54 | % | | 58.52 | % | | 58.59 | % | | 70.76 | % | | 54.12 | % |
aThe amount shown for a share outstanding throughout the period may not correlate with the Statement of Operations for the period due to the timing of sales and
repurchases of the Fund shares in relation to income earned and/or fluctuating fair value of the investments of the Fund.
bBased on average daily shares outstanding.
cNet investment income per share includes approximately $0.03 per share received in the form of a special dividend paid in connection with certain Fund holdings.
Excluding this amount, the ratio of net investment income to average net assets would have been 2.19%.
dAmount rounds to less than $0.01 per share.
eTotal return is not annualized for periods less than one year.
fRatios are annualized for periods less than one year.
gBenefit of expense reduction rounds to less than 0.01%.
36 | Semiannual Report | The accompanying notes are an integral part of these financial statements. franklintempleton.com
| | | | | | | | | | |
| | | FRANKLIN INVESTORS SECURITIES TRUST | |
| | | FINANCIAL HIGHLIGHTS | |
| |
| |
| |
| Franklin Balanced Fund (continued) | | | | | | | | | |
| | | Six Months Ended | | | Year Ended | |
| | | April 30, 2015 | | | October 31, | |
| | | (unaudited) | | | 2014 | | | 2013 | a |
| Class R6 | | | | | | | | | |
| Per share operating performance | | | | | | | | | |
| (for a share outstanding throughout the period) | | | | | | | | | |
| Net asset value, beginning of period | $ | 11.89 | | $ | 11.45 | | $ | 11.08 | |
| Income from investment operationsb: | | | | | | | | | |
| Net investment incomec | | 0.16 | | | 0.37 | d | | 0.19 | |
| Net realized and unrealized gains (losses) | | 0.21 | | | 0.65 | | | 0.38 | |
| Total from investment operations | | 0.37 | | | 1.02 | | | 0.57 | |
| Less distributions from: | | | | | | | | | |
| Net investment income | | (0.20 | ) | | (0.41 | ) | | (0.20 | ) |
| Net realized gains | | (0.16 | ) | | (0.17 | ) | | — | |
| Total distributions | | (0.36 | ) | | (0.58 | ) | | (0.20 | ) |
| Net asset value, end of period | $ | 11.90 | | $ | 11.89 | | $ | 11.45 | |
| |
| Total returne | | 3.23 | % | | 9.29 | % | | 5.15 | % |
| |
| Ratios to average net assetsf | | | | | | | | | |
| Expenses before waiver and payments by affiliates | | 0.69 | % | | 0.68 | % | | 1.82 | % |
| Expenses net of waiver and payments by affiliatesg | | 0.66 | % | | 0.68 | % | | 0.70 | % |
| Net investment income | | 2.49 | % | | 3.05 | %d | | 2.91 | % |
| |
| Supplemental data | | | | | | | | | |
| Net assets, end of period (000’s) | $ | 207 | | $ | 513 | | $ | 5 | |
| Portfolio turnover rate | | 19.44 | % | | 40.54 | % | | 58.52 | % |
aFor the period May 1, 2013 (effective date) to October 31, 2013.
bThe amount shown for a share outstanding throughout the period may not correlate with the Statement of Operations for the period due to the timing of sales and
repurchases of the Fund shares in relation to income earned and/or fluctuating fair value of the investments of the Fund.
cBased on average daily shares outstanding.
dNet investment income per share includes approximately $0.03 per share received in the form of a special dividend paid in connection with certain Fund holdings.
Excluding this amount, the ratio of net investment income to average net assets would have been 2.80%.
eTotal return is not annualized for periods less than one year.
fRatios are annualized for periods less than one year.
gBenefit of expense reduction rounds to less than 0.01%.
franklintempleton.com The accompanying notes are an integral part of these financial statements. | Semiannual Report | 37
FRANKLIN INVESTORS SECURITIES TRUST
FINANCIAL HIGHLIGHTS
| | | | | | | | | | | | | | | | | | | |
| Franklin Balanced Fund (continued) | | | | | | | | | | | | | | | | | | |
| | | Six Months Ended | | | | | | | | | | | | | | | | |
| | | April 30, 2015 | | | | | | Year Ended October 31, | | | | |
| | | (unaudited) | | | 2014 | | | 2013 | | | 2012 | | | 2011 | | | 2010 | |
| Advisor Class | | | | | | | | | | | | | | | | | | |
| Per share operating performance | | | | | | | | | | | | | | | | | | |
| (for a share outstanding throughout the period) | | | | | | | | | | | | | | | | | | |
| Net asset value, beginning of period | $ | 11.88 | | $ | 11.45 | | $ | 10.66 | | $ | 9.89 | | $ | 9.62 | | $ | 8.56 | |
| Income from investment operationsa: | | | | | | | | | | | | | | | | | | |
| Net investment incomeb | | 0.14 | | | 0.35 | c | | 0.30 | | | 0.34 | | | 0.35 | | | 0.34 | |
| Net realized and unrealized gains (losses) | | 0.24 | | | 0.65 | | | 1.02 | | | 0.82 | | | 0.31 | | | 1.11 | |
| Total from investment operations | | 0.38 | | | 1.00 | | | 1.32 | | | 1.16 | | | 0.66 | | | 1.45 | |
| Less distributions from: | | | | | | | | | | | | | | | | | | |
| Net investment income | | (0.20 | ) | | (0.40 | ) | | (0.39 | ) | | (0.39 | ) | | (0.39 | ) | | (0.39 | ) |
| Net realized gains | | (0.16 | ) | | (0.17 | ) | | (0.14 | ) | | (—)d | | | — | | | — | |
| Total distributions | | (0.36 | ) | | (0.57 | ) | | (0.53 | ) | | (0.39 | ) | | (0.39 | ) | | (0.39 | ) |
| Net asset value, end of period | $ | 11.90 | | $ | 11.88 | | $ | 11.45 | | $ | 10.66 | | $ | 9.89 | | $ | 9.62 | |
| |
| Total returne | | 3.26 | % | | 8.97 | % | | 12.82 | % | | 12.01 | % | | 6.93 | % | | 17.30 | % |
| |
| Ratios to average net assetsf | | | | | | | | | | | | | | | | | | |
| Expenses before waiver and payments by | | | | | | | | | | | | | | | | | | |
| affiliates | | 0.77 | % | | 0.79 | % | | 0.82 | % | | 0.85 | % | | 0.87 | % | | 0.92 | % |
| Expenses net of waiver and payments by | | | | | | | | | | | | | | | | | | |
| affiliates | | 0.76 | %g | | 0.79 | %g | | 0.80 | %g | | 0.71 | % | | 0.71 | % | | 0.71 | % |
| Net investment income | | 2.39 | % | | 2.94 | %c | | 2.81 | % | | 3.25 | % | | 3.57 | % | | 3.75 | % |
| |
| Supplemental data | | | | | | | | | | | | | | | | | | |
| Net assets, end of period (000’s) | $ | 56,189 | | $ | 41,494 | | $ | 68,201 | | $ | 13,779 | | $ | 7,477 | | $ | 3,299 | |
| Portfolio turnover rate | | 19.44 | % | | 40.54 | % | | 58.52 | % | | 58.59 | % | | 70.76 | % | | 54.12 | % |
aThe amount shown for a share outstanding throughout the period may not correlate with the Statement of Operations for the period due to the timing of sales and
repurchases of the Fund shares in relation to income earned and/or fluctuating fair value of the investments of the Fund.
bBased on average daily shares outstanding.
cNet investment income per share includes approximately $0.03 per share received in the form of a special dividend paid in connection with certain Fund holdings.
Excluding this amount, the ratio of net investment income to average net assets would have been 2.69%.
dAmount rounds to less than $0.01 per share.
eTotal return is not annualized for periods less than one year.
fRatios are annualized for periods less than one year.
gBenefit of expense reduction rounds to less than 0.01%.
38 | Semiannual Report | The accompanying notes are an integral part of these financial statements. franklintempleton.com
FRANKLIN INVESTORS SECURITIES TRUST
| | | | | |
| Statement of Investments, April 30, 2015 (unaudited) | | | | |
| |
| Franklin Balanced Fund | | | | |
| | Country | Shares | | Value |
| Common Stocks 44.6% | | | | |
| Consumer Discretionary 4.9% | | | | |
| Comcast Corp., A | United States | 500,000 | $ | 28,880,000 |
| Ford Motor Co. | United States | 1,800,000 | | 28,440,000 |
| General Motors Co. | United States | 750,000 | | 26,295,000 |
| Starwood Hotels & Resorts Worldwide Inc. | United States | 250,000 | | 21,487,500 |
| Target Corp. | United States | 550,000 | | 43,356,500 |
| | | | | 148,459,000 |
| Consumer Staples 1.7% | | | | |
| PepsiCo Inc. | United States | 265,000 | | 25,206,800 |
| Walgreens Boots Alliance Inc. | United States | 300,000 | | 24,879,000 |
| | | | | 50,085,800 |
| Energy 4.5% | | | | |
| Anadarko Petroleum Corp. | United States | 250,000 | | 23,525,000 |
| BP PLC, ADR | United Kingdom | 400,000 | | 17,264,000 |
| Chevron Corp. | United States | 250,000 | | 27,765,000 |
| Halliburton Co. | United States | 600,000 | | 29,370,000 |
| Royal Dutch Shell PLC, A, ADR | United Kingdom | 200,000 | | 12,686,000 |
| Schlumberger Ltd. | United States | 265,000 | | 25,071,650 |
| | | | | 135,681,650 |
| Financials 2.7% | | | | |
| Bank of America Corp. | United States | 1,000,000 | | 15,930,000 |
| JPMorgan Chase & Co. | United States | 300,000 | | 18,978,000 |
| MetLife Inc. | United States | 557,270 | | 28,582,378 |
| aVirtu Financial Inc., A | United States | 75,100 | | 1,606,389 |
| Wells Fargo & Co. | United States | 300,000 | | 16,530,000 |
| | | | | 81,626,767 |
| Health Care 4.5% | | | | |
| Amgen Inc. | United States | 175,000 | | 27,634,250 |
| Eli Lilly & Co. | United States | 425,000 | | 30,544,750 |
| Johnson & Johnson | United States | 250,000 | | 24,800,000 |
| Pfizer Inc. | United States | 700,000 | | 23,751,000 |
| Sanofi, ADR | France | 600,000 | | 30,330,000 |
| | | | | 137,060,000 |
| Industrials 7.2% | | | | |
| The Boeing Co. | United States | 210,000 | | 30,101,400 |
| Caterpillar Inc. | United States | 300,000 | | 26,064,000 |
| General Electric Co. | United States | 975,000 | | 26,403,000 |
| Lockheed Martin Corp. | United States | 75,000 | | 13,995,000 |
| Northrop Grumman Corp. | United States | 125,000 | | 19,255,000 |
| Raytheon Co. | United States | 300,000 | | 31,200,000 |
| Republic Services Inc. | United States | 700,000 | | 28,441,000 |
| United Parcel Service Inc., B | United States | 250,000 | | 25,132,500 |
| Waste Management Inc. | United States | 300,000 | | 14,859,000 |
| | | | | 215,450,900 |
franklintempleton.com Semiannual Report | 39
| | | | | |
| FRANKLIN INVESTORS SECURITIES TRUST | | | | |
| STATEMENT OF INVESTMENTS (UNAUDITED) | | | | |
| |
| |
| |
| |
| Franklin Balanced Fund (continued) | | | | |
| | Country | Shares | | Value |
| Common Stocks (continued) | | | | |
| Information Technology 7.1% | | | | |
| Analog Devices Inc. | United States | 450,000 | $ | 27,828,000 |
| Cisco Systems Inc. | United States | 800,000 | | 23,064,000 |
| Intel Corp. | United States | 600,000 | | 19,530,000 |
| Maxim Integrated Products Inc. | United States | 650,000 | | 21,339,500 |
| Microsoft Corp. | United States | 600,000 | | 29,184,000 |
| QUALCOMM Inc. | United States | 500,000 | | 34,000,000 |
| Texas Instruments Inc. | United States | 600,000 | | 32,526,000 |
| Xilinx Inc. | United States | 600,000 | | 26,016,000 |
| | | | | 213,487,500 |
| Materials 5.5% | | | | |
| Agrium Inc. | Canada | 200,000 | | 20,726,000 |
| BHP Billiton Ltd., ADR | Australia | 300,000 | | 15,387,000 |
| The Dow Chemical Co. | United States | 600,000 | | 30,600,000 |
| E. I. du Pont de Nemours and Co. | United States | 450,000 | | 32,940,000 |
| The Mosaic Co. | United States | 568,742 | | 25,024,648 |
| Praxair Inc. | United States | 200,000 | | 24,386,000 |
| Rio Tinto PLC, ADR | United Kingdom | 400,000 | | 17,916,000 |
| | | | | 166,979,648 |
| Telecommunication Services 2.2% | | | | |
| AT&T Inc. | United States | 800,000 | | 27,712,000 |
| Verizon Communications Inc. | United States | 750,000 | | 37,830,000 |
| | | | | 65,542,000 |
| Utilities 4.3% | | | | |
| Duke Energy Corp. | United States | 400,000 | | 31,028,000 |
| Exelon Corp. | United States | 500,000 | | 17,010,000 |
| PG&E Corp. | United States | 500,000 | | 26,460,000 |
| The Southern Co. | United States | 600,000 | | 26,580,000 |
| Xcel Energy Inc. | United States | 800,000 | | 27,128,000 |
| | | | | 128,206,000 |
| Total Common Stocks (Cost $1,153,234,265) | | | | 1,342,579,265 |
| bEquity-Linked Securities 8.3% | | | | |
| Consumer Staples 0.6% | | | | |
| cWells Fargo & Co. into Whole Foods Market Inc., 7.00%, 144A | United States | 400,000 | | 17,430,800 |
| Energy 0.6% | | | | |
| c,dCredit Suisse New York into Schlumberger Ltd., 6.00%, 144A | United States | 200,000 | | 18,519,800 |
| Financials 0.4% | | | | |
| cThe Goldman Sachs Group Inc. into Citigroup Inc., 5.00%, 144A | United States | 212,000 | | 11,028,134 |
| Industrials 0.5% | | | | |
| cThe Goldman Sachs Group Inc. into General Electric Co., 5.50%, 144A | United States | 600,000 | | 16,308,300 |
| Information Technology 4.3% | | | | |
| cCitigroup Inc. into Apple Inc., 7.00%, 144A | United States | 170,000 | | 21,369,850 |
| cCredit Suisse New York into Cisco Systems Inc., 6.00%, 144A | United States | 543,000 | | 15,739,615 |
| cCredit Suisse New York into Freescale Semiconductor Ltd., 7.00%, 144A | United States | 771,000 | | 20,409,295 |
| cCredit Suisse New York into Intel Corp., 6.00%, 144A | United States | 800,000 | | 23,516,800 |
| cCredit Suisse New York into Yahoo! Inc., 7.00%, 144A | United States | 492,000 | | 20,845,843 |
| cJPMorgan Chase & Co. into Google Inc., 4.50%, C, 144A | United States | 50,000 | | 26,568,450 |
| | | | | 128,449,853 |
40 | Semiannual Report franklintempleton.com
FRANKLIN INVESTORS SECURITIES TRUST
STATEMENT OF INVESTMENTS (UNAUDITED)
| | | | | |
| Franklin Balanced Fund (continued) | | | | |
| | Country | Shares | | Value |
| bEquity-Linked Securities (continued) | | | | |
| Materials 1.9% | | | | |
| cCredit Suisse New York into LyondellBasell Industries NV, A, 6.00%, 144A | United States | 272,000 | $ | 28,160,976 |
| cMorgan Stanley into Rio Tinto PLC, 7.50%, 144A | United Kingdom | 260,000 | | 11,848,980 |
| c,dRoyal Bank of Canada into Alcoa Inc., 7.00%, 144A | United States | 1,000,000 | | 13,666,800 |
| cWells Fargo & Co. into Freeport-McMoRan Inc., 7.50%, 144A | United States | 192,000 | | 4,599,245 |
| | | | | 58,276,001 |
| Total Equity-Linked Securities (Cost $242,754,107) | | | | 250,012,888 |
| Convertible Preferred Stocks 4.5% | | | | |
| Energy 0.5% | | | | |
| cPenn Virginia Corp., 6.00%, cvt. pfd., 144A | United States | 75,000 | | 4,766,250 |
| Rex Energy Corp., 6.00%, cvt. pfd., A | United States | 115,000 | | 5,177,300 |
| Sanchez Energy Corp., 4.875%, cvt. pfd. | United States | 60,000 | | 2,418,750 |
| Sanchez Energy Corp., 6.50%, cvt. pfd., B | United States | 90,000 | | 3,897,900 |
| | | | | 16,260,200 |
| Financials 1.7% | | | | |
| American Tower Corp., 5.50%, cvt. pfd. | United States | 350,000 | | 35,910,000 |
| Wells Fargo & Co., 7.50%, cvt. pfd., A | United States | 12,500 | | 15,234,375 |
| | | | | 51,144,375 |
| Health Care 0.3% | | | | |
| Actavis PLC, 5.50%, cvt. pfd. | United States | 7,500 | | 7,504,950 |
| Industrials 0.2% | | | | |
| United Technologies Corp., 7.50%, cvt. pfd. | United States | 93,800 | | 5,517,316 |
| Utilities 1.8% | | | | |
| Dominion Resources Inc., 6.125%, cvt. pfd., A | United States | 350,000 | | 19,834,500 |
| Dominion Resources Inc., 6.375%, cvt. pfd., A | United States | 238,900 | | 11,861,385 |
| Exelon Corp., 6.50%, cvt. pfd. | United States | 100,000 | | 4,927,000 |
| NextEra Energy Inc., 5.599%, cvt. pfd. | United States | 100,000 | | 6,633,500 |
| NextEra Energy Inc., 5.799%, cvt. pfd. | United States | 200,000 | | 11,378,000 |
| | | | | 54,634,385 |
| Total Convertible Preferred Stocks (Cost $139,309,561) | | | | 135,061,226 |
| Preferred Stocks 0.6% | | | | |
| Financials 0.6% | | | | |
| Ally Financial Inc., 8.50%, pfd., A | United States | 120,300 | | 3,187,950 |
| Citigroup Capital XIII, 8.75%, pfd. | United States | 37,000 | | 957,930 |
| Morgan Stanley, 6.375%, pfd., I | United States | 310,000 | | 8,091,000 |
| U.S. Bancorp, 6.00%, pfd., G | United States | 180,000 | | 4,860,000 |
| Total Preferred Stocks (Cost $15,605,532) | | | | 17,096,880 |
| |
| | | Principal | | |
| | | Amount* | | |
| |
| Corporate Bonds 30.9% | | | | |
| Consumer Discretionary 3.2% | | | | |
| CCO Holdings LLC/CCO Holdings Capital Corp., | | | | |
| senior bond, 5.75%, 1/15/24 | United States | 10,000,000 | | 10,150,000 |
| csenior note, 144A, 5.875%, 5/01/27 | United States | 10,000,000 | | 9,937,500 |
| DIRECTV Holdings LLC/DIRECTV Financing Co. Inc., senior bond, 3.95%, | | | | |
| 1/15/25 | United States | 11,700,000 | | 11,925,740 |
franklintempleton.com Semiannual Report | 41
FRANKLIN INVESTORS SECURITIES TRUST
STATEMENT OF INVESTMENTS (UNAUDITED)
| | | | | |
| Franklin Balanced Fund (continued) | | | | |
| | | Principal | | |
| | Country | Amount* | | Value |
| Corporate Bonds (continued) | | | | |
| Consumer Discretionary (continued) | | | | |
| DISH DBS Corp., senior note, 5.875%, 11/15/24 | United States | 5,500,000 | $ | 5,403,750 |
| Dollar General Corp., senior bond, 3.25%, 4/15/23 | United States | 15,000,000 | | 14,644,365 |
| cFiat Chrysler Automobiles NV, senior note, 144A, 5.25%, 4/15/23 | United Kingdom | 3,400,000 | | 3,442,500 |
| Ford Motor Credit Co. LLC, senior note, 3.00%, 6/12/17 | United States | 6,000,000 | | 6,174,018 |
| cSirius XM Radio Inc., senior bond, 144A, 5.375%, 4/15/25 | United States | 15,000,000 | | 15,112,500 |
| cTiffany & Co., senior bond, 144A, 4.90%, 10/01/44 | United States | 7,000,000 | | 7,056,028 |
| Trinity Acquisition PLC, senior note, 4.625%, 8/15/23 | United Kingdom | 7,000,000 | | 7,341,250 |
| Yum! Brands Inc., senior bond, 3.875%, 11/01/23 | United States | 4,000,000 | | 4,139,849 |
| | | | | 95,327,500 |
| Consumer Staples 2.0% | | | | |
| Kraft Foods Group Inc., senior bond, 3.50%, 6/06/22 | United States | 10,000,000 | | 10,242,580 |
| Lorillard Tobacco Co., senior note, 2.30%, 8/21/17 | United States | 10,000,000 | | 10,130,590 |
| Mondelez International Inc., senior bond, 4.00%, 2/01/24 | United States | 15,000,000 | | 16,098,585 |
| Sysco Corp., senior bond, 4.35%, 10/02/34 | United States | 10,000,000 | | 10,262,650 |
| Tyson Foods Inc., senior bond, 3.95%, 8/15/24 | United States | 12,100,000 | | 12,646,532 |
| | | | | 59,380,937 |
| Energy 5.2% | | | | |
| cAntero Resources Corp., senior note, 144A, 5.625%, 6/01/23 | United States | 10,000,000 | | 10,250,000 |
| cCalifornia Resources Corp., senior bond, 144A, 6.00%, 11/15/24 | United States | 10,000,000 | | 9,462,500 |
| Chesapeake Energy Corp., senior note, 5.375%, 6/15/21 | United States | 7,500,000 | | 7,237,500 |
| Ecopetrol SA, senior bond, 4.125%, 1/16/25 | Colombia | 15,000,000 | | 14,486,400 |
| cEnable Midstream Partners LP, senior note, 144A, 3.90%, 5/15/24 | United States | 9,700,000 | | 9,394,091 |
| Energy Transfer Partners LP, senior bond, 3.60%, 2/01/23 | United States | 25,000,000 | | 24,856,125 |
| EOG Resources Inc., senior bond, 2.625%, 3/15/23 | United States | 5,500,000 | | 5,476,449 |
| Kinder Morgan Energy Partners LP, senior note, 4.30%, 5/01/24 | United States | 12,900,000 | | 13,140,056 |
| Linn Energy LLC/Finance Corp., senior note, 6.50%, 5/15/19 | United States | 11,500,000 | | 10,091,250 |
| Oceaneering International Inc., senior note, 4.65%, 11/15/24 | United States | 9,400,000 | | 9,566,578 |
| cPeabody Energy Corp., second lien, 144A, 10.00%, 3/15/22 | United States | 7,000,000 | | 5,950,000 |
| Sabine Pass Liquefaction LLC, senior secured note, first lien, 5.75%, 5/15/24 | United States | 13,200,000 | | 13,398,000 |
| Weatherford International Ltd., senior bond, 5.95%, 4/15/42 | United States | 4,000,000 | | 3,656,612 |
| The Williams Cos. Inc., senior bond, 3.70%, 1/15/23 | United States | 5,000,000 | | 4,737,175 |
| Williams Partners LP, senior note, 3.60%, 3/15/22 | United States | 15,000,000 | | 14,953,230 |
| | | | | 156,655,966 |
| Financials 10.7% | | | | |
| eBank of America Corp., junior sub. bond, | | | | |
| AA, 6.10% to 3/17/25, FRN thereafter, Perpetual | United States | 15,000,000 | | 15,356,250 |
| M, 8.125% to 5/15/18, FRN thereafter, Perpetual | United States | 10,000,000 | | 10,850,000 |
| Capital One Bank USA NA, senior note, 2.30%, 6/05/19 | United States | 14,000,000 | | 14,031,402 |
| Citigroup Inc., | | | | |
| ejunior sub. bond, P, 5.95% to 5/15/25, FRN thereafter, Perpetual | United States | 15,000,000 | | 14,939,055 |
| sub. bond, 5.50%, 9/13/25 | United States | 10,000,000 | | 11,220,020 |
| Compass Bank, sub. note, 3.875%, 4/10/25 | United States | 15,000,000 | | 14,648,160 |
| Deutsche Bank AG, sub. bond, 4.296% to 5/24/23, FRN thereafter, 5/24/28 | Germany | 15,000,000 | | 14,568,750 |
| HCP Inc., senior bond, 3.875%, 8/15/24 | United States | 21,700,000 | | 22,096,828 |
| Healthcare Trust of America Holdings LP, senior note, 3.375%, 7/15/21 | United States | 10,000,000 | | 10,163,210 |
| c,fING Bank NV, senior note, 144A, FRN, 1.907%, 9/25/15 | Netherlands | 5,000,000 | | 5,029,575 |
| eJPMorgan Chase & Co., | | | | |
| junior sub. bond, V, 5.00% to 7/30/19, FRN thereafter, Perpetual | United States | 13,000,000 | | 12,805,000 |
| junior sub. note, I, 7.90% to 4/30/19, FRN thereafter, Perpetual | United States | 10,000,000 | | 10,675,000 |
42 | Semiannual Report franklintempleton.com
FRANKLIN INVESTORS SECURITIES TRUST
STATEMENT OF INVESTMENTS (UNAUDITED)
| | | | | |
| Franklin Balanced Fund (continued) | | | | |
| | | Principal | | |
| | Country | Amount* | | Value |
| Corporate Bonds (continued) | | | | |
| Financials (continued) | | | | |
| cLiberty Mutual Group Inc., senior note, 144A, 4.95%, 5/01/22 | United States | 7,100,000 | $ | 7,827,927 |
| cMizuho Bank Ltd., senior note, 144A, 2.45%, 4/16/19 | Japan | 12,000,000 | | 12,098,676 |
| Morgan Stanley, | | | | |
| ejunior sub. bond, 5.55% to 7/15/20, FRN thereafter, Perpetual | United States | 10,900,000 | | 10,981,750 |
| senior sub. bond, 4.35%, 9/08/26 | United States | 15,000,000 | | 15,322,305 |
| Navient Corp., senior note, 6.125%, 3/25/24 | United States | 15,000,000 | | 14,625,000 |
| cNippon Life Insurance Co., sub. bond, 144A, 5.10% to10/16/24, FRN thereafter, | | | | |
| 10/16/44 | Japan | 15,000,000 | | 16,391,025 |
| ePNC Financial Services Group Inc., junior sub. note, 4.85% to 6/01/23, | | | | |
| FRN thereafter, Perpetual | United States | 12,000,000 | | 11,715,000 |
| Prologis LP, senior note, 4.25%, 8/15/23 | United States | 12,000,000 | | 12,793,296 |
| Prudential Financial Inc., junior sub. note, 5.875%, 9/15/42 | United States | 5,000,000 | | 5,450,000 |
| Realty Income Corp., senior bond, 3.875%, 7/15/24 | United States | 15,000,000 | | 15,468,795 |
| Royal Bank of Scotland Group PLC, sub. note, | | | | |
| 6.125%, 12/15/22 | United Kingdom | 4,000,000 | | 4,442,500 |
| 5.125%, 5/28/24 | United Kingdom | 10,400,000 | | 10,744,500 |
| Senior Housing Properties Trust, senior note, 6.75%, 12/15/21 | United States | 7,000,000 | | 8,078,525 |
| fU.S. Bank NA, sub. note, FRN, 2.282%, 4/29/20 | United States | 4,500,000 | | 4,500,000 |
| eWells Fargo & Co., junior sub. bond, 5.875% to 6/15/25, FRN thereafter, | | | | |
| Perpetual | United States | 15,000,000 | | 16,012,500 |
| | | | | 322,835,049 |
| Health Care 3.3% | | | | |
| Actavis Funding SCS, senior bond, 4.75%, 3/15/45 | United States | 12,000,000 | | 12,146,160 |
| Celgene Corp., senior bond, 4.00%, 8/15/23 | United States | 10,000,000 | | 10,712,270 |
| Edwards Lifesciences Corp., senior note, 2.875%, 10/15/18 | United States | 10,000,000 | | 10,310,700 |
| HCA Inc., senior secured note, first lien, 5.00%, 3/15/24 | United States | 12,000,000 | | 12,840,000 |
| cMedtronic Inc., senior bond, 144A, 4.375%, 3/15/35 | United States | 15,000,000 | | 15,875,490 |
| Thermo Fisher Scientific Inc., senior note, 2.40%, 2/01/19 | United States | 12,000,000 | | 12,145,464 |
| cValeant Pharmaceuticals International Inc., | | | | |
| senior bond, 144A, 6.125%, 4/15/25 | United States | 6,300,000 | | 6,536,250 |
| senior note, 144A, 6.75%, 8/15/18 | United States | 10,400,000 | | 11,037,000 |
| senior note, 144A, 5.875%, 5/15/23 | United States | 8,300,000 | | 8,517,875 |
| | | | | 100,121,209 |
| Industrials 1.1% | | | | |
| cAir Canada 2013-1A Pass Through Trust, first lien, 144A, 4.125%, 11/15/26 | Canada | 6,666,140 | | 7,049,443 |
| cAviation Capital Group Corp., senior note, 144A, 3.875%, 9/27/16 | United States | 12,000,000 | | 12,335,076 |
| cBombardier Inc., senior note, 144A, 6.00%, 10/15/22 | Canada | 5,000,000 | | 4,750,000 |
| eGeneral Electric Capital Corp., junior sub. bond, 7.125% to 6/15/22, | | | | |
| FRN thereafter, Perpetual | United States | 8,000,000 | | 9,330,000 |
| | | | | 33,464,519 |
| Information Technology 0.9% | | | | |
| cFreescale Semiconductor Inc., | | | | |
| secured note, 144A, 5.00%, 5/15/21 | United States | 8,500,000 | | 9,073,750 |
| senior secured note, 144A, 6.00%, 1/15/22 | United States | 6,100,000 | | 6,605,141 |
| Oracle Corp., senior note, 2.50%, 10/15/22 | United States | 10,000,000 | | 9,888,810 |
| | | | | 25,567,701 |
franklintempleton.com
Semiannual Report | 43
FRANKLIN INVESTORS SECURITIES TRUST
STATEMENT OF INVESTMENTS (UNAUDITED)
| | | | | | |
| Franklin Balanced Fund (continued) | | | | | |
| | | Principal | | | |
| | Country | Amount* | | Value | |
| Corporate Bonds (continued) | | | | | |
| Materials 1.3% | | | | | |
| Crown Americas LLC/Crown Americas Capital Corp. IV, senior bond, 4.50%, | | | | | |
| 1/15/23 | United States | 5,000,000 | $ | 5,050,000 | |
| cFMG Resources (August 2006) Pty. Ltd., senior secured note, 144A, 9.75%, | | | | | |
| 3/01/22 | Australia | 12,500,000 | | 12,959,688 | |
| Freeport-McMoRan Inc., senior bond, 3.875%, 3/15/23 | United States | 7,000,000 | | 6,599,320 | |
| cGlencore Funding LLC, senior note, 144A, 4.125%, 5/30/23 | Switzerland | 10,000,000 | | 10,102,070 | |
| Reliance Steel & Aluminum Co., senior note, 4.50%, 4/15/23 | United States | 4,000,000 | | 4,003,732 | |
| | | | | 38,714,810 | |
| Telecommunication Services 1.8% | | | | | |
| dAT&T Inc., senior bond, 4.75%, 5/15/46 | United States | 10,000,000 | | 9,811,990 | |
| cSoftBank Corp., senior note, 144A, 4.50%, 4/15/20 | Japan | 10,000,000 | | 10,281,250 | |
| Sprint Corp., senior note, 7.625%, 2/15/25 | United States | 10,000,000 | | 9,859,000 | |
| Telefonica Emisiones SAU, senior note, 4.57%, 4/27/23 | Spain | 10,000,000 | | 10,956,800 | |
| Verizon Communications Inc., senior bond, 6.55%, 9/15/43 | United States | 11,000,000 | | 13,808,531 | |
| | | | | 54,717,571 | |
| Utilities 1.4% | | | | | |
| Alabama Power Co., senior note, 2.80%, 4/01/25 | United States | 7,000,000 | | 7,002,667 | |
| c,eEDF SA, sub. note, 144A, 5.25% to 1/29/23, FRN thereafter, Perpetual | France | 10,000,000 | | 10,486,500 | |
| cEnogex LLC, senior note, 144A, 6.25%, 3/15/20 | United States | 5,000,000 | | 5,656,915 | |
| cInterGen NV, secured bond, 144A, 7.00%, 6/30/23 | Netherlands | 10,000,000 | | 9,675,000 | |
| NGL Energy Partners LP/NGL Energy Finance Corp., senior note, 6.875%, | | | | | |
| 10/15/21 | United States | 10,000,000 | | 10,575,000 | |
| | | | | 43,396,082 | |
| Total Corporate Bonds (Cost $901,374,409) | | | | 930,181,344 | |
| Total Investments before Short Term Investments | | | | | |
| (Cost $2,452,277,874) | | | | 2,674,931,603 | |
| Short Term Investments 11.9% | | | | | |
| U.S. Government and Agency Securities (Cost $29,999,972) 1.0% | | | | | |
| gU.S. Treasury Bill, 5/07/15 | United States | 30,000,000 | | 30,000,000 | |
| Total Investments before Money Market Funds | | | | | |
| (Cost $2,482,277,846) | | | | 2,704,931,603 | |
| |
| | | Shares | | | |
| Money Market Funds (Cost $327,814,527) 10.9% | | | | | |
| a,hInstitutional Fiduciary Trust Money Market Portfolio | United States | 327,814,527 | | 327,814,527 | |
| Total Investments (Cost $2,810,092,373) 100.8% | | | | 3,032,746,130 | |
| Options Written (0.0)%† | | | | (346,000 | ) |
| Other Assets, less Liabilities (0.8)% | | | | (24,476,617 | ) |
| Net Assets 100.0% | | | $ | 3,007,923,513 | |
44 | Semiannual Report franklintempleton.com
FRANKLIN INVESTORS SECURITIES TRUST
STATEMENT OF INVESTMENTS (UNAUDITED)
| | | | | | |
| Franklin Balanced Fund (continued) | | | | | |
| | | Number of | | | |
| | Country | Contracts | | Value | |
| iOptions Written (Premiums received $336,994) (0.0)%† | | | | | |
| Puts — Exchange-Traded | | | | | |
| Financials (0.0)%† | | | | | |
| SPDR S&P 500 ETF Trust, September Strike Price $190, Expires 9/18/15 | United States | 1,000 | $ | (346,000 | ) |
See Abbreviations on page 92.
*The principal amount is stated in U.S. dollars unless otherwise indicated.
†Rounds to less than 0.1% of net assets.
aNon-income producing.
bSee Note 1(g) regarding equity-linked securities.
cSecurity was purchased pursuant to Rule 144A under the Securities Act of 1933 and may be sold in transactions exempt from registration only to qualified institutional buyers
or in a public offering registered under the Securities Act of 1933. These securities have been deemed liquid under guidelines approved by the Trust’s Board of Trustees. At
April 30, 2015, the aggregate value of these securities was $507,672,908, representing 16.88% of net assets.
dSecurity purchased on a when-issued or delayed delivery basis. See Note 1(d).
ePerpetual security with no stated maturity date.
fThe coupon rate shown represents the rate at period end.
gThe security is traded on a discount basis with no stated coupon rate.
hSee Note 3(f) regarding investments in Institutional Fiduciary Trust Money Market Portfolio.
iSee Note 1(e) regarding written options.
franklintempleton.com The accompanying notes are an integral part of these financial statements. | Semiannual Report | 45
| | | | | | | | | | | | | | | | | | | |
| FRANKLIN INVESTORS SECURITIES TRUST | | | | | | | | | | | | | | | | |
| |
| |
| Financial Highlights | | | | | | | | | | | | | | | | | | |
| Franklin Convertible Securities Fund | | | | | | | | | | | | | | | | | | |
| | | Six Months Ended | | | | | | | | | | | | | | | | |
| | | April 30, 2015 | | | | | | Year Ended October 31, | | | | |
| | | (unaudited) | | | 2014 | | | 2013 | | | 2012 | | | 2011 | | | 2010 | |
| Class A | | | | | | | | | | | | | | | | | | |
| Per share operating performance | | | | | | | | | | | | | | | | | | |
| (for a share outstanding throughout the period) | | | | | | | | | | | | | | | | | | |
| Net asset value, beginning of period | $ | 18.97 | | $ | 17.82 | | $ | 14.93 | | $ | 14.37 | | $ | 14.55 | | $ | 12.28 | |
| Income from investment operationsa: | | | | | | | | | | | | | | | | | | |
| Net investment incomeb | | 0.11 | | | 0.23 | | | 0.37 | | | 0.41 | | | 0.42 | | | 0.37 | |
| Net realized and unrealized gains (losses) | | 0.32 | | | 1.32 | | | 2.99 | | | 0.67 | | | (0.06 | ) | | 2.42 | |
| Total from investment operations | | 0.43 | | | 1.55 | | | 3.36 | | | 1.08 | | | 0.36 | | | 2.79 | |
| Less distributions from: | | | | | | | | | | | | | | | | | | |
| Net investment income | | (0.18 | ) | | (0.33 | ) | | (0.47 | ) | | (0.52 | ) | | (0.54 | ) | | (0.52 | ) |
| Net realized gains | | (0.68 | ) | | (0.07 | ) | | — | | | — | | | — | | | — | |
| Total distributions | | (0.86 | ) | | (0.40 | ) | | (0.47 | ) | | (0.52 | ) | | (0.54 | ) | | (0.52 | ) |
| Net asset value, end of period | $ | 18.54 | | $ | 18.97 | | $ | 17.82 | | $ | 14.93 | | $ | 14.37 | | $ | 14.55 | |
| |
| Total returnc | | 2.48 | % | | 8.85 | % | | 22.92 | % | | 7.66 | % | | 2.35 | % | | 23.17 | % |
| |
| Ratios to average net assetsd | | | | | | | | | | | | | | | | | | |
| Expenses | | 0.86 | %e,f | | 0.88 | %e,f | | 0.88 | %f | | 0.90 | % | | 0.88 | % | | 0.90 | % |
| Net investment income | | 1.25 | % | | 1.23 | % | | 2.25 | % | | 2.84 | % | | 2.77 | % | | 2.78 | % |
| |
| Supplemental data | | | | | | | | | | | | | | | | | | |
| Net assets, end of period (000’s) | $ | 892,276 | | $ | 921,134 | | $ | 844,498 | | $ | 602,804 | | $ | 704,844 | | $ | 651,012 | |
| Portfolio turnover rate | | 6.62 | % | | 23.05 | % | | 34.69 | % | | 12.82 | % | | 23.24 | % | | 29.56 | % |
aThe amount shown for a share outstanding throughout the period may not correlate with the Statement of Operations for the period due to the timing of sales and
repurchases of the Fund shares in relation to income earned and/or fluctuating fair value of the investments of the Fund.
bBased on average daily shares outstanding.
cTotal return does not reflect sales commissions or contingent deferred sales charges, if applicable, and is not annualized for periods less than one year.
dRatios are annualized for periods less than one year.
eBenefit of waiver and payments by affiliates rounds to less than 0.01%.
fBenefit of expense reduction rounds to less than 0.01%.
46 | Semiannual Report | The accompanying notes are an integral part of these financial statements. franklintempleton.com
| | | | | | | | | | | | | | | | | | | |
| | | | | | FRANKLIN INVESTORS SECURITIES TRUST | |
| | | | | | | | | | | | FINANCIAL HIGHLIGHTS | |
| |
| |
| |
| Franklin Convertible Securities Fund (continued) | | | | | | | | | | | | | | | | |
| | | Six Months Ended | | | | | | | | | | | | | | | | |
| | | April 30, 2015 | | | | | | Year Ended October 31, | | | | |
| | | (unaudited) | | | 2014 | | | 2013 | | | 2012 | | | 2011 | | | 2010 | |
| Class C | | | | | | | | | | | | | | | | | | |
| Per share operating performance | | | | | | | | | | | | | | | | | | |
| (for a share outstanding throughout the period) | | | | | | | | | | | | | | | | | | |
| Net asset value, beginning of period | $ | 18.73 | | $ | 17.60 | | $ | 14.75 | | $ | 14.21 | | $ | 14.39 | | $ | 12.16 | |
| Income from investment operationsa: | | | | | | | | | | | | | | | | | | |
| Net investment incomeb | | 0.04 | | | 0.09 | | | 0.24 | | | 0.30 | | | 0.30 | | | 0.27 | |
| Net realized and unrealized gains (losses) | | 0.31 | | | 1.31 | | | 2.97 | | | 0.65 | | | (0.06 | ) | | 2.38 | |
| Total from investment operations | | 0.35 | | | 1.40 | | | 3.21 | | | 0.95 | | | 0.24 | | | 2.65 | |
| Less distributions from: | | | | | | | | | | | | | | | | | | |
| Net investment income | | (0.11 | ) | | (0.20 | ) | | (0.36 | ) | | (0.41 | ) | | (0.42 | ) | | (0.42 | ) |
| Net realized gains | | (0.68 | ) | | (0.07 | ) | | — | | | — | | | — | | | — | |
| Total distributions | | (0.79 | ) | | (0.27 | ) | | (0.36 | ) | | (0.41 | ) | | (0.42 | ) | | (0.42 | ) |
| Net asset value, end of period | $ | 18.29 | | $ | 18.73 | | $ | 17.60 | | $ | 14.75 | | $ | 14.21 | | $ | 14.39 | |
| |
| Total returnc | | 2.07 | % | | 8.01 | % | | 22.11 | % | | 6.79 | % | | 1.60 | % | | 22.16 | % |
| |
| Ratios to average net assetsd | | | | | | | | | | | | | | | | | | |
| Expenses | | 1.61 | %e,f | | 1.63 | %e,f | | 1.63 | %f | | 1.65 | % | | 1.63 | % | | 1.65 | % |
| Net investment income | | 0.50 | % | | 0.48 | % | | 1.50 | % | | 2.09 | % | | 2.02 | % | | 2.03 | % |
| |
| Supplemental data | | | | | | | | | | | | | | | | | | |
| Net assets, end of period (000’s) | $ | 328,937 | | $ | 333,034 | | $ | 273,132 | | $ | 211,630 | | $ | 232,471 | | $ | 222,201 | |
| Portfolio turnover rate | | 6.62 | % | | 23.05 | % | | 34.69 | % | | 12.82 | % | | 23.24 | % | | 29.56 | % |
aThe amount shown for a share outstanding throughout the period may not correlate with the Statement of Operations for the period due to the timing of sales and
repurchases of the Fund shares in relation to income earned and/or fluctuating fair value of the investments of the Fund.
bBased on average daily shares outstanding.
cTotal return does not reflect sales commissions or contingent deferred sales charges, if applicable, and is not annualized for periods less than one year.
dRatios are annualized for periods less than one year.
eBenefit of waiver and payments by affiliates rounds to less than 0.01%.
fBenefit of expense reduction rounds to less than 0.01%.
franklintempleton.com The accompanying notes are an integral part of these financial statements. | Semiannual Report | 47
FRANKLIN INVESTORS SECURITIES TRUST
FINANCIAL HIGHLIGHTS
| | | | | | | |
| Franklin Convertible Securities Fund (continued) | | | | | | |
| | | Six Months Ended | | | | |
| | | April 30, 2015 | | | Period Ended | |
| | | (unaudited) | | | October 31, 2014a | |
| Class R6 | | | | | | |
| Per share operating performance | | | | | | |
| (for a share outstanding throughout the period) | | | | | | |
| Net asset value, beginning of period | $ | 18.99 | | $ | 19.21 | |
| Income from investment operationsb: | | | | | | |
| Net investment incomec | | 0.15 | | | 0.19 | |
| Net realized and unrealized gains (losses) | | 0.30 | | | (0.17 | ) |
| Total from investment operations | | 0.45 | | | 0.02 | |
| Less distributions from: | | | | | | |
| Net investment income | | (0.21 | ) | | (0.24 | ) |
| Net realized gains | | (0.68 | ) | | — | |
| Total distributions | | (0.89 | ) | | (0.24 | ) |
| Net asset value, end of period | $ | 18.55 | | $ | 18.99 | |
| |
| Total returnd | | 2.63 | % | | 0.11 | % |
| |
| Ratios to average net assetse | | | | | | |
| Expensesf | | 0.50 | % | | 0.51 | % |
| Net investment income | | 1.61 | % | | 1.60 | % |
| |
| Supplemental data | | | | | | |
| Net assets, end of period (000’s) | $ | 3,170 | | $ | 3,093 | |
| Portfolio turnover rate | | 6.62 | % | | 23.05 | % |
aFor the period March 4, 2014 (effective date) to October 31, 2014.
bThe amount shown for a share outstanding throughout the period may not correlate with the Statement of Operations for the period due to the timing of sales and
repurchases of the Fund shares in relation to income earned and/or fluctuating fair value of the investments of the Fund.
cBased on average daily shares outstanding.
dTotal return is not annualized for periods less than one year.
eRatios are annualized for periods less than one year.
fBenefit of waiver and payments by affiliates and expense reduction rounds to less than 0.01%.
48 | Semiannual Report | The accompanying notes are an integral part of these financial statements. franklintempleton.com
| | | | | | | | | | | | | | | | | | | |
| | | | | | FRANKLIN INVESTORS SECURITIES TRUST | |
| | | | | | | | | | | | FINANCIAL HIGHLIGHTS | |
| |
| |
| |
| Franklin Convertible Securities Fund (continued) | | | | | | | | | | | | | | | | |
| | | Six Months Ended | | | | | | | | | | | | | | | | |
| | | April 30, 2015 | | | | | | Year Ended October 31, | | | | |
| | | (unaudited) | | | 2014 | | | 2013 | | | 2012 | | | 2011 | | | 2010 | |
| Advisor Class | | | | | | | | | | | | | | | | | | |
| Per share operating performance | | | | | | | | | | | | | | | | | | |
| (for a share outstanding throughout the period) | | | | | | | | | | | | | | | | | | |
| Net asset value, beginning of period | $ | 18.98 | | $ | 17.83 | | $ | 14.94 | | $ | 14.38 | | $ | 14.56 | | $ | 12.29 | |
| Income from investment operationsa: | | | | | | | | | | | | | | | | | | |
| Net investment incomeb | | 0.14 | | | 0.28 | | | 0.41 | | | 0.45 | | | 0.47 | | | 0.41 | |
| Net realized and unrealized gains (losses) | | 0.30 | | | 1.32 | | | 2.99 | | | 0.66 | | | (0.08 | ) | | 2.41 | |
| Total from investment operations | | 0.44 | | | 1.60 | | | 3.40 | | | 1.11 | | | 0.39 | | | 2.82 | |
| Less distributions from: | | | | | | | | | | | | | | | | | | |
| Net investment income | | (0.20 | ) | | (0.38 | ) | | (0.51 | ) | | (0.55 | ) | | (0.57 | ) | | (0.55 | ) |
| Net realized gains | | (0.68 | ) | | (0.07 | ) | | — | | | — | | | — | | | — | |
| Total distributions | | (0.88 | ) | | (0.45 | ) | | (0.51 | ) | | (0.55 | ) | | (0.57 | ) | | (0.55 | ) |
| Net asset value, end of period | $ | 18.54 | | $ | 18.98 | | $ | 17.83 | | $ | 14.94 | | $ | 14.38 | | $ | 14.56 | |
| |
| Total returnc | | 2.56 | % | | 9.13 | % | | 23.21 | % | | 7.93 | % | | 2.60 | % | | 23.45 | % |
| |
| Ratios to average net assetsd | | | | | | | | | | | | | | | | | | |
| Expenses | | 0.61 | %e,f | | 0.63 | %e,f | | 0.63 | %f | | 0.65 | % | | 0.63 | % | | 0.65 | % |
| Net investment income | | 1.50 | % | | 1.48 | % | | 2.50 | % | | 3.09 | % | | 3.02 | % | | 3.03 | % |
| |
| Supplemental data | | | | | | | | | | | | | | | | | | |
| Net assets, end of period (000’s) | $ | 952,592 | | $ | 877,190 | | $ | 387,528 | | $ | 196,765 | | $ | 181,611 | | $ | 68,526 | |
| Portfolio turnover rate | | 6.62 | % | | 23.05 | % | | 34.69 | % | | 12.82 | % | | 23.24 | % | | 29.56 | % |
aThe amount shown for a share outstanding throughout the period may not correlate with the Statement of Operations for the period due to the timing of sales and
repurchases of the Fund shares in relation to income earned and/or fluctuating fair value of the investments of the Fund.
bBased on average daily shares outstanding.
cTotal return is not annualized for periods less than one year.
dRatios are annualized for periods less than one year.
eBenefit of waiver and payments by affiliates rounds to less than 0.01%.
fBenefit of expense reduction rounds to less than 0.01%.
franklintempleton.com The accompanying notes are an integral part of these financial statements. | Semiannual Report | 49
| | | | | |
| FRANKLIN INVESTORS SECURITIES TRUST | | | | |
| |
| |
| |
| |
| Statement of Investments, April 30, 2015 (unaudited) | | | | |
| |
| Franklin Convertible Securities Fund | | | | |
| | Country | Shares | | Value |
| Common Stocks 1.9% | | | | |
| Consumer Discretionary 1.8% | | | | |
| aMGM Resorts International | United States | 1,884,074 | $ | 39,848,165 |
| Energy 0.1% | | | | |
| aSandRidge Energy Inc. | United States | 378,125 | | 714,656 |
| Total Common Stocks (Cost $41,642,001) | | | | 40,562,821 |
| Convertible Preferred Stocks 20.5% | | | | |
| Consumer Staples 3.0% | | | | |
| Post Holdings Inc., 5.25%, cvt. pfd. | United States | 95,200 | | 9,085,413 |
| bPost Holdings Inc., 2.50%, cvt. pfd., 144A | United States | 176,200 | | 16,507,737 |
| Tyson Foods Inc., 4.75%, cvt. pfd. | United States | 800,000 | | 39,352,000 |
| | | | | 64,945,150 |
| Energy 2.9% | | | | |
| bChesapeake Energy Corp., 5.75%, cvt. pfd., 144A | United States | 18,500 | | 15,967,813 |
| McDermott International Inc., 6.25%, cvt. pfd. | United States | 960,000 | | 18,566,400 |
| Rex Energy Corp., 6.00%, cvt. pfd., A | United States | 250,000 | | 11,255,000 |
| Sanchez Energy Corp., 6.50%, cvt. pfd., B | United States | 236,000 | | 10,221,160 |
| SandRidge Energy Inc., 7.00%, cvt. pfd. | United States | 200,000 | | 7,546,000 |
| | | | | 63,556,373 |
| Financials 0.7% | | | | |
| Wintrust Financial Corp., 5.00%, cvt. pfd. | United States | 12,300 | | 16,008,450 |
| Health Care 1.9% | | | | |
| Actavis PLC, 5.50%, cvt. pfd. | United States | 41,500 | | 41,527,390 |
| Industrials 3.4% | | | | |
| Stanley Black & Decker Inc., 4.75%, cvt. pfd. | United States | 297,600 | | 41,189,447 |
| United Technologies Corp., 7.50%, cvt. pfd. | United States | 570,100 | | 33,533,282 |
| | | | | 74,722,729 |
| Materials 2.1% | | | | |
| Alcoa Inc., 5.375%, cvt. pfd. | United States | 750,000 | | 34,215,000 |
| ArcelorMittal, 6.00%, cvt. pfd. | Luxembourg | 395,000 | | 6,687,350 |
| Cliffs Natural Resources Inc., 7.00%, cvt. pfd. | United States | 792,000 | | 4,736,160 |
| | | | | 45,638,510 |
| Telecommunication Services 1.7% | | | | |
| T-Mobile US Inc., 5.50%, cvt. pfd. | United States | 600,000 | | 37,410,000 |
| Utilities 4.8% | | | | |
| Dominion Resources Inc., 6.00%, cvt. pfd., B | United States | 310,000 | | 17,657,600 |
| Dominion Resources Inc., 6.125%, cvt. pfd., A | United States | 220,000 | | 12,467,400 |
| Dominion Resources Inc., 6.375%, cvt. pfd., A | United States | 185,200 | | 9,195,180 |
| Exelon Corp., 6.50%, cvt. pfd. | United States | 500,000 | | 24,635,000 |
| The Laclede Group Inc., 6.75%, cvt. pfd. | United States | 60,000 | | 3,298,800 |
| NextEra Energy Inc., 5.599%, cvt. pfd. | United States | 400,000 | | 26,534,000 |
| NextEra Energy Inc., 5.799%, cvt. pfd. | United States | 164,000 | | 9,329,960 |
| | | | | 103,117,940 |
| Total Convertible Preferred Stocks (Cost $474,480,653) | | | | 446,926,542 |
50 | Semiannual Report
franklintempleton.com
FRANKLIN INVESTORS SECURITIES TRUST
STATEMENT OF INVESTMENTS (UNAUDITED)
| | | | | |
| Franklin Convertible Securities Fund (continued) | | | | |
| | | Principal | | |
| | Country | Amount* | | Value |
| Convertible Bonds 72.8% | | | | |
| Consumer Discretionary 10.4% | | | | |
| Ctrip.com International Ltd., cvt., senior note, 1.25%, 10/15/18 | China | 19,200,000 | $ | 21,291,168 |
| Iconix Brand Group Inc., cvt., senior sub. note, 2.50%, 6/01/16 | United States | 30,190,000 | | 31,397,600 |
| Jarden Corp., cvt., senior sub. bond, 1.125%, 3/15/34 | United States | 40,000,000 | | 46,450,000 |
| Liberty Interactive LLC, cvt., senior note, 0.75%, 3/30/43 | United States | 17,250,000 | | 25,055,625 |
| Liberty Interactive LLC into Motorola Solutions Inc., cvt., senior deb., 3.50%, | | | | |
| 1/15/31 | United States | 5,500,000 | | 3,011,250 |
| Liberty Media Corp., cvt., senior note, 1.375%, 10/15/23 | United States | 21,200,000 | | 21,332,500 |
| The Priceline Group Inc., cvt., senior note, 0.35%, 6/15/20 | United States | 35,000,000 | | 41,431,250 |
| Shutterfly Inc., cvt., 0.25%, 5/15/18 | United States | 37,465,000 | | 37,090,350 |
| | | | | 227,059,743 |
| Energy 1.6% | | | | |
| Cobalt International Energy Inc., cvt., | | | | |
| senior bond, 3.125%, 5/15/24 | United States | 25,000,000 | | 19,640,625 |
| senior note, 2.625%, 12/01/19 | United States | 19,900,000 | | 15,298,125 |
| | | | | 34,938,750 |
| Financials 2.2% | | | | |
| Forest City Enterprises Inc., cvt., | | | | |
| A, senior note, 3.625%, 8/15/20 | United States | 20,250,000 | | 22,895,156 |
| senior note, 4.25%, 8/15/18 | United States | 20,000,000 | | 24,300,000 |
| | | | | 47,195,156 |
| Health Care 17.1% | | | | |
| BioMarin Pharmaceutical Inc., cvt., senior sub. note, 1.50%, 10/15/20 | United States | 28,200,000 | | 39,709,125 |
| Brookdale Senior Living Inc., cvt., senior note, 2.75%, 6/15/18 | United States | 26,200,000 | | 35,697,500 |
| Corsicanto Ltd., cvt., senior bond, 3.50%, 1/15/32 | Ireland | 12,500,000 | | 12,453,125 |
| Depomed Inc., cvt., senior note, 2.50%, 9/01/21 | United States | 16,000,000 | | 22,550,000 |
| Fluidigm Corp., cvt., senior bond, 2.75%, 2/01/34 | United States | 14,418,000 | | 14,652,293 |
| HeartWare International Inc., cvt., senior note, 3.50%, 12/15/17 | United States | 10,000,000 | | 10,787,500 |
| bIllumina Inc., cvt., senior bond, 144A, 0.50%, 6/15/21 | United States | 33,000,000 | | 38,197,500 |
| bJazz Investments I Ltd., cvt., senior note, 144A, 1.875%, 8/15/21 | United States | 35,000,000 | | 42,171,500 |
| Mylan Inc., cvt., senior note, 3.75%, 9/15/15 | United States | 5,000,000 | | 27,071,875 |
| Omnicare Inc., cvt., senior sub. note, 3.50%, 2/15/44 | United States | 36,563,000 | | 49,314,346 |
| Pacira Pharmaceuticals Inc., cvt., senior note, 3.25%, 2/01/19 | United States | 5,880,000 | | 16,192,050 |
| Salix Pharmaceuticals Ltd., cvt., senior note, 2.75%, 5/15/15 | United States | 12,000,000 | | 44,752,500 |
| Spectranetics Corp., cvt., senior note, 2.625%, 6/01/34 | United States | 17,000,000 | | 18,646,875 |
| | | | | 372,196,189 |
| Industrials 2.1% | | | | |
| The KEYW Holding Corp., cvt., senior note, 2.50%, 7/15/19 | United States | 20,000,000 | | 17,675,000 |
| UTI Worldwide Inc., cvt., senior note, 4.50%, 3/01/19 | United States | 28,000,000 | | 27,965,000 |
| | | | | 45,640,000 |
| Information Technology 37.4% | | | | |
| Bottomline Technologies Inc., cvt., senior note, 1.50%, 12/01/17 | United States | 16,400,000 | | 18,009,250 |
| Electronic Arts Inc., cvt., senior note, 0.75%, 7/15/16 | United States | 34,600,000 | | 63,361,250 |
| bElectronics for Imaging Inc., cvt., senior note, 144A, 0.75%, 9/01/19 | United States | 22,000,000 | | 22,646,140 |
| HomeAway Inc., cvt., senior note, 0.125%, 4/01/19 | United States | 36,500,000 | | 34,583,750 |
franklintempleton.com
Semiannual Report | 51
| | | | | |
| FRANKLIN INVESTORS SECURITIES TRUST | | | | |
| STATEMENT OF INVESTMENTS (UNAUDITED) | | | | |
| |
| |
| |
| |
| Franklin Convertible Securities Fund (continued) | | | | |
| | | Principal | | |
| | Country | Amount* | | Value |
| Convertible Bonds (continued) | | | | |
| Information Technology (continued) | | | | |
| Intel Corp., cvt., | | | | |
| junior sub., 3.25%, 8/01/39 | United States | 8,000,000 | $ | 13,050,040 |
| bjunior sub. bond, 144A, 2.95%, 12/15/35 | United States | 19,000,000 | | 24,248,750 |
| junior sub. deb., 2.95%, 12/15/35 | United States | 2,000,000 | | 2,552,500 |
| JDS Uniphase Corp., cvt., senior bond, 0.625%, 8/15/33 | United States | 39,900,000 | | 40,972,312 |
| bMercadoLibre Inc., cvt., senior note, 144A, 2.25%, 7/01/19 | Argentina | 5,000,000 | | 6,428,125 |
| bMicrochip Technology Inc., cvt., senior sub. note, 144A, 1.625%, 2/15/25 | United States | 40,000,000 | | 41,100,000 |
| Micron Technology Inc., cvt., senior bond, 2.125%, 2/15/33 | United States | 11,800,000 | | 30,591,500 |
| NetSuite Inc., cvt., senior note, 0.25%, 6/01/18 | United States | 36,300,000 | | 38,909,062 |
| Novellus Systems Inc., cvt., senior note, 2.625%, 5/15/41 | United States | 22,600,000 | | 49,903,625 |
| bPalo Alto Networks Inc., cvt., senior note, 144A, zero cpn., 7/01/19 | United States | 32,500,000 | | 46,800,000 |
| Proofpoint Inc., cvt., senior note, 1.25%, 12/15/18 | United States | 18,075,000 | | 26,954,344 |
| bQihoo 360 Technologies Co. Ltd., cvt., senior note, 144A, 1.75%, 8/15/21 | China | 24,000,000 | | 20,655,000 |
| Salesforce.com Inc., cvt., senior note, 0.25%, 4/01/18 | United States | 35,200,000 | | 44,044,000 |
| SanDisk Corp., cvt., senior note, 0.50%, 10/15/20 | United States | 33,000,000 | | 34,113,750 |
| ServiceNow Inc., cvt., zero cpn., 11/01/18 | United States | 35,500,000 | | 42,777,500 |
| Take-Two Interactive Software Inc., cvt., senior note, 1.00%, 7/01/18 | United States | 16,400,000 | | 20,602,500 |
| Trulia Inc., cvt., 2.75%, 12/15/20 | United States | 32,000,000 | | 45,263,680 |
| bTwitter Inc., cvt., senior note, 144A, 1.00%, 9/15/21 | United States | 35,000,000 | | 31,893,750 |
| bVeriSign Inc., cvt., junior sub. bond, 144A, 3.25%, 8/15/37 | United States | 14,000,000 | | 26,600,000 |
| Xilinx Inc., cvt., senior note, 2.625%, 6/15/17 | United States | 19,270,000 | | 29,338,575 |
| Yahoo! Inc., cvt., zero cpn., 12/01/18 | United States | 35,100,000 | | 37,359,563 |
| Yandex NV, cvt., senior note, 1.125%, 12/15/18 | Russia | 23,900,000 | | 20,993,641 |
| | | | | 813,752,607 |
| Materials 2.0% | | | | |
| B2Gold Corp., cvt., senior sub. note, 3.25%, 10/01/18 | Canada | 15,400,000 | | 13,470,380 |
| Cemex SAB de CV, cvt., sub. note, 3.75%, 3/15/18 | Mexico | 24,000,000 | | 29,474,760 |
| Molycorp Inc., cvt., senior note, 5.50%, 2/01/18 | United States | 7,360,000 | | 1,033,432 |
| | | | | 43,978,572 |
| Total Convertible Bonds (Cost $1,330,805,010) | | | | 1,584,761,017 |
| |
| | | Shares | | |
| |
| Escrows and Litigation Trusts 0.4% | | | | |
| Financials 0.4% | | | | |
| aMF Global Holdings Ltd., Escrow Account | United States | 25,000,000 | | 8,062,500 |
| a,cMotors Liquidation Co., Escrow Account, cvt. pfd., D | United States | 376,200 | | — |
| Total Escrows and Litigation Trusts | | | | |
| (Cost $8,310,280) | | | | 8,062,500 |
| Total Investments before Short Term Investments | | | | |
| (Cost $1,855,237,944) | | | | 2,080,312,880 |
52 | Semiannual Report franklintempleton.com
FRANKLIN INVESTORS SECURITIES TRUST
STATEMENT OF INVESTMENTS (UNAUDITED)
| | | | | |
| Franklin Convertible Securities Fund (continued) | | | | |
| | Country | Shares | | Value |
| Short Term Investments (Cost $91,423,464) 4.2% | | | | |
| Money Market Funds 4.2% | | | | |
| a,dInstitutional Fiduciary Trust Money Market Portfolio | United States | 91,423,464 | $ | 91,423,464 |
| Total Investments (Cost $1,946,661,408) 99.8% | | | | 2,171,736,344 |
| Other Assets, less Liabilities 0.2% | | | | 5,237,741 |
| Net Assets 100.0% | | | $ | 2,176,974,085 |
See Abbreviations on page 92.
*The principal amount is stated in U.S. dollars unless otherwise indicated.
aNon-income producing.
bSecurity was purchased pursuant to Rule 144A under the Securities Act of 1933 and may be sold in transactions exempt from registration only to qualified institutional
buyers or in a public offering registered under the Securities Act of 1933. These securities have been deemed liquid under guidelines approved by the Trust’s Board of
Trustees. At April 30, 2015, the aggregate value of these securities was $333,216,315, representing 15.31% of net assets.
cSecurity has been deemed illiquid because it may not be able to be sold within seven days.
dSee Note 3(f) regarding investments in Institutional Fiduciary Trust Money Market Portfolio.
franklintempleton.com The accompanying notes are an integral part of these financial statements. | Semiannual Report | 53
| | | | | | | | | | | | | | | | | | | |
| FRANKLIN INVESTORS SECURITIES TRUST | | | | | | | | | | | | | | | | |
| |
| |
| Financial Highlights | | | | | | | | | | | | | | | | | | |
| Franklin Equity Income Fund | | | | | | | | | | | | | | | | | | |
| | | Six Months Ended | | | | | | | | | | | | | | | | |
| | | April 30, 2015 | | | | | | Year Ended October 31, | | | | |
| | | (unaudited) | | | 2014 | | | 2013 | | | 2012 | | | 2011 | | | 2010 | |
| Class A | | | | | | | | | | | | | | | | | | |
| Per share operating performance | | | | | | | | | | | | | | | | | | |
| (for a share outstanding throughout the period) | | | | | | | | | | | | | | | | | | |
| Net asset value, beginning of period | $ | 23.93 | | $ | 22.16 | | $ | 18.01 | | $ | 16.58 | | $ | 15.93 | | $ | 14.06 | |
| Income from investment operationsa: | | | | | | | | | | | | | | | | | | |
| Net investment incomeb | | 0.28 | | | 0.66 | c | | 0.44 | | | 0.41 | | | 0.41 | | | 0.44 | |
| Net realized and unrealized gains (losses) | | 0.49 | | | 1.73 | | | 4.19 | | | 1.46 | | | 0.75 | | | 1.85 | |
| Total from investment operations | | 0.77 | | | 2.39 | | | 4.63 | | | 1.87 | | | 1.16 | | | 2.29 | |
| Less distributions from: | | | | | | | | | | | | | | | | | | |
| Net investment income | | (0.46 | ) | | (0.50 | ) | | (0.48 | ) | | (0.44 | ) | | (0.51 | ) | | (0.42 | ) |
| Net realized gains | | (1.06 | ) | | (0.12 | ) | | — | | | — | | | — | | | — | |
| Total distributions | | (1.52 | ) | | (0.62 | ) | | (0.48 | ) | | (0.44 | ) | | (0.51 | ) | | (0.42 | ) |
| Net asset value, end of period | $ | 23.18 | | $ | 23.93 | | $ | 22.16 | | $ | 18.01 | | $ | 16.58 | | $ | 15.93 | |
| |
| Total returnd | | 3.50 | % | | 10.99 | % | | 26.07 | % | | 11.43 | % | | 7.27 | % | | 16.48 | % |
| |
| Ratios to average net assetse | | | | | | | | | | | | | | | | | | |
| Expenses | | 0.87 | %f | | 0.87 | %f,g | | 0.91 | %g | | 0.95 | % | | 0.96 | % | | 0.98 | %g |
| Net investment income | | 2.46 | % | | 2.87 | %c | | 2.19 | % | | 2.36 | % | | 2.48 | % | | 2.96 | % |
| |
| Supplemental data | | | | | | | | | | | | | | | | | | |
| Net assets, end of period (000’s) | $ | 1,819,578 | | $ | 1,762,318 | | $ | 1,637,089 | | $ | 1,305,791 | | $ | 1,105,132 | | $ | 799,585 | |
| Portfolio turnover rate | | 11.34 | % | | 20.15 | % | | 33.18 | % | | 19.71 | % | | 19.45 | % | | 11.35 | % |
aThe amount shown for a share outstanding throughout the period may not correlate with the Statement of Operations for the period due to the timing of sales and
repurchases of the Fund shares in relation to income earned and/or fluctuating fair value of the investments of the Fund.
bBased on average daily shares outstanding.
cNet investment income per share includes approximately $0.17 per share received in the form of a special dividend paid in connection with certain Fund holdings.
Excluding this amount, the ratio of net investment income to average net assets would have been 2.15%.
dTotal return does not reflect sales commissions or contingent deferred sales charges, if applicable, and is not annualized for periods less than one year.
eRatios are annualized for periods less than one year.
f Benefit of waiver and payments by affiliates rounds to less than 0.01%.
gBenefit of expense reduction rounds to less than 0.01%.
54 | Semiannual Report | The accompanying notes are an integral part of these financial statements. franklintempleton.com
| | | | | | | | | | | | | | | | | | | |
| | | | | | FRANKLIN INVESTORS SECURITIES TRUST | |
| | | | | | | | | | | | FINANCIAL HIGHLIGHTS | |
| |
| |
| |
| Franklin Equity Income Fund (continued) | | | | | | | | | | | | | | | | |
| | | Six Months Ended | | | | | | | | | | | | | | | | |
| | | April 30, 2015 | | | | | | Year Ended October 31, | | | | |
| | | (unaudited) | | | 2014 | | | 2013 | | | 2012 | | | 2011 | | | 2010 | |
| Class C | | | | | | | | | | | | | | | | | | |
| Per share operating performance | | | | | | | | | | | | | | | | | | |
| (for a share outstanding throughout the period) | | | | | | | | | | | | | | | | | | |
| Net asset value, beginning of period | $ | 23.79 | | $ | 22.04 | | $ | 17.91 | | $ | 16.50 | | $ | 15.85 | | $ | 14.00 | |
| Income from investment operationsa: | | | | | | | | | | | | | | | | | | |
| Net investment incomeb | | 0.20 | | | 0.49 | c | | 0.28 | | | 0.28 | | | 0.29 | | | 0.33 | |
| Net realized and unrealized gains (losses) | | 0.49 | | | 1.71 | | | 4.18 | | | 1.45 | | | 0.74 | | | 1.82 | |
| Total from investment operations | | 0.69 | | | 2.20 | | | 4.46 | | | 1.73 | | | 1.03 | | | 2.15 | |
| Less distributions from: | | | | | | | | | | | | | | | | | | |
| Net investment income | | (0.37 | ) | | (0.33 | ) | | (0.33 | ) | | (0.32 | ) | | (0.38 | ) | | (0.30 | ) |
| Net realized gains | | (1.06 | ) | | (0.12 | ) | | — | | | — | | | — | | | — | |
| Total distributions | | (1.43 | ) | | (0.45 | ) | | (0.33 | ) | | (0.32 | ) | | (0.38 | ) | | (0.30 | ) |
| Net asset value, end of period | $ | 23.05 | | $ | 23.79 | | $ | 22.04 | | $ | 17.91 | | $ | 16.50 | | $ | 15.85 | |
| |
| Total returnd | | 3.18 | % | | 10.14 | % | | 25.18 | % | | 10.56 | % | | 6.44 | % | | 15.59 | % |
| |
| Ratios to average net assetse | | | | | | | | | | | | | | | | | | |
| Expenses | | 1.62 | %f | | 1.62 | %f,g | | 1.66 | %g | | 1.70 | % | | 1.71 | % | | 1.73 | %g |
| Net investment income | | 1.71 | % | | 2.12 | %c | | 1.44 | % | | 1.61 | % | | 1.73 | % | | 2.21 | % |
| |
| Supplemental data | | | | | | | | | | | | | | | | | | |
| Net assets, end of period (000’s) | $ | 255,604 | | $ | 241,566 | | $ | 208,325 | | $ | 134,746 | | $ | 118,686 | | $ | 97,305 | |
| Portfolio turnover rate | | 11.34 | % | | 20.15 | % | | 33.18 | % | | 19.71 | % | | 19.45 | % | | 11.35 | % |
aThe amount shown for a share outstanding throughout the period may not correlate with the Statement of Operations for the period due to the timing of sales and
repurchases of the Fund shares in relation to income earned and/or fluctuating fair value of the investments of the Fund.
bBased on average daily shares outstanding.
cNet investment income per share includes approximately $0.17 per share received in the form of a special dividend paid in connection with certain Fund holdings.
Excluding this amount, the ratio of net investment income to average net assets would have been 1.40%.
dTotal return does not reflect sales commissions or contingent deferred sales charges, if applicable, and is not annualized for periods less than one year.
eRatios are annualized for periods less than one year.
f Benefit of waiver and payments by affiliates rounds to less than 0.01%.
gBenefit of expense reduction rounds to less than 0.01%.
franklintempleton.com The accompanying notes are an integral part of these financial statements. | Semiannual Report | 55
FRANKLIN INVESTORS SECURITIES TRUST
FINANCIAL HIGHLIGHTS
| | | | | | | | | | | | | | | | | | | |
| Franklin Equity Income Fund (continued) | | | | | | | | | | | | | | | | |
| | | Six Months Ended | | | | | | | | | | | | | | | | |
| | | April 30, 2015 | | | | | | Year Ended October 31, | | | | |
| | | (unaudited) | | | 2014 | | | 2013 | | | 2012 | | | 2011 | | | 2010 | |
| Class R | | | | | | | | | | | | | | | | | | |
| Per share operating performance | | | | | | | | | | | | | | | | | | |
| (for a share outstanding throughout the period) | | | | | | | | | | | | | | | | | | |
| Net asset value, beginning of period | $ | 23.93 | | $ | 22.17 | | $ | 18.01 | | $ | 16.58 | | $ | 15.93 | | $ | 14.07 | |
| Income from investment operationsa: | | | | | | | | | | | | | | | | | | |
| Net investment incomeb | | 0.25 | | | 0.61 | c | | 0.39 | | | 0.37 | | | 0.38 | | | 0.41 | |
| Net realized and unrealized gains (losses) | | 0.49 | | | 1.72 | | | 4.20 | | | 1.46 | | | 0.73 | | | 1.83 | |
| Total from investment operations | | 0.74 | | | 2.33 | | | 4.59 | | | 1.83 | | | 1.11 | | | 2.24 | |
| Less distributions from: | | | | | | | | | | | | | | | | | | |
| Net investment income | | (0.43 | ) | | (0.45 | ) | | (0.43 | ) | | (0.40 | ) | | (0.46 | ) | | (0.38 | ) |
| Net realized gains | | (1.06 | ) | | (0.12 | ) | | — | | | — | | | — | | | — | |
| Total distributions | | (1.49 | ) | | (0.57 | ) | | (0.43 | ) | | (0.40 | ) | | (0.46 | ) | | (0.38 | ) |
| Net asset value, end of period | $ | 23.18 | | $ | 23.93 | | $ | 22.17 | | $ | 18.01 | | $ | 16.58 | | $ | 15.93 | |
| |
| Total returnd | | 3.37 | % | | 10.67 | % | | 25.81 | % | | 11.16 | % | | 7.00 | % | | 16.09 | % |
| |
| Ratios to average net assetse | | | | | | | | | | | | | | | | | | |
| Expenses | | 1.12 | %f | | 1.12 | %f,g | | 1.16 | %g | | 1.20 | % | | 1.21 | % | | 1.23 | %g |
| Net investment income | | 2.21 | % | | 2.62 | %c | | 1.94 | % | | 2.11 | % | | 2.23 | % | | 2.71 | % |
| |
| Supplemental data | | | | | | | | | | | | | | | | | | |
| Net assets, end of period (000’s) | $ | 7,260 | | $ | 7,305 | | $ | 5,844 | | $ | 4,940 | | $ | 3,830 | | $ | 3,589 | |
| Portfolio turnover rate | | 11.34 | % | | 20.15 | % | | 33.18 | % | | 19.71 | % | | 19.45 | % | | 11.35 | % |
aThe amount shown for a share outstanding throughout the period may not correlate with the Statement of Operations for the period due to the timing of sales and
repurchases of the Fund shares in relation to income earned and/or fluctuating fair value of the investments of the Fund.
bBased on average daily shares outstanding.
cNet investment income per share includes approximately $0.17 per share received in the form of a special dividend paid in connection with certain Fund holdings.
Excluding this amount, the ratio of net investment income to average net assets would have been 1.90%.
dTotal return is not annualized for periods less than one year.
eRatios are annualized for periods less than one year.
f Benefit of waiver and payments by affiliates rounds to less than 0.01%.
gBenefit of expense reduction rounds to less than 0.01%.
56 | Semiannual Report | The accompanying notes are an integral part of these financial statements. franklintempleton.com
| | | | | | | | | | |
| | | FRANKLIN INVESTORS SECURITIES TRUST | |
| | | FINANCIAL HIGHLIGHTS | |
| |
| |
| |
| Franklin Equity Income Fund (continued) | | | | | | | | | |
| | | Six Months Ended | | | Year Ended | |
| | | April 30, 2015 | | | October 31, | |
| | | (unaudited) | | | 2014 | | | 2013 | a |
| Class R6 | | | | | | | | | |
| Per share operating performance | | | | | | | | | |
| (for a share outstanding throughout the period) | | | | | | | | | |
| Net asset value, beginning of period | $ | 23.95 | | $ | 22.18 | | $ | 20.00 | |
| Income from investment operationsb: | | | | | | | | | |
| Net investment incomec | | 0.33 | | | 0.75 | d | | 0.26 | |
| Net realized and unrealized gains (losses) | | 0.48 | | | 1.73 | | | 2.18 | |
| Total from investment operations | | 0.81 | | | 2.48 | | | 2.44 | |
| Less distributions from: | | | | | | | | | |
| Net investment income | | (0.50 | ) | | (0.59 | ) | | (0.26 | ) |
| Net realized gains | | (1.06 | ) | | (0.12 | ) | | — | |
| Total distributions | | (1.56 | ) | | (0.71 | ) | | (0.26 | ) |
| Net asset value, end of period | $ | 23.20 | | $ | 23.95 | | $ | 22.18 | |
| |
| Total returne | | 3.69 | % | | 11.38 | % | | 12.30 | % |
| |
| Ratios to average net assetsf | | | | | | | | | |
| Expenses before waiver and payments by affiliates | | 2.95 | % | | 1.78 | % | | 2.16 | % |
| Expenses net of waiver and payments by affiliates | | 0.50 | % | | 0.50 | %g | | 0.51 | %g |
| Net investment income | | 2.83 | % | | 3.24 | %d | | 2.59 | % |
| |
| Supplemental data | | | | | | | | | |
| Net assets, end of period (000’s) | $ | 6 | | $ | 6 | | $ | 6 | |
| Portfolio turnover rate | | 11.34 | % | | 20.15 | % | | 33.18 | % |
aFor the period May 1, 2013 (effective date) to October 31, 2013.
bThe amount shown for a share outstanding throughout the period may not correlate with the Statement of Operations for the period due to the timing of sales and
repurchases of the Fund shares in relation to income earned and/or fluctuating fair value of the investments of the Fund.
cBased on average daily shares outstanding.
dNet investment income per share includes approximately $0.17 per share received in the form of a special dividend paid in connection with certain Fund holdings.
Excluding this amount, the ratio of net investment income to average net assets would have been 2.51%.
eTotal return is not annualized for periods less than one year.
f Ratios are annualized for periods less than one year.
gBenefit of expense reduction rounds to less than 0.01%.
franklintempleton.com The accompanying notes are an integral part of these financial statements. | Semiannual Report | 57
FRANKLIN INVESTORS SECURITIES TRUST
FINANCIAL HIGHLIGHTS
| | | | | | | | | | | | | | | | | | | |
| Franklin Equity Income Fund (continued) | | | | | | | | | | | | | | | | |
| | | Six Months Ended | | | | | | | | | | | | | | | | |
| | | April 30, 2015 | | | | | | Year Ended October 31, | | | | |
| | | (unaudited) | | | 2014 | | | 2013 | | | 2012 | | | 2011 | | | 2010 | |
| Advisor Class | | | | | | | | | | | | | | | | | | |
| Per share operating performance | | | | | | | | | | | | | | | | | | |
| (for a share outstanding throughout the period) | | | | | | | | | | | | | | | | | | |
| Net asset value, beginning of period | $ | 23.96 | | $ | 22.19 | | $ | 18.02 | | $ | 16.59 | | $ | 15.94 | | $ | 14.07 | |
| Income from investment operationsa: | | | | | | | | | | | | | | | | | | |
| Net investment incomeb | | 0.31 | | | 0.71 | c | | 0.48 | | | 0.45 | | | 0.45 | | | 0.48 | |
| Net realized and unrealized gains (losses) | | 0.49 | | | 1.74 | | | 4.22 | | | 1.46 | | | 0.75 | | | 1.85 | |
| Total from investment operations | | 0.80 | | | 2.45 | | | 4.70 | | | 1.91 | | | 1.20 | | | 2.33 | |
| Less distributions from: | | | | | | | | | | | | | | | | | | |
| Net investment income | | (0.49 | ) | | (0.56 | ) | | (0.53 | ) | | (0.48 | ) | | (0.55 | ) | | (0.46 | ) |
| Net realized gains | | (1.06 | ) | | (0.12 | ) | | — | | | — | | | — | | | — | |
| Total distributions | | (1.55 | ) | | (0.68 | ) | | (0.53 | ) | | (0.48 | ) | | (0.55 | ) | | (0.46 | ) |
| Net asset value, end of period | $ | 23.21 | | $ | 23.96 | | $ | 22.19 | | $ | 18.02 | | $ | 16.59 | | $ | 15.94 | |
| |
| Total returnd | | 3.63 | % | | 11.25 | % | | 26.48 | % | | 11.69 | % | | 7.54 | % | | 16.76 | % |
| |
| Ratios to average net assetse | | | | | | | | | | | | | | | | | | |
| Expenses | | 0.62 | %f | | 0.62 | %f,g | | 0.66 | %g | | 0.70 | % | | 0.71 | % | | 0.73 | %g |
| Net investment income | | 2.71 | % | | 3.12 | %c | | 2.44 | % | | 2.61 | % | | 2.73 | % | | 3.21 | % |
| |
| Supplemental data | | | | | | | | | | | | | | | | | | |
| Net assets, end of period (000’s) | $ | 32,088 | | $ | 30,166 | | $ | 17,534 | | $ | 10,527 | | $ | 7,467 | | $ | 4,183 | |
| Portfolio turnover rate | | 11.34 | % | | 20.15 | % | | 33.18 | % | | 19.71 | % | | 19.45 | % | | 11.35 | % |
aThe amount shown for a share outstanding throughout the period may not correlate with the Statement of Operations for the period due to the timing of sales and
repurchases of the Fund shares in relation to income earned and/or fluctuating fair value of the investments of the Fund.
bBased on average daily shares outstanding.
cNet investment income per share includes approximately $0.17 per share received in the form of a special dividend paid in connection with certain Fund holdings.
Excluding this amount, the ratio of net investment income to average net assets would have been 2.40%.
dTotal return is not annualized for periods less than one year.
eRatios are annualized for periods less than one year.
f Benefit of waiver and payments by affiliates rounds to less than 0.01%.
gBenefit of expense reduction rounds to less than 0.01%.
58 | Semiannual Report | The accompanying notes are an integral part of these financial statements. franklintempleton.com
FRANKLIN INVESTORS SECURITIES TRUST
| | | | | |
| Statement of Investments, April 30, 2015 (unaudited) | | | | |
| |
| Franklin Equity Income Fund | | | | |
| | Country | Shares | | Value |
| Common Stocks 89.8% | | | | |
| Consumer Discretionary 15.4% | | | | |
| Ford Motor Co. | United States | 3,018,100 | $ | 47,685,980 |
| L Brands Inc. | United States | 515,100 | | 46,029,336 |
| Las Vegas Sands Corp. | United States | 475,100 | | 25,123,288 |
| Lowe’s Cos. Inc. | United States | 600,000 | | 41,316,000 |
| McDonald’s Corp. | United States | 319,300 | | 30,828,415 |
| NIKE Inc., B | United States | 458,000 | | 45,268,720 |
| Starwood Hotels & Resorts Worldwide Inc. | United States | 515,200 | | 44,281,440 |
| Target Corp. | United States | 571,500 | | 45,051,345 |
| | | | | 325,584,524 |
| Consumer Staples 7.1% | | | | |
| Anheuser-Busch InBev NV, ADR | Belgium | 256,000 | | 30,730,240 |
| Mead Johnson Nutrition Co., A | United States | 331,900 | | 31,835,848 |
| Nestle SA | Switzerland | 335,000 | | 26,166,827 |
| PepsiCo Inc. | United States | 448,900 | | 42,699,368 |
| The Procter & Gamble Co. | United States | 237,700 | | 18,899,527 |
| | | | | 150,331,810 |
| Energy 5.9% | | | | |
| BP PLC, ADR | United Kingdom | 391,271 | | 16,887,256 |
| Chevron Corp. | United States | 172,400 | | 19,146,744 |
| Exxon Mobil Corp. | United States | 367,234 | | 32,085,235 |
| HollyFrontier Corp. | United States | 600,000 | | 23,268,000 |
| Royal Dutch Shell PLC, A, ADR | United Kingdom | 512,000 | | 32,476,160 |
| | | | | 123,863,395 |
| Financials 13.4% | | | | |
| Aflac Inc. | United States | 536,200 | | 33,802,048 |
| Arthur J. Gallagher & Co. | United States | 669,300 | | 32,012,619 |
| Bank of America Corp. | United States | 974,700 | | 15,526,971 |
| BlackRock Inc. | United States | 129,700 | | 47,203,018 |
| JPMorgan Chase & Co. | United States | 691,500 | | 43,744,290 |
| MetLife Inc. | United States | 671,905 | | 34,462,008 |
| T. Rowe Price Group Inc. | United States | 450,500 | | 36,571,590 |
| Wells Fargo & Co. | United States | 725,000 | | 39,947,500 |
| | | | | 283,270,044 |
| Health Care 9.9% | | | | |
| Bristol-Myers Squibb Co. | United States | 298,700 | | 19,036,151 |
| Eli Lilly & Co. | United States | 566,400 | | 40,707,168 |
| Johnson & Johnson | United States | 332,000 | | 32,934,400 |
| Pfizer Inc. | United States | 979,300 | | 33,227,649 |
| Roche Holding AG | Switzerland | 139,000 | | 40,122,790 |
| Sanofi, ADR | France | 871,000 | | 44,029,050 |
| | | | | 210,057,208 |
| Industrials 14.6% | | | | |
| Caterpillar Inc. | United States | 327,900 | | 28,487,952 |
| General Electric Co. | United States | 1,228,500 | | 33,267,780 |
| Honeywell International Inc. | United States | 423,800 | | 42,769,896 |
| Lockheed Martin Corp. | United States | 223,100 | | 41,630,460 |
| Nielsen NV | United States | 460,200 | | 20,681,388 |
franklintempleton.com
Semiannual Report | 59
FRANKLIN INVESTORS SECURITIES TRUST
STATEMENT OF INVESTMENTS (UNAUDITED)
| | | | | |
| Franklin Equity Income Fund (continued) | | | | |
| | Country | Shares | | Value |
| Common Stocks (continued) | | | | |
| Industrials (continued) | | | | |
| Raytheon Co. | United States | 293,500 | $ | 30,524,000 |
| Republic Services Inc. | United States | 1,062,800 | | 43,181,564 |
| United Parcel Service Inc., B | United States | 306,600 | | 30,822,498 |
| United Technologies Corp. | United States | 329,700 | | 37,503,375 |
| | | | | 308,868,913 |
| Information Technology 10.9% | | | | |
| CA Inc. | United States | 499,500 | | 15,869,115 |
| Cisco Systems Inc. | United States | 1,665,333 | | 48,011,551 |
| Intel Corp. | United States | 1,336,100 | | 43,490,055 |
| Maxim Integrated Products Inc. | United States | 1,226,000 | | 40,249,580 |
| Microsoft Corp. | United States | 1,001,700 | | 48,722,688 |
| Seagate Technology PLC | United States | 585,200 | | 34,362,944 |
| | | | | 230,705,933 |
| Materials 4.9% | | | | |
| BHP Billiton PLC | Australia | 842,500 | | 20,199,272 |
| The Dow Chemical Co. | United States | 814,400 | | 41,534,400 |
| Freeport-McMoRan Inc., B | United States | 633,906 | | 14,750,993 |
| Potash Corp. of Saskatchewan Inc. | Canada | 858,600 | | 28,024,704 |
| | | | | 104,509,369 |
| Telecommunication Services 1.7% | | | | |
| Rogers Communications Inc., B | Canada | 755,500 | | 26,978,905 |
| Verizon Communications Inc. | United States | 169,371 | | 8,543,073 |
| | | | | 35,521,978 |
| Utilities 6.0% | | | | |
| Dominion Resources Inc. | United States | 391,100 | | 28,034,048 |
| Duke Energy Corp. | United States | 419,690 | | 32,555,353 |
| PG&E Corp. | United States | 809,900 | | 42,859,908 |
| Xcel Energy Inc. | United States | 673,500 | | 22,838,385 |
| | | | | 126,287,694 |
| Total Common Stocks (Cost $1,472,954,348) | | | | 1,899,000,868 |
| aEquity-Linked Securities (Cost $34,171,000) 1.9% | | | | |
| Consumer Discretionary 1.9% | | | | |
| bBarclays Bank PLC into Amazon.com Inc., 3.00%, 144A | United States | 100,000 | | 40,678,350 |
| Convertible Preferred Stocks 7.7% | | | | |
| Energy 0.6% | | | | |
| bChesapeake Energy Corp., 5.75%, cvt. pfd., 144A | United States | 16,000 | | 13,810,000 |
| Financials 1.0% | | | | |
| Bank of America Corp., 7.25%, cvt. pfd., L | United States | 18,000 | | 20,862,000 |
| Health Care 1.4% | | | | |
| Actavis PLC, 5.50%, cvt. pfd. | United States | 30,000 | | 30,019,800 |
| Industrials 1.9% | | | | |
| Genesee & Wyoming Inc., 5.00%, cvt. pfd. | United States | 68,800 | | 8,074,368 |
| Stanley Black & Decker Inc., 6.25%, cvt. pfd. | United States | 279,000 | | 32,603,940 |
| | | | | 40,678,308 |
60 | Semiannual Report
franklintempleton.com
FRANKLIN INVESTORS SECURITIES TRUST
STATEMENT OF INVESTMENTS (UNAUDITED)
| | | | | | |
| Franklin Equity Income Fund (continued) | | | | | |
| | Country | Shares | | Value | |
| Convertible Preferred Stocks (continued) | | | | | |
| Materials 1.3% | | | | | |
| Alcoa Inc., 5.375%, cvt. pfd. | United States | 590,200 | $ | 26,924,924 | |
| Utilities 1.5% | | | | | |
| NextEra Energy Inc., 5.799%, cvt. pfd. | United States | 370,000 | | 21,049,300 | |
| NextEra Energy Inc., 5.889%, cvt. pfd. | United States | 154,000 | | 9,802,100 | |
| | | | | 30,851,400 | |
| Total Convertible Preferred Stocks (Cost $149,214,844) | | | | 163,146,432 | |
| Total Investments before Short Term Investments | | | | | |
| (Cost $1,656,340,192) | | | | 2,102,825,650 | |
| Short Term Investments (Cost $31,078,435) 1.5% | | | | | |
| Money Market Funds 1.5% | | | | | |
| c,dInstitutional Fiduciary Trust Money Market Portfolio | United States | 31,078,435 | | 31,078,435 | |
| Total Investments (Cost $1,687,418,627) 100.9% | | | | 2,133,904,085 | |
| Other Assets, less Liabilities (0.9)% | | | | (19,368,757 | ) |
| Net Assets 100.0% | | | $ | 2,114,535,328 | |
See Abbreviations on page 92.
aSee Note 1(g) regarding equity-linked securities.
bSecurity was purchased pursuant to Rule 144A under the Securities Act of 1933 and may be sold in transactions exempt from registration only to qualified institutional buyers
or in a public offering registered under the Securities Act of 1933. These securities have been deemed liquid under guidelines approved by the Trust’s Board of Trustees. At
April 30, 2015, the aggregate value of these securities was $54,488,350, representing 2.58% of net assets.
cNon-income producing.
dSee Note 3(f) regarding investments in Institutional Fiduciary Trust Money Market Portfolio.
franklintempleton.com The accompanying notes are an integral part of these financial statements. | Semiannual Report | 61
| | | | | | | | | | | | | | | | | | | |
| FRANKLIN INVESTORS SECURITIES TRUST | | | | | | | | | | | | | | | | |
| |
| |
| Financial Highlights | | | | | | | | | | | | | | | | | | |
| Franklin Real Return Fund | | | | | | | | | | | | | | | | | | |
| | | Six Months Ended | | | | | | | | | | | | | | | | |
| | | April 30, 2015 | | | | | | Year Ended October 31, | | | | |
| | | (unaudited) | | | 2014 | | | 2013 | | | 2012 | | | 2011 | | | 2010 | |
| Class A | | | | | | | | | | | | | | | | | | |
| Per share operating performance | | | | | | | | | | | | | | | | | | |
| (for a share outstanding throughout the period) | | | | | | | | | | | | | | | | | | |
| Net asset value, beginning of period | $ | 10.66 | | $ | 10.82 | | $ | 10.94 | | $ | 11.06 | | $ | 11.14 | | $ | 10.74 | |
| Income from investment operationsa: | | | | | | | | | | | | | | | | | | |
| Net investment income (loss)b | | (0.05 | ) | | 0.14 | | | 0.15 | | | 0.17 | | | 0.31 | | | 0.17 | |
| Net realized and unrealized gains (losses) | | (0.13 | ) | | (0.06 | ) | | (0.01 | ) | | 0.01 | | | 0.03 | | | 0.47 | |
| Total from investment operations | | (0.18 | ) | | 0.08 | | | 0.14 | | | 0.18 | | | 0.34 | | | 0.64 | |
| Less distributions from net investment income | | | | | | | | | | | | | | | | | | |
| and net foreign currency gains | | (0.07 | ) | | (0.24 | ) | | (0.26 | ) | | (0.30 | ) | | (0.42 | ) | | (0.24 | ) |
| Net asset value, end of period | $ | 10.41 | | $ | 10.66 | | $ | 10.82 | | $ | 10.94 | | $ | 11.06 | | $ | 11.14 | |
| |
| Total returnc | | (1.69 | )% | | 0.75 | % | | 1.34 | % | | 1.67 | % | | 3.03 | % | | 6.07 | % |
| |
| Ratios to average net assetsd | | | | | | | | | | | | | | | | | | |
| Expenses before waiver and payments by | | | | | | | | | | | | | | | | | | |
| affiliates | | 1.11 | % | | 1.10 | % | | 1.08 | % | | 1.06 | % | | 1.05 | % | | 1.07 | % |
| Expenses net of waiver and payments by | | | | | | | | | | | | | | | | | | |
| affiliates | | 0.90 | %e | | 0.90 | %e | | 0.90 | %e | | 0.90 | % | | 0.90 | % | | 0.90 | %e |
| Net investment income (loss) | | (0.88 | )% | | 1.34 | % | | 1.35 | % | | 1.58 | % | | 2.76 | % | | 1.60 | % |
| |
| Supplemental data | | | | | | | | | | | | | | | | | | |
| Net assets, end of period (000’s) | $ | 219,469 | | $ | 248,313 | | $ | 327,285 | | $ | 411,419 | | $ | 444,465 | | $ | 388,239 | |
| Portfolio turnover rate | | 14.63 | % | | 33.02 | % | | 27.91 | % | | 18.64 | % | | 37.60 | % | | 20.08 | % |
aThe amount shown for a share outstanding throughout the period may not correlate with the Statement of Operations for the period due to the timing of sales and repurchases
of the Fund shares in relation to income earned, adjustments to interest income for the inflation-indexed bonds, and/or fluctuating fair value of the investments of the Fund.
bBased on average daily shares outstanding.
cTotal return does not reflect sales commissions or contingent deferred sales charges, if applicable, and is not annualized for periods less than one year.
dRatios are annualized for periods less than one year.
eBenefit of expense reduction rounds to less than 0.01%.
62 | Semiannual Report | The accompanying notes are an integral part of these financial statements. franklintempleton.com
FRANKLIN INVESTORS SECURITIES TRUST
FINANCIAL HIGHLIGHTS
| | | | | | | | | | | | | | | | | | | |
| Franklin Real Return Fund (continued) | | | | | | | | | | | | | | | | | | |
| | | Six Months Ended | | | | | | | | | | | | | | | | |
| | | April 30, 2015 | | | | | | Year Ended October 31, | | | | |
| | | (unaudited) | | | 2014 | | | 2013 | | | 2012 | | | 2011 | | | 2010 | |
| Class C | | | | | | | | | | | | | | | | | | |
| Per share operating performance | | | | | | | | | | | | | | | | | | |
| (for a share outstanding throughout the period) | | | | | | | | | | | | | | | | | | |
| Net asset value, beginning of period | $ | 10.59 | | $ | 10.76 | | $ | 10.87 | | $ | 11.00 | | $ | 11.08 | | $ | 10.69 | |
| Income from investment operationsa: | | | | | | | | | | | | | | | | | | |
| Net investment income (loss)b | | (0.07 | ) | | 0.10 | | | 0.10 | | | 0.13 | | | 0.27 | | | 0.13 | |
| Net realized and unrealized gains (losses) | | (0.13 | ) | | (0.07 | ) | | 0.01 | | | —c | | | 0.02 | | | 0.47 | |
| Total from investment operations | | (0.20 | ) | | 0.03 | | | 0.11 | | | 0.13 | | | 0.29 | | | 0.60 | |
| Less distributions from net investment income | | | | | | | | | | | | | | | | | | |
| and net foreign currency gains | | (0.06 | ) | | (0.20 | ) | | (0.22 | ) | | (0.26 | ) | | (0.37 | ) | | (0.21 | ) |
| Net asset value, end of period | $ | 10.33 | | $ | 10.59 | | $ | 10.76 | | $ | 10.87 | | $ | 11.00 | | $ | 11.08 | |
| |
| Total returnd | | (1.86 | )% | | 0.22 | % | | 1.03 | % | | 1.22 | % | | 2.65 | % | | 5.68 | % |
| |
| Ratios to average net assetse | | | | | | | | | | | | | | | | | | |
| Expenses before waiver and payments by | | | | | | | | | | | | | | | | | | |
| affiliates | | 1.50 | % | | 1.50 | % | | 1.48 | % | | 1.46 | % | | 1.45 | % | | 1.47 | % |
| Expenses net of waiver and payments by | | | | | | | | | | | | | | | | | | |
| affiliates | | 1.29 | %f | | 1.30 | %f | | 1.30 | %f | | 1.30 | % | | 1.30 | % | | 1.30 | %f |
| Net investment income (loss) | | (1.27 | )% | | 0.94 | % | | 0.95 | % | | 1.18 | % | | 2.36 | % | | 1.20 | % |
| |
| Supplemental data | | | | | | | | | | | | | | | | | | |
| Net assets, end of period (000’s) | $ | 58,823 | | $ | 68,188 | | $ | 83,666 | | $ | 104,682 | | $ | 115,126 | | $ | 62,256 | |
| Portfolio turnover rate | | 14.63 | % | | 33.02 | % | | 27.91 | % | | 18.64 | % | | 37.60 | % | | 20.08 | % |
aThe amount shown for a share outstanding throughout the period may not correlate with the Statement of Operations for the period due to the timing of sales and repurchases
of the Fund shares in relation to income earned, adjustments to interest income for the inflation-indexed bonds, and/or fluctuating fair value of the investments of the Fund.
bBased on average daily shares outstanding.
cAmount rounds to less than $0.01 per share.
dTotal return does not reflect sales commissions or contingent deferred sales charges, if applicable, and is not annualized for periods less than one year.
eRatios are annualized for periods less than one year.
fBenefit of expense reduction rounds to less than 0.01%.
franklintempleton.com The accompanying notes are an integral part of these financial statements. | Semiannual Report | 63
FRANKLIN INVESTORS SECURITIES TRUST
FINANCIAL HIGHLIGHTS
| | | | | | | | | | |
| Franklin Real Return Fund (continued) | | | | | | | | | |
| | | Six Months Ended | | | Year Ended | |
| | | April 30, 2015 | | | October 31, | |
| | | (unaudited) | | | 2014 | | | 2013 | a |
| Class R6 | | | | | | | | | |
| Per share operating performance | | | | | | | | | |
| (for a share outstanding throughout the period) | | | | | | | | | |
| Net asset value, beginning of period | $ | 10.68 | | $ | 10.85 | | $ | 11.01 | |
| Income from investment operationsb: | | | | | | | | | |
| Net investment income (loss)c: | | (0.02 | ) | | 0.21 | | | 0.09 | |
| Net realized and unrealized gains (losses) | | (0.13 | ) | | (0.10 | ) | | (0.10 | ) |
| Total from investment operations | | (0.15 | ) | | 0.11 | | | (0.01 | ) |
| Less distributions from net investment income and net foreign currency gains | | (0.08 | ) | | (0.28 | ) | | (0.15 | ) |
| Net asset value, end of period | $ | 10.45 | | $ | 10.68 | | $ | 10.85 | |
| |
| Total returnd | | (1.43 | )% | | 1.04 | % | | (0.06 | )% |
| |
| Ratios to average net assetse | | | | | | | | | |
| Expenses before waiver and payments by affiliates | | 0.70 | % | | 0.70 | % | | 2.43 | % |
| Expenses net of waiver and payments by affiliatesf | | 0.51 | % | | 0.52 | % | | 0.52 | % |
| Net investment income (loss) | | (0.49 | )% | | 1.72 | % | | 1.73 | % |
| |
| Supplemental data | | | | | | | | | |
| Net assets, end of period (000’s) | $ | 1,814 | | $ | 2,034 | | $ | 5 | |
| Portfolio turnover rate | | 14.63 | % | | 33.02 | % | | 27.91 | % |
aFor the period May 1, 2013 (effective date) to October 31, 2013.
bThe amount shown for a share outstanding throughout the period may not correlate with the Statement of Operations for the period due to the timing of sales and repurchases
of the Fund shares in relation to income earned, adjustments to interest income for the inflation-indexed bonds, and/or fluctuating fair value of the investments of the Fund.
cBased on average daily shares outstanding.
dTotal return is not annualized for periods less than one year.
eRatios are annualized for periods less than one year.
fBenefit of expense reduction rounds to less than 0.01%.
64 | Semiannual Report | The accompanying notes are an integral part of these financial statements. franklintempleton.com
FRANKLIN INVESTORS SECURITIES TRUST
FINANCIAL HIGHLIGHTS
| | | | | | | | | | | | | | | | | | | |
| Franklin Real Return Fund (continued) | | | | | | | | | | | | | | | | | | |
| | | Six Months Ended | | | | | | | | | | | | | | | | |
| | | April 30, 2015 | | | | | | Year Ended October 31, | | | | |
| | | (unaudited) | | | 2014 | | | 2013 | | | 2012 | | | 2011 | | | 2010 | |
| Advisor Class | | | | | | | | | | | | | | | | | | |
| Per share operating performance | | | | | | | | | | | | | | | | | | |
| (for a share outstanding throughout the period) | | | | | | | | | | | | | | | | | | |
| Net asset value, beginning of period | $ | 10.68 | | $ | 10.85 | | $ | 10.97 | | $ | 11.08 | | $ | 11.16 | | $ | 10.78 | |
| Income from investment operationsa: | | | | | | | | | | | | | | | | | | |
| Net investment income (loss)b | | (0.03 | ) | | 0.18 | | | 0.18 | | | 0.20 | | | 0.35 | | | 0.21 | |
| Net realized and unrealized gains (losses) | | (0.14 | ) | | (0.08 | ) | | (0.01 | ) | | 0.01 | | | 0.01 | | | 0.46 | |
| Total from investment operations | | (0.17 | ) | | 0.10 | | | 0.17 | | | 0.21 | | | 0.36 | | | 0.67 | |
| Less distributions from net investment income | | | | | | | | | | | | | | | | | | |
| and net foreign currency gains | | (0.07 | ) | | (0.27 | ) | | (0.29 | ) | | (0.32 | ) | | (0.44 | ) | | (0.29 | ) |
| Net asset value, end of period | $ | 10.44 | | $ | 10.68 | | $ | 10.85 | | $ | 10.97 | | $ | 11.08 | | $ | 11.16 | |
| |
| Total returnc | | (1.55 | )% | | 0.91 | % | | 1.60 | % | | 1.99 | % | | 3.27 | % | | 6.35 | % |
| |
| Ratios to average net assetsd | | | | | | | | | | | | | | | | | | |
| Expenses before waiver and payments by | | | | | | | | | | | | | | | | | | |
| affiliates | | 0.86 | % | | 0.85 | % | | 0.83 | % | | 0.81 | % | | 0.80 | % | | 0.82 | % |
| Expenses net of waiver and payments by | | | | | | | | | | | | | | | | | | |
| affiliates | | 0.65 | %e | | 0.65 | %e | | 0.65 | %e | | 0.65 | % | | 0.65 | % | | 0.65 | %e |
| Net investment income (loss) | | (0.63 | )% | | 1.59 | % | | 1.60 | % | | 1.83 | % | | 3.01 | % | | 1.85 | % |
| |
| Supplemental data | | | | | | | | | | | | | | | | | | |
| Net assets, end of period (000’s) | $ | 67,356 | | $ | 65,958 | | $ | 28,042 | | $ | 35,362 | | $ | 45,575 | | $ | 28,784 | |
| Portfolio turnover rate | | 14.63 | % | | 33.02 | % | | 27.91 | % | | 18.64 | % | | 37.60 | % | | 20.08 | % |
aThe amount shown for a share outstanding throughout the period may not correlate with the Statement of Operations for the period due to the timing of sales and repurchases
of the Fund shares in relation to income earned, adjustments to interest income for the inflation-indexed bonds, and/or fluctuating fair value of the investments of the Fund.
bBased on average daily shares outstanding.
cTotal return is not annualized for periods less than one year.
dRatios are annualized for periods less than one year.
eBenefit of expense reduction rounds to less than 0.01%.
franklintempleton.com The accompanying notes are an integral part of these financial statements. | Semiannual Report | 65
| | | | | |
| FRANKLIN INVESTORS SECURITIES TRUST | | | | |
| |
| |
| |
| |
| Statement of Investments, April 30, 2015 (unaudited) | | | | |
| |
| Franklin Real Return Fund | | | | |
| | Country | Shares | | Value |
| Common Stocks and Other Equity Interests 12.5% | | | | |
| Energy 4.9% | | | | |
| Anadarko Petroleum Corp. | United States | 21,400 | $ | 2,013,740 |
| California Resources Corp. | United States | 6,600 | | 61,380 |
| Chevron Corp. | United States | 18,300 | | 2,032,398 |
| Devon Energy Corp. | United States | 13,500 | | 920,835 |
| Exxon Mobil Corp. | United States | 26,777 | | 2,339,506 |
| Halliburton Co. | United States | 29,000 | | 1,419,550 |
| Marathon Oil Corp. | United States | 42,300 | | 1,315,530 |
| Noble Energy Inc. | United States | 11,800 | | 598,496 |
| Occidental Petroleum Corp. | United States | 16,500 | | 1,321,650 |
| Peabody Energy Corp. | United States | 62,400 | | 295,152 |
| Pioneer Natural Resources Co. | United States | 4,100 | | 708,398 |
| Schlumberger Ltd. | United States | 24,850 | | 2,351,059 |
| aSouthwestern Energy Co. | United States | 25,200 | | 706,356 |
| aWeatherford International PLC | United States | 61,500 | | 894,825 |
| | | | | 16,978,875 |
| Materials 2.7% | | | | |
| BHP Billiton Ltd., ADR | Australia | 19,100 | | 979,639 |
| The Dow Chemical Co. | United States | 38,100 | | 1,943,100 |
| Freeport-McMoRan Inc., B | United States | 55,046 | | 1,280,921 |
| Goldcorp Inc. | Canada | 104,000 | | 1,958,320 |
| Nucor Corp. | United States | 25,400 | | 1,241,044 |
| Potash Corp. of Saskatchewan Inc. | Canada | 37,700 | | 1,230,528 |
| Rio Tinto PLC, ADR | United Kingdom | 17,300 | | 774,867 |
| | | | | 9,408,419 |
| Real Estate 4.9% | | | | |
| SPDR Dow Jones REIT ETF | United States | 193,000 | | 17,177,000 |
| Total Common Stocks and Other Equity Interests | | | | |
| (Cost $36,677,087) | | | | 43,564,294 |
| |
| | | Principal | | |
| | | Amount* | | |
| Corporate Bonds 6.1% | | | | |
| Banks 0.4% | | | | |
| b CIT Group Inc., secured note, 144A, 5.50%, 2/15/19 | United States | 1,200,000 | | 1,254,756 |
| Consumer Services 0.3% | | | | |
| MGM Resorts International, senior note, | | | | |
| 6.625%, 7/15/15 | United States | 300,000 | | 302,625 |
| 8.625%, 2/01/19 | United States | 500,000 | | 575,312 |
| 7.75%, 3/15/22 | United States | 200,000 | | 225,500 |
| | | | | 1,103,437 |
| Diversified Financials 0.3% | | | | |
| Ally Financial Inc., senior note, 7.50%, 9/15/20 | United States | 843,000 | | 989,598 |
| Energy 1.7% | | | | |
| Chesapeake Energy Corp., senior note, | | | | |
| 6.625%, 8/15/20 | United States | 1,000,000 | | 1,035,000 |
| 6.125%, 2/15/21 | United States | 200,000 | | 202,000 |
| CONSOL Energy Inc., senior note, | | | | |
| 5.875%, 4/15/22 | United States | 300,000 | | 278,250 |
| b144A, 8.00%, 4/01/23 | United States | 600,000 | | 610,500 |
66 | Semiannual Report franklintempleton.com
FRANKLIN INVESTORS SECURITIES TRUST
STATEMENT OF INVESTMENTS (UNAUDITED)
| | | | | |
| Franklin Real Return Fund (continued) | | | | |
| | | Principal | | |
| | Country | Amount* | | Value |
| Corporate Bonds (continued) | | | | |
| Energy (continued) | | | | |
| Energy Transfer Equity LP, senior note, first lien, 7.50%, 10/15/20 | United States | 1,000,000 | $ | 1,130,000 |
| Linn Energy LLC/Finance Corp., senior note, 6.25%, 11/01/19 | United States | 1,000,000 | | 852,500 |
| bPeabody Energy Corp., second lien, 144A, 10.00%, 3/15/22 | United States | 1,000,000 | | 850,000 |
| Sabine Pass Liquefaction LLC, first lien, 5.625%, 2/01/21 | United States | 1,000,000 | | 1,027,710 |
| | | | | 5,985,960 |
| Health Care Equipment & Services 0.4% | | | | |
| HCA Inc., senior secured bond, first lien, 5.875%, 3/15/22 | United States | 1,200,000 | | 1,345,500 |
| Materials 1.2% | | | | |
| ArcelorMittal, senior note, 7.00%, 2/25/22 | Luxembourg | 1,200,000 | | 1,314,000 |
| b FMG Resources (August 2006) Pty. Ltd., | | | | |
| senior note, 144A, 6.875%, 2/01/18 | Australia | 355,556 | | 368,444 |
| senior secured note, 144A, 9.75%, 3/01/22 | Australia | 500,000 | | 518,388 |
| Novelis Inc., senior note, | | | | |
| 8.375%, 12/15/17 | Canada | 200,000 | | 208,250 |
| 8.75%, 12/15/20 | Canada | 600,000 | | 643,500 |
| Reynolds Group Issuer Inc./LLC/SA, senior note, 8.50%, 5/15/18 | United States | 1,200,000 | | 1,231,500 |
| | | | | 4,284,082 |
| Media 0.3% | | | | |
| CSC Holdings LLC, senior note, 6.75%, 11/15/21 | United States | 1,000,000 | | 1,133,750 |
| Pharmaceuticals, Biotechnology & Life Sciences 0.3% | | | | |
| b Valeant Pharmaceuticals International Inc., senior note, 144A, | | | | |
| 7.50%, 7/15/21 | United States | 1,000,000 | | 1,087,500 |
| Software & Services 0.3% | | | | |
| b First Data Corp., senior secured note, 144A, 7.375%, 6/15/19 | United States | 1,000,000 | | 1,041,750 |
| Telecommunication Services 0.9% | | | | |
| Frontier Communications Corp., | | | | |
| senior bond, 7.625%, 4/15/24 | United States | 300,000 | | 307,125 |
| senior note, 7.875%, 1/15/27 | United States | 400,000 | | 399,000 |
| Intelsat Jackson Holdings SA, senior note, 7.25%, 10/15/20 | Luxembourg | 1,000,000 | | 1,033,625 |
| b Sprint Communications Inc., senior note, 144A, 7.00%, 3/01/20 | United States | 1,200,000 | | 1,330,500 |
| | | | | 3,070,250 |
| Total Corporate Bonds (Cost $20,333,094) | | | | 21,296,583 |
| c,dSenior Floating Rate Interests 4.5% | | | | |
| Automobiles & Components 0.2% | | | | |
| Crowne Group LLC, Term Loan, 6.00%, 9/30/20 | United States | 238,999 | | 238,700 |
| FRAM Group Holdings Inc. (Autoparts Holdings), Term Loan, 7.00%, | | | | |
| 7/29/17 | United States | 298,079 | | 296,495 |
| Henniges Automotive Holdings Inc., Term Loans, 5.50%, 6/12/21 | United States | 176,171 | | 177,167 |
| UCI International Inc., Term Loan, 5.50%, 7/26/17 | United States | 83,269 | | 82,055 |
| | | | | 794,417 |
| Capital Goods 0.3% | | | | |
| Alfred Fueling Systems Inc. (Wayne Fueling), First Lien Initial Term Loan, | | | | |
| 4.75%, 6/18/21 | United States | 67,093 | | 67,596 |
| Allison Transmission Inc., Term B-3 Loans, 3.50%, 8/23/19 | United States | 68,429 | | 68,953 |
| Doncasters U.S. Finance LLC, Term B Loans, 4.50%, 4/09/20 | United States | 48,081 | | 48,222 |
| eOnsite Rental Group Operations Pty. Ltd., Term B Loan, 5.50%, 7/30/21 | United States | 331,813 | | 328,080 |
franklintempleton.com Semiannual Report | 67
FRANKLIN INVESTORS SECURITIES TRUST
STATEMENT OF INVESTMENTS (UNAUDITED)
| | | | | |
| Franklin Real Return Fund (continued) | | | | |
| | | Principal | | |
| | Country | Amount* | | Value |
| c,dSenior Floating Rate Interests (continued) | | | | |
| Capital Goods (continued) | | | | |
| Sensus USA Inc., First Lien Term Loan, 4.50%, 5/09/17 | United States | 184,878 | $ | 184,762 |
| Signode Industrial Group U.S. Inc., Initial Term B Loan, 3.75%, 5/01/21 | United States | 110,866 | | 111,125 |
| TransDigm Inc., | | | | |
| Tranche C Term Loan, 3.75%, 2/28/20 | United States | 69,137 | | 69,391 |
| Tranche D Term Loan, 3.75%, 6/04/21 | United States | 49,443 | | 49,625 |
| WireCo Worldgroup Inc., Term Loan, 6.00%, 2/15/17 | United States | 7,077 | | 7,095 |
| | | | | 934,849 |
| Consumer Services 0.5% | | | | |
| 24 Hour Fitness Worldwide Inc., Term Loan, 4.75%, 5/28/21 | United States | 200,793 | | 200,918 |
| Boyd Gaming Corp., Term A Loan, 3.146%, 8/14/18 | United States | 8,138 | | 8,135 |
| Cannery Casino Resorts LLC, Term Loan, 6.00%, 10/02/18 | United States | 459,115 | | 458,541 |
| eFitness International LLC, Term B Loan, 5.50%, 7/01/20 | United States | 475,836 | | 452,838 |
| eROC Finance LLC, Funded Term B Loans, 5.00%, 6/20/19 | United States | 279,367 | | 277,970 |
| eSeaworld Parks and Entertainment Inc., Term B-2 Loan, 3.00%, 5/14/20 | United States | 228,276 | | 224,310 |
| TGI Friday’s Inc., First Lien Initial Term Loan, 5.25%, 7/15/20 | United States | 6,953 | | 6,996 |
| | | | | 1,629,708 |
| Diversified Financials 0.1% | | | | |
| Guggenheim Partners Investment Management Holdings LLC, Initial Term | | | | |
| Loan, 4.25%, 7/22/20 | United States | 55,676 | | 56,059 |
| Trans Union LLC, 2014 Replacement Term Loan, 4.00%, 4/09/21 | United States | 321,497 | | 323,305 |
| | | | | 379,364 |
| Energy 0.6% | | | | |
| eBowie Resource Holdings LLC, First Lien Initial Term Loan, 6.75%, | | | | |
| 8/16/20 | United States | 216,758 | | 210,797 |
| Citgo Petroleum Corp., Term B Loan, 4.50%, 7/29/21 | United States | 33,733 | | 33,891 |
| Drillships Ocean Ventures Inc. and Drillships Ventures Projects Inc., | | | | |
| Term Loan, 5.50%, 7/25/21 | United States | 149,836 | | 130,607 |
| eFieldwood Energy LLC, Loans, 3.875%, 10/01/18 | United States | 345,212 | | 337,444 |
| McJunkin Red Man Corp., 2013 Term Loan, 5.00%, 11/08/19 | United States | 144,392 | | 142,813 |
| OSG Bulk Ships Inc., Initial Term Loan, 5.25%, 8/05/19 | United States | 180,142 | | 181,042 |
| OSG International Inc., Initial Term Loan, (OIN), 5.75%, 8/05/19 | United States | 289,318 | | 291,849 |
| ePeabody Energy Corp., Term Loan, 4.25%, 9/24/20 | United States | 202,437 | | 183,206 |
| UTEX Industries Inc., First Lien Initial Term Loan, 5.00%, 5/21/21 | United States | 557,858 | | 530,663 |
| | | | | 2,042,312 |
| Health Care Equipment & Services 0.2% | | | | |
| Connolly LLC, Initial Term Loan, 5.00%, 5/14/21 | United States | 282,305 | | 284,776 |
| eKinetic Concepts Inc., Dollar Term E-1 Loan, 4.50%, 5/04/18 | United States | 145,331 | | 146,542 |
| Millennium Health LLC, Tranche B Term Loan, 5.25%, 4/16/21 | United States | 192,876 | | 159,604 |
| Truven Health Analytics Inc., New Tranche B Term Loan, 4.50%, 6/06/19 | United States | 181,657 | | 182,336 |
| | | | | 773,258 |
| Household & Personal Products 0.3% | | | | |
| FGI Operating Co. LLC (Freedom Group), Term B Loans, 5.50%, 4/19/19 | United States | 848,818 | | 833,257 |
| Revlon Consumer Products Corp., Replacement Term Loan, 3.25%, | | | | |
| 11/19/17 | United States | 66,172 | | 66,296 |
| | | | | 899,553 |
68 | Semiannual Report franklintempleton.com
FRANKLIN INVESTORS SECURITIES TRUST
STATEMENT OF INVESTMENTS (UNAUDITED)
| | | | | |
| Franklin Real Return Fund (continued) | | | | |
| | | Principal | | |
| | Country | Amount* | | Value |
| c,dSenior Floating Rate Interests (continued) | | | | |
| Materials 0.7% | | | | |
| Appvion Inc., Term Loan, 5.75%, 6/28/19 | United States | 267,430 | $ | 248,710 |
| Caraustar Industries Inc., | | | | |
| Term Loan B, 8.00%, 5/01/19 | United States | 231,315 | | 232,616 |
| Term Loan C, 8.00%, 5/01/19 | United States | 399,000 | | 401,244 |
| Cyanco Intermediate Corp., Initial Term Loan, 5.50%, 5/01/20 | United States | 540,464 | | 540,464 |
| FMG America Finance Inc. (Fortescue Metals Group), Loans, 3.75%, | | | | |
| 6/30/19 | Australia | 618,635 | | 560,337 |
| eIneos U.S. Finance LLC, Dollar Term Loan, 3.75%, 3/31/22 | United States | 59,104 | | 59,526 |
| eNexeo Solutions LLC, | | | | |
| Term B-1 Loan, 6.00%, 9/08/17 | United States | 13,619 | | 13,466 |
| Term B-3 Loan, 5.75%, 9/08/17 | United States | 215 | | 213 |
| OCI Beaumont LLC, Term B-3 Loan, 5.50%, 8/20/19 | United States | 155,355 | | 157,297 |
| Oxbow Carbon LLC, First Lien Tranche B Term Loan, 4.25%, 7/19/19 | United States | 62,551 | | 62,030 |
| Tronox Pigments (Netherlands) BV, Term Loan, 4.25%, 3/19/20 | Netherlands | 138,105 | | 138,727 |
| Univar Inc., Term B Loan, 5.00%, 6/30/17 | United States | 31,014 | | 31,179 |
| | | | | 2,445,809 |
| Media 0.4% | | | | |
| eCharter Communications Operating LLC, Term Loan E, (CCO Safari), | | | | |
| 4.50%, 7/01/20 | United States | 16,000 | | 15,927 |
| Cumulus Media Holdings Inc., Term Loans, 4.25%, 12/23/20 | United States | 76,061 | | 75,129 |
| Radio One Inc., Term Loan B, 4.78%, 12/31/18 | United States | 950,374 | | 952,156 |
| eRegal Cinemas Corp., Term Loan, 3.75%, 4/01/22 | United States | 68,217 | | 68,651 |
| eSinclair Television Group Inc., Incremental Term Loan B-1, 5.00%, 7/30/21 | United States | 24,737 | | 24,799 |
| UPC Financing Partnership (UPC Broadband Holdings BV), Term Loan AH, | | | | |
| 3.25%, 6/30/21 | Netherlands | 177,271 | | 177,461 |
| Zuffa LLC, Initial Term Loan, 3.75%, 2/25/20 | United States | 46,743 | | 46,283 |
| | | | | 1,360,406 |
| Pharmaceuticals, Biotechnology & Life Sciences 0.2% | | | | |
| Grifols Worldwide Operations USA Inc., US Tranche B Term Loan, 3.184%, | | | | |
| 2/27/21 | United States | 150,252 | | 150,918 |
| Valeant Pharmaceuticals International Inc., Series F-1 New Term Loan, 4.00%, | | | | |
| 4/01/22 | United States | 503,175 | | 507,295 |
| | | | | 658,213 |
| Retailing 0.3% | | | | |
| BJ’s Wholesale Club Inc., 2013 (Nov) Replacement Loans, 4.50%, | | | | |
| 9/26/19 | United States | 321,882 | | 324,071 |
| Dollar Tree Inc., Initial Term B Loans, 4.25%, 3/09/22 | United States | 147,409 | | 149,516 |
| Evergreen AcqCo. 1 LP (Savers), Term Loan, 5.00%, 7/09/19 | United States | 580,646 | | 572,390 |
| The Men’s Wearhouse Inc., Tranche B Term Loan, 4.50%, 6/18/21 | United States | 136,941 | | 138,610 |
| | | | | 1,184,587 |
| Semiconductors & Semiconductor Equipment 0.0%† | | | | |
| M/A-COM Technology Solutions Holdings Inc., Initial Term Loan, 4.50%, | | | | |
| 5/07/21 | United States | 96,769 | | 97,736 |
| Software & Services 0.5% | | | | |
| BMC Software Finance Inc., Initial U.S. Term Loans, 5.00%, 9/10/20 | United States | 699,453 | | 688,524 |
| MoneyGram International Inc., Term Loan, 4.25%, 3/27/20 | United States | 727,657 | | 686,575 |
| Sungard Availability Services Capital Inc., Tranche B Term Loan, 6.00%, | | | | |
| 3/29/19 | United States | 506,532 | | 471,920 |
| | | | | 1,847,019 |
franklintempleton.com Semiannual Report | 69
| | | | | | |
| FRANKLIN INVESTORS SECURITIES TRUST | | | | | |
| STATEMENT OF INVESTMENTS (UNAUDITED) | | | | | |
| |
| |
| |
| |
| Franklin Real Return Fund (continued) | | | | | |
| | | Principal | | | |
| | Country | Amount* | | | Value |
| c,dSenior Floating Rate Interests (continued) | | | | | |
| Technology Hardware & Equipment 0.0%† | | | | | |
| CIENA Corp., Term Loan, 3.75%, 7/15/19 | United States | 32,930 | | $ | 33,094 |
| Telecommunication Services 0.1% | | | | | |
| Intelsat Jackson Holdings SA, Tranche B-2 Term Loan, 3.75%, 6/30/19 | Luxembourg | 191,340 | | | 191,532 |
| Utilities 0.1% | | | | | |
| Calpine Construction Finance Co. LP, | | | | | |
| eTerm B-1 Loan, 3.00%, 5/03/20 | United States | 183,135 | | | 182,471 |
| Term B-2 Loan, 3.25%, 1/31/22 | United States | 70,651 | | | 70,529 |
| | | | | | 253,000 |
| Total Senior Floating Rate Interests | | | | | |
| (Cost $15,594,227) | | | | | 15,524,857 |
| Foreign Government and Agency Securities 20.5% | | | | | |
| Government of Hungary, senior note, | | | | | |
| 6.375%, 3/29/21 | Hungary | 620,000 | | | 722,040 |
| fReg S, 3.50%, 7/18/16 | Hungary | 60,000 | EUR | | 69,698 |
| fReg S, 4.375%, 7/04/17 | Hungary | 150,000 | EUR | | 180,695 |
| fReg S, 5.75%, 6/11/18 | Hungary | 435,000 | EUR | | 557,862 |
| fReg S, 3.875%, 2/24/20 | Hungary | 180,000 | EUR | | 226,438 |
| Government of Ireland, senior bond, 4.40%, 6/18/19 | Ireland | 1,200,000 | EUR | | 1,584,952 |
| Government of Malaysia, | | | | | |
| 3.835%, 8/12/15 | Malaysia | 5,660,000 | MYR | | 1,591,918 |
| 4.72%, 9/30/15 | Malaysia | 12,580,000 | MYR | | 3,553,828 |
| 3.197%, 10/15/15 | Malaysia | 10,795,000 | MYR | | 3,031,418 |
| senior bond, 3.814%, 2/15/17 | Malaysia | 6,100,000 | MYR | | 1,729,181 |
| senior note, 3.172%, 7/15/16 | Malaysia | 14,200,000 | MYR | | 3,984,171 |
| Government of Mexico, | | | | | |
| 8.00%, 12/17/15 | Mexico | 1,273,000g MXN | | 8,546,512 |
| 6.25%, 6/16/16 | Mexico | 630,000g MXN | | 4,228,816 |
| Government of Poland, | | | | | |
| 6.25%, 10/24/15 | Poland | 11,600,000 | PLN | | 3,291,572 |
| 5.00%, 4/25/16 | Poland | 11,500,000 | PLN | | 3,295,788 |
| dFRN, 2.01%, 1/25/17 | Poland | 15,515,000 | PLN | | 4,309,906 |
| dFRN, 2.01%, 1/25/21 | Poland | 9,388,000 | PLN | | 2,586,000 |
| Korea Monetary Stabilization Bond, | | | | | |
| senior bond, 2.80%, 8/02/15 | South Korea | 275,650,000 | KRW | | 256,537 |
| senior bond, 2.81%, 10/02/15 | South Korea | 175,000,000 | KRW | | 163,167 |
| senior bond, 1.96%, 2/02/17 | South Korea | 5,200,000,000 | KRW | | 4,842,381 |
| senior note, 2.76%, 6/02/15 | South Korea | 379,500,000 | KRW | | 352,539 |
| senior note, 2.07%, 12/02/16 | South Korea | 680,000,000 | KRW | | 634,193 |
| Korea Treasury Bond, senior note, | | | | | |
| 3.25%, 6/10/15 | South Korea | 101,000,000 | KRW | | 93,891 |
| 2.75%, 12/10/15 | South Korea | 1,081,700,000 | KRW | | 1,010,428 |
| 2.75%, 6/10/16 | South Korea | 3,000,000,000 | KRW | | 2,815,082 |
| 3.00%, 12/10/16 | South Korea | 9,258,500,000 | KRW | | 8,760,559 |
70 | Semiannual Report
franklintempleton.com
| | | | | | | |
| | | FRANKLIN INVESTORS SECURITIES TRUST |
| | | STATEMENT OF INVESTMENTS (UNAUDITED) |
| |
| |
| |
| |
| Franklin Real Return Fund (continued) | | | | | | |
| | | | Principal | | | |
| | | Country | Amount* | | | Value |
| Foreign Government and Agency Securities (continued) | | | | | | |
| h Mexican Udibonos, Index Linked, 5.00%, 6/16/16 | | Mexico | 485,824 | i MXN | $ | 3,309,977 |
| j Nota Do Tesouro Nacional, Index Linked, 6.00%, | | | | | | |
| 5/15/15 | | Brazil | 2,100 | k BRL | | 1,830,609 |
| 8/15/16 | | Brazil | 1,343 | k BRL | | 1,152,101 |
| 8/15/18 | | Brazil | 1,270 | k BRL | | 1,083,253 |
| 5/15/45 | | Brazil | 1,680 | k BRL | | 1,441,996 |
| Total Foreign Government and Agency Securities | | | | | | |
| (Cost $78,584,219) | | | | | | 71,237,508 |
U.S. Government and Agency Securities 50.3% | | | | | | |
| h U.S. Treasury Note, Index Linked, | | | | | | |
| 1.875%, 7/15/15 | | United States | 50,072,361 | | | 50,706,076 |
| 2.00%, 1/15/16 | | United States | 39,020,607 | | | 40,005,253 |
| 0.125%, 4/15/17 | | United States | 38,231,120 | | | 39,061,462 |
| 2.625%, 7/15/17 | | United States | 22,647,134 | | | 24,619,904 |
| 1.625%, 1/15/18 | | United States | 19,044,231 | | | 20,343,105 |
| Total U.S. Government and Agency Securities | | | | | | |
| (Cost $174,131,324) | | | | | | 174,735,800 |
| Total Investments before Short Term Investments | | | | | | |
| (Cost $325,319,951) | | | | | | 326,359,042 |
| Short Term Investments (Cost $15,793,809) 4.6% | | | | | | |
| Repurchase Agreements 4.6% | | | | | | |
| lJoint Repurchase Agreement, 0.066%, 5/01/15 | | | | | | |
| (Maturity Value $15,793,837) | | United States | 15,793,809 | | | 15,793,809 |
| BNP Paribas Securities Corp. (Maturity Value $2,232,301) | | | | | | |
| Credit Suisse Securities (USA) LLC (Maturity Value $6,697,061) | | | | | | |
| HSBC Securities (USA) Inc. (Maturity Value $4,687,927) | | | | | | |
| Merrill Lynch, Pierce, Fenner & Smith Inc. (Maturity Value $2,176,548) | | | | | | |
| Collateralized by U.S. Government Agency Securities, 0.183% - 5.50%, | | | | | | |
| 5/27/15 - 3/27/19; U.S. Government Agency Securities, Strips, | | | | | | |
| 6/01/17; U.S. Treasury Notes, 0.375% - 1.50%, 3/15/16 - 3/15/18; | | | | | | |
| and U.S. Treasury Notes, Index Linked, 2.50%, 7/15/16 | | | | | | |
| (valued at $16,115,353) | | | | | | |
| Total Investments (Cost $341,113,760) 98.5% | | | | | | 342,152,851 |
| Other Assets, less Liabilities 1.5% | | | | | | 5,309,183 |
| Net Assets 100.0% | | | | | $ | 347,462,034 |
franklintempleton.com Semiannual Report | 71
FRANKLIN INVESTORS SECURITIES TRUST
STATEMENT OF INVESTMENTS (UNAUDITED)
Franklin Real Return Fund (continued)
*The principal amount is stated in U.S. dollars unless otherwise indicated.
†Rounds to less than 0.1% of net assets.
aNon-income producing.
bSecurity was purchased pursuant to Rule 144A under the Securities Act of 1933 and may be sold in transactions exempt from registration only to qualified institutional buyers
or in a public offering registered under the Securities Act of 1933. These securities have been deemed liquid under guidelines approved by the Trust’s Board of Trustees.
At April 30, 2015, the aggregate value of these securities was $7,061,838, representing 2.03% of net assets.
cSee Note 1(h) regarding senior floating rate interests.
dThe coupon rate shown represents the rate at period end.
eA portion or all of the security purchased on a when-issued or delayed delivery basis. See Note 1(d).
fSecurity was purchased pursuant to Regulation S under the Securities Act of 1933, which exempts from registration securities offered and sold outside of the United States.
Such a security cannot be sold in the United States without either an effective registration statement filed pursuant to the Securities Act of 1933, or pursuant to an exemption
from registration. These securities have been deemed liquid under guidelines approved by the Trust’s Board of Trustees. At April 30, 2015, the aggregate value of these
securities was $1,034,693, representing 0.30% of net assets.
gPrincipal amount is stated in 100 Mexican Peso Units.
hPrincipal amount of security is adjusted for inflation. See Note 1(j).
iPrincipal amount is stated in 100 Unidad de Inversion Units.
jRedemption price at maturity is adjusted for inflation. See Note 1(j).
kPrincipal amount is stated in 1,000 Brazilian Real Units.
lSee Note 1(c) regarding joint repurchase agreement.
At April 30, 2015, the Fund had the following forward exchange contracts outstanding. See Note 1(e).
| | | | | | | | | | | | |
| Forward Exchange Contracts | | | | | | | | | | | |
| |
| | | | | | Contract | Settlement | | Unrealized | | Unrealized | |
| Currency | Counterpartya Type | Quantity | | Amount | Date | | Appreciation | | Depreciation | |
| Chilean Peso | JPHQ | Buy | 1,159,473,700 | $ | 1,972,229 | 5/07/15 | $ | — | $ | (78,265 | ) |
| Euro | DBAB | Sell | 1,465,200 | | 1,998,826 | 5/07/15 | | 354,646 | | — | |
| Euro | MSCO | Sell | 2,700,000 | | 3,395,412 | 6/18/15 | | 363,885 | | — | |
| Chilean Peso | DBAB | Buy | 328,810,000 | | 516,428 | 7/23/15 | | 16,783 | | — | |
| Euro | DBAB | Sell | 7,044,000 | | 8,412,861 | 7/23/15 | | 500,085 | | — | |
| Singapore Dollar | DBAB | Buy | 3,787,800 | | 2,834,755 | 7/23/15 | | 22,366 | | — | |
| Euro | DBAB | Sell | 1,121,244 | | 1,283,936 | 8/27/15 | | 23,688 | | — | |
| Euro | DBAB | Sell | 334,323 | | 359,832 | 9/17/15 | | — | | (16,070 | ) |
| Singapore Dollar | DBAB | Buy | 4,395,600 | | 3,235,866 | 9/17/15 | | 76,292 | | — | |
| Unrealized appreciation (depreciation) | | | | | | | 1,357,745 | | (94,335 | ) |
| Net unrealized appreciation (depreciation) | | | | | | $ | 1,263,410 | | | |
| aMay be comprised of multiple contracts with the same counterparty, currency and settlement date. | | | | | | | | |
See Abbreviations on page 92.
72 | Semiannual Report | The accompanying notes are an integral part of these financial statements. franklintempleton.com
| | | | | | | | | | | | |
| | | | | | FRANKLIN INVESTORS SECURITIES TRUST | |
| |
| |
| |
| |
| Financial Statements | | | | | | | | | | | |
| |
| Statements of Assets and Liabilities | | | | | | | | | | | |
| April 30, 2015 (unaudited) | | | | | | | | | | | |
| |
| | | | | | Franklin | | | | | | |
| | | Franklin | | | Convertible | | | Franklin Equity | | Franklin Real | |
| | | Balanced Fund | | | Securities Fund | | | Income Fund | | Return Fund | |
| Assets: | | | | | | | | | | | |
| Investments in securities: | | | | | | | | | | | |
| Cost - Unaffiliated issuers | $ | 2,482,277,846 | | $ | 1,855,237,944 | | $ | 1,656,340,192 | $ | 325,319,951 | |
| Cost - Sweep Money Fund (Note 3f) | | 327,814,527 | | | 91,423,464 | | | 31,078,435 | | — | |
| Cost - Repurchase agreements | | — | | | — | | | — | | 15,793,809 | |
| Total cost of investments | $ | 2,810,092,373 | | $ | 1,946,661,408 | | $ | 1,687,418,627 | $ | 341,113,760 | |
| Value - Unaffiliated issuers | $ | 2,704,931,603 | | $ | 2,080,312,880 | | $ | 2,102,825,650 | $ | 326,359,042 | |
| Value - Sweep Money Fund (Note 3f) | | 327,814,527 | | | 91,423,464 | | | 31,078,435 | | — | |
| Value - Repurchase agreements | | — | | | — | | | — | | 15,793,809 | |
| Total value of investments | | 3,032,746,130 | | | 2,171,736,344 | | | 2,133,904,085 | | 342,152,851 | |
| Cash | | 336,000 | | | — | | | — | | 19,386 | |
| Restricted Cash (Note 1f) | | — | | | — | | | — | | 1,858,600 | |
| Foreign currency, at value (cost $-, $-, $- and $389,517, | | | | | | | | | | | |
| respectively) | | — | | | — | | | — | | 396,432 | |
| Receivables: | | | | | | | | | | | |
| Investment securities sold | | 8,567,623 | | | — | | | 20,434,794 | | 2,634,961 | |
| Capital shares sold | | 7,974,825 | | | 4,733,274 | | | 2,060,105 | | 764,734 | |
| Dividends and interest | | 12,310,959 | | | 7,721,352 | | | 3,784,257 | | 2,200,228 | |
| Unrealized appreciation on forward exchange contracts | | — | | | — | | | — | | 1,357,745 | |
| Other assets | | 1,496 | | | 1,093 | | | 1,095 | | 195 | |
| Total assets | | 3,061,937,033 | | | 2,184,192,063 | | | 2,160,184,336 | | 351,385,132 | |
| Liabilities: | | | | | | | | | | | |
| Payables: | | | | | | | | | | | |
| Investment securities purchased | | 46,700,090 | | | — | | | 41,064,846 | | 868,870 | |
| Capital shares redeemed | | 3,876,377 | | | 5,394,603 | | | 2,731,189 | | 784,361 | |
| Management fees | | 1,537,168 | | | 832,238 | | | 812,216 | | 120,749 | |
| Distribution fees | | 1,057,529 | | | 454,944 | | | 588,610 | | 77,205 | |
| Transfer agent fees | | 435,016 | | | 507,722 | | | 351,198 | | 70,963 | |
| Due to brokers | | — | | | — | | | — | | 1,858,600 | |
| Options written, at value (premiums received $336,994, $-, | | | | | | | | | | | |
| $- and $-, respectively) | | 346,000 | | | — | | | — | | — | |
| Unrealized depreciation on forward exchange contracts | | — | | | — | | | — | | 94,335 | |
| Accrued expenses and other liabilities | | 61,340 | | | 28,471 | | | 100,949 | | 48,015 | |
| Total liabilities | | 54,013,520 | | | 7,217,978 | | | 45,649,008 | | 3,923,098 | |
| Net assets, at value | $ | 3,007,923,513 | | $ | 2,176,974,085 | | $ | 2,114,535,328 | $ | 347,462,034 | |
| Net assets consist of: | | | | | | | | | | | |
| Paid-in capital | $ | 2,758,465,531 | | $ | 1,934,375,350 | | $ | 1,606,077,896 | $ | 366,997,734 | |
| Undistributed net investment income (distributions in excess of | | | | | | | | | | | |
| net investment income) | | (13,316,012 | ) | | (52,638,577 | ) | | 3,518,553 | | (11,799,236 | ) |
| Net unrealized appreciation (depreciation) | | 222,644,751 | | | 225,074,936 | | | 446,473,895 | | 2,295,005 | |
| Accumulated net realized gain (loss) | | 40,129,243 | | | 70,162,376 | | | 58,464,984 | | (10,031,469 | ) |
| Net assets, at value | $ | 3,007,923,513 | | $ | 2,176,974,085 | | $ | 2,114,535,328 | $ | 347,462,034 | |
franklintempleton.com The accompanying notes are an integral part of these financial statements. | Semiannual Report | 73
| | | | | | | | | | | |
| FRANKLIN INVESTORS SECURITIES TRUST | | | | | | | | | | |
| FINANCIAL STATEMENTS | | | | | | | | | | |
| |
| |
| Statements of Assets and Liabilities (continued) | | | | | | | | | | |
| April 30, 2015 (unaudited) | | | | | | | | | | |
| |
| | | | | | Franklin | | | | | |
| | | | Franklin | | Convertible | | | Franklin Equity | | Franklin Real |
| | | | Balanced Fund | | Securities Fund | | | Income Fund | | Return Fund |
| Class A: | | | | | | | | | | |
| Net assets, at value | $ | | 2,365,438,014 | $ | 892,275,602 | $ | | 1,819,577,582 | $ | 219,468,617 |
| Shares outstanding | | | 199,135,078 | | 48,134,376 | | | 78,491,821 | | 21,081,528 |
| Net asset value per sharea | | $ | 11.88 | $ | 18.54 | | $ | 23.18 | $ | 10.41 |
| Maximum offering price per share (net asset value | | | | | | | | | | |
| per share ÷ 94.25%, 94.25%, 94.25% and 95.75%, | | | | | | | | | | |
| respectively) | | $ | 12.60 | $ | 19.67 | | $ | 24.59 | $ | 10.87 |
| Class C: | | | | | | | | | | |
| Net assets, at value | $ | | 581,361,054 | $ | 328,936,725 | $ | | 255,604,199 | $ | 58,823,165 |
| Shares outstanding | | | 49,334,428 | | 17,985,372 | | | 11,091,395 | | 5,691,943 |
| Net asset value and maximum offering price per sharea | | $ | 11.78 | $ | 18.29 | | $ | 23.05 | $ | 10.33 |
| Class R: | | | | | | | | | | |
| Net assets, at value | $ | | 4,728,160 | | — | $ | | 7,259,718 | | — |
| Shares outstanding | | | 397,193 | | — | | | 313,174 | | — |
| Net asset value and maximum offering price per share | | $ | 11.90 | | — | | $ | 23.18 | | — |
| Class R6: | | | | | | | | | | |
| Net assets, at value | $ | | 207,330 | $ | 3,170,064 | $ | | 5,800 | $ | 1,814,288 |
| Shares outstanding | | | 17,427 | | 170,886 | | | 250 | | 173,582 |
| Net asset value and maximum offering price per share | | $ | 11.90 | $ | 18.55 | | $ | 23.20 | $ | 10.45 |
| Advisor Class: | | | | | | | | | | |
| Net assets, at value | $ | | 56,188,955 | $ | 952,591,694 | $ | | 32,088,029 | $ | 67,355,964 |
| Shares outstanding | | | 4,721,860 | | 51,369,084 | | | 1,382,468 | | 6,450,152 |
| Net asset value and maximum offering price per share | | $ | 11.90 | $ | 18.54 | | $ | 23.21 | $ | 10.44 |
aRedemption price is equal to net asset value less contingent deferred sales charges, if applicable.
74 | Semiannual Report | The accompanying notes are an integral part of these financial statements. franklintempleton.com
| | | | | | | | | | | | | |
| | | | | | FRANKLIN INVESTORS SECURITIES TRUST | |
| | | | | | | | | FINANCIAL STATEMENTS | |
| |
| |
| Statements of Operations | | | | | | | | | | | | |
| for the six months ended April 30, 2015 (unaudited) | | | | | | | | | | | | |
| |
| | | | | | Franklin | | | | | | | |
| | | Franklin | | | Convertible | | | Franklin Equity | | | Franklin Real | |
| | | Balanced Fund | | | Securities Fund | | | Income Fund | | | Return Fund | |
| Investment income: | | | | | | | | | | | | |
| Dividends | $ | 24,388,765 | | $ | 10,024,000 | | $ | 34,577,242 | | $ | 790,129 | |
| Interest | | 19,489,211 | | | 12,083,725 | | | — | | | 1,136,155 | |
| Inflation principal adjustments | | — | | | — | | | — | | | (1,898,210 | ) |
| Total investment income | | 43,877,976 | | | 22,107,725 | | | 34,577,242 | | | 28,074 | |
| Expenses: | | | | | | | | | | | | |
| Management fees (Note 3a) | | 8,865,327 | | | 4,882,919 | | | 4,844,499 | | | 1,126,222 | |
| Distribution fees: (Note 3c) | | | | | | | | | | | | |
| Class A | | 3,288,476 | | | 1,126,766 | | | 2,236,279 | | | 287,904 | |
| Class C | | 2,679,488 | | | 1,631,255 | | | 1,248,877 | | | 199,127 | |
| Class R | | 10,582 | | | — | | | 18,481 | | | — | |
| Transfer agent fees: (Note 3e) | | | | | | | | | | | | |
| Class A | | 1,186,818 | | | 557,307 | | | 1,117,611 | | | 195,052 | |
| Class C | | 290,095 | | | 201,822 | | | 156,054 | | | 52,682 | |
| Class R | | 2,290 | | | — | | | 4,620 | | | — | |
| Class R6 | | 72 | | | 77 | | | 71 | | | 77 | |
| Advisor Class | | 26,120 | | | 532,800 | | | 20,128 | | | 55,761 | |
| Custodian fees (Note 4) | | 11,740 | | | 11,781 | | | 14,069 | | | 22,937 | |
| Reports to shareholders | | 120,557 | | | 96,754 | | | 142,900 | | | 35,500 | |
| Registration and filing fees | | 141,735 | | | 109,393 | | | 72,667 | | | 35,986 | |
| Professional fees | | 30,185 | | | 23,601 | | | 31,554 | | | 18,189 | |
| Trustees’ fees and expenses | | 11,928 | | | 10,410 | | | 10,906 | | | 2,236 | |
| Other | | 28,324 | | | 34,042 | | | 17,391 | | | 11,390 | |
| Total expenses | | 16,693,737 | | | 9,218,927 | | | 9,936,107 | | | 2,043,063 | |
| Expense reductions (Note 4) | | (100 | ) | | (12 | ) | | — | | | (35 | ) |
| Expenses waived/paid by affiliates (Notes 3f and 3g) | | (108,636 | ) | | (14,803 | ) | | (15,053 | ) | | (386,725 | ) |
| Net expenses | | 16,585,001 | | | 9,204,112 | | | 9,921,054 | | | 1,656,303 | |
| Net investment income (loss) | | 27,292,975 | | | 12,903,613 | | | 24,656,188 | | | (1,628,229 | ) |
| Realized and unrealized gains (losses): | | | | | | | | | | | | |
| Net realized gain (loss) from: | | | | | | | | | | | | |
| Investments | | 40,900,610 | | | 69,968,057 | | | 56,277,008 | | | 5,880,085 | |
| Written options (Note 6) | | 1,075,621 | | | — | | | — | | | — | |
| Foreign currency transactions | | 65,557 | | | — | | | (25,098 | ) | | 342,379 | |
| Net realized gain (loss) | | 42,041,788 | | | 69,968,057 | | | 56,251,910 | | | 6,222,464 | |
| Net change in unrealized appreciation (depreciation) on: | | | | | | | | | | | | |
| Investments | | 13,886,855 | | | (34,481,315 | ) | | (10,155,016 | ) | | (11,710,672 | ) |
| Translation of other assets and liabilities denominated in | | | | | | | | | | | | |
| foreign currencies | | (71,979 | ) | | — | | | 42,727 | | | 657,869 | |
| Net change in unrealized appreciation | | | | | | | | | | | | |
| (depreciation) | | 13,814,876 | | | (34,481,315 | ) | | (10,112,289 | ) | | (11,052,803 | ) |
| Net realized and unrealized gain (loss) | | 55,856,664 | | | 35,486,742 | | | 46,139,621 | | | (4,830,339 | ) |
| Net increase (decrease) in net assets resulting from | | | | | | | | | | | | |
| operations | $ | 83,149,639 | | $ | 48,390,355 | | $ | 70,795,809 | | $ | (6,458,568 | ) |
franklintempleton.com The accompanying notes are an integral part of these financial statements. | Semiannual Report | 75
| | | | | | | | | | | | | |
| FRANKLIN INVESTORS SECURITIES TRUST | | | | | | | | | | |
| FINANCIAL STATEMENTS | | | | | | | | | | | | |
| |
| |
| Statements of Changes in Net Assets | | | | | | | | | | | | |
| |
| | | Franklin | | | Franklin | |
| | | Balanced Fund | | | Convertible Securities Fund | |
| | | Six Months Ended | | | | | | Six Months Ended | | | | |
| | | April 30, 2015 | | | Year Ended | | | April 30, 2015 | | | Year Ended | |
| | | (unaudited) | | | October 31, 2014 | | | (unaudited) | | | October 31, 2014 | |
| Increase (decrease) in net assets: | | | | | | | | | | | | |
| Operations: | | | | | | | | | | | | |
| Net investment income | $ | 27,292,975 | | $ | 56,907,004 | | $ | 12,903,613 | | $ | 23,160,422 | |
| Net realized gain (loss) from investments, written | | | | | | | | | | | | |
| options and foreign currency transactions | | 42,041,788 | | | 47,138,461 | | | 69,968,057 | | | 82,062,069 | |
| Net change in unrealized appreciation | | | | | | | | | | | | |
| (depreciation) on investments and translation | | | | | | | | | | | | |
| of other assets and liabilities denominated in | | | | | | | | | | | | |
| foreign currencies | | 13,814,876 | | | 78,345,189 | | | (34,481,315 | ) | | 37,746,132 | |
| Net increase (decrease) in net assets | | | | | | | | | | | | |
| resulting from operations | | 83,149,639 | | | 182,390,654 | | | 48,390,355 | | | 142,968,623 | |
| Distributions to shareholders from: | | | | | | | | | | | | |
| Net investment income: | | | | | | | | | | | | |
| Class A | | (33,545,389 | ) | | (53,805,163 | ) | | (8,624,908 | ) | | (16,548,915 | ) |
| Class C | | (6,366,055 | ) | | (10,368,963 | ) | | (1,939,516 | ) | | (3,385,775 | ) |
| Class R | | (60,338 | ) | | (99,616 | ) | | — | | | — | |
| Class R6 | | (8,192 | ) | | (405,265 | ) | | (35,175 | ) | | (29,180 | ) |
| Advisor Class | | (808,728 | ) | | (2,049,327 | ) | | (9,187,540 | ) | | (13,433,835 | ) |
| Net realized gains: | | | | | | | | | | | | |
| Class A | | (27,941,174 | ) | | (21,130,494 | ) | | (33,359,983 | ) | | (3,610,981 | ) |
| Class C | | (6,796,815 | ) | | (5,535,467 | ) | | (12,014,078 | ) | | (1,182,145 | ) |
| Class R | | (50,807 | ) | | (49,346 | ) | | — | | | — | |
| Class R6 | | (6,909 | ) | | (77 | ) | | (110,660 | ) | | — | |
| Advisor Class | | (575,222 | ) | | (1,029,638 | ) | | (30,218,257 | ) | | (1,752,124 | ) |
| Total distributions to shareholders | | (76,159,629 | ) | | (94,473,356 | ) | | (95,490,117 | ) | | (39,942,955 | ) |
| Capital share transactions: (Note 2) | | | | | | | | | | | | |
| Class A | | 306,492,211 | | | 631,528,743 | | | (8,610,531 | ) | | 19,418,004 | |
| Class C | | 87,448,588 | | | 121,929,628 | | | 3,170,296 | | | 41,623,199 | |
| Class R | | 1,113,698 | | | 211,518 | | | — | | | — | |
| Class R6 | | (306,740 | ) | | (507,737 | ) | | 140,781 | | | 3,034,117 | |
| Advisor Class | | 14,443,861 | | | (29,866,192 | ) | | 94,922,840 | | | 462,191,003 | |
| Total capital share transactions | | 409,191,618 | | | 723,295,960 | | | 89,623,386 | | | 526,266,323 | |
| Net increase (decrease) in net assets | | 416,181,628 | | | 811,213,258 | | | 42,523,624 | | | 629,291,991 | |
| Net assets: | | | | | | | | | | | | |
| Beginning of period | | 2,591,741,885 | | | 1,780,528,627 | | | 2,134,450,461 | | | 1,505,158,470 | |
| End of period | $ | 3,007,923,513 | | $ | 2,591,741,885 | | $ | 2,176,974,085 | | $ | 2,134,450,461 | |
| Undistributed net investment income (distributions | | | | | | | | | | | | |
| in excess of net investment income) included in | | | | | | | | | | | | |
| net assets: | | | | | | | | | | | | |
| End of period | $ | (13,316,012 | ) | $ | 179,715 | | $ | (52,638,577 | ) | $ | (45,755,051 | ) |
76 | Semiannual Report | The accompanying notes are an integral part of these financial statements. franklintempleton.com
| | | | | | | | | | | | | |
| | | | | | FRANKLIN INVESTORS SECURITIES TRUST | |
| | | | | | | | | FINANCIAL STATEMENTS | |
| |
| |
| Statements of Changes in Net Assets (continued) | | | | | | | | | | |
| |
| | | Franklin | | | Franklin | |
| | | Equity Income Fund | | | Real Return Fund | |
| | | Six Months Ended | | | | | | Six Months Ended | | | | |
| | | April 30, 2015 | | | Year Ended | | | April 30, 2015 | | | Year Ended | |
| | | (unaudited) | | | October 31, 2014 | | | (unaudited) | | | October 31, 2014 | |
| Increase (decrease) in net assets: | | | | | | | | | | | | |
| Operations: | | | | | | | | | | | | |
| Net investment income (loss) | $ | 24,656,188 | | $ | 55,167,852 | | $ | (1,628,229 | ) | $ | 5,261,372 | |
| Net realized gain (loss) from investments | | | | | | | | | | | | |
| and foreign currency transactions | | 56,251,910 | | | 93,535,383 | | | 6,222,464 | | | (6,997,577 | ) |
| Net change in unrealized appreciation | | | | | | | | | | | | |
| (depreciation) on investments and translation | | | | | | | | | | | | |
| of other assets and liabilities denominated in | | | | | | | | | | | | |
| foreign currencies | | (10,112,289 | ) | | 54,401,873 | | | (11,052,803 | ) | | 4,304,237 | |
| Net increase (decrease) in net assets | | | | | | | | | | | | |
| resulting from operations | | 70,795,809 | | | 203,105,108 | | | (6,458,568 | ) | | 2,568,032 | |
| Distributions to shareholders from: | | | | | | | | | | | | |
| Net investment income: | | | | | | | | | | | | |
| Class A | | (34,645,305 | ) | | (37,460,224 | ) | | (1,588,069 | ) | | (6,315,367 | ) |
| Class C | | (3,881,783 | ) | | (3,335,356 | ) | | (394,395 | ) | | (1,348,226 | ) |
| Class R | | (134,332 | ) | | (128,725 | ) | | — | | | — | |
| Class R6 | | (126 | ) | | (147 | ) | | (13,635 | ) | | (35,942 | ) |
| Advisor Class | | (680,515 | ) | | (558,920 | ) | | (472,365 | ) | | (1,166,992 | ) |
| Net realized gains: | | | | | | | | | | | | |
| Class A | | (78,698,350 | ) | | (8,968,025 | ) | | — | | | — | |
| Class C | | (10,880,987 | ) | | (1,168,619 | ) | | — | | | — | |
| Class R | | (327,751 | ) | | (32,534 | ) | | — | | | — | |
| Class R6 | | (266 | ) | | (30 | ) | | — | | | — | |
| Advisor Class | | (1,523,805 | ) | | (108,872 | ) | | — | | | — | |
| Total distributions to shareholders | | (130,773,220 | ) | | (51,761,452 | ) | | (2,468,464 | ) | | (8,866,527 | ) |
| Capital share transactions: (Note 2) | | | | | | | | | | | | |
| Class A | | 108,824,831 | | | (6,390,580 | ) | | (23,088,394 | ) | | (74,942,273 | ) |
| Class C | | 21,092,165 | | | 15,710,603 | | | (7,708,505 | ) | | (14,361,649 | ) |
| Class R | | 172,033 | | | 945,497 | | | — | | | — | |
| Class R6 | | — | | | — | | | (172,669 | ) | | 2,036,837 | |
| Advisor Class | | 3,062,926 | | | 10,954,875 | | | 2,864,895 | | | 39,061,277 | |
| Total capital share transactions | | 133,151,955 | | | 21,220,395 | | | (28,104,673 | ) | | (48,205,808 | ) |
| Net increase (decrease) in net assets | | 73,174,544 | | | 172,564,051 | | | (37,031,705 | ) | | (54,504,303 | ) |
| Net assets: | | | | | | | | | | | | |
| Beginning of period | | 2,041,360,784 | | | 1,868,796,733 | | | 384,493,739 | | | 438,998,042 | |
| End of period | $ | 2,114,535,328 | | $ | 2,041,360,784 | | $ | 347,462,034 | | $ | 384,493,739 | |
| Undistributed net investment income (distributions | | | | | | | | | | | | |
| in excess of net investment income) included in | | | | | | | | | | | | |
| net assets: | | | | | | | | | | | | |
| End of period | $ | 3,518,553 | | $ | 18,204,426 | | $ | (11,799,236 | ) | $ | (7,702,543 | ) |
franklintempleton.com The accompanying notes are an integral part of these financial statements. | Semiannual Report | 77
FRANKLIN INVESTORS SECURITIES TRUST
Notes to Financial Statements (unaudited)
1. Organization and Significant Accounting Policies
Franklin Investors Securities Trust (Trust) is registered under the Investment Company Act of 1940, as amended, (1940 Act) as an open-end management investment company, consisting of eight separate funds, four of which are included in this report (Funds) and applies the specialized accounting and reporting guidance in U.S. Generally Accepted Accounting Principles (U.S. GAAP). The financial statements of the remaining funds in the Trust are presented separately. Each class of shares differs by its initial sales load, contingent deferred sales charges, voting rights on matters affecting a single class, its exchange privilege and fees primarily due to differing arrangements for distribution and transfer agent fees.
| |
| Class A, Class C, Class R, Class R6 & Advisor Class |
| Franklin Balanced Fund |
| Franklin Equity Income Fund |
| |
| Class A, Class C, Class R6 & Advisor Class |
| Franklin Convertible Securities Fund |
| Franklin Real Return Fund |
The following summarizes the Funds’ significant accounting policies.
a. Financial Instrument Valuation
The Funds’ investments in financial instruments are carried at fair value daily. Fair value is the price that would be received to sell an asset or paid to transfer a liability in an orderly transaction between market participants on the measurement date. The Funds calculate the net asset value (NAV) per share at the close of the New York Stock Exchange (NYSE), generally at 4 p.m. Eastern time (NYSE close) on each day the NYSE is open for trading. Under compliance policies and procedures approved by the Trust’s Board of Trustees (the Board), the Funds’ administrator has responsibility for oversight of valuation, including leading the cross-functional Valuation and Liquidity Oversight Committee (VLOC). The VLOC provides administration and oversight of the Funds’ valuation policies and procedures, which are approved annually by the Board. Among other things, these procedures allow the Funds to utilize independent pricing services, quotations from securities and financial instrument dealers, and other market sources to determine fair value.
Equity securities, exchange traded funds, and derivative financial instruments (derivatives) listed on an exchange or on the NASDAQ National Market System are valued at the last quoted sale price or the official closing price of the day, respectively. Foreign equity securities are valued as of the close of trading on the foreign stock exchange on which the security is primarily traded or as of the NYSE close, whichever is earlier. The value is then converted into its U.S. dollar equivalent at the foreign exchange rate in effect at the NYSE close on the day that the value of the security is determined. Over-the-counter (OTC) securities are valued within the range of the most recent quoted bid and ask prices. Securities that trade in multiple markets or on multiple exchanges are valued according to the broadest and most representative market. Certain equity securities are valued based upon fundamental characteristics or relationships to similar securities. Investments in open-end mutual funds are valued at the closing NAV.
Debt and certain preferred securities generally trade in the OTC market rather than on a securities exchange. The Funds’ pricing services use multiple valuation techniques to determine fair value. In instances where sufficient market activity exists, the pricing services may utilize a market-based approach through which quotes from market makers are used to determine fair value. In instances where sufficient market activity may not exist or is limited, the pricing services also utilize proprietary valuation models which may consider market characteristics such as benchmark yield curves, credit spreads, estimated default rates, anticipated market interest rate volatility, coupon rates, anticipated timing of principal repayments, underlying collateral, and other unique security features in order to estimate the relevant cash flows, which are then discounted to calculate the fair value. Securities denominated in a foreign currency are converted into their U.S. dollar equivalent at the foreign exchange rate in effect at the NYSE close on the date that the values of the foreign debt securities are determined. Repurchase agreements are valued at cost, which approximates fair value.
Certain derivatives trade in the OTC market. The Funds’ pricing services use various techniques including industry standard option pricing models and proprietary discounted cash flow models to determine the fair value of those instruments. The Funds’ net benefit or obligation under the derivative contract, as measured by the fair value of the contract, is included in net assets.
The Funds have procedures to determine the fair value of financial instruments for which market prices are not reliable or readily available. Under these procedures, the VLOC convenes on a regular basis to review such financial instruments and considers a number of factors, including significant unob-
78 | Semiannual Report
franklintempleton.com
FRANKLIN INVESTORS SECURITIES TRUST
NOTES TO FINANCIAL STATEMENTS (UNAUDITED)
servable valuation inputs, when arriving at fair value. The VLOC primarily employs a market-based approach which may use related or comparable assets or liabilities, recent transactions, market multiples, book values, and other relevant information for the investment to determine the fair value of the investment. An income-based valuation approach may also be used in which the anticipated future cash flows of the investment are discounted to calculate fair value. Discounts may also be applied due to the nature or duration of any restrictions on the disposition of the investments. Due to the inherent uncertainty of valuations of such investments, the fair values may differ significantly from the values that would have been used had an active market existed. The VLOC employs various methods for calibrating these valuation approaches including a regular review of key inputs and assumptions, transactional back-testing or disposition analysis, and reviews of any related market activity.
Trading in securities on foreign securities stock exchanges and OTC markets may be completed before the daily NYSE close. In addition, trading in certain foreign markets may not take place on every NYSE business day. Occasionally, events occur between the time at which trading in a foreign security is completed and the close of the NYSE that might call into question the reliability of the value of a portfolio security held by the fund. As a result, differences may arise between the value of the Funds’ portfolio securities as determined at the foreign market close and the latest indications of value at the close of the NYSE. In order to minimize the potential for these differences, the VLOC monitors price movements following the close of trading in foreign stock markets through a series of country specific market proxies (such as baskets of American Depositary Receipts, futures contracts and exchange traded funds). These price movements are measured against established trigger thresholds for each specific market proxy to assist in determining if an event has occurred that may call into question the reliability of the values of the foreign securities held by the Funds. If such an event occurs, the securities may be valued using fair value procedures, which may include the use of independent pricing services.
When the last day of the reporting period is a non-business day, certain foreign markets may be open on those days that the NYSE is closed, which could result in differences between the value of the Funds’ portfolio securities on the last business day and the last calendar day of the reporting period. Any significant security valuation changes due to an open foreign market are adjusted and reflected by the Funds for financial reporting purposes.
b. Foreign Currency Translation
Portfolio securities and other assets and liabilities denominated in foreign currencies are translated into U.S. dollars based on the exchange rate of such currencies against U.S. dollars on the date of valuation. The Funds may enter into foreign currency exchange contracts to facilitate transactions denominated in a foreign currency. Purchases and sales of securities, income and expense items denominated in foreign currencies are translated into U.S. dollars at the exchange rate in effect on the transaction date. Portfolio securities and assets and liabilities denominated in foreign currencies contain risks that those currencies will decline in value relative to the U.S. dollar. Occasionally, events may impact the availability or reliability of foreign exchange rates used to convert the U.S. dollar equivalent value. If such an event occurs, the foreign exchange rate will be valued at fair value using procedures established and approved by the Board.
The Funds do not separately report the effect of changes in foreign exchange rates from changes in market prices on securities held. Such changes are included in net realized and unrealized gain or loss from investments in the Statements of Operations.
Realized foreign exchange gains or losses arise from sales of foreign currencies, currency gains or losses realized between the trade and settlement dates on securities transactions and the difference between the recorded amounts of dividends, interest, and foreign withholding taxes and the U.S. dollar equivalent of the amounts actually received or paid. Net unrealized foreign exchange gains and losses arise from changes in foreign exchange rates on foreign denominated assets and liabilities other than investments in securities held at the end of the reporting period.
c. Joint Repurchase Agreement
Franklin Real Return Fund enters into a joint repurchase agreement whereby its uninvested cash balance is deposited into a joint cash account with other funds managed by the investment manager or an affiliate of the investment manager and is used to invest in one or more repurchase agreements. The value and face amount of the joint repurchase agreement are allocated to the funds based on their pro-rata interest. A repurchase agreement is accounted for as a loan by the fund to the seller, collateralized by securities which are delivered to the fund’s custodian. The fair value, including accrued interest, of the initial collateralization is required to be at least 102% of the dollar amount invested by the funds, with the value of the underlying securities marked to market daily to maintain coverage of at least 100%. Repurchase
franklintempleton.com
Semiannual Report | 79
FRANKLIN INVESTORS SECURITIES TRUST
NOTES TO FINANCIAL STATEMENTS (UNAUDITED)
1. Organization And Significant Accounting
Policies (continued)
c. Joint Repurchase Agreement (continued)
agreements are subject to the terms of Master Repurchase Agreements (MRAs) with approved counterparties (sellers). The MRAs contain various provisions, including but not limited to events of default and maintenance of collateral for repurchase agreements. In the event of default by either the seller or the fund, certain MRAs may permit the non-defaulting party to net and close-out all transactions, if any, traded under such agreements. The fund may sell securities it holds as collateral and apply the proceeds towards the repurchase price and any other amounts owed by the seller to the fund in the event of default by the seller. This could involve costs or delays in addition to a loss on the securities if their value falls below the repurchase price owed by the seller. The joint repurchase agreement held by the fund at period end, as indicated in the Statement of Investments, had been entered into on April 30, 2015.
d. Securities Purchased on a When-Issued and Delayed Delivery Basis
Certain funds purchase securities on a when-issued and delayed delivery basis, with payment and delivery scheduled for a future date. These transactions are subject to market fluctuations and are subject to the risk that the value at delivery may be more or less than the trade date purchase price. Although the funds will generally purchase these securities with the intention of holding the securities, they may sell the securities before the settlement date. Sufficient assets have been segregated for these securities.
e. Derivative Financial Instruments
Franklin Balanced Fund and Franklin Real Return Fund invested in derivatives in order to manage risk or gain exposure to various other investments or markets. Derivatives are financial contracts based on an underlying or notional amount, require no initial investment or an initial net investment that is smaller than would normally be required to have a similar response to changes in market factors, and require or permit net settlement. Derivatives contain various risks including the potential inability of the counterparty to fulfill their obligations under the terms of the contract, the potential for an illiquid secondary market, and/or the potential for market movements which expose the fund to gains or losses in excess of the amounts shown in the Statements of Assets and Liabilities. Realized gain and loss and unrealized appreciation and depreciation on these contracts for the period are included in the Statements of Operations.
Derivative counterparty credit risk is managed through a formal evaluation of the creditworthiness of all potential coun-terparties. Franklin Balanced Fund and Franklin Real Return Fund attempts to reduce their exposure to counterparty credit risk on OTC derivatives, whenever possible, by entering into International Swaps and Derivatives Association (ISDA) master agreements with certain counterparties. These agreements contain various provisions, including but not limited to collateral requirements, events of default, or early termination. Termination events applicable to the counterparty include certain deteriorations in the credit quality of the counterparty. Termination events applicable to the funds include failure of the funds to maintain certain net asset levels and/or limit the decline in net assets over various periods of time. In the event of default or early termination, the ISDA master agreement gives the non-defaulting party the right to net and close-out all transactions traded, whether or not arising under the ISDA agreement, to one net amount payable by one counterparty to the other. However, absent an event of default or early termination, OTC derivative assets and liabilities are presented gross and not offset in the Statements of Assets and Liabilities. Early termination by the counterparty may result in an immediate payment by the funds of any net liability owed to that counter-party under the ISDA agreement. At April 30, 2015, Franklin Real Return Fund had OTC derivatives in a net liability position of $78,265.
Collateral requirements differ by type of derivative. Collateral or initial margin requirements are set by the broker or exchange clearing house for exchange traded and centrally cleared derivatives. Initial margin deposited is held at the exchange and can be in the form of cash and/or securities. For OTC derivatives traded under an ISDA master agreement, posting of collateral is required by either the fund or the applicable counterparty if the total net exposure of all OTC derivatives with the applicable counterparty exceeds the minimum transfer amount, which typically ranges from $100,000 to $250,000, and can vary depending on the counterparty and the type of the agreement. Generally, collateral is determined at the close of fund business each day and any additional collateral required due to changes in derivative values may be delivered by the fund or the counterparty within a few business
80 | Semiannual Report
franklintempleton.com
FRANKLIN INVESTORS SECURITIES TRUST
NOTES TO FINANCIAL STATEMENTS (UNAUDITED)
days. Collateral pledged and/or received by the fund for OTC derivatives, if any, is held in segregated accounts with the fund’s custodian/counterparty broker and can be in the form of cash and/or securities. Unrestricted cash may be invested according to the fund’s investment objectives.
Franklin Balanced Fund and Franklin Real Return Fund entered into OTC forward exchange contracts primarily to manage and/or gain exposure to certain foreign currencies. A forward exchange contract is an agreement between the fund and a counterparty to buy or sell a foreign currency at a specific exchange rate on a future date.
Franklin Balanced Fund purchased or wrote exchange traded option contracts primarily to manage exposure to equity price risk. An option is a contract entitling the holder to purchase or sell a specific amount of shares or units of an asset or notional amount of a swap (swaption), at a specified price. Options purchased are recorded as an asset while options written are recorded as a liability. Upon exercise of an option, the acquisition cost or sales proceeds of the underlying investment is adjusted by any premium received or paid. Upon expiration of an option, any premium received or paid is recorded as a realized gain or loss. Upon closing an option other than through expiration or exercise, the difference between the premium and the cost to close the position is recorded as a realized gain or loss.
See Notes 6 and 8 regarding investment transactions and other derivative information, respectively.
f. Restricted Cash
At April 30, 2015, Franklin Real Return Fund held restricted cash in connection with investments in certain derivative securities. Restricted cash is held in a segregated account with the fund’s custodian and is reflected in the Statements of Assets and Liabilities.
g. Equity-Linked Securities
Franklin Balanced Fund and Franklin Equity Income Fund invest in equity-linked securities. Equity-linked securities are hybrid financial instruments that generally combine both debt and equity characteristics into a single note form. Income received from equity-linked securities is recorded as realized gains in the Statements of Operations and may be based on the performance of an underlying equity security, an equity index, or an option position. The risks of investing in equity-linked securities include unfavorable price movements in the underlying security and the credit risk of the issuing financial institution. There may be no guarantee of a return of principal with equity-linked securities and the appreciation potential may be limited. Equity-linked securities may be more volatile and less liquid than other investments held by the funds.
h. Senior Floating Rate Interests
Franklin Real Return Fund invests in senior secured corporate loans that pay interest at rates which are periodically reset by reference to a base lending rate plus a spread. These base lending rates are generally the prime rate offered by a designated U.S. bank or the London InterBank Offered Rate (LIBOR). Senior secured corporate loans often require prepayment of principal from excess cash flows or at the discretion of the borrower. As a result, actual maturity may be substantially less than the stated maturity. Senior secured corporate loans in which the fund invests are generally readily marketable, but may be subject to certain restrictions on resale.
i. Income and Deferred Taxes
It is each fund’s policy to qualify as a regulated investment company under the Internal Revenue Code. Each fund intends to distribute to shareholders substantially all of its taxable income and net realized gains to relieve it from federal income and excise taxes. As a result, no provision for U.S. federal income taxes is required.
The Funds may be subject to foreign taxation related to income received, capital gains on the sale of securities and certain foreign currency transactions in the foreign jurisdictions in which the Funds invest. Foreign taxes, if any, are recorded based on the tax regulations and rates that exist in the foreign markets in which the Funds invest. When a capital gain tax is determined to apply, the Funds record an estimated deferred tax liability in an amount that would be payable if the securities were disposed of on the valuation date. As a result of several court cases, in certain countries across the European Union, Franklin Equity Income Fund has filed additional tax reclaims for previously withheld taxes on dividends earned in those countries. These additional filings are subject to various administrative proceedings by the local jurisdictions’ tax authorities within the European Union, as well as a number of related judicial proceedings. At this time, uncertainty exists as to the ultimate resolution of these proceedings, the likelihood of receipt of these reclaims, and the potential timing of payment, and accordingly, no amounts are reflected in the financial statements.
franklintempleton.com Semiannual Report | 81
FRANKLIN INVESTORS SECURITIES TRUST
NOTES TO FINANCIAL STATEMENTS (UNAUDITED)
1. Organization And Significant Accounting
Policies (continued)
i. Income and Deferred Taxes (continued)
Each fund recognizes the tax benefits of uncertain tax positions only when the position is “more likely than not” to be sustained upon examination by the tax authorities based on the technical merits of the tax position. As of April 30, 2015, and for all open tax years, each fund has determined that no liability for unrecognized tax benefits is required in each fund’s financial statements related to uncertain tax positions taken on a tax return (or expected to be taken on future tax returns). Open tax years are those that remain subject to examination and are based on each tax jurisdiction’s statute of limitation.
j. Security Transactions, Investment Income, Expenses and Distributions
Security transactions are accounted for on trade date. Realized gains and losses on security transactions are determined on a specific identification basis. Interest income and estimated expenses are accrued daily. Amortization of premium and accretion of discount on debt securities are included in interest income. Facility fees are recognized as income over the expected term of the loan. Dividend income is recorded on the ex-dividend date except for certain dividends from foreign securities where the dividend rate is not available. In such cases, the dividend is recorded as soon as the information is received by the Funds. Distributions to shareholders are recorded on the ex-dividend date and are determined according to income tax regulations (tax basis). Distributable earnings determined on a tax basis may differ from earnings recorded in accordance with U.S. GAAP. These differences may be permanent or temporary. Permanent differences are reclassified among capital accounts to reflect their tax character. These reclassifications have no impact on net assets or the results of operations. Temporary differences are not reclassified, as they may reverse in subsequent periods.
Common expenses incurred by the Trust are allocated among the funds based on the ratio of net assets of each fund to the combined net assets of the Trust. Fund specific expenses are charged directly to the fund that incurred the expense.
Realized and unrealized gains and losses and net investment income, not including class specific expenses, are allocated daily to each class of shares based upon the relative proportion of net assets of each class. Differences in per share distributions, by class, are generally due to differences in class specific expenses.
Inflation-indexed bonds are adjusted for inflation through periodic increases or decreases in the security’s interest accruals, face amount, or principal redemption value, by amounts corresponding to the rate of inflation as measured by an index. Any increase or decrease in the face amount or principal redemption value will be included as inflation principal adjustments in the Statements of Operations.
k. Accounting Estimates
The preparation of financial statements in accordance with U.S. GAAP requires management to make estimates and assumptions that affect the reported amounts of assets and liabilities at the date of the financial statements and the amounts of income and expenses during the reporting period. Actual results could differ from those estimates.
l. Guarantees and Indemnifications
Under the Trust’s organizational documents, its officers and trustees are indemnified by the Trust against certain liabilities arising out of the performance of their duties to the Trust. Additionally, in the normal course of business, the Trust, on behalf of the Funds, enters into contracts with service providers that contain general indemnification clauses. The Trust’s maximum exposure under these arrangements is unknown as this would involve future claims that may be made against the Trust that have not yet occurred. Currently, the Trust expects the risk of loss to be remote.
82 | Semiannual Report
franklintempleton.com
FRANKLIN INVESTORS SECURITIES TRUST
NOTES TO FINANCIAL STATEMENTS (UNAUDITED)
2. Shares of Beneficial Interest
At April 30, 2015, there were an unlimited number of shares authorized (without par value). Transactions in the Funds’ shares were as follows:
| | | | | | | | | | | | | |
| | Franklin | | | Franklin | | |
| | Balanced Fund | | Convertible Securities Fund | |
| | Shares | | | Amount | | Shares | | | Amount | |
| |
| Class A Shares: | | | | | | | | | | | | |
| Six Months ended April 30, 2015 | | | | | | | | | | | | |
| Shares sold | 34,053,387 | | $ | 402,176,779 | | 8,687,460 | | $ | 160,881,258 | |
| Shares issued in reinvestment of distributions | 5,198,739 | | | | 60,300,686 | | 2,234,427 | | | | 39,439,425 | |
| Shares redeemed | (13,207,840 | ) | | (155,985,254 | ) | (11,343,607 | ) | | (208,931,214 | ) |
| Net increase (decrease) | 26,044,286 | | $ | 306,492,211 | | (421,720 | ) | | $ | (8,610,531 | ) |
| Year ended October 31, 2014 | | | | | | | | | | | | |
| Shares sold | 70,233,522 | | $ | 815,165,988 | | 20,560,472 | | $ | 383,527,012 | |
| Shares issued in reinvestment of distributions | 6,361,863 | | | | 73,139,209 | | 1,027,227 | | | 18,842,876 | |
| Shares redeemed | (22,041,115 | ) | | (256,776,454 | ) | (20,415,610 | ) | | (382,951,884 | ) |
| Net increase (decrease) | 54,554,270 | | $ | 631,528,743 | | 1,172,089 | | | $ | 19,418,004 | |
| Class C Shares: | | | | | | | | | | | | |
| Six Months ended April 30, 2015 | | | | | | | | | | | | |
| Shares sold | 10,215,081 | | $ | 119,599,029 | | 1,094,246 | | | $ | 19,838,732 | |
| Shares issued in reinvestment of distributions | 1,053,823 | | | | 12,108,215 | | 639,462 | | | | 11,141,574 | |
| Shares redeemed | (3,773,294 | ) | | (44,258,656 | ) | (1,531,335 | ) | | (27,810,010 | ) |
| Net increase (decrease) | 7,495,610 | | | $ | 87,448,588 | | 202,373 | | | $ | 3,170,296 | |
| Year ended October 31, 2014 | | | | | | | | | | | | |
| Shares sold | 15,225,489 | | $ | 175,593,130 | | 4,373,788 | | | $ | 80,504,373 | |
| Shares issued in reinvestment of distributions | 1,263,947 | | | | 14,379,400 | | 200,407 | | | | 3,615,096 | |
| Shares redeemed | (5,890,178 | ) | | (68,042,902 | ) | (2,305,848 | ) | | (42,496,270 | ) |
| Net increase (decrease) | 10,599,258 | | $ | 121,929,628 | | 2,268,347 | | | $ | 41,623,199 | |
| Class R Shares: | | | | | | | | | | | | |
| Six Months ended April 30, 2015 | | | | | | | | | | | | |
| Shares sold | 104,356 | | | $ | 1,231,536 | | | | | | | |
| Shares issued in reinvestment of distributions | 9,562 | | | | 111,145 | | | | | | | |
| Shares redeemed | (19,267 | ) | | | (228,983 | ) | | | | | | |
| Net increase (decrease) | 94,651 | | | $ | 1,113,698 | | | | | | | |
| Year ended October 31, 2014 | | | | | | | | | | | | |
| Shares sold | 49,487 | | | $ | 579,565 | | | | | | | |
| Shares issued in reinvestment of distributions | 12,967 | | | | 148,963 | | | | | | | |
| Shares redeemed | (43,956 | ) | | | (517,010 | ) | | | | | | |
| Net increase (decrease) | 18,498 | | | $ | 211,518 | | | | | | | |
| Class R6 Shares: | | | | | | | | | | | | |
| Six Months ended April 30, 2015 | | | | | | | | | | | | |
| Shares sold | 2,783 | | | $ | 32,849 | | — | | | $ | — | |
| Shares issued on reinvestment of distributions | 1,291 | | | | 14,983 | | 8,244 | | | | 145,614 | |
| Shares redeemed | (29,769 | ) | | | (354,572 | ) | (261 | ) | | | (4,833 | ) |
| Net increase (decrease) | (25,695 | ) | | $ | (306,740 | ) | 7,983 | | | $ | 140,781 | |
| Year ended October 31, 2014a | | | | | | | | | | | | |
| Shares sold | 4,223,183 | | | $ | 50,203,110 | | 161,378 | | | $ | 3,005,000 | |
| Shares issued in reinvestment of distributions | 33,755 | | | | 405,080 | | 1,525 | | | | 29,117 | |
| Shares redeemed | (4,214,267 | ) | | (51,115,927 | ) | — | | | | — | |
| Net increase (decrease) | 42,671 | | | $ | (507,737 | ) | 162,903 | | | $ | 3,034,117 | |
franklintempleton.com Semiannual Report | 83
| | | | | | | | | | | | |
| FRANKLIN INVESTORS SECURITIES TRUST | | | | | | | | | | | |
| NOTES TO FINANCIAL STATEMENTS (UNAUDITED) | | | | | | | | | | | |
| |
| |
| |
| |
| 2. Shares of Beneficial Interest (continued) | | | | | | | | | | | |
| | Franklin | | | Franklin | |
| | Balanced Fund | | Convertible Securities Fund | |
| | Shares | | | Amount | | Shares | | | Amount | |
| Advisor Class Shares: | | | | | | | | | | | |
| Six Months ended April 30, 2015 | | | | | | | | | | | |
| Shares sold | 1,713,336 | | | $ | 20,175,637 | | 16,621,648 | | $ | 306,505,525 | |
| Shares issued in reinvestment of distributions | 104,271 | | | | 1,213,178 | | 1,917,721 | | | 33,874,434 | |
| Shares redeemed | (587,056 | ) | | | (6,944,954 | ) | (13,387,971 | ) | | (245,457,119 | ) |
| Net increase (decrease) | 1,230,551 | | | $ | 14,443,861 | | 5,151,398 | | $ | 94,922,840 | |
| Year ended October 31, 2014 | | | | | | | | | | | |
| Shares sold | 2,648,763 | | | $ | 30,742,430 | | 37,218,867 | | $ | 697,062,012 | |
| Shares issued in reinvestment of distributions | 251,541 | | | | 2,876,344 | | 692,532 | | | 12,858,748 | |
| Shares redeemed | (5,366,832 | ) | | (63,484,966 | ) | (13,426,115 | ) | | (247,729,757 | ) |
| Net increase (decrease) | (2,466,528 | ) | $ | (29,866,192 | ) | 24,485,284 | | $ | 462,191,003 | |
| aFor the period March 4, 2014 (effective date) to October 31, 2014 for Franklin Convertible Securities Fund. | | | | | | |
| | | | | | | | | | | | | |
| | Franklin | | | Franklin | |
| | Equity Income Fund | | Real Return Fund | |
| | Shares | | | Amount | | Shares | | | | Amount | |
| Class A Shares: | | | | | | | | | | | | |
| Six Months ended April 30, 2015 | | | | | | | | | | | | |
| Shares sold | 5,971,725 | | $ | 139,184,184 | | 1,448,054 | | | $ | 15,064,044 | |
| Shares issued in reinvestment of distributions | 4,927,600 | | | 110,450,141 | | 145,574 | | | | 1,511,728 | |
| Shares redeemed | (6,063,070 | ) | | (140,809,494 | ) | (3,813,932 | ) | | | (39,664,166 | ) |
| Net increase (decrease) | 4,836,255 | | $ | 108,824,831 | | (2,220,304 | ) | $ | (23,088,394 | ) |
| Year ended October 31, 2014 | | | | | | | | | | | | |
| Shares sold | 10,330,092 | | $ | 237,602,884 | | 3,579,355 | | | $ | 38,673,672 | |
| Shares issued in reinvestment of distributions | 1,983,644 | | | | 45,135,334 | | 557,168 | | | | 6,020,961 | |
| Shares redeemed | (12,525,875 | ) | | (289,128,798 | ) | (11,073,134 | ) | | (119,636,906 | ) |
| Net increase (decrease) | (212,139 | ) | | $ | (6,390,580 | ) | (6,936,611 | ) | $ | (74,942,273 | ) |
| Class C Shares: | | | | | | | | | | | | |
| Six Months ended April 30, 2015 | | | | | | | | | | | | |
| Shares sold | 1,407,874 | | | $ | 32,582,406 | | 292,686 | | | $ | 3,013,841 | |
| Shares issued in reinvestment of distributions | 634,273 | | | | 14,108,907 | | 36,785 | | | | 379,592 | |
| Shares redeemed | (1,103,423 | ) | | (25,599,148 | ) | (1,074,659 | ) | | | (11,101,938 | ) |
| Net increase (decrease) | 938,724 | | | $ | 21,092,165 | | (745,188 | ) | | $ | (7,708,505 | ) |
| Year ended October 31, 2014 | | | | | | | | | | | | |
| Shares sold | 2,334,827 | | | $ | 53,392,570 | | 859,860 | | | $ | 9,243,498 | |
| Shares issued in reinvestment of distributions | 190,661 | | | | 4,300,491 | | 120,299 | | | | 1,292,542 | |
| Shares redeemed | (1,823,609 | ) | | (41,982,458 | ) | (2,320,740 | ) | | | (24,897,689 | ) |
| Net increase (decrease) | 701,879 | | | $ | 15,710,603 | | (1,340,581 | ) | $ | (14,361,649 | ) |
| Class R Shares: | | | | | | | | | | | | |
| Six Months ended April 30, 2015 | | | | | | | | | | | | |
| Shares sold | 39,395 | | | $ | 917,893 | | | | | | | |
| Shares issued in reinvestment of distributions | 18,701 | | | | 418,887 | | | | | | | |
| Shares redeemed | (50,188 | ) | | | (1,164,747 | ) | | | | | | |
| Net increase (decrease) | 7,908 | | | $ | 172,033 | | | | | | | |
| Year ended October 31, 2014 | | | | | | | | | | | | |
| Shares sold | 93,752 | | | $ | 2,145,753 | | | | | | | |
| Shares issued in reinvestment of distributions | 6,533 | | | | 148,655 | | | | | | | |
| Shares redeemed | (58,667 | ) | | | (1,348,911 | ) | | | | | | |
| Net increase (decrease) | 41,618 | | | $ | 945,497 | | | | | | | |
84 | Semiannual Report franklintempleton.com
FRANKLIN INVESTORS SECURITIES TRUST
NOTES TO FINANCIAL STATEMENTS (UNAUDITED)
| | | | | | | | | | | |
| | Franklin | | | Franklin | |
| | Equity Income Fund | | Real Return Fund | |
| | Shares | | Amount | | Shares | | | Amount | |
| |
| Class R6 Shares: | | | | | | | | | | |
| Six Months ended April 30, 2015 | | | | | | | | | | |
| Shares sold | — | | $ | — | | 21,910 | | $ | 228,932 | |
| Shares issued on reinvestment of distributions | — | | | — | | 4 | | | 41 | |
| Shares redeemed | — | | | — | | (38,701 | ) | | (401,642 | ) |
| Net increase (decrease) | — | | $ | — | | (16,787 | ) | $ | (172,669 | ) |
| Year ended October 31, 2014 | | | | | | | | | | |
| Shares sold | — | | $ | — | | 220,110 | | $ | 2,365,667 | |
| Shares issued in reinvestment of distributions | — | | | — | | 1,720 | | | 18,859 | |
| Shares redeemed | — | | | — | | (31,915 | ) | | (347,689 | ) |
| Net increase (decrease) | — | | $ | — | | 189,915 | | $ | 2,036,837 | |
| Advisor Class Shares: | | | | | | | | | | |
| Six Months ended April 30, 2015 | | | | | | | | | | |
| Shares sold | 374,708 | | $ | 8,907,469 | | 1,583,829 | | $ | 16,519,318 | |
| Shares issued in reinvestment of distributions | 81,735 | | | 1,834,705 | | 43,881 | | | 456,992 | |
| Shares redeemed | (333,234 | ) | | (7,679,248 | ) | (1,353,333 | ) | | (14,111,415 | ) |
| Net increase (decrease) | 123,209 | | $ | 3,062,926 | | 274,377 | | $ | 2,864,895 | |
| Year ended October 31, 2014 | | | | | | | | | | |
| Shares sold | 743,489 | | $ | 17,291,317 | | 5,138,314 | | $ | 55,811,393 | |
| Shares issued in reinvestment of distributions | 26,209 | | | 598,539 | | 101,280 | | | 1,100,209 | |
| Shares redeemed | (300,655 | ) | | (6,934,981 | ) | (1,648,547 | ) | | (17,850,325 | ) |
| Net increase (decrease) | 469,043 | | $ | 10,954,875 | | 3,591,047 | | $ | 39,061,277 | |
3. Transactions with Affiliates
Franklin Resources, Inc. is the holding company for various subsidiaries that together are referred to as Franklin Templeton Investments. Certain officers and trustees of the Trust are also officers and/or directors of the following subsidiaries:
| | |
| Subsidiary | Affiliation |
| Franklin Advisers, Inc. (Advisers) | Investment manager |
| Franklin Templeton Services, LLC (FT Services) | Administrative manager |
| Franklin Templeton Distributors, Inc. (Distributors) | Principal underwriter |
| Franklin Templeton Investor Services, LLC (Investor Services) | Transfer agent |
a. Management Fees
Franklin Balanced Fund pays an investment management fee to Advisers based on the average daily net assets of the fund as follows:
| | | |
| Annualized Fee Rate | | Net Assets |
| 0.700 | % | Up to and including $250 million |
| 0.675 | % | Over $250 million, up to and including $500 million |
| 0.650 | % | Over $500 million, up to and including $1 billion |
| 0.625 | % | Over $1 billion, up to and including $2.5 billion |
| 0.600 | % | Over $2.5 billion, up to and including $5 billion |
| 0.575 | % | Over $5 billion, up to and including $10 billion |
| 0.550 | % | Over $10 billion, up to and including $15 billion |
| 0.525 | % | Over $15 billion, up to and including $20 billion |
| 0.500 | % | In excess of $20 billion |
franklintempleton.com Semiannual Report | 85
FRANKLIN INVESTORS SECURITIES TRUST
NOTES TO FINANCIAL STATEMENTS (UNAUDITED)
3. Transactions with Affiliates (continued)
a. Management Fees (continued)
Franklin Convertible Securities Fund and Franklin Equity Income Fund pay an investment management fee to Advisers based on the month-end net assets of each of the funds as follows:
| | | |
| Annualized Fee Rate | | Net Assets |
| 0.625 | % | Up to and including $100 million |
| 0.500 | % | Over $100 million, up to and including $250 million |
| 0.450 | % | Over $250 million, up to and including $7.5 billion |
| 0.440 | % | Over $7.5 billion, up to and including $10 billion |
| 0.430 | % | Over $10 billion, up to and including $12.5 billion |
| 0.420 | % | Over $12.5 billion, up to and including $15 billion |
| 0.400 | % | Over $15 billion, up to and including $17.5 billion |
| 0.380 | % | Over $17.5 billion, up to and including $20 billion |
| 0.360 | % | Over $20 billion, up to and including $35 billion |
| 0.355 | % | Over $35 billion, up to and including $50 billion |
| 0.350 | % | In excess of $50 billion |
Franklin Real Return Fund pays an investment management fee to Advisers based on the average daily net assets of the fund as follows:
| | | |
| Annualized Fee Rate | | Net Assets |
| 0.625 | % | Up to and including $500 million |
| 0.525 | % | Over $500 million, up to and including $1 billion |
| 0.480 | % | Over $1 billion, up to and including $1.5 billion |
| 0.435 | % | Over $1.5 billion, up to and including $6.5 billion |
| 0.415 | % | Over $6.5 billion, up to and including $11.5 billion |
| 0.400 | % | Over $11.5 billion, up to and including $16.5 billion |
| 0.390 | % | Over $16.5 billion, up to and including $19 billion |
| 0.380 | % | Over $19 billion, up to and including $21.5 billion |
| 0.370 | % | In excess of $21.5 billion |
b. Administrative Fees
Under an agreement with Advisers, FT Services provides administrative services to the Funds. The fee is paid by Advisers based on each of the Funds’ average daily net assets, and is not an additional expense of the Funds.
c. Distribution Fees
The Board has adopted distribution plans for each share class, with the exception of Class R6 and Advisor Class shares, pursuant to Rule 12b-1 under the 1940 Act. Distribution fees are not charged on shares held by affiliates. Under the Funds’ Class A reimbursement distribution plans, the Funds reimburse Distributors for costs incurred in connection with the servicing, sale and distribution of each fund’s shares up to the maximum annual plan rate for each class. Under the Class A reimbursement distribution plans, costs exceeding the maximum for the current plan year cannot be reimbursed in subsequent periods. In addition, under the Funds’ Class C and R compensation distribution plans, the Funds pay Distributors for costs incurred in connection with the servicing, sale and distribution of each fund’s shares up to the maximum annual plan rate for each class. The plan year, for purposes of monitoring compliance with the maximum annual plan rates, is February 1 through January 31 for each fund.
86 | Semiannual Report
franklintempleton.com
FRANKLIN INVESTORS SECURITIES TRUST
NOTES TO FINANCIAL STATEMENTS (UNAUDITED)
The maximum annual plan rates, based on the average daily net assets, for each class, are as follows:
| | | | | | | | | |
| | | | Franklin | | | | | |
| | Franklin | | Convertible | | Franklin Equity | | Franklin Real | |
| | Balanced Fund | | Securities Fund | | Income Fund | | Return Fund | |
| Reimbursement Plans: | | | | | | | | |
| Class A | 0.35 | % | 0.25 | % | 0.25 | % | 0.25 | % |
| Compensation Plans: | | | | | | | | |
| Class C | 1.00 | % | 1.00 | % | 1.00 | % | 0.65 | % |
| Class R | 0.50 | % | — | | 0.50 | % | — | |
The Board has set the current rate at 0.30% per year for Class A shares for Franklin Balanced Fund until further notice and approval by the Board.
d. Sales Charges/Underwriting Agreements
Front-end sales charges and contingent deferred sales charges (CDSC) do not represent expenses of the Funds. These charges are deducted from the proceeds of sales of fund shares prior to investment or from redemption proceeds prior to remittance, as applicable. Distributors has advised the Funds of the following commission transactions related to the sales and redemptions of the Funds’ shares for the period:
| | | | | | | | | |
| | | | | Franklin | | | | |
| | | Franklin | | Convertible | | Franklin Equity | | Franklin Real |
| | | Balanced Fund | | Securities Fund | | Income Fund | | Return Fund |
| Sales charges retained net of commissions paid to | | | | | | | | |
| unaffiliated broker/dealers | $ | 1,312,601 | $ | 87,413 | $ | 432,646 | $ | 31,374 |
| CDSC retained | $ | 54,957 | $ | 28,276 | $ | 11,828 | $ | 1,895 |
e. Transfer Agent Fees
Each class of shares, except for Class R6, pays transfer agent fees to Investor Services for its performance of shareholder servicing obligations and reimburses Investor Services for out of pocket expenses incurred, including shareholding servicing fees paid to third parties. These fees are allocated daily based upon their relative proportion of such classes’ aggregate net assets. Class R6 pays Investor Services transfer agent fees specific to that class.
For the period ended April 30, 2015, the Funds paid transfer agent fees as noted in the Statements of Operations of which the following amounts were retained by Investor Services:
| | | | | | | | | |
| | | | | Franklin | | | | |
| | | Franklin | | Convertible | | Franklin Equity | | Franklin Real |
| | | Balanced Fund | | Securities Fund | | Income Fund | | Return Fund |
| |
| Transfer agent fees | $ | 515,330 | $ | 405,749 | $ | 496,526 | $ | 120,286 |
f. Investments in Institutional Fiduciary Trust Money Market Portfolio
The Funds except Franklin Real Return Fund, invest in Institutional Fiduciary Trust Money Market Portfolio (Sweep Money Fund), an affiliated open-end management investment company. Management fees paid by the Funds are waived on assets invested in the Sweep Money Fund, as noted in the Statements of Operations, in an amount not to exceed the management and administrative fees paid directly or indirectly by the Sweep Money Fund. Prior to November 1, 2013, the waiver was accounted for as a reduction to management fees.
franklintempleton.com
Semiannual Report | 87
FRANKLIN INVESTORS SECURITIES TRUST
NOTES TO FINANCIAL STATEMENTS (UNAUDITED)
3. Transactions with Affiliates (continued)
g. Waiver and Expense Reimbursements
Advisers and Investor Services have contractually agreed in advance to waive or limit their respective fees and to assume as their own expense certain expenses otherwise payable by Franklin Real Return Fund so that the expenses (excluding distribution fees, and acquired fund fees and expenses) for Class A, Class C and Advisor Class of the fund do not exceed 0.65%, and Class R6 does not exceed 0.52% based on the average net assets of each class (other than certain non-routine expenses or costs, including those relating to litigation, indemnification, reorganizations, and liquidations) until February 29, 2016.
Additionally, Investor Services has contractually agreed in advance to waive or limit its fees so that the Class R6 transfer agent fees do not exceed 0.01% until February 29, 2016. For Franklin Convertible Securities Fund and Franklin Real Return Fund, there were no Class R6 transfer agent fees waived during the period ended April 30, 2015.
4. Expense Offset Arrangement
The Funds have entered into an arrangement with their custodian whereby credits realized as a result of uninvested cash balances are used to reduce a portion of the Funds’ custodian expenses. During the period ended April 30, 2015, the custodian fees were reduced as noted in the Statements of Operations.
5. Income Taxes
For tax purposes, capital losses may be carried over to offset future capital gains. Capital loss carryforwards with no expiration, if any, must be fully utilized before those losses with expiration dates.
At October 31, 2014, capital loss carryforwards were as follows:
| | | |
| | | Franklin Real |
| | | Return Fund |
| Capital loss carryforwards subject to expiration: | | |
| 2016 | $ | 1,161,482 |
| 2017 | | 1,207,907 |
| 2018 | | 1,206,586 |
| Capital loss carryforwards not subject to expiration: | | |
| Short term | | 359,718 |
| Long term | | 12,290,884 |
| Total capital loss carryforwards | $ | 16,226,577 |
At April 30, 2015, the cost of investments and net unrealized appreciation (depreciation) for income tax purposes were as follows:
| | | | | | | | | | | | | |
| | | | | | Franklin | | | | | | | |
| | | Franklin | | | Convertible | | | Franklin Equity | | | Franklin Real | |
| | | Balanced Fund | | | Securities Fund | | | Income Fund | | | Return Fund | |
| Cost of investments | $ | 2,812,752,192 | | $ | 2,001,410,140 | | $ | 1,684,967,487 | | $ | 350,465,232 | |
| |
| Unrealized appreciation | $ | 256,057,845 | | $ | 302,293,070 | | $ | 491,336,229 | | $ | 13,127,730 | |
| Unrealized depreciation | | (36,063,907 | ) | | (131,966,866 | ) | | (42,399,631 | ) | | (21,440,111 | ) |
| Net unrealized appreciation (depreciation) | $ | 219,993,938 | | $ | 170,326,204 | | $ | 448,936,598 | | $ | (8,312,381 | ) |
Differences between income and/or capital gains as determined on a book basis and a tax basis are primarily due to differing treatments of bond discounts and premiums and foreign currency transactions.
88 | Semiannual Report
franklintempleton.com
FRANKLIN INVESTORS SECURITIES TRUST
NOTES TO FINANCIAL STATEMENTS (UNAUDITED)
6. Investment Transactions
Purchases and sales of investments (excluding short term securities) for the period ended April 30, 2015, were as follows:
| | | | | | | | | | | | | |
| | | | | | | | Franklin | | | | | |
| �� | | Franklin | | Convertible | | | Franklin Equity | | Franklin Real |
| | | Balanced Fund | | Securities Fund | | | Income Fund | | Return Fund |
| Purchases | $ | 673,527,405 | $ | 137,240,096 | | $ | 258,219,908 | $ | 50,290,646 |
| Sales | $ | 491,547,148 | $ | 171,390,418 | | $ | 233,858,795 | $ | 76,050,126 |
| |
| Transactions in options written during the period ended April 30, 2015, were as follows: | | | | | |
| |
| | | Number of | | | | | | | | | | |
| | | Contracts | | | | | Premiums | | | | | |
| Franklin Balanced Fund | | | | | | | | | | | | |
| Options outstanding at October 31, 2014 | | 2,500 | | $ | 406,518 | | | | | |
| Options written | | 11,817 | | | | | 2,431,282 | | | | | |
| Options expired | | (4,337 | ) | | | | (826,643 | ) | | | | |
| Options exercised | | (7,980 | ) | | | | (1,414,147 | ) | | | | |
| Options closed | | (1,000 | ) | | | | (260,016 | ) | | | | |
| Options outstanding at April 30, 2015 | | 1,000 | | $ | 336,994 | | | | | |
See Notes 1(e) and 8 regarding derivative financial instruments and other derivative information, respectively.
7. Credit Risk
At April 30, 2015, Franklin Balanced Fund, Franklin Convertible Securities Fund and Franklin Real Return Fund had 9.90%, 78.27% and 11.28%, respectively, of their portfolio invested in high yield securities, senior secured floating rate notes, or other securities rated below investment grade. These securities may be more sensitive to economic conditions causing greater price volatility and are potentially subject to a greater risk of loss due to default than higher rated securities.
8. Other Derivative Information
At April 30, 2015, the funds’ investments in derivative contracts are reflected in the Statements of Assets and Liabilities as follows:
| | | | | | | |
| | Asset Derivatives | | | Liability Derivatives | | |
| Derivative Contracts | | | | | | |
| Not Accounted for as | Statements of Assets and | | | Statements of Assets and | | |
| Hedging Instruments | Liabilities Location | | Fair Value | Liabilities Location | | Fair Value |
| Franklin Balanced Fund | | | | | | |
| Equity contracts | Investments, at value | $ | — | Options written, at value | $ | 346,000 |
| Franklin Real Return Fund | | | | | | |
| Foreign exchange contracts | Unrealized appreciation on | | | Unrealized depreciation on | | |
| | forward exchange contracts | $ | 1,357,745 | forward exchange contracts | $ | 94,335 |
franklintempleton.com
Semiannual Report | 89
FRANKLIN INVESTORS SECURITIES TRUST
NOTES TO FINANCIAL STATEMENTS (UNAUDITED)
8. Other Derivative Information (continued)
For the period ended April 30, 2015, the effect of derivative contracts in the funds’ Statements of Operations was as follows:
| | | | | | | |
| | | | | | Change in | |
| | | | | | Unrealized | |
| Derivative Contracts | | | Realized | | Appreciation | |
| Not Accounted for as | | | Gain (Loss) | | (Depreciation) | |
| Hedging Instruments | Statements of Operations Locations | | for the Period | | for the Period | |
| Franklin Balanced Fund | | | | | | |
| Foreign exchange contracts | Net realized gain (loss) from foreign | | | | | |
| | currency transactions / Net change | | | | | |
| in unrealized appreciation (depreciation) |
| | on translation of other assets and liabilities | | | | | |
| | denominated in foreign currencies | $ | 74,419 | $ | (74,419 | ) |
| |
| Equity contracts | Net realized gain (loss) from investments | | | | | |
| | and written options / Net change in unrealized | | | | | |
| | appreciation (depreciation) on investments | | 1,075,621 | | (253,024 | ) |
| |
| Franklin Real Return Fund | | | | | | |
| Foreign exchange contracts | Net realized gain (loss) from foreign currency | | | | | |
| | transactions / Net change in unrealized appreciation | | | | | |
| | (depreciation) on translation of other assets and | | | | | |
| | liabilities denominated in foreign currencies | $ | 672,070 | $ | 623,538 | |
For the period ended April 30, 2015, the average month end fair value of derivatives represented 0.04% and 0.66%, respectively, of each fund’s average month end net assets. The average month end number of open derivative contracts for the period was 3 and 10, respectively, for each fund.
See Note 1(e) and 6 regarding derivative financial instruments and investment transactions, respectively.
9. Credit Facility
The Funds, together with other U.S. registered and foreign investment funds (collectively, Borrowers), managed by Franklin Templeton Investments, are borrowers in a joint syndicated senior unsecured credit facility totaling $2 billion (Global Credit Facility) which matures on February 12, 2016. This Global Credit Facility provides a source of funds to the Borrowers for temporary and emergency purposes, including the ability to meet future unanticipated or unusually large redemption requests.
Under the terms of the Global Credit Facility, the Funds shall, in addition to interest charged on any borrowings made by the Funds and other costs incurred by the Funds, pay their share of fees and expenses incurred in connection with the implementation and maintenance of the Global Credit Facility, based upon their relative share of the aggregate net assets of all of the Borrowers, including an annual commitment fee of 0.07% based upon the unused portion of the Global Credit Facility. These fees are reflected in other expenses in the Statements of Operations. During the period ended April 30, 2015, the Funds did not use the Global Credit Facility.
90 | Semiannual Report
franklintempleton.com
FRANKLIN INVESTORS SECURITIES TRUST
NOTES TO FINANCIAL STATEMENTS (UNAUDITED)
10. Fair Value Measurements
The Funds follow a fair value hierarchy that distinguishes between market data obtained from independent sources (observable inputs) and the Funds’ own market assumptions (unobservable inputs). These inputs are used in determining the value of the Funds’ financial instruments and are summarized in the following fair value hierarchy:
- Level 1 – quoted prices in active markets for identical financial instruments
- Level 2 – other significant observable inputs (including quoted prices for similar financial instruments, interest rates, prepayment speed, credit risk, etc.)
- Level 3 – significant unobservable inputs (including the Funds’ own assumptions in determining the fair value of financial instruments)
The input levels are not necessarily an indication of the risk or liquidity associated with financial instruments at that level.
For movements between the levels within the fair value hierarchy, the Funds have adopted a policy of recognizing the transfers as of the date of the underlying event which caused the movement.
A summary of inputs used as of April 30, 2015, in valuing the Funds’ assets and liabilities carried at fair value, is as follows:
| | | | | | | | | |
| | | Level 1 | | Level 2 | | Level 3 | | Total |
| Franklin Balanced Fund | | | | | | | | |
| Assets: | | | | | | | | |
| Investments in Securities: | | | | | | | | |
| Equity Investments:a | | | | | | | | |
| Energy | $ | 135,681,650 | $ | 11,082,900 | $ | 5,177,300 | $ | 151,941,850 |
| Utilities | | 176,206,885 | | 6,633,500 | | — | | 182,840,385 |
| Other Equity Investmentsb | | 1,159,955,136 | | — | | — | | 1,159,955,136 |
| Equity-Linked Securities | | — | | 250,012,888 | | — | | 250,012,888 |
| Corporate Bonds | | — | | 930,181,344 | | — | | 930,181,344 |
| Short Term Investments | | 357,814,527 | | — | | — | | 357,814,527 |
| Total Investments in Securities | $ | 1,829,658,198 | $ | 1,197,910,632 | $ | 5,177,300 | $ | 3,032,746,130 |
| Liabilities: | | | | | | | | |
| Other Financial Instruments | | | | | | | | |
| Options Written | $ | 346,000 | $ | — | $ | — | $ | 346,000 |
| Franklin Convertible Securities Fund | | | | | | | | |
| Assets: | | | | | | | | |
| Investments in Securities: | | | | | | | | |
| Equity Investments:a | | | | | | | | |
| Consumer Staples | $ | 39,352,000 | $ | 25,593,150 | $ | — | $ | 64,945,150 |
| Energy | | 714,656 | | 52,301,373 | | 11,255,000 | | 64,271,029 |
| Financials | | — | | 16,008,450 | | — | | 16,008,450 |
| Utilities | | 73,285,140 | | 29,832,800 | | — | | 103,117,940 |
| Other Equity Investmentsb | | 239,146,794 | | — | | — | | 239,146,794 |
| Convertible Bonds | | — | | 1,584,761,017 | | — | | 1,584,761,017 |
| Escrows and Litigation Trusts | | — | | 8,062,500 | | —c | | 8,062,500 |
| Short Term Investments | | 91,423,464 | | — | | — | | 91,423,464 |
| Total Investments in Securities | $ | 443,922,054 | $ | 1,716,559,290 | $ | 11,255,000 | $ | 2,171,736,344 |
franklintempleton.com
Semiannual Report | 91
FRANKLIN INVESTORS SECURITIES TRUST
NOTES TO FINANCIAL STATEMENTS (UNAUDITED)
| | | | | | | | | | |
| 10. Fair Value Measurements (continued) | | | | | | | | | |
| |
| | | | Level 1 | | Level 2 | | Level 3 | | Total |
| Franklin Equity Income Fund | | | | | | | | | |
| Assets: | | | | | | | | | |
| Investments in Securities: | | | | | | | | | |
| Equity Investments:a | | | | | | | | | |
| Energy | $ | 123,863,395 | $ | 13,810,000 | $ | — | $ | 137,673,395 |
| Other Equity Investmentsb | | 1,924,473,905 | | — | | — | | 1,924,473,905 |
| Equity-Linked Securities | | | — | | 40,678,350 | | — | | 40,678,350 |
| Short Term Investments | | | 31,078,435 | | — | | — | | 31,078,435 |
| Total Investments in Securities | $ | 2,079,415,735 | $ | 54,488,350 | $ | — | $ | 2,133,904,085 |
| Franklin Real Return Fund | | | | | | | | | |
| Assets: | | | | | | | | | |
| Investments in Securities: | | | | | | | | | |
| Equity Investmentsa,b | | $ | 43,564,294 | $ | — | $ | — | $ | 43,564,294 |
| Corporate Bonds | | | — | | 21,296,583 | | — | | 21,296,583 |
| Senior Floating Rate Interests | | | — | | 15,524,857 | | — | | 15,524,857 |
| Foreign Government and Agency Securities | | | — | | 71,237,508 | | — | | 71,237,508 |
| U.S. Government and Agency Securities | | | — | | 174,735,800 | | — | | 174,735,800 |
| Short Term Investments | | | — | | 15,793,809 | | — | | 15,793,809 |
| Total Investments in Securities | | $ | 43,564,294 | $ | 298,588,557 | $ | — | $ | 342,152,851 |
| Other Financial Instruments | | | | | | | | | |
| Forward Exchange Contracts | | $ | — | $ | 1,357,745 | $ | — | $ | 1,357,745 |
| Liabilities: | | | | | | | | | |
| Other Financial Instruments | | | | | | | | | |
| Forward Exchange Contracts | | $ | — | $ | 94,335 | $ | — | $ | 94,335 |
| aIncludes common, preferred and convertible preferred stocks as well as other equity investments. | | | | | | |
| bFor detailed categories, see the accompanying Statement of Investments. | | | | | | | | | |
| cIncludes securities determined to have no value at April 30, 2015. | | | | | | | | | |
A reconciliation of assets in which Level 3 inputs are used in determining fair value is presented when there are significant Level 3 financial instruments at the end of the period.
11. Subsequent Events
The Funds have evaluated subsequent events through the issuance of the financial statements and determined that no events have occurred that require disclosure.
| | | | | | |
| Abbreviations | | | | |
| Counterparty | Currency | Selected Portfolio |
| DBAB | Deutsche Bank AG | BRL | Brazilian Real | ADR | American Depositary Receipt |
| JPHQ | JP Morgan Chase & Co. | EUR | Euro | ETF | Exchange Traded Fund |
| MSCO | Morgan Stanley | KRW | South Korean Won | FRN | Floating Rate Note |
| | | MXN | Mexican Peso | REIT | Real Estate Investment Trust |
| | | MYR | Malaysian Ringgit | SPDR | S&P Depositary Receipt |
| | | PLN | Polish Zloty | | |
92 | Semiannual Report
franklintempleton.com
FRANKLIN INVESTORS SECURITIES TRUST
Shareholder Information
Board Review of Investment Management Agreement
At a meeting held February 24, 2015, the Board of Trustees (Board), including a majority of non-interested or independent Trustees, approved renewal of the investment management agreement for each of the separate funds within Franklin Investors Securities Trust (Fund(s)). In reaching this decision, the Board took into account information furnished throughout the year at regular Board meetings, as well as information prepared specifically in connection with the annual renewal review process. Information furnished and discussed throughout the year included investment performance reports and related financial information for each Fund, along with periodic reports on expenses, shareholder services, legal and compliance matters, pricing, brokerage commissions and execution and other services provided by the Investment Manager (Manager) and its affiliates, as well as marketing support payments made to financial intermediaries. Information furnished specifically in connection with the renewal process included a report for each Fund prepared by Lipper, Inc. (Lipper), an independent organization, as well as additional material, including a Fund profitability analysis prepared by management. The Lipper reports compared each Fund’s investment performance and expenses with those of other mutual funds deemed comparable to the Fund as selected by Lipper. The Fund profitability analysis discussed the profitability to Franklin Templeton Investments (FTI) from its overall U.S. fund operations, as well as on an individual fund-by-fund basis. Additional material accompanying such profitability analysis included information on a fund-by-fund basis listing portfolio managers and other accounts they manage, as well as information on management fees charged by the Manager and its affiliates to U.S. mutual funds and other accounts, including management’s explanation of differences where relevant. Such material also included a memorandum prepared by management describing project initiatives and capital investments relating to the services provided to the Funds by the FTI organization, as well as a memorandum relating to economies of scale and an analysis concerning transfer agent fees charged by an affiliate of the Manager. The Board also received a report on all marketing support payments made by FTI to financial intermediaries during the past year.
In considering such materials, the independent Trustees received assistance and advice from and met separately with independent counsel. While the investment management agreements for all Funds were considered at the same Board meeting, the Board dealt with each Fund separately. In approving continuance of the investment management agreement for each Fund, the Board, including a majority of independent Trustees, determined that the existing management fee structure was fair and reasonable and that continuance of the investment management agreement was in the best interests of each Fund and its shareholders. While attention was given to all information furnished, the following discusses some primary factors relevant to the Board’s decision.
NATURE, EXTENT AND QUALITY OF SERVICES. The Board was satisfied with the nature and quality of the overall services provided by the Manager and its affiliates to the Funds and their shareholders. In addition to investment performance and expenses discussed later, the Board’s opinion was based, in part, upon periodic reports furnished it showing that the investment policies and restrictions for each Fund were consistently complied with as well as other reports periodically furnished the Board covering matters such as the compliance of portfolio managers and other management personnel with the code of ethics adopted throughout the Franklin Templeton fund complex, the adherence to fair value pricing procedures established by the Board, and the accuracy of net asset value calculations. The Board also noted the extent of benefits provided Fund shareholders from being part of the Franklin Templeton family of funds, including the right to exchange investments between the same class of shares of different funds without a sales charge, the ability to reinvest Fund dividends into other funds and the right to combine holdings in other funds to obtain a reduced sales charge. Favorable consideration was given to management’s continual efforts and expenditures in establishing effective business continuity plans and developing strategies to address cybersecurity threats. Additionally, the Board noted the Manager’s continued attention to pricing and valuation issues, particularly with respect to complex securities. Among other factors taken into account by the Board were the Manager’s best execution trading policies, including a favorable report by an independent portfolio trading analytical firm, which also covered FOREX transactions. Consideration was also given to the experience of each Fund’s portfolio management team, the number of accounts managed and general method of compensation. In this latter respect, the Board noted that a primary factor in management’s determination of a portfolio manager’s bonus compensation was the relative investment performance of the funds he or she managed and that a portion of such bonus was required to be invested in a predesignated list of funds within such person’s fund management area so as to be aligned with the interests of shareholders. The Board also took
franklintempleton.com
Semiannual Report | 93
FRANKLIN INVESTORS SECURITIES TRUST
SHAREHOLDER INFORMATION
Board Review of Investment Management
Agreement (continued) into account the quality of transfer agent and shareholder services provided Fund shareholders by an affiliate of the Manager and the continual enhancements to the Franklin Templeton website. Particular attention was given to management’s conservative approach and diligent risk management procedures, including continual monitoring of counterparty credit risk and attention given to derivative and other complex instruments including expanded collateralization requirements. The Board also took into account, among other things, management’s efforts in establishing a global credit facility for the benefit of the Funds and other accounts managed by FTI to provide a source of cash for temporary and emergency purposes or to meet unusual redemption requests as well as the strong financial position of the Manager’s parent company and its commitment to the mutual fund business as evidenced by its continued subsidization of money market funds.
INVESTMENT PERFORMANCE. The Board placed significant emphasis on the investment performance of each Fund in view of its importance to shareholders. While consideration was given to performance reports and discussions with portfolio managers at Board meetings during the year, particular attention in assessing performance was given to the Lipper reports furnished for the agreement renewals. The Lipper reports prepared for each individual Fund showed the investment performance of its Class A shares in comparison with its selected performance universe during 2014 and during the previous 10 years ended December 31, 2014, unless otherwise noted. Performance on a total return basis was shown by Lipper for all Funds with performance on an income return basis being shown for those Funds having income return as an element of their investment objective. The following summarizes the performance results for each Fund.
Franklin Balanced Fund – The Fund’s investment performance was shown in comparison to a performance universe consisting of all retail and institutional mixed-asset target allocation growth funds as selected by Lipper during 2014 and previous years during which the Fund has been in existence. The Lipper report showed the Fund’s income return to be in the highest quintile of such universe during 2014, as well as the previous three- and five-year periods on an annualized basis. The Lipper report showed the Fund’s total return performance during 2014 to be in the second-highest performing quintile of its performance universe, but to be in the second-lowest performing quintile of such universe during the previous three-year period and the second-highest performing quintile of such universe during the previous five-year period on an annualized basis. The Board was satisfied with such comparative performance and noted that the Fund’s total return for 2014 exceeded 7% as shown in the Lipper report.
Franklin Convertible Securities Fund – The Fund’s investment performance was shown in comparison to a performance universe consisting of all retail and institutional convertible securities funds as selected by Lipper. The Lipper report showed the Fund’s income return during 2014 to be in the second-lowest quintile of its performance universe but on an annualized basis during each of the previous three-, five- and 10-year periods to be in the highest or second-highest quintile of such performance universe. The Lipper report showed the Fund’s total return during 2014 to be in the second-lowest performing quintile of its performance universe, and on an annualized basis to be in either the middle or second-highest performing quintile of such universe for each of the previous three-, five- and 10-year periods. The Board found the Fund’s comparative performance as set forth in the Lipper report to be acceptable, noting management’s discussion of the Fund’s focus on balanced convertible securities to provide investors with positive risk-adjusted returns over the long term.
Franklin Equity Income Fund – The Fund’s investment performance was shown in comparison to a performance universe consisting of all retail and institutional equity income funds as selected by Lipper. The Lipper report showed the Fund’s income return during 2014 to be in the highest quintile of the performance universe, and on an annualized basis during each of the previous three-, five- and 10-year periods to be in either the highest or second-highest quintile of such performance universe. The Lipper report showed the Fund’s total return during 2014 to be in the second-lowest performing quintile of such universe and on an annualized basis to be in the middle quintile of such universe for the previous three- and five-year periods and the lowest performing quintile of such universe for the previous 10-year period. In discussing such performance, management explained that it reflected the Fund’s long-standing strategy of investing in securities with yields higher than the overall market and Lipper peers. The Board believed the Fund’s overall performance as shown in the Lipper report to be satisfactory, noting its consistently good comparative income returns and the fact that its total return in 2014 as shown in the Lipper report exceeded 9%.
94 | Semiannual Report
franklintempleton.com
FRANKLIN INVESTORS SECURITIES TRUST
SHAREHOLDER INFORMATION
Franklin Real Return Fund – The Fund’s investment performance was shown in comparison to a performance universe consisting of all retail and institutional inflation protected bond funds as selected by Lipper. The Lipper report showed the Fund’s income return during 2014 to be in the second-highest quintile of such performance universe, and on an annualized basis to also be in either the highest or second-highest quintile of such universe during the previous three-, five- and 10-year periods. The Lipper report showed the Fund’s 2014 total return to be in the lowest performing quintile of its performance universe, and on an annualized basis to be in the highest performing quintile of such universe during the previous three-year period, in the lowest performing quintile for the previous five-year period, and in the second-lowest performing quintile for the previous 10-year period. In discussing the Fund’s total return underperformance, management expressed the view that the performance universe contained many funds that invested primarily in treasury inflation protected securities (TIPS) and held longer term TIPS that performed better during such periods than the Fund’s portfolio, which had a lesser weighting in TIPS with those held being of shorter duration. They indicated that the Fund is positioned correctly to protect investors from a rise in inflation. The Board found the Fund’s overall performance as shown in the Lipper report to be acceptable, noting management’s explanation.
COMPARATIVE EXPENSES. Consideration was given to a comparative analysis of the management fees and total expense ratio of each Fund compared with those of a group of other funds selected by Lipper as constituting its appropriate Lipper expense group. Lipper expense data is based upon information taken from each fund’s most recent annual report, which reflects historical asset levels that may be quite different from those currently existing, particularly in a period of market volatility. While recognizing such inherent limitation and the fact that expense ratios generally increase as assets decline and decrease as assets grow, the Board believed the independent analysis conducted by Lipper to be an appropriate measure of comparative expenses. In reviewing comparative costs, Lipper provides information on each Fund’s contractual investment management fee in comparison with the contractual investment management fee that would have been charged by other funds within its Lipper expense group assuming they were similar in size to the Fund, as well as the actual total expense ratio of the Fund in comparison with those of its expense group. The Lipper contractual investment management fee analysis includes within such fee any separate administrative fees, and Lipper total expenses, for comparative consistency, are shown by Lipper for Fund Class A shares. The results of such expense comparisons showed that the contractual investment management fee rate and actual total expense ratio for each of Franklin Convertible Securities Fund and Franklin Equity Income Fund were below the median of its respective Lipper expense group. The Board was satisfied with the comparative contractual investment management fee rate and actual total expense ratios of these Funds as shown in the Lipper reports. The contractual investment management fee rate and actual total expense ratio of Franklin Balanced Fund and Franklin Real Return Fund were, in each case, above the median of its respective expense group. The Board found the comparative contractual investment fee rate and actual total expense ratios of these Funds as shown in their Lipper reports to be acceptable, noting that management had a fee waiver in place for each Fund.
MANAGEMENT PROFITABILITY. The Board also considered the level of profits realized by the Manager and its affiliates in connection with the operation of each Fund. In this respect, the Board reviewed the Fund profitability analysis that addresses the overall profitability of Franklin Templeton’s U.S. fund business, as well as its profits in providing management and other services to each of the individual funds during the 12-month period ended September 30, 2014, being the most recent fiscal year-end for Franklin Resources, Inc., the Manager’s parent. In reviewing the analysis, the Board recognized that allocation methodologies are inherently subjective and various allocation methodologies may be reasonable while producing different results. In this respect, the Board noted that while management continually makes refinements to its methodologies in response to organizational and product related changes, the overall approach as defined by the primary drivers and activity measurements has remained consistent with that used in the Funds’ profitability report presentations from prior years. Additionally, the Funds’ independent registered public accounting firm had been engaged by the Manager to periodically review the reasonableness of the allocation methodologies to be used solely by the Funds’ Board in reference to the profitability analysis. In reviewing and discussing such analysis, management discussed with the Board its belief that costs incurred in establishing the infrastructure necessary for the type of mutual fund operations conducted by the Manager and its affiliates may not be fully reflected in the expenses allocated to each Fund in determining its profitability, as well as the fact that the level of profits, to a certain extent, reflected operational cost savings and efficiencies initiated by management. The Board also took into account management’s expenditures in improving shareholder services provided the
franklintempleton.com
Semiannual Report | 95
FRANKLIN INVESTORS SECURITIES TRUST
SHAREHOLDER INFORMATION
Board Review of Investment Management
Agreement (continued)
Funds, as well as the need to implement systems and meet additional regulatory and compliance requirements resulting from statutes such as the Sarbanes-Oxley and Dodd-Frank Acts and recent SEC and other regulatory requirements. In addition, the Board considered a third-party study comparing the profitability of the Manager’s parent on an overall basis to other publicly held managers broken down to show profitability from management operations exclusive of distribution expenses, as well as profitability including distribution expenses. The Board also considered the extent to which the Manager and its affiliates might derive ancillary benefits from fund operations, including revenues generated from transfer agent services and potential benefits resulting from personnel and systems enhancements necessitated by fund growth, increased leverage with service providers and counterparties, allocation of fund brokerage and the use of commission dollars to pay for research. Based upon its consideration of all these factors, the Board determined that the level of profits realized by the Manager and its affiliates from providing services to each Fund was not excessive in view of the nature, quality and extent of services provided.
ECONOMIES OF SCALE. The Board also considered whether economies of scale are realized by the Manager as the Funds grow larger and the extent to which this is reflected in the level of management fees charged. While recognizing that any precise determination is inherently subjective, the Board noted that based upon the Fund profitability analysis, it appears that as some funds get larger, at some point economies of scale do result in the Manager realizing a larger profit margin on management services provided such a fund. The Board also noted that economies of scale are shared with each Fund and its shareholders through management fee breakpoints so that as a Fund grows in size, its effective management fee rate declines. Based on their year-end asset levels, all of the Funds benefited from breakpoints contained in their management fee structures with additional breakpoints continuing beyond such asset levels. The Board believed that to the extent economies of scale may be realized by the Manager and its affiliates, the schedule of fees under the investment management agreement for each of such Funds provides a sharing of benefits with the Fund and its shareholders.
Proxy Voting Policies and Procedures
The Trust’s investment manager has established Proxy Voting Policies and Procedures (Policies) that the Trust uses to determine how to vote proxies relating to portfolio securities. Shareholders may view the Trust’s complete Policies online at franklintempleton.com. Alternatively, shareholders may request copies of the Policies free of charge by calling the Proxy Group collect at (954) 527-7678 or by sending a written request to: Franklin Templeton Companies, LLC, 300 S.E. 2nd Street, Fort Lauderdale, FL 33301, Attention: Proxy Group. Copies of the Trust’s proxy voting records are also made available online at franklintempleton.com and posted on the U.S. Securities and Exchange Commission’s website at sec.gov and reflect the most recent 12-month period ended June 30.
Quarterly Statement of Investments
The Trust files a complete statement of investments with the U.S. Securities and Exchange Commission for the first and third quarters for each fiscal year on Form N-Q. Shareholders may view the filed Form N-Q by visiting the Commission’s website at sec.gov. The filed form may also be viewed and copied at the Commission’s Public Reference Room in Washington, DC. Information regarding the operations of the Public Reference Room may be obtained by calling (800) SEC-0330.
96 | Semiannual Report
franklintempleton.com

Franklin Templeton Investments
Gain From Our Perspective®
At Franklin Templeton Investments, we’re dedicated to one goal: delivering exceptional asset management for our clients. By bringing together multiple, world-class investment teams in a single firm, we’re able to offer specialized expertise across styles and asset classes, all supported by the strength and resources of one of the world’s largest asset managers. This has helped us to become a trusted partner to individual and institutional investors across the globe.
Focus on Investment Excellence
At the core of our firm, you’ll find multiple independent investment teams—each with a focused area of expertise—from traditional to alternative strategies and multi-asset solutions. And because our portfolio groups operate autonomously, their strategies can be combined to deliver true style and asset class diversification.
All of our investment teams share a common commitment to excellence grounded in rigorous, fundamental research and robust, disciplined risk management. Decade after decade, our consistent, research-driven processes have helped Franklin Templeton earn an impressive record of strong, long-term results.
Global Perspective Shaped by Local Expertise
In today’s complex and interconnected world, smart investing demands a global perspective. Franklin Templeton pioneered international investing over 60 years ago, and our expertise in emerging markets spans more than a quarter of a century. Today, our investment professionals are on the ground across the globe, spotting investment ideas and potential risks firsthand. These locally based teams bring in-depth understanding of local companies, economies and cultural nuances, and share their best thinking across our global research network.
Strength and Experience
Franklin Templeton is a global leader in asset management serving clients in over 150 countries.1 We run our business with the same prudence we apply to asset management, staying focused on delivering relevant investment solutions, strong long-term results and reliable, personal service. This approach, focused on putting clients first, has helped us to become one of the most trusted names in financial services.
1. As of 12/31/14. Clients are represented by the total number of shareholder accounts.
Not FDIC Insured | May Lose Value | No Bank Guarantee
| |
| Contents | |
| |
| Semiannual Report | |
| Economic and Market Overview | 3 |
| Franklin Adjustable | |
| U.S. Government Securities Fund | 4 |
| Franklin Floating Rate | |
| Daily Access Fund | 11 |
| Franklin Low Duration | |
| Total Return Fund | 20 |
| Franklin Total Return Fund | 28 |
| Financial Highlights and | |
| Statements of Investments | 36 |
| Financial Statements | 113 |
| Notes to Financial Statements | 118 |
| Shareholder Information | 141 |
franklintempleton.com
1
Semiannual Report
Economic and Market Overview
U.S. economic growth moderated during the six-month period ended April 30, 2015. In the first half of the period, greater spending by consumers, businesses, and state and local governments aided growth. However, in the latter half, low energy prices and U.S. dollar strength led export levels to fall. In addition, harsh weather and labor disruptions weighed on business spending. Housing market data improved, as home sales and prices rose while mortgage rates fell. Retail sales remained mixed but increased toward period-end as auto sales surged. Inflation, as measured by the Consumer Price Index, remained subdued during the six months but rose late in the period amid higher energy prices bouncing from recent lows. Manufacturing and non-manufacturing activities increased, and the unemployment rate declined to 5.4% in April 2015 from 5.7% in October 2014.1
Although the Federal Reserve Board (Fed) had repeatedly stated that it could be patient with regard to raising interest rates, in March, the Fed removed the word “patient” from its monetary policy guidance. It added, however, that it might keep interest rates lower than what it viewed as normal. In its April meeting, the Fed attributed the economy’s first-quarter slowdown to transitory factors. The Fed reiterated that it would raise interest rates when it saw further improvement in the labor market and was reasonably confident that inflation would move back to its 2% objective over the medium term.
The 10-year Treasury yield, which moves inversely to price, declined from 2.35% at the start of the period to 2.05% by period-end, as investors sought less risky assets given concerns about the crisis in Ukraine, Greece’s debt negotiations and relatively weak economic growth in Europe and Japan, as well as less robust growth in China. Near period-end, soft domestic data and the Fed’s cautious tone on raising interest rates also supported Treasury prices.
The foregoing information reflects our analysis and opinions as of April 30, 2015. The information is not a complete analysis of every aspect of any market, country, industry, security or fund. Statements of fact are from sources considered reliable.
1. Source: Bureau of Labor Statistics.
franklintempleton.com
Semiannual Report | 3
Franklin Adjustable U.S. Government Securities Fund
This semiannual report for Franklin Adjustable U.S. Government Securities Fund covers the period ended April 30, 2015.
Your Fund’s Goal and Main Investments
The Fund seeks to provide a high level of current income while providing lower volatility of principal than a fund that invests in fixed-rate securities by investing at least 80% of its net assets in adjustable-rate U.S. government mortgage securities, which are issued or guaranteed by the U.S. government, its agencies or instrumentalities.1 The Fund’s investments may include securities issued by Ginnie Mae (GNMA) and government-sponsored entities, such as Fannie Mae (FNMA) and Freddie Mac (FHLMC).2
Performance Overview
The Fund’s Class A shares produced a +0.11% cumulative total return for the six months under review. In comparison, the Fund’s benchmark, the Barclays U.S. Government Index: 1-2 Year Component, posted a +0.28% total return.3 The index measures public obligations of the U.S. Treasury with one to two years to final maturity and publicly issued debt of U.S. government agencies, quasi-federal corporations, and corporate or foreign debt guaranteed by the U.S. government. You can find the Fund’s long-term performance data in the Performance Summary beginning on page 6.
Performance data represent past performance, which does not guarantee future results. Investment return and principal value will fluctuate, and you may have a gain or loss when you sell your shares. Current performance may differ from figures shown. Please visit franklintempleton.com or call (800) 342-5236 for most recent month-end performance.
Investment Strategy
We employ a conservative investment strategy as we strive to produce solid performance in a variety of interest rate climates. We choose securities using a value-oriented approach, emphasizing the bonds’ economic fundamentals in relation to comparable securities as well as their historical prepayment performance.
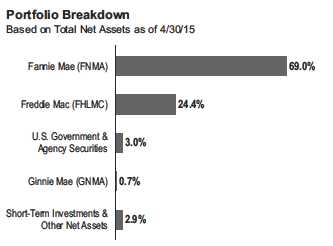
Manager’s Discussion
The economy grew slowly during the period. Growth in the fourth quarter of 2014 stemmed from greater spending by consumers, businesses, and state and local governments. Economic activity moderated in 2015’s first quarter, however, partly because of an ongoing energy price collapse, shrinking exports and weaker business spending. Despite the slowdown, home prices and sales increased while mortgage rates fell.
Near period-end, the Federal Reserve Board (Fed) noted it expected economic activity would expand at a moderate pace with appropriate policy accommodation. The Fed also stated it would raise interest rates when inflation and employment data met its expectations.
The Fund employed a conservative strategy that invested primarily in adjustable-rate mortgage securities (ARMs) that are either explicitly or implicitly backed by the U.S. government.1 The Fund invested predominantly in securities issued or guaranteed by FNMA and FHLMC. The Fund took a collateral-intensive research approach to analyze the prepayment behavior of individual ARM securities to identify those with the most attractive prepayment profiles and focused on seasoned ARMs. Such securities have typically been through several interest rate cycles and therefore tend to be less sensitive to changes in interest rates, compared to newer issued counterparts. We have
1. Securities owned by the Fund, but not shares of the Fund, are issued or guaranteed by the U.S. government, its agencies or instrumentalities, including government-
sponsored entities, as to timely payment of principal and interest.
2. Although U.S. government-sponsored entities may be chartered or sponsored by acts of Congress, their securities are neither issued nor guaranteed by the U.S.
government. Please see the Fund’s prospectus for a detailed discussion regarding various levels of credit support for government agency or instrumentality securities.
The Fund’s yield and share price are not guaranteed and will vary with market conditions.
3. Source: Barclays.
The index is unmanaged and includes reinvested interest. One cannot invest directly in an index, and an index is not representative of the Fund’s portfolio.
The dollar value, number of shares or principal amount, and names of all portfolio holdings are listed in the Fund’s Statement of Investments (SOI).
The SOI begins on page 41.
4 | Semiannual Report
franklintempleton.com
FRANKLIN ADJUSTABLE U.S. GOVERNMENT SECURITIES FUND
| | | | | |
| Dividend Distributions* | | | |
| 11/1/14–4/30/15 | | | | |
| | | Dividend per Share (cents) | |
| | | | | | Advisor |
| Month | Class A | Class A1 | Class C | Class R6 | Class |
| November | 0.7544 | 0.9984 | 0.4457 | 1.1909 | 0.9362 |
| December | 0.8625 | 1.0123 | 0.5478 | 1.1706 | 1.0602 |
| January | 0.7912 | 0.9028 | 0.5061 | 1.0586 | 0.9701 |
| February | 0.8735 | 0.9775 | 0.6080 | 1.1233 | 1.0405 |
| March | 0.8211 | 0.9321 | 0.5205 | 1.1093 | 1.0113 |
| April | 0.8222 | 0.9329 | 0.5380 | 1.0888 | 0.9910 |
| Total | 4.9249 | 5.7560 | 3.1661 | 6.7415 | 6.0093 |
*Assumes shares were purchased and held for the entire accrual period. Since
dividends accrue daily, your actual distributions will vary depending on the date
you purchased your shares and any account activity. All Fund distributions will vary
depending upon current market conditions, and past distributions are not indicative
of future trends.
found such securities historically have experienced lower volatility than comparable maturity Treasuries and have provided more consistent income. We continued to focus on seasoned, post-reset FNMA and FHLMC ARM positions with average coupons below 3%.
Although mortgage rates have moved lower, mortgage credit has remained constrained, and actual prepayment levels have been relatively low. The Fund’s focus on seasoned, short duration, high-quality ARMs that tend to be less sensitive to interest rate changes benefited performance, as did the Fund’s post-reset LIBOR indexed securities.4
What is duration?
Duration is a measure of a bond’s price sensitivity to interest rate changes. In general, a portfolio of securities with a lower duration can be expected to be less sensitive to interest rate changes than a portfolio with a higher duration.
Thank you for your continued participation in Franklin Adjustable U.S. Government Securities Fund. We look forward to serving your future investment needs.

The foregoing information reflects our analysis, opinions and portfolio holdings as of April 30, 2015, the end of the reporting period. The way we implement our main investment strategies and the resulting portfolio holdings may change depending on factors such as market and economic conditions. These opinions may not be relied upon as investment advice or an offer for a particular security. The information is not a complete analysis of every aspect of any market, country, industry, security or the Fund. Statements of fact are from sources considered reliable, but the investment manager makes no representation or warranty as to their completeness or accuracy. Although historical performance is no guarantee of future results, these insights may help you understand our investment management philosophy.
CFA® is a trademark owned by CFA Institute.
4. The London Interbank Offered Rate (LIBOR) is the interest rate banks charge each other for loans. LIBOR is a widely used benchmark for short-term interest rates.
See www.franklintempletondatasources.com for additional data provider information.
franklintempleton.com
Semiannual Report | 5
FRANKLIN ADJUSTABLE U.S. GOVERNMENT SECURITIES FUND
Performance Summary as of April 30, 2015
Your dividend income will vary depending on dividends or interest paid by securities in the Fund’s portfolio, adjusted for operating expenses of each class. Capital gain distributions are net profits realized from the sale of portfolio securities. The performance tables do not reflect any taxes that a shareholder would pay on Fund dividends, capital gain distributions, if any, or any realized gains on the sale of Fund shares. Total return reflects reinvestment of the Fund’s dividends and capital gain distributions, if any, and any unrealized gains or losses.
| | | | | | |
| Net Asset Value | | | | | | |
| Share Class (Symbol) | | 4/30/15 | | 10/31/14 | | Change |
| A (FISAX) | $ | 8.63 | $ | 8.67 | -$ | 0.04 |
| A1 (FAUGX) | $ | 8.62 | $ | 8.67 | -$ | 0.05 |
| C (FCSCX) | $ | 8.62 | $ | 8.66 | -$ | 0.04 |
| R6 (N/A) | $ | 8.64 | $ | 8.68 | -$ | 0.04 |
| Advisor (FAUZX) | $ | 8.64 | $ | 8.68 | -$ | 0.04 |
| |
| |
| Distributions (11/1/14–4/30/15) | | | | | | |
| Dividend |
| Share Class | | Income | | | | |
| A | $ | 0.049249 | | | | |
| A1 | $ | 0.057560 | | | | |
| C | $ | 0.031661 | | | | |
| R6 | $ | 0.067415 | | | | |
| Advisor | $ | 0.060093 | | | | |
6 | Semiannual Report
franklintempleton.com
FRANKLIN ADJUSTABLE U.S. GOVERNMENT SECURITIES FUND
PERFORMANCE SUMMARY
Performance as of 4/30/151
Cumulative total return excludes sales charges. Average annual total returns include maximum sales charges. Class A/A1: 2.25% maximum initial sales charge; Class C: 1% contingent deferred sales charge in first year only; Class R6/Advisor Class: no sales charges.
| | | | | | | | |
| | Cumulative | | Average Annual | | Average Annual | | Total Annual | |
| Share Class | Total Return2 | | Total Return3 | | Total Return (3/31/15)4 | | Operating Expenses5 | |
| A | | | | | | | 0.93 | % |
| 6-Month | +0.11 | % | -2.15 | % | | | | |
| 1-Year | +0.27 | % | -1.98 | % | -1.87 | % | | |
| 5-Year | +4.40 | % | +0.40 | % | +0.49 | % | | |
| 10-Year | +25.74 | % | +2.08 | % | +2.11 | % | | |
| A16 | | | | | | | 0.78 | % |
| 6-Month | +0.09 | % | -2.17 | % | | | | |
| 1-Year | +0.31 | % | -1.95 | % | -1.84 | % | | |
| 5-Year | +4.44 | % | +0.41 | % | +0.50 | % | | |
| 10-Year | +25.79 | % | +2.09 | % | +2.11 | % | | |
| C | | | | | | | 1.33 | % |
| 6-Month | -0.10 | % | -1.09 | % | | | | |
| 1-Year | -0.14 | % | -1.13 | % | -1.01 | % | | |
| 5-Year | +2.33 | % | +0.46 | % | +0.53 | % | | |
| 10-Year | +20.84 | % | +1.91 | % | +1.93 | % | | |
| R6 | | | | | | | 0.56 | % |
| 6-Month | +0.32 | % | +0.32 | % | | | | |
| 1-Year | +0.66 | % | +0.66 | % | +0.78 | % | | |
| Since Inception (9/20/13) | +1.53 | % | +0.95 | % | +1.00 | % | | |
| Advisor7 | | | | | | | 0.68 | % |
| 6-Month | +0.23 | % | +0.23 | % | | | | |
| 1-Year | +0.64 | % | +0.64 | % | +0.64 | % | | |
| 5-Year | +5.71 | % | +1.12 | % | +1.21 | % | | |
| 10-Year | +28.10 | % | +2.51 | % | +2.53 | % | | |
| | | | | | |
| | | | | |
| | Distribution | | 30-Day Standardized Yield9 | |
| Share Class | Rate8 | | (with waiver) | | (without waiver) | |
| A | 1.13 | % | 0.40 | % | 0.40 | % |
| A1 | 1.29 | % | 0.57 | % | 0.57 | % |
| C | 0.76 | % | 0.02 | % | 0.02 | % |
| R6 | 1.53 | % | 0.78 | % | 0.78 | % |
| Advisor | 1.40 | % | 0.66 | % | 0.66 | % |
Performance data represent past performance, which does not guarantee future results. Investment return and principal value will fluctuate, and you may have a gain or loss when you sell your shares. Current performance may differ from figures shown. For most recent month-end performance, go to franklintempleton.com or call (800) 342-5236.
franklintempleton.com Semiannual Report | 7
FRANKLIN ADJUSTABLE U.S. GOVERNMENT SECURITIES FUND
PERFORMANCE SUMMARY
All investments involve risks, including possible loss of principal. Interest rate movements, unscheduled mortgage prepayments and other risk factors will affect the Fund’s share price and yield. Bond prices generally move in the opposite direction of interest rates. As prices of bonds in the Fund adjust to a rise in interest rates, the Fund’s share price may decline. Changes in the financial strength of a bond issuer or in a bond’s credit rating may affect its value. The Fund is actively managed but there is no guarantee that the manager’s investment decisions will produce the desired results. The Fund’s prospectus also includes a description of the main investment risks.
| |
| Class A1: | Effective 6/18/14, Class A1 shares were established for shareholders of Franklin Limited Maturity U.S. Government Securities Fund Class A as a result of |
| | its reorganization into this Fund on the same date. Class A1 shares are closed to new investors. |
| Class C: | These shares have higher annual fees and expenses than Class A shares. |
| Class R6: | Shares are available to certain eligible investors as described in the prospectus. |
| Advisor Class: | Shares are available to certain eligible investors as described in the prospectus. |
1. The Fund has a fee waiver associated with its investments in a Franklin Templeton money fund, contractually guaranteed through at least its current fiscal year-end.
Class R6 has a fee waiver contractually guaranteed through at least 2/29/16. Fund investment results reflect the fee waivers, to the extent applicable; without these
reductions, the results would have been lower.
2. Cumulative total return represents the change in value of an investment over the periods indicated.
3. Average annual total return represents the average annual change in value of an investment over the periods indicated. Six-month return has not been annualized.
4. In accordance with SEC rules, we provide standardized average annual total return information through the latest calendar quarter.
5. Figures are as stated in the Fund’s current prospectus. In periods of market volatility, assets may decline significantly, causing total annual Fund operating expenses to
become higher than the figures shown.
6. Performance for Class A1 has been calculated as follows: (a) for periods prior to 6/18/14, Franklin Adjustable U.S. Government Securities Fund’s Class A performance is
used, and (b) for periods after 6/18/14, actual Class A1 performance is used, reflecting all charges and fees applicable to that class.
7. Effective 5/15/08, the Fund began offering Advisor Class shares, which do not have sales charges or a Rule 12b-1 plan. Performance quotations for this class reflect the
following methods of calculation: (a) For periods prior to 5/15/08, a restated figure is used based upon the Fund’s Class A performance, excluding the effect of Class A’s
maximum initial sales charge, but reflecting the effect of the Class A Rule 12b-1 fees; and (b) for periods after 5/15/08, actual Advisor Class performance is used reflecting
all charges and fees applicable to that class. Since 5/15/08 (commencement of sales), the cumulative and average annual total returns of Advisor Class shares were
+13.78% and +1.87%.
8. Distribution rate is based on an annualization of the sum of the respective class’s past 30 days’ daily distributions and the maximum offering price (NAV for Classes C,
R6 and Advisor) per share on 4/30/15.
9. The 30-day standardized yield for the 30 days ended 4/30/15 reflects an estimated yield to maturity (assuming all portfolio securities are held to maturity). It should be
regarded as an estimate of the Fund’s rate of investment income, and it may not equal the Fund’s actual income distribution rate (which reflects the Fund’s past dividends
paid to shareholders) or the income reported in the Fund’s financial statements.
8 | Semiannual Report
franklintempleton.com
FRANKLIN ADJUSTABLE U.S. GOVERNMENT SECURITIES FUND
Your Fund’s Expenses
As a Fund shareholder, you can incur two types of costs:
- Transaction costs, including sales charges (loads) on Fund purchases; and
- Ongoing Fund costs, including management fees, distribu- tion and service (12b-1) fees, and other Fund expenses. All mutual funds have ongoing costs, sometimes referred to as operating expenses.
The following table shows ongoing costs of investing in the Fund and can help you understand these costs and compare them with those of other mutual funds. The table assumes a $1,000 investment held for the six months indicated.
Actual Fund Expenses
The first line (Actual) for each share class listed in the table provides actual account values and expenses. The “Ending Account Value” is derived from the Fund’s actual return, which includes the effect of Fund expenses.
You can estimate the expenses you paid during the period by following these steps. Of course, your account value and expenses will differ from those in this illustration:
| 1. | Divide your account value by $1,000. |
| | If an account had an $8,600 value, then $8,600 ÷ $1,000 = 8.6. |
| 2. | Multiply the result by the number under the heading “Expenses Paid During Period.” |
| | If Expenses Paid During Period were $7.50, then 8.6 x $7.50 = $64.50. |
In this illustration, the estimated expenses paid this period are $64.50.
Hypothetical Example for Comparison with Other Funds
Information in the second line (Hypothetical) for each class in the table can help you compare ongoing costs of investing in the Fund with those of other mutual funds. This information may not be used to estimate the actual ending account balance or expenses you paid during the period. The hypothetical “Ending Account Value” is based on the actual expense ratio for each class and an assumed 5% annual rate of return before expenses, which does not represent the Fund’s actual return. The figure under the heading “Expenses Paid During Period” shows the hypothetical expenses your account would have incurred under this scenario. You can compare this figure with the 5% hypothetical examples that appear in shareholder reports of other funds.
Please note that expenses shown in the table are meant to highlight ongoing costs and do not reflect any transaction costs, such as sales charges. Therefore, the second line for each class is useful in comparing ongoing costs only, and will not help you compare total costs of owning different funds. In addition, if transaction costs were included, your total costs would have been higher. Please refer to the Fund prospectus for additional information on operating expenses.
franklintempleton.com
Semiannual Report | 9
| | | | | | |
| FRANKLIN ADJUSTABLE U.S. GOVERNMENT SECURITIES FUND | | |
| YOUR FUND’S EXPENSES | | | | | | |
| |
| |
| |
| | | Beginning Account | | Ending Account | | Expenses Paid During |
| Share Class | | Value 11/1/14 | | Value 4/30/15 | | Period* 11/1/14–4/30/15 |
| A | | | | | | |
| Actual | $ | 1,000 | $ | 1,001.10 | $ | 4.56 |
| Hypothetical (5% return before expenses) | $ | 1,000 | $ | 1,020.23 | $ | 4.61 |
| A1 | | | | | | |
| Actual | $ | 1,000 | $ | 1,000.90 | $ | 3.77 |
| Hypothetical (5% return before expenses) | $ | 1,000 | $ | 1,021.03 | $ | 3.81 |
| C | | | | | | |
| Actual | $ | 1,000 | $ | 999.00 | $ | 6.54 |
| Hypothetical (5% return before expenses) | $ | 1,000 | $ | 1,018.25 | $ | 6.61 |
| R6 | | | | | | |
| Actual | $ | 1,000 | $ | 1,003.20 | $ | 2.63 |
| Hypothetical (5% return before expenses) | $ | 1,000 | $ | 1,022.17 | $ | 2.66 |
| Advisor | | | | | | |
| Actual | $ | 1,000 | $ | 1,002.30 | $ | 3.33 |
| Hypothetical (5% return before expenses) | $ | 1,000 | $ | 1,021.47 | $ | 3.36 |
*Expenses are calculated using the most recent six-month expense ratio, net of expense waivers, annualized for each class (A: 0.92%;
A1: 0.76%; C: 1.32%; R6: 0.53%; and Advisor: 0.67%), multiplied by the average account value over the period, multiplied by 181/365
to reflect the one-half year period.
10 | Semiannual Report
franklintempleton.com
Franklin Floating Rate Daily Access Fund
This semiannual report for Franklin Floating Rate Daily Access Fund covers the period ended April 30, 2015.
Your Fund’s Goals and Main Investments
The Fund seeks to provide a high level of current income and, secondarily, preservation of capital by investing at least 80% of its net assets in income-producing floating interest rate corporate loans and corporate debt securities.
Performance Overview
The Fund’s Class A shares delivered a +2.21% cumulative total return for the six months under review. In comparison, the Credit Suisse Leveraged Loan Index (CS LLI), which is designed to mirror the investable universe of the U.S. dollar-denominated leveraged loan market, posted a +2.31% total return.1 You can find the Fund’s long-term performance data in the Performance Summary beginning on page 15.
Performance data represent past performance, which does not guarantee future results. Investment return and principal value will fluctuate, and you may have a gain or loss when you sell your shares. Current performance may differ from figures shown. Please visit franklintempleton.com or call (800) 342-5236 for most recent month-end performance.
Corporate Loan Market Overview
Oil price declines and uncertainty about the strength of the global economic recovery helped roil credit markets near the beginning of the six-month period. The high yield bond market’s relatively high exposure to energy producers led to significant volatility, which spilled over into the loan market. As outflows from loan retail vehicles accelerated, the formation of new collateralized loan obligations (CLOs) decelerated and removed much of the support to loan prices. However, expectations for the Federal Reserve’s continued accommodative policies and more stable oil prices in the latter part of the period helped reduce capital market volatility, improving technical conditions as outflows from loan retail vehicles moderated and issuance of new CLOs rebounded. Meanwhile, overall activity in the primary market was subdued, which contributed to generally stronger bids for loans in the secondary market.
What are corporate loans?
Corporate loans are typically floating rate loans to corporate borrowers made by a group, or syndicate, of banks and other financial institutions. These loans provide capital to companies for varied purposes, such as merger and acquisition activity, leveraged buyouts or refinancings. These loans are typically syndicated to a group of investors.
Market volatility dampened CLO issuance at the beginning of the period and pushed financing costs higher, removing an important source of loan demand that had helped support loan prices in prior months. The decline in issuance followed the announcement of finalized financial reform regulations in the U.S. that included risk retention provisions, which some market participants expected to possibly curtail CLO issuance. Formation of new vehicles rebounded, however, as CLO arrangers benefited from an eventual decline in financing costs, and despite tightening loan spreads that challenged the arbitrage necessary to structure new CLOs. Some arrangers also reduced financing costs and improved arbitrage by taking advantage of lower European interest rates by issuing U.S. CLOs that complied with European risk retention rules and also benefited from relatively wider spreads in the U.S. loan market.
In addition to slower CLO activity at the beginning of the period, concerns about slowing global economic growth and U.S. Treasury yields generally reaching the lowest levels since 2013 led some investors to adjust their expectations for higher interest rates, leading to significant outflows from loan retail vehicles. Moreover, heightened outflows from high yield bond retail vehicles compounded technical pressure in the loan market as high yield bond fund managers sold loans to meet share redemptions. However, outflows from loan retail vehicles moderated later in the period, which helped support loan prices as selling pressure abated.
Although new-issue deals were largely absent amid heightened volatility at the beginning of the period, volume eventually rebounded modestly. New activity was driven by a handful of large deals related to mergers and acquisitions (M&A), including the largest deals in the loan market since September 2014. However, overall volume remained at relatively low levels as new issuance was offset by large loan issuers paying down
1. Source: Credit Suisse Group.
The index is unmanaged and includes reinvested interest. One cannot invest directly in an index, and an index is not representative of the Fund’s portfolio.
The dollar value, number of shares or principal amount, and names of all portfolio holdings are listed in the Fund’s Statement of Investments (SOI).
The SOI begins on page 48.
franklintempleton.com
Semiannual Report | 11
FRANKLIN FLOATING RATE DAILY ACCESS FUND
*Figures reflect certain derivatives held in the portfolio (or their underlying reference
assets) and may not total 100% or may be negative due to rounding, use of any
derivatives, unsettled trades or other factors.
debt. The dearth of new issuance partly resulted from U.S. regulators’ increased scrutiny of highly leveraged transactions, which helped constrain leveraged buyouts and refinancing activity. As a result, stronger demand and low supply allowed arrangers to tighten pricing in the syndication process and bring back repricing transactions (refinancing deals that tightened spreads).
The default rate by volume declined during the period despite the expected bankruptcy filing of a large issuer in the gaming and leisure industry, which was the loan market’s largest bankruptcy since the default by an electrical utility issuer in 2014. The large electrical utility’s default was no longer included in the lagging 12-month loan default rate calculation, contributing to the default rate decline over the period, but the lower default rate also reflected the loan market’s continued supportive fundamental environment. Many issuers reported year-over-year revenue and earnings growth, which helped to modestly lower average financial leverage and maintain average interest coverage at record levels.
Investment Strategy
We use a detailed credit analysis process to select corporate loan and corporate debt securities that meet our criteria. We conduct ongoing credit monitoring of our investments. To help manage the credit risk associated with investing in below-investment-grade securities, we seek to diversify the Fund by investing in a large number of loans of companies that we have identified as having attractive risk/reward profiles, favorable capital structures, strong asset coverage and dominant market shares. This diversification potentially reduces credit risk by spreading assets across many different industries.
| | | | |
| Dividend Distributions* | | |
| 11/1/14–4/30/15 | | | |
| | | Dividend per Share (cents) |
| Month | Class A | Class C | Class R6 | Advisor Class |
| November | 3.1279 | 2.8514 | 3.3703 | 3.3027 |
| December | 3.7489 | 3.4266 | 4.0207 | 3.9521 |
| January | 3.4783 | 3.1864 | 3.6995 | 3.6628 |
| February | 3.2371 | 2.9629 | 3.4660 | 3.4095 |
| March | 3.6293 | 3.3152 | 3.8795 | 3.8270 |
| April | 3.4152 | 3.1196 | 3.6657 | 3.6017 |
| Total | 20.6367 | 18.8621 | 22.1017 | 21.7558 |
*Assumes shares were purchased and held for the entire accrual period. Since
dividends accrue daily, your actual distributions will vary depending on the date you
purchased your shares and any account activity. All Fund distributions will vary
depending upon current market conditions, and past distributions are not indicative
of future trends.
In addition, we seek to exploit market inefficiencies by assigning forward-looking credit-risk tiers to issuers based upon our forward-looking analysis of the issuers’ prospects in the near term. This independent analysis enables us to express differences between backward-looking rating assignments of credit-risk tiers and our analysts’ forward-looking assessment of credit risk, thereby allowing us to potentially take advantage of credit risks the market may be overstating or avoid uncompensated credit risks the market may not have adequately identified.
Manager’s Discussion
During the six months under review, the Fund underperformed its benchmark, the CS LLI. Based on the index, loans in the market’s upper tier, including loans rated BB- and Ba3 and higher, as rated by independent rating agencies Standard & Poor’s or Moody’s Investors Service, outperformed the overall market in the first half of the period, but middle-tier loans, including loans rated B+ to B-, outperformed in the second half. For the six-month period, upper-tier loans generally outperformed middle-tier loans, while lower-tier loans, including CCC-rated and distressed loans, had negative returns, according to the CS LLI. However, Fund returns were primarily driven by loan selection within credit rating tiers, rather than allocation among rating tiers, as the upper and middle tiers in the index performed largely in line with each other, and individual issuers were impacted by industry-specific concerns such as commodity exposure.
12 | Semiannual Report
franklintempleton.com
FRANKLIN FLOATING RATE DAILY ACCESS FUND
The top contributors to Fund performance during the six months under review included loans that traded at significant discounts to par early in the period and eventually traded higher following favorable news and as technical conditions improved. The term loan of Sun Products, a large private-label detergent manufacturer, traded higher after the company reported better-than-expected results following earlier investor concerns surrounding competitive pressure. Furthermore, William Morris Endeavor Entertainment, a global talent, entertainment and media company, reported better-than-expected results and stated the company was on track to reach its cost-saving targets following its acquisition of IMG Worldwide Holdings. The issuer’s first-lien and second-lien term loans, which combined had been among the Fund’s largest investments in prior periods, traded higher due to the improved results and relatively attractive income generation as technical conditions supported demand for higher coupon loans.
| | |
| Top 10 Holdings | | |
| 4/30/15 | | |
| Company | % of Total | |
| Sector/Industry | Net Assets | |
| |
| Community Health Systems Inc. | 2.3 | % |
| Health Care Facilities | | |
| MoneyGram International Inc. | 2.2 | % |
| Data Processing & Outsourced Services | | |
| Valeant Pharmaceuticals International Inc. | 1.9 | % |
| Pharmaceuticals | | |
| Caesars Entertainment Resort Properties LLC | 1.9 | % |
| Casinos & Gaming | | |
| BMC Software Finance Inc. | 1.8 | % |
| Internet Software & Services | | |
| Sun Products Corp. | 1.6 | % |
| Household Products | | |
| Cyanco Intermediate Corp. | 1.6 | % |
| Commodity Chemicals | | |
| Cannery Casino Resorts LLC | 1.5 | % |
| Casinos & Gaming | | |
| Alinta Energy Finance Pty. Ltd. (Australia) | 1.5 | % |
| Electric Utilities | | |
| Fitness International LLC | 1.3 | % |
| Leisure Facilities | | |
In contrast, the top detractors from Fund performance included issuers that reported weaker-than-expected results and continued to face headwinds resulting from lower commodity prices. Samson Investment, an oil and gas producer, was among the Fund’s worst performers, largely due to credit rating downgrades and reports that the company was hiring restructuring advisors as investors expected lower oil and gas prices to negatively impact performance. Similarly, the term loans of Ocean Rig, an offshore drilling company, declined amid uncertainty surrounding the company’s ability to secure drilling contracts given lower oil prices.2
During the period, we focused on increasing the Fund’s weighting in upper-tier loans, with purchases predominantly among loans with higher credit ratings trading at discounts to par, which would be less impacted by refinancing activity, in our view. We executed this strategy through secondary purchases and through participation in select M&A deals in the primary market. Among the large investments during the period were Valeant Pharmaceuticals International’s new term loans, which the company issued to finance its acquisition of Salix Pharmaceuticals, another specialty pharmaceutical company that develops and manufactures a broad range of branded and generic pharmaceuticals. We invested in the new loans because of the company’s position as a leader in fast-growing markets, diversified product portfolio and track record of organic growth. Furthermore, we invested in the new term loans of Dollar Tree, an operator of a U.S. discount variety store chain. The company issued the new term loans to finance its acquisition of Family Dollar, a similar discount store chain. We participated in the new deal as a result of our assessment of the company’s consistent results throughout varied economic conditions, strong free cash flow generation and the combined company’s complementary business models.
To help manage liquidity, the Fund used iShares iBoxx $ High Yield Corporate Bond ETF,3 an exchange-traded fund (ETF) that seeks to track the high yield bond market, and PowerShares Senior Loan Portfolio, an ETF that seeks to track the leveraged loan market. We invested in these ETFs to gain liquid exposure to credit while seeking to maintain sufficient daily liquidity for our shareholders in the event of share redemptions. We also purchased and sold protection in the High Yield Credit Default Swap Index, an index of high yield bond credit default swaps providing synthetic exposure to the high yield bond market, to gain additional exposure to credit, or alternatively, to protect against further credit market volatility. Our combined exposure in these instruments was limited to no more than 3% of the Fund’s net assets during the period.
2. Ocean Rig loan holdings are in subsidiaries Drillships Financing Holding, Drillships Ocean Ventures Inc. and Drillships Ventures Projects Inc. in the SOI.
3. Not held by period-end.
See www.franklintempletondatasources.com for additional data provider information.
franklintempleton.com
Semiannual Report | 13
FRANKLIN FLOATING RATE DAILY ACCESS FUND
What is a credit default swap?
A credit default swap is an agreement between two parties whereby the buyer receives credit protection from the seller. The buyer makes periodic payments over the term of the agreement in return for a payment by the seller in the event of a default or other credit event.
As outflows from loan mutual funds moderated and CLO activity accelerated, primary market activity slowed significantly, furthering a supply-and-demand imbalance in the loan market. We believed such an imbalance might possibly be exacerbated by the prospect of an extended period of rising interest rates, which could lead to increased demand for floating rate assets. Consequently, we believed refinancing activity could be a significant concern due to the potential for reduced income and loss of principal (for assets purchased above par). To mitigate the possible adverse impacts of increased refinancing activity, we focused on shifting toward loans that we viewed to be less susceptible to refinancing, including those trading at discounts to par or those with relatively lower coupons. The loans with these characteristics were concentrated among loans with higher credit ratings, resulting in the Fund’s shift toward the upper tier. During the period, the Fund narrowed its underweighting in upper-tier loans compared to the index, while paring its overweighting in middle-tier and lower-tier loans.
Thank you for your continued participation in Franklin Floating Rate Daily Access Fund. We look forward to serving your future investment needs.

The foregoing information reflects our analysis, opinions and portfolio holdings as of April 30, 2015, the end of the reporting period. The way we implement our main investment strategies and the resulting portfolio holdings may change depending on factors such as market and economic conditions. These opinions may not be relied upon as investment advice or an offer for a particular security. The information is not a complete analysis of every aspect of any market, country, industry, security or the Fund. Statements of fact are from sources considered reliable, but the investment manager makes no representation or warranty as to their completeness or accuracy. Although historical performance is no guarantee of future results, these insights may help you understand our investment management philosophy.
14 | Semiannual Report
franklintempleton.com
FRANKLIN FLOATING RATE DAILY ACCESS FUND
Performance Summary as of April 30, 2015
Your dividend income will vary depending on dividends or interest paid by securities in the Fund’s portfolio, adjusted for operating expenses of each class. Capital gain distributions are net profits realized from the sale of portfolio securities. The performance tables do not reflect any taxes that a shareholder would pay on Fund dividends, capital gain distributions, if any, or any realized gains on the sale of Fund shares. Total return reflects reinvestment of the Fund’s dividends and capital gain distributions, if any, and any unrealized gains or losses.
| | | | | | |
| Net Asset Value | | | | | | |
| Share Class (Symbol) | | 4/30/15 | | 10/31/14 | | Change |
| A (FAFRX) | $ | 9.03 | $ | 9.04 | -$ | 0.01 |
| C (FCFRX) | $ | 9.03 | $ | 9.05 | -$ | 0.02 |
| R6 (N/A) | $ | 9.02 | $ | 9.05 | -$ | 0.03 |
| Advisor (FDAAX) | $ | 9.03 | $ | 9.05 | -$ | 0.02 |
| |
| |
| Distributions (11/1/14–4/30/15) | | | | | | |
| Dividend |
| Share Class | | Income | | | | |
| A | $ | 0.206367 | | | | |
| C | $ | 0.188621 | | | | |
| R6 | $ | 0.221017 | | | | |
| Advisor | $ | 0.217558 | | | | |
franklintempleton.com
Semiannual Report | 15
FRANKLIN FLOATING RATE DAILY ACCESS FUND
PERFORMANCE SUMMARY
Performance as of 4/30/151
Cumulative total return excludes sales charges. Average annual total returns include maximum sales charges. Class A: 2.25% maximum initial sales charge; Class C: 1% contingent deferred sales charge in first year only; Class R6/Advisor Class: no sales charges.
| | | | | | | | | | |
| | | | | | | | | |
| | Cumulative | | Average Annual | | Average Annual | | Total Annual Operating Expenses5 | |
| Share Class | Total Return2 | | Total Return3 | | Total Return (3/31/15)4 | | (with waiver) | | (without waiver) | |
| A | | | | | | | 0.84 | % | 0.85 | % |
| 6-Month | +2.21 | % | -0.11 | % | | | | | | |
| 1-Year | +2.82 | % | +0.52 | % | -0.45 | % | | | | |
| 5-Year | +22.48 | % | +3.66 | % | +3.65 | % | | | | |
| 10-Year | +41.89 | % | +3.33 | % | +3.24 | % | | | | |
| C | | | | | | | 1.24 | % | 1.25 | % |
| 6-Month | +1.89 | % | +0.90 | % | | | | | | |
| 1-Year | +2.30 | % | +1.32 | % | +0.33 | % | | | | |
| 5-Year | +20.07 | % | +3.73 | % | +3.71 | % | | | | |
| 10-Year | +36.39 | % | +3.15 | % | +3.06 | % | | | | |
| R6 | | | | | | | 0.51 | % | 0.53 | % |
| 6-Month | +2.15 | % | +2.15 | % | | | | | | |
| 1-Year | +2.94 | % | +2.94 | % | +2.05 | % | | | | |
| Since Inception (5/1/13) | +6.44 | % | +3.17 | % | +2.85 | % | | | | |
| Advisor | | | | | | | 0.59 | % | 0.60 | % |
| 6-Month | +2.22 | % | +2.22 | % | | | | | | |
| 1-Year | +2.97 | % | +2.97 | % | +1.97 | % | | | | |
| 5-Year | +24.02 | % | +4.40 | % | +4.38 | % | | | | |
| 10-Year | +45.33 | % | +3.81 | % | +3.72 | % | | | | |
| | | | | | |
| | | | | |
| | Distribution | | 30-Day Standardized Yield7 | |
| Share Class | Rate6 | | (with waiver) | | (without waiver) | |
| A | 4.50 | % | 5.26 | % | 5.26 | % |
| C | 4.20 | % | 4.98 | % | 4.97 | % |
| R6 | 4.94 | % | 5.73 | % | 5.71 | % |
| Advisor | 4.85 | % | 5.64 | % | 5.63 | % |
Performance data represent past performance, which does not guarantee future results. Investment return and principal value will fluctuate, and you may have a gain or loss when you sell your shares. Current performance may differ from figures shown. For most recent month-end performance, go to franklintempleton.com or call (800) 342-5236.
16 | Semiannual Report
franklintempleton.com
FRANKLIN FLOATING RATE DAILY ACCESS FUND
PERFORMANCE SUMMARY
All investments involve risks, including possible loss of principal. Investors should be aware that the Fund’s share price and yield will fluctuate with market conditions. The Fund should not be considered an alternative to money market funds or certificates of deposit (CDs). The floating rate loans and debt securities in which the Fund invests tend to be rated below investment grade. Investing in higher yielding, lower rated, floating rate loans and debt securities involves greater risk of default, which could result in loss of principal — a risk that may be heightened in a slowing economy. Interest earned on floating rate loans varies with changes in prevailing interest rates. Therefore, while floating rate loans offer higher interest income when interest rates rise, they will also generate less income when interest rates decline. Changes in the financial strength of a bond issuer or in a bond’s credit rating may affect its value. The Fund is actively managed but there is no guarantee that the manager’s investment decisions will produce the desired results. The Fund’s prospectus also includes a description of the main investment risks.
| |
| Class C: | These shares have higher annual fees and expenses than Class A shares. |
| Class R6: | Shares are available to certain eligible investors as described in the prospectus. |
| Advisor Class: | Shares are available to certain eligible investors as described in the prospectus. |
1. The Fund has a fee waiver associated with its investments in a Franklin Templeton money fund, contractually guaranteed through at least its current fiscal year-end.
Class R6 has a fee waiver contractually guaranteed through at least 2/29/16. Fund investment results reflect the fee waivers, to the extent applicable; without these
reductions, the results would have been lower.
2. Cumulative total return represents the change in value of an investment over the periods indicated.
3. Average annual total return represents the average annual change in value of an investment over the periods indicated. Six-month return has not been annualized.
4. In accordance with SEC rules, we provide standardized average annual total return information through the latest calendar quarter.
5. Figures are as stated in the Fund’s current prospectus. In periods of market volatility, assets may decline significantly, causing total annual Fund operating expenses to
become higher than the figures shown.
6. Distribution rate is based on an annualization of the respective class’s past 30 days’ daily distributions and the maximum offering price (NAV for Classes C, R6 and
Advisor) per share on 4/30/15.
7. The 30-day standardized yield for the 30 days ended 4/30/15 reflects an estimated yield to maturity (assuming all portfolio securities are held to maturity). It should be
regarded as an estimate of the Fund’s rate of investment income, and it may not equal the Fund’s actual income distribution rate (which reflects the Fund’s past dividends
paid to shareholders) or the income reported in the Fund’s financial statements.
franklintempleton.com
Semiannual Report | 17
FRANKLIN FLOATING RATE DAILY ACCESS FUND
Your Fund’s Expenses
As a Fund shareholder, you can incur two types of costs:
- Transaction costs, including sales charges (loads) on Fund purchases; and
- Ongoing Fund costs, including management fees, distribu- tion and service (12b-1) fees, and other Fund expenses. All mutual funds have ongoing costs, sometimes referred to as operating expenses.
The following table shows ongoing costs of investing in the Fund and can help you understand these costs and compare them with those of other mutual funds. The table assumes a $1,000 investment held for the six months indicated.
Actual Fund Expenses
The first line (Actual) for each share class listed in the table provides actual account values and expenses. The “Ending Account Value” is derived from the Fund’s actual return, which includes the effect of Fund expenses.
You can estimate the expenses you paid during the period by following these steps. Of course, your account value and expenses will differ from those in this illustration:
| 1. | Divide your account value by $1,000. |
| | If an account had an $8,600 value, then $8,600 ÷ $1,000 = 8.6. |
| 2. | Multiply the result by the number under the heading “Expenses Paid During Period.” |
| | If Expenses Paid During Period were $7.50, then 8.6 x $7.50 = $64.50. |
In this illustration, the estimated expenses paid this period are $64.50.
Hypothetical Example for Comparison with Other Funds
Information in the second line (Hypothetical) for each class in the table can help you compare ongoing costs of investing in the Fund with those of other mutual funds. This information may not be used to estimate the actual ending account balance or expenses you paid during the period. The hypothetical “Ending Account Value” is based on the actual expense ratio for each class and an assumed 5% annual rate of return before expenses, which does not represent the Fund’s actual return. The figure under the heading “Expenses Paid During Period” shows the hypothetical expenses your account would have incurred under this scenario. You can compare this figure with the 5% hypothetical examples that appear in shareholder reports of other funds.
Please note that expenses shown in the table are meant to highlight ongoing costs and do not reflect any transaction costs, such as sales charges. Therefore, the second line for each class is useful in comparing ongoing costs only, and will not help you compare total costs of owning different funds. In addition, if transaction costs were included, your total costs would have been higher. Please refer to the Fund prospectus for additional information on operating expenses.
18 | Semiannual Report
franklintempleton.com
FRANKLIN FLOATING RATE DAILY ACCESS FUND
YOUR FUND’S EXPENSES
| | | | | | |
| | | Beginning Account | | Ending Account | | Expenses Paid During |
| Share Class | | Value 11/1/14 | | Value 4/30/15 | | Period* 11/1/14–4/30/15 |
| A | | | | | | |
| Actual | $ | 1,000 | $ | 1,022.10 | $ | 4.31 |
| Hypothetical (5% return before expenses) | $ | 1,000 | $ | 1,020.53 | $ | 4.31 |
| C | | | | | | |
| Actual | $ | 1,000 | $ | 1,018.90 | $ | 6.31 |
| Hypothetical (5% return before expenses) | $ | 1,000 | $ | 1,018.55 | $ | 6.31 |
| R6 | | | | | | |
| Actual | $ | 1,000 | $ | 1,021.50 | $ | 2.61 |
| Hypothetical (5% return before expenses) | $ | 1,000 | $ | 1,022.22 | $ | 2.61 |
| Advisor | | | | | | |
| Actual | $ | 1,000 | $ | 1,022.20 | $ | 3.06 |
| Hypothetical (5% return before expenses) | $ | 1,000 | $ | 1,021.77 | $ | 3.06 |
*Expenses are calculated using the most recent six-month expense ratio, net of expense waivers, annualized for each class (A: 0.86%;
C: 1.26%; R6: 0.52%; and Advisor: 0.61%), multiplied by the average account value over the period, multiplied by 181/365 to reflect the
one-half year period.
franklintempleton.com
Semiannual Report | 19
Franklin Low Duration Total Return Fund
We are pleased to bring you Franklin Low Duration Total Return Fund’s semiannual report for the period ended April 30, 2015.
Your Fund’s Goal and Main Investments
The Fund seeks a high level of current income as is consistent with prudent investing, while seeking capital preservation. The Fund invests primarily in investment-grade debt securities, including government and corporate debt securities and mortgage- and asset-backed securities, targeting an estimated average portfolio duration of three years or less.
What is duration?
Duration is a measure of a bond’s price sensitivity to interest rate changes. In general, a portfolio of securities with a lower duration can be expected to be less sensitive to interest rate changes than a portfolio with a higher duration.
Performance Overview
The Fund’s Class A shares delivered a +0.66% cumulative total return for the six months under review. In comparison, the Fund’s benchmark, the Barclays U.S. Government/Credit Index: 1-3 Year Component, posted a +0.56% total return.1 The index tracks public obligations of the U.S. Treasury with one to three years to final maturity and publicly issued debt of U.S. government agencies, quasi-federal corporations, and corporate or foreign debt guaranteed by the U.S. government. You can find more of the Fund’s performance data in the Performance Summary beginning on page 23.
Performance data represent past performance, which does not guarantee future results. Investment return and principal value will fluctuate, and you may have a gain or loss when you sell your shares. Current performance may differ from figures shown. Please visit franklintempleton.com or call (800) 342-5236 for most recent month-end performance.
Investment Strategy
We seek to invest in a combination of fixed income securities, primarily from across the investment-grade debt universe. We analyze securities using proprietary and nonproprietary research to help us identify attractive investment opportunities across the entire fixed income opportunity set, on a relative basis. When making investment decisions, we evaluate business cycles, yield curves, and values between and within markets. Through a low duration portfolio, we seek to position the Fund to be less affected by interest rate changes than a fund with a higher duration. In addition, we may use derivative transactions, such as forwards, futures contracts and swap agreements to obtain net long or short exposures to select currencies, interest rates, countries, duration or credit risks.
What is a yield curve?
The yield curve is a line that plots the interest rates, at a set point in time, of bonds having equal credit quality but differing maturity rates. The most frequently reported yield curve compares three-month, two-year and 30-year U.S. Treasury debt.
What is a currency forward contract?
A currency forward contract, or a currency forward, is an agreement between the Fund and a counterparty to buy or sell a foreign currency at a specific exchange rate on a future date.
What is a futures contract?
A futures contract is an agreement between the Fund and a counterparty made through a U.S. or foreign futures exchange to buy or sell an underlying instrument or asset at a specific price on a future date.
What are swap agreements?
Swap agreements, such as interest rate, currency and credit default swaps, are contracts between the Fund and another party (the swap counterparty). In a basic swap transaction, the Fund agrees with the swap counterparty to exchange the returns (or differentials in rates of return) earned or realized on a particular “notional amount” of underlying instruments. The notional amount is the set amount selected by the parties as the basis on which to calculate the obligations that they have agreed to exchange. The parties typically do not actually exchange the notional amount. Instead, they agree to exchange the returns that would be earned or realized if the notional amount were invested in given instruments or at given interest rates.
1. Source: Morningstar.
The index is unmanaged and includes reinvestment of any income or distributions. One cannot invest directly in an index, and an index is not representative of the
Fund’s portfolio.
See www.franklintempletondatasources.com for additional data provider information.
The dollar value, number of shares or principal amount, and names of all portfolio holdings are listed in the Fund’s Statement of Investments (SOI).
The SOI begins on page 61.
20 | Semiannual Report
franklintempleton.com
FRANKLIN LOW DURATION TOTAL RETURN FUND

*Figures reflect certain derivatives held in the portfolio (or their underlying reference
assets) and may not total 100% or may be negative due to rounding, use of
derivatives, unsettled trades or other factors.
Manager’s Discussion
The economy grew slowly during the period. Growth in the fourth quarter of 2014 stemmed from greater spending by consumers, businesses, and state and local governments. Economic activity moderated in 2015’s first quarter, however, partly because of an ongoing energy price collapse, shrinking exports and weaker business spending. Despite the slowdown, home prices and sales increased while mortgage rates fell.
Near period-end, the Federal Reserve Board (Fed) noted it expected economic activity would expand at a moderate pace with appropriate policy accommodation. The Fed also stated it would raise interest rates when inflation and employment data met its expectations.
From a perspective of excess returns over Treasuries, senior floating rate loans performed well. Investors’ search for protection from interest rate risk helped the asset class outperform Treasuries as measured by the Credit Suisse Leveraged Loan Index. Other major fixed income sectors that delivered positive
| | | | |
| Dividend Distributions* | | |
| 11/1/14–4/30/15 | | | |
| | | Dividend per Share (cents) |
| Month | Class A | Class C | Class R6 | Advisor Class |
| November | 1.1118 | 0.8014 | 1.4051 | 1.3095 |
| December** | 9.2737 | 8.9863 | 9.5737 | 9.4782 |
| January | 1.0979 | 0.7900 | 1.3961 | 1.2874 |
| February | 0.7358 | 0.5485 | 0.9155 | 0.8549 |
| March | 0.0254 | — | 0.0569 | 0.0462 |
| April | 1.3161 | 0.9655 | 1.6458 | 1.5349 |
| Total | 13.5607 | 12.0917 | 14.9931 | 14.5111 |
*Assumes shares were purchased and held for the entire accrual period, which
differs from the calendar month. Since dividends accrue daily, your actual
distributions will vary depending on the date you purchased your shares and any
account activity. All Fund distributions will vary depending upon current market
conditions, and past distributions are not indicative of future trends.
**Includes an additional 8.2 cent per share distribution to meet excise tax
requirements.
excess returns, as measured by Barclays indexes, included commercial mortgage-backed securities (CMBS) and asset-backed securities (ABS). In contrast, U.S. dollar-denominated emerging market bonds, municipal bonds, U.S. Treasury Inflation Protected Securities (TIPS) and U.S. investment-grade corporate bonds underperformed Treasuries.
During the period, the Fund’s exposure to corporate credit, particularly senior secured floating rate loans, benefited performance. The Fund’s CMBS exposure aided results as did our allocation to non-agency residential mortgage-backed securities (RMBS) and adjustable-rate agency mortgage-backed securities (ARMS). Foreign currencies and exposure to non-U.S. yield curves also contributed to Fund performance. In contrast, the Fund’s U.S. yield curve positioning was a detractor as yield curve movements had a negative impact relative to the benchmark as the Fund’s defensive positioning underperformed the benchmark.
At period-end, we were overweighted compared to the benchmark in many of the credit sectors, including corporate credit and securitized products, based on our belief that valuations remained relatively attractive on a longer term basis. Over the period, we increased our allocations to investment grade corporate credit, RMBS, and senior secured floating rate loans. We decreased our exposure to ARMS and certain Treasury positions as we found better relative opportunities. We maintained exposure to international bonds and currencies.
franklintempleton.com
Semiannual Report | 21
FRANKLIN LOW DURATION TOTAL RETURN FUND
The portfolio utilized derivatives, including credit default and currency swaps, currency forwards, Treasury futures, and currency, interest rate swap and credit default swap options, principally as a tool for efficient portfolio management and to manage overall portfolio risk. These derivative transactions may provide the same, or similar, net long or short exposure to select currencies, interest rates, countries, duration or credit risks in a less expensive way than by directly purchasing securities. In those markets where portfolio securities are readily available, the cost difference in normal market conditions may be small.
What is a credit default swap?
A credit default swap is an agreement between two parties whereby the buyer receives credit protection from the seller. The buyer makes periodic payments over the term of the agreement in return for a payment by the seller in the event of a default or other credit event.
What is an option?
An option is a contract to buy or sell a specific financial product known as the option’s underlying instrument at a specific price. The buyer of an option has the right, but not the obligation, to buy or sell the underlying instrument at or until a specified expiration date. Conversely, the seller (“writer”) of an option who opens a transaction is obligated to buy or sell the underlying instrument should the option holder exercise that right.
Thank you for your continued participation in Franklin Low Duration Total Return Fund. We look forward to serving your future investment needs.

The foregoing information reflects our analysis, opinions and portfolio holdings as of April 30, 2015, the end of the reporting period. The way we implement our main investment strategies and the resulting portfolio holdings may change depending on factors such as market and economic conditions. These opinions may not be relied upon as investment advice or an offer for a particular security. The information is not a complete analysis of every aspect of any market, country, industry, security or the Fund. Statements of fact are from sources considered reliable, but the investment manager makes no representation or warranty as to their completeness or accuracy. Although historical performance is no guarantee of future results, these insights may help you understand our investment management philosophy.
22 | Semiannual Report
franklintempleton.com
FRANKLIN LOW DURATION TOTAL RETURN FUND
Performance Summary as of April 30, 2015
Your dividend income will vary depending on dividends or interest paid by securities in the Fund’s portfolio, adjusted for operating expenses of each class. Capital gain distributions are net profits realized from the sale of portfolio securities. The performance tables do not reflect any taxes that a shareholder would pay on Fund dividends, capital gain distributions, if any, or any realized gains on the sale of Fund shares. Total return reflects reinvestment of the Fund’s dividends and capital gain distributions, if any, and any unrealized gains or losses.
| | | | | | |
| Net Asset Value | | | | | | |
| Share Class (Symbol) | | 4/30/15 | | 10/31/14 | | Change |
| A (FLDAX) | $ | 10.04 | $ | 10.11 | -$ | 0.07 |
| C (FLDCX) | $ | 10.03 | $ | 10.11 | -$ | 0.08 |
| R6 (FLRRX) | $ | 10.08 | $ | 10.14 | -$ | 0.06 |
| Advisor (FLDZX) | $ | 10.08 | $ | 10.14 | -$ | 0.06 |
| |
| |
| Distributions (11/1/14–4/30/15) | | | | | | |
| Dividend |
| Share Class | | Income | | | | |
| A | $ | 0.135607 | | | | |
| C | $ | 0.120917 | | | | |
| R6 | $ | 0.149931 | | | | |
| Advisor | $ | 0.145111 | | | | |
franklintempleton.com
Semiannual Report | 23
FRANKLIN LOW DURATION TOTAL RETURN FUND
PERFORMANCE SUMMARY
Performance as of 4/30/151
Cumulative total return excludes sales charges. Average annual total returns include maximum sales charges. Class A: 2.25% maximum initial sales charge; Class C: 1% contingent deferred sales charge in first year only; Class R6/Advisor Class: no sales charges.
| | | | | | | | | | |
| | | | | | | | | |
| | Cumulative | | Average Annual | | Average Annual | | Total Annual Operating Expenses5 | |
| Share Class | Total Return2 | | Total Return3 | | Total Return (3/31/15)4 | | (with waiver) | | (without waiver) | |
| A | | | | | | | 0.81 | % | 0.94 | % |
| 6-Month | +0.66 | % | -1.58 | % | | | | | | |
| 1-Year | +1.17 | % | -1.07 | % | -1.11 | % | | | | |
| 5-Year | +10.50 | % | +1.55 | % | +1.63 | % | | | | |
| 10-Year | +39.50 | % | +3.15 | % | +3.18 | % | | | | |
| C | | | | | | | 1.21 | % | 1.34 | % |
| 6-Month | +0.41 | % | -0.58 | % | | | | | | |
| 1-Year | +0.74 | % | -0.25 | % | -0.18 | % | | | | |
| Since Inception (10/1/12) | +2.53 | % | +0.98 | % | +0.97 | % | | | | |
| R6 | | | | | | | 0.43 | % | 0.56 | % |
| 6-Month | +0.90 | % | +0.90 | % | | | | | | |
| 1-Year | +1.59 | % | +1.59 | % | +1.55 | % | | | | |
| Since Inception (5/1/13) | +3.01 | % | +1.50 | % | +1.42 | % | | | | |
| Advisor6 | | | | | | | 0.56 | % | 0.69 | % |
| 6-Month | +0.85 | % | +0.85 | % | | | | | | |
| 1-Year | +1.48 | % | +1.48 | % | +1.35 | % | | | | |
| 5-Year | +11.91 | % | +2.28 | % | +2.36 | % | | | | |
| 10-Year | +42.20 | % | +3.58 | % | +3.61 | % | | | | |
| | | | | | |
| | | | | |
| | Distribution | | 30-Day Standardized Yield8 | |
| Share Class | Rate7 | | (with waiver) | | (without waiver) | |
| A | 1.54 | % | 1.13 | % | 0.96 | % |
| C | 1.16 | % | 0.75 | % | 0.58 | % |
| R6 | 1.96 | % | 1.52 | % | 1.42 | % |
| Advisor | 1.83 | % | 1.40 | % | 1.23 | % |
Performance data represent past performance, which does not guarantee future results. Investment return and principal value will fluctuate, and you may have a gain or loss when you sell your shares. Current performance may differ from figures shown. For most recent month-end performance, go to franklintempleton.com or call (800) 342-5236.
24 | Semiannual Report
franklintempleton.com
FRANKLIN LOW DURATION TOTAL RETURN FUND
PERFORMANCE SUMMARY
All investments involve risks, including possible loss of principal. Interest rate movements and mortgage prepayments will affect the Fund’s share price and yield. Bond prices generally move in the opposite direction of interest rates. As prices of bonds in the Fund adjust to a rise in interest rates, the Fund’s share price may decline. Changes in the financial strength of a bond issuer or in a bond’s credit rating may affect its value. Derivatives, including currency management strategies, involve costs and can create economic leverage in the portfolio that may result in significant volatility and cause the Fund to participate in losses (as well as enable gains) on an amount that exceeds the Fund’s initial investment. The Fund may not achieve the anticipated benefits, and may realize losses when a counterparty fails to perform as promised. Some derivatives are particularly sensitive to changes in interest rates. Foreign securities involve special risks, including currency fluctuations and economic and political uncertainty. The Fund is actively managed but there is no guarantee that the manager’s investment decisions will produce the desired results. The Fund’s prospectus also includes a description of the main investment risks.
| |
| Class C: | These shares have higher annual fees and expenses than Class A shares. |
| Class R6: | Shares are available to certain eligible investors as described in the prospectus. |
| Advisor Class: | Shares are available to certain eligible investors as described in the prospectus. |
1. The Fund has an expense reduction contractually guaranteed through at least 2/29/16 and a fee waiver associated with its investments in a Franklin Templeton money
fund, contractually guaranteed through at least its current fiscal year-end. Fund investment results reflect the expense reduction and fee waiver, to the extent applicable;
without these reductions, the results would have been lower.
2. Cumulative total return represents the change in value of an investment over the periods indicated.
3. Average annual total return represents the average annual change in value of an investment over the periods indicated. Six-month return has not been annualized.
4. In accordance with SEC rules, we provide standardized average annual total return information through the latest calendar quarter.
5. Figures are as stated in the Fund’s current prospectus. In periods of market volatility, assets may decline significantly, causing total annual Fund operating expenses to
become higher than the figures shown.
6. Effective 5/15/08, the Fund began offering Advisor Class shares, which do not have sales charges or a Rule 12b-1 plan. Performance quotations for this class reflect the
following methods of calculation: (a) For periods prior to 5/15/08, a restated figure is used based upon the Fund’s Class A performance, excluding the effect of Class A’s
maximum initial sales charge, but reflecting the effect of the Class A Rule 12b-1 fees; and (b) for periods after 5/15/08, actual Advisor Class performance is used reflecting
all charges and fees applicable to that class. Since 5/15/08 (commencement of sales), the cumulative and average annual total returns of Advisor Class shares were
+25.23% and +3.29%.
7. Distribution rate is based on an annualization of the sum of the respective class’s past 30 days’ daily distributions and the maximum offering price (NAV for Classes C,
R6 and Advisor) per share on 4/30/15.
8. The 30-day standardized yield for the 30 days ended 4/30/15 reflects an estimated yield to maturity (assuming all portfolio securities are held to maturity). It should be
regarded as an estimate of the Fund’s rate of investment income, and it may not equal the Fund’s actual income distribution rate (which reflects the Fund’s past dividends
paid to shareholders) or the income reported in the Fund’s financial statements.
franklintempleton.com
Semiannual Report | 25
FRANKLIN LOW DURATION TOTAL RETURN FUND
Your Fund’s Expenses
As a Fund shareholder, you can incur two types of costs:
- Transaction costs, including sales charges (loads) on Fund purchases; and
- Ongoing Fund costs, including management fees, distribu- tion and service (12b-1) fees, and other Fund expenses. All mutual funds have ongoing costs, sometimes referred to as operating expenses.
The following table shows ongoing costs of investing in the Fund and can help you understand these costs and compare them with those of other mutual funds. The table assumes a $1,000 investment held for the six months indicated.
Actual Fund Expenses
The first line (Actual) for each share class listed in the table provides actual account values and expenses. The “Ending Account Value” is derived from the Fund’s actual return, which includes the effect of Fund expenses.
You can estimate the expenses you paid during the period by following these steps. Of course, your account value and expenses will differ from those in this illustration:
| 1. | Divide your account value by $1,000. |
| | If an account had an $8,600 value, then $8,600 ÷ $1,000 = 8.6. |
| 2. | Multiply the result by the number under the heading “Expenses Paid During Period.” |
| | If Expenses Paid During Period were $7.50, then 8.6 x $7.50 = $64.50. |
In this illustration, the estimated expenses paid this period are $64.50.
Hypothetical Example for Comparison with Other Funds
Information in the second line (Hypothetical) for each class in the table can help you compare ongoing costs of investing in the Fund with those of other mutual funds. This information may not be used to estimate the actual ending account balance or expenses you paid during the period. The hypothetical “Ending Account Value” is based on the actual expense ratio for each class and an assumed 5% annual rate of return before expenses, which does not represent the Fund’s actual return. The figure under the heading “Expenses Paid During Period” shows the hypothetical expenses your account would have incurred under this scenario. You can compare this figure with the 5% hypothetical examples that appear in shareholder reports of other funds.
Please note that expenses shown in the table are meant to highlight ongoing costs and do not reflect any transaction costs, such as sales charges. Therefore, the second line for each class is useful in comparing ongoing costs only, and will not help you compare total costs of owning different funds. In addition, if transaction costs were included, your total costs would have been higher. Please refer to the Fund prospectus for additional information on operating expenses.
26 | Semiannual Report
franklintempleton.com
FRANKLIN LOW DURATION TOTAL RETURN FUND
YOUR FUND’S EXPENSES
| | | | | | |
| | | Beginning Account | | Ending Account | | Expenses Paid During |
| Share Class | | Value 11/1/14 | | Value 4/30/15 | | Period* 11/1/14–4/30/15 |
| A | | | | | | |
| Actual | $ | 1,000 | $ | 1,006.57 | $ | 3.98 |
| Hypothetical (5% return before expenses) | $ | 1,000 | $ | 1,020.83 | $ | 4.01 |
| C | | | | | | |
| Actual | $ | 1,000 | $ | 1,004.11 | $ | 5.96 |
| Hypothetical (5% return before expenses) | $ | 1,000 | $ | 1,018.84 | $ | 6.01 |
| R6 | | | | | | |
| Actual | $ | 1,000 | $ | 1,009.00 | $ | 2.09 |
| Hypothetical (5% return before expenses) | $ | 1,000 | $ | 1,022.71 | $ | 2.11 |
| Advisor | | | | | | |
| Actual | $ | 1,000 | $ | 1,008.50 | $ | 2.74 |
| Hypothetical (5% return before expenses) | $ | 1,000 | $ | 1,022.07 | $ | 2.76 |
*Expenses are calculated using the most recent six-month expense ratio, net of expense waivers, annualized for each class (A: 0.80%;
C: 1.20%; R6: 0.42%; and Advisor: 0.55%), multiplied by the average account value over the period, multiplied by 181/365 to reflect the
one-half year period.
franklintempleton.com
Semiannual Report | 27
Franklin Total Return Fund
This semiannual report for Franklin Total Return Fund covers the period ended April 30, 2015.
Your Fund’s Goals and Main Investments
The Fund seeks to provide investors with high current income consistent with preservation of capital. Capital appreciation over the long term is a secondary goal. The Fund invests at least 80% of its assets in investment-grade debt securities. The Fund currently focuses on government and corporate debt securities and mortgage- and asset-backed securities.
Performance Overview
The Fund’s Class A shares delivered a +1.58% cumulative total return for the six months under review. In comparison, the Fund’s benchmark, the Barclays U.S. Aggregate Bond Index, which measures the U.S. investment-grade, fixed-rate, taxable bond market with index components for government and corporate, mortgage pass-through and asset-backed securities, posted a +2.06% total return.1 You can find the Fund’s long-term performance data in the Performance Summary beginning on page 31.
Performance data represent past performance, which does not guarantee future results. Investment return and principal value will fluctuate, and you may have a gain or loss when you sell your shares. Current performance may differ from figures shown. Please visit franklintempleton.com or call (800) 342-5236 for most recent month-end performance.
Investment Strategy
We seek to invest in a combination of fixed income securities, predominantly from across the investment-grade debt universe. We analyze securities using proprietary and nonproprietary research to help us identify attractive investment opportunities, across the entire fixed income opportunity set, on a relative basis. The Fund may also invest up to 20% of its total assets in noninvestment-grade debt securities. In addition, we may use derivative transactions, such as currency and cross-currency forwards, futures contracts and swap agreements, to obtain net long or short exposures to select currencies, interest rates, countries, duration or credit risks.
*Figures reflect certain derivatives held in the portfolio (or their underlying
reference assets) and may not total 100% or may be negative due to rounding,
use of derivatives, unsettled trades or other factors.
**Rounds to less than 0.1% of total net assets.
What is a currency forward contract?
A currency forward contract, or a currency forward, is an agreement between the Fund and a counterparty to buy or sell a foreign currency at a specific exchange rate on a future date.
1. Source: Morningstar.
The index is unmanaged and includes reinvestment of any income or distributions. One cannot invest directly in an index, and an index is not representative of the
Fund’s portfolio.
See www.franklintempletondatasources.com for additional data provider information.
The dollar value, number of shares or principal amount, and names of all portfolio holdings are listed in the Fund’s Statement of Investments (SOI).
The SOI begins on page 90.
28 | Semiannual Report
franklintempleton.com
FRANKLIN TOTAL RETURN FUND
What is a futures contract?
A futures contract is an agreement between the Fund and a counterparty made through a U.S. or foreign futures exchange to buy or sell an underlying instrument or asset at a specific price on a future date.
What are swap agreements?
Swap agreements, such as interest rate, currency and credit default swaps, are contracts between the Fund and another party (the swap counterparty). In a basic swap transaction, the Fund agrees with the swap counterparty to exchange the returns (or differentials in rates of return) earned or realized on a particular “notional amount” of underlying instruments. The notional amount is the set amount selected by the parties as the basis on which to calculate the obligations that they have agreed to exchange. The parties typically do not actually exchange the notional amount. Instead, they agree to exchange the returns that would be earned or realized if the notional amount were invested in given instruments or at given interest rates.
What is duration?
Duration is a measure of a bond’s price sensitivity to interest rate changes. In general, a portfolio of securities with a lower duration can be expected to be less sensitive to interest rate changes than a portfolio with a higher duration.
Manager’s Discussion
The economy grew slowly during the period. Growth in the fourth quarter of 2014 stemmed from greater spending by consumers, businesses, and state and local governments. Economic activity moderated in 2015’s first quarter, however, partly because of an ongoing energy price collapse, shrinking exports and weaker business spending. Despite the slowdown, home prices and sales increased while mortgage rates fell.
Near period-end, the Federal Reserve Board (Fed) noted it expected economic activity would expand at a moderate pace with appropriate policy accommodation. The Fed also stated it would raise interest rates when inflation and employment data met its expectations.
From a perspective of excess returns over Treasuries, senior floating rate loans performed well. Investors’ search for protection from interest rate risk helped the asset class outperform Treasuries as measured by the Credit Suisse Leveraged Loan Index. Other major fixed income sectors that delivered positive excess returns, as measured by Barclays indexes, included commercial mortgage-backed securities (CMBS) and asset-backed
| | | | | |
| Dividend Distributions* | | | |
| 11/1/14–4/30/15 | | | | |
| | | Dividend per Share (cents) | |
| | | | | | Advisor |
| Month | Class A | Class C | Class R | Class R6 | Class |
| November | 1.5559 | 1.2410 | 1.3587 | 1.8785 | 1.7554 |
| December** | 17.1094 | 16.8402 | 16.9413 | 17.3868 | 17.2811 |
| January | 0.7813 | 0.6144 | 0.6772 | 0.9527 | 0.8870 |
| February | 0.4896 | 0.3444 | 0.3988 | 0.6380 | 0.5810 |
| March | 0.3005 | 0.2442 | 0.2654 | 0.3566 | 0.3363 |
| April | 1.6126 | 1.2849 | 1.4083 | 1.9382 | 1.8204 |
| Total | 21.8493 | 20.5691 | 21.0497 | 23.1508 | 22.6612 |
*Assumes shares were purchased and held for the entire accrual period, which
differs from the calendar month. Since dividends accrue daily, your actual
distributions will vary depending on the date you purchased your shares and any
account activity. All Fund distributions will vary depending upon current market
conditions, and past distributions are not indicative of future trends.
**Includes an additional 15.8 cent per share distribution to meet excise tax
requirements.
securities (ABS). In contrast, U.S. dollar-denominated emerging market bonds, municipal bonds, U.S. Treasury Inflation Protected Securities (TIPS) and U.S. investment-grade corporate bonds underperformed Treasuries.
During the period, the Fund’s investment-grade corporate and senior secured floating rate loans benefited performance. The Fund’s CMBS exposure aided results as did our allocation to non-agency residential mortgage-backed securities (RMBS) and security selection within the agency mortgage-backed securities (MBS) sector. Foreign currencies and exposure to non-U.S. yield curves also contributed to Fund performance. In contrast, the Fund’s positions in tax-exempt municipal bonds detracted from performance. U.S. yield curve positioning was a detractor as yield curve movements had a negative impact relative to the benchmark as the Fund’s defensive positioning underperformed the benchmark.
At period-end, we were slightly overweighted compared to the benchmark in many of the credit sectors, including high yield corporate securities and securitized products, based on our belief that valuations remained relatively attractive on a longer term basis. Over the period, we decreased our exposure to U.S. Treasury securities and fixed-rate MBS as we found better relative opportunities. We slightly decreased our exposure to CMBS and tax-exempt municipal bonds. In contrast, we increased our exposure to investment-grade corporate bonds and residential MBS and maintained significant exposure to international bonds and currencies.
franklintempleton.com
Semiannual Report | 29
FRANKLIN TOTAL RETURN FUND
The portfolio utilized derivatives, including credit default and currency swaps, currency forwards, Treasury futures, and currency, interest rate swap and credit default swap options, principally as a tool for efficient portfolio management and to manage overall portfolio risk. These derivative transactions may provide the same, or similar, net long or short exposure to select currencies, interest rates, countries, duration or credit risks in a less expensive way than by directly purchasing securities. In those markets where portfolio securities are readily available, the cost difference in normal market conditions may be small.
What is a credit default swap?
A credit default swap is an agreement between two parties whereby the buyer receives credit protection from the seller. The buyer makes periodic payments over the term of the agreement in return for a payment by the seller in the event of a default or other credit event.
What is an option?
An option is a contract to buy or sell a specific financial product known as the option’s underlying instrument at a specific price. The buyer of an option has the right, but not the obligation, to buy or sell the underlying instrument at or until a specified expiration date. Conversely, the seller (“writer”) of an option who opens a transaction is obligated to buy or sell the underlying instrument should the option holder exercise that right.
Thank you for your continued participation in Franklin Total Return Fund. We look forward to serving your future investment needs.

The foregoing information reflects our analysis, opinions and portfolio holdings as of April 30, 2015, the end of the reporting period. The way we implement our main investment strategies and the resulting portfolio holdings may change depending on factors such as market and economic conditions. These opinions may not be relied upon as investment advice or an offer for a particular security. The information is not a complete analysis of every aspect of any market, country, industry, security or the Fund. Statements of fact are from sources considered reliable, but the investment manager makes no representation or warranty as to their completeness or accuracy. Although historical performance is no guarantee of future results, these insights may help you understand our investment management philosophy.
30 | Semiannual Report
franklintempleton.com
FRANKLIN TOTAL RETURN FUND
Performance Summary as of April 30, 2015
Your dividend income will vary depending on dividends or interest paid by securities in the Fund’s portfolio, adjusted for operating expenses of each class. Capital gain distributions are net profits realized from the sale of portfolio securities. The performance tables do not reflect any taxes that a shareholder would pay on Fund dividends, capital gain distributions, if any, or any realized gains on the sale of Fund shares. Total return reflects reinvestment of the Fund’s dividends and capital gain distributions, if any, and any unrealized gains or losses.
| | | | | | |
| Net Asset Value | | | | | | |
| Share Class (Symbol) | | 4/30/15 | | 10/31/14 | | Change |
| A (FKBAX) | $ | 10.12 | $ | 10.18 | -$ | 0.06 |
| C (FCTLX) | $ | 10.09 | $ | 10.16 | -$ | 0.07 |
| R (FTRRX) | $ | 10.10 | $ | 10.17 | -$ | 0.07 |
| R6 (FRERX) | $ | 10.15 | $ | 10.20 | -$ | 0.05 |
| Advisor (FBDAX) | $ | 10.15 | $ | 10.20 | -$ | 0.05 |
| |
| |
| Distributions (11/1/14–4/30/15) | | | | | | |
| Dividend |
| Share Class | | Income | | | | |
| A | $ | 0.218493 | | | | |
| C | $ | 0.205691 | | | | |
| R | $ | 0.210497 | | | | |
| R6 | $ | 0.231508 | | | | |
| Advisor | $ | 0.226612 | | | | |
franklintempleton.com
Semiannual Report | 31
FRANKLIN TOTAL RETURN FUND
PERFORMANCE SUMMARY
Performance as of 4/30/151
Cumulative total return excludes sales charges. Average annual total returns include maximum sales charges. Class A: 4.25% maximum initial sales charge; Class C: 1% contingent deferred sales charge in first year only; Class R/R6/Advisor Class: no sales charges.
| | | | | | | | | | |
| | | | | | | | | |
| | Cumulative | | Average Annual | | Average Annual | | Total Annual Operating Expenses5 | |
| Share Class | Total Return2 | | Total Return3 | | Total Return (3/31/15)4 | | (with waiver) | | (without waiver) | |
| A | | | | | | | 0.89 | % | 0.94 | % |
| 6-Month | +1.58 | % | -2.72 | % | | | | | | |
| 1-Year | +4.07 | % | -0.39 | % | +0.88 | % | | | | |
| 5-Year | +27.10 | % | +4.01 | % | +4.39 | % | | | | |
| 10-Year | +62.55 | % | +4.52 | % | +4.65 | % | | | | |
| C | | | | | | | 1.29 | % | 1.34 | % |
| 6-Month | +1.35 | % | +0.36 | % | | | | | | |
| 1-Year | +3.64 | % | +2.64 | % | +3.91 | % | | | | |
| 5-Year | +24.62 | % | +4.50 | % | +4.90 | % | | | | |
| 10-Year | +56.09 | % | +4.55 | % | +4.70 | % | | | | |
| R | | | | | | | 1.14 | % | 1.19 | % |
| 6-Month | +1.40 | % | +1.40 | % | | | | | | |
| 1-Year | +3.76 | % | +3.76 | % | +5.03 | % | | | | |
| 5-Year | +25.58 | % | +4.66 | % | +5.04 | % | | | | |
| 10-Year | +58.48 | % | +4.71 | % | +4.85 | % | | | | |
| R6 | | | | | | | 0.46 | % | 0.51 | % |
| 6-Month | +1.80 | % | +1.80 | % | | | | | | |
| 1-Year | +4.50 | % | +4.50 | % | +5.65 | % | | | | |
| Since Inception (5/1/13) | +5.02 | % | +2.48 | % | +2.75 | % | | | | |
| Advisor | | | | | | | 0.64 | % | 0.69 | % |
| 6-Month | +1.75 | % | +1.75 | % | | | | | | |
| 1-Year | +4.37 | % | +4.37 | % | +5.62 | % | | | | |
| 5-Year | +28.77 | % | +5.19 | % | +5.57 | % | | | | |
| 10-Year | +66.55 | % | +5.23 | % | +5.38 | % | | | | |
| | | | | | |
| | | | | |
| | Distribution | | 30-Day Standardized Yield7 | |
| Share Class | Rate6 | | (with waiver) | | (without waiver) | |
| A | 1.83 | % | 1.69 | % | 1.66 | % |
| C | 1.53 | % | 1.38 | % | 1.33 | % |
| R | 1.67 | % | 1.52 | % | 1.49 | % |
| R6 | 2.29 | % | 2.18 | % | 2.13 | % |
| Advisor | 2.15 | % | 2.02 | % | 1.98 | % |
Performance data represent past performance, which does not guarantee future results. Investment return and principal value will fluctuate, and you may have a gain or loss when you sell your shares. Current performance may differ from figures shown. For most recent month-end performance, go to franklintempleton.com or call (800) 342-5236.
32 | Semiannual Report
franklintempleton.com
FRANKLIN TOTAL RETURN FUND
PERFORMANCE SUMMARY
All investments involve risks, including possible loss of principal. Interest rate movements and mortgage prepayments will affect the Fund’s share price and yield. Bond prices generally move in the opposite direction of interest rates. Thus, as prices of bonds in the Fund adjust to a rise in interest rates, the Fund’s share price may decline. Changes in the financial strength of a bond issuer or in a bond’s credit rating may affect its value. The risks associated with higher yielding, lower rated securities (commonly called junk bonds) include higher risk of default and loss of principal. Investment in foreign securities also involves special risks, including currency fluctuations, and political and economic uncertainty. Derivatives, including currency management strategies, involve costs and can create economic leverage in the portfolio that may result in significant volatility and cause the Fund to participate in losses (as well as enable gains) on an amount that exceeds the Fund’s initial investment. The Fund may not achieve the anticipated benefits, and may realize losses when a counterparty fails to perform as promised. The Fund is actively managed but there is no guarantee that the manager’s investment decisions will produce the desired results. The Fund’s prospectus also includes a description of the main investment risks.
| |
| Class C: | These shares have higher annual fees and expenses than Class A shares. |
| Class R: | Shares are available to certain eligible investors as described in the prospectus. These shares have higher annual fees and expenses than Class A shares. |
| Class R6: | Shares are available to certain eligible investors as described in the prospectus. |
| Advisor Class: | Shares are available to certain eligible investors as described in the prospectus. |
1. The Fund has an expense reduction contractually guaranteed through at least 2/29/16 and a fee waiver associated with its investments in a Franklin Templeton money
fund, contractually guaranteed through at least its current fiscal year-end. Fund investment results reflect the expense reduction and fee waiver, to the extent applicable;
without these reductions, the results would have been lower.
2. Cumulative total return represents the change in value of an investment over the periods indicated.
3. Average annual total return represents the average annual change in value of an investment over the periods indicated. Six-month return has not been annualized.
4. In accordance with SEC rules, we provide standardized average annual total return information through the latest calendar quarter.
5. Figures are as stated in the Fund’s current prospectus. In periods of market volatility, assets may decline significantly, causing total annual Fund operating expenses to
become higher than the figures shown.
6. Distribution rate is based on an annualization of the sum of the respective class’s past 30 days’ daily distributions and the maximum offering price (NAV for Classes C, R,
R6 and Advisor) per share on 4/30/15.
7. The 30-day standardized yield for the 30 days ended 4/30/15 reflects an estimated yield to maturity (assuming all portfolio securities are held to maturity). It should be
regarded as an estimate of the Fund’s rate of investment income, and it may not equal the Fund’s actual income distribution rate (which reflects the Fund’s past dividends
paid to shareholders) or the income reported in the Fund’s financial statements.
franklintempleton.com
Semiannual Report | 33
FRANKLIN TOTAL RETURN FUND
Your Fund’s Expenses
As a Fund shareholder, you can incur two types of costs:
- Transaction costs, including sales charges (loads) on Fund purchases; and
- Ongoing Fund costs, including management fees, distribu- tion and service (12b-1) fees, and other Fund expenses. All mutual funds have ongoing costs, sometimes referred to as operating expenses.
The following table shows ongoing costs of investing in the Fund and can help you understand these costs and compare them with those of other mutual funds. The table assumes a $1,000 investment held for the six months indicated.
Actual Fund Expenses
The first line (Actual) for each share class listed in the table provides actual account values and expenses. The “Ending Account Value” is derived from the Fund’s actual return, which includes the effect of Fund expenses.
You can estimate the expenses you paid during the period by following these steps. Of course, your account value and expenses will differ from those in this illustration:
| 1. | Divide your account value by $1,000. |
| | If an account had an $8,600 value, then $8,600 ÷ $1,000 = 8.6. |
| 2. | Multiply the result by the number under the heading “Expenses Paid During Period.” |
| | If Expenses Paid During Period were $7.50, then 8.6 x $7.50 = $64.50. |
In this illustration, the estimated expenses paid this period are $64.50.
Hypothetical Example for Comparison with Other Funds
Information in the second line (Hypothetical) for each class in the table can help you compare ongoing costs of investing in the Fund with those of other mutual funds. This information may not be used to estimate the actual ending account balance or expenses you paid during the period. The hypothetical “Ending Account Value” is based on the actual expense ratio for each class and an assumed 5% annual rate of return before expenses, which does not represent the Fund’s actual return. The figure under the heading “Expenses Paid During Period” shows the hypothetical expenses your account would have incurred under this scenario. You can compare this figure with the 5% hypothetical examples that appear in shareholder reports of other funds.
Please note that expenses shown in the table are meant to highlight ongoing costs and do not reflect any transaction costs, such as sales charges. Therefore, the second line for each class is useful in comparing ongoing costs only, and will not help you compare total costs of owning different funds. In addition, if transaction costs were included, your total costs would have been higher. Please refer to the Fund prospectus for additional information on operating expenses.
34 | Semiannual Report
franklintempleton.com
FRANKLIN TOTAL RETURN FUND
YOUR FUND’S EXPENSES
| | | | | | |
| | | Beginning Account | | Ending Account | | Expenses Paid During |
| Share Class | | Value 11/1/14 | | Value 4/30/15 | | Period* 11/1/14–4/30/15 |
| A | | | | | | |
| Actual | $ | 1,000 | $ | 1,015.80 | $ | 4.35 |
| Hypothetical (5% return before expenses) | $ | 1,000 | $ | 1,020.48 | $ | 4.36 |
| C | | | | | | |
| Actual | $ | 1,000 | $ | 1,013.50 | $ | 6.34 |
| Hypothetical (5% return before expenses) | $ | 1,000 | $ | 1,018.50 | $ | 6.36 |
| R | | | | | | |
| Actual | $ | 1,000 | $ | 1,014.00 | $ | 5.59 |
| Hypothetical (5% return before expenses) | $ | 1,000 | $ | 1,019.24 | $ | 5.61 |
| R6 | | | | | | |
| Actual | $ | 1,000 | $ | 1,018.00 | $ | 2.30 |
| Hypothetical (5% return before expenses) | $ | 1,000 | $ | 1,022.51 | $ | 2.31 |
| Advisor | | | | | | |
| Actual | $ | 1,000 | $ | 1,017.50 | $ | 3.10 |
| Hypothetical (5% return before expenses) | $ | 1,000 | $ | 1,021.72 | $ | 3.11 |
*Expenses are calculated using the most recent six-month expense ratio, net of expense waivers, annualized for each class (A: 0.87%;
C: 1.27%; R: 1.12%; R6: 0.46%; and Advisor: 0.62%), multiplied by the average account value over the period, multiplied by 181/365
to reflect the one-half year period.
franklintempleton.com
Semiannual Report | 35
| | | | | | | | | | | | | | | | | | |
| FRANKLIN INVESTORS SECURITIES TRUST | | | | | | | | | | | | | | | | |
| |
| |
| Financial Highlights | | | | | | | | | | | | | | | | | | |
| Franklin Adjustable U.S. Government Securities Fund | | | | | | | | | | | | | | | | |
| | | Six Months Ended | | | | | | | | | | | | | | | | |
| | | April 30, 2015 | | | | | | Year Ended October 31, | | | | |
| | | (unaudited) | | | 2014 | | | 2013 | | | 2012 | | | 2011 | | | 2010 | |
| Class A | | | | | | | | | | | | | | | | | | |
| Per share operating performance | | | | | | | | | | | | | | | | | | |
| (for a share outstanding throughout the period) | | | | | | | | | | | | | | | | | | |
| Net asset value, beginning of period | $ | 8.67 | | $ | 8.72 | | $ | 8.90 | | $ | 8.84 | | $ | 8.90 | | $ | 8.96 | |
| Income from investment operationsa: | | | | | | | | | | | | | | | | | | |
| Net investment income | | 0.021 | | | 0.043 | | | 0.048 | | | 0.078 | | | 0.103 | | | 0.109 | |
| Net realized and unrealized gains (losses) | | (0.012 | ) | | 0.006 | | | (0.098 | ) | | 0.117 | | | 0.011 | | | 0.073 | |
| Total from investment operations | | 0.009 | | | 0.049 | | | (0.050 | ) | | 0.195 | | | 0.114 | | | 0.182 | |
| Less distributions from net investment | | | | | | | | | | | | | | | | | | |
| income | | (0.049 | ) | | (0.099 | ) | | (0.130 | ) | | (0.135 | ) | | (0.174 | ) | | (0.242 | ) |
| Net asset value, end of period | $ | 8.63 | | $ | 8.67 | | $ | 8.72 | | $ | 8.90 | | $ | 8.84 | | $ | 8.90 | |
| |
| Total returnb | | 0.11 | % | | 0.56 | % | | (0.56 | )% | | 2.22 | % | | 1.30 | % | | 2.06 | % |
| |
| Ratios to average net assetsc | | | | | | | | | | | | | | | | | | |
| Expenses | | 0.92 | %d | | 0.93 | %d | | 0.87 | % | | 0.87 | % | | 0.86 | % | | 0.86 | % |
| Net investment income | | 0.49 | % | | 0.48 | % | | 0.63 | % | | 0.91 | % | | 1.16 | % | | 1.24 | % |
| |
| Supplemental data | | | | | | | | | | | | | | | | | | |
| Net assets, end of period (000’s) | $ | 1,012,126 | | $ | 1,058,838 | | $ | 1,105,674 | | $ | 1,308,971 | | $ | 1,470,029 | | $ | 1,536,981 | |
| Portfolio turnover rate | | 3.52 | % | | 14.18 | % | | 8.66 | % | | 9.69 | % | | 19.65 | % | | 43.37 | % |
aThe amount shown for a share outstanding throughout the period may not correlate with the Statement of Operations for the period due to the timing of sales and
repurchases of the Fund shares in relation to income earned and/or fluctuating fair value of the investments of the Fund.
bTotal return does not reflect sales commissions or contingent deferred sales charges, if applicable, and is not annualized for periods less than one year.
cRatios are annualized for periods less than one year.
dBenefit of waiver and payments by affiliates and expense reduction rounds to less than 0.01%.
36 | Semiannual Report | The accompanying notes are an integral part of these financial statements. franklintempleton.com
| | | | | | |
| | | FRANKLIN INVESTORS SECURITIES TRUST | |
| | | FINANCIAL HIGHLIGHTS | |
| |
| |
| |
| Franklin Adjustable U.S. Government Securities Fund (continued) | | | | | | |
| | | Six Months Ended | | | | |
| | | April 30, 2015 | | | Period Ended | |
| | | (unaudited) | | | October 31, 2014a | |
| Class A1 | | | | | | |
| Per share operating performance | | | | | | |
| (for a share outstanding throughout the period) | | | | | | |
| Net asset value, beginning of period | $ | 8.67 | | $ | 8.68 | |
| Income from investment operations: | | | | | | |
| Net investment incomeb | | 0.028 | | | 0.018 | |
| Net realized and unrealized gains (losses) | | (0.020 | ) | | 0.010 | |
| Total from investment operations | | 0.008 | | | 0.028 | |
| Less distributions from net investment income | | (0.058 | ) | | (0.038 | ) |
| Net asset value, end of period | $ | 8.62 | | $ | 8.67 | |
| |
| Total returnc | | 0.09 | % | | 0.32 | % |
| |
| Ratios to average net assetsd | | | | | | |
| Expensese | | 0.76 | % | | 0.78 | % |
| Net investment income | | 0.65 | % | | 0.63 | % |
| |
| Supplemental data | | | | | | |
| Net assets, end of period (000’s) | $ | 219,920 | | $ | 253,021 | |
| Portfolio turnover rate | | 3.52 | % | | 14.18 | % |
aFor the period June 18, 2014 (effective date) to October 31, 2014.
bThe amount shown for a share outstanding throughout the period may not correlate with the Statement of Operations for the period due to the timing of sales and
repurchases of the Fund shares in relation to income earned and/or fluctuating fair value of the investments of the Fund.
cTotal return does not reflect sales commissions or contingent deferred sales charges, if applicable, and is not annualized for periods less than one year.
dRatios are annualized for periods less than one year.
eBenefit of waiver and payments by affiliates and expense reduction rounds to less than 0.01%.
franklintempleton.com The accompanying notes are an integral part of these financial statements. | Semiannual Report | 37
| | | | | | | | | | | | | | | | | | |
| FRANKLIN INVESTORS SECURITIES TRUST | | | | | | | | | | | | | | | | |
| FINANCIAL HIGHLIGHTS | | | | | | | | | | | | | | | | | | |
| |
| |
| |
| Franklin Adjustable U.S. Government Securities Fund (continued) | | | | | | | | | | | | | |
| | | Six Months Ended | | | | | | | | | | | | | | | | |
| | | April 30, 2015 | | | | | | Year Ended October 31, | | | | |
| | | (unaudited) | | | 2014 | | | 2013 | | | 2012 | | | 2011 | | | 2010 | |
| Class C | | | | | | | | | | | | | | | | | | |
| Per share operating performance | | | | | | | | | | | | | | | | | | |
| (for a share outstanding throughout the period) | | | | | | | | | | | | | | | | | | |
| Net asset value, beginning of period | $ | 8.66 | | $ | 8.71 | | $ | 8.90 | | $ | 8.83 | | $ | 8.89 | | $ | 8.96 | |
| Income from investment operationsa: | | | | | | | | | | | | | | | | | | |
| Net investment income (loss) | | (0.001 | ) | | (0.004 | ) | | 0.006 | | | 0.042 | | | 0.064 | | | 0.087 | |
| Net realized and unrealized gains (losses) | | (0.007 | ) | | 0.018 | | | (0.101 | ) | | 0.128 | | | 0.015 | | | 0.049 | |
| Total from investment operations | | (0.008 | ) | | 0.014 | | | (0.095 | ) | | 0.170 | | | 0.079 | | | 0.136 | |
| Less distributions from net investment | | | | | | | | | | | | | | | | | | |
| income | | (0.032 | ) | | (0.064 | ) | | (0.095 | ) | | (0.100 | ) | | (0.139 | ) | | (0.206 | ) |
| Net asset value, end of period | $ | 8.62 | | $ | 8.66 | | $ | 8.71 | | $ | 8.90 | | $ | 8.83 | | $ | 8.89 | |
| |
| Total returnb | | (0.10 | )% | | 0.16 | % | | (1.07 | )% | | 1.93 | % | | 0.89 | % | | 1.53 | % |
| |
| Ratios to average net assetsc | | | | | | | | | | | | | | | | | | |
| Expenses | | 1.32 | %d | | 1.33 | %d | | 1.27 | % | | 1.27 | % | | 1.26 | % | | 1.26 | % |
| Net investment income | | 0.09 | % | | 0.08 | % | | 0.23 | % | | 0.51 | % | | 0.76 | % | | 0.84 | % |
| |
| Supplemental data | | | | | | | | | | | | | | | | | | |
| Net assets, end of period (000’s) | $ | 373,397 | | $ | 428,031 | | $ | 603,067 | | $ | 794,201 | | $ | 856,366 | | $ | 956,002 | |
| Portfolio turnover rate | | 3.52 | % | | 14.18 | % | | 8.66 | % | | 9.69 | % | | 19.65 | % | | 43.37 | % |
aThe amount shown for a share outstanding throughout the period may not correlate with the Statement of Operations for the period due to the timing of sales and
repurchases of the Fund shares in relation to income earned and/or fluctuating fair value of the investments of the Fund.
bTotal return does not reflect sales commissions or contingent deferred sales charges, if applicable, and is not annualized for periods less than one year.
cRatios are annualized for periods less than one year.
dBenefit of waiver and payments by affiliates and expense reduction rounds to less than 0.01%.
38 | Semiannual Report | The accompanying notes are an integral part of these financial statements. franklintempleton.com
| | | | | | | | | |
| | | FRANKLIN INVESTORS SECURITIES TRUST | |
| | | FINANCIAL HIGHLIGHTS | |
| |
| |
| |
| Franklin Adjustable U.S. Government Securities Fund (continued) | | | | | | | | | |
| | | Six Months Ended | | | Year Ended | |
| | | April 30, 2015 | | | October 31, | |
| | | (unaudited) | | | 2014 | | | 2013 | a |
| Class R6 | | | | | | | | | |
| Per share operating performance | | | | | | | | | |
| (for a share outstanding throughout the period) | | | | | | | | | |
| Net asset value, beginning of period | $ | 8.68 | | $ | 8.73 | | $ | 8.72 | |
| Income from investment operationsb: | | | | | | | | | |
| Net investment income | | 0.031 | | | 0.088 | c | | 0.008 | |
| Net realized and unrealized gains (losses) | | (0.004 | ) | | (0.009 | ) | | 0.018 | |
| Total from investment operations | | 0.027 | | | 0.079 | | | 0.026 | |
| Less distributions from net investment income | | (0.067 | ) | | (0.129 | ) | | (0.016 | ) |
| Net asset value, end of period | $ | 8.64 | | $ | 8.68 | | $ | 8.73 | |
| |
| Total returnd | | 0.32 | % | | 0.92 | % | | 0.30 | % |
| |
| Ratios to average net assetse | | | | | | | | | |
| Expenses | | 0.53 | %f | | 0.56 | %f | | 0.53 | % |
| Net investment income | | 0.88 | % | | 0.85 | % | | 0.97 | % |
| |
| Supplemental data | | | | | | | | | |
| Net assets, end of period (000’s) | $ | 5,437 | | $ | 7,193 | | $ | 335 | |
| Portfolio turnover rate | | 3.52 | % | | 14.18 | % | | 8.66 | % |
aFor the period September 20, 2013 (effective date) to October 31, 2013.
bThe amount shown for a share outstanding throughout the period may not correlate with the Statement of Operations for the period due to the timing of sales and
repurchases of the Fund shares in relation to income earned and/or fluctuating fair value of the investments of the Fund.
cBased on average daily shares outstanding.
dTotal return is not annualized for periods less than one year.
eRatios are annualized for periods less than one year.
fBenefit of waiver and payments by affiliates and expense reduction rounds to less than 0.01%.
franklintempleton.com The accompanying notes are an integral part of these financial statements. | Semiannual Report | 39
| | | | | | | | | | | | | | | | | | |
| FRANKLIN INVESTORS SECURITIES TRUST | | | | | | | | | | | | | | | | |
| FINANCIAL HIGHLIGHTS | | | | | | | | | | | | | | | | | | |
| |
| |
| |
| Franklin Adjustable U.S. Government Securities Fund (continued) | | | | | | | | | | | | | |
| | | Six Months Ended | | | | | | | | | | | | | | | | |
| | | April 30, 2015 | | | | | | Year Ended October 31, | | | | |
| | | (unaudited) | | | 2014 | | | 2013 | | | 2012 | | | 2011 | | | 2010 | |
| Advisor Class | | | | | | | | | | | | | | | | | | |
| Per share operating performance | | | | | | | | | | | | | | | | | | |
| (for a share outstanding throughout the period) | | | | | | | | | | | | | | | | | | |
| Net asset value, beginning of period | $ | 8.68 | | $ | 8.73 | | $ | 8.91 | | $ | 8.85 | | $ | 8.91 | | $ | 8.97 | |
| Income from investment operationsa: | | | | | | | | | | | | | | | | | | |
| Net investment income | | 0.026 | | | 0.068 | | | 0.073 | | | 0.107 | | | 0.139 | | | 0.181 | |
| Net realized and unrealized gains (losses) | | (0.006 | ) | | 0.003 | | | (0.101 | ) | | 0.111 | | | (0.002 | ) | | 0.024 | |
| Total from investment operations | | 0.020 | | | 0.071 | | | (0.028 | ) | | 0.218 | | | 0.137 | | | 0.205 | |
| Less distributions from net investment | | | | | | | | | | | | | | | | | | |
| income | | (0.060 | ) | | (0.121 | ) | | (0.152 | ) | | (0.158 | ) | | (0.197 | ) | | (0.265 | ) |
| Net asset value, end of period | $ | 8.64 | | $ | 8.68 | | $ | 8.73 | | $ | 8.91 | | $ | 8.85 | | $ | 8.91 | |
| |
| Total returnb | | 0.23 | % | | 0.82 | % | | (0.31 | )% | | 2.48 | % | | 1.55 | % | | 2.31 | % |
| |
| Ratios to average net assetsc | | | | | | | | | | | | | | | | | | |
| Expenses | | 0.67 | %d | | 0.68 | %d | | 0.62 | % | | 0.62 | % | | 0.61 | % | | 0.61 | % |
| Net investment income | | 0.74 | % | | 0.73 | % | | 0.88 | % | | 1.16 | % | | 1.41 | % | | 1.49 | % |
| |
| Supplemental data | | | | | | | | | | | | | | | | | | |
| Net assets, end of period (000’s) | $ | 348,833 | | $ | 416,854 | | $ | 411,228 | | $ | 437,540 | | $ | 489,675 | | $ | 368,400 | |
| Portfolio turnover rate | | 3.52 | % | | 14.18 | % | | 8.66 | % | | 9.69 | % | | 19.65 | % | | 43.37 | % |
aThe amount shown for a share outstanding throughout the period may not correlate with the Statement of Operations for the period due to the timing of sales and
repurchases of the Fund shares in relation to income earned and/or fluctuating fair value of the investments of the Fund.
bTotal return is not annualized for periods less than one year.
cRatios are annualized for periods less than one year.
dBenefit of waiver and payments by affiliates and expense reduction rounds to less than 0.01%.
40 | Semiannual Report | The accompanying notes are an integral part of these financial statements. franklintempleton.com
| | | | |
| | | FRANKLIN INVESTORS SECURITIES TRUST |
| |
| |
| |
| |
| Statement of Investments, April 30, 2015 (unaudited) | | | | |
| |
| Franklin Adjustable U.S. Government Securities Fund | | | | |
| | | Principal | | |
| | | Amount | | Value |
| Mortgage-Backed Securities 94.1% | | | | |
| aFederal Home Loan Mortgage Corp. (FHLMC) Adjustable Rate 24.4% | | | | |
| FHLMC, 1.845%, 9/01/35 | $ | 18,137,823 | $ | 19,218,152 |
| FHLMC, 1.904%, 4/01/36 | | 10,745,158 | | 11,296,104 |
| FHLMC, 2.03%, 4/01/35 | | 14,312,875 | | 15,051,527 |
| FHLMC, 2.067%, 1/01/36 | | 9,242,751 | | 9,872,124 |
| FHLMC, 2.125%, 4/01/38 | | 9,408,000 | | 10,004,009 |
| FHLMC, 2.171%, 9/01/36 | | 9,093,685 | | 9,713,608 |
| FHLMC, 0.76% - 2.185%, 11/01/16 - 4/01/42 | | 18,542,812 | | 19,530,270 |
| FHLMC, 2.187% - 2.266%, 1/01/18 - 7/01/38 | | 16,850,445 | | 17,921,565 |
| FHLMC, 2.266% - 2.294%, 11/01/17 - 9/01/37 | | 15,228,153 | | 16,228,932 |
| FHLMC, 2.298%, 11/01/37 | | 10,563,720 | | 11,360,560 |
| FHLMC, 2.295% - 2.311%, 4/01/25 - 4/01/40 | | 16,937,320 | | 17,987,098 |
| FHLMC, 2.312%, 9/01/37 | | 53,281,071 | | 56,863,182 |
| FHLMC, 2.33%, 12/01/35 | | 10,098,972 | | 10,767,948 |
| FHLMC, 2.312% - 2.337%, 10/01/22 - 3/01/39 | | 17,316,949 | | 18,461,569 |
| FHLMC, 2.337% - 2.35%, 9/01/24 - 6/01/41 | | 16,053,902 | | 17,198,643 |
| FHLMC, 2.35% - 2.37%, 1/01/19 - 11/01/41 | | 18,005,941 | | 19,254,624 |
| FHLMC, 2.371%, 9/01/38 | | 9,701,028 | | 10,355,939 |
| FHLMC, 2.37% - 2.393%, 5/01/18 - 10/01/41 | | 15,784,005 | | 16,870,014 |
| FHLMC, 2.407%, 11/01/36 | | 9,272,404 | | 9,908,376 |
| FHLMC, 2.393% - 2.431%, 12/01/19 - 9/01/41 | | 18,318,190 | | 19,583,144 |
| FHLMC, 2.432% - 2.467%, 3/01/19 - 9/01/37 | | 17,124,096 | | 18,327,586 |
| FHLMC, 2.476%, 9/01/37 | | 13,996,674 | | 14,904,273 |
| FHLMC, 2.521%, 1/01/37 | | 9,376,266 | | 10,085,540 |
| FHLMC, 2.527%, 6/01/37 | | 18,776,669 | | 20,132,299 |
| FHLMC, 2.467% - 2.622%, 11/01/18 - 5/01/42 | | 18,189,033 | | 19,390,146 |
| FHLMC, 2.776%, 7/01/38 | | 20,330,369 | | 21,624,134 |
| FHLMC, 3.359%, 11/01/40 | | 15,263,816 | | 16,139,113 |
| FHLMC, 2.622% - 6.635%, 3/01/17 - 7/01/41 | | 18,282,481 | | 19,357,769 |
| | | | | 477,408,248 |
| aFederal National Mortgage Association (FNMA) Adjustable Rate 69.0% | | |
| FNMA, 0.848% - 1.692%, 6/01/15 - 11/01/44 | | 18,713,426 | | 19,450,150 |
| FNMA, 1.695% - 1.819%, 7/01/17 - 4/01/38 | | 18,451,854 | | 19,399,824 |
| FNMA, 1.846%, 1/01/35 | | 13,054,437 | | 13,699,211 |
| FNMA, 1.82% - 1.87%, 12/01/15 - 2/01/39 | | 18,156,134 | | 19,139,370 |
| FNMA, 1.885%, 1/01/36 | | 8,321,676 | | 8,820,883 |
| FNMA, 1.893%, 12/01/34 | | 18,830,023 | | 19,788,016 |
| FNMA, 1.873% - 1.905%, 7/01/17 - 6/01/37 | | 16,981,914 | | 17,839,317 |
| FNMA, 1.905% - 1.913%, 6/01/20 - 8/01/37 | | 18,220,056 | | 19,287,372 |
| FNMA, 1.921%, 3/01/35 | | 10,187,040 | | 10,705,487 |
| FNMA, 1.925%, 5/01/35 | | 9,265,016 | | 9,738,434 |
| FNMA, 1.914% - 1.94%, 11/01/16 - 4/01/36 | | 18,300,187 | | 19,322,404 |
| FNMA, 1.94% - 1.953%, 2/01/17 - 11/01/40 | | 15,943,058 | | 16,765,721 |
| FNMA, 1.955% - 1.967%, 4/01/18 - 10/01/37 | | 13,429,819 | | 14,207,388 |
| FNMA, 1.967% - 1.989%, 1/01/18 - 12/01/43 | | 18,436,888 | | 19,483,183 |
| FNMA, 2.002%, 2/01/36 | | 18,635,962 | | 19,724,895 |
| FNMA, 1.99% - 2.015%, 11/01/17 - 5/01/38 | | 10,916,163 | | 11,575,112 |
| FNMA, 2.015% - 2.02%, 12/01/17 - 3/01/37 | | 15,350,099 | | 16,162,992 |
| FNMA, 2.021% - 2.044%, 3/01/18 - 9/01/43 | | 14,685,381 | | 15,527,555 |
| FNMA, 2.044% - 2.075%, 10/01/22 - 3/01/43 | | 17,977,182 | | 19,066,929 |
| FNMA, 2.082%, 1/01/36 | | 15,167,163 | | 16,118,191 |
franklintempleton.com Semiannual Report | 41
| | | | |
| FRANKLIN INVESTORS SECURITIES TRUST | | | | |
| STATEMENT OF INVESTMENTS (UNAUDITED) | | | | |
| |
| |
| |
| |
| Franklin Adjustable U.S. Government Securities Fund (continued) | | | | |
| | | Principal | | |
| | | Amount | | Value |
| Mortgage-Backed Securities (continued) | | | | |
| aFederal National Mortgage Association (FNMA) Adjustable Rate (continued) | | | | |
| FNMA, 2.075% - 2.095%, 12/01/17 - 4/01/38 | $ | 18,327,415 | $ | 19,430,255 |
| FNMA, 2.099%, 5/01/39 | | 16,209,507 | | 17,173,764 |
| FNMA, 2.096% - 2.114%, 4/01/18 - 11/01/37 | | 18,360,677 | | 19,524,081 |
| FNMA, 2.116%, 8/01/39 | | 13,642,619 | | 14,488,868 |
| FNMA, 2.125%, 11/01/34 | | 10,679,529 | | 11,360,270 |
| FNMA, 2.115% - 2.13%, 10/01/16 - 8/01/36 | | 17,174,668 | | 18,244,639 |
| FNMA, 2.13% - 2.15%, 11/01/17 - 1/01/37 | | 16,710,386 | | 17,788,168 |
| FNMA, 2.171%, 2/01/36 | | 11,433,377 | | 12,193,179 |
| FNMA, 2.15% - 2.171%, 7/01/19 - 7/01/42 | | 17,082,230 | | 18,228,563 |
| FNMA, 2.179%, 2/01/36 | | 11,023,841 | | 11,792,239 |
| FNMA, 2.171% - 2.182%, 8/01/18 - 11/01/39 | | 18,294,660 | | 19,545,602 |
| FNMA, 2.182% - 2.191%, 8/01/22 - 8/01/39 | | 17,503,028 | | 18,637,016 |
| FNMA, 2.192% - 2.204%, 7/01/17 - 4/01/38 | | 16,533,465 | | 17,605,976 |
| FNMA, 2.206%, 1/01/38 | | 19,195,475 | | 20,465,145 |
| FNMA, 2.204% - 2.207%, 1/01/24 - 12/01/39 | | 16,577,409 | | 17,688,298 |
| FNMA, 2.208% - 2.22%, 1/01/19 - 3/01/41 | | 18,315,131 | | 19,506,378 |
| FNMA, 2.22% - 2.23%, 3/01/18 - 2/01/37 | | 18,176,449 | | 19,397,082 |
| FNMA, 2.23% - 2.237%, 9/01/17 - 9/01/38 | | 15,569,928 | | 16,599,755 |
| FNMA, 2.238% - 2.244%, 11/01/20 - 9/01/38 | | 15,505,957 | | 16,523,601 |
| FNMA, 2.247%, 1/01/38 | | 11,181,404 | | 11,965,144 |
| FNMA, 2.259%, 11/01/34 | | 10,407,252 | | 11,063,061 |
| FNMA, 2.244% - 2.267%, 6/01/19 - 9/01/40 | | 18,141,595 | | 19,322,641 |
| FNMA, 2.273%, 3/01/35 | | 16,367,469 | | 17,388,683 |
| FNMA, 2.267% - 2.28%, 7/01/23 - 5/01/48 | | 18,055,406 | | 19,244,856 |
| FNMA, 2.28% - 2.284%, 4/01/33 - 9/01/39 | | 15,724,497 | | 16,770,899 |
| FNMA, 2.287%, 9/01/36 | | 11,747,165 | | 12,477,850 |
| FNMA, 2.289%, 1/01/39 | | 10,449,095 | | 11,094,562 |
| FNMA, 2.284% - 2.295%, 5/01/22 - 5/01/37 | | 17,653,267 | | 18,797,515 |
| FNMA, 2.303%, 5/01/38 | | 17,579,181 | | 18,713,310 |
| FNMA, 2.295% - 2.303%, 11/01/20 - 11/01/41 | | 18,355,713 | | 19,564,796 |
| FNMA, 2.31%, 12/01/36 | | 14,391,155 | | 15,319,779 |
| FNMA, 2.303% - 2.311%, 4/01/19 - 1/01/42 | | 17,041,820 | | 18,129,915 |
| FNMA, 2.312%, 3/01/38 | | 9,344,113 | | 9,999,019 |
| FNMA, 2.312% - 2.318%, 7/01/22 - 9/01/38 | | 18,307,109 | | 19,531,720 |
| FNMA, 2.318% - 2.324%, 9/01/22 - 3/01/40 | | 16,894,823 | | 18,007,669 |
| FNMA, 2.324% - 2.329%, 1/01/18 - 11/01/42 | | 17,348,262 | | 18,494,348 |
| FNMA, 2.329% - 2.338%, 3/01/21 - 4/01/40 | | 18,125,140 | | 19,347,722 |
| FNMA, 2.346%, 1/01/38 | | 12,838,175 | | 13,634,903 |
| FNMA, 2.339% - 2.355%, 11/01/18 - 9/01/39 | | 17,471,410 | | 18,617,556 |
| FNMA, 2.355% - 2.358%, 6/01/32 - 8/01/36 | | 15,143,347 | | 16,199,576 |
| FNMA, 2.359%, 2/01/37 | | 10,651,556 | | 11,473,619 |
| FNMA, 2.358% - 2.361%, 5/01/33 - 12/01/37 | | 15,117,686 | | 16,123,812 |
| FNMA, 2.361% - 2.366%, 7/01/18 - 7/01/40 | | 16,011,280 | | 17,135,676 |
| FNMA, 2.367%, 1/01/37 | | 11,619,074 | | 12,410,788 |
| FNMA, 2.371%, 11/01/37 | | 17,820,619 | | 19,009,520 |
| FNMA, 2.366% - 2.382%, 12/01/18 - 1/01/39 | | 17,630,380 | | 18,753,985 |
| FNMA, 2.382% - 2.407%, 10/01/18 - 5/01/48 | | 16,998,280 | | 18,110,852 |
| FNMA, 2.414%, 1/01/36 | | 9,727,105 | | 10,443,473 |
| FNMA, 2.407% - 2.423%, 10/01/17 - 9/01/39 | | 18,298,616 | | 19,514,624 |
| FNMA, 2.423%, 6/01/35 | | 8,514,717 | | 9,172,668 |
| FNMA, 2.435%, 3/01/35 | | 8,596,945 | | 9,254,825 |
42 | Semiannual Report franklintempleton.com
FRANKLIN INVESTORS SECURITIES TRUST
STATEMENT OF INVESTMENTS (UNAUDITED)
| | | | |
| Franklin Adjustable U.S. Government Securities Fund (continued) | | | | |
| | | Principal | | |
| | | Amount | | Value |
| Mortgage-Backed Securities (continued) | | | | |
| aFederal National Mortgage Association (FNMA) Adjustable Rate (continued) | | | | |
| FNMA, 2.44%, 9/01/35 | $ | 8,781,858 | $ | 9,397,729 |
| FNMA, 2.423% - 2.442%, 5/01/18 - 1/01/40 | | 18,210,299 | | 19,458,426 |
| FNMA, 2.445%, 1/01/36 | | 10,067,652 | | 10,897,305 |
| FNMA, 2.442% - 2.471%, 7/01/17 - 3/01/47 | | 16,608,896 | | 17,811,464 |
| FNMA, 2.472%, 7/01/46 | | 13,809,433 | | 14,792,406 |
| FNMA, 2.473% - 2.50%, 5/01/17 - 4/01/44 | | 15,444,707 | | 16,492,098 |
| FNMA, 2.503% - 2.548%, 9/01/17 - 1/01/42 | | 17,543,902 | | 18,679,969 |
| FNMA, 2.579%, 5/01/40 | | 10,386,827 | | 11,171,440 |
| FNMA, 2.55% - 2.75%, 5/01/16 - 10/01/41 | | 18,399,480 | | 19,388,475 |
| FNMA, 2.959%, 3/01/41 | | 16,330,980 | | 17,457,895 |
| FNMA, 2.752% - 3.075%, 11/01/16 - 11/01/46 | | 18,259,586 | | 19,433,258 |
| FNMA, 3.078% - 6.387%, 11/01/15 - 4/01/41 | | 18,339,248 | | 19,382,540 |
| FNMA, 6.989% - 8.125%, 2/01/20 - 3/01/25 | | 296,700 | | 304,289 |
| | | | | 1,351,771,973 |
| aGovernment National Mortgage Association (GNMA) Adjustable Rate 0.7% | | | | |
| GNMA, 1.625% - 3.00%, 3/20/16 - 5/20/36 | | 14,375,714 | | 14,911,480 |
| Total Mortgage-Backed Securities (Cost $1,812,538,384) | | | | 1,844,091,701 |
| U.S. Government and Agency Securities 3.0% | | | | |
| U.S. Treasury Note, | | | | |
| 1.25%, 10/31/15 | | 6,000,000 | | 6,034,452 |
| 1.375%, 11/30/15 | | 30,000,000 | | 30,217,980 |
| 4.125%, 5/15/15 | | 15,000,000 | | 15,024,030 |
| 4.25%, 8/15/15 | | 8,000,000 | | 8,098,440 |
| Total U.S. Government and Agency Securities (Cost $59,308,936) | | | | 59,374,902 |
| Total Investments before Short Term Investments (Cost $1,871,847,320) | | | | 1,903,466,603 |
| |
| | | Shares | | |
| |
| Short Term Investments (Cost $49,863,762) 2.6% | | | | |
| Money Market Funds 2.6% | | | | |
| b,cInstitutional Fiduciary Trust Money Market Portfolio | | 49,863,762 | | 49,863,762 |
| Total Investments (Cost $1,921,711,082) 99.7% | | | | 1,953,330,365 |
| Other Assets, less Liabilities 0.3% | | | | 6,382,261 |
| Net Assets 100.0% | | | $ | 1,959,712,626 |
See Abbreviations on page 140.
aThe coupon rate shown represents the rate at period end.
bNon-income producing.
cSee Note 3(f) regarding investments in Institutional Fiduciary Trust Money Market Portfolio.
franklintempleton.com The accompanying notes are an integral part of these financial statements. | Semiannual Report | 43
| | | | | | | | | | | | | | | | | | |
| FRANKLIN INVESTORS SECURITIES TRUST | | | | | | | | | | | | | | | | |
| |
| |
| Financial Highlights | | | | | | | | | | | | | | | | | | |
| Franklin Floating Rate Daily Access Fund | | | | | | | | | | | | | | | | |
| | | Six Months Ended | | | | | | | | | | | | | | | | |
| | | April 30, 2015 | | | | | | Year Ended October 31, | | | | |
| | | (unaudited) | | | 2014 | | | 2013 | | | 2012 | | | 2011 | | | 2010 | |
| Class A | | | | | | | | | | | | | | | | | | |
| Per share operating performance | | | | | | | | | | | | | | | | | | |
| (for a share outstanding throughout the period) | | | | | | | | | | | | | | | | | | |
| Net asset value, beginning of period | $ | 9.04 | | $ | 9.20 | | $ | 9.11 | | $ | 8.89 | | $ | 9.11 | | $ | 8.73 | |
| Income from investment operationsa: | | | | | | | | | | | | | | | | | | |
| Net investment income | | 0.207 | | | 0.335 | | | 0.333 | | | 0.403 | | | 0.418 | | | 0.370 | |
| Net realized and unrealized gains (losses) | | (0.011 | ) | | (0.160 | ) | | 0.088 | | | 0.225 | | | (0.220 | ) | | 0.376 | |
| Total from investment operations | | 0.196 | | | 0.175 | | | 0.421 | | | 0.628 | | | 0.198 | | | 0.746 | |
| Less distributions from net investment | | | | | | | | | | | | | | | | | | |
| income | | (0.206 | ) | | (0.335 | ) | | (0.331 | ) | | (0.408 | ) | | (0.418 | ) | | (0.366 | ) |
| Net asset value, end of period | $ | 9.03 | | $ | 9.04 | | $ | 9.20 | | $ | 9.11 | | $ | 8.89 | | $ | 9.11 | |
| |
| Total returnb | | 2.21 | % | | 1.91 | % | | 4.69 | % | | 7.22 | % | | 2.17 | % | | 8.69 | % |
| |
| Ratios to average net assetsc | | | | | | | | | | | | | | | | | | |
| Expenses before waiver and payments by | | | | | | | | | | | | | | | | | | |
| affiliates | | 0.87 | % | | 0.84 | % | | 0.83 | % | | 0.90 | % | | 0.89 | % | | 0.95 | % |
| Expenses net of waiver and payments by | | | | | | | | | | | | | | | | | | |
| affiliates | | 0.86 | %d | | 0.82 | %d | | 0.83 | %d,e | | 0.90 | % | | 0.89 | %d | | 0.95 | %d |
| Net investment income | | 4.66 | % | | 3.64 | % | | 3.60 | % | | 4.52 | % | | 4.56 | % | | 4.15 | % |
| |
| Supplemental data | | | | | | | | | | | | | | | | | | |
| Net assets, end of period (000’s) | $ | 1,664,782 | | $ | 1,874,867 | | $ | 1,991,138 | | $ | 1,295,166 | | $ | 1,246,489 | | $ | 1,082,656 | |
| Portfolio turnover rate | | 16.52 | % | | 83.93 | % | | 42.72 | % | | 80.88 | % | | 126.99 | % | | 82.13 | % |
aThe amount shown for a share outstanding throughout the period may not correlate with the Statement of Operations for the period due to the timing of sales and
repurchases of the Fund shares in relation to income earned and/or fluctuating fair value of the investments of the Fund.
bTotal return does not reflect sales commissions or contingent deferred sales charges, if applicable, and is not annualized for periods less than one year.
cRatios are annualized for periods less than one year.
dBenefit of expense reduction rounds to less than 0.01%.
eBenefit of waiver and payments by affiliates rounds to less than 0.01%.
44 | Semiannual Report | The accompanying notes are an integral part of these financial statements. franklintempleton.com
| | | | | | | | | | | | | | | | | | |
| | | | | | | | | FRANKLIN INVESTORS SECURITIES TRUST | |
| | | | | | | | | | | | FINANCIAL HIGHLIGHTS | |
| |
| |
| |
| Franklin Floating Rate Daily Access Fund (continued) | | | | | | | | | | | | | | | | |
| | | Six Months Ended | | | | | | | | | | | | | | | | |
| | | April 30, 2015 | | | | | | Year Ended October 31, | | | | |
| | | (unaudited) | | | 2014 | | | 2013 | | | 2012 | | | 2011 | | | 2010 | |
| Class C | | | | | | | | | | | | | | | | | | |
| Per share operating performance | | | | | | | | | | | | | | | | | | |
| (for a share outstanding throughout the period) | | | | | | | | | | | | | | | | | | |
| Net asset value, beginning of period | $ | 9.05 | | $ | 9.20 | | $ | 9.11 | | $ | 8.89 | | $ | 9.11 | | $ | 8.73 | |
| Income from investment operationsa: | | | | | | | | | | | | | | | | | | |
| Net investment income | | 0.190 | | | 0.298 | | | 0.296 | | | 0.368 | | | 0.380 | | | 0.334 | |
| Net realized and unrealized gains (losses) | | (0.021 | ) | | (0.150 | ) | | 0.088 | | | 0.224 | | | (0.219 | ) | | 0.376 | |
| Total from investment operations | | 0.169 | | | 0.148 | | | 0.384 | | | 0.592 | | | 0.161 | | | 0.710 | |
| Less distributions from net investment | | | | | | | | | | | | | | | | | | |
| income | | (0.189 | ) | | (0.298 | ) | | (0.294 | ) | | (0.372 | ) | | (0.381 | ) | | (0.330 | ) |
| Net asset value, end of period | $ | 9.03 | | $ | 9.05 | | $ | 9.20 | | $ | 9.11 | | $ | 8.89 | | $ | 9.11 | |
| |
| Total returnb | | 1.89 | % | | 1.62 | % | | 4.28 | % | | 6.79 | % | | 1.76 | % | | 8.26 | % |
| |
| Ratios to average net assetsc | | | | | | | | | | | | | | | | | | |
| Expenses before waiver and payments by | | | | | | | | | | | | | | | | | | |
| affiliates | | 1.27 | % | | 1.24 | % | | 1.23 | % | | 1.30 | % | | 1.29 | % | | 1.35 | % |
| Expenses net of waiver and payments by | | | | | | | | | | | | | | | | | | |
| affiliates | | 1.26 | %d | | 1.22 | %d | | 1.23 | %d,e | | 1.30 | % | | 1.29 | %d | | 1.35 | %d |
| Net investment income | | 4.26 | % | | 3.24 | % | | 3.20 | % | | 4.12 | % | | 4.16 | % | | 3.75 | % |
| |
| Supplemental data | | | | | | | | | | | | | | | | | | |
| Net assets, end of period (000’s) | $ | 663,970 | | $ | 742,602 | | $ | 765,839 | | $ | 431,818 | | $ | 423,309 | | $ | 272,602 | |
| Portfolio turnover rate | | 16.52 | % | | 83.93 | % | | 42.72 | % | | 80.88 | % | | 126.99 | % | | 82.13 | % |
aThe amount shown for a share outstanding throughout the period may not correlate with the Statement of Operations for the period due to the timing of sales and
repurchases of the Fund shares in relation to income earned and/or fluctuating fair value of the investments of the Fund.
bTotal return does not reflect sales commissions or contingent deferred sales charges, if applicable, and is not annualized for periods less than one year.
cRatios are annualized for periods less than one year.
dBenefit of expense reduction rounds to less than 0.01%.
eBenefit of waiver and payments by affiliates rounds to less than 0.01%.
franklintempleton.com The accompanying notes are an integral part of these financial statements. | Semiannual Report | 45
FRANKLIN INVESTORS SECURITIES TRUST
FINANCIAL HIGHLIGHTS
| | | | | | | | | |
| Franklin Floating Rate Daily Access Fund (continued) | | | | | | | | | |
| | | Six Months Ended | | | Year Ended | |
| | | April 30, 2015 | | | October 31, | |
| | | (unaudited) | | | 2014 | | | 2013 | a |
| Class R6 | | | | | | | | | |
| Per share operating performance | | | | | | | | | |
| (for a share outstanding throughout the period) | | | | | | | | | |
| Net asset value, beginning of period | $ | 9.05 | | $ | 9.21 | | $ | 9.21 | |
| Income from investment operationsb: | | | | | | | | | |
| Net investment income | | 0.226 | | | 0.364 | | | 0.175 | |
| Net realized and unrealized gains (losses) | | (0.035 | ) | | (0.159 | ) | | (0.001 | ) |
| Total from investment operations | | 0.191 | | | 0.205 | | | 0.174 | |
| Less distributions from net investment income | | (0.221 | ) | | (0.365 | ) | | (0.174 | ) |
| Net asset value, end of period | $ | 9.02 | | $ | 9.05 | | $ | 9.21 | |
| |
| Total returnc | | 2.15 | % | | 2.36 | % | | 1.80 | % |
| |
| Ratios to average net assetsd | | | | | | | | | |
| Expenses before waiver and payments by affiliates | | 0.62 | % | | 0.52 | % | | 0.51 | % |
| Expenses net of waiver and payments by affiliates | | 0.52 | %e | | 0.50 | %e | | 0.51 | %e,f |
| Net investment income | | 5.00 | % | | 3.96 | % | | 3.92 | % |
| |
| Supplemental data | | | | | | | | | |
| Net assets, end of period (000’s) | $ | 7 | | $ | 465 | | $ | 1,339 | |
| Portfolio turnover rate | | 16.52 | % | | 83.93 | % | | 42.72 | % |
aFor the period May 1, 2013 (effective date) to October 31, 2013.
bThe amount shown for a share outstanding throughout the period may not correlate with the Statement of Operations for the period due to the timing of sales and
repurchases of the Fund shares in relation to income earned and/or fluctuating fair value of the investments of the Fund.
cTotal return is not annualized for periods less than one year.
dRatios are annualized for periods less than one year.
eBenefit of expense reduction rounds to less than 0.01%.
fBenefit of waiver and payments by affiliates rounds to less than 0.01%.
46 | Semiannual Report | The accompanying notes are an integral part of these financial statements. franklintempleton.com
| | | | | | | | | | | | | | | | | | |
| | | | | | | | | FRANKLIN INVESTORS SECURITIES TRUST | |
| | | | | | | | | | | | FINANCIAL HIGHLIGHTS | |
| |
| |
| |
| Franklin Floating Rate Daily Access Fund (continued) | | | | | | | | | | | | | | | | |
| | | Six Months Ended | | | | | | | | | | | | | | | | |
| | | April 30, 2015 | | | | | | Year Ended October 31, | | | | |
| | | (unaudited) | | | 2014 | | | 2013 | | | 2012 | | | 2011 | | | 2010 | |
| Advisor Class | | | | | | | | | | | | | | | | | | |
| Per share operating performance | | | | | | | | | | | | | | | | | | |
| (for a share outstanding throughout the period) | | | | | | | | | | | | | | | | | | |
| Net asset value, beginning of period | $ | 9.05 | | $ | 9.20 | | $ | 9.11 | | $ | 8.89 | | $ | 9.11 | | $ | 8.73 | |
| Income from investment operationsa: | | | | | | | | | | | | | | | | | | |
| Net investment income | | 0.218 | | | 0.358 | | | 0.355 | | | 0.426 | | | 0.442 | | | 0.393 | |
| Net realized and unrealized gains (losses) | | (0.020 | ) | | (0.150 | ) | | 0.089 | | | 0.225 | | | (0.221 | ) | | 0.375 | |
| Total from investment operations | | 0.198 | | | 0.208 | | | 0.444 | | | 0.651 | | | 0.221 | | | 0.768 | |
| Less distributions from net investment | | | | | | | | | | | | | | | | | | |
| income | | (0.218 | ) | | (0.358 | ) | | (0.354 | ) | | (0.431 | ) | | (0.441 | ) | | (0.388 | ) |
| Net asset value, end of period | $ | 9.03 | | $ | 9.05 | | $ | 9.20 | | $ | 9.11 | | $ | 8.89 | | $ | 9.11 | |
| |
| Total returnb | | 2.22 | % | | 2.28 | % | | 4.95 | % | | 7.49 | % | | 2.43 | % | | 8.84 | % |
| |
| Ratios to average net assetsc | | | | | | | | | | | | | | | | | | |
| Expenses before waiver and payments by | | | | | | | | | | | | | | | | | | |
| affiliates | | 0.62 | % | | 0.59 | % | | 0.58 | % | | 0.65 | % | | 0.64 | % | | 0.70 | % |
| Expenses net of waiver and payments by | | | | | | | | | | | | | | | | | | |
| affiliates | | 0.61 | %d | | 0.57 | %d | | 0.58 | %d,e | | 0.65 | % | | 0.64 | %d | | 0.70 | %d |
| Net investment income | | 4.91 | % | | 3.89 | % | | 3.85 | % | | 4.77 | % | | 4.81 | % | | 4.40 | % |
| |
| Supplemental data | | | | | | | | | | | | | | | | | | |
| Net assets, end of period (000’s) | $ | 1,559,448 | | $ | 2,019,477 | | $ | 2,374,914 | | $ | 739,974 | | $ | 524,938 | | $ | 273,158 | |
| Portfolio turnover rate | | 16.52 | % | | 83.93 | % | | 42.72 | % | | 80.88 | % | | 126.99 | % | | 82.13 | % |
aThe amount shown for a share outstanding throughout the period may not correlate with the Statement of Operations for the period due to the timing of sales and
repurchases of the Fund shares in relation to income earned and/or fluctuating fair value of the investments of the Fund.
bTotal return is not annualized for periods less than one year.
cRatios are annualized for periods less than one year.
dBenefit of expense reduction rounds to less than 0.01%.
eBenefit of waiver and payments by affiliates rounds to less than 0.01%.
franklintempleton.com The accompanying notes are an integral part of these financial statements. | Semiannual Report | 47
| | | | |
| FRANKLIN INVESTORS SECURITIES TRUST | | | | |
| |
| |
| |
| |
| Statement of Investments, April 30, 2015 (unaudited) | | | | |
| |
| Franklin Floating Rate Daily Access Fund | | | | |
| | Country | Shares | | Value |
| Common Stocks and Exchange Traded Funds 0.3% | | | | |
| Broadcasting 0.0%† | | | | |
| aCumulus Media Inc., A | United States | 5,725 | $ | 13,053 |
| Diversified Capital Markets 0.3% | | | | |
| PowerShares Senior Loan Portfolio, ETF | United States | 482,700 | | 11,672,183 |
| Health Care Distributors 0.0% | | | | |
| a,bRoTech Medical Corp. | United States | 26,267 | | — |
| Total Common Stocks and Exchange Traded Funds | | | | |
| (Cost $11,719,276) | | | | 11,685,236 |
| |
| | | Principal | | |
| | | Amount* | | |
| |
| c,dSenior Floating Rate Interests 90.2% | | | | |
| Aerospace & Defense 2.7% | | | | |
| CAMP International Holding Co., 2013 Replacement Term Loan, 4.75%, | | | | |
| 5/31/19 | United States | 19,345,289 | | 19,498,446 |
| Doncasters U.S. Finance LLC, | | | | |
| Second Lien Term Loan, 9.50%, 10/09/20 | United States | 10,788,940 | | 10,802,426 |
| Term B Loans, 4.50%, 4/09/20 | United States | 16,011,989 | | 16,058,696 |
| eErickson Inc., Purchase Price Notes, 6.00%, 11/02/20 | United States | 763,924 | | 668,540 |
| Fly Funding II S.A.R.L., Loans, 3.75%, 8/09/19 | Luxembourg | 20,779,314 | | 20,779,314 |
| TransDigm Inc., Tranche C Term Loan, 3.75%, 2/28/20 | United States | 36,073,812 | | 36,206,600 |
| | | | | 104,014,022 |
| Agricultural Products 0.1% | | | | |
| Allflex Holdings III Inc., Second Lien Initial Term Loan, 8.00%, 7/19/21 | United States | 2,287,774 | | 2,306,076 |
| Airlines 1.0% | | | | |
| Air Canada, Term Loan, 5.50%, 9/26/19 | Canada | 17,752,394 | | 18,018,680 |
| American Airlines Inc., Class B Term Loan, 3.75%, 6/27/19 | United States | 9,974,619 | | 10,030,727 |
| fU.S. Airways Inc., Tranche B1 Term Loan, 3.50%, 5/23/19 | United States | 9,726,395 | | 9,749,845 |
| | | | | 37,799,252 |
| Apparel Retail 0.3% | | | | |
| The Men’s Wearhouse Inc., Tranche B Term Loan, 4.50%, 6/18/21 | United States | 13,160,775 | | 13,321,179 |
| Application Software 0.3% | | | | |
| CCC Information Services Inc., Term Loan, 4.00%, 12/20/19 | United States | 10,019,987 | | 10,054,436 |
| Auto Parts & Equipment 3.7% | | | | |
| Crowne Group LLC, Term Loan, 6.00%, 9/30/20 | United States | 25,273,000 | | 25,241,409 |
| Federal-Mogul Holdings Corp., Tranche C Term Loans, 4.75%, 4/15/21 | United States | 24,160,143 | | 24,157,123 |
| FRAM Group Holdings Inc. (Autoparts Holdings), Term Loan, 7.00%, 7/29/17 | United States | 11,066,610 | | 11,007,824 |
| Gates Global LLC, Initial Dollar Term Loans, 4.25%, 7/06/21 | United States | 21,964,855 | | 22,013,881 |
| Henniges Automotive Holdings Inc., Term Loans, 5.50%, 6/12/21 | United States | 20,203,768 | | 20,317,920 |
| TI Group Automotive Systems LLC, Term Loan, 4.25%, 7/02/21 | United States | 15,150,251 | | 15,197,595 |
| Tower Automotive Holdings USA LLC, Initial Term Loan, 4.00%, 4/23/20 | United States | 13,206,916 | | 13,264,697 |
| UCI International Inc., Term Loan, 5.50%, 7/26/17 | United States | 11,487,933 | | 11,320,404 |
| | | | | 142,520,853 |
| Broadcasting 4.8% | | | | |
| Cumulus Media Holdings Inc., Term Loans, 4.25%, 12/23/20 | United States | 39,180,728 | | 38,700,764 |
| Grande Communications Networks LLC, Initial Term Loan, 4.50%, 5/29/20 | United States | 17,107,435 | | 17,043,282 |
| Gray Television Inc., Term Loan B, 3.75%, 6/13/21 | United States | 17,523,307 | | 17,609,101 |
48 | Semiannual Report
franklintempleton.com
FRANKLIN INVESTORS SECURITIES TRUST
STATEMENT OF INVESTMENTS (UNAUDITED)
| | | | |
| Franklin Floating Rate Daily Access Fund (continued) | | | | |
| | | Principal | | |
| | Country | Amount* | | Value |
| c,dSenior Floating Rate Interests (continued) | | | | |
| Broadcasting (continued) | | | | |
| iHeartCommunications Inc., | | | | |
| Tranche D Term Loan, 6.934%, 1/30/19 | United States | 23,889,566 | $ | 22,916,066 |
| Tranche E Term Loan, 7.684%, 7/30/19 | United States | 10,331,493 | | 10,052,223 |
| MediArena Acquisition BV, Second Lien Dollar Term B Loan, 10.00%, | | | | |
| 8/13/22 | Netherlands | 10,400,000 | | 10,387,000 |
| Radio One Inc., Term Loan B, 4.78%, 12/31/18 | United States | 41,000,000 | | 41,076,875 |
| fSinclair Television Group Inc., Incremental Term Loan B-1, 5.00%, 7/30/21 | United States | 2,995,759 | | 3,003,248 |
| Univision Communications Inc., Replacement First-Lien Term Loan, 4.00%, | | | | |
| 3/01/20 | United States | 25,484,951 | | 25,523,637 |
| | | | | 186,312,196 |
| Building Products 0.5% | | | | |
| Quikrete Holdings Inc., First Lien Initial Loan, 4.00%, 9/28/20 | United States | 17,657,333 | | 17,730,911 |
| Cable & Satellite 0.7% | | | | |
| fCharter Communications Operating LLC, Term G Loans, 5.75%, 9/12/21 | United States | 4,848,485 | | 4,838,788 |
| UPC Financing Partnership (UPC Broadband Holdings BV), Term Loan AH, | | | | |
| 3.25%, 6/30/21 | Netherlands | 11,890,462 | | 11,903,196 |
| Virgin Media Bristol LLC, B Facility, 3.50%, 6/07/20 | United States | 9,625,154 | | 9,644,405 |
| | | | | 26,386,389 |
| Casinos & Gaming 6.0% | | | | |
| Caesars Entertainment Resort Properties LLC, Term B Loans, 7.00%, | | | | |
| 10/11/20 | United States | 75,856,551 | | 72,741,047 |
| Cannery Casino Resorts LLC, | | | | |
| fSecond Lien Term Loan, 10.00%, 10/02/19 | United States | 16,523,000 | | 14,358,487 |
| Term Loan, 6.00%, 10/02/18 | United States | 45,238,169 | | 45,181,621 |
| CCM Merger Inc. (MotorCity Casino), Term Loans, 4.50%, 8/06/21 | United States | 12,929,295 | | 13,032,328 |
| MGM Resorts International, Term B Loan, 3.50%, 12/20/19 | United States | 3,989,796 | | 3,997,277 |
| ROC Finance LLC, Funded Term B Loans, 5.00%, 6/20/19 | United States | 40,095,796 | | 39,895,317 |
| Scientific Games International Inc., Term B-1 Loan, 6.00%, 10/18/20 | United States | 35,945,000 | | 36,349,381 |
| Tropicana Entertainment Inc., Term Loans, 4.00%, 11/27/20 | United States | 5,869,605 | | 5,891,616 |
| | | | | 231,447,074 |
| Coal & Consumable Fuels 2.4% | | | | |
| Bowie Resource Holdings LLC, | | | | |
| First Lien Initial Term Loan, 6.75%, 8/16/20 | United States | 10,950,791 | | 10,649,644 |
| Second Lien Initial Term Loan, 11.75%, 2/16/21 | United States | 2,288,000 | | 2,230,800 |
| fForesight Energy LLC, Term Loans, 5.50%, 8/21/20 | United States | 19,859,875 | | 19,686,101 |
| fPeabody Energy Corp., Term Loan, 4.25%, 9/24/20 | United States | 54,914,869 | | 49,697,956 |
| Westmoreland Coal Co., Term Loan, 7.50%, 12/16/20 | United States | 10,419,224 | | 10,315,032 |
| | | | | 92,579,533 |
| Commodity Chemicals 1.6% | | | | |
| Cyanco Intermediate Corp., Initial Term Loan, 5.50%, 5/01/20 | United States | 63,028,407 | | 63,028,407 |
| Communications Equipment 0.4% | | | | |
| CIENA Corp., Term Loan, 3.75%, 7/15/19 | United States | 13,835,528 | | 13,904,706 |
| Construction Machinery & Heavy Trucks 0.5% | | | | |
| fAllison Transmission Inc., Term B-3 Loans, 3.50%, 8/23/19 | United States | 9,787,960 | | 9,862,896 |
| Doosan Infracore International and Doosan Holdings Europe, Tranche B Term | | | | |
| Loan, 4.50%, 5/28/21 | United States | 10,391,798 | | 10,521,696 |
| | | | | 20,384,592 |
franklintempleton.com Semiannual Report | 49
| | | | |
| FRANKLIN INVESTORS SECURITIES TRUST | | | | |
| STATEMENT OF INVESTMENTS (UNAUDITED) | | | | |
| |
| |
| |
| |
| Franklin Floating Rate Daily Access Fund (continued) | | | | |
| | | Principal | | |
| | Country | Amount* | | Value |
| c,dSenior Floating Rate Interests (continued) | | | | |
| Data Processing & Outsourced Services 2.2% | | | | |
| MoneyGram International Inc., Term Loan, 4.25%, 3/28/20 | United States | 89,175,165 | $ | 84,140,513 |
| Worldpay U.S. Inc., Additional Term Facility, 4.50%, 11/29/19 | United States | 1,487,370 | | 1,496,666 |
| | | | | 85,637,179 |
| Diversified Chemicals 2.5% | | | | |
| fIneos U.S. Finance LLC, Dollar Term Loan, 3.75%, 5/04/18 | United States | 25,828,248 | | 25,907,490 |
| OCI Beaumont LLC, Term B-3 Loan, 5.50%, 8/20/19 | United States | 22,692,094 | | 22,975,746 |
| OXEA GmbH, | | | | |
| First Lien Tranche B-2 Term Loan, 4.25%, 1/15/20 | Luxembourg | 8,874,850 | | 8,713,993 |
| Second Lien Term Loan, 8.25%, 7/15/20 | Luxembourg | 40,515,474 | | 37,881,968 |
| | | | | 95,479,197 |
| Diversified Metals & Mining 1.6% | | | | |
| Atkore International Inc., | | | | |
| Initial Term Loan, 4.50%, 4/09/21 | United States | 9,716,575 | | 9,595,118 |
| Second Lien Initial Term Loan, 7.75%, 10/09/21 | United States | 12,510,459 | | 11,853,659 |
| fFMG America Finance Inc. (Fortescue Metals Group), Loans, 3.75%, | | | | |
| 6/30/19 | Australia | 46,643,796 | | 42,248,272 |
| | | | | 63,697,049 |
| Diversified Support Services 1.5% | | | | |
| AlixPartners LLP, | | | | |
| 2014 Jan Replacement Term B2 Loans, 4.00%, 7/10/20 | United States | 21,850,119 | | 22,020,834 |
| Second Lien 2013 Recapitalization Term Loan, 9.00%, 7/10/21 | United States | 7,548,950 | | 7,636,238 |
| Interactive Data Corp., Term Loan, 4.75%, 5/02/21 | United States | 27,657,200 | | 27,877,601 |
| | | | | 57,534,673 |
| Electric Utilities 1.5% | | | | |
| Alinta Energy Finance Pty. Ltd., | | | | |
| gDelayed Draw Term Commitments, 6.375%, 8/13/18 | Australia | 951,464 | | 958,203 |
| Term B Loans, 6.375%, 8/13/19 | Australia | 56,031,073 | | 56,427,941 |
| | | | | 57,386,144 |
| Electronic Equipment & Instruments 0.0%† | | | | |
| Oberthur Technologies of America Corp., Tranche B-2 Term Loan, 4.50%, | | | | |
| 10/18/19 | United States | 1,304,290 | | 1,309,996 |
| Forest Products 2.4% | | | | |
| Appvion Inc., Term Loan, 5.75%, 6/28/19 | United States | 45,995,657 | | 42,775,962 |
| Caraustar Industries Inc., | | | | |
| Term Loan B, 8.00%, 5/01/19 | United States | 30,594,695 | | 30,766,790 |
| Term Loan C, 8.00%, 5/01/19 | United States | 18,453,750 | | 18,557,552 |
| | | | | 92,100,304 |
| General Merchandise Stores 0.8% | | | | |
| Dollar Tree Inc., Initial Term B Loans, 4.25%, 3/09/22 | United States | 32,208,259 | | 32,668,644 |
| Health Care Equipment 1.2% | | | | |
| Carestream Health Inc., | | | | |
| Second Lien Loan, 9.50%, 12/07/19 | United States | 16,163,260 | | 16,223,872 |
| Term Loan, 5.00%, 6/07/19 | United States | 15,983,507 | | 16,159,997 |
| Kinetic Concepts Inc., Dollar Term E-1 Loan, 4.50%, 5/04/18 | United States | 13,002,698 | | 13,111,050 |
| | | | | 45,494,919 |
50 | Semiannual Report franklintempleton.com
FRANKLIN INVESTORS SECURITIES TRUST
STATEMENT OF INVESTMENTS (UNAUDITED)
| | | | |
| Franklin Floating Rate Daily Access Fund (continued) | | | | |
| | | Principal | | |
| | Country | Amount* | | Value |
| c,dSenior Floating Rate Interests (continued) | | | | |
| Health Care Facilities 2.5% | | | | |
| Amsurg Corp., Initial Term Loan, 3.75%, 7/16/21 | United States | 2,992,462 | $ | 3,010,363 |
| Community Health Systems Inc., | | | | |
| f2018 Term F Loans, 3.434%, 12/31/18 | United States | 64,433,230 | | 64,889,611 |
| 2021 Term D Loan, 4.25%, 1/27/21 | United States | 24,442,126 | | 24,617,816 |
| United Surgical Partners International Inc., Extended Term Loan, 4.25%, | | | | |
| 4/19/17 | United States | 5,221,157 | | 5,235,844 |
| | | | | 97,753,634 |
| Health Care Services 4.3% | | | | |
| Connolly LLC, | | | | |
| Initial Term Loan, 5.00%, 5/14/21 | United States | 9,657,889 | | 9,742,395 |
| Second Lien Initial Term Loan, 8.00%, 5/13/22 | United States | 24,202,500 | | 24,202,500 |
| Dialysis Newco Inc., Term Loan B, 4.50%, 4/23/21 | United States | 15,534,550 | | 15,612,222 |
| Millennium Health LLC, Tranche B Term Loan, 5.25%, 4/16/21 | United States | 35,528,914 | | 29,400,177 |
| National Mentor Holdings Inc., Initial Tranche B Term Loan, 4.25%, 1/31/21 | United States | 27,144,670 | | 27,288,890 |
| Surgery Centers Holdings Inc., | | | | |
| Second Lien Term Loan, 8.50%, 11/03/21 | United States | 12,120,000 | | 12,089,700 |
| Term Loan, 5.25%, 11/03/20 | United States | 11,640,825 | | 11,728,131 |
| U.S. Renal Care Inc., Tranche B-2 Term Loan, 4.25%, 7/03/19 | United States | 35,758,107 | | 36,003,944 |
| | | | | 166,067,959 |
| Health Care Supplies 0.2% | | | | |
| Alere Inc., B Term Loan, 4.25%, 6/30/17 | United States | 8,899,296 | | 8,963,816 |
| Health Care Technology 0.7% | | | | |
| Truven Health Analytics Inc., New Tranche B Term Loan, 4.50%, 6/06/19 | United States | 27,701,672 | | 27,805,221 |
| Hotels, Resorts & Cruise Lines 0.1% | | | | |
| Diamond Resorts Corp., Term Loans, 5.50%, 5/09/21 | United States | 5,591,126 | | 5,633,060 |
| Household Products 1.6% | | | | |
| Sun Products Corp., Tranche B Term Loan, 5.50%, 3/23/20 | United States | 65,406,671 | | 63,199,196 |
| Independent Power Producers & Energy Traders 0.4% | | | | |
| Calpine Construction Finance Co. LP, | | | | |
| Term B-1 Loan, 3.00%, 5/03/20 | United States | 9,304,730 | | 9,271,001 |
| Term B-2 Loan, 4.75%, 1/31/22 | United States | 7,347,598 | | 7,334,967 |
| | | | | 16,605,968 |
| Industrial Conglomerates 0.2% | | | | |
| Unifrax I LLC, New Term Dollar Loans, 4.25%, 11/28/18 | United States | 6,039,970 | | 6,039,970 |
| Industrial Machinery 4.8% | | | | |
| Alfred Fueling Systems Inc. (Wayne Fueling), | | | | |
| First Lien Initial Term Loan, 4.75%, 6/18/21 | United States | 16,157,900 | | 16,279,084 |
| Second Lien Initial Term Loan, 8.50%, 6/20/22 | United States | 23,842,353 | | 23,603,929 |
| Husky Injection Molding Systems Ltd., Initial Term Loan, 4.25%, 6/30/21 | United States | 18,814,539 | | 18,948,498 |
| Milacron LLC, Term B Loan, 4.00%, 3/28/20 | United States | 13,836,429 | | 13,836,429 |
| Navistar Inc., Tranche B Term Loan, 5.75%, 8/17/17 | United States | 27,258,604 | | 27,491,447 |
| Onsite Rental Group Operations Pty. Ltd., Term B Loan, 5.50%, 7/30/21 | United States | 36,047,429 | | 35,641,895 |
| RBS Global Inc. (Rexnord), Term B Loan, 4.00%, 8/21/20 | United States | 14,657,125 | | 14,729,047 |
| Sensus USA Inc., | | | | |
| First Lien Term Loan, 4.50%, 5/09/17 | United States | 16,308,673 | | 16,298,480 |
| Second Lien Term Loan, 8.50%, 5/09/18 | United States | 15,314,541 | | 15,199,682 |
| WireCo Worldgroup Inc., Term Loan, 6.00%, 2/15/17 | United States | 5,544,360 | | 5,558,221 |
| | | | | 187,586,712 |
franklintempleton.com Semiannual Report | 51
FRANKLIN INVESTORS SECURITIES TRUST
STATEMENT OF INVESTMENTS (UNAUDITED)
| | | | |
| Franklin Floating Rate Daily Access Fund (continued) | | | | |
| | | Principal | | |
| | Country | Amount* | | Value |
| c,dSenior Floating Rate Interests (continued) | | | | |
| Insurance Brokers 0.4% | | | | |
| HUB International Ltd., Initial Term Loan, 4.00%, 10/02/20 | United States | 17,175,096 | $ | 17,146,465 |
| Integrated Telecommunication Services 2.1% | | | | |
| Genesys Telecom Holdings U.S. Inc., Dollar Term Loan, 4.00%, 2/08/20 | United States | 8,655,247 | | 8,687,704 |
| Integra Telecom Holdings Inc., | | | | |
| First Lien Term Loan, 5.25%, 2/22/19 | United States | 20,388,260 | | 20,505,493 |
| Second Lien Initial Loan, 9.75%, 2/21/20 | United States | 8,213,247 | | 8,209,822 |
| fIntelsat Jackson Holdings SA, Tranche B-2 Term Loan, 3.75%, 6/30/19 | Luxembourg | 28,761,687 | | 28,790,448 |
| LTS Buyer LLC, | | | | |
| First Lien Term B Loan, 4.00%, 4/13/20 | United States | 7,083,329 | | 7,098,778 |
| Second Lien Initial Loan, 8.00%, 4/12/21 | United States | 7,417,489 | | 7,442,212 |
| | | | | 80,734,457 |
| Internet Software & Services 1.8% | | | | |
| BMC Software Finance Inc., Initial U.S. Term Loans, 5.00%, 9/10/20 | United States | 69,577,611 | | 68,490,461 |
| Investment Banking & Brokerage 0.5% | | | | |
| Guggenheim Partners Investment Management Holdings LLC, Initial Term | | | | |
| Loan, 4.25%, 7/22/20 | United States | 18,548,269 | | 18,675,789 |
| IT Consulting & Other Services 0.8% | | | | |
| Sungard Availability Services Capital Inc., Tranche B Term Loan, 6.00%, | | | | |
| 3/29/19 | United States | 32,976,900 | | 30,723,489 |
| Leisure Facilities 2.9% | | | | |
| 24 Hour Fitness Worldwide Inc., Term Loan, 4.75%, 5/28/21 | United States | 23,301,766 | | 23,316,330 |
| Fitness International LLC, Term B Loan, 5.50%, 7/01/20 | United States | 53,968,944 | | 51,360,463 |
| fSeaworld Parks and Entertainment Inc., Term B-2 Loan, 3.00%, 5/14/20 | United States | 12,915,205 | | 12,690,803 |
| Town Sports International LLC, Initial Term Loan, 4.50%, 11/15/20 | United States | 27,500,609 | | 23,684,899 |
| | | | | 111,052,495 |
| Life Sciences Tools & Services 0.2% | | | | |
| Pharmaceutical Product Development LLC, Term Loan, 4.00%, 12/05/18 | United States | 7,678,768 | | 7,725,386 |
| Marine 0.8% | | | | |
| Navios Maritime Partners LP, Initial Term Loan, 5.25%, 6/27/18 | Marshall Islands | 31,101,870 | | 31,335,134 |
| Metal & Glass Containers 0.7% | | | | |
| CD&R Millennium U.S. Acquico LLC, | | | | |
| Initial Dollar Term Loan, 4.50%, 7/31/21 | United States | 6,208,800 | | 6,219,150 |
| Second Lien Initial Term Loan, 8.25%, 7/31/22 | United States | 22,149,800 | | 21,983,677 |
| | | | | 28,202,827 |
| Movies & Entertainment 1.8% | | | | |
| fRegal Cinemas Corp., Term Loan, 3.75%, 4/01/22 | United States | 6,190,356 | | 6,229,789 |
| William Morris Endeavor Entertainment LLC, Term Loans Second Lien, 8.25%, | | | | |
| 5/06/22 | United States | 49,591,290 | | 48,971,399 |
| Zuffa LLC, Initial Term Loan, 3.75%, 2/25/20 | United States | 14,929,017 | | 14,782,056 |
| | | | | 69,983,244 |
| Oil & Gas Drilling 1.3% | | | | |
| Drillships Financing Holding Inc., Tranche B-1 Term Loan, 6.00%, 3/31/21 | Marshall Islands | 35,525,096 | | 28,881,903 |
| fDrillships Ocean Ventures Inc. and Drillships Ventures Projects Inc., Term Loan, | | | | |
| 5.50%, 7/25/21 | Marshall Islands | 16,480,487 | | 14,365,497 |
| Offshore Group Investment Ltd. (Vantage Delaware), Loans, 5.75%, 3/28/19 | United States | 13,573,000 | | 9,026,045 |
| | | | | 52,273,445 |
52 | Semiannual Report franklintempleton.com
FRANKLIN INVESTORS SECURITIES TRUST
STATEMENT OF INVESTMENTS (UNAUDITED)
| | | | |
| Franklin Floating Rate Daily Access Fund (continued) | | | | |
| | | Principal | | |
| | Country | Amount* | | Value |
| c,dSenior Floating Rate Interests (continued) | | | | |
| Oil & Gas Equipment & Services 0.6% | | | | |
| McJunkin Red Man Corp., 2013 Term Loan, 5.00%, 11/08/19 | United States | 24,885,349 | $ | 24,613,177 |
| Oil & Gas Exploration & Production 2.3% | | | | |
| Fieldwood Energy LLC, | | | | |
| fLoans, 3.875%, 10/01/18 | United States | 28,126,514 | | 27,493,668 |
| Second Lien Loans, 8.375%, 9/30/20 | United States | 5,530,000 | | 4,327,225 |
| Obsidian Natural Gas Trust, Term Loan, 7.00%, 11/02/15 | United States | 2,406,265 | | 2,395,737 |
| Samson Investment Co., Second Lien Tranche I Term Loan, 5.00%, 9/25/18 | United States | 27,720,000 | | 13,444,200 |
| UTEX Industries Inc., | | | | |
| First Lien Initial Term Loan, 5.00%, 5/21/21 | United States | 34,172,444 | | 32,506,537 |
| Second Lien Initial Term Loan, 8.25%, 5/20/22 | United States | 12,147,156 | | 10,264,347 |
| | | | | 90,431,714 |
| Oil & Gas Storage & Transportation 1.1% | | | | |
| OSG Bulk Ships Inc., Initial Term Loan, 5.25%, 8/05/19 | United States | 24,385,725 | | 24,507,653 |
| OSG International Inc. (OIN), Initial Term Loan, 5.75%, 8/05/19 | United States | 18,063,500 | | 18,221,556 |
| | | | | 42,729,209 |
| Packaged Foods & Meats 1.8% | | | | |
| AdvancePierre Foods Inc., | | | | |
| Loans, 5.75%, 7/10/17 | United States | 8,689,926 | | 8,770,038 |
| Second Lien Term Loan, 9.50%, 10/10/17 | United States | 24,560,081 | | 24,713,582 |
| CSM Bakery Supplies LLC (U.S. Acquisition), Second Lien Term Loan, 8.75%, | | | | |
| 7/03/21 | United States | 11,591,497 | | 10,896,007 |
| JBS USA LLC, Incremental Term Loan, 3.75%, 9/18/20 | United States | 5,565,051 | | 5,603,311 |
| fPost Holdings Inc., Series A Incremental Term Loan, 3.75%, 6/02/21 | United States | 18,639,510 | | 18,734,366 |
| | | | | 68,717,304 |
| Paper Packaging 1.2% | | | | |
| Coveris Holdings SA, USD Term Loan, 5.25%, 5/08/19 | Luxembourg | 42,218,067 | | 42,552,307 |
| Reynolds Group Holdings Inc., U.S. Term Loan, 4.50%, 12/01/18 | United States | 3,783,397 | | 3,823,856 |
| | | | | 46,376,163 |
| Personal Products 1.0% | | | | |
| FGI Operating Co. LLC (Freedom Group), Term B Loans, 5.50%, 4/19/19 | United States | 41,562,805 | | 40,800,834 |
| Pharmaceuticals 2.4% | | | | |
| Akorn Inc., Loans, 4.50%, 4/16/21 | United States | 15,722,533 | | 15,781,492 |
| fHorizon Pharma Inc., Term Loan B, 5.75%, 5/07/21 | United States | 1,810,437 | | 1,825,713 |
| Valeant Pharmaceuticals International Inc., | | | | |
| Series C-2 Tranche B Term Loan, 3.50%, 12/11/19 | United States | 10,000,000 | | 10,042,360 |
| fSeries D-2 Tranche B Term Loan, 5.25%, 2/13/19 | United States | 7,568,424 | | 7,603,307 |
| Series E-1 Tranche B Term Loan, 3.50%, 8/05/20 | United States | 3,009,040 | | 3,020,908 |
| Series F-1 New Term Loan, 4.00%, 4/01/22 | United States | 52,991,233 | | 53,425,126 |
| | | | | 91,698,906 |
| Publishing 1.1% | | | | |
| Cengage Learning Acquisitions Inc., Original Term Loans, 7.00%, 3/31/20 | United States | 42,149,026 | | 42,487,103 |
| Restaurants 0.2% | | | | |
| TGI Friday’s Inc., First Lien Initial Term Loan, 5.25%, 7/15/20 | United States | 6,418,894 | | 6,459,012 |
| Retail REITs 0.1% | | | | |
| Capital Automotive LP, Second Lien Term Loan, 6.00%, 4/30/20 | United States | 4,896,250 | | 5,006,416 |
franklintempleton.com
Semiannual Report | 53
FRANKLIN INVESTORS SECURITIES TRUST
STATEMENT OF INVESTMENTS (UNAUDITED)
| | | | |
| Franklin Floating Rate Daily Access Fund (continued) | | | | |
| | | Principal | | |
| | Country | Amount* | | Value |
| c,dSenior Floating Rate Interests (continued) | | | | |
| Semiconductors 0.4% | | | | |
| M/A-COM Technology Solutions Holdings Inc., Initial Term Loan, 4.50%, | | | | |
| 5/07/21 | United States | 16,396,100 | $ | 16,560,061 |
| Specialized Consumer Services 0.6% | | | | |
| Travelport Finance Luxembourg S.A.R.L., Initial Term Loan, 5.75%, 9/02/21 | Luxembourg | 23,690,625 | | 23,966,408 |
| Specialized Finance 0.6% | | | | |
| Trans Union LLC, 2014 Replacement Term Loan, 4.00%, 4/09/21 | United States | 23,142,584 | | 23,272,761 |
| Specialty Chemicals 3.8% | | | | |
| Axalta Coating Systems U.S. Holdings Inc., 2014 Specified Refinancing Term, | | | | |
| 3.75%, 2/01/20 | United States | 23,143,616 | | 23,238,667 |
| AZ Chem U.S. Inc., Second Lien Initial Term Loan, 7.50%, 6/10/22 | United States | 10,343,756 | | 10,312,725 |
| fNexeo Solutions LLC, | | | | |
| Term B-1 Loan, 5.00%, 9/08/17 | United States | 5,989,610 | | 5,922,227 |
| Term B-2 Loan, 5.00%, 9/08/17 | United States | 12,259,478 | | 12,121,559 |
| Term B-3 Loan, 5.00%, 9/08/17 | United States | 10,659,489 | | 10,539,570 |
| Oxbow Carbon LLC, | | | | |
| First Lien Tranche B Term Loan, 4.25%, 7/19/19 | United States | 23,467,108 | | 23,271,556 |
| Second Lien Initial Term Loan, 8.00%, 1/17/20 | United States | 16,364,314 | | 14,809,704 |
| Solenis International LP and Solenis Holdings, | | | | |
| First Lien Term Loan, 4.25%, 7/31/21 | United States | 10,016,452 | | 10,052,451 |
| Second Lien Term Loan, 7.75%, 7/31/22 | United States | 7,800,000 | | 7,605,000 |
| Sonneborn LLC, Initial US Term Loan, 5.50%, 12/10/20 | United States | 7,129,869 | | 7,192,256 |
| Sonneborn Refined Products BV, Initial BV Term Loan, 5.50%, 12/10/20 | Netherlands | 1,258,212 | | 1,269,221 |
| Univar Inc., Term B Loan, 5.00%, 6/30/17 | United States | 23,037,217 | | 23,159,614 |
| | | | | 149,494,550 |
| Specialty Stores 2.5% | | | | |
| Academy Ltd., Initial Term Loans, 4.50%, 8/03/18 | United States | 12,457,209 | | 12,549,081 |
| BJ’s Wholesale Club Inc., | | | | |
| 2013 (Nov) Replacement Loans, 4.50%, 9/26/19 | United States | 1,099,905 | | 1,107,380 |
| Second Lien 2013 (Nov) Replacement Loans, 8.50%, 3/26/20 | United States | 35,190,476 | | 35,630,357 |
| Evergreen AcqCo. 1 LP (Savers), Term Loan, 5.00%, 7/09/19 | United States | 48,075,575 | | 47,391,988 |
| | | | | 96,678,806 |
| Steel 0.2% | | | | |
| Walter Energy Inc., B Term Loan, 7.25%, 4/01/18 | United States | 14,171,429 | | 9,038,721 |
| Systems Software 1.6% | | | | |
| Blue Coat Systems Inc., | | | | |
| Second Lien Loans, 9.50%, 6/26/20 | United States | 12,027,143 | | 12,297,754 |
| Term Loan, 4.00%, 5/31/19 | United States | 9,381,522 | | 9,397,940 |
| Websense Inc., | | | | |
| First Lien Term Loan, 4.50%, 6/25/20 | United States | 18,279,042 | | 18,313,315 |
| Second Lien Term Loan, 8.25%, 12/24/20 | United States | 22,205,846 | | 22,372,390 |
| | | | | 62,381,399 |
| Technology Hardware, Storage & Peripherals 0.5% | | | | |
| Dell International LLC, Term B Loan, 4.50%, 4/29/20 | United States | 19,401,120 | | 19,500,822 |
| Tires & Rubber 0.4% | | | | |
| The Goodyear Tire & Rubber Co., Second Lien Term Loan, 4.75%, 4/30/19 | United States | 15,604,167 | | 15,799,219 |
54 | Semiannual Report
franklintempleton.com
FRANKLIN INVESTORS SECURITIES TRUST
STATEMENT OF INVESTMENTS (UNAUDITED)
| | | | | |
| Franklin Floating Rate Daily Access Fund (continued) | | | | | |
| | | Principal | | | |
| | Country | Amount* | | Value | |
| c,dSenior Floating Rate Interests (continued) | | | | | |
| Trucking 1.0% | | | | | |
| Hertz Corp., | | | | | |
| Credit Linked Deposit, 3.75%, 3/11/18 | United States | 18,350,000 | $ | 18,200,906 | |
| Tranche B-1 Term Loan, 4.00%, 3/11/18 | United States | 12,228,525 | | 12,289,668 | |
| Tranche B-2 Term Loan, 3.50%, 3/11/18 | United States | 9,976,350 | | 10,005,032 | |
| | | | | 40,495,606 | |
| Total Senior Floating Rate Interests (Cost $3,556,607,811) | | | | 3,505,604,650 | |
| Asset-Backed Securities and Commercial | | | | | |
| Mortgage-Backed Securities 3.1% | | | | | |
| Other Diversified Financial Services 3.1% | | | | | |
| hApidos CDO, 2013-14A, C2, 144A, 4.85%, 4/15/25 | United States | 3,540,000 | | 3,546,549 | |
| c,hAtrium IX, 9A, C, 144A, FRN, 3.512%, 2/28/24 | United States | 2,500,000 | | 2,512,950 | |
| c,hAtrium XI, 11A, C, 144A, FRN, 3.477%, 10/23/25 | Cayman Islands | 29,700,000 | | 29,838,402 | |
| c,hBallyrock CLO LLC, 2014-1A, B, 144A, FRN, 3.475%, 10/20/26 | United States | 5,200,000 | | 5,193,136 | |
| c,hCarlyle Global Market Strategies CLO Ltd., 2014-4A, C, 144A, FRN, 3.40%, | | | | | |
| 10/15/26 | Cayman Islands | 6,500,000 | | 6,520,800 | |
| c,hCatamaran CLO Ltd., | | | | | |
| 2013-1A, C, 144A, FRN, 2.877%, 1/27/25 | Cayman Islands | 3,500,000 | | 3,400,915 | |
| 2014-2A, B, 144A, FRN, 3.275%, 10/18/26 | United States | 13,240,000 | | 13,139,773 | |
| c,hCent CLO LP, | | | | | |
| 2013-17A, D, 144A, FRN, 3.255%, 1/30/25 | Cayman Islands | 3,850,000 | | 3,849,422 | |
| 2014-22A, B, 144A, FRN, 3.433%, 11/07/26 | Cayman Islands | 7,400,000 | | 7,416,798 | |
| c,hEaton Vance CDO Ltd., 2014-1A, | | | | | |
| A, 144A, FRN, 1.725%, 7/15/26 | Cayman Islands | 6,510,000 | | 6,496,069 | |
| B, 144A, FRN, 2.325%, 7/15/26 | United States | 6,510,000 | | 6,487,085 | |
| C, 144A, FRN, 3.275%, 7/15/26 | United States | 5,630,000 | | 5,619,697 | |
| hEmerson Park CLO Ltd., 2013-1A, C2, 144A, 5.64%, 7/15/25 | United States | 3,600,000 | | 3,623,256 | |
| hHighbridge Loan Management Ltd., 2013-2A, B2, 144A, 5.80%, 10/20/24 | United States | 3,500,000 | | 3,518,165 | |
| c,hING Investment Management CLO Ltd., | | | | | |
| 2013-1A, B, 144A, FRN, 3.153%, 4/15/24 | Cayman Islands | 3,850,000 | | 3,869,173 | |
| 2013-1A, C, 144A, FRN, 3.775%, 4/15/24 | Cayman Islands | 3,850,000 | | 3,769,304 | |
| 2013-2A, B, 144A, FRN, 2.957%, 4/25/25 | United States | 3,850,000 | | 3,822,088 | |
| c,hLimerock CLO III LLC, 2014-3A, B, 144A, FRN, 3.429%, 10/20/26 | Cayman Islands | 6,700,000 | | 6,717,889 | |
| c,hZiggurat CLO I Ltd., 2014-1A, C, 144A, FRN, 3.375%, 10/17/26 | United States | 1,340,000 | | 1,338,271 | |
| Total Asset-Backed Securities and Commercial | | | | | |
| Mortgage-Backed Securities (Cost $120,052,004) | | | | 120,679,742 | |
| Total Investments before Short Term Investments | | | | | |
| (Cost $3,688,379,091) | | | | 3,637,969,628 | |
| |
| | | Shares | | | |
| |
| Short Term Investments (Cost $251,639,882) 6.4% | | | | | |
| Money Market Funds 6.4% | | | | | |
| a,iInstitutional Fiduciary Trust Money Market Portfolio | United States | 251,639,882 | | 251,639,882 | |
| Total Investments (Cost $3,940,018,973) 100.0% | | | | 3,889,609,510 | |
| Other Assets, less Liabilities (0.0)%† | | | | (1,402,460 | ) |
| Net Assets 100.0% | | | $ | 3,888,207,050 | |
franklintempleton.com
Semiannual Report | 55
FRANKLIN INVESTORS SECURITIES TRUST
STATEMENT OF INVESTMENTS (UNAUDITED)
Franklin Floating Rate Daily Access Fund (continued)
†Rounds to less than 0.1% of net assets.
*The principal amount is stated in U.S. dollars unless otherwise indicated.
aNon-income producing.
bSee Note 8 regarding restricted securities.
cThe coupon rate shown represents the rate at period end.
dSee Note 1(i) regarding senior floating rate interests.
eSecurity has been deemed illiquid because it may not be able to be sold within seven days. At April 30, 2015, the aggregate value of these securities was $668,540,
representing 0.02% of net assets.
fA portion or all of the security purchased on a when-issued or delayed delivery basis. See Note 1(c).
gSee Note 9 regarding unfunded loan commitments.
hSecurity was purchased pursuant to Rule 144A under the Securities Act of 1933 and may be sold in transactions exempt from registration only to qualified institutional
buyers or in a public offering registered under the Securities Act of 1933. These securities have been deemed liquid under guidelines approved by the Trust’s Board of
Trustees. At April 30, 2015, the aggregate value of these securities was $120,679,742 representing 3.10% of net assets.
iSee Note 3(f) regarding investments in Institutional Fiduciary Trust Money Market Portfolio.
At April 30, 2015, the Fund had the following credit default swap contracts outstanding. See Note 1(d).
| | | | | | | | | | | | | | | | |
| Credit Default Swap Contracts | | | | | | | | | | | | | | | |
| | | | | | | | | Upfront | | | | | | | | |
| | | | | Periodic | | | | Premiums | | | | | | | | |
| | | | Notional | Payment | | Expiration | | Paid | | Unrealized | | Unrealized | | | Market | |
| Description | Exchange | | Amount | Rate | | Date | | (Received) | | Appreciation | | Depreciation | | | Value | |
| Centrally Cleared Swaps | | | | | | | | | | | | | | | | |
| Contracts to Buy Protection | | | | | | | | | | | | | | | | |
| Traded Index | | | | | | | | | | | | | | | | |
| CDX.NA.HY.23 | ICE | $ | 85,554,000 | 5.00 | % | 12/20/19 | $ | (6,986,631 | ) | $ — | $ | (636,823 | ) | $ | (7,623,454 | ) |
| |
| Centrally Cleared Swaps unrealized appreciation (depreciation) | | | | | | | | $ | (636,823 | ) | | | |
See Abbreviations on page 140.
56 | Semiannual Report | The accompanying notes are an integral part of these financial statements. franklintempleton.com
| | | | | | | | | | | | | | | | | | |
| | | | | | | | | FRANKLIN INVESTORS SECURITIES TRUST | |
| |
| |
| Financial Highlights | | | | | | | | | | | | | | | | | | |
| Franklin Low Duration Total Return Fund | | | | | | | | | | | | | | | | |
| | | Six Months Ended | | | | | | | | | | | | | | | | |
| | | April 30, 2015 | | | | | | Year Ended October 31, | | | | |
| | | (unaudited) | | | 2014 | | | 2013 | | | 2012 | | | 2011 | | | 2010 | |
| Class A | | | | | | | | | | | | | | | | | | |
| Per share operating performance | | | | | | | | | | | | | | | | | | |
| (for a share outstanding throughout the period) | | | | | | | | | | | | | | | | | | |
| Net asset value, beginning of period | $ | 10.11 | | $ | 10.16 | | $ | 10.29 | | $ | 10.27 | | $ | 10.44 | | $ | 10.19 | |
| Income from investment operationsa: | | | | | | | | | | | | | | | | | | |
| Net investment income | | 0.062 | | | 0.144 | | | 0.166 | | | 0.169 | | | 0.214 | | | 0.240 | |
| Net realized and unrealized gains (losses) | | 0.004 | | | (0.011 | ) | | (0.032 | ) | | 0.158 | | | (0.111 | ) | | 0.334 | |
| Total from investment operations | | 0.066 | | | 0.133 | | | 0.134 | | | 0.327 | | | 0.103 | | | 0.574 | |
| Less distributions from: | | | | | | | | | | | | | | | | | | |
| Net investment income and net foreign | | | | | | | | | | | | | | | | | | |
| currency gains | | (0.136 | ) | | (0.183 | ) | | (0.264 | ) | | (0.307 | ) | | (0.233 | ) | | (0.292 | ) |
| Net realized gains | | — | | | — | | | — | | | — | | | (0.040 | ) | | (0.032 | ) |
| Total distributions | | (0.136 | ) | | (0.183 | ) | | (0.264 | ) | | (0.307 | ) | | (0.273 | ) | | (0.324 | ) |
| Net asset value, end of period | $ | 10.04 | | $ | 10.11 | | $ | 10.16 | | $ | 10.29 | | $ | 10.27 | | $ | 10.44 | |
| |
| Total returnb | | 0.66 | % | | 1.32 | % | | 1.32 | % | | 3.26 | % | | 0.99 | % | | 5.74 | % |
| |
| Ratios to average net assetsc | | | | | | | | | | | | | | | | | | |
| Expenses before waiver and payments by | | | | | | | | | | | | | | | | | | |
| affiliates | | 0.95 | % | | 0.93 | % | | 0.98 | % | | 1.01 | % | | 1.03 | % | | 1.06 | % |
| Expenses net of waiver and payments by | | | | | | | | | | | | | | | | | | |
| affiliates | | 0.80 | %d | | 0.80 | %d | | 0.80 | %d | | 0.89 | % | | 0.90 | % | | 0.90 | %d |
| Net investment income | | 1.18 | % | | 1.24 | % | | 1.25 | % | | 1.47 | % | | 1.95 | % | | 2.15 | % |
| |
| Supplemental data | | | | | | | | | | | | | | | | | | |
| Net assets, end of period (000’s) | $ | 1,630,715 | | $ | 1,589,854 | | $ | 1,296,612 | | $ | 904,878 | | $ | 636,622 | | $ | 369,836 | |
| Portfolio turnover rate | | 15.68 | % | | 78.63 | % | | 64.86 | % | | 51.42 | % | | 75.51 | % | | 49.84 | % |
aThe amount shown for a share outstanding throughout the period may not correlate with the Statement of Operations for the period due to the timing of sales and
repurchases of the Fund shares in relation to income earned and/or fluctuating fair value of the investments of the Fund.
bTotal return does not reflect sales commissions or contingent deferred sales charges, if applicable, and is not annualized for periods less than one year.
cRatios are annualized for periods less than one year.
dBenefit of expense reduction rounds to less than 0.01%.
franklintempleton.com The accompanying notes are an integral part of these financial statements. | Semiannual Report | 57
FRANKLIN INVESTORS SECURITIES TRUST
FINANCIAL HIGHLIGHTS
| | | | | | | | | | | | |
| Franklin Low Duration Total Return Fund (continued) | | | | | | | | | | | | |
| | | Six Months Ended | | | | | | | | | | |
| | | April 30, 2015 | | | Year Ended October 31, | |
| | | (unaudited) | | | 2014 | | | 2013 | | | 2012 | a |
| Class C | | | | | | | | | | | | |
| Per share operating performance | | | | | | | | | | | | |
| (for a share outstanding throughout the period) | | | | | | | | | | | | |
| Net asset value, beginning of period | $ | 10.11 | | $ | 10.16 | | $ | 10.29 | | $ | 10.29 | |
| Income from investment operationsb: | | | | | | | | | | | | |
| Net investment income | | 0.042 | | | 0.098 | | | 0.189 | | | 0.013 | |
| Net realized and unrealized gains (losses) | | (0.001 | ) | | (0.001 | ) | | (0.090 | ) | | 0.005 | |
| Total from investment operations | | 0.041 | | | 0.097 | | | 0.099 | | | 0.018 | |
| Less distributions from net investment income and net foreign currency | | | | | | | | | | | | |
| gains | | (0.121 | ) | | (0.147 | ) | | (0.229 | ) | | (0.018 | ) |
| Net asset value, end of period | $ | 10.03 | | $ | 10.11 | | $ | 10.16 | | $ | 10.29 | |
| |
| Total returnc | | 0.41 | % | | 0.96 | % | | 0.97 | % | | 0.17 | % |
| |
| Ratios to average net assetsd | | | | | | | | | | | | |
| Expenses before waiver and payments by affiliates | | 1.35 | % | | 1.33 | % | | 1.38 | % | | 1.41 | % |
| Expenses net of waiver and payments by affiliates | | 1.20 | %e | | 1.20 | %e | | 1.20 | %e | | 1.29 | % |
| Net investment income | | 0.78 | % | | 0.84 | % | | 0.84 | % | | 1.07 | % |
| |
| Supplemental data | | | | | | | | | | | | |
| Net assets, end of period (000’s) | $ | 179,862 | | $ | 165,952 | | $ | 114,200 | | $ | 1,034 | |
| Portfolio turnover rate | | 15.68 | % | | 78.63 | % | | 64.86 | % | | 51.42 | % |
aFor the period October 1, 2012 (effective date) to October 31, 2012.
bThe amount shown for a share outstanding throughout the period may not correlate with the Statement of Operations for the period due to the timing of sales and
repurchases of the Fund shares in relation to income earned and/or fluctuating fair value of the investments of the Fund.
cTotal return does not reflect sales commissions or contingent deferred sales charges, if applicable, and is not annualized for periods less than one year.
dRatios are annualized for periods less than one year.
eBenefit of expense reduction rounds to less than 0.01%.
58 | Semiannual Report | The accompanying notes are an integral part of these financial statements. franklintempleton.com
| | | | | | | | | |
| | | FRANKLIN INVESTORS SECURITIES TRUST | |
| | | FINANCIAL HIGHLIGHTS | |
| |
| |
| |
| Franklin Low Duration Total Return Fund (continued) | | | | | | | | | |
| | | Six Months Ended | | | Year Ended | |
| | | April 30, 2015 | | | October 31, | |
| | | (unaudited) | | | 2014 | | | 2013 | a |
| Class R6 | | | | | | | | | |
| Per share operating performance | | | | | | | | | |
| (for a share outstanding throughout the period) | | | | | | | | | |
| Net asset value, beginning of period | $ | 10.14 | | $ | 10.19 | | $ | 10.27 | |
| Income from investment operationsb: | | | | | | | | | |
| Net investment income | | 0.074 | | | 0.164 | c | | 0.089 | |
| Net realized and unrealized gains (losses) | | 0.016 | | | 0.003 | | | (0.046 | ) |
| Total from investment operations | | 0.090 | | | 0.167 | | | 0.043 | |
| Less distributions from net investment income and net foreign currency gains | | (0.150 | ) | | (0.217 | ) | | (0.123 | ) |
| Net asset value, end of period | $ | 10.08 | | $ | 10.14 | | $ | 10.19 | |
| |
| Total returnd | | 0.90 | % | | 1.66 | % | | 0.43 | % |
| |
| Ratios to average net assetse | | | | | | | | | |
| Expenses before waiver and payments by affiliates | | 0.54 | % | | 0.55 | % | | 0.62 | % |
| Expenses net of waiver and payments by affiliatesf | | 0.42 | % | | 0.42 | % | | 0.43 | % |
| Net investment income | | 1.56 | % | | 1.62 | % | | 1.61 | % |
| |
| Supplemental data | | | | | | | | | |
| Net assets, end of period (000’s) | $ | 500,240 | | $ | 418,539 | | $ | 943 | |
| Portfolio turnover rate | | 15.68 | % | | 78.63 | % | | 64.86 | % |
aFor the period May 1, 2013 (effective date) to October 31, 2013.
bThe amount shown for a share outstanding throughout the period may not correlate with the Statement of Operations for the period due to the timing of sales and
repurchases of the Fund shares in relation to income earned and/or fluctuating fair value of the investments of the Fund.
cBased on average daily shares outstanding.
dTotal return is not annualized for periods less than one year.
eRatios are annualized for periods less than one year.
fBenefit of expense reduction rounds to less than 0.01%.
franklintempleton.com The accompanying notes are an integral part of these financial statements. | Semiannual Report | 59
FRANKLIN INVESTORS SECURITIES TRUST
FINANCIAL HIGHLIGHTS
| | | | | | | | | | | | | | | | | | |
| Franklin Low Duration Total Return Fund (continued) | | | | | | | | | | | | | | | | |
| | | Six Months Ended | | | | | | | | | | | | | | | | |
| | | April 30, 2015 | | | | | | Year Ended October 31, | | | | |
| | | (unaudited) | | | 2014 | | | 2013 | | | 2012 | | | 2011 | | | 2010 | |
| Advisor Class | | | | | | | | | | | | | | | | | | |
| Per share operating performance | | | | | | | | | | | | | | | | | | |
| (for a share outstanding throughout the period) | | | | | | | | | | | | | | | | | | |
| Net asset value, beginning of period | $ | 10.14 | | $ | 10.19 | | $ | 10.31 | | $ | 10.29 | | $ | 10.46 | | $ | 10.20 | |
| Income from investment operationsa: | | | | | | | | | | | | | | | | | | |
| Net investment income | | 0.058 | | | 0.166 | | | 0.231 | | | 0.202 | | | 0.249 | | | 0.248 | |
| Net realized and unrealized gains (losses) | | 0.027 | | | (0.010 | ) | | (0.064 | ) | | 0.146 | | | (0.122 | ) | | 0.363 | |
| Total from investment operations | | 0.085 | | | 0.156 | | | 0.167 | | | 0.348 | | | 0.127 | | | 0.611 | |
| Less distributions from: | | | | | | | | | | | | | | | | | | |
| Net investment income and net foreign | | | | | | | | | | | | | | | | | | |
| currency gains | | (0.145 | ) | | (0.206 | ) | | (0.287 | ) | | (0.328 | ) | | (0.257 | ) | | (0.319 | ) |
| Net realized gains | | — | | | — | | | — | | | — | | | (0.040 | ) | | (0.032 | ) |
| Total distributions | | (0.145 | ) | | (0.206 | ) | | (0.287 | ) | | (0.328 | ) | | (0.297 | ) | | (0.351 | ) |
| Net asset value, end of period | $ | 10.08 | | $ | 10.14 | | $ | 10.19 | | $ | 10.31 | | $ | 10.29 | | $ | 10.46 | |
| |
| Total returnb | | 0.85 | % | | 1.54 | % | | 1.64 | % | | 3.46 | % | | 1.22 | % | | 6.11 | % |
| |
| Ratios to average net assetsc | | | | | | | | | | | | | | | | | | |
| Expenses before waiver and payments by | | | | | | | | | | | | | | | | | | |
| affiliates | | 0.70 | % | | 0.68 | % | | 0.73 | % | | 0.76 | % | | 0.78 | % | | 0.81 | % |
| Expenses net of waiver and payments by | | | | | | | | | | | | | | | | | | |
| affiliates | | 0.55 | %d | | 0.55 | %d | | 0.55 | %d | | 0.64 | % | | 0.65 | % | | 0.65 | %d |
| Net investment income | | 1.43 | % | | 1.49 | % | | 1.50 | % | | 1.72 | % | | 2.20 | % | | 2.40 | % |
| |
| Supplemental data | | | | | | | | | | | | | | | | | | |
| Net assets, end of period (000’s) | $ | 160,567 | | $ | 198,694 | | $ | 156,129 | | $ | 70,442 | | $ | 49,682 | | $ | 16,200 | |
| Portfolio turnover rate | | 15.68 | % | | 78.63 | % | | 64.86 | % | | 51.42 | % | | 75.51 | % | | 49.84 | % |
aThe amount shown for a share outstanding throughout the period may not correlate with the Statement of Operations for the period due to the timing of sales and
repurchases of the Fund shares in relation to income earned and/or fluctuating fair value of the investments of the Fund.
bTotal return is not annualized for periods less than one year.
cRatios are annualized for periods less than one year.
dBenefit of expense reduction rounds to less than 0.01%.
60 | Semiannual Report | The accompanying notes are an integral part of these financial statements. franklintempleton.com
FRANKLIN INVESTORS SECURITIES TRUST
| | | | | |
| Statement of Investments, April 30, 2015 (unaudited) | | | | | |
| |
| Franklin Low Duration Total Return Fund | | | | | |
| | Country | Shares | | | Value |
| Common Stocks and Exchange Traded Funds 0.8% | | | | | |
| Diversified Financials 0.8% | | | | | |
| PowerShares Senior Loan Portfolio, ETF | United States | 825,000 | | $ | 19,948,500 |
| Materials 0.0%† | | | | | |
| aVerso Corp. | United States | 1,886 | | | 2,640 |
| Total Common Stocks and Exchange Traded Funds | | | | | |
| (Cost $20,183,305) | | | | | 19,951,140 |
| |
| | | Principal | | | |
| | | Amount* | | | |
| Corporate Bonds 37.6% | | | | | |
| Automobiles & Components 0.5% | | | | | |
| Ford Motor Credit Co. LLC, senior note, | | | | | |
| 2.375%, 1/16/18 | United States | 3,000,000 | | | 3,048,519 |
| 2.597%, 11/04/19 | United States | 4,000,000 | | | 4,045,168 |
| bFRN, 0.784%, 9/08/17 | United States | 4,000,000 | | | 3,982,836 |
| | | | | | 11,076,523 |
| Banks 10.0% | | | | | |
| cANZ New Zealand International Ltd./London, senior note, 144A, 1.40%, | | | | | |
| 4/27/17 | New Zealand | 2,500,000 | | | 2,507,800 |
| Australia & New Zealand Banking Group Ltd., senior note, 1.25%, | | | | | |
| 1/10/17 | Australia | 11,000,000 | | | 11,065,065 |
| dBanca Monte Dei Paschi Di Siena SpA, secured note, Reg S, 2.875%, | | | | | |
| 4/16/21 | Italy | 6,300,000 | EUR | | 7,871,590 |
| Banco Comercial Portugues SA, 4.75%, 6/22/17 | Portugal | 4,500,000 | EUR | | 5,508,932 |
| Bank of America Corp., senior note, | | | | | |
| 2.65%, 4/01/19 | United States | 5,500,000 | | | 5,601,178 |
| bFRN, 1.315%, 1/15/19 | United States | 12,671,000 | | | 12,851,549 |
| dBankinter SA, senior note, Reg S, 1.75%, 6/10/19 | Spain | 6,400,000 | EUR | | 7,460,717 |
| BB&T Corp., senior note, | | | | | |
| 2.05%, 6/19/18 | United States | 1,000,000 | | | 1,013,011 |
| bFRN, 0.915%, 2/01/19 | United States | 2,000,000 | | | 2,007,722 |
| BNP Paribas SA, senior note, 2.70%, 8/20/18 | France | 3,500,000 | | | 3,603,968 |
| CIT Group Inc., | | | | | |
| 4.25%, 8/15/17 | United States | 5,500,000 | | | 5,610,000 |
| senior note, 5.00%, 5/15/17 | United States | 500,000 | | | 518,750 |
| senior note, 5.25%, 3/15/18 | United States | 2,000,000 | | | 2,078,000 |
| senior note, 3.875%, 2/19/19 | United States | 3,100,000 | | | 3,080,625 |
| bCitigroup Inc., sub. note, FRN, 0.534%, 6/09/16 | United States | 11,200,000 | | | 11,151,918 |
| Depfa ACS Bank, secured bond, | | | | | |
| 1.65%, 12/20/16 | Ireland | 550,000,000 | JPY | | 4,715,065 |
| 2.125%, 10/13/17 | Ireland | 5,000,000 | CHF | | 5,652,497 |
| cThe Export-Import Bank of China, senior note, 144A, 2.50%, 7/31/19 | China | 8,000,000 | | | 8,103,360 |
| First Horizon National Corp., senior note, 5.375%, 12/15/15 | United States | 2,000,000 | | | 2,051,426 |
| cHSBC Bank Brasil SA, senior note, 144A, 4.00%, 5/11/16 | Brazil | 3,000,000 | | | 3,073,965 |
| Industrial & Commercial Bank of China Ltd./New York, 3.231%, | | | | | |
| 11/13/19 | China | 5,400,000 | | | 5,549,121 |
| b,cING Bank NV, senior note, 144A, FRN, | | | | | |
| 1.907%, 9/25/15 | Netherlands | 3,800,000 | | | 3,822,477 |
| 0.964%, 10/01/19 | Netherlands | 5,000,000 | | | 5,012,850 |
franklintempleton.com
Semiannual Report | 61
FRANKLIN INVESTORS SECURITIES TRUST
STATEMENT OF INVESTMENTS (UNAUDITED)
| | | | | |
| Franklin Low Duration Total Return Fund (continued) | | | | | |
| | | Principal | | | |
| | Country | Amount* | | | Value |
| Corporate Bonds (continued) | | | | | |
| Banks (continued) | | | | | |
| Intesa Sanpaolo SpA, senior note, | | | | | |
| 2.375%, 1/13/17 | Italy | 1,500,000 | | $ | 1,516,425 |
| 3.875%, 1/16/18 | Italy | 5,900,000 | | | 6,171,105 |
| 3.875%, 1/15/19 | Italy | 1,100,000 | | | 1,156,018 |
| bFRN, 0.198%, 5/18/17 | Italy | 2,150,000 | EUR | | 2,395,581 |
| b,dReg S, FRN, 1.498%, 7/29/15 | Italy | 4,400,000 | EUR | | 4,951,288 |
| JPMorgan Chase & Co., senior note, | | | | | |
| 2.20%, 10/22/19 | United States | 11,000,000 | | | 11,008,778 |
| bFRN, 1.177%, 1/25/18 | United States | 8,000,000 | | | 8,083,256 |
| bJPMorgan Chase Bank NA, sub. note, FRN, 0.60%, 6/13/16 | United States | 1,500,000 | | | 1,496,787 |
| cNorddeutsche Landesbank Girozentrale, secured note, 144A, 2.00%, | | | | | |
| 2/05/19 | Germany | 6,500,000 | | | 6,595,842 |
| Nykredit Realkredit AS, secured note, 12H, 2.00%, 4/01/16 | Denmark | 114,985,000 | DKK | | 17,643,913 |
| PNC Funding Corp., senior note, 2.70%, 9/19/16 | United States | 1,200,000 | | | 1,228,604 |
| Regions Financial Corp., senior note, 2.00%, 5/15/18 | United States | 4,500,000 | | | 4,489,744 |
| bRoyal Bank of Canada, senior note, FRN, 0.634%, 3/08/16 | Canada | 3,000,000 | | | 3,008,844 |
| The Royal Bank of Scotland PLC, sub. note, 6.934%, 4/09/18 | United Kingdom | 2,500,000 | EUR | | 3,215,374 |
| bSvenska Handelsbanken AB, senior note, FRN, 0.761%, 6/17/19 | Sweden | 5,300,000 | | | 5,313,064 |
| bU.S. Bank NA, sub. note, FRN, 2.282%, 4/29/20 | United States | 3,000,000 | | | 3,000,000 |
| b,dUniCredit SpA, senior note, Reg S, FRN, | | | | | |
| 1.548%, 7/24/15 | Italy | 4,200,000 | EUR | | 4,725,852 |
| 0.964%, 4/10/17 | Italy | 3,400,000 | EUR | | 3,844,250 |
| bUnion Bank NA, senior note, FRN, 1.019%, 9/26/16 | United States | 2,400,000 | | | 2,404,046 |
| dUnione di Banche Italiane SCpA, senior note, Reg S, 2.875%, 2/18/19 | Italy | 5,800,000 | EUR | | 6,918,603 |
| bWachovia Corp., sub. note, FRN, 0.645%, 10/15/16 | United States | 14,723,000 | | | 14,697,294 |
| cWoori Bank, sub.note, 144A, 4.75%, 4/30/24 | South Korea | 5,300,000 | | | 5,654,464 |
| b,dYorkshire Building Society, secured note, Reg S, FRN, 2.314%, | | | | | |
| 3/23/16 | United Kingdom | 4,868,000 | GBP | | 7,577,473 |
| | | | | | 247,008,191 |
| Capital Goods 0.6% | | | | | |
| dAeroporti Di Roma SpA, senior note, Reg S, 3.25%, 2/20/21 | Italy | 1,100,000 | EUR | | 1,383,791 |
| The Boeing Co., senior note, 0.95%, 5/15/18 | United States | 1,500,000 | | | 1,488,641 |
| General Electric Capital Corp., senior note, 3.35%, 10/17/16 | United States | 2,000,000 | | | 2,076,572 |
| USG Corp., senior note, 6.30%, 11/15/16 | United States | 9,220,000 | | | 9,738,625 |
| | | | | | 14,687,629 |
| Commercial & Professional Services 0.0%† | | | | | |
| Republic Services Inc., senior note, 3.80%, 5/15/18 | United States | 1,035,000 | | | 1,098,624 |
| Consumer Durables & Apparel 0.8% | | | | | |
| Beazer Homes USA Inc., senior note, 5.75%, 6/15/19 | United States | 4,500,000 | | | 4,455,000 |
| Centex LLC, senior note, 6.50%, 5/01/16 | United States | 5,000,000 | | | 5,237,500 |
| D.R. Horton Inc., | | | | | |
| senior bond, 5.625%, 1/15/16 | United States | 2,400,000 | | | 2,469,000 |
| senior note, 4.75%, 5/15/17 | United States | 1,500,000 | | | 1,573,125 |
| senior note, 3.75%, 3/01/19 | United States | 2,000,000 | | | 2,025,720 |
| KB Home, senior note, 4.75%, 5/15/19 | United States | 1,000,000 | | | 997,500 |
| Lennar Corp., senior note, 4.50%, 6/15/19 | United States | 3,408,000 | | | 3,527,280 |
| | | | | | 20,285,125 |
62 | Semiannual Report
franklintempleton.com
FRANKLIN INVESTORS SECURITIES TRUST
STATEMENT OF INVESTMENTS (UNAUDITED)
| | | | | |
| Franklin Low Duration Total Return Fund (continued) | | | | | |
| | | Principal | | | |
| | Country | Amount* | | | Value |
| Corporate Bonds (continued) | | | | | |
| Consumer Services 0.4% | | | | | |
| Carnival Corp., senior note, 3.95%, 10/15/20 | United States | 7,400,000 | | $ | 7,878,447 |
| Yum! Brands Inc., senior note, 4.25%, 9/15/15 | United States | 750,000 | | | 759,208 |
| | | | | | 8,637,655 |
| Diversified Financials 5.0% | | | | | |
| American Express Credit Corp., senior note, 1.55%, 9/22/17 | United States | 4,600,000 | | | 4,627,218 |
| cBayer US Finance LLC, senior note, 144A, 2.375%, 10/08/19 | Germany | 8,700,000 | | | 8,837,051 |
| Capital One Bank USA NA, senior note, 2.30%, 6/05/19 | United States | 8,100,000 | | | 8,118,168 |
| bCredit Suisse New York, senior note, FRN, 0.751%, 5/26/17 | Switzerland | 5,400,000 | | | 5,399,282 |
| bFifth Third Bank, senior note, FRN, 0.766%, 11/18/16 | United States | 11,000,000 | | | 11,022,891 |
| General Motors Financial Co. Inc., senior note, 2.625%, 7/10/17 | United States | 4,000,000 | | | 4,052,032 |
| The Goldman Sachs Group Inc., senior note, | | | | | |
| 3.30%, 5/03/15 | United States | 1,000,000 | | | 1,000,000 |
| bFRN, 1.437%, 4/23/20 | United States | 11,000,000 | | | 11,139,766 |
| cHutchison Whampoa International 14 Ltd., 144A, 1.625%, 10/31/17 | Hong Kong | 4,700,000 | | | 4,686,723 |
| cHyundai Capital Services Inc., senior note, 144A, 2.625%, 9/29/20 | South Korea | 6,300,000 | | | 6,367,794 |
| International Lease Finance Corp., senior note, | | | | | |
| 8.625%, 9/15/15 | United States | 8,325,000 | | | 8,533,125 |
| 8.75%, 3/15/17 | United States | 5,000,000 | | | 5,568,000 |
| John Deere Capital Corp., senior note, | | | | | |
| 1.30%, 3/12/18 | United States | 1,700,000 | | | 1,702,939 |
| 1.95%, 3/04/19 | United States | 3,750,000 | | | 3,788,625 |
| Morgan Stanley, senior note, | | | | | |
| 4.50%, 2/23/16 | United States | 2,000,000 | EUR | | 2,321,847 |
| bFRN, 1.417%, 1/27/20 | United States | 9,900,000 | | | 10,056,608 |
| Navient Corp., senior note, | | | | | |
| 8.45%, 6/15/18 | United States | 800,000 | | | 894,560 |
| 5.50%, 1/15/19 | United States | 2,500,000 | | | 2,547,500 |
| cPrudential Covered Trust, secured note, 144A, 2.997%, 9/30/15 | United States | 10,537,100 | | | 10,618,152 |
| b,cSeven and Seven Ltd., senior note, 144A, FRN, 1.404%, 9/11/19 | South Korea | 1,800,000 | | | 1,796,077 |
| Springleaf Finance Corp., senior note, I, 5.40%, 12/01/15 | United States | 7,000,000 | | | 7,113,750 |
| cStone Street Trust, senior note, 144A, 5.902%, 12/15/15 | United States | 2,000,000 | | | 2,053,290 |
| | | | | | 122,245,398 |
| Energy 4.7% | | | | | |
| cBG Energy Capital PLC, senior note, 144A, 2.875%, 10/15/16 | United Kingdom | 3,500,000 | | | 3,589,320 |
| California Resources Corp., senior note, 5.50%, 9/15/21 | United States | 3,500,000 | | | 3,333,750 |
| Canadian Natural Resources Ltd., senior note, 1.75%, 1/15/18 | Canada | 5,200,000 | | | 5,182,544 |
| Chesapeake Energy Corp., senior note, | | | | | |
| 6.50%, 8/15/17 | United States | 1,000,000 | | | 1,068,750 |
| bFRN, 3.525%, 4/15/19 | United States | 2,500,000 | | | 2,406,250 |
| CNOOC Nexen Finance 2014 ULC, senior note, 1.625%, 4/30/17 | China | 10,800,000 | | | 10,820,704 |
| cCNPC General Capital Ltd., senior note, 144A, | | | | | |
| 1.95%, 4/16/18 | China | 1,500,000 | | | 1,494,660 |
| bFRN, 1.157%, 5/14/17 | China | 7,500,000 | | | 7,508,287 |
| cCNPC HK Overseas Capital Ltd., senior note, 144A, 3.125%, 4/28/16 | China | 2,000,000 | | | 2,035,934 |
| cEnable Midstream Partners LP, senior note, 144A, 2.40%, 5/15/19 | United States | 7,400,000 | | | 7,243,416 |
| cEnergy XXI Gulf Coast Inc., senior secured note, second lien, 144A, | | | | | |
| 11.00%, 3/15/20 | United States | 3,000,000 | | | 2,895,000 |
| EnLink Midstream Partners LP, senior note, 2.70%, 4/01/19 | United States | 2,700,000 | | | 2,700,853 |
franklintempleton.com
Semiannual Report | 63
FRANKLIN INVESTORS SECURITIES TRUST
STATEMENT OF INVESTMENTS (UNAUDITED)
| | | | | |
| Franklin Low Duration Total Return Fund (continued) | | | | | |
| | | Principal | | | |
| | Country | Amount* | | | Value |
| Corporate Bonds (continued) | | | | | |
| Energy (continued) | | | | | |
| Ensco PLC, senior note, 4.70%, 3/15/21 | United States | 7,800,000 | | $ | 7,985,094 |
| Enterprise Products Operating LLC, senior note, 2.55%, 10/15/19 | United States | 5,500,000 | | | 5,597,790 |
| Halcon Resources Corp., senior note, 9.75%, 7/15/20 | United States | 900,000 | | | 742,500 |
| Kinder Morgan Energy Partners LP, senior note, | | | | | |
| 3.50%, 3/01/16 | United States | 2,000,000 | | | 2,040,738 |
| 2.65%, 2/01/19 | United States | 4,500,000 | | | 4,512,492 |
| Kinder Morgan Finance Co. LLC, | | | | | |
| senior bond, 5.70%, 1/05/16 | United States | 11,500,000 | | | 11,863,825 |
| csenior secured note, 144A, 6.00%, 1/15/18 | United States | 2,500,000 | | | 2,747,947 |
| Kinder Morgan Inc., senior note, 3.05%, 12/01/19 | United States | 500,000 | | | 505,638 |
| Linn Energy LLC/Finance Corp., senior note, | | | | | |
| 6.50%, 5/15/19 | United States | 2,000,000 | | | 1,755,000 |
| 6.25%, 11/01/19 | United States | 500,000 | | | 426,250 |
| cLUKOIL International Finance BV, senior note, 144A, 3.416%, 4/24/18 | Russia | 2,300,000 | | | 2,174,938 |
| Peabody Energy Corp., senior note, 6.00%, 11/15/18 | United States | 3,500,000 | | | 2,747,150 |
| bPetrobras Global Finance BV, senior note, FRN, 3.151%, 3/17/20 | Brazil | 5,100,000 | | | 4,794,000 |
| cPetrofac Ltd., senior note, 144A, 3.40%, 10/10/18 | United Kingdom | 1,300,000 | | | 1,279,636 |
| Sanchez Energy Corp., senior note, 7.75%, 6/15/21 | United States | 2,500,000 | | | 2,618,750 |
| cSinopec Group Overseas Development 2015 Ltd., senior note, 144A, | | | | | |
| 2.50%, 4/28/20 | China | 7,400,000 | | | 7,349,828 |
| bStatoil ASA, senior note, FRN, 0.716%, 11/08/18 | Norway | 6,900,000 | | | 6,900,517 |
| | | | | | 116,321,561 |
| Food & Staples Retailing 1.3% | | | | | |
| dCasino Guichard Perrachon SA, senior note, Reg S, 3.311%, 1/25/23 | France | 1,700,000 | EUR | | 2,152,692 |
| CVS Health Corp., senior note, 1.20%, 12/05/16 | United States | 10,000,000 | | | 10,068,070 |
| The Kroger Co., senior note, 1.20%, 10/17/16 | United States | 5,000,000 | | | 5,012,800 |
| Sysco Corp., senior note, 1.45%, 10/02/17 | United States | 7,700,000 | | | 7,759,067 |
| Walgreens Boots Alliance Inc., senior note, 1.75%, 11/17/17 | United States | 5,900,000 | | | 5,947,300 |
| cWoolworths Ltd., senior note, 144A, 2.55%, 9/22/15 | Australia | 260,000 | | | 261,972 |
| | | | | | 31,201,901 |
| Food, Beverage & Tobacco 2.0% | | | | | |
| Altria Group Inc., senior note, 2.625%, 1/14/20 | United States | 6,000,000 | | | 6,131,934 |
| dAnheuser-Busch InBev NV, senior bond, Reg S, 2.875%, 9/25/24 | Belgium | 500,000 | EUR | | 645,215 |
| Anheuser-Busch InBev Worldwide Inc., senior note, 1.375%, 7/15/17 | Belgium | 1,200,000 | | | 1,209,959 |
| Bunge Ltd. Finance Corp., 4.10%, 3/15/16 | United States | 2,000,000 | | | 2,050,238 |
| Coca-Cola Femsa SAB de CV, senior note, 2.375%, 11/26/18 | Mexico | 5,500,000 | | | 5,615,582 |
| Constellation Brands Inc., senior note, 7.25%, 5/15/17 | United States | 6,600,000 | | | 7,292,175 |
| cHeineken NV, senior note, 144A, 0.80%, 10/01/15 | Netherlands | 4,500,000 | | | 4,503,937 |
| Ingredion Inc., senior note, 3.20%, 11/01/15 | United States | 1,500,000 | | | 1,514,909 |
| cJapan Tobacco Inc., senior note, 144A, 2.10%, 7/23/18 | Japan | 5,000,000 | | | 5,084,950 |
| Kraft Foods Group Inc., senior note, | | | | | |
| 1.625%, 6/04/15 | United States | 1,000,000 | | | 1,000,882 |
| 2.25%, 6/05/17 | United States | 7,000,000 | | | 7,127,281 |
| bMondelez International Inc., senior note, FRN, 0.775%, 2/01/19 | United States | 500,000 | | | 495,332 |
| dPernod Ricard SA, senior note, Reg S, 2.125%, 9/27/24 | France | 500,000 | EUR | | 594,106 |
| Reynolds American Inc., senior note, 1.05%, 10/30/15 | United States | 1,000,000 | | | 1,000,179 |
| Tyson Foods Inc., senior note, 2.65%, 8/15/19 | United States | 3,900,000 | | | 3,983,916 |
| | | | | | 48,250,595 |
64 | Semiannual Report
franklintempleton.com
FRANKLIN INVESTORS SECURITIES TRUST
STATEMENT OF INVESTMENTS (UNAUDITED)
| | | | | |
| Franklin Low Duration Total Return Fund (continued) | | | | | |
| | | Principal | | | |
| | Country | Amount* | | | Value |
| Corporate Bonds (continued) | | | | | |
| Health Care Equipment & Services 0.6% | | | | | |
| Aetna Inc., senior note, 1.50%, 11/15/17 | United States | 1,000,000 | | $ | 1,005,964 |
| Alere Inc, senior note, 8.625%, 10/01/18 | United States | 2,000,000 | | | 2,080,000 |
| Becton, Dickinson & Co., senior note, 2.675%, 12/15/19 | United States | 5,900,000 | | | 6,024,508 |
| Edwards Lifesciences Corp., senior note, 2.875%, 10/15/18 | United States | 1,600,000 | | | 1,649,712 |
| HCA Inc., senior secured note, first lien, 4.25%, 10/15/19 | United States | 1,100,000 | | | 1,150,875 |
| Laboratory Corp. of America Holdings, 2.20%, 8/23/17 | United States | 1,000,000 | | | 1,017,316 |
| Medco Health Solutions Inc., senior note, 2.75%, 9/15/15 | United States | 1,500,000 | | | 1,510,650 |
| cTenet Healthcare Corp., senior note, 144A, 5.00%, 3/01/19 | United States | 1,500,000 | | | 1,494,375 |
| | | | | | 15,933,400 |
| Household & Personal Products 0.1% | | | | | |
| Colgate-Palmolive Co., senior note, 0.90%, 5/01/18 | United States | 2,200,000 | | | 2,186,584 |
| Insurance 1.2% | | | | | |
| cMetropolitan Life Global Funding I, secured note, 144A, 1.30%, 4/10/17 | United States | 10,000,000 | | | 10,059,770 |
| cNew York Life Global Funding, secured note, 144A, 2.10%, 1/02/19 | United States | 10,000,000 | | | 10,176,510 |
| bPrudential Financial Inc., senior note, FRN, 1.037%, 8/15/18 | United States | 10,000,000 | | | 10,066,140 |
| | | | | | 30,302,420 |
| Materials 1.3% | | | | | |
| ArcelorMittal, senior note, | | | | | |
| 4.50%, 3/01/16 | Luxembourg | 2,000,000 | | | 2,042,500 |
| 5.25%, 2/25/17 | Luxembourg | 1,500,000 | | | 1,561,875 |
| dArkema SA, senior note, Reg S, 1.50%, 1/20/25 | France | 2,000,000 | EUR | | 2,244,369 |
| cFMG Resources (August 2006) Pty. Ltd., senior note, 144A, | | | | | |
| 6.00%, 4/01/17 | Australia | 800,000 | | | 825,500 |
| 6.875%, 2/01/18 | Australia | 888,889 | | | 921,111 |
| 8.25%, 11/01/19 | Australia | 2,500,000 | | | 2,200,000 |
| Freeport-McMoRan Copper & Gold Inc., senior note, 2.30%, 11/14/17 | United States | 6,000,000 | | | 6,032,796 |
| cGlencore Funding LLC, 144A, 3.125%, 4/29/19 | Switzerland | 5,000,000 | | | 5,104,000 |
| cIncitec Pivot Ltd., senior note, 144A, 4.00%, 12/07/15 | Australia | 2,000,000 | | | 2,042,618 |
| cIneos Group Holdings SA, senior note, 144A, 5.875%, 2/15/19 | Switzerland | 500,000 | | | 507,500 |
| Reynolds Group Holdings Inc., senior note, 8.125%, 6/15/17 | United States | 2,100,000 | | | 2,315,250 |
| Reynolds Group Issuer Inc./LLC/SA, senior note, 8.50%, 5/15/18 | United States | 3,000,000 | | | 3,078,750 |
| Verso Paper Holdings LLC/Inc., senior secured note, first lien, 11.75%, | | | | | |
| 1/15/19 | United States | 90,000 | | | 78,975 |
| cXstrata Finance Canada Ltd., secured note, 144A, 2.05%, 10/23/15 | Switzerland | 3,000,000 | | | 3,011,991 |
| | | | | | 31,967,235 |
| Media 1.1% | | | | | |
| DIRECTV Holdings LLC/DIRECTV Financing Co. Inc., senior note, 2.40%, | | | | | |
| 3/15/17 | United States | 2,900,000 | | | 2,953,253 |
| DISH DBS Corp., senior note, 7.125%, 2/01/16 | United States | 10,500,000 | | | 10,880,625 |
| The New York Times Co., senior note, 6.625%, 12/15/16 | United States | 2,000,000 | | | 2,145,000 |
| Time Warner Inc., | | | | | |
| 3.15%, 7/15/15 | United States | 1,000,000 | | | 1,005,479 |
| senior note, 2.10%, 6/01/19 | United States | 4,500,000 | | | 4,524,331 |
| Viacom Inc., | | | | | |
| 2.75%, 12/15/19 | United States | 2,700,000 | | | 2,742,506 |
| senior note, 2.20%, 4/01/19 | United States | 3,200,000 | | | 3,197,466 |
| | | | | | 27,448,660 |
franklintempleton.com
Semiannual Report | 65
FRANKLIN INVESTORS SECURITIES TRUST
STATEMENT OF INVESTMENTS (UNAUDITED)
| | | | | |
| Franklin Low Duration Total Return Fund (continued) | | | | | |
| | | Principal | | | |
| | Country | Amount* | | | Value |
| Corporate Bonds (continued) | | | | | |
| Pharmaceuticals, Biotechnology & Life Sciences 1.1% | | | | | |
| Actavis Funding SCS, senior note, 2.35%, 3/12/18 | United States | 6,200,000 | | $ | 6,277,395 |
| Amgen Inc., senior note, | | | | | |
| 2.125%, 5/15/17 | United States | 2,500,000 | | | 2,546,358 |
| bFRN, 0.862%, 5/22/19 | United States | 6,200,000 | | | 6,210,949 |
| Celgene Corp., senior note, | | | | | |
| 2.45%, 10/15/15 | United States | 2,000,000 | | | 2,015,540 |
| 2.30%, 8/15/18 | United States | 3,000,000 | | | 3,058,275 |
| Life Technologies Corp., senior note, 3.50%, 1/15/16 | United States | 2,000,000 | | | 2,034,914 |
| cValeant Pharmaceuticals International Inc., senior note, 144A, 5.375%, | | | | | |
| 3/15/20 | United States | 3,000,000 | | | 3,084,375 |
| Zoetis Inc., senior note, | | | | | |
| 1.15%, 2/01/16 | United States | 1,800,000 | | | 1,799,865 |
| 1.875%, 2/01/18 | United States | 1,200,000 | | | 1,201,807 |
| | | | | | 28,229,478 |
| Real Estate 1.0% | | | | | |
| American Tower Corp., senior note, 3.40%, 2/15/19 | United States | 10,100,000 | | | 10,476,881 |
| Boston Properties LP, senior note, 3.70%, 11/15/18 | United States | 4,900,000 | | | 5,214,781 |
| HCP Inc., senior note, 3.75%, 2/01/19 | United States | 5,500,000 | | | 5,784,004 |
| Hospitality Properties Trust, senior note, 5.625%, 3/15/17 | United States | 3,000,000 | | | 3,195,543 |
| | | | | | 24,671,209 |
| Retailing 0.2% | | | | | |
| cEdcon Pty. Ltd., secured note, 144A, 9.50%, 3/01/18 | South Africa | 1,500,000 | EUR | | 1,376,966 |
| cExperian Finance PLC, 144A, 2.375%, 6/15/17 | United Kingdom | 1,000,000 | | | 1,011,180 |
| Toys R Us Inc., senior bond, 7.375%, 10/15/18 | United States | 4,250,000 | | | 3,060,000 |
| | | | | | 5,448,146 |
| Semiconductors & Semiconductor Equipment 0.2% | | | | | |
| Maxim Integrated Products Inc., senior note, 2.50%, 11/15/18 | United States | 5,200,000 | | | 5,283,143 |
| Software & Services 1.0% | | | | | |
| cAlibaba Group Holding Ltd., senior note, 144A, 2.50%, 11/28/19 | China | 11,900,000 | | | 11,891,432 |
| bOracle Corp., senior note, FRN, 0.855%, 1/15/19 | United States | 12,000,000 | | | 12,133,560 |
| | | | | | 24,024,992 |
| Technology Hardware & Equipment 1.7% | | | | | |
| cAlcatel-Lucent USA Inc., senior note, 144A, 4.625%, 7/01/17 | France | 11,000,000 | | | 11,467,500 |
| bApple Inc., FRN, 0.503%, 5/03/18 | United States | 13,000,000 | | | 13,048,347 |
| Dell Inc., senior note, | | | | | |
| 2.30%, 9/10/15 | United States | 1,500,000 | | | 1,503,855 |
| 3.10%, 4/01/16 | United States | 5,000,000 | | | 5,043,750 |
| Juniper Networks Inc., senior note, 3.30%, 6/15/20 | United States | 4,000,000 | | | 4,103,460 |
| b,cNBCUniversal Enterprise Inc., 144A, FRN, 0.96%, 4/15/18 | United States | 7,500,000 | | | 7,559,032 |
| | | | | | 42,725,944 |
| Telecommunication Services 1.1% | | | | | |
| eAT&T Inc., senior note, 2.45%, 6/30/20 | United States | 7,400,000 | | | 7,406,534 |
| Embarq Corp., senior note, 7.082%, 6/01/16 | United States | 3,000,000 | | | 3,166,476 |
| cSprint Communications Inc., senior note, 144A, 9.00%, 11/15/18 | United States | 3,500,000 | | | 3,991,085 |
| Telefonica Emisiones SAU, senior note, 3.192%, 4/27/18 | Spain | 2,300,000 | | | 2,392,149 |
66 | Semiannual Report
franklintempleton.com
FRANKLIN INVESTORS SECURITIES TRUST
STATEMENT OF INVESTMENTS (UNAUDITED)
| | | | | |
| Franklin Low Duration Total Return Fund (continued) | | | | | |
| | | Principal | | | |
| | Country | Amount* | | | Value |
| Corporate Bonds (continued) | | | | | |
| Telecommunication Services (continued) | | | | | |
| cTelefonica Movil Chile SA, senior note, 144A, 2.875%, 11/09/15 | Chile | 2,000,000 | | $ | 2,018,620 |
| Verizon Communications Inc., senior note, 2.625%, 2/21/20 | United States | 8,824,000 | | | 8,956,925 |
| | | | | | 27,931,789 |
| Transportation 0.2% | | | | | |
| cAviation Capital Group Corp., senior note, 144A, 3.875%, 9/27/16 | United States | 3,700,000 | | | 3,803,315 |
| Utilities 1.5% | | | | | |
| DPL Inc., senior note, 6.50%, 10/15/16 | United States | 1,049,000 | | | 1,104,072 |
| Duke Energy Corp., senior note, 2.10%, 6/15/18 | United States | 5,100,000 | | | 5,202,724 |
| cGDF Suez, senior note, 144A, 1.625%, 10/10/17 | France | 1,000,000 | | | 1,008,690 |
| Georgia Power Co., senior note, 12D, 0.625%, 11/15/15 | United States | 1,000,000 | | | 1,000,831 |
| cKorea Western Power Co. Ltd., senior note, 144A, 3.125%, 5/10/17 | South Korea | 5,200,000 | | | 5,349,266 |
| NGL Energy Partners LP/NGL Energy Finance Corp., senior note, 5.125%, | | | | | |
| 7/15/19 | United States | 2,000,000 | | | 1,975,000 |
| PPL Energy Supply LLC, senior note, 6.20%, 5/15/16 | United States | 8,000,000 | | | 8,257,144 |
| The Southern Co., senior note, 2.45%, 9/01/18 | United States | 7,000,000 | | | 7,201,327 |
| cState Grid Overseas Investment 2013 Ltd., senior note, 144A, 1.75%, | | | | | |
| 5/22/18 | China | 2,000,000 | | | 1,992,160 |
| cState Grid Overseas Investment 2014 Ltd., senior note, 144A, 2.75%, | | | | | |
| 5/07/19 | China | 2,200,000 | | | 2,253,293 |
| dVeolia Environnement SA, senior bond, Reg S, 4.625%, 3/30/27 | France | 1,000,000 | EUR | | 1,500,944 |
| Virginia Electric & Power Co., senior note, 1.20%, 1/15/18 | United States | 900,000 | | | 899,569 |
| | | | | | 37,745,020 |
| Total Corporate Bonds (Cost $929,332,017) | | | | | 928,514,537 |
| b,fSenior Floating Rate Interests 5.1% | | | | | |
| Automobiles & Components 0.2% | | | | | |
| Crowne Group LLC, Term Loan, 6.00%, 9/30/20 | United States | 1,704,137 | | | 1,702,006 |
| FRAM Group Holdings Inc. (Autoparts Holdings), Term Loan, 7.00%, | | | | | |
| 7/29/17 | United States | 2,421,891 | | | 2,409,025 |
| Henniges Automotive Holdings Inc., Term Loans, 5.50%, 6/12/21 | United States | 1,270,124 | | | 1,277,301 |
| UCI International Inc., Term Loan, 5.50%, 7/26/17 | United States | 601,388 | | | 592,618 |
| | | | | | 5,980,950 |
| Capital Goods 0.3% | | | | | |
| Alfred Fueling Systems Inc. (Wayne Fueling), First Lien Initial Term Loan, | | | | | |
| 4.75%, 6/18/21 | United States | 475,805 | | | 479,373 |
| Allison Transmission Inc., Term B-3 Loans, 3.50%, 8/23/19 | United States | 491,079 | | | 494,839 |
| Doncasters U.S. Finance LLC, Term B Loans, 4.50%, 4/09/20 | United States | 312,041 | | | 312,951 |
| eOnsite Rental Group Operations Pty. Ltd., Term B Loan, 5.50%, 7/30/21 | United States | 2,543,611 | | | 2,514,996 |
| Sensus USA Inc., First Lien Term Loan, 4.50%, 5/09/17 | United States | 1,335,230 | | | 1,334,395 |
| Signode Industrial Group U.S. Inc., Initial Term B Loan, 3.75%, 5/01/21 | United States | 724,796 | | | 726,495 |
| TransDigm Inc., | | | | | |
| Tranche C Term Loan, 3.75%, 2/28/20 | United States | 549,472 | | | 551,494 |
| Tranche D Term Loan, 3.75%, 6/04/21 | United States | 321,846 | | | 323,028 |
| WireCo Worldgroup Inc., Term Loan, 6.00%, 2/15/17 | United States | 51,111 | | | 51,239 |
| | | | | | 6,788,810 |
| Commercial & Professional Services 0.1% | | | | | |
| Interactive Data Corp., Term Loan, 4.75%, 5/02/21 | United States | 2,606,968 | | | 2,627,743 |
franklintempleton.com
Semiannual Report | 67
FRANKLIN INVESTORS SECURITIES TRUST
STATEMENT OF INVESTMENTS (UNAUDITED)
| | | | |
| Franklin Low Duration Total Return Fund (continued) | | | | |
| | | Principal | | |
| | Country | Amount* | | Value |
| b,fSenior Floating Rate Interests (continued) | | | | |
| Consumer Services 0.6% | | | | |
| 24 Hour Fitness Worldwide Inc., Term Loan, 4.75%, 5/28/21 | United States | 1,404,806 | $ | 1,405,684 |
| Boyd Gaming Corp., Term A Loan, 3.146%, 8/14/18 | United States | 58,772 | | 58,753 |
| Cannery Casino Resorts LLC, Term Loan, 6.00%, 10/02/18 | United States | 3,421,672 | | 3,417,396 |
| eFitness International LLC, Term B Loan, 5.50%, 7/01/20 | United States | 3,600,118 | | 3,426,114 |
| eROC Finance LLC, Funded Term B Loans, 5.00%, 6/20/19 | United States | 2,343,479 | | 2,331,762 |
| eSeaworld Parks and Entertainment Inc., Term B-2 Loan, 3.00%, | | | | |
| 5/14/20 | United States | 1,734,162 | | 1,704,031 |
| TGI Friday’s Inc., First Lien Initial Term Loan, 5.25%, 7/15/20 | United States | 49,977 | | 50,289 |
| Travelport Finance Luxembourg S.A.R.L., Initial Term Loan, 5.75%, | | | | |
| 9/02/21 | Luxembourg | 3,290,135 | | 3,328,435 |
| | | | | 15,722,464 |
| Diversified Financials 0.1% | | | | |
| Guggenheim Partners Investment Management Holdings LLC, Initial Term | | | | |
| Loan, 4.25%, 7/22/20 | United States | 406,108 | | 408,900 |
| Trans Union LLC, 2014 Replacement Term Loan, 4.00%, 4/09/21 | United States | 3,328,142 | | 3,346,862 |
| | | | | 3,755,762 |
| Energy 0.6% | | | | |
| eBowie Resource Holdings LLC, First Lien Initial Term Loan, 6.75%, | | | | |
| 8/16/20 | United States | 1,812,636 | | 1,762,789 |
| Citgo Petroleum Corp., Term B Loan, 4.50%, 7/29/21 | United States | 246,687 | | 247,844 |
| Drillships Ocean Ventures Inc. and Drillships Ventures Projects Inc., | | | | |
| 5.50%, 7/25/21 | Marshall Islands | 1,079,258 | | 940,754 |
| eFieldwood Energy LLC, Loans, 3.875%, 10/01/18 | United States | 2,814,556 | | 2,751,228 |
| OSG Bulk Ships Inc., Initial Term Loan, 5.25%, 8/05/19 | United States | 1,303,210 | | 1,309,726 |
| OSG International Inc. (OIN), Initial Term Loan, 5.75%, 8/05/19 | United States | 2,147,868 | | 2,166,662 |
| ePeabody Energy Corp., Term Loan, 4.25%, 9/24/20 | United States | 1,657,223 | | 1,499,786 |
| UTEX Industries Inc., First Lien Initial Term Loan, 5.00%, 5/21/21 | United States | 3,998,815 | | 3,803,873 |
| | | | | 14,482,662 |
| Health Care Equipment & Services 0.3% | | | | |
| Connolly LLC, Initial Term Loan, 5.00%, 5/14/21 | United States | 1,959,958 | | 1,977,108 |
| eKinetic Concepts Inc., Dollar Term E-1 Loan, 4.50%, 5/04/18 | United States | 1,049,614 | | 1,058,360 |
| Millennium Health LLC, Tranche B Term Loan, 5.25%, 4/16/21 | United States | 1,247,959 | | 1,032,686 |
| Truven Health Analytics Inc., New Tranche B Term Loan, 4.50%, | | | | |
| 6/06/19 | United States | 721,720 | | 724,417 |
| U.S. Renal Care Inc., Tranche B-2 Term Loan, 4.25%, 7/03/19 | United States | 1,571,575 | | 1,582,379 |
| | | | | 6,374,950 |
| Household & Personal Products 0.2% | | | | |
| FGI Operating Co. LLC (Freedom Group), Term B Loans, 5.50%, | | | | |
| 4/19/19 | United States | 5,674,615 | | 5,570,583 |
| Revlon Consumer Products Corp., Replacement Term Loan, 3.25%, | | | | |
| 11/19/17 | United States | 477,911 | | 478,807 |
| | | | | 6,049,390 |
| Materials 0.9% | | | | |
| Appvion Inc., Term Loan, 5.75%, 6/28/19 | United States | 2,018,505 | | 1,877,209 |
| Caraustar Industries Inc., | | | | |
| Term Loan B, 8.00%, 5/01/19 | United States | 1,700,188 | | 1,709,752 |
| Term Loan C, 8.00%, 5/01/19 | United States | 2,842,875 | | 2,858,866 |
68 | Semiannual Report franklintempleton.com
FRANKLIN INVESTORS SECURITIES TRUST
STATEMENT OF INVESTMENTS (UNAUDITED)
| | | | |
| Franklin Low Duration Total Return Fund (continued) | | | | |
| | | Principal | | |
| | Country | Amount* | | Value |
| b,fSenior Floating Rate Interests (continued) | | | | |
| Materials (continued) | | | | |
| Coveris Holdings SA, USD Term Loan, 5.25%, 5/08/19 | Luxembourg | 3,774,048 | $ | 3,803,927 |
| Cyanco Intermediate Corp., Initial Term Loan, 5.50%, 5/01/20 | United States | 4,033,547 | | 4,033,547 |
| FMG America Finance Inc. (Fortescue Metals Group), Loans, 3.75%, | | | | |
| 6/30/19 | Australia | 4,511,273 | | 4,086,149 |
| eIneos U.S. Finance LLC, Dollar Term Loan, 3.75%, 3/31/22 | United States | 425,548 | | 428,588 |
| eNexeo Solutions LLC, | | | | |
| Term B-1 Loan, 5.00%, 9/08/17 | United States | 108,955 | | 107,729 |
| Term B-3 Loan, 5.00%, 9/08/17 | United States | 1,721 | | 1,702 |
| OCI Beaumont LLC, Term B-3 Loan, 5.50%, 8/20/19 | United States | 927,697 | | 939,293 |
| Oxbow Carbon LLC, First Lien Tranche B Term Loan, 4.25%, 7/19/19 | United States | 679,718 | | 674,054 |
| Tronox Pigments (Netherlands) BV, Term Loan, 4.25%, 3/19/20 | Netherlands | 497,385 | | 499,623 |
| Univar Inc., Term B Loan, 5.00%, 6/30/17 | United States | 223,993 | | 225,183 |
| | | | | 21,245,622 |
| Media 0.4% | | | | |
| eCharter Communications Operating LLC, Term E Loan, (CCO Safari), | | | | |
| 4.25%, 7/01/20 | United States | 124,000 | | 123,435 |
| Cumulus Media Holdings Inc., Term Loans, 4.25%, 12/23/20 | United States | 494,631 | | 488,572 |
| Radio One Inc., Term Loan B, 4.78%, 12/31/18 | United States | 6,929,333 | | 6,942,326 |
| eRegal Cinemas Corp., Term Loan, 3.75%, 4/01/22 | United States | 492,769 | | 495,908 |
| eSinclair Television Group Inc., Incremental Term Loan B-1, 3.00%, | | | | |
| 7/30/21 | United States | 175,632 | | 176,071 |
| UPC Financing Partnership (UPC Broadband Holdings BV), Term Loan AH, | | | | |
| 3.25%, 6/30/21 | Netherlands | 1,280,286 | | 1,281,657 |
| Zuffa LLC, Initial Term Loan, 3.75%, 2/25/20 | United States | 337,586 | | 334,263 |
| | | | | 9,842,232 |
| Pharmaceuticals, Biotechnology & Life Sciences 0.2% | | | | |
| Grifols Worldwide Operations USA Inc., US Tranche B Term Loan, 3.184%, | | | | |
| 2/27/21 | United States | 1,085,148 | | 1,089,957 |
| Valeant Pharmaceuticals International Inc., Series F-1 New Term Loan, | | | | |
| 4.00%, 4/01/22 | United States | 3,624,222 | | 3,653,897 |
| | | | | 4,743,854 |
| Retailing 0.4% | | | | |
| BJ’s Wholesale Club Inc., 2013 (Nov) Replacement Loans, 4.50%, | | | | |
| 9/26/19 | United States | 3,100,276 | | 3,121,349 |
| Dollar Tree Inc., Initial Term B Loans, 4.25%, 3/09/22 | United States | 1,064,622 | | 1,079,839 |
| Evergreen AcqCo. 1 LP (Savers), Term Loan, 5.00%, 7/09/19 | United States | 3,714,625 | | 3,661,807 |
| The Men’s Wearhouse Inc., Tranche B Term Loan, 4.50%, 6/18/21 | United States | 885,890 | | 896,688 |
| Party City Holdings Inc., 2014 Replacement Term Loan, 4.00%, | | | | |
| 7/27/19 | United States | 1,407,080 | | 1,412,733 |
| | | | | 10,172,416 |
| Semiconductors & Semiconductor Equipment 0.0%† | | | | |
| M/A-COM Technology Solutions Holdings Inc., Initial Term Loan, 4.50%, | | | | |
| 5/07/21 | United States | 616,442 | | 622,606 |
| Software & Services 0.6% | | | | |
| BMC Software Finance Inc., Initial U.S. Term Loans, 5.00%, 9/10/20 | United States | 5,849,179 | | 5,757,786 |
| MoneyGram International Inc., Term Loan, 4.25%, 3/28/20 | United States | 5,251,300 | | 4,954,822 |
franklintempleton.com
Semiannual Report | 69
FRANKLIN INVESTORS SECURITIES TRUST
STATEMENT OF INVESTMENTS (UNAUDITED)
| | | | | |
| Franklin Low Duration Total Return Fund (continued) | | | | | |
| | | Principal | | | |
| | Country | Amount* | | | Value |
| b,fSenior Floating Rate Interests (continued) | | | | | |
| Software & Services (continued) | | | | | |
| Sungard Availability Services Capital Inc., Tranche B Term Loan, 6.00%, | | | | | |
| 3/29/19 | United States | 3,447,894 | | $ | 3,212,289 |
| | | | | | 13,924,897 |
| Technology Hardware & Equipment 0.0%† | | | | | |
| CIENA Corp., Term Loan, 3.75%, 7/15/19 | United States | 237,826 | | | 239,015 |
| Telecommunication Services 0.1% | | | | | |
| Intelsat Jackson Holdings SA, Tranche B-2 Term Loan, 3.75%, 6/30/19 | Luxembourg | 1,381,898 | | | 1,383,280 |
| Utilities 0.1% | | | | | |
| Calpine Construction Finance Co. LP, | | | | | |
| eTerm B-1 Loan, 3.00%, 5/03/20 | United States | 1,383,974 | | | 1,378,958 |
| Term B-2 Loan, 3.25%, 1/31/22 | United States | 510,258 | | | 509,380 |
| | | | | | 1,888,338 |
| Total Senior Floating Rate Interests | | | | | |
| (Cost $126,159,497) | | | | | 125,844,991 |
| Foreign Government and Agency Securities 3.4% | | | | | |
| The Export-Import Bank of Korea, senior note, 2.25%, 1/21/20 | South Korea | 11,200,000 | | | 11,261,432 |
| Government of Hungary, | | | | | |
| 7.75%, 8/24/15 | Hungary | 4,100,000 | HUF | | 15,420 |
| 5.50%, 12/22/16 | Hungary | 750,880,000 | HUF | | 2,947,429 |
| A, 6.75%, 11/24/17 | Hungary | 3,910,000 | HUF | | 16,213 |
| A, 5.50%, 12/20/18 | Hungary | 428,710,000 | HUF | | 1,751,752 |
| Government of Malaysia, | | | | | |
| 3.835%, 8/12/15 | Malaysia | 9,860,000 | MYR | | 2,773,199 |
| 4.72%, 9/30/15 | Malaysia | 24,950,000 | MYR | | 7,048,331 |
| 3.197%, 10/15/15 | Malaysia | 3,055,000 | MYR | | 857,895 |
| senior bond, 4.262%, 9/15/16 | Malaysia | 2,300,000 | MYR | | 654,485 |
| senior note, 3.172%, 7/15/16 | Malaysia | 5,550,000 | MYR | | 1,557,194 |
| Government of Mexico, | | | | | |
| 6.00%, 6/18/15 | Mexico | 4,060 | gMXN | | 26,563 |
| 8.00%, 12/17/15 | Mexico | 1,156,900 | gMXN | | 7,767,054 |
| 6.25%, 6/16/16 | Mexico | 1,174,500 | gMXN | | 7,883,722 |
| 7.25%, 12/15/16 | Mexico | 749,000 | gMXN | | 5,150,658 |
| Government of Poland, | | | | | |
| 6.25%, 10/24/15 | Poland | 403,000 | PLN | | 114,354 |
| 5.00%, 4/25/16 | Poland | 14,225,000 | PLN | | 4,076,746 |
| bFRN, 2.01%, 1/25/17 | Poland | 1,338,000 | PLN | | 371,683 |
| bFRN, 2.01%, 1/25/21 | Poland | 1,356,000 | PLN | | 373,521 |
| Strip, 7/25/15 | Poland | 4,579,000 | PLN | | 1,267,016 |
| cGovernment of Serbia, senior note, 144A, 5.25%, 11/21/17 | Serbia | 1,800,000 | | | 1,865,952 |
| Government of Singapore, senior note, 1.125%, 4/01/16 | Singapore | 2,010,000 | SGD | | 1,519,882 |
| Government of Sri Lanka, | | | | | |
| A, 6.50%, 7/15/15 | Sri Lanka | 2,060,000 | LKR | | 15,458 |
| A, 11.00%, 8/01/15 | Sri Lanka | 13,400,000 | LKR | | 101,574 |
| A, 6.40%, 8/01/16 | Sri Lanka | 1,500,000 | LKR | | 11,216 |
| A, 8.00%, 11/15/18 | Sri Lanka | 3,780,000 | LKR | | 28,349 |
| A, 9.00%, 5/01/21 | Sri Lanka | 4,890,000 | LKR | | 37,817 |
| C, 8.50%, 4/01/18 | Sri Lanka | 2,890,000 | LKR | | 22,060 |
| D, 8.50%, 6/01/18 | Sri Lanka | 1,960,000 | LKR | | 14,942 |
70 | Semiannual Report franklintempleton.com
FRANKLIN INVESTORS SECURITIES TRUST
STATEMENT OF INVESTMENTS (UNAUDITED)
| | | | | |
| Franklin Low Duration Total Return Fund (continued) | | | | | |
| | | Principal | | | |
| | Country | Amount* | | | Value |
| Foreign Government and Agency Securities (continued) | | | | | |
| Government of the Philippines, | | | | | |
| senior bond, 7.00%, 1/27/16 | Philippines | 3,500,000 | PHP | $ | 80,572 |
| senior note, 1.625%, 4/25/16 | Philippines | 19,230,000 | PHP | | 427,011 |
| Korea Monetary Stabilization Bond, | | | | | |
| senior bond, 2.80%, 8/02/15 | South Korea | 6,330,230,000 | KRW | | 5,891,316 |
| senior bond, 2.81%, 10/02/15 | South Korea | 1,860,000,000 | KRW | | 1,734,236 |
| senior note, 2.76%, 6/02/15 | South Korea | 1,334,100,000 | KRW | | 1,239,322 |
| senior note, 2.07%, 12/02/16 | South Korea | 1,700,000,000 | KRW | | 1,585,482 |
| cKorea National Oil Corp., senior note, 144A, 2.875%, 11/09/15 | South Korea | 2,000,000 | | | 2,022,150 |
| Korea Treasury Bond, senior note, | | | | | |
| 3.25%, 6/10/15 | South Korea | 420,970,000 | KRW | | 391,340 |
| 2.75%, 12/10/15 | South Korea | 2,527,740,000 | KRW | | 2,361,190 |
| 2.75%, 6/10/16 | South Korea | 4,800,000,000 | KRW | | 4,504,131 |
| 3.00%, 12/10/16 | South Korea | 1,590,000,000 | KRW | | 1,504,487 |
| hNota Do Tesouro Nacional, Index Linked, 6.00%, | | | | | |
| 8/15/16 | Brazil | 789 | i BRL | | 676,848 |
| 5/15/17 | Brazil | 150 | i BRL | | 128,802 |
| 8/15/18 | Brazil | 1,810 | i BRL | | 1,543,849 |
| Total Foreign Government and Agency Securities | | | | | |
| (Cost $90,586,336) | | | | | 83,622,653 |
| U.S. Government and Agency Securities 5.4% | | | | | |
| U.S. Treasury Note, | | | | | |
| 4.125%, 5/15/15 | United States | 15,000,000 | | | 15,024,030 |
| 2.125%, 5/31/15 | United States | 44,200,000 | | | 44,277,704 |
| 1.875%, 6/30/15 | United States | 30,000,000 | | | 30,091,410 |
| 0.25%, 7/15/15 | United States | 5,000,000 | | | 5,002,345 |
| 4.25%, 8/15/15 | United States | 34,000,000 | | | 34,418,370 |
| jIndex Linked, 0.125%, 4/15/16 | United States | 3,189,712 | | | 3,230,081 |
| Total U.S. Government and Agency Securities | | | | | |
| (Cost $131,987,819) | | | | | 132,043,940 |
| Asset-Backed Securities and Commercial | | | | | |
| Mortgage-Backed Securities 31.7% | | | | | |
| Banks 10.3% | | | | | |
| Banc of America Commercial Mortgage Trust, | | | | | |
| 2006-1, AJ, 5.46%, 9/10/45 | United States | 8,350,000 | | | 8,559,042 |
| b2006-1, D, FRN, 5.449%, 9/10/45 | United States | 1,776,000 | | | 1,786,609 |
| 2006-4, AJ, 5.695%, 7/10/46 | United States | 7,087,000 | | | 7,298,228 |
| 2006-4, AM, 5.675%, 7/10/46 | United States | 6,710,000 | | | 7,062,785 |
| Bear Stearns Commercial Mortgage Securities Inc., | | | | | |
| b2006-PW11, AJ, FRN, 5.605%, 3/11/39 | United States | 5,382,000 | | | 5,509,742 |
| b2006-PW12, AJ, FRN, 5.751%, 9/11/38 | United States | 1,770,000 | | | 1,820,802 |
| 2006-PW13, AJ, 5.611%, 9/11/41 | United States | 7,000,000 | | | 7,203,252 |
| b2007-PW16, AM, FRN, 5.71%, 6/11/40 | United States | 2,100,000 | | | 2,268,601 |
| Bear Stearns Commercial Mortgage Securities Trust, | | | | | |
| b2005-T20, E, FRN, 5.288%, 10/12/42 | United States | 2,000,000 | | | 2,003,597 |
| 2006-PW13, A4, 5.54%, 9/11/41 | United States | 3,263,265 | | | 3,398,807 |
| b2007-PW16, A4, FRN, 5.706%, 6/11/40 | United States | 1,710,000 | | | 1,844,154 |
| Capital One Multi-Asset Execution Trust, | | | | | |
| 2006-A6, A3, 5.05%, 12/17/18 | United States | 6,100,000 | | | 6,314,281 |
| b2006-A11, A11, FRN, 0.272%, 6/17/19 | United States | 12,000,000 | | | 11,986,140 |
| b2007-A1, A1, FRN, 0.232%, 11/15/19 | United States | 12,220,000 | | | 12,178,018 |
franklintempleton.com Semiannual Report | 71
FRANKLIN INVESTORS SECURITIES TRUST
STATEMENT OF INVESTMENTS (UNAUDITED)
| | | | |
| Franklin Low Duration Total Return Fund (continued) | | | | |
| | | Principal | | |
| | Country | Amount* | | Value |
| Asset-Backed Securities and Commercial | | | | |
| Mortgage-Backed Securities (continued) | | | | |
| Banks (continued) | | | | |
| Capital One Multi-Asset Execution Trust, (continued) | | | | |
| b2007-A2, A2, FRN, 0.262%, 12/16/19 | United States | 11,390,000 | $ | 11,355,289 |
| b2007-A5, A5, FRN, 0.222%, 7/15/20 | United States | 10,200,000 | | 10,136,944 |
| bCD Commercial Mortgage Trust, 2005-CD1, AJ, FRN, 5.219%, 7/15/44 | United States | 3,258,000 | | 3,297,192 |
| Citibank Credit Card Issuance Trust, | | | | |
| 2003-A7, A7, 4.15%, 7/07/17 | United States | 2,900,000 | | 2,919,929 |
| 2005-A9, A9, 5.10%, 11/20/17 | United States | 6,200,000 | | 6,359,458 |
| b2006-A3, A3, FRN, 5.30%, 3/15/18 | United States | 2,160,000 | | 2,248,468 |
| b2006-A8, A8, FRN, 0.315%, 12/17/18 | United States | 6,230,000 | | 6,216,141 |
| b2008-A6, A6, FRN, 1.381%, 5/22/17 | United States | 5,780,000 | | 5,783,274 |
| 2012-A1, A1, 0.55%, 10/10/17 | United States | 4,100,000 | | 4,100,461 |
| b2013-A11, A11, FRN, 0.418%, 2/07/18 | United States | 9,620,000 | | 9,625,267 |
| b2013-A12, A12, FRN, 0.486%, 11/07/18 | United States | 6,200,000 | | 6,198,500 |
| b2014-A9, A9, FRN, 0.38%, 5/09/18 | United States | 2,180,000 | | 2,180,233 |
| Citigroup Commercial Mortgage Trust, | | | | |
| k2006-C5, AJ, 5.482%, 10/15/49 | United States | 1,379,000 | | 1,370,607 |
| b2007-C6, AM, FRN, 5.706%, 6/10/17 | United States | 7,000,000 | | 7,473,004 |
| bCitigroup/Deutsche Bank Commercial Mortgage Trust, 2005-CD1, E, FRN, | | | | |
| 5.219%, 7/15/44 | United States | 3,495,000 | | 3,499,926 |
| bCountrywide Asset-Backed Certificates, | | | | |
| 2001-BC3, A, FRN, 0.661%, 12/25/31 | United States | 1,765 | | 1,340 |
| 2002-3, 1A1, FRN, 0.921%, 5/25/32 | United States | 1,795 | | 1,709 |
| 2004-1, M1, FRN, 0.931%, 3/25/34 | United States | 480,182 | | 461,266 |
| 2004-7, MV3, FRN, 1.231%, 12/25/34 | United States | 653,689 | | 651,674 |
| 2004-14, M1, FRN, 0.946%, 6/25/35 | United States | 328,649 | | 328,767 |
| Credit Suisse First Boston Mortgage Securities Corp., | | | | |
| 2004-6, 3A1, 5.00%, 9/25/19 | United States | 1,741,160 | | 1,820,193 |
| b2004-AR3, 5A1, FRN, 0.267%, 4/25/34 | United States | 2,375,553 | | 2,432,130 |
| b2005-C5, C, FRN, 5.10%, 8/15/38 | United States | 6,350,000 | | 6,412,341 |
| bGreenwich Capital Commercial Funding Corp., 2006-GG7, | | | | |
| AJ, FRN, 5.82%, 7/10/38 | United States | 6,800,000 | | 6,955,081 |
| AM, FRN, 6.014%, 7/10/38 | United States | 660,000 | | 689,535 |
| bImpac Secured Assets CMN Owner Trust, 2004-4, M1, FRN, 0.946%, | | | | |
| 2/25/35 | United States | 1,120,000 | | 1,077,681 |
| JP Morgan Chase Commercial Mortgage Securities Trust, | | | | |
| 2004-LN2, A2, 5.115%, 7/15/41 | United States | 99,169 | | 99,533 |
| 2006-CB17, AM, 5.464%, 12/12/43 | United States | 2,350,000 | | 2,427,268 |
| b,k2006-LDP7, AJ, FRN, 5.873%, 4/15/45 | United States | 7,000,000 | | 7,069,090 |
| bLB-UBS Commercial Mortgage Trust, | | | | |
| 2006-C1, AJ, FRN, 5.276%, 2/15/41 | United States | 967,000 | | 981,718 |
| 2006-C4, AJ, FRN, 5.857%, 6/15/38 | United States | 4,000,000 | | 4,140,540 |
| bMerrill Lynch Mortgage Investors Trust, | | | | |
| 2003-A, 1A, FRN, 0.921%, 3/25/28 | United States | 727,063 | | 694,468 |
| 2005-1, 2A2, FRN, 2.297%, 4/25/35 | United States | 847,489 | | 826,087 |
| 2006-3, 2A1, FRN, 2.275%, 10/25/36 | United States | 3,763,235 | | 3,699,745 |
| bMerrill Lynch Mortgage Trust, 2005-CKI1, AJ, FRN, 5.282%, 11/12/37 | United States | 1,750,000 | | 1,775,121 |
| bMorgan Stanley ABS Capital I Inc. Trust, 2005-WMC, M2, FRN, 0.916%, | | | | |
| 1/25/35 | United States | 532,840 | | 521,317 |
| bMorgan Stanley Capital I Trust, 2006-HQ8, | | | | |
| A4, FRN, 5.417%, 3/12/44 | United States | 3,139,209 | | 3,175,788 |
| AJ, FRN, 5.497%, 3/12/44 | United States | 7,000,000 | | 7,143,860 |
72 | Semiannual Report franklintempleton.com
FRANKLIN INVESTORS SECURITIES TRUST
STATEMENT OF INVESTMENTS (UNAUDITED)
| | | | |
| Franklin Low Duration Total Return Fund (continued) | | | | |
| | | Principal | | |
| | Country | Amount* | | Value |
| Asset-Backed Securities and Commercial | | | | |
| Mortgage-Backed Securities (continued) | | | | |
| Banks (continued) | | | | |
| bWachovia Bank Commercial Mortgage Trust, | | | | |
| c2003-C7, F, 144A, FRN, 5.004%, 10/15/35 | United States | 1,500,000 | $ | 1,511,970 |
| 2006-C23, AJ, FRN, 5.515%, 1/18/45 | United States | 8,000,000 | | 8,205,416 |
| 2006-C23, AM, FRN, 5.466%, 1/15/45 | United States | 2,730,000 | | 2,799,693 |
| 2006-C25, AJ, FRN, 5.86%, 5/15/43 | United States | 5,700,000 | | 5,887,832 |
| 2006-C27, AM, FRN, 5.795%, 7/17/45 | United States | 2,755,000 | | 2,892,350 |
| 2006-C28, AM, FRN, 5.603%, 10/15/48 | United States | 7,330,000 | | 7,739,927 |
| bWells Fargo Mortgage Backed Securities Trust, | | | | |
| 2004-I, 2A1, FRN, 2.654%, 6/25/34 | United States | 2,527,814 | | 2,546,398 |
| 2004-V, 2A1, FRN, 2.632%, 10/25/34 | United States | 2,125,057 | | 2,153,929 |
| 2004-W, A9, FRN, 2.616%, 11/25/34 | United States | 218,536 | | 222,474 |
| 2005-AR, 1A1, FRN, 2.61%, 2/25/35 | United States | 2,675,235 | | 2,695,572 |
| 2005-AR9, 2A2, FRN, 2.641%, 10/25/33 | United States | 288,718 | | 285,784 |
| 2005-AR10, 2A3, FRN, 2.616%, 6/25/35 | United States | 1,180,795 | | 1,171,641 |
| | | | | 253,497,989 |
| Diversified Financials 21.2% | | | | |
| cABSC Manufactured Housing Contract Resecuritization Trust, 2004-0K1, | | | | |
| A4, 144A, 5.019%, 4/16/30 | United States | 838,385 | | 845,298 |
| bAmerican Express Credit Account Master Trust, | | | | |
| 2008-2, A, FRN, 1.442%, 9/15/20 | United States | 2,900,000 | | 2,975,910 |
| 2008-6, A, FRN, 1.382%, 2/15/18 | United States | 8,850,000 | | 8,868,678 |
| 2012-1, A, FRN, 0.452%, 1/15/20 | United States | 11,890,000 | | 11,904,167 |
| 2012-3, A, FRN, 0.332%, 3/15/18 | United States | 2,480,000 | | 2,480,131 |
| bAmerican Home Mortgage Investment Trust, | | | | |
| 2004-3, 4A, FRN, 1.903%, 10/25/34 | United States | 4,779,894 | | 4,716,904 |
| 2005-1, 6A, FRN, 2.378%, 6/25/45 | United States | 2,191,673 | | 2,158,968 |
| b,kAmeriquest Mortgage Securities Inc. Asset-Backed Pass-Through | | | | |
| Certificates, 2004-R4, M1, FRN, 1.006%, 6/25/34 | United States | 1,555,269 | | 1,525,132 |
| cApidos CDO, 2013-14A, C2, 144A, 4.85%, 4/15/25 | United States | 1,900,000 | | 1,903,515 |
| b,cARCap REIT Inc., 2004-RR3, A2, 144A, FRN, 4.76%, 9/21/45 | United States | 6,400,637 | | 6,548,875 |
| cARCap Resecuritization Trust, 2004-A1, A, 144A, 4.73%, 4/21/24 | United States | 2,215,976 | | 2,237,028 |
| b,cAres IIIR/IVR CLO Ltd., 2007-3RA, | | | | |
| A2, 144A, FRN, 0.496%, 4/16/21 | United States | 4,227,815 | | 4,161,354 |
| B, 144A, FRN, 0.646%, 4/16/21 | United States | 3,700,000 | | 3,577,049 |
| b,cARES XI CLO Ltd., 2007-11A, | | | | |
| A1B, 144A, FRN, 0.536%, 10/11/21 | United States | 9,688,317 | | 9,559,462 |
| A1C, 144A, FRN, 0.546%, 10/11/21 | United States | 2,340,357 | | 2,299,026 |
| bArgent Securities Inc., 2005-W2, A2C, FRN, 0.541%, 10/25/35 | United States | 1,155,000 | | 1,098,881 |
| b,cAtrium CDO Corp., 10A, A, 144A, FRN, 1.396%, 7/16/25 | United States | 1,390,000 | | 1,371,318 |
| b,cAtrium XI, 11A, C, 144A, FRN, 3.477%, 10/23/25 | Cayman Islands | 6,750,000 | | 6,781,455 |
| b,cBabson CLO Inc., 2007-1A, A1, 144A, FRN, 0.50%, 1/18/21 | United States | 2,701,067 | | 2,670,004 |
| bBank of America Credit Card Trust, 2014-A2, A, FRN, 0.452%, 9/16/19 | United States | 9,620,000 | | 9,626,349 |
| bBear Stearns Alt-A Trust, | | | | |
| 2004-10, 1A3, FRN, 1.181%, 9/25/34 | United States | 3,183,591 | | 3,189,102 |
| 2004-13, A2, FRN, 1.061%, 11/25/34 | United States | 164,308 | | 158,124 |
| b,cBear Stearns Commercial Mortgage Securities Trust, 2006-PW12, B, | | | | |
| 144A, FRN, 5.742%, 9/11/38 | United States | 1,860,000 | | 1,830,366 |
| b,cCarlyle Global Market Strategies CLO Ltd., 2012-4A, A, 144A, FRN, | | | | |
| 1.665%, 1/20/25 | United States | 4,020,000 | | 4,017,789 |
| b,cCatamaran CLO Ltd., 2014-2A, B, 144A, FRN, 3.275%, 10/18/26 | United States | 3,011,300 | | 2,988,504 |
franklintempleton.com Semiannual Report | 73
FRANKLIN INVESTORS SECURITIES TRUST
STATEMENT OF INVESTMENTS (UNAUDITED)
| | | | |
| Franklin Low Duration Total Return Fund (continued) | | | | |
| | | Principal | | |
| | Country | Amount* | | Value |
| Asset-Backed Securities and Commercial | | | | |
| Mortgage-Backed Securities (continued) | | | | |
| Diversified Financials (continued) | | | | |
| b,cCent CDO XI Ltd., 2006-11A, B, 144A, FRN, 1.077%, 4/25/19 | United States | 1,280,000 | $ | 1,235,149 |
| b,cCent CLO 21 Ltd., 14-21A, B, 144A, FRN, 3.077%, 7/27/26 | Cayman Islands | 780,000 | | 773,620 |
| b,cCent CLO LP, 2014-22A, B, 144A, FRN, 3.433%, 11/07/26 | Cayman Islands | 4,050,000 | | 4,059,194 |
| bChase Funding Mortgage Loan Asset-Backed Certificates, 2004-2, 2A2, | | | | |
| FRN, 0.681%, 2/25/35 | United States | 13,246 | | 11,797 |
| Chase Issuance Trust, | | | | |
| b2007-A2, A2, FRN, 0.232%, 4/15/19 | United States | 6,468,000 | | 6,452,943 |
| b2007-B1, B1, FRN, 0.432%, 4/15/19 | United States | 9,400,000 | | 9,356,182 |
| b2007-C1, C1, FRN, 0.642%, 4/15/19 | United States | 3,800,000 | | 3,779,873 |
| 2012-A3, A3, 0.79%, 6/15/17 | United States | 2,290,000 | | 2,291,032 |
| b2012-A6, A, FRN, 0.312%, 8/15/17 | United States | 10,620,000 | | 10,619,915 |
| 2012-A8, A8, 0.54%, 10/16/17 | United States | 5,910,000 | | 5,910,641 |
| b2012-A9, A9, FRN, 0.332%, 10/16/17 | United States | 7,620,000 | | 7,620,621 |
| b2013-A3, A3, FRN, 0.462%, 4/15/20 | United States | 6,147,000 | | 6,140,641 |
| b2014-A3, A3, FRN, 0.382%, 5/15/18 | United States | 11,780,000 | | 11,775,206 |
| b2014-A5, A5, FRN, 0.552%, 4/15/21 | United States | 7,310,000 | | 7,319,858 |
| b,cCIFC Funding Ltd., 2007-3A, A1J, 144A, FRN, 0.677%, 7/26/21 | United States | 6,700,000 | | 6,553,672 |
| b,cColony American Homes, 2014-1A, | | | | |
| A, 144A, FRN, 1.40%, 5/17/31 | United States | 4,775,750 | | 4,759,889 |
| C, 144A, FRN, 2.10%, 5/17/31 | United States | 700,000 | | 692,018 |
| cColony MFM Trust, 2014-1, A, 144A, 2.543%, 4/20/50 | United States | 10,357,728 | | 10,392,841 |
| cColumbusNova CLO IV Ltd., 2007-2A, B, 144A, 1.525%, 10/15/21 | United States | 760,000 | | 748,311 |
| bCommercial Mortgage Trust, | | | | |
| 2005-GG5, AJ, FRN, 5.239%, 4/10/37 | United States | 6,677,000 | | 6,737,046 |
| 2007-C9, A1A, FRN, 6.01%, 12/10/49 | United States | 7,766,714 | | 8,393,616 |
| b,cCornerstone CLO Ltd., 2007-1A, B, 144A, FRN, 1.225%, 7/15/21 | Cayman Islands | 995,000 | | 965,349 |
| cCountryplace Manufactured Housing Contract Trust, | | | | |
| 2005-A3, 144A, 4.80%, 12/15/35 | United States | 84,040 | | 85,296 |
| 2007-1, A3, 144A, 5.593%, 7/15/37 | United States | 136,272 | | 138,675 |
| bCountrywide Home Loans, | | | | |
| 2004-6, 1A1, FRN, 2.687%, 5/25/34 | United States | 3,161,217 | | 3,156,580 |
| 2004-11, 2A1, FRN, 2.243%, 7/25/34 | United States | 3,971,940 | | 3,943,656 |
| b,cCrest Ltd., 2004-1A, B1, 144A, FRN, 0.769%, 1/28/40 | United States | 325,285 | | 323,216 |
| cCT CDO III Ltd., 2005-3A, C, 144A, 5.471%, 6/25/35 | United States | 1,804,209 | | 1,804,281 |
| b,cCT CDO IV Ltd., 2006-4A, A1, 144A, FRN, 0.491%, 10/20/43 | United States | 4,567,157 | | 4,554,848 |
| Discover Card Execution Note Trust, | | | | |
| b2010-A2, A2, FRN, 0.762%, 3/15/18 | United States | 5,000,000 | | 5,006,520 |
| 2012-A3, A3, 0.86%, 11/15/17 | United States | 5,805,000 | | 5,806,088 |
| b2012-A4, A4, FRN, 0.552%, 11/15/19 | United States | 10,500,000 | | 10,530,859 |
| b2012-A5, A5, FRN, 0.382%, 1/16/18 | United States | 11,983,000 | | 11,985,187 |
| b2013-A6, A6, FRN, 0.632%, 4/15/21 | United States | 5,520,000 | | 5,547,931 |
| b2014-A1, A1, FRN, 0.612%, 7/15/21 | United States | 7,690,000 | | 7,728,650 |
| b,cEaton Vance CDO Ltd., 2014-1A, | | | | |
| B, 144A, FRN, 2.325%, 7/15/26 | United States | 858,000 | | 854,980 |
| C, 144A, FRN, 3.275%, 7/15/26 | United States | 739,600 | | 738,247 |
| cEmerson Park CLO Ltd., 2013-1A, C2, 144A, 5.64%, 7/15/25 | United States | 630,000 | | 634,070 |
| b,cFairfield Street Solar, 2004-1A, A1, 144A, FRN, 0.612%, 11/28/39 | Cayman Islands | 6,657,227 | | 6,432,080 |
74 | Semiannual Report
franklintempleton.com
FRANKLIN INVESTORS SECURITIES TRUST
STATEMENT OF INVESTMENTS (UNAUDITED)
| | | | |
| Franklin Low Duration Total Return Fund (continued) | | | | |
| | | Principal | | |
| | Country | Amount* | | Value |
| Asset-Backed Securities and Commercial | | | | |
| Mortgage-Backed Securities (continued) | | | | |
| Diversified Financials (continued) | | | | |
| bFHLMC Structured Agency Credit Risk Debt Notes, | | | | |
| 2014-DN4, M2, FRN, 2.574%, 10/25/24 | United States | 7,500,000 | $ | 7,614,525 |
| 2015-DN1, M2, FRN, 2.581%, 1/25/25 | United States | 10,535,000 | | 10,747,528 |
| 2015-DNA1, M2, FRN, 2.03%, 10/25/27 | United States | 3,650,000 | | 3,650,000 |
| 2015-HQ1, M1, FRN, 1.231%, 3/25/25 | United States | 4,177,640 | | 4,164,942 |
| bFirst Horizon Alternative Mortgage Securities Trust, 2004-AA5, 2A1, FRN, | | | | |
| 2.068%, 12/25/34 | United States | 3,441,403 | | 3,368,228 |
| bFNMA Connecticut Avenue Securities, FRN, 1.131%, 5/25/24 | United States | 1,566,071 | | 1,556,703 |
| Ford Credit Auto Owner Trust, | | | | |
| 2012-A, A4, 1.15%, 6/15/17 | United States | 2,975,298 | | 2,982,660 |
| 2012-D, A3, 0.51%, 4/15/17 | United States | 3,006,750 | | 3,006,675 |
| cG-Force LLC, | | | | |
| b2005-RR2, A3FL, 144A, FRN, 0.481%, 12/25/39 | United States | 1,198,522 | | 1,181,179 |
| 2005-RRA, B, 144A, 5.09%, 8/22/36 | United States | 3,234,312 | | 3,289,926 |
| b,cGleneagles CLO Ltd., 2005-1A, A2, 144A, FRN, 0.655%, 11/01/17 | United States | 2,000,000 | | 1,990,700 |
| kGMAC Commercial Mortgage Securities Inc., 2005-C1, B, 4.936%, | | | | |
| 5/10/43 | United States | 1,615,000 | | 405,244 |
| bGSAA Home Equity Trust, | | | | |
| 2005-5, M3, FRN, 1.126%, 2/25/35 | United States | 5,950,000 | | 5,624,547 |
| FRN, 0.551%, 6/25/35 | United States | 727,454 | | 701,017 |
| bGSAMP Trust, 2005-HE3, M2, FRN, 1.186%, 6/25/35 | United States | 1,774,209 | | 1,721,063 |
| bGSR Mortgage Loan Trust, 2005-AR1, 1A1, FRN, 2.865%, 1/25/35 | United States | 1,014,856 | | 972,211 |
| cHighbridge Loan Management Ltd., 2013-2A, B2, 144A, 5.80%, | | | | |
| 10/20/24 | United States | 570,000 | | 572,958 |
| b,cHilton USA Trust, 2013-HLF, | | | | |
| AFL, 144A, FRN, 1.174%, 11/05/30 | United States | 6,932,747 | | 6,934,549 |
| BFL, 144A, FRN, 1.674%, 11/05/30 | United States | 1,783,692 | | 1,785,364 |
| b,cInvitation Homes Trust, | | | | |
| 2014-SFR1, B, 144A, FRN, 1.68%, 6/17/31 | United States | 1,130,000 | | 1,132,793 |
| 2014-SFR2, A, 144A, FRN, 1.28%, 9/17/31 | United States | 4,510,000 | | 4,519,994 |
| 2014-SFR2, B, 144A, FRN, 1.78%, 9/17/31 | United States | 8,500,000 | | 8,515,513 |
| 2015-SFR1, A, 144A, FRN, 1.63%, 3/17/32 | United States | 2,432,873 | | 2,462,617 |
| 2015-SFR2, A, 144A, FRN, 1.528%, 6/17/32 | United States | 3,500,000 | | 3,525,935 |
| b,cJefferies & Co., 2009-R2, 4A, 144A, FRN, 2.581%, 5/26/37 | United States | 2,226,452 | | 2,246,064 |
| bJP Morgan Chase Commercial Mortgage Securities Trust, | | | | |
| c2005-LDP1, E, 144A, FRN, 5.409%, 3/15/46 | United States | 36,280 | | 36,267 |
| 2005-LDP5, A, FRN, 5.393%, 12/15/44 | United States | 1,150,000 | | 1,166,733 |
| 2005-LPD5, F, FRN, 5.383%, 12/15/44 | United States | 5,100,000 | | 5,160,468 |
| 2006-LDP7, A4, FRN, 5.873%, 4/15/45 | United States | 811,595 | | 836,486 |
| bJP Morgan Mortgage Acquisition Corp., 2006-ACC1, A4, FRN, 0.331%, | | | | |
| 5/25/36 | United States | 231,247 | | 229,852 |
| bJP Morgan Mortgage Trust, 2004-A1, 5A1, FRN, 2.523%, 2/25/34 | United States | 144,372 | | 143,661 |
| b,cKildare Securities Ltd., 2007-1A, A2, 144A, FRN, 0.385%, 12/10/43 | Ireland | 785,062 | | 785,876 |
| b,cLandmark IX CDO Ltd., 2007-9A, C, 144A, FRN, 0.975%, 4/15/21 | United States | 1,040,000 | | 1,012,950 |
| b,cLB-UBS Commercial Mortgage Trust, | | | | |
| 2001-C3, E, 144A, FRN, 6.95%, 6/15/36 | United States | 700,000 | | 705,413 |
| 2004-C7, H, 144A, FRN, 5.239%, 10/15/36 | United States | 980,000 | | 996,974 |
| b,cLNR CDO Ltd., | | | | |
| 2002-1A, DFL, 144A, FRN, 1.582%, 7/24/37 | Cayman Islands | 7,303,130 | | 7,265,446 |
| 2003-1A, EFL, 144A, FRN, 3.182%, 7/23/36 | Cayman Islands | 1,862,356 | | 1,862,803 |
franklintempleton.com Semiannual Report | 75
FRANKLIN INVESTORS SECURITIES TRUST
STATEMENT OF INVESTMENTS (UNAUDITED)
| | | | | |
| | Franklin Low Duration Total Return Fund (continued) | | | | |
| | | | Principal | | |
| | | Country | Amount* | | Value |
| | Asset-Backed Securities and Commercial | | | | |
| | Mortgage-Backed Securities (continued) | | | | |
| | Diversified Financials (continued) | | | | |
| | bLong Beach Mortgage Loan Trust, 2005-WL2, M1, FRN, 0.651%, | | | | |
| | 8/25/35 | United States | 1,216,064 | $ | 1,207,982 |
| | b,cMach One 2004-1A ULC, H, 144A, FRN, 6.237%, 5/28/40 | United States | 2,525,805 | | 2,523,178 |
| | bMadison Avenue Manufactured Housing Contract Trust, 2002-A, B1, FRN, | | | | |
| | 3.431%, 3/25/32 | United States | 2,610,000 | | 2,671,941 |
| | MASTR Alternative Loan Trust, | | | | |
| | 2003-1, 3A1, 5.00%, 2/25/18 | United States | 717,700 | | 736,887 |
| | 2003-6, 2A1, 5.00%, 8/25/18 | United States | 1,618,631 | | 1,674,420 |
| | 2003-9, 1A1, 5.50%, 12/25/18 | United States | 716,166 | | 738,715 |
| | 2004-4, 5A1, 5.50%, 4/25/19 | United States | 1,930,652 | | 2,010,940 |
| | b2004-11, 2A1, FRN, 5.561%, 11/25/19 | United States | 1,878,500 | | 1,960,258 |
| | bMASTR ARM Trust, | | | | |
| | 2007-1, I2A2, FRN, 0.341%, 1/25/47 | United States | 1,184,566 | | 1,173,532 |
| | k2007-3, I2A2, FRN, 0.381%, 5/25/47 | United States | 709,429 | | 701,010 |
| | bMerrill Lynch Mortgage Investors Trust Inc., | | | | |
| | 2003-E, A1, FRN, 0.801%, 10/25/28 | United States | 1,366,907 | | 1,314,519 |
| | 2003-G, A2, FRN, 1.007%, 1/25/29 | United States | 1,322,440 | | 1,281,233 |
| | bMerrill Lynch Mortgage Investors Trust, 2005-A10, A, FRN, 0.391%, | | | | |
| | 2/25/36 | United States | 4,996,808 | | 4,601,481 |
| | bMerrill Lynch Mortgage Trust, 2005-CKI1, D, FRN, 5.282%, 11/12/37 | United States | 3,250,000 | | 3,267,184 |
| bML-CFC Commercial Mortgage Trust, 2006-3, A1A, FRN, 5.409%, | | | | |
| | 7/12/46 | United States | 2,978,682 | | 3,125,035 |
| b,cN-Star Real Estate CDO Ltd., 2006-6A, A1, 144A, FRN, 0.601%, | | | | |
| | 6/16/41 | Cayman Islands | 3,005,506 | | 2,926,671 |
| | bNew York Mortgage Trust, 2005-3, M1, FRN, 0.631%, 2/25/36 | United States | 699,505 | | 647,761 |
| | b,cNewcastle CDO Ltd., 2004-5A, 1, 144A, FRN, 0.607%, 12/24/39 | United States | 1,004,739 | | 990,984 |
| | b,cNZCG Funding Ltd., 2015-2A, A1, 144A, FRN, 1.821%, 4/27/27 | Cayman Islands | 8,101,875 | | 8,099,444 |
| | bOwnit Mortgage Loan Asset-Backed Certificates, 2005-2, M4, FRN, | | | | |
| | 1.111%, 3/25/36 | United States | 2,689,963 | | 2,651,731 |
| | bPark Place Securities Inc. Asset-Backed Pass-Through Certificates, | | | | |
| | 2004-MCW1, M1, FRN, 1.119%, 10/25/34 | United States | 287,163 | | 286,531 |
| | 2004-WHQ2, M2, FRN, 1.126%, 2/25/35 | United States | 2,140,426 | | 2,138,664 |
| | b,cProgress Residential Trust, | | | | |
| | 2014-SFR, B, 144A, FRN, 2.08%, 10/17/31 | United States | 1,960,000 | | 1,973,632 |
| | 2014-SFR1, A, 144A, FRN, 1.28%, 10/17/31 | United States | 2,400,000 | | 2,395,283 |
| | 2015-SFR1, A, 144A, FRN, 1.58%, 2/17/32 | United States | 10,820,000 | | 10,864,903 |
| | bRAAC, 2004-SP1, AII, FRN, 0.881%, 3/25/34 | United States | 913,344 | | 877,363 |
| | bResidential Funding Mortgage Securities II, 2004-HI3, A5, FRN, 5.48%, | | | | |
| | 6/25/34 | United States | 521,128 | | 540,247 |
| | b,cResource Capital Corp. Ltd., 2014-CRE2, A, 144A, FRN, 1.23%, | | | | |
| | 4/15/32 | Cayman Islands | 3,236,000 | | 3,208,746 |
| | b,cSeawall SPC, 2006-1A, C1, 144A, FRN, 1.432%, 4/15/46 | United States | 607,645 | | 606,247 |
| | bSequoia Mortgage Trust, 2003-4, | | | | |
| | 1A1, FRN, 0.801%, 7/20/33 | United States | 449,263 | | 424,614 |
| | 1A2, FRN, 1.015%, 7/20/33 | United States | 388,287 | | 367,072 |
| | b,cSilver Bay Realty Trust, 2014-1, | | | | |
| | A, 144A, FRN, 1.18%, 9/17/31 | United States | 1,240,392 | | 1,232,216 |
| | B, 144A, FRN, 1.63%, 9/17/31 | United States | 540,000 | | 539,405 |
| | bStructured ARM Loan Trust, 2004-12, 3A1, FRN, 2.414%, 9/25/34 | United States | 5,179,796 | | 5,230,765 |
76 | Semiannual Report
franklintempleton.com
FRANKLIN INVESTORS SECURITIES TRUST
STATEMENT OF INVESTMENTS (UNAUDITED)
| | | | | |
| Franklin Low Duration Total Return Fund (continued) | | | | | |
| | | Principal | | | |
| | Country | Amount* | | | Value |
| Asset-Backed Securities and Commercial | | | | | |
| Mortgage-Backed Securities (continued) | | | | | |
| Diversified Financials (continued) | | | | | |
| bStructured Asset Investment Loan Trust, 2004-BNC2, A2, FRN, 1.221%, | | | | | |
| 12/25/34 | United States | 2,814,533 | | $ | 2,773,619 |
| bStructured Asset Mortgage Investments Trust, | | | | | |
| 2003-AR1, A1, FRN, 0.921%, 10/19/33 | United States | 480,237 | | | 455,734 |
| 2003-AR2, A1, FRN, 0.921%, 12/19/33 | United States | 1,196,084 | | | 1,156,334 |
| bStructured Asset Mortgage Investments II Trust, 2004-AR6, A1A, FRN, | | | | | |
| 0.881%, 2/19/35 | United States | 2,677,716 | | | 2,530,479 |
| bStructured Asset Securities Corp., 2006-WF1, A5, FRN, 0.481%, | | | | | |
| 2/25/36 | United States | 1,101,422 | | | 1,086,136 |
| b,cSWAY Residential 2014-1 Trust, 2014-1, A, 144A, FRN, 1.48%, | | | | | |
| 1/17/32 | United States | 4,758,237 | | | 4,762,353 |
| b,dTalisman 6 Finance, Reg S, FRN, 0.191%, 10/22/16 | Germany | 2,766,721 | EUR | | 3,081,893 |
| bThornburg Mortgage Securities Trust, | | | | | |
| 2003-4, A1, FRN, 0.821%, 9/25/43 | United States | 3,352,155 | | | 3,255,449 |
| 2004-3, A, FRN, 0.921%, 9/25/44 | United States | 1,778,004 | | | 1,715,578 |
| 2007-4, 1A1, FRN, 2.341%, 9/25/37 | United States | 1,159,054 | | | 1,139,607 |
| b,cTrade MAPS Ltd., 2013-1A, A, 144A, FRN, 0.881%, 12/10/18 | Ireland | 8,500,000 | | | 8,495,453 |
| c,eTricon American Homes Trust, 2015-SFR1, A, 144A, 1.43%, 5/17/32 | United States | 7,870,000 | | | 7,870,000 |
| Vanderbilt Acquisition Loan Trust, 2002-1, M1, 7.33%, 5/07/32 | United States | 326,113 | | | 353,845 |
| b,cVeritas CLO Ltd., 2006-2A, A2, 144A, FRN, 0.606%, 7/11/21 | United States | 2,000,000 | | | 1,982,300 |
| WaMu Mortgage Pass-Through Certificates, | | | | | |
| b2005-AR8, 1A1A, FRN, 0.471%, 7/25/45 | United States | 1,885,549 | | | 1,762,283 |
| 2005-AR13, A1A1, 0.471%, 10/25/45 | United States | 6,525,811 | | | 6,172,941 |
| b2005-AR19, A1A1, FRN, 0.451%, 12/25/45 | United States | 4,945,045 | | | 4,622,386 |
| bWells Fargo Home Equity Trust Mortgage Pass-Through Certificates, | | | | | |
| 2004-1, A3, FRN, 0.551%, 4/25/34 | United States | 1,980,000 | | | 1,896,915 |
| b,cWest CLO Ltd., 2014-1A, | | | | | |
| A2, 144A, FRN, 2.375%, 7/18/26 | United States | 1,360,000 | | | 1,350,888 |
| B, 144A, FRN, 3.125%, 7/18/26 | United States | 3,590,000 | | | 3,486,285 |
| | | | | | 525,170,903 |
| Real Estate 0.2% | | | | | |
| b,cAmerican Homes 4 Rent, 2014-SFR1, | | | | | |
| A, 144A, FRN, 1.25%, 6/17/31 | United States | 3,142,544 | | | 3,131,243 |
| C, 144A, FRN, 2.00%, 6/17/31 | United States | 492,000 | | | 493,403 |
| bNovastar Home Equity Loan, 2004-4, M4, FRN, 1.831%, 3/25/35 | United States | 2,000,000 | | | 1,972,850 |
| | | | | | 5,597,496 |
| Total Asset-Backed Securities and Commercial | | | | | |
| Mortgage-Backed Securities (Cost $784,867,681) | | | | | 784,266,388 |
| Mortgage-Backed Securities 3.2% | | | | | |
| bFederal Home Loan Mortgage Corp. (FHLMC) Adjustable | | | | | |
| Rate 0.7% | | | | | |
| FHLMC, 1.780% - 6.423%, 11/01/17 - 9/01/41 | United States | 17,081,117 | | | 18,130,797 |
| Federal Home Loan Mortgage Corp. (FHLMC) Fixed Rate 0.0%† | | | | | |
| FHLMC Gold 15 Year, 5.00%, 10/01/23 | United States | 238,858 | | | 256,661 |
| FHLMC Gold 15 Year, 6.00%, 6/01/23 | United States | 92,834 | | | 104,471 |
| FHLMC Gold 30 Year, 5.00%, 1/01/39 | United States | 318,996 | | | 354,227 |
| | | | | | 715,359 |
franklintempleton.com Semiannual Report | 77
FRANKLIN INVESTORS SECURITIES TRUST
STATEMENT OF INVESTMENTS (UNAUDITED)
| | | | |
| Franklin Low Duration Total Return Fund (continued) | | | | |
| | | Principal | | |
| | Country | Amount* | | Value |
| Mortgage-Backed Securities (continued) | | | | |
| bFederal National Mortgage Association (FNMA) Adjustable | | | | |
| Rate 2.0% | | | | |
| FNMA, 1.194% - 2.281%, 3/01/17 - 10/01/44 | United States | 23,166,142 | $ | 24,480,443 |
| FNMA, 2.292% - 6.141%, 8/01/15 - 3/01/50 | United States | 22,336,524 | | 23,704,107 |
| | | | | 48,184,550 |
| Federal National Mortgage Association (FNMA) Fixed | | | | |
| Rate 0.5% | | | | |
| FNMA 15 Year, 3.50%, 10/01/25 | United States | 2,274,540 | | 2,418,589 |
| FNMA 15 Year, 4.00%, 12/01/25 | United States | 3,545,739 | | 3,811,324 |
| FNMA 15 Year, 4.50%, 5/01/16 - 6/01/25 | United States | 5,777,893 | | 6,053,534 |
| FNMA 30 Year, 5.00%, 3/01/38 | United States | 81,632 | | 90,822 |
| | | | | 12,374,269 |
| bGovernment National Mortgage Association (GNMA) | | | | |
| Adjustable Rate 0.0%† | | | | |
| GNMA, 1.625%, 4/20/26 - 9/20/26 | United States | 35,668 | | 36,996 |
| Total Mortgage-Backed Securities (Cost $78,416,746) | | | | 79,441,971 |
| Municipal Bonds 0.8% | | | | |
| Acalanes UHSD, GO, Contra Costa County, Refunding, 1.427%, | | | | |
| 8/01/18 | United States | 1,000,000 | | 995,360 |
| Arkansas State GO, Four-Lane Highway Construction and Improvement | | | | |
| Bonds, 3.25%, 6/15/22 | United States | 765,000 | | 829,375 |
| bCalifornia State Judgement Trust COP, Monthly FRN, 1.609%, 6/01/15 | United States | 540,000 | | 539,671 |
| Colorado State ISD, GO, Mitchell and Scurry Counties, School Building, | | | | |
| PSF Guarantee, 5.00%, 8/15/43 | United States | 350,000 | | 393,585 |
| Florida State Hurricane Catastrophe Fund Finance Corp. Revenue, | | | | |
| Series A, 2.107%, 7/01/18 | United States | 2,000,000 | | 2,036,900 |
| Minnesota State GO, Series C, 2.50%, 8/01/18 | United States | 1,500,000 | | 1,553,985 |
| Puerto Rico Sales Tax FICO Sales Tax Revenue, Refunding, Series A, | | | | |
| NATL Insured, zero cpn., 8/01/45 | United States | 4,305,000 | | 588,709 |
| Rhode Island State and Providence Plantations GO, Consolidated Capital | | | | |
| Development Loan of 2012, Refunding, Series A, 5.00%, 8/01/19 | United States | 2,500,000 | | 2,876,900 |
| Riverside County RDA Tax Allocation, Housing, Series A-T, | | | | |
| 6.00%, 10/01/15 | United States | 1,075,000 | | 1,083,482 |
| 6.25%, 10/01/16 | United States | 1,140,000 | | 1,164,863 |
| bUniversity of California Revenue, | | | | |
| Series Y-1, Monthly FRN, 0.679%, 7/01/41 | United States | 7,600,000 | | 7,601,216 |
| Series Y-2, Monthly FRN, 0.679%, 7/01/41 | United States | 390,000 | | 390,062 |
| Total Municipal Bonds (Cost $19,722,038) | | | | 20,054,108 |
| | | Shares | | |
| Escrows and Litigation Trusts (Cost $—) 0.0% | | | | |
| a,lNewPage Corp., Litigation Trust | United States | 500,000 | | — |
78 | Semiannual Report
franklintempleton.com
FRANKLIN INVESTORS SECURITIES TRUST
STATEMENT OF INVESTMENTS (UNAUDITED)
| | | | | | |
| Franklin Low Duration Total Return Fund (continued) | | | | | | |
| | | Notional | | | | |
| | Counterparty | Amount* | | | Value | |
| Options Purchased 0.0%† | | | | | | |
| Puts – Over-the-Counter | | | | | | |
| Credit Default Swaptions 0.0%† | | | | | | |
| Buy protection on CDX.NA.HY.23, Premium Rate 5.00%, | | | | | | |
| Strike Price $106.50, Expires 6/17/15 | FBCO | 18,400,000 | m | $ | 74,058 | |
| Buy protection on CDX.NA.HY.24, Premium Rate 5.00%, | | | | | | |
| Strike Price $104.50, Expires 9/16/15 | FBCO | 9,200,000 | m | | 138,110 | |
| Buy protection on CDX.NA.IG.23, Premium Rate 1.00%, | | | | | | |
| Strike Price $65, Expires 6/17/15 | CITI | 37,000,000 | m | | 57,942 | |
| Total Options Purchased (Cost $485,607) | | | | | 270,110 | |
| Total Investments before Short Term Investments | | | | | | |
| (Cost $2,181,741,046) | | | | $ | 2,174,009,838 | |
| |
| | | Principal | | | | |
| | Country | Amount* | | | | |
| Short Term Investments 12.1% | | | | | | |
| Corporate Bonds (Cost $11,280,247) 0.4% | | | | | | |
| HCA Inc., senior bond, 7.19%, 11/15/15 | United States | 11,000,000 | | | 11,357,500 | |
| U.S. Government and Agency Securities 2.7% | | | | | | |
| nU.S. Treasury Bills, | | | | | | |
| 5/07/15 | United States | 30,000,000 | | | 30,000,000 | |
| 6/04/15 - 6/11/15 | United States | 11,250,000 | | | 11,250,105 | |
| 7/09/15 | United States | 25,000,000 | | | 25,000,250 | |
| Total U.S. Government and Agency Securities | | | | | | |
| (Cost $66,248,845) | | | | | 66,250,355 | |
| Total Investments before Money Market Funds | | | | | | |
| (Cost $2,259,270,138) | | | | | 2,251,617,693 | |
| | | Shares | | | | |
| Money Market Funds (Cost $222,138,754) 9.0% | | | | | | |
| a,oInstitutional Fiduciary Trust Money Market Portfolio | United States | 222,138,754 | | | 222,138,754 | |
| Total Investments (Cost $2,481,408,892) 100.1% | | | | | 2,473,756,447 | |
| Options Written (0.0)%† | | | | | (111,019 | ) |
| Other Assets, less Liabilities (0.1)% | | | | | (2,262,365 | ) |
| Net Assets 100.0% | | | | $ | 2,471,383,063 | |
| |
| | | Notional | | | | |
| | Counterparty | Amount* | | | | |
| pOptions Written (0.0)%† | | | | | | |
| Puts – Over-the-Counter | | | | | | |
| Credit Default Swaptions (0.0)%† | | | | | | |
| Buy protection on CDX.NA.HY.23, Premium Rate 5.00%, Strike Price $103, | | | | | | |
| Expires 6/17/15 | FBCO | 18,400,000 | m | | (25,281 | ) |
| Buy protection on CDX.NA.HY.24, Premium Rate 5.00%, Strike Price $101, | | | | | | |
| Expires 9/16/15 | FBCO | 9,200,000 | m | | (68,015 | ) |
| Buy protection on CDX.NA.IG.23, Premium Rate 1.00%, Strike Price $85, | | | | | | |
| Expires 6/17/15 | CITI | 37,000,000 | m | | (17,723 | ) |
| Total Options Written (Premiums Received $206,402) | | | | $ | (111,019 | ) |
franklintempleton.com
Semiannual Report | 79
FRANKLIN INVESTORS SECURITIES TRUST
STATEMENT OF INVESTMENTS (UNAUDITED)
Franklin Low Duration Total Return Fund (continued)
†Rounds to less than 0.1% of net assets.
*The principal/notional amount is stated in U.S. dollars unless otherwise indicated.
aNon-income producing.
bThe coupon rate shown represents the rate at period end.
cSecurity was purchased pursuant to Rule 144A under the Securities Act of 1933 and may be sold in transactions exempt from registration only to qualified institutional buy-
ers or in a public offering registered under the Securities Act of 1933. These securities have been deemed liquid under guidelines approved by the Trust’s Board of Trustees.
At April 30, 2015, the aggregate value of these securities was $430,142,765, representing 17.40% of net assets.
dSecurity was purchased pursuant to Regulation S under the Securities Act of 1933, which exempts from registration securities offered and sold outside of the United States.
Such a security cannot be sold in the United States without either an effective registration statement filed pursuant to the Securities Act of 1933, or pursuant to an exemption
from registration. These securities have been deemed liquid under guidelines approved by the Trust’s Board of Trustees. At April 30, 2015, the aggregate value of these
securities was $54,952,783, representing 2.22% of net assets.
eA portion or all of the security purchased on a when-issued or delayed delivery basis. See Note 1(c).
fSee Note 1(i) regarding senior floating rate interests.
gPrincipal amount is stated in 100 Mexican Peso Units.
hRedemption price at maturity is adjusted for inflation. See Note 1(k).
iPrincipal amount is stated in 1,000 Brazilian Real Units.
jPrincipal amount of security is adjusted for inflation. See Note 1(k).
kThe bond pays interest and/or principal based upon the issuer’s ability to pay, which may be less than the stated interest rate or principal paydown.
lSecurity has been deemed illiquid because it may not be able to be sold within seven days.
mAmount represents notional amount under the terms of the option.
nThe security is traded on a discount basis with no stated coupon rate.
oSee Note 3(f) regarding investments in Institutional Fiduciary Trust Money Market Portfolio.
pSee Note 1(d) regarding written options.
At April 30, 2015, the Fund had the following financial futures contracts outstanding. See Note 1(d).
| | | | | | | | | | | | |
| Financial Futures Contracts | | | | | | | | | | | | |
| | | | Number of | | Notional | Expiration | | | Unrealized | | Unrealized | |
| Description | | Type | Contracts | | Value | Date | Appreciation | | Depreciation | |
| Interest Rate Contracts | | | | | | | | | | | | |
| CME Ultra Long Term U.S. Treasury Bond | Short | 17 | $ | 2,796,500 | 6/19/15 | | $ | 74,989 | $ | — | |
| U.S. Treasury 2 Yr. Note | | Short | 236 | | 51,746,688 | 6/30/15 | | | — | | (146,215 | ) |
| U.S. Treasury 5 Yr. Note | | Short | 787 | | 94,544,523 | 6/30/15 | | | — | | (507,219 | ) |
| U.S. Treasury 10 Yr. Note | | Short | 404 | | 51,863,500 | 6/19/15 | | | — | | (89,405 | ) |
| U.S. Treasury 30 Yr. Bond | | Short | 3 | | 478,781 | 6/19/15 | | | 8,923 | | — | |
| Unrealized appreciation (depreciation) | | | | | | | | 83,912 | | (742,839 | ) |
| Net unrealized appreciation (depreciation) | | | | | | | | | $ | (658,927 | ) |
| |
| |
| At April 30, 2015, the Fund had the following forward exchange contracts outstanding. See Note 1(d). | | | | | |
| |
| Forward Exchange Contracts | | | | | | | | | | | | |
| | | | | | Contract | Settlement | | | Unrealized | | Unrealized | |
| Currency | Counterpartya Type | Quantity | | Amount | Date | Appreciation | | Depreciation | |
| Chilean Peso | CITI | Buy | 47,586,000 | $ | 79,909 | 5/07/15 | $ | | — | $ | (2,179 | ) |
| Chilean Peso | CITI | Sell | 47,586,000 | | 77,137 | 5/07/15 | | | — | | (593 | ) |
| Chilean Peso | MSCO | Buy | 614,647,000 | | 1,061,750 | 5/07/15 | | | — | | (57,743 | ) |
| Chilean Peso | MSCO | Sell | 614,647,000 | | 997,642 | 5/07/15 | | | — | | (6,365 | ) |
| Euro | BZWS | Sell | 54,017 | | 70,460 | 5/07/15 | | | 9,845 | | — | |
| Euro | CITI | Sell | 39,262 | | 52,592 | 5/07/15 | | | 8,534 | | — | |
| Euro | DBAB | Buy | 21,074,122 | | 23,416,264 | 5/07/15 | | | 268,141 | | (36,000 | ) |
| Euro | DBAB | Sell | 30,838,974 | | 41,350,565 | 5/07/15 | | | 6,744,494 | | — | |
| Euro | HSBC | Sell | 6,000 | | 7,685 | 5/07/15 | | | 952 | | — | |
80 | Semiannual Report
franklintempleton.com
| | | | | | | | | | | |
| | | | | | FRANKLIN INVESTORS SECURITIES TRUST | |
| | | | | | STATEMENT OF INVESTMENTS (UNAUDITED) | |
| |
| |
| |
| |
| Franklin Low Duration Total Return Fund (continued) | | | | | | | | |
| |
| Forward Exchange Contracts (continued) | | | | | | | | | | |
| | | | | | Contract | Settlement | | Unrealized | | Unrealized | |
| Currency | Counterpartya Type | Quantity | | Amount | Date | Appreciation | | Depreciation | |
| Euro | JPHQ | Sell | 29,904 | $ | 40,071 | 5/07/15 | $ | 6,514 | $ | — | |
| Japanese Yen | DBAB | Sell | 305,837,300 | | 2,898,636 | 5/07/15 | | 336,802 | | — | |
| Philippine Peso | JPHQ | Buy | 94,860,000 | | 2,154,685 | 5/07/15 | | — | | (29,383 | ) |
| Swiss Franc | DBAB | Buy | 1,500,000 | | 1,506,932 | 5/07/15 | | 100,670 | | — | |
| Swiss Franc | DBAB | Sell | 1,603,755 | | 1,748,724 | 5/07/15 | | 29,924 | | — | |
| Euro | DBAB | Sell | 4,600,000 | | 6,061,420 | 6/05/15 | | 897,518 | | — | |
| Australian Dollar | DBAB | Sell | 4,681,098 | | 3,709,856 | 6/18/15 | | 33,922 | | (18,067 | ) |
| Chilean Peso | DBAB | Buy | 457,429,000 | | 771,967 | 6/18/15 | | — | | (27,767 | ) |
| Chilean Peso | DBAB | Sell | 457,429,000 | | 739,339 | 6/18/15 | | — | | (4,861 | ) |
| Euro | DBAB | Sell | 14,218,263 | | 17,699,429 | 6/18/15 | | 1,735,336 | | — | |
| Euro | JPHQ | Sell | 2,600,000 | | 3,236,741 | 6/18/15 | | 317,492 | | — | |
| Euro | MSCO | Sell | 977,590 | | 1,220,640 | 6/18/15 | | 123,014 | | — | |
| Japanese Yen | DBAB | Sell | 1,072,725,000 | | 9,406,701 | 6/18/15 | | 443,497 | | (26,944 | ) |
| Japanese Yen | JPHQ | Sell | 227,754,944 | | 1,972,270 | 6/18/15 | | 63,532 | | — | |
| Malaysian Ringgit | DBAB | Buy | 227,680 | | 65,625 | 6/18/15 | | — | | (1,934 | ) |
| Malaysian Ringgit | HSBC | Buy | 48,000 | | 14,110 | 6/18/15 | | — | | (683 | ) |
| Singapore Dollar | DBAB | Buy | 2,163,000 | | 1,700,605 | 6/18/15 | | — | | (68,105 | ) |
| Singapore Dollar | MSCO | Buy | 2,682,949 | | 2,077,269 | 6/18/15 | | — | | (52,343 | ) |
| British Pound | DBAB | Sell | 3,387,851 | | 5,134,289 | 7/23/15 | | — | | (66,064 | ) |
| Canadian Dollar | BZWS | Buy | 789,000 | | 666,751 | 7/23/15 | | — | | (13,718 | ) |
| Canadian Dollar | BZWS | Sell | 789,000 | | 626,782 | 7/23/15 | | — | | (26,251 | ) |
| Canadian Dollar | CITI | Buy | 259,000 | | 218,939 | 7/23/15 | | — | | (4,572 | ) |
| Canadian Dollar | CITI | Sell | 259,000 | | 205,755 | 7/23/15 | | — | | (8,612 | ) |
| Canadian Dollar | DBAB | Buy | 977,000 | | 823,430 | 7/23/15 | | — | | (14,795 | ) |
| Canadian Dollar | DBAB | Sell | 977,000 | | 776,044 | 7/23/15 | | — | | (32,592 | ) |
| Euro | BZWS | Sell | 140,843 | | 168,129 | 7/23/15 | | 9,915 | | — | |
| Euro | CITI | Sell | 352,000 | | 420,079 | 7/23/15 | | 24,665 | | — | |
| Euro | DBAB | Sell | 21,494,359 | | 25,364,663 | 7/23/15 | | 1,219,287 | | — | |
| Euro | JPHQ | Sell | 66,188 | | 79,073 | 7/23/15 | | 4,722 | | — | |
| Japanese Yen | BZWS | Sell | 76,810,000 | | 648,033 | 7/23/15 | | 4,010 | | — | |
| Japanese Yen | CITI | Sell | 153,390,000 | | 1,292,260 | 7/23/15 | | 6,145 | | — | |
| Japanese Yen | DBAB | Sell | 4,167,426,920 | | 35,094,713 | 7/23/15 | | 152,454 | | — | |
| Japanese Yen | GSCO | Sell | 51,310,000 | | 433,636 | 7/23/15 | | 3,422 | | — | |
| Japanese Yen | HSBC | Sell | 77,220,000 | | 652,430 | 7/23/15 | | 4,970 | | — | |
| Japanese Yen | JPHQ | Sell | 179,653,000 | | 1,517,692 | 7/23/15 | | 11,371 | | — | |
| Malaysian Ringgit | DBAB | Buy | 462,000 | | 126,923 | 7/23/15 | | 1,976 | | — | |
| Singapore Dollar | DBAB | Buy | 1,186,560 | | 884,658 | 7/23/15 | | 10,359 | | — | |
| Singapore Dollar | HSBC | Buy | 490,000 | | 362,909 | 7/23/15 | | 6,696 | | — | |
| Singapore Dollar | JPHQ | Buy | 304,000 | | 225,135 | 7/23/15 | | 4,171 | | — | |
| British Pound | DBAB | Sell | 1,615,576 | | 2,455,353 | 8/27/15 | | — | | (24,057 | ) |
| Euro | DBAB | Sell | 10,606,274 | | 12,134,849 | 8/27/15 | | 213,683 | | — | |
| Euro | JPHQ | Sell | 923,800 | | 1,057,534 | 8/27/15 | | 19,208 | | — | |
| Euro | DBAB | Sell | 23,580,467 | | 26,585,548 | 9/17/15 | | 233,504 | | (161,045 | ) |
| Euro | GSCO | Sell | 420,000 | | 477,733 | 9/17/15 | | 5,499 | | — | |
| Japanese Yen | DBAB | Sell | 857,355,500 | | 7,201,649 | 9/17/15 | | 23,569 | | (17,682 | ) |
| Japanese Yen | HSBC | Sell | 99,540,000 | | 839,752 | 9/17/15 | | 4,315 | | — | |
| Japanese Yen | JPHQ | Sell | 292,080,000 | | 2,463,333 | 9/17/15 | | 11,913 | | — | |
| Japanese Yen | MSCO | Sell | 211,800,000 | | 1,786,874 | 9/17/15 | | 9,242 | | — | |
| Singapore Dollar | DBAB | Buy | 2,799,600 | | 2,060,954 | 9/17/15 | | 48,590 | | — | |
| Singapore Dollar | HSBC | Buy | 369,000 | | 271,833 | 9/17/15 | | 6,214 | | — | |
| Australian Dollar | DBAB | Sell | 1,540,000 | | 1,220,450 | 10/22/15 | | 13,209 | | — | |
franklintempleton.com Semiannual Report | 81
FRANKLIN INVESTORS SECURITIES TRUST
STATEMENT OF INVESTMENTS (UNAUDITED)
| | | | | | | | | | | |
| Franklin Low Duration Total Return Fund (continued) | | | | | | | | |
| |
| Forward Exchange Contracts (continued) | | | | | | | | | | |
| | | | | | Contract | Settlement | | Unrealized | | Unrealized | |
| Currency | Counterpartya Type | Quantity | | Amount | Date | | Appreciation | | Depreciation | |
| Euro | DBAB | Sell | 6,000,521 | $ | 6,717,583 | 10/22/15 | $ | — | $ | (33,141 | ) |
| Euro | DBAB | Sell | 82,500 | | 110,798 | 11/03/15 | | 17,961 | | — | |
| Danish Krone | DBAB | Buy | 34,000,000 | | 5,304,543 | 1/15/16 | | — | | (152,443 | ) |
| Euro | DBAB | Sell | 1,727,000 | | 2,259,908 | 2/05/16 | | 312,263 | | — | |
| Danish Krone | RBS | Sell | 120,185,472 | | 18,424,877 | 2/17/16 | | 191,352 | | — | |
| Euro | DBAB | Sell | 2,360,000 | | 3,106,468 | 3/01/16 | | 443,033 | | — | |
| Euro | DBAB | Sell | 2,300,000 | | 3,021,510 | 4/07/16 | | 423,019 | | — | |
| Euro | DBAB | Sell | 3,300,000 | | 4,453,350 | 8/05/16 | | 712,132 | | — | |
| Japanese Yen | JPHQ | Sell | 566,101,041 | | 5,149,880 | 9/02/16 | | 350,630 | | — | |
| Euro | DBAB | Buy | 2,082,500 | | 2,764,519 | 11/03/16 | | — | | (397,418 | ) |
| Euro | DBAB | Sell | 2,082,500 | | 2,795,756 | 11/03/16 | | 428,656 | | — | |
| Unrealized appreciation (depreciation) | | | | | | | 16,052,342 | | (1,285,357 | ) |
| Net unrealized appreciation (depreciation) | | | | | | $ | 14,766,985 | | | |
| aMay be comprised of multiple contracts with the same counterparty, currency and settlement date. | | | | | | |
At April 30, 2015, the Fund had the following credit default swap contracts outstanding. See Note 1(d).
| | | | | | | | | | | | | | | | | |
| Credit Default Swap Contracts | | | | | | | | | | | | | | | | |
| | | | | | | | Upfront | | | | | | | | | | |
| | | | Periodic | | | | Premiums | | | | | | | | | | |
| | Counterparty/ | Notional | Payment | | Expiration | | Paid | | | Unrealized | | Unrealized | | | Market | | |
| Description | Exchange | Amounta | Rate | | Date | | (Received) | | | Appreciation | | Depreciation | | | Value | | Ratingb |
| Centrally Cleared Swaps | | | | | | | | | | | | | | | | | |
| Contracts to Sell Protectionc | | | | | | | | | | | | | | | | | |
| Traded Index | | | | | | | | | | | | | | | | | |
| CDX.NA.HY.23 | ICE | 11,760,000 | 5.00 | % | 12/20/19 | $ | 733,848 | | $ | 247,083 | $ | — | | $ | 980,931 | | Non |
| | | | | | | | | | | | | | | | | | Investment |
| | | | | | | | | | | | | | | | | | Grade |
| Centrally Cleared Swaps unrealized appreciation (depreciation) | | | | | | | $ | 247,083 | $ | — | | | | | |
| |
| OTC Swaps | | | | | | | | | | | | | | | | | |
| Contracts to Buy Protection | | | | | | | | | | | | | | | | | |
| Single Name | | | | | | | | | | | | | | | | | |
| Alcatel-Lucent USA Inc. | BZWS | 1,000,000 | 5.00 | % | 9/20/17 | | (90,082 | ) | | — | | (15,966 | ) | | (106,048 | ) | |
| Alcatel-Lucent USA Inc. | GSCO | 10,000,000 | 5.00 | % | 9/20/17 | | (716,551 | ) | | — | | (343,924 | ) | | (1,060,475 | ) | |
| Bank of America Corp. | FBCO | 2,000,000 | 1.00 | % | 9/20/17 | | 2,296 | | | — | | (29,980 | ) | | (27,684 | ) | |
| Beazer Homes USA Inc. | CITI | 1,500,000 | 5.00 | % | 6/20/19 | | (76,001 | ) | | 2,767 | | — | | | (73,234 | ) | |
| Beazer Homes USA Inc. | GSCO | 3,000,000 | 5.00 | % | 6/20/19 | | (146,411 | ) | | — | | (56 | ) | | (146,467 | ) | |
| Centex Corp. | FBCO | 1,000,000 | 5.00 | % | 6/20/16 | | (28,589 | ) | | — | | (28,211 | ) | | (56,800 | ) | |
| Centex Corp. | JPHQ | 4,000,000 | 5.00 | % | 6/20/16 | | (136,879 | ) | | — | | (90,321 | ) | | (227,200 | ) | |
| CIT Group Inc. | MSCO | 5,000,000 | 5.00 | % | 9/20/17 | | (392,551 | ) | | — | | (23,391 | ) | | (415,942 | ) | |
| Constellation Brands Inc. | DBAB | 6,600,000 | 5.00 | % | 6/20/17 | | (512,229 | ) | | — | | (144,744 | ) | | (656,973 | ) | |
| D.R. Horton Inc. | CITI | 1,500,000 | 5.00 | % | 6/20/17 | | (87,727 | ) | | — | | (56,371 | ) | | (144,098 | ) | |
| D.R. Horton Inc. | JPHQ | 2,400,000 | 5.00 | % | 3/20/16 | | (82,526 | ) | | — | | (20,273 | ) | | (102,799 | ) | |
| Dell Inc. | GSCO | 1,500,000 | 1.00 | % | 9/20/15 | | (3,261 | ) | | — | | (179 | ) | | (3,440 | ) | |
| Dell Inc. | GSCO | 5,000,000 | 5.00 | % | 6/20/16 | | (236,915 | ) | | — | | (23,537 | ) | | (260,452 | ) | |
| DISH DBS Corp. | BZWS | 3,500,000 | 5.00 | % | 3/20/16 | | (134,552 | ) | | 1,486 | | — | | | (133,066 | ) | |
| DISH DBS Corp. | GSCO | 5,000,000 | 5.00 | % | 3/20/16 | | (181,141 | ) | | — | | (8,952 | ) | | (190,093 | ) | |
| DISH DBS Corp. | JPHQ | 2,000,000 | 5.00 | % | 3/20/16 | | (69,335 | ) | | — | | (6,702 | ) | | (76,037 | ) | |
| DPL Inc. | JPHQ | 1,049,000 | 5.00 | % | 12/20/16 | | (65,608 | ) | | — | | (615 | ) | | (66,223 | ) | |
82 | Semiannual Report franklintempleton.com
FRANKLIN INVESTORS SECURITIES TRUST
STATEMENT OF INVESTMENTS (UNAUDITED)
| | | | | | | | | | | | | | | | | | |
| Franklin Low Duration Total Return Fund (continued) | | | | | | | | | | | | | | |
| |
| Credit Default Swap Contracts (continued) | | | | | | | | | | | | | | | | |
| | | | | | | | | Upfront | | | | | | | | | | |
| | | | | Periodic | | | | Premiums | | | | | | | | | | |
| | Counterparty/ | Notional | | Payment | | Expiration | | Paid | | | Unrealized | | Unrealized | | | Market | | |
| Description | Exchange | Amounta | | Rate | | Date | | (Received) | | | Appreciation | | Depreciation | | | Value | | Ratingb |
| OTC Swaps (continued) | | | | | | | | | | | | | | | | | | |
| Contracts to Buy Protection (continued) | | | | | | | | | | | | | | | | | |
| Single Name (continued) | | | | | | | | | | | | | | | | | | |
| Embarq Corp. | BZWS | 3,000,000 | | 5.00 | % | 6/20/16 | $ | (88,503 | ) | $ | — | $ | (76,908 | ) | $ | (165,411 | ) | |
| Ford Motor Credit Co. | | | | | | | | | | | | | | | | | | |
| LLC | GSCO | 5,000,000 | | 5.00 | % | 6/20/15 | | (30,880 | ) | | — | | (3,548 | ) | | (34,428 | ) | |
| HCA Inc. | GSCO | 11,000,000 | | 5.00 | % | 12/20/15 | | (309,193 | ) | | — | | (24,621 | ) | | (333,814 | ) | |
| Hospitality Properties Trust . | BOFA | 3,000,000 | | 5.00 | % | 3/20/17 | | (219,007 | ) | | — | | (40,085 | ) | | (259,092 | ) | |
| International Lease Finance | | | | | | | | | | | | | | | | | | |
| Corp. | DBAB | 8,325,000 | | 5.00 | % | 9/20/15 | | (140,579 | ) | | — | | (248 | ) | | (140,827 | ) | |
| International Lease Finance | | | | | | | | | | | | | | | | | | |
| Corp. | GSCO | 5,000,000 | | 5.00 | % | 3/20/17 | | (345,766 | ) | | — | | (29,527 | ) | | (375,293 | ) | |
| Kinder Morgan Inc. | GSCO | 11,500,000 | | 5.00 | % | 3/20/16 | | (449,823 | ) | | — | | (41,457 | ) | | (491,280 | ) | |
| Lennar Corp. | CITI | 1,800,000 | | 5.00 | % | 9/20/19 | | (178,355 | ) | | — | | (67,340 | ) | | (245,695 | ) | |
| Lennar Corp. | CITI | 2,700,000 | | 5.00 | % | 12/20/19 | | (316,654 | ) | | — | | (57,546 | ) | | (374,200 | ) | |
| Lennar Corp. | GSCO | 3,408,000 | | 5.00 | % | 6/20/19 | | (422,031 | ) | | — | | (35,768 | ) | | (457,799 | ) | |
| The New York Times Co. | GSCO | 2,000,000 | | 5.00 | % | 12/20/16 | | (56,816 | ) | | — | | (99,261 | ) | | (156,077 | ) | |
| Pactiv LLC | BZWS | 2,100,000 | | 5.00 | % | 6/20/17 | | (107,071 | ) | | — | | (81,434 | ) | | (188,505 | ) | |
| PPL Energy Supply LLC | JPHQ | 8,000,000 | | 5.00 | % | 6/20/16 | | (390,084 | ) | | — | | (29,847 | ) | | (419,931 | ) | |
| Springleaf Finance Corp. | GSCO | 7,000,000 | | 5.00 | % | 12/20/15 | | (76,256 | ) | | — | | (113,660 | ) | | (189,916 | ) | |
| Tenet Healthcare Corp. | BZWS | 5,600,000 | | 5.00 | % | 12/20/16 | | (278,336 | ) | | — | | (109,256 | ) | | (387,592 | ) | |
| Toys R Us Inc. | CITI | 2,000,000 | | 5.00 | % | 12/20/18 | | 490,000 | | | — | | — | | | 490,000 | | |
| Toys R Us Inc. | DBAB | 2,250,000 | | 5.00 | % | 12/20/18 | | 604,473 | | | — | | (53,223 | ) | | 551,250 | | |
| USG Corp. | GSCO | 9,220,000 | | 5.00 | % | 12/20/16 | | (405,784 | ) | | — | | (206,625 | ) | | (612,409 | ) | |
| |
| Contracts to Sell Protectionc | | | | | | | | | | | | | | | | | | |
| Single Name | | | | | | | | | | | | | | | | | | |
| Anadarko Petroleum | | | | | | | | | | | | | | | | | | |
| Corp. | BZWS | 4,300,000 | | 1.00 | % | 9/20/19 | | 88,714 | | | — | | (5,647 | ) | | 83,067 | | BBB |
| Bank of America Corp. | FBCO | 2,000,000 | | 1.00 | % | 9/20/17 | | (2,296 | ) | | 32,849 | | — | | | 30,553 | | A- |
| Beazer Homes USA Inc. | CITI | 1,800,000 | | 5.00 | % | 9/20/19 | | 32,196 | | | 43,820 | | — | | | 76,016 | | CCC |
| Beazer Homes USA Inc. | CITI | 2,700,000 | | 5.00 | % | 12/20/19 | | 71,453 | | | 25,595 | | — | | | 97,048 | | CCC |
| Berkshire Hathaway Inc. | BOFA | 2,700,000 | | 1.00 | % | 9/20/15 | | 5,280 | | | 4,237 | | — | | | 9,517 | | AA |
| Berkshire Hathaway Inc. | CITI | 6,400,000 | | 1.00 | % | 3/20/22 | | 76,274 | | | — | | (6,698 | ) | | 69,576 | | AA |
| Government of Lithuania | FBCO | 250,000 | | 1.00 | % | 6/20/16 | | (2,562 | ) | | 4,850 | | — | | | 2,288 | | BBB |
| Government of Mexico | CITI | 2,500,000 | | 1.00 | % | 6/20/20 | | (30,761 | ) | | 5,330 | | — | | | (25,431 | ) | BBB+ |
| Government of Portugal | DBAB | 3,700,000 | | 1.00 | % | 9/20/19 | | (175,685 | ) | | 139,512 | | — | | | (36,173 | ) | NR |
| Government of Portugal | JPHQ | 5,300,000 | | 1.00 | % | 9/20/19 | | (221,709 | ) | | 169,893 | | — | | | (51,816 | ) | NR |
| iHeartCommunications | | | | | | | | | | | | | | | | | | |
| Inc. | BZWS | 2,400,000 | | 5.00 | % | 6/20/18 | | (534,409 | ) | | — | | (40,968 | ) | | (575,377 | ) | CCC- |
| PSEG Power LLC | JPHQ | 7,600,000 | | 1.00 | % | 3/20/20 | | (103,407 | ) | | 64,591 | | — | | | (38,816 | ) | BBB+ |
| Tate & Lyle International | | | | | | | | | | | | | | | | | | |
| Finance PLC | CITI | 3,000,000 | EUR | 1.00 | % | 9/20/19 | | 58,699 | | | — | | (11,440 | ) | | 47,259 | | BBB |
| Tenet Healthcare Corp. | BZWS | 4,000,000 | | 5.00 | % | 12/20/18 | | 195,421 | | | 203,856 | | — | | | 399,277 | | CCC+ |
franklintempleton.com
Semiannual Report | 83
FRANKLIN INVESTORS SECURITIES TRUST
STATEMENT OF INVESTMENTS (UNAUDITED)
| | | | | | | | | | | | | | | |
| Franklin Low Duration Total Return Fund (continued) | | | | | | | | | | | | |
| |
| Credit Default Swap Contracts (continued) | | | | | | | | | | | | | |
| | | | | | | | Upfront | | | | | | | | |
| | | | Periodic | | | | Premiums | | | | | | | | |
| | Counterparty/ | Notional | Payment | | Expiration | | Paid | | Unrealized | | Unrealized | | | Market | |
| Description | Exchange | Amounta | Rate | | Date | | (Received) | | Appreciation | | Depreciation | | | Value | Ratingb |
| OTC Swaps (continued) | | | | | | | | | | | | | | | |
| Contracts to Sell Protectionc (continued) | | | | | | | | | | | | | | |
| Traded Index | | | | | | | | | | | | | | | |
| LCDX.NA.21 | FBCO | 1,274,000 | 2.50 | % | 12/20/18 | $ | 35,766 | $ | 4,976 | $ | — | | $ | 40,742 | Non |
| | | | | | | | | | | | | | | | Investment |
| | | | | | | | | | | | | | | | Grade |
| MCDX.NA.24 | CITI | 4,500,000 | 1.00 | % | 6/20/20 | | 10,324 | | 6,319 | | — | | | 16,643 | Investment |
| | | | | | | | | | | | | | | | Grade |
| MCDX.NA.24 | GSCO | 4,350,000 | 1.00 | % | 6/20/20 | | 9,980 | | 6,109 | | — | | | 16,089 | Investment |
| | | | | | | | | | | | | | | | Grade |
| OTC Swaps unrealized appreciation (depreciation) | | | | | | | 716,190 | | (1,928,329 | ) | | | |
| Total Credit Default Swaps unrealized appreciation (depreciation) | | | | | | 963,273 | | (1,928,329 | ) | | | |
| Net unrealized appreciation (depreciation) | | | | | | | | | $ | (965,056 | ) | | | |
aIn U.S. dollars unless otherwise indicated. For contracts to sell protection, the notional amount is equal to the maximum potential amount of the future payments and no
recourse provisions have been entered into in association with the contracts.
bBased on Standard and Poor’s (S&P) Rating for single name swaps and internal ratings for index swaps. Internal ratings based on mapping into equivalent ratings from
external vendors.
cThe fund enters contracts to sell protection to create a long credit position. Performance triggers include default, bankruptcy or restructuring for single name swaps, and
failure to pay or bankruptcy of the underlying securities for traded index swaps.
At April 30, 2015, the Fund had the following cross-currency swap contracts outstanding. See Note 1(d).
| | | | | | | | | |
| Cross-Currency Swap Contracts | | | | | | | | | |
| | | Expiration | Notional | | | Unrealized | | Unrealized | |
| Description | Counterparty | Date | Amount | | | Appreciation | | Depreciation | |
| Receive Fixed Semi-Annual 4.50% | CITI | 1/01/16 | 2,747,819 | USD | $ | 341,272 | $ | — | |
| Pay Fixed Annual 4.00% | | | 16,000,000 | DKK | | | | | |
| Receive Float Quarterly 3-month BBA USD | | | | | | | | | |
| LIBOR + 2.18% | CITI | 10/13/17 | 3,922,448 | USD | | 82,299 | | — | |
| Pay Fixed Annual 2.125% | | | 3,500,000 | CHF | | | | | |
| Receive Fixed Semi-Annual 2.47% | DBAB | 1/04/16 | 2,953,953 | USD | | 392,277 | | — | |
| Pay Fixed Annual 2.00% | | | 17,000,000 | DKK | | | | | |
| Receive Float Quarterly 3-month BBA USD | | | | | | | | | |
| LIBOR + 3.29% | JPHQ | 10/13/17 | 1,562,500 | USD | | — | | (36,217 | ) |
| Pay Fixed Annual 2.125% | | | 1,500,000 | CHF | | | | | |
| Unrealized appreciation (depreciation) | | | | | | 815,848 | | (36,217 | ) |
| Net unrealized appreciation (depreciation) | | | | | $ | 779,631 | | | |
| See Notes 6 and 10 regarding investment transactions and other derivative information, respectively. | | | | | | | |
See Abbreviations on page 140.
84 | Semiannual Report | The accompanying notes are an integral part of these financial statements. franklintempleton.com
| | | | | | | | | | | | | | | | | | |
| | | | | | | | | FRANKLIN INVESTORS SECURITIES TRUST | |
| |
| |
| Financial Highlights | | | | | | | | | | | | | | | | | | |
| Franklin Total Return Fund | | | | | | | | | | | | | | | | | | |
| | | Six Months Ended | | | | | | | | | | | | | | | | |
| | | April 30, 2015 | | | | | | Year Ended October 31, | | | | |
| | | (unaudited) | | | 2014 | | | 2013 | | | 2012 | | | 2011 | | | 2010 | |
| Class A | | | | | | | | | | | | | | | | | | |
| Per share operating performance | | | | | | | | | | | | | | | | | | |
| (for a share outstanding throughout the period) | | | | | | | | | | | | | | | | | | |
| Net asset value, beginning of period | $ | 10.18 | | $ | 10.05 | | $ | 10.53 | | $ | 10.32 | | $ | 10.33 | | $ | 9.65 | |
| Income from investment operationsa: | | | | | | | | | | | | | | | | | | |
| Net investment income | | 0.101 | | | 0.257 | | | 0.236 | | | 0.297 | | | 0.353 | | | 0.401 | |
| Net realized and unrealized gains (losses) | | 0.058 | | | 0.214 | | | (0.205 | ) | | 0.472 | | | 0.074 | | | 0.710 | |
| Total from investment operations | | 0.159 | | | 0.471 | | | 0.031 | | | 0.769 | | | 0.427 | | | 1.111 | |
| Less distributions from: | | | | | | | | | | | | | | | | | | |
| Net investment income and net foreign | | | | | | | | | | | | | | | | | | |
| currency gains | | (0.219 | ) | | (0.341 | ) | | (0.351 | ) | | (0.447 | ) | | (0.380 | ) | | (0.431 | ) |
| Net realized gains | | — | | | — | | | (0.160 | ) | | (0.112 | ) | | (0.057 | ) | | — | |
| Total distributions | | (0.219 | ) | | (0.341 | ) | | (0.511 | ) | | (0.559 | ) | | (0.437 | ) | | (0.431 | ) |
| Net asset value, end of period | $ | 10.12 | | $ | 10.18 | | $ | 10.05 | | $ | 10.53 | | $ | 10.32 | | $ | 10.33 | |
| |
| Total returnb | | 1.58 | % | | 4.80 | % | | 0.30 | % | | 7.74 | % | | 4.26 | % | | 11.81 | % |
| |
| Ratios to average net assetsc | | | | | | | | | | | | | | | | | | |
| Expenses before waiver and payments by | | | | | | | | | | | | | | | | | | |
| affiliates | | 0.90 | % | | 0.93 | % | | 0.91 | % | | 0.92 | % | | 0.93 | % | | 0.95 | % |
| Expenses net of waiver and payments by | | | | | | | | | | | | | | | | | | |
| affiliates | | 0.87 | %d | | 0.88 | %d | | 0.88 | %d | | 0.88 | % | | 0.88 | %d | | 0.87 | %d |
| Net investment income | | 1.90 | % | | 2.46 | % | | 2.36 | % | | 2.69 | % | | 3.45 | % | | 4.14 | % |
| |
| Supplemental data | | | | | | | | | | | | | | | | | | |
| Net assets, end of period (000’s) | $ | 3,457,786 | | $ | 3,213,446 | | $ | 3,019,228 | | $ | 3,134,211 | | $ | 2,245,312 | | $ | 1,867,411 | |
| Portfolio turnover rate | | 149.54 | % | | 273.96 | % | | 371.54 | % | | 314.62 | % | | 255.55 | % | | 131.91 | % |
| Portfolio turnover rate excluding mortgage | | | | | | | | | | | | | | | | | | |
| dollar rollse | | 44.14 | % | | 85.03 | % | | 156.49 | % | | 122.04 | % | | 98.96 | % | | 53.26 | % |
aThe amount shown for a share outstanding throughout the period may not correlate with the Statement of Operations for the period due to the timing of sales and
repurchases of the Fund shares in relation to income earned and/or fluctuating fair value of the investments of the Fund.
bTotal return does not reflect sales commissions or contingent deferred sales charges, if applicable, and is not annualized for periods less than one year.
cRatios are annualized for periods less than one year.
dBenefit of expense reduction rounds to less than 0.01%.
eSee Note 1(h) regarding mortgage dollar rolls.
franklintempleton.com The accompanying notes are an integral part of these financial statements. | Semiannual Report | 85
FRANKLIN INVESTORS SECURITIES TRUST
FINANCIAL HIGHLIGHTS
| | | | | | | | | | | | | | | | | | |
| Franklin Total Return Fund (continued) | | | | | | | | | | | | | | | | | | |
| | | Six Months Ended | | | | | | | | | | | | | | | | |
| | | April 30, 2015 | | | | | | Year Ended October 31, | | | | |
| | | (unaudited) | | | 2014 | | | 2013 | | | 2012 | | | 2011 | | | 2010 | |
| Class C | | | | | | | | | | | | | | | | | | |
| Per share operating performance | | | | | | | | | | | | | | | | | | |
| (for a share outstanding throughout the period) | | | | | | | | | | | | | | | | | | |
| Net asset value, beginning of period | $ | 10.16 | | $ | 10.03 | | $ | 10.51 | | $ | 10.31 | | $ | 10.32 | | $ | 9.65 | |
| Income from investment operationsa: | | | | | | | | | | | | | | | | | | |
| Net investment income | | 0.083 | | | 0.201 | | | 0.174 | | | 0.253 | | | 0.313 | | | 0.357 | |
| Net realized and unrealized gains (losses) | | 0.053 | | | 0.232 | | | (0.182 | ) | | 0.467 | | | 0.076 | | | 0.706 | |
| Total from investment operations | | 0.136 | | | 0.433 | | | (0.008 | ) | | 0.720 | | | 0.389 | | | 1.063 | |
| Less distributions from: | | | | | | | | | | | | | | | | | | |
| Net investment income and net foreign | | | | | | | | | | | | | | | | | | |
| currency gains | | (0.206 | ) | | (0.303 | ) | | (0.312 | ) | | (0.408 | ) | | (0.342 | ) | | (0.393 | ) |
| Net realized gains | | — | | | — | | | (0.160 | ) | | (0.112 | ) | | (0.057 | ) | | — | |
| Total distributions | | (0.206 | ) | | (0.303 | ) | | (0.472 | ) | | (0.520 | ) | | (0.399 | ) | | (0.393 | ) |
| Net asset value, end of period | $ | 10.09 | | $ | 10.16 | | $ | 10.03 | | $ | 10.51 | | $ | 10.31 | | $ | 10.32 | |
| |
| Total returnb | | 1.35 | % | | 4.42 | % | | (0.08 | )% | | 7.25 | % | | 3.88 | % | | 11.40 | % |
| |
| Ratios to average net assetsc | | | | | | | | | | | | | | | | | | |
| Expenses before waiver and payments by | | | | | | | | | | | | | | | | | | |
| affiliates | | 1.30 | % | | 1.33 | % | | 1.31 | % | | 1.32 | % | | 1.33 | % | | 1.35 | % |
| Expenses net of waiver and payments by | | | | | | | | | | | | | | | | | | |
| affiliates | | 1.27 | %d | | 1.28 | %d | | 1.28 | %d | | 1.28 | % | | 1.28 | %d | | 1.27 | %d |
| Net investment income | | 1.50 | % | | 2.06 | % | | 1.96 | % | | 2.29 | % | | 3.05 | % | | 3.74 | % |
| |
| Supplemental data | | | | | | | | | | | | | | | | | | |
| Net assets, end of period (000’s) | $ | 467,332 | | $ | 432,767 | | $ | 455,720 | | $ | 571,206 | | $ | 394,777 | | $ | 366,888 | |
| Portfolio turnover rate | | 149.54 | % | | 273.96 | % | | 371.54 | % | | 314.62 | % | | 255.55 | % | | 131.91 | % |
| Portfolio turnover rate excluding mortgage | | | | | | | | | | | | | | | | | | |
| dollar rollse | | 44.14 | % | | 85.03 | % | | 156.49 | % | | 122.04 | % | | 98.96 | % | | 53.26 | % |
aThe amount shown for a share outstanding throughout the period may not correlate with the Statement of Operations for the period due to the timing of sales and
repurchases of the Fund shares in relation to income earned and/or fluctuating fair value of the investments of the Fund.
bTotal return does not reflect sales commissions or contingent deferred sales charges, if applicable, and is not annualized for periods less than one year.
cRatios are annualized for periods less than one year.
dBenefit of expense reduction rounds to less than 0.01%.
eSee Note 1(h) regarding mortgage dollar rolls.
86 | Semiannual Report | The accompanying notes are an integral part of these financial statements. franklintempleton.com
FRANKLIN INVESTORS SECURITIES TRUST
FINANCIAL HIGHLIGHTS
| | | | | | | | | | | | | | | | | | |
| Franklin Total Return Fund (continued) | | | | | | | | | | | | | | | | | | |
| | | Six Months Ended | | | | | | | | | | | | | | | | |
| | | April 30, 2015 | | | | | | Year Ended October 31, | | | | |
| | | (unaudited) | | | 2014 | | | 2013 | | | 2012 | | | 2011 | | | 2010 | |
| Class R | | | | | | | | | | | | | | | | | | |
| Per share operating performance | | | | | | | | | | | | | | | | | | |
| (for a share outstanding throughout the period) | | | | | | | | | | | | | | | | | | |
| Net asset value, beginning of period | $ | 10.17 | | $ | 10.04 | | $ | 10.52 | | $ | 10.32 | | $ | 10.33 | | $ | 9.65 | |
| Income from investment operationsa: | | | | | | | | | | | | | | | | | | |
| Net investment income | | 0.094 | | | 0.209 | | | 0.204 | | | 0.255 | | | 0.330 | | | 0.390 | |
| Net realized and unrealized gains (losses) | | 0.047 | | | 0.238 | | | (0.197 | ) | | 0.480 | | | 0.073 | | | 0.698 | |
| Total from investment operations | | 0.141 | | | 0.447 | | | 0.007 | | | 0.735 | | | 0.403 | | | 1.088 | |
| Less distributions from: | | | | | | | | | | | | | | | | | | |
| Net investment income and net foreign | | | | | | | | | | | | | | | | | | |
| currency gains | | (0.211 | ) | | (0.317 | ) | | (0.327 | ) | | (0.423 | ) | | (0.356 | ) | | (0.408 | ) |
| Net realized gains | | — | | | — | | | (0.160 | ) | | (0.112 | ) | | (0.057 | ) | | — | |
| Total distributions | | (0.211 | ) | | (0.317 | ) | | (0.487 | ) | | (0.535 | ) | | (0.413 | ) | | (0.408 | ) |
| Net asset value, end of period | $ | 10.10 | | $ | 10.17 | | $ | 10.04 | | $ | 10.52 | | $ | 10.32 | | $ | 10.33 | |
| �� |
| Total returnb | | 1.40 | % | | 4.56 | % | | 0.06 | % | | 7.39 | % | | 4.02 | % | | 11.55 | % |
| |
| Ratios to average net assetsc | | | | | | | | | | | | | | | | | | |
| Expenses before waiver and payments by | | | | | | | | | | | | | | | | | | |
| affiliates | | 1.15 | % | | 1.18 | % | | 1.16 | % | | 1.17 | % | | 1.18 | % | | 1.20 | % |
| Expenses net of waiver and payments by | | | | | | | | | | | | | | | | | | |
| affiliates | | 1.12 | %d | | 1.13 | %d | | 1.13 | %d | | 1.13 | % | | 1.13 | %d | | 1.12 | %d |
| Net investment income | | 1.65 | % | | 2.21 | % | | 2.11 | % | | 2.44 | % | | 3.20 | % | | 3.89 | % |
| |
| Supplemental data | | | | | | | | | | | | | | | | | | |
| Net assets, end of period (000’s) | $ | 69,483 | | $ | 59,307 | | $ | 65,601 | | $ | 87,235 | | $ | 84,708 | | $ | 86,750 | |
| Portfolio turnover rate | | 149.54 | % | | 273.96 | % | | 371.54 | % | | 314.62 | % | | 255.55 | % | | 131.91 | % |
| Portfolio turnover rate excluding mortgage | | | | | | | | | | | | | | | | | | |
| dollar rollse | | 44.14 | % | | 85.03 | % | | 156.49 | % | | 122.04 | % | | 98.96 | % | | 53.26 | % |
aThe amount shown for a share outstanding throughout the period may not correlate with the Statement of Operations for the period due to the timing of sales and
repurchases of the Fund shares in relation to income earned and/or fluctuating fair value of the investments of the Fund.
bTotal return is not annualized for periods less than one year.
cRatios are annualized for periods less than one year.
dBenefit of expense reduction rounds to less than 0.01%.
eSee Note 1(h) regarding mortgage dollar rolls.
franklintempleton.com The accompanying notes are an integral part of these financial statements. | Semiannual Report | 87
FRANKLIN INVESTORS SECURITIES TRUST
FINANCIAL HIGHLIGHTS
| | | | | | | | | |
| Franklin Total Return Fund (continued) | | | | | | | | | |
| | | Six Months Ended | | | Year Ended | |
| | | April 30, 2015 | | | October 31, | |
| | | (unaudited) | | | 2014 | | | 2013 | a |
| Class R6 | | | | | | | | | |
| Per share operating performance | | | | | | | | | |
| (for a share outstanding throughout the period) | | | | | | | | | |
| Net asset value, beginning of period | $ | 10.20 | | $ | 10.07 | | $ | 10.44 | |
| Income from investment operationsb: | | | | | | | | | |
| Net investment income (loss) | | 0.116 | c | | 0.317 | c | | 0.145 | |
| Net realized and unrealized gains (losses) | | 0.066 | | | 0.191 | | | (0.348 | ) |
| Total from investment operations | | 0.182 | | | 0.508 | | | (0.203 | ) |
| Less distributions from net investment income and net foreign currency gains | | (0.232 | ) | | (0.378 | ) | | (0.167 | ) |
| Net asset value, end of period | $ | 10.15 | | $ | 10.20 | | $ | 10.07 | |
| |
| Total returnd | | 1.80 | % | | 5.18 | % | | (1.92 | )% |
| |
| Ratios to average net assetse | | | | | | | | | |
| Expenses before waiver and payments by affiliates | | 0.49 | % | | 0.50 | % | | 0.50 | % |
| Expenses net of waiver and payments by affiliatesf | | 0.46 | % | | 0.48 | % | | 0.49 | % |
| Net investment income | | 2.31 | % | | 2.86 | % | | 2.75 | % |
| |
| Supplemental data | | | | | | | | | |
| Net assets, end of period (000’s) | $ | 61,257 | | $ | 26,123 | | $ | 329,806 | |
| Portfolio turnover rate | | 149.54 | % | | 273.96 | % | | 371.54 | % |
| Portfolio turnover rate excluding mortgage dollar rollsg | | 44.14 | % | | 85.03 | % | | 156.49 | % |
aFor the period May 1, 2013 (effective date) to October 31, 2013.
bThe amount shown for a share outstanding throughout the period may not correlate with the Statement of Operations for the period due to the timing of sales and
repurchases of the Fund shares in relation to income earned and/or fluctuating fair value of the investments of the Fund.
cBased on average daily shares outstanding.
dTotal return is not annualized for periods less than one year.
eRatios are annualized for periods less than one year.
fBenefit of expense reduction rounds to less than 0.01%.
gSee Note 1(h) regarding mortgage dollar rolls.
88 | Semiannual Report | The accompanying notes are an integral part of these financial statements. franklintempleton.com
FRANKLIN INVESTORS SECURITIES TRUST
FINANCIAL HIGHLIGHTS
| | | | | | | | | | | | | | | | | | |
| Franklin Total Return Fund (continued) | | | | | | | | | | | | | | | | | | |
| | | Six Months Ended | | | | | | | | | | | | | | | | |
| | | April 30, 2015 | | | | | | Year Ended October 31, | | | | |
| | | (unaudited) | | | 2014 | | | 2013 | | | 2012 | | | 2011 | | | 2010 | |
| Advisor Class | | | | | | | | | | | | | | | | | | |
| Per share operating performance | | | | | | | | | | | | | | | | | | |
| (for a share outstanding throughout the period) | | | | | | | | | | | | | | | | | | |
| Net asset value, beginning of period | $ | 10.20 | | $ | 10.07 | | $ | 10.55 | | $ | 10.34 | | $ | 10.35 | | $ | 9.67 | |
| Income from investment operationsa: | | | | | | | | | | | | | | | | | | |
| Net investment income | | 0.113 | | | 0.288 | | | 0.242 | | | 0.319 | | | 0.380 | | | 0.431 | |
| Net realized and unrealized gains (losses) | | 0.064 | | | 0.206 | | | (0.186 | ) | | 0.474 | | | 0.071 | | | 0.705 | |
| Total from investment operations | | 0.177 | | | 0.494 | | | 0.056 | | | 0.793 | | | 0.451 | | | 1.136 | |
| Less distributions from: | | | | | | | | | | | | | | | | | | |
| Net investment income and net foreign | | | | | | | | | | | | | | | | | | |
| currency gains | | (0.227 | ) | | (0.364 | ) | | (0.376 | ) | | (0.471 | ) | | (0.404 | ) | | (0.456 | ) |
| Net realized gains | | — | | | — | | | (0.160 | ) | | (0.112 | ) | | (0.057 | ) | | — | |
| Total distributions | | (0.227 | ) | | (0.364 | ) | | (0.536 | ) | | (0.583 | ) | | (0.461 | ) | | (0.456 | ) |
| Net asset value, end of period | $ | 10.15 | | $ | 10.20 | | $ | 10.07 | | $ | 10.55 | | $ | 10.34 | | $ | 10.35 | |
| |
| Total returnb | | 1.75 | % | | 5.03 | % | | 0.54 | % | | 7.98 | % | | 4.50 | % | | 12.17 | % |
| |
| Ratios to average net assetsc | | | | | | | | | | | | | | | | | | |
| Expenses before waiver and payments by | | | | | | | | | | | | | | | | | | |
| affiliates | | 0.65 | % | | 0.68 | % | | 0.66 | % | | 0.67 | % | | 0.68 | % | | 0.70 | % |
| Expenses net of waiver and payments by | | | | | | | | | | | | | | | | | | |
| affiliates | | 0.62 | %d | | 0.63 | %d | | 0.63 | %d | | 0.63 | % | | 0.63 | %d | | 0.62 | %d |
| Net investment income | | 2.15 | % | | 2.71 | % | | 2.61 | % | | 2.94 | % | | 3.70 | % | | 4.39 | % |
| |
| Supplemental data | | | | | | | | | | | | | | | | | | |
| Net assets, end of period (000’s) | $ | 1,331,915 | | $ | 1,281,151 | | $ | 1,148,451 | | $ | 1,482,994 | | $ | 1,158,243 | | $ | 972,218 | |
| Portfolio turnover rate | | 149.54 | % | | 273.96 | % | | 371.54 | % | | 314.62 | % | | 255.55 | % | | 131.91 | % |
| Portfolio turnover rate excluding mortgage | | | | | | | | | | | | | | | | | | |
| dollar rollse | | 44.14 | % | | 85.03 | % | | 156.49 | % | | 122.04 | % | | 98.96 | % | | 53.26 | % |
aThe amount shown for a share outstanding throughout the period may not correlate with the Statement of Operations for the period due to the timing of sales and
repurchases of the Fund shares in relation to income earned and/or fluctuating fair value of the investments of the Fund.
bTotal return is not annualized for periods less than one year.
cRatios are annualized for periods less than one year.
dBenefit of expense reduction rounds to less than 0.01%.
eSee Note 1(h) regarding mortgage dollar rolls.
franklintempleton.com The accompanying notes are an integral part of these financial statements. | Semiannual Report | 89
| | | | | |
| FRANKLIN INVESTORS SECURITIES TRUST | | | | | |
| |
| |
| |
| |
| Statement of Investments, April 30, 2015 (unaudited) | | | | | |
| |
| Franklin Total Return Fund | | | | | |
| | | Shares/ | | | |
| | Country | Warrants | | | Value |
| Common Stocks and Other Equity Interests 1.2% | | | | | |
| Automobiles & Components 0.0%† | | | | | |
| General Motors Co. | United States | 4,796 | | $ | 168,148 |
| aGeneral Motors Co., wts., 7/10/16 | United States | 4,361 | | | 111,685 |
| aGeneral Motors Co., wts., 7/10/19 | United States | 4,361 | | | 75,707 |
| | | | | | 355,540 |
| Consumer Services 0.1% | | | | | |
| a,b,cTurtle Bay Resort | United States | 1,550,568 | | | 3,077,877 |
| Diversified Financials 1.1% | | | | | |
| PowerShares Senior Loan Portfolio, ETF | United States | 2,640,000 | | | 63,835,200 |
| Materials 0.0%† | | | | | |
| aVerso Corp. | United States | 9,431 | | | 13,203 |
| Total Common Stocks and Other Equity Interests | | | | | |
| (Cost $67,355,020) | | | | | 67,281,820 |
| Preferred Stocks 0.4% | | | | | |
| Banks 0.3% | | | | | |
| U.S. Bancorp, 6.00%, pfd., G | United States | 640,000 | | | 17,280,000 |
| Diversified Financials 0.1% | | | | | |
| Citigroup Capital XIII, 8.75%, pfd. | United States | 93,000 | | | 2,407,770 |
| Total Preferred Stocks (Cost $18,325,000) | | | | | 19,687,770 |
| |
| | | Principal | | | |
| | | Amount* | | | |
| Corporate Bonds 37.7% | | | | | |
| Automobiles & Components 0.6% | | | | | |
| BorgWarner Inc., senior bond, 4.375%, 3/15/45 | United States | 9,300,000 | | | 9,449,692 |
| Ford Motor Co., senior bond, 4.75%, 1/15/43 | United States | 10,200,000 | | | 10,695,546 |
| Ford Motor Credit Co. LLC, senior note, 3.664%, 9/08/24 | United States | 5,000,000 | | | 5,118,610 |
| dHyundai Capital America, senior note, 144A, 4.00%, 6/08/17 | South Korea | 4,400,000 | | | 4,620,616 |
| | | | | | 29,884,464 |
| Banks 7.7% | | | | | |
| eBanca Monte Dei Paschi Di Siena SpA, secured note, Reg S, 2.875%, | | | | | |
| 4/16/21 | Italy | 13,500,000 | EUR | | 16,867,693 |
| Banco Comercial Portugues SA, 4.75%, 6/22/17 | Portugal | 5,400,000 | EUR | | 6,610,718 |
| Bank of America Corp., | | | | | |
| fjunior sub. bond, M, 8.125% to 5/15/18, FRN thereafter, Perpetual | United States | 6,000,000 | | | 6,510,000 |
| senior note, 4.75%, 8/01/15 | United States | 8,000,000 | | | 8,076,592 |
| sub. note, 4.00%, 1/22/25 | United States | 20,400,000 | | | 20,268,318 |
| eBankinter SA, senior note, Reg S, 1.75%, 6/10/19 | Spain | 12,500,000 | EUR | | 14,571,712 |
| eBarclays Bank PLC, senior sub. note, Reg S, 6.00%, 1/14/21 | United Kingdom | 8,000,000 | EUR | | 11,002,373 |
| Barclays PLC, sub. note, 4.375%, 9/11/24 | United Kingdom | 500,000 | | | 500,625 |
| CIT Group Inc., senior note, 5.00%, | | | | | |
| 5/15/17 | United States | 22,500,000 | | | 23,343,750 |
| 8/15/22 | United States | 8,000,000 | | | 8,235,000 |
| Citigroup Inc., | | | | | |
| senior note, 8.125%, 7/15/39 | United States | 4,400,000 | | | 6,729,320 |
| sub. note, 3.50%, 5/15/23 | United States | 20,000,000 | | | 19,812,560 |
90 | Semiannual Report
franklintempleton.com
FRANKLIN INVESTORS SECURITIES TRUST
STATEMENT OF INVESTMENTS (UNAUDITED)
| | | | | |
| Franklin Total Return Fund (continued) | | | | | |
| | | Principal | | | |
| | Country | Amount* | | | Value |
| Corporate Bonds (continued) | | | | | |
| Banks (continued) | | | | | |
| Depfa ACS Bank, secured bond, | | | | | |
| 1.65%, 12/20/16 | Ireland | 720,000,000 | JPY | $ | 6,172,449 |
| 2.125%, 10/13/17 | Ireland | 12,250,000 | CHF | | 13,848,616 |
| dHSBC Bank Brasil SA, senior note, 144A, 4.00%, 5/11/16 | Brazil | 7,500,000 | | | 7,684,913 |
| HSBC Holdings PLC, | | | | | |
| fjunior sub. bond, 6.375% to 3/30/25, FRN thereafter, Perpetual | United Kingdom | 8,700,000 | | | 8,989,144 |
| sub. note, 6.50%, 9/15/37 | United Kingdom | 3,000,000 | | | 3,791,730 |
| Intesa Sanpaolo SpA, senior note, | | | | | |
| 2.375%, 1/13/17 | Italy | 24,500,000 | | | 24,768,275 |
| 3.875%, 1/16/18 | Italy | 4,300,000 | | | 4,497,585 |
| 3.875%, 1/15/19 | Italy | 10,450,000 | | | 10,982,166 |
| JPMorgan Chase & Co., | | | | | |
| fjunior sub. bond, V, 5.00% to 7/30/19, FRN thereafter, Perpetual | United States | 6,500,000 | | | 6,402,500 |
| fjunior sub. note, X, 6.10% to 10/01/24, FRN thereafter, Perpetual | United States | 10,400,000 | | | 10,790,000 |
| senior note, 4.25%, 10/15/20 | United States | 9,000,000 | | | 9,779,715 |
| senior note, 3.25%, 9/23/22 | United States | 11,400,000 | | | 11,583,061 |
| JPMorgan Chase Bank NA, sub. note, 6.00%, 10/01/17 | United States | 3,000,000 | | | 3,317,997 |
| dMizuho Financial Group Cayman 3 Ltd., sub. note, 144A, 4.60%, | | | | | |
| 3/27/24 | Japan | 8,700,000 | | | 9,303,606 |
| dNorddeutsche Landesbank Girozentrale, secured note, 144A, 2.00%, | | | | | |
| 2/05/19 | Germany | 7,000,000 | | | 7,103,215 |
| Nykredit Realkredit AS, secured note, 12H, 2.00%, 4/01/16 | Denmark | 185,500,000 | DKK | | 28,464,112 |
| Royal Bank of Scotland Group PLC, sub. note, 6.125%, 12/15/22 | United Kingdom | 1,100,000 | | | 1,221,688 |
| The Royal Bank of Scotland PLC, sub. note, 6.934%, 4/09/18 | United Kingdom | 4,000,000 | EUR | | 5,144,599 |
| dShinhan Bank, senior note, 144A, 1.875%, 7/30/18 | South Korea | 10,000,000 | | | 9,987,500 |
| SVB Financial Group, senior note, 3.50%, 1/29/25 | United States | 6,000,000 | | | 5,928,750 |
| gUniCredit SpA, senior note, FRN, 1.995%, 10/31/17 | Italy | 9,500,000 | EUR | | 10,920,579 |
| eUnione di Banche Italiane SCpA, senior note, Reg S, 2.875%, 2/18/19 | Italy | 12,000,000 | EUR | | 14,314,351 |
| f,gWachovia Capital Trust III, junior sub. bond, FRN, 5.57%, Perpetual | United States | 15,600,000 | | | 15,619,500 |
| Wells Fargo & Co., | | | | | |
| fjunior sub. bond, 5.875% to 6/15/25, FRN thereafter, Perpetual | United States | 9,900,000 | | | 10,568,250 |
| fjunior sub. bond, S, 5.90% to 6/15/24, FRN thereafter, Perpetual | United States | 5,500,000 | | | 5,775,000 |
| sub. bond, 4.65%, 11/04/44 | United States | 10,000,000 | | | 10,230,500 |
| dWoori Bank, sub.note, 144A, 4.75%, 4/30/24 | South Korea | 11,750,000 | | | 12,535,840 |
| | | | | | 412,254,302 |
| Capital Goods 0.8% | | | | | |
| eAeroporti Di Roma SpA, senior note, Reg S, 3.25%, 2/20/21 | Italy | 5,000,000 | EUR | | 6,289,960 |
| General Electric Capital Corp., senior note, | | | | | |
| 5.625%, 5/01/18 | United States | 500,000 | | | 562,441 |
| A, 8.50%, 4/06/18 | United States | 135,000,000 | MXN | | 9,669,943 |
| NBCUniversal Media LLC, senior bond, 4.45%, 1/15/43 | United States | 8,100,000 | | | 8,486,491 |
| dSydney Airport Finance Co. Pty. Ltd., 144A, 3.90%, 3/22/23 | Australia | 14,000,000 | | | 14,567,910 |
| USG Corp., senior note, 6.30%, 11/15/16 | United States | 4,000,000 | | | 4,225,000 |
| | | | | | 43,801,745 |
| Consumer Durables & Apparel 1.1% | | | | | |
| Beazer Homes USA Inc., senior note, 5.75%, 6/15/19 | United States | 18,500,000 | | | 18,315,000 |
| Centex LLC, senior note, 6.50%, 5/01/16 | United States | 19,795,000 | | | 20,735,263 |
| D.R. Horton Inc., senior bond, 5.625%, 1/15/16 | United States | 7,000,000 | | | 7,201,250 |
franklintempleton.com
Semiannual Report | 91
| | | | |
| FRANKLIN INVESTORS SECURITIES TRUST | | | | |
| STATEMENT OF INVESTMENTS (UNAUDITED) | | | | |
| |
| |
| |
| |
| Franklin Total Return Fund (continued) | | | | |
| | | Principal | | |
| | Country | Amount* | | Value |
| Corporate Bonds (continued) | | | | |
| Consumer Durables & Apparel (continued) | | | | |
| Lennar Corp., senior note, | | | | |
| 5.60%, 5/31/15 | United States | 7,692,000 | $ | 7,726,229 |
| 4.50%, 6/15/19 | United States | 4,235,000 | | 4,383,225 |
| Toll Brothers Finance Corp., senior note, 5.15%, 5/15/15 | United States | 2,010,000 | | 2,012,261 |
| | | | | 60,373,228 |
| Consumer Services 0.1% | | | | |
| Yum! Brands Inc., senior note, 5.30%, 9/15/19 | United States | 3,000,000 | | 3,343,482 |
| Diversified Financials 2.2% | | | | |
| American Express Centurion Bank, senior note, 5.95%, 6/12/17 | United States | 800,000 | | 876,614 |
| Capital One Bank USA NA, sub. bond, 3.375%, 2/15/23 | United States | 6,000,000 | | 6,044,592 |
| Deutsche Bank AG, sub. bond, 4.296% to 5/24/23, FRN thereafter, | | | | |
| 5/24/28 | Germany | 10,000,000 | | 9,712,500 |
| Discover Bank, sub. note, 8.70%, 11/18/19 | United States | 948,000 | | 1,162,344 |
| Discover Financial Services, senior note, 3.85%, 11/21/22 | United States | 3,052,000 | | 3,140,877 |
| General Motors Financial Co. Inc., senior note, 4.375%, 9/25/21 | United States | 12,500,000 | | 13,295,375 |
| fThe Goldman Sachs Group Inc., junior sub. bond, M, 5.375% to 5/10/20, | | | | |
| FRN thereafter, Perpetual | United States | 7,700,000 | | 7,728,875 |
| dHutchison Whampoa International 11 Ltd., senior note, 144A, 3.50%, | | | | |
| 1/13/17 | Hong Kong | 9,500,000 | | 9,809,748 |
| International Lease Finance Corp., senior note, 8.75%, 3/15/17 | United States | 10,000,000 | | 11,136,000 |
| Morgan Stanley, | | | | |
| senior bond, 4.30%, 1/27/45 | United States | 10,000,000 | | 9,870,510 |
| senior sub. bond, 4.35%, 9/08/26 | United States | 12,500,000 | | 12,768,587 |
| Navient Corp., senior note, | | | | |
| 8.45%, 6/15/18 | United States | 3,400,000 | | 3,801,880 |
| 5.50%, 1/15/19 | United States | 5,000,000 | | 5,095,000 |
| dPrudential Covered Trust, secured note, 144A, 2.997%, 9/30/15 | United States | 11,816,000 | | 11,906,889 |
| Springleaf Finance Corp., senior bond, 5.75%, 9/15/16 | United States | 14,000,000 | | 14,542,500 |
| | | | | 120,892,291 |
| Energy 7.3% | | | | |
| Anadarko Petroleum Corp., senior note, 6.45%, 9/15/36 | United States | 2,260,000 | | 2,800,635 |
| Apache Corp., senior bond, 4.25%, 1/15/44 | United States | 19,800,000 | | 18,919,791 |
| dCalifornia Resources Corp., senior bond, 144A, 6.00%, 11/15/24 | United States | 10,000,000 | | 9,462,500 |
| CGG SA, senior note, 6.50%, 6/01/21 | France | 3,000,000 | | 2,445,000 |
| Chesapeake Energy Corp., senior note, | | | | |
| 6.625%, 8/15/20 | United States | 2,000,000 | | 2,070,000 |
| 5.75%, 3/15/23 | United States | 5,000,000 | | 4,825,000 |
| CNOOC Finance 2013 Ltd., senior note, 3.00%, 5/09/23 | China | 14,000,000 | | 13,564,390 |
| CNOOC Nexen Finance 2014 ULC, senior note, 4.25%, 4/30/24 | China | 11,100,000 | | 11,741,003 |
| dEnable Midstream Partners LP, | | | | |
| senior bond, 144A, 5.00%, 5/15/44 | United States | 2,400,000 | | 2,182,459 |
| senior note, 144A, 3.90%, 5/15/24 | United States | 7,300,000 | | 7,069,780 |
| Energy Transfer Equity LP, senior note, first lien, 7.50%, 10/15/20 | United States | 6,000,000 | | 6,780,000 |
| Energy Transfer Partners LP, senior bond, | | | | |
| 4.90%, 3/15/35 | United States | 15,400,000 | | 15,077,478 |
| 5.15%, 2/01/43 | United States | 6,000,000 | | 5,888,334 |
| dEnergy XXI Gulf Coast Inc., senior secured note, second lien, 144A, | | | | |
| 11.00%, 3/15/20 | United States | 7,000,000 | | 6,755,000 |
| EnLink Midstream Partners LP, senior bond, 5.05%, 4/01/45 | United States | 12,500,000 | | 12,541,812 |
| Ensco PLC, senior bond, 5.75%, 10/01/44 | United States | 16,600,000 | | 16,429,452 |
92 | Semiannual Report franklintempleton.com
FRANKLIN INVESTORS SECURITIES TRUST
STATEMENT OF INVESTMENTS (UNAUDITED)
| | | | | |
| Franklin Total Return Fund (continued) | | | | | |
| | | Principal | | | |
| | Country | Amount* | | | Value |
| Corporate Bonds (continued) | | | | | |
| Energy (continued) | | | | | |
| Enterprise Products Operating LLC, | | | | | |
| junior sub. note, 7.034% to 1/15/18, FRN thereafter, 1/15/68 | United States | 3,500,000 | | $ | 3,801,875 |
| senior bond, 4.45%, 2/15/43 | United States | 12,000,000 | | | 11,814,924 |
| Exxon Mobil Corp., senior note, 2.709%, 3/06/25 | United States | 21,500,000 | | | 21,651,166 |
| d,hGaz Capital SA (OJSC Gazprom), loan participation, | | | | | |
| senior bond, 144A, 6.212%, 11/22/16 | Russia | 2,800,000 | | | 2,872,694 |
| senior note, 144A, 3.85%, 2/06/20 | Russia | 10,000,000 | | | 9,181,250 |
| Halcon Resources Corp., senior note, 9.75%, 7/15/20 | United States | 2,000,000 | | | 1,650,000 |
| Kinder Morgan Energy Partners LP, senior note, | | | | | |
| 6.85%, 2/15/20 | United States | 1,000,000 | | | 1,170,557 |
| 4.30%, 5/01/24 | United States | 11,000,000 | | | 11,204,699 |
| Kinder Morgan Finance Co. LLC, senior bond, 5.70%, 1/05/16 | United States | 28,205,000 | | | 29,097,321 |
| Kinder Morgan Inc., senior bond, | | | | | |
| 5.55%, 6/01/45 | United States | 6,100,000 | | | 6,110,400 |
| 5.05%, 2/15/46 | United States | 18,700,000 | | | 17,620,655 |
| Linn Energy LLC/Finance Corp., senior note, 6.25%, 11/01/19 | United States | 7,000,000 | | | 5,967,500 |
| dLUKOIL International Finance BV, senior note, 144A, 4.563%, 4/24/23 | Russia | 19,000,000 | | | 16,933,750 |
| MPLX LP, 4.00%, 2/15/25 | United States | 9,300,000 | | | 9,376,548 |
| Oceaneering International Inc., senior note, 4.65%, 11/15/24 | United States | 7,900,000 | | | 8,039,996 |
| Peabody Energy Corp., senior note, 6.25%, 11/15/21 | United States | 8,000,000 | | | 4,840,000 |
| gPetrobras Global Finance BV, senior note, FRN, 3.15%, 3/17/20 | Brazil | 14,400,000 | | | 13,536,000 |
| dPetrofac Ltd., senior note, 144A, 3.40%, 10/10/18 | United Kingdom | 7,600,000 | | | 7,480,946 |
| Sanchez Energy Corp., senior note, 6.125%, 1/15/23 | United States | 7,000,000 | | | 6,895,000 |
| dSinopec Group Overseas Development 2014 Ltd., senior note, 144A, | | | | | |
| 4.375%, 4/10/24 | China | 9,300,000 | | | 10,049,301 |
| dSinopec Group Overseas Development 2015 Ltd., senior note, 144A, | | | | | |
| 3.25%, 4/28/25 | China | 16,400,000 | | | 16,059,618 |
| Sunoco Logistics Partners Operations LP, senior note, 4.25%, 4/01/24 | United States | 9,300,000 | | | 9,564,418 |
| Transcontinental Gas Pipe Line Corp., senior note, 6.05%, 6/15/18 | United States | 550,000 | | | 615,295 |
| Valero Energy Corp., senior bond., 4.90%, 3/15/45 | United States | 13,500,000 | | | 13,716,594 |
| Weatherford International Ltd., senior bond, 5.95%, 4/15/42 | United States | 4,900,000 | | | 4,479,350 |
| Williams Partners LP, senior bond, 5.10%, 9/15/45 | United States | 13,300,000 | | | 12,540,158 |
| | | | | | 394,822,649 |
| Food & Staples Retailing 0.9% | | | | | |
| eCasino Guichard Perrachon SA, senior note, Reg S, 3.311%, 1/25/23 | France | 9,000,000 | EUR | | 11,396,606 |
| dCencosud SA, senior note, 144A, 4.875%, 1/20/23 | Chile | 17,000,000 | | | 17,334,305 |
| CVS Health Corp., senior note, 5.75%, 6/01/17 | United States | 362,000 | | | 396,495 |
| The Kroger Co., senior note, 4.00%, 2/01/24 | United States | 15,400,000 | | | 16,480,218 |
| | | | | | 45,607,624 |
| Food, Beverage & Tobacco 1.8% | | | | | |
| Altria Group Inc., senior bond, 4.25%, 8/09/42 | United States | 25,100,000 | | | 24,126,421 |
| eAnheuser-Busch InBev NV, senior bond, Reg S, 2.875%, 9/25/24 | Belgium | 3,300,000 | EUR | | 4,258,420 |
| Bunge Ltd. Finance Corp., | | | | | |
| 4.10%, 3/15/16 | United States | 8,000,000 | | | 8,200,952 |
| senior note, 5.10%, 7/15/15 | United States | 680,000 | | | 685,608 |
| Constellation Brands Inc., senior note, | | | | | |
| 7.25%, 5/15/17 | United States | 7,000,000 | | | 7,734,125 |
| A, 7.25%, 9/01/16 | United States | 6,000,000 | | | 6,449,400 |
| dHeineken NV, senior bond, 144A, 2.75%, 4/01/23 | Netherlands | 10,000,000 | | | 9,960,950 |
| Lorillard Tobacco Co., senior note, 3.75%, 5/20/23 | United States | 10,700,000 | | | 10,891,830 |
franklintempleton.com Semiannual Report | 93
FRANKLIN INVESTORS SECURITIES TRUST
STATEMENT OF INVESTMENTS (UNAUDITED)
| | | | | |
| Franklin Total Return Fund (continued) | | | | | |
| | | Principal | | | |
| | Country | Amount* | | | Value |
| Corporate Bonds (continued) | | | | | |
| Food, Beverage & Tobacco (continued) | | | | | |
| Mondelez International Inc., senior bond, 4.00%, 2/01/24 | United States | 8,400,000 | | $ | 9,015,208 |
| ePernod Ricard SA, senior note, Reg S, 2.125%, 9/27/24 | France | 3,300,000 | EUR | | 3,921,098 |
| Tyson Foods Inc., senior bond, 3.95%, 8/15/24 | United States | 12,000,000 | | | 12,542,016 |
| | | | | | 97,786,028 |
| Health Care Equipment & Services 1.0% | | | | | |
| Becton, Dickinson & Co., senior bond, 4.685%, 12/15/44 | United States | 13,600,000 | | | 14,305,962 |
| Express Scripts Holding Co., senior bond, 3.50%, 6/15/24 | United States | 14,500,000 | | | 14,759,927 |
| HCA Holdings Inc., senior note, 6.25%, 2/15/21 | United States | 2,000,000 | | | 2,189,000 |
| HCA Inc., senior note, | | | | | |
| 6.50%, 2/15/16 | United States | 5,054,000 | | | 5,249,843 |
| 5.875%, 5/01/23 | United States | 6,000,000 | | | 6,502,500 |
| Medco Health Solutions Inc., senior note, 4.125%, 9/15/20 | United States | 3,500,000 | | | 3,779,776 |
| Zimmer Holdings Inc., senior bond, 4.25%, 8/15/35 | United States | 6,500,000 | | | 6,484,218 |
| | | | | | 53,271,226 |
| Insurance 1.4% | | | | | |
| Aflac Inc., senior bond, 3.625%, 6/15/23 | United States | 17,500,000 | | | 18,507,440 |
| The Allstate Corp., junior sub. note, 5.75% to 8/14/23, FRN thereafter, | | | | | |
| 8/15/53 | United States | 4,750,000 | | | 5,186,406 |
| dLiberty Mutual Group Inc., senior note, 144A, 4.95%, 5/01/22 | United States | 12,000,000 | | | 13,230,300 |
| MetLife Inc., junior sub. note, 6.40% to 12/15/36, FRN thereafter, | | | | | |
| 12/15/66 | United States | 4,000,000 | | | 4,730,000 |
| Prudential Financial Inc., junior sub. note, 5.875%, 9/15/42 | United States | 7,000,000 | | | 7,630,000 |
| dTeachers Insurance & Annuity Assn. of America, sub. bond, 144A, 4.90%, | | | | | |
| 9/15/44 | United States | 20,400,000 | | | 22,400,465 |
| dTIAA Asset Management Finance LLC, senior note, 144A, 2.95%, | | | | | |
| 11/01/19 | United States | 5,800,000 | | | 5,932,229 |
| | | | | | 77,616,840 |
| Materials 2.0% | | | | | |
| dAlpek SA de CV, senior note, 144A, 4.50%, 11/20/22 | Mexico | 10,500,000 | | | 10,909,342 |
| ArcelorMittal, senior note, 6.25%, 3/01/21 | Luxembourg | 10,000,000 | | | 10,545,000 |
| eArkema SA, senior note, Reg S, 1.50%, 1/20/25 | France | 12,000,000 | EUR | | 13,466,215 |
| dCemex Finance LLC, senior secured note, 144A, 9.375%, 10/12/22 | Mexico | 1,000,000 | | | 1,143,500 |
| dCemex SAB de CV, first lien, 144A, 5.70%, 1/11/25 | Mexico | 5,000,000 | | | 5,015,625 |
| dFMG Resources (August 2006) Pty. Ltd., senior note, 144A, 6.875%, | | | | | |
| 4/01/22 | Australia | 8,000,000 | | | 6,040,000 |
| dGlencore Finance Canada Ltd., senior bond, 144A, 4.95%, 11/15/21 | Switzerland | 7,000,000 | | | 7,562,142 |
| dGlencore Funding LLC, senior note, 144A, 4.125%, 5/30/23 | Switzerland | 15,000,000 | | | 15,153,105 |
| LyondellBasell Industries NV, senior bond, 4.625%, 2/26/55 | United States | 18,400,000 | | | 17,804,613 |
| Reliance Steel & Aluminum Co., senior note, 4.50%, 4/15/23 | United States | 5,600,000 | | | 5,605,225 |
| Reynolds Group Holdings Inc., senior note, 8.125%, 6/15/17 | United States | 12,000,000 | | | 13,230,000 |
| dRPM U.K. GP, 144A, 6.70%, 11/01/15 | United States | 1,000,000 | | | 1,023,358 |
| Verso Paper Holdings LLC/Inc., senior secured note, first lien, 11.75%, | | | | | |
| 1/15/19 | United States | 451,000 | | | 395,753 |
| | | | | | 107,893,878 |
| Media 1.6% | | | | | |
| 21st Century Fox America Inc., | | | | | |
| senior bond, 6.90%, 8/15/39 | United States | 1,800,000 | | | 2,418,300 |
| senior bond, 7.90%, 12/01/95 | United States | 500,000 | | | 653,947 |
| senior note, 3.00%, 9/15/22 | United States | 15,400,000 | | | 15,618,126 |
94 | Semiannual Report franklintempleton.com
FRANKLIN INVESTORS SECURITIES TRUST
STATEMENT OF INVESTMENTS (UNAUDITED)
| | | | | |
| Franklin Total Return Fund (continued) | | | | | |
| | | Principal | | | |
| | Country | Amount* | | | Value |
| Corporate Bonds (continued) | | | | | |
| Media (continued) | | | | | |
| DIRECTV Holdings LLC/DIRECTV Financing Co. Inc., senior bond, | | | | | |
| 3.95%, 1/15/25 | United States | 7,400,000 | | $ | 7,542,776 |
| DISH DBS Corp., senior note, 7.125%, 2/01/16 | United States | 16,000,000 | | | 16,580,000 |
| Gannett Co. Inc., senior note, 6.375%, 9/01/15 | United States | 3,000,000 | | | 3,045,000 |
| The New York Times Co., senior note, 6.625%, 12/15/16 | United States | 11,700,000 | | | 12,548,250 |
| Time Warner Inc., | | | | | |
| 7.70%, 5/01/32 | United States | 550,000 | | | 768,190 |
| 6.10%, 7/15/40 | United States | 8,600,000 | | | 10,514,979 |
| Viacom Inc., senior bond, | | | | | |
| 4.25%, 9/01/23 | United States | 1,000,000 | | | 1,044,782 |
| 4.85%, 12/15/34 | United States | 16,500,000 | | | 16,359,057 |
| | | | | | 87,093,407 |
| Pharmaceuticals, Biotechnology & Life Sciences 1.3% | | | | | |
| Actavis Funding SCS, senior bond, 4.55%, 3/15/35 | United States | 13,400,000 | | | 13,488,775 |
| Gilead Sciences Inc., senior bond, 4.50%, 2/01/45 | United States | 15,000,000 | | | 15,835,065 |
| PerkinElmer Inc., senior note, 5.00%, 11/15/21 | United States | 13,200,000 | | | 14,572,813 |
| dValeant Pharmaceuticals International Inc., senior bond, 144A, 6.125%, | | | | | |
| 4/15/25 | United States | 3,800,000 | | | 3,942,500 |
| Zoetis Inc., senior bond, 4.70%, 2/01/43 | United States | 20,000,000 | | | 20,282,680 |
| | | | | | 68,121,833 |
| Real Estate 1.4% | | | | | |
| American Tower Corp., senior bond, | | | | | |
| 3.50%, 1/31/23 | United States | 17,700,000 | | | 17,421,420 |
| 5.00%, 2/15/24 | United States | 4,400,000 | | | 4,764,914 |
| ERP Operating LP, 5.75%, 6/15/17 | United States | 2,000,000 | | | 2,184,654 |
| HCP Inc., senior bond, 3.875%, 8/15/24 | United States | 17,000,000 | | | 17,310,879 |
| Healthcare Realty Trust Inc., senior note, 6.50%, 1/17/17 | United States | 5,000,000 | | | 5,459,045 |
| Realty Income Corp., senior bond, 4.125%, 10/15/26 | United States | 12,500,000 | | | 13,117,450 |
| Senior Housing Properties Trust, senior note, 6.75%, 12/15/21 | United States | 14,500,000 | | | 16,734,087 |
| | | | | | 76,992,449 |
| Retailing 0.8% | | | | | |
| Bed Bath & Beyond Inc, senior bond, 5.165%, 8/01/44 | United States | 18,600,000 | | | 19,838,630 |
| dEdcon Pty. Ltd., secured note, 144A, 9.50%, 3/01/18 | South Africa | 3,500,000 | EUR | | 3,212,920 |
| dTiffany & Co., senior bond, 144A, 4.90%, 10/01/44 | United States | 10,300,000 | | | 10,382,441 |
| Toys R Us Inc., senior bond, 7.375%, 10/15/18 | United States | 14,000,000 | | | 10,080,000 |
| | | | | | 43,513,991 |
| Semiconductors & Semiconductor Equipment 0.4% | | | | | |
| Maxim Integrated Products Inc., senior note, 3.375%, 3/15/23 | United States | 22,000,000 | | | 22,072,622 |
| Software & Services 0.3% | | | | | |
| dAlibaba Group Holding Ltd., senior bond, 144A, 4.50%, 11/28/34 | China | 10,000,000 | | | 10,012,650 |
| dFirst Data Corp., senior secured bond, second lien, 144A, 8.25%, | | | | | |
| 1/15/21 | United States | 6,000,000 | | | 6,391,860 |
| | | | | | 16,404,510 |
| Technology Hardware & Equipment 1.2% | | | | | |
| dAlcatel-Lucent USA Inc., senior note, 144A, 4.625%, 7/01/17 | France | 21,500,000 | | | 22,413,750 |
franklintempleton.com
Semiannual Report | 95
| | | | | |
| FRANKLIN INVESTORS SECURITIES TRUST | | | | | |
| STATEMENT OF INVESTMENTS (UNAUDITED) | | | | | |
| |
| |
| |
| |
| Franklin Total Return Fund (continued) | | | | | |
| | | Principal | | | |
| | Country | Amount* | | | Value |
| Corporate Bonds (continued) | | | | | |
| Technology Hardware & Equipment (continued) | | | | | |
| Dell Inc., senior note, | | | | | |
| 3.10%, 4/01/16 | United States | 15,000,000 | | $ | 15,131,250 |
| 5.65%, 4/15/18 | United States | 5,725,000 | | | 6,175,844 |
| 5.875%, 6/15/19 | United States | 6,746,000 | | | 7,433,215 |
| Juniper Networks Inc., senior bond, | | | | | |
| 4.50%, 3/15/24 | United States | 4,500,000 | | | 4,630,545 |
| 4.35%, 6/15/25 | United States | 9,300,000 | | | 9,521,154 |
| | | | | | 65,305,758 |
| Telecommunication Services 2.1% | | | | | |
| iAT&T Inc., senior bond, 4.50%, 5/15/35 | United States | 16,200,000 | | | 15,910,230 |
| Embarq Corp., senior note, 7.082%, 6/01/16 | United States | 22,500,000 | | | 23,748,570 |
| Frontier Communications Corp., senior note, | | | | | |
| 8.75%, 4/15/22 | United States | 1,300,000 | | | 1,430,000 |
| 7.125%, 1/15/23 | United States | 1,800,000 | | | 1,809,000 |
| Intelsat Jackson Holdings SA, senior bond, 6.625%, 12/15/22 | Luxembourg | 6,000,000 | | | 5,910,000 |
| Sprint Communications Inc., | | | | | |
| senior bond, 6.00%, 12/01/16 | United States | 15,000,000 | | | 15,675,000 |
| senior note, 6.00%, 11/15/22 | United States | 7,000,000 | | | 6,606,250 |
| Sprint Corp., senior note, 7.625%, 2/15/25 | United States | 3,000,000 | | | 2,957,700 |
| Telefonica Emisiones SAU, senior note, 4.57%, 4/27/23 | Spain | 9,000,000 | | | 9,861,120 |
| Verizon Communications Inc., senior bond, | | | | | |
| 6.40%, 9/15/33 | United States | 10,255,000 | | | 12,471,475 |
| 4.862%, 8/21/46 | United States | 10,656,000 | | | 10,747,972 |
| Verizon New York Inc., senior deb., B, 7.375%, 4/01/32 | United States | 1,000,000 | | | 1,248,040 |
| dWind Acquisition Finance SA, senior note, 144A, 7.375%, 4/23/21 | Italy | 5,000,000 | | | 5,137,500 |
| | | | | | 113,512,857 |
| Transportation 0.2% | | | | | |
| dAviation Capital Group Corp., 144A, 7.125%, 10/15/20 | United States | 6,000,000 | | | 7,062,480 |
| Burlington Northern and Santa Fe 99-2 Trust, secured bond, 7.57%, | | | | | |
| 1/02/21 | United States | 132,271 | | | 150,704 |
| dDP World Ltd., 144A, 6.85%, 7/02/37 | United Arab | | | | |
| | Emirates | 3,700,000 | | | 4,163,776 |
| Union Pacific Railroad Co. 1998 Pass Trust, 98-B, 6.85%, 1/02/19 | United States | 320,370 | | | 349,918 |
| Union Pacific Railroad Co. 2005 Pass Trust, 05-1, 5.082%, 1/02/29 | United States | 213,341 | | | 238,755 |
| | | | | | 11,965,633 |
| Utilities 1.5% | | | | | |
| Commonwealth Edison Co., secured bond, 6.45%, 1/15/38 | United States | 700,000 | | | 964,146 |
| DPL Inc., senior note, 6.50%, 10/15/16 | United States | 875,000 | | | 920,938 |
| d,fEDF SA, sub. note, 144A, 5.25% to 1/29/23, FRN thereafter, Perpetual | France | 24,000,000 | | | 25,167,600 |
| dEnogex LLC, senior note, 144A, 6.25%, 3/15/20 | United States | 5,000,000 | | | 5,656,915 |
| Georgia Power Co., senior note, 4.30%, 3/15/42 | United States | 9,000,000 | | | 9,567,738 |
| MidAmerican Energy Co., senior note, 5.95%, 7/15/17 | United States | 2,200,000 | | | 2,419,727 |
| PPL Energy Supply LLC, senior note, 6.20%, 5/15/16 | United States | 12,400,000 | | | 12,798,573 |
| dState Grid Overseas Investment 2013 Ltd., senior note, 144A, 3.125%, | | | | | |
| 5/22/23 | China | 10,400,000 | | | 10,456,576 |
| eVeolia Environnement SA, senior bond, Reg S, 4.625%, 3/30/27 | France | 7,800,000 | EUR | | 11,707,362 |
| | | | | | 79,659,575 |
| Total Corporate Bonds (Cost $2,013,026,982) | | | | | 2,032,190,392 |
96 | Semiannual Report franklintempleton.com
FRANKLIN INVESTORS SECURITIES TRUST
STATEMENT OF INVESTMENTS (UNAUDITED)
| | | | |
| Franklin Total Return Fund (continued) | | | | |
| | | Principal | | |
| | Country | Amount* | | Value |
| g,jSenior Floating Rate Interests 1.7% | | | | |
| Automobiles & Components 0.0%† | | | | |
| FRAM Group Holdings Inc. (Autoparts Holdings), Second Lien Term Loan, | | | | |
| 10.50%, 1/29/18 | United States | 428,336 | $ | 411,203 |
| Capital Goods 0.1% | | | | |
| kErickson Inc., Purchase Price Notes, 6.00%, 11/02/20 | United States | 14,786 | | 12,940 |
| iOnsite Rental Group Operations Pty. Ltd., Term B Loan, 5.50%, | | | | |
| 7/30/21 | United States | 3,739,826 | | 3,697,753 |
| Sensus USA Inc., Second Lien Term Loan, 8.50%, 5/09/18 | United States | 156,142 | | 154,971 |
| TransDigm Inc., Tranche C Term Loan, 3.75%, 2/28/20 | United States | 2,789,923 | | 2,800,192 |
| | | | | 6,665,856 |
| Commercial & Professional Services 0.1% | | | | |
| Interactive Data Corp., Term Loan, 4.75%, 5/02/21 | United States | 2,561,574 | | 2,581,987 |
| Consumer Services 0.2% | | | | |
| iFitness International LLC, Term B Loan, 6.75%, 7/01/20 | United States | 1,549,559 | | 1,474,664 |
| iROC Finance LLC, Funded Term B Loans, 5.00%, 6/20/19 | United States | 3,241,421 | | 3,225,214 |
| iSeaworld Parks and Entertainment Inc., Term B-2 Loan, 4.50%, | | | | |
| 5/14/20 | United States | 552,932 | | 543,325 |
| c,lTurtle Bay Holdings LLC, Term Loan B, PIK, 3.00%, 6/30/16 | United States | 4,056,827 | | 3,955,406 |
| | | | | 9,198,609 |
| Diversified Financials 0.1% | | | | |
| Guggenheim Partners Investment Management Holdings LLC, Initial Term | | | | |
| Loan, 4.25%, 7/22/20 | United States | 1,652,975 | | 1,664,339 |
| Trans Union LLC, 2014 Replacement Term Loan, 4.00%, 4/09/21 | United States | 5,837,709 | | 5,870,546 |
| | | | | 7,534,885 |
| Energy 0.2% | | | | |
| Bowie Resource Holdings LLC, | | | | |
| iFirst Lien Initial Term Loan, 8.00%, 8/16/20 | United States | 2,458,844 | | 2,391,226 |
| Second Lien Initial Term Loan, 11.75%, 2/16/21 | United States | 263,184 | | 256,604 |
| Drillships Ocean Ventures Inc. and Drillships Ventures Projects Inc., Term | | | | |
| Loan, 6.75%, 7/25/21 | Marshall Islands | 398,995 | | 347,791 |
| iFieldwood Energy LLC, Loans, 3.875%, 10/01/18 | United States | 3,458,547 | | 3,380,730 |
| iPeabody Energy Corp., Term Loan, 5.50%, 9/24/20 | United States | 1,994,937 | | 1,805,417 |
| | | | | 8,181,768 |
| Food, Beverage & Tobacco 0.0%† | | | | |
| AdvancePierre Foods Inc., Second Lien Term Loan, 9.50%, 10/10/17 | United States | 226,800 | | 228,218 |
| iCSM Bakery Supplies LLC (U.S. Acquisition), Second Lien Term Loan, | | | | |
| 9.75%, 7/03/21 | United States | 52,000 | | 48,880 |
| | | | | 277,098 |
| Health Care Equipment & Services 0.0%† | | | | |
| Carestream Health Inc., Second Lien Loan, 9.50%, 12/07/19 | United States | 516,848 | | 518,786 |
| U.S. Renal Care Inc., Tranche B-2 Term Loan, 4.25%, 7/03/19 | United States | 1,767,669 | | 1,779,822 |
| | | | | 2,298,608 |
| Household & Personal Products 0.1% | | | | |
| FGI Operating Co. LLC (Freedom Group), Term B Loans, 5.50%, | | | | |
| 4/19/19 | United States | 7,627,957 | | 7,488,113 |
franklintempleton.com
Semiannual Report | 97
| | | | | |
| FRANKLIN INVESTORS SECURITIES TRUST | | | | | |
| STATEMENT OF INVESTMENTS (UNAUDITED) | | | | | |
| |
| |
| |
| |
| Franklin Total Return Fund (continued) | | | | | |
| | | Principal | | | |
| | Country | Amount* | | | Value |
| g,jSenior Floating Rate Interests (continued) | | | | | |
| Materials 0.2% | | | | | |
| Coveris Holdings SA, USD Term Loan, 5.25%, 5/08/19 | Luxembourg | 1,310,250 | | $ | 1,320,623 |
| FMG America Finance Inc. (Fortescue Metals Group), Loans, 3.75%, | | | | | |
| 6/30/19 | Australia | 5,984,810 | | | 5,420,826 |
| iNexeo Solutions LLC, | | | | | |
| Term B-1 Loan, 6.00%, 9/08/17 | United States | 154,494 | | | 152,756 |
| Term B-3 Loan, 5.75%, 9/08/17 | United States | 2,441 | | | 2,414 |
| OCI Beaumont LLC, Term B-3 Loan, 5.50%, 8/20/19 | United States | 1,074,292 | | | 1,087,720 |
| Oxbow Carbon LLC, First Lien Tranche B Term Loan, 4.25%, 7/19/19 | United States | 1,320,964 | | | 1,309,956 |
| OXEA GmbH, Second Lien Term Loan, 8.25%, 7/15/20 | Luxembourg | 322,548 | | | 301,582 |
| Tronox Pigments (Netherlands) BV, Term Loan, 4.25%, 3/19/20 | Netherlands | 1,238,345 | | | 1,243,917 |
| | | | | | 10,839,794 |
| Media 0.2% | | | | | |
| iCharter Communications Operating LLC, Term E Loan, (CCO Safari), | | | | | |
| 4.50%, 7/01/20 | United States | 178,000 | | | 177,188 |
| Cumulus Media Holdings Inc., Term Loans, 4.25%, 12/23/20 | United States | 906,621 | | | 895,515 |
| Radio One Inc., Term Loan B, 4.78%, 12/31/18 | United States | 7,054,117 | | | 7,067,344 |
| iSinclair Television Group Inc., Incremental Term Loan B-1, 5.00%, | | | | | |
| 7/30/21 | United States | 245,720 | | | 246,334 |
| | | | | | 8,386,381 |
| Retailing 0.2% | | | | | |
| BJ’s Wholesale Club Inc., 2013 (Nov) Replacement Loans, 4.50%, | | | | | |
| 9/26/19 | United States | 7,315,487 | | | 7,365,210 |
| Evergreen AcqCo. 1 LP (Savers), Term Loan, 5.00%, 7/09/19 | United States | 3,024,928 | | | 2,981,916 |
| Party City Holdings Inc., 2014 Replacement Term Loan, 4.00%, | | | | | |
| 7/27/19 | United States | 2,176,526 | | | 2,185,272 |
| | | | | | 12,532,398 |
| Software & Services 0.3% | | | | | |
| BMC Software Finance Inc., Initial U.S. Term Loans, 5.00%, 9/10/20 | United States | 9,447,781 | | | 9,300,160 |
| MoneyGram International Inc., Term Loan, 4.25%, 3/28/20 | United States | 7,891,212 | | | 7,445,689 |
| Vertafore Inc., Second Lien Term Loan, 9.75%, 10/27/17 | United States | 467,548 | | | 472,028 |
| | | | | | 17,217,877 |
| Utilities 0.0%† | | | | | |
| iCalpine Construction Finance Co. LP, Term B-1 Loan, 4.50%, 5/03/20 | United States | 610,132 | | | 607,921 |
| Total Senior Floating Rate Interests | | | | | |
| (Cost $94,365,720) | | | | | 94,222,498 |
| Foreign Government and Agency Securities 7.3% | | | | | |
| The Export-Import Bank of Korea, senior note, | | | | | |
| 1.25%, 11/20/15 | South Korea | 5,000,000 | | | 5,014,375 |
| 2.25%, 1/21/20 | South Korea | 18,800,000 | | | 18,903,118 |
| eGovernment of Ghana, Reg S, 8.50%, 10/04/17 | Ghana | 300,000 | | | 312,870 |
| Government of Hungary, | | | | | |
| 7.75%, 8/24/15 | Hungary | 28,900,000 | HUF | | 108,690 |
| 5.50%, 12/22/16 | Hungary | 3,092,050,000 | HUF | | 12,137,224 |
| 6.00%, 1/11/19 | Hungary | 1,820,000 | EUR | | 2,398,544 |
| A, 6.75%, 11/24/17 | Hungary | 1,457,960,000 | HUF | | 6,045,616 |
| A, 5.50%, 12/20/18 | Hungary | 205,390,000 | HUF | | 839,244 |
98 | Semiannual Report
franklintempleton.com
| | | | |
| | FRANKLIN INVESTORS SECURITIES TRUST |
| | STATEMENT OF INVESTMENTS (UNAUDITED) |
| |
| |
| |
| |
| Franklin Total Return Fund (continued) | | | | |
| | | Principal | | |
| | Country | Amount* | | Value |
| Foreign Government and Agency Securities (continued) | | | | |
| Government of Hungary, (continued) | | | | |
| esenior note, Reg S, 3.50%, 7/18/16 | Hungary | 115,000 | EUR $ | 133,587 |
| esenior note, Reg S, 4.375%, 7/04/17 | Hungary | 215,000 | EUR | 258,996 |
| esenior note, Reg S, 5.75%, 6/11/18 | Hungary | 695,000 | EUR | 891,297 |
| esenior note, Reg S, 3.875%, 2/24/20 | Hungary | 285,000 | EUR | 358,526 |
| eGovernment of Iceland, senior note, Reg S, 2.50%, 7/15/20 | Iceland | 2,300,000 | EUR | 2,709,906 |
| Government of Ireland, | | | | |
| 4.50%, 4/18/20 | Ireland | 3,243,000 | EUR | 4,389,312 |
| 5.00%, 10/18/20 | Ireland | 2,107,000 | EUR | 2,954,844 |
| senior bond, 5.40%, 3/13/25 | Ireland | 10,374,640 | EUR | 16,529,737 |
| dGovernment of Lithuania, 144A, 7.375%, 2/11/20 | Lithuania | 4,670,000 | | 5,681,849 |
| Government of Malaysia, | | | | |
| 3.835%, 8/12/15 | Malaysia | 48,200,000 | MYR | 13,556,614 |
| 4.72%, 9/30/15 | Malaysia | 44,720,000 | MYR | 12,633,321 |
| 3.197%, 10/15/15 | Malaysia | 30,200,000 | MYR | 8,480,669 |
| senior bond, 4.262%, 9/15/16 | Malaysia | 18,000,000 | MYR | 5,122,055 |
| senior note, 3.172%, 7/15/16 | Malaysia | 37,000,000 | MYR | 10,381,291 |
| Government of Mexico, | | | | |
| 6.00%, 6/18/15 | Mexico | 43,520 | mMXN | 284,731 |
| 8.00%, 12/17/15 | Mexico | 3,235,540 | mMXN | 21,722,374 |
| 6.25%, 6/16/16 | Mexico | 4,031,510 | mMXN | 27,061,135 |
| 7.25%, 12/15/16 | Mexico | 2,974,390 | mMXN | 20,454,027 |
| Government of Poland, | | | | |
| 5.00%, 4/25/16 | Poland | 18,390,000 | PLN | 5,270,394 |
| gFRN, 2.01%, 1/25/17 | Poland | 859,000 | PLN | 238,621 |
| gFRN, 2.01%, 1/25/21 | Poland | 871,000 | PLN | 239,924 |
| Strip, 1/25/16 | Poland | 54,440,000 | PLN | 14,944,102 |
| dGovernment of Portugal, 144A, 5.125%, 10/15/24 | Portugal | 12,100,000 | | 13,135,034 |
| dGovernment of Serbia, senior note, 144A, 4.875%, 2/25/20 | Serbia | 6,000,000 | | 6,177,090 |
| Government of Singapore, senior note, 1.125%, 4/01/16 | Singapore | 750,000 | SGD | 567,120 |
| dGovernment of Spain, senior bond, 144A, 2.75%, 10/31/24 | Spain | 11,500,000 | EUR | 14,357,872 |
| Government of Sri Lanka, | | | | |
| A, 6.50%, 7/15/15 | Sri Lanka | 35,020,000 | LKR | 262,779 |
| A, 11.00%, 8/01/15 | Sri Lanka | 241,800,000 | LKR | 1,832,873 |
| A, 6.40%, 8/01/16 | Sri Lanka | 23,800,000 | LKR | 177,955 |
| A, 8.00%, 11/15/18 | Sri Lanka | 86,100,000 | LKR | 645,731 |
| A, 9.00%, 5/01/21 | Sri Lanka | 89,150,000 | LKR | 689,444 |
| B, 6.40%, 10/01/16 | Sri Lanka | 18,900,000 | LKR | 140,826 |
| B, 8.50%, 7/15/18 | Sri Lanka | 18,990,000 | LKR | 145,311 |
| C, 8.50%, 4/01/18 | Sri Lanka | 50,980,000 | LKR | 389,144 |
| D, 8.50%, 6/01/18 | Sri Lanka | 65,480,000 | LKR | 499,183 |
| Government of the Philippines, | | | | |
| senior bond, 7.00%, 1/27/16 | Philippines | 17,100,000 | PHP | 393,654 |
| senior note, 1.625%, 4/25/16 | Philippines | 118,200,000 | PHP | 2,624,685 |
| dGovernment of Ukraine, senior note, 144A, 7.95%, 2/23/21 | Ukraine | 2,370,000 | | 1,094,644 |
| nGovernment of Uruguay, senior bond, Index Linked, 4.375%, 12/15/28 | Uruguay | 210,887,838 | UYU | 7,889,883 |
| dGovernment of Vietnam, 144A, | | | | |
| 6.875%, 1/15/16 | Vietnam | 150,000 | | 155,710 |
| 6.75%, 1/29/20 | Vietnam | 5,120,000 | | 5,824,000 |
| Italy Treasury Bond, 2.50%, 12/01/24 | Italy | 12,100,000 | EUR | 14,771,428 |
franklintempleton.com
Semiannual Report | 99
| | | | | |
| FRANKLIN INVESTORS SECURITIES TRUST | | | | | |
| STATEMENT OF INVESTMENTS (UNAUDITED) | | | | | |
| |
| |
| |
| |
| Franklin Total Return Fund (continued) | | | | | |
| | | Principal | | | |
| | Country | Amount* | | | Value |
| Foreign Government and Agency Securities (continued) | | | | | |
| Korea Monetary Stabilization Bond, | | | | | |
| senior bond, 2.80%, 8/02/15 | South Korea | 20,907,710,000 | KRW | $ | 19,458,049 |
| senior bond, 2.81%, 10/02/15 | South Korea | 6,242,000,000 | KRW | | 5,819,945 |
| senior note, 2.76%, 6/02/15 | South Korea | 16,598,900,000 | KRW | | 15,419,676 |
| senior note, 2.07%, 12/02/16 | South Korea | 3,000,000,000 | KRW | | 2,797,909 |
| Korea Treasury Bond, senior note, | | | | | |
| 3.25%, 6/10/15 | South Korea | 3,634,290,000 | KRW | | 3,378,490 |
| 2.75%, 12/10/15 | South Korea | 2,942,150,000 | KRW | | 2,748,295 |
| 2.75%, 6/10/16 | South Korea | 2,400,000,000 | KRW | | 2,252,065 |
| 3.00%, 12/10/16 | South Korea | 37,100,000,000 | KRW | | 35,104,688 |
| oNota Do Tesouro Nacional, Index Linked, 6.00%, | | | | | |
| 5/15/15 | Brazil | 840 | p BRL | | 732,244 |
| 8/15/18 | Brazil | 13,695 | p BRL | | 11,681,221 |
| dPeru Enhanced Pass-Through Finance Ltd., senior secured bond, A-1, | | | | | |
| 144A, zero cpn., 5/31/18 | Peru | 508,338 | | | 487,502 |
| Total Foreign Government and Agency Securities | | | | | |
| (Cost $416,692,442) | | | | | 391,711,443 |
| U.S. Government and Agency Securities 3.4% | | | | | |
| U.S. Treasury Bond, | | | | | |
| 3.50%, 2/15/39 | United States | 56,000,000 | | | 64,045,632 |
| 2.875%, 5/15/43 | United States | 53,000,000 | | | 54,296,009 |
| nU.S. Treasury Note, Index Linked, | | | | | |
| 2.00%, 1/15/16 | United States | 8,217,976 | | | 8,425,349 |
| 0.125%, 4/15/16 | United States | 53,161,867 | | | 53,834,684 |
| Total U.S. Government and Agency Securities | | | | | |
| (Cost $169,249,796) | | | | | 180,601,674 |
| Asset-Backed Securities and Commercial | | | | | |
| Mortgage-Backed Securities 16.9% | | | | | |
| Banks 6.8% | | | | | |
| Banc of America Commercial Mortgage Trust, | | | | | |
| 2006-4, AJ, 5.695%, 7/10/46 | United States | 20,562,000 | | | 21,174,850 |
| 2006-4, AM, 5.675%, 7/10/46 | United States | 7,350,000 | | | 7,736,434 |
| g2007-3, AM, FRN, 5.74%, 6/10/49 | United States | 17,730,000 | | | 19,088,739 |
| Bear Stearns Commercial Mortgage Securities Inc., | | | | | |
| g2006-PW11, AJ, FRN, 5.43%, 3/11/39 | United States | 19,594,000 | | | 20,059,064 |
| g2006-PW12, AJ, FRN, 5.751%, 9/11/38 | United States | 3,286,000 | | | 3,380,313 |
| 2006-PW13, AJ, 5.611%, 9/11/41 | United States | 18,023,000 | | | 18,546,316 |
| g2007-PW16, AM, FRN, 5.705%, 6/11/40 | United States | 11,110,000 | | | 12,001,977 |
| gCapital One Multi-Asset Execution Trust, | | | | | |
| 2007-A1, A1, FRN, 0.232%, 11/15/19 | United States | 4,400,000 | | | 4,384,884 |
| 2007-A2, A2, FRN, 0.262%, 12/16/19 | United States | 26,136,000 | | | 26,056,351 |
| Citibank Credit Card Issuance Trust, | | | | | |
| 2012-A1, A1, 0.55%, 10/10/17 | United States | 7,986,000 | | | 7,986,898 |
| g2013-A12, A12, FRN, 0.486%, 11/07/18 | United States | 7,050,000 | | | 7,048,294 |
| g2013-A7, A7, FRN, 0.611%, 9/10/20 | United States | 11,130,000 | | | 11,173,351 |
| g2014-A9, A9, FRN, 0.38%, 5/09/18 | United States | 5,000,000 | | | 5,000,535 |
| qCitigroup Commercial Mortgage Trust, 2006-C5, AJ, 5.482%, 10/15/49 | United States | 11,847,000 | | | 11,774,893 |
| gCountrywide Asset-Backed Certificates, 2004-1, M1, FRN, 0.931%, | | | | | |
| 3/25/34 | United States | 2,591,763 | | | 2,489,663 |
100 | Semiannual Report
franklintempleton.com
FRANKLIN INVESTORS SECURITIES TRUST
STATEMENT OF INVESTMENTS (UNAUDITED)
| | | | |
| Franklin Total Return Fund (continued) | | | | |
| | | Principal | | |
| | Country | Amount* | | Value |
| Asset-Backed Securities and Commercial | | | | |
| Mortgage-Backed Securities (continued) | | | | |
| Banks (continued) | | | | |
| Credit Suisse First Boston Mortgage Securities Corp., 2004-6, 3A1, | | | | |
| 5.00%, 9/25/19 | United States | 1,264,953 | $ | 1,322,370 |
| d,gCredit Suisse Mortgage Capital Certificates, 2009-15R, 3A1, 144A, FRN, | | | | |
| 5.543%, 3/26/36 | United States | 6,097,101 | | 6,189,097 |
| gFNMA, 2005-122, FN, FRN, 0.531%, 1/25/36 | United States | 787,320 | | 784,651 |
| Greenwich Capital Commercial Funding Corp., | | | | |
| g2006-GG7, AJ, FRN, 5.819%, 7/10/38 | United States | 18,910,000 | | 19,341,262 |
| g2006-GG7, AM, FRN, 5.819%, 7/10/38 | United States | 4,685,000 | | 4,894,651 |
| 2007-GG9, A4, 5.444%, 3/10/39 | United States | 22,885,000 | | 24,116,133 |
| JP Morgan Chase Commercial Mortgage Securities Trust, | | | | |
| g,q2006-CB14, B, FRN, 5.564%, 12/12/44 | United States | 8,000,000 | | 3,228,400 |
| g,q2006-CB16, B, FRN, 5.672%, 5/12/45 | United States | 6,745,000 | | 4,653,892 |
| 2006-CB17, AM, 5.464%, 12/12/43 | United States | 16,790,000 | | 17,342,055 |
| g,q2006-LDP7, AJ, FRN, 5.905%, 4/15/45 | United States | 18,983,000 | | 19,170,362 |
| gLB-UBS Commercial Mortgage Trust, 2006-C4, AJ, FRN, 5.852%, | | | | |
| 6/15/38 | United States | 11,540,000 | | 11,945,458 |
| gMerrill Lynch Mortgage Investors Trust, 2003-A, 1A, FRN, 0.921%, | | | | |
| 3/25/28 | United States | 2,115,491 | | 2,020,651 |
| gMerrill Lynch Mortgage Trust, 2005-CKI1, AJ, FRN, 5.275%, 11/12/37 | United States | 8,000,000 | | 8,114,840 |
| gMorgan Stanley ABS Capital I Inc. Trust, | | | | |
| 2003-HE1, M1, FRN, 1.381%, 5/25/33 | United States | 3,861,064 | | 3,649,853 |
| 2005-WMC, M2, FRN, 0.916%, 1/25/35 | United States | 3,197,039 | | 3,127,900 |
| Morgan Stanley Capital I Trust, | | | | |
| d2005-RR6, AJ, 144A, 5.233%, 5/24/43 | United States | 2,786,805 | | 2,789,201 |
| g2006-HQ8, AJ, FRN, 5.498%, 3/12/44 | United States | 14,956,000 | | 15,263,368 |
| g2007-IQ16, AM, FRN, 6.084%, 12/12/49 | United States | 21,470,000 | | 23,732,723 |
| gWachovia Bank Commercial Mortgage Trust, | | | | |
| 2006-C23, AJ, FRN, 5.515%, 1/18/45 | United States | 7,675,000 | | 7,872,071 |
| FRN, 5.712%, 5/15/16 | United States | 6,683,000 | | 6,791,331 |
| Wells Fargo Mortgage Backed Securities Trust, | | | | |
| g2004-I, 2A1, FRN, 2.654%, 6/25/34 | United States | 1,506,829 | | 1,517,907 |
| g2004-W, A9, FRN, 2.616%, 11/25/34 | United States | 2,299,764 | | 2,341,207 |
| 2007-3, 3A1, 5.50%, 4/25/37 | United States | 456,661 | | 472,446 |
| kWeyerhaeuser Mortgage Co., 1984-A, 7.43%, 1/01/24 | United States | 18,342 | | 18,342 |
| | | | | 368,602,733 |
| Diversified Financials 10.0% | | | | |
| gAmerican Express Credit Account Master Trust, | | | | |
| 2008-2, A, FRN, 1.442%, 9/15/20 | United States | 15,550,000 | | 15,957,037 |
| 2008-6, A, FRN, 1.382%, 2/15/18 | United States | 2,827,000 | | 2,832,966 |
| 2012-1, A, FRN, 0.452%, 1/15/20 | United States | 8,160,000 | | 8,169,723 |
| 2012-3, A, FRN, 0.332%, 3/15/18 | United States | 5,630,000 | | 5,630,298 |
| gAmerican Express Credit Account Secured Note Trust, 2012-4, A, FRN, | | | | |
| 0.422%, 5/15/20 | United States | 11,193,000 | | 11,198,031 |
| gAmerican Home Mortgage Investment Trust, 2004-3, 4A, FRN, 1.903%, | | | | |
| 10/25/34 | United States | 2,811,033 | | 2,773,989 |
| g,qAmeriquest Mortgage Securities Inc. Asset-Backed Pass-Through | | | | |
| Certificates, 2004-R4, M1, FRN, 1.006%, 6/25/34 | United States | 8,375,175 | | 8,212,885 |
| dApidos CDO, 2013-14A, C2, 144A, 4.85%, 4/15/25 | United States | 8,740,000 | | 8,756,169 |
| d,gARCap REIT Inc., 2004-RR3, A2, 144A, FRN, 4.76%, 9/21/45 | United States | 13,267,270 | | 13,574,540 |
| |
| |
| franklintempleton.com | | Semiannual Report | 101 |
FRANKLIN INVESTORS SECURITIES TRUST
STATEMENT OF INVESTMENTS (UNAUDITED)
| | | | |
| Franklin Total Return Fund (continued) | | | | |
| | | Principal | | |
| | Country | Amount* | | Value |
| Asset-Backed Securities and Commercial | | | | |
| Mortgage-Backed Securities (continued) | | | | |
| Diversified Financials (continued) | | | | |
| d,gARES CLO XII Ltd., 2007-12A, B, 144A, FRN, 1.262%, 11/25/20 | United States | 1,090,000 | $ | 1,083,220 |
| d,gAres IIIR/IVR CLO Ltd., 2007-3RA, | | | | |
| A2, 144A, FRN, 0.496%, 4/16/21 | United States | 9,512,584 | | 9,363,047 |
| B, 144A, FRN, 0.646%, 4/16/21 | United States | 9,780,000 | | 9,455,011 |
| d,gARES XI CLO Ltd., 2007-11A, | | | | |
| A1B, 144A, FRN, 0.536%, 10/11/21 | United States | 21,783,229 | | 21,493,512 |
| A1C, 144A, FRN, 0.546%, 10/11/21 | United States | 4,922,820 | | 4,835,883 |
| gArgent Securities Inc., 2005-W2, A2C, FRN, 0.541%, 10/25/35 | United States | 6,225,000 | | 5,922,540 |
| d,gAtrium CDO Corp., 10A, | | | | |
| A, 144A, FRN, 1.396%, 7/16/25 | United States | 3,140,000 | | 3,097,798 |
| C, 144A, FRN, 2.876%, 7/16/25 | United States | 4,650,000 | | 4,594,990 |
| d,gAtrium IX, 9A, C, 144A, FRN, 3.512%, 2/28/24 | United States | 3,500,000 | | 3,518,130 |
| d,gBabson CLO Inc., 2007-1A, A1, 144A, FRN, 0.50%, 1/18/21 | United States | 5,677,242 | | 5,611,954 |
| d,gBallyrock CLO LLC, 2014-1A, B, 144A, FRN, 3.475%, 10/20/26 | United States | 10,000,000 | | 9,986,800 |
| gBear Stearns Alt-A Trust, 2004-13, A2, FRN, 1.061%, 11/25/34 | United States | 1,510,102 | | 1,453,264 |
| d,gBridgeport CLO Ltd., 2006-1A, B, 144A, FRN, 0.926%, 7/21/20 | United States | 2,000,000 | | 1,929,600 |
| d,gCarlyle Global Market Strategies CLO Ltd., 2012-4A, A, 144A, FRN, | | | | |
| 1.665%, 1/20/25 | United States | 9,040,000 | | 9,035,028 |
| d,gCatamaran CLO Ltd., 2014-2A, B, 144A, FRN, 3.275%, 10/18/26 | United States | 6,401,000 | | 6,352,544 |
| d,gCent CDO Ltd., 2007-15A, | | | | |
| A2B, 144A, FRN, 0.607%, 3/11/21 | United States | 5,686,824 | | 5,402,710 |
| B, 144A, FRN, 0.987%, 3/11/21 | United States | 6,000,000 | | 5,662,260 |
| d,gCent CDO XI Ltd., 2006-11A, B, 144A, FRN, 1.077%, 4/25/19 | United States | 2,680,000 | | 2,586,093 |
| d,gCent CLO 20 Ltd., 2013-20A, C, 144A, FRN, 3.277%, 1/25/26 | United States | 3,500,000 | | 3,498,320 |
| d,gCent CLO 21 Ltd., 14-21A, B, 144A, FRN, 3.077%, 7/27/26 | Cayman Islands | 1,760,000 | | 1,745,603 |
| d,gCent CLO LP, 2013-20A, A, 144A, FRN, 1.757%, 1/25/26 | United States | 3,000,000 | | 3,001,170 |
| gChase Funding Mortgage Loan Asset-Backed Certificates, 2004-2, 2A2, | | | | |
| FRN, 0.681%, 2/25/35 | United States | 675,545 | | 601,664 |
| Chase Issuance Trust, | | | | |
| 2012-A3, A3, 0.79%, 6/15/17 | United States | 4,460,000 | | 4,462,009 |
| g2012-A6, A, FRN, 0.312%, 8/15/17 | United States | 2,210,000 | | 2,209,982 |
| 2012-A8, A8, 0.54%, 10/16/17 | United States | 11,460,000 | | 11,461,243 |
| g2012-A9, A9, FRN, 0.332%, 10/16/17 | United States | 2,210,000 | | 2,210,180 |
| g2013-A6, A6, FRN, 0.602%, 7/15/20 | United States | 17,443,000 | | 17,512,345 |
| g2014-A3, A3, FRN, 0.382%, 5/15/18 | United States | 22,980,000 | | 22,970,647 |
| d,gCIFC Funding Ltd., 2007-3A, A1J, 144A, FRN, 0.677%, 7/26/21 | United States | 16,495,000 | | 16,134,749 |
| d,gColony American Homes, 2014-1A, A, 144A, FRN, 1.40%, 5/17/31 | United States | 10,002,597 | | 9,969,378 |
| dColony MFM Trust, 2014-1, A, 144A, 2.543%, 4/20/50 | United States | 21,621,757 | | 21,695,055 |
| dColumbusNova CLO IV Ltd., 2007-2A, B, 144A, 1.525%, 10/15/21 | United States | 1,590,000 | | 1,565,546 |
| d,gColumbusNova CLO Ltd., 2007-2A, A2, 144A, FRN, 1.275%, 10/15/21 | United States | 690,000 | | 675,890 |
| d,gCornerstone CLO Ltd., 2007-1A, B, 144A, FRN, 1.225%, 7/15/21 | Cayman Islands | 8,986,000 | | 8,718,217 |
| dCountryplace Manufactured Housing Contract Trust, 2005-A3, 144A, | | | | |
| 4.80%, 12/15/35 | United States | 455,538 | | 462,351 |
| d,gCT CDO IV Ltd., 2006-4A, A1, 144A, FRN, 0.491%, 10/20/43 | United States | 10,838,635 | | 10,809,425 |
| d,gEaton Vance CDO Ltd., 2014-1A, | | | | |
| B, 144A, FRN, 2.325%, 7/15/26 | United States | 1,813,400 | | 1,807,017 |
| C, 144A, FRN, 3.275%, 7/15/26 | United States | 1,558,600 | | 1,555,748 |
| dEmerson Park CLO Ltd., 2013-1A, C2, 144A, 5.64%, 7/15/25 | United States | 2,920,000 | | 2,938,863 |
| gFHLMC Structured Agency Credit Risk Debt Notes, | | | | |
| 2014-DN1, M3, FRN, 4.681%, 2/25/24 | United States | 9,075,000 | | 9,595,410 |
| 2014-DNA, M3, FRN, 4.731%, 10/25/24 | United States | 9,500,000 | | 9,945,835 |
| |
| |
| 102 | Semiannual Report | | | | franklintempleton.com |
FRANKLIN INVESTORS SECURITIES TRUST
STATEMENT OF INVESTMENTS (UNAUDITED)
| | | | | |
| Franklin Total Return Fund (continued) | | | | | |
| | | Principal | | | |
| | Country | Amount* | | | Value |
| Asset-Backed Securities and Commercial | | | | | |
| Mortgage-Backed Securities (continued) | | | | | |
| Diversified Financials (continued) | | | | | |
| gFHLMC Structured Agency Credit Risk Debt Notes, (continued) | | | | | |
| 2015-DN1, M3, FRN, 4.331%, 1/25/25 | United States | 9,310,000 | | $ | 9,698,646 |
| 2015-DNA1, M3, FRN, 3.48%, 10/25/27 | United States | 3,920,000 | | | 3,956,456 |
| 2015-HQ1, M3, FRN, 3.981%, 3/25/25 | United States | 2,000,000 | | | 2,034,811 |
| dG-Force LLC, 2005-RRA, C, 144A, 5.20%, 8/22/36 | United States | 9,275,000 | | | 9,034,870 |
| d,g,qGCCFC Commercial Mortgage Trust, 2007-GG9, G, 144A, FRN, 5.66%, | | | | | |
| 3/10/39 | United States | 7,350,000 | | | 849,109 |
| d,gGleneagles CLO Ltd., 2005-1A, A2, 144A, FRN, 0.655%, 11/01/17 | United States | 4,700,000 | | | 4,678,145 |
| qGMAC Commercial Mortgage Securities Inc., 2005-C1, B, 4.936%, | | | | | |
| 5/10/43 | United States | 10,285,000 | | | 2,580,764 |
| Green Tree Financial Corp., 1996-9, M1, 7.63%, 8/15/27 | United States | 3,685,076 | | | 4,047,236 |
| Greenpoint Manufactured Housing, 1999-3, 1A7, 7.27%, 6/15/29 | United States | 15,095,579 | | | 15,250,686 |
| gGSAA Home Equity Trust, 2005-5, M3, FRN, 1.126%, 2/25/35 | United States | 3,550,000 | | | 3,355,822 |
| dHighbridge Loan Management Ltd., 2013-2A, B2, 144A, 5.80%, | | | | | |
| 10/20/24 | United States | 2,620,000 | | | 2,633,598 |
| g,qHome Equity Mortgage Trust, 2004-4, M3, FRN, 1.156%, 12/25/34 | United States | 3,775,334 | | | 3,469,630 |
| d,gInvitation Homes Trust, | | | | | |
| 2014-SFR3, C, 144A, FRN, 2.68%, 12/17/31 | United States | 1,250,000 | | | 1,281,523 |
| 2015-SFR1, B, 144A, FRN, 2.03%, 3/17/32 | United States | 7,400,000 | | | 7,508,210 |
| 2015-SFR2, C, 144A, FRN, 2.178%, 6/17/32 | United States | 2,340,000 | | | 2,350,600 |
| gJP Morgan Mortgage Acquisition Corp., 2006-ACC1, A4, FRN, 0.331%, | | | | | |
| 5/25/36 | United States | 1,246,777 | | | 1,239,254 |
| d,gKatonah Ltd., 2007-IA, A2L, 144A, FRN, 1.777%, 4/23/22 | United States | 5,416,684 | | | 5,411,051 |
| d,gLandmark IX CDO Ltd., 2007-9A, C, 144A, FRN, 0.975%, 4/15/21 | United States | 2,190,000 | | | 2,133,038 |
| d,gLCM XI LP, 11A, B, 144A, FRN, 2.425%, 4/19/22 | Cayman Islands | 10,000,000 | | | 10,016,600 |
| dLegacy Benefits Insurance Settlements LLC, 2004-1, A, 144A, 5.35%, | | | | | |
| 2/10/39 | United States | 1,512,840 | | | 1,447,031 |
| gLong Beach Mortgage Loan Trust, 2005-WL2, M1, FRN, 0.651%, | | | | | |
| 8/25/35 | United States | 1,740,302 | | | 1,728,736 |
| g,qMerrill Lynch Mortgage Investors Trust, 2004-A1, M1, FRN, 4.717%, | | | | | |
| 2/25/34 | United States | 1,807,140 | | | 1,535,265 |
| d,gMountain View CLO II Ltd., 2006-2A, C, 144A, FRN, 0.976%, 1/12/21 | United States | 4,000,000 | | | 3,821,400 |
| d,gNewcastle CDO Ltd., 2004-5A, 1, 144A, FRN, 0.607%, 12/24/39 | United States | 1,799,411 | | | 1,774,778 |
| d,gNZCG Funding Ltd., 2015-2A, A1, 144A, FRN, 1.821%, 4/27/27 | Cayman Islands | 18,215,625 | | | 18,210,160 |
| d,gProgress Residential Trust, 2015-SFR1, A, 144A, FRN, 1.58%, 2/17/32 | United States | 11,130,000 | | | 11,176,189 |
| Residential Asset Securities Corp., | | | | | |
| 2001-KS2, AI5, 7.514%, 6/25/31 | United States | 8,448 | | | 8,721 |
| 2004-KS1, AI4, 4.213%, 4/25/32 | United States | 102,010 | | | 101,970 |
| dSilverado CLO 2006-II Ltd., 2006-2A, B, 144A, 0.966%, 10/16/20 | Cayman Islands | 9,000,000 | | | 8,648,010 |
| gSLM Student Loan Trust, 2005-4, A2, FRN, 0.357%, 4/26/21 | United States | 6,526 | | | 6,524 |
| gStructured Asset Securities Corp., | | | | | |
| 2002-1A, 2A1, FRN, 1.743%, 2/25/32 | United States | 26,125 | | | 23,427 |
| 2006-WF1, A5, FRN, 0.481%, 2/25/36 | United States | 5,923,380 | | | 5,841,176 |
| e,gTalisman 6 Finance, Reg S, FRN, 0.191%, 10/22/16 | Germany | 10,504,827 | EUR | | 11,701,485 |
| d,iTricon American Homes Trust, 2015-SFR1, C, 144A, 2.08%, 5/17/32 | United States | 8,170,000 | | | 8,170,000 |
| d,gVeritas CLO Ltd., 2006-2A, A2, 144A, FRN, 0.606%, 7/11/21 | United States | 1,300,000 | | | 1,288,495 |
| d,gWest CLO Ltd., 2014-1A, | | | | | |
| A2, 144A, FRN, 2.375%, 7/18/26 | United States | 2,860,000 | | | 2,840,838 |
| B, 144A, FRN, 3.125%, 7/18/26 | United States | 7,540,000 | | | 7,322,169 |
franklintempleton.com
Semiannual Report | 103
FRANKLIN INVESTORS SECURITIES TRUST
STATEMENT OF INVESTMENTS (UNAUDITED)
| | | | |
| Franklin Total Return Fund (continued) | | | | |
| | | Principal | | |
| | Country | Amount* | | Value |
| Asset-Backed Securities and Commercial | | | | |
| Mortgage-Backed Securities (continued) | | | | |
| Diversified Financials (continued) | | | | |
| d,gWestchester CLO Ltd., 2007-1A, A1A, 144A, FRN, 0.48%, 8/01/22 | United States | 3,196,736 | $ | 3,148,338 |
| d,gZiggurat CLO I Ltd., 2014-1A, C, 144A, FRN, 3.375%, 10/17/26 | United States | 2,000,000 | | 1,997,420 |
| | | | | 536,358,850 |
| Real Estate 0.1% | | | | |
| d,gAmerican Homes 4 Rent, 2014-SFR1, A, 144A, FRN, 1.25%, 6/17/31 | United States | 2,403,701 | | 2,395,057 |
| d,gCitigroup Mortgage Loan Trust Inc., 2013-A, A, 144A, FRN, 3.00%, | | | | |
| 5/25/42 | United States | 5,221,335 | | 5,287,200 |
| | | | | 7,682,257 |
| Total Asset-Backed Securities and Commercial | | | | |
| Mortgage-Backed Securities (Cost $892,383,687) | | | | 912,643,840 |
| Mortgage-Backed Securities 16.7% | | | | |
| gFederal Home Loan Mortgage Corp. (FHLMC) | | | | |
| Adjustable Rate 0.1% | | | | |
| FHLMC, 1.948% - 3.275%, 3/01/25 - 10/01/36 | United States | 3,600,549 | | 3,753,422 |
| Federal Home Loan Mortgage Corp. (FHLMC) | | | | |
| Fixed Rate 2.2% | | | | |
| iFHLMC 30 Year, 3.50%, 5/01/45 | United States | 72,000,000 | | 75,328,605 |
| FHLMC 30 Year, 6.00%, 6/01/37 | United States | 88,421 | | 100,753 |
| FHLMC 30 Year, 6.50%, 8/01/25 - 11/01/31 | United States | 123,681 | | 142,186 |
| FHLMC 30 Year, 7.00%, 7/01/31 | United States | 7,220 | | 7,714 |
| FHLMC 30 Year, 8.00%, 2/01/30 | United States | 39,908 | | 47,042 |
| FHLMC 30 Year, 8.50%, 10/01/24 | United States | 7,316 | | 8,558 |
| FHLMC Gold 15 Year, 5.00%, 10/01/17 - 9/01/18 | United States | 69,890 | | 73,374 |
| FHLMC Gold 15 Year, 5.50%, 11/01/22 | United States | 232,191 | | 249,207 |
| FHLMC Gold 15 Year, 6.00%, 2/01/17 - 9/01/22 | United States | 663,300 | | 720,799 |
| FHLMC Gold 30 Year, 4.50%, 3/01/39 | United States | 3,576,644 | | 3,896,709 |
| FHLMC Gold 30 Year, 5.00%, 8/01/33 - 2/01/39 | United States | 25,492,741 | | 28,313,987 |
| FHLMC Gold 30 Year, 5.50%, 1/01/35 - 12/01/37 | United States | 2,307,322 | | 2,601,193 |
| FHLMC Gold 30 Year, 6.00%, 5/01/33 - 4/01/38 | United States | 2,738,526 | | 3,117,624 |
| FHLMC Gold 30 Year, 6.50%, 4/01/28 - 3/01/39 | United States | 1,992,327 | | 2,330,729 |
| FHLMC Gold 30 Year, 7.00%, 1/01/28 - 7/01/32 | United States | 131,662 | | 153,447 |
| FHLMC Gold 30 Year, 7.50%, 3/01/32 | United States | 27,340 | | 33,326 |
| FHLMC Gold 30 Year, 8.50%, 8/01/30 | United States | 4,799 | | 5,592 |
| FHLMC Gold 30 Year, 9.00%, 1/01/22 | United States | 8,169 | | 8,270 |
| FHLMC Gold 30 Year, 10.00%, 10/01/30 | United States | 21,824 | | 22,252 |
| | | | | 117,161,367 |
| gFederal National Mortgage Association (FNMA) | | | | |
| Adjustable Rate 0.2% | | | | |
| FNMA, 1.737% - 4.352%, 6/01/15 - 3/01/37 | United States | 8,567,438 | | 9,100,636 |
| Federal National Mortgage Association (FNMA) | | | | |
| Fixed Rate 11.5% | | | | |
| iFNMA 15 Year, 2.50%, 5/01/30 | United States | 161,000,000 | | 165,065,849 |
| FNMA 15 Year, 4.50%, 3/01/19 - 6/01/19 | United States | 195,356 | | 204,555 |
| FNMA 15 Year, 5.00%, 6/01/18 - 7/01/18 | United States | 147,270 | | 154,746 |
104 | Semiannual Report
franklintempleton.com
FRANKLIN INVESTORS SECURITIES TRUST
STATEMENT OF INVESTMENTS (UNAUDITED)
| | | | |
| Franklin Total Return Fund (continued) | | | | |
| | | Principal | | |
| | Country | Amount* | | Value |
| Mortgage-Backed Securities (continued) | | | | |
| Federal National Mortgage Association (FNMA) | | | | |
| Fixed Rate (continued) | | | | |
| FNMA 15 Year, 5.50%, 6/01/16 - 12/01/23 | United States | 504,255 | $ | 553,741 |
| FNMA 15 Year, 6.00%, 5/01/17 - 9/01/22 | United States | 96,472 | | 101,565 |
| FNMA 15 Year, 6.50%, 4/01/16 - 9/01/16 | United States | 1,899 | | 1,916 |
| iFNMA 30 Year, 3.00%, 5/01/45 | United States | 155,000,000 | | 157,727,912 |
| iFNMA 30 Year, 3.50%, 5/01/45 | United States | 226,000,000 | | 236,787,959 |
| iFNMA 30 Year, 4.00%, 5/01/45 | United States | 21,000,000 | | 22,441,701 |
| FNMA 30 Year, 5.00%, 6/01/36 - 5/01/39 | United States | 3,533,114 | | 3,931,511 |
| FNMA 30 Year, 5.50%, 6/01/33 - 8/01/37 | United States | 12,046,597 | | 13,768,475 |
| FNMA 30 Year, 6.00%, 9/01/32 - 9/01/38 | United States | 17,383,074 | | 19,907,335 |
| FNMA 30 Year, 6.50%, 5/01/28 - 5/01/37 | United States | 425,884 | | 493,735 |
| FNMA 30 Year, 7.00%, 11/01/25 | United States | 4,411 | | 4,499 |
| FNMA 30 Year, 7.50%, 1/01/30 | United States | 18,191 | | 21,700 |
| FNMA 30 Year, 8.50%, 4/01/30 - 5/01/32 | United States | 113,058 | | 142,848 |
| FNMA 30 Year, 9.00%, 11/01/26 - 5/01/27 | United States | 127,724 | | 141,384 |
| | | | | 621,451,431 |
| gGovernment National Mortgage Association (GNMA) | | | | |
| Adjustable Rate 0.0%† | | | | |
| GNMA, 1.625%, 1/20/23 - 10/20/26 | United States | 66,035 | | 68,401 |
| Government National Mortgage Association (GNMA) | | | | |
| Fixed Rate 2.7% | | | | |
| GNMA I SF 30 Year, 6.00%, 1/15/39 | United States | 359,185 | | 408,849 |
| GNMA I SF 30 Year, 6.50%, 10/15/31 - 7/15/38 | United States | 78,972 | | 94,680 |
| GNMA I SF 30 Year, 7.00%, 10/15/27 - 6/15/31 | United States | 56,563 | | 65,993 |
| GNMA I SF 30 Year, 7.50%, 2/15/17 - 5/15/26 | United States | 161,761 | | 169,674 |
| GNMA I SF 30 Year, 8.00%, 8/15/16 - 5/15/17 | United States | 28,934 | | 29,156 |
| GNMA I SF 30 Year, 9.00%, 9/15/25 - 1/15/31 | United States | 1,908 | | 2,006 |
| iGNMA II SF 30 Year, 3.00%, 5/01/45 | United States | 20,000,000 | | 20,565,233 |
| iGNMA II SF 30 Year, 3.50%, 5/01/45 | United States | 120,000,000 | | 126,600,003 |
| GNMA II SF 30 Year, 6.00%, 5/20/31 | United States | 8,319 | | 9,659 |
| GNMA II SF 30 Year, 6.50%, 3/20/28 - 7/20/38 | United States | 856,339 | | 984,722 |
| GNMA II SF 30 Year, 7.50%, 8/20/30 - 1/20/33 | United States | 82,849 | | 100,156 |
| GNMA II SF 30 Year, 8.00%, 7/20/27 | United States | 50,121 | | 51,592 |
| | | | | 149,081,723 |
| Total Mortgage-Backed Securities | | | | |
| (Cost $894,086,966) | | | | 900,616,980 |
| Municipal Bonds 3.3% | | | | |
| Arkansas State GO, Four-Lane Highway Construction and Improvement | | | | |
| Bonds, 3.25%, 6/15/22 | United States | 13,800,000 | | 14,961,270 |
| California State GO, Various Purpose, 6.00%, 11/01/39 | United States | 2,385,000 | | 2,878,027 |
| gCalifornia State Judgement Trust COP, Monthly FRN, 1.609%, 6/01/15 | United States | 1,000,000 | | 999,390 |
| Chicago GO, | | | | |
| Build America Bonds, Direct Payment, Taxable Project, Series B, | | | | |
| 7.517%, 1/01/40 | United States | 1,760,000 | | 1,888,533 |
| Taxable Project, Series B, 6.034%, 1/01/42 | United States | 2,485,000 | | 2,249,223 |
| Chicago Transit Authority Sales and Transfer Tax Receipts Revenue, | | | | |
| Pension Funding, Series A, 6.899%, 12/01/40 | United States | 800,000 | | 1,012,272 |
franklintempleton.com
Semiannual Report | 105
FRANKLIN INVESTORS SECURITIES TRUST
STATEMENT OF INVESTMENTS (UNAUDITED)
| | | | | |
| Franklin Total Return Fund (continued) | | | | | |
| | | | Principal | | |
| | | Country | Amount* | | Value |
| Municipal Bonds (continued) | | | | | |
| Coachella Valley USD, GO, Riverside and Imperial Counties, Election of | | | | | |
| 2005, Series D, AGMC Insured, 5.00%, 8/01/37 | | United States | 6,395,000 | $ | 7,050,679 |
| Colorado State ISD, GO, Mitchell and Scurry Counties, School Building, | | | | | |
| PSF Guarantee, 5.00%, 8/15/38 | | United States | 2,600,000 | | 2,949,986 |
| Connecticut State GO, Series B, 5.00%, 4/15/18 | | United States | 650,000 | | 722,040 |
| Evansville Local Public Improvement Bond Bank Revenue, Sewage | | | | | |
| Works Project, Series A, 5.00%, 7/01/36 | | United States | 1,355,000 | | 1,502,383 |
| Florida Hurricane Catastrophe Fund Finance Corp. Revenue, Series A, | | | | | |
| 2.995%, 7/01/20 | | United States | 16,800,000 | | 17,243,856 |
| Illinois State GO, 5.877%, 3/01/19 | | United States | 9,200,000 | | 10,278,424 |
| Massachusetts State GO, Consolidated Loan of 2014, Series A, 4.50%, | | | | | |
| 12/01/43 | | United States | 4,950,000 | | 5,271,156 |
| Memorial Sloan-Kettering Cancer Center Revenue, 4.20%, 7/01/55 | | United States | 7,500,000 | | 7,317,878 |
| Minnesota State GO, Various Purpose, Refunding, Series F, 4.00%, | | | | | |
| 10/01/24 | | United States | 5,760,000 | | 6,575,328 |
| Nassau County GO, General Improvement Bonds, Series B, 5.00%, | | | | | |
| 4/01/39 | | United States | 7,700,000 | | 8,441,279 |
| 4/01/43 | | United States | 8,150,000 | | 8,852,774 |
| New Jersey EDA Revenue, School Facilities Construction, Refunding, | | | | | |
| Series NN, 5.00%, 3/01/30 | | United States | 3,300,000 | | 3,487,803 |
| New York City Municipal Water Finance Authority Water and Sewer | | | | | |
| System Revenue, Second General Resolution, Fiscal 2014, Refunding, | | | | | |
| Series BB, 5.00%, 6/15/46 | | United States | 4,865,000 | | 5,419,902 |
| New York State Public Library Revenue, 4.305%, 7/01/45 | | United States | 6,500,000 | | 6,410,320 |
| New York State Urban Development Corp. Revenue, State Personal | | | | | |
| Income Tax, General Purpose, Series C, 5.00%, 3/15/29 | | United States | 20,725,000 | | 23,969,084 |
| Puerto Rico Electric Power Authority Power Revenue, Series A, 6.75%, | | | | | |
| 7/01/36 | | United States | 12,000,000 | | 7,230,960 |
| Puerto Rico Sales Tax FICO Revenue, Capital Appreciation, Refunding, | | | | | |
| Series A, zero cpn., 8/01/26 | | United States | 10,300,000 | | 3,205,566 |
| Puerto Rico Sales Tax FICO Sales Tax Revenue, | | | | | |
| first subordinate, Series A, 6.50%, 8/01/44 | | United States | 13,200,000 | | 8,039,460 |
| Capital Appreciation, Series A, zero cpn., 8/01/25 | | United States | 7,450,000 | | 2,572,411 |
| South Carolina State Public Service Authority Revenue, Refunding, | | | | | |
| Series B, 5.00%, 12/01/38 | | United States | 4,500,000 | | 4,971,510 |
| University of California Revenue, Limited Project, Refunding, Series J, | | | | | |
| 4.131%, 5/15/45 | | United States | 10,750,000 | | 10,733,552 |
| Total Municipal Bonds (Cost $176,958,139) | | | | | 176,235,066 |
| |
| | | | Shares | | |
| Escrows and Litigation Trusts 0.0%† | | | | | |
| a,kComfort Co. Inc., Escrow Account | | United States | 716 | | — |
| a,kMotors Liquidation Co., Escrow Account, cvt. pfd., C | | United States | 43,500 | | — |
| Motors Liquidation Co., GUC Trust, Escrow Account | | United States | 1,113 | | 22,260 |
| a,kNewPage Corp., Litigation Trust | | United States | 2,500,000 | | — |
| Total Escrows and Litigation Trusts (Cost $34,091) | | | | | 22,260 |
106 | Semiannual Report
franklintempleton.com
FRANKLIN INVESTORS SECURITIES TRUST
STATEMENT OF INVESTMENTS (UNAUDITED)
| | | | | | |
| Franklin Total Return Fund (continued) | | | | | | |
| | | Notional | | | | |
| | Counterparty | Amount* | | | Value | |
| Options Purchased 0.0%† | | | | | | |
| Puts – Over-the-Counter | | | | | | |
| Credit Default Swaptions 0.0%† | | | | | | |
| Buy protection on CDX.NA.HY.23, Premium Rate 5.00%, | | | | | | |
| Strike Price $106.50, Expires 6/17/15 | FBCO | 40,000,000 | r | $ | 160,994 | |
| Buy protection on CDX.NA.HY.24, Premium Rate 5.00%, | | | | | | |
| Strike Price $104.50, Expires 9/16/15 | FBCO | 20,000,000 | r | | 300,240 | |
| Buy protection on CDX.NA.IG.23, Premium Rate 1.00%, | | | | | | |
| Strike Price $65, Expires 6/17/15 | CITI | 80,000,000 | r | | 125,280 | |
| Total Options Purchased (Cost $1,054,320) | | | | | 586,514 | |
| Total Investments before Short Term Investments | | | | | | |
| (Cost $4,743,532,163) | | | | | 4,775,800,257 | |
| |
| | | Principal | | | | |
| | Country | Amount* | | | | |
| Short Term Investments 25.2% | | | | | | |
| U.S. Government and Agency Securities 3.1% | | | | | | |
| sU.S. Treasury Bills, | | | | | | |
| 6/11/15 | United States | 54,500,000 | | | 54,500,763 | |
| 5/07/15 - 7/09/15 | United States | 112,250,000 | | | 112,250,500 | |
| Total U.S. Government and Agency Securities | | | | | | |
| (Cost $166,747,104) | | | | | 166,751,263 | |
| Total Investments before Money Market Funds | | | | | | |
| (Cost $4,910,279,267) | | | | | 4,942,551,520 | |
| |
| | | Shares | | | | |
| Money Market Funds (Cost $1,187,230,746) 22.1% | | | | | | |
| a,tInstitutional Fiduciary Trust Money Market Portfolio | United States | 1,187,230,746 | | | 1,187,230,746 | |
| Total Investments (Cost $6,097,510,013) 113.8% | | | | | 6,129,782,266 | |
| Options Written (0.0)%† | | | | | (241,138 | ) |
| Other Assets, less Liabilities (13.8)% | | | | | (741,767,828 | ) |
| Net Assets 100.0% | | | | $ | 5,387,773,300 | |
| |
| |
| |
| | | Notional | | | | |
| | Counterparty | Amount* | | | | |
| uOptions Written (0.0)%† | | | | | | |
| Puts – Over-the-Counter | | | | | | |
| Credit Default Swaptions (0.0)%† | | | | | | |
| Buy protection on CDX.NA.HY.23, Premium Rate 5.00%, | | | | | | |
| Strike Price $103, Expires 6/17/15 | FBCO | 40,000,000 | r | $ | (54,958 | ) |
| Buy protection on CDX.NA.HY.24, Premium Rate 5.00%, | | | | | | |
| Strike Price $101, Expires 9/16/15 | FBCO | 20,000,000 | r | | (147,860 | ) |
| Buy protection on CDX.NA.IG.23, Premium Rate 1.00%, | | | | | | |
| Strike Price $85, Expires 6/17/15 | CITI | 80,000,000 | r | | (38,320 | ) |
| Total Options Written | | | | | | |
| (Premiums Received $448,200) | | | | $ | (241,138 | ) |
franklintempleton.com Semiannual Report | 107
FRANKLIN INVESTORS SECURITIES TRUST
STATEMENT OF INVESTMENTS (UNAUDITED)
Franklin Total Return Fund (continued)
†Rounds to less than 0.1% of net assets.
*The principal/notional amount is stated in U.S. dollars unless otherwise indicated.
aNon-income producing.
bThe security is owned by FT Holdings Corporation I, a wholly-owned subsidiary of the Fund. See Note 1(g).
cAt April 30, 2015, pursuant to the Fund’s policies and the requirements of applicable securities law, the Fund may be restricted from trading these securities for a limited
or extended period of time.
dSecurity was purchased pursuant to Rule 144A under the Securities Act of 1933 and may be sold in transactions exempt from registration only to qualified institutional
buyers or in a public offering registered under the Securities Act of 1933. These securities have been deemed liquid under guidelines approved by the Trust’s Board of
Trustees. At April 30, 2015, the aggregate value of these securities was $795,506,273, representing 14.77% of net assets.
eSecurity was purchased pursuant to Regulation S under the Securities Act of 1933, which exempts from registration securities offered and sold outside of the United
States. Such a security cannot be sold in the United States without either an effective registration statement filed pursuant to the Securities Act of 1933, or pursuant to an
exemption from registration. These securities have been deemed liquid under guidelines approved by the Trust’s Board of Trustees. At April 30, 2015, the aggregate value
of these securities was $124,162,457, representing 2.30% of net assets.
fPerpetual security with no stated maturity date.
gThe coupon rate shown represents the rate at period end.
hSee Note 1(f) regarding loan participation notes.
iSecurity purchased on a when-issued, delayed delivery or to-be-announced (TBA) basis. See Note 1(c).
jSee Note 1(i) regarding senior floating rate interests.
kSecurity has been deemed illiquid because it may not be able to be sold within seven days. At April 30, 2015, the aggregate value of these securities was $31,282,
representing less than 0.01% of net assets.
lIncome may be received in additional securities and/or cash.
mPrincipal amount is stated in 100 Mexican Peso Units.
nPrincipal amount of security is adjusted for inflation. See Note 1(k).
oRedemption price at maturity is adjusted for inflation. See Note 1(k).
pPrincipal amount is stated in 1,000 Brazilian Real Units.
qThe bond pays interest and/or principal based upon the issuer’s ability to pay, which may be less than the stated interest rate or principal paydown.
rAmount represents notional amount under the terms of the option.
sThe security is traded on a discount basis with no stated coupon rate.
tSee Note 3(f) regarding investments in Institutional Fiduciary Trust Money Market Portfolio.
uSee Note 1(d) regarding written options.
At April 30, 2015, the Fund had the following financial futures contracts outstanding. See Note 1(d).
| | | | | | | | | | | | | | |
| Financial Futures Contracts | | | | | | | | | | | | | |
| | | | | Number of | | Notional | Expiration | | | Unrealized | | Unrealized | |
| Description | | | Type Contracts | | Value | Date | Appreciation | | Depreciation | |
| Interest Rate Contracts | | | | | | | | | | | | | | |
| Australia 10 Yr. Bond | | | Long | | 650 | $ | 66,488,305 | 6/15/15 | | $ | — | $ | (726,501 | ) |
| Euro-Bund | | | Long | | 350 | | 61,538,831 | 6/8/15 | | | 10,999 | | — | |
| U.S. Treasury 2 Yr. Note | | | Short | | 796 | | 174,535,438 | 6/30/15 | | | — | | (499,490 | ) |
| U.S. Treasury 5 Yr. Note | | | Short | 3,256 | | 391,152,438 | 6/30/15 | | | — | | (2,098,475 | ) |
| U.S. Treasury 10 Yr. Note | | | Short | | 330 | | 42,363,750 | 6/19/15 | | | — | | (73,029 | ) |
| Unrealized appreciation (depreciation) | | | | | | | | | | 10,999 | | (3,397,495 | ) |
| Net unrealized appreciation (depreciation) | | | | | | | | | | $ | (3,386,496 | ) |
| |
| At April 30, 2015, the Fund had the following forward exchange contracts outstanding. See Note 1(d). | | | | | |
| |
| Forward Exchange Contracts | | | | | | | | | | | | | |
| | | | | | | | Contract | Settlement | | | Unrealized | | Unrealized | |
| Currency | Counterpartya Type | Quantity | | | Amount | Date | Appreciation | | Depreciation | |
| Chilean Peso | CITI | Buy | 906,403,000 | $ | | 1,522,087 | 5/07/15 | $ | | — | $ | (41,506 | ) |
| Chilean Peso | CITI | Sell | 906,403,000 | | | 1,469,287 | 5/07/15 | | | — | | (11,295 | ) |
| Chilean Peso | MSCO | Buy | 3,670,729,000 | | | 6,340,869 | 5/07/15 | | | — | | (344,846 | ) |
| Chilean Peso | MSCO | Sell | 3,670,729,000 | | | 5,958,008 | 5/07/15 | | | — | | (38,014 | ) |
| Euro | BZWS | Sell | 1,973,970 | | | 2,600,266 | 5/07/15 | | | 385,168 | | — | |
108 | Semiannual Report franklintempleton.com
| | | | | | | | | | | |
| | | | | | FRANKLIN INVESTORS SECURITIES TRUST | |
| | | | | | STATEMENT OF INVESTMENTS (UNAUDITED) | |
| |
| |
| |
| |
| Franklin Total Return Fund (continued) | | | | | | | | | |
| Forward Exchange Contracts (continued) | | | | | | | | | |
| | | | | | Contract | Settlement | | Unrealized | Unrealized | |
| Currency | Counterpartya Type | Quantity | | Amount | Date | | Appreciation | Depreciation | |
| Euro | CITI | Sell | 615,870 | $ | 824,967 | 5/07/15 | $ | 133,867 | $ | — | |
| Euro | DBAB | Buy | 37,699,060 | | 41,966,653 | 5/07/15 | | 545,272 | | (207,783 | ) |
| Euro | DBAB | Sell | 65,571,692 | | 86,315,843 | 5/07/15 | | 12,734,321 | | — | |
| Euro | HSBC | Sell | 267,000 | | 341,979 | 5/07/15 | | 42,364 | | — | |
| Euro | JPHQ | Sell | 3,445,999 | | 4,617,570 | 5/07/15 | | 750,629 | | — | |
| Japanese Yen | DBAB | Sell | 117,763,200 | | 1,092,220 | 5/07/15 | | 105,782 | | — | |
| Philippine Peso | JPHQ | Buy | 566,370,000 | | 12,864,736 | 5/07/15 | | — | | (175,436 | ) |
| Philippine Peso | JPHQ | Sell | 388,890,000 | | 8,653,538 | 5/07/15 | | — | | (59,392 | ) |
| Swiss Franc | DBAB | Buy | 12,250,000 | | 12,306,610 | 5/07/15 | | 822,141 | | — | |
| Swiss Franc | DBAB | Sell | 13,097,334 | | 14,281,250 | 5/07/15 | | 244,381 | | — | |
| Euro | DBAB | Sell | 31,500,000 | | 41,507,550 | 6/05/15 | | 6,146,046 | | — | |
| Australian Dollar | DBAB | Sell | 21,034,082 | | 16,640,931 | 6/18/15 | | 138,402 | | (96,125 | ) |
| Chilean Peso | DBAB | Buy | 651,808,600 | | 1,100,006 | 6/18/15 | | — | | (39,566 | ) |
| Chilean Peso | DBAB | Sell | 651,808,600 | | 1,053,513 | 6/18/15 | | — | | (6,927 | ) |
| Euro | DBAB | Sell | 90,991,853 | | 113,511,061 | 6/18/15 | | 11,346,517 | | — | |
| Euro | JPHQ | Sell | 966,580 | | 1,206,247 | 6/18/15 | | 120,983 | | — | |
| Euro | MSCO | Sell | 5,621,360 | | 7,017,278 | 6/18/15 | | 705,683 | | — | |
| Japanese Yen | JPHQ | Sell | 3,094,000,360 | | 26,815,911 | 6/18/15 | | 886,132 | | — | |
| Malaysian Ringgit | DBAB | Buy | 3,367,980 | | 970,169 | 6/18/15 | | — | | (28,013 | ) |
| Malaysian Ringgit | HSBC | Buy | 790,000 | | 232,230 | 6/18/15 | | — | | (11,236 | ) |
| Singapore Dollar | MSCO | Buy | 14,102,839 | | 10,919,102 | 6/18/15 | | — | | (275,142 | ) |
| Euro | DBAB | Sell | 1,710,278 | | 2,198,391 | 6/22/15 | | 278,007 | | — | |
| Canadian Dollar | BZWS | Buy | 8,841,000 | | 7,471,162 | 7/23/15 | | — | | (153,716 | ) |
| Canadian Dollar | BZWS | Sell | 8,841,000 | | 7,023,300 | 7/23/15 | | — | | (294,147 | ) |
| Canadian Dollar | CITI | Buy | 2,898,000 | | 2,449,752 | 7/23/15 | | — | | (51,159 | ) |
| Canadian Dollar | CITI | Sell | 2,898,000 | | 2,302,229 | 7/23/15 | | — | | (96,364 | ) |
| Canadian Dollar | DBAB | Buy | 4,703,000 | | 3,963,759 | 7/23/15 | | — | | (71,218 | ) |
| Canadian Dollar | DBAB | Sell | 4,703,000 | | 3,735,653 | 7/23/15 | | — | | (156,888 | ) |
| Euro | BZWS | Sell | 2,472,961 | | 2,952,048 | 7/23/15 | | 174,083 | | — | |
| Euro | CITI | Sell | 2,584,200 | | 3,084,000 | 7/23/15 | | 181,076 | | — | |
| Euro | DBAB | Sell | 87,185,488 | | 102,506,583 | 7/23/15 | | 4,568,032 | | — | |
| Euro | JPHQ | Sell | 1,062,724 | | 1,269,608 | 7/23/15 | | 75,812 | | — | |
| Japanese Yen | BZWS | Sell | 716,900,000 | | 6,048,360 | 7/23/15 | | 37,431 | | — | |
| Japanese Yen | CITI | Sell | 1,431,560,000 | | 12,060,422 | 7/23/15 | | 57,346 | | — | |
| Japanese Yen | DBAB | Sell | 16,384,564,120 | | 138,195,474 | 7/23/15 | | 817,257 | | — | |
| Japanese Yen | GSCO | Sell | 478,870,000 | | 4,047,074 | 7/23/15 | | 31,934 | | — | |
| Japanese Yen | HSBC | Sell | 720,750,000 | | 6,089,601 | 7/23/15 | | 46,392 | | — | |
| Japanese Yen | JPHQ | Sell | 1,676,801,000 | | 14,165,461 | 7/23/15 | | 106,135 | | — | |
| Malaysian Ringgit | DBAB | Buy | 11,905,000 | | 3,270,604 | 7/23/15 | | 50,918 | | — | |
| Singapore Dollar | DBAB | Buy | 8,523,000 | | 6,355,364 | 7/23/15 | | 73,499 | | — | |
| Singapore Dollar | HSBC | Buy | 3,390,000 | | 2,510,739 | 7/23/15 | | 46,323 | | — | |
| Singapore Dollar | JPHQ | Buy | 2,117,000 | | 1,567,800 | 7/23/15 | | 29,044 | | — | |
| Euro | DBAB | Sell | 64,359,107 | | 73,599,103 | 8/27/15 | | 1,261,202 | | — | |
| Euro | JPHQ | Sell | 6,587,400 | | 7,541,025 | 8/27/15 | | 136,965 | | — | |
| Euro | DBAB | Sell | 28,202,540 | | 31,120,140 | 9/17/15 | | 105,900 | | (695,752 | ) |
| Euro | GSCO | Sell | 1,024,000 | | 1,164,759 | 9/17/15 | | 13,408 | | — | |
| Euro | JPHQ | Sell | 11,680,000 | | 13,284,622 | 9/17/15 | | 152,020 | | — | |
| Japanese Yen | DBAB | Sell | 7,062,259,000 | | 59,473,598 | 9/17/15 | | 257,533 | | (57,291 | ) |
| Japanese Yen | HSBC | Sell | 452,730,000 | | 3,819,378 | 9/17/15 | | 19,627 | | — | |
| Japanese Yen | JPHQ | Sell | 1,328,470,000 | | 11,203,997 | 9/17/15 | | 54,183 | | — | |
| Singapore Dollar | DBAB | Buy | 3,192,500 | | 2,350,191 | 9/17/15 | | 55,410 | | — | |
| Singapore Dollar | HSBC | Buy | 2,551,000 | | 1,879,259 | 9/17/15 | | 42,961 | | — | |
franklintempleton.com Semiannual Report | 109
| | | | | | | | | | | |
| FRANKLIN INVESTORS SECURITIES TRUST | | | | | | | | |
| STATEMENT OF INVESTMENTS (UNAUDITED) | | | | | | | | |
| |
| |
| |
| |
| Franklin Total Return Fund (continued) | | | | | | | | | |
| |
| Forward Exchange Contracts (continued) | | | | | | | | | |
| | | | | | Contract | Settlement | | Unrealized | | Unrealized | |
| Currency | Counterpartya Type | Quantity | | Amount | Date | | Appreciation | | Depreciation | |
| Singapore Dollar | JPHQ | Buy | 15,450,000 | $ | 11,401,373 | 9/17/15 | $ | 240,456 | $ | — | |
| Singapore Dollar | MSCO | Buy | 8,200,000 | | 6,033,848 | 9/17/15 | | 144,986 | | — | |
| Australian Dollar | DBAB | Sell | 6,700,000 | | 5,309,750 | 10/22/15 | | 57,468 | | — | |
| Euro | DBAB | Sell | 6,009,460 | | 6,727,591 | 10/22/15 | | — | | (33,191 | ) |
| Danish Krone | DBAB | Buy | 186,000,000 | | 29,018,972 | 1/15/16 | | — | | (833,952 | ) |
| Euro | DBAB | Sell | 8,374,000 | | 10,963,814 | 2/05/16 | | 1,519,935 | | — | |
| Danish Krone | RBS | Sell | 193,889,682 | | 29,724,005 | 2/17/16 | | 308,699 | | — | |
| Euro | DBAB | Sell | 10,260,000 | | 13,583,727 | 8/05/16 | | 1,951,939 | | — | |
| Japanese Yen | JPHQ | Sell | 743,278,833 | | 7,020,294 | 9/02/16 | | 718,979 | | — | |
| Unrealized appreciation (depreciation) | | | | | | | 48,722,648 | | (3,778,959 | ) |
| Net unrealized appreciation (depreciation) | | | | | | $ | 44,943,689 | | | |
| aMay be comprised of multiple contracts with the same counterparty, currency and settlement date. | | | | | | |
| | | | | | | | | | | | | | | | | |
| At April 30, 2015, the Fund had the following credit default swap contracts outstanding. See Note 1(d). | | | | | |
| |
| Credit Default Swap Contracts | | | | | | | | | | | | | | | | |
| | | | | | | | Upfront | | | | | | | | | | |
| | | | Periodic | | | | Premiums | | | | | | | | | | |
| | Counterparty/ | Notional | Payment | | Expiration | | Paid | | Unrealized | | Unrealized | | | Market | | |
| Description | Exchange | Amounta | Rate | | Date | | (Received) | | Appreciation | | Depreciation | | | Value | | Ratingb |
| Centrally Cleared Swaps | | | | | | | | | | | | | | | | | |
| Contracts to Sell Protectionc | | | | | | | | | | | | | | | | | |
| Traded Index | | | | | | | | | | | | | | | | | |
| CDX.NA.IG.24 | ICE | 25,000,000 | 1.00 | % | 6/20/25 | $ | (59,399 | ) | $ | — | $ | (41,901 | ) | $ | (101,300 | ) | Investment |
| | | | | | | | | | | | | | | | | | Grade |
| Centrally Cleared Swaps unrealized appreciation (depreciation) | | | | | | | $ | — | $ | (41,901 | ) | | | | |
| OTC Swaps | | | | | | | | | | | | | | | | | |
| Contracts to Buy Protection | | | | | | | | | | | | | | | | | |
| Single Name | | | | | | | | | | | | | | | | | |
| Alcatel-Lucent USA Inc. | BZWS | 1,500,000 | 5.00 | % | 9/20/17 | | (159,157 | ) | | 85 | | — | | | (159,071 | ) | |
| Alcatel-Lucent USA Inc. | GSCO | 20,000,000 | 5.00 | % | 9/20/17 | | (1,765,974 | ) | | — | | (354,975 | ) | | (2,120,950 | ) | |
| Bank of America Corp. | FBCO | 20,000,000 | 1.00 | % | 9/20/17 | | 143,956 | | | — | | (420,794 | ) | | (276,838 | ) | |
| Beazer Homes USA Inc. | CITI | 4,000,000 | 5.00 | % | 6/20/19 | | (195,027 | ) | | — | | (263 | ) | | (195,290 | ) | |
| Beazer Homes USA Inc. | GSCO | 10,000,000 | 5.00 | % | 6/20/19 | | (514,539 | ) | 26,315 | | — | | | (488,225 | ) | |
| Centex Corp. | FBCO | 7,795,000 | 5.00 | % | 6/20/16 | | (222,848 | ) | | — | | (219,909 | ) | | (442,757 | ) | |
| Centex Corp. | JPHQ | 12,000,000 | 5.00 | % | 6/20/16 | | (410,637 | ) | | — | | (270,964 | ) | | (681,601 | ) | |
| CIT Group Inc. | GSCO | 22,500,000 | 5.00 | % | 6/20/17 | | (1,511,272 | ) | | — | | (214,918 | ) | | (1,726,191 | ) | |
| Constellation Brands Inc. | BZWS | 5,000,000 | 5.00 | % | 6/20/17 | | (327,517 | ) | | — | | (170,190 | ) | | (497,707 | ) | |
| Constellation Brands Inc. | DBAB | 2,000,000 | 5.00 | % | 6/20/17 | | (131,906 | ) | | — | | (67,177 | ) | | (199,083 | ) | |
| Constellation Brands Inc. | GSCO | 6,000,000 | 5.00 | % | 9/20/16 | | (385,948 | ) | | — | | (13,282 | ) | | (399,230 | ) | |
| D.R. Horton Inc. | JPHQ | 7,000,000 | 5.00 | % | 3/20/16 | | (240,701 | ) | | — | | (59,128 | ) | | (299,829 | ) | |
| Dell Inc. | BZWS | 1,500,000 | 5.00 | % | 6/20/19 | | (213,241 | ) | | 1,725 | | — | | | (211,516 | ) | |
| Dell Inc. | GSCO | 15,000,000 | 5.00 | % | 6/20/16 | | (710,746 | ) | | — | | (70,610 | ) | | (781,355 | ) | |
| Dell Inc. | GSCO | 5,725,000 | 5.00 | % | 6/20/18 | | (720,941 | ) | | 3,870 | | — | | | (717,070 | ) | |
| Dell Inc. | GSCO | 5,246,000 | 5.00 | % | 6/20/19 | | (715,270 | ) | | — | | (24,471 | ) | | (739,741 | ) | |
| DISH DBS Corp. | GSCO | 10,000,000 | 5.00 | % | 3/20/16 | | (354,478 | ) | | — | | (25,708 | ) | | (380,186 | ) | |
| DISH DBS Corp. | JPHQ | 6,000,000 | 5.00 | % | 3/20/16 | | (208,005 | ) | | — | | (20,107 | ) | | (228,112 | ) | |
| DPL Inc. | MSCO | 875,000 | 5.00 | % | 12/20/16 | | (47,067 | ) | | — | | (8,170 | ) | | (55,238 | ) | |
| El Paso Corp. | GSCO | 1,100,000 | 5.00 | % | 6/20/17 | | (88,902 | ) | | — | | (24,477 | ) | | (113,379 | ) | |
110 | Semiannual Report franklintempleton.com
| | | | | | | | | | | | | | | | | |
| | | | | | | | FRANKLIN INVESTORS SECURITIES TRUST |
| | | | | | | | STATEMENT OF INVESTMENTS (UNAUDITED) |
| |
| |
| |
| |
| Franklin Total Return Fund (continued) | | | | | | | | | | | | | | | |
| |
| Credit Default Swap Contracts (continued) | | | | | | | | | | | | | | | |
| | | | | | | | Upfront | | | | | | | | | | |
| | | | Periodic | | | | Premiums | | | | | | | | | | |
| | Counterparty/ | Notional | Payment | | Expiration | | Paid | | Unrealized | | Unrealized | | | Market | | |
| Description | Exchange | Amounta | Rate | | Date | | (Received) | | Appreciation | | Depreciation | | | Value | | Ratingb |
| OTC Swaps (continued) | | | | | | | | | | | | | | | | | |
| Contracts to Buy Protection (continued) | | | | | | | | | | | | | | | | |
| Single Name (continued) | | | | | | | | | | | | | | | | | |
| Embarq Corp. | BZWS | 8,500,000 | 5.00 | % | 6/20/16 | $ | (250,757 | ) | $ | — | $ | (217,905 | ) | $ | (468,663 | ) | |
| Embarq Corp. | DBAB | 1,500,000 | 5.00 | % | 6/20/16 | | (45,641 | ) | | — | | (37,064 | ) | | (82,705 | ) | |
| Embarq Corp. | GSCO | 10,000,000 | 5.00 | % | 6/20/16 | | (333,730 | ) | | — | | (217,638 | ) | | (551,368 | ) | |
| Gannett Co. Inc. | GSCO | 3,000,000 | 5.00 | % | 9/20/15 | | (55,654 | ) | | — | | (1,532 | ) | | (57,186 | ) | |
| HCA Inc. | GSCO | 5,054,000 | 5.00 | % | 3/20/16 | | (141,773 | ) | | — | | (69,478 | ) | | (211,251 | ) | |
| International Lease Finance | | | | | | | | | | | | | | | | | |
| Corp. | GSCO | 10,000,000 | 5.00 | % | 3/20/17 | | (691,531 | ) | | — | | (59,055 | ) | | (750,586 | ) | |
| Kinder Morgan Energy | | | | | | | | | | | | | | | | | |
| Partners LP | CITI | 1,000,000 | 5.00 | % | 3/20/20 | | (212,542 | ) | | — | | (4,088 | ) | | (216,630 | ) | |
| Kinder Morgan Inc. | GSCO | 28,205,000 | 5.00 | % | 3/20/16 | | (1,096,869 | ) | | — | | (108,053 | ) | | (1,204,921 | ) | |
| Lennar Corp. | CITI | 4,150,000 | 5.00 | % | 9/20/19 | | (411,207 | ) | | — | | (155,256 | ) | | (566,462 | ) | |
| Lennar Corp. | CITI | 6,200,000 | 5.00 | % | 12/20/19 | | (727,131 | ) | | — | | (132,144 | ) | | (859,275 | ) | |
| Lennar Corp. | FBCO | 4,500,000 | 5.00 | % | 9/20/19 | | (578,499 | ) | | — | | (35,738 | ) | | (614,236 | ) | |
| Lennar Corp. | GSCO | 7,692,000 | 5.00 | % | 6/20/15 | | (3,170 | ) | | — | | (47,536 | ) | | (50,706 | ) | |
| Lennar Corp. | GSCO | 4,235,000 | 5.00 | % | 6/20/19 | | (502,537 | ) | | — | | (66,353 | ) | | (568,890 | ) | |
| The New York Times Co. | GSCO | 11,700,000 | 5.00 | % | 12/20/16 | | (345,797 | ) | | — | | (567,255 | ) | | (913,052 | ) | |
| Pactiv LLC | UBSW | 12,000,000 | 5.00 | % | 6/20/17 | | 375,353 | | | — | | (1,452,520 | ) | | (1,077,168 | ) | |
| PPL Energy Supply LLC | GSCO | 1,000,000 | 5.00 | % | 6/20/16 | | (49,785 | ) | | — | | (2,706 | ) | | (52,491 | ) | |
| PPL Energy Supply LLC | JPHQ | 11,400,000 | 5.00 | % | 6/20/16 | | (557,281 | ) | | — | | (41,120 | ) | | (598,401 | ) | |
| Springleaf Finance Corp. | GSCO | 10,000,000 | 5.00 | % | 9/20/16 | | (497,676 | ) | | — | | (23,791 | ) | | (521,466 | ) | |
| Springleaf Finance Corp. | JPHQ | 4,000,000 | 5.00 | % | 9/20/16 | | (199,039 | ) | | — | | (9,548 | ) | | (208,587 | ) | |
| Sprint Communications | | | | | | | | | | | | | | | | | |
| Inc. | GSCO | 15,000,000 | 5.00 | % | 12/20/16 | | (795,338 | ) | | — | | (17,790 | ) | | (813,128 | ) | |
| Tenet Healthcare Corp | BZWS | 13,160,000 | 5.00 | % | 12/20/16 | | (654,090 | ) | | — | | (256,753 | ) | | (910,843 | ) | |
| Toll Brothers Inc. | FBCO | 2,010,000 | 5.00 | % | 6/20/15 | | (7,928 | ) | | — | | (5,865 | ) | | (13,792 | ) | |
| Toys R Us Inc. | DBAB | 14,000,000 | 5.00 | % | 12/20/18 | | 3,763,947 | | | — | | (333,947 | ) | | 3,430,000 | | |
| USG Corp. | GSCO | 4,000,000 | 5.00 | % | 12/20/16 | | (246,906 | ) | | — | | (18,781 | ) | | (265,687 | ) | |
| Contracts to Sell Protectionc | | | | | | | | | | | | | | | | | |
| Single Name | | | | | | | | | | | | | | | | | |
| Anadarko Petroleum | | | | | | | | | | | | | | | | | |
| Corp. | BZWS | 10,000,000 | 1.00 | % | 9/20/19 | | 206,312 | | | — | | (13,132 | ) | | 193,179 | | BBB |
| Bank of America Corp. | FBCO | 20,000,000 | 1.00 | % | 9/20/17 | | (143,956 | ) | 449,489 | | — | | | 305,533 | | A- |
| Beazer Homes USA Inc. | CITI | 4,150,000 | 5.00 | % | 9/20/19 | | 74,231 | | 101,030 | | — | | | 175,261 | | CCC |
| Beazer Homes USA Inc. | CITI | 6,200,000 | 5.00 | % | 12/20/19 | | 164,077 | | | 58,775 | | — | | | 222,852 | | CCC |
| Berkshire Hathaway Inc. | CITI | 24,300,000 | 1.00 | % | 3/20/22 | | 289,604 | | | — | | (25,430 | ) | | 264,174 | | AA |
| Citigroup Inc. | FBCO | 2,500,000 | 1.00 | % | 9/20/20 | | 10,982 | | | 16,569 | | — | | | 27,552 | | A- |
| Freeport-McMoRan Inc. | DBAB | 6,500,000 | 1.00 | % | 3/20/23 | | (370,231 | ) | | — | | (549,389 | ) | | (919,620 | ) | BBB- |
| Government of Mexico | CITI | 8,400,000 | 1.00 | % | 6/20/20 | | (103,357 | ) | | 17,908 | | — | | | (85,449 | ) | BBB+ |
| Government of Poland | GSCO | 5,300,000 | 1.00 | % | 12/20/19 | | 85,675 | | | 29,088 | | — | | | 114,763 | | A- |
| Government of Portugal | DBAB | 8,500,000 | 1.00 | % | 9/20/19 | | (403,602 | ) | 320,501 | | — | | | (83,100 | ) | NR |
| iHeartCommunications | | | | | | | | | | | | | | | | | |
| Inc. | BZWS | 5,000,000 | 5.00 | % | 6/20/18 | | (1,113,352 | ) | | — | | (85,351 | ) | | (1,198,703 | ) | CCC- |
| Prudential Financial Inc. | BOFA | 8,800,000 | 1.00 | % | 12/20/21 | | (172,906 | ) | 143,451 | | — | | | (29,455 | ) | A |
franklintempleton.com
Semiannual Report | 111
FRANKLIN INVESTORS SECURITIES TRUST
STATEMENT OF INVESTMENTS (UNAUDITED)
| | | | | | | | | | | | | | | | | |
| Franklin Total Return Fund (continued) | | | | | | | | | | | | | | | |
| |
| Credit Default Swap Contracts (continued) | | | | | | | | | | | | | | | |
| | | | | | | | Upfront | | | | | | | | | | |
| | | | | Periodic | | | Premiums | | | | | | | | | | |
| | Counterparty/ | Notional | | Payment | | Expiration | Paid | | | Unrealized | | Unrealized | | | Market | | |
| Description | Exchange | Amounta | | Rate | | Date | (Received) | | | Appreciation | | Depreciation | | | Value | | Ratingb |
| OTC Swaps (continued) | | | | | | | | | | | | | | | | | |
| Contracts to Sell Protectionc (continued) | | | | | | | | | | | | | | | | |
| Single Name (continued) | | | | | | | | | | | | | | | | | |
| PSEG Power LLC | JPHQ | 17,400,000 | | 1.00 | % | 3/20/20 | (236,748 | ) | $ | 147,878 | $ | — | | $ | (88,870 | ) | BBB+ |
| Tate & Lyle International | | | | | | | | | | | | | | | | | |
| Finance PLC | CITI | 7,200,000 | EUR | 1.00 | % | 9/20/19 | 140,875 | | | — | | (27,454 | ) | | 113,421 | | BBB |
| Tenet Healthcare Corp. | BZWS | 9,400,000 | | 5.00 | % | 12/20/18 | 459,240 | | | 479,063 | | — | | | 938,303 | | CCC+ |
| Traded Index | | | | | | | | | | | | | | | | | |
| LCDX.NA.21 | FBCO | 6,958,000 | | 2.50 | % | 12/20/18 | 195,338 | | | 27,177 | | — | | | 222,515 | | Non |
| | | | | | | | | | | | | | | | | | Investment |
| | | | | | | | | | | | | | | | | | Grade |
| MCDX.NA.24 | CITI | 10,400,000 | | 1.00 | % | 6/20/20 | 23,860 | | | 14,604 | | — | | | 38,465 | | Investment |
| | | | | | | | | | | | | | | | | | Grade |
| MCDX.NA.24 | GSCO | 19,100,000 | | 1.00 | % | 6/20/25 | (618,717 | ) | | 21,307 | | — | | | (597,410 | ) | Investment |
| | | | | | | | | | | | | | | | | | Grade |
| OTC Swaps unrealized appreciation (depreciation) | | | | | | | | 1,858,835 | | (6,547,815 | ) | | | | |
| Total Credit Default Swaps unrealized appreciation (depreciation) | | | | | | 1,858,835 | | (6,589,716 | ) | | | | |
| Net unrealized appreciation (depreciation) | | | | | | | | | $ | (4,730,881 | ) | | | | |
aIn U.S. dollars unless otherwise indicated. For contracts to sell protection, the notional amount is equal to the maximum potential amount of the future payments and no
recourse provisions have been entered into in association with the contracts.
bBased on Standard and Poor’s (S&P) Rating for single name swaps and internal ratings for index swaps. Internal ratings based on mapping into equivalent ratings from
external vendors.
cThe fund enters contracts to sell protection to create a long credit position. Performance triggers include default, bankruptcy or restructuring for single name swaps, and
failure to pay or bankruptcy of the underlying securities for traded index swaps.
At April 30, 2015, the Fund had the following cross-currency swap contracts outstanding. See Note 1(d).
| | | | | | | | | |
| Cross-Currency Swap Contracts | | | | | | | | | |
| | | Expiration | Notional | | | Unrealized | | Unrealized | |
| Description | Counterparty | Date | Amount | | | Appreciation | | Depreciation | |
| Receive Fixed Semi-Annual 4.50% | CITI | 1/01/16 | 15,456,481 | USD | $ | 1,919,654 | $ | — | |
| Pay Fixed Annual 4.00% | | | 90,000,000 | DKK | | | | | |
| Receive Fixed Semi-Annual 2.47% | DBAB | 1/04/16 | 15,638,575 | USD | | 2,076,762 | | — | |
| Pay Fixed Annual 2.00% | | | 90,000,000 | DKK | | | | | |
| Receive Float Quarterly 3-month BBA USD | | | | | | | | | |
| LIBOR + 3.29% | JPHQ | 10/13/17 | 12,760,417 | USD | | — | | (295,769 | ) |
| Pay Fixed Annual 2.125% | | | 12,250,000 | CHF | | | | | |
| Unrealized appreciation (depreciation) | | | | | | 3,996,416 | | (295,769 | ) |
| Net unrealized appreciation (depreciation) | | | | | $ | 3,700,647 | | | |
See Notes 6 and 10 regarding investment transactions and other derivative information, respectively.
See Abbreviations on page 140.
112 | Semiannual Report | The accompanying notes are an integral part of these financial statements. franklintempleton.com
FRANKLIN INVESTORS SECURITIES TRUST
Financial Statements
Statements of Assets and Liabilities
April 30, 2015 (unaudited)
| | | | | | | | | |
| | | | Franklin | | Franklin | | Franklin | | |
| | | | Adjustable | | Floating Rate | | Low Duration | | Franklin |
| | | | U.S. Government | | Daily Access | | Total Return | | Total Return |
| | | | Securities Fund | | Fund | | Fund | | Fund |
| Assets: | | | | | | | | | |
| Investments in securities: | | | | | | | | | |
| Cost - Unaffiliated issuers | | $ | 1,871,847,320 | $ | 3,688,379,091 | $ | 2,259,270,138 | $ | 4,910,279,267 |
| Cost - Sweep Money Fund (Note 3f) | | 49,863,762 | | 251,639,882 | | 222,138,754 | | 1,187,230,746 |
| Total cost of investments | | $ | 1,921,711,082 | $ | 3,940,018,973 | $ | 2,481,408,892 | $ | 6,097,510,013 |
| Value - Unaffiliated issuers | $ | 1,903,466,603 | $ | 3,637,969,628 | $ | 2,251,617,693 | $ | 4,942,551,520 |
| Value - Sweep Money Fund (Note 3f) | | 49,863,762 | | 251,639,882 | | 222,138,754 | | 1,187,230,746 |
| Total value of investments | | | 1,953,330,365 | | 3,889,609,510 | | 2,473,756,447 | | 6,129,782,266 |
| Cash | | | — | | 3,596,309 | | 701,813 | | 195,230 |
| Restricted cash (Note 1e) | | | — | | — | | 16,018,000 | | 53,299,700 |
| Foreign currency, at value (cost $-, $-, $4,218,397 and | | | | | | | | |
| $3,855,798) | | | — | | — | | 4,193,357 | | 3,834,382 |
| Receivables: | | | | | | | | | |
| Investment securities sold | | | 5,884,756 | | 105,285,586 | | 4,489,081 | | 11,443,014 |
| Capital shares sold | | | 1,904,633 | | 12,763,286 | | 9,131,747 | | 30,643,268 |
| Interest | | | 4,620,100 | | 14,534,105 | | 10,154,931 | | 34,899,008 |
| Affiliates | | | — | | — | | 311,485 | | — |
| Due from brokers | | | — | | 2,241,913 | | 8,640,163 | | 26,564,465 |
| Variation margin | | | — | | 388,783 | | 140,879 | | — |
| OTC swap contracts (premiums paid $-, $-, $1,865,936 | | | | | | | | |
| and $7,179,229) | | | — | | — | | 1,680,876 | | 5,933,450 |
| Unrealized appreciation on forward exchange contracts | | — | | — | | 16,052,342 | | 48,722,648 |
| Unrealized appreciation on OTC swap contracts | | — | | — | | 1,532,038 | | 5,855,251 |
| Unrealized appreciation on unfunded loan commitments | | | | | | | | |
| (Note 9) | | | — | | 39,747 | | — | | — |
| Other assets | | | 1,100 | | 2,163 | | 208 | | 4,225 |
| Total assets | | | 1,965,740,954 | | 4,028,461,402 | | 2,546,803,367 | | 6,351,176,907 |
| Liabilities: | | | | | | | | | |
| Payables: | | | | | | | | | |
| Investment securities purchased | | — | | 123,589,577 | | 40,566,619 | | 848,756,706 |
| Capital shares redeemed | | | 3,672,137 | | 8,558,707 | | 5,379,207 | | 24,082,794 |
| Management fees | | | 808,101 | | 1,544,906 | | 779,908 | | 1,885,584 |
| Distribution fees | | | 428,585 | | 695,824 | | 429,689 | | 998,469 |
| Transfer agent fees | | | 695,900 | | 896,279 | | 242,303 | | 1,316,787 |
| Trustees’ fees and expenses | | 694 | | 1,783 | | 946 | | 1,668 |
| Variation margin | | | — | | — | | — | | 235,031 |
| Distributions to shareholders | | 286,953 | | 4,712,203 | | 364,080 | | 552,115 |
| OTC swaps contracts (premiums received $-, $-, | | | | | | | | |
| $12,799,726 and $31,542,861) | | — | | — | | 7,846,325 | | 20,491,926 |
| Options written, at value (premiums received $-, $-, $206,402 | | | | | | | | |
| and $448,200) | | | — | | — | | 111,019 | | 241,138 |
| Due to brokers | | | — | | — | | 16,018,000 | | 53,338,700 |
| Unrealized depreciation on forward exchange contracts | | — | | — | | 1,285,357 | | 3,778,959 |
| Unrealized depreciation on OTC swap contracts | | — | | — | | 1,964,546 | | 6,843,584 |
| Unrealized depreciation on unfunded loan commitments | | | | | | | | |
| (Note 9) | | | — | | — | | 42,031 | | 94,775 |
| Accrued expenses and other liabilities | | 135,958 | | 255,073 | | 390,274 | | 785,371 |
| Total liabilities | | | 6,028,328 | | 140,254,352 | | 75,420,304 | | 963,403,607 |
| Net assets, at value | $ | 1,959,712,626 | $ | 3,888,207,050 | $ | 2,471,383,063 | $ | 5,387,773,300 |
| |
| |
| franklintempleton.com | The accompanying notes are an integral part of these financial statements. | Semiannual Report | 113 |
FRANKLIN INVESTORS SECURITIES TRUST
FINANCIAL STATEMENTS
| | | | | | | | | | | | | |
| Statements of Assets and Liabilities (continued) | | | | | | | | | | | | | |
| April 30, 2015 (unaudited) | | | | | | | | | | | | | |
| |
| | | | Franklin | | | Franklin | | | Franklin | | | | |
| | | | Adjustable | | | Floating Rate | | | Low Duration | | | Franklin | |
| | | | U.S. Government | | | Daily Access | | | Total Return | | | Total Return | |
| | | | Securities Fund | | | Fund | | | Fund | | | Fund | |
| Net assets consist of: | | | | | | | | | | | | | |
| Paid-in capital | $ | | 2,070,304,608 | | $ | 4,179,590,012 | | $ | 2,506,525,417 | | $ | 5,324,636,129 | |
| Undistributed net investment income (distributions in excess | | | | | | | | | | | | | |
| of net investment income) | | | (9,139,673 | ) | | 1,359,785 | | | (25,931,718 | ) | | (47,264,447 | ) |
| Net unrealized appreciation (depreciation) | | | 31,619,283 | | | (51,006,539 | ) | | 6,266,490 | | | 72,625,293 | |
| Accumulated net realized gain (loss) | | | (133,071,592 | ) | | (241,736,208 | ) | | (15,477,126 | ) | | 37,776,325 | |
| Net assets, at value | $ | | 1,959,712,626 | | $ | 3,888,207,050 | | $ | 2,471,383,063 | | $ | 5,387,773,300 | |
| Class A: | | | | | | | | | | | | | |
| Net assets, at value | $ | | 1,012,125,768 | | $ | 1,664,782,382 | | $ | 1,630,714,811 | | $ | 3,457,786,415 | |
| Shares outstanding | | | 117,323,845 | | | 184,432,867 | | | 162,353,741 | | | 341,732,151 | |
| Net asset value per sharea | | $ | 8.63 | | $ | 9.03 | | $ | 10.04 | | $ | 10.12 | |
| Maximum offering price per share (net asset value | | | | | | | | | | | | | |
| per share ÷ 97.75%, 97.75%, 97.75% and 95.75%, | | | | | | | | | | | | | |
| respectively) | | $ | 8.83 | | $ | 9.24 | | $ | 10.27 | | $ | 10.57 | |
| Class A1: | | | | | | | | | | | | | |
| Net assets, at value | $ | | 219,920,159 | | | — | | | — | | | — | |
| Shares outstanding | | | 25,498,810 | | | — | | | — | | | — | |
| Net asset value per sharea | | $ | 8.62 | | | — | | | — | | | — | |
| Maximum offering price per share (net asset value | | | | | | | | | | | | | |
| per share ÷ 97.75%) | | $ | 8.82 | | | — | | | — | | | — | |
| Class C: | | | | | | | | | | | | | |
| Net assets, at value | $ | | 373,397,103 | | $ | 663,969,582 | | $ | 179,861,625 | | $ | 467,332,155 | |
| Shares outstanding | | | 43,310,472 | | | 73,541,368 | | | 17,929,543 | | | 46,320,881 | |
| Net asset value and maximum offering price per sharea | | $ | 8.62 | | $ | 9.03 | | $ | 10.03 | | $ | 10.09 | |
| Class R: | | | | | | | | | | | | | |
| Net assets, at value | | | — | | | — | | | — | | $ | 69,482,944 | |
| Shares outstanding | | | — | | | — | | | — | | | 6,876,834 | |
| Net asset value and maximum offering price per share | | | — | | | — | | | — | | $ | 10.10 | |
| Class R6: | | | | | | | | | | | | | |
| Net assets, at value | $ | | 5,436,771 | | $ | 6,710 | | $ | 500,239,640 | | $ | 61,256,720 | |
| Shares outstanding | | | 629,272 | | | 744 | | | 49,646,675 | | | 6,034,826 | |
| Net asset value and maximum offering price per share | | $ | 8.64 | | $ | 9.02 | | $ | 10.08 | | $ | 10.15 | |
| Advisor Class: | | | | | | | | | | | | | |
| Net assets, at value | $ | | 348,832,825 | | $ | 1,559,448,376 | | $ | 160,566,987 | | $ | 1,331,915,066 | |
| Shares outstanding | | | 40,395,214 | | | 172,685,741 | | | 15,934,510 | | | 131,258,327 | |
| Net asset value and maximum offering price per share | | $ | 8.64 | | $ | 9.03 | | $ | 10.08 | | $ | 10.15 | |
| |
| aRedemption price is equal to net asset value less contingent deferred sales charges, if applicable. | |
| 114 | Semiannual Report | The accompanying notes are an integral part of these financial statements. | franklintempleton.com |
FRANKLIN INVESTORS SECURITIES TRUST
FINANCIAL STATEMENTS
| | | | | | | | | | | | |
| Statements of Operations | | | | | | | | | | | | |
| for the six months ended April 30, 2015 (unaudited) | | | | | | | | | | | | |
| |
| | | Franklin | | | Franklin | | | Franklin | | | | |
| | | Adjustable | | | Floating Rate | | | Low Duration | | | Franklin | |
| | | U.S. Government | | | Daily Access | | | Total Return | | | Total Return | |
| | | Securities Fund | | | Fund | | | Fund | | | Fund | |
| Investment income: | | | | | | | | | | | | |
| Dividends | $ | — | | $ | 275,010 | | $ | 365,892 | | $ | 1,957,095 | |
| Interest | | 20,516,724 | | | 112,638,527 | | | 24,125,991 | | | 70,185,528 | |
| Paydown gain (loss) | | (6,084,930 | ) | | — | | | (517,212 | ) | | 78,328 | |
| Total investment income | | 14,431,794 | | | 112,913,537 | | | 23,974,671 | | | 72,220,951 | |
| Expenses: | | | | | | | | | | | | |
| Management fees (Note 3a) | | 5,102,475 | | | 10,098,224 | | | 6,079,509 | | | 12,142,204 | |
| Distribution fees: (Note 3c) | | | | | | | | | | | | |
| Class A | | 1,272,217 | | | 2,146,179 | | | 1,987,621 | | | 4,196,330 | |
| Class A1 | | 107,658 | | | — | | | — | | | — | |
| Class C | | 1,288,368 | | | 2,217,531 | | | 558,985 | | | 1,462,803 | |
| Class R | | — | | | — | | | — | | | 162,768 | |
| Transfer agent fees: (Note 3e) | | | | | | | | | | | | |
| Class A | | 693,706 | | | 872,415 | | | 1,246,010 | | | 2,647,397 | |
| Class A1 | | 160,566 | | | — | | | — | | | — | |
| Class C | | 270,182 | | | 346,550 | | | 135,704 | | | 355,232 | |
| Class R | | — | | | — | | | — | | | 51,249 | |
| Class R6 | | 116 | | | 83 | | | 198 | | | 158 | |
| Advisor Class | | 260,852 | | | 863,474 | | | 133,286 | | | 1,029,428 | |
| Custodian fees (Note 4) | | 8,262 | | | 19,050 | | | 43,663 | | | 142,531 | |
| Reports to shareholders | | 103,101 | | | 176,711 | | | 113,766 | | | 328,989 | |
| Registration and filing fees | | 85,790 | | | 123,510 | | | 132,150 | | | 133,554 | |
| Professional fees | | 57,229 | | | 54,762 | | | 45,911 | | | 62,844 | |
| Trustees’ fees and expenses | | 11,568 | | | 31,180 | | | 15,101 | | | 27,802 | |
| Other | | 113,343 | | | 49,789 | | | 106,400 | | | 97,514 | |
| Total expenses | | 9,535,433 | | | 16,999,458 | | | 10,598,304 | | | 22,840,803 | |
| Expense reductions (Note 4) | | (65 | ) | | (821 | ) | | (997 | ) | | (2,835 | ) |
| Expenses waived/paid by affiliates (Note 3f and 3g) | | (33,332 | ) | | (202,997 | ) | | (1,700,010 | ) | | (852,105 | ) |
| Net expenses | | 9,502,036 | | | 16,795,640 | | | 8,897,297 | | | 21,985,863 | |
| Net investment income | | 4,929,758 | | | 96,117,897 | | | 15,077,374 | | | 50,235,088 | |
| Realized and unrealized gains (losses): | | | | | | | | | | | | |
| Net realized gain (loss) from: | | | | | | | | | | | | |
| Investments | | 1,708,673 | | | (2,155,429 | ) | | (3,256,565 | ) | | 31,628,192 | |
| Written options | | — | | | — | | | (207,580 | ) | | (817,890 | ) |
| Foreign currency transactions | | — | | | — | | | 17,404,507 | | | 59,625,804 | |
| Futures contracts | | — | | | — | | | (2,305,288 | ) | | (3,431,824 | ) |
| Swap contracts | | — | | | 737,324 | | | (273,183 | ) | | 31,134 | |
| Net realized gain (loss) | | 1,708,673 | | | (1,418,105 | ) | | 11,361,891 | | | 87,035,416 | |
| Net change in unrealized appreciation (depreciation) on: | | | | | | | | | | | | |
| Investments | | (4,872,448 | ) | | (15,193,799 | ) | | (9,374,436 | ) | | (52,106,088 | ) |
| Translation of other assets and liabilities denominated in | | | | | | | | | | | | |
| foreign currencies | | — | | | — | | | 243,537 | | | (1,780,992 | ) |
| Net change in unrealized appreciation | | | | | | | | | | | | |
| (depreciation) | | (4,872,448 | ) | | (14,706,616 | ) | | (9,130,899 | ) | | (53,887,080 | ) |
| Net realized and unrealized gain (loss) | | (3,163,775 | ) | | (16,611,904 | ) | | 2,230,992 | | | 33,148,336 | |
| Net increase (decrease) in net assets resulting from operations | $ | 1,765,983 | | $ | 79,505,993 | | $ | 17,308,366 | | $ | 83,383,424 | |
franklintempleton.com The accompanying notes are an integral part of these financial statements. | Semiannual Report | 115
| | | | | | | | | | | | |
| FRANKLIN INVESTORS SECURITIES TRUST | | | | | | | | | | |
| FINANCIAL STATEMENTS | | | | | | | | | | | | |
| |
| |
| Statements of Changes in Net Assets | | | | | | | | | | | | |
| |
| | | Franklin Adjustable U.S. | | | Franklin Floating Rate | |
| | | Government Securities Fund | | | Daily Access Fund | |
| | | Six Months Ended | | | | | | Six Months Ended | | | | |
| | | April 30, 2015 | | | Year Ended | | | April 30, 2015 | | | Year Ended | |
| | | (unaudited) | | | October 31, 2014 | | | (unaudited) | | | October 31, 2014 | |
| Increase (decrease) in net assets: | | | | | | | | | | | | |
| Operations: | | | | | | | | | | | | |
| Net investment income | $ | 4,929,758 | | $ | 9,067,013 | | $ | 96,117,897 | | $ | 198,907,227 | |
| Net realized gain (loss) from investments, | | | | | | | | | | | | |
| foreign currency transactions and | | | | | | | | | | | | |
| swap contracts | | 1,708,673 | | | 3,915,694 | | | (1,418,105 | ) | | (8,313,287 | ) |
| Net change in unrealized appreciation | | | | | | | | | | | | |
| (depreciation) on investments | | (4,872,448 | ) | | (2,629,298 | ) | | (15,193,799 | ) | | (81,149,255 | ) |
| Net increase (decrease) in net assets | | | | | | | | | | | | |
| resulting from operations | | 1,765,983 | | | 10,353,409 | | | 79,505,993 | | | 109,444,685 | |
| Distributions to shareholders from: | | | | | | | | | | | | |
| Net investment income: | | | | | | | | | | | | |
| Class A | | (5,842,304 | ) | | (11,928,926 | ) | | (39,905,698 | ) | | (74,547,275 | ) |
| Class A1 | | (1,585,690 | ) | | (1,177,522 | ) | | — | | | — | |
| Class C | | (1,464,056 | ) | | (3,781,138 | ) | | (14,486,809 | ) | | (25,713,482 | ) |
| Class R6 | | (53,047 | ) | | (16,641 | ) | | (4,012 | ) | | (41,968 | ) |
| Advisor Class | | (2,686,139 | ) | | (5,442,375 | ) | | (41,554,081 | ) | | (98,835,459 | ) |
| Total distributions to shareholders | | (11,631,236 | ) | | (22,346,602 | ) | | (95,950,600 | ) | | (199,138,184 | ) |
| Capital share transactions: (Note 2) | | | | | | | | | | | | |
| Class A | | (41,784,420 | ) | | (40,535,806 | ) | | (204,481,851 | ) | | (82,128,941 | ) |
| Class A1 | | (31,915,739 | ) | | 253,376,829 | | | — | | | — | |
| Class C | | (52,740,096 | ) | | (172,020,740 | ) | | (76,423,089 | ) | | (9,898,411 | ) |
| Class R6 | | (1,717,834 | ) | | 6,866,077 | | | (451,801 | ) | | (858,754 | ) |
| Advisor Class | | (66,200,660 | ) | | 7,939,064 | | | (451,403,761 | ) | | (313,238,514 | ) |
| Total capital share transactions | | (194,358,749 | ) | | 55,625,424 | | | (732,760,502 | ) | | (406,124,620 | ) |
| Net increase (decrease) in net assets | | (204,224,002 | ) | | 43,632,231 | | | (749,205,109 | ) | | (495,818,119 | ) |
| Net assets: | | | | | | | | | | | | |
| Beginning of period | | 2,163,936,628 | | | 2,120,304,397 | | | 4,637,412,159 | | | 5,133,230,278 | |
| End of period | $ | 1,959,712,626 | | $ | 2,163,936,628 | | $ | 3,888,207,050 | | $ | 4,637,412,159 | |
| Undistributed net investment income | | | | | | | | | | | | |
| (distributions in excess of net investment | | | | | | | | | | | | |
| income) included in net assets: | | | | | | | | | | | | |
| End of period | $ | (9,139,673 | ) | $ | (2,438,195 | ) | $ | 1,359,785 | | $ | 1,192,488 | |
116 | Semiannual Report | The accompanying notes are an integral part of these financial statements. franklintempleton.com
| | | | | | | | | | | | |
| | | | | | FRANKLIN INVESTORS SECURITIES TRUST | |
| | | | | | | | | FINANCIAL STATEMENTS | |
| |
| |
| Statements of Changes in Net Assets (continued) | | | | | | | | | | |
| |
| | | Franklin Low Duration | | | Franklin | |
| | | Total Return Fund | | | Total Return Fund | |
| | | Six Months Ended | | | | | | Six Months Ended | | | | |
| | | April 30, 2015 | | | Year Ended | | | April 30, 2015 | | | Year Ended | |
| | | (unaudited) | | | October 31, 2014 | | | (unaudited) | | | October 31, 2014 | |
| Increase (decrease) in net assets: | | | | | | | | | | | | |
| Operations: | | | | | | | | | | | | |
| Net investment income | $ | 15,077,374 | | $ | 27,496,896 | | $ | 50,235,088 | | $ | 118,502,329 | |
| Net realized gain (loss) from investments, | | | | | | | | | | | | |
| written options, foreign currency transactions, | | | | | | | | | | | | |
| futures contracts and swap contracts | | 11,361,891 | | | (1,379,529 | ) | | 87,035,416 | | | 88,651,417 | |
| Net change in unrealized appreciation | | | | | | | | | | | | |
| (depreciation) on investments and translation | | | | | | | | | | | | |
| of other assets and liabilities denominated in | | | | | | | | | | | | |
| foreign currencies | | (9,130,899 | ) | | 2,295,605 | | | (53,887,080 | ) | | 11,313,890 | |
| Net increase (decrease) in net assets | | | | | | | | | | | | |
| resulting from operations | | 17,308,366 | | | 28,412,972 | | | 83,383,424 | | | 218,467,636 | |
| Distributions to shareholders from: | | | | | | | | | | | | |
| Net investment income and net foreign | | | | | | | | | | | | |
| currency gains: | | | | | | | | | | | | |
| Class A | | (21,533,179 | ) | | (24,898,289 | ) | | (71,674,504 | ) | | (102,897,067 | ) |
| Class C | | (2,100,163 | ) | | (1,997,803 | ) | | (9,074,789 | ) | | (12,913,703 | ) |
| Class R | | — | | | — | | | (1,321,696 | ) | | (1,884,664 | ) |
| Class R6 | | (7,612,238 | ) | | (8,217,276 | ) | | (799,522 | ) | | (1,155,656 | ) |
| Advisor Class | | (2,517,581 | ) | | (3,503,516 | ) | | (28,882,594 | ) | | (42,392,733 | ) |
| Total distributions to shareholders | | (33,763,161 | ) | | (38,616,884 | ) | | (111,753,105 | ) | | (161,243,823 | ) |
| Capital share transactions: (Note 2) | | | | | | | | | | | | |
| Class A | | 51,728,844 | | | 299,933,209 | | | 262,650,161 | | | 155,465,903 | |
| Class C | | 15,155,510 | | | 52,495,559 | | | 37,426,415 | | | (27,632,362 | ) |
| Class R | | — | | | — | | | 10,556,260 | | | (6,823,750 | ) |
| Class R6 | | 84,797,047 | | | 419,577,578 | | | 35,318,007 | | | (301,532,836 | ) |
| Advisor Class | | (36,882,707 | ) | | 43,352,531 | | | 57,398,191 | | | 117,287,658 | |
| Total capital share transactions | | 114,798,694 | | | 815,358,877 | | | 403,349,034 | | | (63,235,387 | ) |
| Net increase (decrease) in net assets | | 98,343,899 | | | 805,154,965 | | | 374,979,353 | | | (6,011,574 | ) |
| Net assets: | | | | | | | | | | | | |
| Beginning of period | | 2,373,039,164 | | | 1,567,884,199 | | | 5,012,793,947 | | | 5,018,805,521 | |
| End of period | $ | 2,471,383,063 | | $ | 2,373,039,164 | | $ | 5,387,773,300 | | $ | 5,012,793,947 | |
| Undistributed net investment income | | | | | | | | | | | | |
| (distributions in excess of net investment | | | | | | | | | | | | |
| income) included in net assets: | | | | | | | | | | | | |
| End of period | $ | (25,931,718 | ) | $ | (7,245,931 | ) | $ | (47,264,447 | ) | $ | 14,253,570 | |
franklintempleton.com The accompanying notes are an integral part of these financial statements. | Semiannual Report | 117
FRANKLIN INVESTORS SECURITIES TRUST
Notes to Financial Statements (unaudited)
1. Organization and Significant Accounting Policies
Franklin Investors Securities Trust (Trust) is registered under the Investment Company Act of 1940, as amended, (1940 Act) as an open-end management investment company, consisting of eight separate funds, four of which are included in this report (Funds) and applies the specialized accounting and reporting guidance in U.S. Generally Accepted Accounting Principles (U.S. GAAP). The financial statements of the remaining funds in the Trust are presented separately. The classes of shares offered within each of the Funds are indicated below. Each class of shares differs by its initial sales load, contingent deferred sales charges, voting rights on matters affecting a single class, its exchange privilege and fees primarily due to differing arrangements for distribution and transfer agent fees.
|
| Class A, Class A1, Class C, Class R6 & Advisor Class |
| Franklin Adjustable U.S. Government Securities Fund |
| |
| Class A, Class C, Class R6 & Advisor Class |
| Franklin Floating Rate Daily Access Fund |
| Franklin Low Duration Total Return Fund |
| |
| Class A, Class C, Class R, Class R6 & Advisor Class |
| Franklin Total Return Fund |
The following summarizes the Funds’ significant accounting policies.
a. Financial Instrument Valuation
The Funds’ investments in financial instruments are carried at fair value daily. Fair value is the price that would be received to sell an asset or paid to transfer a liability in an orderly trans action between market participants on the measurement date. The Funds calculate the net asset value (NAV) per share at the close of the New York Stock Exchange (NYSE), generally at 4 p.m. Eastern time (NYSE close) on each day the NYSE is open for trading. Under compliance policies and procedures approved by the Trust’s Board of Trustees (the Board), the Funds’ administrator has responsibility for oversight of valuation, including leading the cross-functional Valuation and Liquidity Oversight Committee (VLOC). The VLOC provides administration and oversight of the Funds’ valuation policies and procedures, which are approved annually by the Board. Among other things, these procedures allow the Funds to utilize independent pricing services, quotations from securities and financial instrument dealers, and other market sources to determine fair value.
Equity securities, exchange traded funds and derivative financial instruments (derivatives) listed on an exchange or on the NASDAQ National Market System are valued at the last quoted sale price or the official closing price of the day, respectively. Over-the-counter (OTC) securities are valued within the range of the most recent quoted bid and ask prices. Securities that trade in multiple markets or on multiple exchanges are valued according to the broadest and most representative market. Certain equity securities are valued based upon fundamental characteristics or relationships to similar securities. Investments in open-end mutual funds are valued at the closing NAV.
Debt securities generally trade in the OTC market rather than on a securities exchange. The Funds’ pricing services use multiple valuation techniques to determine fair value. In instances where sufficient market activity exists, the pricing services may utilize a market-based approach through which quotes from market makers are used to determine fair value. In instances where sufficient market activity may not exist or is limited, the pricing services also utilize proprietary valuation models which may consider market characteristics such as benchmark yield curves, credit spreads, estimated default rates, anticipated market interest rate volatility, coupon rates, anticipated timing of principal repayments, underlying collateral, and other unique security features in order to estimate the relevant cash flows, which are then discounted to calculate the fair value. Securities denominated in a foreign currency are converted into their U.S. dollar equivalent at the foreign exchange rate in effect at the NYSE close on the date that the values of the foreign debt securities are determined.
Certain derivatives trade in the OTC market. The Funds’ pricing services use various techniques including industry standard option pricing models and proprietary discounted cash flow models to determine the fair value of those instruments. The Funds’ net benefit or obligation under the derivative contract, as measured by the fair value of the contract, is included in net assets.
The Funds have procedures to determine the fair value of financial instruments for which market prices are not reliable or readily available. Under these procedures, the VLOC convenes on a regular basis to review such financial instruments and considers a number of factors, including significant unobservable valuation inputs, when arriving at fair value. The VLOC primarily employs a market-based approach which may use related or comparable assets or liabilities, recent transactions, market multiples, book values, and other relevant
118 | Semiannual Report
franklintempleton.com
FRANKLIN INVESTORS SECURITIES TRUST
NOTES TO FINANCIAL STATEMENTS (UNAUDITED)
information for the investment to determine the fair value of the investment. An income-based valuation approach may also be used in which the anticipated future cash flows of the investment are discounted to calculate fair value. Discounts may also be applied due to the nature or duration of any restrictions on the disposition of the investments. Due to the inherent uncertainty of valuations of such investments, the fair values may differ significantly from the values that would have been used had an active market existed. The VLOC employs various methods for calibrating these valuation approaches including a regular review of key inputs and assumptions, transactional back-testing or disposition analysis, and reviews of any related market activity.
b. Foreign Currency Translation
Portfolio securities and other assets and liabilities denominated in foreign currencies are translated into U.S. dollars based on the exchange rate of such currencies against U.S. dollars on the date of valuation. The Funds may enter into foreign currency exchange contracts to facilitate transactions denominated in a foreign currency. Purchases and sales of securities, income and expense items denominated in foreign currencies are translated into U.S. dollars at the exchange rate in effect on the transaction date. Portfolio securities and assets and liabilities denominated in foreign currencies contain risks that those currencies will decline in value relative to the U.S. dollar. Occasionally, events may impact the availability or reliability of foreign exchange rates used to convert the U.S. dollar equivalent value. If such an event occurs, the foreign exchange rate will be valued at fair value using procedures established and approved by the Board.
The Funds do not separately report the effect of changes in foreign exchange rates from changes in market prices on securities held. Such changes are included in net realized and unrealized gain or loss from investments in the Statements of Operations.
Realized foreign exchange gains or losses arise from sales of foreign currencies, currency gains or losses realized between the trade and settlement dates on securities transactions and the difference between the recorded amounts of dividends, interest, and foreign withholding taxes and the U.S. dollar equivalent of the amounts actually received or paid. Net unrealized foreign exchange gains and losses arise from changes in foreign exchange rates on foreign denominated assets and liabilities other than investments in securities held at the end of the reporting period.
c. Securities Purchased on a When-Issued, Delayed Delivery, and TBA Basis
The Funds purchase securities on a when-issued, delayed delivery, and to-be-announced (TBA) basis, with payment and delivery scheduled for a future date. These transactions are subject to market fluctuations and are subject to the risk that the value at delivery may be more or less than the trade date purchase price. Although the Funds will generally purchase these securities with the intention of holding the securities, they may sell the securities before the settlement date. Sufficient assets have been segregated for these securities and collateral has been pledged and/or received for open TBA trades.
d. Derivative Financial Instruments
The Funds, except Franklin Adjustable U.S. Government Securities Fund, invested in derivatives in order to manage risk or gain exposure to various other investments or markets. Derivatives are financial contracts based on an underlying or notional amount, require no initial investment or an initial net investment that is smaller than would normally be required to have a similar response to changes in market factors, and require or permit net settlement. Derivatives contain various risks including the potential inability of the counterparty to fulfill their obligations under the terms of the contract, the potential for an illiquid secondary market, and/or the potential for market movements which expose the fund to gains or losses in excess of the amounts shown in the Statements of Assets and Liabilities. Realized gain and loss and unrealized appreciation and depreciation on these contracts for the period are included in the Statements of Operations.
Derivative counterparty credit risk is managed through a formal evaluation of the creditworthiness of all potential counterparties. Franklin Low Duration Total Return Fund and Franklin Total Return Fund attempt to reduce their exposure to counterparty credit risk on OTC derivatives, whenever possible, by entering into International Swaps and Derivatives Association (ISDA) master agreements with certain counter-parties. These agreements contain various provisions, including but not limited to collateral requirements, events of default, or early termination. Termination events applicable to the counter-party include certain deteriorations in the credit quality of the counterparty. Termination events applicable to the funds include failure of the funds to maintain certain net asset levels and/or limit the decline in net assets over various periods of time. In the event of default or early termination, the ISDA
franklintempleton.com
Semiannual Report | 119
FRANKLIN INVESTORS SECURITIES TRUST
NOTES TO FINANCIAL STATEMENTS (UNAUDITED)
1. Organization and Significant Accounting
Policies (continued)
d. Derivative Financial Instruments (continued)
master agreement gives the non-defaulting party the right to net and close-out all transactions traded, whether or not arising under the ISDA agreement, to one net amount payable by one counterparty to the other. However, absent an event of default or early termination, OTC derivative assets and liabilities are presented gross and not offset in the Statements of Assets and Liabilities. Early termination by the counterparty may result in an immediate payment by the funds of any net liability owed to that counterparty under the ISDA agreement.
Collateral requirements differ by type of derivative. Collateral or initial margin requirements are set by the broker or exchange clearing house for exchange traded and centrally cleared derivatives. Initial margin deposited is held at the exchange and can be in the form of cash and/or securities. For OTC derivatives traded under an ISDA master agreement, posting of collateral is required by either the fund or the applicable counterparty if the total net exposure of all OTC derivatives with the applicable counterparty exceeds the minimum transfer amount, which typically ranges from $100,000 to $250,000, and can vary depending on the counterparty and the type of the agreement. Generally, collateral is determined at the close of fund business each day and any additional collateral required due to changes in derivative values may be delivered by the fund or the counterparty within a few business days. Collateral pledged and/or received by the fund for OTC derivatives, if any, is held in segregated accounts with the fund’s custodian/ counterparty broker and can be in the form of cash and/or securities. Unrestricted cash may be invested according to the funds’ investment objectives.
Franklin Low Duration Total Return Fund and Franklin Total Return Fund entered into exchange traded financial futures contracts primarily to manage and/or gain exposure to interest rate risk. A futures contract is an agreement between the fund and a counterparty to buy or sell an asset for a specified price on a future date. Required initial margins are pledged by the fund, and the daily change in fair value is accounted for as a variation margin payable or receivable in the Statements of Assets and Liabilities.
Franklin Low Duration Total Return Fund and Franklin Total Return Fund entered into OTC forward exchange contracts primarily to manage and/or gain exposure to certain foreign currencies. A forward exchange contract is an agreement between the fund and a counterparty to buy or sell a foreign currency at a specific exchange rate on a future date.
The Funds, except Franklin Adjustable U.S. Government Securities Fund, entered into credit default swap contracts primarily to manage and/or gain exposure to credit risk. A credit default swap is an agreement between the fund and a counter-party whereby the buyer of the contract receives credit protection and the seller of the contract guarantees the credit worthiness of a referenced debt obligation. These agreements may be privately negotiated in the over-the-counter market (“OTC credit default swaps”) or may be executed in a multilateral trade facility platform, such as a registered exchange (“centrally cleared credit default swaps”). The underlying referenced debt obligation may be a single issuer of corporate or sovereign debt, a credit index, or a tranche of a credit index. In the event of a default of the underlying referenced debt obligation, the buyer is entitled to receive the notional amount of the credit default swap contract from the seller in exchange for the referenced debt obligation, a net settlement amount equal to the notional amount of the credit default swap less the recovery value of the referenced debt obligation, or other agreed upon amount. For centrally cleared credit default swaps, required initial margins are pledged by the fund, and the daily change in fair value is accounted for as a variation margin payable or receivable in the Statements of Assets and Liabilities. Over the term of the contract, the buyer pays the seller a periodic stream of payments, provided that no event of default has occurred. Such periodic payments are accrued daily as an unrealized appreciation or depreciation until the payments are made, at which time they are realized. Payments received or paid to initiate a credit default swap contract are reflected in the Statements of Assets and Liabilities and represent compensating factors between stated terms of the credit default swap agreement and prevailing market conditions (credit spreads and other relevant factors). These upfront payments are amortized over the term of the contract as a realized gain or loss in the Statements of Operations.
Franklin Low Duration Total Return Fund and Franklin Total Return Fund entered into OTC cross currency swap contracts primarily to manage and/or gain exposure to interest rate risk and certain foreign currencies. A cross currency swap is an agreement between the fund and a counterparty to exchange cash flows (determined using either a fixed or floating rate) based on the notional amounts of two different currencies. The notional amounts are typically determined based on the spot
120 | Semiannual Report
franklintempleton.com
FRANKLIN INVESTORS SECURITIES TRUST
NOTES TO FINANCIAL STATEMENTS (UNAUDITED)
exchange rates at the opening of the contract. Cross currency swaps may require the exchange of notional amounts at the opening and/or closing of the contract. Over the term of the contract, contractually required payments to be paid and to be received are accrued daily and recorded as unrealized depreciation and appreciation until the payments are made, at which time they are realized. Payments received or paid to initiate a cross currency swap contract are reflected in the Statements of Assets and Liabilities and represent compensating factors between stated terms of the cross currency swap contract and prevailing market conditions (interest rate spreads and other relevant factors). These upfront payments are amortized over the term of the contract as a realized gain or loss in the Statements of Operations.
Franklin Low Duration Total Return Fund and Franklin Total Return Fund purchased or wrote OTC option contracts primarily to manage and/or gain exposure to credit risk. An option is a contract entitling the holder to purchase or sell a specific amount of shares or units of an asset or notional amount of a swap (swaption), at a specified price. Options purchased are recorded as an asset while options written are recorded as a liability. Upon exercise of an option, the acquisition cost or sales proceeds of the underlying investment is adjusted by any premium received or paid. Upon expiration of an option, any premium received or paid is recorded as a realized gain or loss. Upon closing an option other than through expiration or exercise, the difference between the premium received or paid and the cost to close the position is recorded as a realized gain or loss.
See Notes 6 and 10 regarding investment transactions and other derivative information, respectively.
e. Restricted Cash
At April 30, 2015, Franklin Low Duration Total Return Fund and Franklin Total Return Fund held restricted cash in connection with investments in certain derivative securities. Restricted cash is held in a segregated account with the fund’s custodian and is reflected in the Statements of Assets and Liabilities.
f. Loan Participation Notes
Franklin Total Return Fund invests in loan participation notes (“Participations”). Participations are loans originally issued to a borrower by one or more financial institutions (the “Lender”) and subsequently sold to other investors, such as the fund. Participations typically result in the fund having a contractual relationship only with the Lender and not with the borrower.
The fund has the right to receive from the Lender any payments of principal, interest and fees which the Lender received from the borrower. The fund generally has no rights to either enforce compliance by the borrower with the terms of the loan agreement or to any collateral relating to the original loan. As a result, the fund assumes the credit risk of both the borrower and the Lender that is selling the Participation. The Participations may also involve interest rate risk and liquidity risk, including the potential default or insolvency of the borrower and/or the Lender.
g. Investments in FT Holdings Corporation I (FT Subsidiary)
Franklin Total Return Fund invests in certain financial instruments through its investment in the FT subsidiary. The FT subsidiary is a Delaware Corporation, is a wholly-owned subsidiary of the fund, and is able to invest in certain financial instruments consistent with the investment objective of the fund. At April 30, 2015, the FT subsidiary’s investment, Turtle Bay Resort, as well as any other assets and liabilities of the FT subsidiary are reflected in the fund’s Statement of Investments and Statement of Assets and Liabilities. The financial statements have been consolidated and include the accounts of the fund and the FT subsidiary. All intercompany transactions and balances have been eliminated.
h. Mortgage Dollar Rolls
Franklin Total Return Fund enters into mortgage dollar rolls, typically on a TBA basis. Mortgage dollar rolls are agreements between the fund and a financial institution to simultaneously sell and repurchase mortgage-backed securities at a future date. Gains or losses are realized on the initial sale, and the difference between the repurchase price and the sale price is recorded as an unrealized gain or loss to the fund upon entering into the mortgage dollar roll. In addition, the fund may invest the cash proceeds that are received from the initial sale. During the period between the sale and repurchase, the fund is not entitled to principal and interest paid on the mortgage backed securities. The risks of mortgage dollar roll transactions include the potential inability of the counterparty to fulfill its obligations.
i. Senior Floating Rate Interests
The Funds, except Franklin Adjustable U.S. Government Securities Fund, invest in senior secured corporate loans that pay interest at rates which are periodically reset by reference to a base lending rate plus a spread. These base lending rates are generally the prime rate offered by a designated U.S. bank or
franklintempleton.com
Semiannual Report | 121
FRANKLIN INVESTORS SECURITIES TRUST
NOTES TO FINANCIAL STATEMENTS (UNAUDITED)
1. Organization and Significant Accounting
Policies (continued)
i. Senior Floating Rate Interests (continued)
he London InterBank Offered Rate (LIBOR). Senior secured corporate loans often require prepayment of principal from excess cash flows or at the discretion of the borrower. As a result, actual maturity may be substantially less than the stated maturity. Senior secured corporate loans in which the funds invest are generally readily marketable, but may be subject to certain restrictions on resale.
j. Income and Deferred Taxes
It is each fund’s policy to qualify as a regulated investment company under the Internal Revenue Code. Each fund intends to distribute to shareholders substantially all of its taxable income and net realized gains to relieve it from federal income and excise taxes. As a result, no provision for U.S. federal income taxes is required.
The Funds may be subject to foreign taxation related to income received, capital gains on the sale of securities and certain foreign currency transactions in the foreign jurisdictions in which the Funds invest. Foreign taxes, if any, are recorded based on the tax regulations and rates that exist in the foreign markets in which the Funds invest. When a capital gain tax is determined to apply, the Funds record an estimated deferred tax liability in an amount that would be payable if the securities were disposed of on the valuation date.
Each fund recognizes the tax benefits of uncertain tax positions only when the position is “more likely than not” to be sustained upon examination by the tax authorities based on the technical merits of the tax position. As of April 30, 2015, and for all open tax years, each fund has determined that no liability for unrecognized tax benefits is required in each fund’s financial statements related to uncertain tax positions taken on a tax return (or expected to be taken on future tax returns). Open tax years are those that remain subject to examination and are based on each tax jurisdiction’s statute of limitation.
k. Security Transactions, Investment Income, Expenses and Distributions
Security transactions are accounted for on trade date. Realized gains and losses on security transactions are determined on a specific identification basis. Interest income and estimated expenses are accrued daily. Amortization of premium and accretion of discount on debt securities are included in interest income. Paydown gains and losses are recorded separately in the Statements of Operations. Facility fees are recognized as income over the expected term of the loan. Dividend income is recorded on the ex-dividend date. Dividends from net investment income are normally declared daily; these dividends may be reinvested or paid monthly to shareholders. Distributions to shareholders are determined according to income tax regulations (tax basis). Distributable earnings determined on a tax basis may differ from earnings recorded in accordance with U.S. GAAP. These differences may be permanent or temporary. Permanent differences are reclassified among capital accounts to reflect their tax character. These reclassifications have no impact on net assets or the results of operations. Temporary differences are not reclassified, as they may reverse in subsequent periods.
Common expenses incurred by the Trust are allocated among the funds based on the ratio of net assets of each fund to the combined net assets of the Trust. Fund specific expenses are charged directly to the fund that incurred the expense.
Net investment income, not including class specific expenses, is allocated daily to each class of shares based upon the relative value of the settled shares of each class. Realized and unrealized gains and losses are allocated daily to each class of shares based upon the relative proportion of net assets of each class. Differences in per share distributions, by class, are generally due to differences in class specific expenses.
Inflation-indexed bonds are adjusted for inflation through periodic increases or decreases in the security’s interest accruals, face amount, or principal redemption value, by amounts corresponding to the rate of inflation as measured by an index. Any increase or decrease in the face amount or principal redemption value will be included as interest income in the Statements of Operations.
122 | Semiannual Report
franklintempleton.com
FRANKLIN INVESTORS SECURITIES TRUST
NOTES TO FINANCIAL STATEMENTS (UNAUDITED)
l. Accounting Estimates
The preparation of financial statements in accordance with U.S. GAAP requires management to make estimates and assumptions that affect the reported amounts of assets and liabilities at the date of the financial statements and the amounts of income and expenses during the reporting period. Actual results could differ from those estimates.
m. Guarantees and Indemnifications
Under the Trust’s organizational documents, its officers and trustees are indemnified by the Trust against certain liabilities arising out of the performance of their duties to the Trust. Additionally, in the normal course of business, the Trust, on behalf of the Funds, enters into contracts with service providers that contain general indemnification clauses. The Trust’s maximum exposure under these arrangements is unknown as this would involve future claims that may be made against the Trust that have not yet occurred. Currently, the Trust expects the risk of loss to be remote.
2. Shares of Beneficial Interest
At April 30, 2015, there were an unlimited number of shares authorized (without par value). Transactions in the Funds’ shares were as follows:
| | | | | | | | | | |
| | Franklin Adjustable | | | | | | |
| | U.S. Government | | Franklin Floating Rate | |
| | Securities Fund | | Daily Access Fund | |
| | Shares | | | Amount | | Shares | | | Amount | |
| |
| Class A Shares: | | | | | | | | | | |
| Six Months ended April 30, 2015 | | | | | | | | | | |
| Shares sold | 14,171,733 | | $ | 122,589,074 | | 13,997,933 | | $ | 125,537,151 | |
| Shares issued in reinvestment of distributions | 545,333 | | | 4,715,179 | | 4,052,237 | | | 36,363,436 | |
| Shares redeemed | (19,537,012 | ) | | (169,088,673 | ) | (40,903,707 | ) | | (366,382,438 | ) |
| Net increase (decrease) | (4,819,946 | ) | $ | (41,784,420 | ) | (22,853,537 | ) | $ | (204,481,851 | ) |
| Year ended October 31, 2014 | | | | | | | | | | |
| Shares sold | 56,726,333 | | $ | 493,156,230 | | 62,743,683 | | $ | 576,216,697 | |
| Shares issued in reinvestment of distributions | 1,211,754 | | | 10,533,553 | | 7,278,949 | | | 66,675,264 | |
| Shares redeemed | (62,585,334 | ) | | (544,225,589 | ) | (79,152,310 | ) | | (725,020,902 | ) |
| Net increase (decrease) | (4,647,247 | ) | $ | (40,535,806 | ) | (9,129,678 | ) | $ | (82,128,941 | ) |
| Class A1 Shares: | | | | | | | | | | |
| Six Months ended April 30, 2015 | | | | | | | | | | |
| Shares sold | 749,779 | | $ | 6,477,994 | | | | | | |
| Shares issued in reinvestment of distributions | 172,337 | | | 1,489,438 | | | | | | |
| Shares redeemed | (4,613,376 | ) | | (39,883,171 | ) | | | | | |
| Net increase (decrease) | (3,691,260 | ) | $ | (31,915,739 | ) | | | | | |
| Year ended October 31, 2014a | | | | | | | | | | |
| Shares sold | 479,762 | | $ | 4,165,394 | | | | | | |
| Shares issued in reinvestment of distributions | 127,369 | | | 1,104,946 | | | | | | |
| Shares issued on reorganization (Note 11) | 32,861,221 | | | 285,235,398 | | | | | | |
| Shares redeemed | (4,278,282 | ) | | (37,128,909 | ) | | | | | |
| Net increase (decrease) | 29,190,070 | | $ | 253,376,829 | | | | | | |
franklintempleton.com
Semiannual Report | 123
FRANKLIN INVESTORS SECURITIES TRUST
NOTES TO FINANCIAL STATEMENTS (UNAUDITED)
| | | | | | | | | | | |
| 2. Shares of Beneficial Interest (continued) | | | | | | | | | | | |
| | Franklin Adjustable | | | | | | | |
| | U.S. Government | | Franklin Floating Rate | |
| | Securities Fund | | Daily Access Fund | |
| | Shares | | | Amount | | Shares | | | | Amount | |
| |
| Class C Shares: | | | | | | | | | | | |
| Six Months ended April 30, 2015 | | | | | | | | | | | |
| Shares sold | 2,482,913 | | $ | 21,465,483 | | 5,011,762 | | | $ | 44,974,736 | |
| Shares issued in reinvestment of distributions | 155,602 | | | 1,344,618 | | 1,443,831 | | | | 12,956,462 | |
| Shares redeemed | (8,737,882 | ) | | (75,550,197 | ) | (14,998,116 | ) | | (134,354,287 | ) |
| Net increase (decrease) | (6,099,367 | ) | $ | (52,740,096 | ) | (8,542,523 | ) | | $ | (76,423,089 | ) |
| Year ended October 31, 2014 | | | | | | | | | | | |
| Shares sold | 5,880,151 | | $ | 51,098,838 | | 23,556,769 | | | $ | 216,418,991 | |
| Shares issued in reinvestment of distributions | 399,478 | | | 3,470,678 | | 2,500,639 | | | | 22,916,196 | |
| Shares redeemed | (26,069,904 | ) | | (226,590,256 | ) | (27,193,901 | ) | | (249,233,598 | ) |
| Net increase (decrease) | (19,790,275 | ) | $ | (172,020,740 | ) | (1,136,493 | ) | | $ | (9,898,411 | ) |
| Class R6 Shares: | | | | | | | | | | | |
| Six Months ended April 30, 2015 | | | | | | | | | | | |
| Shares sold | 353,578 | | $ | 3,068,698 | | 634 | | | $ | 5,649 | |
| Shares issued on reinvestment of distributions | 6,122 | | | 53,020 | | 439 | | | | 3,938 | |
| Shares redeemed | (558,770 | ) | | (4,839,552 | ) | (51,762 | ) | | | (461,388 | ) |
| Net increase (decrease) | (199,070 | ) | $ | (1,717,834 | ) | (50,689 | ) | | $ | (451,801 | ) |
| Year ended October 31, 2014 | | | | | | | | | | | |
| Shares sold | 944,164 | | $ | 8,206,447 | | 32,816 | | | $ | 300,925 | |
| Shares issued in reinvestment of distributions | 1,906 | | | 16,566 | | 4,573 | | | | 41,968 | |
| Shares issued on reorganization (Note 11) | 73 | | | 634 | | — | | | | — | |
| Shares redeemed | (156,214 | ) | | (1,357,570 | ) | (131,382 | ) | | | (1,201,647 | ) |
| Net increase (decrease) | 789,929 | | $ | 6,866,077 | | (93,993 | ) | | $ | (858,754 | ) |
| Advisor Class Shares: | | | | | | | | | | | |
| Six Months ended April 30, 2015 | | | | | | | | | | | |
| Shares sold | 6,936,322 | | $ | 60,056,213 | | 20,716,218 | | | $ | 185,982,874 | |
| Shares issued in reinvestment of distributions | 257,946 | | | 2,232,583 | | 1,650,815 | | | | 14,814,886 | |
| Shares redeemed | (14,836,516 | ) | | (128,489,456 | ) | (72,856,822 | ) | | (652,201,521 | ) |
| Net increase (decrease) | (7,642,248 | ) | $ | (66,200,660 | ) | (50,489,789 | ) | $ | (451,403,761 | ) |
| Year ended October 31, 2014 | | | | | | | | | | | |
| Shares sold | 19,026,464 | | $ | 165,565,812 | | 116,221,189 | | $ | 1,068,319,332 | |
| Shares issued in reinvestment of distributions | 500,990 | | | 4,358,956 | | 3,385,525 | | | | 31,034,838 | |
| Shares issued on reorganization (Note 11) | 5,945,834 | | | 51,669,297 | | — | | | | — | |
| Shares redeemed | (24,545,150 | ) | | (213,655,001 | ) | (154,435,901 | ) | | (1,412,592,684 | ) |
| Net increase (decrease) | 928,138 | | $ | 7,939,064 | | (34,829,187 | ) | $ | (313,238,514 | ) |
aFor the period June 18, 2014 (effective date) to October 31, 2014 for the Franklin Adjustable U.S. Government Securities Fund.
124 | Semiannual Report
franklintempleton.com
FRANKLIN INVESTORS SECURITIES TRUST
NOTES TO FINANCIAL STATEMENTS (UNAUDITED)
| | | | | | | | | | | |
| | Franklin Low Duration | | | | | | |
| | Total Return Fund | | Franklin Total Return Fund | |
| | Shares | | | | Amount | | Shares | | | Amount | |
| |
| Class A Shares: | | | | | | | | | | | |
| Six Months ended April 30, 2015 | | | | | | | | | | | |
| Shares sold | 28,779,504 | | $ | 289,172,133 | | 58,266,729 | | $ | 591,305,356 | |
| Shares issued in reinvestment of distributions | 1,878,203 | | | | 18,810,781 | | 6,899,096 | | | 69,448,416 | |
| Shares redeemed | (25,505,082 | ) | | (256,254,070 | ) | (39,194,161 | ) | | (398,103,611 | ) |
| Net increase (decrease) | 5,152,625 | | | $ | 51,728,844 | | 25,971,664 | | $ | 262,650,161 | |
| Year ended October 31, 2014 | | | | | | | | | | | |
| Shares sold | 77,018,825 | | $ | 780,315,075 | | 92,296,531 | | $ | 928,904,095 | |
| Shares issued in reinvestment of distributions | 2,326,807 | | | | 23,575,249 | | 9,547,433 | | | 95,480,955 | |
| Shares redeemed | (49,716,506 | ) | | (503,957,115 | ) | (86,470,305 | ) | | (868,919,147 | ) |
| Net increase (decrease) | 29,629,126 | | $ | 299,933,209 | | 15,373,659 | | $ | 155,465,903 | |
| Class C Shares: | | | | | | | | | | | |
| Six Months ended April 30, 2015 | | | | | | | | | | | |
| Shares sold | 4,732,055 | | | $ | 47,513,743 | | 7,810,445 | | $ | 79,051,197 | |
| Shares issued in reinvestment of distributions | 186,224 | | | | 1,862,762 | | 820,786 | | | 8,234,822 | |
| Shares redeemed | (3,410,255 | ) | | | (34,220,995 | ) | (4,926,333 | ) | | (49,859,604 | ) |
| Net increase (decrease) | 1,508,024 | | | $ | 15,155,510 | | 3,704,898 | | $ | 37,426,415 | |
| Year ended October 31, 2014 | | | | | | | | | | | |
| Shares sold | 10,574,750 | | $ | 107,125,166 | | 9,336,837 | | $ | 93,844,642 | |
| Shares issued in reinvestment of distributions | 176,213 | | | | 1,784,721 | | 1,173,668 | | | 11,698,857 | |
| Shares redeemed | (5,569,257 | ) | | | (56,414,328 | ) | (13,316,301 | ) | | (133,175,861 | ) |
| Net increase (decrease) | 5,181,706 | | | $ | 52,495,559 | | (2,805,796 | ) | $ | (27,632,362 | ) |
| Class R Shares: | | | | | | | | | | | |
| Six Months ended April 30, 2015 | | | | | | | | | | | |
| Shares sold | | | | | | | 1,634,512 | | $ | 16,559,171 | |
| Shares issued in reinvestment of distributions | | | | | | | 124,835 | | | 1,254,924 | |
| Shares redeemed | | | | | | | (715,747 | ) | | (7,257,835 | ) |
| Net increase (decrease) | | | | | | | 1,043,600 | | $ | 10,556,260 | |
| Year ended October 31, 2014 | | | | | | | | | | | |
| Shares sold | | | | | | | 1,646,059 | | $ | 16,541,833 | |
| Shares issued in reinvestment of distributions | | | | | | | 178,820 | | | 1,784,140 | |
| Shares redeemed | | | | | | | (2,522,745 | ) | | (25,149,723 | ) |
| Net increase (decrease) | | | | | | | (697,866 | ) | $ | (6,823,750 | ) |
| Class R6 Shares: | | | | | | | | | | | |
| Six Months ended April 30, 2015 | | | | | | | | | | | |
| Shares sold | 12,042,123 | | $ | 121,689,892 | | 3,625,000 | | $ | 36,852,687 | |
| Shares issued on reinvestment of distributions | 755,472 | | | | 7,589,358 | | 3,157 | | | 31,878 | |
| Shares redeemed | (4,425,321 | ) | | | (44,482,203 | ) | (153,827 | ) | | (1,566,558 | ) |
| Net increase (decrease) | 8,372,274 | | | $ | 84,797,047 | | 3,474,330 | | $ | 35,318,007 | |
| Year ended October 31, 2014 | | | | | | | | | | | |
| Shares sold | 43,247,917 | | $ | 440,572,603 | | 2,714,332 | | $ | 27,312,171 | |
| Shares issued in reinvestment of distributions | 808,495 | | | | 8,209,754 | | 97,701 | | | 978,007 | |
| Shares redeemed | (2,874,545 | ) | | | (29,204,779 | ) | (32,991,314 | ) | | (329,823,014 | ) |
| Net increase (decrease) | 41,181,867 | | $ | 419,577,578 | | (30,179,281 | ) | $ | (301,532,836 | ) |
franklintempleton.com
Semiannual Report | 125
FRANKLIN INVESTORS SECURITIES TRUST
NOTES TO FINANCIAL STATEMENTS (UNAUDITED)
| | | | | | | | | | |
| 2. Shares of Beneficial Interest (continued) | | | | | | | | | | |
| | Franklin Low Duration | | | | | | |
| | Total Return Fund | | Franklin Total Return Fund | |
| | Shares | | | Amount | | Shares | | | Amount | |
| |
| Advisor Class Shares: | | | | | | | | | | |
| Six Months ended April 30, 2015 | | | | | | | | | | |
| Shares sold | 3,712,228 | | $ | 37,411,333 | | 16,450,631 | | $ | 167,315,267 | |
| Shares issued in reinvestment of distributions | 173,973 | | | 1,747,968 | | 2,574,402 | | | 25,978,407 | |
| Shares redeemed | (7,540,833 | ) | | (76,042,008 | ) | (13,358,542 | ) | | (135,895,483 | ) |
| Net increase (decrease) | (3,654,632 | ) | $ | (36,882,707 | ) | 5,666,491 | | $ | 57,398,191 | |
| Year ended October 31, 2014 | | | | | | | | | | |
| Shares sold | 14,828,530 | | $ | 150,675,321 | | 32,191,963 | | $ | 324,690,560 | |
| Shares issued in reinvestment of distributions | 234,320 | | | 2,380,850 | | 3,762,761 | | | 37,724,042 | |
| Shares redeemed | (10,796,013 | ) | | (109,703,640 | ) | (24,377,626 | ) | | (245,126,944 | ) |
| Net increase (decrease) | 4,266,837 | | $ | 43,352,531 | | 11,577,098 | | $ | 117,287,658 | |
3. Transactions with Affiliates
Franklin Resources, Inc. is the holding company for various subsidiaries that together are referred to as Franklin Templeton Investments. Certain officers and trustees of the Trust are also officers and/or directors of the following subsidiaries:
| |
| Subsidiary | Affiliation |
| Franklin Advisers, Inc. (Advisers) | Investment manager |
| Franklin Templeton Institutional, LLC (FT Institutional) | Investment manager |
| Franklin Templeton Services, LLC (FT Services) | Administrative manager |
| Franklin Templeton Distributors, Inc. (Distributors) | Principal underwriter |
| Franklin Templeton Investor Services, LLC (Investor Services) | Transfer agent |
a. Management Fees
Franklin Adjustable U.S. Government Securities Fund pays an investment management fee to Advisers based on the average daily net assets of the fund as follows:
| | |
| Annualized Fee Rate | | Net Assets |
| 0.500 | % | Up to and including $5 billion |
| 0.440 | % | Over $5 billion, up to and including $10 billion |
| 0.410 | % | Over $10 billion, up to and including $15 billion |
| 0.380 | % | In excess of $15 billion |
126 | Semiannual Report
franklintempleton.com
FRANKLIN INVESTORS SECURITIES TRUST
NOTES TO FINANCIAL STATEMENTS (UNAUDITED)
Franklin Floating Rate Daily Access Fund pays an investment management fee to Advisers based on the average daily net assets of the fund as follows:
| | |
| Annualized Fee Rate | | Net Assets |
| 0.650 | % | Up to and including $500 million |
| 0.550 | % | Over $500 million, up to and including $1 billion |
| 0.500 | % | Over $1 billion, up to and including $1.5 billion |
| 0.450 | % | Over $1.5 billion, up to and including $6.5 billion |
| 0.425 | % | Over $6.5 billion, up to and including $11.5 billion |
| 0.400 | % | Over $11.5 billion, up to and including $16.5 billion |
| 0.390 | % | Over $16.5 billion, up to and including $19 billion |
| 0.380 | % | Over $19 billion, up to and including $21.5 billion |
| 0.370 | % | In excess of $21.5 billion |
Franklin Low Duration Total Return Fund and Franklin Total Return Fund pay an investment management fee to Advisers based on the average daily net assets of each of the funds as follows:
| | |
| Annualized Fee Rate | | Net Assets |
| 0.625 | % | Up to and including $500 million |
| 0.525 | % | Over $500 million, up to and including $1 billion |
| 0.480 | % | Over $1 billion, up to and including $1.5 billion |
| 0.435 | % | Over $1.5 billion, up to and including $6.5 billion |
| 0.415 | % | Over $6.5 billion, up to and including $11.5 billion |
| 0.400 | % | Over $11.5 billion, up to and including $16.5 billion |
| 0.390 | % | Over $16.5 billion, up to and including $19 billion |
| 0.380 | % | Over $19 billion, up to and including $21.5 billion |
| 0.370 | % | In excess of $21.5 billion |
Under a subadvisory agreement, FT Institutional, an affiliate of Advisers, provides subadvisory services to Franklin Total Return Fund. The subadvisory fee is paid by Advisers based on the fund’s average daily net assets, and is not an additional expense of the fund.
b. Administrative Fees
Under an agreement with Advisers, FT Services provides administrative services to the Funds. The fee is paid by Advisers based on each of the Funds’ average daily net assets, and is not an additional expense of the Funds.
c. Distribution Fees
The Board has adopted distribution plans for each share class, with the exception of Class R6 and Advisor Class shares, pursuant to Rule 12b-1 under the 1940 Act. Distribution fees are not charged on shares held by affiliates. Under the funds’ Class A and A1 reimbursement distribution plans, the funds reimburse Distributors for costs incurred in connection with the servicing, sale and distribution of each fund’s shares up to the maximum annual plan rate for each class. Under the Class A and A1 reimbursement distribution plans, costs exceeding the maximum for the current plan year cannot be reimbursed in subsequent periods. In addition, under the funds’ Class C and R compensation distribution plans, the funds pays Distributors for costs incurred in connection with the servicing, sale and distribution of each fund’s shares up to the maximum annual plan rate for each class. The plan year, for purposes of monitoring compliance with the maximum annual plan rates, is February 1 through January 31 for each fund.
franklintempleton.com
Semiannual Report | 127
FRANKLIN INVESTORS SECURITIES TRUST
NOTES TO FINANCIAL STATEMENTS (UNAUDITED)
3. Transactions with Affiliates (continued)
c. Distribution Fees (continued)
The maximum annual plan rates, based on the average daily net assets, for each class, are as follows:
| | | | | | | | |
| | Franklin | | Franklin | | Franklin | | | |
| | Adjustable | | Floating | | Low Duration | | Franklin | |
| | U.S. Government | | Rate Daily | | Total Return | | Total Return | |
| | Securities Fund | | Access Fund | | Fund | | Fund | |
| Reimbursement Plans: | | | | | | | | |
| Class A | 0.25 | % | 0.25 | % | 0.25 | % | 0.25 | % |
| Class A1 | 0.10 | % | — | | — | | — | |
| Compensation Plans: | | | | | | | | |
| Class C | 0.65 | % | 0.65 | % | 0.65 | % | 0.65 | % |
| Class R | — | | — | | — | | 0.50 | % |
d. Sales Charges/Underwriting Agreements
Front-end sales charges and contingent deferred sales charges (CDSC) do not represent expenses of the Funds. These charges are deducted from the proceeds of sales of fund shares prior to investment or from redemption proceeds prior to remittance, as applicable. Distributors has advised the Funds of the following commission transactions related to the sales and redemptions of the Funds’ shares for the period:
| | | | | | | | |
| | | Franklin | | Franklin | | Franklin | | |
| | | Adjustable | | Floating | | Low Duration | | Franklin |
| | | U.S. Government | | Rate Daily | | Total Return | | Total Return |
| | | Securities Fund | | Access Fund | | Fund | | Fund |
| |
| Sales charges retained net of commissions paid to unaffiliated | | | | | | | | |
| broker/dealers | $ | 67,653 | $ | 73,710 | $ | 290,149 | $ | 1,415,598 |
| CDSC retained | $ | 23,884 | $ | 67,789 | $ | 45,168 | $ | 30,165 |
e. Transfer Agent Fees
Each class of shares, except for Class R6, pays transfer agent fees to Investor Services for its performance of shareholder servicing obligations and reimburses Investor Services for out of pocket expenses incurred, including shareholding servicing fees paid to third parties. These fees are allocated daily based upon their relative proportion of such classes’ aggregate net assets. Class R6 pays Investor Services transfer agent fees specific to that class.
For the period ended April 30, 2015, the Funds paid transfer agent fees as noted in the Statements of Operations of which the following amounts were retained by Investor Services:
| | | | | | | | |
| | | Franklin | | Franklin | | Franklin | | |
| | | Adjustable | | Floating | | Low Duration | | Franklin |
| | | U.S. Government | | Rate Daily | | Total Return | | Total Return |
| | | Securities Fund | | Access Fund | | Fund | | Fund |
| |
| Transfer agent fees | $ | 631,255 | $ | 634,385 | $ | 613,068 | $ | 1,337,908 |
128 | Semiannual Report
franklintempleton.com
FRANKLIN INVESTORS SECURITIES TRUST
NOTES TO FINANCIAL STATEMENTS (UNAUDITED)
f. Investments in Institutional Fiduciary Trust Money Market Portfolio
The Funds invest in Institutional Fiduciary Trust Money Market Portfolio (Sweep Money Fund), an affiliated open-end management investment company. Management fees paid by the Funds are waived on assets invested in the Sweep Money Fund, as noted in the Statements of Operations, in an amount not to exceed the management and administrative fees paid by the Sweep Money Fund. Prior to November 1, 2013, the waiver was accounted for as a reduction to management fees.
g. Waiver and Expense Reimbursements
Advisers and Investor Services have contractually agreed in advance to waive or limit their respective fees and to assume as their own expense certain expenses otherwise payable by Franklin Low Duration Total Return Fund and Franklin Total Return Fund so that the expenses (excluding distribution fees, and acquired fund fees and expenses) for Class A, Class C, Class R and Advisor Class of the funds do not exceed 0.55% and 0.63%, respectively, and Class R6 does not exceed 0.42% and 0.45%, respectively, based on the average net assets of each class (other than certain non-routine expenses or costs, including those relating to litigation, indemnification, reorganizations, and liquidations) until February 29, 2016.
Investor Services has contractually agreed in advance to waive or limit its fees so that the Class R6 transfer agent fees do not exceed 0.01% until February 29, 2016.
Additionally, Advisers has voluntarily agreed to waive or limit a portion of its investment management fees for Franklin Floating Rate Daily Access Fund and Franklin Total Return Fund based on the average daily net assets of each of the funds as follows:
| | |
| Annualized Waiver Rate | | Net Assets |
| 0.015 | % | Over $2.5 billion, up to and including $5 billion |
| 0.025 | % | In excess of $5 billion |
Advisers may discontinue this waiver at any time.
h. Other Affiliated Transactions
At April 30, 2015, one or more of the funds in Franklin Fund Allocator Series owned a percentage of the following funds’ outstanding shares:
| | | |
| Franklin | | | |
| Low Duration | | Franklin | |
| Total Return Fund | | Total Return Fund | |
| 20.06 | % | 0.02 | % |
4. Expense Offset Arrangement
The Funds have entered into an arrangement with their custodian whereby credits realized as a result of uninvested cash balances are used to reduce a portion of the Funds’ custodian expenses. During the period ended April 30, 2015, the custodian fees were reduced as noted in the Statements of Operations.
franklintempleton.com
Semiannual Report | 129
FRANKLIN INVESTORS SECURITIES TRUST
NOTES TO FINANCIAL STATEMENTS (UNAUDITED)
5. Income Taxes
For tax purposes, capital losses may be carried over to offset future capital gains. Capital loss carryforwards with no expiration, if any, must be fully utilized before those losses with expiration dates.
| | | | | | | | | | | |
| At October 31, 2014, capital loss carryforwards were as follows: | | | | | | | | | |
| |
| | | Franklin | | | Franklin | | | Franklin | | | |
| | | Adjustable | | | Floating | | Low Duration | | | Franklin |
| | | U.S. Government | | | Rate Daily | | Total Return | | Total Return |
| | | Securities Fund | | | Access Fund | | | Fund | | | Fund |
| Capital loss carryforwards subject to expiration: | | | | | | | | | | | |
| 2015 | $ | 3,215,296 | | $ | 15,799,002 | | $ | — | | $ | — |
| 2016 | | 1,492,446 | | | 91,562,953 | | | — | | | 1,260,827 |
| 2017 | | 4,398,245 | | | 113,325,538 | | | — | | | — |
| 2018 | | 39,689,305 | | | — | | | — | | | — |
| 2019 | | 21,934,757 | | | 10,282,409 | | | 5,327,487 | | | — |
| Capital loss carryforwards not subject to expiration: | | | | | | | | | | | |
| Short term | | 14,491,283 | | | 9,252,777 | | | 6,220,177 | | | 39,132,140 |
| Long term | | 49,558,936 | | | — | | 15,582,855 | | | 9,045,914 |
| Total capital loss carryforwards | $ | 134,780,268 | a | $ | 240,222,679 | $ | 27,130,519 | $ | 49,438,881 |
| aIncludes $21,214,088 from the merged Franklin Limited Maturity U.S. Government Securities Fund, which may be carried over to offset future capital gains, subject to |
| certain limitations. | | | | | | | | | | | |
At April 30, 2015, the cost of investments and net unrealized appreciation (depreciation) for income tax purposes were as follows:
| | | | | | | | | | | | |
| | | Franklin | | | Franklin | | | Franklin | | | | |
| | | Adjustable | | | Floating | | | Low Duration | | | Franklin | |
| | | U.S. Government | | | Rate Daily | | | Total Return | | | Total Return | |
| | | Securities Fund | | | Access Fund | | | Fund | | | Fund | |
| Cost of investments | $ | 1,924,750,234 | | $ | 3,939,488,989 | | $ | 2,494,877,819 | | $ | 6,114,564,578 | |
| |
| Unrealized appreciation | $ | 33,228,953 | | $ | 27,410,589 | | $ | 17,522,763 | | $ | 129,578,363 | |
| Unrealized depreciation | | (4,648,822 | ) | | (77,290,068 | ) | | (38,644,135 | ) | | (114,360,675 | ) |
| Net unrealized appreciation (depreciation) | $ | 28,580,131 | | $ | (49,879,479 | ) | $ | (21,121,372 | ) | $ | 15,217,688 | |
Differences between income and/or capital gains as determined on a book basis and a tax basis are primarily due to differing treatments of foreign currency transactions, mortgage dollar rolls, paydown losses, bond discounts and premiums, and wash sales.
6. Investment Transactions
Purchases and sales of investments (excluding short term securities) for the period ended April 30, 2015, were as follows:
| | | | | | | | |
| | | Franklin | | Franklin | | Franklin | | |
| | | Adjustable | | Floating | | Low Duration | | Franklin |
| | | U.S. Government | | Rate Daily | | Total Return | | Total Return |
| | | Securities Fund | | Access Fund | | Fund | | Fund |
| |
| Purchases | $ | 69,438,154 | $ | 650,022,418 | $ | 548,728,809 | $ | 7,210,263,591 |
| Sales | $ | 209,762,288 | $ | 1,346,909,458 | $ | 323,529,284 | $ | 6,835,930,063 |
130 | Semiannual Report
franklintempleton.com
| | | | | | | | | | |
| | | | | FRANKLIN INVESTORS SECURITIES TRUST | |
| | | | | NOTES TO FINANCIAL STATEMENTS (UNAUDITED) | |
| |
| |
| |
| |
| Transactions in swaptions written during the period ended April 30, 2015, were as follows: | | | | | | |
| |
| | Franklin Low Duration | | Franklin | |
| | Total Return Fund | | Total Return Fund | |
| | Notional | | | | | Notional | | | | |
| | Amount* | | | Premiums | | Amount* | | | Premiums | |
| Options outstanding at October 31, 2014 | 5,300,000 | | $ | 20,765 | | 23,900,000 | | $ | 93,655 | |
| Options written | 96,400,000 | | | 498,962 | | 212,000,000 | | | 1,110,600 | |
| Options expired | (15,900,000 | ) | | (162,180 | ) | (36,000,000 | ) | | (367,200 | ) |
| Options exercised | — | | | — | | — | | | — | |
| Options closed | (21,200,000 | ) | | (151,145 | ) | (59,900,000 | ) | | (388,855 | ) |
| Options outstanding at April 30, 2015 | 64,600,000 | | $ | 206,402 | | 140,000,000 | | $ | 448,200 | |
| *The notional amount is stated in U.S. dollars unless otherwise indicated. | | | | | | | | | | |
See Notes 1(d) and 10 regarding derivative financial instruments and other derivative information, respectively.
7. Credit Risk
At April 30, 2015, Franklin Floating Rate Daily Access Fund, Franklin Low Duration Total Return Fund and Franklin Total Return Fund had 89.63%, 22.12% and 16.94%, respectively, of their portfolio invested in high yield securities, senior secured floating rate notes, or other securities rated below investment grade. These securities may be more sensitive to economic conditions causing greater price volatility and are potentially subject to a greater risk of loss due to default than higher rated securities.
8. Restricted Securities
Franklin Floating Rate Daily Access Fund invests in securities that are restricted under the Securities Act of 1933 (1933 Act) or which are subject to legal, contractual, or other agreed upon restrictions on resale. Restricted securities are often purchased in private placement transactions, and cannot be sold without prior registration unless the sale is pursuant to an exemption under the 1933 Act. Disposal of these securities may require greater effort and expense, and prompt sale at an acceptable price may be difficult. The fund may have registration rights for restricted securities. The issuer generally incurs all registration costs.
At April 30, 2015, Franklin Floating Rate Daily Access Fund held investments in restricted securities, excluding certain securities exempt from registration under the 1933 Act deemed to be liquid, as follows:
| | | | |
| | | Acquisition | | |
| Shares | Issuer | Date | Cost | Value |
| |
| 26,267 | RoTech Medical Corp. (Value is 0.00% of Net Assets) | 12/03/10 | $ — | $ — |
9. Unfunded Loan Commitments
The Funds, except Franklin Adjustable U.S. Government Securities Fund, enter into certain credit agreements, all or a portion of which may be unfunded. The funds are obligated to fund these loan commitments at the borrowers’ discretion. Funded portions of credit agreements are presented in the Statements of Investments.
franklintempleton.com
Semiannual Report | 131
FRANKLIN INVESTORS SECURITIES TRUST
NOTES TO FINANCIAL STATEMENTS (UNAUDITED)
| | |
| 9. Unfunded Loan Commitments (continued) | | |
| At April 30, 2015, unfunded commitments were as follows: | | |
| | | Unfunded |
| Borrower | | Commitment |
| Franklin Floating Rate Daily Access Fund | | |
| Alinta Energy Finance Pty. Ltd., Delayed Draw Term Commitments | $ | 2,762,486 |
| Franklin Low Duration Total Return Fund | | |
| BMC Software Finance Inc., Initial U.S. Revolving Commitment | $ | 3,492,917 |
| Franklin Total Return Fund | | |
| BMC Software Finance Inc., Initial U.S. Revolving Commitment | $ | 7,629,911 |
| Patriot Coal Corp., L/C Facility | | 27,601 |
| | $ | 7,657,512 |
Unfunded loan commitments and funded portions of credit agreements are marked to market daily and any unrealized appreciation or depreciation is included in the Statements of Assets and Liabilities and the Statements of Operations.
10. Other Derivative Information
At April 30, 2015, the funds’ investments in derivative contracts are reflected in the Statements of Assets and Liabilities as follows:
| | | | | | | | |
| | Asset Derivatives | | | | Liability Derivatives | | | |
| Derivative Contracts | | | | | | | | |
| Not Accounted for as | Statement of Assets and | | | | Statement of Assets and | | | |
| Hedging Instruments | Liabilities Location | | Fair Value | | Liabilities Location | | Fair Value | |
| Franklin Floating Rate Daily | | | | | | | | |
| Access Fund | | | | | | | | |
| Credit contracts | Variation margin / Net assets | | | | Variation margin / Net assets | | | |
| | consist of – net unrealized | | | | consist of – net unrealized | | | |
| | appreciation (depreciation) | $ | — | | appreciation (depreciation) | $ | 636,823 | a |
| |
| Franklin Low Duration Total Return | | | | | | | | |
| Fund | | | | | | | | |
| Interest rate contracts | Unrealized appreciation on OTC | | | | Unrealized depreciation on OTC | | | |
| | swap contracts / Variation margin / | | | | swap contracts / Variation margin / | | | |
| | Net assets consist of – net | | | | Net assets consist of – net | | | |
| | unrealized appreciation | | | | unrealized appreciation | | | |
| | (depreciation) | | 899,760 | a | (depreciation) | | 779,056 | a |
| Foreign exchange contracts | Unrealized appreciation on forward | | | | Unrealized depreciation on forward | | | |
| | exchange contracts / Net assets | | | | exchange contracts / Net assets | | | |
| | consist of – net unrealized | | | | consist of – net unrealized | | | |
| | appreciation (depreciation) | | 16,052,342 | | appreciation (depreciation) | | 1,285,357 | |
| Credit contracts | Investments, at value / Unrealized | | | | Options written, at value / Unrealized | | | |
| | appreciation on OTC swap | | | | depreciation on OTC swap | | | |
| | contracts / Variation margin / | | | | contracts / Variation margin / | | | |
| | Net assets consist of – net | | | | Net assets consist of – net | | | |
| | unrealized appreciation | | | | unrealized appreciation | | | |
| | (depreciation) | | 1,233,383 | a | (depreciation) | | 2,039,348 | a |
132 | Semiannual Report
franklintempleton.com
| | | | | | | | |
| | | | FRANKLIN INVESTORS SECURITIES TRUST | |
| | NOTES TO FINANCIAL STATEMENTS (UNAUDITED) | |
| |
| |
| |
| |
| | Asset Derivatives | | | | Liability Derivatives | | | |
| Derivative Contracts | | | | | | | | |
| Not Accounted for as | Statement of Assets and | | | | Statement of Assets and | | | |
| Hedging Instruments | Liabilities Location | | Fair Value | | Liabilities Location | | Fair Value | |
| Franklin Total Return Fund | | | | | | | | |
| Interest rate contracts | Unrealized appreciation on OTC swap | | Unrealized depreciation on OTC swap | | | |
| | contracts / Variation margin / Net | | | | contracts / Variation margin / Net | | | |
| | assets consist of – net unrealized | | | | unrealized appreciation | | | |
| | appreciation (depreciation) | $ | 4,007,415 | a | (depreciation) | $ | 3,693,264 | a |
| Foreign exchange contracts | Unrealized appreciation on forward | | | | Unrealized depreciation on forward | | | |
| | exchange contracts / Net assets | | | | exchange contracts / Net assets | | | |
| | consist of – net unrealized | | | | consist of – net unrealized | | | |
| | appreciation (depreciation) | | 48,722,648 | | appreciation (depreciation) | | 3,778,959 | |
| |
| Credit contracts | Investments, at value / Unrealized | | | | Options written, at value / Unrealized | | | |
| | appreciation on OTC swap contracts / | | depreciation on OTC swap contracts / | | | |
| | Variation margin / Net assets consist | | Variation margin / Net assets consist | | | |
| | of – net unrealized appreciation | | | | of – net unrealized appreciation | | | |
| | (depreciation) | | 2,445,349 | a | (depreciation) | | 6,830,854 | a |
aIncludes cumulative appreciation (depreciation) of futures contracts and centrally cleared swaps as reported in the Statements of Investments. Only current day’s variation
margin is separately reported within the Statements of Assets and Liabilities.
For the period ended April 30, 2015, the effect of derivative contracts in the funds’ Statements of Operations was as follows:
| | | | | | | |
| | | | | | | Change in | |
| | | | | | | Unrealized | |
| Derivative Contracts | | | Realized | | | Appreciation | |
| Not Accounted for as | | | Gain (Loss) | | | (Depreciation) | |
| Hedging Instruments | Statement of Operations Locations | | for the Period | | | for the Period | |
| Franklin Floating Rate Daily Access Fund | | | | | | | |
| Credit contracts | Net realized gain (loss) from swap contracts / Net | | | | | | |
| | change in unrealized appreciation (depreciation) | | | | | | |
| | on investments | $ | 737,324 | | $ | (1,004,633 | ) |
| Franklin Low Duration Total Return Fund | | | | | | | |
| Interest rate contracts | Net realized gain (loss) from futures and swap contracts / | | | | | | |
| | Net change in unrealized appreciation (depreciation) | | | | | | |
| | on investments | | (2,269,326 | ) | | 194,519 | |
| Foreign exchange contracts | Net realized gain (loss) from investments, written | | | | | | |
| | options, and foreign currency transactions / Net change | | | | | | |
| | in unrealized appreciation (depreciation) on investments | | | | | | |
| | and translation of other assets and liabilities denominated | | | | |
| | in foreign currencies | | 18,175,917 | | | 206,976 | |
| Credit contracts | Net realized gain (loss) from investments, written | | | | | | |
| | options, and swap contracts / Net change in | | | | | | |
| | unrealized appreciation (depreciation) on investments | | (765,412 | ) | | 212,542 | |
franklintempleton.com
Semiannual Report | 133
FRANKLIN INVESTORS SECURITIES TRUST
NOTES TO FINANCIAL STATEMENTS (UNAUDITED)
| | | | | | | |
| 10. Other Derivative Information (continued) | | | | | | |
| | | | | | | Change in | |
| | | | | | | Unrealized | |
| Derivative Contracts | | | Realized | | | Appreciation | |
| Not Accounted for as | | | Gain (Loss) | | | (Depreciation) | |
| Hedging Instruments | Statement of Operations Locations | | for the Period | | | for the Period | |
| Franklin Total Return Fund | | | | | | | |
| Interest rate contracts | Net realized gain (loss) from futures and swap contracts / | | | | | | |
| | Net change in unrealized appreciation (depreciation) | | | | | | |
| | on investments | $ | (5,077,790 | ) | $ | 5,242,024 | |
| Foreign exchange contracts | Net realized gain (loss) from investments, written | | | | | | |
| | options, and foreign currency transactions / Net change | | | | | | |
| | in unrealized appreciation (depreciation) on investments | | | | | | |
| | and translation of other assets and liabilities denominated | | | | |
| | in foreign currencies | | 63,074,711 | | | (1,776,670 | ) |
| Credit contracts | Net realized gain (loss) from investments, written | | | | | | |
| | options, and swap contracts / Net change in unrealized | | | | | | |
| | appreciation (depreciation) on investments | | (1,589,275 | ) | | (352,715 | ) |
For the period ended April 30, 2015, the average month end fair value of derivatives for Franklin Floating Rate Daily Access Fund, Franklin Low Duration Total Return Fund, and Franklin Total Return Fund represented 0.00%, 1.07% and 1.64%, respectively, of average month end net assets. The average month end number of open derivative contracts for the period was one, 221 and 224, respectively.
At April 30, 2015, the funds’ OTC derivative assets and liabilities, are as follows:
| | | | |
| | | Gross and Net Amounts of Assets and Liabilities |
| | | Presented in the Statements of Assets and Liabilities |
| | | Assetsa | | Liabilitiesa |
| Derivatives | | | | |
| Franklin Low Duration Total Return Fund | | | | |
| Forward exchange contracts | $ | 16,052,342 | $ | 1,285,357 |
| Options purchased | | 270,110 | | — |
| Options written | | — | | 111,019 |
| Swap contracts | | 3,212,914 | | 9,810,871 |
| Total | $ | 19,535,366 | $ | 11,207,247 |
| Franklin Total Return Fund | | | | |
| Forward exchange contracts | $ | 48,722,648 | $ | 3,778,959 |
| Options purchased | | 586,514 | | — |
| Options written | | — | | 241,138 |
| Swap contracts | | 11,788,701 | | 27,335,510 |
| Total | $ | 61,097,863 | $ | 31,355,607 |
aAbsent an event of default or early termination, OTC derivative assets and liabilities are presented gross and not offset in the Statements of Assets and Liabilities.
134 | Semiannual Report
franklintempleton.com
FRANKLIN INVESTORS SECURITIES TRUST
NOTES TO FINANCIAL STATEMENTS (UNAUDITED)
At April 30, 2015, the funds’ OTC derivative assets which may be offset against the funds’ OTC derivative liabilities and collateral received from the counterparty, is as follows:
| | | | | | | | | | | | | | | |
| | | | | Amounts Not Offset in the | | | | |
| | | | | Statements of Assets and Liabilities | | | |
| | | Gross and | | | | | | | | | | | | | |
| | | Net Amounts of | | Financial | | | | Financial | | | | | | | |
| | | Assets Presented in | | Instruments | | | Instruments | | | | Cash | | | Net Amount |
| | | the Statements of | | Available for | | | | Collateral | | | | Collateral | | | (Not less |
| | | Assets and Liabilities | | Offset | | | | Receiveda,b | | | | Receivedb | | | than zero) |
| Franklin Low Duration Total Return Fund | | | | | | | | | | | | | | | |
| Counterparty | | | | | | | | | | | | | | | |
| BOFA | $ | 9,517 | $ | (9,517 | ) | | $ | — | | | $ | — | | $ | — |
| BZWS | | 513,247 | | (513,247 | ) | | | — | | | | — | | | — |
| CITI | | 1,343,634 | | (922,572 | ) | | | (61,067 | ) | | | — | | | 359,995 |
| DBAB | | 15,980,261 | | (2,109,623 | ) | | | — | | | (13,870,638 | ) | | — |
| FBCO | | 292,905 | | (184,934 | ) | | | — | | | | — | | | 107,971 |
| GSCO | | 25,010 | | (25,010 | ) | | | — | | | | — | | | — |
| HSBC | | 23,147 | | (683 | ) | | | — | | | | — | | | 22,464 |
| JPHQ | | 1,024,037 | | (1,024,037 | ) | | | — | | | | — | | | — |
| MSCO | | 132,256 | | (132,256 | ) | | | — | | | | — | | | — |
| RBS | | 191,352 | | — | | | | — | | | | — | | | 191,352 |
| Total | $ | 19,535,366 | $ | (4,921,879 | ) | | $ | (61,067 | ) | $ | (13,870,638 | ) | $ | 681,782 |
| |
| |
| | | | | Amounts Not Offset in the | | | | |
| | | | | Statements of Assets and Liabilities | | | |
| | | Gross and | | | | | | | | | | | | | |
| | | Net Amounts of | | Financial | | | | Financial | | | | | | | |
| | | Assets Presented in | | Instruments | | | Instruments | | | | Cash | | | Net Amount |
| | | the Statements of | | Available for | | | | Collateral | | | | Collateral | | | (Not less |
| | | Assets and Liabilities | | Offset | | | | Receiveda,b | | | | Receivedb | | | than zero) |
| Franklin Total Return Fund | | | | | | | | | | | | | | | |
| Counterparty | | | | | | | | | | | | | | | |
| BOFA | $ | 143,451 | $ | (143,451 | ) | | $ | — | | | $ | — | | $ | — |
| BZWS | | 1,743,107 | | (1,743,107 | ) | | | — | | | | — | | | — |
| CITI | | 3,302,187 | | (2,232,543 | ) | | (1,069,644 | ) | | | — | | | — |
| DBAB | | 49,241,172 | | (4,165,663 | ) | | | — | | | (45,075,509 | ) | | — |
| FBCO | | 1,304,745 | | (1,304,745 | ) | | | — | | | | — | | | — |
| GSCO | | 211,597 | | (211,597 | ) | | | — | | | | — | | | — |
| HSBC | | 197,667 | | (11,236 | ) | | | (141,592 | ) | | | — | | | 44,839 |
| JPHQ | | 3,419,216 | | (2,783,875 | ) | | | (635,341 | ) | | | — | | | — |
| MSCO | | 850,669 | | (713,239 | ) | | | — | | | | (137,430 | ) | | — |
| RBS | | 308,699 | | — | | | | — | | | | — | | | 308,699 |
| UBSW | | 375,353 | | (375,353 | ) | | | — | | | | — | | | — |
| Total | $ | 61,097,863 | $ | (13,684,809 | ) | $ | (1,846,577 | ) | $ | (45,212,939 | ) | $ | 353,538 |
aAt April 30, 2015, the Fund received Italy Treasury Notes, U.S. Government and Agency securities and U.S. Treasury Notes as collateral for derivatives.
bIn some instances, the collateral amounts disclosed in the table above were adjusted due to the requirement to limit collateral amounts to avoid the effect of
overcollateralization. Actual collateral received and/or pledged may be more than the amounts disclosed herein.
franklintempleton.com
Semiannual Report | 135
FRANKLIN INVESTORS SECURITIES TRUST
NOTES TO FINANCIAL STATEMENTS (UNAUDITED)
10. Other Derivative Information (continued)
At April 30, 2015, the funds’ OTC derivative liabilities which may be offset against the funds’ OTC derivative assets and collateral pledged to the counterparty, is as follows:
| | | | | | | | | | | | | |
| | | | | Amounts Not Offset in the | | | | |
| | | | | Statements of Assets and Liabilities | | | | |
| | | Gross and | | | | | | | | | | | |
| | | Net Amounts of | | Financial | | | Financial | | | | | | |
| | | Liabilities Presented | | Instruments | | | Instruments | | Cash | | | | Net Amount |
| | | in the Statements of | | Available for | | | Collateral | | Collateral | | | | (Not less |
| | | Assets and Liabilities | | Offset | | | Pledged | | Pledgeda | | | | than zero) |
| Franklin Low Duration Total Return Fund | | | | | | | | | | | | | |
| Counterparty | | | | | | | | | | | | | |
| BOFA | $ | 259,092 | $ | (9,517 | ) | $ | — | $ | (249,575 | ) | $ | | — |
| BZWS | | 1,603,101 | | (513,247 | ) | | — | | (1,089,854 | ) | | | — |
| CITI | | 922,572 | | (922,572 | ) | | — | | — | | | | — |
| DBAB | | 2,109,623 | | (2,109,623 | ) | | — | | — | | | | — |
| FBCO | | 184,934 | | (184,934 | ) | | — | | — | | | | — |
| GSCO | | 4,311,943 | | (25,010 | ) | | — | | (4,286,933 | ) | | | — |
| HSBC | | 683 | | (683 | ) | | — | | — | | | | — |
| JPHQ | | 1,282,906 | | (1,024,037 | ) | | — | | — | | | | 258,869 |
| MSCO | | 532,393 | | (132,256 | ) | | — | | (400,137 | ) | | | — |
| RBS | | — | | — | | | — | | — | | | | — |
| Total | $ | 11,207,247 | $ | (4,921,879 | ) | $ | — | $ | (6,026,499 | ) | $ | | 258,869 |
| |
| |
| | | | | Amounts Not Offset in the | | | | |
| | | | | Statements of Assets and Liabilities | | | | |
| | | Gross and | | | | | | | | | | | |
| | | Net Amounts of | | Financial | | | Financial | | | | | | |
| | | Liabilities Presented | | Instruments | | | Instruments | | Cash | | | | Net Amount |
| | | in the Statements of | | Available for | | | Collateral | | Collateral | | | | (Not less |
| | | Assets and Liabilities | | Offset | | | Pledged | | Pledgeda | | | | than zero) |
| Franklin Total Return Fund | | | | | | | | | | | | | |
| Counterparty | | | | | | | | | | | | | |
| BOFA | $ | 172,906 | $ | (143,451 | ) | $ | — | $ | — | | | $ | 29,455 |
| BZWS | | 3,909,308 | | (1,743,107 | ) | | — | | (2,210,000 | ) | | | 43,799 |
| CITI | | 2,232,543 | | (2,232,543 | ) | | — | | — | | | | — |
| DBAB | | 4,165,663 | | (4,165,663 | ) | | — | | — | | | | — |
| FBCO | | 1,838,355 | | (1,304,745 | ) | | — | | (533,610 | ) | | | — |
| GSCO | | 14,075,962 | | (211,597 | ) | | — | | (13,864,365 | ) | | | — |
| HSBC | | 11,236 | | (11,236 | ) | | — | | — | | | | — |
| JPHQ | | 2,783,875 | | (2,783,875 | ) | | — | | — | | | | — |
| MSCO | | 713,239 | | (713,239 | ) | | — | | — | | | | — |
| RBS | | — | | — | | | — | | — | | | | — |
| UBSW | | 1,452,520 | | (375,353 | ) | | — | | (1,077,167 | ) | | | — |
| Total | $ | 31,355,607 | $ | (13,684,809 | ) | $ | — | $ | (17,685,142 | ) | | $ | 73,254 |
aIn some instances, the collateral amounts disclosed in the table above were adjusted due to the requirement to limit collateral amounts to avoid the effect of
overcollateralization. Actual collateral received and/or pledged may be more than the amounts disclosed herein.
See Notes 1(d) and 6 regarding derivative financial instruments and investment transactions, respectively.
See Abbreviations on page 140.
136 | Semiannual Report
franklintempleton.com
FRANKLIN INVESTORS SECURITIES TRUST
NOTES TO FINANCIAL STATEMENTS (UNAUDITED)
11. Reorganization
On June 18, 2014, the Franklin Adjustable U.S. Government Securities Fund (Surviving Fund), pursuant to a plan of reorganization approved on May 30, 2014 by shareholders of Franklin Limited Maturity U.S. Government Securities Fund (Acquired Fund), acquired 100% of the Acquired Fund’s net assets, primarily made up of investment securities, which included $2,097,543 of unrealized appreciation (depreciation), through a tax-free exchange of 38,807,128 shares of the Surviving Fund (valued at $336,905,329). Immediately after the completion of the reorganization, the combined net assets of the Surviving Fund were $2,285,620,454.
The primary purpose for the reorganization was to combine the Acquired Fund with a larger fund that has generally similar goals and investment policies. The estimated cost of the reorganization was $194,753 of which the Surviving Fund and the Acquired Fund each paid 25% and Advisers paid 50%. The allocated portion of the Surviving Fund’s reorganization expenses are included with other expenses in the Statement of Operations.
Assuming the reorganization had been completed on November 1, 2012, the Surviving Fund’s pro forma results of operations would have been as follows:
| | | | | | | | |
| | | | | | | | Net Increase | |
| | | Net | | Net Realized | | | (Decrease) in | |
| | | Investment | | and Unrealized | | | Net Assets from | |
| Period | | Income | | Gain (Loss) | | | Operations | |
| |
| For the period November 1, 2012 through October 31, 2013 | $ | 15,962,697 | $ | (33,488,657 | ) | $ | (17,525,960 | ) |
| For the period November 1, 2013 through October 31, 2014 | $ | 10,460,196 | $ | 1,259,718 | | $ | 11,719,914 | |
Subsequent to the reorganization, the Surviving Fund has been managed as a single entity. Accordingly, it is impracticable to identify the amounts of investment income and net investment income attributable to the Acquired Fund’s assets after the completion of the reorganization.
12. Credit Facility
The Funds, together with other U.S. registered and foreign investment funds (collectively, Borrowers), managed by Franklin Templeton Investments, are borrowers in a joint syndicated senior unsecured credit facility totaling $2 billion (Global Credit Facility) which matures on February 12, 2016. This Global Credit Facility provides a source of funds to the Borrowers for temporary and emergency purposes, including the ability to meet future unanticipated or unusually large redemption requests.
Under the terms of the Global Credit Facility, the Funds shall, in addition to interest charged on any borrowings made by the Funds and other costs incurred by the Funds, pay their share of fees and expenses incurred in connection with the implementation and maintenance of the Global Credit Facility, based upon their relative share of the aggregate net assets of all of the Borrowers, including an annual commitment fee of 0.07% based upon the unused portion of the Global Credit Facility. These fees are reflected in other expenses in the Statements of Operations. During the period ended April 30, 2015, the Funds did not use the Global Credit Facility.
franklintempleton.com
Semiannual Report | 137
FRANKLIN INVESTORS SECURITIES TRUST
NOTES TO FINANCIAL STATEMENTS (UNAUDITED)
13. Fair Value Measurements
The Funds follow a fair value hierarchy that distinguishes between market data obtained from independent sources (observable inputs) and the Funds’ own market assumptions (unobservable inputs). These inputs are used in determining the value of the Funds’ financial instruments and are summarized in the following fair value hierarchy:
- Level 1 – quoted prices in active markets for identical financial instruments
- Level 2 – other significant observable inputs (including quoted prices for similar financial instruments, interest rates, prepayment speed, credit risk, etc.)
- Level 3 – significant unobservable inputs (including the Funds’ own assumptions in determining the fair value of financial instruments)
The input levels are not necessarily an indication of the risk or liquidity associated with financial instruments at that level.
For movements between the levels within the fair value hierarchy, the Funds have adopted a policy of recognizing the transfers as of the date of the underlying event which caused the movement.
A summary of inputs used as of April 30, 2015, in valuing the Funds’ assets and liabilities carried at fair value, is as follows:
| | | | | | | | |
| | | Level 1 | | Level 2 | | Level 3 | | Total |
| |
| Franklin Adjustable U.S. Government Securities Fund | | | | | | | | |
| Assets: | | | | | | | | |
| Investments in Securities: | | | | | | | | |
| Mortgage-Backed Securities | $ | — | $ | 1,844,091,701 | $ | — | $ | 1,844,091,701 |
| U.S. Government and Agency Securities | | — | | 59,374,902 | | — | | 59,374,902 |
| Short Term Investments | | 49,863,762 | | — | | — | | 49,863,762 |
| Total Investments in Securities | $ | 49,863,762 | $ | 1,903,466,603 | $ | — | $ | 1,953,330,365 |
| Franklin Floating Rate Daily Access Fund | | | | | | | | |
| Assets: | | | | | | | | |
| Investments in Securities: | | | | | | | | |
| Equity Investmentsa,b | $ | 11,685,236 | $ | — | $ | —c | $ | 11,685,236 |
| Senior Floating Rate Interests | | — | | 3,504,936,110 | | 668,540 | | 3,505,604,650 |
| Asset-Backed Securities and Commercial Mortgage-Backed | | | | | | | | |
| Securities | | — | | 120,679,742 | | — | | 120,679,742 |
| Short Term Investments | | 251,639,882 | | — | | — | | 251,639,882 |
| Total Investments in Securities | $ | 263,325,118 | $ | 3,625,615,852 | $ | 668,540 | $ | 3,889,609,510 |
| Other Financial Instruments | | | | | | | | |
| Unfunded Loan Commitments | | — | $ | 39,747 | | — | $ | 39,747 |
| Liabilities: | | | | | | | | |
| Other Financial Instruments | | | | | | | | |
| Swap Contracts | | — | $ | 636,823 | | — | $ | 636,823 |
138 | Semiannual Report
franklintempleton.com
| | | | | | | | | |
| | | FRANKLIN INVESTORS SECURITIES TRUST |
| | | NOTES TO FINANCIAL STATEMENTS (UNAUDITED) |
| |
| |
| |
| |
| | | Level 1 | | Level 2 | | Level 3 | | Total |
| |
| Franklin Low Duration Total Return Fund | | | | | | | | | |
| Assets: | | | | | | | | | |
| Investments in Securities: | | | | | | | | | |
| Equity Investmentsa,b | $ | 19,951,140 | $ | — | | $ | — | $ | 19,951,140 |
| Corporate Bonds | | — | | 928,514,537 | | | — | | 928,514,537 |
| Senior Floating Rate Interests | | — | | 125,844,991 | | | — | | 125,844,991 |
| Foreign Government and Agency Securities | | — | | 83,622,653 | | | — | | 83,622,653 |
| U.S. Government and Agency Securities | | — | | 132,043,940 | | | — | | 132,043,940 |
| Asset-Backed Securities and Commercial Mortgage-Backed | | | | | | | | | |
| Securities | | — | | 784,266,388 | | | — | | 784,266,388 |
| Mortgage-Backed Securities | | — | | 79,441,971 | | | — | | 79,441,971 |
| Municipal Bonds | | — | | 20,054,108 | | | — | | 20,054,108 |
| Escrow and Litigation Trusts | | — | | — | | | —c | | — |
| Options Purchased | | — | | 270,110 | | | — | | 270,110 |
| Short Term Investments | | 288,389,109 | | 11,357,500 | | | — | | 299,746,609 |
| Total Investments in Securities | $ | 308,340,249 | $ | 2,165,416,198 | | $ | — | $ | 2,473,756,447 |
| Other Financial Instruments | | | | | | | | | |
| Futures Contracts | $ | 83,912 | $ | — | | $ | — | $ | 83,912 |
| Forward Exchange Contracts | | — | | 16,052,342 | | | — | | 16,052,342 |
| Swap Contracts | | — | | 1,779,121 | | | — | | 1,779,121 |
| Total Other Financial Instruments | $ | 83,912 | $ | 17,831,463 | | $ | — | $ | 17,915,375 |
| Liabilities: | | | | | | | | | |
| Other Financial Instruments | | | | | | | | | |
| Options Written | $ | — | $ | 111,019 | | $ | — | $ | 111,019 |
| Futures Contracts | | 742,839 | | — | | | — | | 742,839 |
| Forward Exchange Contracts | | — | | 1,285,357 | | | — | | 1,285,357 |
| Swap Contracts | | — | | 1,964,546 | | | — | | 1,964,546 |
| Unfunded Loan Commitments | | — | | 42,031 | | | — | | 42,031 |
| Total Other Financial Instruments | $ | 742,839 | $ | 3,402,953 | | $ | — | $ | 4,145,792 |
| Franklin Total Return Fund | | | | | | | | | |
| Assets: | | | | | | | | | |
| Investments in Securities: | | | | | | | | | |
| Equity Investments:a | | | | | | | | | |
| Consumer Services | $ | — | $ | 3,077,877 | | $ | — | $ | 3,077,877 |
| All Other Equity Investmentsb | | 83,891,713 | | — | | | — | | 83,891,713 |
| Corporate Bonds | | — | | 2,032,190,392 | | | — | | 2,032,190,392 |
| Senior Floating Rate Interests | | — | | 94,209,558 | | 12,940 | | 94,222,498 |
| Foreign Government and Agency Securities | | — | | 391,711,443 | | | — | | 391,711,443 |
| U.S. Government and Agency Securities | | — | | 180,601,674 | | | — | | 180,601,674 |
| Asset-Backed Securities and Commercial Mortgage-Backed | | | | | | | | | |
| Securities | | — | | 911,178,467 | | 1,465,373 | | 912,643,840 |
| Mortgage-Backed Securities | | — | | 900,616,980 | | | — | | 900,616,980 |
| Municipal Bonds | | — | | 176,235,066 | | | — | | 176,235,066 |
| Escrow and Litigation Trusts | | 22,260 | | — | | | —c | | 22,260 |
| Options Purchased | | — | | 586,514 | | | — | | 586,514 |
| Short Term Investments | | 1,353,982,009 | | — | | | — | | 1,353,982,009 |
| Total Investments in Securities | $ | 1,437,895,982 | $ | 4,690,407,971 | $ | 1,478,313 | $ | 6,129,782,266 |
| Other Financial Instruments | | | | | | | | | |
| Futures Contracts | $ | 10,999 | $ | — | | $ | — | $ | 10,999 |
| Forward Exchange Contracts | | — | | 48,722,648 | | | — | | 48,722,648 |
| Swap Contracts | | — | | 5,855,251 | | | — | | 5,855,251 |
| Total Other Financial Instruments | $ | 10,999 | $ | 54,577,899 | | $ | — | $ | 54,588,898 |
franklintempleton.com
Semiannual Report | 139
| | | | | | | | |
| FRANKLIN INVESTORS SECURITIES TRUST | | | | | | | | |
| NOTES TO FINANCIAL STATEMENTS (UNAUDITED) | | | | | | | | |
| |
| |
| |
| |
| 13. Fair Value Measurements (continued) | | | | | | | | |
| | | Level 1 | | Level 2 | | Level 3 | | Total |
| |
| Franklin Total Return Fund (continued) | | | | | | | | |
| Liabilities: | | | | | | | | |
| Other Financial Instruments | | | | | | | | |
| Options Written | $ | — | $ | 241,138 | $ | — | $ | 241,138 |
| Futures Contracts | | 3,397,495 | | — | | — | | 3,397,495 |
| Forward Exchange Contracts | | — | | 3,778,959 | | — | | 3,778,959 |
| Swap Contracts | | — | | 6,885,485 | | — | | 6,885,485 |
| Unfunded Loan Commitments | | — | | 94,775 | | — | | 94,775 |
| Total Other Financial Instruments | $ | 3,397,495 | $ | 11,000,357 | $ | — | $ | 14,397,852 |
aIncludes common, preferred stocks as well as other equity investments.
bFor detailed categories, see the accompanying Statement of Investments.
cIncludes securities determined to have no value at April 30, 2015.
A reconciliation of assets in which Level 3 inputs are used in determining fair value is presented when there are significant Level 3 financial instruments at the end of the period.
14. Subsequent Events
The Funds have evaluated subsequent events through the issuance of the financial statements and determined that no events have occurred that require disclosure.
| | | | | |
| Abbreviations | | | | |
| Counterparty/Exchange | Currency | Selected Portfolio |
| BOFA | Bank of America Corp. | BRL | Brazilian Real | AGMC | Assured Guaranty Municipal Corp. |
| BZWS | Barclays Bank PLC | CHF | Swiss Franc | ARM | Adjustable Rate Mortgage |
| CITI | Citigroup, Inc. | DKK | Danish Krone | CDO | Collateralized Debt Obligation |
| DBAB | Deutsche Bank AG | EUR | Euro | CLO | Collateralized Loan Obligation |
| FBCO | Credit Suisse Group AG | GBP | British Pound | COP | Certificate of Participation |
| GSCO | The Goldman Sachs Group, Inc. | HUF | Hungarian Forint | EDA | Economic Development Authority |
| HSBC | HSBC Bank USA, N.A. | JPY | Japanese Yen | ETF | Exchange Traded Fund |
| ICE | Intercontinental Exchange | KRW South Korean Won | FICO | Financing Corp. |
| JPHQ | JP Morgan Chase & Co. | LKR | Sri Lankan Rupee | FRN | Floating Rate Note |
| MSCO | Morgan Stanley | MXN | Mexican Peso | GO | General Obligation |
| RBS | Royal Bank of Scotland PLC | MYR | Malaysian Ringgit | ISD | Independent School District |
| UBSW UBS AG | PHP | Philippine Peso | L/C | Letter of Credit |
| | | PLN | Polish Zloty | MFM | Multi-Family Mortgage |
| | | SGD | Singapore Dollar | NATL | National Public Financial Guarantee Corp. |
| | | USD | United States Dollar | PIK | Payment-In-Kind |
| | | UYU | Uruguayan Peso | PSF | Permanent School Fund |
| | | | | RDA | Redevelopment Agency/Authority |
| | | | | REIT | Real Estate Investment Trust |
| | | | | SF | Single Family |
| | | | | SFR | Single Family Revenue |
| | | | | UHSD | Unified/Union High School District |
| | | | | USD | Unified/Union School District |
140 | Semiannual Report
franklintempleton.com
FRANKLIN INVESTORS SECURITIES TRUST
Shareholder Information
Board Review of Investment Management Agreement
At a meeting held February 24, 2015, the Board of Trustees (Board), including a majority of non-interested or independent Trustees, approved renewal of the investment management agreement for each of the separate funds within Franklin Investors Securities Trust (Fund(s)). In reaching this decision, the Board took into account information furnished throughout the year at regular Board meetings, as well as information prepared specifically in connection with the annual renewal review process. Information furnished and discussed throughout the year included investment performance reports and related financial information for each Fund, along with periodic reports on expenses, shareholder services, legal and compliance matters, pricing, brokerage commissions and execution and other services provided by the Investment Manager (Manager) and its affiliates, as well as marketing support payments made to financial intermediaries. Information furnished specifically in connection with the renewal process included a report for each Fund prepared by Lipper, Inc. (Lipper), an independent organization, as well as additional material, including a Fund profitability analysis prepared by management. The Lipper reports compared each Fund’s investment performance and expenses with those of other mutual funds deemed comparable to the Fund as selected by Lipper. The Fund profitability analysis discussed the profitability to Franklin Templeton Investments (FTI) from its overall U.S. fund operations, as well as on an individual fund-by-fund basis. Additional material accompanying such profitability analysis included information on a fund-by-fund basis listing portfolio managers and other accounts they manage, as well as information on management fees charged by the Manager and its affiliates to U.S. mutual funds and other accounts, including management’s explanation of differences where relevant. Such material also included a memorandum prepared by management describing project initiatives and capital investments relating to the services provided to the Funds by the FTI organization, as well as a memorandum relating to economies of scale and an analysis concerning transfer agent fees charged by an affiliate of the Manager. The Board also received a report on all marketing support payments made by FTI to financial intermediaries during the past year.
In considering such materials, the independent Trustees received assistance and advice from and met separately with independent counsel. While the investment management agreements for all Funds were considered at the same Board meeting, the Board dealt with each Fund separately. In approving continuance of the investment management agreement for each Fund, the Board, including a majority of independent Trustees, determined that the existing management fee structure was fair and reasonable and that continuance of the investment management agreement was in the best interests of each Fund and its shareholders. While attention was given to all information furnished, the following discusses some primary factors relevant to the Board’s decision.
NATURE, EXTENT AND QUALITY OF SERVICES. The Board was satisfied with the nature and quality of the overall services provided by the Manager and its affiliates to the Funds and their shareholders, except as noted later in the discussion of investment performance. The Board’s opinion was based, in part, upon periodic reports furnished it showing that the investment policies and restrictions for each Fund were consistently complied with as well as other reports periodically furnished the Board covering matters such as the compliance of portfolio managers and other management personnel with the code of ethics adopted throughout the Franklin Templeton fund complex, the adherence to fair value pricing procedures established by the Board, and the accuracy of net asset value calculations. The Board also noted the extent of benefits provided Fund shareholders from being part of the Franklin Templeton family of funds, including the right to exchange investments between the same class of shares of different funds without a sales charge, the ability to reinvest Fund dividends into other funds and the right to combine holdings in other funds to obtain a reduced sales charge. Favorable consideration was given to management’s continual efforts and expenditures in establishing effective business continuity plans and developing strategies to address cybersecurity threats. Additionally, the Board noted the Manager’s continued attention to pricing and valuation issues, particularly with respect to complex securities. Among other factors taken into account by the Board were the Manager’s best execution trading policies, including a favorable report by an independent portfolio trading analytical firm, which also covered FOREX transactions. Consideration was also given to the experience of each Fund’s portfolio management team, the number of accounts managed and general method of compensation. In this latter respect, the Board noted that a primary factor in management’s determination of a portfolio manager’s bonus compensation was the relative investment performance of the funds he or she managed and that a portion of such bonus was required to be invested in a predesignated list of funds within such person’s fund management area so as to be
franklintempleton.com
Semiannual Report | 141
FRANKLIN INVESTORS SECURITIES TRUST
SHAREHOLDER INFORMATION
Board Review of Investment Management
Agreement (continued) aligned with the interests of shareholders. The Board also took into account the quality of transfer agent and shareholder services provided Fund shareholders by an affiliate of the Manager and the continual enhancements to the Franklin Templeton website. Particular attention was given to management’s conservative approach and diligent risk management procedures, including continual monitoring of counterparty credit risk and attention given to derivative and other complex instruments including expanded collateralization requirements. The Board also took into account, among other things, management’s efforts in establishing a global credit facility for the benefit of the Funds and other accounts managed by FTI to provide a source of cash for temporary and emergency purposes or to meet unusual redemption requests as well as the strong financial position of the Manager’s parent company and its commitment to the mutual fund business as evidenced by its continued subsidization of money market funds.
INVESTMENT PERFORMANCE. The Board placed significant emphasis on the investment performance of each Fund in view of its importance to shareholders. While consideration was given to performance reports and discussions with portfolio managers at Board meetings during the year, particular attention in assessing performance was given to the Lipper reports furnished for the agreement renewals. The Lipper reports prepared for each individual Fund showed the investment performance of its Class A shares in comparison with its selected performance universe during 2014 and during the previous 10 years ended December 31, 2014, unless otherwise noted. Performance on a total return basis was shown by Lipper for all Funds with performance on an income return basis being shown for those Funds having income return as an element of their investment objective. The following summarizes the performance results for each Fund.
Franklin Adjustable U.S. Government Securities Fund –
Franklin Limited Maturity U.S. Government Securities Fund merged into the Franklin Adjustable U.S. Government Securities Fund in 2014. The Fund’s investment performance was shown in comparison to a performance universe consisting of all retail and institutional ultra-short obligation funds as selected by Lipper. The Lipper report showed the Fund’s income return in 2014 to be in the second-highest quintile of such performance universe, and on an annualized basis to be in the highest quin-tile of such universe during each of the previous three-, five-and 10-year periods. The Lipper report showed the Fund’s total return during 2014 to be in the second-highest performing quintile of its performance universe, and on an annualized basis to be in the second-lowest performing quintile for the previous three-year period, in the middle performing quintile for the previous five-year period, and in the highest performing quintile of such universe for the previous 10-year period. The Board found the Fund’s comparative performance as set forth in the Lipper report to be satisfactory and noted the Fund’s income oriented investment objective.
Franklin Floating Rate Daily Access Fund – The Fund’s investment performance was shown in comparison to a performance universe consisting of all retail and institutional loan participation funds as selected by Lipper. The Lipper report showed its income return during 2014 to be in the middle quin-tile of its performance universe, and its income return on an annualized basis during the previous three- and five-year periods to be in the second-lowest quintile and in the middle quintile of its performance universe for the previous 10-year period. The Lipper report showed the Fund’s total return during 2014 to be in the middle performing quintile of its performance universe and on an annualized basis for the previous three-, five- and 10-year periods to be in the second-lowest performing quintile of such universe. In discussing such performance, management pointed out, among other things, that the Fund’s returns should be viewed on a risk-adjusted basis, and reflected its conservative approach to investing. They noted resources recently added to the management of the Fund and some changes to the investment approach to capture additional income. Management also expressed its belief that the Fund’s performance was favorable in comparison to other similarly managed funds within its Lipper performance universe. While not satisfied with the Fund’s comparative performance as set forth in the Lipper report, the Board found such performance to be acceptable in view of management’s explanation of recent changes associated with the Fund’s management.
Franklin Low Duration Total Return Fund – The Fund’s investment performance was shown in comparison to a performance universe consisting of all retail and institutional short investment-grade debt funds as selected by Lipper. The Lipper report showed its income return for 2014 to be in the second-lowest quintile of its performance universe, and on an annualized basis to be in either the highest quintile or second-highest quintile of such universe for the previous three-, five-and 10-year periods. The Lipper report showed the Fund’s total return for 2014 to be in the second-highest performing quintile of its performance universe, and on an annualized basis to be in the second-highest or highest performing quintile for the
142 | Semiannual Report
franklintempleton.com
FRANKLIN INVESTORS SECURITIES TRUST
SHAREHOLDER INFORMATION
previous three-, five- and 10-year periods. The Board was satisfied with the Fund’s comparative performance as shown in the Lipper report.
Franklin Total Return Fund – The Fund’s investment performance was shown in comparison to a performance universe consisting of all retail and institutional core plus bond funds as selected by Lipper. The Lipper report showed the Fund’s income return to be in the highest quintile of its performance universe during 2014 and to be in either the highest or second-highest quintile of such universe for the previous three-, five-and 10-year periods on an annualized basis. The Lipper report showed the Fund’s total return during 2014 to be in the second-highest performing quintile of its performance universe, and on an annualized basis to also be in the second-highest or middle performing quintile of such universe for the previous three-, five- and 10-year periods. The Board found the Fund’s comparative performance as set forth in the Lipper report to be satisfactory.
COMPARATIVE EXPENSES. Consideration was given to a comparative analysis of the management fees and total expense ratio of each Fund compared with those of a group of other funds selected by Lipper as constituting its appropriate Lipper expense group. Lipper expense data is based upon information taken from each fund’s most recent annual report, which reflects historical asset levels that may be quite different from those currently existing, particularly in a period of market volatility. While recognizing such inherent limitation and the fact that expense ratios generally increase as assets decline and decrease as assets grow, the Board believed the independent analysis conducted by Lipper to be an appropriate measure of comparative expenses. In reviewing comparative costs, Lipper provides information on each Fund’s contractual investment management fee in comparison with the contractual investment management fee that would have been charged by other funds within its Lipper expense group assuming they were similar in size to the Fund, as well as the actual total expense ratio of the Fund in comparison with those of its expense group. The Lipper contractual investment management fee analysis includes within such fee any separate administrative fees, and Lipper total expenses, for comparative consistency, are shown by Lipper for Fund Class A shares. The results of such expense comparisons showed that the contractual investment management fee rate and actual total expense ratio for Franklin Floating Rate Daily Access Fund were below the median of its Lipper expense group. The Board was satisfied with the comparative contractual investment management fee rate and actual total expense ratio of the Fund as shown in the Lipper reports. The contractual investment management fee rate and actual total expense ratio of Franklin Adjustable U.S. Government Securities Fund were above the median of its expense group. The Board found the comparative contractual investment fee rate and actual total expense ratio of the Fund as shown in the Lipper reports to be acceptable, noting that management had a fee waiver in place for the Fund. While the contractual investment management fee rate of Franklin Low Duration Total Return Fund was eight basis points above the median of its Lipper expense group, the Fund benefited from a fee waiver that reduced this fee rate to four basis points below the median and its actual total expense ratio was slightly below the median of such group. The contractual investment management fee rate for Franklin Total Return Fund was above the median of its respective Lipper expense group but was reduced to the median as a result of a waiver, and its actual total expense ratio was within nine basis points above the median of its expense group. The Board found the contractual management fees and total expense ratios of these two Funds to be acceptable, noting that their expenses were subsidized by management.
MANAGEMENT PROFITABILITY. The Board also considered the level of profits realized by the Manager and its affiliates in connection with the operation of each Fund. In this respect, the Board reviewed the Fund profitability analysis that addresses the overall profitability of Franklin Templeton’s U.S. fund business, as well as its profits in providing management and other services to each of the individual funds during the 12-month period ended September 30, 2014, being the most recent fiscal year-end for Franklin Resources, Inc., the Manager’s parent. In reviewing the analysis, the Board recognized that allocation methodologies are inherently subjective and various allocation methodologies may be reasonable while producing different results. In this respect, the Board noted that while management continually makes refinements to its methodologies in response to organizational and product related changes, the overall approach as defined by the primary drivers and activity measurements has remained consistent with that used in the Funds’ profitability report presentations from prior years. Additionally, the Funds’ independent registered public accounting firm had been engaged by the Manager to periodically review the reasonableness of the allocation methodologies to be used solely by the Funds’ Board in reference to the profitability analysis. In reviewing and discussing such analysis, management discussed with the Board its belief that costs incurred in establishing the infrastructure necessary for the type of mutual fund operations conducted by the Manager and its affiliates may not be fully reflected in the expenses allocated to each Fund in determining its profitability, as well as the fact
franklintempleton.com
Semiannual Report | 143
FRANKLIN INVESTORS SECURITIES TRUST
SHAREHOLDER INFORMATION
Board Review of Investment Management
Agreement (continued) that the level of profits, to a certain extent, reflected operational cost savings and efficiencies initiated by management. The Board also took into account management’s expenditures in improving shareholder services provided the Funds, as well as the need to implement systems and meet additional regulatory and compliance requirements resulting from statutes such as the Sarbanes-Oxley and Dodd-Frank Acts and recent SEC and other regulatory requirements. In addition, the Board considered a third-party study comparing the profitability of the Manager’s parent on an overall basis to other publicly held managers broken down to show profitability from management operations exclusive of distribution expenses, as well as profitability including distribution expenses. The Board also considered the extent to which the Manager and its affiliates might derive ancillary benefits from fund operations, including revenues generated from transfer agent services and potential benefits resulting from personnel and systems enhancements necessitated by fund growth, increased leverage with service providers and counterparties, allocation of fund brokerage and the use of commission dollars to pay for research. Based upon its consideration of all these factors, the Board determined that the level of profits realized by the Manager and its affiliates from providing services to each Fund was not excessive in view of the nature, quality and extent of services provided.
ECONOMIES OF SCALE. The Board also considered whether economies of scale are realized by the Manager as the Funds grow larger and the extent to which this is reflected in the level of management fees charged. While recognizing that any precise determination is inherently subjective, the Board noted that based upon the Fund profitability analysis, it appears that as some funds get larger, at some point economies of scale do result in the Manager realizing a larger profit margin on management services provided such a fund. The Board also noted that economies of scale are shared with each Fund and its shareholders through management fee breakpoints so that as a Fund grows in size, its effective management fee rate declines. The management fee for Franklin Adjustable U.S. Government Securities Fund provides a fee of 0.50% on the first $5 billion of assets, with breakpoints continuing at stages thereafter. In discussing such fee, management expressed the view that this initial rate anticipated economies of scale. In support of this position, management pointed to the competitive contractual management fee rate and expense ratio of this Fund, which had assets of approximately $2.07 billion at year-end, with those of its Lipper expense group. The Board believed that to the extent economies of scale may be realized by the Manager and its affiliates, such initial rate did reflect economies of scale benefiting this Fund and its shareholders. Based on their year-end asset levels, all of the other Funds benefited from breakpoints contained in their management fee structures with additional breakpoints continuing beyond such asset levels. The Board believed that to the extent economies of scale may be realized by the Manager and its affiliates, the schedule of fees under the investment management agreement for each of such Funds provides a sharing of benefits with the Fund and its shareholders.
Proxy Voting Policies and Procedures
The Trust’s investment manager has established Proxy Voting Policies and Procedures (Policies) that the Trust uses to determine how to vote proxies relating to portfolio securities. Shareholders may view the Trust’s complete Policies online at franklintempleton.com. Alternatively, shareholders may request copies of the Policies free of charge by calling the Proxy Group collect at (954) 527-7678 or by sending a written request to: Franklin Templeton Companies, LLC, 300 S.E. 2nd Street, Fort Lauderdale, FL 33301, Attention: Proxy Group. Copies of the Trust’s proxy voting records are also made available online at franklintempleton.com and posted on the U.S. Securities and Exchange Commission’s website at sec.gov and reflect the most recent 12-month period ended June 30.
Quarterly Statement of Investments
The Trust files a complete statement of investments with the U.S. Securities and Exchange Commission for the first and third quarters for each fiscal year on Form N-Q. Shareholders may view the filed Form N-Q by visiting the Commission’s website at sec.gov. The filed form may also be viewed and copied at the Commission’s Public Reference Room in Washington, DC. Information regarding the operations of the Public Reference Room may be obtained by calling (800) SEC-0330.
144 | Semiannual Report
franklintempleton.com
Item 2. Code of Ethics.
(a) The Registrant has adopted a code of ethics that applies to its principal executive officers and principal financial and accounting officer.
(c) N/A
(d) N/A
(f) Pursuant to Item 12(a)(1), the Registrant is attaching as an exhibit a copy of its code of ethics that applies to its principal executive officers and principal financial and accounting officer.
Item 3. Audit Committee Financial Expert.
(a)(1) The Registrant has an audit committee financial expert serving on its audit committee.
(2) The audit committee financial expert is John B. Wilson and he is "independent" as defined under the relevant Securities and Exchange Commission Rules and Releases.
Item 4. Principal Accountant Fees and Services. N/A
Item 5. Audit Committee of Listed Registrants. N/A
Item 6. Schedule of Investments. N/A
Item 7. Disclosure of Proxy Voting Policies and Procedures for Closed-End Management Investment Companies. N/A
Item 8. Portfolio Managers of Closed-End Management Investment Companies. N/A
Item 9. Purchases of Equity Securities by Closed-End Management Investment Company and Affiliated Purchasers. N/A
Item 10. Submission of Matters to a Vote of Security Holders.
There have been no changes to the procedures by which shareholders may recommend nominees to the Registrant's Board of Trustees that would require disclosure herein.
Item 11. Controls and Procedures.
(a) Evaluation of Disclosure Controls and Procedures. The Registrant maintains disclosure controls and procedures that are designed to ensure that information required to be disclosed in the Registrant’s filings under the Securities Exchange Act of 1934 and the Investment Company Act of 1940 is recorded, processed, summarized and reported within the periods specified in the rules and forms of the Securities and Exchange Commission. Such information is accumulated and communicated to the Registrant’s management, including its principal executive officer and principal financial officer, as appropriate, to allow timely decisions regarding required disclosure. The Registrant’s management, including the principal executive officer and the principal financial officer, recognizes that any set of controls and procedures, no matter how well designed and operated, can provide only reasonable assurance of achieving the desired control objectives.
Within 90 days prior to the filing date of this Shareholder Report on Form N-CSR, the Registrant had carried out an evaluation, under the supervision and with the participation of the Registrant’s management, including the Registrant’s principal executive officer and the Registrant’s principal financial officer, of the effectiveness of the design and operation of the Registrant’s disclosure controls and procedures. Based on such evaluation, the Registrant’s principal executive officer and principal financial officer concluded that the Registrant’s disclosure controls and procedures are effective.
(b) Changes in Internal Controls. There have been no changes in the Registrant’s internal controls or in other factors that could materially affect the internal controls over financial reporting subsequent to the date of their evaluation in connection with the preparation of this Shareholder Report on Form N-CSR.
Item 12. Exhibits.
(a)(1) Code of Ethics
(a)(2) Certifications pursuant to Section 302 of the Sarbanes-Oxley Act of 2002 of Laura F. Fergerson, Chief Executive Officer - Finance and Administration, and Gaston Gardey, Chief Financial Officer and Chief Accounting Officer
(b) Certifications pursuant to Section 906 of the Sarbanes-Oxley Act of 2002 of Laura F. Fergerson, Chief Executive Officer - Finance and Administration, and Gaston Gardey, Chief Financial Officer and Chief Accounting Officer
SIGNATURES
Pursuant to the requirements of the Securities Exchange Act of 1934 and the Investment Company Act of 1940, the registrant has duly caused this report to be signed on its behalf by the undersigned, thereunto duly authorized.
FRANKLIN INVESTORS SECURITIES TRUST
By /s/Laura F. Fergerson
Laura F. Fergerson
Chief Executive Officer –
Finance and Administration
Date June 25, 2015
Pursuant to the requirements of the Securities Exchange Act of 1934 and the Investment Company Act of 1940, this report has been signed below by the following persons on behalf of the registrant and in the capacities and on the dates indicated.
By /s/Laura F. Fergerson
Laura F. Fergerson
Chief Executive Officer –
Finance and Administration
Date June 25, 2015
By /s/Gaston Gardey
Gaston Gardey
Chief Financial Officer and
Chief Accounting Officer
Date June 25, 2015