1
Semiannual Report
Economic and Market Overview
The U.S. economy, as measured by gross domestic product growth, expanded during the six-month period ended April 30, 2012. The national unemployment rate for April 2012 stood at 8.1%, compared with 8.9% at the start of the period.1 Jobless claims touched a four-year low in February, and job creation was fairly robust. Consistent with employment trends, industrial production and manufacturing activity increased toward the end of the period. Automobile sales rose to their highest levels since February 2008, and consumer confidence climbed to pre-recession levels. Outside of the U.S., Greece secured bailout financing as bondholders agreed to concessions and the country enacted austerity measures. Although the long-term resolution of the European debt situation remained unclear, the European Central Bank’s plan to increase liquidity through loans was well received and seemed to improve investor sentiment.
At the end of the reporting period, however, significant challenges to the economy remained, including uncertainty surrounding deeply indebted European countries, soaring gas prices amid political turmoil in the Middle East, indications of reduced economic stimulus from the federal government, and continued malaise in the U.S. housing market. Signs of China’s economic growth slowdown contributed to pessimism as, despite a higher overall level of U.S. exports, the U.S. trade deficit widened following decreases in exports to China and the eurozone.
Amid the improved economic reports, U.S. stock markets reached multi-year highs in late March and early April 2012. The Dow Jones Industrial Average exceeded the 13,000 level for the first time since 2008, and the NASDAQ Composite Index hit an 11-year high. Leading market sectors included consumer discretionary, information technology and financials. Conversely, utilities and energy lagged the broader market. In this environment, investment-grade bonds posted modest returns and outperformed U.S. Treasuries.
The foregoing information reflects our analysis and opinions as of April 30, 2012. The information is not a complete analysis of every aspect of any market, country, industry, security or fund. Statements of fact are from sources considered reliable.
1. Source: Bureau of Labor Statistics.
Semiannual Report | 3
Franklin Balanced Fund
Your Fund’s Goal and Main Investments: Franklin Balanced Fund seeks income and capital appreciation by investing in a combination of stocks, convertible securities and debt securities. The Fund will normally invest at least 25% of its total assets in equity securities (primarily common and preferred stock) and at least 25% of its total assets in debt securities, including bonds, notes, debentures and money market securities.
Performance data represent past performance, which does not guarantee future results. Investment return and principal value will fluctuate, and you may have a gain or loss when you sell your shares. Current performance may differ from figures shown. Please visit franklintempleton.com or call (800) 342-5236 for most recent month-end performance.
This semiannual report for Franklin Balanced Fund covers the period ended April 30, 2012.
Performance Overview
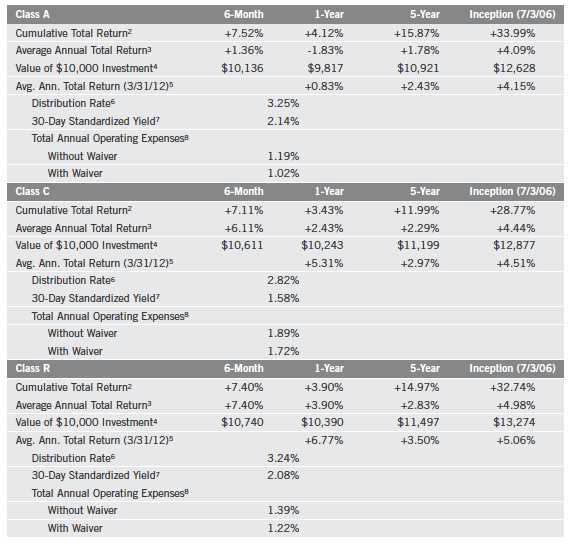
For the six months under review, Franklin Balanced Fund – Class A delivered a +7.52% cumulative total return. The Fund underperformed the +12.77% total return of its equity benchmark, the Standard & Poor’s® 500 Index (S&P 500®), which is a broad measure of U.S. stock performance.1 However, the Fund outperformed the +2.44% of its fixed income benchmark, the Barclays Capital (BC) U.S. Aggregate Index, which tracks the U.S. investment-grade, taxable bond market.1 You can find the Fund’s long-term performance data in the Performance Summary beginning on page 8.
Investment Strategy
We apply a bottom-up approach to investing in individual securities. We will assess the market price of a company’s securities relative to our evaluation of the company’s long-term earnings, asset value and cash flow potential. We also consider a company’s price/earnings ratio, profit margins and liquidation value. In determining an optimal mix of equity and fixed income investments for the Fund, we assess changing economic, market and industry conditions. We may sell securities for a number of possible reasons, including the achievement of certain stock prices or credit spreads, changes in the fundamental outlook or risk/reward profile of a security, less attractive values relative to market peers, or broad economic conditions affecting certain fixed income sectors.
1. Source: © 2012 Morningstar. All Rights Reserved. The information contained herein: (1) is proprietary to Morningstar and/or its content providers; (2) may not be copied or distributed; and (3) is not warranted to be accurate, complete or timely. Neither Morningstar nor its content providers are responsible for any damages or losses arising from any use of this information. STANDARD & POOR’S®, S&P® and S&P 500® are registered trademarks of Standard & Poor’s Financial Services LLC. The indexes are unmanaged and include reinvestment of any income or distributions. One cannot invest directly in an index, and an index is not representative of the Fund’s portfolio.
The dollar value, number of shares or principal amount, and names of all portfolio holdings are listed in the Fund’s Statement of Investments (SOI). The SOI begins on page 50.
4 | Semiannual Report

*All Fund distributions will vary depending upon current market conditions, and past distributions are not indicative of future trends.
Manager’s Discussion
During the six months under review, as equity markets rallied, the Fund’s equity securities delivered the bulk of returns. Our equity sectors were well diversified, with our largest weightings in industrials, materials, financials and information technology (IT) at period-end. Within fixed income markets, we remained focused on opportunities in investment-grade corporate bonds and select high yield corporate bonds. Our largest sector weightings in corporate bonds were energy, banking and consumer non-cyclical companies at period-end.
Among the Fund’s equity holdings, the industrials, financials and IT sectors were stand-out performers. General Electric in the industrials sector benefited from renewed investor confidence during a sustained period of modest global economic growth. Within financials, JPMorgan Chase & Co. shares performed well following the Federal Reserve Board’s stress test, which resulted in the company’s approval for a higher dividend and share buybacks. Shortly after this reporting period ended, JPMorgan announced a massive hedging loss that meaningfully pressured its stock price. Our U.S. Bancorp holding aided Fund performance largely due to good expense control and continued credit improvement following a decrease in the amount of uncollected loans. Intel was a top contributor among IT holdings, benefiting from solid enterprise and emerging market demand for PCs that offset weak consumer demand. Our shares of Comcast in consumer discretionary also positively impacted performance, due in part to the company’s strong digital video and high-speed Internet services. Energy was the Fund’s only equity sector detractor, reflecting losses from Chesapeake Energy, BP and Canadian Oil Sands.

Semiannual Report | 5

Within our fixed income holdings, the Fund’s corporate bond positions generally aided performance amid the backdrop of continued low and range-bound long-term U.S. interest rates. The 10-year U.S. Treasury note averaged around 2.00% yield for the period, while corporate credit yield spreads over Treasuries declined from 202 basis points (bps; 100 basis points equal one percentage point) on October 31, 2011, to 185 bps on April 30, 2012. Our banking, insurance, communications and consumer non-cyclical holdings generally contributed to results. Individual positions that bolstered Fund performance included JPMorgan Chase & Co. in banking, American International Group in insurance, Prudential Financial in finance, and Sprint Nextel and Charter Communications2 in communications. In contrast, among brokerage companies, our position in MF Global Holdings, which used to be a major global financial derivatives broker, was a major detractor. The company filed for bankruptcy protection on October 31, 2011, and near period-end was investigated by lawmakers due to liquidity problems arising from investments in European sovereign bonds. The company, which we sold before period-end, is considered to be the first major American victim of the European sovereign debt crisis. Petroplus Finance, another detractor, is an independent oil refiner in Europe that faced liquidity strains amid weak demand.
2. Sold by period-end.
6 | Semiannual Report
Thank you for your continued participation in Franklin Balanced Fund.
We look forward to serving your future investment needs.

CFA® is a trademark owned by CFA Institute.
The foregoing information reflects our analysis, opinions and portfolio holdings as of April 30, 2012, the end of the reporting period. The way we implement our main investment strategies and the resulting portfolio holdings may change depending on factors such as market and economic conditions. These opinions may not be relied upon as investment advice or an offer for a particular security. The information is not a complete analysis of every aspect of any market, country, industry, security or the Fund. Statements of fact are from sources considered reliable, but the investment manager makes no representation or warranty as to their completeness or accuracy. Although historical performance is no guarantee of future results, these insights may help you understand our investment management philosophy.
Semiannual Report | 7
Performance Summary as of 4/30/12
Franklin Balanced Fund
Your dividend income will vary depending on dividends or interest paid by securities in the Fund’s portfolio, adjusted for operating expenses of each class. Capital gain distributions are net profits realized from the sale of portfolio securities. The performance table does not reflect any taxes that a shareholder would pay on Fund dividends, capital gain distributions, if any, or any realized gains on the sale of Fund shares. Total return reflects reinvestment of the Fund’s dividends and capital gain distributions, if any, and any unrealized gains or losses.

8 | Semiannual Report
Performance Summary (continued)
Performance1
Cumulative total return excludes sales charges. Average annual total returns and value of $10,000 investment include maximum sales charges. Class A: 5.75% maximum initial sales charge; Class C: 1% contingent deferred sales charge in first year only; Class R/Advisor Class: no sales charges.
Semiannual Report | 9


Performance data represent past performance, which does not guarantee future results. Investment return and principal value will fluctuate, and you may have a gain or loss when you sell your shares. Current performance may differ from figures shown. For most recent month-end performance, go to franklintempleton.com or call (800) 342-5236.
The investment manager and administrator have contractually agreed to waive or assume certain expenses so that common expenses (excluding Rule 12b-1 fees and acquired fund fees and expenses) for each class of the Fund do not exceed 0.71% (other than certain nonroutine expenses) until 2/28/13.
Endnotes
All investments involve risks, including possible loss of principal. The Fund’s share price and yield will be affected by interest rate movements. Bond prices generally move in the opposite direction of interest rates. As prices of bonds in the Fund adjust to a rise in interest rates, the Fund’s share price may decline. Stock prices fluctuate, sometimes rapidly and dramatically, due to factors affecting individual companies, particular industries or sectors, or general market conditions. The Fund is actively managed but there is no guarantee that the manager’s investment decisions will produce the desired results. The Fund’s prospectus also includes a description of the main investment risks.
| |
Class C: Class R: | These shares have higher annual fees and expenses than Class A shares. Shares are available to certain eligible investors as described in the prospectus. These shares have a higher annual fees and expenses than Class A shares. |
Advisor Class: | Shares are available to certain eligible investors as described in the prospectus. |
1. If the manager and administrator had not waived fees, the Fund’s distribution rates and total returns would have been lower, and yields for the period would have been 2.07%, 1.51%, 2.01%, and 2.49% for Classes A, C, R and Advisor, respectively.
2. Cumulative total return represents the change in value of an investment over the periods indicated.
3. Average annual total return represents the average annual change in value of an investment over the periods indicated. Six-month return has not been annualized.
4. These figures represent the value of a hypothetical $10,000 investment in the Fund over the periods indicated.
5. In accordance with SEC rules, we provide standardized average annual total return information through the latest calendar quarter.
6. Distribution rate is based on an annualization of the respective class’s April dividend and the maximum offering price (NAV for Classes C, R and Advisor) per share on 4/30/12.
7. The 30-day standardized yield for the 30 days ended 4/30/12 reflects an estimated yield to maturity (assuming all portfolio securities are held to maturity). It should be regarded as an estimate of the Fund’s rate of investment income, and it may not equal the Fund’s actual income distribution rate (which reflects the Fund’s past dividends paid to shareholders) or the income reported in the Fund’s financial statements.
8. Figures are as stated in the Fund’s prospectus current as of the date of this report. In periods of market volatility, assets may decline significantly, causing total annual Fund operating expenses to become higher than the figures shown.
10 | Semiannual Report
Your Fund’s Expenses
Franklin Balanced Fund
As a Fund shareholder, you can incur two types of costs:
- Transaction costs, including sales charges (loads) on Fund purchases; and
- Ongoing Fund costs, including management fees, distribution and service (12b-1) fees, and other Fund expenses. All mutual funds have ongoing costs, sometimes referred to as operating expenses.
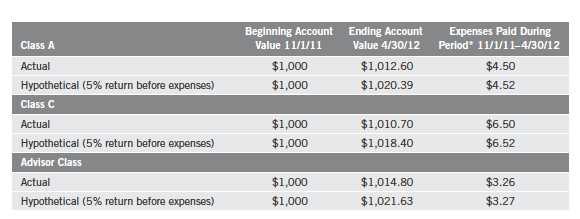
The following table shows ongoing costs of investing in the Fund and can help you understand these costs and compare them with those of other mutual funds. The table assumes a $1,000 investment held for the six months indicated.
Actual Fund Expenses
The first line (Actual) for each share class listed in the table provides actual account values and expenses. The “Ending Account Value” is derived from the Fund’s actual return, which includes the effect of Fund expenses.
You can estimate the expenses you paid during the period by following these steps. Of course, your account value and expenses will differ from those in this illustration:
| 1. | Divide your account value by $1,000. |
| | If an account had an $8,600 value, then $8,600 ÷ $1,000 = 8.6. |
| 2. | Multiply the result by the number under the heading “Expenses Paid During Period.” |
| | If Expenses Paid During Period were $7.50, then 8.6 x $7.50 = $64.50. |
In this illustration, the estimated expenses paid this period are $64.50.
Hypothetical Example for Comparison with Other Funds
Information in the second line (Hypothetical) for each class in the table can help you compare ongoing costs of investing in the Fund with those of other mutual funds. This information may not be used to estimate the actual ending account balance or expenses you paid during the period. The hypothetical “Ending Account Value” is based on the actual expense ratio for each class and an assumed 5% annual rate of return before expenses, which does not represent the Fund’s actual return. The figure under the heading “Expenses Paid During Period” shows the hypothetical expenses your account would have incurred under this scenario. You can compare this figure with the 5% hypothetical examples that appear in shareholder reports of other funds.
Semiannual Report | 11
Your Fund’s Expenses (continued)
Please note that expenses shown in the table are meant to highlight ongoing costs and do not reflect any transaction costs, such as sales charges. Therefore, the second line for each class is useful in comparing ongoing costs only, and will not help you compare total costs of owning different funds. In addition, if transaction costs were included, your total costs would have been higher. Please refer to the Fund prospectus for additional information on operating expenses.

*Expenses are calculated using the most recent six-month expense ratio, net of expense waivers, annualized for each class (A: 1.01%; C: 1.71%; R: 1.21%; and Advisor: 0.71%), multiplied by the average account value over the period, multiplied by 182/366 to reflect the one-half year period.
12 | Semiannual Report
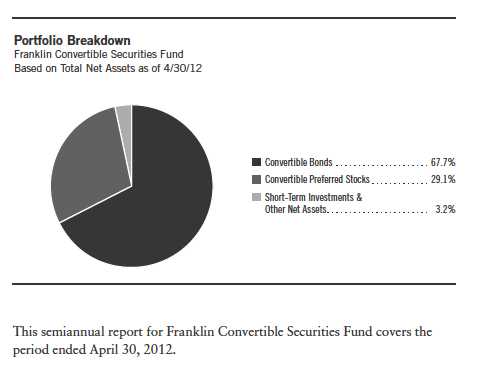
Franklin Convertible Securities Fund
Your Fund’s Goal and Main Investments: Franklin Convertible Securities Fund seeks to maximize total return, consistent with reasonable risk, by seeking to optimize capital appreciation and high current income under varying market conditions and investing at least 80% of its net assets in convertible securities.
Performance data represent past performance, which does not guarantee future results. Investment return and principal value will fluctuate, and you may have a gain or loss when you sell your shares. Current performance may differ from figures shown. Please visit franklintempleton.com or call (800) 342-5236 for most recent month-end performance.
Performance Overview
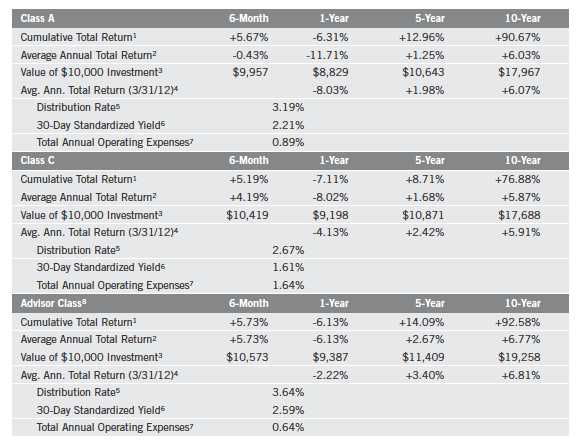
For the six months under review, Franklin Convertible Securities Fund – Class A delivered a +5.67% cumulative total return. The Fund underperformed the +6.44% total return of its benchmark, the BofA Merrill Lynch (BofAML) All Total Return Alternatives U.S. Convertibles Index, which tracks the domestic convertible securities market.1 You can find the Fund’s long-term performance data in the Performance Summary beginning on page 16.
1. Source: Bank of America Corp. The index is unmanaged and includes reinvestment of any income or distributions. One cannot invest directly in an index, and an index is not representative of the Fund’s portfolio.
The dollar value, number of shares or principal amount, and names of all portfolio holdings are listed in the Fund’s Statement of Investments (SOI). The SOI begins on page 60.
Semiannual Report | 13

Investment Strategy
We follow a strategy of maintaining a balance in the portfolio between the equity and debt characteristics of convertible securities with an emphasis on the equity features. Convertible securities are attractive for two reasons: the opportunity to participate in common stocks’ potential growth with relatively reduced volatility, and the potential for current income with potential downside protection from bonds. Typically we sell securities whose equity sensitivity becomes too high and no longer offers appropriate downside protection. Likewise, as securities become too bond-like — reducing their ability to appreciate with increases in the underlying common stock — we attempt to redeploy those assets into more balanced convertible securities and maintain the potential for the Fund’s upside participation. Our experienced team of analysts searches for investment opportunities among all economic sectors and considers a company’s long-term earnings, asset value and cash flow potential, to create a broadly diversified portfolio.
Manager’s Discussion
Nearly every sector the Fund invested in rose in value, as did most of the portfolio’s individual securities, supporting overall performance during the six-month reporting period. The Fund’s economically sensitive (or cyclical) sectors such as information technology (IT), health care, industrials, financials and materials fared particularly well and accounted for the bulk of the Fund’s total return.
Within IT, the Fund’s holdings of semiconductor and IT services-related convertible bonds enjoyed some of the largest gains as many technology companies continued to post strong corporate earnings. An acquisition agreement announced in December led holdings of semiconductor equipment manufacturer Novellus Systems to be a top contributor. Alliance Data Systems, which provides data-driven loyalty marketing solutions was also a strong performer as the company signed multi-year renewal agreements with key customers and raised its fiscal year 2012 earnings guidance.
The Fund’s top performers in the health care sector included Salix Pharmaceuticals, which develops and markets gastroenterology medicines, and biotechnology firm Gilead Sciences, which specializes in developing antiviral and pulmonary drugs. Strong contributors among industrials included WESCO International, an electrical products distributor, and commercial products manufacturer Ingersoll-Rand (sold by period-end). Other standout holdings included real estate firm Forest City Enterprises and Mexican cement giant Cemex.
Despite the Fund’s positive results this reporting period, there were a few disappointments in the portfolio. Our consumer discretionary and energy holdings
14 | Semiannual Report
detracted from performance as these sectors fell largely out of favor among investors. On an individual security basis, key detractors included Goodyear Tire & Rubber, James River Coal, and Chesapeake Energy. Goodyear reported lower-than-expected second quarter sales and management warned that tire sales would be lower in 2012 as the company focuses on higher-margin products, leading shares to decline. Falling coal prices weighed on James River Coal, and low natural gas prices hurt Chesapeake Energy.
Thank you for your continued participation in Franklin Convertible Securities Fund. We look forward to serving your future investment needs.

The foregoing information reflects our analysis, opinions and portfolio holdings as of April 30, 2012, the end of the reporting period. The way we implement our main investment strategies and the resulting portfolio holdings may change depending on factors such as market and economic conditions. These opinions may not be relied upon as investment advice or an offer for a particular security. The information is not a complete analysis of every aspect of any market, country, industry, security or the Fund. Statements of fact are from sources considered reliable, but the investment manager makes no representation or warranty as to their completeness or accuracy. Although historical performance is no guarantee of future results, these insights may help you understand our investment management philosophy.
Semiannual Report | 15
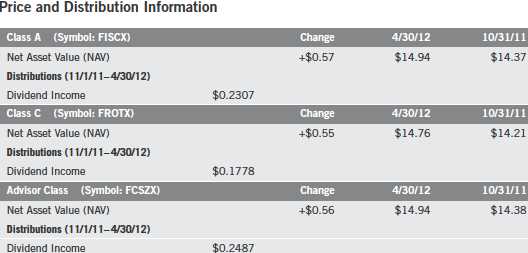
Performance Summary as of 4/30/12
Franklin Convertible Securities Fund
Your dividend income will vary depending on dividends or interest paid by securities in the Fund’s portfolio, adjusted for operating expenses of each class. Capital gain distributions are net profits realized from the sale of portfolio securities. The performance table does not reflect any taxes that a shareholder would pay on Fund dividends, capital gain distributions, if any, or any realized gains on the sale of Fund shares. Total return reflects reinvestment of the Fund’s dividends and capital gain distributions, if any, and any unrealized gains or losses.
16 | Semiannual Report
Performance Summary (continued)
Performance
Cumulative total return excludes sales charges. Average annual total returns and value of $10,000 investment include maximum sales charges. Class A: 5.75% maximum initial sales charge; Class C: 1% contingent deferred sales charge in first year only; Advisor Class: no sales charges.
Performance data represent past performance, which does not guarantee future results. Investment return and principal value will fluctuate, and you may have a gain or loss when you sell your shares. Current performance may differ from figures shown. For most recent month-end performance, go to franklintempleton.com or call (800) 342-5236.
Semiannual Report | 17
Performance Summary (continued)
Endnotes
All investments involve risks, including possible loss of principal. The Fund may invest in high yielding, fixed income securities. High yields reflect the higher credit risk associated with these lower rated securities and, in some cases, the lower market prices for these instruments. Interest rate movements may affect the Fund’s share price and yield. Bond prices generally move in the opposite direction of interest rates. As prices of bonds in the Fund adjust to a rise in interest rates, the Fund’s share price may decline. The Fund may also invest in foreign securities, which involve special risks, including political uncertainty and currency volatility. The Fund is actively managed but there is no guarantee that the manager’s investment decisions will produce the desired results. The Fund’s prospectus also includes a description of the main investment risks.
| |
Class C: | Prior to 1/1/04, these shares were offered with an initial sales charge; thus actual total returns would have differed. These shares have higher annual fees and expenses than Class A shares. |
Advisor Class: | Shares are available to certain eligible investors as described in the prospectus. |
1. Cumulative total return represents the change in value of an investment over the periods indicated.
2. Average annual total return represents the average annual change in value of an investment over the periods indicated. Six-month return has not been annualized.
3. These figures represent the value of a hypothetical $10,000 investment in the Fund over the periods indicated.
4. In accordance with SEC rules, we provide standardized average annual total return information through the latest calendar quarter.
5. Distribution rate is based on the sum of the respective class’s last four quarterly dividends and the maximum offering price (NAV for Classes C and Advisor) per share on 4/30/12.
6. The 30-day standardized yield for the 30 days ended 4/30/12 reflects an estimated yield to maturity (assuming all portfolio securities are held to maturity). It should be regarded as an estimate of the Fund’s rate of investment income, and it may not equal the Fund’s actual income distribution rate (which reflects the Fund’s past dividends paid to shareholders) or the income reported in the Fund’s financial statements.
7. Figures are as stated in the Fund’s prospectus current as of the date of this report. In periods of market volatility, assets may decline significantly, causing total annual Fund operating expenses to become higher than the figures shown.
8. Effective 5/15/08, the Fund began offering Advisor Class shares, which do not have sales charges or a Rule 12b-1 plan. Performance quotations for this class reflect the following methods of calculation: (a) For periods prior to 5/15/08, a restated figure is used based upon the Fund’s Class A performance, excluding the effect of Class A’s maximum initial sales charge, but reflecting the effect of the Class A Rule 12b-1 fees; and (b) for periods after 5/15/08, actual Advisor Class performance is used reflecting all charges and fees applicable to that class. Since 5/15/08 (commencement of sales), the cumulative and average annual total returns of Advisor Class shares were +16.40% and +3.91%.
18 | Semiannual Report
Your Fund’s Expenses
Franklin Convertible Securities Fund
As a Fund shareholder, you can incur two types of costs:
- Transaction costs, including sales charges (loads) on Fund purchases; and
- Ongoing Fund costs, including management fees, distribution and service (12b-1) fees, and other Fund expenses. All mutual funds have ongoing costs, sometimes referred to as operating expenses.
The following table shows ongoing costs of investing in the Fund and can help you understand these costs and compare them with those of other mutual funds. The table assumes a $1,000 investment held for the six months indicated.
Actual Fund Expenses
The first line (Actual) for each share class listed in the table provides actual account values and expenses. The “Ending Account Value” is derived from the Fund’s actual return, which includes the effect of Fund expenses.
You can estimate the expenses you paid during the period by following these steps. Of course, your account value and expenses will differ from those in this illustration:
| 1. | Divide your account value by $1,000. |
| | If an account had an $8,600 value, then $8,600 ÷ $1,000 = 8.6. |
| 2. | Multiply the result by the number under the heading “Expenses Paid During Period.” |
| | If Expenses Paid During Period were $7.50, then 8.6 x $7.50 = $64.50. |
In this illustration, the estimated expenses paid this period are $64.50.
Hypothetical Example for Comparison with Other Funds
Information in the second line (Hypothetical) for each class in the table can help you compare ongoing costs of investing in the Fund with those of other mutual funds. This information may not be used to estimate the actual ending account balance or expenses you paid during the period. The hypothetical “Ending Account Value” is based on the actual expense ratio for each class and an assumed 5% annual rate of return before expenses, which does not represent the Fund’s actual return. The figure under the heading “Expenses Paid During Period” shows the hypothetical expenses your account would have incurred under this scenario. You can compare this figure with the 5% hypothetical examples that appear in shareholder reports of other funds.
Semiannual Report | 19
Your Fund’s Expenses (continued)
Please note that expenses shown in the table are meant to highlight ongoing costs and do not reflect any transaction costs, such as sales charges. Therefore, the second line for each class is useful in comparing ongoing costs only, and will not help you compare total costs of owning different funds. In addition, if transaction costs were included, your total costs would have been higher. Please refer to the Fund prospectus for additional information on operating expenses.

*Expenses are calculated using the most recent six-month expense ratio, annualized for each class (A: 0.89%; C: 1.64%; and Advisor: 0.64%), multiplied by the average account value over the period, multiplied by 182/366 to reflect the one-half year period.
20 | Semiannual Report
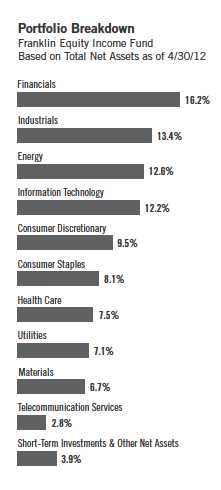
Franklin Equity Income Fund
Your Fund’s Goal and Main Investments: Franklin Equity Income Fund seeks to maximize total return, emphasizing high current income and long-term capital appreciation, consistent with reasonable risk, by investing at least 80% of its net assets in equity securities including securities convertible into common stocks.
Performance data represent past performance, which does not guarantee future results. Investment return and principal value will fluctuate, and you may have a gain or loss when you sell your shares. Current performance may differ from figures shown. Please visit franklintempleton.com or call (800) 342-5236 for most recent month-end performance.
This semiannual report for Franklin Equity Income Fund covers the period ended April 30, 2012.
Performance Overview
For the six months under review, Franklin Equity Income Fund – Class A delivered a +9.32% cumulative total return. The Fund underperformed the +12.77% total return of its benchmark, the Standard & Poor’s 500 Index (S&P 500), which tracks the broad U.S. stock market.1 The Fund also under-performed the +10.34% total return of its peers in the Lipper Equity Income Funds Classification Average, which consists of funds chosen by Lipper that seek relatively high current income and growth of income by investing at least 60% of their portfolios in stocks.2 You can find the Fund’s long-term performance data in the Performance Summary beginning on page 24.
Investment Strategy
We seek to invest in a broadly diversified portfolio of equity securities that we consider to be financially strong, with a focus on “blue chip” companies. We apply a bottom-up approach to investing in individual securities. We will assess the market price of a company’s securities relative to our evaluation of the company’s long-term earnings, asset value and cash flow potential. We also consider a company’s price/earnings ratio, profit margins, balance sheet and liquidation value. We consider dividend yield in selecting stocks for the Fund because we believe that, over time, dividend income can contribute significantly to total return and can be a more consistent source of investment return than capital
1. Source: © 2012 Morningstar. All Rights Reserved. The information contained herein: (1) is proprietary to Morningstar and/or its content providers; (2) may not be copied or distributed; and (3) is not warranted to be accurate, complete or timely. Neither Morningstar nor its content providers are responsible for any damages or losses arising from any use of this information.
2. Source: Lipper Inc. For the six-month period ended 4/30/12, this category consisted of 314 funds. Lipper calculations do not include sales charges, or expense subsidization by a fund’s manager. The Fund’s performance relative to the average may have differed if these and other factors had been considered.
The indexes are unmanaged and include reinvested dividends. One cannot invest directly in an index, and an index is not representative of the Fund’s portfolio.
The dollar value, number of shares or principal amount, and names of all portfolio holdings are listed in the Fund’s Statement of Investments (SOI). The SOI begins on page 68.
Semiannual Report | 21

* All Fund distributions will vary depending upon current market conditions, and past distributions are not indicative of future trends.
** Includes an additional 2.20 cent per share distribution to meet excise tax requirements.
appreciation. We seek to take advantage of price dislocations that result from the market’s short-term focus and choose to invest in those companies that, in our opinion, offer the best trade-off between growth opportunity, business and financial risk, and valuation.
Manager’s Discussion
During the six months under review, broad-based strength in equity markets led most of our holdings to appreciate, and Fund performance benefited from positive results in several sectors, including industrials, financials, consumer discretionary, and information technology (IT). Among industrials, top performers included conglomerate General Electric and our off-benchmark position in trucking company J.B. Hunt Transport Services, where growth in the intermodal transportation division led the company to post strong earnings and increase its dividend. Within the financials sector, top performers included investment management firm BlackRock and financial services company Wells Fargo. Home improvement retailer Lowe’s and sports equipment and apparel maker NIKE were top performers in the consumer discretionary sector. As corporate earnings improved, businesses continued to engage in long-awaited equipment and productivity upgrades that had been delayed by the recession. This shift in business sentiment had a positive impact on many of the Fund’s technology-related holdings, including microchip manufacturer Intel and International Business Machines, which benefited as many companies increased spending to upgrade their technology infrastructure.
22 | Semiannual Report
There were, however, some notable detractors from Fund performance. QBE Insurance Group declined as the firm reduced its dividend, announced a planned acquisition and issued shares. Low natural gas prices led our Chesapeake Energy convertible preferred shares to hurt performance. Similarly, convertible preferred shares of gold mining company AngloGold Ashanti Holdings also detracted from performance.
Thank you for your continued participation in Franklin Equity Income Fund.
We look forward to serving your future investment needs.

The foregoing information reflects our analysis, opinions and portfolio holdings as of April 30, 2012, the end of the reporting period. The way we implement our main investment strategies and the resulting portfolio holdings may change depending on factors such as market and economic conditions. These opinions may not be relied upon as investment advice or an offer for a particular security. The information is not a complete analysis of every aspect of any market, country, industry, security or the Fund. Statements of fact are from sources considered reliable, but the investment manager makes no representation or warranty as to their completeness or accuracy. Although historical performance is no guarantee of future results, these insights may help you understand our investment management philosophy.

Semiannual Report | 23
Performance Summary as of 4/30/12
Franklin Equity Income Fund
Your dividend income will vary depending on dividends or interest paid by securities in the Fund’s portfolio, adjusted for operating expenses of each class. Capital gain distributions are net profits realized from the sale of portfolio securities. The performance table does not reflect any taxes that a shareholder would pay on Fund dividends, capital gain distributions, if any, or any realized gains on the sale of Fund shares. Total return reflects reinvestment of the Fund’s dividends and capital gain distributions, if any, and any unrealized gains or losses.

24 | Semiannual Report
Performance Summary (continued)
Performance
Cumulative total return excludes sales charges. Average annual total returns and value of $10,000 investment include maximum sales charges. Class A: 5.75% maximum initial sales charge; Class B: contingent deferred sales charge (CDSC) declining from 4% to 1% over six years, and eliminated thereafter; Class C: 1% CDSC in first year only;
Class R/Advisor Class: no sales charges.

Performance data represent past performance, which does not guarantee future results. Investment return and principal value will fluctuate, and you may have a gain or loss when you sell your shares. Current performance may differ from figures shown. For most recent month-end performance, go to franklintempleton.com or call (800) 342-5236.
Semiannual Report | 25
Performance Summary (continued)
Endnotes
All investments involve risks, including possible loss of principal. Stock prices fluctuate, sometimes rapidly and dramatically, due to factors affecting individual companies, particular industries or sectors, or general market conditions. The Fund’s investment in foreign securities also involves special risks, including currency fluctuations and economic as well as political uncertainty. The Fund is actively managed but there is no guarantee that the manager’s investment decisions will produce the desired results. The Fund’s prospectus also includes a description of the main investment risks.
| |
Class B: Class C: | These shares have higher annual fees and expenses than Class A shares. Prior to 1/1/04, these shares were offered with an initial sales charge; thus actual total returns would have differed. These shares have higher annual fees and expenses than Class A shares. |
Class R: | Shares are available to certain eligible investors as described in the prospectus. These shares have higher annual fees and expenses than Class A shares. |
Advisor Class: | Shares are available to certain eligible investors as described in the prospectus. |
1. Cumulative total return represents the change in value of an investment over the periods indicated.
2. Average annual total return represents the average annual change in value of an investment over the periods indicated. Six-month return has not been annualized.
3. These figures represent the value of a hypothetical $10,000 investment in the Fund over the periods indicated.
4. In accordance with SEC rules, we provide standardized average annual total return information through the latest calendar quarter.
5. Distribution rate is based on an annualization of the respective class’s April dividend and the maximum offering price (NAV for Classes B, C, R and Advisor) per share on 4/30/12.
6. The 30-day standardized yield for the 30 days ended 4/30/12 reflects an estimated yield to maturity (assuming all portfolio securities are held to maturity). It should be regarded as an estimate of the Fund’s rate of investment income, and it may not equal the Fund’s actual income distribution rate (which reflects the Fund’s past dividends paid to shareholders) or the income reported in the Fund’s financial statements.
7. Figures are as stated in the Fund’s prospectus current as of the date of this report. In periods of market volatility, assets may decline significantly, causing total annual Fund operating expenses to become higher than the figures shown.
8. Effective 5/15/08, the Fund began offering Advisor Class shares, which do not have sales charges or a Rule 12b-1 plan. Performance quotations for this class reflect the following methods of calculation: (a) For periods prior to 5/15/08, a restated figure is used based upon the Fund’s Class A performance, excluding the effect of Class A’s maximum initial sales charge, but reflecting the effect of the Class A Rule 12b-1 fees; and (b) for periods after 5/15/08, actual Advisor Class performance is used reflecting all charges and fees applicable to that class. Since 5/15/08 (commencement of sales), the cumulative and average annual total returns of Advisor Class shares were +4.39% and +1.09%.
26 | Semiannual Report
Your Fund’s Expenses
Franklin Equity Income Fund
As a Fund shareholder, you can incur two types of costs:
- Transaction costs, including sales charges (loads) on Fund purchases; and
- Ongoing Fund costs, including management fees, distribution and service (12b-1) fees, and other Fund expenses. All mutual funds have ongoing costs, sometimes referred to as operating expenses.
The following table shows ongoing costs of investing in the Fund and can help you understand these costs and compare them with those of other mutual funds. The table assumes a $1,000 investment held for the six months indicated.
Actual Fund Expenses
The first line (Actual) for each share class listed in the table provides actual account values and expenses. The “Ending Account Value” is derived from the Fund’s actual return, which includes the effect of Fund expenses.
You can estimate the expenses you paid during the period by following these steps. Of course, your account value and expenses will differ from those in this illustration:
| 1. | Divide your account value by $1,000. |
| | If an account had an $8,600 value, then $8,600 ÷ $1,000 = 8.6. |
| 2. | Multiply the result by the number under the heading “Expenses Paid During Period.” |
| | If Expenses Paid During Period were $7.50, then 8.6 x $7.50 = $64.50. |
In this illustration, the estimated expenses paid this period are $64.50.
Hypothetical Example for Comparison with Other Funds
Information in the second line (Hypothetical) for each class in the table can help you compare ongoing costs of investing in the Fund with those of other mutual funds. This information may not be used to estimate the actual ending account balance or expenses you paid during the period. The hypothetical “Ending Account Value” is based on the actual expense ratio for each class and an assumed 5% annual rate of return before expenses, which does not represent the Fund’s actual return. The figure under the heading “Expenses Paid During Period” shows the hypothetical expenses your account would have incurred under this scenario. You can compare this figure with the 5% hypothetical examples that appear in shareholder reports of other funds.
Semiannual Report | 27
Your Fund’s Expenses (continued)
Please note that expenses shown in the table are meant to highlight ongoing costs and do not reflect any transaction costs, such as sales charges. Therefore, the second line for each class is useful in comparing ongoing costs only, and will not help you compare total costs of owning different funds. In addition, if transaction costs were included, your total costs would have been higher. Please refer to the Fund prospectus for additional information on operating expenses.

*Expenses are calculated using the most recent six-month expense ratio, annualized for each class (A: 0.95%; B: 1.70%; C: 1.70%; R: 1.20%; and Advisor: 0.70%), multiplied by the average account value over the period, multiplied by 182/366 to reflect the one-half year period.
28 | Semiannual Report
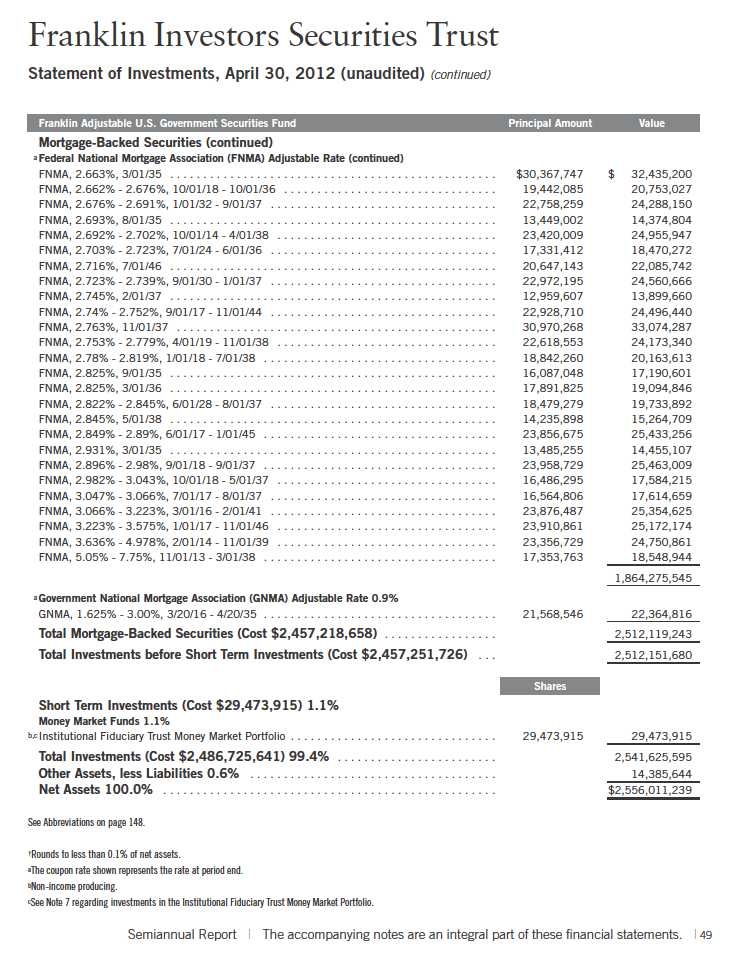
Franklin Limited Maturity U.S. Government Securities Fund
Your Fund’s Goal and Main Investments: Franklin Limited Maturity U.S. Government Securities Fund seeks to provide investors with as high a level of current income as is consistent with prudent investing, while seeking to preserve shareholders’ capital, by investing at least 80% of its net assets in securities with a dollar-weighted average maturity of less than 10 years1 and issued or guaranteed by the U.S. government, its agencies or instrumentalities.2 Some of the Fund’s investments may include securities issued by U.S. government-sponsored entities such as Fannie Mae and Freddie Mac.3

Performance data represent past performance, which does not guarantee future results. Investment return and principal value will fluctuate, and you may have a gain or loss when you sell your shares. Current performance may differ from figures shown. Please visit franklintempleton.com or call (800) 342-5236 for most recent month-end performance.
We are pleased to bring you Franklin Limited Maturity U.S. Government Securities Fund’s semiannual report for the period ended April 30, 2012.
Performance Overview
For the six months under review, Franklin Limited Maturity U.S. Government Securities Fund – Class A delivered a +0.66% cumulative total return. The
1. In determining a security’s maturity for the purposes of calculating the Fund’s average maturity, an estimate of the average time for its principal to be paid may be used. This can be substantially shorter than its stated final maturity.
2. Securities owned by the Fund, but not shares of the Fund, are issued or guaranteed by the U.S. government, its agencies or instrumentalities, including government-sponsored entities, as to timely payment of principal and interest.
3. Although U.S. government-sponsored entities may be chartered or sponsored by acts of Congress, their securities are neither insured nor guaranteed by the U.S. government. Please refer to the Fund’s prospectus for a detailed discussion regarding various levels of credit support. The Fund’s yield and share price are not guaranteed and will vary with market conditions.
The dollar value, number of shares or principal amount, and names of all portfolio holdings are listed in the Fund’s Statement of Investments (SOI). The SOI begins on page 74.
Semiannual Report | 29

*Assumes shares were purchased and held for the entire accrual period. Since dividends accrue daily, your actual distributions will vary depending on the date you purchased your shares and any account activity. All Fund distributions will vary depending upon current market conditions, and past distributions are not indicative of future trends.
**Includes an additional 0.58 cent per share distribution to meet excise tax requirements.
Fund outperformed the +0.62% total return of its primary benchmark, the Barclays Capital (BC) U.S. Treasury Index: 1-5 Year Component, which tracks U.S. Treasury securities with one to five years remaining maturity.4 The Fund also outperformed the +0.24% total return of its secondary benchmark, the BC U.S. Treasury Index: 1-3 Year Component, which tracks U.S. Treasury securities with one to three years remaining maturity.4 You can find the Fund’s long-term performance data in the Performance Summary beginning on page 33.
Investment Strategy
We currently maintain the portfolio’s average dollar-weighted maturity between one and five years. The Fund’s average dollar-weighted maturity will vary with market conditions and the outlook for interest rates. We invest primarily in short- to intermediate-term securities issued or guaranteed by the U.S. government, its agencies and instrumentalities.2 Some of the Fund’s investments may include securities issued by U.S. government-sponsored entities, such as Fannie Mae (FNMA) and Freddie Mac (FHLMC).3 The Fund’s portfolio emphasizes mortgage-backed bonds and agency debentures, while also diversifying across components of the U.S. Treasury sector. We analyze securities using proprietary and nonproprietary research to help identify attractive investment opportunities.
4. Source: © 2012 Morningstar. All Rights Reserved. The information contained herein: (1) is proprietary to Morningstar and/or its content providers; (2) may not be copied or distributed; and (3) is not warranted to be accurate, complete or timely. Neither Morningstar nor its content providers are responsible for any damages or losses arising from any use of this information. The indexes are unmanaged and include reinvestment of any income or distributions. One cannot invest directly in an index, and an index is not representative of the Fund’s portfolio.
30 | Semiannual Report
Manager’s Discussion
During the period, capital markets generally favored risk assets based on improving U.S. economic data. Although economic data remained supportive of a U.S. economic recovery, a number of uncertainties led investors to question if this positive momentum was sustainable. Investors seemed to recall periods in 2010 and 2011 when the economy initially gained momentum but then turned sluggish, raising the possibility of another recession. During the reporting period, market concerns persisted regarding the eurozone debt crisis, a potential hard landing in China, the U.S. presidential election and the potential fiscal ramifications of expiring policy initiatives. Although significant headwinds still exist, we believe the U.S. economic recovery should remain positive, but uneven. Furthermore, we think efforts by foreign monetary institutions have helped reduce fears of systemic risk associated with the European sovereign credit crisis.
As measured by BC Indexes, most fixed income sectors posted positive returns during the period, including the U.S. TIPS Index (+3.74%), the U.S. Agency Fixed Rate Mortgage-Backed Securities (MBS) Index (+2.11%), the Ginnie Mae (GNMA) Index (+2.10%), the U.S. Treasury Index (+1.87%), the U.S. Hybrid Adjustable-Rate Mortgage (ARM) Index (+1.59%) and the U.S. Agency Index (+1.32%).3
The Fund invested in U.S. Treasuries, including TIPS, agency debentures, agency mortgage pass-through securities, other U.S. government related bonds and cash investments. We looked for what we viewed as attractive valuations within lower interest rate risk government bond markets.
Most of the broad sectors we invested in outperformed comparable maturity Treasuries and contributed positively to absolute returns. As a sector, agency ARMs outperformed comparable maturity Treasuries and contributed significantly to relative and absolute performance. Agency debentures, agency residential fixed-rate mortgages and TIPS generally outperformed comparable maturity Treasuries and provided a slight boost to performance versus the benchmark. Agency multi-family mortgages also contributed to returns. The portfolio had less interest rate risk than the benchmark BC U.S. Treasury Index: 1-5 Year Component due to our concern that interest rates could eventually rise from their historically low levels and lead to negative returns. However, during the period, interest rates fell and as a result, our lower interest rate risk positioning detracted from performance relative to the benchmark.
Semiannual Report | 31
During the period, we continued to emphasize agency mortgages and agency debentures because in our view they offer better return potential, as well as an income advantage over Treasuries. We found opportunities during the period to add agency ARMs that offered what we considered to be attractive yields relative to other high-quality low-duration assets. We reduced exposure to agency debentures after they become more fully valued, in our assessment.
Thank you for your continued participation in Franklin Limited Maturity U.S. Government Securities Fund. We look forward to serving your future investment needs.

Portfolio Management Team
Franklin Limited Maturity
U.S. Government Securities Fund
The foregoing information reflects our analysis, opinions and portfolio holdings as of April 30, 2012, the end of the reporting period. The way we implement our main investment strategies and the resulting portfolio holdings may change depending on factors such as market and economic conditions. These opinions may not be relied upon as investment advice or an offer for a particular security. The information is not a complete analysis of every aspect of any market, country, industry, security or the Fund. Statements of fact are from sources considered reliable, but the investment manager makes no representation or warranty as to their completeness or accuracy. Although historical performance is no guarantee of future results, these insights may help you understand our investment management philosophy.
32 | Semiannual Report
Performance Summary as of 4/30/12
Franklin Limited Maturity U.S. Government Securities Fund
Your dividend income will vary depending on dividends or interest paid by securities in the Fund’s portfolio, adjusted for operating expenses of each class. Capital gain distributions are net profits realized from the sale of portfolio securities. The performance table does not reflect any taxes that a shareholder would pay on Fund dividends, capital gain distributions, if any, or any realized gains on the sale of Fund shares. Total return reflects reinvestment of the Fund’s dividends and capital gain distributions, if any, and any unrealized gains or losses.

Performance
Cumulative total return excludes sales charges. Average annual total returns include maximum sales charges. Class A: 2.25% maximum initial sales charge; Advisor Class: no sales charges.

Performance data represent past performance, which does not guarantee future results. Investment return and principal value will fluctuate, and you may have a gain or loss when you sell your shares. Current performance may differ from figures shown. For most recent month-end performance, go to franklintempleton.com or call (800) 342-5236.
Semiannual Report | 33
Performance Summary (continued)
Endnotes
All investments involve risks, including possible loss of principal. Interest rate movements, unscheduled mortgage prepayments and other risk factors will affect the Fund’s share price and yield. Bond prices, and thus a fund’s share price, generally move in the opposite direction of interest rates. Therefore, as prices of bonds in the Fund adjust to a rise in interest rates, the Fund’s share price may decline. Changes in the financial strength of a bond issuer or in a bond’s credit rating may affect its value. The Fund is actively managed but there is no guarantee that the manager’s investment decisions will produce the desired results. The Fund’s prospectus also includes a description of the main investment risks.
Advisor Class: Shares are available to certain eligible investors as described in the prospectus.
1. Cumulative total return represents the change in value of an investment over the periods indicated.
2. Average annual total return represents the average annual change in value of an investment over the periods indicated. Six-month return has not been annualized.
3. In accordance with SEC rules, we provide standardized average annual total return information through the latest calendar quarter.
4. Distribution rate is based on an annualization of the respective class’s April dividend and the maximum offering price (NAV for Advisor Class) per share on 4/30/12.
5. The 30-day standardized yield for the 30 days ended 4/30/12 reflects an estimated yield to maturity (assuming all portfolio securities are held to maturity). It should be regarded as an estimate of the Fund’s rate of investment income, and it may not equal the Fund’s actual income distribution rate (which reflects the Fund’s past dividends paid to shareholders) or the income reported in the Fund’s financial statements.
6. Figures are as stated in the Fund’s prospectus current as of the date of this report. In periods of market volatility, assets may decline significantly, causing total annual Fund operating expenses to become higher than the figures shown.
34 | Semiannual Report
Your Fund’s Expenses
Franklin Limited Maturity U.S. Government Securities Fund
As a Fund shareholder, you can incur two types of costs:
- Transaction costs, including sales charges (loads) on Fund purchases; and
- Ongoing Fund costs, including management fees, distribution and service (12b-1) fees, and other Fund expenses. All mutual funds have ongoing costs, sometimes referred to as operating expenses.
The following table shows ongoing costs of investing in the Fund and can help you understand these costs and compare them with those of other mutual funds. The table assumes a $1,000 investment held for the six months indicated.
Actual Fund Expenses
The first line (Actual) for each share class listed in the table provides actual account values and expenses. The “Ending Account Value” is derived from the Fund’s actual return, which includes the effect of Fund expenses.
You can estimate the expenses you paid during the period by following these steps. Of course, your account value and expenses will differ from those in this illustration:
| 1. | Divide your account value by $1,000. |
| | If an account had an $8,600 value, then $8,600 ÷ $1,000 = 8.6 |
| 2. | Multiply the result by the number under the heading “Expenses Paid During Period.” |
| | If Expenses Paid During Period were $7.50, then 8.6 x $7.50 = $64.50. |
In this illustration, the estimated expenses paid this period are $64.50.
Hypothetical Example for Comparison with Other Funds
Information in the second line (Hypothetical) for each class in the table can help you compare ongoing costs of investing in the Fund with those of other mutual funds. This information may not be used to estimate the actual ending account balance or expenses you paid during the period. The hypothetical “Ending Account Value” is based on the actual expense ratio for each class and an assumed 5% annual rate of return before expenses, which does not represent the Fund’s actual return. The figure under the heading “Expenses Paid During Period” shows the hypothetical expenses your account would have incurred under this scenario. You can compare this figure with the 5% hypothetical examples that appear in shareholder reports of other funds.
Semiannual Report | 35
Your Fund’s Expenses (continued)
Please note that expenses shown in the table are meant to highlight ongoing costs and do not reflect any transaction costs, such as sales charges. Therefore, the second line for each class is useful in comparing ongoing costs only, and will not help you compare total costs of owning different funds. In addition, if transaction costs were included, your total costs would have been higher. Please refer to the Fund prospectus for additional information on operating expenses.

*Expenses are calculated using the most recent six-month expense ratio, annualized for each class (A: 0.76% and Advisor: 0.66%), multiplied by the average account value over the period, multiplied by 182/366 to reflect the one-half year period.
36 | Semiannual Report
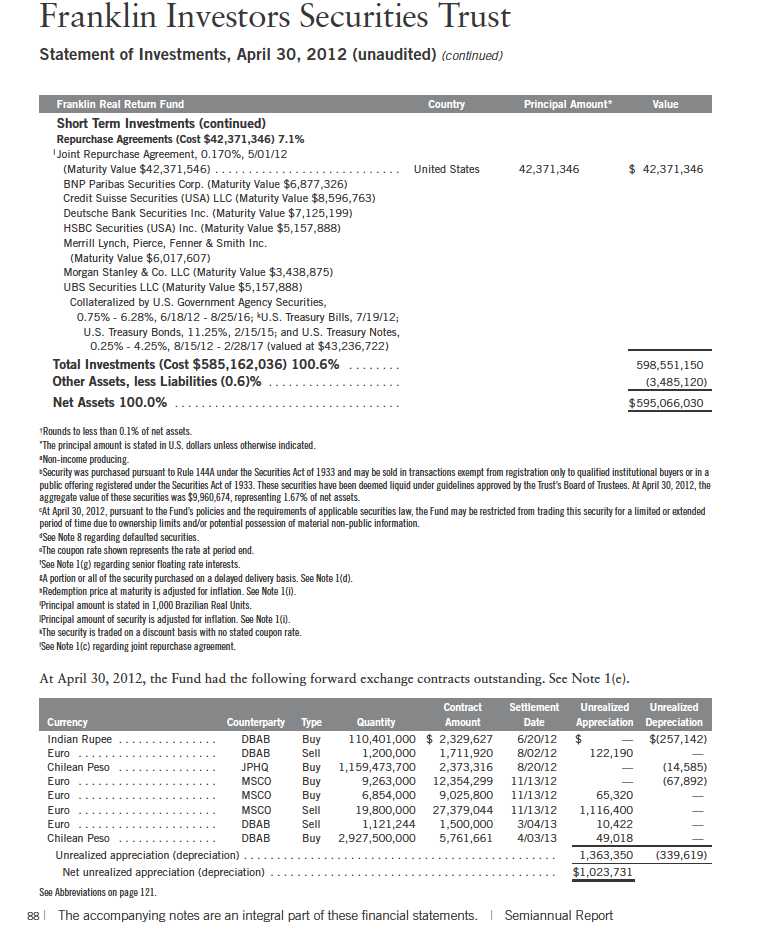
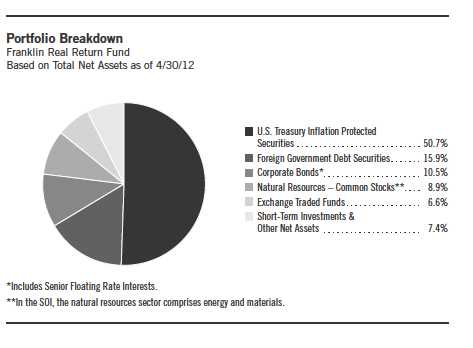
Franklin Real Return Fund
Your Fund’s Goal and Main Investments: Franklin Real Return Fund seeks to achieve total return that exceeds the rate of inflation over an economic cycle. The Fund will generally invest a substantial portion of its assets in inflation-protected securities. Managers also have the flexibility to invest in other sectors of the market to increase real return (total return less the rate of inflation) potential and offer greater diversification.
Performance data represent past performance, which does not guarantee future results. Investment return and principal value will fluctuate, and you may have a gain or loss when you sell your shares. Current performance may differ from figures shown. Please visit franklintempleton.com or call (800) 342-5236 for most recent month-end performance.
This semiannual report for Franklin Real Return Fund covers the period ended April 30, 2012.
Performance Overview
For the six months under review, Franklin Real Return Fund – Class A delivered a +1.26% cumulative total return. The Fund underperformed the +3.74% total return of its benchmark, the Barclays Capital (BC) U.S. TIPS Index, which tracks the universe of inflation-protected notes issued by the U.S. Treasury that have at least one year to final maturity.1 The Fund underperformed the Consumer Price
1. Source: © 2012 Morningstar. All Rights Reserved. The information contained herein: (1) is proprietary to Morningstar and/or its content providers; (2) may not be copied or distributed; and (3) is not warranted to be accurate, complete or timely. Neither Morningstar nor its content providers are responsible for any damages or losses arising from any use of this information. The indexes are unmanaged. The BC U.S. TIPS Index includes reinvested interest. One cannot invest directly in an index, and an index is not representative of the Fund’s portfolio.
The dollar value, number of shares or principal amount, and names of all portfolio holdings are listed in the Fund’s Statement of Investments (SOI). The SOI begins on page 81.
Semiannual Report | 37

*All Fund distributions will vary depending upon current market conditions, and past distributions are not indicative of future trends.
**Distributions are higher than in other months primarily due to the inclusion of net foreign currency gains to meet excise tax requirements.
***The Fund paid no dividends due to negative inflation adjustments for TIPS, which are the Fund’s primary investments.
Index (CPI) for Urban Consumers (All Items) NSA (non-seasonally adjusted), a measure of the average change in prices of all goods and services purchased for consumption by urban householders, which rose 1.62% for the same period.1 You can find more of the Fund’s performance data in the Performance Summary beginning on page 41.
Investment Strategy
We seek to allocate assets among investments to achieve the highest level of real return (total return less the rate of inflation) consistent with an acceptable level of risk. We will allocate the Fund’s assets among securities in various market sectors based on our assessment of changing economic, global market, industry and issuer conditions. When making our investment decisions, we use a “top-down” analysis of macroeconomic trends combined with a “bottom-up” fundamental analysis of market sectors, industries and issuers to try to take advantage of varying sector reactions to economic events. We will evaluate such criteria as country risk, business cycles, yield curves, and values between and within markets.
38 | Semiannual Report
Manager’s Discussion
During the period, capital markets generally favored risk assets based on improving U.S. economic data. Although economic data remained supportive of a U.S. economic recovery, a number of uncertainties led investors to question if this positive momentum was sustainable. Investors seemed to recall periods in 2010 and 2011 when the economy initially gained momentum but then turned sluggish, raising the possibility of another recession. During the reporting period, market concerns persisted regarding the eurozone debt crisis, a potential hard landing in China, the U.S. presidential election and the potential fiscal ramifications of expiring policy initiatives. Although significant headwinds still exist, we believe the U.S. economic recovery should remain positive, but uneven. Furthermore, we think efforts by foreign monetary institutions have helped reduce fears of systemic risk associated with the European sovereign credit crisis.
During the period, we invested the Fund’s assets in the allowable sectors. At period-end, roughly half of the Fund’s total net assets were invested in Treasury Inflation Protected Securities (TIPS). For diversification, we also allocated some of the Fund’s assets to short-term non-U.S. dollar securities as well as the natural resources, real estate investment trusts (REITs), bank loan and high yield sectors. We employed a non-U.S. dollar strategy to help hedge against dollar weakness versus certain currencies and concentrated our TIPS holdings in shorter maturities.
Our diversified mix of inflation-sensitive assets underperformed during the period. Our non-U.S. dollar holdings and allocation to REITs contributed to performance relative to the benchmark index. In contrast, our exposure to TIPS, natural resources securities and bank loans hurt performance.
Semiannual Report | 39
Thank you for your continued participation in Franklin Real Return Fund.
We look forward to serving your future investment needs.

The foregoing information reflects our analysis, opinions and portfolio holdings as of April 30, 2012, the end of the reporting period. The way we implement our main investment strategies and the resulting portfolio holdings may change depending on factors such as market and economic conditions. These opinions may not be relied upon as investment advice or an offer for a particular security. The information is not a complete analysis of every aspect of any market, country, industry, security or the Fund. Statements of fact are from sources considered reliable, but the investment manager makes no representation or warranty as to their completeness or accuracy. Although historical performance is no guarantee of future results, these insights may help you understand our investment management philosophy.
40 | Semiannual Report
Performance Summary as of 4/30/12
Franklin Real Return Fund
Your dividend income will vary depending on dividends or interest paid by securities in the Fund’s portfolio, adjusted for operating expenses of each class. Capital gain distributions are net profits realized from the sale of portfolio securities. The performance table does not reflect any taxes that a shareholder would pay on Fund dividends, capital gain distributions, if any, or any realized gains on the sale of Fund shares. Total return reflects reinvestment of the Fund’s dividends and capital gain distributions, if any, and any unrealized gains or losses.

Semiannual Report | 41
Performance Summary (continued)
Performance1
Cumulative total return excludes sales charges. Average annual total returns include maximum sales charges. Class A: 4.25% maximum initial sales charge; Class C: 1% contingent deferred sales charge in first year only; Advisor Class: no sales charges.

Performance data represent past performance, which does not guarantee future results. Investment return and principal value will fluctuate, and you may have a gain or loss when you sell your shares. Current performance may differ from figures shown. For most recent month-end performance, go to franklintempleton.com or call (800) 342-5236.
The investment manager and administrator have contractually agreed to waive or assume certain expenses so that common expenses (excluding Rule 12b-1 fees and acquired fees and expenses) for each class of the Fund do not exceed 0.65% (other than certain nonroutine expenses) until 2/28/13.
42 | Semiannual Report
Performance Summary (continued)
Endnotes
All investments involve risks, including possible loss of principal. Interest rate movements will affect the Fund’s share price and yield. Bond prices generally move in the opposite direction of interest rates. Thus, as prices of bonds in the Fund adjust to a rise in interest rates, the Fund’s share price may decline. The risks of foreign securities include currency fluctuations and political uncertainty. Changes in the financial strength of a bond issuer or in a bond’s credit rating may affect its value. Stock prices fluctuate, sometimes rapidly and dramatically, due to factors affecting individual companies, particular industries or sectors, or general market conditions. The Fund is actively managed but there is no guarantee that the manager’s investment decisions will produce the desired results. The Fund’s prospectus also includes a description of the main investment risks.
| |
Class C: Advisor Class: | These shares have higher annual fees and expenses than Class A shares. Shares are available to certain eligible investors as described in the prospectus. |
1. If the manager and administrator had not waived fees, the Fund’s distribution rates and total returns would have been lower, and yields for the period would have been 1.85%, 1.54% and 2.18% for Classes A, C and Advisor, respectively.
2. Cumulative total return represents the change in value of an investment over the periods indicated.
3. Average annual total return represents the average annual change in value of an investment over the periods indicated. Six-month return has not been annualized.
4. In accordance with SEC rules, we provide standardized average annual total return information through the latest calendar quarter.
5. Distribution rate is based on an annualization of the respective class’s April dividend and the maximum offering price (NAV for Classes C and Advisor) per share on 4/30/12.
6. The 30-day standardized yield for the 30 days ended 4/30/12 reflects an estimated yield to maturity (assuming all portfolio securities are held to maturity). It should be regarded as an estimate of the Fund’s rate of investment income, and it may not equal the Fund’s actual income distribution rate (which reflects the Fund’s past dividends paid to shareholders) or the income reported in the Fund’s financial statements.
7. Figures are as stated in the Fund’s prospectus current as of the date of this report. In periods of market volatility, assets may decline significantly, causing total annual Fund operating expenses to become higher than the figures shown.
Semiannual Report | 43
Your Fund’s Expenses
Franklin Real Return Fund
As a Fund shareholder, you can incur two types of costs:
- Transaction costs, including sales charges (loads) on Fund purchases; and
- Ongoing Fund costs, including management fees, distribution and service (12b-1) fees, and other Fund expenses. All mutual funds have ongoing costs, sometimes referred to as operating expenses.
The following table shows ongoing costs of investing in the Fund and can help you understand these costs and compare them with those of other mutual funds. The table assumes a $1,000 investment held for the six months indicated.
Actual Fund Expenses
The first line (Actual) for each share class listed in the table provides actual account values and expenses. The “Ending Account Value” is derived from the Fund’s actual return, which includes the effect of Fund expenses.
You can estimate the expenses you paid during the period by following these steps. Of course, your account value and expenses will differ from those in this illustration:
| 1. | Divide your account value by $1,000. |
| | If an account had an $8,600 value, then $8,600 ÷ $1,000 = 8.6. |
| 2. | Multiply the result by the number under the heading “Expenses Paid During Period.” |
| | If Expenses Paid During Period were $7.50, then 8.6 x $7.50 = $64.50. |
In this illustration, the estimated expenses paid this period are $64.50.
Hypothetical Example for Comparison with Other Funds
Information in the second line (Hypothetical) for each class in the table can help you compare ongoing costs of investing in the Fund with those of other mutual funds. This information may not be used to estimate the actual ending account balance or expenses you paid during the period. The hypothetical “Ending Account Value” is based on the actual expense ratio for each class and an assumed 5% annual rate of return before expenses, which does not represent the Fund’s actual return. The figure under the heading “Expenses Paid During Period” shows the hypothetical expenses your account would have incurred under this scenario. You can compare this figure with the 5% hypothetical examples that appear in shareholder reports of other funds.
44 | Semiannual Report
Your Fund’s Expenses (continued)
Please note that expenses shown in the table are meant to highlight ongoing costs and do not reflect any transaction costs, such as sales charges. Therefore, the second line for each class is useful in comparing ongoing costs only, and will not help you compare total costs of owning different funds. In addition, if transaction costs were included, your total costs would have been higher. Please refer to the Fund prospectus for additional information on operating expenses.
*Expenses are calculated using the most recent six-month expense ratio, net of expense waivers, annualized for each class (A: 0.90%; C: 1.30%; and Advisor: 0.65%), multiplied by the average account value over the period, multiplied by 182/366 to reflect the one-half year period.
Semiannual Report | 45

aThe amount shown for a share outstanding throughout the period may not correlate with the Statement of Operations for the period due to the timing of sales and repurchases of
the Fund shares in relation to income earned and/or fluctuating market value of the investments of the Fund.
bBased on average daily shares outstanding.
cAmount rounds to less than $0.01 per share.
dEffective September 1, 2008, the redemption fee was eliminated.
eTotal return does not reflect sales commissions or contingent deferred sales charges, if applicable, and is not annualized for periods less than one year.
fRatios are annualized for periods less than one year.
46 | The accompanying notes are an integral part of these financial statements. | Semiannual Report

aThe amount shown for a share outstanding throughout the period may not correlate with the Statement of Operations for the period due to the timing of sales and repurchases of
the Fund shares in relation to income earned and/or fluctuating market value of the investments of the Fund.
bBased on average daily shares outstanding.
cAmount rounds to less than $0.01 per share.
dEffective September 1, 2008, the redemption fee was eliminated.
eTotal return does not reflect sales commissions or contingent deferred sales charges, if applicable, and is not annualized for periods less than one year.
fRatios are annualized for periods less than one year.
Semiannual Report | The accompanying notes are an integral part of these financial statements. | 47
aThe amount shown for a share outstanding throughout the period may not correlate with the Statement of Operations for the period due to the timing of sales and repurchases of
the Fund shares in relation to income earned and/or fluctuating market value of the investments of the Fund.
bBased on average daily shares outstanding.
cAmount rounds to less than $0.01 per share.
dEffective September 1, 2008, the redemption fee was eliminated.
eTotal return does not reflect sales commissions or contingent deferred sales charges, if applicable, and is not annualized for periods less than one year.
fRatios are annualized for periods less than one year.
48 | The accompanying notes are an integral part of these financial statements. | Semiannual Report

aThe amount shown for a share outstanding throughout the period may not correlate with the Statement of Operations for the period due to the timing of sales and repurchases of
the Fund shares in relation to income earned and/or fluctuating market value of the investments of the Fund.
bBased on average daily shares outstanding.
cAmount rounds to less than $0.01 per share.
dEffective September 1, 2008, the redemption fee was eliminated.
eTotal return is not annualized for periods less than one year.
fRatios are annualized for periods less than one year.
Semiannual Report | The accompanying notes are an integral part of these financial statements. | 49
54 | Semiannual Report
Franklin Investors Securities Trust
Statement of Investments, April 30, 2012 (unaudited) (continued)

Semiannual Report | 55
Franklin Investors Securities Trust
Statement of Investments, April 30, 2012 (unaudited) (continued)
56 | The accompanying notes are an integral part of these financial statements. | Semiannual Report

aThe amount shown for a share outstanding throughout the period may not correlate with the Statement of Operations for the period due to the timing of sales and repurchases of
the Fund shares in relation to income earned and/or fluctuating market value of the investments of the Fund.
bBased on average daily shares outstanding.
cEffective September 1, 2008, the redemption fee was eliminated.
dAmount rounds to less than $0.01 per share.
eTotal return does not reflect sales commissions or contingent deferred sales charges, if applicable, and is not annualized for periods less than one year.
fRatios are annualized for periods less than one year.
gBenefit of expense reduction rounds to less than 0.01%.
Semiannual Report | The accompanying notes are an integral part of these financial statements. | 57
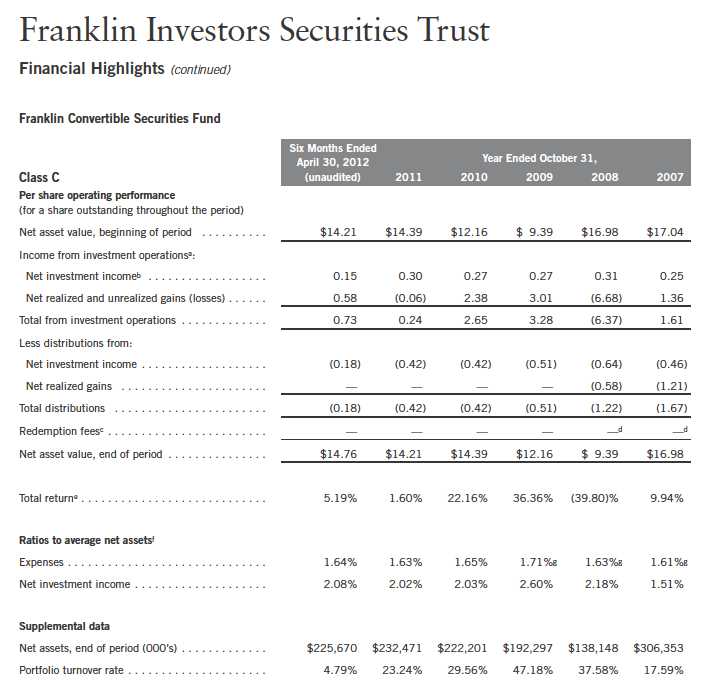
aThe amount shown for a share outstanding throughout the period may not correlate with the Statement of Operations for the period due to the timing of sales and repurchases of
the Fund shares in relation to income earned and/or fluctuating market value of the investments of the Fund.
bBased on average daily shares outstanding.
cEffective September 1, 2008, the redemption fee was eliminated.
dAmount rounds to less than $0.01 per share.
eTotal return does not reflect sales commissions or contingent deferred sales charges, if applicable, and is not annualized for periods less than one year.
fRatios are annualized for periods less than one year.
gBenefit of expense reduction rounds to less than 0.01%.
58 | The accompanying notes are an integral part of these financial statements. | Semiannual Report

aFor the period May 15, 2008 (effective date) to October 31, 2008.
bThe amount shown for a share outstanding throughout the period may not correlate with the Statement of Operations for the period due to the timing of sales and repurchases of
the Fund shares in relation to income earned and/or fluctuating market value of the investments of the Fund.
cBased on average daily shares outstanding.
dEffective September 1, 2008, the redemption fee was eliminated.
eAmount rounds to less than $0.01 per share.
fTotal return is not annualized for periods less than one year.
gRatios are annualized for periods less than one year.
hBenefit of expense reduction rounds to less than 0.01%.
Semiannual Report | The accompanying notes are an integral part of these financial statements. | 59

Semiannual Report | 61
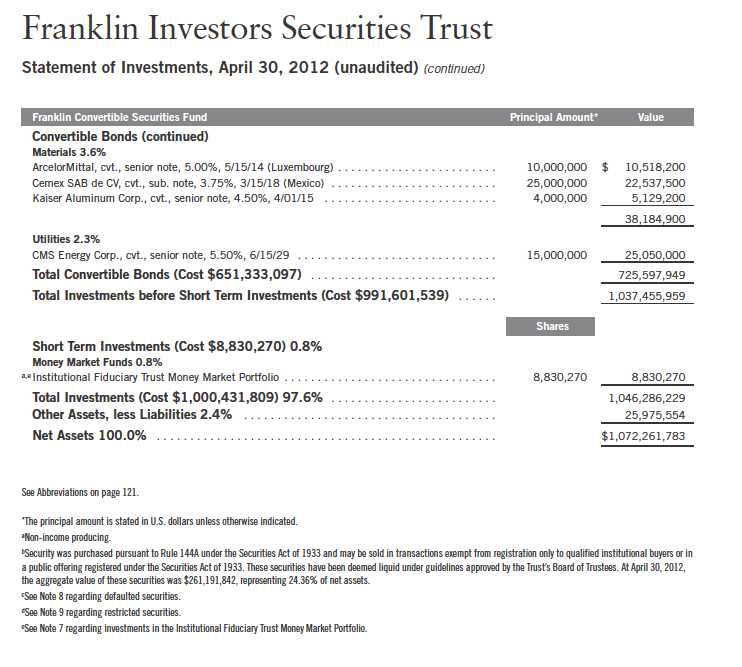
62 | The accompanying notes are an integral part of these financial statements. | Semiannual Report

aThe amount shown for a share outstanding throughout the period may not correlate with the Statement of Operations for the period due to the timing of sales and repurchases of
the Fund shares in relation to income earned and/or fluctuating market value of the investments of the Fund.
bBased on average daily shares outstanding.
cEffective September 1, 2008, the redemption fee was eliminated.
dAmount rounds to less than $0.01 per share.
eTotal return does not reflect sales commissions or contingent deferred sales charges, if applicable, and is not annualized for periods less than one year.
fRatios are annualized for periods less than one year.
gBenefit of expense reduction rounds to less than 0.01%.
Semiannual Report | The accompanying notes are an integral part of these financial statements. | 63

aThe amount shown for a share outstanding throughout the period may not correlate with the Statement of Operations for the period due to the timing of sales and repurchases of
the Fund shares in relation to income earned and/or fluctuating market value of the investments of the Fund.
bBased on average daily shares outstanding.
cEffective September 1, 2008, the redemption fee was eliminated.
dAmount rounds to less than $0.01 per share.
eTotal return does not reflect sales commissions or contingent deferred sales charges, if applicable, and is not annualized for periods less than one year.
fRatios are annualized for periods less than one year.
gBenefit of expense reduction rounds to less than 0.01%.
64 | The accompanying notes are an integral part of these financial statements. | Semiannual Report
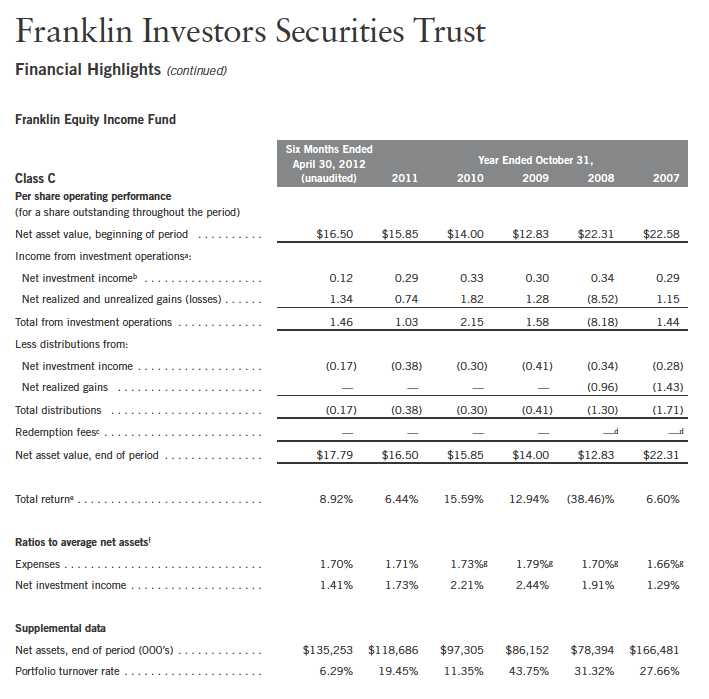
aThe amount shown for a share outstanding throughout the period may not correlate with the Statement of Operations for the period due to the timing of sales and repurchases of
the Fund shares in relation to income earned and/or fluctuating market value of the investments of the Fund.
bBased on average daily shares outstanding.
cEffective September 1, 2008, the redemption fee was eliminated.
dAmount rounds to less than $0.01 per share.
eTotal return does not reflect sales commissions or contingent deferred sales charges, if applicable, and is not annualized for periods less than one year.
fRatios are annualized for periods less than one year.
gBenefit of expense reduction rounds to less than 0.01%.
Semiannual Report | The accompanying notes are an integral part of these financial statements. | 65
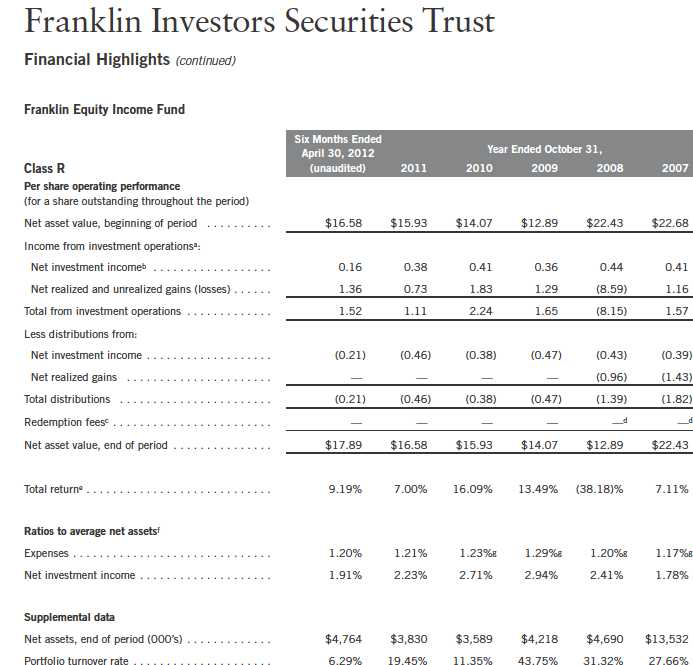
aThe amount shown for a share outstanding throughout the period may not correlate with the Statement of Operations for the period due to the timing of sales and repurchases of
the Fund shares in relation to income earned and/or fluctuating market value of the investments of the Fund.
bBased on average daily shares outstanding.
cEffective September 1, 2008, the redemption fee was eliminated.
dAmount rounds to less than $0.01 per share.
eTotal return does not reflect sales commissions or contingent deferred sales charges, if applicable, and is not annualized for periods less than one year.
fRatios are annualized for periods less than one year.
gBenefit of expense reduction rounds to less than 0.01%.
66 | The accompanying notes are an integral part of these financial statements. | Semiannual Report

aFor the period May 15, 2008 (effective date) to October 31, 2008.
bThe amount shown for a share outstanding throughout the period may not correlate with the Statement of Operations for the period due to the timing of sales and repurchases of
the Fund shares in relation to income earned and/or fluctuating market value of the investments of the Fund.
cBased on average daily shares outstanding.
dEffective September 1, 2008, the redemption fee was eliminated.
eAmount rounds to less than $0.01 per share.
fTotal return is not annualized for periods less than one year.
gRatios are annualized for periods less than one year.
hBenefit of expense reduction rounds to less than 0.01%.
Semiannual Report | The accompanying notes are an integral part of these financial statements. | 67

68 | Semiannual Report

Semiannual Report | 69
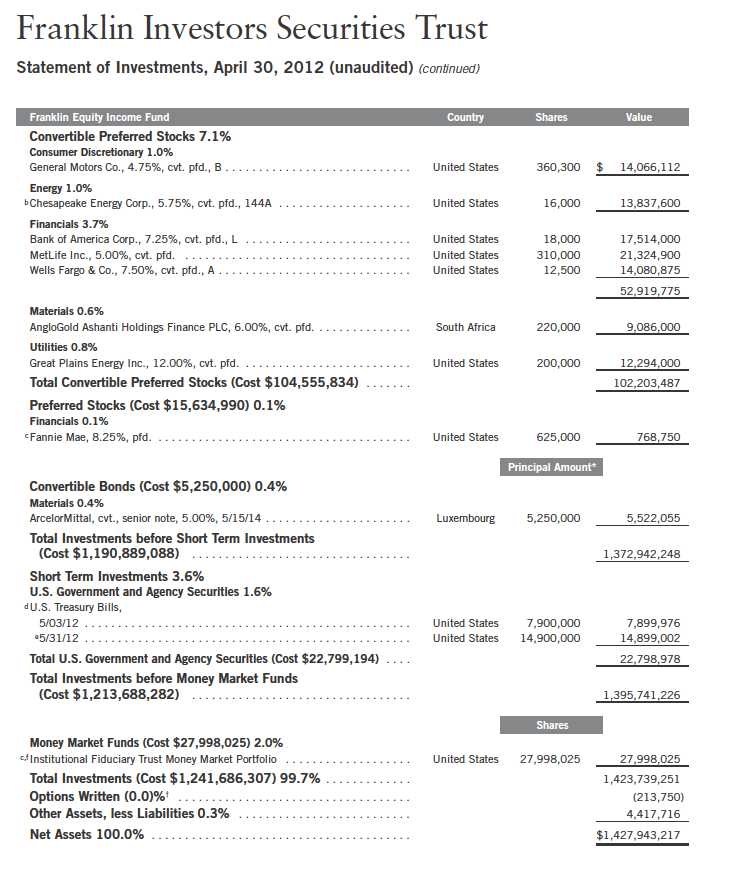
70 | Semiannual Report
Franklin Investors Securities Trust
Statement of Investments, April 30, 2012 (unaudited) (continued)

Semiannual Report | The accompanying notes are an integral part of these financial statements. | 71

aThe amount shown for a share outstanding throughout the period may not correlate with the Statement of Operations for the period due to the timing of sales and repurchases of
the Fund shares in relation to income earned and/or fluctuating market value of the investments of the Fund.
bBased on average daily shares outstanding.
cEffective September 1, 2008, the redemption fee was eliminated.
dAmount rounds to less than $0.01 per share.
eTotal return does not reflect sales commissions or contingent deferred sales charges, if applicable, and is not annualized for periods less than one year.
fRatios are annualized for periods less than one year.
gBenefit of expense reduction rounds to less than 0.01%.
72 | The accompanying notes are an integral part of these financial statements. | Semiannual Report
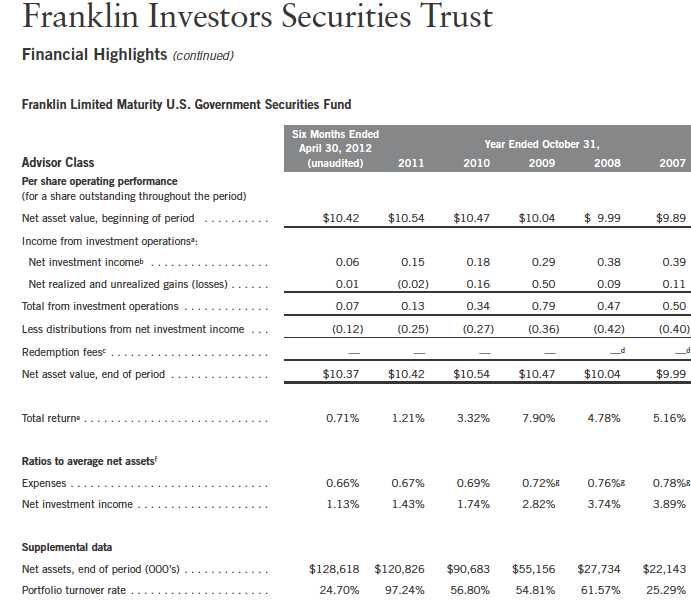
aThe amount shown for a share outstanding throughout the period may not correlate with the Statement of Operations for the period due to the timing of sales and repurchases of
the Fund shares in relation to income earned and/or fluctuating market value of the investments of the Fund.
bBased on average daily shares outstanding.
cEffective September 1, 2008, the redemption fee was eliminated.
dAmount rounds to less than $0.01 per share.
eTotal return is not annualized for periods less than one year.
fRatios are annualized for periods less than one year.
gBenefit of expense reduction rounds to less than 0.01%.
Semiannual Report | The accompanying notes are an integral part of these financial statements. | 73

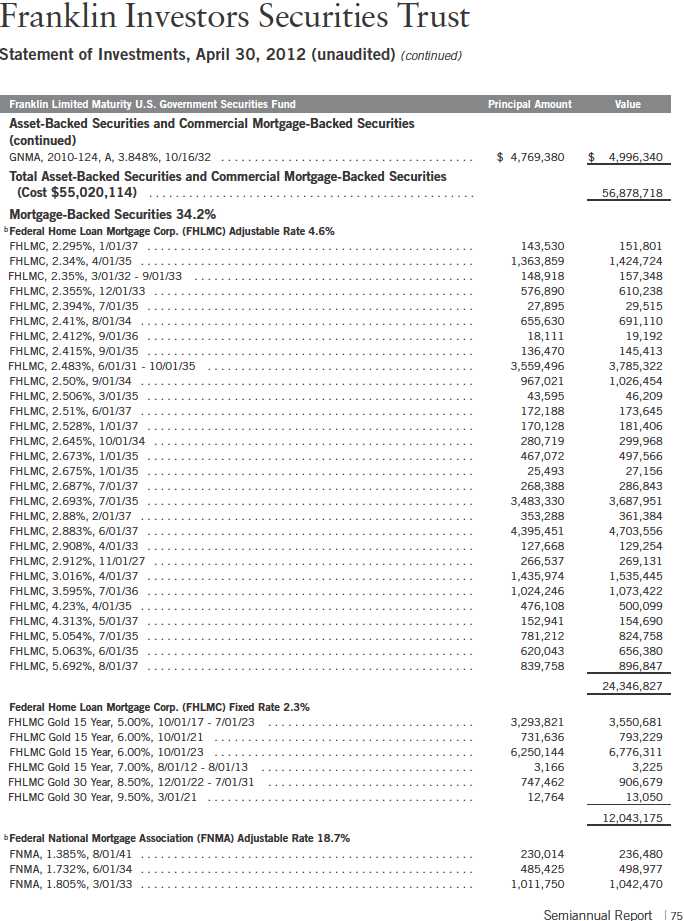

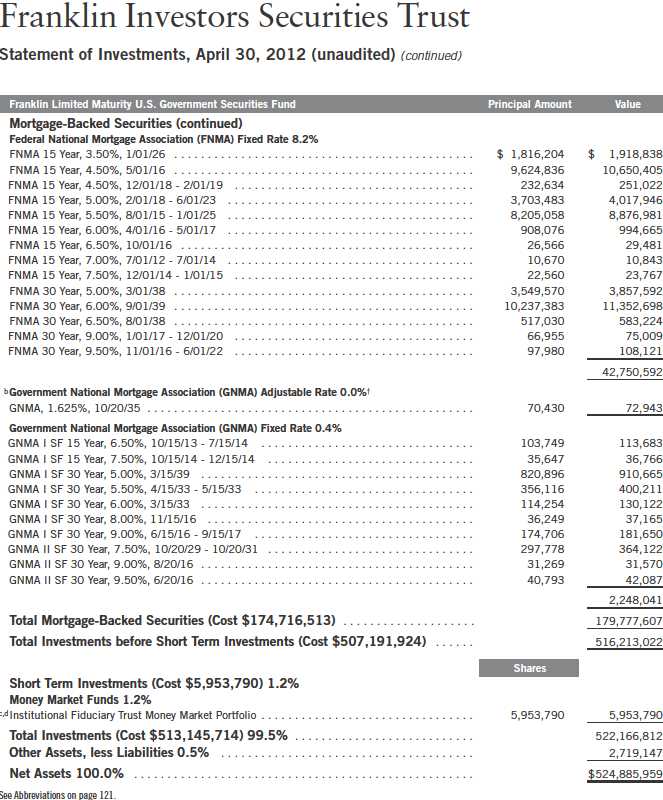
†Rounds to less than 0.1% of net assets.
aPrincipal amount of security is adjusted for inflation. See Note 1(i).
bThe coupon rate shown represents the rate at period end.
cNon-income producing.
dSee Note 7 regarding investments in the Institutional Fiduciary Trust Money Market Portfolio.
Semiannual Report | The accompanying notes are an integral part of these financial statements. | 77

aThe amount shown for a share outstanding throughout the period may not correlate with the Statement of Operations for the period and may fluctuate between classes due to the
timing of sales and repurchases of the Fund shares in relation to income earned, adjustments to interest income for the inflation-indexed bonds, and/or fluctuating market value of
the investments of the Fund.
bBased on average daily shares outstanding.
cAmount rounds to less than $0.01 per share.
dEffective September 1, 2008, the redemption fee was eliminated.
eTotal return does not reflect sales commissions or contingent deferred sales charges, if applicable, and is not annualized for periods less than one year.
fRatios are annualized for periods less than one year.
gBenefit of expense reduction rounds to less than 0.01%.
78 | The accompanying notes are an integral part of these financial statements. | Semiannual Report

aFor the period November 3, 2008 (effective date) to October 31, 2009.
bThe amount shown for a share outstanding throughout the period may not correlate with the Statement of Operations for the period and may fluctuate between classes due to the
timing of sales and repurchases of the Fund shares in relation to income earned, adjustments to interest income for the inflation-indexed bonds, and/or fluctuating market value of
the investments of the Fund.
cBased on average daily shares outstanding.
dTotal return does not reflect sales commissions or contingent deferred sales charges, if applicable, and is not annualized for periods less than one year.
eRatios are annualized for periods less than one year.
fBenefit of expense reduction rounds to less than 0.01%.
gRatio is calculated based on the Fund level net investment income, as reflected on the Statement of Operations, and adjusted for class specific expenses. The amount may not
correlate with the per share amount due to the timing of income earned and/or fluctuating market value of the investments of the Fund in relation to the timing of sales and
repurchases of Fund shares.
Semiannual Report | The accompanying notes are an integral part of these financial statements. | 79

aThe amount shown for a share outstanding throughout the period may not correlate with the Statement of Operations for the period and may fluctuate between classes due to the
timing of sales and repurchases of the Fund shares in relation to income earned, adjustments to interest income for the inflation-indexed bonds, and/or fluctuating market value of
the investments of the Fund.
bBased on average daily shares outstanding.
cEffective September 1, 2008, the redemption fee was eliminated.
dAmount rounds to less than $0.01 per share.
eTotal return is not annualized for periods less than one year.
fRatios are annualized for periods less than one year.
gBenefit of expense reduction rounds to less than 0.01%.
80 | The accompanying notes are an integral part of these financial statements. | Semiannual Report
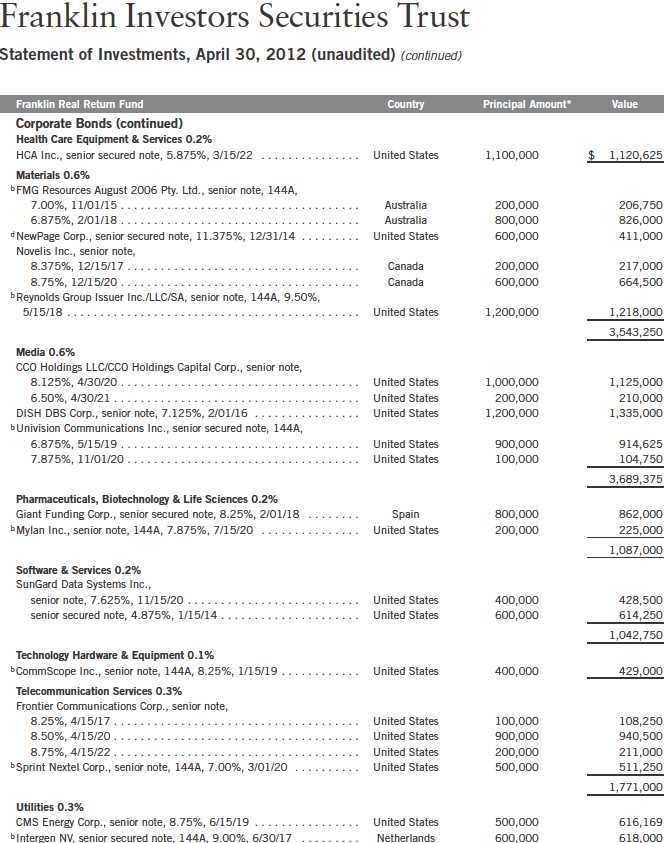
Semiannual Report | 83

84 | Semiannual Report

Semiannual Report | 85
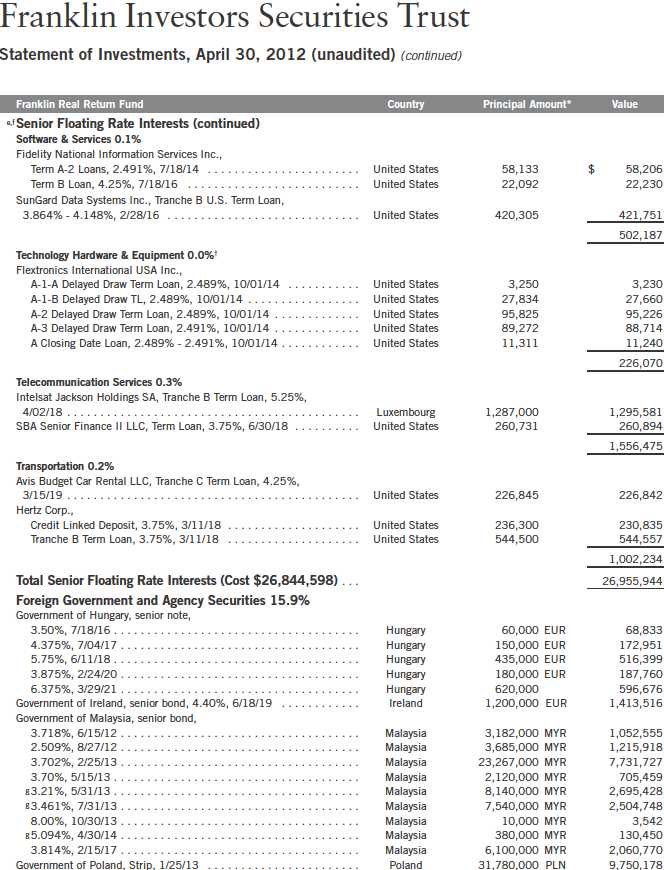
86 | Semiannual Report

Semiannual Report | 87

Semiannual Report | The accompanying notes are an integral part of these financial statements. | 89

90 | The accompanying notes are an integral part of these financial statements. | Semiannual Report
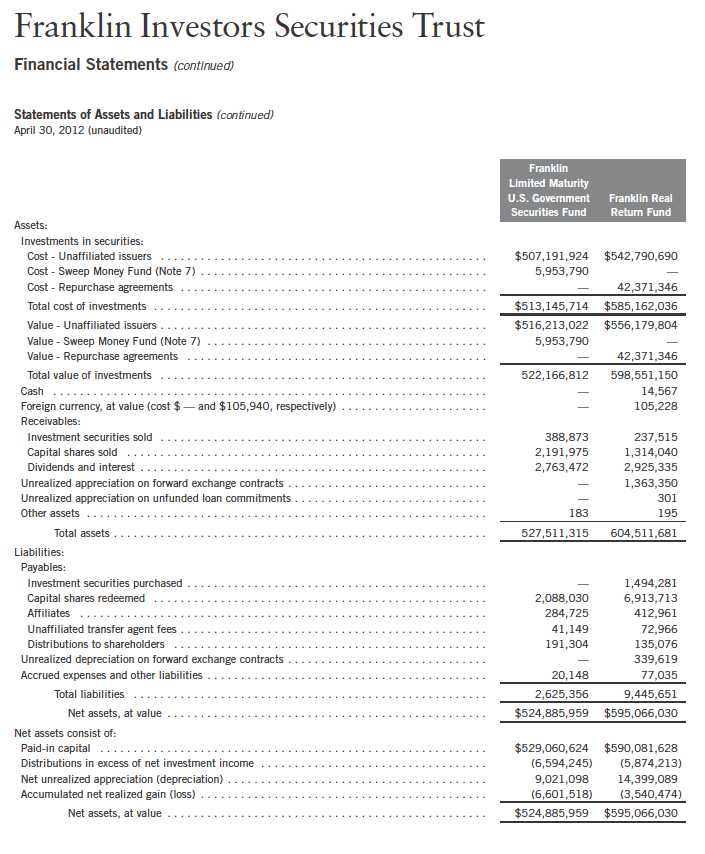
Semiannual Report | The accompanying notes are an integral part of these financial statements. | 91

92 | The accompanying notes are an integral part of these financial statements. | Semiannual Report

Semiannual Report | The accompanying notes are an integral part of these financial statements. | 93

94 | The accompanying notes are an integral part of these financial statements. | Semiannual Report

Semiannual Report | The accompanying notes are an integral part of these financial statements. | 95

96 | The accompanying notes are an integral part of these financial statements. | Semiannual Report
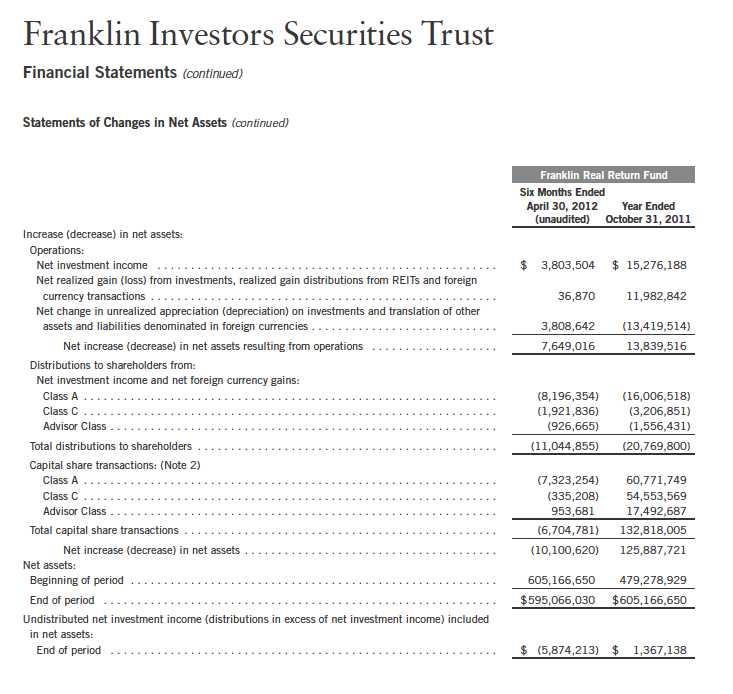
Semiannual Report | The accompanying notes are an integral part of these financial statements. | 97
Franklin Investors Securities Trust
Notes to Financial Statements (unaudited)
1. ORGANIZATION AND SIGNIFICANT ACCOUNTING POLICIES
Franklin Investors Securities Trust (Trust) is registered under the Investment Company Act of 1940, as amended, (1940 Act) as an open-end investment company, consisting of nine separate funds, five of which are included in this report (Funds). The financial statements of the remaining funds in the Trust are presented separately. The classes of shares offered within each of the Funds are indicated below. Each class of shares differs by its initial sales load, contingent deferred sales charges, distribution fees, voting rights on matters affecting a single class and its exchange privilege.

The following summarizes the Funds’ significant accounting policies.
a. Financial Instrument Valuation
The Funds’ investments in securities and other financial instruments are carried at fair value daily. Fair value is the price that would be received to sell an asset or paid to transfer a liability in an orderly transaction between market participants on the measurement date. Under procedures approved by the Trust’s Board of Trustees (the Board), the Funds’ administrator, investment manager and other affiliates have formed the Valuation and Liquidity Oversight Committee (VLOC). The VLOC provides administration and oversight of the Funds’ valuation policies and procedures, which are approved annually by the Board. Among other things, these procedures allow the Funds to utilize independent pricing services, quotations from securities and financial instrument dealers, and other market sources to determine fair value.
Equity securities, exchange traded funds, and derivative financial instruments (derivatives) listed on an exchange or on the NASDAQ National Market System are valued at the last quoted sale price or the official closing price of the day, respectively. Foreign equity securities are valued as of the close of trading on the foreign stock exchange on which the security is primarily traded, or the NYSE, whichever is earlier. The value is then converted into its U.S. dollar equivalent at the foreign exchange rate in effect at the close of the NYSE on the day that the value of the security is determined. Over-the-counter securities are valued within the range of the most recent quoted bid and ask prices. Securities that trade in multiple markets or on multiple exchanges are valued according to the broadest and most representative market. Certain equity securities are valued based upon fundamental characteristics or relationships to similar securities. Investments in open-end mutual funds are valued at the closing net asset value.
98 | Semiannual Report
Franklin Investors Securities Trust
Notes to Financial Statements (unaudited) (continued)
| 1. | ORGANIZATION AND SIGNIFICANT ACCOUNTING POLICIES (continued) |
| a. | Financial Instrument Valuation (continued) |
Debt and certain preferred securities generally trade in the over-the-counter market rather than on a securities exchange. The Funds’ pricing services use multiple valuation techniques to determine fair value. In instances where sufficient market activity exists, the pricing services may utilize a market-based approach through which quotes from market makers are used to determine fair value. In instances where sufficient market activity may not exist or is limited, the pricing services also utilize proprietary valuation models which may consider market characteristics such as benchmark yield curves, credit spreads, estimated default rates, anticipated market interest rate volatility, coupon rates, anticipated timing of principal repayments, underlying collateral, and other unique security features in order to estimate the relevant cash flows, which are then discounted to calculate the fair value. Securities denominated in a foreign currency are converted into their U.S. dollar equivalent at the foreign exchange rate in effect at the close of the NYSE on the date that the values of the foreign debt securities are determined. Repurchase agreements are valued at cost, which approximates market value.
Certain derivatives trade in the over-the-counter market. The Funds’ pricing services use various techniques including industry standard option pricing models and proprietary discounted cash flow models to determine the fair value of those instruments. The Funds’ net benefit or obligation under the derivative contract, as measured by the fair market value of the contract, is included in net assets.
The Funds have procedures to determine the fair value of securities and other financial instruments for which market prices are not reliable or readily available. Under these procedures, the VLOC convenes on a regular basis to review such securities and considers a number of factors, including significant unobservable valuation inputs, when arriving at fair value. The VLOC primarily employs a market-based approach which may use related or comparable assets or liabilities, recent transactions, market multiples, book values, and other relevant information for the investment to determine the fair value of the investment. An income-based valuation approach may also be used in which the anticipated future cash flows of the investment are discounted to calculate fair value. Discounts may also be applied due to the nature or duration of any restrictions on the disposition of the investments. Due to the inherent uncertainty of valuations of such investments, the fair values may differ significantly from the values that would have been used had an active market existed. The VLOC employs various methods for calibrating these valuation approaches including a regular review of key inputs and assumptions, transactional back-testing or disposition analysis, and reviews of any related market activity.
Trading in securities on foreign securities stock exchanges and over-the-counter markets may be completed before the daily close of business on the NYSE. Occasionally, events occur between the time at which trading in a foreign security is completed and the close of the NYSE that might call into question the reliability of the value of a portfolio security held by the fund. As a result, differences may arise between the value of the Funds’ portfolio securities as determined at
Semiannual Report | 99
Franklin Investors Securities Trust
Notes to Financial Statements (unaudited) (continued)
| 1. | ORGANIZATION AND SIGNIFICANT ACCOUNTING POLICIES (continued) |
| a. | Financial Instrument Valuation (continued) |
the foreign market close and the latest indications of value at the close of the NYSE. In order to minimize the potential for these differences, the VLOC monitors price movements following the close of trading in foreign stock markets through a series of country specific market proxies (such as baskets of American Depositary Receipts, futures contracts and exchange traded funds). These price movements are measured against established trigger thresholds for each specific market proxy to assist in determining if an event has occurred that may call into question the reliability of the values of the foreign securities held by the Funds. If such an event occurs, the securities may be valued using fair value procedures, which may include the use of independent pricing services.
b. Foreign Currency Translation
Portfolio securities and other assets and liabilities denominated in foreign currencies are translated into U.S. dollars based on the exchange rate of such currencies against U.S. dollars on the date of valuation. The Funds may enter into foreign currency exchange contracts to facilitate transactions denominated in a foreign currency. Purchases and sales of securities, income and expense items denominated in foreign currencies are translated into U.S. dollars at the exchange rate in effect on the transaction date. Portfolio securities and assets and liabilities denominated in foreign currencies contain risks that those currencies will decline in value relative to the U.S. dollar. Occasionally, events may impact the availability or reliability of foreign exchange rates used to convert the U.S. dollar equivalent value. If such an event occurs, the foreign exchange rate will be valued at fair value using procedures established and approved by the Board.
The Funds do not separately report the effect of changes in foreign exchange rates from changes in market prices on securities held. Such changes are included in net realized and unrealized gain or loss from investments on the Statement of Operations.
Realized foreign exchange gains or losses arise from sales of foreign currencies, currency gains or losses realized between the trade and settlement dates on securities transactions and the difference between the recorded amounts of dividends, interest, and foreign withholding taxes and the U.S. dollar equivalent of the amounts actually received or paid. Net unrealized foreign exchange gains and losses arise from changes in foreign exchange rates on foreign denominated assets and liabilities other than investments in securities held at the end of the reporting period.
c. Joint Repurchase Agreement
Certain funds enter into a joint repurchase agreement whereby their uninvested cash balance is deposited into a joint cash account with other funds managed by the investment manager or an affiliate of the investment manager and is used to invest in one or more repurchase agreements. The value and face amount of the joint repurchase agreement are allocated to the funds based on their pro-rata interest. A repurchase agreement is accounted for as a loan by the fund to the seller, collateralized by securities which are delivered to the fund’s custodian. The market value,
100 | Semiannual Report
Franklin Investors Securities Trust
Notes to Financial Statements (unaudited) (continued)
| 1. | ORGANIZATION AND SIGNIFICANT ACCOUNTING POLICIES (continued) |
| c. | Joint Repurchase Agreement (continued) |
including accrued interest, of the initial collateralization is required to be at least 102% of the dollar amount invested by the funds, with the value of the underlying securities marked to market daily to maintain coverage of at least 100%. The joint repurchase agreement held by the Funds at period end had been entered into on April 30, 2012.
d. Securities Purchased on a Delayed Delivery Basis
Certain funds purchase securities on a delayed delivery basis, with payment and delivery scheduled for a future date. These transactions are subject to market fluctuations and are subject to the risk that the value at delivery may be more or less than the trade date purchase price. Although the Funds will generally purchase these securities with the intention of holding the securities, they may sell the securities before the settlement date. Sufficient assets have been segregated for these securities.
e. Derivative Financial Instruments
The Franklin Balanced Fund, the Franklin Equity Income Fund, and the Franklin Real Return Fund invested in derivatives in order to manage risk or gain exposure to various other investments or markets. Derivatives are financial contracts based on an underlying or notional amount, require no initial investment or an initial net investment that is smaller than would normally be required to have a similar response to changes in market factors, and require or permit net settlement. Derivatives contain various risks including the potential inability of the counter-party to fulfill their obligations under the terms of the contract, the potential for an illiquid secondary market, and/or the potential for market movements which expose the fund to gains or losses in excess of the amounts shown on the Statement of Assets and Liabilities. Realized gain and loss and unrealized appreciation and depreciation on these contracts for the period are included in the Statements of Operations.
The Franklin Balanced Fund and the Franklin Real Return Fund entered into forward exchange contracts primarily to manage and/or gain exposure to certain foreign currencies. A forward exchange contract is an agreement between the fund and a counterparty to buy or sell a foreign currency for a specific exchange rate on a future date. Pursuant to the terms of the forward exchange contracts, cash or securities may be required to be deposited as collateral. Unrestricted cash may be invested according to the funds’ investment objectives.
The Franklin Balanced Fund and the Franklin Equity Income Fund purchased or wrote option contracts primarily to manage and/or gain exposure to equity price risk. An option is a contract entitling the holder to purchase or sell a specific amount of shares or units of an asset or notional amount of a swap (swaption), at a specified price. Options purchased are recorded as an asset while options written are recorded as a liability. Upon exercise of an option, the acquisition cost or sales proceeds of the underlying investment is adjusted by any premium received or paid. Upon expiration of an option, any premium received or paid is recorded as a realized gain
Semiannual Report | 101
Franklin Investors Securities Trust
Notes to Financial Statements (unaudited) (continued)
| 1. | ORGANIZATION AND SIGNIFICANT ACCOUNTING POLICIES (continued) |
| e. | Derivative Financial Instruments (continued) |
or loss. Upon closing an option other than through expiration or exercise, the difference between the premium and the cost to close the position is recorded as a realized gain or loss. Pursuant to the terms of the written option contract, cash or securities may be required to be deposited as collateral.
At April 30, 2012, the Franklin Real Return Fund holds $1,230,369 in U.S. Treasury holdings as collateral for derivatives.
See Notes 6 and 11 regarding investment transactions and other derivative information, respectively.
f. Equity-Linked Securities
The Franklin Balanced Fund and the Franklin Equity Income Fund invest in equity-linked securities. Equity-linked securities are hybrid financial instruments that generally combine both debt and equity characteristics into a single note form. Income received from equity linked securities is recorded as realized gains in the Statement of Operations and may be based on the performance of an underlying equity security, an equity index, or an option position. The risks of investing in equity-linked securities include unfavorable price movements in the underlying security and the credit risk of the issuing financial institution. There may be no guarantee of a return of principal with equity linked securities and the appreciation potential may be limited. Equity-linked securities may be more volatile and less liquid than other investments held by the fund.
g. Senior Floating Rate Interests
The Franklin Real Return Fund invests in senior secured corporate loans that pay interest at rates which are periodically reset by reference to a base lending rate plus a spread. These base lending rates are generally the prime rate offered by a designated U.S. bank or the London InterBank Offered Rate (LIBOR). Senior secured corporate loans often require prepayment of principal from excess cash flows or at the discretion of the borrower. As a result, actual maturity may be substantially less than the stated maturity.
Senior secured corporate loans in which the fund invests are generally readily marketable, but may be subject to some restrictions on resale.
h. Income Taxes
It is each fund’s policy to qualify as a regulated investment company under the Internal Revenue Code. Each fund intends to distribute to shareholders substantially all of its taxable income and net realized gains to relieve it from federal income and excise taxes. As a result, no provision for U.S. federal income taxes is required.
The Funds may be subject to foreign taxation related to income received, capital gains on the sale of securities and certain foreign currency transactions in the foreign jurisdictions in which it
102 | Semiannual Report
Franklin Investors Securities Trust
Notes to Financial Statements (unaudited) (continued)
| 1. | ORGANIZATION AND SIGNIFICANT ACCOUNTING POLICIES (continued) |
| h. | Income Taxes (continued) |
invests. Foreign taxes, if any, are recorded based on the tax regulations and rates that exist in the foreign markets in which the Funds invest. When a capital gain tax is determined to apply the Funds record an estimated deferred tax liability in an amount that would be payable if the securities were disposed of on the valuation date.
Each fund recognizes the tax benefits of uncertain tax positions only when the position is “more likely than not” to be sustained upon examination by the tax authorities based on the technical merits of the tax position. As of April 30, 2012, and for all open tax years, each fund has determined that no liability for unrecognized tax benefits is required in each fund’s financial statements related to uncertain tax positions taken on a tax return (or expected to be taken on future tax returns). Open tax years are those that remain subject to examination and are based on each tax jurisdiction statute of limitation.
i. Security Transactions, Investment Income, Expenses and Distributions
Security transactions are accounted for on trade date. Realized gains and losses on security transactions are determined on a specific identification basis. Interest income and estimated expenses are accrued daily. Amortization of premium and accretion of discount on debt securities are included in interest income. Facility fees are recognized as income over the expected term of the loan. Dividend income is recorded on the ex-dividend date except that certain dividends from foreign securities are recognized as soon as the Funds are notified of the ex-dividend date. Distributions to shareholders are recorded on the ex-dividend date and are determined according to income tax regulations (tax basis). Distributable earnings determined on a tax basis may differ from earnings recorded in accordance with accounting principles generally accepted in the United States of America. These differences may be permanent or temporary. Permanent differences are reclassified among capital accounts to reflect their tax character. These reclassifications have no impact on net assets or the results of operations. Temporary differences are not reclassified, as they may reverse in subsequent periods.
Common expenses incurred by the Trust are allocated among the funds based on the ratio of net assets of each fund to the combined net assets of the Trust. Fund specific expenses are charged directly to the fund that incurred the expense.
Realized and unrealized gains and losses and net investment income, not including class specific expenses, are allocated daily to each class of shares based upon the relative proportion of net assets of each class. Differences in per share distributions, by class, are generally due to differences in class specific expenses.
Inflation-indexed bonds are adjusted for inflation through periodic increases or decreases in the security’s interest accruals, face amount, or principal redemption value, by amounts corresponding to the rate of inflation as measured by an index. Any increase or decrease in the face amount or
Semiannual Report | 103
Franklin Investors Securities Trust
Notes to Financial Statements (unaudited) (continued)
| 1. | ORGANIZATION AND SIGNIFICANT ACCOUNTING POLICIES (continued) |
| i. | Security Transactions, Investment Income, Expenses and Distributions (continued) |
principal redemption value will be included as inflation principal adjustments on the Statements of Operations.
j. Accounting Estimates
The preparation of financial statements in accordance with accounting principles generally accepted in the United States of America requires management to make estimates and assumptions that affect the reported amounts of assets and liabilities at the date of the financial statements and the amounts of income and expenses during the reporting period. Actual results could differ from those estimates.
k. Guarantees and Indemnifications
Under the Trust’s organizational documents, its officers and trustees are indemnified by the Trust against certain liabilities arising out of the performance of their duties to the Trust. Additionally, in the normal course of business, the Trust, on behalf of the Funds, enters into contracts with service providers that contain general indemnification clauses. The Trust’s maximum exposure under these arrangements is unknown as this would involve future claims that may be made against the Trust that have not yet occurred. Currently, the Trust expects the risk of loss to be remote.
2. SHARES OF BENEFICIAL INTEREST
At April 30, 2012, there were an unlimited number of shares authorized (without par value).
Transactions in the Funds’ shares were as follows:

104 | Semiannual Report
Franklin Investors Securities Trust
Notes to Financial Statements (unaudited) (continued)

Semiannual Report | 105
Franklin Investors Securities Trust
Notes to Financial Statements (unaudited) (continued)

106 | Semiannual Report
Franklin Investors Securities Trust
Notes to Financial Statements (unaudited) (continued)

Semiannual Report | 107
Franklin Investors Securities Trust
Notes to Financial Statements (unaudited) (continued)
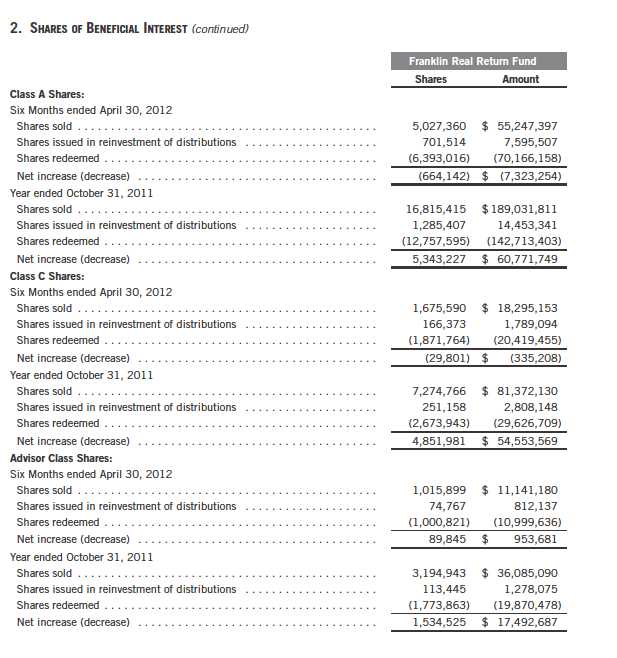
108 | Semiannual Report
Franklin Investors Securities Trust
Notes to Financial Statements (unaudited) (continued)
3. TRANSACTIONS WITH AFFILIATES
Franklin Resources, Inc. is the holding company for various subsidiaries that together are referred to as Franklin Templeton Investments. Certain officers and trustees of the Trust are also officers and/or directors of the following subsidiaries:

Semiannual Report | 109
Franklin Investors Securities Trust
Notes to Financial Statements (unaudited) (continued)
| 3. | TRANSACTIONS WITH AFFILIATES (continued) |
| a. | Management Fees (continued) |
The Franklin Limited Maturity U.S. Government Securities Fund pays an investment management fee to Advisers based on the month-end net assets of the fund as follows:

b. Administrative Fees
FT Services provides administrative services to the Funds. The Franklin Balanced Fund and the Franklin Real Return Fund each pay an administrative fee to FT Services of 0.20% per year of their respective average daily net assets. Under an agreement with Advisers, the administrative fee for the Franklin Convertible Securities Fund, the Franklin Equity Income Fund, and the Franklin Limited Maturity U.S. Government Securities Fund is paid by Advisers based on each fund’s average daily net assets, and is not an additional expense of the funds.
c. Distribution Fees
The Board has adopted distribution plans for each share class, with the exception of Advisor Class shares, pursuant to Rule 12b-1 under the 1940 Act. Under the Funds’ Class A reimbursement distribution plans, the Funds reimburse Distributors for costs incurred in connection with the servicing, sale and distribution of each fund’s shares up to the maximum annual plan rate. Under the Class A reimbursement distribution plans, costs exceeding the maximum for the current plan year cannot be reimbursed in subsequent periods.
In addition, under the Funds’ Class B, C and R compensation distribution plans, the Funds pay Distributors for costs incurred in connection with the servicing, sale and distribution of each fund’s shares up to the maximum annual plan rate for each class.
110 | Semiannual Report
Franklin Investors Securities Trust
Notes to Financial Statements (unaudited) (continued)
| 3. | TRANSACTIONS WITH AFFILIATES (continued) |
| c. | Distribution Fees (continued) |
The maximum annual plan rates, based on the average daily net assets, for each class, are as follows:
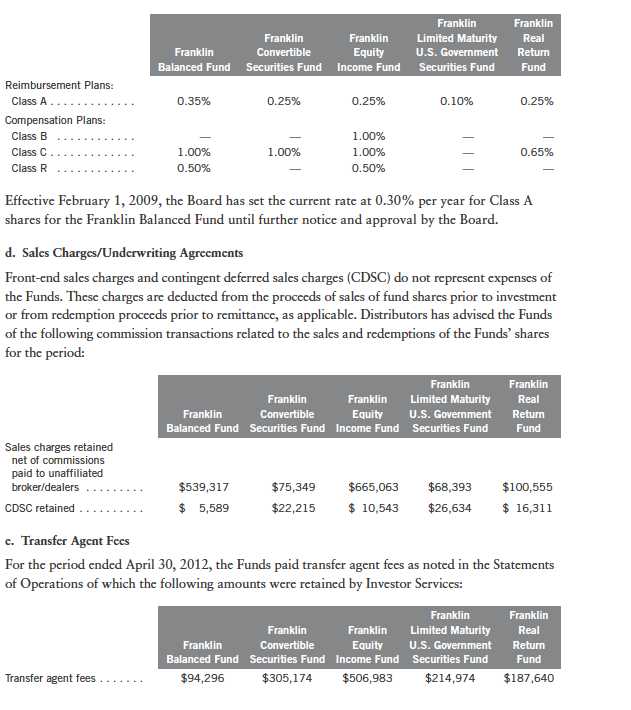
Semiannual Report | 111
Franklin Investors Securities Trust
Notes to Financial Statements (unaudited) (continued)
| 3. | TRANSACTIONS WITH AFFILIATES (continued) |
| f. | Waiver and Expense Reimbursements |
FT Services has contractually agreed in advance to waive or limit its fees and to assume as its own expense certain expenses otherwise payable by the Franklin Balanced Fund and the Franklin Real Return Fund so that the common expenses (i.e. a combination of management fees, administrative fees, and other expenses, but excluding distribution fees and acquired fund fees and expenses), for each class of the funds do not exceed 0.71% and 0.65%, respectively (other than certain non-routine expenses or costs, including those relating to litigation, indemnification, reorganizations, and liquidations) until February 28, 2013.
4. EXPENSE OFFSET ARRANGEMENT
The Funds have entered into an arrangement with their custodian whereby credits realized as a result of uninvested cash balances are used to reduce a portion of the Funds’ custodian expenses. During the period ended April 30, 2012, there were no credits earned.
5. INCOME TAXES
For tax purposes, capital losses may be carried over to offset future capital gains, if any. At October 31, 2011, the capital loss carryforwards were as follows:

Under the Regulated Investment Company Modernization Act of 2010, the Funds will be permitted to carry forward capital losses incurred in taxable years beginning after December 22, 2010 for an unlimited period. Post-enactment capital loss carryforwards will retain their character as either short-term or long-term capital losses rather than being considered short-term as under previous law. Any post-enactment capital losses generated will be required to be utilized prior to the losses incurred in pre-enactment tax years.
112 | Semiannual Report
Franklin Investors Securities Trust
Notes to Financial Statements (unaudited) (continued)
5. INCOME TAXES (continued)
At April 30, 2012, the cost of investments and net unrealized appreciation (depreciation) for income tax purposes were as follows:

Semiannual Report | 113
Franklin Investors Securities Trust
Notes to Financial Statements (unaudited) (continued)
6. INVESTMENT TRANSACTIONS (continued)
Transactions in options written during the period ended April 30, 2012, were as follows:
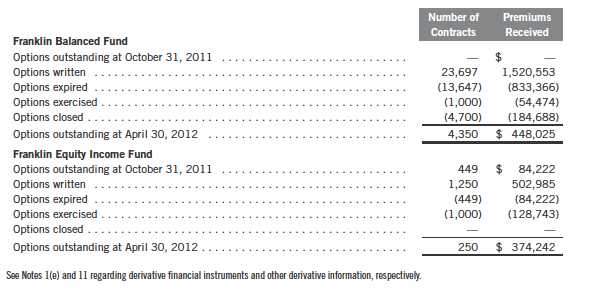
7. INVESTMENTS IN INSTITUTIONAL FIDUCIARY TRUST MONEY MARKET PORTFOLIO
The Franklin Balanced Fund, the Franklin Convertible Securities Fund, the Franklin Equity Income Fund, and the Franklin Limited Maturity U.S. Government Securities Fund invest in the Institutional Fiduciary Trust Money Market Portfolio (Sweep Money Fund), an open-end investment company managed by Advisers. Management fees paid by the funds are reduced on assets invested in the Sweep Money Fund, in an amount not to exceed the management and administrative fees paid by the Sweep Money Fund.
8. CREDIT RISK AND DEFAULTED SECURITIES
At April 30, 2012, the Franklin Balanced Fund, the Franklin Convertible Securities Fund, and the Franklin Real Return Fund had 6.83%, 80.94%, and 10.71%, respectively, of their portfolio invested in high yield securities, senior secured floating rate notes, or other securities rated below investment grade. These securities may be more sensitive to economic conditions causing greater price volatility and are potentially subject to a greater risk of loss due to default than higher rated securities.
The Franklin Balanced Fund, the Franklin Convertible Securities Fund, and the Franklin Real Return Fund held defaulted securities and/or other securities for which the income has been deemed uncollectible. At April 30, 2012, the aggregate value of these securities for the Franklin
114 | Semiannual Report
Franklin Investors Securities Trust
Notes to Financial Statements (unaudited) (continued)
8. CREDIT RISK AND DEFAULTED SECURITIES (continued)
Balanced Fund, the Franklin Convertible Securities Fund, and the Franklin Real Return Fund was $437,500, $15,400,000, and $516,000, representing 0.09%, 1.44%, and 0.09%, respectively, of each fund’s net assets. The Funds discontinue accruing income on securities for which income has been deemed uncollectible and provide an estimate for losses on interest receivable. The securities have been identified on the accompanying Statement of Investments.
9. RESTRICTED SECURITIES
The Franklin Convertible Securities Fund invests in securities that are restricted under the Securities Act of 1933 (1933 Act) or which are subject to legal, contractual, or other agreed upon restrictions on resale. Restricted securities are often purchased in private placement transactions, and cannot be sold without prior registration unless the sale is pursuant to an exemption under the 1933 Act. Disposal of these securities may require greater effort and expense, and prompt sale at an acceptable price may be difficult. The fund may have registration rights for restricted securities. The issuer generally incurs all registration costs.
At April 30, 2012, the Franklin Convertible Securities Fund held investments in restricted securities, excluding certain securities exempt from registration under the 1933 Act deemed to be liquid, as follows:
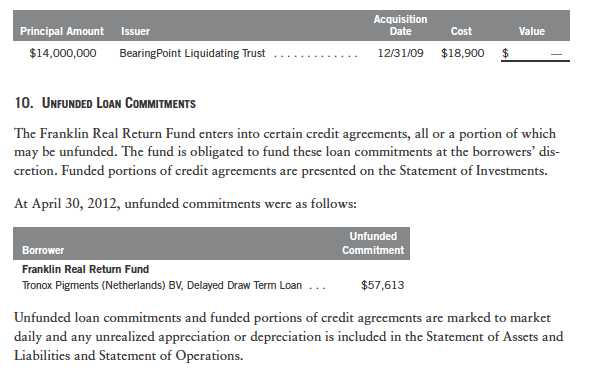
Semiannual Report | 115
Franklin Investors Securities Trust
Notes to Financial Statements (unaudited) (continued)
11. OTHER DERIVATIVE INFORMATION
At April 30, 2012, the Franklin Balanced Fund, the Franklin Equity Income Fund, and the Franklin Real Return Fund have invested in derivative contracts which are reflected on the Statements of Assets and Liabilities as follows:

116 | Semiannual Report
Franklin Investors Securities Trust
Notes to Financial Statements (unaudited) (continued)

For the period ended April 30, 2012, the average month end market value of derivatives represented 0.05%, 0.01%, and 0.30%, respectively, of average month end net assets. The average month end number of open derivative contracts for the period was 6, 1, and 9, respectively.
See Notes 1(e) and 6 regarding derivative financial instruments and investment transactions, respectively.
12. CREDIT FACILITY
The Funds, together with other U.S. registered and foreign investment funds (collectively, Borrowers), managed by Franklin Templeton Investments, are borrowers in a joint syndicated senior unsecured credit facility totaling $1.5 billion (Global Credit Facility) which matures on January 18, 2013. This Global Credit Facility provides a source of funds to the Borrowers for temporary and emergency purposes, including the ability to meet future unanticipated or unusually large redemption requests.
Under the terms of the Global Credit Facility, the Funds shall, in addition to interest charged on any borrowings made by the Funds and other costs incurred by the Funds, pay their share of fees and expenses incurred in connection with the implementation and maintenance of the Global Credit Facility, based upon their relative share of the aggregate net assets of all of the Borrowers, including an annual commitment fee of 0.08% based upon the unused portion of the Global Credit Facility, which is reflected in other expenses on the Statements of Operations. During the period ended April 30, 2012, the Funds did not use the Global Credit Facility.
Semiannual Report | 117
Franklin Investors Securities Trust
Notes to Financial Statements (unaudited) (continued)
13. FAIR VALUE MEASUREMENTS
The Funds follows a fair value hierarchy that distinguishes between market data obtained from independent sources (observable inputs) and the Funds’ own market assumptions (unobservable inputs). These inputs are used in determining the value of the Funds’ investments and are summarized in the following fair value hierarchy:
- Level 1 – quoted prices in active markets for identical securities
- Level 2 – other significant observable inputs (including quoted prices for similar securi- ties, interest rates, prepayment speed, credit risk, etc.)
- Level 3 – significant unobservable inputs (including the Funds’ own assumptions in determining the fair value of investments)
The inputs or methodology used for valuing securities are not an indication of the risk associated with investing in those securities.
For movements between the levels within the fair value hierarchy, the Funds have adopted a policy of recognizing the transfers as of the date of the underlying event which caused the movement.
A summary of inputs used as of April 30, 2012, in valuing the Funds’ assets and liabilities carried at fair value, is as follows:
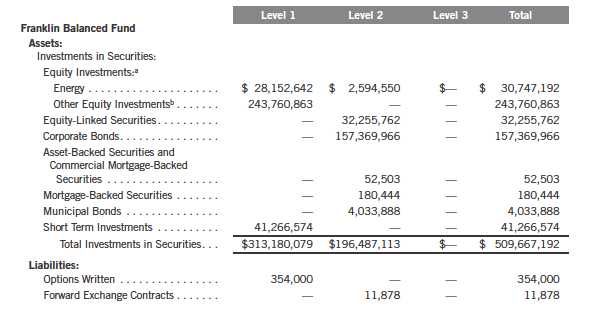
118 | Semiannual Report
Franklin Investors Securities Trust
Notes to Financial Statements (unaudited) (continued)

Semiannual Report | 119
Franklin Investors Securities Trust
Notes to Financial Statements (unaudited) (continued)
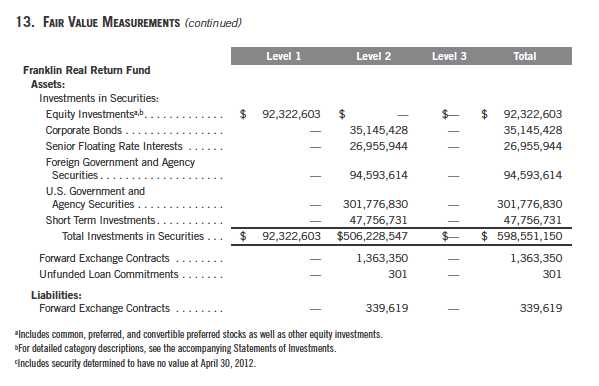
14. NEW ACCOUNTING PRONOUNCEMENTS
In May 2011, the Financial Accounting Standards Board (FASB) issued Accounting Standards Update (ASU) No. 2011-04, Fair Value Measurement (Topic 820): Amendments to Achieve Common Fair Value Measurement and Disclosure Requirements in U.S. GAAP and IFRSs. The amendments in the ASU will improve the comparability of fair value measurements presented and disclosed in financial statements prepared in accordance with U.S. GAAP (Generally Accepted Accounting Principles) and IFRS (International Financial Reporting Standards) and include new guidance for certain fair value measurement principles and disclosure requirements. The ASU is effective for interim and annual periods beginning after December 15, 2011. The Funds believe the adoption of this ASU will not have a material impact on their financial statements.
In December 2011, FASB issued ASU No. 2011-11, Balance Sheet (Topic 210): Disclosures about Offsetting Assets and Liabilities. The amendments in the ASU enhance disclosures about offsetting of financial assets and liabilities to enable investors to understand the effect of these arrangements on a fund’s financial position. The ASU is effective for interim and annual reporting periods beginning on or after January 1, 2013. The Funds believe the adoption of this ASU will not have a material impact on their financial statements.
120 | Semiannual Report
Franklin Investors Securities Trust
Notes to Financial Statements (unaudited) (continued)
15. SUBSEQUENT EVENTS
The Funds have evaluated subsequent events through the issuance of the financial statements and determined that no events have occurred that require disclosure.

Semiannual Report | 121
Franklin Investors Securities Trust
Shareholder Information
Board Review of Investment Management Agreement
At a meeting held February 28, 2012, the Board of Trustees (Board), including a majority of non-interested or independent Trustees, approved renewal of the investment management agreement for each of the separate funds that constitute Franklin Investors Securities Trust (Fund(s)). In reaching this decision, the Board took into account information furnished throughout the year at regular Board meetings, as well as information prepared specifically in connection with the annual renewal review process. Information furnished and discussed throughout the year included investment performance reports and related financial information for each Fund, as well as periodic reports on expenses, shareholder services, legal and compliance matters, pricing, brokerage commissions and execution and other services provided by the Investment Manager (Manager) and its affiliates. Information furnished specifically in connection with the renewal process included a report for each Fund prepared by Lipper, Inc. (Lipper), an independent organization, as well as additional material, including a Fund profitability analysis prepared by management. The Lipper reports compared each Fund’s investment performance and expenses with those of other mutual funds deemed comparable to the Fund as selected by Lipper. The Fund profitability analysis discussed the profitability to Franklin Templeton Investments from its overall U.S. fund operations, as well as on an individual fund-by-fund basis. Additional material accompanying such profitability analysis included information on a fund-by-fund basis listing portfolio managers and other accounts they manage, as well as information on management fees charged by the Manager and its affiliates to U.S. mutual funds and other accounts, including management’s explanation of differences where relevant. Such material also included a memorandum prepared by management describing project initiatives and capital investments relating to the services provided to the Funds by the Franklin Templeton Investments organization, as well as a memorandum relating to economies of scale and an analysis concerning transfer agent fees charged by an affiliate of the Manager.
In considering such materials, the independent Trustees received assistance and advice from and met separately with independent counsel. While the investment management agreements for all Funds were considered at the same Board meeting, the Board dealt with each Fund separately. In approving continuance of the investment management agreement for each Fund, the Board, including a majority of independent Trustees, determined that the existing management fee structure was fair and reasonable and that continuance of the investment management agreement was in the best interests of each Fund and its shareholders. While attention was given to all information furnished, the following discusses some primary factors relevant to the Board’s decision.
NATURE, EXTENT AND QUALITY OF SERVICES. The Board was satisfied with the nature and quality of the overall services provided by the Manager and its affiliates to the Funds and their shareholders. In addition to investment performance and expenses discussed later, the Board’s opinion was based, in part, upon periodic reports furnished it showing that the investment policies and restrictions for each Fund were consistently complied with as well as other reports periodically furnished the Board covering matters such as the compliance of portfolio managers and other management personnel with the code of ethics adopted throughout the Franklin Templeton fund complex, the adherence to fair value pricing procedures established by the Board, and the accuracy
122 | Semiannual Report
Franklin Investors Securities Trust
Shareholder Information (continued)
Board Review of Investment Management Agreement (continued)
of net asset value calculations. The Board also noted the extent of benefits provided Fund shareholders from being part of the Franklin Templeton family of funds, including the right to exchange investments between the same class of funds without a sales charge, the ability to reinvest Fund dividends into other funds and the right to combine holdings in other funds to obtain a reduced sales charge. Favorable consideration was given to management’s continuous efforts and expenditures in establishing back-up systems and recovery procedures to function in the event of a natural disaster, it being noted by the Board that such systems and procedures had functioned smoothly during the Florida hurricanes and blackouts experienced in previous years. Among other factors taken into account by the Board were the Manager’s best execution trading policies, including a favorable report by an independent portfolio trading analytical firm, which also covered FOREX transactions. Consideration was also given to the experience of each Fund’s portfolio management team, the number of accounts managed and general method of compensation. In this latter respect, the Board noted that a primary factor in management’s determination of a portfolio manager’s bonus compensation was the relative investment performance of the funds he or she managed and that a portion of such bonus was required to be invested in a predesignated list of funds within such person’s fund management area so as to be aligned with the interests of shareholders. The Board also took into account the quality of transfer agent and shareholder services provided Fund shareholders by an affiliate of the Manager and the continuous enhancements to the Franklin Templeton website. Particular attention was given to management’s conservative approach and diligent risk management procedures, including continuous monitoring of counterparty credit risk and attention given to derivative and other complex instruments including expanded collateralization requirements. The Board also took into account, among other things, management’s efforts in establishing a global credit facility for the benefit of the Funds and other accounts managed by Franklin Templeton Investments to provide a source of cash for temporary and emergency purposes or to meet unusual redemption requests as well as the strong financial position of the Manager’s parent company and its commitment to the mutual fund business as evidenced by its subsidization of money market funds.
INVESTMENT PERFORMANCE. The Board placed significant emphasis on the investment performance of each Fund in view of its importance to shareholders. While consideration was given to performance reports and discussions with portfolio managers at Board meetings during the year, particular attention in assessing performance was given to the Lipper reports furnished for the agreement renewals. The Lipper reports prepared for each individual Fund showed the investment performance of its Class A shares in comparison with its selected performance universe during 2011 and during the previous 10 years ended December 31, 2011, unless otherwise noted. Performance on a total return basis was shown by Lipper for all Funds with performance on an income return basis being shown for those Funds having income return as an element of their investment objective. The following summarizes the performance results for each Fund.
Franklin Balanced Fund – The Fund’s investment performance was shown in comparison with a performance universe consisting of all retail and institutional mixed-asset target allocation growth funds as selected by Lipper during 2011 and the previous five years during which the Fund has
Semiannual Report | 123
Franklin Investors Securities Trust
Shareholder Information (continued)
Board Review of Investment Management Agreement (continued)
been in existence. The Lipper report showed both the Fund’s income return and total return to be in the highest quintile of its performance universe during 2011, and its income return and total return on an annualized basis to each be in the highest quintile of such universe during its five-year period of operations. The Board was satisfied with such comparative performance.
Franklin Convertible Securities Fund – The Fund’s investment performance was shown in comparison with a performance universe consisting of all retail and institutional convertible securities funds as selected by Lipper. The Lipper report showed the Fund’s income return during 2011 to be in the highest or best performing quintile of its performance universe and on an annualized basis during each of the previous three-, five- and 10-year periods to be in the highest quintile of such performance universe. The Lipper report showed that the Fund’s total return during 2011 was in the middle quintile of its performance universe and on an annualized basis was in the highest quintile of such universe for the previous three-year period, the middle quintile of such universe for the previous five-year period, and the second-highest quintile of such universe for the previous 10-year period. The Board was satisfied with the Fund’s comparative performance as set forth in the Lipper report.
Franklin Equity Income Fund – The Fund’s investment performance was shown in comparison with a performance universe consisting of all retail and institutional equity income funds as selected by Lipper. The Lipper report showed the Fund’s income return during 2011 to be in the second-highest quintile of the performance universe, and on an annualized basis during each of the previous three-, five- and 10-year periods to be in the highest or best performing quintile of such performance universe. The Lipper report showed the Fund’s total return during 2011 to be in the second-lowest quintile of such universe and on an annualized basis to be in the second-highest quintile of such universe for the previous three-year period, and in the lowest quintile of such universe for each of the previous five- and 10-year periods. The Board believed the Fund’s performance to be acceptable, noting its consistently high comparative income returns and the fact that its annualized total return for the previous three-year period exceeded 14% as shown in the Lipper report.
Franklin Limited Maturity U.S. Government Securities Fund – The Fund’s investment performance was shown in comparison to a performance universe consisting of all retail and institutional short U.S. government funds as selected by Lipper. The Lipper report showed the Fund’s income return during 2011 to be in the highest or best performing quintile of its performance universe and on an annualized basis to be in either the highest or second-highest quintile of such universe during each of the previous three-, five- and 10-year periods. The Lipper report showed the Fund’s total return to be in the second-highest quintile of its performance universe during 2011 and on an annualized basis to be in the middle quintile of such universe for the previous three-year period but in the highest quintile of such universe for each of the previous five- and 10-year periods. The Board was satisfied with the Fund’s comparative performance as shown in the Lipper report.
Franklin Real Return Fund – The Fund’s investment performance was shown in comparison to a performance universe consisting of all retail and institutional Treasury inflation-protected securities (TIPS) funds as selected by Lipper. The Fund has been in operation for less than 10 years, and the
124 | Semiannual Report
Franklin Investors Securities Trust
Shareholder Information (continued)
Board Review of Investment Management Agreement (continued)
Lipper report showed the Fund’s income return during 2011 to be in the highest or best performing quintile of such performance universe, and on an annualized basis to be in the second-highest quin-tile of such universe during the previous three-year period, and the middle quintile of such universe during the previous five-year period. The Lipper report showed the Fund’s 2011 total return to be in the lowest quintile of its performance universe, and on an annualized basis to be in the lowest quintile of such universe during each of the previous three- and five-year periods. In discussing such performance, management expressed the view that the performance universe contained many TIPS-only funds that performed better in 2011 than multi-sector funds such as the Fund, and also pointed out that consistent with its objective, the Fund had obtained total returns in excess of the rate of inflation in all time periods longer than one year. While intending to monitor the Fund’s performance on an ongoing basis, the Board did not believe that the Fund’s comparative total returns as shown in the Lipper report warranted any immediate change in portfolio managers.
COMPARATIVE EXPENSES. Consideration was given to a comparative analysis of the management fees and total expense ratios of each Fund compared with those of a group of other funds selected by Lipper as constituting its appropriate Lipper expense group. Lipper expense data is based upon information taken from each fund’s most recent annual report, which reflects historical asset levels that may be quite different from those currently existing, particularly in a period of market volatility. While recognizing such inherent limitation and the fact that expense ratios generally increase as assets decline and decrease as assets grow, the Board believed the independent analysis conducted by Lipper to be an appropriate measure of comparative expenses. In reviewing comparative costs, Lipper provides information on each Fund’s contractual investment management fee in comparison with the contractual investment management fee that would have been charged by other funds within its Lipper expense group assuming they were similar in size to the Fund, as well as the actual total expense ratio of the Fund in comparison with those of its expense group. The Lipper contractual investment management fee analysis includes within such fee any separate administrative fees, and the Lipper total expenses, for comparative consistency, are shown by Lipper for Fund Class A shares. The results of such expense comparisons showed that the contractual investment management fee rate and actual total expense ratio for each of Franklin Convertible Securities Fund and Franklin Equity Income Fund were in either the least expensive or second least expensive quintile of their respective Lipper expense groups. The Board was satisfied with the comparative contractual investment management fee rate and actual total expense ratios of these Funds as shown in the Lipper reports. The contractual investment management fee rate for Franklin Balanced Fund was above the median of its Lipper expense group, but due to fee waivers, its actual investment management fee rate was below the expense group median and its actual total expense ratio was in the least expensive quintile of such group. The Board was satisfied with the comparative contractual investment management fee rate and actual total expense ratio of such Fund as shown in the Lipper reports. The contractual management fee rate of Franklin Limited Maturity U.S. Government Securities Fund as well as its actual total expense ratio was below the median of its Lipper expense group. The Board was satisfied with the comparative contractual management fee rate and actual total expense ratio of this Fund as shown in the Lipper report. The contractual
Semiannual Report | 125
Franklin Investors Securities Trust
Shareholder Information (continued)
Board Review of Investment Management Agreement (continued)
investment management fee and actual total expense ratio for Franklin Real Return Fund were above the median of its Lipper expense group, but its actual total expense ratio was less than six basis points above the median of its expense group. The Board found the contractual management fees and total expense ratio of the Fund to be acceptable, noting that its expenses were subsidized through management fee waivers and reimbursements.
MANAGEMENT PROFITABILITY. The Board also considered the level of profits realized by the Manager and its affiliates in connection with the operation of each Fund. In this respect, the Board reviewed the Fund profitability analysis that addresses the overall profitability of Franklin Templeton’s U.S. fund business, as well as its profits in providing management and other services to each of the individual funds during the 12-month period ended September 30, 2011, being the most recent fiscal year-end for Franklin Resources, Inc., the Manager’s parent. In reviewing the analysis, attention was given to the methodology followed in allocating costs to each Fund, it being recognized that allocation methodologies are inherently subjective and various allocation methodologies may each be reasonable while producing different results. In this respect, the Board noted that, while being continuously refined and reflecting changes in the Manager’s own cost accounting, the cost allocation methodology was consistent with that followed in profitability report presentations for the Funds made in prior years and that the Funds’ independent registered public accounting firm had been engaged by the Manager to review the reasonableness of the allocation methodologies solely for use by the Funds’ Board in reference to the profitability analysis. In reviewing and discussing such analysis, management discussed with the Board its belief that costs incurred in establishing the infrastructure necessary for the type of mutual fund operations conducted by the Manager and its affiliates may not be fully reflected in the expenses allocated to each Fund in determining its profitability, as well as the fact that the level of profits, to a certain extent, reflected operational cost savings and efficiencies initiated by management. The Board also took into account management’s expenditures in improving shareholder services provided the Funds, as well as the need to implement systems to meet additional regulatory and compliance requirements resulting from statutes such as the Sarbanes-Oxley and Dodd-Frank Acts and recent SEC and other regulatory requirements. In addition, the Board considered a third-party study comparing the profitability of the Manager’s parent on an overall basis to other publicly held managers broken down to show profitability from management operations exclusive of distribution expenses, as well as profitability including distribution expenses. The Board also considered the extent to which the Manager and its affiliates might derive ancillary benefits from fund operations, including revenues generated from transfer agent services and potential benefits resulting from allocation of fund brokerage and the use of commission dollars to pay for research. Based upon its consideration of all these factors, the Board determined that the level of profits realized by the Manager and its affiliates from providing services to each Fund was not excessive in view of the nature, quality and extent of services provided.
ECONOMIES OF SCALE. The Board also considered whether economies of scale are realized by the Manager as the Funds grow larger and the extent to which this is reflected in the level of management fees charged. While recognizing that any precise determination is inherently subjective,
126 | Semiannual Report
Franklin Investors Securities Trust
Shareholder Information (continued)
Board Review of Investment Management Agreement (continued)
the Board noted that based upon the Fund profitability analysis, it appears that as some funds get larger, at some point economies of scale do result in the Manager realizing a larger profit margin on management services provided such a fund. The Board also noted that economies of scale are shared with each Fund and its shareholders through management fee breakpoints so that as a Fund grows in size, its effective management fee rate declines. The management fee structure including a separate fixed administrative fee for Franklin Real Return Fund provides for breakpoints in stages going to the $21.5 billion asset level, which far exceeded the size of the Fund, which at year-end was approximately $591 million. The Board believed that to the extent economies of scale may be realized by the Manager of the Fund and its affiliates, that this schedule of fees provided a sharing of benefits with the Fund and its shareholders, and noted also that the expenses of Franklin Real Return Fund were partially subsidized by management. The management fee structure, which includes administrative expenses, for Franklin Limited Maturity U.S. Government Securities Fund, provides an initial fee of 0.625% on the first $100 million of assets; 0.50% on the next $150 million of assets; and 0.45% on assets in excess of $250 million. At 2011 year-end, the Fund’s assets were approximately $556 million. The Board noted the Fund’s favorable contractual management fee rate and total expense ratio in respect to its Lipper expense group, as well as the fact that assets in excess of a fund’s last breakpoint still resulted in an overall lower investment management fee rate and believed that to the extent economies of scale may be realized by the Manager and its affiliates, there was a sharing of benefits with this Fund and its shareholders. The management fee structure, which includes administrative expenses for each of Franklin Convertible Securities Fund and Franklin Equity Income Fund, provides an initial fee of 0.625% on the first $100 million of assets; 0.50% on the next $150 million of assets; and 0.45% on assets in excess of $250 million, with additional breakpoints for assets at the $7.5 billion and $10 billion level, and other breakpoints continuing thereafter. Franklin Convertible Securities Fund and Franklin Equity Income Fund had assets of $1.05 billion and $1.27 billion, respectively, at year-end, and the Board believed that to the extent economies of scale may be realized by the Manager and its affiliates, the schedule of fees under the investment management agreement for each of these Funds provides a sharing of benefits with each of these Funds and its shareholders, noting the favorable contractual management fee rate and total expense ratio of each in comparison to its respective Lipper expense group. Franklin Balanced Fund benefited from existing breakpoints under its management fee structure with additional breakpoints extending beyond its year-end asset level. The Board believed such fee schedule provided a sharing of benefits with the Fund and its shareholders, but believed it unlikely that its current asset size afforded any economies of scale, noting that the expenses of the Fund were subsidized by management fee waivers.
Semiannual Report | 127
Franklin Investors Securities Trust
Shareholder Information (continued)
Proxy Voting Policies and Procedures
The Trust’s investment manager has established Proxy Voting Policies and Procedures (Policies) that the Trust uses to determine how to vote proxies relating to portfolio securities. Shareholders may view the Trust’s complete Policies online at franklintempleton.com. Alternatively, shareholders may request copies of the Policies free of charge by calling the Proxy Group collect at (954) 527-7678 or by sending a written request to: Franklin Templeton Companies, LLC, 300 S.E. 2nd Street, Fort Lauderdale, FL 33301, Attention: Proxy Group. Copies of the Trust’s proxy voting records are also made available online at franklintempleton.com and posted on the U.S. Securities and Exchange Commission’s website at sec.gov and reflect the most recent 12-month period ended June 30.
Quarterly Statement of Investments
The Trust files a complete statement of investments with the U.S. Securities and Exchange Commission for the first and third quarters for each fiscal year on Form N-Q. Shareholders may view the filed Form N-Q by visiting the Commission’s website at sec.gov. The filed form may also be viewed and copied at the Commission’s Public Reference Room in Washington, DC. Information regarding the operations of the Public Reference Room may be obtained by calling (800) SEC-0330.
128 | Semiannual Report


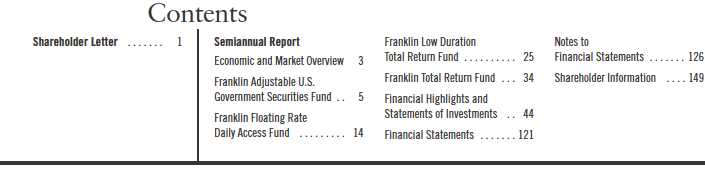
| 1
Semiannual Report
Economic and Market Overview
During the six months under review, Federal Reserve Board (Fed) policymakers maintained historically low interest rates while adopting a restrained view of the economy primarily because of the European sovereign debt crisis and signs the U.S. economic expansion needed further support. In October, the Fed implemented its program (dubbed Operation Twist by commentators) designed to boost the economy by driving down long-term interest rates, which involved the sale of $400 billion in short-term securities and the purchase of an equal amount of long-term securities. During its April meeting, the Fed also anticipated it would keep the federal funds target rate at 0% to 0.25% at least through late 2014.
The economy grew moderately during the period, but the housing market continued to struggle and home foreclosures remained historically high. To help support mortgage market conditions, the Fed decided to reinvest principal received from agency debt and agency mortgage-backed securities (MBS) in agency MBS. Additionally, federal lawmakers made efforts to strengthen the real estate market by removing some eligibility restrictions and charges associated with refinancing. Personal consumption expenditures, private inventory investment and residential fixed investment supported the pace of economic expansion. Driven by private sector job creation and a four-year low in applications for jobless claims, the unemployment rate fell to a multi-year low of 8.1% in April.1 Geopolitical instability in some oil-producing regions and demand from many emerging markets contributed to volatility in crude oil prices. Oil prices rose during the period and added to global inflation pressures.
Generally favorable economic improvements and positive corporate earnings reports somewhat eased investor concerns. During the six months under review, investment-grade fixed income markets, as measured by the Barclays Capital U.S. Aggregate Index, posted modest returns. U.S. stocks, as measured by the Standard & Poor’s® 500 Index, rose strongly in January and February and ended the period with robust gains.2 Global financial markets, however, were volatile early in the period, due to ongoing concerns over Europe’s sovereign debt crisis. Markets rebounded as investors became generally more optimistic
1. Source: Bureau of Labor Statistics.
2. STANDARD & POOR’S®, S&P® and S&P 500® are registered trademarks of Standard & Poor’s Financial Services LLC.
Semiannual Report | 3
about the European Union and European Central Bank leaders’ progress in solving the region’s sovereign debt and banking crises. The 10-year U.S. Treasury note yield declined from 2.17% on October 31, 2011, to 1.95% on April 30, 2012, based on investor concerns about eurozone manufacturing contractions and weak U.S. employment gains.
The foregoing information reflects our analysis and opinions as of April 30, 2012. The information is not a complete analysis of every aspect of any market, country, industry, security or fund. Statements of fact are from sources considered reliable.
4 | Semiannual Report
Franklin Adjustable
U.S. Government Securities Fund
Your Fund’s Goal and Main Investments: Franklin Adjustable U.S. Government
Securities Fund seeks to provide a high level of current income while providing lower volatility of principal than a fund that invests in fixed-rate securities by investing at least 80% of its net assets in adjustable-rate U.S. government mortgage securities, which are issued or guaranteed by the U.S. government, its agency or instrumentalities.1 The Fund’s investments may include securities issued or guaranteed by Ginnie Mae and government-sponsored entities, such as Fannie Mae and Freddie Mac.2
Performance data represent past performance, which does not guarantee future results. Investment return and principal value will fluctuate, and you may have a gain or loss when you sell your shares. Current performance may differ from figures shown. Please visit franklintempleton.com or call (800) 342-5236 for most recent month-end performance.

We are pleased to bring you Franklin Adjustable U.S. Government Securities Fund’s semiannual report for the period ended April 30, 2012.
Performance Overview
Franklin Adjustable U.S. Government Securities Fund – Class A delivered a +1.34% cumulative total return for the six months under review. The Fund outperformed the +0.19% total return of its benchmark, the Barclays Capital (BC) U.S. Government Index: 1-2 Year Component, which measures public obligations of the U.S. Treasury with one to two years to final maturity and publicly issued debt of U.S. government agencies, quasi-federal corporations, and corporate or foreign debt guaranteed by the U.S. government.3 You can find the Fund’s long-term performance data in the Performance Summary beginning on page 9.
1. Securities owned by the Fund, but not shares of the Fund, are issued or guaranteed by the U.S. government, its agencies or instrumentalities, including government-sponsored entities, as to timely payment of principal and interest.
2. Although U.S. government-sponsored entities may be chartered or sponsored by acts of Congress, their securities are neither issued nor guaranteed by the U.S. Treasury. Please see the Fund’s prospectus for a detailed discussion regarding various levels of credit support for government agency or instrumentality securities. The Fund’s yield and share price are not guaranteed and will vary with market conditions.
3. Source: © 2012 Morningstar. All Rights Reserved. The information contained herein: (1) is proprietary to Morningstar and/or its content providers; (2) may not be copied or distributed; and (3) is not warranted to be accurate, complete or timely. Neither Morningstar nor its content providers are responsible for any damages or losses arising from any use of this information. The index is unmanaged and includes reinvested interest. One cannot invest directly in an index, and an index is not representative of the Fund’s portfolio.
The dollar value, number of shares or principal amount, and names of all portfolio holdings are listed in the Fund’s Statement of Investments (SOI). The SOI begins on page 47.
Semiannual Report | 5

*Assumes shares were purchased and held for the entire accrual period. Since dividends accrue daily, your actual distributions will vary depending on the date you purchased your shares and any account activity. All Fund distributions will vary depending upon current market conditions, and past distributions are not indicative of future trends.
Investment Strategy
We employ a conservative investment strategy as we strive to produce solid performance in a variety of interest rate climates. We tend to invest in seasoned adjustable-rate mortgage (ARM) securities, which have been through different interest rate cycles and tend to have a lower sensitivity to shifts in interest rates. We choose securities using a value-oriented approach, emphasizing the bonds’ economic fundamentals in relation to comparable securities as well as their historical prepayment performance.
Manager’s Discussion
During the period, capital markets generally favored risk assets based on improving U.S. economic data. Although economic data remained supportive of a U.S. economic recovery, a number of uncertainties led investors to question if this positive momentum was sustainable. Investors seemed to recall periods in 2010 and 2011 when the economy initially gained momentum but then turned sluggish, raising the possibility of another recession. During the
6 | Semiannual Report
reporting period, market concerns persisted regarding the eurozone debt crisis, a potential hard landing in China, the U.S. presidential election and the potential fiscal ramifications of expiring policy initiatives. Although significant headwinds still exist, we believe the U.S. economic recovery should remain positive, but uneven. Furthermore, we think efforts by foreign monetary institutions have helped reduce fears of systemic risk associated with the European sovereign credit crisis.

The Fund employed a conservative strategy investing primarily in agency adjustable-rate mortgage (ARM) securities that were either explicitly or implicitly backed by the U.S. government and government-sponsored entities. The Fund focused on securities guaranteed by Fannie Mae (FNMA) and Freddie Mac (FHLMC).1, 2 The Fund took a collateral-intensive research approach seeking to uncover opportunities across the investment universe and focused on seasoned ARMs. Such securities typically have been though several interest rate cycles and therefore have prepayment rates that tend to be less sensitive to interest rate changes, compared to their fixed rate counterparts. We have found these securities in the Fund historically have experienced lower volatility than comparable short-duration Treasuries and have provided more consistent income. Over the period, we sold seasoned, post-reset FNMA and FHLMC ARM positions pegged to the One-Year Constant Maturity Treasury Index.
The ARM sector outperformed Treasuries on an excess returns basis, and contributed to relative and absolute performance. The Fund had a shorter duration than the benchmark BC U.S. Government Index: 1-2 Year Component, and our lower interest rate risk positioning detracted from performance as rates decreased. Our focus on seasoned, shorter duration, high-quality ARMs that tend to be less sensitive to interest rate changes continued to help performance.
Treasury rates rose from their recent, range-bound lows during the period and mortgages continued to outperform in this environment. Prepayment risk remained heightened largely due to historically low mortgage rates and premium market prices. However, prepayment was relatively contained as home price depreciation, loss of home equity and tighter underwriting standards inhibited mortgage holders’ ability to refinance their homes.
Semiannual Report | 7
Thank you for your continued participation in Franklin Adjustable U.S. Government Securities Fund. We look forward to serving your future investment needs.

CFA® is a trademark owned by CFA Institute.
The foregoing information reflects our analysis, opinions and portfolio holdings as of April 30, 2012, the end of the reporting period. The way we implement our main investment strategies and the resulting portfolio holdings may change depending on factors such as market and economic conditions. These opinions may not be relied upon as investment advice or an offer for a particular security. The information is not a complete analysis of every aspect of any market, country, industry, security or the Fund. Statements of fact are from sources considered reliable, but the investment manager makes no representation or warranty as to their completeness or accuracy. Although historical performance is no guarantee of future results, these insights may help you understand our investment management philosophy.
8 | Semiannual Report
Performance Summary as of 4/30/12
Franklin Adjustable U.S. Government Securities Fund
Your dividend income will vary depending on dividends or interest paid by securities in the Fund’s portfolio, adjusted for operating expenses of each class. Capital gain distributions are net profits realized from the sale of portfolio securities. The performance table does not reflect any taxes that a shareholder would pay on Fund dividends, capital gain distributions, if any, or any realized gains on the sale of Fund shares. Total return reflects reinvestment of the Fund’s dividends and capital gain distributions, if any, and any unrealized gains or losses.
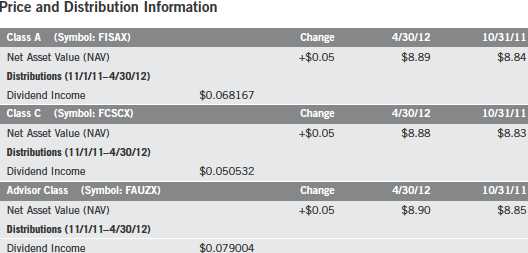
Semiannual Report | 9
Performance Summary (continued)
Performance
Cumulative total return excludes sales charges. Average annual total returns include maximum sales charges. Class A: 2.25% maximum initial sales charge; Class C: 1% contingent deferred sales charge in first year only; Advisor Class: no sales charges.
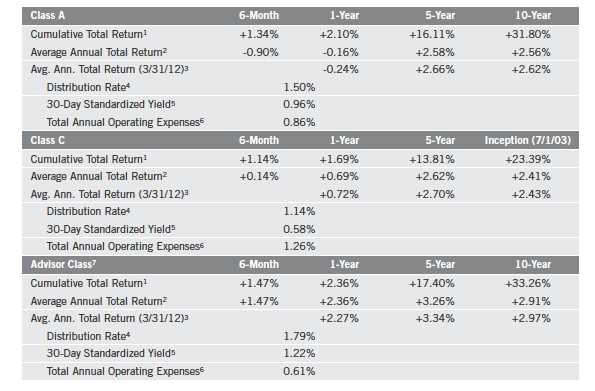
Performance data represent past performance, which does not guarantee future results. Investment return and principal value will fluctuate, and you may have a gain or loss when you sell your shares. Current performance may differ from figures shown. For most recent month-end performance, go to franklintempleton.com or call (800) 342-5236.
10 | Semiannual Report
Performance Summary (continued)
Endnotes
All investments involve risks, including possible loss of principal. Interest rate movements, unscheduled mortgage prepayments and other risk factors will affect the Fund’s share price and yield. Bond prices generally move in the opposite direction of interest rates. Thus, as prices of bonds in the Fund adjust to a rise in interest rates, the Fund’s share price may decline. Changes in the financial strength of a bond issuer or in a bond’s credit rating may affect its value. The Fund is actively managed but there is no guarantee that the manager’s investment decisions will produce the desired results. The Fund’s prospectus also includes a description of the main investment risks.
Class C: Prior to 1/1/04, these shares were offered with an initial sales charge; thus actual total returns would have differed. These shares
have higher annual fees and expenses than Class A shares.
Advisor Class: Shares are available to certain eligible investors as described in the prospectus.
1. Cumulative total return represents the change in value of an investment over the periods indicated.
2. Average annual total return represents the average annual change in value of an investment over the periods indicated. Six-month return has not been annualized.
3. In accordance with SEC rules, we provide standardized average annual total return information through the latest calendar quarter.
4. Distribution rate is based on an annualization of the sum of the respective class’s past 30 days’ daily distributions and the maximum offering price (NAV for Classes C and Advisor) per share on 4/30/12.
5. The 30-day standardized yield for the 30 days ended 4/30/12 reflects an estimated yield to maturity (assuming all portfolio securities are held to maturity). It should be regarded as an estimate of the Fund’s rate of investment income, and it may not equal the Fund’s actual income distribution rate (which reflects the Fund’s past dividends paid to shareholders) or the income reported in the Fund’s financial statements.
6. Figures are as stated in the Fund’s prospectus current as of the date of this report. In periods of market volatility, assets may decline significantly, causing total annual Fund operating expenses to become higher than the figures shown.
7. Effective 5/15/08, the Fund began offering Advisor Class shares, which do not have sales charges or a Rule 12b-1 plan. Performance quotations for this class reflect the following methods of calculation: (a) For periods prior to 5/15/08, a restated figure is used based upon the Fund’s Class A performance, excluding the effect of Class A’s maximum initial sales charge, but reflecting the effect of the Class A Rule 12b-1 fees; and (b) for periods after 5/15/08, actual Advisor Class performance is used reflecting all charges and fees applicable to that class. Since 5/15/08 (commencement of sales), the cumulative and average annual total returns of Advisor Class shares were +11.83% and +2.86%.
Semiannual Report | 11
Your Fund’s Expenses
Franklin Adjustable U.S. Government Securities Fund
As a Fund shareholder, you can incur two types of costs:
- Transaction costs, including sales charges (loads) on Fund purchases; and
- Ongoing Fund costs, including management fees, distribution and service (12b-1) fees, and other Fund expenses. All mutual funds have ongoing costs, sometimes referred to as operating expenses.
The following table shows ongoing costs of investing in the Fund and can help you understand these costs and compare them with those of other mutual funds. The table assumes a $1,000 investment held for the six months indicated.
Actual Fund Expenses
The first line (Actual) for each share class listed in the table provides actual account values and expenses. The “Ending Account Value” is derived from the Fund���s actual return, which includes the effect of Fund expenses.
You can estimate the expenses you paid during the period by following these steps. Of course, your account value and expenses will differ from those in this illustration:
| 1. | Divide your account value by $1,000. |
| | If an account had an $8,600 value, then $8,600 ÷ $1,000 = 8.6. |
| 2. | Multiply the result by the number under the heading “Expenses Paid During Period.” |
| | If Expenses Paid During Period were $7.50, then 8.6 x $7.50 = $64.50. |
In this illustration, the estimated expenses paid this period are $64.50.
Hypothetical Example for Comparison with Other Funds
Information in the second line (Hypothetical) for each class in the table can help you compare ongoing costs of investing in the Fund with those of other mutual funds. This information may not be used to estimate the actual ending account balance or expenses you paid during the period. The hypothetical “Ending Account Value” is based on the actual expense ratio for each class and an assumed 5% annual rate of return before expenses, which does not represent the Fund’s actual return. The figure under the heading “Expenses Paid During Period” shows the hypothetical expenses your account would have incurred under this scenario. You can compare this figure with the 5% hypothetical examples that appear in shareholder reports of other funds.
12 | Semiannual Report
Your Fund’s Expenses (continued)
Please note that expenses shown in the table are meant to highlight ongoing costs and do not reflect any transaction costs, such as sales charges. Therefore, the second line for each class is useful in comparing ongoing costs only, and will not help you compare total costs of owning different funds. In addition, if transaction costs were included, your total costs would have been higher. Please refer to the Fund prospectus for additional information on operating expenses.

*Expenses are calculated using the most recent six-month expense ratio, annualized for each class (A: 0.87%; C: 1.27%; and Advisor: 0.62%), multiplied by the average account value over the period, multiplied by 182/366 to reflect the one-half year period.
Semiannual Report | 13
Franklin Floating Rate Daily Access Fund
Your Fund’s Goals and Main Investments: Franklin Floating Rate Daily Access Fund seeks to provide a high level of current income and, secondarily, preservation of capital by investing at least 80% of its net assets in income-producing floating interest rate corporate loans and corporate debt securities.
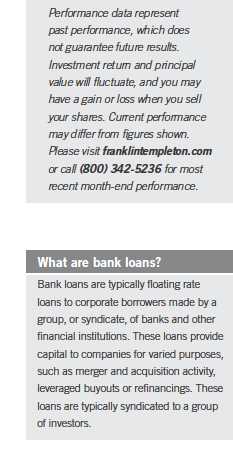
This semiannual report for Franklin Floating Rate Daily Access Fund covers the period ended April 30, 2012.
Performance Overview
Franklin Floating Rate Daily Access Fund – Class A delivered a +4.58% cumulative total return for the six months under review. The Fund performed comparatively to the +4.42% total return of its benchmark, the Credit Suisse Leveraged Loan Index (CS LLI), which is designed to mirror the investable universe of the U.S. dollar-denominated leveraged loan market.1 You can find the Fund’s long-term performance data in the Performance Summary beginning on page 20.
Bank Loan Market Overview
The loan market rallied during the six-month period ended April 30, 2012, posting a +4.42% total return as measured by the CS LLI.1 At the beginning of the period, the loan market continued to be affected by volatility in the broader capital markets following the downgrade of the U.S. long-term credit rating to AA+ from AAA, fears of another U.S. recession, and lingering uncertainty about contagion effects from the eurozone sovereign debt crisis. However, signs of stabilization for the eurozone debt crisis and economic reports indicating a sustained U.S. recovery led to improved technical conditions in the loan market. By period-end, the secondary loan market improved, largely due to higher cash balances resulting from year-end repayments and amortizations, new issuance of collateralized loan obligations (CLOs), positive flows into loan mutual funds, and relatively low net new loan issuance. In this environment, secondary loan prices increased while the average yield spread tightened.
1. Source: © 2012 Morningstar. All Rights Reserved. The information contained herein: (1) is proprietary to Morningstar and/or its content providers; (2) may not be copied or distributed; and (3) is not warranted to be accurate, complete or timely. Neither Morningstar nor its content providers are responsible for any damages or losses arising from any use of this information. The index is unmanaged and includes reinvested interest. One cannot invest directly in an index, and an index is not representative of the Fund’s portfolio.
The dollar value, number of shares or principal amount, and names of all portfolio holdings are listed in the Fund’s Statement of Investments (SOI). The SOI begins on page 54.
14 | Semiannual Report
Fundamental factors remained supportive of the loan market throughout the period as issuers continued to report year-over-year (y-o-y) growth in EBITDA (earnings before income, taxes, depreciation and amortization, which is a measure of a company’s cash flow and ability to service its loan interests). Earnings growth, along with continued double-digit y-o-y revenue growth and modestly improving U.S. economic growth, helped to keep the default rate at very low historical levels. The trailing 12-month default rate by principal amount increased modestly from 0.32% at the end of October to 0.56% at period-end.2 The increase in defaults appeared to us to confirm investor expectations of a slight rise in the default rate in 2012, as a few issuers with near-term maturities will likely face refinancing hurdles amid a relatively modest economic recovery.
Year-end amortizations and repayments boosted investor cash balances, helping to improve the overall loan market’s technical conditions and drive the secondary loan market’s rally in January. The increase in repayment activity was partly driven by a revival in bond-for-loan refinancings amid record inflows to the high yield bond market and high yield bond issuers’ ability to raise capital as many investors seeking relatively higher yield shifted to asset classes that could benefit from a period of historically low interest rates.
The loan market experienced moderate outflows from loan mutual funds in the first half of the period as investors withdrew money partly due to diminished expectations of higher interest rates, particularly after the Federal Reserve Board announced it anticipated maintaining its historically low interest rate at least through late 2014. Compared with the dramatic outflows in July and August, the moderation in flows significantly improved technical conditions and helped to extend the rally in loan prices when flows turned positive in March 2012.
A sharp increase in CLO issuance also contributed to better technical conditions, with issuance in the first four months of 2012 nearly matching the entire volume in 2011, albeit significantly lower than levels reached at the height of the credit boom. Although CLO managers faced the prospect of increased regulation in addition to fewer arbitrage opportunities compared to the 2007 peak, improved economic sentiment supported new CLOs to replace legacy CLOs nearing the end of their reinvestment periods. Many insurance companies, as well as smaller U.S. banks, Asian banks, and pension accounts, drove demand for new CLOs as they found the vehicles relatively attractive compared to other securitized assets.
Following a period of less primary market activity in late 2011, arrangers significantly increased the number of new institutional deals launched in the first months of 2012. Much of the new institutional issuance, however, was related
2. Source: S&P Leveraged Commentary & Data, “LoanStats Weekly,” 5/3/12.
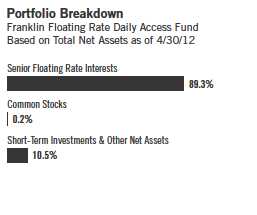
Semiannual Report | 15

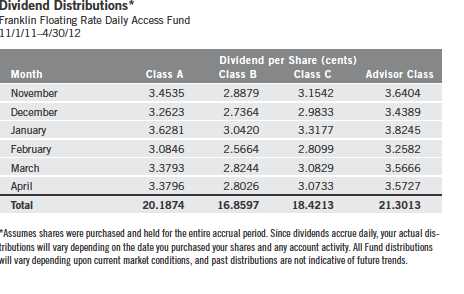
to refinancing transactions and the new volume often was unable to match demand. As demand in the primary market improved in the second half of the period, arrangers brought forth many opportunistic deals that allowed issuers to take advantage of the favorable market conditions. The proportion of new loans with lower credit ratings increased during the period, while the volume of second-lien tranches and loans with no financial covenants, or “covenant-lite” loans, increased as well. The volume of dividend-related deals also rebounded by period-end as many equity sponsors attempted to monetize their investments.
Issuers also took advantage of improving demand by amending the terms of their loans and extending maturities. Amend-to-extend volume increased sharply after these transactions were largely absent from the market in the second half of 2011.The increase in amend-to-extend transactions in early 2012 resumed the trend from the first half of 2011, when many issuers sought to take advantage of robust demand for loans to reduce the wall of upcoming maturities in 2013 and 2014. As a result, the total amount of loans outstanding with near-term maturities continued to decline through repayments, high yield bond refinancings and amend-to-extend transactions.
Investment Strategy
We use a detailed credit analysis process to select corporate loan and corporate debt securities that meet our criteria. We conduct ongoing credit monitoring of our investments. To help manage the credit risk associated with investing in below-investment-grade securities, we seek to diversify the Fund by investing in a large number of loans of companies that we have identified as having attractive risk/reward profiles, favorable capital structures, strong asset coverage and
16 | Semiannual Report
dominant market shares. This diversification potentially reduces credit risk by spreading assets across many different industries.
Manager’s Discussion
During the six-month period ended April 30, 2012, the Fund’s Class A shares performed comparably to the benchmark CS LLI. The Fund’s relative performance was positively impacted by our exposure to the more liquid, larger, higher-beta loan facilities held by a broader base of investors and our exposure to second-lien loans, which both outperformed during the period. Second-lien loans returned +7.56%, while first-lien loans returned +4.33% for the six months under review, as measured by the CS LLI.3 Additionally, our loan selection in the portfolio helped to drive relative performance, particularly our media holdings.4
The Fund continued to invest in companies we have identified as having adequate liquidity and strong cash flow to service debt in the primary and secondary markets, while maintaining a small exposure to second-lien loans. The Fund also targeted a shorter weighted average maturity to better match its benchmark and help reduce price volatility, while also creating what we considered to be some positive event risk in loans that will likely need to be refinanced in the near to intermediate term due to their upcoming maturities.
However, the Fund’s bias toward higher-rated credits detracted from relative performance due to our overweighting in loans rated BB and underweighting in distressed loans. For the six-month period ended April 30, 2012, BB-rated loans returned +3.51%, B-rated loans returned +6.28%, CCC-rated loans returned +7.75%, and distressed (CC, C and default) loans returned +10.54%, as measured by the CS LLI.3 Within the Fund, a few holdings detracted from performance, generally credits that did not participate much in the loan price rally during the period. Our investment in Evergreen International Aviation declined as the company was negatively affected by softer commercial business and European cargo companies that moved capacity into Asia from weak home markets.
In the diversified media industry, Dex One,5 a provider of print and online marketing through yellow pages directories and websites, was one of the top contributors to Fund performance. The company benefited from an amendment that allowed it to repurchase its existing debt at a deep discount, which
3. Source: Credit Suisse.
4. Media holdings are in broadcasting, cable and satellite, movies and entertainment, and publishing in the SOI.
5. R.H. Donnelly Inc. in the SOI.
Semiannual Report | 17
set a floor to loan valuations and gave the company additional flexibility to manage its leverage, debt service and liquidity.
The Fund also maintained its overweighted position in the automotive industry, which contributed to performance relative to the index.6 Chrysler Group, one of the three largest U.S. automobile manufacturers, was among the top performers during the period due to an improved economic outlook that many investors expected would support increased automobile sales. Many of the automotive loans we acquired during the period contributed to performance, including Allison Transmission and Goodyear Tire and Rubber. Allison Transmission, a designer and manufacturer of commercial and military automatic transmissions, reported strong earnings results as the automobile market recovered. We also found the company’s term loan compelling due to the company’s improved profit margins resulting from higher volumes and cost controls. Furthermore, we also invested in the second-lien term loan of Goodyear Tire and Rubber, the world’s largest tire company. We found the company attractive due to its diverse product line and strong market share in the U.S., Europe and Latin America. In April 2012, the company refinanced the second-lien term loan and repaid the original loan to the Fund. The Fund also invested in the refinanced term loan.
During the period, the Fund used two derivative instruments, the Markit North American Loan Credit Default Swap Index (LCDX), a tradable index of 100 equally weighted loan credit default swaps, and Markit CDX North American High Yield Index (CDX HY), a tradable index of 100 equally weighted high yield bond credit default swaps. We used these indexes in conjunction with carrying higher cash balances as tools to help maintain daily liquidity while also seeking to minimize any cash drag on performance, which also positively contributed to performance over the six-month period.
6. Automotive holdings are in auto parts and equipment, automobile manufacturers, and tires and rubber in the SOI.
18 | Semiannual Report
Thank you for your continued participation in Franklin Floating Rate Daily Access Fund. We look forward to serving your future investment needs.

The foregoing information reflects our analysis, opinions and portfolio holdings as of April 30, 2012, the end of the reporting period. The way we implement our main investment strategies and the resulting portfolio holdings may change depending on factors such as market and economic conditions. These opinions may not be relied upon as investment advice or an offer for a particular security. The information is not a complete analysis of every aspect of any market, country, industry, security or the Fund. Statements of fact are from sources considered reliable, but the investment manager makes no representation or warranty as to their completeness or accuracy. Although historical performance is no guarantee of future results, these insights may help you understand our investment management philosophy.
Semiannual Report | 19
Performance Summary as of 4/30/12
Franklin Floating Rate Daily Access Fund
Your dividend income will vary depending on dividends or interest paid by securities in the Fund’s portfolio, adjusted for operating expenses of each class. Capital gain distributions are net profits realized from the sale of portfolio securities. The performance table does not reflect any taxes that a shareholder would pay on Fund dividends, capital gain distributions, if any, or any realized gains on the sale of Fund shares. Total return reflects reinvestment of the Fund’s dividends and capital gain distributions, if any, and any unrealized gains or losses.

20 | Semiannual Report
Performance Summary (continued)
Performance
Cumulative total return excludes sales charges. Average annual total returns include maximum sales charges. Class A: 2.25% maximum initial sales charge; Class B: contingent deferred sales charge (CDSC) declining from 4% to 1% over six years, and eliminated thereafter; Class C: 1% CDSC in first year only; Advisor Class: no sales charges.

Performance data represent past performance, which does not guarantee future results. Investment return and principal value will fluctuate, and you may have a gain or loss when you sell your shares. Current performance may differ from figures shown. For most recent month-end performance, go to franklintempleton.com or call (800) 342-5236.
Semiannual Report | 21
Performance Summary (continued)
Endnotes
All investments involve risks, including possible loss of principal. Investors should be aware that the Fund’s share price and yield will fluctuate with market conditions. The Fund should not be considered an alternative to money market funds or certificates of deposit (CDs). The floating rate loans and debt securities in which the Fund invests tend to be rated below investment grade. Investing in higher yielding, lower rated, floating rate loans and debt securities involves greater risk of default, which could result in loss of principal — a risk that may be heightened in a slowing economy. Interest earned on floating rate loans varies with changes in prevailing interest rates. Therefore, while floating rate loans offer higher interest income when interest rates rise, they will also generate less income when interest rates decline. Changes in the financial strength of a bond issuer or in a bond’s credit rating may affect its value. The Fund is actively managed but there is no guarantee that the manager’s investment decisions will produce the desired results. The Fund’s prospectus also includes a description of the main investment risks.
Class B: These shares have higher annual fees and expenses than Class A shares.
Class C: These shares have higher annual fees and expenses than Class A shares.
Advisor Class: Shares are available to certain eligible investors as described in the prospectus.
1. Cumulative total return represents the change in value of an investment over the periods indicated.
2. Average annual total return represents the average annual change in value of an investment over the periods indicated. Six-month return has not been annualized.
3. In accordance with SEC rules, we provide standardized average annual total return information through the latest calendar quarter.
4. Distribution rate is based on an annualization of the sum of the respective class’s past 30 days’ daily distributions and the maximum offering price (NAV for Classes B, C and Advisor) per share on 4/30/12.
5. The 30-day standardized yield for the 30 days ended 4/30/12 reflects an estimated yield to maturity (assuming all portfolio securities are held to maturity). It should be regarded as an estimate of the Fund’s rate of investment income, and it may not equal the Fund’s actual income distribution rate (which reflects the Fund’s past dividends paid to shareholders) or the income reported in the Fund’s financial statements.
6. Figures are as stated in the Fund’s prospectus current as of the date of this report. In periods of market volatility, assets may decline significantly, causing total annual Fund operating expenses to become higher than the figures shown.
22 | Semiannual Report
Your Fund’s Expenses
Franklin Floating Rate Daily Access Fund
As a Fund shareholder, you can incur two types of costs:
- Transaction costs, including sales charges (loads) on Fund purchases; and
- Ongoing Fund costs, including management fees, distribution and service (12b-1) fees, and other Fund expenses. All mutual funds have ongoing costs, sometimes referred to as operating expenses.
The following table shows ongoing costs of investing in the Fund and can help you understand these costs and compare them with those of other mutual funds. The table assumes a $1,000 investment held for the six months indicated.
Actual Fund Expenses
The first line (Actual) for each share class listed in the table provides actual account values and expenses. The “Ending Account Value” is derived from the Fund’s actual return, which includes the effect of Fund expenses.
You can estimate the expenses you paid during the period by following these steps. Of course, your account value and expenses will differ from those in this illustration:
| 1. | Divide your account value by $1,000. |
| | If an account had an $8,600 value, then $8,600 ÷ $1,000 = 8.6. |
| 2. | Multiply the result by the number under the heading “Expenses Paid During Period.” |
| | If Expenses Paid During Period were $7.50, then 8.6 x $7.50 = $64.50. |
In this illustration, the estimated expenses paid this period are $64.50.
Hypothetical Example for Comparison with Other Funds
Information in the second line (Hypothetical) for each class in the table can help you compare ongoing costs of investing in the Fund with those of other mutual funds. This information may not be used to estimate the actual ending account balance or expenses you paid during the period. The hypothetical “Ending Account Value” is based on the actual expense ratio for each class and an assumed 5% annual rate of return before expenses, which does not represent the Fund’s actual return. The figure under the heading “Expenses Paid During Period” shows the hypothetical expenses your account would have incurred under this scenario. You can compare this figure with the 5% hypothetical examples that appear in shareholder reports of other funds.
Semiannual Report | 23
Your Fund’s Expenses (continued)
Please note that expenses shown in the table are meant to highlight ongoing costs and do not reflect any transaction costs, such as sales charges. Therefore, the second line for each class is useful in comparing ongoing costs only, and will not help you compare total costs of owning different funds. In addition, if transaction costs were included, your total costs would have been higher. Please refer to the Fund prospectus for additional information on operating expenses.

*Expenses are calculated using the most recent six-month expense ratio, annualized for each class (A: 0.91%; B: 1.66%; C: 1.31%; and Advisor: 0.66%), multiplied by the average account value over the period, multiplied by 182/366 to reflect the one-half year period.
24 | Semiannual Report
Franklin Low Duration Total Return Fund
Your Fund’s Goal and Main Investments: Franklin Low Duration Total Return Fund seeks a high level of current income as is consistent with prudent investing, while seeking capital preservation. The Fund invests primarily in investment-grade debt securities, including government and corporate debt securities and mortgage- and asset-backed securities, targeting an estimated average
portfolio duration of three years or less.
Duration is a measure of a bond’s price sensitivity to interest rate changes. In general, a portfolio of securities with a lower duration can be expected to be less sensitive to interest rate changes than a portfolio with a higher duration.
Performance data represent past performance, which does not guarantee future results. Investment return and principal value will fluctuate, and you may have a gain or loss when you sell your shares. Current performance may differ from figures shown. Please visit franklintempleton.com or call (800) 342-5236 for most recent month-end performance.
We are pleased to bring you Franklin Low Duration Total Return Fund’s semi-annual report for the period ended April 30, 2012.
Performance Overview
Franklin Low Duration Total Return Fund – Class A delivered a +1.76% cumulative total return for the six months under review. The Fund outperformed the +0.59% total return of its benchmark, the Barclays Capital (BC) U.S. Government/Credit Index: 1-3 Year Component, which tracks public obligations of the U.S. Treasury with one to three years to final maturity and publicly issued debt of U.S. government agencies, quasi-federal corporations, and corporate or foreign debt guaranteed by the U.S. government.1 You can find more of the Fund’s performance data in the Performance Summary beginning on page 29.
Investment Strategy
We seek to invest in a combination of fixed income securities, primarily from across the investment-grade debt universe. We analyze securities using proprietary and nonproprietary research to help us identify attractive investment opportunities across the entire fixed income opportunity set, on a relative basis. When making investment decisions, we evaluate business cycles, yield curves, and values between and within markets. Through a low duration portfolio, we seek to position the Fund to be less affected by interest rate changes than a fund with a higher duration. In addition, we may use derivative transactions, such as forwards, futures contracts and swap agreements, to obtain net long or short exposures to select currencies, interest rates, countries, duration or credit risks.
1. Source: © 2012 Morningstar. All Rights Reserved. The information contained herein: (1) is proprietary to Morningstar and/or its content providers; (2) may not be copied or distributed; and (3) is not warranted to be accurate, complete or timely. Neither Morningstar nor its content providers are responsible for any damages or losses arising from any use of this information. One cannot invest directly in an index, and an index is not representative of the Fund’s portfolio.
The dollar value, number of shares or principal amount, and names of all portfolio holdings are listed in the Fund’s Statement of Investments (SOI). The SOI begins on page 67.
Semiannual Report | 25

*Assumes shares were purchased and held for the entire accrual period. Since dividends accrue daily, your actual distributions will vary depending on the date you purchased your shares and any account activity. All Fund distributions will vary depending upon current market conditions, and past distributions are not indicative of future trends.
**Includes an additional 10.86 cent per share distribution to meet excise tax requirements.
Manager’s Discussion
During the period, capital markets generally favored risk assets based on improving U.S. economic data. Although economic data remained supportive of a U.S. economic recovery, a number of uncertainties led investors to question if this positive momentum was sustainable. Investors seemed to recall periods in 2010 and 2011 when the economy initially gained momentum but then turned sluggish, raising the possibility of another recession. During the reporting period, market concerns persisted regarding the eurozone debt crisis, a potential hard landing in China, the U.S. presidential election and the potential fiscal ramifications of expiring policy initiatives. Although significant headwinds still exist, we believe the U.S. economic recovery should remain positive, but uneven. Furthermore, we think efforts by foreign monetary institutions have helped reduce fears of systemic risk associated with the European sovereign credit crisis.
26 | Semiannual Report
Investors’ continued search for yield helped high yield bonds post among the best absolute performance during the period, as measured by the BC U.S. Corporate High Yield Index, which tracks below-investment-grade bonds (+6.91%).1 Several other BC indexes for major fixed income sectors delivered positive returns as well, including the Emerging Markets (U.S. Dollar) Index (+6.23%), the Commercial Mortgage-Backed Securities (CMBS) Index (+5.69%), the U.S. TIPS Index (+3.74%), the U.S. Corporate Investment Grade Index (+3.64%), the U.S. MBS Index (+2.11%), the Asset-Backed Securities Index (+1.87%), the U.S. Treasury Index (+1.87%) and the U.S. Agency Index (+1.32%).1
The portfolio’s positioning in credit, in particular below-investment-grade credit, boosted overall performance as the credit sectors were among the best performing fixed income sectors. Many of our non-U.S. dollar denominated bonds benefited from certain foreign currency appreciation, and local market performance in non-U.S. markets was a major contributor to performance. The Fund’s CMBS allocation continued to provide strong results. The Fund’s municipal bond exposure benefited the portfolio as the sector delivered positive performance. Our lower weighting in agency securities, relative to our benchmark, detracted from results as these sectors outperformed comparable maturity Treasuries and produced positive total returns during the period.
We remained overweighted in many credit sectors based on our belief that valuations remained attractive on a longer term basis. However, our expectations were tempered as credit sectors continued to deliver strong returns. We took the opportunity to reduce exposure to some high yield corporate bonds that delivered strong performance, while we increased the Fund’s allocation to the slightly more defensive bank loan sector. We reduced our Treasury Inflation Protected Securities and municipal bond exposures, and selectively added to small, non-agency, residential MBS positions seeking to take advantage of improved fundamentals in that sector. We continued to feel that many of the best opportunities in global bond markets were outside the U.S. and accordingly, we maintained strong exposure to international bonds and currencies.
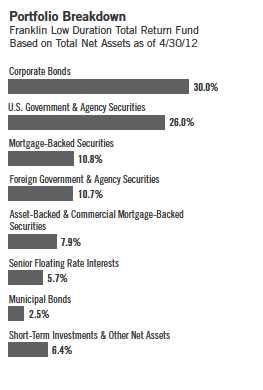
Semiannual Report | 27
Thank you for your continued participation in Franklin Low Duration Total Return Fund. We look forward to serving your future investment needs.

The foregoing information reflects our analysis, opinions and portfolio holdings as of April 30, 2012, the end of the reporting period. The way we implement our main investment strategies and the resulting portfolio holdings may change depending on factors such as market and economic conditions. These opinions may not be relied upon as investment advice or an offer for a particular security. The information is not a complete analysis of every aspect of any market, country, industry, security or the Fund. Statements of fact are from sources considered reliable, but the investment manager makes no representation or warranty as to their completeness or accuracy. Although historical performance is no guarantee of future results, these insights may help you understand our investment management philosophy.
28 | Semiannual Report
Performance Summary as of 4/30/12
Franklin Low Duration Total Return Fund
Your dividend income will vary depending on dividends or interest paid by securities in the Fund’s portfolio, adjusted for operating expenses of each class. Capital gain distributions are net profits realized from the sale of portfolio securities. The performance table does not reflect any taxes that a shareholder would pay on Fund dividends, capital gain distributions, if any, or any realized gains on the sale of Fund shares. Total return reflects reinvestment of the Fund’s dividends and capital gain distributions, if any, and any unrealized gains or losses.

Semiannual Report | 29
Performance Summary (continued)
Performance1
Cumulative total return excludes sales charges. Average annual total returns include maximum sales charges. Class A: 2.25% maximum initial sales charge; Advisor Class: no sales charges.

Performance data represent past performance, which does not guarantee future results. Investment return and principal value will fluctuate, and you may have a gain or loss when you sell your shares. Current performance may differ from figures shown. For most recent month-end performance, go to franklintempleton.com or call (800) 342-5236.
The investment manager and administrator have contractually agreed to waive or assume certain expenses so that common expenses (excluding the Rule 12b-1 fees and acquired fund fees and expenses) for each class of the Fund do not exceed 0.65% (other than certain nonroutine expenses) until 2/28/13.
30 | Semiannual Report
Performance Summary (continued)
Endnotes
All investments involve risks, including possible loss of principal. Interest rate movements will affect the Fund’s share price and yield. Bond prices generally move in the opposite direction of interest rates. Thus, as prices of bonds in the Fund adjust to a rise in interest rates, the Fund’s share price may decline. The Fund’s investment in derivatives, such as financial futures and option contracts, and the Fund’s use of foreign currency techniques involve special risks as such may not achieve the anticipated benefits and/or may result in losses to the Fund. Some derivatives are particularly sensitive to changes in interest rates. The risks of foreign securities include currency fluctuations and political uncertainty. Changes in the financial strength of a bond issuer or in a bond’s credit rating may affect its value. The Fund is actively managed but there is no guarantee that the manager’s investment decisions will produce the desired results. The Fund’s prospectus also includes a description of the main investment risks.
Advisor Class: Shares are available to certain eligible investors as described in the prospectus.
1. If the manager and administrator had not waived fees, the Fund’s distribution rates and total returns would have been lower, and yields for the period would have been 1.01% for Class A and 1.28% for Advisor Class.
2. Cumulative total return represents the change in value of an investment over the periods indicated.
3. Average annual total return represents the average annual change in value of an investment over the periods indicated. Six-month return has not been annualized.
4. In accordance with SEC rules, we provide standardized average annual total return information through the latest calendar quarter.
5. Distribution rate is based on an annualization of the sum of the respective class’s past 30 days’ daily distributions and the maximum offering price (NAV for Advisor Class) per share on 4/30/12.
6. The 30-day standardized yield for the 30 days ended 4/30/12 reflects an estimated yield to maturity (assuming all portfolio securities are held to maturity). It should be regarded as an estimate of the Fund’s rate of investment income, and it may not equal the Fund’s actual income distribution rate (which reflects the Fund’s past dividends paid to shareholders) or the income reported in the Fund’s financial statements.
7. Figures are as stated in the Fund’s prospectus current as of the date of this report. In periods of market volatility, assets may decline significantly, causing total annual Fund operating expenses to become higher than the figures shown.
8. Effective 5/15/08, the Fund began offering Advisor Class shares, which do not have sales charges or a Rule 12b-1 plan. Performance quotations for this class reflect the following methods of calculation: (a) For periods prior to 5/15/08, a restated figure is used based upon the Fund’s Class A performance, excluding the effect of Class A’s maximum initial sales charge, but reflecting the effect of the Class A Rule 12b-1 fees; and (b) for periods after 5/15/08, actual Advisor Class performance is used reflecting all charges and fees applicable to that class. Since 5/15/08 (commencement of sales), the cumulative and average annual total returns of Advisor Class shares were +18.34% and +4.35%.
Semiannual Report | 31
Your Fund’s Expenses
Franklin Low Duration Total Return Fund
As a Fund shareholder, you can incur two types of costs:
- Transaction costs, including sales charges (loads) on Fund purchases; and
- Ongoing Fund costs, including management fees, distribution and service (12b-1) fees, and other Fund expenses. All mutual funds have ongoing costs, sometimes referred to as operating expenses.
The following table shows ongoing costs of investing in the Fund and can help you understand these costs and compare them with those of other mutual funds. The table assumes a $1,000 investment held for the six months indicated.
Actual Fund Expenses
The first line (Actual) for each share class listed in the table provides actual account values and expenses. The “Ending Account Value” is derived from the Fund’s actual return, which includes the effect of Fund expenses.
You can estimate the expenses you paid during the period by following these steps. Of course, your account value and expenses will differ from those in this illustration:
| 1. | Divide your account value by $1,000. |
| | If an account had an $8,600 value, then $8,600 ÷ $1,000 = 8.6. |
| 2. | Multiply the result by the number under the heading “Expenses Paid During Period.” |
| | If Expenses Paid During Period were $7.50, then 8.6 x $7.50 = $64.50. |
In this illustration, the estimated expenses paid this period are $64.50.
Hypothetical Example for Comparison with Other Funds
Information in the second line (Hypothetical) for each class in the table can help you compare ongoing costs of investing in the Fund with those of other mutual funds. This information may not be used to estimate the actual ending account balance or expenses you paid during the period. The hypothetical “Ending Account Value” is based on the actual expense ratio for each class and an assumed 5% annual rate of return before expenses, which does not represent the Fund’s actual return. The figure under the heading “Expenses Paid During Period” shows the hypothetical expenses your account would have incurred under this scenario. You can compare this figure with the 5% hypothetical examples that appear in shareholder reports of other funds.
32 | Semiannual Report
Your Fund’s Expenses (continued)
Please note that expenses shown in the table are meant to highlight ongoing costs and do not reflect any transaction costs, such as sales charges. Therefore, the second line for each class is useful in comparing ongoing costs only, and will not help you compare total costs of owning different funds. In addition, if transaction costs were included, your total costs would have been higher. Please refer to the Fund prospectus for additional information on operating expenses.
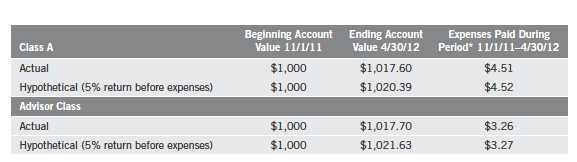
*Expenses are calculated using the most recent six-month annualized expense ratio, net of expense waivers, annualized for each class (A: 0.90% and Advisor: 0.65%), multiplied by the average account value over the period, multiplied by 182/366 to reflect the one-half year period.
Semiannual Report | 33
Franklin Total Return Fund
Your Fund’s Goals and Main Investments: Franklin Total Return Fund seeks to provide investors with high current income consistent with preservation of capital. Capital appreciation over the long term is a secondary goal. The Fund invests at least 80% of its assets in investment-grade debt securities. The Fund currently focuses on government and corporate debt securities and mortgage- and asset-backed securities.
Performance data represent past performance, which does not guarantee future results. Investment return and principal value will fluctuate, and you may have a gain or loss when you sell your shares. Current performance may differ from figures shown. Please visit franklintempleton.com or call (800) 342-5236 for most recent month-end performance.
We are pleased to bring you Franklin Total Return Fund’s semiannual report for the period ended April 30, 2012.
Performance Overview
Franklin Total Return Fund – Class A delivered a +3.61% cumulative total return for the six months under review. The Fund outperformed the +2.44% total return of its benchmark, the Barclays Capital (BC) U.S. Aggregate Index, which measures the U.S. investment-grade, fixed-rate, taxable bond market with index components for government and corporate, mortgage pass-through and asset-backed securities.1 You can find the Fund’s long-term performance data in the Performance Summary beginning on page 38.
Investment Strategy
We seek to invest in a combination of fixed income securities, predominantly from across the investment-grade debt universe. We analyze securities using proprietary and nonproprietary research to help us identify attractive investment opportunities, across the entire fixed income opportunity set, on a relative basis. The Fund may also invest up to 20% of its total assets in noninvestment-grade debt securities. In addition, we may use derivative transactions, such as forwards, futures contracts and swap agreements, to obtain net long or short exposures to select currencies, interest rates, countries, duration or credit risks.
1. Source: © 2012 Morningstar. All Rights Reserved. The information contained herein: (1) is proprietary to Morningstar and/or its content providers; (2) may not be copied or distributed; and (3) is not warranted to be accurate, complete or timely. Neither Morningstar nor its content providers are responsible for any damages or losses arising from any use of this information. The index is unmanaged and includes reinvested interest. One cannot invest directly in an index, and an index is not representative of the Fund’s portfolio.
The dollar value, number of shares or principal amount, and names of all portfolio holdings are listed in the Fund’s Statement of Investments (SOI). The SOI begins on page 92.
34 | Semiannual Report
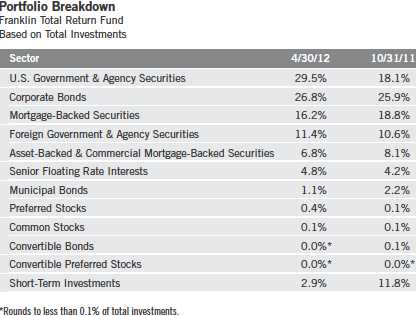
Manager’s Discussion
During the period, capital markets generally favored risk assets based on improving U.S. economic data. Although economic data remained supportive of a U.S. economic recovery, a number of uncertainties led investors to question if this positive momentum was sustainable. Investors seemed to recall periods in 2010 and 2011 when the economy initially gained momentum but then turned sluggish, raising the possibility of another recession. During the reporting period, market concerns persisted regarding the eurozone debt crisis, a potential hard landing in China, the U.S. presidential election and the potential fiscal ramifications of expiring policy initiatives. Although significant headwinds still exist, we believe the U.S. economic recovery should remain positive, but uneven. Furthermore, we think efforts by foreign monetary institutions have helped reduce fears of systemic risk associated with the European sovereign credit crisis.
Investors’ continued search for yield helped high yield bonds post among the best absolute performance during the period, as measured by the BC U.S. Corporate High Yield Index, which tracks below-investment-grade bonds (+6.91%).1 Several other BC indexes for major fixed income sectors delivered positive returns as well, including the Emerging Markets (U.S. Dollar) Index (+7.11%), the Commercial Mortgage-Backed Securities (CMBS) Index (+5.69%), the U.S. TIPS Index (+3.74%), the U.S. Corporate Investment Grade Index (+3.64%), the U.S. MBS Index (+2.11%), the Asset-Backed Securities
Semiannual Report | 35

*Assumes shares were purchased and held for the entire accrual period. Since dividends accrue daily, your actual distributions will vary depending on the date you purchased your shares and any account activity. All Fund distributions will vary depending upon current market conditions, and past distributions are not indicative of future trends.
**Includes an additional 11.92 cent per share distribution to meet excise tax requirements.
Index (+1.87%), the U.S. Treasury Index (+1.87%) and the U.S. Agency Index (+1.32%).1
The portfolio’s positioning in credit, in particular below-investment-grade credit, boosted overall performance as the credit sectors were among the best performing fixed income sectors. Many of our non-U.S. dollar denominated bonds benefited from certain foreign currency appreciation, and local market performance in non-U.S. markets was a major contributor to performance. The Fund’s CMBS allocation continued to provide strong results. The Fund’s municipal bond exposure benefited the portfolio as the sector delivered positive performance. Our lower weighting in agency securities and MBS, relative to our benchmark, detracted from results as these sectors outperformed comparable maturity Treasuries and produced positive total returns during the period. The Fund’s yield curve positioning also detracted from performance.
We remained overweighted in many credit sectors based on our belief that valuations remained attractive on a longer term basis. However, our expectations were tempered as credit sectors continued to deliver strong returns. We took the opportunity to reduce exposure to some high yield corporate bonds that delivered strong performance, while we increased the Fund’s allocation to the slightly more defensive bank loan sector. We reduced our Treasury Inflation Protected Securities and municipal bond exposures and selectively added small, non-agency, residential MBS positions seeking to take advantage of improved fundamentals in that sector. We continued to feel that many of the best opportunities in global bond markets were outside the U.S. and accordingly, we maintained strong exposure to international bonds and currencies.
36 | Semiannual Report
Thank you for your continued participation in Franklin Total Return Fund.
We look forward to serving your future investment needs.
The foregoing information reflects our analysis, opinions and portfolio holdings as of April 30, 2012, the end of the reporting period. The way we implement our main investment strategies and the resulting portfolio holdings may change depending on factors such as market and economic conditions. These opinions may not be relied upon as investment advice or an offer for a particular security. The information is not a complete analysis of every aspect of any market, country, industry, security or the Fund. Statements of fact are from sources considered reliable, but the investment manager makes no representation or warranty as to their completeness or accuracy. Although historical performance is no guarantee of future results, these insights may help you understand our investment management philosophy.
Semiannual Report | 37
Performance Summary as of 4/30/12
Franklin Total Return Fund
Your dividend income will vary depending on dividends or interest paid by securities in the Fund’s portfolio, adjusted for operating expenses of each class. Capital gain distributions are net profits realized from the sale of portfolio securities. The performance table does not reflect any taxes that a shareholder would pay on Fund dividends, capital gain distributions, if any, or any realized gains on the sale of Fund shares. Total return reflects reinvestment of the Fund’s dividends and capital gain distributions, if any, and any unrealized gains or losses.

38 | Semiannual Report
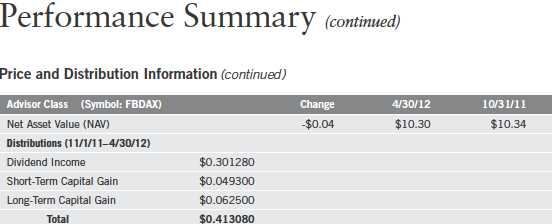
Performance1
Cumulative total return excludes sales charges. Average annual total returns include maximum sales charges. Class A: 4.25% maximum initial sales charge; Class B: contingent deferred sales charge (CDSC) declining from 4% to 1% over six years, and eliminated thereafter; Class C: 1% CDSC in first year only; Class R/Advisor Class: no sales charges.

Semiannual Report | 39
Performance Summary (continued)

Performance data represent past performance, which does not guarantee future results. Investment return and principal value will fluctuate, and you may have a gain or loss when you sell your shares. Current performance may differ from figures shown. For most recent month-end performance, go to franklintempleton.com or call (800) 342-5236.
The investment manager and administrator have contractually agreed to waive or assume certain expenses so that common expenses (excluding the Rule 12b-1 fees and acquired fund fees and expenses) for each class of the Fund do not exceed 0.63% (other than certain nonroutine expenses) until 2/28/13.
40 | Semiannual Report
Performance Summary (continued)
Endnotes
All investments involve risks, including possible loss of principal. Interest rate movements and mortgage prepayments will affect the Fund’s share price and yield. Bond prices generally move in the opposite direction of interest rates. Thus, as prices of bonds in the Fund adjust to a rise in interest rates, the Fund’s share price may decline. Investing in derivative securities, such as financial futures and option contracts, and the use of foreign currency techniques involve special risks as such may not achieve the anticipated benefits and/or may result in losses to the Fund. The risks associated with higher yielding, lower rated securities (commonly called junk bonds) include higher risk of default and loss of principal. Investment in foreign securities also involves special risks, including currency fluctuations, and political and economic uncertainty. Changes in the financial strength of a bond issuer or in a bond’s credit history may affect its value. The Fund is actively managed but there is no guarantee that the manager’s investment decisions will produce the desired results. The Fund’s prospectus also includes a description of the main investment risks.
| |
Class B: Class C: | These shares have higher annual fees and expenses than Class A shares. Prior to 1/1/04, these shares were offered with an initial sales charge; thus actual total returns would have differed. These shares have higher annual fees and expenses than Class A shares. |
Class R: | Shares are available to certain eligible investors as described in the prospectus. These shares have higher annual fees and expenses than Class A shares. |
Advisor Class: | Shares are available to certain eligible investors as described in the prospectus. |
1. If the manager and administrator had not waived fees, the Fund’s distribution rates and total returns would have been lower, and yields for the period would have been 2.06%, 1.75%, 1.75%, 1.90% and 2.39% for Classes A, B, C, R and Advisor, respectively.
2. Cumulative total return represents the change in value of an investment over the periods indicated.
3. Average annual total return represents the average annual change in value of an investment over the periods indicated. Six-month return has not been annualized.
4. In accordance with SEC rules, we provide standardized average annual total return information through the latest calendar quarter.
5. Distribution rate is based on an annualization of the sum of the respective class’s past 30 days’ daily distributions and the maximum offering price (NAV for Classes B, C, R and Advisor) per share on 4/30/12.
6. The 30-day standardized yield for the 30 days ended 4/30/12 reflects an estimated yield to maturity (assuming all portfolio securities are held to maturity). It should be regarded as an estimate of the Fund’s rate of investment income, and it may not equal the Fund’s actual income distribution rate (which reflects the Fund’s past dividends paid to shareholders) or the income reported in the Fund’s financial statements.
7. Figures are as stated in the Fund’s prospectus current as of the date of this report. In periods of market volatility, assets may decline significantly, causing total annual Fund operating expenses to become higher than the figures shown.
Semiannual Report | 41
Your Fund’s Expenses
Franklin Total Return Fund
As a Fund shareholder, you can incur two types of costs:
- Transaction costs, including sales charges (loads) on Fund purchases; and
- Ongoing Fund costs, including management fees, distribution and service (12b-1) fees, and other Fund expenses. All mutual funds have ongoing costs, sometimes referred to as operating expenses.
The following table shows ongoing costs of investing in the Fund and can help you understand these costs and compare them with those of other mutual funds. The table assumes a $1,000 investment held for the six months indicated.
Actual Fund Expenses
The first line (Actual) for each share class listed in the table provides actual account values and expenses. The “Ending Account Value” is derived from the Fund’s actual return, which includes the effect of Fund expenses.
You can estimate the expenses you paid during the period by following these steps. Of course, your account value and expenses will differ from those in this illustration:
| 1. | Divide your account value by $1,000. |
| | If an account had an $8,600 value, then $8,600 ÷ $1,000 = 8.6. |
| 2. | Multiply the result by the number under the heading “Expenses Paid During Period.” |
| | If Expenses Paid During Period were $7.50, then 8.6 x $7.50 = $64.50. |
In this illustration, the estimated expenses paid this period are $64.50.
Hypothetical Example for Comparison with Other Funds
Information in the second line (Hypothetical) for each class in the table can help you compare ongoing costs of investing in the Fund with those of other mutual funds. This information may not be used to estimate the actual ending account balance or expenses you paid during the period. The hypothetical “Ending Account Value” is based on the actual expense ratio for each class and an assumed 5% annual rate of return before expenses, which does not represent the Fund’s actual return. The figure under the heading “Expenses Paid During Period” shows the hypothetical expenses your account would have incurred under this scenario. You can compare this figure with the 5% hypothetical examples that appear in shareholder reports of other funds.
42 | Semiannual Report
Your Fund’s Expenses (continued)
Please note that expenses shown in the table are meant to highlight ongoing costs and do not reflect any transaction costs, such as sales charges. Therefore, the second line for each class is useful in comparing ongoing costs only, and will not help you compare total costs of owning different funds. In addition, if transaction costs were included, your total costs would have been higher. Please refer to the Fund prospectus for additional information on operating expenses.

*Expenses are calculated using the most recent six-month expense ratio, net of expense waivers, annualized for each class (A: 0.88%; B: 1.28%; C: 1.28%; R: 1.13%; and Advisor: 0.63%), multiplied by the average account value over the period, multiplied by 182/366 to reflect the one-half year period.
Semiannual Report | 43

aThe amount shown for a share outstanding throughout the period may not correlate with the Statement of Operations for the period due to the timing of sales and repurchases of
the Fund shares in relation to income earned and/or fluctuating market value of the investments of the Fund.
bEffective September 1, 2008, the redemption fee was eliminated.
cAmount rounds to less than $0.001 per share.
dTotal return does not reflect sales commissions or contingent deferred sales charges, if applicable, and is not annualized for periods less than one year.
eRatios are annualized for periods less than one year.
fBenefit of expense reduction rounds to less than 0.01%.
44 | The accompanying notes are an integral part of these financial statements. | Semiannual Report

aThe amount shown for a share outstanding throughout the period may not correlate with the Statement of Operations for the period due to the timing of sales and repurchases of
the Fund shares in relation to income earned and/or fluctuating market value of the investments of the Fund.
bEffective September 1, 2008, the redemption fee was eliminated.
cAmount rounds to less than $0.001 per share.
dTotal return does not reflect sales commissions or contingent deferred sales charges, if applicable, and is not annualized for periods less than one year.
eRatios are annualized for periods less than one year.
fBenefit of expense reduction rounds to less than 0.01%.
Semiannual Report | The accompanying notes are an integral part of these financial statements. | 45
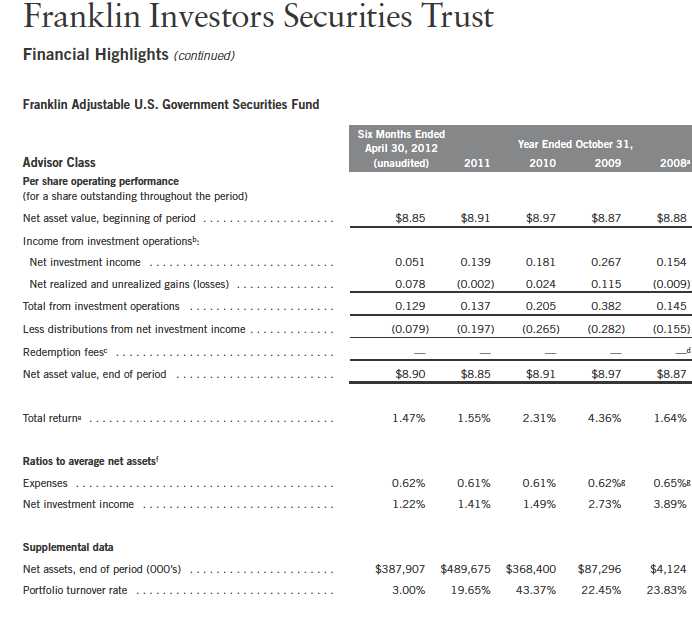
aFor the period May 15, 2008 (effective date) to October 31, 2008.
bThe amount shown for a share outstanding throughout the period may not correlate with the Statement of Operations for the period due to the timing of sales and repurchases of
the Fund shares in relation to income earned and/or fluctuating market value of the investments of the Fund.
cEffective September 1, 2008, the redemption fee was eliminated.
dAmount rounds to less than $0.001 per share.
eTotal return is not annualized for periods less than one year.
fRatios are annualized for periods less than one year.
gBenefit of expense reduction rounds to less than 0.01%.
46 | The accompanying notes are an integral part of these financial statements. | Semiannual Report
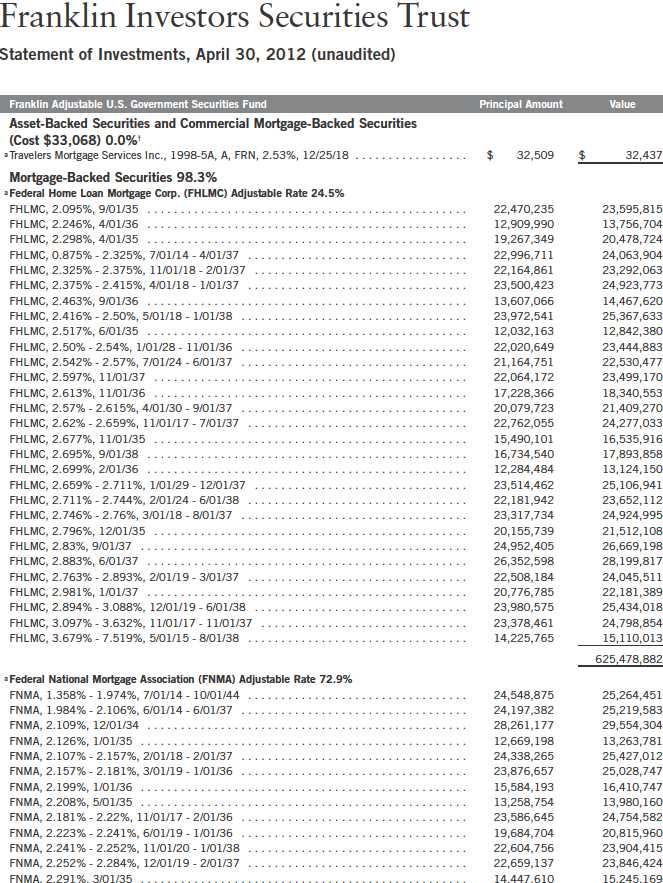
Semiannual Report | 47

48 | Semiannual Report

aThe amount shown for a share outstanding throughout the period may not correlate with the Statement of Operations for the period due to the timing of sales and repurchases of
the Fund shares in relation to income earned and/or fluctuating market value of the investments of the Fund.
bEffective September 1, 2008, the redemption fee was eliminated.
cAmount rounds to less than $0.001 per share.
dTotal return does not reflect sales commissions or contingent deferred sales charges, if applicable, and is not annualized for periods less than one year.
eRatios are annualized for periods less than one year.
fBenefit of expense reduction rounds to less than 0.01%.
50 | The accompanying notes are an integral part of these financial statements. | Semiannual Report

aThe amount shown for a share outstanding throughout the period may not correlate with the Statement of Operations for the period due to the timing of sales and repurchases of
the Fund shares in relation to income earned and/or fluctuating market value of the investments of the Fund.
bEffective September 1, 2008, the redemption fee was eliminated.
cAmount rounds to less than $0.001 per share.
dTotal return does not reflect sales commissions or contingent deferred sales charges, if applicable, and is not annualized for periods less than one year.
eRatios are annualized for periods less than one year.
fBenefit of expense reduction rounds to less than 0.01%.
Semiannual Report | The accompanying notes are an integral part of these financial statements. | 51
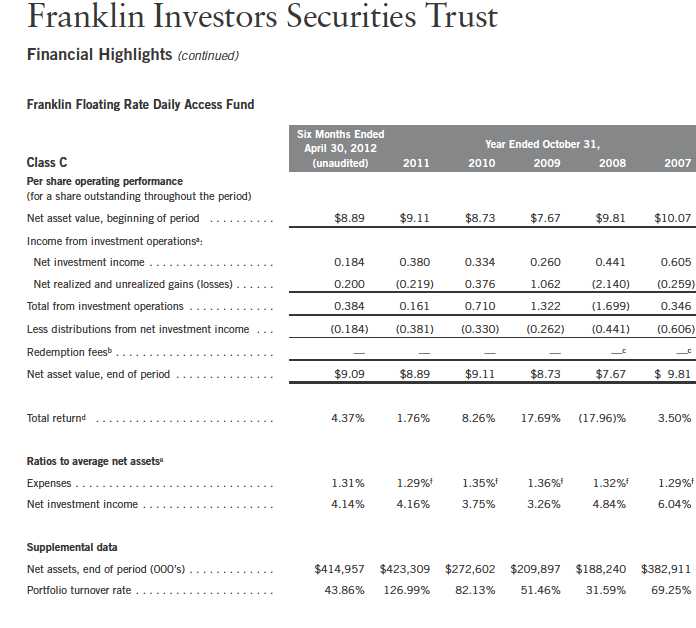
aThe amount shown for a share outstanding throughout the period may not correlate with the Statement of Operations for the period due to the timing of sales and repurchases of
the Fund shares in relation to income earned and/or fluctuating market value of the investments of the Fund.
bEffective September 1, 2008, the redemption fee was eliminated.
cAmount rounds to less than $0.001 per share.
dTotal return does not reflect sales commissions or contingent deferred sales charges, if applicable, and is not annualized for periods less than one year.
eRatios are annualized for periods less than one year.
fBenefit of expense reduction rounds to less than 0.01%.
52 | The accompanying notes are an integral part of these financial statements. | Semiannual Report

aThe amount shown for a share outstanding throughout the period may not correlate with the Statement of Operations for the period due to the timing of sales and repurchases of
the Fund shares in relation to income earned and/or fluctuating market value of the investments of the Fund.
bEffective September 1, 2008, the redemption fee was eliminated.
cAmount rounds to less than $0.001 per share.
dTotal return is not annualized for periods less than one year.
eRatios are annualized for periods less than one year.
fBenefit of expense reduction rounds to less than 0.01%.
Semiannual Report | The accompanying notes are an integral part of these financial statements. | 53

54 | Semiannual Report

Semiannual Report | 55
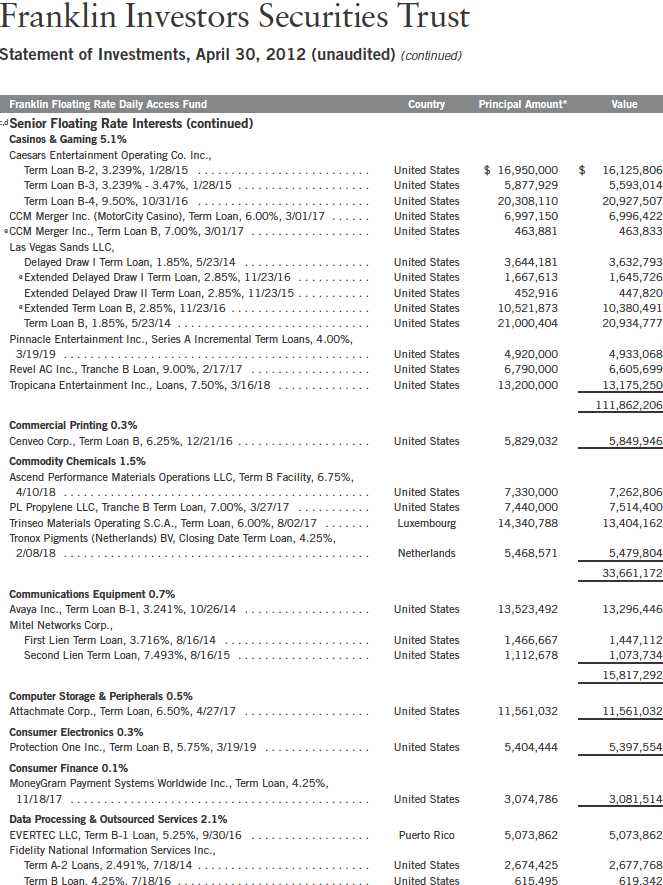
56 | Semiannual Report

Semiannual Report | 57

58 | Semiannual Report

60 | Semiannual Report

Semiannual Report | 61

62 | Semiannual Report

Semiannual Report | 63

64 | The accompanying notes are an integral part of these financial statements. | Semiannual Report

aThe amount shown for a share outstanding throughout the period may not correlate with the Statement of Operations for the period due to the timing of sales and repurchases of
the Fund shares in relation to income earned and/or fluctuating market value of the investments of the Fund.
bEffective September 1, 2008, the redemption fee was eliminated.
cAmount rounds to less than $0.001 per share.
dTotal return does not reflect sales commissions or contingent deferred sales charges, if applicable, and is not annualized for periods less than one year.
eRatios are annualized for periods less than one year.
fBenefit of expense reduction rounds to less than 0.01%.
gSee Note 1(g) regarding mortgage dollar rolls.
Semiannual Report | The accompanying notes are an integral part of these financial statements. | 65

aFor the period May 15, 2008 (effective date) to October 31, 2008.
bThe amount shown for a share outstanding throughout the period may not correlate with the Statement of Operations for the period due to the timing of sales and repurchases of
the Fund shares in relation to income earned and/or fluctuating market value of the investments of the Fund.
cEffective September 1, 2008, the redemption fee was eliminated.
dAmount rounds to less than $0.001 per share.
eTotal return is not annualized for periods less than one year.
fRatios are annualized for periods less than one year.
gBenefit of expense reduction rounds to less than 0.01%.
hSee Note 1(g) regarding mortgage dollar rolls.
66 | The accompanying notes are an integral part of these financial statements. | Semiannual Report
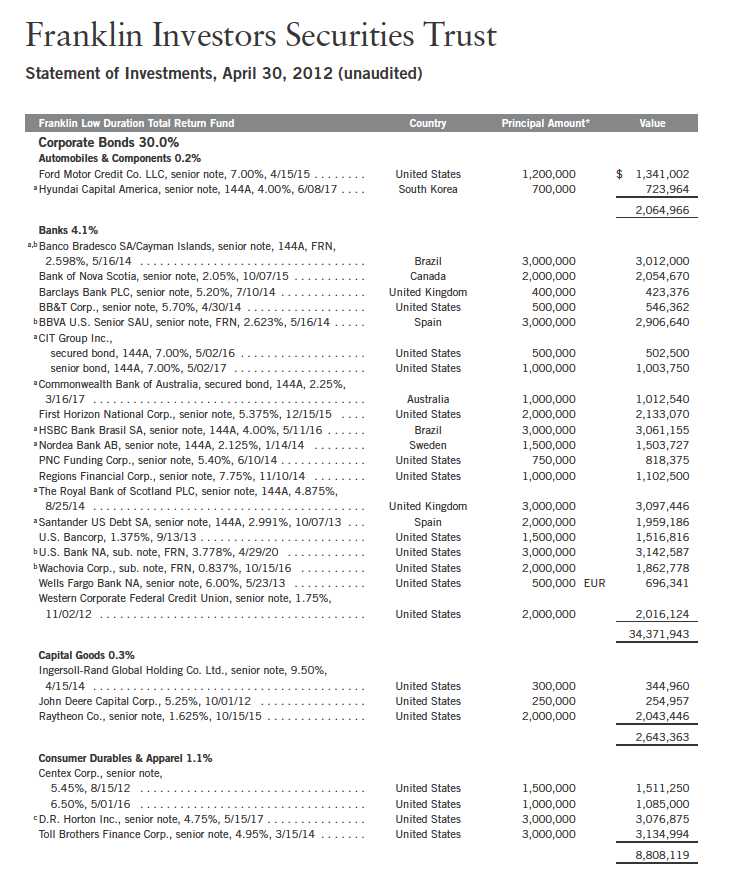
Semiannual Report | 67

68 | Semiannual Report
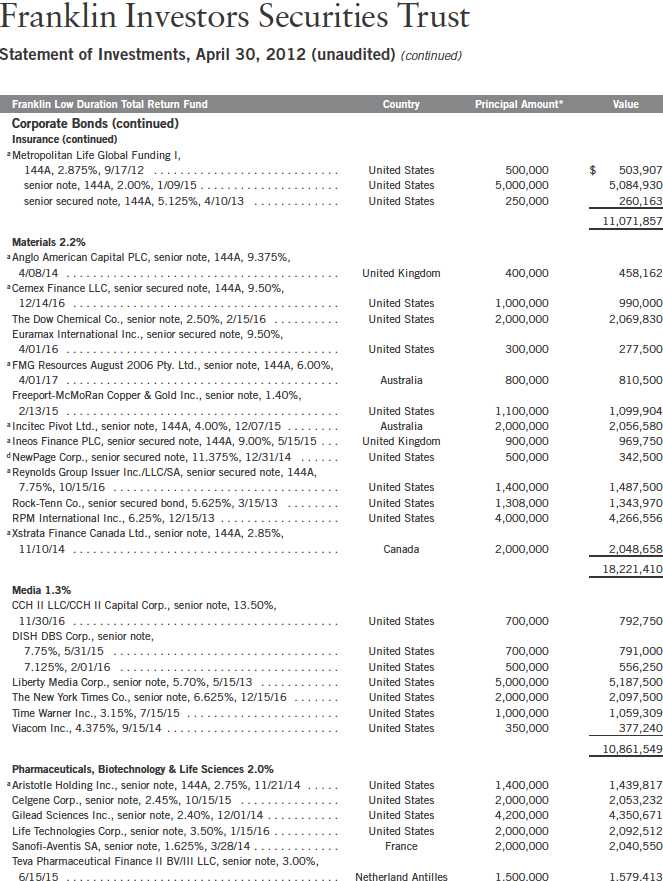
70 | Semiannual Report

Semiannual Report | 71

Semiannual Report | 73
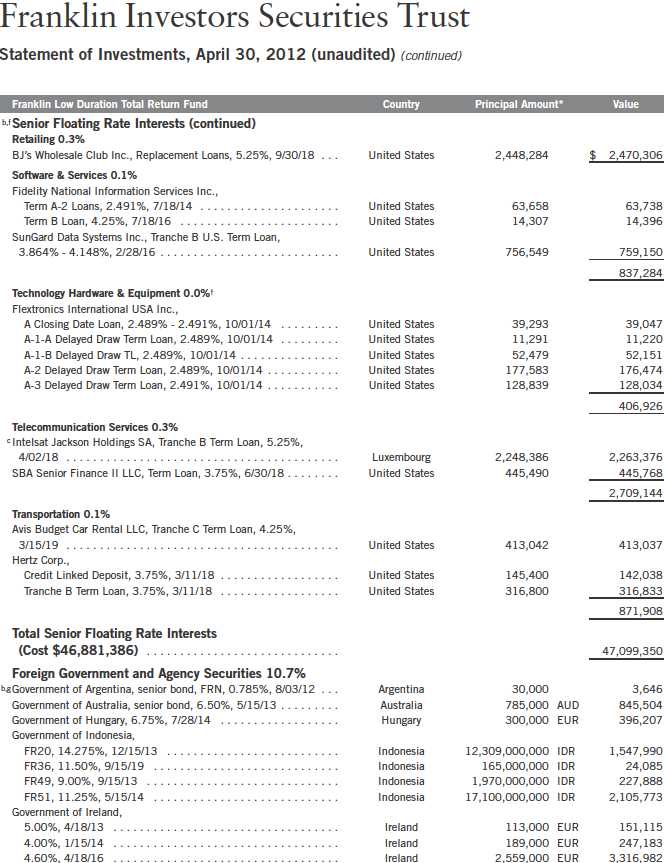
74 | Semiannual Report

Semiannual Report | 75

76 | Semiannual Report
Franklin Investors Securities Trust
Statement of Investments, April 30, 2012 (unaudited) (continued)

Semiannual Report | 77

78 | Semiannual Report

Semiannual Report | 79

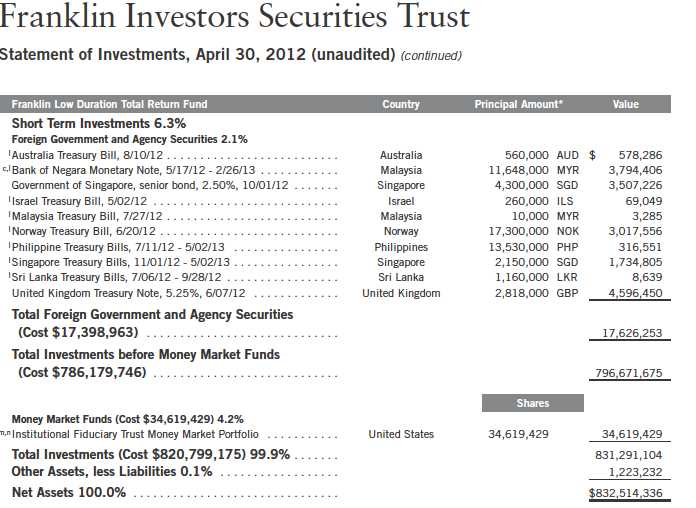
†Rounds to less than 0.1% of net assets.
*The principal amount is stated in U.S. dollars unless otherwise indicated.
aSecurity was purchased pursuant to Rule 144A under the Securities Act of 1933 and may be sold in transactions exempt from registration only to qualified institutional buyers or
in a public offering registered under the Securities Act of 1933. These securities have been deemed liquid under guidelines approved by the Trust’s Board of Trustees. At April 30,
2012, the aggregate value of these securities was $92,594,417, representing 11.12% of net assets.
bThe coupon rate shown represents the rate at period end.
cA portion or all of the security purchased on a when-issued or delayed delivery basis. See Note 1(d).
dSee Note 8 regarding defaulted securities.
eSecurity was purchased pursuant to Regulation S under the Securities Act of 1933, which exempts from registration securities offered and sold outside of the United States. Such a
security cannot be sold in the United States without either an effective registration statement filed pursuant to the Securities Act of 1933, or pursuant to an exemption from regis-
tration. This security has been deemed liquid under guidelines approved by the Trust’s Board of Trustees. At April 30, 2012, the value of this security was $8,049,268, representing
0.97% of net assets.
fSee Note 1(g) regarding senior floating rate interests.
gThe principal amount is stated in original face, and scheduled paydowns are reflected in the market price on ex-date.
hPrincipal amount is stated in 100 Mexican Peso Units.
iPrincipal amount is stated in 1,000 Brazilian Real Units.
jRedemption price at maturity is adjusted for inflation. See Note 1(i).
kPrincipal amount of security is adjusted for inflation. See Note 1(i).
lThe security is traded on a discount basis with no stated coupon rate.
mNon-income producing.
nSee Note 7 regarding investments in the Institutional Fiduciary Trust Money Market Portfolio.
Semiannual Report | 81

82 | Semiannual Report
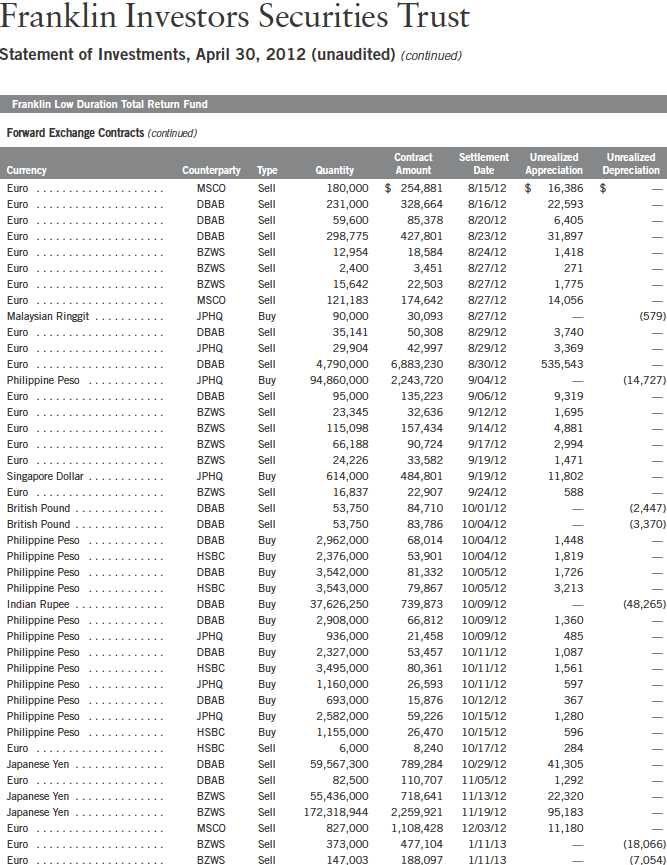
Semiannual Report | 83
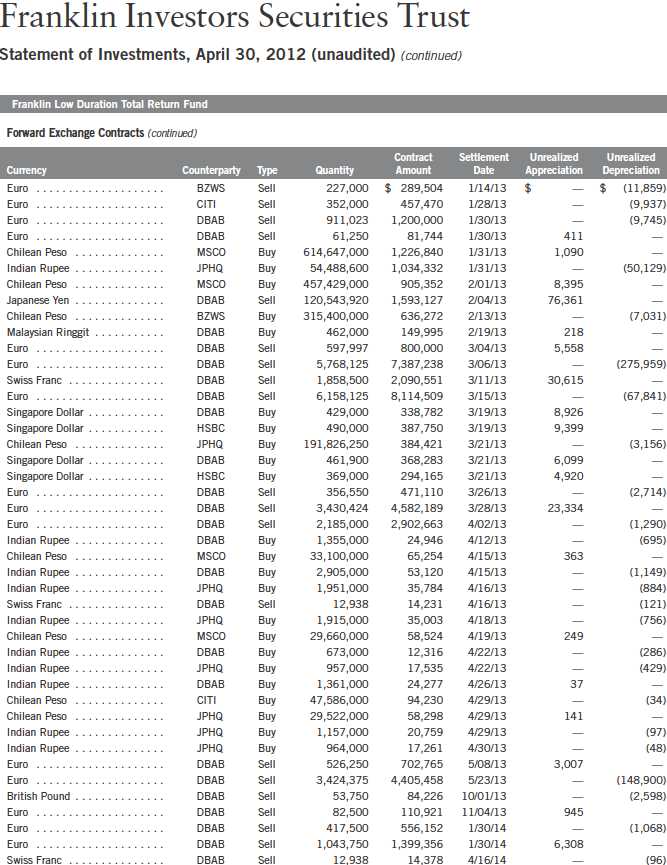
84 | Semiannual Report
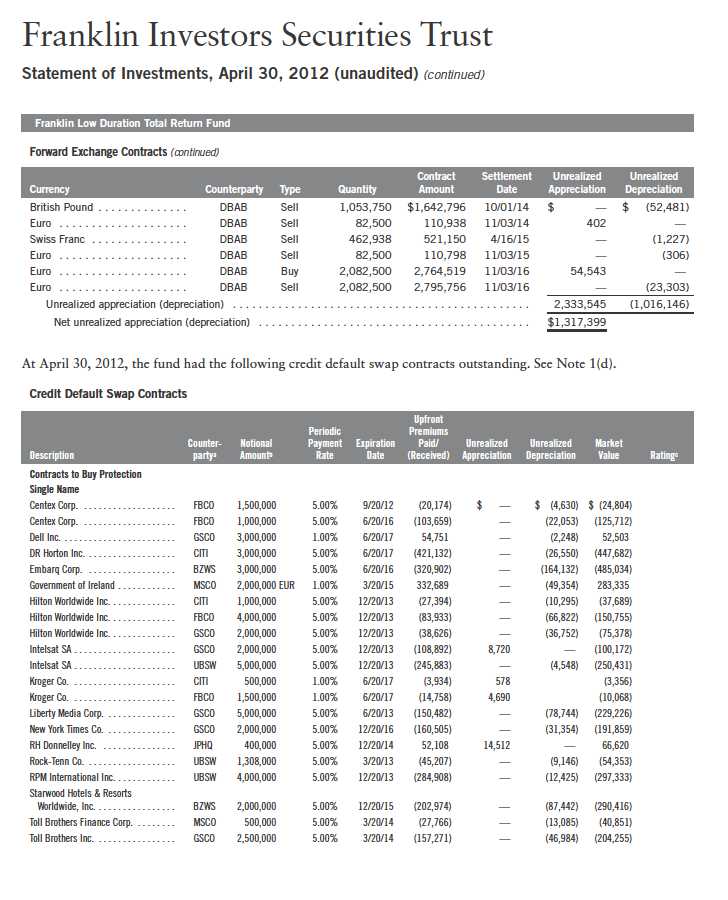
Semiannual Report | 85

86 | The accompanying notes are an integral part of these financial statements. | Semiannual Report

aThe amount shown for a share outstanding throughout the period may not correlate with the Statement of Operations for the period due to the timing of sales and repurchases of
the Fund shares in relation to income earned and/or fluctuating market value of the investments of the Fund.
bEffective September 1, 2008, the redemption fee was eliminated.
cAmount rounds to less than $0.001 per share.
dTotal return does not reflect sales commissions or contingent deferred sales charges, if applicable, and is not annualized for periods less than one year.
eRatios are annualized for periods less than one year.
fBenefit of expense reduction rounds to less than 0.01%.
gSee Note 1(g) regarding mortgage dollar rolls.
Semiannual Report | The accompanying notes are an integral part of these financial statements. | 87

aThe amount shown for a share outstanding throughout the period may not correlate with the Statement of Operations for the period due to the timing of sales and repurchases of
the Fund shares in relation to income earned and/or fluctuating market value of the investments of the Fund.
bEffective September 1, 2008, the redemption fee was eliminated.
cAmount rounds to less than $0.001 per share.
dTotal return does not reflect sales commissions or contingent deferred sales charges, if applicable, and is not annualized for periods less than one year.
eRatios are annualized for periods less than one year.
fBenefit of expense reduction rounds to less than 0.01%.
gSee Note 1(g) regarding mortgage dollar rolls.
88 | The accompanying notes are an integral part of these financial statements. | Semiannual Report

aThe amount shown for a share outstanding throughout the period may not correlate with the Statement of Operations for the period due to the timing of sales and repurchases of
the Fund shares in relation to income earned and/or fluctuating market value of the investments of the Fund.
bEffective September 1, 2008, the redemption fee was eliminated.
cAmount rounds to less than $0.001 per share.
dTotal return does not reflect sales commissions or contingent deferred sales charges, if applicable, and is not annualized for periods less than one year.
eRatios are annualized for periods less than one year.
fBenefit of expense reduction rounds to less than 0.01%.
gSee Note 1(g) regarding mortgage dollar rolls.
Semiannual Report | The accompanying notes are an integral part of these financial statements. | 89

aThe amount shown for a share outstanding throughout the period may not correlate with the Statement of Operations for the period due to the timing of sales and repurchases of
the Fund shares in relation to income earned and/or fluctuating market value of the investments of the Fund.
bEffective September 1, 2008, the redemption fee was eliminated.
cAmount rounds to less than $0.001 per share.
dTotal return does not reflect sales commissions or contingent deferred sales charges, if applicable, and is not annualized for periods less than one year.
eRatios are annualized for periods less than one year.
fBenefit of expense reduction rounds to less than 0.01%.
gSee Note 1(g) regarding mortgage dollar rolls.
90 | The accompanying notes are an integral part of these financial statements. | Semiannual Report
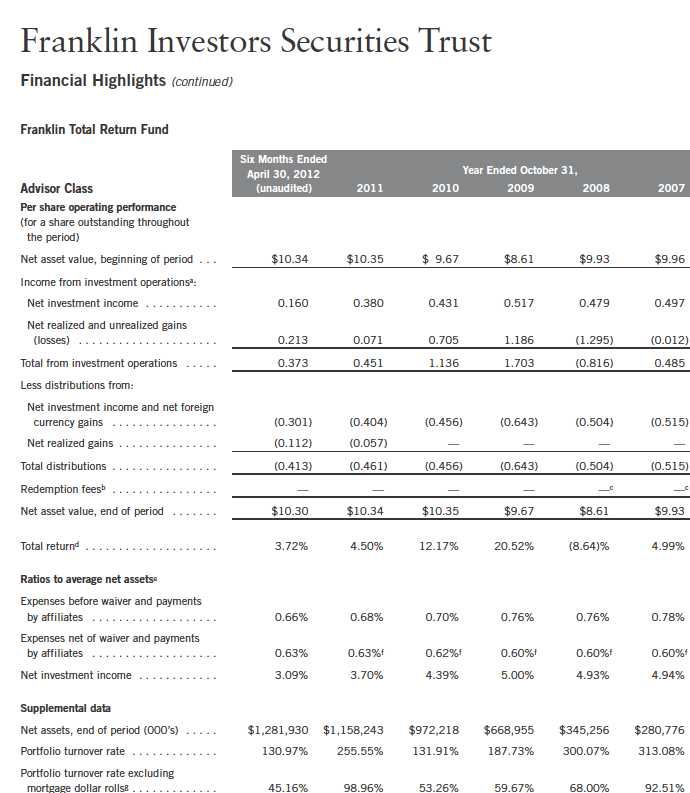
aThe amount shown for a share outstanding throughout the period may not correlate with the Statement of Operations for the period due to the timing of sales and repurchases of
the Fund shares in relation to income earned and/or fluctuating market value of the investments of the Fund.
bEffective September 1, 2008, the redemption fee was eliminated.
cAmount rounds to less than $0.001 per share.
dTotal return is not annualized for periods less than one year.
eRatios are annualized for periods less than one year.
fBenefit of expense reduction rounds to less than 0.01%.
gSee Note 1(g) regarding mortgage dollar rolls.
Semiannual Report | The accompanying notes are an integral part of these financial statements. | 91

Semiannual Report | 93

94 | Semiannual Report
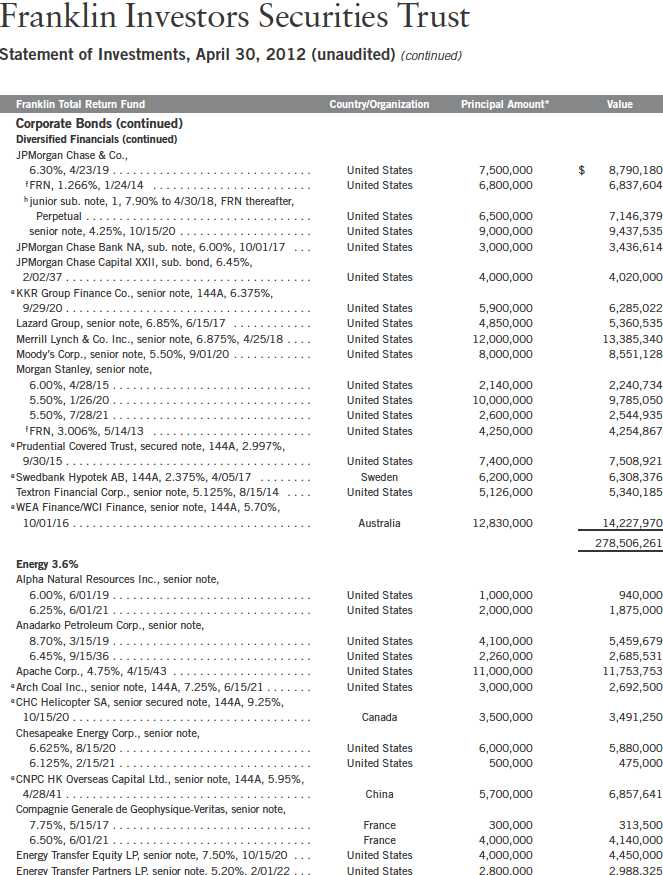
Semiannual Report | 95

96 | Semiannual Report

Semiannual Report | 97

98 | Semiannual Report

Semiannual Report | 99

100 | Semiannual Report

Semiannual Report | 101

Semiannual Report | 103

104 | Semiannual Report

Semiannual Report | 105
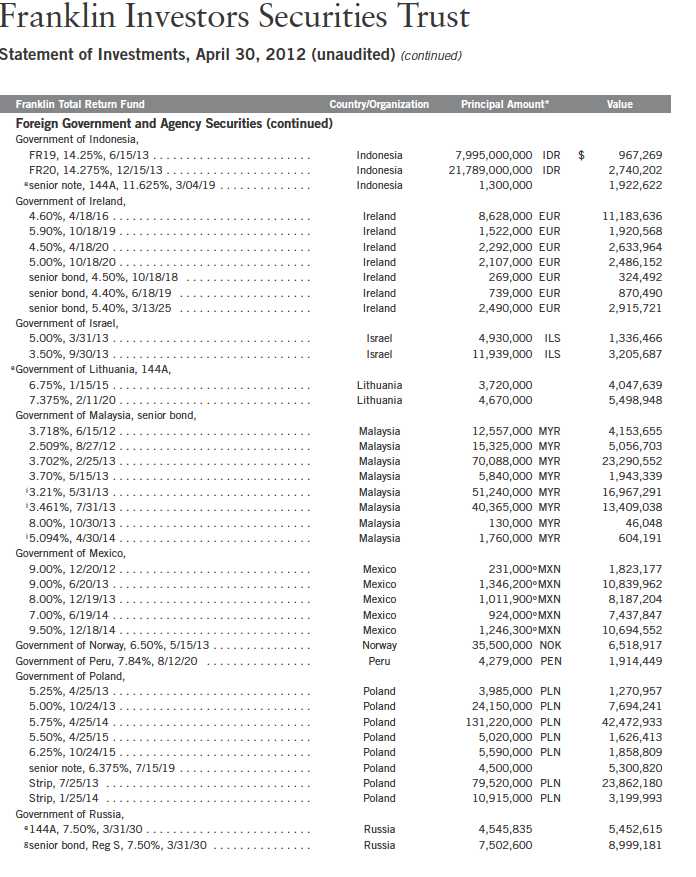
106 | Semiannual Report

Semiannual Report | 107
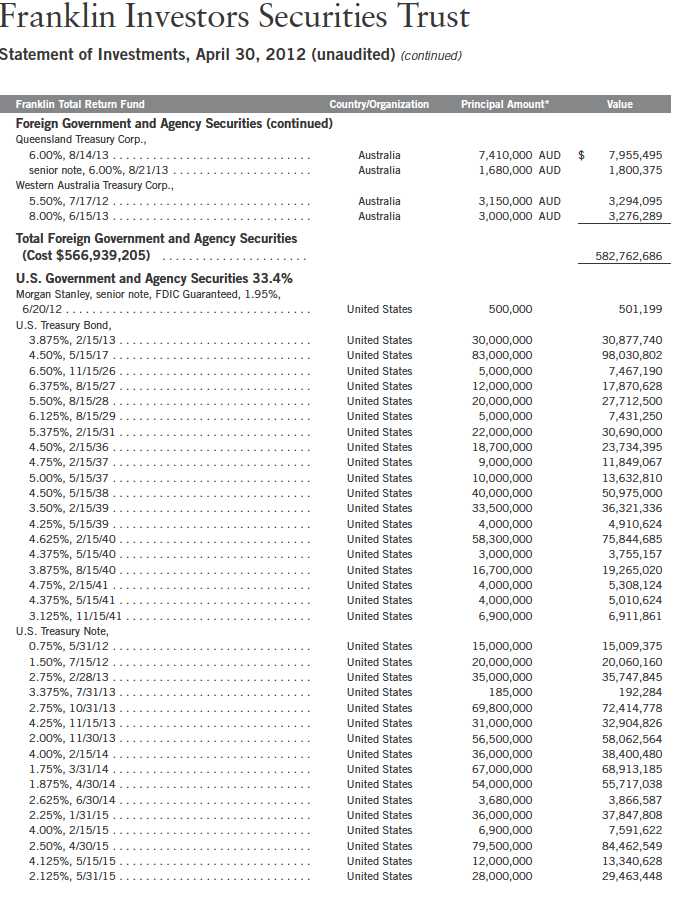
108 | Semiannual Report
Franklin Investors Securities Trust
Statement of Investments, April 30, 2012 (unaudited) (continued)

Semiannual Report | 109

110 | Semiannual Report
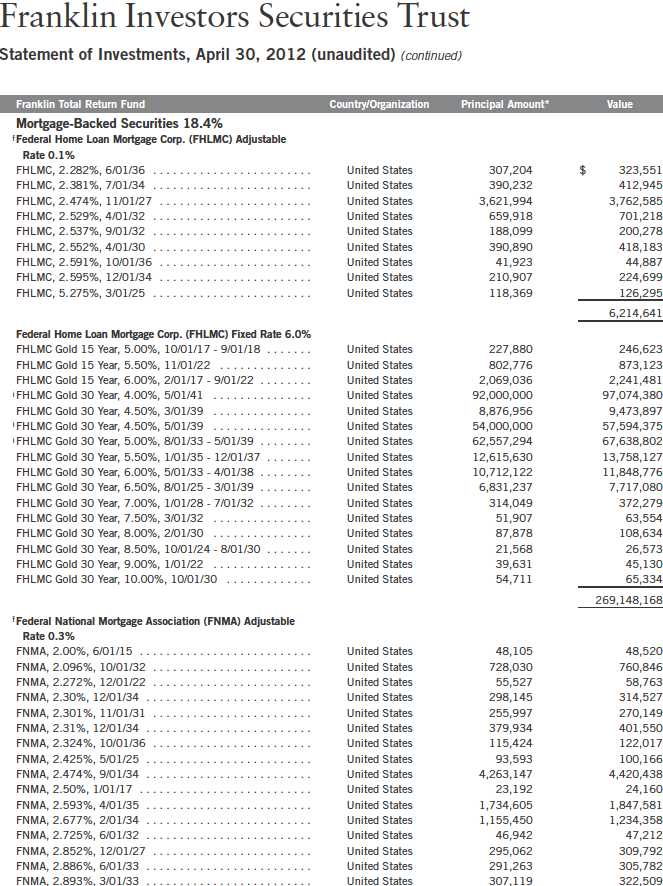
112 | Semiannual Report
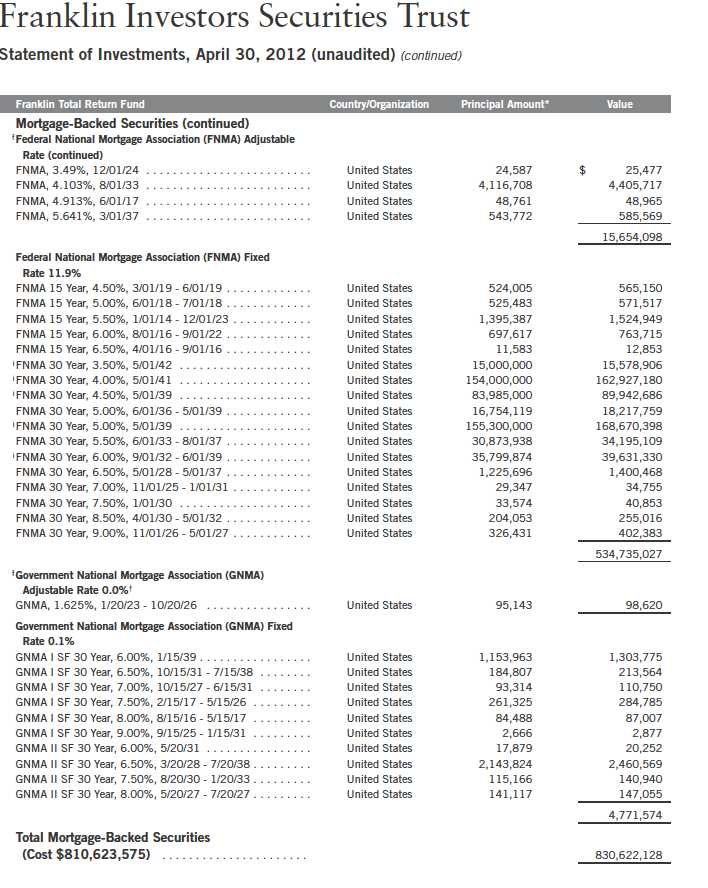
Semiannual Report | 113
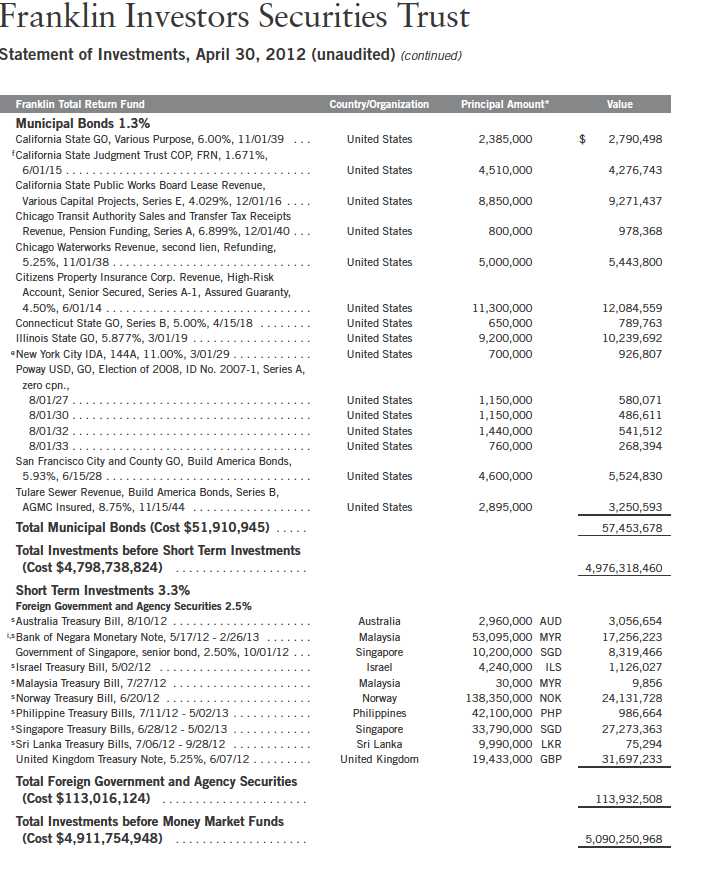
114 | Semiannual Report
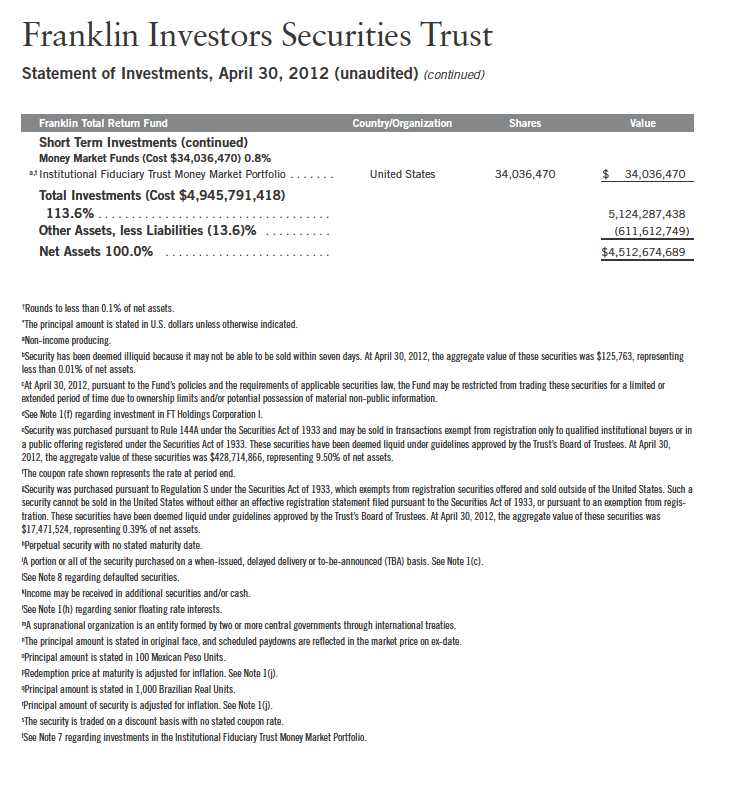
Semiannual Report | 115

116 | Semiannual Report

Semiannual Report | 117

118 | Semiannual Report
Franklin Investors Securities Trust
Statement of Investments, April 30, 2012 (unaudited) (continued)
Franklin Total Return Fund
At April 30, 2012, the fund had the following credit default swap contracts outstanding. See Note 1(d).

Semiannual Report | 119

120 | The accompanying notes are an integral part of these financial statements. | Semiannual Report

122 | The accompanying notes are an integral part of these financial statements. | Semiannual Report

Semiannual Report | The accompanying notes are an integral part of these financial statements. | 123

124 | The accompanying notes are an integral part of these financial statements. | Semiannual Report

Semiannual Report | The accompanying notes are an integral part of these financial statements. | 125
Franklin Investors Securities Trust
Notes to Financial Statements (unaudited)
1. ORGANIZATION AND SIGNIFICANT ACCOUNTING POLICIES
Franklin Investors Securities Trust (Trust) is registered under the Investment Company Act of 1940, as amended, (1940 Act) as an open-end investment company, consisting of nine separate funds, four of which are included in this report (Funds). The financial statements of the remaining funds in the Trust are presented separately. The classes of shares offered within each of the Funds are indicated below. Each class of shares differs by its initial sales load, contingent deferred sales charges, distribution fees, voting rights on matters affecting a single class and its exchange privilege.

The following summarizes the Funds’ significant accounting policies.
a. Financial Instrument Valuation
The Funds’ investments in securities and other financial instruments are carried at fair value daily. Fair value is the price that would be received to sell an asset or paid to transfer a liability in an orderly transaction between market participants on the measurement date. Under procedures approved by the Trust’s Board of Trustees (the Board), the Fund’s administrator, investment manager and other affiliates have formed the Valuation and Liquidity Oversight Committee (VLOC). The VLOC provides administration and oversight of the Funds’ valuation policies and procedures, which are approved annually by the Board. Among other things, these procedures allow the Funds to utilize independent pricing services, quotations from securities and financial instrument dealers, and other market sources to determine fair value.
Equity securities and derivative financial instruments (derivatives) listed on an exchange or on the NASDAQ National Market System are valued at the last quoted sale price or the official closing price of the day, respectively. Over-the-counter securities are valued within the range of the most recent quoted bid and ask prices. Securities that trade in multiple markets or on multiple exchanges are valued according to the broadest and most representative market. Certain equity securities are valued based upon fundamental characteristics or relationships to similar securities. Investments in open-end mutual funds are valued at the closing net asset value.
Debt securities generally trade in the over-the-counter market rather than on a securities exchange. The Funds’ pricing services use multiple valuation techniques to determine fair value. In instances where sufficient market activity exists, the pricing services may utilize a market-based approach through which quotes from market makers are used to determine fair value. In instances where sufficient market activity may not exist or is limited, the pricing services also utilize proprietary valuation models which may consider market characteristics such as benchmark yield curves, credit spreads, estimated default rates, anticipated market interest rate volatility, coupon rates, anticipated timing of principal repayments, underlying collateral, and other unique security features in
126 | Semiannual Report
Franklin Investors Securities Trust
Notes to Financial Statements (unaudited) (continued)
| 1. | ORGANIZATION AND SIGNIFICANT ACCOUNTING POLICIES (continued) |
| a. | Financial Instrument Valuation (continued) |
order to estimate the relevant cash flows, which are then discounted to calculate the fair value. Securities denominated in a foreign currency are converted into their U.S. dollar equivalent at the foreign exchange rate in effect at the close of the NYSE on the date that the values of the foreign debt securities are determined.
Certain derivatives trade in the over-the-counter market. The Funds’ pricing services use various techniques including industry standard option pricing models and proprietary discounted cash flow models to determine the fair value of those instruments. The Fund’s net benefit or obligation under the derivative contract, as measured by the fair market value of the contract, is included in net assets.
The Funds have procedures to determine the fair value of securities and other financial instruments for which market prices are not reliable or readily available. Under these procedures, VLOC convenes on a regular basis to review such securities and considers a number of factors, including significant unobservable valuation inputs, when arriving at fair value. The VLOC primarily employs a market-based approach which may use related or comparable assets or liabilities, recent transactions, market multiples, book values, and other relevant information for the investment to determine the fair value of the investment. An income-based valuation approach may also be used in which the anticipated future cash flows of the investment are discounted to calculate fair value. Discounts may also be applied due to the nature or duration of any restrictions on the disposition of the investments. Due to the inherent uncertainty of valuations of such investments, the fair values may differ significantly from the values that would have been used had an active market existed. The VLOC employs various methods for calibrating these valuation approaches including a regular review of key inputs and assumptions, transactional back-testing or disposition analysis, and reviews of any related market activity.
b. Foreign Currency Translation
Portfolio securities and other assets and liabilities denominated in foreign currencies are translated into U.S. dollars based on the exchange rate of such currencies against U.S. dollars on the date of valuation. The Funds may enter into foreign currency exchange contracts to facilitate transactions denominated in a foreign currency. Purchases and sales of securities, income and expense items denominated in foreign currencies are translated into U.S. dollars at the exchange rate in effect on the transaction date. Portfolio securities and assets and liabilities denominated in foreign currencies contain risks that those currencies will decline in value relative to the U.S. dollar. Occasionally, events may impact the availability or reliability of foreign exchange rates used to convert the U.S. dollar equivalent value. If such an event occurs, the foreign exchange rate will be valued at fair value using procedures established and approved by the Board.
The Funds do not separately report the effect of changes in foreign exchange rates from changes in market prices on securities held. Such changes are included in net realized and unrealized gain or loss from investments on the Statements of Operations.
Semiannual Report | 127
Franklin Investors Securities Trust
Notes to Financial Statements (unaudited) (continued)
| 1. | ORGANIZATION AND SIGNIFICANT ACCOUNTING POLICIES (continued) |
| b. | Foreign Currency Translation (continued) |
Realized foreign exchange gains or losses arise from sales of foreign currencies, currency gains or losses realized between the trade and settlement dates on securities transactions and the difference between the recorded amounts of dividends, interest, and foreign withholding taxes and the U.S. dollar equivalent of the amounts actually received or paid. Net unrealized foreign exchange gains and losses arise from changes in foreign exchange rates on foreign denominated assets and liabilities other than investments in securities held at the end of the reporting period.
c. Securities Purchased on a When-Issued, Delayed Delivery and TBA Basis
The Funds purchase securities on a when-issued, delayed delivery, and to-be-announced (TBA) basis, with payment and delivery scheduled for a future date. These transactions are subject to market fluctuations and are subject to the risk that the value at delivery may be more or less than the trade date purchase price. Although the Funds will generally purchase these securities with the intention of holding the securities, they may sell the securities before the settlement date. Sufficient assets have been segregated for these securities.
d. Derivative Financial Instruments
The Funds, except Franklin Adjustable U.S. Government Securities Fund, invested in derivatives in order to manage risk or gain exposure to various other investments or markets. Derivatives are financial contracts based on an underlying or notional amount, require no initial investment or an initial net investment that is smaller than would normally be required to have a similar response to changes in market factors, and require or permit net settlement. Derivatives contain various risks including the potential inability of the counterparty to fulfill their obligations under the terms of the contract, the potential for an illiquid secondary market, and/or the potential for market movements which expose the fund to gains or losses in excess of the amounts shown on the Statements of Assets and Liabilities. Realized gain and loss and unrealized appreciation and depreciation on these contracts for the period are included in the Statements of Operations.
The Franklin Low Duration Total Return Fund and Franklin Total Return Fund entered into financial futures contracts primarily to manage interest rate risk. A futures contract is an agreement between the fund and a counterparty to buy or sell an asset for a specific price on a future date. Required initial margin deposits of cash or securities are pledged by the fund. Subsequent payments, known as variation margin, are made or received by the fund, depending on fluctuations in the value of the underlying security. Such variation margin is accounted for as unrealized appreciation or depreciation until the contract is closed, at which time the gains or losses are realized.
The Franklin Low Duration Total Return Fund and Franklin Total Return Fund entered into forward exchange contracts primarily to manage and/or gain exposure to certain foreign currencies. A forward exchange contract is an agreement between the fund and a counterparty to buy or sell a foreign currency for a specific exchange rate on a future date. Pursuant to the terms of
128 | Semiannual Report
Franklin Investors Securities Trust
Notes to Financial Statements (unaudited) (continued)
| 1. | ORGANIZATION AND SIGNIFICANT ACCOUNTING POLICIES (continued) |
| d. | Derivative Financial Instruments (continued) |
the forward exchange contracts, cash or securities may be required to be deposited as collateral. Unrestricted cash may be invested according to the funds’ investment objectives.
The Funds, except Franklin Adjustable U.S. Government Securities Fund, entered into credit default swap contracts primarily to manage and/or gain exposure to credit risk. A credit default swap is an agreement between the fund and a counterparty whereby the buyer of the contract receives credit protection and the seller of the contract guarantees the credit worthiness of a referenced debt obligation. The underlying referenced debt obligation may be a single issuer of corporate or sovereign debt, a credit index, or a tranche of a credit index. In the event of a default of the underlying referenced debt obligation, the buyer is entitled to receive the notional amount of the credit default swap contract from the seller in exchange for the referenced debt obligation, a net settlement amount equal to the notional amount of the credit default swap less the recovery value of the referenced debt obligation, or other agreed upon amount. Over the term of the contract, the buyer pays the seller a periodic stream of payments, provided that no event of default has occurred. Such periodic payments are accrued daily as an unrealized appreciation or depreciation until the payments are made, at which time they are realized. Payments received or paid to initiate a credit default swap contract are reflected on the Statements of Assets and Liabilities and represent compensating factors between stated terms of the credit default swap agreement and prevailing market conditions (credit spreads and other relevant factors). These upfront payments are amortized over the term of the contract as a realized gain or loss on the Statements of Operations. Pursuant to the terms of the credit default swap contract, cash or securities may be required to be deposited as collateral. Unrestricted cash may be invested according to the funds’ investment objectives.
At April 30, 2012, the Franklin Low Duration Total Return Fund and Franklin Total Return Fund hold $393,210 and $2,854,701, respectively, in U.S. Treasury Bills and Bonds as collateral for derivatives.
See Note 10 regarding other derivative information.
e. Restricted Cash
At April 30, 2012, the Franklin Low Duration Total Return Fund and Franklin Total Return Fund held restricted cash in connection with investments in certain derivative securities. Restricted cash is held in a segregated account with the funds’ custodian and is reflected in the Statements of Assets and Liabilities.
f. FT Holdings Corporation I
The Franklin Total Return Fund invests in certain securities through its investment in FT Holdings Corporation I, a Delaware Corporation and a wholly-owned subsidiary (Subsidiary) of the fund. The Subsidiary has the ability to invest in securities consistent with the investment objective of
Semiannual Report | 129
Franklin Investors Securities Trust
Notes to Financial Statements (unaudited) (continued)
| 1. | ORGANIZATION AND SIGNIFICANT ACCOUNTING POLICIES (continued) |
| f. | FT Holdings Corporation I (continued) |
the fund. At April 30, 2012, all Subsidiary investments as well as any other assets and liabilities are reflected in the fund’s Statement of Investments and Statement of Assets and Liabilities.
All income and expenses of the Subsidiary during the period ended April 30, 2012, have been included in the fund’s Statement of Operations.
g. Mortgage Dollar Rolls
The Franklin Total Return Fund enters into mortgage dollar rolls, typically on a TBA basis. Mortgage dollar rolls are agreements between the fund and a financial institution to simultaneously sell and repurchase mortgage-backed securities at a future date. Gains or losses are realized on the initial sale, and the difference between the repurchase price and the sale price is recorded as an unrealized gain or loss to the fund upon entering into the mortgage dollar roll. In addition, the fund may invest the cash proceeds that are received from the initial sale. During the period between the sale and repurchase, the fund is not entitled to principal and interest paid on the mortgage backed securities. The risks of mortgage dollar roll transactions include the potential inability of the counterparty to fulfill its obligations.
h. Senior Floating Rate Interests
The Funds, except Franklin Adjustable U.S. Government Securities Fund, invest in senior secured corporate loans that pay interest at rates which are periodically reset by reference to a base lending rate plus a spread. These base lending rates are generally the prime rate offered by a designated U.S. bank or the London InterBank Offered Rate (LIBOR). Senior secured corporate loans often require prepayment of principal from excess cash flows or at the discretion of the borrower. As a result, actual maturity may be substantially less than the stated maturity.
Senior secured corporate loans in which the funds invest are generally readily marketable, but may be subject to some restrictions on resale.
i. Income and Deferred Taxes
It is each fund’s policy to qualify as a regulated investment company under the Internal Revenue Code. Each fund intends to distribute to shareholders substantially all of its taxable income and net realized gains to relieve it from federal income and excise taxes. As a result, no provision for U.S. federal income taxes is required. Each fund files U.S. income tax returns as well as tax returns in certain other jurisdictions.
The Funds may be subject to foreign taxation related to income received, capital gains on the sale of securities and certain foreign currency transactions in the foreign jurisdictions in which it invests. Foreign taxes, if any, are recorded based on the tax regulations and rates that exist in the foreign markets in which the Funds invest. When a capital gain tax is determined to apply the Funds record an estimated deferred tax liability in an amount that would be payable if the securities were disposed of on the valuation date.
130 | Semiannual Report
Franklin Investors Securities Trust
Notes to Financial Statements (unaudited) (continued)
| 1. | ORGANIZATION AND SIGNIFICANT ACCOUNTING POLICIES (continued) |
| i. | Income and Deferred Taxes (continued) |
Each fund recognizes the tax benefits of uncertain tax positions only when the position is “more likely than not” to be sustained upon examination by the tax authorities based on the technical merits of the tax position. As of April 30, 2012, and for all open tax years, each fund has determined that no liability for unrecognized tax benefits is required in each fund’s financial statements related to uncertain tax positions taken on a tax return (or expected to be taken on future tax returns). Open tax years are those that remain subject to examination and are based on each tax jurisdiction statute of limitation.
j. Security Transactions, Investment Income, Expenses and Distributions
Security transactions are accounted for on trade date. Realized gains and losses on security transactions are determined on a specific identification basis. Interest income and estimated expenses are accrued daily. Amortization of premium and accretion of discount on debt securities are included in interest income. Facility fees are recognized as income over the expected term of the loan. Dividend income is recorded on the ex-dividend date. Dividends from net investment income are normally declared daily; these dividends may be reinvested or paid monthly to shareholders. Distributions from realized capital gains and other distributions, if any, are recorded on the ex-dividend date. Distributions to shareholders are determined according to income tax regulations (tax basis). Distributable earnings determined on a tax basis may differ from earnings recorded in accordance with accounting principles generally accepted in the United States of America. These differences may be permanent or temporary. Permanent differences are reclassified among capital accounts to reflect their tax character. These reclassifications have no impact on net assets or the results of operations. Temporary differences are not reclassified, as they may reverse in subsequent periods.
Common expenses incurred by the Trust are allocated among the funds based on the ratio of net assets of each fund to the combined net assets of the Trust. Fund specific expenses are charged directly to the fund that incurred the expense.
Net investment income, not including class specific expenses, is allocated daily to each class of shares based upon the relative value of the settled shares of each class. Realized and unrealized gains and losses are allocated daily to each class of shares based upon the relative proportion of net assets of each class. Differences in per share distributions, by class, are generally due to differences in class specific expenses.
Inflation-indexed bonds are adjusted for inflation through periodic increases or decreases in the security’s interest accruals, face amount, or principal redemption value, by amounts corresponding to the rate of inflation as measured by an index. Any increase or decrease in the face amount or principal redemption value will be included as interest income on the Statements of Operations.
Semiannual Report | 131
Franklin Investors Securities Trust
Notes to Financial Statements (unaudited) (continued)
| 1. | ORGANIZATION AND SIGNIFICANT ACCOUNTING POLICIES (continued) |
| k. | Accounting Estimates |
The preparation of financial statements in accordance with accounting principles generally accepted in the United States of America requires management to make estimates and assumptions that affect the reported amounts of assets and liabilities at the date of the financial statements and the amounts of income and expenses during the reporting period. Actual results could differ from those estimates.
l. Guarantees and Indemnifications
Under the Trust’s organizational documents, its officers and trustees are indemnified by the Trust against certain liabilities arising out of the performance of their duties to the Trust. Additionally, in the normal course of business, the Trust, on behalf of the Funds, enters into contracts with service providers that contain general indemnification clauses. The Trust’s maximum exposure under these arrangements is unknown as this would involve future claims that may be made against the Trust that have not yet occurred. Currently, the Trust expects the risk of loss to be remote.
2. SHARES OF BENEFICIAL INTEREST
At April 30, 2012, there were an unlimited number of shares authorized (without par value).
Transactions in the Funds’ shares were as follows:
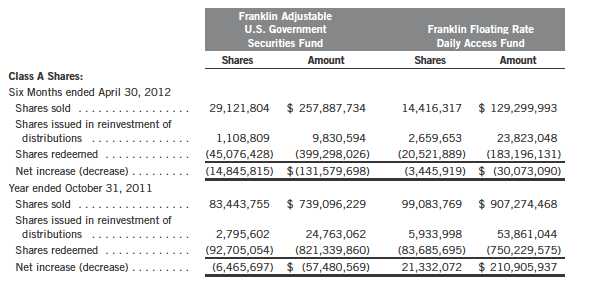
132 | Semiannual Report
Franklin Investors Securities Trust
Notes to Financial Statements (unaudited) (continued)

Semiannual Report | 133
Franklin Investors Securities Trust
Notes to Financial Statements (unaudited) (continued)

134 | Semiannual Report
Franklin Investors Securities Trust
Notes to Financial Statements (unaudited) (continued)

Semiannual Report | 135
Franklin Investors Securities Trust
Notes to Financial Statements (unaudited) (continued)
| 3. | TRANSACTIONS WITH AFFILIATES (continued) |
| a. | Management Fees |
The Franklin Adjustable U.S. Government Securities Fund pays an investment management fee to Advisers based on the average daily net assets of the fund as follows:
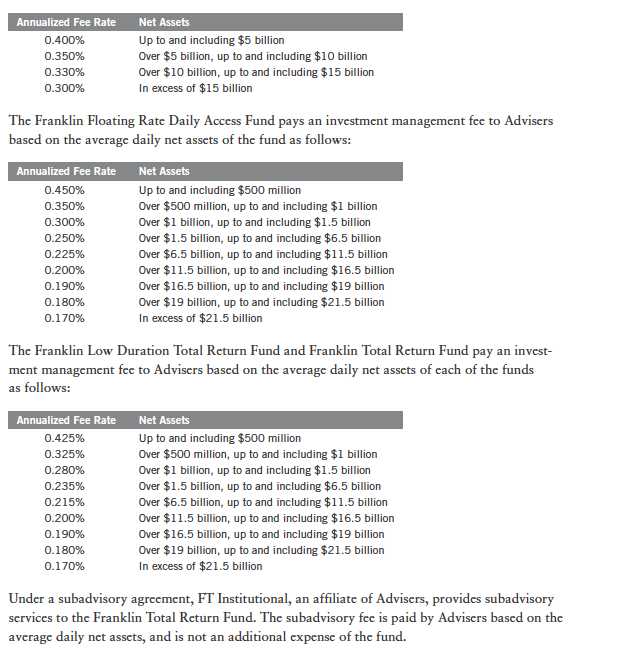
136 | Semiannual Report
Franklin Investors Securities Trust
Notes to Financial Statements (unaudited) (continued)
| 3. | TRANSACTIONS WITH AFFILIATES (continued) |
| b. | Administrative Fees |
The Franklin Adjustable U.S. Government Securities Fund pays an administrative fee to Advisers based on the fund’s average daily net assets as follows:

Semiannual Report | 137
Franklin Investors Securities Trust
Notes to Financial Statements (unaudited) (continued)
| 3. | TRANSACTIONS WITH AFFILIATES (continued) |
| d. | Sales Charges/Underwriting Agreements |
Front-end sales charges and contingent deferred sales charges (CDSC) do not represent expenses of the Funds. These charges are deducted from the proceeds of sales of fund shares prior to investment or from redemption proceeds prior to remittance, as applicable. Distributors has advised the Funds of the following commission transactions related to the sales and redemptions of the Funds’ shares for the period:

FT Services has contractually agreed in advance to waive or limit its fees and to assume as its own expense certain expenses otherwise payable by the Franklin Low Duration Total Return Fund and Franklin Total Return Fund so that the common expenses (i.e. a combination of management fees, administrative fees, and other expenses, but excluding distribution fees, and acquired fund fees and expenses) for each class of the funds do not exceed 0.65% and 0.63%, respectively (other than certain non-routine expenses or costs, including those relating to litigation, indemnification, reorganizations, and liquidations) until February 28, 2013.
4. EXPENSE OFFSET ARRANGEMENT
The Funds have entered into an arrangement with their custodian whereby credits realized as a result of uninvested cash balances are used to reduce a portion of the Funds’ custodian expenses. During the period ended April 30, 2012, there were no credits earned.
138 | Semiannual Report
Franklin Investors Securities Trust
Notes to Financial Statements (unaudited) (continued)
5. INCOME TAXES
For tax purposes, capital losses may be carried over to offset future capital gains, if any. At October 31, 2011, the capital loss carryforwards were as follows:

Semiannual Report | 139
Franklin Investors Securities Trust
Notes to Financial Statements (unaudited) (continued)
6. INVESTMENT TRANSACTIONS
Purchases and sales of investments (excluding short term securities) for the period ended April 30, 2012, were as follows:

7. INVESTMENTS IN INSTITUTIONAL FIDUCIARY TRUST MONEY MARKET PORTFOLIO
The Funds invest in the Institutional Fiduciary Trust Money Market Portfolio (Sweep Money Fund), an open-end investment company managed by Advisers. Management fees paid by the Funds are reduced on assets invested in the Sweep Money Fund, in an amount not to exceed the management and administrative fees paid by the Sweep Money Fund.
8. CREDIT RISK AND DEFAULTED SECURITIES
At April 30, 2012, the Franklin Floating Rate Daily Access Fund, Franklin Low Duration Total Return Fund and Franklin Total Return Fund had 98.40%, 13.59%, and 12.98%, respectively, of their portfolio invested in high yield, senior secured floating rate notes, or other securities rated below investment grade. These securities may be more sensitive to economic conditions causing greater price volatility and are potentially subject to a greater risk of loss due to default than higher rated securities.
The Franklin Low Duration Total Return Fund and Franklin Total Return Fund held defaulted securities and/or other securities for which the income has been deemed uncollectible. At April 30, 2012, the aggregate value of these securities for the Franklin Low Duration Total Return Fund and Franklin Total Return Fund was $986,500 and $3,519,760, representing 0.12% and 0.08%, respectively, of each fund’s net assets. The funds discontinue accruing income on securities for which income has been deemed uncollectible and provide an estimate for losses on interest receivable. The securities have been identified on the accompanying Statements of Investments.
9. UNFUNDED LOAN COMMITMENTS
The Funds, except Franklin Adjustable U.S. Government Securities Fund, enter into certain credit agreements, all or a portion of which may be unfunded. The funds are obligated to fund these loan commitments at the borrowers’ discretion. Funded portions of credit agreements are presented on the Statements of Investments.
140 | Semiannual Report
Franklin Investors Securities Trust
Notes to Financial Statements (unaudited) (continued)

Semiannual Report | 141
Franklin Investors Securities Trust
Notes to Financial Statements (unaudited) (continued)
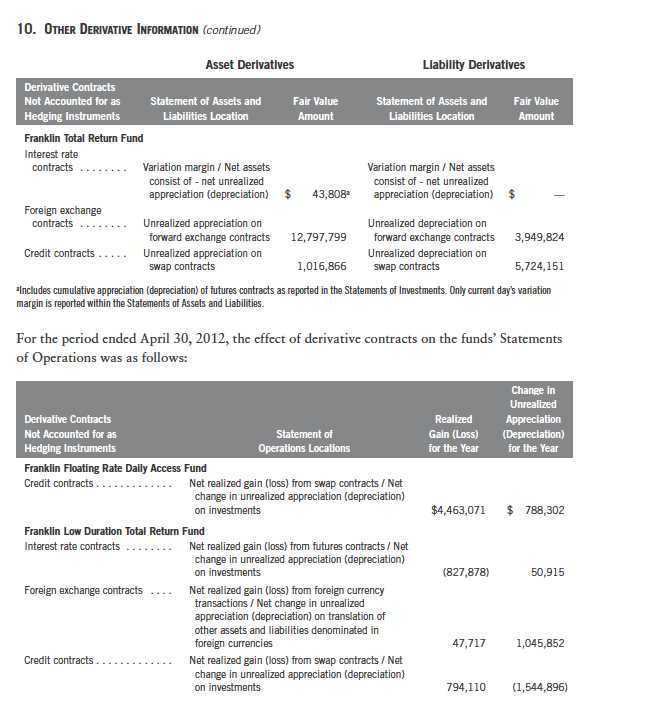
142 | Semiannual Report
Franklin Investors Securities Trust
Notes to Financial Statements (unaudited) (continued)

For the period ended April 30, 2012, the average month end market value of derivatives represented 0.05%, 0.57%, and 0.61% respectively, of average month end net assets. The average month end number of open derivative contracts for the period was 1, 150, and 170, respectively.
See Note 1(d) regarding derivative financial instruments.
11. SPECIAL SERVICING AGREEMENT
The Funds, except Franklin Adjustable U.S. Government Securities Fund, which are eligible underlying investments of one or more of the Franklin Templeton Fund Allocator Series Funds (Allocator Funds), participate in a Special Servicing Agreement (SSA) with the Allocator Funds and certain service providers of the funds and the Allocator Funds. Under the SSA, the funds may pay a portion of the Allocator Funds’ expenses (other than any asset allocation, administrative and distribution fees), to the extent such payments are less than the amount of the benefits realized or expected to be realized by the funds (e.g., due to reduced costs associated with servicing accounts) from the investment in the funds by the Allocator Funds. The Allocator Funds are either managed by Advisers or administered by FT Services. For the period ended April 30, 2012, the Franklin Total Return Fund was held by one or more of the Allocator Funds and the amount of expenses borne by the fund is noted in the Statement of Operations. At April 30, 2012, 4.97% of the fund’s outstanding shares was held by one or more of the Allocator Funds.
12. CREDIT FACILITY
The Funds, together with other U.S. registered and foreign investment funds (collectively, Borrowers), managed by Franklin Templeton Investments, are borrowers in a joint syndicated senior unsecured credit facility totaling $1.5 billion (Global Credit Facility) which matures on January 18, 2013. This Global Credit Facility provides a source of funds to the Borrowers for
Semiannual Report | 143
Franklin Investors Securities Trust
Notes to Financial Statements (unaudited) (continued)
12. CREDIT FACILITY (continued)
temporary and emergency purposes, including the ability to meet future unanticipated or unusually large redemption requests.
Under the terms of the Global Credit Facility, the Funds shall, in addition to interest charged on any borrowings made by the Funds and other costs incurred by the Funds, pay their share of fees and expenses incurred in connection with the implementation and maintenance of the Global Credit Facility, based upon its relative share of the aggregate net assets of all of the Borrowers, including an annual commitment fee of 0.08% based upon the unused portion of the Global Credit Facility, which is reflected in other expenses on the Statements of Operations. During the period ended April 30, 2012, the Funds did not use the Global Credit Facility.
13. FAIR VALUE MEASUREMENTS
The Funds follow a fair value hierarchy that distinguishes between market data obtained from independent sources (observable inputs) and the Funds’ own market assumptions (unobservable inputs). These inputs are used in determining the value of the Funds’ investments and are summarized in the following fair value hierarchy:
- Level 1 – quoted prices in active markets for identical securities
- Level 2 – other significant observable inputs (including quoted prices for similar securities, interest rates, prepayment speed, credit risk, etc.)
- Level 3 – significant unobservable inputs (including the Funds’ own assumptions in determining the fair value of investments)
The inputs or methodology used for valuing securities are not an indication of the risk associated with investing in those securities.
For movements between the levels within the fair value hierarchy, the Funds have adopted a policy of recognizing the transfers as of the date of the underlying event which caused the movement.
A summary of inputs used as of April 30, 2012, in valuing the Funds’ assets and liabilities carried at fair value, is as follows:
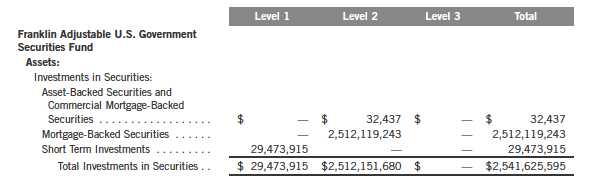
144 | Semiannual Report
Franklin Investors Securities Trust
Notes to Financial Statements (unaudited) (continued)

Semiannual Report | 145
Franklin Investors Securities Trust
Notes to Financial Statements (unaudited) (continued)
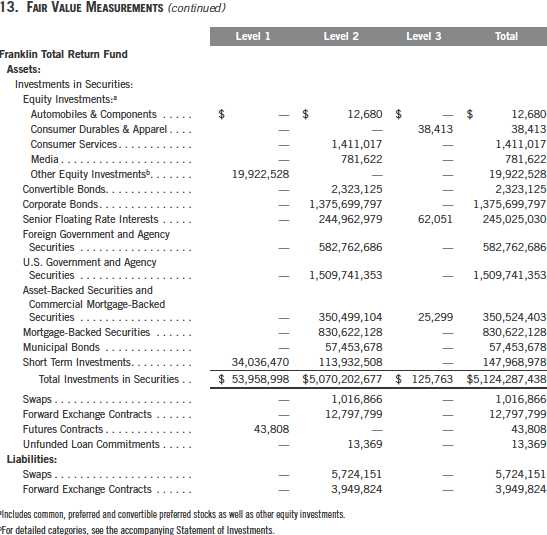
14. NEW ACCOUNTING PRONOUNCEMENTS
In May 2011, the Financial Accounting Standards Board (FASB) issued Accounting Standards Update (ASU) No. 2011-04, Fair Value Measurement (Topic 820): Amendments to Achieve Common Fair Value Measurement and Disclosure Requirements in U.S. GAAP and IFRSs. The amendments in the ASU will improve the comparability of fair value measurements presented and disclosed in financial statements prepared in accordance with U.S. GAAP (Generally Accepted Accounting Principles) and IFRS (International Financial Reporting Standards) and include new guidance for certain fair value measurement principles and disclosure requirements. The ASU is effective for interim and annual periods beginning after December 15, 2011. The Fund believes the adoption of this ASU will not have a material impact on its financial statements.
146 | Semiannual Report
Franklin Investors Securities Trust
Notes to Financial Statements (unaudited) (continued)
14. NEW ACCOUNTING PRONOUNCEMENTS (continued)
In December 2011, FASB issued ASU No. 2011-11, Balance Sheet (Topic 210): Disclosures about Offsetting Assets and Liabilities. The amendments in the ASU enhance disclosures about offsetting of financial assets and liabilities to enable investors to understand the effect of these arrangements on a Fund’s financial position. The ASU is effective for interim and annual reporting periods beginning on or after January 1, 2013. The Funds believe the adoption of this ASU will not have a material impact on their financial statements.
15. SUBSEQUENT EVENTS
The Funds have evaluated subsequent events through the issuance of the financial statements and determined that no events have occurred that require disclosure.
Semiannual Report | 147
Franklin Investors Securities Trust
Notes to Financial Statements (unaudited) (continued)

148 | Semiannual Report
Franklin Investors Securities Trust
Shareholder Information
Board Review of Investment Management Agreement
At a meeting held February 28, 2012, the Board of Trustees (Board), including a majority of non-interested or independent Trustees, approved renewal of the investment management agreement for each of the separate funds that constitute Franklin Investors Securities Trust (Fund(s)). In reaching this decision, the Board took into account information furnished throughout the year at regular Board meetings, as well as information prepared specifically in connection with the annual renewal review process. Information furnished and discussed throughout the year included investment performance reports and related financial information for each Fund, as well as periodic reports on expenses, shareholder services, legal and compliance matters, pricing, brokerage commissions and execution and other services provided by the Investment Manager (Manager) and its affiliates. Information furnished specifically in connection with the renewal process included a report for each Fund prepared by Lipper, Inc. (Lipper), an independent organization, as well as additional material, including a Fund profitability analysis prepared by management. The Lipper reports compared each Fund’s investment performance and expenses with those of other mutual funds deemed comparable to the Fund as selected by Lipper. The Fund profitability analysis discussed the profitability to Franklin Templeton Investments from its overall U.S. fund operations, as well as on an individual fund-by-fund basis. Additional material accompanying such profitability analysis included information on a fund-by-fund basis listing portfolio managers and other accounts they manage, as well as information on management fees charged by the Manager and its affiliates to U.S. mutual funds and other accounts, including management’s explanation of differences where relevant. Such material also included a memorandum prepared by management describing project initiatives and capital investments relating to the services provided to the Funds by the Franklin Templeton Investments organization, as well as a memorandum relating to economies of scale and an analysis concerning transfer agent fees charged by an affiliate of the Manager.
In considering such materials, the independent Trustees received assistance and advice from and met separately with independent counsel. While the investment management agreements for all Funds were considered at the same Board meeting, the Board dealt with each Fund separately. In approving continuance of the investment management agreement for each Fund, the Board, including a majority of independent Trustees, determined that the existing management fee structure was fair and reasonable and that continuance of the investment management agreement was in the best interests of each Fund and its shareholders. While attention was given to all information furnished, the following discusses some primary factors relevant to the Board’s decision.
NATURE, EXTENT AND QUALITY OF SERVICES. The Board was satisfied with the nature and quality of the overall services provided by the Manager and its affiliates to the Funds and their shareholders. In addition to investment performance and expenses discussed later, the Board’s opinion was based, in part, upon periodic reports furnished it showing that the investment policies and restrictions for each Fund were consistently complied with as well as other reports periodically furnished the Board covering matters such as the compliance of portfolio managers and other
Semiannual Report | 149
Franklin Investors Securities Trust
Shareholder Information (continued)
Board Review of Investment Management Agreement (continued)
management personnel with the code of ethics adopted throughout the Franklin Templeton fund complex, the adherence to fair value pricing procedures established by the Board, and the accuracy of net asset value calculations. The Board also noted the extent of benefits provided Fund shareholders from being part of the Franklin Templeton family of funds, including the right to exchange investments between the same class of funds without a sales charge, the ability to reinvest Fund dividends into other funds and the right to combine holdings in other funds to obtain a reduced sales charge. Favorable consideration was given to management’s continuous efforts and expenditures in establishing back-up systems and recovery procedures to function in the event of a natural disaster, it being noted by the Board that such systems and procedures had functioned smoothly during the Florida hurricanes and blackouts experienced in previous years. Among other factors taken into account by the Board were the Manager’s best execution trading policies, including a favorable report by an independent portfolio trading analytical firm, which also covered FOREX transactions. Consideration was also given to the experience of each Fund’s portfolio management team, the number of accounts managed and general method of compensation. In this latter respect, the Board noted that a primary factor in management’s determination of a portfolio manager’s bonus compensation was the relative investment performance of the funds he or she managed and that a portion of such bonus was required to be invested in a predesignated list of funds within such person’s fund management area so as to be aligned with the interests of shareholders. The Board also took into account the quality of transfer agent and shareholder services provided Fund shareholders by an affiliate of the Manager and the continuous enhancements to the Franklin Templeton website. Particular attention was given to management’s conservative approach and diligent risk management procedures, including continuous monitoring of counterparty credit risk and attention given to derivative and other complex instruments including expanded collateralization requirements. The Board also took into account, among other things, management’s efforts in establishing a global credit facility for the benefit of the Funds and other accounts managed by Franklin Templeton Investments to provide a source of cash for temporary and emergency purposes or to meet unusual redemption requests as well as the strong financial position of the Manager’s parent company and its commitment to the mutual fund business as evidenced by its subsidization of money market funds.
INVESTMENT PERFORMANCE. The Board placed significant emphasis on the investment performance of each Fund in view of its importance to shareholders. While consideration was given to performance reports and discussions with portfolio managers at Board meetings during the year, particular attention in assessing performance was given to the Lipper reports furnished for the agreement renewals. The Lipper reports prepared for each individual Fund showed the investment performance of its Class A shares in comparison with its selected performance universe during 2011 and during the previous 10 years ended December 31, 2011, unless otherwise noted. Performance on a total return basis was shown by Lipper for all Funds with performance on an income return basis being shown for those Funds having income return as an element of their investment objective. The following summarizes the performance results for each Fund.
150 | Semiannual Report
Franklin Investors Securities Trust
Shareholder Information (continued)
Board Review of Investment Management Agreement (continued)
Franklin Adjustable U.S. Government Securities Fund – The Fund’s investment performance was shown in comparison with a performance universe consisting of all retail and institutional ultra-short obligation funds as selected by Lipper. The Lipper report showed the Fund’s income return in 2011 to be in the highest or best performing quintile of such performance universe, and on an annualized basis to also be in the highest quintile of such universe during each of the previous three-, five- and 10-year periods. The Lipper report showed the Fund’s total return during 2011 to also be in the highest quintile of its performance universe, and on an annualized basis to be in the highest quintile of its performance universe for each of the previous five- and 10-year periods, and in the middle quintile of such universe for the previous three-year period. The Board was satisfied with the Fund’s comparative performance as set forth in the Lipper report.
Franklin Floating Rate Daily Access Fund – The Fund’s investment performance was shown in comparison with a performance universe consisting of all retail and institutional loan participation funds as selected by Lipper. The Lipper report showed its income return during 2011 to be in the middle quintile of its performance universe, and its income return on an annualized basis during the previous three-, five- and 10-year periods to be in either the lowest or second-lowest quintile of its performance universe. The Lipper report showed the Fund’s total return during 2011 to be in the second-lowest quintile of its performance universe and on an annualized basis for the previous three-, five- and 10-year periods to be in either the lowest or second-lowest quintile of such universe. In discussing such performance, management pointed out that during 2011 the Fund’s performance was negatively impacted by one particular investment, absent which the Fund’s total return would have exceeded the performance universe median and that maintaining cash to meet a high level of redemptions had also hurt performance. The Board was not satisfied with the Fund’s comparative performance as set forth in the Lipper report and intends to continue monitoring ongoing performance. The Board, however, did not believe that any immediate change in portfolio managers was warranted and noted that the Fund’s total return for each of the annualized previous five- and 10-year periods were within 26 basis points of the performance universe median as shown in the Lipper report.
Franklin Low Duration Total Return Fund – The Fund’s investment performance was shown in comparison to a performance universe consisting of all retail and institutional short investment-grade debt funds as selected by Lipper. The Fund has been in operation for less than 10 years and the Lipper report showed its income return for 2011 to be in the highest or best performing quin-tile of its performance universe, and on an annualized basis to be in the second-highest quintile of the performance universe for each of the previous three- and five-year periods. The Lipper report showed the Fund’s total return for 2011 to be in the second-lowest quintile of its performance universe, and on an annualized basis to be in the middle quintile of such universe for the previous three-year period, but to be in the highest quintile of such universe for the previous five-year period. The Board believed the Fund’s performance as shown in the Lipper report to be acceptable, noting its favorable income and longer term total return comparative performances and the Fund’s investment objective of providing a high level of current income while seeking preservation of capital.
Semiannual Report | 151
Franklin Investors Securities Trust
Shareholder Information (continued)
Board Review of Investment Management Agreement (continued)
Franklin Total Return Fund – The Fund’s investment performance was shown in comparison to a performance universe consisting of all retail and institutional intermediate investment-grade debt funds as selected by Lipper. The Lipper report showed the Fund’s income return to be in the highest or best performing quintile of its performance universe during 2011 and to also be in the highest quintile of such universe for the previous three-, five- and 10-year periods on an annualized basis. The Lipper report showed the Fund’s total return during 2011 to be in the second-lowest quintile of its performance universe, but on an annualized basis to be in the second-highest quintiles of such universe for the previous three- and 10-year periods, and the middle quintile of such universe for the previous five-year period. The Board was satisfied with the Fund’s overall comparative performance, noting the Fund’s objective of seeking current income consistent with preservation of capital and that the Fund’s 2011 total return exceeded 5 1 / 2% as shown in the Lipper report.
COMPARATIVE EXPENSES. Consideration was given to a comparative analysis of the management fees and total expense ratios of each Fund compared with those of a group of other funds selected by Lipper as constituting its appropriate Lipper expense group. Lipper expense data is based upon information taken from each fund’s most recent annual report, which reflects historical asset levels that may be quite different from those currently existing, particularly in a period of market volatility. While recognizing such inherent limitation and the fact that expense ratios generally increase as asset decline and decrease as assets grow, the Board believed the independent analysis conducted by Lipper to be an appropriate measure of comparative expenses. In reviewing comparative costs, Lipper provides information on each Fund’s contractual investment management fee in comparison with the contractual investment management fee that would have been charged by other funds within its Lipper expense group assuming they were similar in size to the Fund, as well as the actual total expense ratio of the Fund in comparison with those of its expense group. The Lipper contractual investment management fee analysis includes within such fee any separate administrative fees, and the Lipper total expenses, for comparative consistency, are shown by Lipper for Fund Class A shares. The results of such expense comparisons showed that the contractual investment management fee rate and actual total expense ratio for Franklin Floating Rate Daily Access Fund were in the second least expensive quintile of its Lipper expense group. The Board was satisfied with the comparative contractual investment management fee rate and actual total expense ratio of the Fund as shown in the Lipper reports. The contractual investment management fee rate as well as the actual total expense ratio of Franklin Adjustable U.S. Government Securities Fund was above the median of its Lipper expense group but was within six basis points of the median for such group. The Board found the comparative contractual investment fee rate and actual total expense ratio of this Fund as shown in the Lipper report to be acceptable. The contractual investment management fee and actual total expense ratios for Franklin Total Return Fund and Franklin Low Duration Total Return Fund were each above the median of their respective Lipper expense groups, but their actual total expense ratios were less than six basis points above the median of their expense groups. The Board found the contractual management fees and total expense ratios of each of these Funds to be acceptable, noting that their expenses were subsidized through management fee waivers and reimbursements.
152 | Semiannual Report
Franklin Investors Securities Trust
Shareholder Information (continued)
Board Review of Investment Management Agreement (continued)
MANAGEMENT PROFITABILITY. The Board also considered the level of profits realized by the Manager and its affiliates in connection with the operation of each Fund. In this respect, the Board reviewed the Fund profitability analysis that addresses the overall profitability of Franklin Templeton’s U.S. fund business, as well as its profits in providing management and other services to each of the individual funds during the 12-month period ended September 30, 2011, being the most recent fiscal year-end for Franklin Resources, Inc., the Manager’s parent. In reviewing the analysis, attention was given to the methodology followed in allocating costs to each Fund, it being recognized that allocation methodologies are inherently subjective and various allocation methodologies may each be reasonable while producing different results. In this respect, the Board noted that, while being continuously refined and reflecting changes in the Manager’s own cost accounting, the cost allocation methodology was consistent with that followed in profitability report presentations for the Funds made in prior years and that the Funds’ independent registered public accounting firm had been engaged by the Manager to review the reasonableness of the allocation methodologies solely for use by the Funds’ Board in reference to the profitability analysis. In reviewing and discussing such analysis, management discussed with the Board its belief that costs incurred in establishing the infrastructure necessary for the type of mutual fund operations conducted by the Manager and its affiliates may not be fully reflected in the expenses allocated to each Fund in determining its profitability, as well as the fact that the level of profits, to a certain extent, reflected operational cost savings and efficiencies initiated by management. The Board also took into account management’s expenditures in improving shareholder services provided the Funds, as well as the need to implement systems to meet additional regulatory and compliance requirements resulting from statutes such as the Sarbanes-Oxley and Dodd-Frank Acts and recent SEC and other regulatory requirements. In addition, the Board considered a third-party study comparing the profitability of the Manager’s parent on an overall basis to other publicly held managers broken down to show profitability from management operations exclusive of distribution expenses, as well as profitability including distribution expenses. The Board also considered the extent to which the Manager and its affiliates might derive ancillary benefits from fund operations, including revenues generated from transfer agent services and potential benefits resulting from allocation of fund brokerage and the use of commission dollars to pay for research. Based upon its consideration of all these factors, the Board determined that the level of profits realized by the Manager and its affiliates from providing services to each Fund was not excessive in view of the nature, quality and extent of services provided.
ECONOMIES OF SCALE. The Board also considered whether economies of scale are realized by the Manager as the Funds grow larger and the extent to which this is reflected in the level of management fees charged. While recognizing that any precise determination is inherently subjective, the Board noted that based upon the Fund profitability analysis, it appears that as some funds get larger, at some point economies of scale do result in the Manager realizing a larger profit margin on management services provided such a fund. The Board also noted that economies of scale are shared with each Fund and its shareholders through management fee breakpoints so that as a Fund grows
Semiannual Report | 153
Franklin Investors Securities Trust
Shareholder Information (continued)
Board Review of Investment Management Agreement (continued)
in size, its effective management fee rate declines. The management fee structure including a separate fixed administrative fee for each of Franklin Floating Rate Daily Access Fund and Franklin Total Return Fund provides for breakpoints in stages going to the $21.5 billion asset level, which far exceeded the sizes of these Funds, which at year-end were approximately $2.1 billion and $3.96 billion, respectively. The Board believed that to the extent economies of scale may be realized by the Manager of these Funds and its affiliates, that this schedule of fees provided a sharing of benefits with each of these Funds and their shareholders, and noted also that the expenses of Franklin Total Return Fund were partially subsidized by management. The fee structure, including a separate administrative fee, for Franklin Adjustable U.S. Government Securities Fund provides a management fee of 0.50% on the first $5 billion of assets, with breakpoints continuing at stages thereafter. In discussing such fee, management expressed the view that this initial rate anticipated economies of scale. In support of this position, management pointed to the competitive contractual management fee rate and expense ratio of this Fund, which had assets of approximately $2.7 billion at year-end, with those of its Lipper expense group. The Board intends to monitor the growth of this Fund, but believed that to the extent economies of scale may be realized by the Manager and its affiliates, such initial rate did reflect economies of scale benefiting this Fund and its shareholders. Franklin Low Duration Total Return Fund benefited from existing breakpoints under its management fee structure with additional breakpoints extending beyond its year-end asset levels. The Board believed such fee schedule provided a sharing of benefits with the Fund and its shareholders but believed it unlikely that its current asset size afforded any economies of scale, noting that the expenses of the Fund were subsidized by management fee waivers.
Proxy Voting Policies and Procedures
The Trust’s investment manager has established Proxy Voting Policies and Procedures (Policies) that the Trust uses to determine how to vote proxies relating to portfolio securities. Shareholders may view the Trust’s complete Policies online at franklintempleton.com. Alternatively, shareholders may request copies of the Policies free of charge by calling the Proxy Group collect at (954) 527-7678 or by sending a written request to: Franklin Templeton Companies, LLC, 300 S.E. 2nd Street, Fort Lauderdale, FL 33301, Attention: Proxy Group. Copies of the Trust’s proxy voting records are also made available online at franklintempleton.com and posted on the U.S. Securities and Exchange Commission’s website at sec.gov and reflect the most recent 12-month period ended June 30.
Quarterly Statement of Investments
The Trust files a complete statement of investments with the U.S. Securities and Exchange Commission for the first and third quarters for each fiscal year on Form N-Q. Shareholders may view the filed Form N-Q by visiting the Commission’s website at sec.gov. The filed form may also be viewed and copied at the Commission’s Public Reference Room in Washington, DC. Information regarding the operations of the Public Reference Room may be obtained by calling (800) SEC-0330.
154 | Semiannual Report
This page intentionally left blank.
This page intentionally left blank.

(a) Evaluation of Disclosure Controls and Procedures. The Registrant maintains disclosure controls and procedures that are designed to ensure that information required to be disclosed in the Registrant’s filings under the Securities Exchange Act of 1934 and the Investment Company Act of 1940 is recorded, processed, summarized and reported within the periods specified in the rules and forms of the Securities and Exchange Commission. Such information is accumulated and communicated to the Registrant’s management, including its principal executive officer and principal financial officer, as appropriate, to allow timely decisions regarding required disclosure. The Registrant’s management, including the principal executive officer and the principal financial officer, recognizes that any set of controls and procedures, no matter how well designed and operated, can provide only reasonable assurance of achieving the desired control objectives.
Within 90 days prior to the filing date of this Shareholder Report on Form N-CSR, the Registrant had carried out an evaluation, under the supervision and with the participation of the Registrant’s management, including the Registrant’s principal executive officer and the Registrant’s principal financial officer, of the effectiveness of the design and operation of the Registrant’s disclosure controls and procedures. Based on such evaluation, the Registrant’s principal executive officer and principal financial officer concluded that the Registrant’s disclosure controls and procedures are effective.
(b) Changes in Internal Controls. There have been no significant changes in the Registrant’s internal controls or in other factors that could significantly affect the internal controls subsequent to the date of their evaluation in connection with the preparation of this Shareholder Report on Form N-CSR.
Item 12. Exhibits.
(a)(1) Code of Ethics
(a)(2) Certifications pursuant to Section 302 of the Sarbanes-Oxley Act of 2002 of Laura F. Fergerson, Chief Executive Officer - Finance and Administration, and Gaston Gardey, Chief Financial Officer and Chief Accounting Officer
(b) Certifications pursuant to Section 906 of the Sarbanes-Oxley Act of 2002 of Laura F. Fergerson, Chief Executive Officer - Finance and Administration, and Gaston Gardey, Chief Financial Officer and Chief Accounting Officer
SIGNATURES
Pursuant to the requirements of the Securities Exchange Act of 1934 and the Investment Company Act of 1940, the registrant has duly caused this report to be signed on its behalf by the undersigned, thereunto duly authorized.
FRANKLIN INVESTORS SECURITIES TRUST
By /s/LAURA F. FERGERSON
Laura F. Fergerson
Chief Executive Officer –
Finance and Administration
Date June 26, 2012
Pursuant to the requirements of the Securities Exchange Act of 1934 and the Investment Company Act of 1940, this report has been signed below by the following persons on behalf of the registrant and in the capacities and on the dates indicated.
By /s/LAURA F. FERGERSON
Laura F. Fergerson
Chief Executive Officer –
Finance and Administration
Date June 26, 2012
By /s/GASTON GARDEY
Gaston Gardey
Chief Financial Officer and
Chief Accounting Officer
Date June 26, 2012