UNITED STATES SECURITIES AND EXCHANGE COMMISSION
Washington, D.C. 20549
FORM N-CSRS
CERTIFIED SHAREHOLDER REPORT OF REGISTERED MANAGEMENT INVESTMENT COMPANIES
Investment Company Act file number 811-04986
Franklin Investors Securities Trust
(Exact name of registrant as specified in charter)

Craig S. Tyle, One Franklin Parkway, San Mateo, CA 94403-1906
(Name and address of agent for service)
Registrant's telephone number, including area Code: (650) 312-2000
Date of fiscal year end: 10/31
Date of reporting period: 4/30/11
Item 1. Reports to Stockholders.
APRIL 30, 2011
SEMIANNUAL REPORT
AND SHAREHOLDER LETTER
Franklin Balanced Fund
Franklin Convertible Securities Fund
Franklin Equity Income Fund
Franklin Limited Maturity
U.S. Government Securities Fund
Franklin Real Return Fund
Sign up for electronic delivery
on franklintempleton.com


Semiannual Report
Economic and Market Overview
The U.S. economy expanded despite geopolitical and inflationary pressures from around the globe during the six-month period ended April 30, 2011. Business activity increased and consumer spending recovered to pre-recession levels. The U.S. has been a key engine in an ongoing global manufacturing rebound, which accelerated in the first quarter of 2011 and helped spur U.S. economic output. Worldwide demand for capital goods aided U.S. manufacturing profits and increased employment in the industry.
Unemployment and underemployment eased as job creation began to gain some traction and the U.S. jobless rate declined to 9.0% in April.1 Consumer spending rose for the tenth consecutive month in April, but rising gasoline and food prices led to a sharp drop in consumer confidence. The banking sector appeared closer to a full recovery, although the U.S. still faced challenges dealing with massive debt at period-end.
Inflation at the consumer, producer and trade levels rose across much of the world, but in the U.S. it remained relatively contained. The Federal Open Market Committee kept monetary policy unchanged while continuing its second round of quantitative easing, scheduled to terminate in June.
Investor confidence shifted with each release of encouraging or discouraging economic, regulatory and geopolitical news, causing equity market volatility to increase globally. U.S. investors weathered international events that included revolutions and ongoing civil unrest across the Middle East and North Africa, sovereign debt worries and credit downgrades in Europe, and the multiple crises triggered by Japan’s earthquake and tsunami. Ultimately, stock indexes experienced solid gains during the six months under review as domestic and global equity markets rose amid generally improving economic signs and rising consumer spending.
At times of uncertainty, wary investors favored short-term Treasuries, and Treasury yields dipped to low levels during the period. However, as stock markets rallied, Treasury prices declined and yields rose.
The foregoing information reflects our analysis and opinions as of April 30, 2011. The information is not a complete analysis of every aspect of any market, country, industry, security or fund. Statements of fact are from sources considered reliable.
1. Source: Bureau of Labor Statistics.
Semiannual Report | 3
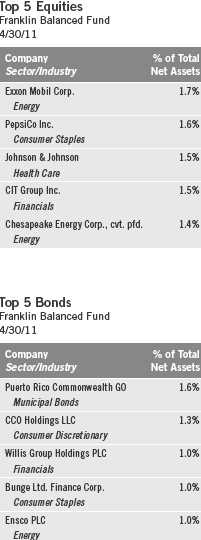
Franklin Balanced Fund
Your Fund’s Goal and Main Investments: Franklin Balanced Fund seeks income and capital appreciation by investing in a combination of stocks, convertible securities and debt securities. The Fund will normally invest at least 25% of its total assets in equity securities and at least 25% of its total assets in debt securities, including money market securities.
Performance data represent past performance, which does not guarantee future results. Investment return and principal value will fluctuate, and you may have a gain or loss when you sell your shares. Current performance may differ from figures shown. Please visit franklintempleton.com or call (800) 342-5236 for most recent month-end performance.
This semiannual report for Franklin Balanced Fund covers the period ended April 30, 2011.
Performance Overview
For the six months under review, Franklin Balanced Fund – Class A delivered a cumulative total return of +9.98%. The Fund underperformed the +16.36% total return of its equity benchmark, the Standard & Poor’s 500 Index (S&P 500), which tracks the broad U.S. stock market.1 However, the Fund outperformed the +0.02% total return of its fixed income benchmark, the Barclays Capital (BC) U.S. Aggregate Index, which tracks the U.S. investment-grade, taxable bond market.1 You can find the Fund’s long-term performance data in the Performance Summary beginning on page 8.
Investment Strategy
We seek income by investing in a combination of corporate, agency and government bonds issued in the U.S. and other countries, as well as dividend-paying common stocks and convertible securities. We seek capital appreciation by investing in equity securities and convertible securities of companies from a variety of industries. We will generally invest in investment-grade debt securities, but may invest up to 10% of our total assets in nonconvertible bonds rated below investment grade. We apply a bottom-up approach to investing in individual securities. We will assess the market price of a company’s securities relative to our evaluation of the company’s long-term earnings, asset value and cash flow potential. We also consider a company’s price/earnings ratio, profit
1. Source: © 2011 Morningstar. All Rights Reserved. The information contained herein: (1) is proprietary to Morningstar and/or its content providers; (2) may not be copied or distributed; and (3) is not warranted to be accurate, complete or timely. Neither Morningstar nor its content providers are responsible for any damages or losses arising from any use of this information. STANDARD & POOR’S®, S&P® and S&P 500® are registered trademarks of Standard & Poor’s Financial Services LLC. Standard & Poor’s does not sponsor, endorse, sell or promote any S&P index-based product. The indexes are unmanaged and include reinvestment of any income or distributions. One cannot invest directly in an index, and an index is not representative of the Fund’s portfolio.
The dollar value, number of shares or principal amount, and names of all portfolio holdings are listed in the Fund’s Statement of Investments (SOI). The SOI begins on page 50.
4 | Semiannual Report

*All Fund distributions will vary depending upon current market conditions, and past distributions are not indicative of future trends.
margins and liquidation value. In determining an optimal mix of equity and fixed income investments for the Fund, we assess changing economic, market and industry conditions.
Manager’s Discussion
During the period under review, the Fund’s strong equity holdings’ performance was driven by factors including continued economic recovery in the U.S.; positive economic growth in leading emerging economies, particularly China and Brazil; continued corporate profitability and rising cash levels on corporate balance sheets. In our assessment, many company management teams shifted their focus from balance sheet strengthening, debt extending and liquidity building to more shareholder-oriented activities including issuing stock dividends and share buybacks, pursuing mergers and acquisition opportunities and increasing capital investment. Although we believe these activities can significantly contribute to a holding’s equity total returns, they do not always benefit credit spreads and by extension, corporate bond total returns.
Long-term interest rates rose along with the 10-year U.S. Treasury note yield, which increased from 2.63% at the beginning of the period to 3.32% by period-end. Investment-grade corporate bond credit spreads over Treasuries contracted during the period from 168 basis points (bps; 100 basis points equal one percentage point) to 138 bps and partially offset the negative impact of higher long-term interest rates.
During the period, the Fund’s equity securities weighting increased from 56.5% to 58.3% of total net assets, its fixed income weighting increased from 29.5% to 34.3%, and its cash holdings decreased from 14.0% to 7.4%

Semiannual Report | 5
6 | Semiannual Report
Energy, materials and industrials were some of the top-performing equity sectors, largely driven by strong global economic conditions and rising commodity prices. Positive performance from companies related to oil, metals and agricultural commodities also contributed to these sectors’ strength. Individual holdings providing major support to performance included oil service industry companies Baker Hughes, Halliburton and Schlumberger, and energy producers Exxon Mobil, ConocoPhillips and Chesapeake Energy. Although nearly all the Fund’s equity holdings contributed to performance, several lost value including Microsoft, Xerox and Cisco Systems as well as electric utility PG&E (sold by period-end).
The increase in the Fund’s fixed income weighting during the period reflected select opportunities in corporate bonds as well as additions to government-related holdings, mainly municipal debt securities. At period-end the fixed income portion of the portfolio mainly consisted of corporate bonds. Bonds issued by iStar Financial performed well, while those from Italian integrated energy company ENI declined in value.
Thank you for your continued participation in Franklin Balanced Fund.
We look forward to serving your future investment needs.


Edward D. Perks, CFA
Shawn Lyons, CFA
Blair Schmicker, CFA
Brent Loder
Alan E. Muschott, CFA
Portfolio Management Team
Franklin Balanced Fund
CFA® is a trademark owned by CFA Institute.
The foregoing information reflects our analysis, opinions and portfolio holdings as of April 30, 2011, the end of the reporting period. The way we implement our main investment strategies and the resulting portfolio holdings may change depending on factors such as market and economic conditions. These opinions may not be relied upon as investment advice or an offer for a particular security. The information is not a complete analysis of every aspect of any market, country, industry, security or the Fund. Statements of fact are from sources considered reliable, but the investment manager makes no representation or warranty as to their completeness or accuracy. Although historical performance is no guarantee of future results, these insights may help you understand our investment management philosophy.
Brent Loder assumed portfolio manager responsibilities for the Fund in March 2011. His research focuses on regional banks and payment processors. Prior to joining Franklin Templeton Investments in 2006, he worked as an associate at Blum Capital Partners where he helped evaluate, execute and monitor investments in public and private companies. Previously, Mr. Loder worked at Morgan Stanley as an analyst in corporate finance and mergers and acquisitions.
Blair Schmicker assumed portfolio manager responsibilities for the Fund in March 2011. He specializes in equity research analysis of the utilities and industrials sectors. His primary research coverage includes the integrated utility, capital goods, alternative energy and construction sectors. Prior to joining Franklin Templeton Investments in 2007, Mr. Schmicker worked as an associate at Aetos Capital and as an analyst at Credit Suisse.
Semiannual Report | 7
Performance Summary as of 4/30/11
Franklin Balanced Fund
Your dividend income will vary depending on dividends or interest paid by securities in the Fund’s portfolio, adjusted for operating expenses of each class. Capital gain distributions are net profits realized from the sale of portfolio securities. The performance table does not reflect any taxes that a shareholder would pay on Fund dividends, capital gain distributions, if any, or any realized gains on the sale of Fund shares. Total return reflects reinvestment of the Fund’s dividends and capital gain distributions, if any, and any unrealized gains or losses.
Performance1
Cumulative total return excludes sales charges. Average annual total returns and value of $10,000 investment include maximum sales charges. Class A: 5.75% maximum initial sales charge; Class C: 1% contingent deferred sales charge in first year only; Class R/Advisor Class: no sales charges.
8 | Semiannual Report

Performance data represent past performance, which does not guarantee future results. Investment return and principal value will fluctuate, and you may have a gain or loss when you sell your shares. Current performance may differ from figures shown. For most recent month-end performance, go to franklintempleton.com or call (800) 342-5236.
The investment manager and administrator have contractually agreed to waive or assume certain expenses so that common expenses (excluding Rule 12b-1 fees and acquired fund fees and expenses) for each class of the Fund do not exceed 0.71% (other than certain nonroutine expenses) until 2/29/12.
Semiannual Report | 9
Performance Summary (continued)
Endnotes
The Fund’s share price and yield will be affected by interest rate movements. Bond prices generally move in the opposite direction of interest rates. As prices of bonds in the Fund adjust to a rise in interest rates, the Fund’s share price may decline. While stocks have historically outperformed other asset classes over the long term, they tend to fluctuate more dramatically over the short term as a result of factors affecting individual companies, industries or the securities market as a whole. The manager applies various techniques and analyses in making investment decisions for the Fund, but there can be no guarantee that these decisions will produce the desired results. The Fund’s prospectus also includes a description of the main investment risks.
| |
Class C: Class R: | These shares have higher annual fees and expenses than Class A shares. Shares are available to certain eligible investors as described in the prospectus. These shares have a higher annual fees and expenses than Class A shares. |
Advisor Class: | Shares are available to certain eligible investors as described in the prospectus. |
1. If the manager and administrator had not waived fees, the Fund’s distribution rate and total return would have been lower, and yields for the period would have been 2.12%, 1.56%, 2.06%, and 2.54% for Classes A, C, R and Advisor, respectively.
2. Cumulative total return represents the change in value of an investment over the periods indicated.
3. Average annual total return represents the average annual change in value of an investment over the periods indicated. Six-month return has not been annualized.
4. These figures represent the value of a hypothetical $10,000 investment in the Fund over the periods indicated.
5. In accordance with SEC rules, we provide standardized average annual total return information through the latest calendar quarter.
6. Distribution rate is based on an annualization of the respective class’s April dividend and the maximum offering price (NAV for Classes C, R and Advisor) per share on 4/30/11.
7. The 30-day standardized yield for the 30 days ended 4/30/11 reflects an estimated yield to maturity (assuming all portfolio securities are held to maturity). It should be regarded as an estimate of the Fund’s rate of investment income, and it may not equal the Fund’s actual income distribution rate (which reflects the Fund’s past dividends paid to shareholders) or the income reported in the Fund’s financial statements.
8. Figures are as stated in the Fund’s prospectus current as of the date of this report. In periods of market volatility, assets may decline significantly, causing total annual Fund operating expenses to become higher than the figures shown.
10 | Semiannual Report
Your Fund’s Expenses
Franklin Balanced Fund
As a Fund shareholder, you can incur two types of costs:
- Transaction costs, including sales charges (loads) on Fund purchases; and
- Ongoing Fund costs, including management fees, distribution and service (12b-1) fees, and other Fund expenses. All mutual funds have ongoing costs, sometimes referred to as operating expenses.
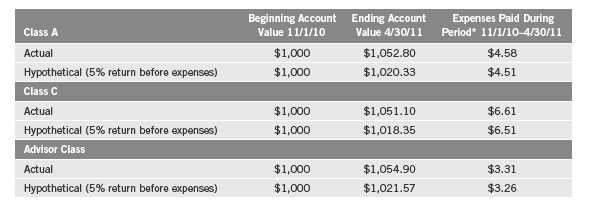
The following table shows ongoing costs of investing in the Fund and can help you understand these costs and compare them with those of other mutual funds. The table assumes a $1,000 investment held for the six months indicated.
Actual Fund Expenses
The first line (Actual) for each share class listed in the table provides actual account values and expenses. The “Ending Account Value” is derived from the Fund’s actual return, which includes the effect of Fund expenses.
You can estimate the expenses you paid during the period by following these steps. Of course, your account value and expenses will differ from those in this illustration:
| 1. | Divide your account value by $1,000. |
| | If an account had an $8,600 value, then $8,600 ÷ $1,000 = 8.6. |
| 2. | Multiply the result by the number under the heading “Expenses Paid During Period.” |
| | If Expenses Paid During Period were $7.50, then 8.6 x $7.50 = $64.50. |
In this illustration, the estimated expenses paid this period are $64.50.
Hypothetical Example for Comparison with Other Funds
Information in the second line (Hypothetical) for each class in the table can help you compare ongoing costs of investing in the Fund with those of other mutual funds. This information may not be used to estimate the actual ending account balance or expenses you paid during the period. The hypothetical “Ending Account Value” is based on the actual expense ratio for each class and an assumed 5% annual rate of return before expenses, which does not represent the Fund’s actual return. The figure under the heading “Expenses Paid During Period” shows the hypothetical expenses your account would have incurred under this scenario. You can compare this figure with the 5% hypothetical examples that appear in shareholder reports of other funds.
Semiannual Report | 11
Your Fund’s Expenses (continued)
Please note that expenses shown in the table are meant to highlight ongoing costs and do not reflect any transaction costs, such as sales charges. Therefore, the second line for each class is useful in comparing ongoing costs only, and will not help you compare total costs of owning different funds. In addition, if transaction costs were included, your total costs would have been higher. Please refer to the Fund prospectus for additional information on operating expenses.

*Expenses are calculated using the most recent six-month expense ratio, net of expense waivers, annualized for each class (A: 1.01%; C: 1.71%; R: 1.21%; and Advisor: 0.71%), multiplied by the average account value over the period, multiplied by 181/365 to reflect the one-half year period.
12 | Semiannual Report
Franklin Convertible Securities Fund
Your Fund’s Goal and Main Investments: Franklin Convertible Securities Fund seeks to maximize total return consistent with reasonable risk by seeking to optimize capital appreciation and high current income under varying market conditions and investing at least 80% of its net assets in
convertible securities.
Performance data represent past performance, which does not guarantee future results. Investment return and principal value will fluctuate, and you may have a gain or loss when you sell your shares. Current performance may differ from figures shown. Please visit franklintempleton.com or call (800) 342-5236 for most recent month-end performance.
We are pleased to bring you Franklin Convertible Securities Fund’s semiannual report for the period ended April 30, 2011.
Performance Overview
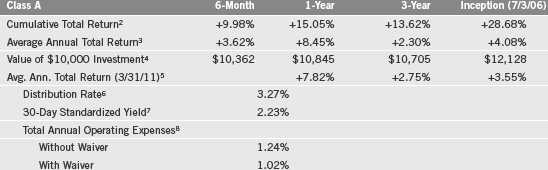
For the six months under review, Franklin Convertible Securities Fund – Class A delivered a +15.44% cumulative total return. The Fund outperformed the +13.86% total return of its benchmark, the BofA Merrill Lynch (BofAML) All Total Return Alternatives U.S. Convertibles Index, which tracks the domestic convertible securities market.1 You can find the Fund’s long-term performance data in the Performance Summary beginning on page 16.
1. Source: © 2011 Morningstar. All Rights Reserved. The information contained herein: (1) is proprietary to Morningstar and/or its content providers; (2) may not be copied or distributed; and (3) is not warranted to be accurate, complete or timely. Neither Morningstar nor its content providers are responsible for any damages or losses arising from any use of this information. The index is unmanaged and includes reinvestment of any income or distributions. One cannot invest directly in an index, and an index is not representative of the Fund’s portfolio.
The dollar value, number of shares or principal amount, and names of all portfolio holdings are listed in the Fund’s Statement of Investments (SOI). The SOI begins on page 60.
Semiannual Report | 13
Investment Strategy
We follow a strategy of maintaining a balance in the portfolio between the equity and debt characteristics of convertible securities with an emphasis on the equity features. Convertible securities are attractive for two reasons: the opportunity to participate in common stocks’ potential growth with relatively reduced volatility, and the potential for current income with potential downside protection from bonds. Typically we sell securities whose equity sensitivity becomes too high and no longer offers appropriate downside protection. Likewise, as securities become too bond-like — reducing their ability to appreciate with increases in the underlying common stock — we attempt to redeploy those assets into more balanced convertible securities and maintain the potential for the Fund’s upside participation. Our experienced team of analysts searches for investment opportunities among all economic sectors and considers a company’s long-term earnings, asset value and cash flow potential, to create a broadly diversified portfolio.
Manager’s Discussion
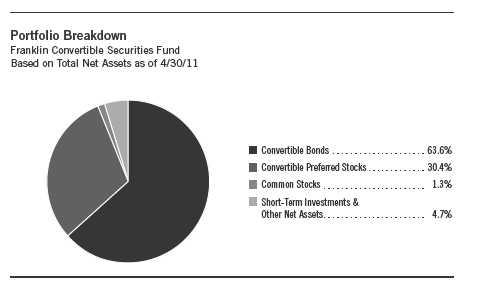
Every sector the Fund invested in rose in value, as did nearly all of the portfolio’s individual securities, supporting overall performance during the six-month reporting period. In an environment of rising investor confidence as well as rebounding consumer and business spending, the Fund’s economically sensitive sectors such as information technology (IT), health care, industrials, consumer discretionary and energy fared particularly well and accounted for the bulk of the Fund’s total return.
Within IT, the Fund’s holdings of semiconductor and IT services-related stocks enjoyed some of the largest gains as many technology companies continued to post stronger-than-expected corporate earnings results through the calendar quarter ended March 31, 2011. As computer hardware and software sales improved at the business and consumer levels, the Fund benefited from its positions in manufacturers of memory chips and semiconductors, particularly Microchip Technology and Micron Technology. Among IT services investments, a major contributor was our holding in VeriFone Holdings, a leading supplier of electronic payment equipment such as point-of-sale software and terminals, smart card and check readers, receipt printers, and Internet commerce software.
The Fund’s top performers in the health care sector included Tenet Healthcare, which operates hospitals and other medical facilities across the U.S., and Omnicare, which provides a suite of products and services aimed primarily at assisted living, nursing home and hospice settings. Strong contributors among industrials included WESCO International, an electrical products distributor, and commercial products manufacturer Ingersoll-Rand. The Fund’s standouts among consumer discretionary holdings were automotive component makers
14 | Semiannual Report
Top 10 Holdings
Franklin Convertible Securities Fund 4/30/11

BorgWarner and Goodyear Tire & Rubber. In the energy sector, oil and gas exploration companies Chesapeake Energy and Apache boosted the Fund’s results.
Despite the Fund’s solid advance this reporting period, there were a few disappointments in the portfolio. Two sectors traditionally considered non-cyclical, consumer staples and utilities, posted relatively small positive results as they fell largely out of favor among investors. On an individual security basis, key detractors included electronics retailer Best Buy; Coinstar, which operates supermarket coin-counting machines and DVD rental kiosks; and AMR, the parent company of American Airlines.
Thank you for your continued participation in Franklin Convertible Securities Fund. We look forward to serving your future investment needs.


Alan E. Muschott, CFA

Blair Schmicker, CFA
Portfolio Management Team
Franklin Convertible Securities Fund
The foregoing information reflects our analysis, opinions and portfolio holdings as of April 30, 2011, the end of the reporting period. The way we implement our main investment strategies and the resulting portfolio holdings may change depending on factors such as market and economic conditions. These opinions may not be relied upon as investment advice or an offer for a particular security. The information is not a complete analysis of every aspect of any market, country, industry, security or the Fund. Statements of fact are from sources considered reliable, but the investment manager makes no representation or warranty as to their completeness or accuracy. Although historical performance is no guarantee of future results, these insights may help you understand our investment management philosophy.
Semiannual Report | 15
Performance Summary as of 4/30/11
Franklin Convertible Securities Fund
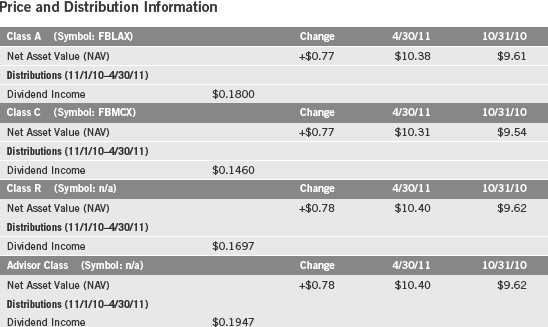
Your dividend income will vary depending on dividends or interest paid by securities in the Fund’s portfolio, adjusted for operating expenses of each class. Capital gain distributions are net profits realized from the sale of portfolio securities. The performance table does not reflect any taxes that a shareholder would pay on Fund dividends, capital gain distributions, if any, or any realized gains on the sale of Fund shares. Total return reflects reinvestment of the Fund’s dividends and capital gain distributions, if any, and any unrealized gains or losses.

16 | Semiannual Report
Performance Summary (continued)
Performance
Cumulative total return excludes sales charges. Average annual total returns and value of $10,000 investment include maximum sales charges. Class A: 5.75% maximum initial sales charge; Class C: 1% contingent deferred sales charge in first year only; Advisor Class: no sales charges.

Performance data represent past performance, which does not guarantee future results. Investment return and principal value will fluctuate, and you may have a gain or loss when you sell your shares. Current performance may differ from figures shown. For most recent month-end performance, go to franklintempleton.com or call (800) 342-5236.
Semiannual Report | 17
Performance Summary (continued)
Endnotes
The Fund may invest in high yielding, fixed income securities. High yields reflect the higher credit risk associated with these lower rated securities and, in some cases, the lower market prices for these instruments. Interest rate movements may affect the Fund’s share price and yield. Bond prices generally move in the opposite direction of interest rates. As prices of bonds in the Fund adjust to a rise in interest rates, the Fund’s share price may decline. The Fund may also invest in foreign securities, which involve special risks, including political uncertainty and currency volatility. The manager applies various techniques and analyses in making investment decisions for the Fund, but there can be no guarantee that these decisions will produce the desired results. The Fund’s prospectus also includes a description of the main investment risks.
| |
Class C: | Prior to 1/1/04, these shares were offered with an initial sales charge; thus actual total returns would have differed. These shares have higher annual fees and expenses than Class A shares. |
Advisor Class: | Shares are available to certain eligible investors as described in the prospectus. |
1. Cumulative total return represents the change in value of an investment over the periods indicated.
2. Average annual total return represents the average annual change in value of an investment over the periods indicated. Six-month return has not been annualized.
3. These figures represent the value of a hypothetical $10,000 investment in the Fund over the periods indicated.
4. In accordance with SEC rules, we provide standardized average annual total return information through the latest calendar quarter.
5. Distribution rate is based on the sum of the respective class’s last four quarterly dividends and the maximum offering price (NAV for Classes C and Advisor) per share on 4/30/11.
6. The 30-day standardized yield for the 30 days ended 4/30/11 reflects an estimated yield to maturity (assuming all portfolio securities are held to maturity). It should be regarded as an estimate of the Fund’s rate of investment income, and it may not equal the Fund’s actual income distribution rate (which reflects the Fund’s past dividends paid to shareholders) or the income reported in the Fund’s financial statements.
7. Figures are as stated in the Fund’s prospectus current as of the date of this report. In periods of market volatility, assets may decline significantly, causing total annual Fund operating expenses to become higher than the figures shown.
8. Effective 5/15/08, the Fund began offering Advisor Class shares, which do not have sales charges or a Rule 12b-1 plan. Performance quotations for this class reflect the following methods of calculation: (a) For periods prior to 5/15/08, a restated figure is used based upon the Fund’s Class A performance, excluding the effect of Class A’s maximum initial sales charge, but reflecting the effect of the Class A Rule 12b-1 fees; and (b) for periods after 5/14/08, actual Advisor Class performance is used reflecting all charges and fees applicable to that class. Since 5/15/08 (commencement of sales), the cumulative and average annual total returns of Advisor Class shares were +24.00% and +7.54%.
18 | Semiannual Report
Your Fund’s Expenses
Franklin Convertible Securities Fund
As a Fund shareholder, you can incur two types of costs:
- Transaction costs, including sales charges (loads) on Fund purchases; and
- Ongoing Fund costs, including management fees, distribution and service (12b-1) fees, and other Fund expenses. All mutual funds have ongoing costs, sometimes referred to as operating expenses.
The following table shows ongoing costs of investing in the Fund and can help you understand these costs and compare them with those of other mutual funds. The table assumes a $1,000 investment held for the six months indicated.
Actual Fund Expenses
The first line (Actual) for each share class listed in the table provides actual account values and expenses. The “Ending Account Value” is derived from the Fund’s actual return, which includes the effect of Fund expenses.
You can estimate the expenses you paid during the period by following these steps. Of course, your account value and expenses will differ from those in this illustration:
| 1. | Divide your account value by $1,000. |
| | If an account had an $8,600 value, then $8,600 ÷ $1,000 = 8.6. |
| 2. | Multiply the result by the number under the heading “Expenses Paid During Period.” |
| | If Expenses Paid During Period were $7.50, then 8.6 x $7.50 = $64.50. |
In this illustration, the estimated expenses paid this period are $64.50.
Hypothetical Example for Comparison with Other Funds
Information in the second line (Hypothetical) for each class in the table can help you compare ongoing costs of investing in the Fund with those of other mutual funds. This information may not be used to estimate the actual ending account balance or expenses you paid during the period. The hypothetical “Ending Account Value” is based on the actual expense ratio for each class and an assumed 5% annual rate of return before expenses, which does not represent the Fund’s actual return. The figure under the heading “Expenses Paid During Period” shows the hypothetical expenses your account would have incurred under this scenario. You can compare this figure with the 5% hypothetical examples that appear in shareholder reports of other funds.
Semiannual Report | 19
Your Fund’s Expenses (continued)
Please note that expenses shown in the table are meant to highlight ongoing costs and do not reflect any transaction costs, such as sales charges. Therefore, the second line for each class is useful in comparing ongoing costs only, and will not help you compare total costs of owning different funds. In addition, if transaction costs were included, your total costs would have been higher. Please refer to the Fund prospectus for additional information on operating expenses.
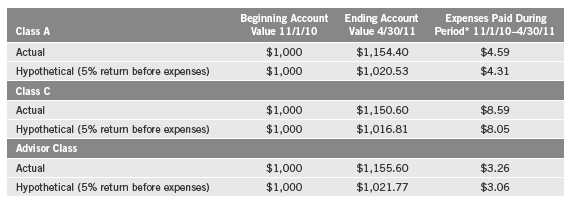
*Expenses are calculated using the most recent six-month expense ratio, annualized for each class (A: 0.86%; C: 1.61%; and Advisor: 0.61%), multiplied by the average account value over the period, multiplied by 181/365 to reflect the one-half year period.
20 | Semiannual Report
Franklin Equity Income Fund
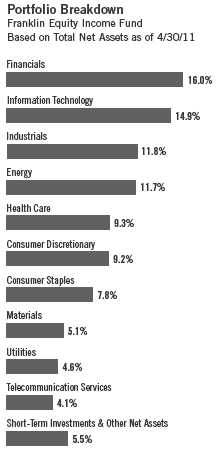
Your Fund’s Goal and Main Investments: Franklin Equity Income Fund seeks to maximize total return, emphasizing high current income and long-term capital appreciation, consistent with reasonable risk, by investing at least 80% of its net assets in equity securities including securities convertible into common stocks.
Performance data represent past performance, which does not guarantee future results. Investment return and principal value will fluctuate, and you may have a gain or loss when you sell your shares. Current performance may differ from figures shown. Please visit franklintempleton.com or call (800) 342-5236 for most recent month-end performance.
This semiannual report for Franklin Equity Income Fund covers the period ended April 30, 2011.
Performance Overview
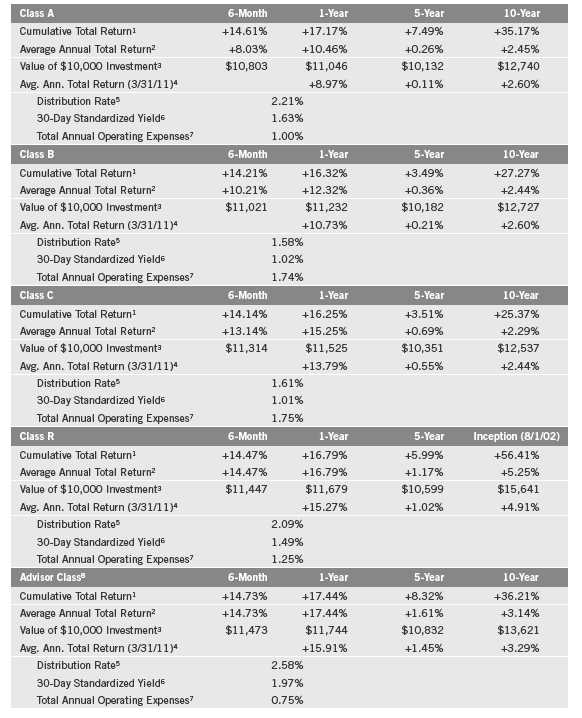
For the six months under review, Franklin Equity Income Fund – Class A delivered a +14.61% cumulative total return. The Fund underperformed the broad U.S. stock market as measured by the Standard & Poor’s 500 Index (S&P 500), which produced a +16.36% total return.1 The Fund also under-performed the +15.56% total return of its peers in the Lipper Equity Income Funds Classification Average, which consists of funds chosen by Lipper that seek relatively high current income and growth of income by investing at least 60% of their portfolios in stocks.2 You can find the Fund’s long-term performance data in the Performance Summary beginning on page 25.
Investment Strategy
We emphasize dividends in selecting stocks for the Fund because we believe that over time dividend income can contribute significantly to total return. We target companies we believe are financially strong but undervalued by the market. To identify such companies, we use a current relative yield analysis that focuses on a company’s dividend yield (calculated by dividing a stock’s annual per-share dividends by its per-share market price). Our experienced
1. Source: © 2011 Morningstar. All Rights Reserved. The information contained herein: (1) is proprietary to Morningstar and/or its content providers; (2) may not be copied or distributed; and (3) is not warranted to be accurate, complete or timely. Neither Morningstar nor its content providers are responsible for any damages or losses arising from any use of this information.
2. Source: Lipper Inc. For the six-month period ended 4/30/11, this category consisted of 287 funds. Lipper calculations do not include sales charges, or expense subsidization by a fund’s manager. The Fund’s performance relative to the average may have differed if these and other factors had been considered.
The indexes are unmanaged and include reinvested dividends. One cannot invest directly in an index, and an index is not representative of the Fund’s portfolio.
The dollar value, number of shares or principal amount, and names of all portfolio holdings are listed in the Fund’s Statement of Investments (SOI). The SOI begins on page 68.
Semiannual Report | 21

team of analysts searches for investment opportunities among all economic sectors, and considers a company’s long-term earnings, asset value and cash flow potential, to create a broadly diversified portfolio.
Manager’s Discussion
Fund performance benefited from positive and broad-based returns across equity markets, and more specifically from investors’ preference for cyclical (economically sensitive) stocks as the U.S. and global economic recoveries generally gathered momentum. In this environment, every sector the Fund invested in produced positive results, and our holdings in the energy, industrials, information technology (IT), financials and consumer discretionary sectors generated major contributions to return. As prices for petroleum and other energy products climbed sharply throughout the reporting period, many of the Fund’s energy sector positions in major oil producers, as well as oil and gas exploration companies and oilfield services providers, increased in value. Standout performers within the sector included Halliburton, Chesapeake Energy, Chevron, ConocoPhillips and ExxonMobil, all of which posted double-digit returns.
The Fund’s industrials sector stocks were particularly beneficial, led by gains in heavy machinery manufacturer Caterpillar, global air freight and logistics specialist United Parcel Service, trucking firm J.B. Hunt Transport Services, and industrial conglomerates General Electric and 3M. As corporate earnings
22 | Semiannual Report
improved, businesses continued to engage in long-awaited equipment and productivity upgrades that had been delayed by the recession. This shift in business sentiment had a positive impact on many of the Fund’s technology-related holdings. These included makers of computer hardware and electronic consumer products such as IBM and Apple, in addition to microchip manufacturers Intel and Microchip Technology, which benefited as many companies increased spending to upgrade their IT infrastructure.
Among financials, we held relatively large positions in T. Rowe Price Group, Wells Fargo, JPMorgan Chase and Marsh & McLennan during the reporting period, making their double-digit returns even more meaningful to overall higher Fund performance. Elsewhere, an environment of rising consumer sentiment, incomes and increasingly robust discretionary spending combined to aid the Fund’s positions in retailers Limited Brands and The Home Depot, as well as Comcast, the largest U.S. cable services provider.
Despite the Fund’s solid results this reporting period, some typically noncyclical sectors represented in the Fund’s portfolio, notably consumer staples and utilities, lagged the overall market’s advance, producing positive though comparatively weaker returns as they generally fell out of favor with investors. On an individual security basis, only a few holdings hindered performance. Key detractors included Cisco Systems and Xerox from the IT sector, retailers Best Buy (sold by period-end) and Target, and Bank of America common stock.

Semiannual Report | 23
Thank you for your continued participation in Franklin Equity Income Fund.
We look forward to serving your future investment needs.


Alan E. Muschott, CFA

Edward D. Perks, CFA

Frank M. Felicelli, CFA
Portfolio Management Team
Franklin Equity Income Fund
The foregoing information reflects our analysis, opinions and portfolio holdings as of April 30, 2011, the end of the reporting period. The way we implement our main investment strategies and the resulting portfolio holdings may change depending on factors such as market and economic conditions. These opinions may not be relied upon as investment advice or an offer for a particular security. The information is not a complete analysis of every aspect of any market, country, industry, security or the Fund. Statements of fact are from sources considered reliable, but the investment manager makes no representation or warranty as to their completeness or accuracy. Although historical performance is no guarantee of future results, these insights may help you understand our investment management philosophy.
24 | Semiannual Report
Performance Summary as of 4/30/11
Franklin Equity Income Fund
Your dividend income will vary depending on dividends or interest paid by securities in the Fund’s portfolio, adjusted for operating expenses of each class. Capital gain distributions are net profits realized from the sale of portfolio securities. The performance table does not reflect any taxes that a shareholder would pay on Fund dividends, capital gain distributions, if any, or any realized gains on the sale of Fund shares. Total return reflects reinvestment of the Fund’s dividends and capital gain distributions, if any, and any unrealized gains or losses.

Semiannual Report | 25
Performance Summary (continued)
Performance
Cumulative total return excludes sales charges. Average annual total returns and value of $10,000 investment include maximum sales charges. Class A: 5.75% maximum initial sales charge; Class B: contingent deferred sales charge (CDSC) declining from 4% to 1% over six years, and eliminated thereafter; Class C: 1% CDSC in first year only; Class R/Advisor Class: no sales charges.
Performance data represent past performance, which does not guarantee future results. Investment return and principal value will fluctuate, and you may have a gain or loss when you sell your shares. Current performance may differ from figures shown. For most recent month-end performance, go to franklintempleton.com or call (800) 342-5236.
26 | Semiannual Report
Performance Summary (continued)
Endnotes
While stocks have historically outperformed other asset classes over the long term, they tend to fluctuate more dramatically over the short term as a result of factors affecting individual companies, industries or the securities market as a whole. The Fund’s investment in foreign securities also involves special risks, including currency fluctuations and economic as well as political uncertainty. The manager applies various techniques and analyses in making investment decisions for the Fund, but there can be no guarantee that these decisions will produce the desired results. The Fund’s prospectus also includes a description of the main investment risks.
| |
Class B: Class C: | These shares have higher annual fees and expenses than Class A shares. Prior to 1/1/04, these shares were offered with an initial sales charge; thus actual total returns would have differed. These shares have higher annual fees and expenses than Class A shares. |
Class R: | Shares are available to certain eligible investors as described in the prospectus. These shares have higher annual fees and expenses than Class A shares. |
Advisor Class: | Shares are available to certain eligible investors as described in the prospectus. |
1. Cumulative total return represents the change in value of an investment over the periods indicated.
2. Average annual total return represents the average annual change in value of an investment over the periods indicated. Six-month return has not been annualized.
3. These figures represent the value of a hypothetical $10,000 investment in the Fund over the periods indicated.
4. In accordance with SEC rules, we provide standardized average annual total return information through the latest calendar quarter.
5. Distribution rate is based on an annualization of the respective class’s April dividend and the maximum offering price (NAV for Classes B, C, R and Advisor) per share on 4/30/11.
6. The 30-day standardized yield for the 30 days ended 4/30/11 reflects an estimated yield to maturity (assuming all portfolio securities are held to maturity). It should be regarded as an estimate of the Fund’s rate of investment income, and it may not equal the Fund’s actual income distribution rate (which reflects the Fund’s past dividends paid to shareholders) or the income reported in the Fund’s financial statements.
7. Figures are as stated in the Fund’s prospectus current as of the date of this report. In periods of market volatility, assets may decline significantly, causing total annual Fund operating expenses to become higher than the figures shown.
8. Effective 5/15/08, the Fund began offering Advisor Class shares, which do not have sales charges or a Rule 12b-1 plan. Performance quotations for this class reflect the following methods of calculation: (a) For periods prior to 5/15/08, a restated figure is used based upon the Fund’s Class A performance, excluding the effect of Class A’s maximum initial sales charge, but reflecting the effect of the Class A Rule 12b-1 fees; and (b) for periods after 5/14/08, actual Advisor Class performance is used reflecting all charges and fees applicable to that class. Since 5/15/08 (commencement of sales), the cumulative and average annual total returns of Advisor Class shares were +1.76% and +0.59%.
Semiannual Report | 27
Your Fund’s Expenses
Franklin Equity Income Fund
As a Fund shareholder, you can incur two types of costs:
- Transaction costs, including sales charges (loads) on Fund purchases; and
- Ongoing Fund costs, including management fees, distribution and service (12b-1) fees, and other Fund expenses. All mutual funds have ongoing costs, sometimes referred to as operating expenses.
The following table shows ongoing costs of investing in the Fund and can help you understand these costs and compare them with those of other mutual funds. The table assumes a $1,000 investment held for the six months indicated.
Actual Fund Expenses
The first line (Actual) for each share class listed in the table provides actual account values and expenses. The “Ending Account Value” is derived from the Fund’s actual return, which includes the effect of Fund expenses.
You can estimate the expenses you paid during the period by following these steps. Of course, your account value and expenses will differ from those in this illustration:
| 1. | Divide your account value by $1,000. |
| | If an account had an $8,600 value, then $8,600 ÷ $1,000 = 8.6. |
| 2. | Multiply the result by the number under the heading “Expenses Paid During Period.” |
| | If Expenses Paid During Period were $7.50, then 8.6 x $7.50 = $64.50. |
In this illustration, the estimated expenses paid this period are $64.50.
Hypothetical Example for Comparison with Other Funds
Information in the second line (Hypothetical) for each class in the table can help you compare ongoing costs of investing in the Fund with those of other mutual funds. This information may not be used to estimate the actual ending account balance or expenses you paid during the period. The hypothetical “Ending Account Value” is based on the actual expense ratio for each class and an assumed 5% annual rate of return before expenses, which does not represent the Fund’s actual return. The figure under the heading “Expenses Paid During Period” shows the hypothetical expenses your account would have incurred under this scenario. You can compare this figure with the 5% hypothetical examples that appear in shareholder reports of other funds.
28 | Semiannual Report
Your Fund’s Expenses (continued)
Please note that expenses shown in the table are meant to highlight ongoing costs and do not reflect any transaction costs, such as sales charges. Therefore, the second line for each class is useful in comparing ongoing costs only, and will not help you compare total costs of owning different funds. In addition, if transaction costs were included, your total costs would have been higher. Please refer to the Fund prospectus for additional information on operating expenses.

*Expenses are calculated using the most recent six-month expense ratio, annualized for each class (A: 0.92%; B: 1.66%; C: 1.67%; R: 1.17%; and Advisor: 0.67%), multiplied by the average account value over the period, multiplied by 181/365 to reflect the one-half year period.
Semiannual Report | 29
Franklin Limited Maturity U.S. Government Securities Fund
Your Fund’s Goal and Main Investments: Franklin Limited Maturity U.S. Government Securities Fund seeks to provide investors with as high a level of current income as is consistent with prudent investing, while seeking to preserve shareholders’ capital, by investing at least 80% of its net assets in securities with a dollar-weighted average maturity of less than 10 years and issued or guaranteed by the U.S. government, its agencies or instrumentalities.1 Some of the Fund’s investments may include securities issued by U.S. government-sponsored entities such as Fannie Mae and Freddie Mac.2
Performance data represent past performance, which does not guarantee future results. Investment return and principal value will fluctuate, and you may have a gain or loss when you sell your shares. Current performance may differ from figures shown. Please visit franklintempleton.com or call (800) 342-5236 for most recent month-end performance.

We are pleased to bring you Franklin Limited Maturity U.S. Government Securities Fund’s semiannual report for the period ended April 30, 2011.
Performance Overview
For the six months under review, Franklin Limited Maturity U.S. Government Securities Fund – Class A delivered a +0.18% cumulative total return. The
1. In determining a security’s maturity for the purposes of calculating the Fund’s average maturity, an estimate of the average time for its principal to be paid may be used. This can be substantially shorter than its stated final maturity.
2. Although U.S. government-sponsored entities may be chartered or sponsored by acts of Congress, their securities are neither insured nor guaranteed by the U.S. government. Please refer to the Fund’s prospectus for a detailed discussion regarding various levels of credit support. The Fund’s yield and share price are not guaranteed and will vary with market conditions.
The dollar value, number of shares or principal amount, and names of all portfolio holdings are listed in the Fund’s Statement of Investments (SOI). The SOI begins on page 73.
30 | Semiannual Report

*Assumes shares were purchased and held for the entire accrual period. Since dividends accrue daily, your actual distributions will vary depending on the date you purchased your shares and any account activity. All Fund distributions will vary depending upon current market conditions, and past distributions are not indicative of future trends.
**Includes an additional 0.63 cent per share distribution to meet excise tax requirements.
Fund outperformed the -0.33% total return of its primary benchmark, the Barclays Capital (BC) U.S. Treasury Index: 1-5 Year Component, which tracks U.S. Treasury securities with one to five years remaining maturity.3 The Fund also outperformed the +0.08% total return of its secondary benchmark, the Barclays Capital (BC) U.S. Treasury Index: 1-3 Year Component, which tracks U.S. Treasury securities with one to three years remaining maturity.3 You can find the Fund’s long-term performance data in the Performance Summary beginning on page 34.
Investment Strategy
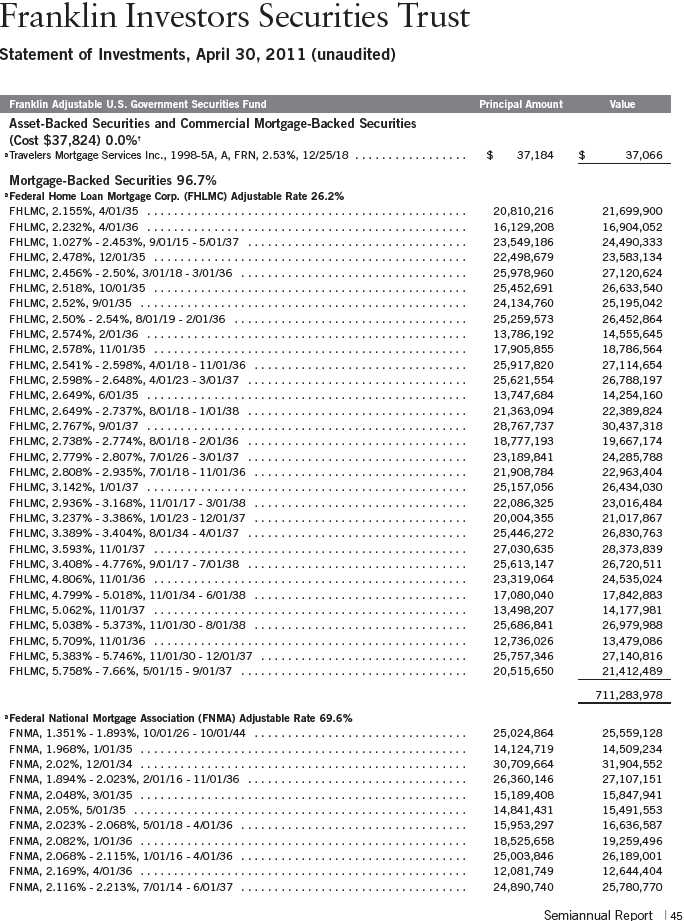
We currently maintain the portfolio’s average dollar-weighted maturity between one and five years. The Fund’s average dollar-weighted maturity will vary with market conditions and the outlook for interest rates. We invest primarily in short-to intermediate-term securities guaranteed by the U.S. government, its agencies and instrumentalities. Some of the Fund’s investments may include securities issued by U.S. government-sponsored entities, such as Fannie Mae (FNMA) and Freddie Mac (FHLMC).2 The Fund’s portfolio emphasizes mortgage-backed bonds and agency debentures, while also diversifying across components of the U.S. Treasury sector. We analyze securities using proprietary and nonpro-prietary research to help identify attractive investment opportunities.
3. Source: © 2011 Morningstar. All Rights Reserved. The information contained herein: (1) is proprietary to Morningstar and/or its content providers; (2) may not be copied or distributed; and (3) is not warranted to be accurate, complete or timely. Neither Morningstar nor its content providers are responsible for any damages or losses arising from any use of this information. The indexes are unmanaged and include reinvestment of any income or distributions. One cannot invest directly in an index, and an index is not representative of the Fund’s portfolio.
Semiannual Report | 31
Manager’s Discussion
During the period, the U.S. economic recovery appeared to make progress despite mixed economic data. The U.S. consumer was resilient and retail sales remained relatively strong, in spite of higher gasoline prices. The labor market showed signs of healing, and the corporate sector generally delivered healthy profits and solid balance sheets. The unemployment rate remained elevated, which restrained labor costs and wages and made it difficult for businesses to pass higher commodity prices to consumers. A global recovery seems to be in place, driven largely by growth in emerging markets. However, potential risks to economic expansion persisted, including U.S. federal debt levels, global inflationary pressures, concerns surrounding some eurozone countries and a distressed U.S. housing market.
Most fixed income sectors, as measured by their relevant BC indexes, posted positive returns during the period, including the Treasury Inflation Protected Securities (TIPS) Index (+1.28%), the Ginnie Mae Index (+1.12%), the U.S. Hybrid Adjustable-Rate Mortgage (ARM) Index (+1.08%) and the U.S. Agency Fixed Rate Mortgage-Backed Securities (MBS) Index (+0.94%).3 In contrast, the U.S. Agency Index lagged with a -0.31% return.3
The Fund, which typically looks for attractive valuations within lower interest rate risk government bond markets, invested in government-related securities, such as U.S. Treasuries, agency debentures, agency mortgage pass-through securities (both fixed and adjustable rate) and cash investments. We continued to emphasize agency debentures and mortgage pass-through securities because we believe they offer better return potential, as well as an income advantage over Treasuries. We slightly decreased exposure to agency ARMs and marginally increased allocation to fixed-rate agency mortgages as we looked for what we considered the best opportunities in these securities. We added agency mortgages backed by commercial properties that were trading, in our view, at attractive yield spreads versus other government related bonds. We reduced our allocation to TIPS after valuations richened.
Our exposure to agency MBS (both fixed and adjustable rate) and agency debentures contributed to performance. The Fund’s Treasury exposure aided returns because of our TIPS holdings. We positioned the portfolio to have less interest rate risk than the benchmark as we were mindful of the potential for rising interest rates.
32 | Semiannual Report
Thank you for your continued participation in Franklin Limited Maturity U.S. Government Securities Fund. We look forward to serving your future investment needs.

Portfolio Management Team
Franklin Limited Maturity
U.S. Government Securities Fund
The foregoing information reflects our analysis, opinions and portfolio holdings as of April 30, 2011, the end of the reporting period. The way we implement our main investment strategies and the resulting portfolio holdings may change depending on factors such as market and economic conditions. These opinions may not be relied upon as investment advice or an offer for a particular security. The information is not a complete analysis of every aspect of any market, country, industry, security or the Fund. Statements of fact are from sources considered reliable, but the investment manager makes no representation or warranty as to their completeness or accuracy. Although historical performance is no guarantee of future results, these insights may help you understand our investment management philosophy.
Semiannual Report | 33
Performance Summary as of 4/30/11
Franklin Limited Maturity U.S. Government Securities Fund
Your dividend income will vary depending on dividends or interest paid by securities in the Fund’s portfolio, adjusted for operating expenses of each class. Capital gain distributions are net profits realized from the sale of portfolio securities. The performance table does not reflect any taxes that a shareholder would pay on Fund dividends, capital gain distributions, if any, or any realized gains on the sale of Fund shares. Total return reflects reinvestment of the Fund’s dividends and capital gain distributions, if any, and any unrealized gains or losses.

Performance
Cumulative total return excludes sales charges. Average annual total returns include maximum sales charges. Class A: 2.25% maximum initial sales charge; Advisor Class: no sales charges.

Performance data represent past performance, which does not guarantee future results. Investment return and principal value will fluctuate, and you may have a gain or loss when you sell your shares. Current performance may differ from figures shown. For most recent month-end performance, go to franklintempleton.com or call (800) 342-5236.
34 | Semiannual Report
Performance Summary (continued)
Endnotes
Interest rate movements, unscheduled mortgage prepayments and other risk factors will affect the Fund’s share price and yield. Bond prices, and thus a fund’s share price, generally move in the opposite direction of interest rates. Therefore, as prices of bonds in the Fund adjust to a rise in interest rates, the Fund’s share price may decline. The manager applies various techniques and analyses in making investment decisions for the Fund, but there can be no guarantee that these decisions will produce the desired results. The Fund’s prospectus also includes a description of the main investment risks.
Advisor Class: Shares are available to certain eligible investors as described in the prospectus.
1. Cumulative total return represents the change in value of an investment over the periods indicated.
2. Average annual total return represents the average annual change in value of an investment over the periods indicated. Six-month return has not been annualized.
3. In accordance with SEC rules, we provide standardized average annual total return information through the latest calendar quarter.
4. Distribution rate is based on an annualization of the respective class’s April dividend and the maximum offering price (NAV for Advisor Class) per share on 4/30/11.
5. The 30-day standardized yield for the 30 days ended 4/30/11 reflects an estimated yield to maturity (assuming all portfolio securities are held to maturity). It should be regarded as an estimate of the Fund’s rate of investment income, and it may not equal the Fund’s actual income distribution rate (which reflects the Fund’s past dividends paid to shareholders) or the income reported in the Fund’s financial statements.
6. Figures are as stated in the Fund’s prospectus current as of the date of this report. In periods of market volatility, assets may decline significantly, causing total annual Fund operating expenses to become higher than the figures shown.
Semiannual Report | 35
Your Fund’s Expenses
Franklin Limited Maturity U.S. Government Securities Fund
As a Fund shareholder, you can incur two types of costs:
- Transaction costs, including sales charges (loads) on Fund purchases; and
- Ongoing Fund costs, including management fees, distribution and service (12b-1) fees, and other Fund expenses. All mutual funds have ongoing costs, sometimes referred to as operating expenses.
The following table shows ongoing costs of investing in the Fund and can help you understand these costs and compare them with those of other mutual funds. The table assumes a $1,000 investment held for the six months indicated.
Actual Fund Expenses
The first line (Actual) for each share class listed in the table provides actual account values and expenses. The “Ending Account Value” is derived from the Fund’s actual return, which includes the effect of Fund expenses.
You can estimate the expenses you paid during the period by following these steps. Of course, your account value and expenses will differ from those in this illustration:
| 1. | Divide your account value by $1,000. |
| | If an account had an $8,600 value, then $8,600 ÷ $1,000 = 8.6. |
| 2. | Multiply the result by the number under the heading “Expenses Paid During Period.” |
| | If Expenses Paid During Period were $7.50, then 8.6 x $7.50 = $64.50. |
In this illustration, the estimated expenses paid this period are $64.50.
Hypothetical Example for Comparison with Other Funds
Information in the second line (Hypothetical) for each class in the table can help you compare ongoing costs of investing in the Fund with those of other mutual funds. This information may not be used to estimate the actual ending account balance or expenses you paid during the period. The hypothetical “Ending Account Value” is based on the actual expense ratio for each class and an assumed 5% annual rate of return before expenses, which does not represent the Fund’s actual return. The figure under the heading “Expenses Paid During Period” shows the hypothetical expenses your account would have incurred under this scenario. You can compare this figure with the 5% hypothetical examples that appear in shareholder reports of other funds.
36 | Semiannual Report
Your Fund’s Expenses (continued)
Please note that expenses shown in the table are meant to highlight ongoing costs and do not reflect any transaction costs, such as sales charges. Therefore, the second line for each class is useful in comparing ongoing costs only, and will not help you compare total costs of owning different funds. In addition, if transaction costs were included, your total costs would have been higher. Please refer to the Fund prospectus for additional information on operating expenses.

*Expenses are calculated using the most recent six-month expense ratio, annualized for each class (A: 0.77% and Advisor: 0.67%), multiplied by the average account value over the period, multiplied by 181/365 to reflect the one-half year period.
Semiannual Report | 37
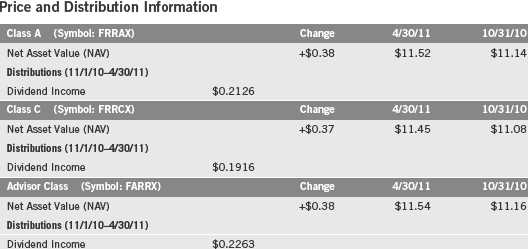
Franklin Real Return Fund
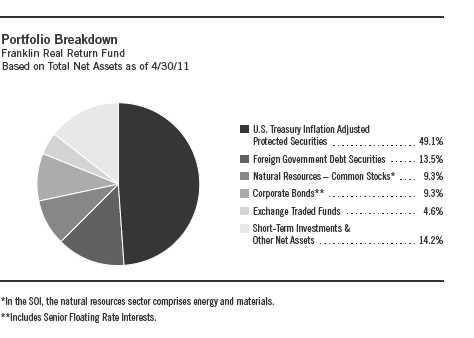
Your Fund’s Goal and Main Investments: Franklin Real Return Fund seeks to achieve total return that exceeds the rate of inflation over an economic cycle. The Fund will generally invest a substantial portion of its assets in inflation-protected securities. Managers also have the flexibility to invest in other sectors of the market to increase real return (total return less the rate of inflation) potential and offer greater diversification.
Performance data represent past performance, which does not guarantee future results. Investment return and principal value will fluctuate, and you may have a gain or loss when you sell your shares. Current performance may differ from figures shown Please visit franklintempleton.com or call (800) 342-5236 for most recent month-end performance.
We are pleased to bring you Franklin Real Return Fund’s semiannual report for the period ended April 30, 2011.
Performance Overview
For the six months under review, Franklin Real Return Fund – Class A delivered a +5.28% cumulative total return. The Fund outperformed the +1.28% total return of its benchmark, the Barclays Capital (BC) U.S. TIPS Index, which tracks the universe of inflation-protected notes issued by the U.S. Treasury that have at least one year to final maturity.1 The Fund outperformed the Consumer Price
1. Source: © 2011 Morningstar. All Rights Reserved. The information contained herein: (1) is proprietary to Morningstar and/or its content providers; (2) may not be copied or distributed; and (3) is not warranted to be accurate, complete or timely. Neither Morningstar nor its content providers are responsible for any damages or losses arising from any use of this information. The indexes are unmanaged. The BC U.S. TIPS Index includes reinvested interest. One cannot invest directly in an index, and an index is not representative of the Fund’s portfolio.
The dollar value, number of shares or principal amount, and names of all portfolio holdings are listed in the Fund’s Statement of Investments (SOI). The SOI begins on page 79.
38 | Semiannual Report

*All Fund distributions will vary depending upon current market conditions, and past distributions are not indicative of future trends.
Index (CPI) for Urban Consumers (All Items) NSA (non-seasonally adjusted), a measure of the average change in prices of all goods and services purchased for consumption by urban householders, which rose 2.83% for the same period.1 You can find more of the Fund’s performance data in the Performance Summary beginning on page 41.
Investment Strategy
We seek to allocate assets among investments to achieve the highest level of real return (total return less the rate of inflation) consistent with an acceptable level of risk. We will allocate the Fund’s assets among securities in various market sectors based on our assessment of changing economic, global market, industry and issuer conditions. When making our investment decisions, we will evaluate such criteria as country risk, business cycles, yield curves, and values between and within markets.
Manager’s Discussion
During the period under review, we invested the Fund’s assets in the allowable sectors. At period-end, nearly half of the Fund’s total net assets were invested in U.S. Treasury Inflation Protected Securities (TIPS). For diversification, we also allocated some of the Fund’s assets to natural resources, real estate investment trusts (REITs), short-term non-U.S. dollar securities, bank loans and high yield sectors. We employed a non-U.S. dollar strategy to help manage against dollar weakness versus certain currencies. We concentrated our TIPS holdings in shorter maturities, helping the Fund’s relative performance as interest rates rose during the period.
Semiannual Report | 39
The global economic recovery continued in early 2011 despite global concerns including European debt, Middle Eastern and North African political unrest and multiple crises triggered by the Japanese earthquake and tsunami. Inflationary pressures began to emerge through increased commodity and energy prices. In the U.S., broad inflation measures picked up, and we believe there is evidence inflation began to affect areas besides food and energy. Manufacturers and retailers showed indications of passing their costs to their end consumers. Our diversified mix of inflation-sensitive assets outperformed during the period as risk assets in general continued to do well versus the safe haven of long-term U.S. Treasuries. In particular, our allocation to natural resources securities and REITs helped performance relative to the BC U.S. TIPS Index.
Thank you for your continued participation in Franklin Real Return Fund. We look forward to serving your future investment needs.


T. Anthony Coffey, CFA

Kent Burns, CFA
Portfolio Management Team
Franklin Real Return Fund
The foregoing information reflects our analysis, opinions and portfolio holdings as of April 30, 2011, the end of the reporting period. The way we implement our main investment strategies and the resulting portfolio holdings may change depending on factors such as market and economic conditions. These opinions may not be relied upon as investment advice or an offer for a particular security. The information is not a complete analysis of every aspect of any market, country, industry, security or the Fund. Statements of fact are from sources considered reliable, but the investment manager makes no representation or warranty as to their completeness or accuracy. Although historical performance is no guarantee of future results, these insights may help you understand our investment management philosophy.
40 | Semiannual Report
Performance Summary as of 4/30/11
Franklin Real Return Fund
Your dividend income will vary depending on dividends or interest paid by securities in the Fund’s portfolio, adjusted for operating expenses of each class. Capital gain distributions are net profits realized from the sale of portfolio securities. The performance table does not reflect any taxes that a shareholder would pay on Fund dividends, capital gain distributions, if any, or any realized gains on the sale of Fund shares. Total return reflects reinvestment of the Fund’s dividends and capital gain distributions, if any, and any unrealized gains or losses.
Semiannual Report | 41
Performance Summary (continued)
Performance1
Cumulative total return excludes sales charges. Average annual total returns include maximum sales charges. Class A: 4.25% maximum initial sales charge; Class C: 1% contingent deferred sales charge in first year only; Advisor Class: no sales charges.

Performance data represent past performance, which does not guarantee future results. Investment return and principal value will fluctuate, and you may have a gain or loss when you sell your shares. Current performance may differ from figures shown. For most recent month-end performance, go to franklintempleton.com or call (800) 342-5236.
The investment manager and administrator have contractually agreed to waive or assume certain expenses so that common expenses (excluding Rule 12b-1 fees and acquired fees and expenses) for each class of the Fund do not exceed 0.65% (other than certain nonroutine expenses) until 2/29/12.
42 | Semiannual Report
Performance Summary (continued)
Endnotes
Interest rate movements will affect the Fund’s share price and yield. Bond prices generally move in the opposite direction of interest rates. Thus, as prices of bonds in the Fund adjust to a rise in interest rates, the Fund’s share price may decline. While stocks have historically outperformed other asset classes over the long term, they tend to fluctuate more dramatically over the short term. These price movements may result from factors affecting individual companies, industries or the securities market as a whole. The risks of foreign securities include currency fluctuations and political uncertainty. The manager applies various techniques and analyses in making investment decisions for the Fund, but there can be no guarantee that these decisions will produce the desired results. The Fund’s prospectus also includes a description of the main investment risks.
Class C: These shares have higher annual fees and expenses than Class A shares.
Advisor Class: Shares are available to certain eligible investors as described in the prospectus.
1. If the manager and administrator had not waived fees, the Fund’s distribution rate and total return would have been lower, and yield for the period would have been 2.46%, 2.16% and 2.81% for Classes A, C and Advisor, respectively.
2. Cumulative total return represents the change in value of an investment over the periods indicated.
3. Average annual total return represents the average annual change in value of an investment over the periods indicated. Six-month return has not been annualized.
4. In accordance with SEC rules, we provide standardized average annual total return information through the latest calendar quarter.
5. Distribution rate is based on an annualization of the respective class’s April dividend and the maximum offering price (NAV for Classes C and Advisor) per share on 4/30/11.
6. The 30-day standardized yield for the 30 days ended 4/30/11 reflects an estimated yield to maturity (assuming all portfolio securities are held to maturity). It should be regarded as an estimate of the Fund’s rate of investment income, and it may not equal the Fund’s actual income distribution rate (which reflects the Fund’s past dividends paid to shareholders) or the income reported in the Fund’s financial statements.
7. Figures are as stated in the Fund’s prospectus current as of the date of this report. In periods of market volatility, assets may decline significantly, causing total annual Fund operating expenses to become higher than the figures shown.
Semiannual Report | 43
Your Fund’s Expenses
Franklin Real Return Fund
As a Fund shareholder, you can incur two types of costs:
- Transaction costs, including sales charges (loads) on Fund purchases; and
- Ongoing Fund costs, including management fees, distribution and service (12b-1) fees, and other Fund expenses. All mutual funds have ongoing costs, sometimes referred to as operating expenses.
The following table shows ongoing costs of investing in the Fund and can help you understand these costs and compare them with those of other mutual funds. The table assumes a $1,000 investment held for the six months indicated.
Actual Fund Expenses
The first line (Actual) for each share class listed in the table provides actual account values and expenses. The “Ending Account Value” is derived from the Fund’s actual return, which includes the effect of Fund expenses.
You can estimate the expenses you paid during the period by following these steps. Of course, your account value and expenses will differ from those in this illustration:
| 1. | Divide your account value by $1,000. |
| | If an account had an $8,600 value, then $8,600 ÷ $1,000 = 8.6. |
| 2. | Multiply the result by the number under the heading “Expenses Paid During Period.” |
| | If Expenses Paid During Period were $7.50, then 8.6 x $7.50 = $64.50. |
In this illustration, the estimated expenses paid this period are $64.50.
Hypothetical Example for Comparison with Other Funds
Information in the second line (Hypothetical) for each class in the table can help you compare ongoing costs of investing in the Fund with those of other mutual funds. This information may not be used to estimate the actual ending account balance or expenses you paid during the period. The hypothetical “Ending Account Value” is based on the actual expense ratio for each class and an assumed 5% annual rate of return before expenses, which does not represent the Fund’s actual return. The figure under the heading “Expenses Paid During Period” shows the hypothetical expenses your account would have incurred under this scenario. You can compare this figure with the 5% hypothetical examples that appear in shareholder reports of other funds.
44 | Semiannual Report
Your Fund’s Expenses (continued)
Please note that expenses shown in the table are meant to highlight ongoing costs and do not reflect any transaction costs, such as sales charges. Therefore, the second line for each class is useful in comparing ongoing costs only, and will not help you compare total costs of owning different funds. In addition, if transaction costs were included, your total costs would have been higher. Please refer to the Fund prospectus for additional information on operating expenses.
*Expenses are calculated using the most recent six-month expense ratio, net of expense waivers, annualized for each class (A: 0.90%; C: 1.30%; and Advisor: 0.65%), multiplied by the average account value over the period, multiplied by 181/365 to reflect the one-half year period.
Semiannual Report | 45

aFor the period July 3, 2006 (commencement of operations) to October 31, 2006.
bThe amount shown for a share outstanding throughout the period may not correlate with the Statement of Operations for the period due to the timing of sales and repurchases of
the Fund shares in relation to income earned and/or fluctuating market value of the investments of the Fund.
cBased on average daily shares outstanding.
dEffective September 1, 2008, the redemption fee was eliminated.
eAmount rounds to less than $0.01 per share.
fTotal return does not reflect sales commissions or contingent deferred sales charges, if applicable, and is not annualized for periods less than one year.
gRatios are annualized for periods less than one year.
46 | The accompanying notes are an integral part of these financial statements. | Semiannual Report
aFor the period July 3, 2006 (commencement of operations) to October 31, 2006.
bThe amount shown for a share outstanding throughout the period may not correlate with the Statement of Operations for the period due to the timing of sales and repurchases of
the Fund shares in relation to income earned and/or fluctuating market value of the investments of the Fund.
cBased on average daily shares outstanding.
dEffective September 1, 2008, the redemption fee was eliminated.
eAmount rounds to less than $0.01 per share.
fTotal return does not reflect sales commissions or contingent deferred sales charges, if applicable, and is not annualized for periods less than one year.
gRatios are annualized for periods less than one year.
Semiannual Report | The accompanying notes are an integral part of these financial statements. | 47

aFor the period July 3, 2006 (commencement of operations) to October 31, 2006.
bThe amount shown for a share outstanding throughout the period may not correlate with the Statement of Operations for the period due to the timing of sales and repurchases of
the Fund shares in relation to income earned and/or fluctuating market value of the investments of the Fund.
cBased on average daily shares outstanding.
dEffective September 1, 2008, the redemption fee was eliminated.
eAmount rounds to less than $0.01 per share.
fTotal return does not reflect sales commissions or contingent deferred sales charges, if applicable, and is not annualized for periods less than one year.
gRatios are annualized for periods less than one year.
48 | The accompanying notes are an integral part of these financial statements. | Semiannual Report

aFor the period July 3, 2006 (commencement of operations) to October 31, 2006.
bThe amount shown for a share outstanding throughout the period may not correlate with the Statement of Operations for the period due to the timing of sales and repurchases of
the Fund shares in relation to income earned and/or fluctuating market value of the investments of the Fund.
cBased on average daily shares outstanding.
dEffective September 1, 2008, the redemption fee was eliminated.
eAmount rounds to less than $0.01 per share.
fTotal return is not annualized for periods less than one year.
gRatios are annualized for periods less than one year.
Semiannual Report | The accompanying notes are an integral part of these financial statements. | 49

50 | Semiannual Report

Semiannual Report | 53

54 | Semiannual Report


See Abbreviations on page 118.
*The principal amount is stated in U.S. dollars unless otherwise indicated.
†Rounds to less than 0.1% of net assets.
aA portion or all of the security is held in connection with written option contracts open at period end.
bNon-income producing.
cSee Note 1(f) regarding equity-linked securities.
dSecurity was purchased pursuant to Rule 144A under the Securities Act of 1933 and may be sold in transactions exempt from registration only to qualified institutional buyers or in
a public offering registered under the Securities Act of 1933. These securities have been deemed liquid under guidelines approved by the Trust’s Board of Trustees. At April 30, 2011,
the aggregate value of these securities was $51,505,433, representing 17.2% of net assets.
ePerpetual security with no stated maturity date.
fThe coupon rate shown represents the rate at period end.
gThe security is traded on a discount basis with no stated coupon rate.
hSecurity or a portion of the security has been segregated as collateral for open written options contracts.
iSee Note 7 regarding investments in the Institutional Fiduciary Trust Money Market Portfolio.
jSee Note 1(e) regarding written options.
56 | The accompanying notes are an integral part of these financial statements. | Semiannual Report

aThe amount shown for a share outstanding throughout the period may not correlate with the Statement of Operations for the period due to the timing of sales and repurchases of
the Fund shares in relation to income earned and/or fluctuating market value of the investments of the Fund.
bBased on average daily shares outstanding.
cEffective September 1, 2008, the redemption fee was eliminated.
dAmount rounds to less than $0.01 per share.
eTotal return does not reflect sales commissions or contingent deferred sales charges, if applicable, and is not annualized for periods less than one year.
fRatios are annualized for periods less than one year.
gBenefit of expense reduction rounds to less than 0.01%.
Semiannual Report | The accompanying notes are an integral part of these financial statements. | 57

aThe amount shown for a share outstanding throughout the period may not correlate with the Statement of Operations for the period due to the timing of sales and repurchases of
the Fund shares in relation to income earned and/or fluctuating market value of the investments of the Fund.
bBased on average daily shares outstanding.
cEffective September 1, 2008, the redemption fee was eliminated.
dAmount rounds to less than $0.01 per share.
eTotal return does not reflect sales commissions or contingent deferred sales charges, if applicable, and is not annualized for periods less than one year.
fRatios are annualized for periods less than one year.
gBenefit of expense reduction rounds to less than 0.01%.
58 | The accompanying notes are an integral part of these financial statements. | Semiannual Report

aFor the period May 15, 2008 (effective date) to October 31, 2008.
bThe amount shown for a share outstanding throughout the period may not correlate with the Statement of Operations for the period due to the timing of sales and repurchases of
the Fund shares in relation to income earned and/or fluctuating market value of the investments of the Fund.
cBased on average daily shares outstanding.
dEffective September 1, 2008, the redemption fee was eliminated.
eAmount rounds to less than $0.01 per share.
fTotal return is not annualized for periods less than one year.
gRatios are annualized for periods less than one year.
hBenefit of expense reduction rounds to less than 0.01%.
Semiannual Report | The accompanying notes are an integral part of these financial statements. | 59
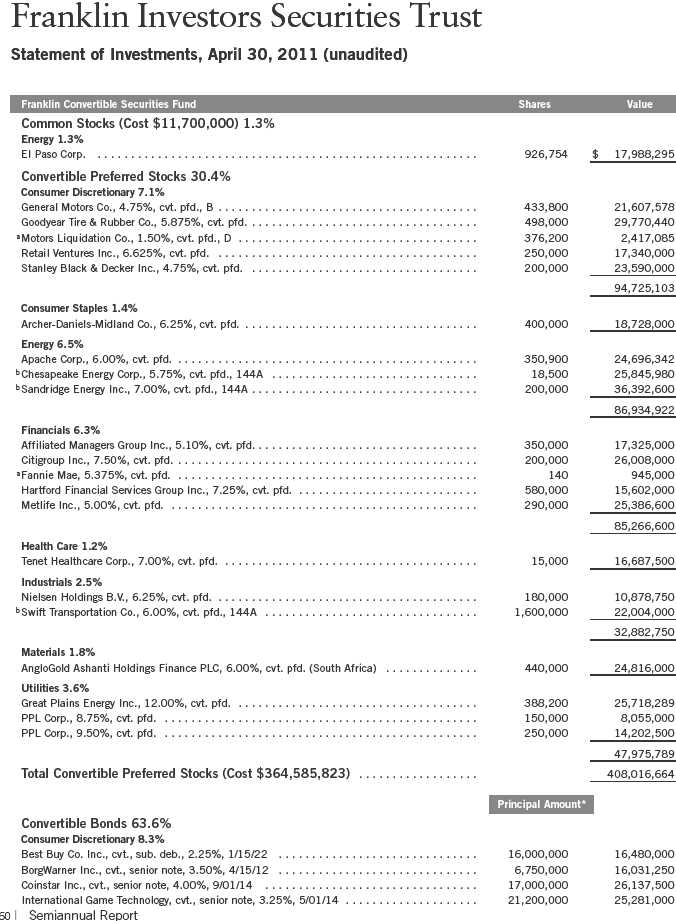


See Abbreviations on page 118.
*The principal amount is stated in U.S. dollars unless otherwise indicated.
aNon-income producing.
bSecurity was purchased pursuant to Rule 144A under the Securities Act of 1933 and may be sold in transactions exempt from registration only to qualified institutional buyers or in
a public offering registered under the Securities Act of 1933. These securities have been deemed liquid under guidelines approved by the Trust’s Board of Trustees. At April 30, 2011,
the aggregate value of these securities was $305,050,735, representing 22.71% of net assets.
cThe coupon rate shown represents the rate at period end.
dDefaulted security.
eSee Note 9 regarding restricted securities.
fSee Note 7 regarding investments in the Institutional Fiduciary Trust Money Market Portfolio.
62 | The accompanying notes are an integral part of these financial statements. | Semiannual Report

aThe amount shown for a share outstanding throughout the period may not correlate with the Statement of Operations for the period due to the timing of sales and repurchases of
the Fund shares in relation to income earned and/or fluctuating market value of the investments of the Fund.
bBased on average daily shares outstanding.
cEffective September 1, 2008, the redemption fee was eliminated.
dAmount rounds to less than $0.01 per share.
eTotal return does not reflect sales commissions or contingent deferred sales charges, if applicable, and is not annualized for periods less than one year.
fRatios are annualized for periods less than one year.
gBenefit of expense reduction rounds to less than 0.01%.
Semiannual Report | The accompanying notes are an integral part of these financial statements. | 63
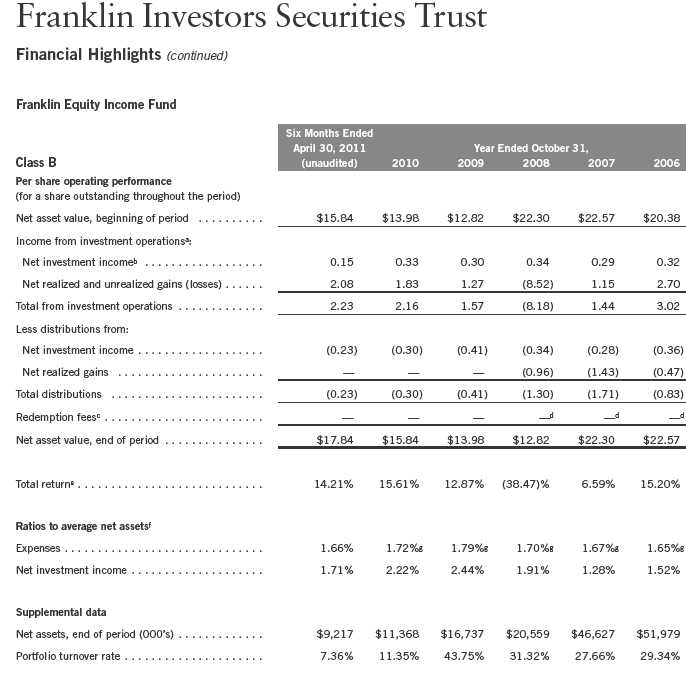
aThe amount shown for a share outstanding throughout the period may not correlate with the Statement of Operations for the period due to the timing of sales and repurchases of
the Fund shares in relation to income earned and/or fluctuating market value of the investments of the Fund.
bBased on average daily shares outstanding.
cEffective September 1, 2008, the redemption fee was eliminated.
dAmount rounds to less than $0.01 per share.
eTotal return does not reflect sales commissions or contingent deferred sales charges, if applicable, and is not annualized for periods less than one year.
fRatios are annualized for periods less than one year.
gBenefit of expense reduction rounds to less than 0.01%.
64 | The accompanying notes are an integral part of these financial statements. | Semiannual Report

aThe amount shown for a share outstanding throughout the period may not correlate with the Statement of Operations for the period due to the timing of sales and repurchases of
the Fund shares in relation to income earned and/or fluctuating market value of the investments of the Fund.
bBased on average daily shares outstanding.
cEffective September 1, 2008, the redemption fee was eliminated.
dAmount rounds to less than $0.01 per share.
eTotal return does not reflect sales commissions or contingent deferred sales charges, if applicable, and is not annualized for periods less than one year.
fRatios are annualized for periods less than one year.
gBenefit of expense reduction rounds to less than 0.01%.
Semiannual Report | The accompanying notes are an integral part of these financial statements. | 65
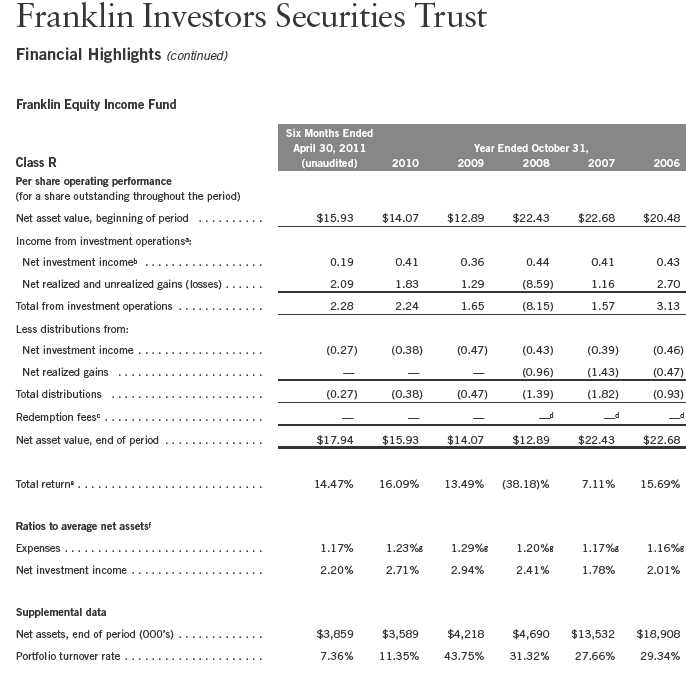
aThe amount shown for a share outstanding throughout the period may not correlate with the Statement of Operations for the period due to the timing of sales and repurchases of
the Fund shares in relation to income earned and/or fluctuating market value of the investments of the Fund.
bBased on average daily shares outstanding.
cEffective September 1, 2008, the redemption fee was eliminated.
dAmount rounds to less than $0.01 per share.
eTotal return does not reflect sales commissions or contingent deferred sales charges, if applicable, and is not annualized for periods less than one year.
fRatios are annualized for periods less than one year.
gBenefit of expense reduction rounds to less than 0.01%.
66 | The accompanying notes are an integral part of these financial statements. | Semiannual Report

aFor the period May 15, 2008 (effective date) to October 31, 2008.
bThe amount shown for a share outstanding throughout the period may not correlate with the Statement of Operations for the period due to the timing of sales and repurchases of
the Fund shares in relation to income earned and/or fluctuating market value of the investments of the Fund.
cBased on average daily shares outstanding.
dEffective September 1, 2008, the redemption fee was eliminated.
eAmount rounds to less than $0.01 per share.
fTotal return is not annualized for periods less than one year.
gRatios are annualized for periods less than one year.
hBenefit of expense reduction rounds to less than 0.01%.
Semiannual Report | The accompanying notes are an integral part of these financial statements. | 67

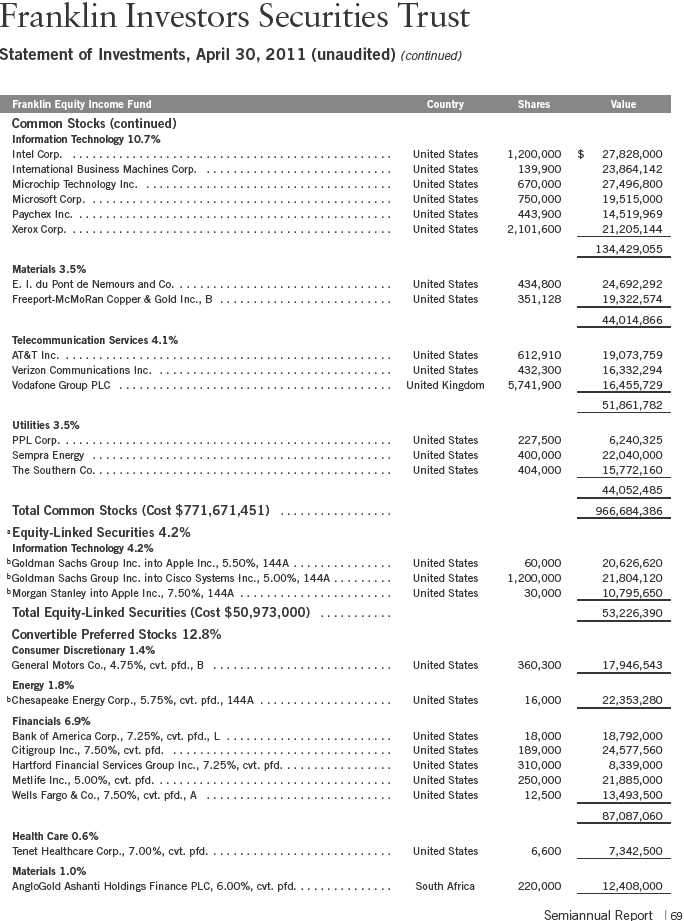

See Abbreviations on page 118.
*The principal amount is stated in U.S. dollars unless otherwise indicated.
†Rounds to less than 0.1% of net assets.
aSee Note 1(f) regarding equity-linked securities.
bSecurity was purchased pursuant to Rule 144A under the Securities Act of 1933 and may be sold in transactions exempt from registration only to qualified institutional buyers or in
a public offering registered under the Securities Act of 1933. These securities have been deemed liquid under guidelines approved by the Trust’s Board of Trustees. At April 30, 2011,
the aggregate value of these securities was $75,579,670, representing 6.00% of net assets.
cNon-income producing.
dSee Note 7 regarding investments in the Institutional Fiduciary Trust Money Market Portfolio.
eSee Note 1(c) regarding joint repurchase agreement.
fThe security is traded on a discount basis with no stated coupon rate.
70 | The accompanying notes are an integral part of these financial statements. | Semiannual Report
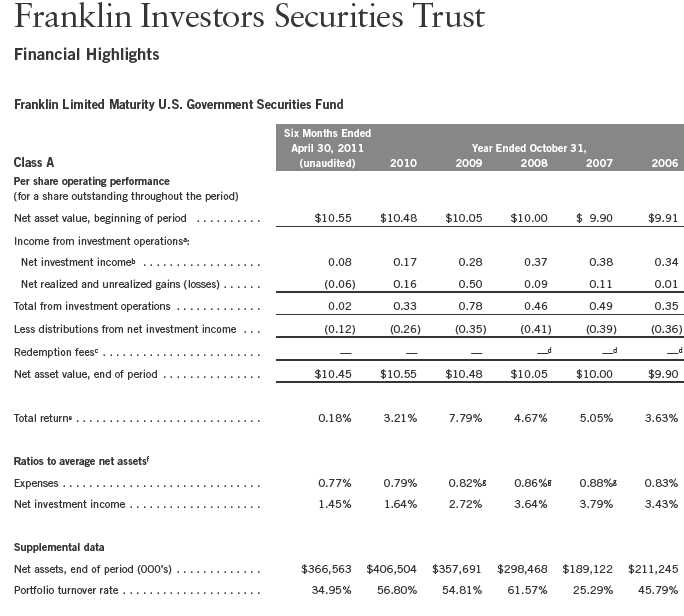
aThe amount shown for a share outstanding throughout the period may not correlate with the Statement of Operations for the period due to the timing of sales and repurchases of
the Fund shares in relation to income earned and/or fluctuating market value of the investments of the Fund.
bBased on average daily shares outstanding.
cEffective September 1, 2008, the redemption fee was eliminated.
dAmount rounds to less than $0.01 per share.
eTotal return does not reflect sales commissions or contingent deferred sales charges, if applicable, and is not annualized for periods less than one year.
fRatios are annualized for periods less than one year.
gBenefit of expense reduction rounds to less than 0.01%.
Semiannual Report | The accompanying notes are an integral part of these financial statements. | 71

aThe amount shown for a share outstanding throughout the period may not correlate with the Statement of Operations for the period due to the timing of sales and repurchases of
the Fund shares in relation to income earned and/or fluctuating market value of the investments of the Fund.
bBased on average daily shares outstanding.
cEffective September 1, 2008, the redemption fee was eliminated.
dAmount rounds to less than $0.01 per share.
eTotal return is not annualized for periods less than one year.
fRatios are annualized for periods less than one year.
gBenefit of expense reduction rounds to less than 0.01%.
72 | The accompanying notes are an integral part of these financial statements. | Semiannual Report

Semiannual Report | 73
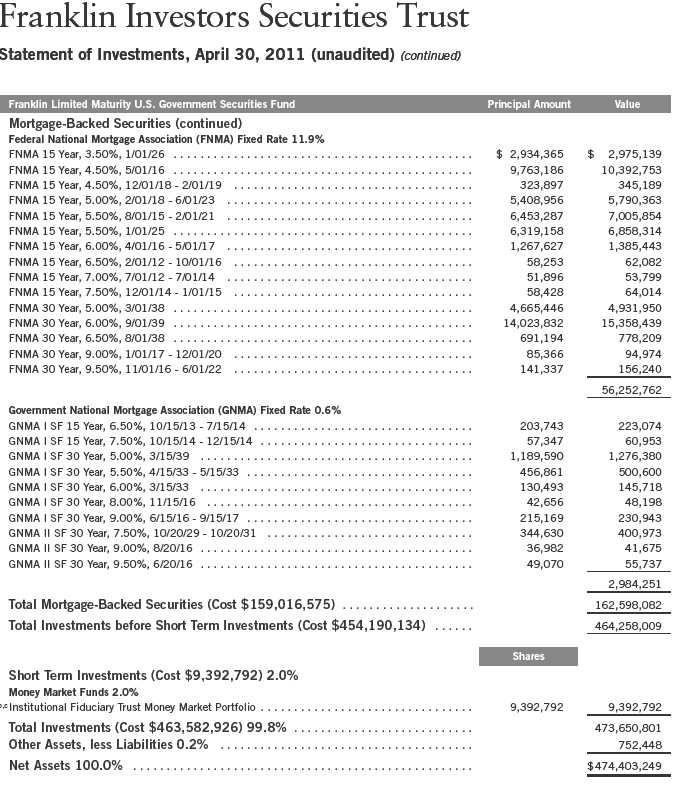
See Abbreviations on page 118.
aThe coupon rate shown represents the rate at period end.
bNon-income producing.
cSee Note 7 regarding investments in the Institutional Fiduciary Trust Money Market Portfolio.
Semiannual Report | The accompanying notes are an integral part of these financial statements. | 75
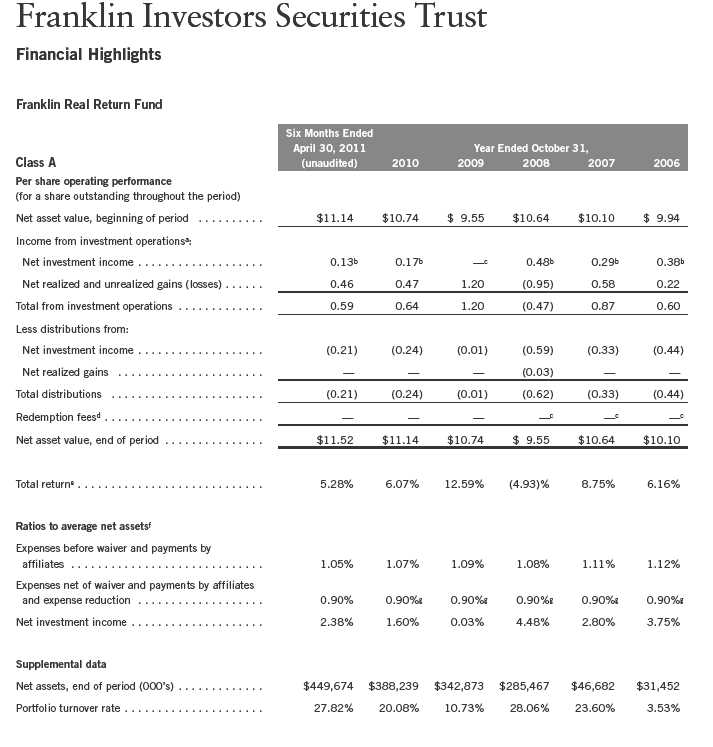
aThe amount shown for a share outstanding throughout the period may not correlate with the Statement of Operations for the period and may fluctuate between classes due to the
timing of sales and repurchases of the Fund shares in relation to income earned, adjustments to interest income for the inflation-indexed bonds, and/or fluctuating market value of
the investments of the Fund.
bBased on average daily shares outstanding.
cAmount rounds to less than $0.01 per share.
dEffective September 1, 2008, the redemption fee was eliminated.
eTotal return does not reflect sales commissions or contingent deferred sales charges, if applicable, and is not annualized for periods less than one year.
fRatios are annualized for periods less than one year.
gBenefit of expense reduction rounds to less than 0.01%.
76 | The accompanying notes are an integral part of these financial statements. | Semiannual Report
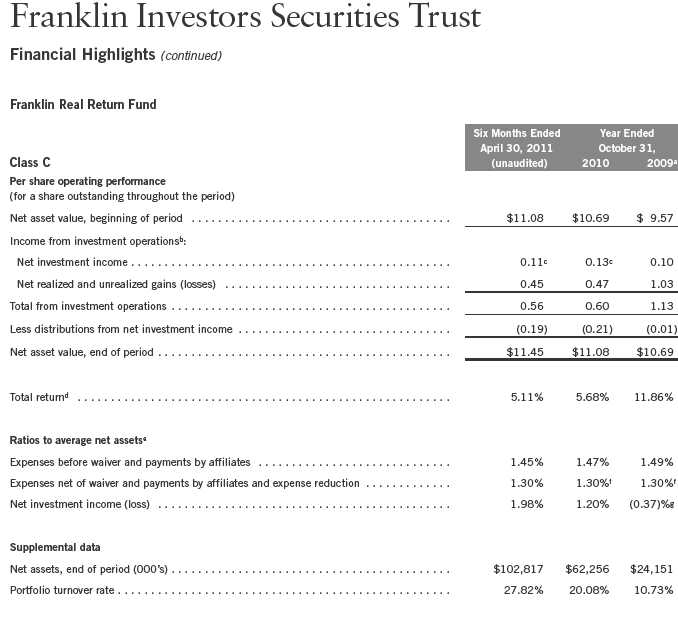
aFor the period November 3, 2008 (effective date) to October 31, 2009.
bThe amount shown for a share outstanding throughout the period may not correlate with the Statement of Operations for the period and may fluctuate between classes due to the
timing of sales and repurchases of the Fund shares in relation to income earned, adjustments to interest income for the inflation-indexed bonds, and/or fluctuating market value of
the investments of the Fund.
cBased on average daily shares outstanding.
dTotal return does not reflect sales commissions or contingent deferred sales charges, if applicable, and is not annualized for periods less than one year.
eRatios are annualized for periods less than one year.
fBenefit of expense reduction rounds to less than 0.01%.
gRatio is calculated based on the Fund level net investment income, as reflected on the Statement of Operations, and adjusted for class specific expenses. The amount may not
correlate with the per share amount due to the timing of income earned and/or fluctuating market value of the investments of the Fund in relation to the timing of sales and
repurchases of Fund shares.
Semiannual Report | The accompanying notes are an integral part of these financial statements. | 77

aThe amount shown for a share outstanding throughout the period may not correlate with the Statement of Operations for the period and may fluctuate between classes due to the
timing of sales and repurchases of the Fund shares in relation to income earned, adjustments to interest income for the inflation-indexed bonds, and/or fluctuating market value of
the investments of the Fund.
bBased on average daily shares outstanding.
cEffective September 1, 2008, the redemption fee was eliminated.
dAmount rounds to less than $0.01 per share.
eTotal return is not annualized for periods less than one year.
fRatios are annualized for periods less than one year.
gBenefit of expense reduction rounds to less than 0.01%.
78 | The accompanying notes are an integral part of these financial statements. | Semiannual Report

Semiannual Report | 79

80 | Semiannual Report

82 | Semiannual Report

Semiannual Report | 83

84 | Semiannual Report

†Rounds to less than 0.1% of net assets.
*The principal amount is stated in U.S. dollars unless otherwise indicated.
aNon-income producing.
bAt April 30, 2011, pursuant to the Fund’s policies and the requirements of applicable securities law, the Fund may be restricted from trading this security for a limited or extended
period of time due to ownership limits and/or potential possession of material non-public information.
cSecurity was purchased pursuant to Rule 144A under the Securities Act of 1933 and may be sold in transactions exempt from registration only to qualified institutional buyers or in
a public offering registered under the Securities Act of 1933. These securities have been deemed liquid under guidelines approved by the Trust’s Board of Trustees. At April 30, 2011,
the aggregate value of these securities was $11,967,330, representing 2.01% of net assets.
dA portion or all of the security purchased on a when-issued or delayed delivery basis. See Note 1(d).
eThe coupon rate shown represents the rate at period end.
fSee Note 1(g) regarding senior floating rate interests.
gPrincipal amount is stated in 1,000 Brazilian Real Units.
hRedemption price at maturity is adjusted for inflation. See Note 1(i).
iPrincipal amount of security is adjusted for inflation. See Note 1(i).
jThe security is traded on a discount basis with no stated coupon rate.
kSee Note 1(c) regarding joint repurchase agreement.
Semiannual Report | 85
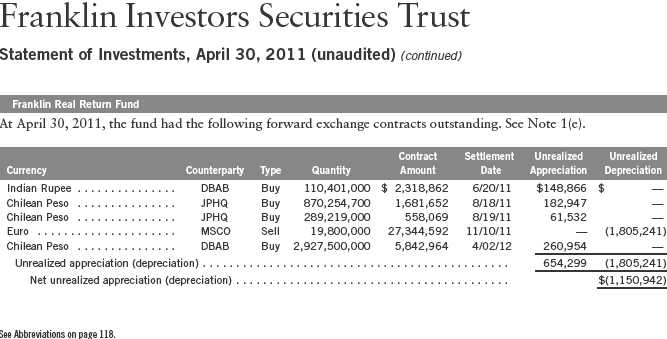
86 | The accompanying notes are an integral part of these financial statements. | Semiannual Report

Semiannual Report | The accompanying notes are an integral part of these financial statements. | 87
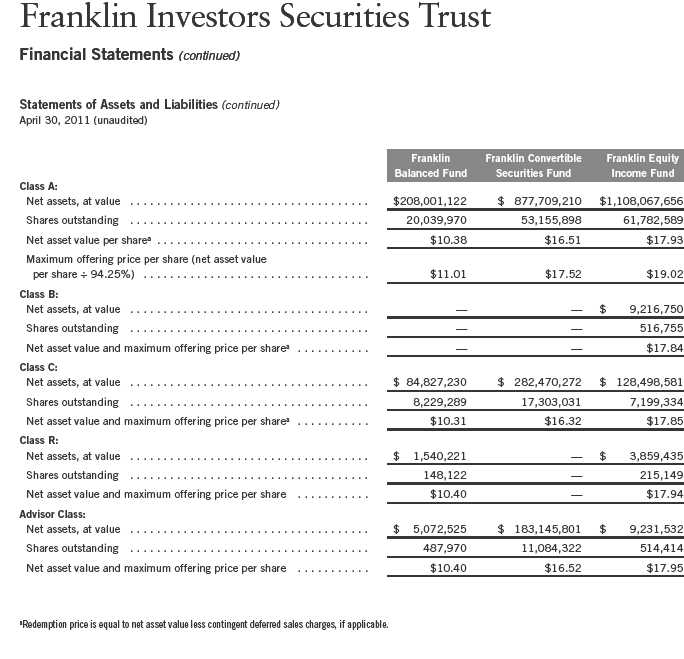
88 | The accompanying notes are an integral part of these financial statements. | Semiannual Report

Semiannual Report | The accompanying notes are an integral part of these financial statements. | 89
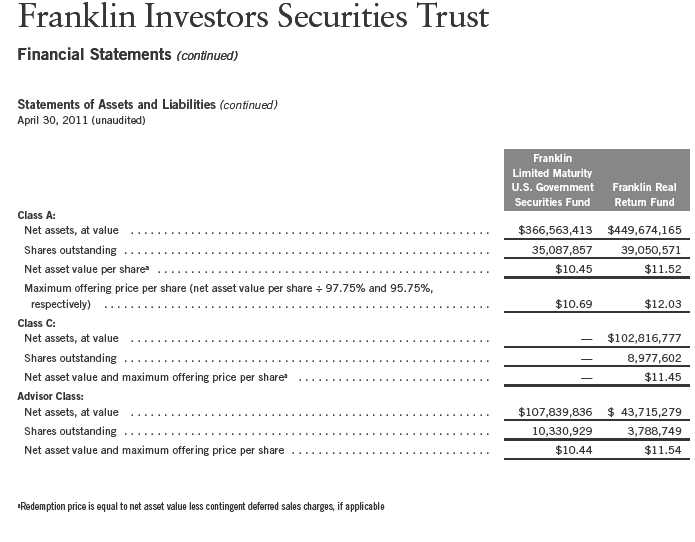
90 | The accompanying notes are an integral part of these financial statements. | Semiannual Report
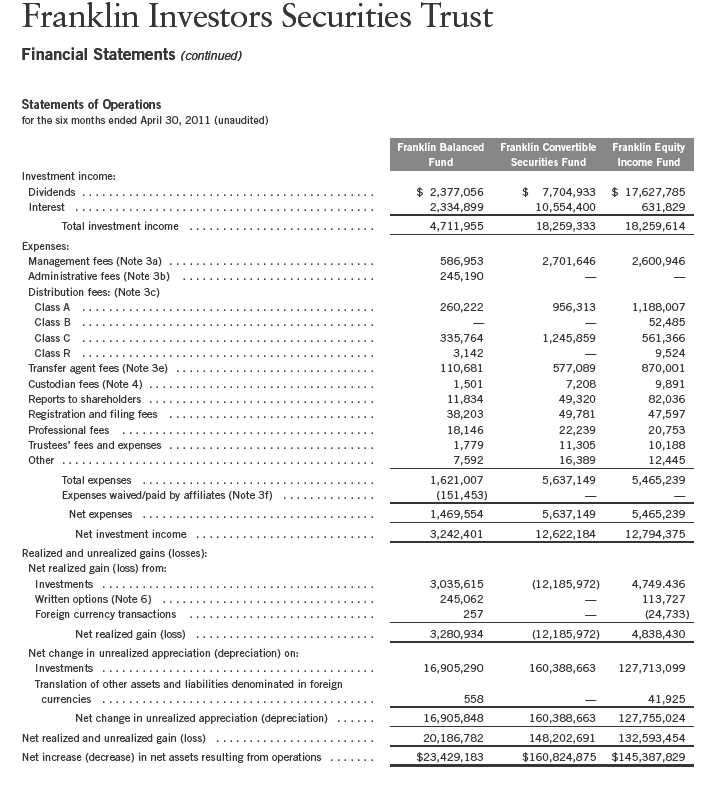
Semiannual Report | The accompanying notes are an integral part of these financial statements. | 91

92 | The accompanying notes are an integral part of these financial statements. | Semiannual Report

Semiannual Report | The accompanying notes are an integral part of these financial statements. | 93
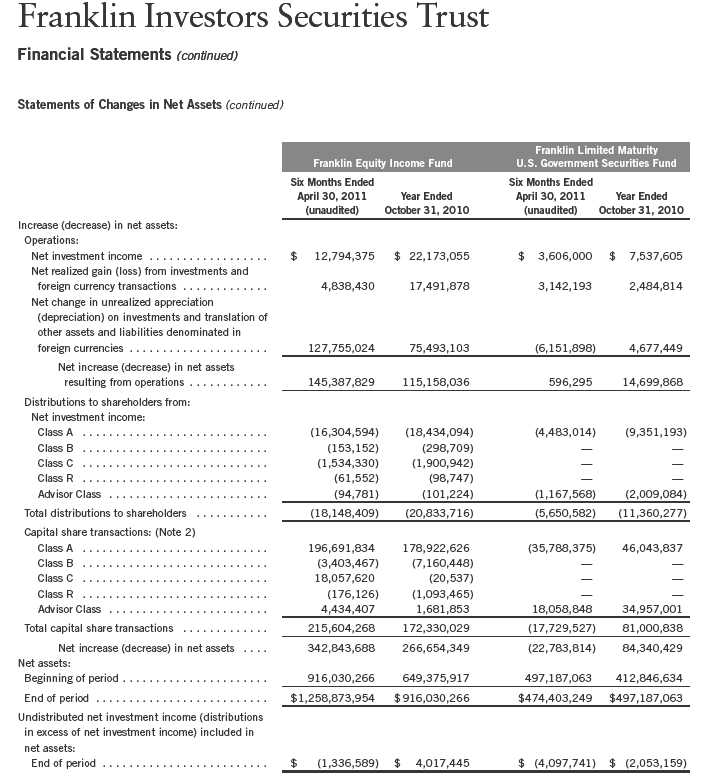
94 | The accompanying notes are an integral part of these financial statements. | Semiannual Report

Semiannual Report | The accompanying notes are an integral part of these financial statements. | 95
Franklin Investors Securities Trust
Notes to Financial Statements (unaudited)
1. ORGANIZATION AND SIGNIFICANT ACCOUNTING POLICIES
Franklin Investors Securities Trust (Trust) is registered under the Investment Company Act of 1940, as amended, (1940 Act) as an open-end investment company, consisting of nine separate funds, five of which are included in this report (Funds). The financial statements of the remaining funds in the Trust are presented separately. The classes of shares offered within each of the Funds are indicated below. Each class of shares differs by its initial sales load, contingent deferred sales charges, distribution fees, voting rights on matters affecting a single class and its exchange privilege.

The following summarizes the Funds’ significant accounting policies.
a. Financial Instrument Valuation
The Funds’ investments in securities and other financial instruments are carried at fair value daily. Fair value is the price that would be received to sell an asset or paid to transfer a liability in an orderly transaction between market participants on the measurement date. Under procedures approved by the Trust’s Board of Trustees, the Funds may utilize independent pricing services, quotations from securities and financial instrument dealers, and other market sources to determine fair value.
Equity securities, exchange traded funds, and derivative financial instruments (derivatives) listed on an exchange or on the NASDAQ National Market System are valued at the last quoted sale price or the official closing price of the day, respectively. Foreign equity securities are valued as of the close of trading on the foreign stock exchange on which the security is primarily traded, or the NYSE, whichever is earlier. The value is then converted into its U.S. dollar equivalent at the foreign exchange rate in effect at the close of the NYSE on the day that the value of the security is determined. Over-the-counter securities are valued within the range of the most recent quoted bid and ask prices. Securities that trade in multiple markets or on multiple exchanges are valued according to the broadest and most representative market. Certain equity securities are valued based upon fundamental characteristics or relationships to similar securities. Investments in open-end mutual funds are valued at the closing net asset value.
Debt and certain preferred securities generally trade in the over-the-counter market rather than on a securities exchange. The Funds’ pricing services use multiple valuation techniques to determine fair value. In instances where sufficient market activity exists, the pricing services may utilize a market-based approach through which quotes from market makers are used to determine fair value. In instances where sufficient market activity may not exist or is limited, the pricing services
96 | Semiannual Report
Franklin Investors Securities Trust
Notes to Financial Statements (unaudited) (continued)
| 1. | ORGANIZATION AND SIGNIFICANT ACCOUNTING POLICIES (continued) |
| a. | Financial Instrument Valuation (continued) |
also utilize proprietary valuation models which may consider market characteristics such as benchmark yield curves, option-adjusted spreads, credit spreads, estimated default rates, coupon rates, anticipated timing of principal repayments, underlying collateral, and other unique security features in order to estimate the relevant cash flows, which are then discounted to calculate the fair value. Securities denominated in a foreign currency are converted into their U.S. dollar equivalent at the foreign exchange rate in effect at the close of the NYSE on the date that the values of the foreign debt securities are determined. Repurchase agreements are valued at cost, which approximates market value.
Certain derivatives trade in the over-the-counter market. The Funds’ pricing services use various techniques including industry standard option pricing models and proprietary discounted cash flow models to determine the fair value of those instruments. The Funds’ net benefit or obligation under the derivative contract, as measured by the fair market value of the contract, is included in net assets.
The Funds have procedures to determine the fair value of securities and other financial instruments for which market prices are not readily available or which may not be reliably priced. Under these procedures, the Funds primarily employ a market-based approach which may use related or comparable assets or liabilities, recent transactions, market multiples, book values, and other relevant information for the investment to determine the fair value of the investment. The Funds may also use an income-based valuation approach in which the anticipated future cash flows of the investment are discounted to calculate fair value. Discounts may also be applied due to the nature or duration of any restrictions on the disposition of the investments. Due to the inherent uncertainty of valuations of such investments, the fair values may differ significantly from the values that would have been used had an active market existed.
Trading in securities on foreign securities stock exchanges and over-the-counter markets may be completed before the daily close of business on the NYSE. Occasionally, events occur between the time at which trading in a foreign security is completed and the close of the NYSE that might call into question the reliability of the value of a portfolio security held by the fund. As a result, differences may arise between the value of the Funds’ portfolio securities as determined at the foreign market close and the latest indications of value at the close of the NYSE. In order to minimize the potential for these differences, the investment manager monitors price movements following the close of trading in foreign stock markets through a series of country specific market proxies (such as baskets of American Depository Receipts, futures contracts and exchange traded funds). These price movements are measured against established trigger thresholds for each specific market proxy to assist in determining if an event has occurred that may call into question the reliability of the values of the foreign securities held by the Funds. If such an event occurs, the securities may be valued using fair value procedures, which may include the use of independent pricing services.
Semiannual Report | 97
Franklin Investors Securities Trust
Notes to Financial Statements (unaudited) (continued)
| 1. | ORGANIZATION AND SIGNIFICANT ACCOUNTING POLICIES (continued) |
| b. | Foreign Currency Translation |
Portfolio securities and other assets and liabilities denominated in foreign currencies are translated into U.S. dollars based on the exchange rate of such currencies against U.S. dollars on the date of valuation. The Funds may enter into foreign currency exchange contracts to facilitate transactions denominated in a foreign currency. Purchases and sales of securities, income and expense items denominated in foreign currencies are translated into U.S. dollars at the exchange rate in effect on the transaction date. Portfolio securities and assets and liabilities denominated in foreign currencies contain risks that those currencies will decline in value relative to the U.S. dollar. Occasionally, events may impact the availability or reliability of foreign exchange rates used to convert the U.S. dollar equivalent value. If such an event occurs, the foreign exchange rate will be valued at fair value using procedures established and approved by the Trust’s Board of Trustees.
The Funds do not separately report the effect of changes in foreign exchange rates from changes in market prices on securities held. Such changes are included in net realized and unrealized gain or loss from investments on the Statement of Operations.
Realized foreign exchange gains or losses arise from sales of foreign currencies, currency gains or losses realized between the trade and settlement dates on securities transactions and the difference between the recorded amounts of dividends, interest, and foreign withholding taxes and the U.S. dollar equivalent of the amounts actually received or paid. Net unrealized foreign exchange gains and losses arise from changes in foreign exchange rates on foreign denominated assets and liabilities other than investments in securities held at the end of the reporting period.
c. Joint Repurchase Agreement
Certain funds enter into a joint repurchase agreement whereby their uninvested cash balance is deposited into a joint cash account with other funds managed by the investment manager or an affiliate of the investment manager and is used to invest in one or more repurchase agreements. The value and face amount of the joint repurchase agreement are allocated to the funds based on their pro-rata interest. A repurchase agreement is accounted for as a loan by the fund to the seller, collateralized by securities which are delivered to the fund’s custodian. The market value, including accrued interest, of the initial collateralization is required to be at least 102% of the dollar amount invested by the funds, with the value of the underlying securities marked to market daily to maintain coverage of at least 100%. The joint repurchase agreement held by the Funds at period end had been entered into on April 29, 2011.
98 | Semiannual Report
Franklin Investors Securities Trust
Notes to Financial Statements (unaudited) (continued)
| 1. | ORGANIZATION AND SIGNIFICANT ACCOUNTING POLICIES (continued) |
| d. | Securities Purchased on a When-Issued and Delayed Delivery Basis |
Certain funds purchase securities on a when-issued and delayed delivery basis, with payment and delivery scheduled for a future date. These transactions are subject to market fluctuations and are subject to the risk that the value at delivery may be more or less than the trade date purchase price. Although the Funds will generally purchase these securities with the intention of holding the securities, they may sell the securities before the settlement date. Sufficient assets have been segregated for these securities.
e. Derivative Financial Instruments
The Franklin Balanced Fund, the Franklin Equity Income Fund, and the Franklin Real Return Fund invested in derivatives in order to manage risk or gain exposure to various other investments or markets. Derivatives are financial contracts based on an underlying or notional amount, require no initial investment or an initial net investment that is smaller than would normally be required to have a similar response to changes in market factors, and require or permit net settlement. Derivatives contain various risks including the potential inability of the counterparty to fulfill their obligations under the terms of the contract, the potential for an illiquid secondary market, and/or the potential for market movements which expose the fund to gains or losses in excess of the amounts shown on the Statement of Assets and Liabilities. Realized gain and loss and unrealized appreciation and depreciation on these contracts for the period are included in the Statements of Operations.
The Franklin Real Return Fund entered into forward exchange contracts primarily to manage and/or gain exposure to certain foreign currencies. A forward exchange contract is an agreement between the fund and a counterparty to buy or sell a foreign currency for a specific exchange rate on a future date. Pursuant to the terms of the forward exchange contracts, cash or securities may be required to be deposited as collateral. Unrestricted cash may be invested according to the fund’s investment objectives.
The Franklin Balanced Fund and the Franklin Equity Income Fund purchased or wrote option contracts primarily to manage and/or gain exposure to equity price risk. An option is a contract entitling the holder to purchase or sell a specific amount of shares or units of a particular security, currency or index, or notional amount of a swap (swaption), at a specified price. Options purchased are recorded as an asset while options written are recorded as a liability. Upon exercise of an option, the acquisition cost or sales proceeds of the security is adjusted by any premium paid or received. Upon expiration of an option, any premium paid or received is recorded as a realized loss or gain. Upon closing an option other than through expiration or exercise, the difference between the premium and the cost to close the position is recorded as a realized gain or loss.
See Notes 6 and 10 regarding investment transactions and other derivative information, respectively.
Semiannual Report | 99
Franklin Investors Securities Trust
Notes to Financial Statements (unaudited) (continued)
| 1. | ORGANIZATION AND SIGNIFICANT ACCOUNTING POLICIES (continued) |
| f. | Equity-Linked Securities |
The Franklin Balanced Fund and the Franklin Equity Income Fund invest in equity-linked securities. Equity-linked securities are hybrid financial instruments that generally combine both debt and equity characteristics into a single note form. Income received from equity linked securities is recorded as realized gains in the Statement of Operations and may be based on the performance of an underlying equity security, an equity index, or an option position. The risks of investing in equity-linked securities include unfavorable price movements in the underlying security and the credit risk of the issuing financial institution. There may be no guarantee of a return of principal with equity linked securities and the appreciation potential may be limited. Equity-linked securities may be more volatile and less liquid than other investments held by the fund.
g. Senior Floating Rate Interests
The Franklin Real Return Fund invests in senior secured corporate loans that pay interest at rates which are periodically reset by reference to a base lending rate plus a spread. These base lending rates are generally the prime rate offered by a designated U.S. bank or the London InterBank Offered Rate (LIBOR). Senior secured corporate loans often require prepayment of principal from excess cash flows or at the discretion of the borrower. As a result, actual maturity may be substantially less than the stated maturity.
Senior secured corporate loans in which the fund invests are generally readily marketable, but may be subject to some restrictions on resale.
h. Income Taxes
It is each fund’s policy to qualify as a regulated investment company under the Internal Revenue Code. Each fund intends to distribute to shareholders substantially all of its taxable income and net realized gains to relieve it from federal income and excise taxes. As a result, no provision for U.S. federal income taxes is required. Each fund files U.S. income tax returns as well as tax returns in certain other jurisdictions. Each fund records a provision for taxes in its financial statements including penalties and interest, if any, for a tax position taken on a tax return (or expected to be taken) when it fails to meet the more likely than not (a greater than 50% probability) threshold and based on the technical merits, the tax position may not be sustained upon examination by the tax authorities. As of April 30, 2011, and for all open tax years, each fund has determined that no provision for income tax is required in each fund’s financial statements. Open tax years are those that remain subject to examination and are based on each tax jurisdiction statute of limitation.
100 | Semiannual Report
Franklin Investors Securities Trust
Notes to Financial Statements (unaudited) (continued)
| 1. | ORGANIZATION AND SIGNIFICANT ACCOUNTING POLICIES (continued) |
| h. | Income Taxes (continued) |
The Funds may be subject to foreign taxation related to income received, capital gains on the sale of securities and certain foreign currency transactions in the foreign jurisdictions in which it invests. Foreign taxes, if any, are recorded based on the tax regulations and rates that exist in the foreign markets in which the Funds invest. When a capital gain tax is determined to apply the Funds record an estimated deferred tax liability for unrealized gains on these securities in an amount that would be payable if the securities were disposed of on the valuation date.
i. Security Transactions, Investment Income, Expenses and Distributions
Security transactions are accounted for on trade date. Realized gains and losses on security transactions are determined on a specific identification basis. Interest income and estimated expenses are accrued daily. Amortization of premium and accretion of discount on debt securities are included in interest income. Facility fees are recognized as income over the expected term of the loan. Dividend income is recorded on the ex-dividend date except that certain dividends from foreign securities are recognized as soon as the Funds are notified of the ex-dividend date. Distributions to shareholders are recorded on the ex-dividend date and are determined according to income tax regulations (tax basis). Distributable earnings determined on a tax basis may differ from earnings recorded in accordance with accounting principles generally accepted in the United States of America. These differences may be permanent or temporary. Permanent differences are reclassified among capital accounts to reflect their tax character. These reclassifications have no impact on net assets or the results of operations. Temporary differences are not reclassified, as they may reverse in subsequent periods.
Common expenses incurred by the Trust are allocated among the funds based on the ratio of net assets of each fund to the combined net assets of the Trust. Fund specific expenses are charged directly to the fund that incurred the expense.
Realized and unrealized gains and losses and net investment income, not including class specific expenses, are allocated daily to each class of shares based upon the relative proportion of net assets of each class. Differences in per share distributions, by class, are generally due to differences in class specific expenses.
Inflation-indexed bonds are adjusted for inflation through periodic increases or decreases in the security’s interest accruals, face amount, or principal redemption value, by amounts corresponding to the rate of inflation as measured by an index. Any increase or decrease in the face amount or principal redemption value will be included as inflation principal adjustments on the Statements of Operations.
Semiannual Report | 101
Franklin Investors Securities Trust
Notes to Financial Statements (unaudited) (continued)
| 1. | ORGANIZATION AND SIGNIFICANT ACCOUNTING POLICIES (continued) |
| j. | Accounting Estimates |
The preparation of financial statements in accordance with accounting principles generally accepted in the United States of America requires management to make estimates and assumptions that affect the reported amounts of assets and liabilities at the date of the financial statements and the amounts of income and expenses during the reporting period. Actual results could differ from those estimates.
k. Guarantees and Indemnifications
Under the Trust’s organizational documents, its officers and trustees are indemnified by the Trust against certain liabilities arising out of the performance of their duties to the Trust. Additionally, in the normal course of business, the Trust, on behalf of the Funds, enters into contracts with service providers that contain general indemnification clauses. The Trust’s maximum exposure under these arrangements is unknown as this would involve future claims that may be made against the Trust that have not yet occurred. Currently, the Trust expects the risk of loss to be remote.
2. SHARES OF BENEFICIAL INTEREST
At April 30, 2011, there were an unlimited number of shares authorized (without par value).
Transactions in the Funds’ shares were as follows:

102 | Semiannual Report
Franklin Investors Securities Trust
Notes to Financial Statements (unaudited) (continued)

Semiannual Report | 103
Franklin Investors Securities Trust
Notes to Financial Statements (unaudited) (continued)

104 | Semiannual Report
Franklin Investors Securities Trust
Notes to Financial Statements (unaudited) (continued)

Semiannual Report | 105
Franklin Investors Securities Trust
Notes to Financial Statements (unaudited) (continued)
2. SHARES OF BENEFICIAL INTEREST (continued)
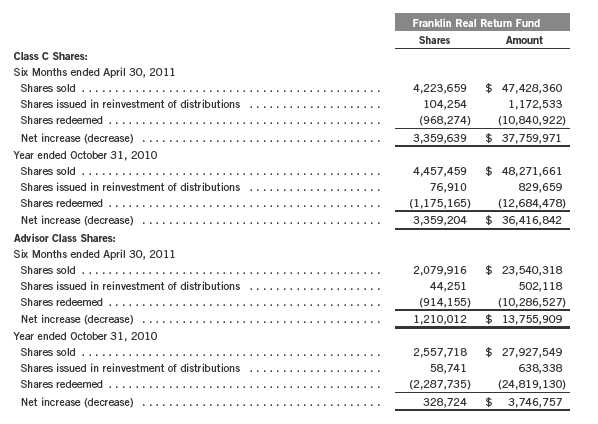
3. TRANSACTIONS WITH AFFILIATES
Franklin Resources, Inc. is the holding company for various subsidiaries that together are referred to as Franklin Templeton Investments. Certain officers and trustees of the Trust are also officers and/or directors of the following subsidiaries:
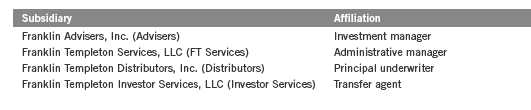
106 | Semiannual Report
Franklin Investors Securities Trust
Notes to Financial Statements (unaudited) (continued)
| 3. | TRANSACTIONS WITH AFFILIATES (continued) |
| a. | Management Fees |
The Franklin Balanced Fund pays an investment management fee to Advisers based on the average daily net assets of the fund as follows:
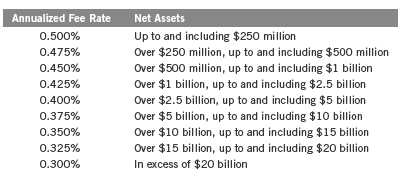
The Franklin Convertible Securities Fund and the Franklin Equity Income Fund pay an investment management fee to Advisers based on the month-end net assets of each of the funds as follows:

The Franklin Limited Maturity U.S. Government Securities Fund pays an investment management fee to Advisers based on the month-end net assets of the fund as follows:

Semiannual Report | 107
Franklin Investors Securities Trust
Notes to Financial Statements (unaudited) (continued)
| 3. | TRANSACTIONS WITH AFFILIATES (continued) |
| a. | Management Fees (continued) |
The Franklin Real Return Fund pays an investment management fee to Advisers based on the average daily net assets of the fund as follows:
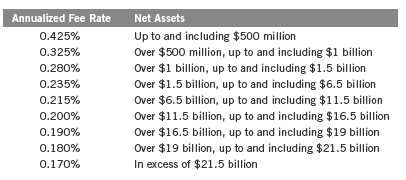
b. Administrative Fees
FT Services provides administrative services to the Funds. The Franklin Balanced Fund and the Franklin Real Return Fund each pay an administrative fee to FT Services of 0.20% per year of their respective average daily net assets. Under an agreement with Advisers, the administrative fee for the Franklin Convertible Securities Fund, the Franklin Equity Income Fund, and the Franklin Limited Maturity U.S. Government Securities Fund are paid by Advisers based on each fund’s average daily net assets, and is not an additional expense of the funds.
c. Distribution Fees
The Trust’s Board of Trustees has adopted distribution plans for each share class, with the exception of Advisor Class shares, pursuant to Rule 12b-1 under the 1940 Act. Under the Funds’ Class A reimbursement distribution plans, the Funds reimburse Distributors for costs incurred in connection with the servicing, sale and distribution of each fund’s shares up to the maximum annual plan rate. Under the Class A reimbursement distribution plans, costs exceeding the maximum for the current plan year cannot be reimbursed in subsequent periods.
In addition, under the Funds’ Class B, C and R compensation distribution plans, the Funds pay Distributors for costs incurred in connection with the servicing, sale and distribution of each fund’s shares up to the maximum annual plan rate for each class.
108 | Semiannual Report
Franklin Investors Securities Trust
Notes to Financial Statements (unaudited) (continued)
| 3. | TRANSACTIONS WITH AFFILIATES (continued) |
| c. | Distribution Fees (continued) |
The maximum annual plan rates, based on the average daily net assets, for each class, are as follows:

Effective February 1, 2009, the Board of Trustees has set the current rate at 0.30% per year for Class A shares for the Franklin Balanced Fund until further notice and approval by the Board.
d. Sales Charges/Underwriting Agreements
Distributors has advised the Funds of the following commission transactions related to the sales and redemptions of the Funds’ shares for the period:

e. Transfer Agent Fees
For the period ended April 30, 2011, the Funds paid transfer agent fees as noted in the Statements of Operations of which the following amounts were retained by Investor Services:
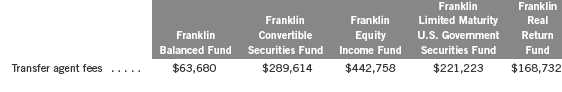
Semiannual Report | 109
Franklin Investors Securities Trust
Notes to Financial Statements (unaudited) (continued)
| 3. | TRANSACTIONS WITH AFFILIATES (continued) |
| f. | Waiver and Expense Reimbursements |
Advisers and FT Services have contractually agreed in advance to waive or limit their respective fees and to assume as their own expense certain expenses otherwise payable by the Franklin Balanced Fund and the Franklin Real Return Fund so that the common expenses (i.e. a combination of management fees, administrative fees, and other expenses, but excluding distribution fees, and acquired fund fees and expenses), for each class of the funds do not exceed 0.71% and 0.65%, respectively (other than certain non-routine expenses or costs, including those relating to litigation, indemnification, reorganizations, and liquidations) until February 29, 2012.
4. EXPENSE OFFSET ARRANGEMENT
The Funds have entered into an arrangement with their custodian whereby credits realized as a result of uninvested cash balances are used to reduce a portion of the Funds’ custodian expenses. During the period ended April 30, 2011, there were no credits earned.
5. INCOME TAXES
For tax purposes, capital losses may be carried over to offset future capital gains, if any. At October 31, 2010, the capital loss carryforwards were as follows:

110 | Semiannual Report
Franklin Investors Securities Trust
Notes to Financial Statements (unaudited) (continued)
5. INCOME TAXES (continued)
At April 30, 2011, the cost of investments and net unrealized appreciation (depreciation) for income tax purposes were as follows:

Net investment income differs for financial statement and tax purposes primarily due to differing treatments of foreign currency transactions, paydown losses, bond discounts and premiums, corporate actions, and inflation related adjustments on foreign securities.
Net realized gains (losses) differ for financial statement and tax purposes primarily due to differing treatments of wash sales, foreign currency transactions, paydown losses, bond discounts and premiums, and corporate actions.
6. INVESTMENT TRANSACTIONS
Purchases and sales of investments (excluding short term securities) for the period ended April 30, 2011, were as follows:

Semiannual Report | 111
Franklin Investors Securities Trust
Notes to Financial Statements (unaudited) (continued)
6. INVESTMENT TRANSACTIONS (continued)
Transactions in options written during the period ended April 30, 2011, were as follows:

See Notes 1(e) and 10 regarding derivative financial instruments and other derivative information, respectively.
7. INVESTMENTS IN INSTITUTIONAL FIDUCIARY TRUST MONEY MARKET PORTFOLIO
Certain funds invest in the Institutional Fiduciary Trust Money Market Portfolio (Sweep Money Fund), an open-end investment company managed by Advisers. Management fees paid by the Funds are reduced on assets invested in the Sweep Money Fund, in an amount not to exceed the management and administrative fees paid by the Sweep Money Fund.
8. CREDIT RISK
At April 30, 2011, the Franklin Balanced Fund, the Franklin Convertible Securities Fund, the Franklin Equity Income Fund, and the Franklin Real Return Fund had 8.96%, 74.40%, 10.09%, and 11.91% respectively, of their portfolio invested in high yield or other securities rated below investment grade. These securities may be more sensitive to economic conditions causing greater price volatility and are potentially subject to a greater risk of loss due to default than higher rated securities.
112 | Semiannual Report
Franklin Investors Securities Trust
Notes to Financial Statements (unaudited) (continued)
9. RESTRICTED SECURITIES
The Franklin Convertible Securities Fund invests in securities that are restricted under the Securities Act of 1933 (1933 Act) or which are subject to legal, contractual, or other agreed upon restrictions on resale. Restricted securities are often purchased in private placement transactions, and cannot be sold without prior registration unless the sale is pursuant to an exemption under the 1933 Act. Disposal of these securities may require greater effort and expense, and prompt sale at an acceptable price may be difficult. The fund may have registration rights for restricted securities. The issuer generally incurs all registration costs.
At April 30, 2011, the Franklin Convertible Securities Fund held investments in restricted securities, excluding certain securities exempt from registration under the 1933 Act deemed to be liquid, as follows:
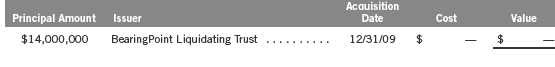
10. OTHER DERIVATIVE INFORMATION
At April 30, 2011, the Franklin Balanced Fund and the Franklin Real Return Fund have invested in derivative contracts which are reflected on the Statement of Assets and Liabilities as follows:
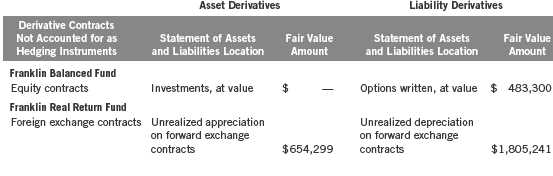
Semiannual Report | 113
Franklin Investors Securities Trust
Notes to Financial Statements (unaudited) (continued)
10. OTHER DERIVATIVE INFORMATION (continued)
For the period ended April 30, 2011, the effect of derivative contracts on the Franklin Balanced Fund’s, the Franklin Equity Income Fund’s, and the Franklin Real Return Fund’s Statements of Operations was as follows:

aRepresents the average number of option contracts or notional amount for other derivative contracts outstanding during the period.
See Note 1(e) regarding derivative financial instruments.
11. CREDIT FACILITY
The Funds, together with other U.S. registered and foreign investment funds (collectively, Borrowers), managed by Franklin Templeton Investments, are borrowers in a joint syndicated senior unsecured credit facility totaling $750 million (Global Credit Facility) which matures on January 20, 2012. This Global Credit Facility provides a source of funds to the Borrowers for temporary and emergency purposes, including the ability to meet future unanticipated or unusually large redemption requests.
114 | Semiannual Report
Franklin Investors Securities Trust
Notes to Financial Statements (unaudited) (continued)
11. CREDIT FACILITY (continued)
Under the terms of the Global Credit Facility, the Funds shall, in addition to interest charged on any borrowings made by the Funds and other costs incurred by the Funds, pay their share of fees and expenses incurred in connection with the implementation and maintenance of the Global Credit Facility, based upon their relative share of the aggregate net assets of all of the Borrowers, including an annual commitment fee of 0.08% based upon the unused portion of the Global Credit Facility, which is reflected in other expenses on the Statements of Operations. During the period ended April 30, 2011, the Funds did not use the Global Credit Facility.
12. FAIR VALUE MEASUREMENTS
The Funds follow a fair value hierarchy that distinguishes between market data obtained from independent sources (observable inputs) and the Funds’ own market assumptions (unobservable inputs). These inputs are used in determining the value of the Funds’ investments and are summarized in the following fair value hierarchy:
- Level 1 – quoted prices in active markets for identical securities
- Level 2 – other significant observable inputs (including quoted prices for similar securities, interest rates, prepayment speed, credit risk, etc.)
- Level 3 – significant unobservable inputs (including the Funds’ own assumptions in determining the fair value of investments)
The inputs or methodology used for valuing securities are not an indication of the risk associated with investing in those securities.
For movements between the levels within the fair value hierarchy, the Funds have adopted a policy of recognizing the transfers as of the date of the underlying event which caused the movement.
Semiannual Report | 115
Franklin Investors Securities Trust
Notes to Financial Statements (unaudited) (continued)
12. FAIR VALUE MEASUREMENTS (continued)
The following is a summary of the inputs used as of April 30, 2011, in valuing the Funds’ assets and liabilities carried at fair value:
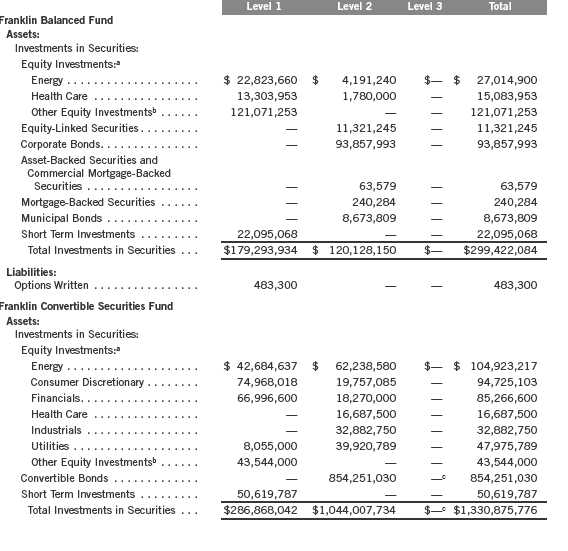
116 | Semiannual Report
Franklin Investors Securities Trust
Notes to Financial Statements (unaudited) (continued)

Semiannual Report | 117
Franklin Investors Securities Trust
Notes to Financial Statements (unaudited) (continued)
12. FAIR VALUE MEASUREMENTS (continued)
At April 30, 2011, the reconciliation of assets in which significant unobservable inputs (Level 3) were used in determining the Funds’ fair value, were as follows:
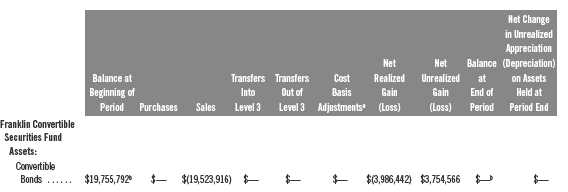
aMay include accretion, amortization, partnership adjustments, and/or other cost basis adjustments. bIncludes security determined to have no value.
13. SUBSEQUENT EVENTS
The Funds have evaluated subsequent events through the issuance of the financial statements and determined that no events have occurred that require disclosure.

118 | Semiannual Report
Franklin Investors Securities Trust
Shareholder Information
Board Review of Investment Management Agreement
At a meeting held March 1, 2011, the Board of Trustees (Board), including a majority of non-interested or independent Trustees, approved renewal of the investment management agreement for each of the separate funds comprising Franklin Investors Securities Trust (Fund(s)). In reaching this decision, the Board took into account information furnished throughout the year at regular Board meetings, as well as information prepared specifically in connection with the annual renewal review process. Information furnished and discussed throughout the year included investment performance reports and related financial information for each Fund, as well as periodic reports on expenses, shareholder services, legal, compliance, pricing, brokerage commissions and execution and other services provided by the Investment Manager (Manager) and its affiliates. Information furnished specifically in connection with the renewal process included a report for each Fund prepared by Lipper, Inc. (Lipper), an independent organization, as well as additional material, including a Fund profitability analysis prepared by management. The Lipper reports compared each Fund’s investment performance and expenses with those of other mutual funds deemed comparable to the Fund as selected by Lipper. The Fund profitability analysis discussed the profitability to Franklin Templeton Investments from its overall U.S. fund operations, as well as on an individual fund-by-fund basis. Additional material accompanying such profitability analysis included information on a fund-by-fund basis listing portfolio managers and other accounts they manage, as well as information on management fees charged by the Manager and its affiliates to U.S. mutual funds and other accounts, including management’s explanation of differences where relevant. Such material also included a memorandum prepared by management describing project initiatives and capital investments relating to the services provided to the Funds by the Franklin Templeton Investments organization, as well as a memorandum relating to economies of scale and a comparative analysis concerning transfer agent fees charged each Fund.
In considering such materials, the independent Trustees received assistance and advice from and met separately with independent counsel. While the investment management agreements for all Funds were considered at the same Board meeting, the Board dealt with each Fund separately. In approving continuance of the investment management agreement for each Fund, the Board, including a majority of independent Trustees, determined that the existing management fee structure was fair and reasonable and that continuance of the investment management agreement was in the best interests of each Fund and its shareholders. While attention was given to all information furnished, the following discusses some primary factors relevant to the Board’s decision.
NATURE, EXTENT AND QUALITY OF SERVICES. The Board was satisfied with the nature and quality of the overall services provided by the Manager and its affiliates to the Funds and their shareholders. In addition to investment performance and expenses discussed later, the Board’s opinion was based, in part, upon periodic reports furnished it showing that the investment policies and restrictions for each Fund were consistently complied with as well as other reports periodically furnished the Board covering matters such as the compliance of portfolio managers and other management personnel with the code of ethics adopted throughout the Franklin Templeton fund complex, the adherence to fair value pricing procedures established by the Board, and the accuracy
Semiannual Report | 119
Franklin Investors Securities Trust
Shareholder Information (continued)
Board Review of Investment Management Agreement (continued)
of net asset value calculations. The Board also noted the extent of benefits provided Fund shareholders from being part of the Franklin Templeton family of funds, including the right to exchange investments between the same class of funds without a sales charge, the ability to reinvest Fund dividends into other funds and the right to combine holdings in other funds to obtain a reduced sales charge. Favorable consideration was given to management’s continuous efforts and expenditures in establishing back-up systems and recovery procedures to function in the event of a natural disaster, it being noted by the Board that such systems and procedures had functioned smoothly during the Florida hurricanes and blackouts experienced in previous years. Among other factors taken into account by the Board were the Manager’s best execution trading policies, including a favorable report by an independent portfolio trading analytical firm. Consideration was also given to the experience of each Fund’s portfolio management team, the number of accounts managed and general method of compensation. In this latter respect, the Board noted that a primary factor in management’s determination of a portfolio manager’s bonus compensation was the relative investment performance of the funds he or she managed and that a portion of such bonus was required to be invested in a predesignated list of funds within such person’s fund management area so as to be aligned with the interests of shareholders. The Board also took into account the quality of transfer agent and shareholder services provided Fund shareholders by an affiliate of the Manager and the continuous enhancements to the Franklin Templeton website. Particular attention was given to management’s conservative approach and diligent risk management procedures, including continuous monitoring of counterparty credit risk and attention given to derivative and other complex instruments. The Board also took into account, among other things, management’s efforts in establishing a global credit facility for the benefit of the Funds and other accounts managed by Franklin Templeton Investments to provide a source of cash for temporary and emergency purposes or to meet unusual redemption requests as well as the strong financial position of the Manager’s parent company and its commitment to the mutual fund business as evidenced by its subsidization of money market funds.
INVESTMENT PERFORMANCE. The Board placed significant emphasis on the investment performance of each Fund in view of its importance to shareholders. While consideration was given to performance reports and discussions with portfolio managers at Board meetings during the year, particular attention in assessing performance was given to the Lipper reports furnished for the agreement renewals. The Lipper reports prepared for each individual Fund showed the investment performance of its Class A shares in comparison with its selected performance universe during 2010 and during the previous 10 years ended December 31, 2010, unless otherwise noted. Performance on a total return basis was shown by Lipper for all Funds with performance on an income return basis being shown for those Funds having income return as an element of their investment objective. The following summarizes the performance results for each Fund.
Franklin Balanced Fund – The Fund’s investment performance was shown in comparison with a performance universe consisting of all retail and institutional mixed-asset target allocation growth funds as selected by Lipper during 2010, 2009, 2008, and 2007, being the Fund’s first four full
120 | Semiannual Report
Franklin Investors Securities Trust
Shareholder Information (continued)
Board Review of Investment Management Agreement (continued)
years of operations. The Lipper report showed both the Fund’s income return and total return to be in the highest quintile of its performance universe during 2010, and its income return and total return on an annualized basis to each be in the highest quintile of such universe during its four-year period of operations. The Board was satisfied with such comparative performance.
Franklin Convertible Securities Fund – The Fund’s investment performance was shown in comparison with a performance universe consisting of all retail and institutional convertible securities funds as selected by Lipper. The Lipper report showed the Fund’s income return during 2010 to be in the second-highest quintile of its performance universe and on an annualized basis during each of the previous three-, five- and 10-year periods to be in the highest quintile of such performance universe. The Lipper report showed that the Fund’s total return during 2010 was in the highest quintile of its performance universe and on an annualized basis was also in the highest quintile of such universe for the previous three- and 10-year periods and in the middle quintile of such universe for the previous five-year period. The Board was satisfied with the Fund’s comparative performance as set forth in the Lipper report.
Franklin Equity Income Fund – The Fund’s investment performance was shown in comparison with a performance universe consisting of all retail and institutional equity income funds as selected by Lipper. The Lipper report showed the Fund’s income return during 2010 to be in the highest quintile of the performance universe, and on an annualized basis during each of the previous three-, five-, and 10-year periods to also be in the highest quintile of such performance universe. The Lipper report showed the Fund’s total return during 2010 to be in the second-highest quintile of such universe and on an annualized basis to be in the middle quintile of such universe for the previous three-year period and in the lowest and next to lowest quintiles, respectively, for the previous five- and 10-year periods. The Board was satisfied with such comparative performance, noting the Fund’s consistently high comparative income return and its improved relative total return in recent years.
Franklin Limited Maturity U.S. Government Securities Fund – The Fund’s investment performance was shown in comparison to a performance universe consisting of all retail and institutional short U.S. government funds as selected by Lipper. The Lipper report showed the Fund’s income return during 2010 to be in the second-highest quintile of its performance universe and on an annualized basis to be in either the highest or second-highest quintile of such universe during each of the previous three-, five- and 10-year periods. The Lipper report showed the Fund’s total return to be in the second-highest quintile of its performance universe during 2010 and on an annualized basis to be in the highest quintile for each of the previous three-, five- and 10-year periods. The Board was satisfied with the Fund’s comparative performance as shown in the Lipper report.
Franklin Real Return Fund – The Fund has been in operation for six full calendar years and its investment performance was shown in comparison to a performance universe consisting of all retail and institutional Treasury inflation-protected securities (TIPS) funds as selected by Lipper. The Lipper report showed the Fund’s income return during 2010 to be in the highest quintile of
Semiannual Report | 121
Franklin Investors Securities Trust
Shareholder Information (continued)
Board Review of Investment Management Agreement (continued)
such performance universe, and on an annualized basis to be in the second-lowest quintile of such universe during each of the previous three- and five-year periods, respectively. The Lipper report showed the Fund’s 2010 total return to be in the second-highest quintile of its performance universe, and on an annualized basis to be in the second-lowest quintile of such universe during the previous three-year period, but to be in the highest or best performing quintile of such universe during the previous five-year period. The Board found the Fund’s comparative performance as set forth in the Lipper report to be acceptable, noting its favorable overall performance in 2010 and its favorable annualized total return over the previous five-year period.
COMPARATIVE EXPENSES. Consideration was given to a comparative analysis of the management fees and total expense ratios of each Fund compared with those of a group of other funds selected by Lipper as constituting its appropriate Lipper expense group. Lipper expense data is based upon information taken from each fund’s most recent annual report, which reflects historical asset levels that may be quite different from those currently existing, particularly in a period of market volatility. While recognizing such inherent limitation and the fact that expense ratios generally increase as assets decline and decrease as assets grow, the Board believed the independent analysis conducted by Lipper to be an appropriate measure of comparative expenses. In reviewing comparative costs, Lipper provides information on each Fund’s contractual investment management fee in comparison with the contractual investment management fee that would have been charged by other funds within its Lipper expense group assuming they were similar in size to the Fund, as well as the actual total expense ratio of the Fund in comparison with those of its expense group. The Lipper contractual investment management fee analysis includes within such fee any separate administrative fees, and the Lipper total expenses, for comparative consistency, are shown by Lipper for Fund Class A shares. The results of such expense comparisons showed that the contractual investment management fee rate and actual total expense ratio for each of Franklin Convertible Securities Fund and Franklin Equity Income Fund were in either the least expensive or second least expensive quintiles of their respective Lipper expense groups. The Board was satisfied with the comparative contractual investment management fee rate and actual total expense ratios of these Funds as shown in the Lipper reports. The contractual investment management fee rate for Franklin Balanced Fund was above the median of its Lipper expense group, but due to fee waivers, its actual investment management fee and total expense ratio were in the least expensive quintiles of such group. The Board was satisfied with the comparative contractual investment management fee rate and actual total expense ratio of this Fund as shown in the Lipper reports. The contractual management fee rate of Franklin Limited Maturity U.S. Government Securities Fund was within two basis points of the median of its Lipper expense group, while its actual total expense ratio was below the median of such group. The Board found the comparative contractual management fee rate and total expense ratio of this Fund as shown in the Lipper report to be acceptable. The contractual investment management fee and actual total expense ratio for Franklin Real Return Fund were above the median of its Lipper expense group, but its actual total expense ratio was within six basis points of the median for such expense group. The Board found the contractual management fees and total expense ratio of the Fund to be acceptable, noting that expenses were subsidized through management fee waivers and reimbursements.
122 | Semiannual Report
Franklin Investors Securities Trust
Shareholder Information (continued)
Board Review of Investment Management Agreement (continued)
MANAGEMENT PROFITABILITY. The Board also considered the level of profits realized by the Manager and its affiliates in connection with the operation of each Fund. In this respect, the Board reviewed the Fund profitability analysis that addresses the overall profitability of Franklin Templeton’s U.S. fund business, as well as its profits in providing management and other services to each of the individual funds during the 12-month period ended September 30, 2010, being the most recent fiscal year-end for Franklin Resources, Inc., the Manager’s parent. In reviewing the analysis, attention was given to the methodology followed in allocating costs to each Fund, it being recognized that allocation methodologies are inherently subjective and various allocation methodologies may each be reasonable while producing different results. In this respect, the Board noted that, while being continuously refined and reflecting changes in the Manager’s own cost accounting, the cost allocation methodology was consistent with that followed in profitability report presentations for the Funds made in prior years and that the Funds’ independent registered public accounting firm had been engaged by the Manager to review the reasonableness of the allocation methodologies solely for use by the Funds’ Board in reference to the profitability analysis. In reviewing and discussing such analysis, management discussed with the Board its belief that costs incurred in establishing the infrastructure necessary for the type of mutual fund operations conducted by the Manager and its affiliates may not be fully reflected in the expenses allocated to each Fund in determining its profitability, as well as the fact that the level of profits, to a certain extent, reflected operational cost savings and efficiencies initiated by management. The Board also took into account management’s expenditures in improving shareholder services provided the Funds, as well as the need to meet additional regulatory and compliance requirements resulting from the Sarbanes-Oxley Act and recent SEC and other regulatory requirements. In addition, the Board considered a third-party study comparing the profitability of the Manager’s parent on an overall basis to other publicly held managers broken down to show profitability from management operations exclusive of distribution expenses, as well as profitability including distribution expenses. The Board also considered the extent to which the Manager and its affiliates might derive ancillary benefits from fund operations, including revenues generated from transfer agent services and potential benefits resulting from allocation of fund brokerage and the use of commission dollars to pay for research. Based upon its consideration of all these factors, the Board determined that the level of profits realized by the Manager and its affiliates from providing services to each Fund was not excessive in view of the nature, quality and extent of services provided.
ECONOMIES OF SCALE. The Board also considered whether economies of scale are realized by the Manager as the Funds grow larger and the extent to which this is reflected in the level of management fees charged. While recognizing that any precise determination is inherently subjective, the Board noted that based upon the Fund profitability analysis, it appears that as some funds get larger, at some point economies of scale do result in the Manager realizing a larger profit margin on management services provided such a fund. The Board also noted that economies of scale are shared with each Fund and its shareholders through management fee breakpoints so that as a Fund grows in size, its effective management fee rate declines. The management fee structure including a separate fixed administrative fee for Franklin Real Return Fund provides for breakpoints in stages
Semiannual Report | 123
Franklin Investors Securities Trust
Shareholder Information (continued)
Board Review of Investment Management Agreement (continued)
going to the $21.5 billion asset level, which far exceeded the size of the Fund, which at year-end was approximately $490 million. The Board believed that to the extent economies of scale may be realized by the Manager of the Fund and its affiliates, that this schedule of fees provided a sharing of benefits with the Fund and its shareholders, and noted also that the expenses of the Fund were partially subsidized by management. The management fee structure, which includes administrative expenses, for Franklin Limited Maturity U.S. Government Securities Fund provides an initial fee of 0.625% on the first $100 million of assets; 0.50% on the next $150 million of assets; and 0.45% on assets in excess of $250 million. At 2010 year-end, the Fund’s assets were approximately $505 million. The Board noted the Fund’s comparative management fee rate and favorable total expense rate in respect to its Lipper expense group, as well as the fact that assets in excess of a fund’s last breakpoint still resulted in an overall lower investment management fee rate and believed that to the extent economies of scale may be realized by the Manager and its affiliates, there was a sharing of benefits with this Fund and its shareholders. The management fee structure, which includes administrative expenses for each of Franklin Convertible Securities Fund and Franklin Equity Income Fund, provides an initial fee of 0.625% on the first $100 million of assets; 0.50% on the next $150 million of assets; and 0.45% on assets in excess of $250 million, with additional breakpoints for assets at the $7.5 billion and $10 billion levels, and other breakpoints continuing thereafter. Franklin Convertible Securities Fund and Franklin Equity Income Fund had assets of $1.07 billion and $1.04 billion, respectively, at year-end, and the Board believed that to the extent economies of scale may be realized by the Manager and its affiliates, the schedule of fees under the investment management agreements for each of these Funds provides a sharing of benefits with each of these Funds and their shareholders, noting the favorable effective management fee rate and total expense ratios of each in comparison to their respective Lipper expense groups. The Board did not believe the asset size of Franklin Balanced Fund, whose expenses were partially subsidized by management, afforded any economies of scale.
Proxy Voting Policies and Procedures
The Trust’s investment manager has established Proxy Voting Policies and Procedures (Policies) that the Trust uses to determine how to vote proxies relating to portfolio securities. Shareholders may view the Trust’s complete Policies online at franklintempleton.com. Alternatively, shareholders may request copies of the Policies free of charge by calling the Proxy Group collect at (954) 527-7678 or by sending a written request to: Franklin Templeton Companies, LLC, 300 S.E. 2nd Street, Fort Lauderdale, FL 33301, Attention: Proxy Group. Copies of the Trust’s proxy voting records are also made available online at franklintempleton.com and posted on the U.S. Securities and Exchange Commission’s website at sec.gov and reflect the most recent 12-month period ended June 30.
124 | Semiannual Report
Franklin Investors Securities Trust
Shareholder Information (continued)
Quarterly Statement of Investments
The Trust files a complete statement of investments with the U.S. Securities and Exchange Commission for the first and third quarters for each fiscal year on Form N-Q. Shareholders may view the filed Form N-Q by visiting the Commission’s website at sec.gov. The filed form may also be viewed and copied at the Commission’s Public Reference Room in Washington, DC. Information regarding the operations of the Public Reference Room may be obtained by calling (800) SEC-0330.
Semiannual Report | 125
This page intentionally left blank.
This page intentionally left blank.
This page intentionally left blank.


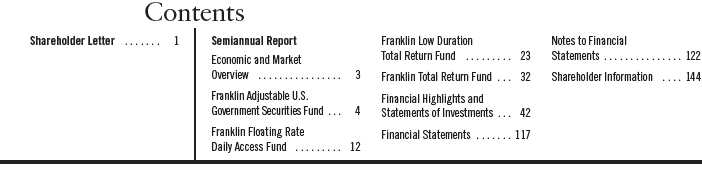
Semiannual Report
Economic and Market Overview
The U.S. economy expanded during the six-month reporting period largely due to rising exports and greater consumer and business spending. Early in the period, consumers were concerned about declines in home sales and fears of a renewed economic slowdown. The Federal Reserve Board (Fed) kept interest rates historically low, and in November, to promote a stronger recovery, the Fed announced its intention to buy $600 billion of longer term Treasury securities by the end of the second quarter of 2011. The job market improved, and employment increased for six consecutive months while the unemployment rate declined. The growing job market boosted consumer confidence, and led to improved real estate and retail activity beginning in March.
Rising oil and food prices, however, eroded consumers’ spending power. Geopolitical instability in North Africa and the Middle East created worries about global supply. Crude oil prices, which began the reporting period at $81 per barrel, reached a six-month high of $114 at period-end. Storms and droughts in several states reduced crop yields, pushing up prices for corn, wheat and soybeans. As oil and food prices rose, the pace of inflation accelerated during the period.
Despite turmoil in North Africa and the Middle East, the multiple crises triggered by Japan’s earthquake and the threat of a U.S. government shutdown, a generally favorable economic backdrop and positive corporate earnings reports gave investors confidence. Equity markets performed well for the six months under review while most fixed income markets produced small gains. In this environment, Treasury prices declined and yields rose.
The foregoing information reflects our analysis and opinions as of April 30, 2011. The information is not a complete analysis of every aspect of any market, country, industry, security or fund. Statements of fact are from sources considered reliable.
Semiannual Report | 3
Franklin Adjustable
U.S. Government Securities Fund
Your Fund’s Goal and Main Investments: Franklin Adjustable U.S. Government
Securities Fund seeks to provide a high level of current income while providing lower volatility of principal than a fund that invests in fixed-rate securities by investing at least 80% of its net assets in adjustable-rate U.S. government mortgage securities, which are issued or guaranteed by the U.S. government, its agency or instrumentalities.1 The Fund’s investments may include securities issued by government-sponsored entities, such as Fannie Mae and Freddie Mac.2
Performance data represent past performance, which does not guarantee future results. Investment return and principal value will fluctuate, and you may have a gain or loss when you sell your shares. Current performance may differ from figures shown. Please visit franklintempleton.com or call (800) 342-5236 for most recent month-end performance.

We are pleased to bring you Franklin Adjustable U.S. Government Securities Fund’s semiannual report for the period ended April 30, 2011.
Performance Overview
Franklin Adjustable U.S. Government Securities Fund – Class A delivered a +0.54% cumulative total return for the six months under review. The Fund outperformed the +0.26% total return of its benchmark, the Barclays Capital (BC) U.S. Government Index: 1-2 Year Component, which measures public obligations of the U.S. Treasury with one to two years to final maturity and publicly issued debt of U.S. government agencies, quasi-federal corporations, and corporate or foreign debt guaranteed by the U.S. government.3 You can find the Fund’s long-term performance data in the Performance Summary beginning on page 7.
Investment Strategy
We employ a conservative investment strategy as we strive to produce solid performance in a variety of interest rate climates. We tend to invest in seasoned
1. Securities owned by the Fund, but not shares of the Fund, are guaranteed by the U.S. government, its agencies or instrumentalities as to timely payment of principal and interest.
2. Although U.S. government-sponsored entities may be chartered or sponsored by acts of Congress, their securities are neither issued nor guaranteed by the U.S. Treasury. Please see the Fund’s prospectus for a detailed discussion regarding various levels of credit support for government agency or instrumentality securities. The Fund’s yield and share price are not guaranteed and will vary with market conditions.
3. Source: © 2011 Morningstar. All Rights Reserved. The information contained herein: (1) is proprietary to Morningstar and/or its content providers; (2) may not be copied or distributed; and (3) is not warranted to be accurate, complete or timely. Neither Morningstar nor its content providers are responsible for any damages or losses arising from any use of this information. The index is unmanaged and includes reinvested interest. One cannot invest directly in an index, and an index is not representative of the Fund’s portfolio.
The dollar value, number of shares or principal amount, and names of all portfolio holdings are listed in the Fund’s Statement of Investments (SOI). The SOI begins on page 45.
4 | Semiannual Report

*Assumes shares were purchased and held for the entire accrual period. Since dividends accrue daily, your actual distributions will vary depending on the date you purchased your shares and any account activity. All Fund distributions will vary depending upon current market conditions, and past distributions are not indicative of future trends.
adjustable-rate mortgage (ARM) securities, which have been through different interest rate cycles and have a lower sensitivity to shifts in interest rates. We choose securities using a value-oriented approach, emphasizing the bonds’ economic fundamentals in relation to comparable securities as well as their historical prepayment performance.
Manager’s Discussion
During the period, the U.S. economic recovery appeared to make progress despite mixed economic data. The U.S. consumer was resilient and retail sales remained relatively strong, in spite of higher gasoline prices. The labor market showed signs of healing, and the corporate sector generally delivered healthy profits and solid balance sheets. The unemployment rate remained elevated, which restrained labor costs and wages and made it difficult for businesses to pass higher commodity prices to consumers. A global recovery seems to be in place, driven largely by growth in emerging markets. However, potential risks to economic expansion persisted, including U.S. federal debt levels, global inflationary pressures, concerns surrounding some eurozone countries and a distressed U.S. housing market.
Interest rates remained historically low and Treasury prices decreased across most maturities during the period. Hybrid ARMs delivered positive total returns in this environment.
We maintained our investment strategy as we continued to utilize collateral-intensive research to identify strong cash flow fundamentals and attractive valuations across the ARM universe. The Fund invested predominantly in
Semiannual Report | 5
Fannie Mae, Freddie Mac and Ginnie Mae ARMs, and continued to focus on seasoned, shorter duration, high-quality ARMs. On a total return basis, ARMs outperformed their fixed-rate MBS counterparts and similar duration U.S. Treasury securities. With the ARM market priced at a premium and mortgage rates at historical lows, prepayment risk remained heightened. Overall prepayment levels, however, were constrained due to the associated cost of refinancing, loss of home equity, tighter underwriting standards and declining home prices. Based on our analysis, we believe prepayment activity levels should remain benign, continue to gradually slow and eventually level off. To the extent we can buy ARMs that will prepay slower than market expectations, we may add value for the Fund’s shareholders.
Thank you for your continued participation in Franklin Adjustable U.S. Government Securities Fund. We look forward to serving your future investment needs.


Roger A. Bayston, CFA

Portfolio Management Team
Franklin Adjustable U.S. Government Securities Fund
CFA® is a trademark owned by CFA Institute.
The foregoing information reflects our analysis, opinions and portfolio holdings as of April 30, 2011, the end of the reporting period. The way we implement our main investment strategies and the resulting portfolio holdings may change depending on factors such as market and economic conditions. These opinions may not be relied upon as investment advice or an offer for a particular security. The information is not a complete analysis of every aspect of any market, country, industry, security or the Fund. Statements of fact are from sources considered reliable, but the investment manager makes no representation or warranty as to their completeness or accuracy. Although historical performance is no guarantee of future results, these insights may help you understand our investment management philosophy.
6 | Semiannual Report
Performance Summary as of 4/30/11
Franklin Adjustable U.S. Government Securities Fund
Your dividend income will vary depending on dividends or interest paid by securities in the Fund’s portfolio, adjusted for operating expenses of each class. Capital gain distributions are net profits realized from the sale of portfolio securities. The performance table does not reflect any taxes that a shareholder would pay on Fund dividends, capital gain distributions, if any, or any realized gains on the sale of Fund shares. Total return reflects reinvestment of the Fund’s dividends and capital gain distributions, if any, and any unrealized gains or losses.

Semiannual Report | 7
Performance Summary (continued)
Performance
Cumulative total return excludes sales charges. Average annual total returns include maximum sales charges. Class A: 2.25% maximum initial sales charge; Class C: 1% contingent deferred sales charge in first year only; Advisor Class: no sales charges.

Performance data represent past performance, which does not guarantee future results. Investment return and principal value will fluctuate, and you may have a gain or loss when you sell your shares. Current performance may differ from figures shown. For most recent month-end performance, go to franklintempleton.com or call (800) 342-5236.
8 | Semiannual Report
Performance Summary (continued)
Endnotes
Interest rate movements, unscheduled mortgage prepayments and other risk factors will affect the Fund’s share price and yield. Bond prices generally move in the opposite direction of interest rates. Thus, as prices of bonds in the Fund adjust to a rise in interest rates, the Fund’s share price may decline. The manager applies various techniques and analyses in making investment decisions for the Fund, but there can be no guarantee that these decisions will produce the desired results. The Fund’s prospectus also includes a description of the main investment risks.
| |
Class C: | Prior to 1/1/04, these shares were offered with an initial sales charge; thus actual total returns would have differed. These shares have higher annual fees and expenses than Class A shares. |
| |
Advisor Class: | Shares are available to certain eligible investors as described in the prospectus. |
1. Cumulative total return represents the change in value of an investment over the periods indicated.
2. Average annual total return represents the average annual change in value of an investment over the periods indicated. Six-month return has not been annualized.
3. In accordance with SEC rules, we provide standardized average annual total return information through the latest calendar quarter.
4. Distribution rate is based on an annualization of the sum of the respective class’s past 30 days’ daily distributions and the maximum offering price (NAV for Classes C and Advisor) per share on 4/30/11.
5. The 30-day standardized yield for the 30 days ended 4/30/11 reflects an estimated yield to maturity (assuming all portfolio securities are held to maturity). It should be regarded as an estimate of the Fund’s rate of investment income, and it may not equal the Fund’s actual income distribution rate (which reflects the Fund’s past dividends paid to shareholders) or the income reported in the Fund’s financial statements.
6. Figures are as stated in the Fund’s prospectus current as of the date of this report. In periods of market volatility, assets may decline significantly, causing total annual Fund operating expenses to become higher than the figures shown.
7. Effective 5/15/08, the Fund began offering Advisor Class shares, which do not have sales charges or a Rule 12b-1 plan. Performance quotations for this class reflect the following methods of calculation: (a) For periods prior to 5/15/08, a restated figure is used based upon the Fund’s Class A performance, excluding the effect of Class A’s maximum initial sales charge, but reflecting the effect of the Class A Rule 12b-1 fees; and (b) for periods after 5/14/08, actual Advisor Class performance is used reflecting all charges and fees applicable to that class. Since 5/15/08 (commencement of sales), the cumulative and average annual total returns of Advisor Class shares were +9.26% and +3.04%.
Semiannual Report | 9
Your Fund’s Expenses
Franklin Adjustable U.S. Government Securities Fund
As a Fund shareholder, you can incur two types of costs:
- Transaction costs, including sales charges (loads) on Fund purchases; and
- Ongoing Fund costs, including management fees, distribution and service (12b-1) fees, and other Fund expenses. All mutual funds have ongoing costs, sometimes referred to as operating expenses.
The following table shows ongoing costs of investing in the Fund and can help you understand these costs and compare them with those of other mutual funds. The table assumes a $1,000 investment held for the six months indicated.
Actual Fund Expenses
The first line (Actual) for each share class listed in the table provides actual account values and expenses. The “Ending Account Value” is derived from the Fund’s actual return, which includes the effect of Fund expenses.
You can estimate the expenses you paid during the period by following these steps. Of course, your account value and expenses will differ from those in this illustration:
| 1. | Divide your account value by $1,000. |
| | If an account had an $8,600 value, then $8,600 ÷ $1,000 = 8.6. |
| 2. | Multiply the result by the number under the heading “Expenses Paid During Period.” |
| | If Expenses Paid During Period were $7.50, then 8.6 x $7.50 = $64.50. |
In this illustration, the estimated expenses paid this period are $64.50.
Hypothetical Example for Comparison with Other Funds
Information in the second line (Hypothetical) for each class in the table can help you compare ongoing costs of investing in the Fund with those of other mutual funds. This information may not be used to estimate the actual ending account balance or expenses you paid during the period. The hypothetical “Ending Account Value” is based on the actual expense ratio for each class and an assumed 5% annual rate of return before expenses, which does not represent the Fund’s actual return. The figure under the heading “Expenses Paid During Period” shows the hypothetical expenses your account would have incurred under this scenario. You can compare this figure with the 5% hypothetical examples that appear in shareholder reports of other funds.
10 | Semiannual Report
Your Fund’s Expenses (continued)
Please note that expenses shown in the table are meant to highlight ongoing costs and do not reflect any transaction costs, such as sales charges. Therefore, the second line for each class is useful in comparing ongoing costs only, and will not help you compare total costs of owning different funds. In addition, if transaction costs were included, your total costs would have been higher. Please refer to the Fund prospectus for additional information on operating expenses.

*Expenses are calculated using the most recent six-month expense ratio, annualized for each class (A: 0.86%; C: 1.26%; and Advisor: 0.61%), multiplied by the average account value over the period, multiplied by 181/365 to reflect the one-half year period.
Semiannual Report | 11
Franklin Floating Rate Daily Access Fund
Your Fund’s Goals and Main Investments: Franklin Floating Rate Daily Access Fund seeks to provide a high level of current income and, secondarily, preservation of capital by investing at least 80% of its net assets in income-producing floating interest rate corporate loans and corporate
debt securities.
Performance data represent past performance, which does not guarantee future results. Investment return and principal value will fluctuate, and you may have a gain or loss when you sell your shares. Current performance may differ from figures shown. Please visit franklintempleton.com or call (800) 342-5236 for most recent month-end performance.
What are syndicated bank loans?
Syndicated bank loans are typically floating rate loans to corporate borrowers made by a group, or syndicate, of banks and other lenders. A group of lenders provides capital to companies for varied purposes, such as merger and acquisition activity, leveraged buyouts or refinancings. Borrowing rates are generally pegged to an index, such as LIBOR, the London Interbank Offered Rate.
This semiannual report for Franklin Floating Rate Daily Access Fund covers the period ended April 30, 2011.
Performance Overview
Franklin Floating Rate Daily Access Fund – Class A delivered a cumulative total return of +3.69% for the six months under review. The Fund underperformed the +5.15% total return of its benchmark, the Credit Suisse Leveraged Loan Index (CS LLI), which is designed to mirror the investable universe of the U.S. dollar-denominated leveraged loan market.1 You can find the Fund’s long-term performance data in the Performance Summary beginning on page 18.
Syndicated Bank Loan Market Overview
The loan market’s strong overall performance during the six-month period under review was characterized largely by robust inflows and repayments that led to strong demand among investors and gains in the secondary market. As measured by the S&P/LCD Flow Names, secondary loan prices rose from 95.89 cents on the dollar at the beginning of the period to 98.26 at period-end, while the average discounted spread to maturity (the interest rate margin over LIBOR, factoring the current trading price and the loan’s maturity) tightened from 401 basis points (bps; 100 bps equal one percentage point) to 377 bps during the same period.2 While investor demand initially led to an active primary market that brought an ample supply of new loans, repricing activity eventually emerged as supply was unable to keep pace with inflows in January
1. Source: © 2011 Morningstar. All Rights Reserved. The information contained herein: (1) is proprietary to Morningstar and/or its content providers; (2) may not be copied or distributed; and (3) is not warranted to be accurate, complete or timely. Neither Morningstar nor its content providers are responsible for any damages or losses arising from any use of this information. The index is unmanaged and includes reinvested interest. One cannot invest directly in an index, and an index is not representative of the Fund’s portfolio.
2. Source: Standard & Poor’s, “Bi-weekly Secondary Price & Spread Levels for Selected Large Institutional Flow Loans,” 4/28/11. S&P/LCD (Standard & Poor’s Leveraged Commentary & Data) Flow Names is a composite of the 15 most actively traded loan facilities. STANDARD & POOR’S®, S&P® and S&P 500® are registered trademarks of Standard & Poor’s Financial Services LLC. Standard & Poor’s does not sponsor, endorse, sell or promote any S&P index-based product.
The dollar value, number of shares or principal amount, and names of all portfolio holdings are listed in the Fund’s Statement of Investments (SOI). The SOI begins on page 52.
12 | Semiannual Report
and February. An increase in risk aversion caused by the turmoil in the Middle East and North Africa and the earthquake and tsunami in Japan dampened issuer repricings, but the loan market began to recover by period-end.
Throughout the period, a wide array of investors, including hedge funds and high yield and multi-strategy accounts, was drawn to the loan asset class in anticipation of higher interest rates and inflation as the economy recovered and the Federal Reserve continued its second round of quantitative easing. Inflows into loan mutual funds reached record levels during the first few months of 2011, surpassing inflows in all of 2010. Expecting continued demand, more investment firms launched new loan mutual funds to capture a portion of the inflows. Issuance of new collateralized loan obligations (CLOs) also began to recover during the reporting period, contributing to demand. However, arbitrage opportunities remained elusive to investors, and potential regulatory issues hampered new structured finance products. CLO issuance also stalled in March amid uncertainty surrounding Japanese banks and insurance companies, which had been major participants in the CLO market. As a result, participation in the primary loan market continued the recent trend where loan mutual funds made up a larger proportion of the market, while the share of CLO participation declined.
Bond-for-loan refinancings provided another source of cash to investor accounts. Amid historically low interest rates, many companies opted to issue new high yield bonds and repay institutional term loans with the proceeds. Repayments, in turn, helped increase cash positions in loan mutual funds and CLOs, which contributed to demand in the primary and secondary markets.
In the first months of 2011, the loan price rally and spread tightening were due in part to a decrease in the supply of new loans, as most loans in the new-issue market were refinancing transactions, rather than new-money deals. January’s lack of new supply was a stark contrast to the end of 2010, when the primary market reached its highest volume since 2007. As demand intensified in the reporting period, many deals were oversubscribed and issuers reduced interest rate spreads over LIBOR and lowered LIBOR floor rates. Although this trend briefly reversed in March and many issuers withdrew repricing transactions, repricing activity resumed in April as demand returned. Repricing activity was mostly centered on 2008- to 2010-vintage deals, which offered wider nominal LIBOR spreads and higher LIBOR floors. The attractive income from 2008- to 2010-vintage loans helped push their prices above face value and provided an incentive for issuers to reprice the deals.
Contributing to the lack of new-issue loans, deals related to mergers and acquisitions (M&A) remained below historical levels for periods with increased liquidity. Investors speculated that the equity market rally may have contributed

Semiannual Report | 13

*Assumes shares were purchased and held for the entire accrual period. Since dividends accrue daily, your actual distributions will vary depending on the date you purchased your shares and any account activity. All Fund distributions will vary depending upon current market conditions, and past distributions are not indicative of future trends.
to acquisition targets being less attractive. Moreover, given expectations for higher valuations in the future, private equity firms may have been reluctant to sell businesses based on performance still affected by the recession. With M&A activity at modest levels, dividend recapitalizations were still prevalent in the market as private equity firms attempted to monetize their investments amid robust inflows and repayments.
Amend-to-extend deals provided another source of relief, especially for a few stressed credits, where the amend-to-extend option provided cheaper financing relative to the new-issue market. Furthermore, with a large percentage of the loan universe maturing in 2013 and 2014, corporate issuers brought amend-to-extend deals to the market with some belief that the economy would continue to improve and other financing options would eventually be available. Amend-to-extend deals provided an additional boost to the loan market as the amended loans with extended maturities and higher coupons traded higher in price.
Fundamental factors also continued to support demand for loans as companies reported improved earnings. During the six-month period, corporate issuers reported significant year-over-year improvement in revenues and EBITDA (earnings before interest, taxes, depreciation and amortization, which is a measure of a company’s cash flow and ability to service its loan interests). As issuers continued to benefit from an improving global economy and better liquidity, the trailing 12-month default rate by principal amount decreased from 2.28% in October 2010 to a 38-month low of 0.95% at period-end.3
3. Source: S&P/LCD, “Loan Stats,” May 2011.
14 | Semiannual Report
Investment Strategy
We use a detailed credit analysis process to select corporate loan and corporate debt securities that meet our criteria. We conduct ongoing credit monitoring of our investments. To help manage the credit risk associated with investing in below investment-grade securities, we diversify the Fund by investing in a large number of loans of companies that we have identified as having attractive risk/reward profiles, favorable capital structures, strong asset coverage and dominant market shares. This diversification potentially reduces credit risk by spreading assets across many different industries.
Manager’s Discussion
The Fund’s higher credit quality focus (in BB-rated loans) led to underperfor-mance relative to the benchmark CS LLI, as higher risk loans (those rated B and below) significantly outperformed BB-rated loans. For the six-month report ing period, BB loans returned +2.97%, B loans returned +6.12%, CCC loans returned +13.16% and Distressed (CC, C and Defaulted) loans returned +9.11%, as measured by the index.4 Although the Fund benefited from its investment in high-quality, new-issue loans with attractive spreads in 2010, many of these loans were candidates for repricing. While repricing activity reduced portfolio income and had some impact on loan prices during the period, this was somewhat mitigated by the soft call protection on a number of our loans, functioning similarly to a prepayment penalty for early refinancing activity.
Higher beta and lower priced loans continued to perform well during the period, particularly the larger, more liquid issues held by both loan and high yield bond investors. Our positions in Caesars Entertainment Operating Co., Univision Communications and First Data provided strong performance. These companies executed amend-to-extend transactions that provided higher coupons along with the extension of maturities, making their return profiles more favorable.
During the period under review, a few individual loans detracted from performance. Carestream Health, a provider of medical and dental imaging products, declined in value as the rising prices of commodities used in film manufacturing affected profit margin and forced the company to raise prices on its film products Furthermore, the term loan of one of our highest yielding investments, Dex One,5 a large directories publisher in the U.S., hurt Fund performance, despite the company’s ability to generate strong free cash flow and pay down debt, due

4. Source: Credit Suisse.
5. R.H. Donnelly Inc. in the SOI.
Semiannual Report | 15
to investor concerns about its declining revenues. The term loan of Metro-Goldwyn-Mayer declined during the six-month period as the company filed for Chapter 11 and unveiled its pre-packaged reorganization plan, which was below the recovery expectations of the lender group. The Fund received equity in MGM Holdings, the new company formed as a result of the reorganization.
Amid robust inflows, the Fund established a position in a bank loan derivative instrument, the Markit North American Loan Credit Default Swap Index (LCDX), a tradable index of 100 equally weighted first-lien loan credit default swaps. LCDX provided the Fund with exposure to leveraged loans prior to investing in cash loans, helping to reduce the negative relative effect of cash held by the Fund. The index positively contributed to performance since the Fund initiated its position.
During the period, the Fund continued to focus on the new-issue market, where we believed there were more attractive opportunities that offered wider LIBOR spreads and higher LIBOR floors, as well as meaningful original issue discounts (OIDs). The Fund participated in a few large new-issue transactions across a broad spectrum of industries, many of which were market leaders with recurring revenues and stable cash flows and were in industries with high barriers to entry. While we remained focused on maximizing the Fund’s risk/reward profile consistent with our conservative investment philosophy, we also attempted to mitigate potential repricing risk should demand continue to outpace supply.
The Fund invested in Hertz, one of the largest U.S. car and equipment rental companies. We liked the company’s strong market position, valuable brand name, low senior-secured leverage, highly variable cost structure and the cyclical recovery in the equipment rental market, which we believed offset the market’s high level of competition. When the company refinanced its loan facilities in early 2011, we participated in the transaction based on the attractive discount margin versus other similarly rated companies in the leveraged loan segment and what we considered a favorable outlook for the company.
The Fund also invested in Intelsat Jackson, the world’s largest fixed-satellite services business. We found the loan attractive due to the company’s leading global satellite fleet, which resulted in stable and diverse revenue generation from a premier customer base. Additionally, the company had ample liquidity, with cash on hand and full use of its revolving credit facility to finance all of its capital expenditure requirements. Finally, we liked the company’s credit profile as the low leverage through the first-lien bank debt was well protected by the company’s assets and current market multiples.
16 | Semiannual Report
Thank you for your continued participation in Franklin Floating Rate Daily Access Fund. We look forward to serving your future investment needs.

Portfolio Management Team
Franklin Floating Rate Daily Access Fund
The foregoing information reflects our analysis, opinions and portfolio holdings as of April 30, 2011, the end of the reporting period. The way we implement our main investment strategies and the resulting portfolio holdings may change depending on factors such as market and economic conditions. These opinions may not be relied upon as investment advice or an offer for a particular security. The information is not a complete analysis of every aspect of any market, country, industry, security or the Fund. Statements of fact are from sources considered reliable, but the investment manager makes no representation or warranty as to their completeness or accuracy. Although historical performance is no guarantee of future results, these insights may help you understand our investment management philosophy.
Semiannual Report | 17
Performance Summary as of 4/30/11
Franklin Floating Rate Daily Access Fund
Your dividend income will vary depending on dividends or interest paid by securities in the Fund’s portfolio, adjusted for operating expenses of each class. Capital gain distributions are net profits realized from the sale of portfolio securities. The performance table does not reflect any taxes that a shareholder would pay on Fund dividends, capital gain distributions, if any, or any realized gains on the sale of Fund shares. Total return reflects reinvestment of the Fund’s dividends and capital gain distributions, if any, and any unrealized gains or losses.

18 | Semiannual Report
Performance Summary (continued)
Performance
Cumulative total return excludes sales charges. Average annual total returns include maximum sales charges. Class A: 2.25% maximum initial sales charge; Class B: contingent deferred sales charge (CDSC) declining from 4% to 1% over six years, and eliminated thereafter; Class C: 1% CDSC in first year only; Advisor Class: no sales charges.

Performance data represent past performance, which does not guarantee future results. Investment return and principal value will fluctuate, and you may have a gain or loss when you sell your shares. Current performance may differ from figures shown. For most recent month-end performance, go to franklintempleton.com or call (800) 342-5236.
Semiannual Report | 19
Performance Summary (continued)
Endnotes
Investors should be aware that the Fund’s share price and yield will fluctuate with market conditions. The Fund should not be considered an alternative to money market funds or certificates of deposit (CDs). The floating rate loans and debt securities in which the Fund invests tend to be rated below investment grade. Investing in higher yielding, lower rated, floating rate loans and debt securities involves greater risk of default, which could result in loss of principal — a risk that may be heightened in a slowing economy. Interest earned on floating rate loans varies with changes in prevailing interest rates. Therefore, while floating rate loans offer higher interest income when interest rates rise, they will also generate less income when interest rates decline. The manager applies various techniques and analyses in making investment decisions for the Fund, but there can be no guarantee that these decisions will produce the desired results. The Fund’s prospectus also includes a description of the main investment risks.

1. Cumulative total return represents the change in value of an investment over the periods indicated.
2. Average annual total return represents the average annual change in value of an investment over the periods indicated. Six-month return has not been annualized.
3. In accordance with SEC rules, we provide standardized average annual total return information through the latest calendar quarter.
4. Distribution rate is based on an annualization of the respective class’s past 30 days’ daily distributions and the maximum offering price (NAV for Classes B, C and Advisor) per share on 4/30/11.
5. The 30-day standardized yield for the 30 days ended 4/30/11 reflects an estimated yield to maturity (assuming all portfolio securities are held to maturity). It should be regarded as an estimate of the Fund’s rate of investment income, and it may not equal the Fund’s actual income distribution rate (which reflects the Fund’s past dividends paid to shareholders) or the income reported in the Fund’s financial statements.
6. Figures are as stated in the Fund’s prospectus current as of the date of this report. In periods of market volatility, assets may decline significantly, causing total annual Fund operating expenses to become higher than the figures shown.
20 | Semiannual Report
Your Fund’s Expenses
Franklin Floating Rate Daily Access Fund
As a Fund shareholder, you can incur two types of costs:
- Transaction costs, including sales charges (loads) on Fund purchases; and
- Ongoing Fund costs, including management fees, distribution and service (12b-1) fees, and other Fund expenses. All mutual funds have ongoing costs, sometimes referred to as operating expenses.
The following table shows ongoing costs of investing in the Fund and can help you understand these costs and compare them with those of other mutual funds. The table assumes a $1,000 investment held for the six months indicated.
Actual Fund Expenses
The first line (Actual) for each share class listed in the table provides actual account values and expenses. The “Ending Account Value” is derived from the Fund’s actual return, which includes the effect of Fund expenses.
You can estimate the expenses you paid during the period by following these steps. Of course, your account value and expenses will differ from those in this illustration:
| 1. | Divide your account value by $1,000. |
| | If an account had an $8,600 value, then $8,600 ÷ $1,000 = 8.6. |
| 2. | Multiply the result by the number under the heading “Expenses Paid During Period.” |
| | If Expenses Paid During Period were $7.50, then 8.6 x $7.50 = $64.50. |
In this illustration, the estimated expenses paid this period are $64.50.
Hypothetical Example for Comparison with Other Funds
Information in the second line (Hypothetical) for each class in the table can help you compare ongoing costs of investing in the Fund with those of other mutual funds. This information may not be used to estimate the actual ending account balance or expenses you paid during the period. The hypothetical “Ending Account Value” is based on the actual expense ratio for each class and an assumed 5% annual rate of return before expenses, which does not represent the Fund’s actual return. The figure under the heading “Expenses Paid During Period” shows the hypothetical expenses your account would have incurred under this scenario. You can compare this figure with the 5% hypothetical examples that appear in shareholder reports of other funds.
Semiannual Report | 21
Your Fund’s Expenses (continued)
Please note that expenses shown in the table are meant to highlight ongoing costs and do not reflect any transaction costs, such as sales charges. Therefore, the second line for each class is useful in comparing ongoing costs only, and will not help you compare total costs of owning different funds. In addition, if transaction costs were included, your total costs would have been higher. Please refer to the Fund prospectus for additional information on operating expenses.

*Expenses are calculated using the most recent six-month expense ratio, annualized for each class (A: 0.87%; B: 1.62%; C: 1.27%; and Advisor: 0.62%), multiplied by the average account value over the period, multiplied by 181/365 to reflect the one-half year period.
22 | Semiannual Report
Franklin Low Duration Total Return Fund
Your Fund’s Goal and Main Investments: Franklin Low Duration Total Return Fund seeks as high a level of current income as is consistent with prudent investing, while seeking capital preservation. The Fund invests primarily in investment-grade debt securities, including government and corporate debt securities and mortgage- and asset-backed securities, targeting an estimated average portfolio duration of three years or less.
Duration is a measure of a bond’s price sensitivity to interest rate changes. In general, a portfolio of securities with a lower duration can be expected to be less sensitive to interest rate changes than a portfolio with a higher duration.
Performance data represent past performance, which does not guarantee future results. Investment return and principal value will fluctuate, and you may have a gain or loss when you sell your shares. Current performance may differ from figures shown. Please visit franklintempleton.com or call (800) 342-5236 for most recent month-end performance.
We are pleased to bring you Franklin Low Duration Total Return Fund’s semiannual report for the period ended April 30, 2011.
Performance Overview
Franklin Low Duration Total Return Fund – Class A delivered a +1.98% cumulative total return for the six months under review. The Fund outperformed the +0.32% total return of its benchmark, the Barclays Capital (BC) U.S. Government/Credit Index: 1-3 Year Component, which tracks public obligations of the U.S. Treasury with one to three years to final maturity and publicly issued debt of U.S. government agencies, quasi-federal corporations, and corporate or foreign debt guaranteed by the U.S. government.1 You can find more of the Fund’s performance data in the Performance Summary beginning on page 27.
Investment Strategy
We seek to invest in a combination of fixed income securities, primarily from across the investment-grade debt universe. We analyze securities using proprietary and nonproprietary research to help us identify attractive investment opportunities across the entire fixed income opportunity set, on a relative basis. When making investment decisions, we evaluate business cycles, yield curves, and values between and within markets. Through a low duration portfolio, we seek to position the Fund to be less affected by interest rate changes than a fund with a higher duration. In addition, we may use derivative transactions, such as currency and cross-currency forwards, futures contracts and swap agreements to obtain net long or short exposures to select currencies, interest rates, countries, duration or credit risks.
1. Source: © 2011 Morningstar. All Rights Reserved. The information contained herein: (1) is proprietary to Morningstar and/or its content providers; (2) may not be copied or distributed; and (3) is not warranted to be accurate, complete or timely. Neither Morningstar nor its content providers are responsible for any damages or losses arising from any use of this information. The index is unmanaged and includes reinvested interest. One cannot invest directly in an index, and an index is not representative of the Fund’s portfolio.
The dollar value, number of shares or principal amount, and names of all portfolio holdings are listed in the Fund’s Statement of Investments (SOI). The SOI begins on page 67.
Semiannual Report | 23

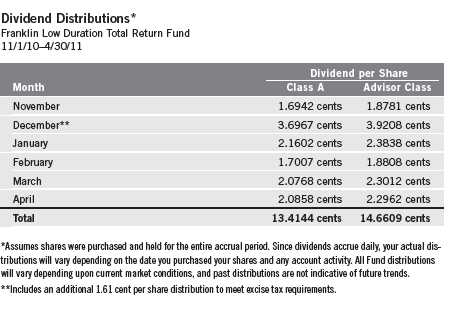
Manager’s Discussion
During the period, the U.S. economic recovery appeared to make progress despite mixed economic data. The U.S. consumer was resilient and retail sales remained relatively strong, in spite of higher gasoline prices. The labor market showed signs of healing, and the corporate sector generally delivered healthy profits and solid balance sheets. The unemployment rate remained elevated, which restrained labor costs and wages and made it difficult for businesses to pass higher commodity prices to consumers. A global recovery seems to be in place, driven largely by growth in emerging markets. However, potential risks to economic expansion persisted, including U.S. federal debt levels, global inflationary pressures, concerns surrounding some eurozone countries and a distressed U.S. housing market.
Using the BC Aggregate Index’s +0.02% return as a proxy for investment-grade bonds, investors’ continued reach for yield helped the U.S. Corporate High Yield Index, which tracks below investment-grade bonds, post the best
24 | Semiannual Report
absolute performance during the period (+6.15%).1 Several other BC indexes for major fixed income sectors delivered positive returns as well, including the Commercial Mortgage-Backed Securities (CMBS) Index (+4.29%), the U.S. MBS Index (+0.95%), the U.S. Corporate Investment Grade Index (+0.83%) and the Emerging Markets (U.S. Dollar) Index (+0.03%). In contrast, the Asset-Backed Securities Index (-0.08%), the U.S. Agency Index (-0.31%) and the U.S. Treasury Index (-1.52%) lagged with negative returns.1
During the reporting period, we remained committed to our investment strategy of emphasizing shorter term and adjustable-rate securities to maintain a lower duration than longer term, fixed-rate securities generally provide. We remained overweighted in many credit sectors based on our belief that valuations remained attractive on a longer term basis. However, we reduced exposure to the high yield sector believing continued strong performance from that sector could be hard to sustain amid concerns over European sovereign and bank credit and potential oil supply disruptions. We took the opportunity to add exposure to some higher quality, more seasoned CMBS with durations short enough to be appropriate for the Fund’s mandate. We also increased municipal bond exposure as we sought to take advantage of opportunities created by that sector’s price dislocations. Our research indicated many of the best opportunities in global bond markets were outside the U.S., and accordingly, we marginally increased exposure to diversified positions in international bonds and currencies.
The Fund’s positioning in credit, in particular below investment-grade credit, continued to boost overall performance as the credit sectors were among the best performing fixed income sectors. Many of our non-U.S. dollar denominated bonds benefited from foreign currency appreciation. The Fund’s increased exposure to municipal bonds benefited the portfolio after the sector rebounded and delivered positive performance. The Fund’s allocation to agency MBS and CMBS produced strong returns and contributed to performance. Our lower weighting in agency debentures, relative to our benchmark, slightly detracted from performance as the sector produced positive excess returns during the period.
Semiannual Report | 25
Thank you for your continued participation in Franklin Low Duration Total Return Fund. We look forward to serving your future investment needs.


Roger A. Bayston, CFA

Kent Burns, CFA

Christopher J. Molumphy, CFA
Portfolio Management Team
Franklin Low Duration Total Return Fund
The foregoing information reflects our analysis, opinions and portfolio holdings as of April 30, 2011, the end of the reporting period. The way we implement our main investment strategies and the resulting portfolio holdings may change depending on factors such as market and economic conditions. These opinions may not be relied upon as investment advice or an offer for a particular security. The information is not a complete analysis of every aspect of any market, country, industry, security or the Fund. Statements of fact are from sources considered reliable, but the investment manager makes no representation or warranty as to their completeness or accuracy. Although historical performance is no guarantee of future results, these insights may help you understand our investment management philosophy.
26 | Semiannual Report
Performance Summary as of 4/30/11
Franklin Low Duration Total Return Fund
Your dividend income will vary depending on dividends or interest paid by securities in the Fund’s portfolio, adjusted for operating expenses of each class. Capital gain distributions are net profits realized from the sale of portfolio securities. The performance table does not reflect any taxes that a shareholder would pay on Fund dividends, capital gain distributions, if any, or any realized gains on the sale of Fund shares. Total return reflects reinvestment of the Fund’s dividends and capital gain distributions, if any, and any unrealized gains or losses.

Semiannual Report | 27
Performance Summary (continued)
Performance1
Cumulative total return excludes sales charges. Average annual total returns include maximum sales charges. Class A: 2.25% maximum initial sales charge; Advisor Class: no sales charges.
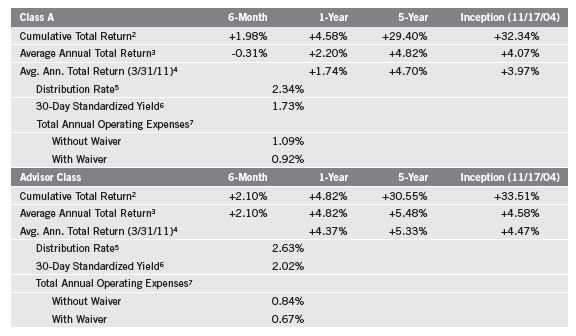
Performance data represent past performance, which does not guarantee future results. Investment return and principal value will fluctuate, and you may have a gain or loss when you sell your shares. Current performance may differ from figures shown. For most recent month-end performance, go to franklintempleton.com or call (800) 342-5236.
The investment manager and administrator have contractually agreed to waive or assume certain expenses so that common expenses (excluding the Rule 12b-1 fees and acquired fund fees and expenses) for each class of the Fund do not exceed 0.65% (other than certain nonroutine expenses) until 2/29/12.
28 | Semiannual Report
Performance Summary (continued)
Endnotes
Interest rate movements will affect the Fund’s share price and yield. Bond prices generally move in the opposite direction of interest rates. Thus, as prices of bonds in the Fund adjust to a rise in interest rates, the Fund’s share price may decline. The Fund’s investment in derivatives, such as financial futures and option contracts, and the Fund’s use of foreign currency techniques involve special risks as such techniques may not achieve the anticipated benefits and/or may result in losses to the Fund. Some derivatives are particularly sensitive to changes in interest rates. The risks of foreign securities include currency fluctuations and political uncertainty. The manager applies various techniques and analyses in making investment decisions for the Fund, but there can be no guarantee that these decisions will produce the desired results. The Fund’s prospectus also includes a description of the main investment risks.
Advisor Class: Shares are available to certain eligible investors as described in the prospectus.
1. If the manager and administrator had not waived fees, the Fund’s distribution rate and total return would have been lower, and yields for the period would have been 1.61% for Class A and 1.89% for Advisor Class.
2. Cumulative total return represents the change in value of an investment over the periods indicated.
3. Average annual total return represents the average annual change in value of an investment over the periods indicated. Six-month return has not been annualized.
4. In accordance with SEC rules, we provide standardized average annual total return information through the latest calendar quarter.
5. Distribution rate is based on an annualization of the sum of the respective class’s past 30 days’ daily distributions and the maximum offering price (NAV for Advisor Class) per share on 4/30/11.
6. The 30-day standardized yield for the 30 days ended 4/30/11 reflects an estimated yield to maturity (assuming all portfolio securities are held to maturity). It should be regarded as an estimate of the Fund’s rate of investment income, and it may not equal the Fund’s actual income distribution rate (which reflects the Fund’s past dividends paid to shareholders) or the income reported in the Fund’s financial statements.
7. Figures are as stated in the Fund’s prospectus current as of the date of this report. In periods of market volatility, assets may decline significantly, causing total annual Fund operating expenses to become higher than the figures shown.
8. Effective 5/15/08, the Fund began offering Advisor Class shares, which do not have sales charges or a Rule 12b-1 plan. Performance quotations for this class reflect the following methods of calculation: (a) For periods prior to 5/15/08, a restated figure is used based upon the Fund’s Class A performance, excluding the effect of Class A’s maximum initial sales charge, but reflecting the effect of the Class A Rule 12b-1 fees; and (b) for periods after 5/14/08, actual Advisor Class performance is used reflecting all charges and fees applicable to that class. Since 5/15/08 (commencement of sales), the cumulative and average annual total returns of Advisor Class shares were +17.30% and +5.54%.
Semiannual Report | 29
Your Fund’s Expenses
Franklin Low Duration Total Return Fund
As a Fund shareholder, you can incur two types of costs:
- Transaction costs, including sales charges (loads) on Fund purchases; and
- Ongoing Fund costs, including management fees, distribution and service (12b-1) fees, and other Fund expenses. All mutual funds have ongoing costs, sometimes referred to as operating expenses.
The following table shows ongoing costs of investing in the Fund and can help you understand these costs and compare them with those of other mutual funds. The table assumes a $1,000 investment held for the six months indicated.
Actual Fund Expenses
The first line (Actual) for each share class listed in the table provides actual account values and expenses. The “Ending Account Value” is derived from the Fund’s actual return, which includes the effect of Fund expenses.
You can estimate the expenses you paid during the period by following these steps. Of course, your account value and expenses will differ from those in this illustration:
| 1. | Divide your account value by $1,000. |
| | If an account had an $8,600 value, then $8,600 ÷ $1,000 = 8.6. |
| 2. | Multiply the result by the number under the heading “Expenses Paid During Period.” |
| | If Expenses Paid During Period were $7.50, then 8.6 x $7.50 = $64.50. |
In this illustration, the estimated expenses paid this period are $64.50.
Hypothetical Example for Comparison with Other Funds
Information in the second line (Hypothetical) for each class in the table can help you compare ongoing costs of investing in the Fund with those of other mutual funds. This information may not be used to estimate the actual ending account balance or expenses you paid during the period. The hypothetical “Ending Account Value” is based on the actual expense ratio for each class and an assumed 5% annual rate of return before expenses, which does not represent the Fund’s actual return. The figure under the heading “Expenses Paid During Period” shows the hypothetical expenses your account would have incurred under this scenario. You can compare this figure with the 5% hypothetical examples that appear in shareholder reports of other funds.
30 | Semiannual Report
Your Fund’s Expenses (continued)
Please note that expenses shown in the table are meant to highlight ongoing costs and do not reflect any transaction costs, such as sales charges. Therefore, the second line for each class is useful in comparing ongoing costs only, and will not help you compare total costs of owning different funds. In addition, if transaction costs were included, your total costs would have been higher. Please refer to the Fund prospectus for additional information on operating expenses.

*Expenses are calculated using the most recent six-month expense ratio, net of expense waivers, annualized for each class (A: 0.90% and Advisor: 0.65%), multiplied by the average account value over the period, multiplied by 181/365 to reflect the one-half year period.
Semiannual Report | 31
Franklin Total Return Fund
Your Fund’s Goals and Main Investments: Franklin Total Return Fund seeks to provide investors with high current income consistent with preservation of capital. Capital appreciation over the long term is a secondary goal. The Fund invests at least 80% of its assets in investment-grade debt securities. The Fund focuses on government and corporate debt securities and mortgage- and asset-
backed securities.
Performance data represent past performance, which does not guarantee future results. Investment return and principal value will fluctuate, and you may have a gain or loss when you sell your shares. Current performance may differ from figures shown. Please visit franklintempleton.com or call (800) 342-5236 for most recent month-end performance.
We are pleased to bring you Franklin Total Return Fund’s semiannual report for the period ended April 30, 2011.
Performance Overview
Franklin Total Return Fund – Class A delivered a +2.19% cumulative total return for the six months under review. The Fund outperformed the +0.02% total return of its benchmark, the Barclays Capital (BC) U.S. Aggregate Index, which measures the U.S. investment-grade, fixed-rate, taxable bond market with index components for government and corporate, mortgage pass-through and asset-backed securities.1 You can find the Fund’s long-term performance data in the Performance Summary beginning on page 36.
Investment Strategy
We seek to invest in a combination of fixed income securities, predominantly from across the investment-grade debt universe. We analyze securities using proprietary and nonproprietary research to help us identify attractive investment opportunities, across the entire fixed income opportunity set, on a relative basis. The Fund may also invest up to 20% of its total assets in noninvestment-grade debt securities. In addition, we may use derivative transactions, such as currency and cross-currency forwards, futures contracts and swap agreements to obtain net long or short exposures to select currencies, interest rates, countries, duration or credit risks.
1. Source: © 2011 Morningstar. All Rights Reserved. The information contained herein: (1) is proprietary to Morningstar and/or its content providers; (2) may not be copied or distributed; and (3) is not warranted to be accurate, complete or timely. Neither Morningstar nor its content providers are responsible for any damages or losses arising from any use of this information. The index is unmanaged and includes reinvested interest. One cannot invest directly in an index, and an index is not representative of the Fund’s portfolio.
The dollar value, number of shares or principal amount, and names of all portfolio holdings are listed in the Fund’s Statement of Investments (SOI). The SOI begins on page 90.
32 | Semiannual Report
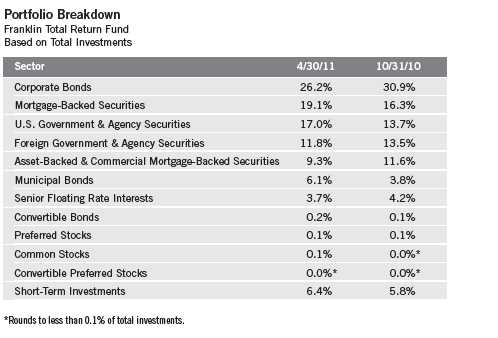
Manager’s Discussion
During the period, the U.S. economic recovery appeared to make progress despite mixed economic data. The U.S. consumer was resilient and retail sales remained relatively strong, in spite of higher gasoline prices. The labor market showed signs of healing, and the corporate sector generally delivered healthy profits and solid balance sheets. The unemployment rate remained elevated, which restrained labor costs and wages and made it difficult for businesses to pass higher commodity prices to consumers. A global recovery seems to be in place, driven largely by growth in emerging markets. However, potential risks to economic expansion persisted, including U.S. federal debt levels, global inflationary pressures, concerns surrounding some eurozone countries and a distressed U.S. housing market.
Using the BC Aggregate Index’s +0.02% return as a proxy for investment-grade bonds, investors’ continued reach for yield helped the U.S. Corporate High Yield Index, which tracks below investment-grade bonds, post the best absolute performance during the period (+6.15%).1 Several other BC indexes for major fixed income sectors delivered positive returns as well, including the Commercial Mortgage-Backed Securities (CMBS) Index (+4.29%), the U.S. MBS Index (+0.95%), the U.S. Corporate Investment Grade Index (+0.83%) and the Emerging Markets (U.S. Dollar) Index (+0.03%). In contrast, the Asset-Backed Securities Index (-0.08%), the U.S. Agency Index (-0.31%) and the U.S. Treasury Index (-1.52%) lagged with negative returns.1
Semiannual Report | 33

*Assumes shares were purchased and held for the entire accrual period. Since dividends accrue daily, your actual distributions will vary depending on the date you purchased your shares and any account activity. All Fund distributions will vary depending upon current market conditions, and past distributions are not indicative of future trends.
**Includes an additional 2.49 cent per share distribution to meet excise tax requirements.
We continued to apply our disciplined process to choose what were, in our view, attractive investment opportunities across debt-related sectors. We remained overweighted in many credit sectors based on our belief that valuations remained attractive on a longer term basis. However, we reduced exposure to the high yield sector believing continued strong performance from that sector could be hard to sustain amid concerns over European sovereign and bank credit and potential oil supply disruptions. We took the opportunity to reduce exposure to some higher quality CMBS securities that had delivered strong performance and increased exposure to municipal bonds as we sought to take advantage of opportunities created by that sector’s price dislocations. Our research indicated many of the best opportunities in global bond markets were outside the U.S., and accordingly, we marginally increased exposure to diversified positions in international bonds and currencies.
The Fund’s positioning in credit, in particular below investment-grade credit, continued to boost overall performance as the credit sectors were among the best performing fixed income sectors. Many of our non-U.S. dollar denominated bonds benefited from foreign currency appreciation. The Fund’s increased exposure to municipal bonds helped the portfolio after the sector rebounded and delivered positive performance. The Fund’s allocation to CMBS produced strong returns and contributed to performance. Our lower weighting in mortgage-backed securities, relative to our benchmark, slightly detracted from performance as that sector produced positive excess returns during the period. Although the currency appreciation of our non-U.S. dollar denominated debt was a large contributor to performance, rising rates in these countries detracted from performance.
34 | Semiannual Report
Thank you for your continued participation in Franklin Total Return Fund.
We look forward to serving your future investment needs.


Roger A. Bayston, CFA

Kent Burns, CFA

Christopher J. Molumphy, CFA

David Yuen, CFA, FRM
Portfolio Management Team
Franklin Total Return Fund
The foregoing information reflects our analysis, opinions and portfolio holdings as of April 30, 2011, the end of the reporting period. The way we implement our main investment strategies and the resulting portfolio holdings may change depending on factors such as market and economic conditions. These opinions may not be relied upon as investment advice or an offer for a particular security. The information is not a complete analysis of every aspect of any market, country, industry, security or the Fund. Statements of fact are from sources considered reliable, but the investment manager makes no representation or warranty as to their completeness or accuracy. Although historical performance is no guarantee of future results, these insights may help you understand our investment management philosophy.
Semiannual Report | 35
Performance Summary as of 4/30/11
Franklin Total Return Fund
Your dividend income will vary depending on dividends or interest paid by securities in the Fund’s portfolio, adjusted for operating expenses of each class. Capital gain distributions are net profits realized from the sale of portfolio securities. The performance table does not reflect any taxes that a shareholder would pay on Fund dividends, capital gain distributions, if any, or any realized gains on the sale of Fund shares. Total return reflects reinvestment of the Fund’s dividends and capital gain distributions, if any, and any unrealized gains or losses.

36 | Semiannual Report

Performance1
Cumulative total return excludes sales charges. Average annual total returns include maximum sales charges. Class A: 4.25% maximum initial sales charge; Class B: contingent deferred sales charge (CDSC) declining from 4% to 1% over six years, and eliminated thereafter; Class C: 1% CDSC in first year only; Class R/Advisor Class: no sales charges.
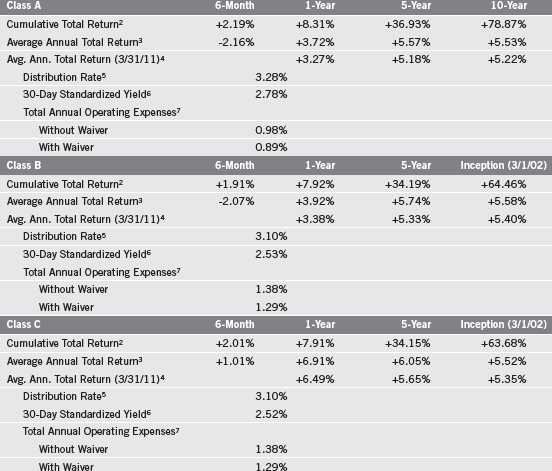
Semiannual Report | 37

Performance data represent past performance, which does not guarantee future results. Investment return and principal value will fluctuate, and you may have a gain or loss when you sell your shares. Current performance may differ from figures shown. For most recent month-end performance, go to franklintempleton.com or call (800) 342-5236.
The investment manager and administrator have contractually agreed to waive or assume certain expenses so that common expenses (excluding the Rule 12b-1 fees and acquired fund fees and expenses) for each class of the Fund do not exceed 0.63% (other than certain nonroutine expenses) until 2/29/12.
38 | Semiannual Report
Performance Summary (continued)
Endnotes
Interest rate movements and mortgage prepayments will affect the Fund’s share price and yield. Bond prices generally move in the opposite direction of interest rates. Thus, as prices of bonds in the Fund adjust to a rise in interest rates, the Fund’s share price may decline. Investing in derivative securities such as financial futures and option contracts involves special risks. The risks associated with higher yielding, lower rated securities (commonly called junk bonds) include higher risk of default and loss of principal. Investment in foreign securities also involves special risks, including currency fluctuations, and political and economic uncertainty. Investing in derivative securities, such as financial futures and option contracts, and the use of foreign currency techniques involve special risks as such techniques may not achieve the anticipated benefits and/or may result in losses to the Fund. The manager applies various techniques and analyses in making investment decisions for the Fund, but there can be no guarantee that these decisions will produce the desired results. The Fund’s prospectus also includes a description of the main investment risks.
| |
Class B: Class C: | These shares have higher annual fees and expenses than Class A shares. Prior to 1/1/04, these shares were offered with an initial sales charge; thus actual total returns would have differed. These shares have higher annual fees and expenses than Class A shares. |
Class R: | Shares are available to certain eligible investors as described in the prospectus. These shares have higher annual fees and expenses than Class A shares. |
Advisor Class: | Shares are available to certain eligible investors as described in the prospectus. |
1. If the manager and administrator had not waived fees, the Fund’s distribution rate and total return would have been lower, and yields for the period would have been 2.73%, 2.47%, 2.47%, 2.61% and 3.11% for Classes A, B, C, R and Advisor, respectively.
2. Cumulative total return represents the change in value of an investment over the periods indicated.
3. Average annual total return represents the average annual change in value of an investment over the periods indicated. Six-month return has not been annualized.
4. In accordance with SEC rules, we provide standardized average annual total return information through the latest calendar quarter.
5. Distribution rate is based on an annualization of the sum of the respective class’s past 30 days’ daily distributions and the maximum offering price (NAV for Classes B, C, R and Advisor) per share on 4/30/11.
6. The 30-day standardized yield for the 30 days ended 4/30/11 reflects an estimated yield to maturity (assuming all portfolio securities are held to maturity). It should be regarded as an estimate of the Fund’s rate of investment income, and it may not equal the Fund’s actual income distribution rate (which reflects the Fund’s past dividends paid to shareholders) or the income reported in the Fund’s financial statements.
7. Figures are as stated in the Fund’s prospectus current as of the date of this report. In periods of market volatility, assets may decline significantly, causing total annual Fund operating expenses to become higher than the figures shown.
Semiannual Report | 39
Your Fund’s Expenses
Franklin Total Return Fund
As a Fund shareholder, you can incur two types of costs:
- Transaction costs, including sales charges (loads) on Fund purchases; and
- Ongoing Fund costs, including management fees, distribution and service (12b-1) fees, and other Fund expenses. All mutual funds have ongoing costs, sometimes referred to as operating expenses.
The following table shows ongoing costs of investing in the Fund and can help you understand these costs and compare them with those of other mutual funds. The table assumes a $1,000 investment held for the six months indicated.
Actual Fund Expenses
The first line (Actual) for each share class listed in the table provides actual account values and expenses. The “Ending Account Value” is derived from the Fund’s actual return, which includes the effect of Fund expenses.
You can estimate the expenses you paid during the period by following these steps. Of course, your account value and expenses will differ from those in this illustration:
| 1. | Divide your account value by $1,000. |
| | If an account had an $8,600 value, then $8,600 ÷ $1,000 = 8.6. |
| 2. | Multiply the result by the number under the heading “Expenses Paid During Period.” |
| | If Expenses Paid During Period were $7.50, then 8.6 x $7.50 = $64.50. |
In this illustration, the estimated expenses paid this period are $64.50.
Hypothetical Example for Comparison with Other Funds
Information in the second line (Hypothetical) for each class in the table can help you compare ongoing costs of investing in the Fund with those of other mutual funds. This information may not be used to estimate the actual ending account balance or expenses you paid during the period. The hypothetical “Ending Account Value” is based on the actual expense ratio for each class and an assumed 5% annual rate of return before expenses, which does not represent the Fund’s actual return. The figure under the heading “Expenses Paid During Period” shows the hypothetical expenses your account would have incurred under this scenario. You can compare this figure with the 5% hypothetical examples that appear in shareholder reports of other funds.
40 | Semiannual Report
Your Fund’s Expenses (continued)
Please note that expenses shown in the table are meant to highlight ongoing costs and do not reflect any transaction costs, such as sales charges. Therefore, the second line for each class is useful in comparing ongoing costs only, and will not help you compare total costs of owning different funds. In addition, if transaction costs were included, your total costs would have been higher. Please refer to the Fund prospectus for additional information on operating expenses.

*Expenses are calculated using the most recent six-month expense ratio, net of expense waivers, annualized for each class (A: 0.88%; B: 1.28%; C: 1.28%; R:1.13%; and Advisor: 0.63%), multiplied by the average account value over the period, multiplied by 181/365 to reflect the one-half year period.
Semiannual Report | 41
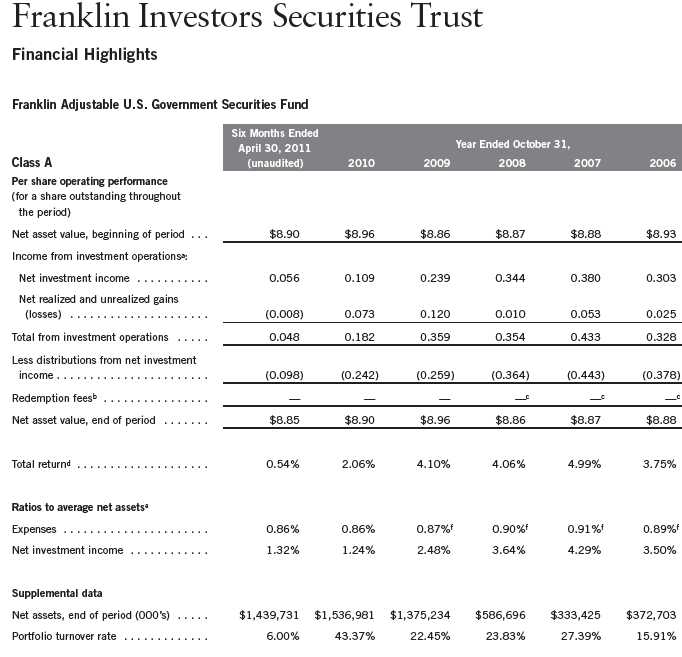
aThe amount shown for a share outstanding throughout the period may not correlate with the Statement of Operations for the period due to the timing of sales and repurchases of
the Fund shares in relation to income earned and/or fluctuating market value of the investments of the Fund.
bEffective September 1, 2008, the redemption fee was eliminated.
cAmount rounds to less than $0.001 per share.
dTotal return does not reflect sales commissions or contingent deferred sales charges, if applicable, and is not annualized for periods less than one year.
eRatios are annualized for periods less than one year.
fBenefit of expense reduction rounds to less than 0.01%.
42 | The accompanying notes are an integral part of these financial statements. | Semiannual Report

aThe amount shown for a share outstanding throughout the period may not correlate with the Statement of Operations for the period due to the timing of sales and repurchases of
the Fund shares in relation to income earned and/or fluctuating market value of the investments of the Fund.
bEffective September 1, 2008, the redemption fee was eliminated.
cAmount rounds to less than $0.001 per share.
dTotal return does not reflect sales commissions or contingent deferred sales charges, if applicable, and is not annualized for periods less than one year.
eRatios are annualized for periods less than one year.
fBenefit of expense reduction rounds to less than 0.01%.
Semiannual Report | The accompanying notes are an integral part of these financial statements. | 43
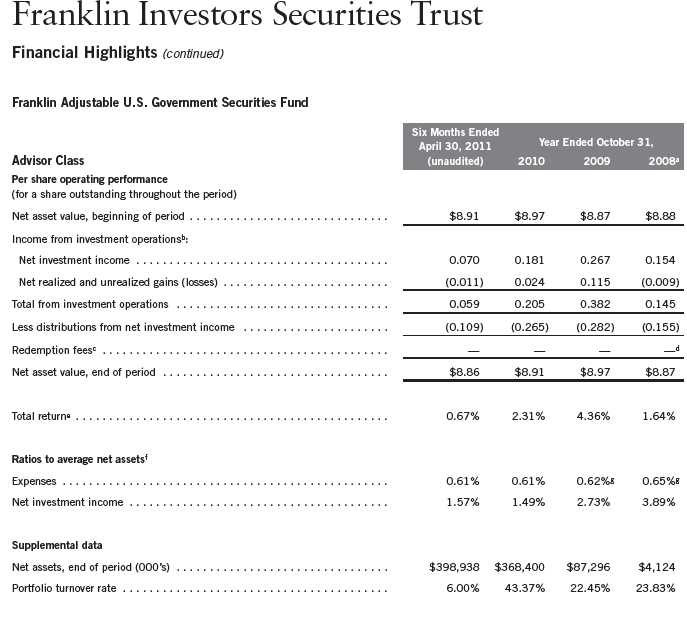
aFor the period May 15, 2008 (effective date) to October 31, 2008.
bThe amount shown for a share outstanding throughout the period may not correlate with the Statement of Operations for the period due to the timing of sales and repurchases of
the Fund shares in relation to income earned and/or fluctuating market value of the investments of the Fund.
cEffective September 1, 2008, the redemption fee was eliminated.
dAmount rounds to less than $0.001 per share.
eTotal return is not annualized for periods less than one year.
fRatios are annualized for periods less than one year.
gBenefit of expense reduction rounds to less than 0.01%.
44 | The accompanying notes are an integral part of these financial statements. | Semiannual Report

46 | Semiannual Report
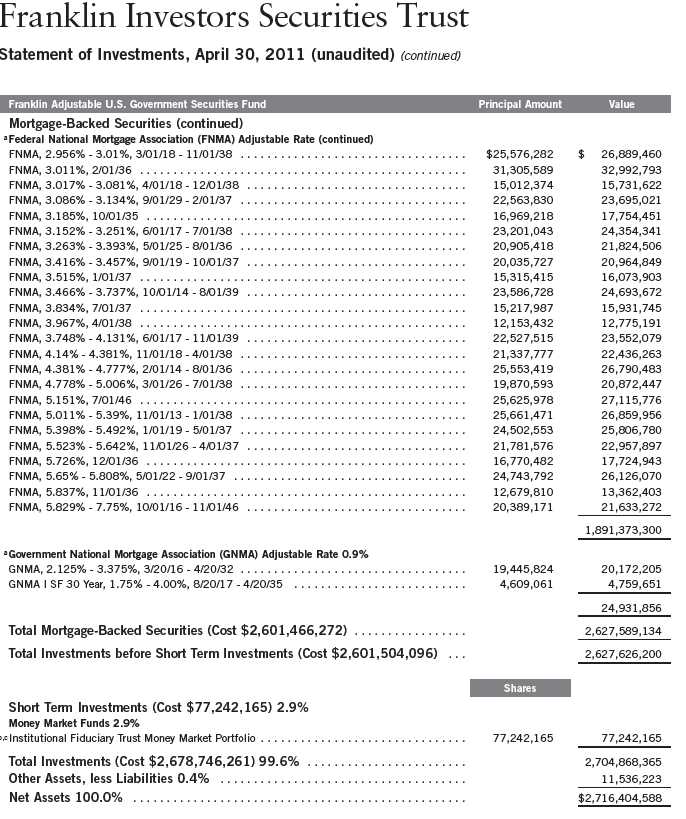
See Abbreviations on page 143.
- Rounds to less than 0.1% of net assets.
- The coupon rate shown represents the rate at period end.
- Non-income producing.
- See Note 7 regarding investments in the Institutional Fiduciary Trust Money Market Portfolio.
Semiannual Report | The accompanying notes are an integral part of these financial statements. | 47

aThe amount shown for a share outstanding throughout the period may not correlate with the Statement of Operations for the period due to the timing of sales and repurchases of
the Fund shares in relation to income earned and/or fluctuating market value of the investments of the Fund.
bEffective September 1, 2008, the redemption fee was eliminated.
cAmount rounds to less than $0.001 per share.
dTotal return does not reflect sales commissions or contingent deferred sales charges, if applicable, and is not annualized for periods less than one year.
eRatios are annualized for periods less than one year.
fBenefit of expense reduction rounds to less than 0.01%.
48 | The accompanying notes are an integral part of these financial statements. | Semiannual Report

aThe amount shown for a share outstanding throughout the period may not correlate with the Statement of Operations for the period due to the timing of sales and repurchases of
the Fund shares in relation to income earned and/or fluctuating market value of the investments of the Fund.
bEffective September 1, 2008, the redemption fee was eliminated.
cAmount rounds to less than $0.001 per share.
dTotal return does not reflect sales commissions or contingent deferred sales charges, if applicable, and is not annualized for periods less than one year.
eRatios are annualized for periods less than one year.
fBenefit of expense reduction rounds to less than 0.01%.
Semiannual Report | The accompanying notes are an integral part of these financial statements. | 49
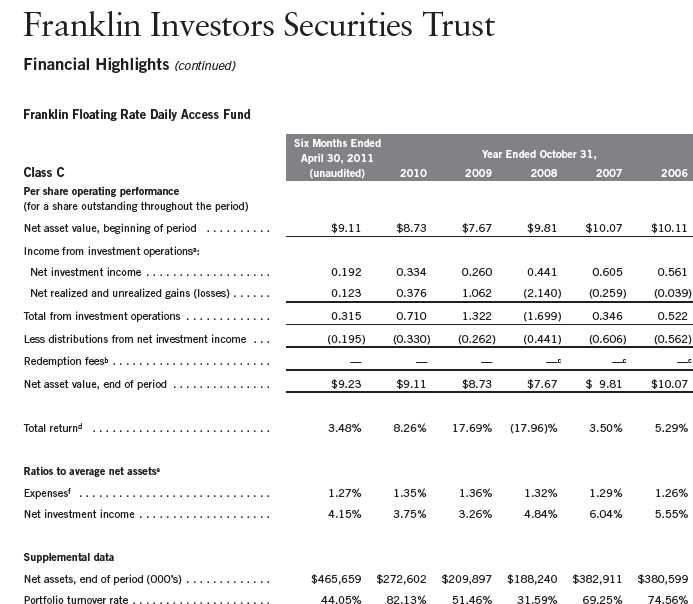
aThe amount shown for a share outstanding throughout the period may not correlate with the Statement of Operations for the period due to the timing of sales and repurchases of
the Fund shares in relation to income earned and/or fluctuating market value of the investments of the Fund.
bEffective September 1, 2008, the redemption fee was eliminated.
cAmount rounds to less than $0.001 per share.
dTotal return does not reflect sales commissions or contingent deferred sales charges, if applicable, and is not annualized for periods less than one year.
eRatios are annualized for periods less than one year.
fBenefit of expense reduction rounds to less than 0.01%.
50 | The accompanying notes are an integral part of these financial statements. | Semiannual Report
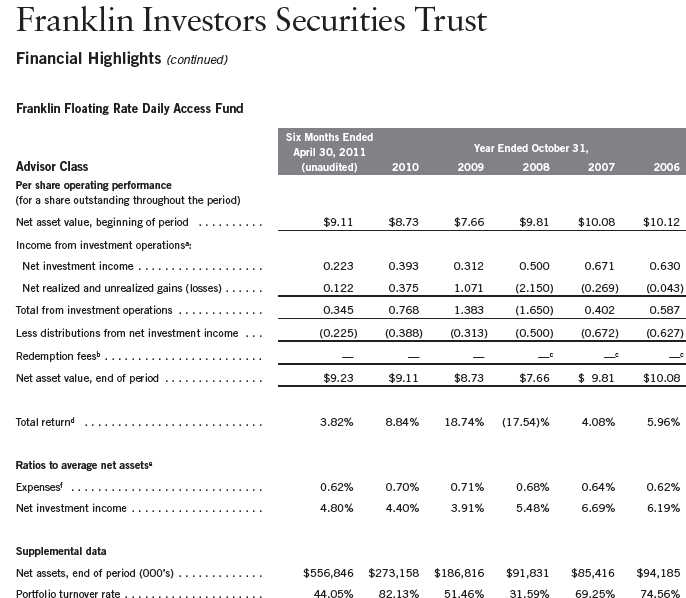
aThe amount shown for a share outstanding throughout the period may not correlate with the Statement of Operations for the period due to the timing of sales and repurchases of
the Fund shares in relation to income earned and/or fluctuating market value of the investments of the Fund.
bEffective September 1, 2008, the redemption fee was eliminated.
cAmount rounds to less than $0.001 per share.
dTotal return is not annualized for periods less than one year.
eRatios are annualized for periods less than one year.
fBenefit of expense reduction rounds to less than 0.01%.
Semiannual Report | The accompanying notes are an integral part of these financial statements. | 51

52 | Semiannual Report

Semiannual Report | 53
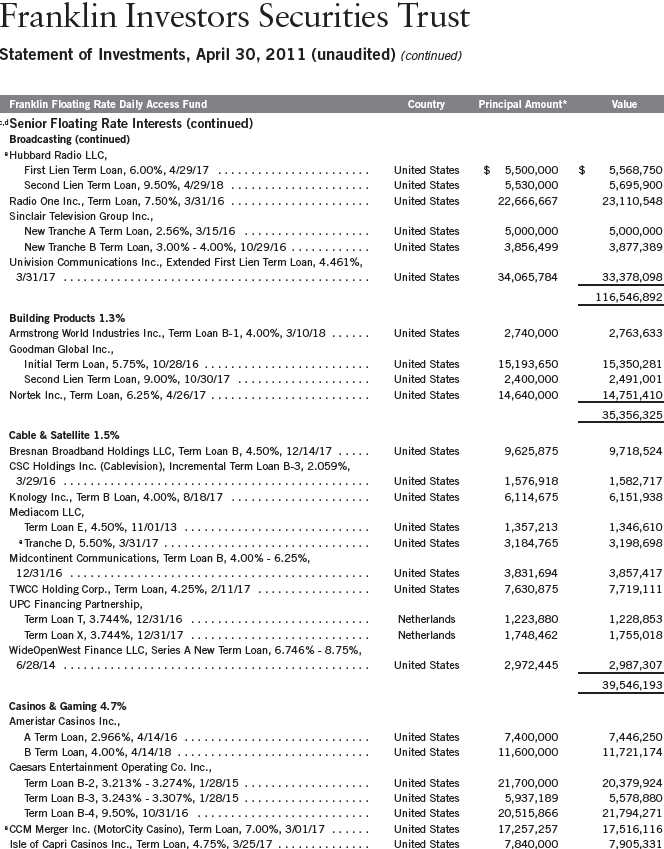
54 | Semiannual Report

Semiannual Report | 55
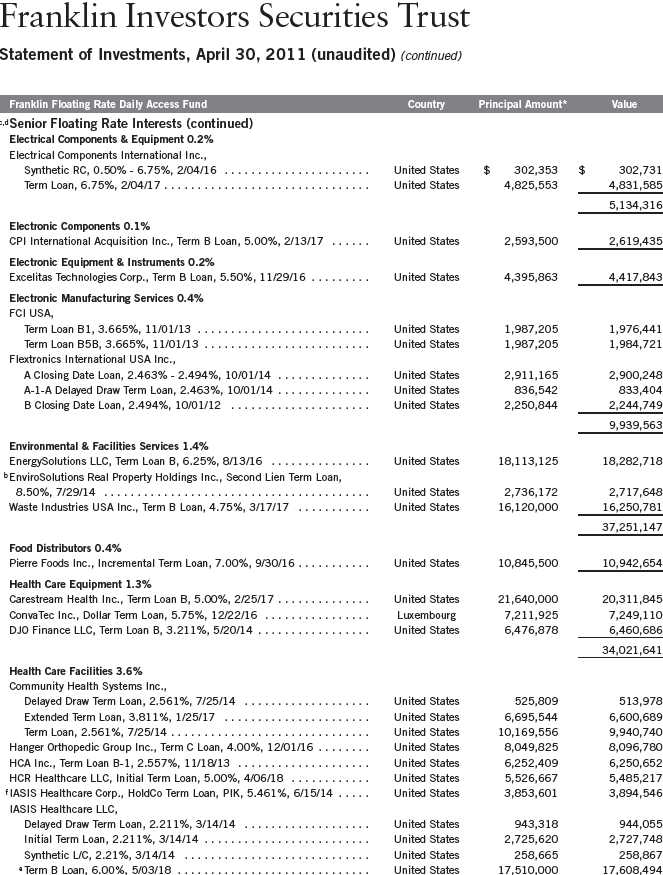
Semiannual Report | 57

58 | Semiannual Report

Semiannual Report | 59

Semiannual Report | 61

62 | Semiannual Report
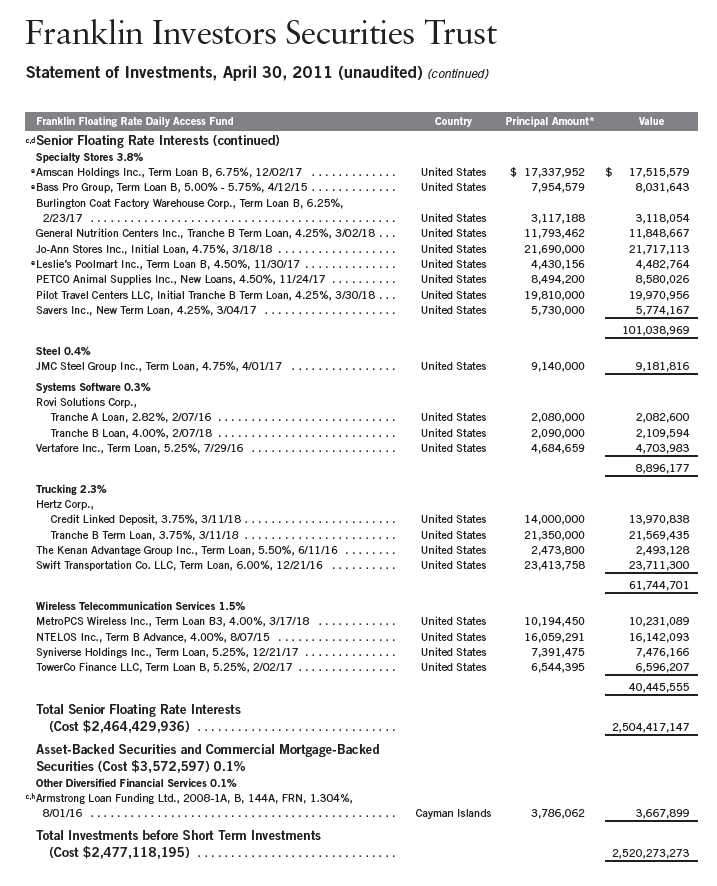
Semiannual Report | 63
Franklin Investors Securities Trust
Statement of Investments, April 30, 2011 (unaudited) (continued)

†Rounds to less than 0.1% of net assets.
*The principal amount is stated in U.S. dollars unless otherwise indicated.
aNon-income producing.
bSecurity has been deemed illiquid because it may not be able to be sold within seven days. At April 30, 2011, the aggregate value of these securities was $5,600,985, representing
0.21% of net assets.
cThe coupon rate shown represents the rate at period end.
dSee Note 1(g) regarding senior floating rate interests.
eA portion or all of the security purchased on a delayed delivery basis. See Note 1(c).
fIncome may be received in additional securities and/or cash.
gSee Note 8 regarding defaulted securities.
hSecurity was purchased pursuant to Rule 144A under the Securities Act of 1933 and may be sold in transactions exempt from registration only to qualified institutional buyers or in
a public offering registered under the Securities Act of 1933. This security has been deemed liquid under guidelines approved by the Trust’s Board of Trustees.
iSee Note 7 regarding investments in the Institutional Fiduciary Trust Money Market Portfolio.
At April 30, 2011, the fund had the following credit default swap contracts outstanding. See Note 1(d).
Credit Default Swap Contracts

bFor contracts to sell protection, the notional amount is equal to the maximum potential amount of the future payments and no recourse provisions have been entered into
in association with the contracts.
cBased on Standard and Poor’s (S&P) Rating for single name swaps and internal ratings for index swaps. Internal ratings based on mapping into equivalent ratings from
external vendors.
dThe fund enters contracts to sell protection to create a long credit position. Performance triggers include failure to pay or bankruptcy for traded index swaps.
See Abbreviations on page 143.
64 | The accompanying notes are an integral part of these financial statements. | Semiannual Report
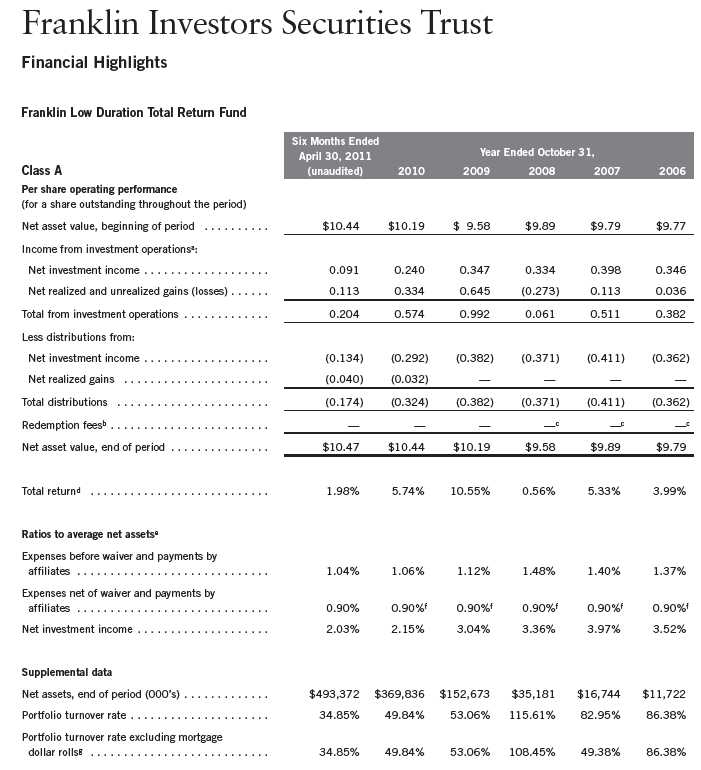
aThe amount shown for a share outstanding throughout the period may not correlate with the Statement of Operations for the period due to the timing of sales and repurchases of
the Fund shares in relation to income earned and/or fluctuating market value of the investments of the Fund.
bEffective September 1, 2008, the redemption fee was eliminated.
cAmount rounds to less than $0.001 per share.
dTotal return does not reflect sales commissions or contingent deferred sales charges, if applicable, and is not annualized for periods less than one year.
eRatios are annualized for periods less than one year.
fBenefit of expense reduction rounds to less than 0.01%.
gSee Note 1(f) regarding mortgage dollar rolls.
Semiannual Report | The accompanying notes are an integral part of these financial statements. | 65
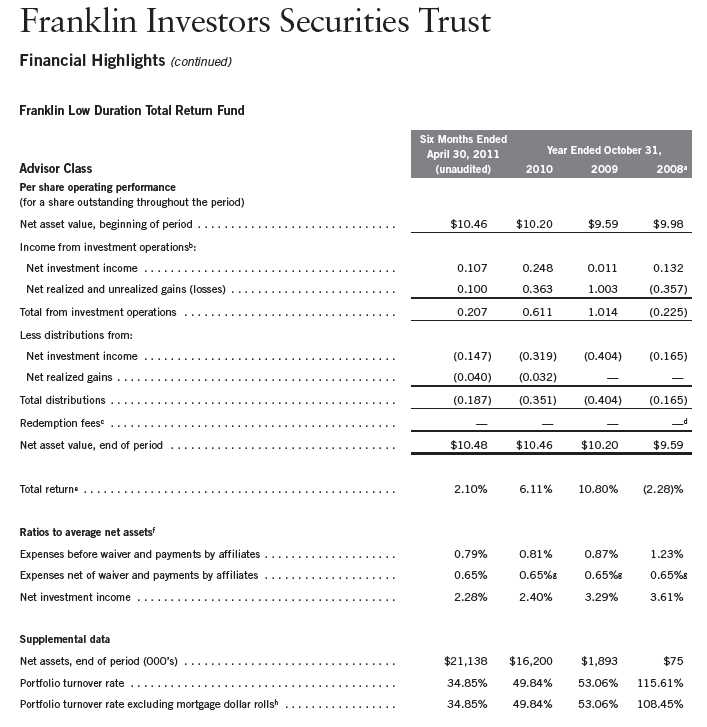
aFor the period May 15, 2008 (effective date) to October 31, 2008.
bThe amount shown for a share outstanding throughout the period may not correlate with the Statement of Operations for the period due to the timing of sales and repurchases of
the Fund shares in relation to income earned and/or fluctuating market value of the investments of the Fund.
cEffective September 1, 2008, the redemption fee was eliminated.
dAmount rounds to less than $0.001 per share.
eTotal return is not annualized for periods less than one year.
fRatios are annualized for periods less than one year.
gBenefit of expense reduction rounds to less than 0.01%.
hSee Note 1(f) regarding mortgage dollar rolls.
66 | The accompanying notes are an integral part of these financial statements. | Semiannual Report
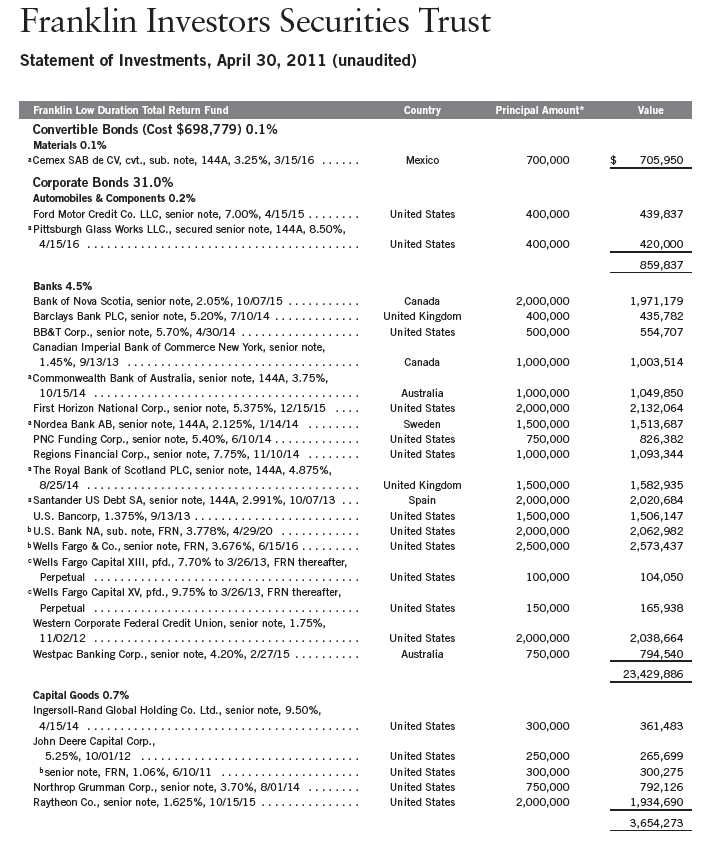
Semiannual Report | 67

68 | Semiannual Report
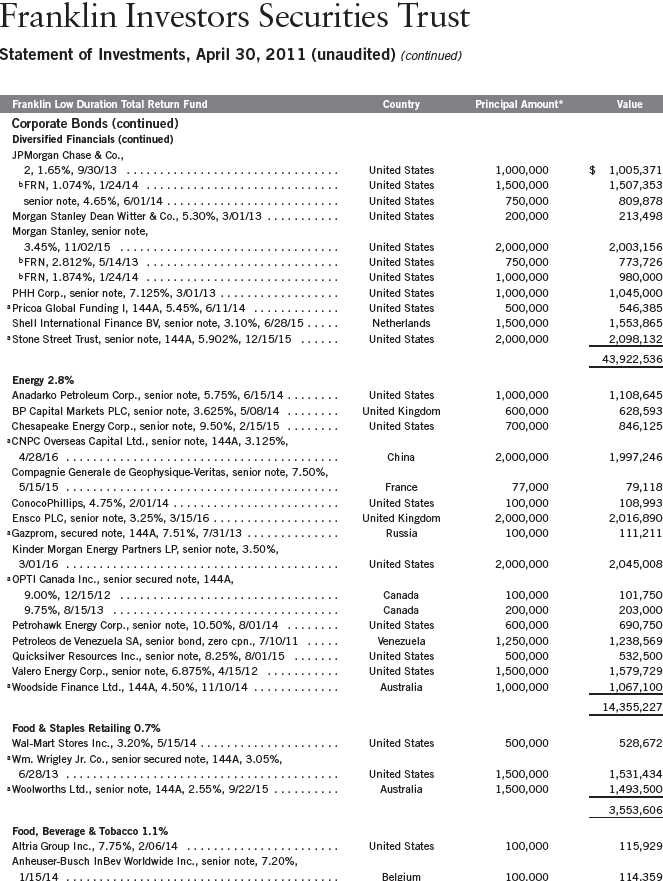
Semiannual Report | 69

70 | Semiannual Report

Semiannual Report | 71

72 | Semiannual Report
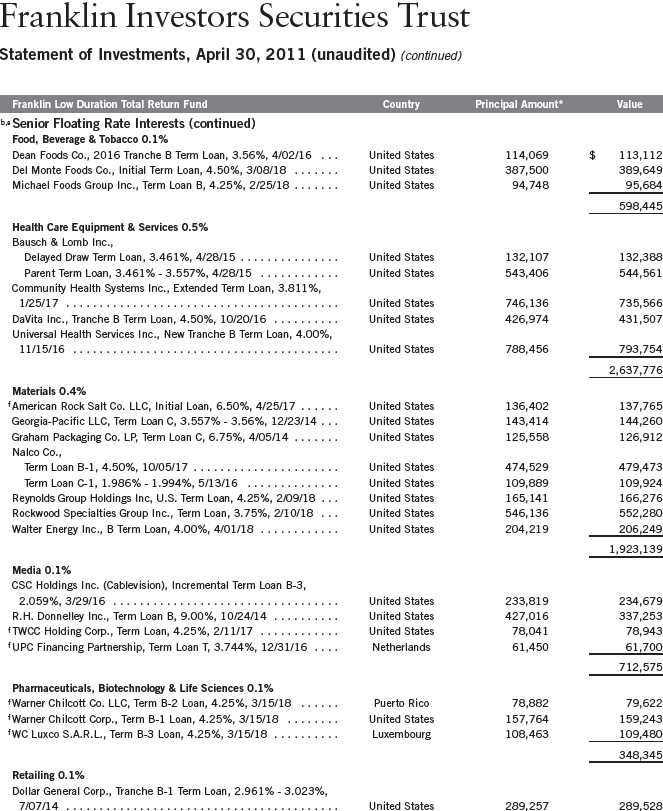
Semiannual Report | 73

Semiannual Report | 75
Franklin Investors Securities Trust
Statement of Investments, April 30, 2011 (unaudited) (continued)

76 | Semiannual Report
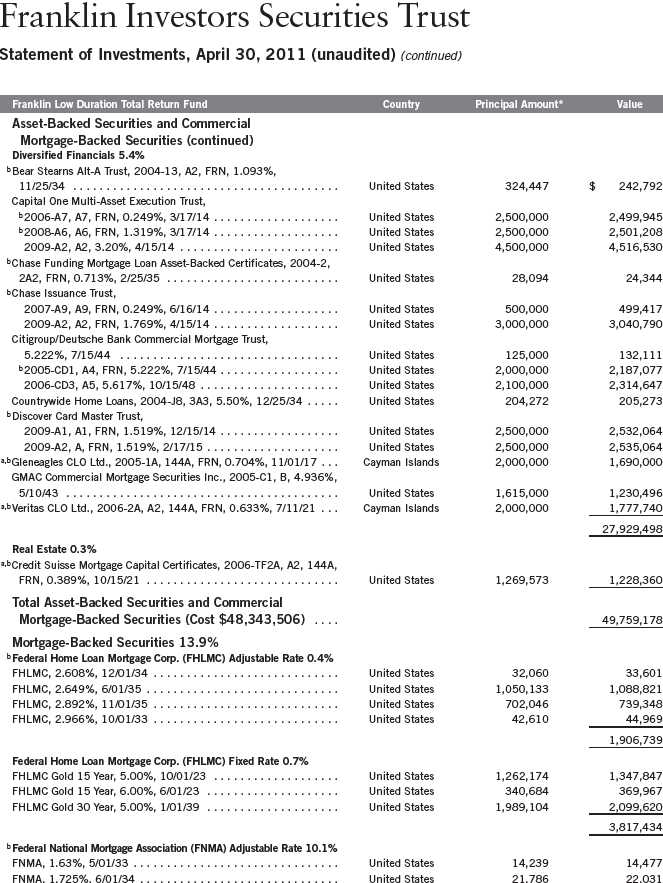
Semiannual Report | 77

78 | Semiannual Report
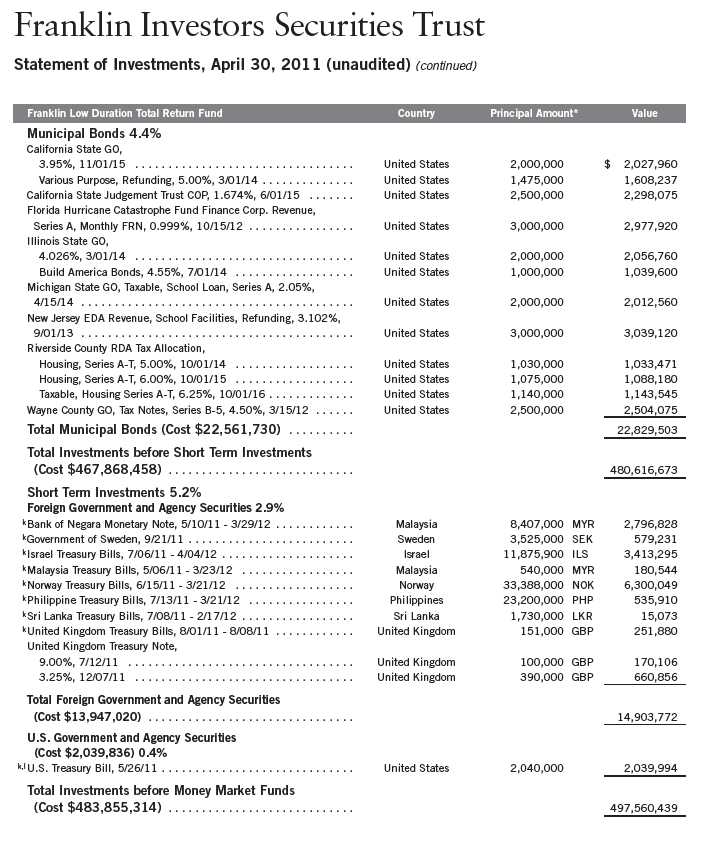
Semiannual Report | 79
Franklin Investors Securities Trust
Statement of Investments, April 30, 2011 (unaudited) (continued)

†Rounds to less than 0.1% of net assets.
*The principal amount is stated in U.S. dollars unless otherwise indicated.
aSecurity was purchased pursuant to Rule 144A under the Securities Act of 1933 and may be sold in transactions exempt from registration only to qualified institutional buyers or in
a public offering registered under the Securities Act of 1933. These securities have been deemed liquid under guidelines approved by the Trust’s Board of Trustees. At April 30, 2011,
the aggregate value of these securities was $49,397,673, representing 9.74% of net assets.
bThe coupon rate shown represents the rate at period end.
cPerpetual security with no stated maturity date.
dSee Note 8 regarding defaulted securities.
eSee Note 1(g) regarding senior floating rate interests.
fA portion or all of the security is purchased on a delayed delivery or to-be-announced (TBA) basis. See Note 1(c).
gThe principal amount is stated in original face, and scheduled paydowns are reflected in the market price on ex-date.
hPrincipal amount is stated in 100 Mexican Peso Units.
iPrincipal amount is stated in 1,000 Brazilian Real Units.
jRedemption price at maturity is adjusted for inflation. See Note 1(i).
kThe security is traded on a discount basis with no stated coupon rate.
lSecurity or a portion of the security has been segregated as collateral for open swap contracts and open future contracts. At April 30, 2011, the value of this security amounted to
$1,003,791, representing 0.20% of net assets.
mNon-income producing.
nSee Note 7 regarding investments in the Institutional Fiduciary Trust Money Market Portfolio.
At April 30, 2011, the fund had the following financial futures contracts outstanding. See Note 1(d).
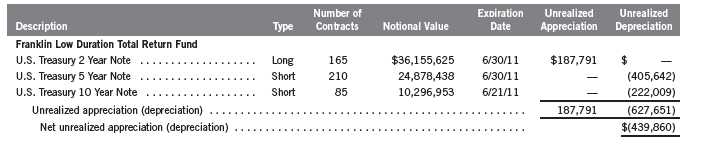
80 | Semiannual Report
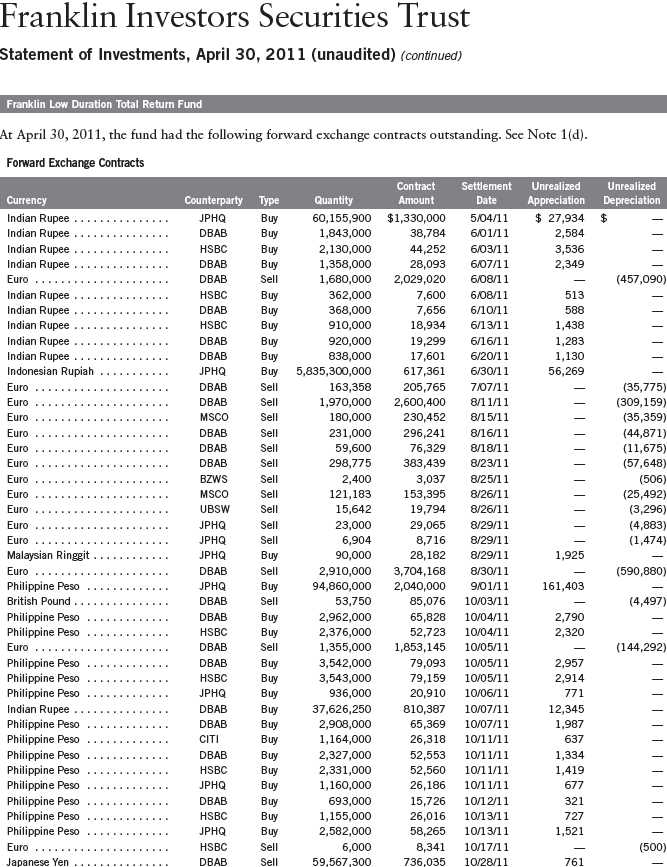
Semiannual Report | 81

82 | Semiannual Report
Franklin Investors Securities Trust
Statement of Investments, April 30, 2011 (unaudited) (continued)
Franklin Low Duration Total Return Fund
At April 30, 2011, the fund had the following credit default swaps contracts outstanding. See Note 1(d).

Semiannual Report | 83

aPositions are generally not collateralized if the market value is under $250,000. Collateral requirements may be net of current positions at the individual counterparty for the fund.
The table below summarizes the cash and/or securities held as collateral for each applicable counterparty at period end:
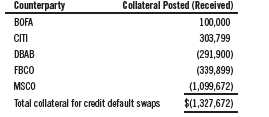
bIn U.S. dollars unless otherwise indicated. For contracts to sell protection, the notional amount is equal to the maximum potential amount of the future payments and no recourse
provisions have been entered into in association with the contracts.
cBased on Standard and Poor’s (S&P) Rating for single name swaps and internal ratings for index swaps. Internal ratings based on mapping into equivalent ratings from external
vendors.
dThe fund enters contracts to sell protection to create a long credit position. Performance triggers include default, bankruptcy or restructuring for single name swaps, and failure to
pay or bankruptcy for traded index swaps.
See Abbreviations on page 143.
84 | The accompanying notes are an integral part of these financial statements. | Semiannual Report

aThe amount shown for a share outstanding throughout the period may not correlate with the Statement of Operations for the period due to the timing of sales and repurchases of
the Fund shares in relation to income earned and/or fluctuating market value of the investments of the Fund.
bEffective September 1, 2008, the redemption fee was eliminated.
cAmount rounds to less than $0.001 per share.
dTotal return does not reflect sales commissions or contingent deferred sales charges, if applicable, and is not annualized for periods less than one year.
eRatios are annualized for periods less than one year.
fBenefit of expense reduction rounds to less than 0.01%.
gSee Note 1(f) regarding mortgage dollar rolls.
Semiannual Report | The accompanying notes are an integral part of these financial statements. | 85

aThe amount shown for a share outstanding throughout the period may not correlate with the Statement of Operations for the period due to the timing of sales and repurchases of
the Fund shares in relation to income earned and/or fluctuating market value of the investments of the Fund.
bEffective September 1, 2008, the redemption fee was eliminated.
cAmount rounds to less than $0.001 per share.
dTotal return does not reflect sales commissions or contingent deferred sales charges, if applicable, and is not annualized for periods less than one year.
eRatios are annualized for periods less than one year.
fBenefit of expense reduction rounds to less than 0.01%.
gSee Note 1(f) regarding mortgage dollar rolls.
86 | The accompanying notes are an integral part of these financial statements. | Semiannual Report

aThe amount shown for a share outstanding throughout the period may not correlate with the Statement of Operations for the period due to the timing of sales and repurchases of
the Fund shares in relation to income earned and/or fluctuating market value of the investments of the Fund.
bEffective September 1, 2008, the redemption fee was eliminated.
cAmount rounds to less than $0.001 per share.
dTotal return does not reflect sales commissions or contingent deferred sales charges, if applicable, and is not annualized for periods less than one year.
eRatios are annualized for periods less than one year.
fBenefit of expense reduction rounds to less than 0.01%.
gSee Note 1(f) regarding mortgage dollar rolls.
Semiannual Report | The accompanying notes are an integral part of these financial statements. | 87

aThe amount shown for a share outstanding throughout the period may not correlate with the Statement of Operations for the period due to the timing of sales and repurchases of
the Fund shares in relation to income earned and/or fluctuating market value of the investments of the Fund.
bEffective September 1, 2008, the redemption fee was eliminated.
cAmount rounds to less than $0.001 per share.
dTotal return does not reflect sales commissions or contingent deferred sales charges, if applicable, and is not annualized for periods less than one year.
eRatios are annualized for periods less than one year.
fBenefit of expense reduction rounds to less than 0.01%.
gSee Note 1(f) regarding mortgage dollar rolls.
88 | The accompanying notes are an integral part of these financial statements. | Semiannual Report

aThe amount shown for a share outstanding throughout the period may not correlate with the Statement of Operations for the period due to the timing of sales and repurchases of
the Fund shares in relation to income earned and/or fluctuating market value of the investments of the Fund.
bEffective September 1, 2008, the redemption fee was eliminated.
cAmount rounds to less than $0.001 per share.
dTotal return is not annualized for periods less than one year.
eRatios are annualized for periods less than one year.
fBenefit of expense reduction rounds to less than 0.01%.
gSee Note 1(f) regarding mortgage dollar rolls.
Semiannual Report | The accompanying notes are an integral part of these financial statements. | 89

90 | Semiannual Report

Semiannual Report | 91
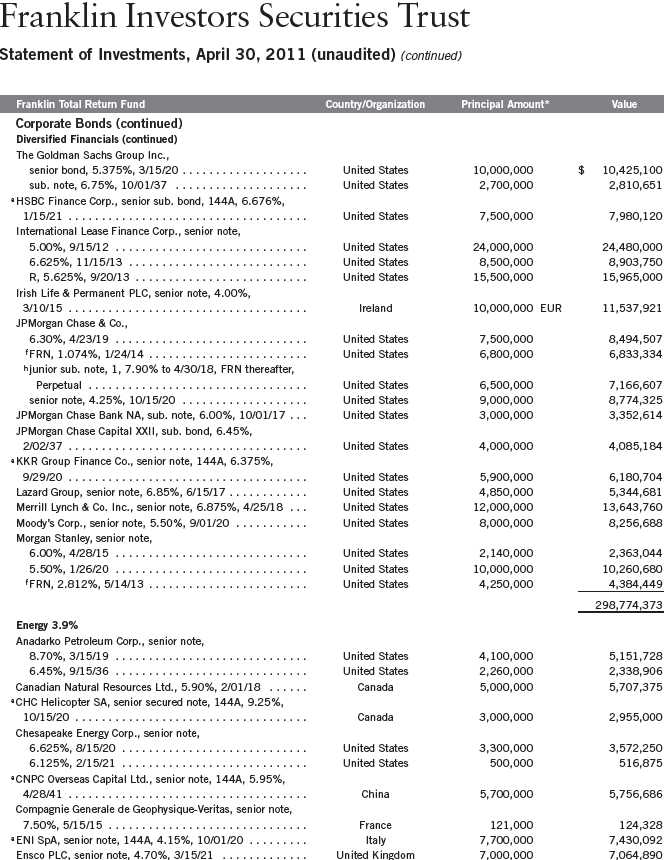
Semiannual Report | 93
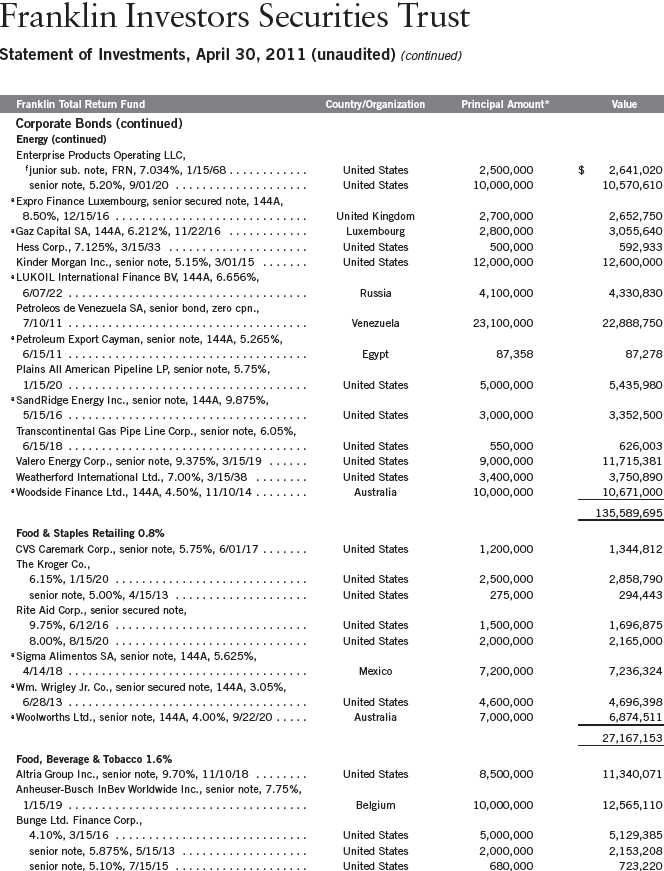
94 | Semiannual Report

Semiannual Report | 95
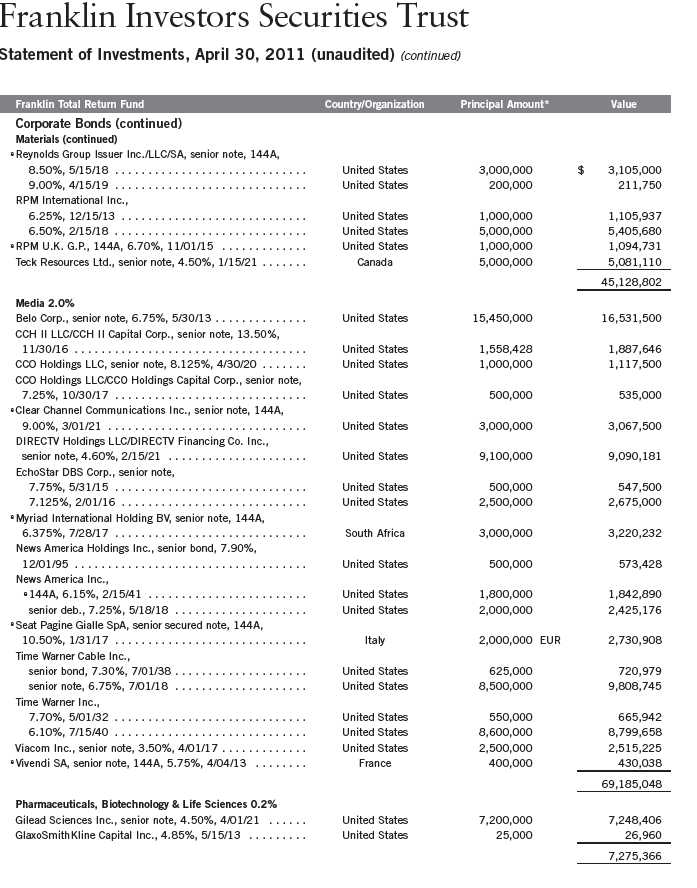
96 | Semiannual Report

Semiannual Report | 97

98 | Semiannual Report
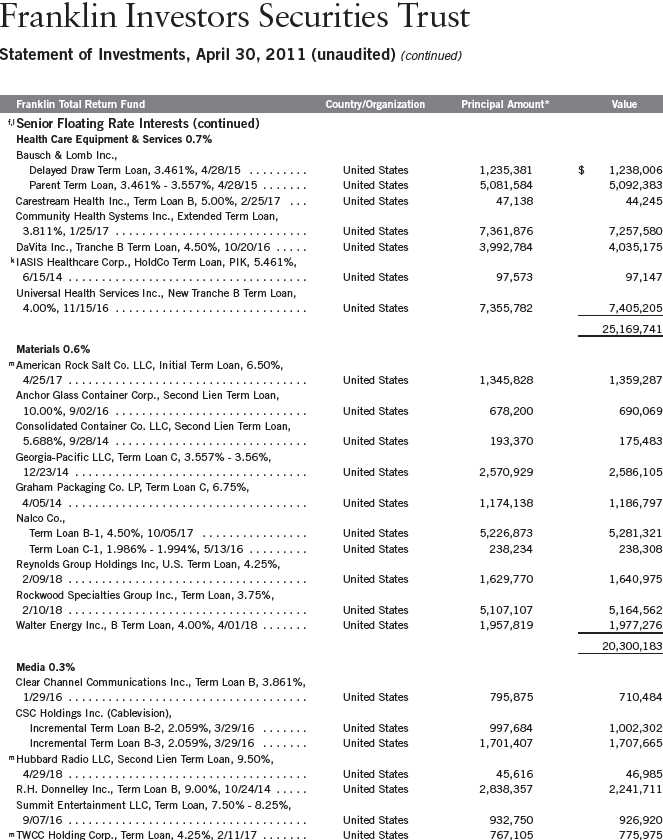
100 | Semiannual Report

Semiannual Report | 101

102 | Semiannual Report
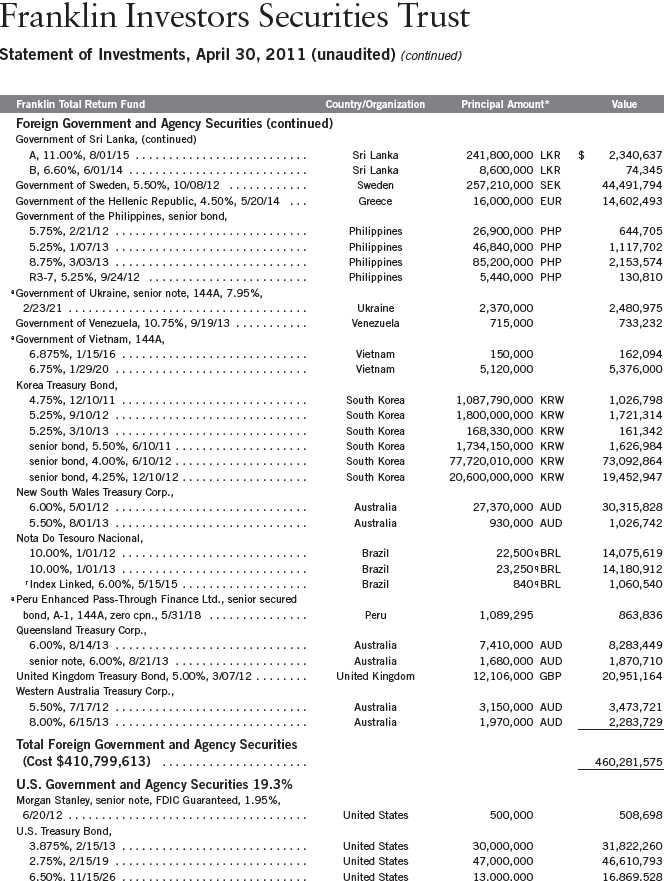
Semiannual Report | 103
Franklin Investors Securities Trust
Statement of Investments, April 30, 2011 (unaudited) (continued)


106 | Semiannual Report

Semiannual Report | 107
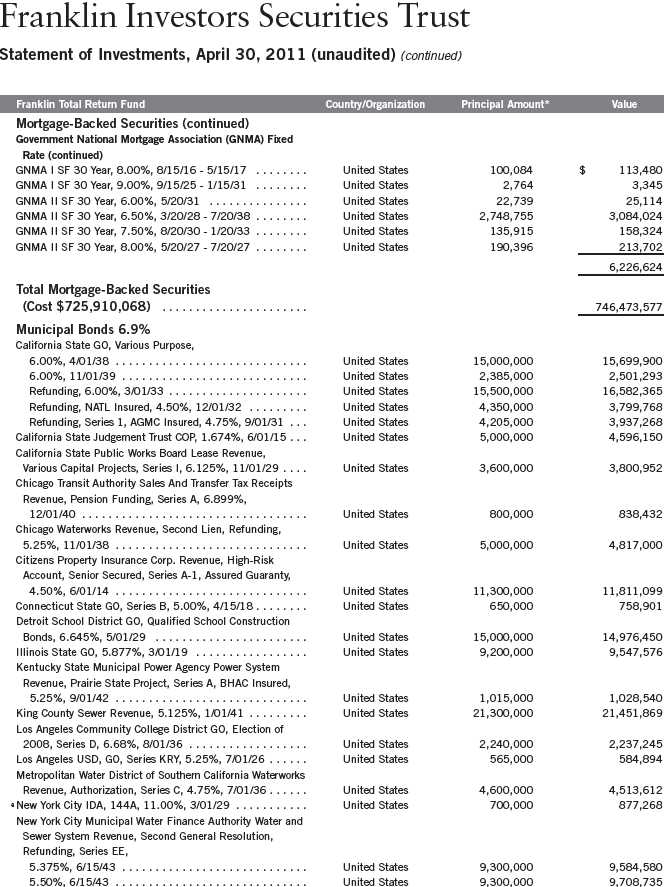
Semiannual Report | 109
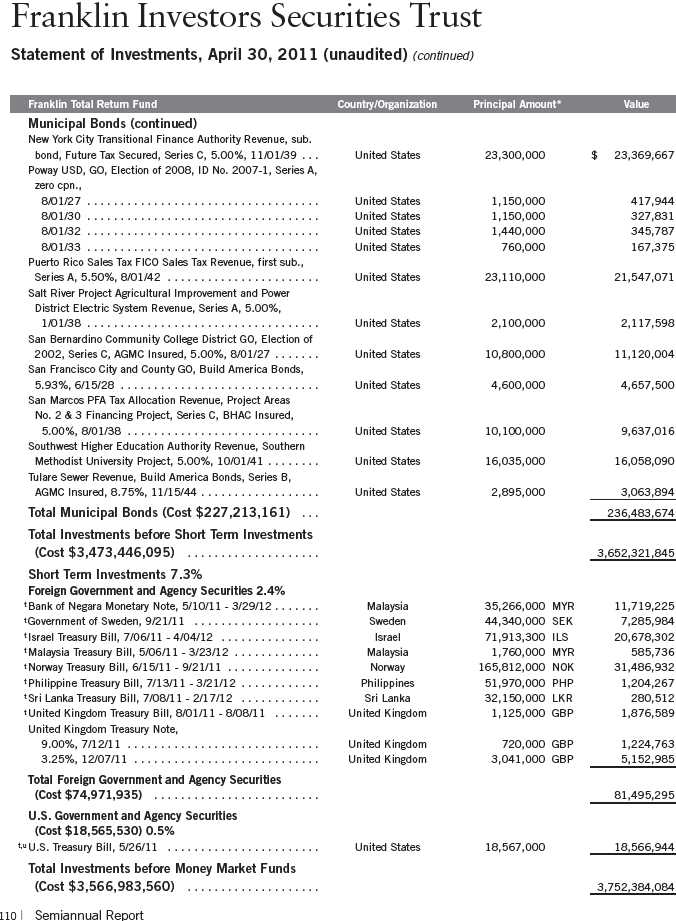
Franklin Investors Securities Trust
Statement of Investments, April 30, 2011 (unaudited) (continued)
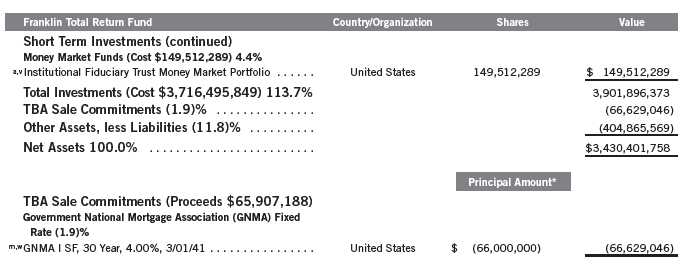
†Rounds to less than 0.1% of net assets.
*The principal amount is stated in U.S. dollars unless otherwise indicated.
aNon-income producing.
bSecurity has been deemed illiquid because it may not be able to be sold within seven days. At April 30, 2011, the aggregate value of these securities was $945,823, representing
0.03% of net assets.
cSee Note 1(e) regarding investment in FT Holdings Corporation I.
dAt April 30, 2011, pursuant to the Fund’s policies and the requirements of applicable securities law, the Fund may be restricted from trading this security for a limited or extended
period of time due to ownership limits and/or potential possession of material non-public information.
eSecurity was purchased pursuant to Rule 144A under the Securities Act of 1933 and may be sold in transactions exempt from registration only to qualified institutional buyers or in
a public offering registered under the Securities Act of 1933. These securities have been deemed liquid under guidelines approved by the Trust’s Board of Trustees. At April 30, 2011,
the aggregate value of these securities was $324,097,342, representing 9.45% of net assets.
fThe coupon rate shown represents the rate at period end.
gSecurity was purchased pursuant to Regulation S under the Securities Act of 1933, which exempts from registration securities offered and sold outside of the United States. Such
a security cannot be sold in the United States without either an effective registration statement filed pursuant to the Securities Act of 1933, or pursuant to an exemption from
registration. These securities have been deemed liquid under guidelines approved by the Trust’s Board of Trustees. At April 30, 2011, the aggregate value of these securities was
$20,181,965, representing 0.59% of net assets.
hPerpetual security with no stated maturity date.
iIncome may be reflected in the redemption value or received in additional securities and/or cash.
jSee Note 8 regarding defaulted securities.
kIncome may be received in additional securities and/or cash.
lSee Note 1(g) regarding senior floating rate interests.
mA portion or all of the security purchased on a delayed delivery or to-be-announced (TBA) basis. See note 1(c).
nA supranational organization is an entity formed by two or more central governments through international treaties.
oThe principal amount is stated in original face, and scheduled paydowns are reflected in the market price on ex-date.
pPrincipal amount is stated in 100 Mexican Peso Units.
qPrincipal amount is stated in 1,000 Brazilian Real Units.
rRedemption price at maturity is adjusted for inflation. See Note 1(i).
sPrincipal amount of security is adjusted for inflation. See Note 1(i).
tThe security is traded on a discount basis with no stated coupon rate.
uSecurity or a portion of the security has been segregated as collateral for open swap contracts and open future contracts. At April 30, 2011, the value of this security amounted to
$8,536,174, representing 0.25% of net assets.
vSee Note 7 regarding investments in the Institutional Fiduciary Trust Money Market Portfolio.
wSecurity sold on a to-be-announced basis resulting in a short position. As such, the Fund is not subject to the deposit requirement or fees and expenses associated with short
sale transactions.
Semiannual Report | 111

112 | Semiannual Report

Semiannual Report | 113
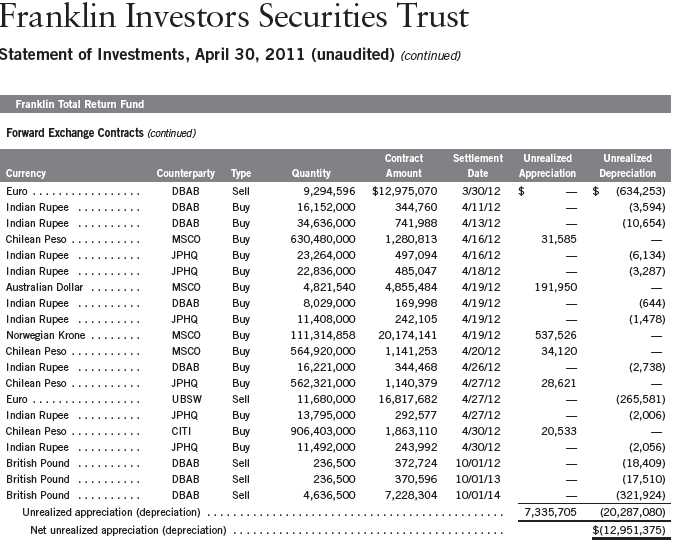
At April 30, 2011, the fund had the following credit default swap contracts outstanding. See Note 1(d).


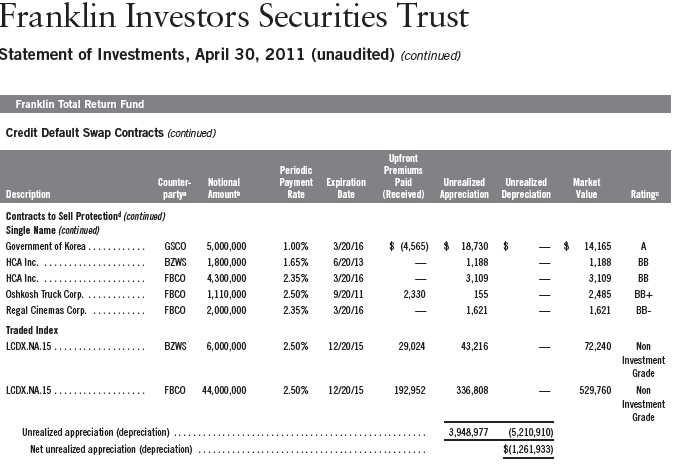
aPositions are generally not collateralized if the market value is under $250,000. Collateral requirements may be net of current positions at the individual counterparty for the fund.
The table below summarizes the cash and/or securities held as collateral for each applicable counterparty at period end:

bIn U.S. dollars unless otherwise indicated. For contracts to sell protection, the notional amount is equal to the maximum potential amount of the future payments and no recourse
provisions have been entered into in association with the contracts.
cBased on Standard and Poor’s (S&P) Rating for single name swaps and internal ratings for index swaps. Internal ratings based on mapping into equivalent ratings from external
vendors.
dThe fund enters contracts to sell protection to create a long credit position. Performance triggers include default, bankruptcy or restructuring for single name swaps, and failure to
pay or bankruptcy for traded index swaps.
See Abbreviations on page 143.
116 | The accompanying notes are an integral part of these financial statements. | Semiannual Report
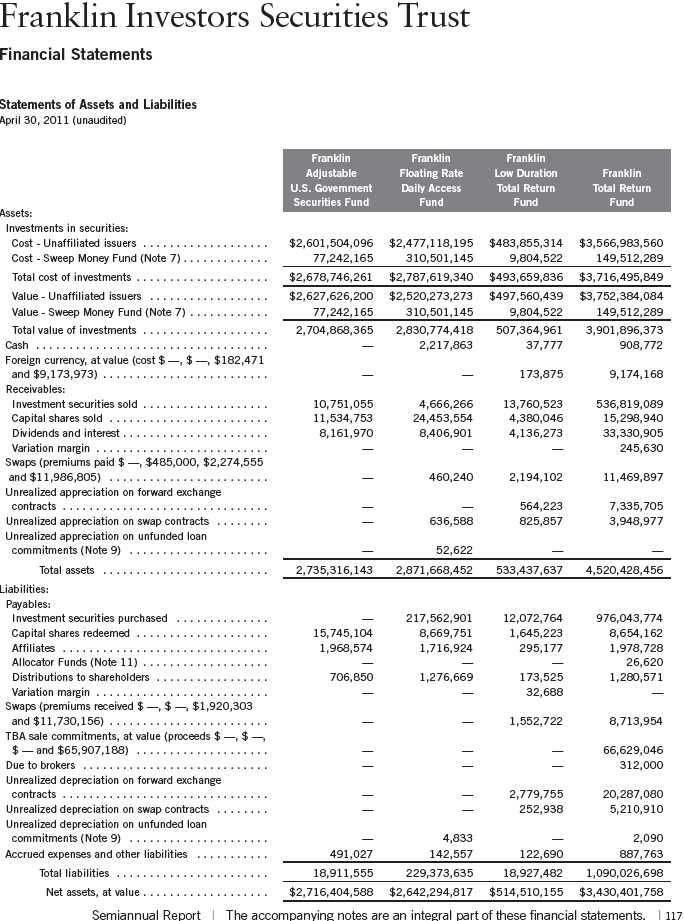

118 | The accompanying notes are an integral part of these financial statements. | Semiannual Report
Franklin Investors Securities Trust
Financial Statements (continued)
Statements of Operations for the six months ended April 30, 2011 (unaudited)
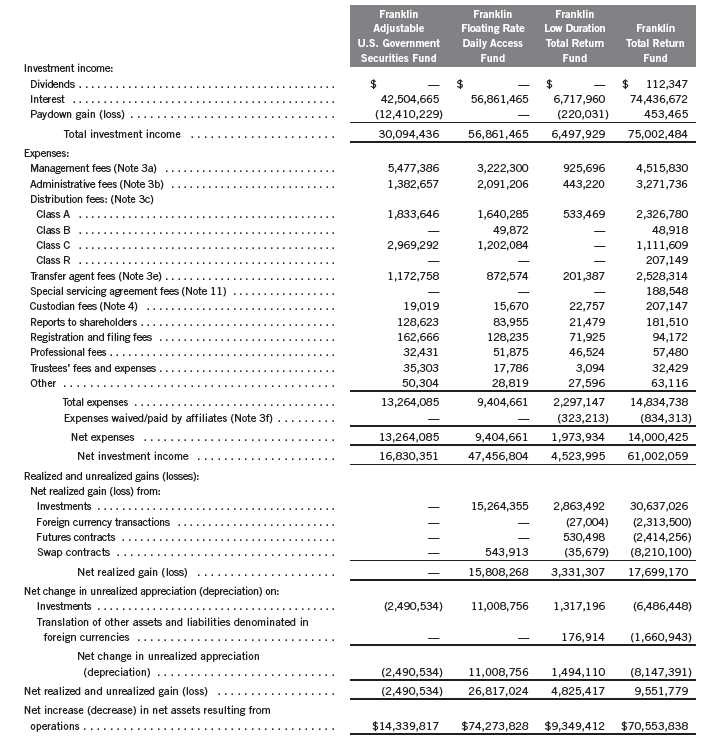
Semiannual Report | The accompanying notes are an integral part of these financial statements. | 119
Franklin Investors Securities Trust
Financial Statements (continued)
Statements of Changes in Net Assets

120 | The accompanying notes are an integral part of these financial statements. | Semiannual Report
Franklin Investors Securities Trust
Financial Statements (continued)
Statements of Changes in Net Assets (continued)

Semiannual Report | The accompanying notes are an integral part of these financial statements. | 121
Franklin Investors Securities Trust
Notes to Financial Statements (unaudited)
1. ORGANIZATION AND SIGNIFICANT ACCOUNTING POLICIES
Franklin Investors Securities Trust (Trust) is registered under the Investment Company Act of 1940, as amended, (1940 Act) as an open-end investment company, consisting of nine separate funds, four of which are included in this report (Funds). The financial statements of the remaining funds in the Trust are presented separately. The classes of shares offered within each of the Funds are indicated below. Each class of shares differs by its initial sales load, contingent deferred sales charges, distribution fees, voting rights on matters affecting a single class and its exchange privilege.

The following summarizes the Funds’ significant accounting policies.
a. Financial Instrument Valuation
The Funds’ investments in securities and other financial instruments are carried at fair value daily. Fair value is the price that would be received to sell an asset or paid to transfer a liability in an orderly transaction between market participants on the measurement date. Under procedures approved by the Trust’s Board of Trustees, the Funds may utilize independent pricing services, quotations from securities and financial instrument dealers, and other market sources to determine fair value.
Equity securities and derivative financial instruments (derivatives) listed on an exchange or on the NASDAQ National Market System are valued at the last quoted sale price or the official closing price of the day, respectively. Over-the-counter securities are valued within the range of the most recent quoted bid and ask prices. Securities that trade in multiple markets or on multiple exchanges are valued according to the broadest and most representative market. Certain equity securities are valued based upon fundamental characteristics or relationships to similar securities. Investments in open-end mutual funds are valued at the closing net asset value.
Debt securities generally trade in the over-the-counter market rather than on a securities exchange. The Funds’ pricing services use multiple valuation techniques to determine fair value. In instances where sufficient market activity exists, the pricing services may utilize a market-based approach through which quotes from market makers are used to determine fair value. In instances where sufficient market activity may not exist or is limited, the pricing services also utilize proprietary valuation models which may consider market characteristics such as benchmark yield curves, option-adjusted spreads, credit spreads, estimated default rates, coupon rates, anticipated timing of principal repayments, underlying collateral, and other unique security features in order to estimate the relevant cash flows, which are then discounted to calculate the fair value. Securities
122 | Semiannual Report
Franklin Investors Securities Trust
Notes to Financial Statements (unaudited) (continued)
| 1. | ORGANIZATION AND SIGNIFICANT ACCOUNTING POLICIES (continued) |
| a. | Financial Instrument Valuation (continued) |
denominated in a foreign currency are converted into their U.S. dollar equivalent at the foreign exchange rate in effect at the close of the NYSE on the date that the values of the foreign debt securities are determined.
Certain derivatives trade in the over-the-counter market. The Funds’ pricing services use various techniques including industry standard option pricing models and proprietary discounted cash flow models to determine the fair value of those instruments. The Funds’ net benefit or obligation under the derivative contract, as measured by the fair market value of the contract, is included in net assets.
The Funds have procedures to determine the fair value of securities and other financial instruments for which market prices are not readily available or which may not be reliably priced. Under these procedures, the Funds primarily employ a market-based approach which may use related or comparable assets or liabilities, recent transactions, market multiples, book values, and other relevant information for the investment to determine the fair value of the investment. The Funds may also use an income-based valuation approach in which the anticipated future cash flows of the investment are discounted to calculate fair value. Discounts may also be applied due to the nature or duration of any restrictions on the disposition of the investments. Due to the inherent uncertainty of valuations of such investments, the fair values may differ significantly from the values that would have been used had an active market existed.
b. Foreign Currency Translation
Portfolio securities and other assets and liabilities denominated in foreign currencies are translated into U.S. dollars based on the exchange rate of such currencies against U.S. dollars on the date of valuation. The Funds may enter into foreign currency exchange contracts to facilitate transactions denominated in a foreign currency. Purchases and sales of securities, income and expense items denominated in foreign currencies are translated into U.S. dollars at the exchange rate in effect on the transaction date. Portfolio securities and assets and liabilities denominated in foreign currencies contain risks that those currencies will decline in value relative to the U.S. dollar. Occasionally, events may impact the availability or reliability of foreign exchange rates used to convert the U.S. dollar equivalent value. If such an event occurs, the foreign exchange rate will be valued at fair value using procedures established and approved by the Trust’s Board of Trustees.
The Funds do not separately report the effect of changes in foreign exchange rates from changes in market prices on securities held. Such changes are included in net realized and unrealized gain or loss from investments on the Statement of Operations.
Semiannual Report | 123
Franklin Investors Securities Trust
Notes to Financial Statements (unaudited) (continued)
| 1. | ORGANIZATION AND SIGNIFICANT ACCOUNTING POLICIES (continued) |
| b. | Foreign Currency Translation (continued) |
Realized foreign exchange gains or losses arise from sales of foreign currencies, currency gains or losses realized between the trade and settlement dates on securities transactions and the difference between the recorded amounts of dividends, interest, and foreign withholding taxes and the U.S. dollar equivalent of the amounts actually received or paid. Net unrealized foreign exchange gains and losses arise from changes in foreign exchange rates on foreign denominated assets and liabilities other than investments in securities held at the end of the reporting period.
c. Securities Traded on a Delayed Delivery and TBA Basis
Certain funds trade securities on a delayed delivery and to-be-announced (TBA) basis, with payment and delivery scheduled for a future date. These transactions are subject to market fluctuations and are subject to the risk that the value at delivery may be more or less than the trade date price. Although the funds will generally purchase these securities with the intention of holding the securities, they may sell the securities before the settlement date. Sufficient assets have been segregated for these securities.
d. Derivative Financial Instruments
The Funds, except Franklin Adjustable U.S. Government Securities Fund, invested in derivatives in order to manage risk or gain exposure to various other investments or markets. Derivatives are financial contracts based on an underlying or notional amount, require no initial investment or an initial net investment that is smaller than would normally be required to have a similar response to changes in market factors, and require or permit net settlement. Derivatives contain various risks including the potential inability of the counterparty to fulfill their obligations under the terms of the contract, the potential for an illiquid secondary market, and/or the potential for market movements which expose the fund to gains or losses in excess of the amounts shown on the Statements of Assets and Liabilities. Realized gain and loss and unrealized appreciation and depreciation on these contracts for the period are included in the Statements of Operations.
Franklin Low Duration Total Return Fund and Franklin Total Return Fund entered into financial futures contracts primarily to manage interest rate risk. A futures contract is an agreement between the fund and a counterparty to buy or sell a security for a specific price on a future date. Required initial margin deposits of cash or securities are pledged by the fund. Subsequent payments, known as variation margin, are made or received by the fund, depending on fluctuations in the value of the underlying security. Such variation margin is accounted for as unrealized appreciation or depreciation until the contract is closed, at which time the gains or losses are realized.
Franklin Low Duration Total Return Fund and Franklin Total Return Fund entered into forward exchange contracts primarily to manage and/or gain exposure to certain foreign currencies. A forward exchange contract is an agreement between the fund and a counterparty to buy or sell a foreign currency for a specific exchange rate on a future date. Pursuant to the terms of the forward
124 | Semiannual Report
Franklin Investors Securities Trust
Notes to Financial Statements (unaudited) (continued)
| 1. | ORGANIZATION AND SIGNIFICANT ACCOUNTING POLICIES (continued) |
| d. | Derivative Financial Instruments (continued) |
exchange contracts, cash or securities may be required to be deposited as collateral. Unrestricted cash may be invested according to the funds’ investment objectives.
The Funds, except Franklin Adjustable U.S. Government Securities Fund, entered into credit default swap contracts primarily to manage and/or gain exposure to credit risk. A credit default swap is an agreement between the fund and a counterparty whereby the buyer of the contract receives credit protection and the seller of the contract guarantees the credit worthiness of a referenced debt obligation. In the event of a default of the underlying referenced debt obligation, the buyer is entitled to receive the notional amount of the credit default swap contract (or other agreed upon amount) from the seller. Over the term of the contract, the buyer pays the seller a periodic stream of payments, provided that no event of default has occurred. Such periodic payments are accrued daily as an unrealized appreciation or depreciation until the payments are made, at which time they are realized. Payments received or paid to initiate a credit default swap contract are reflected on the Statements of Assets and Liabilities and represent compensating factors between stated terms of the credit default swap agreement and prevailing market conditions (credit spreads and other relevant factors). These upfront payments are amortized over the term of the contract as a realized gain or loss on the Statements of Operations. Pursuant to the terms of the credit default swap contract, cash or securities may be required to be deposited as collateral. Unrestricted cash may be invested according to the funds’ investment objectives.
At April 30, 2011, the Franklin Floating Rate Daily Access Fund holds $1,189,730 in U.S. Treasury Bills, the Franklin Low Duration Total Return Fund holds $1,731,471 in U.S. Treasury Bills and Notes, and the Franklin Total Return Fund holds $6,048,140 in U.S. Treasury Bills and Notes, and $312,000 in cash as collateral for derivatives.
See Note 10 regarding other derivative information.
e. FT Holdings Corporation I
The Franklin Total Return Fund invests in certain securities through its investment in FT Holdings Corporation I, a Delaware Corporation and a wholly-owned subsidiary (Subsidiary) of the fund. The Subsidiary has the ability to invest in securities consistent with the investment objective of the fund. At April 30, 2011, all Subsidiary investments as well as any other assets and liabilities are reflected in the fund’s Statement of Investments and Statement of Assets and Liabilities. All income and expenses of the Subsidiary during the period ended April 30, 2011, have been included in the fund’s Statement of Operations.
f. Mortgage Dollar Rolls
The Franklin Total Return Fund enters into mortgage dollar rolls, typically on a TBA basis. Mortgage dollar rolls are agreements between the fund and a financial institution to simultaneously sell and repurchase mortgage-backed securities at a future date. Gains or losses are
Semiannual Report | 125
Franklin Investors Securities Trust
Notes to Financial Statements (unaudited) (continued)
| 1. | ORGANIZATION AND SIGNIFICANT ACCOUNTING POLICIES (continued) |
| f. | Mortgage Dollar Rolls (continued) |
realized on the initial sale, and the difference between the repurchase price and the sale price is recorded as an unrealized gain or loss to the fund upon entering into the mortgage dollar roll. In addition, the fund may invest the cash proceeds that are received from the initial sale. During the period between the sale and repurchase, the fund is not entitled to principal and interest paid on the mortgage backed securities. The risks of mortgage dollar roll transactions include the potential inability of the counterparty to fulfill its obligations.
g. Senior Floating Rate Interests
The Funds, except Franklin Adjustable U.S. Government Securities Fund, invest in senior secured corporate loans that pay interest at rates which are periodically reset by reference to a base lending rate plus a spread. These base lending rates are generally the prime rate offered by a designated U.S. bank or the London InterBank Offered Rate (LIBOR). Senior secured corporate loans often require prepayment of principal from excess cash flows or at the discretion of the borrower. As a result, actual maturity may be substantially less than the stated maturity.
Senior secured corporate loans in which the funds invest are generally readily marketable, but may be subject to some restrictions on resale.
h. Income Taxes
It is each fund’s policy to qualify as a regulated investment company under the Internal Revenue Code. Each fund intends to distribute to shareholders substantially all of its taxable income and net realized gains to relieve it from federal income and excise taxes. As a result, no provision for U.S. federal income taxes is required. Each fund files U.S. income tax returns as well as tax returns in certain other jurisdictions. Each fund records a provision for taxes in its financial statements including penalties and interest, if any, for a tax position taken on a tax return (or expected to be taken) when it fails to meet the more likely than not (a greater than 50% probability) threshold and based on the technical merits, the tax position may not be sustained upon examination by the tax authorities. As of April 30, 2011, and for all open tax years, each fund has determined that no provision for income tax is required in each fund’s financial statements. Open tax years are those that remain subject to examination and are based on each tax jurisdiction statute of limitation.
i. Security Transactions, Investment Income, Expenses and Distributions
Security transactions are accounted for on trade date. Realized gains and losses on security transactions are determined on a specific identification basis. Interest income and estimated expenses are accrued daily. Amortization of premium and accretion of discount on debt securities are included in interest income. Facility fees are recognized as income over the expected term of the loan. Dividend income is recorded on the ex-dividend date. Dividends from net investment
126 | Semiannual Report
Franklin Investors Securities Trust
Notes to Financial Statements (unaudited) (continued)
| 1. | ORGANIZATION AND SIGNIFICANT ACCOUNTING POLICIES (continued) |
| i. | Security Transactions, Investment Income, Expenses and Distributions (continued) |
income are normally declared daily; these dividends may be reinvested or paid monthly to shareholders. Distributions from realized capital gains and other distributions, if any, are recorded on the ex-dividend date. Distributions to shareholders are determined according to income tax regulations (tax basis). Distributable earnings determined on a tax basis may differ from earnings recorded in accordance with accounting principles generally accepted in the United States of America. These differences may be permanent or temporary. Permanent differences are reclassified among capital accounts to reflect their tax character. These reclassifications have no impact on net assets or the results of operations. Temporary differences are not reclassified, as they may reverse in subsequent periods.
Common expenses incurred by the Trust are allocated among the funds based on the ratio of net assets of each fund to the combined net assets of the Trust. Fund specific expenses are charged directly to the fund that incurred the expense.
Net investment income, not including class specific expenses, is allocated daily to each class of shares based upon the relative value of the settled shares of each class. Realized and unrealized gains and losses are allocated daily to each class of shares based upon the relative proportion of net assets of each class. Differences in per share distributions, by class, are generally due to differences in class specific expenses.
Inflation-indexed bonds are adjusted for inflation through periodic increases or decreases in the security’s interest accruals, face amount, or principal redemption value, by amounts corresponding to the rate of inflation as measured by an index. Any increase or decrease in the face amount or principal redemption value will be included as interest income on the Statements of Operations.
j. Accounting Estimates
The preparation of financial statements in accordance with accounting principles generally accepted in the United States of America requires management to make estimates and assumptions that affect the reported amounts of assets and liabilities at the date of the financial statements and the amounts of income and expenses during the reporting period. Actual results could differ from those estimates.
k. Guarantees and Indemnifications
Under the Trust’s organizational documents, its officers and trustees are indemnified by the Trust against certain liabilities arising out of the performance of their duties to the Trust. Additionally, in the normal course of business, the Trust, on behalf of the Funds, enters into contracts with service providers that contain general indemnification clauses. The Trust’s maximum exposure under these arrangements is unknown as this would involve future claims that may be made against the Trust that have not yet occurred. Currently, the Trust expects the risk of loss to be remote.
Semiannual Report | 127
Franklin Investors Securities Trust
Notes to Financial Statements (unaudited) (continued)
2. SHARES OF BENEFICIAL INTEREST
At April 30, 2011, there were an unlimited number of shares authorized (without par value).
Transactions in the Funds’ shares were as follows:

128 | Semiannual Report
Franklin Investors Securities Trust
Notes to Financial Statements (unaudited) (continued)

Semiannual Report | 129
Franklin Investors Securities Trust
Notes to Financial Statements (unaudited) (continued)
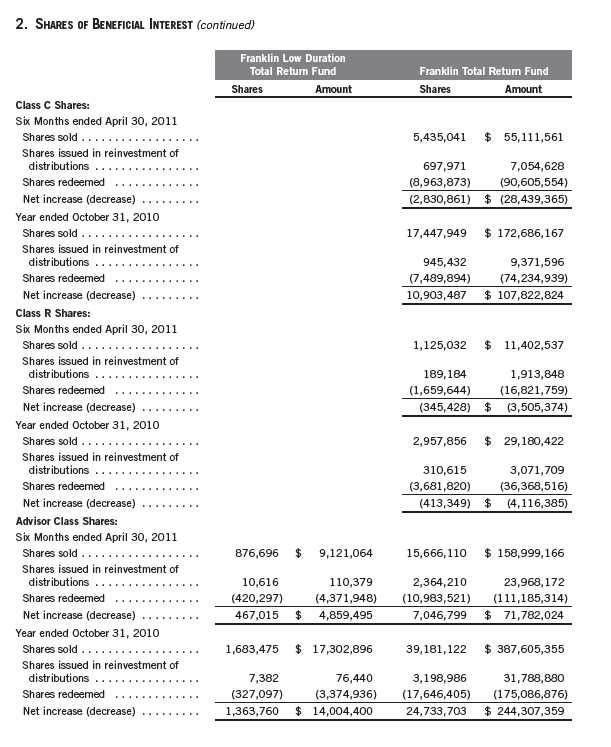
130 | Semiannual Report
Franklin Investors Securities Trust
Notes to Financial Statements (unaudited) (continued)
3. TRANSACTIONS WITH AFFILIATES
Franklin Resources, Inc. is the holding company for various subsidiaries that together are referred to as Franklin Templeton Investments. Certain officers and trustees of the Trust are also officers and/or directors of the following subsidiaries:

a. Management Fees
The Franklin Adjustable U.S. Government Securities Fund pays an investment management fee to Advisers based on the average daily net assets of the fund as follows:
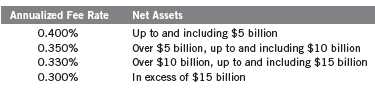
The Franklin Floating Rate Daily Access Fund pays an investment management fee to Advisers based on the average daily net assets of the fund as follows:

The Franklin Low Duration Total Return Fund and the Franklin Total Return Fund pay an investment management fee to Advisers based on the average daily net assets of each of the funds as follows:

Semiannual Report | 131
Franklin Investors Securities Trust
Notes to Financial Statements (unaudited) (continued)
| 3. | TRANSACTIONS WITH AFFILIATES (continued) |
| a. | Management Fees (continued) |
Under a subadvisory agreement, FT Institutional, an affiliate of Advisers, provides subadvisory services to the Franklin Total Return Fund. The subadvisory fee is paid by Advisers based on the average daily net assets, and is not an additional expense of the fund.
b. Administrative Fees
The Franklin Adjustable U.S. Government Securities Fund pays an administrative fee to Advisers based on the fund’s average daily net assets as follows:

The Funds, except Franklin Adjustable U.S. Government Securities Fund, pay an administrative fee to FT Services of 0.20% per year of the average daily net assets of each of the funds.
c. Distribution Fees
The Trust’s Board of Trustees has adopted distribution plans for each share class, with the exception of Advisor Class shares, pursuant to Rule 12b-1 under the 1940 Act. Under the Funds’ Class A reimbursement distribution plans, the Funds reimburse Distributors for costs incurred in connection with the servicing, sale and distribution of the Funds’ shares up to the maximum annual plan rate. Under the Class A reimbursement distribution plans, costs exceeding the maximum for the current plan year cannot be reimbursed in subsequent periods.
In addition, under the funds’ Class B, C and R compensation distribution plans, the funds pay Distributors for costs incurred in connection with the servicing, sale and distribution of each fund’s shares up to the maximum annual plan rate for each class.
The maximum annual plan rates, based on the average daily net assets, for each class, are as follows:

132 | Semiannual Report
Franklin Investors Securities Trust
Notes to Financial Statements (unaudited) (continued)
| 3. | TRANSACTIONS WITH AFFILIATES (continued) |
| d. | Sales Charges/Underwriting Agreements |
Distributors has advised the Funds of the following commission transactions related to the sales and redemptions of the Funds’ shares for the period:

e. Transfer Agent Fees
For the period ended April 30, 2011, the Funds paid transfer agent fees as noted in the Statements of Operations of which the following amounts were retained by Investor Services:
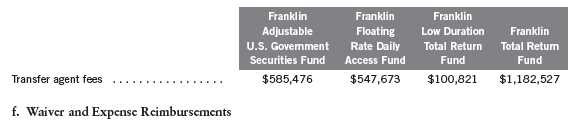
FT Services has contractually agreed in advance to waive or limit its fees and to assume as its own expense certain expenses otherwise payable by the Franklin Low Duration Total Return Fund and the Franklin Total Return Fund so that the common expenses (i.e. a combination of management fees, administrative fees, and other expenses, but excluding distribution fees, and acquired fund fees and expenses) for each class of the funds do not exceed 0.65% and 0.63%, respectively (other than certain non-routine expenses or costs, including those relating to litigation, indemnification, reorganizations, and liquidations) until February 29, 2012.
4. EXPENSE OFFSET ARRANGEMENT
The Funds have entered into an arrangement with their custodian whereby credits realized as a result of uninvested cash balances are used to reduce a portion of the Funds’ custodian expenses. During the period ended April 30, 2011, there were no credits earned.
Semiannual Report | 133
Franklin Investors Securities Trust
Notes to Financial Statements (unaudited) (continued)
5. INCOME TAXES
For tax purposes, capital losses may be carried over to offset future capital gains, if any. At October 31, 2010, the capital loss carryforwards were as follows:
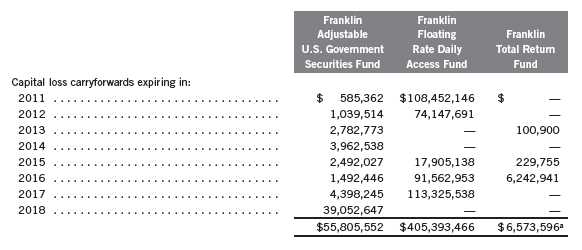
aIncludes $6,573,596 from the reorganized HSBC Investor Core Plus Fixed Income Fund, HSBC Investor Core Plus Fixed Income Fund (Advisor) and HSBC Investor Intermediate Duration Fixed Income Fund which may be carried over to offset future capital gains, subject to certain limitations.
At April 30, 2011, the cost of investments and net unrealized appreciation (depreciation) for income tax purposes were as follows:
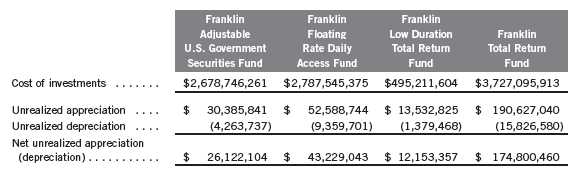
Net investment income differs for financial statement and tax purposes primarily due to differing treatments of defaulted securities, foreign currency transactions, mortgage dollar rolls, pass-through entity income, paydown losses, payments-in-kind, bond discounts and premiums, swaps, tax straddles, and inflation related adjustments on foreign securities.
Net realized gains (losses) differ for financial statement and tax purposes primarily due to differing treatments of wash sales, foreign currency transactions, mortgage dollar rolls, pass-through entity income, financial futures transactions, paydown losses, payments-in-kind, bond discounts and premiums, swaps, tax straddles, and inflation related adjustments on foreign securities.
134 | Semiannual Report
Franklin Investors Securities Trust
Notes to Financial Statements (unaudited) (continued)
6. INVESTMENT TRANSACTIONS
Purchases and sales of investments (excluding short term securities) for the period ended April 30, 2011, were as follows:
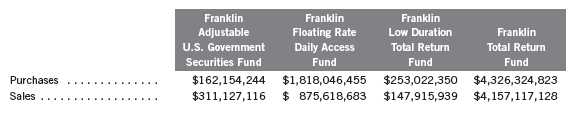
7. INVESTMENTS IN INSTITUTIONAL FIDUCIARY TRUST MONEY MARKET PORTFOLIO
The Funds invest in the Institutional Fiduciary Trust Money Market Portfolio (Sweep Money Fund), an open-end investment company managed by Advisers. Management fees paid by the Funds are reduced on assets invested in the Sweep Money Fund, in an amount not to exceed the management and administrative fees paid by the Sweep Money Fund.
8. CREDIT RISK AND DEFAULTED SECURITIES
At April 30, 2011, the Franklin Floating Rate Daily Access Fund, the Franklin Low Duration Total Return Fund and the Franklin Total Return Fund had 84.46%, 13.06% and 14.19%, respectively, of their portfolio invested in high yield, senior secured floating rate notes, or other securities rated below investment grade. These securities may be more sensitive to economic conditions causing greater price volatility and are potentially subject to a greater risk of loss due to default than higher rated securities.
The funds held defaulted securities and/or other securities for which the income has been deemed uncollectible. At April 30, 2011, the aggregate value of these securities for the Franklin Floating Rate Daily Access Fund, the Franklin Low Duration Total Return Fund and the Franklin Total Return Fund was $20,499,192, $10, and $100, representing 0.78%, less than 0.01%, and less than 0.01%, respectively, of each fund’s net assets. The Funds discontinue accruing income on securities for which income has been deemed uncollectible and provide an estimate for losses on interest receivable. The securities have been identified on the accompanying Statement of Investments.
9. UNFUNDED LOAN COMMITMENTS
The Funds, except Franklin Adjustable U.S. Government Securities Fund, enter into certain credit agreements, all or a portion of which may be unfunded. The funds are obligated to fund these loan commitments at the borrowers’ discretion. Funded portions of credit agreements are presented on the Statements of Investments.
Semiannual Report | 135
Franklin Investors Securities Trust
Notes to Financial Statements (unaudited) (continued)

Unfunded loan commitments and funded portions of credit agreements are marked to market daily and any unrealized appreciation or depreciation is included in the Statements of Assets and Liabilities and Statements of Operations.
10. OTHER DERIVATIVE INFORMATION
At April 30, 2011, the Funds, except Franklin Adjustable U.S. Government Securities Fund, have invested in derivative contracts which are reflected on the Statement of Assets and Liabilities as follows:
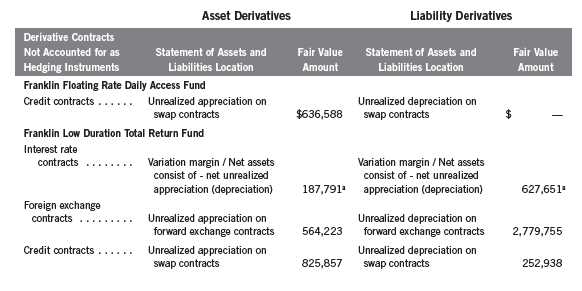
136 | Semiannual Report
Franklin Investors Securities Trust
Notes to Financial Statements (unaudited) (continued)
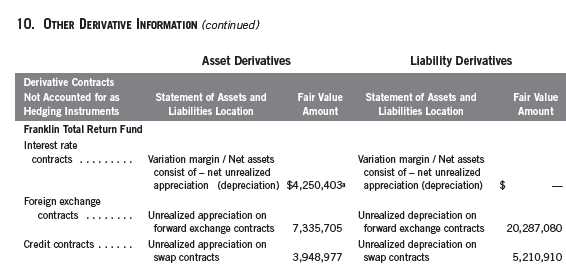
aIncludes cumulative appreciation (depreciation) of futures contracts as reported in the Statements on Investments. Only current day’s variation margin is reported within the Statements of Assets and Liabilities.
For the period ended April 30, 2011, the effect of derivative contracts on the funds’ Statement of Operations was as follows:

Semiannual Report | 137
Franklin Investors Securities Trust
Notes to Financial Statements (unaudited) (continued)

aRepresents the average notional amount for other derivative contracts outstanding during the period. For derivative contracts denominated in foreign currencies, notional amounts are converted into U.S. dollars.
See Note 1(d) regarding derivative financial instruments.
11. SPECIAL SERVICING AGREEMENT
The Franklin Floating Rate Daily Access Fund and the Franklin Total Return Fund, which are eligible underlying investments of one or more of the Franklin Templeton Fund Allocator Series Funds (Allocator Funds), participates in a Special Servicing Agreement (SSA) with the Allocator Funds and certain service providers of the funds and the Allocator Funds. Under the SSA, the funds may pay a portion of the Allocator Funds’ expenses (other than any asset allocation, administrative and distribution fees), to the extent such payments are less than the amount of the benefits realized or expected to be realized by the funds (e.g., due to reduced costs associated with servicing accounts) from the investment in the funds by the Allocator Funds. The Allocator Funds are either managed by Advisers or administered by FT Services. For the period ended April 30, 2011, the Franklin Total Return Fund was held by one or more of the Allocator Funds and the amount of expenses borne by the fund is noted in the Statements of Operations. At April 30, 2011, 6.76% of the fund’s outstanding shares was held by one or more of the Allocator Funds.
12. CREDIT FACILITY
The Funds, together with other U.S. registered and foreign investment funds (collectively, Borrowers), managed by Franklin Templeton Investments, are borrowers in a joint syndicated senior unsecured credit facility totaling $750 million (Global Credit Facility) which matures on
138 | Semiannual Report
Franklin Investors Securities Trust
Notes to Financial Statements (unaudited) (continued)
12. CREDIT FACILITY (continued)
January 20, 2012. This Global Credit Facility provides a source of funds to the Borrowers for temporary and emergency purposes, including the ability to meet future unanticipated or unusually large redemption requests.
Under the terms of the Global Credit Facility, the Funds shall, in addition to interest charged on any borrowings made by the Funds and other costs incurred by the Funds, pay their share of fees and expenses incurred in connection with the implementation and maintenance of the Global Credit Facility, based upon its relative share of the aggregate net assets of all of the Borrowers, including an annual commitment fee of 0.08% based upon the unused portion of the Global Credit Facility, which is reflected in other expenses on the Statements of Operations. During the period ended April 30, 2011, the Funds did not use the Global Credit Facility.
13. FUND LITIGATION
In July 2003, Adelphia Communications Corp. (“Adelphia”) and related parties, along with its Official Committee of Unsecured Creditors, (collectively “Plaintiffs”) filed an adversary proceeding in the then-pending Adelphia bankruptcy case in the U.S. Bankruptcy Court for the Southern District of New York against more than 400 banks, financial services companies, insurance companies, investment banks, mutual funds and other parties that had arranged for the sale of, or purchased the bank debt of, Adelphia or its related parties. Named defendants included Franklin Floating Rate Daily Access Fund (individually and as successor to the Franklin Floating Rate Trust’s interests in the credit facilities at issue), Franklin Floating Rate Trust, and Franklin Floating Rate Master Series (collectively the “Franklin Funds”), and Franklin CLOs I through III, among other defendants. Plaintiffs alleged that the purchasers of the bank debt knew, or should have known, that the loan proceeds would not benefit Adelphia, but instead would be used to enrich Adelphia insiders and sought avoidance of the loans and recovery of fraudulent transfers. Following transfer of the matter to the U.S. District Court for the Southern District of New York, and the agent bank and investment bank defendants’ motion to dismiss the lawsuit, Plaintiffs filed an amended complaint (the “Amended Complaint”).
Defendants, including the Franklin Funds, moved to dismiss the Amended Complaint in December 2007. In June 2008, the court granted the motions and dismissed all of the claims against the non-agent bank defendants, including the Franklin Funds, while leaving other claims against the agent bank and investment bank defendants outstanding. In January 2009, Plaintiffs appealed the dismissal of their claims against the non-agent bank defendants to the U.S. Court of Appeals for the Second Circuit and the court affirmed the dismissal in May 2010. In September 2010, Plaintiffs reached settlement with the agent banks and investment banks and, on that basis, in October 2010, agreed to forego further appeal of the dismissal of the claims against the non-agent bank defendants. The District Court has since approved the settlements and Plaintiffs have dismissed all claims against the non-agent bank defendants, including the Franklin Funds, with prejudice.
Semiannual Report | 139
Franklin Investors Securities Trust
Notes to Financial Statements (unaudited) (continued)
13. FUND LITIGATION (continued)
The final issue for the parties to litigate relates to defendants’ entitlement to payment of certain legal fees under a litigation indemnity fund established as part of the Adelphia bankruptcy plan. A further hearing on that matter is currently scheduled for October 2011.
14. FAIR VALUE MEASUREMENTS
The Funds follow a fair value hierarchy that distinguishes between market data obtained from independent sources (observable inputs) and the Funds’ own market assumptions (unobservable inputs). These inputs are used in determining the value of the Funds’ investments and are summarized in the following fair value hierarchy:
- Level 1 – quoted prices in active markets for identical securities
- Level 2 – other significant observable inputs (including quoted prices for similar securities, interest rates, prepayment speed, credit risk, etc.)
- Level 3 – significant unobservable inputs (including the Funds’ own assumptions in determining the fair value of investments)
The inputs or methodology used for valuing securities are not an indication of the risk associated with investing in those securities.
For movements between the levels within the fair value hierarchy, the Funds have adopted a policy of recognizing the transfers as of the date of the underlying event which caused the movement.
The following is a summary of the inputs used as of April 30, 2011, in valuing the Funds’ assets and liabilities carried at fair value:

140 | Semiannual Report
Franklin Investors Securities Trust
Notes to Financial Statements (unaudited) (continued)
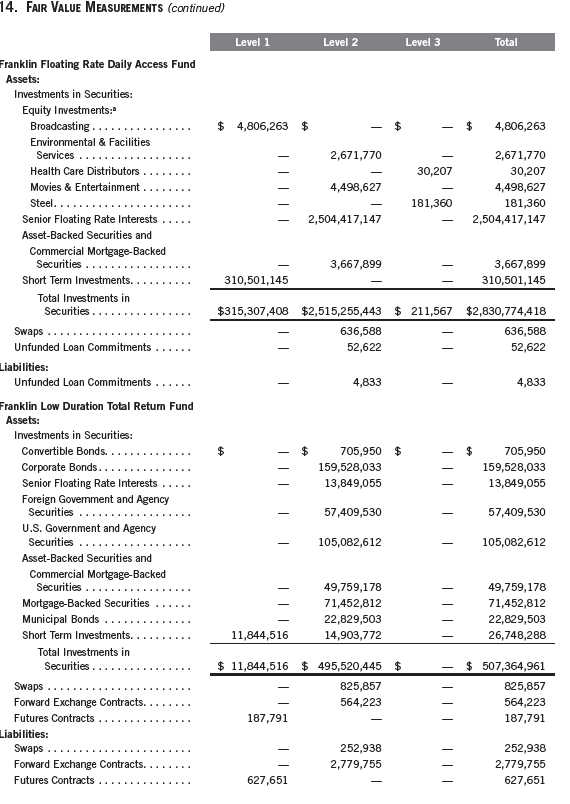
Semiannual Report | 141
Franklin Investors Securities Trust
Notes to Financial Statements (unaudited) (continued)
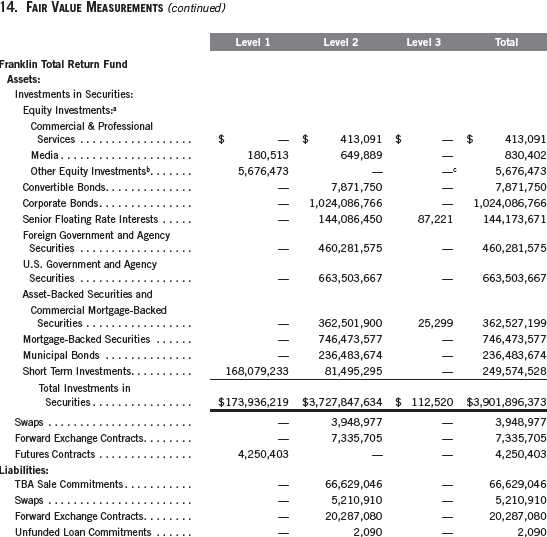
aIncludes common, preferred, and convertible preferred stocks as well as other equity investments.
bFor detailed industry descriptions, see the accompanying Statements of Investments.
cIncludes securities determined to have no value at April 30, 2011.
15. NEW ACCOUNTING PRONOUNCEMENTS
In April 2011, the Financial Accounting Standards Board (FASB) issued Accounting Standards Update (ASU) No. 2011-03, Transfers and Servicing (Topic 860): Reconsideration of Effective Control for Repurchase Agreements with the main objective to improve the accounting for repurchase agreements and other similar agreements that both entitle and obligate a transferor to repurchase or redeem financial assets before their maturity. The ASU modifies the criteria for determining effective control of transferred assets and as a result certain agreements may now be accounted for as secured borrowings. The ASU is effective for transactions occurring in interim
142 | Semiannual Report
Franklin Investors Securities Trust
Notes to Financial Statements (unaudited) (continued)
15. NEW ACCOUNTING PRONOUNCEMENTS (continued)
and annual periods beginning after December 15, 2011. The Funds are currently evaluating the impact, if any, of applying this provision.
16. SUBSEQUENT EVENTS
The Funds have evaluated subsequent events through the issuance of the financial statements and determined that no events have occurred that require disclosure.

Selected Portfolio

Semiannual Report | 143
Franklin Investors Securities Trust
Shareholder Information
Board Review of Investment Management Agreement
At a meeting held March 1, 2011, the Board of Trustees (Board), including a majority of non-interested or independent Trustees, approved renewal of the investment management agreement for each of the separate funds comprising Franklin Investors Securities Trust (Fund(s)). In reaching this decision, the Board took into account information furnished throughout the year at regular Board meetings, as well as information prepared specifically in connection with the annual renewal review process. Information furnished and discussed throughout the year included investment performance reports and related financial information for each Fund, as well as periodic reports on expenses, shareholder services, legal, compliance, pricing, brokerage commissions and execution and other services provided by the Investment Manager (Manager) and its affiliates. Information furnished specifically in connection with the renewal process included a report for each Fund prepared by Lipper, Inc. (Lipper), an independent organization, as well as additional material, including a Fund profitability analysis prepared by management. The Lipper reports compared each Fund’s investment performance and expenses with those of other mutual funds deemed comparable to the Fund as selected by Lipper. The Fund profitability analysis discussed the profitability to Franklin Templeton Investments from its overall U.S. fund operations, as well as on an individual fund-by-fund basis. Additional material accompanying such profitability analysis included information on a fund-by-fund basis listing portfolio managers and other accounts they manage, as well as information on management fees charged by the Manager and its affiliates to U.S. mutual funds and other accounts, including management’s explanation of differences where relevant. Such material also included a memorandum prepared by management describing project initiatives and capital investments relating to the services provided to the Funds by the Franklin Templeton Investments organization, as well as a memorandum relating to economies of scale and a comparative analysis concerning transfer agent fees charged each Fund.
In considering such materials, the independent Trustees received assistance and advice from and met separately with independent counsel. While the investment management agreements for all Funds were considered at the same Board meeting, the Board dealt with each Fund separately. In approving continuance of the investment management agreement for each Fund, the Board, including a majority of independent Trustees, determined that the existing management fee structure was fair and reasonable and that continuance of the investment management agreement was in the best interests of each Fund and its shareholders. While attention was given to all information furnished, the following discusses some primary factors relevant to the Board’s decision.
NATURE, EXTENT AND QUALITY OF SERVICES. The Board was satisfied with the nature and quality of the overall services provided by the Manager and its affiliates to the Funds and their shareholders. In addition to investment performance and expenses discussed later, the Board’s opinion was based, in part, upon periodic reports furnished it showing that the investment policies and restrictions for each Fund were consistently complied with as well as other reports periodically furnished the Board covering matters such as the compliance of portfolio managers and other
144 | Semiannual Report
Franklin Investors Securities Trust
Shareholder Information (continued)
Board Review of Investment Management Agreement (continued)
management personnel with the code of ethics adopted throughout the Franklin Templeton fund complex, the adherence to fair value pricing procedures established by the Board, and the accuracy of net asset value calculations. The Board also noted the extent of benefits provided Fund shareholders from being part of the Franklin Templeton family of funds, including the right to exchange investments between the same class of funds without a sales charge, the ability to reinvest Fund dividends into other funds and the right to combine holdings in other funds to obtain a reduced sales charge. Favorable consideration was given to management’s continuous efforts and expenditures in establishing back-up systems and recovery procedures to function in the event of a natural disaster, it being noted by the Board that such systems and procedures had functioned smoothly during the Florida hurricanes and blackouts experienced in previous years. Among other factors taken into account by the Board were the Manager’s best execution trading policies, including a favorable report by an independent portfolio trading analytical firm. Consideration was also given to the experience of each Fund’s portfolio management team, the number of accounts managed and general method of compensation. In this latter respect, the Board noted that a primary factor in management’s determination of a portfolio manager’s bonus compensation was the relative investment performance of the funds he or she managed and that a portion of such bonus was required to be invested in a predesignated list of funds within such person’s fund management area so as to be aligned with the interests of shareholders. The Board also took into account the quality of transfer agent and shareholder services provided Fund shareholders by an affiliate of the Manager and the continuous enhancements to the Franklin Templeton website. Particular attention was given to management’s conservative approach and diligent risk management procedures, including continuous monitoring of counterparty credit risk and attention given to derivative and other complex instruments. The Board also took into account, among other things, management’s efforts in establishing a global credit facility for the benefit of the Funds and other accounts managed by Franklin Templeton Investments to provide a source of cash for temporary and emergency purposes or to meet unusual redemption requests as well as the strong financial position of the Manager’s parent company and its commitment to the mutual fund business as evidenced by its subsidization of money market funds.
INVESTMENT PERFORMANCE. The Board placed significant emphasis on the investment performance of each Fund in view of its importance to shareholders. While consideration was given to performance reports and discussions with portfolio managers at Board meetings during the year, particular attention in assessing performance was given to the Lipper reports furnished for the agreement renewals. The Lipper reports prepared for each individual Fund showed the investment performance of its Class A shares in comparison with its selected performance universe during 2010 and during the previous 10 years ended December 31, 2010, unless otherwise noted. Performance on a total return basis was shown by Lipper for all Funds with performance on an income return basis being shown for those Funds having income return as an element of their investment objective. The following summarizes the performance results for each Fund.
Semiannual Report | 145
Franklin Investors Securities Trust
Shareholder Information (continued)
Board Review of Investment Management Agreement (continued)
Franklin Adjustable U.S. Government Securities Fund – The Fund’s investment performance was shown in comparison with a performance universe consisting of all retail and institutional general bond funds as selected by Lipper. The Lipper report showed the Fund’s 2.66% income return in 2010 to be in the second-lowest quintile of such performance universe, and its 1.29% total return in 2010 to be in the lowest quintile of such universe. On an annualized basis, the Lipper report showed the Fund’s income and total return for the previous three- and five-year periods to both be in the second-lowest quintile of its performance universe and to both be in the lowest quintile of such universe for the previous 10-year period. The Board believed such performance reflected the nature of the Fund’s investments in plain vanilla, adjustable-rate mortgages and conservative investment strategy and found such performance to be acceptable, noting that the general bond category comprising the performance universe invested in different asset types and that during the market turmoil existing in 2007, the Fund’s income and total return were in the highest and next to highest quintiles of such universe, respectively.
Franklin Floating Rate Daily Access Fund – The Fund’s investment performance was shown in comparison with a performance universe consisting of all retail and institutional loan participation funds as selected by Lipper. This Fund has been in existence for less than 10 full years and the Lipper report showed its income return during 2010 to be in the second-lowest quintile of its performance universe, and its income return on an annualized basis during the previous three- and five-year periods to be in the lowest and second-lowest quintiles, respectively, of its performance universe. The Lipper report showed the Fund’s total return during 2010 to be in the second-lowest quintile of its performance universe and on an annualized basis for the previous three- and five-year periods to be in the second-lowest and middle quintiles of such universe, respectively. In discussing such performance, management pointed out that during 2010 the Fund’s performance was hurt by its focus on higher credit quality investments that underperformed lower rated notes in the environment of improved corporate returns and economic recovery that existed in such year. Management further noted that such focus on higher quality securities had helped the Fund perform better during the market turmoil existing in 2008 when its total return was in the second-highest quintile of its performance universe. The Board found the Fund’s comparative performance as shown in the Lipper report to be acceptable in view of such explanation, noting that for 2010, the Fund’s income return exceeded 4% and its total return exceeded 8% as shown in the Lipper report.
Franklin Low Duration Total Return Fund – This Fund has been in operation for six full calendar years and its investment performance was shown in comparison to a performance universe consisting of all retail and institutional short investment-grade debt funds as selected by Lipper. The Lipper report showed the Fund’s income return and total return to both be in the second-highest quintile of the performance universe for 2010. The Lipper report showed the Fund’s income return on an annualized basis to be in the second-highest quintile of such performance universe for the previous three-year period and the middle quintile of such universe for the previous five-year period, and its
146 | Semiannual Report
Franklin Investors Securities Trust
Shareholder Information (continued)
Board Review of Investment Management Agreement (continued)
total return on an annualized basis to be in the highest quintile of such universe for each of the previous three- and five-year periods. The Board was satisfied with the Fund’s comparative performance as shown in the Lipper report.
Franklin Total Return Fund – The Fund’s investment performance was shown in comparison to a performance universe consisting of all retail and institutional intermediate investment-grade debt funds as selected by Lipper. The Lipper report showed the Fund’s income return to be in the second-highest quintile of its performance universe during 2010 and to be in the highest or best performing quintile of such universe for the previous three-, five- and 10-year periods on an annualized basis. The Lipper report showed the Fund’s total return during 2010 to be in the highest quintile of its performance universe, and on an annualized basis to be in the middle quintile of such universe for the previous three- and five-year periods, and second-highest quintile of such universe for the previous 10-year period. The Board was satisfied with the Fund’s comparative performance as set forth in the Lipper report.
COMPARATIVE EXPENSES. Consideration was given to a comparative analysis of the management fees and total expense ratios of each Fund compared with those of a group of other funds selected by Lipper as constituting its appropriate Lipper expense group. Lipper expense data is based upon information taken from each fund’s most recent annual report, which reflects historical asset levels that may be quite different from those currently existing, particularly in a period of market volatility. While recognizing such inherent limitation and the fact that expense ratios generally increase as assets decline and decrease as assets grow, the Board believed the independent analysis conducted by Lipper to be an appropriate measure of comparative expenses. In reviewing comparative costs, Lipper provides information on each Fund’s contractual investment management fee in comparison with the contractual investment management fee that would have been charged by other funds within its Lipper expense group assuming they were similar in size to the Fund, as well as the actual total expense ratio of the Fund in comparison with those of its expense group. The Lipper contractual investment management fee analysis includes within such fee any separate administrative fees, and the Lipper total expenses, for comparative consistency, are shown by Lipper for Fund Class A shares. The results of such expense comparisons showed that the contractual investment management fee rate and actual total expense ratio for each of Franklin Adjustable U.S. Government Securities Fund and Franklin Floating Rate Daily Access Fund were in either the least expensive or second least expensive quintiles of their respective Lipper expense groups. The Board was satisfied with the comparative contractual investment management fee rate and actual total expense ratios of these Funds as shown in the Lipper reports. The contractual investment management fee rate for Franklin Total Return Fund was above the median of its Lipper expense group, but its actual total expense ratio was below the median of such group. The contractual investment management fee and actual total expense ratio for Franklin Low Duration Total Return Fund were above the medians of its Lipper expense group, but the actual total expense ratio was within nine
Semiannual Report | 147
Franklin Investors Securities Trust
Shareholder Information (continued)
Board Review of Investment Management Agreement (continued)
basis points of the median for such expense group. The Board found the contractual management fees and total expense ratios of each of these Funds to be acceptable, noting that their expenses were subsidized through management fee waivers and reimbursements.
MANAGEMENT PROFITABILITY. The Board also considered the level of profits realized by the Manager and its affiliates in connection with the operation of each Fund. In this respect, the Board reviewed the Fund profitability analysis that addresses the overall profitability of Franklin Templeton’s U.S. fund business, as well as its profits in providing management and other services to each of the individual funds during the 12-month period ended September 30, 2010, being the most recent fiscal year-end for Franklin Resources, Inc., the Manager’s parent. In reviewing the analysis, attention was given to the methodology followed in allocating costs to each Fund, it being recognized that allocation methodologies are inherently subjective and various allocation methodologies may each be reasonable while producing different results. In this respect, the Board noted that, while being continuously refined and reflecting changes in the Manager’s own cost accounting, the cost allocation methodology was consistent with that followed in profitability report presentations for the Funds made in prior years and that the Funds’ independent registered public accounting firm had been engaged by the Manager to review the reasonableness of the allocation methodologies solely for use by the Funds’ Board in reference to the profitability analysis. In reviewing and discussing such analysis, management discussed with the Board its belief that costs incurred in establishing the infrastructure necessary for the type of mutual fund operations conducted by the Manager and its affiliates may not be fully reflected in the expenses allocated to each Fund in determining its profitability, as well as the fact that the level of profits, to a certain extent, reflected operational cost savings and efficiencies initiated by management. The Board also took into account management’s expenditures in improving shareholder services provided the Funds, as well as the need to meet additional regulatory and compliance requirements resulting from the Sarbanes-Oxley Act and recent SEC and other regulatory requirements. In addition, the Board considered a third-party study comparing the profitability of the Manager’s parent on an overall basis to other publicly held managers broken down to show profitability from management operations exclusive of distribution expenses, as well as profitability including distribution expenses. The Board also considered the extent to which the Manager and its affiliates might derive ancillary benefits from fund operations, including revenues generated from transfer agent services and potential benefits resulting from allocation of fund brokerage and the use of commission dollars to pay for research. Based upon its consideration of all these factors, the Board determined that the level of profits realized by the Manager and its affiliates from providing services to each Fund was not excessive in view of the nature, quality and extent of services provided.
ECONOMIES OF SCALE. The Board also considered whether economies of scale are realized by the Manager as the Funds grow larger and the extent to which this is reflected in the level of management fees charged. While recognizing that any precise determination is inherently subjective, the Board noted that based upon the Fund profitability analysis, it appears that as some funds get
148 | Semiannual Report
Franklin Investors Securities Trust
Shareholder Information (continued)
Board Review of Investment Management Agreement (continued)
larger, at some point economies of scale do result in the Manager realizing a larger profit margin on management services provided such a fund. The Board also noted that economies of scale are shared with each Fund and its shareholders through management fee breakpoints so that as a Fund grows in size, its effective management fee rate declines. The management fee structure including a separate fixed administrative fee for each of Franklin Floating Rate Daily Access Fund and Franklin Total Return Fund provides for breakpoints in stages going to the $21.5 billion asset level, which far exceeded the sizes of these Funds, which at year-end were approximately $1.9 billion and $3.2 billion, respectively. The Board believed that to the extent economies of scale may be realized by the Manager of these Funds and its affiliates, that this schedule of fees provided a sharing of benefits with each of these Funds and their shareholders, and noted also that the expenses of Franklin Total Return Fund were partially subsidized by management. The fee structure, including a separate administrative fee, for Franklin Adjustable U.S. Government Securities Fund, provides a management fee of 0.50% on the first $5 billion of assets, with breakpoints continuing at stages thereafter. In discussing such fee, management expressed the view that this initial rate anticipated economies of scale. In support of this position, management pointed to the favorable management fee and expense comparison of this Fund, which had assets of approximately $2.8 billion at year end, with those of its Lipper expense group. The Board believed that to the extent economies of scale may be realized by the Manager and its affiliates, there was a sharing of benefits with this Fund and its shareholders. The Board did not believe the asset size of Franklin Low Duration Total Return Fund, whose expenses were partially subsidized by management, afforded any economies of scale.
Proxy Voting Policies and Procedures
The Trust’s investment manager has established Proxy Voting Policies and Procedures (Policies) that the Trust uses to determine how to vote proxies relating to portfolio securities. Shareholders may view the Trust’s complete Policies online at franklintempleton.com. Alternatively, shareholders may request copies of the Policies free of charge by calling the Proxy Group collect at (954) 527-7678 or by sending a written request to: Franklin Templeton Companies, LLC, 300 S.E. 2nd Street, Fort Lauderdale, FL 33301, Attention: Proxy Group. Copies of the Trust’s proxy voting records are also made available online at franklintempleton.com and posted on the U.S. Securities and Exchange Commission’s website at sec.gov and reflect the most recent 12-month period ended June 30.
Quarterly Statement of Investments
The Trust files a complete statement of investments with the U.S. Securities and Exchange Commission for the first and third quarters for each fiscal year on Form N-Q. Shareholders may view the filed Form N-Q by visiting the Commission’s website at sec.gov. The filed form may also be viewed and copied at the Commission’s Public Reference Room in Washington, DC. Information regarding the operations of the Public Reference Room may be obtained by calling (800) SEC-0330.
Semiannual Report | 149
This page intentionally left blank.
This page intentionally left blank.
This page intentionally left blank.
Item 2. Code of Ethics.
(a) The Registrant has adopted a code of ethics that applies to its principal executive officers and principal financial and accounting officer.
(c) N/A
(d) N/A
(f) Pursuant to Item 12(a)(1), the Registrant is attaching as an exhibit a copy of its code of ethics that applies to its principal executive officers and principal financial and accounting officer.
Item 3. Audit Committee Financial Expert.
(a)(1) The Registrant has an audit committee financial expert serving on its audit committee.
(2) The audit committee financial expert is John B. Wilson and he is "independent" as defined under the relevant Securities and Exchange Commission Rules and Releases.
Item 4. Principal Accountant Fees and Services. N/A
Item 5. Audit Committee f Listed Registrants. N/A
Item 6. Schedule of Investments. N/A
Item 7. Disclosure of Proxy Voting Policies and Procedures for Closed-End Management Investment Companies. N/A
Item 8. Portfolio Managers of Closed-End Management Investment Companies. N/A
Item 9. Purchases of Equity Securities by Closed-End Management Investment Company and Affiliated Purchasers. N/A
Item 10. Submission of Matters to a Vote of Security Holders.
There have been no changes to the procedures by which shareholders may recommend nominees to the Registrant's Board of Trustees that would require disclosure herein.
Item 11. Controls and Procedures.
(a) Evaluation of Disclosure Controls and Procedures. The Registrant maintains disclosure controls and procedures that are designed to ensure that information required to be disclosed in the Registrant’s filings under the Securities Exchange Act of 1934 and the Investment Company Act of 1940 is recorded, processed, summarized and reported within the periods specified in the rules and forms of the Securities and Exchange Commission. Such information is accumulated and communicated to the Registrant’s management, including its principal executive officer and principal financial officer, as appropriate, to allow timely decisions regarding required disclosure. The Registrant’s management, including the principal executive officer and the principal financial officer, recognizes that any set of controls and procedures, no matter how well designed and operated, can provide only reasonable assurance of achieving the desired control objectives.
Within 90 days prior to the filing date of this Shareholder Report on Form N-CSR, the Registrant had carried out an evaluation, under the supervision and with the participation of the Registrant’s management, including the Registrant’s principal executive officer and the Registrant’s principal financial officer, of the effectiveness of the design and operation of the Registrant’s disclosure controls and procedures. Based on such evaluation, the Registrant’s principal executive officer and principal financial officer concluded that the Registrant’s disclosure controls and procedures are effective.
(b) Changes in Internal Controls. There have been no significant changes in the Registrant’s internal controls or in other factors that could significantly affect the internal controls subsequent to the date of their evaluation in connection with the preparation of this Shareholder Report on Form N-CSR.
Item 12. Exhibits.
(a)(1) Code of Ethics
(a)(2) Certifications pursuant to Section 302 of the Sarbanes-Oxley Act of 2002 of Laura F. Fergerson, Chief Executive Officer - Finance and Administration, and Gaston Gardey, Chief Financial Officer and Chief Accounting Officer
(b) Certifications pursuant to Section 906 of the Sarbanes-Oxley Act of 2002 of Laura F. Fergerson, Chief Executive Officer - Finance and Administration, and Gaston Gardey, Chief Financial Officer and Chief Accounting Officer
SIGNATURES
Pursuant to the requirements of the Securities Exchange Act of 1934 and the Investment Company Act of 1940, the registrant has duly caused this report to be signed on its behalf by the undersigned, thereunto duly authorized.
FRANKLIN INVESTORS SECURITIES TRUST
By /s/LAURA F. FERGERSON
Laura F. Fergerson
Chief Executive Officer –
Finance and Administration
Date June 27, 2011
Pursuant to the requirements of the Securities Exchange Act of 1934 and the Investment Company Act of 1940, this report has been signed below by the following persons on behalf of the registrant and in the capacities and on the dates indicated.
By /s/LAURA F. FERGERSON
Laura F. Fergerson
Chief Executive Officer –
Finance and Administration
Date June 27, 2011
By /s/GASTON GARDEY
Gaston Gardey
Chief Financial Officer and
Chief Accounting Officer
Date June 27, 2011