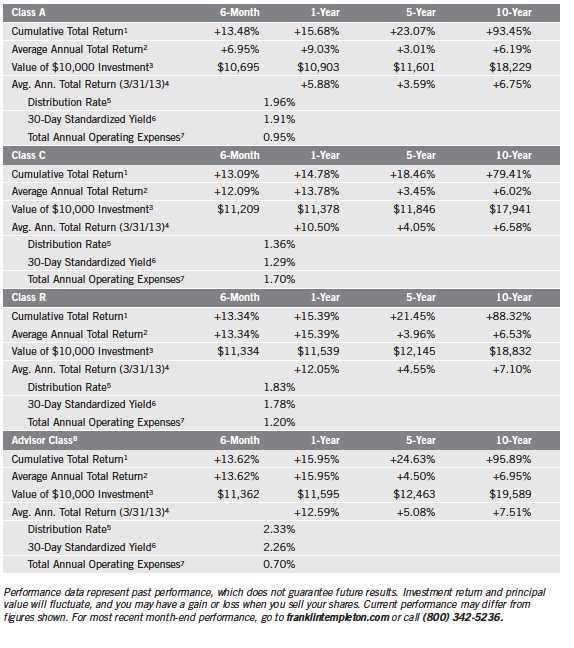
| 1
Semiannual Report
Economic and Market Overview
Modest growth for the U.S. economy, as measured by gross domestic product, characterized the six-month period ended April 30, 2013. Increasing job creation helped the unemployment rate decline during the period, and consumer spending remained strong. In the housing sector, accelerating new and existing homes sales accompanied record-low mortgage rates, affordable housing prices, low new-home inventories and a five-year low in U.S. foreclosures. Orders for manufactured goods and manufacturers’ inventory reached record levels in February and the sector expanded for the fifth consecutive month through period-end.
Businesses and investors awaited the U.S. election that resulted in an unchanged balance of power in Washington, given the re-election of President Obama and respective control of the House and Senate by Republicans and Democrats. Uncertainty surrounding budget deadlines set for the end of 2012 largely abated when an agreement between Congress and the President resolved many issues, including preserving lower income tax rates for most U.S. households. Concerns remained about the effects of the expired payroll tax cut, far-reaching federal spending cuts and future negotiations regarding the federal debt ceiling.
U.S. stocks generated healthy returns as the Standard & Poor’s® 500 Index and Dow Jones Industrial Average reached all-time highs near period-end.1 Rising corporate profits and generally favorable economic data bolstered investor confidence, but some caution surrounded the extent to which positive business and market results were dependent on the Federal Reserve Board’s accommodative monetary policy. The 10-year U.S. Treasury yield declined to 1.70% at period-end from 1.72% on October 31, 2012.
The foregoing information reflects our analysis and opinions as of April 30, 2013. The information is not a complete analysis of every aspect of any market, country, industry, security or fund. Statements of fact are from sources considered reliable
1. STANDARD & POOR’S®, S&P® and S&P 500® are registered trademarks of Standard & Poor’s Financial Services LLC.
Semiannual Report | 3
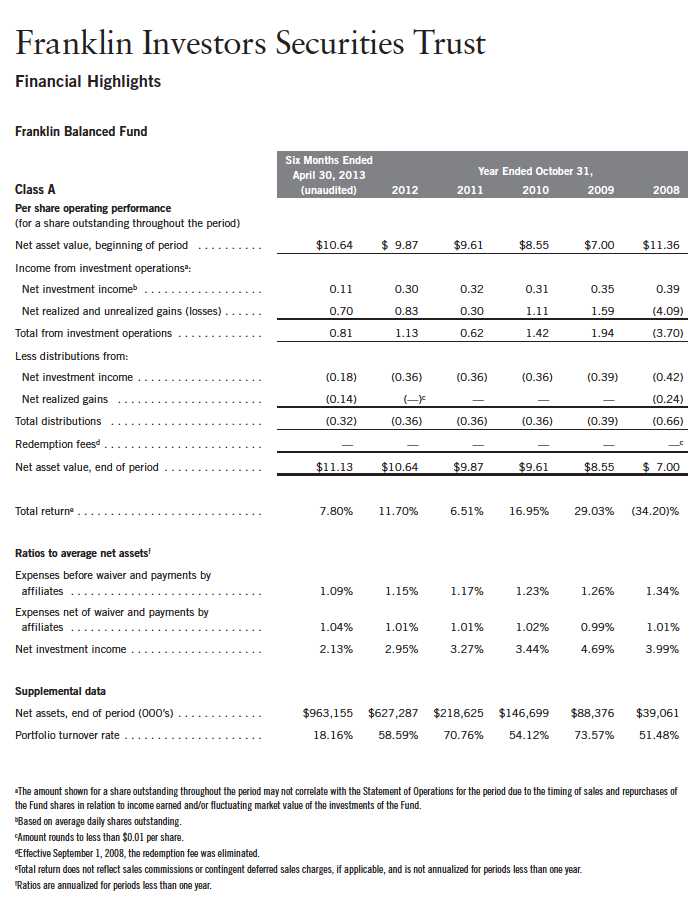
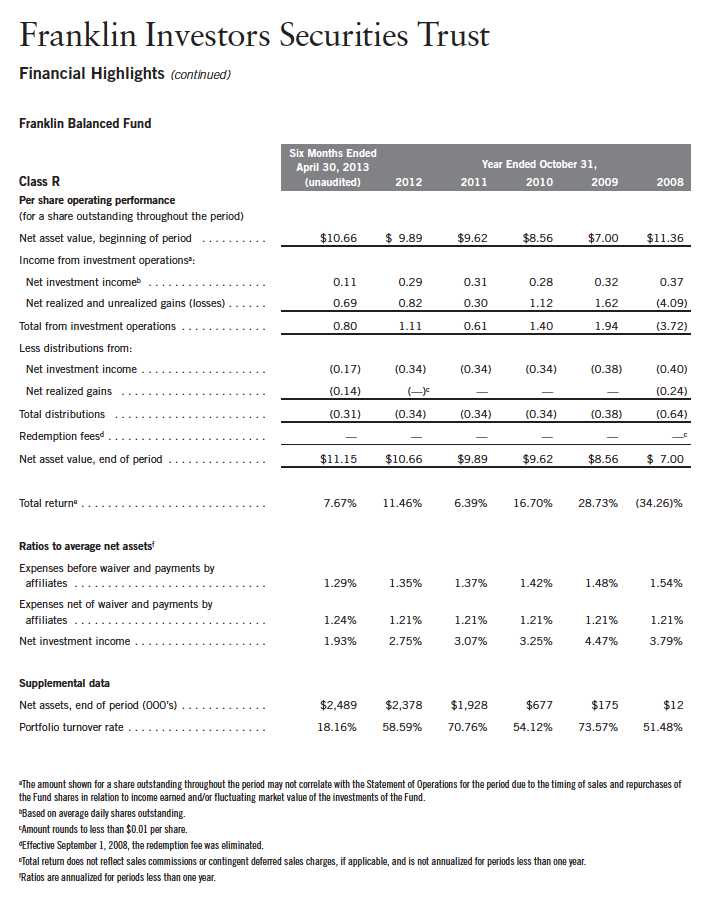
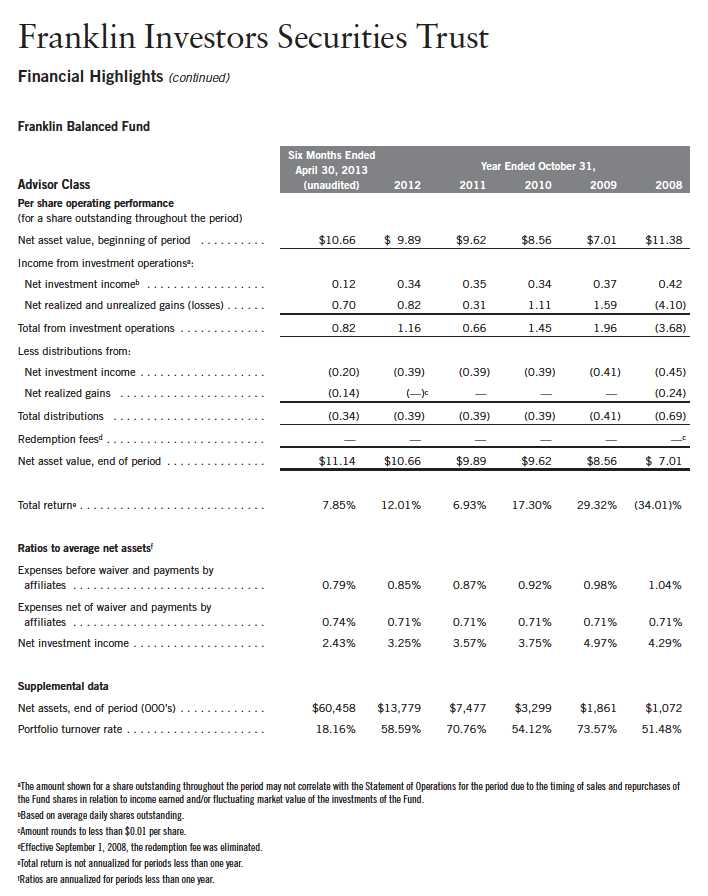
Franklin Balanced Fund
Your Fund’s Goal and Main Investments: Franklin Balanced Fund seeks both income and capital appreciation by investing in a combination of stocks, convertible securities and debt securities. The Fund will normally invest at least 25% of its total assets in equity securities (primarily common and preferred stock) and at least 25% of its total assets in debt securities, including bonds, notes, debentures and money market securities.
Performance data represent past performance, which does not guarantee future results. Investment return and principal value will fluctuate, and you may have a gain or loss when you sell your shares. Current performance may differ from figures shown. Please visit franklintempleton.com or call (800) 342-5236 for most recent month-end performance.
This semiannual report for Franklin Balanced Fund covers the period ended April 30, 2013.
Performance Overview
For the six months under review, Franklin Balanced Fund – Class A delivered a +7.80% cumulative total return. The Fund’s equity benchmark, the Standard & Poor’s 500 Index (S&P 500®), which is a broad measure of U.S. stock performance, posted a +14.42% total return.1 The Fund’s fixed income benchmark, the Barclays U.S. Aggregate Index, which tracks the U.S. investment-grade, taxable bond market, returned +0.90%.1 You can find the Fund’s long-term performance data in the Performance Summary beginning on page 8.
Investment Strategy
We apply a bottom-up approach to investing in individual securities. We will assess the market price of a company’s securities relative to our evaluation of the company’s long-term earnings, asset value and cash flow potential. We also consider a company’s price/earnings ratio, profit margins and liquidation value. In determining an optimal mix of equity and fixed income investments for the Fund, we assess changing economic, market and industry conditions. We may sell securities for a number of possible reasons, including the achievement of certain stock prices or credit spreads, changes in the fundamental outlook or risk/reward profile of a security, less attractive values relative to market peers, or broad economic conditions affecting certain fixed income sectors.
1. Source: © 2013 Morningstar. All Rights Reserved. The information contained herein: (1) is proprietary to Morningstar and/or its content providers; (2) may not be copied or distributed; and (3) is not warranted to be accurate, complete or timely. Neither Morningstar nor its content providers are responsible for any damages or losses arising from any use of this information. The index is unmanaged and includes reinvestment of any income or distributions. One cannot invest directly in an index, and an index is not representative of the Fund’s portfolio.
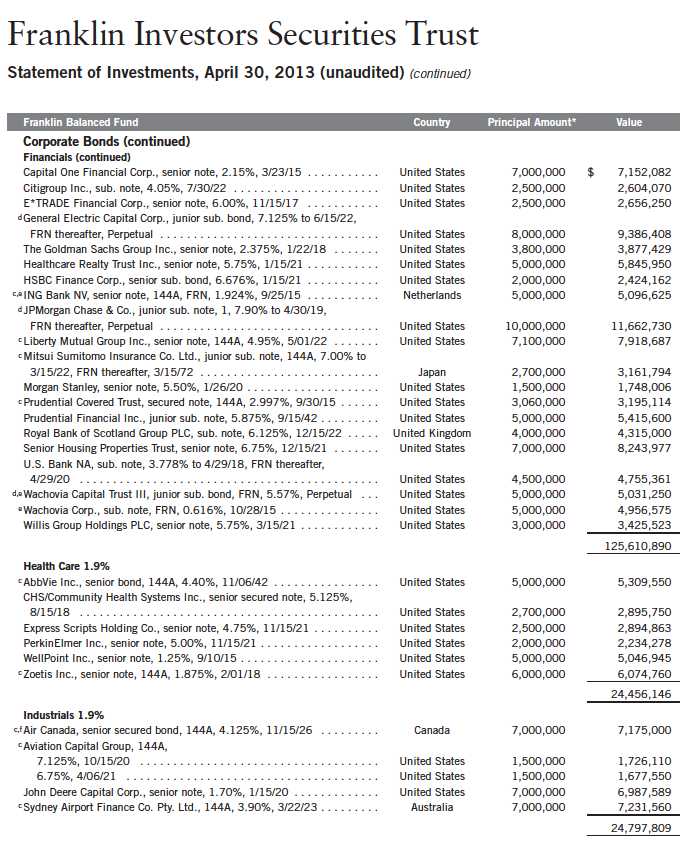
The dollar value, number of shares or principal amount, and names of all portfolio holdings are listed in the Fund’s Statement of Investments (SOI). The SOI begins on page 50.
4 | Semiannual Report
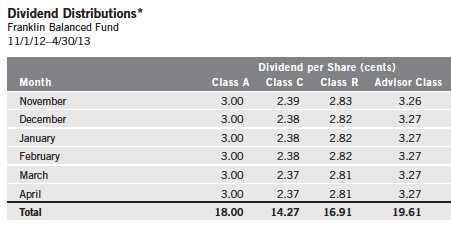
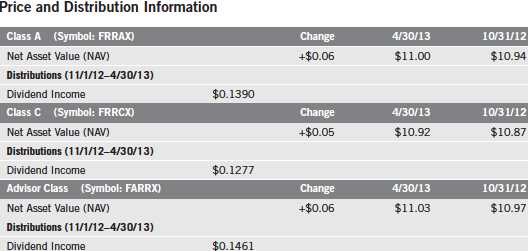
*All Fund distributions will vary depending upon current market conditions, and past distributions are not indicative of future trends.
Manager’s Discussion
During the six months under review, the Fund’s equity and fixed income holdings generally delivered strong performance. Low long-term interest rates and tight corporate credit spreads dampened our enthusiasm for fixed income securities, however, as such securities were less able to provide what we considered to be attractive total returns. In this environment, stocks outperformed fixed income markets and led us to shift our allocation toward equities.
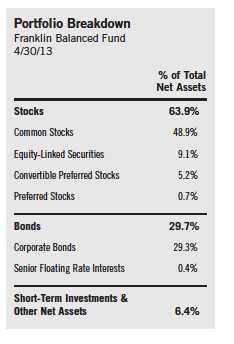
The Fund’s equity exposure increased during the period to 63.9% from 61.6% of total net assets, reflecting our view that relative value swung in favor of equities and away from fixed income securities. The Fund’s total fixed income exposure decreased to 29.7% from 31.1% of total net assets. The Fund’s cash position decreased during the period to 6.4% from 7.3% of total net assets. The Fund’s assets under management increased significantly.
The Fund’s equity sectors remained well diversified, with our largest weightings in energy, materials and industrials at period-end. The industrials, consumer discretionary, utilities and consumer staples sectors were top contributors. In contrast, the materials sector detracted from performance, largely because of investor fears of potential slowdowns in the Chinese and global economies.
Semiannual Report | 5
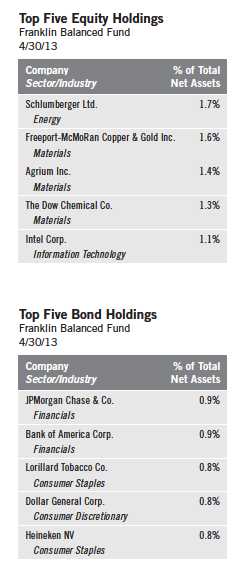
The Fund’s top individual equity contributors were a diverse group of companies with high-quality characteristics including strong balance sheets, name recognition, and dividend yields and dividend growth potential we considered attractive. They included Texas Instruments, NIKE, Boeing, Kellogg and E. I. du Pont de Nemours and Co. In contrast, mining stocks in the materials sector including Barrick Gold, Newmont Mining and AngloGold Ashanti hurt portfolio performance because of falling commodity prices and concerns regarding the industry’s ability to generate better returns on its investments going forward. We maintained our investments in the materials sector as we believed these companies could deliver positive returns over the longer term. The Fund’s positions in Walter Energy and Peabody Energy were hurt by weakening demand for coal during the period.
The Fund’s fixed income sectors generally delivered positive returns, led by energy, banking and basic industry.2 Plains Exploration & Production was a top individual contributor. Our position in the independent oil and gas producer advanced after Freeport-McMoRan Copper & Gold announced it would acquire the company. The Fund’s position in ArcelorMittal (sold by period-end) benefited performance after it took steps to shore up its balance sheet, most notably a sale of common stock and convertible securities that raised a substantial amount of equity. The Fund’s position in Chesapeake Energy performed well following management changes that investors believed could improve the company’s financial discipline and credit rating. In contrast, our position in oil and gas company Apache lost value largely because of a general downturn in the power market.
The portfolio utilized derivatives such as equity options. Equity options are used to hedge against market risk, to earn income, to gain or increase exposure to certain equity securities or segments of the equity markets, or to otherwise enhance Fund returns.
2. Banking holdings are in financials in the SOI. Basic industry holdings are in energy and materials in the SOI.
6 | Semiannual Report
Thank you for your continued participation in Franklin Balanced Fund.
We look forward to serving your future investment needs.

Semiannual Report | 7
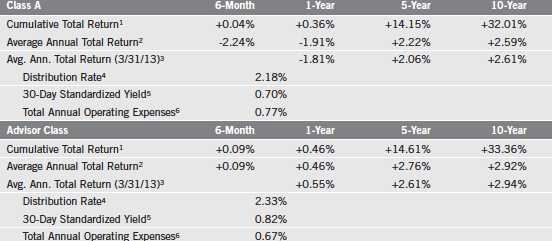
Performance Summary as of 4/30/13
Franklin Balanced Fund
Your dividend income will vary depending on dividends or interest paid by securities in the Fund’s portfolio, adjusted for operating expenses of each class. Capital gain distributions are net profits realized from the sale of portfolio securities. The performance table does not reflect any taxes that a shareholder would pay on Fund dividends, capital gain distributions, if any, or any realized gains on the sale of Fund shares. Total return reflects reinvestment of the Fund’s dividends and capital gain distributions, if any, and any unrealized gains or losses.

8 | Semiannual Report
Performance Summary (continued)
Performance1
Cumulative total return excludes sales charges. Average annual total returns and value of $10,000 investment include maximum sales charges. Class A: 5.75% maximum initial sales charge; Class C: 1% contingent deferred sales charge in first year only; Class R/Advisor Class: no sales charges.

Performance data represent past performance, which does not guarantee future results. Investment return and principal value will fluctuate, and you may have a gain or loss when you sell your shares. Current performance may differ from figures shown. For most recent month-end performance, go to franklintempleton.com or call (800) 342-5236.
Semiannual Report | 9
Performance Summary (continued)
Endnotes
All investments involve risks, including possible loss of principal. The Fund’s share price and yield will be affected by interest rate movements. Bond prices generally move in the opposite direction of interest rates. As prices of bonds in the Fund adjust to a rise in interest rates, the Fund’s share price may decline. Stock prices fluctuate, sometimes rapidly and dramatically, due to factors affecting individual companies, particular industries or sectors, or general market conditions. The Fund is actively managed but there is no guarantee that the manager’s investment decisions will produce the desired results. The Fund’s prospectus also includes a description of the main investment risks.
Class C: These shares have higher annual fees and expenses than Class A shares.
Class R: Shares are available to certain eligible investors as described in the prospectus. These shares have higher annual fees and expenses than Class A shares.
Advisor Class: Shares are available to certain eligible investors as described in the prospectus.
1. Fund investment results reflect past expense reductions, without which the results would have been lower.
2. Cumulative total return represents the change in value of an investment over the periods indicated.
3. Average annual total return represents the average annual change in value of an investment over the periods indicated. Six-month return has not
been annualized.
4. These figures represent the value of a hypothetical $10,000 investment in the Fund over the periods indicated.
5. In accordance with SEC rules, we provide standardized average annual total return information through the latest calendar quarter.
6. Distribution rate is based on an annualization of the respective class’s April dividend and the maximum offering price (NAV for Classes C, R and
Advisor) per share on 4/30/13.
7. The 30-day standardized yield for the 30 days ended 4/30/13 reflects an estimated yield to maturity (assuming all portfolio securities are held to
maturity). It should be regarded as an estimate of the Fund’s rate of investment income, and it may not equal the Fund’s actual income distribution
rate (which reflects the Fund’s past dividends paid to shareholders) or the income reported in the Fund’s financial statements.
8. Figures are as stated in the Fund’s current prospectus. In periods of market volatility, assets may decline significantly, causing total annual Fund
operating expenses to become higher than the figures shown.
10 | Semiannual Report
Your Fund’s Expenses
Franklin Balanced Fund
As a Fund shareholder, you can incur two types of costs:
- Transaction costs, including sales charges (loads) on Fund purchases; and
- Ongoing Fund costs, including management fees, distribution and service (12b-1) fees, and other Fund expenses. All mutual funds have ongoing costs, sometimes referred to as operating expenses.
The following table shows ongoing costs of investing in the Fund and can help you understand these costs and compare them with those of other mutual funds. The table assumes a $1,000 investment held for the six months indicated.
Actual Fund Expenses
The first line (Actual) for each share class listed in the table provides actual account values and expenses. The “Ending Account Value” is derived from the Fund’s actual return, which includes the effect of Fund expenses.
You can estimate the expenses you paid during the period by following these steps. Of course, your account value and expenses will differ from those in this illustration:
| 1. | Divide your account value by $1,000. |
| | If an account had an $8,600 value, then $8,600 ÷ $1,000 = 8.6. |
| 2. | Multiply the result by the number under the heading “Expenses Paid During Period.” |
| | If Expenses Paid During Period were $7.50, then 8.6 x $7.50 = $64.50. |
In this illustration, the estimated expenses paid this period are $64.50.
Hypothetical Example for Comparison with Other Funds
Information in the second line (Hypothetical) for each class in the table can help you compare ongoing costs of investing in the Fund with those of other mutual funds. This information may not be used to estimate the actual ending account balance or expenses you paid during the period. The hypothetical “Ending Account Value” is based on the actual expense ratio for each class and an assumed 5% annual rate of return before expenses, which does not represent the Fund’s actual return. The figure under the heading “Expenses Paid During Period” shows the hypothetical expenses your account would have incurred under this scenario. You can compare this figure with the 5% hypothetical examples that appear in shareholder reports of other funds.
Semiannual Report | 11
Your Fund’s Expenses (continued)
Please note that expenses shown in the table are meant to highlight ongoing costs and do not reflect any transaction costs, such as sales charges. Therefore, the second line for each class is useful in comparing ongoing costs only, and will not help you compare total costs of owning different funds. In addition, if transaction costs were included, your total costs would have been higher. Please refer to the Fund prospectus for additional information on operating expenses.
*Expenses are calculated using the most recent six-month expense ratio, annualized for each class (A: 1.04%; C: 1.74%; R: 1.24%; and Advisor: 0.74%), multiplied by the average account value over the period, multiplied by 181/365 to reflect the one-half year period.
12 | Semiannual Report
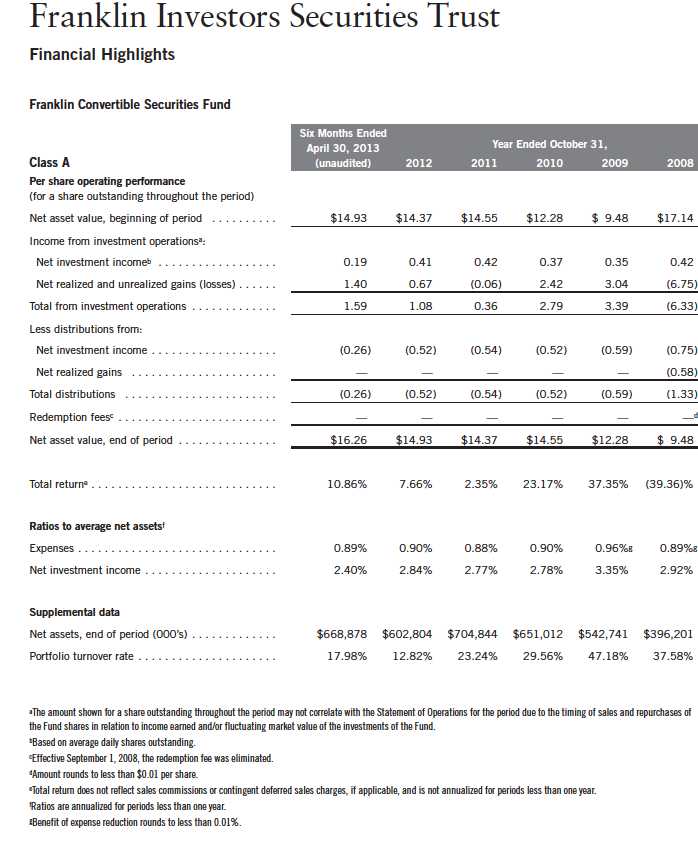
Franklin Convertible Securities Fund
Your Fund’s Goal and Main Investments: Franklin Convertible Securities Fund seeks to maximize total return, consistent with reasonable risk, by seeking to optimize capital appreciation and high current income under varying market conditions and investing at least 80% of its net assets in convertible securities.
Semiannual Report | 13
Investment Strategy
We follow a strategy of maintaining a balance in the portfolio between the equity and debt characteristics of convertible securities with an emphasis on the equity features. Convertible securities are attractive for two reasons: the opportunity to participate in common stocks’ potential growth with relatively reduced volatility, and the potential for current income with potential downside protection from bonds. Typically we sell securities whose equity sensitivity becomes too high and no longer offers appropriate downside protection. Likewise, as securities become too bond-like — reducing their ability to appreciate with increases in the underlying common stock — we attempt to redeploy those assets into more balanced convertible securities and maintain the potential for the Fund’s upside participation. Our experienced team of analysts searches for investment opportunities among all economic sectors and considers a company’s long-term earnings, asset value and cash flow potential, to create a broadly diversified portfolio.
Manager’s Discussion
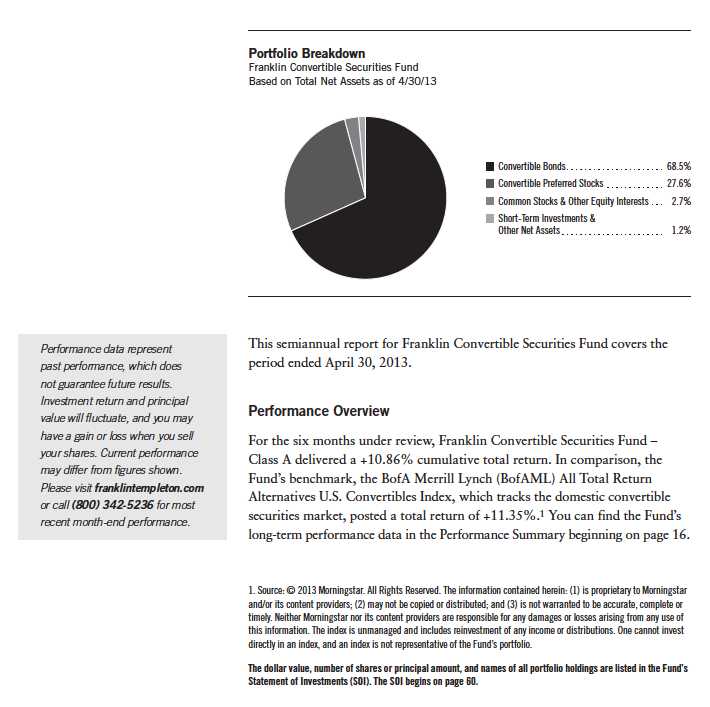
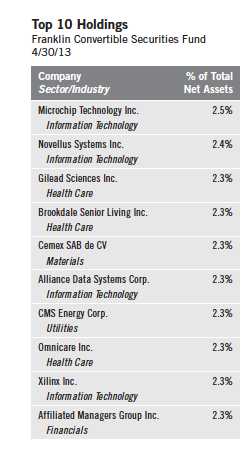
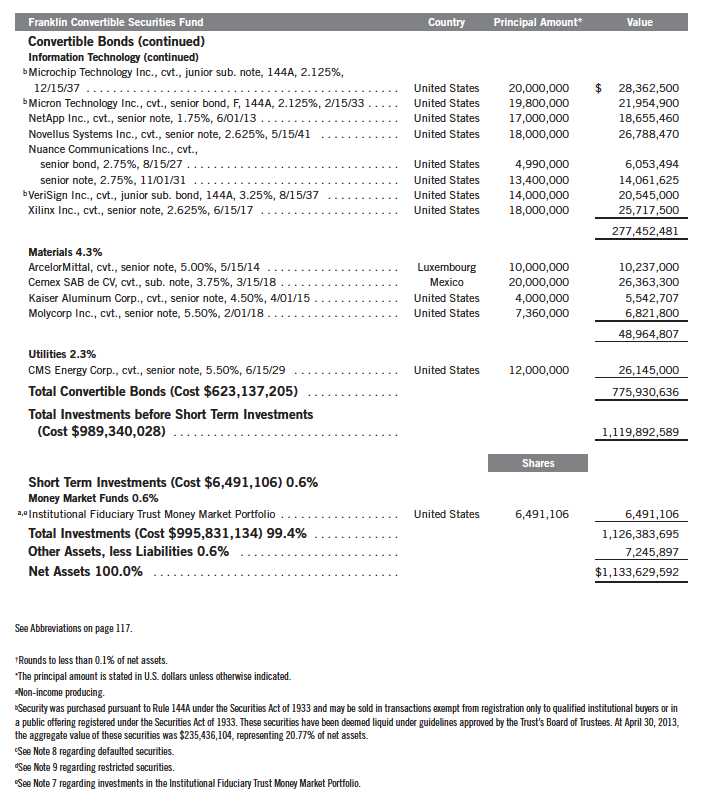
Most sectors the Fund invested in rose in value, supporting overall performance during the six months under review. Investments in the health care, information technology (IT), financials and consumer discretionary sectors accounted for the bulk of the Fund’s total return. Within health care, the Fund’s holdings of biotechnology and pharmaceuticals convertible bonds enjoyed some of the largest gains. Top performers in the sector included Biomarin Pharmaceutical, a maker of innovative drugs, and Gilead Sciences, which specializes in developing antiviral and cardiopulmonary drugs. In IT, semiconductor equipment manufacturer Lam Research (Novellus Systems in the SOI) and Alliance Data Systems, which provides data-driven loyalty marketing solutions, were strong performers. Within financials, investment manager holding company Affiliated Managers Group’s convertible preferred stock was a top contributor. Other standout holdings included convertible bonds of Mexico-based building materials supplier and cement producer Cemex and Michigan-based electric and gas utility CMS Energy.
Despite the Fund’s positive results this reporting period, there were a few disappointments in the portfolio. Our materials and energy holdings detracted from performance as these sectors fell largely out of favor among investors. On an individual security basis, key detractors included convertible preferred stock of AngloGold Ashanti Holdings Finance and Cliffs Natural Resources as well as James River Coal convertible bonds.
14 | Semiannual Report
Thank you for your continued participation in Franklin Convertible Securities Fund. We look forward to serving your future investment needs.

Semiannual Report | 15
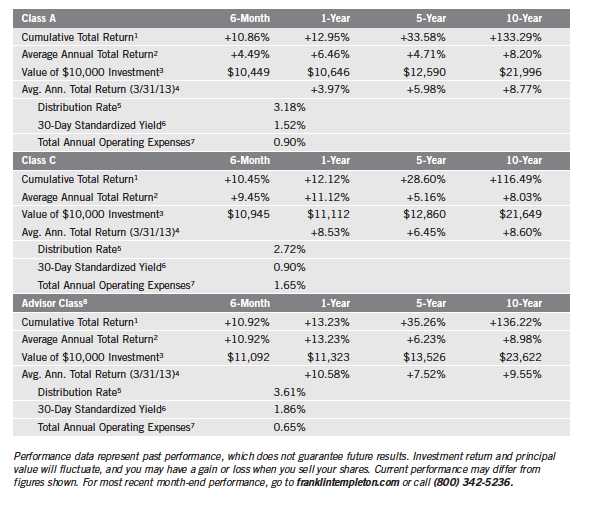
Performance Summary as of 4/30/13
Franklin Convertible Securities Fund
Your dividend income will vary depending on dividends or interest paid by securities in the Fund’s portfolio, adjusted for operating expenses of each class. Capital gain distributions are net profits realized from the sale of portfolio securities. The performance table does not reflect any taxes that a shareholder would pay on Fund dividends, capital gain distributions, if any, or any realized gains on the sale of Fund shares. Total return reflects reinvestment of the Fund’s dividends and capital gain distributions, if any, and any unrealized gains or losses.

16 | Semiannual Report
Performance Summary (continued)
Performance
Cumulative total return excludes sales charges. Average annual total returns and value of $10,000 investment include maximum sales charges. Class A: 5.75% maximum initial sales charge; Class C: 1% contingent deferred sales charge in first year only; Advisor Class: no sales charges.
Semiannual Report | 17
Performance Summary (continued)
Endnotes
All investments involve risks, including possible loss of principal. The Fund may invest in high yielding, fixed income securities. High yields reflect the higher credit risk associated with these lower rated securities and, in some cases, the lower market prices for these instruments. Interest rate movements may affect the Fund’s share price and yield. Bond prices generally move in the opposite direction of interest rates. As prices of bonds in the Fund adjust to a rise in interest rates, the Fund’s share price may decline. The Fund may also invest in foreign securities, which involve special risks, including political uncertainty and currency volatility. The Fund is actively managed but there is no guarantee that the manager’s investment decisions will produce the desired results. The Fund’s prospectus also includes a description of the main investment risks.
Class C: Prior to 1/1/04, these shares were offered with an initial sales charge; thus actual total returns would have differed. These shares have higher annual fees and expenses than Class A shares.
Advisor Class: Shares are available to certain eligible investors as described in the prospectus.
1. Cumulative total return represents the change in value of an investment over the periods indicated.
2. Average annual total return represents the average annual change in value of an investment over the periods indicated. Six-month return has not
been annualized.
3. These figures represent the value of a hypothetical $10,000 investment in the Fund over the periods indicated.
4. In accordance with SEC rules, we provide standardized average annual total return information through the latest calendar quarter.
5. Distribution rate is based on the sum of the respective class’s last four quarterly dividends and the maximum offering price (NAV for Classes C
and Advisor) per share on 4/30/13.
6. The 30-day standardized yield for the 30 days ended 4/30/13 reflects an estimated yield to maturity (assuming all portfolio securities are held to
maturity). It should be regarded as an estimate of the Fund’s rate of investment income, and it may not equal the Fund’s actual income distribution
rate (which reflects the Fund’s past dividends paid to shareholders) or the income reported in the Fund’s financial statements.
7. Figures are as stated in the Fund’s current prospectus. In periods of market volatility, assets may decline significantly, causing total annual Fund
operating expenses to become higher than the figures shown.
8. Effective 5/15/08, the Fund began offering Advisor Class shares, which do not have sales charges or a Rule 12b-1 plan. Performance quotations
for this class reflect the following methods of calculation: (a) For periods prior to 5/15/08, a restated figure is used based upon the Fund’s Class A
performance, excluding the effect of Class A’s maximum initial sales charge, but reflecting the effect of the Class A Rule 12b-1 fees; and (b) for peri-
ods after 5/15/08, actual Advisor Class performance is used reflecting all charges and fees applicable to that class. Since 5/15/08 (commencement
of sales), the cumulative and average annual total returns of Advisor Class shares were +31.80% and +5.73%.
18 | Semiannual Report
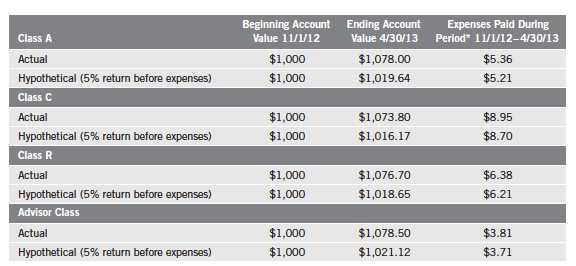
Your Fund’s Expenses
Franklin Convertible Securities Fund
As a Fund shareholder, you can incur two types of costs:
- Transaction costs, including sales charges (loads) on Fund purchases; and
- Ongoing Fund costs, including management fees, distribution and service (12b-1) fees, and other Fund expenses. All mutual funds have ongoing costs, sometimes referred to as operating expenses.
The following table shows ongoing costs of investing in the Fund and can help you understand these costs and compare them with those of other mutual funds. The table assumes a $1,000 investment held for the six months indicated.
Actual Fund Expenses
The first line (Actual) for each share class listed in the table provides actual account values and expenses. The “Ending Account Value” is derived from the Fund’s actual return, which includes the effect of Fund expenses.
You can estimate the expenses you paid during the period by following these steps. Of course, your account value and expenses will differ from those in this illustration:
| 1. | Divide your account value by $1,000. |
| | If an account had an $8,600 value, then $8,600 ÷ $1,000 = 8.6. |
| 2. | Multiply the result by the number under the heading “Expenses Paid During Period.” |
| | If Expenses Paid During Period were $7.50, then 8.6 x $7.50 = $64.50. |
In this illustration, the estimated expenses paid this period are $64.50.
Hypothetical Example for Comparison with Other Funds
Information in the second line (Hypothetical) for each class in the table can help you compare ongoing costs of investing in the Fund with those of other mutual funds. This information may not be used to estimate the actual ending account balance or expenses you paid during the period. The hypothetical “Ending Account Value” is based on the actual expense ratio for each class and an assumed 5% annual rate of return before expenses, which does not represent the Fund’s actual return. The figure under the heading “Expenses Paid During Period” shows the hypothetical expenses your account would have incurred under this scenario. You can compare this figure with the 5% hypothetical examples that appear in shareholder reports of other funds.
Semiannual Report | 19
Your Fund’s Expenses (continued)
Please note that expenses shown in the table are meant to highlight ongoing costs and do not reflect any transaction costs, such as sales charges. Therefore, the second line for each class is useful in comparing ongoing costs only, and will not help you compare total costs of owning different funds. In addition, if transaction costs were included, your total costs would have been higher. Please refer to the Fund prospectus for additional information on operating expenses.

*Expenses are calculated using the most recent six-month expense ratio, annualized for each class (A: 0.89%; C: 1.64%; and Advisor: 0.64%), multiplied by the average account value over the period, multiplied by 181/365 to reflect the one-half year period.
20 | Semiannual Report
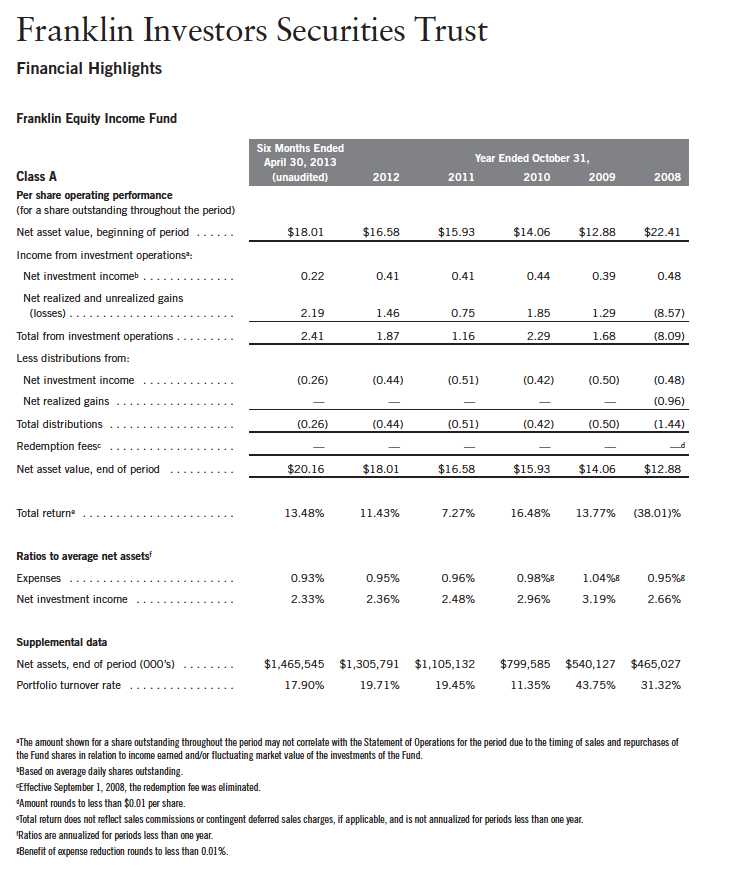
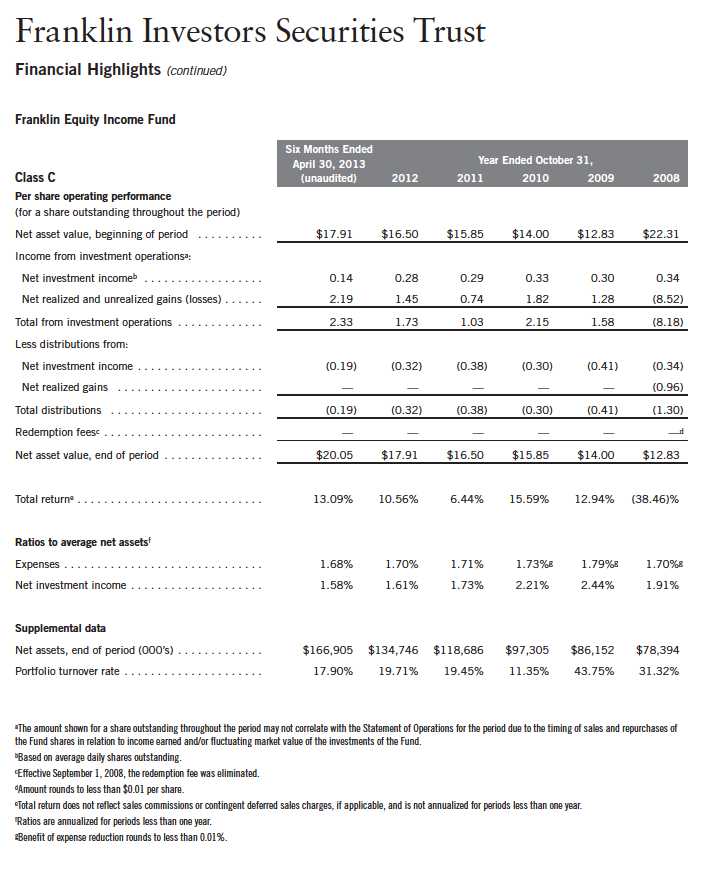
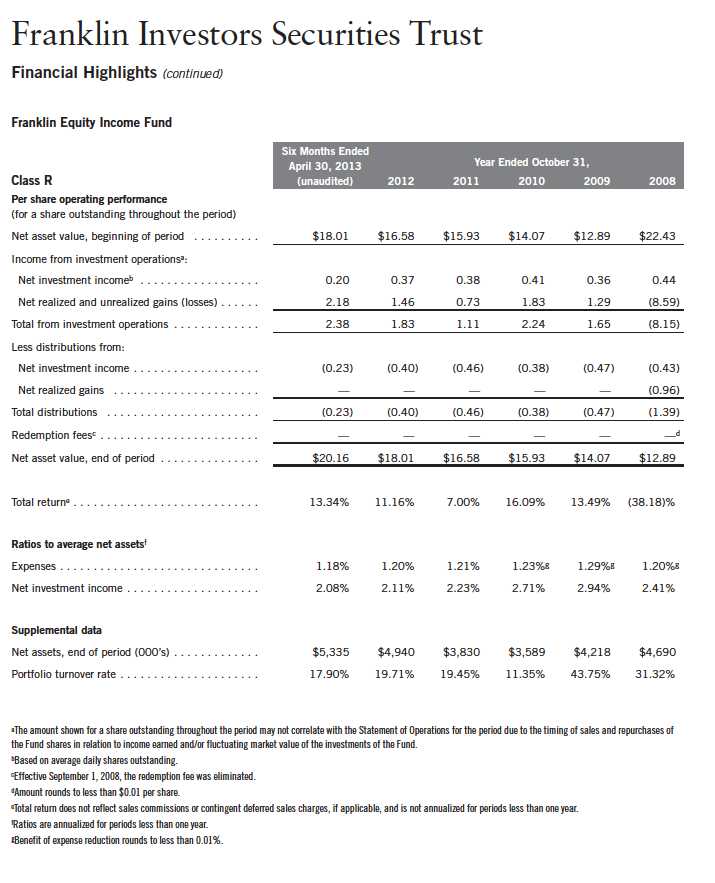
Franklin Equity Income Fund
Your Fund’s Goal and Main Investments: Franklin Equity Income Fund seeks to maximize total return, emphasizing high current income and long-term capital appreciation, consistent with reasonable risk, by investing at least 80% of its net assets in equity securities including securities convertible into common stocks.
Performance data represent past performance, which does not guarantee future results. Investment return and principal value will fluctuate, and you may have a gain or loss when you sell your shares. Current performance may differ from figures shown. Please visit franklintempleton.com or call (800) 342-5236 for most recent month-end performance.
This semiannual report for Franklin Equity Income Fund covers the period ended April 30, 2013.
Performance Overview
For the six months under review, Franklin Equity Income Fund – Class A delivered a +13.48% cumulative total return. In comparison, the Fund’s benchmark, the Standard & Poor’s 500 Index (S&P 500), which tracks the broad U.S. stock market, generated a +14.42% total return.1 The Fund’s peers, as measured by the Lipper Equity Income Funds Classification Average, which consists of funds chosen by Lipper that seek relatively high current income and growth of income by investing at least 60% of their portfolios in stocks, posted a +14.08% total return.2 You can find the Fund’s long-term performance data in the Performance Summary beginning on page 24.
Investment Strategy
We seek to invest in a broadly diversified portfolio of equity securities that we consider to be financially strong, with a focus on “blue chip” companies. We apply a bottom-up approach to investing in individual securities. We will assess the market price of a company’s securities relative to our evaluation of the company’s long-term earnings, asset value and cash flow potential. We also consider a company’s price/earnings ratio, profit margins, balance sheet and liquidation value. We consider dividend yield in selecting stocks for the Fund because we
1. Source: © 2013 Morningstar. All Rights Reserved. The information contained herein: (1) is proprietary to Morningstar and/or its content providers; (2) may not be copied or distributed; and (3) is not warranted to be accurate, complete or timely. Neither Morningstar nor its content providers are responsible for any damages or losses arising from any use of this information.
2. Source: Lipper Inc. For the six-month period ended 4/30/13, this category consisted of 374 funds. Lipper calculations do not include sales charges, or expense subsidization by a fund’s manager. The Fund’s performance relative to the average may have differed if these and other factors had been considered.
The indexes are unmanaged and include reinvested dividends. One cannot invest directly in an index, and an index is not representative of the Fund’s portfolio.
The dollar value, number of shares or principal amount, and names of all portfolio holdings are listed in the Fund’s Statement of Investments (SOI). The SOI begins on page 67.
Semiannual Report | 21


* All Fund distributions will vary depending upon current market conditions, and past distributions are not indicative of future trends.
** Includes an additional 4.63 cent per share distribution to meet excise tax requirements.
believe that, over time, dividend income can contribute significantly to total return and can be a more consistent source of investment return than capital appreciation. We seek to take advantage of price dislocations that result from the market’s short-term focus and choose to invest in those companies that, in our opinion, offer the best trade-off between growth opportunity, business and financial risk, and valuation.
Manager’s Discussion
Nearly every sector the Fund invested in rose in value, as did most of the portfolio’s individual securities, supporting overall performance during the six months under review. Key contributing sectors included financials, industrials, consumer discretionary and consumer staples. Many of the Fund’s positions in capital markets, diversified financial services and insurance companies such as BlackRock, JPMorgan Chase, Bank of America and Aflac were strong performers. Among industrials, leading performers included aerospace firm Boeing, conglomerates Honeywell International and 3M (sold by period-end), and waste management company Republic Services. In consumer discretionary, athletic equipment and apparel manufacturer NIKE and restaurant chain McDonald’s led results. In the consumer staples sector, food products company Kellogg and beverage firm PepsiCo were key contributors.
Despite the Fund’s positive results this reporting period, there were a few disappointments in the portfolio. Our materials sector holdings detracted from performance as prices of several commodities fell during the period. On an individual security basis, key detractors included positions in mining firms,
22 | Semiannual Report
such as AngloGold Ashanti Holdings Finance convertible preferred stock and a Freeport-McMoRan Copper & Gold equity-linked security. An Apple equity-linked security further hurt Fund performance.
Thank you for your continued participation in Franklin Equity Income Fund.
We look forward to serving your future investment needs.


Semiannual Report | 23
Performance Summary as of 4/30/13
Franklin Equity Income Fund
Your dividend income will vary depending on dividends or interest paid by securities in the Fund’s portfolio, adjusted for operating expenses of each class. Capital gain distributions are net profits realized from the sale of portfolio securities. The performance table does not reflect any taxes that a shareholder would pay on Fund dividends, capital gain distributions, if any, or any realized gains on the sale of Fund shares. Total return reflects reinvestment of the Fund’s dividends and capital gain distributions, if any, and any unrealized gains or losses.

24 | Semiannual Report
Performance Summary (continued)
Performance
Cumulative total return excludes sales charges. Average annual total returns and value of $10,000 investment include maximum sales charges. Class A: 5.75% maximum initial sales charge; Class C: 1% contingent deferred sales charge in first year only; Class R/Advisor Class: no sales charges.
Semiannual Report | 25
Performance Summary (continued)
Endnotes
All investments involve risks, including possible loss of principal. Stock prices fluctuate, sometimes rapidly and dramatically, due to factors affecting individual companies, particular industries or sectors, or general market conditions. The Fund’s investment in foreign securities also involves special risks, including currency fluctuations and economic as well as political uncertainty. The Fund is actively managed but there is no guarantee that the manager’s investment decisions will produce the desired results. The Fund’s prospectus also includes a description of the main investment risks.
Class C: Prior to 1/1/04, these shares were offered with an initial sales charge; thus actual total returns would have differed. These shares have higher annual fees and expenses than Class A shares.
Class R: Shares are available to certain eligible investors as described in the prospectus. These shares have higher annual fees and expenses than Class A shares.
Advisor Class: Shares are available to certain eligible investors as described in the prospectus.
1. Cumulative total return represents the change in value of an investment over the periods indicated.
2. Average annual total return represents the average annual change in value of an investment over the periods indicated. Six-month return has not
been annualized.
3. These figures represent the value of a hypothetical $10,000 investment in the Fund over the periods indicated.
4. In accordance with SEC rules, we provide standardized average annual total return information through the latest calendar quarter.
5. Distribution rate is based on an annualization of the respective class’s April dividend and the maximum offering price (NAV for Classes C, R and
Advisor) per share on 4/30/13.
6. The 30-day standardized yield for the 30 days ended 4/30/13 reflects an estimated yield to maturity (assuming all portfolio securities are held to
maturity). It should be regarded as an estimate of the Fund’s rate of investment income, and it may not equal the Fund’s actual income distribution
rate (which reflects the Fund’s past dividends paid to shareholders) or the income reported in the Fund’s financial statements.
7. Figures are as stated in the Fund’s current prospectus. In periods of market volatility, assets may decline significantly, causing total annual Fund
operating expenses to become higher than the figures shown.
8. Effective 5/15/08, the Fund began offering Advisor Class shares, which do not have sales charges or a Rule 12b-1 plan. Performance quotations
for this class reflect the following methods of calculation: (a) For periods prior to 5/15/08, a restated figure is used based upon the Fund’s Class A
performance, excluding the effect of Class A’s maximum initial sales charge, but reflecting the effect of the Class A Rule 12b-1 fees; and (b) for peri-
ods after 5/15/08, actual Advisor Class performance is used reflecting all charges and fees applicable to that class. Since 5/15/08 (commencement
of sales), the cumulative and average annual total returns of Advisor Class shares were +21.04% and +3.93%.
26 | Semiannual Report
Your Fund’s Expenses
Franklin Equity Income Fund
As a Fund shareholder, you can incur two types of costs:
- Transaction costs, including sales charges (loads) on Fund purchases; and
- Ongoing Fund costs, including management fees, distribution and service (12b-1) fees, and other Fund expenses. All mutual funds have ongoing costs, sometimes referred to as operating expenses.
The following table shows ongoing costs of investing in the Fund and can help you understand these costs and compare them with those of other mutual funds. The table assumes a $1,000 investment held for the six months indicated.
Actual Fund Expenses
The first line (Actual) for each share class listed in the table provides actual account values and expenses. The “Ending Account Value” is derived from the Fund’s actual return, which includes the effect of Fund expenses.
You can estimate the expenses you paid during the period by following these steps. Of course, your account value and expenses will differ from those in this illustration:
| 1. | Divide your account value by $1,000. |
| | If an account had an $8,600 value, then $8,600 ÷ $1,000 = 8.6. |
| 2. | Multiply the result by the number under the heading “Expenses Paid During Period.” |
| | If Expenses Paid During Period were $7.50, then 8.6 x $7.50 = $64.50. |
In this illustration, the estimated expenses paid this period are $64.50.
Hypothetical Example for Comparison with Other Funds
Information in the second line (Hypothetical) for each class in the table can help you compare ongoing costs of investing in the Fund with those of other mutual funds. This information may not be used to estimate the actual ending account balance or expenses you paid during the period. The hypothetical “Ending Account Value” is based on the actual expense ratio for each class and an assumed 5% annual rate of return before expenses, which does not represent the Fund’s actual return. The figure under the heading “Expenses Paid During Period” shows the hypothetical expenses your account would have incurred under this scenario. You can compare this figure with the 5% hypothetical examples that appear in shareholder reports of other funds.
Semiannual Report | 27
Your Fund’s Expenses (continued)
Please note that expenses shown in the table are meant to highlight ongoing costs and do not reflect any transaction costs, such as sales charges. Therefore, the second line for each class is useful in comparing ongoing costs only, and will not help you compare total costs of owning different funds. In addition, if transaction costs were included, your total costs would have been higher. Please refer to the Fund prospectus for additional information on operating expenses.
28 | Semiannual Report
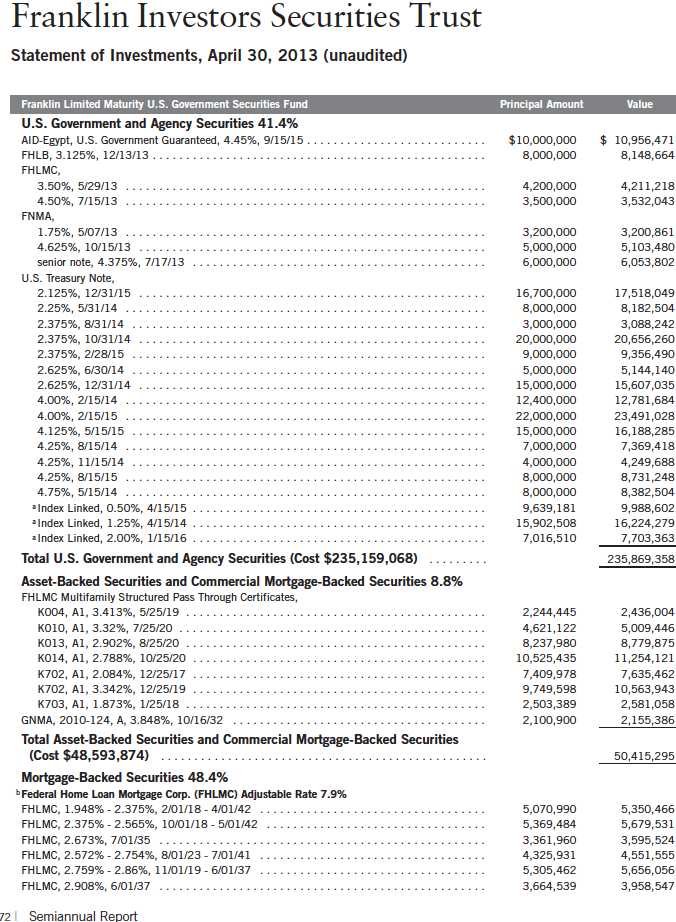
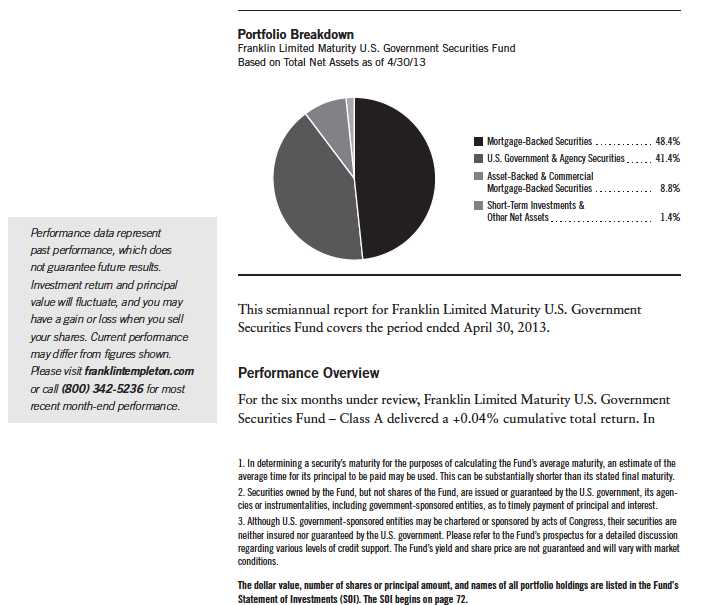
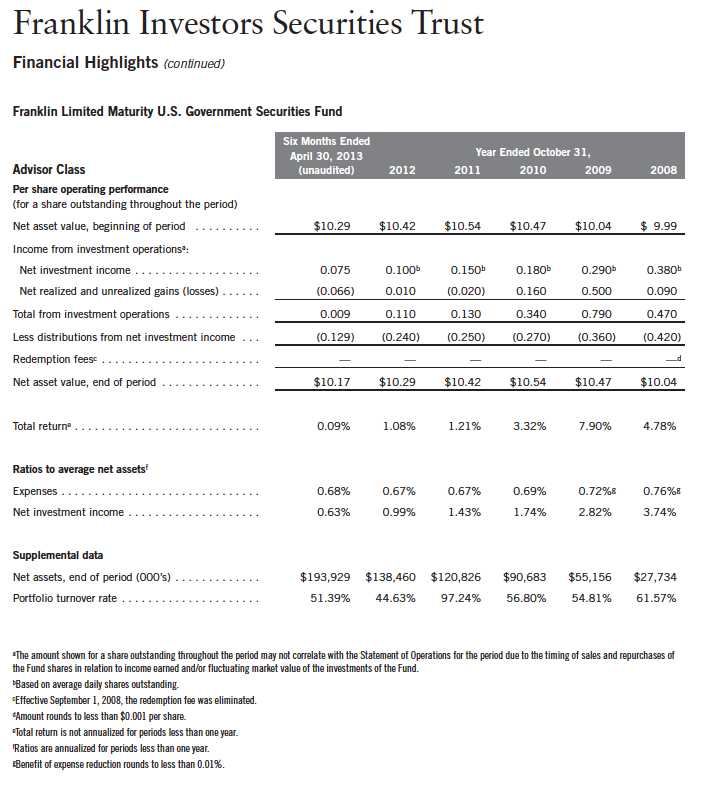
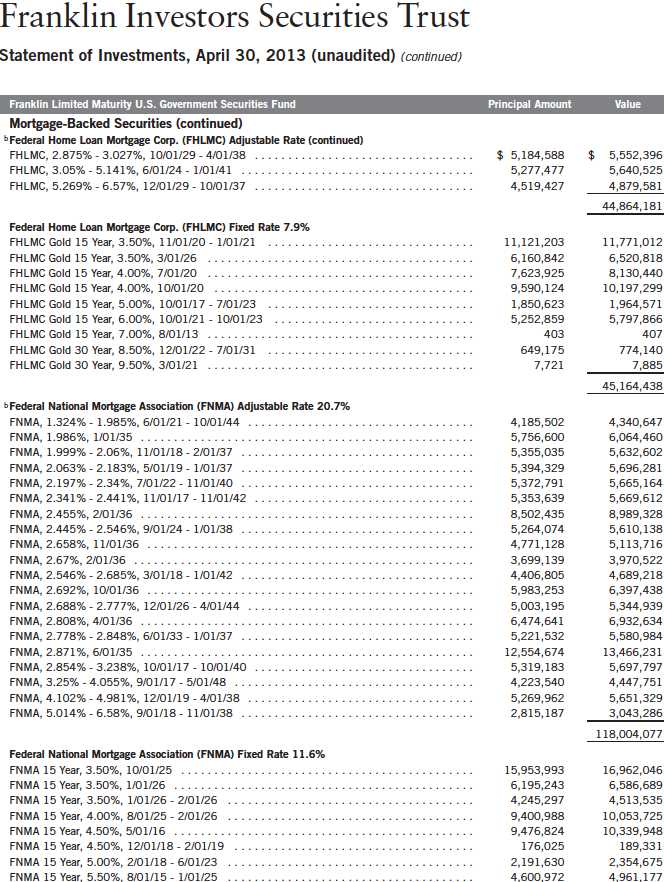
Franklin Limited Maturity U.S. Government Securities Fund
Your Fund’s Goal and Main Investments: Franklin Limited Maturity U.S. Government Securities Fund seeks to provide investors with as high a level of current income as is consistent with prudent investing, while seeking to preserve shareholders’ capital, by investing at least 80% of its net assets in securities with a dollar-weighted average maturity of less than 10 years1 and issued or guaranteed by the U.S. government, its agencies or instrumentalities.2 Some of the Fund’s investments may include securities issued or guaranteed by U.S. government-sponsored entities such as Fannie Mae and Freddie Mac.3
Semiannual Report | 29
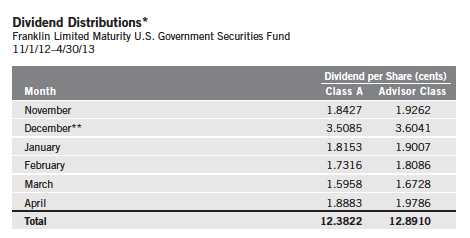
*Assumes shares were purchased and held for the entire accrual period. Since dividends accrue daily, your actual dis-
tributions will vary depending on the date you purchased your shares and any account activity. All Fund distributions
will vary depending upon current market conditions, and past distributions are not indicative of future trends.
**Includes distributions of 1.62 and 1.63 cents per share for Classes A and Advisor, which represent the remaining
undistributed net investment income at the time the Fund converted to a variable-pay dividend.
comparison, the Fund’s primary benchmark, the Barclays U.S. Treasury Index: 1-5 Year Component, which tracks U.S. Treasury securities with one to five years remaining maturity, posted a +0.54% total return.4 Also for comparison, the Fund’s secondary benchmark, the Barclays U.S. Treasury Index: 1-3 Year Component, which tracks U.S. Treasury securities with one to three years remaining maturity, returned +0.35%.4 You can find the Fund’s long-term performance data in the Performance Summary beginning on page 33.
Investment Strategy
We currently maintain the portfolio’s average dollar-weighted maturity between one and five years. The Fund’s average dollar-weighted maturity will vary with market conditions and the outlook for interest rates. We invest primarily in short- to intermediate-term securities issued or guaranteed by the U.S. government, its agencies and instrumentalities.2 Some of the Fund’s investments may include securities issued by U.S. government-sponsored entities, such as Fannie Mae (FNMA) and Freddie Mac (FHLMC).3 The Fund’s portfolio emphasizes mortgage-backed bonds and agency debentures, while also diversifying across components of the U.S. Treasury sector. We analyze securities using proprietary and nonproprietary research to help identify attractive investment opportunities.
4. Source: © 2013 Morningstar. All Rights Reserved. The information contained herein: (1) is proprietary to Morningstar and/or its content providers; (2) may not be copied or distributed; and (3) is not warranted to be accurate, complete or timely. Neither Morningstar nor its content providers are responsible for any damages or losses arising from any use of this information. The index is unmanaged and includes reinvestment of any income or distributions. One cannot invest directly in an index, and an index is not representative of the Fund’s portfolio.
30 | Semiannual Report
Manager’s Discussion
During the period, U.S. economic data releases initially showed a nascent but firming trend. Later economic releases, however, reflected a more moderate, yet still positive, pace of growth. In this environment, U.S. consumers remained fairly strong, although declines in consumer spending suggested that income tax increases took a heavier toll on consumer sentiment than initially indicated. Overall, the labor market remained solid, even though some employment measures missed expectations. The unemployment rate declined from 7.9% to 7.5%, but this slight decline was largely a result of a lower participation rate.5 The U.S. housing market continued to show a gradual but persistent improvement trend. Overall, economic data during the period did not suggest any increased risk that the U.S. Federal Reserve Board (Fed) would exit its quantitative easing policy early.
A Federal Open Market Committee meeting held near period-end did not result in changes to the Fed’s current accommodative monetary policy. The Fed used a cautious tone and acknowledged strains in global financial markets but expected growth to remain moderate and gradually improve over the coming quarters. This expectation was based on improving labor market conditions and housing market gains, although the Fed noted the housing sector remained depressed. We believe short-term rates could remain low until the U.S. economy shows significant upward momentum and threats of systematic risk abate. The Fed continued to provide support to the mortgage sector, as prepayment risk remained heightened with the market priced at a premium and mortgage rates near historical lows. With its purchases and reinvestments totaling about $85 billion a month, the Fed remained the largest source of demand for the market. However, potential risks to the sector exist if the Fed eventually tapers or ends its asset purchase program, which could negatively affect mortgage sector spreads.
As measured by Barclays indexes, most fixed income sectors posted positive total returns during the period, including U.S. Treasury Inflation Protected Securities (TIPS), U.S. agency securities, Ginnie Maes (GNMAs), U.S. agency fixed rate mortgage-backed securities (MBS) and hybrid adjustable-rate mortgage securities (ARMs).
The Fund invested in U.S. Treasuries, including TIPS, agency debentures, agency mortgage pass-through securities, other U.S. government related bonds and cash investments. We looked for what we viewed as attractive valuations within lower interest rate risk government bond markets.
5. Source: Bureau of Labor Statistics.
Semiannual Report | 31
The broad sectors in which we invested had mixed performance versus comparable maturity Treasuries. As a sector, agency ARMs outperformed comparable maturity Treasuries and contributed to relative and absolute performance. Our TIPS allocation was a slight drag on performance versus the benchmark. Our fixed rate and multi-family agency MBS detracted slightly from returns. The Fund’s defensive position against interest rate risk also detracted from returns during the period.
Residential agency mortgages were one of the Fund’s largest sector allocations because of their return potential and income advantage over Treasuries. We added exposure to the adjustable and fixed-rate portions of the sector over the period. We decreased exposure to agency debentures as they had become more fully valued in our assessment. Our exposure to multi-family agency mortgages declined marginally during the period.
Thank you for your continued participation in Franklin Limited Maturity U.S. Government Securities Fund. We look forward to serving your future investment needs.

Portfolio Management Team
Franklin Limited Maturity
U.S. Government Securities Fund
The foregoing information reflects our analysis, opinions and portfolio holdings as of April 30, 2013, the end of the reporting period. The way we implement our main investment strategies and the resulting portfolio holdings may change depending on factors such as market and economic conditions. These opinions may not be relied upon as investment advice or an offer for a particular security. The information is not a complete analysis of every aspect of any market, country, industry, security or the Fund. Statements of fact are from sources considered reliable, but the investment manager makes no representation or warranty as to their completeness or accuracy. Although historical performance is no guarantee of future results, these insights may help you understand our investment management philosophy.
32 | Semiannual Report
Performance Summary as of 4/30/13
Franklin Limited Maturity U.S. Government Securities Fund
Your dividend income will vary depending on dividends or interest paid by securities in the Fund’s portfolio, adjusted for operating expenses of each class. Capital gain distributions are net profits realized from the sale of portfolio securities. The performance table does not reflect any taxes that a shareholder would pay on Fund dividends, capital gain distributions, if any, or any realized gains on the sale of Fund shares. Total return reflects reinvestment of the Fund’s dividends and capital gain distributions, if any, and any unrealized gains or losses.

Performance
Cumulative total return excludes sales charges. Average annual total returns include maximum sales charges. Class A: 2.25% maximum initial sales charge; Advisor Class: no sales charges.
Performance data represent past performance, which does not guarantee future results. Investment return and principal value will fluctuate, and you may have a gain or loss when you sell your shares. Current performance may differ from figures shown. For most recent month-end performance, go to franklintempleton.com or call (800) 342-5236.
Semiannual Report | 33
Performance Summary (continued)
Endnotes
All investments involve risks, including possible loss of principal. Interest rate movements, unscheduled mortgage prepayments and other risk factors will affect the Fund’s share price and yield. Bond prices, and thus a fund’s share price, generally move in the opposite direction of interest rates. Therefore, as prices of bonds in the Fund adjust to a rise in interest rates, the Fund’s share price may decline. Changes in the financial strength of a bond issuer or in a bond’s credit rating may affect its value. The Fund is actively managed but there is no guarantee that the manager’s investment decisions will produce the desired results. The Fund’s prospectus also includes a description of the main investment risks.
Advisor Class: Shares are available to certain eligible investors as described in the prospectus.
1. Cumulative total return represents the change in value of an investment over the periods indicated.
2. Average annual total return represents the average annual change in value of an investment over the periods indicated. Six-month return has not been annualized.
3. In accordance with SEC rules, we provide standardized average annual total return information through the latest calendar quarter.
4. Distribution rate is based on an annualization of the respective class’s April dividend and the maximum offering price (NAV for Advisor Class) per share on 4/30/13.
5. The 30-day standardized yield for the 30 days ended 4/30/13 reflects an estimated yield to maturity (assuming all portfolio securities are held to maturity). It should be regarded as an estimate of the Fund’s rate of investment income, and it may not equal the Fund’s actual income distribution rate (which reflects the Fund’s past dividends paid to shareholders) or the income reported in the Fund’s financial statements.
6. Figures are as stated in the Fund’s current prospectus. In periods of market volatility, assets may decline significantly, causing total annual Fund operating expenses to become higher than the figures shown.
34 | Semiannual Report
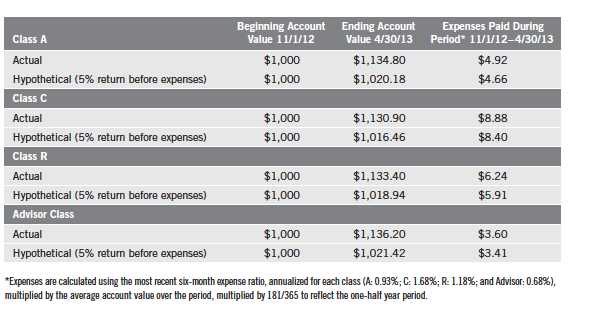
Your Fund’s Expenses
Franklin Limited Maturity U.S. Government Securities Fund
As a Fund shareholder, you can incur two types of costs:
- Transaction costs, including sales charges (loads) on Fund purchases; and
- Ongoing Fund costs, including management fees, distribution and service (12b-1) fees, and other Fund expenses. All mutual funds have ongoing costs, sometimes referred to as operating expenses.
The following table shows ongoing costs of investing in the Fund and can help you understand these costs and compare them with those of other mutual funds. The table assumes a $1,000 investment held for the six months indicated.
Actual Fund Expenses
The first line (Actual) for each share class listed in the table provides actual account values and expenses. The “Ending Account Value” is derived from the Fund’s actual return, which includes the effect of Fund expenses.
You can estimate the expenses you paid during the period by following these steps. Of course, your account value and expenses will differ from those in this illustration:
| 1. | Divide your account value by $1,000. |
| | If an account had an $8,600 value, then $8,600 ÷ $1,000 = 8.6. |
| 2. | Multiply the result by the number under the heading “Expenses Paid During Period.” |
| | If Expenses Paid During Period were $7.50, then 8.6 x $7.50 = $64.50. |
In this illustration, the estimated expenses paid this period are $64.50.
Hypothetical Example for Comparison with Other Funds
Information in the second line (Hypothetical) for each class in the table can help you compare ongoing costs of investing in the Fund with those of other mutual funds. This information may not be used to estimate the actual ending account balance or expenses you paid during the period. The hypothetical “Ending Account Value” is based on the actual expense ratio for each class and an assumed 5% annual rate of return before expenses, which does not represent the Fund’s actual return. The figure under the heading “Expenses Paid During Period” shows the hypothetical expenses your account would have incurred under this scenario. You can compare this figure with the 5% hypothetical examples that appear in shareholder reports of other funds.
Semiannual Report | 35
Your Fund’s Expenses (continued)
Please note that expenses shown in the table are meant to highlight ongoing costs and do not reflect any transaction costs, such as sales charges. Therefore, the second line for each class is useful in comparing ongoing costs only, and will not help you compare total costs of owning different funds. In addition, if transaction costs were included, your total costs would have been higher. Please refer to the Fund prospectus for additional information on operating expenses.

36 | Semiannual Report
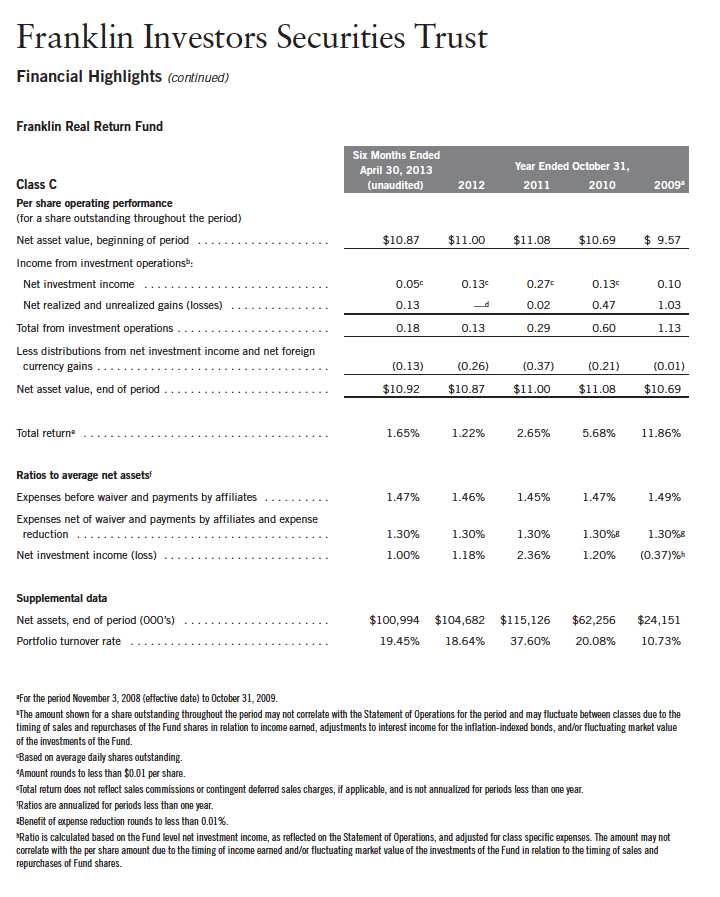
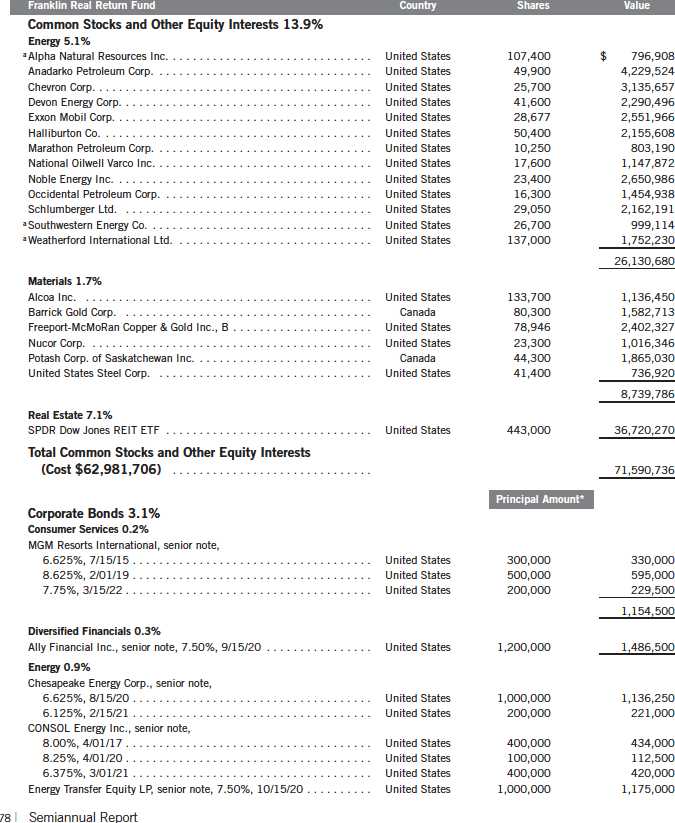
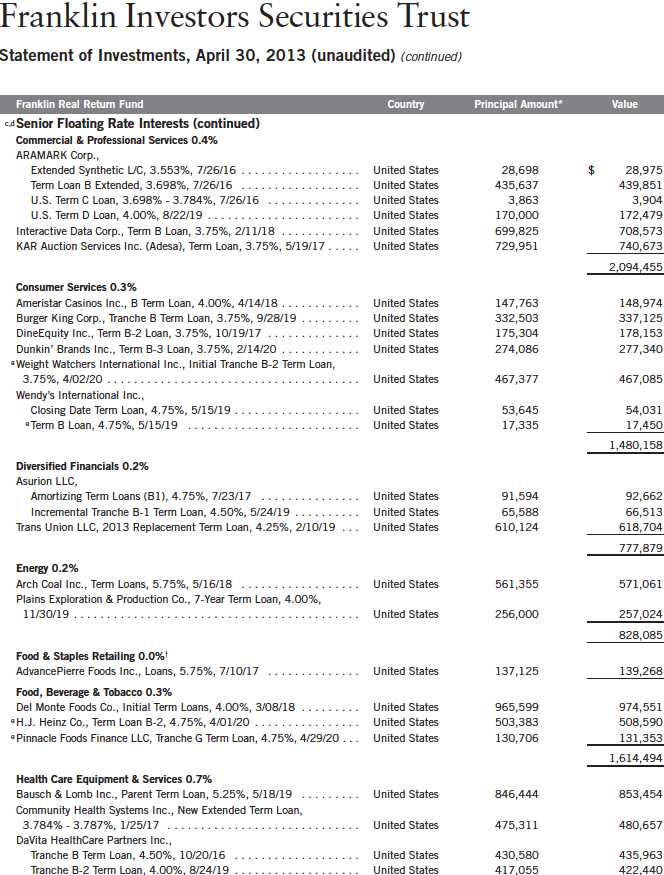
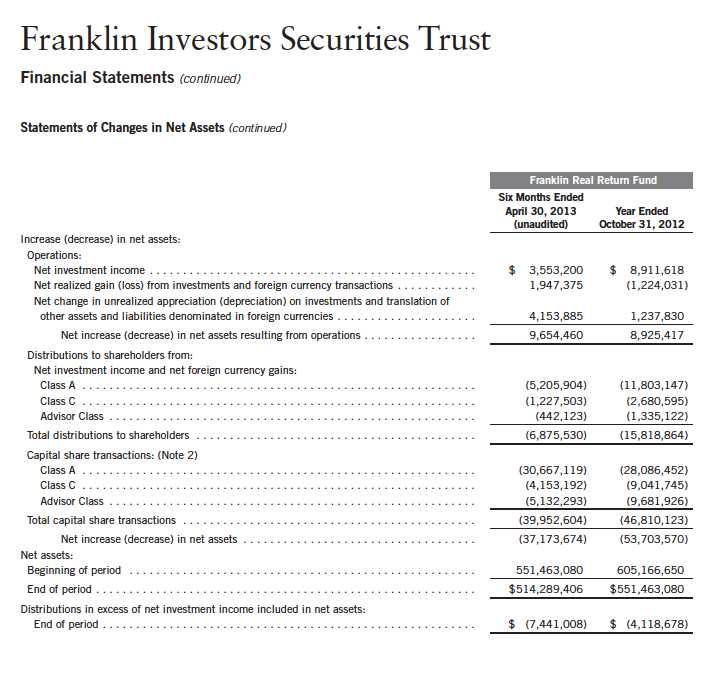
Franklin Real Return Fund
Your Fund’s Goal and Main Investments: Franklin Real Return Fund seeks to achieve total return that exceeds the rate of inflation over an economic cycle. The Fund will generally invest a substantial portion of its assets in inflation-protected securities. Managers also have the flexibility to invest in other sectors of the market to increase real return (total return less inflation) potential and offer greater diversification.


*All Fund distributions will vary depending upon current market conditions, and past distributions are not indicative
of future trends.
**The Fund paid two distributions in November. The distribution scheduled to be paid in October 2012 was paid in
November because of the market’s closure following Hurricane Sandy.
†Distributions are higher than in other months primarily due to the inclusion of net foreign currency gains to meet excise
tax requirements.
The Fund paid no dividends due to negative inflation adjustments for TIPS, which are the Fund’s primary investments.
Consumers (All Items) NSA (non-seasonally adjusted), a measure of the average change in prices of all goods and services purchased for consumption by urban householders, rose 0.52% for the same period.1 You can find more of the Fund’s performance data in the Performance Summary beginning on page 41.
Investment Strategy
We seek to allocate assets among investments to achieve the highest level of real return (total return less the rate of inflation) consistent with an acceptable level of risk. We will allocate the Fund’s assets among securities in various market sectors based on our assessment of changing economic, global market, industry and issuer conditions. When making our investment decisions, we use a “top-down” analysis of macroeconomic trends combined with a “bottom-up” fundamental analysis of market sectors, industries and issuers to try to take advantage of varying sector reactions to economic events. We will evaluate such criteria as country risk, business cycles, yield curves, and values between and within markets.
38 | Semiannual Report
Manager’s Discussion
During the period, U.S. economic data releases initially showed a nascent but firming trend. Later economic releases, however, reflected a more moderate, yet still positive, pace of growth. In this environment, U.S. consumers remained fairly strong, although declines in consumer spending suggested that income tax increases took a heavier toll on consumer sentiment than initially indicated. Overall, the labor market remained solid, even though some employment measures missed expectations. The unemployment rate declined from 7.9% to 7.5%, but this slight decline was largely a result of a lower participation rate.2 The U.S. housing market continued to show a gradual but persistent improvement trend. Overall, economic data during the period did not suggest any increased risk that the U.S. Federal Reserve Board (Fed) would exit its quantitative easing policy early.
A Federal Open Market Committee meeting held near period-end did not result in changes to the Fed’s current accommodative monetary policy. The Fed used a cautious tone and acknowledged strains in global financial markets but expected growth to remain moderate and gradually improve over the coming quarters. This expectation was based on improving labor market conditions and housing market gains, although the Fed noted the housing sector remained depressed. We believe short-term rates could remain low until the U.S. economy shows significant upward momentum and threats of systematic risk abate. The Fed continued to provide support to the mortgage sector, as prepayment risk remained heightened with the market priced at a premium and mortgage rates near historical lows. With its purchases and reinvestments totaling about $85 billion a month, the Fed remained the largest source of demand for the market. However, potential risks to the sector exist if the Fed eventually tapers or ends its asset purchase program, which could negatively affect mortgage sector spreads.
We invested the Fund’s assets in the allowable sectors during the period under review. At period-end, just over half of total net assets were invested in Treasury Inflation Protected Securities (TIPS). For diversification, we also allocated the Fund’s assets to short-term non-U.S. dollar securities, natural resources, real estate investment trusts (REITs), high yield bonds and corporate loans. We employed a non-U.S. dollar strategy to help hedge against U.S. dollar weakness versus certain currencies and concentrated our TIPS holdings in shorter maturities.
2. Source: Bureau of Labor Statistics.
Semiannual Report | 39
Our diversified mix of inflation-sensitive assets did well over the period. In particular, our non-dollar holdings and allocation to REITS, high yield corporate bonds and natural resource securities contributed to performance relative to the benchmark index. Our TIPS and floating rate loan exposures were also positive for returns.
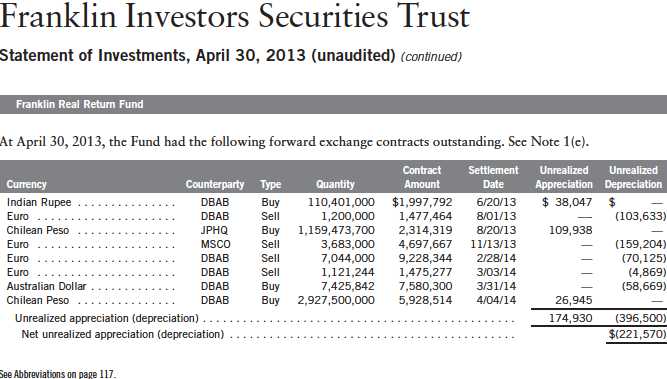
The portfolio utilized derivatives, including currency forwards. Currency forwards are principally used as a tool to reduce a specific risk exposure of a portfolio security or its denominated currency, or to obtain net long exposure to selected currencies.
Thank you for your continued participation in Franklin Real Return Fund.
We look forward to serving your future investment needs.

40 | Semiannual Report
Performance Summary as of 4/30/13
Franklin Real Return Fund
Your dividend income will vary depending on dividends or interest paid by securities in the Fund’s portfolio, adjusted for operating expenses of each class. Capital gain distributions are net profits realized from the sale of portfolio securities. The performance table does not reflect any taxes that a shareholder would pay on Fund dividends, capital gain distributions, if any, or any realized gains on the sale of Fund shares. Total return reflects reinvestment of the Fund’s dividends and capital gain distributions, if any, and any unrealized gains or losses.
Semiannual Report | 41
Performance Summary (continued)
Performance1
Cumulative total return excludes sales charges. Average annual total returns include maximum sales charges. Class A: 4.25% maximum initial sales charge; Class C: 1% contingent deferred sales charge in first year only; Advisor Class: no sales charges.

42 | Semiannual Report
Performance Summary (continued)
Endnotes
All investments involve risks, including possible loss of principal. Interest rate movements will affect the Fund’s share price and yield. Bond
prices generally move in the opposite direction of interest rates. Thus, as prices of bonds in the Fund adjust to a rise in interest rates, the Fund’s
share price may decline. Stock prices fluctuate, sometimes rapidly and dramatically, due to factors affecting individual companies, particular
industries or sectors, or general market conditions. These price movements may result from factors affecting individual companies, industries
or the securities market as a whole. The risks of foreign securities include currency fluctuations and political uncertainty. The Fund is actively
managed but there is no guarantee that the manager’s investment decisions will produce the desired results. The Fund’s prospectus also includes
a description of the main investment risks.
Class C: These shares have higher annual fees and expenses than Class A shares.
Advisor Class: Shares are available to certain eligible investors as described in the prospectus.
1. Fund investment results reflect the expense reduction, without which the results would have been lower, and yields for the period would have been
3.39%, 3.15% and 3.79% for Classes A, C and Advisor, respectively.
2. Cumulative total return represents the change in value of an investment over the periods indicated.
3. Average annual total return represents the average annual change in value of an investment over the periods indicated. Six-month return has not
been annualized.
4. In accordance with SEC rules, we provide standardized average annual total return information through the latest calendar quarter.
5. Distribution rate is based on an annualization of the respective class’s April dividend and the maximum offering price (NAV for Classes C and
Advisor) per share on 4/30/13.
6. The 30-day standardized yield for the 30 days ended 4/30/13 reflects an estimated yield to maturity (assuming all portfolio securities are held to
maturity). It should be regarded as an estimate of the Fund’s rate of investment income, and it may not equal the Fund’s actual income distribution
rate (which reflects the Fund’s past dividends paid to shareholders) or the income reported in the Fund’s financial statements.
7. Figures are as stated in the Fund’s current prospectus. In periods of market volatility, assets may decline significantly, causing total annual Fund
operating expenses to become higher than the figures shown.
Semiannual Report | 43
Your Fund’s Expenses
Franklin Real Return Fund
As a Fund shareholder, you can incur two types of costs:
- Transaction costs, including sales charges (loads) on Fund purchases; and
- Ongoing Fund costs, including management fees, distribution and service (12b-1) fees, and other Fund expenses. All mutual funds have ongoing costs, sometimes referred to as operating expenses.
The following table shows ongoing costs of investing in the Fund and can help you understand these costs and compare them with those of other mutual funds. The table assumes a $1,000 investment held for the six months indicated.
Actual Fund Expenses
The first line (Actual) for each share class listed in the table provides actual account values and expenses. The “Ending Account Value” is derived from the Fund’s actual return, which includes the effect of Fund expenses.
You can estimate the expenses you paid during the period by following these steps. Of course, your account value and expenses will differ from those in this illustration:
| 1. | Divide your account value by $1,000. |
| | If an account had an $8,600 value, then $8,600 ÷ $1,000 = 8.6. |
| 2. | Multiply the result by the number under the heading “Expenses Paid During Period.” |
| | If Expenses Paid During Period were $7.50, then 8.6 x $7.50 = $64.50. |
In this illustration, the estimated expenses paid this period are $64.50.
Hypothetical Example for Comparison with Other Funds
Information in the second line (Hypothetical) for each class in the table can help you compare ongoing costs of investing in the Fund with those of other mutual funds. This information may not be used to estimate the actual ending account balance or expenses you paid during the period. The hypothetical “Ending Account Value” is based on the actual expense ratio for each class and an assumed 5% annual rate of return before expenses, which does not represent the Fund’s actual return. The figure under the heading “Expenses Paid During Period” shows the hypothetical expenses your account would have incurred under this scenario. You can compare this figure with the 5% hypothetical examples that appear in shareholder reports of other funds.
44 | Semiannual Report
Your Fund’s Expenses (continued)
Please note that expenses shown in the table are meant to highlight ongoing costs and do not reflect any transaction costs, such as sales charges. Therefore, the second line for each class is useful in comparing ongoing costs only, and will not help you compare total costs of owning different funds. In addition, if transaction costs were included, your total costs would have been higher. Please refer to the Fund prospectus for additional information on operating expenses.

Semiannual Report | 45
46 | The accompanying notes are an integral part of these financial statements. | Semiannual Report

Semiannual Report | The accompanying notes are an integral part of these financial statements. | 47
48 | The accompanying notes are an integral part of these financial statements. | Semiannual Report
Semiannual Report | The accompanying notes are an integral part of these financial statements. | 49

50 | Semiannual Report
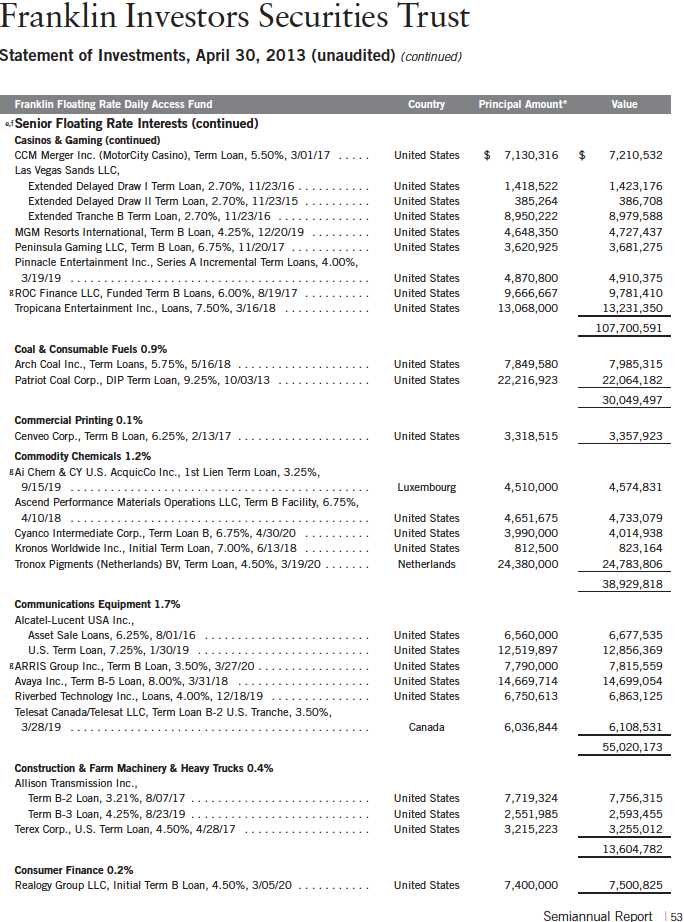
Franklin Investors Securities Trust
Statement of Investments, April 30, 2013 (unaudited) (continued)

54 | Semiannual Report

Semiannual Report | 55
Franklin Investors Securities Trust
Statement of Investments, April 30, 2013 (unaudited) (continued)

56 | The accompanying notes are an integral part of these financial statements. | Semiannual Report
Semiannual Report | The accompanying notes are an integral part of these financial statements. | 57

58 | The accompanying notes are an integral part of these financial statements. | Semiannual Report

Semiannual Report | The accompanying notes are an integral part of these financial statements. | 59
Franklin Investors Securities Trust
Statement of Investments, April 30, 2013 (unaudited)


Semiannual Report | 61
Franklin Investors Securities Trust
Statement of Investments, April 30, 2013 (unaudited) (continued)
62 | The accompanying notes are an integral part of these financial statements. | Semiannual Report
Semiannual Report | The accompanying notes are an integral part of these financial statements. | 63
64 | The accompanying notes are an integral part of these financial statements. | Semiannual Report
Semiannual Report | The accompanying notes are an integral part of these financial statements. | 65

66 | The accompanying notes are an integral part of these financial statements. | Semiannual Report

Semiannual Report | 67

68 | Semiannual Report

Semiannual Report | The accompanying notes are an integral part of these financial statements. | 69

70 | The accompanying notes are an integral part of these financial statements. | Semiannual Report
Semiannual Report | The accompanying notes are an integral part of these financial statements. | 71
Semiannual Report | 73

74 | The accompanying notes are an integral part of these financial statements. | Semiannual Report
76 | The accompanying notes are an integral part of these financial statements. | Semiannual Report
Franklin Investors Securities Trust
Statement of Investments, April 30, 2013 (unaudited)
Franklin Investors Securities Trust
Statement of Investments, April 30, 2013 (unaudited) (continued)

Semiannual Report | 79
80 | Semiannual Report
Franklin Investors Securities Trust
Statement of Investments, April 30, 2013 (unaudited) (continued)
84 | Semiannual Report
Semiannual Report | The accompanying notes are an integral part of these financial statements. | 85
86 | The accompanying notes are an integral part of these financial statements. | Semiannual Report

Semiannual Report | The accompanying notes are an integral part of these financial statements. | 87

88 | The accompanying notes are an integral part of these financial statements. | Semiannual Report
Semiannual Report | The accompanying notes are an integral part of these financial statements. | 89

90 | The accompanying notes are an integral part of these financial statements. | Semiannual Report
Franklin Investors Securities Trust
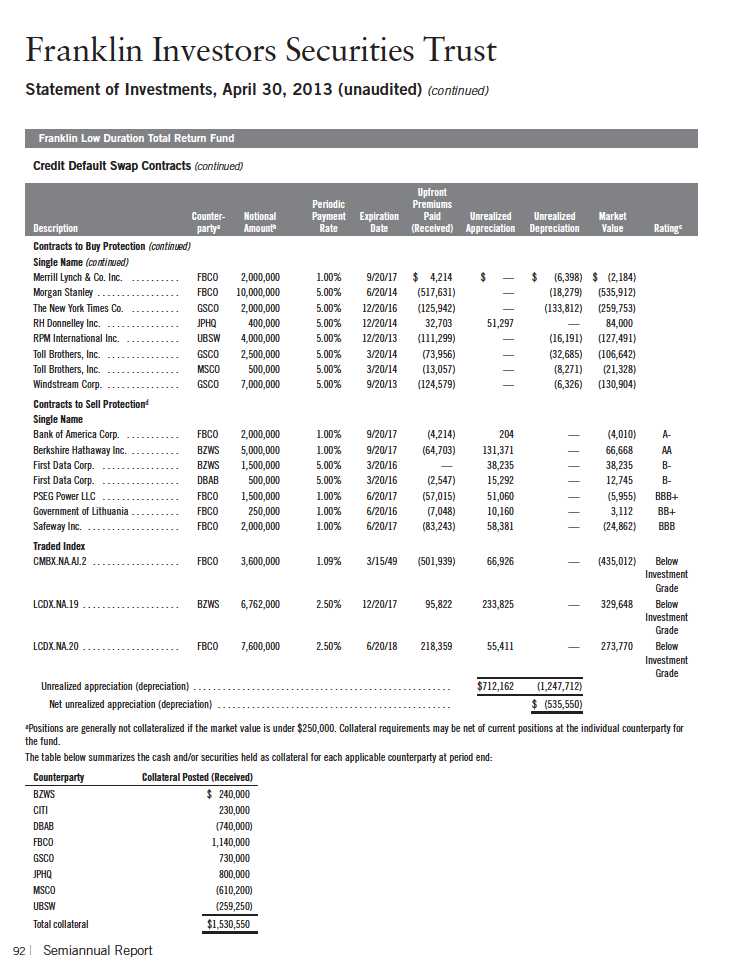
Financial Statements (continued)

Semiannual Report | The accompanying notes are an integral part of these financial statements. | 91

92 | The accompanying notes are an integral part of these financial statements. | Semiannual Report

Semiannual Report | The accompanying notes are an integral part of these financial statements. | 93
94 | The accompanying notes are an integral part of these financial statements. | Semiannual Report
Franklin Investors Securities Trust
Notes to Financial Statements (unaudited)
1. ORGANIZATION AND SIGNIFICANT ACCOUNTING POLICIES
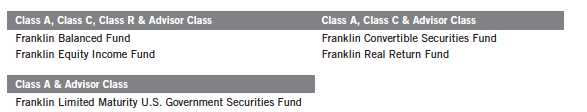
Franklin Investors Securities Trust (Trust) is registered under the Investment Company Act of 1940, as amended, (1940 Act) as an open-end investment company, consisting of nine separate funds, five of which are included in this report (Funds). The financial statements of the remaining funds in the Trust are presented separately. The classes of shares offered within each of the Funds are indicated below. Effective May 1, 2013, the Funds, except the Franklin Convertible Securities Fund, began offering a new class of shares, R6. Effective March 1, 2013, all Class B shares were converted to Class A. Each class of shares differs by its initial sales load, contingent deferred sales charges, voting rights on matters affecting a single class, its exchange privilege and fees primarily due to differing arrangements for distribution and transfer agent fees.
The following summarizes the Funds’ significant accounting policies.
a. Financial Instrument Valuation
The Funds’ investments in financial instruments are carried at fair value daily. Fair value is the price that would be received to sell an asset or paid to transfer a liability in an orderly transaction between market participants on the measurement date. Under procedures approved by the Trust’s Board of Trustees (the Board), the Funds’ administrator, investment manager and other affiliates have formed the Valuation and Liquidity Oversight Committee (VLOC). The VLOC provides administration and oversight of the Funds’ valuation policies and procedures, which are approved annually by the Board. Among other things, these procedures allow the Funds to utilize independent pricing services, quotations from securities and financial instrument dealers, and other market sources to determine fair value.
Equity securities and exchange traded funds listed on an exchange or on the NASDAQ National Market System are valued at the last quoted sale price or the official closing price of the day, respectively. Foreign equity securities are valued as of the close of trading on the foreign stock exchange on which the security is primarily traded, or the NYSE, whichever is earlier. The value is then converted into its U.S. dollar equivalent at the foreign exchange rate in effect at the close of the NYSE on the day that the value of the security is determined. Over-the-counter (OTC) secu rities are valued within the range of the most recent quoted bid and ask prices. Securities that trade in multiple markets or on multiple exchanges are valued according to the broadest and most representative market. Certain equity securities are valued based upon fundamental characteristics or relationships to similar securities. Investments in open-end mutual funds are valued at the closing net asset value.
Semiannual Report | 95
Franklin Investors Securities Trust
Notes to Financial Statements (unaudited) (continued)
| 1. | ORGANIZATION AND SIGNIFICANT ACCOUNTING POLICIES (continued) |
| a. | Financial Instrument Valuation (continued) |
Debt and certain preferred securities generally trade in the OTC market rather than on a securities exchange. The Funds’ pricing services use multiple valuation techniques to determine fair value. In instances where sufficient market activity exists, the pricing services may utilize a market-based approach through which quotes from market makers are used to determine fair value. In instances where sufficient market activity may not exist or is limited, the pricing services also utilize proprietary valuation models which may consider market characteristics such as benchmark yield curves, credit spreads, estimated default rates, anticipated market interest rate volatility, coupon rates, anticipated timing of principal repayments, underlying collateral, and other unique security features in order to estimate the relevant cash flows, which are then discounted to calculate the fair value. Securities denominated in a foreign currency are converted into their U.S. dollar equivalent at the foreign exchange rate in effect at the close of the NYSE on the date that the values of the foreign debt securities are determined. Repurchase agreements are valued at cost, which approximates market value.
Certain derivative financial instruments (derivatives) trade in the OTC market. The Funds’ pricing services use various techniques including industry standard option pricing models and proprietary discounted cash flow models to determine the fair value of those instruments. The Funds’ net benefit or obligation under the derivative contract, as measured by the fair market value of the contract, is included in net assets.
The Funds have procedures to determine the fair value of financial instruments for which market prices are not reliable or readily available. Under these procedures, the VLOC convenes on a regular basis to review such financial instruments and considers a number of factors, including significant unobservable valuation inputs, when arriving at fair value. The VLOC primarily employs a market-based approach which may use related or comparable assets or liabilities, recent transactions, market multiples, book values, and other relevant information for the investment to determine the fair value of the investment. An income-based valuation approach may also be used in which the anticipated future cash flows of the investment are discounted to calculate fair value. Discounts may also be applied due to the nature or duration of any restrictions on the disposition of the investments. Due to the inherent uncertainty of valuations of such investments, the fair values may differ significantly from the values that would have been used had an active market existed. The VLOC employs various methods for calibrating these valuation approaches including a regular review of key inputs and assumptions, transactional back-testing or disposition analysis, and reviews of any related market activity.
Trading in securities on foreign securities stock exchanges and OTC markets may be completed before the daily close of business on the NYSE. Occasionally, events occur between the time at which trading in a foreign security is completed and the close of the NYSE that might call into question the reliability of the value of a portfolio security held by the fund. As a result, differences may arise between the value of the Funds’ portfolio securities as determined at the foreign market close and the latest indications of value at the close of the NYSE. In order to minimize
96 | Semiannual Report
Franklin Investors Securities Trust
Notes to Financial Statements (unaudited) (continued)
| 1. | ORGANIZATION AND SIGNIFICANT ACCOUNTING POLICIES (continued) |
| a. | Financial Instrument Valuation (continued) |
the potential for these differences, the VLOC monitors price movements following the close of trading in foreign stock markets through a series of country specific market proxies (such as baskets of American Depositary Receipts, futures contracts and exchange traded funds). These price movements are measured against established trigger thresholds for each specific market proxy to assist in determining if an event has occurred that may call into question the reliability of the values of the foreign securities held by the Funds. If such an event occurs, the securities may be valued using fair value procedures, which may include the use of independent pricing services.
In addition, certain foreign markets may be open on days that the NYSE is closed, which could result in differences between the value of the Funds’ portfolio securities on the last business day and the last calendar day of the reporting period. Any significant security valuation changes due to an open foreign market are adjusted and reflected by the Funds for financial reporting purposes.
b. Foreign Currency Translation
Portfolio securities and other assets and liabilities denominated in foreign currencies are translated into U.S. dollars based on the exchange rate of such currencies against U.S. dollars on the date of valuation. The Funds may enter into foreign currency exchange contracts to facilitate transactions denominated in a foreign currency. Purchases and sales of securities, income and expense items denominated in foreign currencies are translated into U.S. dollars at the exchange rate in effect on the transaction date. Portfolio securities and assets and liabilities denominated in foreign currencies contain risks that those currencies will decline in value relative to the U.S. dollar. Occasionally, events may impact the availability or reliability of foreign exchange rates used to convert the U.S. dollar equivalent value. If such an event occurs, the foreign exchange rate will be valued at fair value using procedures established and approved by the Board.
The Funds do not separately report the effect of changes in foreign exchange rates from changes in market prices on securities held. Such changes are included in net realized and unrealized gain or loss from investments on the Statements of Operations.
Realized foreign exchange gains or losses arise from sales of foreign currencies, currency gains or losses realized between the trade and settlement dates on securities transactions and the difference between the recorded amounts of dividends, interest, and foreign withholding taxes and the U.S. dollar equivalent of the amounts actually received or paid. Net unrealized foreign exchange gains and losses arise from changes in foreign exchange rates on foreign denominated assets and liabilities other than investments in securities held at the end of the reporting period.
c. Joint Repurchase Agreement
Certain funds enter into a joint repurchase agreement whereby their uninvested cash balance is deposited into a joint cash account with other funds managed by the investment manager or an affiliate of the investment manager and is used to invest in one or more repurchase agreements.
Semiannual Report | 97
Franklin Investors Securities Trust
Notes to Financial Statements (unaudited) (continued)
| 1. | ORGANIZATION AND SIGNIFICANT ACCOUNTING POLICIES (continued) |
| c. | Joint Repurchase Agreement (continued) |
The value and face amount of the joint repurchase agreement are allocated to the funds based on their pro-rata interest. A repurchase agreement is accounted for as a loan by the fund to the seller, collateralized by securities which are delivered to the fund’s custodian. The market value, including accrued interest, of the initial collateralization is required to be at least 102% of the dollar amount invested by the funds, with the value of the underlying securities marked to market daily to maintain coverage of at least 100%. The joint repurchase agreement held by the funds at period end had been entered into on April 30, 2013.
d. Securities Purchased on a When-Issued and Delayed Delivery Basis
Certain funds purchase securities on a when-issued and delayed delivery basis, with payment and delivery scheduled for a future date. These transactions are subject to market fluctuations and are subject to the risk that the value at delivery may be more or less than the trade date purchase price. Although the funds will generally purchase these securities with the intention of holding the securities, they may sell the securities before the settlement date. Sufficient assets have been segregated for these securities.
e. Derivative Financial Instruments
The Franklin Balanced Fund and the Franklin Real Return Fund invested in derivatives in order to manage risk or gain exposure to various other investments or markets. Derivatives are financial contracts based on an underlying or notional amount, require no initial investment or an initial net investment that is smaller than would normally be required to have a similar response to changes in market factors, and require or permit net settlement. Derivatives contain various risks including the potential inability of the counterparty to fulfill their obligations under the terms of the contract, the potential for an illiquid secondary market, and/or the potential for market movements which expose the fund to gains or losses in excess of the amounts shown on the Statements of Assets and Liabilities. Realized gain and loss and unrealized appreciation and depreciation on these contracts for the period are included in the Statements of Operations.
The Franklin Balanced Fund’s and the Franklin Real Return Fund’s investments in OTC derivatives are subject to the terms of International Swaps and Derivatives Association Master Agreements and other related agreements between the funds and certain derivative counter-parties. These agreements contain various provisions, including but not limited to collateral requirements, events of default, requirements for the funds to maintain certain net asset levels and/or limit the decline in net assets over various periods of time. Should the funds fail to meet any of these provisions, the derivative counterparty has the right to terminate the derivative contract and require immediate payment by the funds for those OTC derivatives with that particular counterparty that are in a net liability position. At April 30, 2013, the Franklin Balanced Fund had no OTC derivatives in a net liability position for such contracts. At April 30, 2013, the Franklin Real Return Fund had OTC derivatives in a net liability position of $221,570 and the aggregate value of collateral pledged for such contracts was $220,000.
98 | Semiannual Report
Franklin Investors Securities Trust
Notes to Financial Statements (unaudited) (continued)
| 1. | ORGANIZATION AND SIGNIFICANT ACCOUNTING POLICIES (continued) |
| e. | Derivative Financial Instruments (continued) |
The Franklin Balanced Fund and the Franklin Real Return Fund entered into OTC forward exchange contracts primarily to manage and/or gain exposure to certain foreign currencies. A forward exchange contract is an agreement between the fund and a counterparty to buy or sell a foreign currency at a specific exchange rate on a future date. Pursuant to the terms of the forward exchange contracts, cash or securities may be required to be deposited as collateral. Unrestricted cash may be invested according to the funds’ investment objectives.
The Franklin Balanced Fund purchased or wrote exchange traded option contracts primarily to manage exposure to equity price risk. An option is a contract entitling the holder to purchase or sell a specific amount of shares or units of an asset or notional amount of a swap (swaption), at a specified price. Options purchased are recorded as an asset while options written are recorded as a liability. Upon exercise of an option, the acquisition cost or sales proceeds of the underlying investment is adjusted by any premium received or paid. Upon expiration of an option, any premium received or paid is recorded as a realized gain or loss. Upon closing an option other than through expiration or exercise, the difference between the premium and the cost to close the position is recorded as a realized gain or loss. Pursuant to the terms of the written option contract, cash or securities may be required to be deposited as collateral.
See Notes 6 and 10 regarding investment transactions and other derivative information, respectively.
f. Equity-Linked Securities
The Franklin Balanced Fund and the Franklin Equity Income Fund invest in equity-linked securities. Equity-linked securities are hybrid financial instruments that generally combine both debt and equity characteristics into a single note form. Income received from equity linked securities is recorded as realized gains in the Statement of Operations and may be based on the performance of an underlying equity security, an equity index, or an option position. The risks of investing in equity-linked securities include unfavorable price movements in the underlying security and the credit risk of the issuing financial institution. There may be no guarantee of a return of principal with equity linked securities and the appreciation potential may be limited. Equity-linked securities may be more volatile and less liquid than other investments held by the funds.
g. Senior Floating Rate Interests
The Franklin Balanced Fund and the Franklin Real Return Fund invest in senior secured corporate loans that pay interest at rates which are periodically reset by reference to a base lending rate plus a spread. These base lending rates are generally the prime rate offered by a designated U.S. bank or the London InterBank Offered Rate (LIBOR). Senior secured corporate loans often require prepayment of principal from excess cash flows or at the discretion of the borrower. As a result, actual maturity may be substantially less than the stated maturity.
Semiannual Report | 99
Franklin Investors Securities Trust
Notes to Financial Statements (unaudited) (continued)
| 1. | ORGANIZATION AND SIGNIFICANT ACCOUNTING POLICIES (continued) |
| g. | Senior Floating Rate Interests (continued) |
Senior secured corporate loans in which the funds invest are generally readily marketable, but may be subject to some restrictions on resale.
h. Income and Deferred Taxes
It is each fund’s policy to qualify as a regulated investment company under the Internal Revenue Code. Each fund intends to distribute to shareholders substantially all of its taxable income and net realized gains to relieve it from federal income and excise taxes. As a result, no provision for U.S. federal income taxes is required.
The Funds may be subject to foreign taxation related to income received, capital gains on the sale of securities and certain foreign currency transactions in the foreign jurisdictions in which it invests. Foreign taxes, if any, are recorded based on the tax regulations and rates that exist in the foreign markets in which the Funds invest. When a capital gain tax is determined to apply the Funds record an estimated deferred tax liability in an amount that would be payable if the securities were disposed of on the valuation date.
Each fund recognizes the tax benefits of uncertain tax positions only when the position is “more likely than not” to be sustained upon examination by the tax authorities based on the technical merits of the tax position. As of April 30, 2013, and for all open tax years, each fund has determined that no liability for unrecognized tax benefits is required in each fund’s financial statements related to uncertain tax positions taken on a tax return (or expected to be taken on future tax returns). Open tax years are those that remain subject to examination and are based on each tax jurisdiction statute of limitation.
i. Security Transactions, Investment Income, Expenses and Distributions
Security transactions are accounted for on trade date. Realized gains and losses on security transactions are determined on a specific identification basis. Interest income and estimated expenses are accrued daily. Amortization of premium and accretion of discount on debt securities are included in interest income. Facility fees are recognized as income over the expected term of the loan. Dividend income is recorded on the ex-dividend date except that certain dividends from foreign securities are recognized as soon as the Funds are notified of the ex-dividend date. For all Funds except the Franklin Limited Maturity U.S. Government Securities Fund, distributions to shareholders are recorded on the ex-dividend date. For the Franklin Limited Maturity U.S. Government Securities Fund, dividends from net investment income are normally declared daily; these dividends may be reinvested or paid monthly to shareholders. Distributions from realized capital gains and other distributions, if any, are recorded on the ex-dividend date. Distributions to shareholders are determined according to income tax regulations (tax basis). Distributable earnings determined on a tax basis may differ from earnings recorded in accordance with accounting principles generally accepted in the United States of America. These differences may be permanent or temporary. Permanent differences are reclassified among capital accounts to reflect their tax
100 | Semiannual Report
Franklin Investors Securities Trust
Notes to Financial Statements (unaudited) (continued)
| 1. | ORGANIZATION AND SIGNIFICANT ACCOUNTING POLICIES (continued) |
| i. | Security Transactions, Investment Income, Expenses and Distributions (continued) |
character. These reclassifications have no impact on net assets or the results of operations. Temporary differences are not reclassified, as they may reverse in subsequent periods.
Common expenses incurred by the Trust are allocated among the funds based on the ratio of net assets of each fund to the combined net assets of the Trust. Fund specific expenses are charged directly to the fund that incurred the expense.
For all Funds except the Franklin Limited Maturity U.S. Government Securities Fund, realized and unrealized gains and losses and net investment income, not including class specific expenses, are allocated daily to each class of shares based upon the relative proportion of net assets of each class. Differences in per share distributions, by class, are generally due to differences in class specific expenses. For the Franklin Limited Maturity U.S. Government Securities Fund, net investment income, not including class specific expenses, is allocated daily to each class of shares based upon the relative value of the settled shares of each class. Realized and unrealized gains and losses are allocated daily to each class of shares based upon the relative proportion of net assets of each class. Differences in per share distributions, by class, are generally due to differences in class specific expenses.
Inflation-indexed bonds are adjusted for inflation through periodic increases or decreases in the security’s interest accruals, face amount, or principal redemption value, by amounts corresponding to the rate of inflation as measured by an index. Any increase or decrease in the face amount or principal redemption value will be included as inflation principal adjustments on the Statements of Operations.
j. Accounting Estimates
The preparation of financial statements in accordance with accounting principles generally accepted in the United States of America requires management to make estimates and assumptions that affect the reported amounts of assets and liabilities at the date of the financial statements and the amounts of income and expenses during the reporting period. Actual results could differ from those estimates.
k. Guarantees and Indemnifications
Under the Trust’s organizational documents, its officers and trustees are indemnified by the Trust against certain liabilities arising out of the performance of their duties to the Trust. Additionally, in the normal course of business, the Trust, on behalf of the Funds, enters into contracts with service providers that contain general indemnification clauses. The Trust’s maximum exposure under these arrangements is unknown as this would involve future claims that may be made against the Trust that have not yet occurred. Currently, the Trust expects the risk of loss to be remote.
Semiannual Report | 101
Franklin Investors Securities Trust
Notes to Financial Statements (unaudited) (continued)
2. SHARES OF BENEFICIAL INTEREST
At April 30, 2013, there were an unlimited number of shares authorized (without par value).
Transactions in the Funds’ shares were as follows:

102 | Semiannual Report
Franklin Investors Securities Trust
Notes to Financial Statements (unaudited) (continued)
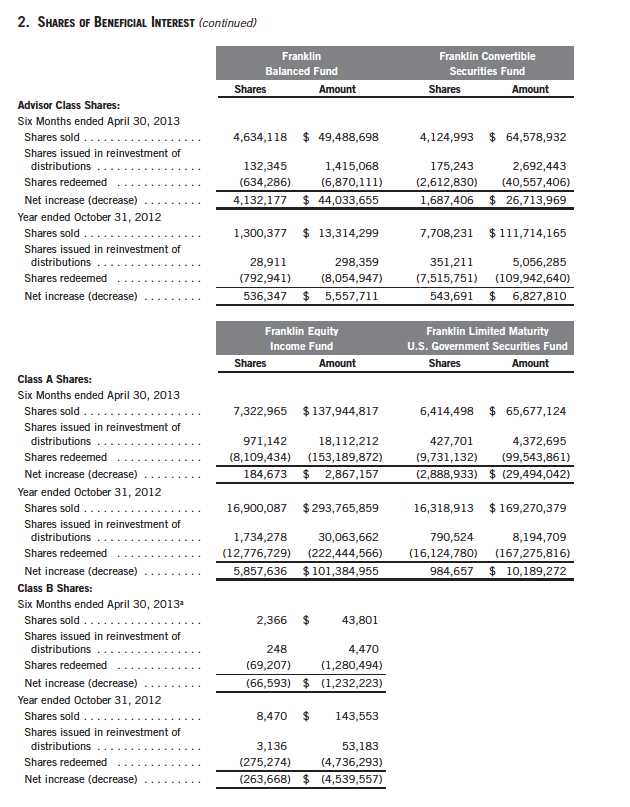
Semiannual Report | 103
Franklin Investors Securities Trust
Notes to Financial Statements (unaudited) (continued)
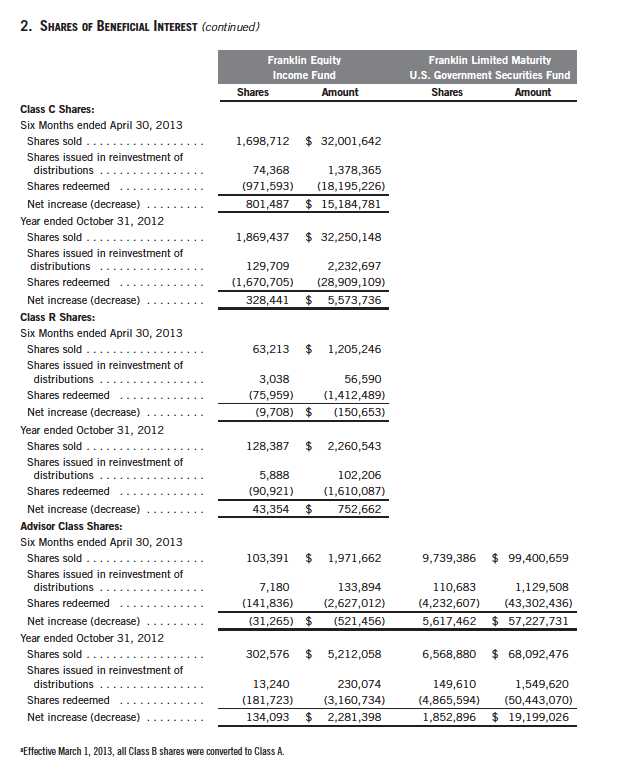
104 | Semiannual Report
Franklin Investors Securities Trust
Notes to Financial Statements (unaudited) (continued)
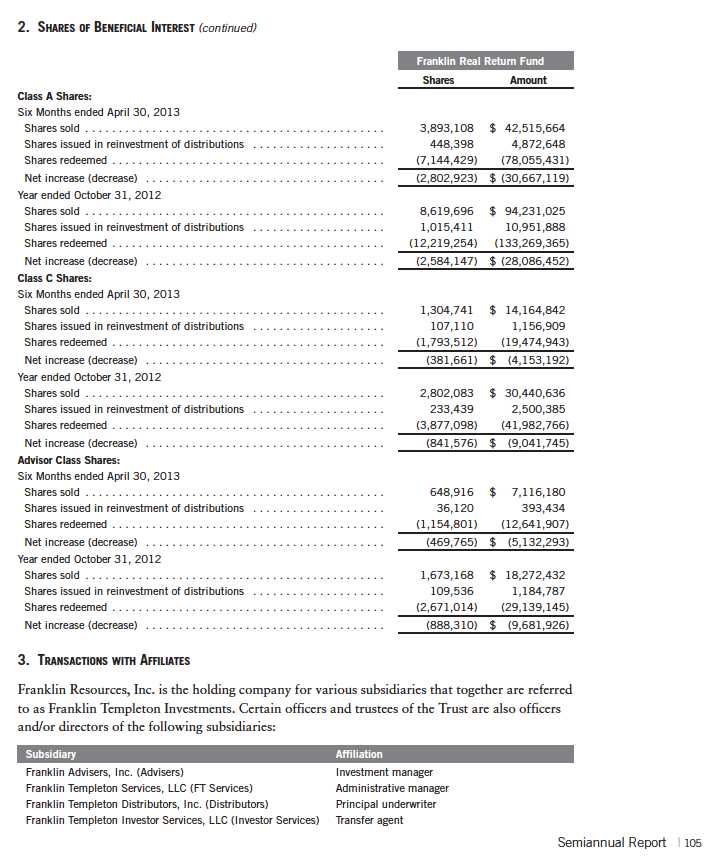
Franklin Investors Securities Trust
Notes to Financial Statements (unaudited) (continued)

106 | Semiannual Report
Franklin Investors Securities Trust
Notes to Financial Statements (unaudited) (continued)
| 3. | TRANSACTIONS WITH AFFILIATES (continued) |
| a. | Management Fees (continued) |
The Franklin Real Return Fund pays an investment management fee to Advisers based on the average daily net assets of the fund as follows:
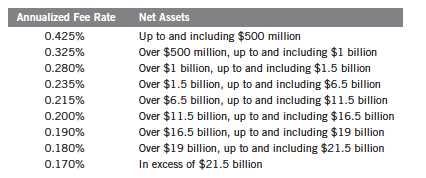
b. Administrative Fees
FT Services provides administrative services to the Funds. The Franklin Balanced Fund and the Franklin Real Return Fund each pay an administrative fee to FT Services of 0.20% per year of their respective average daily net assets. Under an agreement with Advisers, the administrative fee for the Franklin Convertible Securities Fund, the Franklin Equity Income Fund, and the Franklin Limited Maturity U.S. Government Securities Fund is paid by Advisers based on each fund’s average daily net assets, and is not an additional expense of the funds.
On February 26, 2013, the Board approved the proposal to combine the investment management and administration agreements for the Franklin Balanced Fund and the Franklin Real Return Fund. The fees to be paid under the new combined agreement will not exceed the aggregate fees that would have been paid under the separate agreements. The new agreement went into effect on May 1, 2013.
c. Distribution Fees
The Board has adopted distribution plans for each share class, with the exception of Class R6 and Advisor Class shares, pursuant to Rule 12b-1 under the 1940 Act. Distribution fees are not charged on shares held by affiliates. Under the Funds’ Class A reimbursement distribution plans, the Funds reimburse Distributors for costs incurred in connection with the servicing, sale and distribution of each fund’s shares up to the maximum annual plan rate for each class. Under the Class A reimbursement distribution plans, costs exceeding the maximum for the current plan year cannot be reimbursed in subsequent periods. In addition, under the Funds’ Class B, C and R compensation distribution plans, the Funds pay Distributors for costs incurred in connection with the servicing, sale and distribution of each fund’s shares up to the maximum annual plan rate for each class.
Semiannual Report | 107
Franklin Investors Securities Trust
Notes to Financial Statements (unaudited) (continued)
| 3. | TRANSACTIONS WITH AFFILIATES (continued) |
| c. | Distribution Fees (continued) |
The maximum annual plan rates, based on the average daily net assets, for each class, are as follows:

108 | Semiannual Report
Franklin Investors Securities Trust
Notes to Financial Statements (unaudited) (continued)
| 3. | TRANSACTIONS WITH AFFILIATES (continued) |
| e. | Transfer Agent Fees (continued) |
These fees are allocated daily to such classes based upon the relative proportion of net assets of each class. The R6 share class pays Investor Services transfer agent fees specific to that class.
For the period ended April 30, 2013, the Funds paid transfer agent fees as noted in the Statements of Operations of which the following amounts were retained by Investor Services:
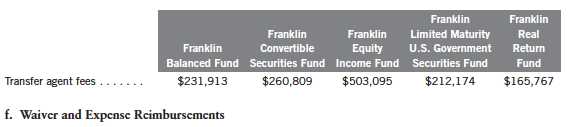
FT Services has contractually agreed in advance to waive or limit its fees and to assume as its own expense certain expenses otherwise payable by the Franklin Real Return Fund so that the expenses (excluding distribution fees and acquired fund fees and expenses) for Class A, Class C and Advisor Class of the fund do not exceed 0.65%, and Class R6 does not exceed 0.52% (other than certain non-routine expenses or costs, including those relating to litigation, indemnification, reorganizations, and liquidations) until February 28, 2014.
FT Services had contractually agreed in advance to waive or limit its fees and to assume as its own expense certain expenses otherwise payable by the Franklin Balanced Fund so that the expenses excluding distribution fees for Class A, Class C, Class R and Advisor Class of the fund did not exceed 0.71% (other than certain non-routine expenses or costs, including those relating to litigation, indemnification, reorganizations, and liquidations) through February 28, 2013. Effective March 1, 2013, the contractual fee waiver was eliminated.
4. EXPENSE OFFSET ARRANGEMENT
The Funds have entered into an arrangement with their custodian whereby credits realized as a result of uninvested cash balances are used to reduce a portion of the Funds’ custodian expenses. During the period ended April 30, 2013, there were no credits earned.
5. INCOME TAXES
For tax purposes, capital losses may be carried over to offset future capital gains. Capital loss carryforwards with no expiration, if any, must be fully utilized before those losses with expiration dates.
Semiannual Report | 109
Franklin Investors Securities Trust
Notes to Financial Statements (unaudited) (continued)
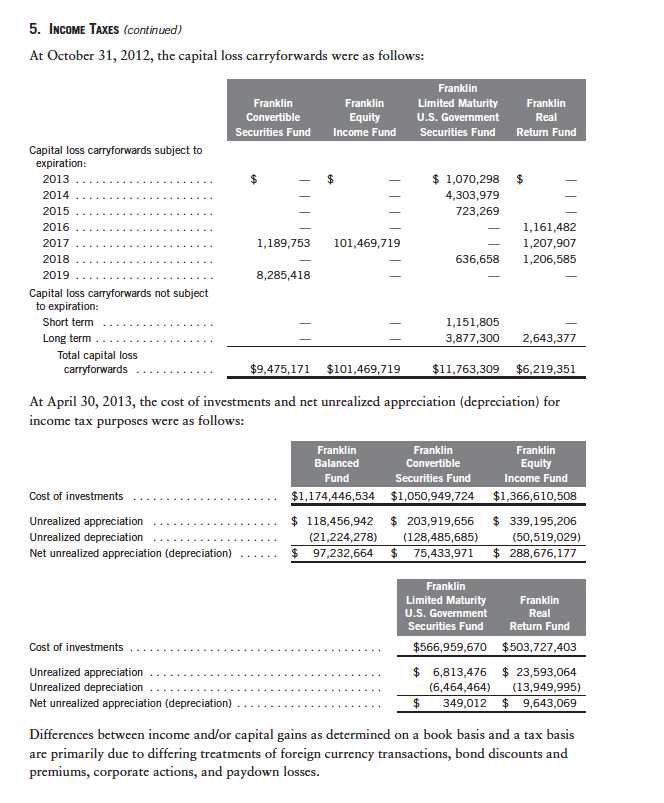
110 | Semiannual Report
Franklin Investors Securities Trust
Notes to Financial Statements (unaudited) (continued)
6. INVESTMENT TRANSACTIONS
Purchases and sales of investments (excluding short term securities) for the period ended April 30, 2013, were as follows:
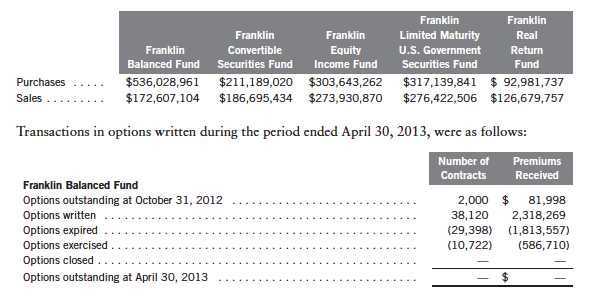
See Notes 1(e) and 10 regarding derivative financial instruments and other derivative information, respectively.
7. INVESTMENTS IN INSTITUTIONAL FIDUCIARY TRUST MONEY MARKET PORTFOLIO
All Funds except the Franklin Real Return Fund invest in the Institutional Fiduciary Trust Money Market Portfolio (Sweep Money Fund), an open-end investment company managed by Advisers. Management fees paid by the funds are reduced on assets invested in the Sweep Money Fund, in an amount not to exceed the management and administrative fees paid by the Sweep Money Fund.
8. CREDIT RISK AND DEFAULTED SECURITIES
At April 30, 2013, the Franklin Balanced Fund, the Franklin Convertible Securities Fund, and the Franklin Real Return Fund had 7.94%, 72.90%, and 10.23%, respectively, of their portfolio invested in high yield securities, senior secured floating rate notes, or other securities rated below investment grade. These securities may be more sensitive to economic conditions causing greater price volatility and are potentially subject to a greater risk of loss due to default than higher rated securities.
Semiannual Report | 111
Franklin Investors Securities Trust
Notes to Financial Statements (unaudited) (continued)
8. CREDIT RISK AND DEFAULTED SECURITIES (continued)
The Franklin Convertible Securities Fund held defaulted securities and/or other securities for which the income has been deemed uncollectible. At April 30, 2013, the aggregate value of these securities was $17,250,000, representing 1.52% of the fund’s net assets. The fund discontinues accruing income on securities for which income has been deemed uncollectible and provides an estimate for losses on interest receivable. The securities have been identified on the accompanying Statement of Investments.
9. RESTRICTED SECURITIES
The Franklin Convertible Securities Fund invests in securities that are restricted under the Securities Act of 1933 (1933 Act) or which are subject to legal, contractual, or other agreed upon restrictions on resale. Restricted securities are often purchased in private placement transactions, and cannot be sold without prior registration unless the sale is pursuant to an exemption under the 1933 Act. Disposal of these securities may require greater effort and expense, and prompt sale at an acceptable price may be difficult. The fund may have registration rights for restricted securities. The issuer generally incurs all registration costs.
At April 30, 2013, the Franklin Convertible Securities Fund held investments in restricted securities, excluding certain securities exempt from registration under the 1933 Act deemed to be liquid, as follows:
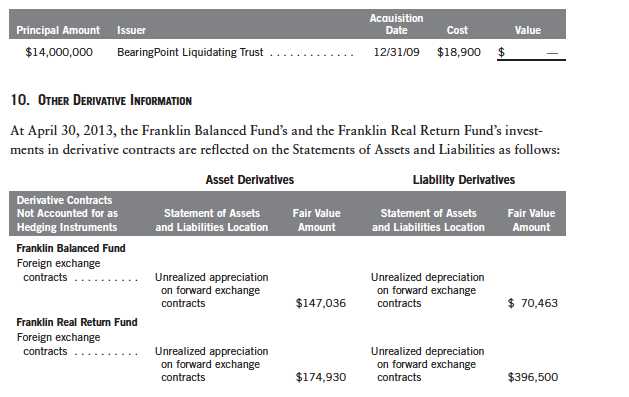
112 | Semiannual Report
Franklin Investors Securities Trust
Notes to Financial Statements (unaudited) (continued)
10. OTHER DERIVATIVE INFORMATION (continued)
For the period ended April 30, 2013, the effect of derivative contracts on the Franklin Balanced Fund’s and the Franklin Real Return Fund’s Statements of Operations was as follows:
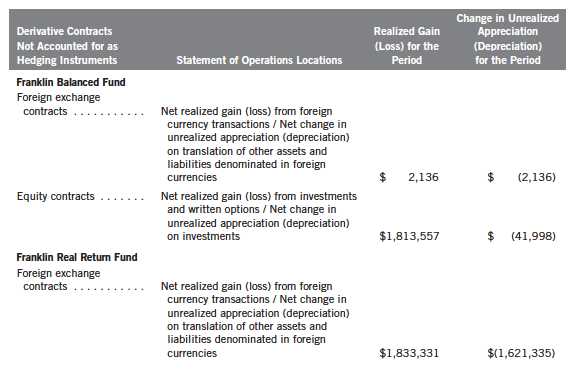
For the period ended April 30, 2013, the average month end market value of derivatives represented 0.12% and 0.14%, respectively, of average month end net assets. The average month end number of open derivative contracts for the period was 10 and 8, respectively.
See Notes 1(e) and 6 regarding derivative financial instruments and investment transactions, respectively.
11. SPECIAL SERVICING AGREEMENT
On February 28, 2013, the Franklin Limited Maturity U.S. Government Securities Fund, which is an eligible underlying investment of one or more of the Franklin Templeton Fund Allocator Series Funds (Allocator Funds), entered into a Special Servicing Agreement (SSA) with the Allocator Funds and certain service providers of the Fund and the Allocator Funds. Under the SSA, the fund may pay a portion of the Allocator Funds’ expenses (other than any asset allocation, administrative, and distribution fees) to the extent such payments are less than the amount of the benefits realized or expected to be realized by the fund (e.g., due to reduced costs associated with servicing accounts) from the investment in the Fund by the Allocator Funds. The Allocator Funds and the fund are either managed by Advisers or administered by FT Services. For the period ended
Semiannual Report | 113
Franklin Investors Securities Trust
Notes to Financial Statements (unaudited) (continued)
11. SPECIAL SERVICING AGREEMENT (continued)
April 30, 2013, the fund was held by one or more of the Allocator Funds and the amount of expenses borne by the fund is noted in the Statement of Operations. At April 30, 2013, 13.20% of the fund’s outstanding shares were held by one or more of the Allocator Funds. Effective May 1, 2013, the SSA was discontinued until further notice and approval by the Board.
12. CREDIT FACILITY
The Funds, together with other U.S. registered and foreign investment funds (collectively, Borrowers), managed by Franklin Templeton Investments, are borrowers in a joint syndicated senior unsecured credit facility totaling $1.5 billion (Global Credit Facility) which matures on January 17, 2014. This Global Credit Facility provides a source of funds to the Borrowers for temporary and emergency purposes, including the ability to meet future unanticipated or unusually large redemption requests.
Under the terms of the Global Credit Facility, the Funds shall, in addition to interest charged on any borrowings made by the Funds and other costs incurred by the Funds, pay their share of fees and expenses incurred in connection with the implementation and maintenance of the Global Credit Facility, based upon their relative share of the aggregate net assets of all of the Borrowers, including an annual commitment fee of 0.07% based upon the unused portion of the Global Credit Facility. These fees are reflected in other expenses on the Statements of Operations. During the period ended April 30, 2013, the Funds did not use the Global Credit Facility.
13. FAIR VALUE MEASUREMENTS
The Funds follow a fair value hierarchy that distinguishes between market data obtained from independent sources (observable inputs) and the Funds’ own market assumptions (unobservable inputs). These inputs are used in determining the value of the Funds’ investments and are summarized in the following fair value hierarchy:
- Level 1 – quoted prices in active markets for identical securities
- Level 2 – other significant observable inputs (including quoted prices for similar securi- ties, interest rates, prepayment speed, credit risk, etc.)
- Level 3 – significant unobservable inputs (including the Funds’ own assumptions in determining the fair value of investments)
The inputs or methodology used for valuing financial instruments are not an indication of the risk associated with investing in those financial instruments.
For movements between the levels within the fair value hierarchy, the Funds have adopted a policy of recognizing the transfers as of the date of the underlying event which caused the movement.
114 | Semiannual Report
Franklin Investors Securities Trust
Notes to Financial Statements (unaudited) (continued)
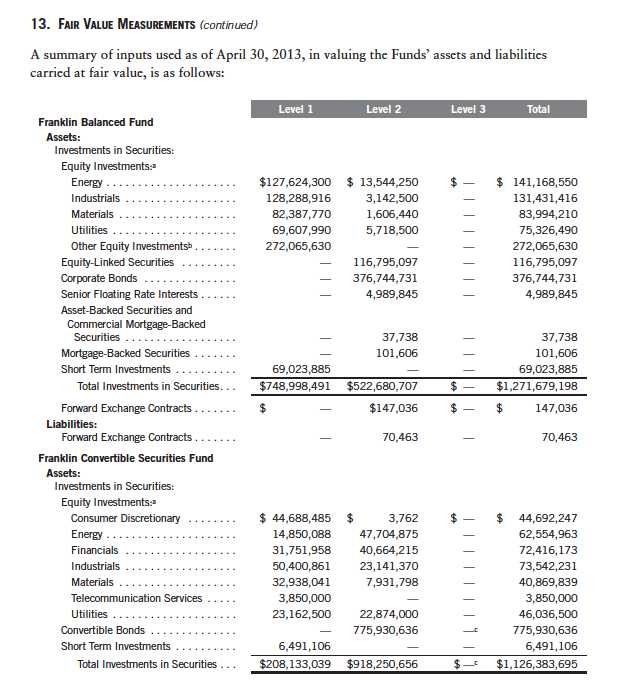
Semiannual Report | 115
Franklin Investors Securities Trust
Notes to Financial Statements (unaudited) (continued)

116 | Semiannual Report
Franklin Investors Securities Trust
Notes to Financial Statements (unaudited) (continued)
14. NEW ACCOUNTING PRONOUNCEMENTS
In December 2011, the Financial Accounting Standards Board (FASB) issued Accounting Standards Update (ASU) No. 2011-11, Balance Sheet (Topic 210): Disclosures about Offsetting Assets and Liabilities. The amendments in the ASU enhance disclosures about offsetting of financial assets and liabilities to enable investors to understand the effect of these arrangements on a fund’s financial position. In January 2013, FASB issued ASU No. 2013-01, Balance Sheet (Topic 210): Clarifying the Scope of Disclosures about Offsetting Assets and Liabilities. The amendments in ASU No. 2013-01 clarify the intended scope of disclosures required by ASU No. 2011-11. These ASUs are effective for interim and annual reporting periods beginning on or after January 1, 2013. The Funds believe the adoption of these ASUs will not have a material impact on their financial statements.
15. SUBSEQUENT EVENTS
The Funds have evaluated subsequent events through the issuance of the financial statements and determined that no events have occurred that require disclosure.

Semiannual Report | 117
Franklin Investors Securities Trust
Shareholder Information
Board Review of Investment Management Agreement
At a meeting held February 26, 2013, the Board of Trustees (Board), including a majority of non-interested or independent Trustees, approved renewal of the investment management agreement for each of the separate funds within Franklin Investors Securities Trust (Fund(s)). In reaching this decision, the Board took into account information furnished throughout the year at regular Board meetings, as well as information prepared specifically in connection with the annual renewal review process. Information furnished and discussed throughout the year included investment performance reports and related financial information for each Fund, along with periodic reports on expenses, shareholder services, legal and compliance matters, pricing, brokerage commissions and execution and other services provided by the Investment Manager (Manager) and its affiliates, as well as a third-party survey of transfer agent fees charged funds within the Franklin Templeton Investments complex in comparison with those charged other fund complexes deemed comparable. Information furnished specifically in connection with the renewal process included a report for each Fund prepared by Lipper, Inc. (Lipper), an independent organization, as well as additional material, including a Fund profitability analysis prepared by management. The Lipper reports compared each Fund’s investment performance and expenses with those of other mutual funds deemed comparable to the Fund as selected by Lipper. The Fund profitability analysis discussed the profitability to Franklin Templeton Investments from its overall U.S. fund operations, as well as on an individual fund-by-fund basis. Additional material accompanying such profitability analysis included information on a fund-by-fund basis listing portfolio managers and other accounts they manage, as well as information on management fees charged by the Manager and its affiliates to U.S. mutual funds and other accounts, including management’s explanation of differences where relevant. Such material also included a memorandum prepared by management describing project initiatives and capital investments relating to the services provided to the Funds by the Franklin Templeton Investments organization, as well as a memorandum relating to economies of scale and an analysis concerning transfer agent fees charged by an affiliate of the Manager.
In considering such materials, the independent Trustees received assistance and advice from and met separately with independent counsel. While the investment management agreements for all Funds were considered at the same Board meeting, the Board dealt with each Fund separately. In approving continuance of the investment management agreement for each Fund, the Board, including a majority of independent Trustees, determined that the existing management fee structure was fair and reasonable and that continuance of the investment management agreement was in the best interests of each Fund and its shareholders. While attention was given to all information furnished, the following discusses some primary factors relevant to the Board’s decision.
NATURE, EXTENT AND QUALITY OF SERVICES. The Board was satisfied with the nature and quality of the overall services provided by the Manager and its affiliates to the Funds and their shareholders. In addition to investment performance and expenses discussed later, the Board’s opinion was based, in part, upon periodic reports furnished it showing that the investment policies and restrictions for each Fund were consistently complied with as well as other reports periodically furnished the Board covering matters such as the compliance of portfolio managers and other
118 | Semiannual Report
Franklin Investors Securities Trust
Shareholder Information (continued)
Board Review of Investment Management Agreement (continued)
management personnel with the code of ethics adopted throughout the Franklin Templeton fund complex, the adherence to fair value pricing procedures established by the Board, and the accuracy of net asset value calculations. The Board also noted the extent of benefits provided Fund shareholders from being part of the Franklin Templeton family of funds, including the right to exchange investments between the same class of funds without a sales charge, the ability to reinvest Fund dividends into other funds and the right to combine holdings in other funds to obtain a reduced sales charge. Favorable consideration was given to management’s continuous efforts and expenditures in establishing back-up systems and recovery procedures to function in the event of a natural disaster, it being noted by the Board that such systems and procedures had functioned well during the Florida hurricanes and blackouts experienced in previous years, and that those operations in the New York/New Jersey area ran smoothly during the more recent Hurricane Sandy. Among other factors taken into account by the Board were the Manager’s best execution trading policies, including a favorable report by an independent portfolio trading analytical firm, which also covered FOREX transactions. Consideration was also given to the experience of each Fund’s portfolio management team, the number of accounts managed and general method of compensation. In this latter respect, the Board noted that a primary factor in management’s determination of a portfolio manager’s bonus compensation was the relative investment performance of the funds he or she managed and that a portion of such bonus was required to be invested in a predesignated list of funds within such person’s fund management area so as to be aligned with the interests of shareholders. The Board also took into account the quality of transfer agent and shareholder services provided Fund shareholders by an affiliate of the Manager and the continuous enhancements to the Franklin Templeton website. Particular attention was given to management’s conservative approach and diligent risk management procedures, including continuous monitoring of counter-party credit risk and attention given to derivative and other complex instruments including expanded collateralization requirements. The Board also took into account, among other things, management’s efforts in establishing a global credit facility for the benefit of the Funds and other accounts managed by Franklin Templeton Investments to provide a source of cash for temporary and emergency purposes or to meet unusual redemption requests as well as the strong financial position of the Manager’s parent company and its commitment to the mutual fund business as evidenced by its subsidization of money market funds.
INVESTMENT PERFORMANCE. The Board placed significant emphasis on the investment performance of each Fund in view of its importance to shareholders. While consideration was given to performance reports and discussions with portfolio managers at Board meetings during the year, particular attention in assessing performance was given to the Lipper reports furnished for the agreement renewals. The Lipper reports prepared for each individual Fund showed the investment performance of its Class A shares in comparison with its selected performance universe during 2012 and during the previous 10 years ended December 31, 2012, unless otherwise noted. Performance on a total return basis was shown by Lipper for all Funds with performance on an income return basis being shown for those Funds having income return as an element of their investment objective. The following summarizes the performance results for each Fund.
Semiannual Report | 119
Franklin Investors Securities Trust
Shareholder Information (continued)
Board Review of Investment Management Agreement (continued)
Franklin Balanced Fund – The Fund’s investment performance was shown in comparison with a performance universe consisting of all retail and institutional mixed-asset target allocation growth funds as selected by Lipper during 2012 and previous years during which the Fund has been in existence. The Lipper report showed the Fund’s income return to be in the highest or best performing quintile of such universe during 2012, as well as the previous three- and five-year periods on an annualized basis. The Lipper report showed the Fund’s total return performance during 2012 to be in the middle performing quintile of its performance universe, but to be in the highest performing quintile of such universe during the previous three- and five-year periods on an annualized basis. The Board was satisfied with such comparative performance.
Franklin Convertible Securities Fund – The Fund’s investment performance was shown in comparison with a performance universe consisting of all retail and institutional convertible securities funds as selected by Lipper. The Lipper report showed the Fund’s income return during 2012 to be in the highest or best performing quintile of its performance universe and on an annualized basis during each of the previous three-, five- and 10-year periods to be in the highest quintile of such performance universe. The Lipper report showed the Fund’s total return during 2012 to be in the second-highest performing quintile of its performance universe and on an annualized basis to be in the highest performing quintile of such universe for each of the previous three-, five- and 10-year periods. The Board was satisfied with the Fund’s comparative performance as set forth in the Lipper report.
Franklin Equity Income Fund – The Fund’s investment performance was shown in comparison with a performance universe consisting of all retail and institutional equity income funds as selected by Lipper. The Lipper report showed the Fund’s income return during 2012 to be in the second-highest performing quintile of the performance universe, and on an annualized basis during each of the previous three-, five- and 10-year periods to be in the highest or best performing quintile of such performance universe. The Lipper report showed the Fund’s total return during 2012 to be in the second-lowest performing quintile of such universe and on an annualized basis to be in the second-lowest quintile of such universe for the previous three-year period, the middle performing quintile of such universe for the previous five-year period, and the lowest performing quintile of such universe for the previous 10-year period. In discussing such performance, management explained that it reflected the Fund’s longstanding strategy of investing in securities with yields higher than the overall market and Lipper peers. The Board believed the Fund’s overall performance as shown in the Lipper report to be acceptable, noting its consistently high comparative income returns and the fact that its total return in 2012 and in each of the previous annualized three- and five-year periods was within 75 basis points of the median of its performance universe.
Franklin Limited Maturity U.S. Government Securities Fund – The Fund’s investment performance was shown in comparison to a performance universe consisting of all retail and institutional short U.S. Government funds as selected by Lipper. The Lipper report showed the Fund’s income return during 2012 to be in the highest or best performing quintile of its performance universe and on an annualized basis to be in either the highest or second-highest performing quintile of such universe
120 | Semiannual Report
Franklin Investors Securities Trust
Shareholder Information (continued)
Board Review of Investment Management Agreement (continued)
during each of the previous three-, five- and 10-year periods. The Lipper report showed the Fund’s total return to be in the middle performing quintile of its performance universe during 2012 and on an annualized basis to be in either the highest or second-highest performing quintile of such universe for each of the previous three-, five- and 10-year periods. The Board was satisfied with the Fund’s comparative performance as shown in the Lipper report.
Franklin Real Return Fund – The Fund’s investment performance was shown in comparison to a performance universe consisting of all retail and institutional inflation-protected bond funds as selected by Lipper. The Fund has been in operation for less than 10 years, and the Lipper report showed the Fund’s income return during 2012 to be in the highest or best performing quintile of such performance universe, and on an annualized basis to also be in the highest performing quin-tile of such universe during the previous three-year period and the middle performing quintile of such universe during the previous five-year period. The Lipper report showed the Fund’s 2012 total return to be in the lowest performing quintile of its performance universe, and on an annualized basis to also be in the lowest quintile of such universe during each of the previous three- and five-year periods. In discussing such performance, management expressed the view that the performance universe contained many funds investing only in treasury inflation protected securities (TIPS) and holding longer term TIPS that performed better in 2012 than risk asset classes held in the Fund’s portfolio, and also pointed out that consistent with its objective, the Fund had obtained total returns in excess of the rate of inflation as shown in the CPI unadjusted index in 2012 and the previous annualized three- and five-year periods. While intending to monitor the Fund’s performance on an ongoing basis, the Board did not believe that the Fund’s comparative total returns as shown in the Lipper report warranted any immediate change in portfolio managers.
COMPARATIVE EXPENSES. Consideration was given to a comparative analysis of the management fees and total expense ratio of each Fund compared with those of a group of other funds selected by Lipper as constituting its appropriate Lipper expense group. Lipper expense data is based upon information taken from each fund’s most recent annual report, which reflects historical asset levels that may be quite different from those currently existing, particularly in a period of market volatility. While recognizing such inherent limitation and the fact that expense ratios generally increase as assets decline and decrease as assets grow, the Board believed the independent analysis conducted by Lipper to be an appropriate measure of comparative expenses. In reviewing comparative costs, Lipper provides information on each Fund’s contractual investment management fee in comparison with the contractual investment management fee that would have been charged by other funds within its Lipper expense group assuming they were similar in size to the Fund, as well as the actual total expense ratio of each Fund in comparison with those of its expense group. The Lipper contractual investment management fee analysis includes within such fee any separate administrative fees, and the Lipper total expenses, for comparative consistency, are shown by Lipper for Fund Class A shares. The results of such expense comparisons showed that the contractual investment management fee rate and actual total expense ratio for Franklin Convertible Securities Fund, Franklin Equity Income Fund, Franklin Balanced Fund and Franklin
Semiannual Report | 121
Franklin Investors Securities Trust
Shareholder Information (continued)
Board Review of Investment Management Agreement (continued)
Limited Maturity U.S. Government Securities Fund were in each case below the medians of their respective Lipper expense groups. The Board was satisfied with the comparative contractual investment management fee rate and actual total expense ratios of these Funds as shown in the Lipper reports. The contractual investment management fee and actual total expense ratio for Franklin Real Return Fund was above the median of its Lipper expense group, and its actual total expense ratio was within six basis points above the median of its expense group. The Board found the contractual management fees and total expense ratio of the Fund to be acceptable, noting that its expenses were subsidized by management fee caps on common expenses.
MANAGEMENT PROFITABILITY. The Board also considered the level of profits realized by the Manager and its affiliates in connection with the operation of each Fund. In this respect, the Board reviewed the Fund profitability analysis that addresses the overall profitability of Franklin Templeton’s U.S. fund business, as well as its profits in providing management and other services to each of the individual funds during the 12-month period ended September 30, 2012, being the most recent fiscal year-end for Franklin Resources, Inc., the Manager’s parent. In reviewing the analysis, attention was given to the methodology followed in allocating costs to each Fund, it being recognized that allocation methodologies are inherently subjective and various allocation methodologies may each be reasonable while producing different results. In this respect, the Board noted that, while being continuously refined and reflecting changes in the Manager’s own cost accounting, the cost allocation methodology was consistent with that followed in profitability report presentations for the Funds made in prior years and that the Funds’ independent registered public accounting firm had been engaged by the Manager to periodically review the reasonableness of the allocation methodologies solely for use by the Funds’ Board in reference to the profitability analysis. In reviewing and discussing such analysis, management discussed with the Board its belief that costs incurred in establishing the infrastructure necessary for the type of mutual fund operations conducted by the Manager and its affiliates may not be fully reflected in the expenses allocated to each Fund in determining its profitability, as well as the fact that the level of profits, to a certain extent, reflected operational cost savings and efficiencies initiated by management. The Board also took into account management’s expenditures in improving shareholder services provided the Funds, as well as the need to implement systems and meet additional regulatory and compliance requirements resulting from statutes such as the Sarbanes-Oxley and Dodd Frank Acts and recent SEC and other regulatory requirements. In addition, the Board considered a third-party study comparing the profitability of the Manager’s parent on an overall basis to other publicly held managers broken down to show profitability from management operations exclusive of distribution expenses, as well as profitability including distribution expenses. The Board also considered the extent to which the Manager and its affiliates might derive ancillary benefits from fund operations, including revenues generated from transfer agent services and potential benefits resulting from allocation of fund brokerage and the use of commission dollars to pay for research. Based upon its consideration of all these factors, the Board determined that the level of profits realized by the Manager and its affiliates from providing services to each Fund was not excessive in view of the nature, quality and extent of services provided.
122 | Semiannual Report
Franklin Investors Securities Trust
Shareholder Information (continued)
Board Review of Investment Management Agreement (continued)
ECONOMIES OF SCALE. The Board also considered whether economies of scale are realized by the Manager as the Funds grow larger and the extent to which this is reflected in the level of management fees charged. While recognizing that any precise determination is inherently subjective, the Board noted that based upon the Fund profitability analysis, it appears that as some funds get larger, at some point economies of scale do result in the Manager realizing a larger profit margin on management services provided such a fund. The Board also noted that economies of scale are shared with each Fund and its shareholders through management fee breakpoints so that as a Fund grows in size, its effective management fee rate declines. The management fee structure, which includes administrative expenses, for Franklin Limited Maturity U.S. Government Securities Fund provides an initial fee of 0.625% on the first $100 million of assets; 0.50% on the next $150 million of assets; and 0.45% on assets in excess of $250 million. At 2012 year-end, the Fund’s assets were approximately $537 million. The Board noted the Fund’s favorable contractual management fee rate and total expense ratio in respect to its Lipper expense group, as well as the fact that assets in excess of a fund’s last breakpoint still resulted in an overall lower investment management fee rate and believed that to the extent economies of scale may be realized by the Manager and its affiliates, there was a sharing of benefits with this Fund and its shareholders. Based on their year-end asset levels, all of the other Funds benefited from breakpoints contained in their management fee structure with additional breakpoints continuing beyond such asset levels. The Board believed that to the extent economies of scale may be realized by the Manager and its affiliates, the schedule of fees under the investment management agreement for each of such Funds provides a sharing of benefits with the Funds and their shareholders.
The investment management agreements for Franklin Convertible Securities Fund and Franklin Equity Income Fund cover both investment advisory services and administrative services. In the case of each of the other Funds, such services are provided under separate agreements with a fixed fee of 20 basis points being charged under an administration agreement for each such Fund. At the February 26, 2013, Board meeting, the Board eliminated the separate agreements and approved a new form of investment management agreement for these Funds combining such services. In approving the new form of investment management agreements, the Board took into account the fact that the types of services and aggregate fee, including breakpoints, would be the same as provided under the previous separate agreements and that combining such services was consistent with Lipper’s methodology of considering contractual investment management fees to include any separately charged administrative fee.
Semiannual Report | 123
Franklin Investors Securities Trust
Shareholder Information (continued)
Proxy Voting Policies and Procedures
The Trust’s investment manager has established Proxy Voting Policies and Procedures (Policies) that the Trust uses to determine how to vote proxies relating to portfolio securities. Shareholders may view the Trust’s complete Policies online at franklintempleton.com. Alternatively, shareholders may request copies of the Policies free of charge by calling the Proxy Group collect at (954) 527-7678 or by sending a written request to: Franklin Templeton Companies, LLC, 300 S.E. 2nd Street, Fort Lauderdale, FL 33301, Attention: Proxy Group. Copies of the Trust’s proxy voting records are also made available online at franklintempleton.com and posted on the U.S. Securities and Exchange Commission’s website at sec.gov and reflect the most recent 12-month period ended June 30.
Quarterly Statement of Investments
The Trust files a complete statement of investments with the U.S. Securities and Exchange Commission for the first and third quarters for each fiscal year on Form N-Q. Shareholders may view the filed Form N-Q by visiting the Commission’s website at sec.gov. The filed form may also be viewed and copied at the Commission’s Public Reference Room in Washington, DC. Information regarding the operations of the Public Reference Room may be obtained by calling (800) SEC-0330.
124 | Semiannual Report


| 1
Semiannual Report
Economic and Market Overview
The U.S. economy, as measured by gross domestic product, grew during the six months ended April 30, 2013. Large declines in federal and local government spending, rising energy prices, business disruptions caused by Hurricane Sandy and the continuing effects of the Midwest drought on farm production partially offset the benefit of solid consumer spending. However, generally positive construction, housing, manufacturing and labor market trends suggested the U.S. economic recovery remained largely intact. Consumer sentiment rose to a five-year high, although potential U.S. tax hikes and spending cuts that took effect in 2013 contributed to fluctuations in consumer and business confidence.
In December 2012, the Federal Reserve Board (Fed) announced a 6.5% unemployment target as a guide to maintaining the historically low federal funds target rate. In 2013, the Fed agreed to continue purchases of mortgage-backed securities and long-term Treasuries at a monthly pace of $85 billion. Although inflation rose slightly during the reporting period, the Fed noted little evidence of wage pressures. Economists, business leaders and market watchers were concerned about the U.S. “fiscal cliff,” which meant that unless Congress acted, automatic income tax increases and federal budget cuts would take effect in 2013. They feared these events could cause another U.S. recession. Lawmakers reached a late compromise on January 1, 2013, that maintained some tax cuts for most Americans but increased rates on the wealthiest. Congress, however, was unable to resolve differences related to a series of automatic federal spending cuts known as the “sequester.” The cuts will reduce funding for domestic and defense programs by $85 billion in the current U.S. fiscal year.
The 10-year U.S. Treasury yield declined to 1.70% at period-end from 1.72% on October 31, 2012, after mixed economic data renewed investor fears of sluggish U.S. growth. During the six months under review, investors sought higher bond returns and were willing to assume some additional risk. Below-investment-grade corporate bonds, as measured by the Credit Suisse High Yield Index, delivered solid results and outperformed investment-grade fixed income markets, as measured by the Barclays U.S. Aggregate Index.
The foregoing information reflects our analysis and opinions as of April 30, 2013. The information is not a complete analysis of every aspect of any market, country, industry, security or fund. Statements of fact are from sources considered reliable.
Semiannual Report | 3
Franklin Adjustable
U.S. Government Securities Fund
Your Fund’s Goal and Main Investments: Franklin Adjustable U.S. Government
Securities Fund seeks to provide a high level of current income while providing lower volatility of principal than a fund that invests in fixed-rate securities by investing at least 80% of its net assets in adjustable-rate U.S. government mortgage securities, which are issued or guaranteed by the U.S. government, its agencies or instrumentalities.1 The Fund’s investments may include securities issued by Ginnie Mae and government-sponsored entities, such as Fannie Mae and Freddie Mac.2
4 | Semiannual Report
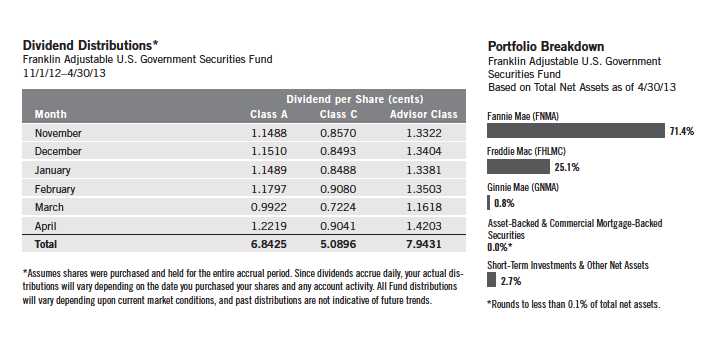
interest rate cycles and tend to have a lower sensitivity to shifts in interest rates. We choose securities using a value-oriented approach, emphasizing the bonds’ economic fundamentals in relation to comparable securities as well as their historical prepayment performance.
Manager’s Discussion
During the period, U.S. economic data releases initially showed a nascent but firming trend. Later economic releases, however, reflected a more moderate, yet still positive, pace of growth. In this environment, U.S. consumers remained fairly strong, although declines in consumer spending suggested that income tax increases took a heavier toll on consumer sentiment than initially indicated. Overall, the labor market remained solid, even though some employment measures missed expectations. The unemployment rate declined from 7.9% to 7.5%, but this slight decline was largely a result of a lower participation rate.4 The U.S. housing market continued to show a gradual but persistent improvement trend. Overall, economic data during the period did not suggest any increased risk that the U.S. Federal Reserve Board (Fed) would exit its quantitative easing policy early.
A Federal Open Market Committee meeting held near period-end did not result in changes to the Fed’s current accommodative monetary policy. The Fed used a cautious tone and acknowledged strains in global financial markets but
4. Source: Bureau of Labor Statistics.
Semiannual Report | 5
What is duration?
Duration is a measure of a bond’s price sensitivity to interest rate changes. In general, a portfolio of securities with a lower duration can be expected to be less sensitive to interest rate changes than a portfolio with a higher duration.
expected growth to remain moderate and gradually improve over the coming quarters. This expectation was based on improving labor market conditions and housing market gains, although the Fed noted the housing sector remained depressed. We believe short-term rates could remain low until the U.S. economy shows significant upward momentum and threats of systematic risk abate. The Fed continued to provide support to the mortgage sector, as prepayment risk remained heightened with the market priced at a premium and mortgage rates near historical lows. With its purchases and reinvestments totaling about $85 billion a month, the Fed remained the largest source of demand for the market. However, potential risks to the sector exist if the Fed eventually tapers or ends its asset purchase program, which could negatively affect mortgage sector spreads.
The Fund employed a conservative strategy that invested primarily in ARMs that are either explicitly or implicitly backed by the U.S. government.1 These include securities issued or guaranteed by Fannie Mae (FNMA), Freddie Mac (FHLMC) or Ginnie Mae.2 The Fund took a collateral-intensive research approach to analyze the prepayment behavior of individual ARMs seeking to identify those with the most attractive prepayment profiles and focused on seasoned ARMs. These securities have typically been through several interest rate cycles and therefore tend to be less sensitive to changes in interest rates, compared to newer issued counterparts. We have found such securities historically have experienced lower volatility than comparable maturity Treasuries and have provided more consistent income.
We continued to focus on seasoned, post-reset FNMA and FHLMC ARM positions with average coupons below three percent. We balanced our portfolio by selling and buying some securities in odd lots, because they generally had what we considered better price profiles than those in round lots.5
We expected prepayments to remain around their recent levels with the potential for gradual increases as homeowners sought to take advantage of mortgage rates near historical lows. However, the factors that kept prepayment rates from reaching elevated levels seen in past prepayment cycles remained in place. Our focus on seasoned, short duration, high-quality ARMs that tend to be less sensitive to interest rate changes benefited performance, as did the Fund’s post-reset London Interbank Offered Rate (LIBOR) indexed securities.
5. An odd lot is an order amount for a security that is less than the normal unit of trading for that particular asset. Odd lots are considered to be anything less than the standard 100 shares. A round lot is a group of 100 shares, or any group of shares that can be evenly divided by 100, such as 500, 2,600 or 14,300. A round lot has historically been the smallest order that can be placed through an exchange.
6 | Semiannual Report
Thank you for your continued participation in Franklin Adjustable U.S. Government Securities Fund. We look forward to serving your future investment needs.
Semiannual Report | 7
Performance Summary as of 4/30/13
Franklin Adjustable U.S. Government Securities Fund
Your dividend income will vary depending on dividends or interest paid by securities in the Fund’s portfolio, adjusted for operating expenses of each class. Capital gain distributions are net profits realized from the sale of portfolio securities. The performance table does not reflect any taxes that a shareholder would pay on Fund dividends, capital gain distributions, if any, or any realized gains on the sale of Fund shares. Total return reflects reinvestment of the Fund’s dividends and capital gain distributions, if any, and any unrealized gains or losses.
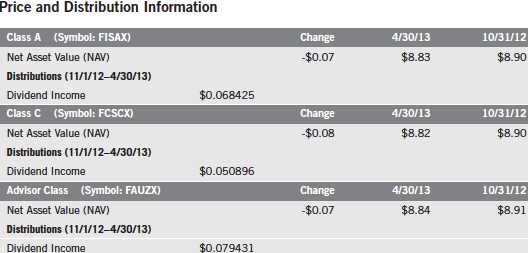
8 | Semiannual Report
Performance Summary (continued)
Performance
Cumulative total return excludes sales charges. Average annual total returns include maximum sales charges. Class A: 2.25% maximum initial sales charge; Class C: 1% contingent deferred sales charge in first year only; Advisor Class: no sales charges.
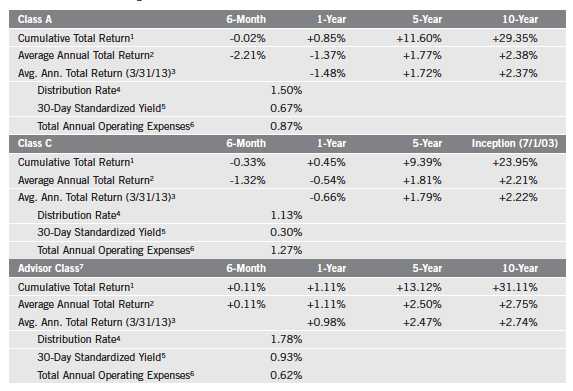
Performance data represent past performance, which does not guarantee future results. Investment return and principal value will fluctuate, and you may have a gain or loss when you sell your shares. Current performance may differ from figures shown. For most recent month-end performance, go to franklintempleton.com or call (800) 342-5236.
Semiannual Report | 9
Performance Summary (continued)
Endnotes
All investments involve risks, including possible loss of principal. Interest rate movements, unscheduled mortgage prepayments and other risk factors will affect the Fund’s share price and yield. Bond prices generally move in the opposite direction of interest rates. As the prices of bonds in a fund adjust to a rise in interest rates, the Fund’s share price may decline. Changes in the financial strength of a bond issuer or in a bond’s credit rating may affect its value. The Fund is actively managed but there is no guarantee that the manager’s investment decisions will produce the desired results. The Fund’s prospectus also includes a description of the main investment risks.
| |
Class C: | Prior to 1/1/04, these shares were offered with an initial sales charge; thus actual total returns would have differed. These shares have higher annual fees and expenses than Class A shares. |
| |
Advisor Class: | Shares are available to certain eligible investors as described in the prospectus. |
1. Cumulative total return represents the change in value of an investment over the periods indicated.
2. Average annual total return represents the average annual change in value of an investment over the periods indicated. Six-month return has not been annualized.
3. In accordance with SEC rules, we provide standardized average annual total return information through the latest calendar quarter.
4. Distribution rate is based on an annualization of the sum of the respective class’s past 30 days’ daily distributions and the maximum offering price (NAV for Classes C and Advisor) per share on 4/30/13.
5. The 30-day standardized yield for the 30 days ended 4/30/13 reflects an estimated yield to maturity (assuming all portfolio securities are held to maturity). It should be regarded as an estimate of the Fund’s rate of investment income, and it may not equal the Fund’s actual income distribution rate (which reflects the Fund’s past dividends paid to shareholders) or the income reported in the Fund’s financial statements.
6. Figures are as stated in the Fund’s current prospectus. In periods of market volatility, assets may decline significantly, causing total annual Fund operating expenses to become higher than the figures shown.
7. Effective 5/15/08, the Fund began offering Advisor Class shares, which do not have sales charges or a Rule 12b-1 plan. Performance quotations for this class reflect the following methods of calculation: (a) For periods prior to 5/15/08, a restated figure is used based upon the Fund’s Class A performance, excluding the effect of Class A’s maximum initial sales charge, but reflecting the effect of the Class A Rule 12b-1 fees; and (b) for periods after 5/15/08, actual Advisor Class performance is used reflecting all charges and fees applicable to that class. Since 5/15/08 (commencement of sales), the cumulative and average annual total returns of Advisor Class shares were +13.07% and +4.44%.
10 | Semiannual Report
Your Fund’s Expenses
Franklin Adjustable U.S. Government Securities Fund
As a Fund shareholder, you can incur two types of costs:
- Transaction costs, including sales charges (loads) on Fund purchases; and
- Ongoing Fund costs, including management fees, distribution and service (12b-1) fees, and other Fund expenses. All mutual funds have ongoing costs, sometimes referred to as operating expenses.
The following table shows ongoing costs of investing in the Fund and can help you understand these costs and compare them with those of other mutual funds. The table assumes a $1,000 investment held for the six months indicated.
Actual Fund Expenses
The first line (Actual) for each share class listed in the table provides actual account values and expenses. The “Ending Account Value” is derived from the Fund’s actual return, which includes the effect of Fund expenses.
You can estimate the expenses you paid during the period by following these steps. Of course, your account value and expenses will differ from those in this illustration:
| 1. | Divide your account value by $1,000. |
| | If an account had an $8,600 value, then $8,600 ÷ $1,000 = 8.6. |
| 2. | Multiply the result by the number under the heading “Expenses Paid During Period.” |
| | If Expenses Paid During Period were $7.50, then 8.6 x $7.50 = $64.50. |
In this illustration, the estimated expenses paid this period are $64.50.
Hypothetical Example for Comparison with Other Funds
Information in the second line (Hypothetical) for each class in the table can help you compare ongoing costs of investing in the Fund with those of other mutual funds. This information may not be used to estimate the actual ending account balance or expenses you paid during the period. The hypothetical “Ending Account Value” is based on the actual expense ratio for each class and an assumed 5% annual rate of return before expenses, which does not represent the Fund’s actual return. The figure under the heading “Expenses Paid During Period” shows the hypothetical expenses your account would have incurred under this scenario. You can compare this figure with the 5% hypothetical examples that appear in shareholder reports of other funds.
Semiannual Report | 11
Your Fund’s Expenses (continued)
Please note that expenses shown in the table are meant to highlight ongoing costs and do not reflect any transaction costs, such as sales charges. Therefore, the second line for each class is useful in comparing ongoing costs only, and will not help you compare total costs of owning different funds. In addition, if transaction costs were included, your total costs would have been higher. Please refer to the Fund prospectus for additional information on operating expenses.

12 | Semiannual Report
Franklin Floating Rate Daily Access Fund
Your Fund’s Goals and Main Investments: Franklin Floating Rate Daily Access Fund seeks to provide a high level of current income and, secondarily, preservation of capital by investing at least 80% of its net assets in income-producing floating interest rate corporate loans and corporate debt securities.
Performance data represent past performance, which does not guarantee future results. Investment return and principal value will fluctuate, and you may have a gain or loss when you sell your shares. Current performance may differ from figures shown. Please visit franklintempleton.com or call (800) 342-5236 for most recent month-end performance.
What are corporate loans?
Corporate loans are typically floating rate loans to corporate borrowers made by a group, or syndicate, of banks and other financial institutions. These loans provide capital to companies for varied purposes, such as merger and acquisition activity, leveraged buyouts or refinancings. These loans are typically syndicated to a group of investors.
This semiannual report for Franklin Floating Rate Daily Access Fund covers the period ended April 30, 2013.
Performance Overview
Franklin Floating Rate Daily Access Fund – Class A delivered a +2.99% cumulative total return for the six months under review. In comparison, the Credit Suisse Leveraged Loan Index (CS LLI), which is designed to mirror the investable universe of the U.S. dollar-denominated leveraged loan market, posted a +4.31% total return.1 You can find the Fund’s long-term performance data in the Performance Summary beginning on page 18.
Corporate Loan Market Overview
A sharp increase in inflows into loan mutual funds, as well as robust formation of collateralized loan obligations (CLOs), contributed to greater demand for loans in the primary and secondary markets during the six-month period. The favorable technical environment generally pushed loan prices higher and credit spreads tighter, leading to stronger principal returns in the broader market, especially among many lower rated loans trading at significant discounts to par. While activity in the primary market increased, the new volume was unable to absorb the additional demand because a majority of deals were related to refi-nancing. The technical imbalance resulted in a rally that pushed more loans to trade at a premium and led to an increase in repricing transactions, refinancing deals that tightened nominal spreads and lowered London Interbank Offered Rate (LIBOR) floors.
Inflows into loan mutual funds accelerated in the middle of the period, reaching the heaviest retail inflows since early 2011. Similar to the prior period of large
1. Source: © 2013 Morningstar. All Rights Reserved. The information contained herein: (1) is proprietary to Morningstar and/or its content providers; (2) may not be copied or distributed; and (3) is not warranted to be accurate, complete or timely. Neither Morningstar nor its content providers are responsible for any damages or losses arising from any use of this information. The index is unmanaged and includes reinvested interest. One cannot invest directly in an index, and an index is not representative of the Fund’s portfolio.
The dollar value, number of shares or principal amount, and names of all portfolio holdings are listed in the Fund’s Statement of Investments (SOI). The SOI begins on page 50.
Semiannual Report | 13

inflows, when many investors expected loans to provide a potential hedge against rising interest rates and possibly inflation, the inflows into loan mutual funds during the period reflected a broader trend toward credit sectors with shorter duration. Furthermore, flows into high yield bond mutual funds were uneven, as some managers shifted investments toward loans as a result of lower bond yields.
CLO issuance also continued to contribute to strong technical conditions as 2012 total volume rose to the highest level since 2007, amid continued demand from banks for CLO tranches rated AAA, as well as demand from non-traditional clients, such as pension and endowment funds, for lower rated tranches and equity. Such demand had typically been dominated by hedge fund investors. The CLO primary market also included the first European CLO since 2008, amid a gradual recovery of investor sentiment in the region. Given expectations of a low default rate environment and high prepayment rates in 2013, many market strategists adjusted expectations for 2013 CLO issuance at levels that would offset the volume of legacy vehicles reaching the end of their reinvestment periods.
In light of inflows and CLO formation helping to push a majority of loans over par, arrangers launched a wave of repricing transactions for a large portion of the loan market. These refinancing transactions included deals that were launched within the prior year, as issuers opted to pay call premiums to investors to refinance their term loans. The heavy volume of repricing caused many loans that were trading at a significant premium to decline slightly as investors avoided paying for loans that were expected to reprice. Offsetting this decline, however, was an increased demand for relatively high-coupon loans with protection against repricing activity, as well as loans trading at a discount to par.
The volume of transactions related to mergers and acquisitions (M&A), including leveraged buyout deals, grew modestly during the six-month period. However, the new M&A deals were unable to compensate for scarcity in supply, which resulted in significant competition for new loans and more deals that reduced spreads in the syndication process. New-issue spreads between loans rated BB and B continued to narrow, as more investors required less incremental spread to compensate for a lower rated credit. Moreover, arrangers altered the structure of loan deals, as covenant-lite loans (loans without financial covenants) represented a larger portion of new institutional volume. Leverage levels increased but remained below 2007 levels and still coincided with wider nominal spreads over LIBOR.
Corporate fundamentals were supportive during the six-month period as earnings growth remained healthy. However, the default rate increased modestly
14 | Semiannual Report

*Assumes shares were purchased and held for the entire accrual period. Since dividends accrue daily, your actual distributions will vary depending on the date you purchased your shares and any account activity. All Fund distributions will vary depending upon current market conditions, and past distributions are not indicative of future trends.
during the period, resulting largely from the expected bankruptcy filings of three large directories publishers, which constituted a large portion of defaulted volume. Despite the slight increase in default rates by principal amount and by number of loans, the rates remained below historical averages. In contrast to the larger loan market, where favorable technical conditions provided additional liquidity, the loans that defaulted during the period tended to be confined to smaller issuers without other sources of liquidity or over-leveraged issuers in industries experiencing secular declines.
Investment Strategy
We use a detailed credit analysis process to select corporate loan and corporate debt securities that meet our criteria. We conduct ongoing credit monitoring of our investments. To help manage the credit risk associated with investing in below-investment-grade securities, we seek to diversify the Fund by investing in a large number of loans of companies that we have identified as having attractive risk/reward profiles, favorable capital structures, strong asset coverage and dominant market shares. This diversification potentially reduces credit risk by spreading assets across many different industries.
Manager’s Discussion
During the six months under review, top contributors to Fund performance included loans that benefited from positive event risk, in particular amendments to credit agreements that helped the companies address their upcoming
Semiannual Report | 15
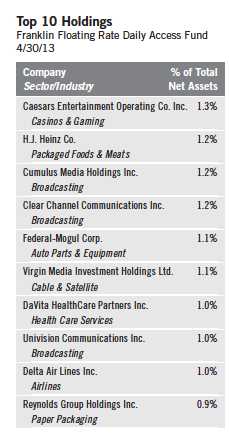
16 | Semiannual Report
maturities. In the diversified media industry,2 Dex One,3 a large U.S. print and online directories publisher, was one of the top contributors to Fund performance. The company benefited from an amendment that allowed a merger with another directories publisher, which led to expectations that Dex One would be able to extend its loan maturities further and allow its investors to continue to earn attractive income. Furthermore, our position in the term loans of Clear Channel Communications, one of the largest U.S. radio and outdoor media companies, boosted performance as the company helped to ease investor concerns about the refinancing of its near-term debt maturities. Prior to the six-month period, the company completed an amendment that exchanged new secured notes for existing term loans, providing cash and flexibility to repay its debt maturities in 2014 and possibly extend the maturity of other term loans.
The Fund maintained modest exposure to second-lien loans at period-end. These investments included the second-lien term loan of Cumulus Media Holdings, the second-largest U.S. radio broadcaster by number of stations. The company’s second-lien term loan appreciated during the period as the relatively higher yield became increasingly attractive in a spread tightening environment, and its portfolio of radio stations provided an attractive asset base for collateral. Relative to the benchmark CS LLI, our overweighting in second-lien term loans, such as Cumulus Media Holdings, contributed to relative performance.
Our allocation to loans with higher credit ratings, in particular our overweighting in loans rated BB- and above and underweighting in loans rated CCC+ and lower, as well as our exclusion of a few larger, higher beta issuers, however, detracted from relative performance.4 For the six months ended April 30, 2013, BB loans returned +3.00%, B loans returned +4.65%, CCC/Split CCC loans returned +9.78%, and Distressed (CC, C and Defaulted) loans returned +12.16%, as measured by the CS LLI.5 As strong technical factors helped drive demand for the overall loan market, many lower rated loans trading at large discounts to par generated higher principal returns and outperformed the broader market. Within lower rated loans, a few of the higher beta issuers we did not own helped drive index performance, including an electric utility company, one of the market’s largest issuers, that rebounded after trading lower earlier in 2012.
Amid a modest increase in M&A-related deals during the six-month period, the Fund’s largest new investments included two of the biggest acquisition deals in
2. The diversified media industry consists of broadcasting, cable and satellite, commercial printing, movies and entertainment, and publishing in the SOI.
3. Dex One consists of Dex Media West and R.H. Donnelley in the SOI.
4. Standard & Poor’s (S&P) is used as the Fund’s primary credit rating source.
5. Source: Credit Suisse. The index reflects combined S&P and Moody’s Investors Service credit ratings.
the period that brought new supply to the market. With its investments in H.J. Heinz and Virgin Media Investment Holdings, the Fund continued to invest in loans of issuers we considered to have adequate liquidity and stable cash flow generation. We invested in the Heinz term loan, which financed Berkshire Hathaway and 3G Capital’s leveraged buyout of the company. Heinz is a processed food products manufacturer and ketchup market leader with strong brand names and market positions, a diversified portfolio and strong track record of organic growth, characteristics we found attractive. The Fund also invested in the term loan of Virgin Media, a provider of broadband Internet, television and mobile telephony services, as the company modestly increased leverage to finance its acquisition by Liberty Global. We found the term loan attractive, because the financing deal resulted in a relatively conservative capital structure and because of the company’s stable subscriber base and growth opportunities in bundled services.
Thank you for your continued participation in Franklin Floating Rate Daily Access Fund. We look forward to serving your future investment needs.
Semiannual Report | 17
Performance Summary as of 4/30/13
Franklin Floating Rate Daily Access Fund
Your dividend income will vary depending on dividends or interest paid by securities in the Fund’s portfolio, adjusted for operating expenses of each class. Capital gain distributions are net profits realized from the sale of portfolio securities. The performance table does not reflect any taxes that a shareholder would pay on Fund dividends, capital gain distributions, if any, or any realized gains on the sale of Fund shares. Total return reflects reinvestment of the Fund’s dividends and capital gain distributions, if any, and any unrealized gains or losses.

18 | Semiannual Report
Performance Summary (continued)
Performance
Cumulative total return excludes sales charges. Average annual total returns include maximum sales charges. Class A: 2.25% maximum initial sales charge; Class C: 1% contingent deferred sales charge in first year only; Advisor Class: no sales charges.

Semiannual Report | 19
Performance Summary (continued)
Endnotes
All investments involve risks, including possible loss of principal. Investors should be aware that the Fund’s share price and yield will fluctuate with market conditions. The Fund should not be considered an alternative to money market funds or certificates of deposit (CDs). The floating rate loans and debt securities in which the Fund invests tend to be rated below investment grade. Investing in higher yielding, lower rated, floating rate loans and debt securities involves greater risk of default, which could result in loss of principal — a risk that may be heightened in a slowing economy. Interest earned on floating rate loans varies with changes in prevailing interest rates. Therefore, while floating rate loans offer higher interest income when interest rates rise, they will also generate less income when interest rates decline. Changes in the financial strength of a bond issuer or in a bond’s credit rating may affect its value. The Fund is actively managed but there is no guarantee that the manager’s investment decisions will produce the desired results. The Fund’s prospectus also includes a description of the main investment risks.
1. Cumulative total return represents the change in value of an investment over the periods indicated.
2. Average annual total return represents the average annual change in value of an investment over the periods indicated. Six-month return has not been annualized.
3. In accordance with SEC rules, we provide standardized average annual total return information through the latest calendar quarter.
4. Distribution rate is based on an annualization of the respective class’s past 30 days’ daily distributions and the maximum offering price (NAV for Classes C and Advisor) per share on 4/30/13.
5. The 30-day standardized yield for the 30 days ended 4/30/13 reflects an estimated yield to maturity (assuming all portfolio securities are held to maturity). It should be regarded as an estimate of the Fund’s rate of investment income, and it may not equal the Fund’s actual income distribution rate (which reflects the Fund’s past dividends paid to shareholders) or the income reported in the Fund’s financial statements.
6. Figures are as stated in the Fund’s current prospectus. In periods of market volatility, assets may decline significantly, causing total annual Fund operating expenses to become higher than the figures shown.
20 | Semiannual Report
Your Fund’s Expenses
Franklin Floating Rate Daily Access Fund
As a Fund shareholder, you can incur two types of costs:
- Transaction costs, including sales charges (loads) on Fund purchases; and
- Ongoing Fund costs, including management fees, distribution and service (12b-1) fees, and other Fund expenses. All mutual funds have ongoing costs, sometimes referred to as operating expenses.
The following table shows ongoing costs of investing in the Fund and can help you understand these costs and compare them with those of other mutual funds. The table assumes a $1,000 investment held for the six months indicated.
Actual Fund Expenses
The first line (Actual) for each share class listed in the table provides actual account values and expenses. The “Ending Account Value” is derived from the Fund’s actual return, which includes the effect of Fund expenses.
You can estimate the expenses you paid during the period by following these steps. Of course, your account value and expenses will differ from those in this illustration:
| 1. | Divide your account value by $1,000. |
| | If an account had an $8,600 value, then $8,600 ÷ $1,000 = 8.6. |
| 2. | Multiply the result by the number under the heading “Expenses Paid During Period.” |
| | If Expenses Paid During Period were $7.50, then 8.6 x $7.50 = $64.50. |
In this illustration, the estimated expenses paid this period are $64.50.
Hypothetical Example for Comparison with Other Funds
Information in the second line (Hypothetical) for each class in the table can help you compare ongoing costs of investing in the Fund with those of other mutual funds. This information may not be used to estimate the actual ending account balance or expenses you paid during the period. The hypothetical “Ending Account Value” is based on the actual expense ratio for each class and an assumed 5% annual rate of return before expenses, which does not represent the Fund’s actual return. The figure under the heading “Expenses Paid During Period” shows the hypothetical expenses your account would have incurred under this scenario. You can compare this figure with the 5% hypothetical examples that appear in shareholder reports of other funds.
Semiannual Report | 21
Your Fund’s Expenses (continued)
Please note that expenses shown in the table are meant to highlight ongoing costs and do not reflect any transaction costs, such as sales charges. Therefore, the second line for each class is useful in comparing ongoing costs only, and will not help you compare total costs of owning different funds. In addition, if transaction costs were included, your total costs would have been higher. Please refer to the Fund prospectus for additional information on operating expenses.
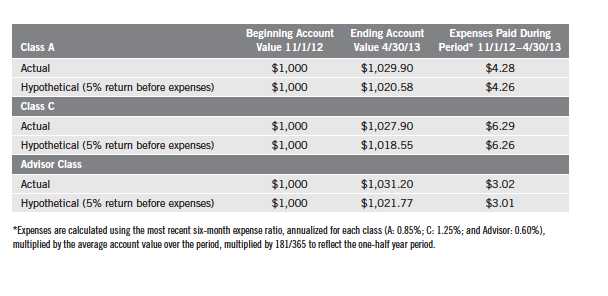
22 | Semiannual Report
Franklin Low Duration Total Return Fund
Your Fund’s Goal and Main Investments: Franklin Low Duration Total Return Fund seeks as high a level of current income as is consistent with prudent investing, while seeking capital preservation. The Fund invests primarily in investment-grade debt securities, including government and corporate debt securities and mortgage- and asset-backed securities, targeting an estimated average portfolio duration of three years or less.
What is duration?
Duration is a measure of a bond’s price sensitivity to interest rate changes. In general, a portfolio of securities with a lower duration can be expected to be less sensitive to interest rate changes than a portfolio with a higher duration.
Performance data represent past performance, which does not guarantee future results. Investment return and principal value will fluctuate, and you may have a gain or loss when you sell your shares. Current performance may differ from figures shown. Please visit franklintempleton.com or call (800) 342-5236 for most recent month-end performance.
We are pleased to bring you Franklin Low Duration Total Return Fund’s semiannual report for the period ended April 30, 2013.
Performance Overview
Franklin Low Duration Total Return Fund – Class A delivered a +1.14% cumulative total return for the six months under review. In comparison, the Fund’s benchmark, the Barclays U.S. Government/Credit Index: 1-3 Year Component, which tracks public obligations of the U.S. Treasury with one to three years to final maturity and publicly issued debt of U.S. government agencies, quasi-federal corporations, and corporate or foreign debt guaranteed by the U.S. government, posted a +0.48% total return.1 You can find more of the Fund’s performance data in the Performance Summary beginning on page 27.
Investment Strategy
We seek to invest in a combination of fixed income securities, primarily from across the investment-grade debt universe. We analyze securities using proprietary and nonproprietary research to help us identify attractive investment opportunities across the entire fixed income opportunity set, on a relative basis. When making investment decisions, we evaluate business cycles, yield curves, and values between and within markets. Through a low duration portfolio, we seek to position the Fund to be less affected by interest rate changes than a fund with a higher duration. In addition, we may use derivative transactions, such as forwards, futures contracts and swap agreements, to obtain net long or short exposures to select currencies, interest rates, countries, duration or credit risks.
1. Source: © 2013 Morningstar. All Rights Reserved. The information contained herein: (1) is proprietary to Morningstar and/or its content providers; (2) may not be copied or distributed; and (3) is not warranted to be accurate, complete or timely. Neither Morningstar nor its content providers are responsible for any damages or losses arising from any use of this information. One cannot invest directly in an index, and an index is not representative of the Fund’s portfolio.
The dollar value, number of shares or principal amount, and names of all portfolio holdings are listed in the Fund’s Statement of Investments (SOI). The SOI begins on page 68.
Semiannual Report | 23

Manager’s Discussion
During the period, U.S. economic data releases initially showed a nascent but firming trend. Later economic releases, however, reflected a more moderate, yet still positive, pace of growth. In this environment, U.S. consumers remained fairly strong, although declines in consumer spending suggested that income tax increases took a heavier toll on consumer sentiment than initially indicated. Overall, the labor market remained solid, even though some employment measures missed expectations. The unemployment rate declined from 7.9% to 7.5%, but this slight decline was largely a result of a lower participation rate.2 The U.S. housing market continued to show a gradual but persistent improvement trend. Overall, economic data during the period did not suggest any increased risk that the U.S. Federal Reserve Board (Fed) would exit its quantitative easing policy early.
A Federal Open Market Committee meeting held near period-end did not result in changes to the Fed’s current accommodative monetary policy. The Fed used a cautious tone and acknowledged strains in global financial markets but expected growth to remain moderate and gradually improve over the coming quarters. This expectation was based on improving labor market conditions and housing market gains, although the Fed noted the housing sector remained depressed. We believe short-term rates could remain low until the U.S. economy shows
2. Source: Bureau of Labor Statistics.
24 | Semiannual Report
significant upward momentum and threats of systematic risk abate. The Fed continued to provide support to the mortgage sector, as prepayment risk remained heightened with the market priced at a premium and mortgage rates near historical lows. With its purchases and reinvestments totaling about $85 billion a month, the Fed remained the largest source of demand for the market. However, potential risks to the sector exist if the Fed eventually tapers or ends its asset purchase program, which could negatively affect mortgage sector spreads.
Higher quality spread sectors generally posted positive yet weak total returns, but many also had negative excess returns that underperformed similar-duration U.S. Treasuries. Investors’ continued search for yield helped high yield bonds post among the best absolute performance during the period, as measured by the Barclays U.S. Corporate High Yield Index, which tracks below-investment-grade bonds. Several other major fixed income sectors delivered positive returns as well, including U.S. Treasury Inflation Protected Securities (TIPS), U.S. dollar-denominated emerging market bonds, commercial mortgage-backed securities (CMBS), investment-grade corporate bonds, asset-backed securities and agency residential mortgage-backed securities (MBS).
Although financial markets were volatile during the period, overall conditions helped risk assets deliver strong results. The portfolio’s corporate credit exposure, particularly to floating rate loans, was a strong contributor to performance. Many of our non-U.S. dollar-denominated bonds benefited from yield accrual and yield curve movements in non-U.S. markets, and the Fund’s foreign currency exposure aided results. Our CMBS positions performed well, largely because of security selection. The Fund’s non-agency residential MBS positions also aided performance. Yield curve positioning detracted from returns as interest rate movements had a negative impact on performance.
During the period, we increased exposure to investment-grade corporate bonds, high yield corporate bonds and CMBS after we found what we considered attractive opportunities in those sectors. We reduced our TIPS and agency MBS positions. We remained convinced that many of the best opportunities in global bond markets were outside of the U.S. and, accordingly, we maintained strong exposure to international bonds and currencies.
The portfolio utilized derivatives, including credit default and currency swaps, currency forwards, Treasury futures, and currency, interest rate swap and credit default swap options, principally as a tool for efficient portfolio management and to manage overall portfolio risk. These derivative transactions may provide the same, or similar, net long or short exposure to select currencies, interest rates, countries, duration or credit risks in a less expensive way than by directly
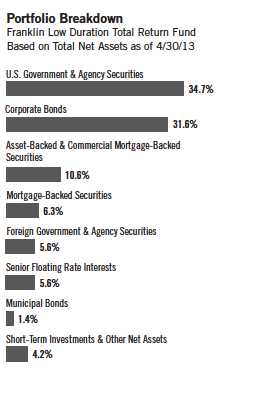
Semiannual Report | 25
purchasing securities. In those markets where portfolio securities are readily available, the cost difference in normal market conditions may be small.
Thank you for your continued participation in Franklin Low Duration Total Return Fund. We look forward to serving your future investment needs.

26 | Semiannual Report
Performance Summary as of 4/30/13
Franklin Low Duration Total Return Fund
Your dividend income will vary depending on dividends or interest paid by securities in the Fund’s portfolio, adjusted for operating expenses of each class. Capital gain distributions are net profits realized from the sale of portfolio securities. The performance table does not reflect any taxes that a shareholder would pay on Fund dividends, capital gain distributions, if any, or any realized gains on the sale of Fund shares. Total return reflects reinvestment of the Fund’s dividends and capital gain distributions, if any, and any unrealized gains or losses.

Semiannual Report | 27
Performance Summary (continued)
Performance1
Cumulative total return excludes sales charges. Aggregate and average annual total returns include maximum sales charges. Class A: 2.25% maximum initial sales charge; Class C: 1% contingent deferred sales charge in first year only; Advisor Class: no sales charges.

28 | Semiannual Report
Performance Summary (continued)
Endnotes
All investments involve risks, including possible loss of principal. Interest rate movements will affect the Fund’s share price and yield. Bond prices generally move in the opposite direction of interest rates. As the prices of bonds in the Fund adjust to a rise in interest rates, the Fund’s share price may decline. The Fund’s investment in derivatives, such as financial futures and option contracts, and the Fund’s use of foreign currency techniques involve special risks as such may not achieve the anticipated benefits and/or may result in losses to the Fund. Some derivatives are particularly sensitive to changes in interest rates. Foreign securities involve special risks, including currency fluctuations and economic and political uncertainty. Changes in the financial strength of a bond issuer or in a bond’s credit rating may affect its value. The Fund is actively managed but there is no guarantee that the manager’s investment decisions will produce the desired results. The Fund’s prospectus also includes a description of the main investment risks.
1. Fund investment results reflect the expense reduction, without which the results would have been lower, and yields for the period would have been 0.50%, 0.12% and 0.76% for Classes A, C and Advisor, respectively.
2. Cumulative total return represents the change in value of an investment over the periods indicated.
3. Average annual total return represents the average annual change in value of an investment over the periods indicated. Six-month return has not been annualized.
4. In accordance with SEC rules, we provide standardized average annual total return information through the latest calendar quarter.
5. Distribution rate is based on an annualization of the sum of the respective class’s past 30 days’ daily distributions and the maximum offering price (NAV for Classes C and Advisor) per share on 4/30/13.
6. The 30-day standardized yield for the 30 days ended 4/30/13 reflects an estimated yield to maturity (assuming all portfolio securities are held to maturity). It should be regarded as an estimate of the Fund’s rate of investment income, and it may not equal the Fund’s actual income distribution rate (which reflects the Fund’s past dividends paid to shareholders) or the income reported in the Fund’s financial statements.
7. Figures are as stated in the Fund’s current prospectus. In periods of market volatility, assets may decline significantly, causing total annual Fund operating expenses to become higher than the figures shown.
8. Aggregate total return represents the change in value of an investment over the period indicated. Since Class C shares have not existed for one year, average annual total returns are not available.
9. Effective 5/15/08, the Fund began offering Advisor Class shares, which do not have sales charges or a Rule 12b-1 plan. Performance quotations for this class reflect the following methods of calculation: (a) For periods prior to 5/15/08, a restated figure is used based upon the Fund’s Class A performance, excluding the effect of Class A’s maximum initial sales charge, but reflecting the effect of the Class A Rule 12b-1 fees; and (b) for periods after 5/15/08, actual Advisor Class performance is used reflecting all charges and fees applicable to that class. Since 5/15/08 (commencement of sales), the cumulative and average annual total returns of Advisor Class shares were +21.82% and +4.06%.
Semiannual Report | 29
Your Fund’s Expenses
Franklin Low Duration Total Return Fund
As a Fund shareholder, you can incur two types of costs:
- Transaction costs, including sales charges (loads) on Fund purchases; and
- Ongoing Fund costs, including management fees, distribution and service (12b-1) fees, and other Fund expenses. All mutual funds have ongoing costs, sometimes referred to as operating expenses.
The following table shows ongoing costs of investing in the Fund and can help you understand these costs and compare them with those of other mutual funds. The table assumes a $1,000 investment held for the six months indicated.
Actual Fund Expenses
The first line (Actual) for each share class listed in the table provides actual account values and expenses. The “Ending Account Value” is derived from the Fund’s actual return, which includes the effect of Fund expenses.
You can estimate the expenses you paid during the period by following these steps. Of course, your account value and expenses will differ from those in this illustration:
| 1. | Divide your account value by $1,000. |
| | If an account had an $8,600 value, then $8,600 ÷ $1,000 = 8.6. |
| 2. | Multiply the result by the number under the heading “Expenses Paid During Period.” |
| | If Expenses Paid During Period were $7.50, then 8.6 x $7.50 = $64.50. |
In this illustration, the estimated expenses paid this period are $64.50.
Hypothetical Example for Comparison with Other Funds
Information in the second line (Hypothetical) for each class in the table can help you compare ongoing costs of investing in the Fund with those of other mutual funds. This information may not be used to estimate the actual ending account balance or expenses you paid during the period. The hypothetical “Ending Account Value” is based on the actual expense ratio for each class and an assumed 5% annual rate of return before expenses, which does not represent the Fund’s actual return. The figure under the heading “Expenses Paid During Period” shows the hypothetical expenses your account would have incurred under this scenario. You can compare this figure with the 5% hypothetical examples that appear in shareholder reports of other funds.
30 | Semiannual Report
Your Fund’s Expenses (continued)
Please note that expenses shown in the table are meant to highlight ongoing costs and do not reflect any transaction costs, such as sales charges. Therefore, the second line for each class is useful in comparing ongoing costs only, and will not help you compare total costs of owning different funds. In addition, if transaction costs were included, your total costs would have been higher. Please refer to the Fund prospectus for additional information on operating expenses.

Semiannual Report | 31
Franklin Total Return Fund
Your Fund’s Goals and Main Investments: Franklin Total Return Fund seeks to provide investors with high current income consistent with preservation of capital. Capital appreciation over the long term is a secondary goal. The Fund invests at least 80% of its assets in investment-grade debt securities. The Fund currently focuses on government and corporate debt securities and mortgage- and asset-backed securities.
Performance data represent past performance, which does not guarantee future results. Investment return and principal value will fluctuate, and you may have a gain or loss when you sell your shares. Current performance may differ from figures shown. Please visit franklintempleton.com or call (800) 342-5236 for most recent month-end performance.
What is duration?
Duration is a measure of a bond’s price sensitivity to interest rate changes. In general, a portfolio of securities with a lower duration can be expected to be less sensitive to interest rate changes than a portfolio with a higher duration.
We are pleased to bring you Franklin Total Return Fund’s semiannual report for the period ended April 30, 2013.
Performance Overview
Franklin Total Return Fund – Class A delivered a +2.25% cumulative total return for the six months under review. In comparison, the Fund’s benchmark, the Barclays U.S. Aggregate Index, which measures the U.S. investment-grade, fixed-rate, taxable bond market with index components for government and corporate, mortgage pass-through and asset-backed securities, posted a +0.90% total return.1 You can find the Fund’s long-term performance data in the Performance Summary beginning on page 36.
Investment Strategy
We seek to invest in a combination of fixed income securities, predominantly from across the investment-grade debt universe. We analyze securities using proprietary and nonproprietary research to help us identify attractive investment opportunities, across the entire fixed income opportunity set, on a relative basis. The Fund may also invest up to 20% of its total assets in noninvestment-grade debt securities. In addition, we may use derivative transactions, such as forwards, futures contracts and swap agreements, to obtain net long or short exposures to select currencies, interest rates, countries, duration or credit risks.
1. Source: © 2013 Morningstar. All Rights Reserved. The information contained herein: (1) is proprietary to Morningstar and/or its content providers; (2) may not be copied or distributed; and (3) is not warranted to be accurate, complete or timely. Neither Morningstar nor its content providers are responsible for any damages or losses arising from any use of this information. The index is unmanaged and includes reinvested interest. One cannot invest directly in an index, and an index is not representative of the Fund’s portfolio.
The dollar value, number of shares or principal amount, and names of all portfolio holdings are listed in the Fund’s Statement of Investments (SOI). The SOI begins on page 98.
32 | Semiannual Report
Manager’s Discussion
During the period, U.S. economic data releases initially showed a nascent but firming trend. Later economic releases, however, reflected a more moderate, yet still positive, pace of growth. In this environment, U.S. consumers remained fairly strong, although declines in consumer spending suggested that income tax increases took a heavier toll on consumer sentiment than initially indicated. Overall, the labor market remained solid, even though some employment measures missed expectations. The unemployment rate declined from 7.9% to 7.5%, but this slight decline was largely a result of a lower participation rate.2 The U.S. housing market continued to show a gradual but persistent improvement trend. Overall, economic data during the period did not suggest any increased risk that the U.S. Federal Reserve Board (Fed) would exit its quantitative easing policy early.
A Federal Open Market Committee meeting held near period-end did not result in changes to the Fed’s current accommodative monetary policy. The Fed used a cautious tone and acknowledged strains in global financial markets but expected growth to remain moderate and gradually improve over the coming quarters. This expectation was based on improving labor market conditions and housing market gains, although the Fed noted the housing sector remained depressed. We believe short-term rates could remain low until the U.S. economy shows significant upward momentum and threats of systematic risk abate. The Fed continued to provide support to the mortgage sector, as prepayment risk remained heightened with the market priced at a premium and mortgage rates near historical lows. With its purchases and reinvestments totaling about $85 billion a month, the Fed remained the largest source of demand for the market. However, potential risks to the sector exist if the Fed eventually tapers or ends its asset purchase program, which could negatively affect mortgage sector spreads.
Higher quality spread sectors generally posted positive yet weak total returns, but many also had negative excess returns that underperformed similar-duration U.S. Treasuries. Investors’ continued search for yield helped high yield bonds post among the best absolute performance during the period, as measured by the Barclays U.S. Corporate High Yield Index, which tracks below-investment-grade bonds. Several other major fixed income sectors delivered positive returns as well, including U.S. Treasury Inflation Protected Securities (TIPS), U.S. dollar-denominated emerging market bonds, commercial mortgage-backed securities (CMBS), investment-grade corporate bonds, asset-backed securities and agency residential mortgage-backed securities (MBS).
2. Source: Bureau of Labor Statistics.

Semiannual Report | 33
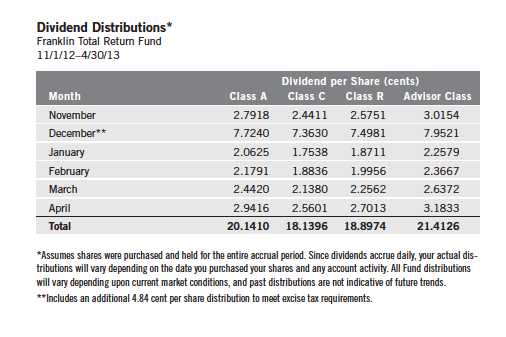
Although financial markets were volatile during the period, overall conditions helped risk assets deliver strong results. The portfolio’s corporate credit exposure, particularly to floating rate loans, was a strong contributor to performance. The investment-grade corporate credit sector contributed slightly. Many of our non-U.S. dollar-denominated bonds benefited from yield accrual and yield curve movements in non-U.S. markets, and the Fund’s foreign currency exposure aided results. Our security selection in agency MBS delivered positive results. Our CMBS positions performed well, largely because of security selection. The Fund’s non-agency residential MBS positions also aided performance. Yield curve positioning detracted from returns as interest rate movements had a negative impact on performance.
During the period, we increased exposure to investment-grade corporate bonds, high yield corporate bonds and CMBS after we found what we considered attractive opportunities in those sectors. We reduced our U.S. TIPS and agency MBS positions. We remained convinced that many of the best opportunities in global bond markets were outside of the U.S. and, accordingly, we maintained strong exposure to international bonds and currencies.
The portfolio utilized derivatives, including credit default and currency swaps, currency forwards, Treasury futures, and currency, interest rate swap and credit default swap options, principally as a tool for efficient portfolio management and to manage overall portfolio risk. These derivative transactions may provide the same, or similar, net long or short exposure to select currencies, interest rates, countries, duration or credit risks in a less expensive way than by directly
34 | Semiannual Report
purchasing securities. In those markets where portfolio securities are readily available, the cost difference in normal market conditions may be small.
Thank you for your continued participation in Franklin Total Return Fund.
We look forward to serving your future investment needs.
Semiannual Report | 35
Performance Summary as of 4/30/13
Franklin Total Return Fund
Your dividend income will vary depending on dividends or interest paid by securities in the Fund’s portfolio, adjusted for operating expenses of each class. Capital gain distributions are net profits realized from the sale of portfolio securities. The performance table does not reflect any taxes that a shareholder would pay on Fund dividends, capital gain distributions, if any, or any realized gains on the sale of Fund shares. Total return reflects reinvestment of the Fund’s dividends and capital gain distributions, if any, and any unrealized gains or losses.
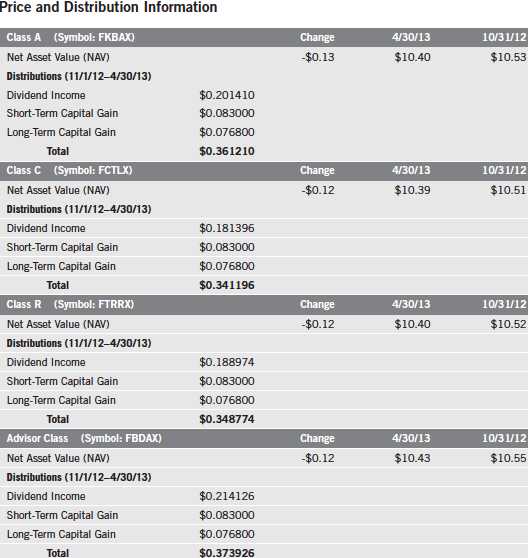
36 | Semiannual Report
Performance Summary (continued)

Performance data represent past performance, which does not guarantee future results. Investment return and principal value will fluctuate, and you may have a gain or loss when you sell your shares. Current performance may differ from figures shown. For most recent month-end performance, go to franklintempleton.com or call (800) 342-5236.
The investment manager and administrator have contractually agreed to waive or assume certain expenses so that common expenses (excluding the Rule 12b-1 fees and acquired fund fees and expenses) for each class of the Fund do not exceed 0.63% (other than certain nonroutine expenses) until 2/28/14.
Semiannual Report | 37
Performance Summary (continued)
Endnotes
All investments involve risks, including possible loss of principal. Interest rate movements and mortgage prepayments will affect the Fund’s share price and yield. Bond prices generally move in the opposite direction of interest rates. Thus, as prices of bonds in the Fund adjust to a rise in interest rates, the Fund’s share price may decline. Investing in derivative securities such as financial futures and option contracts involves special risks. The risks associated with higher yielding, lower rated securities (commonly called junk bonds) include higher risk of default and loss of principal. Investment in foreign securities also involves special risks, including currency fluctuations, and political and economic uncertainty. Investing in derivative securities, such as financial futures and option contracts, and the use of foreign currency techniques involve special risks as such may not achieve the anticipated benefits and/or may result in losses to the Fund. The Fund is actively managed but there is no guarantee that the manager’s investment decisions will produce the desired results. The Fund’s prospectus also includes a description of the main investment risks.

1. Fund investment results reflect the expense reduction, without which the results would have been lower, and yields for the period would have been 1.54%, 1.21%, 1.35% and 1.85% for Classes A, C, R and Advisor, respectively.
2. Cumulative total return represents the change in value of an investment over the periods indicated.
3. Average annual total return represents the average annual change in value of an investment over the periods indicated. Six-month return has not been annualized.
4. In accordance with SEC rules, we provide standardized average annual total return information through the latest calendar quarter.
5. Distribution rate is based on an annualization of the sum of the respective class’s past 30 days’ daily distributions and the maximum offering price (NAV for Classes C, R and Advisor) per share on 4/30/13.
6. The 30-day standardized yield for the 30 days ended 4/30/13 reflects an estimated yield to maturity (assuming all portfolio securities are held to maturity). It should be regarded as an estimate of the Fund’s rate of investment income, and it may not equal the Fund’s actual income distribution rate (which reflects the Fund’s past dividends paid to shareholders) or the income reported in the Fund’s financial statements.
7. Figures are as stated in the Fund’s current prospectus. In periods of market volatility, assets may decline significantly, causing total annual Fund operating expenses to become higher than the figures shown.
38 | Semiannual Report
Your Fund’s Expenses
As a Fund shareholder, you can incur two types of costs:
- Transaction costs, including sales charges (loads) on Fund purchases; and
- Ongoing Fund costs, including management fees, distribution and service (12b-1) fees, and other Fund expenses. All mutual funds have ongoing costs, sometimes referred to as operating expenses.
The following table shows ongoing costs of investing in the Fund and can help you understand these costs and compare them with those of other mutual funds. The table assumes a $1,000 investment held for the six months indicated.
Actual Fund Expenses
The first line (Actual) for each share class listed in the table provides actual account values and expenses. The “Ending Account Value” is derived from the Fund’s actual return, which includes the effect of Fund expenses.
You can estimate the expenses you paid during the period by following these steps. Of course, your account value and expenses will differ from those in this illustration:
| 1. | Divide your account value by $1,000. |
| | If an account had an $8,600 value, then $8,600 ÷ $1,000 = 8.6. |
| 2. | Multiply the result by the number under the heading “Expenses Paid During Period.” |
| | If Expenses Paid During Period were $7.50, then 8.6 x $7.50 = $64.50. |
In this illustration, the estimated expenses paid this period are $64.50.
Hypothetical Example for Comparison with Other Funds
Information in the second line (Hypothetical) for each class in the table can help you compare ongoing costs of investing in the Fund with those of other mutual funds. This information may not be used to estimate the actual ending account balance or expenses you paid during the period. The hypothetical “Ending Account Value” is based on the actual expense ratio for each class and an assumed 5% annual rate of return before expenses, which does not represent the Fund’s actual return. The figure under the heading “Expenses Paid During Period” shows the hypothetical expenses your account would have incurred under this scenario. You can compare this figure with the 5% hypothetical examples that appear in shareholder reports of other funds.
Semiannual Report | 39
Your Fund’s Expenses (continued)
Please note that expenses shown in the table are meant to highlight ongoing costs and do not reflect any transaction costs, such as sales charges. Therefore, the second line for each class is useful in comparing ongoing costs only, and will not help you compare total costs of owning different funds. In addition, if transaction costs were included, your total costs would have been higher. Please refer to the Fund prospectus for additional information on operating expenses.

40 | Semiannual Report

Semiannual Report | The accompanying notes are an integral part of these financial statements. | 41
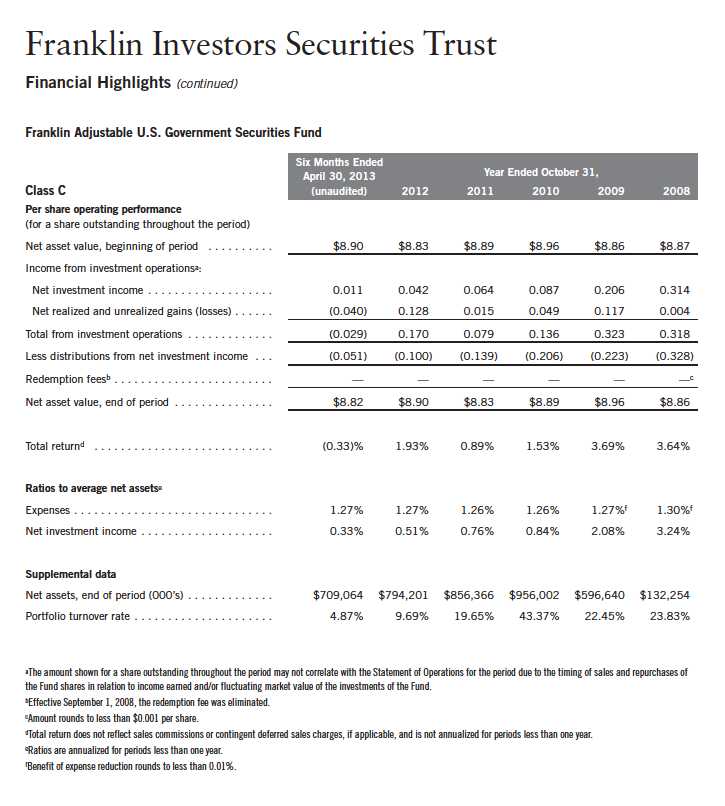
42 | The accompanying notes are an integral part of these financial statements. | Semiannual Report
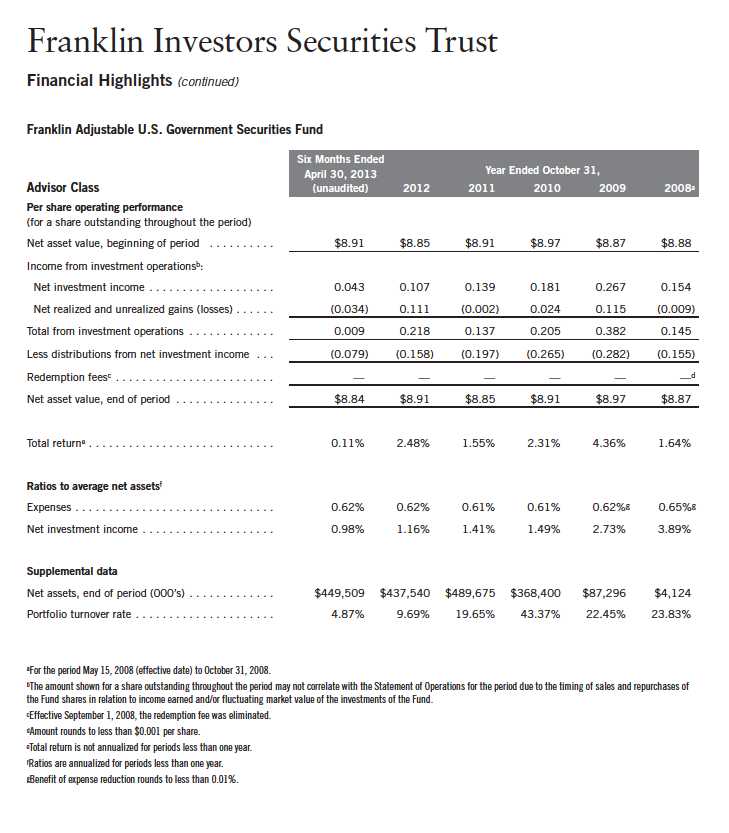
Semiannual Report | The accompanying notes are an integral part of these financial statements. | 43

44 | Semiannual Report
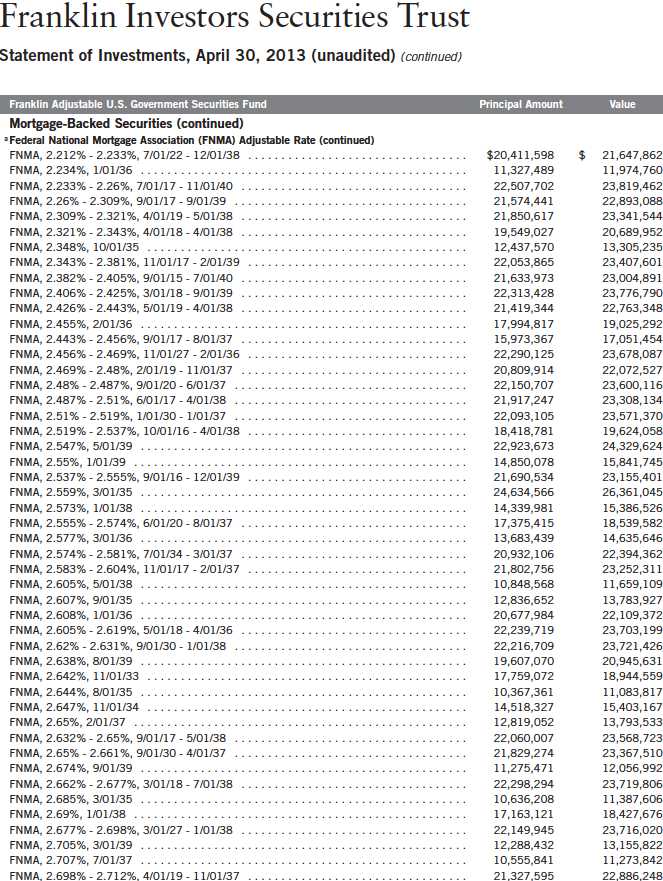
Semiannual Report | 45
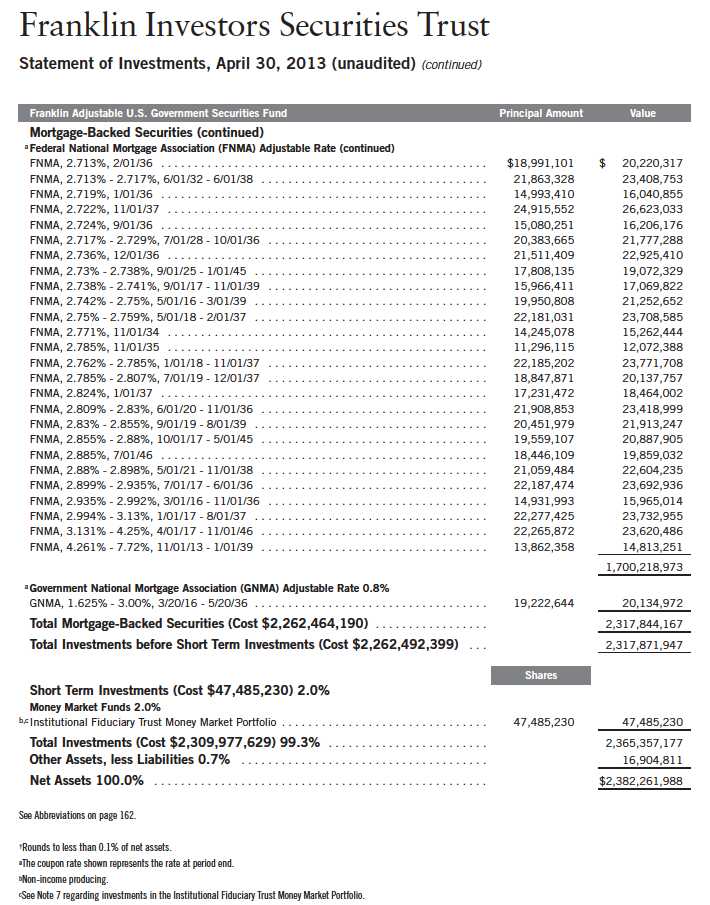
46 | The accompanying notes are an integral part of these financial statements. | Semiannual Report

Semiannual Report | The accompanying notes are an integral part of these financial statements. | 47
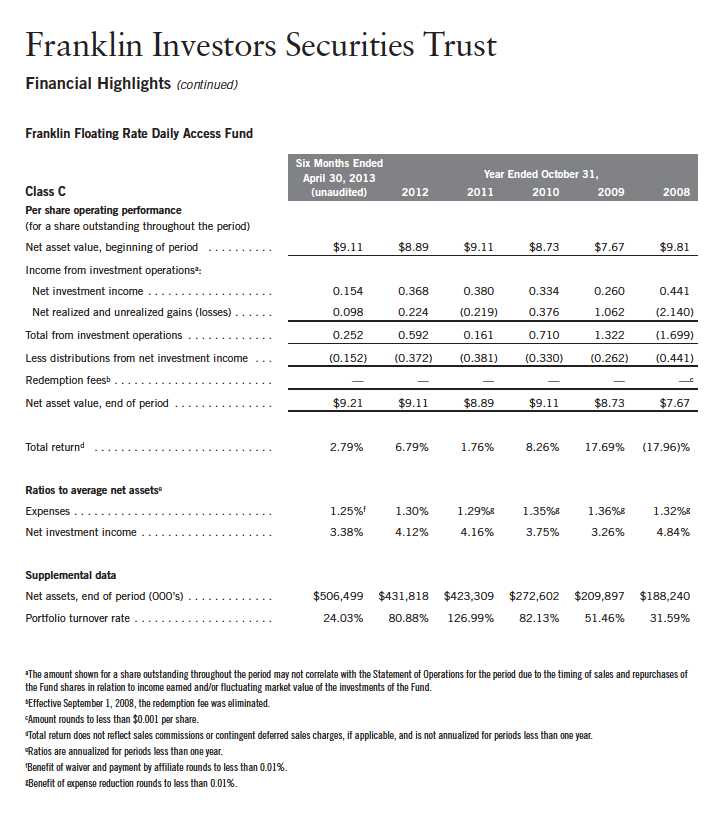
48 | The accompanying notes are an integral part of these financial statements. | Semiannual Report

Semiannual Report | The accompanying notes are an integral part of these financial statements. | 49
Franklin Investors Securities Trust
Statement of Investments, April 30, 2013 (unaudited)

50 | Semiannual Report
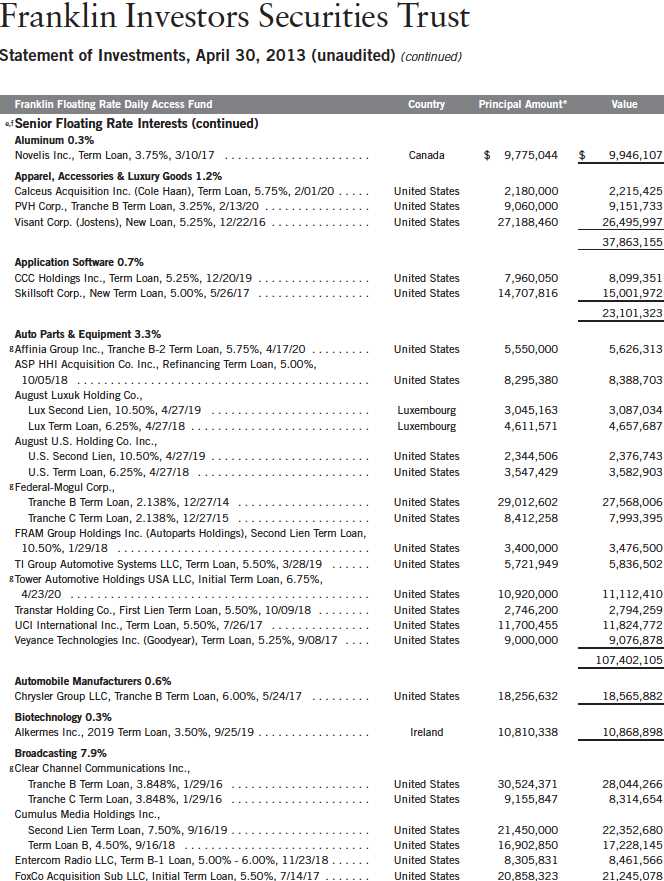
Semiannual Report | 51
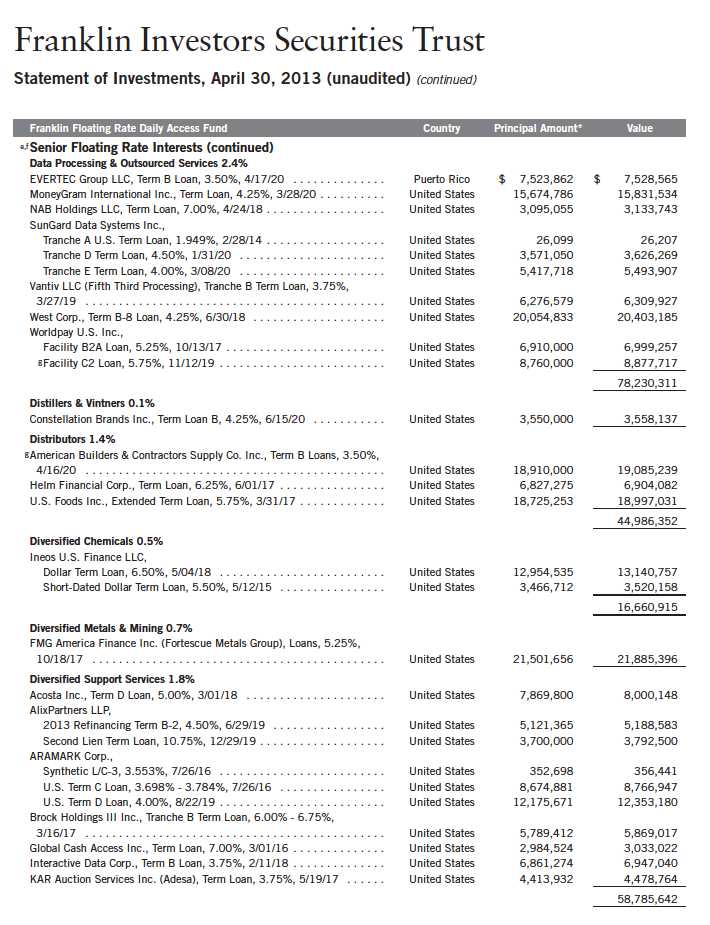
54 | Semiannual Report

Semiannual Report | 55

56 | Semiannual Report

Semiannual Report | 57
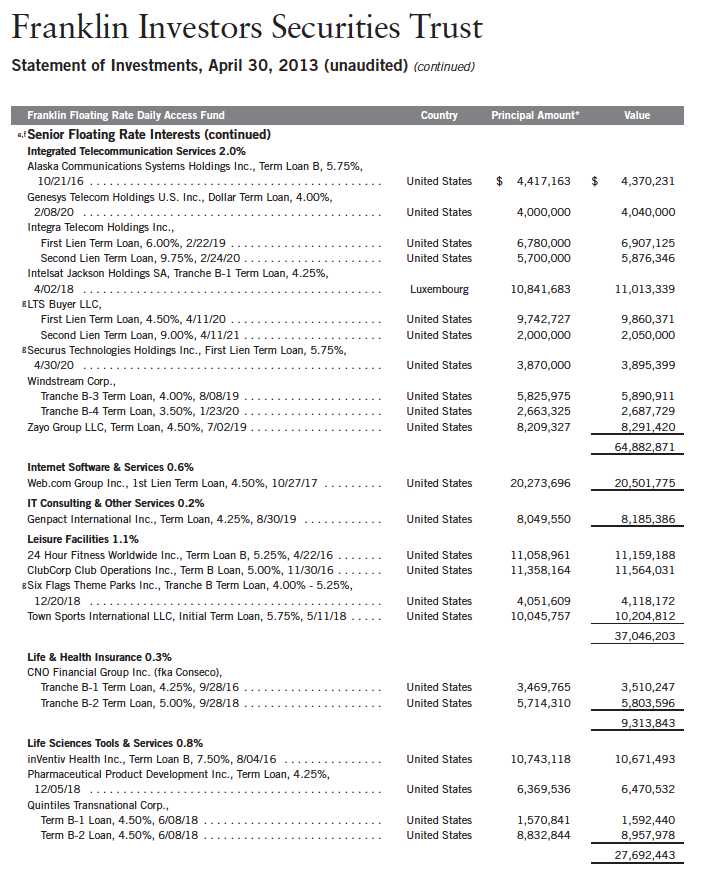
58 | Semiannual Report
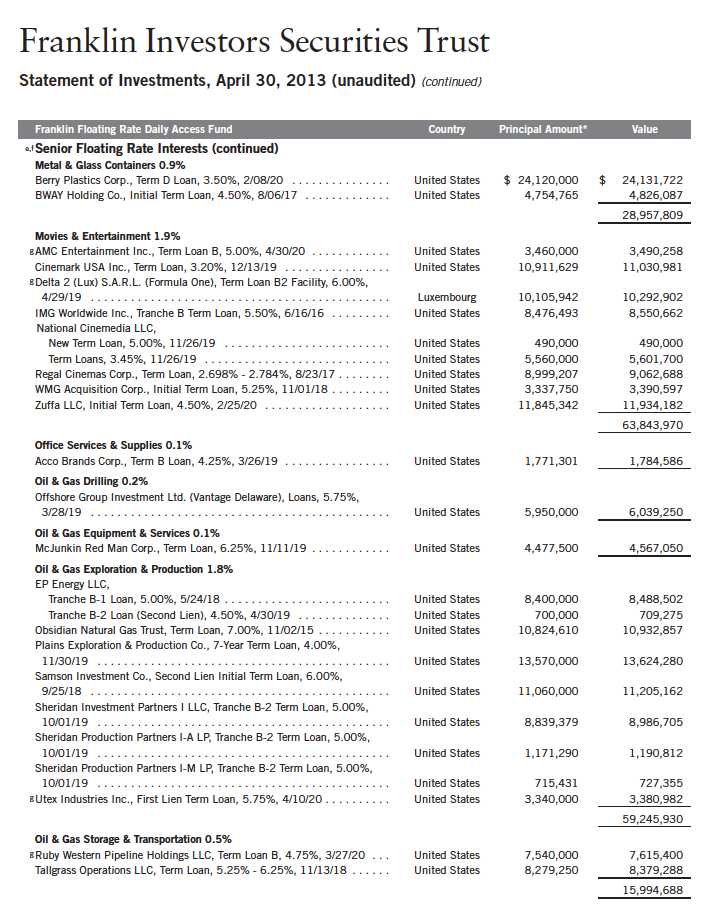
Semiannual Report | 59

60 | Semiannual Report
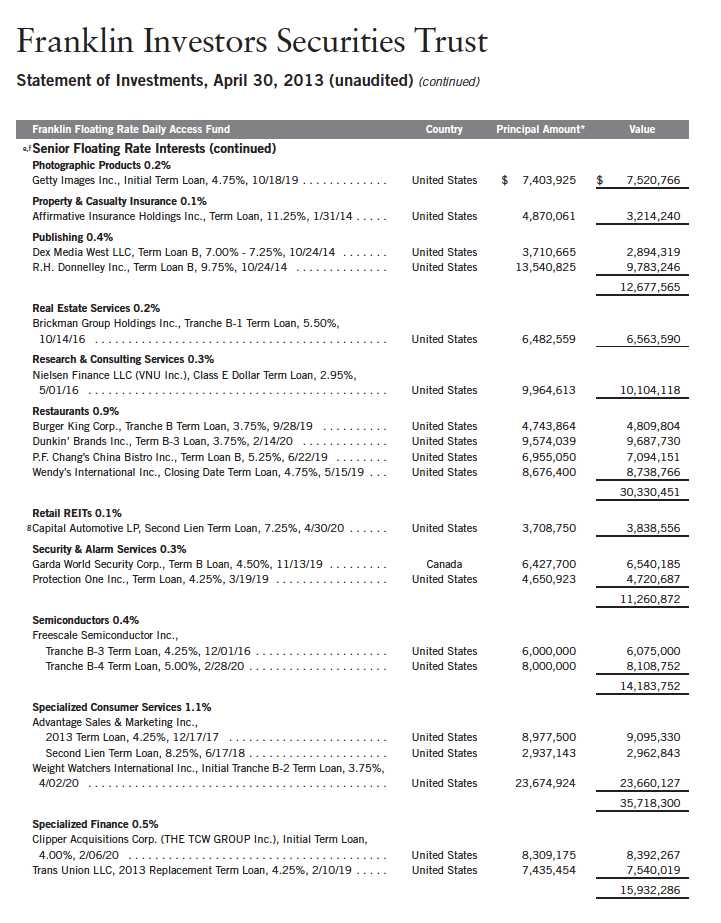
Semiannual Report | 61
Franklin Investors Securities Trust
Statement of Investments, April 30, 2013 (unaudited) (continued)

62 | Semiannual Report

Semiannual Report | 63
Franklin Investors Securities Trust
Statement of Investments, April 30, 2013 (unaudited) (continued)
64 | The accompanying notes are an integral part of these financial statements. | Semiannual Report
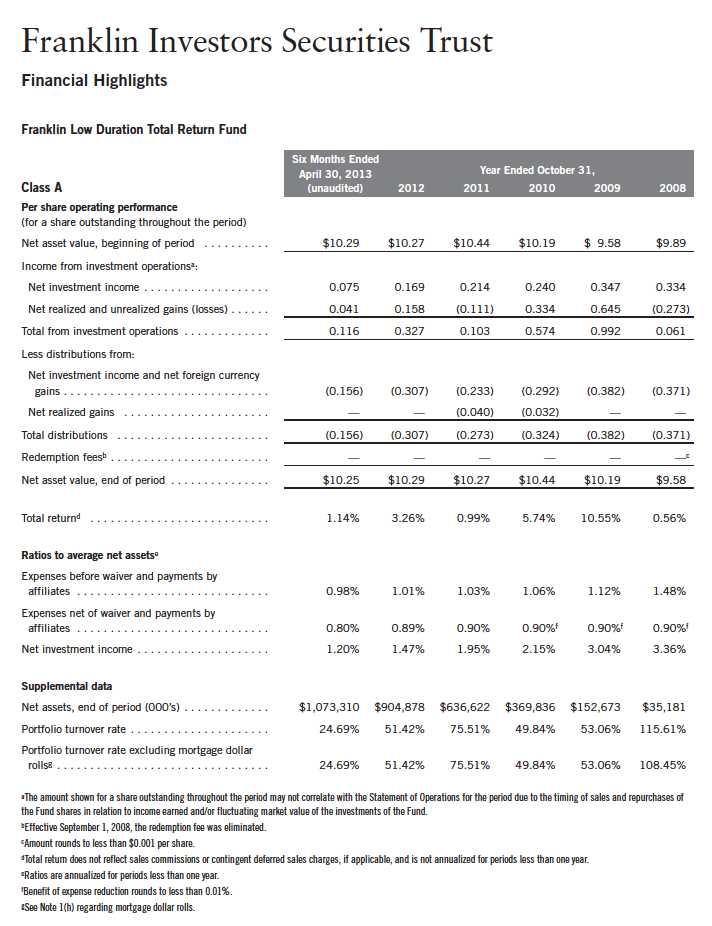
Semiannual Report | The accompanying notes are an integral part of these financial statements. | 65
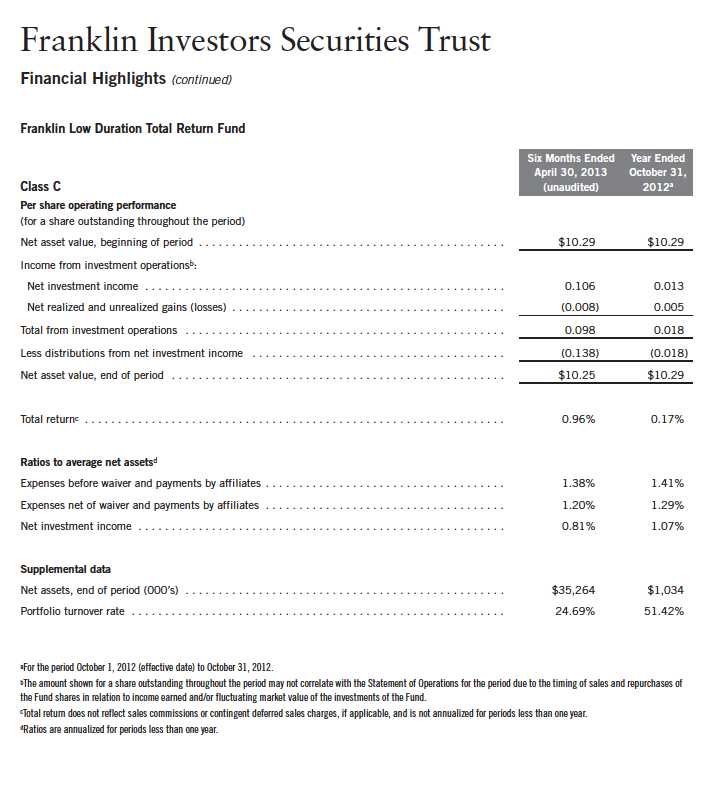
66 | The accompanying notes are an integral part of these financial statements. | Semiannual Report

Semiannual Report | The accompanying notes are an integral part of these financial statements. | 67
Franklin Investors Securities Trust
Statement of Investments, April 30, 2013 (unaudited)

68 | Semiannual Report
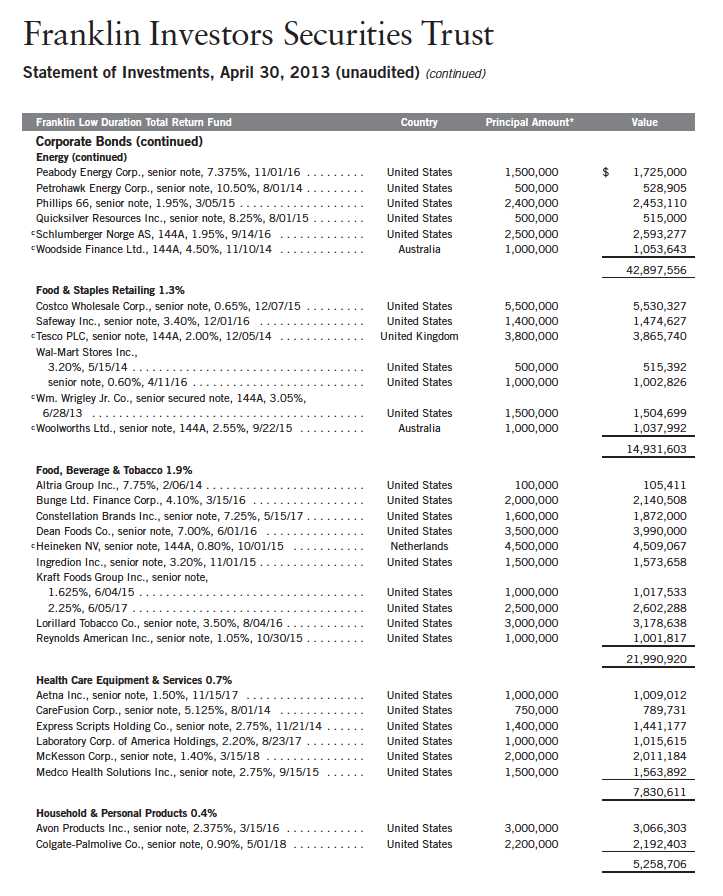
Semiannual Report | 71
Franklin Investors Securities Trust
Statement of Investments, April 30, 2013 (unaudited) (continued)
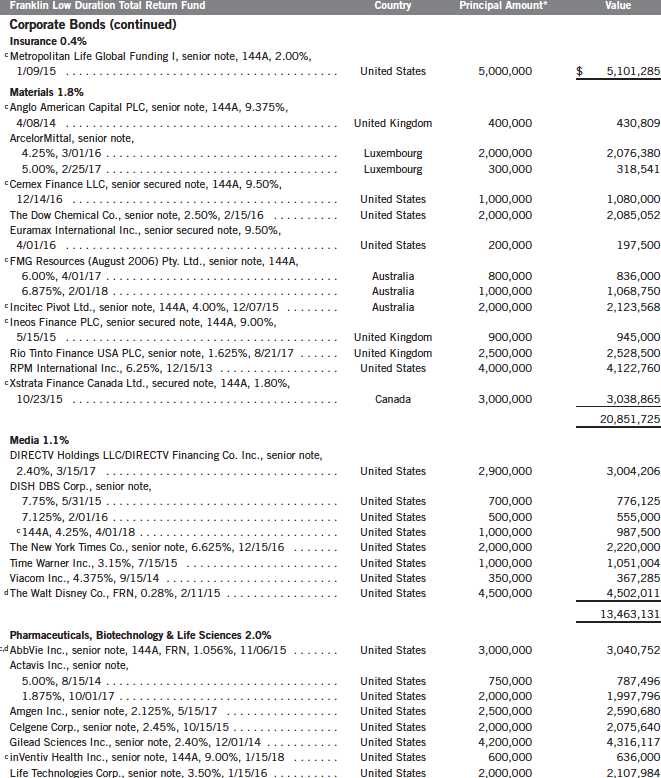
72 | Semiannual Report
Franklin Investors Securities Trust
Statement of Investments, April 30, 2013 (unaudited) (continued)
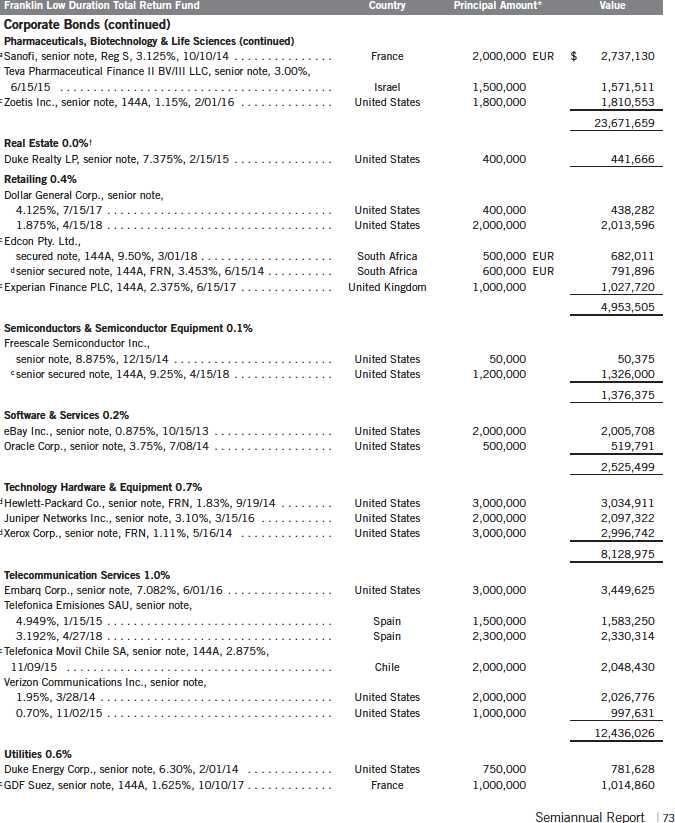
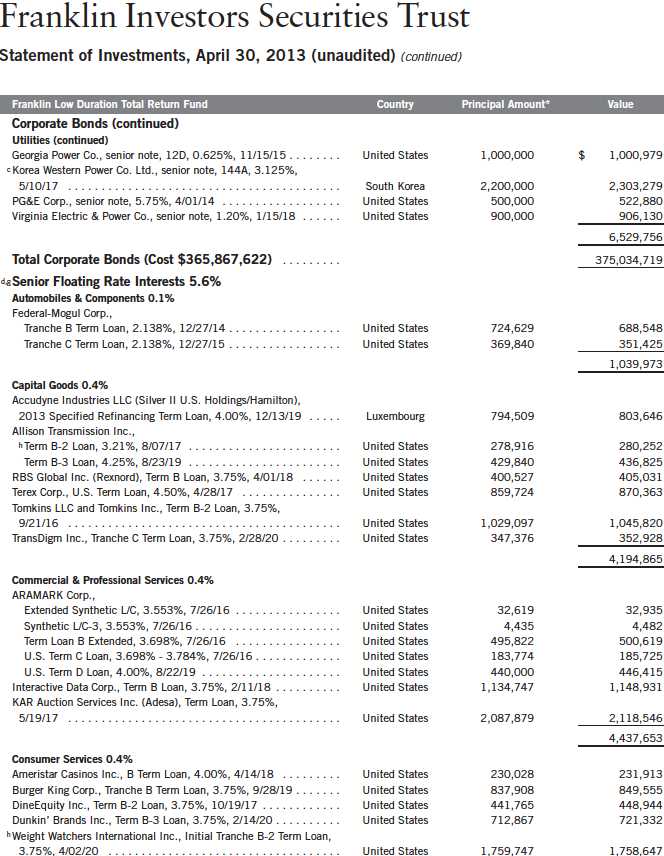
74 | Semiannual Report
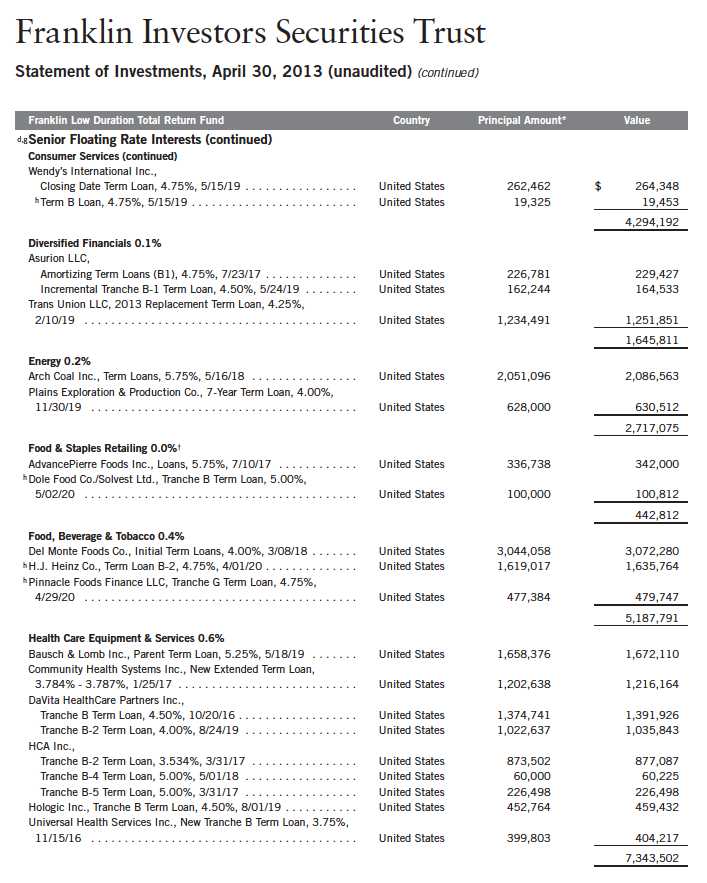
Semiannual Report | 75

76 | Semiannual Report
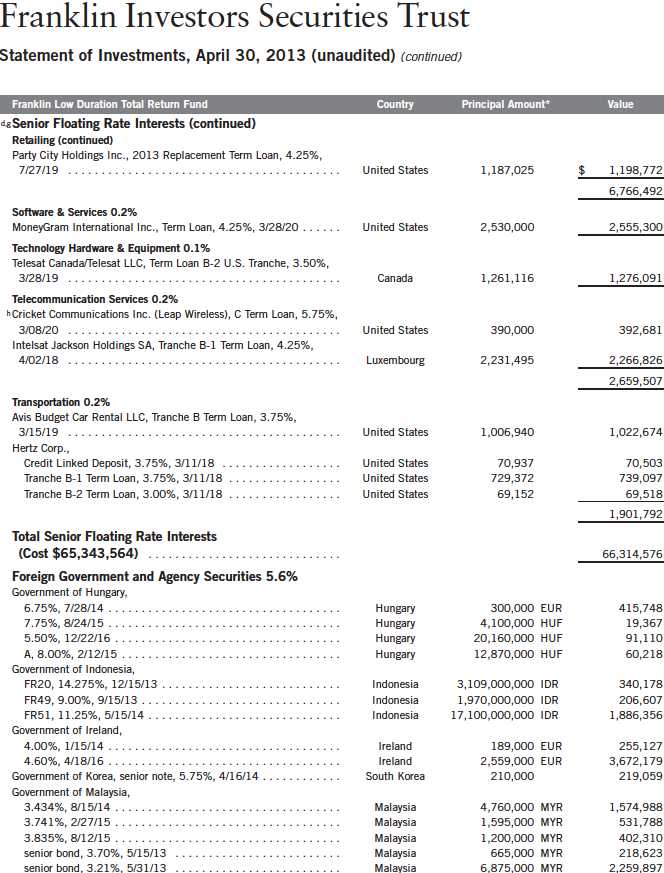
Semiannual Report | 77
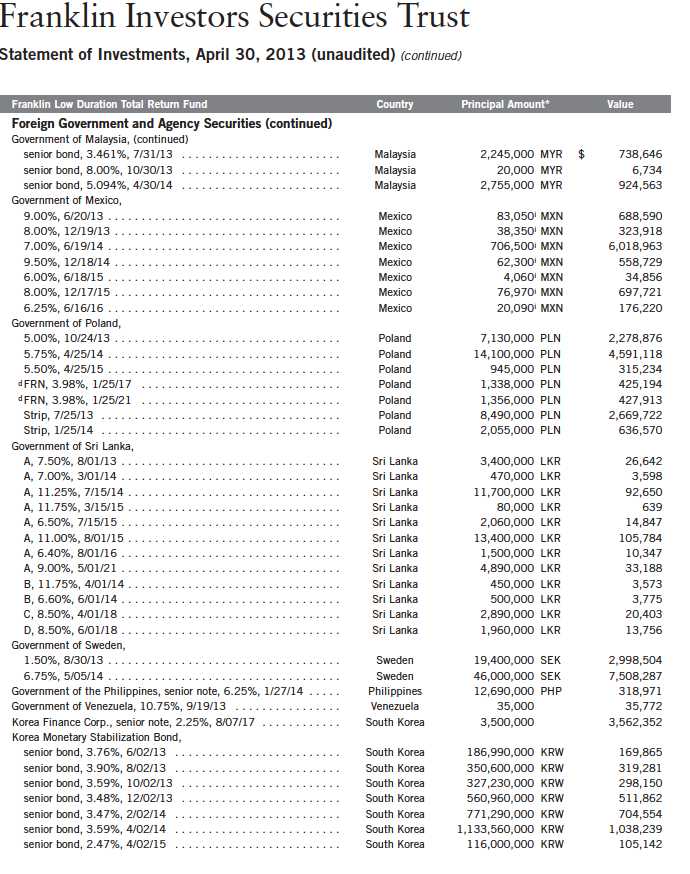
78 | Semiannual Report

Semiannual Report | 79
Franklin Investors Securities Trust
Statement of Investments, April 30, 2013 (unaudited) (continued)
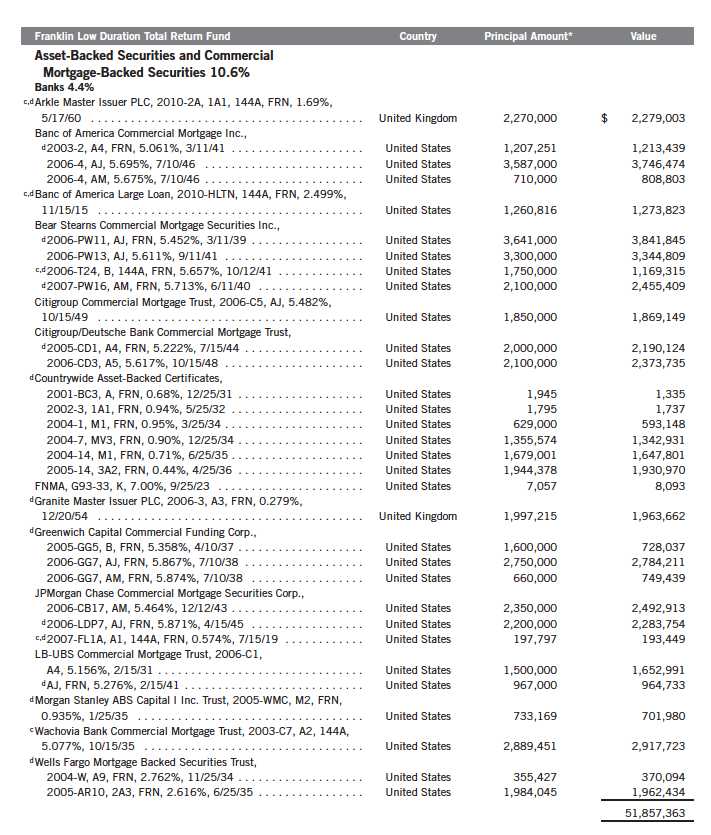
80 | Semiannual Report
Franklin Investors Securities Trust
Statement of Investments, April 30, 2013 (unaudited) (continued)
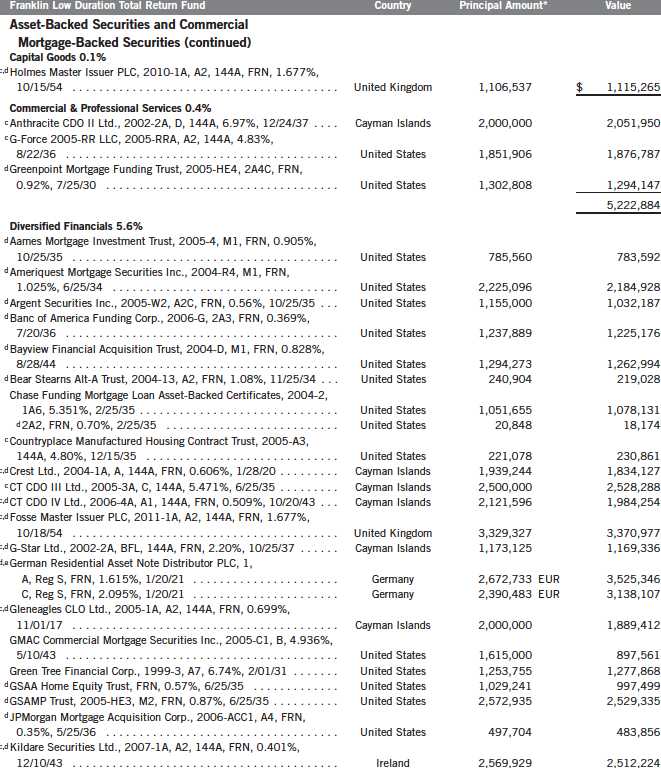
Semiannual Report | 81
Franklin Investors Securities Trust
Statement of Investments, April 30, 2013 (unaudited) (continued)
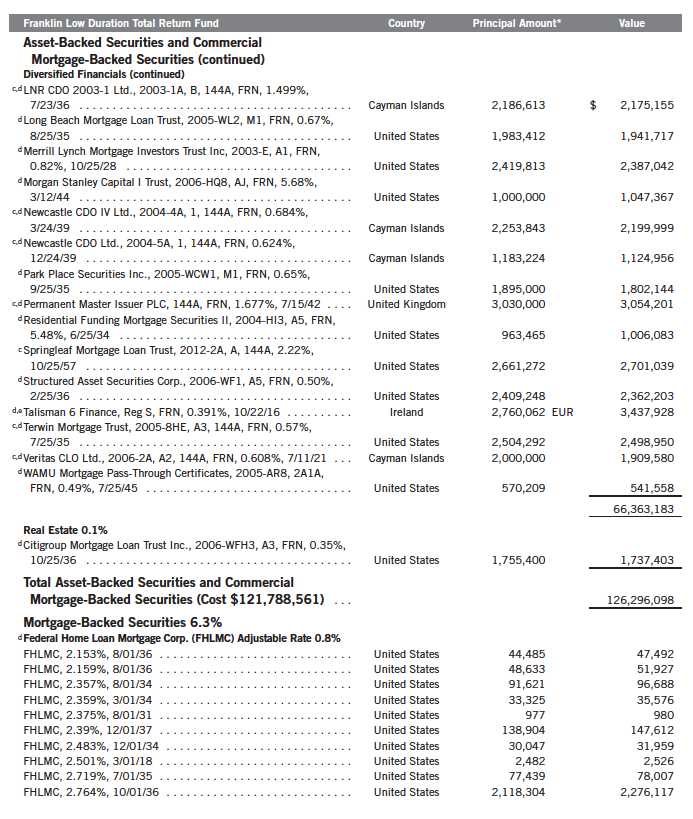
82 | Semiannual Report
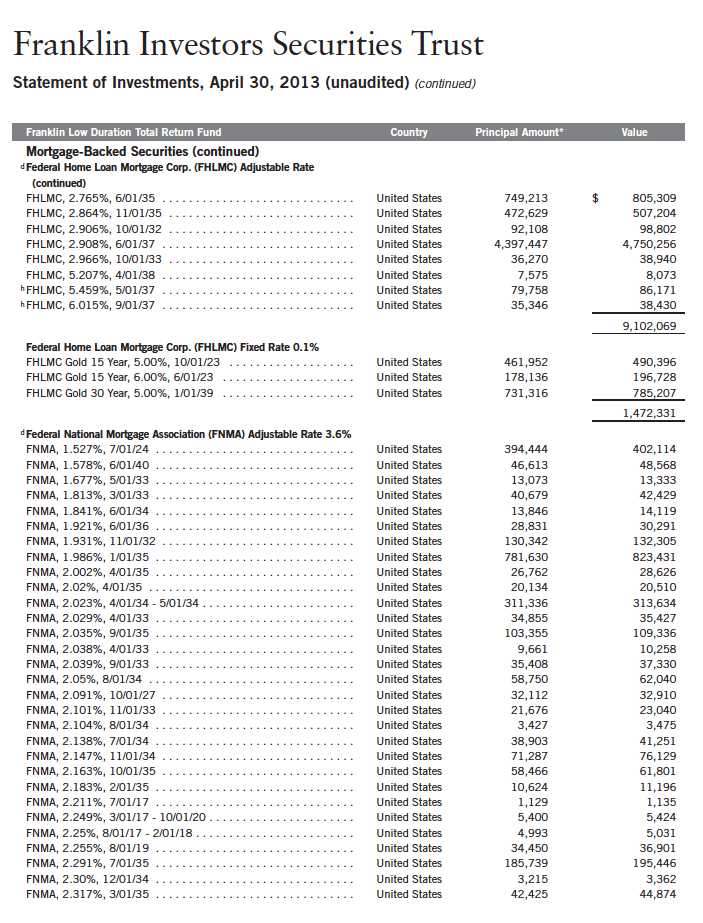
Semiannual Report | 83

84 | Semiannual Report
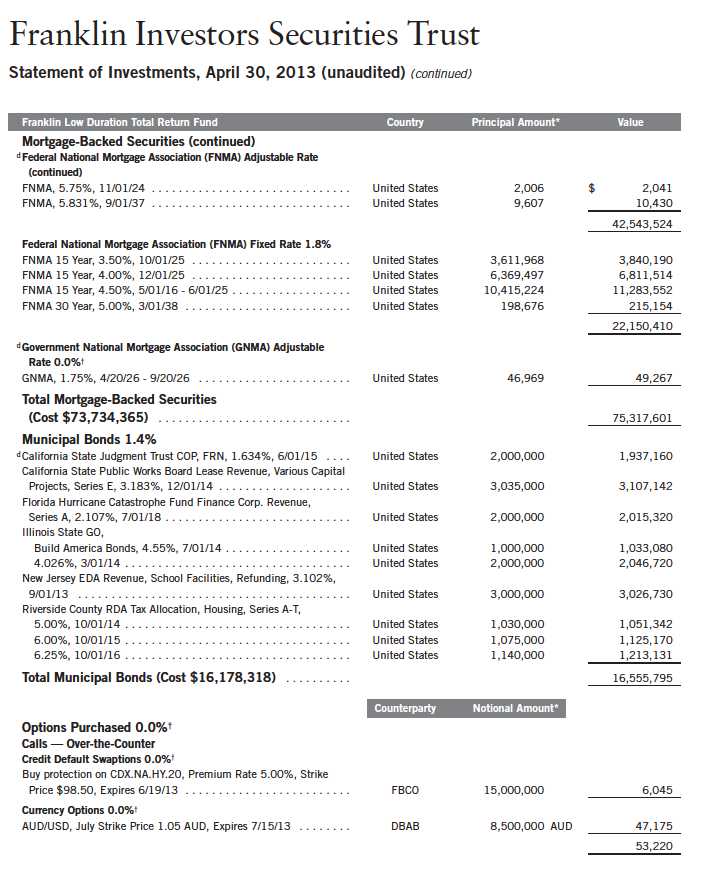
Semiannual Report | 85
Franklin Investors Securities Trust
Statement of Investments, April 30, 2013 (unaudited) (continued)

86 | Semiannual Report
Franklin Investors Securities Trust
Statement of Investments, April 30, 2013 (unaudited) (continued)
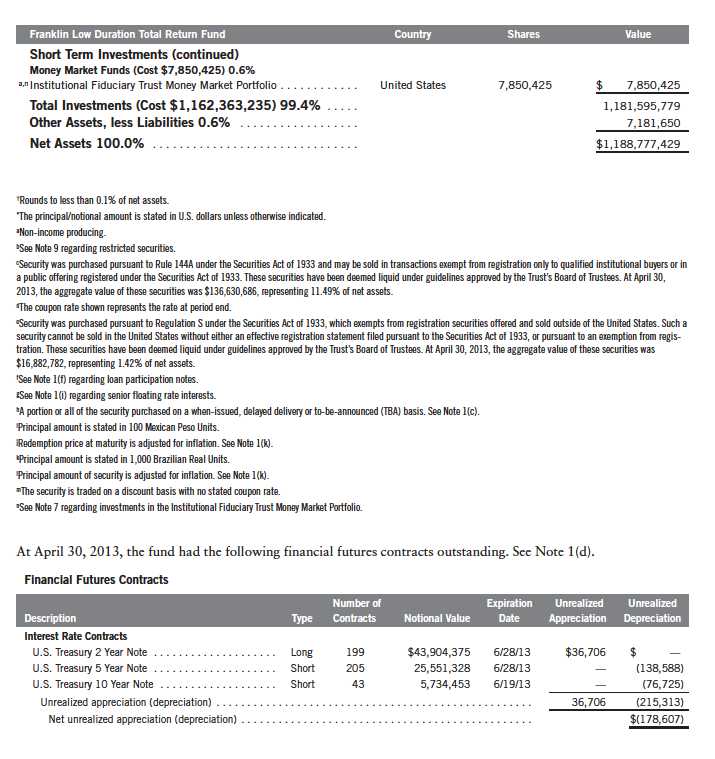
Semiannual Report | 87
Franklin Investors Securities Trust
Statement of Investments, April 30, 2013 (unaudited) (continued)
Franklin Low Duration Total Return Fund
At April 30, 2013, the fund had the following forward exchange contracts outstanding. See Note 1(d).


90 | Semiannual Report
Franklin Investors Securities Trust
Statement of Investments, April 30, 2013 (unaudited) (continued)
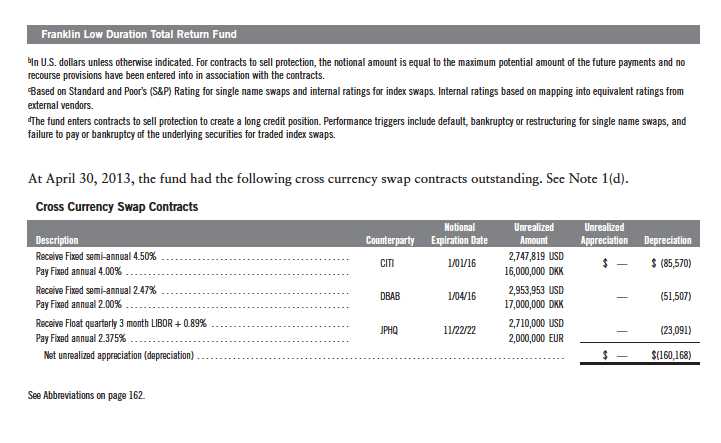
Semiannual Report | The accompanying notes are an integral part of these financial statements. | 93
Franklin Investors Securities Trust
Statement of Investments, April 30, 2013 (unaudited)

98 | Semiannual Report

Semiannual Report | 99
Franklin Investors Securities Trust
Statement of Investments, April 30, 2013 (unaudited) (continued)

100 | Semiannual Report

102 | Semiannual Report
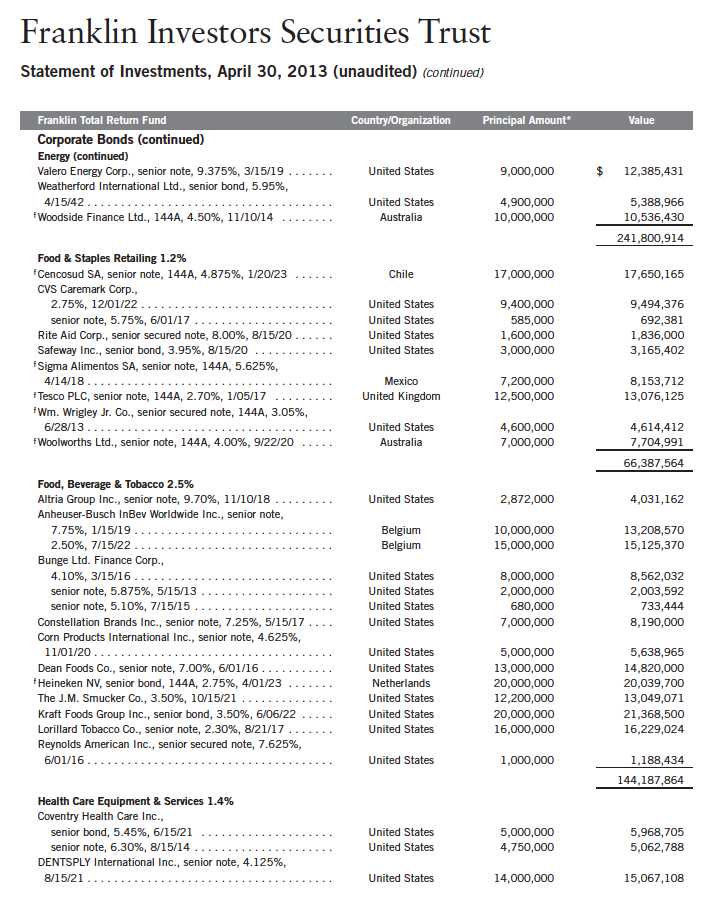
Semiannual Report | 103
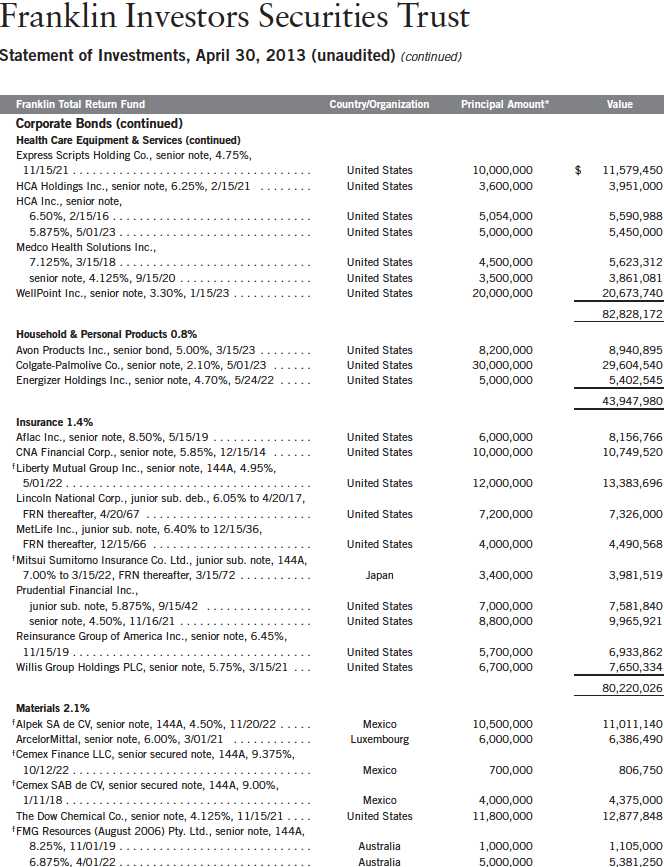
104 | Semiannual Report
Franklin Investors Securities Trust
Statement of Investments, April 30, 2013 (unaudited) (continued)
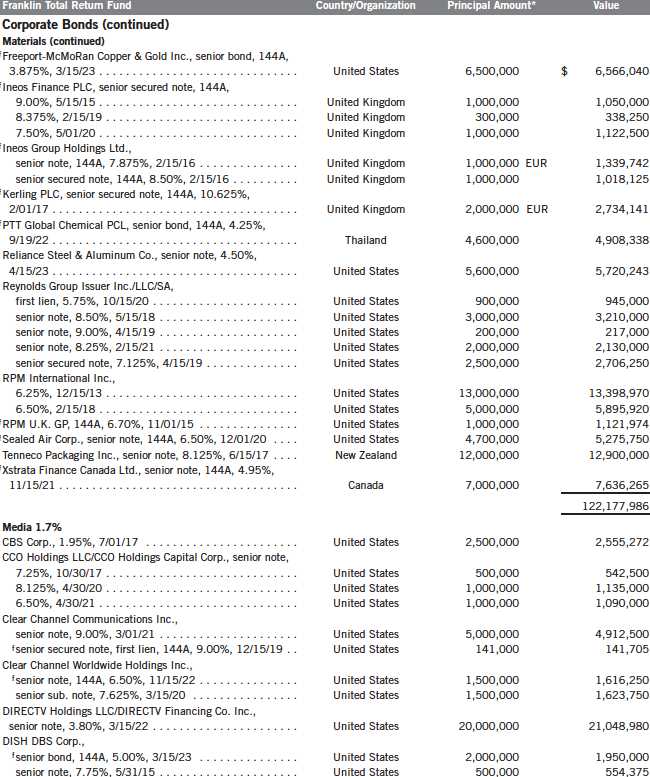
Semiannual Report | 105
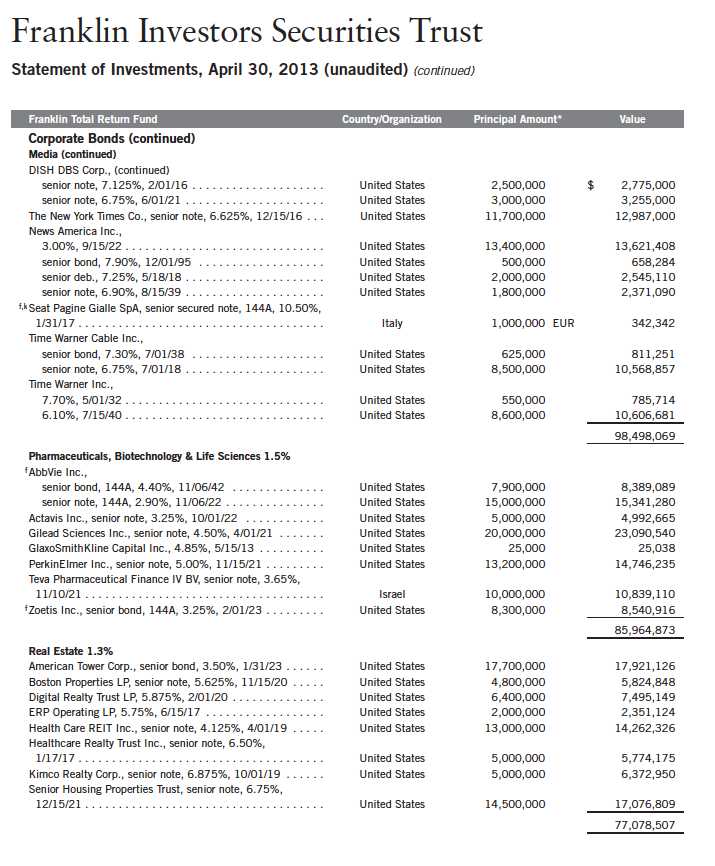
106 | Semiannual Report

Semiannual Report | 107
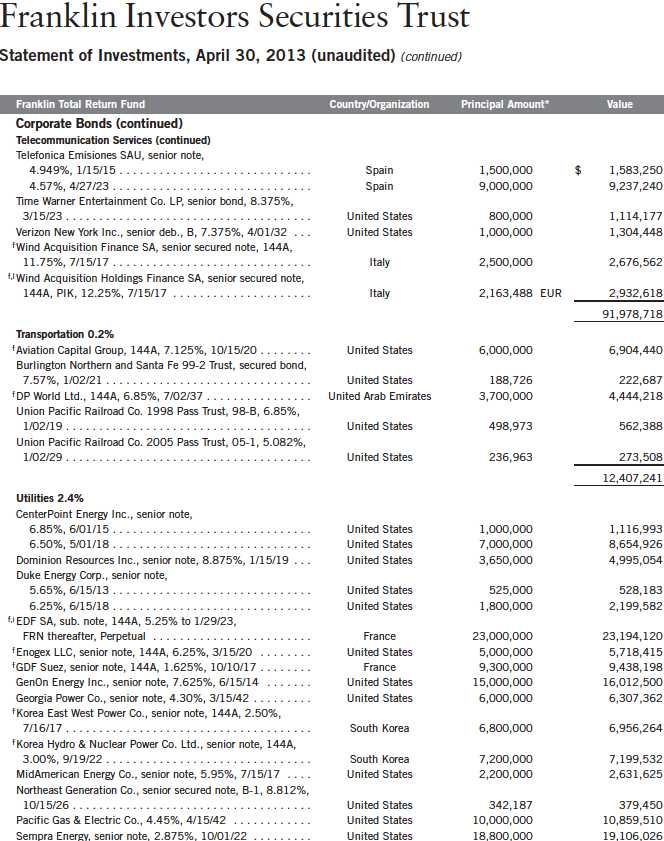
108 | Semiannual Report
Franklin Investors Securities Trust
Statement of Investments, April 30, 2013 (unaudited) (continued)
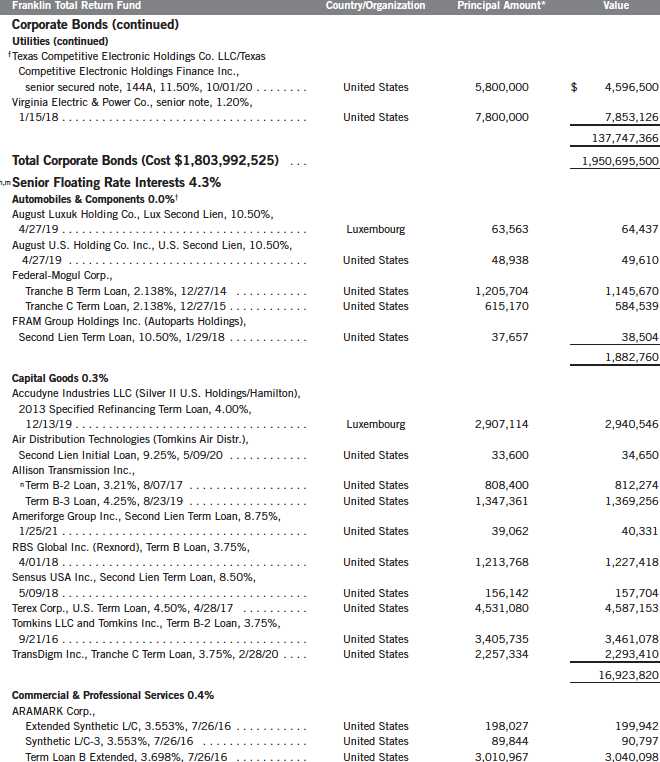
Semiannual Report | 109
Franklin Investors Securities Trust
Statement of Investments, April 30, 2013 (unaudited) (continued)
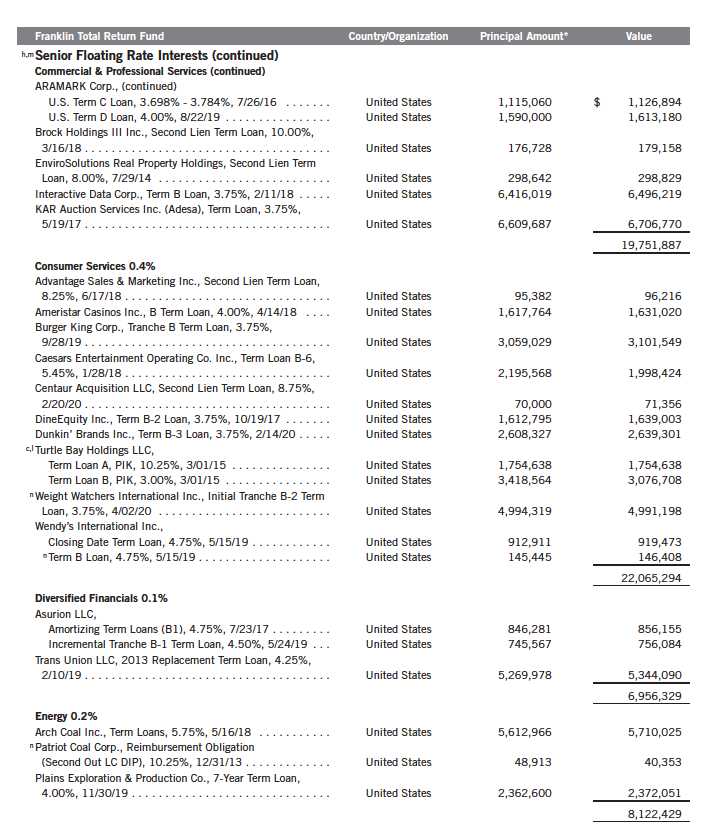
110 | Semiannual Report
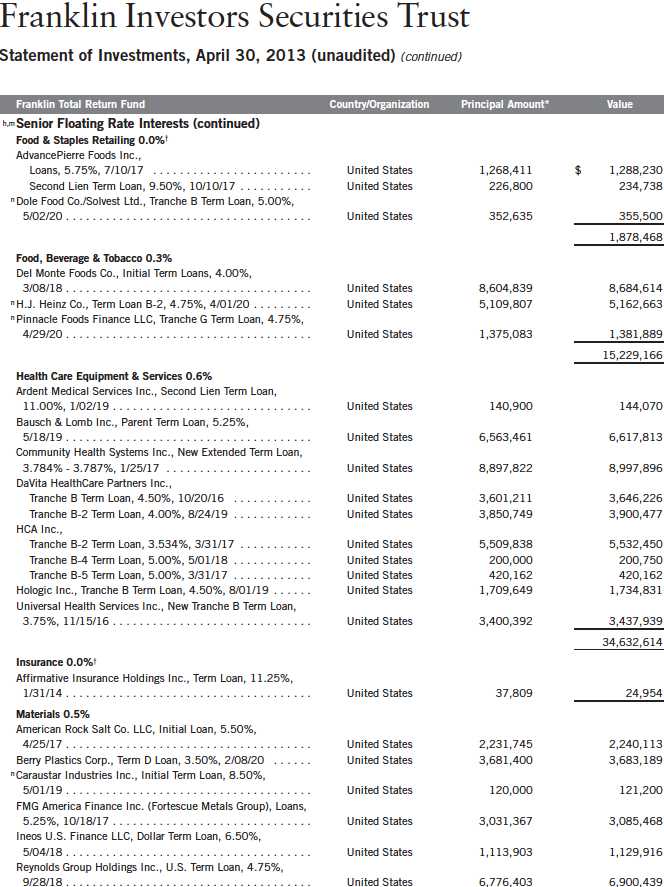
Semiannual Report | 111

112 | Semiannual Report

Semiannual Report | 113
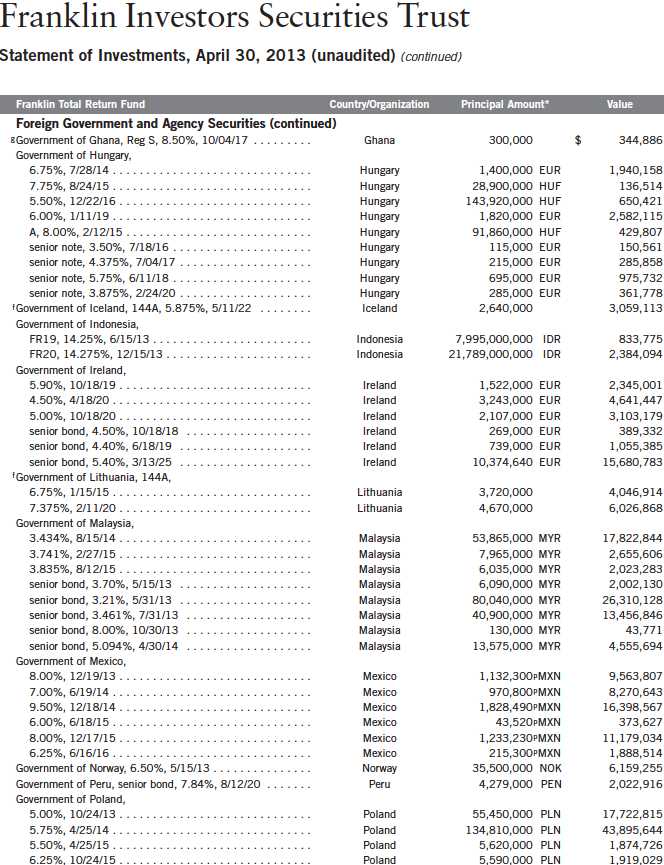
114 | Semiannual Report
Franklin Investors Securities Trust
Statement of Investments, April 30, 2013 (unaudited) (continued)

Semiannual Report | 115

116 | Semiannual Report
Franklin Investors Securities Trust
Statement of Investments, April 30, 2013 (unaudited) (continued)

Semiannual Report | 117
Franklin Investors Securities Trust
Statement of Investments, April 30, 2013 (unaudited) (continued)
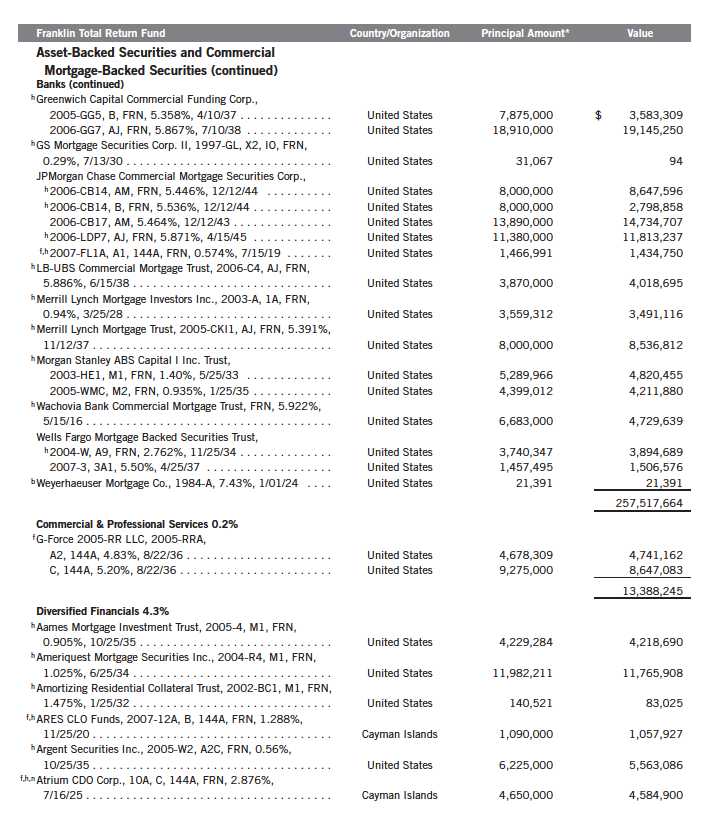
118 | Semiannual Report
Franklin Investors Securities Trust
Statement of Investments, April 30, 2013 (unaudited) (continued)
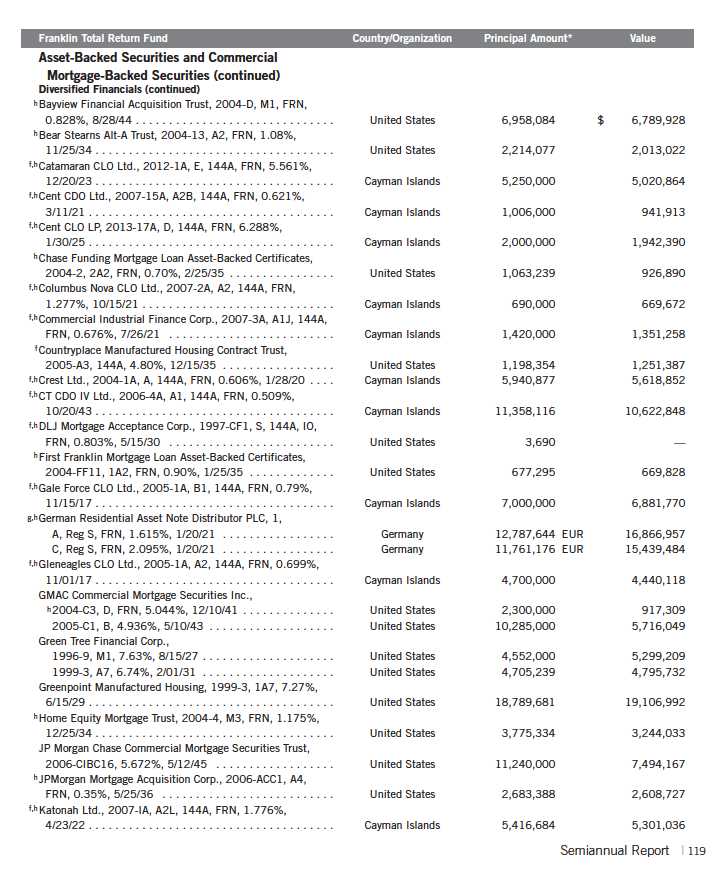
Franklin Investors Securities Trust
Statement of Investments, April 30, 2013 (unaudited) (continued)

120 | Semiannual Report

Semiannual Report | 121
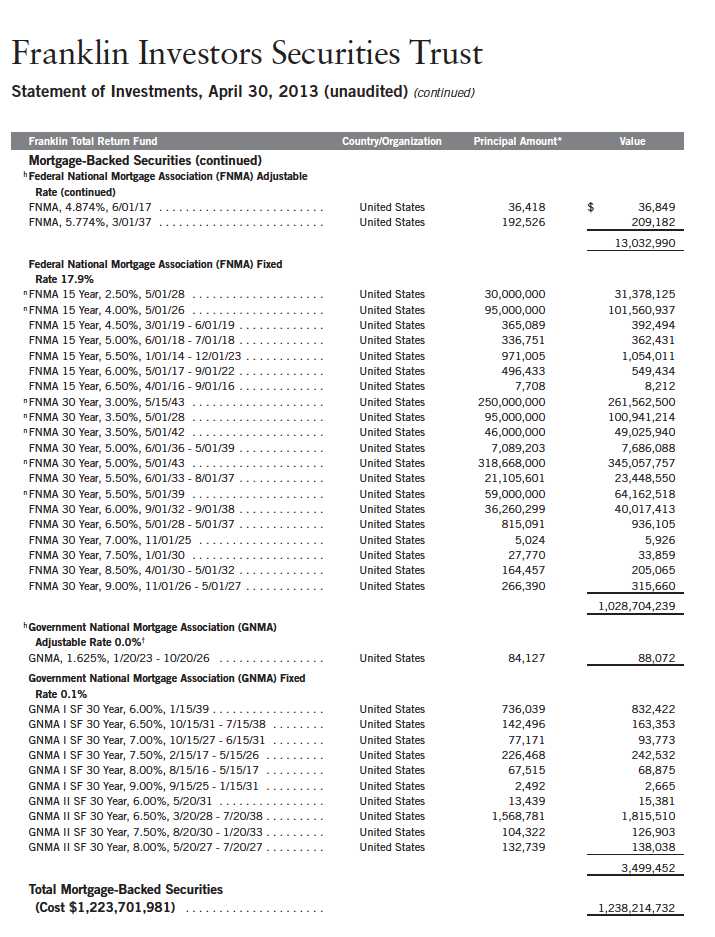
122 | Semiannual Report

Semiannual Report | 123

126 | Semiannual Report

Semiannual Report | 127
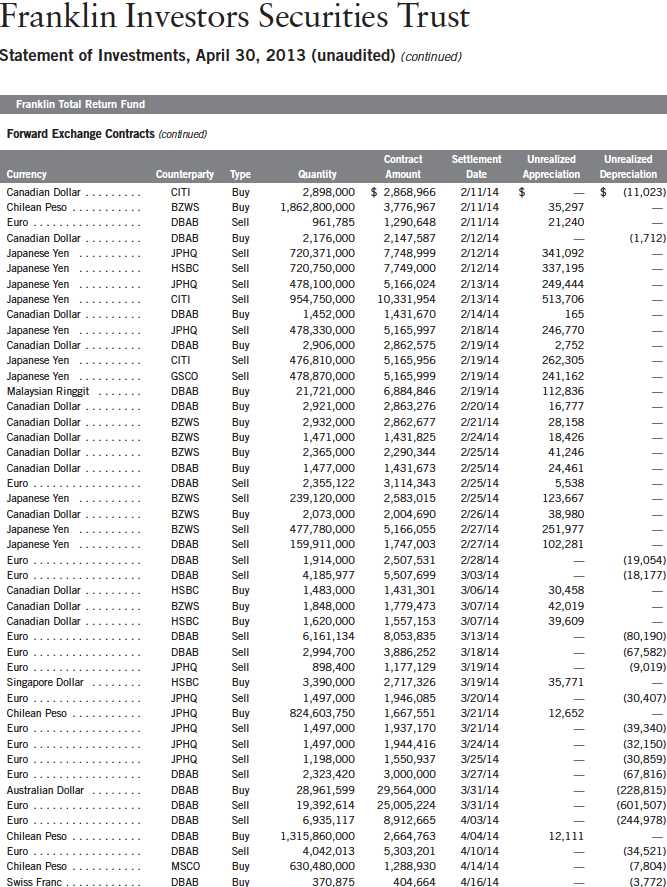
128 | Semiannual Report
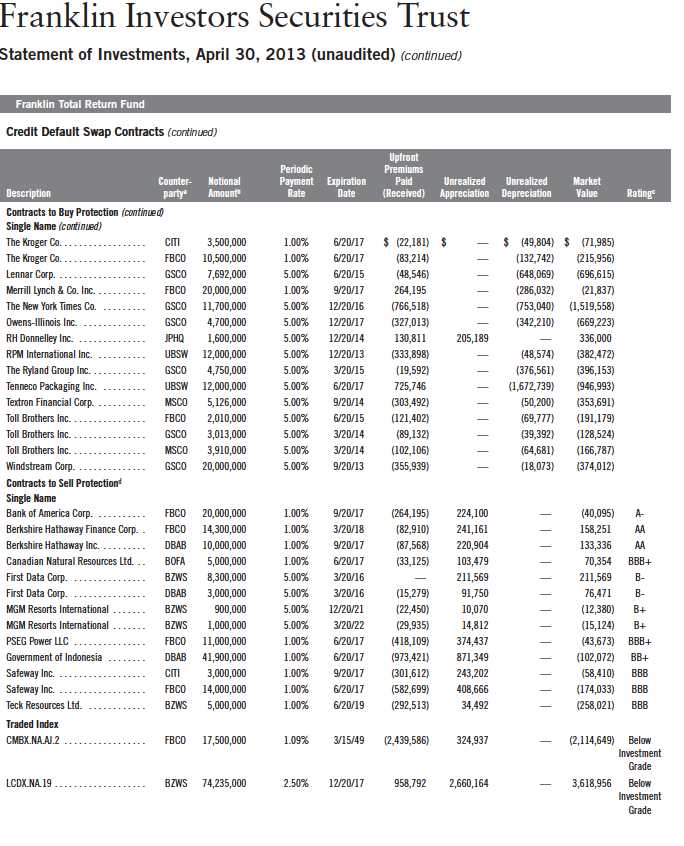
130 | Semiannual Report

Semiannual Report | The accompanying notes are an integral part of these financial statements. | 133

134 | The accompanying notes are an integral part of these financial statements. | Semiannual Report
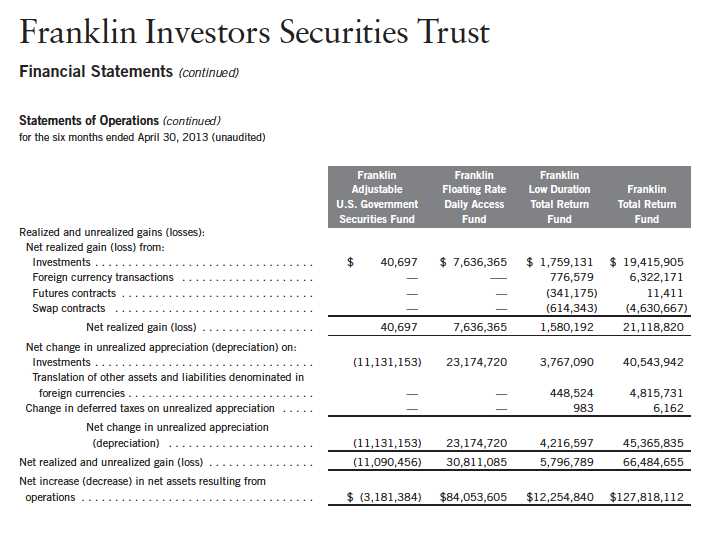
Semiannual Report | The accompanying notes are an integral part of these financial statements. | 135

136 | The accompanying notes are an integral part of these financial statements. | Semiannual Report

Semiannual Report | The accompanying notes are an integral part of these financial statements. | 137
Franklin Investors Securities Trust
Notes to Financial Statements (unaudited)
1. ORGANIZATION AND SIGNIFICANT ACCOUNTING POLICIES
Franklin Investors Securities Trust (Trust) is registered under the Investment Company Act of 1940, as amended, (1940 Act) as an open-end investment company, consisting of nine separate funds, four of which are included in this report (Funds). The financial statements of the remaining funds in the Trust are presented separately. The classes of shares offered within each of the Funds are indicated below. Effective May 1, 2013, the Funds, except Franklin Adjustable U.S. Government Securities Fund, began offering a new class of shares, Class R6. Effective March 1, 2013, all Class B shares were converted to Class A. Each class of shares differs by its initial sales load, contingent deferred sales charges, voting rights on matters affecting a single class, its exchange privilege and fees primarily due to differing arrangements for distribution and transfer agent fees.

The following summarizes the Funds’ significant accounting policies.
a. Financial Instrument Valuation
The Funds’ investments in financial instruments are carried at fair value daily. Fair value is the price that would be received to sell an asset or paid to transfer a liability in an orderly transaction between market participants on the measurement date. Under procedures approved by the Trust’s Board of Trustees (the Board), the Funds’ administrator, investment manager and other affiliates have formed the Valuation and Liquidity Oversight Committee (VLOC). The VLOC provides administration and oversight of the Funds’ valuation policies and procedures, which are approved annually by the Board. Among other things, these procedures allow the Funds to utilize independent pricing services, quotations from securities and financial instrument dealers, and other market sources to determine fair value.
Equity securities and derivative financial instruments (derivatives) listed on an exchange or on the NASDAQ National Market System are valued at the last quoted sale price or the official closing price of the day, respectively. Over-the-counter (OTC) securities are valued within the range of the most recent quoted bid and ask prices. Securities that trade in multiple markets or on multiple exchanges are valued according to the broadest and most representative market. Certain equity securities are valued based upon fundamental characteristics or relationships to similar securities. Investments in open-end mutual funds are valued at the closing net asset value.
Debt securities generally trade in the OTC market rather than on a securities exchange. The Funds’ pricing services use multiple valuation techniques to determine fair value. In instances where sufficient market activity exists, the pricing services may utilize a market-based approach through which quotes from market makers are used to determine fair value.
138 | Semiannual Report
Franklin Investors Securities Trust
Notes to Financial Statements (unaudited) (continued)
| 1. | ORGANIZATION AND SIGNIFICANT ACCOUNTING POLICIES (continued) |
| a. | Financial Instrument Valuation (continued) |
In instances where sufficient market activity may not exist or is limited, the pricing services also utilize proprietary valuation models which may consider market characteristics such as benchmark yield curves, credit spreads, estimated default rates, anticipated market interest rate volatility, coupon rates, anticipated timing of principal repayments, underlying collateral, and other unique security features in order to estimate the relevant cash flows, which are then discounted to calculate the fair value. Securities denominated in a foreign currency are converted into their U.S. dollar equivalent at the foreign exchange rate in effect at the close of the NYSE on the date that the values of the foreign debt securities are determined.
Certain derivatives trade in the OTC market. The Funds’ pricing services use various techniques including industry standard option pricing models and proprietary discounted cash flow models to determine the fair value of those instruments. The Funds’ net benefit or obligation under the derivative contract, as measured by the fair market value of the contract, is included in net assets.
The Funds have procedures to determine the fair value of financial instruments for which market prices are not reliable or readily available. Under these procedures, the VLOC convenes on a regular basis to review such financial instruments and considers a number of factors, including significant unobservable valuation inputs, when arriving at fair value. The VLOC primarily employs a market-based approach which may use related or comparable assets or liabilities, recent transactions, market multiples, book values, and other relevant information for the investment to determine the fair value of the investment. An income-based valuation approach may also be used in which the anticipated future cash flows of the investment are discounted to calculate fair value. Discounts may also be applied due to the nature or duration of any restrictions on the disposition of the investments. Due to the inherent uncertainty of valuations of such investments, the fair values may differ significantly from the values that would have been used had an active market existed. The VLOC employs various methods for calibrating these valuation approaches including a regular review of key inputs and assumptions, transactional back-testing or disposition analysis, and reviews of any related market activity.
b. Foreign Currency Translation
Portfolio securities and other assets and liabilities denominated in foreign currencies are translated into U.S. dollars based on the exchange rate of such currencies against U.S. dollars on the date of valuation. The Funds may enter into foreign currency exchange contracts to facilitate transactions denominated in a foreign currency. Purchases and sales of securities, income and expense items denominated in foreign currencies are translated into U.S. dollars at the exchange rate in effect on the transaction date. Portfolio securities and assets and liabilities denominated in foreign currencies contain risks that those currencies will decline in value relative to the U.S. dollar. Occasionally, events may impact the availability or reliability of foreign exchange rates used to convert the U.S. dollar equivalent value. If such an event occurs, the foreign exchange rate will be valued at fair value using procedures established and approved by the Board.
Semiannual Report | 139
Franklin Investors Securities Trust
Notes to Financial Statements (unaudited) (continued)
| 1. | ORGANIZATION AND SIGNIFICANT ACCOUNTING POLICIES (continued) |
| b. | Foreign Currency Translation (continued) |
The Funds do not separately report the effect of changes in foreign exchange rates from changes in market prices on securities held. Such changes are included in net realized and unrealized gain or loss from investments on the Statements of Operations.
Realized foreign exchange gains or losses arise from sales of foreign currencies, currency gains or losses realized between the trade and settlement dates on securities transactions and the difference between the recorded amounts of dividends, interest, and foreign withholding taxes and the U.S. dollar equivalent of the amounts actually received or paid. Net unrealized foreign exchange gains and losses arise from changes in foreign exchange rates on foreign denominated assets and liabilities other than investments in securities held at the end of the reporting period.
c. Securities Purchased on a When-Issued, Delayed Delivery, and TBA Basis
The Funds purchase securities on a when-issued, delayed delivery, and to-be-announced (TBA) basis, with payment and delivery scheduled for a future date. These transactions are subject to market fluctuations and are subject to the risk that the value at delivery may be more or less than the trade date purchase price. Although the Funds will generally purchase these securities with the intention of holding the securities, they may sell the securities before the settlement date. Sufficient assets have been segregated for these securities.
d. Derivative Financial Instruments
The Franklin Low Duration Total Return Fund and Franklin Total Return Fund invested in derivatives in order to manage risk or gain exposure to various other investments or markets. Derivatives are financial contracts based on an underlying or notional amount, require no initial investment or an initial net investment that is smaller than would normally be required to have a similar response to changes in market factors, and require or permit net settlement. Derivatives contain various risks including the potential inability of the counterparty to fulfill their obligations under the terms of the contract, the potential for an illiquid secondary market, and/or the potential for market movements which expose the fund to gains or losses in excess of the amounts shown on the Statements of Assets and Liabilities. Realized gain and loss and unrealized appreciation and depreciation on these contracts for the period are included in the Statements of Operations.
The Franklin Low Duration Total Return Fund and Franklin Total Return Funds’ investments in OTC derivatives are subject to the terms of International Swaps and Derivatives Association Master Agreements and other related agreements between the funds and certain derivative counterparties. These agreements contain various provisions, including but not limited to collateral requirements, events of default, requirements for the funds to maintain certain net asset levels and/or limit the decline in net assets over various periods of time. Should the funds fail to meet any of these provisions, the derivative counterparty has the right to terminate the
140 | Semiannual Report
Franklin Investors Securities Trust
Notes to Financial Statements (unaudited) (continued)
| 1. | ORGANIZATION AND SIGNIFICANT ACCOUNTING POLICIES (continued) |
| d. | Derivative Financial Instruments (continued) |
derivative contract and require immediate payment by the funds for those OTC derivatives with that particular counterparty that are in a net liability position.
At April 30, 2013, the funds had OTC derivatives in a net liability position and the aggregate value of collateral pledged for such contracts was as follows:

The Franklin Low Duration Total Return Fund and Franklin Total Return Fund entered into exchange traded financial futures contracts primarily to manage and/or gain exposure to interest rate risk. A futures contract is an agreement between the fund and a counterparty to buy or sell an asset for a specified price on a future date. Required initial margin deposits of cash or securities are pledged by the fund. Subsequent payments, known as variation margin, are made or received by the fund, depending on fluctuations in the value of the asset underlying the futures contract. Such variation margin is accounted for as unrealized appreciation or depreciation until the contract is closed, at which time the gains or losses are realized.
The Franklin Low Duration Total Return Fund and Franklin Total Return Fund entered into OTC forward exchange contracts primarily to manage and/or gain exposure to certain foreign currencies. A forward exchange contract is an agreement between the fund and a counterparty to buy or sell a foreign currency at a specific exchange rate on a future date. Pursuant to the terms of the forward exchange contracts, cash or securities may be required to be deposited as collateral. Unrestricted cash may be invested according to the funds’ investment objectives.
The Franklin Low Duration Total Return Fund and Franklin Total Return Fund entered into OTC credit default swap contracts primarily to manage and/or gain exposure to credit risk. A credit default swap is an agreement between the fund and a counterparty whereby the buyer of the contract receives credit protection and the seller of the contract guarantees the credit worthiness of a referenced debt obligation. The underlying referenced debt obligation may be a single issuer of corporate or sovereign debt, a credit index, or a tranche of a credit index. In the event of a default of the underlying referenced debt obligation, the buyer is entitled to receive the notional amount of the credit default swap contract from the seller in exchange for the referenced debt obligation, a net settlement amount equal to the notional amount of the credit default swap less the recovery value of the referenced debt obligation, or other agreed upon amount. Over the term of the contract, the buyer pays the seller a periodic stream of payments, provided that no event of default has occurred. Such periodic payments are accrued daily as an unrealized appreciation or depreciation until the payments are made, at which time they are realized. Payments received or paid to initiate a credit default swap contract are reflected on the Statements of Assets and Liabilities and represent compensating factors between stated terms of the credit
Semiannual Report | 141
Franklin Investors Securities Trust
Notes to Financial Statements (unaudited) (continued)
| 1. | ORGANIZATION AND SIGNIFICANT ACCOUNTING POLICIES (continued) |
| d. | Derivative Financial Instruments (continued) |
default swap agreement and prevailing market conditions (credit spreads and other relevant factors). These upfront payments are amortized over the term of the contract as a realized gain or loss on the Statements of Operations. Pursuant to the terms of the credit default swap contract, cash or securities may be required to be deposited as collateral. Unrestricted cash may be invested according to the funds’ investment objectives.
The Franklin Low Duration Total Return Fund and Franklin Total Return Fund entered into OTC cross currency swap contracts primarily to manage and/or gain exposure to interest rate risk and certain foreign currencies. A cross currency swap is an agreement between the fund and a counter-party to exchange cash flows (determined using either a fixed or floating rate) based on the notional amounts of two different currencies. The notional amounts are typically determined based on the spot exchange rates at the opening of the contract. Cross currency swaps may require the exchange of notional amounts at the opening and/or closing of the contract. Over the term of the contract, contractually required payments to be paid and to be received are accrued daily and recorded as unrealized depreciation and appreciation until the payments are made, at which time they are realized. Payments received or paid to initiate a cross currency swap contract are reflected on the Statements of Assets and Liabilities and represent compensating factors between stated terms of the cross currency swap contract and prevailing market conditions (interest rate spreads and other relevant factors). These upfront payments are amortized over the term of the contract as a realized gain or loss on the Statements of Operations. Pursuant to the terms of the cross currency swap contract, cash or securities may be required to be deposited as collateral. Unrestricted cash may be invested according to the funds’ investment objectives.
The Franklin Low Duration Total Return Fund and Franklin Total Return Fund purchased or wrote OTC option contracts primarily to manage and/or gain exposure to interest rate, foreign currency exchange and credit risk. An option is a contract entitling the holder to purchase or sell a specific amount of shares or units of an asset or notional amount of a swap (swaption), at a specified price. Options purchased are recorded as an asset while options written are recorded as a liability. Upon exercise of an option, the acquisition cost or sales proceeds of the underlying investment is adjusted by any premium received or paid. Upon expiration of an option, any premium received or paid is recorded as a realized gain or loss. Upon closing an option other than through expiration or exercise, the difference between the premium and the cost to close the position is recorded as a realized gain or loss. Pursuant to the terms of the written option contract, cash or securities may be required to be deposited as collateral.
At April 30, 2013, the Franklin Low Duration Total Return Fund held $259,250 in U.S. Treasury Notes, the Franklin Total Return Fund held $5,992,867 in U.K. and U.S. Treasury Notes as collateral for derivatives.
See Note 11 regarding other derivative information.
142 | Semiannual Report
Franklin Investors Securities Trust
Notes to Financial Statements (unaudited) (continued)
| 1. | ORGANIZATION AND SIGNIFICANT ACCOUNTING POLICIES (continued) |
| e. | Restricted Cash |
At April 30, 2013, the Franklin Low Duration Total Return Fund and Franklin Total Return Fund held restricted cash in connection with investments in certain derivative securities. Restricted cash is held in a segregated account with the fund’s custodian and is reflected in the Statements of Assets and Liabilities.
f. Loan Participation Notes
The Franklin Low Duration Total Return Fund and Franklin Total Return Fund invest in loan participation notes (“Participations”). Participations are loans originally issued to a borrower by one or more financial institutions (the “Lender”) and subsequently sold to other investors, such as the funds. Participations typically result in the fund having a contractual relationship only with the Lender, and not with the borrower. The funds have the right to receive from the Lender any payments of principal, interest and fees which the Lender received from the borrower. The funds generally have no rights to either enforce compliance by the borrower with the terms of the loan agreement or to any collateral relating to the original loan. As a result, the funds assume the credit risk of both the borrower and the Lender that is selling the Participation. The Participations may also involve interest rate risk and liquidity risk, including the potential default or insolvency of the borrower and/or the Lender.
g. FT Holdings Corporation I
The Franklin Total Return Fund invests in certain securities through its investment in FT Holdings Corporation I, a Delaware Corporation and a wholly-owned subsidiary (Subsidiary) of the fund. The Subsidiary has the ability to invest in securities consistent with the investment objective of the fund. At April 30, 2013, all Subsidiary investments as well as any other assets and liabilities are reflected in the fund’s Statement of Investments and Statement of Assets and Liabilities. All income and expenses of the Subsidiary during the period ended April 30, 2013, have been included in the fund’s Statement of Operations.
h. Mortgage Dollar Rolls
The Franklin Total Return Fund enters into mortgage dollar rolls, typically on a TBA basis. Mortgage dollar rolls are agreements between the fund and a financial institution to simultaneously sell and repurchase mortgage-backed securities at a future date. Gains or losses are realized on the initial sale, and the difference between the repurchase price and the sale price is recorded as an unrealized gain or loss to the fund upon entering into the mortgage dollar roll. In addition, the fund may invest the cash proceeds that are received from the initial sale. During the period between the sale and repurchase, the fund is not entitled to principal and interest paid on the mortgage backed securities. The risks of mortgage dollar roll transactions include the potential inability of the counterparty to fulfill its obligations.
Semiannual Report | 143
Franklin Investors Securities Trust
Notes to Financial Statements (unaudited) (continued)
| 1. | ORGANIZATION AND SIGNIFICANT ACCOUNTING POLICIES (continued) |
| i. | Senior Floating Rate Interests |
The Funds, except Franklin Adjustable U.S. Government Securities Fund, invest in senior secured corporate loans that pay interest at rates which are periodically reset by reference to a base lending rate plus a spread. These base lending rates are generally the prime rate offered by a designated U.S. bank or the London InterBank Offered Rate (LIBOR). Senior secured corporate loans often require prepayment of principal from excess cash flows or at the discretion of the borrower. As a result, actual maturity may be substantially less than the stated maturity.
Senior secured corporate loans in which the funds invest are generally readily marketable, but may be subject to some restrictions on resale.
j. Income and Deferred Taxes
It is each fund’s policy to qualify as a regulated investment company under the Internal Revenue Code. Each fund intends to distribute to shareholders substantially all of its taxable income and net realized gains to relieve it from federal income and excise taxes. As a result, no provision for U.S. federal income taxes is required.
The Funds may be subject to foreign taxation related to income received, capital gains on the sale of securities and certain foreign currency transactions in the foreign jurisdictions in which it invests. Foreign taxes, if any, are recorded based on the tax regulations and rates that exist in the foreign markets in which the Funds invest. When a capital gain tax is determined to apply the Funds record an estimated deferred tax liability in an amount that would be payable if the securities were disposed of on the valuation date.
Each fund recognizes the tax benefits of uncertain tax positions only when the position is “more likely than not” to be sustained upon examination by the tax authorities based on the technical merits of the tax position. As of April 30, 2013, and for all open tax years, each fund has determined that no liability for unrecognized tax benefits is required in each fund’s financial statements related to uncertain tax positions taken on a tax return (or expected to be taken on future tax returns). Open tax years are those that remain subject to examination and are based on each tax jurisdiction statute of limitation.
k. Security Transactions, Investment Income, Expenses and Distributions
Security transactions are accounted for on trade date. Realized gains and losses on security transactions are determined on a specific identification basis. Interest income and estimated expenses are accrued daily. Amortization of premium and accretion of discount on debt securities are included in interest income. Facility fees are recognized as income over the expected term of the loan. Dividend income is recorded on the ex-dividend date. Dividends from net investment
144 | Semiannual Report
Franklin Investors Securities Trust
Notes to Financial Statements (unaudited) (continued)
| 1. | ORGANIZATION AND SIGNIFICANT ACCOUNTING POLICIES (continued) |
| k. | Security Transactions, Investment Income, Expenses and Distributions (continued) |
income are normally declared daily; these dividends may be reinvested or paid monthly to shareholders. Distributions from realized capital gains and other distributions, if any, are recorded on the ex-dividend date. Distributions to shareholders are determined according to income tax regulations (tax basis). Distributable earnings determined on a tax basis may differ from earnings recorded in accordance with accounting principles generally accepted in the United States of America. These differences may be permanent or temporary. Permanent differences are reclassified among capital accounts to reflect their tax character. These reclassifications have no impact on net assets or the results of operations. Temporary differences are not reclassified, as they may reverse in subsequent periods.
Common expenses incurred by the Trust are allocated among the funds based on the ratio of net assets of each fund to the combined net assets of the Trust. Fund specific expenses are charged directly to the fund that incurred the expense.
Net investment income, not including class specific expenses, is allocated daily to each class of shares based upon the relative value of the settled shares of each class. Realized and unrealized gains and losses are allocated daily to each class of shares based upon the relative proportion of net assets of each class. Differences in per share distributions, by class, are generally due to differences in class specific expenses.
Inflation-indexed bonds are adjusted for inflation through periodic increases or decreases in the security’s interest accruals, face amount, or principal redemption value, by amounts corresponding to the rate of inflation as measured by an index. Any increase or decrease in the face amount or principal redemption value will be included as interest income on the Statements of Operations.
l. Accounting Estimates
The preparation of financial statements in accordance with accounting principles generally accepted in the United States of America requires management to make estimates and assumptions that affect the reported amounts of assets and liabilities at the date of the financial statements and the amounts of income and expenses during the reporting period. Actual results could differ from those estimates.
m. Guarantees and Indemnifications
Under the Trust’s organizational documents, its officers and trustees are indemnified by the Trust against certain liabilities arising out of the performance of their duties to the Trust. Additionally, in the normal course of business, the Trust, on behalf of the Funds, enters into contracts with service providers that contain general indemnification clauses. The Trust’s maximum exposure under these arrangements is unknown as this would involve future claims that may be made against the Trust that have not yet occurred. Currently, the Trust expects the risk of loss to be remote.
Semiannual Report | 145
Franklin Investors Securities Trust
Notes to Financial Statements (unaudited) (continued)
2. SHARES OF BENEFICIAL INTEREST
At April 30, 2013, there were an unlimited number of shares authorized (without par value).
Transactions in the Funds’ shares were as follows:

146 | Semiannual Report
Franklin Investors Securities Trust
Notes to Financial Statements (unaudited) (continued)
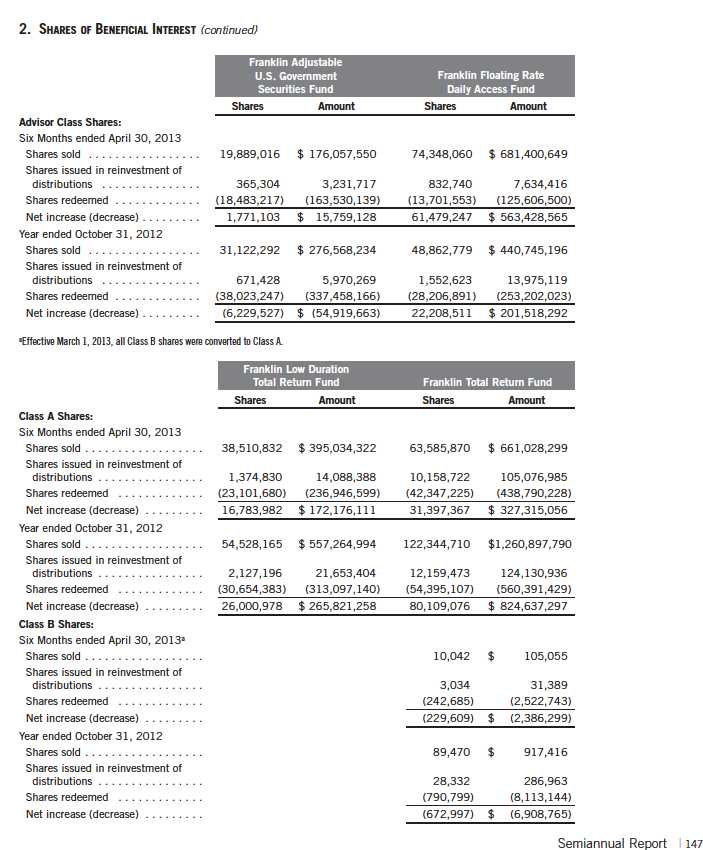
Franklin Investors Securities Trust
Notes to Financial Statements (unaudited) (continued)

148 | Semiannual Report
Franklin Investors Securities Trust
Notes to Financial Statements (unaudited) (continued)
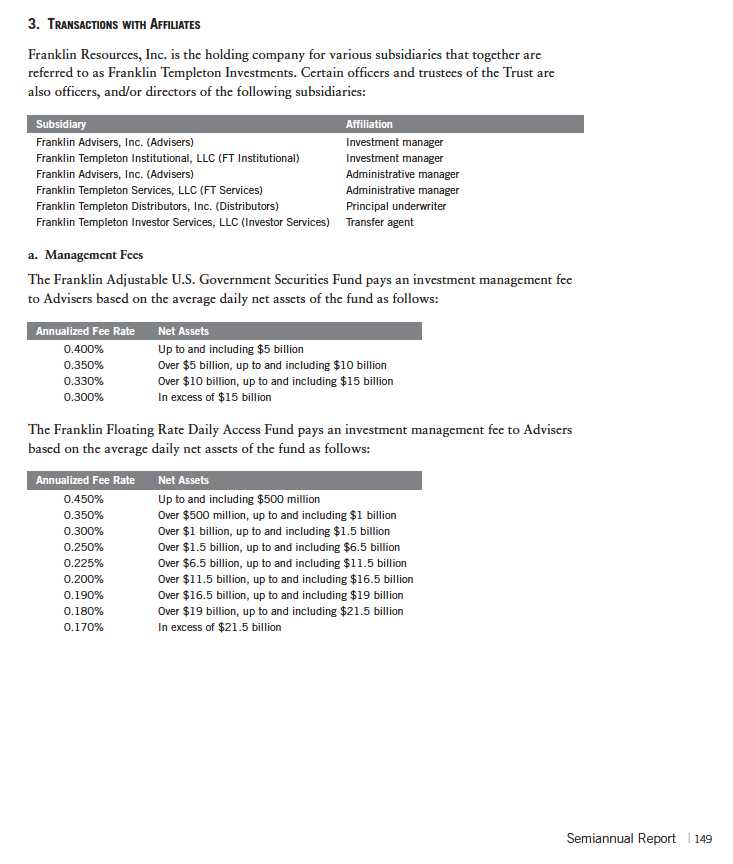
Franklin Investors Securities Trust
Notes to Financial Statements (unaudited) (continued)

150 | Semiannual Report
Franklin Investors Securities Trust
Notes to Financial Statements (unaudited) (continued)
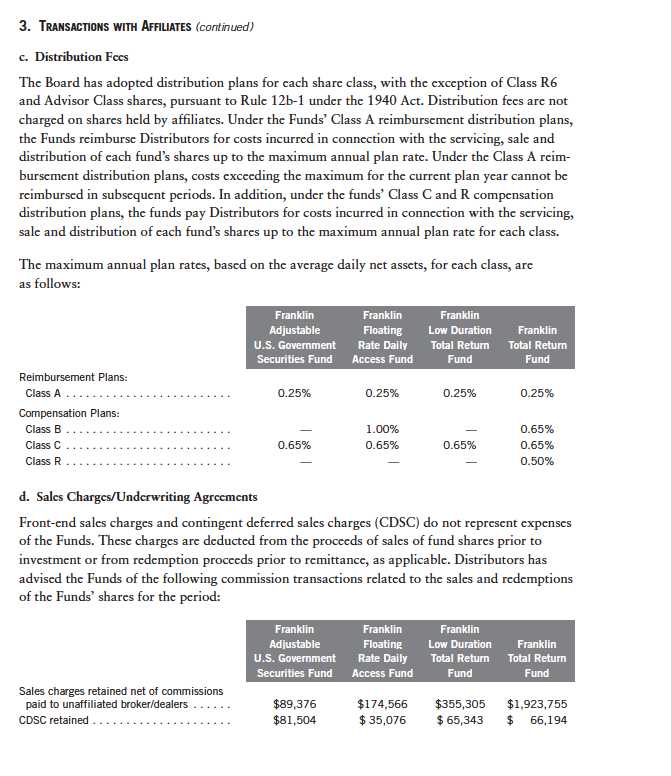
Semiannual Report | 151
Franklin Investors Securities Trust
Notes to Financial Statements (unaudited) (continued)
| 3. | TRANSACTIONS WITH AFFILIATES (continued) |
| e. | Transfer Agent Fees |
Each class of shares, except for the R6 share class, pays transfer agent fees to Investor Services for its performance of shareholder servicing obligations and reimburses Investor Services for out of pocket expenses incurred, including shareholding servicing fees paid to third parties. These fees are allocated daily to such classes based upon the relative proportion of net assets of each class. The R6 share class pays Investor Services transfer agent fees specific to that class.
For the period ended April 30, 2013, the Funds paid transfer agent fees as noted in the Statements of Operations of which the following amounts were retained by Investor Services:

FT Services has contractually agreed in advance to waive or limit its fees and to assume as its own expense certain expenses otherwise payable by the Franklin Low Duration Total Return Fund and Franklin Total Return Fund so that the expenses (excluding distribution fees, and acquired fund fees and expenses) for Class A, Class C, Class R and Advisor Class of the funds do not exceed 0.55% and 0.63%, respectively, and Class R6 does not exceed 0.43% and 0.50%, respectively (other than certain non-routine expenses or costs, including those relating to litigation, indemnification, reorganizations, and liquidations) until February 28, 2014.
4. EXPENSE OFFSET ARRANGEMENT
The Funds have entered into an arrangement with their custodian whereby credits realized as a result of uninvested cash balances are used to reduce a portion of the Funds’ custodian expenses. During the period ended April 30, 2013, there were no credits earned.
5. INCOME TAXES
For tax purposes, capital losses may be carried over to offset future capital gains. Capital loss carryforwards with no expiration, if any, must be fully utilized before those losses with expiration dates.
152 | Semiannual Report
Franklin Investors Securities Trust
Notes to Financial Statements (unaudited) (continued)

Semiannual Report | 153
Franklin Investors Securities Trust
Notes to Financial Statements (unaudited) (continued)
6. INVESTMENT TRANSACTIONS
Purchases and sales of investments (excluding short term securities) for the period ended April 30, 2013, were as follows:
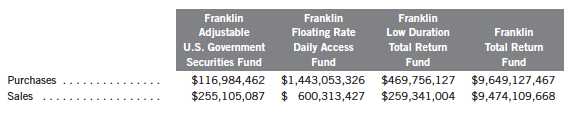
7. INVESTMENTS IN INSTITUTIONAL FIDUCIARY TRUST MONEY MARKET PORTFOLIO
The Funds invest in the Institutional Fiduciary Trust Money Market Portfolio (Sweep Money Fund), an open-end investment company managed by Advisers. Management fees paid by the Funds are reduced on assets invested in the Sweep Money Fund, in an amount not to exceed the management and administrative fees paid by the Sweep Money Fund.
8. CREDIT RISK AND DEFAULTED SECURITIES
At April 30, 2013, the Franklin Floating Rate Daily Access Fund, Franklin Low Duration Total Return Fund and the Franklin Total Return Fund had 83.41%, 16.48% and 15.51%, respectively, of their portfolio invested in high yield, senior secured floating rate notes, or other securities rated below investment grade. These securities may be more sensitive to economic conditions causing greater price volatility and are potentially subject to a greater risk of loss due to default than higher rated securities.
The Franklin Floating Rate Daily Access Fund and Franklin Total Return Fund held defaulted securities and/or other securities for which the income has been deemed uncollectible. At April 30, 2013, the aggregate value of these securities for the Franklin Floating Rate Daily Access Fund and the Franklin Total Return Fund was $8,415,945 and $505,231, representing 0.26% and 0.01%, respectively, of each fund’s net assets. The funds discontinue accruing income on securities for which income has been deemed uncollectible and provide an estimate for losses on interest receivable. The securities have been identified on the accompanying Statements of Investments.
9. RESTRICTED SECURITIES
The Franklin Low Duration Total Return Fund and Franklin Total Return Fund invest in securities that are restricted under the Securities Act of 1933 (1933 Act) or which are subject to legal, contractual, or other agreed upon restrictions on resale. Restricted securities are often purchased
154 | Semiannual Report
Franklin Investors Securities Trust
Notes to Financial Statements (unaudited) (continued)
9. RESTRICTED SECURITIES (continued)
in private placement transactions, and cannot be sold without prior registration unless the sale is pursuant to an exemption under the 1933 Act. Disposal of these securities may require greater effort and expense, and prompt sale at an acceptable price may be difficult. The funds may have registration rights for restricted securities. The issuer generally incurs all registration costs.
At April 30, 2013, the funds held investments in restricted securities, excluding certain securities exempt from registration under the 1933 Act deemed to be liquid, as follows:
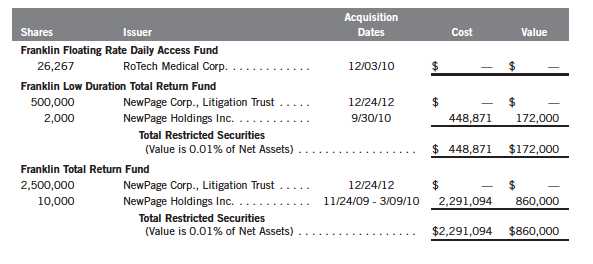
10. UNFUNDED LOAN COMMITMENTS
The Funds, except Franklin Adjustable U.S. Government Securities Fund, enter into certain credit agreements, all or a portion of which may be unfunded. The funds are obligated to fund these loan commitments at the borrowers’ discretion. Funded portions of credit agreements are presented on the Statements of Investments.
Semiannual Report | 155
Franklin Investors Securities Trust
Notes to Financial Statements (unaudited) (continued)

Franklin Investors Securities Trust
Notes to Financial Statements (unaudited) (continued)
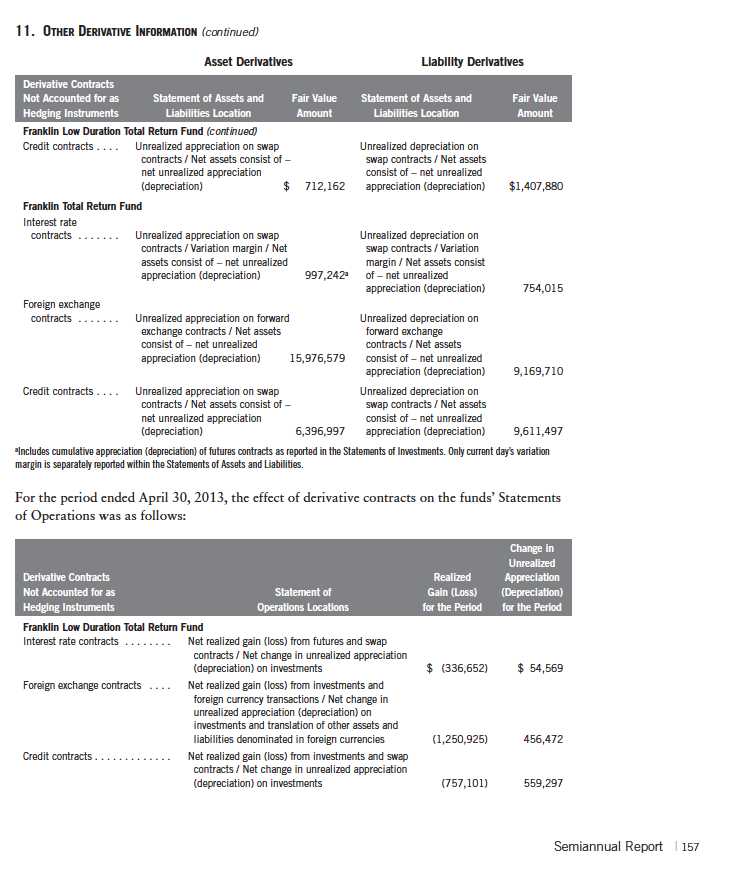
Franklin Investors Securities Trust
Notes to Financial Statements (unaudited) (continued)

For the period ended April 30, 2013, the average month end market value of derivatives represented 0.54% and 0.57%, respectively, of each fund’s average month end net assets. The average month end number of open derivative contracts for the period was 189 and 219, respectively, for each fund.
See Note 1(d) regarding derivative financial instruments.
12. SPECIAL SERVICING AGREEMENT
The Funds, except Franklin Adjustable U.S. Government Securities Fund, which are eligible underlying investments of one or more of the Franklin Templeton Fund Allocator Series Funds (Allocator Funds), participate in a Special Servicing Agreement (SSA) with the Allocator Funds and certain service providers of the funds and the Allocator Funds. Under the SSA, the funds may pay a portion of the Allocator Funds’ expenses (other than any asset allocation, administrative and distribution fees), to the extent such payments are less than the amount of the benefits realized or expected to be realized by the funds (e.g., due to reduced costs associated with servicing accounts) from the investment in the funds by the Allocator Funds. The Allocator Funds are either managed by Advisers or administered by FT Services. For the period ended April 30, 2013, the Franklin Total Return Fund was held by one or more of the Allocator Funds and the amount of expenses borne by the fund is noted in the Statement of Operations. At April 30, 2013, 7.72% of the fund’s outstanding shares were held by one or more of the Allocator Funds.
Effective May 1, 2013, the SSA was discontinued until further notice and approval by the Board.
158 | Semiannual Report
Franklin Investors Securities Trust
Notes to Financial Statements (unaudited) (continued)
13. CREDIT FACILITY
The Funds, together with other U.S. registered and foreign investment funds (collectively, Borrowers), managed by Franklin Templeton Investments, are borrowers in a joint syndicated senior unsecured credit facility totaling $1.5 billion (Global Credit Facility) which matures on January 17, 2014. This Global Credit Facility provides a source of funds to the Borrowers for temporary and emergency purposes, including the ability to meet future unanticipated or unusually large redemption requests.
Under the terms of the Global Credit Facility, the Funds shall, in addition to interest charged on any borrowings made by the Funds and other costs incurred by the Funds, pay their share of fees and expenses incurred in connection with the implementation and maintenance of the Global Credit Facility, based upon their relative share of the aggregate net assets of all of the Borrowers, including an annual commitment fee of 0.07% based upon the unused portion of the Global Credit Facility. These fees are reflected in other expenses on the Statements of Operations. During the period ended April 30, 2013, the Funds did not use the Global Credit Facility.
14. FAIR VALUE MEASUREMENTS
The Funds follow a fair value hierarchy that distinguishes between market data obtained from independent sources (observable inputs) and the Funds’ own market assumptions (unobservable inputs). These inputs are used in determining the value of the Funds’ financial instruments and are summarized in the following fair value hierarchy:
- Level 1 – quoted prices in active markets for identical financial instruments
- Level 2 – other significant observable inputs (including quoted prices for similar financial instruments, interest rates, prepayment speed, credit risk, etc.)
- Level 3 – significant unobservable inputs (including the Funds’ own assumptions in determining the fair value of financial instruments)
The inputs or methodology used for valuing financial instruments are not an indication of the risk associated with investing in those financial instruments.
For movements between the levels within the fair value hierarchy, the Funds have adopted a policy of recognizing the transfers as of the date of the underlying event which caused the movement.
Semiannual Report | 159
Franklin Investors Securities Trust
Notes to Financial Statements (unaudited) (continued)

160 | Semiannual Report
Franklin Investors Securities Trust
Notes to Financial Statements (unaudited) (continued)
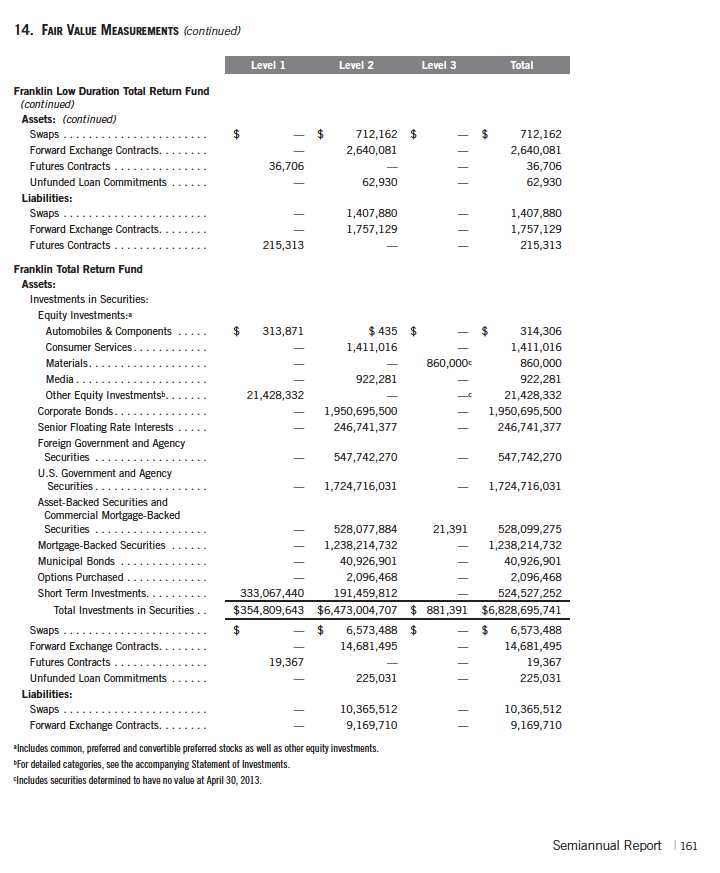
Franklin Investors Securities Trust
Notes to Financial Statements (unaudited) (continued)
15. NEW ACCOUNTING PRONOUNCEMENTS
In December 2011, the Financial Accounting Standards Board (FASB) issued Accounting Standards Update (ASU) No. 2011-11, Balance Sheet (Topic 210): Disclosures about Offsetting Assets and Liabilities. The amendments in the ASU enhance disclosures about offsetting of financial assets and liabilities to enable investors to understand the effect of these arrangements on a fund’s financial position. In January 2013, FASB issued ASU No. 2013-01, Balance Sheet (Topic 210): Clarifying the Scope of Disclosures about Offsetting Assets and Liabilities. The amendments in ASU No. 2013-01 clarify the intended scope of disclosures required by ASU No. 2011-11. These ASUs are effective for interim and annual reporting periods beginning on or after January 1, 2013. The Funds believe the adoption of these ASUs will not have a material impact on their financial statements.
16. SUBSEQUENT EVENTS
The Funds have evaluated subsequent events through the issuance of the financial statements and determined that no events have occurred that require disclosure other than those already disclosed in the financial statements.

162 | Semiannual Report
Franklin Investors Securities Trust
Shareholder Information
Board Review of Investment Management Agreement
At a meeting held February 26, 2013, the Board of Trustees (Board), including a majority of non-interested or independent Trustees, approved renewal of the investment management agreement for each of the separate funds within Franklin Investors Securities Trust (Fund(s)). In reaching this decision, the Board took into account information furnished throughout the year at regular Board meetings, as well as information prepared specifically in connection with the annual renewal review process. Information furnished and discussed throughout the year included investment performance reports and related financial information for each Fund, along with periodic reports on expenses, shareholder services, legal and compliance matters, pricing, brokerage commissions and execution and other services provided by the Investment Manager (Manager) and its affiliates, as well as a third-party survey of transfer agent fees charged funds within the Franklin Templeton Investments complex in comparison with those charged other fund complexes deemed comparable. Information furnished specifically in connection with the renewal process included a report for each Fund prepared by Lipper, Inc. (Lipper), an independent organization, as well as additional material, including a Fund profitability analysis prepared by management. The Lipper reports compared each Fund’s investment performance and expenses with those of other mutual funds deemed comparable to the Fund as selected by Lipper. The Fund profitability analysis discussed the profitability to Franklin Templeton Investments from its overall U.S. fund operations, as well as on an individual fund-by-fund basis. Additional material accompanying such profitability analysis included information on a fund-by-fund basis listing portfolio managers and other accounts they manage, as well as information on management fees charged by the Manager and its affiliates to U.S. mutual funds and other accounts, including management’s explanation of differences where relevant. Such material also included a memorandum prepared by management describing project initiatives and capital investments relating to the services provided to the Funds by the Franklin Templeton Investments organization, as well as a memorandum relating to economies of scale and an analysis concerning transfer agent fees charged by an affiliate of the Manager.
In considering such materials, the independent Trustees received assistance and advice from and met separately with independent counsel. While the investment management agreements for all Funds were considered at the same Board meeting, the Board dealt with each Fund separately. In approving continuance of the investment management agreement for each Fund, the Board, including a majority of independent Trustees, determined that the existing management fee structure was fair and reasonable and that continuance of the investment management agreement was in the best interests of each Fund and its shareholders. While attention was given to all information furnished, the following discusses some primary factors relevant to the Board’s decision.
NATURE, EXTENT AND QUALITY OF SERVICES. The Board was satisfied with the nature and quality of the overall services provided by the Manager and its affiliates to the Funds and their shareholders. In addition to investment performance and expenses discussed later, the Board’s opinion was based, in part, upon periodic reports furnished it showing that the investment policies and restrictions for each Fund were consistently complied with as well as other reports periodically furnished the Board covering matters such as the compliance of portfolio managers and other management personnel with the code of ethics adopted throughout the Franklin Templeton fund complex, the adherence to fair value pricing procedures established by the Board, and the accuracy
Semiannual Report | 163
Franklin Investors Securities Trust
Shareholder Information (continued)
Board Review of Investment Management Agreement (continued)
of net asset value calculations. The Board also noted the extent of benefits provided Fund shareholders from being part of the Franklin Templeton family of funds, including the right to exchange investments between the same class of funds without a sales charge, the ability to reinvest Fund dividends into other funds and the right to combine holdings in other funds to obtain a reduced sales charge. Favorable consideration was given to management’s continuous efforts and expenditures in establishing back-up systems and recovery procedures to function in the event of a natural disaster, it being noted by the Board that such systems and procedures had functioned well during the Florida hurricanes and blackouts experienced in previous years, and that those operations in the New York/New Jersey area ran smoothly during the more recent Hurricane Sandy. Among other factors taken into account by the Board were the Manager’s best execution trading policies, including a favorable report by an independent portfolio trading analytical firm, which also covered FOREX transactions. Consideration was also given to the experience of each Fund’s portfolio management team, the number of accounts managed and general method of compensation. In this latter respect, the Board noted that a primary factor in management’s determination of a portfolio manager’s bonus compensation was the relative investment performance of the funds he or she managed and that a portion of such bonus was required to be invested in a predesignated list of funds within such person’s fund management area so as to be aligned with the interests of shareholders. The Board also took into account the quality of transfer agent and shareholder services provided Fund shareholders by an affiliate of the Manager and the continuous enhancements to the Franklin Templeton website. Particular attention was given to management’s conservative approach and diligent risk management procedures, including continuous monitoring of counterparty credit risk and attention given to derivative and other complex instruments including expanded collateralization requirements. The Board also took into account, among other things, management’s efforts in establishing a global credit facility for the benefit of the Funds and other accounts managed by Franklin Templeton Investments to provide a source of cash for temporary and emergency purposes or to meet unusual redemption requests as well as the strong financial position of the Manager’s parent company and its commitment to the mutual fund business as evidenced by its subsidization of money market funds.
INVESTMENT PERFORMANCE. The Board placed significant emphasis on the investment performance of each Fund in view of its importance to shareholders. While consideration was given to performance reports and discussions with portfolio managers at Board meetings during the year, particular attention in assessing performance was given to the Lipper reports furnished for the agreement renewals. The Lipper reports prepared for each individual Fund showed the investment performance of its Class A shares in comparison with its selected performance universe during 2012 and during the previous 10 years ended December 31, 2012, unless otherwise noted. Performance on a total return basis was shown by Lipper for all Funds with performance on an income return basis being shown for those Funds having income return as an element of their investment objective. The following summarizes the performance results for each Fund.
Franklin Adjustable U.S. Government Securities Fund – The Fund’s investment performance was shown in comparison with a performance universe consisting of all retail and institutional ultra-short obligation funds as selected by Lipper. The Lipper report showed the Fund’s income return
164 | Semiannual Report
Franklin Investors Securities Trust
Shareholder Information (continued)
Board Review of Investment Management Agreement (continued)
in 2012 to be in the highest or best performing quintile of such performance universe, and on an annualized basis to also be in the highest quintile of such universe during each of the previous three-, five- and 10-year periods. The Lipper report showed the Fund’s total return during 2012 to also be in the middle performing quintile of its performance universe, but on an annualized basis to be in the highest performing quintile of its performance universe for each of the previous five- and 10-year periods, and in the second-highest performing quintile of such universe for the previous three-year period. The Board was satisfied with the Fund’s comparative performance as set forth in the Lipper report.
Franklin Floating Rate Daily Access Fund – The Fund’s investment performance was shown in comparison with a performance universe consisting of all retail and institutional loan participation funds as selected by Lipper. The Lipper report showed its income return during 2012 to be in the next-to-lowest performing quintile of its performance universe, and its income return on an annualized basis during the previous three-, five- and 10-year periods to be in the lowest performing quintile of its performance universe. The Lipper report showed the Fund’s total return during 2012 to be in the lowest performing quintile of its performance universe and on an annualized basis for the previous three-, five- and 10-year periods to be in either the lowest or second-lowest performing quintile of such universe. In discussing such performance, management pointed out, among other things, that the Fund’s returns should be viewed on a risk-adjusted basis, noting that its conservative approach to investing had caused it in 2012 to avoid exposure to high yield bonds and to be underweight in lower rated bank loan investments, which had significantly outperformed the bank loan market. Management also pointed out that the five largest funds in the Lipper performance universe with characteristics believed to be similar to the Fund had also been 2012 underperformers. The Board was not satisfied with the Fund’s comparative performance as set forth in the Lipper report and intends to continue monitoring ongoing performance. The Board, however, did not believe that any immediate change in investment strategy or portfolio managers was warranted and noted that as shown in the Lipper report, the Fund’s income return and total return in 2012 were 4.51% and 8.06%, respectively, and that on an annualized basis for the previous 10-year period, the Fund’s income return was within 25 basis points of its performance universe median and total return was within 34 basis points of its performance universe median.
Franklin Low Duration Total Return Fund – The Fund’s investment performance was shown in comparison to a performance universe consisting of all retail and institutional short investment grade debt funds as selected by Lipper. The Fund has been in operation for less than 10 years and the Lipper report showed its income return for 2012 to be in the highest or best performing quintile of its performance universe, and on an annualized basis to be in the highest performing quintile and second-highest performing quintile of such universe for the respective previous three- and five-year periods. The Lipper report showed the Fund’s total return for 2012 to be in the second-highest performing quintile of its performance universe, and on an annualized basis to be in the second-highest quintile of such universe for the previous three-year period and the highest performing quintile of such universe for the previous five-year period. The Board was satisfied with the Fund’s comparative performance as shown in the Lipper report.
Semiannual Report | 165
Franklin Investors Securities Trust
Shareholder Information (continued)
Board Review of Investment Management Agreement (continued)
Franklin Total Return Fund – The Fund’s investment performance was shown in comparison to a performance universe consisting of all retail and institutional intermediate investment-grade debt funds as selected by Lipper. The Lipper report showed the Fund’s income return to be in the highest or best performing quintile of its performance universe during 2012 and to also be in the highest quintile of such universe for the previous three-, five- and 10-year periods on an annualized basis. The Lipper report showed the Fund’s total return during 2012 to be in the second-highest performing quintile of its performance universe, and on an annualized basis to be in either the highest performing or second-highest performing quintile of such universe for the previous three-, five- and 10-year periods. The Board was satisfied with the Fund’s comparative performance as set forth in the Lipper report.
COMPARATIVE EXPENSES. Consideration was given to a comparative analysis of the management fees and total expense ratio of each Fund compared with those of a group of other funds selected by Lipper as constituting its appropriate Lipper expense group. Lipper expense data is based upon information taken from each fund’s most recent annual report, which reflects historical asset levels that may be quite different from those currently existing, particularly in a period of market volatility. While recognizing such inherent limitation and the fact that expense ratios generally increase as assets decline and decrease as assets grow, the Board believed the independent analysis conducted by Lipper to be an appropriate measure of comparative expenses. In reviewing comparative costs, Lipper provides information on each Fund’s contractual investment management fee in comparison with the contractual investment management fee that would have been charged by other funds within its Lipper expense group assuming they were similar in size to the Fund, as well as the actual total expense ratio of each Fund in comparison with those of its expense group. The Lipper contractual investment management fee analysis includes within such fee any separate administrative fees, and the Lipper total expenses, for comparative consistency, are shown by Lipper for Fund Class A shares. The results of such expense comparisons showed that the contractual investment management fee rate and actual total expense ratio for Franklin Floating Rate Daily Access Fund were below the median of its Lipper expense group. The Board was satisfied with the comparative contractual investment management fee rate and actual total expense ratio of the Fund as shown in the Lipper reports. The contractual investment management fee rate of Franklin Adjustable U.S. Government Securities Fund was within half a basis point of the median for its Lipper expense group, while its actual total expense ratio was less than six basis points higher than the median for such group. The Board found the comparative contractual investment management fee rate and actual total expense ratio of this Fund as shown in the Lipper report to be acceptable. The contractual investment management fee rate of Franklin Total Return Fund was below the median of its Lipper expense group, while its actual total expense ratio was five basis points higher than the median of such group. The contractual investment management fee and actual total expense ratio for Franklin Low Duration Total Return Fund were above the median of its respective Lipper expense group, and its actual total expense ratio was within eight basis points above the median of its expense group. The Board found the contractual management fees and total expense ratios of each of these two Funds to be acceptable, noting that their expenses were subsidized by management fee caps on common expenses.
166 | Semiannual Report
Franklin Investors Securities Trust
Shareholder Information (continued)
Board Review of Investment Management Agreement (continued)
MANAGEMENT PROFITABILITY. The Board also considered the level of profits realized by the Manager and its affiliates in connection with the operation of each Fund. In this respect, the Board reviewed the Fund profitability analysis that addresses the overall profitability of Franklin Templeton’s U.S. fund business, as well as its profits in providing management and other services to each of the individual funds during the 12-month period ended September 30, 2012, being the most recent fiscal year-end for Franklin Resources, Inc., the Manager’s parent. In reviewing the analysis, attention was given to the methodology followed in allocating costs to each Fund, it being recognized that allocation methodologies are inherently subjective and various allocation methodologies may each be reasonable while producing different results. In this respect, the Board noted that, while being continuously refined and reflecting changes in the Manager’s own cost accounting, the cost allocation methodology was consistent with that followed in profitability report presentations for the Funds made in prior years and that the Funds’ independent registered public accounting firm had been engaged by the Manager to periodically review the reasonableness of the allocation methodologies solely for use by the Funds’ Board in reference to the profitability analysis. In reviewing and discussing such analysis, management discussed with the Board its belief that costs incurred in establishing the infrastructure necessary for the type of mutual fund operations conducted by the Manager and its affiliates may not be fully reflected in the expenses allocated to each Fund in determining its profitability, as well as the fact that the level of profits, to a certain extent, reflected operational cost savings and efficiencies initiated by management. The Board also took into account management’s expenditures in improving shareholder services provided the Funds, as well as the need to implement systems and meet additional regulatory and compliance requirements resulting from statutes such as the Sarbanes-Oxley and Dodd Frank Acts and recent SEC and other regulatory requirements. In addition, the Board considered a third-party study comparing the profitability of the Manager’s parent on an overall basis to other publicly held managers broken down to show profitability from management operations exclusive of distribution expenses, as well as profitability including distribution expenses. The Board also considered the extent to which the Manager and its affiliates might derive ancillary benefits from fund operations, including revenues generated from transfer agent services and potential benefits resulting from allocation of fund brokerage and the use of commission dollars to pay for research. Based upon its consideration of all these factors, the Board determined that the level of profits realized by the Manager and its affiliates from providing services to each Fund was not excessive in view of the nature, quality and extent of services provided.
ECONOMIES OF SCALE. The Board also considered whether economies of scale are realized by the Manager as the Funds grow larger and the extent to which this is reflected in the level of management fees charged. While recognizing that any precise determination is inherently subjective, the Board noted that based upon the Fund profitability analysis, it appears that as some funds get larger, at some point economies of scale do result in the Manager realizing a larger profit margin on management services provided such a fund. The Board also noted that economies of scale are shared with each Fund and its shareholders through management fee breakpoints so that as a Fund grows in size, its effective management fee rate declines. The management fee structure, including a separate administrative fee, for Franklin Adjustable U.S. Government Securities Fund provides a
Semiannual Report | 167
Franklin Investors Securities Trust
Shareholder Information (continued)
Board Review of Investment Management Agreement (continued)
fee of 0.50% on the first $5 billion of assets, with breakpoints continuing at stages thereafter. In discussing such fee, management expressed the view that this initial rate anticipated economies of scale. In support of this position, management pointed to the competitive contractual investment management fee rate and expense ratio of this Fund, which had assets of approximately $2.5 billion at year-end, with those of its Lipper expense group. The Board intends to monitor the growth of this Fund, but believed that to the extent economies of scale may be realized by the Manager and its affiliates, such initial rate did reflect economies of scale benefiting this Fund and its shareholders. Based on their year-end asset levels, all of the other Funds benefited from breakpoints contained in their management fee structure with additional breakpoints continuing beyond such asset levels. The Board believed that to the extent economies of scale may be realized by the Manager and its affiliates, the schedule of fees under the investment management agreement for each of such Funds provides a sharing of benefits with the Funds and their shareholders.
The investment management agreements for the Funds provide investment advisory services and administrative services under separate agreements with a fixed fee of 20 basis points being charged under an administration agreement for each Fund. At the February 26, 2013, Board meeting, the Board eliminated the separate agreements and approved a new form of investment management agreement for these Funds combining such services. In approving the new form of investment management agreements, the Board took into account the fact that the types of services and aggregate fee, including breakpoints, would be the same as provided under the previous separate agreements and that combining such services was consistent with Lipper’s methodology of considering contractual investment management fees to include any separately charged administrative fee.
Proxy Voting Policies and Procedures
The Trust’s investment manager has established Proxy Voting Policies and Procedures (Policies) that the Trust uses to determine how to vote proxies relating to portfolio securities. Shareholders may view the Trust’s complete Policies online at franklintempleton.com. Alternatively, shareholders may request copies of the Policies free of charge by calling the Proxy Group collect at (954) 527-7678 or by sending a written request to: Franklin Templeton Companies, LLC, 300 S.E. 2nd Street, Fort Lauderdale, FL 33301, Attention: Proxy Group. Copies of the Trust’s proxy voting records are also made available online at franklintempleton.com and posted on the U.S. Securities and Exchange Commission’s website at sec.gov and reflect the most recent 12-month period ended June 30.
Quarterly Statement of Investments
The Trust files a complete statement of investments with the U.S. Securities and Exchange Commission for the first and third quarters for each fiscal year on Form N-Q. Shareholders may view the filed Form N-Q by visiting the Commission’s website at sec.gov. The filed form may also be viewed and copied at the Commission’s Public Reference Room in Washington, DC. Information regarding the operations of the Public Reference Room may be obtained by calling (800) SEC-0330.
168 | Semiannual Report

Item 2. Code of Ethics.
(a) The Registrant has adopted a code of ethics that applies to its principal executive officers and principal financial and accounting officer.
(c) N/A
(d) N/A
(f) Pursuant to Item 12(a)(1), the Registrant is attaching as an exhibit a copy of its code of ethics that applies to its principal executive officers and principal financial and accounting officer.
Item 3. Audit Committee Financial Expert.
(a)(1) The Registrant has an audit committee financial expert serving on its audit committee.
(2) The audit committee financial expert is John B. Wilson and he is "independent" as defined under the relevant Securities and Exchange Commission Rules and Releases.
Item 4. Principal Accountant Fees and Services. N/A
Item 5. Audit Committee f Listed Registrants. N/A
Item 6. Schedule of Investments. N/A
Item 7. Disclosure of Proxy Voting Policies and Procedures for Closed-End Management Investment Companies. N/A
Item 8. Portfolio Managers of Closed-End Management Investment Companies. N/A
Item 9. Purchases of Equity Securities by Closed-End Management Investment Company and Affiliated Purchasers. N/A
Item 10. Submission of Matters to a Vote of Security Holders.
There have been no changes to the procedures by which shareholders may recommend nominees to the Registrant's Board of Trustees that would require disclosure herein.
Item 11. Controls and Procedures.
(a) Evaluation of Disclosure Controls and Procedures. The Registrant maintains disclosure controls and procedures that are designed to ensure that information required to be disclosed in the Registrant’s filings under the Securities Exchange Act of 1934 and the Investment Company Act of 1940 is recorded, processed, summarized and reported within the periods specified in the rules and forms of the Securities and Exchange Commission. Such information is accumulated and communicated to the Registrant’s management, including its principal executive officer and principal financial officer, as appropriate, to allow timely decisions regarding required disclosure. The Registrant’s management, including the principal executive officer and the principal financial officer, recognizes that any set of controls and procedures, no matter how well designed and operated, can provide only reasonable assurance of achieving the desired control objectives.
Within 90 days prior to the filing date of this Shareholder Report on Form N-CSR, the Registrant had carried out an evaluation, under the supervision and with the participation of the Registrant’s management, including the Registrant’s principal executive officer and the Registrant’s principal financial officer, of the effectiveness of the design and operation of the Registrant’s disclosure controls and procedures. Based on such evaluation, the Registrant’s principal executive officer and principal financial officer concluded that the Registrant’s disclosure controls and procedures are effective.
(b) Changes in Internal Controls. There have been no changes in the Registrant’s internal controls or in other factors that could materially affect the internal controls over financial reporting subsequent to the date of their evaluation in connection with the preparation of this Shareholder Report on Form N-CSR.
Item 12. Exhibits.
(a)(1) Code of Ethics
(a)(2) Certifications pursuant to Section 302 of the Sarbanes-Oxley Act of 2002 of Laura F. Fergerson, Chief Executive Officer - Finance and Administration, and Gaston Gardey, Chief Financial Officer and Chief Accounting Officer
(b) Certifications pursuant to Section 906 of the Sarbanes-Oxley Act of 2002 of Laura F. Fergerson, Chief Executive Officer - Finance and Administration, and Gaston Gardey, Chief Financial Officer and Chief Accounting Officer
SIGNATURES
Pursuant to the requirements of the Securities Exchange Act of 1934 and the Investment Company Act of 1940, the registrant has duly caused this report to be signed on its behalf by the undersigned, thereunto duly authorized.
FRANKLIN INVESTORS SECURITIES TRUST
By /s/LAURA F. FERGERSON
Laura F. Fergerson
Chief Executive Officer –
Finance and Administration
Date June 26, 2013
Pursuant to the requirements of the Securities Exchange Act of 1934 and the Investment Company Act of 1940, this report has been signed below by the following persons on behalf of the registrant and in the capacities and on the dates indicated.
By /s/LAURA F. FERGERSON
Laura F. Fergerson
Chief Executive Officer –
Finance and Administration
Date June 26, 2013
By /s/GASTON GARDEY
Gaston Gardey
Chief Financial Officer and
Chief Accounting Officer
Date June 26, 2013