UNITED STATES
SECURITIES AND EXCHANGE COMMISSION
Washington, DC 20549
FORM N-CSRS
CERTIFIED SHAREHOLDER REPORT OF REGISTERED MANAGEMENT INVESTMENT COMPANIES
Investment Company Act file number 811-04986
Franklin Investors Securities Trust
(Exact name of registrant as specified in charter)
One Franklin Parkway, San Mateo, CA 94403-1906
(Address of principal executive offices) (Zip code)
Craig S. Tyle, One Franklin Parkway, San Mateo, CA 94403-1906
(Name and address of agent for service)
Registrant's telephone number, including area Code: (650) 312-2000
Date of fiscal year end: 10/31
Date of reporting period: 4/30/16
Item 1. Reports to Stockholders.
| Contents | |
| Shareholder Letter | 1 |
| Semiannual Report | |
| Economic and Market Overview | 3 |
| Franklin Adjustable U.S. Government Securities Fund | 4 |
| Franklin Floating Rate Daily Access Fund | 11 |
| Franklin Low Duration Total Return Fund | 19 |
| Franklin Total Return Fund | 27 |
| Financial Highlights and Statements of Investments | 35 |
| Financial Statements | 105 |
| Notes to Financial Statements | 110 |
| Shareholder Information | 133 |
Visit franklintempleton.com for fund updates, to access your account, or to find helpful financial planning tools.
2 Semiannual Report
franklintempleton.com
Semiannual Report
Economic and Market Overview
The U.S. economy moderated in 2015’s fourth quarter and slowed further in 2016’s first quarter as exports, business investment and federal government spending declined. The manufacturing sector expanded in March and April after contracting for five consecutive months, while the services sector expanded throughout the six-month period. Growth in services contributed to new jobs and helped the unemployment rate to be largely stable at 5.0% throughout the review period.1 Home sales and prices rose amid relatively low mortgage rates. Monthly retail sales grew during most of the review period and rose to the highest level in April in more than a year, driven mainly by automobile sales. Inflation, as measured by the Consumer Price Index, remained relatively subdued due to low energy prices.
After maintaining a near-zero interest rate for seven years to support the U.S. economy’s recovery, the Federal Reserve (Fed) raised its target range for the federal funds rate to 0.25%–0.50% at its December meeting. At the time of the increase, policy-makers cited the labor market’s considerable improvement and were reasonably confident that inflation would move back to the Fed’s 2.00% medium-term objective. The Fed maintained the rate through period-end, indicating it would monitor domestic and global developments and their implications on the labor markets as it tracks actual and expected progression toward its employment and inflation goals.
The 10-year Treasury yield, which moves inversely to price, shifted throughout the period. It rose from 2.16% on October 31, 2015, to a period high of 2.36% in November, and remained relatively high through the rest of 2015, based partly on upbeat domestic and eurozone economic data as well as the Fed’s interest rate increase. However, the yield declined to 1.83% by period-end due to the Fed’s cautious stance on further interest rate increases, investor concerns about domestic and global economic growth and weak oil and commodity prices.
The foregoing information reflects our analysis and opinions as of April 30, 2016. The information is not a complete analysis of every aspect of any market, country, industry, security or fund. Statements of fact are from sources considered reliable.
1. Source: Bureau of Labor Statistics.
franklintempleton.com
Semiannual Report 3
Franklin Adjustable U.S. Government Securities Fund
This semiannual report for Franklin Adjustable U.S. Government Securities Fund covers the period ended April 30, 2016.
Your Fund’s Goal and Main Investments
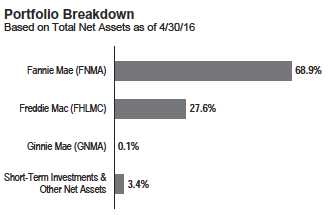
The Fund seeks to provide a high level of current income while providing lower volatility of principal than a fund that invests in fixed-rate securities by investing at least 80% of its net assets in adjustable-rate U.S. government mortgage securities, which are issued or guaranteed by the U.S. government, its agencies or instrumentalities.1 The Fund’s investments may include securities issued by Ginnie Mae (GNMA) and government-sponsored entities, such as Fannie Mae (FNMA) and Freddie Mac (FHLMC).2
Performance Overview
The Fund’s Class A shares had a -0.74% cumulative total return for the six months under review. In comparison, the Fund’s benchmark, the Barclays U.S. Government Index: 1-2 Year Component, posted a +0.40% total return.3 The index measures public obligations of the U.S. Treasury with one to two years to final maturity and publicly issued debt of U.S. government agencies, quasi-federal corporations, and corporate or foreign debt guaranteed by the U.S. government. You can find more of the Fund’s performance data in the Performance Summary beginning on page 6.
Performance data represent past performance, which does not guarantee future results. Investment return and principal value will fluctuate, and you may have a gain or loss when you sell your shares. Current performance may differ from figures shown. Please visit franklintempleton.com or call (800) 342-5236 for most recent month-end performance.
Investment Strategy
We employ a conservative investment strategy as we strive to produce solid performance in a variety of interest rate climates. We choose securities using a value-oriented approach, emphasizing the bonds’ economic fundamentals in relation to comparable securities as well as their historical prepayment performance.
Manager’s Discussion
U.S. economic indicators were generally encouraging during the reporting period. Steady growth in the services sector created new jobs and boosted employment levels. Retail sales grew for most of the period. Low energy prices pulled inflation lower. In this environment, home sales and prices grew.
The Fund employed a conservative strategy that invested primarily in adjustable-rate mortgage securities (ARMs) that are either explicitly or implicitly backed by the U.S. government.1 During the period, the Fund invested predominantly in securities issued or guaranteed by FNMA and FHLMC. The Fund took a collateral-intensive research approach to analyze the prepayment behavior of individual ARMs to identify those with the
1. Securities owned by the Fund, but not shares of the Fund, are issued or guaranteed by the U.S. government, its agencies or instrumentalities, including government-
sponsored entities, as to timely payment of principal and interest.
2. Although U.S. government-sponsored entities may be chartered by acts of Congress, their securities are neither issued nor guaranteed by the U.S. government. Please see
the Fund’s prospectus for a detailed discussion regarding various levels of credit support for government agency or instrumentality securities. The Fund’s yield and share price
are not guaranteed and will vary with market conditions.
3. Source: Barclays.
The index is unmanaged and includes reinvestment of any income or distributions. It does not reflect any fees, expenses or sales charges. One cannot invest directly in an
index, and an index is not representative of the Fund’s portfolio.
The dollar value, number of shares or principal amount, and names of all portfolio holdings are listed in the Fund’s Statement of Investments (SOI). The SOI
begins on page 40.
4 Semiannual Report
franklintempleton.com
FRANKLIN ADJUSTABLE U.S. GOVERNMENT SECURITIES FUND
| Dividend Distributions* | |||||
| 11/1/15–4/30/16 | |||||
| Dividend per Share (cents) | |||||
| Advisor | |||||
| Month | Class A | Class A1 | Class C | Class R6 | Class |
| November | 0.9537 | 1.0662 | 0.6656 | 1.2213 | 1.1371 |
| December | 0.8931 | 1.0056 | 0.6055 | 1.1725 | 1.0728 |
| January | 0.8438 | 0.9473 | 0.5740 | 1.1090 | 1.0132 |
| February | 1.0446 | 1.1549 | 0.7567 | 1.3027 | 1.2254 |
| March | 0.9869 | 1.0968 | 0.7002 | 1.2371 | 1.1669 |
| April | 0.9874 | 1.0928 | 0.7185 | 1.2242 | 1.1563 |
| Total | 5.7095 | 6.3636 | 4.0205 | 7.2668 | 6.7717 |
*The distribution amount is the sum of the dividend payments to shareholders for the
period shown and includes only estimated tax-basis net investment income. Assumes
shares were purchased and held for the entire accrual period. Since dividends accrue
daily, your actual distributions will vary depending on the date you purchased your
shares and any account activity. All Fund distributions will vary depending upon cur-
rent market conditions, and past distributions are not indicative of future trends.
most attractive prepayment profiles and focused on seasoned ARMs. Such securities have typically been through several interest rate cycles and therefore tend to be less sensitive to changes in interest rates, compared to newer issued counterparts. We have found such securities historically have experienced lower volatility than comparable maturity Treasuries and have provided more consistent income. We continued to focus on seasoned, post-reset FNMA and FHLMC ARM positions with average coupons below 3%.
Although mortgage rates have moved lower, mortgage credit has remained constrained, and actual prepayment levels have been relatively low. The Fund’s LIBOR indexed ARMs detracted from value, while ARMs indexed to U.S. Treasuries were generally additive.4
Thank you for your continued participation in Franklin Adjustable U.S. Government Securities Fund. We look forward to serving your future investment needs.

The foregoing information reflects our analysis, opinions and portfolio holdings as of April 30, 2016, the end of the reporting period. The way we implement our main investment strategies and the resulting portfolio holdings may change depending on factors such as market and economic conditions. These opinions may not be relied upon as investment advice or an offer for a particular security. The information is not a complete analysis of every aspect of any market, country, industry, security or the Fund. Statements of fact are from sources considered reliable, but the investment manager makes no representation or warranty as to their completeness or accuracy. Although historical performance is no guarantee of future results, these insights may help you understand our investment management philosophy.
CFA® is a trademark owned by CFA Institute.
4. The London Interbank Offered Rate (LIBOR) is the interest rate banks charge each other for loans. LIBOR is a widely used benchmark for short-term interest rates.
See www.franklintempletondatasources.com for additional data provider information.
franklintempleton.com
Semiannual Report 5
FRANKLIN ADJUSTABLE U.S. GOVERNMENT SECURITIES FUND
Performance Summary as of April 30, 2016
Your dividend income will vary depending on dividends or interest paid by securities in the Fund’s portfolio, adjusted for operating expenses of each class. Capital gain distributions are net profits realized from the sale of portfolio securities. The performance tables do not reflect any taxes that a shareholder would pay on Fund dividends, capital gain distributions, if any, or any realized gains on the sale of Fund shares. Total return reflects reinvestment of the Fund’s dividends and capital gain distributions, if any, and any unrealized gains or losses.
| Net Asset Value | ||||||
| Share Class (Symbol) | 4/30/16 | 10/31/15 | Change | |||
| A (FISAX) | $ | 8.43 | $ | 8.55 | -$ | 0.12 |
| A1 (FAUGX) | $ | 8.43 | $ | 8.54 | -$ | 0.11 |
| C (FCSCX) | $ | 8.42 | $ | 8.54 | -$ | 0.12 |
| R6 (N/A) | $ | 8.44 | $ | 8.55 | -$ | 0.11 |
| Advisor (FAUZX) | $ | 8.44 | $ | 8.55 | -$ | 0.11 |
| Distributions1 (11/1/15–4/30/16) | ||
| Dividend | ||
| Share Class | Income | |
| A | $ | 0.057095 |
| A1 | $ | 0.063636 |
| C | $ | 0.040205 |
| R6 | $ | 0.072668 |
| Advisor | $ | 0.067717 |
See page 8 for Performance Summary footnotes.
6 Semiannual Report
franklintempleton.com
FRANKLIN ADJUSTABLE U.S. GOVERNMENT SECURITIES FUND
PERFORMANCE SUMMARY
Performance as of 4/30/162
Cumulative total return excludes sales charges. Average annual total returns include maximum sales charges. Class A/A1: 2.25% maximum initial sales charge; Class C: 1% contingent deferred sales charge in first year only; Class R6/Advisor Class: no sales charges.
| Cumulative | Average Annual | Average Annual | Total Annual | |||||
| Share Class | Total Return3 | Total Return4 | Total Return (3/31/16)5 | Operating Expenses6 | ||||
| A | 0.91 | % | ||||||
| 6-Month | -0.74 | % | -3.01 | % | ||||
| 1-Year | -1.09 | % | -3.33 | % | -3.34 | % | ||
| 5-Year | +1.98 | % | -0.05 | % | -0.04 | % | ||
| 10-Year | +21.73 | % | +1.76 | % | +1.77 | % | ||
| A17 | 0.75 | % | ||||||
| 6-Month | -0.54 | % | -2.82 | % | ||||
| 1-Year | -0.82 | % | -3.07 | % | -3.08 | % | ||
| 5-Year | +2.30 | % | +0.01 | % | +0.01 | % | ||
| 10-Year | +22.11 | % | +1.79 | % | +1.80 | % | ||
| C | 1.31 | % | ||||||
| 6-Month | -0.94 | % | -1.92 | % | ||||
| 1-Year | -1.48 | % | -2.46 | % | -2.36 | % | ||
| 5-Year | -0.04 | % | -0.01 | % | +0.02 | % | ||
| 10-Year | +16.82 | % | +1.57 | % | +1.60 | % | ||
| R6 | 0.53 | % | ||||||
| 6-Month | -0.44 | % | -0.44 | % | ||||
| 1-Year | -0.72 | % | -0.72 | % | -0.73 | % | ||
| Since Inception (9/20/13) | +0.81 | % | +0.31 | % | +0.31 | % | ||
| Advisor8 | 0.66 | % | ||||||
| 6-Month | -0.50 | % | -0.50 | % | ||||
| 1-Year | -0.84 | % | -0.84 | % | -0.85 | % | ||
| 5-Year | +3.27 | % | +0.65 | % | +0.65 | % | ||
| 10-Year | +24.33 | % | +2.20 | % | +2.21 | % | ||
| Distribution | 30-Day Standardized Yield10 | |||||||
| Share Class | Rate9 | (with waiver) | (without waiver) | |||||
| A | 1.44 | % | 0.44 | % | 0.43 | % | ||
| A1 | 1.60 | % | 0.60 | % | 0.60 | % | ||
| C | 1.08 | % | 0.06 | % | 0.04 | % | ||
| R6 | 1.83 | % | 0.79 | % | 0.78 | % | ||
| Advisor | 1.73 | % | 0.69 | % | 0.69 | % | ||
Performance data represent past performance, which does not guarantee future results. Investment return and principal value will fluctuate, and you may have a gain or loss when you sell your shares. Current performance may differ from figures shown. For most recent month-end performance, go to franklintempleton.com or call (800) 342-5236.
See page 8 for Performance Summary footnotes.
franklintempleton.com
Semiannual Report 7
FRANKLIN ADJUSTABLE U.S. GOVERNMENT SECURITIES FUND
PERFORMANCE SUMMARY
All investments involve risks, including possible loss of principal. Interest rate movements, unscheduled mortgage prepayments and other risk factors will affect the Fund’s share price and yield. Bond prices generally move in the opposite direction of interest rates. As prices of bonds in the Fund adjust to a rise in interest rates, the Fund’s share price may decline. Changes in the financial strength of a bond issuer or in a bond’s credit rating may affect its value. The Fund is actively managed but there is no guarantee that the manager’s investment decisions will produce the desired results. The Fund’s prospectus also includes a description of the main investment risks.
| Class A1: | Effective 6/18/14, Class A1 shares were established for shareholders of Franklin Limited Maturity U.S. Government Securities Fund – Class A as a result of |
| its reorganization into this Fund on the same date. Class A1 shares are closed to new investors. | |
| Class C: | These shares have higher annual fees and expenses than Class A shares. |
| Class R6: | Shares are available to certain eligible investors as described in the prospectus. |
| Advisor Class: | Shares are available to certain eligible investors as described in the prospectus. |
1. The distribution amount is the sum of the dividend payments to shareholders for the period shown and includes only estimated tax-basis net investment income.
2. The Fund has a fee waiver associated with any investment in a Franklin Templeton money fund, contractually guaranteed through at least its current fiscal year-end. Fund
investment results reflect the fee waiver, to the extent applicable; without this reduction, the results would have been lower.
3. Cumulative total return represents the change in value of an investment over the periods indicated.
4. Average annual total return represents the average annual change in value of an investment over the periods indicated. Return for less than one year, if any, has not
been annualized.
5. In accordance with SEC rules, we provide standardized average annual total return information through the latest calendar quarter.
6. Figures are as stated in the Fund’s current prospectus and may differ from the expense ratios disclosed in the Financial Highlights in this report. In periods of market vola-
tility, assets may decline significantly, causing total annual Fund operating expenses to become higher than the figures shown.
7. Performance for Class A1 has been calculated as follows: (a) for periods prior to 6/18/14, Franklin Adjustable U.S. Government Securities Fund’s Class A performance is
used, and (b) for periods after 6/18/14, actual Class A1 performance is used, reflecting all charges and fees applicable to that class.
8. Effective 5/15/08, the Fund began offering Advisor Class shares, which do not have sales charges or a Rule 12b-1 plan. Performance quotations for this class reflect the
following methods of calculation: (a) For periods prior to 5/15/08, a restated figure is used based upon the Fund’s Class A performance, excluding the effect of Class A’s
maximum initial sales charge, but reflecting the effect of the Class A Rule 12b-1 fees; and (b) for periods after 5/15/08 actual Advisor Class performance is used reflecting all
charges and fees applicable to that class. Since 5/15/08 (commencement of sales), the cumulative and average annual total returns of Advisor Class shares were +12.83%
and +1.53%.
9. Distribution rate is based on an annualization of the sum of the respective class’s past 30 days’ daily distributions and the maximum offering price (NAV for Classes C, R6
and Advisor) per share on 4/30/16.
10. The Fund’s 30-day standardized yield is calculated over a trailing 30-day period using the yield to maturity on bonds and/or the dividends accrued on stocks. It may not
equal the Fund’s actual income distribution rate, which reflects the Fund’s past dividends paid to shareholders.
8 Semiannual Report
franklintempleton.com
FRANKLIN ADJUSTABLE U.S. GOVERNMENT SECURITIES FUND
Your Fund’s Expenses
As a Fund shareholder, you can incur two types of costs:
- Transaction costs, including sales charges (loads) on Fund purchases; and
- Ongoing Fund costs, including management fees, distribution and service (12b-1) fees, and other Fund expenses. All mutual funds have ongoing costs, sometimes referred to as operating expenses.
The following table shows ongoing costs of investing in the Fund and can help you understand these costs and compare them with those of other mutual funds. The table assumes a $1,000 investment held for the six months indicated.
Actual Fund Expenses
The first line (Actual) for each share class listed in the table provides actual account values and expenses. The “Ending Account Value” is derived from the Fund’s actual return, which includes the effect of Fund expenses.
You can estimate the expenses you paid during the period by following these steps. Of course, your account value and expenses will differ from those in this illustration:
1. Divide your account value by $1,000.
If an account had an $8,600 value, then $8,600 ÷ $1,000 = 8.6.
2. Multiply the result by the number under the heading “Expenses Paid During Period.”
If Expenses Paid During Period were $7.50, then 8.6 × $7.50 = $64.50.
In this illustration, the estimated expenses paid this period are $64.50.
Hypothetical Example for Comparison with Other Funds
Information in the second line (Hypothetical) for each class in the table can help you compare ongoing costs of investing in the Fund with those of other mutual funds. This information may not be used to estimate the actual ending account balance or expenses you paid during the period. The hypothetical “Ending Account Value” is based on the actual expense ratio for each class and an assumed 5% annual rate of return before expenses, which does not represent the Fund’s actual return. The figure under the heading “Expenses Paid During Period” shows the hypothetical expenses your account would have incurred under this scenario. You can compare this figure with the 5% hypothetical examples that appear in shareholder reports of other funds.
Please note that expenses shown in the table are meant to highlight ongoing costs and do not reflect any transaction costs, such as sales charges. Therefore, the second line for each class is useful in comparing ongoing costs only, and will not help you compare total costs of owning different funds. In addition, if transaction costs were included, your total costs would have been higher. Please refer to the Fund prospectus for additional information on operating expenses.
franklintempleton.com
Semiannual Report 9
FRANKLIN ADJUSTABLE U.S. GOVERNMENT SECURITIES FUND
YOUR FUND’S EXPENSES
| Beginning Account | Ending Account | Expenses Paid During | ||||
| Share Class | Value 11/1/15 | Value 4/30/16 | Period* 11/1/15–4/30/16 | |||
| A | ||||||
| Actual | $ | 1,000 | $ | 992.60 | $ | 4.56 |
| Hypothetical (5% return before expenses) | $ | 1,000 | $ | 1,020.29 | $ | 4.62 |
| A1 | ||||||
| Actual | $ | 1,000 | $ | 994.60 | $ | 3.77 |
| Hypothetical (5% return before expenses) | $ | 1,000 | $ | 1,021.08 | $ | 3.82 |
| C | ||||||
| Actual | $ | 1,000 | $ | 990.60 | $ | 6.53 |
| Hypothetical (5% return before expenses) | $ | 1,000 | $ | 1,018.30 | $ | 6.62 |
| R6 | ||||||
| Actual | $ | 1,000 | $ | 995.60 | $ | 2.73 |
| Hypothetical (5% return before expenses) | $ | 1,000 | $ | 1,022.13 | $ | 2.77 |
| Advisor | ||||||
| Actual | $ | 1,000 | $ | 995.00 | $ | 3.32 |
| Hypothetical (5% return before expenses) | $ | 1,000 | $ | 1,021.53 | $ | 3.37 |
*Expenses are calculated using the most recent six-month expense ratio, net of expense waivers, annualized for each class (A: 0.92%;
A1: 0.76%; C: 1.32%; R6: 0.55%; and Advisor: 0.67%), multiplied by the average account value over the period, multiplied by 182/366 to reflect
the one-half year period.
10 Semiannual Report
franklintempleton.com
Franklin Floating Rate Daily Access Fund
This semiannual report for Franklin Floating Rate Daily Access Fund covers the period ended April 30, 2016.
Your Fund’s Goals and Main Investments
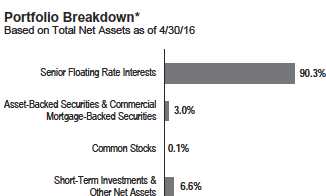
The Fund seeks to provide a high level of current income and, secondarily, preservation of capital by investing at least 80% of its net assets in income-producing floating interest rate corporate loans and corporate debt securities made to or issued by U.S. companies, non-U.S. entities and U.S. subsidiaries of non-U.S. entities.
What are corporate loans?
Corporate loans are typically floating rate loans to corporate borrowers made by a group, or syndicate, of banks and other financial institutions. These loans provide capital to companies for varied purposes, such as merger and acquisition activity, leveraged buyouts or refinancings. These loans are typically syndicated to a group of investors.
Performance Overview
The Fund’s Class A shares delivered a +1.18% cumulative total return for the six months under review. In comparison, the Fund’s benchmark, the Credit Suisse Leveraged Loan Index (CS LLI), which is designed to mirror the investable universe of the U.S. dollar-denominated leveraged loan market, posted a +1.36% total return.1 You can find more of the Fund’s performance data in the Performance Summary beginning on page 14.
Performance data represent past performance, which does not guarantee future results. Investment return and principal value will fluctuate, and you may have a gain or loss when you sell your shares. Current performance may differ from figures shown. Please visit franklintempleton.com or call (800) 342-5236 for most recent month-end performance.
Corporate Loan Market Overview
Falling commodity prices precipitated weaker technical conditions and contributed to significant volatility within the loan market at the beginning of the six-month period. However, rising oil prices since February and continued accommodative policies from central banks eventually helped to improve
*Figures reflect certain derivatives held in the portfolio (or their underlying reference
assets) and may not total 100% or may be negative due to rounding, use of any
derivatives, unsettled trades or other factors.
investor sentiment across risk assets. Although outflows from loan retail vehicles remained and collateralized-loan-obligation (CLO) formation was relatively slow, restrained new issuance and repayment activity helped to support technical conditions later in the period. In a reversal from the first half of the period, the rally in the second half of the period was largely driven by lower rated loans, while higher rated loans generally lagged.
Loan retail vehicles faced significant redemption activity at the beginning of the period, but outflows eventually moderated. However, lower expectations for additional rate increases by the Federal Reserve (Fed) and lower Treasury yields tempered demand from retail investors. Relatively wider spreads in the high yield bond market at the middle of the period also led some crossover investors to shift interest toward that market. Although interest from retail investors remained subdued, there were more reports of pension funds and other institutional accounts investing in the market, which contributed to an improvement in technical conditions toward the end of the period.
Although issuance of new CLOs also improved, overall volume was relatively low. The arbitrage needed for new vehicles continued to be challenging following weaker CLO performance in the secondary market and some potential investors were increasingly concerned about deterioration in credit conditions. Furthermore, substantial downgrades of loans by credit rating
1. Source: Credit Suisse Group.
The index is unmanaged and includes reinvestment of any income or distributions. It does not reflect any fees, expenses or sales charges. One cannot invest directly in an
index, and an index is not representative of the Fund’s portfolio.
See www.franklintempletondatasources.com for additional data provider information.
The dollar value, number of shares or principal amount, and names of all portfolio holdings are listed in the Fund’s Statement of Investments (SOI). The SOI
begins on page 47.
franklintempleton.com
Semiannual Report
11
FRANKLIN FLOATING RATE DAILY ACCESS FUND
agencies resulted in more vehicles breaching restrictions on CCC-rated debt and furthered concern of a possible rise in losses from defaults. However, better conditions in the loan market led to tightening of liability spreads, which helped arbi-trage for some new deals. The slow pace of issuance, nonetheless, led more market strategists to lower forecasts for total CLO issuance in 2016, from levels that were already below last year’s total volume.
Sluggish activity in the primary market helped balance slower demand for loans, although much of the issuance was related to mergers and acquisitions. Many of the deals were related to strategic corporate buyers, rather than leveraged buyout transactions that could have brought significant new supply to the market. Although more deals were forced to widen pricing amid technical headwinds early in the period, low projected volume reduced investor expectations for forthcoming supply and led to tighter pricing for many loans in the syndication process and a stronger bid for loans in the secondary market. Amendment activity also rose as conditions improved and issuers took advantage of stronger investor sentiment to loosen covenants or extend maturities.
Defaults increased during the period and the default rate as measured by number of defaulted loans reached the highest level in six years. The increase was largely attributable to issuers in the energy and metals/minerals industries, whose ratings were downgraded by credit ratings agencies. Defaults were also concentrated among these industries, and recovery values declined for defaulted issuers, as measured by the price of the loan 30 days after the event of default.
Investment Strategy
We use a detailed credit analysis process to select corporate loan and corporate debt securities that meet our criteria. We conduct ongoing credit monitoring of our investments. To help manage the credit risk associated with investing in securities rated below investment grade (or if unrated, of comparable quality), we seek to diversify the Fund by investing in a large number of loans of companies that we have identified as having attractive risk/reward profiles, favorable capital structures, strong asset coverage and dominant market shares. This diversification potentially reduces credit risk by spreading assets across many different industries.
In addition, we seek to exploit market inefficiencies by assigning forward-looking credit-risk tiers to issuers based upon our forward-looking analysis of the issuers’ prospects in the near term. This independent analysis enables us to express differences between backward-looking rating assignments of credit-risk tiers and our analysts’ forward-looking assessment of credit risk, thereby allowing us to potentially take advantage of credit risks the market may be overstating or avoid uncompensated credit risks the market may not have adequately identified.
Dividend Distributions*
11/1/15–4/30/16
| Dividend per Share (cents) | ||||
| Advisor | ||||
| Month | Class A | Class C | Class R6 | Class |
| November | 3.5984 | 3.3100 | 3.8109 | 3.7837 |
| December | 3.4873 | 3.2060 | 3.7189 | 3.6649 |
| January | 3.2374 | 2.9759 | 3.4630 | 3.4029 |
| February | 3.4696 | 3.1942 | 3.7110 | 3.6437 |
| March | 3.4825 | 3.2031 | 3.7328 | 3.6589 |
| April | 3.2063 | 2.9396 | 3.4497 | 3.3746 |
| Total | 20.4815 | 18.8288 | 21.8863 | 21.5287 |
*The distribution amount is the sum of the dividend payments to shareholders for the
period shown and includes only estimated tax-basis net investment income. Assumes
shares were purchased and held for the entire accrual period. Since dividends accrue
daily, your actual distributions will vary depending on the date you purchased your
shares and any account activity. All Fund distributions will vary depending upon cur-
rent market conditions, and past distributions are not indicative of future trends.
Manager’s Discussion
During the period under review, the Fund underperformed its benchmark. Upper tier loans outperformed the other tiers during the period, returning +2.26%, followed by the middle tier return of +1.14% and the lower tier return of -1.43%.1 The Fund’s overweighted position in the upper tier of the market throughout the period contributed to relative performance, but our loan selection within the upper and middle tiers detracted. However, Fund performance benefited from an improvement in investor sentiment, which led the Fund to outperform the index during the second half of the period.
FMG America Finance (FMG), a producer of iron ore, was a major contributor during the period because the price of iron ore increased and investors expected that higher prices would generate additional free cash flow. The Fund’s upper tier term loan position in FMG rallied from deep discounts to par, based on investor expectations that improved prices and cash flow would lead the company to pay down debt. The Fund also benefited from our loan selection in the lower tier, which included a term loan of Cannery Casino Resorts. The Fund’s second lien loan and middle-tier rated first lien loan positions in the casino owner and operator contributed to performance after the company reached agreements to sell its Pennsylvania and Las Vegas assets. We believe the revenue generated from these sales could pay down the company’s term loans.
In contrast, the Fund’s loan selection within the middle tier detracted from relative performance as top detractors continued
12 Semiannual Report
franklintempleton.com
FRANKLIN FLOATING RATE DAILY ACCESS FUND
| Top 10 Holdings | ||
| 4/30/16 | ||
| Company | % of Total | |
| Sector/Industry | Net Assets | |
| FMG America Finance Inc. (Australia) | 2.6 | % |
| Diversified Metals & Mining | ||
| Alinta Energy Finance Pty. Ltd. (Australia) | 2.5 | % |
| Electric Utilities | ||
| Caraustar Industries Inc. | 2.3 | % |
| Forest Products | ||
| Valeant Pharmaceuticals International Inc. | 2.3 | % |
| Pharmaceuticals | ||
| Community Health Systems Inc. | 2.1 | % |
| Health Care Facilities | ||
| Cannery Casino Resorts LLC | 1.9 | % |
| Casinos & Gaming | ||
| Cyanco Intermediate Corp. | 1.9 | % |
| Commodity Chemicals | ||
| Fitness International LLC | 1.8 | % |
| Leisure Facilities | ||
| Chemours Co. LLC | 1.7 | % |
| Diversified Chemicals | ||
| MoneyGram International Inc. | 1.6 | % |
| Data Processing & Outsourced Services |
to face credit-specific issues despite the improved technical environment. The Fund’s term loan of Peabody Energy, a coal producer, detracted from performance as investors anticipated the company would file for bankruptcy, which it eventually did near period-end. The issuer continued to face challenging operating headwinds related to low coal prices. Furthermore, the Fund’s term loans of radio broadcaster Cumulus Media declined after the company reported weak results due to weaker trends in digital and political advertising and license fees.
As outflows increased, we primarily sold middle tier positions with what we considered weak relative value to meet shareholder redemptions, while sales later in the period also included upper tier positions that traded close to par. We also participated in several upper tier primary deals that launched with what we felt were relatively attractive coupons. In previous periods, we increased our weighting in the upper tier of the market and lowered our weighting in the middle and lower tiers. However, during the period, our weighting in the upper tier declined and our weighting in the lower tier increased due to an increase in credit rating downgrades.
During the period, we employed the use of Power Shares Loan Portfolio (BKLN), an exchange traded fund that seeks to track the leveraged loan market by tracking the S&P/LSTA U.S. Leveraged Loan 100 Index. We terminated this position by period-end. We also bought protection in high yield credit default swaps to help to offset heightened volatility in the credit markets and closed the position before period-end. Our combined exposure in all of these instruments was limited to no more than 3% of the Fund during the period.
What is a credit default swap?
A credit default swap, or CDS, is an agreement between two parties whereby the buyer receives credit protection from the seller. The buyer makes periodic payments over the term of the agreement in return for a payment by the seller in the event of a default or other credit event.
Thank you for your continued participation in Franklin Floating Rate Daily Access Fund. We look forward to serving your future investment needs.

The foregoing information reflects our analysis, opinions and portfolio holdings as of April 30, 2016, the end of the reporting period. The way we implement our main investment strategies and the resulting portfolio holdings may change depending on factors such as market and economic conditions. These opinions may not be relied upon as investment advice or an offer for a particular security. The information is not a complete analysis of every aspect of any market, country, industry, security or the Fund. Statements of fact are from sources considered reliable, but the investment manager makes no representation or warranty as to their completeness or accuracy. Although historical performance is no guarantee of future results, these insights may help you understand our investment management philosophy.
franklintempleton.com
Semiannual Report 13
FRANKLIN FLOATING RATE DAILY ACCESS FUND
Performance Summary as of April 30, 2016
Your dividend income will vary depending on dividends or interest paid by securities in the Fund’s portfolio, adjusted for operating expenses of each class. Capital gain distributions are net profits realized from the sale of portfolio securities. The performance tables do not reflect any taxes that a shareholder would pay on Fund dividends, capital gain distributions, if any, or any realized gains on the sale of Fund shares. Total return reflects reinvestment of the Fund’s dividends and capital gain distributions, if any, and any unrealized gains or losses.
| Net Asset Value | ||||||
| Share Class (Symbol) | 4/30/16 | 10/31/15 | Change | |||
| A (FAFRX) | $ | 8.50 | $ | 8.61 | -$ | 0.11 |
| C (FCFRX) | $ | 8.50 | $ | 8.61 | -$ | 0.11 |
| R6 (N/A) | $ | 8.50 | $ | 8.60 | -$ | 0.10 |
| Advisor (FDAAX) | $ | 8.51 | $ | 8.61 | -$ | 0.10 |
| Distributions1 (11/1/15–4/30/16) | ||
| Dividend | ||
| Share Class | Income | |
| A | $ | 0.204815 |
| C | $ | 0.188288 |
| R6 | $ | 0.218863 |
| Advisor | $ | 0.215287 |
See page 16 for Performance Summary footnotes.
14 Semiannual Report
franklintempleton.com
FRANKLIN FLOATING RATE DAILY ACCESS FUND
PERFORMANCE SUMMARY
Performance as of 4/30/162
Cumulative total return excludes sales charges. Average annual total returns include maximum sales charges. Class A: 2.25% maximum initial sales charge; Class C: 1% contingent deferred sales charge in first year only; Class R6/Advisor Class: no sales charges.
| Average Annual | ||||||||||
| Cumulative | Average Annual | Total Return | Total Annual Operating Expenses6 | |||||||
| Share Class | Total Return3 | Total Return4 | (3/31/16 | )5 | (with waiver) | (without waiver) | ||||
| A | 0.85 | % | 0.86 | % | ||||||
| 6-Month | +1.18 | % | -1.12 | % | ||||||
| 1-Year | -1.37 | % | -3.61 | % | -4.80 | % | ||||
| 5-Year | +13.63 | % | +2.13 | % | +1.82 | % | ||||
| 10-Year | +32.96 | % | +2.66 | % | +2.49 | % | ||||
| C | 1.25 | % | 1.26 | % | ||||||
| 6-Month | +0.98 | % | -0.01 | % | ||||||
| 1-Year | -1.77 | % | -2.71 | % | -3.89 | % | ||||
| 5-Year | +11.39 | % | +2.18 | % | +1.88 | % | ||||
| 10-Year | +27.78 | % | +2.48 | % | +2.31 | % | ||||
| R6 | 0.52 | % | 0.73 | % | ||||||
| 6-Month | +1.35 | % | +1.35 | % | ||||||
| 1-Year | -0.94 | % | -0.94 | % | -2.25 | % | ||||
| Since Inception (5/1/13) | +5.44 | % | +1.78 | % | +1.07 | % | ||||
| Advisor | 0.60 | % | 0.61 | % | ||||||
| 6-Month | +1.30 | % | +1.30 | % | ||||||
| 1-Year | -1.13 | % | -1.13 | % | -2.33 | % | ||||
| 5-Year | +15.06 | % | +2.85 | % | +2.54 | % | ||||
| 10-Year | +36.19 | % | +3.14 | % | +2.96 | % | ||||
| Distribution | 30-Day Standardized Yield8 | |||||||||
| Share Class | Rate7 | (with waiver) | (without waiver) | |||||||
| A | 4.66 | % | 7.30 | % | 7.29 | % | ||||
| C | 4.37 | % | 7.08 | % | 7.07 | % | ||||
| R6 | 5.13 | % | 7.82 | % | 7.80 | % | ||||
| Advisor | 5.02 | % | 7.74 | % | 7.71 | % | ||||
Performance data represent past performance, which does not guarantee future results. Investment return and principal value will fluctuate, and you may have a gain or loss when you sell your shares. Current performance may differ from figures shown. For most recent month-end performance, go to franklintempleton.com or call (800) 342-5236.
See page 16 for Performance Summary footnotes.
franklintempleton.com
Semiannual Report 15
FRANKLIN FLOATING RATE DAILY ACCESS FUND
PERFORMANCE SUMMARY
All investments involve risks, including possible loss of principal. Investors should be aware that the Fund’s share price and yield will fluctuate with market conditions. The Fund should not be considered an alternative to money market funds or certificates of deposit (CDs). The floating rate loans and debt securities in which the Fund invests tend to be rated below investment grade. Investing in higher yielding, lower rated, floating rate loans and debt securities involves greater risk of default, which could result in loss of principal—a risk that may be heightened in a slowing economy. Interest earned on floating rate loans varies with changes in prevailing interest rates. Therefore, while floating rate loans offer higher interest income when interest rates rise, they will also generate less income when interest rates decline. Changes in the financial strength of a bond issuer or in a bond’s credit rating may affect its value. The Fund is actively managed but there is no guarantee that the manager’s investment decisions will produce the desired results. The Fund’s prospectus also includes a description of the main investment risks.
| Class C: | These shares have higher annual fees and expenses than Class A shares. |
| Class R6: | Shares are available to certain eligible investors as described in the prospectus. |
| Advisor Class: | Shares are available to certain eligible investors as described in the prospectus. |
1. The distribution amount is the sum of the dividend payments to shareholders for the period shown and includes only estimated tax-basis net investment income.
2. The Fund has a fee waiver associated with any investment in a Franklin Templeton money fund, contractually guaranteed through at least its current fiscal year-end. The
transfer agent has contractually agreed to cap transfer agency fees for Class R6 shares so that transfer agency fees for that class do not exceed 0.01% until at least 2/28/17.
Fund investment results reflect the fee waiver and fee cap, to the extent applicable; without these reductions, the results would have been lower.
3. Cumulative total return represents the change in value of an investment over the periods indicated.
4. Average annual total return represents the average annual change in value of an investment over the periods indicated. Return for less than one year, if any, has not
been annualized.
5. In accordance with SEC rules, we provide standardized average annual total return information through the latest calendar quarter.
6. Figures are as stated in the Fund’s current prospectus and may differ from the expense ratios disclosed in the Financial Highlights in this report. In periods of market vola-
tility, assets may decline significantly, causing total annual Fund operating expenses to become higher than the figures shown.
7. Distribution rate is based on an annualization of the sum of the respective class’s past 30 days’ daily distributions and the maximum offering price (NAV for Classes C, R6
and Advisor) per share on 4/30/16.
8. The Fund’s 30-day standardized yield is calculated over a trailing 30-day period using the yield to maturity on bonds and/or the dividends accrued on stocks. It may not
equal the Fund’s actual income distribution rate, which reflects the Fund’s past dividends paid to shareholders.
16 Semiannual Report
franklintempleton.com
FRANKLIN FLOATING RATE DAILY ACCESS FUND
Your Fund’s Expenses
As a Fund shareholder, you can incur two types of costs:
- Transaction costs, including sales charges (loads) on Fund purchases; and
- Ongoing Fund costs, including management fees, distribution and service (12b-1) fees, and other Fund expenses. All mutual funds have ongoing costs, sometimes referred to as operating expenses.
The following table shows ongoing costs of investing in the Fund and can help you understand these costs and compare them with those of other mutual funds. The table assumes a $1,000 investment held for the six months indicated.
Actual Fund Expenses
The first line (Actual) for each share class listed in the table provides actual account values and expenses. The “Ending Account Value” is derived from the Fund’s actual return, which includes the effect of Fund expenses.
You can estimate the expenses you paid during the period by following these steps. Of course, your account value and expenses will differ from those in this illustration:
1. Divide your account value by $1,000.
If an account had an $8,600 value, then $8,600 ÷ $1,000 = 8.6.
2. Multiply the result by the number under the heading “Expenses Paid During Period.”
If Expenses Paid During Period were $7.50, then 8.6 × $7.50 = $64.50.
In this illustration, the estimated expenses paid this period are $64.50.
Hypothetical Example for Comparison with Other Funds
Information in the second line (Hypothetical) for each class in the table can help you compare ongoing costs of investing in the Fund with those of other mutual funds. This information may not be used to estimate the actual ending account balance or expenses you paid during the period. The hypothetical “Ending Account Value” is based on the actual expense ratio for each class and an assumed 5% annual rate of return before expenses, which does not represent the Fund’s actual return. The figure under the heading “Expenses Paid During Period” shows the hypothetical expenses your account would have incurred under this scenario. You can compare this figure with the 5% hypothetical examples that appear in shareholder reports of other funds.
Please note that expenses shown in the table are meant to highlight ongoing costs and do not reflect any transaction costs, such as sales charges. Therefore, the second line for each class is useful in comparing ongoing costs only, and will not help you compare total costs of owning different funds. In addition, if transaction costs were included, your total costs would have been higher. Please refer to the Fund prospectus for additional information on operating expenses.
franklintempleton.com
Semiannual Report 17
FRANKLIN FLOATING RATE DAILY ACCESS FUND
YOUR FUND’S EXPENSES
| Beginning Account | Ending Account | Expenses Paid During | ||||
| Share Class | Value 11/1/15 | Value 4/30/16 | Period* 11/1/15–4/30/16 | |||
| A | ||||||
| Actual | $ | 1,000 | $ | 1,011.80 | $ | 4.40 |
| Hypothetical (5% return before expenses) | $ | 1,000 | $ | 1,020.49 | $ | 4.42 |
| C | ||||||
| Actual | $ | 1,000 | $ | 1,009.80 | $ | 6.40 |
| Hypothetical (5% return before expenses) | $ | 1,000 | $ | 1,018.50 | $ | 6.42 |
| R6 | ||||||
| Actual | $ | 1,000 | $ | 1,013.50 | $ | 2.65 |
| Hypothetical (5% return before expenses) | $ | 1,000 | $ | 1,022.23 | $ | 2.66 |
| Advisor | ||||||
| Actual | $ | 1,000 | $ | 1,013.00 | $ | 3.15 |
| Hypothetical (5% return before expenses) | $ | 1,000 | $ | 1,021.73 | $ | 3.17 |
*Expenses are calculated using the most recent six-month expense ratio, net of expense waivers, annualized for each class (A: 0.88%;
C: 1.28%; R6: 0.53%; and Advisor: 0.63%), multiplied by the average account value over the period, multiplied by 182/366 to reflect the
one-half year period.
18 Semiannual Report
franklintempleton.com
Franklin Low Duration Total Return Fund
This semiannual report for Franklin Low Duration Total Return Fund covers the period ended April 30, 2016.
Your Fund’s Goal and Main Investments
The Fund seeks to provide a high level of current income as is consistent with prudent investing, while seeking preservation of capital. The Fund invests primarily in investment-grade debt securities and investments, including government and corporate debt securities and mortgage- and asset-backed securities, targeting an estimated average portfolio duration of three years or less.
What is duration?
Duration is a measure of a bond’s price sensitivity to interest rate changes. In general, a portfolio of securities with a lower duration can be expected to be less sensitive to interest rate changes than a portfolio with a higher duration.
Performance Overview
The Fund’s Class A shares delivered a +0.40% cumulative total return for the six months under review. In comparison, the Fund’s benchmark, the Barclays U.S. Government/Credit Index: 1-3 Year Component, posted a +0.79% total return.1 The index tracks public obligations of the U.S. Treasury with one to three years to final maturity and publicly issued debt of U.S. government agencies, quasi-federal corporations, and corporate or foreign debt guaranteed by the U.S. government. You can find more of the Fund’s performance data in the Performance Summary beginning on page 22.
Performance data represent past performance, which does not guarantee future results. Investment return and principal value will fluctuate, and you may have a gain or loss when you sell your shares. Current performance may differ from figures shown. Please visit franklintempleton.com or call (800) 342-5236 for most recent month-end performance.
Investment Strategy
We seek to invest in a combination of fixed income securities, primarily from across the investment-grade debt universe. We
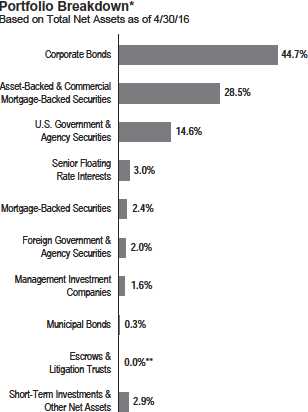
*Figures reflect certain derivatives held in the portfolio (or their underlying reference
assets) and may not total 100% or may be negative due to rounding, use of
derivatives, unsettled trades or other factors.
**Rounds to less than 0.1% of total net assets.
analyze securities using proprietary and nonproprietary research to help us identify attractive investment opportunities across the entire fixed income opportunity set, on a relative basis. When making investment decisions, we evaluate business cycles, yield curves, and values between and within markets. Through a low duration portfolio, we seek to position the Fund to be less affected by interest rate changes than a fund with a higher duration. In addition, we may use derivative transactions, such as currency forwards, futures contracts and swap agreements to obtain net long or short exposures to select currencies, interest rates, countries, duration or credit risks.
1. Source: Morningstar.
The index is unmanaged and includes reinvestment of any income or distributions. It does not reflect any fees, expenses or sales charges. One cannot invest directly in an
index, and an index is not representative of the Fund’s portfolio.
See www.franklintempletondatasources.com for additional data provider information.
The dollar value, number of shares or principal amount, and names of all portfolio holdings are listed in the Fund’s Statement of Investments (SOI). The SOI
begins on page 58.
franklintempleton.com
Semiannual Report
19
FRANKLIN LOW DURATION TOTAL RETURN FUND
What is a yield curve?
The yield curve is a line that plots the interest rates, at a set point in time, of bonds having equal credit quality but differing maturity dates. The most frequently reported yield curve compares three-month, two-year and 30-year U.S. Treasury debt.
What is a currency forward contract?
A currency forward contract, or a currency forward, is an agreement between the Fund and a counterparty to buy or sell a foreign currency at a specific exchange rate on a future date.
What is a futures contract?
A futures contract is an agreement between the Fund and a counterparty made through a U.S. or foreign futures exchange to buy or sell an underlying instrument or asset at a specific price on a future date.
What are swap agreements?
Swap agreements, such as interest rate, fixed income total return, currency, inflation index and credit default swaps, are contracts between the Fund and another party (the swap counterparty). In a basic swap transaction, the Fund agrees with the swap counterparty to exchange the returns (or differentials in rates of return) earned or realized on a particular “notional amount” of underlying instruments. The notional amount is the set amount selected by the parties as the basis on which to calculate the obligations that they have agreed to exchange. The parties typically do not actually exchange the notional amount. Instead, they agree to exchange the returns that would be earned or realized if the notional amount were invested in given instruments or at given interest rates.
Manager’s Discussion
U.S. economic indicators were generally encouraging during the reporting period. Steady growth in the services sector created new jobs and boosted employment levels. Retail sales grew for most of the period. Low energy prices pulled inflation lower. In this environment, home sales and prices grew.
From a perspective of excess returns over Treasuries, U.S. dollar-denominated emerging market bonds performed well. Other major fixed income sectors that delivered positive excess returns, as measured by Barclays indexes, included high yield corporate credit, U.S. investment-grade corporate bonds and Treasury inflation protected securities.
During the period, the Fund’s high yield corporate credit and senior secured floating rate loans exposure benefited performance. Our exposure to non-agency residential mortgage-backed securities and non-U.S. yield curves also contributed to results. In contrast, the Fund’s exposure to foreign currency and investment-grade corporate bonds detracted from results.
| Dividend Distributions* | �� | |||
| 11/1/15–4/30/16 | ||||
| Dividend per Share (cents) | ||||
| Advisor | ||||
| Month | Class A | Class C | Class R6 | Class |
| November | 2.1509 | 1.8126 | 2.4784 | 2.3689 |
| December** | 8.5987 | 8.2618 | 8.9311 | 8.8224 |
| January | 1.1178 | 0.9466 | 1.2845 | 1.2292 |
| February | 0.9289 | 0.7290 | 1.1237 | 1.0577 |
| March | 1.2919 | 1.0006 | 1.5989 | 1.4766 |
| April | 0.6957 | 0.5351 | 0.8688 | 0.7998 |
| Total | 14.7839 | 13.2857 | 16.2854 | 15.7546 |
*The distribution amount is the sum of the dividend payments to shareholders for the
period shown and includes only estimated tax-basis net investment income. Assumes
shares were purchased and held for the entire accrual period. Since dividends accrue
daily, your actual distributions will vary depending on the date you purchased your
shares and any account activity. All Fund distributions will vary depending upon cur-
rent market conditions, and past distributions are not indicative of future trends.
**Includes an additional 4.36 cent per share distribution to meet excise tax requirements.
At period-end, we were overweighted compared to the benchmark in many of the credit sectors, including corporate credit and securitized products, based on our belief that valuations remained relatively attractive on a longer term basis. Over the period, we increased our exposure to certain Treasury positions, investment-grade corporate credit and floating rate loans. We decreased our exposures to commercial mortgage-backed securities, asset-backed securities and select international bonds.
During the period, the portfolio utilized derivatives, including credit default and currency swaps, currency forwards, Treasury futures, interest rate swaps and currency and credit default swap options, principally as a tool for efficient portfolio management and to manage overall portfolio risk. These derivative transactions may provide the same, or similar, net long or short exposure to select currencies, interest rates, countries, duration or credit risks in a less expensive way than by directly purchasing securities. In those markets where portfolio securities are readily available, the cost difference in normal market conditions may be small.
What is an option?
An option is a contract to buy or sell a specific financial product known as the option’s underlying instrument at a specific price. The buyer of an option has the right, but not the obligation, to buy or sell the underlying instrument at or until a specified expiration date. Conversely, the seller (“writer”) of an option who opens a transaction is obligated to buy or sell the underlying instrument should the option holder exercise that right.
20 Semiannual Report
franklintempleton.com
FRANKLIN LOW DURATION TOTAL RETURN FUND
Thank you for your continued participation in Franklin Low Duration Total Return Fund. We look forward to serving your future investment needs.

The foregoing information reflects our analysis, opinions and portfolio holdings as of April 30, 2016, the end of the reporting period. The way we implement our main investment strategies and the resulting portfolio holdings may change depending on factors such as market and economic conditions. These opinions may not be relied upon as
investment advice or an offer for a particular security. The information is not a complete analysis of every aspect of any market, country, industry, security or the Fund. Statements of fact are from sources considered reliable, but the investment manager makes no representation or warranty as to their completeness or accuracy. Although historical performance is no guarantee of future results, these insights may help you understand our investment management philosophy.
David Yuen, senior vice president, serves as a director of quantitative strategy and risk management in the Franklin Templeton Fixed Income department. Mr. Yuen develops portfolio strategies and investment processes with emphasis on sector allocation, portfolio construction and relative value security selection procedures. In addition, he implements and manages the risk management system and the performance attribution procedures. Prior to joining Franklin Templeton, Mr. Yuen was senior investment officer for Susquehanna Partners and a manager of fixed income trading at Alex Brown, Inc. Mr. Yuen holds a B.S., with honors, in chemistry from the California Institute of Technology and an M.B.A., with honors, in finance from the University of California, Los Angeles Graduate School of Management. Mr. Yuen is a Chartered Financial Analyst (CFA) charterholder and is a qualified Financial Risk Manager (FRM), as certified by the Global Association of Risk Professionals. He has authored various financial and portfolio management publications and speaks at diverse financial and capital market seminars and conferences.
franklintempleton.com
Semiannual Report 21
FRANKLIN LOW DURATION TOTAL RETURN FUND
Performance Summary as of April 30, 2016
Your dividend income will vary depending on dividends or interest paid by securities in the Fund’s portfolio, adjusted for operating expenses of each class. Capital gain distributions are net profits realized from the sale of portfolio securities. The performance tables do not reflect any taxes that a shareholder would pay on Fund dividends, capital gain distributions, if any, or any realized gains on the sale of Fund shares. Total return reflects reinvestment of the Fund’s dividends and capital gain distributions, if any, and any unrealized gains or losses.
| Net Asset Value | ||||||
| Share Class (Symbol) | 4/30/16 | 10/31/15 | Change | |||
| A (FLDAX) | $ | 9.80 | $ | 9.91 | -$ | 0.11 |
| C (FLDCX) | $ | 9.77 | $ | 9.90 | -$ | 0.13 |
| R6 (FLRRX) | $ | 9.84 | $ | 9.95 | -$ | 0.11 |
| Advisor (FLDZX) | $ | 9.83 | $ | 9.95 | -$ | 0.12 |
| Distributions1 (11/1/15–4/30/16) | ||
| Dividend | ||
| Share Class | Income | |
| A | $ | 0.147839 |
| C | $ | 0.132857 |
| R6 | $ | 0.162854 |
| Advisor | $ | 0.157546 |
See page 24 for Performance Summary footnotes.
22 Semiannual Report
franklintempleton.com
FRANKLIN LOW DURATION TOTAL RETURN FUND
PERFORMANCE SUMMARY
Performance as of 4/30/162
Cumulative total return excludes sales charges. Average annual total returns include maximum sales charges. Class A: 2.25% maximum initial sales charge; Class C: 1% contingent deferred sales charge in first year only; Class R6/Advisor Class: no sales charges.
| Average Annual | ||||||||||
| Cumulative | Average Annual | Total Return | Total Annual Operating Expenses6 | |||||||
| Share Class | Total Return3 | Total Return4 | (3/31/16 | )5 | (with waiver) | (without waiver) | ||||
| A | 0.82 | % | 0.97 | % | ||||||
| 6-Month | +0.40 | % | -1.88 | % | ||||||
| 1-Year | -0.28 | % | -2.51 | % | -2.95 | % | ||||
| 5-Year | +5.37 | % | +0.59 | % | +0.67 | % | ||||
| 10-Year | +36.35 | % | +2.92 | % | +2.90 | % | ||||
| C | 1.22 | % | 1.37 | % | ||||||
| 6-Month | +0.14 | % | -0.85 | % | ||||||
| 1-Year | -0.68 | % | -1.66 | % | -2.12 | % | ||||
| Since Inception (10/1/12) | +1.84 | % | +0.51 | % | +0.36 | % | ||||
| R6 | 0.44 | % | 0.55 | % | ||||||
| 6-Month | +0.55 | % | +0.55 | % | ||||||
| 1-Year | +0.02 | % | +0.02 | % | -0.31 | % | ||||
| Since Inception (5/1/13) | +3.04 | % | +1.00 | % | +0.82 | % | ||||
| Advisor7 | 0.57 | % | 0.72 | % | ||||||
| 6-Month | +0.49 | % | +0.49 | % | ||||||
| 1-Year | -0.08 | % | -0.08 | % | -0.42 | % | ||||
| 5-Year | +6.68 | % | +1.30 | % | +1.40 | % | ||||
| 10-Year | +39.27 | % | +3.37 | % | +3.35 | % | ||||
| Distribution | 30-Day Standardized Yield9 | |||||||||
| Share Class | Rate8 | (with waiver) | (without waiver) | |||||||
| A | 0.83 | % | 1.66 | % | 1.51 | % | ||||
| C | 0.66 | % | 1.29 | % | 1.15 | % | ||||
| R6 | 1.06 | % | 2.10 | % | 1.96 | % | ||||
| Advisor | 0.98 | % | 1.93 | % | 1.79 | % | ||||
Performance data represent past performance, which does not guarantee future results. Investment return and principal value will fluctuate, and you may have a gain or loss when you sell your shares. Current performance may differ from figures shown. For most recent month-end performance, go to franklintempleton.com or call (800) 342-5236.
See page 24 for Performance Summary footnotes.
franklintempleton.com
Semiannual Report 23
FRANKLIN LOW DURATION TOTAL RETURN FUND
PERFORMANCE SUMMARY
All investments involve risks, including possible loss of principal. Interest rate movements and mortgage prepayments will affect the Fund’s share price and yield. Bond prices generally move in the opposite direction of interest rates. As prices of bonds in the Fund adjust to a rise in interest rates, the Fund’s share price may decline. Derivatives, including currency management strategies, involve costs and can create economic leverage in the portfolio, which may result in significant volatility and cause the Fund to participate in losses (as well as enable gains) on an amount that exceeds the Fund’s initial investment. The Fund may not achieve the anticipated benefits and may realize losses when a counterparty fails to perform. Some derivatives are particularly sensitive to changes in interest rates. Foreign securities involve special risks, including currency fluctuations and economic and political uncertainty. The Fund is actively managed but there is no guarantee that the manager’s investment decisions will produce the desired results. The Fund’s prospectus also includes a description of the main investment risks.
| Class C: | These shares have higher annual fees and expenses than Class A shares. |
| Class R6: | Shares are available to certain eligible investors as described in the prospectus. |
| Advisor Class: | Shares are available to certain eligible investors as described in the prospectus. |
1. The distribution amount is the sum of the dividend payments to shareholders for the period shown and includes only estimated tax-basis net investment income.
2. The Fund has an expense reduction contractually guaranteed through at least 2/28/17 and a fee waiver associated with any investment in a Franklin Templeton money fund
and/or other Franklin Templeton fund, as applicable, contractually guaranteed through at least the Fund’s current fiscal year-end. Fund investment results reflect the expense
reduction and fee waiver, to the extent applicable; without these reductions, the results would have been lower.
3. Cumulative total return represents the change in value of an investment over the periods indicated.
4. Average annual total return represents the average annual change in value of an investment over the periods indicated. Return for less than one year, if any, has not
been annualized.
5. In accordance with SEC rules, we provide standardized average annual total return information through the latest calendar quarter.
6. Figures are as stated in the Fund’s current prospectus and may differ from the expense ratios disclosed in the Financial Highlights in this report. In periods of market vola-
tility, assets may decline significantly, causing total annual Fund operating expenses to become higher than the figures shown.
7. Effective 5/15/08, the Fund began offering Advisor class shares, which do not have sales charges or a Rule 12b-1 plan. Performance quotations for this class reflect the
following methods of calculation: (a) For periods prior to 5/15/08, a restated figure is used based upon the Fund’s Class A performance, excluding the effect of Class A’s
maximum initial sales charge, but reflecting the effect of the Class A Rule 12b-1 fees; and (b) for periods after 5/15/08 actual Advisor Class performance is used reflecting all
charges and fees applicable to that class. Since 5/15/08 (commencement of sales), the cumulative and average annual total returns of Advisor Class shares were +25.13%
and +2.86%.
8. Distribution rate is based on an annualization of the sum of the respective class’s past 30 days’ daily distributions and the maximum offering price (NAV for Classes C, R6
and Advisor) per share on 4/30/16.
9. The Fund’s 30-day standardized yield is calculated over a trailing 30-day period using the yield to maturity on bonds and/or the dividends accrued on stocks. It may not
equal the Fund’s actual income distribution rate, which reflects the Fund’s past dividends paid to shareholders.
24 Semiannual Report
franklintempleton.com
FRANKLIN LOW DURATION TOTAL RETURN FUND
Your Fund’s Expenses
As a Fund shareholder, you can incur two types of costs:
- Transaction costs, including sales charges (loads) on Fund purchases; and
- Ongoing Fund costs, including management fees, distribution and service (12b-1) fees, and other Fund expenses. All mutual funds have ongoing costs, sometimes referred to as operating expenses.
The following table shows ongoing costs of investing in the Fund and can help you understand these costs and compare them with those of other mutual funds. The table assumes a $1,000 investment held for the six months indicated.
Actual Fund Expenses
The first line (Actual) for each share class listed in the table provides actual account values and expenses. The “Ending Account Value” is derived from the Fund’s actual return, which includes the effect of Fund expenses.
You can estimate the expenses you paid during the period by following these steps. Of course, your account value and expenses will differ from those in this illustration:
1. Divide your account value by $1,000.
If an account had an $8,600 value, then $8,600 ÷ $1,000 = 8.6.
2. Multiply the result by the number under the heading “Expenses Paid During Period.”
If Expenses Paid During Period were $7.50, then 8.6 × $7.50 = $64.50.
In this illustration, the estimated expenses paid this period are $64.50.
Hypothetical Example for Comparison with Other Funds
Information in the second line (Hypothetical) for each class in the table can help you compare ongoing costs of investing in the Fund with those of other mutual funds. This information may not be used to estimate the actual ending account balance or expenses you paid during the period. The hypothetical “Ending Account Value” is based on the actual expense ratio for each class and an assumed 5% annual rate of return before expenses, which does not represent the Fund’s actual return. The figure under the heading “Expenses Paid During Period” shows the hypothetical expenses your account would have incurred under this scenario. You can compare this figure with the 5% hypothetical examples that appear in shareholder reports of other funds.
Please note that expenses shown in the table are meant to highlight ongoing costs and do not reflect any transaction costs, such as sales charges. Therefore, the second line for each class is useful in comparing ongoing costs only, and will not help you compare total costs of owning different funds. In addition, if transaction costs were included, your total costs would have been higher. Please refer to the Fund prospectus for additional information on operating expenses.
franklintempleton.com
Semiannual Report 25
FRANKLIN LOW DURATION TOTAL RETURN FUND
YOUR FUND’S EXPENSES
| Beginning Account | Ending Account | Expenses Paid During | ||||
| Share Class | Value 11/1/15 | Value 4/30/16 | Period* 11/1/15–4/30/16 | |||
| A | ||||||
| Actual | $ | 1,000 | $ | 1,004.00 | $ | 3.99 |
| Hypothetical (5% return before expenses) | $ | 1,000 | $ | 1,020.89 | $ | 4.02 |
| C | ||||||
| Actual | $ | 1,000 | $ | 1,001.40 | $ | 5.97 |
| Hypothetical (5% return before expenses) | $ | 1,000 | $ | 1,018.90 | $ | 6.02 |
| R6 | ||||||
| Actual | $ | 1,000 | $ | 1,005.50 | $ | 2.09 |
| Hypothetical (5% return before expenses) | $ | 1,000 | $ | 1,022.77 | $ | 2.11 |
| Advisor | ||||||
| Actual | $ | 1,000 | $ | 1,004.90 | $ | 2.74 |
| Hypothetical (5% return before expenses) | $ | 1,000 | $ | 1,022.13 | $ | 2.77 |
*Expenses are calculated using the most recent six-month expense ratio, net of expense waivers annualized for each class (A: 0.80%;
C: 1.20%; R6: 0.42%; and Advisor: 0.55%), multiplied by the average account value over the period, multiplied by 182/366 to reflect the one-
half year period.
26 Semiannual Report
franklintempleton.com
Franklin Total Return Fund
This semiannual report for Franklin Total Return Fund covers the period ended April 30, 2016.
Your Fund’s Goals and Main Investments
The Fund seeks to provide high current income, consistent with preservation of capital. Capital appreciation over the long term is a secondary goal. The Fund invests at least 80% of its assets in investment-grade debt securities and investments. The Fund currently focuses on government and corporate debt securities and mortgage- and asset-backed securities.
Performance Overview
The Fund’s Class A shares delivered a +1.26% cumulative total return for the six months under review. In comparison, the Fund’s benchmark, the Barclays U.S. Aggregate Bond Index, which measures the U.S. investment-grade, fixed-rate, taxable bond market with index components for government and corporate, mortgage pass-through and asset-backed securities, posted a +2.82% total return.1 You can find more of the Fund’s performance data in the Performance Summary beginning on page 30.
Performance data represent past performance, which does not guarantee future results. Investment return and principal value will fluctuate, and you may have a gain or loss when you sell your shares. Current performance may differ from figures shown. Please visit franklintempleton.com or call (800) 342-5236 for most recent month-end performance.
Investment Strategy
We seek to invest in a combination of fixed income securities, predominantly from across the investment-grade debt universe. We analyze securities using proprietary and nonproprietary research to help us identify attractive investment opportunities, across the entire fixed income opportunity set, on a relative basis. The Fund may also invest up to 20% of its total assets in noninvestment-grade debt securities. In addition, we may use derivative transactions, such as currency and cross-currency forwards, futures contracts and swap agreements, to obtain net long or short exposures to select currencies, interest rates, countries, duration or credit risks.
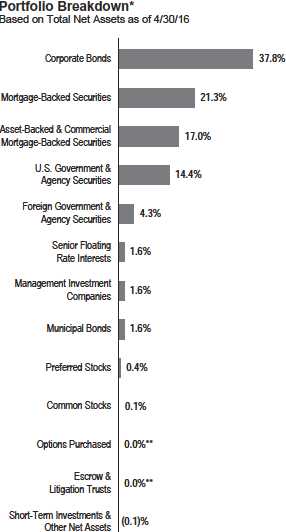
*Figures reflect certain derivatives held in the portfolio (or their underlying reference
assets) and may not total 100% or may be negative due to rounding, use of
derivatives, unsettled trades or other factors.
**Rounds to less than 0.1% of total net assets.
What is a currency forward contract?
A currency forward contract, or a currency forward, is an agreement between the Fund and a counterparty to buy or sell a foreign currency at a specific exchange rate on a future date.
1. Source: Morningstar.
The index is unmanaged and includes reinvestment of any income or distributions. It does not reflect any fees, expenses or sales charges. One cannot invest directly in an
index, and an index is not representative of the Fund’s portfolio.
See www.franklintempletondatasources.com for additional data provider information.
The dollar value, number of shares or principal amount, and names of all portfolio holdings are listed in the Fund’s Consolidated Statement of Investments (SOI).
The Consolidated SOI begins on page 84.
franklintempleton.com
Semiannual Report
27
FRANKLIN TOTAL RETURN FUND
What is a futures contract?
A futures contract is an agreement between the Fund and a counterparty made through a U.S. or foreign futures exchange to buy or sell an underlying instrument or asset at a specific price on a future date.
What are swap agreements?
Swap agreements, such as interest rate, fixed income total return, currency, inflation index and credit default swaps, are contracts between the Fund and another party (the swap counterparty). In a basic swap transaction, the Fund agrees with the swap counterparty to exchange the returns (or differentials in rates of return) earned or realized on a particular “notional amount” of underlying instruments. The notional amount is the set amount selected by the parties as the basis on which to calculate the obligations that they have agreed to exchange. The parties typically do not actually exchange the notional amount. Instead, they agree to exchange the returns that would be earned or realized if the notional amount were invested in given instruments or at given interest rates.
Manager’s Discussion
U.S. economic indicators were generally encouraging during the reporting period. Steady growth in the services sector created new jobs and boosted employment levels. Retail sales grew for most of the period. Low energy prices pulled inflation lower. In this environment, home sales and prices grew.
| Dividend Distributions* | |||||
| 11/1/15–4/30/16 | |||||
| Dividend per Share (cents) | |||||
| Advisor | |||||
| Month | Class A | Class C | Class R | Class R6 | Class |
| November | 3.2070 | 2.8646 | 2.9920 | 3.5813 | 3.4054 |
| December** | 17.0009 | 16.6524 | 16.7844 | 17.3772 | 17.2315 |
| January | 0.8366 | 0.7061 | 0.7543 | 0.9691 | 0.9200 |
| February | 1.1923 | 1.0145 | 1.0814 | 1.3752 | 1.3066 |
| March | 1.2066 | 0.9925 | 1.0730 | 1.4147 | 1.3433 |
| April | 0.4785 | 0.4025 | 0.4303 | 0.5533 | 0.5282 |
| Total | 23.9219 | 22.6326 | 23.1154 | 25.2708 | 24.7350 |
*The distribution amount is the sum of the dividend payments to shareholders for the
period shown and includes only estimated tax-basis net investment income.
Assumes shares were purchased and held for the entire accrual period. Since divi-
dends accrue daily, your actual distributions will vary depending on the date you
purchased your shares and any account activity. All Fund distributions will vary
depending upon current market conditions, and past distributions are not indicative
of future trends.
**Includes an additional 10.5 cent per share distribution to meet excise
tax requirements.
From a perspective of excess returns over Treasuries, U.S. dollar-denominated emerging market bonds performed well. Other major fixed income sectors that delivered positive excess returns, as measured by Barclays indexes, included high yield corporate credit, U.S. investment-grade corporate bonds and Treasury inflation protected securities.
During the period, the Fund’s exposure to non-U.S. yield curves contributed to performance. The Fund’s exposure to residential mortgage-backed securities, senior secured floating rate loans and tax-exempt municipal bonds also aided results. In contrast, the Fund’s defensive U.S. yield curve positioning was a detractor as yield curve movements had a negative impact on the Fund relative to its benchmark. The Fund’s exposure to foreign currencies and investment-grade corporate bonds also detracted from performance.
What is a yield curve?
The yield curve is a line that plots the interest rates, at a set point in time, of bonds having equal credit quality but differing maturity dates. The most frequently reported yield curve compares three-month, two-year and 30-year U.S. Treasury debt.
At period-end, we were overweighted compared to the benchmark in many of the credit sectors, including corporate credit and most securitized products, based on our belief that valuations remained relatively attractive on a longer term basis. Over the period, we increased our exposure to certain Treasury positions, floating-rate loans and agency mortgage-backed securities. We decreased our exposure to international bonds, investment-grade corporate credit and municipal bonds as we found better relative opportunities.
During the period, the portfolio utilized derivatives, including credit default and currency swaps, currency forwards, Treasury futures, interest rate swaps and currency and credit default swap options, principally as a tool for efficient portfolio management and to manage overall portfolio risk. These derivative transactions may provide the same, or similar, net long or short exposure to select currencies, interest rates, countries, duration or credit risks in a less expensive way than by directly purchasing securities. In those markets where portfolio securities are readily available, the cost difference in normal market conditions may be small.
What is an option?
An option is a contract to buy or sell a specific financial product known as the option’s underlying instrument at a specific price. The buyer of an option has the right, but not the obligation, to buy or sell the underlying instrument at or until a specified expiration date. Conversely, the seller (“writer”) of an option who opens a transaction is obligated to buy or sell the underlying instrument should the option holder exercise that right.
28 Semiannual Report
franklintempleton.com
FRANKLIN TOTAL RETURN FUND
Thank you for your continued participation in Franklin Total Return Fund. We look forward to serving your future investment needs.

The foregoing information reflects our analysis, opinions and portfolio holdings as of April 30, 2016, the end of the reporting period. The way we implement our main investment strategies and the resulting portfolio holdings may change depending on factors such as market and economic conditions. These opinions may not be relied upon as investment advice or an offer for a particular security. The information is not a complete analysis of every aspect of any market, country, industry, security or the Fund. Statements of fact are from sources considered reliable, but the investment manager makes no representation or warranty as to their completeness or accuracy. Although historical performance is no guarantee of future results, these insights may help you understand our investment management philosophy.
franklintempleton.com
Semiannual Report 29
FRANKLIN TOTAL RETURN FUND
Performance Summary as of April 30, 2016
Your dividend income will vary depending on dividends or interest paid by securities in the Fund’s portfolio, adjusted for operating expenses of each class. Capital gain distributions are net profits realized from the sale of portfolio securities. The performance tables do not reflect any taxes that a shareholder would pay on Fund dividends, capital gain distributions, if any, or any realized gains on the sale of Fund shares. Total return reflects reinvestment of the Fund’s dividends and capital gain distributions, if any, and any unrealized gains or losses.
| Net Asset Value | ||||||
| Share Class (Symbol) | 4/30/16 | 10/31/15 | Change | |||
| A (FKBAX) | $ | 9.74 | $ | 9.87 | -$ | 0.13 |
| C (FCTLX) | $ | 9.70 | $ | 9.84 | -$ | 0.14 |
| R (FTRRX) | $ | 9.72 | $ | 9.85 | -$ | 0.13 |
| R6 (FRERX) | $ | 9.79 | $ | 9.91 | -$ | 0.12 |
| Advisor (FBDAX) | $ | 9.78 | $ | 9.91 | -$ | 0.13 |
| Distributions1 (11/1/15–4/30/16) | ||
| Dividend | ||
| Share Class | Income | |
| A | $ | 0.239219 |
| C | $ | 0.226326 |
| R | $ | 0.231154 |
| R6 | $ | 0.252708 |
| Advisor | $ | 0.247350 |
See page 32 for Performance Summary footnotes.
30 Semiannual Report
franklintempleton.com
FRANKLIN TOTAL RETURN FUND
PERFORMANCE SUMMARY
Performance as of 4/30/162
Cumulative total return excludes sales charges. Average annual total returns include maximum sales charges. Class A: 4.25% maximum initial sales charge; Class C: 1% contingent deferred sales charge in first year only; Class R/R6/Advisor Class: no sales charges.
| Average Annual | ||||||||||
| Cumulative | Average Annual | Total Return | Total Annual Operating Expenses6 | |||||||
| Share Class | Total Return3 | Total Return4 | (3/31/16 | )5 | (with waiver) | (without waiver) | ||||
| A | 0.91 | % | 0.94 | % | ||||||
| 6-Month | +1.26 | % | -3.06 | % | ||||||
| 1-Year | -0.36 | % | -4.60 | % | -5.63 | % | ||||
| 5-Year | +16.93 | % | +2.28 | % | +2.52 | % | ||||
| 10-Year | +60.11 | % | +4.37 | % | +4.30 | % | ||||
| C | 1.31 | % | 1.34 | % | ||||||
| 6-Month | +1.03 | % | +0.04 | % | ||||||
| 1-Year | -0.75 | % | -1.71 | % | -2.82 | % | ||||
| 5-Year | +14.62 | % | +2.77 | % | +3.01 | % | ||||
| 10-Year | +53.76 | % | +4.40 | % | +4.32 | % | ||||
| R | 1.16 | % | 1.19 | % | ||||||
| 6-Month | +1.18 | % | +1.18 | % | ||||||
| 1-Year | -0.54 | % | -0.54 | % | -1.65 | % | ||||
| 5-Year | +15.58 | % | +2.94 | % | +3.16 | % | ||||
| 10-Year | +56.21 | % | +4.56 | % | +4.49 | % | ||||
| R6 | 0.50 | % | 0.53 | % | ||||||
| 6-Month | +1.40 | % | +1.40 | % | ||||||
| 1-Year | +0.04 | % | +0.04 | % | -1.03 | % | ||||
| Since Inception (5/1/13) | +5.06 | % | +1.66 | % | +1.44 | % | ||||
| Advisor | 0.66 | % | 0.69 | % | ||||||
| 6-Month | +1.34 | % | +1.34 | % | ||||||
| 1-Year | -0.07 | % | -0.07 | % | -1.15 | % | ||||
| 5-Year | +18.53 | % | +3.46 | % | +3.69 | % | ||||
| 10-Year | +64.10 | % | +5.08 | % | +5.01 | % | ||||
| Distribution | 30-Day Standardized Yield8 | |||||||||
| Share Class | Rate7 | (with waiver) | (without waiver) | |||||||
| A | 0.56 | % | 2.19 | % | 2.15 | % | ||||
| C | 0.50 | % | 1.89 | % | 1.85 | % | ||||
| R | 0.53 | % | 2.03 | % | 2.01 | % | ||||
| R6 | 0.68 | % | 2.66 | % | 2.64 | % | ||||
| Advisor | 0.65 | % | 2.54 | % | 2.50 | % | ||||
Performance data represent past performance, which does not guarantee future results. Investment return and principal value will fluctuate, and you may have a gain or loss when you sell your shares. Current performance may differ from figures shown. For most recent month-end performance, go to franklintempleton.com or call (800) 342-5236.
See page 32 for Performance Summary footnotes.
franklintempleton.com
Semiannual Report 31
FRANKLIN TOTAL RETURN FUND
PERFORMANCE SUMMARY
All investments involve risks, including possible loss of principal. Interest rate movements and mortgage prepayments will affect the Fund’s share price and yield. Bond prices generally move in the opposite direction of interest rates. Thus, as prices of bonds in the Fund adjust to a rise in interest rates, the Fund’s share price may decline. Changes in the financial strength of a bond issuer or in a bond’s credit rating may affect its value. The risks associated with higher yielding, lower rated securities (commonly called junk bonds) include higher risk of default and loss of principal. Investment in foreign securities also involves special risks, including currency fluctuations, and political and economic uncertainty. Derivatives, including currency management strategies, involve costs and can create economic leverage in the portfolio which may result in significant volatility and cause the Fund to participate in losses (as well as enable gains) on an amount that exceeds the Fund’s initial investment. The Fund may not achieve the anticipated benefits and may realize losses when a counterparty fails to perform as promised. The Fund is actively managed but there is no guarantee that the manager’s investment decisions will produce the desired results. The Fund’s prospectus also includes a description of the main investment risks.
Class C: Class R: Class R6: Advisor Class: | These shares have higher annual fees and expenses than Class A shares. Shares are available to certain eligible investors as described in the prospectus. These shares have higher annual fees and expenses than Class A shares. Shares are available to certain eligible investors as described in the prospectus. Shares are available to certain eligible investors as described in the prospectus. |
1. The distribution amount is the sum of the dividend payments to shareholders for the period shown and includes only estimated tax-basis net investment income.
2. The Fund has an expense reduction contractually guaranteed through at least 2/28/17 and a fee waiver associated with any investment in a Franklin Templeton money fund and/or other Franklin Templeton fund, as applicable, contractually guaranteed through at least the Fund’s current fiscal year-end. Fund investment results reflect the expense reduction and fee waiver, to the extent applicable; without these reductions, the results would have been lower.
3. Cumulative total return represents the change in value of an investment over the periods indicated.
4. Average annual total return represents the average annual change in value of an investment over the periods indicated. Return for less than one year, if any, has not been annualized.
5. In accordance with SEC rules, we provide standardized average annual total return information through the latest calendar quarter.
6. Figures are as stated in the Fund’s current prospectus and may differ from the expense ratios disclosed in the Financial Highlights in this report. In periods of market volatility, assets may decline significantly, causing total annual Fund operating expenses to become higher than the figures shown.
7. Distribution rate is based on an annualization of the sum of the respective class’s past 30 days’ daily distributions and the maximum offering price (NAV for Classes C, R, R6 and Advisor) per share on 4/30/16.
8. The Fund’s 30-day standardized yield is calculated over a trailing 30-day period using the yield to maturity on bonds and/or the dividends accrued on stocks. It may not equal the Fund’s actual income distribution rate, which reflects the Fund’s past dividends paid to shareholders.
32 Semiannual Report
franklintempleton.com
FRANKLIN TOTAL RETURN FUND
Your Fund’s Expenses
As a Fund shareholder, you can incur two types of costs:
- Transaction costs, including sales charges (loads) on Fund purchases; and
- Ongoing Fund costs, including management fees, distribution and service (12b-1) fees, and other Fund expenses. All mutual funds have ongoing costs, sometimes referred to as operating expenses.
The following table shows ongoing costs of investing in the Fund and can help you understand these costs and compare them with those of other mutual funds. The table assumes a $1,000 investment held for the six months indicated.
Actual Fund Expenses
The first line (Actual) for each share class listed in the table provides actual account values and expenses. The “Ending Account Value” is derived from the Fund’s actual return, which includes the effect of Fund expenses.
You can estimate the expenses you paid during the period by following these steps. Of course, your account value and expenses will differ from those in this illustration:
1. Divide your account value by $1,000.
If an account had an $8,600 value, then $8,600 ÷ $1,000 = 8.6.
2. Multiply the result by the number under the heading “Expenses Paid During Period.”
If Expenses Paid During Period were $7.50, then 8.6 × $7.50 = $64.50.
In this illustration, the estimated expenses paid this period are $64.50.
Hypothetical Example for Comparison with Other Funds
Information in the second line (Hypothetical) for each class in the table can help you compare ongoing costs of investing in the Fund with those of other mutual funds. This information may not be used to estimate the actual ending account balance or expenses you paid during the period. The hypothetical “Ending Account Value” is based on the actual expense ratio for each class and an assumed 5% annual rate of return before expenses, which does not represent the Fund’s actual return. The figure under the heading “Expenses Paid During Period” shows the hypothetical expenses your account would have incurred under this scenario. You can compare this figure with the 5% hypothetical examples that appear in shareholder reports of other funds.
Please note that expenses shown in the table are meant to highlight ongoing costs and do not reflect any transaction costs, such as sales charges. Therefore, the second line for each class is useful in comparing ongoing costs only, and will not help you compare total costs of owning different funds. In addition, if transaction costs were included, your total costs would have been higher. Please refer to the Fund prospectus for additional information on operating expenses.
franklintempleton.com
Semiannual Report 33
FRANKLIN TOTAL RETURN FUND
YOUR FUND’S EXPENSES
| Beginning Account | Ending Account | Expenses Paid During | ||||
| Share Class | Value 11/1/15 | Value 4/30/16 | Period* 11/1/15–4/30/16 | |||
| A | ||||||
| Actual | $ | 1,000 | $ | 1,012.60 | $ | 4.30 |
| Hypothetical (5% return before expenses) | $ | 1,000 | $ | 1,020.59 | $ | 4.32 |
| C | ||||||
| Actual | $ | 1,000 | $ | 1,010.30 | $ | 6.30 |
| Hypothetical (5% return before expenses) | $ | 1,000 | $ | 1,018.60 | $ | 6.32 |
| R | ||||||
| Actual | $ | 1,000 | $ | 1,011.80 | $ | 5.55 |
| Hypothetical (5% return before expenses) | $ | 1,000 | $ | 1,019.34 | $ | 5.57 |
| R6 | ||||||
| Actual | $ | 1,000 | $ | 1,014.00 | $ | 2.25 |
| Hypothetical (5% return before expenses) | $ | 1,000 | $ | 1,022.63 | $ | 2.26 |
| Advisor | ||||||
| Actual | $ | 1,000 | $ | 1,013.40 | $ | 3.05 |
| Hypothetical (5% return before expenses) | $ | 1,000 | $ | 1,021.83 | $ | 3.07 |
*Expenses are calculated using the most recent six-month expense ratio, net of expense waivers, annualized for each class (A: 0.86%;
C: 1.26%; R: 1.11%; R6: 0.45%; and Advisor: 0.61%), multiplied by the average account value over the period, multiplied by 182/366 to reflect
the one-half year period.
34 Semiannual Report
franklintempleton.com
FRANKLIN INVESTORS SECURITIES TRUST
| Financial Highlights | ||||||||||||||||||
| Franklin Adjustable U.S. Government Securities Fund | ||||||||||||||||||
| Six Months Ended | Year Ended October 31, | |||||||||||||||||
| April 30, 2016 | ||||||||||||||||||
| (unaudited) | 2015 | 2014 | 2013 | 2012 | 2011 | |||||||||||||
| Class A | ||||||||||||||||||
| Per share operating performance | ||||||||||||||||||
| (for a share outstanding throughout the period) | ||||||||||||||||||
| Net asset value, beginning of period | $ | 8.55 | $ | 8.67 | $ | 8.72 | $ | 8.90 | $ | 8.84 | $ | 8.90 | ||||||
| Income from investment operationsa: | ||||||||||||||||||
| Net investment income | 0.018 | 0.019 | 0.043 | 0.048 | 0.078 | 0.103 | ||||||||||||
| Net realized and unrealized gains (losses) | (0.081 | ) | (0.040 | ) | 0.006 | (0.098 | ) | 0.117 | 0.011 | |||||||||
| Total from investment operations | (0.063 | ) | (0.021 | ) | 0.049 | (0.050 | ) | 0.195 | 0.114 | |||||||||
| Less distributions from net investment income | (0.057 | ) | (0.099 | ) | (0.099 | ) | (0.130 | ) | (0.135 | ) | (0.174 | ) | ||||||
| Net asset value, end of period | $ | 8.43 | $ | 8.55 | $ | 8.67 | $ | 8.72 | $ | 8.90 | $ | 8.84 | ||||||
| Total returnb | (0.74 | )% | (0.24 | )% | 0.56 | % | (0.56 | )% | 2.22 | % | 1.30 | % | ||||||
| Ratios to average net assetsc | ||||||||||||||||||
| Expenses | 0.92 | %d | 0.91 | %d,e | 0.93 | %d,e | 0.87 | % | 0.87 | % | 0.86 | % | ||||||
| Net investment income | 0.47 | % | 0.39 | % | 0.48 | % | 0.63 | % | 0.91 | % | 1.16 | % | ||||||
| Supplemental data | ||||||||||||||||||
| Net assets, end of period (000’s) | $ | 768,818 | $ | 848,918 | $ | 1,058,838 | $ | 1,105,674 | $ | 1,308,971 | $ | 1,470,029 | ||||||
| Portfolio turnover rate | 1.99 | % | 9.98 | % | 14.18 | % | 8.66 | % | 9.69 | % | 19.65 | % | ||||||
aThe amount shown for a share outstanding throughout the period may not correlate with the Statement of Operations for the period due to the timing of sales and repurchases
of the Fund’s shares in relation to income earned and/or fluctuating fair value of the investments of the Fund.
bTotal return does not reflect sales commissions or contingent deferred sales charges, if applicable, and is not annualized for periods less than one year.
cRatios are annualized for periods less than one year.
dBenefit of waiver and payments by affiliates rounds to less than 0.01%.
eBenefit of expense reduction rounds to less than 0.01%.
franklintempleton.com
The accompanying notes are an integral part of these financial statements. | Semiannual Report 35
FRANKLIN INVESTORS SECURITIES TRUST
FINANCIAL H IGHLIGHTS
| Franklin Adjustable U.S. Government Securities Fund (continued) | |||||||||
| Six Months Ended | Year Ended October 31, | ||||||||
| April 30, 2016 | |||||||||
| (unaudited) | 2015 | 2014 | a | ||||||
| Class A1 | |||||||||
| Per share operating performance | |||||||||
| (for a share outstanding throughout the period) | |||||||||
| Net asset value, beginning of period | $ | 8.54 | $ | 8.67 | $ | 8.68 | |||
| Income from investment operationsb: | |||||||||
| Net investment income | 0.029 | 0.046 | 0.018 | ||||||
| Net realized and unrealized gains (losses) | (0.075 | ) | (0.062 | ) | 0.010 | ||||
| Total from investment operations | (0.046 | ) | (0.016 | ) | 0.028 | ||||
| Less distributions from net investment income | (0.064 | ) | (0.114 | ) | (0.038 | ) | |||
| Net asset value, end of period | $ | 8.43 | $ | 8.54 | $ | 8.67 | |||
| Total returnc | (0.54 | )% | (0.19 | )% | 0.32 | % | |||
| Ratios to average net assetsd | |||||||||
| Expenses | 0.76 | %e | 0.75 | %e,f | 0.78 | %e,f | |||
| Net investment income | 0.63 | % | 0.55 | % | 0.63 | % | |||
| Supplemental data | |||||||||
| Net assets, end of period (000’s) | $ | 178,907 | $ | 198,670 | $ | 253,021 | |||
| Portfolio turnover rate | 1.99 | % | 9.98 | % | 14.18 | % | |||
aFor the period June 18, 2014 (effective date) to October 31, 2014.
bThe amount shown for a share outstanding throughout the period may not correlate with the Statement of Operations for the period due to the timing of sales and repurchases
of the Fund’s shares in relation to income earned and/or fluctuating fair value of the investments of the Fund.
cTotal return does not reflect sales commissions or contingent deferred sales charges, if applicable, and is not annualized for periods less than one year.
dRatios are annualized for periods less than one year.
eBenefit of waiver and payments by affiliates rounds to less than 0.01%.
fBenefit of expense reduction rounds to less than 0.01%.
36 Semiannual Report | The accompanying notes are an integral part of these financial statements.
franklintempleton.com
FRANKLIN INVESTORS SECURITIES TRUST
FINANCIAL H IGHLIGHTS
| Franklin Adjustable U.S. Government Securities Fund (continued) | ||||||||||||||||||
| Six Months Ended | Year Ended October 31, | |||||||||||||||||
| April 30, 2016 | ||||||||||||||||||
| (unaudited) | 2015 | 2014 | 2013 | 2012 | 2011 | |||||||||||||
| Class C | ||||||||||||||||||
| Per share operating performance | ||||||||||||||||||
| (for a share outstanding throughout the period) | ||||||||||||||||||
| Net asset value, beginning of period | $ | 8.54 | $ | 8.66 | $ | 8.71 | $ | 8.90 | $ | 8.83 | $ | 8.89 | ||||||
| Income from investment operationsa: | ||||||||||||||||||
| Net investment income (loss) | — | (0.013 | ) | (0.004 | ) | 0.006 | 0.042 | 0.064 | ||||||||||
| Net realized and unrealized gains (losses) | (0.080 | ) | (0.043 | ) | 0.018 | (0.101 | ) | 0.128 | 0.015 | |||||||||
| Total from investment operations | (0.080 | ) | (0.056 | ) | 0.014 | (0.095 | ) | 0.170 | 0.079 | |||||||||
| Less distributions from net investment income | (0.040 | ) | (0.064 | ) | (0.064 | ) | (0.095 | ) | (0.100 | ) | (0.139 | ) | ||||||
| Net asset value, end of period | $ | 8.42 | $ | 8.54 | $ | 8.66 | $ | 8.71 | $ | 8.90 | $ | 8.83 | ||||||
| Total returnb | (0.94 | )% | (0.65 | )% | 0.16 | % | (1.07 | )% | 1.93 | % | 0.89 | % | ||||||
| Ratios to average net assetsc | ||||||||||||||||||
| Expenses | 1.32 | %d | 1.31 | %d,e | 1.33 | %d,e | 1.27 | % | 1.27 | % | 1.26 | % | ||||||
| Net investment income (loss) | 0.07 | % | (0.01 | )% | 0.08 | % | 0.23 | % | 0.51 | % | 0.76 | % | ||||||
| Supplemental data | ||||||||||||||||||
| Net assets, end of period (000’s) | $ | 302,465 | $ | 336,254 | $ | 428,031 | $ | 603,067 | $ | 794,201 | $ | 856,366 | ||||||
| Portfolio turnover rate | 1.99 | % | 9.98 | % | 14.18 | % | 8.66 | % | 9.69 | % | 19.65 | % | ||||||
aThe amount shown for a share outstanding throughout the period may not correlate with the Statement of Operations for the period due to the timing of sales and repurchases
of the Fund’s shares in relation to income earned and/or fluctuating fair value of the investments of the Fund.
bTotal return does not reflect sales commissions or contingent deferred sales charges, if applicable, and is not annualized for periods less than one year.
cRatios are annualized for periods less than one year.
dBenefit of waiver and payments by affiliates rounds to less than 0.01%.
eBenefit of expense reduction rounds to less than 0.01%.
franklintempleton.com
The accompanying notes are an integral part of these financial statements. | Semiannual Report 37
FRANKLIN INVESTORS SECURITIES TRUST
FINANCIAL H IGHLIGHTS
| Franklin Adjustable U.S. Government Securities Fund (continued) | ||||||||||||
| Six Months Ended | Year Ended October 31, | |||||||||||
| April 30, 2016 | ||||||||||||
| (unaudited) | 2015 | 2014 | 2013 | a | ||||||||
| Class R6 | ||||||||||||
| Per share operating performance | ||||||||||||
| (for a share outstanding throughout the period) | ||||||||||||
| Net asset value, beginning of period | $ | 8.55 | $ | 8.68 | $ | 8.73 | $ | 8.72 | ||||
| Income from investment operationsb: | ||||||||||||
| Net investment income | 0.034 | 0.013 | 0.088 | c | 0.008 | |||||||
| Net realized and unrealized gains (losses) | (0.071 | ) | (0.010 | ) | (0.009 | ) | 0.018 | |||||
| Total from investment operations | (0.037 | ) | 0.003 | 0.079 | 0.026 | |||||||
| Less distributions from net investment income | (0.073 | ) | (0.133 | ) | (0.129 | ) | (0.016 | ) | ||||
| Net asset value, end of period | $ | 8.44 | $ | 8.55 | $ | 8.68 | $ | 8.73 | ||||
| Total returnd | (0.44 | )% | 0.03 | % | 0.92 | % | 0.30 | % | ||||
| Ratios to average net assetse | ||||||||||||
| Expenses | 0.55 | %f | 0.53 | %f,g | 0.56 | %f,g | 0.53 | % | ||||
| Net investment income | 0.84 | % | 0.77 | % | 0.85 | % | 0.97 | % | ||||
| Supplemental data | ||||||||||||
| Net assets, end of period (000’s) | $ | 2,284 | $ | 2,176 | $ | 7,193 | $ | 335 | ||||
| Portfolio turnover rate | 1.99 | % | 9.98 | % | 14.18 | % | 8.66 | % | ||||
aFor the period September 20, 2013 (effective date) to October 31, 2013.
bThe amount shown for a share outstanding throughout the period may not correlate with the Statement of Operations for the period due to the timing of sales and repurchases
of the Fund’s shares in relation to income earned and/or fluctuating fair value of the investments of the Fund.
cBased on average daily shares outstanding.
dTotal return is not annualized for periods less than one year.
eRatios are annualized for periods less than one year.
fBenefit of waiver and payments by affiliates rounds to less than 0.01%.
gBenefit of expense reduction rounds to less than 0.01%.
38 Semiannual Report | The accompanying notes are an integral part of these financial statements.
franklintempleton.com
FRANKLIN INVESTORS SECURITIES TRUST
FINANCIAL H IGHLIGHTS
| Franklin Adjustable U.S. Government Securities Fund (continued) | ||||||||||||||||||
| Six Months Ended | Year Ended October 31, | |||||||||||||||||
| April 30, 2016 | ||||||||||||||||||
| (unaudited) | 2015 | 2014 | 2013 | 2012 | 2011 | |||||||||||||
| Advisor Class | ||||||||||||||||||
| Per share operating performance | ||||||||||||||||||
| (for a share outstanding throughout the period) | ||||||||||||||||||
| Net asset value, beginning of period | $ | 8.55 | $ | 8.68 | $ | 8.73 | $ | 8.91 | $ | 8.85 | $ | 8.91 | ||||||
| Income from investment operationsa: | ||||||||||||||||||
| Net investment income | 0.025 | 0.040 | 0.068 | 0.073 | 0.107 | 0.139 | ||||||||||||
| Net realized and unrealized gains (losses) | (0.067 | ) | (0.049 | ) | 0.003 | (0.101 | ) | 0.111 | (0.002 | ) | ||||||||
| Total from investment operations | (0.042 | ) | (0.009 | ) | 0.071 | (0.028 | ) | 0.218 | 0.137 | |||||||||
| Less distributions from net investment income | (0.068 | ) | (0.121 | ) | (0.121 | ) | (0.152 | ) | (0.158 | ) | (0.197 | ) | ||||||
| Net asset value, end of period | $ | 8.44 | $ | 8.55 | $ | 8.68 | $ | 8.73 | $ | 8.91 | $ | 8.85 | ||||||
| Total returnb | (0.50 | )% | (0.11 | )% | 0.82 | % | (0.31 | )% | 2.48 | % | 1.55 | % | ||||||
| Ratios to average net assetsc | ||||||||||||||||||
| Expenses | 0.67 | %d | 0.66 | %d,e | 0.68 | %d,e | 0.62 | % | 0.62 | % | 0.61 | % | ||||||
| Net investment income | 0.72 | % | 0.64 | % | 0.73 | % | 0.88 | % | 1.16 | % | 1.41 | % | ||||||
| Supplemental data | ||||||||||||||||||
| Net assets, end of period (000’s) | $ | 244,950 | $ | 308,683 | $ | 416,854 | $ | 411,228 | $ | 437,540 | $ | 489,675 | ||||||
| Portfolio turnover rate | 1.99 | % | 9.98 | % | 14.18 | % | 8.66 | % | 9.69 | % | 19.65 | % | ||||||
aThe amount shown for a share outstanding throughout the period may not correlate with the Statement of Operations for the period due to the timing of sales and repurchases
of the Fund’s shares in relation to income earned and/or fluctuating fair value of the investments of the Fund.
bTotal return is not annualized for periods less than one year.
cRatios are annualized for periods less than one year.
dBenefit of waiver and payments by affiliates rounds to less than 0.01%.
eBenefit of expense reduction rounds to less than 0.01%.
franklintempleton.com
The accompanying notes are an integral part of these financial statements. | Semiannual Report 39
| F R A N K L I N I N V E S T O R S S E C U R I T I E S T R U S T | ||||
| Statement of Investments, April 30, 2016 (unaudited) | ||||
| Franklin Adjustable U.S. Government Securities Fund | ||||
| Principal | ||||
| Amount | Value | |||
| Mortgage-Backed Securities 96.6% | ||||
| a Federal Home Loan Mortgage Corp. (FHLMC) Adjustable Rate 27.6% | ||||
| FHLMC, 2.094%, 9/01/35 | $ | 12,747,725 | $ | 13,417,183 |
| FHLMC, 2.361%, 1/01/36 | 7,596,450 | 8,051,704 | ||
| FHLMC, 0.746% - 2.412%, 11/01/16 - 4/01/42 | 14,320,375 | 14,956,159 | ||
| FHLMC, 2.414%, 4/01/38 | 7,692,378 | 8,077,835 | ||
| FHLMC, 2.424%, 9/01/36 | 7,773,410 | 8,215,341 | ||
| FHLMC, 2.506%, 12/01/35 | 7,184,246 | 7,571,242 | ||
| FHLMC, 2.415% - 2.515%, 12/01/18 - 7/01/41 | 14,125,001 | 14,885,491 | ||
| FHLMC, 2.517% - 2.547%, 4/01/19 - 5/01/41 | 13,007,178 | 13,719,529 | ||
| FHLMC, 2.558%, 11/01/37 | 9,370,308 | 9,886,511 | ||
| FHLMC, 2.547% - 2.571%, 5/01/18 - 10/01/38 | 13,012,466 | 13,706,185 | ||
| FHLMC, 2.571% - 2.586%, 2/01/19 - 9/01/37 | 12,984,133 | 13,680,625 | ||
| FHLMC, 2.593%, 12/01/35 | 6,624,942 | 6,934,274 | ||
| FHLMC, 2.598%, 7/01/38 | 15,384,446 | 16,178,838 | ||
| FHLMC, 2.587% - 2.599%, 11/01/18 - 10/01/37 | 12,280,253 | 12,938,249 | ||
| FHLMC, 2.599% - 2.608%, 10/01/25 - 6/01/40 | 11,410,371 | 12,042,780 | ||
| FHLMC, 2.61%, 9/01/37 | 42,636,330 | 44,916,870 | ||
| FHLMC, 2.609% - 2.619%, 5/01/33 - 11/01/41 | 14,047,359 | 14,803,589 | ||
| FHLMC, 2.661%, 9/01/38 | 8,181,470 | 8,654,954 | ||
| FHLMC, 2.62% - 2.667%, 11/01/17 - 9/01/41 | 11,524,420 | 12,189,811 | ||
| FHLMC, 2.669%, 2/01/36 | 6,466,165 | 6,836,029 | ||
| FHLMC, 2.669% - 2.686%, 8/01/18 - 9/01/38 | 13,720,906 | 14,441,953 | ||
| FHLMC, 2.692% - 2.70%, 5/01/23 - 3/01/38 | 10,286,004 | 10,844,581 | ||
| FHLMC, 2.708%, 11/01/36 | 8,000,485 | 8,426,296 | ||
| FHLMC, 2.711%, 11/01/40 | 10,632,970 | 11,193,239 | ||
| FHLMC, 2.70% - 2.75%, 11/01/18 - 5/01/42 | 13,118,971 | 13,818,335 | ||
| FHLMC, 2.781%, 12/01/35 | 8,167,109 | 8,683,719 | ||
| FHLMC, 2.788%, 1/01/37 | 7,169,117 | 7,592,506 | ||
| FHLMC, 2.75% - 2.795%, 3/01/23 - 7/01/41 | 12,314,615 | 13,037,349 | ||
| FHLMC, 2.819%, 10/01/41 | 8,719,621 | 9,175,576 | ||
| FHLMC, 2.828%, 3/01/37 | 6,466,719 | 6,839,867 | ||
| FHLMC, 2.798% - 2.85%, 5/01/20 - 3/01/39 | 12,368,675 | 13,079,271 | ||
| FHLMC, 2.861%, 6/01/37 | 15,704,021 | 16,617,405 | ||
| FHLMC, 2.85% - 3.80%, 3/01/17 - 5/01/41 | 11,625,764 | 12,240,983 | ||
| FHLMC, 3.866% - 6.635%, 9/01/21 - 7/01/40 | 5,395,711 | 5,638,178 | ||
| 413,292,457 | ||||
| a Federal National Mortgage Association (FNMA) Adjustable Rate 68.9% | ||||
| FNMA, 1.148% - 1.897%, 8/01/16 - 11/01/44 | 14,566,409 | 14,967,351 | ||
| FNMA, 1.897% - 2.014%, 11/01/16 - 11/01/40 | 13,117,449 | 13,703,191 | ||
| FNMA, 2.085%, 12/01/34 | 13,584,874 | 14,295,371 | ||
| FNMA, 2.015% - 2.10%, 9/01/17 - 3/01/43 | 13,820,885 | 14,407,132 | ||
| FNMA, 2.10% - 2.15%, 10/01/16 - 9/01/38 | 14,207,779 | 14,834,769 | ||
| FNMA, 2.15% - 2.162%, 7/01/19 - 2/01/39 | 10,126,825 | 10,554,630 | ||
| FNMA, 2.162% - 2.177%, 4/01/18 - 10/01/37 | 14,260,506 | 14,973,575 | ||
| FNMA, 2.196%, 1/01/36 | 7,714,846 | 8,047,477 | ||
| FNMA, 2.182% - 2.243%, 7/01/17 - 10/01/37 | 12,317,359 | 12,892,900 | ||
| FNMA, 2.243% - 2.275%, 2/01/18 - 2/01/37 | 12,568,693 | 13,215,902 | ||
| FNMA, 2.275% - 2.295%, 11/01/17 - 9/01/43 | 13,749,271 | 14,393,483 | ||
| FNMA, 2.295% - 2.304%, 10/01/19 - 8/01/37 | 9,164,014 | 9,485,682 | ||
| FNMA, 2.304% - 2.315%, 8/01/22 - 4/01/38 | 14,038,974 | 14,653,115 | ||
| FNMA, 2.32%, 2/01/36 | 15,014,884 | 15,600,562 | ||
| FNMA, 2.316% - 2.347%, 3/01/19 - 11/01/42 | 14,243,572 | 14,948,280 | ||
40 Semiannual Report
franklintempleton.com
| F R A N K L I N | I N V E S T O R S S E C U R I T I E S T R U S T | |
| S T A T E M E N T | O F I N V E S T M E N T S ( U N A U D I T E D ) |
| Franklin Adjustable U.S. Government Securities Fund (continued) | ||||
| Principal | ||||
| Amount | Value | |||
| Mortgage-Backed Securities (continued) | ||||
| a Federal National Mortgage Association (FNMA) Adjustable Rate (continued) | ||||
| FNMA, 2.347% - 2.36%, 7/01/19 - 7/01/37 | $ | 13,442,361 | $ | 14,091,152 |
| FNMA, 2.364%, 3/01/35 | 6,736,419 | 7,022,677 | ||
| FNMA, 2.36% - 2.378%, 11/01/17 - 9/01/38 | 12,664,049 | 13,343,952 | ||
| FNMA, 2.378% - 2.39%, 8/01/29 - 4/01/38 | 13,798,241 | 14,520,149 | ||
| FNMA, 2.39% - 2.399%, 1/01/25 - 2/01/43 | 14,004,538 | 14,772,058 | ||
| FNMA, 2.399% - 2.411%, 10/01/17 - 7/01/42 | 13,615,215 | 14,345,744 | ||
| FNMA, 2.413%, 5/01/39 | 12,773,770 | 13,330,215 | ||
| FNMA, 2.411% - 2.438%, 1/01/18 - 6/01/37 | 13,783,255 | 14,449,526 | ||
| FNMA, 2.438% - 2.447%, 6/01/19 - 8/01/39 | 14,170,838 | 14,865,383 | ||
| FNMA, 2.454%, 2/01/36 | 9,162,900 | 9,620,633 | ||
| FNMA, 2.447% - 2.46%, 4/01/18 - 8/01/39 | 14,110,298 | 14,867,075 | ||
| FNMA, 2.467%, 11/01/34 | 8,990,691 | 9,470,188 | ||
| FNMA, 2.47%, 2/01/36 | 8,176,188 | 8,639,827 | ||
| FNMA, 2.46% - 2.476%, 6/01/18 - 3/01/41 | 13,522,311 | 14,222,992 | ||
| FNMA, 2.476% - 2.483%, 9/01/19 - 11/01/37 | 14,109,315 | 14,936,992 | ||
| FNMA, 2.483% - 2.50%, 5/01/17 - 9/01/38 | 14,077,322 | 14,843,586 | ||
| FNMA, 2.50% - 2.508%, 9/01/22 - 9/01/40 | 13,820,308 | 14,535,097 | ||
| FNMA, 2.508% - 2.513%, 10/01/17 - 9/01/39 | 11,925,286 | 12,552,019 | ||
| FNMA, 2.518%, 11/01/34 | 9,403,457 | 9,918,244 | ||
| FNMA, 2.522%, 3/01/38 | 8,070,980 | 8,492,715 | ||
| FNMA, 2.513% - 2.523%, 9/01/31 - 7/01/40 | 14,034,751 | 14,795,693 | ||
| FNMA, 2.523% - 2.535%, 11/01/18 - 12/01/39 | 9,435,015 | 9,918,532 | ||
| FNMA, 2.535% - 2.54%, 9/01/17 - 8/01/38 | 13,164,359 | 13,850,792 | ||
| FNMA, 2.542% - 2.546%, 12/01/25 - 8/01/40 | 13,992,524 | 14,760,341 | ||
| FNMA, 2.547%, 9/01/37 | 6,414,879 | 6,782,600 | ||
| FNMA, 2.546% - 2.552%, 5/01/18 - 7/01/42 | 10,068,514 | 10,619,795 | ||
| FNMA, 2.553% - 2.561%, 1/01/27 - 5/01/40 | 14,179,392 | 14,914,019 | ||
| FNMA, 2.564%, 7/01/40 | 9,245,643 | 9,775,042 | ||
| FNMA, 2.561% - 2.572%, 1/01/18 - 5/01/48 | 12,929,062 | 13,567,351 | ||
| FNMA, 2.573% - 2.581%, 12/01/20 - 11/01/37 | 12,783,790 | 13,467,004 | ||
| FNMA, 2.582%, 1/01/38 | 10,530,198 | 10,993,975 | ||
| FNMA, 2.587%, 10/01/35 | 6,622,622 | 6,954,416 | ||
| FNMA, 2.581% - 2.59%, 12/01/18 - 10/01/38 | 12,250,889 | 12,903,892 | ||
| FNMA, 2.595%, 11/01/35 | 6,306,343 | 6,651,255 | ||
| FNMA, 2.599%, 12/01/36 | 12,005,284 | 12,687,819 | ||
| FNMA, 2.592% - 2.599%, 6/01/19 - 1/01/42 | 11,935,791 | 12,599,692 | ||
| FNMA, 2.606%, 6/01/35 | 6,694,924 | 7,045,160 | ||
| FNMA, 2.599% - 2.606%, 4/01/22 - 2/01/37 | 9,632,039 | 10,159,040 | ||
| FNMA, 2.609%, 5/01/38 | 14,482,943 | 15,277,603 | ||
| FNMA, 2.611%, 9/01/39 | 6,494,349 | 6,846,074 | ||
| FNMA, 2.607% - 2.612%, 11/01/20 - 12/01/37 | 13,833,870 | 14,640,557 | ||
| FNMA, 2.614%, 9/01/36 | 8,743,377 | 9,167,021 | ||
| FNMA, 2.612% - 2.629%, 3/01/18 - 9/01/39 | 14,278,260 | 14,961,077 | ||
| FNMA, 2.632%, 1/01/36 | 8,206,818 | 8,707,819 | ||
| FNMA, 2.629% - 2.634%, 5/01/26 - 10/01/40 | 12,316,638 | 12,970,163 | ||
| FNMA, 2.634% - 2.654%, 4/01/19 - 11/01/41 | 13,092,505 | 13,771,673 | ||
| FNMA, 2.658%, 1/01/37 | 9,804,331 | 10,381,520 | ||
| FNMA, 2.654% - 2.66%, 1/01/24 - 1/01/40 | 9,958,578 | 10,487,314 | ||
| FNMA, 2.669%, 3/01/41 | 11,413,690 | 11,894,307 | ||
| FNMA, 2.661% - 2.671%, 11/01/20 - 11/01/38 | 12,572,164 | 13,190,551 | ||
| FNMA, 2.675%, 3/01/35 | 13,776,750 | 14,524,771 | ||
franklintempleton.com
Semiannual Report 41
FRANKLIN INVESTORS SECURITIES TRUST
STATEMENT OF INVESTMENTS (UNAUDITED)
| Franklin Adjustable U.S. Government Securities Fund (continued) | ||||
| Principal | ||||
| Amount | Value | |||
| Mortgage-Backed Securities (continued) | ||||
| a Federal National Mortgage Association (FNMA) Adjustable Rate (continued) | ||||
| FNMA, 2.672% - 2.687%, 10/01/18 - 3/01/40 | $ | 13,527,738 | $ | 14,250,873 |
| FNMA, 2.687% - 2.697%, 9/01/24 - 1/01/41 | 13,830,742 | 14,575,884 | ||
| FNMA, 2.697% - 2.709%, 3/01/23 - 8/01/39 | 10,092,164 | 10,627,352 | ||
| FNMA, 2.716%, 1/01/39 | 8,946,965 | 9,387,052 | ||
| FNMA, 2.71% - 2.725%, 3/01/18 - 2/01/41 | 14,069,118 | 14,798,652 | ||
| FNMA, 2.725% - 2.75%, 6/01/17 - 9/01/39 | 14,193,648 | 14,948,809 | ||
| FNMA, 2.762%, 4/01/38 | 7,530,742 | 7,929,276 | ||
| FNMA, 2.793%, 1/01/36 | 8,719,276 | 9,203,222 | ||
| FNMA, 2.75% - 2.802%, 2/01/17 - 10/01/41 | 14,147,199 | 14,838,541 | ||
| FNMA, 2.803%, 1/01/36 | 6,313,961 | 6,664,796 | ||
| FNMA, 2.817%, 5/01/38 | 6,626,071 | 6,987,663 | ||
| FNMA, 2.861%, 5/01/40 | 8,561,209 | 9,056,745 | ||
| FNMA, 2.802% - 2.862%, 11/01/17 - 4/01/38 | 13,910,226 | 14,592,733 | ||
| FNMA, 2.864% - 2.903%, 8/01/16 - 4/01/38 | 14,133,914 | 14,825,204 | ||
| FNMA, 2.908% - 2.976%, 4/01/18 - 4/01/41 | 13,291,119 | 13,938,023 | ||
| FNMA, 3.014%, 3/01/35 | 7,164,548 | 7,534,816 | ||
| FNMA, 2.979% - 3.053%, 11/01/16 - 4/01/44 | 14,083,787 | 14,795,723 | ||
| FNMA, 3.056% - 3.35%, 9/01/17 - 3/01/47 | 13,701,909 | 14,457,158 | ||
| FNMA, 3.397% - 7.67%, 4/01/17 - 3/01/38 | 5,286,217 | 5,464,983 | ||
| 1,031,958,017 | ||||
| a Government National Mortgage Association (GNMA) Adjustable Rate 0.1% | ||||
| GNMA, 1.75% - 2.00%, 9/20/33 - 5/20/36 | 1,614,431 | 1,666,910 | ||
| Total Mortgage-Backed Securities (Cost $1,441,595,511) | 1,446,917,384 | |||
| Shares | ||||
| Short Term Investments (Cost $39,753,347) 2.7% | ||||
| Money Market Funds 2.7% | ||||
| b,c Institutional Fiduciary Trust Money Market Portfolio | 39,753,347 | 39,753,347 | ||
| Total Investments (Cost $1,481,348,858) 99.3% | 1,486,670,731 | |||
| Other Assets, less Liabilities 0.7% | 10,753,721 | |||
| Net Assets 100.0% | $ | 1,497,424,452 | ||
aThe coupon rate shown represents the rate at period end.
bNon-income producing.
cSee Note 3(f) regarding investments in affiliated management investment companies.
42 Semiannual Report | The accompanying notes are an integral part of these financial statements.
franklintempleton.com
FRANKLIN INVESTORS SECURITIES TRUST
| Financial Highlights | |||||||||||||||||||||
| Franklin Floating Rate Daily Access Fund | |||||||||||||||||||||
| Six Months Ended | Year Ended October 31, | ||||||||||||||||||||
| April 30, 2016 | |||||||||||||||||||||
| (unaudited) | 2015 | 2014 | 2013 | 2012 | 2011 | ||||||||||||||||
| Class A | |||||||||||||||||||||
| Per share operating performance | |||||||||||||||||||||
| (for a share outstanding throughout the period) | |||||||||||||||||||||
| Net asset value, beginning of period | $ | 8.61 | $ | 9.04 | $ | 9.20 | $ | 9.11 | $ | 8.89 | $ | 9.11 | |||||||||
| Income from investment operationsa: | |||||||||||||||||||||
| Net investment income | 0.207 | 0.406 | 0.335 | 0.333 | 0.403 | 0.418 | |||||||||||||||
| Net realized and unrealized gains (losses) | (0.112 | ) | (0.434 | ) | (0.160 | ) | 0.088 | 0.225 | (0.220 | ) | |||||||||||
| Total from investment operations | 0.095 | (0.028 | ) | 0.175 | 0.421 | 0.628 | 0.198 | ||||||||||||||
| Less distributions from net investment income | (0.205 | ) | (0.402 | ) | (0.335 | ) | (0.331 | ) | (0.408 | ) | (0.418 | ) | |||||||||
| Net asset value, end of period | $ | 8.50 | $ | 8.61 | $ | 9.04 | $ | 9.20 | $ | 9.11 | $ | 8.89 | |||||||||
| Total returnb | 1.18 | % | (0.37 | )% | 1.91 | % | 4.69 | % | 7.22 | % | 2.17 | % | |||||||||
| Ratios to average net assetsc | |||||||||||||||||||||
| Expenses before waiver and payments by affiliates | 0.89 | % | 0.85 | % | 0.84 | % | 0.83 | % | 0.90 | % | 0.89 | % | |||||||||
| Expenses net of waiver and payments by affiliates | 0.88 | %d | 0.84 | %d | 0.82 | %d | 0.83 | %d,e | 0.90 | % | 0.89 | %d | |||||||||
| Net investment income | 4.97 | % | 4.55 | % | 3.64 | % | 3.60 | % | 4.52 | % | 4.56 | % | |||||||||
| Supplemental data | |||||||||||||||||||||
| Net assets, end of period (000’s) | $ | 1,347,530 | $ | 1,553,100 | $ | 1,874,867 | $ | 1,991,138 | $ | 1,295,166 | $ | 1,246,489 | |||||||||
| Portfolio turnover rate | 7.89 | % | 46.72 | % | 83.93 | % | 42.72 | % | 80.88 | % | 126.99 | % | |||||||||
aThe amount shown for a share outstanding throughout the period may not correlate with the Statement of Operations for the period due to the timing of sales and repurchases
of the Fund’s shares in relation to income earned and/or fluctuating fair value of the investments of the Fund.
bTotal return does not reflect sales commissions or contingent deferred sales charges, if applicable, and is not annualized for periods less than one year.
cRatios are annualized for periods less than one year.
dBenefit of expense reduction rounds to less than 0.01%.
eBenefit of waiver and payments by affiliates rounds to less than 0.01%.
franklintempleton.com
The accompanying notes are an integral part of these financial statements. | Semiannual Report 43
FRANKLIN INVESTORS SECURITIES TRUST
FINANCIAL H IGHLIGHTS
| Franklin Floating Rate Daily Access Fund (continued) | ||||||||||||||||||
| Six Months Ended | Year Ended October 31, | |||||||||||||||||
| April 30, 2016 | ||||||||||||||||||
| (unaudited) | 2015 | 2014 | 2013 | 2012 | 2011 | |||||||||||||
| Class C | ||||||||||||||||||
| Per share operating performance | ||||||||||||||||||
| (for a share outstanding throughout the period) | ||||||||||||||||||
| Net asset value, beginning of period | $ | 8.61 | $ | 9.05 | $ | 9.20 | $ | 9.11 | $ | 8.89 | $ | 9.11 | ||||||
| Income from investment operationsa: | ||||||||||||||||||
| Net investment income | 0.189 | 0.369 | 0.298 | 0.296 | 0.368 | 0.380 | ||||||||||||
| Net realized and unrealized gains (losses) | (0.111 | ) | (0.443 | ) | (0.150 | ) | 0.088 | 0.224 | (0.219 | ) | ||||||||
| Total from investment operations | 0.078 | (0.074 | ) | 0.148 | 0.384 | 0.592 | 0.161 | |||||||||||
| Less distributions from net investment income | (0.188 | ) | (0.366 | ) | (0.298 | ) | (0.294 | ) | (0.372 | ) | (0.381 | ) | ||||||
| Net asset value, end of period | $ | 8.50 | $ | 8.61 | $ | 9.05 | $ | 9.20 | $ | 9.11 | $ | 8.89 | ||||||
| Total returnb | 0.98 | % | (0.87 | )% | 1.62 | % | 4.28 | % | 6.79 | % | 1.76 | % | ||||||
| Ratios to average net assetsc | ||||||||||||||||||
| Expenses before waiver and payments by affiliates | 1.29 | % | 1.25 | % | 1.24 | % | 1.23 | % | 1.30 | % | 1.29 | % | ||||||
| Expenses net of waiver and payments by affiliates | 1.28 | %d | 1.24 | %d | 1.22 | %d | 1.23 | %d,e | 1.30 | % | 1.29 | %d | ||||||
| Net investment income | 4.57 | % | 4.15 | % | 3.24 | % | 3.20 | % | 4.12 | % | 4.16 | % | ||||||
| Supplemental data | ||||||||||||||||||
| Net assets, end of period (000’s) | $ | 541,460 | $ | 627,805 | $ | 742,602 | $ | 765,839 | $ | 431,818 | $ | 423,309 | ||||||
| Portfolio turnover rate | 7.89 | % | 46.72 | % | 83.93 | % | 42.72 | % | 80.88 | % | 126.99 | % | ||||||
aThe amount shown for a share outstanding throughout the period may not correlate with the Statement of Operations for the period due to the timing of sales and repurchases
of the Fund’s shares in relation to income earned and/or fluctuating fair value of the investments of the Fund.
bTotal return does not reflect sales commissions or contingent deferred sales charges, if applicable, and is not annualized for periods less than one year.
cRatios are annualized for periods less than one year.
dBenefit of expense reduction rounds to less than 0.01%.
eBenefit of waiver and payments by affiliates rounds to less than 0.01%.
44 Semiannual Report | The accompanying notes are an integral part of these financial statements.
franklintempleton.com
FRANKLIN INVESTORS SECURITIES TRUST
FINANCIAL H IGHLIGHTS
| Franklin Floating Rate Daily Access Fund (continued) | ||||||||||||
| Six Months Ended | Year Ended October 31, | |||||||||||
| April 30, 2016 | ||||||||||||
| (unaudited) | 2015 | 2014 | 2013 | a | ||||||||
| Class R6 | ||||||||||||
| Per share operating performance | ||||||||||||
| (for a share outstanding throughout the period) | ||||||||||||
| Net asset value, beginning of period | $ | 8.60 | $ | 9.05 | $ | 9.21 | $ | 9.21 | ||||
| Income from investment operationsb: | ||||||||||||
| Net investment income | 0.213 | 0.437 | 0.364 | 0.175 | ||||||||
| Net realized and unrealized gains (losses) | (0.094 | ) | (0.457 | ) | (0.159 | ) | (0.001 | ) | ||||
| Total from investment operations | 0.119 | (0.020 | ) | 0.205 | 0.174 | |||||||
| Less distributions from net investment income | (0.219 | ) | (0.430 | ) | (0.365 | ) | (0.174 | ) | ||||
| Net asset value, end of period | $ | 8.50 | $ | 8.60 | $ | 9.05 | $ | 9.21 | ||||
| Total returnc | 1.35 | % | (0.16 | )% | 2.36 | % | 1.80 | % | ||||
| Ratios to average net assetsd | ||||||||||||
| Expenses before waiver and payments by affiliates | 2.30 | % | 0.72 | % | 0.52 | % | 0.51 | % | ||||
| Expenses net of waiver and payments by affiliates | 0.53 | %e | 0.51 | %e | 0.50 | %e | 0.51 | %e,f | ||||
| Net investment income | 5.32 | % | 4.88 | % | 3.96 | % | 3.92 | % | ||||
| Supplemental data | ||||||||||||
| Net assets, end of period (000’s) | $ | 9,412 | $ | 7 | $ | 465 | $ | 1,339 | ||||
| Portfolio turnover rate | 7.89 | % | 46.72 | % | 83.93 | % | 42.72 | % | ||||
aFor the period May 1, 2013 (effective date) to October 31, 2013.
bThe amount shown for a share outstanding throughout the period may not correlate with the Statement of Operations for the period due to the timing of sales and repurchases
of the Fund’s shares in relation to income earned and/or fluctuating fair value of the investments of the Fund.
cTotal return is not annualized for periods less than one year.
dRatios are annualized for periods less than one year.
eBenefit of expense reduction rounds to less than 0.01%.
fBenefit of waiver and payments by affiliates rounds to less than 0.01%.
franklintempleton.com
The accompanying notes are an integral part of these financial statements. | Semiannual Report 45
FRANKLIN INVESTORS SECURITIES TRUST
FINANCIAL H IGHLIGHTS
| Franklin Floating Rate Daily Access Fund (continued) | |||||||||||||||||||||
| Six Months Ended | �� | Year Ended October 31, | |||||||||||||||||||
| April 30, 2016 | |||||||||||||||||||||
| (unaudited) | 2015 | 2014 | 2013 | 2012 | 2011 | ||||||||||||||||
| Advisor Class | |||||||||||||||||||||
| Per share operating performance | |||||||||||||||||||||
| (for a share outstanding throughout the period) | |||||||||||||||||||||
| Net asset value, beginning of period | $ | 8.61 | $ | 9.05 | $ | 9.20 | $ | 9.11 | $ | 8.89 | $ | 9.11 | |||||||||
| Income from investment operationsa: | |||||||||||||||||||||
| Net investment income | 0.217 | 0.427 | 0.358 | 0.355 | 0.426 | 0.442 | |||||||||||||||
| Net realized and unrealized gains (losses) | (0.102 | ) | (0.443 | ) | (0.150 | ) | 0.089 | 0.225 | (0.221 | ) | |||||||||||
| Total from investment operations | 0.115 | (0.016 | ) | 0.208 | 0.444 | 0.651 | 0.221 | ||||||||||||||
| Less distributions from net investment income | (0.215 | ) | (0.424 | ) | (0.358 | ) | (0.354 | ) | (0.431 | ) | (0.441 | ) | |||||||||
| Net asset value, end of period | $ | 8.51 | $ | 8.61 | $ | 9.05 | $ | 9.20 | $ | 9.11 | $ | 8.89 | |||||||||
| Total returnb | 1.30 | % | (0.23 | )% | 2.28 | % | 4.95 | % | 7.49 | % | 2.43 | % | |||||||||
| Ratios to average net assetsc | |||||||||||||||||||||
| Expenses before waiver and payments by affiliates | 0.64 | % | 0.60 | % | 0.59 | % | 0.58 | % | 0.65 | % | 0.64 | % | |||||||||
| Expenses net of waiver and payments by affiliates | 0.63 | %d | 0.59 | %d | 0.57 | %d | 0.58 | %d,e | 0.65 | % | 0.64 | %d | |||||||||
| Net investment income | 5.22 | % | 4.80 | % | 3.89 | % | 3.85 | % | 4.77 | % | 4.81 | % | |||||||||
| Supplemental data | |||||||||||||||||||||
| Net assets, end of period (000’s) | $ | 1,034,961 | $ | 1,405,281 | $ | 2,019,477 | $ | 2,374,914 | $ | 739,974 | $ | 524,938 | |||||||||
| Portfolio turnover rate | 7.89 | % | 46.72 | % | 83.93 | % | 42.72 | % | 80.88 | % | 126.99 | % | |||||||||
aThe amount shown for a share outstanding throughout the period may not correlate with the Statement of Operations for the period due to the timing of sales and repurchases
of the Fund’s shares in relation to income earned and/or fluctuating fair value of the investments of the Fund.
bTotal return is not annualized for periods less than one year.
cRatios are annualized for periods less than one year.
dBenefit of expense reduction rounds to less than 0.01%.
eBenefit of waiver and payments by affiliates rounds to less than 0.01%.
46 Semiannual Report | The accompanying notes are an integral part of these financial statements.
franklintempleton.com
FRANKLIN INVESTORS SECURITIES TRUST
| Statement of Investments, April 30, 2016 (unaudited) | ||||
| Franklin Floating Rate Daily Access Fund | ||||
| Country | Shares | Value | ||
| Common Stocks 0.1% | ||||
| Broadcasting 0.0%† | ||||
| a Cumulus Media Inc., A | United States | 5,725 | $ | 2,128 |
| Coal & Consumable Fuels 0.0%† | ||||
| a,b Warrior Met Coal LLC, A | United States | 6,893 | 694,927 | |
| Health Care Distributors 0.0% | ||||
| a,b RoTech Medical Corp | United States | 26,267 | — | |
| Health Care Services 0.1% | ||||
| a New Millennium Holdco Inc | United States | 135,858 | 1,052,900 | |
| Total Common Stocks (Cost $14,021,512) | 1,749,955 | |||
| Principal | ||||
| Amount* | ||||
| Corporate Bonds (Cost $578,730) 0.0%† | ||||
| Aerospace & Defense 0.0%† | ||||
| c Erickson Air-Crane Inc., Purchase Price Notes, 6.00%, 11/02/20 | United States | 578,730 | 465,111 | |
| d,e Senior Floating Rate Interests 90.3% | ||||
| Aerospace & Defense 1.9% | ||||
| CAMP International Holding Co., 2013 Replacement Term Loan, 4.75%, 5/31/19 | United States | 11,035,998 | 10,953,228 | |
| Delos Finance S.A.R.L. (ILFC), Loans, 3.50%, 3/06/21 | United States | 23,200,000 | 23,319,619 | |
| Doncasters U.S. Finance LLC, | ||||
| Second Lien Term Loan, 9.50%, 10/09/20 | United States | 6,608,226 | 6,195,212 | |
| Term B Loans, 4.50%, 4/09/20 | United States | 15,844,606 | 14,992,958 | |
| 55,461,017 | ||||
| Agricultural Products 0.1% | ||||
| Allflex Holdings III Inc., Second Lien Initial Term Loan, 8.00%, 7/19/21 | United States | 2,287,774 | 2,226,766 | |
| Airlines 1.5% | ||||
| Air Canada, Term Loan, 4.00%, 9/26/19 | Canada | 14,635,727 | 14,722,634 | |
| f American Airlines Inc., Class B Term Loans, 5.25%, 4/28/23 | United States | 7,217,835 | 7,195,279 | |
| Flying Fortress Inc. (ILFC), New Loan, 3.50%, 4/30/20 | United States | 11,584,329 | 11,649,491 | |
| U.S. Airways Inc., Tranche B1 Term Loan, 3.50%, 5/23/19 | United States | 10,828,149 | 10,837,169 | |
| 44,404,573 | ||||
| Aluminum 0.5% | ||||
| Novelis Inc., Initial Term Loan, 4.00%, 6/02/22 | Canada | 15,245,629 | 15,190,364 | |
| Apparel Retail 1.8% | ||||
| Ascena Retail Group Inc., Tranche B Term Loan, 5.25%, 8/21/22 | United States | 39,792,507 | 39,215,516 | |
| The Men’s Wearhouse Inc., Tranche B Term Loan, 4.50%, 6/18/21 | United States | 14,639,931 | 14,383,732 | |
| 53,599,248 | ||||
| Auto Parts & Equipment 2.3% | ||||
| Crowne Group LLC, Term Loan, 6.00%, 9/30/20 | United States | 11,866,420 | 11,451,095 | |
| FRAM Group Holdings Inc. (Autoparts Holdings), Term Loan, 7.00%, 7/29/17 | United States | 29,769,778 | 26,718,376 | |
| TI Group Automotive Systems LLC, Initial U.S. Term Loan, 4.50%, 6/25/22 | United States | 30,125,225 | 30,125,225 | |
| 68,294,696 | ||||
| Broadcasting 5.2% | ||||
| Cumulus Media Holdings Inc., Term Loans, 4.25%, 12/23/20 | United States | 54,369,098 | 37,571,330 | |
| Gray Television Inc., | ||||
| Initial Term Loan, 3.938%, 6/13/21 | United States | 26,898,307 | 26,962,190 | |
| Term Loan C, 4.25%, 6/13/21 | United States | 4,528,684 | 4,554,158 | |
franklintempleton.com
Semiannual Report 47
FRANKLIN INVESTORS SECURITIES TRUST
STATEMENT OF INVESTMENTS (UNAUDITED)
| Franklin Floating Rate Daily Access Fund (continued) | ||||
| Principal | ||||
| Country | Amount* | Value | ||
| d,e Senior Floating Rate Interests (continued) | ||||
| Broadcasting (continued) | ||||
| Media General Inc., Term B Loan, 4.00%, 7/31/20 | United States | 38,022,520 | $ | 38,060,542 |
| Radio One Inc., Term Loan B, 5.14%, 12/31/18 | United States | 40,692,500 | 40,972,261 | |
| Sinclair Television Group Inc., Incremental Term Loan B-1, 3.50%, 7/31/21 | United States | 2,973,291 | 2,973,291 | |
| 151,093,772 | ||||
| Cable & Satellite 2.5% | ||||
| CSC Holdings Inc. (Cablevision), Initial Term Loans, 5.00%, 10/09/22 | United States | 34,346,473 | 34,556,846 | |
| UPC Financing Partnership, Facility AH, 3.344%, 6/30/21 | Netherlands | 15,818,282 | 15,814,042 | |
| Virgin Media Bristol LLC, F Facility, 3.649%, 6/30/23 | United States | 24,326,626 | 24,315,217 | |
| 74,686,105 | ||||
| Casinos & Gaming 5.0% | ||||
| Aristocrat Technologies Inc., First Lien Initial Term Loan, 4.75%, 10/20/21 | United States | 9,222,047 | 9,275,203 | |
| Caesars Entertainment Resort Properties LLC, Term B Loans, 7.00%, 10/11/20 | United States | 15,196,510 | 14,403,449 | |
| Cannery Casino Resorts LLC, | ||||
| g Second Lien Term Loan, PIK, 12.50%, 10/02/19 | United States | 12,612,076 | 12,612,076 | |
| Term Loan, 6.00%, 10/02/18 | United States | 42,787,779 | 42,645,167 | |
| Jack Ohio Finance LLC, Funded Term B Loans, 5.00%, 6/20/19 | United States | 39,688,732 | 37,902,739 | |
| Scientific Games International Inc., Term B-1 Loan, 6.00%, 10/18/20 | United States | 29,081,000 | 28,717,488 | |
| 145,556,122 | ||||
| Coal & Consumable Fuels 3.8% | ||||
| Bowie Resource Holdings LLC, | ||||
| First Lien Initial Term Loan, 8.75%, 8/16/20 | United States | 30,137,283 | 26,822,182 | |
| Second Lien Initial Term Loan, 12.50%, 2/16/21 | United States | 4,464,778 | 3,750,414 | |
| Foresight Energy LLC, Term Loans, 7.50%, 8/21/20 | United States | 39,247,004 | 34,537,364 | |
| Peabody Energy Corp., | ||||
| f Commitment (DIP Facility), 11.50%, 4/18/17 | United States | 4,436,015 | 4,447,105 | |
| Term Loan, 4.25%, 9/24/20 | United States | 87,233,174 | 38,055,472 | |
| Westmoreland Coal Co., Term Loan, 7.50%, 12/16/20 | United States | 8,020,777 | 4,812,466 | |
| 112,425,003 | ||||
| Commodity Chemicals 1.9% | ||||
| Cyanco Intermediate Corp., Initial Term Loan, 5.50%, 5/01/20 | United States | 55,896,260 | 54,848,205 | |
| Communications Equipment 1.3% | ||||
| f Ciena Corp., 2016 Term Loans, 6.00%, 4/25/21 | United States | 6,598,222 | 6,639,461 | |
| Ciena Corp., Term Loan, 3.75%, 7/15/19 | United States | 13,696,128 | 13,670,447 | |
| CommScope Inc., Tranche 5 Term Loan, 3.828%, 12/29/22 | United States | 19,141,144 | 19,196,979 | |
| 39,506,887 | ||||
| Construction & Engineering 0.1% | ||||
| Ventia Pty. Ltd., Term B Loans, 5.50%, 5/21/22 | Australia | 3,423,015 | 3,431,573 | |
| Consumer Electronics 0.2% | ||||
| f Prime Security Services Borrower LLC, Term B-1 Loans, 7.00%, 5/02/22 | United States | 4,403,888 | 4,425,220 | |
| Data Processing & Outsourced Services 1.6% | ||||
| MoneyGram International Inc., Term Loan, 4.25%, 3/27/20 | United States | 49,692,129 | 47,021,177 | |
| Diversified Chemicals 3.2% | ||||
| The Chemours Co. LLC, Tranche B Term Loan, 3.75%, 5/12/22 | United States | 51,236,087 | 50,083,275 | |
| Ineos U.S. Finance LLC, 2018 Dollar Term Loans, 3.75%, 5/04/18 | United States | 21,215,173 | 21,232,230 | |
48 Semiannual Report
franklintempleton.com
FRANKLIN INVESTORS SECURITIES TRUST
STATEMENT OF INVESTMENTS (UNAUDITED)
| Franklin Floating Rate Daily Access Fund (continued) | ||||
| Principal | ||||
| Country | Amount* | Value | ||
| d,e Senior Floating Rate Interests (continued) | ||||
| Diversified Chemicals (continued) | ||||
| OCI Beaumont LLC, Term B-3 Loan, 7.75%, 8/20/19 | United States | 22,463,124 | $ | 22,687,755 |
| 94,003,260 | ||||
| Diversified Metals & Mining 2.6% | ||||
| FMG America Finance Inc. (Fortescue Metals Group), Loans, 4.25%, 6/30/19 | Australia | 80,496,099 | 76,179,496 | |
| Electric Utilities 2.5% | ||||
| Alinta Energy Finance Pty. Ltd., | ||||
| Delayed Draw Term Commitments, 6.375%, 8/13/18 | Australia | 4,747,774 | 4,640,949 | |
| Term B Loans, 6.375%, 8/13/19 | Australia | 71,472,151 | 69,864,028 | |
| 74,504,977 | ||||
| Forest Products 3.0% | ||||
| Appvion Inc., Term Loan, 6.25%, 6/28/19 | United States | 19,632,956 | 18,774,014 | |
| Caraustar Industries Inc., | ||||
| Term Loan B, 8.00%, 5/01/19 | United States | 31,338,241 | 31,272,964 | |
| Term Loan C, 8.00%, 5/01/19 | United States | 37,610,647 | 37,532,304 | |
| 87,579,282 | ||||
| General Merchandise Stores 0.2% | ||||
| Dollar Tree Inc., Term B-1 Loans, 3.50%, 3/09/22 | United States | 7,256,573 | 7,288,967 | |
| Health Care Equipment 1.8% | ||||
| Carestream Health Inc., | ||||
| Second Lien Loan, 9.50%, 12/07/19 | United States | 16,163,260 | 14,264,077 | |
| Term Loan, 5.00%, 6/07/19 | United States | 6,904,946 | 6,663,273 | |
| Kinetic Concepts Inc., Dollar Term E-1 Loan, 4.50%, 5/04/18 | United States | 32,064,237 | 32,092,293 | |
| 53,019,643 | ||||
| Health Care Facilities 3.1% | ||||
| Amsurg Corp., Initial Term Loan, 3.50%, 7/16/21 | United States | 29,117,528 | 29,226,719 | |
| Community Health Systems Inc., 2018 Term F Loans, | ||||
| 3.685% - 3.886%, 12/31/18 | United States | 61,540,509 | 61,324,132 | |
| 90,550,851 | ||||
| Health Care Services 0.9% | ||||
| Cotiviti Corp., Second Lien Initial Term Loan, 8.00%, 5/13/22 | United States | 23,166,136 | 22,442,195 | |
| New Millennium Holdco Inc., Closing Date Term Loan, 7.50%, 12/18/20 | United States | 4,638,901 | 3,618,342 | |
| 26,060,537 | ||||
| Household Products 1.4% | ||||
| Spectrum Brands Inc., Initial Term Loans, 3.50%, 6/23/22 | United States | 10,153,709 | 10,210,824 | |
| Sun Products Corp., Tranche B Term Loan, 5.50%, 3/23/20 | United States | 31,585,066 | 30,962,840 | |
| 41,173,664 | ||||
| Independent Power Producers & Energy Traders 1.8% | ||||
| Calpine Construction Finance Co. LP, | ||||
| Term B-1 Loan, 3.00%, 5/03/20 | United States | 9,210,026 | 9,056,522 | |
| Term B-2 Loan, 3.25%, 1/31/22 | United States | 7,273,035 | 7,163,940 | |
| Calpine Corp., | ||||
| Term Loan (B5), 3.50%, 5/27/22 | United States | 19,510,598 | 19,390,178 | |
| Term Loan (B6), 4.00%, 1/15/23 | United States | 8,977,500 | 8,963,477 | |
franklintempleton.com
Semiannual Report 49
FRANKLIN INVESTORS SECURITIES TRUST
STATEMENT OF INVESTMENTS (UNAUDITED)
| Franklin Floating Rate Daily Access Fund (continued) | ||||
| Principal | ||||
| Country | Amount* | Value | ||
| d,e Senior Floating Rate Interests (continued) | ||||
| Independent Power Producers & Energy Traders (continued) | ||||
| NRG Energy Inc., Term Loan, 2.75%, 7/01/18 | United States | 7,498,080 | $ | 7,478,555 |
| 52,052,672 | ||||
| Industrial Machinery 4.1% | ||||
| Alfred Fueling Systems Inc. (Wayne Fueling), | ||||
| First Lien Initial Term Loan, 4.75%, 6/18/21 | United States | 14,890,517 | 14,592,707 | |
| Second Lien Initial Term Loan, 8.50%, 6/20/22 | United States | 23,842,353 | 22,726,769 | |
| Generac Power Systems Inc., Term Loans, 3.50%, 5/31/20 | United States | 9,650,950 | 9,620,791 | |
| Navistar Inc., Tranche B Term Loans, 6.50%, 8/07/20 | United States | 37,941,554 | 36,076,082 | |
| Onsite Rental Group Operations Pty. Ltd., Term B Loan, 5.50%, 7/30/21 | Australia | 39,555,846 | 31,051,339 | |
| WireCo Worldgroup Inc., Term Loan, 6.00%, 2/15/17 | United States | 5,487,495 | 5,429,190 | |
| 119,496,878 | ||||
| Integrated Telecommunication Services 2.5% | ||||
| Intelsat Jackson Holdings SA, Tranche B-2 Term Loan, 3.75%, 6/30/19 | Luxembourg | 49,718,904 | 46,748,200 | |
| Windstream Corp., Traunche B-5 Term Loan, 3.50%, 8/08/19 | United States | 12,645,445 | 12,508,457 | |
| Zayo Group LLC, 2021 Term Loans, 3.75%, 5/06/21 | United States | 13,741,035 | 13,753,305 | |
| 73,009,962 | ||||
| Internet Software & Services 1.3% | ||||
| BMC Software Finance Inc., Initial U.S. Term Loans, 5.00%, 9/10/20 | United States | 42,527,893 | 36,839,787 | |
| Investment Banking & Brokerage 0.3% | ||||
| Guggenheim Partners Investment Management Holdings LLC, Initial Term Loan, | ||||
| 4.25%, 7/22/20 | United States | 8,027,742 | 8,046,141 | |
| IT Consulting & Other Services 0.9% | ||||
| Sungard Availability Services Capital Inc., Tranche B Term Loan, | ||||
| 6.00%, 3/29/19 | United States | 29,116,931 | 26,059,653 | |
| Leisure Facilities 3.2% | ||||
| 24 Hour Fitness Worldwide Inc., Term Loan, 4.75%, 5/28/21 | United States | 28,378,568 | 27,527,211 | |
| Fitness International LLC, Term B Loan, 5.50% - 7.00%, 7/01/20 | United States | 54,266,434 | 53,316,771 | |
| h Town Sports International LLC, Initial Term Loan, 4.50%, 11/15/20 | United States | 27,222,122 | 12,522,176 | |
| 93,366,158 | ||||
| Marine 0.9% | ||||
| Navios Maritime Partners LP, Initial Term Loan, 5.25%, 6/27/18 | Marshall Islands | 30,875,010 | 27,324,384 | |
| Metal & Glass Containers 0.7% | ||||
| CD&R Millennium U.S. Acquico LLC, Second Lien Initial Term Loan, | ||||
| 8.75%, 7/31/22 | United States | 22,149,800 | 20,045,569 | |
| Movies & Entertainment 0.5% | ||||
| Regal Cinemas Corp., Term Loan, 3.75%, 4/01/22 | United States | 9,551,915 | 9,603,409 | |
| Zuffa LLC, Initial Term Loan, 3.75%, 2/25/20 | United States | 5,623,908 | 5,590,519 | |
| 15,193,928 | ||||
| Oil & Gas Equipment & Services 0.2% | ||||
| h McDermott Finance LLC, Term Loan, 5.25%, 4/16/19 | United States | 6,955,530 | 6,716,433 | |
| Oil & Gas Exploration & Production 2.5% | ||||
| h Fieldwood Energy LLC, Loans, 3.875%, 10/01/18 | United States | 50,446,892 | 38,087,403 | |
| i Samson Investment Co., Second Lien Tranche I Term Loan, 6.50%, 9/25/18 | United States | 27,720,000 | 438,891 | |
50 Semiannual Report
franklintempleton.com
FRANKLIN INVESTORS SECURITIES TRUST
STATEMENT OF INVESTMENTS (UNAUDITED)
| Franklin Floating Rate Daily Access Fund (continued) | ||||
| Principal | ||||
| Country | Amount* | Value | ||
| d,e Senior Floating Rate Interests (continued) | ||||
| Oil & Gas Exploration & Production (continued) | ||||
| UTEX Industries Inc., First Lien Initial Term Loan, 5.00%, 5/21/21 | United States | 42,669,979 | $ | 33,709,283 |
| 72,235,577 | ||||
| Oil & Gas Storage & Transportation 1.3% | ||||
| OSG Bulk Ships Inc., Initial Term Loan, 5.25%, 8/05/19 | United States | 21,953,289 | 21,075,158 | |
| OSG International Inc., Initial Term Loan, 5.75%, 8/05/19 | United States | 15,875,799 | 15,717,040 | |
| 36,792,198 | ||||
| Packaged Foods & Meats 1.9% | ||||
| AdvancePierre Foods Inc., Second Lien Term Loans, 9.50%, 10/10/17 | United States | 24,560,081 | 24,544,731 | |
| B&G Foods Inc., Tranche B Term Loan, 3.75% - 5.50%, 11/02/22 | United States | 4,274,042 | 4,297,417 | |
| CSM Bakery Supplies LLC, Second Lien Term Loan, 8.75%, 7/03/21 | United States | 11,591,497 | 10,896,007 | |
| JBS USA LLC, | ||||
| Incremental Term Loan, 3.75%, 9/18/20 | United States | 7,157,606 | 7,175,500 | |
| Initial Term Loan, 3.75%, 5/25/18 | United States | 153,160 | 153,256 | |
| Post Holdings Inc., Series A Incremental Term Loan, 3.75%, 6/02/21 | United States | 7,815,541 | 7,863,575 | |
| 54,930,486 | ||||
| Paper Packaging 0.7% | ||||
| Coveris Holdings SA, Term B-1 Loans, 4.50%, 5/08/19 | Luxembourg | 20,718,084 | 20,562,699 | |
| Personal Products 1.2% | ||||
| FGI Operating Co. LLC (Freedom Group), Term B Loans, 5.50%, 4/19/19 | United States | 46,523,575 | 36,288,389 | |
| Pharmaceuticals 4.7% | ||||
| Endo Luxembourg Finance Co. I S.A.R.L. and Endo LLC, 2015 Incremental Term B | ||||
| Loans, 3.75%, 9/25/22 | United States | 36,680,024 | 36,618,878 | |
| Grifols Worldwide Operations USA Inc., US Tranche B Term Loan, | ||||
| 3.435%, 2/27/21 | United States | 33,517,091 | 33,600,883 | |
| Valeant Pharmaceuticals International Inc., | ||||
| Series C-2 Tranche B Term Loan, 4.75%, 12/11/19 | United States | 21,667,718 | 21,153,109 | |
| Series D-2 Tranche B Term Loan, 4.50%, 2/13/19 | United States | 11,856,527 | 11,584,812 | |
| Series F-1 Tranche B Term Loan, 5.00%, 4/01/22 | United States | 36,754,536 | 36,065,389 | |
| 139,023,071 | ||||
| Publishing 0.7% | ||||
| Cengage Learning Acquisitions Inc., Original Term Loans, 7.00%, 3/31/20 | United States | 21,755,502 | 21,668,480 | |
| Semiconductor Equipment 0.1% | ||||
| f MKS Instruments Inc., Term Loan, 6.50%, 4/25/23 | United States | 3,496,470 | 3,516,138 | |
| Semiconductors 2.1% | ||||
| Avago Technologies Cayman Finance Ltd., Term B-1 Dollar Loans, | ||||
| 4.25%, 2/01/23 | United States | 28,859,075 | 28,929,231 | |
| M/A-COM Technology Solutions Holdings Inc., Initial Term Loan, | ||||
| 4.50%, 5/07/21 | United States | 16,230,900 | 16,230,900 | |
| NXP BV/NXP Funding LLC, Tranche B Loan, 3.75%, 12/07/20 | United States | 6,331,716 | 6,361,399 | |
| ON Semiconductor Corp., Closing Date Term Loans, 5.25%, 3/31/23 | United States | 11,000,000 | 11,072,875 | |
| 62,594,405 | ||||
| Specialized Consumer Services 0.8% | ||||
| Travelport Finance Luxembourg S.A.R.L., Initial Term Loan, 5.75%, 9/02/21 | Luxembourg | 23,417,500 | 23,498,009 | |
franklintempleton.com
Semiannual Report 51
FRANKLIN INVESTORS SECURITIES TRUST
STATEMENT OF INVESTMENTS (UNAUDITED)
| Franklin Floating Rate Daily Access Fund (continued) | ||||
| Principal | ||||
| Country | Amount* | Value | ||
| d,e Senior Floating Rate Interests (continued) | ||||
| Specialty Chemicals 3.1% | ||||
| Axalta Coating Systems U.S. Holdings Inc., 2014 Specified Refinancing Term, | ||||
| 3.75%, 2/01/20 | United States | 13,859,810 | $ | 13,860,891 |
| Nexeo Solutions LLC, | ||||
| Term B-1 Loan, 5.00%, 9/08/17 | United States | 8,697,579 | 8,686,707 | |
| Term B-2 Loan, 5.00%, 9/08/17 | United States | 12,493,179 | 12,482,772 | |
| Term B-3 Loan, 5.00%, 9/08/17 | United States | 16,785,425 | 16,785,425 | |
| Oxbow Carbon LLC, | ||||
| Second Lien Initial Term Loan, 8.00%, 1/17/20 | United States | 16,364,314 | 15,464,276 | |
| Tranche B Term Loan, 4.25%, 7/19/19 | United States | 15,953,834 | 15,784,325 | |
| Solenis International LP and Solenis Holdings 3 LLC, Second Lien Term Loan, | ||||
| 7.75%, 7/31/22 | United States | 7,800,000 | 7,072,003 | |
| 90,136,399 | ||||
| Specialty Stores 4.1% | ||||
| 99 Cents Only Stores, Tranche B-2 Loan, 4.50%, 1/11/19 | United States | 26,755,324 | 17,290,628 | |
| BJ’s Wholesale Club Inc., Second Lien 2013 (Nov) Replacement Loans, | ||||
| 8.50%, 3/26/20 | United States | 35,022,851 | 34,059,723 | |
| Evergreen AcqCo. 1 LP (Savers), Term Loan, 5.00%, 7/09/19 | United States | 46,302,778 | 39,588,875 | |
| Jo-Ann Stores Inc., Term B Loan, 4.00%, 3/16/18 | United States | 1,831,450 | 1,814,235 | |
| PetSmart Inc., Term Loans, 4.25%, 3/10/22 | United States | 28,218,627 | 28,162,499 | |
| 120,915,960 | ||||
| Technology Hardware, Storage & Peripherals 0.6% | ||||
| f Western Digital Corp., U.S. Term B Loan, 8.00%, 4/29/23 | United States | 17,567,636 | 17,315,101 | |
| Tires & Rubber 0.3% | ||||
| The Goodyear Tire & Rubber Co., Second Lien Loans, 3.75%, 4/30/19 | United States | 7,885,418 | 7,912,528 | |
| Trucking 1.4% | ||||
| Hertz Corp., | ||||
| Credit Linked Deposit, 3.75%, 3/11/18 | United States | 18,350,000 | 18,097,687 | |
| Tranche B-1 Term Loan, 3.75%, 3/11/18 | United States | 10,452,779 | 10,464,915 | |
| Tranche B-2 Term Loan, 3.00%, 3/11/18 | United States | 11,507,775 | 11,491,952 | |
| 40,054,554 | ||||
| Total Senior Floating Rate Interests (Cost $2,831,855,240) | 2,648,126,964 | |||
| Asset-Backed Securities and Commercial | ||||
| Mortgage-Backed Securities 3.0% | ||||
| Other Diversified Financial Services 3.0% | ||||
| j Apidos CDO, 2013-14A, C2, 144A, 4.85%, 4/15/25 | United States | 3,540,000 | 3,527,504 | |
| d,j Atrium IX, 9A, C, 144A, FRN, 3.886%, 2/28/24 | United States | 2,500,000 | 2,507,175 | |
| d,j Ballyrock CLO LLC, 2014-1A, B, 144A, FRN, 3.834%, 10/20/26 | United States | 5,200,000 | 4,837,560 | |
| d,j Carlyle Global Market Strategies CLO Ltd., 2014-4A, C, 144A, FRN, | ||||
| 3.778%, 10/15/26 | United States | 6,500,000 | 6,495,385 | |
| d,j Catamaran CLO Ltd., | ||||
| 2013-1A, C, 144A, FRN, 3.234%, 1/27/25 | United States | 3,500,000 | 3,307,395 | |
| 2014-2A, B, 144A, FRN, 3.633%, 10/18/26 | United States | 13,240,000 | 12,892,847 | |
| d,j Cent CLO LP, | ||||
| 2013-17A, D, 144A, FRN, 3.616%, 1/30/25 | United States | 3,850,000 | 3,749,900 | |
| 2014-22A, B, 144A, FRN, 3.82%, 11/07/26 | United States | 7,400,000 | 7,306,242 | |
| d,j Cumberland Park CLO Ltd., 2015-2A, C, 144A, FRN, 3.484%, 7/20/26 | United States | 3,850,000 | 3,776,619 | |
52 Semiannual Report
franklintempleton.com
FRANKLIN INVESTORS SECURITIES TRUST
STATEMENT OF INVESTMENTS (UNAUDITED)
| Franklin Floating Rate Daily Access Fund (continued) | ||||
| Principal | ||||
| Country | Amount* | Value | ||
| Asset-Backed Securities and Commercial | ||||
| Mortgage-Backed Securities (continued) | ||||
| Other Diversified Financial Services (continued) | ||||
| d,j Eaton Vance CDO Ltd., 2014-1A, | ||||
| A, 144A, FRN, 2.078%, 7/15/26 | United States | 6,510,000 | $ | 6,465,862 |
| B, 144A, FRN, 2.678%, 7/15/26 | United States | 6,510,000 | 6,369,710 | |
| C, 144A, FRN, 3.628%, 7/15/26 | United States | 5,630,000 | 5,495,499 | |
| j Emerson Park CLO Ltd., 2013-1A, C2, 144A, 5.64%, 7/15/25 | United States | 3,600,000 | 3,639,240 | |
| j Highbridge Loan Management Ltd., 2013-2A, B2, 144A, 5.80%, 10/20/24 | United States | 3,500,000 | 3,537,450 | |
| d,j Limerock CLO III LLC, 2014-3A, B, 144A, FRN, 3.834%, 10/20/26 | United States | 6,700,000 | 6,693,970 | |
| d,j Voya CLO Ltd., | ||||
| 2013-1A, B, 144A, FRN, 3.528%, 4/15/24 | United States | 3,850,000 | 3,846,689 | |
| 2013-2A, B, 144A, FRN, 3.318%, 4/25/25 | United States | 3,850,000 | 3,745,049 | |
| d,j Ziggurat CLO I Ltd., 2014-1A, C, 144A, FRN, 3.733%, 10/17/26 | United States | 1,340,000 | 1,315,692 | |
| Total Asset-Backed Securities and Commercial Mortgage- | ||||
| Backed Securities (Cost $90,457,926) | 89,509,788 | |||
| Total Investments before Short Term Investments | ||||
| (Cost $2,936,913,408) | 2,739,851,818 | |||
| Shares | ||||
| Short Term Investments (Cost $187,596,154) 6.4% | ||||
| Money Market Funds 6.4% | ||||
| a,k Institutional Fiduciary Trust Money Market Portfolio | United States | 187,596,154 | 187,596,154 | |
| Total Investments (Cost $3,124,509,562) 99.8% | 2,927,447,972 | |||
| Other Assets, less Liabilities 0.2% | 5,915,458 | |||
| Net Assets 100.0% | $ | 2,933,363,430 | ||
See Abbreviations on page 132.
†Rounds to less than 0.1% of net assets.
*The principal amount is stated in U.S. dollars unless otherwise indicated.
aNon-income producing.
bSee Note 8 regarding restricted securities.
cSecurity has been deemed illiquid because it may not be able to be sold within seven days.
dThe coupon rate shown represents the rate at period end.
eSee Note 1(h) regarding senior floating rate interests.
fA portion or all of the security purchased on a delayed delivery basis. See Note 1(c).
gIncome may be received in additional securities and/or cash.
hAt April 30, 2016, pursuant to the Fund’s policies and the requirements of applicable securities law, the Fund is restricted from trading these securities at period end.
iSee Note 7 regarding defaulted securities.
jSecurity was purchased pursuant to Rule 144A under the Securities Act of 1933 and may be sold in transactions exempt from registration only to qualified institutional buyers
or in a public offering registered under the Securities Act of 1933. These securities have been deemed liquid under guidelines approved by the Trust’s Board of Trustees. At
April 30, 2016, the aggregate value of these securities was $89,509,788, representing 3.05% of net assets.
kSee Note 3(f) regarding investments in affiliated management investment companies.
franklintempleton.com The accompanying notes are an integral part of these financial statements. | Semiannual Report 53
FRANKLIN INVESTORS SECURITIES TRUST
| Financial Highlights | ||||||||||||||||||
| Franklin Low Duration Total Return Fund | ||||||||||||||||||
| Six Months Ended | Year Ended October 31, | |||||||||||||||||
| April 30, 2016 | ||||||||||||||||||
| (unaudited) | 2015 | 2014 | 2013 | 2012 | 2011 | |||||||||||||
| Class A | ||||||||||||||||||
| Per share operating performance | ||||||||||||||||||
| (for a share outstanding throughout the period) | ||||||||||||||||||
| Net asset value, beginning of period | $ | 9.91 | $ | 10.11 | $ | 10.16 | $ | 10.29 | $ | 10.27 | $ | 10.44 | ||||||
| Income from investment operationsa: | ||||||||||||||||||
| Net investment income | 0.072 | 0.134 | 0.144 | 0.166 | 0.169 | 0.214 | ||||||||||||
| Net realized and unrealized gains (losses) | (0.034 | ) | (0.135 | ) | (0.011 | ) | (0.032 | ) | 0.158 | (0.111 | ) | |||||||
| Total from investment operations | 0.038 | (0.001 | ) | 0.133 | 0.134 | 0.327 | 0.103 | |||||||||||
| Less distributions from: | ||||||||||||||||||
| Net investment income and net foreign | ||||||||||||||||||
| currency gains | (0.148 | ) | (0.199 | ) | (0.183 | ) | (0.264 | ) | (0.307 | ) | (0.233 | ) | ||||||
| Net realized gains | — | — | — | — | — | (0.040 | ) | |||||||||||
| Total distributions | (0.148 | ) | (0.199 | ) | (0.183 | ) | (0.264 | ) | (0.307 | ) | (0.273 | ) | ||||||
| Net asset value, end of period | $ | 9.80 | $ | 9.91 | $ | 10.11 | $ | 10.16 | $ | 10.29 | $ | 10.27 | ||||||
| Total returnb | 0.40 | % | (0.02 | )% | 1.32 | % | 1.32 | % | 3.26 | % | 0.99 | % | ||||||
| Ratios to average net assetsc | ||||||||||||||||||
| Expenses before waiver and payments by affiliates | 0.95 | % | 0.96 | % | 0.93 | % | 0.98 | % | 1.01 | % | 1.03 | % | ||||||
| Expenses net of waiver and payments by affiliates | 0.80 | %d | 0.80 | %d | 0.80 | %d | 0.80 | %d | 0.89 | % | 0.90 | % | ||||||
| Net investment income | 1.49 | % | 1.27 | % | 1.24 | % | 1.25 | % | 1.47 | % | 1.95 | % | ||||||
| Supplemental data | ||||||||||||||||||
| Net assets, end of period (000’s) | $ | 1,607,479 | $ | 1,656,001 | $ | 1,589,854 | $ | 1,296,612 | $ | 904,878 | $ | 636,622 | ||||||
| Portfolio turnover rate | 20.58 | % | 41.28 | % | 78.63 | % | 64.86 | % | 51.42 | % | 75.51 | % | ||||||
aThe amount shown for a share outstanding throughout the period may not correlate with the Statement of Operations for the period due to the timing of sales and repurchases
of the Fund’s shares in relation to income earned and/or fluctuating fair value of the investments of the Fund.
bTotal return does not reflect sales commissions or contingent deferred sales charges, if applicable, and is not annualized for periods less than one year.
cRatios are annualized for periods less than one year.
dBenefit of expense reduction rounds to less than 0.01%.
54 Semiannual Report | The accompanying notes are an integral part of these financial statements.
franklintempleton.com
FRANKLIN INVESTORS SECURITIES TRUST
FINANCIAL H IGHLIGHTS
| Franklin Low Duration Total Return Fund (continued) | |||||||||||||||
| Six Months Ended | Year Ended October 31, | ||||||||||||||
| April 30, 2016 | |||||||||||||||
| (unaudited) | 2015 | 2014 | 2013 | 2012 | a | ||||||||||
| Class C | |||||||||||||||
| Per share operating performance | |||||||||||||||
| (for a share outstanding throughout the period) | |||||||||||||||
| Net asset value, beginning of period | $ | 9.90 | $ | 10.11 | $ | 10.16 | $ | 10.29 | $ | 10.29 | |||||
| Income from investment operationsb: | |||||||||||||||
| Net investment income | 0.053 | 0.104 | 0.098 | 0.189 | 0.013 | ||||||||||
| Net realized and unrealized gains (losses) | (0.050 | ) | (0.145 | ) | (0.001 | ) | (0.090 | ) | 0.005 | ||||||
| Total from investment operations | 0.003 | (0.041 | ) | 0.097 | 0.099 | 0.018 | |||||||||
| Less distributions from net investment income and net foreign | |||||||||||||||
| currency gains | (0.133 | ) | (0.169 | ) | (0.147 | ) | (0.229 | ) | (0.018 | ) | |||||
| Net asset value, end of period | $ | 9.77 | $ | 9.90 | $ | 10.11 | $ | 10.16 | $ | 10.29 | |||||
| Total returnc | 0.14 | % | (0.41 | )% | 0.96 | % | 0.97 | % | 0.17 | % | |||||
| Ratios to average net assetsd | |||||||||||||||
| Expenses before waiver and payments by affiliates | 1.35 | % | 1.36 | % | 1.33 | % | 1.38 | % | 1.41 | % | |||||
| Expenses net of waiver and payments by affiliates | 1.20 | %e | 1.20 | %e | 1.20 | %e | 1.20 | %e | 1.29 | % | |||||
| Net investment income | 1.09 | % | 0.87 | % | 0.84 | % | 0.84 | % | 1.07 | % | |||||
| Supplemental data | |||||||||||||||
| Net assets, end of period (000’s) | $ | 227,204 | $ | 211,354 | $ | 165,952 | $ | 114,200 | $ | 1,034 | |||||
| Portfolio turnover rate | 20.58 | % | 41.28 | % | 78.63 | % | 64.86 | % | 51.42 | % | |||||
aFor the period October 1, 2012 (effective date) to October 31, 2012.
bThe amount shown for a share outstanding throughout the period may not correlate with the Statement of Operations for the period due to the timing of sales and repurchases
of the Fund’s shares in relation to income earned and/or fluctuating fair value of the investments of the Fund.
cTotal return does not reflect sales commissions or contingent deferred sales charges, if applicable, and is not annualized for periods less than one year.
dRatios are annualized for periods less than one year.
eBenefit of expense reduction rounds to less than 0.01%.
franklintempleton.com
The accompanying notes are an integral part of these financial statements. | Semiannual Report 55
FRANKLIN INVESTORS SECURITIES TRUST
FINANCIAL H IGHLIGHTS
| Franklin Low Duration Total Return Fund (continued) | ||||||||||||
| Six Months Ended | Year Ended October 31, | |||||||||||
| April 30, 2016 | ||||||||||||
| (unaudited) | 2015 | 2014 | 2013 | a | ||||||||
| Class R6 | ||||||||||||
| Per share operating performance | ||||||||||||
| (for a share outstanding throughout the period) | ||||||||||||
| Net asset value, beginning of period | $ | 9.95 | $ | 10.14 | $ | 10.19 | $ | 10.27 | ||||
| Income from investment operationsb: | ||||||||||||
| Net investment income | 0.094 | 0.165 | 0.164 | c | 0.089 | |||||||
| Net realized and unrealized gains (losses) | (0.041 | ) | (0.130 | ) | 0.003 | (0.046 | ) | |||||
| Total from investment operations | 0.053 | 0.035 | 0.167 | 0.043 | ||||||||
| Less distributions from net investment income and net foreign currency gains | (0.163 | ) | (0.228 | ) | (0.217 | ) | (0.123 | ) | ||||
| Net asset value, end of period | $ | 9.84 | $ | 9.95 | $ | 10.14 | $ | 10.19 | ||||
| Total returnd | 0.55 | % | 0.37 | % | 1.66 | % | 0.43 | % | ||||
| Ratios to average net assetse | ||||||||||||
| Expenses before waiver and payments by affiliates | 0.53 | % | 0.54 | % | 0.55 | % | 0.62 | % | ||||
| Expenses net of waiver and payments by affiliatesf | 0.42 | % | 0.42 | % | 0.42 | % | 0.43 | % | ||||
| Net investment income | 1.87 | % | 1.65 | % | 1.62 | % | 1.61 | % | ||||
| Supplemental data | ||||||||||||
| Net assets, end of period (000’s) | $ | 554,956 | $ | 508,675 | $ | 418,539 | $ | 943 | ||||
| Portfolio turnover rate | 20.58 | % | 41.28 | % | 78.63 | % | 64.86 | % | ||||
aFor the period May 1, 2013 (effective date) to October 31, 2013.
bThe amount shown for a share outstanding throughout the period may not correlate with the Statement of Operations for the period due to the timing of sales and repurchases
of the Fund’s shares in relation to income earned and/or fluctuating fair value of the investments of the Fund.
cBased on average daily shares outstanding.
dTotal return is not annualized for periods less than one year.
eRatios are annualized for periods less than one year.
fBenefit of expense reduction rounds to less than 0.01%.
56 Semiannual Report | The accompanying notes are an integral part of these financial statements.
franklintempleton.com
FRANKLIN INVESTORS SECURITIES TRUST
FINANCIAL H IGHLIGHTS
| Franklin Low Duration Total Return Fund (continued) | ||||||||||||||||||
| Six Months Ended | Year Ended October 31, | |||||||||||||||||
| April 30, 2016 | ||||||||||||||||||
| (unaudited) | 2015 | 2014 | 2013 | 2012 | 2011 | |||||||||||||
| Advisor Class | ||||||||||||||||||
| Per share operating performance | ||||||||||||||||||
| (for a share outstanding throughout the period) | ||||||||||||||||||
| Net asset value, beginning of period | $ | 9.95 | $ | 10.14 | $ | 10.19 | $ | 10.31 | $ | 10.29 | $ | 10.46 | ||||||
| Income from investment operationsa: | ||||||||||||||||||
| Net investment income | 0.089 | 0.134 | 0.166 | 0.231 | 0.202 | 0.249 | ||||||||||||
| Net realized and unrealized gains (losses) | (0.051 | ) | (0.106 | ) | (0.010 | ) | (0.064 | ) | 0.146 | (0.122 | ) | |||||||
| Total from investment operations | 0.038 | 0.028 | 0.156 | 0.167 | 0.348 | 0.127 | ||||||||||||
| Less distributions from: | ||||||||||||||||||
| Net investment income and net foreign currency gains | (0.158 | ) | (0.218 | ) | (0.206 | ) | (0.287 | ) | (0.328 | ) | (0.257 | ) | ||||||
| Net realized gains | — | — | — | — | — | (0.040 | ) | |||||||||||
| Total distributions | (0.158 | ) | (0.218 | ) | (0.206 | ) | (0.287 | ) | (0.328 | ) | (0.297 | ) | ||||||
| Net asset value, end of period | $ | 9.83 | $ | 9.95 | $ | 10.14 | $ | 10.19 | $ | 10.31 | $ | 10.29 | ||||||
| Total returnb | 0.49 | % | 0.27 | % | 1.54 | % | 1.64 | % | 3.46 | % | 1.22 | % | ||||||
| Ratios to average net assetsc | ||||||||||||||||||
| Expenses before waiver and payments by affiliates | 0.70 | % | 0.71 | % | 0.68 | % | 0.73 | % | 0.76 | % | 0.78 | % | ||||||
| Expenses net of waiver and payments by affiliates | 0.55 | %d | 0.55 | %d | 0.55 | %d | 0.55 | %d | 0.64 | % | 0.65 | % | ||||||
| Net investment income | 1.74 | % | 1.52 | % | 1.49 | % | 1.50 | % | 1.72 | % | 2.20 | % | ||||||
| Supplemental data | ||||||||||||||||||
| Net assets, end of period (000’s) | $ | 156,821 | $ | 150,464 | $ | 198,694 | $ | 156,129 | $ | 70,442 | $ | 49,682 | ||||||
| Portfolio turnover rate | 20.58 | % | 41.28 | % | 78.63 | % | 64.86 | % | 51.42 | % | 75.51 | % | ||||||
aThe amount shown for a share outstanding throughout the period may not correlate with the Statement of Operations for the period due to the timing of sales and repurchases
of the Fund’s shares in relation to income earned and/or fluctuating fair value of the investments of the Fund.
bTotal return is not annualized for periods less than one year.
cRatios are annualized for periods less than one year.
dBenefit of expense reduction rounds to less than 0.01%.
franklintempleton.com
The accompanying notes are an integral part of these financial statements. | Semiannual Report 57
FRANKLIN INVESTORS SECURITIES TRUST
| Statement of Investments, April 30, 2016 (unaudited) | |||||
| Franklin Low Duration Total Return Fund | |||||
| Country | Shares | Value | |||
| Management Investment Companies 1.6% | |||||
| Diversified Financials 1.6% | |||||
| a Franklin Lower Tier Floating Rate Fund | United States | 1,893,663 | $ | 18,501,090 | |
| a Franklin Middle Tier Floating Rate Fund | United States | 2,389,308 | 22,793,994 | ||
| Total Management Investment Companies | |||||
| (Cost $41,451,171) | 41,295,084 | ||||
| Principal | |||||
| Amount* | |||||
| Corporate Bonds 44.7% | |||||
| Automobiles & Components 1.2% | |||||
| Delphi Automotive PLC, senior note, 3.15%, 11/19/20 | United Kingdom | 10,500,000 | 10,847,970 | ||
| Fiat Chrysler Automobiles NV, 4.50%, 4/15/20 | United Kingdom | 4,000,000 | 4,100,000 | ||
| Ford Motor Credit Co. LLC, senior note, | |||||
| 2.597%, 11/04/19 | United States | 4,000,000 | 4,052,767 | ||
| 3.157%, 8/04/20 | United States | 11,300,000 | 11,585,449 | ||
| 30,586,186 | |||||
| Banks 11.7% | |||||
| b ANZ New Zealand International Ltd. of London, senior note, 144A, | |||||
| 2.85%, 8/06/20 | New Zealand | 7,500,000 | 7,686,225 | ||
| c Banca Monte dei Paschi Di Siena SpA, secured note, Reg S, | |||||
| 2.875%, 4/16/21 | Italy | 6,300,000 | EUR | 7,918,503 | |
| Banco Comercial Portugues SA, 4.75%, 6/22/17 | Portugal | 4,500,000 | EUR | 5,411,221 | |
| Bank of America Corp., senior note, | |||||
| 2.65%, 4/01/19 | United States | 9,300,000 | 9,476,347 | ||
| d FRN, 1.668%, 1/15/19 | United States | 12,671,000 | 12,678,590 | ||
| c Bankinter SA, senior note, Reg S, 1.75%, 6/10/19 | Spain | 6,400,000 | EUR | 7,620,983 | |
| Barclays PLC, senior note, 3.25%, 1/12/21 | United Kingdom | 14,000,000 | 14,158,900 | ||
| BB&T Corp., senior note, | |||||
| 2.05%, 6/19/18 | United States | 1,000,000 | 1,012,570 | ||
| d FRN, 1.276%, 2/01/19 | United States | 2,000,000 | 1,983,662 | ||
| CIT Group Inc., | |||||
| 4.25%, 8/15/17 | United States | 500,000 | 508,438 | ||
| senior note, 5.00%, 5/15/17 | United States | 500,000 | 511,563 | ||
| senior note, 5.25%, 3/15/18 | United States | 2,000,000 | 2,067,500 | ||
| senior note, 3.875%, 2/19/19 | United States | 3,100,000 | 3,123,250 | ||
| Citigroup Inc., | |||||
| senior note, 2.40%, 2/18/20 | United States | 11,300,000 | 11,398,186 | ||
| d sub. note, FRN, 0.906%, 6/09/16 | United States | 11,200,000 | 11,201,288 | ||
| Depfa ACS Bank, secured bond, | |||||
| 1.65%, 12/20/16 | Ireland | 550,000,000 | JPY | 5,198,338 | |
| 2.125%, 10/13/17 | Ireland | 5,000,000 | CHF | 5,388,136 | |
| b The Export-Import Bank of China, senior note, 144A, 2.50%, 7/31/19 | China | 8,000,000 | 8,174,320 | ||
| b HSBC Bank Brasil SA, senior note, 144A, 4.00%, 5/11/16 | Brazil | 3,000,000 | 3,005,925 | ||
| HSBC Holdings PLC, senior note, 3.40%, 3/08/21 | United Kingdom | 3,300,000 | 3,420,170 | ||
| HSBC USA Inc., senior note, 2.00%, 8/07/18 | United States | 7,500,000 | 7,545,247 | ||
| Industrial and Commercial Bank of China Ltd./New York, 3.231%, 11/13/19 | China | 5,400,000 | 5,604,444 | ||
| b,d ING Bank NV, senior note, 144A, FRN, 1.315%, 10/01/19 | Netherlands | 5,000,000 | 4,928,850 | ||
| Intesa Sanpaolo SpA, senior note, | |||||
| 2.375%, 1/13/17 | Italy | 1,500,000 | 1,508,550 | ||
| 3.875%, 1/16/18 | Italy | 5,900,000 | 6,068,415 | ||
| 3.875%, 1/15/19 | Italy | 10,100,000 | 10,454,106 | ||
| c,d Reg S, FRN, 5/18/17 | Italy | 2,150,000 | EUR | 2,458,059 | |
58 Semiannual Report
franklintempleton.com
FRANKLIN INVESTORS SECURITIES TRUST
STATEMENT OF INVESTMENTS (UNAUDITED)
| Franklin Low Duration Total Return Fund (continued) | |||||
| Principal | |||||
| Country | Amount* | Value | |||
| Corporate Bonds (continued) | |||||
| Banks (continued) | |||||
| JPMorgan Chase & Co., senior note, | |||||
| 2.20%, 10/22/19 | United States | 11,000,000 | $ | 11,142,879 | |
| d FRN, 1.538%, 1/25/18 | United States | 8,000,000 | 8,036,760 | ||
| d JPMorgan Chase Bank NA, sub. note, FRN, 0.962%, 6/13/16 | United States | 1,500,000 | 1,500,461 | ||
| National Australia Bank of New York, senior note, 1.875%, 7/23/18 | Australia | 7,600,000 | 7,651,870 | ||
| b Norddeutsche Landesbank Girozentrale, secured note, 144A, 2.00%, 2/05/19 | Germany | 6,500,000 | 6,578,162 | ||
| PHH Corp., senior note, 7.375%, 9/01/19 | United States | 1,800,000 | 1,759,500 | ||
| PNC Funding Corp., senior note, 2.70%, 9/19/16 | United States | 1,200,000 | 1,206,826 | ||
| Regions Financial Corp., senior note, 2.00%, 5/15/18 | United States | 4,500,000 | 4,496,278 | ||
| Royal Bank of Canada, secured note, 2.10%, 10/14/20 | Canada | 6,300,000 | 6,340,522 | ||
| The Royal Bank of Scotland PLC, sub. note, 6.934%, 4/09/18 | United Kingdom | 2,500,000 | EUR | 3,152,011 | |
| d Svenska Handelsbanken AB, senior note, FRN, 1.132%, 6/17/19 | Sweden | 5,300,000 | 5,242,150 | ||
| b The Toronto-Dominion Bank, secured note, 144A, 2.25%, 3/15/21 | Canada | 12,700,000 | 12,926,638 | ||
| c,d UniCredit SpA, senior note, Reg S, FRN, 0.703%, 4/10/17 | Italy | 3,400,000 | EUR | 3,914,905 | |
| d Union Bank NA, senior note, FRN, 1.38%, 9/26/16 | United States | 2,400,000 | 2,404,188 | ||
| c Unione di Banche Italiane SCpA, senior note, Reg S, 2.875%, 2/18/19 | Italy | 5,800,000 | EUR | 7,060,607 | |
| d Wachovia Corp., sub. note, FRN, 0.998%, 10/15/16 | United States | 14,723,000 | 14,730,406 | ||
| d Wells Fargo & Co., senior note, FRN, 1.515%, 7/22/20 | United States | 17,600,000 | 17,624,358 | ||
| b Westpac Banking Corp., | |||||
| secured note, 144A, 2.10%, 2/25/22 | Australia | 9,700,000 | 9,774,108 | ||
| senior secured note, 144A, 2.25%, 11/09/20 | Australia | 6,300,000 | 6,393,492 | ||
| b Woori Bank, sub. note, 144A, 4.75%, 4/30/24 | South Korea | 5,300,000 | 5,487,540 | ||
| 297,935,447 | |||||
| Capital Goods 0.6% | |||||
| The Boeing Co., senior note, 0.95%, 5/15/18 | United States | 1,500,000 | 1,500,486 | ||
| Lockheed Martin Corp., senior note, 1.85%, 11/23/18 | United States | 4,200,000 | 4,261,543 | ||
| United Technologies Corp., senior note, 4.50%, 4/15/20 | United States | 7,500,000 | 8,345,002 | ||
| 14,107,031 | |||||
| Commercial & Professional Services 0.0%† | |||||
| Republic Services Inc., senior note, 3.80%, 5/15/18 | United States | 1,035,000 | 1,083,767 | ||
| Consumer Durables & Apparel 0.6% | |||||
| Beazer Homes USA Inc., senior note, 5.75%, 6/15/19 | United States | 4,500,000 | 4,196,250 | ||
| Centex LLC, senior note | United States | 5,000,000 | 5,000,000 | ||
| D.R. Horton Inc., senior note, 3.75%, 3/01/19 | United States | 2,000,000 | 2,050,000 | ||
| KB Home, senior note, 4.75%, 5/15/19 | United States | 5,000,000 | 5,050,000 | ||
| 16,296,250 | |||||
| Consumer Services 0.8% | |||||
| b International Game Technology PLC, senior note, 144A, 5.625%, 2/15/20 | United States | 4,000,000 | 4,210,000 | ||
| Marriott International Inc., senior note, 2.875%, 3/01/21 | United States | 10,000,000 | 10,163,280 | ||
| Yum! Brands Inc., senior bond, 6.25%, 3/15/18 | United States | 5,500,000 | 5,885,000 | ||
| 20,258,280 | |||||
| Diversified Financials 5.2% | |||||
| AerCap Ireland Capital Ltd./AerCap Global Aviation Trust, senior note, | |||||
| 4.25%, 7/01/20 | Netherlands | 4,700,000 | 4,820,625 | ||
| American Express Credit Corp., senior note, 1.55%, 9/22/17 | United States | 4,600,000 | 4,619,752 | ||
| d Bank of New York Mellon Corp., senior note, FRN, 1.488%, 8/17/20 | United States | 6,400,000 | 6,384,058 | ||
| b Bayer US Finance LLC, senior note, 144A, 2.375%, 10/08/19 | Germany | 8,700,000 | 8,954,031 | ||
franklintempleton.com
Semiannual Report 59
FRANKLIN INVESTORS SECURITIES TRUST
STATEMENT OF INVESTMENTS (UNAUDITED)
| Franklin Low Duration Total Return Fund (continued) | ||||
| Principal | ||||
| Country | Amount* | Value | ||
| Corporate Bonds (continued) | ||||
| Diversified Financials (continued) | ||||
| Capital One Bank USA NA, senior note, 2.30%, 6/05/19 | United States | 11,900,000 | $ | 11,882,376 |
| d Credit Suisse New York, senior note, FRN, 1.125%, 5/26/17 | Switzerland | 5,400,000 | 5,388,692 | |
| d Deutsche Bank AG, senior note, FRN, 1.928%, 8/20/20 | Germany | 7,500,000 | 7,286,400 | |
| d Fifth Third Bank, senior note, FRN, 1.128%, 11/18/16 | United States | 11,000,000 | 11,015,290 | |
| General Motors Financial Co. Inc., senior note, 2.625%, 7/10/17 | United States | 1,500,000 | 1,512,842 | |
| d The Goldman Sachs Group Inc., senior note, FRN, 1.834%, 9/15/20 | United States | 15,000,000 | 14,940,945 | |
| b Hutchison Whampoa International 14 Ltd., 144A, 1.625%, 10/31/17 | Hong Kong | 4,700,000 | 4,707,920 | |
| International Lease Finance Corp., senior note, 8.75%, 3/15/17 | United States | 8,000,000 | 8,444,000 | |
| John Deere Capital Corp., senior note, | ||||
| 1.30%, 3/12/18 | United States | 1,700,000 | 1,707,708 | |
| 1.95%, 3/04/19 | United States | 3,750,000 | 3,810,510 | |
| b Lincoln Finance Ltd., senior secured note, 144A, 7.375%, 4/15/21 | Netherlands | 400,000 | 425,500 | |
| d Morgan Stanley, senior note, FRN, 1.774%, 1/27/20 | United States | 17,400,000 | 17,420,428 | |
| Navient Corp., senior note, | ||||
| 8.45%, 6/15/18 | United States | 800,000 | 859,000 | |
| 5.50%, 1/15/19 | United States | 3,500,000 | 3,478,125 | |
| b Pricoa Global Funding I, secured note, 144A, 2.55%, 11/24/20 | United States | 5,600,000 | 5,657,691 | |
| b,d Seven and Seven Ltd., senior note, 144A, FRN, 1.898%, 9/11/19 | South Korea | 1,400,000 | 1,396,871 | |
| Springleaf Finance Corp., senior note, J, 6.90%, 12/15/17 | United States | 8,500,000 | 8,903,750 | |
| 133,616,514 | ||||
| Energy 3.2% | ||||
| b BG Energy Capital PLC, senior note, 144A, 2.875%, 10/15/16 | United Kingdom | 3,500,000 | 3,520,615 | |
| b California Resources Corp., secured note, second lien, 144A, | ||||
| 8.00%, 12/15/22 | United States | 1,656,000 | 1,140,570 | |
| Canadian Natural Resources Ltd., senior bond, 5.90%, 2/01/18 | Canada | 5,500,000 | 5,735,155 | |
| b Chesapeake Energy Corp., secured note, second lien, 144A, 8.00%, 12/15/22 | United States | 1,770,000 | 1,212,450 | |
| CNOOC Finance 2015 Australia Pty. Ltd., senior note, 2.625%, 5/05/20 | China | 3,900,000 | 3,890,133 | |
| CNOOC Nexen Finance 2014 ULC, senior note, 1.625%, 4/30/17 | China | 6,800,000 | 6,794,288 | |
| b CNPC General Capital Ltd., senior note, 144A, | ||||
| 1.95%, 4/16/18 | China | 1,500,000 | 1,499,303 | |
| d FRN, 1.518%, 5/14/17 | China | 7,500,000 | 7,496,738 | |
| Enable Midstream Partners LP, senior note, 2.40%, 5/15/19 | United States | 3,700,000 | 3,358,094 | |
| Energy Transfer Partners LP, senior note, 4.15%, 10/01/20 | United States | 2,600,000 | 2,571,535 | |
| b,e Energy XXI Gulf Coast Inc., senior secured note, second lien, 144A, | ||||
| 11.00%, 3/15/20 | United States | 3,000,000 | 1,065,000 | |
| EnLink Midstream Partners LP, senior note, 2.70%, 4/01/19 | United States | 800,000 | 738,902 | |
| Ensco PLC, senior note, 4.70%, 3/15/21 | United States | 3,900,000 | 3,285,750 | |
| Enterprise Products Operating LLC, senior note, 2.55%, 10/15/19 | United States | 3,500,000 | 3,560,193 | |
| f Halcon Resources Corp., | ||||
| senior note, 9.75%, 7/15/20 | United States | 1,500,000 | 337,500 | |
| b senior secured note, third lien, 144A, 13.00%, 2/15/22 | United States | 975,000 | 316,875 | |
| Kinder Morgan Energy Partners LP, senior note, 5.95%, 2/15/18 | United States | 6,600,000 | 6,935,821 | |
| b Kinder Morgan Finance Co. LLC, senior secured note, 144A, 6.00%, 1/15/18 | United States | 2,500,000 | 2,637,088 | |
| Kinder Morgan Inc., senior note, 3.05%, 12/01/19 | United States | 500,000 | 497,564 | |
| b,e,f Linn Energy LLC/Finance Corp., senior secured note, second lien, 144A, | ||||
| 12.00%, 12/15/16 | United States | 750,000 | 146,250 | |
| b LUKOIL International Finance BV, senior note, 144A, 3.416%, 4/24/18 | Russia | 2,300,000 | 2,309,499 | |
| b,e Peabody Energy Corp., secured note, second lien, 144A, 10.00%, 3/15/22 | United States | 3,000,000 | 352,800 | |
| d Petrobras Global Finance BV, senior note, FRN, 3.522%, 3/17/20 | Brazil | 5,100,000 | 4,201,125 | |
| b Petrofac Ltd., senior note, 144A, 3.40%, 10/10/18 | United Kingdom | 1,300,000 | 1,261,621 | |
| Sanchez Energy Corp., senior note, 7.75%, 6/15/21 | United States | 1,900,000 | 1,572,250 | |
60 Semiannual Report
franklintempleton.com
FRANKLIN INVESTORS SECURITIES TRUST
STATEMENT OF INVESTMENTS (UNAUDITED)
| Franklin Low Duration Total Return Fund (continued) | |||||
| Principal | |||||
| Country | Amount* | Value | |||
| Corporate Bonds (continued) | |||||
| Energy (continued) | |||||
| b Sinopec Group Overseas Development 2015 Ltd., senior note, 144A, | |||||
| 2.50%, 4/28/20 | China | 7,400,000 | $ | 7,404,921 | |
| d Statoil ASA, senior note, FRN, 1.08%, 11/08/18 | Norway | 6,900,000 | 6,865,638 | ||
| Williams Partners LP, senior note, 4.125%, 11/15/20 | United States | 1,700,000 | 1,601,908 | ||
| 82,309,586 | |||||
| Food & Staples Retailing 1.1% | |||||
| CVS Health Corp., senior note, 1.20%, 12/05/16 | United States | 10,000,000 | 10,025,630 | ||
| The Kroger Co., senior note, | |||||
| 1.20%, 10/17/16 | United States | 5,000,000 | 5,008,675 | ||
| 2.60%, 2/01/21 | United States | 7,500,000 | 7,727,265 | ||
| Walgreens Boots Alliance Inc., senior note, 1.75%, 11/17/17 | United States | 5,900,000 | 5,931,447 | ||
| 28,693,017 | |||||
| Food, Beverage & Tobacco 2.2% | |||||
| Altria Group Inc., senior note, 2.625%, 1/14/20 | United States | 6,000,000 | 6,223,722 | ||
| Anheuser-Busch InBev Finance Inc., senior note, 2.65%, 2/01/21 | Belgium | 6,500,000 | 6,680,082 | ||
| Coca-Cola Femsa SAB de CV, senior note, 2.375%, 11/26/18 | Mexico | 5,500,000 | 5,585,085 | ||
| Constellation Brands Inc., senior note, 7.25%, 5/15/17 | United States | 6,600,000 | 6,971,250 | ||
| b H.J. Heinz Co., senior note, 144A, 2.00%, 7/02/18 | United States | 6,400,000 | 6,472,109 | ||
| b Japan Tobacco Inc., senior note, 144A, 2.10%, 7/23/18 | Japan | 5,000,000 | 5,059,075 | ||
| b JBS USA LLC/Finance Inc., senior note, 144A, | |||||
| 8.25%, 2/01/20 | United States | 1,990,000 | 2,084,525 | ||
| 7.25%, 6/01/21 | United States | 2,500,000 | 2,575,000 | ||
| Kraft Foods Group Inc., senior note, 2.25%, 6/05/17 | United States | 7,000,000 | 7,072,366 | ||
| d Mondelez International Inc., senior note, FRN, 1.136%, 2/01/19 | United States | 500,000 | 495,328 | ||
| c Pernod Ricard SA, senior note, Reg S, 2.125%, 9/27/24 | France | 500,000 | EUR | 609,764 | |
| Reynolds American Inc., senior note, 2.30%, 6/12/18 | United States | 6,200,000 | 6,324,304 | ||
| 56,152,610 | |||||
| Health Care Equipment & Services 2.3% | |||||
| Aetna Inc., senior note, 1.50%, 11/15/17 | United States | 1,000,000 | 1,003,977 | ||
| Alere Inc., senior sub. note, 6.50%, 6/15/20 | United States | 1,600,000 | 1,588,000 | ||
| Becton, Dickinson and Co., senior note, 2.675%, 12/15/19 | United States | 5,900,000 | 6,058,840 | ||
| CHS/Community Health Systems Inc., senior note, 7.125%, 7/15/20 | United States | 4,800,000 | 4,656,000 | ||
| Edwards Lifesciences Corp., senior note, 2.875%, 10/15/18 | United States | 1,600,000 | 1,640,422 | ||
| Express Scripts Holding Co., senior note, 3.30%, 2/25/21 | United States | 4,300,000 | 4,441,612 | ||
| HCA Inc., senior secured note, first lien, 4.25%, 10/15/19 | United States | 5,500,000 | 5,726,875 | ||
| Laboratory Corp. of America Holdings, 2.20%, 8/23/17 | United States | 1,000,000 | 1,006,732 | ||
| Stryker Corp., senior note, 2.00%, 3/08/19 | United States | 10,100,000 | 10,240,532 | ||
| Tenet Healthcare Corp., senior note, | |||||
| 5.00%, 3/01/19 | United States | 10,600,000 | 10,547,000 | ||
| 5.50%, 3/01/19 | United States | 3,000,000 | 3,015,000 | ||
| Zimmer Holdings Inc., senior note, 2.70%, 4/01/20 | United States | 7,500,000 | 7,656,075 | ||
| 57,581,065 | |||||
| Household & Personal Products 0.4% | |||||
| Avon Products Inc., senior note, 6.35%, 3/15/20 | United States | 10,000,000 | 8,525,000 | ||
| Colgate-Palmolive Co., senior note, 0.90%, 5/01/18 | United States | 2,200,000 | 2,203,126 | ||
| 10,728,126 | |||||
franklintempleton.com
Semiannual Report 61
FRANKLIN INVESTORS SECURITIES TRUST
STATEMENT OF INVESTMENTS (UNAUDITED)
| Franklin Low Duration Total Return Fund (continued) | |||||
| Principal | |||||
| Country | Amount* | Value | |||
| Corporate Bonds (continued) | |||||
| Insurance 1.6% | |||||
| b Jackson National Life Global Funding, secured note, 144A, 2.25%, 4/29/21 | United States | 7,600,000 | $ | 7,643,996 | |
| b Met Life Global Funding I, senior secured bond, 144A, 3.875%, 4/11/22 | United States | 2,400,000 | 2,578,200 | ||
| b Metropolitan Life Global Funding I, secured note, 144A, 1.30%, 4/10/17 | United States | 10,000,000 | 10,016,080 | ||
| b New York Life Global Funding, secured note, 144A, 2.10%, 1/02/19 | United States | 10,000,000 | 10,182,330 | ||
| b Protective Life Global Funding, senior secured note, 144A, 1.722%, 4/15/19 | United States | 4,300,000 | 4,307,800 | ||
| d Prudential Financial Inc., senior note, FRN, 1.398%, 8/15/18 | United States | 5,700,000 | 5,688,623 | ||
| 40,417,029 | |||||
| Materials 1.4% | |||||
| ArcelorMittal, senior note, 5.50%, 2/25/17 | Luxembourg | 2,500,000 | 2,583,875 | ||
| c Arkema SA, senior note, Reg S, 1.50%, 1/20/25 | France | 2,000,000 | EUR | 2,319,204 | |
| b,g BlueScope Steel Ltd./BlueScope Steel Finance, senior note, 144A, | |||||
| 6.50%, 5/15/21 | Australia | 4,300,000 | 4,402,125 | ||
| b Cemex SAB de CV, senior secured note, 144A, 6.50%, 12/10/19 | Mexico | 4,000,000 | 4,228,980 | ||
| Freeport-McMoRan Copper & Gold Inc., senior note, 2.30%, 11/14/17 | United States | 6,000,000 | 5,880,000 | ||
| Owens-Illinois Inc., senior note, 7.80%, 5/15/18 | United States | 7,400,000 | 8,140,000 | ||
| Reynolds Group Holdings Inc., senior note, 8.125%, 6/15/17 | United States | 2,100,000 | 2,163,000 | ||
| Reynolds Group Issuer Inc./LLC/SA, senior note, 8.50%, 5/15/18 | United States | 5,000,000 | 5,012,250 | ||
| e Verso Paper Holdings LLC/Inc., senior secured note, first lien, 11.75%, 1/15/19 | United States | 90,000 | 11,475 | ||
| 34,740,909 | |||||
| Media 1.2% | |||||
| CBS Corp., senior note, 2.30%, 8/15/19 | United States | 11,437,000 | 11,600,709 | ||
| CSC Holdings LLC, | |||||
| senior bond, 7.625%, 7/15/18 | United States | 3,500,000 | 3,797,500 | ||
| senior note, 8.625%, 2/15/19 | United States | 3,000,000 | 3,337,500 | ||
| The New York Times Co., senior note, 6.625%, 12/15/16 | United States | 2,000,000 | 2,048,094 | ||
| Time Warner Inc., senior note, 2.10%, 6/01/19 | United States | 4,500,000 | 4,571,483 | ||
| Viacom Inc., senior note, | |||||
| 2.20%, 4/01/19 | United States | 3,200,000 | 3,208,774 | ||
| 2.75%, 12/15/19 | United States | 2,700,000 | 2,729,036 | ||
| 31,293,096 | |||||
| Pharmaceuticals, Biotechnology & Life Sciences 2.1% | |||||
| Abbvie Inc., senior note, 1.80%, 5/14/18 | United States | 8,600,000 | 8,664,474 | ||
| Actavis Funding SCS, senior note, 2.35%, 3/12/18 | United States | 6,200,000 | 6,268,076 | ||
| Amgen Inc., senior note, | |||||
| 2.125%, 5/15/17 | United States | 2,500,000 | 2,526,648 | ||
| d FRN, 1.218%, 5/22/19 | United States | 6,200,000 | 6,149,997 | ||
| b Baxalta Inc., senior note, 144A, 2.00%, 6/22/18 | United States | 10,200,000 | 10,179,335 | ||
| Biogen Inc., senior note, 2.90%, 9/15/20 | United States | 7,500,000 | 7,779,315 | ||
| Celgene Corp., senior note, 2.30%, 8/15/18 | United States | 3,000,000 | 3,045,504 | ||
| Perrigo Finance Unlimited Co., senior note, 3.50%, 3/15/21 | United States | 2,600,000 | 2,663,287 | ||
| b Valeant Pharmaceuticals International Inc., senior note, 144A, 5.375%, 3/15/20 | United States | 5,000,000 | 4,453,125 | ||
| Zoetis Inc., senior note, 1.875%, 2/01/18 | United States | 1,200,000 | 1,199,282 | ||
| 52,929,043 | |||||
| Real Estate 1.0% | |||||
| American Tower Corp., senior note, | |||||
| 3.40%, 2/15/19 | United States | 3,600,000 | 3,715,625 | ||
| 3.30%, 2/15/21 | United States | 6,500,000 | 6,716,164 | ||
| Boston Properties LP, senior note, 3.70%, 11/15/18 | United States | 4,900,000 | 5,137,841 | ||
62 Semiannual Report
franklintempleton.com
| F R A N K L I N | I N V E S T O R S S E C U R I T I E S T R U S T | |
| S T A T E M E N T | O F I N V E S T M E N T S ( U N A U D I T E D ) |
| Franklin Low Duration Total Return Fund (continued) | |||||
| Principal | |||||
| Country | Amount* | Value | |||
| Corporate Bonds (continued) | |||||
| Real Estate (continued) | |||||
| HCP Inc., senior note, 3.75%, 2/01/19 | United States | 5,500,000 | $ | 5,689,381 | |
| Hospitality Properties Trust, senior note, 5.625%, 3/15/17 | United States | 3,000,000 | 3,089,793 | ||
| 24,348,804 | |||||
| Retailing 0.6% | |||||
| Dollar General Corp., senior note, 1.875%, 4/15/18 | United States | 8,200,000 | 8,276,916 | ||
| b,e,f Edcon Ltd., secured note, 144A, 9.50%, 3/01/18 | South Africa | 1,500,000 | EUR | 601,204 | |
| b Experian Finance PLC, 144A, 2.375%, 6/15/17 | United Kingdom | 1,000,000 | 1,003,880 | ||
| Toys R Us Inc., senior bond, 7.375%, 10/15/18 | United States | 8,250,000 | 6,723,750 | ||
| 16,605,750 | |||||
| Semiconductors & Semiconductor Equipment 0.2% | |||||
| Maxim Integrated Products Inc., senior note, 2.50%, 11/15/18 | United States | 5,200,000 | 5,258,458 | ||
| Software & Services 1.4% | |||||
| Alibaba Group Holding Ltd., senior note, 2.50%, 11/28/19 | China | 11,900,000 | 11,996,925 | ||
| Fiserv Inc., senior note, 2.70%, 6/01/20 | United States | 11,300,000 | 11,597,631 | ||
| d Oracle Corp., senior note, FRN, 1.208%, 1/15/19 | United States | 12,000,000 | 12,064,500 | ||
| 35,659,056 | |||||
| Technology Hardware & Equipment 1.6% | |||||
| d Apple Inc., | |||||
| FRN, 0.869%, 5/03/18 | United States | 7,300,000 | 7,303,592 | ||
| senior note, FRN, 1.438%, 2/22/19 | United States | 5,700,000 | 5,770,412 | ||
| b,d Hewlett Packard Enterprise Co., senior note, 144A, FRN, 2.559%, 10/05/18 | United States | 8,100,000 | 8,189,221 | ||
| Juniper Networks Inc., senior note, | |||||
| 3.125%, 2/26/19 | United States | 7,500,000 | 7,650,532 | ||
| 3.30%, 6/15/20 | United States | 4,500,000 | 4,600,823 | ||
| b,d NBCUniversal Enterprise Inc., 144A, FRN, 1.313%, 4/15/18 | United States | 7,500,000 | 7,511,468 | ||
| 41,026,048 | |||||
| Telecommunication Services 1.7% | |||||
| AT&T Inc., senior note, 2.45%, 6/30/20 | United States | 7,400,000 | 7,512,080 | ||
| CenturyLink Inc., senior note, 5.625%, 4/01/20 | United States | 5,000,000 | 5,156,250 | ||
| Embarq Corp., senior note, 7.082%, 6/01/16 | United States | 3,000,000 | 3,021,384 | ||
| Intelsat Jackson Holdings SA, senior note, 7.25%, 10/15/20 | Luxembourg | 2,500,000 | 1,834,375 | ||
| b Sprint Communications Inc., senior note, 144A, 9.00%, 11/15/18 | United States | 3,500,000 | 3,710,000 | ||
| T-Mobile USA Inc., senior note, | |||||
| 6.542%, 4/28/20 | United States | 2,500,000 | 2,578,155 | ||
| 6.633%, 4/28/21 | United States | 2,000,000 | 2,115,000 | ||
| Telefonica Emisiones SAU, senior note, 3.192%, 4/27/18 | Spain | 2,300,000 | 2,367,793 | ||
| Verizon Communications Inc., senior note, | |||||
| 2.625%, 2/21/20 | United States | 8,824,000 | 9,093,000 | ||
| d FRN, 2.382%, 9/14/18 | United States | 4,800,000 | 4,929,336 | ||
| 42,317,373 | |||||
| Transportation 0.5% | |||||
| b Aviation Capital Group Corp., senior note, 144A, 3.875%, 9/27/16 | United States | 3,700,000 | 3,727,935 | ||
| FedEx Corp., senior note, 2.30%, 2/01/20 | United States | 8,000,000 | 8,162,736 | ||
| 11,890,671 | |||||
| Utilities 2.1% | |||||
| Dominion Resources Inc., senior note, 2.50%, 12/01/19 | United States | 9,500,000 | 9,673,764 | ||
| DPL Inc., senior note, 6.50%, 10/15/16 | United States | 471,000 | 481,009 | ||
franklintempleton.com
Semiannual Report 63
FRANKLIN INVESTORS SECURITIES TRUST
STATEMENT OF INVESTMENTS (UNAUDITED)
| Franklin Low Duration Total Return Fund (continued) | |||||
| Principal | |||||
| Country | Amount* | Value | |||
| Corporate Bonds (continued) | |||||
| Utilities (continued) | |||||
| Duke Energy Corp., senior note, 2.10%, 6/15/18 | United States | 5,100,000 | $ | 5,153,713 | |
| b Engie SA, senior note, 144A, 1.625%, 10/10/17 | France | 1,000,000 | 1,000,775 | ||
| b Korea Western Power Co. Ltd., senior note, 144A, 3.125%, 5/10/17 | South Korea | 5,200,000 | 5,284,214 | ||
| PPL Energy Supply LLC, senior note, 6.20%, 5/15/16 | United States | 8,000,000 | 8,004,000 | ||
| Sempra Energy, senior note, 2.85%, 11/15/20 | United States | 9,600,000 | 9,839,769 | ||
| The Southern Co., senior note, 2.45%, 9/01/18 | United States | 7,000,000 | 7,144,060 | ||
| b State Grid Overseas Investment 2013 Ltd., senior note, 144A, 1.75%, 5/22/18 | China | 2,000,000 | 2,000,740 | ||
| b State Grid Overseas Investment 2014 Ltd., senior note, 144A, 2.75%, 5/07/19 | China | 2,200,000 | 2,257,077 | ||
| c Veolia Environnement SA, senior bond, Reg S, 4.625%, 3/30/27 | France | 1,000,000 | EUR | 1,537,559 | |
| Virginia Electric & Power Co., senior note, 1.20%, 1/15/18 | United States | 900,000 | 899,599 | ||
| 53,276,279 | |||||
| Total Corporate Bonds (Cost $1,141,567,003) | 1,139,110,395 | ||||
| d,h Senior Floating Rate Interests 3.0% | |||||
| Automobiles & Components 0.1% | |||||
| Crowne Group LLC, Term Loan, 6.00%, 9/30/20 | United States | 963,220 | 929,507 | ||
| TI Group Automotive Systems LLC, Initial U.S. Term Loan, 4.50%, 6/25/22 | United States | 1,257,344 | 1,257,344 | ||
| 2,186,851 | |||||
| Capital Goods 0.1% | |||||
| Sensus USA Inc., Term Loan, 6.50%, 4/05/23 | United States | 2,290,000 | 2,252,787 | ||
| Commercial & Professional Services 0.0%† | |||||
| Kar Auction Services Inc., Tranche B-3 Term Loan, 4.25%, 3/09/23 | United States | 913,408 | 916,833 | ||
| Consumer Durables & Apparel 0.0%† | |||||
| g Prime Security Services Borrower LLC, Term B-1 Loans, 7.00%, 5/02/22 | United States | 272,259 | 273,577 | ||
| Consumer Services 0.2% | |||||
| Fitness International LLC, Term B Loan, 5.529%, 7/01/20 | United States | 4,391,630 | 4,314,777 | ||
| Diversified Financials 0.1% | |||||
| First Eagle Investment Management, Initial Term Loans, 4.75%, 12/01/22 | United States | 1,590,991 | 1,581,048 | ||
| Guggenheim Partners Investment Management Holdings LLC, Initial Term Loan, | |||||
| 4.25%, 7/22/20 | United States | 401,985 | 402,906 | ||
| 1,983,954 | |||||
| Energy 0.3% | |||||
| Bowie Resource Holdings LLC, First Lien Initial Term Loan, 8.75%, 8/16/20 | United States | 2,287,401 | 2,035,787 | ||
| f Fieldwood Energy LLC, Loans, 3.875%, 10/01/18 | United States | 4,428,826 | 3,343,763 | ||
| f McDermott Finance LLC, Term Loan, 5.25%, 4/16/19 | United States | 187,912 | 181,453 | ||
| OSG Bulk Ships Inc., Initial Term Loan, 5.25%, 8/05/19 | United States | 1,173,217 | 1,126,289 | ||
| OSG International Inc., Initial Term Loan, 5.75%, 8/05/19 | United States | 2,125,549 | 2,104,293 | ||
| 8,791,585 | |||||
| Health Care Equipment & Services 0.1% | |||||
| Community Health Systems Inc., 2018 Term F Loans, | |||||
| 3.685% - 3.886%, 12/31/18 | United States | 1,887,968 | 1,881,329 | ||
| Kinetic Concepts Inc., Dollar Term E-1 Loan, 4.50%, 5/04/18 | United States | 1,536,440 | 1,537,785 | ||
| New Millennium Holdco Inc., Closing Date Term Loan, 7.50%, 12/18/20 | United States | 162,942 | 127,095 | ||
| 3,546,209 | |||||
64 Semiannual Report
franklintempleton.com
FRANKLIN INVESTORS SECURITIES TRUST
STATEMENT OF INVESTMENTS (UNAUDITED)
| Franklin Low Duration Total Return Fund (continued) | ||||
| Principal | ||||
| Country | Amount* | Value | ||
| d,h Senior Floating Rate Interests (continued) | ||||
| Materials 0.4% | ||||
| The Chemours Co. LLC, Tranche B Term Loan, 3.75%, 5/12/22 | United States | 2,869,541 | $ | 2,804,976 |
| FMG America Finance Inc. (Fortescue Metals Group), Loans, 4.25%, 6/30/19 | Australia | 4,650,273 | 4,400,902 | |
| Novelis Inc., Initial Term Loan, 4.00%, 6/02/22 | Canada | 1,748,817 | 1,742,478 | |
| OCI Beaumont LLC, Term B-3 Loan, 7.75%, 8/20/19 | United States | 1,541,979 | 1,557,399 | |
| 10,505,755 | ||||
| Media 0.4% | ||||
| CSC Holdings Inc. (Cablevision), Initial Term Loans, 5.00%, 10/09/22 | United States | 1,899,580 | 1,911,215 | |
| Gray Television Inc., Term Loan C, 4.25%, 6/13/21 | United States | 877,007 | 881,940 | |
| Media General Inc., Term B Loan, 4.00%, 7/31/20 | United States | 217,381 | 217,598 | |
| Radio One Inc., Term Loan B, 5.14%, 12/31/18 | United States | 6,877,363 | 6,924,645 | |
| 9,935,398 | ||||
| Pharmaceuticals, Biotechnology & Life Sciences 0.4% | ||||
| Endo Luxembourg Finance Co. I S.A.R.L. and Endo LLC, 2015 Incremental Term B | ||||
| Loans, 3.75%, 9/25/22 | United States | 3,323,589 | 3,318,048 | |
| Grifols Worldwide Operations USA Inc., US Tranche B Term Loan, | ||||
| 3.435%, 2/27/21 | United States | 1,697,823 | 1,702,068 | |
| Valeant Pharmaceuticals International Inc., | ||||
| Series D-2 Tranche B Term Loan, 4.50%, 2/13/19 | United States | 1,256,043 | 1,227,259 | |
| Series F-1 Tranche B Term Loan, 5.00%, 4/01/22 | United States | 3,548,550 | 3,482,014 | |
| 9,729,389 | ||||
| Retailing 0.2% | ||||
| Ascena Retail Group Inc., Tranche B Term Loan, 5.25%, 8/21/22 | United States | 3,512,059 | 3,461,133 | |
| The Men’s Wearhouse Inc., Tranche B Term Loan, 4.50%, 6/18/21 | United States | 322,492 | 316,849 | |
| g PetSmart Inc., Term Loans, 4.25%, 3/10/22 | United States | 708,744 | 707,334 | |
| 4,485,316 | ||||
| Semiconductors & Semiconductor Equipment 0.2% | ||||
| g Avago Technologies Cayman Finance Ltd., Term B-1 Dollar Loans, | ||||
| 4.25%, 2/01/23 | United States | 2,120,616 | 2,125,771 | |
| M/A-COM Technology Solutions Holdings Inc., Initial Term Loan, 4.50%, 5/07/21 | United States | 610,231 | 610,231 | |
| g MKS Instruments Inc., Term Loan, 6.50%, 4/25/23 | United States | 206,224 | 207,383 | |
| ON Semiconductor Corp., Closing Date Term Loans, 5.25%, 3/31/23 | United States | 2,247,145 | 2,262,032 | |
| 5,205,417 | ||||
| Software & Services 0.2% | ||||
| Match Group Inc., Term B-1 Loans, 5.50%, 11/16/22 | United States | 842,984 | 850,361 | |
| MoneyGram International Inc., Term Loan, 4.25%, 3/27/20 | United States | 5,197,715 | 4,918,338 | |
| 5,768,699 | ||||
| Technology Hardware & Equipment 0.1% | ||||
| Ciena Corp., Term Loan, 3.75%, 7/15/19 | United States | 235,429 | 234,988 | |
| Dell International LLC, Term B-2 Loan, 4.00%, 4/29/20 | United States | 1,320,978 | 1,321,557 | |
| g Western Digital Corp., U.S. Term B Loan, 8.00%, 4/29/23 | United States | 1,102,120 | 1,086,277 | |
| 2,642,822 | ||||
| Telecommunication Services 0.1% | ||||
| Intelsat Jackson Holdings SA, Tranche B-2 Term Loan, 3.75%, 6/30/19 | Luxembourg | 686,550 | 645,529 | |
| Windstream Corp., tranche B-5 Term Loan, 3.50%, 8/08/19 | United States | 539,678 | 533,831 | |
| 1,179,360 | ||||
franklintempleton.com
Semiannual Report 65
FRANKLIN INVESTORS SECURITIES TRUST
STATEMENT OF INVESTMENTS (UNAUDITED)
| Franklin Low Duration Total Return Fund (continued) | ||||
| Principal | ||||
| Country | Amount* | Value | ||
| d,h Senior Floating Rate Interests (continued) | ||||
| Transportation 0.1% | ||||
| Hertz Corp., Credit Linked Deposit, 3.75%, 3/11/18 | United States | 750,000 | $ | 739,688 |
| Navios Maritime Midstream Partners LP, Initial Term Loan, 5.50%, 6/18/20 | Marshall Islands | 1,228,181 | 1,111,504 | |
| Navios Maritime Partners LP, Initial Term Loan, 5.25%, 6/27/18 | Marshall Islands | 67,504 | 59,741 | |
| 1,910,933 | ||||
| Utilities 0.0%† | ||||
| Calpine Corp., Term Loan (B6), 4.00%, 1/15/23 | United States | 661,871 | 660,837 | |
| Total Senior Floating Rate Interests | ||||
| (Cost $77,235,671) | 76,290,499 | |||
| Foreign Government and Agency Securities 2.0% | ||||
| The Export-Import Bank of Korea, senior note, 2.25%, 1/21/20 | South Korea | 11,200,000 | 11,319,392 | |
| Government of Hungary, | ||||
| 5.50%, 12/22/16 | Hungary | 750,880,000 | HUF | 2,834,705 |
| A, 6.75%, 11/24/17 | Hungary | 3,910,000 | HUF | 15,648 |
| A, 5.50%, 12/20/18 | Hungary | 428,710,000 | HUF | 1,739,342 |
| Government of Malaysia, | ||||
| senior bond, 4.262%, 9/15/16 | Malaysia | 2,300,000 | MYR | 592,483 |
| senior note, 3.172%, 7/15/16 | Malaysia | 5,550,000 | MYR | 1,422,727 |
| senior note, 4.012%, 9/15/17 | Malaysia | 29,800,000 | MYR | 7,746,093 |
| Government of Mexico, | ||||
| 7.25%, 12/15/16 | Mexico | 894,000i MXN | 5,306,844 | |
| 7.75%, 12/14/17 | Mexico | 930,000i MXN | 5,722,286 | |
| M, 4.75%, 6/14/18 | Mexico | 510,000i MXN | 2,985,948 | |
| senior note, 8.50%, 12/13/18 | Mexico | 600,000i MXN | 3,824,014 | |
| b Government of Serbia, senior note, 144A, 5.25%, 11/21/17 | Serbia | 1,800,000 | 1,863,900 | |
| Government of Sri Lanka, A, 6.40%, 8/01/16 | Sri Lanka | 1,500,000 | LKR | 10,182 |
| Korea Monetary Stabilization Bond, senior note, 1.96%, 2/02/17 | South Korea | 2,800,000,000 | KRW | 2,454,562 |
| Korea Treasury Bond, senior note, 3.00%, 12/10/16 | South Korea | 1,590,000,000 | KRW | 1,401,342 |
| j Nota Do Tesouro Nacional, Index Linked, 6.00%, | ||||
| 8/15/16 | Brazil | 789k BRL | 651,023 | |
| 5/15/17 | Brazil | 150k BRL | 124,571 | |
| 8/15/18 | Brazil | 1,810k BRL | 1,500,703 | |
| Total Foreign Government and Agency Securities | ||||
| (Cost $55,085,961) | 51,515,765 | |||
| U.S. Government and Agency Securities 14.6% | ||||
| U.S. Treasury Note, | ||||
| 3.50%, 2/15/18 | United States | 38,000,000 | 39,858,428 | |
| 1.00%, 8/15/18 | United States | 120,000,000 | 120,487,440 | |
| 1.50%, 12/31/18 | United States | 50,000,000 | 50,828,100 | |
| 1.375%, 2/28/19 | United States | 70,000,000 | 70,929,670 | |
| 1.50%, 2/28/19 | United States | 76,000,000 | 77,273,608 | |
| 1.50%, 3/31/19 | United States | 12,500,000 | 12,714,350 | |
| Total U.S. Government and Agency Securities | ||||
| (Cost $369,212,701) | 372,091,596 | |||
66 Semiannual Report
franklintempleton.com
FRANKLIN INVESTORS SECURITIES TRUST
STATEMENT OF INVESTMENTS (UNAUDITED)
| Franklin Low Duration Total Return Fund (continued) | ||||
| Principal | ||||
| Country | Amount* | Value | ||
| Asset-Backed Securities and Commercial | ||||
| Mortgage-Backed Securities 28.5% | ||||
| Banks 6.1% | ||||
| Banc of America Commercial Mortgage Trust, | ||||
| 2006-1, AJ, 5.46%, 9/10/45 | United States | 2,049,329 | $ | 2,048,886 |
| d 2006-1, D, FRN, 5.585%, 9/10/45 | United States | 1,776,000 | 1,771,794 | |
| 2006-4, AJ, 5.695%, 7/10/46 | United States | 7,087,000 | 7,038,464 | |
| 2006-4, AM, 5.675%, 7/10/46 | United States | 6,710,000 | 6,728,600 | |
| Bear Stearns Commercial Mortgage Securities Inc., | ||||
| d 2006-PW11, AJ, FRN, 5.426%, 3/11/39 | United States | 5,382,000 | 5,155,295 | |
| d 2006-PW12, AJ, FRN, 5.885%, 9/11/38 | United States | 1,670,766 | 1,669,285 | |
| 2006-PW13, AJ, 5.611%, 9/11/41 | United States | 5,090,000 | 5,080,244 | |
| d 2007-PW16, AM, FRN, 5.72%, 6/11/40 | United States | 2,100,000 | 2,160,697 | |
| Bear Stearns Commercial Mortgage Securities Trust, | ||||
| d 2005-T20, E, FRN, 5.14%, 10/12/42 | United States | 2,000,000 | 1,981,350 | |
| 2006-PW13, A4, 5.54%, 9/11/41 | United States | 1,998,558 | 2,002,987 | |
| d 2007-PW16, A4, FRN, 5.72%, 6/11/40 | United States | 1,314,097 | 1,355,554 | |
| d Capital One Multi-Asset Execution Trust, | ||||
| 2006-A11, A11, FRN, 0.523%, 6/17/19 | United States | 12,000,000 | 11,995,495 | |
| 2007-A2, A2, FRN, 0.513%, 12/16/19 | United States | 11,390,000 | 11,381,001 | |
| 2007-A5, A5, FRN, 0.473%, 7/15/20 | United States | 10,200,000 | 10,201,533 | |
| d Citibank Credit Card Issuance Trust, | ||||
| 2006-A8, A8, FRN, 0.668%, 12/17/18 | United States | 6,230,000 | 6,230,381 | |
| 2013-A12, A12, FRN, 0.85%, 11/07/18 | United States | 6,200,000 | 6,204,171 | |
| Citigroup Commercial Mortgage Trust, | ||||
| 2006-C5, AJ, 5.482%, 10/15/49 | United States | 1,219,000 | 1,095,668 | |
| d 2007-C6, AM, FRN, 5.711%, 12/10/49 | United States | 7,000,000 | 7,043,750 | |
| d Citigroup/Deutsche Bank Commercial Mortgage Trust, 2005-CD1, E, FRN, | ||||
| 5.207%, 7/15/44 | United States | 3,495,000 | 3,491,681 | |
| d Countrywide Asset-Backed Certificates, | ||||
| 2001-BC3, A, FRN, 0.679%, 12/25/31 | United States | 1,558 | 1,161 | |
| 2002-3, 1A1, FRN, 1.179%, 5/25/32 | United States | 1,686 | 1,606 | |
| 2004-1, M1, FRN, 1.189%, 3/25/34 | United States | 365,974 | 352,783 | |
| 2004-7, MV3, FRN, 1.489%, 12/25/34 | United States | 513,119 | 512,622 | |
| Credit Suisse First Boston Mortgage Securities Corp., 2004-6, 3A1, | ||||
| 5.00%, 9/25/19 | United States | 1,126,912 | 1,158,978 | |
| d Greenwich Capital Commercial Funding Corp., 2006-GG7, | ||||
| AJ, FRN, 5.921%, 7/10/38 | United States | 7,310,000 | 6,633,140 | |
| l AM, FRN, 5.921%, 7/10/38 | United States | 660,000 | 660,600 | |
| d Impac Secured Assets CMN Owner Trust, 2004-4, M1, FRN, 1.204%, 2/25/35 | United States | 1,120,000 | 1,064,866 | |
| JP Morgan Chase Commercial Mortgage Securities Trust, | ||||
| 2004-LN2, A2, 5.115%, 7/15/41 | United States | 48,971 | 49,097 | |
| 2006-CB17, AM, 5.464%, 12/12/43 | United States | 2,350,000 | 2,328,121 | |
| d,l 2006-LDP7, AJ, FRN, 5.981%, 4/17/45 | United States | 2,629,000 | 1,979,637 | |
| d LB-UBS Commercial Mortgage Trust, | ||||
| 2006-C1, AJ, FRN, 5.276%, 2/15/41 | United States | 1,945,691 | 1,941,887 | |
| 2006-C3, AJ, FRN, 5.72%, 3/15/39 | United States | 1,508,979 | 1,506,911 | |
| 2006-C4, AJ, FRN, 6.116%, 6/15/38 | United States | 5,860,000 | 5,852,821 | |
| d Merrill Lynch Mortgage Investors Trust, | ||||
| 2003-A, 1A, FRN, 1.179%, 3/25/28 | United States | 563,748 | 535,819 | |
| 2005-1, 2A2, FRN, 2.394%, 4/25/35 | United States | 637,392 | 618,483 | |
| 2006-3, 2A1, FRN, 2.525%, 10/25/36 | United States | 3,274,481 | 3,207,402 | |
franklintempleton.com
Semiannual Report 67
FRANKLIN INVESTORS SECURITIES TRUST
STATEMENT OF INVESTMENTS (UNAUDITED)
| Franklin Low Duration Total Return Fund (continued) | ||||
| Principal | ||||
| Country | Amount* | Value | ||
| Asset-Backed Securities and Commercial | ||||
| Mortgage-Backed Securities (continued) | ||||
| Banks (continued) | ||||
| d Morgan Stanley ABS Capital I Inc. Trust, 2005-WMC, M2, FRN, | ||||
| 1.174%, 1/25/35 | United States | 431,514 | $ | 419,891 |
| Morgan Stanley Capital I Trust, | ||||
| b 2005-RR6, B, 144A, 5.306%, 5/24/43 | United States | 3,298,000 | 3,253,939 | |
| d 2006-HQ8, AJ, FRN, 5.423%, 3/12/44 | United States | 3,285,058 | 3,279,143 | |
| 2007-IQ13, A1A, 5.312%, 3/15/44 | United States | 3,347,512 | 3,426,307 | |
| d Wachovia Bank Commercial Mortgage Trust, | ||||
| b 2003-C7, F, 144A, FRN, 5.906%, 10/15/35 | United States | 642,675 | 647,013 | |
| 2006-C25, AJ, FRN, 6.044%, 5/15/43 | United States | 6,353,861 | 6,353,163 | |
| 2006-C27, AM, FRN, 5.795%, 7/15/45 | United States | 2,755,000 | 2,768,105 | |
| 2006-C28, AM, FRN, 5.603%, 10/15/48 | United States | 7,330,000 | 7,412,697 | |
| d Wells Fargo Mortgage Backed Securities Trust, | ||||
| 2004-W, A9, FRN, 2.753%, 11/25/34 | United States | 182,641 | 185,002 | |
| 2005-AR, 1A1, FRN, 2.765%, 2/25/35 | United States | 2,191,427 | 2,180,245 | |
| 2005-AR9, 2A2, FRN, 2.744%, 10/25/33 | United States | 216,625 | 213,507 | |
| 2005-AR10, 2A3, FRN, 2.825%, 6/25/35 | United States | 922,166 | 910,395 | |
| 154,092,177 | ||||
| Commercial & Professional Services 0.0%† | ||||
| Merrill Lynch Mortgage Trust, 2006-C2, AM, 5.782%, 8/12/43 | United States | 450,000 | 451,836 | |
| Diversified Financials 22.2% | ||||
| b,d ALM VIII Ltd., 2013-8A, A1A, 144A, FRN, 2.084%, 1/20/26 | Cayman Islands | 3,370,000 | 3,364,237 | |
| d American Express Credit Account Master Trust, | ||||
| 2008-2, A, FRN, 1.693%, 9/15/20 | United States | 2,900,000 | 2,952,180 | |
| 2012-1, A, FRN, 0.703%, 1/15/20 | United States | 11,890,000 | 11,903,402 | |
| d American Home Mortgage Investment Trust, | ||||
| 2004-3, 4A, FRN, 2.366%, 10/25/34 | United States | 3,815,328 | 3,725,133 | |
| 2005-1, 6A, FRN, 2.899%, 6/25/45 | United States | 1,835,770 | 1,777,886 | |
| d,l Ameriquest Mortgage Securities Inc. Asset-Backed Pass-Through Certificates, | ||||
| 2004-R4, M1, FRN, 1.264%, 6/25/34 | United States | 1,252,286 | 1,228,507 | |
| b Apidos CDO, 2013-14A, C2, 144A, 4.85%, 4/15/25 | United States | 1,900,000 | 1,893,293 | |
| b,d ARCap REIT Inc., 2004-RR3, A2, 144A, FRN, 4.76%, 9/21/45 | United States | 5,259,347 | 5,323,984 | |
| b ARCap Resecuritization Trust, 2004-A1, A, 144A, 4.73%, 4/21/24 | United States | 21,751 | 21,800 | |
| b,d Ares IIIR/IVR CLO Ltd., 2007-3RA, | ||||
| A2, 144A, FRN, 0.853%, 4/16/21 | United States | 2,576,561 | 2,534,202 | |
| B, 144A, FRN, 1.003%, 4/16/21 | United States | 3,700,000 | 3,546,857 | |
| b,d ARES XI CLO Ltd., 2007-11A, | ||||
| A1B, 144A, FRN, 0.889%, 10/11/21 | United States | 5,921,060 | 5,817,619 | |
| A1C, 144A, FRN, 0.899%, 10/11/21 | United States | 1,535,231 | 1,510,268 | |
| d Argent Securities Inc., 2005-W2, A2C, FRN, 0.799%, 10/25/35 | United States | 942,261 | 899,644 | |
| b,d Atrium CDO Corp., 10A, A, 144A, FRN, 1.753%, 7/16/25 | United States | 1,390,000 | 1,377,420 | |
| b,d Atrium IX, 9A, A, 144A, FRN, 1.936%, 2/28/24 | United States | 3,370,000 | 3,352,847 | |
| b,d Atrium XI, 11A, C, 144A, FRN, 3.838%, 10/23/25 | Cayman Islands | 6,750,000 | 6,781,522 | |
| b,d Babson CLO Inc., 2007-1A, A1, 144A, FRN, 0.858%, 1/18/21 | United States | 1,081,074 | 1,063,247 | |
| b BAMLL Commercial Mortgage Securities Trust, 2012-PARK, A, 144A, | ||||
| 2.959%, 12/10/30 | United States | 3,200,000 | 3,296,177 | |
| d Bank of America Credit Card Trust, 2014-A2, A, FRN, 0.703%, 9/16/19 | United States | 9,620,000 | 9,628,620 | |
| d Bear Stearns Alt-A Trust, | ||||
| 2004-10, 1A3, FRN, 1.439%, 9/25/34 | United States | 1,916,426 | 1,897,019 | |
| 2004-13, A2, FRN, 1.319%, 11/25/34 | United States | 127,838 | 122,206 | |
68 Semiannual Report
franklintempleton.com
FRANKLIN INVESTORS SECURITIES TRUST
STATEMENT OF INVESTMENTS (UNAUDITED)
| Franklin Low Duration Total Return Fund (continued) | ||||
| Principal | ||||
| Country | Amount* | Value | ||
| Asset-Backed Securities and Commercial | ||||
| Mortgage-Backed Securities (continued) | ||||
| Diversified Financials (continued) | ||||
| b,d Bear Stearns Commercial Mortgage Securities Trust, 2006-PW12, B, 144A, FRN, | ||||
| 5.885%, 9/11/38 | United States | 1,860,000 | $ | 1,822,896 |
| b,d Bluemountain CLO Ltd., 2013-3A, A, 144A, FRN, 2.038%, 10/29/25 | United States | 1,448,215 | 1,443,407 | |
| b,d Carefree Portfolio Trust, 2014-CARE, A, 144A, FRN, 1.753%, 11/15/19 | United States | 5,795,000 | 5,797,463 | |
| b,d Carlyle Global Market Strategies CLO Ltd., 2012-4A, A, 144A, FRN, | ||||
| 2.024%, 1/20/25 | United States | 4,020,000 | 4,009,950 | |
| b,d Catamaran CLO Ltd., 2014-2A, B, 144A, FRN, 3.633%, 10/18/26 | United States | 3,011,300 | 2,932,344 | |
| b,d Cent CLO, 13-17A, A1, 144A, FRN, 1.916%, 1/30/25 | United States | 8,916,000 | 8,758,900 | |
| b,d Cent CLO 21 Ltd., 2014-21A, B, 144A, FRN, 3.434%, 7/27/26 | United States | 780,000 | 752,575 | |
| b,d Cent CLO LP, 2014-22A, B, 144A, FRN, 3.82%, 11/07/26 | United States | 4,050,000 | 3,998,686 | |
| b Centerline REIT Inc., 2004-RR3, B, 144A, 5.04%, 9/21/45 | United States | 2,227,000 | 1,997,441 | |
| d Chase Funding Mortgage Loan Asset-Backed Certificates, 2004-2, 2A2, FRN, | ||||
| 0.939%, 2/25/35 | United States | 12,256 | 10,765 | |
| Chase Issuance Trust, | ||||
| d 2007-A2, A2, FRN, 0.483%, 4/15/19 | United States | 6,468,000 | 6,466,950 | |
| d 2007-B1, B1, FRN, 0.683%, 4/15/19 | United States | 9,400,000 | 9,366,314 | |
| d 2007-C1, C1, FRN, 0.893%, 4/15/19 | United States | 3,800,000 | 3,787,584 | |
| d 2013-A3, A3, FRN, 0.713%, 4/15/20 | United States | 6,147,000 | 6,148,497 | |
| d 2014-A5, A5, FRN, 0.803%, 4/15/21 | United States | 7,310,000 | 7,317,214 | |
| 2015-A2, A2, 1.59%, 2/18/20 | United States | 8,200,000 | 8,270,505 | |
| 2015-A7, A7, 1.62%, 7/15/20 | United States | 5,005,000 | 5,040,475 | |
| b,d CIFC Funding Ltd., 2007-3A, A1J, 144A, FRN, 1.036%, 7/26/21 | United States | 6,700,000 | 6,601,845 | |
| b,d Colony American Homes, 2014-1A, | ||||
| A, 144A, FRN, 1.586%, 5/17/31 | United States | 4,632,902 | 4,596,100 | |
| C, 144A, FRN, 2.286%, 5/17/31 | United States | 700,000 | 687,137 | |
| b Colony MFM Trust, 2014-1, A, 144A, 2.543%, 4/20/50 | United States | 7,281,790 | 7,250,888 | |
| b COMM Mortgage Trust, 2012-9W57, A, 144A, 2.365%, 2/10/29 | United States | 7,805,000 | 7,858,289 | |
| d Commercial Mortgage Trust, | ||||
| 2005-GG5, AJ, FRN, 5.45%, 4/10/37 | United States | 513,617 | 513,328 | |
| 2007-C9, A1A, FRN, 5.813%, 12/10/49 | United States | 7,674,111 | 7,979,771 | |
| b 2014-BBG, A, 144A, FRN, 1.233%, 3/15/29 | United States | 6,600,000 | 6,481,803 | |
| d Conseco Finance Securitizations Corp., 2002-2, M1, FRN, 7.424%, 3/01/33 | United States | 985,000 | 1,072,643 | |
| Conseco Financial Corp., | ||||
| d 1997-3, A7, FRN, 7.64%, 3/15/28 | United States | 2,141,219 | 2,253,486 | |
| 1998-6, A8, 6.66%, 6/01/30 | United States | 9,042,490 | 9,749,609 | |
| b Core Industrial Trust, 2015-CALW, A, 144A, 3.04%, 2/10/34 | United States | 8,290,000 | 8,609,334 | |
| b,d Cornerstone CLO Ltd., 2007-1A, B, 144A, FRN, 1.578%, 7/15/21 | United States | 995,000 | 965,150 | |
| b Countryplace Manufactured Housing Contract Trust, | ||||
| 2005-A3, 144A, 4.80%, 12/15/35 | United States | 27,092 | 27,179 | |
| 2007-1, A3, 144A, 5.593%, 7/15/37 | United States | 67,532 | 67,858 | |
| d Countrywide Home Loans, | ||||
| 2004-6, 1A1, FRN, 2.64%, 5/25/34 | United States | 2,775,239 | 2,758,144 | |
| l 2004-11, 2A1, FRN, 2.275%, 7/25/34 | United States | 3,096,234 | 3,059,626 | |
| b,d CT CDO IV Ltd., 2006-4A, A1, 144A, FRN, 0.749%, 10/20/43 | United States | 358,040 | 357,267 | |
| Discover Card Execution Note Trust, | ||||
| d 2012-A4, A4, FRN, 0.803%, 11/15/19 | United States | 10,500,000 | 10,518,818 | |
| d 2013-A6, A6, FRN, 0.883%, 4/15/21 | United States | 5,520,000 | 5,535,256 | |
| d 2014-A1, A1, FRN, 0.863%, 7/15/21 | United States | 7,690,000 | 7,695,028 | |
| 2014-A5, A, 1.39%, 4/15/20 | United States | 2,060,000 | 2,069,999 | |
| b,d Dryden 33 Senior Loan Fund, 2014-33A, A, 144A, FRN, 2.108%, 7/15/26 | United States | 6,535,000 | 6,518,793 | |
franklintempleton.com
Semiannual Report 69
FRANKLIN INVESTORS SECURITIES TRUST
STATEMENT OF INVESTMENTS (UNAUDITED)
| Franklin Low Duration Total Return Fund (continued) | ||||
| Principal | ||||
| Country | Amount* | Value | ||
| Asset-Backed Securities and Commercial | ||||
| Mortgage-Backed Securities (continued) | ||||
| Diversified Financials (continued) | ||||
| b,d Eaton Vance CDO Ltd., 2014-1A, | ||||
| A, 144A, FRN, 2.078%, 7/15/26 | United States | 5,266,000 | $ | 5,230,297 |
| B, 144A, FRN, 2.678%, 7/15/26 | United States | 858,000 | 839,510 | |
| C, 144A, FRN, 3.628%, 7/15/26 | United States | 739,600 | 721,931 | |
| b Emerson Park CLO Ltd., 2013-1A, C2, 144A, 5.64%, 7/15/25 | United States | 630,000 | 636,867 | |
| d Fannie Mae Connecticut Avenue Securities, | ||||
| 2013-C01, M1, FRN, 2.439%, 10/25/23 | United States | 6,319,587 | 6,354,002 | |
| 2014-C02, 2M1, FRN, 1.389%, 5/25/24 | United States | 959,515 | 952,050 | |
| 2015-C02, 2M1, FRN, 1.639%, 5/25/25 | United States | 1,967,013 | 1,967,994 | |
| d FHLMC Structured Agency Credit Risk Debt Notes, | ||||
| 2014-DN3, M2, FRN, 2.839%, 8/25/24 | United States | 2,374,279 | 2,398,962 | |
| 2014-DN4, M2, FRN, 2.839%, 10/25/24 | United States | 8,001,480 | 8,088,290 | |
| 2014-HQ1, M2, FRN, 2.939%, 8/25/24 | United States | 7,195,000 | 7,327,352 | |
| 2014-HQ3, M2, FRN, 3.089%, 10/25/24 | United States | 5,650,000 | 5,731,737 | |
| 2015-DN1, M2, FRN, 2.839%, 1/25/25 | United States | 10,535,000 | 10,702,928 | |
| 2015-DNA1, M2, FRN, 2.289%, 10/25/27 | United States | 7,170,000 | 7,127,521 | |
| 2015-DNA2, M2, FRN, 3.039%, 12/25/27 | United States | 8,145,000 | 8,204,651 | |
| 2015-HQ1, M1, FRN, 1.489%, 3/25/25 | United States | 2,324,954 | 2,325,446 | |
| 2015-HQ1, M2, FRN, 2.639%, 3/25/25 | United States | 6,000,000 | 6,056,485 | |
| 2015-HQA1, M2, FRN, 3.089%, 3/25/28 | United States | 6,500,000 | 6,621,949 | |
| 2015-HQA2, M2, FRN, 3.239%, 5/25/28 | United States | 8,520,000 | 8,689,114 | |
| 2016-HQ1, M1, FRN, 2.189%, 9/25/28 | United States | 4,466,167 | 4,473,138 | |
| d First Horizon Alternative Mortgage Securities Trust, 2004-AA5, 2A1, FRN, | ||||
| 2.225%, 12/25/34 | United States | 2,277,675 | 2,207,077 | |
| b G-Force LLC, | ||||
| d 2005-RR2, A3FL, 144A, FRN, 0.739%, 12/25/39 | United States | 250,658 | 249,764 | |
| 2005-RRA, B, 144A, 5.09%, 8/22/36 | United States | 1,987,776 | 1,989,118 | |
| b,d Galaxy XV CLO Ltd., 2013-15A, A, 144A, FRN, 1.878%, 4/15/25 | United States | 10,063,000 | 9,951,401 | |
| l GMAC Commercial Mortgage Securities Inc., 2005-C1, B, 4.936%, 5/10/43 | United States | 1,460,724 | 244,584 | |
| d GSAA Home Equity Trust, | ||||
| l 2005-5, M3, FRN, 1.384%, 2/25/35 | United States | 5,950,000 | 5,664,973 | |
| FRN, 0.809%, 6/25/35 | United States | 524,985 | 502,815 | |
| d GSAMP Trust, 2005-HE3, M2, FRN, 1.444%, 6/25/35 | United States | 1,260,449 | 1,242,513 | |
| d GSR Mortgage Loan Trust, 2005-AR1, 1A1, FRN, 2.974%, 1/25/35 | United States | 816,104 | 772,832 | |
| b Highbridge Loan Management Ltd., 2013-2A, B2, 144A, 5.80%, 10/20/24 | United States | 570,000 | 576,099 | |
| b,d Hilton USA Trust, 2013-HLF, | ||||
| AFL, 144A, FRN, 1.437%, 11/05/30 | United States | 7,249,181 | 7,245,497 | |
| BFL, 144A, FRN, 1.939%, 11/05/30 | United States | 1,641,153 | 1,640,339 | |
| CFL, 144A, FRN, 2.339%, 11/05/30 | United States | 607,499 | 607,205 | |
| b,d Invitation Homes Trust, | ||||
| 2014-SFR1, B, 144A, FRN, 1.936%, 6/17/31 | United States | 1,130,000 | 1,115,511 | |
| 2014-SFR2, A, 144A, FRN, 1.536%, 9/17/31 | United States | 4,414,055 | 4,381,478 | |
| 2014-SFR2, B, 144A, FRN, 2.036%, 9/17/31 | United States | 8,500,000 | 8,410,587 | |
| 2015-SFR1, A, 144A, FRN, 1.886%, 3/17/32 | United States | 2,387,374 | 2,395,019 | |
| 2015-SFR2, A, 144A, FRN, 1.786%, 6/17/32 | United States | 7,957,982 | 7,944,221 | |
| 2015-SFR3, A, 144A, FRN, 1.736%, 8/17/32 | United States | 4,293,105 | 4,308,905 | |
| d IXIS Real Estate Capital Trust, 2005-HE4, A3, FRN, 1.119%, 2/25/36 | United States | 868,561 | 862,407 | |
| b,d Jefferies & Co., 2009-R2, 4A, 144A, FRN, 3.006%, 5/26/37 | United States | 1,529,078 | 1,532,966 | |
70 Semiannual Report
franklintempleton.com
FRANKLIN INVESTORS SECURITIES TRUST
STATEMENT OF INVESTMENTS (UNAUDITED)
| Franklin Low Duration Total Return Fund (continued) | ||||
| Principal | ||||
| Country | Amount* | Value | ||
| Asset-Backed Securities and Commercial | ||||
| Mortgage-Backed Securities (continued) | ||||
| Diversified Financials (continued) | ||||
| d JP Morgan Chase Commercial Mortgage Securities Trust, | ||||
| l 2005-LDP5, E, FRN, 5.737%, 12/15/44 | United States | 1,150,000 | $ | 1,146,594 |
| l 2005-LPD5, F, FRN, 5.553%, 12/15/44 | United States | 7,850,000 | 7,828,701 | |
| 2006-LDP7, A4, FRN, 5.981%, 4/17/45 | United States | 119,004 | 118,885 | |
| d JP Morgan Mortgage Trust, 2004-A1, 5A1, FRN, 2.803%, 2/25/34 | United States | 116,658 | 115,176 | |
| b,d Landmark IX CDO Ltd., 2007-9A, C, 144A, FRN, 1.328%, 4/15/21 | United States | 1,040,000 | 1,007,313 | |
| b,d LB-UBS Commercial Mortgage Trust, 2001-C3, E, 144A, FRN, 6.95%, 6/15/36 | United States | 700,000 | 700,115 | |
| Lehman XS Trust, 2005-4, 1A4, 0.999%, 10/25/35 | United States | 1,150,646 | 1,041,297 | |
| b LNR CDO Ltd., | ||||
| d 2002-1A, DFL, 144A, FRN, 1.839%, 7/24/37 | United States | 2,257,813 | 2,254,042 | |
| 2002-1A, DFX, 144A, 6.727%, 7/24/37 | United States | 587,031 | 588,927 | |
| d 2003-1A, EFL, 144A, FRN, 3.439%, 7/23/36 | United States | 814,144 | 815,023 | |
| b,d Mach One ULC, 2004-1A, | ||||
| H, 144A, FRN, 6.05%, 5/28/40 | United States | 103,728 | 104,325 | |
| K, 144A, FRN, 5.45%, 5/28/40 | United States | 2,825,400 | 2,828,819 | |
| L, 144A, FRN, 5.45%, 5/28/40 | United States | 2,136,500 | 2,132,291 | |
| M, 144A, FRN, 5.45%, 5/28/40 | United States | 640,000 | 638,195 | |
| d Madison Avenue Manufactured Housing Contract Trust, 2002-A, B1, FRN, | ||||
| 3.689%, 3/25/32 | United States | 2,270,059 | 2,304,247 | |
| d Manufactured Housing Contract Trust Pass Through Certificates, 2001-1, IIM2, | ||||
| FRN, 1.889%, 4/20/32 | United States | 8,409,564 | 7,831,894 | |
| MASTR Alternative Loan Trust, | ||||
| 2003-1, 3A1, 5.00%, 2/25/18 | United States | 342,295 | 346,992 | |
| 2003-6, 2A1, 5.00%, 8/25/18 | United States | 929,399 | 943,388 | |
| 2003-9, 1A1, 5.50%, 12/25/18 | United States | 382,666 | 385,604 | |
| 2004-4, 5A1, 5.50%, 4/25/19 | United States | 1,166,105 | 1,191,148 | |
| d 2004-11, 2A1, FRN, 5.534%, 11/25/19 | United States | 1,313,055 | 1,345,658 | |
| d,l MASTR ARM Trust, 2007-3, 12A2, FRN, 0.639%, 5/25/47 | United States | 346,578 | 344,178 | |
| d Merrill Lynch Mortgage Investors Trust Inc., 2003-E, A1, FRN, | ||||
| 1.059%, 10/25/28 | United States | 1,136,103 | 1,088,044 | |
| d Merrill Lynch Mortgage Investors Trust, | ||||
| 2003-G, A2, FRN, 1.313%, 1/25/29 | United States | 1,100,599 | 1,051,936 | |
| 2005-A10, A, FRN, 0.649%, 2/25/36 | United States | 4,006,544 | 3,654,700 | |
| d,l Merrill Lynch Mortgage Trust, 2005-CKI1, D, FRN, 5.346%, 11/12/37 | United States | 2,844,105 | 2,768,014 | |
| d ML-CFC Commercial Mortgage Trust, 2006-3, A1A, FRN, 5.409%, 7/12/46 | United States | 2,638,682 | 2,657,117 | |
| b,d N-Star Real Estate CDO Ltd., 2006-6A, A1, 144A, FRN, 0.97%, 6/16/41 | Cayman Islands | 1,246,773 | 1,238,607 | |
| d New York Mortgage Trust, 2005-3, M1, FRN, 0.889%, 2/25/36 | United States | 554,738 | 491,411 | |
| b,d Newcastle CDO Ltd., 2004-5A, 1, 144A, FRN, 0.968%, 12/24/39 | United States | 41,215 | 41,166 | |
| b,d NZCG Funding Ltd., 2015-2A, A1, 144A, FRN, 2.184%, 4/27/27 | United States | 8,101,875 | 8,071,250 | |
| b OBP Depositor LLC Trust, 2010-OBP, A, 144A, 4.646%, 7/15/45 | United States | 1,700,000 | 1,869,919 | |
| b,d Octagon Investment Partners XXIII Ltd., 15-1A, | ||||
| A1, 144A, FRN, 2.048%, 7/15/27 | United States | 4,160,328 | 4,118,600 | |
| A2, 144A, FRN, 2.048%, 7/15/27 | United States | 3,949,678 | 3,910,063 | |
| d Ownit Mortgage Loan Asset-Backed Certificates, 2005-2, M4, FRN, | ||||
| 1.369%, 3/25/36 | United States | 1,812,976 | 1,790,206 | |
| d Park Place Securities Inc. Asset-Backed Pass-Through Certificates, | ||||
| 2004-MCW1, M1, FRN, 1.376%, 10/25/34 | United States | 50,782 | 50,862 | |
| 2004-WHQ2, M2, FRN, 1.384%, 2/25/35 | United States | 1,706,957 | 1,705,149 | |
franklintempleton.com
Semiannual Report 71
FRANKLIN INVESTORS SECURITIES TRUST
STATEMENT OF INVESTMENTS (UNAUDITED)
| Franklin Low Duration Total Return Fund (continued) | ||||
| Principal | ||||
| Country | Amount* | Value | ||
| Asset-Backed Securities and Commercial | ||||
| Mortgage-Backed Securities (continued) | ||||
| Diversified Financials (continued) | ||||
| b,d Progress Residential Trust, | ||||
| 2014-SFR, B, 144A, FRN, 2.336%, 10/17/31 | United States | 1,960,000 | $ | 1,958,644 |
| 2014-SFR1, A, 144A, FRN, 1.536%, 10/17/31 | United States | 2,394,957 | 2,374,362 | |
| 2015-SFR1, A, 144A, FRN, 1.836%, 2/17/32 | United States | 10,820,000 | 10,822,737 | |
| d RAAC, 2004-SP1, AII, FRN, 1.139%, 3/25/34 | United States | 790,383 | 752,757 | |
| d Residential Funding Mortgage Securities II, 2004-HI3, A5, FRN, | ||||
| 5.48%, 6/25/34 | United States | 354,728 | 371,046 | |
| b,d Resource Capital Corp. Ltd., | ||||
| 2014-CRE2, A, 144A, FRN, 1.483%, 4/15/32 | United States | 2,328,479 | 2,297,240 | |
| l 2015-CRE4, A, 144A, FRN, 1.833%, 8/15/32 | United States | 1,900,000 | 1,875,813 | |
| b,d Silver Bay Realty Trust, 2014-1, | ||||
| A, 144A, FRN, 1.436%, 9/17/31 | United States | 1,184,189 | 1,163,745 | |
| B, 144A, FRN, 1.886%, 9/17/31 | United States | 540,000 | 522,386 | |
| d Structured ARM Loan Trust, 2004-12, 3A1, FRN, 2.774%, 9/25/34 | United States | 4,183,540 | 4,132,058 | |
| d Structured Asset Investment Loan Trust, 2004-BNC2, A2, FRN, | ||||
| 1.479%, 12/25/34 | United States | 1,740,798 | 1,734,639 | |
| d Structured Asset Mortgage Investments II Trust, 2004-AR6, A1A, FRN, | ||||
| 1.136%, 2/19/35 | United States | 2,263,921 | 2,118,313 | |
| d Structured Asset Mortgage Investments Trust, | ||||
| 2003-AR1, A1, FRN, 1.176%, 10/19/33 | United States | 442,043 | 413,007 | |
| 2003-AR2, A1, FRN, 1.176%, 12/19/33 | United States | 1,030,613 | 991,710 | |
| b,d SWAY Residential 2014-1 Trust, 2014-1, A, 144A, FRN, 1.736%, 1/17/32 | United States | 6,245,186 | 6,215,984 | |
| d Thornburg Mortgage Securities Trust, | ||||
| 2003-4, A1, FRN, 1.079%, 9/25/43 | United States | 2,810,048 | 2,714,978 | |
| 2004-3, A, FRN, 1.179%, 9/25/44 | United States | 1,454,285 | 1,346,091 | |
| 2005-1, A3, FRN, 2.534%, 4/25/45 | United States | 457,586 | 452,227 | |
| b,d Trade MAPS Ltd., 2013-1A, A, 144A, FRN, 1.137%, 12/10/18 | Ireland | 8,500,000 | 8,447,045 | |
| b,d Tricon American Homes Trust, 2015-SFR1, A, 144A, FRN, 1.686%, 5/17/32 | United States | 7,870,000 | 7,756,881 | |
| Vanderbilt Acquisition Loan Trust, 2002-1, M1, 7.33%, 5/07/32 | United States | 266,542 | 286,226 | |
| b,d Veritas CLO Ltd., 2006-2A, A2, 144A, FRN, 0.959%, 7/11/21 | United States | 1,732,110 | 1,724,905 | |
| b,d Voya CLO Ltd., | ||||
| 2014-4A, A1, 144A, FRN, 2.13%, 10/14/26 | Cayman Islands | 6,450,000 | 6,433,875 | |
| 2015-1A, A1, 144A, FRN, 2.113%, 4/18/27 | United States | 3,780,000 | 3,778,223 | |
| d WaMu Mortgage Pass-Through Certificates, | ||||
| 2005-AR8, 1A1A, FRN, 0.729%, 7/25/45 | United States | 1,631,991 | 1,537,022 | |
| 2005-AR19, A1A1, FRN, 0.709%, 12/25/45 | United States | 4,284,866 | 3,962,065 | |
| b,d West CLO Ltd., 2014-1A, | ||||
| A2, 144A, FRN, 2.733%, 7/18/26 | United States | 1,360,000 | 1,318,058 | |
| B, 144A, FRN, 3.483%, 7/18/26 | United States | 3,590,000 | 3,336,905 | |
| 564,821,720 | ||||
| Real Estate 0.2% | ||||
| b,d American Homes 4 Rent, 2014-SFR1, | ||||
| A, 144A, FRN, 1.436%, 6/17/31 | United States | 3,085,596 | 3,049,407 | |
| C, 144A, FRN, 2.186%, 6/17/31 | United States | 492,000 | 481,519 | |
| d Novastar Home Equity Loan, 2004-4, M4, FRN, 2.089%, 3/25/35 | United States | 1,907,805 | 1,893,167 | |
| 5,424,093 | ||||
| Total Asset-Backed Securities and Commercial Mortgage- | ||||
| Backed Securities (Cost $729,846,852) | 724,789,826 | |||
72 Semiannual Report
franklintempleton.com
FRANKLIN INVESTORS SECURITIES TRUST
STATEMENT OF INVESTMENTS (UNAUDITED)
| Franklin Low Duration Total Return Fund (continued) | ||||
| Principal | ||||
| Country | Amount* | Value | ||
| Mortgage-Backed Securities 2.4% | ||||
| d Federal Home Loan Mortgage Corp. (FHLMC) Adjustable Rate 0.6% | ||||
| FHLMC, 1.929% - 6.423%, 11/01/17 - 9/01/41 | United States | 14,358,835 | $ | 15,095,489 |
| Federal Home Loan Mortgage Corp. (FHLMC) Fixed Rate 0.0%† | ||||
| FHLMC Gold 15 Year, 5.00%, 10/01/23 | United States | 181,692 | 193,272 | |
| FHLMC Gold 15 Year, 6.00%, 6/01/23 | United States | 64,147 | 70,982 | |
| FHLMC Gold 30 Year, 5.00%, 1/01/39 | United States | 232,777 | 255,983 | |
| 520,237 | ||||
| d Federal National Mortgage Association (FNMA) | ||||
| Adjustable Rate 1.5% | ||||
| FNMA, 1.544% - 2.86%, 5/01/18 - 2/01/44 | United States | 23,870,363 | 24,976,254 | |
| FNMA, 1.728% - 6.141%, 8/01/16 - 10/01/38 | United States | 12,360,198 | 12,981,701 | |
| 37,957,955 | ||||
| Federal National Mortgage Association (FNMA) Fixed Rate 0.3% | ||||
| FNMA 15 Year, 3.50%, 10/01/25 | United States | 1,721,325 | 1,822,506 | |
| FNMA 15 Year, 4.00%, 12/01/25 | United States | 2,713,210 | 2,889,315 | |
| FNMA 15 Year, 4.50%, 5/01/23 - 6/01/25 | United States | 2,028,180 | 2,160,496 | |
| FNMA 30 Year, 5.00%, 3/01/38 | United States | 54,549 | 60,334 | |
| 6,932,651 | ||||
| d Government National Mortgage Association (GNMA) | ||||
| Adjustable Rate 0.0%† | ||||
| GNMA, 1.75%, 4/20/26 | United States | 12,189 | 12,618 | |
| GNMA, 1.875%, 8/20/26 - 9/20/26 | United States | 18,301 | 18,954 | |
| 31,572 | ||||
| Total Mortgage-Backed Securities (Cost $60,239,992) | 60,537,904 | |||
| Municipal Bonds 0.3% | ||||
| Industry Public Facilities Authority Tax Allocation Revenue, Transportation District, | ||||
| Industrial Redevelopment Project No. 2, Refunding, Series B, AGMC Insured, | ||||
| 3.389%, 1/01/20 | United States | 5,900,000 | 6,284,385 | |
| Riverside County RDA Tax Allocation, Housing, Series A-T, 6.25%, 10/01/16 | United States | 1,140,000 | 1,154,637 | |
| d University of California Revenue, Series Y-2, Monthly FRN, 0.934%, 7/01/41 | United States | 390,000 | 390,094 | |
| Total Municipal Bonds (Cost $7,428,169) | 7,829,116 | |||
| Shares | ||||
| Escrows and Litigation Trusts (Cost $—) 0.0% | ||||
| m,n NewPage Corp., Litigation Trust | United States | 500,000 | — | |
| Total Investments before Short Term Investments | ||||
| (Cost $2,482,067,520) | 2,473,460,185 | |||
| Principal | ||||
| Amount* | ||||
| Short Term Investments 2.4% | ||||
| Corporate Bonds (Cost $2,933,057) 0.1% | ||||
| AT&T Inc., senior note, 2.40%, 3/15/17 | United States | 2,900,000 | 2,930,499 | |
| Total Investments before Money Market Funds | ||||
| (Cost $2,485,000,577) | 2,476,390,684 | |||
franklintempleton.com
Semiannual Report 73
FRANKLIN INVESTORS SECURITIES TRUST
STATEMENT OF INVESTMENTS (UNAUDITED)
| Franklin Low Duration Total Return Fund (continued) | ||||
| Country | Shares | Value | ||
| Money Market Funds (Cost $56,581,987) 2.3% | ||||
| a,n Institutional Fiduciary Trust Money Market Portfolio | United States | 56,581,987 | $ | 56,581,987 |
| Total Investments (Cost $2,541,582,564) 99.5% | 2,532,972,671 | |||
| Other Assets, less Liabilities 0.5% | 13,487,576 | |||
| Net Assets 100.0% | $ | 2,546,460,247 |
†Rounds to less than 0.1% of net assets.
*The principal amount is stated in U.S. dollars unless otherwise indicated.
aSee Note 3(f) regarding investments in affiliated management investment companies.
bSecurity was purchased pursuant to Rule 144A under the Securities Act of 1933 and may be sold in transactions exempt from registration only to qualified institutional buyers
or in a public offering registered under the Securities Act of 1933. These securities have been deemed liquid under guidelines approved by the Trust’s Board of Trustees. At
April 30, 2016, the aggregate value of these securities was $510,976,926, representing 20.07% of net assets.
cSecurity was purchased pursuant to Regulation S under the Securities Act of 1933, which exempts from registration securities offered and sold outside of the United States.
Such a security cannot be sold in the United States without either an effective registration statement filed pursuant to the Securities Act of 1933, or pursuant to an exemption
from registration. These securities have been deemed liquid under guidelines approved by the Trust’s Board of Trustees. At April 30, 2016, the aggregate value of these secu-
rities was $33,439,584, representing 1.31% of net assets.
dThe coupon rate shown represents the rate at period end.
eSee Note 7 regarding defaulted securities.
fAt April 30, 2016, pursuant to the Fund’s policies and the requirements of applicable securities law, the Fund is restricted from trading these securities at period end.
gA portion or all of the security purchased on a when-issued or delayed delivery basis. See Note 1(c).
hSee Note 1(h) regarding senior floating rate interests.
iPrincipal amount is stated in 100 Mexican Peso Units.
jRedemption price at maturity is adjusted for inflation. See Note 1(j).
kPrincipal amount is stated in 1,000 Brazilian Real Units.
lThe bond pays interest and/or principal based upon the issuer’s ability to pay, which may be less than the stated interest rate or principal paydown.
mSecurity has been deemed illiquid because it may not be able to be sold within seven days.
nNon-income producing.
74 Semiannual Report
franklintempleton.com
FRANKLIN INVESTORS SECURITIES TRUST
STATEMENT OF INVESTMENTS (UNAUDITED)
Franklin Low Duration Total Return Fund (continued)
At April 30, 2016, the Fund had the following financial futures contracts outstanding. See Note 1(d).
| Financial Futures Contracts | ||||||||||||||
| Number of | Notional | Expiration | Unrealized | Unrealized | ||||||||||
| Description | Type Contracts | Value | Date | Appreciation | Depreciation | |||||||||
| Interest Rate Contracts | ||||||||||||||
| Canadian 5 Yr. Bond | Long | 129 | $ | 12,728,727 | 6/21/16 | $ | — | $ | (136,878 | ) | ||||
| CME Ultra Long Term U.S. Treasury Bond | Short | 16 | 2,741,500 | 6/21/16 | — | (3,158 | ) | |||||||
| U.S. Treasury 2 Yr. Note | Long | 360 | 78,705,000 | 6/30/16 | 77,850 | — | ||||||||
| U.S. Treasury 5 Yr. Note | Short | 901 | 108,943,570 | 6/30/16 | — | (486,047 | ) | |||||||
| U.S. Treasury 10 Yr. Note | Short | 37 | 4,812,313 | 6/21/16 | — | (26,130 | ) | |||||||
| U.S. Treasury 30 Yr. Bond | Short | 3 | 489,937 | 6/21/16 | — | (1,789 | ) | |||||||
| Total Financial Futures Contracts | $ | 77,850 | $ | (654,002 | ) | |||||||||
| Net unrealized appreciation (depreciation) | $ | (576,152 | ) | |||||||||||
| At April 30, 2016, the Fund had the following forward exchange contracts outstanding. See Note 1(d). | ||||||||||||||
| Forward Exchange Contracts | ||||||||||||||
| Contract | Settlement | Unrealized | Unrealized | |||||||||||
| Currency | Counterpartya Type | Quantity | Amount | Date | Appreciation | Depreciation | ||||||||
| OTC Forward Exchange Contracts | ||||||||||||||
| South Korean Won | JPHQ | Sell | 4,500,000,000 | $ | 3,618,090 | 5/20/16 | $ | — | $ | (309,818 | ) | |||
| Australian Dollar | DBAB | Sell | 3,410,144 | 2,467,307 | 6/16/16 | — | (120,073 | ) | ||||||
| Euro | DBAB | Sell | 15,599,102 | 17,177,732 | 6/16/16 | — | (712,784 | ) | ||||||
| Euro | JPHQ | Sell | 2,600,000 | 2,865,005 | 6/16/16 | — | (116,919 | ) | ||||||
| Euro | MSCO | Sell | 977,590 | 1,076,718 | 6/16/16 | — | (44,474 | ) | ||||||
| Japanese Yen | DBAB | Sell | 1,072,725,000 | 8,878,704 | 6/16/16 | — | (1,209,962 | ) | ||||||
| Japanese Yen | JPHQ | Sell | 227,754,944 | 1,884,843 | 6/16/16 | — | (257,126 | ) | ||||||
| Malaysian Ringgit | DBAB | Buy | 227,680 | 53,202 | 6/16/16 | 5,032 | — | |||||||
| Malaysian Ringgit | HSBC | Buy | 48,000 | 11,211 | 6/16/16 | 1,067 | — | |||||||
| Euro | DBAB | Sell | 3,300,000 | 4,453,350 | 8/05/16 | 662,527 | — | |||||||
| Australian Dollar | DBAB | Sell | 3,360,000 | 2,448,491 | 8/18/16 | — | (94,451 | ) | ||||||
| Euro | BZWS | Sell | 140,843 | 154,072 | 8/18/16 | — | (7,795 | ) | ||||||
| Euro | CITI | Sell | 352,000 | 384,996 | 8/18/16 | — | (19,548 | ) | ||||||
| Euro | DBAB | Sell | 46,977,626 | 52,493,240 | 8/18/16 | — | (1,496,842 | ) | ||||||
| Euro | GSCO | Sell | 420,000 | 477,939 | 8/18/16 | — | (4,755 | ) | ||||||
| Euro | JPHQ | Sell | 989,988 | 1,124,989 | 8/18/16 | — | (12,777 | ) | ||||||
| Hungarian Forint | DBAB | Sell | 900,000,000 | 3,275,824 | 8/18/16 | — | (24,931 | ) | ||||||
| Indian Rupee | DBAB | Buy | 135,900,000 | 1,982,495 | 8/18/16 | 26,283 | — | |||||||
| Japanese Yen | CITI | Sell | 47,882,500 | 408,387 | 8/18/16 | — | (42,897 | ) | ||||||
| Japanese Yen | DBAB | Buy | 3,178,000,000 | 27,327,458 | 8/18/16 | 2,624,650 | — | |||||||
| Japanese Yen | DBAB | Sell | 3,470,237,420 | 29,772,571 | 8/18/16 | — | (2,933,824 | ) | ||||||
| Japanese Yen | HSBC | Sell | 99,540,000 | 892,735 | 8/18/16 | — | (45,412 | ) | ||||||
| Japanese Yen | JPHQ | Sell | 471,733,000 | 4,150,824 | 8/18/16 | — | (295,179 | ) | ||||||
| Japanese Yen | MSCO | Sell | 211,800,000 | 1,899,926 | 8/18/16 | — | (96,252 | ) | ||||||
| New Zealand Dollar | DBAB | Buy | 25,430,101 | 17,590,965 | 8/18/16 | 90,338 | (23,868 | ) | ||||||
| New Zealand Dollar | DBAB | Sell | 25,430,101 | 16,674,517 | 8/18/16 | — | (982,919 | ) | ||||||
| South Korean Won | DBAB | Buy | 3,913,800,000 | 3,269,538 | 8/18/16 | 141,107 | — | |||||||
| South Korean Won | DBAB | Sell | 3,913,800,000 | 3,160,879 | 8/18/16 | — | (249,766 | ) | ||||||
| Japanese Yen | JPHQ | Sell | 566,101,041 | 5,149,880 | 9/02/16 | 96,771 | (285,286 | ) | ||||||
| Australian Dollar | DBAB | Sell | 11,750,000 | 8,298,925 | 10/20/16 | — | (572,150 | ) | ||||||
| Brazilian Real | DBAB | Buy | 7,500,000 | 1,776,409 | 10/20/16 | 290,260 | — | |||||||
| Canadian Dollar | DBAB | Sell | 1,350,000 | 1,064,845 | 10/20/16 | — | (11,628 | ) | ||||||
| Euro | BZWS | Sell | 54,017 | 61,258 | 10/20/16 | — | (963 | ) | ||||||
| Euro | CITI | Sell | 39,262 | 44,480 | 10/20/16 | — | (746 | ) | ||||||
| Euro | DBAB | Sell | 2,847,873 | 3,262,306 | 10/20/16 | — | (18,119 | ) | ||||||
| Euro | HSBC | Sell | 6,000 | 6,804 | 10/20/16 | — | (108 | ) | ||||||
| Euro | JPHQ | Sell | 2,329,904 | 2,666,583 | 10/20/16 | — | (17,201 | ) | ||||||
| Hungarian Forint | JPHQ | Sell | 430,000,000 | 1,464,328 | 10/20/16 | — | (112,702 | ) | ||||||
franklintempleton.com
Semiannual Report 75
FRANKLIN INVESTORS SECURITIES TRUST
STATEMENT OF INVESTMENTS (UNAUDITED)
| Franklin Low Duration Total Return Fund (continued) | |||||||||||
| Forward Exchange Contracts (continued) | |||||||||||
| Contract | Settlement | Unrealized | Unrealized | ||||||||
| Currency | Counterpartya Type | Quantity | Amount | Date | Appreciation | Depreciation | |||||
| OTC Forward Exchange Contracts (continued) | |||||||||||
| Indian Rupee | DBAB | Buy | 78,000,000 | $ | 1,138,852 | 10/20/16 | $ | 2,468 | $ | — | |
| Indonesian Rupiah | JPHQ | Buy | 41,430,000,000 | 2,784,274 | 10/20/16 | 258,492 | — | ||||
| Japanese Yen | DBAB | Sell | 305,837,300 | 2,770,290 | 10/20/16 | — | (118,969 | ) | |||
| Mexican Peso | DBAB | Sell | 30,000,000 | 1,705,854 | 10/20/16 | — | (10,562 | ) | |||
| Philippine Peso | JPHQ | Buy | 94,860,000 | 2,000,000 | 10/20/16 | — | (9,401 | ) | |||
| Polish Zloty | DBAB | Buy | 4,070,734 | 1,020,055 | 10/20/16 | 44,449 | — | ||||
| Polish Zloty | DBAB | Sell | 4,070,734 | 1,041,908 | 10/20/16 | — | (22,597 | ) | |||
| Euro | DBAB | Buy | 2,082,500 | 2,764,519 | 11/03/16 | — | (364,401 | ) | |||
| Euro | DBAB | Sell | 2,082,500 | 2,795,756 | 11/03/16 | 395,638 | — | ||||
| Total Forward Exchange Contracts | $ | 4,639,082 | $ | (10,647,205 | ) | ||||||
| Net unrealized appreciation (depreciation) | $ | (6,008,123 | ) | ||||||||
| aMay be comprised of multiple contracts with the same counterparty, currency and settlement date. | |||||||||||||||||||
| At April 30, 2016, the Fund had the following credit default swap contracts outstanding. See Note 1(d). | |||||||||||||||||||
| Credit Default Swap Contracts | |||||||||||||||||||
| Unamortized | |||||||||||||||||||
| Periodic | Upfront | ||||||||||||||||||
| Payment Counterparty/ | Notional | Expiration | Payments | Unrealized | Unrealized | ||||||||||||||
| Description | Rate | Exchange | Amounta | Date | (Receipts) | Appreciation | Depreciation | Value | Ratingb | ||||||||||
| Centrally Cleared Swap Contracts | |||||||||||||||||||
| Contracts to Sell Protectionc | |||||||||||||||||||
| Traded Index | |||||||||||||||||||
| CDX.NA.IG.26 | 1.00 | % | ICE | 31,500,000 | 6/20/21 | $ | 373,365 | $ | 11,845 | $ | — | $ | 385,210 | Investment | |||||
| Grade | |||||||||||||||||||
| ITRX.EUR.25 | 1.00 | % | ICE | 11,100,000 | EUR | 6/20/21 | 126,085 | 56,937 | — | 183,022 | Investment | ||||||||
| Grade | |||||||||||||||||||
| ITRX.EUR.SNRFIN.S25 | 1.00 | % | ICE | 28,550,000 | EUR | 6/20/21 | 202,097 | — | (1,228 | ) | 200,869 | Investment | |||||||
| Grade | |||||||||||||||||||
| Total Centrally Cleared Swap Contracts | 701,547 | 68,782 | (1,228 | ) | 769,101 | ||||||||||||||
| OTC Swap Contracts | |||||||||||||||||||
| Contracts to Buy Protection | |||||||||||||||||||
| Single Name | |||||||||||||||||||
| Avon Products Inc | 5.00 | % | GSCO | 10,000,000 | 3/20/20 | $ | 1,171,327 | $ | — | $ | (152,428 | ) | $ | 1,018,899 | |||||
| Bank of America Corp | 1.00 | % | FBCO | 2,000,000 | 9/20/17 | 1,335 | — | (18,382 | ) | (17,047 | ) | ||||||||
| Beazer Homes USA Inc | 5.00 | % | CITI | 1,500,000 | 6/20/19 | (57,604 | ) | 94,271 | — | 36,667 | |||||||||
| Beazer Homes USA Inc | 5.00 | % | GSCO | 3,000,000 | 6/20/19 | (110,971 | ) | 184,305 | — | 73,334 | |||||||||
| Canadian Natural Resources Ltd | 5.00 | % | JPHQ | 5,500,000 | 3/20/18 | (142,033 | ) | — | (293,680 | ) | (435,713 | ) | |||||||
| Centex Corp | 5.00 | % | FBCO | 1,000,000 | 6/20/16 | (3,496 | ) | — | (9,167 | ) | (12,663 | ) | |||||||
| Centex Corp | 5.00 | % | JPHQ | 4,000,000 | 6/20/16 | (16,741 | ) | — | (33,912 | ) | (50,653 | ) | |||||||
| Constellation Brands Inc | 5.00 | % | DBAB | 6,600,000 | 6/20/17 | (272,490 | ) | — | (133,030 | ) | (405,520 | ) | |||||||
| CSC Holdings LLC | 5.00 | % | GSCO | 3,500,000 | 9/20/18 | (172,295 | ) | — | (115,596 | ) | (287,891 | ) | |||||||
| CSC Holdings LLC | 5.00 | % | GSCO | 3,000,000 | 3/20/19 | (103,214 | ) | — | (150,070 | ) | (253,284 | ) | |||||||
| Dell Inc | 5.00 | % | GSCO | 5,000,000 | 6/20/16 | (28,976 | ) | — | (25,585 | ) | (54,561 | ) | |||||||
| DPLInc | 5.00 | % | JPHQ | 471,000 | 12/20/16 | (11,488 | ) | — | (4,584 | ) | (16,072 | ) | |||||||
| Embarq Corp | 5.00 | % | BZWS | 3,000,000 | 6/20/16 | (10,824 | ) | — | (26,936 | ) | (37,760 | ) | |||||||
| Hartford Financial Services | |||||||||||||||||||
| Group Inc | 1.00 | % | CITI | 7,300,000 | 12/21/20 | (87,587 | ) | — | (72,661 | ) | (160,248 | ) | |||||||
| Hospitality Properties Trust | 5.00 | % | BOFA | 3,000,000 | 3/20/17 | (102,838 | ) | — | (40,787 | ) | (143,625 | ) | |||||||
| International Lease Finance Corp | 5.00 | % | GSCO | 8,000,000 | 3/20/17 | (262,850 | ) | — | (77,045 | ) | (339,895 | ) | |||||||
| Kinder Morgan Energy Partners LP | 5.00 | % | CITI | 6,600,000 | 3/20/18 | (466,115 | ) | — | (61,217 | ) | (527,332 | ) | |||||||
76 Semiannual Report
franklintempleton.com
FRANKLIN INVESTORS SECURITIES TRUST
STATEMENT OF INVESTMENTS (UNAUDITED)
| Franklin Low Duration Total Return Fund (continued) | ||||||||||||||||||
| Credit Default Swap Contracts (continued) | ||||||||||||||||||
| Unamortized | ||||||||||||||||||
| Periodic | Upfront | |||||||||||||||||
| Payment Counterparty/ | Notional | Expiration | Payments | Unrealized | Unrealized | |||||||||||||
| Description | Rate | Exchange | Amounta | Date | (Receipts) | Appreciation | Depreciation | Value Ratingb | ||||||||||
| Contracts to Buy Protection (continued) | ||||||||||||||||||
| Single Name (continued) | ||||||||||||||||||
| Lanxess AG | 1.00 | % | CITI | 5,780,000 | EUR | 12/20/20 | $ | 48,041 | $ | — | $ | (168,391 | ) | $ | (120,350 | ) | ||
| Lennar Corp | 5.00 | % | CITI | 1,800,000 | 9/20/19 | (137,658 | ) | — | (90,208 | ) | (227,866 | ) | ||||||
| Lennar Corp | 5.00 | % | CITI | 2,700,000 | 12/20/19 | (248,279 | ) | — | (105,025 | ) | (353,304 | ) | ||||||
| Lennar Corp | 5.00 | % | GSCO | 3,200,000 | 12/20/20 | (300,839 | ) | — | (154,674 | ) | (455,513 | ) | ||||||
| The New York Times Co | 5.00 | % | GSCO | 2,000,000 | 12/20/16 | (22,159 | ) | — | (53,287 | ) | (75,446 | ) | ||||||
| Owens-Illinois Inc | 5.00 | % | CITI | 7,400,000 | 6/20/18 | (614,451 | ) | — | (185,078 | ) | (799,529 | ) | ||||||
| Pactiv LLC | 5.00 | % | BZWS | 2,100,000 | 6/20/17 | (56,959 | ) | — | (56,360 | ) | (113,319 | ) | ||||||
| PHH Corp | 5.00 | % | GSCO | 1,800,000 | 9/20/19 | 15,732 | 10,456 | — | 26,188 | |||||||||
| PPL Energy Supply LLC | 5.00 | % | JPHQ | 8,000,000 | 6/20/16 | (47,709 | ) | — | (33,849 | ) | (81,558 | ) | ||||||
| Rite Aid Corp | 5.00 | % | JPHQ | 6,300,000 | 12/20/20 | (1,053,252 | ) | 7,210 | — | (1,046,042 | ) | |||||||
| Springleaf Finance Corp | 5.00 | % | GSCO | 8,500,000 | 12/20/17 | (419,272 | ) | 84,176 | — | (335,096 | ) | |||||||
| Tenet Healthcare Corp | 5.00 | % | BZWS | 4,000,000 | 12/20/16 | (77,536 | ) | — | (59,101 | ) | (136,637 | ) | ||||||
| Tenet Healthcare Corp | 5.00 | % | DBAB | 3,000,000 | 3/20/19 | (226,993 | ) | — | (17,123 | ) | (244,116 | ) | ||||||
| Tenet Healthcare Corp | 5.00 | % | GSCO | 9,100,000 | 3/20/19 | (751,244 | ) | 10,759 | — | (740,485 | ) | |||||||
| Toys R Us Inc | 5.00 | % | CITI | 2,000,000 | 12/20/18 | 355,425 | — | (125,358 | ) | 230,067 | ||||||||
| Toys R Us Inc | 5.00 | % | DBAB | 2,250,000 | 12/20/18 | 438,129 | — | (179,304 | ) | 258,825 | ||||||||
| Toys R Us Inc | 5.00 | % | GSCO | 4,000,000 | 12/20/18 | 1,070,633 | — | (610,499 | ) | 460,134 | ||||||||
| Yum! Brands Inc | 5.00 | % | CITI | 1,500,000 | 3/20/18 | (108,539 | ) | — | (19,686 | ) | (128,225 | ) | ||||||
| Yum! Brands Inc | 5.00 | % | FBCO | 4,000,000 | 3/20/18 | (275,145 | ) | — | (66,789 | ) | (341,934 | ) | ||||||
| Contracts to Sell Protectionc | ||||||||||||||||||
| Single Name | ||||||||||||||||||
| Bank of America Corp | 1.00 | % | FBCO | 2,000,000 | 9/20/17 | (1,335 | ) | 18,382 | — | 17,047 | BBB+ | |||||||
| Beazer Homes USA Inc | 5.00 | % | CITI | 1,800,000 | 9/20/19 | 24,850 | — | (95,653 | ) | (70,803 | ) | CCC+ | ||||||
| Beazer Homes USA Inc | 5.00 | % | CITI | 2,700,000 | 12/20/19 | 56,024 | — | (200,036 | ) | (144,012 | ) | CCC+ | ||||||
| Beazer Homes USA Inc | 5.00 | % | GSCO | 3,200,000 | 12/20/20 | (345,957 | ) | 20,129 | — | (325,828 | ) | CCC+ | ||||||
| Electricite de France SA | 1.00 | % | BZWS | 5,300,000 | EUR | 9/20/20 | 120,042 | — | (25,336 | ) | 94,706 | A+ | ||||||
| Engie | 1.00 | % | BZWS | 4,300,000 | EUR | 9/20/20 | 120,283 | — | (8,500 | ) | 111,783 | A- | ||||||
| Government of China | 1.00 | % | GSCO | 5,000,000 | 9/20/20 | 10,335 | — | (25,260 | ) | (14,925 | ) | AA- | ||||||
| Government of Lithuania | 1.00 | % | FBCO | 250,000 | 6/20/16 | (314 | ) | 918 | — | 604 | BBB | |||||||
| Government of Mexico | 1.00 | % | CITI | 2,500,000 | 6/20/20 | (24,766 | ) | — | (880 | ) | (25,646 | ) | BBB+ | |||||
| iHeartCommunications Inc | 5.00 | % | BZWS | 2,400,000 | 6/20/18 | (363,883 | ) | — | (1,046,365 | ) | (1,410,248 | ) | CC | |||||
| MetLife Inc | 1.00 | % | CITI | 7,300,000 | 12/21/20 | (202,737 | ) | 171,946 | — | (30,791 | ) | A- | ||||||
| Orange SA | 1.00 | % | CITI | 5,300,000 | EUR | 9/20/20 | 97,157 | 14,146 | — | 111,303 | BBB+ | |||||||
| Solvay SA | 1.00 | % | CITI | 5,780,000 | EUR | 12/20/20 | (144,910 | ) | 203,645 | — | 58,735 | BBB- | ||||||
| Tenet Healthcare Corp | 5.00 | % | BZWS | 4,000,000 | 12/20/18 | 141,644 | 193,138 | — | 334,782 | CCC+ | ||||||||
| Total OTC Swap Contracts | (3,602,502 | ) | 1,013,481 | (4,541,842 | ) | (7,130,863 | ) | |||||||||||
| Total Credit Default Swap Contracts | $ | (2,900,955 | ) | $ | 1,082,263 | $ | (4,543,070 | ) | $ | (6,361,762 | ) | |||||||
| Net unrealized appreciation (depreciation) | $ | (3,460,807 | ) | |||||||||||||||
aIn U.S. dollars unless otherwise indicated. For contracts to sell protection, the notional amount is equal to the maximum potential amount of the future payments and no
recourse provisions have been entered into in association with the contracts.
bBased on Standard and Poor’s (S&P) Rating for single name swaps and internal ratings for index swaps. Internal ratings based on mapping into equivalent ratings from
external vendors.
cThe fund enters contracts to sell protection to create a long credit position. Performance triggers include default, bankruptcy or restructuring for single name swaps, and fail-
ure to pay or bankruptcy of the underlying securities for traded index swaps.
franklintempleton.com
Semiannual Report 77
FRANKLIN INVESTORS SECURITIES TRUST
STATEMENT OF INVESTMENTS (UNAUDITED)
| Franklin Low Duration Total Return Fund (continued) | ||||||||
| At April 30, 2016, the Fund had the following cross-currency swap contracts outstanding. See Note 1(d). | ||||||||
| Cross-Currency Swap Contracts | ||||||||
| Notional | Expiration | Unrealized | Unrealized | |||||
| Description | Counterparty | Amount | Date | Appreciation | Depreciation | |||
| OTC Swap Contracts | ||||||||
| Receive Floating Quarterly 3-month BBA USD LIBOR + 2.18% | 3,922,448 | USD | $ | 189,380 | $ | — | ||
| CITI | 10/13/17 | |||||||
| Pay Fixed Annual 2.125% | 3,500,000 | CHF | ||||||
| Receive Floating Quarterly 3-month BBA USD LIBOR + 3.29% | 1,562,500 | USD | — | (15,112 | ) | |||
| JPHQ | 10/13/17 | |||||||
| Pay Fixed Annual 2.125% | 1,500,000 | CHF | ||||||
| Totals Cross-Currency Swap Contracts | $ | 189,380 | $ | (15,112 | ) | |||
| Net unrealized appreciation (depreciation) | $ | 174,268 | ||||||
| At April 30, 2016, the Fund had the following interest rate swap contracts outstanding. See Note 1(d). | ||||||||||||||
| Interest Rate Swap Contracts | ||||||||||||||
| Unamortized | ||||||||||||||
| Upfront | ||||||||||||||
| Notional | Expiration | Payments/ | Unrealized | Unrealized | ||||||||||
| Description | Exchange | Amount | Date | (Receipts) | Appreciation | Depreciation | Value | |||||||
| Centrally Cleared Swap Contracts | ||||||||||||||
| Receive Floating 3-month BBA USD LIBOR + 0.634% | ||||||||||||||
| Pay Fixed 2.00% | LCH | $ | 40,480,000 | 6/15/23 | $ | (1,080,022 | ) | $— | $ | (284,876 | ) | $ | (1,364,898 | ) |
| Net unrealized appreciation (depreciation) | $ | (284,876 | ) | |||||||||||
See Notes 6 and 10 regarding investment transactions and other derivative information, respectively.
See Abbreviations on Page 132.
78 Annual Report | The accompanying notes are an integral part of these financial statements.
franklintempleton.com
FRANKLIN INVESTORS SECURITIES TRUST
Consolidated Financial Highlights
Franklin Total Return Fund
| Six Months Ended | Year Ended October 31, | |||||||||||||||||
| April 30, 2016 | ||||||||||||||||||
| (unaudited) | 2015 | 2014 | 2013 | 2012 | 2011 | |||||||||||||
| Class A | ||||||||||||||||||
| Per share operating performance | ||||||||||||||||||
| (for a share outstanding throughout the period) | ||||||||||||||||||
| Net asset value, beginning of period | $ | 9.87 | $ | 10.18 | $ | 10.05 | $ | 10.53 | $ | 10.32 | $ | 10.33 | ||||||
| Income from investment operationsa: | ||||||||||||||||||
| Net investment income | 0.116 | 0.217 | 0.257 | 0.236 | 0.297 | 0.353 | ||||||||||||
| Net realized and unrealized gains (losses) | (0.007 | ) | (0.220 | ) | 0.214 | (0.205 | ) | 0.472 | 0.074 | |||||||||
| Total from investment operations | 0.109 | (0.003 | ) | 0.471 | 0.031 | 0.769 | 0.427 | |||||||||||
| Less distributions from: | ||||||||||||||||||
| Net investment income and net foreign | ||||||||||||||||||
| currency gains | (0.239 | ) | (0.307 | ) | (0.341 | ) | (0.351 | ) | (0.447 | ) | (0.380 | ) | ||||||
| Net realized gains | — | — | — | (0.160 | ) | (0.112 | ) | (0.057 | ) | |||||||||
| Total distributions | (0.239 | ) | (0.307 | ) | (0.341 | ) | (0.511 | ) | (0.559 | ) | (0.437 | ) | ||||||
| Net asset value, end of period | $ | 9.74 | $ | 9.87 | $ | 10.18 | $ | 10.05 | $ | 10.53 | $ | 10.32 | ||||||
| Total returnb | 1.26 | % | (0.05 | )% | 4.80 | % | 0.30 | % | 7.74 | % | 4.26 | % | ||||||
| Ratios to average net assetsc | ||||||||||||||||||
| Expenses before waiver and payments by affiliates | 0.92 | % | 0.91 | % | 0.93 | % | 0.91 | % | 0.92 | % | 0.93 | % | ||||||
| Expenses net of waiver and payments by affiliates | 0.86 | %d | 0.87 | %d | 0.88 | %d | 0.88 | %d | 0.88 | % | 0.88 | %d | ||||||
| Net investment income | 2.38 | % | 2.08 | % | 2.46 | % | 2.36 | % | 2.69 | % | 3.45 | % | ||||||
| Supplemental data | ||||||||||||||||||
| Net assets, end of period (000’s) | $ | 3,701,296 | $ | 3,527,479 | $ | 3,213,446 | $ | 3,019,228 | $ | 3,134,211 | $ | 2,245,312 | ||||||
| Portfolio turnover rate | 149.35 | % | 294.80 | % | 273.96 | % | 371.54 | % | 314.62 | % | 255.55 | % | ||||||
| Portfolio turnover rate excluding mortgage | ||||||||||||||||||
| dollar rollse | 41.34 | % | 95.06 | % | 85.03 | % | 156.49 | % | 122.04 | % | 98.96 | % | ||||||
aThe amount shown for a share outstanding throughout the period may not correlate with the Consolidated Statement of Operations for the period due to the timing of sales
and repurchases of the Fund’s shares in relation to income earned and/or fluctuating fair value of the investments of the Fund.
bTotal return does not reflect sales commissions or contingent deferred sales charges, if applicable, and is not annualized for periods less than one year.
cRatios are annualized for periods less than one year.
dBenefit of expense reduction rounds to less than 0.01%.
eSee Note 1(g) regarding mortgage dollar rolls.
franklintempleton.com
The accompanying notes are an integral part of these financial statements. | Semiannual Report 79
FRANKLIN INVESTORS SECURITIES TRUST
CONSOLIDATED FINANCIAL HIGHLIGHTS
| Franklin Total Return Fund (continued) | ||||||||||||||||||
| Six Months Ended | Year Ended October 31, | |||||||||||||||||
| April 30, 2016 | ||||||||||||||||||
| (unaudited) | 2015 | 2014 | 2013 | 2012 | 2011 | |||||||||||||
| Class C | ||||||||||||||||||
| Per share operating performance | ||||||||||||||||||
| (for a share outstanding throughout the period) | ||||||||||||||||||
| Net asset value, beginning of period | $ | 9.84 | $ | 10.16 | $ | 10.03 | $ | 10.51 | $ | 10.31 | $ | 10.32 | ||||||
| Income from investment operationsa: | ||||||||||||||||||
| Net investment income | 0.097 | 0.172 | 0.201 | 0.174 | 0.253 | 0.313 | ||||||||||||
| Net realized and unrealized gains (losses) | (0.011 | ) | (0.214 | ) | 0.232 | (0.182 | ) | 0.467 | 0.076 | |||||||||
| Total from investment operations | 0.086 | (0.042 | ) | 0.433 | (0.008 | ) | 0.720 | 0.389 | ||||||||||
| Less distributions from: | ||||||||||||||||||
| Net investment income and net foreign | ||||||||||||||||||
| currency gains | (0.226 | ) | (0.278 | ) | (0.303 | ) | (0.312 | ) | (0.408 | ) | (0.342 | ) | ||||||
| Net realized gains | — | — | — | (0.160 | ) | (0.112 | ) | (0.057 | ) | |||||||||
| Total distributions | (0.226 | ) | (0.278 | ) | (0.303 | ) | (0.472 | ) | (0.520 | ) | (0.399 | ) | ||||||
| Net asset value, end of period | $ | 9.70 | $ | 9.84 | $ | 10.16 | $ | 10.03 | $ | 10.51 | $ | 10.31 | ||||||
| Total returnb | 1.03 | % | (0.43 | )% | 4.42 | % | (0.08 | )% | 7.25 | % | 3.88 | % | ||||||
| Ratios to average net assetsc | ||||||||||||||||||
| Expenses before waiver and payments | ||||||||||||||||||
| by affiliates | 1.32 | % | 1.31 | % | 1.33 | % | 1.31 | % | 1.32 | % | 1.33 | % | ||||||
| Expenses net of waiver and payments by affiliates | 1.26 | %d | 1.27 | %d | 1.28 | %d | 1.28 | %d | 1.28 | % | 1.28 | %d | ||||||
| Net investment income | 1.98 | % | 1.68 | % | 2.06 | % | 1.96 | % | 2.29 | % | 3.05 | % | ||||||
| Supplemental data | ||||||||||||||||||
| Net assets, end of period (000’s) | $ | 451,885 | $ | 444,253 | $ | 432,767 | $ | 455,720 | $ | 571,206 | $ | 394,777 | ||||||
| Portfolio turnover rate | 149.35 | % | 294.80 | % | 273.96 | % | 371.54 | % | 314.62 | % | 255.55 | % | ||||||
| Portfolio turnover rate excluding mortgage | ||||||||||||||||||
| dollar rollse | 41.34 | % | 95.06 | % | 85.03 | % | 156.49 | % | 122.04 | % | 98.96 | % | ||||||
aThe amount shown for a share outstanding throughout the period may not correlate with the Consolidated Statement of Operations for the period due to the timing of sales
and repurchases of the Fund’s shares in relation to income earned and/or fluctuating fair value of the investments of the Fund.
bTotal return does not reflect sales commissions or contingent deferred sales charges, if applicable, and is not annualized for periods less than one year.
cRatios are annualized for periods less than one year.
dBenefit of expense reduction rounds to less than 0.01%.
eSee Note 1(g) regarding mortgage dollar rolls.
80 Semiannual Report | The accompanying notes are an integral part of these financial statements.
franklintempleton.com
FRANKLIN INVESTORS SECURITIES TRUST
CONSOLIDATED FINANCIAL HIGHLIGHTS
| Franklin Total Return Fund (continued) | ||||||||||||||||||
| Six Months Ended | Year Ended October 31, | |||||||||||||||||
| April 30, 2016 | ||||||||||||||||||
| (unaudited) | 2015 | 2014 | 2013 | 2012 | 2011 | |||||||||||||
| Class R | ||||||||||||||||||
| Per share operating performance | ||||||||||||||||||
| (for a share outstanding throughout the period) | ||||||||||||||||||
| Net asset value, beginning of period | $ | 9.85 | $ | 10.17 | $ | 10.04 | $ | 10.52 | $ | 10.32 | $ | 10.33 | ||||||
| Income from investment operationsa: | ||||||||||||||||||
| Net investment income | 0.101 | 0.198 | 0.209 | 0.204 | 0.255 | 0.330 | ||||||||||||
| Net realized and unrealized gains (losses) | (—)b | (0.229 | ) | 0.238 | (0.197 | ) | 0.480 | 0.073 | ||||||||||
| Total from investment operations | 0.101 | (0.031 | ) | 0.447 | 0.007 | 0.735 | 0.403 | |||||||||||
| Less distributions from: | ||||||||||||||||||
| Net investment income and net foreign | ||||||||||||||||||
| currency gains | (0.231 | ) | (0.289 | ) | (0.317 | ) | (0.327 | ) | (0.423 | ) | (0.356 | ) | ||||||
| Net realized gains | — | — | — | (0.160 | ) | (0.112 | ) | (0.057 | ) | |||||||||
| Total distributions | (0.231 | ) | (0.289 | ) | (0.317 | ) | (0.487 | ) | (0.535 | ) | (0.413 | ) | ||||||
| Net asset value, end of period | $ | 9.72 | $ | 9.85 | $ | 10.17 | $ | 10.04 | $ | 10.52 | $ | 10.32 | ||||||
| Total returnc | 1.18 | % | (0.32 | )% | 4.56 | % | 0.06 | % | 7.39 | % | 4.02 | % | ||||||
| Ratios to average net assetsd | ||||||||||||||||||
| Expenses before waiver and payments by affiliates | 1.17 | % | 1.16 | % | 1.18 | % | 1.16 | % | 1.17 | % | 1.18 | % | ||||||
| Expenses net of waiver and payments by affiliates | 1.11 | %e | 1.12 | %e | 1.13 | %e | 1.13 | %e | 1.13 | % | 1.13 | %e | ||||||
| Net investment income | 2.13 | % | 1.83 | % | 2.21 | % | 2.11 | % | 2.44 | % | 3.20 | % | ||||||
| Supplemental data | ||||||||||||||||||
| Net assets, end of period (000’s) | $ | 66,644 | $ | 70,506 | $ | 59,307 | $ | 65,601 | $ | 87,235 | $ | 84,708 | ||||||
| Portfolio turnover rate | 149.35 | % | 294.80 | % | 273.96 | % | 371.54 | % | 314.62 | % | 255.55 | % | ||||||
| Portfolio turnover rate excluding mortgage | ||||||||||||||||||
| dollar rollsf | 41.34 | % | 95.06 | % | 85.03 | % | 156.49 | % | 122.04 | % | 98.96 | % | ||||||
aThe amount shown for a share outstanding throughout the period may not correlate with the Consolidated Statement of Operations for the period due to the timing of sales
and repurchases of the Fund’s shares in relation to income earned and/or fluctuating fair value of the investments of the Fund.
bAmount rounds to less than $0.001 per share.
cTotal return is not annualized for periods less than one year.
dRatios are annualized for periods less than one year.
eBenefit of expense reduction rounds to less than 0.01%.
fSee Note 1(g) regarding mortgage dollar rolls.
franklintempleton.com
The accompanying notes are an integral part of these financial statements. | Semiannual Report 81
FRANKLIN INVESTORS SECURITIES TRUST
CONSOLIDATED FINANCIAL HIGHLIGHTS
| Franklin Total Return Fund (continued) | ||||||||||||
| Six Months Ended | Year Ended October 31, | |||||||||||
| April 30, 2016 | ||||||||||||
| (unaudited) | 2015 | 2014 | 2013 | a | ||||||||
| Class R6 | ||||||||||||
| Per share operating performance | ||||||||||||
| (for a share outstanding throughout the period) | ||||||||||||
| Net asset value, beginning of period | $ | 9.91 | $ | 10.20 | $ | 10.07 | $ | 10.44 | ||||
| Income from investment operationsb: | ||||||||||||
| Net investment income | 0.109 | 0.255 | c | 0.317 | c | 0.145 | ||||||
| Net realized and unrealized gains (losses) | 0.024 | (0.209 | ) | 0.191 | (0.348 | ) | ||||||
| Total from investment operations | 0.133 | 0.046 | 0.508 | (0.203 | ) | |||||||
| Less distributions from net investment income and net foreign | ||||||||||||
| currency gains | (0.253 | ) | (0.336 | ) | (0.378 | ) | (0.167 | ) | ||||
| Net asset value, end of period | $ | 9.79 | $ | 9.91 | $ | 10.20 | $ | 10.07 | ||||
| Total returnd | 1.40 | % | 0.44 | % | 5.18 | % | (1.92 | )% | ||||
| Ratios to average net assetse | ||||||||||||
| Expenses before waiver and payments by affiliates | 0.51 | % | 0.50 | % | 0.50 | % | 0.50 | % | ||||
| Expenses net of waiver and payments by affiliatesf | 0.45 | % | 0.46 | % | 0.48 | % | 0.49 | % | ||||
| Net investment income | 2.79 | % | 2.49 | % | 2.86 | % | 2.75 | % | ||||
| Supplemental data | ||||||||||||
| Net assets, end of period (000’s) | $ | 75,348 | $ | 68,848 | $ | 26,123 | $ | 329,806 | ||||
| Portfolio turnover rate | 149.35 | % | 294.80 | % | 273.96 | % | 371.54 | % | ||||
| Portfolio turnover rate excluding mortgage dollar rollsg | 41.34 | % | 95.06 | % | 85.03 | % | 156.49 | % | ||||
aFor the period May 1, 2013 (effective date) to October 31, 2013.
bThe amount shown for a share outstanding throughout the period may not correlate with the Consolidated Statement of Operations for the period due to the timing of sales
and repurchases of the Fund’s shares in relation to income earned and/or fluctuating fair value of the investments of the Fund.
cBased on average daily shares outstanding.
dTotal return is not annualized for periods less than one year.
eRatios are annualized for periods less than one year.
fBenefit of expense reduction rounds to less than 0.01%.
gSee Note 1(g) regarding mortgage dollar rolls.
82 Semiannual Report | The accompanying notes are an integral part of these financial statements.
franklintempleton.com
FRANKLIN INVESTORS SECURITIES TRUST
CONSOLIDATED FINANCIAL HIGHLIGHTS
| Franklin Total Return Fund (continued) | ||||||||||||||||||
| Six Months Ended | Year Ended October 31, | |||||||||||||||||
| April 30, 2016 | ||||||||||||||||||
| (unaudited) | 2015 | 2014 | 2013 | 2012 | 2011 | |||||||||||||
| Advisor Class | ||||||||||||||||||
| Per share operating performance | ||||||||||||||||||
| (for a share outstanding throughout the period) | ||||||||||||||||||
| Net asset value, beginning of period | $ | 9.91 | $ | 10.20 | $ | 10.07 | $ | 10.55 | $ | 10.34 | $ | 10.35 | ||||||
| Income from investment operationsa: | ||||||||||||||||||
| Net investment income | 0.128 | 0.127 | 0.288 | 0.242 | 0.319 | 0.380 | ||||||||||||
| Net realized and unrealized gains (losses) | (0.011 | ) | (0.092 | ) | 0.206 | (0.186 | ) | 0.474 | 0.071 | |||||||||
| Total from investment operations | 0.117 | 0.035 | 0.494 | 0.056 | 0.793 | 0.451 | ||||||||||||
| Less distributions from: | ||||||||||||||||||
| Net investment income and net foreign | ||||||||||||||||||
| currency gains | (0.247 | ) | (0.325 | ) | (0.364 | ) | (0.376 | ) | (0.471 | ) | (0.404 | ) | ||||||
| Net realized gains | — | — | — | (0.160 | ) | (0.112 | ) | (0.057 | ) | |||||||||
| Total distributions | (0.247 | ) | (0.325 | ) | (0.364 | ) | (0.536 | ) | (0.583 | ) | (0.461 | ) | ||||||
| Net asset value, end of period | $ | 9.78 | $ | 9.91 | $ | 10.20 | $ | 10.07 | $ | 10.55 | $ | 10.34 | ||||||
| Total returnb | 1.34 | % | 0.33 | % | 5.03 | % | 0.54 | % | 7.98 | % | 4.50 | % | ||||||
| Ratios to average net assetsc | ||||||||||||||||||
| Expenses before waiver and payments | ||||||||||||||||||
| by affiliates | 0.67 | % | 0.66 | % | 0.68 | % | 0.66 | % | 0.67 | % | 0.68 | % | ||||||
| Expenses net of waiver and payments | ||||||||||||||||||
| by affiliates | 0.61 | %d | 0.62 | %d | 0.63 | %d | 0.63 | %d | 0.63 | % | 0.63 | %d | ||||||
| Net investment income | 2.63 | % | 2.33 | % | 2.71 | % | 2.61 | % | 2.94 | % | 3.70 | % | ||||||
| Supplemental data | ||||||||||||||||||
| Net assets, end of period (000’s) | $ | 467,722 | $ | 526,749 | $ | 1,281,151 | $ | 1,148,451 | $ | 1,482,994 | $ | 1,158,243 | ||||||
| Portfolio turnover rate | 149.35 | % | 294.80 | % | 273.96 | % | 371.54 | % | 314.62 | % | 255.55 | % | ||||||
| Portfolio turnover rate excluding mortgage | ||||||||||||||||||
| dollar rollse | 41.34 | % | 95.06 | % | 85.03 | % | 156.49 | % | 122.04 | % | 98.96 | % | ||||||
aThe amount shown for a share outstanding throughout the period may not correlate with the Consolidated Statement of Operations for the period due to the timing of sales
and repurchases of the Fund’s shares in relation to income earned and/or fluctuating fair value of the investments of the Fund.
bTotal return is not annualized for periods less than one year.
cRatios are annualized for periods less than one year.
dBenefit of expense reduction rounds to less than 0.01%.
eSee Note 1(g) regarding mortgage dollar rolls.
franklintempleton.com
The accompanying notes are an integral part of these financial statements. | Semiannual Report 83
FRANKLIN INVESTORS SECURITIES TRUST
| Consolidated Statement of Investments, April 30, 2016 (unaudited) | |||||
| Franklin Total Return Fund | |||||
| Country | Shares | Value | |||
| Common Stocks (Cost $1,717,674) 0.1% | |||||
| Consumer Services 0.1% | |||||
| a,b,c Turtle Bay Resort | United States | 1,550,568 | $ | 4,031,476 | |
| d Management Investment Companies 1.6% | |||||
| Diversified Financials 1.6% | |||||
| Franklin Lower Tier Floating Rate Fund | United States | 997,589 | 9,746,445 | ||
| Franklin Middle Tier Floating Rate Fund | United States | 1,889,310 | 18,024,019 | ||
| Franklin Short Duration U.S. Government ETF | United States | 500,000 | 48,936,900 | ||
| Total Management Investment Companies | |||||
| (Cost $77,434,310) | 76,707,364 | ||||
| Preferred Stocks 0.4% | |||||
| Banks 0.3% | |||||
| U.S. Bancorp, 6.00%, pfd., G | United States | 640,000 | 16,902,400 | ||
| Diversified Financials 0.1% | |||||
| Citigroup Capital XIII, 6.692%, pfd | United States | 93,000 | 2,431,950 | ||
| Total Preferred Stocks (Cost $18,325,000) | 19,334,350 | ||||
| Principal | |||||
| Amount* | |||||
| Corporate Bonds 37.8% | |||||
| Automobiles & Components 0.8% | |||||
| BorgWarner Inc., senior bond, 4.375%, 3/15/45 | United States | 9,300,000 | 9,060,193 | ||
| Delphi Corp., senior bond, 4.15%, 3/15/24 | United Kingdom | 5,100,000 | 5,361,242 | ||
| Fiat Chrysler Automobiles NV, senior note, 4.50%, 4/15/20 | United Kingdom | 6,000,000 | 6,150,000 | ||
| Ford Motor Co., senior bond, 4.75%, 1/15/43 | United States | 18,200,000 | 18,935,408 | ||
| 39,506,843 | |||||
| Banks 7.8% | |||||
| Banco Comercial Portugues SA, 4.75%, 6/22/17 | Portugal | 5,400,000 | EUR | 6,493,465 | |
| Bank of America Corp., | |||||
| senior bond, 3.875%, 8/01/25 | United States | 6,000,000 | 6,259,344 | ||
| sub. note, 4.00%, 1/22/25 | United States | 20,400,000 | 20,447,491 | ||
| e Bankinter SA, senior note, Reg S, 1.75%, 6/10/19 | Spain | 12,500,000 | EUR | 14,884,732 | |
| e Barclays Bank PLC, senior sub. note, Reg S, 6.00%, 1/14/21 | United Kingdom | 8,000,000 | EUR | 10,453,525 | |
| Barclays PLC, sub. note, 4.375%, 9/11/24 | United Kingdom | 500,000 | 485,453 | ||
| CIT Group Inc., senior note, 5.00%, 8/15/22 | United States | 9,000,000 | 9,450,000 | ||
| Citigroup Inc., | |||||
| senior note, 8.125%, 7/15/39 | United States | 4,400,000 | 6,764,498 | ||
| sub. bond, 4.45%, 9/29/27 | United States | 20,000,000 | 20,451,640 | ||
| Depfa ACS Bank, secured bond, | |||||
| 1.65%, 12/20/16 | Ireland | 720,000,000 | JPY | 6,805,097 | |
| 2.125%, 10/13/17 | Ireland | 12,250,000 | CHF | 13,200,933 | |
| HSBC Holdings PLC, | |||||
| senior note, 4.30%, 3/08/26 | United Kingdom | 14,800,000 | 15,560,868 | ||
| sub. bond, 6.50%, 9/15/37 | United Kingdom | 3,000,000 | 3,629,640 | ||
| sub. note, 4.25%, 8/18/25 | United Kingdom | 2,600,000 | 2,619,903 | ||
| f Industrial and Commercial Bank of China Ltd., sub. note, 144A, | |||||
| 4.875%, 9/21/25 | China | 11,600,000 | 11,977,116 | ||
| Intesa Sanpaolo SpA, | |||||
| senior note, 2.375%, 1/13/17 | Italy | 24,500,000 | 24,639,650 | ||
| senior note, 3.875%, 1/16/18 | Italy | 4,300,000 | 4,422,744 | ||
| f sub. note, 144A, 5.71%, 1/15/26 | Italy | 17,500,000 | 17,160,062 | ||
84 Semiannual Report
franklintempleton.com
FRANKLIN INVESTORS SECURITIES TRUST
CONSOLIDATED STATEMENT OF INVESTMENTS (UNAUDITED)
| Franklin Total Return Fund (continued) | ||||||
| Principal | ||||||
| Country | Amount* | Value | ||||
| Corporate Bonds (continued) | ||||||
| Banks (continued) | ||||||
| JPMorgan Chase & Co., | ||||||
| g junior sub. bond, V, 5.00% to 7/30/19, FRN thereafter, Perpetual | United States | 6,500,000 | $ | 6,265,025 | ||
| g junior sub. bond, X, 6.10% to 10/01/24, FRN thereafter, Perpetual | United States | 10,400,000 | 10,712,000 | |||
| senior note, 3.25%, 9/23/22 | United States | 11,400,000 | 11,857,254 | |||
| f Mizuho Financial Group Cayman 3 Ltd., sub. note, 144A, 4.60%, 3/27/24 | Japan | 8,700,000 | 9,138,602 | |||
| f Norddeutsche Landesbank Girozentrale, secured note, 144A, | ||||||
| 2.00%, 2/05/19 | Germany | 7,000,000 | 7,084,175 | |||
| PHH Corp., senior note, 7.375%, 9/01/19 | United States | 5,400,000 | 5,278,500 | |||
| Royal Bank of Canada, secured note, 2.10%, 10/14/20 | Canada | 11,500,000 | 11,573,968 | |||
| Royal Bank of Scotland Group PLC, sub. note, 6.125%, 12/15/22 | United Kingdom | 4,100,000 | 4,386,898 | |||
| The Royal Bank of Scotland PLC, sub. note, 6.934%, 4/09/18 | United Kingdom | 4,000,000 | EUR | 5,043,218 | ||
| f Shinhan Bank, senior note, 144A, 1.875%, 7/30/18 | South Korea | 10,000,000 | 10,011,700 | |||
| SVB Financial Group, senior note, 3.50%, 1/29/25 | United States | 6,000,000 | 6,011,148 | |||
| h UniCredit SpA, senior note, FRN, 1.84%, 10/31/17 | Italy | 9,500,000 | EUR | 11,071,156 | ||
| e Unione di Banche Italiane SCpA, senior note, Reg S, 2.875%, 2/18/19 | Italy | 12,000,000 | EUR | 14,608,153 | ||
| g,h Wachovia Capital Trust III, junior sub. bond, FRN, 5.57%, Perpetual | United States | 15,600,000 | 15,580,500 | |||
| Wells Fargo & Co., | ||||||
| g junior sub. bond, 5.875% to 6/15/25, FRN thereafter, Perpetual | United States | 9,900,000 | 10,586,812 | |||
| g junior sub. bond, S, 5.90% to 6/15/24, FRN thereafter, Perpetual | United States | 5,500,000 | 5,637,500 | |||
| sub. bond, 4.65%, 11/04/44 | United States | 10,000,000 | 10,399,250 | |||
| f Westpac Banking Corp., senior secured note, 144A, 2.25%, 11/09/20 | Australia | 10,800,000 | 10,960,272 | |||
| f Woori Bank, sub. note, 144A, 4.75%, 4/30/24 | South Korea | 9,750,000 | 10,095,004 | |||
| 372,007,296 | ||||||
| Capital Goods 1.3% | ||||||
| f Amcor Finance USA Inc., senior note, 144A, 3.625%, 4/28/26 | Australia | 11,800,000 | 11,893,220 | |||
| i Erickson Air-Crane Inc., Purchase Price Notes, 6.00%, 11/02/20 | United States | 11,201 | 9,002 | |||
| General Electric Co., senior note, A, 8.50%, 4/06/18 | United States | 135,000,000 | MXN | 8,362,539 | ||
| f HD Supply Inc., senior note, 144A, 5.75%, 4/15/24 | United States | 1,400,000 | 1,471,750 | |||
| Lockheed Martin Corp., senior bond, 4.70%, 5/15/46 | United States | 13,900,000 | 16,040,906 | |||
| NBCUniversal Media LLC, senior bond, 4.45%, 1/15/43 | United States | 8,100,000 | 8,890,795 | |||
| f Sydney Airport Finance Co. Pty. Ltd., 144A, 3.90%, 3/22/23 | Australia | 5,800,000 | 6,085,708 | |||
| United Technologies Corp., senior note, 3.10%, 6/01/22 | United States | 11,800,000 | 12,474,901 | |||
| 65,228,821 | ||||||
| Consumer Durables & Apparel 0.7% | ||||||
| Beazer Homes USA Inc., senior note, 5.75%, 6/15/19 | United States | 13,500,000 | 12,588,750 | |||
| Centex LLC, senior note, 6.50%, 5/01/16 | United States | 19,795,000 | 19,795,000 | |||
| 32,383,750 | ||||||
| Consumer Services 0.7% | ||||||
| f International Game Technology PLC, senior secured bond, 144A, | ||||||
| 6.50%, 2/15/25 | United States | 6,000,000 | 6,105,000 | |||
| Marriott International Inc., senior bond, 3.75%, 10/01/25 | United States | 18,400,000 | 19,123,322 | |||
| Yum! Brands Inc., | ||||||
| senior bond, 6.25%, 3/15/18 | United States | 4,000,000 | 4,280,000 | |||
| senior note, 5.30%, 9/15/19 | United States | 3,000,000 | 3,206,250 | |||
| 32,714,572 | ||||||
| Diversified Financials 2.9% | ||||||
| AerCap Ireland Capital Ltd./AerCap Global Aviation Trust, senior note, | ||||||
| 4.25%, 7/01/20 | Netherlands | 6,000,000 | 6,153,990 | |||
| American Express Centurion Bank, senior note, 5.95%, 6/12/17 | United States | 800,000 | 839,045 | |||
franklintempleton.com
Semiannual Report 85
FRANKLIN INVESTORS SECURITIES TRUST
CONSOLIDATED STATEMENT OF INVESTMENTS (UNAUDITED)
| Franklin Total Return Fund (continued) | ||||
| Principal | ||||
| Country | Amount* | Value | ||
| Corporate Bonds (continued) | ||||
| Diversified Financials (continued) | ||||
| Capital One Bank USA NA, sub. bond, 3.375%, 2/15/23 | United States | 6,000,000 | $ | 6,044,244 |
| Deutsche Bank AG, sub. bond, 4.296% to 5/24/23, FRN thereafter, 5/24/28 | Germany | 10,000,000 | 8,932,000 | |
| Discover Financial Services, senior note, 3.85%, 11/21/22 | United States | 3,052,000 | 3,093,928 | |
| The Goldman Sachs Group Inc., | ||||
| g junior sub. bond, M, 5.375% to 5/10/20, FRN thereafter, Perpetual | United States | 3,500,000 | 3,381,875 | |
| senior note, 3.75%, 5/22/25 | United States | 7,700,000 | 7,923,985 | |
| senior note, 3.75%, 2/25/26 | United States | 9,300,000 | 9,579,158 | |
| f Hutchison Whampoa International 11 Ltd., senior note, 144A, 3.50%, 1/13/17 | Hong Kong | 9,500,000 | 9,642,168 | |
| International Lease Finance Corp., senior note, 8.75%, 3/15/17 | United States | 12,000,000 | 12,666,000 | |
| Morgan Stanley, | ||||
| senior bond, 4.30%, 1/27/45 | United States | 10,000,000 | 10,199,360 | |
| senior sub. bond, 4.35%, 9/08/26 | United States | 12,500,000 | 12,935,775 | |
| Navient Corp., senior note, | ||||
| 8.45%, 6/15/18 | United States | 2,000,000 | 2,147,500 | |
| 5.50%, 1/15/19 | United States | 7,000,000 | 6,956,250 | |
| Springleaf Finance Corp., | ||||
| senior bond, 5.75%, 9/15/16 | United States | 14,000,000 | 14,116,256 | |
| senior note, 6.00%, 6/01/20 | United States | 1,200,000 | 1,153,500 | |
| senior note, 7.75%, 10/01/21 | United States | 1,000,000 | 991,250 | |
| f Three Gorges Finance I Cayman Islands Ltd., senior note, 144A, | ||||
| 3.70%, 6/10/25 | China | 12,800,000 | 13,442,688 | |
| f Transurban Finance Co. Pty. Ltd., senior secured bond, 144A, | ||||
| 4.125%, 2/02/26 | Australia | 8,200,000 | 8,506,819 | |
| 138,705,791 | ||||
| Energy 4.6% | ||||
| Anadarko Petroleum Corp., senior note, 6.45%, 9/15/36 | United States | 2,260,000 | 2,444,283 | |
| f California Resources Corp., secured note, second lien, 144A, 8.00%, 12/15/22 | United States | 4,000,000 | 2,755,000 | |
| f Calumet Specialty Products Partners LP/Calumet Finance Corp., senior note, | ||||
| 144A, 11.50%, 1/15/21 | United States | 2,100,000 | 2,289,000 | |
| Canadian Natural Resources Ltd., senior note, 5.70%, 5/15/17 | Canada | 5,400,000 | 5,565,804 | |
| CGG SA, senior note, 6.50%, 6/01/21 | France | 3,000,000 | 1,215,000 | |
| f Chesapeake Energy Corp., secured note, second lien, 144A, 8.00%, 12/15/22 | United States | 1,857,000 | 1,272,045 | |
| CNOOC Finance 2013 Ltd., senior note, 3.00%, 5/09/23 | China | 14,000,000 | 13,626,830 | |
| CNOOC Nexen Finance 2014 ULC, senior note, 4.25%, 4/30/24 | China | 11,100,000 | 11,554,367 | |
| Enable Midstream Partners LP, | ||||
| senior bond, 5.00%, 5/15/44 | United States | 1,200,000 | 897,000 | |
| senior note, 3.90%, 5/15/24 | United States | 3,600,000 | 3,040,931 | |
| Energy Transfer Equity LP, senior note, first lien, 7.50%, 10/15/20 | United States | 6,000,000 | 6,075,000 | |
| Energy Transfer Partners LP, senior bond, | ||||
| 4.90%, 3/15/35 | United States | 15,400,000 | 13,272,105 | |
| 5.15%, 2/01/43 | United States | 6,000,000 | 5,096,868 | |
| f,j Energy XXI Gulf Coast Inc., senior secured note, second lien, 144A, | ||||
| 11.00%, 3/15/20 | United States | 6,000,000 | 2,130,000 | |
| EnLink Midstream Partners LP, senior bond, 5.05%, 4/01/45 | United States | 6,200,000 | 4,672,983 | |
| Ensco PLC, senior bond, 5.75%, 10/01/44 | United States | 3,700,000 | 2,474,375 | |
| Enterprise Products Operating LLC, senior bond, 4.45%, 2/15/43 | United States | 6,000,000 | 5,748,648 | |
| Exxon Mobil Corp., senior note, 2.709%, 3/06/25 | United States | 21,500,000 | 21,946,899 | |
| f,k Gaz Capital SA (OJSC Gazprom), loan participation, senior note, 144A, | ||||
| 3.85%, 2/06/20 | Russia | 10,000,000 | 9,898,350 | |
| c Halcon Resources Corp., | ||||
| senior note, 9.75%, 7/15/20 | United States | 3,500,000 | 787,500 | |
| f senior secured note, third lien, 144A, 13.00%, 2/15/22 | United States | 2,275,000 | 739,375 | |
86 Semiannual Report
franklintempleton.com
FRANKLIN INVESTORS SECURITIES TRUST
CONSOLIDATED STATEMENT OF INVESTMENTS (UNAUDITED)
| Franklin Total Return Fund (continued) | |||||
| Principal | |||||
| Country | Amount* | Value | |||
| Corporate Bonds (continued) | |||||
| Energy (continued) | |||||
| Kinder Morgan Energy Partners LP, senior note, | |||||
| 5.95%, 2/15/18 | United States | 12,300,000 | $ | 12,925,849 | |
| 6.85%, 2/15/20 | United States | 1,000,000 | 1,104,273 | ||
| c,f,j Linn Energy LLC/Finance Corp., senior secured note, second lien, 144A, | |||||
| 12.00%, 12/15/16 | United States | 3,000,000 | 585,000 | ||
| f LUKOIL International Finance BV, senior note, 144A, 4.563%, 4/24/23 | Russia | 9,500,000 | 9,281,927 | ||
| MPLX LP, 4.00%, 2/15/25 | United States | 4,600,000 | 4,110,413 | ||
| Oceaneering International Inc., senior note, 4.65%, 11/15/24 | United States | 7,900,000 | 7,179,449 | ||
| f,j Peabody Energy Corp., secured note, second lien, 144A, 10.00%, 3/15/22 | United States | 5,000,000 | 588,000 | ||
| h Petrobras Global Finance BV, senior note, FRN, 3.522%, 3/17/20 | Brazil | 14,400,000 | 11,862,000 | ||
| f Petrofac Ltd., senior note, 144A, 3.40%, 10/10/18 | United Kingdom | 7,600,000 | 7,375,633 | ||
| Sanchez Energy Corp., senior note, 6.125%, 1/15/23 | United States | 3,000,000 | 2,257,500 | ||
| f Sinopec Group Overseas Development 2014 Ltd., senior note, 144A, | |||||
| 4.375%, 4/10/24 | China | 9,300,000 | 9,896,781 | ||
| f Sinopec Group Overseas Development 2015 Ltd., senior note, 144A, | |||||
| 3.25%, 4/28/25 | China | 16,400,000 | 16,169,006 | ||
| Sunoco Logistics Partners Operations LP, senior note, 4.25%, 4/01/24 | United States | 9,300,000 | 9,029,054 | ||
| Transcontinental Gas Pipe Line Corp., senior note, 6.05%, 6/15/18 | United States | 550,000 | 566,261 | ||
| Valero Energy Corp., senior bond, 4.90%, 3/15/45 | United States | 6,700,000 | 6,267,227 | ||
| Weatherford International Ltd., senior bond, 5.95%, 4/15/42 | United States | 2,400,000 | 1,788,000 | ||
| 218,488,736 | |||||
| Food & Staples Retailing 0.7% | |||||
| f Cencosud SA, senior note, 144A, 4.875%, 1/20/23 | Chile | 17,000,000 | 17,223,040 | ||
| CVS Health Corp., senior note, 5.75%, 6/01/17 | United States | 362,000 | 380,320 | ||
| The Kroger Co., senior note, 4.00%, 2/01/24 | United States | 15,400,000 | 16,791,729 | ||
| 34,395,089 | |||||
| Food, Beverage & Tobacco 1.3% | |||||
| Constellation Brands Inc., senior note, | |||||
| 7.25%, 5/15/17 | United States | 5,000,000 | 5,281,250 | ||
| A, 7.25%, 9/01/16 | United States | 6,000,000 | 6,117,510 | ||
| f H.J. Heinz Co., senior note, 144A, 3.50%, 7/15/22 | United States | 21,400,000 | 22,615,477 | ||
| e Pernod Ricard SA, senior note, Reg S, 2.125%, 9/27/24 | France | 3,300,000 | EUR | 4,024,441 | |
| Reynolds American Inc., senior bond, 5.70%, 8/15/35 | United States | 9,300,000 | 11,130,194 | ||
| Tyson Foods Inc., senior bond, 3.95%, 8/15/24 | United States | 12,000,000 | 12,928,224 | ||
| 62,097,096 | |||||
| Health Care Equipment & Services 1.0% | |||||
| Express Scripts Holding Co., senior bond, 3.50%, 6/15/24 | United States | 14,500,000 | 14,750,226 | ||
| HCA Holdings Inc., senior note, 6.25%, 2/15/21 | United States | 2,000,000 | 2,183,000 | ||
| HCA Inc., senior bond, 5.875%, 5/01/23 | United States | 8,000,000 | 8,455,000 | ||
| Medco Health Solutions Inc., senior note, 4.125%, 9/15/20 | United States | 3,500,000 | 3,710,042 | ||
| Stryker Corp., senior bond, 3.50%, 3/15/26 | United States | 3,000,000 | 3,150,342 | ||
| Tenet Healthcare Corp., senior note, 5.50%, 3/01/19 | United States | 7,000,000 | 7,035,000 | ||
| Zimmer Holdings Inc., senior bond, 4.25%, 8/15/35 | United States | 6,500,000 | 6,521,925 | ||
| 45,805,535 | |||||
| Household & Personal Products 0.3% | |||||
| Avon Products Inc., senior note, 6.35%, 3/15/20 | United States | 18,500,000 | 15,771,250 | ||
| Insurance 1.6% | |||||
| Aflac Inc., senior bond, 3.625%, 6/15/23 | United States | 17,500,000 | 18,563,632 | ||
franklintempleton.com
Semiannual Report 87
FRANKLIN INVESTORS SECURITIES TRUST
CONSOLIDATED STATEMENT OF INVESTMENTS (UNAUDITED)
| Franklin Total Return Fund (continued) | |||||
| Principal | |||||
| Country | Amount* | Value | |||
| Corporate Bonds (continued) | |||||
| Insurance (continued) | |||||
| f Liberty Mutual Group Inc., senior note, 144A, 4.95%, 5/01/22 | United States | 12,000,000 | $ | 13,061,532 | |
| MetLife Inc., junior sub. note, | |||||
| 6.40% to 12/15/36, FRN thereafter, 12/15/66 | United States | 4,000,000 | 4,272,400 | ||
| g 5.25% to 6/15/20, FRN thereafter, Perpetual | United States | 2,000,000 | 1,952,400 | ||
| Metlife Inc., senior note, 3.00%, 3/01/25 | United States | 1,500,000 | 1,504,787 | ||
| Prudential Financial Inc., junior sub. note, 5.875%, 9/15/42 | United States | 7,000,000 | 7,574,000 | ||
| f Teachers Insurance & Annuity Assn. of America, sub. bond, 144A, | |||||
| 4.90%, 9/15/44 | United States | 20,400,000 | 22,078,328 | ||
| f TIAA Asset Management Finance LLC, senior note, 144A, 2.95%, 11/01/19 | United States | 5,800,000 | 5,920,472 | ||
| 74,927,551 | |||||
| Materials 1.7% | |||||
| ArcelorMittal, senior note, 6.50%, 3/01/21 | Luxembourg | 8,000,000 | 8,193,280 | ||
| e Arkema SA, senior note, Reg S, 1.50%, 1/20/25 | France | 12,000,000 | EUR | 13,915,222 | |
| f Cemex Finance LLC, senior secured note, 144A, 9.375%, 10/12/22 | Mexico | 1,000,000 | 1,105,000 | ||
| f Cemex SAB de CV, first lien, 144A, 5.70%, 1/11/25 | Mexico | 8,000,000 | 7,734,600 | ||
| f FMG Resources (August 2006) Pty. Ltd., senior secured note, 144A, | |||||
| 9.75%, 3/01/22 | Australia | 1,600,000 | 1,684,160 | ||
| f Glencore Finance Canada Ltd., senior bond, 144A, 4.95%, 11/15/21 | Switzerland | 4,700,000 | 4,587,961 | ||
| LyondellBasell Industries NV, senior bond, 4.625%, 2/26/55 | United States | 18,400,000 | 17,274,122 | ||
| Owens-Illinois Inc., senior note, 7.80%, 5/15/18 | United States | 9,200,000 | 10,120,000 | ||
| Reliance Steel & Aluminum Co., senior note, 4.50%, 4/15/23 | United States | 5,600,000 | 5,661,897 | ||
| Reynolds Group Holdings Inc., senior note, 8.125%, 6/15/17 | United States | 12,000,000 | 12,360,000 | ||
| j Verso Paper Holdings LLC/Inc., senior secured note, first lien, | |||||
| 11.75%,1/15/19 | United States | 451,000 | 57,503 | ||
| 82,693,745 | |||||
| Media 1.7% | |||||
| 21st Century Fox America Inc., | |||||
| senior bond, 6.90%, 8/15/39 | United States | 1,800,000 | 2,355,044 | ||
| senior bond, 7.90%, 12/01/95 | United States | 500,000 | 645,321 | ||
| senior note, 3.00%, 9/15/22 | United States | 5,100,000 | 5,300,710 | ||
| senior note, 3.70%, 10/15/25 | United States | 2,300,000 | 2,466,364 | ||
| f Altice U.S. Finance I Corp., senior secured bond, 144A, 5.50%, 5/15/26 | United States | 3,500,000 | 3,543,750 | ||
| AMC Networks Inc., senior note, 5.00%, 4/01/24 | United States | 3,400,000 | 3,412,750 | ||
| f CCO Holdings LLC/CCO Holdings Capital Corp., senior bond, 144A, | |||||
| 5.375%, 5/01/25 | United States | 7,000,000 | 7,183,750 | ||
| CSC Holdings LLC, | |||||
| senior bond, 7.625%, 7/15/18 | United States | 3,000,000 | 3,255,000 | ||
| senior note, 8.625%, 2/15/19 | United States | 9,000,000 | 10,012,500 | ||
| The New York Times Co., senior note, 6.625%, 12/15/16 | United States | 11,700,000 | 11,981,350 | ||
| Time Warner Inc., | |||||
| 7.70%, 5/01/32 | United States | 550,000 | 716,146 | ||
| 6.10%, 7/15/40 | United States | 8,600,000 | 10,435,421 | ||
| Viacom Inc., senior bond, | |||||
| 4.25%, 9/01/23 | United States | 1,000,000 | 1,030,873 | ||
| 4.85%, 12/15/34 | United States | 16,500,000 | 14,872,440 | ||
| f Virgin Media Secured Finance PLC, senior secured bond, first lien, 144A, | |||||
| 5.50%, 8/15/26 | United Kingdom | 4,300,000 | 4,343,000 | ||
| 81,554,419 | |||||
| Pharmaceuticals, Biotechnology & Life Sciences 1.9% | |||||
| Actavis Funding SCS, senior bond, 4.55%, 3/15/35 | United States | 13,400,000 | 13,388,034 | ||
88 Semiannual Report
franklintempleton.com
FRANKLIN INVESTORS SECURITIES TRUST
CONSOLIDATED STATEMENT OF INVESTMENTS (UNAUDITED)
| Franklin Total Return Fund (continued) | |||||
| Principal | |||||
| Country | Amount* | Value | |||
| Corporate Bonds (continued) | |||||
| Pharmaceuticals, Biotechnology & Life Sciences (continued) | |||||
| f Baxalta Inc., senior note, 144A, 3.60%, 6/23/22 | United States | 8,300,000 | $ | 8,535,803 | |
| Biogen Inc., senior bond, 5.20%, 9/15/45 | United States | 9,200,000 | 10,518,894 | ||
| Gilead Sciences Inc., senior bond, | |||||
| 4.50%, 2/01/45 | United States | 6,000,000 | 6,410,922 | ||
| 4.75%, 3/01/46 | United States | 9,000,000 | 10,002,204 | ||
| PerkinElmer Inc., senior note, 5.00%, 11/15/21 | United States | 13,200,000 | 14,492,623 | ||
| f Valeant Pharmaceuticals International Inc., senior bond, 144A, | |||||
| 6.125%, 4/15/25 | United States | 6,800,000 | 5,661,000 | ||
| Zoetis Inc., senior bond, 4.70%, 2/01/43 | United States | 20,000,000 | 19,668,180 | ||
| 88,677,660 | |||||
| Real Estate 1.5% | |||||
| American Tower Corp., senior bond, | |||||
| 3.50%, 1/31/23 | United States | 12,700,000 | 13,023,837 | ||
| 4.40%, 2/15/26 | United States | 9,400,000 | 10,145,599 | ||
| ERP Operating LP, 5.75%, 6/15/17 | United States | 881,000 | 925,446 | ||
| HCP Inc., senior bond, 3.875%, 8/15/24 | United States | 17,000,000 | 16,697,604 | ||
| Realty Income Corp., senior bond, 4.125%, 10/15/26 | United States | 12,500,000 | 12,979,075 | ||
| Senior Housing Properties Trust, senior note, 6.75%, 12/15/21 | United States | 14,500,000 | 16,037,740 | ||
| 69,809,301 | |||||
| Retailing 1.4% | |||||
| Bed Bath & Beyond Inc., senior bond, 5.165%, 8/01/44 | United States | 18,600,000 | 16,884,373 | ||
| Dollar General Corp., senior bond, 4.15%, 11/01/25 | United States | 12,700,000 | 13,492,201 | ||
| c,f,j Edcon Ltd., secured note, 144A, 9.50%, 3/01/18 | South Africa | 3,500,000 | EUR | 1,402,809 | |
| Tiffany & Co., senior bond, 4.90%, 10/01/44 | United States | 10,300,000 | 10,053,861 | ||
| Toys R Us Inc., senior bond, 7.375%, 10/15/18 | United States | 28,800,000 | 23,472,000 | ||
| 65,305,244 | |||||
| Semiconductors & Semiconductor Equipment 0.5% | |||||
| Maxim Integrated Products Inc., senior note, 3.375%, 3/15/23 | United States | 22,000,000 | 22,397,342 | ||
| Software & Services 0.6% | |||||
| Alibaba Group Holding Ltd., senior bond, 4.50%, 11/28/34 | China | 10,000,000 | 10,336,300 | ||
| f First Data Corp., secured note, first lien, 144A, 5.00%, 1/15/24 | United States | 7,700,000 | 7,805,875 | ||
| Fiserv Inc., senior bond, 3.85%, 6/01/25 | United States | 9,300,000 | 9,828,007 | ||
| 27,970,182 | |||||
| Technology Hardware & Equipment 0.5% | |||||
| Juniper Networks Inc., senior bond, | |||||
| 4.50%, 3/15/24 | United States | 4,500,000 | 4,587,876 | ||
| 4.35%, 6/15/25 | United States | 9,300,000 | 9,400,673 | ||
| f Western Digital Corp., senior note, 144A, 10.50%, 4/01/24 | United States | 9,800,000 | 9,555,000 | ||
| 23,543,549 | |||||
| Telecommunication Services 2.0% | |||||
| AT&T Inc., | |||||
| senior bond, 4.50%, 5/15/35 | United States | 16,200,000 | 16,368,804 | ||
| senior note, 3.95%, 1/15/25 | United States | 7,400,000 | 7,807,015 | ||
| Embarq Corp., senior note, 7.082%, 6/01/16 | United States | 22,500,000 | 22,660,380 | ||
| Intelsat Jackson Holdings SA, senior bond, 6.625%, 12/15/22 | Luxembourg | 6,000,000 | 3,907,500 | ||
| Sprint Communications Inc., senior note, 6.00%, 11/15/22 | United States | 7,000,000 | 5,183,570 | ||
| Sprint Corp., senior note, 7.625%, 2/15/25 | United States | 2,000,000 | 1,510,000 | ||
franklintempleton.com
Semiannual Report 89
FRANKLIN INVESTORS SECURITIES TRUST
CONSOLIDATED STATEMENT OF INVESTMENTS (UNAUDITED)
| Franklin Total Return Fund (continued) | |||||
| Principal | |||||
| Country | Amount* | Value | |||
| Corporate Bonds (continued) | |||||
| Telecommunication Services (continued) | |||||
| Telefonica Emisiones SAU, senior note, 4.57%, 4/27/23 | Spain | 9,000,000 | $ | 9,933,705 | |
| Verizon Communications Inc., senior bond, | |||||
| 6.40%, 9/15/33 | United States | 10,255,000 | 12,885,879 | ||
| 4.522%, 9/15/48 | United States | 10,700,000 | 10,919,446 | ||
| f Wind Acquisition Finance SA, secured note, second lien, 144A, | |||||
| 7.375%, 4/23/21 | Italy | 7,000,000 | 6,256,250 | ||
| 97,432,549 | |||||
| Transportation 0.3% | |||||
| f Aviation Capital Group Corp., 144A, 7.125%, 10/15/20 | United States | 6,000,000 | 6,787,500 | ||
| Burlington Northern and Santa Fe 99-2 Trust, secured bond, | |||||
| 7.57%, 1/02/21 | United States | 102,620 | 113,570 | ||
| f DP World Ltd., senior bond, 144A, 6.85%, 7/02/37 | United Arab Emirates | 3,700,000 | 3,848,462 | ||
| The Hertz Corp., senior note, 4.25%, 4/01/18 | United States | 5,000,000 | 5,075,000 | ||
| Union Pacific Railroad Co. 2005 Pass Trust, 05-1, 5.082%, 1/02/29 | United States | 201,039 | 223,925 | ||
| 16,048,457 | |||||
| Utilities 2.0% | |||||
| Commonwealth Edison Co., secured bond, 6.45%, 1/15/38 | United States | 700,000 | 960,807 | ||
| Dominion Resources Inc., senior bond, 3.90%, 10/01/25 | United States | 9,300,000 | 9,796,797 | ||
| DPL Inc., senior note, 6.50%, 10/15/16 | United States | 337,000 | 344,161 | ||
| f,g EDF SA, sub. note, 144A, 5.25% to 1/29/23, FRN thereafter, Perpetual | France | 24,000,000 | 23,208,000 | ||
| f Enogex LLC, senior note, 144A, 6.25%, 3/15/20 | United States | 5,000,000 | 4,513,750 | ||
| Georgia Power Co., senior note, 4.30%, 3/15/42 | United States | 9,000,000 | 9,702,774 | ||
| MidAmerican Energy Co., senior note, 5.95%, 7/15/17 | United States | 2,200,000 | 2,319,814 | ||
| PPL Energy Supply LLC, senior note, 6.20%, 5/15/16 | United States | 12,400,000 | 12,406,200 | ||
| Sempra Energy, senior note, 3.75%, 11/15/25 | United States | 8,200,000 | 8,587,098 | ||
| f State Grid Overseas Investment 2013 Ltd., senior note, 144A, | |||||
| 3.125%, 5/22/23 | China | 10,400,000 | 10,560,524 | ||
| e Veolia Environnement SA, senior bond, Reg S, 4.625%, 3/30/27 | France | 7,800,000 | EUR | 11,992,957 | |
| 94,392,882 | |||||
| Total Corporate Bonds (Cost $1,804,977,199) | 1,801,857,660 | ||||
| h,l Senior Floating Rate Interests 1.6% | |||||
| Automobiles & Components 0.0%† | |||||
| TI Group Automotive Systems LLC, Initial U.S. Term Loan, | |||||
| 4.50%, 6/25/22 | United States | 1,150,336 | 1,150,336 | ||
| Capital Goods 0.0%† | |||||
| Sensus USA Inc., Term Loan, 6.50%, 4/05/23 | United States | 2,070,000 | 2,036,362 | ||
| Consumer Durables & Apparel 0.0%† | |||||
| m Prime Security Services Borrower LLC, Term B-1 Loans, | |||||
| 7.00%, 5/02/22 | United States | 247,508 | 248,707 | ||
| Consumer Services 0.1% | |||||
| Fitness International LLC, Term B Loan, 5.529%, 7/01/20 | United States | 2,543,779 | 2,499,263 | ||
| c,n Turtle Bay Holdings LLC, Term Loan B, PIK, 3.25%, 6/30/16 | United States | 734,537 | 704,055 | ||
| 3,203,318 | |||||
| Diversified Financials 0.1% | |||||
| First Eagle Investment Management, Initial Term Loans, | |||||
| 4.75%, 12/01/22 | United States | 848,974 | 843,668 | ||
90 Semiannual Report
franklintempleton.com
FRANKLIN INVESTORS SECURITIES TRUST
CONSOLIDATED STATEMENT OF INVESTMENTS (UNAUDITED)
| Franklin Total Return Fund (continued) | ||||
| Principal | ||||
| Country | Amount* | Value | ||
| h,l Senior Floating Rate Interests (continued) | ||||
| Diversified Financials (continued) | ||||
| Guggenheim Partners Investment Management Holdings LLC, Initial Term Loan, | ||||
| 4.25%, 7/22/20 | United States | 1,636,193 | $ | 1,639,944 |
| 2,483,612 | ||||
| Energy 0.2% | ||||
| Bowie Resource Holdings LLC, | ||||
| First Lien Initial Term Loan, 8.75%, 8/16/20 | United States | 3,381,323 | 3,009,377 | |
| Second Lien Initial Term Loan, 12.50%, 2/16/21 | United States | 592,359 | 497,581 | |
| c Fieldwood Energy LLC, Loans, 3.875%, 10/01/18 | United States | 4,457,711 | 3,365,572 | |
| Foresight Energy LLC, Term Loans, 7.50%, 8/21/20 | United States | 500,000 | 440,000 | |
| c McDermott Finance LLC, Term Loan, 5.25%, 4/16/19 | United States | 191,329 | 184,752 | |
| 7,497,282 | ||||
| Health Care Equipment & Services 0.1% | ||||
| Community Health Systems Inc., 2018 Term F Loans, 3.685% - 3.886%, | ||||
| 12/31/18 | United States | 3,061,012 | 3,050,249 | |
| Kinetic Concepts Inc., Dollar Term E-1 Loan, 4.50%, 5/04/18 | United States | 994,911 | 995,782 | |
| 4,046,031 | ||||
| Materials 0.3% | ||||
| The Chemours Co. LLC, Tranche B Term Loan, 3.75%, 5/12/22 | United States | 3,356,911 | 3,281,380 | |
| FMG America Finance Inc. (Fortescue Metals Group), Loans, 4.25%, 6/30/19 | Australia | 6,126,175 | 5,797,659 | |
| Huntsman International LLC, Extended Term Loan B, 3.435% - 3.519%, 4/19/19 | United States | 1,750,226 | 1,749,496 | |
| Novelis Inc., Initial Term Loan, 4.00%, 6/02/22 | Canada | 2,065,425 | 2,057,938 | |
| OCI Beaumont LLC, Term B-3 Loan, 7.75%, 8/20/19 | United States | 1,934,572 | 1,953,918 | |
| 14,840,391 | ||||
| Media 0.2% | ||||
| CSC Holdings Inc. (Cablevision), Initial Term Loans, 5.00%, 10/09/22 | United States | 1,675,149 | 1,685,409 | |
| Media General Inc., Term B Loan, 4.00%, 7/31/20 | United States | 203,687 | 203,891 | |
| Radio One Inc., Term Loan B, 5.14%, 12/31/18 | United States | 7,001,211 | 7,049,345 | |
| 8,938,645 | ||||
| Pharmaceuticals, Biotechnology & Life Sciences 0.2% | ||||
| Endo Luxembourg Finance Co. I S.A.R.L. and Endo LLC, 2015 Incremental | ||||
| Term B Loans, 3.75%, 9/25/22 | United States | 3,272,648 | 3,267,192 | |
| Grifols Worldwide Operations USA Inc., US Tranche B Term Loan, | ||||
| 3.435%, 2/27/21 | United States | 2,838,139 | 2,845,234 | |
| Valeant Pharmaceuticals International Inc., Series D-2 Tranche B Term Loan, | ||||
| 4.50%, 2/13/19 | United States | 1,780,219 | 1,739,422 | |
| 7,851,848 | ||||
| Retailing 0.1% | ||||
| Ascena Retail Group Inc., Tranche B Term Loan, 5.25%, 8/21/22 | United States | 3,561,664 | 3,510,020 | |
| m PetSmart Inc., Term Loans, 4.25%, 3/10/22 | United States | 2,646,200 | 2,640,936 | |
| 6,150,956 | ||||
| Semiconductors & Semiconductor Equipment 0.1% | ||||
| m Avago Technologies Cayman Finance Ltd., Term B-1 Dollar Loans, | ||||
| 4.25%, 2/01/23 | United States | 1,909,554 | 1,914,196 | |
| m MKS Instruments Inc., Term Loan, 6.50%, 4/25/23 | United States | 187,781 | 188,837 | |
franklintempleton.com
Semiannual Report 91
FRANKLIN INVESTORS SECURITIES TRUST
CONSOLIDATED STATEMENT OF INVESTMENTS (UNAUDITED)
| Franklin Total Return Fund (continued) | ||||
| Principal | ||||
| Country | Amount* | Value | ||
| h,l Senior Floating Rate Interests (continued) | ||||
| Semiconductors & Semiconductor Equipment (continued) | ||||
| ON Semiconductor Corp., Closing Date Term Loans, 5.25%, 3/31/23 | United States | 2,019,174 | $ | 2,032,551 |
| 4,135,584 | ||||
| Software & Services 0.2% | ||||
| Match Group Inc., Term B-1 Loans, 5.50%, 11/16/22 | United States | 772,736 | 779,497 | |
| MoneyGram International Inc., Term Loan, 4.25%, 3/27/20 | United States | 7,810,689 | 7,390,865 | |
| Vertafore Inc., Second Lien Term Loan, 9.75%, 10/27/17 | United States | 467,548 | 469,067 | |
| 8,639,429 | ||||
| Technology Hardware & Equipment 0.0%† | ||||
| Dell International LLC, Term B-2 Loan, 4.00%, 4/29/20 | United States | 1,352,518 | 1,353,111 | |
| m Western Digital Corp., U.S. Term Loan B, 8.00%, 4/29/23 | United States | 998,146 | 983,797 | |
| 2,336,908 | ||||
| Telecommunication Services 0.0%† | ||||
| Intelsat Jackson Holdings SA, Tranche B-2 Term Loan, 3.75%, 6/30/19 | Luxembourg | 525,899 | 494,476 | |
| Windstream Corp., Tranche B-5 Term Loan, 3.50%, 8/08/19 | United States | 505,412 | 499,937 | |
| 994,413 | ||||
| Transportation 0.0%† | ||||
| Navios Maritime Midstream Partners LP, Initial Term Loan, | ||||
| 5.50%, 6/18/20 | Marshall Islands | 1,727,130 | 1,563,053 | |
| Navios Maritime Partners LP, Initial Term Loan, 5.25%, 6/27/18 | Marshall Islands | 62,540 | 55,348 | |
| 1,618,401 | ||||
| Utilities 0.0%† | ||||
| Calpine Corp., Term Loan (B6), 4.00%, 1/15/23 | United States | 605,541 | 604,595 | |
| Total Senior Floating Rate Interests | ||||
| (Cost $77,991,348) | 76,776,818 | |||
| Foreign Government and Agency Securities 4.3% | ||||
| The Export-Import Bank of Korea, senior note, 2.25%, 1/21/20 | South Korea | 18,800,000 | 19,000,408 | |
| Government of Hungary, | ||||
| 5.50%, 12/22/16 | Hungary | 3,092,050,000 | HUF | 11,673,038 |
| 6.00%, 1/11/19 | Hungary | 1,820,000 | EUR | 2,381,564 |
| A, 6.75%, 11/24/17 | Hungary | 1,457,960,000 | HUF | 5,834,650 |
| A, 5.50%, 12/20/18 | Hungary | 205,390,000 | HUF | 833,299 |
| e senior bond, Reg S, 3.875%, 2/24/20 | Hungary | 285,000 | EUR | 365,124 |
| e senior note, Reg S, 3.50%, 7/18/16 | Hungary | 115,000 | EUR | 132,785 |
| e senior note, Reg S, 4.375%, 7/04/17 | Hungary | 215,000 | EUR | 258,752 |
| e senior note, Reg S, 5.75%, 6/11/18 | Hungary | 695,000 | EUR | 883,744 |
| f Government of Lithuania, 144A, 7.375%, 2/11/20 | Lithuania | 4,670,000 | 5,533,179 | |
| Government of Malaysia, | ||||
| senior bond, 4.262%, 9/15/16 | Malaysia | 18,000,000 | MYR | 4,636,826 |
| senior bond, 4.24%, 2/07/18 | Malaysia | 29,500,000 | MYR | 7,716,970 |
| senior note, 3.172%, 7/15/16 | Malaysia | 37,000,000 | MYR | 9,484,843 |
| senior note, 4.012%, 9/15/17 | Malaysia | 76,500,000 | MYR | 19,885,104 |
| Government of Mexico, | ||||
| 7.25%, 12/15/16 | Mexico | 3,414,390o MXN | 20,268,049 | |
| 7.75%, 12/14/17 | Mexico | 2,600,000o MXN | 15,997,789 | |
| M, 4.75%, 6/14/18 | Mexico | 1,840,000o MXN | 10,772,831 | |
| senior note, 8.50%, 12/13/18 | Mexico | 2,000,000o MXN | 12,746,713 | |
92 Semiannual Report
franklintempleton.com
FRANKLIN INVESTORS SECURITIES TRUST
CONSOLIDATED STATEMENT OF INVESTMENTS (UNAUDITED)
| Franklin Total Return Fund (continued) | ||||
| Principal | ||||
| Country | Amount* | Value | ||
| Foreign Government and Agency Securities (continued) | ||||
| f Government of Serbia, senior note, 144A, 4.875%, 2/25/20 | Serbia | 6,000,000 | $ | 6,158,010 |
| f Government of Spain, senior bond, 144A, 2.75%, 10/31/24 | Spain | 5,700,000 | EUR | 7,240,469 |
| Government of Sri Lanka, | ||||
| A, 6.40%, 8/01/16 | Sri Lanka | 23,800,000 | LKR | 161,556 |
| B, 6.40%, 10/01/16 | Sri Lanka | 18,900,000 | LKR | 127,563 |
| f Government of Ukraine, 144A, | ||||
| 7.75%, 9/01/20 | Ukraine | 292,000 | 281,561 | |
| 7.75%, 9/01/21 | Ukraine | 229,000 | 219,703 | |
| 7.75%, 9/01/22 | Ukraine | 229,000 | 219,130 | |
| 7.75%, 9/01/23 | Ukraine | 229,000 | 218,386 | |
| 7.75%, 9/01/24 | Ukraine | 229,000 | 218,409 | |
| 7.75%, 9/01/25 | Ukraine | 229,000 | 216,691 | |
| 7.75%, 9/01/26 | Ukraine | 229,000 | 215,254 | |
| 7.75%, 9/01/27 | Ukraine | 229,000 | 213,978 | |
| a,p VRI, GDP Linked Securities, 5/31/40 | Ukraine | 474,000 | 148,836 | |
| f Government of Vietnam, 144A, 6.75%, 1/29/20 | Vietnam | 5,120,000 | 5,724,570 | |
| Italy Treasury Bond, 2.50%, 12/01/24 | Italy | 6,000,000 | EUR | 7,524,323 |
| Korea Treasury Bond, senior note, 3.00%, 12/10/16 | South Korea | 21,100,000,000 | KRW | 18,596,430 |
| q Nota Do Tesouro Nacional, Index Linked, 6.00%, 8/15/18 | Brazil | 13,695r BRL | 11,354,762 | |
| f Peru Enhanced Pass-Through Finance Ltd., senior secured bond, A-1, 144A, | ||||
| zero cpn., 5/31/18 | Peru | 363,098 | 350,547 | |
| Total Foreign Government and Agency Securities | ||||
| (Cost $224,969,501) | 207,595,846 | |||
| U.S. Government and Agency Securities 14.4% | ||||
| U.S. Treasury Bond, | ||||
| 6.25%, 8/15/23 | United States | 60,000,000 | 79,282,020 | |
| 5.50%, 8/15/28 | United States | 15,000,000 | 20,751,570 | |
| 6.25%, 5/15/30 | United States | 30,000,000 | 45,451,170 | |
| 4.75%, 2/15/37 | United States | 19,750,000 | 27,709,408 | |
| 3.875%, 8/15/40 | United States | 52,000,000 | 64,731,888 | |
| 4.75%, 2/15/41 | United States | 34,000,000 | 47,959,244 | |
| 3.125%, 2/15/43 | United States | 17,000,000 | 18,683,068 | |
| 2.875%, 5/15/43 | United States | 82,000,000 | 85,805,292 | |
| 2.875%, 8/15/45 | United States | 5,000,000 | 5,215,040 | |
| U.S. Treasury Note, | ||||
| 3.625%, 2/15/21 | United States | 25,000,000 | 27,720,700 | |
| 3.125%, 5/15/21 | United States | 90,000,000 | 97,968,150 | |
| 2.125%, 6/30/21 | United States | 75,000,000 | 77,970,675 | |
| 2.00%, 8/31/21 | United States | 30,000,000 | 30,969,720 | |
| 2.00%, 11/30/22 | United States | 36,900,000 | 37,891,688 | |
| 2.75%, 11/15/23 | United States | 15,000,000 | 16,188,570 | |
| Total U.S. Government and Agency Securities | ||||
| (Cost $669,673,769) | 684,298,203 | |||
| Asset-Backed Securities and Commercial | ||||
| Mortgage-Backed Securities 17.0% | ||||
| Banks 5.4% | ||||
| Banc of America Commercial Mortgage Trust, | ||||
| 2006-4, AJ, 5.695%, 7/10/46 | United States | 10,562,000 | 10,489,665 | |
| 2006-4, AM, 5.675%, 7/10/46 | United States | 7,350,000 | 7,370,374 | |
| h 2007-3, AM, FRN, 5.716%, 6/10/49 | United States | 17,730,000 | 18,258,003 | |
franklintempleton.com
Semiannual Report 93
FRANKLIN INVESTORS SECURITIES TRUST
CONSOLIDATED STATEMENT OF INVESTMENTS (UNAUDITED)
| Franklin Total Return Fund (continued) | ||||
| Principal | ||||
| Country | Amount* | Value | ||
| Asset-Backed Securities and Commercial | ||||
| Mortgage-Backed Securities (continued) | ||||
| Banks (continued) | ||||
| Bear Stearns Commercial Mortgage Securities Inc., | ||||
| h 2006-PW11, AJ, FRN, 5.558%, 3/11/39 | United States | 17,194,000 | $ | 16,469,741 |
| h 2006-PW12, AJ, FRN, 5.973%, 9/11/38 | United States | 3,101,773 | 3,099,022 | |
| 2006-PW13, AJ, 5.611%, 9/11/41 | United States | 9,453,000 | 9,434,881 | |
| h 2007-PW16, AM, FRN, 5.911%, 6/11/40 | United States | 11,110,000 | 11,431,118 | |
| h Capital One Multi-Asset Execution Trust, | ||||
| 2007-A1, A1, FRN, 0.483%, 11/15/19 | United States | 4,400,000 | 4,395,927 | |
| 2007-A2, A2, FRN, 0.513%, 12/16/19 | United States | 26,136,000 | 26,115,350 | |
| h Citibank Credit Card Issuance Trust, | ||||
| 2013-A7, A7, FRN, 0.867%, 9/10/20 | United States | 11,130,000 | 11,162,701 | |
| 2013-A12, A12, FRN, 0.85%, 11/07/18 | United States | 7,050,000 | 7,054,743 | |
| 2014-A3, A3, FRN, 0.637%, 5/09/18 | United States | 5,000,000 | 5,000,258 | |
| Citigroup Commercial Mortgage Trust, 2006-C5, AJ, 5.482%, 10/15/49 | United States | 10,492,000 | 9,430,472 | |
| h Countrywide Asset-Backed Certificates, 2004-1, M1, FRN, 1.189%, 3/25/34 | United States | 1,975,330 | 1,904,132 | |
| Credit Suisse First Boston Mortgage Securities Corp., 2004-6, 3A1, | ||||
| 5.00%, 9/25/19 | United States | 818,701 | 841,998 | |
| f,h Credit Suisse Mortgage Capital Certificates, 2009-15R, 3A1, 144A, FRN, | ||||
| 2.965%, 3/26/36 | United States | 3,859,238 | 3,824,923 | |
| h FNMA, 2005-122, FN, FRN, 0.789%, 1/25/36 | United States | 620,775 | 616,028 | |
| Greenwich Capital Commercial Funding Corp., | ||||
| h 2006-GG7, AJ, FRN, 6.129%, 7/10/38 | United States | 13,910,000 | 12,622,022 | |
| h,s 2006-GG7, AM, FRN, 6.129%, 7/10/38 | United States | 4,685,000 | 4,689,259 | |
| 2007-GG9, A4, 5.444%, 3/10/39 | United States | 15,051,323 | 15,310,098 | |
| JP Morgan Chase Commercial Mortgage Securities Trust, | ||||
| h,s 2006-CB16, B, FRN, 5.672%, 5/12/45 | United States | 6,745,000 | 2,664,275 | |
| 2006-CB17, AM, 5.464%, 12/12/43 | United States | 13,790,000 | 13,661,615 | |
| h,s 2006-LDP7, AJ, FRN, 6.147%, 4/17/45 | United States | 5,193,000 | 3,910,329 | |
| h LB-UBS Commercial Mortgage Trust, 2006-C4, AJ, FRN, 6.116%, 6/15/38 | United States | 11,540,000 | 11,525,863 | |
| h Merrill Lynch Mortgage Investors Trust, 2003-A, 1A, FRN, 1.179%, 3/25/28 | United States | 1,640,303 | 1,559,039 | |
| h Morgan Stanley ABS Capital I Inc. Trust, | ||||
| 2003-HE1, M1, FRN, 1.639%, 5/25/33 | United States | 3,306,138 | 3,151,516 | |
| 2005-WMC, M2, FRN, 1.174%, 1/25/35 | United States | 2,589,081 | 2,519,343 | |
| Morgan Stanley Capital I Trust, | ||||
| f 2005-RR6, AJ, 144A, 5.233%, 5/24/43 | United States | 420,081 | 420,080 | |
| h 2006-HQ8, AJ, FRN, 5.59%, 3/12/44 | United States | 7,018,762 | 7,006,124 | |
| h 2007-IQ16, AM, FRN, 6.256%, 12/12/49 | United States | 16,470,000 | 17,269,948 | |
| h Wachovia Bank Commercial Mortgage Trust, | ||||
| 2006-C25, AJ, FRN, 6.044%, 5/15/43 | United States | 3,611,790 | 3,611,393 | |
| FRN, 6.044%, 5/15/43 | United States | 6,683,000 | 6,671,723 | |
| Wells Fargo Mortgage Backed Securities Trust, | ||||
| h 2004-W, A9, FRN, 2.753%, 11/25/34 | United States | 1,922,025 | 1,946,870 | |
| s 2007-3, 3A1, 5.50%, 4/25/22 | United States | 289,008 | 293,022 | |
| i Weyerhaeuser Mortgage Co., 1984-A, 7.43%, 1/01/24 | United States | 16,622 | 16,622 | |
| 255,748,477 | ||||
| Diversified Financials 11.5% | ||||
| f,h ALM VIII Ltd., 2013-8A, A1A, 144A, FRN, 2.084%, 1/20/26 | Cayman Islands | 3,360,000 | 3,354,254 | |
| h American Express Credit Account Master Trust, | ||||
| 2008-2, A, FRN, 1.693%, 9/15/20 | United States | 15,550,000 | 15,829,794 | |
| 2012-1, A, FRN, 0.703%, 1/15/20 | United States | 8,160,000 | 8,169,198 | |
94 Semiannual Report
franklintempleton.com
FRANKLIN INVESTORS SECURITIES TRUST
CONSOLIDATED STATEMENT OF INVESTMENTS (UNAUDITED)
| Franklin Total Return Fund (continued) | ||||
| Principal | ||||
| Country | Amount* | Value | ||
| Asset-Backed Securities and Commercial | ||||
| Mortgage-Backed Securities (continued) | ||||
| Diversified Financials (continued) | ||||
| h American Express Credit Account Secured Note Trust, 2012-4, A, FRN, | ||||
| 0.673%, 5/15/20 | United States | 11,193,000 | $ | 11,201,585 |
| h American Home Mortgage Investment Trust, 2004-3, 4A, FRN, | ||||
| 2.366%, 10/25/34 | United States | 2,243,776 | 2,190,733 | |
| h,s Ameriquest Mortgage Securities Inc. Asset-Backed Pass-Through Certificates, | ||||
| 2004-R4, M1, FRN, 1.264%, 6/25/34 | United States | 6,743,600 | 6,615,546 | |
| f Apidos CDO, 2013-14A, C2, 144A, 4.85%, 4/15/25 | United States | 8,740,000 | 8,709,148 | |
| f,h Apidos CDO V, 2007-5A, B, 144A, FRN, 1.328%, 4/15/21 | United States | 3,000,000 | 2,895,000 | |
| f,h ARCap REIT Inc., 2004-RR3, A2, 144A, FRN, 4.76%, 9/21/45 | United States | 10,901,599 | 11,035,579 | |
| f,h ARES CLO XII Ltd., 2007-12A, B, 144A, FRN, 1.629%, 11/25/20 | United States | 1,090,000 | 1,074,860 | |
| f,h Ares IIIR/IVR CLO Ltd., 2007-3RA, | ||||
| A2, 144A, FRN, 0.853%, 4/16/21 | United States | 5,797,262 | 5,701,955 | |
| B, 144A, FRN, 1.003%, 4/16/21 | United States | 9,780,000 | 9,375,206 | |
| f,h ARES XI CLO Ltd., 2007-11A, | ||||
| A1B, 144A, FRN, 0.889%, 10/11/21 | United States | 13,312,923 | 13,080,346 | |
| A1C, 144A, FRN, 0.899%, 10/11/21 | United States | 3,229,278 | 3,176,770 | |
| h Argent Securities Inc., 2005-W2, A2C, FRN, 0.799%, 10/25/35 | United States | 5,078,422 | 4,848,729 | |
| f,h Atrium CDO Corp., 10A, | ||||
| A, 144A, FRN, 1.753%, 7/16/25 | United States | 3,890,000 | 3,854,796 | |
| C, 144A, FRN, 3.233%, 7/16/25 | United States | 4,650,000 | 4,516,592 | |
| f,h Atrium IX, 9A, | ||||
| A, 144A, FRN, 1.936%, 2/28/24 | United States | 3,360,000 | 3,342,898 | |
| C, 144A, FRN, 3.886%, 2/28/24 | United States | 3,500,000 | 3,510,045 | |
| f,h Babson CLO Inc., 2007-1A, A1, 144A, FRN, 0.858%, 1/18/21 | United States | 2,272,256 | 2,234,787 | |
| f,h Ballyrock CLO LLC, 2014-1A, B, 144A, FRN, 3.834%, 10/20/26 | United States | 10,000,000 | 9,303,000 | |
| h Bear Stearns Alt-A Trust, 2004-13, A2, FRN, 1.319%, 11/25/34 | United States | 1,174,919 | 1,123,155 | |
| f,h Bluemountain CLO Ltd., 2013-3A, A, 144A, FRN, 2.038%, 10/29/25 | United States | 2,638,970 | 2,630,209 | |
| f,h Bridgeport CLO Ltd., 2006-1A, B, 144A, FRN, 1.285%, 7/21/20 | United States | 2,000,000 | 1,928,840 | |
| f,h Carlyle Global Market Strategies CLO Ltd., 2012-4A, A, 144A, FRN, | ||||
| 2.024%, 1/20/25 | United States | 9,040,000 | 9,017,400 | |
| f,h Carlyle Global Market Strategies Ltd., 2014-2A, B2, 144A, FRN, | ||||
| 2.668%, 5/15/25 | United States | 3,400,000 | 3,390,786 | |
| f,h Catamaran CLO Ltd., 2014-2A, B, 144A, FRN, 3.633%, 10/18/26 | United States | 6,401,000 | 6,233,166 | |
| f,h Cent CDO Ltd., 2007-15A, | ||||
| A2B, 144A, FRN, 0.975%, 3/11/21 | United States | 5,686,824 | 5,447,522 | |
| B, 144A, FRN, 1.355%, 3/11/21 | United States | 8,500,000 | 7,240,725 | |
| f,h Cent CLO 20 Ltd., 2013-20A, C, 144A, FRN, 3.638%, 1/25/26 | United States | 3,500,000 | 3,421,670 | |
| f,h Cent CLO 21 Ltd., 2014-21A, B, 144A, FRN, 3.434%, 7/27/26 | United States | 1,760,000 | 1,698,118 | |
| f,h Cent CLO LP, | ||||
| 2013-17A, D, 144A, FRN, 3.616%, 1/30/25 | United States | 3,500,000 | 3,409,000 | |
| 2013-20A, A, 144A, FRN, 2.118%, 1/25/26 | United States | 3,000,000 | 2,986,650 | |
| f,h Cent CLO, 13-17A, A1, 144A, FRN, 1.916%, 1/30/25 | United States | 16,246,000 | 15,959,746 | |
| h Chase Funding Mortgage Loan Asset-Backed Certificates, 2004-2, 2A2, FRN, | ||||
| 0.939%, 2/25/35 | United States | 625,033 | 549,026 | |
| h Chase Issuance Trust, | ||||
| 2013-A6, A6, FRN, 0.853%, 7/15/20 | United States | 17,443,000 | 17,470,058 | |
| 2014-A3, A3, FRN, 0.633%, 5/15/18 | United States | 22,980,000 | 22,980,216 | |
| f,h CIFC Funding Ltd., 2007-3A, A1J, 144A, FRN, 1.036%, 7/26/21 | United States | 16,495,000 | 16,253,348 | |
| f,h Colony American Homes, | ||||
| 2014-1A, A, 144A, FRN, 1.586%, 5/17/31 | United States | 9,703,409 | 9,626,328 | |
| 2014-2A, C, 144A, FRN, 2.336%, 7/17/31 | United States | 10,105,000 | 9,925,358 | |
franklintempleton.com
Semiannual Report 95
FRANKLIN INVESTORS SECURITIES TRUST
CONSOLIDATED STATEMENT OF INVESTMENTS (UNAUDITED)
| Franklin Total Return Fund (continued) | ||||
| Principal | ||||
| Country | Amount* | Value | ||
| Asset-Backed Securities and Commercial | ||||
| Mortgage-Backed Securities (continued) | ||||
| Diversified Financials (continued) | ||||
| f Colony MFM Trust, 2014-1, A, 144A, 2.543%, 4/20/50 | United States | 12,166,658 | $ | 12,115,025 |
| f,h Cornerstone CLO Ltd., 2007-1A, B, 144A, FRN, 1.578%, 7/15/21 | United States | 8,986,000 | 8,716,420 | |
| f Countryplace Manufactured Housing Contract Trust, 2005-A3, 144A, | ||||
| 4.80%, 12/15/35 | United States | 146,851 | 147,323 | |
| f,h CT CDO IV Ltd., 2006-4A, A1, 144A, FRN, 0.749%, 10/20/43 | United States | 849,690 | 847,855 | |
| f,h Dryden 33 Senior Loan Fund, 2014-33A, A, 144A, FRN, 2.108%, 7/15/26 | United States | 6,460,000 | 6,443,979 | |
| f,h Eaton Vance CDO Ltd., 2014-1A, | ||||
| A, 144A, FRN, 2.078%, 7/15/26 | United States | 10,096,000 | 10,027,549 | |
| B, 144A, FRN, 2.678%, 7/15/26 | United States | 1,813,400 | 1,774,321 | |
| C, 144A, FRN, 3.628%, 7/15/26 | United States | 1,558,600 | 1,521,365 | |
| f,h Eleven Madison Trust Mortgage Trust, 2015-11MD, A, 144A, FRN, | ||||
| 3.673%, 9/10/35 | United States | 3,255,000 | 3,480,407 | |
| f Emerson Park CLO Ltd., 2013-1A, C2, 144A, 5.64%, 7/15/25 | United States | 2,920,000 | 2,951,828 | |
| h FHLMC Structured Agency Credit Risk Debt Notes, | ||||
| 2014-DN1, M3, FRN, 4.939%, 2/25/24 | United States | 9,075,000 | 9,348,600 | |
| 2014-DN3, M3, FRN, 4.439%, 8/25/24 | United States | 3,028,000 | 2,989,984 | |
| 2014-DN4, M3, FRN, 4.989%, 10/25/24 | United States | 9,500,000 | 9,789,607 | |
| 2015-DN1, M3, FRN, 4.589%, 1/25/25 | United States | 9,310,000 | 9,868,850 | |
| 2015-DNA1, M3, FRN, 3.739%, 10/25/27 | United States | 3,920,000 | 3,900,128 | |
| 2015-HQ1, M3, FRN, 4.239%, 3/25/25 | United States | 2,000,000 | 2,028,347 | |
| f G-Force LLC, 2005-RRA, C, 144A, 5.20%, 8/22/36 | United States | 9,275,000 | 8,975,649 | |
| f,h Galaxy XV CLO Ltd., 2013-15A, A, 144A, FRN, 1.878%, 4/15/25 | United States | 15,465,000 | 15,293,493 | |
| s GMAC Commercial Mortgage Securities Inc., 2005-C1, B, 4.936%, 5/10/43 | United States | 9,302,507 | 1,557,614 | |
| f,h Goldman Sachs Asset Management CLO PLC, 2007-1A, C, 144A, FRN, | ||||
| 1.716%, 8/01/22 | United States | 1,560,000 | 1,537,942 | |
| Green Tree Financial Corp., 1996-9, M1, 7.63%, 8/15/27 | United States | 3,085,984 | 3,372,991 | |
| Greenpoint Manufactured Housing, 1999-3, 1A7, 7.27%, 6/15/29 | United States | 13,406,953 | 13,287,591 | |
| h,s GSAA Home Equity Trust, 2005-5, M3, FRN, 1.384%, 2/25/35 | United States | 3,550,000 | 3,379,942 | |
| f Highbridge Loan Management Ltd., 2013-2A, B2, 144A, 5.80%, 10/20/24 | United States | 2,620,000 | 2,648,034 | |
| h Home Equity Mortgage Trust, 2004-4, M3, FRN, 1.414%, 12/25/34 | United States | 3,619,040 | 3,402,446 | |
| f,h Invitation Homes Trust, | ||||
| 2014-SFR3, C, 144A, FRN, 2.936%, 12/17/31 | United States | 1,250,000 | 1,251,963 | |
| 2015-SFR1, B, 144A, FRN, 2.286%, 3/17/32 | United States | 7,400,000 | 7,372,251 | |
| 2015-SFR2, C, 144A, FRN, 2.436%, 6/17/32 | United States | 2,340,000 | 2,296,538 | |
| 2015-SFR3, C, 144A, FRN, 2.436%, 8/17/32 | United States | 10,402,000 | 10,189,531 | |
| f,h Katonah Ltd., 2007-IA, A2L, 144A, FRN, 2.138%, 4/23/22 | United States | 5,416,684 | 5,373,513 | |
| f,h Landmark IX CDO Ltd., 2007-9A, C, 144A, FRN, 1.328%, 4/15/21 | United States | 2,190,000 | 2,121,168 | |
| f,h LCM XI LP, 11A, B, 144A, FRN, 2.783%, 4/19/22 | United States | 10,000,000 | 10,050,900 | |
| h Merrill Lynch Mortgage Investors Trust, 2004-A1, M1, FRN, 2.804%, 2/25/34 | United States | 1,635,362 | 1,275,380 | |
| f,h Mountain View CLO II Ltd., 2006-2A, C, 144A, FRN, 1.331%, 1/12/21 | United States | 4,000,000 | 3,810,080 | |
| f,h Newcastle CDO Ltd., 2004-5A, 1, 144A, FRN, 0.968%, 12/24/39 | United States | 73,812 | 73,725 | |
| f,h NZCG Funding Ltd., 2015-2A, A1, 144A, FRN, 2.184%, 4/27/27 | United States | 18,215,625 | 18,146,770 | |
| f,h Octagon Investment Partners XXIII Ltd., 15-1A, | ||||
| A1, 144A, FRN, 2.048%, 7/15/27 | United States | 7,581,042 | 7,505,004 | |
| A2, 144A, FRN, 2.048%, 7/15/27 | United States | 7,197,192 | 7,125,004 | |
| f,h Progress Residential Trust, 2015-SFR1, A, 144A, FRN, 1.836%, 2/17/32 | United States | 6,130,000 | 6,131,551 | |
| Residential Asset Securities Corp., 2001-KS2, AI5, 7.514%, 6/25/31 | United States | 7,750 | 8,049 | |
| f,h Silverado CLO 2006-II Ltd., 2006-2A, B, 144A, FRN, 1.323%, 10/16/20 | United States | 9,000,000 | 8,577,540 | |
| h Structured Asset Securities Corp., 2002-1A, 2A1, FRN, 1.868%, 2/25/32 | United States | 21,978 | 19,938 | |
| f,h Tricon American Homes Trust, 2015-SFR1, C, 144A, FRN, 2.336%, 5/17/32 | United States | 8,170,000 | 7,910,148 | |
96 Semiannual Report
franklintempleton.com
FRANKLIN INVESTORS SECURITIES TRUST
CONSOLIDATED STATEMENT OF INVESTMENTS (UNAUDITED)
| Franklin Total Return Fund (continued) | ||||
| Principal | ||||
| Country | Amount* | Value | ||
| Asset-Backed Securities and Commercial | ||||
| Mortgage-Backed Securities (continued) | ||||
| Diversified Financials (continued) | ||||
| f,h Trimaran CLO VII Ltd., 2007-1A, A2L, 144A, FRN, 1.004%, 6/15/21 | United States | 2,000,000 | $ | 1,955,000 |
| f,h Veritas CLO Ltd., 2006-2A, A2, 144A, FRN, 0.959%, 7/11/21 | United States | 1,125,872 | 1,121,188 | |
| f,h Voya CLO Ltd., | ||||
| 2013-3A, A2, 144A, FRN, 2.433%, 1/18/26 | United States | 900,000 | 885,240 | |
| 2014-4A, A1, 144A, FRN, 2.13%, 10/14/26 | Cayman Islands | 6,420,000 | 6,403,950 | |
| 2015-1A, A1, 144A, FRN, 2.113%, 4/18/27 | United States | 3,790,000 | 3,788,219 | |
| f,h Voya CLO II Ltd., 2006-2A, C, 144A, FRN, 1.316%, 8/01/20 | United States | 3,500,000 | 3,408,230 | |
| f,h West CLO Ltd., 2014-1A, | ||||
| A2, 144A, FRN, 2.733%, 7/18/26 | United States | 2,860,000 | 2,771,798 | |
| B, 144A, FRN, 3.483%, 7/18/26 | United States | 7,540,000 | 7,008,430 | |
| f,h Westchester CLO Ltd., 2007-1A, A1A, 144A, FRN, 0.841%, 8/01/22 | United States | 2,007,143 | 1,982,475 | |
| f,h Ziggurat CLO I Ltd., 2014-1A, C, 144A, FRN, 3.733%, 10/17/26 | United States | 2,000,000 | 1,963,720 | |
| 545,246,735 | ||||
| Insurance 0.0%† | ||||
| f,h Voya CLO III Ltd., 2006-3A, B, 144A, FRN, 1.313%, 12/13/20 | United States | 2,000,000 | 1,970,000 | |
| Real Estate 0.1% | ||||
| f,h American Homes 4 Rent, 2014-SFR1, A, 144A, FRN, 1.686%, 6/17/31 | United States | 2,360,142 | 2,332,462 | |
| f,h Citigroup Mortgage Loan Trust Inc., 2013-A, A, 144A, FRN, 3.00%, 5/25/42 | United States | 3,933,353 | 3,914,453 | |
| 6,246,915 | ||||
| Total Asset-Backed Securities and Commercial Mortgage- | ||||
| Backed Securities (Cost $813,699,041) | 809,212,127 | |||
| Mortgage-Backed Securities 21.3% | ||||
| h Federal Home Loan Mortgage Corp. (FHLMC) Adjustable Rate 0.1% | ||||
| FHLMC, 1.914% - 3.455%, 3/01/25 - 10/01/36 | United States | 3,189,631 | 3,309,580 | |
| Federal Home Loan Mortgage Corp. (FHLMC) Fixed Rate 4.1% | ||||
| FHLMC 30 Year, 6.00%, 6/01/37 | United States | 66,413 | 75,804 | |
| FHLMC 30 Year, 6.50%, 8/01/25 - 11/01/31 | United States | 96,366 | 109,849 | |
| FHLMC 30 Year, 7.00%, 7/01/31 | United States | 6,907 | 7,340 | |
| FHLMC 30 Year, 8.00%, 2/01/30 | United States | 30,600 | 35,471 | |
| FHLMC 30 Year, 8.50%, 10/01/24 | United States | 6,528 | 7,595 | |
| FHLMC Gold 15 Year, 5.00%, 10/01/17 - 9/01/18 | United States | 39,522 | 40,722 | |
| FHLMC Gold 15 Year, 5.50%, 11/01/22 | United States | 171,779 | 181,163 | |
| FHLMC Gold 15 Year, 6.00%, 2/01/17 - 9/01/22 | United States | 482,724 | 518,774 | |
| m FHLMC Gold 30 Year, 3.50%, 5/01/46 | United States | 105,000,000 | 109,962,891 | |
| m FHLMC Gold 30 Year, 4.00%, 5/01/46 | United States | 53,500,000 | 57,123,775 | |
| FHLMC Gold 30 Year, 4.50%, 3/01/39 | United States | 2,803,332 | 3,058,216 | |
| FHLMC Gold 30 Year, 5.00%, 8/01/33 - 2/01/39 | United States | 18,669,528 | 20,542,648 | |
| FHLMC Gold 30 Year, 5.50%, 1/01/35 - 12/01/37 | United States | 1,554,960 | 1,745,142 | |
| FHLMC Gold 30 Year, 6.00%, 5/01/33 - 4/01/38 | United States | 2,040,314 | 2,324,078 | |
| FHLMC Gold 30 Year, 6.50%, 4/01/28 - 3/01/39 | United States | 1,474,383 | 1,727,476 | |
| FHLMC Gold 30 Year, 7.00%, 1/01/28 - 7/01/32 | United States | 105,249 | 122,813 | |
| FHLMC Gold 30 Year, 7.50%, 3/01/32 | United States | 24,028 | 29,134 | |
| FHLMC Gold 30 Year, 8.50%, 8/01/30 | United States | 4,035 | 4,745 | |
| FHLMC Gold 30 Year, 9.00%, 1/01/22 | United States | 2,907 | 2,939 | |
| FHLMC Gold 30 Year, 10.00%, 10/01/30 | United States | 16,486 | 16,780 | |
| 197,637,355 | ||||
franklintempleton.com
Semiannual Report 97
FRANKLIN INVESTORS SECURITIES TRUST
CONSOLIDATED STATEMENT OF INVESTMENTS (UNAUDITED)
| Franklin Total Return Fund (continued) | ||||
| Principal | ||||
| Country | Amount* | Value | ||
| h Federal National Mortgage Association (FNMA) | ||||
| Adjustable Rate 0.2% | ||||
| FNMA, 1.915% - 4.103%, 6/01/17 - 3/01/37 | United States | 7,152,044 | $ | 7,549,943 |
| Federal National Mortgage Association (FNMA) Fixed Rate 11.5% | ||||
| FNMA 15 Year, 4.50%, 3/01/19 - 6/01/19 | United States | 114,085 | 117,595 | |
| FNMA 15 Year, 5.00%, 6/01/18 - 7/01/18 | United States | 86,284 | 89,192 | |
| FNMA 15 Year, 5.50%, 12/01/16 - 12/01/23 | United States | 305,264 | 326,693 | |
| FNMA 15 Year, 6.00%, 6/01/17 - 9/01/22 | United States | 77,718 | 81,292 | |
| FNMA 15 Year, 6.50%, 9/01/16 | United States | 39 | 39 | |
| m FNMA 30 Year, 3.50%, 5/01/46 | United States | 207,500,000 | 217,460,898 | |
| m FNMA 30 Year, 4.00%, 5/01/46 | United States | 231,200,000 | 247,004,654 | |
| m FNMA 30 Year, 4.50%, 5/01/46 | United States | 49,500,000 | 53,900,859 | |
| FNMA 30 Year, 5.00%, 6/01/36 - 5/01/39 | United States | 2,653,549 | 2,938,529 | |
| FNMA 30 Year, 5.50%, 6/01/33 - 8/01/37 | United States | 9,818,443 | 11,158,966 | |
| FNMA 30 Year, 6.00%, 9/01/32 - 9/01/38 | United States | 13,456,892 | 15,378,282 | |
| FNMA 30 Year, 6.50%, 5/01/28 - 5/01/37 | United States | 360,676 | 414,076 | |
| FNMA 30 Year, 7.00%, 11/01/25 | United States | 4,109 | 4,172 | |
| FNMA 30 Year, 7.50%, 1/01/30 | United States | 16,704 | 20,705 | |
| FNMA 30 Year, 8.50%, 4/01/30 - 5/01/32 | United States | 96,826 | 121,878 | |
| FNMA 30 Year, 9.00%, 11/01/26 - 5/01/27 | United States | 116,286 | 127,324 | |
| 549,145,154 | ||||
| h Government National Mortgage Association (GNMA) | ||||
| Adjustable Rate 0.0%† | ||||
| GNMA, 2.00%, 1/20/23 - 10/20/26 | United States | 56,056 | 57,959 | |
| Government National Mortgage Association (GNMA) | ||||
| Fixed Rate 5.4% | ||||
| GNMA I SF 30 Year, 6.00%, 1/15/39 | United States | 259,507 | 292,629 | |
| GNMA I SF 30 Year, 6.50%, 10/15/31 - 7/15/38 | United States | 54,521 | 64,731 | |
| GNMA I SF 30 Year, 7.00%, 10/15/27 - 6/15/31 | United States | 44,136 | 51,475 | |
| GNMA I SF 30 Year, 7.50%, 2/15/17 - 5/15/26 | United States | 135,924 | 141,118 | |
| GNMA I SF 30 Year, 9.00%, 9/15/25 - 1/15/31 | United States | 1,763 | 1,841 | |
| m GNMA II SF 30 Year, 3.00%, 5/01/46 | United States | 50,000,000 | 51,755,856 | |
| m GNMA II SF 30 Year, 3.50%, 5/01/46 | United States | 191,000,000 | 201,706,528 | |
| GNMA II SF 30 Year, 6.00%, 5/20/31 | United States | 6,498 | 7,511 | |
| GNMA II SF 30 Year, 6.50%, 3/20/28 - 7/20/38 | United States | 672,387 | 792,604 | |
| GNMA II SF 30 Year, 7.50%, 8/20/30 - 1/20/33 | United States | 75,887 | 91,848 | |
| 254,906,141 | ||||
| Total Mortgage-Backed Securities | ||||
| (Cost $1,007,201,839) | 1,012,606,132 | |||
| Municipal Bonds 1.6% | ||||
| California State GO, Various Purpose, 6.00%, 11/01/39 | United States | 2,385,000 | 2,784,249 | |
| Chicago Transit Authority Sales and Transfer Tax Receipts Revenue, Pension | ||||
| Funding, Series A, 6.899%, 12/01/40 | United States | 800,000 | 983,304 | |
| Connecticut State GO, Series B, 5.00%, 4/15/18 | United States | 650,000 | 702,773 | |
| Industry Public Facilities Authority Tax Allocation Revenue, Transportation | ||||
| District, Industrial Redevelopment Project No. 2, Refunding, Series B, AGMC | ||||
| Insured, 4.294%, 1/01/23 | United States | 10,000,000 | 10,557,800 | |
| Minnesota State GO, Various Purpose, Refunding, Series F, 4.00%, 10/01/24 | United States | 5,760,000 | 6,766,042 | |
| New Jersey EDA Revenue, School Facilities Construction, Refunding, Series NN, | ||||
| 5.00%, 3/01/30 | United States | 3,300,000 | 3,558,555 | |
98 Semiannual Report
franklintempleton.com
FRANKLIN INVESTORS SECURITIES TRUST
CONSOLIDATED STATEMENT OF INVESTMENTS (UNAUDITED)
| Franklin Total Return Fund (continued) | ||||||
| Principal | ||||||
| Country | Amount* | Value | ||||
| Municipal Bonds (continued) | ||||||
| Port Authority of New York and New Jersey Revenue, Consolidated, | ||||||
| One Hundred Ninety-First Series, 4.823%, 6/01/45 | United States | 11,040,000 | $ | 11,640,355 | ||
| Series 192, 4.81%, 10/15/65 | United States | 15,000,000 | 17,185,350 | |||
| Puerto Rico Electric Power Authority Power Revenue, Series A, | ||||||
| 6.75%, 7/01/36 | United States | 12,000,000 | 7,170,000 | |||
| Puerto Rico Sales Tax FICO Sales Tax Revenue, first subordinate, Series A, | ||||||
| 6.50%, 8/01/44 | United States | 9,005,000 | 3,815,869 | |||
| University of California Revenue, Limited Project, Refunding, Series J, | ||||||
| 4.131%, 5/15/45 | United States | 10,750,000 | 11,018,750 | |||
| Total Municipal Bonds (Cost $80,721,134) | 76,183,047 | |||||
| Shares | ||||||
| Escrows and Litigation Trusts 0.0%† | ||||||
| a,i Comfort Co. Inc., Escrow Account | United States | 716 | 350 | |||
| a,i Motors Liquidation Co., Escrow Account, cvt. pfd., C | United States | 43,500 | — | |||
| a,i NewPage Corp., Escrow Account | United States | 2,500,000 | — | |||
| Total Escrows and Litigation Trusts (Cost $2,307) | 350 | |||||
| Number of | ||||||
| Exchange | Contracts | |||||
| Options Purchased 0.0%† | ||||||
| Calls – Exchange-Traded | ||||||
| Options on Interest Rate Futures 0.0%† | ||||||
| Euro-Bund, May Strike Price 164 EUR, Expires 5/26/16 | EUX | 230 | EUR | 44,776 | ||
| Euro-Bund, May Strike Price 164.50 EUR, Expires 5/26/16 | EUX | 59 | EUR | 7,432 | ||
| Total Options Purchased (Cost $357,706) | 52,208 | |||||
| Total Investments before Short Term Investments | ||||||
| (Cost $4,777,070,828) | 4,768,655,581 | |||||
| Country | Shares | |||||
| Short Term Investments (Cost $823,534,323) 17.3% | ||||||
| Money Market Funds 17.3% | ||||||
| a,d Institutional Fiduciary Trust Money Market Portfolio | United States | 823,534,323 | 823,534,323 | |||
| Total Investments (Cost $5,600,605,151) 117.4% | 5,592,189,904 | |||||
| Other Assets, less Liabilities (17.4)% | (829,295,099 | ) | ||||
| Net Assets 100.0% | $ | 4,762,894,805 | ||||
franklintempleton.com
Semiannual Report 99
FRANKLIN INVESTORS SECURITIES TRUST
CONSOLIDATED STATEMENT OF INVESTMENTS (UNAUDITED)
Franklin Total Return Fund (continued)
†Rounds to less than 0.1% of net assets.
*The principal amount is stated in U.S. dollars unless otherwise indicated.
aNon-income producing.
bThe security is owned by FT Holdings Corporation I, a wholly-owned subsidiary of the Fund. See Note 1(f).
cAt April 30, 2016, pursuant to the Fund’s policies and the requirements of applicable securities law, the Fund is restricted from trading these securities at period end.
dSee Note 3(f) regarding investments in affiliated management investment companies.
eSecurity was purchased pursuant to Regulation S under the Securities Act of 1933, which exempts from registration securities offered and sold outside of the United States.
Such a security cannot be sold in the United States without either an effective registration statement filed pursuant to the Securities Act of 1933, or pursuant to an exemption
from registration. These securities have been deemed liquid under guidelines approved by the Trust’s Board of Trustees. At April 30, 2016, the aggregate value of these secu-
rities was $71,519,435, representing 1.50% of net assets.
fSecurity was purchased pursuant to Rule 144A under the Securities Act of 1933 and may be sold in transactions exempt from registration only to qualified institutional buyers
or in a public offering registered under the Securities Act of 1933. These securities have been deemed liquid under guidelines approved by the Trust’s Board of Trustees. At
April 30, 2016, the aggregate value of these securities was $825,230,313, representing 17.33% of net assets.
gPerpetual security with no stated maturity date.
hThe coupon rate shown represents the rate at period end.
iSecurity has been deemed illiquid because it may not be able to be sold within seven days. At April 30, 2016, the aggregate value of these securities was $25,974, represent-
ing less than 0.01% of net assets.
jSee Note 7 regarding defaulted securities.
kSee Note 1(e) regarding loan participation notes.
lSee Note 1(h) regarding senior floating rate interests.
mA portion or all of the security purchased on a when-issued, delayed delivery, or to-be-announced (TBA) basis. See Note 1(c).
nIncome may be received in additional securities and/or cash.
oPrincipal amount is stated in 100 Mexican Peso Units.
pThe principal represents the notional amount. See Note 1(d) regarding value recovery instruments.
qRedemption price at maturity is adjusted for inflation. See Note 1(j).
rPrincipal amount is stated in 1,000 Brazilian Real Units.
sThe bond pays interest and/or principal based upon the issuer’s ability to pay, which may be less than the stated interest rate or principal paydown.
100 Semiannual Report
franklintempleton.com
FRANKLIN INVESTORS SECURITIES TRUST
CONSOLIDATED STATEMENT OF INVESTMENTS (UNAUDITED)
| Franklin Total Return Fund (continued) | |||||||||||||
| At April 30, 2016, the Fund had the following financial futures contracts outstanding. See Note 1(d). | |||||||||||||
| Financial Futures Contracts | |||||||||||||
| Number of | Notional | Expiration | Unrealized | Unrealized | |||||||||
| Description | Type | Contracts | Value | Date | Appreciation | Depreciation | |||||||
| Interest Rate Contracts | |||||||||||||
| Australian 10 Yr. Bond | Long | 650 | $ | 64,563,562 | 6/15/16 | $ | 455,782 | $ | — | ||||
| Canadian 5 Yr. Bond | Long | 543 | 53,579,060 | 6/21/16 | — | (576,160 | ) | ||||||
| U.S. Treasury 2 Yr. Note | Short | 476 | 104,065,500 | 6/30/16 | — | (187,127 | ) | ||||||
| Total Financial Futures Contracts | $ | 455,782 | $ | (763,287 | ) | ||||||||
| Net unrealized appreciation (depreciation) | $ | (307,505 | ) | ||||||||||
| At April 30, 2016, the Fund had the following forward exchange contracts outstanding. See Note 1(d). | |||||||||||||
| Forward Exchange Contracts | |||||||||||||
| Contract | Settlement | Unrealized | Unrealized | ||||||||||
| Currency | Counterpartya Type | Quantity | Amount | Date | Appreciation | Depreciation | |||||||
| OTC Forward Exchange Contracts | |||||||||||||
| South Korean Won | JPHQ | Sell | 21,600,000,000 | $ | 17,366,834 | 5/20/16 | $ | — | $ | (1,487,124 | ) | ||
| Australian Dollar | DBAB | Sell | 9,789,527 | 7,082,919 | 6/16/16 | — | (344,694 | ) | |||||
| Euro | DBAB | Buy | 36,238,555 | 39,521,406 | 6/16/16 | 2,040,372 | — | ||||||
| Euro | DBAB | Sell | 124,202,131 | 136,771,387 | 6/16/16 | — | (5,675,279 | ) | |||||
| Euro | JPHQ | Sell | 966,580 | 1,065,099 | 6/16/16 | — | (43,466 | ) | |||||
| Euro | MSCO | Sell | 5,621,360 | 6,191,366 | 6/16/16 | — | (255,738 | ) | |||||
| Japanese Yen | JPHQ | Sell | 3,094,000,360 | 25,605,167 | 6/16/16 | — | (3,493,004 | ) | |||||
| Malaysian Ringgit | DBAB | Buy | 3,367,980 | 787,003 | 6/16/16 | 74,430 | — | ||||||
| Malaysian Ringgit | HSBC | Buy | 790,000 | 184,506 | 6/16/16 | 17,553 | — | ||||||
| Euro | DBAB | Sell | 10,260,000 | 13,583,727 | 8/05/16 | 1,797,713 | — | ||||||
| Australian Dollar | DBAB | Sell | 33,150,000 | 23,778,382 | 8/18/16 | — | (1,310,470 | ) | |||||
| Euro | BZWS | Sell | 2,472,961 | 2,705,236 | 8/18/16 | — | (136,869 | ) | |||||
| Euro | CITI | Sell | 2,584,200 | 2,826,438 | 8/18/16 | — | (143,512 | ) | |||||
| Euro | DBAB | Buy | 13,358,813 | 15,051,374 | 8/18/16 | 301,538 | — | ||||||
| Euro | DBAB | Sell | 121,622,792 | 134,352,718 | 8/18/16 | — | (5,424,980 | ) | |||||
| Euro | GSCO | Sell | 1,024,000 | 1,165,261 | 8/18/16 | — | (11,594 | ) | |||||
| Euro | JPHQ | Sell | 19,330,124 | 21,976,556 | 8/18/16 | — | (239,019 | ) | |||||
| Hungarian Forint | DBAB | Sell | 4,332,000,000 | 15,767,635 | 8/18/16 | — | (120,002 | ) | |||||
| Indian Rupee | DBAB | Buy | 631,935,000 | 9,218,600 | 8/18/16 | 122,214 | — | ||||||
| Indonesian Rupiah | DBAB | Buy | 139,844,100,000 | 9,984,585 | 8/18/16 | 415,181 | — | ||||||
| Japanese Yen | CITI | Sell | 1,431,560,000 | 12,209,696 | 8/18/16 | — | (1,282,513 | ) | |||||
| Japanese Yen | DBAB | Buy | 10,515,000,000 | 90,230,009 | 8/18/16 | 8,872,071 | — | ||||||
| Japanese Yen | DBAB | Sell | 15,105,288,120 | 129,749,969 | 8/18/16 | — | (12,614,794 | ) | |||||
| Japanese Yen | HSBC | Sell | 1,038,822,700 | 9,059,017 | 8/18/16 | — | (731,710 | ) | |||||
| Japanese Yen | JPHQ | Sell | 3,005,271,000 | 26,208,880 | 8/18/16 | — | (2,115,287 | ) | |||||
| New Zealand Dollar | DBAB | Buy | 112,392,053 | 77,553,511 | 8/18/16 | 585,841 | (99,730 | ) | |||||
| New Zealand Dollar | DBAB | Sell | 112,392,053 | 73,695,469 | 8/18/16 | — | (4,344,152 | ) | |||||
| South Korean Won | DBAB | Buy | 4,151,000,000 | 3,467,691 | 8/18/16 | 149,659 | — | ||||||
| South Korean Won | DBAB | Sell | 4,151,000,000 | 3,352,447 | 8/18/16 | — | (264,903 | ) | |||||
| Japanese Yen | JPHQ | Sell | 743,278,833 | 7,020,294 | 9/02/16 | 201,283 | (190,190 | ) | |||||
| Australian Dollar | DBAB | Sell | 36,198,000 | 25,404,261 | 10/20/16 | — | (1,924,689 | ) | |||||
| Canadian Dollar | DBAB | Sell | 4,900,000 | 3,864,993 | 10/20/16 | — | (42,205 | ) | |||||
| Euro | BZWS | Sell | 1,973,970 | 2,238,581 | 10/20/16 | — | (35,207 | ) | |||||
| Euro | CITI | Sell | 615,870 | 697,717 | 10/20/16 | — | (11,695 | ) | |||||
| Euro | DBAB | Sell | 6,009,460 | 6,879,029 | 10/20/16 | — | (43,184 | ) | |||||
| Euro | HSBC | Sell | 267,000 | 302,770 | 10/20/16 | — | (4,783 | ) | |||||
| Euro | JPHQ | Sell | 3,445,999 | 3,905,109 | 10/20/16 | — | (64,289 | ) | |||||
| Hungarian Forint | JPHQ | Sell | 935,000,000 | 3,184,063 | 10/20/16 | — | (245,062 | ) | |||||
| Indian Rupee | DBAB | Buy | 260,000,000 | 3,796,175 | 10/20/16 | 8,226 | — | ||||||
| Japanese Yen | DBAB | Sell | 117,763,200 | 1,066,705 | 10/20/16 | — | (45,809 | ) | |||||
| Mexican Peso | DBAB | Sell | 72,000,000 | 4,094,049 | 10/20/16 | — | (25,348 | ) | |||||
franklintempleton.com
Semiannual Report 101
FRANKLIN INVESTORS SECURITIES TRUST
CONSOLIDATED STATEMENT OF INVESTMENTS (UNAUDITED)
| Franklin Total Return Fund (continued) | |||||||||||
| Forward Exchange Contracts (continued) | |||||||||||
| Contract | Settlement | Unrealized | Unrealized | ||||||||
| Currency | Counterpartya Type | Quantity | Amount | Date | Appreciation | Depreciation | |||||
| OTC Forward Exchange Contracts (continued) | |||||||||||
| Philippine Peso | JPHQ | Buy | 177,480,000 | $ | 3,741,935 | 10/20/16 | $ | — | $ | (17,589 | ) |
| Polish Zloty | DBAB | Buy | 43,363,122 | 10,866,044 | 10/20/16 | 473,495 | — | ||||
| Polish Zloty | DBAB | Sell | 43,363,122 | 11,098,828 | 10/20/16 | — | (240,710 | ) | |||
| Total Forward Exchange Contracts | $ | 15,059,576 | $ | (43,029,600 | ) | ||||||
| Net unrealized appreciation (depreciation) | $ | (27,970,024 | ) | ||||||||
| aMay be comprised of multiple contracts with the same counterparty, currency and settlement date. | |||||||||||
| At April 30, 2016, the Fund had the following credit default swap contracts outstanding. See Note 1(d). | |||||||||||
| Credit Default Swap Contracts | ||||||||||||||||||
| Unamortized | ||||||||||||||||||
| Periodic | Upfront | |||||||||||||||||
| Payment Counterparty/ | Notional | Expiration | Payments | Unrealized | Unrealized | �� | ||||||||||||
| Description | Rate | Exchange | Amounta | Date | (Receipts) Appreciation | Depreciation | Value | Ratingb | ||||||||||
| Centrally Cleared Swap Contracts | ||||||||||||||||||
| Contracts to Sell Protectionc | ||||||||||||||||||
| Traded Index | ||||||||||||||||||
| CDX.NA.IG.24 | 1.00 | % | ICE | 25,000,000 | 6/20/25 | $ | (53,529 | ) | $ | — | $ | (353,067 | ) | $ | (406,596 | ) | Investment | |
| Grade | ||||||||||||||||||
| CDX.NA.IG.26 | 1.00 | % | ICE | 32,400,000 | 6/20/21 | 384,032 | 12,184 | — | 396,216 | Investment | ||||||||
| Grade | ||||||||||||||||||
| ITRX.EUR.25 | 1.00 | % | ICE | 20,650,000 | EUR | 6/20/21 | 234,562 | 105,924 | — | 340,486 | Investment | |||||||
| Grade | ||||||||||||||||||
| ITRX.EUR.SNRFIN.S25 | 1.00 | % | ICE | 52,250,000 | EUR | 6/20/21 | 369,864 | — | (2,248 | ) | 367,616 | Investment | ||||||
| Grade | ||||||||||||||||||
| Total Centrally Cleared Swap Contracts | 934,929 | 118,108 | (355,315 | ) | 697,722 | |||||||||||||
| OTC Swap Contracts | ||||||||||||||||||
| Contracts to Buy Protection | ||||||||||||||||||
| Single Name | ||||||||||||||||||
| Avon Products Inc | 5.00 | % | GSCO | 18,500,000 | 3/20/20 | $ | 2,361,375 | $ | — | $ | (476,414 | ) | $ | 1,884,961 | ||||
| Bank of America Corp | 1.00 | % | FBCO | 20,000,000 | 9/20/17 | 83,673 | — | (254,143 | ) | (170,470 | ) | |||||||
| Beazer Homes USA Inc | 5.00 | % | CITI | 4,000,000 | 6/20/19 | (147,818 | ) | 245,597 | — | 97,779 | ||||||||
| Beazer Homes USA Inc | 5.00 | % | GSCO | 5,000,000 | 6/20/19 | (194,994 | ) | 317,218 | — | 122,224 | ||||||||
| Canadian Natural Resources Ltd | 5.00 | % | GSCO | 5,400,000 | 6/20/17 | (223,814 | ) | — | (77,857 | ) | (301,671 | ) | ||||||
| Centex Corp | 5.00 | % | FBCO | 7,795,000 | 6/20/16 | (27,255 | ) | — | (71,454 | ) | (98,709 | ) | ||||||
| Centex Corp | 5.00 | % | JPHQ | 12,000,000 | 6/20/16 | (50,222 | ) | — | (101,736 | ) | (151,958 | ) | ||||||
| Constellation Brands Inc | 5.00 | % | BZWS | 3,000,000 | 6/20/17 | (104,537 | ) | — | (79,790 | ) | (184,327 | ) | ||||||
| Constellation Brands Inc | 5.00 | % | DBAB | 2,000,000 | 6/20/17 | (70,170 | ) | — | (52,715 | ) | (122,885 | ) | ||||||
| Constellation Brands Inc | 5.00 | % | GSCO | 6,000,000 | 9/20/16 | (108,430 | ) | — | (41,802 | ) | (150,232 | ) | ||||||
| CSC Holdings LLC | 5.00 | % | GSCO | 3,000,000 | 9/20/18 | (147,681 | ) | — | (99,082 | ) | (246,763 | ) | ||||||
| CSC Holdings LLC | 5.00 | % | GSCO | 9,000,000 | 3/20/19 | (344,194 | ) | — | (415,660 | ) | (759,854 | ) | ||||||
| Dell Inc | 5.00 | % | GSCO | 10,000,000 | 6/20/16 | (57,950 | ) | — | (51,171 | ) | (109,121 | ) | ||||||
| DPL Inc | 5.00 | % | MSCO | 337,000 | 12/20/16 | (7,070 | ) | — | (4,430 | ) | (11,500 | ) | ||||||
| El Paso Corp | 5.00 | % | GSCO | 1,100,000 | 6/20/17 | (47,293 | ) | — | (18,275 | ) | (65,568 | ) | ||||||
| Embarq Corp | 5.00 | % | BZWS | 10,000,000 | 6/20/16 | (36,250 | ) | — | (89,617 | ) | (125,867 | ) | ||||||
| Embarq Corp | 5.00 | % | GSCO | 10,000,000 | 6/20/16 | (40,816 | ) | — | (85,051 | ) | (125,867 | ) | ||||||
| Hartford Financial Services | ||||||||||||||||||
| Group Inc | 1.00 | % | CITI | 13,000,000 | 12/21/20 | (155,952 | ) | — | (129,422 | ) | (285,374 | ) | ||||||
| The Hertz Corp | 5.00 | % | FBCO | 5,000,000 | 6/20/18 | (318,431 | ) | — | (64,995 | ) | (383,426 | ) | ||||||
| International Lease Finance Corp | 5.00 | % | GSCO | 12,000,000 | 3/20/17 | (392,655 | ) | — | (117,187 | ) | (509,842 | ) | ||||||
| Kinder Morgan Energy Partners LP | 5.00 | % | CITI | 12,300,000 | 3/20/18 | (867,392 | ) | — | (115,364 | ) | (982,756 | ) | ||||||
| Kinder Morgan Energy Partners LP | 5.00 | % | CITI | 1,000,000 | 3/20/20 | (168,987 | ) | 34,161 | — | (134,826 | ) | |||||||
102 Semiannual Report
franklintempleton.com
FRANKLIN INVESTORS SECURITIES TRUST
CONSOLIDATED STATEMENT OF INVESTMENTS (UNAUDITED)
| Franklin Total Return Fund (continued) | ||||||||||||||||||
| Credit Default Swap Contracts (continued) | ||||||||||||||||||
| Unamortized | ||||||||||||||||||
| Periodic | Upfront | |||||||||||||||||
| Payment Counterparty/ | Notional | Expiration | Payments | Unrealized | Unrealized | |||||||||||||
| Description | Rate | Exchange | Amounta | Date | (Receipts) Appreciation | Depreciation | Value Ratingb | |||||||||||
| OTC Swap Contracts (continued) | ||||||||||||||||||
| Contracts to Buy Protection (continued) | ||||||||||||||||||
| Single Name (continued) | ||||||||||||||||||
| Lanxess AG | 1.00 | % | CITI | 10,400,000 | EUR | 12/20/20 | $ | 86,440 | $ | — | $ | (302,987 | ) | $ | (216,547 | ) | ||
| Lennar Corp | 5.00 | % | CITI | 4,150,000 | 9/20/19 | (317,378 | ) | — | (207,980 | ) | (525,358 | ) | ||||||
| Lennar Corp | 5.00 | % | CITI | 6,200,000 | 12/20/19 | (570,122 | ) | — | (241,168 | ) | (811,290 | ) | ||||||
| Lennar Corp | 5.00 | % | FBCO | 4,500,000 | 9/20/19 | (446,497 | ) | — | (123,168 | ) | (569,665 | ) | ||||||
| Lennar Corp | 5.00 | % | GSCO | 3,900,000 | 12/20/20 | (366,647 | ) | — | (188,509 | ) | (555,156 | ) | ||||||
| The New York Times Co | 5.00 | % | GSCO | 11,700,000 | 12/20/16 | (134,861 | ) | — | (306,496 | ) | (441,357 | ) | ||||||
| Owens-Illinois Inc | 5.00 | % | CITI | 9,200,000 | 6/20/18 | (752,169 | ) | — | (241,839 | ) | (994,008 | ) | ||||||
| Pactiv LLC | 5.00 | % | UBSW | 12,000,000 | 6/20/17 | 199,676 | — | (847,211 | ) | (647,535 | ) | |||||||
| PHH Corp | 5.00 | % | GSCO | 5,400,000 | 9/20/19 | 31,795 | 46,768 | — | 78,563 | |||||||||
| PPL Energy Supply LLC | 5.00 | % | GSCO | 1,000,000 | 6/20/16 | (6,089 | ) | — | (4,106 | ) | (10,195 | ) | ||||||
| PPL Energy Supply LLC | 5.00 | % | JPHQ | 11,400,000 | 6/20/16 | (68,157 | ) | — | (48,063 | ) | (116,220 | ) | ||||||
| Rite Aid Corp | 5.00 | % | JPHQ | 7,000,000 | 12/20/20 | (1,170,280 | ) | 8,011 | — | (1,162,269 | ) | |||||||
| Springleaf Finance Corp | 5.00 | % | BZWS | 1,000,000 | 12/20/21 | (10,241 | ) | 15,929 | — | 5,688 | ||||||||
| Springleaf Finance Corp | 5.00 | % | GSCO | 10,000,000 | 9/20/16 | (139,819 | ) | — | (48,298 | ) | (188,117 | ) | ||||||
| Springleaf Finance Corp | 5.00 | % | GSCO | 1,200,000 | 6/20/20 | (59,974 | ) | 27,985 | — | (31,989 | ) | |||||||
| Springleaf Finance Corp | 5.00 | % | JPHQ | 4,000,000 | 9/20/16 | (55,919 | ) | — | (19,328 | ) | (75,247 | ) | ||||||
| Tenet Healthcare Corp | 5.00 | % | BZWS | 9,400,000 | 12/20/16 | (182,210 | ) | — | (138,887 | ) | (321,097 | ) | ||||||
| Tenet Healthcare Corp | 5.00 | % | BZWS | 3,000,000 | 3/20/19 | (209,755 | ) | — | (34,361 | ) | (244,116 | ) | ||||||
| Tenet Healthcare Corp | 5.00 | % | DBAB | 4,000,000 | 3/20/19 | (302,657 | ) | — | (22,831 | ) | (325,488 | ) | ||||||
| Toys R Us Inc | 5.00 | % | DBAB | 14,000,000 | 12/20/18 | 2,728,153 | — | (1,117,685 | ) | 1,610,468 | ||||||||
| Toys R Us Inc | 5.00 | % | GSCO | 14,800,000 | 12/20/18 | 3,512,846 | — | (1,810,351 | ) | 1,702,495 | ||||||||
| Yum! Brands Inc | 5.00 | % | CITI | 2,000,000 | 3/20/18 | (144,719 | ) | — | (26,248 | ) | (170,967 | ) | ||||||
| Yum! Brands Inc | 5.00 | % | FBCO | 2,000,000 | 3/20/18 | (142,321 | ) | — | (28,646 | ) | (170,967 | ) | ||||||
| Contracts to Sell Protectionc | ||||||||||||||||||
| Single Name | ||||||||||||||||||
| Bank of America Corp | 1.00 | % | FBCO | 20,000,000 | 9/20/17 | (83,673 | ) | 254,143 | — | 170,470 | BBB+ | |||||||
| Beazer Homes USA Inc | 5.00 | % | CITI | 4,150,000 | 9/20/19 | 57,292 | — | (220,532 | ) | (163,240 | ) | CCC+ | ||||||
| Beazer Homes USA Inc | 5.00 | % | CITI | 6,200,000 | 12/20/19 | 128,648 | — | (459,343 | ) | (330,695 | ) | CCC+ | ||||||
| Beazer Homes USA Inc | 5.00 | % | GSCO | 3,900,000 | 12/20/20 | (421,634 | ) | 24,532 | — | (397,102 | ) | CCC+ | ||||||
| Electricite de France SA | 1.00 | % | BZWS | 10,500,000 | EUR | 9/20/20 | 237,819 | — | (50,193 | ) | 187,626 | A+ | ||||||
| Engie | 1.00 | % | BZWS | 10,500,000 | EUR | 9/20/20 | 293,710 | — | (20,752 | ) | 272,958 | A- | ||||||
| Freeport-McMoRan Inc | 1.00 | % | DBAB | 6,500,000 | 3/20/23 | (323,197 | ) | — | (1,119,021 | ) | (1,442,218 | ) | BB | |||||
| Government of China | 1.00 | % | GSCO | 10,600,000 | 9/20/20 | 21,910 | — | (53,551 | ) | (31,641 | ) | AA- | ||||||
| Government of Mexico | 1.00 | % | CITI | 8,400,000 | 6/20/20 | (83,213 | ) | — | (2,956 | ) | (86,169 | ) | BBB+ | |||||
| iHeartCommunications Inc | 5.00 | % | BZWS | 5,000,000 | 6/20/18 | (758,089 | ) | — | (2,179,927 | ) | (2,938,016 | ) | CC | |||||
| MetLife Inc | 1.00 | % | CITI | 13,000,000 | 12/21/20 | (361,041 | ) | 306,206 | — | (54,835 | ) | A- | ||||||
| Orange SA | 1.00 | % | CITI | 10,500,000 | EUR | 9/20/20 | 192,479 | 28,027 | — | 220,506 | BBB+ | |||||||
| Prudential Financial Inc | 1.00 | % | BOFA | 8,800,000 | 12/20/21 | (146,820 | ) | 10,461 | — | (136,359 | ) | A | ||||||
| Solvay SA | 1.00 | % | CITI | 10,400,000 | EUR | 12/20/20 | (260,738 | ) | 366,420 | — | 105,682 | BBB- | ||||||
| Tenet Healthcare Corp | 5.00 | % | BZWS | 9,400,000 | 12/20/18 | 332,863 | 453,874 | — | 786,737 | CCC+ | ||||||||
| Total OTC Swap Contracts | (761,452 | ) | 2,139,332 | (12,210,602 | ) | (10,832,722 | ) | |||||||||||
| Total Credit Default Swap Contracts | $ | 173,477 | $ | 2,257,440 | $ | (12,565,917 | ) | $ | (10,135,000 | ) | ||||||||
| Net unrealized appreciation (depreciation) | $ | (10,308,477 | ) | |||||||||||||||
aIn U.S. dollars unless otherwise indicated. For contracts to sell protection, the notional amount is equal to the maximum potential amount of the future payments and no
recourse provisions have been entered into in association with the contracts.
bBased on Standard and Poor’s (S&P) Rating for single name swaps and internal ratings for index swaps. Internal ratings based on mapping into equivalent ratings from
external vendors.
cThe Fund enters contracts to sell protection to create a long credit position. Performance triggers include default, bankruptcy or restructuring for single name swaps, and fail-
ure to pay or bankruptcy of the underlying securities for traded index swaps.
franklintempleton.com
Semiannual Report 103
FRANKLIN INVESTORS SECURITIES TRUST
CONSOLIDATED STATEMENT OF INVESTMENTS (UNAUDITED)
| Franklin Total Return Fund (continued) | ||||||||
| At April 30, 2016, the Fund had the following cross-currency swap contracts outstanding. See Note 1(d). | ||||||||
| Cross-Currency Swap Contracts | ||||||||
| Notional | Expiration | Unrealized | Unrealized | |||||
| Description | Counterparty | Amount | Date | Appreciation | Depreciation | |||
| OTC Swap Contracts | ||||||||
| Receive Floating Quarterly 3-month BBA USD LIBOR + 3.29% | 12,760,417 | USD | $— | $ | (123,420 | ) | ||
| JPHQ | 10/13/17 | |||||||
| Pay Fixed Annual 2.125% | 12,250,000 | CHF | ||||||
| Net unrealized appreciation (depreciation) | $ | (123,420 | ) | |||||
See Notes 6 and 10 regarding investment transactions and other derivative information, respectively.
See Abbreviations on page 132.
104 Semiannual Report | The accompanying notes are an integral part of these financial statements. franklintempleton.com
FRANKLIN INVESTORS SECURITIES TRUST
| Financial Statements | ||||||||||||
| Statements of Assets and Liabilities | ||||||||||||
| April 30, 2016 (unaudited) | ||||||||||||
| Franklin | Franklin | Franklin | ||||||||||
| Adjustable U.S. | Floating Rate | Low Duration | Franklin | |||||||||
| Government | Daily Access | Total Return | Total Return | |||||||||
| Securities Fund | Fund | Fund | Fund* | |||||||||
| Assets: | ||||||||||||
| Investments in securities: | ||||||||||||
| Cost - Unaffiliated issuers | $ | 1,441,595,511 | $ | 2,936,913,408 | $ | 2,443,549,406 | $ | 4,699,636,518 | ||||
| Cost - Controlled affiliates (Note 3f) | — | — | — | 49,445,350 | ||||||||
| Cost - Non-controlled affiliates (Note 3f) | 39,753,347 | 187,596,154 | 98,033,158 | 851,523,283 | ||||||||
| Total cost of investments | $ | 1,481,348,858 | $ | 3,124,509,562 | $ | 2,541,582,564 | $ | 5,600,605,151 | ||||
| Value - Unaffiliated issuers | $ | 1,446,917,384 | $ | 2,739,851,818 | $ | 2,435,095,600 | $ | 4,691,948,217 | ||||
| Value - Controlled affiliates (Note 3f) | — | — | — | 48,936,900 | ||||||||
| Value - Non-controlled affiliates (Note 3f) | 39,753,347 | 187,596,154 | 97,877,071 | 851,304,787 | ||||||||
| Total value of investments | 1,486,670,731 | 2,927,447,972 | 2,532,972,671 | 5,592,189,904 | ||||||||
| Cash | — | 13,673,907 | 501,185 | 3,041,036 | ||||||||
| Foreign currency, at value (cost $—, $—, $16,403,169 | ||||||||||||
| and $68,428,744) | — | — | 16,451,164 | 68,619,321 | ||||||||
| Receivables: | ||||||||||||
| Investment securities sold | 8,039,835 | 23,953,554 | 7,217,572 | 15,133,051 | ||||||||
| Capital shares sold | 3,980,540 | 12,388,554 | 5,501,330 | 10,549,823 | ||||||||
| Dividends and interest | 3,704,718 | 12,291,390 | 12,269,554 | 34,832,045 | ||||||||
| Due from brokers | — | — | 14,448,910 | 34,459,344 | ||||||||
| OTC swap contracts (Upfront payments $—, $—, $5,270,868 | ||||||||||||
| and $14,985,428) | — | — | 3,670,957 | 10,268,679 | ||||||||
| Unrealized appreciation on OTC forward exchange contracts | — | — | 4,639,082 | 15,059,576 | ||||||||
| Unrealized appreciation on OTC swap contracts | — | — | 1,202,861 | 2,139,332 | ||||||||
| Other assets | 950 | 1,772 | 1,649 | 4,214 | ||||||||
| Total assets | 1,502,396,774 | 2,989,757,149 | 2,598,876,935 | 5,786,296,325 | ||||||||
| Liabilities: | ||||||||||||
| Payables: | ||||||||||||
| Investment securities purchased | — | 42,805,108 | 6,427,906 | 942,201,401 | ||||||||
| Capital shares redeemed | 3,317,767 | 7,252,943 | 20,826,235 | 9,080,007 | ||||||||
| Management fees | 612,689 | 1,173,466 | 718,657 | 1,605,219 | ||||||||
| Distribution fees | 337,071 | 563,229 | 452,590 | 1,025,109 | ||||||||
| Transfer agent fees | 440,723 | 641,763 | 558,990 | 1,650,842 | ||||||||
| Variation margin | — | — | 267,542 | 267,066 | ||||||||
| Distributions to shareholders | 113,418 | 2,769,957 | 195,180 | 147,030 | ||||||||
| Trustees’ fees and expenses | 1,159 | 2,145 | 7,731 | 2,270 | ||||||||
| OTC swap contracts (Upfront receipts $—, $—, $13,677,411 | ||||||||||||
| and $23,670,782) | — | — | 7,273,459 | 11,030,131 | ||||||||
| Unrealized depreciation on OTC forward exchange contracts | — | — | 10,647,205 | 43,029,600 | ||||||||
| Unrealized depreciation on OTC swap contracts | — | — | 4,556,954 | 12,334,022 | ||||||||
| Unrealized depreciation on unfunded loan commitments (Note 9) | — | 112,143 | 88,507 | 193,334 | ||||||||
| Accrued expenses and other liabilities | 149,495 | 1,072,965 | 395,732 | 835,489 | ||||||||
| Total liabilities | 4,972,322 | 56,393,719 | 52,416,688 | 1,023,401,520 | ||||||||
| Net assets, at value | $ | 1,497,424,452 | $ | 2,933,363,430 | $ | 2,546,460,247 | $ | 4,762,894,805 | ||||
| Net assets consist of: | ||||||||||||
| Paid-in capital | $ | 1,643,779,106 | $ | 3,444,258,375 | $ | 2,643,362,059 | $ | 4,887,754,262 | ||||
| Undistributed net investment income (distributions in excess of net | ||||||||||||
| investment income) | (7,383,207 | ) | 2,506,023 | (11,832,988 | ) | (9,689,105 | ) | |||||
| Net unrealized appreciation (depreciation) | 5,321,873 | (197,173,733 | ) | (19,388,782 | ) | (48,555,691 | ) | |||||
| Accumulated net realized gain (loss) | (144,293,320 | ) | (316,227,235 | ) | (65,680,042 | ) | (66,614,661 | ) | ||||
| Net assets, at value | $ | 1,497,424,452 | $ | 2,933,363,430 | $ | 2,546,460,247 | $ | 4,762,894,805 | ||||
| *Consolidated financial statement. See Note 1(f). | ||||||||||||
franklintempleton.com The accompanying notes are an integral part of these financial statements. | Semiannual Report 105
FRANKLIN INVESTORS SECURITIES TRUST
FINANCIAL STATEMENTS
| Statements of Assets and Liabilities (continued) | ||||||||
| April 30, 2016 (unaudited) | ||||||||
| Franklin | Franklin | Franklin | ||||||
| Adjustable U.S. | Floating Rate | Low Duration | Franklin | |||||
| Government | Daily Access | Total Return | Total Return | |||||
| Securities Fund | Fund | Fund | Fund* | |||||
| Class A: | ||||||||
| Net assets, at value | $ | 768,818,305 | $ | 1,347,530,108 | $ | 1,607,478,752 | $ | 3,701,296,021 |
| Shares outstanding | 91,190,532 | 158,476,620 | 164,100,723 | 379,831,431 | ||||
| Net asset value per sharea | $ | 8.43 | $ | 8.50 | $ | 9.80 | $ | 9.74 |
| Maximum offering price per share (net asset value per share ÷ | ||||||||
| 97.75%, 97.75%, 97.75% and 95.75%, respectively) | $ | 8.62 | $ | 8.70 | $ | 10.03 | $ | 10.17 |
| Class A1: | ||||||||
| Net assets, at value | $ | 178,907,450 | ||||||
| Shares outstanding | 21,227,150 | |||||||
| Net asset value per sharea | $ | 8.43 | ||||||
| Maximum offering price per share (net asset value per | ||||||||
| share ÷ 97.75%) | $ | 8.62 | ||||||
| Class C: | ||||||||
| Net assets, at value | $ | 302,464,945 | $ | 541,459,828 | $ | 227,204,340 | $ | 451,884,678 |
| Shares outstanding | 35,901,604 | 63,665,253 | 23,246,802 | 46,564,409 | ||||
| Net asset value and maximum offering price per sharea | $ | 8.42 | $ | 8.50 | $ | 9.77 | $ | 9.70 |
| Class R: | ||||||||
| Net assets, at value | $ | 66,644,173 | ||||||
| Shares outstanding | 6,853,927 | |||||||
| Net asset value and maximum offering price per share | $ | 9.72 | ||||||
| Class R6: | ||||||||
| Net assets, at value | $ | 2,284,138 | $ | 9,412,150 | $ | 554,956,446 | $ | 75,347,742 |
| Shares outstanding | 270,659 | 1,107,050 | 56,421,011 | 7,698,557 | ||||
| Net asset value and maximum offering price per share | $ | 8.44 | $ | 8.50 | $ | 9.84 | $ | 9.79 |
| Advisor Class: | ||||||||
| Net assets, at value | $ | 244,949,614 | $ | 1,034,961,344 | $ | 156,820,709 | $ | 467,722,191 |
| Shares outstanding | 29,027,733 | 121,669,314 | 15,947,498 | 47,802,412 | ||||
| Net asset value and maximum offering price per share | $ | 8.44 | $ | 8.51 | $ | 9.83 | $ | 9.78 |
*Consolidated financial statement. See Note 1(f).
aRedemption price is equal to net asset value less contingent deferred sales charges, if applicable.
106 Semiannual Report | The accompanying notes are an integral part of these financial statements. franklintempleton.com
FRANKLIN INVESTORS SECURITIES TRUST
FINANCIAL STATEMENTS
| Statements of Operations | ||||||||||||
| for the six months ended April 30, 2016 (unaudited) | ||||||||||||
| Franklin | Franklin | Franklin | ||||||||||
| Adjustable U.S. | Floating Rate | Low Duration | Franklin | |||||||||
| Government | Daily Access | Total Return | Total Return | |||||||||
| Securities Fund | Fund | Fund | Fund* | |||||||||
| Investment income: | ||||||||||||
| Dividends: | ||||||||||||
| Unaffiliated issuers | $ | — | $ | 195,960 | $ | 8,964 | $ | 560,399 | ||||
| Controlled affiliates (Note 3f) | — | — | — | 388,715 | ||||||||
| Non-controlled affiliates (Note 3f) | — | — | 1,219,316 | 790,051 | ||||||||
| Interest | 17,782,428 | 89,503,336 | 30,444,227 | 72,407,606 | ||||||||
| Paydown gain (loss) | (6,834,090 | ) | — | (3,016,390 | ) | 386,916 | ||||||
| Total investment income | 10,948,338 | 89,699,296 | 28,656,117 | 74,533,687 | ||||||||
| Expenses: | ||||||||||||
| Management fees (Note 3a) | 3,946,873 | 7,780,024 | 6,254,370 | 10,816,601 | ||||||||
| Distribution fees: (Note 3c) | ||||||||||||
| Class A | 1,008,935 | 1,737,815 | 2,007,829 | 4,430,423 | ||||||||
| Class A1 | 88,703 | — | — | — | ||||||||
| Class C | 1,038,621 | 1,823,288 | 728,676 | 1,431,489 | ||||||||
| Class R | — | — | — | 168,835 | ||||||||
| Transfer agent fees: (Note 3e) | ||||||||||||
| Class A | 521,742 | 747,753 | 1,362,776 | 2,766,750 | ||||||||
| Class A1 | 120,846 | — | — | — | ||||||||
| Class C | 206,189 | 301,751 | 190,173 | 343,873 | ||||||||
| Class R | — | — | — | 52,700 | ||||||||
| Class R6 | 130 | 125 | 191 | 590 | ||||||||
| Advisor Class | 169,804 | 602,024 | 127,951 | 379,767 | ||||||||
| Custodian fees (Note 4) | 7,846 | 13,763 | 31,987 | 103,491 | ||||||||
| Reports to shareholders | 85,692 | 135,654 | 108,207 | 320,638 | ||||||||
| Registration and filing fees | 78,285 | 94,888 | 111,422 | 160,133 | ||||||||
| Professional fees | 27,302 | 54,505 | 47,620 | 78,587 | ||||||||
| Trustees’ fees and expenses | 11,340 | 22,538 | 15,884 | 29,046 | ||||||||
| Other | 98,418 | 41,585 | 113,910 | 183,667 | ||||||||
| Total expenses | 7,410,726 | 13,355,713 | 11,100,996 | 21,266,590 | ||||||||
| Expense reductions (Note 4) | — | (1,137 | ) | (1,969 | ) | (5,033 | ) | |||||
| Expenses waived/paid by affiliates (Note 3f and 3g) | (28,926 | ) | (141,863 | ) | (1,849,849 | ) | (1,337,487 | ) | ||||
| Net expenses | 7,381,800 | 13,212,713 | 9,249,178 | 19,924,070 | ||||||||
| Net investment income | 3,566,538 | 76,486,583 | 19,406,939 | 54,609,617 | ||||||||
| Realized and unrealized gains (losses): | ||||||||||||
| Net realized gain (loss) from: | ||||||||||||
| Investments | 269,934 | (34,974,616 | ) | (13,933,084 | ) | (35,688,246 | ) | |||||
| Written options | — | — | 307,231 | 655,836 | ||||||||
| Foreign currency transactions | — | — | 396,006 | (1,789,293 | ) | |||||||
| Futures contracts | — | — | (971,432 | ) | 3,848,610 | |||||||
| Swap contracts | — | 204,965 | (3,269,944 | ) | (6,006,499 | ) | ||||||
| Net realized gain (loss) | 269,934 | (34,769,651 | ) | (17,471,223 | ) | (38,979,592 | ) | |||||
| Net change in unrealized appreciation (depreciation) on: | ||||||||||||
| Investments | (14,714,579 | ) | (21,735,586 | ) | 22,033,215 | 86,483,956 | ||||||
| Translation of other assets and liabilities denominated in | ||||||||||||
| foreign currencies | — | — | (10,001,629 | ) | (34,540,195 | ) | ||||||
| Written options | — | — | (308,273 | ) | (659,146 | ) | ||||||
| Futures contracts | — | — | (287,928 | ) | (171,486 | ) | ||||||
| Swap contracts | — | 47,565 | (4,435,912 | ) | (10,786,773 | ) | ||||||
| Net change in unrealized appreciation (depreciation) | (14,714,579 | ) | (21,688,021 | ) | 6,999,473 | 40,326,356 | ||||||
| Net realized and unrealized gain (loss) | (14,444,645 | ) | (56,457,672 | ) | (10,471,750 | ) | 1,346,764 | |||||
| Net increase (decrease) in net assets resulting from operations | $ | (10,878,107 | ) | $ | 20,028,911 | $ | 8,935,189 | $ | 55,956,381 | |||
| *Consolidated financial statement. See Note 1(f). | ||||||||||||
franklintempleton.com The accompanying notes are an integral part of these financial statements. | Semiannual Report 107
FRANKLIN INVESTORS SECURITIES TRUST
FINANCIAL STATEMENTS
| Statements of Changes in Net Assets | ||||||||||||
| Franklin Adjustable U.S. | Franklin Floating Rate | |||||||||||
| Government Securities Fund | Daily Access Fund | |||||||||||
| Six Months Ended | Six Months Ended | |||||||||||
| April 30, 2016 | Year Ended | April 30, 2016 | Year Ended | |||||||||
| (unaudited) | October 31, 2015 | (unaudited) | October 31, 2015 | |||||||||
| Increase (decrease) in net assets: | ||||||||||||
| Operations: | ||||||||||||
| Net investment income | $ | 3,566,538 | $ | 7,386,710 | $ | 76,486,583 | $ | 181,670,130 | ||||
| Net realized gain (loss) | 269,934 | 3,977,176 | (34,769,651 | ) | (57,017,412 | ) | ||||||
| Net change in unrealized | ||||||||||||
| appreciation (depreciation) | (14,714,579 | ) | (16,455,279 | ) | (21,688,021 | ) | (139,672,972 | ) | ||||
| Net increase (decrease) in net assets | ||||||||||||
| resulting from operations | (10,878,107 | ) | (5,091,393 | ) | 20,028,911 | (15,020,254 | ) | |||||
| Distributions to shareholders from: | ||||||||||||
| Net investment income: | ||||||||||||
| Class A | (5,459,294 | ) | (11,496,470 | ) | (34,400,323 | ) | (75,905,826 | ) | ||||
| Class A1 | (1,412,374 | ) | (2,962,707 | ) | — | — | ||||||
| Class C | (1,522,504 | ) | (2,804,429 | ) | (12,761,774 | ) | (27,606,089 | ) | ||||
| Class R6 | (19,560 | ) | (71,457 | ) | (369 | ) | (4,174 | ) | ||||
| Advisor Class | (2,105,460 | ) | (5,038,156 | ) | (29,149,545 | ) | (76,936,149 | ) | ||||
| Total distributions to shareholders | (10,519,192 | ) | (22,373,219 | ) | (76,312,011 | ) | (180,452,238 | ) | ||||
| Capital share transactions: (Note 2) | ||||||||||||
| Class A | (69,177,117 | ) | (195,883,210 | ) | (182,492,792 | ) | (239,383,605 | ) | ||||
| Class A1 | (17,218,732 | ) | (51,188,248 | ) | — | — | ||||||
| Class C | (29,451,242 | ) | (86,549,659 | ) | (76,991,235 | ) | (81,761,761 | ) | ||||
| Class R6 | 139,335 | (4,959,369 | ) | 9,402,739 | (451,181 | ) | ||||||
| Advisor Class | (60,170,478 | ) | (103,191,545 | ) | (346,464,736 | ) | (534,150,566 | ) | ||||
| Total capital share transactions | (175,878,234 | ) | (441,772,031 | ) | (596,546,024 | ) | (855,747,113 | ) | ||||
| Net increase (decrease) in net assets | (197,275,533 | ) | (469,236,643 | ) | (652,829,124 | ) | (1,051,219,605 | ) | ||||
| Net assets: | ||||||||||||
| Beginning of period | 1,694,699,985 | 2,163,936,628 | 3,586,192,554 | 4,637,412,159 | ||||||||
| End of period | $ | 1,497,424,452 | $ | 1,694,699,985 | $ | 2,933,363,430 | $ | 3,586,192,554 | ||||
| Undistributed net investment income (distributions | ||||||||||||
| in excess of net investment income) included in | ||||||||||||
| net assets: | ||||||||||||
| End of period | $ | (7,383,207 | ) | $ | (430,553 | ) | $ | 2,506,023 | $ | 2,331,451 | ||
108 Semiannual Report | The accompanying notes are an integral part of these financial statements. franklintempleton.com
FRANKLIN INVESTORS SECURITIES TRUST
FINANCIAL STATEMENTS
| Statements of Changes in Net Assets | ||||||||||||
| Franklin Low Duration | Franklin | |||||||||||
| Total Return Fund | Total Return Fund* | |||||||||||
| Six Months Ended | Six Months Ended | |||||||||||
| April 30, 2016 | Year Ended | April 30, 2016 | Year Ended | |||||||||
| (unaudited) | October 31, 2015 | (unaudited) | October 31, 2015 | |||||||||
| Increase (decrease) in net assets: | ||||||||||||
| Operations: | ||||||||||||
| Net investment income | $ | 19,406,939 | $ | 33,091,804 | $ | 54,609,617 | $ | 108,016,847 | ||||
| Net realized gain (loss) | (17,471,223 | ) | 10,086,678 | (38,979,592 | ) | 105,081,761 | ||||||
| Net change in unrealized | ||||||||||||
| appreciation (depreciation) | 6,999,473 | (41,785,644 | ) | 40,326,356 | (215,394,420 | ) | ||||||
| Net increase (decrease) in net assets resulting | ||||||||||||
| from operations | 8,935,189 | 1,392,838 | 55,956,381 | (2,295,812 | ) | |||||||
| Distributions to shareholders from: | ||||||||||||
| Net investment income and net foreign currency gains: | ||||||||||||
| Class A | (24,438,222 | ) | (31,970,213 | ) | (86,787,269 | ) | (102,580,350 | ) | ||||
| Class C | (3,012,407 | ) | (3,021,768 | ) | (10,282,905 | ) | (12,390,512 | ) | ||||
| Class R | — | — | (1,637,026 | ) | (1,874,785 | ) | ||||||
| Class R6 | (8,519,430 | ) | (11,544,553 | ) | (1,811,413 | ) | (1,493,816 | ) | ||||
| Advisor Class | (2,398,947 | ) | (3,636,737 | ) | (12,965,801 | ) | (38,204,478 | ) | ||||
| Total distributions to shareholders | (38,369,006 | ) | (50,173,271 | ) | (113,484,414 | ) | (156,543,941 | ) | ||||
| Capital share transactions: (Note 2) | ||||||||||||
| Class A | (28,703,216 | ) | 98,528,651 | 216,277,432 | 417,940,997 | |||||||
| Class C | 18,469,706 | 49,157,590 | 13,395,972 | 25,914,042 | ||||||||
| Class R | — | — | (2,885,042 | ) | 13,325,622 | |||||||
| Class R6 | 51,612,835 | 99,586,210 | 7,308,114 | 44,485,978 | ||||||||
| Advisor Class | 8,020,543 | (45,036,986 | ) | (51,509,049 | ) | (717,785,422 | ) | |||||
| Total capital share transactions | 49,399,868 | 202,235,465 | 182,587,427 | (216,118,783 | ) | |||||||
| Net increase (decrease) in net assets | 19,966,051 | 153,455,032 | 125,059,394 | (374,958,536 | ) | |||||||
| Net assets: | ||||||||||||
| Beginning of period | 2,526,494,196 | 2,373,039,164 | 4,637,835,411 | 5,012,793,947 | ||||||||
| End of period | $ | 2,546,460,247 | $ | 2,526,494,196 | $ | 4,762,894,805 | $ | 4,637,835,411 | ||||
| Undistributed net investment income (distributions in | ||||||||||||
| excess of net investment income) included in | ||||||||||||
| net assets: | ||||||||||||
| End of period | $ | (11,832,988 | ) | $ | 7,129,079 | $ | (9,689,105 | ) | $ | 49,185,692 | ||
*Consolidated financial statement. See Note 1(f).
franklintempleton.com The accompanying notes are an integral part of these financial statements. | Semiannual Report 109
FRANKLIN INVESTORS SECURITIES TRUST
Notes to Financial Statements (unaudited)
1. Organization and Significant Accounting Policies
Franklin Investors Securities Trust (Trust) is registered under the Investment Company Act of 1940 (1940 Act) as an open-end management investment company, consisting of eight separate funds, four of which are included in this report (Funds) and applies the specialized accounting and reporting guidance in U.S. Generally Accepted Accounting Principles (U.S. GAAP). The financial statements of the remaining funds in the Trust are presented separately. The classes of shares offered within each of the Funds are indicated below. Each class of shares differs by its initial sales load, contingent deferred sales charges, voting rights on matters affecting a single class, its exchange privilege and fees primarily due to differing arrangements for distribution and transfer agent fees.
| Class A, Class A1, Class C, Class R6 & Advisor Class |
| Franklin Adjustable U.S. Government Securities Fund |
| Class A, Class C, Class R6 & Advisor Class |
| Franklin Floating Rate Daily Access Fund |
| Franklin Low Duration Total Return Fund |
| Class A, Class C, Class R, Class R6 & Advisor Class |
| Franklin Total Return Fund |
The following summarizes the Funds’ significant accounting policies.
a. Financial Instrument Valuation
The Funds’ investments in financial instruments are carried at fair value daily. Fair value is the price that would be received to sell an asset or paid to transfer a liability in an orderly transaction between market participants on the measurement date. The Funds calculate the net asset value (NAV) per share as of 4 p.m. Eastern time each day the New York Stock Exchange (NYSE) is open for trading. Under compliance policies and procedures approved by the Trust’s Board of Trustees (the Board), the Funds’ administrator has responsibility for oversight of valuation, including leading the cross-functional Valuation and Liquidity Oversight Committee (VLOC). The VLOC provides administration and oversight of the Funds’ valuation policies and procedures, which are approved annually by the Board. Among other things, these procedures allow the Funds to utilize independent pricing services, quotations from securities and financial instrument dealers, and other market sources to determine fair value.
Equity securities, exchange traded funds and derivative financial instruments (derivatives) listed on an exchange or on the NASDAQ National Market System are valued at the last quoted sale price or the official closing price of the day, respectively. Foreign equity securities and foreign exchange traded derivatives are valued as of the close of trading on the foreign stock exchange on which the security is primarily traded or as of 4 p.m. Eastern time whichever is earlier. The value is then converted into its U.S. dollar equivalent at the foreign exchange rate in effect at 4 p.m. Eastern time on the day that the value of the security is determined. Over-the-counter (OTC) securities are valued within the range of the most recent quoted bid and ask prices. Securities that trade in multiple markets or on multiple exchanges are valued according to the broadest and most representative market. Certain equity securities are valued based upon fundamental characteristics or relationships to similar securities.
Debt securities generally trade in the OTC market rather than on a securities exchange. The Funds’ pricing services use multiple valuation techniques to determine fair value. In instances where sufficient market activity exists, the pricing services may utilize a market-based approach through which quotes from market makers are used to determine fair value. In instances where sufficient market activity may not exist or is limited, the pricing services also utilize proprietary valuation models which may consider market characteristics such as benchmark yield curves, credit spreads, estimated default rates, anticipated market interest rate volatility, coupon rates, anticipated timing of principal repayments, underlying collateral, and other unique security features in order to estimate the relevant cash flows, which are then discounted to calculate the fair value. Securities denominated in a foreign currency are converted into their U.S. dollar equivalent at the foreign exchange rate in effect at 4 p.m. Eastern time on the date that the values of the foreign debt securities are determined.
Investments in open-end mutual funds are valued at the closing NAV.
Certain derivatives trade in the OTC market. The Funds’ pricing services use various techniques including industry standard option pricing models and proprietary discounted cash flow models to determine the fair value of those instruments. The Funds’ net benefit or obligation under the derivative contract, as measured by the fair value of the contract, is included in net assets.
110 Semiannual Report
franklintempleton.com
FRANKLIN INVESTORS SECURITIES TRUST
NOTES TO FINANCIAL STATEMENTS (UNAUDITED)
The Funds have procedures to determine the fair value of financial instruments for which market prices are not reliable or readily available. Under these procedures, the VLOC convenes on a regular basis to review such financial instruments and considers a number of factors, including significant unobservable valuation inputs, when arriving at fair value. The VLOC primarily employs a market-based approach which may use related or comparable assets or liabilities, recent transactions, market multiples, book values, and other relevant information for the investment to determine the fair value of the investment. An income-based valuation approach may also be used in which the anticipated future cash flows of the investment are discounted to calculate fair value. Discounts may also be applied due to the nature or duration of any restrictions on the disposition of the investments. Due to the inherent uncertainty of valuations of such investments, the fair values may differ significantly from the values that would have been used had an active market existed. The VLOC employs various methods for calibrating these valuation approaches including a regular review of key inputs and assumptions, transactional back-testing or disposition analysis, and reviews of any related market activity.
b. Foreign Currency Translation
Portfolio securities and other assets and liabilities denominated in foreign currencies are translated into U.S. dollars based on the exchange rate of such currencies against U.S. dollars on the date of valuation. The Funds may enter into foreign currency exchange contracts to facilitate transactions denominated in a foreign currency. Purchases and sales of securities, income and expense items denominated in foreign currencies are translated into U.S. dollars at the exchange rate in effect on the transaction date. Portfolio securities and assets and liabilities denominated in foreign currencies contain risks that those currencies will decline in value relative to the U.S. dollar. Occasionally, events may impact the availability or reliability of foreign exchange rates used to convert the U.S. dollar equivalent value. If such an event occurs, the foreign exchange rate will be valued at fair value using procedures established and approved by the Board.
The Funds do not separately report the effect of changes in foreign exchange rates from changes in market prices on securities held. Such changes are included in net realized and unrealized gain or loss from investments in the Statements of Operations.
Realized foreign exchange gains or losses arise from sales of foreign currencies, currency gains or losses realized between
the trade and settlement dates on securities transactions and the difference between the recorded amounts of dividends, interest, and foreign withholding taxes and the U.S. dollar equivalent of the amounts actually received or paid. Net unrealized foreign exchange gains and losses arise from changes in foreign exchange rates on foreign denominated assets and liabilities other than investments in securities held at the end of the reporting period.
c. Securities Purchased on a When-Issued, Delayed Delivery, and TBA Basis
Certain or all Funds purchase securities on a when-issued, delayed delivery and to-be-announced (TBA) basis, with payment and delivery scheduled for a future date. These transactions are subject to market fluctuations and are subject to the risk that the value at delivery may be more or less than the trade date purchase price. Although the Funds will generally purchase these securities with the intention of holding the securities, they may sell the securities before the settlement date. Sufficient assets have been segregated for these securities and collateral has been pledged and/or received for open TBA trades.
d. Derivative Financial Instruments
Certain or all Funds invested in derivatives in order to manage risk or gain exposure to various other investments or markets. Derivatives are financial contracts based on an underlying or notional amount, require no initial investment or an initial net investment that is smaller than would normally be required to have a similar response to changes in market factors, and require or permit net settlement. Derivatives contain various risks including the potential inability of the counterparty to fulfill their obligations under the terms of the contract, the potential for an illiquid secondary market, and/or the potential for market movements which expose the Fund to gains or losses in excess of the amounts shown in the Statements of Assets and Liabilities. Realized gain and loss and unrealized appreciation and depreciation on these contracts for the period are included in the Statements of Operations.
Derivative counterparty credit risk is managed through a formal evaluation of the creditworthiness of all potential counter-parties. Certain or all Funds attempt to reduce their exposure to counterparty credit risk on OTC derivatives, whenever possible, by entering into International Swaps and Derivatives Association (ISDA) master agreements with certain counterparties. These agreements contain various provisions, including but not
franklintempleton.com
Semiannual Report 111
FRANKLIN INVESTORS SECURITIES TRUST
NOTES TO FINANCIAL STATEMENTS (UNAUDITED)
1. Organization and Significant Accounting
Policies (continued)
d. Derivative Financial Instruments (continued)
limited to collateral requirements, events of default, or early termination. Termination events applicable to the counterparty include certain deteriorations in the credit quality of the counterparty. Termination events applicable to the Funds include failure of the Funds to maintain certain net asset levels and/or limit the decline in net assets over various periods of time. In the event of default or early termination, the ISDA master agreement gives the non-defaulting party the right to net and close-out all transactions traded, whether or not arising under the ISDA agreement, to one net amount payable by one counterparty to the other. However, absent an event of default or early termination, OTC derivative assets and liabilities are presented gross and not offset in the Statements of Assets and Liabilities. Early termination by the counterparty may result in an immediate payment by the Funds of any net liability owed to that counterparty under the ISDA agreement.
Collateral requirements differ by type of derivative. Collateral or initial margin requirements are set by the broker or exchange clearing house for exchange traded and centrally cleared derivatives. Initial margin deposited is held at the exchange and can be in the form of cash and/or securities. For OTC derivatives traded under an ISDA master agreement, posting of collateral is required by either the Fund or the applicable coun-terparty if the total net exposure of all OTC derivatives with the applicable counterparty exceeds the minimum transfer amount, which typically ranges from $100,000 to $250,000, and can vary depending on the counterparty and the type of the agreement. Generally, collateral is determined at the close of Fund business each day and any additional collateral required due to changes in derivative values may be delivered by the Fund or the counterparty within a few business days. Collateral pledged and/or received by the Fund for OTC derivatives, if any, is held in segregated accounts with the Fund’s custodian/counterparty broker and can be in the form of cash and/or securities. Unrestricted cash may be invested according to the Funds’ investment objectives. To the extent that the amounts due to the Fund from its counterparties are not subject to collateralization or are not fully collateralized, the Fund bears the risk of loss from counterparty non-performance.
Certain or all Funds entered into exchange traded financial futures contracts primarily to manage and/or gain exposure to interest rate risk. A futures contract is an agreement between the Fund and a counterparty to buy or sell an asset for a specified price on a future date. Required initial margins are pledged by the Fund, and the daily change in fair value is accounted for as a variation margin payable or receivable in the Statements of Assets and Liabilities.
Certain or all Funds entered into OTC forward exchange contracts primarily to manage and/or gain exposure to certain foreign currencies. A forward exchange contract is an agreement between the Fund and a counterparty to buy or sell a foreign currency at a specific exchange rate on a future date.
Certain or all Funds entered into credit default swap contracts primarily to manage and/or gain exposure to credit risk. A credit default swap is an agreement between the Fund and a counterparty whereby the buyer of the contract receives credit protection and the seller of the contract guarantees the credit worthiness of a referenced debt obligation. These agreements may be privately negotiated in the over-the-counter market (OTC credit default swaps) or may be executed in a multilateral trade facility platform, such as a registered exchange (centrally cleared credit default swaps). The underlying referenced debt obligation may be a single issuer of corporate or sovereign debt, a credit index, a basket of issuers or indices, or a tranche of a credit index or basket of issuers or indices. In the event of a default of the underlying referenced debt obligation, the buyer is entitled to receive the notional amount of the credit default swap contract from the seller in exchange for the referenced debt obligation, a net settlement amount equal to the notional amount of the credit default swap less the recovery value of the referenced debt obligation, or other agreed upon amount. For centrally cleared credit default swaps, required initial margins are pledged by the Fund, and the daily change in fair value is accounted for as a variation margin payable or receivable in the Statements of Assets and Liabilities. Over the term of the contract, the buyer pays the seller a periodic stream of payments, provided that no event of default has occurred. Such periodic payments are accrued daily as an unrealized appreciation or depreciation until the payments are made, at which time they are realized. Upfront payments and receipts are reflected in the Statements of Assets and Liabilities and represent compensating factors between stated terms of the credit default swap agreement and prevailing market conditions (credit spreads and other relevant factors). These upfront payments and receipts are amortized over the term of the contract as a realized gain or loss in the Statements of Operations.
112 Semiannual Report
franklintempleton.com
FRANKLIN INVESTORS SECURITIES TRUST
NOTES TO FINANCIAL STATEMENTS (UNAUDITED)
Certain or all Funds entered into OTC cross currency swap contracts primarily to manage and/or gain exposure to interest rate risk and certain foreign currencies. A cross currency swap is an agreement between the Fund and a counterparty to exchange cash flows (determined using either a fixed or floating rate) based on the notional amounts of two different currencies. The notional amounts are typically determined based on the spot exchange rates at the opening of the contract. Cross currency swaps may require the exchange of notional amounts at the opening and/or closing of the contract. Over the term of the contract, contractually required payments to be paid and to be received are accrued daily and recorded as unrealized depreciation and appreciation until the payments are made, at which time they are realized. Upfront payments and receipts are reflected in the Statements of Assets and Liabilities and represent compensating factors between stated terms of the cross currency swap contract and prevailing market conditions (interest rate spreads and other relevant factors). These upfront payments and receipts are amortized over the term of the contract as a realized gain or loss in the Statements of Operations.
Certain or all Funds entered into interest rate swap contracts primarily to manage interest rate risk. An interest rate swap is an agreement between the Fund and a counterparty to exchange cash flows based on the difference between two interest rates, applied to a notional amount. These agreements may be privately negotiated in the over-the-counter market (OTC interest rate swaps) or may be executed on a registered exchange (centrally cleared interest rate swaps). For centrally cleared interest rate swaps, required initial margins are pledged by the Fund, and the daily change in fair value is accounted for as a variation margin payable or receivable in the Statements of Assets and Liabilities. Over the term of the contract, contractually required payments to be paid and to be received are accrued daily and recorded as unrealized depreciation and appreciation until the payments are made, at which time they are realized.
Certain or all Funds purchased or wrote exchange traded and/or OTC option contracts primarily to manage and/or gain exposure to interest rate, foreign exchange rate, and credit risk. An option is a contract entitling the holder to purchase or sell a specific amount of shares or units of an asset or notional amount of a swap (swaption), at a specified price. When an option is purchased or written, an amount equal to the premium paid or received is recorded as an asset or liability, respectively. Certain option contracts are marked-to-market daily and the daily change in fair value is accounted for as variation margin payable or
receivable in the Statements of Assets and Liabilities. Upon exercise of an option, the acquisition cost or sales proceeds of the underlying investment is adjusted by any premium received or paid. Upon expiration of an option, any premium received or paid is recorded as a realized gain or loss. Upon closing an option other than through expiration or exercise, the difference between the premium received or paid and the cost to close the position is recorded as a realized gain or loss.
Certain or all Funds invest in value recovery instruments (VRI) primarily to gain exposure to growth risk. Periodic payments from VRI are dependent on established benchmarks for underlying variables. VRI has a notional amount, which is used to calculate amounts of payments to holders. Payments are recorded upon receipt as realized gains in the Statements of Operations. The risks of investing in VRI included growth risk, liquidity, and the potential loss of investment.
See Notes 6 and 10 regarding investment transactions and other derivative information, respectively.
e. Loan Participation Notes
Certain or all Funds invest in loan participation notes (Participations). Participations are loans originally issued to a borrower by one or more financial institutions (the Lender) and subsequently sold to other investors, such as the Funds. Participations typically result in the Fund having a contractual relationship only with the Lender and not with the borrower. The Funds have the right to receive from the Lender any payments of principal, interest and fees which the Lender received from the borrower. The Funds generally have no rights to either enforce compliance by the borrower with the terms of the loan agreement or to any collateral relating to the original loan. As a result, the Funds assume the credit risk of both the borrower and the Lender that is selling the Participation. The Participations may also involve interest rate risk and liquidity risk, including the potential default or insolvency of the borrower and/or the Lender.
f. Investments in FT Holdings Corporation I (FT Subsidiary)
Franklin Total Return Fund invests in certain financial instruments through its investment in the FT Subsidiary. The FT Subsidiary is a Delaware Corporation, is a wholly-owned subsidiary of the Fund, and is able to invest in certain financial instruments consistent with the investment objective of the Fund. At April 30, 2016, the FT Subsidiary’s investment, Turtle Bay Resort, as well as any other assets and liabilities of the FT
franklintempleton.com
Semiannual Report 113
FRANKLIN INVESTORS SECURITIES TRUST
NOTES TO FINANCIAL STATEMENTS (UNAUDITED)
1. Organization and Significant Accounting
Policies (continued)
f. Investments in FT Holdings Corporation I (FT Subsidiary) (continued)
Subsidiary are reflected in the Fund���s Consolidated Statement of Investments and Consolidated Statement of Assets and Liabilities. The financial statements have been consolidated and include the accounts of the Fund and the FT Subsidiary. All intercompany transactions and balances have been eliminated. At April 30, 2016, the net assets of the FT Subsidiary were $4,303,418, representing less than 1.0% of the Fund’s consolidated net assets. The Fund’s investment in the FT Subsidiary is limited to 25% of consolidated assets.
g. Mortgage Dollar Rolls
Certain or all Funds enter into mortgage dollar rolls, typically on a TBA basis. Mortgage dollar rolls are agreements between the Fund and a financial institution where the Fund sells (or buys) mortgage-backed securities for delivery on a specified date and simultaneously contracts to repurchase (or sell) substantially similar (same type, coupon, and maturity) securities at a future date and at a predetermined price. Gains or losses are realized on the initial sale, and the difference between the repurchase price and the sale price is recorded as an unrealized gain or loss to the Fund upon entering into the mortgage dollar roll. In addition, the Fund may invest the cash proceeds that are received from the initial sale. During the period between the sale and repurchase, the Fund is not entitled to principal and interest paid on the mortgage backed securities. Transactions in mortgage dollar rolls are accounted for as purchases and sales and may result in an increase to the Fund’s portfolio turnover rate. The risks of mortgage dollar roll transactions include the potential inability of the counterparty to fulfill its obligations.
h. Senior Floating Rate Interests
Certain or all Funds invest in senior secured corporate loans that pay interest at rates which are periodically reset by reference to a base lending rate plus a spread. These base lending rates are generally the prime rate offered by a designated U.S. bank or the London InterBank Offered Rate (LIBOR). Senior secured corporate loans often require prepayment of principal from excess cash flows or at the discretion of the borrower. As a result, actual maturity may be substantially less than the stated maturity. Senior secured corporate loans in which the Funds invest are generally readily marketable, but may be subject to certain restrictions on resale.
i. Income and Deferred Taxes
It is each Fund’s policy to qualify as a regulated investment company under the Internal Revenue Code. Each Fund intends to distribute to shareholders substantially all of its taxable income and net realized gains to relieve it from federal income and excise taxes. As a result, no provision for U.S. federal income taxes is required.
The Funds may be subject to foreign taxation related to income received, capital gains on the sale of securities and certain foreign currency transactions in the foreign jurisdictions in which the Funds invest. Foreign taxes, if any, are recorded based on the tax regulations and rates that exist in the foreign markets in which the Funds invest. When a capital gain tax is determined to apply, the Funds record an estimated deferred tax liability in an amount that would be payable if the securities were disposed of on the valuation date.
Each Fund may recognize an income tax liability related to its uncertain tax positions under U.S. GAAP when the uncertain tax position has a less than 50% probability that it will be sustained upon examination by the tax authorities based on its technical merits. As of April 30, 2016, each Fund has determined that no tax liability is required in its financial statements related to uncertain tax positions for any open tax years (or expected to be taken in future tax years). Open tax years are those that remain subject to examination and are based on each tax jurisdiction’s statute of limitation.
j. Security Transactions, Investment Income, Expenses and Distributions
Security transactions are accounted for on trade date. Realized gains and losses on security transactions are determined on a specific identification basis. Interest income and estimated expenses are accrued daily. Amortization of premium and accretion of discount on debt securities are included in interest income. Paydown gains and losses are recorded separately in the Statements of Operations. Facility fees are recognized as income over the expected term of the loan. Dividend income is recorded on the ex-dividend date. Dividends from net investment income are normally declared daily; these dividends may be reinvested or paid monthly to shareholders. Distributions to shareholders are determined according to income tax regulations (tax basis). Distributable earnings determined on a tax basis may differ from earnings recorded in accordance with U.S. GAAP. These differences may be permanent or temporary. Permanent differences are reclassified among capital accounts
114 Semiannual Report
franklintempleton.com
FRANKLIN INVESTORS SECURITIES TRUST
NOTES TO FINANCIAL STATEMENTS (UNAUDITED)
to reflect their tax character. These reclassifications have no impact on net assets or the results of operations. Temporary differences are not reclassified, as they may reverse in subsequent periods.
Common expenses incurred by the Trust are allocated among the Funds based on the ratio of net assets of each Fund to the combined net assets of the Trust. Fund specific expenses are charged directly to the fund that incurred the expense.
Net investment income, not including class specific expenses, is allocated daily to each class of shares based upon the relative value of the settled shares of each class. Realized and unrealized gains and losses are allocated daily to each class of shares based upon the relative proportion of net assets of each class. Differences in per share distributions, by class, are generally due to differences in class specific expenses.
Inflation-indexed bonds are adjusted for inflation through periodic increases or decreases in the security’s interest accruals, face amount, or principal redemption value, by amounts corresponding to the rate of inflation as measured by an index. Any increase or decrease in the face amount or principal redemption value will be included as interest income in the Statements of Operations.
k. Accounting Estimates
The preparation of financial statements in accordance with U.S. GAAP requires management to make estimates and assumptions that affect the reported amounts of assets and liabilities at the date of the financial statements and the amounts of income and expenses during the reporting period. Actual results could differ from those estimates.
l. Guarantees and Indemnifications
Under the Trust’s organizational documents, its officers and trustees are indemnified by the Trust against certain liabilities arising out of the performance of their duties to the Trust. Additionally, in the normal course of business, the Trust, on behalf of the Funds, enters into contracts with service providers that contain general indemnification clauses. The Trust’s maximum exposure under these arrangements is unknown as this would involve future claims that may be made against the Trust that have not yet occurred. Currently, the Trust expects the risk of loss to be remote.
2. Shares of Beneficial Interest
At April 30, 2016, there were an unlimited number of shares authorized (without par value). Transactions in the Funds’ shares were as follows:
| Franklin Adjustable | ||||||||||
| U.S. Government | Franklin Floating Rate | |||||||||
| Securities Fund | Daily Access Fund | |||||||||
| Shares | Amount | Shares | Amount | |||||||
| Class A Shares: | ||||||||||
| Six Months ended April 30, 2016 | ||||||||||
| Shares sold | 15,104,222 | $ | 128,246,628 | 11,150,536 | $ | 93,041,026 | ||||
| Shares issued in reinvestment of distributions | 613,929 | 5,202,789 | 3,842,108 | 31,991,173 | ||||||
| Shares redeemed | (23,869,281 | ) | (202,626,534 | ) | (36,907,574 | ) | (307,524,991 | ) | ||
| Net increase (decrease) | (8,151,130 | ) | $ | (69,177,117 | ) | (21,914,930 | ) | $ | (182,492,792 | ) |
| Year ended October 31, 2015 | ||||||||||
| Shares sold | 29,600,803 | $ | 255,228,822 | 35,259,302 | $ | 314,270,932 | ||||
| Shares issued in reinvestment of distributions | 1,093,408 | 9,421,052 | 7,762,505 | 69,039,598 | ||||||
| Shares redeemed | (53,496,340 | ) | (460,533,084 | ) | (69,916,661 | ) | (622,694,135 | ) | ||
| Net increase (decrease) | (22,802,129 | ) | $ | (195,883,210 | ) | (26,894,854 | ) | $ | (239,383,605 | ) |
franklintempleton.com
Semiannual Report 115
FRANKLIN INVESTORS SECURITIES TRUST
NOTES TO FINANCIAL STATEMENTS (UNAUDITED)
| 2. Shares of Beneficial Interest (continued) | ||||||||||
| Franklin Adjustable | ||||||||||
| U.S. Government | Franklin Floating Rate | |||||||||
| Securities Fund | Daily Access Fund | |||||||||
| Shares | Amount | Shares | Amount | |||||||
| Class A1 Shares: | ||||||||||
| Six Months ended April 30, 2016 | ||||||||||
| Shares sold | 393,146 | $ | 3,335,450 | |||||||
| Shares issued in reinvestment of distributions | 157,957 | 1,338,620 | ||||||||
| Shares redeemed | (2,579,758 | ) | (21,892,802 | ) | ||||||
| Net increase (decrease) | (2,028,655 | ) | $ | (17,218,732 | ) | |||||
| Year ended October 31, 2015 | ||||||||||
| Shares sold | 1,222,138 | $ | 10,538,383 | |||||||
| Shares issued in reinvestment of distributions | 322,924 | 2,781,758 | ||||||||
| Shares redeemed | (7,479,327 | ) | (64,508,389 | ) | ||||||
| Net increase (decrease) | (5,934,265 | ) | $ | (51,188,248 | ) | |||||
| Class C Shares: | ||||||||||
| Six Months ended April 30, 2016 | ||||||||||
| Shares sold | 3,130,294 | $ | 26,574,535 | 4,472,213 | $ | 37,294,696 | ||||
| Shares issued in reinvestment of distributions | 165,584 | 1,402,227 | 1,386,332 | 11,545,345 | ||||||
| Shares redeemed | (6,771,761 | ) | (57,428,004 | ) | (15,096,798 | ) | (125,831,276 | ) | ||
| Net increase (decrease) | (3,475,883 | ) | $ | (29,451,242 | ) | (9,238,253 | ) | $ | (76,991,235 | ) |
| Year ended October 31, 2015 | ||||||||||
| Shares sold | 5,349,068 | $ | 46,082,804 | 14,110,236 | $ | 125,708,580 | ||||
| Shares issued in reinvestment of distributions | 298,946 | 2,574,236 | 2,777,065 | 24,699,170 | ||||||
| Shares redeemed | (15,680,366 | ) | (135,206,699 | ) | (26,067,686 | ) | (232,169,511 | ) | ||
| Net increase (decrease) | (10,032,352 | ) | $ | (86,549,659 | ) | (9,180,385 | ) | $ | (81,761,761 | ) |
| Class R6 Shares: | ||||||||||
| Six Months ended April 30, 2016 | ||||||||||
| Shares sold | 36,117 | $ | 306,970 | 1,106,207 | $ | 9,402,500 | ||||
| Shares issued in reinvestment of distributions | 2,306 | 19,560 | 30 | 246 | ||||||
| Shares redeemed | (22,114 | ) | (187,195 | ) | (1 | ) | (7 | ) | ||
| Net increase (decrease) | 16,309 | $ | 139,335 | 1,106,236 | $ | 9,402,739 | ||||
| Year ended October 31, 2015 | ||||||||||
| Shares sold | 398,482 | $ | 3,455,605 | 702 | $ | 6,249 | ||||
| Shares issued in reinvestment of distributions | 8,176 | 70,673 | 444 | 3,983 | ||||||
| Shares redeemed | (980,650 | ) | (8,485,647 | ) | (51,765 | ) | (461,413 | ) | ||
| Net increase (decrease) | (573,992 | ) | $ | (4,959,369 | ) | (50,619 | ) | $ | (451,181 | ) |
| Advisor Class Shares: | ||||||||||
| Six Months ended April 30, 2016 | ||||||||||
| Shares sold | 5,986,594 | $ | 50,827,469 | 23,175,528 | $ | 193,774,845 | ||||
| Shares issued in reinvestment of distributions | 217,383 | 1,844,590 | 1,553,693 | 12,944,359 | ||||||
| Shares redeemed | (13,265,328 | ) | (112,842,537 | ) | (66,212,443 | ) | (553,183,940 | ) | ||
| Net increase (decrease) | (7,061,351 | ) | $ | (60,170,478 | ) | (41,483,222 | ) | $ | (346,464,736 | ) |
| Year ended October 31, 2015 | ||||||||||
| Shares sold | 16,262,514 | $ | 140,248,227 | 50,519,163 | $ | 450,379,688 | ||||
| Shares issued in reinvestment of distributions | 492,842 | 4,251,127 | 3,269,592 | 29,068,251 | ||||||
| Shares redeemed | (28,703,734 | ) | (247,690,899 | ) | (113,811,749 | ) | (1,013,598,505 | ) | ||
| Net increase (decrease) | (11,948,378 | ) | $ | (103,191,545 | ) | (60,022,994 | ) | $ | (534,150,566 | ) |
116 Semiannual Report
franklintempleton.com
FRANKLIN INVESTORS SECURITIES TRUST
NOTES TO FINANCIAL STATEMENTS (UNAUDITED)
| Franklin Low Duration | |||||||||||
| Total Return Fund | Franklin Total Return Fund | ||||||||||
| Shares | Amount | Shares | Amount | ||||||||
| Class A Shares: | |||||||||||
| Six Months ended April 30, 2016 | |||||||||||
| Shares sold | 26,292,874 | $ | 256,789,039 | 49,718,176 | $ | 479,734,283 | |||||
| Shares issued in reinvestment of distributions | 2,207,565 | 21,539,540 | 8,836,935 | 84,881,259 | |||||||
| Shares redeemed | (31,428,990 | ) | (307,031,795 | ) | (36,093,770 | ) | (348,338,110 | ) | |||
| Net increase (decrease) | (2,928,551 | ) | $ | (28,703,216 | ) | 22,461,341 | $ | 216,277,432 | |||
| Year ended October 31, 2015 | |||||||||||
| Shares sold | 62,045,618 | $ | 620,756,628 | 106,013,942 | $ | 1,065,164,455 | |||||
| Shares issued in reinvestment of distributions | 2,798,272 | 27,971,757 | 9,933,392 | 99,512,096 | |||||||
| Shares redeemed | (55,015,732 | ) | (550,199,734 | ) | (74,337,731 | ) | (746,735,554 | ) | |||
| Net increase (decrease) | 9,828,158 | $ | 98,528,651 | 41,609,603 | $ | 417,940,997 | |||||
| Class C Shares: | |||||||||||
| Six Months ended April 30, 2016 | |||||||||||
| Shares sold | 7,547,538 | $ | 73,540,459 | 6,927,402 | $ | 66,530,587 | |||||
| Shares issued in reinvestment of distributions | 261,657 | 2,548,948 | 978,676 | 9,359,732 | |||||||
| Shares redeemed | (5,917,856 | ) | (57,619,701 | ) | (6,500,886 | ) | (62,494,347 | ) | |||
| Net increase (decrease) | 1,891,339 | $ | 18,469,706 | 1,405,192 | $ | 13,395,972 | |||||
| Year ended October 31, 2015 | |||||||||||
| Shares sold | 11,804,941 | $ | 117,806,725 | 13,450,866 | $ | 134,822,571 | |||||
| Shares issued in reinvestment of distributions | 267,721 | 2,673,011 | 1,125,209 | 11,241,167 | |||||||
| Shares redeemed | (7,138,718 | ) | (71,322,146 | ) | (12,032,841 | ) | (120,149,696 | ) | |||
| Net increase (decrease) | 4,933,944 | $ | 49,157,590 | 2,543,234 | $ | 25,914,042 | |||||
| Class R Shares: | |||||||||||
| Six Months ended April 30, 2016 | |||||||||||
| Shares sold | 898,488 | $ | 8,654,298 | ||||||||
| Shares issued in reinvestment of distributions | 164,349 | 1,575,087 | |||||||||
| Shares redeemed | (1,364,236 | ) | (13,114,427 | ) | |||||||
| Net increase (decrease) | (301,399 | ) | $ | (2,885,042 | ) | ||||||
| Year ended October 31, 2015 | |||||||||||
| Shares sold | 2,816,817 | $ | 28,284,445 | ||||||||
| Shares issued in reinvestment of distributions | 178,317 | 1,783,880 | |||||||||
| Shares redeemed | (1,673,042 | ) | (16,742,703 | ) | |||||||
| Net increase (decrease) | 1,322,092 | $ | 13,325,622 | ||||||||
| Class R6 Shares: | |||||||||||
| Six Months ended April 30, 2016 | |||||||||||
| Shares sold | 7,716,056 | $ | 75,362,324 | 1,684,981 | $ | 16,386,434 | |||||
| Shares issued in reinvestment of distributions | 865,604 | 8,479,542 | 5,705 | 54,953 | |||||||
| Shares redeemed | (3,280,606 | ) | (32,229,031 | ) | (941,771 | ) | (9,133,273 | ) | |||
| Net increase (decrease) | 5,301,054 | $ | 51,612,835 | 748,915 | $ | 7,308,114 | |||||
| Year ended October 31, 2015 | |||||||||||
| Shares sold | 14,096,020 | $ | 142,249,562 | 5,543,739 | $ | 56,013,679 | |||||
| Shares issued in reinvestment of distributions | 1,147,359 | 11,505,176 | 4,715 | 47,383 | |||||||
| Shares redeemed | (5,397,823 | ) | (54,168,528 | ) | (1,159,308 | ) | (11,575,084 | ) | |||
| Net increase (decrease) | 9,845,556 | $ | 99,586,210 | 4,389,146 | $ | 44,485,978 | |||||
franklintempleton.com
Semiannual Report 117
FRANKLIN INVESTORS SECURITIES TRUST
NOTES TO FINANCIAL STATEMENTS (UNAUDITED)
| 2. Shares of Beneficial Interest (continued) | ||||||||||
| Franklin Low Duration | ||||||||||
| Total Return Fund | Franklin Total Return Fund | |||||||||
| Shares | Amount | Shares | Amount | |||||||
| Advisor Class Shares: | ||||||||||
| Six Months ended April 30, 2016 | ||||||||||
| Shares sold | 4,525,685 | $ | 44,365,329 | 5,697,685 | $ | 55,234,740 | ||||
| Shares issued in reinvestment of distributions | 184,658 | 1,808,801 | 1,084,137 | 10,448,067 | ||||||
| Shares redeemed | (3,885,540 | ) | (38,153,587 | ) | (12,152,696 | ) | (117,191,856 | ) | ||
| Net increase (decrease) | 824,803 | $ | 8,020,543 | (5,370,874 | ) | $ | (51,509,049 | ) | ||
| Year ended October 31, 2015 | ||||||||||
| Shares sold | 7,865,807 | $ | 78,985,437 | 26,269,640 | $ | 265,286,213 | ||||
| Shares issued in reinvestment of distributions | 252,897 | 2,536,877 | 3,401,485 | 34,224,878 | ||||||
| Shares redeemed | (12,585,151 | ) | (126,559,300 | ) | (102,089,675 | ) | (1,017,296,513 | ) | ||
| Net increase (decrease) | (4,466,447 | ) | $ | (45,036,986 | ) | (72,418,550 | ) | $ | (717,785,422 | ) |
3. Transactions with Affiliates
Franklin Resources, Inc. is the holding company for various subsidiaries that together are referred to as Franklin Templeton Investments. Certain officers and trustees of the Trust are also officers and/or directors of the following subsidiaries:
| Subsidiary | Affiliation |
| Franklin Advisers, Inc. (Advisers) | Investment manager |
| Franklin Templeton Institutional, LLC (FT Institutional) | Investment manager |
| Franklin Templeton Services, LLC (FT Services) | Administrative manager |
| Franklin Templeton Distributors, Inc. (Distributors) | Principal underwriter |
| Franklin Templeton Investor Services, LLC (Investor Services) | Transfer agent |
a. Management Fees
Franklin Adjustable U.S. Government Securities Fund pays an investment management fee to Advisers based on the average daily net assets of the Fund as follows:
| Annualized Fee Rate | Net Assets | |
| 0.500 | % | Up to and including $5 billion |
| 0.440 | % | Over $5 billion, up to and including $10 billion |
| 0.410 | % | Over $10 billion, up to and including $15 billion |
| 0.380 | % | In excess of $15 billion |
118 Semiannual Report
franklintempleton.com
FRANKLIN INVESTORS SECURITIES TRUST
NOTES TO FINANCIAL STATEMENTS (UNAUDITED)
Franklin Floating Rate Daily Access Fund pays an investment management fee to Advisers based on the average daily net assets of the Fund as follows:
| Annualized Fee Rate | Net Assets | |
| 0.650 | % | Up to and including $500 million |
| 0.550 | % | Over $500 million, up to and including $1 billion |
| 0.500 | % | Over $1 billion, up to and including $1.5 billion |
| 0.450 | % | Over $1.5 billion, up to and including $6.5 billion |
| 0.425 | % | Over $6.5 billion, up to and including $11.5 billion |
| 0.400 | % | Over $11.5 billion, up to and including $16.5 billion |
| 0.390 | % | Over $16.5 billion, up to and including $19 billion |
| 0.380 | % | Over $19 billion, up to and including $21.5 billion |
| 0.370 | % | In excess of $21.5 billion |
Franklin Low Duration Total Return Fund and Franklin Total Return Fund pay an investment management fee to Advisers based on the average daily net assets of each of the Funds as follows:
| Annualized Fee Rate | Net Assets | |
| 0.625 | % | Up to and including $500 million |
| 0.525 | % | Over $500 million, up to and including $1 billion |
| 0.480 | % | Over $1 billion, up to and including $1.5 billion |
| 0.435 | % | Over $1.5 billion, up to and including $6.5 billion |
| 0.415 | % | Over $6.5 billion, up to and including $11.5 billion |
| 0.400 | % | Over $11.5 billion, up to and including $16.5 billion |
| 0.390 | % | Over $16.5 billion, up to and including $19 billion |
| 0.380 | % | Over $19 billion, up to and including $21.5 billion |
| 0.370 | % | In excess of $21.5 billion |
Under a subadvisory agreement, FT Institutional, an affiliate of Advisers, provides subadvisory services to Franklin Total Return Fund. The subadvisory fee is paid by Advisers based on the Fund’s average daily net assets, and is not an additional expense of the Fund.
For the period ended April 30, 2016, each Fund’s annualized effective investment management fee rate based on average daily net assets were as follows:
| Franklin | Franklin | Franklin | |||||
| Adjustable | Floating | Low Duration | Franklin | ||||
| U.S. Government | Rate Daily | Total Return | Total Return | ||||
| Securities Fund | Access Fund | Fund | Fund | ||||
| 0.500 | % | 0.507 | % | 0.499 | % | 0.470 | % |
b. Administrative Fees
Under an agreement with Advisers, FT Services provides administrative services to the Funds. The fee is paid by Advisers based on each of the Funds’ average daily net assets, and is not an additional expense of the Funds.
c. Distribution Fees
The Board has adopted distribution plans for each share class, with the exception of Class R6 and Advisor Class shares, pursuant to Rule 12b-1 under the 1940 Act. Under the Funds’ Class A and A1 reimbursement distribution plans, the Funds reimburse
franklintempleton.com
Semiannual Report 119
FRANKLIN INVESTORS SECURITIES TRUST
NOTES TO FINANCIAL STATEMENTS (UNAUDITED)
3. Transactions with Affiliates (continued)
c. Distribution Fees (continued)
Distributors for costs incurred in connection with the servicing, sale and distribution of each Fund’s shares up to the maximum annual plan rate for each class. Under the Class A and A1 reimbursement distribution plans, costs exceeding the maximum for the current plan year cannot be reimbursed in subsequent periods. In addition, under the Funds’ Class C and R compensation distribution plans, the Funds pay Distributors for costs incurred in connection with the servicing, sale and distribution of each Fund’s shares up to the maximum annual plan rate for each class. The plan year, for purposes of monitoring compliance with the maximum annual plan rates, is February 1 through January 31 for each Fund.
The maximum annual plan rates, based on the average daily net assets, for each class, are as follows:
| Franklin | Franklin | Franklin | ||||||
| Adjustable | Floating | Low Duration | Franklin | |||||
| U.S. Government | Rate Daily | Total Return | Total Return | |||||
| Securities Fund | Access Fund | Fund | Fund | |||||
| Reimbursement Plans: | �� | |||||||
| Class A | 0.25 | % | 0.25 | % | 0.25 | % | 0.25 | % |
| Class A1 | 0.10 | % | — | — | — | |||
| Compensation Plans: | ||||||||
| Class C | 0.65 | % | 0.65 | % | 0.65 | % | 0.65 | % |
| Class R | — | — | — | 0.50 | % | |||
d. Sales Charges/Underwriting Agreements
Front-end sales charges and contingent deferred sales charges (CDSC) do not represent expenses of the Funds. These charges are deducted from the proceeds of sales of fund shares prior to investment or from redemption proceeds prior to remittance, as applicable. Distributors has advised the Funds of the following commission transactions related to the sales and redemptions of the Funds’ shares for the period:
| Franklin | Franklin | Franklin | ||||||
| Adjustable | Floating | Low Duration | Franklin | |||||
| U.S. Government | Rate Daily | Total Return | Total Return | |||||
| Securities Fund | Access Fund | Fund | Fund | |||||
| Sales charges retained net of commissions | ||||||||
| paid to unaffiliated broker/dealers | $ | 61,976 | $ | 46,466 | $ | 158,508 | $ | 1,063,809 |
| CDSC retained | $ | 21,275 | $ | 31,205 | $ | 57,560 | $ | 37,131 |
e. Transfer Agent Fees
Each class of shares, except for Class R6, pays transfer agent fees to Investor Services for its performance of shareholder servicing obligations and reimburses Investor Services for out of pocket expenses incurred, including shareholder servicing fees paid to third parties. These fees are allocated daily based upon their relative proportion of such classes’ aggregate net assets. Class R6 pays Investor Services transfer agent fees specific to that class.
For the period ended April 30, 2016, the Funds paid transfer agent fees as noted in the Statements of Operations of which the following amounts were retained by Investor Services:
| Franklin | Franklin | Franklin | ||||||
| Adjustable | Floating | Low Duration | Franklin | |||||
| U.S. Government | Rate Daily | Total Return | Total Return | |||||
| Securities Fund | Access Fund | Fund | Fund | |||||
| Transfer agent fees | $ | 374,633 | $ | 573,720 | $ | 636,578 | $ | 1,243,374 |
120 Semiannual Report
franklintempleton.com
FRANKLIN INVESTORS SECURITIES TRUST
NOTES TO FINANCIAL STATEMENTS (UNAUDITED)
f. Investments in Affiliated Management Investment Companies
Certain or all Funds invest in affiliated management investment companies for purposes other than exercising a controlling influence over the management or policies. Management fees paid by the Funds are waived on assets invested in the affiliated management investment companies, as noted in the Statements of Operations, in an amount not to exceed the management and administrative fees paid directly or indirectly by each affiliate. Prior to November 1, 2013, the waiver was accounted for as a reduction to management fees.
| % of Affiliated | ||||||||||||||||
| Number of | Number of | Fund Shares | ||||||||||||||
| Shares Held | Shares Held | Value | Outstanding | |||||||||||||
| at Beginning | Gross | Gross | at End | at End | Investment | Realized | Held at End | |||||||||
| of Period | Additions | Reductions | of Period | of Period | Income | Gain (Loss) | of Period | |||||||||
| Franklin Adjustable | ||||||||||||||||
| U.S. Government | ||||||||||||||||
| Securities Fund | ||||||||||||||||
| Non-Controlled | �� | |||||||||||||||
| Affiliates | ||||||||||||||||
| Institutional Fiduciary | ||||||||||||||||
| Trust Money Market | ||||||||||||||||
| Portfolio | 35,774,086 | 234,813,264 | (230,834,003) | 39,753,347 | $ | 39,753,347 | $ | — | $ | — | 0.20 | % | ||||
| Franklin Floating Rate | ||||||||||||||||
| Daily Access Fund | ||||||||||||||||
| Non-Controlled | ||||||||||||||||
| Affiliates | ||||||||||||||||
| Institutional Fiduciary | ||||||||||||||||
| Trust Money Market | ||||||||||||||||
| Portfolio | 152,604,455 | 448,524,171 | (413,532,472) | 187,596,154 | $ | 187,596,154 | $ | - | $ | - | 0.95 | % | ||||
| Franklin Low Duration | ||||||||||||||||
| Total Return Fund | ||||||||||||||||
| Non-Controlled | ||||||||||||||||
| Affiliates | ||||||||||||||||
| Franklin Lower Tier | ||||||||||||||||
| Floating Rate Fund | — | 1,893,663 | a | — | 1,893,663 | $ | 18,501,090 | $ | 681,815 | $ | — | 4.24 | % | |||
| Franklin Middle Tier | ||||||||||||||||
| Floating Rate Fund | — | 2,389,308 | b | — | 2,389,308 | 22,793,994 | 537,501 | — | 6.54 | % | ||||||
| Institutional Fiduciary | ||||||||||||||||
| Trust Money Market | ||||||||||||||||
| Portfolio | 253,268,073 | 392,486,161 | (589,172,247) | 56,581,987 | 56,581,987 | — | — | 0.29 | % | |||||||
| Total | $ | 97,877,071 | $ | 1,219,316 | $ | — | ||||||||||
| Franklin Total Return | ||||||||||||||||
| Fund | ||||||||||||||||
| Controlled Affiliates | ||||||||||||||||
| Franklin Short Duration | ||||||||||||||||
| U.S. Government | ||||||||||||||||
| ETF | 500,000 | — | — | 500,000 | $ | 48,936,900 | $ | 388,715 | $ | — | 25.30 | % | ||||
| Non-Controlled | ||||||||||||||||
| Affiliates | ||||||||||||||||
| Franklin Lower Tier | ||||||||||||||||
| Floating Rate Fund | — | 997,589 | a | — | 997,589 | 9,746,445 | 361,924 | — | 2.23 | % | ||||||
| Franklin Middle Tier | ||||||||||||||||
| Floating Rate Fund | — | 1,889,310 | b | — | 1,889,310 | 18,024,019 | 428,127 | — | 5.17 | % | ||||||
| Institutional Fiduciary | ||||||||||||||||
| Trust Money Market | ||||||||||||||||
| Portfolio | 591,212,333 | 1,015,465,273 | (783,143,283) | 823,534,323 | 823,534,323 | - | - | 4.16 | % | |||||||
| Total | $ | 900,241,687 | $ | 1,178,766 | $ | — | ||||||||||
franklintempleton.com
Semiannual Report 121
FRANKLIN INVESTORS SECURITIES TRUST
NOTES TO FINANCIAL STATEMENTS (UNAUDITED)
3. Transactions with Affiliates (continued)
f. Investments in Affiliated Management Investment Companies (continued)
aThe Funds purchased shares of the affiliate through an in-kind transfer of securities. Market value and cost basis of the securities transferred on the date of the transfer were
as follows:
| Franklin | ||||
| Low Duration | Franklin | |||
| Total Return | Total Return | |||
| Fund | Fund | |||
| Market value | $ | 17,742,918 | $ | 9,347,037 |
| Cost basis | $ | 21,119,532 | $ | 11,616,851 |
bThe Funds purchased shares of the affiliate through an in-kind transfer of securities. Market value and cost basis of the securities transferred on the date of the transfer were
as follows:
| Franklin | ||||
| Low Duration | Franklin | |||
| Total Return | Total Return | |||
| Fund | Fund | |||
| Market value | $ | 22,984,002 | $ | 18,174,265 |
| Cost basis | $ | 25,105,536 | $ | 21,006,435 |
g. Waiver and Expense Reimbursements
Advisers and Investor Services have contractually agreed in advance to waive or limit their respective fees and to assume as their own expense certain expenses otherwise payable by Franklin Low Duration Total Return Fund and Franklin Total Return Fund so that the expenses (excluding distribution fees, and acquired fund fees and expenses) for Class A, Class C, Class R and Advisor Class of the Funds do not exceed 0.55% and 0.63%, respectively, and Class R6 does not exceed 0.42% and 0.47%, respectively, based on the average net assets of each class (other than certain non-routine expenses or costs, including those relating to litigation, indemnification, reorganizations, and liquidations) until February 28, 2017.
Additionally, Investor Services has contractually agreed in advance to waive or limit its fees so that the Class R6 transfer agent fees do not exceed 0.01% until February 28, 2017. For Franklin Low Duration Total Return Fund and Franklin Total Return Fund there were no class R6 transfer agent fees waived during the period ended April 30, 2016.
h. Other Affiliated Transactions
At April 30, 2016, one or more of the funds in Franklin Fund Allocator Series owned a percentage of the following Funds’ outstanding shares.
| Franklin | Franklin | Franklin | |||||
| Adjustable | Floating | Low Duration | Franklin | ||||
| U.S. Government | Rate Daily | Total Return | Total Return | ||||
| Securities Fund | Access Fund | Fund | Fund | ||||
| 0.14 | % | 0.32 | % | 19.92 | % | 0.01 | % |
4. Expense Offset Arrangement
The Funds have entered into an arrangement with their custodian whereby credits realized as a result of uninvested cash balances are used to reduce a portion of the Funds’ custodian expenses. During the period ended April 30, 2016, the custodian fees were reduced as noted in the Statements of Operations.
5. Income Taxes
For tax purposes, capital losses may be carried over to offset future capital gains. Capital loss carryforwards with no expiration, if any, must be fully utilized before those losses with expiration dates.
122 Semiannual Report
franklintempleton.com
FRANKLIN INVESTORS SECURITIES TRUST
NOTES TO FINANCIAL STATEMENTS (UNAUDITED)
| At October 31, 2015, the capital loss carryforwards were as follows: | |||||||||
| Franklin | Franklin | Franklin | |||||||
| Adjustable | Floating | Low Duration | Franklin | ||||||
| U.S. Government | Rate Daily | Total Return | Total Return | ||||||
| Securities Fund | Access Fund | Fund | Fund | ||||||
| Capital loss carryforwards subject to expiration: | |||||||||
| 2016 | $ | 1,492,445 | $ | 91,562,953 | $ | — | $ | 1,260,827 | |
| 2017 | 4,398,245 | 113,325,538 | — | — | |||||
| 2018 | 39,689,305 | — | — | — | |||||
| 2019 | 21,934,756 | 10,282,409 | 5,327,487 | — | |||||
| Capital loss carryforwards not subject to expiration: | |||||||||
| Short term | 17,721,200 | 17,126,939 | 15,995,796 | 21,412,101 | |||||
| Long term | 59,327,304 | 48,861,223 | 26,955,357 | 4,114,910 | |||||
| Total capital loss carryforwards | $ | 144,563,255 | a | $ | 281,159,062 | $ | 48,278,640 | $ | 26,787,838 |
aIncludes $20,490,819 from the merged Franklin Limited Maturity U.S. Government Securities Fund, which may be carried over to offset future capital gains, subject to
certain limitations.
At April 30, 2016, the cost of investments and net unrealized appreciation (depreciation), for income tax purposes were as follows:
| Franklin | Franklin | Franklin | ||||||||||
| Adjustable | Floating | Low Duration | Franklin | |||||||||
| U.S. Government | Rate Daily | Total Return | Total Return | |||||||||
| Securities Fund | Access Fund | Fund | Fund | |||||||||
| Cost of investments | $ | 1,481,348,858 | $ | 3,123,837,707 | $ | 2,548,611,315 | $ | 5,617,968,329 | ||||
| Unrealized appreciation | $ | 12,312,942 | $ | 16,525,403 | $ | 23,013,267 | $ | 111,676,406 | ||||
| Unrealized depreciation | (6,991,069 | ) | (212,915,138 | ) | (38,651,911 | ) | (137,454,831 | ) | ||||
| Net unrealized appreciation (depreciation) | $ | 5,321,873 | $ | (196,389,735 | ) | $ | (15,638,644 | ) | $ | (25,778,425 | ) |
Differences between income and/or capital gains as determined on a book basis and a tax basis are primarily due to differing treatments of defaulted securities, foreign currency transactions, passive foreign investment company shares, paydown losses, bond discounts and premiums, defaulted bond interest and amortization.
6. Investment Transactions
Purchases and sales of investments (excluding short term securities) for the period ended April 30, 2016, were as follows:
| Franklin | Franklin | Franklin | ||||||
| Adjustable | Floating | Low Duration | Franklin | |||||
| U.S. Government | Rate Daily | Total Return | Total Return | |||||
| Securities Fund | Access Fund | Fund | Fund | |||||
| Purchases | $ | 30,750,306 | $ | 233,467,069 | $ | 868,379,663 | $ | 6,990,020,933 |
| Sales | $ | 209,395,177 | $ | 856,704,900 | $ | 486,883,590 | $ | 6,896,954,650 |
franklintempleton.com
Semiannual Report 123
FRANKLIN INVESTORS SECURITIES TRUST
NOTES TO FINANCIAL STATEMENTS (UNAUDITED)
6. Investment Transactions (continued)
Transactions in options and swaptions written during the period ended April 30, 2016, were as follows:
| Options | Swaptions | ||||||||||||
| Notional | Notional | ||||||||||||
| Amount* | Premiums | Amount* | Premiums | ||||||||||
| Franklin Low Duration Total Return Fund | |||||||||||||
| Options outstanding at October 31, 2015 | $ | 2,500,000 | $ | 15,425 | $ | 55,400,000 | $ | 327,600 | |||||
| Options written | 7,500,000 | 52,404 | — | — | |||||||||
| Options expired | (2,500,000 | ) | (22,839 | ) | (46,200,000 | ) | (229,689 | ) | |||||
| Options exercised | (5,000,000 | ) | (29,565 | ) | — | — | |||||||
| Options closed | (2,500,000 | ) | (15,425 | ) | (9,200,000 | ) | (97,911 | ) | |||||
| Options outstanding at April 30, 2016 | $ | — | $ | — | $ | — | $ | — | |||||
| Franklin Total Return Fund | |||||||||||||
| Options outstanding at October 31, 2015 | $ | 3,800,000 | $ | 23,446 | $ | 120,000,000 | $ | 711,000 | |||||
| Options written | 16,530,000 | 115,498 | — | — | |||||||||
| Options expired | (5,510,000 | ) | (50,337 | ) | (100,000,000 | ) | (498,150 | ) | |||||
| Options exercised | — | — | — | — | |||||||||
| Options closed | (14,820,000 | ) | (88,607 | ) | (20,000,000 | ) | (212,850 | ) | |||||
| Options outstanding at April 30, 2016 | $ | — | $ | — | $ | — | $ | — | |||||
*The notional amount is stated in U.S. dollars unless otherwise indicated.
See Notes 1(d) and 10 regarding derivative financial instruments and other derivative information, respectively.
7. Credit Risk and Defaulted Securities
At April 30, 2016, Franklin Floating Rate Daily Access Fund, Franklin Low Duration Total Return Fund and Franklin Total Return Fund had 87.80%, 18.00% and 14.29%, respectively, of their portfolio invested in high yield securities, senior secured floating rate notes, or other securities rated below investment grade. These securities may be more sensitive to economic conditions causing greater price volatility and are potentially subject to a greater risk of loss due to default than higher rated securities.
Certain or all Funds held defaulted securities and/or other securities for which the income has been deemed uncollectible. At April 30, 2016, the aggregate value of these securities for Franklin Floating Rate Daily Access Fund, Franklin Low Duration Total Return Fund and Franklin Total Return Fund was $438,891, $2,176,729 and $4,763,312, representing 0.01%, 0.09% and 0.10%, respectively, of each Fund’s net assets. The Funds discontinue accruing income on securities for which income has been deemed uncollectible and provide an estimate for losses on interest receivable. The securities have been identified in the accompanying Statements of Investments.
8. Restricted Securities
Certain or all Funds invest in securities that are restricted under the Securities Act of 1933 (1933 Act) or which are subject to legal, contractual, or other agreed upon restrictions on resale. Restricted securities are often purchased in private placement transactions, and cannot be sold without prior registration unless the sale is pursuant to an exemption under the 1933 Act. Disposal of these securities may require greater effort and expense, and prompt sale at an acceptable price may be difficult. The Funds may have registration rights for restricted securities. The issuer generally incurs all registration costs.
124 Semiannual Report
franklintempleton.com
FRANKLIN INVESTORS SECURITIES TRUST
NOTES TO FINANCIAL STATEMENTS (UNAUDITED)
At April 30, 2016, Franklin Floating Rate Daily Access Fund held investments in restricted securities, excluding certain securities exempt from registration under the 1933 Act deemed to be liquid, as follows:
| Acquisition | ||||||
| Shares | Issuer | Date | Cost | Value | ||
| 26,267 | RoTech Medical Corp | 12/03/10 | $ | — | $ | — |
| 6,893 | Warrior Met Coal LLC, A | 3/31/16 | 13,170,468 | 694,927 | ||
| Total Restricted Securities (Value is 0.02% of Net Assets) | $ | 13,170,468 | $ | 694,927 |
9. Unfunded Loan Commitments
Certain or all Funds enter into certain credit agreements, all or a portion of which may be unfunded. The Funds are obligated to fund these loan commitments at the borrowers’ discretion. Unfunded loan commitments and funded portions of credit agreements are marked to market daily and any unrealized appreciation or depreciation is included in the Statements of Assets and Liabilities and the Statements of Operations. Funded portions of credit agreements are presented in the Statements of Investments.
| At April 30, 2016, unfunded commitments were as follows: | ||
| Unfunded | ||
| Borrower | Commitment | |
| Franklin Floating Rate Daily Access Fund | ||
| BMC Software Finance Inc., Initial U.S. Revolving Commitment | $ | 13,260,000 |
| Franklin Low Duration Total Return Fund | ||
| BMC Software Finance Inc., Initial U.S. Revolving Commitment | $ | 3,492,917 |
| Franklin Total Return Fund | ||
| BMC Software Finance Inc., Initial U.S. Revolving Commitment | $ | 7,629,911 |
10. Other Derivative Information
At April 30, 2016, the Funds’ investments in derivative contracts are reflected in the Statements of Assets and Liabilities as follows:
| Asset Derivatives | Liability Derivatives | |||||||
| Derivative Contracts | ||||||||
| Not Accounted for as | Statements of Assets and | Statements of Assets and | ||||||
| Hedging Instruments | Liabilities Location | Fair Value | Liabilities Location | Fair Value | ||||
| Franklin Low Duration | ||||||||
| Total Return Fund | ||||||||
| Interest rate contracts | Variation margin | $ | 77,850 | a | Variation margin | $ | 938,878 | a |
| Unrealized appreciation on | 189,380 | Unrealized depreciation on | 15,112 | |||||
| OTC swap contracts | OTC swap contracts | |||||||
| Foreign exchange contracts | Unrealized appreciation on | 4,639,082 | Unrealized depreciation on | 10,647,205 | ||||
| OTC forward exchange | OTC forward exchange | |||||||
| contracts | contracts | |||||||
| Credit contracts | Variation margin | 68,782 | a | Variation margin | 1,228 | a | ||
| OTC swap contracts | 3,670,957 | OTC swap contracts | 7,273,459 | |||||
| (Upfront payments) | (Upfront receipts) | |||||||
| Unrealized appreciation on | 1,013,481 | Unrealized depreciation on | 4,541,842 | |||||
| OTC swap contracts | OTC swap contracts | |||||||
| Totals | $ | 9,659,532 | $ | 23,417,724 | ||||
franklintempleton.com
Semiannual Report 125
FRANKLIN INVESTORS SECURITIES TRUST
NOTES TO FINANCIAL STATEMENTS (UNAUDITED)
| 10. Other Derivative Information (continued) | ||||||||
| Asset Derivatives | Liability Derivatives | |||||||
| Derivative Contracts | ||||||||
| Not Accounted for as | Statements of Assets and | Statements of Assets and | ||||||
| Hedging Instruments | Liabilities Location | Fair Value | Liabilities Location | Fair Value | ||||
| Franklin Total Return Fund | ||||||||
| Interest rate contracts | Investments in securities, | $ | 52,208 | b | Options written, at value | $ | — | |
| at value | ||||||||
| Variation margin | 455,782 | a | Variation margin | 763,287 | a | |||
| Unrealized appreciation on | — | Unrealized depreciation on | 123,420 | |||||
| OTC swap contracts | OTC swap contracts | |||||||
| Foreign exchange contracts | Unrealized appreciation on | 15,059,576 | Unrealized depreciation on | 43,029,600 | ||||
| OTC forward exchange | OTC forward exchange | |||||||
| contracts | contracts | |||||||
| Credit contracts | Variation margin | 118,108 | a | Variation margin | 355,315 | a | ||
| OTC swap contracts | 10,268,679 | OTC swap contracts | 11,030,131 | |||||
| (Upfront payments) | (Upfront receipts) | |||||||
| Unrealized appreciation on | 2,139,332 | Unrealized depreciation on | 12,210,602 | |||||
| OTC swap contracts | OTC swap contracts | |||||||
| Value recovery instruments | Investments in securities, | 148,836 | Investments in securities, | — | ||||
| at value | at value | |||||||
| Totals | $ | 28,242,521 | $ | 67,512,355 | ||||
a This amount reflects the cumulative appreciation (depreciation) of future contracts and/or centrally cleared swaps contracts as reported in the Statements of Invest-
ments. Only the variation margin receivable/payable at period end is separately reported within the Statements of Assets and Liabilities. Prior variation margin movements
were recorded to cash upon receipt or payment.
b Purchased option contracts are included in investments in securities, at value in the Statements of Assets and Liabilities.
For the period ended April 30, 2016, the effect of derivative contracts in the Funds’ Statements of Operations was as follows:
| Net Change | ||||||||
| in Unrealized | ||||||||
| Derivative Contracts | Net Realized | Appreciation | ||||||
| Not Accounted for as | Statements | Gain (Loss) | Statements | (Depreciation) | ||||
| Hedging Instruments | of Operations Location | for the Period | of Operations Location | for the Period | ||||
| Net realized gain (loss) from: | Net change in unrealized | |||||||
| appreciation (depreciation) on: | ||||||||
| Franklin Floating Rate Daily | ||||||||
| Access Fund | ||||||||
| Credit contracts | Swap contracts | $ | 204,965 | Swap contracts | $ | 47,565 | ||
| Franklin Low Duration Total | ||||||||
| Return Fund | ||||||||
| Interest rate contracts | Futures contracts | $ | (971,432 | ) | Futures contracts | $ | (287,928 | ) |
| Swap contracts | (970,635 | ) | Swap contracts | (1,285,223 | ) | |||
| Foreign exchange contracts | Investments | (55,795 | )a | Investments | 29,215 | a | ||
| Written options | (16,726 | ) | Written options | (15,295 | ) | |||
| Foreign currency | 447,181 | b | Translation of other assets | (10,081,469 | )b | |||
| transactions | and liabilities denominated | |||||||
| in foreign currencies | ||||||||
| Credit contracts | Investments | (172,761 | )a | Investments | 490,454 | a | ||
| Written options | 323,957 | Written options | (292,978 | ) | ||||
| Swap contracts | (2,299,309 | ) | Swap contracts | (3,150,689 | ) | |||
| Totals | $ | (3,715,520 | ) | $ | (14,593,913 | ) |
126 Semiannual Report
franklintempleton.com
FRANKLIN INVESTORS SECURITIES TRUST
NOTES TO FINANCIAL STATEMENTS (UNAUDITED)
| Net Change | ||||||||
| in Unrealized | ||||||||
| Derivative Contracts | Net Realized | Appreciation | ||||||
| Not Accounted for as | Statements | Gain (Loss) | Statements | (Depreciation) | ||||
| Hedging Instruments | of Operations Location | for the Period | of Operations Location | for the Period | ||||
| Franklin Total Return Fund | ||||||||
| Interest rate contracts | Investments | $ | (402,461 | )a | Investments | $ | (278,954 | )a |
| Futures contracts | 3,848,610 | Futures contracts | (171,486 | ) | ||||
| Swap contracts | 287,395 | Swap contracts | (5,053,879 | ) | ||||
| Foreign exchange contracts | Investments | (213,464 | )a | Investments | 44,407 | a | ||
| Written options | (47,244 | ) | Written options | (23,249 | ) | |||
| Foreign currency | (1,099,817 | )b | Translation of other assets | (34,961,100 | )b | |||
| transactions | and liabilities denominated | |||||||
| in foreign currencies | ||||||||
| Credit contracts | Investments | (1,101,000 | )a | Investments | 1,064,331 | a | ||
| Written options | 703,080 | Written options | (635,897 | ) | ||||
| Swap contracts | (6,293,894 | ) | Swap contracts | (5,732,894 | ) | |||
| Value recovery instruments | Investments | — | Investments | (38,394 | ) | |||
| Totals | $ | (4,318,795 | ) | $ | (45,787,115 | ) |
aPurchased option contracts are included in net realized gain (loss) from investments and net change in unrealized appreciation (depreciation) on investments in the
Statements of Operations.
bForward exchange contracts are included in net realized gain (loss) from foreign currency transactions and net change in unrealized appreciation (depreciation) on translation
of other assets and liabilities denominated in foreign currencies in the Statements of Operations.
For the period ended April 30, 2016, the average month end fair value of derivatives, as a percentage of average month end net
assets, and the average month end number of open derivative contracts for the period were as follows:
| Franklin | ||||||
| Franklin | Low Duration | Franklin | ||||
| Floating Rate | Total Return | Total Return | ||||
| Daily Access Fund | Fund | Fund | ||||
| Average month end fair value of derivatives | 0.00 | % | 0.76 | % | 1.07 | % |
| Average month end number of open derivative contracts | — | 164 | 173 | |||
At April 30, 2016, the Funds’ OTC derivative assets and liabilities are as follows:
| Gross and Net Amounts | ||||
| of Assets and Liabilities | ||||
| Presented in the | ||||
| Statements of | ||||
| Assets and Liabilities | ||||
| Assetsa | Liabilitiesa | |||
| Derivatives | ||||
| Franklin Low Duration Total Return Fund | ||||
| Forward exchange contracts | $ | 4,639,082 | $ | 10,647,205 |
| Swap contracts | 4,873,818 | 11,830,413 | ||
| Total | $ | 9,512,900 | $ | 22,477,618 |
| Franklin Total Return Fund | ||||
| Forward exchange contracts | $ | 15,059,576 | $ | 43,029,600 |
| Swap contracts | 12,408,011 | 23,364,153 | ||
| Total | $ | 27,467,587 | $ | 66,393,753 |
aAbsent an event of default or early termination, OTC derivative assets and liabilities are presented gross and not offset in the Statements of Assets and Liabilities.
franklintempleton.com
Semiannual Report 127
FRANKLIN INVESTORS SECURITIES TRUST
NOTES TO FINANCIAL STATEMENTS (UNAUDITED)
10. Other Derivative Information (continued)
At April 30, 2016, the Funds’ OTC derivative assets, which may be offset against the Funds’ OTC derivative liabilities and collateral received from the counterparty, are as follows:
| Amounts Not Offset in the | ||||||||||||
| Statements of Assets and Liabilities | ||||||||||||
| Gross and Net | ||||||||||||
| Amounts of Assets | Financial | |||||||||||
| Presented in the | Financial | Instruments | Cash | |||||||||
| Statements of | Instruments | Collateral | Collateral | Net Amount (Not | ||||||||
| Assets and Liabilities | Available for Offset | Received | Received | less than zero) | ||||||||
| Franklin Low Duration Total Return Fund | ||||||||||||
| Counterparty | ||||||||||||
| BOFA | $ | — | $ | — | $ | — | $ | — | $ | — | ||
| BZWS | 575,107 | (575,107 | ) | — | — | — | ||||||
| CITI | 1,254,885 | (1,254,885 | ) | — | — | — | ||||||
| DBAB | 4,720,881 | (4,720,881 | ) | — | — | — | ||||||
| FBCO | 20,635 | (20,635 | ) | — | — | — | ||||||
| GSCO | 2,577,852 | (2,577,852 | ) | — | — | — | ||||||
| HSBC | 1,067 | (1,067 | ) | — | — | — | ||||||
| JPHQ | 362,473 | (362,473 | ) | — | — | — | ||||||
| MSCO | — | — | — | — | — | |||||||
| Total | $ | 9,512,900 | $ | (9,512,900 | ) | $ | — | $ | — | $ | — | |
| Franklin Total Return Fund | ||||||||||||
| Counterparty | ||||||||||||
| BOFA | $ | 10,461 | $ | (10,461 | ) | $ | — | $ | — | $ | — | |
| BZWS | 1,334,195 | (1,334,195 | ) | — | — | — | ||||||
| CITI | 1,445,270 | (1,445,270 | ) | — | — | — | ||||||
| DBAB | 17,568,893 | (17,568,893 | ) | — | — | — | ||||||
| FBCO | 337,816 | (337,816 | ) | — | — | — | ||||||
| GSCO | 6,344,429 | (6,344,429 | ) | — | — | — | ||||||
| HSBC | 17,553 | (17,553 | ) | — | — | — | ||||||
| JPHQ | 209,294 | (209,294 | ) | — | — | — | ||||||
| MSCO | — | — | — | — | — | |||||||
| UBSW | 199,676 | (199,676 | ) | — | — | — | ||||||
| Total | $ | 27,467,587 | $ | (27,467,587 | ) | $ | — | $ | — | $ | — | |
128 Semiannual Report
franklintempleton.com
FRANKLIN INVESTORS SECURITIES TRUST
NOTES TO FINANCIAL STATEMENTS (UNAUDITED)
At April 30, 2016, the Funds’ OTC derivative liabilities, which may be offset against the Funds’ OTC derivative assets and collateral pledged to the counterparty, are as follows:
| Amounts Not Offset in the | ||||||||||||
| Statements of Assets and Liabilities | ||||||||||||
| Gross and Net | ||||||||||||
| Amounts of Liabilities | Financial | |||||||||||
| Presented in the | Financial | Instruments | Cash | |||||||||
| Statements of | Instruments | Collateral | Collateral | Net Amount (Not | ||||||||
| Assets and Liabilities | Available for Offset | Pledged | Pledgeda | less than zero) | ||||||||
| Franklin Low Duration Total Return Fund | ||||||||||||
| Counterparty | ||||||||||||
| BOFA | $ | 143,625 | $ | — | $ | — | $ | (143,625 | ) | $ | — | |
| BZWS | 1,740,558 | (575,107 | ) | — | (1,140,000 | ) | 25,451 | |||||
| CITI | 3,280,030 | (1,254,885 | ) | — | (1,940,000 | ) | 85,145 | |||||
| DBAB | 9,796,786 | (4,720,881 | ) | — | (2,480,000 | ) | 2,595,905 | |||||
| FBCO | 374,628 | (20,635 | ) | — | — | 353,993 | ||||||
| GSCO | 3,886,976 | (2,577,852 | ) | — | (1,309,124 | ) | — | |||||
| HSBC | 45,520 | (1,067 | ) | — | — | 44,453 | ||||||
| JPHQ | 3,068,769 | (362,473 | ) | — | (2,000,000 | ) | 706,296 | |||||
| MSCO | 140,726 | — | — | — | 140,726 | |||||||
| Total | $ | 22,477,618 | $ | (9,512,900 | ) | $ | — | $ | (9,012,749 | ) | $ | 3,951,969 |
| Franklin Total Return Fund | ||||||||||||
| Counterparty | ||||||||||||
| BOFA | $ | 146,820 | $ | (10,461 | ) | $ | — | $ | (136,359 | ) | $ | — |
| BZWS | 4,066,685 | (1,334,195 | ) | — | (2,450,000 | ) | 282,490 | |||||
| CITI | 7,215,088 | (1,445,270 | ) | — | (5,040,000 | ) | 729,818 | |||||
| DBAB | 35,529,225 | (17,568,893 | ) | — | (10,550,000 | ) | 7,410,332 | |||||
| FBCO | 1,560,583 | (337,816 | ) | — | (1,222,767 | ) | — | |||||
| GSCO | 6,492,255 | (6,344,429 | ) | — | (147,826 | ) | — | |||||
| HSBC | 736,493 | (17,553 | ) | — | (290,000 | ) | 428,940 | |||||
| JPHQ | 9,532,155 | (209,294 | ) | — | (5,690,000 | ) | 3,632,861 | |||||
| MSCO | 267,238 | — | — | (40,000 | ) | 227,238 | ||||||
| UBSW | 847,211 | (199,676 | ) | — | (565,000 | ) | 82,535 | |||||
| Total | $ | 66,393,753 | $ | (27,467,587 | ) | $ | — | $ | (26,131,952 | ) | $ | 12,794,214 |
aIn some instances, the collateral amounts disclosed in the table above were adjusted due to the requirement to limit collateral amounts to avoid the effect of
overcollateralization. Actual collateral received and/or pledged may be more than the amounts disclosed herein.
See Notes 1(d) and 6 regarding derivative financial instruments and investment transactions, respectively.
See Abbreviations on page 132.
11. Credit Facility
Certain or all Funds, together with other U.S. registered and foreign investment funds (collectively, Borrowers), managed by Frank-lin Templeton Investments, are borrowers in a joint syndicated senior unsecured credit facility totaling $2 billion (Global Credit Facility) which matures on February 10, 2017. This Global Credit Facility provides a source of funds to the Borrowers for temporary and emergency purposes, including the ability to meet future unanticipated or unusually large redemption requests.
Under the terms of the Global Credit Facility, the Funds shall, in addition to interest charged on any borrowings made by the Funds and other costs incurred by the Funds, pay their share of fees and expenses incurred in connection with the implementation and maintenance of the Global Credit Facility, based upon their relative share of the aggregate net assets of all of the Borrowers, including an annual commitment fee of 0.07% based upon the unused portion of the Global Credit Facility. Effective February 12, 2016, the annual commitment fee is 0.15%. These fees are reflected in other expenses in the Statements of Operations. During the period ended April 30, 2016, the Funds did not use the Global Credit Facility.
franklintempleton.com
Semiannual Report 129
FRANKLIN INVESTORS SECURITIES TRUST
NOTES TO FINANCIAL STATEMENTS (UNAUDITED)
12. Fair Value Measurements
The Funds follow a fair value hierarchy that distinguishes between market data obtained from independent sources (observable inputs) and the Funds’ own market assumptions (unobservable inputs). These inputs are used in determining the value of the Funds’ financial instruments and are summarized in the following fair value hierarchy:
- Level 1 – quoted prices in active markets for identical financial instruments
- Level 2 – other significant observable inputs (including quoted prices for similar financial instruments, interest rates, prepay- ment speed, credit risk, etc.)
- Level 3 – significant unobservable inputs (including the Funds’ own assumptions in determining the fair value of finan- cial instruments)
The input levels are not necessarily an indication of the risk or liquidity associated with financial instruments at that level.
For movements between the levels within the fair value hierarchy, the Funds have adopted a policy of recognizing the transfers as of the date of the underlying event which caused the movement.
A summary of inputs used as of April 30, 2016, in valuing the Funds’ assets and liabilities carried at fair value, is as follows:
| Level 1 | Level 2 | Level 3 | Total | |||||
| Franklin Adjustable U.S. Government Securities Fund | ||||||||
| Assets: | ||||||||
| Investments in Securities | ||||||||
| Mortgage-Backed Securities | $ | — | $ | 1,446,917,384 | $ | — | $ | 1,446,917,384 |
| Short Term Investments | 39,753,347 | — | — | 39,753,347 | ||||
| Total Investments in Securities | $ | 39,753,347 | $ | 1,446,917,384 | $ | — | $ | 1,486,670,731 |
| Franklin Floating Rate Daily Access Fund | ||||||||
| Assets: | ||||||||
| Investments in Securities: | ||||||||
| Equity Investmentsa: | ||||||||
| Health Care Services | $ | — | $ | 1,052,900 | $ | — | $ | 1,052,900 |
| Coal & Consumable Fuels | — | — | 694,927 | 694,927 | ||||
| All Other Equity Investmentsb | 2,128 | — | —c | 2,128 | ||||
| Corporate Bonds | — | — | 465,111 | 465,111 | ||||
| Senior Floating Rate Interests | — | 2,648,126,964 | — | 2,648,126,964 | ||||
| Asset-Backed Securities and Commercial Mortgage-Backed | ||||||||
| Securities | — | 89,509,788 | — | 89,509,788 | ||||
| Short Term Investments | 187,596,154 | — | — | 187,596,154 | ||||
| Total Investments in Securities | $ | 187,598,282 | $ | 2,738,689,652 | $ | 1,160,038 | $ | 2,927,447,972 |
| Liabilities: | ||||||||
| Other Financial Instruments: | ||||||||
| Unfunded Loan Commitments | $ | — | $ | 112,143 | $ | — | $ | 112,143 |
130 Semiannual Report
franklintempleton.com
FRANKLIN INVESTORS SECURITIES TRUST
NOTES TO FINANCIAL STATEMENTS (UNAUDITED)
| Level 1 | Level 2 | Level 3 | Total | ||||||
| Franklin Low Duration Total Return Fund | |||||||||
| Assets: | |||||||||
| Investments in Securities: | |||||||||
| Equity Investmentsa,b | $ | 41,295,084 | $ | — | $ | — | $ | 41,295,084 | |
| Corporate Bonds | — | 1,139,110,395 | — | 1,139,110,395 | |||||
| Senior Floating Rate Interests | — | 76,290,499 | — | 76,290,499 | |||||
| Foreign Government and Agency Securities | — | 51,515,765 | — | 51,515,765 | |||||
| U.S. Government and Agency Securities | — | 372,091,596 | — | 372,091,596 | |||||
| Asset-Backed Securities and Commercial Mortgage-Backed | |||||||||
| Securities | — | 724,789,826 | — | 724,789,826 | |||||
| Mortgage-Backed Securities | — | 60,537,904 | — | 60,537,904 | |||||
| Municipal Bonds | — | 7,829,116 | — | 7,829,116 | |||||
| Escrows and Litigation Trusts | — | — | —c | — | |||||
| Short Term Investments | 56,581,987 | 2,930,499 | — | 59,512,486 | |||||
| Total Investments in Securities | $ | 97,877,071 | $ | 2,435,095,600 | $ | — | $ | 2,532,972,671 | |
| Other Financial Instruments: | |||||||||
| Futures Contracts | $ | 77,850 | $ | — | $ | — | $ | 77,850 | |
| Forward Exchange Contracts | — | 4,639,082 | — | 4,639,082 | |||||
| Swap Contracts | — | 1,271,643 | — | 1,271,643 | |||||
| Total Other Financial Instruments | $ | 77,850 | $ | 5,910,725 | $ | — | $ | 5,988,575 | |
| Liabilities: | |||||||||
| Other Financial Instruments: | |||||||||
| Futures Contracts | $ | 654,002 | $ | — | $ | — | $ | 654,002 | |
| Forward Exchange Contracts | — | 10,647,205 | — | 10,647,205 | |||||
| Swap Contracts | — | 4,843,058 | — | 4,843,058 | |||||
| Unfunded Loan Commitments | — | 88,507 | — | 88,507 | |||||
| Total Other Financial Instruments | $ | 654,002 | $ | 15,578,770 | $ | — | $ | 16,232,772 | |
| Franklin Total Return Fund | |||||||||
| Assets: | |||||||||
| Investments in Securities: | |||||||||
| Equity Investments:a | |||||||||
| Consumer Services | $ | — | $ | 4,031,476 | $ | — | $ | 4,031,476 | |
| All Other Equity Investmentsb | 96,041,714 | — | — | 96,041,714 | |||||
| Corporate Bonds | — | 1,801,848,658 | 9,002 | 1,801,857,660 | |||||
| Senior Floating Rate Interests | — | 76,776,818 | — | 76,776,818 | |||||
| Foreign Government and Agency Securities | — | 207,595,846 | — | 207,595,846 | |||||
| U.S. Government and Agency Securities | — | 684,298,203 | — | 684,298,203 | |||||
| Asset-Backed Securities and Commercial Mortgage-Backed | |||||||||
| Securities | — | 809,195,505 | 16,622 | 809,212,127 | |||||
| Mortgage-Backed Securities | — | 1,012,606,132 | — | 1,012,606,132 | |||||
| Municipal Bonds | — | 76,183,047 | — | 76,183,047 | |||||
| Escrows and Litigation Trusts | — | — | 350 | c | 350 | ||||
| Options Purchased | 52,208 | — | — | 52,208 | |||||
| Short Term Investments | 823,534,323 | — | — | 823,534,323 | |||||
| Total Investments in Securities | $ | 919,628,245 | $ | 4,672,535,685 | $ | 25,974 | $ | 5,592,189,904 | |
| Other Financial Instruments: | |||||||||
| Futures Contracts | $ | 455,782 | $ | — | $ | — | $ | 455,782 | |
| Forward Exchange Contracts | — | 15,059,576 | — | 15,059,576 | |||||
| Swap Contracts | — | 2,257,440 | — | 2,257,440 | |||||
| Total Other Financial Instruments | $ | 455,782 | $ | 17,317,016 | $ | — | $ | 17,772,798 | |
franklintempleton.com
Semiannual Report 131
FRANKLIN INVESTORS SECURITIES TRUST
NOTES TO FINANCIAL STATEMENTS (UNAUDITED)
| 12. Fair Value Measurements (continued) | ||||||||
| Level 1 | Level 2 | Level 3 | Total | |||||
| Liabilities: | ||||||||
| Other Financial Instruments: | ||||||||
| Futures Contracts | $ | 763,287 | $ | — | $ | — | $ | 763,287 |
| Forward Exchange Contracts | — | 43,029,600 | — | 43,029,600 | ||||
| Swap Contracts | — | 12,689,337 | — | 12,689,337 | ||||
| Unfunded Loan Commitments | — | 193,334 | — | 193,334 | ||||
| Total Other Financial Instruments | $ | 763,287 | $ | 55,912,271 | $ | — | $ | 56,675,558 |
aIncludes common and preferred stocks, and management investment companies.
bFor detailed categories, see the accompanying Statement of Investments.
cIncludes securities determined to have no value at April 30, 2016.
A reconciliation of assets in which Level 3 inputs are used in determining fair value is presented when there are significant Level 3 financial instruments at the end of the period.
13. Subsequent Events
The Funds have evaluated subsequent events through the issuance of the financial statements and determined that no events have occurred that require disclosure.
| Abbreviations | |||||
| Counterparty/Exchange | Currency | Selected Portfolio | |||
| BOFA | Bank of America, N.A. | BRL | Brazilian Real | AGMC | Assured Guaranty Municipal Corp. |
| BZWS | Barclays Bank PLC | CHF | Swiss Franc | ARM | Adjustable Rate Mortgage |
| CITI | Citigroup, Inc. | EUR | Euro | CDO | Collateralized Debt Obligation |
| DBAB | Deutsche Bank AG | HUF | Hungarian Forint | CLO | Collateralized Loan Obligation |
| EUX | Eurex | JPY | Japanese Yen | DIP | Debtor-In-Possession |
| FBCO | Credit Suisse Group AG | KRW | South Korean Won | EDA | Economic Development Authority |
| GSCO | The Goldman Sachs Group, Inc. | LKR | Sri Lankan Rupee | ETF | Exchange Traded Fund |
| HSBC | HSBC Bank USA, N.A. | MXN | Mexican Peso | FICO | Financing Corp. |
| ICE | Intercontinental Exchange | MYR | Malaysian Ringgit | FRN | Floating Rate Note |
| JPHQ | JP Morgan Chase & Co. | USD | United States Dollar | GDP | Gross Domestic Product |
| LCH | LCH.Clearnet LLC | GO | General Obligation | ||
| MSCO | Morgan Stanley | MFM | Multi-Family Mortgage | ||
| UBSW | UBS AG | PIK | Payment-In-Kind | ||
| RDA | Redevelopment Agency/Authority | ||||
| REIT | Real Estate Investment Trust | ||||
| SF | Single Family | ||||
| SFR | Single Family Revenue | ||||
| VRI | Value Recovery Instruments | ||||
132 Semiannual Report
franklintempleton.com
FRANKLIN INVESTORS SECURITIES TRUST
Shareholder Information
Board Review of Investment Management Agreement
At a meeting held February 23, 2016, the Board of Trustees (Board), including a majority of trustees that are not “interested persons” as such term is defined in section 2(a)(19) of the Investment Company Act of 1940 (hereinafter referred to as “non-interested Trustees” or “independent Trustees”), approved renewal of the investment management agreement for each of the separate funds within Franklin Investors Securities Trust (Fund(s)). In reaching this decision, the Board took into account information furnished throughout the year at regular Board meetings, as well as information prepared specifically in connection with the annual renewal review process. Information furnished and discussed throughout the year included investment performance reports and related financial information for each Fund, along with periodic reports on expenses, shareholder services, legal and compliance matters, risk control, pricing, brokerage commissions and execution, and other services provided by the Investment Manager (Manager) and its affiliates, as well as marketing support payments made to financial intermediaries. Information furnished specifically in connection with the renewal process included a report for each Fund prepared by Broadridge Financial Solutions, Inc. (Broadridge), an independent organization, as well as additional material, including a Fund profitability analysis prepared by management. The Broadridge reports, which utilize data from Lipper, Inc. (Lipper), compared each Fund’s investment performance and expenses with those of other mutual funds deemed comparable to the Fund as selected by Lipper. The Fund profitability analysis discussed the profitability to Franklin Templeton Investments (FTI) from its overall U.S. fund operations, as well as on an individual fund-by-fund basis. Additional material accompanying such profitability analysis included information on a fund-by-fund basis listing portfolio managers and other accounts they manage, as well as information on management fees charged by the Manager and its affiliates to U.S. mutual funds and other accounts, including management’s explanation of differences where relevant. Such material also included a memorandum prepared by management describing project initiatives and capital investments relating to the services provided to the Funds by the FTI organization, as well as a memorandum relating to economies of scale and an analysis concerning transfer agent fees charged by an affiliate of the Manager. The Board also received a report on all marketing support payments made by FTI to financial intermediaries during the past year, as well as a memorandum relating to third-party servicing arrangements in response to a Guidance Update from the U.S. Securities and Exchange Commission (SEC) relating to mutual fund distribution and sub-accounting fees.
In considering such materials, the independent Trustees received assistance and advice from and met separately with independent counsel. While the investment management agreements for all Funds were considered at the same Board meeting, the Board dealt with each Fund separately. In approving continuance of the investment management agreement for each Fund, and the subadvisory agreement for Franklin Total Return Fund, the Board, including a majority of independent Trustees, determined that the existing management fee structure was fair and reasonable and that continuance of the investment management agreement was in the best interests of each Fund and its shareholders. While attention was given to all information furnished, the following discusses some primary factors relevant to the Board’s decision.
NATURE, EXTENT AND QUALITY OF SERVICES. The Board was satisfied with the nature and quality of the overall services provided by the Manager and its affiliates to the Funds and their shareholders. In addition to investment performance and expenses discussed later, the Board’s opinion was based, in part, upon periodic reports furnished it showing that the investment policies and restrictions for each Fund were consistently complied with as well as other reports periodically furnished the Board covering matters such as the compliance of portfolio managers and other management personnel with the code of ethics adopted throughout the Franklin Templeton fund complex, the adherence to fair value pricing procedures established by the Board, and the accuracy of net asset value calculations. The Board also noted the extent of benefits provided Fund shareholders from being part of the Franklin Templeton family of funds, including the right to exchange investments between the same class of shares of different funds without a sales charge, the ability to reinvest Fund dividends into other funds and the right to combine holdings in other funds to obtain a reduced sales charge. Favorable consideration was given to management’s continual efforts and expenditures in establishing effective business continuity plans and developing strategies to address cybersecurity threats. Additionally, the Board noted the Manager’s continued attention to pricing and valuation issues, particularly with respect to complex securities. Among other factors taken into account by the Board were the Manager’s best execution trading policies, including a favorable report by an independent portfolio trading analytical firm, which also covered FOREX transactions. Consideration was also given to the experience of each Fund’s portfolio management team, the number of accounts managed and general
franklintempleton.com
Semiannual Report 133
FRANKLIN INVESTORS SECURITIES TRUST
SHAREHOLDER INFORMATION
method of compensation. In this latter respect, the Board noted that a primary factor in management’s determination of a portfolio manager’s bonus compensation was the relative investment performance of the funds he or she managed and that a portion of such bonus was required to be invested in a pre-designated list of funds within such person’s fund management area so as to be aligned with the interests of shareholders. The Board also took into account the quality of transfer agent and shareholder services provided Fund shareholders by an affiliate of the Manager and steps taken by FTI to enhance analytical support to the investment management groups and provide additional oversight of liquidity risk and complex securities. The Board also took into account, among other things, management’s efforts in establishing a global credit facility for the benefit of the Funds and other accounts managed by FTI to provide a source of cash for temporary and emergency purposes or to meet unusual redemption requests as well as the strong financial position of the Manager’s parent company and its commitment to the mutual fund business as evidenced by its continued introduction of new funds and reassessment of fund offerings in response to the market environment.
INVESTMENT PERFORMANCE. The Board placed significant emphasis on the investment performance of each Fund in view of its importance to shareholders. While consideration was given to performance reports and discussions with portfolio managers at Board meetings during the year, particular attention in assessing performance was given to the Broadridge reports furnished for the agreement renewals. The Broadridge reports prepared for each individual Fund showed the investment performance of its Class A shares in comparison with its selected performance universe during 2015 and during the previous 10 years ended December 31, 2015, unless otherwise noted. Performance on a total return basis was shown by Broadridge for all Funds, with performance on an income return basis also being shown for those Funds having income return as an element of their investment objective. The following summarizes the performance results for each Fund.
Franklin Adjustable U.S. Government Securities Fund –
The Fund’s investment performance was shown in comparison to a performance universe consisting of all retail and institutional ultra-short obligation funds as selected by Lipper. The Broadridge report showed the Fund’s income return in 2015 to be in the highest quintile of such performance universe, and on an annualized basis to also be in the highest quintile of such universe during each of the previous three-, five- and 10-year periods. The Broadridge report showed the Fund’s total return during 2015 to be in the second-lowest performing quintile of
its performance universe, and on an annualized basis to be in the second-lowest performing quintile of such universe for the previous three-year period, and in the second-highest performing quintile for the previous five- and 10-year periods. The Board found the Fund’s comparative performance as set forth in the Broadridge report to be acceptable, noting the Fund’s income-oriented investment objective and its more favorable comparative longer-term total return.
Franklin Floating Rate Daily Access Fund – The Fund’s investment performance was shown in comparison to a performance universe consisting of all retail and institutional loan participation funds as selected by Lipper. The Broadridge report showed its income return during 2015 to be in the second-highest quintile of its performance universe, and its income return on an annualized basis during the previous three-, five- and 10-year periods to be in the middle quintile of its performance universe. The Broadridge report showed the Fund’s total return during 2015 to be in the second-lowest performing quintile of its performance universe and on an annualized basis for the previous three-, five- and 10-year periods to also be in the second-lowest performing quintile of such universe. In discussing such performance, management pointed out, among other things, that the Fund’s returns should be viewed on a risk-adjusted basis, and reflected its conservative approach to investing. They noted the positive impact of resources added in 2014 to the management of the Fund and some changes to the investment approach to capture additional income. Management also expressed its belief that the Fund’s performance was favorable in comparison to other similarly managed funds within its Lipper performance universe. The Board found such performance to be acceptable in view of the level of income return achieved by the Fund.
Franklin Low Duration Total Return Fund – The Fund’s investment performance was shown in comparison to a performance universe consisting of all retail and institutional short investment-grade debt funds as selected by Lipper. The Broadridge report showed its income return for 2015 to be in the highest quintile of its performance universe, and on an annualized basis to be in either the highest quintile or second-highest quintile of such universe for the previous three-, five-and 10-year periods. The Broadridge report showed the Fund’s total return for 2015 to be in the lowest performing quintile of its performance universe, and on an annualized basis to be in the middle performing quintile for the previous three- and five-year periods, and the highest performing quintile for the previous 10-year period. The Board found the Fund’s comparative performance as shown in the Broadridge report to be
134 Semiannual Report
franklintempleton.com
FRANKLIN INVESTORS SECURITIES TRUST
SHAREHOLDER INFORMATION
acceptable, noting the Fund’s commendable income returns and favorable comparative longer term total return.
Franklin Total Return Fund – The Fund’s investment performance was shown in comparison to a performance universe consisting of all retail and institutional core plus bond funds as selected by Lipper. The Broadridge report showed the Fund’s income return to be in the highest quintile of its performance universe during 2015 and to also be in the highest quintile of such universe for the previous three-, five- and 10-year periods on an annualized basis. The Broadridge report showed the Fund’s total return during 2015 to be in the lowest performing quintile of its performance universe, and on an annualized basis to be in the middle performing quintile of such universe for the previous three- and five-year periods, and in the second-lowest performing quintile of such universe for the previous 10-year period. The Board found the Fund’s comparative performance as set forth in the Broadridge report to be acceptable in light of the satisfactory income returns of the Fund.
COMPARATIVE EXPENSES. Consideration was given to the management fees and total expense ratio of each Fund compared with those of a group of other funds selected by Lipper as constituting its appropriate Lipper expense group. Lipper expense data is based upon information taken from each fund’s most recent annual report, which reflects historical asset levels that may be quite different from those currently existing, particularly in a period of market volatility. While recognizing such inherent limitation and the fact that expense ratios generally increase as assets decline and decrease as assets grow, the Board believed the independent analysis conducted by Lipper to be an appropriate measure of comparative expenses. In reviewing comparative costs, Lipper provides information on each Fund’s contractual investment management fee in comparison with the contractual investment management fee that would have been charged by other funds within its Lipper expense group assuming they were similar in size to the Fund, as well as the actual total expense ratio of the Fund in comparison with those of its expense group. The Lipper contractual investment management fee analysis includes within such fee any separate administrative fees, and Lipper total expenses, for comparative consistency, are shown by Lipper for Fund Class A shares. The results of such expense comparisons showed that the contractual investment management fee rate and actual total expense ratio for Franklin Floating Rate Daily Access Fund were below the median of its Lipper expense group. The Board was satisfied with the comparative contractual investment management fee rate and actual total expense ratios of the Fund as shown in the Broadridge reports. The contractual investment management fee rate and actual total expense ratio of Franklin Adjustable U.S. Government Securities Fund were above the median of its expense group. The Board found the comparative contractual investment fee rate and actual total expense ratios of the Fund as shown in their Broadridge reports to be acceptable. While the contractual investment management fee rate of Franklin Low Duration Total Return Fund was less than five basis points above the median of its Lipper expense group, the Fund benefited from a fee waiver that reduced its actual total expense ratio to the median of such group. The contractual investment management fee rate for Franklin Total Return Fund was above the median of its respective Lipper expense group but was reduced to within 2.1 basis points of the median as a result of a waiver, and its actual total expense ratio was within seven basis points above the median of its expense group. The Board found the contractual management fees and total expense ratios of these two Funds to be acceptable, noting that their expenses were subsidized by management.
MANAGEMENT PROFITABILITY. The Board also considered the level of profits realized by the Manager and its affiliates in connection with the operation of each Fund. In this respect, the Board reviewed the Fund profitability analysis that addresses the overall profitability of Franklin Templeton’s U.S. fund business, as well as its profits in providing management and other services to each of the individual funds during the 12-month period ended September 30, 2015, being the most recent fiscal year-end for Franklin Resources, Inc., the Manager’s parent. In reviewing the analysis, the Board recognized that allocation methodologies are inherently subjective and various allocation methodologies may be reasonable while producing different results. In this respect, the Board noted that while management continually makes refinements to its methodologies in response to organizational and product related changes, the overall approach as defined by the primary drivers and activity measurements has remained consistent with that used in the Funds’ profitability report presentations from prior years. Additionally, the Funds’ independent registered public accounting firm had been engaged by the Manager to periodically review the reasonableness of the allocation methodologies to be used solely by the Funds’ Board in reference to the profitability analysis. In reviewing and discussing such analysis, management discussed with the Board its belief that costs incurred in establishing the infrastructure necessary for the type of mutual fund operations conducted by the Manager and its affiliates may not be fully reflected in the expenses allocated to each Fund in determining its profitability, as well as the fact that the level of profits, to a certain extent, reflected operational cost savings and efficiencies initiated by management. The
franklintempleton.com
Semiannual Report 135
FRANKLIN INVESTORS SECURITIES TRUST
SHAREHOLDER INFORMATION
Board also took into account management’s expenditures in improving shareholder services provided the Funds, as well as the need to implement systems and meet additional regulatory and compliance requirements resulting from statutes such as the Sarbanes-Oxley and Dodd-Frank Acts and recent SEC and other regulatory requirements. In addition, the Board considered a third-party study comparing the profitability of the Manager’s parent on an overall basis to other publicly held managers broken down to show profitability from management operations exclusive of distribution expenses, as well as profitability including distribution expenses. The Board also considered the extent to which the Manager and its affiliates might derive ancillary benefits from fund operations, including revenues generated from transfer agent services and potential benefits resulting from personnel and systems enhancements necessitated by fund growth, as well as increased leverage with service providers and counterparties, allocation of fund brokerage and the use of commission dollars to pay for research. Based upon its consideration of all these factors, the Board determined that the level of profits realized by the Manager and its affiliates from providing services to each Fund was not excessive in view of the nature, quality and extent of services provided.
ECONOMIES OF SCALE. The Board also considered whether economies of scale are realized by the Manager as the Funds grow larger and the extent to which this is reflected in the level of management fees charged. While recognizing that any precise determination is inherently subjective, the Board noted that based upon the Fund profitability analysis, it appears that as some funds get larger, at some point economies of scale do result in the Manager realizing a larger profit margin on management services provided such a fund. The Board also noted that economies of scale are shared with each Fund and its shareholders through management fee breakpoints so that as a Fund grows in size, its effective management fee rate declines. The management fee for Franklin Adjustable U.S. Government Securities Fund provides a fee of 0.50% on the first $5 billion of net assets, with breakpoints continuing at stages thereafter until reaching a final breakpoint of 0.38% for net assets in excess of $15 billion. Based on their year-end asset levels, all of the Funds, except Franklin Adjustable U.S. Government Securities Fund, benefited from breakpoints contained in their management fee structures with additional breakpoints continuing beyond such asset levels. With respect to Franklin Adjustable U.S. Government Securities Fund, the Board determined that the initial management fee established for this Fund reflected certain economies of scale. The Board believed that to the extent economies of scale may be realized by the Manager and its affiliates, the schedule of fees under the investment management agreement for each Fund provides a sharing of benefits with the Fund and its shareholders as the Fund grows.
Proxy Voting Policies and Procedures
The Trust’s investment manager has established Proxy Voting Policies and Procedures (Policies) that the Trust uses to determine how to vote proxies relating to portfolio securities. Shareholders may view the Trust’s complete Policies online at franklintempleton.com. Alternatively, shareholders may request copies of the Policies free of charge by calling the Proxy Group collect at (954) 527-7678 or by sending a written request to: Franklin Templeton Companies, LLC, 300 S.E. 2nd Street, Fort Lauderdale, FL 33301, Attention: Proxy Group. Copies of the Trust’s proxy voting records are also made available online at franklintempleton.com and posted on the U.S. Securities and Exchange Commission’s website at sec.gov and reflect the most recent 12-month period ended June 30.
Quarterly Statement of Investments
The Trust files a complete statement of investments with the U.S. Securities and Exchange Commission for the first and third quarters for each fiscal year on Form N-Q. Shareholders may view the filed Form N-Q by visiting the Commission’s website at sec.gov. The filed form may also be viewed and copied at the Commission’s Public Reference Room in Wash-ington, DC. Information regarding the operations of the Public Reference Room may be obtained by calling (800) SEC-0330.
136 Semiannual Report
franklintempleton.com
| Contents | |
| Semiannual Report | |
| Economic and Market Overview | 3 |
| Franklin Balanced Fund | 4 |
| Franklin Convertible Securities Fund | 13 |
| Franklin Equity Income Fund | 21 |
| Franklin Real Return Fund | 30 |
| Financial Highlights and Statements of Investments | 37 |
| Financial Statements | 73 |
| Notes to Financial Statements | 78 |
| Shareholder Information | 95 |
Visit franklintempleton.com for fund updates, to access your account, or to find helpful financial planning tools.
2 Semiannual Report
franklintempleton.com
Semiannual Report
Economic and Market Overview
The U.S. economy moderated in 2015’s fourth quarter and slowed further in 2016’s first quarter as exports, business investment and federal government spending declined. The manufacturing sector expanded in March and April after contracting for five consecutive months, while the services sector expanded throughout the six-month period. Growth in services contributed to new jobs and helped the unemployment rate to be largely stable at 5.0% throughout the review period.1 Home sales and prices rose amid relatively low mortgage rates. Monthly retail sales grew during most of the review period and rose to the highest level in April in more than a year, driven mainly by automobile sales. Inflation, as measured by the Consumer Price Index, remained relatively subdued due to low energy prices.
After maintaining a near-zero interest rate for seven years to support the U.S. economy’s recovery, the U.S. Federal Reserve (Fed) raised its target range for the federal funds rate to 0.25%–0.50% at its December meeting. At the time of the increase, policymakers cited the labor market’s considerable improvement and were reasonably confident that inflation would move back to the Fed’s 2.00% medium-term objective. The Fed maintained the rate through period-end, indicating it would monitor domestic and global developments and their implications on the labor markets as it tracks actual and expected progression toward its employment and inflation goals.
U.S. stock markets experienced sell-offs during the period under review, resulting from investor concerns about the timing of the Fed’s interest rate increases, global economic growth, China’s slowing economy and tumbling stock market, geopolitical tensions in certain regions and a plunge in crude oil prices. Investors generally remained confident, however as the Fed remained cautious about further interest rate increases, the eurozone economy improved, the European Central Bank expanded its quantitative easing measures and cut its benchmark interest rate to zero, the People’s Bank of China introduced further easing measures, and the Bank of Japan adopted a negative interest rate policy. The rally in crude oil prices toward period-end also boosted investor sentiment. Despite periods of volatility, the broad U.S. stock market ended the six-month period relatively flat, as measured by the Standard & Poor’s® 500 Index.
The foregoing information reflects our analysis and opinions as of April 30, 2016. The information is not a complete analysis of every aspect of any market, country, industry, security or fund. Statements of fact are from sources considered reliable.
franklintempleton.com
Semiannual Report 3
Franklin Balanced Fund
This semiannual report for Franklin Balanced Fund covers the period ended April 30, 2016.
Your Fund’s Goal and Main Investments
The Fund seeks both income and capital appreciation by investing in a combination of stocks, convertible securities and debt securities. The Fund will normally invest at least 25% of its total assets in equity securities (primarily common and preferred stock) and at least 25% of its total assets in debt securities, including bonds, notes, debentures and money market securities.
| Portfolio Breakdown* | ||
| 4/30/16 | ||
| % of Total | ||
| Net Assets | ||
| Stocks | 65.1 | % |
| Common Stocks | 48.3 | % |
| Equity-Linked Securities | 9.4 | % |
| Convertible Preferred Stocks | 5.4 | % |
| Management Investment Companies | 1.6 | % |
| Preferred Stocks | 0.4 | % |
| Bonds | 29.1 | % |
| Corporate Bonds | 29.1 | % |
| Short-Term Investments & Other Net Assets | 5.8 | % |
*Percentages reflect certain derivatives held in the portfolio (or their underlying
reference assets) and may not total 100% or may be negative due to rounding, use
of derivatives, unsettled trades or other factors. The breakdown may not match the
SOI.
Performance Overview
For the six months under review, the Fund’s Class A shares delivered a cumulative total return of +1.78%. In comparison, the Fund’s equity benchmark, the Standard & Poor’s 500 Index (S&P 500®), which is a broad measure of U.S. stock performance, posted a +0.43% total return.1 The Fund’s fixed income benchmark, the Barclays U.S. Aggregate Bond Index, which tracks the U.S. investment-grade, taxable bond market, posted a +2.82% return.1 You can find the Fund’s long-term performance data in the Performance Summary beginning on page 8.
Performance data represent past performance, which does not guarantee future results. Investment return and principal value will fluctuate, and you may have a gain or loss when you sell your shares. Current performance may differ from figures
shown. For most recent month-end performance, go to franklintempleton.com or call (800) 342-5236.
Investment Strategy
We apply a bottom-up approach to investing in individual securities. We will assess the market price of a company’s securities relative to our evaluation of the company’s long-term earnings, asset value and cash flow potential. We also consider a company’s price/earnings ratio, profit margins and liquidation value. In determining an optimal mix of equity and fixed income investments for the Fund, we assess changing economic, market and industry conditions. We may sell securities for a number of possible reasons, including the achievement of certain stock prices or credit spreads, changes in the fundamental outlook or risk/reward profile of a security, less attractive values relative to market peers, or broad economic conditions affecting certain fixed income sectors. For purposes of pursuing the Fund’s investment goal, we may enter into various equity-related transactions involving derivative instruments. We may also invest in equity-linked notes, which are hybrid derivative-type instruments specially designed to combine the characteristics of one or more reference securities (usually a single stock, a stock index or a basket of stocks) and a related equity derivative, such as a put or call option.
What is an equity-linked note?
An equity-linked note is a derivative instrument whose return is determined by the performance of a single equity security, a basket of equity securities, or an equity index. The purchase of equity-linked notes may involve investment in related equity derivatives, such as put and call options
What are put and call options?
A put option is a contract giving the owner the right, but not the obligation, to sell a specified amount of an underlying security at a specified price within a specified time. Put options are most commonly used to protect against the decline of a stock price below a certain price. Conversely, a call option gives the holder the right to buy shares at a specified price within a specified time, regardless of the price in the future before the expiration date. If the stock price rises, the holder of the call option has the right to buy at the agreed-upon price, which could be lower.
1. Source: Morningstar.
The indexes are unmanaged and include reinvested dividends. They do not reflect any fees, expenses or sales charges. One cannot invest directly in an index, and an index is
not representative of the Fund’s portfolio.
The dollar value, number of shares or principal amount, and names of all portfolio holdings are listed in the Fund’s Statement of Investments (SOI).
The SOI begins on page 42.
4 Semiannual Report
franklintempleton.com
FRANKLIN BALANCED FUND
| Dividend Distributions* | |||||
| 11/1/15–4/30/16 | |||||
| Dividend per Share (cents) | |||||
| Advisor | |||||
| Month | Class A | Class C | Class R | Class R6 | Class |
| November | 3.00 | 2.29 | 2.76 | 3.29 | 3.23 |
| December | 3.45 | 2.76 | 3.21 | 3.76 | 3.67 |
| January | 3.00 | 2.31 | 2.76 | 3.31 | 3.22 |
| February | 3.00 | 2.31 | 2.76 | 3.31 | 3.22 |
| March | 3.00 | 2.35 | 2.89 | 3.33 | 3.22 |
| April | 3.00 | 2.35 | 2.89 | 3.33 | 3.22 |
| Total | 18.45 | 14.37 | 17.27 | 20.33 | 19.78 |
*The distribution amount is the sum of the dividend payments to shareholders for
the period shown and includes only estimated tax-basis net investment income. All
Fund distributions will vary depending upon current market conditions, and past
distributions are not indicative of future trends.
Manager’s Discussion
During the six months under review, we continued to strategically shift the Fund’s asset mix seeking to manage risks, and our equity and fixed income holdings increased. The Fund’s equity weighting rose to 65.1% from 60.9% of total net assets, and the Fund’s fixed income weighting rose to 29.1% from 27.6%. Our cash position fell during the period to 5.8% from 11.5% of total net assets.
In equities, the energy sector produced strong returns as oil prices bottomed and rebounded from recent lows. Standout contributors included a convertible preferred security issued by Hess,2 an equity position in Chevron and a new position in Anadarko Petroleum.2 Our return on Hess surged after we added it to the portfolio.
The utilities and telecommunication services sectors were also strong contributors to Fund performance as investors sought the relative safety of the consistent cash flow often associated with companies in these sectors. We took advantage of this strength to take profits and reduce our exposure to these sectors. Within utilities, a convertible preferred stock position in NextEra Energy and Xcel Energy3 posted strong returns as did Verizon Communications in telecommunication services.
Individual equity positions that significantly contributed to Fund performance included health care company Johnson & Johnson and industrial conglomerate General Electric and defense contractor Raytheon.
| Top Five Equity Holdings | ||
| 4/30/16 | ||
| Company | % of Total | |
| Sector/Industry | Net Assets | |
| General Electric Co. | 1.8 | % |
| Industrials | ||
| JPMorgan Chase & Co. | 1.7 | % |
| Financials | ||
| Oracle Corp. | 1.6 | % |
| Information Technology | ||
| Chevron Corp. | 1.6 | % |
| Energy | ||
| Microsoft Corp. | 1.6 | % |
| Information Technology |
In contrast, information technology detracted from equity Fund performance. Apple shares slid based on investor concerns about slowing iPhone sales, while QUALCOMM shares fell based on investor concerns about revenues from the Chinese market. Amid the sector’s volatility, however, the Fund added new positions in Oracle and Analog Devices, both of which performed well following our purchases. We bought Oracle amid its transition to a cloud-based business model and Analog Devices as its shares declined due to concerns about iPhone sales.
Health care was another detractor from the Fund’s performance, particularly our convertible preferred stock position in Allergan. Pfizer canceled its planned acquisition of Allergan after the U.S. government issued new rules related to mergers that could result in the reduction of a company’s tax rate. The cancellation of this deal led to a sell-off in Allergan shares. Other pharmaceutical holdings, including Teva Pharmaceutical Industries2 and AstraZeneca, also experienced weakness as election year rhetoric about drug prices raised investor concerns about future revenues. Consumer discretionary was another detractor, and our positions in upscale fashion retailer Nordstrom and automobile manufacturers Ford Motor and Daimler2 reported weak performance.
Individual equity positions that significantly detracted from Fund performance included fertilizer company Mosaic, an equity-linked security in financial services provider Bank of America and aerospace manufacturer Boeing.
During the period, our fixed income positions exceeded the return of the benchmark Barclays U.S. Aggregate Bond Index.
2. New position during the period.
3. Sold by period-end.
franklintempleton.com
Semiannual Report 5
FRANKLIN BALANCED FUND
Our credit focus resulted in a sluggish start to the period, but delivered strong performance by period-end.
Our fixed income holdings in the consumer non-cyclical, communications and consumer cyclical sectors delivered positive performance during the period.4 In consumer non-cyclical, our position in beverage and brewing company Anheuser-Busch InBev Finance was a strong performer and the company completed a large bond offering in January 2016.2 Our positions in Reynolds American, Whole Foods Market2 and Tyson Foods also contributed to returns. In communications, Verizon Communications, Charter Communications5 and Telefonica Emisiones boosted results. The consumer cyclical sector also delivered positive performance, and key contributors included Yum! Brands, Dollar General and CVS Health.
Individual fixed income holdings that significantly contributed to Fund performance included a position in industrial conglomerate General Electric.
Fixed income sectors tied to the commodities market provided mixed results during the period. Energy sector holdings such as NGL Energy Partners3 and Linn Energy3 detracted from performance after oil prices reached record lows.6 The electric utility sector also posted poor results, with InterGen a key dectractor.7 However, new energy positions that we initiated during the period, such as Anadarko Petroleum, contributed to performance. Other commodities-related positions, including FMG Resources, Freeport-McMoRan and Kinder Morgan Energy Partners, rebounded toward period-end.
Individual fixed income positions that significantly detracted from Fund performance included telecommunications provider Sprint and financial services companies Deutsche Bank and Royal Bank of Scotland Group.
The Fund used derivative instruments during the period, such as equity options. The goal of these instruments is to enhance Fund returns and more efficiently enter and exit stock positions at prices the Fund deems attractive. None of these positions had a material impact on performance. We were comfortable with the Fund’s rising cash position during the period, as we
| Top Five Bond Holdings | ||
| 4/30/16 | ||
| Company | % of Total | |
| Sector/Industry | Net Assets | |
| Morgan Stanley | 1.3 | % |
| Financials | ||
| Citigroup Inc. | 0.8 | % |
| Financials | ||
| Bank of America Corp. | 0.8 | % |
| Financials | ||
| Energy Transfer Partners LP | 0.7 | % |
| Energy | ||
| Reynolds American Inc. | 0.7 | % |
| Consumer Staples |
believed it helped reduce volatility and enabled us to invest opportunistically at times when the markets retreated.
Thank you for your continued participation in Franklin Balanced Fund. We look forward to serving your future investment needs.

6 Semiannual Report
CFA® is a trademark owned by CFA Institute.
4. Consumer non-cyclical companies are in consumer staples and health care in the fixed income section of the SOI. Communications companies are in consumer discretionary
and telecommunication services in the fixed income section of the SOI. Consumer cyclical companies are in consumer discretionary, consumer staples and health care in the
fixed income section of the SOI.
5. This position listed as CCO Safari II LLC in the fixed income corporate bonds section of the SOI.
6. Energy companies are in energy and utilities in the fixed income section of the SOI.
7. Electric utility companies are in utilities in the fixed income section of the SOI.
See www.franklintempletondatasources.com for additional data provider information.
franklintempleton.com
FRANKLIN BALANCED FUND
The foregoing information reflects our analysis, opinions and portfolio
holdings as of April 30, 2016, the end of the reporting period. The way
we implement our main investment strategies and the resulting
portfolio holdings may change depending on factors such as market
and economic conditions. These opinions may not be relied upon as
investment advice or an offer for a particular security. The information
is not a complete analysis of every aspect of any market, country,
industry, security or the Fund. Statements of fact are from sources
considered reliable, but the investment manager makes no
representation or warranty as to their completeness or accuracy.
Although historical performance is no guarantee of future results,
these insights may help you understand our investment management
philosophy.
franklintempleton.com
Semiannual Report 7
FRANKLIN BALANCED FUND
Performance Summary as of April 30, 2016
Your dividend income will vary depending on dividends or interest paid by securities in the Fund’s portfolio, adjusted for operating expenses of each class. Capital gain distributions are net profits realized from the sale of portfolio securities. The performance tables do not reflect any taxes that a shareholder would pay on Fund dividends, capital gain distributions, if any, or any realized gains on the sale of Fund shares. Total return reflects reinvestment of the Fund’s dividends and capital gain distributions, if any, and any unrealized gains or losses.
| Net Asset Value | |||||
| Share Class (Symbol) | 4/30/16 | 10/31/15 | Change | ||
| A (FBLAX) | $ | 11.41 | $ | 11.40 | +$0.01 |
| C (FBMCX) | $ | 11.32 | $ | 11.31 | +$0.01 |
| R (N/A) | $ | 11.44 | $ | 11.42 | +$0.02 |
| R6 (FBFRX) | $ | 11.43 | $ | 11.42 | +$0.01 |
| Advisor (FBFZX) | $ | 11.43 | $ | 11.42 | +$0.01 |
| Distributions1 (11/1/15–4/30/16) | |||||
| Dividend | |||||
| Share Class | Income | ||||
| A | $ | 0.1845 | |||
| C | $ | 0.1437 | |||
| R | $ | 0.1727 | |||
| R6 | $ | 0.2033 | |||
| Advisor | $ | 0.1978 | |||
See page 10 for Performance Summary footnotes.
8 Semiannual Report
franklintempleton.com
FRANKLIN BALANCED FUND
PERFORMANCE SUMMARY
Performance as of 4/30/162
Cumulative total return excludes sales charges. Average annual total returns and value of $10,000 investment include maximum sales charges. Class A: 5.75% maximum initial sales charge; Class C: 1% contingent deferred sales charge in first year only;
Class R/R6/Advisor Class: no sales charges.
| Value of | Average Annual | |||||||||||
| Cumulative | Average Annual | $ | 10,000 | Total Return | Total Annual Operating Expenses7 | |||||||
| Share Class | Total Return3 | Total Return4 | Investment5 | (3/31/16 | )6 | (with waiver) | (without waiver) | |||||
| A | 1.03 | % | 1.04 | % | ||||||||
| 6-Month | +1.78 | % | -4.11 | % | $ | 9,589 | ||||||
| 1-Year | -0.78 | % | -6.45 | % | $ | 9,355 | -6.78 | % | ||||
| 5-Year | +35.29 | % | +4.99 | % | $ | 12,755 | +5.27 | % | ||||
| Since Inception (7/3/06) | +74.09 | % | +5.17 | % | $ | 16,409 | +5.07 | % | ||||
| C | 1.78 | % | 1.79 | % | ||||||||
| 6-Month | +1.42 | % | +0.42 | % | $ | 10,042 | ||||||
| 1-Year | -1.44 | % | -2.40 | % | $ | 9,760 | -2.79 | % | ||||
| 5-Year | +30.63 | % | +5.49 | % | $ | 13,063 | +5.77 | % | ||||
| Since Inception (7/3/06) | +62.64 | % | +5.08 | % | $ | 16,264 | +4.97 | % | ||||
| R | 1.28 | % | 1.29 | % | ||||||||
| 6-Month | +1.76 | % | +1.76 | % | $ | 10,176 | ||||||
| 1-Year | -0.92 | % | -0.92 | % | $ | 9,908 | -1.31 | % | ||||
| 5-Year | +33.95 | % | +6.02 | % | $ | 13,395 | +6.30 | % | ||||
| Since Inception (7/3/06) | +71.13 | % | +5.62 | % | $ | 17,113 | +5.52 | % | ||||
| R6 | 0.67 | % | 0.68 | % | ||||||||
| 6-Month | +1.95 | % | +1.95 | % | $ | 10,195 | ||||||
| 1-Year | -0.44 | % | -0.44 | % | $ | 9,957 | -0.74 | % | ||||
| Since Inception (5/1/13) | +18.11 | % | +5.71 | % | $ | 11,811 | +5.39 | % | ||||
| Advisor | 0.78 | % | 0.79 | % | ||||||||
| 6-Month | +1.90 | % | +1.90 | % | $ | 10,190 | ||||||
| 1-Year | -0.52 | % | -0.52 | % | $ | 9,948 | -0.82 | % | ||||
| 5-Year | +37.21 | % | +6.53 | % | $ | 13,721 | +6.83 | % | ||||
| Since Inception (7/3/06) | +79.28 | % | +6.12 | % | $ | 17,928 | +6.03 | % | ||||
| Distribution | 30-Day Standardized Yield9 | |||||
| Share Class | Rate8 | (with waiver) | (without waiver) | |||
| A | 2.97 | % | 2.20 | % | 2.19 | % |
| C | 2.49 | % | 1.60 | % | 1.57 | % |
| R | 3.03 | % | 2.09 | % | 2.07 | % |
| R6 | 3.50 | % | 2.70 | % | 2.67 | % |
| Advisor | 3.38 | % | 2.59 | % | 2.56 | % |
Performance data represent past performance, which does not guarantee future results. Investment return and principal value will fluctuate, and you may have a gain or loss when you sell your shares. Current performance may differ from figures shown. For most recent month-end performance, go to franklintempleton.com or call (800) 342-5236.
See page 10 for Performance Summary footnotes.
franklintempleton.com
Semiannual Report 9
| FRANKLIN BALANCED FUND |
| PERFORMANCE SUMMARY |
All investments involve risks, including possible loss of principal. The Fund’s share price and yield will be affected by interest rate movements. Bond prices generally move in the opposite direction of interest rates. As prices of bonds in the Fund adjust to a rise in interest rates, the Fund’s share price may decline. Stock prices fluctuate, sometimes rapidly and dramatically, due to factors affecting individual companies, particular industries or sectors, or general market conditions. The Fund is actively managed but there is no guarantee that the manager’s investment decisions will produce the desired results. The Fund’s prospectus also includes a description of the main investment risks.
| Class C: | These shares have higher annual fees and expenses than Class A shares. |
| Class R: | Shares are available to certain eligible investors as described in the prospectus. These shares have higher annual fees and expenses than Class A shares. |
| Class R6: | Shares are available to certain eligible investors as described in the prospectus. |
| Advisor Class: | Shares are available to certain eligible investors as described in the prospectus. |
1. The distribution amount is the sum of the dividend payments to shareholders for the period shown and includes only estimated tax-basis net investment income.
2. The Fund has a fee waiver associated with any investment in a Franklin Templeton money fund, contractually guaranteed through at least its current fiscal year-end. Fund
investment results reflect the fee waiver, to the extent applicable; without this reduction, the results would have been lower.
3. Cumulative total return represents the change in value of an investment over the periods indicated.
4. Average annual total return represents the average annual change in value of an investment over the periods indicated. Return for less than one year, ifany,hasnotbeen
annualized.
5. These figures represent the value of a hypothetical $10,000 investment in the Fund over the periods indicated.
6. In accordance with SEC rules, we provide standardized average annual total return information through the latest calendar quarter.
7. Figures are as stated in the Fund’s current prospectus and may differ from the expense ratios disclosed in the Financial Highlights in this report. In periods of market volatility,
assets may decline significantly, causing total annual Fund operating expenses to become higher than the figures shown.
8. Distribution rate is based on an annualization of the respective class’s April dividend and the maximum offering price (NAV for Classes C, R, R6 and Advisor) per share on
4/30/16.
9. The Fund’s 30-day standardized yield is calculated over a trailing 30-day period using the yield to maturity on bonds and/or the dividends accrued on stocks. It may not equal
the fund’s actual income distribution rate, which reflects the fund’s past dividends paid to shareholders.
10 Semiannual Report
franklintempleton.com
FRANKLIN BALANCED FUND
Your Fund’s Expenses
As a Fund shareholder, you can incur two types of costs:
- Transaction costs, including sales charges (loads) on Fund purchases; and
- Ongoing Fund costs, including management fees, distribution and service (12b-1) fees, and other Fund expenses. All mutual funds have ongoing costs, sometimes referred to as operating expenses.
The following table shows ongoing costs of investing in the Fund and can help you understand these costs and compare them with those of other mutual funds. The table assumes a $1,000 investment held for the six months indicated.
Actual Fund Expenses
The first line (Actual) for each share class listed in the table provides actual account values and expenses. The “Ending Account Value” is derived from the Fund’s actual return, which includes the effect of Fund expenses.
You can estimate the expenses you paid during the period by following these steps. Of course, your account value and expenses will differ from those in this illustration:
| 1. | Divide your account value by $1,000. |
| If an account had an $8,600 value, then $8,600 ÷ $1,000 = 8.6. | |
| 2. | Multiply the result by the number under the heading “Expenses Paid During Period.” |
| If Expenses Paid During Period were $7.50, then 8.6 x $7.50 = $64.50. |
In this illustration, the estimated expenses paid this period are $64.50.
Hypothetical Example for Comparison with Other Funds
Information in the second line (Hypothetical) for each class in the table can help you compare ongoing costs of investing in the Fund with those of other mutual funds. This information may not be used to estimate the actual ending account balance or expenses you paid during the period. The hypothetical “Ending Account Value” is based on the actual expense ratio for each class and an assumed 5% annual rate of return before expenses, which does not represent the Fund’s actual return. The figure under the heading “Expenses Paid During Period” shows the hypothetical expenses your account would have incurred under this scenario. You can compare this figure with the 5% hypothetical examples that appear in shareholder reports of other funds.
Please note that expenses shown in the table are meant to highlight ongoing costs and do not reflect any transaction costs, such as sales charges. Therefore, the second line for each class is useful in comparing ongoing costs only, and will not help you compare total costs of owning different funds. In addition, if transaction costs were included, your total costs would have been higher. Please refer to the Fund prospectus for additional information on operating expenses.
franklintempleton.com
Semiannual Report 11
| FRANKLIN BALANCED FUND | ||||||
| YOUR FUND’S EXPENSES | ||||||
| Beginning Account | Ending Account | Expenses Paid During | ||||
| Share Class | Value 11/1/15 | Value 4/30/16 | Period* 11/1/15–4/30/16 | |||
| A | ||||||
| Actual | $ | 1,000 | $ | 1,017.80 | $ | 5.02 |
| Hypothetical (5% return before expenses) | $ | 1,000 | $ | 1,019.89 | $ | 5.02 |
| C | ||||||
| Actual | $ | 1,000 | $ | 1,014.20 | $ | 8.76 |
| Hypothetical (5% return before expenses) | $ | 1,000 | $ | 1,016.16 | $ | 8.77 |
| R | ||||||
| Actual | $ | 1,000 | $ | 1,017.60 | $ | 6.27 |
| Hypothetical (5% return before expenses) | $ | 1,000 | $ | 1,018.65 | $ | 6.27 |
| R6 | ||||||
| Actual | $ | 1,000 | $ | 1,019.50 | $ | 3.26 |
| Hypothetical (5% return before expenses) | $ | 1,000 | $ | 1,021.63 | $ | 3.27 |
| Advisor | ||||||
| Actual | $ | 1,000 | $ | 1,019.00 | $ | 3.76 |
| Hypothetical (5% return before expenses) | $ | 1,000 | $ | 1,021.13 | $ | 3.77 |
*Expenses are calculated using the most recent six-month expense ratio, net of expense waivers, annualized for each class (A: 1.00%;
C: 1.75%; R: 1.25%; R6: 0.65%; and Advisor: 0.75%), multiplied by the average account value over the period, multiplied by 182/366 to reflect
the one-half year period.
12 Semiannual Report
franklintempleton.com
Franklin Convertible Securities Fund
This semiannual report for Franklin Convertible Securities Fund covers the period ended April 30, 2016.
Your Fund’s Goal and Main Investments
The Fund seeks to maximize total return, consistent with reasonable risk, by seeking to optimize capital appreciation and high current income under varying market conditions and investing at least 80% of its net assets in convertible securities.
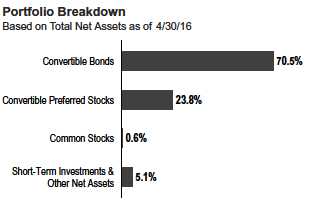
Performance Overview
For the six months under review, the Fund’s Class A shares delivered a +0.07% cumulative total return. In comparison, the Fund’s benchmark, the BofA Merrill Lynch (BofAML) All Total Return Alternatives U.S. Convertibles Index, which tracks the domestic convertible securities market, posted a -2.08% total return.1 You can find the Fund’s long-term performance data in the Performance Summary beginning on page 16.
Performance data represent past performance, which does not guarantee future results. Investment return and principal value will fluctuate, and you may have a gain or loss when you sell your shares. Current performance may differ from figures shown. For most recent month-end performance, go to franklintempleton.com or call (800) 342-5236.
Investment Strategy
We follow a strategy of maintaining a balance in the portfolio between the equity and debt characteristics of convertible securities with an emphasis on the equity features. Convertible securities are attractive for two reasons: the opportunity to participate in common stocks’ potential growth, and the potential for current income and reduced price volatility with potential downside protection from bonds. Typically we sell securities whose equity sensitivity becomes too high and no longer offers appropriate downside protection from bonds. Likewise, as securities become too bond-like—reducing their ability to appreciate with increases in the underlying common stock—we attempt to redeploy those assets into more balanced convertible securities and maintain the potential for the Fund’s upside participation. Our experienced team of analysts searches for investment opportunities among all economic sectors and considers a company’s long-term earnings, asset value and cash flow potential.
Manager’s Discussion
Several sectors the Fund invested in rose in value during the six months under review and supported performance. The consumer staples, utilities and consumer discretionary sectors contributed most to Fund returns during the period. Within consumer staples, the Fund’s holdings of convertible preferred stock issued by food products manufacturer Tyson Foods and cereal maker Post Holdings posted significant gains. Tyson Foods continued to benefit from meat and protein, a category that has been growing at a higher-than-average rate and generally responds well to innovation. The company has been successfully introducing value-added products to its portfolio to further distance itself from its commodity-protein past, creating a less volatile and higher margin business. Post Holdings benefited from solid sales growth momentum across its businesses and the realization of synergies from recent acquisitions. Each of the company’s business segments are distinct platforms that we believe Post can continue to build. We believe that the active nutrition segment has a particularly favorable growth profile and operates in a very fragmented category with many acquisition opportunities to drive incremental growth. Post generates strong free cash flow given its relatively high margin profile and modest capital and working capital requirements. In the utilities sector, our convertible preferred stock positions in diversified energy company Black Hills2 and electric and gas utility provider Exelon benefited the Fund’s results. Black Hills completed its acquisition of SourceGas during the period and announced accelerated earnings increases and growth opportunities relative
1. Source: BofA Merrill Lynch.
The index is unmanaged and includes reinvested dividends. It does not reflect any fees, expenses or sales charges. One cannot invest directly in an index, and an index is not
representative of the Fund’s portfolio.
2. New position during the period.
The dollar value, number of shares or principal amount, and names of all portfolio holdings are listed in the Fund’s Statement of Investments (SOI).
The SOI begins on page 52.
franklintempleton.com
Semiannual Report 13
FRANKLIN CONVERTIBLE SECURITIES FUND
to prior investor expectations. Exelon’s decision to increase its dividend and explain its long-term growth metrics was viewed positively by investors.
| Top 10 Holdings | ||
| 4/30/16 | ||
| Company | % of Total | |
| Sector/Industry | Net Assets | |
| Proofpoint Inc. | 2.3 | % |
| Information Technology | ||
| Tyson Foods Inc. | 2.3 | % |
| Consumer Staples | ||
| Stanley Black & Decker Inc. | 2.2 | % |
| Industrials | ||
| Jarden Corp. | 2.2 | % |
| Consumer Discretionary | ||
| Salesforce.com Inc. | 2.1 | % |
| Information Technology | ||
| Post Holdings Inc. | 2.1 | % |
| Consumer Staples | ||
| The Priceline Group Inc. | 2.1 | % |
| Consumer Discretionary | ||
| Impax Laboratories Inc. | 2.0 | % |
| Health Care | ||
| Microchip Technology Inc. | 2.0 | % |
| Information Technology | ||
| ServiceNow Inc. | 2.0 | % |
| Information Technology |
Among consumer discretionary holdings, our convertible bonds in consumer goods manufacturer Jarden and media conglomerate Liberty Interactive contributed to the Fund’s performance. During the reporting period, Jarden was acquired by Newell Rubbermaid in a cash and stock deal. Jarden’s stock price benefited from continued strong results at Newell. During the period, Jarden also reported strong growth numbers due to innovation, marketing programs and recent acquisitions. Liberty Interactive owns shares of Time Warner and Time Warner Cable, both of which performed well during the reporting period. Time Warner rebounded from earlier fears related to a decline in its Turner network fees as Time Warner renewed all contracts with various distributors, which we believe could lead to double-digit growth rates for the next five years. The company has also been the beneficiary of a rebound in advertising. Time Warner Cable’s share price increased during the period as a result of the approval of its merger with Charter Communications by the Federal Communications Commission and the U.S. Department of Justice.
In the materials sector, a convertible preferred stock in Alcoa helped results, as the company benefited from improving aluminum futures prices. During the reporting period, Alcoa continued with its plans to split into a downstream-focused advanced materials company and an upstream-focused primary metal producer. The company’s first-quarter results exceeded analysts’ expectations, and despite reduced earnings guidance for the company’s downstream business, analysts raised their full-year forecasts following the positive first-quarter results and as expectations improved for aluminum prices. In the industrials sector, the Fund’s convertible preferred stock in tool manufacturer Stanley Black & Decker contributed to results amid continued strong performance in its core tools business, particularly sales of professional power tools, amid a strengthening construction environment. The company made significant progress cutting costs and overhead expenses, and it restructured its previously challenged security business. A convertible bond in health care sector holding Anacor Pharmaceuticals2 benefited results. The company focuses on discovering, developing and commercializing new small-molecule therapeutics derived from its boron chemistry platform. During the reporting period, the company executed a convertible note offering, which removed a financial overhang and led to analyst upgrades.
In contrast, the information technology, health care and energy sectors detracted from the Fund’s performance during the six months under review. In information technology, our convertible bond position in semiconductor manufacturer Micron Technology hampered relative results. Demand for the company’s memory products deteriorated drastically, partly due to weak personal computer demand. Micron’s manufacturing execution lagged the industry leader, further constraining its ability to compete profitably. In addition, the company continues to trail in its lithography and manufacturing execution in the NAND flash memory market. The Fund’s convertible bond in online real estate services provider Trulia also hindered results. Delays in the closing of Zillow’s acquisition of the company negatively impacted revenue growth and traffic at Trulia. In addition, Zillow’s integration of Trulia proved more difficult than anticipated, and combined revenue and profitability came in below analysts’ expectations. A convertible bond in video game company Electronic Arts was also among the largest detractors from results. The company’s stock struggled through most of 2016 after rising significantly over the past two years. Health care holdings that hindered the Fund’s performance during the period included convertible preferred stocks in pharmaceutical firm Allergan and generic drug manufacturer Teva Pharmaceutical Industries,2 as well as a convertible bond in drug maker BioMarin Pharmaceutical. Allergan’s shares fell following the termination of its merger with Pfizer after the U.S. Treasury Department placed constraints on tax inversions. BioMarin’s
14 Semiannual Report
franklintempleton.com
FRANKLIN CONVERTIBLE SECURITIES FUND
shares declined as one of the company’s drugs under development received a negative recommendation from an advisory committee and later received a complete response letter from the Food and Drug Administration (FDA) that rejected the drug. Teva’s shares declined largely due to a delay in its acquisition of Allergan’s generics portfolio amid longer-than-anticipated deliberations with the U.S. Federal Trade Commission and the FDA. In the energy sector, convertible preferred stocks in oil and gas companies Rex Energy and Chesapeake Energy, and a convertible bond in Cobalt International Energy, hindered the Fund’s results. All these companies’ shares lost value as crude oil and natural gas prices generally fell.
Elsewhere, the Fund’s convertible preferred stock in waste management company Stericycle hindered relative results in the industrials sector. Although the company’s core regulated medical waste and compliance business continued to perform well during the reporting period, the company struggled with its industrial hazardous waste business, which led to volatility in its financial results.
Thank you for your continued participation in Franklin Convertible Securities Fund. We look forward to serving your future investment needs.

The foregoing information reflects our analysis, opinions and portfolio holdings as of April 30, 2016, the end of the reporting period. The way we implement our main investment strategies and the resulting portfolio holdings may change depending on factors such as market and economic conditions. These opinions may not be relied upon as investment advice or an offer for a particular security. The information is not a complete analysis of every aspect of any market, country, industry, security or the Fund. Statements of fact are from sources considered reliable, but the investment manager makes no representation or warranty as to their completeness or accuracy. Although historical performance is no guarantee of future results, these insights may help you understand our investment management philosophy.
Eric Webster is a research analyst and portfolio manager with the Franklin Equity Group. Mr. Webster specializes in research of the housing and travel and leisure industries, with coverage responsibilities for companies within home building, building products, environmental services, lodging, gaming, cruise lines, online travel agencies and the Government Sponsored Enterprises. Prior to joining Franklin Templeton Investments in 2012, Mr. Webster previously worked as an associate at LitiNomics and Charles River Associates, where he performed economic damages and valuation analysis for a wide range of high-profile clients involved in patent infringement cases, M&A disputes, and class-action securities fraud litigation. Mr. Webster earned a B.S. in physics and B.A. in economics from the University of California at San Diego, an M.B.A. in analytic finance and economics from the University of Chicago Booth School of Business. He is a Chartered Financial Analyst charterholder.
franklintempleton.com
Semiannual Report 15
FRANKLIN CONVERTIBLE SECURITIES FUND
Performance Summary as of April 30, 2016
Your dividend income will vary depending on dividends or interest paid by securities in the Fund’s portfolio, adjusted for operating expenses of each class. Capital gain distributions are net profits realized from the sale of portfolio securities. The performance tables do not reflect any taxes that a shareholder would pay on Fund dividends, capital gain distributions, if any, or any realized gains on the sale of Fund shares. Total return reflects reinvestment of the Fund’s dividends and capital gain distributions, if any, and any unrealized gains or losses.
| Net Asset Value | ||||||
| Share Class (Symbol) | 4/30/16 | 10/31/15 | Change | |||
| A (FISCX) | $ | 17.35 | $ | 18.00 | -$ | 0.65 |
| C (FROTX) | $ | 17.11 | $ | 17.75 | -$ | 0.64 |
| R6 (N/A) | $ | 17.44 | $ | 18.09 | -$ | 0.65 |
| Advisor (FCSZX) | $ | 17.35 | $ | 18.00 | -$ | 0.65 |
| Distributions1 (11/1/15–4/30/16) | ||||||
| Dividend | Long-Term | |||||
| Share Class | Income | Capital Gain | Total | |||
| A | $ | 0.2941 | $ | 0.3597 | $ | 0.6538 |
| C | $ | 0.2300 | $ | 0.3597 | $ | 0.5897 |
| R6 | $ | 0.3279 | $ | 0.3597 | $ | 0.6876 |
| Advisor | $ | 0.3159 | $ | 0.3597 | $ | 0.6756 |
See page 18 for Performance Summary footnotes.
16 Semiannual Report
franklintempleton.com
FRANKLIN CONVERTIBLE SECURITIES FUND
PERFORMANCE SUMMARY
Performance as of 4/30/162
Cumulative total return excludes sales charges. Average annual total returns and value of $10,000 investment include maximum sales charges. Class A: 5.75% maximum initial sales charge; Class C: 1% contingent deferred sales charge in first year only;
Class R6/Advisor Class: no sales charges.
| Cumulative | Average Annual | Value of | Average Annual | Total Annual | ||||||
| Share Class | Total Return3 | Total Return4 | $ | 10,000 Investment5 | Total Return (3/31/16)6 | Operating Expenses7 | ||||
| A | 0.86 | % | ||||||||
| 6-Month | +0.07 | % | -5.69 | % | $ | 9,431 | ||||
| 1-Year | -1.71 | % | -7.35 | % | $ | 9,265 | -7.81 | % | ||
| 5-Year | +28.64 | % | +3.92 | % | $ | 12,123 | +4.30 | % | ||
| 10-Year | +74.94 | % | +5.13 | % | $ | 16,487 | +5.03 | % | ||
| C | 1.61 | % | ||||||||
| 6-Month | -0.24 | % | -1.21 | % | $ | 9,879 | ||||
| 1-Year | -2.41 | % | -3.35 | % | $ | 9,665 | -3.84 | % | ||
| 5-Year | +23.88 | % | +4.38 | % | $ | 12,388 | +4.75 | % | ||
| 10-Year | +62.39 | % | +4.97 | % | $ | 16,239 | +4.88 | % | ||
| R6 | 0.50 | % | ||||||||
| 6-Month | +0.27 | % | +0.27 | % | $ | 10,027 | ||||
| 1-Year | -1.34 | % | -1.34 | % | $ | 9,866 | -1.84 | % | ||
| Since Inception (3/4/14) | +1.37 | % | +0.63 | % | $ | 10,137 | +0.10 | % | ||
| Advisor8 | 0.61 | % | ||||||||
| 6-Month | +0.20 | % | +0.20 | % | $ | 10,020 | ||||
| 1-Year | -1.45 | % | -1.45 | % | $ | 9,855 | -1.95 | % | ||
| 5-Year | +30.23 | % | +5.42 | % | $ | 13,023 | +5.80 | % | ||
| 10-Year | +78.52 | % | +5.97 | % | $ | 17,852 | +5.88 | % |
| Distribution | 30-Day Standardized Yield10 | |||||
| Share Class | Rate9 | (with waiver) | (without waiver) | |||
| A | 2.75 | % | 1.10 | % | 1.09 | % |
| C | 2.18 | % | 0.43 | % | 0.42 | % |
| R6 | 2.83 | % | 1.55 | % | 1.50 | % |
| Advisor | 3.19 | % | 1.43 | % | 1.40 | % |
Performance data represent past performance, which does not guarantee future results. Investment return and principal value will fluctuate, and you may have a gain or loss when you sell your shares. Current performance may differ from figures shown. For most recent month-end performance, go to franklintempleton.com or call (800) 342-5236.
See page 18 for Performance Summary footnotes.
franklintempleton.com
Semiannual Report 17
FRANKLIN CONVERTIBLE SECURITIES FUND
PERFORMANCE SUMMARY
All investments involve risks, including possible loss of principal. The Fund may invest in high yielding, fixed income securities. High yields reflect the higher credit risk associated with these lower rated securities and, in some cases, the lower market prices for these instruments. Interest rate movements may affect the Fund’s share price and yield. Bond prices generally move in the opposite direction of interest rates. As prices of bonds in the Fund adjust to a rise in interest rates, the Fund’s share price may decline. The Fund may also invest in foreign securities, which involve special risks, including political uncertainty and currency volatility. The Fund is actively managed but there is no guarantee that the manager’s investment decisions will produce the desired results. The Fund’s prospectus also includes a description of the main investment risks.
| Class C: | These shares have higher annual fees and expenses than Class A shares. |
| Class R6: | Shares are available to certain eligible investors as described in the prospectus. |
| Advisor Class: | Shares are available to certain eligible investors as described in the prospectus. |
1. The distribution amount is the sum of the dividend payments to shareholders for the period shown and includes only estimated tax-basis net investment income and capital
gain.
2. The Fund has a fee waiver associated with any investment in a Franklin Templeton money fund, contractually guaranteed through at least its current fiscal year-end. Fund
investment results reflect the fee waiver, to the extent applicable; without this reduction, the results would have been lower.
3. Cumulative total return represents the change in value of an investment over the periods indicated.
4. Average annual total return represents the average annual change in value of an investment over the periods indicated. Return for less than one year, ifany,hasnotbeen
annualized.
5. These figures represent the value of a hypothetical $10,000 investment in the Fund over the periods indicated.
6. In accordance with SEC rules, we provide standardized average annual total return information through the latest calendar quarter.
7. Figures are as stated in the Fund’s current prospectus and may differ from the expense ratios disclosed in the Financial Highlights in this report. In periods of market volatility,
assets may decline significantly, causing total annual Fund operating expenses to become higher than the figures shown.
8. Effective 5/15/08, the Fund began offering Advisor Class shares, which do not have sales charges or a Rule 12b-1 plan. Performance quotations for this class reflect the
following methods of calculation: (a) For periods prior to 5/15/08, a restated figure is used based upon the Fund’s Class A performance, excluding the effect of Class A’s
maximum initial sales charge, but reflecting the effect of the Class A Rule 12b-1 fees; and (b) for periods after 5/15/08 actual Advisor Class performance is used reflecting all
charges and fees applicable to that class. Since 5/15/08 (commencement of sales), the cumulative and average annual total returns of Advisor Class shares were +61.48% and
+6.21%.
9. Distribution rate is based on the sum of the respective class’s past four quarterly dividends and the maximum offering price (NAV for Classes C, R6 and Advisor) per share on
4/30/16.
10. The Fund’s 30-day standardized yield is calculated over a trailing 30-day period using the yield to maturity on bonds and/or the dividends accrued on stocks. It may not
equal the Fund’s actual income distribution rate, which reflects the Fund’s past dividends paid to shareholders.
18 Semiannual Report
franklintempleton.com
FRANKLIN CONVERTIBLE SECURITIES FUND
Your Fund’s Expenses
As a Fund shareholder, you can incur two types of costs:
- Transaction costs, including sales charges (loads) on Fund purchases; and
- Ongoing Fund costs, including management fees, distribution and service (12b-1) fees, and other Fund expenses. All mutual funds have ongoing costs, sometimes referred to as operating expenses.
The following table shows ongoing costs of investing in the Fund and can help you understand these costs and compare them with those of other mutual funds. The table assumes a $1,000 investment held for the six months indicated.
Actual Fund Expenses
The first line (Actual) for each share class listed in the table provides actual account values and expenses. The “Ending Account Value” is derived from the Fund’s actual return, which includes the effect of Fund expenses.
You can estimate the expenses you paid during the period by following these steps. Of course, your account value and expenses will differ from those in this illustration:
| 1. | Divide your account value by $1,000. |
| If an account had an $8,600 value, then $8,600 ÷ $1,000 = 8.6. | |
| 2. | Multiply the result by the number under the heading “Expenses Paid During Period.” |
| If Expenses Paid During Period were $7.50, then 8.6 x $7.50 = $64.50. |
In this illustration, the estimated expenses paid this period are $64.50.
Hypothetical Example for Comparison with Other Funds
Information in the second line (Hypothetical) for each class in the table can help you compare ongoing costs of investing in the Fund with those of other mutual funds. This information may not be used to estimate the actual ending account balance or expenses you paid during the period. The hypothetical “Ending Account Value” is based on the actual expense ratio for each class and an assumed 5% annual rate of return before expenses, which does not represent the Fund’s actual return. The figure under the heading “Expenses Paid During Period” shows the hypothetical expenses your account would have incurred under this scenario. You can compare this figure with the 5% hypothetical examples that appear in shareholder reports of other funds.
Please note that expenses shown in the table are meant to highlight ongoing costs and do not reflect any transaction costs, such as sales charges. Therefore, the second line for each class is useful in comparing ongoing costs only, and will not help you compare total costs of owning different funds. In addition, if transaction costs were included, your total costs would have been higher. Please refer to the Fund prospectus for additional information on operating expenses.
franklintempleton.com
Semiannual Report 19
| FRANKLIN CONVERTIBLE SECURITIES FUND | ||||||
| YOUR FUND’S EXPENSES | ||||||
| Beginning Account | Ending Account | Expenses Paid During | ||||
| Share Class | Value 11/1/15 | Value 4/30/16 | Period* 11/1/15–4/30/16 | |||
| A | ||||||
| Actual | $ | 1,000 | $ | 1,000.70 | $ | 4.33 |
| Hypothetical (5% return before expenses) | $ | 1,000 | $ | 1,020.54 | $ | 4.37 |
| C | ||||||
| Actual | $ | 1,000 | $ | 997.60 | $ | 8.05 |
| Hypothetical (5% return before expenses) | $ | 1,000 | $ | 1,016.81 | $ | 8.12 |
| R6 | ||||||
| Actual | $ | 1,000 | $ | 1,002.70 | $ | 2.49 |
| Hypothetical (5% return before expenses) | $ | 1,000 | $ | 1,022.38 | $ | 2.51 |
| Advisor | ||||||
| Actual | $ | 1,000 | $ | 1,002.00 | $ | 3.09 |
| Hypothetical (5% return before expenses) | $ | 1,000 | $ | 1,021.78 | $ | 3.12 |
*Expenses are calculated using the most recent six-month expense ratio, net of expense waivers, annualized for each class (A: 0.87%;
C: 1.62%; R6: 0.50%; and Advisor: 0.62%), multiplied by the average account value over the period, multiplied by 182/366 to reflect the
one-half year period.
20 Semiannual Report
franklintempleton.com
Franklin Equity Income Fund
This semiannual report for Franklin Equity Income Fund covers the period ended April 30, 2016.
Your Fund’s Goal and Main Investments
The Fund seeks to maximize total return, emphasizing high current income and long-term capital appreciation, consistent with reasonable risk, by investing at least 80% of its net assets in equity securities including securities convertible into common stocks.
Performance Overview
For the six months under review, the Fund’s Class A shares delivered a -0.06% cumulative total return. In comparison, the Fund’s benchmark, the Standard & Poor’s 500 Index (S&P 500), which tracks the broad U.S. stock market, generated a +0.43% total return.1 The Fund’s peers, as measured by the Lipper Equity Income Funds Classification Average, which consists of funds chosen by Lipper that seek relatively high current income and growth of income by investing at least 60% of their portfolios in stocks, posted a +1.52% total return.2 You can find the Fund’s long-term performance data in the Performance Summary beginning on page 25.
Performance data represent past performance, which does not guarantee future results. Investment return and principal value will fluctuate, and you may have a gain or loss when you sell your shares. Current performance may differ from figures shown. For most recent month-end performance, go to franklintempleton.com or call (800) 342-5236.
Investment Strategy
We seek to invest in a broadly diversified portfolio of equity securities that we consider to be financially strong, with a focus on “blue chip” companies. We apply a bottom-up approach to investing in individual securities. We will assess the market price of a company’s securities relative to our evaluation of the company’s long-term earnings, asset value and cash flow potential. We also consider a company’s price/earnings ratio, profit margins, balance sheet and liquidation value. We consider dividend yield in selecting stocks for the Fund because we believe that, over time, dividend income can contribute significantly to total return and can be a more consistent source of investment return than capital appreciation. We seek to take advantage of price dislocations that result from the market’s short-term focus and choose to invest in those companies that, in our opinion, offer the best trade-off between growth opportunity, business and financial risk, and valuation.
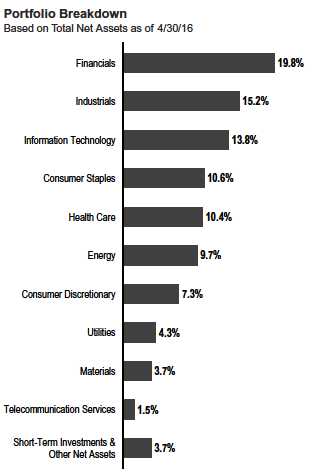
Manager’s Discussion
Several sectors the Fund invested in increased in value during the six-month reporting period and supported performance. The industrials, energy and utilities sectors contributed most to Fund returns during the period.
In the industrials sector, Illinois Tool Works, General Electric and Nielsen Holdings helped performance. Industrial products and equipment manufacturer Illinois Tool Works posted strong
1. Source: Morningstar.
2. Source: Lipper, a Thomson Reuters Company. For the six-month period ended 4/30/16, this category consisted of 532 funds. Lipper calculations do not include sales
charges, or expense subsidization by a fund’s manager. The Fund’s performance relative to the average may have differed if these and other factors had been considered.
The indexes are unmanaged and include reinvested dividends. They do not reflect any fees, expenses or sales charges. One cannot invest directly in an index, and an index is
not representative of the Fund’s portfolio.
The dollar value, number of shares or principal amount, and names of all portfolio holdings are listed in the Fund’s Statement of Investments (SOI).
The SOI begins on page 60.
franklintempleton.com
Semiannual Report 21
FRANKLIN EQUITY INCOME FUND
| Dividend Distributions* | |||||
| 11/1/15–4/30/16 | |||||
| Dividend per Share (cents) | |||||
| Advisor | |||||
| Month | Class A | Class C | Class R | Class R6 | Class |
| November | 3.90 | 2.48 | 3.40 | 4.60 | 4.38 |
| December** | 14.11 | 12.71 | 13.63 | 14.81 | 14.58 |
| March | 12.96 | 10.16 | 12.09 | 14.38 | 13.92 |
| Total | 30.97 | 25.35 | 29.12 | 33.79 | 32.88 |
*The distribution amount is the sum of the dividend payments to shareholders for
the period shown and includes only estimated tax-basis net investment income. All
Fund distributions will vary depending upon current market conditions, and past
distributions are not indicative of future trends.
**Includes an additional 10.21 cent per share distribution to meet excise tax
requirements.
earnings results for the fourth quarter of 2015, which were partially driven by excellent cost controls and strength in its consumer-facing businesses. The company also completed a medium-sized acquisition within its automotive original equipment manufacturer division. Industrial conglomerate General Electric’s shares continued to respond positively to the company’s plan to gradually divest itself of GE Capital and reinvest into its industrials businesses. Information and measurement company Nielsen Holdings made incremental progress over the past year toward developing and coalescing support for the company’s total audience measurement ratings platform, which supports our healthier long-term outlook for the business.
Within the energy sector, major oil and gas companies Chevron and Exxon Mobil boosted results, as did the Fund’s new position in oilfield services company Schlumberger. Chevron recovered strongly following several disappointments related to project execution during 2015. In addition, the company provided updated earnings guidance related to capital spending for the next several years that gave investors a roadmap to cash flow neutrality, an important topic for all energy producers in a lower price environment. Exxon, among the more diverse and financially sound energy producers, in our analysis, typically holds up better during periods of declining commodity prices, and the past year was no exception as the company’s shares performed well. Although the shares’ recovery was muted, the limited downside the company experienced along with a moderate recovery was enough to make the stock a relatively strong performer, particularly in light of general market weakness. Schlumberger is a leader in the oilfield services industry and was one of the few such companies still generating free cash flow and buying back stock. The company produced commendable results, in our opinion, during one of the industry’s worst downturns since the 1980s. Largely as a result, Schlumberger’s shares held up relatively well and posted a solid gain during the reporting period.
Utilities companies that benefited the Fund’s performance during the reporting period included NextEra Energy,3 Xcel Energy and Dominion Resources. Clean energy company NextEra Energy benefited from the passage of a congressional spending bill that included multi-year extensions of solar and wind tax credits. The passage of this legislation surprised investors and was a positive event for renewables developers, of which NextEra is among the U.S.’s leading players. The legislation also helped provide greater clarity into the company’s earnings growth trajectory. Electric utility company Xcel Energy benefited from an increase in investor appetite for defensive oriented businesses with what we considered attractive dividend yields. The company increased its dividend for the third year in a row in early 2016. Dominion, another utility holding, also benefited much like Xcel did from investors seeking yield and perceived stability.
Elsewhere, contributors included Avago Technologies in the information technology sector, and Johnson & Johnson in the health care sector. Semiconductor company Avago Technologies, renamed Broadcom after its recent acquisition of that company, increased as it had consistent execution and high profitability levels compared to other semiconductor companies. The company has differentiated its optical and wireless communications products, which have been experiencing rapid adoption and high demand. Johnson & Johnson’s shares rose as the company issued better-than-expected 2016 financial guidance that included an unanticipated cost management program, which aims to improve the company’s operating margins.
In contrast, the health care, financials and information technology sectors detracted from the Fund’s performance during the six months under review. In health care, our position in drug maker Sanofi3 and convertible preferred stocks in generic drug manufacturer Teva Pharmaceutical Industries4 and pharmaceutical firm Allergan hindered results. Sanofi’s shares declined amid threats to its insulin franchise, a slow launch for its new cholesterol drug and a disappointing earnings outlook.
3. Sold by period-end.
4. New position during the period.
See www.franklintempletondatasources.com for additional data provider information.
22 Semiannual Report
franklintempleton.com
FRANKLIN EQUITY INCOME FUND
Meanwhile, Teva’s shares declined largely due to a delay in its acquisition of Allergan’s generics portfolio amid longer-than-anticipated deliberations with the U.S. Federal Trade Commission and the Food and Drug Administration. Allergan’s shares fell following the termination of its merger with Pfizer after the U.S. Treasury Department placed constraints on tax inversions.
In the financials sector, Morgan Stanley,4 MetLife and Wells Fargo detracted from Fund performance. Along with other capital market firms, Morgan Stanley suffered due to weak cyclical industry trading and investment banking activity. However, its shares notably rebounded since their period low in February. Shares of insurer MetLife fell amid equity market volatility and declining long-term interest rates. Like shares of many other banks, Wells Fargo’s shares declined due to concerns over rising credit costs and energy exposure, and cyclically weak trading revenue.
| Top 10 Holdings | ||
| 4/30/16 | ||
| Company | % of Total | |
| Sector/Industry | Net Assets | |
| Microsoft Corp. | 3.2 | % |
| Information Technology | ||
| JPMorgan Chase & Co. | 3.1 | % |
| Financials | ||
| Wells Fargo & Co. | 2.7 | % |
| Financials | ||
| General Electric Co. | 2.5 | % |
| Industrials | ||
| PepsiCo Inc. | 2.5 | % |
| Consumer Staples | ||
| Chevron Corp. | 2.4 | % |
| Energy | ||
| BlackRock Inc. | 2.3 | % |
| Financials | ||
| U.S. Bancorp | 2.2 | % |
| Financials | ||
| Cisco Systems Inc. | 2.1 | % |
| Information Technology | ||
| Lockheed Martin Corp. | 2.1 | % |
| Industrials |
In the information technology sector, Intel, Seagate Technology3 and Maxim Integrated Products3 hindered Fund performance. Semiconductor manufacturer Intel suffered from a weak global personal computer demand environment. In addition, the company has continued to struggle in its efforts to enter and gain market share in the mobile phone market. Data storage products maker Seagate has been pressured by a faster-than-expected transition to next-generation storage technologies and a weak personal computer market due to macroeconomic challenges. Within these pressures, the margin and earnings potential of the business has been significantly undermined and has raised investor concerns about the sustainability of the company’s dividend. Maxim designs and manufactures a broad array of highly integrated analog circuits for consumer, industrial, communications and automotive applications. The company’s share price had risen in the fall of 2015 amid speculation the company may be acquired. During the reporting period, two rumored buyers issued press releases indicating no transaction was imminent, and Maxim’s shares declined. In addition, smart phone demand at the beginning of 2016 was weaker than expected.
Elsewhere, in the consumer discretionary sector, Starwood Hotels & Resorts3 detracted from the Fund’s performance. The hotel operator suffered as investors were disappointed by the initial acquisition price from Marriott and the lodging industry saw deteriorating metrics in late 2015 and early 2016, which led to investor concerns that lodging was nearing the late stages of its cycle. Anadarko Petroleum4 hindered the Fund’s performance in the energy sector. The share price of Anadarko dropped after it was revealed the company made an unsolicited preliminary offer to buy petroleum and natural gas producer Apache. The news sparked a sell-off as investors previously saw Anadarko as a potential seller to larger oil companies.
Thank you for your continued participation in Franklin Equity Income Fund. We look forward to serving your future investment needs.

franklintempleton.com
Semiannual Report 23
FRANKLIN EQUITY INCOME FUND
The foregoing information reflects our analysis, opinions and portfolio holdings as of April 30, 2016, the end of the reporting period. The way we implement our main investment strategies and the resulting portfolio holdings may change depending on factors such as market and economic conditions. These opinions may not be relied upon as investment advice or an offer for a particular security. The information is not a complete analysis of every aspect of any market, country, industry, security or the Fund. Statements of fact are from sources considered reliable, but the investment manager makes no representation or warranty as to their completeness or accuracy. Although historical performance is no guarantee of future results, these insights may help you understand our investment management philosophy.
Todd Brighton is a vice president and research analyst for Franklin Equity Group. Mr. Brighton analyzes equity and equity-linked investments for the Core/Hybrid team and specializes in the development of volatility-based strategies. Mr. Brighton joined Franklin Templeton Investments in 2000. His prior responsibilities included the trading of equities, equity derivatives, convertibles and high yield bonds. Mr. Brighton earned his B.S. degree in Managerial Economics from the University of California, Davis. He is a Chartered Financial Analyst (CFA) charterholder and a member of the CFA Institute and the CFA Society of San Francisco.
24 Semiannual Report
franklintempleton.com
FRANKLIN EQUITY INCOME FUND
Performance Summary as of April 30, 2016
Your dividend income will vary depending on dividends or interest paid by securities in the Fund’s portfolio, adjusted for operating expenses of each class. Capital gain distributions are net profits realized from the sale of portfolio securities. The performance tables do not reflect any taxes that a shareholder would pay on Fund dividends, capital gain distributions, if any, or any realized gains on the sale of Fund shares. Total return reflects reinvestment of the Fund’s dividends and capital gain distributions, if any, and any unrealized gains or losses.
| Net Asset Value | ||||||
| Share Class (Symbol) | 4/30/16 | 10/31/15 | Change | |||
| A (FISEX) | $ | 22.05 | $ | 22.99 | -$ | 0.94 |
| C (FRETX) | $ | 21.89 | $ | 22.85 | -$ | 0.96 |
| R (FREIX) | $ | 22.04 | $ | 22.99 | -$ | 0.95 |
| R6 (FEIQX) | $ | 22.09 | $ | 23.01 | -$ | 0.92 |
| Advisor (FEIFX) | $ | 22.09 | $ | 23.02 | -$ | 0.93 |
| Distributions1 (11/1/15–4/30/16) | ||||||
| Dividend | Long-Term | |||||
| Share Class | Income | Capital Gain | Total | |||
| A | $ | 0.3097 | $ | 0.5966 | $ | 0.9063 |
| C | $ | 0.2535 | $ | 0.5966 | $ | 0.8501 |
| R | $ | 0.2912 | $ | 0.5966 | $ | 0.8878 |
| R6 | $ | 0.3379 | $ | 0.5966 | $ | 0.9345 |
| Advisor | $ | 0.3288 | $ | 0.5966 | $ | 0.9254 |
See page 27 for Performance Summary footnotes.
franklintempleton.com
Semiannual Report 25
FRANKLIN EQUITY INCOME FUND
PERFORMANCE SUMMARY
Performance as of 4/30/162
Cumulative total return excludes sales charges. Average annual total returns and value of $10,000 investment include maximum sales charges. Class A: 5.75% maximum initial sales charge; Class C: 1% contingent deferred sales charge in first year only;
Class R/R6/Advisor Class: no sales charges.
| Value of | Average Annual | |||||||||||
| Cumulative | Average Annual | $ | 10,000 | Total Return | Total Annual Operating Expenses7 | |||||||
| Share Class | Total Return3 | Total Return4 | Investment5 | (3/31/16 | )6 | (with waiver) | (without waiver) | |||||
| A | 0.86 | % | 0.86 | % | ||||||||
| 6-Month | -0.06 | % | -5.80 | % | $ | 9,420 | ||||||
| 1-Year | +0.14 | % | -5.60 | % | $ | 9,440 | -5.45 | % | ||||
| 5-Year | +51.27 | % | +7.36 | % | $ | 14,261 | +7.86 | % | ||||
| 10-Year | +62.60 | % | +4.36 | % | $ | 15,328 | +4.53 | % | ||||
| C | 1.61 | % | 1.61 | % | ||||||||
| 6-Month | -0.41 | % | -1.37 | % | $ | 9,863 | ||||||
| 1-Year | -0.62 | % | -1.57 | % | $ | 9,843 | -1.42 | % | ||||
| 5-Year | +45.75 | % | +7.83 | % | $ | 14,575 | +8.32 | % | ||||
| 10-Year | +50.87 | % | +4.20 | % | $ | 15,087 | +4.36 | % | ||||
| R | 1.11 | % | 1.11 | % | ||||||||
| 6-Month | -0.19 | % | -0.19 | % | $ | 9,981 | ||||||
| 1-Year | -0.11 | % | -0.11 | % | $ | 9,989 | +0.03 | % | ||||
| 5-Year | +49.38 | % | +8.36 | % | $ | 14,938 | +8.86 | % | ||||
| 10-Year | +58.32 | % | +4.70 | % | $ | 15,832 | +4.87 | % | ||||
| R6 | 0.49 | % | 2.88 | % | ||||||||
| 6-Month | +0.16 | % | +0.16 | % | $ | 10,016 | ||||||
| 1-Year | +0.55 | % | +0.55 | % | $ | 10,055 | +0.70 | % | ||||
| Since Inception (5/1/13) | +30.41 | % | +9.26 | % | $ | 13,041 | +9.18 | % | ||||
| Advisor8 | 0.61 | % | 0.61 | % | ||||||||
| 6-Month | +0.07 | % | +0.07 | % | $ | 10,007 | ||||||
| 1-Year | +0.40 | % | +0.40 | % | $ | 10,040 | +0.55 | % | ||||
| 5-Year | +53.27 | % | +8.92 | % | $ | 15,327 | +9.42 | % | ||||
| 10-Year | +66.03 | % | +5.20 | % | $ | 16,603 | +5.36 | % | ||||
| Distribution | 30-Day Standardized Yield10 | |||||
| Share Class | Rate9 | (with waiver) | (without waiver) | |||
| A | 2.22 | % | 1.83 | % | 1.81 | % |
| C | 1.86 | % | 1.20 | % | 1.19 | % |
| R | 2.19 | % | 1.69 | % | 1.68 | % |
| R6 | 2.60 | % | 2.31 | % | 2.30 | % |
| Advisor | 2.52 | % | 2.19 | % | 2.18 | % |
Performance data represent past performance, which does not guarantee future results. Investment return and principal value will fluctuate, and you may have a gain or loss when you sell your shares. Current performance may differ from figures shown. For most recent month-end performance, go to franklintempleton.com or call (800) 342-5236.
See page 27 for Performance Summary footnotes.
26 Semiannual Report
franklintempleton.com
FRANKLIN EQUITY INCOME FUND
PERFORMANCE SUMMARY
All investments involve risks, including possible loss of principal. Stock prices fluctuate, sometimes rapidly and dramatically, due to factors affecting individual companies, particular industries or sectors, or general market conditions. Convertible securities are subject to the risks of stocks when the underlying stock price is high relative to the conversion price and debt securities when the underlying stock price is low relative to the conversion price. The Fund’s investment in foreign securities also involves special risks, including currency fluctuations and economic as well as political uncertainty. The Fund is actively managed but there is no guarantee that the manager’s investment decisions will produce the desired results. The Fund’s prospectus also includes a description of the main investment risks.
| Class C: | These shares have higher annual fees and expenses than Class A shares. |
| Class R: | Shares are available to certain eligible investors as described in the prospectus. These shares have higher annual fees and expenses than Class A shares. |
| Class R6: | Shares are available to certain eligible investors as described in the prospectus. |
| Advisor Class: | Shares are available to certain eligible investors as described in the prospectus. |
1. The distribution amount is the sum of the dividend payments to shareholders for the period shown and includes only estimated tax-basis net investment income and capital
gain.
2. The Fund has a fee waiver associated with any investment in a Franklin Templeton money fund, contractually guaranteed through at least its current fiscal year-end. The
transfer agent has contractually agreed to cap transfer agency fees for Class R6 shares so that transfer agency fees for that class do not exceed 0.01% until at least 2/28/17.
Fund investment results reflect the fee waiver and fee cap, to the extent applicable; without these reductions, the results would have been lower.
3. Cumulative total return represents the change in value of an investment over the periods indicated.
4. Average annual total return represents the average annual change in value of an investment over the periods indicated. Return for less than one year, ifany,hasnotbeen
annualized.
5. These figures represent the value of a hypothetical $10,000 investment in the Fund over the periods indicated.
6. In accordance with SEC rules, we provide standardized average annual total return information through the latest calendar quarter.
7. Figures are as stated in the Fund’s current prospectus and may differ from the expense ratios disclosed in the Financial Highlights in this report. In periods of market volatility,
assets may decline significantly, causing total annual Fund operating expenses to become higher than the figures shown.
8. Effective 5/15/08, the Fund began offering Advisor Class shares, which do not have sales charges or a Rule 12b-1 plan. Performance quotations for this class reflect the
following methods of calculation: (a) For periods prior to 5/15/08, a restated figure is used based upon the Fund’s Class A performance, excluding the effect of Class A’s
maximum initial sales charge, but reflecting the effect of the Class A Rule 12b-1 fees; and (b) for periods after 5/15/08, actual Advisor Class performance is used reflecting all
charges and fees applicable to that class. Since 5/15/08 (commencement of sales), the cumulative and average annual total returns of Advisor Class shares were +55.98% and
+5.74%.
9. Distribution rate is based on an annualization of the respective class’s current quarterly dividend and the maximum offering price (NAV for Classes C, R, R6 and Advisor) per
share on 4/30/16.
10. The Fund’s 30-day standardized yield is calculated over a trailing 30-day period using the yield to maturity on bonds and/or the dividends accrued on stocks. It may not
equal the Fund’s actual income distribution rate, which reflects the Fund’s past dividends paid to shareholders.
franklintempleton.com
Semiannual Report 27
FRANKLIN EQUITY INCOME FUND
Your Fund’s Expenses
As a Fund shareholder, you can incur two types of costs:
- Transaction costs, including sales charges (loads) on Fund purchases; and
- Ongoing Fund costs, including management fees, distribution and service (12b-1) fees, and other Fund expenses. All mutual funds have ongoing costs, sometimes referred to as operating expenses.
The following table shows ongoing costs of investing in the Fund and can help you understand these costs and compare them with those of other mutual funds. The table assumes a $1,000 investment held for the six months indicated.
Actual Fund Expenses
The first line (Actual) for each share class listed in the table provides actual account values and expenses. The “Ending Account Value” is derived from the Fund’s actual return, which includes the effect of Fund expenses.
You can estimate the expenses you paid during the period by following these steps. Of course, your account value and expenses will differ from those in this illustration:
| 1. | Divide your account value by $1,000. |
| If an account had an $8,600 value, then $8,600 ÷ $1,000 = 8.6. | |
| 2. | Multiply the result by the number under the heading “Expenses Paid During Period.” |
| If Expenses Paid During Period were $7.50, then 8.6 x $7.50 = $64.50. |
In this illustration, the estimated expenses paid this period are $64.50.
Hypothetical Example for Comparison with Other Funds
Information in the second line (Hypothetical) for each class in the table can help you compare ongoing costs of investing in the Fund with those of other mutual funds. This information may not be used to estimate the actual ending account balance or expenses you paid during the period. The hypothetical “Ending Account Value” is based on the actual expense ratio for each class and an assumed 5% annual rate of return before expenses, which does not represent the Fund’s actual return. The figure under the heading “Expenses Paid During Period” shows the hypothetical expenses your account would have incurred under this scenario. You can compare this figure with the 5% hypothetical examples that appear in shareholder reports of other funds.
Please note that expenses shown in the table are meant to highlight ongoing costs and do not reflect any transaction costs, such as sales charges. Therefore, the second line for each class is useful in comparing ongoing costs only, and will not help you compare total costs of owning different funds. In addition, if transaction costs were included, your total costs would have been higher. Please refer to the Fund prospectus for additional information on operating expenses.
28 Semiannual Report
franklintempleton.com
| FRANKLIN EQUITY INCOME FUND | ||||||
| YOUR FUND’S EXPENSES | ||||||
| Beginning Account | Ending Account | Expenses Paid During | ||||
| Share Class | Value 11/1/15 | Value 4/30/16 | Period* 11/1/15–4/30/16 | |||
| A | ||||||
| Actual | $ | 1,000 | $ | 999.40 | $ | 4.32 |
| Hypothetical (5% return before expenses) | $ | 1,000 | $ | 1,020.54 | $ | 4.37 |
| C | ||||||
| Actual | $ | 1,000 | $ | 995.90 | $ | 8.04 |
| Hypothetical (5% return before expenses) | $ | 1,000 | $ | 1,016.81 | $ | 8.12 |
| R | ||||||
| Actual | $ | 1,000 | $ | 998.10 | $ | 5.56 |
| Hypothetical (5% return before expenses) | $ | 1,000 | $ | 1,019.29 | $ | 5.62 |
| R6 | ||||||
| Actual | $ | 1,000 | $ | 1,001.60 | $ | 2.49 |
| Hypothetical (5% return before expenses) | $ | 1,000 | $ | 1,022.38 | $ | 2.51 |
| Advisor | ||||||
| Actual | $ | 1,000 | $ | 1,000.70 | $ | 3.08 |
| Hypothetical (5% return before expenses) | $ | 1,000 | $ | 1,021.78 | $ | 3.12 |
*Expenses are calculated using the most recent six-month expense ratio, net of expense waivers, annualized for each class (A: 0.87%;
C: 1.62%; R: 1.12%; R6: 0.50%; and Advisor: 0.62%), multiplied by the average account value over the period, multiplied by 182/366 to reflect
the one-half year period.
franklintempleton.com
Semiannual Report 29
Franklin Real Return Fund
This semiannual report for Franklin Real Return Fund covers the period ended April 30, 2016.
Your Fund’s Goal and Main Investments
The Fund seeks to achieve total return that exceeds the rate of inflation over an economic cycle. The Fund will generally invest a substantial portion of its assets in inflation-protected securities. The managers also have the flexibility to invest in other sectors of the market to increase real return (total return less the rate of inflation) potential and offer greater diversification.
*Figures reflect certain derivatives held in the portfolio (or their underlying reference
assets) and may not total 100% or may be negative due to rounding, use of any
derivatives, unsettled trades or other factors.
**Includes Senior Floating Rate Interests.
***In the SOI, the natural resources sector comprises energy and materials.
Performance Overview
For the six months under review, the Fund’s Class A shares had a +1.55% cumulative total return. In comparison, the Barclays U.S. TIPS Index, which tracks the universe of inflation-protected notes issued by the U.S. Treasury that have at least one year to final maturity, posted a +3.89% total return.1 Also for comparison, the Consumer Price Index (CPI) for Urban Consumers (All Items) NSA (non-seasonally adjusted), a measure of the average change in prices of all goods and services purchased for consumption by urban householders, rose 0.60% for the same period.2 You can find more of the Fund’s performance data in the Performance Summary beginning on page 32.
Performance data represent past performance, which does not guarantee future results. Investment return and principal value will fluctuate, and you may have a gain or loss when you sell your shares. Current performance may differ from figures shown. For most recent month-end performance, go to franklintempleton.com or call (800) 342-5236.
Investment Strategy
We seek to allocate assets among investments to achieve the highest level of real return (total return less the rate of inflation) consistent with an acceptable level of risk. We will allocate the Fund’s assets among securities in various market sectors based on our assessment of changing economic, global market, industry and issuer conditions. When making our investment decisions, we use a “top-down” analysis of macroeconomic trends combined with a “bottom-up” fundamental analysis of market sectors, industries and issuers to try to take advantage of varying sector reactions to economic events. We will evaluate such criteria as country risk, business cycles, yield curves, and values between and within markets.
What is a yield curve?
The yield curve is a line that plots the interest rates, at a set point in time, of bonds having equal credit quality but differing maturity dates. The most frequently reported yield curve compares three-month, two-year and 30-year U.S. Treasury debt.
Manager’s Discussion
U.S. economic indicators were generally encouraging during the reporting period. Steady growth in the services sector created new jobs and boosted employment levels. Retail sales grew for most of the period. Low energy prices pulled inflation lower. In this environment, home sales and prices grew.
At period-end, slightly more than half of total net assets were invested in Treasury Inflation Protected Securities (TIPS). For
1. Source: Morningstar.
The index is unmanaged and includes reinvested dividends. It does not reflect any fees, expenses or sales charges. One cannot invest directly in an index, and an index is not
representative of the Fund’s portfolio.
2. Source: Bureau of Labor Statistics, bls.gov/cpi.
See www.franklintempletondatasources.com for additional data provider information.
The dollar value, number of shares or principal amount, and names of all portfolio holdings are listed in the Fund’s Statement of Investments (SOI).
The SOI begins on page 67.
30 Semiannual Report
franklintempleton.com
FRANKLIN REAL RETURN FUND
diversification, we also allocated the Fund’s assets to foreign government and agency securities, management investment companies, common stocks, corporate bonds, senior secured floating rate loans and short-term investments. We employed a non-U.S. dollar strategy to help hedge against potential U.S. dollar weakness versus certain currencies and concentrated our TIPS holdings in shorter maturities.
| Dividend Distributions* | ||||
| 11/1/15–4/30/16 | ||||
| Dividend per Share (cents) | ||||
| Advisor | ||||
| Month | Class A | Class C | Class R6 | Class |
| November** | — | — | — | — |
| December | 10.02 | 5.68 | 14.63 | 12.64 |
| January** | — | — | — | — |
| February** | — | — | — | — |
| March** | — | — | — | — |
| April** | — | — | — | — |
| Total | 10.02 | 5.68 | 14.63 | 12.64 |
*The distribution amount is the sum of the dividend payments to shareholders for
the period shown and includes only estimated tax-basis net investment income. All
Fund distributions will vary depending upon current market conditions, and past
distributions are not indicative of future trends.
**The Fund paid no dividends due to negative inflation adjustments for TIPS, which
are the Fund’s primary investments.
During the period, we increased the Fund’s allocations to TIPS, high yield corporate credit and natural resources. In contrast, we decreased the Fund’s allocation to foreign government debt securities. The Fund’s heaviest allocations were in TIPS and foreign government debt securities.
The Fund’s investments in TIPS, foreign government bonds and natural resources helped results. In contrast, the Fund’s positions in non-U.S. dollar holdings and high yield corporate credit hindered Fund performance.
Thank you for your continued participation in Franklin Real Return Fund. We look forward to serving your future investment needs.

The foregoing information reflects our analysis, opinions and portfolio holdings as of April 30, 2016, the end of the reporting period. The way we implement our main investment strategies and the resulting portfolio holdings may change depending on factors such as market and economic conditions. These opinions may not be relied upon as investment advice or an offer for a particular security. The information is not a complete analysis of every aspect of any market, country, industry, security or the Fund. Statements of fact are from sources considered reliable, but the investment manager makes no representation or warranty as to their completeness or accuracy. Although historical performance is no guarantee of future results, these insights may help you understand our investment management philosophy.
franklintempleton.com
Semiannual Report 31
FRANKLIN REAL RETURN FUND
Performance Summary as of April 30, 2016
Your dividend income will vary depending on dividends or interest paid by securities in the Fund’s portfolio, adjusted for operating expenses of each class. Capital gain distributions are net profits realized from the sale of portfolio securities. The performance tables do not reflect any taxes that a shareholder would pay on Fund dividends, capital gain distributions, if any, or any realized gains on the sale of Fund shares. Total return reflects reinvestment of the Fund’s dividends and capital gain distributions, if any, and any unrealized gains or losses.
| Net Asset Value | |||||
| Share Class (Symbol) | 4/30/16 | 10/31/15 | Change | ||
| A (FRRAX) | $ | 9.97 | $ | 9.92 | +$0.05 |
| C (FRRCX) | $ | 9.90 | $ | 9.82 | +$0.08 |
| R6 (FRRRX) | $ | 10.00 | $ | 9.98 | +$0.02 |
| Advisor (FARRX) | $ | 10.00 | $ | 9.96 | +$0.04 |
| Distributions1 (11/1/15–4/30/16) | |||||
| Dividend | |||||
| Share Class | Income | ||||
| A | $ | 0.1002 | |||
| C | $ | 0.0568 | |||
| R6 | $ | 0.1463 | |||
| Advisor | $ | 0.1264 | |||
See page 34 for Performance Summary footnotes.
32 Semiannual Report
franklintempleton.com
FRANKLIN REAL RETURN FUND
PERFORMANCE SUMMARY
Performance as of 4/30/162
Cumulative total return excludes sales charges. Average annual total returns include maximum sales charges. Class A: 4.25% maximum initial sales charge; Class C: 1% contingent deferred sales charge in first year only; Class R6/Advisor Class: no sales charges.
| Cumulative | Average Annual | Average Annual | Total Annual Operating Expenses6 | |||||||
| Share Class | Total Return3 | Total Return4 | Total Return (3/31/16)5 | (with waiver) | (without waiver) | |||||
| A | 0.92 | % | 1.12 | % | ||||||
| 6-Month | +1.55 | % | -2.76 | % | ||||||
| 1-Year | -3.23 | % | -7.32 | % | -7.51 | % | ||||
| 5-Year | -3.36 | % | -1.54 | % | -1.52 | % | ||||
| 10-Year | +28.43 | % | +2.09 | % | +2.08 | % | ||||
| C | 1.32 | % | 1.52 | % | ||||||
| 6-Month | +1.41 | % | +0.41 | % | ||||||
| 1-Year | -3.59 | % | -4.55 | % | -4.60 | % | ||||
| 5-Year | -5.31 | % | -1.09 | % | -1.04 | % | ||||
| Since Inception (11/3/08) | +17.65 | % | +2.20 | % | +2.05 | % | ||||
| R6 | 0.52 | % | 0.73 | % | ||||||
| 6-Month | +1.72 | % | +1.72 | % | ||||||
| 1-Year | -2.85 | % | -2.85 | % | -2.91 | % | ||||
| Since Inception (5/1/13) | -3.30 | % | -1.11 | % | -1.59 | % | ||||
| Advisor | 0.67 | % | 0.87 | % | ||||||
| 6-Month | +1.72 | % | +1.72 | % | ||||||
| 1-Year | -2.96 | % | -2.96 | % | -3.11 | % | ||||
| 5-Year | -2.19 | % | -0.44 | % | -0.39 | % | ||||
| 10-Year | +31.69 | % | +2.79 | % | +2.79 | % | ||||
| Distribution | 30-Day Standardized Yield8 | ||||
| Share Class | Rate7 | (with waiver) | (without waiver) | ||
| A | — | 2.00 | % | 1.78 | % |
| C | — | 1.68 | % | 1.46 | % |
| R6 | — | 2.47 | % | 2.25 | % |
| Advisor | — | 2.32 | % | 2.10 | % |
Performance data represent past performance, which does not guarantee future results. Investment return and principal value will fluctuate, and you may have a gain or loss when you sell your shares. Current performance may differ from figures shown. For most recent month-end performance, go to franklintempleton.com or call (800) 342-5236.
See page 34 for Performance Summary footnotes.
franklintempleton.com
Semiannual Report 33
FRANKLIN REAL RETURN FUND
PERFORMANCE SUMMARY
All investments involve risks, including possible loss of principal. Interest rate movements will affect the Fund’s share price and yield. Bond prices generally move in the opposite direction of interest rates. As prices of bonds in a fund adjust to a rise in interest rates, the Fund’s share price may decline. Foreign securities involve special risks, including currency fluctuations and economic and political uncertainties. Changes in the financial strength of a bond issuer or in a bond’s credit rating may affect its value. Stock prices fluctuate, sometimes rapidly and dramatically, due to factors affecting individual companies, particular industries or sectors, or general market conditions. The Fund is actively managed but there is no guarantee that the manager’s investment decisions will produce the desired results. The Fund’s prospectus also includes a description of the main investment risks.
| Class C: | These shares have higher annual fees and expenses than Class A shares. |
| Class R6: | Shares are available to certain eligible investors as described in the prospectus. |
| Advisor Class: | Shares are available to certain eligible investors as described in the prospectus. |
1. The distribution amount is the sum of the dividend payments to shareholders for the period shown and includes only estimated tax-basis net investment income.
2. The Fund has an expense reduction contractually guaranteed through at least 2/28/17. The transfer agent has contractually agreed to cap transfer agency fees for Class R6
shares so that transfer agency fees for that class do not exceed 0.01% until at least 2/28/17. Fund investment results reflect the expense reduction and fee cap, to the extent
applicable; without these reductions, the results would have been lower.
3. Cumulative total return represents the change in value of an investment over the periods indicated.
4. Average annual total return represents the average annual change in value of an investment over the periods indicated. Return for less than one year, ifany,hasnotbeen
annualized.
5. In accordance with SEC rules, we provide standardized average annual total return information through the latest calendar quarter.
6. Figures are as stated in the Fund’s current prospectus and may differ from the expense ratios disclosed in the Financial Highlights in this report. In periods of market volatility,
assets may decline significantly, causing total annual Fund operating expenses to become higher than the figures shown.
7. Distribution rate is based on an annualization of the respective class’s April dividend and the maximum offering price (NAV for Classes C, R6 and Advisor) per share on
4/30/16.
8. The Fund’s 30-day standardized yield is calculated over a trailing 30-day period using the yield to maturity on bonds and/or the dividends accrued on stocks. It may not equal
the Fund’s actual income distribution rate, which reflects the Fund’s past dividends paid to shareholders.
34 Semiannual Report
franklintempleton.com
FRANKLIN REAL RETURN FUND
Your Fund’s Expenses
As a Fund shareholder, you can incur two types of costs:
- Transaction costs, including sales charges (loads) on Fund purchases; and
- Ongoing Fund costs, including management fees, distribution and service (12b-1) fees, and other Fund expenses. All mutual funds have ongoing costs, sometimes referred to as operating expenses.
The following table shows ongoing costs of investing in the Fund and can help you understand these costs and compare them with those of other mutual funds. The table assumes a $1,000 investment held for the six months indicated.
Actual Fund Expenses
The first line (Actual) for each share class listed in the table provides actual account values and expenses. The “Ending Account Value” is derived from the Fund’s actual return, which includes the effect of Fund expenses.
You can estimate the expenses you paid during the period by following these steps. Of course, your account value and expenses will differ from those in this illustration:
| 1. | Divide your account value by $1,000. |
| If an account had an $8,600 value, then $8,600 ÷ $1,000 = 8.6. | |
| 2. | Multiply the result by the number under the heading “Expenses Paid During Period.” |
| If Expenses Paid During Period were $7.50, then 8.6 x $7.50 = $64.50. |
In this illustration, the estimated expenses paid this period are $64.50.
Hypothetical Example for Comparison with Other Funds
Information in the second line (Hypothetical) for each class in the table can help you compare ongoing costs of investing in the Fund with those of other mutual funds. This information may not be used to estimate the actual ending account balance or expenses you paid during the period. The hypothetical “Ending Account Value” is based on the actual expense ratio for each class and an assumed 5% annual rate of return before expenses, which does not represent the Fund’s actual return. The figure under the heading “Expenses Paid During Period” shows the hypothetical expenses your account would have incurred under this scenario. You can compare this figure with the 5% hypothetical examples that appear in shareholder reports of other funds.
Please note that expenses shown in the table are meant to highlight ongoing costs and do not reflect any transaction costs, such as sales charges. Therefore, the second line for each class is useful in comparing ongoing costs only, and will not help you compare total costs of owning different funds. In addition, if transaction costs were included, your total costs would have been higher. Please refer to the Fund prospectus for additional information on operating expenses.
franklintempleton.com
Semiannual Report 35
| FRANKLIN REAL RETURN FUND | ||||||
| YOUR FUND’S EXPENSES | ||||||
| Beginning Account | Ending Account | Expenses Paid During | ||||
| Share Class | Value 11/1/15 | Value 4/30/16 | Period* 11/1/15–4/30/16 | |||
| A | ||||||
| Actual | $ | 1,000 | $ | 1,015.50 | $ | 4.46 |
| Hypothetical (5% return before expenses) | $ | 1,000 | $ | 1,020.44 | $ | 4.47 |
| C | ||||||
| Actual | $ | 1,000 | $ | 1,014.10 | $ | 6.46 |
| Hypothetical (5% return before expenses) | $ | 1,000 | $ | 1,018.45 | $ | 6.47 |
| R6 | ||||||
| Actual | $ | 1,000 | $ | 1,017.20 | $ | 2.51 |
| Hypothetical (5% return before expenses) | $ | 1,000 | $ | 1,022.38 | $ | 2.51 |
| Advisor | ||||||
| Actual | $ | 1,000 | $ | 1,017.20 | $ | 3.21 |
| Hypothetical (5% return before expenses) | $ | 1,000 | $ | 1,021.68 | $ | 3.22 |
*Expenses are calculated using the most recent six-month expense ratio, net of expense waivers, annualized for each class (A: 0.89%;
C: 1.29%; R6: 0.50%; and Advisor: 0.64%), multiplied by the average account value over the period, multiplied by 182/366 to reflect the
one-half year period.
36 Semiannual Report
franklintempleton.com
FRANKLIN INVESTORS SECURITIES TRUST
| Financial Highlights | ||||||||||||||||||
| Franklin Balanced Fund | ||||||||||||||||||
| Six Months Ended | ||||||||||||||||||
| April 30, 2016 | Year Ended October 31, | |||||||||||||||||
| (unaudited) | 2015 | 2014 | 2013 | 2012 | 2011 | |||||||||||||
| Class A | ||||||||||||||||||
| Per share operating performance | ||||||||||||||||||
| (for a share outstanding throughout the period) | ||||||||||||||||||
| Net asset value, beginning of period | $ | 11.40 | $ | 11.86 | $ | 11.43 | $ | 10.64 | $ | 9.87 | $ | 9.61 | ||||||
| Income from investment operationsa: | ||||||||||||||||||
| Net investment incomeb | 0.15 | 0.30 | 0.31 | c | 0.27 | 0.30 | 0.32 | |||||||||||
| Net realized and unrealized gains (losses) | 0.04 | (0.24 | ) | 0.65 | 1.02 | 0.83 | 0.30 | |||||||||||
| Total from investment operations | 0.19 | 0.06 | 0.96 | 1.29 | 1.13 | 0.62 | ||||||||||||
| Less distributions from: | ||||||||||||||||||
| Net investment income. | (0.18 | ) | (0.36 | ) | (0.36 | ) | (0.36 | ) | (0.36 | ) | (0.36 | ) | ||||||
| Net realized gains | — | (0.16 | ) | (0.17 | ) | (0.14 | ) | (—)d | — | |||||||||
| Total distributions | (0.18 | ) | (0.52 | ) | (0.53 | ) | (0.50 | ) | (0.36 | ) | (0.36 | ) | ||||||
| Net asset value, end of period | $ | 11.41 | $ | 11.40 | $ | 11.86 | $ | 11.43 | $ | 10.64 | $ | 9.87 | ||||||
| Total returne | 1.78 | % | 0.51 | % | 8.66 | % | 12.51 | % | 11.70 | % | 6.51 | % | ||||||
| Ratios to average net assetsf | ||||||||||||||||||
| Expenses before waiver and payments by | ||||||||||||||||||
| affiliates | 1.02 | % | 1.06 | % | 1.09 | % | 1.12 | % | 1.15 | % | 1.17 | % | ||||||
| Expenses net of waiver and payments by | ||||||||||||||||||
| affiliates | 1.00 | %g | 1.06 | %g,h | 1.09 | %g,h | 1.10 | %g | 1.01 | % | 1.01 | % | ||||||
| Net investment income | 2.68 | % | 2.56 | % | 2.64 | %c | 2.51 | % | 2.95 | % | 3.27 | % | ||||||
| Supplemental data | ||||||||||||||||||
| Net assets, end of period (000’s) | $ | 2,512,685 | $ | 2,371,133 | $ | 2,053,623 | $ | 1,354,710 | $ | 627,287 | $ | 218,625 | ||||||
| Portfolio turnover rate | 13.82 | % | 69.23 | % | 40.54 | % | 58.52 | % | 58.59 | % | 70.76 | % | ||||||
aThe amount shown for a share outstanding throughout the period may not correlate with the Statement of Operations for the period due to the timing of sales and
repurchases of the Fund’s shares in relation to income earned and/or fluctuating fair value of the investments of the Fund.
bBased on average daily shares outstanding.
cNet investment income per share includes approximately $0.03 per share related to income received in the form of a special dividend in connection with certain Fund
holdings. Excluding this amount, the ratio of net investment income to average net assets would have been 2.39%.
dAmount rounds to less than $0.01 per share.
eTotal return does not reflect sales commissions or contingent deferred sales charges, if applicable, and is not annualized for periods less than one year.
fRatios are annualized for periods less than one year.
gBenefit of expense reduction rounds to less than 0.01%.
hBenefit of waiver and payments by affiliates rounds to less than 0.01%.
franklintempleton.com The accompanying notes are an integral part of these financial statements. | Semiannual Report 37
| FRANKLIN INVESTORS SECURITIES TRUST | ||||||||||||||||||
| FINANCIAL HIGHLIGHTS | ||||||||||||||||||
| Franklin Balanced Fund (continued) | ||||||||||||||||||
| Six Months Ended | ||||||||||||||||||
| April 30, 2016 | Year Ended October 31, | |||||||||||||||||
| (unaudited) | 2015 | 2014 | 2013 | 2012 | 2011 | |||||||||||||
| Class C | ||||||||||||||||||
| Per share operating performance | ||||||||||||||||||
| (for a share outstanding throughout the period) | ||||||||||||||||||
| Net asset value, beginning of period | $ | 11.31 | $ | 11.77 | $ | 11.34 | $ | 10.57 | $ | 9.81 | $ | 9.54 | ||||||
| Income from investment operationsa: | ||||||||||||||||||
| Net investment incomeb | 0.11 | 0.21 | 0.23 | c | 0.20 | 0.23 | 0.25 | |||||||||||
| Net realized and unrealized gains (losses) | 0.04 | (0.23 | ) | 0.65 | 0.99 | 0.82 | 0.31 | |||||||||||
| Total from investment operations | 0.15 | (0.02 | ) | 0.88 | 1.19 | 1.05 | 0.56 | |||||||||||
| Less distributions from: | ||||||||||||||||||
| Net investment income. | (0.14 | ) | (0.28 | ) | (0.28 | ) | (0.28 | ) | (0.29 | ) | (0.29 | ) | ||||||
| Net realized gains | — | (0.16 | ) | (0.17 | ) | (0.14 | ) | (—)d | — | |||||||||
| Total distributions | (0.14 | ) | (0.44 | ) | (0.45 | ) | (0.42 | ) | (0.29 | ) | (0.29 | ) | ||||||
| Net asset value, end of period | $ | 11.32 | $ | 11.31 | $ | 11.77 | $ | 11.34 | $ | 10.57 | $ | 9.81 | ||||||
| Total returne | 1.42 | % | (0.20 | )% | 7.97 | % | 11.62 | % | 10.91 | % | 5.91 | % | ||||||
| Ratios to average net assetsf | ||||||||||||||||||
| Expenses before waiver and payments by | ||||||||||||||||||
| affiliates | 1.77 | % | 1.77 | % | 1.79 | % | 1.82 | % | 1.85 | % | 1.87 | % | ||||||
| Expenses net of waiver and payments by | ||||||||||||||||||
| affiliates | 1.75 | %g | 1.77 | %g,h | 1.79 | %g,h | 1.80 | %g | 1.71 | % | 1.71 | % | ||||||
| Net investment income | 1.93 | % | 1.85 | % | 1.94 | %c | 1.81 | % | 2.25 | % | 2.57 | % | ||||||
| Supplemental data | ||||||||||||||||||
| Net assets, end of period (000’s) | $ | 609,481 | $ | 563,419 | $ | 492,514 | $ | 354,359 | $ | 187,991 | $ | 85,302 | ||||||
| Portfolio turnover rate | 13.82 | % | 69.23 | % | 40.54 | % | 58.52 | % | 58.59 | % | 70.76 | % | ||||||
aThe amount shown for a share outstanding throughout the period may not correlate with the Statement of Operations for the period due to the timing of sales and
repurchases of the Fund’s shares in relation to income earned and/or fluctuating fair value of the investments of the Fund.
bBased on average daily shares outstanding.
cNet investment income per share includes approximately $0.03 per share related to income received in the form of a special dividend in connection with certain Fund
holdings. Excluding this amount, the ratio of net investment income to average net assets would have been 1.69%.
dAmount rounds to less than $0.01 per share.
eTotal return does not reflect sales commissions or contingent deferred sales charges, if applicable, and is not annualized for periods less than one year.
fRatios are annualized for periods less than one year.
gBenefit of expense reduction rounds to less than 0.01%.
hBenefit of waiver and payments by affiliates rounds to less than 0.01%.
38 Semiannual Report | The accompanying notes are an integral part of these financial statements. franklintempleton.com
| FRANKLIN INVESTORS SECURITIES TRUST | ||||||||||||||||||
| FINANCIAL HIGHLIGHTS | ||||||||||||||||||
| Franklin Balanced Fund (continued) | ||||||||||||||||||
| Six Months Ended | ||||||||||||||||||
| April 30, 2016 | Year Ended October 31, | |||||||||||||||||
| (unaudited) | 2015 | 2014 | 2013 | 2012 | 2011 | |||||||||||||
| Class R | ||||||||||||||||||
| Per share operating performance | ||||||||||||||||||
| (for a share outstanding throughout the period) | ||||||||||||||||||
| Net asset value, beginning of period | $ | 11.42 | $ | 11.89 | $ | 11.45 | $ | 10.66 | $ | 9.89 | $ | 9.62 | ||||||
| Income from investment operationsa: | ||||||||||||||||||
| Net investment incomeb | 0.14 | 0.27 | 0.29 | c | 0.26 | 0.29 | 0.31 | |||||||||||
| Net realized and unrealized gains (losses) | 0.05 | (0.24 | ) | 0.66 | 1.01 | 0.82 | 0.30 | |||||||||||
| Total from investment operations | 0.19 | 0.03 | 0.95 | 1.27 | 1.11 | 0.61 | ||||||||||||
| Less distributions from: | ||||||||||||||||||
| Net investment income. | (0.17 | ) | (0.34 | ) | (0.34 | ) | (0.34 | ) | (0.34 | ) | (0.34 | ) | ||||||
| Net realized gains | — | (0.16 | ) | (0.17 | ) | (0.14 | ) | (—)d | — | |||||||||
| Total distributions | (0.17 | ) | (0.50 | ) | (0.51 | ) | (0.48 | ) | (0.34 | ) | (0.34 | ) | ||||||
| Net asset value, end of period | $ | 11.44 | $ | 11.42 | $ | 11.89 | $ | 11.45 | $ | 10.66 | $ | 9.89 | ||||||
| Total returne | 1.76 | % | 0.21 | % | 8.51 | % | 12.26 | % | 11.46 | % | 6.39 | % | ||||||
| Ratios to average net assetsf | ||||||||||||||||||
| Expenses before waiver and payments by | ||||||||||||||||||
| affiliates | 1.27 | % | 1.27 | % | 1.29 | % | 1.32 | % | 1.35 | % | 1.37 | % | ||||||
| Expenses net of waiver and payments by | ||||||||||||||||||
| affiliates | 1.25 | %g | 1.27 | %g,h | 1.29 | %g,h | 1.30 | %g | 1.21 | % | 1.21 | % | ||||||
| Net investment income | 2.43 | % | 2.35 | % | 2.44 | %c | 2.31 | % | 2.75 | % | 3.07 | % | ||||||
| Supplemental data | ||||||||||||||||||
| Net assets, end of period (000’s) | $ | 4,496 | $ | 4,699 | $ | 3,598 | $ | 3,253 | $ | 2,378 | $ | 1,928 | ||||||
| Portfolio turnover rate | 13.82 | % | 69.23 | % | 40.54 | % | 58.52 | % | 58.59 | % | 70.76 | % | ||||||
aThe amount shown for a share outstanding throughout the period may not correlate with the Statement of Operations for the period due to the timing of sales and
repurchases of the Fund’s shares in relation to income earned and/or fluctuating fair value of the investments of the Fund.
bBased on average daily shares outstanding.
cNet investment income per share includes approximately $0.03 per share related to income received in the form of a special dividend in connection with certain Fund
holdings. Excluding this amount, the ratio of net investment income to average net assets would have been 2.19%.
dAmount rounds to less than $0.01 per share.
eTotal return is not annualized for periods less than one year.
fRatios are annualized for periods less than one year.
gBenefit of expense reduction rounds to less than 0.01%.
hBenefit of waiver and payments by affiliates rounds to less than 0.01%.
franklintempleton.com The accompanying notes are an integral part of these financial statements. | Semiannual Report 39
| FRANKLIN INVESTORS SECURITIES TRUST | ||||||||||||
| FINANCIAL HIGHLIGHTS | ||||||||||||
| Franklin Balanced Fund (continued) | ||||||||||||
| Six Months Ended | ||||||||||||
| April 30, 2016 | Year Ended October 31, | |||||||||||
| (unaudited) | 2015 | 2014 | 2013 | a | ||||||||
| Class R6 | ||||||||||||
| Per share operating performance | ||||||||||||
| (for a share outstanding throughout the period) | ||||||||||||
| Net asset value, beginning of period | $ | 11.42 | $ | 11.89 | $ | 11.45 | $ | 11.08 | ||||
| Income from investment operationsb: | ||||||||||||
| Net investment incomec | 0.16 | 0.35 | 0.37 | d | 0.19 | |||||||
| Net realized and unrealized gains (losses) | 0.05 | (0.25 | ) | 0.65 | 0.38 | |||||||
| Total from investment operations | 0.21 | 0.10 | 1.02 | 0.57 | ||||||||
| Less distributions from: | ||||||||||||
| Net investment income | (0.20 | ) | (0.41 | ) | (0.41 | ) | (0.20 | ) | ||||
| Net realized gains | — | (0.16 | ) | (0.17 | ) | — | ||||||
| Total distributions | (0.20 | ) | (0.57 | ) | (0.58 | ) | (0.20 | ) | ||||
| Net asset value, end of period | $ | 11.43 | $ | 11.42 | $ | 11.89 | $ | 11.45 | ||||
| Total returne | 1.95 | % | 0.81 | % | 9.29 | % | 5.15 | % | ||||
| Ratios to average net assetsf | ||||||||||||
| Expenses before waiver and payments by affiliates | 0.73 | % | 0.70 | % | 0.68 | % | 1.82 | % | ||||
| Expenses net of waiver and payments by affiliatesg | 0.65 | % | 0.67 | % | 0.68 | %h | 0.70 | % | ||||
| Net investment income | 3.03 | % | 2.95 | % | 3.05 | %d | 2.91 | % | ||||
| Supplemental data | ||||||||||||
| Net assets, end of period (000’s) | $ | 260 | $ | 221 | $ | 513 | $ | 5 | ||||
| Portfolio turnover rate. | 13.82 | % | 69.23 | % | 40.54 | % | 58.52 | % | ||||
aFor the period May 1, 2013 (effective date) to October 31, 2013.
bThe amount shown for a share outstanding throughout the period may not correlate with the Statement of Operations for the period due to the timing of sales and
repurchases of the Fund’s shares in relation to income earned and/or fluctuating fair value of the investments of the Fund.
cBased on average daily shares outstanding.
dNet investment income per share includes approximately $0.03 per share related to income received in the form of a special dividend in connection with certain Fund
holdings. Excluding this amount, the ratio of net investment income to average net assets would have been 2.80%.
eTotal return is not annualized for periods less than one year.
fRatios are annualized for periods less than one year.
gBenefit of expense reduction rounds to less than 0.01%.
hBenefit of waiver and payments by affiliates rounds to less than 0.01%.
40 Semiannual Report | The accompanying notes are an integral part of these financial statements. franklintempleton.com
| FRANKLIN INVESTORS SECURITIES TRUST | ||||||||||||||||||
| FINANCIAL HIGHLIGHTS | ||||||||||||||||||
| Franklin Balanced Fund (continued) | ||||||||||||||||||
| Six Months Ended | ||||||||||||||||||
| April 30, 2016 | Year Ended October 31, | |||||||||||||||||
| (unaudited) | 2015 | 2014 | 2013 | 2012 | 2011 | |||||||||||||
| Advisor Class | ||||||||||||||||||
| Per share operating performance | ||||||||||||||||||
| (for a share outstanding throughout the period) | ||||||||||||||||||
| Net asset value, beginning of period | $ | 11.42 | $ | 11.88 | $ | 11.45 | $ | 10.66 | $ | 9.89 | $ | 9.62 | ||||||
| Income from investment operationsa: | ||||||||||||||||||
| Net investment incomeb | 0.16 | 0.33 | 0.35 | c | 0.30 | 0.34 | 0.35 | |||||||||||
| Net realized and unrealized gains (losses) | 0.05 | (0.24 | ) | 0.65 | 1.02 | 0.82 | 0.31 | |||||||||||
| Total from investment operations | 0.21 | 0.09 | 1.00 | 1.32 | 1.16 | 0.66 | ||||||||||||
| Less distributions from: | ||||||||||||||||||
| Net investment income. | (0.20 | ) | (0.39 | ) | (0.40 | ) | (0.39 | ) | (0.39 | ) | (0.39 | ) | ||||||
| Net realized gains | — | (0.16 | ) | (0.17 | ) | (0.14 | ) | (—)d | — | |||||||||
| Total distributions | (0.20 | ) | (0.55 | ) | (0.57 | ) | (0.53 | ) | (0.39 | ) | (0.39 | ) | ||||||
| Net asset value, end of period | $ | 11.43 | $ | 11.42 | $ | 11.88 | $ | 11.45 | $ | 10.66 | $ | 9.89 | ||||||
| Total returne | 1.90 | % | 0.81 | % | 8.97 | % | 12.82 | % | 12.01 | % | 6.93 | % | ||||||
| Ratios to average net assetsf | ||||||||||||||||||
| Expenses before waiver and payments by | ||||||||||||||||||
| affiliates | 0.77 | % | 0.77 | % | 0.79 | % | 0.82 | % | 0.85 | % | 0.87 | % | ||||||
| Expenses net of waiver and payments by | ||||||||||||||||||
| affiliates | 0.75 | %g | 0.77 | %g,h | 0.79 | %g,h | 0.80 | %g | 0.71 | % | 0.71 | % | ||||||
| Net investment income | 2.93 | % | 2.85 | % | 2.94 | %c | 2.81 | % | 3.25 | % | 3.57 | % | ||||||
| Supplemental data | ||||||||||||||||||
| Net assets, end of period (000’s) | $ | 71,816 | $ | 54,881 | $ | 41,494 | $ | 68,201 | $ | 13,779 | $ | 7,477 | ||||||
| Portfolio turnover rate | 13.82 | % | 69.23 | % | 40.54 | % | 58.52 | % | 58.59 | % | 70.76 | % | ||||||
aThe amount shown for a share outstanding throughout the period may not correlate with the Statement of Operations for the period due to the timing of sales and
repurchases of the Fund’s shares in relation to income earned and/or fluctuating fair value of the investments of the Fund.
bBased on average daily shares outstanding.
cNet investment income per share includes approximately $0.03 per share related to income received in the form of a special dividend in connection with certain Fund
holdings. Excluding this amount, the ratio of net investment income to average net assets would have been 2.69%.
dAmount rounds to less than $0.01 per share.
eTotal return is not annualized for periods less than one year.
fRatios are annualized for periods less than one year.
gBenefit of expense reduction rounds to less than 0.01%.
hBenefit of waiver and payments by affiliates rounds to less than 0.01%.
franklintempleton.com The accompanying notes are an integral part of these financial statements. | Semiannual Report 41
| FRANKLIN INVESTORS SECURITIES TRUST | ||||
| Statement of Investments, April 30, 2016 (unaudited) | ||||
| Franklin Balanced Fund | ||||
| Country | Shares | Value | ||
| Common Stocks 48.3% | ||||
| Consumer Discretionary 3.5% | ||||
| Daimler AG | Germany | 200,000 | $ | 13,899,831 |
| Ford Motor Co | United States | 2,500,000 | 33,900,000 | |
| Nordstrom Inc | United States | 500,000 | 25,565,000 | |
| Target Corp | United States | 500,000 | 39,750,000 | |
| 113,114,831 | ||||
| Consumer Staples 2.8% | ||||
| Anheuser-Busch InBev NV, ADR. | Belgium | 200,000 | 24,836,000 | |
| CVS Health Corp | United States | 300,000 | 30,150,000 | |
| PepsiCo Inc | United States | 350,000 | 36,036,000 | |
| 91,022,000 | ||||
| Energy 5.5% | ||||
| Anadarko Petroleum Corp | United States | 500,000 | 26,380,000 | |
| Chevron Corp | United States | 500,000 | 51,090,000 | |
| Exxon Mobil Corp | United States | 300,000 | 26,520,000 | |
| Occidental Petroleum Corp | United States | 300,000 | 22,995,000 | |
| Royal Dutch Shell PLC, A, ADR | United Kingdom | 419,264 | 22,174,873 | |
| Total SA, B, ADR | France | 500,000 | 25,375,000 | |
| 174,534,873 | ||||
| Financials 8.9% | ||||
| BlackRock Inc | United States | 100,000 | 35,633,000 | |
| The Charles Schwab Corp | United States | 1,000,000 | 28,410,000 | |
| JPMorgan Chase & Co | United States | 850,000 | 53,720,000 | |
| Royal Bank of Canada | Canada | 500,000 | 31,060,000 | |
| T. Rowe Price Group Inc | United States | 400,000 | 30,116,000 | |
| The Toronto-Dominion Bank | Canada | 750,000 | 33,375,000 | |
| U.S. Bancorp | United States | 750,000 | 32,017,500 | |
| Wells Fargo & Co | United States | 800,000 | 39,984,000 | |
| 284,315,500 | ||||
| Health Care 5.0% | ||||
| a Amgen Inc | United States | 175,000 | 27,702,500 | |
| AstraZeneca PLC, ADR | United Kingdom | 1,285,000 | 37,213,600 | |
| Johnson & Johnson. | United States | 400,000 | 44,832,000 | |
| Pfizer Inc | United States | 1,500,000 | 49,065,000 | |
| 158,813,100 | ||||
| Industrials 6.3% | ||||
| The Boeing Co | United States | 210,000 | 28,308,000 | |
| General Electric Co | United States | 1,250,000 | 38,437,500 | |
| Northrop Grumman Corp | United States | 125,000 | 25,782,500 | |
| Raytheon Co | United States | 300,000 | 37,905,000 | |
| Republic Services Inc | United States | 700,000 | 32,949,000 | |
| United Parcel Service Inc., B | United States | 350,000 | 36,774,500 | |
| 200,156,500 | ||||
| Information Technology 9.4% | ||||
| Analog Devices Inc | United States | 600,000 | 33,792,000 | |
| Apple Inc | United States | 450,000 | 42,183,000 | |
| Computer Sciences Corp | United States | 300,000 | 9,939,000 | |
| CSRA Inc | United States | 300,000 | 7,788,000 | |
| Ericsson, B, ADR | Sweden | 1,500,000 | 12,135,000 | |
| Intel Corp | United States | 1,000,000 | 30,280,000 | |
42 Semiannual Report
franklintempleton.com
FRANKLIN INVESTORS SECURITIES TRUST
STATEMENT OF INVESTMENTS (UNAUDITED)
| Franklin Balanced Fund (continued) | ||||
| Country | Shares | Value | ||
| Common Stocks (continued) | ||||
| Information Technology (continued) | ||||
| Maxim Integrated Products Inc | United States | 700,000 | $ | 25,004,000 |
| Microsoft Corp | United States | 1,000,000 | 49,870,000 | |
| Oracle Corp | United States | 440,000 | 17,538,400 | |
| QUALCOMM Inc | United States | 600,000 | 30,312,000 | |
| Texas Instruments Inc | United States | 750,000 | 42,780,000 | |
| 301,621,400 | ||||
| Materials 3.9% | ||||
| BASF SE | Germany | 400,000 | 33,049,031 | |
| a E. I. du Pont de Nemours and Co | United States | 500,000 | 32,955,000 | |
| The Mosaic Co | United States | 850,000 | 23,791,500 | |
| Praxair Inc | United States | 300,000 | 35,238,000 | |
| 125,033,531 | ||||
| Telecommunication Services 2.4% | ||||
| Rogers Communications Inc., B | Canada | 900,000 | 34,992,000 | |
| Verizon Communications Inc | United States | 800,000 | 40,752,000 | |
| 75,744,000 | ||||
| Utilities 0.6% | ||||
| Dominion Resources Inc | United States | 270,480 | 19,331,205 | |
| Total Common Stocks (Cost $1,419,718,033) | 1,543,686,940 | |||
| Management Investment Companies 1.6% | ||||
| Financials 1.6% | ||||
| iShares Core U.S. Aggregate Bond ETF | United States | 200,000 | 22,178,000 | |
| iShares iBoxx High Yield Corporate Bond ETF | United States | 350,000 | 29,347,500 | |
| Total Management Investment Companies | ||||
| (Cost $49,847,930) | 51,525,500 | |||
| b Equity-Linked Securities 9.4% | ||||
| Energy 1.3% | ||||
| c Barclays Bank PLC into Halliburton Co., 6.00%, 144A | United States | 604,000 | 24,899,115 | |
| c Credit Suisse New York into Schlumberger Ltd., 6.00%, 144A | United States | 200,000 | 16,018,280 | |
| 40,917,395 | ||||
| Financials 0.7% | ||||
| c Barclays Bank PLC into Bank of America Corp., 6.00%, 144A | United States | 1,500,000 | 22,022,550 | |
| Industrials 2.7% | ||||
| c The Goldman Sachs Group Inc. into General Electric Co., 5.50%, 144A | United States | 600,000 | 17,774,520 | |
| c Merrill Lynch International & Co. CV into Union Pacific Corp., 5.75%, 144A | United States | 386,000 | 33,747,169 | |
| c Merrill Lynch International & Co. CV into United Technologies Corp., 5.00%, 144A | United States | 354,000 | 36,465,540 | |
| 87,987,229 | ||||
| Information Technology 3.2% | ||||
| c Citigroup Inc. into Cisco Systems Inc., 7.50%, 144A | United States | 1,442,000 | 39,493,784 | |
| c JPMorgan Chase & Co. into Google Inc., 4.50%, C, 144A | United States | 50,000 | 29,373,400 | |
| c JPMorgan Chase & Co. into Oracle Corp., 6.00%, 144A | United States | 865,000 | 34,392,746 | |
| 103,259,930 | ||||
franklintempleton.com
Semiannual Report 43
FRANKLIN INVESTORS SECURITIES TRUST
STATEMENT OF INVESTMENTS (UNAUDITED)
| Franklin Balanced Fund (continued) | ||||
| Country | Shares | Value | ||
| b Equity-Linked Securities (continued) | ||||
| Materials 1.5% | ||||
| c Deutsche Bank AG into Rio Tinto PLC, 9.00%, 144A | United Kingdom | 680,000 | $ | 23,062,404 |
| c The Goldman Sachs Group Inc. into LyondellBasell Industries NV, 7.50%, 144A. | United States | 294,400 | 24,490,371 | |
| 47,552,775 | ||||
| Total Equity-Linked Securities (Cost $319,120,094) | 301,739,879 | |||
| Convertible Preferred Stocks 5.4% | ||||
| Energy 1.0% | ||||
| Hess Corp., 8.00%, cvt. pfd | United States | 400,000 | 30,408,000 | |
| Financials 1.1% | ||||
| American Tower Corp., 5.50%, cvt. pfd | United States | 350,000 | 36,288,000 | |
| Health Care 1.7% | ||||
| Allergan PLC, 5.50%, cvt. pfd | United States | 35,102 | 28,484,922 | |
| Teva Pharmaceutical Industries Ltd., 7.00%, cvt. pfd | Israel | 30,000 | 27,030,000 | |
| 55,514,922 | ||||
| Utilities 1.6% | ||||
| Dominion Resources Inc., 6.375%, cvt. pfd., A | United States | 438,900 | 21,650,937 | |
| NextEra Energy Inc., 5.799%, cvt. pfd | United States | 200,000 | 12,090,000 | |
| NextEra Energy Inc., 6.371%, cvt. pfd | United States | 260,000 | 15,548,000 | |
| 49,288,937 | ||||
| Total Convertible Preferred Stocks (Cost $164,822,250) | 171,499,859 | |||
| Preferred Stocks 0.4% | ||||
| Financials 0.4% | ||||
| Morgan Stanley, 6.375%, pfd., I | United States | 310,000 | 8,221,200 | |
| U.S. Bancorp, 6.00%, pfd., G | United States | 180,000 | 4,753,800 | |
| Total Preferred Stocks (Cost $12,250,000) | 12,975,000 | |||
| Principal | ||||
| Amount* | ||||
| Corporate Bonds 29.1% | ||||
| Consumer Discretionary 2.9% | ||||
| c CCO Safari II LLC, senior secured note, 144A, 4.908%, 7/23/25 | United States | 20,000,000 | 21,581,040 | |
| Dollar General Corp., senior bond, 3.25%, 4/15/23 | United States | 15,000,000 | 15,133,425 | |
| Ford Motor Credit Co. LLC, senior note, 2.551%, 10/05/18 | United States | 5,000,000 | 5,067,920 | |
| KB Home, senior note, 7.625%, 5/15/23 | United States | 2,625,000 | 2,690,625 | |
| c Sirius XM Radio Inc., senior bond, 144A, 5.375%, 4/15/25 | United States | 15,000,000 | 15,375,000 | |
| Tiffany & Co., senior bond, 4.90%, 10/01/44. | United States | 7,000,000 | 6,832,721 | |
| Trinity Acquisition PLC, senior note, 4.625%, 8/15/23 | United States | 7,000,000 | 7,306,873 | |
| Yum! Brands Inc., senior bond, 3.875%, 11/01/23 | United States | 17,950,000 | 17,117,659 | |
| 91,105,263 | ||||
| Consumer Staples 3.5% | ||||
| Anheuser-Busch InBev Finance Inc., senior bond, 4.90%, 2/01/46 | Belgium | 15,000,000 | 16,991,520 | |
| CVS Health Corp., senior note, 3.875%, 7/20/25. | United States | 10,000,000 | 10,808,940 | |
| Kraft Foods Group Inc., senior bond, 3.50%, 6/06/22. | United States | 10,000,000 | 10,623,740 | |
| Mondelez International Inc., senior bond, 4.00%, 2/01/24 | United States | 15,000,000 | 16,239,990 | |
| Reynolds American Inc., | ||||
| senior note, 2.30%, 8/21/17 | United States | 6,100,000 | 6,178,519 | |
| senior note, 4.45%, 6/12/25 | United States | 15,000,000 | 16,686,885 | |
| Tyson Foods Inc., senior bond, 3.95%, 8/15/24. | United States | 12,100,000 | 13,035,959 | |
44 Semiannual Report
franklintempleton.com
FRANKLIN INVESTORS SECURITIES TRUST
STATEMENT OF INVESTMENTS (UNAUDITED)
| Franklin Balanced Fund (continued) | ||||
| Principal | ||||
| Country | Amount* | Value | ||
| Corporate Bonds (continued) | ||||
| Consumer Staples (continued) | ||||
| c Whole Foods Market Inc., senior note, 144A, 5.20%, 12/03/25 | United States | 20,000,000 | $ | 21,091,140 |
| 111,656,693 | ||||
| Energy 3.3% | ||||
| Anadarko Petroleum Corp., senior note, 8.70%, 3/15/19 | United States | 7,215,000 | 8,224,350 | |
| Antero Resources Corp., senior note, 5.625%, 6/01/23 | United States | 10,000,000 | 9,750,000 | |
| Energy Transfer Partners LP, senior bond, 3.60%, 2/01/23 | United States | 25,000,000 | 22,914,700 | |
| EOG Resources Inc., senior bond, 2.625%, 3/15/23 | United States | 5,500,000 | 5,379,468 | |
| c Ferrellgas LP/Ferrellgas Finance Corp., senior note, 144A, 6.75%, 6/15/23 | United States | 18,800,000 | 17,625,000 | |
| Kinder Morgan Energy Partners LP, senior note, 4.30%, 5/01/24 | United States | 12,900,000 | 12,598,759 | |
| Oceaneering International Inc., senior note, 4.65%, 11/15/24 | United States | 9,400,000 | 8,542,635 | |
| Weatherford International Ltd., senior bond, 5.95%, 4/15/42 | United States | 4,000,000 | 2,980,000 | |
| The Williams Cos. Inc., senior bond, 3.70%, 1/15/23 | United States | 5,000,000 | 4,223,950 | |
| Williams Partners LP, senior note, 3.60%, 3/15/22 | United States | 15,000,000 | 13,558,020 | |
| 105,796,882 | ||||
| Financials 10.4% | ||||
| d Bank of America Corp., | ||||
| junior sub. bond, AA, 6.10% to 3/17/25, FRN thereafter, Perpetual | United States | 15,000,000 | 15,028,125 | |
| junior sub. bond, M, 8.125% to 5/15/18, FRN thereafter, Perpetual | United States | 10,000,000 | 9,837,500 | |
| Capital One Bank USA NA, senior note, 2.30%, 6/05/19 | United States | 14,000,000 | 13,979,266 | |
| Citigroup Inc., | ||||
| d junior sub. bond, P, 5.95% to 5/15/25, FRN thereafter, Perpetual | United States | 15,000,000 | 14,540,625 | |
| sub. bond, 5.50%, 9/13/25 | United States | 10,000,000 | 11,092,940 | |
| Compass Bank, sub. note, 3.875%, 4/10/25 | United States | 15,000,000 | 14,213,145 | |
| Deutsche Bank AG, sub. bond, 4.296% to 5/24/23, FRN thereafter, 5/24/28 | Germany | 15,000,000 | 13,398,000 | |
| HCP Inc., senior bond, 3.875%, 8/15/24 | United States | 21,700,000 | 21,314,000 | |
| Healthcare Trust of America Holdings LP, senior note, 3.375%, 7/15/21 | United States | 10,000,000 | 10,040,120 | |
| d JPMorgan Chase & Co., | ||||
| junior sub. bond, I, 7.90% to 4/30/19, FRN thereafter, Perpetual | United States | 10,000,000 | 10,068,750 | |
| junior sub. bond, V, 5.00% to 7/30/19, FRN thereafter, Perpetual | United States | 13,000,000 | 12,530,050 | |
| c Liberty Mutual Group Inc., senior note, 144A, 4.95%, 5/01/22 | United States | 7,100,000 | 7,728,073 | |
| d MetLife Inc., junior sub. note, 5.25% to 6/15/20, FRN thereafter, Perpetual | United States | 2,500,000 | 2,440,500 | |
| c Mizuho Bank Ltd., senior note, 144A, 2.45%, 4/16/19 | Japan | 12,000,000 | 12,159,324 | |
| Morgan Stanley, | ||||
| d junior sub. bond, 5.55% to 7/15/20, FRN thereafter, Perpetual | United States | 10,900,000 | 10,804,625 | |
| senior note, 2.50%, 4/21/21 | United States | 15,000,000 | 15,054,540 | |
| senior sub. bond, 4.35%, 9/08/26. | United States | 15,000,000 | 15,522,930 | |
| Navient Corp., senior note, 6.125%, 3/25/24. | United States | 15,000,000 | 13,507,500 | |
| c Nippon Life Insurance Co., sub. bond, 144A, 5.10% to 10/16/24, FRN thereafter, | ||||
| 10/16/44. | Japan | 15,000,000 | 16,350,000 | |
| d PNC Financial Services Group Inc., junior sub. note, 4.85% to 6/01/23, FRN | ||||
| thereafter, Perpetual | United States | 12,000,000 | 11,520,000 | |
| Prologis LP, senior note, 4.25%, 8/15/23 | United States | 12,000,000 | 13,168,440 | |
| Prudential Financial Inc., | ||||
| 3.50%, 5/15/24 | United States | 10,000,000 | 10,300,410 | |
| junior sub. note, 5.875%, 9/15/42 | United States | 5,000,000 | 5,410,000 | |
| Realty Income Corp., senior bond, 3.875%, 7/15/24 | United States | 15,000,000 | 15,333,630 | |
| Royal Bank of Scotland Group PLC, | ||||
| sub. note, 6.125%, 12/15/22 | United Kingdom | 4,000,000 | 4,279,900 | |
| sub. note, 5.125%, 5/28/24 | United Kingdom | 10,400,000 | 10,125,492 | |
| Senior Housing Properties Trust, senior note, 6.75%, 12/15/21. | United States | 7,000,000 | 7,742,357 | |
franklintempleton.com
Semiannual Report 45
FRANKLIN INVESTORS SECURITIES TRUST
STATEMENT OF INVESTMENTS (UNAUDITED)
| Franklin Balanced Fund (continued) | ||||
| Principal | ||||
| Country | Amount* | Value | ||
| Corporate Bonds (continued) | ||||
| Financials (continued) | ||||
| d Wells Fargo & Co., junior sub. bond, 5.875% to 6/15/25, FRN thereafter, Perpetual | United States | 15,000,000 | $ | 16,040,625 |
| 333,530,867 | ||||
| Health Care 3.0% | ||||
| Actavis Funding SCS, senior bond, 4.75%, 3/15/45 | United States | 12,000,000 | 12,179,088 | |
| c AMAG Pharmaceuticals Inc., senior note, 144A, 7.875%, 9/01/23 | United States | 16,000,000 | 14,440,000 | |
| c Baxalta Inc., senior note, 144A, 4.00%, 6/23/25 | United States | 11,900,000 | 12,258,892 | |
| Biogen Inc., senior note, 3.625%, 9/15/22 | United States | 10,000,000 | 10,609,580 | |
| Celgene Corp., senior bond, 4.00%, 8/15/23 | United States | 10,000,000 | 10,746,330 | |
| Edwards Lifesciences Corp., senior note, 2.875%, 10/15/18 | United States | 10,000,000 | 10,252,640 | |
| HCA Inc., senior secured note, first lien, 5.00%, 3/15/24 | United States | 12,000,000 | 12,450,000 | |
| c Valeant Pharmaceuticals International Inc., | ||||
| senior bond, 144A, 6.125%, 4/15/25 | United States | 6,300,000 | 5,244,750 | |
| senior note, 144A, 5.875%, 5/15/23 | United States | 8,300,000 | 7,018,688 | |
| 95,199,968 | ||||
| Industrials 1.7% | ||||
| c Air Canada 2013-1A Pass Through Trust, first lien, 144A, 4.125%, 11/15/26 | Canada | 6,332,279 | 6,498,502 | |
| c Aviation Capital Group Corp., senior note, 144A, 3.875%, 9/27/16 | United States | 12,000,000 | 12,090,600 | |
| d General Electric Co., junior sub. bond, 5.00% to 1/21/21, FRN thereafter, Perpetual | United States | 9,876,000 | 10,271,040 | |
| Lockheed Martin Corp., senior bond, 3.55%, 1/15/26 | United States | 15,000,000 | 16,100,085 | |
| e United Rentals North America Inc., senior bond, 5.875%, 9/15/26. | United States | 4,300,000 | 4,300,000 | |
| c XPO Logistics Inc., senior note, 144A, 7.875%, 9/01/19. | United States | 5,000,000 | 5,275,000 | |
| 54,535,227 | ||||
| Information Technology 1.1% | ||||
| c Microsemi Corp., senior note, 144A, 9.125%, 4/15/23 | United States | 5,500,000 | 6,091,250 | |
| Oracle Corp., senior note, 2.50%, 10/15/22 | United States | 10,000,000 | 10,211,460 | |
| c Western Digital Corp., senior secured note, 144A, 7.375%, 4/01/23 | United States | 20,000,000 | 20,200,000 | |
| 36,502,710 | ||||
| Materials 0.9% | ||||
| Crown Americas LLC/Crown Americas Capital Corp. IV, senior bond, 4.50%, 1/15/23 . | United States | 5,000,000 | 5,125,000 | |
| c FMG Resources (August 2006) Pty. Ltd., senior secured note, 144A, 9.75%, 3/01/22 . | Australia | 12,500,000 | 13,157,500 | |
| Freeport-McMoRan Inc., senior bond, 3.875%, 3/15/23 | United States | 7,000,000 | 5,880,000 | |
| Reliance Steel & Aluminum Co., senior note, 4.50%, 4/15/23 | United States | 4,000,000 | 4,044,212 | |
| 28,206,712 | ||||
| Telecommunication Services 1.4% | ||||
| AT&T Inc., senior note, 3.95%, 1/15/25 | United States | 11,700,000 | 12,343,523 | |
| Sprint Corp., senior note, 7.625%, 2/15/25 | United States | 10,000,000 | 7,550,000 | |
| Telefonica Emisiones SAU, senior note, 4.57%, 4/27/23. | Spain | 10,000,000 | 11,037,450 | |
| Verizon Communications Inc., senior bond, 6.55%, 9/15/43 | United States | 11,000,000 | 14,645,565 | |
| 45,576,538 | ||||
| Utilities 0.9% | ||||
| Alabama Power Co., senior note, 2.80%, 4/01/25 | United States | 7,000,000 | 7,141,428 | |
| c,d EDF SA, sub. note, 144A, 5.25% to 1/29/23, FRN thereafter, Perpetual | France | 10,000,000 | 9,670,000 | |
| c Enogex LLC, senior note, 144A, 6.25%, 3/15/20 | United States | 5,000,000 | 4,513,750 | |
46 Semiannual Report
franklintempleton.com
FRANKLIN INVESTORS SECURITIES TRUST
STATEMENT OF INVESTMENTS (UNAUDITED)
| Franklin Balanced Fund (continued) | |||||
| Principal | |||||
| Country | Amount* | Value | |||
| Corporate Bonds (continued) | |||||
| Utilities (continued) | |||||
| c InterGen NV, secured bond, 144A, 7.00%, 6/30/23 | Netherlands | 10,000,000 | $ | 6,950,000 | |
| 28,275,178 | |||||
| Total Corporate Bonds (Cost $919,722,877) | 930,386,038 | ||||
| Total Investments before Short Term Investments | |||||
| (Cost $2,885,481,184) | 3,011,813,216 | ||||
| Shares | |||||
| Short Term Investments (Cost $175,970,880) 5.5% | |||||
| Money Market Funds 5.5% | |||||
| f,g Institutional Fiduciary Trust Money Market Portfolio | United States | 175,970,880 | 175,970,880 | ||
| Total Investments (Cost $3,061,452,064) 99.7%. | 3,187,784,096 | ||||
| Options Written (0.0)%† | (1,296,250 | ) | |||
| Other Assets, less Liabilities 0.3% | 12,250,837 | ||||
| Net Assets 100.0% | $ | 3,198,738,683 | |||
| Number of | |||||
| Contracts | |||||
| h Options Written (0.0)%† | |||||
| Calls - Exchange-Traded | |||||
| Health Care (0.0)%† | |||||
| Amgen Inc., May Strike Price $160, Expires 5/20/16 | 1,750 | (411,250 | ) | ||
| Materials (0.0)%† | |||||
| E. I. du Pont de Nemours and Co., May Strike Price $65, Expires 5/20/16 | 5,000 | (885,000 | ) | ||
| Total Options Written (Premiums received $894,203) | $ | (1,296,250 | ) | ||
See Abbreviations on page 94.
†Rounds to less than 0.1% of net assets.
*The principal amount is stated in U.S. dollars unless otherwise indicated.
aA portion or all of the security is held in connection with written option contracts open at period end.
bSee Note 1(f) regarding equity-linked securities.
cSecurity was purchased pursuant to Rule 144A under the Securities Act of 1933 and may be sold in transactions exempt from registration only to qualified institutional buyers
or in a public offering registered under the Securities Act of 1933. These securities have been deemed liquid under guidelines approved by the Trust’s Board of Trustees. At
April 30, 2016, the aggregate value of these securities was $537,058,388, representing 16.79% of net assets.
dPerpetual security with no stated maturity date.
eSecurity purchased on a when-issued basis. See Note 1(d).
fNon-income producing.
gSee Note 3(f) regarding investments in affiliated management investment companies.
hSee Note 1(e) regarding written options.
franklintempleton.com The accompanying notes are an integral part of these financial statements. | Semiannual Report 47
FRANKLIN INVESTORS SECURITIES TRUST
| Financial Highlights | ||||||||||||||||||
| Franklin Convertible Securities Fund | ||||||||||||||||||
| Six Months Ended | ||||||||||||||||||
| April 30, 2016 | Year Ended October 31, | |||||||||||||||||
| (unaudited) | 2015 | 2014 | 2013 | 2012 | 2011 | |||||||||||||
| Class A | ||||||||||||||||||
| Per share operating performance | ||||||||||||||||||
| (for a share outstanding throughout the period) | ||||||||||||||||||
| Net asset value, beginning of period | $ | 18.00 | $ | 18.97 | $ | 17.82 | $ | 14.93 | $ | 14.37 | $ | 14.55 | ||||||
| Income from investment operationsa: | ||||||||||||||||||
| Net investment incomeb | 0.12 | 0.24 | 0.23 | 0.37 | 0.41 | 0.42 | ||||||||||||
| Net realized and unrealized gains (losses) | (0.12 | ) | (0.14 | ) | 1.32 | 2.99 | 0.67 | (0.06 | ) | |||||||||
| Total from investment operations | — | 0.10 | 1.55 | 3.36 | 1.08 | 0.36 | ||||||||||||
| Less distributions from: | ||||||||||||||||||
| Net investment income. | (0.29 | ) | (0.39 | ) | (0.33 | ) | (0.47 | ) | (0.52 | ) | (0.54 | ) | ||||||
| Net realized gains | (0.36 | ) | (0.68 | ) | (0.07 | ) | — | — | — | |||||||||
| Total distributions | (0.65 | ) | (1.07 | ) | (0.40 | ) | (0.47 | ) | (0.52 | ) | (0.54 | ) | ||||||
| Net asset value, end of period | $ | 17.35 | $ | 18.00 | $ | 18.97 | $ | 17.82 | $ | 14.93 | $ | 14.37 | ||||||
| Total returnc | 0.07 | % | 0.66 | % | 8.85 | % | 22.92 | % | 7.66 | % | 2.35 | % | ||||||
| Ratios to average net assetsd | ||||||||||||||||||
| Expenses before waiver and payments by | ||||||||||||||||||
| affiliates | 0.88 | % | 0.86 | % | 0.88 | % | 0.88 | % | 0.90 | % | 0.88 | % | ||||||
| Expenses net of waiver and payments by | ||||||||||||||||||
| affiliates | 0.87 | %e | 0.86 | %e,f | 0.88 | %e,f | 0.88 | %e | 0.90 | % | 0.88 | % | ||||||
| Net investment income | 1.35 | % | 1.33 | % | 1.23 | % | 2.25 | % | 2.84 | % | 2.77 | % | ||||||
| Supplemental data | ||||||||||||||||||
| Net assets, end of period (000’s) | $ | 729,672 | $ | 818,082 | $ | 921,134 | $ | 844,498 | $ | 602,804 | $ | 704,844 | ||||||
| Portfolio turnover rate | 14.50 | % | 17.30 | % | 23.05 | % | 34.69 | % | 12.82 | % | 23.24 | % | ||||||
aThe amount shown for a share outstanding throughout the period may not correlate with the Statement of Operations for the period due to the timing of sales and
repurchases of the Fund’s shares in relation to income earned and/or fluctuating fair value of the investments of the Fund.
bBased on average daily shares outstanding.
cTotal return does not reflect sales commissions or contingent deferred sales charges, if applicable, and is not annualized for periods less than one year.
dRatios are annualized for periods less than one year.
eBenefit of expense reduction rounds to less than 0.01%.
fBenefit of waiver and payments by affiliates rounds to less than 0.01%.
48 Semiannual Report | The accompanying notes are an integral part of these financial statements. franklintempleton.com
| FRANKLIN INVESTORS SECURITIES TRUST | ||||||||||||||||||
| FINANCIAL HIGHLIGHTS | ||||||||||||||||||
| Franklin Convertible Securities Fund (continued) | ||||||||||||||||||
| Six Months Ended | ||||||||||||||||||
| April 30, 2016 | Year Ended October 31, | |||||||||||||||||
| (unaudited) | 2015 | 2014 | 2013 | 2012 | 2011 | |||||||||||||
| Class C | ||||||||||||||||||
| Per share operating performance | ||||||||||||||||||
| (for a share outstanding throughout the period) | ||||||||||||||||||
| Net asset value, beginning of period | $ | 17.75 | $ | 18.73 | $ | 17.60 | $ | 14.75 | $ | 14.21 | $ | 14.39 | ||||||
| Income from investment operationsa: | ||||||||||||||||||
| Net investment incomeb | 0.05 | 0.11 | 0.09 | 0.24 | 0.30 | 0.30 | ||||||||||||
| Net realized and unrealized gains (losses) | (0.10 | ) | (0.16 | ) | 1.31 | 2.97 | 0.65 | (0.06 | ) | |||||||||
| Total from investment operations | (0.05 | ) | (0.05 | ) | 1.40 | 3.21 | 0.95 | 0.24 | ||||||||||
| Less distributions from: | ||||||||||||||||||
| Net investment income. | (0.23 | ) | (0.25 | ) | (0.20 | ) | (0.36 | ) | (0.41 | ) | (0.42 | ) | ||||||
| Net realized gains | (0.36 | ) | (0.68 | ) | (0.07 | ) | — | — | — | |||||||||
| Total distributions | (0.59 | ) | (0.93 | ) | (0.27 | ) | (0.36 | ) | (0.41 | ) | (0.42 | ) | ||||||
| Net asset value, end of period | $ | 17.11 | $ | 17.75 | $ | 18.73 | $ | 17.60 | $ | 14.75 | $ | 14.21 | ||||||
| Total returnc | (0.24 | )% | (0.15 | )% | 8.01 | % | 22.11 | % | 6.79 | % | 1.60 | % | ||||||
| Ratios to average net assetsd | ||||||||||||||||||
| Expenses before waiver and payments by | ||||||||||||||||||
| affiliates | 1.63 | % | 1.61 | % | 1.63 | % | 1.63 | % | 1.65 | % | 1.63 | % | ||||||
| Expenses net of waiver and payments by | ||||||||||||||||||
| affiliates | 1.62 | %e | 1.61 | %e,f | 1.63 | %e,f | 1.63 | %e | 1.65 | % | 1.63 | % | ||||||
| Net investment income | 0.60 | % | 0.58 | % | 0.48 | % | 1.50 | % | 2.09 | % | 2.02 | % | ||||||
| Supplemental data | ||||||||||||||||||
| Net assets, end of period (000’s) | $ | 291,004 | $ | 311,951 | $ | 333,034 | $ | 273,132 | $ | 211,630 | $ | 232,471 | ||||||
| Portfolio turnover rate | 14.50 | % | 17.30 | % | 23.05 | % | 34.69 | % | 12.82 | % | 23.24 | % | ||||||
aThe amount shown for a share outstanding throughout the period may not correlate with the Statement of Operations for the period due to the timing of sales and
repurchases of the Fund’s shares in relation to income earned and/or fluctuating fair value of the investments of the Fund.
bBased on average daily shares outstanding.
cTotal return does not reflect sales commissions or contingent deferred sales charges, if applicable, and is not annualized for periods less than one year.
dRatios are annualized for periods less than one year.
eBenefit of expense reduction rounds to less than 0.01%.
fBenefit of waiver and payments by affiliates rounds to less than 0.01%.
franklintempleton.com The accompanying notes are an integral part of these financial statements. | Semiannual Report 49
| FRANKLIN INVESTORS SECURITIES TRUST | |||||||||
| FINANCIAL HIGHLIGHTS | |||||||||
| Franklin Convertible Securities Fund (continued) | |||||||||
| Six Months Ended | |||||||||
| April 30, 2016 | Year Ended October 31, | ||||||||
| (unaudited) | 2015 | 2014 | a | ||||||
| Class R6 | |||||||||
| Per share operating performance | |||||||||
| (for a share outstanding throughout the period) | |||||||||
| Net asset value, beginning of period | $ | 18.09 | $ | 18.99 | $ | 19.21 | |||
| Income from investment operationsb: | |||||||||
| Net investment incomec | 0.07 | 0.30 | 0.19 | ||||||
| Net realized and unrealized gains (losses) | (0.03 | ) | (0.14 | ) | (0.17 | ) | |||
| Total from investment operations | 0.04 | 0.16 | 0.02 | ||||||
| Less distributions from: | |||||||||
| Net investment income | (0.33 | ) | (0.38 | ) | (0.24 | ) | |||
| Net realized gains. | (0.36 | ) | (0.68 | ) | — | ||||
| Total distributions | (0.69 | ) | (1.06 | ) | (0.24 | ) | |||
| Net asset value, end of period | $ | 17.44 | $ | 18.09 | $ | 18.99 | |||
| Total returnd | 0.27 | % | 0.99 | % | 0.11 | % | |||
| Ratios to average net assetse | |||||||||
| Expenses before waiver and payments by affiliates | 0.55 | % | 0.50 | % | 0.51 | % | |||
| Expenses net of waiver and payments by affiliatesf | 0.50 | % | 0.50 | %g | 0.51 | %g | |||
| Net investment income | 1.72 | % | 1.69 | % | 1.60 | % | |||
| Supplemental data | |||||||||
| Net assets, end of period (000’s) | $ | 6,143 | $ | 5 | $ | 3,093 | |||
| Portfolio turnover rate | 14.50 | % | 17.30 | % | 23.05 | % | |||
aFor the period March 4, 2014 (effective date) to October 31, 2014.
bThe amount shown for a share outstanding throughout the period may not correlate with the Statement of Operations for the period due to the timing of sales and
repurchases of the Fund’s shares in relation to income earned and/or fluctuating fair value of the investments of the Fund.
cBased on average daily shares outstanding.
dTotal return is not annualized for periods less than one year.
eRatios are annualized for periods less than one year.
fBenefit of expense reduction rounds to less than 0.01%.
gBenefit of waiver and payments by affiliates rounds to less than 0.01%.
50 Semiannual Report | The accompanying notes are an integral part of these financial statements. franklintempleton.com
| FRANKLIN INVESTORS SECURITIES TRUST | ||||||||||||||||||
| FINANCIAL HIGHLIGHTS | ||||||||||||||||||
| Franklin Convertible Securities Fund (continued) | ||||||||||||||||||
| Six Months Ended | ||||||||||||||||||
| April 30, 2016 | Year Ended October 31, | |||||||||||||||||
| (unaudited) | 2015 | 2014 | 2013 | 2012 | 2011 | |||||||||||||
| Advisor Class | ||||||||||||||||||
| Per share operating performance | ||||||||||||||||||
| (for a share outstanding throughout the period) | ||||||||||||||||||
| Net asset value, beginning of period | $ | 18.00 | $ | 18.98 | $ | 17.83 | $ | 14.94 | $ | 14.38 | $ | 14.56 | ||||||
| Income from investment operationsa: | ||||||||||||||||||
| Net investment incomeb | 0.13 | 0.29 | 0.28 | 0.41 | 0.45 | 0.47 | ||||||||||||
| Net realized and unrealized gains (losses) | (0.10 | ) | (0.15 | ) | 1.32 | 2.99 | 0.66 | (0.08 | ) | |||||||||
| Total from investment operations | 0.03 | 0.14 | 1.60 | 3.40 | 1.11 | 0.39 | ||||||||||||
| Less distributions from: | ||||||||||||||||||
| Net investment income. | (0.32 | ) | (0.44 | ) | (0.38 | ) | (0.51 | ) | (0.55 | ) | (0.57 | ) | ||||||
| Net realized gains | (0.36 | ) | (0.68 | ) | (0.07 | ) | — | — | — | |||||||||
| Total distributions | (0.68 | ) | (1.12 | ) | (0.45 | ) | (0.51 | ) | (0.55 | ) | (0.57 | ) | ||||||
| Net asset value, end of period | $ | 17.35 | $ | 18.00 | $ | 18.98 | $ | 17.83 | $ | 14.94 | $ | 14.38 | ||||||
| Total returnc | 0.20 | % | 0.87 | % | 9.13 | % | 23.21 | % | 7.93 | % | 2.60 | % | ||||||
| Ratios to average net assetsd | ||||||||||||||||||
| Expenses before waiver and payments by | ||||||||||||||||||
| affiliates | 0.63 | % | 0.61 | % | 0.63 | % | 0.63 | % | 0.65 | % | 0.63 | % | ||||||
| Expenses net of waiver and payments by | ||||||||||||||||||
| affiliates | 0.62 | %e | 0.61 | %e,f | 0.63 | %e,f | 0.63 | %e | 0.65 | % | 0.63 | % | ||||||
| Net investment income | 1.60 | % | 1.58 | % | 1.48 | % | 2.50 | % | 3.09 | % | 3.02 | % | ||||||
| Supplemental data | ||||||||||||||||||
| Net assets, end of period (000’s) | $ | 1,050,101 | $ | 899,441 | $ | 877,190 | $ | 387,528 | $ | 196,765 | $ | 181,611 | ||||||
| Portfolio turnover rate | 14.50 | % | 17.30 | % | 23.05 | % | 34.69 | % | 12.82 | % | 23.24 | % | ||||||
aThe amount shown for a share outstanding throughout the period may not correlate with the Statement of Operations for the period due to the timing of sales and
repurchases of the Fund’s shares in relation to income earned and/or fluctuating fair value of the investments of the Fund.
bBased on average daily shares outstanding.
cTotal return is not annualized for periods less than one year.
dRatios are annualized for periods less than one year.
eBenefit of expense reduction rounds to less than 0.01%.
fBenefit of waiver and payments by affiliates rounds to less than 0.01%.
franklintempleton.com The accompanying notes are an integral part of these financial statements. | Semiannual Report 51
| FRANKLIN INVESTORS SECURITIES TRUST | ||||
| Statement of Investments, April 30, 2016 (unaudited) | ||||
| Franklin Convertible Securities Fund | ||||
| Country | Shares | Value | ||
| Common Stocks (Cost $10,780,000) 0.6% | ||||
| Utilities 0.6% | ||||
| Dominion Resources Inc | United States | 170,016 | $ | 12,151,043 |
| Convertible Preferred Stocks 23.8% | ||||
| Consumer Staples 4.4% | ||||
| Post Holdings Inc., 5.25%, cvt. pfd | United States | 95,200 | 12,463,108 | |
| Post Holdings Inc., 2.50%, cvt. pfd | United States | 231,200 | 31,847,800 | |
| Tyson Foods Inc., 4.75%, cvt. pfd | United States | 650,000 | 47,411,000 | |
| 91,721,908 | ||||
| Energy 1.4% | ||||
| Chesapeake Energy Corp., 5.75%, cvt. pfd | United States | 18,500 | 5,711,875 | |
| McDermott International Inc., 6.25%, cvt. pfd | United States | 960,000 | 16,118,400 | |
| Rex Energy Corp., 6.00%, cvt. pfd., A | United States | 250,000 | 1,600,000 | |
| Sanchez Energy Corp., 6.50%, cvt. pfd., B. | United States | 236,000 | 5,982,600 | |
| 29,412,875 | ||||
| Financials 1.1% | ||||
| Wintrust Financial Corp., 5.00%, cvt. pfd | United States | 17,800 | 23,544,950 | |
| Health Care 3.6% | ||||
| Allergan PLC, 5.50%, cvt. pfd | United States | 45,500 | 36,922,795 | |
| Teva Pharmaceutical Industries Ltd., 7.00%, cvt. pfd | Israel | 42,500 | 38,292,500 | |
| 75,215,295 | ||||
| Industrials 3.7% | ||||
| Stanley Black & Decker Inc., 6.25%, cvt. pfd | United States | 389,900 | 46,171,958 | |
| Stericycle Inc., 5.25%, cvt. pfd | United States | 380,000 | 29,510,800 | |
| 75,682,758 | ||||
| Materials 1.4% | ||||
| Alcoa Inc., 5.375%, cvt. pfd | United States | 750,000 | 28,560,000 | |
| Telecommunication Services 3.3% | ||||
| Frontier Communications Corp., 11.125%, cvt. pfd | United States | 267,060 | 27,854,358 | |
| T-Mobile US Inc., 5.50%, cvt. pfd | United States | 600,000 | 40,686,000 | |
| 68,540,358 | ||||
| Utilities 4.9% | ||||
| Black Hills Corp., 7.75%, cvt. pfd | United States | 606,000 | 41,098,920 | |
| Dominion Resources Inc., 6.375%, cvt. pfd., A | United States | 185,200 | 9,135,916 | |
| Dominion Resources Inc., 6.00%, cvt. pfd., B | United States | 310,000 | 17,208,100 | |
| Exelon Corp., 6.50%, cvt. pfd | United States | 500,000 | 24,230,000 | |
| NextEra Energy Inc., 5.799%, cvt. pfd | United States | 164,000 | 9,913,800 | |
| 101,586,736 | ||||
| Total Convertible Preferred Stocks (Cost $513,142,396) | 494,264,880 | |||
| Principal | ||||
| Amount* | ||||
| Convertible Bonds 70.5% | ||||
| Consumer Discretionary 10.8% | ||||
| Ctrip.com International Ltd., cvt., senior note, 1.25%, 10/15/18. | China | 19,200,000 | 24,480,000 | |
| a GNC Holdings Inc., cvt., senior note, 144A, 1.50%, 8/15/20 | United States | 5,000,000 | 3,907,625 | |
| Iconix Brand Group Inc., cvt., senior sub. note, 2.50%, 6/01/16. | United States | 20,190,000 | 20,047,661 | |
| Jarden Corp., cvt., senior sub. bond, 1.125%, 3/15/34 | United States | 35,000,000 | 45,793,300 | |
52 Semiannual Report
franklintempleton.com
FRANKLIN INVESTORS SECURITIES TRUST
STATEMENT OF INVESTMENTS (UNAUDITED)
| Franklin Convertible Securities Fund (continued) | ||||
| Principal | ||||
| Country | Amount* | Value | ||
| Convertible Bonds (continued) | ||||
| Consumer Discretionary (continued) | ||||
| Liberty Interactive LLC, cvt., senior note, 0.75%, 3/30/43 | United States | 17,250,000 | $ | 29,810,156 |
| Liberty Media Corp., cvt., senior note, 1.375%, 10/15/23 | United States | 21,200,000 | 21,412,000 | |
| The Priceline Group Inc., cvt., senior note, 0.35%, 6/15/20 | United States | 35,000,000 | 42,918,750 | |
| Shutterfly Inc., cvt., 0.25%, 5/15/18 | United States | 37,465,000 | 37,535,247 | |
| 225,904,739 | ||||
| Energy 0.5% | ||||
| Cobalt International Energy Inc., cvt., senior bond, 3.125%, 5/15/24 | United States | 25,000,000 | 10,812,500 | |
| Financials 1.7% | ||||
| Forest City Enterprises Inc., | ||||
| cvt., senior note, 4.25%, 8/15/18 | United States | 17,110,000 | 18,863,775 | |
| cvt., senior note, A, 3.625%, 8/15/20 | United States | 15,250,000 | 16,031,563 | |
| 34,895,338 | ||||
| Health Care 16.0% | ||||
| a Anacor Pharmaceuticals Inc., cvt., senior note, 144A, 2.00%, 4/15/23 | United States | 24,000,000 | 27,630,000 | |
| BioMarin Pharmaceutical Inc., cvt., senior sub. note, 1.50%, 10/15/20. | United States | 28,200,000 | 34,333,500 | |
| Brookdale Senior Living Inc., cvt., senior note, 2.75%, 6/15/18 | United States | 26,200,000 | 26,150,875 | |
| Corsicanto Ltd., cvt., senior bond, 3.50%, 1/15/32 | Ireland | 12,500,000 | 11,796,875 | |
| Depomed Inc., cvt., senior note, 2.50%, 9/01/21 | United States | 16,000,000 | 17,710,000 | |
| Fluidigm Corp., cvt., senior bond, 2.75%, 2/01/34 | United States | 14,418,000 | 9,146,419 | |
| a HeartWare International Inc., cvt., senior note, 144A, 1.75%, 12/15/21 | United States | 21,728,000 | 15,481,200 | |
| Illumina Inc., cvt., senior note, 0.50%, 6/15/21 | United States | 33,000,000 | 34,155,000 | |
| a Impax Laboratories Inc., cvt., senior note, 144A, 2.00%, 6/15/22 | United States | 45,000,000 | 41,878,125 | |
| Jazz Investments I Ltd., cvt., senior note, 1.875%, 8/15/21. | United States | 35,000,000 | 39,112,500 | |
| a Novavax Inc., senior note, 144A, cvt., 3.75%, 2/01/23 | United States | 34,000,000 | 34,559,300 | |
| a Nuvasive Inc., cvt., senior note, 144A, 2.25%, 3/15/21. | United States | 12,000,000 | 13,567,500 | |
| Pacira Pharmaceuticals Inc., cvt., senior note, 3.25%, 2/01/19 | United States | 5,880,000 | 13,288,800 | |
| Spectranetics Corp., cvt., senior note, 2.625%, 6/01/34 | United States | 17,000,000 | 14,354,375 | |
| 333,164,469 | ||||
| Industrials 0.8% | ||||
| The KEYW Holding Corp., cvt., senior note, 2.50%, 7/15/19. | United States | 20,000,000 | 16,150,000 | |
| Information Technology 38.8% | ||||
| Bottomline Technologies Inc., cvt., senior note, 1.50%, 12/01/17 | United States | 21,400,000 | 22,309,500 | |
| Electronic Arts Inc., cvt., senior note, 0.75%, 7/15/16 | United States | 18,100,000 | 35,068,750 | |
| Electronics for Imaging Inc., cvt., senior note, 0.75%, 9/01/19 | United States | 22,000,000 | 22,591,250 | |
| a Integrated Device Technology Inc., cvt., senior note, 144A, 0.875%, 11/15/22 | United States | 4,700,000 | 4,403,313 | |
| Intel Corp., | ||||
| cvt., junior sub. bond, 3.25%, 8/01/39. | United States | 8,000,000 | 12,180,040 | |
| a cvt., junior sub. bond, 144A, 2.95%, 12/15/35 | United States | 19,000,000 | 23,571,875 | |
| cvt., junior sub. deb., 2.95%, 12/15/35 | United States | 2,000,000 | 2,481,250 | |
| Mercadolibre Inc., cvt., 2.25%, 7/01/19 | Argentina | 5,000,000 | 5,884,375 | |
| Microchip Technology Inc., cvt., senior sub. bond, 1.625%, 2/15/25. | United States | 40,000,000 | 41,675,000 | |
| Micron Technology Inc., | ||||
| cvt., senior bond, 2.125%, 2/15/33. | United States | 11,800,000 | 14,381,250 | |
| cvt., senior bond, G, 3.00%, 11/15/43 | United States | 20,000,000 | 14,262,500 | |
| NetSuite Inc., cvt., senior note, 0.25%, 6/01/18. | United States | 36,300,000 | 36,345,375 | |
| Novellus Systems Inc., cvt., senior note, 2.625%, 5/15/41 | United States | 17,600,000 | 40,117,000 | |
| NXP Semiconductors NV, senior note, cvt., 1.00%, 12/01/19 | Netherlands | 35,000,000 | 39,812,500 | |
| Palo Alto Networks Inc., cvt., zero cpn., 7/01/19 | United States | 26,500,000 | 39,087,500 | |
franklintempleton.com
Semiannual Report 53
FRANKLIN INVESTORS SECURITIES TRUST
STATEMENT OF INVESTMENTS (UNAUDITED)
| Franklin Convertible Securities Fund (continued) | ||||
| Principal | ||||
| Country | Amount* | Value | ||
| Convertible Bonds (continued) | ||||
| Information Technology (continued) | ||||
| Proofpoint Inc., | ||||
| cvt., senior note, 1.25%, 12/15/18 | United States | 22,075,000 | $ | 34,588,766 |
| a cvt., senior note, 144A, 0.75%, 6/15/20 | United States | 12,500,000 | 12,828,125 | |
| Qihoo 360 Technologies Co. Ltd., cvt., senior note, 1.75%, 8/15/21. | China | 24,000,000 | 23,835,000 | |
| Red Hat Inc., cvt., senior note, 0.25%, 10/01/19 | United States | 29,250,000 | 36,178,594 | |
| Salesforce.com Inc., cvt., senior note, 0.25%, 4/01/18 | United States | 35,200,000 | 44,484,000 | |
| SanDisk Corp., cvt., senior note, 0.50%, 10/15/20. | United States | 33,000,000 | 34,340,625 | |
| ServiceNow Inc., cvt., zero cpn., 11/01/18 | United States | 35,500,000 | 41,290,937 | |
| Take-Two Interactive Software Inc., cvt., senior note, 1.00%, 7/01/18 | United States | 16,400,000 | 26,926,750 | |
| Trulia Inc., cvt., 2.75%, 12/15/20 | United States | 32,000,000 | 36,694,080 | |
| Twitter Inc., cvt., senior note, 1.00%, 9/15/21 | United States | 35,000,000 | 29,553,125 | |
| VeriSign Inc., cvt., junior sub. bond, 3.25%, 8/15/37 | United States | 11,000,000 | 27,823,125 | |
| Viavi Solutions Inc., cvt., senior bond, 0.625%, 8/15/33 | United States | 39,900,000 | 38,678,062 | |
| Xilinx Inc., cvt., senior note, 2.625%, 6/15/17 | United States | 19,270,000 | 28,977,262 | |
| Yahoo! Inc., cvt., zero cpn., 12/01/18 | United States | 35,100,000 | 35,451,000 | |
| 805,820,929 | ||||
| Materials 1.9% | ||||
| B2Gold Corp., cvt., senior sub. note, 3.25%, 10/01/18 | Canada | 13,900,000 | 12,883,562 | |
| Cemex SAB de CV, cvt., sub. note, 3.75%, 3/15/18 | Mexico | 24,000,000 | 26,242,800 | |
| 39,126,362 | ||||
| Total Convertible Bonds (Cost $1,339,491,288) | 1,465,874,337 | |||
| Shares | ||||
| Escrows and Litigation Trusts (Cost $22,362) 0.0% | ||||
| b,c Motors Liquidation Co., Escrow Account | United States | 376,200 | — | |
| Total Investments before Short Term Investments | ||||
| (Cost $1,863,436,046) | 1,972,290,260 | |||
| Short Term Investments (Cost $101,308,445) 4.9% | ||||
| Money Market Funds 4.9% | ||||
| b,d Institutional Fiduciary Trust Money Market Portfolio. | United States | 101,308,445 | 101,308,445 | |
| Total Investments (Cost $1,964,744,491) 99.8% | 2,073,598,705 | |||
| Other Assets, less Liabilities 0.2% | 3,321,095 | |||
| Net Assets 100.0% | $ | 2,076,919,800 | ||
See Abbreviations on page 94.
*The principal amount is stated in U.S. dollars unless otherwise indicated.
aSecurity was purchased pursuant to Rule 144A under the Securities Act of 1933 and may be sold in transactions exempt from registration only to qualified institutional buyers
or in a public offering registered under the Securities Act of 1933. These securities have been deemed liquid under guidelines approved by the Trust’s Board of Trustees. At
April 30, 2016, the aggregate value of these securities was $177,827,063, representing 8.56% of net assets.
bNon-income producing.
cSecurity has been deemed illiquid because it may not be able to be sold within seven days.
dSee Note 3(f) regarding investments in affiliated management investment companies.
54 Semiannual Report | The accompanying notes are an integral part of these financial statements. franklintempleton.com
FRANKLIN INVESTORS SECURITIES TRUST
| Financial Highlights | ||||||||||||||||||
| Franklin Equity Income Fund | ||||||||||||||||||
| Six Months Ended | ||||||||||||||||||
| April 30, 2016 | Year Ended October 31, | |||||||||||||||||
| (unaudited) | 2015 | 2014 | 2013 | 2012 | 2011 | |||||||||||||
| Class A | ||||||||||||||||||
| Per share operating performance | ||||||||||||||||||
| (for a share outstanding throughout the period) | ||||||||||||||||||
| Net asset value, beginning of period | $ | 22.99 | $ | 23.93 | $ | 22.16 | $ | 18.01 | $ | 16.58 | $ | 15.93 | ||||||
| Income from investment operationsa: | ||||||||||||||||||
| Net investment incomeb | 0.25 | 0.55 | 0.66 | c | 0.44 | 0.41 | 0.41 | |||||||||||
| Net realized and unrealized gains (losses) | (0.28 | ) | 0.26 | 1.73 | 4.19 | 1.46 | 0.75 | |||||||||||
| Total from investment operations | (0.03 | ) | 0.81 | 2.39 | 4.63 | 1.87 | 1.16 | |||||||||||
| Less distributions from: | ||||||||||||||||||
| Net investment income. | (0.31 | ) | (0.69 | ) | (0.50 | ) | (0.48 | ) | (0.44 | ) | (0.51 | ) | ||||||
| Net realized gains | (0.60 | ) | (1.06 | ) | (0.12 | ) | — | — | — | |||||||||
| Total distributions | (0.91 | ) | (1.75 | ) | (0.62 | ) | (0.48 | ) | (0.44 | ) | (0.51 | ) | ||||||
| Net asset value, end of period | $ | 22.05 | $ | 22.99 | $ | 23.93 | $ | 22.16 | $ | 18.01 | $ | 16.58 | ||||||
| Total returnd | (0.06 | )% | 3.72 | % | 10.99 | % | 26.07 | % | 11.43 | % | 7.27 | % | ||||||
| Ratios to average net assetse | ||||||||||||||||||
| Expenses. | 0.87 | %f | 0.86 | %f | 0.87 | %f | 0.91 | % | 0.95 | % | 0.96 | % | ||||||
| Net investment income | 2.36 | % | 2.37 | % | 2.87 | %c | 2.19 | % | 2.36 | % | 2.48 | % | ||||||
| Supplemental data | ||||||||||||||||||
| Net assets, end of period (000’s) | $ | 1,767,093 | $ | 1,790,392 | $ | 1,762,318 | $ | 1,637,089 | $ | 1,305,791 | $ | 1,105,132 | ||||||
| Portfolio turnover rate | 35.79 | % | 34.09 | % | 20.15 | % | 33.18 | % | 19.71 | % | 19.45 | % | ||||||
aThe amount shown for a share outstanding throughout the period may not correlate with the Statement of Operations for the period due to the timing of sales and
repurchases of the Fund’s shares in relation to income earned and/or fluctuating fair value of the investments of the Fund.
bBased on average daily shares outstanding.
cNet investment income per share includes approximately $0.17 per share related to income received in the form of a special dividend in connection with certain Fund
holdings. Excluding this amount, the ratio of net investment income to average net assets would have been 2.15%.
dTotal return does not reflect sales commissions or contingent deferred sales charges, if applicable, and is not annualized for periods less than one year.
eRatios are annualized for periods less than one year.
fBenefit of waiver and payments by affiliates rounds to less than 0.01%.
franklintempleton.com The accompanying notes are an integral part of these financial statements. | Semiannual Report 55
| FRANKLIN INVESTORS SECURITIES TRUST | ||||||||||||||||||
| FINANCIAL HIGHLIGHTS | ||||||||||||||||||
| Franklin Equity Income Fund (continued) | ||||||||||||||||||
| Six Months Ended | ||||||||||||||||||
| April 30, 2016 | Year Ended October 31, | |||||||||||||||||
| (unaudited) | 2015 | 2014 | 2013 | 2012 | 2011 | |||||||||||||
| Class C | ||||||||||||||||||
| Per share operating performance | ||||||||||||||||||
| (for a share outstanding throughout the period) | ||||||||||||||||||
| Net asset value, beginning of period | $ | 22.85 | $ | 23.79 | $ | 22.04 | $ | 17.91 | $ | 16.50 | $ | 15.85 | ||||||
| Income from investment operationsa: | ||||||||||||||||||
| Net investment incomeb | 0.17 | 0.37 | 0.49 | c | 0.28 | 0.28 | 0.29 | |||||||||||
| Net realized and unrealized gains (losses) | (0.28 | ) | 0.27 | 1.71 | 4.18 | 1.45 | 0.74 | |||||||||||
| Total from investment operations | (0.11 | ) | 0.64 | 2.20 | 4.46 | 1.73 | 1.03 | |||||||||||
| Less distributions from: | ||||||||||||||||||
| Net investment income. | (0.25 | ) | (0.52 | ) | (0.33 | ) | (0.33 | ) | (0.32 | ) | (0.38 | ) | ||||||
| Net realized gains | (0.60 | ) | (1.06 | ) | (0.12 | ) | — | — | — | |||||||||
| Total distributions | (0.85 | ) | (1.58 | ) | (0.45 | ) | (0.33 | ) | (0.32 | ) | (0.38 | ) | ||||||
| Net asset value, end of period | $ | 21.89 | $ | 22.85 | $ | 23.79 | $ | 22.04 | $ | 17.91 | $ | 16.50 | ||||||
| Total returnd | (0.41 | )% | 2.96 | % | 10.14 | % | 25.18 | % | 10.56 | % | 6.44 | % | ||||||
| Ratios to average net assetse | ||||||||||||||||||
| Expenses. | 1.62 | %f,g | 1.61 | %f,g | 1.62 | %f,g | 1.66 | %g | 1.70 | % | 1.71 | % | ||||||
| Net investment income | 1.61 | % | 1.62 | % | 2.12 | %c | 1.44 | % | 1.61 | % | 1.73 | % | ||||||
| Supplemental data | ||||||||||||||||||
| Net assets, end of period (000’s) | $ | 251,325 | $ | 250,347 | $ | 241,566 | $ | 208,325 | $ | 134,746 | $ | 118,686 | ||||||
| Portfolio turnover rate | 35.79 | % | 34.09 | % | 20.15 | % | 33.18 | % | 19.71 | % | 19.45 | % | ||||||
aThe amount shown for a share outstanding throughout the period may not correlate with the Statement of Operations for the period due to the timing of sales and
repurchases of the Fund’s shares in relation to income earned and/or fluctuating fair value of the investments of the Fund.
bBased on average daily shares outstanding.
cNet investment income per share includes approximately $0.17 per share related to income received in the form of a special dividend in connection with certain Fund
holdings. Excluding this amount, the ratio of net investment income to average net assets would have been 1.40%.
dTotal return does not reflect sales commissions or contingent deferred sales charges, if applicable, and is not annualized for periods less than one year.
eRatios are annualized for periods less than one year.
fBenefit of waiver and payments by affiliates rounds to less than 0.01%.
gBenefit of expense reduction rounds to less than 0.01%.
56 Semiannual Report | The accompanying notes are an integral part of these financial statements. franklintempleton.com
| FRANKLIN INVESTORS SECURITIES TRUST | ||||||||||||||||||
| FINANCIAL HIGHLIGHTS | ||||||||||||||||||
| Franklin Equity Income Fund (continued) | ||||||||||||||||||
| Six Months Ended | ||||||||||||||||||
| April 30, 2016 | Year Ended October 31, | |||||||||||||||||
| (unaudited) | 2015 | 2014 | 2013 | 2012 | 2011 | |||||||||||||
| Class R | ||||||||||||||||||
| Per share operating performance | ||||||||||||||||||
| (for a share outstanding throughout the period) | ||||||||||||||||||
| Net asset value, beginning of period | $ | 22.99 | $ | 23.93 | $ | 22.17 | $ | 18.01 | $ | 16.58 | $ | 15.93 | ||||||
| Income from investment operationsa: | ||||||||||||||||||
| Net investment incomeb | 0.23 | 0.50 | 0.61 | c | 0.39 | 0.37 | 0.38 | |||||||||||
| Net realized and unrealized gains (losses) | (0.29 | ) | 0.25 | 1.72 | 4.20 | 1.46 | 0.73 | |||||||||||
| Total from investment operations | (0.06 | ) | 0.75 | 2.33 | 4.59 | 1.83 | 1.11 | |||||||||||
| Less distributions from: | ||||||||||||||||||
| Net investment income. | (0.29 | ) | (0.63 | ) | (0.45 | ) | (0.43 | ) | (0.40 | ) | (0.46 | ) | ||||||
| Net realized gains | (0.60 | ) | (1.06 | ) | (0.12 | ) | — | — | — | |||||||||
| Total distributions | (0.89 | ) | (1.69 | ) | (0.57 | ) | (0.43 | ) | (0.40 | ) | (0.46 | ) | ||||||
| Net asset value, end of period | $ | 22.04 | $ | 22.99 | $ | 23.93 | $ | 22.17 | $ | 18.01 | $ | 16.58 | ||||||
| Total returnd | (0.19 | )% | 3.45 | % | 10.67 | % | 25.81 | % | 11.16 | % | 7.00 | % | ||||||
| Ratios to average net assetse | ||||||||||||||||||
| Expenses. | 1.12 | %f,g | 1.11 | %f,g | 1.12 | %f,g | 1.16 | %g | 1.20 | % | 1.21 | % | ||||||
| Net investment income | 2.11 | % | 2.12 | % | 2.62 | %c | 1.94 | % | 2.11 | % | 2.23 | % | ||||||
| Supplemental data | ||||||||||||||||||
| Net assets, end of period (000’s) | $ | 6,170 | $ | 6,265 | $ | 7,305 | $ | 5,844 | $ | 4,940 | $ | 3,830 | ||||||
| Portfolio turnover rate | 35.79 | % | 34.09 | % | 20.15 | % | 33.18 | % | 19.71 | % | 19.45 | % | ||||||
aThe amount shown for a share outstanding throughout the period may not correlate with the Statement of Operations for the period due to the timing of sales and
repurchases of the Fund’s shares in relation to income earned and/or fluctuating fair value of the investments of the Fund.
bBased on average daily shares outstanding.
cNet investment income per share includes approximately $0.17 per share related to income received in the form of a special dividend in connection with certain Fund
holdings. Excluding this amount, the ratio of net investment income to average net assets would have been 1.90%.
dTotal return is not annualized for periods less than one year.
eRatios are annualized for periods less than one year.
fBenefit of waiver and payments by affiliates rounds to less than 0.01%.
gBenefit of expense reduction rounds to less than 0.01%.
franklintempleton.com The accompanying notes are an integral part of these financial statements. | Semiannual Report 57
| FRANKLIN INVESTORS SECURITIES TRUST | ||||||||||||
| FINANCIAL HIGHLIGHTS | ||||||||||||
| Franklin Equity Income Fund (continued) | ||||||||||||
| Six Months Ended | ||||||||||||
| April 30, 2016 | Year Ended October 31, | |||||||||||
| (unaudited) | 2015 | 2014 | 2013 | a | ||||||||
| Class R6 | ||||||||||||
| Per share operating performance | ||||||||||||
| (for a share outstanding throughout the period) | ||||||||||||
| Net asset value, beginning of period | $ | 23.01 | $ | 23.95 | $ | 22.18 | $ | 20.00 | ||||
| Income from investment operationsb: | ||||||||||||
| Net investment incomec | 0.15 | 0.63 | 0.75 | d | 0.26 | |||||||
| Net realized and unrealized gains (losses) | (0.13 | ) | 0.27 | 1.73 | 2.18 | |||||||
| Total from investment operations | 0.02 | 0.90 | 2.48 | 2.44 | ||||||||
| Less distributions from: | ||||||||||||
| Net investment income | (0.34 | ) | (0.78 | ) | (0.59 | ) | (0.26 | ) | ||||
| Net realized gains | (0.60 | ) | (1.06 | ) | (0.12 | ) | — | |||||
| Total distributions | (0.94 | ) | (1.84 | ) | (0.71 | ) | (0.26 | ) | ||||
| Net asset value, end of period | $ | 22.09 | $ | 23.01 | $ | 23.95 | $ | 22.18 | ||||
| Total returne | 0.16 | % | 4.10 | % | 11.38 | % | 12.30 | % | ||||
| Ratios to average net assetsf | ||||||||||||
| Expenses before waiver and payments by affiliates | 0.50 | % | 2.89 | % | 1.78 | % | 2.16 | % | ||||
| Expenses net of waiver and payments by affiliatesg | 0.50 | %h | 0.48 | % | 0.50 | % | 0.51 | % | ||||
| Net investment income | 2.73 | % | 2.75 | % | 3.24 | %d | 2.59 | % | ||||
| Supplemental data | ||||||||||||
| Net assets, end of period (000’s) | $ | 7,902 | $ | 6 | $ | 6 | $ | 6 | ||||
| Portfolio turnover rate. | 35.79 | % | 34.09 | % | 20.15 | % | 33.18 | % | ||||
aFor the period May 1, 2013 (effective date) to October 31, 2013.
bThe amount shown for a share outstanding throughout the period may not correlate with the Statement of Operations for the period due to the timing of sales and
repurchases of the Fund’s shares in relation to income earned and/or fluctuating fair value of the investments of the Fund.
cBased on average daily shares outstanding.
dNet investment income per share includes approximately $0.17 per share related to income received in the form of a special dividend in connection with certain Fund
holdings. Excluding this amount, the ratio of net investment income to average net assets would have been 2.51%.
eTotal return is not annualized for periods less than one year.
fRatios are annualized for periods less than one year.
gBenefit of expense reduction rounds to less than 0.01%.
hBenefit of waiver and payments by affiliates rounds to less than 0.01%.
58 Semiannual Report | The accompanying notes are an integral part of these financial statements. franklintempleton.com
| FRANKLIN INVESTORS SECURITIES TRUST | ||||||||||||||||||
| FINANCIAL HIGHLIGHTS | ||||||||||||||||||
| Franklin Equity Income Fund (continued) | ||||||||||||||||||
| Six Months Ended | ||||||||||||||||||
| April 30, 2016 | Year Ended October 31, | |||||||||||||||||
| (unaudited) | 2015 | 2014 | 2013 | 2012 | 2011 | |||||||||||||
| Advisor Class | ||||||||||||||||||
| Per share operating performance | ||||||||||||||||||
| (for a share outstanding throughout the period) | ||||||||||||||||||
| Net asset value, beginning of period | $ | 23.02 | $ | 23.96 | $ | 22.19 | $ | 18.02 | $ | 16.59 | $ | 15.94 | ||||||
| Income from investment operationsa: | ||||||||||||||||||
| Net investment incomeb | 0.27 | 0.60 | 0.71 | c | 0.48 | 0.45 | 0.45 | |||||||||||
| Net realized and unrealized gains (losses) | (0.27 | ) | 0.27 | 1.74 | 4.22 | 1.46 | 0.75 | |||||||||||
| Total from investment operations | — | 0.87 | 2.45 | 4.70 | 1.91 | 1.20 | ||||||||||||
| Less distributions from: | ||||||||||||||||||
| Net investment income. | (0.33 | ) | (0.75 | ) | (0.56 | ) | (0.53 | ) | (0.48 | ) | (0.55 | ) | ||||||
| Net realized gains | (0.60 | ) | (1.06 | ) | (0.12 | ) | — | — | — | |||||||||
| Total distributions | (0.93 | ) | (1.81 | ) | (0.68 | ) | (0.53 | ) | (0.48 | ) | (0.55 | ) | ||||||
| Net asset value, end of period | $ | 22.09 | $ | 23.02 | $ | 23.96 | $ | 22.19 | $ | 18.02 | $ | 16.59 | ||||||
| Total returnd | 0.07 | % | 3.98 | % | 11.25 | % | 26.48 | % | 11.69 | % | 7.54 | % | ||||||
| Ratios to average net assetse | ||||||||||||||||||
| Expenses. | 0.62 | %f,g | 0.61 | %f,g | 0.62 | %f,g | 0.66 | %g | 0.70 | % | 0.71 | % | ||||||
| Net investment income | 2.61 | % | 2.62 | % | 3.12 | %c | 2.44 | % | 2.61 | % | 2.73 | % | ||||||
| Supplemental data | ||||||||||||||||||
| Net assets, end of period (000’s) | $ | 46,617 | $ | 34,577 | $ | 30,166 | $ | 17,534 | $ | 10,527 | $ | 7,467 | ||||||
| Portfolio turnover rate | 35.79 | % | 34.09 | % | 20.15 | % | 33.18 | % | 19.71 | % | 19.45 | % | ||||||
aThe amount shown for a share outstanding throughout the period may not correlate with the Statement of Operations for the period due to the timing of sales and
repurchases of the Fund’s shares in relation to income earned and/or fluctuating fair value of the investments of the Fund.
bBased on average daily shares outstanding.
cNet investment income per share includes approximately $0.17 per share related to income received in the form of a special dividend in connection with certain Fund
holdings. Excluding this amount, the ratio of net investment income to average net assets would have been 2.40%.
dTotal return is not annualized for periods less than one year.
eRatios are annualized for periods less than one year.
fBenefit of waiver and payments by affiliates rounds to less than 0.01%.
gBenefit of expense reduction rounds to less than 0.01%.
franklintempleton.com The accompanying notes are an integral part of these financial statements. | Semiannual Report 59
| FRANKLIN INVESTORS SECURITIES TRUST | ||||
| Statement of Investments, April 30, 2016 (unaudited) | ||||
| Franklin Equity Income Fund | ||||
| Country | Shares | Value | ||
| Common Stocks 84.6% | ||||
| Consumer Discretionary 6.3% | ||||
| Ford Motor Co | United States | 2,131,700 | $ | 28,905,852 |
| Lowe’s Cos. Inc | United States | 515,000 | 39,150,300 | |
| NIKE Inc., B | United States | 169,400 | 9,984,436 | |
| Nordstrom Inc | United States | 237,800 | 12,158,714 | |
| Target Corp | United States | 519,900 | 41,332,050 | |
| 131,531,352 | ||||
| Consumer Staples 10.6% | ||||
| Anheuser-Busch InBev NV, ADR | Belgium | 290,100 | 36,024,618 | |
| CVS Health Corp | United States | 406,000 | 40,803,000 | |
| The Kraft Heinz Co | United States | 516,100 | 40,291,927 | |
| Nestle SA | Switzerland | 280,000 | 20,871,560 | |
| PepsiCo Inc | United States | 505,500 | 52,046,280 | |
| Reynolds American Inc | United States | 621,500 | 30,826,400 | |
| 220,863,785 | ||||
| Energy 9.0% | ||||
| Anadarko Petroleum Corp | United States | 193,200 | 10,193,232 | |
| Chevron Corp | United States | 482,800 | 49,332,504 | |
| ConocoPhillips | United States | 310,000 | 14,814,900 | |
| Exxon Mobil Corp | United States | 367,234 | 32,463,486 | |
| Royal Dutch Shell PLC, A, ADR | United Kingdom | 755,900 | 39,979,551 | |
| Schlumberger Ltd | United States | 488,000 | 39,205,920 | |
| 185,989,593 | ||||
| Financials 18.4% | ||||
| Arthur J. Gallagher & Co | United States | 669,300 | 30,814,572 | |
| BB&T Corp | United States | 620,000 | 21,935,600 | |
| BlackRock Inc | United States | 135,200 | 48,175,816 | |
| Host Hotels & Resorts Inc | United States | 1,127,000 | 17,829,140 | |
| JPMorgan Chase & Co | United States | 1,030,300 | 65,114,960 | |
| MetLife Inc | United States | 749,905 | 33,820,715 | |
| Morgan Stanley | United States | 1,131,000 | 30,604,860 | |
| T. Rowe Price Group Inc | United States | 450,500 | 33,918,145 | |
| U.S. Bancorp | United States | 1,076,800 | 45,968,592 | |
| Wells Fargo & Co | United States | 1,105,000 | 55,227,900 | |
| 383,410,300 | ||||
| Health Care 7.4% | ||||
| AstraZeneca PLC, ADR | United Kingdom | 650,000 | 18,824,000 | |
| Bristol-Myers Squibb Co | United States | 90,300 | 6,517,854 | |
| Eli Lilly & Co | United States | 525,400 | 39,683,462 | |
| Johnson & Johnson | United States | 144,000 | 16,139,520 | |
| Medtronic PLC | United States | 493,000 | 39,020,950 | |
| Pfizer Inc | United States | 1,044,300 | 34,159,053 | |
| 154,344,839 | ||||
| Industrials 13.6% | ||||
| General Electric Co | United States | 1,698,500 | 52,228,875 | |
| Illinois Tool Works Inc | United States | 302,700 | 31,638,204 | |
| Lockheed Martin Corp | United States | 184,100 | 42,781,158 | |
| Nielsen Holdings PLC | United States | 449,600 | 23,442,144 | |
| Raytheon Co | United States | 293,500 | 37,083,725 | |
| Republic Services Inc | United States | 698,500 | 32,878,395 | |
| United Parcel Service Inc., B | United States | 266,600 | 28,011,662 | |
60 Semiannual Report
franklintempleton.com
FRANKLIN INVESTORS SECURITIES TRUST
STATEMENT OF INVESTMENTS (UNAUDITED)
| Franklin Equity Income Fund (continued) | ||||
| Country | Shares | Value | ||
| Common Stocks (continued) | ||||
| Industrials (continued) | ||||
| United Technologies Corp | United States | 329,700 | $ | 34,410,789 |
| 282,474,952 | ||||
| Information Technology 11.4% | ||||
| Apple Inc | United States | 288,000 | 26,997,120 | |
| Broadcom Ltd | Singapore | 42,000 | 6,121,500 | |
| Cisco Systems Inc | United States | 1,590,333 | 43,718,254 | |
| Intel Corp | United States | 711,100 | 21,532,108 | |
| Microsoft Corp | United States | 1,348,100 | 67,229,747 | |
| Oracle Corp | United States | 838,000 | 33,402,680 | |
| Texas Instruments Inc | United States | 673,000 | 38,387,920 | |
| 237,389,329 | ||||
| Materials 3.7% | ||||
| BASF SE | Germany | 336,500 | 27,802,497 | |
| The Dow Chemical Co | United States | 305,400 | 16,067,094 | |
| International Paper Co | United States | 757,600 | 32,781,352 | |
| 76,650,943 | ||||
| Telecommunication Services 1.5% | ||||
| Rogers Communications Inc., B | Canada | 362,700 | 14,101,776 | |
| Verizon Communications Inc | United States | 313,000 | 15,944,220 | |
| 30,045,996 | ||||
| Utilities 2.7% | ||||
| Dominion Resources Inc | United States | 421,100 | 30,096,017 | |
| Xcel Energy Inc | United States | 673,500 | 26,960,205 | |
| 57,056,222 | ||||
| Total Common Stocks (Cost $1,441,905,987) | 1,759,757,311 | |||
| a Equity-Linked Securities 5.5% | ||||
| Consumer Discretionary 1.0% | ||||
| b Bank of America Merrill Lynch into Dollar General Corp., 6.00%, 144A | United States | 266,000 | 20,950,107 | |
| Energy 0.7% | ||||
| b JPMorgan Chase & Co. into Anadarko Petroleum Co., 9.00%, 144A | United States | 272,000 | 13,674,147 | |
| Financials 1.4% | ||||
| b The Goldman Sachs International into Charles Schwab Corp., 6.50%, 144A | United States | 1,000,000 | 28,448,900 | |
| Information Technology 2.4% | ||||
| b Barclays Bank PLC into Broadcom Ltd., 9.00%, 144A | Singapore | 160,000 | 23,367,680 | |
| b The Goldman Sachs International into Intel Corp., 7.00%, 144A | United States | 875,000 | 26,940,812 | |
| 50,308,492 | ||||
| Total Equity-Linked Securities (Cost $116,633,770) | 113,381,646 | |||
| Convertible Preferred Stocks 6.2% | ||||
| Health Care 3.0% | ||||
| Allergan PLC, 5.50%, cvt. pfd | United States | 41,700 | 33,839,133 | |
| Teva Pharmaceutical Industries Ltd., 7.00%, cvt. pfd | Israel | 30,900 | 27,840,900 | |
| 61,680,033 | ||||
| Industrials 1.6% | ||||
| Stanley Black & Decker Inc., 6.25%, cvt. pfd | United States | 279,000 | 33,039,180 | |
franklintempleton.com
Semiannual Report 61
FRANKLIN INVESTORS SECURITIES TRUST
STATEMENT OF INVESTMENTS (UNAUDITED)
| Franklin Equity Income Fund (continued) | |||||
| Country | Shares | Value | |||
| Convertible Preferred Stocks (continued) | |||||
| Utilities 1.6% | |||||
| NextEra Energy Inc., 6.371%, cvt. pfd | United States | 575,000 | $ | 34,385,000 | |
| Total Convertible Preferred Stocks (Cost $130,915,193) | 129,104,213 | ||||
| Total Investments before Short Term Investments | |||||
| (Cost $1,689,454,950) | 2,002,243,170 | ||||
| Short Term Investments (Cost $93,183,793) 4.5% | |||||
| Money Market Funds 4.5% | |||||
| c,d Institutional Fiduciary Trust Money Market Portfolio. | United States | 93,183,793 | 93,183,793 | ||
| Total Investments (Cost $1,782,638,743) 100.8% | 2,095,426,963 | ||||
| Other Assets, less Liabilities (0.8)% | (16,319,616 | ) | |||
| Net Assets 100.0% | $ | 2,079,107,347 | |||
See Abbreviations on page 94.
aSee Note 1(f) regarding equity-linked securities.
bSecurity was purchased pursuant to Rule 144A under the Securities Act of 1933 and may be sold in transactions exempt from registration only to qualified institutional buyers
or in a public offering registered under the Securities Act of 1933. These securities have been deemed liquid under guidelines approved by the Trust’s Board of Trustees. At
April 30, 2016, the aggregate value of these securities was $113,381,646, representing 5.45% of net assets.
cNon-income producing.
dSee Note 3(f) regarding investments in affiliated management investment companies.
62 Semiannual Report | The accompanying notes are an integral part of these financial statements. franklintempleton.com
FRANKLIN INVESTORS SECURITIES TRUST
| Financial Highlights | ||||||||||||||||||
| Franklin Real Return Fund | ||||||||||||||||||
| Six Months Ended | ||||||||||||||||||
| April 30, 2016 | Year Ended October 31, | |||||||||||||||||
| (unaudited) | 2015 | 2014 | 2013 | 2012 | 2011 | |||||||||||||
| Class A | ||||||||||||||||||
| Per share operating performance | ||||||||||||||||||
| (for a share outstanding throughout the period) | ||||||||||||||||||
| Net asset value, beginning of period | $ | 9.92 | $ | 10.66 | $ | 10.82 | $ | 10.94 | $ | 11.06 | $ | 11.14 | ||||||
| Income from investment operationsa: | ||||||||||||||||||
| Net investment incomeb | 0.01 | 0.05 | 0.14 | 0.15 | 0.17 | 0.31 | ||||||||||||
| Net realized and unrealized gains (losses) | 0.14 | (0.72 | ) | (0.06 | ) | (0.01 | ) | 0.01 | 0.03 | |||||||||
| Total from investment operations | 0.15 | (0.67 | ) | 0.08 | 0.14 | 0.18 | 0.34 | |||||||||||
| Less distributions from net investment income | ||||||||||||||||||
| and net foreign currency gains | (0.10 | ) | (0.07 | ) | (0.24 | ) | (0.26 | ) | (0.30 | ) | (0.42 | ) | ||||||
| Net asset value, end of period | $ | 9.97 | $ | 9.92 | $ | 10.66 | $ | 10.82 | $ | 10.94 | $ | 11.06 | ||||||
| Total returnc | 1.55 | % | (6.32 | )% | 0.75 | % | 1.34 | % | 1.67 | % | 3.03 | % | ||||||
| Ratios to average net assetsd | ||||||||||||||||||
| Expenses before waiver and payments by | ||||||||||||||||||
| affiliates | 1.12 | % | 1.10 | % | 1.10 | % | 1.08 | % | 1.06 | % | 1.05 | % | ||||||
| Expenses net of waiver and payments by | ||||||||||||||||||
| affiliates | 0.89 | %e | 0.90 | %e | 0.90 | %e | 0.90 | %e | 0.90 | % | 0.90 | % | ||||||
| Net investment income | 0.10 | % | 0.43 | % | 1.34 | % | 1.35 | % | 1.58 | % | 2.76 | % | ||||||
| Supplemental data | ||||||||||||||||||
| Net assets, end of period (000’s) | $ | 167,631 | $ | 185,743 | $ | 248,313 | $ | 327,285 | $ | 411,419 | $ | 444,465 | ||||||
| Portfolio turnover rate | 23.98 | % | 26.57 | % | 33.02 | % | 27.91 | % | 18.64 | % | 37.60 | % | ||||||
aThe amount shown for a share outstanding throughout the period may not correlate with the Statement of Operations for the period due to the timing of sales and
repurchases of the Fund’s shares in relation to income earned, adjustments to interest income for the inflation-indexed bonds, and/or fluctuating fair value of the investments
of the Fund.
bBased on average daily shares outstanding.
cTotal return does not reflect sales commissions or contingent deferred sales charges, if applicable, and is not annualized for periods less than one year.
dRatios are annualized for periods less than one year.
eBenefit of expense reduction rounds to less than 0.01%.
franklintempleton.com The accompanying notes are an integral part of these financial statements. | Semiannual Report 63
| FRANKLIN INVESTORS SECURITIES TRUST | ||||||||||||||||||
| FINANCIAL HIGHLIGHTS | ||||||||||||||||||
| Franklin Real Return Fund (continued) | ||||||||||||||||||
| Six Months Ended | ||||||||||||||||||
| April 30, 2016 | Year Ended October 31, | |||||||||||||||||
| (unaudited) | 2015 | 2014 | 2013 | 2012 | 2011 | |||||||||||||
| Class C | ||||||||||||||||||
| Per share operating performance | ||||||||||||||||||
| (for a share outstanding throughout the period) | ||||||||||||||||||
| Net asset value, beginning of period | $ | 9.82 | $ | 10.59 | $ | 10.76 | $ | 10.87 | $ | 11.00 | $ | 11.08 | ||||||
| Income from investment operationsa: | ||||||||||||||||||
| Net investment income (loss)b | (0.02 | ) | —c | 0.10 | 0.10 | 0.13 | 0.27 | |||||||||||
| Net realized and unrealized gains (losses) | 0.16 | (0.71 | ) | (0.07 | ) | 0.01 | —c | 0.02 | ||||||||||
| Total from investment operations | 0.14 | (0.71 | ) | 0.03 | 0.11 | 0.13 | 0.29 | |||||||||||
| Less distributions from net investment income | ||||||||||||||||||
| and net foreign currency gains | (0.06 | ) | (0.06 | ) | (0.20 | ) | (0.22 | ) | (0.26 | ) | (0.37 | ) | ||||||
| Net asset value, end of period | $ | 9.90 | $ | 9.82 | $ | 10.59 | $ | 10.76 | $ | 10.87 | $ | 11.00 | ||||||
| Total returnd | 1.41 | % | (6.70 | )% | 0.22 | % | 1.03 | % | 1.22 | % | 2.65 | % | ||||||
| Ratios to average net assetse | ||||||||||||||||||
| Expenses before waiver and payments by | ||||||||||||||||||
| affiliates | 1.52 | % | 1.50 | % | 1.50 | % | 1.48 | % | 1.46 | % | 1.45 | % | ||||||
| Expenses net of waiver and payments by | ||||||||||||||||||
| affiliates | 1.29 | %f | 1.30 | %f | 1.30 | %f | 1.30 | %f | 1.30 | % | 1.30 | % | ||||||
| Net investment income (loss) | (0.30 | )% | 0.04 | % | 0.94 | % | 0.95 | % | 1.18 | % | 2.36 | % | ||||||
| Supplemental data | ||||||||||||||||||
| Net assets, end of period (000’s) | $ | 43,734 | $ | 48,084 | $ | 68,188 | $ | 83,666 | $ | 104,682 | $ | 115,126 | ||||||
| Portfolio turnover rate | 23.98 | % | 26.57 | % | 33.02 | % | 27.91 | % | 18.64 | % | 37.60 | % | ||||||
aThe amount shown for a share outstanding throughout the period may not correlate with the Statement of Operations for the period due to the timing of sales and
repurchases of the Fund’s shares in relation to income earned, adjustments to interest income for the inflation-indexed bonds, and/or fluctuating fair value of the investments
of the Fund.
bBased on average daily shares outstanding.
cAmount rounds to less than $0.01 per share.
dTotal return does not reflect sales commissions or contingent deferred sales charges, if applicable, and is not annualized for periods less than one year.
eRatios are annualized for periods less than one year.
fBenefit of expense reduction rounds to less than 0.01%.
64 Semiannual Report | The accompanying notes are an integral part of these financial statements. franklintempleton.com
FRANKLIN INVESTORS SECURITIES TRUST
FINANCIAL HIGHLIGHTS
| Franklin Real Return Fund (continued) | ||||||||||||
| Six Months Ended | ||||||||||||
| April 30, 2016 | Year Ended October 31, | |||||||||||
| (unaudited) | 2015 | 2014 | 2013 | a | ||||||||
| Class R6 | ||||||||||||
| Per share operating performance | ||||||||||||
| (for a share outstanding throughout the period) | ||||||||||||
| Net asset value, beginning of period | $ | 9.98 | $ | 10.68 | $ | 10.85 | $ | 11.01 | ||||
| Income from investment operationsb: | ||||||||||||
| Net investment incomec | 0.03 | 0.10 | 0.21 | 0.09 | ||||||||
| Net realized and unrealized gains (losses) | 0.14 | (0.72 | ) | (0.10 | ) | (0.10 | ) | |||||
| Total from investment operations | 0.17 | (0.62 | ) | 0.11 | (0.01 | ) | ||||||
| Less distributions from net investment income and net foreign currency | ||||||||||||
| gains | (0.15 | ) | (0.08 | ) | (0.28 | ) | (0.15 | ) | ||||
| Net asset value, end of period | $ | 10.00 | $ | 9.98 | $ | 10.68 | $ | 10.85 | ||||
| Total returnd | 1.72 | % | (5.87 | )% | 1.04 | % | (0.06 | )% | ||||
| Ratios to average net assetse | ||||||||||||
| Expenses before waiver and payments by affiliates | 0.73 | % | 0.71 | % | 0.70 | % | 2.43 | % | ||||
| Expenses net of waiver and payments by affiliatesf | 0.50 | % | 0.50 | % | 0.52 | % | 0.52 | % | ||||
| Net investment income | 0.49 | % | 0.83 | % | 1.72 | % | 1.73 | % | ||||
| Supplemental data | ||||||||||||
| Net assets, end of period (000’s) | $ | 1,795 | $ | 1,730 | $ | 2,034 | $ | 5 | ||||
| Portfolio turnover rate. | 23.98 | % | 26.57 | % | 33.02 | % | 27.91 | % | ||||
aFor the period May 1, 2013 (effective date) to October 31, 2013.
bThe amount shown for a share outstanding throughout the period may not correlate with the Statement of Operations for the period due to the timing of sales and
repurchases of the Fund’s shares in relation to income earned, adjustments to interest income for the inflation-indexed bonds, and/or fluctuating fair value of the investments
of the Fund.
cBased on average daily shares outstanding.
dTotal return is not annualized for periods less than one year.
eRatios are annualized for periods less than one year.
fBenefit of expense reduction rounds to less than 0.01%.
franklintempleton.com The accompanying notes are an integral part of these financial statements. | Semiannual Report 65
| FRANKLIN INVESTORS SECURITIES TRUST | ||||||||||||||||||
| FINANCIAL HIGHLIGHTS | ||||||||||||||||||
| Franklin Real Return Fund (continued) | ||||||||||||||||||
| Six Months Ended | ||||||||||||||||||
| April 30, 2016 | Year Ended October 31, | |||||||||||||||||
| (unaudited) | 2015 | 2014 | 2013 | 2012 | 2011 | |||||||||||||
| Advisor Class | ||||||||||||||||||
| Per share operating performance | ||||||||||||||||||
| (for a share outstanding throughout the period) | ||||||||||||||||||
| Net asset value, beginning of period | $ | 9.96 | $ | 10.68 | $ | 10.85 | $ | 10.97 | $ | 11.08 | $ | 11.16 | ||||||
| Income from investment operationsa: | ||||||||||||||||||
| Net investment incomeb | 0.02 | 0.05 | 0.18 | 0.18 | 0.20 | 0.35 | ||||||||||||
| Net realized and unrealized gains (losses) | 0.15 | (0.70 | ) | (0.08 | ) | (0.01 | ) | 0.01 | 0.01 | |||||||||
| Total from investment operations | 0.17 | (0.65 | ) | 0.10 | 0.17 | 0.21 | 0.36 | |||||||||||
| Less distributions from net investment income | ||||||||||||||||||
| and net foreign currency gains | (0.13 | ) | (0.07 | ) | (0.27 | ) | (0.29 | ) | (0.32 | ) | (0.44 | ) | ||||||
| Net asset value, end of period | $ | 10.00 | $ | 9.96 | $ | 10.68 | $ | 10.85 | $ | 10.97 | $ | 11.08 | ||||||
| Total returnc | 1.72 | % | (6.08 | )% | 0.91 | % | 1.60 | % | 1.99 | % | 3.27 | % | ||||||
| Ratios to average net assetsd | ||||||||||||||||||
| Expenses before waiver and payments by | ||||||||||||||||||
| affiliates | 0.87 | % | 0.85 | % | 0.85 | % | 0.83 | % | 0.81 | % | 0.80 | % | ||||||
| Expenses net of waiver and payments by | ||||||||||||||||||
| affiliates | 0.64 | %e | 0.65 | %e | 0.65 | %e | 0.65 | %e | 0.65 | % | 0.65 | % | ||||||
| Net investment income | 0.35 | % | 0.68 | % | 1.59 | % | 1.60 | % | 1.83 | % | 3.01 | % | ||||||
| Supplemental data | ||||||||||||||||||
| Net assets, end of period (000’s) | $ | 35,212 | $ | 37,758 | $ | 65,958 | $ | 28,042 | $ | 35,362 | $ | 45,575 | ||||||
| Portfolio turnover rate | 23.98 | % | 26.57 | % | 33.02 | % | 27.91 | % | 18.64 | % | 37.60 | % | ||||||
aThe amount shown for a share outstanding throughout the period may not correlate with the Statement of Operations for the period due to the timing of sales and
repurchases of the Fund’s shares in relation to income earned, adjustments to interest income for the inflation-indexed bonds, and/or fluctuating fair value of the investments
of the Fund.
bBased on average daily shares outstanding.
cTotal return is not annualized for periods less than one year.
dRatios are annualized for periods less than one year.
eBenefit of expense reduction rounds to less than 0.01%.
66 Semiannual Report | The accompanying notes are an integral part of these financial statements. franklintempleton.com
FRANKLIN INVESTORS SECURITIES TRUST
| Statement of Investments, April 30, 2016 (unaudited) | ||||
| Franklin Real Return Fund | ||||
| Country | Shares | Value | ||
| Common Stocks 8.4% | ||||
| Energy 5.2% | ||||
| Anadarko Petroleum Corp | United States | 21,400 | $ | 1,129,064 |
| California Resources Corp | United States | 8,144 | 17,917 | |
| Chevron Corp | United States | 18,300 | 1,869,895 | |
| Devon Energy Corp | United States | 13,500 | 468,180 | |
| Exxon Mobil Corp | United States | 26,777 | 2,367,087 | |
| Halliburton Co | United States | 29,000 | 1,197,990 | |
| Marathon Oil Corp | United States | 42,300 | 596,007 | |
| Noble Energy Inc | United States | 11,800 | 426,098 | |
| Occidental Petroleum Corp | United States | 16,500 | 1,264,725 | |
| Peabody Energy Corp | United States | 4,160 | 7,072 | |
| Pioneer Natural Resources Co | United States | 4,100 | 681,010 | |
| Schlumberger Ltd | United States | 24,850 | 1,996,449 | |
| a Southwestern Energy Co | United States | 25,200 | 338,436 | |
| a Weatherford International PLC | United States | 61,500 | 499,995 | |
| 12,859,925 | ||||
| Materials 3.2% | ||||
| BHP Billiton Ltd., ADR | Australia | 19,100 | 598,594 | |
| The Dow Chemical Co | United States | 38,100 | 2,004,441 | |
| Freeport-McMoRan Inc., B | United States | 55,046 | 770,644 | |
| Goldcorp Inc | Canada | 104,000 | 2,095,600 | |
| Nucor Corp | United States | 25,400 | 1,264,412 | |
| Potash Corp. of Saskatchewan Inc | Canada | 37,700 | 668,044 | |
| Rio Tinto PLC, ADR | United Kingdom | 17,300 | 582,318 | |
| a South32 Ltd., ADR | Australia | 7,640 | 47,444 | |
| 8,031,497 | ||||
| Total Common Stocks (Cost $27,377,587) | 20,891,422 | |||
| Management Investment Companies 8.6% | ||||
| Diversified Financials 1.4% | ||||
| b Franklin Lower Tier Floating Rate Fund | United States | 265,044 | 2,589,486 | |
| b Franklin Middle Tier Floating Rate Fund | United States | 101,647 | 969,710 | |
| 3,559,196 | ||||
| Real Estate 7.2% | ||||
| SPDR Dow Jones REIT ETF | United States | 193,000 | 17,819,690 | |
| Total Management Investment Companies | ||||
| (Cost $12,983,230) | 21,378,886 | |||
| Principal | ||||
| Amount* | ||||
| Corporate Bonds 6.1% | ||||
| Banks 0.5% | ||||
| c CIT Group Inc., secured note, 144A, 5.50%, 2/15/19 | United States | 1,200,000 | 1,258,800 | |
| Consumer Services 0.3% | ||||
| MGM Resorts International, | ||||
| senior note, 8.625%, 2/01/19 | United States | 500,000 | 571,250 | |
| senior note, 7.75%, 3/15/22 | United States | 200,000 | 224,250 | |
| 795,500 | ||||
franklintempleton.com
Semiannual Report 67
FRANKLIN INVESTORS SECURITIES TRUST
STATEMENT OF INVESTMENTS (UNAUDITED)
| Franklin Real Return Fund (continued) | ||||
| Principal | ||||
| Country | Amount* | Value | ||
| Corporate Bonds (continued) | ||||
| Energy 1.3% | ||||
| c Chesapeake Energy Corp., secured note, second lien, 144A, 8.00%, | ||||
| 12/15/22 | United States | 425,000 | $ | 291,125 |
| CONSOL Energy Inc., | ||||
| senior note, 5.875%, 4/15/22 | United States | 300,000 | 250,125 | |
| senior note, 8.00%, 4/01/23 | United States | 600,000 | 514,500 | |
| Energy Transfer Equity LP, senior note, first lien, 7.50%, 10/15/20 | United States | 1,000,000 | 1,012,500 | |
| c,d Peabody Energy Corp., secured note, second lien, 144A, 10.00%, 3/15/22 . | United States | 1,000,000 | 117,600 | |
| Sabine Pass Liquefaction LLC, first lien, 5.625%, 2/01/21 | United States | 1,000,000 | 998,750 | |
| 3,184,600 | ||||
| Health Care Equipment & Services 0.5% | ||||
| HCA Inc., senior secured bond, first lien, 5.875%, 3/15/22. | United States | 1,200,000 | 1,314,000 | |
| Materials 1.5% | ||||
| ArcelorMittal, senior note, 7.25%, 2/25/22 | Luxembourg | 1,200,000 | 1,258,452 | |
| c FMG Resources (August 2006) Pty. Ltd., senior secured note, 144A, | ||||
| 9.75%, 3/01/22 | Australia | 400,000 | 421,040 | |
| Novelis Inc., | ||||
| senior note, 8.375%, 12/15/17 | Canada | 200,000 | 204,000 | |
| senior note, 8.75%, 12/15/20 | Canada | 600,000 | 622,500 | |
| Reynolds Group Issuer Inc./LLC/SA, senior note, 8.50%, 5/15/18 | United States | 1,200,000 | 1,202,940 | |
| 3,708,932 | ||||
| Media 0.6% | ||||
| c Altice U.S. Finance I Corp., senior secured bond, 144A, 5.50%, 5/15/26 | United States | 300,000 | 303,750 | |
| CSC Holdings LLC, senior note, 6.75%, 11/15/21 | United States | 1,000,000 | 1,034,375 | |
| 1,338,125 | ||||
| Pharmaceuticals, Biotechnology & Life Sciences 0.4% | ||||
| c Valeant Pharmaceuticals International Inc., senior note, 144A, 7.50%, | ||||
| 7/15/21 | United States | 1,000,000 | 920,000 | |
| Technology Hardware & Equipment 0.2% | ||||
| c Western Digital Corp., | ||||
| senior note, 144A, 10.50%, 4/01/24 | United States | 400,000 | 390,000 | |
| senior secured note, 144A, 7.375%, 4/01/23. | United States | 200,000 | 202,000 | |
| 592,000 | ||||
| Telecommunication Services 0.8% | ||||
| Intelsat Jackson Holdings SA, senior note, 7.25%, 10/15/20 | Luxembourg | 1,000,000 | 733,750 | |
| c Sprint Communications Inc., senior note, 144A, 7.00%, 3/01/20 | United States | 1,200,000 | 1,237,500 | |
| 1,971,250 | ||||
| Total Corporate Bonds (Cost $16,394,202) | 15,083,207 | |||
| e,f Senior Floating Rate Interests 2.4% | ||||
| Automobiles & Components 0.1% | ||||
| Crowne Group LLC, Term Loan, 6.00%, 9/30/20 | United States | 135,088 | 130,360 | |
| TI Group Automotive Systems LLC, Initial U.S. Term Loan, 4.50%, 6/25/22 . | United States | 118,416 | 118,416 | |
| 248,776 | ||||
| Capital Goods 0.1% | ||||
| Sensus USA Inc., Term Loan, 6.50%, 4/05/23 | United States | 250,000 | 245,938 | |
| Commercial & Professional Services 0.0%† | ||||
| Kar Auction Services Inc., Tranche B-3 Term Loan, 4.25%, 3/09/23 | United States | 92,179 | 92,524 | |
68 Semiannual Report
franklintempleton.com
FRANKLIN INVESTORS SECURITIES TRUST
STATEMENT OF INVESTMENTS (UNAUDITED)
| Franklin Real Return Fund (continued) | ||||
| Principal | ||||
| Country | Amount* | Value | ||
| e,f Senior Floating Rate Interests (continued) | ||||
| Consumer Durables & Apparel 0.0%† | ||||
| g Prime Security Services Borrower LLC, Term B-1 Loans, 7.00%, 5/02/22 | United States | 29,701 | $ | 29,845 |
| Diversified Financials 0.1% | ||||
| First Eagle Investment Management, Initial Term Loans, 4.75%, 12/01/22 | United States | 86,903 | 86,360 | |
| Guggenheim Partners Investment Management Holdings LLC, Initial Term | ||||
| Loan, 4.25%, 7/22/20 | United States | 55,111 | 55,237 | |
| 141,597 | ||||
| Energy 0.2% | ||||
| Bowie Resource Holdings LLC, First Lien Initial Term Loan, 8.75%, | ||||
| 8/16/20 | United States | 218,939 | 194,856 | |
| h Fieldwood Energy LLC, Loans, 3.875%, 10/01/18. | United States | 342,585 | 258,651 | |
| h McDermott Finance LLC, Term Loan, 5.25%, 4/16/19 | United States | 13,666 | 13,197 | |
| 466,704 | ||||
| Health Care Equipment & Services 0.2% | ||||
| Community Health Systems Inc., 2018 Term F Loans, 3.685% - 3.886%, | ||||
| 12/31/18 | United States | 186,558 | 185,901 | |
| Kinetic Concepts Inc., Dollar Term E-1 Loan, 4.50%, 5/04/18. | United States | 143,859 | 143,985 | |
| New Millennium Holdco Inc., Closing Date Term Loan, 7.50%, 12/18/20 | United States | 25,183 | 19,643 | |
| 349,529 | ||||
| Materials 0.4% | ||||
| The Chemours Co. LLC, Tranche B Term Loan, 3.75%, 5/12/22 | United States | 178,212 | 174,202 | |
| FMG America Finance Inc. (Fortescue Metals Group), Loans, 4.25%, | ||||
| 6/30/19 | Australia | 625,348 | 591,814 | |
| OCI Beaumont LLC, Term B-3 Loan, 7.75%, 8/20/19 | United States | 232,980 | 235,310 | |
| 1,001,326 | ||||
| Media 0.5% | ||||
| CSC Holdings Inc. (Cablevision), Initial Term Loans, 5.00%, 10/09/22 | United States | 184,511 | 185,642 | |
| Gray Television Inc., Term Loan C, 4.25%, 6/13/21 | United States | 91,178 | 91,691 | |
| Media General Inc., Term B Loan, 4.00%, 7/31/20 | United States | 15,405 | 15,420 | |
| Radio One Inc., Term Loan B, 5.14%, 12/31/18 | United States | 943,247 | 949,731 | |
| 1,242,484 | ||||
| Pharmaceuticals, Biotechnology & Life Sciences 0.2% | ||||
| Endo Luxembourg Finance Co. I S.A.R.L. and Endo LLC, 2015 Incremental | ||||
| Term B Loans, 3.75%, 9/25/22 | United States | 185,750 | 185,441 | |
| Grifols Worldwide Operations USA Inc., US Tranche B Term Loan, 3.435%, | ||||
| 2/27/21 | United States | 227,926 | 228,496 | |
| Valeant Pharmaceuticals International Inc., Series D-2 Tranche B Term | ||||
| Loan, 4.50%, 2/13/19 | United States | 158,242 | 154,615 | |
| 568,552 | ||||
| Retailing 0.1% | ||||
| Ascena Retail Group Inc., Tranche B Term Loan, 5.25%, 8/21/22 | United States | 248,026 | 244,430 | |
| The Men’s Wearhouse Inc., Tranche B Term Loan, 4.50%, 6/18/21. | United States | 49,851 | 48,978 | |
| g PetSmart Inc., Term Loans, 4.25%, 3/10/22 | United States | 50,000 | 49,901 | |
| 343,309 | ||||
franklintempleton.com
Semiannual Report 69
FRANKLIN INVESTORS SECURITIES TRUST
STATEMENT OF INVESTMENTS (UNAUDITED)
| Franklin Real Return Fund (continued) | ||||||
| Principal | ||||||
| Country | Amount* | Value | ||||
| e,f Senior Floating Rate Interests (continued) | ||||||
| Semiconductors & Semiconductor Equipment 0.3% | ||||||
| g Avago Technologies Cayman Finance Ltd., Term B-1 Dollar Loans, 4.25%, | ||||||
| 2/01/23 | United States | 221,061 | $ | 221,599 | ||
| M/A-COM Technology Solutions Holdings Inc., Initial Term Loan, 4.50%, | ||||||
| 5/07/21 | United States | 95,794 | 95,794 | |||
| g MKS Instruments Inc., Term Loan, 6.50%, 4/29/23 | United States | 33,026 | 33,212 | |||
| NXP BV/NXP Funding LLC, Tranche B Loan, 3.75%, 12/07/20. | United States | 14,339 | 14,406 | |||
| ON Semiconductor Corp., Closing Date Term Loans, 5.25%, 3/31/23 | United States | 240,998 | 242,594 | |||
| 607,605 | ||||||
| Software & Services 0.0%† | ||||||
| Match Group Inc., Term B-1 Loans, 5.50%, 11/16/22 | United States | 81,957 | 82,674 | |||
| Technology Hardware & Equipment 0.1% | ||||||
| Ciena Corp., Term Loan, 3.75%, 7/15/19 | United States | 32,598 | 32,536 | |||
| Dell International LLC, Term B-2 Loan, 4.00%, 4/29/20 | United States | 121,656 | 121,710 | |||
| g Western Digital Corp., U.S. Term B Loan, 8.00%, 4/29/23 | United States | 114,371 | 112,727 | |||
| 266,973 | ||||||
| Telecommunication Services 0.0%† | ||||||
| Windstream Corp., Tranche B-5 Term Loan, 3.50%, 8/08/19 | United States | 42,832 | 42,368 | |||
| Transportation 0.1% | ||||||
| Hertz Corp., Credit Linked Deposit, 3.75%, 3/11/18 | United States | 120,000 | 118,350 | |||
| Navios Maritime Midstream Partners LP, Initial Term Loan, 5.50%, 6/18/20 . | Marshall Islands | 86,356 | 78,152 | |||
| Navios Maritime Partners LP, Initial Term Loan, 5.25%, 6/27/18 | Marshall Islands | 6,949 | 6,150 | |||
| 202,652 | ||||||
| Utilities 0.0%† | ||||||
| Calpine Corp., Term Loan (B6), 4.00%, 1/15/23 | United States | 63,371 | 63,272 | |||
| Total Senior Floating Rate Interests (Cost $6,030,390) | 5,996,128 | |||||
| Foreign Government and Agency Securities 12.7% | ||||||
| Government of Hungary, | ||||||
| i senior bond, Reg S, 3.875%, 2/24/20. | Hungary | 180,000 | EUR | 230,605 | ||
| senior note, 6.375%, 3/29/21 | Hungary | 620,000 | 706,521 | |||
| i senior note, Reg S, 3.50%, 7/18/16 | Hungary | 60,000 | EUR | 69,279 | ||
| i senior note, Reg S, 4.375%, 7/04/17 | Hungary | 150,000 | EUR | 180,524 | ||
| i senior note, Reg S, 5.75%, 6/11/18 | Hungary | 435,000 | EUR | 553,135 | ||
| Government of Indonesia, senior bond, FR53, 8.25%, 7/15/21 | Indonesia | 42,000,000,000 | IDR | 3,304,703 | ||
| Government of Malaysia, | ||||||
| senior bond, 3.814%, 2/15/17 | Malaysia | 6,100,000 | MYR | 1,575,257 | ||
| senior note, 3.172%, 7/15/16 | Malaysia | 14,200,000 | MYR | 3,640,129 | ||
| Government of Mexico, | ||||||
| 6.25%, 6/16/16 | Mexico | 630,000 | j | MXN | 3,677,217 | |
| senior note, M, 5.00%, 6/15/17 | Mexico | 750,000 | j | MXN | 4,406,850 | |
| f Government of Poland, | ||||||
| FRN, 1.75%, 1/25/17 | Poland | 4,515,000 | PLN | 1,185,968 | ||
| FRN, 1.75%, 1/25/21 | Poland | 9,388,000 | PLN | 2,426,366 | ||
70 Semiannual Report
franklintempleton.com
FRANKLIN INVESTORS SECURITIES TRUST
STATEMENT OF INVESTMENTS (UNAUDITED)
| Franklin Real Return Fund (continued) | |||||||
| Principal | |||||||
| Country | Amount* | Value | |||||
| Foreign Government and Agency Securities (continued) | |||||||
| k Mexican Udibonos, Index Linked, 5.00%, 6/16/16 | Mexico | 498,094 | l | MXN | $ | 2,888,656 | |
| Nota Do Tesouro Nacional, | |||||||
| 10.00%, 1/01/21 | Brazil | 17,200m BRL | 4,628,975 | ||||
| n Index Linked, 6.00%, 8/15/16 | Brazil | 1,343 | m | BRL | 1,108,141 | ||
| n Index Linked, 6.00%, 8/15/18 | Brazil | 1,270 | m | BRL | 1,052,979 | ||
| Total Foreign Government and Agency Securities | |||||||
| (Cost $34,906,132) | 31,635,305 | ||||||
| U.S. Government and Agency Securities 56.9% | |||||||
| k U.S. Treasury Note, | |||||||
| Index Linked, 2.375%, 1/15/17 | United States | 3,527,212 | 3,624,002 | ||||
| Index Linked, 0.125%, 4/15/17 | United States | 38,624,745 | 38,993,650 | ||||
| Index Linked, 2.625%, 7/15/17 | United States | 22,880,308 | 24,006,454 | ||||
| Index Linked, 1.625%, 1/15/18 | United States | 32,821,704 | 34,237,993 | ||||
| Index Linked, 2.125%, 1/15/19 | United States | 37,548,038 | 40,458,987 | ||||
| Total U.S. Government and Agency Securities | |||||||
| (Cost $140,313,998) | 141,321,086 | ||||||
| Total Investments before Short Term Investments | |||||||
| (Cost $238,005,539) | 236,306,034 | ||||||
| Short Term Investments (Cost $11,320,424) 4.6% | |||||||
| Repurchase Agreements 4.6% | |||||||
| o Joint Repurchase Agreement, 0.282%, 5/02/16 | |||||||
| (Maturity Value $11,320,690) | |||||||
| BNP Paribas Securities Corp. (Maturity Value $4,142,693) | |||||||
| Deutsche Bank Securities Inc. (Maturity Value $1,378,181) | |||||||
| HSBC Securities (USA) Inc. (Maturity Value $5,178,423) | |||||||
| Merrill Lynch, Pierce, Fenner & Smith Inc. (Maturity Value $621,393) | |||||||
| Collateralized by U.S. Government Agency Securities, 0.00% - 5.50%, | |||||||
| 5/02/16 - 2/26/21; U.S. Government Agency Securities, Strips, | |||||||
| 6/01/17; and U.S. Treasury Note, 0.625% - 1.625%, 12/31/16 - | |||||||
| 2/28/21 (valued at $11,549,831) | United States | 11,320,424 | 11,320,424 | ||||
| Total Investments (Cost $249,325,963) 99.7% | 247,626,458 | ||||||
| Other Assets, less Liabilities 0.3% | 745,901 | ||||||
| Net Assets 100.0%. | $ | 248,372,359 | |||||
franklintempleton.com
Semiannual Report 71
FRANKLIN INVESTORS SECURITIES TRUST
STATEMENT OF INVESTMENTS (UNAUDITED)
Franklin Real Return Fund (continued)
†Rounds to less than 0.1% of net assets.
*The principal amount is stated in U.S. dollars unless otherwise indicated.
aNon-income producing.
bSee Note 3(f) regarding investments in affiliated management investment companies.
cSecurity was purchased pursuant to Rule 144A under the Securities Act of 1933 and may be sold in transactions exempt from registration only to qualified institutional buyers
or in a public offering registered under the Securities Act of 1933. These securities have been deemed liquid under guidelines approved by the Trust’s Board of Trustees. At
April 30,2016, the aggregate value of these securities was $5,141,815, representing 2.07% of net assets.
dSee Note 7 regarding defaulted securities.
eSee Note 1(g) regarding senior floating rate interests.
fThe coupon rate shown represents the rate at period end.
gA portion or all of the security purchased on a delayed delivery basis. See Note 1(d).
hAt April 30, 2016, pursuant to the Fund’s policies and the requirements of applicable securities law, the Fund is restricted from trading these securities at period end.
iSecurity was purchased pursuant to Regulation S under the Securities Act of 1933, which exempts from registration securities offered and sold outside of the United States.
Such a security cannot be sold in the United States without either an effective registration statement filed pursuant to the Securities Act of 1933, or pursuant to an exemption
from registration. These securities have been deemed liquid under guidelines approved by the Trust’s Board of Trustees. At April 30, 2016, the aggregate value of these
securities was $1,033,543, representing 0.42% of net assets.
jPrincipal amount is stated in 100 Mexican Peso Units.
kPrincipal amount of security is adjusted for inflation. See Note 1(i).
lPrincipal amount is stated in 100 Unidad de Inversion Units.
mPrincipal amount is stated in 1,000 Brazilian Real Peso Units.
nRedemption price at maturity is adjusted for inflation. See Note 1(i).
oSee Note 1(c) regarding joint repurchase agreement.
At April 30, 2016, the Fund had the following forward exchange contracts outstanding. See Note 1(e).
| Forward Exchange Contracts | |||||||||||
| Contract | Settlement | Unrealized | Unrealized | ||||||||
| Currency | Counterpartya Type | Quantity | Amount | Date | Appreciation | Depreciation | |||||
| OTC Forward Exchange Contracts | |||||||||||
| Chilean Peso | DBAB | Buy | 328,810,000 | $ | 447,117 | 8/18/16 | $ | 45,391 | $ | — | |
| Euro | DBAB | Sell | 3,072,361 | 3,362,853 | 8/18/16 | — | (168,126 | ) | |||
| Chilean Peso | JPHQ | Buy | 1,159,473,700 | 1,715,452 | 10/20/16 | 11,344 | — | ||||
| Euro | DBAB | Sell | 1,150,100 | 1,304,386 | 10/20/16 | — | (20,398 | ) | |||
| Indian Rupee | JPHQ | Buy | 188,000,000 | 2,685,714 | 10/20/16 | 65,160 | — | ||||
| Total Forward Exchange Contracts | $ | 121,895 | $ | (188,524 | ) | ||||||
| Net unrealized appreciation (depreciation) | $ | (66,629 | ) | ||||||||
| aMay be comprised of multiple contracts with the same counterparty, currency and settlement date. | |||||||||||
| See Note 8 regarding other derivative information. | |||||||||||
See Abbreviations on page 94.
72 Semiannual Report | The accompanying notes are an integral part of these financial statements. franklintempleton.com
| FRANKLIN INVESTORS SECURITIES TRUST | |||||||||||
| Financial Statements | |||||||||||
| Statements of Assets and Liabilities | |||||||||||
| April 30, 2016 (unaudited) | |||||||||||
| Franklin | |||||||||||
| Franklin | Convertible | Franklin Equity | Franklin Real | ||||||||
| Balanced Fund | Securities Fund | Income Fund | Return Fund | ||||||||
| Assets: | |||||||||||
| Investments in securities: | |||||||||||
| Cost - Unaffiliated issuers | $ | 2,885,481,184 | $ | 1,863,436,046 | $ | 1,689,454,950 | $ | 234,383,686 | |||
| Cost - Non-controlled affiliates (Note 3f) | 175,970,880 | 101,308,445 | 93,183,793 | 3,621,853 | |||||||
| Cost - Repurchase agreements | — | — | — | 11,320,424 | |||||||
| Total cost of investments | $ | 3,061,452,064 | $ | 1,964,744,491 | $ | 1,782,638,743 | $ | 249,325,963 | |||
| Value - Unaffiliated issuers | $ | 3,011,813,216 | $ | 1,972,290,260 | $ | 2,002,243,170 | $ | 232,746,838 | |||
| Value - Non-controlled affiliates (Note 3f) | 175,970,880 | 101,308,445 | 93,183,793 | 3,559,196 | |||||||
| Value - Repurchase agreements | — | — | — | 11,320,424 | |||||||
| Total value of investments | 3,187,784,096 | 2,073,598,705 | 2,095,426,963 | 247,626,458 | |||||||
| Cash | 64,599 | — | 561,504 | 25,718 | |||||||
| Receivables: | |||||||||||
| Investment securities sold | 14,309,300 | — | — | 115,782 | |||||||
| Capital shares sold | 6,149,844 | 3,450,040 | 2,136,753 | 406,260 | |||||||
| Dividends and interest | 16,096,726 | 6,323,758 | 3,124,738 | 1,469,604 | |||||||
| Unrealized appreciation on OTC forward exchange | |||||||||||
| contracts | — | — | — | 121,895 | |||||||
| Other assets | 1,773 | 1,161 | 1,164 | 148 | |||||||
| Total assets | 3,224,406,338 | 2,083,373,664 | 2,101,251,122 | 249,765,865 | |||||||
| Liabilities: | |||||||||||
| Payables: | |||||||||||
| Investment securities purchased | 14,754,433 | — | 17,677,378 | 239,348 | |||||||
| Capital shares redeemed | 6,253,339 | 4,638,354 | 2,592,338 | 680,806 | |||||||
| Management fees | 1,601,176 | 776,885 | 780,008 | 83,440 | |||||||
| Distribution fees | 1,000,652 | 392,425 | 574,618 | 58,076 | |||||||
| Transfer agent fees | 593,210 | 519,398 | 418,865 | 51,262 | |||||||
| Trustees’ fees and expenses | 96 | 682 | 71 | 348 | |||||||
| Options written, at value (premiums received $894,203, | |||||||||||
| $—, $— and $—) | 1,296,250 | — | — | — | |||||||
| Unrealized depreciation on OTC forward exchange | |||||||||||
| contracts | — | — | — | 188,524 | |||||||
| Deferred tax | — | — | — | 14,179 | |||||||
| Accrued expenses and other liabilities | 168,499 | 126,120 | 100,497 | 77,523 | |||||||
| Total liabilities | 25,667,655 | 6,453,864 | 22,143,775 | 1,393,506 | |||||||
| Net assets, at value | $ | 3,198,738,683 | $ | 2,076,919,800 | $ | 2,079,107,347 | $ | 248,372,359 | |||
| Net assets consist of: | |||||||||||
| Paid-in capital | $ | 3,063,209,594 | $ | 1,966,051,594 | $ | 1,673,448,020 | $ | 282,334,682 | |||
| Undistributed net investment income | — | — | 1,151,380 | — | |||||||
| Distributions in excess of net investment income | (10,416,968 | ) | (28,958,363 | ) | — | (6,923,888 | ) | ||||
| Net unrealized appreciation (depreciation) | 125,930,370 | 108,854,214 | 312,775,200 | (1,755,374 | ) | ||||||
| Accumulated net realized gain (loss) | 20,015,687 | 30,972,355 | 91,732,747 | (25,283,061 | ) | ||||||
| Net assets, at value | $ | 3,198,738,683 | $ | 2,076,919,800 | $ | 2,079,107,347 | $ | 248,372,359 | |||
franklintempleton.com The accompanying notes are an integral part of these financial statements. | Semiannual Report 73
| FRANKLIN INVESTORS SECURITIES TRUST | ||||||||||||
| FINANCIAL STATEMENTS | ||||||||||||
| Statements of Assets and Liabilities (continued) | ||||||||||||
| April 30, 2016 (unaudited) | ||||||||||||
| Franklin | ||||||||||||
| Franklin | Convertible | Franklin Equity | Franklin Real | |||||||||
| Balanced Fund | Securities Fund | Income Fund | Return Fund | |||||||||
| Class A: | ||||||||||||
| Net assets, at value | $ | 2,512,685,399 | $ | 729,671,546 | $ | 1,767,093,242 | $ | 167,631,381 | ||||
| Shares outstanding | 220,142,425 | 42,056,368 | 80,137,251 | 16,816,784 | ||||||||
| Net asset value per sharea | $ | 11.41 | $ | 17.35 | $ | 22.05 | $ | 9.97 | ||||
| Maximum offering price per share (net asset value per | ||||||||||||
| share ÷ 94.25%, 94.25%, 94.25% and 95.75%, | ||||||||||||
| respectively) | $ | 12.11 | $ | 18.41 | $ | 23.40 | $ | 10.41 | ||||
| Class C: | ||||||||||||
| Net assets, at value | $ | 609,481,384 | $ | 291,004,278 | $ | 251,325,033 | $ | 43,733,820 | ||||
| Shares outstanding | 53,838,453 | 17,010,728 | 11,481,999 | 4,417,783 | ||||||||
| Net asset value and maximum offering price per sharea | $ | 11.32 | $ | 17.11 | $ | 21.89 | $ | 9.90 | ||||
| Class R: | ||||||||||||
| Net assets, at value | $ | 4,496,097 | $ | 6,170,442 | ||||||||
| Shares outstanding | 393,130 | 279,933 | ||||||||||
| Net asset value and maximum offering price per share | $ | 11.44 | $ | 22.04 | ||||||||
| Class R6: | ||||||||||||
| Net assets, at value | $ | 259,552 | $ | 6,143,388 | $ | 7,901,798 | $ | 1,795,055 | ||||
| Shares outstanding | 22,700 | 352,183 | 357,715 | 179,488 | ||||||||
| Net asset value and maximum offering price per share | $ | 11.43 | $ | 17.44 | $ | 22.09 | $ | 10.00 | ||||
| Advisor Class: | ||||||||||||
| Net assets, at value | $ | 71,816,251 | $ | 1,050,100,588 | $ | 46,616,832 | $ | 35,212,103 | ||||
| Shares outstanding | 6,280,460 | 60,508,463 | 2,110,574 | 3,522,557 | ||||||||
| Net asset value and maximum offering price per share | $ | 11.43 | $ | 17.35 | $ | 22.09 | $ | 10.00 | ||||
aRedemption price is equal to net asset value less contingent deferred sales charges, if applicable.
74 Semiannual Report | The accompanying notes are an integral part of these financial statements. franklintempleton.com
| FRANKLIN INVESTORS SECURITIES TRUST | ||||||||||||
| FINANCIAL STATEMENTS | ||||||||||||
| Statements of Operations | ||||||||||||
| for the six months ended April 30, 2016 (unaudited) | ||||||||||||
| Franklin | ||||||||||||
| Franklin | Convertible | Franklin Equity | Franklin Real | |||||||||
| Balanced Fund | Securities Fund | Income Fund | Return Fund | |||||||||
| Investment income: | ||||||||||||
| Dividends: | ||||||||||||
| Unaffiliated issuers | $ | 33,577,805 | $ | 11,247,117 | $ | 32,289,338 | $ | 647,003 | ||||
| Non-controlled affiliates (Note 3f) | — | — | — | 118,078 | ||||||||
| Interest | 21,892,275 | 10,313,253 | 78 | 929,442 | ||||||||
| Inflation principal adjustments. | — | — | — | (444,708 | ) | |||||||
| Total investment income. | 55,470,080 | 21,560,370 | 32,289,416 | 1,249,815 | ||||||||
| Expenses: | ||||||||||||
| Management fees (Note 3a) | 9,548,568 | 4,567,207 | 4,682,270 | 789,590 | ||||||||
| Distribution fees: (Note 3c) | ||||||||||||
| Class A | 2,956,927 | 926,572 | 2,140,057 | 213,566 | ||||||||
| Class C | 2,865,690 | 1,464,988 | 1,213,880 | 147,118 | ||||||||
| Class R | 10,797 | — | 14,504 | — | ||||||||
| Transfer agent fees: (Note 3e) | ||||||||||||
| Class A | 1,331,603 | 496,121 | 1,083,929 | 131,976 | ||||||||
| Class C | 324,452 | 196,111 | 153,706 | 34,969 | ||||||||
| Class R | 2,429 | — | 3,691 | — | ||||||||
| Class R6 | 80 | 79 | 69 | 79 | ||||||||
| Advisor Class | 36,497 | 613,186 | 25,867 | 27,068 | ||||||||
| Custodian fees (Note 4) | 14,183 | 9,404 | 10,759 | 15,713 | ||||||||
| Reports to shareholders | 141,849 | 94,844 | 124,109 | 28,795 | ||||||||
| Registration and filing fees | 120,607 | 81,636 | 77,459 | 34,072 | ||||||||
| Professional fees | 25,611 | 27,521 | 23,520 | 26,768 | ||||||||
| Trustees’ fees and expenses | 16,082 | 12,285 | 11,715 | 1,915 | ||||||||
| Other. | 35,223 | 34,783 | 26,446 | 9,056 | ||||||||
| Total expenses | 17,430,598 | 8,524,737 | 9,591,981 | 1,460,685 | ||||||||
| Expense reductions (Note 4) | (104 | ) | (135 | ) | (13 | ) | (59 | ) | ||||
| Expenses waived/paid by affiliates (Note 3f and | ||||||||||||
| 3g) | (228,663 | ) | (91,661 | ) | (61,663 | ) | (288,223 | ) | ||||
| Net expenses | 17,201,831 | 8,432,941 | 9,530,305 | 1,172,403 | ||||||||
| Net investment income | 38,268,249 | 13,127,429 | 22,759,111 | 77,412 | ||||||||
| Realized and unrealized gains (losses): | ||||||||||||
| Net realized gain (loss) from: | ||||||||||||
| Investments | 27,952,874 | 30,979,896 | 89,764,724 | (9,209,761 | ) | |||||||
| Written options | 2,954,702 | — | — | — | ||||||||
| Foreign currency transactions | 49,627 | — | (242,373 | ) | 169,101 | |||||||
| Net realized gain (loss) | 30,957,203 | 30,979,896 | 89,522,351 | (9,040,660 | ) | |||||||
| Net change in unrealized appreciation (depreciation) on: | ||||||||||||
| Investments | (11,495,576 | ) | (36,655,285 | ) | (115,087,158 | ) | 12,217,585 | |||||
| Translation of other assets and liabilities | ||||||||||||
| denominated in foreign currencies | 384 | — | (1,188 | ) | (39,465 | ) | ||||||
| Written options | (1,044,634 | ) | — | — | — | |||||||
| Change in deferred taxes on unrealized appreciation. | — | — | — | (14,179 | ) | |||||||
| Net change in unrealized appreciation | ||||||||||||
| (depreciation) | (12,539,826 | ) | (36,655,285 | ) | (115,088,346 | ) | 12,163,941 | |||||
| Net realized and unrealized gain (loss) | 18,417,377 | (5,675,389 | ) | (25,565,995 | ) | 3,123,281 | ||||||
| Net increase (decrease) in net assets resulting from | ||||||||||||
| operations | $ | 56,685,626 | $ | 7,452,040 | $ | (2,806,884 | ) | $ | 3,200,693 | |||
franklintempleton.com The accompanying notes are an integral part of these financial statements. | Semiannual Report 75
| FRANKLIN INVESTORS SECURITIES TRUST | ||||||||||||
| FINANCIAL STATEMENTS | ||||||||||||
| Statements of Changes in Net Assets | ||||||||||||
| Franklin | Franklin | |||||||||||
| Balanced Fund | Convertible Securities Fund | |||||||||||
| Six Months Ended | Six Months Ended | |||||||||||
| April 30, 2016 | Year Ended | April 30, 2016 | Year Ended | |||||||||
| (unaudited) | October 31, 2015 | (unaudited) | October 31, 2015 | |||||||||
| Increase (decrease) in net assets: | ||||||||||||
| Operations: | ||||||||||||
| Net investment income | $ | 38,268,249 | $ | 69,887,156 | $ | 13,127,429 | $ | 28,248,902 | ||||
| Net realized gain (loss) | 30,957,203 | 5,876,467 | 30,979,896 | 89,937,146 | ||||||||
| Net change in unrealized appreciation | ||||||||||||
| (depreciation) | (12,539,826 | ) | (70,359,679 | ) | (36,655,285 | ) | (114,046,752 | ) | ||||
| Net increase (decrease) in net assets | ||||||||||||
| resulting from operations | 56,685,626 | 5,403,944 | 7,452,040 | 4,139,296 | ||||||||
| Distributions to shareholders from: | ||||||||||||
| Net investment income: | ||||||||||||
| Class A. | (39,588,270 | ) | (70,156,845 | ) | (12,766,738 | ) | (18,571,018 | ) | ||||
| Class C. | (7,567,859 | ) | (13,270,654 | ) | (3,978,164 | ) | (4,490,159 | ) | ||||
| Class R. | (67,697 | ) | (129,500 | ) | — | — | ||||||
| Class R6 | (4,104 | ) | (11,849 | ) | (89 | ) | (50,746 | ) | ||||
| Advisor Class | (1,152,003 | ) | (1,708,745 | ) | (15,270,793 | ) | (21,965,450 | ) | ||||
| Net realized gains: | ||||||||||||
| Class A. | — | (27,941,174 | ) | (15,784,677 | ) | (33,348,512 | ) | |||||
| Class C. | — | (6,796,815 | ) | (6,225,597 | ) | (12,006,606 | ) | |||||
| Class R. | — | (50,807 | ) | — | — | |||||||
| Class R6 | — | (6,909 | ) | (98 | ) | (110,660 | ) | |||||
| Advisor Class | — | (575,222 | ) | (15,633,160 | ) | (30,219,160 | ) | |||||
| Total distributions to shareholders | (48,379,933 | ) | (120,648,520 | ) | (69,659,316 | ) | (120,762,311 | ) | ||||
| Capital share transactions: (Note 2) | ||||||||||||
| Class A. | 134,937,809 | 408,259,572 | (56,876,226 | ) | (55,036,014 | ) | ||||||
| Class C. | 44,777,539 | 93,503,518 | (9,204,771 | ) | (4,278,396 | ) | ||||||
| Class R. | (180,020 | ) | 1,269,988 | — | — | |||||||
| Class R6 | 37,117 | (284,447 | ) | 6,165,447 | (3,003,286 | ) | ||||||
| Advisor Class | 16,507,644 | 15,106,961 | 169,563,618 | 73,969,258 | ||||||||
| Total capital share transactions | 196,080,089 | 517,855,592 | 109,648,068 | 11,651,562 | ||||||||
| Net increase (decrease) in net assets . | 204,385,782 | 402,611,016 | 47,440,792 | (104,971,453 | ) | |||||||
| Net assets: | ||||||||||||
| Beginning of period. | 2,994,352,901 | 2,591,741,885 | 2,029,479,008 | 2,134,450,461 | ||||||||
| End of period | $ | 3,198,738,683 | $ | 2,994,352,901 | $ | 2,076,919,800 | $ | 2,029,479,008 | ||||
| Distributions in excess of net investment | ||||||||||||
| income included in net assets: | ||||||||||||
| End of period | $ | (10,416,968 | ) | $ | (305,284 | ) | $ | (28,958,363 | ) | $ | (10,070,008 | ) |
76 Semiannual Report | The accompanying notes are an integral part of these financial statements. franklintempleton.com
| FRANKLIN INVESTORS SECURITIES TRUST | ||||||||||||||||
| FINANCIAL STATEMENTS | ||||||||||||||||
| Statements of Changes in Net Assets (continued) | ||||||||||||||||
| Franklin | Franklin | |||||||||||||||
| Equity Income Fund | Real Return Fund | |||||||||||||||
| Six Months Ended | Six Months Ended | |||||||||||||||
| April 30, 2016 | Year Ended | April 30, 2016 | Year Ended | |||||||||||||
| (unaudited) | October 31, 2015 | (unaudited) | October 31, 2015 | |||||||||||||
| Increase (decrease) in net assets: | ||||||||||||||||
| Operations: | ||||||||||||||||
| Net investment income | $ | 22,759,111 | $ | 47,416,333 | $ | 77,412 | $ | 1,310,527 | ||||||||
| Net realized gain (loss) | 89,522,351 | 54,413,447 | (9,040,660 | ) | 4,458,658 | |||||||||||
| Net change in unrealized appreciation | ||||||||||||||||
| (depreciation) | (115,088,346 | ) | (28,722,638 | ) | 12,163,941 | (27,267,123 | ) | |||||||||
| Net increase (decrease) in net assets | ||||||||||||||||
| resulting from operations | (2,806,884 | ) | 73,107,142 | 3,200,693 | (21,497,938 | ) | ||||||||||
| Distributions to shareholders from: | ||||||||||||||||
| Net investment income: | ||||||||||||||||
| Class A. | (24,388,435 | ) | (52,888,906 | ) | (1,805,621 | ) | (1,588,071 | ) | ||||||||
| Class C. | (2,833,340 | ) | (5,529,325 | ) | (277,889 | ) | (394,395 | ) | ||||||||
| Class R. | (78,459 | ) | (193,924 | ) | — | — | ||||||||||
| Class R6 | (47,724 | ) | (195 | ) | (25,412 | ) | (13,635 | ) | ||||||||
| Advisor Class | (572,989 | ) | (1,042,538 | ) | (479,022 | ) | (472,365 | ) | ||||||||
| Net realized gains: | ||||||||||||||||
| Class A. | (46,499,583 | ) | (78,681,119 | ) | — | — | ||||||||||
| Class C. | (6,537,589 | ) | (10,878,951 | ) | — | — | ||||||||||
| Class R. | (161,343 | ) | (327,751 | ) | — | — | ||||||||||
| Class R6 | (149 | ) | (266 | ) | — | — | ||||||||||
| Advisor Class | (889,611 | ) | (1,523,577 | ) | — | — | ||||||||||
| Total distributions to shareholders | (82,009,222 | ) | (151,066,552 | ) | (2,587,944 | ) | (2,468,466 | ) | ||||||||
| Capital share transactions: (Note 2) | ||||||||||||||||
| Class A. | 49,943,388 | 95,079,558 | (18,517,198 | ) | (46,641,225 | ) | ||||||||||
| Class C. | 11,636,791 | 18,093,330 | (4,550,396 | ) | (15,672,201 | ) | ||||||||||
| Class R. | 156,852 | (751,079 | ) | — | — | |||||||||||
| Class R6 | 7,453,573 | — | 62,789 | (174,433 | ) | |||||||||||
| Advisor Class | 13,145,880 | 5,763,786 | (2,549,790 | ) | (24,725,271 | ) | ||||||||||
| Total capital share transactions | 82,336,484 | 118,185,595 | (25,554,595 | ) | (87,213,130 | ) | ||||||||||
| Net increase (decrease) in net assets . | (2,479,622 | ) | 40,226,185 | (24,941,846 | ) | (111,179,534 | ) | |||||||||
| Net assets: | ||||||||||||||||
| Beginning of period. | 2,081,586,969 | 2,041,360,784 | 273,314,205 | 384,493,739 | ||||||||||||
| End of period | $ | 2,079,107,347 | $ | 2,081,586,969 | $ | 248,372,359 | $ | 273,314,205 | ||||||||
| Undistributed net investment income included | ||||||||||||||||
| in net assets: | ||||||||||||||||
| End of period | $ | 1,151,380 | $ | 6,313,216 | $ | — | $ | — | ||||||||
| Distributions in excess of net investment | ||||||||||||||||
| income included in net assets: | ||||||||||||||||
| End of period | $ | — | $ | — | $ | (6,923,888 | ) | $ | (4,413,356 | ) | ||||||
franklintempleton.com The accompanying notes are an integral part of these financial statements. | Semiannual Report 77
FRANKLIN INVESTORS SECURITIES TRUST
Notes to Financial Statements (unaudited)
1. Organization and Significant Accounting Policies
Franklin Investors Securities Trust (Trust) is registered under the Investment Company Act of 1940 (1940 Act) as an open-end management investment company, consisting of eight separate funds, four of which are included in this report (Funds) and applies the specialized accounting and reporting guidance in U.S. Generally Accepted Accounting Principles (U.S. GAAP). The financial statements of the remaining funds in the Trust are presented separately. The classes of shares offered within each of the Funds are indicated below. Each class of shares differs by its initial sales load, contingent deferred sales charges, voting rights on matters affecting a single class, its exchange privilege and fees primarily due to differing arrangements for distribution and transfer agent fees.
| Class A, Class C, Class R, Class R6 & Advisor Class |
| Franklin Balanced Fund |
| Franklin Equity Income Fund |
| Class A, Class C, Class R6 & Advisor Class |
| Franklin Convertible Securities Fund |
| Franklin Real Return Fund |
The following summarizes the Funds’ significant accounting policies.
a. Financial Instrument Valuation
The Funds’ investments in financial instruments are carried at fair value daily. Fair value is the price that would be received to sell an asset or paid to transfer a liability in an orderly transaction between market participants on the measurement date. The Funds calculate the net asset value (NAV) per share as of 4 p.m. Eastern time each day the New York Stock Exchange (NYSE) is open for trading. Under compliance policies and procedures approved by the Trust’s Board of Trustees (the Board), the Funds’ administrator has responsibility for oversight of valuation, including leading the cross-functional Valuation and Liquidity Oversight Committee (VLOC). The VLOC provides administration and oversight of the Funds’ valuation policies and procedures, which are approved annually by the Board. Among other things, these procedures allow the Funds to utilize independent pricing services, quotations from securities and financial instrument dealers, and other market sources to determine fair value.
Equity securities, exchange traded funds and derivative financial instruments (derivatives) listed on an exchange or on the NASDAQ National Market System are valued at the last quoted sale price or the official closing price of the day, respectively. Foreign equity securities are valued as of the close of trading on the foreign stock exchange on which the security is primarily traded or as 4 p.m. Eastern time, whichever is earlier. The value is then converted into its U.S. dollar equivalent at the foreign exchange rate in effect at 4 p.m. Eastern time on the day that the value of the security is determined. Over-the-counter (OTC) securities are valued within the range of the most recent quoted bid and ask prices. Securities that trade in multiple markets or on multiple exchanges are valued according to the broadest and most representative market. Certain equity securities are valued based upon fundamental characteristics or relationships to similar securities.
Debt and certain preferred securities generally trade in the OTC market rather than on a securities exchange. The Funds’ pricing services use multiple valuation techniques to determine fair value. In instances where sufficient market activity exists, the pricing services may utilize a market-based approach through which quotes from market makers are used to determine fair value. In instances where sufficient market activity may not exist or is limited, the pricing services also utilize proprietary valuation models which may consider market characteristics such as benchmark yield curves, credit spreads, estimated default rates, anticipated market interest rate volatility, coupon rates, anticipated timing of principal repayments, underlying collateral, and other unique security features in order to estimate the relevant cash flows, which are then discounted to calculate the fair value. Securities denominated in a foreign currency are converted into their U.S. dollar equivalent at the foreign exchange rate in effect at 4 p.m. Eastern time on the date that the values of the foreign debt securities are determined.
Investments in open-end mutual funds are valued at the closing NAV. Repurchase agreements are valued at cost, which approximates fair value.
Certain derivatives trade in the OTC market. The Funds’ pricing services use various techniques including industry standard option pricing models and proprietary discounted cash flow models to determine the fair value of those instruments. The Funds’ net benefit or obligation under the derivative contract, as measured by the fair value of the contract, is included in net assets.
78 Semiannual Report
franklintempleton.com
FRANKLIN INVESTORS SECURITIES TRUST
NOTES TO FINANCIAL STATEMENTS (UNAUDITED)
The Funds have procedures to determine the fair value of financial instruments for which market prices are not reliable or readily available. Under these procedures, the VLOC convenes on a regular basis to review such financial instruments and considers a number of factors, including significant unobservable valuation inputs, when arriving at fair value. The VLOC primarily employs a market-based approach which may use related or comparable assets or liabilities, recent transactions, market multiples, book values, and other relevant information for the investment to determine the fair value of the investment. An income-based valuation approach may also be used in which the anticipated future cash flows of the investment are discounted to calculate fair value. Discounts may also be applied due to the nature or duration of any restrictions on the disposition of the investments. Due to the inherent uncertainty of valuations of such investments, the fair values may differ significantly from the values that would have been used had an active market existed. The VLOC employs various methods for calibrating these valuation approaches including a regular review of key inputs and assumptions, transactional back-testing or disposition analysis, and reviews of any related market activity.
Trading in securities on foreign securities stock exchanges and OTC markets may be completed before 4 p.m. Eastern time. In addition, trading in certain foreign markets may not take place on every NYSE business day. Occasionally, events occur between the time at which trading in a foreign security is completed and the close of the NYSE that might call into question the reliability of the value of a portfolio security held by the Fund. As a result, differences may arise between the value of the Funds’ portfolio securities as determined at the foreign market close and the latest indications of value at the close of the NYSE. In order to minimize the potential for these differences, the VLOC monitors price movements following the close of trading in foreign stock markets through a series of country specific market proxies (such as baskets of American Depositary Receipts, futures contracts and exchange traded funds). These price movements are measured against established trigger thresholds for each specific market proxy to assist in determining if an event has occurred that may call into question the reliability of the values of the foreign securities held by the Funds. If such an event occurs, the securities may be valued using fair value procedures, which may include the use of independent pricing services.
When the last day of the reporting period is a non-business day, certain foreign markets may be open on those days that the NYSE is closed, which could result in differences between the value of the Funds’ portfolio securities on the last business day and the last calendar day of the reporting period. Any significant security valuation changes due to an open foreign market are adjusted and reflected by the Funds for financial reporting purposes.
b. Foreign Currency Translation
Portfolio securities and other assets and liabilities denominated in foreign currencies are translated into U.S. dollars based on the exchange rate of such currencies against U.S. dollars on the date of valuation. The Funds may enter into foreign currency exchange contracts to facilitate transactions denominated in a foreign currency. Purchases and sales of securities, income and expense items denominated in foreign currencies are translated into U.S. dollars at the exchange rate in effect on the transaction date. Portfolio securities and assets and liabilities denominated in foreign currencies contain risks that those currencies will decline in value relative to the U.S. dollar. Occasionally, events may impact the availability or reliability of foreign exchange rates used to convert the U.S. dollar equivalent value. If such an event occurs, the foreign exchange rate will be valued at fair value using procedures established and approved by the Board.
The Funds do not separately report the effect of changes in foreign exchange rates from changes in market prices on securities held. Such changes are included in net realized and unrealized gain or loss from investments in the Statements of Operations.
Realized foreign exchange gains or losses arise from sales of foreign currencies, currency gains or losses realized between the trade and settlement dates on securities transactions and the difference between the recorded amounts of dividends, interest, and foreign withholding taxes and the U.S. dollar equivalent of the amounts actually received or paid. Net unrealized foreign exchange gains and losses arise from changes in foreign exchange rates on foreign denominated assets and liabilities other than investments in securities held at the end of the reporting period.
c. Joint Repurchase Agreement
Certain or all Funds enter into a joint repurchase agreement whereby their uninvested cash balance is deposited into a joint cash account with other funds managed by the investment
franklintempleton.com
Semiannual Report 79
FRANKLIN INVESTORS SECURITIES TRUST
NOTES TO FINANCIAL STATEMENTS (UNAUDITED)
1. Organization and Significant Accounting
Policies (continued)
c. Joint Repurchase Agreement (continued)
manager or an affiliate of the investment manager and is used to invest in one or more repurchase agreements. The value and face amount of the joint repurchase agreement are allocated to the funds based on their pro-rata interest. A repurchase agreement is accounted for as a loan by the Fund to the seller, collateralized by securities which are delivered to the Funds’ custodian. The fair value, including accrued interest, of the initial collateralization is required to be at least 102% of the dollar amount invested by the funds, with the value of the underlying securities marked to market daily to maintain coverage of at least 100%. Repurchase agreements are subject to the terms of Master Repurchase Agreements (MRAs) with approved counterparties (sellers). The MRAs contain various provisions, including but not limited to events of default and maintenance of collateral for repurchase agreements. In the event of default by either the seller or the Funds, certain MRAs may permit the non-defaulting party to net and close-out all transactions, if any, traded under such agreements. The Funds may sell securities it holds as collateral and apply the proceeds towards the repurchase price and any other amounts owed by the seller to the Funds in the event of default by the seller. This could involve costs or delays in addition to a loss on the securities if their value falls below the repurchase price owed by the seller. The joint repurchase agreement held by the Funds at period end, as indicated in the Statements of Investments, had been entered into on April 29, 2016.
d. Securities Purchased on a When-Issued or Delayed Delivery Basis
Certain or all Funds purchase securities on a when-issued or delayed delivery basis, with payment and delivery scheduled for a future date. These transactions are subject to market fluctuations and are subject to the risk that the value at delivery may be more or less than the trade date purchase price. Although the Funds will generally purchase these securities with the intention of holding the securities, they may sell the securities before the settlement date. Sufficient assets have been segregated for these securities.
e. Derivative Financial Instruments
Certain or all Funds invested in derivatives in order to manage risk or gain exposure to various other investments or markets. Derivatives are financial contracts based on an underlying or notional amount, require no initial investment or an initial net investment that is smaller than would normally be required to have a similar response to changes in market factors, and require or permit net settlement. Derivatives contain various risks including the potential inability of the counterparty to fulfill their obligations under the terms of the contract, the potential for an illiquid secondary market, and/or the potential for market movements which expose the Fund to gains or losses in excess of the amounts shown in the Statements of Assets and Liabilities. Realized gain and loss and unrealized appreciation and depreciation on these contracts for the period are included in the Statements of Operations.
Derivative counterparty credit risk is managed through a formal evaluation of the creditworthiness of all potential counterparties Certain or all Funds attempt to reduce their exposure to counterparty credit risk on OTC derivatives, whenever possible, by entering into International Swaps and Derivatives Association (ISDA) master agreements with certain counterparties. These agreements contain various provisions, including but not limited to collateral requirements, events of default, or early termination. Termination events applicable to the counterparty include certain deteriorations in the credit quality of the counterparty. Termination events applicable to the Funds include failure of the Funds to maintain certain net asset levels and/or limit the decline in net assets over various periods of time. In the event of default or early termination, the ISDA master agreement gives the non-defaulting party the right to net and close-out all transactions traded, whether or not arising under the ISDA agreement, to one net amount payable by one counterparty to the other. However, absent an event of default or early termination, OTC derivative assets and liabilities are presented gross and not offset in the Statements of Assets and Liabilities. Early termination by the counterparty may result in an immediate payment by the Funds of any net liability owed to that counterparty under the ISDA agreement. At April 30, 2016, Franklin Real Return Fund had OTC derivatives in a net liability position for such contracts of $143,133.
Collateral requirements differ by type of derivative. Collateral or initial margin requirements are set by the broker or exchange clearing house for exchange traded and centrally cleared derivatives. Initial margin deposited is held at the exchange and can be in the form of cash and/or securities. For OTC derivatives traded under an ISDA master agreement, posting of collateral is required by either the Fund or the applicable counterparty if the total net exposure of all OTC derivatives
80 Semiannual Report
franklintempleton.com
FRANKLIN INVESTORS SECURITIES TRUST
NOTES TO FINANCIAL STATEMENTS (UNAUDITED)
with the applicable counterparty exceeds the minimum transfer amount, which typically ranges from $100,000 to $250,000, and can vary depending on the counterparty and the type of the agreement. Generally, collateral is determined at the close of Fund business each day and any additional collateral required due to changes in derivative values may be delivered by the Fund or the counterparty within a few business days. Collateral pledged and/or received by the Fund for OTC derivatives, if any, is held in segregated accounts with the Fund’s custodian/counterparty broker and can be in the form of cash and/or securities. Unrestricted cash may be invested according to the Funds’ investment objectives. To the extent that the amounts due to the Fund from its counterparties are not subject to collateralization or are not fully collateralized, the Fund bears the risk of loss from counterparty non-performance.
Certain or all Funds entered into OTC forward exchange contracts primarily to manage and/or gain exposure to certain foreign currencies. A forward exchange contract is an agreement between the Fund and a counterparty to buy or sell a foreign currency at a specific exchange rate on a future date.
Certain or all Funds purchased or wrote exchange traded option contracts primarily to manage exposure to equity price risk. An option is a contract entitling the holder to purchase or sell a specific amount of shares or units of an asset or notional amount of a swap (swaption), at a specified price. When an option is purchased or written, an amount equal to the premium paid or received is recorded as an asset or liability, respectively. Upon exercise of an option, the acquisition cost or sales proceeds of the underlying investment is adjusted by any premium received or paid. Upon expiration of an option, any premium received or paid is recorded as a realized gain or loss. Upon closing an option other than through expiration or exercise, the difference between the premium received or paid and the cost to close the position is recorded as a realized gain or loss.
See Notes 6 and 8 regarding investment transactions and other derivative information, respectively.
f. Equity-Linked Securities
Certain or all Funds invest in equity-linked securities. Equity-linked securities are hybrid financial instruments that generally combine both debt and equity characteristics into a single note form. Income received from equity-linked securities is recorded as realized gains in the Statements of Operations and may be based on the performance of an underlying equity security, an equity index, or an option position. The risks of investing in equity-linked securities include unfavorable price movements in the underlying security and the credit risk of the issuing financial institution. There may be no guarantee of a return of principal with equity-linked securities and the appreciation potential may be limited. Equity-linked securities may be more volatile and less liquid than other investments held by the Funds.
g. Senior Floating Rate Interests
Certain or all Funds invest in senior secured corporate loans that pay interest at rates which are periodically reset by reference to a base lending rate plus a spread. These base lending rates are generally the prime rate offered by a designated U.S. bank or the London InterBank Offered Rate (LIBOR). Senior secured corporate loans often require prepayment of principal from excess cash flows or at the discretion of the borrower. As a result, actual maturity may be substantially less than the stated maturity. Senior secured corporate loans in which the Funds invest are generally readily marketable, but may be subject to certain restrictions on resale.
h. Income and Deferred Taxes
It is each Fund’s policy to qualify as a regulated investment company under the Internal Revenue Code. Each Fund intends to distribute to shareholders substantially all of its taxable income and net realized gains to relieve it from federal income and excise taxes. As a result, no provision for U.S. federal income taxes is required.
The Funds may be subject to foreign taxation related to income received, capital gains on the sale of securities and certain foreign currency transactions in the foreign jurisdictions in which the Funds invest. Foreign taxes, if any, are recorded based on the tax regulations and rates that exist in the foreign markets in which the Funds invest. When a capital gain tax is determined to apply, certain or all Funds record an estimated deferred tax liability in an amount that would be payable if the securities were disposed of on the valuation date. As a result of several court cases, in certain countries across the European Union, certain or all Funds filed additional tax reclaims for previously withheld taxes on dividends earned in those countries (EU reclaims). These additional filings are subject to various administrative proceedings by the local jurisdictions’ tax authorities within the European Union, as well as a number of related judicial proceedings. Income recognized, if any, for EU reclaims is reflected as other income in the Statements of
franklintempleton.com
Semiannual Report 81
FRANKLIN INVESTORS SECURITIES TRUST
NOTES TO FINANCIAL STATEMENTS (UNAUDITED)
1. Organization and Significant Accounting
Policies (continued)
h. Income and Deferred Taxes (continued)
Operations and any related receivable, if any, is reflected as European Union tax reclaims in the Statements of Assets and Liabilities. When uncertainty exists as to the ultimate resolution of these proceedings, the likelihood of receipt of these EU reclaims, and the potential timing of payment, no amounts are reflected in the financial statements.
Each Fund may recognize an income tax liability related to its uncertain tax positions under U.S. GAAP when the uncertain tax position has a less than 50% probability that it will be sustained upon examination by the tax authorities based on its technical merits. As of April 30, 2016, each Fund has determined that no tax liability is required in its financial statements related to uncertain tax positions for any open tax years (or expected to be taken in future tax years). Open tax years are those that remain subject to examination and are based on each tax jurisdiction’s statute of limitation.
i. Security Transactions, Investment Income, Expenses and Distributions
Security transactions are accounted for on trade date. Realized gains and losses on security transactions are determined on a specific identification basis. Interest income and estimated expenses are accrued daily. Amortization of premium and accretion of discount on debt securities are included in interest income. Facility fees are recognized as income over the expected term of the loan. Dividend income is recorded on the ex-dividend date except for certain dividends from foreign securities where the dividend rate is not available. In such cases, the dividend is recorded as soon as the information is received by the Funds. Distributions to shareholders are recorded on the ex-dividend date and are determined according to income tax regulations (tax basis). Distributable earnings determined on a tax basis may differ from earnings recorded in accordance with U.S. GAAP. These differences may be permanent or temporary. Permanent differences are reclassified among capital accounts to reflect their tax character. These reclassifications have no impact on net assets or the results of operations. Temporary differences are not reclassified, as they may reverse in subsequent periods.
Common expenses incurred by the Trust are allocated among the Funds based on the ratio of net assets of each Fund to the combined net assets of the Trust. Fund specific expenses are charged directly to the Fund that incurred the expense.
Realized and unrealized gains and losses and net investment income, not including class specific expenses, are allocated daily to each class of shares based upon the relative proportion of net assets of each class. Differences in per share distributions, by class, are generally due to differences in class specific expenses.
Inflation-indexed bonds are adjusted for inflation through periodic increases or decreases in the security’s interest accruals, face amount, or principal redemption value, by amounts corresponding to the rate of inflation as measured by an index. Any increase or decrease in the face amount or principal redemption value will be included as inflation principal adjustments in the Statements of Operations.
j. Accounting Estimates
The preparation of financial statements in accordance with U.S. GAAP requires management to make estimates and assumptions that affect the reported amounts of assets and liabilities at the date of the financial statements and the amounts of income and expenses during the reporting period. Actual results could differ from those estimates.
k. Guarantees and Indemnifications
Under the Trust’s organizational documents, its officers and trustees are indemnified by the Trust against certain liabilities arising out of the performance of their duties to the Trust. Additionally, in the normal course of business, the Trust, on behalf of the Funds, enters into contracts with service providers that contain general indemnification clauses. The Trust’s maximum exposure under these arrangements is unknown as this would involve future claims that may be made against the Trust that have not yet occurred. Currently, the Trust expects the risk of loss to be remote.
82 Semiannual Report
franklintempleton.com
FRANKLIN INVESTORS SECURITIES TRUST
NOTES TO FINANCIAL STATEMENTS (UNAUDITED)
2. Shares of Beneficial Interest
At April 30, 2016, there were an unlimited number of shares authorized (without par value). Transactions in the Funds’ shares were as follows:
| Franklin | Franklin | |||||||||||
| Balanced Fund | Convertible Securities Fund | |||||||||||
| Shares | Amount | Shares | Amount | |||||||||
| Class A Shares: | ||||||||||||
| Six Months ended April 30, 2016 | ||||||||||||
| Shares sold | 34,225,983 | $ | 377,677,643 | 4,491,941 | $ | 77,186,804 | ||||||
| Shares issued in reinvestment of distributions | 3,539,754 | 38,842,457 | 1,570,398 | 26,987,433 | ||||||||
| Shares redeemed | (25,625,531 | ) | (281,582,291 | ) | (9,463,042 | ) | (161,050,463 | ) | ||||
| Net increase (decrease) | 12,140,206 | $ | 134,937,809 | (3,400,703 | ) | $ | (56,876,226 | ) | ||||
| Year ended October 31, 2015 | ||||||||||||
| Shares sold | 58,341,044 | $ | 678,734,826 | 15,996,161 | $ | 295,084,541 | ||||||
| Shares issued in reinvestment of distributions | 8,328,938 | 96,129,984 | 2,736,597 | 48,590,091 | ||||||||
| Shares redeemed | (31,758,555 | ) | (366,605,238 | ) | (21,831,783 | ) | (398,710,646 | ) | ||||
| Net increase (decrease) | 34,911,427 | $ | 408,259,572 | (3,099,025 | ) | $ | (55,036,014 | ) | ||||
| Class C Shares: | ||||||||||||
| Six Months ended April 30, 2016 | ||||||||||||
| Shares sold | 11,187,241 | $ | 122,697,916 | 1,146,714 | $ | 19,476,235 | ||||||
| Shares issued in reinvestment of distributions | 641,087 | 6,979,693 | 484,852 | 8,227,978 | ||||||||
| Shares redeemed | (7,817,306 | ) | (84,900,070 | ) | (2,191,876 | ) | (36,908,984 | ) | ||||
| Net increase (decrease) | 4,011,022 | $ | 44,777,539 | (560,310 | ) | $ | (9,204,771 | ) | ||||
| Year ended October 31, 2015 | ||||||||||||
| Shares sold | 16,412,206 | $ | 189,653,141 | 2,203,232 | $ | 39,873,587 | ||||||
| Shares issued in reinvestment of distributions | 1,614,671 | 18,479,927 | 751,799 | 13,156,989 | ||||||||
| Shares redeemed | (10,038,264 | ) | (114,629,550 | ) | (3,166,992 | ) | (57,308,972 | ) | ||||
| Net increase (decrease) | 7,988,613 | $ | 93,503,518 | (211,961 | ) | $ | (4,278,396 | ) | ||||
| Class R Shares: | ||||||||||||
| Six Months ended April 30, 2016 | ||||||||||||
| Shares sold | 74,593 | $ | 822,879 | |||||||||
| Shares issued in reinvestment of distributions | 6,149 | 67,697 | ||||||||||
| Shares redeemed | (98,904 | ) | (1,070,596 | ) | ||||||||
| Net increase (decrease) | (18,162 | ) | $ | (180,020 | ) | |||||||
| Year ended October 31, 2015 | ||||||||||||
| Shares sold | 163,363 | $ | 1,900,373 | |||||||||
| Shares issued in reinvestment of distributions | 15,593 | 180,307 | ||||||||||
| Shares redeemed | (70,206 | ) | (810,692 | ) | ||||||||
| Net increase (decrease) | 108,750 | $ | 1,269,988 | |||||||||
franklintempleton.com
Semiannual Report 83
| FRANKLIN INVESTORS SECURITIES TRUST | ||||||||||||
| NOTES TO FINANCIAL STATEMENTS (UNAUDITED) | ||||||||||||
| 2. Shares of Beneficial Interest (continued) | ||||||||||||
| Franklin | Franklin | |||||||||||
| Balanced Fund | Convertible Securities Fund | |||||||||||
| Shares | Amount | Shares | Amount | |||||||||
| Class R6 Shares: | ||||||||||||
| Six Months ended April 30, 2016 | ||||||||||||
| Shares sold | 3,047 | $ | 34,245 | 352,988 | $ | 6,184,371 | ||||||
| Shares issued in reinvestment of distributions | 373 | 4,104 | — | — | ||||||||
| Shares redeemed | (117 | ) | (1,232 | ) | (1,077 | ) | (18,924 | ) | ||||
| Net increase (decrease) | 3,303 | $ | 37,117 | 351,911 | $ | 6,165,447 | ||||||
| Year ended October 31, 2015 | ||||||||||||
| Shares sold | 4,434 | $ | 51,485 | 272 | $ | 5,000 | ||||||
| Shares issued in reinvestment of distributions | 1,610 | 18,640 | 9,077 | 161,165 | ||||||||
| Shares redeemed | (29,769 | ) | (354,572 | ) | (171,980 | ) | (3,169,451 | ) | ||||
| Net increase (decrease) | (23,725 | ) | $ | (284,447 | ) | (162,631 | ) | $ | (3,003,286 | ) | ||
| Advisor Class Shares: | ||||||||||||
| Six Months ended April 30, 2016 | ||||||||||||
| Shares sold | 3,091,486 | $ | 34,315,062 | 35,792,560 | $ | 595,647,552 | ||||||
| Shares issued in reinvestment of distributions | 86,193 | 946,614 | 1,561,535 | 26,792,265 | ||||||||
| Shares redeemed | (1,703,077 | ) | (18,754,032 | ) | (26,807,923 | ) | (452,876,199 | ) | ||||
| Net increase (decrease) | 1,474,602 | $ | 16,507,644 | 10,546,172 | $ | 169,563,618 | ||||||
| Year ended October 31, 2015 | ||||||||||||
| Shares sold | 3,112,842 | $ | 35,919,601 | 31,770,692 | $ | 581,733,680 | ||||||
| Shares issued in reinvestment of distributions | 172,717 | 1,998,279 | 2,529,808 | 45,025,673 | ||||||||
| Shares redeemed | (1,971,010 | ) | (22,810,919 | ) | (30,555,895 | ) | (552,790,095 | ) | ||||
| Net increase (decrease) | 1,314,549 | $ | 15,106,961 | 3,744,605 | $ | 73,969,258 | ||||||
| Franklin | Franklin | |||||||||||
| Equity Income Fund | Real Return Fund | |||||||||||
| Shares | Amount | Shares | Amount | |||||||||
| Class A Shares: | ||||||||||||
| Six Months ended April 30, 2016 | ||||||||||||
| Shares sold | 6,571,722 | $ | 142,035,399 | 1,386,372 | $ | 13,463,194 | ||||||
| Shares issued in reinvestment of distributions | 3,194,659 | 69,387,373 | 182,566 | 1,756,282 | ||||||||
| Shares redeemed | (7,508,185 | ) | (161,479,384 | ) | (3,483,632 | ) | (33,736,674 | ) | ||||
| Net increase (decrease) | 2,258,196 | $ | 49,943,388 | (1,914,694 | ) | $ | (18,517,198 | ) | ||||
| Year ended October 31, 2015 | ||||||||||||
| Shares sold | 10,456,818 | $ | 240,034,722 | 2,322,585 | $ | 23,857,606 | ||||||
| Shares issued in reinvestment of distributions | 5,707,305 | 128,177,676 | 145,574 | 1,511,730 | ||||||||
| Shares redeemed | (11,940,634 | ) | (273,132,840 | ) | (7,038,513 | ) | (72,010,561 | ) | ||||
| Net increase (decrease) | 4,223,489 | $ | 95,079,558 | (4,570,354 | ) | $ | (46,641,225 | ) | ||||
84 Semiannual Report
franklintempleton.com
FRANKLIN INVESTORS SECURITIES TRUST
NOTES TO FINANCIAL STATEMENTS (UNAUDITED)
| Franklin | Franklin | ||||||||||
| Equity Income Fund | Real Return Fund | ||||||||||
| Shares | Amount | Shares | Amount | ||||||||
| Class C Shares: | |||||||||||
| Six Months ended April 30, 2016 | |||||||||||
| Shares sold | 1,549,931 | $ | 33,271,900 | 402,485 | $ | 3,897,885 | |||||
| Shares issued in reinvestment of distributions | 413,093 | 8,915,684 | 28,218 | 269,768 | |||||||
| Shares redeemed | (1,436,097 | ) | (30,550,793 | ) | (907,532 | ) | (8,718,049 | ) | |||
| Net increase (decrease) | 526,927 | $ | 11,636,791 | (476,829 | ) | $ | (4,550,396 | ) | |||
| Year ended October 31, 2015 | |||||||||||
| Shares sold | 2,326,522 | $ | 53,166,635 | 468,524 | $ | 4,780,847 | |||||
| Shares issued in reinvestment of distributions | 703,433 | 15,672,536 | 36,785 | 379,592 | |||||||
| Shares redeemed | (2,227,554 | ) | (50,745,841 | ) | (2,047,828 | ) | (20,832,640 | ) | |||
| Net increase (decrease) | 802,401 | $ | 18,093,330 | (1,542,519 | ) | $ | (15,672,201 | ) | |||
| Class R Shares: | |||||||||||
| Six Months ended April 30, 2016 | |||||||||||
| Shares sold | 54,342 | $ | 1,154,289 | ||||||||
| Shares issued in reinvestment of distributions | 9,768 | 212,168 | |||||||||
| Shares redeemed | (56,684 | ) | (1,209,605 | ) | |||||||
| Net increase (decrease) | 7,426 | $ | 156,852 | ||||||||
| Year ended October 31, 2015 | |||||||||||
| Shares sold | 58,721 | $ | 1,354,831 | ||||||||
| Shares issued in reinvestment of distributions | 21,048 | 472,310 | |||||||||
| Shares redeemed | (112,528 | ) | (2,578,220 | ) | |||||||
| Net increase (decrease) | (32,759 | ) | $ | (751,079 | ) | ||||||
| Class R6 Shares: | |||||||||||
| Six Months ended April 30, 2016 | |||||||||||
| Shares sold | 374,561 | $ | 7,828,218 | 36,899 | $ | 360,133 | |||||
| Shares issued in reinvestment of distributions | — | — | 10 | 93 | |||||||
| Shares redeemed | (17,096 | ) | (374,645 | ) | (30,858 | ) | (297,437 | ) | |||
| Net increase (decrease) | 357,465 | $ | 7,453,573 | 6,051 | $ | 62,789 | |||||
| Year ended October 31, 2015 | |||||||||||
| Shares sold | — | $ | — | 34,529 | $ | 354,907 | |||||
| Shares issued in reinvestment of distributions | — | — | 4 | 41 | |||||||
| Shares redeemed | — | — | (51,465 | ) | (529,381 | ) | |||||
| Net increase (decrease) | — | $ | — | (16,932 | ) | $ | (174,433 | ) | |||
| Advisor Class Shares: | |||||||||||
| Six Months ended April 30, 2016 | |||||||||||
| Shares sold | 979,559 | $ | 21,134,571 | 872,865 | $ | 8,458,198 | |||||
| Shares issued in reinvestment of distributions | 60,893 | 1,323,311 | 47,451 | 457,432 | |||||||
| Shares redeemed | (432,045 | ) | (9,312,002 | ) | (1,189,272 | ) | (11,465,420 | ) | |||
| Net increase (decrease) | 608,407 | $ | 13,145,880 | (268,956 | ) | $ | (2,549,790 | ) | |||
| Year ended October 31, 2015 | |||||||||||
| Shares sold | 762,782 | $ | 17,712,527 | 3,343,973 | $ | 34,412,614 | |||||
| Shares issued in reinvestment of distributions | 96,069 | 2,160,788 | 43,881 | 456,992 | |||||||
| Shares redeemed | (615,943 | ) | (14,109,529 | ) | (5,772,116 | ) | (59,594,877 | ) | |||
| Net increase (decrease) | 242,908 | $ | 5,763,786 | (2,384,262 | ) | $ | (24,725,271 | ) | |||
franklintempleton.com
Semiannual Report 85
FRANKLIN INVESTORS SECURITIES TRUST
NOTES TO FINANCIAL STATEMENTS (UNAUDITED)
3. Transactions with Affiliates
Franklin Resources, Inc. is the holding company for various subsidiaries that together are referred to as Franklin Templeton Investments. Certain officers and trustees of the Trust are also officers and/or directors of the following subsidiaries:
| Subsidiary | Affiliation |
| Franklin Advisers, Inc. (Advisers) | Investment manager |
| Franklin Templeton Services, LLC (FT Services) | Administrative manager |
| Franklin Templeton Distributors, Inc. (Distributors) | Principal underwriter |
| Franklin Templeton Investor Services, LLC (Investor Services) | Transfer agent |
a. Management Fees
Franklin Balanced Fund pays an investment management fee to Advisers based on the average daily net assets of the fund as follows:
| Annualized Fee Rate | Net Assets | |
| 0.700 | % | Up to and including $250 million |
| 0.675 | % | Over $250 million, up to and including $500 million |
| 0.650 | % | Over $500 million, up to and including $1 billion |
| 0.625 | % | Over $1 billion, up to and including $2.5 billion |
| 0.600 | % | Over $2.5 billion, up to and including $5 billion |
| 0.575 | % | Over $5 billion, up to and including $10 billion |
| 0.550 | % | Over $10 billion, up to and including $15 billion |
| 0.525 | % | Over $15 billion, up to and including $20 billion |
| 0.500 | % | In excess of $20 billion |
Franklin Convertible Securities Fund and Franklin Equity Income Fund pay an investment management fee to Advisers based on the month-end net assets of each of the funds as follows:
| Annualized Fee Rate | Net Assets | |
| 0.625 | % | Up to and including $100 million |
| 0.500 | % | Over $100 million, up to and including $250 million |
| 0.450 | % | Over $250 million, up to and including $7.5 billion |
| 0.440 | % | Over $7.5 billion, up to and including $10 billion |
| 0.430 | % | Over $10 billion, up to and including $12.5 billion |
| 0.420 | % | Over $12.5 billion, up to and including $15 billion |
| 0.400 | % | Over $15 billion, up to and including $17.5 billion |
| 0.380 | % | Over $17.5 billion, up to and including $20 billion |
| 0.360 | % | Over $20 billion, up to and including $35 billion |
| 0.355 | % | Over $35 billion, up to and including $50 billion |
| 0.350 | % | In excess of $50 billion |
86 Semiannual Report
franklintempleton.com
FRANKLIN INVESTORS SECURITIES TRUST
NOTES TO FINANCIAL STATEMENTS (UNAUDITED)
Franklin Real Return Fund pays an investment management fee to Advisers based on the average daily net assets of the fund as follows:
| Annualized Fee Rate | Net Assets | |
| 0.625 | % | Up to and including $500 million |
| 0.525 | % | Over $500 million, up to and including $1 billion |
| 0.480 | % | Over $1 billion, up to and including $1.5 billion |
| 0.435 | % | Over $1.5 billion, up to and including $6.5 billion |
| 0.415 | % | Over $6.5 billion, up to and including $11.5 billion |
| 0.400 | % | Over $11.5 billion, up to and including $16.5 billion |
| 0.390 | % | Over $16.5 billion, up to and including $19 billion |
| 0.380 | % | Over $19 billion, up to and including $21.5 billion |
| 0.370 | % | In excess of $21.5 billion |
For the period ended April 30, 2016, each Fund’s annualized effective investment management fee rate based on average daily net assets was as follows:
| Franklin | |||||||
| Franklin | Convertible | Franklin Equity | Franklin Real | ||||
| Balanced Fund | Securities Fund | Income Fund | Return Fund | ||||
| 0.635 | % | 0.469 | % | 0.468 | % | 0.625 | % |
b. Administrative Fees
Under an agreement with Advisers, FT Services provides administrative services to the Funds. The fee is paid by Advisers based on each of the Funds’ average daily net assets, and is not an additional expense of the Funds.
c. Distribution Fees
The Board has adopted distribution plans for each share class, with the exception of Class R6 and Advisor Class shares, pursuant to Rule 12b-1 under the 1940 Act. Under the Funds’ Class A reimbursement distribution plans, the Funds reimburse Distributors for costs incurred in connection with the servicing, sale and distribution of each Fund’s shares up to the maximum annual plan rate for each class. Under the Class A reimbursement distribution plans, costs exceeding the maximum for the current plan year cannot be reimbursed in subsequent periods. In addition, under the Funds’ Class C and R compensation distribution plans, the Funds pay Distributors for costs incurred in connection with the servicing, sale and distribution of each Fund’s shares up to the maximum annual plan rate for each class. The plan year, for purposes of monitoring compliance with the maximum annual plan rates, is February 1 through January 31 for each Fund.
The maximum annual plan rates, based on the average daily net assets, for each class, are as follows:
| Franklin | ||||||||
| Franklin | Convertible | Franklin Equity | Franklin Real | |||||
| Balanced Fund | Securities Fund | Income Fund | Return Fund | |||||
| Reimbursement Plans: | ||||||||
| Class A | 0.35 | % | 0.25 | % | 0.25 | % | 0.25 | % |
| Compensation Plans: | ||||||||
| Class C. | 1.00 | % | 1.00 | % | 1.00 | % | 0.65 | % |
| Class R. | 0.50 | % | — | 0.50 | % | — | ||
For Franklin Balanced Fund, the Board has set the current rate at 0.25% per year for Class A shares until further notice and approval by the Board.
franklintempleton.com
Semiannual Report 87
FRANKLIN INVESTORS SECURITIES TRUST
NOTES TO FINANCIAL STATEMENTS (UNAUDITED)
| 3. | Transactions with Affiliates (continued) |
| d. | Sales Charges/Underwriting Agreements |
Front-end sales charges and contingent deferred sales charges (CDSC) do not represent expenses of the Funds. These charges are deducted from the proceeds of sales of fund shares prior to investment or from redemption proceeds prior to remittance, as applicable. Distributors has advised the Funds of the following commission transactions related to the sales and redemptions of the Funds’ shares for the period:
| Franklin | ||||||||
| Franklin | Convertible | Franklin Equity | Franklin Real | |||||
| Balanced Fund | Securities Fund | Income Fund | Return Fund | |||||
| Sales charges retained net of commissions paid to | ||||||||
| unaffiliated brokers/dealers | $ | 753,959 | $ | 61,130 | $ | 320,226 | $ | 12,343 |
| CDSC retained | $ | 52,341 | $ | 7,409 | $ | 14,665 | $ | 3,634 |
e. Transfer Agent Fees
Each class of shares, except for Class R6, pays transfer agent fees to Investor Services for its performance of shareholder servicing obligations and reimburses Investor Services for out of pocket expenses incurred, including shareholder servicing fees paid to third parties. These fees are allocated daily based upon their relative proportion of such classes’ aggregate net assets. Class R6 pays Investor Services transfer agent fees specific to that class.
For the period ended April 30, 2016, the Funds paid transfer agent fees as noted in the Statements of Operations of which the following amounts were retained by Investor Services:
| Franklin | ||||||||
| Franklin | Convertible | Franklin Equity | Franklin Real | |||||
| Balanced Fund | Securities Fund | Income Fund | Return Fund | |||||
| Transfer agent fees | $ | 590,182 | $ | 394,246 | $ | 495,491 | $ | 101,295 |
f. Investments in Affiliated Management Investment Companies
Certain or all Funds invest in affiliated management investment companies for purposes other than exercising a controlling influence over the management or policies. Management fees paid by the Funds are waived on assets invested in the affiliated management investment companies, as noted in the Statements of Operations, in an amount not to exceed the management and administrative fees paid directly or indirectly by each affiliate. Prior to November 1, 2013, the waiver was accounted for as a reduction to management fees.
| % of | ||||||||||||
| Affiliated | ||||||||||||
| Number of | Number of | Fund Shares | ||||||||||
| Shares Held | Shares | Value | Outstanding | |||||||||
| at Beginning | Gross | Gross | Held at End | at End | Investment | Realized | Held at End | |||||
| of Period | Additions | Reductions | of Period | of Period | Income | Gain (Loss) | of Period | |||||
| Franklin Balanced Fund | ||||||||||||
| Non-Controlled Affiliates | ||||||||||||
| Institutional Fiduciary Trust Money | ||||||||||||
| Market Portfolio | 229,883,180 | 578,395,851 | (632,308,151 | ) | 175,970,880 | $ | 175,970,880 | $ | — | $ — | 0.89 | % |
| Franklin Convertible Securities Fund | ||||||||||||
| Non-Controlled Affiliates | ||||||||||||
| Institutional Fiduciary Trust Money | ||||||||||||
| Market Portfolio | 65,178,257 | 190,983,200 | (154,853,012 | ) | 101,308,445 | $ | 101,308,445 | $ | — | $ — | 0.51 | % |
88 Semiannual Report
franklintempleton.com
FRANKLIN INVESTORS SECURITIES TRUST
NOTES TO FINANCIAL STATEMENTS (UNAUDITED)
| % of | ||||||||||||||
| Affiliated | ||||||||||||||
| Number of | Number of | Fund Shares | ||||||||||||
| Shares Held | Shares | Value | Outstanding | |||||||||||
| at Beginning | Gross | Gross | Held at End | at End | Investment | Realized | Held at End | |||||||
| of Period | Additions | Reductions | of Period | of Period | Income | Gain (Loss) | of Period | |||||||
| Franklin Equity Income Fund | ||||||||||||||
| Non-Controlled Affiliates | ||||||||||||||
| Institutional Fiduciary Trust Money | ||||||||||||||
| Market Portfolio | 45,153,270 | 380,947,059 | (332,916,536 | ) | 93,183,793 | $ | 93,183,793 | $ | — | $ | — | 0.47 | % | |
| Franklin Real Return Fund | ||||||||||||||
| Non-Controlled Affiliates | ||||||||||||||
| Franklin Lower Tier Floating Rate | ||||||||||||||
| Fund | — | 265,044 | a | — | 265,044 | $ | 2,589,486 | $ | 95,250 | $ | — | 0.59 | % | |
| Franklin Middle Tier Floating Rate | ||||||||||||||
| Fund | — | 101,647 | b | — | 101,647 | 969,710 | 22,828 | — | 0.28 | % | ||||
| Total | $ | 3,559,196 | $ | 118,078 | $ | — | ||||||||
aThe Fund purchased shares of the affiliate through an in-kind transfer of securities. The securities transferred had a market value of $2,519,518 and a cost basis of
$2,868,716 on the date of the transfer.
bThe Fund purchased shares of the affiliate through an in-kind transfer of securities. The securities transferred had a market value of $983,344 and cost basis of $1,046,227
on the date of the transfer.
g. Waiver and Expense Reimbursements
Advisers and Investor Services have contractually agreed in advance to waive or limit their respective fees and to assume as their own expense certain expenses otherwise payable by Franklin Real Return Fund so that the expenses (excluding distribution fees, and acquired fund fees and expenses) for Class A, Class C, and Advisor Class of the Fund do not exceed 0.65%, and Class R6 does not exceed 0.52% based on the average net assets of each class (other than certain non-routine expenses or costs, including those relating to litigation, indemnification, reorganizations, and liquidations) until February 28, 2017.
Additionally, Investor Services has contractually agreed in advance to waive or limit its fees so that the Class R6 transfer agent fees do not exceed 0.01% until February 28, 2017. For Franklin Equity Income Fund and Franklin Real Return Fund, there were no Class R6 transfer agent fees waived during the period ended April 30, 2016.
4. Expense Offset Arrangement
The Funds have entered into an arrangement with their custodian whereby credits realized as a result of uninvested cash balances are used to reduce a portion of the Funds’ custodian expenses. During the period ended April 30, 2016, the custodian fees were reduced as noted in the Statements of Operations.
5. Income Taxes
For tax purposes, capital losses may be carried over to offset future capital gains. Capital loss carryforwards with no expiration, if any, must be fully utilized before those losses with expiration dates.
franklintempleton.com
Semiannual Report 89
FRANKLIN INVESTORS SECURITIES TRUST
NOTES TO FINANCIAL STATEMENTS (UNAUDITED)
| 5. Income Taxes (continued) | |||||
| At October 31, 2015, the capital loss carryforwards were as follows: | |||||
| Franklin | Franklin Real | ||||
| Balanced Fund | Return Fund | ||||
| Capital loss carryforwards subject to expiration: | |||||
| 2016 | $ | — | $ | 1,161,482 | |
| 2017 | — | 1,207,907 | |||
| 2018 | — | 1,206,586 | |||
| Capital loss carryforwards not subject to expiration: | |||||
| Short term | 10,604,468 | 593,952 | |||
| Long term | — | 12,064,324 | |||
| Total capital loss carryforwards | $ | 10,604,468 | $ | 16,234,251 | |
At April 30, 2016, the cost of investments and net unrealized appreciation (depreciation) for income tax purposes were as follows:
| Franklin | ||||||||||||
| Franklin | Convertible | Franklin Equity | Franklin Real | |||||||||
| Balanced Fund | Securities Fund | Income Fund | Return Fund | |||||||||
| Cost of investments | $ | 3,065,237,853 | $ | 1,990,081,977 | $ | 1,780,533,742 | $ | 253,851,263 | ||||
| Unrealized appreciation. | $ | 248,988,445 | $ | 254,473,446 | $ | 366,994,089 | $ | 13,580,789 | ||||
| Unrealized depreciation. | (126,442,202 | ) | (170,956,718 | ) | (52,100,868 | ) | (19,805,594 | ) | ||||
| Net unrealized appreciation (depreciation) | $ | 122,546,243 | $ | 83,516,728 | $ | 314,893,221 | $ | (6,224,805 | ) | |||
Differences between income and/or capital gains as determined on a book basis and a tax basis are primarily due to differing treatments of foreign currency transactions, bond discounts and premiums and wash sales.
6. Investment Transactions
Purchases and sales of investments (excluding short term securities) for the period ended April 30, 2016, were as follows:
| Franklin | ||||||||||
| Franklin | Convertible | Franklin Equity | Franklin Real | |||||||
| Balanced Fund | Securities Fund | Income Fund | Return Fund | |||||||
| Purchases | $ | 737,294,037 | $ | 284,867,791 | $ | 709,502,743 | $ | 57,738,423 | ||
| Sales | $ | 382,498,790 | $ | 272,504,851 | $ | 730,075,282 | $ | 75,570,364 | ||
| Transactions in options written during the period ended April 30, 2016, were as follows: | ||||||||||
| Number of | Premiums | |||||||||
| Contracts | Received | |||||||||
| Franklin Balanced Fund | ||||||||||
| Options outstanding at October 31, 2015 | 10,000 | $ | 1,094,838 | |||||||
| Options written | 23,587 | 3,331,246 | ||||||||
| Options expired | (24,337 | ) | (3,159,188 | ) | ||||||
| Options exercised | (10 | ) | (1,491 | ) | ||||||
| Options closed | (2,490 | ) | (371,202 | ) | ||||||
| Options outstanding at April 30, 2016. | 6,750 | $ | 894,203 | |||||||
See Notes 1(e) and 8 regarding derivative financial instruments and other derivative information, respectively.
90 Semiannual Report
franklintempleton.com
FRANKLIN INVESTORS SECURITIES TRUST
NOTES TO FINANCIAL STATEMENTS (UNAUDITED)
7. Credit Risk
At April 30, 2016, Franklin Balanced Fund, Franklin Convertible Securities Fund and Franklin Real Return Fund had 9.61%, 61.99% and 13.22%, respectively, of their portfolio invested in high yield securities, senior secured floating rate notes, or other securities rated below investment grade. These securities may be more sensitive to economic conditions causing greater price volatility and are potentially subject to a greater risk of loss due to default than higher rated securities.
Certain or all funds held a defaulted security and/or other securities for which the income has been deemed uncollectible. At April 30. 2016, the aggregate value of the security for Franklin Real Return Fund represents less than 0.05% of the Fund’s net assets. The Fund discontinued accruing income on securities for which income has been deemed uncollectible and provide an estimate for losses on interest receivable. The security has been identified in the accompanying Statement of Investments.
8. Other Derivative Information
At April 30, 2016, the Funds’ investments in derivative contracts are reflected in the Statements of Assets and Liabilities as follows:
| Asset Derivatives | Liability Derivatives | |||||
| Derivative Contracts | ||||||
| Not Accounted for as | Statement of Assets and | Statement of Assets and | ||||
| Hedging Instruments | Liabilities Location | Fair Value | Liabilities Location | Fair Value | ||
| Franklin Balanced Fund | ||||||
| Equity contracts | Investments in securities, at value | $ | — | Options written, at value | $ | 1,296,250 |
| Franklin Real Return Fund | ||||||
| Foreign exchange contracts | Unrealized appreciation on OTC | $ | 121,895 | Unrealized depreciation on OTC | $ | 188,524 |
| forward exchange contracts | forward exchange contracts | |||||
For the period ended April 30, 2016, the effect of derivative contracts in the Funds’ Statements of Operations was as follows:
| Net Change | ||||||||
| in Unrealized | ||||||||
| Derivative Contracts | Net Realized | Appreciation | ||||||
| Not Accounted for as | Statement of | Gain (Loss) | Statement of | (Depreciation) | ||||
| Hedging Instruments | Operations Locations | for the Period | Operations Locations | for the Period | ||||
| Net realized gain (loss) from: | Net change in unrealized | |||||||
| appreciation (depreciation) on: | ||||||||
| Franklin Balanced Fund | ||||||||
| Equity contracts | Written options | $ | 2,954,702 | Written options | $ | (1,044,634 | ) | |
| Franklin Real Return Fund | ||||||||
| Foreign exchange contracts | Foreign currency transactions | $ | 305,417 | a | Translation of other assets and | $ | (74,735 | )a |
| liabilities denominated in foreign | ||||||||
| currencies | ||||||||
aForward exchange contracts are included in net realized gain (loss) from foreign currency transactions and net change in unrealized appreciation (depreciation) on
translation of other assets and liabilities denominated in foreign currencies in the Statements of Operations.
For Franklin Balanced Fund and Franklin Real Return Fund for the period ended April 30, 2016, the average month end fair value of derivatives represented 0.02% and 0.15%, respectively, of each Fund’s average month end net assets. The average month end number of open derivatives contracts for the period was 2 and 8, respectively.
See Note 1(e) regarding derivative financial instruments.
franklintempleton.com
Semiannual Report 91
FRANKLIN INVESTORS SECURITIES TRUST
NOTES TO FINANCIAL STATEMENTS (UNAUDITED)
9. Credit Facility
Certain or all Funds, together with other U.S. registered and foreign investment funds (collectively, Borrowers), managed by Franklin Templeton Investments, are borrowers in a joint syndicated senior unsecured credit facility totaling $2 billion (Global Credit Facility) which matures on February 10, 2017. This Global Credit Facility provides a source of funds to the Borrowers for temporary and emergency purposes, including the ability to meet future unanticipated or unusually large redemption requests.
Under the terms of the Global Credit Facility, the Funds shall, in addition to interest charged on any borrowings made by the Funds and other costs incurred by the Funds, pay their share of fees and expenses incurred in connection with the implementation and maintenance of the Global Credit Facility, based upon their relative share of the aggregate net assets of all of the Borrowers, including an annual commitment fee of 0.07% based upon the unused portion of the Global Credit Facility. Effective February 12, 2016, the annual commitment fee is 0.15%. These fees are reflected in other expenses in the Statements of Operations. During the period ended April 30, 2016, the Funds did not use the Global Credit Facility.
10. Fair Value Measurements
The Funds follow a fair value hierarchy that distinguishes between market data obtained from independent sources (observable inputs) and the Funds’ own market assumptions (unobservable inputs). These inputs are used in determining the value of the Funds’ financial instruments and are summarized in the following fair value hierarchy:
- Level 1 – quoted prices in active markets for identical financial instruments
- Level 2 – other significant observable inputs (including quoted prices for similar financial instruments, interest rates, prepayment speed, credit risk, etc.)
- Level 3 – significant unobservable inputs (including the Funds’ own assumptions in determining the fair value of financial instruments)
The input levels are not necessarily an indication of the risk or liquidity associated with financial instruments at that level.
For movements between the levels within the fair value hierarchy, the Funds have adopted a policy of recognizing the transfers as of the date of the underlying event which caused the movement.
A summary of inputs used as of April 30, 2016, in valuing the Funds’ assets and liabilities carried at fair value, is as follows:
| Level 1 | Level 2 | Level 3 | Total | |||||
| Franklin Balanced Fund | ||||||||
| Assets: | ||||||||
| Investments in Securities: | ||||||||
| Equity Investmentsa,b | $ | 1,779,687,299 | $ | — | $ | — | $ | 1,779,687,299 |
| Equity-Linked Securities | — | 301,739,879 | — | 301,739,879 | ||||
| Corporate Bonds | — | 930,386,038 | — | 930,386,038 | ||||
| Short Term Investments | 175,970,880 | — | — | 175,970,880 | ||||
| Total Investments in Securities | $ | 1,955,658,179 | $ | 1,232,125,917 | $ | — | $ | 3,187,784,096 |
| Liabilities: | ||||||||
| Other Financial Instruments: | ||||||||
| Options Written | $ | 1,296,250 | $ | — | $ | — | $ | 1,296,250 |
92 Semiannual Report
franklintempleton.com
FRANKLIN INVESTORS SECURITIES TRUST
NOTES TO FINANCIAL STATEMENTS (UNAUDITED)
| Level 1 | Level 2 | Level 3 | Total | |||||
| Franklin Convertible Securities Fund | ||||||||
| Assets: | ||||||||
| Investments in Securities: | ||||||||
| Equity Investments:a | ||||||||
| Consumer Staples | $ | 47,411,000 | $ | 44,310,908 | $ | — | $ | 91,721,908 |
| Energy. | — | 29,412,875 | — | 29,412,875 | ||||
| Financials | — | 23,544,950 | — | 23,544,950 | ||||
| All Other Equity Investmentsb | 361,736,190 | — | — | 361,736,190 | ||||
| Convertible Bonds | — | 1,465,874,337 | — | 1,465,874,337 | ||||
| Escrows and Litigation Trusts | — | — | —c | — | ||||
| Short Term Investments | 101,308,445 | — | — | 101,308,445 | ||||
| Total Investments in Securities | $ | 510,455,635 | $ | 1,563,143,070 | $ | — | $ | 2,073,598,705 |
| Franklin Equity Income Fund | ||||||||
| Assets: | ||||||||
| Investments in Securities: | ||||||||
| Equity Investmentsa,b | $ | 1,888,861,524 | $ | — | $ | — | $ | 1,888,861,524 |
| Equity-Linked Securities | — | 113,381,646 | — | 113,381,646 | ||||
| Short Term Investments | 93,183,793 | — | — | 93,183,793 | ||||
| Total Investments in Securities | $ | 1,982,045,317 | $ | 113,381,646 | $ | — | $ | 2,095,426,963 |
| Franklin Real Return Fund | ||||||||
| Assets: | ||||||||
| Investments in Securities: | ||||||||
| Equity Investmentsa,b | $ | 42,270,308 | $ | — | $ | — | $ | 42,270,308 |
| Corporate Bonds | — | 15,083,207 | — | 15,083,207 | ||||
| Senior Floating Rate Interests | — | 5,996,128 | — | 5,996,128 | ||||
| Foreign Government and Agency Securities | — | 31,635,305 | — | 31,635,305 | ||||
| U.S. Government and Agency Securities | — | 141,321,086 | — | 141,321,086 | ||||
| Short Term Investments | — | 11,320,424 | — | 11,320,424 | ||||
| Total Investments in Securities | $ | 42,270,308 | $ | 205,356,150 | $ | — | $ | 247,626,458 |
| Other Financial Instruments: | ||||||||
| Forward Exchange Contracts | $ | — | $ | 121,895 | $ | — | $ | 121,895 |
| Liabilities: | ||||||||
| Other Financial Instruments: | ||||||||
| Forward Exchange Contracts | $ | — | $ | 188,524 | $ | — | $ | 188,524 |
aIncludes common, preferred, convertible preferred stocks and management investment companies.
bFor detailed categories, see the accompanying Statement of Investments.
cIncludes securities determined to have no value at April 30, 2016.
11. Subsequent Events
The Funds have evaluated subsequent events through the issuance of the financial statements and determined that no events have occurred that require disclosure.
franklintempleton.com
Semiannual Report 93
FRANKLIN INVESTORS SECURITIES TRUST
NOTES TO FINANCIAL STATEMENTS (UNAUDITED)
| Abbreviations | |||||
| Counterparty | Currency | Selected Portfolio | |||
| DBAB | Deutsche Bank AG | BRL | Brazilian Real | ADR | American Depositary Receipt |
| JPHQ | JP Morgan Chase & Co. | EUR | Euro | ETF | Exchange Traded Fund |
| IDR | Indonesian Rupiah | FRN | Floating Rate Note | ||
| MXN | Mexican Peso | REIT | Real Estate Investment Trust | ||
| MYR | Malaysian Ringgit | SPDR | S&P Depository Receipt | ||
| PLN | Polish Zloty | ||||
94 Semiannual Report
franklintempleton.com
FRANKLIN INVESTORS SECURITIES TRUST
Shareholder Information
Board Review of Investment Management Agreement
At a meeting held February 23, 2016, the Board of Trustees (Board), including a majority of trustees that are not “interested persons” as such term is defined in section 2(a)(19) of the Investment Company Act of 1940 (hereinafter referred to as “non-interested Trustees” or “independent Trustees”), approved renewal of the investment management agreement for each of the separate funds within Franklin Investors Securities Trust (Fund(s)). In reaching this decision, the Board took into account information furnished throughout the year at regular Board meetings, as well as information prepared specifically in connection with the annual renewal review process. Information furnished and discussed throughout the year included investment performance reports and related financial information for each Fund, along with periodic reports on expenses, shareholder services, legal and compliance matters, risk control, pricing, brokerage commissions and execution, and other services provided by the Investment Manager (Manager) and its affiliates, as well as marketing support payments made to financial intermediaries. Information furnished specifically in connection with the renewal process included a report for each Fund prepared by Broadridge Financial Solutions, Inc. (Broadridge), an independent organization, as well as additional material, including a Fund profitability analysis prepared by management. The Broadridge reports, which utilize data from Lipper, Inc. (Lipper), compared each Fund’s investment performance and expenses with those of other mutual funds deemed comparable to the Fund as selected by Lipper. The Fund profitability analysis discussed the profitability to Franklin Templeton Investments (FTI) from its overall U.S. fund operations, as well as on an individual fund-by-fund basis. Additional material accompanying such profitability analysis included information on a fund-by-fund basis listing portfolio managers and other accounts they manage, as well as information on management fees charged by the Manager and its affiliates to U.S. mutual funds and other accounts, including management’s explanation of differences where relevant. Such material also included a memorandum prepared by management describing project initiatives and capital investments relating to the services provided to the Funds by the FTI organization, as well as a memorandum relating to economies of scale and an analysis concerning transfer agent fees charged by an affiliate of the Manager. The Board also received a report on all marketing support payments made by FTI to financial intermediaries during the past year, as well as a memorandum relating to third-party servicing arrangements in response to a Guidance Update from the U.S. Securities and Exchange Commission (SEC) relating to mutual fund distribution and sub-accounting fees.
In considering such materials, the independent Trustees received assistance and advice from and met separately with independent counsel. While the investment management agreements for all Funds were considered at the same Board meeting, the Board dealt with each Fund separately. In approving continuance of the investment management agreement for each Fund, and the subadvisory agreement for Franklin Total Return Fund, the Board, including a majority of independent Trustees, determined that the existing management fee structure was fair and reasonable and that continuance of the investment management agreement was in the best interests of each Fund and its shareholders. While attention was given to all information furnished, the following discusses some primary factors relevant to the Board’s decision.
NATURE, EXTENT AND QUALITY OF SERVICES. The Board was satisfied with the nature and quality of the overall services provided by the Manager and its affiliates to the Funds and their shareholders. In addition to investment performance and expenses discussed later, the Board’s opinion was based, in part, upon periodic reports furnished it showing that the investment policies and restrictions for each Fund were consistently complied with as well as other reports periodically furnished the Board covering matters such as the compliance of portfolio managers and other management personnel with the code of ethics adopted throughout the Franklin Templeton fund complex, the adherence to fair value pricing procedures established by the Board, and the accuracy of net asset value calculations. The Board also noted the extent of benefits provided Fund shareholders from being part of the Franklin Templeton family of funds, including the right to exchange investments between the same class of shares of different funds without a sales charge, the ability to reinvest Fund dividends into other funds and the right to combine holdings in other funds to obtain a reduced sales charge. Favorable consideration was given to management’s continual efforts and expenditures in establishing effective business continuity plans and developing strategies to address cybersecurity threats. Additionally, the Board noted the Manager’s continued attention to pricing and valuation issues, particularly with
franklintempleton.com
Semiannual Report 95
FRANKLIN INVESTORS SECURITIES TRUST
SHAREHOLDER INFORMATION
respect to complex securities. Among other factors taken into account by the Board were the Manager’s best execution trading policies, including a favorable report by an independent portfolio trading analytical firm, which also covered FOREX transactions. Consideration was also given to the experience of each Fund’s portfolio management team, the number of accounts managed and general method of compensation. In this latter respect, the Board noted that a primary factor in management’s determination of a portfolio manager’s bonus compensation was the relative investment performance of the funds he or she managed and that a portion of such bonus was required to be invested in a pre-designated list of funds within such person’s fund management area so as to be aligned with the interests of shareholders. The Board also took into account the quality of transfer agent and shareholder services provided Fund shareholders by an affiliate of the Manager and steps taken by FTI to enhance analytical support to the investment management groups and provide additional oversight of liquidity risk and complex securities. The Board also took into account, among other things, management’s efforts in establishing a global credit facility for the benefit of the Funds and other accounts managed by FTI to provide a source of cash for temporary and emergency purposes or to meet unusual redemption requests as well as the strong financial position of the Manager’s parent company and its commitment to the mutual fund business as evidenced by its continued introduction of new funds and reassessment of fund offerings in response to the market environment.
INVESTMENT PERFORMANCE. The Board placed significant emphasis on the investment performance of each Fund in view of its importance to shareholders. While consideration was given to performance reports and discussions with portfolio managers at Board meetings during the year, particular attention in assessing performance was given to the Broadridge reports furnished for the agreement renewals. The Broadridge reports prepared for each individual Fund showed the investment performance of its Class A shares in comparison with its selected performance universe during 2015 and during the previous 10 years ended December 31, 2015, unless otherwise noted. Performance on a total return basis was shown by Broadridge for all Funds, with performance on an income return basis also being shown for those Funds having income return as an element of their investment objective. The following summarizes the performance results for each Fund.
Franklin Balanced Fund - The Fund’s investment performance was shown in comparison to a performance universe consisting of all retail and institutional mixed-asset target allocation moderate funds as selected by Lipper during 2015 and previous years during which the Fund has been in existence. The Broadridge report showed the Fund’s income return to be in the highest quintile of such universe during 2015, as well as during the previous three- and five-year periods on an annualized basis. The Broadridge report showed the Fund’s total return performance during 2015 to be in the second-lowest performing quintile of its performance universe, and on an annualized basis to be in the middle performing quintile of such universe during the previous three-year period and the second-highest performing quintile of such universe during the previous five-year period. The Board found such comparative performance to be acceptable and noted that the Fund’s total return for 2015 was within 1.24 basis points of the performance universe median for such period as shown in the Broadridge report.
Franklin Convertible Securities Fund - The Fund’s investment performance was shown in comparison to a performance universe consisting of all retail and institutional convertible securities funds as selected by Lipper. The Broadridge report showed the Fund’s income return during 2015 to be in the middle performing quintile of its performance universe, and on an annualized basis to be in the middle quintile of such performance universe for the previous three-year period, in the second-highest quintile for the previous five-year period, and in the highest quintile for the previous 10-year period. The Broadridge report showed the Fund’s total return during 2015 to be in the highest performing quintile of its performance universe, and on an annualized basis to be in either the highest or second-highest performing quintile of such universe for each of the previous three-, five- and 10-year periods. The Board found the Fund’s overall comparative performance as set forth in the Broadridge report to be satisfactory, noting management’s discussion of the Fund’s focus on select convertible securities to provide investors with positive risk-adjusted returns over the long term.
96 Semiannual Report
franklintempleton.com
FRANKLIN INVESTORS SECURITIES TRUST
SHAREHOLDER INFORMATION
Franklin Equity Income Fund - The Fund’s investment performance was shown in comparison to a performance universe consisting of all retail and institutional equity income funds as selected by Lipper. The Broadridge report showed the Fund’s income return during 2015 to be in the second-highest quintile of the performance universe, and on an annualized basis during each of the previous three-, five- and 10-year periods to be in either the highest or second-highest quintile of such performance universe. The Broadridge report showed the Fund’s total return during 2015 to be in the second-highest performing quintile of such universe and on an annualized basis to be in the second-highest performing quintile of such universe for the previous three-year period, the middle performing quintile for the previous five-year period, and the second-lowest performing quintile of such universe for the previous 10-year period. In discussing such performance, management explained that it reflected the Fund’s long-standing strategy of investing in securities with yields higher than the overall market and Lipper peers. The Board believed the Fund’s overall performance as shown in the Broadridge report to be satisfactory, noting its consistently good comparative income returns and the fact that the Broadridge report showed the Fund’s total return for the one-, three- and five-year annualized periods to be significantly better than the performance universe median.
Franklin Real Return Fund - The Fund’s investment performance was shown in comparison to a performance universe consisting of all retail and institutional inflation protected bond funds as selected by Lipper. The Broadridge report showed the Fund’s income return during 2015 to be in the second highest quintile of such performance universe, and on an annualized basis to be in either the highest or second-highest quintile of such universe during the previous three-, five- and 10-year periods. The Broadridge report showed the Fund’s 2015 total return to be in the lowest performing quintile of its performance universe, and on an annualized basis to be in the second-highest performing quintile of such universe during the previous three-year period, in the lowest performing quintile for the previous five-year period, and in the second-lowest performing quintile for the previous 10-year period. In discussing the Fund’s total return underperformance, management expressed the view that the performance universe contained many funds that invested primarily in treasury inflation protected securities (TIPS) and held longer term TIPS that performed better during such periods than the Fund’s portfolio, which had a lesser weighting in TIPS with those held being of shorter duration. They indicated that the Fund is positioned correctly to protect investors from a rise in inflation. The Board found the Fund’s overall performance as shown in the Broadridge report to be acceptable, noting management’s explanation and the level of income returns achieved by the Fund.
COMPARATIVE EXPENSES. Consideration was given to the management fees and total expense ratio of each Fund compared with those of a group of other funds selected by Lipper as constituting its appropriate Lipper expense group. Lipper expense data is based upon information taken from each fund’s most recent annual report, which reflects historical asset levels that may be quite different from those currently existing, particularly in a period of market volatility. While recognizing such inherent limitation and the fact that expense ratios generally increase as assets decline and decrease as assets grow, the Board believed the independent analysis conducted by Lipper to be an appropriate measure of comparative expenses. In reviewing comparative costs, Lipper provides information on each Fund’s contractual investment management fee in comparison with the contractual investment management fee that would have been charged by other funds within its Lipper expense group assuming they were similar in size to the Fund, as well as the actual total expense ratio of the Fund in comparison with those of its expense group. The Lipper contractual investment management fee analysis includes within such fee any separate administrative fees, and Lipper total expenses, for comparative consistency, are shown by Lipper for Fund Class A shares. The results of such expense comparisons showed that the contractual investment management fee rate and actual total expense ratio for Franklin Convertible Securities Fund and Franklin Equity Income Fund were in each case below the median of its respective Lipper expense group. The Board was satisfied with the comparative contractual investment management fee rate and actual total expense ratios of these Funds as shown in the Broadridge reports. The contractual investment management fee rate and actual total expense ratio of Franklin Balanced Fund and
franklintempleton.com
Semiannual Report 97
FRANKLIN INVESTORS SECURITIES TRUST
SHAREHOLDER INFORMATION
Franklin Real Return Fund were, in each case, above the median of its respective expense group. The Board found the comparative contractual investment fee rate and actual total expense ratios of these Funds as shown in their Broadridge reports to be acceptable.
MANAGEMENT PROFITABILITY. The Board also considered the level of profits realized by the Manager and its affiliates in connection with the operation of each Fund. In this respect, the Board reviewed the Fund profitability analysis that addresses the overall profitability of Franklin Templeton’s U.S. fund business, as well as its profits in providing management and other services to each of the individual funds during the 12-month period ended September 30, 2015, being the most recent fiscal year-end for Franklin Resources, Inc., the Manager’s parent. In reviewing the analysis, the Board recognized that allocation methodologies are inherently subjective and various allocation methodologies may be reasonable while producing different results. In this respect, the Board noted that while management continually makes refinements to its methodologies in response to organizational and product related changes, the overall approach as defined by the primary drivers and activity measurements has remained consistent with that used in the Funds’ profitability report presentations from prior years. Additionally, the Funds’ independent registered public accounting firm had been engaged by the Manager to periodically review the reasonableness of the allocation methodologies to be used solely by the Funds’ Board in reference to the profitability analysis. In reviewing and discussing such analysis, management discussed with the Board its belief that costs incurred in establishing the infrastructure necessary for the type of mutual fund operations conducted by the Manager and its affiliates may not be fully reflected in the expenses allocated to each Fund in determining its profitability, as well as the fact that the level of profits, to a certain extent, reflected operational cost savings and efficiencies initiated by management. The Board also took into account management’s expenditures in improving shareholder services provided the Funds, as well as the need to implement systems and meet additional regulatory and compliance requirements resulting from statutes such as the Sarbanes-Oxley and Dodd-Frank Acts and recent SEC and other regulatory requirements. In addition, the Board considered a third-party study comparing the profitability of the Manager’s parent on an overall basis to other publicly held managers broken down to show profitability from management operations exclusive of distribution expenses, as well as profitability including distribution expenses. The Board also considered the extent to which the Manager and its affiliates might derive ancillary benefits from fund operations, including revenues generated from transfer agent services and potential benefits resulting from personnel and systems enhancements necessitated by fund growth, as well as increased leverage with service providers and counterparties, allocation of fund brokerage and the use of commission dollars to pay for research. Based upon its consideration of all these factors, the Board determined that the level of profits realized by the Manager and its affiliates from providing services to each Fund was not excessive in view of the nature, quality and extent of services provided.
ECONOMIES OF SCALE. The Board also considered whether economies of scale are realized by the Manager as the Funds grow larger and the extent to which this is reflected in the level of management fees charged. While recognizing that any precise determination is inherently subjective, the Board noted that based upon the Fund profitability analysis, it appears that as some funds get larger, at some point economies of scale do result in the Manager realizing a larger profit margin on management services provided such a fund. The Board also noted that economies of scale are shared with each Fund and its shareholders through management fee breakpoints so that as a Fund grows in size, its effective management fee rate declines. Based on their year-end asset levels, all of the Funds, except Franklin Real Return Fund, benefited from breakpoints contained in their management fee structures with additional breakpoints continuing beyond such asset levels. The Board believed that to the extent economies of scale may be realized by the Manager and its affiliates, the schedule of fees under the investment management agreement for each Fund provides a sharing of benefits with the Fund and its shareholders as the Fund grows.
98 Semiannual Report
franklintempleton.com
FRANKLIN INVESTORS SECURITIES TRUST
SHAREHOLDER INFORMATION
Proxy Voting Policies and Procedures
The Trust’s investment manager has established Proxy Voting Policies and Procedures (Policies) that the Trust uses to determine how to vote proxies relating to portfolio securities. Shareholders may view the Trust’s complete Policies online at franklintempleton.com. Alternatively, shareholders may request copies of the Policies free of charge by calling the Proxy Group collect at (954) 527-7678 or by sending a written request to: Franklin Templeton Companies, LLC, 300 S.E. 2nd Street, Fort Lauderdale, FL 33301, Attention: Proxy Group. Copies of the Trust’s proxy voting records are also made available online at franklintempleton.com and posted on the U.S. Securities and Exchange Commission’s website at sec.gov and reflect the most recent 12-month period ended June 30.
Quarterly Statement of Investments
The Trust files a complete statement of investments with the U.S. Securities and Exchange Commission for the first and third quarters for each fiscal year on Form N-Q. Shareholders may view the filed Form N-Q by visiting the Commission’s website at sec.gov. The filed form may also be viewed and copied at the Commission’s Public Reference Room in Washington, DC. Information regarding the operations of the Public Reference Room may be obtained by calling (800) SEC-0330.
franklintempleton.com
Semiannual Report 99
FIST1_P1_0616
SUPPLEMENT DATED JUNE 16, 2016
TO THE PROSPECTUS DATED MARCH 1, 2016
OF
FRANKLIN BALANCED FUND
(Franklin Investors Securities Trust)
The Prospectus is amended as follows:
I. The “Fund Summary - Annual Fund Operating Expenses” table on page 3 is revised as follows:
| Annual Fund Operating Expenses | ||||||||||
| (expenses that you pay each year as a percentage of the value of your investment) | ||||||||||
| Advisor | ||||||||||
| Class A | Class C | Class R | Class R6 | Class | ||||||
| Management fees | 0.64 | % | 0.64 | % | 0.64 | % | 0.64 | % | 0.64 | % |
| Distribution and service (12b-1) fees | 0.25 | %1 | 1.00 | % | 0.50 | % | None | None | ||
| Other expenses | 0.14 | % | 0.14 | % | 0.14 | % | 0.03 | % | 0.14 | % |
| Acquired fund fees and expenses | 0.01 | % | 0.01 | % | 0.01 | % | 0.01 | % | 0.01 | % |
| Total annual Fund operating expenses | 1.04 | % | 1.79 | % | 1.29 | % | 0.68 | % | 0.79 | % |
| Fee waiver and/or expense reimbursement2 | -0.01 | % | -0.01 | % | -0.01 | % | -0.01 | % | -0.01 | % |
| Total annual Fund operating expenses after fee | ||||||||||
| waiver and/or expense reimbursement2,3 | 1.03 | % | 1.78 | % | 1.28 | % | 0.67 | % | 0.78 | % |
1. Class A distribution and service (12b-1) fees have been restated to reflect the maximum annual rate set by the board of trustees. Consequently, the total annual Fund
operating expenses differ from the ratio of expenses to average net assets shown in the Financial Highlights due to a different 12b-1 fee rate paid in the Fund’s most recent
fiscal year.
2. The investment manager has contractually agreed in advance to reduce its fee as a result of the Fund’s investment in a Franklin Templeton money fund (acquired fund) for
at least the next 12-month period. Contractual fee waiver and/or expense reimbursement agreements may not be changed or terminated during the time periods set forth
above.
3. Total annual Fund operating expenses differ from the ratio of expenses to average net assets shown in the Financial Highlights, which reflect the operating expenses of the
Fund and do not include acquired fund fees and expenses.
Please keep this supplement with your prospectus for future reference.
Item 2. Code of Ethics.
(a) The Registrant has adopted a code of ethics that applies to its principal executive officers and principal financial and accounting officer.
(c) N/A
(d) N/A
(f) Pursuant to Item 12(a)(1), the Registrant is attaching as an exhibit a copy of its code of ethics that applies to its principal executive officers and principal financial and accounting officer.
Item 3. Audit Committee Financial Expert.
(a)(1) The Registrant has an audit committee financial expert serving on its audit committee.
(2) The audit committee financial expert is John B. Wilson and he is "independent" as defined under the relevant Securities and Exchange Commission Rules and Releases.
Item 4. Principal Accountant Fees and Services. N/A
Item 5. Audit Committee of Listed Registrants. N/A
Item 6. Schedule of Investments. N/A
Item 7. Disclosure of Proxy Voting Policies and Procedures for Closed-End Management Investment Companies. N/A
Item 8. Portfolio Managers of Closed-End Management Investment Companies. N/A
Item 9. Purchases of Equity Securities by Closed-End Management Investment Company and Affiliated Purchasers. N/A
Item 10. Submission of Matters to a Vote of Security Holders.
There have been no changes to the procedures by which shareholders may recommend nominees to the Registrant's Board of Trustees that would require disclosure herein.
Item 11. Controls and Procedures.
(a) Evaluation of Disclosure Controls and Procedures. The Registrant maintains disclosure controls and procedures that are designed to ensure that information required to be disclosed in the Registrant’s filings under the Securities Exchange Act of 1934 and the Investment Company Act of 1940 is recorded, processed, summarized and reported within the periods specified in the rules and forms of the Securities and Exchange Commission. Such information is accumulated and communicated to the Registrant’s management, including its principal executive officer and principal financial officer, as appropriate, to allow timely decisions regarding required disclosure. The Registrant’s management, including the principal executive officer and the principal financial officer, recognizes that any set of controls and procedures, no matter how well designed and operated, can provide only reasonable assurance of achieving the desired control objectives.
Within 90 days prior to the filing date of this Shareholder Report on Form N-CSR, the Registrant had carried out an evaluation, under the supervision and with the participation of the Registrant’s management, including the Registrant’s principal executive officer and the Registrant’s principal financial officer, of the effectiveness of the design and operation of the Registrant’s disclosure controls and procedures. Based on such evaluation, the Registrant’s principal executive officer and principal financial officer concluded that the Registrant’s disclosure controls and procedures are effective.
(b) Changes in Internal Controls. There have been no changes in the Registrant’s internal controls or in other factors that could materially affect the internal controls over financial reporting subsequent to the date of their evaluation in connection with the preparation of this Shareholder Report on Form N-CSR.
Item 12. Exhibits.
(a)(1) Code of Ethics
(a)(2) Certifications pursuant to Section 302 of the Sarbanes-Oxley Act of 2002 of Laura F. Fergerson, Chief Executive Officer - Finance and Administration, and Gaston Gardey, Chief Financial Officer and Chief Accounting Officer
(b) Certifications pursuant to Section 906 of the Sarbanes-Oxley Act of 2002 of Laura F. Fergerson, Chief Executive Officer - Finance and Administration, and Gaston Gardey, Chief Financial Officer and Chief Accounting Officer
SIGNATURES
Pursuant to the requirements of the Securities Exchange Act of 1934 and the Investment Company Act of 1940, the registrant has duly caused this report to be signed on its behalf by the undersigned, thereunto duly authorized.
FRANKLIN INVESTORS SECURITIES TRUST
By /s/Laura F. Fergerson
Laura F. Fergerson
Chief Executive Officer –
Finance and Administration
Date June 24, 2016
Pursuant to the requirements of the Securities Exchange Act of 1934 and the Investment Company Act of 1940, this report has been signed below by the following persons on behalf of the registrant and in the capacities and on the dates indicated.
By /s/Laura F. Fergerson
Laura F. Fergerson
Chief Executive Officer –
Finance and Administration
Date June 24, 2016
By /s/Gaston Gardey
Gaston Gardey
Chief Financial Officer and
Chief Accounting Officer
Date June 24, 2016