UNITED STATES
SECURITIES AND EXCHANGE COMMISSION
Washington, DC 20549
FORM N-CSRS
CERTIFIED SHAREHOLDER REPORT OF REGISTERED MANAGEMENT INVESTMENT COMPANIES
Investment Company Act file number 811-04986
Franklin Investors Securities Trust
(Exact name of registrant as specified in charter)
__One Franklin Parkway, San Mateo, CA 94403-1906_
(Address of principal executive offices) (Zip code)
Craig S. Tyle, One Franklin Parkway, San Mateo, CA 94403-1906
(Name and address of agent for service)
Registrant's telephone number, including area Code: (650) 312-2000
Date of fiscal year end: 10/31
Date of reporting period: 4/30/14
Item 1. Reports to Stockholders.

| | | | | | | |
| | Contents | | | | | |
| |
| | | | | | Financial Highlights and | |
| Shareholder Letter | 1 | Semiannual Report | | Franklin Equity Income Fund | 22 | Statements of Investments | 48 |
| | | | | | | | |
| | | | | Franklin Limited Maturity | | | |
| | | Economic and Market | | U.S. Government Securities | | Financial Statements | 95 |
| | | Overview | 3 | Fund | 30 | | |
| | | | | | | |
| | | | | | | Notes to Financial | |
| | | Franklin Balanced Fund | 4 | Franklin Real Return Fund | 39 | Statements | 104 |
| | | | | | | |
| | | Franklin Convertible Securities | | | | | |
| | | Fund | 14 | | | Shareholder Information | 129 |
| 1
Semiannual Report
Economic and Market Overview
The U.S. economy continued to show signs of recovery during the six-month period ended April 30, 2014. Strong consumer and business spending and rising inventories underpinned economic growth in the fourth quarter of 2013. Despite the abnormally cold weather that suppressed economic activity in the first quarter of 2014, economic indicators were still broadly supportive of recovery at period-end. Manufacturing activity expanded and retail sales rose year-over-year. Home sales declined because of rising mortgage rates and lower inventories as well as the impact of extreme weather in early 2014, but home prices rose in comparison with year-ago figures. The unemployment rate declined to 6.3% in April 2014 from 7.2% in October 2013,1 and inflation remained below the U.S. Federal Reserve Board’s (Fed’s) 2.0% target.
In January, Congress passed a spending bill to fund the federal government through September 2014. Congress then approved suspension of the debt ceiling until March 2015. Despite speculation that it would start tapering its quantitative easing, the Fed maintained its monthly bond purchases at $85 billion through December 2013, gradually reducing them beginning in January, based on continued positive economic and employment data. Although economic data in early 2014 were soft in part because of severe winter weather, Fed Chair Janet Yellen kept the pace of asset-purchase tapering intact while adopting a more qualitative approach to rate-hike guidance. However, the Fed remained committed to keeping interest rates low for a considerable time even after the asset purchase program ends, depending on inflation and unemployment trends. Despite volatility in U.S. equity markets toward period-end heightened by geopolitical risks from the crisis in Ukraine, markets continued to advance.
Investors’ confidence grew as corporate profits rose and generally favorable economic data indicated continued recovery despite brief sell-offs when markets reacted to the Fed’s statements, political instability in certain emerging markets and China’s slowing economy. U.S. stocks generated strong returns for the six months under review as the Standard & Poor’s 500 Index (S&P 500) and Dow Jones Industrial Average reached all-time highs.2
The 10-year Treasury yield rose from 2.57% at the beginning of the period to a high of 3.04% on December 31, 2013, mainly because of an improved economic environment and market certainty about the Fed’s plans. However, some weakening economic data and increasing political tension in Ukraine contributed to the 10-year U.S. Treasury yield’s decline to 2.67% at period-end.
The foregoing information reflects our analysis and opinions as of April 30, 2014. The information is not a complete analysis of every
aspect of any market, country, industry, security or fund. Statements of fact are from sources considered reliable.
1. Source: Bureau of Labor Statistics.
2. S&P Dow Jones Indices. Copyright © 2014, S&P Dow Jones Indices LLC. All rights reserved. Reproduction of S&P Dow Jones Indices in any
form is prohibited except with the prior written permission of S&P. S&P does not guarantee the accuracy, adequacy, completeness or avail-
ability of any information and is not responsible for any errors or omissions, regardless of the cause or for the results obtained from the use
of such information. S&P DISCLAIMS ANY AND ALL EXPRESS OR IMPLIED WARRANTIES, INCLUDING, BUT NOT LIMITED TO, ANY WARRANTIES
OF MERCHANTABILITY OR FITNESS FOR A PARTICULAR PURPOSE OR USE. In no event shall S&P be liable for any direct, indirect, special or
consequential damages, costs, expenses, legal fees, or losses (including lost income or lost profit and opportunity costs) in connection with
subscriber’s or others’ use of S&P Dow Jones Indices.
Semiannual Report | 3
Franklin Balanced Fund
Your Fund’s Goal and Main Investments: Franklin Balanced Fund seeks both income and capital appreciation by investing in a combination of stocks, convertible securities and debt securities. The Fund will normally invest at least 25% of its total assets in equity securities (primarily common and preferred stock) and at least 25% of its total assets in debt securities, including bonds, notes,
debentures and money market securities.
Performance data represent past performance, which does not guarantee future results. Investment return and principal value will fluctuate, and you may have a gain or loss when you sell your shares. Current performance may differ from figures shown. Please visit franklintempleton.com or call (800) 342-5236 for most recent month-end performance.
This semiannual report for Franklin Balanced Fund covers the period ended April 30, 2014.
Performance Overview
For the six months under review, Franklin Balanced Fund – Class A delivered a +6.03% cumulative total return. The Fund’s equity benchmark, the Standard & Poor’s 500 Index (S&P 500), which is a broad measure of U.S. stock performance, posted a total return of +8.36%.1, 2 The Fund’s fixed income benchmark, the Barclays U.S. Aggregate Index, which tracks the U.S. investment-grade, taxable bond market, returned +1.74%.1, 3 You can find the Fund’s long-term performance data in the Performance Summary beginning on page 9.
Investment Strategy
We apply a bottom-up approach to investing in individual securities. We will assess the market price of a company’s securities relative to our evaluation of the company’s long-term earnings, asset value and cash flow potential. We also consider a company’s price/earnings ratio, profit margins and liquidation value. In determining an optimal mix of equity and fixed income investments for the Fund, we assess changing economic, market and industry conditions. We may sell securities for a number of possible reasons, including the achievement of certain stock prices or credit spreads, changes in the fundamental outlook or risk/reward profile of a security, less attractive values relative to market peers, or broad economic conditions affecting certain fixed income sectors.
The dollar value, number of shares or principal amount, and names of all portfolio holdings are listed in the Fund’s
Statement of Investments (SOI). The SOI begins on page 53.
4 | Semiannual Report
| | | | | |
| Dividend Distributions* | | | | |
| Franklin Balanced Fund | | | | |
| 11/1/13–4/30/14 | | | | | |
| | | Dividend per Share (cents) | |
| Month | Class A | Class C | Class R | Class R6 | Advisor Class |
| November | 3.00 | 2.36 | 2.82 | 3.39 | 3.28 |
| December | 3.00 | 2.33 | 2.81 | 3.44 | 3.29 |
| January | 3.00 | 2.33 | 2.81 | 3.44 | 3.29 |
| February | 3.00 | 2.33 | 2.81 | 3.44 | 3.29 |
| March | 3.00 | 2.34 | 2.81 | 3.41 | 3.29 |
| April | 3.00 | 2.34 | 2.81 | 3.41 | 3.29 |
| Total | 18.00 | 14.03 | 16.87 | 20.53 | 19.73 |
*All Fund distributions will vary depending upon current market conditions, and past distributions are not indicative
of future trends.
| | |
| Portfolio Breakdown | | |
| Franklin Balanced Fund | | |
| 4/30/14 | | |
| | % of Total | |
| | Net Assets | |
| Stocks | 66.8 | % |
| Common Stocks | 57.8 | % |
| Equity-Linked Securities | 4.4 | % |
| Convertible Preferred Stocks | 4.2 | % |
| Preferred Stocks | 0.4 | % |
| Bonds | 27.9 | % |
| Corporate Bonds | 27.3 | % |
| Senior Floating Rate Interests | 0.6 | % |
| Short-Term Investments & | | |
| Other Net Assets | 5.3 | % |
Manager’s Discussion
During the six months under review, the Fund’s equity and fixed income components continued to contribute to absolute performance. The majority of the Fund’s equity sector positions delivered positive results, led by materials, information technology and industrials. In contrast, the telecommunication services sector detracted from performance. All of the Fund’s fixed income sectors contributed to performance, but strong corporate bond performance was the main driver of results. The U.S. corporate bond market benefited from low default rates, improved credit quality and investor demand for income.
Although the Fund remained well diversified, we decreased the Fund’s overall equity weighting from 69.1% to 66.8% of total net assets, particularly with reductions to the consumer staples and energy sectors. In contrast, we added to the Fund’s equity sector weightings in consumer discretionary, health care and information technology during the period, seeking to take advantage of what we considered were strong dividend growth and attractive valuations. The Fund’s fixed income exposure slightly increased from 27.4% to 27.9% of total net assets. The Fund’s cash position increased during the period from 3.5% to 5.3% of total net assets.
Most of our materials sector equity positions performed well, particularly chemical conglomerates such as The Dow Chemical Co. and LyondellBasell Industries. Prices for a wide variety of raw materials, including U.S. crude oil and natural gas, precious metals and agricultural products, rose during the period from their 2013 lows, and these higher price levels supported results across the materials and energy sectors. Shares of The Williams Cos., an energy infrastructure company, also benefited from this favorable pricing environment and improved cash
Semiannual Report | 5
| | | |
| Top 5 Equity Holdings | | | |
| Franklin Balanced Fund | | | |
| 4/30/14 | | | |
| |
| Company | % of Total | |
| Sector/Industry | Net Assets | |
| Schlumberger Ltd., ord. & equity-linked | 1.7 | % |
| Energy | | | |
| Freeport-McMoRan Copper & Gold Inc., B | 1.6 | % |
| Materials | | | |
| Apple Inc. | | 1.4 | % |
| Information Technology | | | |
| Intel Corp. | | 1.4 | % |
| Information Technology | | | |
| Wells Fargo & Co., ord. & cvt. pfd. | | 1.3 | % |
| Financials | | | |
| |
| |
| |
| Top 5 Bond Holdings | | | |
| Franklin Balanced Fund | | | |
| 4/30/14 | | | |
| |
| Company | % of Total | |
| Sector/Industry | Net Assets | |
| Energy Transfer Partners LP | | 1.0 | % |
| Energy | | | |
| Citigroup Inc. | | 0.9 | % |
| Financials | | | |
| Mondelez International Inc. | | 0.7 | % |
| Consumer Staples | | | |
| Freescale Semiconductor Inc. | | 0.6 | % |
| Information Technology | | | |
| SLM Corp. | | 0.6 | % |
| Financials | | | |
flow. Overall, the Fund’s information technology positions performed well. Strong product sales helped technology leader Apple and several semiconductor companies deliver positive performance. Diversified equipment manufacturer Caterpillar led our industrials positions, and its share price rose in tandem with an increase in construction activity that could drive margins and profitability higher. Defense-related companies such as Raytheon performed well amid increased political turmoil in several regions around the world during the period. Utilities including NextEra Energy and The Southern Co. generally outperformed broader equity markets, supported by factors including investors’ continued attraction to yield-oriented investments, relatively stable interest rates and a modest decline in the benchmark 10-year Treasury yield. Eli Lilly & Co. was a major contributor among health care holdings.
In contrast, Cobalt International Energy was a major equity detractor.4 The energy company’s shares declined after a number of exploration projects failed to meet the high end of expectations. Also in the energy sector, shares of Diamond Offshore Drilling4 and Kinder Morgan suffered after releasing disappointing performance results. In the materials sector, the common stock of Freeport-McMoRan Copper & Gold declined as copper prices fell to a multi-year low during the period. General Motors, in consumer discretionary, lost value after the discovery of a faulty product design that raised the possibility of higher costs associated with a recall effort for thousands of cars. In the telecommunication services sector, Verizon Communications’ share price declined because of falling prices and higher competition in the wireless industry that hurt results.
During a challenging period, in which the 10-year Treasury yield reached a high of 3.04%, the fixed income portion of the Fund’s portfolio produced positive results and outperformed its fixed income benchmark, largely though sector and security selection.
Among the benchmark Barclays U.S. Aggregate Index’s major components, corporate credit continued to outperform Treasuries, agencies and mortgage-backed securities during the period. Our significant overweighting in corporate credit relative to these other sectors supported the Fund’s fixed income performance.
Last year’s bond sell-off allowed us to purchase fixed income securities with higher yields and add to positions that we favored in the communications and banking sectors at prices we considered attractive.5 Communications companies Verizon Communications, Sprint and DISH performed well for the period. Verizon, which completed one of the largest investment-grade transactions between two companies ever recorded, was a key contributor. In the banking
6 | Semiannual Report
sector, we continued to move down the capital structure by purchasing subordinated bonds and saw fundamental improvement. Bank of America, PNC Financial Services Group, Citigroup and JPMorgan Chase & Co. contributed to total returns. In addition, energy sector holdings Ecopetrol, Sandridge Energy and Weatherford International aided performance.
Among the Fund’s fixed income detractors, Russia-based, global energy company Gazprom was likely affected by tensions between Russia and Ukraine.6 Our bonds of International Game Technology also declined.4
The Fund utilized derivative instruments during the period, such as equity options. The goal of these instruments is to enhance Fund returns and more efficiently enter and exit stock positions at prices the Fund deems attractive. None of these positions had a material impact on performance.
Thank you for your continued participation in Franklin Balanced Fund.
We look forward to serving your future investment needs.

CFA® is a trademark owned by CFA Institute.
Semiannual Report | 7
The foregoing information reflects our analysis, opinions and portfolio holdings as of April 30, 2014, the end of the
reporting period. The way we implement our main investment strategies and the resulting portfolio holdings may
change depending on factors such as market and economic conditions. These opinions may not be relied upon as
investment advice or an offer for a particular security. The information is not a complete analysis of every aspect
of any market, country, industry, security or the Fund. Statements of fact are from sources considered reliable,
but the investment manager makes no representation or warranty as to their completeness or accuracy. Although
historical performance is no guarantee of future results, these insights may help you understand our investment
management philosophy.
The index is unmanaged and includes reinvestment of any income or distributions. One cannot invest directly in an index,
and an index is not representative of the Fund’s portfolio.
1. Source: © 2014 Morningstar. All Rights Reserved. The information contained herein: (1) is proprietary to Morningstar
and/or its content providers; (2) may not be copied or distributed; and (3) is not warranted to be accurate, complete or
timely. Neither Morningstar nor its content providers are responsible for any damages or losses arising from any use of
this information.
2. S&P 500: Copyright © 2014, S&P Dow Jones Indices LLC. All rights reserved. Reproduction of S&P U.S. Index data in
any form is prohibited except with the prior written permission of S&P. S&P does not guarantee the accuracy, adequacy,
completeness or availability of any information and is not responsible for any errors or omissions, regardless of the cause
or for the results obtained from the use of such information. S&P DISCLAIMS ANY AND ALL EXPRESS OR IMPLIED WAR-
RANTIES, INCLUDING, BUT NOT LIMITED TO, ANY WARRANTIES OF MERCHANTABILITY OR FITNESS FOR A PARTICULAR
PURPOSE OR USE. In no event shall S&P be liable for any direct, indirect, special or consequential damages, costs,
expenses, legal fees, or losses (including lost income or lost profit and opportunity costs) in connection with subscriber’s
or others’ use of S&P U.S. Index data.
3. Source: Barclays Global Family of Indices. © 2014 Barclays Capital Inc. Used with permission.
4. No longer held at period-end.
5. Communications holdings are in consumer discretionary, information technology and telecommunication services in
the SOI. Banking holdings are in financials in the SOI.
6. Listed as Gaz Capital SA in the SOI.
8 | Semiannual Report
Performance Summary as of 4/30/14
Franklin Balanced Fund
Your dividend income will vary depending on dividends or interest paid by securities in the Fund’s portfolio, adjusted for operating expenses of each class. Capital gain distributions are net profits realized from the sale of portfolio securities. The performance table does not reflect any taxes that a shareholder would pay on Fund dividends, capital gain distributions, if any, or any realized gains on the sale of Fund shares. Total return reflects reinvestment of the Fund’s dividends and capital gain distributions, if any, and any unrealized gains or losses.
| | | | |
| Net Asset Value | | | | |
| Share Class | 4/30/14 | 10/31/13 | | Change |
| A (FBLAX) | $11.75 | $11.43 | | +$0.32 |
| C (FBMCX) | $11.66 | $11.34 | | +$0.32 |
| R (n/a) | $11.78 | $11.45 | | +$0.33 |
| R6(n/a) | $11.76 | $11.45 | | +$0.31 |
| Advisor (FBFZX) | $11.77 | $11.45 | | +$0.32 |
| |
| |
| Distributions | | | | |
| | Dividend | Short-Term | Long-Term | |
| Share Class | Income | Capital Gain | Capital Gain | Total |
| A(11/1/13–4/30/14) | $0.1800 | $0.0312 | $0.1395 | $0.3507 |
| C 11/1/13–4/30/14) | $0.1403 | $0.0312 | $0.1395 | $0.3110 |
| R(11/1/13–4/30/14) | $0.1687 | $0.0312 | $0.1395 | $0.3394 |
| R6(11/1/13–4/30/14) | $0.2053 | $0.0312 | $0.1395 | $0.3760 |
| Advisor (11/1/13–4/30/14) | $0.1973 | $0.0312 | $0.1395 | $0.3680 |
Semiannual Report | 9
Performance Summary (continued)
Performance as of 4/30/141
Cumulative total return excludes sales charges. Average annual total returns and value of $10,000 investment include maximum sales charges.
Class A: 5.75% maximum initial sales charge; Class C: 1% contingent deferred sales charge in first year only; Class R/R6/Advisor Class: no sales
charges.
| | | | | | | | | | | |
| | | | | | Value of | Average Annual | | | | | |
| | Cumulative | | Average Annual | | 10,000 | Total Return | | Total Annual Operating Expenses6 | |
| Share Class | Total Return2 | | Total Return3 | | Investment4 | (3/31/14)5 | | (with waiver) | | (without waiver) | |
| A | | | | | | | | 1.13 | % | 1.14 | % |
| 6-Month | +6.03 | % | -0.09 | % | $9,991 | | | | | | |
| 1-Year | +10.66 | % | +4.29 | % | $10,429 | +4.03 | % | | | | |
| 5-Year | +103.86 | % | +13.97 | % | $19,225 | +15.80 | % | | | | |
| Since Inception (7/3/06) | +66.05 | % | +5.89 | % | $15,651 | +5.76 | % | | | | |
| C | | | | | | | | 1.83 | % | 1.84 | % |
| 6-Month | +5.70 | % | +4.70 | % | $10,470 | | | | | | |
| 1-Year | +9.88 | % | +8.88 | % | $10,888 | +8.57 | % | | | | |
| 5-Year | +97.03 | % | +14.53 | % | $19,703 | +16.37 | % | | | | |
| Since Inception (7/3/06) | +57.33 | % | +5.96 | % | $15,733 | +5.83 | % | | | | |
| R | | | | | | | | 1.33 | % | 1.34 | % |
| 6-Month | +6.00 | % | +6.00 | % | $10,600 | | | | | | |
| 1-Year | +10.51 | % | +10.51 | % | $11,051 | +10.20 | % | | | | |
| 5-Year | +102.00 | % | +15.10 | % | $20,200 | +16.97 | % | | | | |
| Since Inception (7/3/06) | +63.93 | % | +6.52 | % | $16,393 | +6.39 | % | | | | |
| R6 | | | | | | | | 0.72 | % | 0.73 | % |
| 6-Month | +6.25 | % | +6.25 | % | $10,625 | | | | | | |
| Since Inception (5/1/13)7 | +11.72 | % | +11.72 | % | $11,172 | +10.17 | % | | | | |
| Advisor | | | | | | | | 0.83 | % | 0.84 | % |
| 6-Month | +6.18 | % | +6.18 | % | $10,618 | | | | | | |
| 1-Year | +11.07 | % | +11.07 | % | $11,107 | +10.76 | % | | | | |
| 5-Year | +106.89 | % | +15.65 | % | $20,689 | +17.53 | % | | | | |
| Since Inception (7/3/06) | +70.06 | % | +7.02 | % | $17,006 | +6.89 | % | | | | |
| | | | | | |
| | Distribution | | 30-Day Standardized Yield9 | |
| Share Class | Rate8 | | (with waiver) | | (without waiver) | |
| A | 2.89 | % | 1.93 | % | 1.93 | % |
| C | 2.41 | % | 1.37 | % | 1.37 | % |
| R | 2.86 | % | 1.86 | % | 1.86 | % |
| R6 | 3.48 | % | 2.47 | % | 2.46 | % |
| Advisor | 3.35 | % | 2.36 | % | 2.35 | % |
Performance data represent past performance, which does not guarantee future results. Investment return and principal value will fluctuate, and
you may have a gain or loss when you sell your shares. Current performance may differ from figures shown. For most recent month-end performance,
go to franklintempleton.com or call (800) 342-5236.
10 | Semiannual Report
Performance Summary (continued)
All investments involve risks, including possible loss of principal. Stock prices fluctuate, sometimes rapidly and dramatically, due to factors
affecting individual companies, particular industries or sectors, or general market conditions. The Fund’s share price and yield will be affected
by interest rate movements. Bond prices generally move in the opposite direction of interest rates. As prices of bonds in the Fund adjust to a
rise in interest rates, the Fund’s share price may decline. The Fund is actively managed but there is no guarantee that the manager’s invest-
ment decisions will produce the desired results. The Fund’s prospectus also includes a description of the main investment risks.
| |
| Class C: | These shares have higher annual fees and expenses than Class A shares. |
| Class R: | Shares are available to certain eligible investors as described in the prospectus. |
| | These shares have a higher annual fees and expenses than Class A shares. |
| Class R6: | Shares are available to certain eligible investors as described in the prospectus. |
| Advisor Class: | Shares are available to certain eligible investors as described in the prospectus. |
1. The Fund has a fee waiver associated with its investments in a Franklin Templeton money fund, contractually guaranteed through at least its current
fiscal year-end. Fund investment results reflect the fee waiver, to the extent applicable; without this reduction, the results would have been lower.
2. Cumulative total return represents the change in value of an investment over the periods indicated.
3. Average annual total return represents the average annual change in value of an investment over the periods indicated. Six-month return has not
been annualized.
4. These figures represent the value of a hypothetical $10,000 investment in the Fund over the periods indicated.
5. In accordance with SEC rules, we provide standardized average annual total return information through the latest calendar quarter.
6. Figures are as stated in the Fund’s current prospectus. In periods of market volatility, assets may decline significantly, causing total annual Fund
operating expenses to become higher than the figures shown.
7. Performance shown is not annualized.
8. Distribution rate is based on an annualization of the respective class’s April dividend and the maximum offering price (NAV for Classes C, R, R6
and Advisor) per share on 4/30/14.
9. The 30-day standardized yield for the 30 days ended 4/30/14 reflects an estimated yield to maturity (assuming all portfolio securities are held to
maturity). It should be regarded as an estimate of the Fund’s rate of investment income, and it may not equal the Fund’s actual income distribution
rate (which reflects the Fund’s past dividends paid to shareholders) or the income reported in the Fund’s financial statements.
Semiannual Report | 11
Your Fund’s Expenses
Franklin Balanced Fund
As a Fund shareholder, you can incur two types of costs:
- Transaction costs, including sales charges (loads) on Fund purchases; and
- Ongoing Fund costs, including management fees, distribution and service (12b-1) fees, and other Fund expenses. All mutual funds have ongoing costs, sometimes referred to as operating expenses.
The following table shows ongoing costs of investing in the Fund and can help you understand these costs and compare them with those of other mutual funds. The table assumes a $1,000 investment held for the six months indicated.
Actual Fund Expenses
The first line (Actual) for each share class listed in the table provides actual account values and expenses. The “Ending Account Value” is derived from the Fund’s actual return, which includes the effect of Fund expenses.
You can estimate the expenses you paid during the period by following these steps. Of course, your account value and expenses will differ from those in this illustration:
| 1. | Divide your account value by $1,000. |
| | If an account had an $8,600 value, then $8,600 ÷ $1,000 = 8.6. |
| 2. | Multiply the result by the number under the heading “Expenses Paid During Period.” |
| | If Expenses Paid During Period were $7.50, then 8.6 x $7.50 = $64.50. |
In this illustration, the estimated expenses paid this period are $64.50.
Hypothetical Example for Comparison with Other Funds
Information in the second line (Hypothetical) for each class in the table can help you compare ongoing costs of investing in the Fund with those of other mutual funds. This information may not be used to estimate the actual ending account balance or expenses you paid during the period. The hypothetical “Ending Account Value” is based on the actual expense ratio for each class and an assumed 5% annual rate of return before expenses, which does not represent the Fund’s actual return. The figure under the heading “Expenses Paid During Period” shows the hypothetical expenses your account would have incurred under this scenario. You can compare this figure with the 5% hypothetical examples that appear in shareholder reports of other funds.
12 | Semiannual Report
Your Fund’s Expenses (continued)
Please note that expenses shown in the table are meant to highlight ongoing costs and do not reflect any transaction costs, such as sales charges. Therefore, the second line for each class is useful in comparing ongoing costs only, and will not help you compare total costs of owning different funds. In addition, if transaction costs were included, your total costs would have been higher. Please refer to the Fund prospectus for additional information on operating expenses.
| | | | | | |
| | | Beginning Account | | Ending Account | | Expenses Paid During |
| Share Class | | Value 11/1/13 | | Value 4/30/14 | | Period* 11/1/13–4/30/14 |
| A | | | | | | |
| Actual | $ | 1,000 | $ | 1,060.30 | $ | 5.52 |
| Hypothetical (5% return before expenses) | $ | 1,000 | $ | 1,019.44 | $ | 5.41 |
| C | | | | | | |
| Actual | $ | 1,000 | $ | 1,057.00 | $ | 9.08 |
| Hypothetical (5% return before expenses) | $ | 1,000 | $ | 1,015.97 | $ | 8.90 |
| R | | | | | | |
| Actual | $ | 1,000 | $ | 1,060.00 | $ | 6.54 |
| Hypothetical (5% return before expenses) | $ | 1,000 | $ | 1,018.45 | $ | 6.41 |
| R6 | | | | | | |
| Actual | $ | 1,000 | $ | 1,062.50 | $ | 3.48 |
| Hypothetical (5% return before expenses) | $ | 1,000 | $ | 1,021.42 | $ | 3.41 |
| Advisor | | | | | | |
| Actual | $ | 1,000 | $ | 1,061.80 | $ | 3.99 |
| Hypothetical (5% return before expenses) | $ | 1,000 | $ | 1,020.93 | $ | 3.91 |
*Expenses are calculated using the most recent six-month expense ratio, net of expense waivers, annualized for each class (A: 1.08%; C: 1.78%;
R: 1.28%; R6: 0.68%; and Advisor: 0.78%), multiplied by the average account value over the period, multiplied by 181/365 to reflect the one-half
year period.
Semiannual Report | 13
Franklin Convertible Securities Fund
Your Fund’s Goal and Main Investments: Franklin Convertible Securities Fund seeks to maximize total return consistent with reasonable risk by seeking to optimize capital appreciation and high current income under varying market conditions and investing at least 80% of its net assets in convertible securities.
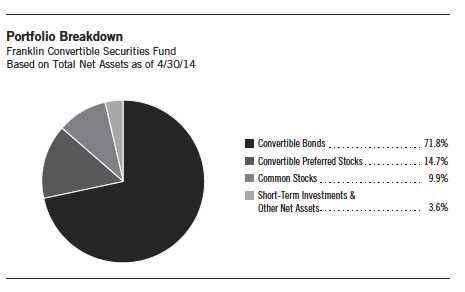
This semiannual report for Franklin Convertible Securities Fund covers the period ended April 30, 2014.
Performance data represent past performance, which does not guarantee future results. Investment return and principal value will fluctuate, and you may have a gain or loss when you sell your shares. Current performance may differ from figures shown. Please visit franklintempleton.com or call (800) 342-5236 for most recent month-end performance.
Performance Overview
For the six months under review, Franklin Convertible Securities Fund –Class A delivered a +6.03% cumulative total return. In comparison, the Fund’s benchmark, the BofA Merrill Lynch (BofAML) All Total Return Alternatives U.S. Convertibles Index, which tracks the domestic convertible securities market, posted a +7.17% total return.1, 2 You can find the Fund’s long-term performance data in the Performance Summary beginning on page 17.
Investment Strategy
We follow a strategy of maintaining a balance in the portfolio between the equity and debt characteristics of convertible securities with an emphasis on
The dollar value, number of shares or principal amount, and names of all portfolio holdings are listed in the Fund’s
Statement of Investments (SOI). The SOI begins on page 65.
14 | Semiannual Report
the equity features. Convertible securities are attractive for two reasons: the opportunity to participate in common stocks’ potential growth with relatively reduced volatility, and the potential for current income with potential downside protection from bonds. Typically we sell securities whose equity sensitivity becomes too high and no longer offers appropriate downside protection. Likewise, as securities become too bond-like — reducing their ability to appreciate with increases in the underlying common stock — we attempt to redeploy those assets into more balanced convertible securities and maintain the potential for the Fund’s upside participation. Our experienced team of analysts searches for investment opportunities among all economic sectors and considers a company’s long-term earnings, asset value and cash flow potential, to create a broadly diversified portfolio.
Manager’s Discussion
During the six months under review, most sectors the Fund invested in rose in value, as did the majority of the portfolio’s individual securities. Investments in the health care, information technology (IT), consumer discretionary and industrials sectors accounted for the greater part of the Fund’s total return. Within health care, the Fund’s holdings of convertible bonds issued by specialty pharmaceutical companies such as Salix Pharmaceuticals and Pacira Pharmaceuticals enjoyed some of the largest gains, as did our holding in Mylan, a generics and specialty pharmaceutical company. The Fund’s holdings of convertible bonds issued by semiconductor and semiconductor equipment companies such as Micron Technology and Microchip Technology were key contributors in the IT sector. Top-performing consumer discretionary holdings included Goodyear Tire & Rubber and convertible bonds of MGM Resorts International. In the industrials sector, trucking company Swift Transportation was a standout performer.
Despite the Fund’s positive results this reporting period, there were some disappointments. Our energy sector holdings hindered performance, and top individual detractors were convertible bonds of James River Coal and oil and gas company Cobalt International Energy. Elsewhere, key detractors included convertible bonds of integrated travel and expense management solutions provider Concur Technologies, Internet-based image publishing service provider Shutterfly and a new position in Russian Internet search engine services company Yandex.
Top 10 Holdings
Franklin Convertible Securities Fund 4/30/14
| | |
| Company | % of Total | |
| Sector/Industry | Net Assets | |
| Micron Technology Inc. | 2.5 | % |
| Information Technology | | |
| MGM Resorts International | 2.1 | % |
| Consumer Discretionary | | |
| Iconix Brand Group Inc. | 2.1 | % |
| Consumer Discretionary | | |
| Novellus Systems Inc. | 2.1 | % |
| Information Technology | | |
| Jarden Corp. | 2.1 | % |
| Consumer Discretionary | | |
| Stanley Black & Decker Inc. | 2.0 | % |
| Industrials | | |
| Trulia Inc. | 2.0 | % |
| Information Technology | | |
| United Technologies Corp. | 1.9 | % |
| Industrials | | |
| SanDisk Corp. | 1.9 | % |
| Information Technology | | |
| NetSuite Inc. | 1.9 | % |
| Information Technology | | |
Semiannual Report | 15
Thank you for your continued participation in Franklin Convertible Securities Fund. We look forward to serving your future investment needs.

The foregoing information reflects our analysis, opinions and portfolio holdings as of April 30, 2014, the end of the
reporting period. The way we implement our main investment strategies and the resulting portfolio holdings may
change depending on factors such as market and economic conditions. These opinions may not be relied upon as
investment advice or an offer for a particular security. The information is not a complete analysis of every aspect
of any market, country, industry, security or the Fund. Statements of fact are from sources considered reliable,
but the investment manager makes no representation or warranty as to their completeness or accuracy. Although
historical performance is no guarantee of future results, these insights may help you understand our investment
management philosophy.
The index is unmanaged and includes reinvestment of any income or distributions. One cannot invest directly in an
index, and an index is not representative of the Fund’s portfolio.
1. Source: © 2014 Morningstar. All Rights Reserved. The information contained herein: (1) is proprietary to Morningstar
and/or its content providers; (2) may not be copied or distributed; and (3) is not warranted to be accurate, complete or
timely. Neither Morningstar nor its content providers are responsible for any damages or losses arising from any use of
this information.
2. Source BofA Merrill Lynch, used with permission. BOFA MERRILL LYNCH IS LICENSING THE MERRILL LYNCH INDICES
“AS IS,” MAKES NO WARRANTIES REGARDING SAME, DOES NOT GUARANTEE THE QUALITY, ACCURACY AND/OR
COMPLETENESS OF THE MERRILL LYNCH INDICES OR ANY DATA INCLUDED THEREIN OR DERIVED THEREFROM, AND
ASSUMES NO LIABILITY IN CONNNECTION WITH THEIR USE.
16 | Semiannual Report
Performance Summary as of 4/30/14
Franklin Convertible Securities Fund
Your dividend income will vary depending on dividends or interest paid by securities in the Fund’s portfolio, adjusted for operating expenses of each class. Capital gain distributions are net profits realized from the sale of portfolio securities. The performance table does not reflect any taxes that a shareholder would pay on Fund dividends, capital gain distributions, if any, or any realized gains on the sale of Fund shares. Total return reflects reinvestment of the Fund’s dividends and capital gain distributions, if any, and any unrealized gains or losses.
| | | |
| Net Asset Value | | | |
| Share Class | 4/30/14 | 10/31/13 | Change |
| A (FISCX) | $18.62 | $17.82 | -$0.80 |
| C (FROTX) | $18.39 | $17.60 | -$0.79 |
| Advisor (FCSZX) | $18.63 | $17.83 | -$0.80 |
| | | 3/4/14 | |
| R6(n/a) | $18.64 | $19.21 | -$0.57 |
| |
| |
| Distributions | | | |
| |
| | Dividend | Long-Term | |
| Share Class | Income | Capital Gain | Total |
| A(11/1/13-4/30/14) | $0.1897 | $0.0745 | $0.2642 |
| C(11/1/13-4/30/14) | $0.1263 | $0.0745 | $0.2008 |
| R6(3/4/14-4/30/14) | $0.0598 | — | $0.0598 |
| Advisor (11/1/13-4/30/14) | $0.2130 | $0.0745 | $0.2875 |
Semiannual Report | 17
Performance Summary (continued)
Performance as of 4/30/141
Cumulative total return excludes sales charges. Average annual total returns and value of $10,000 investment include
maximum sales charges. Class A: 5.75% maximum initial sales charge; Class C: 1% contingent deferred sales charge in
first year only; Class R6/Advisor Class: no sales charges.
| | | | | | | | | |
| | | | | | Value of | Average Annual | | Total Annual | |
| | Cumulative | | Average Annual | | 10,000 | Total Return | | Operating | |
| Share Class | Total Return2 | | Total Return3 | | Investment4 | (3/31/14)5 | | Expenses6 | |
| A | | | | | | | | 0.88 | % |
| 6-Month | +6.03 | % | -0.08 | % | $9,992 | | | | |
| 1-Year | +17.56 | % | +10.82 | % | $11,082 | +12.91 | % | | |
| 5-Year | +116.48 | % | +15.33 | % | $20,399 | +17.74 | % | | |
| 10-Year | +110.28 | % | +7.08 | % | $19,820 | +7.11 | % | | |
| C | | | | | | | | 1.63 | % |
| 6-Month | +5.62 | % | +4.62 | % | $10,462 | | | | |
| 1-Year | +16.77 | % | +15.77 | % | $11,577 | +17.86 | % | | |
| 5-Year | +108.73 | % | +15.86 | % | $20,873 | +18.25 | % | | |
| 10-Year | +95.07 | % | +6.91 | % | $19,507 | +6.94 | % | | |
| R67 | | | | | | | | 0.52 | % |
| Since Inception (3/4/14) | -2.66 | % | -2.66 | % | $9,734 | -2.14 | % | | |
| Advisor8 | | | | | | | | 0.63 | % |
| 6-Month | +6.16 | % | +6.16 | % | $10,616 | | | | |
| 1-Year | +17.92 | % | +17.92 | % | $11,792 | +20.09 | % | | |
| 5-Year | +119.27 | % | +17.00 | % | $21,927 | +19.43 | % | | |
| 10-Year | +113.56 | % | +7.88 | % | $21,356 | +7.90 | % | | |
| | | | | | |
| | Distribution | | 30-Day Standardized Yield10 | |
| Share Class | Rate9 | | (with waiver) | | (without waiver) | |
| A | 2.02 | % | 0.68 | % | 0.68 | % |
| C | 1.50 | % | 0.00 | % | 0.00 | % |
| R6 | 2.39 | % | 1.08 | % | 1.07 | % |
| Advisor | 2.37 | % | 0.97 | % | 0.96 | % |
Performance data represent past performance, which does not guarantee future results. Investment return and principal
value will fluctuate, and you may have a gain or loss when you sell your shares. Current performance may differ from
figures shown. For most recent month-end performance, go to franklintempleton.com or call (800) 342-5236.
18 | Semiannual Report
Performance Summary (continued)
All investments involve risks, including possible loss of principal. Convertible securities are subject to the risks of stocks when the underlying
stock price is high relative to the conversion price and debt securities when the underlying stock price is low relative to the conversion price.
The Fund may invest in high yielding, fixed income securities. High yields reflect the higher credit risk associated with these lower rated secu-
rities and, in some cases, the lower market prices for these instruments. Interest rate movements may affect the Fund’s share price and yield.
Bond prices generally move in the opposite direction of interest rates. As the prices of bonds in the Fund adjust to a rise in interest rates, the
Fund’s share price may decline. The Fund may also invest in foreign securities, which involve special risks, including political uncertainty and
currency volatility. The Fund is actively managed but there is no guarantee that the manager’s investment decisions will produce the desired
results. The Fund’s prospectus also includes a description of the main investment risks.
| |
| Class C: | These shares have higher annual fees and expenses than Class A shares. |
| Class R6: | Shares are available to certain eligible investors as described in the prospectus. |
| Advisor Class: | Shares are available to certain eligible investors as described in the prospectus. |
1. The Fund has a fee waiver associated with its investments in a Franklin Templeton money fund, contractually guaranteed through at least its cur-
rent fiscal year-end. Fund investment results reflect the fee waiver, to the extent applicable; without this reduction, the results would have been lower.
2. Cumulative total return represents the change in value of an investment over the periods indicated.
3. Average annual total return represents the average annual change in value of an investment over the periods indicated. Six-month return has not
been annualized.
4. These figures represent the value of a hypothetical $10,000 investment in the Fund over the periods indicated.
5. In accordance with SEC rules, we provide standardized average annual total return information through the latest calendar quarter.
6. Figures are as stated in the Fund’s current prospectus. In periods of market volatility, assets may decline significantly, causing total annual Fund
operating expenses to become higher than the figures shown.
7. Performance shown is not annualized.
8. Effective 5/15/08, the Fund began offering Advisor Class shares, which do not have sales charges or a Rule 12b-1 plan. Performance quotations
for this class reflect the following methods of calculation: (a) For periods prior to 5/15/08, a restated figure is used based upon the Fund’s Class A
performance, excluding the effect of Class A’s maximum initial sales charge, but reflecting the effect of the Class A Rule 12b-1 fees; and (b) for peri-
ods after 5/15/08, actual Advisor Class performance is used reflecting all charges and fees applicable to that class. Since 5/15/08 (commencement
of sales), the cumulative and average annual total returns of Advisor Class shares were +55.42% and +7.68%.
9. Distribution rate is based on the sum of the respective class’s last four quarterly dividends (Class R6: based on the most recent quarterly dividend
for Class R6 and prior three quarterly dividends for Advisor Class) and the maximum offering price (NAV for Classes C, R6 and Advisor) per share
on 4/30/14.
10. The 30-day standardized yield for the 30 days ended 4/30/14 reflects an estimated yield to maturity (assuming all portfolio securities are held to
maturity). It should be regarded as an estimate of the Fund’s rate of investment income, and it may not equal the Fund’s actual income distribution
rate (which reflects the Fund’s past dividends paid to shareholders) or the income reported in the Fund’s financial statements.
Semiannual Report | 19
Your Fund’s Expenses
Franklin Convertible Securities Fund
As a Fund shareholder, you can incur two types of costs:
- Transaction costs, including sales charges (loads) on Fund purchases; and
- Ongoing Fund costs, including management fees, distribution and service (12b-1) fees, and other Fund expenses. All mutual funds have ongoing costs, sometimes referred to as operating expenses.
The following table shows ongoing costs of investing in the Fund and can help you understand these costs and compare them with those of other mutual funds. The table assumes a $1,000 investment held for the six months indicated.
Actual Fund Expenses
The first line (Actual) for each share class listed in the table provides actual account values and expenses. The “Ending Account Value” is derived from the Fund’s actual return, which includes the effect of Fund expenses.
You can estimate the expenses you paid during the period by following these steps. Of course, your account value and expenses will differ from those in this illustration:
| 1. | Divide your account value by $1,000. |
| | If an account had an $8,600 value, then $8,600 ÷ $1,000 = 8.6. |
| 2. | Multiply the result by the number under the heading “Expenses Paid During Period.” |
| | If Expenses Paid During Period were $7.50, then 8.6 x $7.50 = $64.50. |
In this illustration, the estimated expenses paid this period are $64.50.
Hypothetical Example for Comparison with Other Funds
Information in the second line (Hypothetical) for each class in the table can help you compare ongoing costs of investing in the Fund with those of other mutual funds. This information may not be used to estimate the actual ending account balance or expenses you paid during the period. The hypothetical “Ending Account Value” is based on the actual expense ratio for each class and an assumed 5% annual rate of return before expenses, which does not represent the Fund’s actual return. The figure under the heading “Expenses Paid During Period” shows the hypothetical expenses your account would have incurred under this scenario. You can compare this figure with the 5% hypothetical examples that appear in shareholder reports of other funds.
20 | Semiannual Report
Your Fund’s Expenses (continued)
Please note that expenses shown in the table are meant to highlight ongoing costs and do not reflect any transaction costs, such as sales charges. Therefore, the second line for each class is useful in comparing ongoing costs only, and will not help you compare total costs of owning different funds. In addition, if transaction costs were included, your total costs would have been higher. Please refer to the Fund prospectus for additional information on operating expenses.
| | | | | | |
| | | Beginning Account | | Ending Account | | Expenses Paid During |
| Share Class | | Value 11/1/13 | | Value 4/30/14 | | Period* 11/1/13–4/30/14 |
| A | | | | | | |
| Actual | $ | 1,000 | $ | 1,060.30 | $ | 4.39 |
| Hypothetical (5% return before expenses) | $ | 1,000 | $ | 1,020.53 | $ | 4.31 |
| C | | | | | | |
| Actual | $ | 1,000 | $ | 1,056.20 | $ | 8.21 |
| Hypothetical (5% return before expenses) | $ | 1,000 | $ | 1,016.81 | $ | 8.05 |
| R6 | | | | | | |
| Actual (3/4/14-4/30/14) | $ | 1,000 | $ | 973.40 | $ | 0.80 |
| Hypothetical (5% return before expenses) | $ | 1,000 | $ | 1,022.27 | $ | 2.56 |
| Advisor | | | | | | |
| Actual | $ | 1,000 | $ | 1,061.60 | $ | 3.12 |
| Hypothetical (5% return before expenses) | $ | 1,000 | $ | 1,021.77 | $ | 3.06 |
*Expenses are calculated using the most recent six-month expense ratio, net of expense waivers, annualized for each class (A: 0.86%; C: 1.61%;
R6: 0.51%; and Advisor: 0.61%), multiplied by the average account value over the period, multiplied by 181/365 to reflect the one-half year period
for Class R6 hypothetical expenses and actual and hypothetical expenses for Classes A, C and Advisor. The multiplier is 58/365 for Class R6 actual
expenses to reflect the number of days since inception.
Semiannual Report | 21
Franklin Equity Income Fund
Your Fund’s Goal and Main Investments: Franklin Equity Income Fund seeks to maximize total return, emphasizing high current income and long-term capital appreciation, consistent with reasonable risk, by investing at least 80% of its net assets in equity securities including securities convertible into common stocks.
Performance data represent past performance, which does not guarantee future results. Investment return and principal value will fluctuate, and you may have a gain or loss when you sell your shares. Current performance may differ from figures shown. Please visit franklintempleton.com or call (800) 342-5236 for most recent month-end performance.
This semiannual report for Franklin Equity Income Fund covers the period ended April 30, 2014.
Performance Overview
For the six months under review, Franklin Equity Income Fund – Class A delivered a +7.00% cumulative total return. In comparison, the Fund’s benchmark, the Standard & Poor’s 500 Index (S&P 500), which tracks the broad U.S. stock market, posted a total return of +8.36%.1, 2 The Fund’s peers, as measured by the Lipper Equity Income Funds Classification Average, which consists of funds chosen by Lipper that seek relatively high current income and growth of income by investing at least 60% of their portfolios in stocks, posted a +7.37% total return.3 You can find the Fund’s long-term performance data in the Performance Summary beginning on page 25.
Investment Strategy
We seek to invest in a broadly diversified portfolio of equity securities that we consider to be financially strong, with a focus on “blue chip” companies. We apply a bottom-up approach to investing in individual securities. We will assess the market price of a company’s securities relative to our evaluation of the company’s long-term earnings, asset value and cash flow potential. We also consider a company’s price/earnings ratio, profit margins, balance sheet and liquidation value. We consider dividend yield in selecting stocks for the Fund because we believe that, over time, dividend income can contribute significantly to total return and can be a more consistent source of investment return than capital appreciation. We seek to take advantage of price dislocations that result from the market’s short-term focus and choose to invest in those companies that, in our opinion, offer the best trade-off between growth opportunity, business and financial risk, and valuation.
The dollar value, number of shares or principal amount, and names of all portfolio holdings are listed in the
Fund’s Statement of Investments (SOI). The SOI begins on page 74.
22 | Semiannual Report
| | | | | |
| Dividend Distributions* | | | | | |
| Franklin Equity Income Fund | | | | | |
| 11/1/13–4/30/14 | | | | | |
| | | Dividend per Share (cents) | |
| Month | Class A | Class C | Class R | Class R6 | Advisor |
| November | 3.70 | 2.40 | 3.26 | 4.41 | 4.14 |
| December** | 8.77 | 7.36 | 8.28 | 9.47 | 9.25 |
| January | 3.70 | 2.29 | 3.21 | 4.40 | 4.18 |
| February | 3.70 | 2.29 | 3.21 | 4.40 | 4.18 |
| March | 3.70 | 2.29 | 3.23 | 4.34 | 4.17 |
| April | 3.70 | 2.29 | 3.23 | 4.34 | 4.17 |
| Total | 27.27 | 18.92 | 24.42 | 31.36 | 30.09 |
* All Fund distributions will vary depending upon current market conditions, and past distributions are not indicative
of future trends.
**Includes an additional 5.07 cent per share distribution to meet excise tax requirements.
| |
| Portfolio Breakdown | |
| Franklin Equity Income Fund | |
| Based on Total Net Assets as of 4/30/14 | |
| |
| Consumer Discretionary | |
| 16.5 | % |
| Industrials | |
| 16.3 | % |
| Financials | |
| 13.3 | % |
| Information Technology | |
| 10.6 | % |
| Health Care | |
| 9.4 | % |
| Materials | |
| 7.8 | % |
| Consumer Staples | |
| 7.8 | % |
| Utilities | |
| 7.4 | % |
| Energy | |
| 7.0 | % |
| Telecommunication Services | |
| 2.4 | % |
| Short-Term Investments & Other Net Assets | |
| 1.5 | % |
Manager’s Discussion
Every sector the Fund invested in rose in value, as did most of the portfolio’s individual securities, supporting overall performance during the six months under review. Key contributing sectors included industrials, financials, materials and energy. Within the industrials sector, the Fund’s positions in aerospace and defense firm Lockheed Martin and industrial engines manufacturer Cummins were strong performers. In financials, a top contributor was banking and diversified financial services firm Wells Fargo & Co. Within materials, The Dow Chemical Co. and Canadian fertilizer producer Potash Corp. of Saskatchewan led results. In the energy sector, oil and gas companies Royal Dutch Shell (U.K.) and Exxon Mobil aided performance.
Despite the Fund’s positive results this reporting period, there were a few disappointments in the portfolio. Key detractors included consumer discretionary sector holdings such as home improvement retailer Lowe’s Cos., auto manufacturer Ford Motor, mass-market discount retailer Target, hotel and resort company Starwood Hotels & Resorts Worldwide and online retail shopping provider Amazon.com. Software firm CA and U.K. premium alcoholic beverage manufacturer Diageo also hindered returns during the period.
Semiannual Report | 23
| | |
| Top 10 Holdings | | |
| Franklin Equity Income Fund | | |
| 4/30/14 | | |
| |
| Company | % of Total | |
| Sector/Industry | Net Assets | |
| Republic Services Inc. | 2.1 | % |
| Industrials | | |
| Lockheed Martin Corp. | 2.1 | % |
| Industrials | | |
| Microsoft Corp. | 2.1 | % |
| Information Technology | | |
| Roche Holding AG (Switzerland) | 2.0 | % |
| Health Care | | |
| The Dow Chemical Co. | 2.0 | % |
| Materials | | |
| McDonald’s Corp. | 2.0 | % |
| Consumer Discretionary | | |
| Royal Dutch Shell PLC, A (U.K.) | 2.0 | % |
| Energy | | |
| Maxim Integrated Products Inc. | 2.0 | % |
| Information Technology | | |
| Ford Motor Co. | 2.0 | % |
| Consumer Discretionary | | |
| BlackRock Inc. | 2.0 | % |
| Financials | | |
Thank you for your continued participation in Franklin Equity Income Fund.
We look forward to serving your future investment needs.

The foregoing information reflects our analysis, opinions and portfolio holdings as of April 30, 2014, the end of the
reporting period. The way we implement our main investment strategies and the resulting portfolio holdings may change
depending on factors such as market and economic conditions. These opinions may not be relied upon as investment
advice or an offer for a particular security. The information is not a complete analysis of every aspect of any market,
country, industry, security or the Fund. Statements of fact are from sources considered reliable, but the investment man-
ager makes no representation or warranty as to their completeness or accuracy. Although historical performance is
no guarantee of future results, these insights may help you understand our investment management philosophy.
The index is unmanaged and includes reinvested dividends. One cannot invest directly in an index, and an index is not
representative of the Fund’s portfolio.
1. Source: © 2014 Morningstar. All Rights Reserved. The information contained herein: (1) is proprietary to Morningstar and/or
its content providers; (2) may not be copied or distributed; and (3) is not warranted to be accurate, complete or timely. Neither
Morningstar nor its content providers are responsible for any damages or losses arising from any use of this information.
2. S&P 500: Copyright © 2014, S&P Dow Jones Indices LLC. All rights reserved. Reproduction of S&P U.S. Index data in
any form is prohibited except with the prior written permission of S&P. S&P does not guarantee the accuracy, adequacy,
completeness or availability of any information and is not responsible for any errors or omissions, regardless of the
cause or for the results obtained from the use of such information. S&P DISCLAIMS ANY AND ALL EXPRESS OR IMPLIED
WARRANTIES, INCLUDING, BUT NOT LIMITED TO, ANY WARRANTIES OF MERCHANTABILITY OR FITNESS FOR A PARTICULAR
PURPOSE OR USE. In no event shall S&P be liable for any direct, indirect, special or consequential damages, costs, expenses,
legal fees, or losses (including lost income or lost profit and opportunity costs) in connection with subscriber’s or others’
use of S&P U.S. Index data.
3. Source: Lipper, a Thomson Reuters Company. For the six-month period ended 4/30/14, this category consisted of
475 funds. Lipper calculations do not include sales charges or expense subsidization by a fund’s manager. The Fund’s
performance relative to the average may have differed if these and other factors had been considered.
24 | Semiannual Report
Performance Summary as of 4/30/14
Franklin Equity Income Fund
Your dividend income will vary depending on dividends or interest paid by securities in the Fund’s portfolio, adjusted for operating expenses of each class. Capital gain distributions are net profits realized from the sale of portfolio securities. The performance table does not reflect any taxes that a shareholder would pay on Fund dividends, capital gain distributions, if any, or any realized gains on the sale of Fund shares. Total return reflects reinvestment of the Fund’s dividends and capital gain distributions, if any, and any unrealized gains or losses.
| | | |
| Net Asset Value | | | |
| Share Class | 4/30/14 | 10/31/13 | Change |
| A (FISEX) | $23.30 | $22.16 | +$1.14 |
| C (FRETX) | $23.17 | $22.04 | +$1.13 |
| R (FREIX) | $23.30 | $22.17 | +$1.13 |
| R6(n/a) | $23.32 | $22.18 | +$1.14 |
| Advisor (FEIFX) | $23.33 | $22.19 | +$1.14 |
| |
| |
| Distributions | | | |
| | Dividend | Long-Term | |
| Share Class | Income | Capital Gain | Total |
| A(11/1/13–4/30/14) | $0.2727 | $0.1212 | $0.3939 |
| C(11/1/13–4/30/14) | $0.1892 | $0.1212 | $0.3104 |
| R(11/1/13–4/30/14) | $0.2442 | $0.1212 | $0.3654 |
| R6(11/1/13–4/30/14) | $0.3136 | $0.1212 | $0.4348 |
| Advisor (11/1/13–4/30/14) | $0.3009 | $0.1212 | $0.4221 |
Semiannual Report | 25
Performance Summary (continued)
Performance as of 4/30/141
Cumulative total return excludes sales charges. Average annual total returns and value of $10,000 investment include
maximum sales charges. Class A: 5.75% maximum initial sales charge; Class C: 1% contingent deferred sales charge
in first year only; Class R/R6/Advisor Class: no sales charges.
| | | | | | | | | |
| | | | | | Value of | Average Annual | | Total Annual | |
| | Cumulative | | Average Annual | | 10,000 | Total Return | | Operating | |
| Share Class | Total Return2 | | Total Return3 | | Investment4 | (3/31/14)5 | | Expenses6 | |
| A | | | | | | | | 0.91 | % |
| 6-Month | +7.00 | % | +0.86 | % | $10,086 | | | | |
| 1-Year | +18.87 | % | +12.03 | % | $11,203 | +13.50 | % | | |
| 5-Year | +127.60 | % | +16.49 | % | $21,450 | +17.93 | % | | |
| 10-Year | +82.40 | % | +5.57 | % | $17,189 | +5.34 | % | | |
| C | | | | | | | | 1.66 | % |
| 6-Month | +6.60 | % | +5.60 | % | $10,560 | | | | |
| 1-Year | +18.01 | % | +17.01 | % | $11,701 | +18.52 | % | | |
| 5-Year | +119.24 | % | +17.00 | % | $21,924 | +18.43 | % | | |
| 10-Year | +69.24 | % | +5.40 | % | $16,924 | +5.18 | % | | |
| R | | | | | | | | 1.16 | % |
| 6-Month | +6.82 | % | +6.82 | % | $10,682 | | | | |
| 1-Year | +18.57 | % | +18.57 | % | $11,857 | +20.14 | % | | |
| 5-Year | +124.76 | % | +17.58 | % | $22,476 | +19.01 | % | | |
| 10-Year | +77.67 | % | +5.92 | % | $17,767 | +5.69 | % | | |
| R6 | | | | | | | | 0.49 | % |
| 6-Month | +7.19 | % | +7.19 | % | $10,719 | | | | |
| Since Inception (5/1/13)7 | +20.37 | % | +20.37 | % | $12,037 | +19.42 | % | | |
| Advisor8 | | | | | | | | 0.66 | % |
| 6-Month | +7.13 | % | +7.13 | % | $10,713 | | | | |
| 1-Year | +19.25 | % | +19.25 | % | $11,925 | +20.78 | % | | |
| 5-Year | +130.65 | % | +18.19 | % | $23,065 | +19.64 | % | | |
| 10-Year | +85.30 | % | +6.36 | % | $18,530 | +6.13 | % | | |
| | | | | | |
| | Distribution | | 30-Day Standardized Yield10 | |
| Share Class | Rate9 | | (with waiver) | | (without waiver) | |
| A | 1.80 | % | 1.97 | % | 1.96 | % |
| C | 1.19 | % | 1.35 | % | 1.35 | % |
| R | 1.66 | % | 1.84 | % | 1.84 | % |
| R6 | 2.23 | % | 2.46 | % | 2.46 | % |
| Advisor | 2.14 | % | 2.33 | % | 2.33 | % |
Performance data represent past performance, which does not guarantee future results. Investment return and principal
value will fluctuate, and you may have a gain or loss when you sell your shares. Current performance may differ from
figures shown. For most recent month-end performance, go to franklintempleton.com or call (800) 342-5236.
26 | Semiannual Report
Performance Summary (continued)
All investments involve risks, including possible loss of principal. Stock prices fluctuate, sometimes rapidly and dramatically, due to factors affecting individual companies, particular industries or sectors, or general market conditions. While stocks have historically outperformed other asset classes over the long term, they tend to fluctuate dramatically over the short term as a result of factors affecting individual companies, industries or the securities market as a whole. Convertible securities are subject to the risks of stocks when the underlying stock price is high relative to the conversion price and debt securities when the underlying stock price is low relative to the conversion price. The Fund’s investment in foreign securities also involves special risks, including currency fluctuations and economic as well as political uncertainty. The Fund is actively managed but there is no guarantee that the manager’s investment decisions will produce the desired results. The Fund’s prospectus also includes a description of the main investment risks.
| |
| Class C: | These shares have higher annual fees and expenses than Class A shares. |
| Class R: | Shares are available to certain eligible investors as described in the prospectus. |
| | These shares have higher annual fees and expenses than Class A shares. |
| Class R6: | Shares are available to certain eligible investors as described in the prospectus. |
| Advisor Class: | Shares are available to certain eligible investors as described in the prospectus. |
1. The Fund has a fee waiver associated with its investments in a Franklin Templeton money fund, contractually guaranteed through at least its
current fiscal year-end. Fund investment results reflect the fee waiver, to the extent applicable; without this reduction, the results would have been
lower.
2. Cumulative total return represents the change in value of an investment over the periods indicated.
3. Average annual total return represents the average annual change in value of an investment over the periods indicated. Six-month return has not
been annualized.
4. These figures represent the value of a hypothetical $10,000 investment in the Fund over the periods indicated.
5. In accordance with SEC rules, we provide standardized average annual total return information through the latest calendar quarter.
6. Figures are as stated in the Fund’s current prospectus. In periods of market volatility, assets may decline significantly, causing total annual Fund
operating expenses to become higher than the figures shown.
7. Performance shown is not annualized.
8. Effective 5/15/08, the Fund began offering Advisor Class shares, which do not have sales charges or a Rule 12b-1 plan. Performance quotations
for this class reflect the following methods of calculation: (a) For periods prior to 5/15/08, a restated figure is used based upon the Fund’s Class A
performance, excluding the effect of Class A’s maximum initial sales charge, but reflecting the effect of the Class A Rule 12b-1 fees; and (b) for peri-
ods after 5/15/08, actual Advisor Class performance is used reflecting all charges and fees applicable to that class. Since 5/15/08 (commencement
of sales), the cumulative and average annual total returns of Advisor Class shares were +44.34% and +6.35%.
9. Distribution rate is based on an annualization of the respective class’s April dividend and the maximum offering price (NAV for Classes C, R, R6
and Advisor) per share on 4/30/14.
10. The 30-day standardized yield for the 30 days ended 4/30/14 reflects an estimated yield to maturity (assuming all portfolio securities are held to
maturity). It should be regarded as an estimate of the Fund’s rate of investment income, and it may not equal the Fund’s actual income distribution
rate (which reflects the Fund’s past dividends paid to shareholders) or the income reported in the Fund’s financial statements.
Semiannual Report | 27
Your Fund’s Expenses
Franklin Equity Income Fund
As a Fund shareholder, you can incur two types of costs:
- Transaction costs, including sales charges (loads) on Fund purchases; and
- Ongoing Fund costs, including management fees, distribution and service (12b-1) fees, and other Fund expenses. All mutual funds have ongoing costs, sometimes referred to as operating expenses.
The following table shows ongoing costs of investing in the Fund and can help you understand these costs and compare them with those of other mutual funds. The table assumes a $1,000 investment held for the six months indicated.
Actual Fund Expenses
The first line (Actual) for each share class listed in the table provides actual account values and expenses. The “Ending Account Value” is derived from the Fund’s actual return, which includes the effect of Fund expenses.
You can estimate the expenses you paid during the period by following these steps. Of course, your account value and expenses will differ from those in this illustration:
| 1. | Divide your account value by $1,000. |
| | If an account had an $8,600 value, then $8,600 ÷ $1,000 = 8.6. |
| 2. | Multiply the result by the number under the heading “Expenses Paid During Period.” |
| | If Expenses Paid During Period were $7.50, then 8.6 x $7.50 = $64.50. |
In this illustration, the estimated expenses paid this period are $64.50.
Hypothetical Example for Comparison with Other Funds
Information in the second line (Hypothetical) for each class in the table can help you compare ongoing costs of investing in the Fund with those of other mutual funds. This information may not be used to estimate the actual ending account balance or expenses you paid during the period. The hypothetical “Ending Account Value” is based on the actual expense ratio for each class and an assumed 5% annual rate of return before expenses, which does not represent the Fund’s actual return. The figure under the heading “Expenses Paid During Period” shows the hypothetical expenses your account would have incurred under this scenario. You can compare this figure with the 5% hypothetical examples that appear in shareholder reports of other funds.
28 | Semiannual Report
Your Fund’s Expenses (continued)
Please note that expenses shown in the table are meant to highlight ongoing costs and do not reflect any transaction costs, such as sales charges. Therefore, the second line for each class is useful in comparing ongoing costs only, and will not help you compare total costs of owning different funds. In addition, if transaction costs were included, your total costs would have been higher. Please refer to the Fund prospectus for additional information on operating expenses.
| | | | | | |
| | | Beginning Account | | Ending Account | | Expenses Paid During |
| Share Class | | Value 11/1/13 | | Value 4/30/14 | | Period* 11/1/13–4/30/14 |
| A | | | | | | |
| Actual | $ | 1,000 | $ | 1,070.00 | $ | 4.57 |
| Hypothetical (5% return before expenses) | $ | 1,000 | $ | 1,020.38 | $ | 4.46 |
| C | | | | | | |
| Actual | $ | 1,000 | $ | 1,066.00 | $ | 8.40 |
| Hypothetical (5% return before expenses) | $ | 1,000 | $ | 1,016.66 | $ | 8.20 |
| R | | | | | | |
| Actual | $ | 1,000 | $ | 1,068.20 | $ | 5.85 |
| Hypothetical (5% return before expenses) | $ | 1,000 | $ | 1,019.14 | $ | 5.71 |
| R6 | | | | | | |
| Actual | $ | 1,000 | $ | 1,071.90 | $ | 2.62 |
| Hypothetical (5% return before expenses) | $ | 1,000 | $ | 1,022.27 | $ | 2.56 |
| Advisor | | | | | | |
| Actual | $ | 1,000 | $ | 1,071.30 | $ | 3.29 |
| Hypothetical (5% return before expenses) | $ | 1,000 | $ | 1,021.62 | $ | 3.21 |
*Expenses are calculated using the most recent six-month expense ratio, net of expense waivers, annualized for each class (A: 0.89%; C: 1.64%;
R: 1.14%; R6: 0.51%; and Advisor: 0.64%), multiplied by the average account value over the period, multiplied by 181/365 to reflect the one-half
year period.
Semiannual Report | 29
Franklin Limited Maturity U.S. Government Securities Fund
Your Fund’s Goal and Main Investments: Franklin Limited Maturity U.S. Government Securities Fund seeks to provide investors with as high a level of current income as is consistent with prudent investing, while seeking to preserve shareholders’ capital, by investing at least 80% of its net assets in securities with a dollar-weighted average maturity of less than 10 years1 and issued or guaranteed by the U.S. government, its agencies or instrumentalities.2 Some of the Fund’s investments may include securities issued or guaranteed by U.S. government-sponsored entities such as Fannie Mae and Freddie Mac.3
Performance data represent past performance, which does not guarantee future results. Investment return and principal value will fluctuate, and you may have a gain or loss when you sell your shares. Current performance may differ from figures shown. Please visit franklintempleton.com or call (800) 342-5236 for most recent month-end performance.
We are pleased to bring you Franklin Limited Maturity U.S. Government Securities Fund’s semiannual report for the period ended April 30, 2014. Effective January 22, 2014, Franklin Limited Maturity U.S. Government Securities Fund closed to new investors. The Fund is expected to merge into Franklin Adjustable U.S. Government Securities Fund on June 18, 2014.
Performance Overview
For the six months under review, Franklin Limited Maturity U.S. Government Securities Fund – Class A delivered a +0.32% cumulative total return. In comparison, the Fund’s primary benchmark, the Barclays U.S. Treasury Index: 1-5 Year Component, which tracks U.S. Treasury securities with one to five years remaining maturity, posted a +0.15% total return.4, 5 Also for comparison, the Fund’s secondary benchmark, the Barclays U.S. Treasury Index: 1-3 Year Component, which tracks U.S. Treasury securities with one to three years remaining maturity, returned +0.23%.4, 5 You can find the Fund’s long-term performance data in the Performance Summary beginning on page 34.
Investment Strategy
We currently maintain the portfolio’s average dollar-weighted maturity between one and five years. The Fund’s average dollar-weighted maturity will vary with market conditions and the outlook for interest rates. We invest primarily in short- to intermediate-term securities issued or guaranteed by
The dollar value, number of shares or principal amount, and names of all portfolio holdings are listed in the
Fund’s Statement of Investments (SOI). The SOI begins on page 80.
30 | Semiannual Report
| | | |
| Dividend Distributions* | | | |
| Franklin Limited Maturity U.S. Government Securities Fund | | |
| 11/1/13–4/30/14 | | | |
| | Dividend per Share (cents) |
| Month | Class A | Class R6 | Advisor Class |
| November | 1.5197 | 1.7183 | 1.5952 |
| December | 1.8181 | 2.0250 | 1.9049 |
| January | 1.4974 | 1.6944 | 1.5810 |
| February | 1.4720 | 1.6468 | 1.5456 |
| March | 1.4556 | 1.6913 | 1.5386 |
| April | 1.4137 | 1.6487 | 1.4945 |
| Total | 9.1765 | 10.4245 | 9.6598 |
*Assumes shares were purchased and held for the entire accrual period. Since dividends accrue daily, your actual
distributions will vary depending on the date you purchased your shares and any account activity. All Fund distributions
will vary depending upon current market conditions, and past distributions are not indicative of future trends.
the U.S. government, its agencies and instrumentalities.2 Some of the Fund’s investments may include securities issued by U.S. government-sponsored entities, such as Fannie Mae (FNMA) and Freddie Mac (FHLMC).3 The Fund’s portfolio emphasizes mortgage-backed bonds and agency debentures, while also diversifying across components of the U.S. Treasury sector. We analyze securities using proprietary and nonproprietary research to help identify attractive investment opportunities.
Manager’s Discussion
During the reporting period, economic indicators broadly supported the U.S. economy’s modest recovery. Much of the U.S. economic data released during the first quarter of 2014 was softer than many observers predicted and likely reflected the transitory effects of severe winter weather across much of the nation. U.S. economic data released near period-end, however, reflected a mild rebound that occurred after the sustained period of cold weather ended. However, despite the soft patch, employment data generally indicated the labor market continued to improve. Consumers’ financial situations in the fourth quarter of 2013 also continued to show meaningful improvement, which we thought could support consumption trends. Retail sales in March exceeded expectations, which suggested to us that consumer activity could recover from the weakness early in 2014. Although housing data were mixed, the housing market showed signs of recovery during the period after the effects of the severe winter and 2013’s higher mortgage rates subsided. Although
Semiannual Report | 31
| |
| Portfolio Breakdown | |
| Franklin Limited Maturity | |
| U.S. Government Securities Fund | |
| Based on Total Net Assets as of 4/30/14 | |
| |
| Mortgage-Backed Securities | |
| 54.8 | % |
| U.S. Government & Agency Securities | |
| 29.3 | % |
| Asset-Backed & Commercial Mortgage-Backed Securities | |
| 10.5 | % |
| Repurchase Agreements | |
| 3.2 | % |
| Money Market Funds | |
| 2.0 | % |
| Other Net Assets | |
| 0.2 | % |
consumer price inflation recently began to rise, it remained below the U.S. Federal Reserve Board’s (Fed’s) 2.0% target.
In a sign of more confidence in the economic outlook, the Fed revised its quantitative easing policy by reducing its monthly asset purchases starting in January. The reduction was split evenly between mortgage-backed securities (MBS) and Treasuries. The Fed also reiterated that it was not following a “preset course” and emphasized that future decisions would continue to be “contingent” on new economic data.
As measured by Barclays indexes,5 most fixed income sectors posted positive total returns during the period, including U.S. Treasury Inflation Protected Securities (TIPS), Ginnie Maes, U.S. agency fixed-rate MBS, U.S. hybrid adjustable-rate mortgage (ARM) securities and U.S. agencies.
The Fund invested in U.S. Treasuries, including TIPS, agency debentures, agency mortgage pass-through securities and other U.S. government-related bonds, as we looked for strong valuations within lower interest rate risk government bond markets.
During the period, many of the broad sectors in which we invested outperformed comparable maturity Treasuries. Our ARM positions and shorter-duration fixed-rate agency MBS outperformed Treasuries and contributed to performance. Our multi-family agency MBS slightly detracted relative to comparable maturity Treasuries.
Agency MBS was one of the Fund’s largest sector allocations because of its return potential and income advantage over Treasuries. Over the period, we marginally increased exposure to agency ARMs, and slightly reduced exposure to residential fixed-rate agency MBS. Our exposure to agency debentures remained at historically low levels as they remained more fully valued in our assessment.
32 | Semiannual Report
Thank you for your participation in Franklin Limited Maturity U.S.
Government Securities Fund.

The foregoing information reflects our analysis, opinions and portfolio holdings as of April 30, 2014, the end of the
reporting period. The way we implement our main investment strategies and the resulting portfolio holdings may
change depending on factors such as market and economic conditions. These opinions may not be relied upon as
investment advice or an offer for a particular security. The information is not a complete analysis of every aspect
of any market, country, industry, security or the Fund. Statements of fact are from sources considered reliable,
but the investment manager makes no representation or warranty as to their completeness or accuracy. Although
historical performance is no guarantee of future results, these insights may help you understand our investment
management philosophy.
The index is unmanaged and includes reinvestment of any income or distributions. One cannot invest directly in an
index, and an index is not representative of the Fund’s portfolio.
1. In determining a security’s maturity for the purposes of calculating the Fund’s average maturity, an estimate of the
average time for its principal to be paid may be used. This can be substantially shorter than its stated final maturity.
2. Securities owned by the Fund, but not shares of the Fund, are issued or guaranteed by the U.S. government, its agen-
cies or instrumentalities, including government-sponsored entities, as to timely payment of principal and interest.
3. Although U.S. government-sponsored entities may be chartered or sponsored by acts of Congress, their securities are
neither insured nor guaranteed by the U.S. government. Please refer to the Fund’s prospectus for a detailed discussion
regarding various levels of credit support. The Fund’s yield and share price are not guaranteed and will vary with market
conditions.
4. Source: © 2014 Morningstar. All Rights Reserved. The information contained herein: (1) is proprietary to Morningstar
and/or its content providers; (2) may not be copied or distributed; and (3) is not warranted to be accurate, complete or
timely. Neither Morningstar nor its content providers are responsible for any damages or losses arising from any use of
this information.
5. Source: Barclays Global Family of Indices. © 2014 Barclays Capital Inc. Used with permission.
Semiannual Report | 33
Performance Summary as of 4/30/14
Franklin Limited Maturity U.S. Government Securities Fund
Your dividend income will vary depending on dividends or interest paid by securities in the Fund’s portfolio, adjusted for operating expenses of each class. Capital gain distributions are net profits realized from the sale of portfolio securities. The performance table does not reflect any taxes that a shareholder would pay on Fund dividends, capital gain distributions, if any, or any realized gains on the sale of Fund shares. Total return reflects reinvestment of the Fund’s dividends and capital gain distributions, if any, and any unrealized gains or losses.
| | | |
| Net Asset Value | | | |
| Share Class | 4/30/14 | 10/31/13 | Change |
| A (FRGVX) | $9.97 | $10.04 | -$0.07 |
| R6 (FLMRX) | $9.99 | $10.03 | -$0.04 |
| Advisor (FSUAX) | $9.96 | $10.03 | -$0.07 |
| |
| |
| Distributions | | | |
| Share Class | Dividend Income | | |
| A (11/1/13–4/30/14) | $0.091765 | | |
| R6 (11/1/13–4/30/14) | $0.104245 | | |
| Advisor (11/1/13–4/30/14) | $0.096598 | | |
34 | Semiannual Report
Performance Summary (continued)
Performance as of 4/30/141
Cumulative total return excludes sales charges. Average annual total returns includes maximum sales charges.
Class A: 2.25% maximum initial sales charge; Class R6/Advisor Class: no sales charges.
| | | | | | | | |
| | | | | | Average Annual | | Total Annual | |
| | Cumulative | | Average Annual | | Total Return | | Operating | |
| Share Class | Total Return2 | | Total Return3 | | (3/31/14)4 | | Expenses5 | |
| A | | | | | | | 0.79 | % |
| 6-Month | +0.32 | % | -1.93 | % | | | | |
| 1-Year | -0.01 | % | -2.22 | % | -2.27 | % | | |
| 5-Year | +7.24 | % | +0.95 | % | +0.97 | % | | |
| 10-Year | +31.39 | % | +2.53 | % | +2.35 | % | | |
| R6 | | | | | | | 0.54 | % |
| 6-Month | +0.64 | % | +0.64 | % | | | | |
| Since Inception (5/1/13)6 | +0.42 | % | +0.42 | % | +0.36 | % | | |
| Advisor | | | | | | | 0.69 | % |
| 6-Month | +0.37 | % | +0.37 | % | | | | |
| 1-Year | +0.09 | % | +0.09 | % | +0.03 | % | | |
| 5-Year | +7.77 | % | +1.51 | % | +1.53 | % | | |
| 10-Year | +32.73 | % | +2.87 | % | +2.69 | % | | |
| | | | | | |
| | Distribution | | 30-Day Standardized Yield8 | |
| Share Class | Rate7 | | (with waiver) | | (without waiver) | |
| A | 1.66 | % | 0.74 | % | 0.74 | % |
| R6 | 1.98 | % | 1.04 | % | 1.04 | % |
| Advisor | 1.80 | % | 0.86 | % | 0.86 | % |
Performance data represent past performance, which does not guarantee future results. Investment return and principal
value will fluctuate, and you may have a gain or loss when you sell your shares. Current performance may differ from
figures shown. For most recent month-end performance, go to franklintempleton.com or call (800) 342-5236.
Semiannual Report | 35
Performance Summary (continued)
All investments involve risks, including possible loss of principal. Interest rate movements, unscheduled mortgage prepayments and other risk factors will affect the Fund’s share price and yield. Bond prices, and thus a fund’s share price, generally move in the opposite direction of interest rates. Therefore, as prices of bonds in the Fund adjust to a rise in interest rates, the Fund’s share price may decline. Changes in the financial strength of a bond issuer or in a bond’s credit rating may affect its value. The Fund is actively managed but there is no guarantee that the manager’s investment decisions will produce the desired results. The Fund’s prospectus also includes a description of the main investment risks.
| |
| Class R6: | Shares are available to certain eligible investors as described in the prospectus. |
| Advisor Class: | Shares are available to certain eligible investors as described in the prospectus. |
1. The Fund has a fee waiver associated with its investments in a Franklin Templeton money fund, contractually guaranteed through at least its current
fiscal year-end. Fund investment results reflect the fee waiver, to the extent applicable; without this reduction, the results would have been lower.
2. Cumulative total return represents the change in value of an investment over the periods indicated.
3. Average annual total return represents the average annual change in value of an investment over the periods indicated. Six-month return has not
been annualized.
4. In accordance with SEC rules, we provide standardized average annual total return information through the latest calendar quarter.
5. Figures are as stated in the Fund’s current prospectus. In periods of market volatility, assets may decline significantly, causing total annual Fund
operating expenses to become higher than the figures shown.
6. Performance shown is not annualized.
7. Distribution rate is based on an annualization of the respective class’s April dividend and the maximum offering price (NAV for Classes R6 and
Advisor) per share on 4/30/14.
8. The 30-day standardized yield for the 30 days ended 4/30/14 reflects an estimated yield to maturity (assuming all portfolio securities are held to
maturity). It should be regarded as an estimate of the Fund’s rate of investment income, and it may not equal the Fund’s actual income distribution
rate (which reflects the Fund’s past dividends paid to shareholders) or the income reported in the Fund’s financial statements.
36 | Semiannual Report
Your Fund’s Expenses
Franklin Limited Maturity U.S. Government Securities Fund
As a Fund shareholder, you can incur two types of costs:
- Transaction costs, including sales charges (loads) on Fund purchases; and
- Ongoing Fund costs, including management fees, distribution and service (12b-1) fees, and other Fund expenses. All mutual funds have ongoing costs, sometimes referred to as operating expenses.
The following table shows ongoing costs of investing in the Fund and can help you understand these costs and compare them with those of other mutual funds. The table assumes a $1,000 investment held for the six months indicated.
Actual Fund Expenses
The first line (Actual) for each share class listed in the table provides actual account values and expenses. The “Ending Account Value” is derived from the Fund’s actual return, which includes the effect of Fund expenses.
You can estimate the expenses you paid during the period by following these steps. Of course, your account value and expenses will differ from those in this illustration:
| 1. | Divide your account value by $1,000. |
| | If an account had an $8,600 value, then $8,600 ÷ $1,000 = 8.6. |
| 2. | Multiply the result by the number under the heading “Expenses Paid During Period.” |
| | If Expenses Paid During Period were $7.50, then 8.6 x $7.50 = $64.50. |
In this illustration, the estimated expenses paid this period are $64.50.
Hypothetical Example for Comparison with Other Funds
Information in the second line (Hypothetical) for each class in the table can help you compare ongoing costs of investing in the Fund with those of other mutual funds. This information may not be used to estimate the actual ending account balance or expenses you paid during the period. The hypothetical “Ending Account Value” is based on the actual expense ratio for each class and an assumed 5% annual rate of return before expenses, which does not represent the Fund’s actual return. The figure under the heading “Expenses Paid During Period” shows the hypothetical expenses your account would have incurred under this scenario. You can compare this figure with the 5% hypothetical examples that appear in shareholder reports of other funds.
Semiannual Report | 37
Your Fund’s Expenses (continued)
Please note that expenses shown in the table are meant to highlight ongoing costs and do not reflect any transaction costs, such as sales charges. Therefore, the second line for each class is useful in comparing ongoing costs only, and will not help you compare total costs of owning different funds. In addition, if transaction costs were included, your total costs would have been higher. Please refer to the Fund prospectus for additional information on operating expenses.
| | | | | | |
| | | Beginning Account | | Ending Account | | Expenses Paid During |
| Share Class | | Value 11/1/13 | | Value 4/30/14 | | Period* 11/1/13–4/30/14 |
| A | | | | | | |
| Actual | $ | 1,000 | $ | 1,003.20 | $ | 4.52 |
| Hypothetical (5% return before expenses) | $ | 1,000 | $ | 1,020.28 | $ | 4.56 |
| R6 | | | | | | |
| Actual | $ | 1,000 | $ | 1,006.40 | $ | 2.69 |
| Hypothetical (5% return before expenses) | $ | 1,000 | $ | 1,022.12 | $ | 2.71 |
| Advisor | | | | | | |
| Actual | $ | 1,000 | $ | 1,003.70 | $ | 4.02 |
| Hypothetical (5% return before expenses) | $ | 1,000 | $ | 1,020.78 | $ | 4.06 |
*Expenses are calculated using the most recent six-month expense ratio, net of expense waivers, annualized for each class (A: 0.91%; R6: 0.54%; and Advisor: 0.81%), multiplied by the average account value over the period, multiplied by 181/365 to reflect the one-half year period.
38 | Semiannual Report
Franklin Real Return Fund
Your Fund’s Goal and Main Investments: Franklin Real Return Fund seeks to achieve total return that exceeds the rate of inflation over an economic cycle. The Fund will generally invest a substantial portion of its assets in inflation-protected securities. Managers also have the flexibility to invest in other sectors of the market to increase real return (total return less inflation) potential and offer greater diversification.
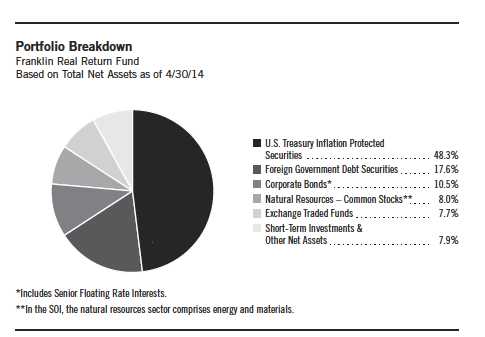
Performance data represent past performance, which does not guarantee future results. Investment return and principal value will fluctuate, and you may have a gain or loss when you sell your shares. Current performance may differ from figures shown Please visit franklintempleton.com or call (800) 342-5236 for most recent month-end performance.
We are pleased to bring you Franklin Real Return Fund’s semiannual report for the period ended April 30, 2014.
Performance Overview
For the six months under review, Franklin Real Return Fund — Class A delivered a +1.64% cumulative total return. In comparison, the Barclays U.S. TIPS Index, which tracks the universe of inflation-protected notes issued by the U.S. Treasury that have at least one year to final maturity, posted a +0.70% total return.1, 2 Also for comparison, the Consumer Price Index (CPI)
The dollar value, number of shares or principal amount, and names of all portfolio holdings are listed in the Fund’s
Statement of Investments (SOI). The SOI begins on page 88.
Semiannual Report | 39
| | | | |
| Dividend Distributions* | | | | |
| Franklin Real Return Fund | | | | |
| 11/1/13–4/30/14 | | | | |
| | | Dividend per Share (cents) |
| Month | Class A | Class C | Class R6 | Advisor Class |
| November | 0.89 | 0.56 | 1.20 | 1.10 |
| December | 7.18 | 6.83 | 7.53 | 7.40 |
| January** | — | — | — | — |
| February** | — | — | — | — |
| March | 1.47 | — | 2.52 | 2.18 |
| April** | — | — | — | — |
| Total | 9.54 | 7.39 | 11.25 | 10.68 |
*All Fund distributions will vary depending upon current market conditions, and past distributions are not indicative
of future trends.
**The Fund paid no dividends due to negative inflation adjustments for TIPS, which are the Fund’s primary investments.
for Urban Consumers (All Items) NSA (non-seasonally adjusted), a measure of the average change in prices of all goods and services purchased for consumption by urban householders, rose 1.51% for the same period.3 You can find more of the Fund’s performance data in the Performance Summary beginning on page 43.
Investment Strategy
We seek to allocate assets among investments to achieve the highest level of real return (total return less the rate of inflation) consistent with an acceptable level of risk. We will allocate the Fund’s assets among securities in various market sectors based on our assessment of changing economic, global market, industry and issuer conditions. When making our investment decisions, we use a “top-down” analysis of macroeconomic trends combined with a “bottom-up” fundamental analysis of market sectors, industries and issuers to try to take advantage of varying sector reactions to economic events. We will evaluate such criteria as country risk, business cycles, yield curves, and values between and within markets.
40 | Semiannual Report
Manager’s Discussion
During the reporting period, economic indicators broadly supported the U.S. economy’s modest recovery. Much of the U.S. economic data released during the first quarter of 2014 was softer than many observers predicted and likely reflected the transitory effects of severe winter weather across much of the nation. U.S. economic data released near period-end, however, reflected a mild rebound that occurred after the sustained period of cold weather ended. However, despite the soft patch, employment data generally indicated the labor market continued to improve. Consumers’ financial situations in the fourth quarter of 2013 also continued to show meaningful improvement, which we thought could support consumption trends. Retail sales in March exceeded expectations, which suggested to us that consumer activity could recover from the weakness early in 2014. Although housing data were mixed, the housing market showed signs of recovery during the period after the effects of the severe winter and 2013’s higher mortgage rates subsided. Although consumer price inflation recently began to rise, it remained below the U.S. Federal Reserve Board’s (Fed’s) 2.0% target.
In a sign of more confidence in the economic outlook, the Fed revised its quantitative easing policy by reducing its monthly asset purchases starting in January. The reduction was split evenly between mortgage-backed securities (MBS) and Treasuries. The Fed also reiterated that it was not following a “preset course” and emphasized that future decisions would continue to be “contingent” on new economic data.
We invested the Fund’s assets in the allowable sectors during the period under review. At period-end, just under half of total net assets were invested in Treasury Inflation Protected Securities (TIPS). For diversification, we also allocated the Fund’s assets to short-term non-U.S. dollar securities, natural resources, real estate investment trusts (REITs), high yield bonds and senior secured floating rate loans. We employed a non-U.S. dollar strategy to help hedge against U.S. dollar weakness versus certain currencies and concentrated our TIPS holdings in shorter maturities.
Our diversified mix of inflation-sensitive assets performed relatively well over the period. In particular, our exposures to natural resources, REITs, high yield corporate bonds, TIPS and senior secured floating rate loans contributed to performance relative to the benchmark Barclays U.S. TIPS Index. In contrast, the Fund’s non-U.S. dollar holdings were detractors.
Semiannual Report | 41
Thank you for your continued participation in Franklin Real Return Fund.
We look forward to serving your future investment needs.

The foregoing information reflects our analysis, opinions and portfolio holdings as of April 30, 2014, the end of the
reporting period. The way we implement our main investment strategies and the resulting portfolio holdings may
change depending on factors such as market and economic conditions. These opinions may not be relied upon as
investment advice or an offer for a particular security. The information is not a complete analysis of every aspect
of any market, country, industry, security or the Fund. Statements of fact are from sources considered reliable,
but the investment manager makes no representation or warranty as to their completeness or accuracy. Although
historical performance is no guarantee of future results, these insights may help you understand our investment
management philosophy.
The index is unmanaged and includes reinvestment of any income or distributions. One cannot invest directly in an
index, and an index is not representative of the Fund’s portfolio.
1. Source: © 2014 Morningstar. All Rights Reserved. The information contained herein: (1) is proprietary to Morningstar
and/or its content providers; (2) may not be copied or distributed; and (3) is not warranted to be accurate, complete or
timely. Neither Morningstar nor its content providers are responsible for any damages or losses arising from any use of
this information.
2. Source: Barclays Global Family of Indices. © 2014 Barclays Capital Inc. Used with permission.
3. Source: Bureau of Labor Statistics.
42 | Semiannual Report
Performance Summary as of 4/30/14
Franklin Real Return Fund
Your dividend income will vary depending on dividends or interest paid by securities in the Fund’s portfolio, adjusted for operating expenses of each class. Capital gain distributions are net profits realized from the sale of portfolio securities. The performance table does not reflect any taxes that a shareholder would pay on Fund dividends, capital gain distributions, if any, or any realized gains on the sale of Fund shares. Total return reflects reinvestment of the Fund’s dividends and capital gain distributions, if any, and any unrealized gains or losses.
| | | |
| Net Asset Value | | | |
| Share Class | 4/30/14 | 10/31/13 | Change |
| A (FRRAX) | $10.90 | $10.82 | +$0.08 |
| C (FRRCX) | $10.84 | $10.76 | +$0.08 |
| R6 (FRRRX) | $10.94 | $10.85 | +$0.09 |
| Advisor (FARRX) | $10.93 | $10.85 | +$0.08 |
| |
| Distributions | |
| Share Class | Dividend Income |
| A(11/1/13–4/30/14) | $0.0954 |
| C(11/1/13–4/30/14) | $0.0739 |
| R6(11/1/13–4/30/14) | $0.1125 |
| Advisor (11/1/13–4/30/14) | $0.1068 |
Semiannual Report | 43
Performance Summary (continued)
Performance as of 4/30/141
Cumulative total return excludes sales charges. Average annual total returns include maximum sales charges. Class A: 4.25% maximum initial sales
charge; Class C: 1% contingent deferred sales charge in first year only; Class R6/Advisor Class: no sales charges.
| | | | | | | | | | |
| | | | | | Average Annual | | | | | |
| | Cumulative | | Average Annual | | Total Return | | Total Annual Operating Expenses5 | |
| Share Class | Total Return2 | | Total Return3 | | (3/31/14)4 | | (with waiver) | | (without waiver) | |
| A | | | | | | | 0.92 | % | 1.10 | % |
| 6-Month | +1.64 | % | -2.68 | % | | | | | | |
| 1-Year | +1.14 | % | -3.17 | % | -3.73 | % | | | | |
| 5-Year | +22.17 | % | +3.18 | % | +3.19 | % | | | | |
| Since Inception (11/17/04) | +46.42 | % | +3.64 | % | +3.57 | % | | | | |
| C | | | | | | | 1.32 | % | 1.50 | % |
| 6-Month | +1.45 | % | +0.45 | % | | | | | | |
| 1-Year | +0.82 | % | -0.17 | % | -0.82 | % | | | | |
| 5-Year | +19.81 | % | +3.68 | % | +3.68 | % | | | | |
| Since Inception (11/03/08) | +25.87 | % | +4.28 | % | +4.15 | % | | | | |
| R6 | | | | | | | 0.54 | % | 0.72 | % |
| 6-Month | +1.89 | % | +1.89 | % | | | | | | |
| Since Inception (5/1/13)6 | +1.83 | % | +1.83 | % | +0.71 | % | | | | |
| Advisor | | | | | | | 0.67 | % | 0.85 | % |
| 6-Month | +1.74 | % | +1.74 | % | | | | | | |
| 1-Year | +1.44 | % | +1.44 | % | +0.79 | % | | | | |
| 5-Year | +23.71 | % | +4.35 | % | +4.35 | % | | | | |
| Since Inception (11/17/04) | +50.00 | % | +4.38 | % | +4.30 | % | | | | |
| | | | | | |
| | Distribution | | 30-Day Standardized Yield8 | |
| Share Class | Rate7 | | (with waiver) | | (without waiver) | |
| A | 0.00 | % | 1.44 | % | 1.25 | % |
| C | 0.00 | % | 1.10 | % | 0.91 | % |
| R6 | 0.00 | % | 1.89 | % | 1.69 | % |
| Advisor | 0.00 | % | 1.75 | % | 1.55 | % |
Performance data represent past performance, which does not guarantee future results. Investment return and principal value will fluctuate, and
you may have a gain or loss when you sell your shares. Current performance may differ from figures shown. For most recent month-end performance,
go to franklintempleton.com or call (800) 342-5236.
44 | Semiannual Report
Performance Summary (continued)
All investments involve risks, including possible loss of principal. Interest rate movements will affect the Fund’s share price and yield. Bond prices generally move in the opposite direction of interest rates. As the prices of bonds in the Fund adjust to a rise in interest rates, the Fund’s share price may decline. Foreign securities involve special risks, including currency fluctuations and economic and political uncertainties. Changes in the financial strength of a bond issuer or in a bond’s credit rating may affect its value. Stock prices fluctuate, sometimes rapidly and dramatically, due to factors affecting individual companies, particular industries or sectors, or general market conditions. The Fund is actively managed but there is no guarantee that the manager’s investment decisions will produce the desired results. The Fund’s prospectus also includes a description of the main investment risks.
| |
| Class C: | These shares have higher annual fees and expenses than Class A shares. |
| Class R6: | Shares are available to certain eligible investors as described in the prospectus. |
| Advisor Class: | Shares are available to certain eligible investors as described in the prospectus. |
1. The Fund has an expense reduction contractually guaranteed through at least 2/28/15 and a fee waiver associated with its investments in a
Franklin Templeton money fund, contractually guaranteed through at least its current fiscal year-end. Fund investment results reflect the expense
reduction and fee waiver, to the extent applicable; without these reductions, the results would have been lower.
2. Cumulative total return represents the change in value of an investment over the periods indicated.
3. Average annual total return represents the average annual change in value of an investment over the periods indicated. Six-month return has not
been annualized.
4. In accordance with SEC rules, we provide standardized average annual total return information through the latest calendar quarter.
5. Figures are as stated in the Fund’s current prospectus. In periods of market volatility, assets may decline significantly, causing total annual Fund
operating expenses to become higher than the figures shown.
6. Performance shown is not annualized.
7. Distribution rate is based on an annualization of the respective class’s April dividend and the maximum offering price (NAV for Classes C, R6 and
Advisor) per share on 4/30/14.
8. The 30-day standardized yield for the 30 days ended 4/30/14 reflects an estimated yield to maturity (assuming all portfolio securities are held to
maturity). It should be regarded as an estimate of the Fund’s rate of investment income, and it may not equal the Fund’s actual income distribution
rate (which reflects the Fund’s past dividends paid to shareholders) or the income reported in the Fund’s financial statements.
Semiannual Report | 45
Your Fund’s Expenses
Franklin Real Return Fund
As a Fund shareholder, you can incur two types of costs:
- Transaction costs, including sales charges (loads) on Fund purchases; and
- Ongoing Fund costs, including management fees, distribution and service (12b-1) fees, and other Fund expenses. All mutual funds have ongoing costs, sometimes referred to as operating expenses.
The following table shows ongoing costs of investing in the Fund and can help you understand these costs and compare them with those of other mutual funds. The table assumes a $1,000 investment held for the six months indicated.
Actual Fund Expenses
The first line (Actual) for each share class listed in the table provides actual account values and expenses. The “Ending Account Value” is derived from the Fund’s actual return, which includes the effect of Fund expenses.
You can estimate the expenses you paid during the period by following these steps. Of course, your account value and expenses will differ from those in this illustration:
| 1. | Divide your account value by $1,000. |
| | If an account had an $8,600 value, then $8,600 ÷ $1,000 = 8.6. |
| 2. | Multiply the result by the number under the heading “Expenses Paid During Period.” |
| | If Expenses Paid During Period were $7.50, then 8.6 x $7.50 = $64.50. |
In this illustration, the estimated expenses paid this period are $64.50.
Hypothetical Example for Comparison with Other Funds
Information in the second line (Hypothetical) for each class in the table can help you compare ongoing costs of investing in the Fund with those of other mutual funds. This information may not be used to estimate the actual ending account balance or expenses you paid during the period. The hypothetical “Ending Account Value” is based on the actual expense ratio for each class and an assumed 5% annual rate of return before expenses, which does not represent the Fund’s actual return. The figure under the heading “Expenses Paid During Period” shows the hypothetical expenses your account would have incurred under this scenario. You can compare this figure with the 5% hypothetical examples that appear in shareholder reports of other funds.
46 | Semiannual Report
Your Fund’s Expenses (continued)
Please note that expenses shown in the table are meant to highlight ongoing costs and do not reflect any transaction costs, such as sales charges. Therefore, the second line for each class is useful in comparing ongoing costs only, and will not help you compare total costs of owning different funds. In addition, if transaction costs were included, your total costs would have been higher. Please refer to the Fund prospectus for additional information on operating expenses.
| | | | | | |
| | | Beginning Account | | Ending Account | | Expenses Paid During |
| Share Class | | Value 11/1/13 | | Value 4/30/14 | | Period* 11/1/13–4/30/14 |
| A | | | | | | |
| Actual | $ | 1,000 | $ | 1,016.40 | $ | 4.50 |
| Hypothetical (5% return before expenses) | $ | 1,000 | $ | 1,020.33 | $ | 4.51 |
| C | | | | | | |
| Actual | $ | 1,000 | $ | 1,014.50 | $ | 6.49 |
| Hypothetical (5% return before expenses) | $ | 1,000 | $ | 1,018.35 | $ | 6.51 |
| R6 | | | | | | |
| Actual | $ | 1,000 | $ | 1,018.90 | $ | 2.60 |
| Hypothetical (5% return before expenses) | $ | 1,000 | $ | 1,022.22 | $ | 2.61 |
| Advisor | | | | | | |
| Actual | $ | 1,000 | $ | 1,017.40 | $ | 3.25 |
| Hypothetical (5% return before expenses) | $ | 1,000 | $ | 1,021.57 | $ | 3.26 |
*Expenses are calculated using the most recent six-month expense ratio, net of expense waivers, annualized for each class (A: 0.90%; C: 1.30%;
R6: 0.52%; and Advisor: 0.65%), multiplied by the average account value over the period, multiplied by 181/365 to reflect the one-half year period.
Semiannual Report | 47
| | | | | | | | | | | | | | | | | | |
| Franklin Investors Securities Trust | | | | | | | |
| |
| Financial Highlights | | | | | | | | | | | | | | | | | | |
| |
| Franklin Balanced Fund | | | | | | | | | | | | | | | | | | |
| | | Six Months Ended | | | | | | | | | | | | | |
| | | April 30, 2014 | | | Year Ended October 31, | | | | |
| Class A | | (unaudited) | | | 2013 | | | 2012 | | | 2011 | | | 2010 | | | 2009 | |
| Per share operating performance | | | | | | | | | | | | | | | | | | |
| (for a share outstanding throughout | | | | | | | | | | | | | | | | | | |
| the period) | | | | | | | | | | | | | | | | | | |
| Net asset value, beginning of period | $ | 11.43 | | $ | 10.64 | | $ | 9.87 | | $ | 9.61 | | $ | 8.55 | | $ | 7.00 | |
| Income from investment operationsa: | | | | | | | | | | | | | | | | | | |
| Net investment incomeb | | 0.16 | c | | 0.27 | | | 0.30 | | | 0.32 | | | 0.31 | | | 0.35 | |
| Net realized and unrealized gains | | | | | | | | | | | | | | | | | | |
| (losses) | | 0.51 | | | 1.02 | | | 0.83 | | | 0.30 | | | 1.11 | | | 1.59 | |
| Total from investment operations | | 0.67 | | | 1.29 | | | 1.13 | | | 0.62 | | | 1.42 | | | 1.94 | |
| Less distributions from: | | | | | | | | | | | | | | | | | | |
| Net investment income | | (0.18 | ) | | (0.36 | ) | | (0.36 | ) | | (0.36 | ) | | (0.36 | ) | | (0.39 | ) |
| Net realized gains | | (0.17 | ) | | (0.14 | ) | | (—)d | | | — | | | — | | | — | |
| Total distributions | | (0.35 | ) | | (0.50 | ) | | (0.36 | ) | | (0.36 | ) | | (0.36 | ) | | (0.39 | ) |
| Net asset value, end of period | $ | 11.75 | | $ | 11.43 | | $ | 10.64 | | $ | 9.87 | | $ | 9.61 | | $ | 8.55 | |
| |
| Total returne | | 6.03 | % | | 12.51 | % | | 11.70 | % | | 6.51 | % | | 16.95 | % | | 29.03 | % |
| |
| Ratios to average net assetsf | | | | | | | | | | | | | | | | | | |
| Expenses before waiver and payments by | | | | | | | | | | | | | | | | | | |
| affiliates | | 1.09 | % | | 1.12 | % | | 1.15 | % | | 1.17 | % | | 1.23 | % | | 1.26 | % |
| Expenses net of waiver and payments by | | | | | | | | | | | | | | | | | | |
| affiliates | | 1.08 | %g | | 1.10 | %g | | 1.01 | % | | 1.01 | % | | 1.02 | % | | 0.99 | % |
| Net investment income | | 2.79 | %c | | 2.51 | % | | 2.95 | % | | 3.27 | % | | 3.44 | % | | 4.69 | % |
| |
| Supplemental data | | | | | | | | | | | | | | | | | | |
| Net assets, end of period (000’s) | $ | 1,805,700 | | $ | 1,354,710 | | $ | 627,287 | | $ | 218,625 | | $ | 146,699 | | $ | 88,376 | |
| Portfolio turnover rate | | 14.15 | % | | 58.52 | % | | 58.59 | % | | 70.76 | % | | 54.12 | % | | 73.57 | % |
aThe amount shown for a share outstanding throughout the period may not correlate with the Statement of Operations for the period due to the timing of sales and repurchases of
the Fund shares in relation to income earned and/or fluctuating fair value of the investments of the Fund.
bBased on average daily shares outstanding.
cNet investment income per share includes approximately $0.03 per share received in the form of a special dividend paid in connection with certain Fund holdings. Excluding this
amount, the ratio of net investment income to average net assets would have been 2.23%.
dAmount rounds to less than $0.01 per share.
eTotal return does not reflect sales commissions or contingent deferred sales charges, if applicable, and is not annualized for periods less than one year.
fRatios are annualized for periods less than one year.
gBenefit of expense reduction rounds to less than 0.01%.
48 | The accompanying notes are an integral part of these financial statements. | Semiannual Report
| | | | | | | | | | | | | | | | | | |
| Franklin Investors Securities Trust | | | | | | | | | | |
| |
| Financial Highlights (continued) | | | | | | | | | | | | | | | | | | |
| |
| Franklin Balanced Fund | | | | | | | | | | | | | | | | | | |
| | | Six Months Ended | | | | | | | | | | | | | |
| | | April 30, 2014 | | | | | | Year Ended October 31, | | | | |
| Class C | | (unaudited) | | | 2013 | | | 2012 | | | 2011 | | | 2010 | | | 2009 | |
| Per share operating performance | | | | | | | | | | | | | | | | | | |
| (for a share outstanding throughout the period) | | | | | | | | | | | | | | | | | | |
| Net asset value, beginning of period | $ | 11.34 | | $ | 10.57 | | $ | 9.81 | | $ | 9.54 | | $ | 8.49 | | $ | 6.96 | |
| Income from investment operationsa: | | | | | | | | | | | | | | | | | | |
| Net investment incomeb | | 0.12 | c | | 0.20 | | | 0.23 | | | 0.25 | | | 0.24 | | | 0.29 | |
| Net realized and unrealized gains (losses) | | 0.51 | | | 0.99 | | | 0.82 | | | 0.31 | | | 1.11 | | | 1.59 | |
| Total from investment operations | | 0.63 | | | 1.19 | | | 1.05 | | | 0.56 | | | 1.35 | | | 1.88 | |
| Less distributions from: | | | | | | | | | | | | | | | | | | |
| Net investment income | | (0.14 | ) | | (0.28 | ) | | (0.29 | ) | | (0.29 | ) | | (0.30 | ) | | (0.35 | ) |
| Net realized gains | | (0.17 | ) | | (0.14 | ) | | (—)d | | | — | | | — | | | — | |
| Total distributions | | (0.31 | ) | | (0.42 | ) | | (0.29 | ) | | (0.29 | ) | | (0.30 | ) | | (0.35 | ) |
| Net asset value, end of period | $ | 11.66 | | $ | 11.34 | | $ | 10.57 | | $ | 9.81 | | $ | 9.54 | | $ | 8.49 | |
| |
| Total returne | | 5.70 | % | | 11.62 | % | | 10.91 | % | | 5.91 | % | | 16.12 | % | | 28.08 | % |
| |
| Ratios to average net assetsf | | | | | | | | | | | | | | | | | | |
| Expenses before waiver and payments by | | | | | | | | | | | | | | | | | | |
| affiliates | | 1.79 | % | | 1.82 | % | | 1.85 | % | | 1.87 | % | | 1.92 | % | | 1.96 | % |
| Expenses net of waiver and payments by | | | | | | | | | | | | | | | | | | |
| affiliates | | 1.78 | %g | | 1.80 | %g | | 1.71 | % | | 1.71 | % | | 1.71 | % | | 1.69 | % |
| Net investment income | | 2.09 | %c | | 1.81 | % | | 2.25 | % | | 2.57 | % | | 2.75 | % | | 3.99 | % |
| |
| Supplemental data | | | | | | | | | | | | | | | | | | |
| Net assets, end of period (000’s) | $ | 439,615 | | $ | 354,359 | | $ | 187,991 | | $ | 85,302 | | $ | 47,219 | | $ | 19,423 | |
| Portfolio turnover rate | | 14.15 | % | | 58.52 | % | | 58.59 | % | | 70.76 | % | | 54.12 | % | | 73.57 | % |
aThe amount shown for a share outstanding throughout the period may not correlate with the Statement of Operations for the period due to the timing of sales and repurchases of
the Fund shares in relation to income earned and/or fluctuating fair value of the investments of the Fund.
bBased on average daily shares outstanding.
cNet investment income per share includes approximately $0.03 per share received in the form of a special dividend paid in connection with certain Fund holdings. Excluding this
amount, the ratio of net investment income to average net assets would have been 1.53%.
dAmount rounds to less than $0.01 per share.
eTotal return does not reflect sales commissions or contingent deferred sales charges, if applicable, and is not annualized for periods less than one year.
fRatios are annualized for periods less than one year.
gBenefit of expense reduction rounds to less than 0.01%.
Semiannual Report | The accompanying notes are an integral part of these financial statements. | 49
| | | | | | | | | | | | | | | | | | |
| Franklin Investors Securities Trust | | | | | | | | | | |
| |
| Financial Highlights (continued) | | | | | | | | | | | | | | | | | | |
| |
| Franklin Balanced Fund | | | | | | | | | | | | | | | | | | |
| | | Six Months Ended | | | | | | | | | | | | | | | | |
| | | April 30, 2014 | | | | | | Year Ended October 31, | | | | |
| Class R | | (unaudited) | | | 2013 | | | 2012 | | | 2011 | | | 2010 | | | 2009 | |
| Per share operating performance | | �� | | | | | | | | | | | | | | | | |
| (for a share outstanding throughout the period) | | | | | | | | | | | | | | | | | | |
| Net asset value, beginning of period | $ | 11.45 | | $ | 10.66 | | $ | 9.89 | | $ | 9.62 | | $ | 8.56 | | $ | 7.00 | |
| Income from investment operationsa: | | | | | | | | | | | | | | | | | | |
| Net investment incomeb | | 0.15 | c | | 0.26 | | | 0.29 | | | 0.31 | | | 0.28 | | | 0.32 | |
| Net realized and unrealized gains (losses) | | 0.52 | | | 1.01 | | | 0.82 | | | 0.30 | | | 1.12 | | | 1.62 | |
| Total from investment operations | | 0.67 | | | 1.27 | | | 1.11 | | | 0.61 | | | 1.40 | | | 1.94 | |
| Less distributions from: | | | | | | | | | | | | | | | | | | |
| Net investment income | | (0.17 | ) | | (0.34 | ) | | (0.34 | ) | | (0.34 | ) | | (0.34 | ) | | (0.38 | ) |
| Net realized gains | | (0.17 | ) | | (0.14 | ) | | (—)d | | | — | | | — | | | — | |
| Total distributions | | (0.34 | ) | | (0.48 | ) | | (0.34 | ) | | (0.34 | ) | | (0.34 | ) | | (0.38 | ) |
| Net asset value, end of period | $ | 11.78 | | $ | 11.45 | | $ | 10.66 | | $ | 9.89 | | $ | 9.62 | | $ | 8.56 | |
| |
| Total returne | | 6.00 | % | | 12.26 | % | | 11.46 | % | | 6.39 | % | | 16.70 | % | | 28.73 | % |
| |
| Ratios to average net assetsf | | | | | | | | | | | | | | | | | | |
| Expenses before waiver and payments by | | | | | | | | | | | | | | | | | | |
| affiliates | | 1.29 | % | | 1.32 | % | | 1.35 | % | | 1.37 | % | | 1.42 | % | | 1.48 | % |
| Expenses net of waiver and payments by | | | | | | | | | | | | | | | | | | |
| affiliates | | 1.28 | %g | | 1.30 | %g | | 1.21 | % | | 1.21 | % | | 1.21 | % | | 1.21 | % |
| Net investment income | | 2.59 | %c | | 2.31 | % | | 2.75 | % | | 3.07 | % | | 3.25 | % | | 4.47 | % |
| |
| Supplemental data | | | | | | | | | | | | | | | | | | |
| Net assets, end of period (000’s) | $ | 3,512 | | $ | 3,253 | | $ | 2,378 | | $ | 1,928 | | $ | 677 | | $ | 175 | |
| Portfolio turnover rate | | 14.15 | % | | 58.52 | % | | 58.59 | % | | 70.76 | % | | 54.12 | % | | 73.57 | % |
aThe amount shown for a share outstanding throughout the period may not correlate with the Statement of Operations for the period due to the timing of sales and repurchases of
the Fund shares in relation to income earned and/or fluctuating fair value of the investments of the Fund.
bBased on average daily shares outstanding.
cNet investment income per share includes approximately $0.03 per share received in the form of a special dividend paid in connection with certain Fund holdings. Excluding this
amount, the ratio of net investment income to average net assets would have been 2.03%.
dAmount rounds to less than $0.01 per share.
eTotal return is not annualized for periods less than one year.
fRatios are annualized for periods less than one year.
gBenefit of expense reduction rounds to less than 0.01%.
50 | The accompanying notes are an integral part of these financial statements. | Semiannual Report
| | | | |
| Franklin Investors Securities Trust | | | | |
| |
| Financial Highlights (continued) | | | | |
| |
| Franklin Balanced Fund | | | | |
| | Six Months Ended | | Period Ended | |
| | April 30, 2014 | | October 31, | |
| Class R6 | (unaudited) | | 2013a | |
| Per share operating performance | | | | |
| (for a share outstanding throughout the period) | | | | |
| Net asset value, beginning of period | $11.45 | | $11.08 | |
| Income from investment operationsb: | | | | |
| Net investment incomec | 0.18 | d | 0.19 | |
| Net realized and unrealized gains (losses) | 0.51 | | 0.38 | |
| Total from investment operations | 0.69 | | 0.57 | |
| Less distributions from: | | | | |
| Net investment income | (0.21 | ) | (0.20 | ) |
| Net realized gains | (0.17 | ) | — | |
| Total distributions | (0.38 | ) | (0.20 | ) |
| Net asset value, end of period | $11.76 | | $11.45 | |
| |
| Total returne | 6.25 | % | 5.15 | % |
| |
| Ratios to average net assetsf | | | | |
| Expenses before waiver and payments by affiliates | 1.46 | % | 1.82 | % |
| Expenses net of waiver and payments by affiliatesg | 0.68 | % | 0.70 | % |
| Net investment income | 3.19 | %d | 2.91 | % |
| |
| Supplemental data | | | | |
| Net assets, end of period (000’s) | $5 | | $5 | |
| Portfolio turnover rate | 14.15 | % | 58.52 | % |
aFor the period May 1, 2013 (effective date) to October 31, 2013.
bThe amount shown for a share outstanding throughout the period may not correlate with the Statement of Operations for the period due to the timing of sales and repurchases of
the Fund shares in relation to income earned and/or fluctuating fair value of the investments of the Fund.
cBased on average daily shares outstanding.
dNet investment income per share includes approximately $0.03 per share received in the form of a special dividend paid in connection with certain Fund holdings. Excluding this
amount, the ratio of net investment income to average net assets would have been 2.63%.
eTotal return is not annualized for periods less than one year.
fRatios are annualized for periods less than one year.
gBenefit of expense reduction rounds to less than 0.01%.
Semiannual Report | The accompanying notes are an integral part of these financial statements. | 51
| | | | | | | | | | | | | | | | | | |
| Franklin Investors Securities Trust | | | | | | | | | | |
| |
| Financial Highlights (continued) | | | | | | | | | | | | | | | | | | |
| |
| Franklin Balanced Fund | | | | | | | | | | | | | | | | | | |
| | | Six Months Ended | | | | | | | | | | | | | | | | |
| | | April 30, 2014 | | | | | | Year Ended October 31, | | | | |
| Advisor Class | | (unaudited) | | | 2013 | | | 2012 | | | 2011 | | | 2010 | | | 2009 | |
| Per share operating performance | | | | | | | | | | | | | | | | | | |
| (for a share outstanding throughout the period) | | | | | | | | | | | | | | | | | | |
| Net asset value, beginning of period | $ | 11.45 | | $ | 10.66 | | $ | 9.89 | | $ | 9.62 | | $ | 8.56 | | $ | 7.01 | |
| Income from investment operationsa: | | | | | | | | | | | | | | | | | | |
| Net investment incomeb | | 0.18 | c | | 0.30 | | | 0.34 | | | 0.35 | | | 0.34 | | | 0.37 | |
| Net realized and unrealized gains (losses) | | 0.51 | | | 1.02 | | | 0.82 | | | 0.31 | | | 1.11 | | | 1.59 | |
| Total from investment operations | | 0.69 | | | 1.32 | | | 1.16 | | | 0.66 | | | 1.45 | | | 1.96 | |
| Less distributions from: | | | | | | | | | | | | | | | | | | |
| Net investment income | | (0.20 | ) | | (0.39 | ) | | (0.39 | ) | | (0.39 | ) | | (0.39 | ) | | (0.41 | ) |
| Net realized gains | | (0.17 | ) | | (0.14 | ) | | (—)d | | | — | | | — | | | — | |
| Total distributions | | (0.37 | ) | | (0.53 | ) | | (0.39 | ) | | (0.39 | ) | | (0.39 | ) | | (0.41 | ) |
| Net asset value, end of period | $ | 11.77 | | $ | 11.45 | | $ | 10.66 | | $ | 9.89 | | $ | 9.62 | | $ | 8.56 | |
| |
| Total returne | | 6.18 | % | | 12.82 | % | | 12.01 | % | | 6.93 | % | | 17.30 | % | | 29.32 | % |
| |
| Ratios to average net assetsf | | | | | | | | | | | | | | | | | | |
| Expenses before waiver and payments by | | | | | | | | | | | | | | | | | | |
| affiliates | | 0.79 | % | | 0.82 | % | | 0.85 | % | | 0.87 | % | | 0.92 | % | | 0.98 | % |
| Expenses net of waiver and payments by | | | | | | | | | | | | | | | | | | |
| affiliates | | 0.78 | %g | | 0.80 | %g | | 0.71 | % | | 0.71 | % | | 0.71 | % | | 0.71 | % |
| Net investment income | | 3.09 | %c | | 2.81 | % | | 3.25 | % | | 3.57 | % | | 3.75 | % | | 4.97 | % |
| |
| Supplemental data | | | | | | | | | | | | | | | | | | |
| Net assets, end of period (000’s) | $ | 81,780 | | $ | 68,201 | | $ | 13,779 | | $ | 7,477 | | $ | 3,299 | | $ | 1,861 | |
| Portfolio turnover rate | | 14.15 | % | | 58.52 | % | | 58.59 | % | | 70.76 | % | | 54.12 | % | | 73.57 | % |
aThe amount shown for a share outstanding throughout the period may not correlate with the Statement of Operations for the period due to the timing of sales and repurchases of
the Fund shares in relation to income earned and/or fluctuating fair value of the investments of the Fund.
bBased on average daily shares outstanding.
cNet investment income per share includes approximately $0.03 per share received in the form of a special dividend paid in connection with certain Fund holdings. Excluding this
amount, the ratio of net investment income to average net assets would have been 2.53%.
dAmount rounds to less than $0.01 per share.
eTotal return is not annualized for periods less than one year.
fRatios are annualized for periods less than one year.
gBenefit of expense reduction rounds to less than 0.01%.
52 | The accompanying notes are an integral part of these financial statements. | Semiannual Report
| | | | |
| Franklin Investors Securities Trust | | | |
| |
| Statement of Investments, April 30, 2014 (unaudited) | | | | |
| |
| |
| Franklin Balanced Fund | Country | Shares | | Value |
| Common Stocks 57.8% | | | | |
| Consumer Discretionary 7.5% | | | | |
| Comcast Corp., A | United States | 450,000 | $ | 23,292,000 |
| Ford Motor Co. | United States | 1,600,000 | | 25,840,000 |
| General Motors Co. | United States | 612,080 | | 21,104,518 |
| L Brands Inc. | United States | 400,000 | | 21,680,000 |
| Lowe’s Cos. Inc. | United States | 398,000 | | 18,272,180 |
| McDonald’s Corp. | United States | 200,000 | | 20,276,000 |
| Starwood Hotels & Resorts Worldwide Inc. | United States | 250,000 | | 19,162,500 |
| Target Corp. | United States | 400,000 | | 24,700,000 |
| | | | | 174,327,198 |
| Consumer Staples 2.2% | | | | |
| The Coca-Cola Co. | United States | 400,000 | | 16,316,000 |
| PepsiCo Inc. | United States | 265,000 | | 22,760,850 |
| The Procter & Gamble Co. | United States | 140,000 | | 11,557,000 |
| | | | | 50,633,850 |
| Energy 7.3% | | | | |
| BP PLC, ADR | United Kingdom | 400,000 | | 20,248,000 |
| Chevron Corp. | United States | 160,000 | | 20,083,200 |
| Exxon Mobil Corp. | United States | 250,000 | | 25,602,500 |
| Kinder Morgan Inc. | United States | 560,000 | | 18,289,600 |
| Peabody Energy Corp. | United States | 633,810 | | 12,048,728 |
| Royal Dutch Shell PLC, A, ADR | United Kingdom | 200,000 | | 15,748,000 |
| Schlumberger Ltd. | United States | 250,000 | | 25,387,500 |
| Transocean Ltd. | United States | 300,000 | | 12,921,000 |
| The Williams Cos. Inc. | United States | 500,000 | | 21,085,000 |
| | | | | 171,413,528 |
| Financials 3.5% | | | | |
| Citigroup Inc. | United States | 250,000 | | 11,977,500 |
| Digital Realty Trust Inc. | United States | 300,000 | | 16,020,000 |
| JPMorgan Chase & Co. | United States | 300,000 | | 16,794,000 |
| MetLife Inc. | United States | 400,000 | | 20,940,000 |
| Wells Fargo & Co. | United States | 300,000 | | 14,892,000 |
| | | | | 80,623,500 |
| Health Care 4.6% | | | | |
| Baxter International Inc. | United States | 300,000 | | 21,837,000 |
| Eli Lilly & Co. | United States | 425,000 | | 25,117,500 |
| Johnson & Johnson | United States | 150,000 | | 15,193,500 |
| Pfizer Inc. | United States | 600,000 | | 18,768,000 |
| Sanofi, ADR | France | 500,000 | | 26,900,000 |
| | | | | 107,816,000 |
| Industrials 8.6% | | | | |
| The Boeing Co. | United States | 170,000 | | 21,933,400 |
| a Caterpillar Inc. | United States | 200,000 | | 21,080,000 |
| Deere & Co. | United States | 200,000 | | 18,668,000 |
| Emerson Electric Co. | United States | 225,000 | | 15,340,500 |
| General Electric Co. | United States | 599,998 | | 16,133,946 |
| Norfolk Southern Corp. | United States | 100,000 | | 9,453,000 |
| | | Semiannual Report | 53 |
| | | | |
| Franklin Investors Securities Trust | | | |
| |
| Statement of Investments, April 30, 2014 (unaudited) (continued) | | | |
| |
| |
| Franklin Balanced Fund | Country | Shares | | Value |
| Common Stocks (continued) | | | | |
| Industrials (continued) | | | | |
| Northrop Grumman Corp. | United States | 125,000 | $ | 15,188,750 |
| Raytheon Co. | United States | 210,000 | | 20,050,800 |
| Republic Services Inc. | United States | 700,000 | | 24,563,000 |
| United Parcel Service Inc., B | United States | 250,000 | | 24,625,000 |
| Waste Management Inc. | United States | 300,000 | | 13,335,000 |
| | | | | 200,371,396 |
| Information Technology 8.0% | | | | |
| Analog Devices Inc. | United States | 350,000 | | 17,951,500 |
| Apple Inc. | United States | 55,034 | | 32,475,013 |
| Cisco Systems Inc. | United States | 1,000,000 | | 23,110,000 |
| Intel Corp. | United States | 1,200,000 | | 32,028,000 |
| International Business Machines Corp. | United States | 110,000 | | 21,611,700 |
| Maxim Integrated Products Inc. | United States | 650,000 | | 21,086,000 |
| QUALCOMM Inc. | United States | 200,000 | | 15,742,000 |
| Texas Instruments Inc. | United States | 500,000 | | 22,725,000 |
| | | | | 186,729,213 |
| Materials 9.2% | | | | |
| Agrium Inc. | Canada | 200,000 | | 19,214,000 |
| Barrick Gold Corp. | Canada | 384,480 | | 6,716,866 |
| BHP Billiton Ltd., ADR | Australia | 300,000 | | 21,162,000 |
| The Dow Chemical Co. | United States | 500,000 | | 24,950,000 |
| E. I. du Pont de Nemours and Co. | United States | 275,000 | | 18,513,000 |
| Freeport-McMoRan Copper & Gold Inc., B | United States | 1,065,373 | | 36,616,870 |
| LyondellBasell Industries NV, A | United States | 200,000 | | 18,500,000 |
| The Mosaic Co. | United States | 450,000 | | 22,518,000 |
| Potash Corp. of Saskatchewan Inc. | Canada | 450,000 | | 16,272,000 |
| Praxair Inc. | United States | 100,000 | | 13,055,000 |
| Rio Tinto PLC, ADR | United Kingdom | 300,000 | | 16,287,000 |
| | | | | 213,804,736 |
| Telecommunication Services 2.6% | | | | |
| AT&T Inc. | United States | 750,000 | | 26,775,000 |
| Verizon Communications Inc. | United States | 600,000 | | 28,038,000 |
| Vodafone Group PLC, ADR | United Kingdom | 163,636 | | 6,211,623 |
| | | | | 61,024,623 |
| Utilities 4.3% | | | | |
| Duke Energy Corp. | United States | 300,000 | | 22,347,000 |
| Hawaiian Electric Industries Inc. | United States | 450,000 | | 10,795,500 |
| NextEra Energy Inc. | United States | 100,000 | | 9,985,000 |
| Portland General Electric Co. | United States | 300,000 | | 10,041,000 |
| The Southern Co. | United States | 600,000 | | 27,498,000 |
| Xcel Energy Inc. | United States | 600,000 | | 19,122,000 |
| | | | | 99,788,500 |
| Total Common Stocks (Cost $1,196,759,272) | | | | 1,346,532,544 |
54 | Semiannual Report
Franklin Investors Securities Trust
Statement of Investments, April 30, 2014 (unaudited) (continued)
| | | | |
| Franklin Balanced Fund | Country | Shares | | Value |
| bEquity-Linked Securities 4.4% | | | | |
| Consumer Discretionary 0.5% | | | | |
| c Credit Suisse New York into Johnson Controls Inc., 6.50%, 144A | United States | 304,000 | $ | 12,917,264 |
| Energy 1.9% | | | | |
| c Bank of America Corp. into Schlumberger Ltd., 6.00%, 144A | United States | 155,000 | | 15,045,075 |
| c Credit Suisse New York into Halliburton Co., 6.50%, 144A | United States | 296,000 | | 15,054,974 |
| c JPMorgan Chase & Co. into Anadarko Petroleum Corp., 5.00%, 144A | United States | 135,000 | | 13,260,213 |
| | | | | 43,360,262 |
| Financials 0.4% | | | | |
| c Citigroup Inc. into Bank of America Corp., 6.00%, 144A | United States | 578,000 | | 8,708,495 |
| Industrials 0.4% | | | | |
| c Credit Suisse New York into Deere & Co., 6.50%, 144A | United States | 100,000 | | 9,176,320 |
| Information Technology 0.9% | | | | |
| c Barclays Bank PLC into Broadcom Corp., 6.50%, 144A | United States | 286,000 | | 8,972,907 |
| c Morgan Stanley Inc. into Applied Materials Inc., 6.00%, 144A | United States | 750,000 | | 13,357,200 |
| | | | | 22,330,107 |
| Materials 0.3% | | | | |
| c Barclays Bank PLC into The Mosaic Co., 7.50%, 144A | United States | 120,000 | | 6,128,280 |
| Total Equity-Linked Securities (Cost $94,812,640) | | | | 102,620,728 |
| Convertible Preferred Stocks 4.2% | | | | |
| Energy 1.1% | | | | |
| c Chesapeake Energy Corp., 5.75%, cvt. pfd., 144A | United States | 11,000 | | 13,048,750 |
| c Sanchez Energy Corp., 4.875%, cvt. pfd., 144A | United States | 60,000 | | 4,314,372 |
| Sanchez Energy Corp., 6.50%, cvt. pfd., B | United States | 90,000 | | 6,749,496 |
| | | | | 24,112,618 |
| Financials 1.4% | | | | |
| Bank of America Corp., 7.25%, cvt. pfd., L | United States | 12,901 | | 14,684,564 |
| MetLife Inc., 5.00%, cvt. pfd. | United States | 100,000 | | 3,045,000 |
| Wells Fargo & Co., 7.50%, cvt. pfd., A | United States | 12,500 | | 14,937,500 |
| | | | | 32,667,064 |
| Industrials 0.1% | | | | |
| United Technologies Corp., 7.50%, cvt. pfd. | United States | 43,800 | | 2,896,932 |
| Materials 0.1% | | | | |
| ArcelorMittal, 6.00%, cvt. pfd. | Luxembourg | 80,000 | | 1,945,000 |
| Utilities 1.5% | | | | |
| Dominion Resources Inc., 6.125%, cvt. pfd., A | United States | 300,000 | | 17,586,000 |
| NextEra Energy Inc., 5.599%, cvt. pfd. | United States | 100,000 | | 6,573,500 |
| NextEra Energy Inc., 5.799%, cvt. pfd. | United States | 200,000 | | 11,348,000 |
| | | | | 35,507,500 |
| Total Convertible Preferred Stocks (Cost $82,766,765) | | | | 97,129,114 |
| Preferred Stocks 0.4% | | | | |
| Financials 0.4% | | | | |
| Ally Financial Inc., 8.50%, pfd., A | United States | 120,300 | | 3,252,912 |
| Citigroup Capital XIII, 8.75%, pfd. | United States | 37,000 | | 1,008,620 |
| U.S. Bancorp, 6.00%, pfd., G | United States | 180,000 | | 4,986,000 |
| Total Preferred Stocks (Cost $7,855,532) | | | | 9,247,532 |
| | | Semiannual Report | 55 |
| | | | |
| Franklin Investors Securities Trust | | | |
| |
| Statement of Investments, April 30, 2014 (unaudited) (continued) | | | |
| |
| |
| Franklin Balanced Fund | Country | Principal Amount* | | Value |
| Corporate Bonds 27.3% | | | | |
| Consumer Discretionary 2.2% | | | | |
| CCO Holdings LLC/CCO Holdings Capital Corp., senior bond, 5.75%, | | | | |
| 1/15/24 | United States | 10,000,000 | $ | 10,112,500 |
| DISH DBS Corp., senior note, 5.875%, 7/15/22 | United States | 6,000,000 | | 6,487,500 |
| Dollar General Corp., senior bond, 3.25%, 4/15/23 | United States | 15,000,000 | | 14,184,450 |
| Ford Motor Credit Co. LLC, senior note, 3.00%, 6/12/17 | United States | 6,000,000 | | 6,262,782 |
| c S.A.C.I. Falabella, senior note, 144A, 3.75%, 4/30/23 | Chile | 7,000,000 | | 6,775,286 |
| Trinity Acquisition PLC, senior note, 4.625%, 8/15/23 | United Kingdom | 7,000,000 | | 7,173,810 |
| | | | | 50,996,328 |
| Consumer Staples 1.8% | | | | |
| c Cencosud SA, senior note, 144A, 4.875%, 1/20/23 | Chile | 7,000,000 | | 6,832,315 |
| Kraft Foods Group Inc., senior bond, 3.50%, 6/06/22 | United States | 10,000,000 | | 10,177,630 |
| Lorillard Tobacco Co., senior note, 2.30%, 8/21/17 | United States | 10,000,000 | | 10,214,420 |
| Mondelez International Inc., senior bond, 4.00%, 2/01/24 | United States | 15,000,000 | | 15,383,340 |
| | | | | 42,607,705 |
| Energy 4.8% | | | | |
| Chesapeake Energy Corp., senior note, 5.375%, 6/15/21 | United States | 7,500,000 | | 7,893,750 |
| Ecopetrol SA, senior note, 5.875%, 9/18/23 | Colombia | 10,000,000 | | 11,007,200 |
| El Paso Pipeline Partners Operating Co. LLC, senior note, 4.30%, 5/01/24 | United States | 12,900,000 | | 12,992,299 |
| Energy Transfer Partners LP, senior bond, 3.60%, 2/01/23 | United States | 25,000,000 | | 24,342,825 |
| EOG Resources Inc., senior bond, 2.625%, 3/15/23 | United States | 5,500,000 | | 5,254,200 |
| c,d Gaz Capital SA (OJSC Gazprom), loan participation, senior note, 144A, 3.85%, | | | | |
| 2/06/20 | Russia | 3,100,000 | | 2,817,001 |
| Offshore Group Investment Ltd., senior bond, first lien, 7.125%, 4/01/23 | United States | 4,600,000 | | 4,554,000 |
| Peabody Energy Corp., senior note, 6.25%, 11/15/21 | United States | 4,000,000 | | 4,080,000 |
| c Petrofac Ltd., senior note, 144A, 3.40%, 10/10/18 | United Kingdom | 3,000,000 | | 3,091,380 |
| Phillips 66, senior note, 1.95%, 3/05/15 | United States | 7,500,000 | | 7,594,125 |
| Plains Exploration & Production Co., senior note, | | | | |
| 6.125%, 6/15/19 | United States | 2,900,000 | | 3,211,750 |
| 6.50%, 11/15/20 | United States | 5,000,000 | | 5,543,750 |
| Sabine Pass Liquefaction LLC, first lien, 5.625%, 2/01/21 | United States | 7,500,000 | | 7,781,250 |
| SandRidge Energy Inc., senior note, 7.50%, 2/15/23 | United States | 2,700,000 | | 2,875,500 |
| Weatherford International Ltd., senior bond, 5.95%, 4/15/42 | United States | 4,000,000 | | 4,509,036 |
| The Williams Cos. Inc., senior bond, 3.70%, 1/15/23 | United States | 5,000,000 | | 4,623,220 |
| | | | | 112,171,286 |
| Financials 7.9% | | | | |
| e Bank of America Corp., junior sub. bond, M, 8.125% to 5/15/18, FRN | | | | |
| thereafter, Perpetual | United States | 10,000,000 | | 11,409,370 |
| Capital One Bank USA NA, sub. bond, 3.375%, 2/15/23 | United States | 5,000,000 | | 4,946,165 |
| Capital One Financial Corp., senior note, 2.15%, 3/23/15 | United States | 7,000,000 | | 7,105,119 |
| Citigroup Inc., | | | | |
| ejunior sub. bond, M, 6.30% to 5/15/24, FRN thereafter, Perpetual | United States | 9,100,000 | | 9,103,867 |
| sub. bond, 5.50%, 9/13/25 | United States | 10,000,000 | | 10,864,070 |
| Deutsche Bank AG, sub. bond, 4.296% to 5/24/23, FRN thereafter, 5/24/28 | Germany | 15,000,000 | | 14,373,750 |
| e General Electric Capital Corp., junior sub. bond, 7.125% to 6/15/22, FRN | | | | |
| thereafter, Perpetual | United States | 8,000,000 | | 9,214,472 |
| Healthcare Realty Trust Inc., senior note, 5.75%, 1/15/21 | United States | 5,000,000 | | 5,578,060 |
56 | Semiannual Report
| | | | |
| Franklin Investors Securities Trust | | | |
| |
| Statement of Investments, April 30, 2014 (unaudited) (continued) | | | |
| |
| |
| Franklin Balanced Fund | Country | Principal Amount* | | Value |
| Corporate Bonds (continued) | | | | |
| Financials (continued) | | | | |
| HSBC Finance Corp., senior sub. bond, 6.676%, 1/15/21 | United States | 2,000,000 | $ | 2,368,414 |
| c,f ING Bank NV, senior note, 144A, FRN, 1.873%, 9/25/15 | Netherlands | 5,000,000 | | 5,094,800 |
| e JPMorgan Chase & Co., junior sub. note, 1, 7.90% to 4/30/19, FRN | | | | |
| thereafter, Perpetual | United States | 10,000,000 | | 11,350,000 |
| c Liberty Mutual Group Inc., senior note, 144A, 4.95%, 5/01/22 | United States | 7,100,000 | | 7,669,115 |
| c Mizuho Bank Ltd., senior note, 144A, 2.45%, 4/16/19 | Japan | 12,000,000 | | 12,045,096 |
| Morgan Stanley, senior note, 5.50%, 1/26/20 | United States | 1,500,000 | | 1,700,999 |
| e PNC Financial Services Group Inc., junior sub. note, 4.85% to 6/01/23, FRN | | | | |
| thereafter, Perpetual | United States | 12,000,000 | | 11,325,000 |
| Prologis LP, senior note, 4.25%, 8/15/23 | United States | 12,000,000 | | 12,410,964 |
| c Prudential Covered Trust, secured note, 144A, 2.997%, 9/30/15 | United States | 2,720,000 | | 2,796,644 |
| Prudential Financial Inc., junior sub. note, 5.875%, 9/15/42 | United States | 5,000,000 | | 5,287,500 |
| Royal Bank of Scotland Group PLC, sub. note, 6.125%, 12/15/22 | United Kingdom | 4,000,000 | | 4,260,000 |
| Senior Housing Properties Trust, senior note, 6.75%, 12/15/21 | United States | 7,000,000 | | 7,936,173 |
| SLM Corp., senior note, 6.125%, 3/25/24 | United States | 15,000,000 | | 14,940,000 |
| U.S. Bank NA, sub. note, 3.778% to 4/29/18, FRN thereafter, 4/29/20 | United States | 4,500,000 | | 4,626,018 |
| e Wells Fargo & Co., S, junior sub. bond, 5.90% to 6/15/14, FRN thereafter, | | | | |
| Perpetual | United States | 7,900,000 | | 8,114,106 |
| | | | | 184,519,702 |
| Health Care 2.4% | | | | |
| Celgene Corp., senior bond, 4.00%, 8/15/23 | United States | 10,000,000 | | 10,290,270 |
| Edwards Lifesciences Corp., senior note, 2.875%, 10/15/18 | United States | 10,000,000 | | 10,140,320 |
| Express Scripts Holding Co., senior note, 4.75%, 11/15/21 | United States | 2,500,000 | | 2,743,680 |
| HCA Inc., secured note, 5.00%, 3/15/24 | United States | 7,000,000 | | 6,965,000 |
| PerkinElmer Inc., senior note, 5.00%, 11/15/21 | United States | 2,000,000 | | 2,133,318 |
| Thermo Fisher Scientific Inc., senior note, 2.40%, 2/01/19 | United States | 12,000,000 | | 12,129,264 |
| c Valeant Pharmaceuticals International Inc., senior note, 144A, 6.75%, | | | | |
| 8/15/18 | United States | 10,400,000 | | 11,310,000 |
| | | | | 55,711,852 |
| Industrials 1.1% | | | | |
| c Air Canada 2013-1A Pass Through Trust, first lien, 144A, 4.125%, | | | | |
| 11/15/26 | Canada | 7,000,000 | | 7,017,500 |
| c Aviation Capital Group Corp., senior note, 144A, 3.875%, 9/27/16 | United States | 12,000,000 | | 12,401,820 |
| c Bombardier Inc., senior note, 144A, 6.00%, 10/15/22 | Canada | 5,000,000 | | 5,093,750 |
| | | | | 24,513,070 |
| Information Technology 1.3% | | | | |
| c Freescale Semiconductor Inc., | | | | |
| secured note, 144A, 5.00%, 5/15/21 | United States | 8,500,000 | | 8,627,500 |
| senior secured note, 144A, 6.00%, 1/15/22 | United States | 6,100,000 | | 6,389,750 |
| Oracle Corp., senior note, 2.50%, 10/15/22 | United States | 10,000,000 | | 9,558,450 |
| ViaSat Inc., senior note, 6.875%, 6/15/20 | United States | 5,000,000 | | 5,381,250 |
| | | | | 29,956,950 |
| Materials 2.0% | | | | |
| Air Products and Chemicals Inc., senior note, 2.75%, 2/03/23 | United States | 7,500,000 | | 7,129,222 |
| c Alpek SA de CV, senior note, 144A, 4.50%, 11/20/22 | Mexico | 5,000,000 | | 5,022,200 |
Semiannual Report | 57
Franklin Investors Securities Trust
Statement of Investments, April 30, 2014 (unaudited) (continued)
| | | | |
| Franklin Balanced Fund | Country | Principal Amount* | | Value |
| Corporate Bonds (continued) | | | | |
| Materials (continued) | | | | |
| c Cemex SAB de CV, | | | | |
| secured note, 144A, 5.875%, 3/25/19 | Mexico | 2,000,000 | $ | 2,053,750 |
| senior secured note, 144A, 6.50%, 12/10/19 | Mexico | 6,000,000 | | 6,322,500 |
| Crown Americas LLC/Crown Americas Capital Corp. IV, senior bond, 4.50%, | | | | |
| 1/15/23 | United States | 5,000,000 | | 4,800,000 |
| Freeport-McMoRan Copper & Gold Inc., senior bond, 3.875%, 3/15/23 | United States | 7,000,000 | | 6,823,642 |
| c Glencore Funding LLC, senior note, 144A, 4.125%, 5/30/23 | Switzerland | 10,000,000 | | 9,717,060 |
| Reliance Steel & Aluminum Co., senior note, 4.50%, 4/15/23 | United States | 4,000,000 | | 4,049,436 |
| | | | | 45,917,810 |
| Telecommunication Services 1.9% | | | | |
| c SoftBank Corp., senior note, 144A, 4.50%, 4/15/20 | Japan | 10,000,000 | | 10,050,000 |
| c Sprint Corp., senior note, 144A, 7.875%, 9/15/23 | United States | 9,400,000 | | 10,387,000 |
| Telefonica Emisiones SAU, senior note, 4.57%, 4/27/23 | Spain | 10,000,000 | | 10,492,300 |
| Verizon Communications Inc., senior bond, 6.55%, 9/15/43 | United States | 11,000,000 | | 13,599,982 |
| | | | | 44,529,282 |
| Utilities 1.9% | | | | |
| c Calpine Corp., senior secured note, first lien, 144A, 6.00%, 1/15/22 | United States | 7,400,000 | | 7,899,500 |
| c,e EDF SA, sub. note, 144A, 5.25% to 1/29/23, FRN thereafter, Perpetual | France | 10,000,000 | | 10,237,500 |
| c Enogex LLC, senior note, 144A, 6.25%, 3/15/20 | United States | 5,000,000 | | 5,457,115 |
| c InterGen NV, secured bond, 144A, 7.00%, 6/30/23 | Netherlands | 10,000,000 | | 10,587,500 |
| c NGL Energy Partners LP/NGL Energy Finance Corp., senior note, 144A, | | | | |
| 6.875%, 10/15/21 | United States | 10,000,000 | | 10,450,000 |
| | | | | 44,631,615 |
| Total Corporate Bonds (Cost $610,055,549) | | | | 635,555,600 |
| f,gSenior Floating Rate Interests 0.6% | | | | |
| Energy 0.4% | | | | |
| Drillships Financing Holding Inc., Tranche B-1 Term Loan, 6.00%, 3/31/21 | Marshall Islands | 9,974,874 | | 10,118,263 |
| Information Technology 0.2% | | | | |
| First Data Corp., 2018 Term Loan, 4.152%, 3/24/18 | United States | 5,000,000 | | 5,001,040 |
| Total Senior Floating Rate Interests (Cost $14,921,554) | | | | 15,119,303 |
| Asset-Backed Securities and Commercial Mortgage-Backed | | | | |
| Securities (Cost $23,034) 0.0%† | | | | |
| Financials 0.0%† | | | | |
| f Accredited Mortgage Loan Trust, 2005-3, A1, FRN, 0.39%, 9/25/35 | United States | 23,020 | | 22,921 |
| Mortgage-Backed Securities 0.0%† | | | | |
| Federal National Mortgage Association (FNMA) Fixed Rate 0.0%† | | | | |
| FNMA 30 Year, 6.00%, 8/01/36 | United States | 30,120 | | 33,748 |
| FNMA 30 Year, 6.50%, 4/01/36 | United States | 15,948 | | 17,946 |
| Total Mortgage-Backed Securities (Cost $45,478) | | | | 51,694 |
| Total Investments before Short Term Investments | | | | |
| (Cost $2,007,239,824) | | | | 2,206,279,436 |
58 | Semiannual Report
Franklin Investors Securities Trust
Statement of Investments, April 30, 2014 (unaudited) (continued)
| | | | | |
| Franklin Balanced Fund | Country | Principal Amount* | | Value | |
| Short Term Investments 4.8% | | | | | |
| U.S. Government and Agency Securities 3.2% | | | | | |
| h U.S. Treasury Bills, | | | | | |
| i 5/22/14 | United States | 50,000,000 | $ | 49,999,750 | |
| 6/05/14 | United States | 25,000,000 | | 24,999,825 | |
| Total U.S. Government and Agency Securities | | | | | |
| (Cost $74,998,781) | | | | 74,999,575 | |
| Total Investments before Money Market Funds | | | | | |
| (Cost $2,082,238,605) | | | | 2,281,279,011 | |
| |
| | | Shares | | | |
| Money Market Funds (Cost $37,349,105) 1.6% | | | | | |
| j,k Institutional Fiduciary Trust Money Market Portfolio | United States | 37,349,105 | | 37,349,105 | |
| Total Investments (Cost $2,119,587,710) 99.5% | | | | 2,318,628,116 | |
| Options Written (0.0)%† | | | | (270,000 | ) |
| Other Assets, less Liabilities 0.5% | | | | 12,255,663 | |
| Net Assets 100.0% | | | $ | 2,330,613,779 | |
| |
| | | Number of | | | |
| | | Contracts | | | |
| lOptions Written (0.0)%† | | | | | |
| Calls – Exchange-Traded | | | | | |
| Industrials (0.0)%† | | | | | |
| Caterpillar Inc., May Strike Price $105, Expires 5/17/14 | United States | 1,000 | $ | (171,000 | ) |
| Puts – Exchange-Traded | | | | | |
| Consumer Discretionary (0.0)%† | | | | | |
| Amazon.com Inc., May Strike Price $265, Expires 5/17/14 | United States | 500 | | (29,000 | ) |
| Information Technology (0.0)%† | | | | | |
| Google Inc., A, May Strike Price $500, Expires 5/17/14 | United States | 500 | | (70,000 | ) |
| | | | | (99,000 | ) |
| Total Options Written (Premiums received $718,004) | | | $ | (270,000 | ) |
†Rounds to less than 0.1% of net assets.
*The principal amount is stated in U.S. dollars unless otherwise indicated.
aA portion or all of the security is held in connection with written option contracts open at period end.
bSee Note 1(g) regarding equity-linked securities.
cSecurity was purchased pursuant to Rule 144A under the Securities Act of 1933 and may be sold in transactions exempt from registration only to qualified institutional buyers or
in a public offering registered under the Securities Act of 1933. These securities have been deemed liquid under guidelines approved by the Trust’s Board of Trustees. At April 30,
2014, the aggregate value of these securities was $306,129,932, representing 13.14% of net assets.
dSee Note 1(f) regarding loan participation notes.
ePerpetual security with no stated maturity date.
fThe coupon rate shown represents the rate at period end.
gSee Note 1(h) regarding senior floating rate interests.
hThe security is traded on a discount basis with no stated coupon rate.
Semiannual Report | 59
Franklin Investors Securities Trust
Statement of Investments, April 30, 2014 (unaudited) (continued)
iSecurity or a portion of the security has been pledged as collateral for written options contracts. At April 30, 2014, the value of this security and cash pledged as collateral was
$52,560,799, representing 2.26% of net assets.
jNon-income producing.
kSee Note 3(f) regarding investments in the Institutional Fiduciary Trust Money Market Portfolio.
lSee Note 1(e) regarding written options.
At April 30, 2014, the fund had the following forward exchange contracts outstanding. See Note 1(e).
| | | | | | | |
| | | | | Contract | Settlement | Unrealized | Unrealized |
| Currency | Counterpartya | Type | Quantity | Amount | Date | Appreciation | Depreciation |
| Swiss Franc | DBAB | Buy | 3,806,375 | $4,210,592 | 4/16/15 | $130,024 | $— |
| Swiss Franc | DBAB | Sell | 3,806,375 | 4,285,011 | 4/16/15 | — | (55,605) |
| Unrealized appreciation (depreciation) | | | | | | 130,024 | (55,605) |
| Net unrealized appreciation (depreciation) | | | | | $74,419 | |
aMay be comprised of multiple contracts using the same currency and settlement date.
See Abbreviations on page 128.
60 | The accompanying notes are an integral part of these financial statements. | Semiannual Report
| | | | | | | | | | | | | | | | | | |
| Franklin Investors Securities Trust | | | | | | | | | | |
| |
| Financial Highlights | | | | | | | | | | | | | | | | | | |
| |
| Franklin Convertible Securities Fund | | | | | | | | | | | | | | | | | | |
| | | Six Months Ended | | | | | | | | | | | | | |
| | | April 30, 2014 | | | | | | Year Ended October 31, | | | | |
| Class A | | (unaudited) | | | 2013 | | | 2012 | | | 2011 | | | 2010 | | | 2009 | |
| Per share operating performance | | | | | | | | | | | | | | | | | | |
| (for a share outstanding throughout the period) | | | | | | | | | | | | | | | | | | |
| Net asset value, beginning of period | $ | 17.82 | | $ | 14.93 | | $ | 14.37 | | $ | 14.55 | | $ | 12.28 | | $ | 9.48 | |
| Income from investment operationsa: | | | | | | | | | | | | | | | | | | |
| Net investment incomeb | | 0.13 | | | 0.37 | | | 0.41 | | | 0.42 | | | 0.37 | | | 0.35 | |
| Net realized and unrealized gains (losses) | | 0.93 | | | 2.99 | | | 0.67 | | | (0.06 | ) | | 2.42 | | | 3.04 | |
| Total from investment operations | | 1.06 | | | 3.36 | | | 1.08 | | | 0.36 | | | 2.79 | | | 3.39 | |
| Less distributions from: | | | | | | | | | | | | | | | | | | |
| Net investment income | | (0.19 | ) | | (0.47 | ) | | (0.52 | ) | | (0.54 | ) | | (0.52 | ) | | (0.59 | ) |
| Net realized gains | | (0.07 | ) | | — | | | — | | | — | | | — | | | — | |
| Total distributions | | (0.26 | ) | | (0.47 | ) | | (0.52 | ) | | (0.54 | ) | | (0.52 | ) | | (0.59 | ) |
| Net asset value, end of period | $ | 18.62 | | $ | 17.82 | | $ | 14.93 | | $ | 14.37 | | $ | 14.55 | | $ | 12.28 | |
| |
| Total returnc | | 6.03 | % | | 22.92 | % | | 7.66 | % | | 2.35 | % | | 23.17 | % | | 37.35 | % |
| |
| Ratios to average net assetsd | | | | | | | | | | | | | | | | | | |
| Expenses before waiver and payments by | | | | | | | | | | | | | | | | | | |
| affiliates | | 0.87 | % | | 0.88 | % | | 0.90 | % | | 0.88 | % | | 0.90 | % | | 0.96 | % |
| Expenses net of waiver and payments by | | | | | | | | | | | | | | | | | | |
| affiliates | | 0.86 | %e | | 0.88 | %e | | 0.90 | % | | 0.88 | % | | 0.90 | % | | 0.96 | %e |
| Net investment income | | 1.42 | % | | 2.25 | % | | 2.84 | % | | 2.77 | % | | 2.78 | % | | 3.35 | % |
| |
| Supplemental data | | | | | | | | | | | | | | | | | | |
| Net assets, end of period (000’s) | $ | 933,952 | | $ | 844,498 | | $ | 602,804 | | $ | 704,844 | | $ | 651,012 | | $ | 542,741 | |
| Portfolio turnover rate | | 6.53 | % | | 34.69 | % | | 12.82 | % | | 23.24 | % | | 29.56 | % | | 47.18 | % |
aThe amount shown for a share outstanding throughout the period may not correlate with the Statement of Operations for the period due to the timing of sales and repurchases of
the Fund shares in relation to income earned and/or fluctuating fair value of the investments of the Fund.
bBased on average daily shares outstanding.
cTotal return does not reflect sales commissions or contingent deferred sales charges, if applicable, and is not annualized for periods less than one year.
dRatios are annualized for periods less than one year.
eBenefit of expense reduction rounds to less than 0.01%.
Semiannual Report | The accompanying notes are an integral part of these financial statements. | 61
| | | | | | | | | | | | | | | | | | |
| Franklin Investors Securities Trust | | | | | | | | | | |
| |
| Financial Highlights (continued) | | | | | | | | | | | | | | | | | | |
| |
| Franklin Convertible Securities Fund | | | | | | | | | | | | | | | | | | |
| | | Six Months Ended | | | | | | | | | | | | | |
| | | April 30, 2014 | | | | | | Year Ended October 31, | | | | |
| Class C | | (unaudited) | | | 2013 | | | 2012 | | | 2011 | | | 2010 | | | 2009 | |
| Per share operating performance | | | | | | | | | | | | | | | | | | |
| (for a share outstanding throughout the period) | | | | | | | | | | | | | | | | | | |
| Net asset value, beginning of period | $ | 17.60 | | $ | 14.75 | | $ | 14.21 | | $ | 14.39 | | $ | 12.16 | | $ | 9.39 | |
| Income from investment operationsa: | | | | | | | | | | | | | | | | | | |
| Net investment incomeb | | 0.06 | | | 0.24 | | | 0.30 | | | 0.30 | | | 0.27 | | | 0.27 | |
| Net realized and unrealized gains (losses) | | 0.93 | | | 2.97 | | | 0.65 | | | (0.06 | ) | | 2.38 | | | 3.01 | |
| Total from investment operations | | 0.99 | | | 3.21 | | | 0.95 | | | 0.24 | | | 2.65 | | | 3.28 | |
| Less distributions from: | | | | | | | | | | | | | | | | | | |
| Net investment income | | (0.13 | ) | | (0.36 | ) | | (0.41 | ) | | (0.42 | ) | | (0.42 | ) | | (0.51 | ) |
| Net realized gains | | (0.07 | ) | | — | | | — | | | — | | | — | | | — | |
| Total distributions | | (0.20 | ) | | (0.36 | ) | | (0.41 | ) | | (0.42 | ) | | (0.42 | ) | | (0.51 | ) |
| Net asset value, end of period | $ | 18.39 | | $ | 17.60 | | $ | 14.75 | | $ | 14.21 | | $ | 14.39 | | $ | 12.16 | |
| |
| Total returnc | | 5.62 | % | | 22.11 | % | | 6.79 | % | | 1.60 | % | | 22.16 | % | | 36.36 | % |
| |
| Ratios to average net assetsd | | | | | | | | | | | | | | | | | | |
| Expenses before waiver and payments by | | | | | | | | | | | | | | | | | | |
| affiliates | | 1.62 | % | | 1.63 | % | | 1.65 | % | | 1.63 | % | | 1.65 | % | | 1.71 | % |
| Expenses net of waiver and payments by | | | | | | | | | | | | | | | | | | |
| affiliates | | 1.61 | %e | | 1.63 | %e | | 1.65 | % | | 1.63 | % | | 1.65 | % | | 1.71 | %e |
| Net investment income | | 0.67 | % | | 1.50 | % | | 2.09 | % | | 2.02 | % | | 2.03 | % | | 2.60 | % |
| |
| Supplemental data | | | | | | | | | | | | | | | | | | |
| Net assets, end of period (000’s) | $ | 318,315 | | $ | 273,132 | | $ | 211,630 | | $ | 232,471 | | $ | 222,201 | | $ | 192,297 | |
| Portfolio turnover rate | | 6.53 | % | | 34.69 | % | | 12.82 | % | | 23.24 | % | | 29.56 | % | | 47.18 | % |
aThe amount shown for a share outstanding throughout the period may not correlate with the Statement of Operations for the period due to the timing of sales and repurchases of
the Fund shares in relation to income earned and/or fluctuating fair value of the investments of the Fund.
bBased on average daily shares outstanding.
cTotal return does not reflect sales commissions or contingent deferred sales charges, if applicable, and is not annualized for periods less than one year.
dRatios are annualized for periods less than one year.
eBenefit of expense reduction rounds to less than 0.01%.
62 | The accompanying notes are an integral part of these financial statements. | Semiannual Report
| |
| Franklin Investors Securities Trust | |
| |
| Financial Highlights (continued) | |
| |
| Franklin Convertible Securities Fund | |
| | Period Ended |
| | April 30, 2014a |
| Class R6 | (unaudited) |
| Per share operating performance | |
| (for a share outstanding throughout the period) | |
| Net asset value, beginning of period | $19.21 |
| Income from investment operationsb: | |
| Net investment incomec | 0.06 |
| Net realized and unrealized gains (losses) | (0.57) |
| Total from investment operations | (0.51) |
| Less distributions from net investment income | (0.06) |
| Net asset value, end of period | $18.64 |
| |
| Total returnd | (2.66)% |
| |
| Ratios to average net assetse | |
| Expenses before waiver and payments by affiliates | 0.52% |
| Expenses net of waiver and payments by affiliatesf | 0.51% |
| Net investment income | 1.77% |
| |
| Supplemental data | |
| Net assets, end of period (000’s) | $5 |
| Portfolio turnover rate | 6.53% |
aFor the period March 4, 2014 (effective date) to April 30, 2014.
bThe amount shown for a share outstanding throughout the period may not correlate with the Statement of Operations for the period due to the timing of sales and repurchases of
the Fund shares in relation to income earned and/or fluctuating fair value of the investments of the Fund.
cBased on average daily shares outstanding.
dTotal return is not annualized for periods less than one year.
eRatios are annualized for periods less than one year.
fBenefit of expense reduction rounds to less than 0.01%.
Semiannual Report | The accompanying notes are an integral part of these financial statements. | 63
| | | | | | | | | | | | | | | | | | |
| Franklin Investors Securities Trust | | | | | | | | | | |
| |
| Financial Highlights (continued) | | | | | | | | | | | | | | | | | | |
| |
| Franklin Convertible Securities Fund | | | | | | | | | | | | | | | | | | |
| | | Six Months Ended | | | | | | | | | | | | | |
| | | April 30, 2014 | | | | | | Year Ended October 31, | | | | |
| Advisor Class | | (unaudited) | | | 2013 | | | 2012 | | | 2011 | | | 2010 | | | 2009 | |
| Per share operating performance | | | | | | | | | | | | | | | | | | |
| (for a share outstanding throughout the period) | | | | | | | | | | | | | | | | | | |
| Net asset value, beginning of period | $ | 17.83 | | $ | 14.94 | | $ | 14.38 | | $ | 14.56 | | $ | 12.29 | | $ | 9.48 | |
| Income from investment operationsa: | | | | | | | | | | | | | | | | | | |
| Net investment incomeb | | 0.15 | | | 0.41 | | | 0.45 | | | 0.47 | | | 0.41 | | | 0.39 | |
| Net realized and unrealized gains (losses) | | 0.93 | | | 2.99 | | | 0.66 | | | (0.08 | ) | | 2.41 | | | 3.03 | |
| Total from investment operations | | 1.08 | | | 3.40 | | | 1.11 | | | 0.39 | | | 2.82 | | | 3.42 | |
| Less distributions from: | | | | | | | | | | | | | | | | | | |
| Net investment income | | (0.21 | ) | | (0.51 | ) | | (0.55 | ) | | (0.57 | ) | | (0.55 | ) | | (0.61 | ) |
| Net realized gains | | (0.07 | ) | | — | | | — | | | — | | | — | | | — | |
| Total distributions | | (0.28 | ) | | (0.51 | ) | | (0.55 | ) | | (0.57 | ) | | (0.55 | ) | | (0.61 | ) |
| Net asset value, end of period | $ | 18.63 | | $ | 17.83 | | $ | 14.94 | | $ | 14.38 | | $ | 14.56 | | $ | 12.29 | |
| |
| Total returnc | | 6.16 | % | | 23.21 | % | | 7.93 | % | | 2.60 | % | | 23.45 | % | | 37.81 | % |
| |
| Ratios to average net assetsd | | | | | | | | | | | | | | | | | | |
| Expenses before waiver and payments by | | | | | | | | | | | | | | | | | | |
| affiliates | | 0.62 | % | | 0.63 | % | | 0.65 | % | | 0.63 | % | | 0.65 | % | | 0.71 | % |
| Expenses net of waiver and payments by | | | | | | | | | | | | | | | | | | |
| affiliates | | 0.61 | %e | | 0.63 | %e | | 0.65 | % | | 0.63 | % | | 0.65 | % | | 0.71 | %e |
| Net investment income | | 1.67 | % | | 2.50 | % | | 3.09 | % | | 3.02 | % | | 3.03 | % | | 3.60 | % |
| |
| Supplemental data | | | | | | | | | | | | | | | | | | |
| Net assets, end of period (000’s) | $ | 700,171 | | $ | 387,528 | | $ | 196,765 | | $ | 181,611 | | $ | 68,526 | | $ | 32,003 | |
| Portfolio turnover rate | | 6.53 | % | | 34.69 | % | | 12.82 | % | | 23.24 | % | | 29.56 | % | | 47.18 | % |
aThe amount shown for a share outstanding throughout the period may not correlate with the Statement of Operations for the period due to the timing of sales and repurchases of
the Fund shares in relation to income earned and/or fluctuating fair value of the investments of the Fund.
bBased on average daily shares outstanding.
cTotal return is not annualized for periods less than one year.
dRatios are annualized for periods less than one year.
eBenefit of expense reduction rounds to less than 0.01%.
64 | The accompanying notes are an integral part of these financial statements. | Semiannual Report
| | | | |
| Franklin Investors Securities Trust | | | |
| |
| Statement of Investments, April 30, 2014 (unaudited) | | | | |
| |
| |
| Franklin Convertible Securities Fund | Country | Shares | | Value |
| Common Stocks 9.9% | | | | |
| Consumer Discretionary 3.0% | | | | |
| General Motors Co. | United States | 672,732 | $ | 23,195,800 |
| The Goodyear Tire & Rubber Co. | United States | 1,373,185 | | 34,604,262 |
| | | | | 57,800,062 |
| Energy 0.9% | | | | |
| Apache Corp. | United States | 199,823 | | 17,344,636 |
| Financials 2.8% | | | | |
| a Affiliated Managers Group Inc. | United States | 132,553 | | 26,272,005 |
| The Hartford Financial Services Group Inc. | United States | 403,764 | | 14,483,015 |
| Leucadia National Corp. | United States | 169,991 | | 4,338,170 |
| MetLife Inc. | United States | 189,378 | | 9,913,938 |
| | | | | 55,007,128 |
| Industrials 2.1% | | | | |
| Nielsen Holdings NV | United States | 327,543 | | 15,378,144 |
| a Swift Transportation Co. | United States | 1,099,908 | | 26,452,787 |
| | | | | 41,830,931 |
| Information Technology 0.4% | | | | |
| EMC Corp. | United States | 297,925 | | 7,686,465 |
| Utilities 0.7% | | | | |
| PPL Corp. | United States | 435,125 | | 14,507,068 |
| Total Common Stocks (Cost $157,068,943) | | | | 194,176,290 |
| Convertible Preferred Stocks 14.7% | | | | |
| Energy 4.4% | | | | |
| b Chesapeake Energy Corp., 5.75%, cvt. pfd., 144A | United States | 18,500 | | 21,945,625 |
| McDermott International Inc., 6.25%, cvt. pfd. | United States | 960,000 | | 24,709,440 |
| Sanchez Energy Corp., 6.50%, cvt. pfd., B | United States | 236,000 | | 17,698,678 |
| SandRidge Energy Inc., 7.00%, cvt. pfd. | United States | 200,000 | | 21,950,000 |
| | | | | 86,303,743 |
| Financials 1.3% | | | | |
| MetLife Inc., 5.00%, cvt. pfd. | United States | 334,000 | | 10,170,300 |
| Wintrust Financial Corp., 5.00%, cvt. pfd. | United States | 12,300 | | 14,999,850 |
| | | | | 25,170,150 |
| Industrials 3.9% | | | | |
| Stanley Black & Decker Inc., 4.75%, cvt. pfd. | United States | 297,600 | | 38,676,096 |
| United Technologies Corp., 7.50%, cvt. pfd. | United States | 570,100 | | 37,706,414 |
| | | | | 76,382,510 |
| Materials 1.3% | | | | |
| ArcelorMittal, 6.00%, cvt. pfd. | Luxembourg | 395,000 | | 9,603,438 |
| Cliffs Natural Resources Inc., 7.00%, cvt. pfd. | United States | 792,000 | | 15,055,920 |
| | | | | 24,659,358 |
Semiannual Report | 65
| | | | |
| Franklin Investors Securities Trust | | | |
| |
| Statement of Investments, April 30, 2014 (unaudited) (continued) | | | |
| |
| |
| Franklin Convertible Securities Fund | Country | Shares | | Value |
| Convertible Preferred Stocks (continued) | | | | |
| Utilities 3.8% | | | | |
| Dominion Resources Inc., 6.00%, cvt. pfd., B | United States | 310,000 | $ | 18,224,900 |
| Dominion Resources Inc., 6.125%, cvt. pfd., A | United States | 220,000 | | 12,896,400 |
| NextEra Energy Inc., 5.599%, cvt. pfd. | United States | 400,000 | | 26,294,000 |
| NextEra Energy Inc., 5.799%, cvt. pfd. | United States | 164,000 | | 9,305,360 |
| PPL Corp., 8.75%, cvt. pfd. | United States | 150,000 | | 8,100,000 |
| | | | | 74,820,660 |
| Total Convertible Preferred Stocks (Cost $255,405,592) | | | | 287,336,421 |
| |
| | | Principal Amount* | |
| Convertible Bonds 71.8% | | | | |
| Consumer Discretionary 17.5% | | | | |
| b Ctrip.com International Ltd., cvt., senior note, 144A, 1.25%, 10/15/18 | China | 19,200,000 | | 18,971,520 |
| b Homeaway Inc., cvt., senior note, 144A, 0.125%, 4/01/19 | United States | 36,500,000 | | 35,524,598 |
| Iconix Brand Group Inc., cvt., senior sub. note, 2.50%, 6/01/16 | United States | 28,190,000 | | 40,311,700 |
| International Game Technology, cvt., senior note, 3.25%, 5/01/14 | United States | 21,200,000 | | 21,200,000 |
| b Jarden Corp., cvt., sub. bond, 144A, 1.125%, 3/15/34 | United States | 40,000,000 | | 40,090,667 |
| Liberty Interactive LLC, cvt., senior note, 0.75%, 3/30/43 | United States | 17,250,000 | | 22,350,825 |
| Liberty Interactive LLC into Motorola Solutions Inc., cvt., senior deb., 3.50%, | | | | |
| 1/15/31 | United States | 8,000,000 | | 4,170,000 |
| b Liberty Media Corp., cvt., senior note, 144A, 1.375%, 10/15/23 | United States | 21,200,000 | | 20,511,000 |
| MGM Resorts International, cvt., senior note, 4.25%, 4/15/15 | United States | 29,000,000 | | 41,451,875 |
| Outerwall Inc., cvt., senior note, 4.00%, 9/01/14 | United States | 14,000,000 | | 24,167,500 |
| b The Priceline Group Inc., cvt., senior note, 144A, 0.35%, 6/15/20 | United States | 30,000,000 | | 35,737,500 |
| b Shutterfly Inc., cvt., senior note, 144A, 0.25%, 5/15/18 | United States | 37,465,000 | | 36,942,438 |
| | | | | 341,429,623 |
| Energy 1.0% | | | | |
| Cobalt International Energy Inc., cvt., senior note, 2.625%, 12/01/19 | United States | 19,900,000 | | 18,718,438 |
| b,c James River Coal Co., cvt., senior note, 144A, 10.00%, 6/01/18 | United States | 5,500,000 | | 701,250 |
| | | | | 19,419,688 |
| Financials 2.5% | | | | |
| Forest City Enterprises Inc., cvt., senior note, | | | | |
| 4.25%, 8/15/18 | United States | 20,000,000 | | 22,437,500 |
| b144A, 3.625%, 8/15/20 | United States | 13,000,000 | | 13,495,625 |
| c MF Global Holdings Ltd., cvt., senior note, 1.875%, 2/01/16 | United States | 25,000,000 | | 11,875,000 |
| | | | | 47,808,125 |
| Health Care 11.0% | | | | |
| BioMarin Pharmaceutical Inc., cvt., senior sub. note, | | | | |
| 0.75%, 10/15/18 | United States | 6,000,000 | | 6,176,250 |
| 1.50%, 10/15/20 | United States | 25,700,000 | | 26,599,500 |
| Brookdale Senior Living Inc., cvt., senior note, 2.75%, 6/15/18 | United States | 26,200,000 | | 34,387,500 |
| Corsicanto Ltd., cvt., senior bond, 3.50%, 1/15/32 | Ireland | 12,500,000 | | 9,140,625 |
| Fluidigm Corp, cvt., senior bond, 2.75%, 2/01/34 | United States | 10,200,000 | | 10,843,875 |
| HeartWare International Inc., cvt., senior note, 3.50%, 12/15/17 | United States | 10,000,000 | | 11,606,250 |
| Mylan Inc., cvt., senior note, 3.75%, 9/15/15 | United States | 9,500,000 | | 36,307,812 |
| Omnicare Inc., cvt., senior sub. note, 3.50%, 2/15/44 | United States | 34,663,000 | | 35,269,603 |
66 | Semiannual Report
| | | | |
| Franklin Investors Securities Trust | | | |
| |
| Statement of Investments, April 30, 2014 (unaudited) (continued) | | | |
| |
| |
| Franklin Convertible Securities Fund | Country | Principal Amount* | | Value |
| Convertible Bonds (continued) | | | | |
| Health Care (continued) | | | | |
| Pacira Pharmaceuticals Inc., cvt., senior note, 3.25%, 2/01/19 | United States | 5,880,000 | $ | 16,611,529 |
| Salix Pharmaceuticals Ltd., cvt., senior note, 2.75%, 5/15/15 | United States | 12,000,000 | | 28,635,000 |
| | | | | 215,577,944 |
| Industrials 2.5% | | | | |
| b L-3 Communications Corp., cvt., senior bond, 144A, 3.00%, 8/01/35 | United States | 15,000,000 | | 19,603,125 |
| b UTI Worldwide Inc., senior note, 144A, cvt., 4.50%, 3/01/19 | United States | 28,000,000 | | 28,710,640 |
| | | | | 48,313,765 |
| Information Technology 32.1% | | | | |
| c,d BearingPoint Liquidating Trust | United States | 14,000,000 | | — |
| Bottomline Technologies Inc., cvt., senior note, 1.50%, 12/01/17 | United States | 16,400,000 | | 20,049,000 |
| b Concur Technologies Inc., cvt., senior note, 144A, | | | | |
| 2.50%, 4/15/15 | United States | 3,900,000 | | 6,203,438 |
| 0.50%, 6/15/18 | United States | 19,700,000 | | 21,140,562 |
| Electronic Arts Inc., cvt., senior note, 0.75%, 7/15/16 | United States | 32,100,000 | | 36,661,410 |
| Intel Corp., cvt., | | | | |
| junior sub., 3.25%, 8/01/39 | United States | 8,000,000 | | 11,270,040 |
| b junior sub. bond, 144A, 2.95%, 12/15/35 | United States | 19,000,000 | | 22,610,000 |
| junior sub. deb., 2.95%, 12/15/35 | United States | 2,000,000 | | 2,380,000 |
| b JDS Uniphase Corp., cvt., 144A, 0.625%, 8/15/33 | United States | 34,900,000 | | 36,274,187 |
| b Microchip Technology Inc., cvt., junior sub. note, 144A, 2.125%, 12/15/37 | United States | 20,000,000 | | 37,037,500 |
| Micron Technology Inc., cvt., senior bond, 2.125%, 2/15/33 | United States | 19,800,000 | | 48,695,625 |
| b NetSuite Inc., cvt., senior note, 144A, 0.25%, 6/01/18 | United States | 36,300,000 | | 37,462,144 |
| Novellus Systems Inc., cvt., senior note, 2.625%, 5/15/41 | United States | 22,600,000 | | 40,199,750 |
| Nuance Communications Inc., cvt., | | | | |
| senior bond, 2.75%, 8/15/27 | United States | 4,990,000 | | 5,233,263 |
| senior note, 2.75%, 11/01/31 | United States | 13,400,000 | | 13,534,000 |
| b Proofpoint Inc., cvt., senior note, 144A, 1.25%, 12/15/18 | United States | 18,075,000 | | 18,187,969 |
| Salesforce.com Inc., cvt., senior note, 0.25%, 4/01/18 | United States | 30,200,000 | | 33,295,500 |
| b SanDisk Corp., cvt., senior note, 144A, 0.50%, 10/15/20 | United States | 33,000,000 | | 37,578,750 |
| b ServiceNow Inc., cvt., senior note, 144A, zero cpn., 11/01/18 | United States | 31,500,000 | | 31,696,875 |
| Take-Two Interactive Software Inc., cvt., senior note, 1.00%, 7/01/18 | United States | 16,400,000 | | 19,229,000 |
| b Trulia Inc., cvt., senior note, 144A, 2.75%, 12/15/20 | United States | 32,000,000 | | 38,640,000 |
| b VeriSign Inc., cvt., junior sub. bond, 144A, 3.25%, 8/15/37 | United States | 14,000,000 | | 20,720,000 |
| Xilinx Inc., cvt., senior note, 2.625%, 6/15/17 | United States | 19,270,000 | | 31,940,025 |
| b Yahoo! Inc., cvt., 144A, zero cpn., 12/01/18 | United States | 35,100,000 | | 36,087,187 |
| b Yandex NV, cvt., senior note, 144A, 1.125%, 12/15/18 | Russia | 23,900,000 | | 20,897,563 |
| | | | | 627,023,788 |
| Materials 3.8% | | | | |
| ArcelorMittal, cvt., senior note, 5.00%, 5/15/14 | Luxembourg | 10,000,000 | | 10,022,700 |
| b B2Gold Corp., cvt., senior sub. note, 144A, 3.25%, 10/01/18 | Canada | 15,400,000 | | 16,632,000 |
| Cemex SAB de CV, cvt., sub. note, 3.75%, 3/15/18 | Mexico | 24,000,000 | | 35,935,560 |
| Kaiser Aluminum Corp., cvt., senior note, 4.50%, 4/01/15 | United States | 4,000,000 | | 5,977,500 |
| Molycorp Inc., cvt., senior note, 5.50%, 2/01/18 | United States | 7,360,000 | | 6,551,430 |
| | | | | 75,119,190 |
Semiannual Report | 67
| | | | | |
| Franklin Investors Securities Trust | | | | |
| |
| Statement of Investments, April 30, 2014 (unaudited) (continued) | | | | |
| |
| Franklin Convertible Securities Fund | Country | Principal Amount* | | Value | |
| Convertible Bonds (continued) | | | | | |
| Utilities 1.4% | | | | | |
| CMS Energy Corp., cvt., senior note, 5.50%, 6/15/29 | United States | 12,000,000 | $ | 26,871,120 | |
| Total Convertible Bonds (Cost $1,197,078,816) | | | | 1,401,563,243 | |
| | | Shares | | | |
| Escrow Accounts and Litigation Trusts (Cost $22,362) 0.0%† | | | | | |
| a Motors Liquidation Co., Escrow Account, cvt. pfd., D | United States | 376,200 | | 3,762 | |
| Total Investments before Short Term Investments | | | | | |
| (Cost $1,609,575,713) | | | | 1,883,079,716 | |
| Short Term Investments (Cost $70,609,419) 3.7% | | | | | |
| Money Market Funds 3.7% | | | | | |
| a,e Institutional Fiduciary Trust Money Market Portfolio | United States | 70,609,419 | | 70,609,419 | |
| Total Investments (Cost $1,680,185,132) 100.1% | | | | 1,953,689,135 | |
| Other Assets, less Liabilities (0.1)% | | | | (1,246,371 | ) |
| Net Assets 100.0% | | | $ | 1,952,442,764 | |
See Abbreviations on page 128.
*The principal amount is stated in U.S. dollars unless otherwise indicated.
†Rounds to less than 0.1% of net assets.
aNon-income producing.
bSecurity was purchased pursuant to Rule 144A under the Securities Act of 1933 and may be sold in transactions exempt from registration only to qualified institutional buyers or
in a public offering registered under the Securities Act of 1933. These securities have been deemed liquid under guidelines approved by the Trust’s Board of Trustees. At April 30,
2014, the aggregate value of these securities was $653,402,163, representing 33.47% of net assets.
cSee Note 7 regarding defaulted securities.
dSee Note 8 regarding restricted securities.
eSee Note 3(f) regarding investments in the Institutional Fiduciary Trust Money Market Portfolio.
68 | The accompanying notes are an integral part of these financial statements. | Semiannual Report
| | | | | | | | | | | | | | | | | | |
| Franklin Investors Securities Trust | | | | | | | | | | |
| |
| Financial Highlights | | | | | | | | | | | | | | | | | | |
| |
| Franklin Equity Income Fund | | | | | | | | | | | | | | | | | | |
| | | Six Months Ended | | | | | | | | | | | | | |
| | | April 30, 2014 | | | Year Ended October 31, | | | | |
| Class A | | (unaudited) | | | 2013 | | | 2012 | | | 2011 | | | 2010 | | | 2009 | |
| Per share operating performance | | | | | | | | | | | | | | | | | | |
| (for a share outstanding throughout the period) | | | | | | | | | | | | | | | | | | |
| Net asset value, beginning of period | $ | 22.16 | | $ | 18.01 | | $ | 16.58 | | $ | 15.93 | | $ | 14.06 | | $ | 12.88 | |
| Income from investment operationsa: | | | | | | | | | | | | | | | | | | |
| Net investment incomeb | | 0.40 | c | | 0.44 | | | 0.41 | | | 0.41 | | | 0.44 | | | 0.39 | |
| Net realized and unrealized gains (losses) | | 1.13 | | | 4.19 | | | 1.46 | | | 0.75 | | | 1.85 | | | 1.29 | |
| Total from investment operations | | 1.53 | | | 4.63 | | | 1.87 | | | 1.16 | | | 2.29 | | | 1.68 | |
| Less distributions from: | | | | | | | | | | | | | | | | | | |
| Net investment income | | (0.27 | ) | | (0.48 | ) | | (0.44 | ) | | (0.51 | ) | | (0.42 | ) | | (0.50 | ) |
| Net realized gains | | (0.12 | ) | - | — | | | — | | | — | | | — | | | — | |
| Total distributions | | (0.39 | ) | | (0.48 | ) | | (0.44 | ) | | (0.51 | ) | | (0.42 | ) | | (0.50 | ) |
| Net asset value, end of period | $ | 23.30 | | $ | 22.16 | | $ | 18.01 | | $ | 16.58 | | $ | 15.93 | | $ | 14.06 | |
| |
| Total returnd | | 7.00 | % | | 26.07 | % | | 11.43 | % | | 7.27 | % | | 16.48 | % | | 13.77 | % |
| |
| Ratios to average net assetse | | | | | | | | | | | | | | | | | | |
| Expenses | | 0.89 | %f,g | | 0.91 | %g | | 0.95 | % | | 0.96 | % | | 0.98 | %g | | 1.04 | %g |
| Net investment income | | 3.58 | % | | 2.19 | % | | 2.36 | % | | 2.48 | % | | 2.96 | % | | 3.19 | % |
| |
| Supplemental data | | | | | | | | | | | | | | | | | | |
| Net assets, end of period (000’s) | $ | 1,735,662 | | $ | 1,637,089 | | $ | 1,305,791 | | $ | 1,105,132 | | $ | 799,585 | | $ | 540,127 | |
| Portfolio turnover rate | | 9.69 | % | | 33.18 | % | | 19.71 | % | | 19.45 | % | | 11.35 | % | | 43.75 | % |
aThe amount shown for a share outstanding throughout the period may not correlate with the Statement of Operations for the period due to the timing of sales and repurchases of
the Fund shares in relation to income earned and/or fluctuating fair value of the investments of the Fund.
bBased on average daily shares outstanding.
cNet investment income per share includes approximately $0.17 per share received in the form of a special dividend paid in connection with certain Fund holdings. Excluding this
amount, the ratio of net investment income to average net assets would have been 2.10%.
dTotal return does not reflect sales commissions or contingent deferred sales charges, if applicable, and is not annualized for periods less than one year.
eRatios are annualized for periods less than one year.
fBenefit of waiver and payment by affiliate rounds to less than 0.01%.
gBenefit of expense reduction rounds to less than 0.01%.
Semiannual Report | The accompanying notes are an integral part of these financial statements. | 69
| | | | | | | | | | | | | | | | | | |
| Franklin Investors Securities Trust | | | | | | | | | | |
| |
| Financial Highlights (continued) | | | | | | | | | | | | | | | | | | |
| |
| Franklin Equity Income Fund | | | | | | | | | | | | | | | | | | |
| | | Six Months Ended | | | | | | | | | | | | | |
| | | April 30, 2014 | | | | | | Year Ended October 31, | | | | |
| Class C | | (unaudited) | | | 2013 | | | 2012 | | | 2011 | | | 2010 | | | 2009 | |
| Per share operating performance | | | | | | | | | | | | | | | | | | |
| (for a share outstanding throughout the period) | | | | | | | | | | | | | | | | | | |
| Net asset value, beginning of period | $ | 22.04 | | $ | 17.91 | | $ | 16.50 | | $ | 15.85 | | $ | 14.00 | | $ | 12.83 | |
| Income from investment operationsa: | | | | | | | | | | | | | | | | | | |
| Net investment incomeb | | 0.32 | c | | 0.28 | | | 0.28 | | | 0.29 | | | 0.33 | | | 0.30 | |
| Net realized and unrealized gains (losses) | | 1.12 | | | 4.18 | | | 1.45 | | | 0.74 | | | 1.82 | | | 1.28 | |
| Total from investment operations | | 1.44 | | | 4.46 | | | 1.73 | | | 1.03 | | | 2.15 | | | 1.58 | |
| Less distributions from: | | | | | | | | | | | | | | | | | | |
| Net investment income | | (0.19 | ) | | (0.33 | ) | | (0.32 | ) | | (0.38 | ) | | (0.30 | ) | | (0.41 | ) |
| Net realized gains | | (0.12 | ) | | — | | | — | | | — | | | — | | | — | |
| Total distributions | | (0.31 | ) | | (0.33 | ) | | (0.32 | ) | | (0.38 | ) | | (0.30 | ) | | (0.41 | ) |
| Net asset value, end of period | $ | 23.17 | | $ | 22.04 | | $ | 17.91 | | $ | 16.50 | | $ | 15.85 | | $ | 14.00 | |
| |
| Total returnd | | 6.60 | % | | 25.18 | % | | 10.56 | % | | 6.44 | % | | 15.59 | % | | 12.94 | % |
| |
| Ratios to average net assetse | | | | | | | | | | | | | | | | | | |
| Expenses | | 1.64 | %f,g | | 1.66 | %g | | 1.70 | % | | 1.71 | % | | 1.73 | %g | | 1.79 | %g |
| Net investment income | | 2.83 | % | | 1.44 | % | | 1.61 | % | | 1.73 | % | | 2.21 | % | | 2.44 | % |
| |
| Supplemental data | | | | | | | | | | | | | | | | | | |
| Net assets, end of period (000’s) | $ | 236,421 | | $ | 208,325 | | $ | 134,746 | | $ | 118,686 | | $ | 97,305 | | $ | 86,152 | |
| Portfolio turnover rate | | 9.69 | % | | 33.18 | % | | 19.71 | % | | 19.45 | % | | 11.35 | % | | 43.75 | % |
aThe amount shown for a share outstanding throughout the period may not correlate with the Statement of Operations for the period due to the timing of sales and repurchases of
the Fund shares in relation to income earned and/or fluctuating fair value of the investments of the Fund.
bBased on average daily shares outstanding.
cNet investment income per share includes approximately $0.17 per share received in the form of a special dividend paid in connection with certain Fund holdings. Excluding this
amount, the ratio of net investment income to average net assets would have been 1.35%.
dTotal return does not reflect sales commissions or contingent deferred sales charges, if applicable, and is not annualized for periods less than one year.
eRatios are annualized for periods less than one year.
fBenefit of waiver and payment by affiliate rounds to less than 0.01%.
gBenefit of expense reduction rounds to less than 0.01%.
70 | The accompanying notes are an integral part of these financial statements. | Semiannual Report
| | | | | | | | | | | | | | | | | | |
| Franklin Investors Securities Trust | | | | | | | | | | |
| |
| Financial Highlights (continued) | | | | | | | | | | | | | | | | | | |
| |
| Franklin Equity Income Fund | | | | | | | | | | | | | | | | | | |
| | | Six Months Ended | | | | | | | | | | | | | | | | |
| | | April 30, 2014 | | | | | | Year Ended October 31, | | | | |
| Class R | | (unaudited) | | | 2013 | | | 2012 | | | 2011 | | | 2010 | | | 2009 | |
| Per share operating performance | | | | | | | | | | | | | | | | | | |
| (for a share outstanding throughout the period) | | | | | | | | | | | | | | | | | | |
| Net asset value, beginning of period | $ | 22.17 | | $ | 18.01 | | $ | 16.58 | | $ | 15.93 | | $ | 14.07 | | $ | 12.89 | |
| Income from investment operationsa: | | | | | | | | | | | | | | | | | | |
| Net investment incomeb | | 0.38 | c | | 0.39 | | | 0.37 | | | 0.38 | | | 0.41 | | | 0.36 | |
| Net realized and unrealized gains (losses) | | 1.11 | | | 4.20 | | | 1.46 | | | 0.73 | | | 1.83 | | | 1.29 | |
| Total from investment operations | | 1.49 | | | 4.59 | | | 1.83 | | | 1.11 | | | 2.24 | | | 1.65 | |
| Less distributions from: | | | | | | | | | | | | | | | | | | |
| Net investment income | | (0.24 | ) | | (0.43 | ) | | (0.40 | ) | | (0.46 | ) | | (0.38 | ) | | (0.47 | ) |
| Net realized gains | | (0.12 | ) | | — | | | — | | | — | | | — | | | — | |
| Total distributions | | (0.36 | ) | | (0.43 | ) | | (0.40 | ) | | (0.46 | ) | | (0.38 | ) | | (0.47 | ) |
| Net asset value, end of period | $ | 23.30 | | $ | 22.17 | | $ | 18.01 | | $ | 16.58 | | $ | 15.93 | | $ | 14.07 | |
| |
| Total returnd | | 6.82 | % | | 25.81 | % | | 11.16 | % | | 7.00 | % | | 16.09 | % | | 13.49 | % |
| |
| Ratios to average net assetse | | | | | | | | | | | | | | | | | | |
| Expenses | | 1.14 | %f,g | | 1.16 | %g | | 1.20 | % | | 1.21 | % | | 1.23 | %g | | 1.29 | %g |
| Net investment income | | 3.33 | % | | 1.94 | % | | 2.11 | % | | 2.23 | % | | 2.71 | % | | 2.94 | % |
| |
| Supplemental data | | | | | | | | | | | | | | | | | | |
| Net assets, end of period (000’s) | $ | 6,720 | | $ | 5,844 | | $ | 4,940 | | $ | 3,830 | | $ | 3,589 | | $ | 4,218 | |
| Portfolio turnover rate | | 9.69 | % | | 33.18 | % | | 19.71 | % | | 19.45 | % | | 11.35 | % | | 43.75 | % |
aThe amount shown for a share outstanding throughout the period may not correlate with the Statement of Operations for the period due to the timing of sales and repurchases of
the Fund shares in relation to income earned and/or fluctuating fair value of the investments of the Fund.
bBased on average daily shares outstanding.
cNet investment income per share includes approximately $0.17 per share received in the form of a special dividend paid in connection with certain Fund holdings. Excluding this
amount, the ratio of net investment income to average net assets would have been 1.85%.
dTotal return is not annualized for periods less than one year.
eRatios are annualized for periods less than one year.
fBenefit of waiver and payment by affiliate rounds to less than 0.01%.
gBenefit of expense reduction rounds to less than 0.01%.
Semiannual Report | The accompanying notes are an integral part of these financial statements. | 71
| | | | | | |
| Franklin Investors Securities Trust | | | | | | |
| |
| Financial Highlights (continued) | | | | | | |
| |
| Franklin Equity Income Fund | | | | | | |
| | | Six Months Ended | | | Period Ended | |
| | | April 30, 2014 | | | October 31, | |
| Class R6 | | (unaudited) | | | 2013a | |
| Per share operating performance | | | | | | |
| (for a share outstanding throughout the period) | | | | | | |
| Net asset value, beginning of period | $ | 22.18 | | $ | 20.00 | |
| Income from investment operationsb: | | | | | | |
| Net investment incomec | | 0.45 | d | | 0.26 | |
| Net realized and unrealized gains (losses) | | 1.12 | | | 2.18 | |
| Total from investment operations | | 1.57 | | | 2.44 | |
| Less distributions from: | | | | | | |
| Net investment income | | (0.31 | ) | | (0.26 | ) |
| Net realized gains | | (0.12 | ) | | — | |
| Total distributions | | (0.43 | ) | | (0.26 | ) |
| Net asset value, end of period | $ | 23.32 | | $ | 22.18 | |
| |
| Total returne | | 7.19 | % | | 12.30 | % |
| |
| Ratios to average net assetsf | | | | | | |
| Expenses before waiver and payments by affiliates | | 1.71 | % | | 2.16 | % |
| Expenses net of waiver and payments by affiliatesg | | 0.51 | % | | 0.51 | % |
| Net investment income | | 3.96 | % | | 2.59 | % |
| |
| Supplemental data | | | | | | |
| Net assets, end of period (000’s) | $ | 6 | | $ | 6 | |
| Portfolio turnover rate | | 9.69 | % | | 33.18 | % |
aFor the period May 1, 2013 (effective date) to October 31, 2013.
bThe amount shown for a share outstanding throughout the period may not correlate with the Statement of Operations for the period due to the timing of sales and repurchases of
the Fund shares in relation to income earned and/or fluctuating fair value of the investments of the Fund.
cBased on average daily shares outstanding.
dNet investment income per share includes approximately $0.17 per share received in the form of a special dividend paid in connection with certain Fund holdings. Excluding this
amount, the ratio of net investment income to average net assets would have been 2.49%.
eTotal return is not annualized for periods less than one year.
fRatios are annualized for periods less than one year.
gBenefit of expense reduction rounds to less than 0.01%.
72 | The accompanying notes are an integral part of these financial statements. | Semiannual Report
| | | | | | | | | | | | | | | | | | |
| Franklin Investors Securities Trust | | | | | | | | | | |
| |
| Financial Highlights (continued) | | | | | | | | | | | | | | | | | | |
| |
| Franklin Equity Income Fund | | | | | | | | | | | | | | | | | | |
| | | Six Months Ended | | | | | | | | | | | | | | | | |
| | | April 30, 2014 | | | | | | Year Ended October 31, | | | | |
| Advisor Class | | (unaudited) | | | 2013 | | | 2012 | | | 2011 | | | 2010 | | | 2009 | |
| Per share operating performance | | | | | | | | | | | | | | | | | | |
| (for a share outstanding throughout the period) | | | | | | | | | | | | | | | | | | |
| Net asset value, beginning of period | $ | 22.19 | | $ | 18.02 | | $ | 16.59 | | $ | 15.94 | | $ | 14.07 | | $ | 12.88 | |
| Income from investment operationsa: | | | | | | | | | | | | | | | | | | |
| Net investment incomeb | | 0.43 | c | | 0.48 | | | 0.45 | | | 0.45 | | | 0.48 | | | 0.42 | |
| Net realized and unrealized gains (losses) | | 1.13 | | | 4.22 | | | 1.46 | | | 0.75 | | | 1.85 | | | 1.30 | |
| Total from investment operations | | 1.56 | | | 4.70 | | | 1.91 | | | 1.20 | | | 2.33 | | | 1.72 | |
| Less distributions from: | | | | | | | | | | | | | | | | | | |
| Net investment income | | (0.30 | ) | | (0.53 | ) | | (0.48 | ) | | (0.55 | ) | | (0.46 | ) | | (0.53 | ) |
| Net realized gains | | (0.12 | ) | | — | | | — | | | — | | | — | | | — | |
| Total distributions | | (0.42 | ) | | (0.53 | ) | | (0.48 | ) | | (0.55 | ) | | (0.46 | ) | | (0.53 | ) |
| Net asset value, end of period | $ | 23.33 | | $ | 22.19 | | $ | 18.02 | | $ | 16.59 | | $ | 15.94 | | $ | 14.07 | |
| |
| Total returnd | | 7.13 | % | | 26.48 | % | | 11.69 | % | | 7.54 | % | | 16.76 | % | | 14.12 | % |
| |
| Ratios to average net assetse | | | | | | | | | | | | | | | | | | |
| Expenses | | 0.64 | %f,g | | 0.66 | %g | | 0.70 | % | | 0.71 | % | | 0.73 | %g | | 0.79 | %g |
| Net investment income | | 3.83 | % | | 2.44 | % | | 2.61 | % | | 2.73 | % | | 3.21 | % | | 3.44 | % |
| |
| Supplemental data | | | | | | | | | | | | | | | | | | |
| Net assets, end of period (000’s) | $ | 22,929 | | $ | 17,534 | | $ | 10,527 | | $ | 7,467 | | $ | 4,183 | | $ | 2,142 | |
| Portfolio turnover rate | | 9.69 | % | | 33.18 | % | | 19.71 | % | | 19.45 | % | | 11.35 | % | | 43.75 | % |
aThe amount shown for a share outstanding throughout the period may not correlate with the Statement of Operations for the period due to the timing of sales and repurchases of
the Fund shares in relation to income earned and/or fluctuating fair value of the investments of the Fund.
bBased on average daily shares outstanding.
cNet investment income per share includes approximately $0.17 per share received in the form of a special dividend paid in connection with certain Fund holdings. Excluding this
amount, the ratio of net investment income to average net assets would have been 2.35%.
dTotal return is not annualized for periods less than one year.
eRatios are annualized for periods less than one year.
fBenefit of waiver and payment by affiliate rounds to less than 0.01%.
gBenefit of expense reduction rounds to less than 0.01%.
Semiannual Report | The accompanying notes are an integral part of these financial statements. | 73
| | | | |
| Franklin Investors Securities Trust | | | |
| |
| Statement of Investments, April 30, 2014 (unaudited) | | | | |
| |
| |
| Franklin Equity Income Fund | Country | Shares | | Value |
| Common Stocks 92.5% | | | | |
| Consumer Discretionary 16.5% | | | | |
| a Amazon.com Inc. | United States | 97,500 | $ | 29,652,675 |
| ClubCorp Holdings Inc. | United States | 658,346 | | 12,403,238 |
| Ford Motor Co. | United States | 2,440,200 | | 39,409,230 |
| General Motors Co. | United States | 231,564 | | 7,984,327 |
| L Brands Inc. | United States | 622,200 | | 33,723,240 |
| Lowe’s Cos. Inc. | United States | 600,000 | | 27,546,000 |
| McDonald’s Corp. | United States | 398,900 | | 40,440,482 |
| NIKE Inc., B | United States | 458,000 | | 33,411,100 |
| Starwood Hotels & Resorts Worldwide Inc. | United States | 453,700 | | 34,776,105 |
| Target Corp. | United States | 571,500 | | 35,290,125 |
| Wynn Resorts Ltd. | United States | 175,600 | | 35,803,084 |
| | | | | 330,439,606 |
| Consumer Staples 7.8% | | | | |
| Diageo PLC, ADR | United Kingdom | 284,000 | | 34,869,520 |
| Mead Johnson Nutrition Co., A | United States | 415,200 | | 36,645,552 |
| Nestle SA | Switzerland | 335,000 | | 25,862,921 |
| PepsiCo Inc. | United States | 448,900 | | 38,556,021 |
| The Procter & Gamble Co. | United States | 237,700 | | 19,622,135 |
| | | | | 155,556,149 |
| Energy 6.0% | | | | |
| BP PLC, ADR | United Kingdom | 391,271 | | 19,806,138 |
| Chevron Corp. | United States | 172,400 | | 21,639,648 |
| Exxon Mobil Corp. | United States | 367,234 | | 37,608,434 |
| Royal Dutch Shell PLC, A, ADR | United Kingdom | 512,000 | | 40,314,880 |
| | | | | 119,369,100 |
| Financials 11.8% | | | | |
| Aflac Inc. | United States | 536,200 | | 33,630,464 |
| Bank of America Corp. | United States | 974,700 | | 14,756,958 |
| BlackRock Inc. | United States | 129,700 | | 39,039,700 |
| JPMorgan Chase & Co. | United States | 691,500 | | 38,710,170 |
| Marsh & McLennan Cos. Inc. | United States | 497,700 | | 24,541,587 |
| MetLife Inc. | United States | 394,568 | | 20,655,635 |
| T. Rowe Price Group Inc. | United States | 347,800 | | 28,564,814 |
| Wells Fargo & Co. | United States | 725,000 | | 35,989,000 |
| | | | | 235,888,328 |
| Health Care 9.4% | | | | |
| Bristol-Myers Squibb Co. | United States | 298,700 | | 14,961,883 |
| Eli Lilly & Co. | United States | 566,400 | | 33,474,240 |
| Johnson & Johnson | United States | 332,000 | | 33,628,280 |
| Pfizer Inc. | United States | 979,300 | | 30,632,504 |
| Roche Holding AG | Switzerland | 139,000 | | 40,745,327 |
| Sanofi, ADR | France | 659,200 | | 35,464,960 |
| | | | | 188,907,194 |
74 | Semiannual Report
| | | | |
| Franklin Investors Securities Trust | | | |
| |
| Statement of Investments, April 30, 2014 (unaudited) (continued) | | | |
| |
| |
| Franklin Equity Income Fund | Country | Shares | | Value |
| Common Stocks (continued) | | | | |
| Industrials 14.3% | | | | |
| The Boeing Co. | United States | 218,200 | $ | 28,152,164 |
| Cummins Inc. | United States | 223,500 | | 33,714,975 |
| Emerson Electric Co. | United States | 569,000 | | 38,794,420 |
| General Electric Co. | United States | 1,228,500 | | 33,034,365 |
| Honeywell International Inc. | United States | 393,800 | | 36,584,020 |
| Lockheed Martin Corp. | United States | 254,900 | | 41,839,286 |
| Republic Services Inc. | United States | 1,216,500 | | 42,686,985 |
| United Parcel Service Inc., B | United States | 306,600 | | 30,200,100 |
| | | | | 285,006,315 |
| Information Technology 10.6% | | | | |
| CA Inc. | United States | 1,144,700 | | 34,501,258 |
| Cisco Systems Inc. | United States | 1,665,333 | | 38,485,846 |
| Intel Corp. | United States | 1,200,000 | | 32,028,000 |
| Maxim Integrated Products Inc. | United States | 1,226,000 | | 39,771,440 |
| Microsoft Corp. | United States | 1,034,100 | | 41,777,640 |
| Paychex Inc. | United States | 629,100 | | 26,302,671 |
| | | | | 212,866,855 |
| Materials 7.8% | | | | |
| BHP Billiton PLC | United Kingdom | 842,500 | | 27,296,038 |
| The Dow Chemical Co. | United States | 814,400 | | 40,638,560 |
| E. I. du Pont de Nemours and Co. | United States | 532,100 | | 35,820,972 |
| Freeport-McMoRan Copper & Gold Inc., B | United States | 633,906 | | 21,787,349 |
| Potash Corp. of Saskatchewan Inc. | Canada | 858,600 | | 31,046,976 |
| | | | | 156,589,895 |
| Telecommunication Services 2.4% | | | | |
| AT&T Inc. | United States | 634,410 | | 22,648,437 |
| Verizon Communications Inc. | United States | 206,771 | | 9,662,409 |
| Vodafone Group PLC, ADR | United Kingdom | 428,836 | | 16,278,614 |
| | | | | 48,589,460 |
| Utilities 5.9% | | | | |
| Dominion Resources Inc. | United States | 391,100 | | 28,370,394 |
| Duke Energy Corp. | United States | 419,690 | | 31,262,708 |
| PG&E Corp. | United States | 809,900 | | 36,915,242 |
| Xcel Energy Inc. | United States | 673,500 | | 21,464,445 |
| | | | | 118,012,789 |
| Total Common Stocks (Cost $1,425,548,574) | | | | 1,851,225,691 |
| Convertible Preferred Stocks 6.0% | | | | |
| Energy 1.0% | | | | |
| b Chesapeake Energy Corp., 5.75%, cvt. pfd., 144A | United States | 16,000 | | 18,980,000 |
| Financials 1.5% | | | | |
| Bank of America Corp., 7.25%, cvt. pfd., L | United States | 18,000 | | 20,488,500 |
| MetLife Inc., 5.00%, cvt. pfd. | United States | 310,000 | | 9,439,500 |
| | | | | 29,928,000 |
Semiannual Report | 75
| | | | |
| Franklin Investors Securities Trust | | | |
| |
| Statement of Investments, April 30, 2014 (unaudited) (continued) | | | |
| |
| Franklin Equity Income Fund | Country | Shares | | Value |
| Convertible Preferred Stocks (Continued) | | | | |
| Industrials 2.0% | | | | |
| Genesee & Wyoming Inc., 5.00%, cvt. pfd. | United States | 68,800 | $ | 8,958,792 |
| Stanley Black & Decker Inc., 6.25%, cvt., pfd. | United States | 279,000 | | 31,200,570 |
| | | | | 40,159,362 |
| Utilities 1.5% | | | | |
| NextEra Energy Inc., 5.799%, cvt. pfd. | United States | 370,000 | | 20,993,800 |
| NextEra Energy Inc., 5.889%, cvt. pfd. | United States | 154,000 | | 9,839,060 |
| | | | | 30,832,860 |
| Total Convertible Preferred Stocks (Cost $97,647,313) | | | | 119,900,222 |
| Total Investments before Short Term Investments | | | | |
| (Cost $1,523,195,887) | | | | 1,971,125,913 |
| Short Term Investments (Cost $28,170,895) 1.4% | | | | |
| Money Market Funds 1.4% | | | | |
| a,cInstitutional Fiduciary Trust Money Market Portfolio | United States | 28,170,895 | | 28,170,895 |
| Total Investments (Cost $1,551,366,782) 99.9% | | | | 1,999,296,808 |
| Other Assets, less Liabilities 0.1% | | | | 2,441,846 |
| Net Assets 100.0% | | | $ | 2,001,738,654 |
See Abbreviations on page 128.
aNon-income producing.
bSecurity was purchased pursuant to Rule 144A under the Securities Act of 1933 and may be sold in transactions exempt from registration only to qualified institutional buyers or in
a public offering registered under the Securities Act of 1933. This security has been deemed liquid under guidelines approved by the Trust’s Board of Trustees.
cSee Note 3(f) regarding investments in the Institutional Fiduciary Trust Money Market Portfolio.
76 | The accompanying notes are an integral part of these financial statements. | Semiannual Report
| | | | | | | | | | | | | | | | | | |
| Franklin Investors Securities Trust | | | | | | | | | | |
| Financial Highlights | | | | | | | | | | | | | | | | | | |
| |
| Franklin Limited Maturity U.S. Government Securities Fund | | | | | | | | | | | | | | | | |
| | | Six Months Ended | | | | | | | | | | | | | |
| | | April 30, 2014 | | | | | | Year Ended October 31, | | | | |
| Class A | | (unaudited) | | | 2013 | | | 2012 | | | 2011 | | | 2010 | | | 2009 | |
| Per share operating performance | | | | | | | | | | | | | | | | | | |
| (for a share outstanding throughout the period) | | | | | | | | | | | | | | | | | | |
| Net asset value, beginning of period | $ | 10.04 | | $ | 10.30 | | $ | 10.43 | | $ | 10.55 | | $ | 10.48 | | $ | 10.05 | |
| Income from investment operationsa: | | | | | | | | | | | | | | | | | | |
| Net investment income | | 0.022 | b | | 0.092 | | | 0.090 | b | | 0.140 | b | | 0.170 | b | | 0.280 | b |
| Net realized and unrealized gains (losses) | | —c | | | (0.122 | ) | | 0.010 | | | (0.020 | ) | | 0.160 | | | 0.500 | |
| Total from investment operations | | 0.022 | | | (0.030 | ) | | 0.100 | | | 0.120 | | | 0.330 | | | 0.780 | |
| Less distributions from net investment income | | (0.092 | ) | | (0.230 | ) | | (0.230 | ) | | (0.240 | ) | | (0.260 | ) | | (0.350 | ) |
| Net asset value, end of period | $ | 9.97 | | $ | 10.04 | | $ | 10.30 | | $ | 10.43 | | $ | 10.55 | | $ | 10.48 | |
| |
| Total returnd | | 0.32 | % | | (0.29 | )% | | 0.98 | % | | 1.11 | % | | 3.21 | % | | 7.79 | % |
| |
| Ratios to average net assetse | | | | | | | | | | | | | | | | | | |
| Expenses | | 0.91 | %f | | 0.79 | %g | | 0.77 | % | | 0.77 | % | | 0.79 | % | | 0.82 | %g |
| Net investment income | | 0.43 | % | | 0.45 | % | | 0.89 | % | | 1.33 | % | | 1.64 | % | | 2.72 | % |
| |
| Supplemental data | | | | | | | | | | | | | | | | | | |
| Net assets, end of period (000’s) | $ | 425,700 | | $ | 460,029 | | $ | 410,810 | | $ | 405,506 | | $ | 406,504 | | $ | 357,691 | |
| Portfolio turnover rate | | 11.56 | % | | 92.56 | % | | 44.63 | % | | 97.24 | % | | 56.80 | % | | 54.81 | % |
aThe amount shown for a share outstanding throughout the period may not correlate with the Statement of Operations for the period due to the timing of sales and repurchases of
the Fund shares in relation to income earned and/or fluctuating fair value of the investments of the Fund.
bBased on average daily shares outstanding.
cAmount rounds to less than $0.001 per share.
dTotal return does not reflect sales commissions or contingent deferred sales charges, if applicable, and is not annualized for periods less than one year.
eRatios are annualized for periods less than one year.
fBenefit of waiver and payment by affiliate rounds to less than 0.01%.
gBenefit of expense reduction rounds to less than 0.01%.
Semiannual Report | The accompanying notes are an integral part of these financial statements. | 77
| | | | | | |
| Franklin Investors Securities Trust | | | | | | |
| Financial Highlights (continued) | | | | | | |
| |
| Franklin Limited Maturity U.S. Government Securities Fund | | | | | | |
| | | Six Months Ended | | | Period Ended | |
| | | April 30, 2014 | | | October 31, | |
| Class R6 | | (unaudited) | | | 2013 | a |
| Per share operating performance | | | | | | |
| (for a share outstanding throughout the period) | | | | | | |
| Net asset value, beginning of period | $ | 10.03 | | $ | 10.17 | |
| Income from investment operationsb: | | | | | | |
| Net investment income | | 0.020 | c | | 0.034 | |
| Net realized and unrealized gains (losses) | | 0.044 | | | (0.056 | ) |
| Total from investment operations | | 0.064 | | | (0.022 | ) |
| Less distributions from net investment income | | (0.104 | ) | | (0.118 | ) |
| Net asset value, end of period | $ | 9.99 | | $ | 10.03 | |
| |
| Total returnd | | 0.64 | % | | (0.22 | )% |
| |
| Ratios to average net assetse | | | | | | |
| Expenses | | 0.54 | %f | | 0.54 | %g |
| Net investment income | | 0.80 | % | | 0.70 | % |
| |
| Supplemental data | | | | | | |
| Net assets, end of period (000’s) | $ | 5 | | $ | 80,334 | |
| Portfolio turnover rate | | 11.56 | % | | 92.56 | % |
aFor the period May 1, 2013 (effective date) to October 31, 2013.
bThe amount shown for a share outstanding throughout the period may not correlate with the Statement of Operations for the period due to the timing of sales and repurchases of
the Fund shares in relation to income earned and/or fluctuating fair value of the investments of the Fund.
cBased on average daily shares outstanding.
dTotal return is not annualized for periods less than one year.
eRatios are annualized for periods less than one year.
fBenefit of waiver and payment by affiliate rounds to less than 0.01%.
gBenefit of expense reduction rounds to less than 0.01%.
78 | The accompanying notes are an integral part of these financial statements. | Semiannual Report
| | | | | | | | | | | | | | | | | | |
| Franklin Investors Securities Trust | | | | | | | | | | |
| Financial Highlights (continued) | | | | | | | | | | | | | | | | | | |
| |
| Franklin Limited Maturity U.S. Government Securities Fund | | | | | | | | | | | | | | | | |
| | | Six Months Ended | | | | | | | | | | | | | | | | |
| | | April 30, 2014 | | | | | | Year Ended October 31, | | | | |
| Advisor Class | | (unaudited) | | | 2013 | | | 2012 | | | 2011 | | | 2010 | | | 2009 | |
| Per share operating performance | | | | | | | | | | | | | | | | | | |
| (for a share outstanding throughout the period) | | | | | | | | | | | | | | | | | | |
| Net asset value, beginning of period | $ | 10.03 | | $ | 10.29 | | $ | 10.42 | | $ | 10.54 | | $ | 10.47 | | $ | 10.04 | |
| Income from investment operationsa: | | | | | | | | | | | | | | | | | | |
| Net investment income (loss) | | 0.026 | b | | (0.112 | ) | | 0.100 | b | | 0.150 | b | | 0.180 | b | | 0.290 | b |
| Net realized and unrealized gains (losses) | | 0.001 | | | 0.092 | | | 0.010 | | | (0.020 | ) | | 0.160 | | | 0.500 | |
| Total from investment operations | | 0.027 | | | (0.020 | ) | | 0.110 | | | 0.130 | | | 0.340 | | | 0.790 | |
| Less distributions from net investment income | | (0.097 | ) | | (0.240 | ) | | (0.240 | ) | | (0.250 | ) | | (0.270 | ) | | (0.360 | ) |
| Net asset value, end of period | $ | 9.96 | | $ | 10.03 | | $ | 10.29 | | $ | 10.42 | | $ | 10.54 | | $ | 10.47 | |
| |
| Total returnc | | 0.37 | % | | (0.19 | )% | | 1.08 | % | | 1.21 | % | | 3.32 | % | | 7.90 | % |
| |
| Ratios to average net assetsd | | | | | | | | | | | | | | | | | | |
| Expenses | | 0.81 | %e | | 0.68 | %f | | 0.67 | % | | 0.67 | % | | 0.69 | % | | 0.72 | %f |
| Net investment income | | 0.53 | % | | 0.56 | % | | 0.99 | % | | 1.43 | % | | 1.74 | % | | 2.82 | % |
| |
| Supplemental data | | | | | | | | | | | | | | | | | | |
| Net assets, end of period (000’s) | $ | 55,876 | | $ | 73,742 | | $ | 138,460 | | $ | 120,826 | | $ | 90,683 | | $ | 55,156 | |
| Portfolio turnover rate | | 11.56 | % | | 92.56 | % | | 44.63 | % | | 97.24 | % | | 56.80 | % | | 54.81 | % |
aThe amount shown for a share outstanding throughout the period may not correlate with the Statement of Operations for the period due to the timing of sales and repurchases of
the Fund shares in relation to income earned and/or fluctuating fair value of the investments of the Fund.
bBased on average daily shares outstanding.
cTotal return is not annualized for periods less than one year.
dRatios are annualized for periods less than one year.
eBenefit of waiver and payment by affiliate rounds to less than 0.01%.
fBenefit of expense reduction rounds to less than 0.01%.
Semiannual Report | The accompanying notes are an integral part of these financial statements. | 79
| | | | | | |
| | Franklin Investors Securities Trust | | | | | |
| |
| | Statement of Investments, April 30, 2014 (unaudited) | | | | | |
| |
| |
| | Franklin Limited Maturity U.S. Government Securities Fund | | | Principal Amount | | Value |
| | U.S. Government and Agency Securities 29.3% | | | | | |
| AID-Egypt, U.S. Government Guaranteed, 4.45%, 9/15/15 | | $ | 10,000,000 | $ | 10,563,170 |
| | U.S. Treasury Note, | | | | | |
| | 1.25%, 10/31/15 | | | 6,000,000 | | 6,092,346 |
| | 1.375%, 11/30/15 | | | 30,000,000 | | 30,537,900 |
| | 1.50%, 7/31/16 | | | 18,000,000 | | 18,393,750 |
| | 2.00%, 1/31/16 | | | 8,000,000 | | 8,237,184 |
| | 2.625%, 2/29/16 | | | 6,000,000 | | 6,251,130 |
| | 3.25%, 5/31/16 | | | 6,000,000 | | 6,349,920 |
| | 3.875%, 5/15/18 | | | 12,000,000 | | 13,208,904 |
| | 4.125%, 5/15/15 | | | 15,000,000 | | 15,624,900 |
| | 4.25%, 8/15/15 | | | 8,000,000 | | 8,422,496 |
| | aIndex Linked, 0.50%, 4/15/15 | | | 9,749,195 | | 9,935,804 |
| | aIndex Linked, 2.00%, 1/15/16 | | | 7,096,591 | | 7,528,759 |
| | Total U.S. Government and Agency Securities (Cost $140,758,017) | | | | | 141,146,263 |
| Asset-Backed Securities and Commercial Mortgage-Backed Securities 10.5% | | | | | |
| | FHLMC MF Structured Pass Through Certificates, | | | | | |
| | K004,A1, 3.413%, 5/25/19 | | | 1,949,722 | | 2,063,974 |
| | K008,A1, 2.746%, 12/25/19 | | | 5,049,996 | | 5,246,330 |
| | K010,A1, 3.32%, 7/25/20 | | | 4,025,034 | | 4,248,047 |
| | K013,A1, 2.902%, 8/25/20 | | | 7,656,613 | | 7,980,744 |
| | K014,A1, 2.788%, 10/25/20 | | | 9,384,678 | | 9,758,128 |
| | K019,A1, 1.459%, 9/25/21 | | | 4,072,397 | | 4,041,310 |
| | K702,A1, 2.084%, 12/25/17 | | | 6,013,403 | | 6,151,393 |
| | K702,A1, 3.342%, 12/25/19 | | | 8,231,248 | | 8,663,862 |
| | K703,A1, 1.873%, 1/25/18 | | | 2,104,287 | | 2,145,093 |
| | GNMA, 2010-124, A, 3.848%, 10/16/32 | | | 329,820 | | 330,471 |
| |
| | Total Asset-Backed Securities and Commercial Mortgage-Backed Securities | | | | | |
| | (Cost $49,937,026) | | | | | 50,629,352 |
| | Mortgage-Backed Securities 54.8% | | | | | |
| | b Federal Home Loan Mortgage Corp. (FHLMC) Adjustable Rate 11.7% | | | | | |
| | FHLMC, 1.823% - 2.177%, 2/01/18 - 4/01/42 | | | 4,414,485 | | 4,655,683 |
| | FHLMC, 2.211% - 2.348%, 4/01/21 - 3/01/39 | | | 4,573,059 | | 4,813,813 |
| | FHLMC, 2.348% - 2.356%, 10/01/18 - 8/01/36 | | | 3,298,834 | | 3,505,684 |
| | FHLMC, 2.357% - 2.375%, 5/01/23 - 12/01/37 | | | 4,131,655 | | 4,407,237 |
| | FHLMC, 2.375% - 2.404%, 11/01/25 - 7/01/38 | | | 4,509,200 | | 4,769,360 |
| | FHLMC, 2.406% - 2.421%, 1/01/33 - 5/01/42 | | | 4,532,569 | | 4,790,560 |
| | FHLMC, 2.422% - 2.50%, 8/01/23 - 7/01/41 | | | 4,314,907 | | 4,587,053 |
| | FHLMC, 2.502% - 2.543%, 9/01/24 - 6/01/41 | | | 3,385,305 | | 3,567,941 |
| | FHLMC, 2.545% - 2.585%, 7/01/26 - 4/01/38 | | | 4,402,519 | | 4,672,716 |
| | FHLMC, 2.593% - 2.621%, 6/01/24 - 7/01/38 | | | 4,263,141 | | 4,552,781 |
| | FHLMC, 2.629% - 2.672%, 11/01/35 - 5/01/41 | | | 1,790,289 | | 1,907,331 |
| | FHLMC, 2.673% - 2.756%, 2/01/32 - 7/01/41 | | | 4,246,743 | | 4,519,827 |
| | FHLMC, 2.776% - 5.874%, 11/01/19 - 1/01/41 | | | 4,516,068 | | 4,790,611 |
| | FHLMC, 5.894% - 6.288%, 7/01/36 - 10/01/37 | | | 674,666 | | 715,181 |
| | | | | | | 56,255,778 |
80 | Semiannual Report
| | | | |
| Franklin Investors Securities Trust | | | | |
| |
| Statement of Investments, April 30, 2014 (unaudited) (continued) | | | | |
| |
| |
| Franklin Limited Maturity U.S. Government Securities Fund | | Principal Amount | | Value |
| Mortgage-Backed Securities (continued) | | | | |
| Federal Home Loan Mortgage Corp. (FHLMC) Fixed Rate 6.5% | | | | |
| FHLMC Gold 15 Year, 3.50%, 11/01/20 | $ | 1,925,879 | $ | 2,032,154 |
| FHLMC Gold 15 Year, 3.50%, 11/01/20 - 1/01/21 | | 4,385,980 | | 4,628,110 |
| FHLMC Gold 15 Year, 3.50%, 1/01/21 | | 1,685,137 | | 1,778,303 |
| FHLMC Gold 15 Year, 3.50%, 3/01/26 | | 4,743,098 | | 4,996,177 |
| FHLMC Gold 15 Year, 4.00%, 7/01/20 | | 5,070,854 | | 5,389,610 |
| FHLMC Gold 15 Year, 4.00%, 10/01/20 | | 6,401,194 | | 6,792,063 |
| FHLMC Gold 15 Year, 5.00%, 10/01/17 - 7/01/23 | | 1,284,434 | | 1,399,004 |
| FHLMC Gold 15 Year, 6.00%, 10/01/21 - 10/01/23 | | 3,462,732 | | 3,763,754 |
| FHLMC Gold 30 Year, 8.50%, 12/01/22 - 7/01/31 | | 506,637 | | 589,562 |
| FHLMC Gold 30 Year, 9.50%, 3/01/21 | | 5,115 | | 5,171 |
| | | | | 31,373,908 |
| b Federal National Mortgage Association (FNMA) Adjustable Rate 27.2% | | | | |
| FNMA, 1.193% - 1.70%, 6/01/21 - 11/01/44 | | 4,371,537 | | 4,529,139 |
| FNMA, 1.74% - 1.793%, 11/01/32 - 4/01/35 | | 2,726,629 | | 2,865,453 |
| FNMA, 1.793% - 1.84%, 3/01/33 - 12/01/35 | | 3,792,035 | | 3,942,888 |
| FNMA, 1.848%, 1/01/35 | | 5,161,948 | | 5,508,472 |
| FNMA, 1.861% - 1.925%, 6/01/18 - 3/01/43 | | 3,564,945 | | 3,759,208 |
| FNMA, 1.925% - 1.972%, 1/01/18 - 11/01/40 | | 4,511,234 | | 4,784,087 |
| FNMA, 1.975% - 2.034%, 11/01/18 - 1/01/36 | | 4,416,013 | | 4,666,359 |
| FNMA, 2.035% - 2.10%, 5/01/19 - 4/01/37 | | 1,862,653 | | 1,964,632 |
| FNMA, 2.102%, 2/01/36 | | 6,839,457 | | 7,227,330 |
| FNMA, 2.104% - 2.154%, 7/01/19 - 3/01/38 | | 4,123,104 | | 4,351,902 |
| FNMA, 2.157% - 2.182%, 11/01/22 - 5/01/38 | | 4,443,531 | | 4,718,688 |
| FNMA, 2.185% - 2.24%, 7/01/20 - 2/01/36 | | 4,163,648 | | 4,430,204 |
| FNMA, 2.24% - 2.279%, 11/01/17 - 2/01/38 | | 4,308,727 | | 4,576,924 |
| FNMA, 2.283% - 2.326%, 10/01/18 - 11/01/42 | | 4,153,741 | | 4,397,201 |
| FNMA, 2.326% - 2.337%, 4/01/27 - 10/01/37 | | 1,846,373 | | 1,956,831 |
| FNMA, 2.337% - 2.342%, 12/01/32 - 3/01/38 | | 4,472,052 | | 4,745,564 |
| FNMA, 2.343% - 2.383%, 4/01/22 - 9/01/40 | | 4,535,932 | | 4,802,370 |
| FNMA, 2.385% - 2.393%, 4/01/33 - 8/01/41 | | 1,665,497 | | 1,744,509 |
| FNMA, 2.394%, 10/01/36 | | 4,850,526 | | 5,142,863 |
| FNMA, 2.395% - 2.42%, 5/01/29 - 7/01/42 | | 3,876,878 | | 4,124,048 |
| FNMA, 2.42% - 2.425%, 3/01/32 - 4/01/36 | | 3,412,100 | | 3,664,864 |
| FNMA, 2.431% - 2.453%, 3/01/25 - 5/01/48 | | 3,737,597 | | 3,960,238 |
| FNMA, 2.455% - 2.528%, 11/01/27 - 4/01/44 | | 4,491,787 | | 4,764,969 |
| FNMA, 2.532%, 4/01/36 | | 4,960,073 | | 5,265,781 |
| FNMA, 2.536% - 2.54%, 10/01/32 - 7/01/35 | | 1,832,599 | | 1,964,937 |
| FNMA, 2.546%, 6/01/35 | | 9,674,815 | | 10,371,151 |
| FNMA, 2.552% - 2.56%, 8/01/33 - 12/01/36 | | 3,124,631 | | 3,336,754 |
| FNMA, 2.568% - 3.22%, 10/01/17 - 5/01/48 | | 4,505,791 | | 4,804,574 |
| FNMA, 3.25% - 4.03%, 9/01/17 - 3/01/50 | | 3,084,844 | | 3,256,092 |
| FNMA, 4.091% - 5.541%, 9/01/18 - 9/01/38 | | 4,408,836 | | 4,712,515 |
| FNMA, 5.755% - 6.189%, 5/01/21 - 12/01/37 | | 553,294 | | 580,009 |
| | | | | 130,920,556 |
Semiannual Report | 81
| | | | |
| Franklin Investors Securities Trust | | | | |
| |
| Statement of Investments, April 30, 2014 (unaudited) (continued) | | | | |
| |
| |
| Franklin Limited Maturity U.S. Government Securities Fund | | Principal Amount | | Value |
| Mortgage-Backed Securities (continued) | | | | |
| Federal National Mortgage Association (FNMA) Fixed Rate 9.2% | | | | |
| FNMA 15 Year, 3.50%, 10/01/25 | $ | 7,670,378 | $ | 8,095,322 |
| FNMA 15 Year, 3.50%, 1/01/26 | | 4,893,722 | | 5,165,134 |
| FNMA 15 Year, 3.50%, 2/01/26 | | 2,567,428 | | 2,709,802 |
| FNMA 15 Year, 4.00%, 8/01/25 | | 3,031,446 | | 3,230,413 |
| FNMA 15 Year, 4.00%, 11/01/25 - 2/01/26 | | 3,800,365 | | 4,049,182 |
| FNMA 15 Year, 4.50%, 5/01/16 | | 9,320,103 | | 9,834,455 |
| FNMA 15 Year, 4.50%, 12/01/18 - 2/01/19 | | 130,084 | | 138,360 |
| FNMA 15 Year, 5.00%, 2/01/18 - 6/01/23 | | 1,314,634 | | 1,421,333 |
| FNMA 15 Year, 5.50%, 8/01/15 - 1/01/25 | | 2,697,993 | | 2,936,670 |
| FNMA 15 Year, 6.00%, 4/01/16 - 5/01/17 | | 295,142 | | 305,536 |
| FNMA 15 Year, 6.50%, 10/01/16 | | 6,795 | | 6,826 |
| FNMA 15 Year, 7.00%, 7/01/14 | | 23 | | 24 |
| FNMA 15 Year, 7.50%, 1/01/15 | | 2,277 | | 2,309 |
| FNMA 30 Year, 5.00%, 3/01/38 | | 1,176,051 | | 1,288,965 |
| FNMA 30 Year, 6.00%, 9/01/39 | | 4,158,346 | | 4,673,241 |
| FNMA 30 Year, 6.50%, 8/01/38 | | 188,533 | | 212,448 |
| FNMA 30 Year, 9.00%, 1/01/17 | | 30,486 | | 32,268 |
| FNMA 30 Year, 9.50%, 11/01/16 - 6/01/22 | | 35,715 | | 37,132 |
| | | | | 44,139,420 |
| b Government National Mortgage Association (GNMA) Adjustable Rate 0.0%† | | | | |
| GNMA, 1.625%, 10/20/35 | | 56,754 | | 59,096 |
| Government National Mortgage Association (GNMA) Fixed Rate 0.2% | | | | |
| GNMA I SF 15 Year, 6.50%, 6/15/14 - 7/15/14 | | 2,313 | | 2,320 |
| GNMA I SF 15 Year, 7.50%, 10/15/14 | | 2,137 | | 2,155 |
| GNMA I SF 30 Year, 5.00%, 3/15/39 | | 228,222 | | 251,200 |
| GNMA I SF 30 Year, 5.50%, 4/15/33 - 5/15/33 | | 222,561 | | 247,776 |
| GNMA I SF 30 Year, 6.00%, 3/15/33 | | 80,305 | | 91,011 |
| GNMA I SF 30 Year, 8.00%, 11/15/16 | | 8,288 | | 8,338 |
| GNMA I SF 30 Year, 9.00%, 6/15/16 - 9/15/17 | | 84,299 | | 86,414 |
| GNMA II SF 30 Year, 7.50%, 10/20/29 - 10/20/31 | | 218,603 | | 264,562 |
| GNMA II SF 30 Year, 9.00%, 8/20/16 | | 18,088 | | 18,206 |
| GNMA II SF 30 Year, 9.50%, 6/20/16 | | 6,342 | | 6,384 |
| | | | | 978,366 |
| Total Mortgage-Backed Securities (Cost $260,481,656) | | | | 263,727,124 |
| Total Investments before Short Term Investments (Cost $451,176,699) | | | | 455,502,739 |
| |
| | | Shares | | |
| Short Term Investments 5.2% | | | | |
| Money Market Funds (Cost $9,639,412) 2.0% | | | | |
| c,dInstitutional Fiduciary Trust Money Market Portfolio | | 9,639,412 | | 9,639,412 |
82 | Semiannual Report
| | | | |
| Franklin Investors Securities Trust | | | | |
| |
| Statement of Investments, April 30, 2014 (unaudited) (continued) | | | | |
| |
| |
| Franklin Limited Maturity U.S. Government Securities Fund | | Principal Amount | | Value |
| Short Term Investments (continued) | | | | |
| Repurchase Agreements (Cost $15,421,239) 3.2% | | | | |
| e Joint Repurchase Agreement, 0.038%, 5/01/14 (Maturity Value $15,421,255) | $ | 15,421,239 | $ | 15,421,239 |
| BNP Paribas Securities Corp. (Maturity Value $1,815,390) | | | | |
| Credit Suisse Securities (USA) LLC (Maturity Value $1,815,390) | | | | |
| Deutsche Bank Securities Inc. (Maturity Value $6,208,135) | | | | |
| HSBC Securities (USA) Inc. (Maturity Value $3,812,288) | | | | |
| Merrill Lynch, Pierce, Fenner & Smith Inc. (Maturity Value $1,770,052) | | | | |
| Collateralized by U.S. Government Agency Securities, 0.00% - 6.25%, 6/11/14 - 7/15/32; | | | | |
| U.S. Government Agency Securities, Strips, 6/01/17; fU.S. Treasury Bills, 5/22/14 - 4/02/15; | �� | | | |
| U.S. Treasury Bonds, 7.25% - 10.625%, 8/15/15 - 11/15/18; U.S. Treasury Notes, | | | | |
| 0.25% - 4.875%, 1/31/15 - 3/31/19; and U.S. Treasury Notes, Index Linked, | | | | |
| 0.125% - 2.625%, 7/15/14 - 1/15/19 (valued at $15,732,108) | | | | |
| Total Investments (Cost $476,237,350) 99.8% | | | | 480,563,390 |
| Other Assets, less Liabilities 0.2% | | | | 1,017,142 |
| Net Assets 100.0% | | | $ | 481,580,532 |
See Abbreviations on page 128.
†Rounds to less than 0.1% of net assets.
aPrincipal amount of security is adjusted for inflation. See Note 1(j).
bThe coupon rate shown represents the rate at period end.
cNon-income producing.
dSee Note 3(f) regarding investments in the Institutional Fiduciary Trust Money Market Portfolio.
eSee Note 1(c) regarding joint repurchase agreement.
fThe security is traded on a discount basis with no stated coupon rate.
Semiannual Report | The accompanying notes are an integral part of these financial statements. | 83
| | | | | | | | | | | | | | | | | | |
| Franklin Investors Securities Trust | | | | | | | | | | |
| |
| Financial Highlights | | | | | | | | | | | | | | | | | | |
| |
| Franklin Real Return Fund | | | | | | | | | | | | | | | | | | |
| | | Six Months Ended | | | | | | | | | | | | | |
| | | April 30, 2014 | | | | | | Year Ended October 31, | | | | |
| Class A | | (unaudited) | | | 2013 | | | 2012 | | | 2011 | | | 2010 | | | 2009 | |
| Per share operating performance | | | | | | | | | | | | | | | | | | |
| (for a share outstanding throughout the period) | | | | | | | | | | | | | | | | | | |
| Net asset value, beginning of period | $ | 10.82 | | $ | 10.94 | | $ | 11.06 | | $ | 11.14 | | $ | 10.74 | | $ | 9.55 | |
| Income from investment operationsa: | | | | | | | | | | | | | | | | | | |
| Net investment income | | 0.06 | b | | 0.15 | b | | 0.17 | b | | 0.31 | b | | 0.17 | b | | —c | |
| Net realized and unrealized gains (losses) | | 0.12 | | | (0.01 | ) | | 0.01 | | | 0.03 | | | 0.47 | | | 1.20 | |
| Total from investment operations | | 0.18 | | | 0.14 | | | 0.18 | | | 0.34 | | | 0.64 | | | 1.20 | |
| Less distributions from net investment income | | | | | | | | | | | | | | | | | | |
| and net foreign currency gains | | (0.10 | ) | | (0.26 | ) | | (0.30 | ) | | (0.42 | ) | | (0.24 | ) | | (0.01 | ) |
| Net asset value, end of period | $ | 10.90 | | $ | 10.82 | | $ | 10.94 | | $ | 11.06 | | $ | 11.14 | | $ | 10.74 | |
| |
| Total returnd | | 1.64 | % | | 1.34 | % | | 1.67 | % | | 3.03 | % | | 6.07 | % | | 12.59 | % |
| |
| Ratios to average net assetse | | | | | | | | | | | | | | | | | | |
| Expenses before waiver and payments by | | | | | | | | | | | | | | | | | | |
| affiliates | | 1.09 | % | | 1.08 | % | | 1.06 | % | | 1.05 | % | | 1.07 | % | | 1.09 | % |
| Expenses net of waiver and payments by | | | | | | | | | | | | | | | | | | |
| affiliates | | 0.90 | %f | | 0.90 | %f | | 0.90 | % | | 0.90 | % | | 0.90 | %f | | 0.90 | %f |
| Net investment income | | 1.05 | % | | 1.35 | % | | 1.58 | % | | 2.76 | % | | 1.60 | % | | 0.03 | % |
| |
| Supplemental data | | | | | | | | | | | | | | | | | | |
| Net assets, end of period (000’s) | $ | 273,052 | | $ | 327,285 | | $ | 411,419 | | $ | 444,465 | | $ | 388,239 | | $ | 342,873 | |
| Portfolio turnover rate | | 23.36 | % | | 27.91 | % | | 18.64 | % | | 37.60 | % | | 20.08 | % | | 10.73 | % |
aThe amount shown for a share outstanding throughout the period may not correlate with the Statement of Operations for the period and may fluctuate between classes due to the
timing of sales and repurchases of the Fund shares in relation to income earned, adjustments to interest income for the inflation-indexed bonds, and/or fluctuating fair value of
the investments of the Fund.
bBased on average daily shares outstanding.
cAmount rounds to less than $0.01 per share.
dTotal return does not reflect sales commissions or contingent deferred sales charges, if applicable, and is not annualized for periods less than one year.
eRatios are annualized for periods less than one year.
fBenefit of expense reduction rounds to less than 0.01%.
84 | The accompanying notes are an integral part of these financial statements. | Semiannual Report
| | | | | | | | | | | | | | | | | | |
| Franklin Investors Securities Trust | | | | | | | | | | |
| |
| Financial Highlights (continued) | | | | | | | | | | | | | | | | | | |
| |
| Franklin Real Return Fund | | | | | | | | | | | | | | | | | | |
| | | Six Months Ended | | | | | | | | | | | | | | | | |
| | | April 30, 2014 | | | | | | Year Ended October 31, | | | | |
| Class C | | (unaudited) | | | 2013 | | | 2012 | | | 2011 | | | 2010 | | | 2009 | a |
| Per share operating performance | | | | | | | | | | | | | | | | | | |
| (for a share outstanding throughout the period) | | | | | | | | | | | | | | | | | | |
| Net asset value, beginning of period | $ | 10.76 | | $ | 10.87 | | $ | 11.00 | | $ | 11.08 | | $ | 10.69 | | $ | 9.57 | |
| Income from investment operationsb: | | | | | | | | | | | | | | | | | | |
| Net investment income | | 0.03 | c | | 0.10 | c | | 0.13 | c | | 0.27 | c | | 0.13 | c | | 0.10 | |
| Net realized and unrealized gains (losses) | | 0.12 | | | 0.01 | | | —d | | | 0.02 | | | 0.47 | | | 1.03 | |
| Total from investment operations | | 0.15 | | | 0.11 | | | 0.13 | | | 0.29 | | | 0.60 | | | 1.13 | |
| Less distributions from net investment income | | | | | | | | | | | | | | | | | | |
| and net foreign currency gains | | (0.07 | ) | | (0.22 | ) | | (0.26 | ) | | (0.37 | ) | | (0.21 | ) | | (0.01 | ) |
| Net asset value, end of period | $ | 10.84 | | $ | 10.76 | | $ | 10.87 | | $ | 11.00 | | $ | 11.08 | | $ | 10.69 | |
| |
| Total returne | | 1.45 | % | | 1.03 | % | | 1.22 | % | | 2.65 | % | | 5.68 | % | | 11.86 | % |
| |
| Ratios to average net assetsf | | | | | | | | | | | | | | | | | | |
| Expenses before waiver and payments by | | | | | | | | | | | | | | | | | | |
| affiliates | | 1.49 | % | | 1.48 | % | | 1.46 | % | | 1.45 | % | | 1.47 | % | | 1.49 | % |
| Expenses net of waiver and payments by | | | | | | | | | | | | | | | | | | |
| affiliates | | 1.30 | %g | | 1.30 | %g | | 1.30 | % | | 1.30 | % | | 1.30 | %g | | 1.30 | %g |
| Net investment income (loss) | | 0.65 | % | | 0.95 | % | | 1.18 | % | | 2.36 | % | | 1.20 | % | | (0.37 | )%h |
| |
| Supplemental data | | | | | | | | | | | | | | | | | | |
| Net assets, end of period (000’s) | $ | 73,716 | | $ | 83,666 | | $ | 104,682 | | $ | 115,126 | | $ | 62,256 | | $ | 24,151 | |
| Portfolio turnover rate | | 23.36 | % | | 27.91 | % | | 18.64 | % | | 37.60 | % | | 20.08 | % | | 10.73 | % |
aFor the period November 3, 2008 (effective date) to October 31, 2009.
bThe amount shown for a share outstanding throughout the period may not correlate with the Statement of Operations for the period and may fluctuate between classes due to the
timing of sales and repurchases of the Fund shares in relation to income earned, adjustments to interest income for the inflation-indexed bonds, and/or fluctuating fair value of
the investments of the Fund.
cBased on average daily shares outstanding.
dAmount rounds to less than $0.01 per share.
eTotal return does not reflect sales commissions or contingent deferred sales charges, if applicable, and is not annualized for periods less than one year.
fRatios are annualized for periods less than one year.
gBenefit of expense reduction rounds to less than 0.01%.
hRatio is calculated based on the Fund level net investment income, as reflected on the Statement of Operations, and adjusted for class specific expenses. The amount may
not correlate with the per share amount due to the timing of income earned and/or fluctuating market value of the investments of the Fund in relation to the timing of sales and
repurchases of Fund shares.
Semiannual Report | The accompanying notes are an integral part of these financial statements. | 85
| | | | | | |
| Franklin Investors Securities Trust | | | | | | |
| |
| Financial Highlights (continued) | | | | | | |
| |
| Franklin Real Return Fund | | | | | | |
| | | Six Months Ended | | | Period Ended | |
| | | April 30, 2014 | | | October 31, | |
| Class R6 | | (unaudited) | | | 2013a | |
| Per share operating performance | | | | | | |
| (for a share outstanding throughout the period) | | | | | | |
| Net asset value, beginning of period | $ | 10.85 | | $ | 11.01 | |
| Income from investment operationsb: | | | | | | |
| Net investment incomec | | 0.10 | | | 0.09 | |
| Net realized and unrealized gains (losses) | | 0.10 | | | (0.10 | ) |
| Total from investment operations | | 0.20 | | | (0.01 | ) |
| Less distributions from net investment income | | (0.11 | ) | | (0.15 | ) |
| Net asset value, end of period | $ | 10.94 | | $ | 10.85 | |
| |
| Total returnd | | 1.89 | % | | (0.06 | )% |
| |
| Ratios to average net assetse | | | | | | |
| Expenses before waiver and payments by affiliates | | 0.70 | % | | 2.43 | % |
| Expenses net of waiver and payments by affiliatesf | | 0.52 | % | | 0.52 | % |
| Net investment income | | 1.43 | % | | 1.73 | % |
| |
| Supplemental data | | | | | | |
| Net assets, end of period (000’s) | $ | 1,931 | | $ | 5 | |
| Portfolio turnover rate | | 23.36 | % | | 27.91 | % |
aFor the period May 1, 2013 (effective date) to October 31, 2013.
bThe amount shown for a share outstanding throughout the period may not correlate with the Statement of Operations for the period and may fluctuate between classes due to the
timing of sales and repurchases of the Fund shares in relation to income earned, adjustments to interest income for the inflation-indexed bonds, and/or fluctuating fair value of
the investments of the Fund.
cBased on average daily shares outstanding.
dTotal return is not annualized for periods less than one year.
eRatios are annualized for periods less than one year.
fBenefit of expense reduction rounds to less than 0.01%.
86 | The accompanying notes are an integral part of these financial statements. | Semiannual Report
| | | | | | | | | | | | | | | | | | |
| Franklin Investors Securities Trust | | | | | | | | | | |
| |
| Financial Highlights (continued) | | | | | | | | | | | | | | | | | | |
| |
| Franklin Real Return Fund | | | | | | | | | | | | | | | | | | |
| | | Six Months Ended | | | | | | | | | | | | | | | | |
| | | April 30, 2014 | | | | | | Year Ended October 31, | | | | |
| Advisor Class | | (unaudited) | | | 2013 | | | 2012 | | | 2011 | | | 2010 | | | 2009 | |
| Per share operating performance | | | | | | | | | | | | | | | | | | |
| (for a share outstanding throughout the period) | | | | | | | | | | | | | | | | | | |
| Net asset value, beginning of period | $ | 10.85 | | $ | 10.97 | | $ | 11.08 | | $ | 11.16 | | $ | 10.78 | | $ | 9.57 | |
| Income from investment operationsa: | | | | | | | | | | | | | | | | | | |
| Net investment income | | 0.08 | b | | 0.18 | b | | 0.20 | b | | 0.35 | b | | 0.21 | b | | 0.05 | |
| Net realized and unrealized gains (losses) | | 0.11 | | | (0.01 | ) | | 0.01 | | | 0.01 | | | 0.46 | | | 1.17 | |
| Total from investment operations | | 0.19 | | | 0.17 | | | 0.21 | | | 0.36 | | | 0.67 | | | 1.22 | |
| Less distributions from net investment income | | | | | | | | | | | | | | | | | | |
| and net foreign currency gains | | (0.11 | ) | | (0.29 | ) | | (0.32 | ) | | (0.44 | ) | | (0.29 | ) | | (0.01 | ) |
| Net asset value, end of period | $ | 10.93 | | $ | 10.85 | | $ | 10.97 | | $ | 11.08 | | $ | 11.16 | | $ | 10.78 | |
| |
| Total returnc | | 1.74 | % | | 1.60 | % | | 1.99 | % | | 3.27 | % | | 6.35 | % | | 12.80 | % |
| |
| Ratios to average net assetsd | | | | | | | | | | | | | | | | | | |
| Expenses before waiver and payments by | | | | | | | | | | | | | | | | | | |
| affiliates | | 0.84 | % | | 0.83 | % | | 0.81 | % | | 0.80 | % | | 0.82 | % | | 0.84 | % |
| Expenses net of waiver and payments by | | | | | | | | | | | | | | | | | | |
| affiliates | | 0.65 | %e | | 0.65 | %e | | 0.65 | % | | 0.65 | % | | 0.65 | %e | | 0.65 | %e |
| Net investment income | | 1.30 | % | | 1.60 | % | | 1.83 | % | | 3.01 | % | | 1.85 | % | | 0.28 | % |
| |
| Supplemental data | | | | | | | | | | | | | | | | | | |
| Net assets, end of period (000’s) | $ | 54,097 | | $ | 28,042 | | $ | 35,362 | | $ | 45,575 | | $ | 28,784 | | $ | 24,256 | |
| Portfolio turnover rate | | 23.36 | % | | 27.91 | % | | 18.64 | % | | 37.60 | % | | 20.08 | % | | 10.73 | % |
aThe amount shown for a share outstanding throughout the period may not correlate with the Statement of Operations for the period and may fluctuate between classes due to the
timing of sales and repurchases of the Fund shares in relation to income earned, adjustments to interest income for the inflation-indexed bonds, and/or fluctuating fair value of
the investments of the Fund.
bBased on average daily shares outstanding.
cTotal return is not annualized for periods less than one year.
dRatios are annualized for periods less than one year.
eBenefit of expense reduction rounds to less than 0.01%.
Semiannual Report | The accompanying notes are an integral part of these financial statements. | 87
| | | | |
| Franklin Investors Securities Trust | | | |
| |
| Statement of Investments, April 30, 2014 (unaudited) | | | |
| |
| |
| Franklin Real Return Fund | Country | Shares | | Value |
| Common Stocks and Other Equity Interests 15.7% | | | | |
| Diversified Financials 7.7% | | | | |
| SPDR Dow Jones REIT ETF | United States | 383,000 | $ | 30,996,190 |
| Energy 5.2% | | | | |
| Anadarko Petroleum Corp. | United States | 29,700 | | 2,940,894 |
| Chevron Corp. | United States | 17,500 | | 2,196,600 |
| Devon Energy Corp. | United States | 15,000 | | 1,050,000 |
| Exxon Mobil Corp. | United States | 26,077 | | 2,670,546 |
| Halliburton Co. | United States | 27,400 | | 1,728,118 |
| Marathon Oil Corp. | United States | 33,200 | | 1,200,180 |
| National Oilwell Varco Inc. | United States | 14,700 | | 1,154,391 |
| Noble Energy Inc. | United States | 15,900 | | 1,141,302 |
| Occidental Petroleum Corp. | United States | 12,500 | | 1,196,875 |
| Peabody Energy Corp. | United States | 43,200 | | 821,232 |
| Schlumberger Ltd. | United States | 19,350 | | 1,964,992 |
| a Southwestern Energy Co. | United States | 24,900 | | 1,192,212 |
| a Weatherford International Ltd. | United States | 70,700 | | 1,484,700 |
| | | | | 20,742,042 |
| Materials 2.8% | | | | |
| BHP Billiton Ltd., ADR | Australia | 19,100 | | 1,347,314 |
| The Dow Chemical Co. | United States | 38,100 | | 1,901,190 |
| Freeport-McMoRan Copper & Gold Inc., B | United States | 74,346 | | 2,555,272 |
| Goldcorp Inc. | Canada | 112,400 | | 2,778,528 |
| Nucor Corp. | United States | 22,100 | | 1,143,675 |
| Potash Corp. of Saskatchewan Inc. | Canada | 46,300 | | 1,674,208 |
| | | | | 11,400,187 |
| |
| Total Common Stocks and Other Equity Interests | | | | |
| (Cost $46,285,004) | | | | 63,138,419 |
| |
| | | Principal Amount* | | |
| Corporate Bonds 6.2% | | | | |
| Banks 0.3% | | | | |
| b CIT Group Inc., secured note, 144A, 5.50%, 2/15/19 | United States | 1,200,000 | | 1,296,750 |
| Consumer Services 0.3% | | | | |
| MGM Resorts International, senior note, | | | | |
| 6.625%, 7/15/15 | United States | 300,000 | | 318,750 |
| 8.625%, 2/01/19 | United States | 500,000 | | 599,375 |
| 7.75%, 3/15/22 | United States | 200,000 | | 233,100 |
| | | | | 1,151,225 |
| Diversified Financials 0.3% | | | | |
| Ally Financial Inc., senior note, 7.50%, 9/15/20 | United States | 1,200,000 | | 1,426,500 |
| Energy 1.9% | | | | |
| Chesapeake Energy Corp., senior note, | | | | |
| 6.625%, 8/15/20 | United States | 1,000,000 | | 1,128,750 |
| 6.125%, 2/15/21 | United States | 200,000 | | 220,000 |
88 | Semiannual Report
| | | | |
| Franklin Investors Securities Trust | | | |
| |
| Statement of Investments, April 30, 2014 (unaudited) (continued) | | | |
| |
| |
| Franklin Real Return Fund | Country | Principal Amount* | | Value |
| Corporate Bonds (continued) | | | | |
| Energy (continued) | | | | |
| CONSOL Energy Inc., senior note, | | | | |
| 8.00%, 4/01/17 | United States | 400,000 | $ | 416,920 |
| 8.25%, 4/01/20 | United States | 100,000 | | 109,375 |
| 6.375%, 3/01/21 | United States | 400,000 | | 423,500 |
| b 144A, 5.875%, 4/15/22 | United States | 300,000 | | 309,750 |
| Energy Transfer Equity LP, senior note, 7.50%, 10/15/20 | United States | 1,000,000 | | 1,157,500 |
| b Linn Energy LLC/Finance Corp., senior note, 144A, 6.25%, | | | | |
| 11/01/19 | United States | 1,000,000 | | 1,038,750 |
| Peabody Energy Corp., senior note, 6.25%, 11/15/21 | United States | 1,000,000 | | 1,020,000 |
| Sabine Pass Liquefaction LLC, first lien, 5.625%, 2/01/21 | United States | 1,000,000 | | 1,037,500 |
| b Samson Investment Co., senior note, 144A, 9.75%, 2/15/20 | United States | 900,000 | | 954,000 |
| | | | | 7,816,045 |
| Food, Beverage & Tobacco 0.2% | | | | |
| Del Monte Corp., senior note, 7.625%, 2/15/19 | United States | 686,000 | | 716,012 |
| Health Care Equipment & Services 0.3% | | | | |
| HCA Inc., senior secured note, 5.875%, 3/15/22 | United States | 1,200,000 | | 1,290,000 |
| Materials 1.1% | | | | |
| ArcelorMittal, senior note, 6.75%, 2/25/22 | Luxembourg | 1,200,000 | | 1,329,138 |
| b FMG Resources (August 2006) Pty. Ltd., senior note, 144A, | | | | |
| 6.875%, 2/01/18 | Australia | 800,000 | | 846,000 |
| Novelis Inc., senior note, | | | | |
| 8.375%, 12/15/17 | Canada | 200,000 | | 213,750 |
| 8.75%, 12/15/20 | Canada | 600,000 | | 672,000 |
| Reynolds Group Issuer Inc./LLC/SA, senior note, 8.50%, 5/15/18 | United States | 1,200,000 | | 1,255,500 |
| | | | | 4,316,388 |
| Media 0.3% | | | | |
| CSC Holdings LLC, senior note, 6.75%, 11/15/21 | United States | 1,000,000 | | 1,118,750 |
| Pharmaceuticals, Biotechnology & Life Sciences 0.3% | | | | |
| b Valeant Pharmaceuticals International Inc., senior note, 144A, 7.50%, | | | | |
| 7/15/21 | United States | 1,000,000 | | 1,120,000 |
| Software & Services 0.3% | | | | |
| b First Data Corp., senior secured note, 144A, 7.375%, 6/15/19 | United States | 1,000,000 | | 1,075,000 |
| Telecommunication Services 0.9% | | | | |
| Frontier Communications Corp., | | | | |
| senior bond, 7.625%, 4/15/24 | United States | 600,000 | | 625,500 |
| senior note, 7.875%, 1/15/27 | United States | 400,000 | | 404,500 |
| Intelsat Jackson Holdings SA, senior note, 7.25%, 10/15/20 | Luxembourg | 1,000,000 | | 1,082,500 |
| b Sprint Nextel Corp., senior note, 144A, 7.00%, 3/01/20 | United States | 1,200,000 | | 1,390,500 |
| | | | | 3,503,000 |
| |
| Total Corporate Bonds (Cost $23,039,138) | | | | 24,829,670 |
| |
| |
| c,dSenior Floating Rate Interests 4.3% | | | | |
| Automobiles & Components 0.0%† | | | | |
| FRAM Group Holdings Inc. (Autoparts Holdings), Term Loan, 6.50%, | | | | |
| 7/29/17 | United States | 56,110 | | 56,157 |
Semiannual Report | 89
| | | | |
| Franklin Investors Securities Trust | | | |
| |
| Statement of Investments, April 30, 2014 (unaudited) (continued) | | | |
| |
| |
| Franklin Real Return Fund | Country | Principal Amount* | | Value |
| c,dSenior Floating Rate Interests (continued) | | | | |
| Capital Goods 0.3% | | | | |
| e Doncasters U.S. Finance LLC, Term B Loans, 5.75%, 4/09/20 | United States | 49,847 | $ | 50,055 |
| Quikrete Holdings Inc., First Lien Initial Loan, 4.00%, 9/26/20 | United States | 281,679 | | 281,890 |
| e Signode Industrial Group U.S. Inc., Term Loan B, 5.25%, 5/01/21 | United States | 216,700 | | 216,192 |
| TransDigm Inc., Tranche C Term Loan, 3.75%, 2/28/20 | United States | 411,872 | | 410,424 |
| Wesco Distribution Inc., Tranche B-1 Loan, 3.75%, 12/12/19 | United States | 292,217 | | 292,215 |
| | | | | 1,250,776 |
| Commercial & Professional Services 0.1% | | | | |
| Interactive Data Corp., | | | | |
| Term B Loan, 3.75%, 2/11/18 | United States | 527,820 | | 527,710 |
| Term Loan, 6.00%, 5/05/21 | United States | 74,916 | | 74,975 |
| | | | | 602,685 |
| Consumer Services 0.1% | | | | |
| e ClubCorp Club Operations Inc., Term B Loans, 5.25%, 7/24/20 | United States | 102,400 | | 102,272 |
| Diamond Resorts Corp., First Lien Term Loan, 6.75%, 5/09/21 | United States | 63,500 | | 63,619 |
| Hilton Worldwide Finance LLC, Initial Term Loan, 3.50%, 10/25/20 | United States | 880 | | 878 |
| La Quinta Intermediate Holdings LLC, Initial Term Loans, 4.00%, | | | | |
| 4/14/21 | United States | 240,200 | | 239,600 |
| | | | | 406,369 |
| Diversified Financials 0.2% | | | | |
| Asurion LLC, Incremental Tranche B-1 Term Loan, 5.00%, 5/24/19 | United States | 45,087 | | 45,162 |
| Guggenheim Partners Investment Management Holdings LLC, Initial | | | | |
| Term Loan, 4.25%, 7/22/20 | United States | 477,600 | | 479,630 |
| Trans Union LLC, 2014 Replacement Term Loan, 4.00%, 4/09/21 | United States | 387,200 | | 386,171 |
| | | | | 910,963 |
| Energy 0.1% | | | | |
| McJunkin Red Man Corp., 2013 Term Loan, 4.75%, 11/11/19 | United States | 145,858 | | 147,088 |
| Pacific Drilling SA, Term Loan, 4.50%, 6/03/18 | Luxembourg | 203,170 | | 203,488 |
| | | | | 350,576 |
| Food, Beverage & Tobacco 0.0%† | | | | |
| Big Heart Pet Brands (Del Monte Pet), Initial Term Loans, 3.50%, | | | | |
| 2/24/20 | United States | 201,685 | | 200,324 |
| Health Care Equipment & Services 0.6% | | | | |
| Community Health Systems Inc., | | | | |
| 2017 Term E Loan, 3.447% - 3.483%, 1/25/17 | United States | 123,183 | | 123,435 |
| 2021 Term D Loan, 4.25%, 1/27/21 | United States | 388,970 | | 390,670 |
| DaVita HealthCare Partners Inc., Tranche B Term Loan, 4.50%, | | | | |
| 10/20/16 | United States | 426,175 | | 427,665 |
| e Dialysis Newco Inc., First Lien Term Loan, 6.00%, 4/21/21 | United States | 86,100 | | 86,208 |
| e Millennium Laboratories LLC, Tranche B Term Loan, 6.50%, | | | | |
| 4/16/21 | United States | 713,200 | | 710,298 |
| e Truven Health Analytics Inc., New Tranche B Term Loan, 5.50%, | | | | |
| 6/06/19 | United States | 183,511 | | 182,479 |
| e U.S. Renal Care Inc., Tranche B-2 Term Loan, 4.25%, 7/03/19 | United States | 475,713 | | 476,308 |
| | | | | 2,397,063 |
90 | Semiannual Report
| | | | |
| Franklin Investors Securities Trust | | | |
| |
| Statement of Investments, April 30, 2014 (unaudited) (continued) | | | |
| |
| |
| Franklin Real Return Fund | Country | Principal Amount* | | Value |
| c,dSenior Floating Rate Interests (continued) | | | | |
| Household & Personal Products 0.3% | | | | |
| FGI Operating Co. LLC (Freedom Group), Term B Loans, 5.50%, | | | | |
| 4/19/19 | United States | 663,465 | $ | 672,588 |
| Otter Products LLC, Loans, 5.25%, 4/29/19 | United States | 501,413 | | 501,622 |
| | | | | 1,174,210 |
| Insurance 0.0%† | | | | |
| e HUB International Ltd., Initial Term Loan, 5.50%, 10/02/20 | United States | 81,300 | | 81,269 |
| Materials 0.9% | | | | |
| American Rock Salt Co. LLC, Initial Loan, 6.00%, 4/25/17 | United States | 449,129 | | 450,111 |
| Arysta Lifescience SPC LLC, Initial Term Loan, 4.50%, 5/29/20 | United States | 820,560 | | 820,554 |
| Axalta Coating Systems U.S. Holdings Inc., 2014 Specified | | | | |
| Refinancing Term B Loan, 4.00%, 2/01/20 | United States | 305,729 | | 305,326 |
| Exopack Holdings SA, USD Term Loan, 5.25%, 5/08/19 | Luxembourg | 104,792 | | 105,971 |
| FMG America Finance Inc. (Fortescue Metals Group), Loans, 4.25%, | | | | |
| 6/30/19 | United States | 292,623 | | 292,828 |
| MacDermid Holdings LLC, First Lien Tranche B Term Loan, 4.00%, | | | | |
| 6/07/20 | United States | 418,984 | | 418,146 |
| OCI Beaumont LLC, Term B-3 Loan, 5.00%, 8/20/19 | United States | 91,432 | | 92,460 |
| Oxbow Carbon LLC, First Lien Tranche B Term Loan, 4.25%, | | | | |
| 7/19/19 | United States | 240,625 | | 241,377 |
| Reynolds Group Holdings Inc., U.S. Term Loan, 4.00%, 12/01/18 | United States | 246,555 | | 247,036 |
| Tronox Pigments (Netherlands) BV, Term Loan, 4.00%, 3/19/20 | Netherlands | 515,028 | | 515,592 |
| | | | | 3,489,401 |
| Media 0.3% | | | | |
| Cumulus Media Holdings Inc., Term Loans, 4.25%, 12/23/20 | United States | 80,663 | | 80,663 |
| e William Morris Endeavor Entertainment LLC, Term Loans First Lien, | | | | |
| 6.50%, 3/21/21 | United States | 955,800 | | 955,322 |
| Zuffa LLC, Initial Term Loan, 3.75%, 2/25/20 | United States | 105,727 | | 105,396 |
| | | | | 1,141,381 |
| Pharmaceuticals, Biotechnology & Life Sciences 0.1% | | | | |
| Valeant Pharmaceuticals International Inc., Series E-1 Tranche B Term | | | | |
| Loan, 3.75%, 8/05/20 | Canada | 332,861 | | 333,161 |
| Retailing 0.7% | | | | |
| BJ’s Wholesale Club Inc., 2013 (Nov) Replacement Loans, 4.50%, | | | | |
| 9/26/19 | United States | 390,369 | | 390,478 |
| Evergreen AcqCo. 1 LP (Savers), Term Loan, 5.00%, 7/09/19 | United States | 451,455 | | 452,960 |
| Harbor Freight Tools USA Inc., Loans, 4.75%, 7/26/19 | United States | 359,788 | | 361,495 |
| e The Men’s Wearhouse Inc., Term Loan B, 5.75%, 4/15/21 | United States | 286,900 | | 286,506 |
| The Neiman Marcus Group Ltd. Inc., Other Term Loan, 4.25%, | | | | |
| 10/25/20 | United States | 166,700 | | 166,561 |
| e Sears Roebuck Acceptance Corp., Term Loan, 5.50%, 6/30/18 | United States | 804,065 | | 811,457 |
| Sungard Availability Services Capital Inc., Tranche B Term Loan, | | | | |
| 6.00%, 3/31/19 | United States | 393,881 | | 391,912 |
| | | | | 2,861,369 |
| Software & Services 0.3% | | | | |
| BMC Software Finance Inc., Initial U.S. Term Loans, 5.00%, | | | | |
| 9/10/20 | United States | 427,175 | | 427,042 |
| MoneyGram International Inc., Term Loan, 4.25%, 3/28/20 | United States | 674,751 | | 660,412 |
| | | | | 1,087,454 |
| |
| | | Semiannual Report | 91 |
| | | | | |
| Franklin Investors Securities Trust | | | |
| |
| Statement of Investments, April 30, 2014 (unaudited) (continued) | | | | |
| |
| |
| Franklin Real Return Fund | Country | Principal Amount* | | Value |
| c,dSenior Floating Rate Interests (continued) | | | | | |
| Technology Hardware & Equipment 0.2% | | | | | |
| Alcatel-Lucent USA Inc., US Term Loan C (TLC), 4.50%, 1/30/19 | France | 417,538 | | $ | 418,277 |
| Dell International LLC, Term B Loan, 4.50%, 4/29/20 | United States | 250,069 | | | 249,479 |
| e Presidio Inc., Term Loan, 6.25%, 3/31/17 | United States | 136,200 | | | 137,051 |
| | | | | | 804,807 |
| Telecommunication Services 0.0%† | | | | | |
| Intelsat Jackson Holdings SA, Tranche B-2 Term Loan, 3.75%, | | | | | |
| 6/30/19 | Luxembourg | 161,068 | | | 161,236 |
| Transportation 0.1% | | | | | |
| Global Tip Finance BV/Finance America LLC, Facility C Commitment, | | | | | |
| 6.50%, 10/16/20 | United States | 271,786 | | | 268,389 |
| |
| Total Senior Floating Rate Interests (Cost $17,527,372) | | | | | 17,577,590 |
| |
| Foreign Government and Agency Securities 17.6% | | | | | |
| Government of Hungary, senior note, | | | | | |
| 6.375%, 3/29/21 | Hungary | 620,000 | | | 691,687 |
| f Reg S, 3.50%, 7/18/16 | Hungary | 60,000 | EUR | | 86,145 |
| f Reg S, 4.375%, 7/04/17 | Hungary | 150,000 | EUR | | 220,024 |
| f Reg S, 5.75%, 6/11/18 | Hungary | 435,000 | EUR | | 669,810 |
| f Reg S, 3.875%, 2/24/20 | Hungary | 180,000 | EUR | | 258,785 |
| Government of Ireland, senior bond, 4.40%, 6/18/19 | Ireland | 1,200,000 | EUR | | 1,916,500 |
| Government of Malaysia, | | | | | |
| 3.434%, 8/15/14 | Malaysia | 2,305,000 | MYR | | 707,503 |
| 3.741%, 2/27/15 | Malaysia | 14,275,000 | MYR | | 4,401,732 |
| 3.835%, 8/12/15 | Malaysia | 3,560,000 | MYR | | 1,101,008 |
| 4.72%, 9/30/15 | Malaysia | 180,000 | MYR | | 56,370 |
| 3.197%, 10/15/15 | Malaysia | 2,395,000 | MYR | | 734,613 |
| senior bond, 3.814%, 2/15/17 | Malaysia | 6,100,000 | MYR | | 1,891,795 |
| senior note, 3.172%, 7/15/16 | Malaysia | 600,000 | MYR | | 183,559 |
| Government of Mexico, 7.00%, 6/19/14 | Mexico | 853,000g MXN | | 6,550,366 |
| Government of Poland, | | | | | |
| 6.25%, 10/24/15 | Poland | 11,600,000 | PLN | | 4,020,750 |
| d FRN, 2.72%, 1/25/17 | Poland | 15,515,000 | PLN | | 5,113,835 |
| d FRN, 2.72%, 1/25/21 | Poland | 15,738,000 | PLN | | 5,106,940 |
| Government of Sweden, 6.75%, 5/05/14 | Sweden | 33,250,000 | SEK | | 5,113,418 |
| Korea Monetary Stabilization Bond, | | | | | |
| senior bond, 2.47%, 4/02/15 | South Korea | 407,700,000 | KRW | | 393,971 |
| senior bond, 2.80%, 8/02/15 | South Korea | 275,650,000 | KRW | | 267,128 |
| senior note, 3.28%, 6/02/14 | South Korea | 382,370,000 | KRW | | 370,320 |
| senior note, 2.82%, 8/02/14 | South Korea | 1,574,200,000 | KRW | | 1,524,640 |
| senior note, 2.78%, 10/02/14 | South Korea | 6,276,800,000 | KRW | | 6,079,857 |
| senior note, 2.84%, 12/02/14 | South Korea | 2,223,570,000 | KRW | | 2,155,001 |
| senior note, 2.76%, 6/02/15 | South Korea | 379,500,000 | KRW | | 367,665 |
| Korea Treasury Bond, senior note, | | | | | |
| 3.25%, 12/10/14 | South Korea | 606,880,000 | KRW | | 589,623 |
| 3.25%, 6/10/15 | South Korea | 101,000,000 | KRW | | 98,363 |
| 2.75%, 12/10/15 | South Korea | 491,700,000 | KRW | | 475,982 |
| 3.00%, 12/10/16 | South Korea | 9,258,500,000 | KRW | | 8,994,735 |
| h Mexican Udibonos, Index Linked, 5.00%, 6/16/16 | Mexico | 470,714i MXN | | 3,901,700 |
92 | Semiannual Report
| | | | | | |
| Franklin Investors Securities Trust | | | | |
| |
| Statement of Investments, April 30, 2014 (unaudited) (continued) | | | | |
| |
| |
| Franklin Real Return Fund | | Country | Principal Amount* | | Value |
| Foreign Government and Agency Securities (continued) | | | | | | |
| h Nota Do Tesouro Nacional, Index Linked, 6.00%, | | | | | | |
| 5/15/15 | | Brazil | 2,100j BRL | $ | 2,313,064 |
| 8/15/16 | | Brazil | 1,343j BRL | | 1,471,811 |
| 8/15/18 | | Brazil | 1,270j BRL | | 1,378,548 |
| 5/15/45 | | Brazil | 1,680j BRL | | 1,702,585 |
| Total Foreign Government and Agency Securities | | | | | | |
| (Cost $69,986,576) | | | | | | 70,909,833 |
| U.S. Government and Agency Securities 48.3% | | | | | | |
| k U.S. Treasury Bond, Index Linked, 0.125%, 4/15/17 | | United States | 38,241,545 | | | 39,461,986 |
| k U.S. Treasury Note, Index Linked, | | | | | | |
| 2.00%, 7/15/14 | | United States | 1,245,391 | | | 1,263,196 |
| 1.625%, 1/15/15 | | United States | 9,835,375 | | | 10,076,647 |
| 0.50%, 4/15/15 | | United States | 28,705,963 | | | 29,255,424 |
| 1.875%, 7/15/15 | | United States | 50,086,016 | | | 52,449,474 |
| 2.00%, 1/15/16 | | United States | 39,031,248 | | | 41,408,173 |
| 1.625%, 1/15/18 | | United States | 19,049,424 | | | 20,743,033 |
| Total U.S. Government and Agency Securities | | | | | | |
| (Cost $193,384,989) | | | | | | 194,657,933 |
| Total Investments before Short Term Investments | | | | | | |
| (Cost $350,223,079) | | | | | | 371,113,445 |
| Short Term Investments 7.7% | | | | | | |
| Foreign Government and Agency Securities 2.1% | | | | | | |
| l Bank of Negara Monetary Notes, 5/15/14 - 11/06/14 | | Malaysia | 13,508,000MYR | | | 4,110,249 |
| Korea Monetary Stabilization Bond, | | | | | | |
| senior bond, 2.55%, 5/09/14 | | South Korea | 157,500,000 | KRW | | 152,453 |
| senior note, 2.57%, 6/09/14 | | South Korea | 369,000,000 | KRW | | 357,177 |
| l Malaysia Treasury Bill, 5/30/14 | | Malaysia | 300,000 | MYR | | 91,743 |
| l Singapore Treasury Bill, 5/16/14 | | Singapore | 4,400,000 | SGD | | 3,509,548 |
| Total Foreign Government and Agency Securities | | | | | | |
| (Cost $8,235,624) | | | | | | 8,221,170 |
| Total Investments before Repurchase Agreements | | | | | | |
| (Cost $358,458,703) | | | | | | 379,334,615 |
| Repurchase Agreements (Cost $22,530,250) 5.6% | | | | | | |
| m Joint Repurchase Agreement, 0.038%, 5/01/14 | | | | | | |
| (Maturity Value $22,530,274) | | United States | 22,530,250 | | | 22,530,250 |
| BNP Paribas Securities Corp. (Maturity Value $2,652,264) | | | | | | |
| Credit Suisse Securities (USA) LLC (Maturity Value $2,652,264) | | | | | | |
| Deutsche Bank Securities Inc. (Maturity Value $9,070,012) | | | | | | |
| HSBC Securities (USA) Inc. (Maturity Value $5,569,709) | | | | | | |
| Merrill Lynch, Pierce, Fenner & Smith Inc. (Maturity Value $2,586,025) | | | | | | |
| Collateralized by U.S. Government Agency Securities, 0.00% - 6.25%, | | | | | | |
| 6/11/14 - 7/15/32; U.S. Government Agency Securities, Strips, | | | | | | |
| 6/01/17; lU.S. Treasury Bills, 5/22/14 - 4/02/15; U.S. Treasury Bonds, | | | | | | |
| 7.25% - 10.625%, 8/15/15 - 11/15/18; U.S. Treasury Notes, | | | | | | |
| 0.25% - 4.875%, 1/31/15 - 3/31/19; and U.S. Treasury Notes, Index | | | | | | |
| Linked, 0.125% - 2.625%, 7/15/14 - 1/15/19 (valued at $22,984,426) | | | | | | |
Semiannual Report | 93
| | |
| Franklin Investors Securities Trust | | |
| Statement of Investments, April 30, 2014 (unaudited) (continued) | | |
| |
| Franklin Real Return Fund | | Value |
| Total Investments (Cost $380,988,953) 99.8% | $ | 401,864,865 |
| Other Assets, less Liabilities 0.2% | | 930,551 |
| Net Assets 100.0% | $ | 402,795,416 |
*The principal amount is stated in U.S. dollars unless otherwise indicated.
†Rounds to less than 0.1% of net assets.
aNon-income producing.
bSecurity was purchased pursuant to Rule 144A under the Securities Act of 1933 and may be sold in transactions exempt from registration only to qualified institutional buyers or
in a public offering registered under the Securities Act of 1933. These securities have been deemed liquid under guidelines approved by the Trust’s Board of Trustees. At April 30,
2014, the aggregate value of these securities was $8,030,750, representing 1.99% of net assets.
cSee Note 1(h) regarding senior floating rate interests.
dThe coupon rate shown represents the rate at period end.
eA portion or all of the security purchased on a delayed delivery basis. See Note 1(d).
fSecurity was purchased pursuant to Regulation S under the Securities Act of 1933, which exempts from registration securities offered and sold outside of the United States. Such
a security cannot be sold in the United States without either an effective registration statement filed pursuant to the Securities Act of 1933, or pursuant to an exemption from
registration. These securities have been deemed liquid under guidelines approved by the Trust’s Board of Trustees. At April 30, 2014, the aggregate value of these securities was
$1,234,764, representing 0.31% of net assets.
gPrincipal amount is stated in 100 Mexican Peso Units.
hRedemption price at maturity is adjusted for inflation. See Note 1(j).
iPrincipal amount is stated in 100 Unidad de Inversion Units.
jPrincipal amount is stated in 1,000 Brazilian Real Units.
kPrincipal amount of security is adjusted for inflation. See Note 1(j).
lThe security is traded on a discount basis with no stated coupon rate.
mSee Note 1(c) regarding joint repurchase agreement.
| | | | | | | | | | | | |
| At April 30, 2014, the fund had the following forward exchange contracts outstanding. See Note 1(e). | | | | |
| |
| | | | | | Contract | Settlement | | Unrealized | | Unrealized | |
| Currency | Counterpartya Type | Quantity | | Amount | Date | | Appreciation Depreciation | |
| Euro | DBAB | Buy | 1,200,000 | $ | 1,648,680 | 8/01/14 | $ | 15,649 | | $ | — | |
| Euro | DBAB | Sell | 1,200,000 | | 1,594,332 | 8/01/14 | | — | | | (69,997 | ) |
| Chilean Peso | JPHQ | Buy | 1,159,473,700 | | 2,182,333 | 8/20/14 | | — | | | (151,630 | ) |
| Euro | MSCO | Buy | 983,000 | | 1,350,799 | 11/13/14 | | 12,466 | | | — | |
| Euro | MSCO | Sell | 3,683,000 | | 4,949,842 | 11/13/14 | | — | | | (157,897 | ) |
| Euro | DBAB | Sell | 7,044,000 | | 9,693,248 | 1/09/15 | | — | | | (75,711 | ) |
| Singapore Dollar | DBAB | Buy | 3,787,800 | | 3,002,616 | 1/09/15 | | 19,810 | | | — | |
| Chilean Peso | DBAB | Buy | 328,810,000 | | 568,875 | 2/09/15 | | — | | | (1,823 | ) |
| Euro | DBAB | Sell | 1,121,244 | | 1,542,271 | 2/09/15 | | — | | | (12,766 | ) |
| Unrealized appreciation (depreciation) | | | | | | | 47,925 | | | (469,824 | ) |
| Net unrealized appreciation (depreciation) | | | | | | | | $ | (421,899 | ) |
| |
| aMay be comprised of multiple contracts using the same currency and settlement date. | | | | | | | | | |
| |
| See Abbreviations on page 128. | | | | | | | | | | | | |
94 | The accompanying notes are an integral part of these financial statements. | Semiannual Report
| | | | | | | | |
| Franklin Investors Securities Trust | | | | | | |
| |
| Financial Statements | | | | | | | | |
| |
| |
| Statements of Assets and Liabilities | | | | | | | | |
| April 30, 2014 (unaudited) | | | | | | | | |
| |
| | | | | | Franklin | | | |
| | | Franklin | | | Convertible | | | Franklin Equity |
| | | Balanced Fund | | | Securities Fund | | | Income Fund |
| Assets: | | | | | | | | |
| Investments in securities: | | | | | | | | |
| Cost - Unaffiliated issuers | $ | 2,082,238,605 | | $ | 1,609,575,713 | | $ | 1,523,195,887 |
| Cost - Sweep Money Fund (Note 3f) | | 37,349,105 | | | 70,609,419 | | | 28,170,895 |
| Total cost of investments | $ | 2,119,587,710 | | $ | 1,680,185,132 | | $ | 1,551,366,782 |
| Value - Unaffiliated issuers | $ | 2,281,279,011 | | $ | 1,883,079,716 | | $ | 1,971,125,913 |
| Value - Sweep Money Fund (Note 3f) | | 37,349,105 | | | 70,609,419 | | | 28,170,895 |
| Total value of investments | | 2,318,628,116 | | | 1,953,689,135 | | | 1,999,296,808 |
| Cash | | — | | | 565 | | | — |
| Receivables: | | | | | | | | |
| Investment securities sold | | — | | | — | | | 1,345,163 |
| Capital shares sold | | 7,978,617 | | | 16,249,408 | | | 2,396,262 |
| Dividends and interest | | 9,684,215 | | | 8,556,295 | | | 2,864,669 |
| Due from brokers | | 12,392,000 | | | — | | | — |
| Unrealized appreciation on forward exchange contracts | | 130,024 | | | — | | | — |
| Other assets | | 1,536 | | | 1,000 | | | 1,122 |
| Total assets | | 2,348,814,508 | | | 1,978,496,403 | | | 2,005,904,024 |
| Liabilities: | | | | | | | | |
| Payables: | | | | | | | | |
| Investment securities purchased | | 12,895,872 | | | 17,324,071 | | | — |
| Capital shares redeemed | | 2,636,786 | | | 7,381,419 | | | 2,363,030 |
| Management fees | | 1,197,987 | | | 744,796 | | | 769,238 |
| Distribution fees | | 790,070 | | | 450,758 | | | 547,363 |
| Transfer agent fees | | 324,914 | | | 138,700 | | | 402,810 |
| Options written, at value (premiums received $718,004, $—, and $—, | | | | | | | | |
| respectively) | | 270,000 | | | — | | | — |
| Unrealized depreciation on forward exchange contracts | | 55,605 | | | — | | | — |
| Accrued expenses and other liabilities | | 29,495 | | | 13,895 | | | 82,929 |
| Total liabilities | | 18,200,729 | | | 26,053,639 | | | 4,165,370 |
| Net assets, at value | $ | 2,330,613,779 | | $ | 1,952,442,764 | | $ | 2,001,738,654 |
| Net assets consist of: | | | | | | | | |
| Paid-in capital | $ | 2,111,051,246 | | $ | 1,694,520,731 | | $ | 1,487,365,048 |
| Undistributed net investment income (distributions in excess of net | | | | | | | | |
| investment income) | | (4,970,035 | ) | | (46,660,021 | ) | | 14,268,011 |
| Net unrealized appreciation (depreciation) | | 199,564,988 | | | 273,504,003 | | | 447,967,511 |
| Accumulated net realized gain (loss) | | 24,967,580 | | | 31,078,051 | | | 52,138,084 |
| Net assets, at value | $ | 2,330,613,779 | | $ | 1,952,442,764 | | $ | 2,001,738,654 |
Semiannual Report | The accompanying notes are an integral part of these financial statements. | 95
| | | | | | |
| Franklin Investors Securities Trust | | | | |
| |
| Financial Statements (continued) | | | | | | |
| |
| |
| Statements of Assets and Liabilities (continued) | | | | | | |
| April 30, 2014 (unaudited) | | | | | | |
| |
| | | | | Franklin | | |
| | | Franklin | | Convertible | | Franklin Equity |
| | | Balanced Fund | | Securities Fund | | Income Fund |
| Class A: | | | | | | |
| Net assets, at value | $ | 1,805,700,289 | $ | 933,952,310 | $ | 1,735,661,994 |
| Shares outstanding | | 153,691,040 | | 50,145,855 | | 74,498,995 |
| Net asset value per sharea | | $11.75 | | $18.62 | | $23.30 |
| Maximum offering price per share (net asset value per share ÷ 94.25%) | | $12.47 | | $19.76 | | $24.72 |
| Class C: | | | | | | |
| Net assets, at value | $ | 439,615,411 | $ | 318,314,631 | $ | 236,421,396 |
| Shares outstanding | | 37,706,703 | | 17,308,345 | | 10,203,665 |
| Net asset value and maximum offering price per sharea | | $11.66 | | $18.39 | | $23.17 |
| Class R: | | | | | | |
| Net assets, at value | $ | 3,512,362 | | — | $ | 6,720,260 |
| Shares outstanding | | 298,282 | | — | | 288,389 |
| Net asset value and maximum offering price per share | | $11.78 | | — | | $23.30 |
| Class R6: | | | | | | |
| Net assets, at value | $ | 5,307 | $ | 4,851 | $ | 5,831 |
| Shares outstanding | | 451 | | 260 | | 250 |
| Net asset value and maximum offering price per shareb | | $11.76 | | $18.64 | | $23.32 |
| Advisor Class: | | | | | | |
| Net assets, at value | $ | 81,780,410 | $ | 700,170,972 | $ | 22,929,173 |
| Shares outstanding | | 6,949,231 | | 37,574,609 | | 982,991 |
| Net asset value and maximum offering price per share | | $11.77 | | $18.63 | | $23.33 |
aRedemption price is equal to net asset value less contingent deferred sales charges, if applicable.
bNet asset value and maximum offering price may not recalculate due to rounding of net assets and/or shares outstanding.
96 | The accompanying notes are an integral part of these financial statements. | Semiannual Report
| | | | | | |
| Franklin Investors Securities Trust | | | | | | |
| |
| Financial Statements (continued) | | | | | | |
| |
| |
| Statements of Assets and Liabilities (continued) | | | | | | |
| April 30, 2014 (unaudited) | | | | | | |
| |
| | | Franklin | | | | |
| | | Limited Maturity | | | | |
| | | U.S. Government | | | Franklin Real | |
| | | Securities Fund | | | Return Fund | |
| Assets: | | | | | | |
| Investments in securities: | | | | | | |
| Cost - Unaffiliated issuers | $ | 451,176,699 | | $ | 358,458,703 | |
| Cost - Sweep Money Fund (Note 3f) | | 9,639,412 | | | — | |
| Cost - Repurchase agreements | | 15,421,239 | | | 22,530,250 | |
| Total cost of investments | $ | 476,237,350 | | $ | 380,988,953 | |
| Value - Unaffiliated issuers | $ | 455,502,739 | | $ | 379,334,615 | |
| Value - Sweep Money Fund (Note 3f) | | 9,639,412 | | | — | |
| Value - Repurchase agreements | | 15,421,239 | | | 22,530,250 | |
| Total value of investments | | 480,563,390 | | | 401,864,865 | |
| Cash | | — | | | 17,737 | |
| Foreign currency, at value (cost $— and $100,439, respectively) | | — | | | 100,283 | |
| Receivables: | | | | | | |
| Investment securities sold | | 478,898 | | | 2,640,604 | |
| Capital shares sold | | 357,614 | | | 410,507 | |
| Dividends and interest | | 1,867,837 | | | 2,445,894 | |
| Affiliates | | — | | | 56,718 | |
| Due from brokers | | — | | | 120,000 | |
| Unrealized appreciation on forward exchange contracts | | — | | | 47,925 | |
| Other assets | | 295 | | | 242 | |
| Total assets | | 483,268,034 | | | 407,704,775 | |
| Liabilities: | | | | | | |
| Payables: | | | | | | |
| Investment securities purchased | | — | | | 3,304,350 | |
| Capital shares redeemed | | 1,056,359 | | | 789,257 | |
| Management fees | | 200,739 | | | 145,215 | |
| Distribution fees | | 35,183 | | | 96,840 | |
| Transfer agent fees | | 123,317 | | | 43,475 | |
| Distributions to shareholders | | 268,483 | | | — | |
| Unrealized depreciation on forward exchange contracts | | — | | | 469,824 | |
| Accrued expenses and other liabilities | | 3,421 | | | 60,398 | |
| Total liabilities | | 1,687,502 | | | 4,909,359 | |
| Net assets, at value | $ | 481,580,532 | | $ | 402,795,416 | |
| Net assets consist of: | | | | | | |
| Paid-in capital | $ | 506,014,282 | | $ | 404,470,445 | |
| Distributions in excess of net investment income | | (8,528,354 | ) | | (6,725,795 | ) |
| Net unrealized appreciation (depreciation) | | 4,326,040 | | | 20,471,973 | |
| Accumulated net realized gain (loss) | | (20,231,436 | ) | | (15,421,207 | ) |
| Net assets, at value | $ | 481,580,532 | | $ | 402,795,416 | |
Semiannual Report | The accompanying notes are an integral part of these financial statements. | 97
| | | | |
| Franklin Investors Securities Trust | | | | |
| |
| Financial Statements (continued) | | | | |
| |
| |
| Statements of Assets and Liabilities (continued) | | | | |
| April 30, 2014 (unaudited) | | | | |
| |
| | | Franklin | | |
| | | Limited Maturity | | |
| | | U.S. Government | | Franklin Real |
| | | Securities Fund | | Return Fund |
| Class A: | | | | |
| Net assets, at value | $ | 425,699,643 | $ | 273,051,505 |
| Shares outstanding | | 42,684,480 | | 25,043,793 |
| Net asset value per sharea | | $9.97 | | $10.90 |
| Maximum offering price per share (net asset value per share ÷ 97.75% and 95.75%, | | | | |
| respectively) | | $10.20 | | $11.38 |
| Class C: | | | | |
| Net assets, at value | | — | $ | 73,715,620 |
| Shares outstanding | | — | | 6,803,256 |
| Net asset value and maximum offering price per sharea | | — | | $10.84 |
| Class R6: | | | | |
| Net assets, at value | $ | 5,377 | $ | 1,931,158 |
| Shares outstanding | | 538 | | 176,588 |
| Net asset value and maximum offering price per share | | $9.99 | | $10.94 |
| Advisor Class: | | | | |
| Net assets, at value | $ | 55,875,512 | $ | 54,097,133 |
| Shares outstanding | | 5,607,361 | | 4,949,279 |
| Net asset value and maximum offering price per share | | $9.96 | | $10.93 |
aRedemption price is equal to net asset value less contingent deferred sales charges, if applicable.
98 | The accompanying notes are an integral part of these financial statements. | Semiannual Report
| | | | | | | | | |
| Franklin Investors Securities Trust | | | | | | | |
| |
| Financial Statements (continued) | | | | | | | | | |
| |
| |
| Statements of Operations | | | | | | | | | |
| for the six months ended April 30, 2014 (unaudited) | | | | | | | | | |
| |
| | | | | | Franklin | | | | |
| | | Franklin | | | Convertible | | | Franklin Equity | |
| | | Balanced Fund | | | Securities Fund | | | Income Fund | |
| Investment income: | | | | | | | | | |
| Dividends | $ | 25,756,195 | | $ | 9,287,891 | | $ | 42,918,145 | |
| Interest | | 13,134,101 | | | 10,061,232 | | | — | |
| Total investment income | | 38,890,296 | | | 19,349,123 | | | 42,918,145 | |
| Expenses: | | | | | | | | | |
| Management fees (Note 3a) | | 6,481,774 | | | 4,078,044 | | | 4,530,447 | |
| Distribution fees: (Note 3c) | | | | | | | | | |
| Class A | | 2,311,432 | | | 1,128,335 | | | 2,093,077 | |
| Class C | | 1,948,906 | | | 1,477,652 | | | 1,109,932 | |
| Class R | | 8,325 | | | — | | | 15,795 | |
| Transfer agent fees: (Note 3e) | | | | | | | | | |
| Class A | | 854,292 | | | 471,691 | | | 1,139,206 | |
| Class C | | 216,102 | | | 154,552 | | | 150,907 | |
| Class R | | 1,846 | | | — | | | 4,292 | |
| Class R6 | | 20 | | | — | | | 34 | |
| Advisor Class | | 40,635 | | | 264,451 | | | 14,060 | |
| Custodian fees (Note 4) | | 8,923 | | | 6,501 | | | 12,018 | |
| Reports to shareholders | | 76,470 | | | 65,145 | | | 128,713 | |
| Registration and filing fees | | 162,527 | | | 126,334 | | | 60,879 | |
| Professional fees | | 25,763 | | | 21,732 | | | 27,285 | |
| Trustees’ fees and expenses | | 7,649 | | | 7,245 | | | 10,233 | |
| Other | | 21,713 | | | 19,269 | | | 17,617 | |
| Total expenses | | 12,166,377 | | | 7,820,951 | | | 9,314,495 | |
| Expense reductions (Note 4) | | (83 | ) | | (17 | ) | | (41 | ) |
| Expenses waived/paid by affiliates (Note 3f and 3g) | | (37,020 | ) | | (31,454 | ) | | (15,069 | ) |
| Net expenses | | 12,129,274 | | | 7,789,480 | | | 9,299,385 | |
| Net investment income | | 26,761,022 | | | 11,559,643 | | | 33,618,760 | |
| Realized and unrealized gains (losses): | | | | | | | | | |
| Net realized gain (loss) from: | | | | | | | | | |
| Investments | | 26,508,560 | | | 31,334,033 | | | 50,508,057 | |
| Written options (Note 6) | | 948,767 | | | — | | | — | |
| Foreign currency transactions | | 3,471 | | | — | | | 154,282 | |
| Net realized gain (loss) | | 27,460,798 | | | 31,334,033 | | | 50,662,339 | |
| Net change in unrealized appreciation (depreciation) on: | | | | | | | | | |
| Investments | | 69,080,849 | | | 51,693,884 | | | 45,761,956 | |
| Translation of other assets and liabilities denominated in foreign | | | | | | | | | |
| currencies | | (547 | ) | | — | | | 21,244 | |
| Net change in unrealized appreciation (depreciation) | | 69,080,302 | | | 51,693,884 | | | 45,783,200 | |
| Net realized and unrealized gain (loss) | | 96,541,100 | | | 83,027,917 | | | 96,445,539 | |
| Net increase (decrease) in net assets resulting from operations | $ | 123,302,122 | | $ | 94,587,560 | | $ | 130,064,299 | |
Semiannual Report | The accompanying notes are an integral part of these financial statements. | 99
| | | | | | |
| Franklin Investors Securities Trust | | | | | | |
| |
| Financial Statements (continued) | | | | | | |
| |
| |
| Statements of Operations (continued) | | | | | | |
| for the six months ended April 30, 2014 (unaudited) | | | | | | |
| |
| | | Franklin | | | | |
| | | Limited Maturity | | | | |
| | | U.S. Government | | | Franklin Real | |
| | | Securities Fund | | | Return Fund | |
| Investment income: | | | | | | |
| Dividends | $ | — | | $ | 813,898 | |
| Interest | | 4,815,267 | | | 2,161,122 | |
| Paydown gain (loss) | | (1,485,670 | ) | | — | |
| Inflation principal adjustments | | 92,426 | | | 1,046,156 | |
| Total investment income | | 3,422,023 | | | 4,021,176 | |
| Expenses: | | | | | | |
| Management fees (Note 3a) | | 1,251,227 | | | 1,286,532 | |
| Distribution fees: (Note 3c) | | | | | | |
| Class A | | 219,559 | | | 378,124 | |
| Class C | | — | | | 249,765 | |
| Transfer agent fees: (Note 3e) | | | | | | |
| Class A | | 593,517 | | | 232,116 | |
| Class C | | — | | | 58,963 | |
| Class R6 | | 132 | | | 55 | |
| Advisor Class | | 84,862 | | | 23,808 | |
| Custodian fees (Note 4) | | 2,298 | | | 22,800 | |
| Reports to shareholders | | 26,043 | | | 37,244 | |
| Registration and filing fees | | 46,975 | | | 42,769 | |
| Professional fees | | 19,963 | | | 18,938 | |
| Trustees’ fees and expenses | | 3,486 | | | 3,287 | |
| Other | | 24,960 | | | 14,365 | |
| Total expenses | | 2,273,022 | | | 2,368,766 | |
| Expense reductions (Note 4) | | — | | | (216 | ) |
| Expenses waived/paid by affiliates (Note 3f and 3g) | | (3,447 | ) | | (404,511 | ) |
| Net expenses | | 2,269,575 | | | 1,964,039 | |
| Net investment income | | 1,152,448 | | | 2,057,137 | |
| Realized and unrealized gains (losses): | | | | | | |
| Net realized gain (loss) from: | | | | | | |
| Investments | | 346,182 | | | (5,402,595 | ) |
| Foreign currency transactions | | — | | | (1,854,170 | ) |
| Net realized gain (loss) | | 346,182 | | | (7,256,765 | ) |
| Net change in unrealized appreciation (depreciation) on: | | | | | | |
| Investments | | (111,137 | ) | | 12,463,209 | |
| Translation of other assets and liabilities denominated in foreign currencies | | — | | | (1,034,807 | ) |
| Net change in unrealized appreciation (depreciation) | | (111,137 | ) | | 11,428,402 | |
| Net realized and unrealized gain (loss) | | 235,045 | | | 4,171,637 | |
| Net increase (decrease) in net assets resulting from operations | $ | 1,387,493 | | $ | 6,228,774 | |
100 | The accompanying notes are an integral part of these financial statements. | Semiannual Report
| | | | | | | | | | | | |
| Franklin Investors Securities Trust | | | | | | | |
| |
| Financial Statements (continued) | | | | | | | | | | | | |
| |
| |
| Statements of Changes in Net Assets | | | | | | | | | | | | |
| |
| |
| | | | | | | | | Franklin Convertible | |
| | | Franklin Balanced Fund | | | Securities Fund | |
| | | Six Months Ended | | | | | | Six Months Ended | | | | |
| | | April 30, 2014 | | | Year Ended | | | April 30, 2014 | | | Year Ended | |
| | | (unaudited) | | | October 31, 2013 | | | (unaudited) | | | October 31, 2013 | |
| Increase (decrease) in net assets: | | | | | | | | | | | | |
| Operations: | | | | | | | | | | | | |
| Net investment income | $ | 26,761,022 | | $ | 30,588,789 | | $ | 11,559,643 | | $ | 25,374,035 | |
| Net realized gain (loss) from investments, written | | | | | | | | | | | | |
| options and foreign currency transactions | | 27,460,798 | | | 34,637,971 | | | 31,334,033 | | | 29,669,190 | |
| Net change in unrealized appreciation | | | | | | | | | | | | |
| (depreciation) on investments and translation | | | | | | | | | | | | |
| of other assets and liabilities denominated in | | | | | | | | | | | | |
| foreign currencies | | 69,080,302 | | | 88,446,229 | | | 51,693,884 | | | 184,240,411 | |
| Net increase (decrease) in net assets | | | | | | | | | | | | |
| resulting from operations | | 123,302,122 | | | 153,672,989 | | | 94,587,560 | | | 239,283,636 | |
| Distributions to shareholders from: | | | | | | | | | | | | |
| Net investment income: | | | | | | | | | | | | |
| Class A | | (24,378,516 | ) | | (31,627,258 | ) | | (9,267,418 | ) | | (19,664,656 | ) |
| Class C | | (4,845,960 | ) | | (6,826,129 | ) | | (2,033,697 | ) | | (5,072,710 | ) |
| Class R | | (49,317 | ) | | (84,629 | ) | | — | | | — | |
| Class R6 | | (93 | ) | | (92 | ) | | (15 | ) | | — | |
| Advisor Class | | (1,271,360 | ) | | (2,004,586 | ) | | (5,492,243 | ) | | (7,730,041 | ) |
| Net realized gains: | | | | | | | | | | | | |
| Class A | | (21,130,494 | ) | | (9,205,486 | ) | | (3,610,981 | ) | | — | |
| Class C | | (5,535,467 | ) | | (2,644,332 | ) | | (1,182,145 | ) | | — | |
| Class R | | (49,346 | ) | | (33,876 | ) | | — | | | — | |
| Class R6 | | (77 | ) | | — | | | — | | | — | |
| Advisor Class | | (1,029,638 | ) | | (646,925 | ) | | (1,752,124 | ) | | — | |
| Total distributions to shareholders | | (58,290,268 | ) | | (53,073,313 | ) | | (23,338,623 | ) | | (32,467,407 | ) |
| Capital share transactions: (Note 2) | | | | | | | | | | | | |
| Class A | | 400,582,749 | | | 651,592,294 | | | 49,268,323 | | | 119,798,228 | |
| Class C | | 73,085,353 | | | 146,263,810 | | | 32,629,903 | | | 20,827,459 | |
| Class R | | 162,120 | | | 673,732 | | | — | | | — | |
| Class R6 | | — | | | 5,000 | | | 5,000 | | | — | |
| Advisor Class | | 11,243,076 | | | 49,958,689 | | | 294,132,131 | | | 146,517,178 | |
| Total capital share transactions | | 485,073,298 | | | 848,493,525 | | | 376,035,357 | | | 287,142,865 | |
| Net increase (decrease) in net assets | | 550,085,152 | | | 949,093,201 | | | 447,284,294 | | | 493,959,094 | |
| Net assets: | | | | | | | | | | | | |
| Beginning of period | | 1,780,528,627 | | | 831,435,426 | | | 1,505,158,470 | | | 1,011,199,376 | |
| End of period | $ | 2,330,613,779 | | $ | 1,780,528,627 | | $ | 1,952,442,764 | | $ | 1,505,158,470 | |
| Distributions in excess of net investment income | | | | | | | | | | | | |
| included in net assets: | | | | | | | | | | | | |
| End of period | $ | (4,970,035 | ) | $ | (1,185,811 | ) | $ | (46,660,021 | ) | $ | (41,426,291 | ) |
Semiannual Report | The accompanying notes are an integral part of these financial statements. | 101
| | | | | | | | | | | | |
| Franklin Investors Securities Trust | | | | | | | |
| |
| Financial Statements (continued) | | | | | | | | | | | | |
| |
| |
| Statements of Changes in Net Assets (continued) | | | | | | | | | | | | |
| |
| |
| | | | | | | | | Franklin Limited Maturity | |
| | | Franklin Equity Income Fund | | | U.S. Government Securities Fund | |
| | | Six Months Ended | | | | | | Six Months Ended | | | | |
| | | April 30, 2014 | | | Year Ended | | | April 30, 2014 | | | Year Ended | |
| | | (unaudited) | | | October 31, 2013 | | | (unaudited) | | | October 31, 2013 | |
| Increase (decrease) in net assets: | | | | | | | | | | | | |
| Operations: | | | | | | | | | | | | |
| Net investment income | $ | 33,618,760 | | $ | 34,516,211 | | $ | 1,152,448 | | $ | 2,692,814 | |
| Net realized gain (loss) from investments | | | | | | | | | | | | |
| and foreign currency transactions | | 50,662,339 | | | 118,457,716 | | | 346,182 | | | 202,491 | |
| Net change in unrealized appreciation | | | | | | | | | | | | |
| (depreciation) on investments and translation | | | | | | | | | | | | |
| of other assets and liabilities denominated in | | | | | | | | | | | | |
| foreign currencies | | 45,783,200 | | | 225,524,693 | | | (111,137 | ) | | (4,313,943 | ) |
| Net increase (decrease) in net assets | | | | | | | | | | | | |
| resulting from operations | | 130,064,299 | | | 378,498,620 | | | 1,387,493 | | | (1,418,638 | ) |
| Distributions to shareholders from: | | | | | | | | | | | | |
| Net investment income: | | | | | | | | | | | | |
| Class A | | (20,295,328 | ) | | (34,825,572 | ) | | (4,059,342 | ) | | (8,656,320 | ) |
| Class B | | — | | | (5,632 | ) | | — | | | — | |
| Class C | | (1,865,555 | ) | | (2,752,030 | ) | | — | | | — | |
| Class R | | (68,242 | ) | | (111,174 | ) | | — | | | — | |
| Class R6 | | (78 | ) | | (66 | ) | | (92,236 | ) | | (924,762 | ) |
| Advisor Class | | (274,597 | ) | | (316,984 | ) | | (615,204 | ) | | (2,934,137 | ) |
| Net realized gains: | | | | | | | | | | | | |
| Class A | | (8,968,025 | ) | | — | | | — | | | — | |
| Class C | | (1,168,619 | ) | | — | | | — | | | — | |
| Class R | | (32,534 | ) | | — | | | — | | | — | |
| Class R6 | | (30 | ) | | — | | | — | | | — | |
| Advisor Class | | (108,872 | ) | | — | | | — | | | — | |
| Total distributions to shareholders | | (32,781,880 | ) | | (38,011,458 | ) | | (4,766,782 | ) | | (12,515,219 | ) |
| Capital share transactions: (Note 2) | | | | | | | | | | | | |
| Class A | | 13,874,639 | | | 29,106,749 | | | (31,371,575 | ) | | 58,906,444 | |
| Class B | | — | | | (1,232,223 | ) | | — | | | — | |
| Class C | | 16,857,154 | | | 38,897,785 | | | — | | | — | |
| Class R | | 544,988 | | | (169,938 | ) | | — | | | — | |
| Class R6 | | — | | | 5,000 | | | (80,342,508 | ) | | 81,392,999 | |
| Advisor Class | | 4,382,721 | | | 4,503,835 | | | (17,431,371 | ) | | (61,529,826 | ) |
| Total capital share transactions | | 35,659,502 | | | 71,111,208 | | | (129,145,454 | ) | | 78,769,617 | |
| Net increase (decrease) in net assets | | 132,941,921 | | | 411,598,370 | | | (132,524,743 | ) | | 64,835,760 | |
| Net assets: | | | | | | | | | | | | |
| Beginning of period | | 1,868,796,733 | | | 1,457,198,363 | | | 614,105,275 | | | 549,269,515 | |
| End of period | $ | 2,001,738,654 | | $ | 1,868,796,733 | | $ | 481,580,532 | | $ | 614,105,275 | |
| Undistributed net investment income (distributions | | | | | | | | | | | | |
| in excess of net investment income) included | | | | | | | | | | | | |
| in net assets: | | | | | | | | | | | | |
| End of period | $ | 14,268,011 | | $ | 3,153,051 | | $ | (8,528,354 | ) | $ | (4,914,020 | ) |
102 | The accompanying notes are an integral part of these financial statements. | Semiannual Report
| | | | | | |
| Franklin Investors Securities Trust | | | | | | |
| |
| Financial Statements (continued) | | | | | | |
| |
| |
| Statements of Changes in Net Assets (continued) | | | | | | |
| |
| |
| | | Franklin Real Return Fund | |
| | | Six Months Ended | | | | |
| | | April 30, 2014 | | | Year Ended | |
| | | (unaudited) | | | October 31, 2013 | |
| Increase (decrease) in net assets: | | | | | | |
| Operations: | | | | | | |
| Net investment income | $ | 2,057,137 | | $ | 6,459,975 | |
| Net realized gain (loss) from investments and foreign currency transactions | | (7,256,765 | ) | | 2,550,882 | |
| Net change in unrealized appreciation (depreciation) on investments and translation of | | | | | | |
| other assets and liabilities denominated in foreign currencies | | 11,428,402 | | | (2,784,706 | ) |
| Net increase (decrease) in net assets resulting from operations | | 6,228,774 | | | 6,226,151 | |
| Distributions to shareholders from: | | | | | | |
| Net investment income: | | | | | | |
| Class A | | (2,756,669 | ) | | (9,207,617 | ) |
| Class C | | (549,057 | ) | | (1,995,653 | ) |
| Class R6 | | (4,088 | ) | | (69 | ) |
| Advisor Class | | (283,615 | ) | | (819,980 | ) |
| Total distributions to shareholders | | (3,593,429 | ) | | (12,023,319 | ) |
| Capital share transactions: (Note 2) | | | | | | |
| Class A | | (55,958,909 | ) | | (79,849,877 | ) |
| Class C | | (10,397,110 | ) | | (19,847,338 | ) |
| Class R6 | | 1,886,821 | | | 5,000 | |
| Advisor Class | | 25,631,227 | | | (6,975,655 | ) |
| Total capital share transactions | | (38,837,971 | ) | | (106,667,870 | ) |
| Net increase (decrease) in net assets | | (36,202,626 | ) | | (112,465,038 | ) |
| Net assets: | | | | | | |
| Beginning of period | | 438,998,042 | | | 551,463,080 | |
| End of period | $ | 402,795,416 | | $ | 438,998,042 | |
| Distributions in excess of net investment income included in net assets: | | | | | | |
| End of period | $ | (6,725,795 | ) | $ | (5,189,503 | ) |
Semiannual Report | The accompanying notes are an integral part of these financial statements. | 103
Franklin Investors Securities Trust
Notes to Financial Statements (unaudited)
1. ORGANIZATION AND SIGNIFICANT ACCOUNTING POLICIES
Franklin Investors Securities Trust (Trust) is registered under the Investment Company Act of 1940, as amended, (1940 Act) as an open-end management investment company, consisting of nine separate funds, five of which are included in this report (Funds). The financial statements of the remaining funds in the Trust are presented separately. Effective March 4, 2014, the Franklin Convertible Securities Fund began offering a new class of shares, Class R6. Effective March 1, 2013, all Class B shares were converted to Class A. Each class of shares differs by its initial sales load, contingent deferred sales charges, voting rights on matters affecting a single class, its exchange privilege and fees primarily due to differing arrangements for distribution and transfer agent fees. The Franklin Limited Maturity U.S. Government Securities Fund was closed to new investors effective January 22, 2014.
| |
| Class A, Class C, Class R, Class R6 & Advisor Class | Class A, Class C, Class R6 & Advisor Class |
| Franklin Balanced Fund | Franklin Convertible Securities Fund |
| Franklin Equity Income Fund | Franklin Real Return Fund |
|
| Class A, Class R6 & Advisor Class |
| Franklin Limited Maturity U.S. Government Securities Fund |
The following summarizes the Funds’ significant accounting policies.
a. Financial Instrument Valuation
The Funds’ investments in financial instruments are carried at fair value daily. Fair value is the price that would be received to sell an asset or paid to transfer a liability in an orderly transaction between market participants on the measurement date. The Funds calculate the net asset value (NAV) per share at the close of the New York Stock Exchange (NYSE), generally at 4 p.m. Eastern time (NYSE close) on each day the NYSE is open for trading. Under procedures approved by the Trust’s Board of Trustees (the Board), the Funds’ administrator, investment manager and other affiliates have formed the Valuation and Liquidity Oversight Committee (VLOC). The VLOC provides administration and oversight of the Funds’ valuation policies and procedures, which are approved annually by the Board. Among other things, these procedures allow the Funds to utilize independent pricing services, quotations from securities and financial instrument dealers, and other market sources to determine fair value.
Equity securities, exchange traded funds, and derivative financial instruments (derivatives) listed on an exchange or on the NASDAQ National Market System are valued at the last quoted sale price or the official closing price of the day, respectively. Foreign equity securities are valued as of the close of trading on the foreign stock exchange on which the security is primarily traded or as of the NYSE close, whichever is earlier. The value is then converted into its U.S. dollar equivalent at the foreign exchange rate in effect at the NYSE close on the day that the value of the security is determined. Over-the-counter (OTC) securities are valued within the range of the most recent quoted bid and ask prices. Securities that trade in multiple markets or on multiple exchanges are valued according to the broadest and most representative market. Certain equity securities are valued based upon fundamental characteristics or relationships to similar securities. Investments in open-end mutual funds are valued at the closing net asset value.
104 | Semiannual Report
Franklin Investors Securities Trust
Notes to Financial Statements (unaudited) (continued)
| 1. | ORGANIZATION AND SIGNIFICANT ACCOUNTING POLICIES (continued) |
| a. | Financial Instrument Valuation (continued) |
Debt and certain preferred securities generally trade in the OTC market rather than on a securities exchange. The Funds’ pricing services use multiple valuation techniques to determine fair value. In instances where sufficient market activity exists, the pricing services may utilize a market-based approach through which quotes from market makers are used to determine fair value. In instances where sufficient market activity may not exist or is limited, the pricing services also utilize proprietary valuation models which may consider market characteristics such as benchmark yield curves, credit spreads, estimated default rates, anticipated market interest rate volatility, coupon rates, anticipated timing of principal repayments, underlying collateral, and other unique security features in order to estimate the relevant cash flows, which are then discounted to calculate the fair value. Securities denominated in a foreign currency are converted into their U.S. dollar equivalent at the foreign exchange rate in effect at the NYSE close on the date that the values of the foreign debt securities are determined. Repurchase agreements are valued at cost, which approximates fair value.
Certain derivatives trade in the OTC market. The Funds’ pricing services use various techniques including industry standard option pricing models and proprietary discounted cash flow models to determine the fair value of those instruments. The Funds’ net benefit or obligation under the derivative contract, as measured by the fair value of the contract, is included in net assets.
The Funds have procedures to determine the fair value of financial instruments for which market prices are not reliable or readily available. Under these procedures, the VLOC convenes on a regular basis to review such financial instruments and considers a number of factors, including significant unobservable valuation inputs, when arriving at fair value. The VLOC primarily employs a market-based approach which may use related or comparable assets or liabilities, recent transactions, market multiples, book values, and other relevant information for the investment to determine the fair value of the investment. An income-based valuation approach may also be used in which the anticipated future cash flows of the investment are discounted to calculate fair value. Discounts may also be applied due to the nature or duration of any restrictions on the disposition of the investments. Due to the inherent uncertainty of valuations of such investments, the fair values may differ significantly from the values that would have been used had an active market existed. The VLOC employs various methods for calibrating these valuation approaches including a regular review of key inputs and assumptions, transactional back-testing or disposition analysis, and reviews of any related market activity.
Trading in securities on foreign securities stock exchanges and OTC markets may be completed before the daily NYSE close. In addition, trading in certain foreign markets may not take place on every NYSE business day. Occasionally, events occur between the time at which trading in a foreign security is completed and the close of the NYSE that might call into question the reliability of the value of a portfolio security held by the fund. As a result, differences may arise between the value of the Funds’ portfolio securities as determined at the foreign market close
Semiannual Report | 105
Franklin Investors Securities Trust
Notes to Financial Statements (unaudited) (continued)
| 1. | ORGANIZATION AND SIGNIFICANT ACCOUNTING POLICIES (continued) |
| a. | Financial Instrument Valuation (continued) |
and the latest indications of value at the close of the NYSE. In order to minimize the potential for these differences, the VLOC monitors price movements following the close of trading in foreign stock markets through a series of country specific market proxies (such as baskets of American Depositary Receipts, futures contracts and exchange traded funds). These price movements are measured against established trigger thresholds for each specific market proxy to assist in determining if an event has occurred that may call into question the reliability of the values of the foreign securities held by the Funds. If such an event occurs, the securities may be valued using fair value procedures, which may include the use of independent pricing services.
Also, when the last day of the reporting period is a non-business day, certain foreign markets may be open on those days that the NYSE is closed, which could result in differences between the value of the Funds’ portfolio securities on the last business day and the last calendar day of the reporting period. Any significant security valuation changes due to an open foreign market are adjusted and reflected by the Funds for financial reporting purposes.
b. Foreign Currency Translation
Portfolio securities and other assets and liabilities denominated in foreign currencies are translated into U.S. dollars based on the exchange rate of such currencies against U.S. dollars on the date of valuation. The Funds may enter into foreign currency exchange contracts to facilitate transactions denominated in a foreign currency. Purchases and sales of securities, income and expense items denominated in foreign currencies are translated into U.S. dollars at the exchange rate in effect on the transaction date. Portfolio securities and assets and liabilities denominated in foreign currencies contain risks that those currencies will decline in value relative to the U.S. dollar. Occasionally, events may impact the availability or reliability of foreign exchange rates used to convert the U.S. dollar equivalent value. If such an event occurs, the foreign exchange rate will be valued at fair value using procedures established and approved by the Board.
The Funds do not separately report the effect of changes in foreign exchange rates from changes in market prices on securities held. Such changes are included in net realized and unrealized gain or loss from investments on the Statements of Operations.
Realized foreign exchange gains or losses arise from sales of foreign currencies, currency gains or losses realized between the trade and settlement dates on securities transactions and the difference between the recorded amounts of dividends, interest, and foreign withholding taxes and the U.S. dollar equivalent of the amounts actually received or paid. Net unrealized foreign exchange gains and losses arise from changes in foreign exchange rates on foreign denominated assets and liabilities other than investments in securities held at the end of the reporting period.
c. Joint Repurchase Agreement
Certain funds enter into a joint repurchase agreement whereby their uninvested cash balance is deposited into a joint cash account with other funds managed by the investment manager or an
106 | Semiannual Report
Franklin Investors Securities Trust
Notes to Financial Statements (unaudited) (continued)
| 1. | ORGANIZATION AND SIGNIFICANT ACCOUNTING POLICIES (continued) |
| c. | Joint Repurchase Agreement (continued) |
affiliate of the investment manager and is used to invest in one or more repurchase agreements. The value and face amount of the joint repurchase agreement are allocated to the funds based on their pro-rata interest. A repurchase agreement is accounted for as a loan by the fund to the seller, collateralized by securities which are delivered to the fund’s custodian. The fair value, including accrued interest, of the initial collateralization is required to be at least 102% of the dollar amount invested by the funds, with the value of the underlying securities marked to market daily to maintain coverage of at least 100%. Repurchase agreements are subject to the terms of Master Repurchase Agreements (MRAs) with approved counterparties (sellers). The MRAs contain various provisions, including but not limited to events of default and maintenance of collateral for repurchase agreements. In the event of default by either the seller or the funds, certain MRAs may permit the non-defaulting party to net and close-out all transactions, if any, traded under such agreements. The funds may sell securities it holds as collateral and apply the proceeds towards the repurchase price and any other amounts owed by the seller to the funds in the event of default by the seller. This could involve costs or delays in addition to a loss on the securities if their value falls below the repurchase price owed by the seller. The joint repurchase agreement held by the funds at period end, as indicated in the Statements of Investments, had been entered into on April 30, 2014.
d. Securities Purchased on a Delayed Delivery Basis
Certain funds purchase securities on a delayed delivery basis, with payment and delivery scheduled for a future date. These transactions are subject to market fluctuations and are subject to the risk that the value at delivery may be more or less than the trade date purchase price. Although the funds will generally purchase these securities with the intention of holding the securities, they may sell the securities before the settlement date. Sufficient assets have been segregated for these securities.
e. Derivative Financial Instruments
The Franklin Balanced Fund and Franklin Real Return Fund invested in derivatives in order to manage risk or gain exposure to various other investments or markets. Derivatives are financial contracts based on an underlying or notional amount, require no initial investment or an initial net investment that is smaller than would normally be required to have a similar response to changes in market factors, and require or permit net settlement. Derivatives contain various risks including the potential inability of the counterparty to fulfill their obligations under the terms of the contract, the potential for an illiquid secondary market, and/or the potential for market movements which expose the fund to gains or losses in excess of the amounts shown on the Statements of Assets and Liabilities. Realized gain and loss and unrealized appreciation and depreciation on these contracts for the period are included in the Statements of Operations.
Derivative counterparty credit risk is managed through a formal evaluation of the creditworthi-ness of all potential counterparties. The Franklin Balanced Fund and Franklin Real Return Fund
Semiannual Report | 107
Franklin Investors Securities Trust
Notes to Financial Statements (unaudited) (continued)
| 1. | ORGANIZATION AND SIGNIFICANT ACCOUNTING POLICIES (continued) |
| e. | Derivative Financial Instruments (continued) |
attempt to reduce its exposure to counterparty credit risk on OTC derivatives, whenever possible, by entering into International Swaps and Derivatives Association (ISDA) master agreements with certain counterparties. These agreements contain various provisions, including but not limited to collateral requirements, events of default, or early termination. Termination events applicable to the counterparty include certain deteriorations in the credit quality of the counter-party. Termination events applicable to the funds include failure of the funds to maintain certain net asset levels and/or limit the decline in net assets over various periods of time. In the event of default or early termination, the ISDA master agreement gives the non-defaulting party the right to net and close-out all transactions traded, whether or not arising under the ISDA agreement, to one net amount payable by one counterparty to the other. However, absent an event of default or early termination, OTC derivative assets and liabilities are presented gross and not offset in the Statements of Assets and Liabilities. Early termination by the counterparty may result in an immediate payment by the funds of any net liability owed to that counterparty under the ISDA agreement. At April 30, 2014, the funds had OTC derivatives in a net liability position and the aggregate value of collateral pledged for such contracts was as follows:
| | | | |
| | | Net Liability | | Collateral Pledged |
| Franklin Balanced Fund | $ | — | $ | — |
| Franklin Real Return Fund | $ | 421,899 | $ | 120,000 |
Collateral requirements differ by type of derivative. Collateral or initial margin requirements are set by the broker or exchange clearing house for exchange traded and centrally cleared derivatives. Initial margin deposited is held at the exchange and can be in the form of cash and/or securities. For OTC derivatives traded under an ISDA master agreement, posting of collateral is required by either the fund or the applicable counterparty if the total net exposure of all OTC derivatives with the applicable counterparty exceeds the minimum transfer amount, which typically ranges from $100,000 to $250,000, and can vary depending on the counterparty and the type of the agreement. Generally, collateral is determined at the close of fund business each day and any additional collateral required due to changes in derivative values may be delivered by the fund or the counterparty within a few business days. Collateral pledged and/or received by the fund for OTC derivatives, if any, is held in segregated accounts with the fund’s custodian/counterparty broker and can be in the form of cash and/or securities. Unrestricted cash may be invested according to the funds’ investment objectives.
The Franklin Balanced Fund and Franklin Real Return Fund entered into OTC forward exchange contracts primarily to manage and/or gain exposure to certain foreign currencies. A forward exchange contract is an agreement between the fund and a counterparty to buy or sell a foreign currency at a specific exchange rate on a future date.
The Franklin Balanced Fund purchased or wrote exchange traded option contracts primarily to manage exposure to equity price risk. An option is a contract entitling the holder to purchase or
108 | Semiannual Report
Franklin Investors Securities Trust
Notes to Financial Statements (unaudited) (continued)
| 1. | ORGANIZATION AND SIGNIFICANT ACCOUNTING POLICIES (continued) |
| e. | Derivative Financial Instruments (continued) |
sell a specific amount of shares or units of an asset or notional amount of a swap (swaption), at a specified price. Options purchased are recorded as an asset while options written are recorded as a liability. Upon exercise of an option, the acquisition cost or sales proceeds of the underlying investment is adjusted by any premium received or paid. Upon expiration of an option, any premium received or paid is recorded as a realized gain or loss. Upon closing an option other than through expiration or exercise, the difference between the premium and the cost to close the position is recorded as a realized gain or loss.
See Notes 6 and 9 regarding investment transactions and other derivative information, respectively.
f. Loan Participation Notes
The Franklin Balanced Fund invests in loan participation notes (“Participations”). Participations are loans originally issued to a borrower by one or more financial institutions (the “Lender”) and subsequently sold to other investors, such as the fund. Participations typically result in the fund having a contractual relationship only with the Lender and not with the borrower. The fund has the right to receive from the Lender any payments of principal, interest and fees which the Lender received from the borrower. The fund generally has no rights to either enforce compliance by the borrower with the terms of the loan agreement or to any collateral relating to the original loan. As a result, the fund assumes the credit risk of both the borrower and the Lender that is selling the Participation. The Participations may also involve interest rate risk and liquidity risk, including the potential default or insolvency of the borrower and/or the Lender.
g. Equity-Linked Securities
The Franklin Balanced Fund and Franklin Equity Income Fund invest in equity-linked securities. Equity-linked securities are hybrid financial instruments that generally combine both debt and equity characteristics into a single note form. Income received from equity-linked securities is recorded as realized gains in the Statement of Operations and may be based on the performance of an underlying equity security, an equity index, or an option position. The risks of investing in equity-linked securities include unfavorable price movements in the underlying security and the credit risk of the issuing financial institution. There may be no guarantee of a return of principal with equity-linked securities and the appreciation potential may be limited. Equity-linked securities may be more volatile and less liquid than other investments held by the funds.
h. Senior Floating Rate Interests
The Franklin Balanced Fund and Franklin Real Return Fund invest in senior secured corporate loans that pay interest at rates which are periodically reset by reference to a base lending rate plus a spread. These base lending rates are generally the prime rate offered by a designated U.S. bank or the London InterBank Offered Rate (LIBOR). Senior secured corporate loans often require prepayment of principal from excess cash flows or at the discretion of the borrower.
As a result, actual maturity may be substantially less than the stated maturity.
Semiannual Report | 109
Franklin Investors Securities Trust
Notes to Financial Statements (unaudited) (continued)
| 1. | ORGANIZATION AND SIGNIFICANT ACCOUNTING POLICIES (continued) |
| h. | Senior Floating Rate Interests (continued) |
Senior secured corporate loans in which the funds invest are generally readily marketable, but may be subject to certain restrictions on resale.
i. Income and Deferred Taxes
It is each fund’s policy to qualify as a regulated investment company under the Internal Revenue Code. Each fund intends to distribute to shareholders substantially all of its taxable income and net realized gains to relieve it from federal income and excise taxes. As a result, no provision for U.S. federal income taxes is required.
The Funds may be subject to foreign taxation related to income received, capital gains on the sale of securities and certain foreign currency transactions in the foreign jurisdictions in which it invests. Foreign taxes, if any, are recorded based on the tax regulations and rates that exist in the foreign markets in which the Funds invest. When a capital gain tax is determined to apply the Funds record an estimated deferred tax liability in an amount that would be payable if the securities were disposed of on the valuation date.
Each fund recognizes the tax benefits of uncertain tax positions only when the position is “more likely than not” to be sustained upon examination by the tax authorities based on the technical merits of the tax position. As of April 30, 2014, and for all open tax years, each fund has determined that no liability for unrecognized tax benefits is required in each fund’s financial statements related to uncertain tax positions taken on a tax return (or expected to be taken on future tax returns). Open tax years are those that remain subject to examination and are based on each tax jurisdiction statute of limitation.
j. Security Transactions, Investment Income, Expenses and Distributions
Security transactions are accounted for on trade date. Realized gains and losses on security transactions are determined on a specific identification basis. Interest income and estimated expenses are accrued daily. Amortization of premium and accretion of discount on debt securities are included in interest income. Paydown gains and losses are recorded separately on the Statements of Operations. Facility fees are recognized as income over the expected term of the loan. Dividend income is recorded on the ex-dividend date except that certain dividends from foreign securities are recognized as soon as the Funds are notified of the ex-dividend date. For all Funds except the Franklin Limited Maturity U.S. Government Securities Fund, distributions to shareholders are recorded on the ex-dividend date. For the Franklin Limited Maturity U.S. Government Securities Fund, dividends from net investment income are normally declared daily; these dividends may be reinvested or paid monthly to shareholders. Distributions to shareholders are determined according to income tax regulations (tax basis). Distributable earnings determined on a tax basis may differ from earnings recorded in accordance with accounting principles generally accepted in the United States of America. These differences may be permanent or temporary.
110 | Semiannual Report
Franklin Investors Securities Trust
Notes to Financial Statements (unaudited) (continued)
| 1. | ORGANIZATION AND SIGNIFICANT ACCOUNTING POLICIES (continued) |
| j. | Security Transactions, Investment Income, Expenses and Distributions (continued) |
Permanent differences are reclassified among capital accounts to reflect their tax character. These reclassifications have no impact on net assets or the results of operations. Temporary differences are not reclassified, as they may reverse in subsequent periods.
Common expenses incurred by the Trust are allocated among the funds based on the ratio of net assets of each fund to the combined net assets of the Trust. Fund specific expenses are charged directly to the fund that incurred the expense.
For all Funds except the Franklin Limited Maturity U.S. Government Securities Fund, realized and unrealized gains and losses and net investment income, not including class specific expenses, are allocated daily to each class of shares based upon the relative proportion of net assets of each class. Differences in per share distributions, by class, are generally due to differences in class specific expenses. For the Franklin Limited Maturity U.S. Government Securities Fund, net investment income, not including class specific expenses, is allocated daily to each class of shares based upon the relative value of the settled shares of each class. Realized and unrealized gains and losses are allocated daily to each class of shares based upon the relative proportion of net assets of each class. Differences in per share distributions, by class, are generally due to differences in class specific expenses.
Inflation-indexed bonds are adjusted for inflation through periodic increases or decreases in the security’s interest accruals, face amount, or principal redemption value, by amounts corresponding to the rate of inflation as measured by an index. Any increase or decrease in the face amount or principal redemption value will be included as inflation principal adjustments on the Statements of Operations.
k. Accounting Estimates
The preparation of financial statements in accordance with accounting principles generally accepted in the United States of America requires management to make estimates and assumptions that affect the reported amounts of assets and liabilities at the date of the financial statements and the amounts of income and expenses during the reporting period. Actual results could differ from those estimates.
l. Guarantees and Indemnifications
Under the Trust’s organizational documents, its officers and trustees are indemnified by the Trust against certain liabilities arising out of the performance of their duties to the Trust. Additionally, in the normal course of business, the Trust, on behalf of the Funds, enters into contracts with service providers that contain general indemnification clauses. The Trust’s maximum exposure under these arrangements is unknown as this would involve future claims that may be made against the Trust that have not yet occurred. Currently, the Trust expects the risk of loss to be remote.
Semiannual Report | 111
Franklin Investors Securities Trust
Notes to Financial Statements (unaudited) (continued)
2. SHARES OF BENEFICIAL INTEREST
At April 30, 2014, there were an unlimited number of shares authorized (without par value).
Transactions in the Funds’ shares were as follows:
| | | | | | | | | | | | |
| | Franklin | | Franklin Convertible | |
| | Balanced Fund | | Securities Fund | |
| | Shares | | | | Amount | | Shares | | | | Amount | |
| Class A Shares: | | | | | | | | | | | | |
| Six Months ended April 30, 2014 | | | | | | | | | | | | |
| Shares sold | 41,791,533 | | $ | 476,760,730 | | 11,992,693 | | $ | 220,416,961 | |
| Shares issued in reinvestment of | | | | | | | | | | | | |
| distributions | 3,930,792 | | | | 44,391,008 | | 672,646 | | | | 12,075,328 | |
| Shares redeemed | (10,567,807 | ) | | | (120,568,989 | ) | (9,903,491 | ) | | (183,223,966 | ) |
| Net increase (decrease) | 35,154,518 | | $ | 400,582,749 | | 2,761,848 | | | $ | 49,268,323 | |
| Year ended October 31, 2013 | | | | | | | | | | | | |
| Shares sold | 72,046,795 | | $ | 788,307,064 | | 21,773,359 | | $ | 361,514,992 | |
| Shares issued in reinvestment of | | | | | | | | | | | | |
| distributions | 3,617,566 | | | | 39,268,649 | | 1,132,494 | | | | 18,217,413 | |
| Shares redeemed | (16,067,137 | ) | | | (175,983,419 | ) | (15,901,213 | ) | | (259,934,177 | ) |
| Net increase (decrease) | 59,597,224 | | $ | 651,592,294 | | 7,004,640 | | $ | 119,798,228 | |
| Class C Shares: | | | | | | | | | | | | |
| Six Months ended April 30, 2014 | | | | | | | | | | | | |
| Shares sold | 8,606,580 | | | $ | 97,408,751 | | 2,738,162 | | | $ | 49,848,659 | |
| Shares issued in reinvestment of | | | | | | | | | | | | |
| distributions | 834,771 | | | | 9,342,466 | | 143,603 | | | | 2,543,704 | |
| Shares redeemed | (2,974,208 | ) | | | (33,665,864 | ) | (1,088,072 | ) | | | (19,762,460 | ) |
| Net increase (decrease) | 6,467,143 | | | $ | 73,085,353 | | 1,793,693 | | | $ | 32,629,903 | |
| Year ended October 31, 2013 | | | | | | | | | | | | |
| Shares sold | 17,129,960 | | $ | 186,336,571 | | 3,482,839 | | | $ | 57,736,426 | |
| Shares issued in reinvestment of | | | | | | | | | | | | |
| distributions | 755,930 | | | | 8,131,677 | | 247,527 | | | | 3,917,749 | |
| Shares redeemed | (4,436,380 | ) | | | (48,204,438 | ) | (2,559,313 | ) | | | (40,826,716 | ) |
| Net increase (decrease) | 13,449,510 | | $ | 146,263,810 | | 1,171,053 | | | $ | 20,827,459 | |
| Class R Shares: | | | | | | | | | | | | |
| Six Months ended April 30, 2014 | | | | | | | | | | | | |
| Shares sold | 23,893 | | | $ | 273,213 | | | | | | | |
| Shares issued in reinvestment of | | | | | | | | | | | | |
| distributions | 8,724 | | | | 98,664 | | | | | | | |
| Shares redeemed | (18,379 | ) | | | (209,757 | ) | | | | | | |
| Net increase (decrease) | 14,238 | | | $ | 162,120 | | | | | | | |
| Year ended October 31, 2013 | | | | | | | | | | | | |
| Shares sold | 142,530 | | | $ | 1,569,808 | | | | | | | |
| Shares issued in reinvestment of | | | | | | | | | | | | |
| distributions | 10,936 | | | | 118,454 | | | | | | | |
| Shares redeemed | (92,423 | ) | | | (1,014,530 | ) | | | | | | |
| Net increase (decrease) | 61,043 | | | $ | 673,732 | | | | | | | |
112 | Semiannual Report
Franklin Investors Securities Trust
Notes to Financial Statements (unaudited) (continued)
| | | | | | | | | | | |
| 2. SHARES OF BENEFICIAL INTEREST (continued) | | | | | | | | | | |
| |
| | Franklin | | Franklin Convertible | |
| | Balanced Fund | | Securities Fund | |
| | Shares | | | Amount | | Shares | | | | Amount | |
| Class R6 Shares: | | | | | | | | | | | |
| Six Months ended April 30, 2014a | | | | | | | | | | | |
| Shares sold | — | | $ | — | | 260 | | | $ | 5,000 | |
| Year ended October 31, 2013b | | | | | | | | | | | |
| Shares sold | 451 | | $ | 5,000 | | | | | | | |
| Advisor Class Shares: | | | | | | | | | | | |
| Six Months ended April 30, 2014 | | | | | | | | | | | |
| Shares sold | 1,631,797 | | $ | 18,621,473 | | 18,599,129 | | $ | 344,767,822 | |
| Shares issued in reinvestment of | | | | | | | | | | | |
| distributions | 192,498 | | | 2,178,029 | | 333,773 | | | | 6,013,143 | |
| Shares redeemed | (832,901 | ) | | (9,556,426 | ) | (3,090,695 | ) | | | (56,648,834 | ) |
| Net increase (decrease) | 991,394 | | $ | 11,243,076 | | 15,842,207 | | $ | 294,132,131 | |
| Year ended October 31, 2013 | | | | | | | | | | | |
| Shares sold | 5,831,036 | | $ | 62,809,047 | | 13,996,546 | | $ | 234,682,586 | |
| Shares issued in reinvestment of | | | | | | | | | | | |
| distributions | 229,105 | | | 2,491,186 | | 353,318 | | | | 5,730,074 | |
| Shares redeemed | (1,394,879 | ) | | (15,341,544 | ) | (5,791,840 | ) | | | (93,895,482 | ) |
| Net increase (decrease) | 4,665,262 | | $ | 49,958,689 | | 8,558,024 | | $ | 146,517,178 | |
aFor the period March 4, 2014 (effective date) to April 30, 2014 for the Franklin Convertible Securities Fund.
bFor the period May 1, 2013 (effective date) to October 31, 2013 for the Franklin Balanced Fund.
| | | | | | | | | | | |
| | Franklin Equity | | Franklin Limited Maturity | |
| | Income Fund | | U.S. Government Securities Fund | |
| | Shares | | | Amount | | Shares | | | | Amount | |
| Class A Shares: | | | | | | | | | | | |
| Six Months ended April 30, 2014 | | | | | | | | | | | |
| Shares sold | 5,846,150 | | $ | 132,033,156 | | 3,423,625 | | | $ | 34,279,472 | |
| Shares issued in reinvestment of | | | | | | | | | | | |
| distributions | 1,270,233 | | | 28,456,201 | | 267,929 | | | | 2,680,373 | |
| Shares redeemed | (6,485,093 | ) | | (146,614,718 | ) | (6,825,614 | ) | | | (68,331,420 | ) |
| Net increase (decrease) | 631,290 | | $ | 13,874,639 | | (3,134,060 | ) | | $ | (31,371,575 | ) |
| Year ended October 31, 2013 | | | | | | | | | | | |
| Shares sold | 16,399,279 | | $ | 327,965,344 | | 24,854,669 | | $ | 250,904,252 | |
| Shares issued in reinvestment of | | | | | | | | | | | |
| distributions | 1,719,474 | | | 33,834,843 | | 770,994 | | | | 7,828,542 | |
| Shares redeemed | (16,773,881 | ) | | (332,693,438 | ) | (19,685,429 | ) | | (199,826,350 | ) |
| Net increase (decrease) | 1,344,872 | | $ | 29,106,749 | | 5,940,234 | | | $ | 58,906,444 | |
Semiannual Report | 113
Franklin Investors Securities Trust
Notes to Financial Statements (unaudited) (continued)
| | | | | | | |
| 2. SHARES OF BENEFICIAL INTEREST (continued) | | | | | | |
| |
| | Franklin Equity | | Franklin Limited Maturity |
| | Income Fund | | U.S. Government Securities Fund |
| | Shares | | | Amount | | Shares | Amount |
| Class B Shares: | | | | | | | |
| Year ended October 31, 2013a | | | | | | | |
| Shares sold | 2,366 | | $ | 43,801 | | | |
| Shares issued in reinvestment of | | | | | | | |
| distributions | 248 | | | 4,470 | | | |
| Shares redeemed | (69,207 | ) | | (1,280,494 | ) | | |
| Net increase (decrease) | (66,593 | ) | $ | (1,232,223 | ) | | |
| Class C Shares: | | | | | | | |
| Six Months ended April 30, 2014 | | | | | | | |
| Shares sold | 1,414,032 | | $ | 31,762,469 | | | |
| Shares issued in reinvestment of | | | | | | | |
| distributions | 130,518 | | | 2,901,614 | | | |
| Shares redeemed | (791,677 | ) | | (17,806,929 | ) | | |
| Net increase (decrease) | 752,873 | | $ | 16,857,154 | | | |
| Year ended October 31, 2013 | | | | | | | |
| Shares sold | 3,820,493 | | $ | 76,212,146 | | | |
| Shares issued in reinvestment of | | | | | | | |
| distributions | 133,468 | | | 2,614,204 | | | |
| Shares redeemed | (2,024,825 | ) | | (39,928,565 | ) | | |
| Net increase (decrease) | 1,929,136 | | $ | 38,897,785 | | | |
| Class R Shares: | | | | | | | |
| Six Months ended April 30, 2014 | | | | | | | |
| Shares sold | 59,915 | | $ | 1,345,228 | | | |
| Shares issued in reinvestment of | | | | | | | |
| distributions | 4,186 | | | 93,767 | | | |
| Shares redeemed | (39,360 | ) | | (894,007 | ) | | |
| Net increase (decrease) | 24,741 | | $ | 544,988 | | | |
| Year ended October 31, 2013 | | | | | | | |
| Shares sold | 100,846 | | $ | 1,993,196 | | | |
| Shares issued in reinvestment of | | | | | | | |
| distributions | 5,398 | | | 106,177 | | | |
| Shares redeemed | (116,908 | ) | | (2,269,311 | ) | | |
| Net increase (decrease) | (10,664 | ) | $ | (169,938 | ) | | |
114 | Semiannual Report
Franklin Investors Securities Trust
Notes to Financial Statements (unaudited) (continued)
| | | | | | | | | | | |
| 2. SHARES OF BENEFICIAL INTEREST (continued) | | | | | | | | | | |
| |
| | Franklin Equity | | Franklin Limited Maturity | |
| | Income Fund | | U.S. Government Securities Fund | |
| | Shares | | | Amount | | Shares | | | | Amount | |
| Class R6 Shares: | | | | | | | | | | | |
| Six Months ended April 30, 2014 | | | | | | | | | | | |
| Shares sold | — | | $ | — | | 5,775 | | | $ | 57,870 | |
| Shares issued in reinvestment of | | | | | | | | | | | |
| distributions | — | | | — | | 9,182 | | | | 92,186 | |
| Shares redeemed | — | | | — | | (8,020,224 | ) | | | (80,492,564 | ) |
| Net increase (decrease) | — | | $ | — | | (8,005,267 | ) | | $ | (80,342,508 | ) |
| Year ended October 31, 2013b | | | | | | | | | | | |
| Shares soldc | 250 | | $ | 5,000 | | 7,958,232 | | | $ | 80,913,634 | |
| Shares issued in reinvestment of | | | | | | | | | | | |
| distributions | — | | | — | | 91,924 | | | | 924,725 | |
| Shares redeemed | — | | | — | | (44,351 | ) | | | (445,360 | ) |
| Net increase (decrease) | 250 | | $ | 5,000 | | 8,005,805 | | | $ | 81,392,999 | |
| Advisor Class Shares: | | | | | | | | | | | |
| Six Months ended April 30, 2014 | | | | | | | | | | | |
| Shares sold | 343,976 | | $ | 7,814,852 | | 560,142 | | | $ | 5,605,828 | |
| Shares issued in reinvestment of | | | | | | | | | | | |
| distributions | 15,216 | | | 341,516 | | 21,262 | | | | 212,535 | |
| Shares redeemed | (166,417 | ) | | (3,773,647 | ) | (2,324,507 | ) | | | (23,249,734 | ) |
| Net increase (decrease) | 192,775 | | $ | 4,382,721 | | (1,743,103 | ) | | $ | (17,431,371 | ) |
| Year ended October 31, 2013 | | | | | | | | | | | |
| Shares sold | 515,408 | | $ | 10,636,771 | | 10,825,513 | | $ | 110,348,411 | |
| Shares issued in reinvestment of | | | | | | | | | | | |
| distributions | 13,844 | | | 274,209 | | 157,289 | | | | 1,598,777 | |
| Shares redeemedc | (323,317 | ) | | (6,407,145 | ) | (17,082,828 | ) | | (173,477,014 | ) |
| Net increase (decrease) | 205,935 | | $ | 4,503,835 | | (6,100,026 | ) | | $ | (61,529,826 | ) |
aEffective March 1, 2013, all Class B shares were converted to Class A.
bFor the period May 1, 2013 (effective date) to October 31, 2013.
cEffective May 1, 2013, a portion of Advisor Class shares were exchanged into Class R6 for the Franklin Limited Maturity U.S. Government Securities Fund.
| | | | | |
| | Franklin Real Return Fund | |
| | Shares | | | Amount | |
| Class A Shares: | | | | | |
| Six Months ended April 30, 2014 | | | | | |
| Shares sold | 1,979,508 | | $ | 21,257,548 | |
| Shares issued in reinvestment of distributions | 246,404 | | | 2,634,624 | |
| Shares redeemed | (7,420,562 | ) | | (79,851,081 | ) |
| Net increase (decrease) | (5,194,650 | ) | $ | (55,958,909 | ) |
| Year ended October 31, 2013 | | | | | |
| Shares sold | 6,645,189 | | $ | 72,182,703 | |
| Shares issued in reinvestment of distributions | 803,556 | | | 8,686,113 | |
| Shares redeemed | (14,821,262 | ) | | (160,718,693 | ) |
| Net increase (decrease) | (7,372,517 | ) | $ | (79,849,877 | ) |
Semiannual Report | 115
Franklin Investors Securities Trust
Notes to Financial Statements (unaudited) (continued)
| | | | | |
| 2. SHARES OF BENEFICIAL INTEREST (continued) | | | | | |
| |
| | Franklin Real Return Fund | |
| | Shares | | | Amount | |
| Class C Shares: | | | | | |
| Six Months ended April 30, 2014 | | | | | |
| Shares sold | 413,404 | | $ | 4,415,882 | |
| Shares issued in reinvestment of distributions | 49,550 | | | 525,913 | |
| Shares redeemed | (1,437,410 | ) | | (15,338,905 | ) |
| Net increase (decrease) | (974,456 | ) | $ | (10,397,110 | ) |
| Year ended October 31, 2013 | | | | | |
| Shares sold | 1,981,038 | | $ | 21,416,482 | |
| Shares issued in reinvestment of distributions | 175,915 | | | 1,890,751 | |
| Shares redeemed | (4,007,609 | ) | | (43,154,571 | ) |
| Net increase (decrease) | (1,850,656 | ) | $ | (19,847,338 | ) |
| Class R6 Shares: | | | | | |
| Six Months ended April 30, 2014 | | | | | |
| Shares sold | 183,509 | | $ | 1,966,230 | |
| Shares issued on reinvestment of distributions | 373 | | | 4,037 | |
| Shares redeemed | (7,748 | ) | | (83,446 | ) |
| Net increase (decrease) | 176,134 | | $ | 1,886,821 | |
| Year ended October 31, 2013a | | | | | |
| Shares sold | 454 | | $ | 5,000 | |
| Advisor Class Shares: | | | | | |
| Six Months ended April 30, 2014 | | | | | |
| Shares sold | 3,030,399 | | $ | 32,790,071 | |
| Shares issued in reinvestment of distributions | 23,877 | | | 256,147 | |
| Shares redeemed | (689,725 | ) | | (7,414,991 | ) |
| Net increase (decrease) | 2,364,551 | | $ | 25,631,227 | |
| Year ended October 31, 2013 | | | | | |
| Shares sold | 1,308,746 | | $ | 14,232,274 | |
| Shares issued in reinvestment of distributions | 66,927 | | | 725,214 | |
| Shares redeemed | (2,015,897 | ) | | (21,933,143 | ) |
| Net increase (decrease) | (640,224 | ) | $ | (6,975,655 | ) |
aFor the period May 1, 2013 (effective date) to October 31, 2013.
3. TRANSACTIONS WITH AFFILIATES
Franklin Resources, Inc. is the holding company for various subsidiaries that together are referred to as Franklin Templeton Investments. Certain officers and trustees of the Trust are also officers and/or directors of the following subsidiaries:
| |
| Subsidiary | Affiliation |
| Franklin Advisers, Inc. (Advisers) | Investment manager |
| Franklin Templeton Services, LLC (FT Services) | Administrative manager |
| Franklin Templeton Distributors, Inc. (Distributors) | Principal underwriter |
| Franklin Templeton Investor Services, LLC (Investor Services) | Transfer agent |
116 | Semiannual Report
Franklin Investors Securities Trust
Notes to Financial Statements (unaudited) (continued)
| 3. | TRANSACTIONS WITH AFFILIATES (continued) |
| a. | Management Fees |
The Franklin Balanced Fund pays an investment management fee to Advisers based on the average daily net assets of the fund as follows:
| | |
| Annualized Fee Rate | | Net Assets |
| 0.700 | % | Up to and including $250 million |
| 0.675 | % | Over $250 million, up to and including $500 million |
| 0.650 | % | Over $500 million, up to and including $1 billion |
| 0.625 | % | Over $1 billion, up to and including $2.5 billion |
| 0.600 | % | Over $2.5 billion, up to and including $5 billion |
| 0.575 | % | Over $5 billion, up to and including $10 billion |
| 0.550 | % | Over $10 billion, up to and including $15 billion |
| 0.525 | % | Over $15 billion, up to and including $20 billion |
| 0.500 | % | In excess of $20 billion |
The Franklin Convertible Securities Fund and Franklin Equity Income Fund pay an investment management fee to Advisers based on the month-end net assets of each of the funds as follows:
| | |
| Annualized Fee Rate | | Net Assets |
| 0.625 | % | Up to and including $100 million |
| 0.500 | % | Over $100 million, up to and including $250 million |
| 0.450 | % | Over $250 million, up to and including $7.5 billion |
| 0.440 | % | Over $7.5 billion, up to and including $10 billion |
| 0.430 | % | Over $10 billion, up to and including $12.5 billion |
| 0.420 | % | Over $12.5 billion, up to and including $15 billion |
| 0.400 | % | Over $15 billion, up to and including $17.5 billion |
| 0.380 | % | Over $17.5 billion, up to and including $20 billion |
| 0.360 | % | Over $20 billion, up to and including $35 billion |
| 0.355 | % | Over $35 billion, up to and including $50 billion |
| 0.350 | % | In excess of $50 billion |
The Franklin Limited Maturity U.S. Government Securities Fund pays an investment management fee to Advisers based on the month-end net assets of the fund as follows:
| | |
| Annualized Fee Rate | | Net Assets |
| 0.625 | % | Up to and including $100 million |
| 0.500 | % | Over $100 million, up to and including $250 million |
| 0.450 | % | In excess of $250 million |
Semiannual Report | 117
Franklin Investors Securities Trust
Notes to Financial Statements (unaudited) (continued)
| 3. | TRANSACTIONS WITH AFFILIATES (continued) |
| a. | Management Fees (continued) |
The Franklin Real Return Fund pays an investment management fee to Advisers based on the average daily net assets of the fund as follows:
| | |
| Annualized Fee Rate | | Net Assets |
| 0.625 | % | Up to and including $500 million |
| 0.525 | % | Over $500 million, up to and including $1 billion |
| 0.480 | % | Over $1 billion, up to and including $1.5 billion |
| 0.435 | % | Over $1.5 billion, up to and including $6.5 billion |
| 0.415 | % | Over $6.5 billion, up to and including $11.5 billion |
| 0.400 | % | Over $11.5 billion, up to and including $16.5 billion |
| 0.390 | % | Over $16.5 billion, up to and including $19 billion |
| 0.380 | % | Over $19 billion, up to and including $21.5 billion |
| 0.370 | % | In excess of $21.5 billion |
b. Administrative Fees
Under an agreement with Advisers, FT Services provides administrative services to the Funds. The fee is paid by Advisers based on the Funds’ average daily net assets, and is not an additional expense of the Funds.
c. Distribution Fees
The Board has adopted distribution plans for each share class, with the exception of Class R6 and Advisor Class shares, pursuant to Rule 12b-1 under the 1940 Act. Distribution fees are not charged on shares held by affiliates. Under the Funds’ Class A reimbursement distribution plans, the Funds reimburse Distributors for costs incurred in connection with the servicing, sale and distribution of each fund’s shares up to the maximum annual plan rate. Under the Class A reimbursement distribution plans, costs exceeding the maximum for the current plan year cannot be reimbursed in subsequent periods. In addition, under the Funds’ Class C and R compensation distribution plans, the Funds pay Distributors for costs incurred in connection with the servicing, sale and distribution of each fund’s shares up to the maximum annual plan rate for each class. The plan year, for purposes of monitoring compliance with the maximum annual plan rates, is February 1 through January 31 for each fund.
118 | Semiannual Report
Franklin Investors Securities Trust
Notes to Financial Statements (unaudited) (continued)
| 3. | TRANSACTIONS WITH AFFILIATES (continued) |
| c. | Distribution Fees (continued) |
The maximum annual plan rates, based on the average daily net assets, for each class, are as follows:
| | | | | | | | | | |
| | | | | | | | Franklin | | Franklin | |
| | | | Franklin | | Franklin | | Limited Maturity | | Real | |
| | Franklin | | Convertible | | Equity | | U.S. Government | | Return | |
| | Balanced Fund | | Securities Fund | | Income Fund | | Securities Fund | | Fund | |
| Reimbursement Plans: | | | | | | | | | | |
| Class A | 0.35 | % | 0.25 | % | 0.25 | % | 0.10 | % | 0.25 | % |
| Compensation Plans: | | | | | | | | | | |
| Class C | 1.00 | % | 1.00 | % | 1.00 | % | — | | 0.65 | % |
| Class R | 0.50 | % | — | | 0.50 | % | — | | — | |
The Board has set the current rate at 0.30% per year for Class A shares for the Franklin Balanced Fund until further notice and approval by the Board.
d. Sales Charges/Underwriting Agreements
Front-end sales charges and contingent deferred sales charges (CDSC) do not represent expenses of the Funds. These charges are deducted from the proceeds of sales of fund shares prior to investment or from redemption proceeds prior to remittance, as applicable. Distributors has advised the Funds of the following commission transactions related to the sales and redemptions of the Funds’ shares for the period:
| | | | | | |
| | | | | Franklin | | Franklin |
| | | Franklin | | Convertible | | Equity |
| | | Balanced Fund | | Securities Fund | | Income Fund |
| Sales charges retained net of commissions paid to | | | | | | |
| unaffiliated broker/dealers | $ | 1,252,633 | $ | 245,406 | $ | 403,179 |
| CDSC retained | $ | 46,126 | $ | 12,313 | $ | 13,900 |
| | | | |
| | | Franklin | | |
| | | Limited Maturity | | Franklin |
| | | U.S. Government | | Real Return |
| | | Securities Fund | | Fund |
| Sales charges retained net of commissions paid to | | | | |
| unaffiliated broker/dealers | $ | 17,476 | $ | 25,225 |
| CDSC retained | $ | 6,012 | $ | 6,045 |
Semiannual Report | 119
Franklin Investors Securities Trust
Notes to Financial Statements (unaudited) (continued)
| 3. | TRANSACTIONS WITH AFFILIATES (continued) |
| e. | Transfer Agent Fees |
Each class of shares, except for Class R6, pays transfer agent fees to Investor Services for its performance of shareholder servicing obligations and reimburses Investor Services for out of pocket expenses incurred, including shareholding servicing fees paid to third parties. These fees are allocated daily based upon their relative proportion of such classes’ aggregate net assets. Class R6 pays Investor Services transfer agent fees specific to that class.
For the period ended April 30, 2014, the Funds paid transfer agent fees as noted in the Statements of Operations of which the following amounts were retained by Investor Services:
| | | | | | | | | | |
| | | | | | | | | Franklin | | Franklin |
| | | | | Franklin | | Franklin | | Limited Maturity | | Real |
| | | Franklin | | Convertible | | Equity | | U.S. Government | | Return |
| | | Balanced Fund | | Securities Fund | | Income Fund | | Securities Fund | | Fund |
| Transfer agent fees | $ | 395,058 | $ | 329,720 | $ | 492,165 | $ | 382,553 | $ | 140,262 |
| |
| f. Investment in Institutional Fiduciary Trust Money Market Portfolio | | | | |
The Funds, except the Franklin Real Return Fund, invest in the Institutional Fiduciary Trust Money Market Portfolio (Sweep Money Fund), an affiliated open-end investment company. Management fees paid by the funds are waived on assets invested in the Sweep Money Fund, in an amount not to exceed the management and administrative fees paid directly or indirectly by the Sweep Money Fund, as noted on the Statements of Operations. Prior to November 1, 2013, the waiver was accounted for as a reduction to management fees.
g. Waiver and Expense Reimbursements
Advisers has contractually agreed in advance to waive or limit its fees and to assume as its own expense certain expenses otherwise payable by the Franklin Real Return Fund so that the expenses (excluding distribution fees and acquired fund fees and expenses) for Class A, Class C, and Advisor Class of the fund do not exceed 0.65%, and Class R6 does not exceed 0.52% based on the average net assets of each class (other than certain non-routine expenses or costs, including those relating to litigation, indemnification, reorganizations, and liquidations) until February 28, 2015.
Additionally, Investor Services has contractually agreed in advance to waive or limit its fees so that the Class R6 transfer agent fees do not exceed 0.01% until February 28, 2015.
4. EXPENSE OFFSET ARRANGEMENT
The Funds have entered into an arrangement with their custodian whereby credits realized as a result of uninvested cash balances are used to reduce a portion of the Funds’ custodian expenses. During the period ended April 30, 2014, the custodian fees were reduced as noted in the Statements of Operations.
120 | Semiannual Report
Franklin Investors Securities Trust
Notes to Financial Statements (unaudited) (continued)
5. INCOME TAXES
For tax purposes, capital losses may be carried over to offset future capital gains. Capital loss carryforwards with no expiration, if any, must be fully utilized before those losses with expiration dates.
At October 31, 2013, the capital loss carryforwards were as follows:
| | | | |
| Franklin | | Franklin | | |
| | | Limited Maturity | | Franklin |
| | | U.S. Government | | Real |
| | | Securities Fund | | Return Fund |
| Capital loss carryforwards subject to expiration: | | | | |
| 2014 | $ | 4,303,979 | $ | — |
| 2015 | | 723,269 | | — |
| 2016 | | — | | 1,161,482 |
| 2017 | | — | | 1,207,907 |
| 2018 | | 636,658 | | 1,206,586 |
| Capital loss carryforwards not subject to expiration: | | | | |
| Short term | | 4,378,404 | | 162,104 |
| Long term | | 10,303,832 | | 4,423,873 |
| Total capital loss carryforwards | $ | 20,346,142 | $ | 8,161,952 |
At April 30, 2014, the cost of investments and net unrealized appreciation (depreciation) for income tax purposes were as follows:
| | | | | | | | | |
| | | Franklin | | | Franklin | | | Franklin | |
| | | Balanced | | | Convertible | | | Equity | |
| | | Fund | | | Securities Fund | | | Income Fund | |
| Cost of investments | $ | 2,123,428,064 | | $ | 1,728,453,159 | | $ | 1,549,050,722 | |
| |
| Unrealized appreciation | $ | 220,286,011 | | $ | 330,836,338 | | $ | 463,157,482 | |
| Unrealized depreciation | | (25,085,959 | ) | | (105,600,362 | ) | | (12,911,396 | ) |
| Net unrealized appreciation (depreciation) | $ | 195,200,052 | | $ | 225,235,976 | | $ | 450,246,086 | |
| |
| | | Franklin | | | | | | | |
| | | Limited Maturity | | | Franklin | | | | |
| | | U.S. Government | | | Real | | | | |
| | | Securities Fund | | | Return Fund | | | | |
| Cost of investments | $ | 480,031,575 | | $ | 387,762,540 | | | | |
| |
| Unrealized appreciation | $ | 4,703,979 | | $ | 22,892,771 | | | | |
| Unrealized depreciation | | (4,172,164 | ) | | (8,790,446 | ) | | | |
| Net unrealized appreciation (depreciation) | $ | 531,815 | | $ | 14,102,325 | | | | |
Differences between income and/or capital gains as determined on a book basis and a tax basis are primarily due to differing treatments of foreign currency transactions, paydown losses, bond discounts and premiums, corporate actions, and wash sales.
Semiannual Report | 121
Franklin Investors Securities Trust
Notes to Financial Statements (unaudited) (continued)
6. INVESTMENT TRANSACTIONS
Purchases and sales of investments (excluding short term securities) for the period ended April 30, 2014, were as follows:
| | | | | | | | | | |
| | | | | | | | | Franklin | | Franklin |
| | | | | Franklin | | Franklin | | Limited Maturity | | Real |
| | | Franklin | | Convertible | | Equity | | U.S. Government | | Return |
| | | Balanced Fund | | Securities Fund | | Income Fund | | Securities Fund | | Fund |
| Purchases | $ | 666,837,747 | $ | 484,713,159 | $ | 245,188,972 | $ | 57,898,936 | $ | 90,053,601 |
| Sales | $ | 270,975,243 | $ | 106,658,896 | $ | 184,720,833 | $ | 188,035,155 | $ | 129,627,306 |
Transactions in options written during the period ended April 30, 2014, were as follows:
| | | | | |
| | Number of | | | Premiums | |
| | Contracts | | | Received | |
| Franklin Balanced Fund | | | | | |
| Options outstanding at October 31, 2013 | 200 | | $ | 101,084 | |
| Options written | 11,400 | | | 1,909,892 | |
| Options expired | (4,220 | ) | | (384,130 | ) |
| Options exercised | (4,480 | ) | | (259,074 | ) |
| Options closed | (900 | ) | | (649,768 | ) |
| Options outstanding at April 30, 2014 | 2,000 | | $ | 718,004 | |
See Notes 1(e) and 9 regarding derivative financial instruments and other derivative information, respectively.
7. CREDIT RISK AND DEFAULTED SECURITIES
At April 30, 2014, the Franklin Balanced Fund, the Franklin Convertible Securities Fund, and the Franklin Real Return Fund had 9.37%, 66.88% and 10.96%, respectively, of their portfolio invested in high yield securities, senior secured floating rate notes, or other securities rated below investment grade. These securities may be more sensitive to economic conditions causing greater price volatility and are potentially subject to a greater risk of loss due to default than higher rated securities.
The Franklin Convertible Securities Fund held defaulted securities and/or other securities for which the income has been deemed uncollectible. At April 30, 2014, the aggregate value of these securities was $12,576,250, representing 0.64% of the fund’s net assets. The fund discontinues accruing income on securities for which income has been deemed uncollectible and provides an estimate for losses on interest receivable. The securities have been identified on the accompanying Statement of Investments.
122 | Semiannual Report
Franklin Investors Securities Trust
Notes to Financial Statements (unaudited) (continued)
8. RESTRICTED SECURITIES
The Franklin Convertible Securities Fund invests in securities that are restricted under the Securities Act of 1933 (1933 Act) or which are subject to legal, contractual, or other agreed upon restrictions on resale. Restricted securities are often purchased in private placement transactions, and cannot be sold without prior registration unless the sale is pursuant to an exemption under the 1933 Act. Disposal of these securities may require greater effort and expense, and prompt sale at an acceptable price may be difficult. The fund may have registration rights for restricted securities. The issuer generally incurs all registration costs.
At April 30, 2014, the Franklin Convertible Securities Fund held investments in restricted securities, excluding certain securities exempt from registration under the 1933 Act deemed to be liquid, as follows:
| | | | | | |
| | | | Acquisition | | | |
| | Principal Amount | Issuer | Date | | Cost | Value |
| |
| $ | 14,000,000 | BearingPoint Liquidating Trust | 12/31/09 | $ | 18,900 | $ — |
9. OTHER DERIVATIVE INFORMATION
At April 30, 2014, the Franklin Balanced Fund’s and Franklin Real Return Fund’s investments in derivative contracts are reflected on the Statements of Assets and Liabilities as follows:
| | | | | | |
| | Asset Derivatives | Liability Derivatives |
| Derivative Contracts | | | | | | |
| Not Accounted for as | Statement of Assets and | | Fair Value | Statement of Assets and | | Fair Value |
| Hedging Instruments | Liabilities Location | | Amount | Liabilities Location | | Amount |
| Franklin Balanced Fund | | | | | | |
| Foreign exchange | | | | | | |
| contracts | Unrealized appreciation | | | Unrealized depreciation | | |
| | on forward exchange | | | on forward exchange | | |
| | contracts | $ | 130,024 | contracts | $ | 55,605 |
| Equity contracts | Investments, at value | | — | Options written, at value | | 270,000 |
| |
| Franklin Real Return Fund | | | | | | |
| Foreign exchange | | | | | | |
| contracts | Unrealized appreciation | | | Unrealized depreciation | | |
| | on forward exchange | | | on forward exchange | | |
| | contracts | $ | 47,925 | contracts | $ | 469,824 |
Semiannual Report | 123
Franklin Investors Securities Trust
Notes to Financial Statements (unaudited) (continued)
9. OTHER DERIVATIVE INFORMATION (continued)
For the period ended April 30, 2014, the effect of derivative contracts on the Franklin Balanced Fund’s and Franklin Real Return Fund’s Statements of Operations was as follows:
| | | |
| | | | Change in Unrealized |
| Derivative Contracts | | Realized Gain | Appreciation |
| Not Accounted for as | Statement of | (Loss) for the | (Depreciation) |
| Hedging Instruments | Operations Locations | Period | for the Period |
| Franklin Balanced Fund | | | |
| Foreign exchange | | | |
| contracts | Net realized gain (loss) from foreign | | |
| | currency transactions / Net change in | | |
| | unrealized appreciation (depreciation) | | |
| | on translation of other assets and | | |
| | liabilities denominated in foreign | | |
| | currencies | $ 2,154 | $ (2,154) |
| Equity contracts | Net realized gain (loss) from investments | | |
| | and written options / Net change in | | |
| | unrealized appreciation (depreciation) | | |
| | on investments | 948,767 | 371,520 |
| Franklin Real Return Fund | | | |
| Foreign exchange | | | |
| contracts | Net realized gain (loss) from foreign | | |
| | currency transactions / Net change in | | |
| | unrealized appreciation (depreciation) | | |
| | on translation of other assets and | | |
| | liabilities denominated in foreign | | |
| | currencies | (1,655,901) | 1,116,814 |
For the period ended April 30, 2014, the average month end fair value of derivatives represented 0.01% and 0.50%, respectively, of each fund’s average month end net assets. The average month end number of open derivative contracts for the period was 5 and 13, respectively, for each fund.
See Notes 1(e) and 6 regarding derivative financial instruments and investment transactions, respectively.
10. CREDIT FACILITY
The Funds, together with other U.S. registered and foreign investment funds (collectively, Borrowers), managed by Franklin Templeton Investments, are borrowers in a joint syndicated senior unsecured credit facility totaling $1.5 billion (Global Credit Facility) which matures on February 13, 2015. This Global Credit Facility provides a source of funds to the Borrowers for temporary and emergency purposes, including the ability to meet future unanticipated or unusually large redemption requests.
Under the terms of the Global Credit Facility, the Funds shall, in addition to interest charged on any borrowings made by the Funds and other costs incurred by the Funds, pay their share of fees and expenses incurred in connection with the implementation and maintenance of the Global Credit Facility, based upon their relative share of the aggregate net assets of all of the Borrowers,
124 | Semiannual Report
Franklin Investors Securities Trust
Notes to Financial Statements (unaudited) (continued)
10. CREDIT FACILITY (continued)
including an annual commitment fee of 0.07% based upon the unused portion of the Global Credit Facility. These fees are reflected in other expenses on the Statements of Operations. During the period ended April 30, 2014, the Funds did not use the Global Credit Facility.
11. FAIR VALUE MEASUREMENTS
The Funds follow a fair value hierarchy that distinguishes between market data obtained from independent sources (observable inputs) and the Funds’ own market assumptions (unobservable inputs). These inputs are used in determining the value of the Funds’ financial instruments and are summarized in the following fair value hierarchy:
- Level 1 – quoted prices in active markets for identical financial instruments
- Level 2 – other significant observable inputs (including quoted prices for similar financial instruments, interest rates, prepayment speed, credit risk, etc.)
- Level 3 – significant unobservable inputs (including the Funds’ own assumptions in determining the fair value of financial instruments)
The input levels are not necessarily an indication of the risk or liquidity associated with financial instruments at that level.
For movements between the levels within the fair value hierarchy, the Funds have adopted a policy of recognizing the transfers as of the date of the underlying event which caused the movement.
A summary of inputs used as of April 30, 2014, in valuing the Funds’ assets and liabilities carried at fair value, is as follows:
| | | | | | | | |
| | | Level 1 | | Level 2 | | Level 3 | | Total |
| Franklin Balanced Fund | | | | | | | | |
| Assets: | | | | | | | | |
| Investments in Securities: | | | | | | | | |
| Equity Investments:a | | | | | | | | |
| Materials | $ | 213,804,736 | $ | 1,945,000 | $ | — | $ | 215,749,736 |
| Energy | | 171,413,528 | | 24,112,618 | | — | | 195,526,146 |
| Utilities | | 128,722,500 | | 6,573,500 | | — | | 135,296,000 |
| Other Equity Investmentsb | | 906,337,308 | | — | | — | | 906,337,308 |
| Equity-Linked Securities. | | — | | 102,620,728 | | — | | 102,620,728 |
| Corporate Bonds | | — | | 635,555,600 | | — | | 635,555,600 |
| Senior Floating Rate Interests | | — | | 15,119,303 | | — | | 15,119,303 |
| Asset-Backed Securities and | | | | | | | | |
| Commercial Mortgage-Backed | | | | | | | | |
| Securities | | — | | 22,921 | | — | | 22,921 |
| Mortgage-Backed Securities | | — | | 51,694 | | — | | 51,694 |
| Short Term Investments | | 112,348,680 | | — | | — | | 112,348,680 |
| Total Investments in | | | | | | | | |
| Securities. | $ | 1,532,626,752 | $ | 786,001,364 | $ | — | $ | 2,318,628,116 |
| Other Financial Instruments | | | | | | | | |
| Forward Exchange Contracts | $ | — | $ | 130,024 | $ | — | $ | 130,024 |
Semiannual Report | 125
Franklin Investors Securities Trust
Notes to Financial Statements (unaudited) (continued)
| | | | | | | | | |
| 11. FAIR VALUE MEASUREMENTS (continued) | | | | | | |
| |
| | | | Level 1 | | Level 2 | | Level 3 | | Total |
| Franklin Balanced Fund (continued) | | | | | | | | | |
| Liabilities: | | | | | | | | | |
| Other Financial Instruments | | | | | | | | | |
| Options Written | | $ | 270,000 | $ | — | $ | — | $ | 270,000 |
| Forward Exchange Contracts | | | — | | 55,605 | | — | | 55,605 |
| Total Other Financial | | | | | | | | | |
| Instruments | | $ | 270,000 | $ | 55,605 | $ | — | $ | 325,605 |
| Franklin Convertible Securities Fund | | | | | | | | | |
| Assets: | | | | | | | | | |
| Investments in Securities: | | | | | | | | | |
| Equity Investments:a | | | | | | | | | |
| Energy | | $ | 42,054,076 | $ | 61,594,303 | $ | — | $ | 103,648,379 |
| Financials | | | 65,177,428 | | 14,999,850 | | — | | 80,177,278 |
| Materials | | | 15,055,920 | | 9,603,438 | | — | | 24,659,358 |
| Utilities | | | 63,033,728 | | 26,294,000 | | — | | 89,327,728 |
| Other Equity Investmentsb | | | 183,699,968 | | — | | — | | 183,699,968 |
| Convertible Bonds | | | — | | 1,401,563,243 | | —c | | 1,401,563,243 |
| Escrow Accounts and Litigation | | | | | | | | | |
| Trusts | | | — | | — | | 3,762 | | 3,762 |
| Short Term Investments | | | 70,609,419 | | — | | — | | 70,609,419 |
| Total Investments in | | | | | | | | | |
| Securities. | | $ | 439,630,539 | $ | 1,514,054,834 | $ | 3,762 | $ | 1,953,689,135 |
| Franklin Equity Income Fund | | | | | | | | | |
| Assets: | | | | | | | | | |
| Investments in Securities: | | | | | | | | | |
| Equity Investments:a | | | | | | | | | |
| Energy | | $ | 119,369,100 | $ | 18,980,000 | $ | — | $ | 138,349,100 |
| Other Equity Investmentsb | | | 1,832,776,813 | | — | | — | | 1,832,776,813 |
| Short Term Investments | | | 28,170,895 | | — | | — | | 28,170,895 |
| Total Investments in | | | | | | | | | |
| Securities. | $ | 1,980,316,808 | $ | 18,980,000 | $ | — | $ | 1,999,296,808 |
| Franklin Limited Maturity | | | | | | | | | |
| U.S. Government Securities Fund | | | | | | | | | |
| Assets: | | | | | | | | | |
| Investments in Securities: | | | | | | | | | |
| U.S. Government and | | | | | | | | | |
| Agency Securities | | $ | — | $ | 141,146,263 | $ | — | $ | 141,146,263 |
| Asset-Backed Securities and | | | | | | | | | |
| Commercial Mortgage-Backed | | | | | | | | | |
| Securities | | | — | | 50,629,352 | | — | | 50,629,352 |
| Mortgage-Backed Securities | | | — | | 263,727,124 | | — | | 263,727,124 |
| Short Term Investments | | | 9,639,412 | | 15,421,239 | | — | | 25,060,651 |
| Total Investments in | | | | | | | | | |
| Securities. | | $ | 9,639,412 | $ | 470,923,978 | $ | — | $ | 480,563,390 |
126 | Semiannual Report
Franklin Investors Securities Trust
Notes to Financial Statements (unaudited) (continued)
| | | | | | | | |
| 11. FAIR VALUE MEASUREMENTS (continued) | | | | | | | |
| |
| | | Level 1 | | Level 2 | | Level 3 | | Total |
| Franklin Real Return Fund | | | | | | | | |
| Assets: | | | | | | | | |
| Investments in Securities: | | | | | | | | |
| Equity Investmentsa,b | $ | 63,138,419 | $ | — | $ | — | $ | 63,138,419 |
| Corporate Bonds | | — | | 24,829,670 | | — | | 24,829,670 |
| Senior Floating Rate Interests | | — | | 17,577,590 | | — | | 17,577,590 |
| Foreign Government and Agency | | | | | | | | |
| Securities | | — | | 70,909,833 | | — | | 70,909,833 |
| U.S. Government and | | | | | | | | |
| Agency Securities | | — | | 194,657,933 | | — | | 194,657,933 |
| Short Term Investments | | — | | 30,751,420 | | — | | 30,751,420 |
| Total Investments in | | | | | | | | |
| Securities. | $ | 63,138,419 | $ | 338,726,446 | $ | — | $ | 401,864,865 |
| Other Financial Instruments | | | | | | | | |
| Forward Exchange Contracts | $ | — | $ | 47,925 | $ | — | $ | 47,925 |
| Liabilities: | | | | | | | | |
| Other Financial Instruments | | | | | | | | |
| Forward Exchange Contracts | $ | — | $ | 469,824 | $ | — | $ | 469,824 |
aIncludes common, preferred and convertible preferred stocks as well as other equity investments.
bFor detailed categories, see the accompanying Statements of Investments.
cIncludes a security determined to have no value at April 30, 2014.
A reconciliation of assets in which Level 3 inputs are used in determining fair value is presented when there are significant Level 3 financial instruments at the end of the period.
12. NEW ACCOUNTING PRONOUNCEMENTS
In June 2013, the Financial Accounting Standards Board issued Accounting Standards Update (ASU) No. 2013-08, Investment Companies (Topic 946): Amendments to the Scope, Measurement, and Disclosure Requirements. The ASU modifies the criteria used in defining an investment company under U.S. Generally Accepted Accounting Principles and also sets forth certain measurement and disclosure requirements. Under the ASU, an entity that is registered under the 1940 Act automatically qualifies as an investment company. The ASU is effective for interim and annual reporting periods beginning after December 15, 2013. Management has reviewed the requirements and believes the adoption of this ASU will not have a material impact on the financial statements.
Semiannual Report | 127
Franklin Investors Securities Trust
Notes to Financial Statements (unaudited) (continued)
13. SUBSEQUENT EVENTS
The Funds have evaluated subsequent events through the issuance of the financial statements and determined that no events have occurred that require disclosure, except for the following:
On May 30, 2014, shareholders of the Franklin Limited Maturity U.S. Government Securities Fund approved a proposal to reorganize the fund with and into the Franklin Adjustable U.S. Government Securities Fund on or about June 18, 2014.
ABBREVIATIONS
Counterparty Currency Selected Portfolio
DBAB - Deutsche Bank AG BRL - Brazilian Real ADR - American Depositary Receipt
JPHQ - JP Morgan Chase & Co. EUR - Euro FRN - Floating Rate Note
MSCO - Morgan Stanley KRW - South Korean Won MF - Multi-Family
MXN - Mexican Peso SF - Single Family
MYR - Malaysian Ringgit ETF - Exchange Traded Fund
PLN - Polish Zloty REIT - Real Estate Investment Trust
SEK - Swedish Krona SPDR - S&P Depositary Receipt
SGD - Singapore Dollar
128 | Semiannual Report
Franklin Investors Securities Trust
Shareholder Information
Board Review of Investment Management Agreement
At a meeting held February 25, 2014, the Board of Trustees (Board), including a majority of non-interested or independent Trustees, approved renewal of the investment management agreement for each of the separate funds within Franklin Investors Securities Trust (Fund(s)). In reaching this decision, the Board took into account information furnished throughout the year at regular Board meetings, as well as information prepared specifically in connection with the annual renewal review process. Information furnished and discussed throughout the year included investment performance reports and related financial information for each Fund, along with periodic reports on expenses, shareholder services, legal and compliance matters, pricing, brokerage commissions and execution and other services provided by the Investment Manager (Manager) and its affiliates. Information furnished specifically in connection with the renewal process included a report for each Fund prepared by Lipper, Inc. (Lipper), an independent organization, as well as additional material, including a Fund profitability analysis prepared by management. The Lipper reports compared each Fund’s investment performance and expenses with those of other mutual funds deemed comparable to the Fund as selected by Lipper. The Fund profitability analysis discussed the profitability to Franklin Templeton Investments from its overall U.S. fund operations, as well as on an individual fund-by-fund basis. Additional material accompanying such profitability analysis included information on a fund-by-fund basis listing portfolio managers and other accounts they manage, as well as information on management fees charged by the Manager and its affiliates to U.S. mutual funds and other accounts, including management’s explanation of differences where relevant. Such material also included a memorandum prepared by management describing project initiatives and capital investments relating to the services provided to the Funds by the Franklin Templeton Investments organization, as well as a memorandum relating to economies of scale and an analysis concerning transfer agent fees charged by an affiliate of the Manager.
In considering such materials, the independent Trustees received assistance and advice from and met separately with independent counsel. While the investment management agreements for all Funds were considered at the same Board meeting, the Board dealt with each Fund separately. In approving continuance of the investment management agreement for each Fund, the Board, including a majority of independent Trustees, determined that the existing management fee structure was fair and reasonable and that continuance of the investment management agreement was in the best interests of each Fund and its shareholders. While attention was given to all information furnished, the following discusses some primary factors relevant to the Board’s decision.
NATURE, EXTENT AND QUALITY OF SERVICES. The Board was satisfied with the nature and quality of the overall services provided by the Manager and its affiliates to the Funds and their shareholders. In addition to investment performance and expenses discussed later, the Board’s opinion was based, in part, upon periodic reports furnished it showing that the investment policies and restrictions for each Fund were consistently complied with as well as other reports periodically furnished the Board covering matters such as the compliance of portfolio managers and other management personnel with the code of ethics adopted throughout the Franklin Templeton fund complex, the adherence to fair value pricing procedures established by the Board, and the accuracy
Semiannual Report | 129
Franklin Investors Securities Trust
Shareholder Information (continued)
Board Review of Investment Management Agreement (continued)
of net asset value calculations. The Board also noted the extent of benefits provided Fund shareholders from being part of the Franklin Templeton family of funds, including the right to exchange investments between the same class of funds without a sales charge, the ability to reinvest Fund dividends into other funds and the right to combine holdings in other funds to obtain a reduced sales charge. Favorable consideration was given to management’s continual efforts and expenditures in establishing back-up systems and recovery procedures to function in the event of a natural disaster, it being noted that such systems and procedures had functioned well during the Florida hurricanes and blackouts experienced in previous years, and that those operations in the New York/New Jersey area ran smoothly during the period of the 2012 Hurricane Sandy. Among other factors taken into account by the Board were the Manager’s best execution trading policies, including a favorable report by an independent portfolio trading analytical firm, which also covered FOREX transactions. Consideration was also given to the experience of each Fund’s portfolio management team, the number of accounts managed and general method of compensation. In this latter respect, the Board noted that a primary factor in management’s determination of a portfolio manager’s bonus compensation was the relative investment performance of the funds he or she managed and that a portion of such bonus was required to be invested in a predesignated list of funds within such person’s fund management area so as to be aligned with the interests of shareholders. The Board also took into account the quality of transfer agent and shareholder services provided Fund shareholders by an affiliate of the Manager and the continual enhancements to the Franklin Templeton website. Particular attention was given to management’s conservative approach and diligent risk management procedures, including continual monitoring of counter-party credit risk and attention given to derivative and other complex instruments including expanded collateralization requirements. The Board also took into account, among other things, management’s efforts in establishing a global credit facility for the benefit of the Funds and other accounts managed by Franklin Templeton Investments to provide a source of cash for temporary and emergency purposes or to meet unusual redemption requests as well as the strong financial position of the Manager’s parent company and its commitment to the mutual fund business as evidenced by its subsidization of money market funds.
INVESTMENT PERFORMANCE. The Board placed significant emphasis on the investment performance of each Fund in view of its importance to shareholders. While consideration was given to performance reports and discussions with portfolio managers at Board meetings during the year, particular attention in assessing performance was given to the Lipper reports furnished for the agreement renewals. The Lipper reports prepared for each individual Fund showed the investment performance of its Class A shares in comparison with its selected performance universe during 2013 and during the previous 10 years ended December 31, 2013, unless otherwise noted. Performance on a total return basis was shown by Lipper for all Funds with performance on an income return basis being shown for those Funds having income return as an element of their investment objective. The following summarizes the performance results for each Fund.
130 | Semiannual Report
Franklin Investors Securities Trust
Shareholder Information (continued)
Board Review of Investment Management Agreement (continued)
Franklin Balanced Fund – The Fund’s investment performance was shown in comparison with a performance universe consisting of all retail and institutional mixed-asset target allocation growth funds as selected by Lipper during 2013 and previous years during which the Fund has been in existence. The Lipper report showed the Fund’s income return to be in the highest or best performing quintile of such universe during 2013, as well as the previous three- and five-year periods on an annualized basis. The Lipper report showed the Fund’s total return performance during 2013 to be in the lowest performing quintile of its performing universe, but to be in the middle performing quintile of such universe during the previous three-year period and the highest performing quintile of such universe during the previous five-year period on an annualized basis. The Board was satisfied with such comparative performance and noted that the Fund’s total return for 2013 exceeded 13% as shown in the Lipper report.
Franklin Convertible Securities Fund – The Fund’s investment performance was shown in comparison with a performance universe consisting of all retail and institutional convertible securities funds as selected by Lipper. The Lipper report showed the Fund’s income return during 2013 to be in the middle performing quintile, but upper half, of its performance universe and on an annualized basis during each of the previous three-, five- and 10-year periods to be in the highest quintile of such performance universe. The Lipper report showed the Fund’s total return during 2013 to be in the middle performing quintile, but upper half, of its performance universe and on an annualized basis to be in either the highest performing quintile or second-highest performing quintile of such universe for each of the previous three-, five- and 10-year periods. The Board was satisfied with the Fund’s comparative performance as set forth in the Lipper report.
Franklin Equity Income Fund – The Fund’s investment performance was shown in comparison with a performance universe consisting of all retail and institutional equity income funds as selected by Lipper. The Lipper report showed the Fund’s income return during 2013 to be in the second-highest performing quintile of the performance universe, and on an annualized basis during each of the previous three-, five- and 10-year periods to be in either the highest or second-highest performing quintile of such performance universe. The Lipper report showed the Fund’s total return during 2013 to be in the middle performing quintile of such universe and on an annualized basis to be in the second-lowest quintile of such universe for the previous three-year period, the second-highest performing quintile of such universe for the previous five-year period, and the lowest performing quintile of such universe for the previous 10-year period. In discussing such performance, management explained that it reflected the Fund’s longstanding strategy of investing in securities with yields higher than the overall market and Lipper peers. The Board believed the Fund’s overall performance as shown in the Lipper report to be satisfactory, noting its consistently good comparative income returns and the fact that its total return in 2013 as shown in the Lipper report exceeded 29% and was in the upper half of its performance universe.
Semiannual Report | 131
Franklin Investors Securities Trust
Shareholder Information (continued)
Board Review of Investment Management Agreement (continued)
Franklin Limited Maturity U.S. Government Securities Fund – The Fund’s investment performance was shown in comparison to a performance universe consisting of all retail and institutional short U.S. Government funds as selected by Lipper. The Lipper report showed the Fund’s income return during 2013 to be in the highest or best performing quintile of its performance universe and on an annualized basis to be in either the highest or second-highest performing quintile of such universe during each of the previous three-, five- and 10-year periods. The Lipper report showed the Fund’s total return to be in the middle performing quintile of it performance universe during 2013 and on an annualized basis to also be in the middle performing quintile of such universe for each of the previous three- and five-year periods, and to be in the second-highest performing quintile of such universe for the previous 10-year period. The Board was satisfied with the Fund’s comparative performance as shown in the Lipper report.
Franklin Real Return Fund – The Fund’s investment performance was shown in comparison to a performance universe consisting of all retail and institutional inflation protected bond funds as selected by Lipper. The Fund has been in operation for less than 10 years, and the Lipper report showed the Fund’s income return during 2013 to be in the highest or best performing quintile of such performance universe, and on an annualized basis to also be in either the highest or second-highest performing quintile of such universe during the previous three- and five-year periods. The Lipper report showed the Fund’s 2013 total return to be in the highest performing quintile of its performance universe, but on an annualized basis to be in the lowest and next to lowest performing quintiles of such universe during the previous three- and five-year periods, respectively. In discussing the Fund’s total return underperformance during the previous three- and five-year periods, management expressed the view that the performance universe contained many funds investing primarily in treasury inflation protected securities (TIPS) and held longer term TIPS that performed better during such periods than the Fund’s portfolio, which had a lesser weighting in TIPS with those held being of shorter duration. The Board found the Fund’s overall performance as shown in the Lipper report to be satisfactory, noting management’s explanation.
COMPARATIVE EXPENSES. Consideration was given to a comparative analysis of the management fees and total expense ratio of each Fund compared with those of a group of other funds selected by Lipper as constituting its appropriate Lipper expense group. Lipper expense data is based upon information taken from each fund’s most recent annual report, which reflects historical asset levels that may be quite different from those currently existing, particularly in a period of market volatility. While recognizing such inherent limitation and the fact that expense ratios generally increase as assets decline and decrease as assets grow, the Board believed the independent analysis conducted by Lipper to be an appropriate measure of comparative expenses. In reviewing comparative costs, Lipper provides information on each Fund’s contractual investment management fee in comparison with the contractual investment management fee that would have been charged by other funds within its Lipper expense group assuming they were similar in size to the Fund, as well as the actual total expense ratio of the Fund in comparison with those of its expense group. The Lipper contractual investment management fee analysis includes within such fee any
132 | Semiannual Report
Franklin Investors Securities Trust
Shareholder Information (continued)
Board Review of Investment Management Agreement (continued)
separate administrative fees, and Lipper total expenses, for comparative consistency, are shown by Lipper for Fund Class A shares. The results of such expense comparisons showed that the contractual investment management fee rate and actual total expense ratio for each of Franklin Convertible Securities Fund, Franklin Equity Income Fund and Franklin Limited Maturity U.S. Government Securities Fund were below the medians of their respective Lipper expense groups.
The Board was satisfied with the comparative contractual investment management fee rate and actual total expense ratios of these Funds as shown in the Lipper reports. The contractual investment management fee rate of Franklin Balanced Fund was less than two basis points above the median of its Lipper expense group, but its actual expense ratio was below the expense group median. The Board found the comparative contractual investment fee rate and actual total expense ratio of this Fund as shown in its Lipper report to be satisfactory. The contractual investment management fee rate for Franklin Real Return Fund was above the median of its Lipper expense group, and its actual total expense ratio was within eight basis points above the median of its expense group. The Board found the contractual management fees and total expense ratio of this Fund to be acceptable, noting that expenses were subsidized by management.
MANAGEMENT PROFITABILITY. The Board also considered the level of profits realized by the Manager and its affiliates in connection with the operation of each Fund. In this respect, the Board reviewed the Fund profitability analysis that addresses the overall profitability of Franklin Templeton’s U.S. fund business, as well as its profits in providing management and other services to each of the individual funds during the 12-month period ended September 30, 2013, being the most recent fiscal year-end for Franklin Resources, Inc., the Manager’s parent. In reviewing the analysis, the Board recognized that allocation methodologies are inherently subjective and various allocation methodologies may be reasonable while producing different results. In this respect, the Board noted that while management continually makes refinements to its methodologies in response to organizational and product related changes, the overall approach as defined by the primary drivers and activity measurements has remained consistent with that used in the Funds’ profitability report presentations from prior years. Additionally, the Funds’ independent registered public accounting firm had been engaged by the Manager to periodically review the reasonableness of the allocation methodologies to be used solely by the Funds’ Board in reference to the profitability analysis. In reviewing and discussing such analysis, management discussed with the Board its belief that costs incurred in establishing the infrastructure necessary for the type of mutual fund operations conducted by the Manager and its affiliates may not be fully reflected in the expenses allocated to each Fund in determining its profitability, as well as the fact that the level of profits, to a certain extent, reflected operational cost savings and efficiencies initiated by management. The Board also took into account management’s expenditures in improving shareholder services provided the Funds, as well as the need to implement systems and meet additional regulatory and compliance requirements resulting from statutes such as the Sarbanes-Oxley and Dodd-Frank Acts and recent SEC and other regulatory requirements. In addition, the Board considered a third-party study comparing the profitability of the Manager’s parent on an overall basis to other publicly held
Semiannual Report | 133
Franklin Investors Securities Trust
Shareholder Information (continued)
Board Review of Investment Management Agreement (continued)
managers broken down to show profitability from management operations exclusive of distribution expenses, as well as profitability including distribution expenses. The Board also considered the extent to which the Manager and its affiliates might derive ancillary benefits from fund operations, including revenues generated from transfer agent services and potential benefits resulting from allocation of fund brokerage and the use of commission dollars to pay for research. Based upon its consideration of all these factors, the Board determined that the level of profits realized by the Manager and its affiliates from providing services to each Fund was not excessive in view of the nature, quality and extent of services provided.
ECONOMIES OF SCALE. The Board also considered whether economies of scale are realized by the Manager as the Funds grow larger and the extent to which this is reflected in the level of management fees charged. While recognizing that any precise determination is inherently subjective, the Board noted that based upon the Fund profitability analysis, it appears that as some funds get larger, at some point economies of scale do result in the Manager realizing a larger profit margin on management services provided such a fund. The Board also noted that economies of scale are shared with each Fund and its shareholders through management fee breakpoints so that as a Fund grows in size, its effective management fee rate declines. The management fee for Franklin Limited Maturity U.S. Government Securities Fund provides an initial fee of 0.625% on the first $100 million of assets; 0.50% on the next $150 million of assets; and 0.45% on assets in excess of $250 million. At 2013 year-end, the Fund’s assets were approximately $510 million. The Board noted the Fund’s favorable contractual management fee rate and total expense ratio in respect to its Lipper expense group, as well as the fact that assets in excess of a fund’s last breakpoint still resulted in an overall lower investment management fee rate and believed that to the extent economies of scale may be realized by the Manager and its affiliates, there was a sharing of benefits with this Fund and its shareholders. Based on their year-end asset levels, all of the other Funds benefited from breakpoints contained in their management fee structures with additional breakpoints continuing beyond such asset levels. The Board believed that to the extent economies of scale may be realized by the Manager and its affiliates, the schedule of fees under the investment management agreement for each of such Funds provides a sharing of benefits with the Fund and its shareholders.
134 | Semiannual Report
Franklin Investors Securities Trust
Shareholder Information (continued)
Proxy Voting Policies and Procedures
The Trust’s investment manager has established Proxy Voting Policies and Procedures (Policies) that the Trust uses to determine how to vote proxies relating to portfolio securities. Shareholders may view the Trust’s complete Policies online at franklintempleton.com. Alternatively, shareholders may request copies of the Policies free of charge by calling the Proxy Group collect at (954) 527-7678 or by sending a written request to: Franklin Templeton Companies, LLC, 300 S.E. 2nd Street, Fort Lauderdale, FL 33301, Attention: Proxy Group. Copies of the Trust’s proxy voting records are also made available online at franklintempleton.com and posted on the U.S. Securities and Exchange Commission’s website at sec.gov and reflect the most recent 12-month period ended June 30.
Quarterly Statement of Investments
The Trust files a complete statement of investments with the U.S. Securities and Exchange Commission for the first and third quarters for each fiscal year on Form N-Q. Shareholders may view the filed Form N-Q by visiting the Commission’s website at sec.gov. The filed form may also be viewed and copied at the Commission’s Public Reference Room in Washington, DC. Information regarding the operations of the Public Reference Room may be obtained by calling (800) SEC-0330.
Semiannual Report | 135
This page intentionally left blank.
| | | | | | | |
| | Contents | | | | | |
| Shareholder Letter | 1 | Semiannual Report | | Franklin Low Duration | | Notes to | |
| | | Economic and Market Overview | 3 | Total Return Fund | 23 | Financial Statements | 136 |
| | | Franklin Adjustable U.S. | | Franklin Total Return Fund | 32 | Shareholder Information | 165 |
| | | Government Securities Fund | 4 | Financial Highlights and | | | |
| | | Franklin Floating Rate | | Statements of Investments | 41 | | |
| | | Daily Access Fund | 13 | Financial Statements | 129 | | |
| 1
Semiannual Report
Economic and Market Overview
The U.S. economy continued to show signs of recovery during the six-month period ended April 30, 2014, underpinned by strong consumer and business spending and rising inventories in the fourth quarter of 2013. Despite abnormally cold weather that suppressed economic activity in the first quarter of 2014, economic indicators were still broadly supportive of recovery at period-end. Manufacturing activity improved following a January slowdown attributed to adverse weather. Better weather conditions appeared to aid retail sales, which experienced a sharp rebound in March. The housing market had some weather-related weakness early in 2014 as investor interest abated, but home prices were higher than a year ago. The unemployment rate declined to 6.3% in April 2014 from 7.2% in October 2013.1 Inflation remained below the U.S. Federal Reserve Board’s (Fed’s) 2.0% target.
In January, Congress passed a spending bill to fund the federal government through September 2014. Congress then approved suspension of the debt ceiling until March 2015. Long-term Treasury yields rose late in 2013 as the Fed announced it would reduce its bond purchases $10 billion a month beginning in January 2014 while keeping interest rates low. However, yields declined through period-end as investors shifted from emerging market assets to less risky assets because of concerns over emerging market growth prospects and the potential impact of the Fed’s reductions to its asset-purchase program. Although economic data in early 2014 were soft in part because of severe winter weather, Fed Chair Janet Yellen kept the pace of asset-purchase tapering intact in the March meeting, while adopting a more qualitative approach to rate-hike guidance. However, the Fed remained committed to keeping interest rates low for a considerable time even after the asset-purchase program ends, depending on inflation and employment trends.
The 10-year Treasury yield rose from 2.57% at the beginning of the period to a high of 3.04% on December 31, 2013, mainly because of an improved economic environment and market certainty about the Fed’s plans. However, some weakening economic data and increasing political tension in Ukraine contributed to the 10-year U.S. Treasury yield’s decline to 2.67% at period-end.
The foregoing information reflects our analysis and opinions as of April 30, 2014. The information is not a
complete analysis of every aspect of any market, country, industry, security or fund. Statements of fact are
from sources considered reliable.
1. Source: Bureau of Labor Statistics.
Semiannual Report | 3
Franklin Adjustable
U.S. Government Securities Fund
Your Fund’s Goal and Main Investments: Franklin Adjustable U.S. Government
Securities Fund seeks to provide a high level of current income while providing lower volatility of principal than a fund that invests in fixed-rate securities by investing at least 80% of its net assets in adjustable-rate U.S. government mortgage securities, which are issued or guaranteed by the U.S. government, its agencies or instrumentalities.1 The Fund’s investments may include securities issued by Ginnie Mae and government-sponsored entities, such as Fannie Mae and Freddie Mac.2
Performance data represent past performance, which does not guarantee future results. Investment return and principal value will fluctuate, and you may have a gain or loss when you sell your shares. Current performance may differ from figures shown. Please visit franklintempleton.com or call (800) 342-5236 for most recent month-end performance.
We are pleased to bring you Franklin Adjustable U.S. Government Securities Fund’s semiannual report for the period ended April 30, 2014. We welcome shareholders of Franklin Limited Maturity U.S. Government Securities Fund, which has a planned merger into Franklin Adjustable U.S. Government Securities Fund, expected to be completed on June 18, 2014. Franklin Limited Maturity U.S. Government Securities Fund’s former shareholders may receive the Fund’s semiannual report upon request and without charge by calling (800) 342-5236 or by downloading it from our website, franklintempleton.com.
| |
| Portfolio Breakdown | |
| Franklin Adjustable | |
| U.S. Government Securities Fund | |
| Based on Total Net Assets as of 4/30/14 | |
| |
| Fannie Mae (FNMA) | |
| 71.5 | % |
| Freddie Mac (FHLMC) | |
| 21.8 | % |
| Ginnie Mae (GNMA) | |
| 0.9 | % |
| Asset-Backed & Commercial | |
| Mortgage-Backed Securities | |
| 0.0 | %* |
| Short-Term Investments & Other Net Assets | |
| 5.8 | % |
| |
| *Rounds to less than 0.1% of total net assets. | |
Performance Overview
Franklin Adjustable U.S. Government Securities Fund – Class A had a +0.40% cumulative total return for the six months under review. In comparison, the Fund’s benchmark, the Barclays U.S. Government Index: 1-2 Year Component, which measures public obligations of the U.S. Treasury with one to two years to final maturity and publicly issued debt of U.S. government agencies, quasi-federal corporations, and corporate or foreign debt guaranteed by the U.S. government, posted a +0.25% total return.3 You can find the Fund’s long-term performance data in the Performance Summary beginning on page 8.
Investment Strategy
We employ a conservative investment strategy as we strive to produce solid performance in a variety of interest rate climates. We choose securities using a value-oriented approach, emphasizing the bonds’ economic fundamentals in relation to comparable securities as well as their historical prepayment performance.
The dollar value, number of shares or principal amount, and names of all portfolio holdings are listed in the Fund’s Statement of Investments (SOI). The SOI begins on page 45.
4 | Semiannual Report
| | | | |
| Dividend Distributions* | | | | |
| Franklin Adjustable U.S. Government Securities Fund | | |
| 11/1/13–4/30/14 | | | | |
| | | Dividend per Share (cents) |
| Month | Class A | Class C | Class R6 | Advisor Class |
| November | 0.9245 | 0.6476 | 1.1626 | 1.0992 |
| December | 0.9683 | 0.6626 | 1.2239 | 1.1603 |
| January | 0.9155 | 0.6233 | 1.1444 | 1.1017 |
| February | 0.9555 | 0.6866 | 1.1989 | 1.1226 |
| March | 0.8712 | 0.5771 | 1.1208 | 1.0553 |
| April | 0.8461 | 0.5595 | 1.0901 | 1.0259 |
| Total | 5.4811 | 3.7567 | 6.9407 | 6.5650 |
*Assumes shares were purchased and held for the entire accrual period. Since dividends accrue daily, your actual dis-
tributions will vary depending on the date you purchased your shares and any account activity. All Fund distributions
will vary depending upon current market conditions, and past distributions are not indicative of future trends.
Manager’s Discussion
During the reporting period, economic indicators broadly supported the U.S. economy’s modest recovery. Much of the U.S. economic data released during the first quarter of 2014 was softer than many observers predicted and likely reflected the transitory effects of severe winter weather across much of the nation. U.S. economic data released near period-end, however, reflected a mild rebound that occurred after the sustained period of cold weather ended. However, despite the soft patch, employment data generally indicated the labor market continued to improve. Consumers’ financial situations in the fourth quarter of 2013 also continued to show meaningful improvement, which we thought could support consumption trends. Retail sales in March exceeded expectations, which suggested to us that consumer activity could recover from the weakness early in 2014. Although housing data were mixed, the housing market showed signs of recovery during the period after the effects of the severe winter and 2013’s higher mortgage rates subsided. Although consumer price inflation recently began to rise, it remained below the U.S. Federal Reserve Board’s (Fed’s) 2.0% target.
In a sign of more confidence in the economic outlook, the Fed revised its quantitative easing policy by reducing its monthly asset purchases starting in January. The reduction was split evenly between mortgage-backed securities (MBS) and Treasuries. The Fed also reiterated that it was not following a “preset course” and emphasized that future decisions would continue to be “contingent” on new economic data.
Semiannual Report | 5
What is duration?
Duration is a measure of a bond’s price sensitivity to interest rate changes. In general, a portfolio of securities with a lower duration can be expected to be less sensitive to interest rate changes than a portfolio with a higher duration.
The Fund employed a conservative strategy that invested primarily in adjustable rate mortgages (ARMs) that are either explicitly or implicitly backed by the U.S. government.1 These include securities issued or guaranteed by Fannie Mae (FNMA), Freddie Mac (FHLMC) or Ginnie Mae (GNMA). The Fund took a collateral-intensive research approach to analyze the prepayment behavior of individual ARM securities to identify those with the most attractive prepayment profiles and focused on seasoned ARMs. These securities have typically been through several interest rate cycles and therefore tend to be less sensitive to changes in interest rates, compared to newer issued counterparts. We have found such securities historically have experienced lower volatility than comparable maturity Treasuries and have provided more consistent income. We continued to focus on seasoned, post-reset FNMA and FHLMC ARM positions with average coupons below 3%.
At period-end, questions remained, however, about the demand source for agency MBS after the Fed ends its buying program. We felt demand from banks, mortgage real estate investment trusts, overseas investors and domestic money managers would need to rise to compensate for the Fed’s reduced presence in the MBS market after it completes its latest round of quantitative easing operations, which we believe could occur by the end of 2014. The Fed’s quantitative easing program does not include the ARM sector, but we feel ARM valuations could be impacted by movements in the broader fixed-rate agency MBS market following the Fed’s exit. The recent decline in gross issuance may continue to contribute to somewhat tighter spreads, but recent spreads were at the tighter end of historical levels. As interest rates and mortgage rates have moved higher, and mortgage credit remained constrained, actual prepayment levels have declined. The Fund’s focus on seasoned, short duration, high-quality ARMs that tend to be less sensitive to interest rate changes benefited performance, as did the Fund’s post-reset LIBOR indexed securities.4
6 | Semiannual Report
Thank you for your continued participation in Franklin Adjustable U.S. Government Securities Fund. We look forward to serving your future investment needs.

CFA® is a trademark owned by CFA Institute.
The foregoing information reflects our analysis, opinions and portfolio holdings as of April 30, 2014, the end of the
reporting period. The way we implement our main investment strategies and the resulting portfolio holdings may
change depending on factors such as market and economic conditions. These opinions may not be relied upon as
investment advice or an offer for a particular security. The information is not a complete analysis of every aspect
of any market, country, industry, security or the Fund. Statements of fact are from sources considered reliable,
but the investment manager makes no representation or warranty as to their completeness or accuracy. Although
historical performance is no guarantee of future results, these insights may help you understand our investment
management philosophy.
The index is unmanaged and includes reinvested interest. One cannot invest directly in an index, and an index is not
representative of the Fund’s portfolio.
1. Securities owned by the Fund, but not shares of the Fund, are issued or guaranteed by the U.S. government, its
agencies or instrumentalities, including government-sponsored entities, as to timely payment of principal and interest.
2. Although U.S. government-sponsored entities may be chartered or sponsored by acts of Congress, their securities
are neither issued nor guaranteed by the U.S. government. Please see the Fund’s prospectus for a detailed discussion
regarding various levels of credit support for government agency or instrumentality securities. The Fund’s yield and
share price are not guaranteed and will vary with market conditions.
3. Source: © 2014 Morningstar. All Rights Reserved. The information contained herein: (1) is proprietary to Morningstar
and/or its content providers; (2) may not be copied or distributed; and (3) is not warranted to be accurate, complete or
timely. Neither Morningstar nor its content providers are responsible for any damages or losses arising from any use of
this information.
4. The London Interbank Offered Rate (LIBOR) is the interest rate banks charge each other for loans. LIBOR is a widely
used benchmark for short-term interest rates.
Semiannual Report | 7
Performance Summary as of 4/30/14
Franklin Adjustable U.S. Government Securities Fund
Your dividend income will vary depending on dividends or interest paid by securities in the Fund’s portfolio, adjusted for operating expenses of each class. Capital gain distributions are net profits realized from the sale of portfolio securities. The performance table does not reflect any taxes that a shareholder would pay on Fund dividends, capital gain distributions, if any, or any realized gains on the sale of Fund shares. Total return reflects reinvestment of the Fund’s dividends and capital gain distributions, if any, and any unrealized gains or losses.
| | | | | | |
| Net Asset Value | | | | | | |
| Share Class | | 4/30/14 | | 10/31/13 | | Change |
| A (FISAX) | $ | 8.69 | $ | 8.72 | -$ | 0.03 |
| C (FCSCX) | $ | 8.69 | $ | 8.71 | -$ | 0.02 |
| R6 (n/a) | $ | 8.71 | $ | 8.73 | -$ | 0.02 |
| Advisor (FAUZX) | $ | 8.70 | $ | 8.73 | -$ | 0.03 |
| |
| |
| Distributions | | | | | | |
| Share Class | | Dividend Income | | | | |
| A (11/1/13–4/30/14) | $ | 0.054811 | | | | |
| C (11/1/13–4/30/14) | $ | 0.037567 | | | | |
| R6 (11/1/13–4/30/14) | $ | 0.069407 | | | | |
| Advisor (11/1/13–4/30/14) | $ | 0.065650 | | | | |
8 | Semiannual Report
Performance Summary (continued)
Performance as of 4/30/141
Cumulative total return excludes sales charges. Average annual total returns include maximum sales charges. Class A: 2.25%
maximum initial sales charge; Class C: 1% contingent deferred sales charge in first year only; Class R6/Advisor Class: no
sales charges.
| | | | | | | | |
| | Cumulative | | Average Annual | | Average Annual | | Total Annual | |
| Share Class | Total Return2 | | Total Return3 | | Total Return (3/31/14)4 | | Operating Expenses5 | |
| A | | | | | | | 0.87 | % |
| 6-Month | +0.40 | % | -1.85 | % | | | | |
| 1-Year | -0.15 | % | -2.36 | % | -2.21 | % | | |
| 5-Year | +7.19 | % | +0.93 | % | +0.96 | % | | |
| 10-Year | +28.03 | % | +2.27 | % | +2.22 | % | | |
| C | | | | | | | 1.27 | % |
| 6-Month | +0.20 | % | -0.80 | % | | | | |
| 1-Year | -0.54 | % | -1.53 | % | -1.49 | % | | |
| 5-Year | +4.95 | % | +0.97 | % | +1.02 | % | | |
| 10-Year | +22.90 | % | +2.08 | % | +2.04 | % | | |
| R6 | | | | | | | 0.54 | % |
| 6-Month | +0.57 | % | +0.57 | % | | | | |
| Since Inception (9/20/13)6 | +0.87 | % | +0.87 | % | +0.74 | % | | |
| Advisor7 | | | | | | | 0.62 | % |
| 6-Month | +0.41 | % | +0.41 | % | | | | |
| 1-Year | -0.01 | % | -0.01 | % | +0.26 | % | | |
| 5-Year | +8.42 | % | +1.63 | % | +1.71 | % | | |
| 10-Year | +29.95 | % | +2.65 | % | +2.61 | % | | |
| | | | | | |
| | Distribution | | 30-Day Standardized Yield9 | |
| Share Class | Rate8 | | (with waiver) | | (without waiver) | |
| A | 1.16 | % | 0.55 | % | 0.55 | % |
| C | 0.78 | % | 0.16 | % | 0.16 | % |
| R6 | 1.52 | % | 0.90 | % | 0.90 | % |
| Advisor | 1.43 | % | 0.80 | % | 0.80 | % |
Performance data represent past performance, which does not guarantee future results. Investment return and principal value
will fluctuate, and you may have a gain or loss when you sell your shares. Current performance may differ from figures shown.
For most recent month-end performance, go to franklintempleton.com or call (800) 342-5236.
Semiannual Report | 9
Performance Summary (continued)
All investments involve risks, including possible loss of principal. Interest rate movements, unscheduled mortgage prepayments and other risk factors will affect the Fund’s share price and yield. Bond prices generally move in the opposite direction of interest rates. As prices of bonds in the Fund adjust to a rise in interest rates, the Fund’s share price may decline. Changes in the financial strength of a bond issuer or in a bond’s credit rating may affect its value. The Fund is actively managed but there is no guarantee that the manager’s investment decisions will produce the desired results. The Fund’s prospectus also includes a description of the main investment risks.
| |
| Class C: | These shares have higher annual fees and expenses than Class A shares. |
| Class R6: | Shares are available to certain eligible investors as described in the prospectus. |
| Advisor Class: | Shares are available to certain eligible investors as described in the prospectus. |
1. The Fund has a fee waiver associated with its investments in a Franklin Templeton money fund, contractually guaranteed through at least its
current fiscal year-end. Fund investment results reflect the fee waiver, to the extent applicable; without this reduction, the results would have
been lower.
2. Cumulative total return represents the change in value of an investment over the periods indicated.
3. Average annual total return represents the average annual change in value of an investment over the periods indicated. Six-month return has
not been annualized.
4. In accordance with SEC rules, we provide standardized average annual total return information through the latest calendar quarter.
5. Figures are as stated in the Fund’s current prospectus. In periods of market volatility, assets may decline significantly, causing total annual Fund
operating expenses to become higher than the figures shown.
6. Performance shown is not annualized.
7. Effective 5/15/08, the Fund began offering Advisor Class shares, which do not have sales charges or a Rule 12b-1 plan. Performance quotations
for this class reflect the following methods of calculation: (a) For periods prior to 5/15/08, a restated figure is used based upon the Fund’s Class A
performance, excluding the effect of Class A’s maximum initial sales charge, but reflecting the effect of the Class A Rule 12b-1 fees; and (b) for peri-
ods after 5/15/08, actual Advisor Class performance is used reflecting all charges and fees applicable to that class. Since 5/15/08 (commencement
of sales), the cumulative and average annual total returns of Advisor Class shares were +13.06% and +2.08%.
8. Distribution rate is based on an annualization of the sum of the respective class’s past 30 days’ daily distributions and the maximum offering
price (NAV for Classes C, R6 and Advisor) per share on 4/30/14.
9. The 30-day standardized yield for the 30 days ended 4/30/14 reflects an estimated yield to maturity (assuming all portfolio securities are held to
maturity). It should be regarded as an estimate of the Fund’s rate of investment income, and it may not equal the Fund’s actual income distribution
rate (which reflects the Fund’s past dividends paid to shareholders) or the income reported in the Fund’s financial statements.
10 | Semiannual Report
Your Fund’s Expenses
Franklin Adjustable U.S. Government Securities Fund
As a Fund shareholder, you can incur two types of costs:
- Transaction costs, including sales charges (loads) on Fund purchases; and
- Ongoing Fund costs, including management fees, distribution and service (12b-1) fees, and other Fund expenses. All mutual funds have ongoing costs, sometimes referred to as operating expenses.
The following table shows ongoing costs of investing in the Fund and can help you understand these costs and compare them with those of other mutual funds. The table assumes a $1,000 investment held for the six months indicated.
Actual Fund Expenses
The first line (Actual) for each share class listed in the table provides actual account values and expenses. The “Ending Account Value” is derived from the Fund’s actual return, which includes the effect of Fund expenses.
You can estimate the expenses you paid during the period by following these steps. Of course, your account value and expenses will differ from those in this illustration:
| 1. | Divide your account value by $1,000. |
| | If an account had an $8,600 value, then $8,600 ÷ $1,000 = 8.6. |
| 2. | Multiply the result by the number under the heading “Expenses Paid During Period.” |
| | If Expenses Paid During Period were $7.50, then 8.6 x $7.50 = $64.50. |
In this illustration, the estimated expenses paid this period are $64.50.
Hypothetical Example for Comparison with Other Funds
Information in the second line (Hypothetical) for each class in the table can help you compare ongoing costs of investing in the Fund with those of other mutual funds. This information may not be used to estimate the actual ending account balance or expenses you paid during the period. The hypothetical “Ending Account Value” is based on the actual expense ratio for each class and an assumed 5% annual rate of return before expenses, which does not represent the Fund’s actual return. The figure under the heading “Expenses Paid During Period” shows the hypothetical expenses your account would have incurred under this scenario. You can compare this figure with the 5% hypothetical examples that appear in shareholder reports of other funds.
Semiannual Report | 11
Your Fund’s Expenses (continued)
Please note that expenses shown in the table are meant to highlight ongoing costs and do not reflect any transaction costs, such as sales charges. Therefore, the second line for each class is useful in comparing ongoing costs only, and will not help you compare total costs of owning different funds. In addition, if transaction costs were included, your total costs would have been higher. Please refer to the Fund prospectus for additional information on operating expenses.
| | | | | | |
| | | Beginning Account | | Ending Account | | Expenses Paid During |
| Share Class | | Value 11/1/13 | | Value 4/30/14 | | Period* 11/1/13– 4/30/14 |
| A | | | | | | |
| Actual | $ | 1,000 | $ | 1,004.00 | $ | 4.57 |
| Hypothetical (5% return before expenses) | $ | 1,000 | $ | 1,020.23 | $ | 4.61 |
| C | | | | | | |
| Actual | $ | 1,000 | $ | 1,002.00 | $ | 6.55 |
| Hypothetical (5% return before expenses) | $ | 1,000 | $ | 1,018.25 | $ | 6.61 |
| R6 | | | | | | |
| Actual | $ | 1,000 | $ | 1,005.70 | $ | 2.93 |
| Hypothetical (5% return before expenses) | $ | 1,000 | $ | 1,021.87 | $ | 2.96 |
| Advisor | | | | | | |
| Actual | $ | 1,000 | $ | 1,004.10 | $ | 3.33 |
| Hypothetical (5% return before expenses) | $ | 1,000 | $ | 1,021.47 | $ | 3.36 |
*Expenses are calculated using the most recent six-month expense ratio, annualized for each class (A: 0.92%; C: 1.32%; R6: 0.59%; and
Advisor: 0.67%), multiplied by the average account value over the period, multiplied by 181/365 to reflect the one-half year period.
12 | Semiannual Report
Franklin Floating Rate Daily Access Fund
Your Fund’s Goals and Main Investments: Franklin Floating Rate Daily Access Fund seeks to provide a high level of current income and, secondarily, preservation of capital by investing at least 80% of its net assets in income-producing floating interest rate corporate loans and corporate
debt securities.
Performance data represent past performance, which does not guarantee future results. Investment return and principal value will fluctuate, and you may have a gain or loss when you sell your shares. Current performance may differ from figures shown. Please visit franklintempleton.com or call (800) 342-5236 for most recent month-end performance.
What are corporate loans?
Corporate loans are typically floating rate loans to corporate borrowers made by a group, or syndicate, of banks and other financial institutions. These loans provide capital to companies for varied purposes, such as merger and acquisition activity, leveraged buyouts or refinancings. These loans are typically syndicated to a group of investors.
This semiannual report for Franklin Floating Rate Daily Access Fund covers the period ended April 30, 2014.
Performance Overview
Franklin Floating Rate Daily Access Fund – Class A delivered a +1.30% cumulative total return for the six months under review. In comparison, the Credit Suisse Leveraged Loan Index (CS LLI), which is designed to mirror the investable universe of the U.S. dollar-denominated leveraged loan market, posted a +2.56% total return.1 You can find the Fund’s long-term performance data in the Performance Summary beginning on page 18.
Corporate Loan Market Overview
Loan prices rose and spreads tightened during the six-month period amid expectations that accommodative monetary policies could continue despite modest tapering by the Federal Reserve Board, which helped support the overall technical environment for risk assets. Technical conditions specific to the loan market remained supportive as well, given robust demand from new collateralized loan obligations (CLOs) and inflows into loan mutual funds. However, price appreciation in the loan market stalled later in the period as inflows into loan mutual funds decelerated, new supply related to mergers and acquisitions (M&A) increased and repricing activity resumed. As a majority of loans traded above par, repricing transactions, such as refinancing transactions that tightened spreads and lowered LIBOR floors, were still prevalent and many investors were reluctant to pay significant premiums for loans that were largely expected to reprice.2 The softer technical conditions led to muted principal returns, and the Fund’s total returns were primarily driven by the income component.
The dollar value, number of shares or principal amount, and names of all portfolio holdings are listed in the Fund’s Statement of Investments (SOI). The SOI begins on page 53.
Semiannual Report | 13
| |
| Portfolio Breakdown | |
| Franklin Floating Rate Daily Access Fund | |
| Based on Total Net Assets as of 4/30/14 | |
| |
| Senior Floating Rate Interests | |
| 87.1 | % |
| Asset-Backed & Commercial | |
| Mortgage-Backed Securities | |
| 0.5 | % |
| Common Stocks | |
| 0.0 | %* |
| Corporate Bonds | |
| 0.0 | %* |
| Short-Term Investments & Other Net Assets | |
| 12.4 | % |
| |
| *Rounds to less than 0.01% of total net assets. | |
Although much of the primary market activity in prior periods was composed of refinancing activity, transactions related to M&A increased during the period under review and brought new supply to the loan market. However, much of the new issuance came in the form of smaller acquisitions, and refinancing and repricing activity remained a significant portion of primary activity. The newly repriced loans contributed to further tightening of institutional loan spreads, although investors were resistant to some of the more aggressive deals, leading arrangers to increase pricing or provide additional call protection. Still, arrangers sought to capitalize on the loan demand by launching new loans intended to finance dividends to private equity sponsors, which allowed them to monetize their investments. A significant percentage of dividend deals were also financed with second-lien loans amid supportive demand from loan investors, as well as high yield bond accounts seeking relatively higher yields following further tightening in that market.
New CLO volume increased as the period progressed, despite lingering uncertainty concerning potential regulations affecting demand for new vehicles. The looming implementation of these regulations helped constrain bank demand for CLO tranches rated AAA, as banks had been traditional buyers of the tranches. However, investors such as asset managers, insurance companies and pension funds stepped in as incremental buyers during the period, providing continued demand for short-duration products. As technical conditions in the loan market weakened toward period-end, CLOs helped to support loan prices, as the market’s wider loan spreads provided more arbitrage opportunities.
Although retail investors continued to contribute to demand and invest in loan mutual funds at the beginning of the review period, flows slowed markedly toward period-end. In April, loan mutual funds reported their first net monthly outflow since 2012. The stagnant flows followed a period of record inflows into the asset class, as relatively low U.S. Treasury yields possibly softened investor interest in the asset class as a potential hedge against rising interest rates.
The number of issuers defaulting declined during the period as only three issuers defaulted in the broad market, and we did not experience any defaults in our portfolio. However, one of the defaults included an electric utility that was one of the largest leveraged buyouts in loan market history. The company filed for bankruptcy near period-end and ultimately was responsible for the largest default in loan market history, leading to a significantly higher default rate by volume in 2014. Despite the electric utility issuer’s bankruptcy, fundamental factors remained supportive as issuers reported year-over-year revenue and earnings growth and most investors continued to expect below-average default rates. As higher rated loans experienced greater repricing activity and reduced yields, the favorable outlook for loan defaults led investors to seek higher yielding paper such as distressed loans, pushing their average price higher from significant discounts to par.
14 | Semiannual Report
| | | | |
| Dividend Distributions* | | | | |
| Franklin Floating Rate Daily Access Fund | | | |
| 11/1/13–4/30/14 | | | | |
| | | Dividend per Share (cents) |
| Month | Class A | Class C | Class R6 | Advisor Class |
| November | 2.6769 | 2.3859 | 2.9010 | 2.8612 |
| December | 2.9738 | 2.6529 | 3.2231 | 3.1770 |
| January | 2.6160 | 2.3048 | 2.8610 | 2.8147 |
| February | 2.4034 | 2.1228 | 2.6251 | 2.5821 |
| March | 2.6816 | 2.3716 | 2.9296 | 2.8794 |
| April | 2.6002 | 2.3002 | 2.8206 | 2.7915 |
| Total | 15.9519 | 14.1382 | 17.3604 | 17.1059 |
*Assumes shares were purchased and held for the entire accrual period. Since dividends accrue daily, your actual dis-
tributions will vary depending on the date you purchased your shares and any account activity. All Fund distributions
will vary depending upon current market conditions, and past distributions are not indicative of future trends.
Top 10 Holdings
Franklin Floating Rate Daily Access Fund 4/30/14
| | |
| Company | % of Total | |
| Sector/Industry | Net Assets | |
| William Morris Endeavor | | |
| Entertainment LLC | 1.6 | % |
| Movies & Entertainment | | |
| Clear Channel Communications Inc. | 1.4 | % |
| Broadcasting | | |
| Millennium Laboratories LLC | 1.2 | % |
| Health Care Services | | |
| BMC Software Finance Inc. | 1.2 | % |
| Internet Software & Services | | |
| Arysta Lifescience SPC LLC | 1.2 | % |
| Diversified Chemicals | | |
| FMG America Finance Inc. | 1.1 | % |
| Diversified Metals & Mining | | |
| Community Health Systems Inc. | 1.1 | % |
| Health Care Facilities | | |
| Altegrity Inc. | 1.0 | % |
| Human Resource & Employment Services | |
| TransDigm Inc. | 1.0 | % |
| Aerospace & Defense | | |
| Asurion LLC | 1.0 | % |
| Other Diversified Financial Services | |
Investment Strategy
We use a detailed credit analysis process to select corporate loan and corporate debt securities that meet our criteria. We conduct ongoing credit monitoring of our investments. To help manage the credit risk associated with investing in below-investment-grade securities, we seek to diversify the Fund by investing in a large number of loans of companies that we have identified as having attractive risk/reward profiles, favorable capital structures, strong asset coverage and dominant market shares. This diversification potentially reduces credit risk by spreading assets across many different industries.
Manager’s Discussion
The term loans of Clear Channel Communications, one of the largest radio companies, were among the top performers during the period as the company completed an amendment that allowed it to extend the maturities of its shorter dated term loans. The company also executed a debt exchange for its shorter dated high yield bonds. Investors appeared to be drawn to the significantly higher coupon of the extended term loans and took greater comfort in the company’s flexibility to address its near-term maturities. Caesar’s Entertainment term loans were also among the top performers as the company refinanced its mortgage debt in the prior period by issuing new term loans. Investors seemed to prefer the relatively attractive income of the new term loans, which were issued by a separate subsidiary from the operating company and included a collateral package that many investors viewed as attractive. Some investors also believed the transaction reduced refinancing risk for the operating company’s near-term debt within its highly leveraged capital structure, helping the shorter maturity loans trade higher during the period.
Semiannual Report | 15
The Fund continued to maintain modest exposure to second-lien loans, including one issued by Arysta Lifescience, a large agrochemical company specializing in the development, formulation and distribution of crop protection products. The company’s term loans, which were one of the Fund’s largest investments in the six-month period, were among the top contributors to performance owing to the relatively attractive income generation and price appreciation amid overall demand for higher yielding assets.
However, our allocation to loans with higher credit ratings at the beginning of the period, in particular our overweighting in loans rated BB- and above and underweighting in loans rated CCC and distressed, detracted from Fund performance relative to the index during the review period. For the six-month period ended April 30, 2014, distressed loans, which consist of loans rated CC, C and default, had the highest total returns, followed by loans rated CCC and B, according to the CS LLI.1 The upper tier of the index, which includes loans rated BB, had the lowest performance. One distressed issuer, a publisher of educational materials that the Fund did not own, contributed significantly to index performance during the period. The issuer’s default was the largest default by volume in 2013, and prices for its term loans traded higher following an agreement with loan investors that allowed the company to emerge from bankruptcy. In addition, one of the market’s largest issuers, the aforementioned electric utility in the lower tier segment, contributed to index performance amid investor expectations of a higher recovery of principal following its bankruptcy filing.
We invested in a select number of higher yielding loans based on our favorable outlook on loan defaults and in an attempt to lower volatility by seeking to limit spread duration and reduce the possible impact of higher Treasury yields. Our largest investments during the period reflected this strategy and included new issuers that sought to take advantage of stronger primary market conditions for deals related to M&A and dividend recapitalizations. William Morris Endeavor Entertainment, a global talent, entertainment and media company, launched new term loans to finance the company’s acquisition of IMG Worldwide Holdings. We invested in the first- and second-lien term loans largely because of the issuer’s market-leading position as a talent agency in the entertainment industry with key relationships with content owners, sponsors and broadcasters, as well as the company’s revenue diversification and free cash flow generation. We also invested in the term loans of Millennium Laboratories, a leading specialty laboratory focused on toxicology testing and monitoring. We liked the company’s leading market position, free cash flow generation, its U.S. and international growth prospects and the industry’s barriers to entry.
16 | Semiannual Report
Thank you for your continued participation in Franklin Floating Rate Daily Access Fund. We look forward to serving your future investment needs.

The foregoing information reflects our analysis, opinions and portfolio holdings as of April 30, 2014, the end of the
reporting period. The way we implement our main investment strategies and the resulting portfolio holdings may
change depending on factors such as market and economic conditions. These opinions may not be relied upon as
investment advice or an offer for a particular security. The information is not a complete analysis of every aspect
of any market, country, industry, security or the Fund. Statements of fact are from sources considered reliable,
but the investment manager makes no representation or warranty as to their completeness or accuracy. Although
historical performance is no guarantee of future results, these insights may help you understand our investment
management philosophy.
Effective June 1, 2013, Justin Ma joined the portfolio management team. Mr. Ma is an assistant portfolio manager for Franklin Advisers’ Floating Rate Debt Group and is also a member of the Investment Committee. Mr. Ma joined Franklin Templeton in 2006 as a member of the Futures Program and joined the Floating Rate Debt Group as a portfolio analyst in 2008.
The index is unmanaged and includes reinvested interest. One cannot invest directly in an index, and an index is not
representative of the Fund’s portfolio.
1. Copyright © 2014 CREDIT SUISSE GROUP AG and/or its affiliates. All rights reserved.
2. The London Interbank Offered Rate (LIBOR) is the interest rate banks charge each other for loans. LIBOR is a widely
used benchmark for short-term interest rates.
Semiannual Report | 17
Performance Summary as of 4/30/14
Franklin Floating Rate Daily Access Fund
Your dividend income will vary depending on dividends or interest paid by securities in the Fund’s portfolio, adjusted for operating expenses of each class. Capital gain distributions are net profits realized from the sale of portfolio securities. The performance table does not reflect any taxes that a shareholder would pay on Fund dividends, capital gain distributions, if any, or any realized gains on the sale of Fund shares. Total return reflects reinvestment of the Fund’s dividends and capital gain distributions, if any, and any unrealized gains or losses.
| | | | | | |
| Net Asset Value | | | | | | |
| Share Class | | 4/30/14 | | 10/31/13 | | Change |
| A (FAFRX) | $ | 9.16 | $ | 9.20 | -$ | 0.04 |
| C (FCFRX) | $ | 9.17 | $ | 9.20 | -$ | 0.03 |
| R6 (n/a) | $ | 9.17 | $ | 9.21 | -$ | 0.04 |
| Advisor (FDAAX) | $ | 9.17 | $ | 9.20 | -$ | 0.03 |
| |
| |
| Distributions | | | | | | |
| Share Class | | Dividend Income | | | | |
| A (11/1/13–4/30/14) | $ | 0.159519 | | | | |
| C (11/1/13–4/30/14) | $ | 0.141382 | | | | |
| R6 (11/1/13–4/30/14) | $ | 0.173604 | | | | |
| Advisor (11/1/13–4/30/14) | $ | 0.171059 | | | | |
18 | Semiannual Report
Performance Summary (continued)
Performance as of 4/30/141
Cumulative total return excludes sales charges. Average annual total returns include maximum sales charges. Class A: 2.25% maximum initial sales
charge; Class C: 1% contingent deferred sales charge in first year only; Class R6/Advisor Class: no sales charges.
| | | | | | | | | | | | | |
| | | Cumulative | | | Average Annual | | | Average Annual | | Total Annual Operating Expenses5 | |
| Share Class | | Total Return2 | | | Total Return3 | | | Total Return (3/31/14)4 | | (with waiver) | | (without waiver) | |
| A | | | | | | | | | | 0.85 | % | 0.87 | % |
| 6-Month | + | 1.30 | % | | -0.96 | % | | | | | | | |
| 1-Year | + | 2.98 | % | + | 0.68 | % | + | 1.25 | % | | | | |
| 5-Year | + | 42.25 | % | + | 6.82 | % | + | 7.95 | % | | | | |
| 10-Year | + | 42.68 | % | + | 3.39 | % | + | 3.42 | % | | | | |
| C | | | | | | | | | | 1.25 | % | 1.27 | % |
| 6-Month | + | 1.22 | % | + | 0.22 | % | | | | | | | |
| 1-Year | + | 2.68 | % | + | 1.68 | % | + | 2.15 | % | | | | |
| 5-Year | + | 39.60 | % | + | 6.90 | % | + | 8.03 | % | | | | |
| 10-Year | + | 37.28 | % | + | 3.22 | % | + | 3.26 | % | | | | |
| R6 | | | | | | | | | | 0.53 | % | 0.55 | % |
| 6-Month | + | 1.57 | % | + | 1.57 | % | | | | | | | |
| Since Inception (5/1/13)6 | + | 3.40 | % | + | 3.40 | % | + | 4.30 | % | | | | |
| Advisor | | | | | | | | | | 0.60 | % | 0.62 | % |
| 6-Month | + | 1.54 | % | + | 1.54 | % | | | | | | | |
| 1-Year | + | 3.35 | % | + | 3.35 | % | + | 3.83 | % | | | | |
| 5-Year | + | 44.19 | % | + | 7.59 | % | + | 8.70 | % | | | | |
| 10-Year | + | 46.44 | % | + | 3.89 | % | + | 3.93 | % | | | | |
| | | | | | |
| | Distribution | | 30-Day Standardized Yield8 | |
| Share Class | Rate7 | | (with waiver) | | (without waiver) | |
| A | 3.38 | % | 3.12 | % | 3.10 | % |
| C | 3.05 | % | 2.78 | % | 2.77 | % |
| R6 | 3.74 | % | 3.49 | % | 3.46 | % |
| Advisor | 3.70 | % | 3.44 | % | 3.42 | % |
Performance data represent past performance, which does not guarantee future results. Investment return and principal value will fluctuate, and you
may have a gain or loss when you sell your shares. Current performance may differ from figures shown. For most recent month-end performance, go to
franklintempleton.com or call (800) 342-5236.
Semiannual Report | 19
Performance Summary (continued)
All investments involve risks, including possible loss of principal. Investors should be aware that the Fund’s share price and yield will fluctuate
with market conditions. The Fund should not be considered an alternative to money market funds or certificates of deposit (CDs). The floating
rate loans and debt securities in which the Fund invests tend to be rated below investment grade. Investing in higher yielding, lower rated,
floating rate loans and debt securities involves greater risk of default, which could result in loss of principal — a risk that may be heightened
in a slowing economy. Interest earned on floating rate loans varies with changes in prevailing interest rates. Therefore, while floating rate loans
offer higher interest income when interest rates rise, they will also generate less income when interest rates decline. Changes in the financial
strength of a bond issuer or in a bond’s credit rating may affect its value. The Fund is actively managed but there is no guarantee that the man-
ager’s investment decisions will produce the desired results. The Fund’s prospectus also includes a description of the main investment risks.
| |
| Class C: | These shares have higher annual fees and expenses than Class A shares. |
| Class R6: | Shares are available to certain eligible investors as described in the prospectus. |
| Advisor Class: | Shares are available to certain eligible investors as described in the prospectus. |
1. The Fund has a fee waiver associated with its investments in a Franklin Templeton money fund, contractually guaranteed through at least its
current fiscal year-end. Fund investment results reflect the fee waiver; without this reduction, the results would have been lower.
2. Cumulative total return represents the change in value of an investment over the periods indicated.
3. Average annual total return represents the average annual change in value of an investment over the periods indicated. Six-month return has not
been annualized.
4. In accordance with SEC rules, we provide standardized average annual total return information through the latest calendar quarter.
5. Figures are as stated in the Fund’s current prospectus. In periods of market volatility, assets may decline significantly, causing total annual Fund
operating expenses to become higher than the figures shown.
6. Performance shown is not annualized.
7. Distribution rate is based on an annualization of the respective class’s past 30 days’ daily distributions and the maximum offering price (NAV for
Classes C, R6 and Advisor) per share on 4/30/14.
8. The 30-day standardized yield for the 30 days ended 4/30/14 reflects an estimated yield to maturity (assuming all portfolio securities are held to
maturity). It should be regarded as an estimate of the Fund’s rate of investment income, and it may not equal the Fund’s actual income distribution
rate (which reflects the Fund’s past dividends paid to shareholders) or the income reported in the Fund’s financial statements.
20 | Semiannual Report
Your Fund’s Expenses
Franklin Floating Rate Daily Access Fund
As a Fund shareholder, you can incur two types of costs:
- Transaction costs, including sales charges (loads) on Fund purchases; and
- Ongoing Fund costs, including management fees, distribution and service (12b-1) fees, and other Fund expenses. All mutual funds have ongoing costs, sometimes referred to as operating expenses.
The following table shows ongoing costs of investing in the Fund and can help you understand these costs and compare them with those of other mutual funds. The table assumes a $1,000 investment held for the six months indicated.
Actual Fund Expenses
The first line (Actual) for each share class listed in the table provides actual account values and expenses. The “Ending Account Value” is derived from the Fund’s actual return, which includes the effect of Fund expenses.
You can estimate the expenses you paid during the period by following these steps. Of course, your account value and expenses will differ from those in this illustration:
| 1. | Divide your account value by $1,000. |
| | If an account had an $8,600 value, then $8,600 ÷ $1,000 = 8.6. |
| 2. | Multiply the result by the number under the heading “Expenses Paid During Period.” |
| | If Expenses Paid During Period were $7.50, then 8.6 x $7.50 = $64.50. |
In this illustration, the estimated expenses paid this period are $64.50.
Hypothetical Example for Comparison with Other Funds
Information in the second line (Hypothetical) for each class in the table can help you compare ongoing costs of investing in the Fund with those of other mutual funds. This information may not be used to estimate the actual ending account balance or expenses you paid during the period. The hypothetical “Ending Account Value” is based on the actual expense ratio for each class and an assumed 5% annual rate of return before expenses, which does not represent the Fund’s actual return. The figure under the heading “Expenses Paid During Period” shows the hypothetical expenses your account would have incurred under this scenario. You can compare this figure with the 5% hypothetical examples that appear in shareholder reports of other funds.
Semiannual Report | 21
Your Fund’s Expenses (continued)
Please note that expenses shown in the table are meant to highlight ongoing costs and do not reflect any transaction costs, such as sales charges. Therefore, the second line for each class is useful in comparing ongoing costs only, and will not help you compare total costs of owning different funds. In addition, if transaction costs were included, your total costs would have been higher. Please refer to the Fund prospectus for additional information on operating expenses.
| | | | | | |
| | | Beginning Account | | Ending Account | | Expenses Paid During |
| Share Class | | Value 11/1/13 | | Value 4/30/14 | | Period* 11/1/13– 4/30/14 |
| A | | | | | | |
| Actual | $ | 1,000 | $ | 1,013.00 | $ | 3.99 |
| Hypothetical (5% return before expenses) | $ | 1,000 | $ | 1,020.83 | $ | 4.01 |
| C | | | | | | |
| Actual | $ | 1,000 | $ | 1,012.20 | $ | 5.99 |
| Hypothetical (5% return before expenses) | $ | 1,000 | $ | 1,018.84 | $ | 6.01 |
| R6 | | | | | | |
| Actual | $ | 1,000 | $ | 1,015.70 | $ | 2.45 |
| Hypothetical (5% return before expenses) | $ | 1,000 | $ | 1,022.36 | $ | 2.46 |
| Advisor | | | | | | |
| Actual | $ | 1,000 | $ | 1,015.40 | $ | 2.75 |
| Hypothetical (5% return before expenses) | $ | 1,000 | $ | 1,022.07 | $ | 2.76 |
*Expenses are calculated using the most recent six-month expense ratio, net of expense waivers, annualized for each class (A: 0.80%; C: 1.20%;
R6: 0.49%; and Advisor: 0.55%), multiplied by the average account value over the period, multiplied by 181/365 to reflect the one-half year period.
22 | Semiannual Report
Franklin Low Duration Total Return Fund
Your Fund’s Goal and Main Investments: Franklin Low Duration Total Return Fund seeks as high a level of current income as is consistent with prudent investing, while seeking capital preservation. The Fund invests primarily in investment-grade debt securities, including government and corporate debt securities and mortgage- and asset-backed securities, targeting an estimated average portfolio duration of three years or less.
What is duration?
Duration is a measure of a bond’s price sensitivity to interest rate changes. In general, a portfolio of securities with a lower duration can be expected to be less sensitive to interest rate changes than a portfolio with a higher duration.
Performance data represent past performance, which does not guarantee future results. Investment return and principal value will fluctuate, and you may have a gain or loss when you sell your shares. Current performance may differ from figures shown. Please visit franklintempleton.com or call (800) 342-5236 for most recent month-end performance.
We are pleased to bring you Franklin Low Duration Total Return Fund’s semiannual report for the period ended April 30, 2014.
Performance Overview
Franklin Low Duration Total Return Fund – Class A delivered a +0.80% cumulative total return for the six months under review. In comparison, the Fund’s benchmark, the Barclays U.S. Government/Credit Index: 1-3 Year Component, which tracks public obligations of the U.S. Treasury with one to three years to final maturity and publicly issued debt of U.S. government agencies, quasi-federal corporations, and corporate or foreign debt guaranteed by the U.S. government, posted a +0.40% total return.1, 2 You can find more of the Fund’s performance data in the Performance Summary beginning on page 27.
Investment Strategy
We seek to invest in a combination of fixed income securities, primarily from across the investment-grade debt universe. We analyze securities using proprietary and nonproprietary research to help us identify attractive investment opportunities across the entire fixed income opportunity set, on a relative basis. When making investment decisions, we evaluate business cycles, yield curves, and values between and within markets. Through a low duration portfolio, we seek to position the Fund to be less affected by interest rate changes than a fund with a higher duration. In addition, we may use derivative transactions, such as forwards, futures contracts and swap agreements, to obtain net long or short exposures to select currencies, interest rates, countries, duration or credit risks.
The dollar value, number of shares or principal amount, and names of all portfolio holdings are listed in the Fund’s
Statement of Investments (SOI). The SOI begins on page 71.
Semiannual Report | 23
| | | | |
| Dividend Distributions* | | | | |
| Franklin Low Duration Total Return Fund | | | |
| 11/1/13–4/30/14 | | | | |
| | | Dividend per Share (cents) |
| Month | Class A | Class C | Class R6 | Advisor Class |
| November | 1.3840 | 1.1494 | 1.6042 | 1.5348 |
| December** | 4.0621 | 3.7271 | 4.3677 | 4.2765 |
| January | 1.6969 | 1.3829 | 1.9825 | 1.8969 |
| February | 1.6274 | 1.3608 | 1.8789 | 1.7980 |
| March | 1.3555 | 1.0715 | 1.6401 | 1.5402 |
| April | 0.9812 | 0.7027 | 1.2517 | 1.1585 |
| Total | 11.1071 | 9.3944 | 12.7251 | 12.2049 |
*Assumes shares were purchased and held for the entire accrual period, which differs from the calendar month. Since
dividends accrue daily, your actual distributions will vary depending on the date you purchased your shares and any
account activity. All Fund distributions will vary depending upon current market conditions, and past distributions are
not indicative of future trends.
**Includes an additional 2.02 cent per share distribution to meet excise tax requirements.
Manager’s Discussion
During the reporting period, economic indicators broadly supported the U.S. economy’s modest recovery. Much of the U.S. economic data released during the first quarter of 2014 was softer than many observers predicted and likely reflected the transitory effects of severe winter weather across much of the nation. U.S. economic data released near period-end, however, reflected a mild rebound that occurred after the sustained period of cold weather ended. However, despite the soft patch, employment data generally indicated the labor market continued to improve. Consumers’ financial situations in the fourth quarter of 2013 also continued to show meaningful improvement, which we thought could support consumption trends. Retail sales in March exceeded expectations, which suggested to us that consumer activity could recover from the weakness early in 2014. Although housing data were mixed, the housing market showed signs of recovery during the period after the effects of the severe winter and 2013’s higher mortgage rates subsided. Although consumer price inflation recently began to rise, it remained below the U.S. Federal Reserve Board’s (Fed’s) 2.0% target.
In a sign of more confidence in the economic outlook, the Fed revised its quantitative easing policy by reducing its monthly asset purchases starting in January. The reduction was split evenly between mortgage-backed securities (MBS) and Treasuries. The Fed also reiterated that it was not following a “preset course” and emphasized that future decisions would continue to be “contingent” on new economic data.
24 | Semiannual Report
Most fixed income sectors delivered positive performance during the period and outperformed similar-duration U.S. Treasuries. Investors’ continued search for yield helped high yield bonds post among the best absolute performance during the period, as measured by the Barclays U.S. Corporate High Yield Index,2 which tracks below-investment-grade bonds. Several other major fixed income sectors delivered positive returns as well, including U.S. investment-grade corporate bonds, U.S. dollar-denominated emerging market bonds, commercial mortgage-backed securities (CMBS), agency residential MBS (RMBS), asset-backed securities and U.S. Treasury Inflation Protected Securities (TIPS).
During the period, the Fund’s corporate credit holdings, including high yield bonds and investment-grade debt, provided a strong boost to performance. The Fund’s security selection in CMBS provided a particularly strong boost to performance. Our non-agency RMBS positions were also beneficial to returns. For many of our non-U.S. dollar-denominated bonds, yield curve movements in non-U.S. markets had a positive impact on performance. In contrast, U.S. yield curve movements and foreign currencies detracted from results.
At period-end, we were overweighted compared to the benchmark in many of the credit sectors, including corporate credit and securitized products, based on our belief that valuations remained relatively attractive on a longer term basis. Over the period, we decreased our exposure to high yield and other forms of corporate credit as well as CMBS as yield spreads had become less attractive to us. We reduced our exposure to certain Treasury positions as we believed the two-year part of the yield curve might experience volatility in the near term.We maintained significant exposure to international bonds and currencies.
The portfolio utilized derivatives, including credit default and currency swaps, currency forwards, Treasury futures, and currency, interest rate swap and credit default swap options, principally as a tool for efficient portfolio management and to manage overall portfolio risk. These derivative transactions may provide the same, or similar, net long or short exposure to select currencies, interest rates, countries, duration or credit risks in a less expensive way than by directly purchasing securities. In those markets where portfolio securities are readily available, the cost difference in normal market conditions may be small.
| |
| Portfolio Breakdown | |
| Franklin Low Duration Total Return Fund | |
| Based on Total Net Assets as of 4/30/14 | |
| |
| Corporate Bonds | |
| 32.9 | % |
| Asset-Backed & Commercial | |
| Mortgage-Backed Securities | |
| 18.8 | % |
| U.S. Government & Agency Securities | |
| 8.4 | % |
| Senior Floating Rate Interests | |
| 6.0 | % |
| Mortgage-Backed Securities | |
| 4.5 | % |
| Foreign Government & Agency Securities | |
| 4.3 | % |
| Municipal Bonds | |
| 1.2 | % |
| Common Stocks and Exchange-Traded Funds | |
| 0.8 | % |
| Short-Term Investments & Other Net Assets | |
| 23.1 | % |
Semiannual Report | 25
Thank you for your continued participation in Franklin Low Duration Total Return Fund. We look forward to serving your future investment needs.

The foregoing information reflects our analysis, opinions and portfolio holdings as of April 30, 2014, the end of the
reporting period. The way we implement our main investment strategies and the resulting portfolio holdings may
change depending on factors such as market and economic conditions. These opinions may not be relied upon as
investment advice or an offer for a particular security. The information is not a complete analysis of every aspect
of any market, country, industry, security or the Fund. Statements of fact are from sources considered reliable,
but the investment manager makes no representation or warranty as to their completeness or accuracy. Although
historical performance is no guarantee of future results, these insights may help you understand our investment
management philosophy.
The index is unmanaged and includes reinvestment of any income or distributions. One cannot invest directly in an
index, and an index is not representative of the Fund’s portfolio.
1. Source: © 2014 Morningstar. All Rights Reserved. The information contained herein: (1) is proprietary to Morningstar
and/or its content providers; (2) may not be copied or distributed; and (3) is not warranted to be accurate, complete or
timely. Neither Morningstar nor its content providers are responsible for any damages or losses arising from any use of
this information.
2. Source: Barclays Global Family of Indices. © 2014 Barclays Capital Inc. Used with permission.
26 | Semiannual Report
Performance Summary as of 4/30/14
Franklin Low Duration Total Return Fund
Your dividend income will vary depending on dividends or interest paid by securities in the Fund’s portfolio, adjusted for operating expenses of each class. Capital gain distributions are net profits realized from the sale of portfolio securities. The performance table does not reflect any taxes that a shareholder would pay on Fund dividends, capital gain distributions, if any, or any realized gains on the sale of Fund shares. Total return reflects reinvestment of the Fund’s dividends and capital gain distributions, if any, and any unrealized gains or losses.
| | | | | | |
| Net Asset Value | | | | | | |
| Share Class | | 4/30/14 | | 10/31/13 | | Change |
| A (FLDAX) | $ | 10.13 | $ | 10.16 | -$ | 0.03 |
| C (FLDCX) | $ | 10.13 | $ | 10.16 | -$ | 0.03 |
| R6 (n/a) | $ | 10.16 | $ | 10.19 | -$ | 0.03 |
| Advisor (FLDZX) | $ | 10.16 | $ | 10.19 | -$ | 0.03 |
| |
| |
| Distributions | | | | | | |
| Share Class | | Dividend Income | | | | |
| A (11/1/13–4/30/14) | $ | 0.111071 | | | | |
| C (11/1/13–4/30/14) | $ | 0.093944 | | | | |
| R6 (11/1/13–4/30/14) | $ | 0.127251 | | | | |
| Advisor (11/1/13–4/30/14) | $ | 0.122049 | | | | |
Semiannual Report | 27
Performance Summary (continued)
Performance as of 4/30/141
Cumulative total return excludes sales charges. Average annual total returns include maximum sales charges. Class A: 2.25% maximum initial sales
charge; Class C: 1% contingent deferred sales charge in first year only; Class R6/Advisor Class: no sales charges.
| | | | | | | | | | |
| | Cumulative | | Average Annual | | Average Annual | | Total Annual Operating Expenses5 | |
| Share Class | Total Return2 | | Total Return3 | | Total Return (3/31/14)4 | | (with waiver) | | (without waiver) | |
| A | | | | | | | 0.80 | % | 0.98 | % |
| 6-Month | +0.80 | % | -1.43 | % | | | | | | |
| 1-Year | +0.99 | % | -1.32 | % | -1.14 | % | | | | |
| 5-Year | +17.86 | % | +2.87 | % | +3.06 | % | | | | |
| Since Inception (11/17/04) | +38.21 | % | +3.24 | % | +3.25 | % | | | | |
| C | | | | | | | 1.20 | % | 1.38 | % |
| 6-Month | +0.63 | % | -0.36 | % | | | | | | |
| 1-Year | +0.64 | % | -0.34 | % | -0.26 | % | | | | |
| Since Inception (10/1/12) | +1.78 | % | +1.13 | % | +1.07 | % | | | | |
| R6 | | | | | | | 0.44 | % | 0.62 | % |
| 6-Month | +0.96 | % | +0.96 | % | | | | | | |
| Since Inception (5/1/13)6 | +1.40 | % | +1.40 | % | +1.17 | % | | | | |
| Advisor7 | | | | | | | 0.55 | % | 0.73 | % |
| 6-Month | +0.91 | % | +0.91 | % | | | | | | |
| 1-Year | +1.30 | % | +1.30 | % | +1.50 | % | | | | |
| 5-Year | +19.53 | % | +3.63 | % | +3.81 | % | | | | |
| Since Inception (11/17/04) | +40.46 | % | +3.66 | % | +3.68 | % | | | | |
| | | | | | |
| | Distribution | | 30-Day Standardized Yield9 | |
| Share Class | Rate8 | | (with waiver) | | (without waiver) | |
| A | 1.14 | % | 0.86 | % | 0.74 | % |
| C | 0.83 | % | 0.49 | % | 0.36 | % |
| R6 | 1.48 | % | 1.26 | % | 1.14 | % |
| Advisor | 1.37 | % | 1.13 | % | 1.01 | % |
Performance data represent past performance, which does not guarantee future results. Investment return and principal value will fluctuate, and you
may have a gain or loss when you sell your shares. Current performance may differ from figures shown. For most recent month-end performance, go to
franklintempleton.com or call (800) 342-5236.
28 | Semiannual Report
Performance Summary (continued)
All investments involve risks, including possible loss of principal. Interest rate movements and mortgage prepayments will affect the Fund’s share price and yield. Bond prices generally move in the opposite direction of interest rates. As prices of bonds in the Fund adjust to a rise in interest rates, the Fund’s share price may decline. Changes in the financial strength of a bond issuer or in a bond’s credit rating may affect its value. Derivatives, including currency management strategies, involve costs and can create economic leverage in the portfolio that may result in significant volatility and cause the Fund to participate in losses (as well as enable gains) on an amount that exceeds the Fund’s initial investment. The Fund may not achieve the anticipated benefits, and may realize losses when a counterparty fails to perform as promised. Some derivatives are particularly sensitive to changes in interest rates. Foreign securities involve special risks, including currency fluctuations and economic and political uncertainty. The Fund is actively managed but there is no guarantee that the manager’s investment decisions will produce the desired results. The Fund’s prospectus also includes a description of the main investment risks.
| |
| Class C: | These shares have higher annual fees and expenses than Class A shares. |
| Class R6: | Shares are available to certain eligible investors as described in the prospectus. |
| Advisor Class: | Shares are available to certain eligible investors as described in the prospectus. |
1. The Fund has an expense reduction contractually guaranteed through at least 2/28/15 and a fee waiver associated with its investments in a
Franklin Templeton money fund, contractually guaranteed through at least its current fiscal year-end. Fund investment results reflect the expense
reduction and fee waiver, to the extent applicable; without these reductions, the results would have been lower.
2. Cumulative total return represents the change in value of an investment over the periods indicated.
3. Average annual total return represents the average annual change in value of an investment over the periods indicated. Six-month return has
not been annualized.
4. In accordance with SEC rules, we provide standardized average annual total return information through the latest calendar quarter.
5. Figures are as stated in the Fund’s current prospectus. In periods of market volatility, assets may decline significantly, causing total annual Fund
operating expenses to become higher than the figures shown.
6. Performance shown is not annualized.
7. Effective 5/15/08, the Fund began offering Advisor Class shares, which do not have sales charges or a Rule 12b-1 plan. Performance quotations
for this class reflect the following methods of calculation: (a) For periods prior to 5/15/08, a restated figure is used based upon the Fund’s Class A
performance, excluding the effect of Class A’s maximum initial sales charge, but reflecting the effect of the Class A Rule 12b-1 fees; and (b) for peri-
ods after 5/15/08, actual Advisor Class performance is used reflecting all charges and fees applicable to that class. Since 5/15/08 (commencement
of sales), the cumulative and average annual total returns of Advisor Class shares were +23.40% and +3.59%.
8. Distribution rate is based on an annualization of the sum of the respective class’s past 30 days’ daily distributions and the maximum offering
price (NAV for Classes C, R6 and Advisor) per share on 4/30/14.
9. The 30-day standardized yield for the 30 days ended 4/30/14 reflects an estimated yield to maturity (assuming all portfolio securities are held to
maturity). It should be regarded as an estimate of the Fund’s rate of investment income, and it may not equal the Fund’s actual income distribution
rate (which reflects the Fund’s past dividends paid to shareholders) or the income reported in the Fund’s financial statements.
Semiannual Report | 29
Your Fund’s Expenses
Franklin Low Duration Total Return Fund
As a Fund shareholder, you can incur two types of costs:
- Transaction costs, including sales charges (loads) on Fund purchases; and
- Ongoing Fund costs, including management fees, distribution and service (12b-1) fees, and other Fund expenses. All mutual funds have ongoing costs, sometimes referred to as operating expenses.
The following table shows ongoing costs of investing in the Fund and can help you understand these costs and compare them with those of other mutual funds. The table assumes a $1,000 investment held for the six months indicated.
Actual Fund Expenses
The first line (Actual) for each share class listed in the table provides actual account values and expenses. The “Ending Account Value” is derived from the Fund’s actual return, which includes the effect of Fund expenses.
You can estimate the expenses you paid during the period by following these steps. Of course, your account value and expenses will differ from those in this illustration:
| 1. | Divide your account value by $1,000. |
| | If an account had an $8,600 value, then $8,600 ÷ $1,000 = 8.6. |
| 2. | Multiply the result by the number under the heading “Expenses Paid During Period.” |
| | If Expenses Paid During Period were $7.50, then 8.6 x $7.50 = $64.50. |
In this illustration, the estimated expenses paid this period are $64.50.
Hypothetical Example for Comparison with Other Funds
Information in the second line (Hypothetical) for each class in the table can help you compare ongoing costs of investing in the Fund with those of other mutual funds. This information may not be used to estimate the actual ending account balance or expenses you paid during the period. The hypothetical “Ending Account Value” is based on the actual expense ratio for each class and an assumed 5% annual rate of return before expenses, which does not represent the Fund’s actual return. The figure under the heading “Expenses Paid During Period” shows the hypothetical expenses your account would have incurred under this scenario. You can compare this figure with the 5% hypothetical examples that appear in shareholder reports of other funds.
30 | Semiannual Report
Your Fund’s Expenses (continued)
Please note that expenses shown in the table are meant to highlight ongoing costs and do not reflect any transaction costs, such as sales charges. Therefore, the second line for each class is useful in comparing ongoing costs only, and will not help you compare total costs of owning different funds. In addition, if transaction costs were included, your total costs would have been higher. Please refer to the Fund prospectus for additional information on operating expenses.
| | | | | | |
| | | Beginning Account | | Ending Account | | Expenses Paid During |
| Share Class | | Value 11/1/13 | | Value 4/30/14 | | Period* 11/1/13– 4/30/14 |
| A | | | | | | |
| Actual | $ | 1,000 | $ | 1,008.00 | $ | 3.98 |
| Hypothetical (5% return before expenses) | $ | 1,000 | $ | 1,020.83 | $ | 4.01 |
| C | | | | | | |
| Actual | $ | 1,000 | $ | 1,006.30 | $ | 5.97 |
| Hypothetical (5% return before expenses) | $ | 1,000 | $ | 1,018.84 | $ | 6.01 |
| R6 | | | | | | |
| Actual | $ | 1,000 | $ | 1,009.60 | $ | 2.14 |
| Hypothetical (5% return before expenses) | $ | 1,000 | $ | 1,022.66 | $ | 2.16 |
| Advisor | | | | | | |
| Actual | $ | 1,000 | $ | 1,009.10 | $ | 2.74 |
| Hypothetical (5% return before expenses) | $ | 1,000 | $ | 1,022.07 | $ | 2.76 |
*Expenses are calculated using the most recent six-month expense ratio, net of expense waivers, annualized for each class (A: 0.80%; C: 1.20%;
R6: 0.43%; and Advisor: 0.55%), multiplied by the average account value over the period, multiplied by 181/365 to reflect the one-half year period.
Semiannual Report | 31
Franklin Total Return Fund
Your Fund’s Goals and Main Investments: Franklin Total Return Fund seeks to provide investors with high current income consistent with preservation of capital. Capital appreciation over the long term is a secondary goal. The Fund invests at least 80% of its assets in investment-grade debt securities. The Fund currently focuses on government and corporate debt securities and mortgage- and asset-backed securities.
Performance data represent past performance, which does not guarantee future results. Investment return and principal value will fluctuate, and you may have a gain or loss when you sell your shares. Current performance may differ from figures shown. Please visit franklintempleton.com or call (800) 342-5236 for most recent month-end performance.
What is duration?
Duration is a measure of a bond’s price sensitivity to interest rate changes. In general, a portfolio of securities with a lower duration can be expected to be less sensitive to interest rate changes than a portfolio with a higher duration.
We are pleased to bring you Franklin Total Return Fund’s semiannual report for the period ended April 30, 2014.
Performance Overview
Franklin Total Return Fund – Class A delivered a +2.29% cumulative total return for the six months under review. In comparison, the Fund’s benchmark, the Barclays U.S. Aggregate Index, which measures the U.S. investment-grade, fixed-rate, taxable bond market with index components for government and corporate, mortgage pass-through and asset-backed securities, posted a +1.74% total return.1, 2 You can find the Fund’s long-term performance data in the Performance Summary beginning on page 36.
Investment Strategy
We seek to invest in a combination of fixed income securities, predominantly from across the investment-grade debt universe. We analyze securities using proprietary and nonproprietary research to help us identify attractive investment opportunities, across the entire fixed income opportunity set, on a relative basis. The Fund may also invest up to 20% of its total assets in noninvestment-grade debt securities. In addition, we may use derivative transactions, such as forwards, futures contracts and swap agreements, to obtain net long or short exposures to select currencies, interest rates, countries, duration or credit risks.
Manager’s Discussion
During the reporting period, economic indicators broadly supported the U.S. economy’s modest recovery. Much of the U.S. economic data released during the first quarter of 2014 was softer than many observers predicted and likely reflected the transitory effects of severe winter weather across much of the
The dollar value, number of shares or principal amount, and names of all portfolio holdings are listed in the Fund’s
Statement of Investments (SOI). The SOI begins on page 101.
32 | Semiannual Report
| | |
| Portfolio Breakdown | | |
| Franklin Total Return Fund | | |
| Based on Total Investments | | |
| Sector | 4/30/14 | |
| Corporate Bonds | 29.7 | % |
| Mortgage-Backed Securities | 17.2 | % |
| U.S. Government & Agency Securities | 16.7 | % |
| Asset-Backed & Commercial Mortgage-Backed Securities | 10.8 | % |
| Foreign Government & Agency Securities | 7.7 | % |
| Municipal Bonds | 4.4 | % |
| Senior Floating Rate Interests | 3.6 | % |
| Preferred Stocks | 0.4 | % |
| Common Stocks | 0.1 | % |
| Escrow Accounts/Litigation Trusts | 0.0 | %* |
| Options Purchased | 0.0 | %* |
| Short-Term Investments | 9.4 | % |
| |
| *Rounds to less than 0.1% of total investments. | | |
nation. U.S. economic data released near period-end, however, reflected a mild rebound that occurred after the sustained period of cold weather ended. However, despite the soft patch, employment data generally indicated the labor market continued to improve. Consumers’ financial situations in the fourth quarter of 2013 also continued to show meaningful improvement, which we thought could support consumption trends. Retail sales in March exceeded expectations, which suggested to us that consumer activity could recover from the weakness early in 2014. Although housing data were mixed, the housing market showed signs of recovery during the period after the effects of the severe winter and 2013’s higher mortgage rates subsided. Although consumer price inflation recently began to rise, it remained below the U.S. Federal Reserve Board’s (Fed’s) 2.0% target.
In a sign of more confidence in the economic outlook, the Fed revised its quantitative easing policy by reducing its monthly asset purchases starting in January. The reduction was split evenly between mortgage-backed securities (MBS) and Treasuries. The Fed also reiterated that it was not following a “preset course” and emphasized that future decisions would continue to be “contingent” on new economic data.
Most credit sectors delivered positive performance during the period and outperformed similar-duration U.S. Treasuries. Investors’ continued search for yield helped high yield bonds post among the best absolute performance during the period, as measured by the Barclays U.S. Corporate High Yield Index,2
Semiannual Report | 33
| | | | | |
| Dividend Distributions* | | | | |
| Franklin Total Return Fund | | | | |
| 11/1/13–4/30/14 | | | | | |
| | | Dividend per Share (cents) | |
| Month | Class A | Class C | Class R | Class R6 | Advisor Class |
| November | 3.1726 | 2.8505 | 2.9730 | 3.4738 | 3.3784 |
| December** | 10.1921 | 9.8496 | 9.9776 | 10.5203 | 10.4106 |
| January | 3.0305 | 2.7034 | 2.8255 | 3.3340 | 3.2412 |
| February | 2.0258 | 1.7503 | 1.8540 | 2.2945 | 2.2003 |
| March | 2.3745 | 2.0663 | 2.1813 | 2.6855 | 2.5714 |
| April | 1.7399 | 1.5177 | 1.6012 | 2.0089 | 1.8817 |
| Total | 22.5354 | 20.7378 | 21.4126 | 24.3170 | 23.6836 |
*Assumes shares were purchased and held for the entire accrual period. Since dividends accrue daily, your actual dis-
tributions will vary depending on the date you purchased your shares and any account activity. All Fund distributions
will vary depending upon current market conditions, and past distributions are not indicative of future trends.
**Includes an additional 7.02 cent per share distribution to meet excise tax requirements.
which tracks below-investment-grade bonds. Several other major fixed income sectors delivered positive returns as well, including U.S. investment-grade corporate bonds, U.S. dollar-denominated emerging market bonds, commercial mortgage-backed securities (CMBS), agency residential MBS (RMBS), asset-backed securities and U.S. Treasury Inflation Protected Securities (TIPS).
During the period, the Fund’s corporate credit holdings, including high yield bonds and investment-grade debt, provided a strong boost to performance. Our underweighted allocation to agency MBS aided results as did our security selection within the sector. The Fund’s security selection in CMBS provided a particularly strong boost to performance. Our non-agency RMBS and municipal bond positions were also beneficial to returns. For many of our non-U.S. dollar-denominated bonds, yield curve movements in non-U.S. markets had a positive impact on performance. In contrast, U.S. yield curve movements and foreign currencies detracted from results.
At period-end, we were slightly overweighted compared to the benchmark in many of the credit sectors, including corporate credit and securitized products, based on our belief that valuations remained relatively attractive on a longer term basis. Over the period, we decreased our exposure to high yield corporate securities and CMBS as yield spreads had become less attractive to us. We maintained significant exposure to international bonds and currencies.
The portfolio utilized derivatives, including credit default and currency swaps, currency forwards, Treasury futures, and currency and credit default swap options, principally as a tool for efficient portfolio management and to manage
34 | Semiannual Report
overall portfolio risk. These derivative transactions may provide the same, or similar, net long or short exposure to select currencies, interest rates, countries, duration or credit risks in a less expensive way than by directly purchasing securities. In those markets where portfolio securities are readily available, the cost difference in normal market conditions may be small.
Thank you for your continued participation in Franklin Total Return Fund.
We look forward to serving your future investment needs.
The foregoing information reflects our analysis, opinions and portfolio holdings as of April 30, 2014, the end of the
reporting period. The way we implement our main investment strategies and the resulting portfolio holdings may
change depending on factors such as market and economic conditions. These opinions may not be relied upon as
investment advice or an offer for a particular security. The information is not a complete analysis of every aspect
of any market, country, industry, security or the Fund. Statements of fact are from sources considered reliable,
but the investment manager makes no representation or warranty as to their completeness or accuracy. Although
historical performance is no guarantee of future results, these insights may help you understand our investment
management philosophy.
The index is unmanaged and includes reinvested interest. One cannot invest directly in an index, and an index is not
representative of the Fund’s portfolio.
1. Source: © 2014 Morningstar. All Rights Reserved. The information contained herein: (1) is proprietary to Morningstar
and/or its content providers; (2) may not be copied or distributed; and (3) is not warranted to be accurate, complete or
timely. Neither Morningstar nor its content providers are responsible for any damages or losses arising from any use of
this information.
2. Source: Barclays Global Family of Indices. © 2014 Barclays Capital Inc. Used with permission.
Semiannual Report | 35
Performance Summary as of 4/30/14
Franklin Total Return Fund
Your dividend income will vary depending on dividends or interest paid by securities in the Fund’s portfolio, adjusted for operating expenses of each class. Capital gain distributions are net profits realized from the sale of portfolio securities. The performance table does not reflect any taxes that a shareholder would pay on Fund dividends, capital gain distributions, if any, or any realized gains on the sale of Fund shares. Total return reflects reinvestment of the Fund’s dividends and capital gain distributions, if any, and any unrealized gains or losses.
| | | | | | |
| Net Asset Value | | | | | | |
| Share Class | | 4/30/14 | | 10/31/13 | | Change |
| A (FKBAX) | $ | 10.05 | $ | 10.05 | $ | 0.00 |
| C (FCTLX) | $ | 10.03 | $ | 10.03 | $ | 0.00 |
| R (FTRRX) | $ | 10.04 | $ | 10.04 | $ | 0.00 |
| R6 (FRERX) | $ | 10.07 | $ | 10.07 | $ | 0.00 |
| Advisor (FBDAX) | $ | 10.07 | $ | 10.07 | $ | 0.00 |
| |
| Distributions | |
| Share Class | Dividend Income |
| A(11/1/13–4/30/14) | $0.225354 |
| C(11/1/13–4/30/14) | $0.207378 |
| R(11/1/13–4/30/14) | $0.214126 |
| R6(11/1/13–4/30/14) | $0.243170 |
| Advisor (11/1/13–4/30/14) | $0.236836 |
36 | Semiannual Report
Performance Summary (continued)
Performance as of 4/30/141
Cumulative total return excludes sales charges. Average annual total returns includes maximum sales charges. Class A: 4.25% maximum initial sales
charge; Class C: 1% contingent deferred sales charge in first year only; Class R/R6/Advisor Class: no sales charges.
| | | | | | | | | | | | | |
| | | Cumulative | | | Average Annual | | | Average Annual | | Total Annual Operating Expenses5 | |
| Share Class | | Total Return2 | | | Total Return3 | | | Total Return (3/31/14)4 | | (with waiver) | | (without waiver) | |
| A | | | | | | | | | | 0.89 | % | 0.93 | % |
| 6-Month | + | 2.29 | % | | -2.09 | % | | | | | | | |
| 1-Year | + | 0.34 | % | | -3.91 | % | | -3.59 | % | | | | |
| 5-Year | + | 42.01 | % | + | 6.33 | % | + | 6.76 | % | | | | |
| 10-Year | + | 64.97 | % | + | 4.68 | % | + | 4.33 | % | | | | |
| C | | | | | | | | | | 1.29 | % | 1.33 | % |
| 6-Month | + | 2.11 | % | + | 1.11 | % | | | | | | | |
| 1-Year | | -0.13 | % | | -1.09 | % | | -0.64 | % | | | | |
| 5-Year | + | 39.29 | % | + | 6.85 | % | + | 7.25 | % | | | | |
| 10-Year | + | 58.59 | % | + | 4.72 | % | + | 4.36 | % | | | | |
| R | | | | | | | | | | 1.14 | % | 1.18 | % |
| 6-Month | + | 2.18 | % | + | 2.18 | % | | | | | | | |
| 1-Year | + | 0.01 | % | + | 0.01 | % | + | 0.48 | % | | | | |
| 5-Year | + | 40.25 | % | + | 7.00 | % | + | 7.42 | % | | | | |
| 10-Year | + | 61.07 | % | + | 4.88 | % | + | 4.52 | % | | | | |
| R6 | | | | | | | | | | 0.48 | % | 0.52 | % |
| 6-Month | + | 2.47 | % | + | 2.47 | % | | | | | | | |
| Since Inception (5/1/13)6 | + | 0.50 | % | + | 0.50 | % | | -0.39 | % | | | | |
| Advisor | | | | | | | | | | 0.64 | % | 0.68 | % |
| 6-Month | + | 2.40 | % | + | 2.40 | % | | | | | | | |
| 1-Year | + | 0.48 | % | + | 0.48 | % | + | 0.96 | % | | | | |
| 5-Year | + | 43.78 | % | + | 7.53 | % | + | 7.96 | % | | | | |
| 10-Year | + | 69.12 | % | + | 5.39 | % | + | 5.04 | % | | | | |
| | | | | | |
| | Distribution | | 30-Day Standardized Yield8 | |
| Share Class | Rate7 | | (with waiver) | | (without waiver) | |
| A | 1.99 | % | 2.04 | % | 1.98 | % |
| C | 1.82 | % | 1.74 | % | 1.68 | % |
| R | 1.91 | % | 1.89 | % | 1.83 | % |
| R6 | 2.39 | % | 2.53 | % | 2.52 | % |
| Advisor | 2.24 | % | 2.38 | % | 2.32 | % |
Performance data represent past performance, which does not guarantee future results. Investment return and principal value will fluctuate, and you
may have a gain or loss when you sell your shares. Current performance may differ from figures shown. For most recent month-end performance, go to
franklintempleton.com or call (800) 342-5236.
Semiannual Report | 37
Performance Summary (continued)
All investments involve risks, including possible loss of principal. Interest rate movements and mortgage prepayments will affect the Fund’s share price and yield. Bond prices generally move in the opposite direction of interest rates. Thus, as prices of bonds in the Fund adjust to a rise in interest rates, the Fund’s share price may decline. Investing in derivative securities such as financial futures and option contracts involves special risks. The risks associated with higher yielding, lower rated securities (commonly called junk bonds) include higher risk of default and loss of principal. Investment in foreign securities also involves special risks, including currency fluctuations, and political and economic uncertainty. Investing in derivative securities, such as financial futures and option contracts, and the use of foreign currency techniques involve special risks as such may not achieve the anticipated benefits and/or may result in losses to the Fund. The Fund is actively managed but there is no guarantee that the manager’s investment decisions will produce the desired results. The Fund’s prospectus also includes a description of the main investment risks.
| |
| Class C: | These shares have higher annual fees and expenses than Class A shares. |
| Class R: | Shares are available to certain eligible investors as described in the prospectus. These shares have higher annual fees and |
| | expenses than Class A shares. |
| Class R6: | Shares are available to certain eligible investors as described in the prospectus. |
| Advisor Class: | Shares are available to certain eligible investors as described in the prospectus. |
1. The Fund has an expense reduction contractually guaranteed through at least 2/28/15 and a fee waiver associated with its investments in a
Franklin Templeton money fund, contractually guaranteed through at least its current fiscal year-end. Fund investment results reflect the expense
reduction and fee waiver, to the extent applicable; without these reductions, the results would have been lower.
2. Cumulative total return represents the change in value of an investment over the periods indicated.
3. Average annual total return represents the average annual change in value of an investment over the periods indicated. Six-month return has
not been annualized.
4. In accordance with SEC rules, we provide standardized average annual total return information through the latest calendar quarter.
5. Figures are as stated in the Fund’s current prospectus. In periods of market volatility, assets may decline significantly, causing total annual Fund
operating expenses to become higher than the figures shown.
6. Performance shown is not annualized.
7. Distribution rate is based on an annualization of the sum of the respective class’s past 30 days’ daily distributions and the maximum offering
price (NAV for Classes C, R, R6 and Advisor) per share on 4/30/14.
8. The 30-day standardized yield for the 30 days ended 4/30/14 reflects an estimated yield to maturity (assuming all portfolio securities are held to
maturity). It should be regarded as an estimate of the Fund’s rate of investment income, and it may not equal the Fund’s actual income distribution
rate (which reflects the Fund’s past dividends paid to shareholders) or the income reported in the Fund’s financial statements.
38 | Semiannual Report
Your Fund’s Expenses
Franklin Total Return Fund
As a Fund shareholder, you can incur two types of costs:
- Transaction costs, including sales charges (loads) on Fund purchases; and
- Ongoing Fund costs, including management fees, distribution and service (12b-1) fees, and other Fund expenses. All mutual funds have ongoing costs, sometimes referred to as operating expenses.
The following table shows ongoing costs of investing in the Fund and can help you understand these costs and compare them with those of other mutual funds. The table assumes a $1,000 investment held for the six months indicated.
Actual Fund Expenses
The first line (Actual) for each share class listed in the table provides actual account values and expenses. The “Ending Account Value” is derived from the Fund’s actual return, which includes the effect of Fund expenses.
You can estimate the expenses you paid during the period by following these steps. Of course, your account value and expenses will differ from those in this illustration:
| 1. | Divide your account value by $1,000. |
| | If an account had an $8,600 value, then $8,600 ÷ $1,000 = 8.6. |
| 2. | Multiply the result by the number under the heading “Expenses Paid During Period.” |
| | If Expenses Paid During Period were $7.50, then 8.6 x $7.50 = $64.50. |
In this illustration, the estimated expenses paid this period are $64.50.
Hypothetical Example for Comparison with Other Funds
Information in the second line (Hypothetical) for each class in the table can help you compare ongoing costs of investing in the Fund with those of other mutual funds. This information may not be used to estimate the actual ending account balance or expenses you paid during the period. The hypothetical “Ending Account Value” is based on the actual expense ratio for each class and an assumed 5% annual rate of return before expenses, which does not represent the Fund’s actual return. The figure under the heading “Expenses Paid During Period” shows the hypothetical expenses your account would have incurred under this scenario. You can compare this figure with the 5% hypothetical examples that appear in shareholder reports of other funds.
Semiannual Report | 39
Your Fund’s Expenses (continued)
Please note that expenses shown in the table are meant to highlight ongoing costs and do not reflect any transaction costs, such as sales charges. Therefore, the second line for each class is useful in comparing ongoing costs only, and will not help you compare total costs of owning different funds. In addition, if transaction costs were included, your total costs would have been higher. Please refer to the Fund prospectus for additional information on operating expenses.
| | | | | | |
| | | Beginning Account | | Ending Account | | Expenses Paid During |
| Share Class | | Value 11/1/13 | | Value 4/30/14 | | Period* 11/1/13– 4/30/14 |
| A | | | | | | |
| Actual | $ | 1,000 | $ | 1,022.90 | $ | 4.41 |
| Hypothetical (5% return before expenses) | $ | 1,000 | $ | 1,020.43 | $ | 4.41 |
| C | | | | | | |
| Actual | $ | 1,000 | $ | 1,021.10 | $ | 6.41 |
| Hypothetical (5% return before expenses) | $ | 1,000 | $ | 1,018.45 | $ | 6.41 |
| R | | | | | | |
| Actual | $ | 1,000 | $ | 1,021.80 | $ | 5.66 |
| Hypothetical (5% return before expenses) | $ | 1,000 | $ | 1,019.19 | $ | 5.66 |
| R6 | | | | | | |
| Actual | $ | 1,000 | $ | 1,013.60 | $ | 2.50 |
| Hypothetical (5% return before expenses) | $ | 1,000 | $ | 1,022.32 | $ | 2.51 |
| Advisor | | | | | | |
| Actual | $ | 1,000 | $ | 1,024.00 | $ | 3.16 |
| Hypothetical (5% return before expenses) | $ | 1,000 | $ | 1,021.67 | $ | 3.16 |
*Expenses are calculated using the most recent six-month expense ratio, net of expense waivers, annualized for each class (A: 0.88%; C: 1.28%;
R: 1.13%; R6: 0.50%; and Advisor: 0.63%), multiplied by the average account value over the period, multiplied by 181/365 to reflect the one-half
year period.
40 | Semiannual Report
| | | | | | | | | | | | |
| Franklin Investors Securities Trust | | | | | |
| |
| Financial Highlights | | | | | | | | | | | | |
| |
| Franklin Adjustable U.S. Government Securities Fund | | | | | | | | | | | |
| | Six Months Ended | | | | | | | | | |
| | April 30, 2014 | | | | | | Year Ended October 31, | | | |
| Class A | (unaudited) | | 2013 | | 2012 | | 2011 | | 2010 | | 2009 | |
| Per share operating performance | | | | | | | | | | | | |
| (for a share outstanding throughout | | | | | | | | | | | | |
| the period) | | | | | | | | | | | | |
| Net asset value, beginning of period | $8.72 | | $8.90 | | $8.84 | | $8.90 | | $8.96 | | $8.86 | |
| Income from investment operationsa: | | | | | | | | | | | | |
| Net investment income | 0.026 | | 0.048 | | 0.078 | | 0.103 | | 0.109 | | 0.239 | |
| Net realized and unrealized gains | | | | | | | | | | | | |
| (losses) | (0.001 | ) | (0.098 | ) | 0.117 | | 0.011 | | 0.073 | | 0.120 | |
| Total from investment operations | 0.025 | | (0.050 | ) | 0.195 | | 0.114 | | 0.182 | | 0.359 | |
| Less distributions from net investment | | | | | | | | | | | | |
| income | (0.055 | ) | (0.130 | ) | (0.135 | ) | (0.174 | ) | (0.242 | ) | (0.259 | ) |
| Net asset value, end of period | $8.69 | | $8.72 | | $8.90 | | $8.84 | | $8.90 | | $8.96 | |
| |
| Total returnb | 0.40 | % | (0.56 | )% | 2.22 | % | 1.30 | % | 2.06 | % | 4.10 | % |
| |
| Ratios to average net assetsc | | | | | | | | | | | | |
| Expenses | 0.92 | %d,e | 0.87 | % | 0.87 | % | 0.86 | % | 0.86 | % | 0.87 | %e |
| Net investment income | 0.60 | % | 0.63 | % | 0.91 | % | 1.16 | % | 1.24 | % | 2.48 | % |
| |
| Supplemental data | | | | | | | | | | | | |
| Net assets, end of period (000’s) | $992,054 | | $1,105,674 | | $1,308,971 | | $1,470,029 | | $1,536,981 | | $1,375,234 | |
| Portfolio turnover rate | 0.03 | % | 8.66 | % | 9.69 | % | 19.65 | % | 43.37 | % | 22.45 | % |
aThe amount shown for a share outstanding throughout the period may not correlate with the Statement of Operations for the period due to the timing of sales and repurchases of
the Fund shares in relation to income earned and/or fluctuating fair value of the investments of the Fund.
bTotal return does not reflect sales commissions or contingent deferred sales charges, if applicable, and is not annualized for periods less than one year.
cRatios are annualized for periods less than one year.
dBenefit of waiver and payment by affiliate rounds to less than 0.01%.
eBenefit of expense reduction rounds to less than 0.01%.
Semiannual Report | The accompanying notes are an integral part of these financial statements. | 41
| | | | | | | | | | | | |
| Franklin Investors Securities Trust | | | | | | | |
| Financial Highlights (continued) | | | | | | | | | | | | |
| |
| Franklin Adjustable U.S. Government Securities Fund | | | | | | | | | | | |
| | Six Months Ended | | | | | | | | | |
| | April 30, 2014 | | | | Year Ended October 31, | | | |
| Class C | (unaudited) | | 2013 | | 2012 | | 2011 | | 2010 | | 2009 | |
| Per share operating performance | | | | | | | | | | | | |
| (for a share outstanding throughout the period) | | | | | | | | | | | | |
| Net asset value, beginning of period | $8.71 | | $8.90 | | $8.83 | | $8.89 | | $8.96 | | $8.86 | |
| Income from investment operationsa: | | | | | | | | | | | | |
| Net investment income | 0.009 | | 0.006 | | 0.042 | | 0.064 | | 0.087 | | 0.206 | |
| Net realized and unrealized gains (losses) | 0.009 | | (0.101 | ) | 0.128 | | 0.015 | | 0.049 | | 0.117 | |
| Total from investment operations | 0.018 | | (0.095 | ) | 0.170 | | 0.079 | | 0.136 | | 0.323 | |
| Less distributions from net investment income | (0.038 | ) | (0.095 | ) | (0.100 | ) | (0.139 | ) | (0.206 | ) | (0.223 | ) |
| Net asset value, end of period | $8.69 | | $8.71 | | $8.90 | | $8.83 | | $8.89 | | $8.96 | |
| |
| Total returnb | 0.20 | % | (1.07 | )% | 1.93 | % | 0.89 | % | 1.53 | % | 3.69 | % |
| |
| Ratios to average net assetsc | | | | | | | | | | | | |
| Expenses | 1.32 | %d,e | 1.27 | % | 1.27 | % | 1.26 | % | 1.26 | % | 1.27 | %e |
| Net investment income | 0.20 | % | 0.23 | % | 0.51 | % | 0.76 | % | 0.84 | % | 2.08 | % |
| |
| Supplemental data | | | | | | | | | | | | |
| Net assets, end of period (000’s) | $499,140 | | $603,067 | | $794,201 | | $856,366 | | $956,002 | | $596,640 | |
| Portfolio turnover rate | 0.03 | % | 8.66 | % | 9.69 | % | 19.65 | % | 43.37 | % | 22.45 | % |
aThe amount shown for a share outstanding throughout the period may not correlate with the Statement of Operations for the period due to the timing of sales and repurchases of
the Fund shares in relation to income earned and/or fluctuating fair value of the investments of the Fund.
bTotal return does not reflect sales commissions or contingent deferred sales charges, if applicable, and is not annualized for periods less than one year.
cRatios are annualized for periods less than one year.
dBenefit of waiver and payment by affiliate rounds to less than 0.01%.
eBenefit of expense reduction rounds to less than 0.01%.
42 | The accompanying notes are an integral part of these financial statements. | Semiannual Report
| | | | | | |
| Franklin Investors Securities Trust | | | | | | |
| |
| Financial Highlights (continued) | | | | | | |
| |
| Franklin Adjustable U.S. Government Securities Fund | | | | | | |
| | | Six Months Ended | | | Period Ended | |
| | | April 30, 2014 | | | October 31, | |
| Class R6 | | (unaudited) | | | 2013 | a |
| Per share operating performance | | | | | | |
| (for a share outstanding throughout the period) | | | | | | |
| Net asset value, beginning of period | $ | 8.73 | | $ | 8.72 | |
| Income from investment operationsb: | | | | | | |
| Net investment income | | 0.039 | | | 0.008 | |
| Net realized and unrealized gains (losses) | | 0.010 | | | 0.018 | |
| Total from investment operations | | 0.049 | | | 0.026 | |
| Less distributions from net investment income | | (0.069 | ) | | (0.016 | ) |
| Net asset value, end of period | $ | 8.71 | | $ | 8.73 | |
| |
| Total returnc | | 0.57 | % | | 0.30 | % |
| |
| Ratios to average net assetsd | | | | | | |
| Expenses before waiver and payments by affiliates | | 0.59 | %e,f | | 0.53 | % |
| Expenses net of waiver and payments by affiliates | | 0.58 | %e | | 0.53 | % |
| Net investment income | | 0.94 | % | | 0.97 | % |
| |
| Supplemental data | | | | | | |
| Net assets, end of period (000’s) | $ | 544 | | $ | 335 | |
| Portfolio turnover rate | | 0.03 | % | | 8.66 | % |
aFor the period September 20, 2013 (effective date) to October 31, 2013.
bThe amount shown for a share outstanding throughout the period may not correlate with the Statement of Operations for the period due to the timing of sales and repurchases of
the Fund shares in relation to income earned and/or fluctuating fair value of the investments of the Fund.
cTotal return is not annualized for periods less than one year.
dRatios are annualized for periods less than one year.
eBenefit of waiver and payment by affiliate rounds to less than 0.01%.
fBenefit of expense reduction rounds to less than 0.01%.
Semiannual Report | The accompanying notes are an integral part of these financial statements. | 43
| | | | | | | | | | | | |
| Franklin Investors Securities Trust | | | | | | | |
| Financial Highlights (continued) | | | | | | | | | | | | |
| |
| Franklin Adjustable U.S. Government Securities Fund | | | | | | | | | | | |
| | Six Months Ended | | | | | | | | | |
| | April 30, 2014 | | | | Year Ended October 31, | | | |
| Advisor Class | (unaudited) | | 2013 | | 2012 | | 2011 | | 2010 | | 2009 | |
| Per share operating performance | | | | | | | | | | | | |
| (for a share outstanding throughout the period) | | | | | | | | | | | | |
| Net asset value, beginning of period | $8.73 | | $8.91 | | $8.85 | | $8.91 | | $8.97 | | $8.87 | |
| Income from investment operationsa: | | | | | | | | | | | | |
| Net investment income | 0.037 | | 0.073 | | 0.107 | | 0.139 | | 0.181 | | 0.267 | |
| Net realized and unrealized gains (losses) | (0.001 | ) | (0.101 | ) | 0.111 | | (0.002 | ) | 0.024 | | 0.115 | |
| Total from investment operations | 0.036 | | (0.028 | ) | 0.218 | | 0.137 | | 0.205 | | 0.382 | |
| Less distributions from net investment income | (0.066 | ) | (0.152 | ) | (0.158 | ) | (0.197 | ) | (0.265 | ) | (0.282 | ) |
| Net asset value, end of period | $8.70 | | $8.73 | | $8.91 | | $8.85 | | $8.91 | | $8.97 | |
| |
| Total returnb | 0.41 | % | (0.31 | )% | 2.48 | % | 1.55 | % | 2.31 | % | 4.36 | % |
| |
| Ratios to average net assetsc | | | | | | | | | | | | |
| Expenses | 0.67 | %d,e | 0.62 | % | 0.62 | % | 0.61 | % | 0.61 | % | 0.62 | %e |
| Net investment income | 0.85 | % | 0.88 | % | 1.16 | % | 1.41 | % | 1.49 | % | 2.73 | % |
| |
| Supplemental data | | | | | | | | | | | | |
| Net assets, end of period (000’s) | $362,243 | | $411,228 | | $437,540 | | $489,675 | | $368,400 | | $87,296 | |
| Portfolio turnover rate | 0.03 | % | 8.66 | % | 9.69 | % | 19.65 | % | 43.37 | % | 22.45 | % |
aThe amount shown for a share outstanding throughout the period may not correlate with the Statement of Operations for the period due to the timing of sales and repurchases of
the Fund shares in relation to income earned and/or fluctuating fair value of the investments of the Fund.
bTotal return is not annualized for periods less than one year.
cRatios are annualized for periods less than one year.
dBenefit of waiver and payment by affiliate rounds to less than 0.01%.
eBenefit of expense reduction rounds to less than 0.01%.
44 | The accompanying notes are an integral part of these financial statements. | Semiannual Report
| | |
| Franklin Investors Securities Trust | | |
| |
| Statement of Investments, April 30, 2014 (unaudited) | | |
| |
| |
| Franklin Adjustable U.S. Government Securities Fund | Principal Amount | Value |
| Asset-Backed Securities and Commercial Mortgage-Backed Securities | | |
| (Cost $23,211) 0.0%† | | |
| aTravelers Mortgage Services Inc., 1998-5A, A, FRN, 2.53%, 12/25/18 | $ 22,819 | $ 22,887 |
| Mortgage-Backed Securities 94.2% | | |
| aFederal Home Loan Mortgage Corp. (FHLMC) Adjustable Rate 21.8% | | |
| FHLMC, 1.904%, 4/01/36 | 11,234,750 | 11,976,044 |
| FHLMC, 2.015%, 9/01/35 | 19,474,781 | 20,549,920 |
| FHLMC, 2.03%, 4/01/35 | 15,601,734 | 16,503,726 |
| FHLMC, 2.111%, 1/01/36 | 10,129,321 | 10,774,865 |
| FHLMC, 0.757% - 2.215%, 2/01/15 - 4/01/42 | 15,997,398 | 16,838,527 |
| FHLMC, 2.354%, 12/01/35 | 12,554,195 | 13,447,805 |
| FHLMC, 2.216% - 2.354%, 11/01/16 - 1/01/38 | 16,803,414 | 17,857,267 |
| FHLMC, 2.372%, 11/01/36 | 11,362,888 | 12,057,413 |
| FHLMC, 2.355% - 2.381%, 3/01/18 - 9/01/41 | 15,243,612 | 16,195,095 |
| FHLMC, 2.383%, 9/01/36 | 10,063,037 | 10,745,192 |
| FHLMC, 2.389%, 2/01/36 | 9,103,706 | 9,702,431 |
| FHLMC, 2.381% - 2.40%, 11/01/17 - 10/01/41 | 16,693,289 | 17,731,269 |
| FHLMC, 2.423%, 11/01/35 | 8,876,990 | 9,360,709 |
| FHLMC, 2.40% - 2.437%, 11/01/17 - 3/01/38 | 14,842,811 | 15,800,171 |
| FHLMC, 2.437% - 2.452%, 11/01/27 - 2/01/39 | 15,514,175 | 16,515,314 |
| FHLMC, 2.466%, 3/01/37 | 8,617,336 | 9,171,354 |
| FHLMC, 2.482%, 11/01/37 | 13,620,425 | 14,453,929 |
| FHLMC, 2.452% - 2.495%, 9/01/15 - 3/01/38 | 17,267,280 | 18,361,426 |
| FHLMC, 2.516%, 9/01/38 | 11,434,569 | 12,184,331 |
| FHLMC, 2.498% - 2.521%, 4/01/19 - 6/01/38 | 16,737,742 | 17,893,773 |
| FHLMC, 2.523% - 2.538%, 11/01/29 - 8/01/38 | 17,041,019 | 18,232,480 |
| FHLMC, 2.544%, 9/01/37 | 17,815,262 | 18,934,331 |
| FHLMC, 2.611%, 6/01/37 | 18,653,840 | 19,956,715 |
| FHLMC, 2.538% - 2.63%, 11/01/18 - 5/01/41 | 14,571,919 | 15,581,435 |
| FHLMC, 2.733%, 1/01/37 | 10,642,414 | 11,425,390 |
| FHLMC, 2.631% - 2.825%, 10/01/18 - 9/01/37 | 17,179,106 | 18,257,908 |
| FHLMC, 2.828% - 7.483%, 5/01/15 - 11/01/40 | 12,151,500 | 12,877,185 |
| | | 403,386,005 |
| aFederal National Mortgage Association (FNMA) Adjustable Rate 71.5% | | |
| FNMA, 0.848% - 1.679%, 6/01/15 - 10/01/44 | 17,673,546 | 18,377,622 |
| FNMA, 1.688% - 1.791%, 12/01/15 - 2/01/37 | 17,223,111 | 18,010,980 |
| FNMA, 1.848%, 1/01/35 | 9,954,509 | 10,622,761 |
| FNMA, 1.793% - 1.886%, 7/01/14 - 7/01/37 | 17,428,036 | 18,466,587 |
| FNMA, 1.892%, 12/01/34 | 22,748,278 | 24,231,200 |
| FNMA, 1.922%, 3/01/35 | 12,275,147 | 13,128,392 |
| FNMA, 1.888% - 1.923%, 1/01/23 - 3/01/43 | 17,371,970 | 18,375,905 |
| FNMA, 1.925%, 5/01/35 | 10,690,477 | 11,374,674 |
| FNMA, 1.925% - 1.95%, 2/01/16 - 2/01/39 | 16,954,241 | 17,868,397 |
| FNMA, 1.951%, 1/01/36 | 8,939,883 | 9,486,485 |
| FNMA, 1.952% - 1.968%, 12/01/17 - 11/01/40 | 17,380,037 | 18,473,753 |
| FNMA, 1.969% - 2.011%, 8/01/14 - 11/01/36 | 17,256,061 | 18,224,577 |
| FNMA, 2.021%, 4/01/36 | 8,406,869 | 8,862,471 |
| FNMA, 2.011% - 2.03%, 10/01/17 - 6/01/37 | 16,527,205 | 17,465,452 |
| FNMA, 2.03% - 2.055%, 5/01/21 - 3/01/42 | 17,490,455 | 18,406,278 |
| FNMA, 2.055% - 2.088%, 10/01/15 - 4/01/38 | 15,939,368 | 16,879,843 |
| | Semiannual Report | 45 |
| | | | |
| Franklin Investors Securities Trust | | | | |
| |
| Statement of Investments, April 30, 2014 (unaudited) (continued) | | | | |
| |
| |
| Franklin Adjustable U.S. Government Securities Fund | | Principal Amount | | Value |
| Mortgage-Backed Securities (continued) | | | | |
| aFederal National Mortgage Association (FNMA) Adjustable Rate (continued) | | | | |
| FNMA, 2.102%, 2/01/36 | $ | 14,475,239 | $ | 15,296,146 |
| FNMA, 2.089% - 2.117%, 3/01/18 - 10/01/37 | | 17,387,229 | | 18,454,804 |
| FNMA, 2.120%, 8/01/36 | | 7,980,643 | | 8,375,688 |
| FNMA, 2.117% - 2.142%, 11/01/17 - 2/01/37 | | 11,316,138 | | 11,888,560 |
| FNMA, 2.138%, 2/01/36 | | 8,141,865 | | 8,604,386 |
| FNMA, 2.157%, 5/01/39 | | 18,691,404 | | 19,653,584 |
| FNMA, 2.142% - 2.162%, 6/01/19 - 5/01/38 | | 16,236,249 | | 17,167,289 |
| FNMA, 2.162% - 2.174%, 1/01/19 - 4/01/38 | | 17,384,109 | | 18,448,726 |
| FNMA, 2.177% - 2.192%, 3/01/19 - 4/01/38 | | 16,485,483 | | 17,501,979 |
| FNMA, 2.192% - 2.21%, 4/01/18 - 1/01/37 | | 16,217,967 | | 17,306,881 |
| FNMA, 2.21% - 2.223%, 3/01/19 - 12/01/39 | | 17,332,125 | | 18,330,321 |
| FNMA, 2.223% - 2.233%, 3/01/18 - 12/01/38 | | 16,143,914 | | 17,159,153 |
| FNMA, 2.239%, 1/01/36 | | 17,944,421 | | 19,052,208 |
| FNMA, 2.234% - 2.245%, 6/01/18 - 11/01/35 | | 17,245,476 | | 18,321,328 |
| FNMA, 2.251%, 1/01/37 | | 8,314,074 | | 8,836,350 |
| FNMA, 2.245% - 2.252%, 7/01/17 - 3/01/38 | | 12,907,711 | | 13,728,787 |
| FNMA, 2.259%, 11/01/34 | | 12,644,813 | | 13,411,948 |
| FNMA, 2.252% - 2.261%, 12/01/27 - 4/01/38 | | 15,700,365 | | 16,624,148 |
| FNMA, 2.261% - 2.267%, 7/01/24 - 9/01/39 | | 15,504,085 | | 16,429,979 |
| FNMA, 2.267% - 2.272%, 3/01/30 - 8/01/37 | | 17,407,044 | | 18,469,714 |
| FNMA, 2.274%, 8/01/39 | | 15,586,313 | | 16,473,594 |
| FNMA, 2.272% - 2.278%, 3/01/25 - 3/01/39 | | 17,215,986 | | 18,326,957 |
| FNMA, 2.279%, 1/01/39 | | 12,512,341 | | 13,250,580 |
| FNMA, 2.283%, 2/01/36 | | 13,864,692 | | 14,700,194 |
| FNMA, 2.29%, 1/01/38 | | 12,325,847 | | 13,200,934 |
| FNMA, 2.278% - 2.29%, 9/01/15 - 11/01/39 | | 17,337,196 | | 18,413,094 |
| FNMA, 2.297%, 3/01/35 | | 20,255,791 | | 21,461,833 |
| FNMA, 2.29% - 2.30%, 4/01/19 - 5/01/38 | | 16,690,101 | | 17,756,371 |
| FNMA, 2.30% - 2.31%, 6/01/27 - 3/01/38 | | 15,606,450 | | 16,595,712 |
| FNMA, 2.31% - 2.315%, 4/01/18 - 10/01/37 | | 16,080,234 | | 17,137,587 |
| FNMA, 2.322%, 10/01/35 | | 9,951,737 | | 10,577,650 |
| FNMA, 2.315% - 2.333%, 3/01/19 - 3/01/41 | | 17,357,001 | | 18,419,218 |
| FNMA, 2.333% - 2.345%, 2/01/18 - 3/01/38 | | 17,215,295 | | 18,317,445 |
| FNMA, 2.352%, 9/01/35 | | 10,496,153 | | 11,193,839 |
| FNMA, 2.345% - 2.361%, 8/01/27 - 5/01/38 | | 16,228,230 | | 17,257,000 |
| FNMA, 2.366%, 5/01/38 | | 9,223,504 | | 9,782,941 |
| FNMA, 2.373%, 9/01/39 | | 9,334,012 | | 9,919,386 |
| FNMA, 2.375%, 9/01/36 | | 13,110,133 | | 13,949,418 |
| FNMA, 2.362% - 2.375%, 11/01/18 - 7/01/40 | | 17,381,988 | | 18,469,667 |
| FNMA, 2.376%, 8/01/35 | | 8,795,605 | | 9,385,267 |
| FNMA, 2.375% - 2.388%, 7/01/18 - 9/01/39 | | 14,872,065 | | 15,804,443 |
| FNMA, 2.391%, 2/01/37 | | 11,628,926 | | 12,421,055 |
| FNMA, 2.388% - 2.395%, 8/01/22 - 2/01/43 | | 17,340,045 | | 18,418,638 |
| FNMA, 2.401%, 11/01/34 | | 11,842,244 | | 12,597,087 |
| FNMA, 2.395% - 2.402%, 8/01/18 - 1/01/40 | | 17,208,882 | | 18,282,834 |
| FNMA, 2.405%, 12/01/36 | | 17,084,511 | | 18,153,642 |
| FNMA, 2.406%, 11/01/37 | | 20,732,300 | | 22,014,562 |
| FNMA, 2.42%, 10/01/34 | | 8,366,882 | | 8,906,144 |
| FNMA, 2.404% - 2.42%, 7/01/19 - 9/01/38 | | 17,202,325 | | 18,299,390 |
| |
| 46 | Semiannual Report | | | | |
| | | | |
| Franklin Investors Securities Trust | | | | |
| |
| Statement of Investments, April 30, 2014 (unaudited) (continued) | | | | |
| |
| |
| Franklin Adjustable U.S. Government Securities Fund | | Principal Amount | | Value |
| Mortgage-Backed Securities (continued) | | | | |
| aFederal National Mortgage Association (FNMA) Adjustable Rate (continued) | | | | |
| FNMA, 2.423%, 11/01/35 | $ | 8,951,014 | $ | 9,519,164 |
| FNMA, 2.42% - 2.425%, 1/01/19 - 11/01/36 | | 12,971,196 | | 13,783,895 |
| FNMA, 2.435%, 3/01/35 | | 9,229,384 | | 9,875,009 |
| FNMA, 2.425% - 2.438%, 6/01/20 - 3/01/38 | | 17,245,549 | | 18,362,666 |
| FNMA, 2.439% - 2.45%, 9/01/17 - 8/01/37 | | 15,771,668 | | 16,856,245 |
| FNMA, 2.45% - 2.465%, 12/01/23 - 9/01/36 | | 17,052,563 | | 18,231,370 |
| FNMA, 2.467%, 1/01/36 | | 11,758,137 | | 12,601,262 |
| FNMA, 2.465% - 2.473%, 7/01/17 - 9/01/37 | | 15,010,807 | | 15,956,851 |
| FNMA, 2.473% - 2.48%, 7/01/17 - 11/01/38 | | 16,104,100 | | 17,171,760 |
| FNMA, 2.48% - 2.483%, 2/01/29 - 1/01/45 | | 15,325,325 | | 16,300,794 |
| FNMA, 2.483% - 2.50%, 6/01/17 - 11/01/44 | | 16,809,553 | | 17,898,457 |
| FNMA, 2.50% - 2.518%, 12/01/28 - 1/01/39 | | 16,934,134 | | 18,023,480 |
| FNMA, 2.521%, 1/01/37 | | 13,664,551 | | 14,560,956 |
| FNMA, 2.538%, 7/01/46 | | 15,084,164 | | 16,258,765 |
| FNMA, 2.52% - 2.544%, 10/01/16 - 8/01/39 | | 17,135,352 | | 18,206,685 |
| FNMA, 2.545% - 2.623%, 11/01/17 - 5/01/45 | | 17,091,451 | | 18,276,174 |
| FNMA, 2.625% - 2.845%, 3/01/16 - 10/01/36 | | 17,458,795 | | 18,454,173 |
| FNMA, 2.855% - 3.099%, 11/01/16 - 11/01/46 | | 15,765,660 | | 16,689,590 |
| FNMA, 3.10% - 9.095%, 7/01/14 - 4/01/41 | | 16,209,063 | | 17,132,543 |
| | | | | 1,324,963,677 |
| aGovernment National Mortgage Association (GNMA) Adjustable Rate 0.9% | | | | |
| GNMA, 1.625% - 3.00%, 3/20/16 - 5/20/36 | | 16,704,571 | | 17,385,723 |
| Total Mortgage-Backed Securities (Cost $1,711,001,426) | | | | 1,745,735,405 |
| Total Investments before Short Term Investments (Cost $1,711,024,637) | | | | 1,745,758,292 |
| |
| | | Shares | | |
| Short Term Investments 5.5% | | | | |
| Money Market Funds (Cost $92,746,279) 5.0% | | | | |
| b,cInstitutional Fiduciary Trust Money Market Portfolio | | 92,746,279 | | 92,746,279 |
| |
| | | Principal Amount | | |
| Repurchase Agreements (Cost $10,244,802) 0.5% | | | | |
| dJoint Repurchase Agreement, 0.038%, 5/01/14 (Maturity Value $10,244,813) | $ | 10,244,802 | | 10,244,802 |
| BNP Paribas Securities Corp. (Maturity Value $1,206,019) | | | | |
| Credit Suisse Securities (USA) LLC (Maturity Value $1,206,019) | | | | |
| Deutsche Bank Securities Inc. (Maturity Value $4,124,255) | | | | |
| HSBC Securities (USA) Inc. (Maturity Value $2,532,620) | | | | |
| Merrill Lynch, Pierce, Fenner & Smith Inc. (Maturity Value $1,175,900) | | | | |
| Collateralized by U.S. Government Agency Securities, 0.00% - 6.25%, 6/11/14 - 7/15/32; | | | | |
| U.S. Government Agency Securities, Strips, 6/01/17; eU.S. Treasury Bills, | | | | |
| 5/22/14 - 4/02/15; U.S. Treasury Bonds, 7.25% - 10.625%, 8/15/15 - 11/15/18; | | | | |
| U.S. Treasury Notes, 0.25% - 4.875%, 1/31/15 - 3/31/19; and U.S. Treasury Notes, | | | | |
| Index Linked, 0.125% - 2.625%, 7/15/14 - 1/15/19 (valued at $10,451,322) | | | | |
| Total Investments (Cost $1,814,015,718) 99.7% | | | | 1,848,749,373 |
| Other Assets, less Liabilities 0.3% | | | | 5,231,632 |
| Net Assets 100.0% | | | $ | 1,853,981,005 |
| |
| | | Semiannual Report | 47 |
|
| Franklin Investors Securities Trust |
| Statement of Investments, April 30, 2014 (unaudited) (continued) |
| Franklin Adjustable U.S. Government Securities Fund |
See Abbreviations on page 164.
†Rounds to less than 0.1% of net assets.
aThe coupon rate shown represents the rate at period end.
bNon-income producing.
cSee Note 3(f) regarding investments in the Institutional Fiduciary Trust Money Market Portfolio.
dSee Note 1(c) regarding joint repurchase agreement.
eThe security is traded on a discount basis with no stated coupon rate.
48 | The accompanying notes are an integral part of these financial statements. | Semiannual Report
| | | | | | | | | | | | |
| Franklin Investors Securities Trust | | | | | |
| |
| Financial Highlights | | | | | | | | | | | | |
| |
| Franklin Floating Rate Daily Access Fund | | | | | | | | | | | |
| | Six Months Ended | | | | | | | | | |
| | April 30, 2014 | | | | | | Year Ended October 31, | | | |
| Class A | (unaudited) | | 2013 | | 2012 | | 2011 | | 2010 | | 2009 | |
| Per share operating performance | | | | | | | | | | | | |
| (for a share outstanding throughout | | | | | | | | | | | | |
| the period) | | | | | | | | | | | | |
| Net asset value, beginning of period | $9.20 | | $9.11 | | $8.89 | | $9.11 | | $8.73 | | $7.66 | |
| Income from investment operationsa: | | | | | | | | | | | | |
| Net investment income | 0.159 | | 0.333 | | 0.403 | | 0.418 | | 0.370 | | 0.292 | |
| Net realized and unrealized gains | | | | | | | | | | | | |
| (losses) | (0.039 | ) | 0.088 | | 0.225 | | (0.220 | ) | 0.376 | | 1.072 | |
| Total from investment operations | 0.120 | | 0.421 | | 0.628 | | 0.198 | | 0.746 | | 1.364 | |
| Less distributions from net investment | | | | | | | | | | | | |
| income | (0.160 | ) | (0.331 | ) | (0.408 | ) | (0.418 | ) | (0.366 | ) | (0.294 | ) |
| Net asset value, end of period | $9.16 | | $9.20 | | $9.11 | | $8.89 | | $9.11 | | $8.73 | |
| |
| Total returnb | 1.30 | % | 4.69 | % | 7.22 | % | 2.17 | % | 8.69 | % | 18.32 | % |
| |
| Ratios to average net assetsc | | | | | | | | | | | | |
| Expenses before waiver and payments | | | | | | | | | | | | |
| by affiliates | 0.82 | % | 0.83 | % | 0.90 | % | 0.89 | % | 0.95 | % | 0.96 | % |
| Expenses net of waiver and payments | | | | | | | | | | | | |
| by affiliates | 0.80 | %d | 0.83 | %d,e | 0.90 | % | 0.89 | %d | 0.95 | %d | 0.96 | %d |
| Net investment income | 3.50 | % | 3.60 | % | 4.52 | % | 4.56 | % | 4.15 | % | 3.66 | % |
| |
| Supplemental data | | | | | | | | | | | | |
| Net assets, end of period (000’s) | $2,088,190 | | $1,991,138 | | $1,295,166 | | $1,246,489 | | $1,082,656 | | $955,944 | |
| Portfolio turnover rate | 40.45 | % | 42.72 | % | 80.88 | % | 126.99 | % | 82.13 | % | 51.46 | % |
aThe amount shown for a share outstanding throughout the period may not correlate with the Statement of Operations for the period due to the timing of sales and repurchases of
the Fund shares in relation to income earned and/or fluctuating fair value of the investments of the Fund.
bTotal return does not reflect sales commissions or contingent deferred sales charges, if applicable, and is not annualized for periods less than one year.
cRatios are annualized for periods less than one year.
dBenefit of expense reduction rounds to less than 0.01%.
eBenefit of waiver and payment by affiliate rounds to less than 0.01%.
Semiannual Report | The accompanying notes are an integral part of these financial statements. | 49
| | | | | | | | | | | | | | | | | | |
| Franklin Investors Securities Trust | | | | | | | | | | |
| |
| Financial Highlights (continued) | | | | | | | | | | | | | | | | | | |
| |
| Franklin Floating Rate Daily Access Fund | | | | | | | | | | | | | | | | | | |
| | | Six Months Ended | | | | | | | | | | | | | |
| | | April 30, 2014 | | | | | | Year Ended October 31, | | | | |
| Class C | | (unaudited) | | | 2013 | | | 2012 | | | 2011 | | | 2010 | | | 2009 | |
| Per share operating performance | | | | | | | | | | | | | | | | | | |
| (for a share outstanding throughout the period) | | | | | | | | | | | | | | | | | | |
| Net asset value, beginning of period | $ | 9.20 | | $ | 9.11 | | $ | 8.89 | | $ | 9.11 | | $ | 8.73 | | $ | 7.67 | |
| Income from investment operationsa: | | | | | | | | | | | | | | | | | | |
| Net investment income | | 0.141 | | | 0.296 | | | 0.368 | | | 0.380 | | | 0.334 | | | 0.260 | |
| Net realized and unrealized gains (losses) | | (0.030 | ) | | 0.088 | | | 0.224 | | | (0.219 | ) | | 0.376 | | | 1.062 | |
| Total from investment operations | | 0.111 | | | 0.384 | | | 0.592 | | | 0.161 | | | 0.710 | | | 1.322 | |
| Less distributions from net investment income | | (0.141 | ) | | (0.294 | ) | | (0.372 | ) | | (0.381 | ) | | (0.330 | ) | | (0.262 | ) |
| Net asset value, end of period | $ | 9.17 | | $ | 9.20 | | $ | 9.11 | | $ | 8.89 | | $ | 9.11 | | $ | 8.73 | |
| |
| Total returnb | | 1.22 | % | | 4.28 | % | | 6.79 | % | | 1.76 | % | | 8.26 | % | | 17.69 | % |
| |
| Ratios to average net assetsc | | | | | | | | | | | | | | | | | | |
| Expenses before waiver and payments by | | | | | | | | | | | | | | | | | | |
| affiliates | | 1.22 | % | | 1.23 | % | | 1.30 | % | | 1.29 | % | | 1.35 | % | | 1.36 | % |
| Expenses net of waiver and payments by | | | | | | | | | | | | | | | | | | |
| affiliates | | 1.20 | %d | | 1.23 | %d,e | | 1.30 | % | | 1.29 | %d | | 1.35 | %d | | 1.36 | %d |
| Net investment income | | 3.10 | % | | 3.20 | % | | 4.12 | % | | 4.16 | % | | 3.75 | % | | 3.26 | % |
| |
| Supplemental data | | | | | | | | | | | | | | | | | | |
| Net assets, end of period (000’s) | $ | 812,290 | | $ | 765,839 | | $ | 431,818 | | $ | 423,309 | | $ | 272,602 | | $ | 209,897 | |
| Portfolio turnover rate | | 40.45 | % | | 42.72 | % | | 80.88 | % | | 126.99 | % | | 82.13 | % | | 51.46 | % |
aThe amount shown for a share outstanding throughout the period may not correlate with the Statement of Operations for the period due to the timing of sales and repurchases of
the Fund shares in relation to income earned and/or fluctuating fair value of the investments of the Fund.
bTotal return does not reflect sales commissions or contingent deferred sales charges, if applicable, and is not annualized for periods less than one year.
cRatios are annualized for periods less than one year.
dBenefit of expense reduction rounds to less than 0.01%.
eBenefit of waiver and payment by affiliate rounds to less than 0.01%.
50 | The accompanying notes are an integral part of these financial statements. | Semiannual Report
| | | | | | |
| Franklin Investors Securities Trust | | | | | | |
| |
| Financial Highlights (continued) | | | | | | |
| |
| Franklin Floating Rate Daily Access Fund | | | | | | |
| | | Six Months Ended | | | Period Ended | |
| | | April 30, 2014 | | | October 31, | |
| Class R6 | | (unaudited) | | | 2013a | |
| Per share operating performance | | | | | | |
| (for a share outstanding throughout the period) | | | | | | |
| Net asset value, beginning of period | $ | 9.21 | | $ | 9.21 | |
| Income from investment operationsb: | | | | | | |
| Net investment income | | 0.174 | | | 0.175 | |
| Net realized and unrealized gains (losses) | | (0.040 | ) | | (0.001 | ) |
| Total from investment operations | | 0.134 | | | 0.174 | |
| Less distributions from net investment income | | (0.174 | ) | | (0.174 | ) |
| Net asset value, end of period | $ | 9.17 | | $ | 9.21 | |
| |
| Total returnc | | 1.57 | % | | 1.80 | % |
| |
| Ratios to average net assetsd | | | | | | |
| Expenses before waiver and payments by affiliates | | 0.51 | % | | 0.51 | % |
| Expenses net of waiver and payments by affiliates | | 0.49 | %e | | 0.51 | %e,f |
| Net investment income | | 3.80 | % | | 3.92 | % |
| |
| Supplemental data | | | | | | |
| Net assets, end of period (000’s) | $ | 909 | | $ | 1,339 | |
| Portfolio turnover rate | | 40.45 | % | | 42.72 | % |
aFor the period May 1, 2013 (effective date) to October 31, 2013.
bThe amount shown for a share outstanding throughout the period may not correlate with the Statement of Operations for the period due to the timing of sales and repurchases of
the Fund shares in relation to income earned and/or fluctuating fair value of the investments of the Fund.
cTotal return is not annualized for periods less than one year.
dRatios are annualized for periods less than one year.
eBenefit of expense reduction rounds to less than 0.01%.
fBenefit of waiver and payment by affiliate rounds to less than 0.01%.
Semiannual Report | The accompanying notes are an integral part of these financial statements. | 51
| | | | | | | | | | | | | | | | | | |
| Franklin Investors Securities Trust | | | | | | | | | | |
| |
| Financial Highlights (continued) | | | | | | | | | | | | | | | | | | |
| |
| Franklin Floating Rate Daily Access Fund | | | | | | | | | | | | | | | | | | |
| | | Six Months Ended | | | | | | | | | | | | | |
| | | April 30, 2014 | | | | | | Year Ended October 31, | | | | |
| Advisor Class | | (unaudited) | | | 2013 | | | 2012 | | | 2011 | | | 2010 | | | 2009 | |
| Per share operating performance | | | | | | | | | | | | | | | | | | |
| (for a share outstanding throughout the period) | | | | | | | | | | | | | | | | | | |
| Net asset value, beginning of period | $ | 9.20 | | $ | 9.11 | | $ | 8.89 | | $ | 9.11 | | $ | 8.73 | | $ | 7.66 | |
| Income from investment operationsa: | | | | | | | | | | | | | | | | | | |
| Net investment income | | 0.171 | | | 0.355 | | | 0.426 | | | 0.442 | | | 0.393 | | | 0.312 | |
| Net realized and unrealized gains (losses) | | (0.030 | ) | | 0.089 | | | 0.225 | | | (0.221 | ) | | 0.375 | | | 1.071 | |
| Total from investment operations | | 0.141 | | | 0.444 | | | 0.651 | | | 0.221 | | | 0.768 | | | 1.383 | |
| Less distributions from net investment income | | (0.171 | ) | | (0.354 | ) | | (0.431 | ) | | (0.441 | ) | | (0.388 | ) | | (0.313 | ) |
| Net asset value, end of period | $ | 9.17 | | $ | 9.20 | | $ | 9.11 | | $ | 8.89 | | $ | 9.11 | | $ | 8.73 | |
| |
| Total returnb | | 1.54 | % | | 4.95 | % | | 7.49 | % | | 2.43 | % | | 8.84 | % | | 18.74 | % |
| |
| Ratios to average net assetsc | | | | | | | | | | | | | | | | | | |
| Expenses before waiver and payments by | | | | | | | | | | | | | | | | | | |
| affiliates | | 0.57 | % | | 0.58 | % | | 0.65 | % | | 0.64 | % | | 0.70 | % | | 0.71 | % |
| Expenses net of waiver and payments by | | | | | | | | | | | | | | | | | | |
| affiliates | | 0.55 | %d | | 0.58 | %d,e | | 0.65 | % | | 0.64 | %d | | 0.70 | %d | | 0.71 | %d |
| Net investment income | | 3.75 | % | | 3.85 | % | | 4.77 | % | | 4.81 | % | | 4.40 | % | | 3.91 | % |
| |
| Supplemental data | | | | | | | | | | | | | | | | | | |
| Net assets, end of period (000’s) | $ | 2,667,626 | | $ | 2,374,914 | | $ | 739,974 | | $ | 524,938 | | $ | 273,158 | | $ | 186,816 | |
| Portfolio turnover rate | | 40.45 | % | | 42.72 | % | | 80.88 | % | | 126.99 | % | | 82.13 | % | | 51.46 | % |
aThe amount shown for a share outstanding throughout the period may not correlate with the Statement of Operations for the period due to the timing of sales and repurchases of
the Fund shares in relation to income earned and/or fluctuating fair value of the investments of the Fund.
bTotal return is not annualized for periods less than one year.
cRatios are annualized for periods less than one year.
dBenefit of expense reduction rounds to less than 0.01%.
eBenefit of waiver and payment by affiliate rounds to less than 0.01%.
52 | The accompanying notes are an integral part of these financial statements. | Semiannual Report
Franklin Investors Securities Trust
Statement of Investments, April 30, 2014 (unaudited)
| | | | | |
| Franklin Floating Rate Daily Access Fund | Country | | Shares | | Value |
| Common Stocks (Cost $—) 0.0% | | | | | |
| Health Care Distributors 0.0% | | | | | |
| a,bRoTech Medical Corp. | United States | | 26,267 | $ | — |
| |
| | | | Principal Amount* | |
| Corporate Bonds (Cost $2,082,777) 0.0%† | | | | | |
| Broadcasting 0.0%† | | | | | |
| Clear Channel Communications Inc., senior secured note, first lien, | | | | | |
| 9.00%, 12/15/19 | United States | $ | 2,211,000 | | 2,365,770 |
| c,dSenior Floating Rate Interests 87.1% | | | | | |
| Aerospace & Defense 2.9% | | | | | |
| AWAS Finance Luxembourg 2012 SA, Term Loan, 3.50%, 7/16/18 | Luxembourg | | 4,068,452 | | 4,078,623 |
| AWAS Finance Luxembourg SA, Loans, 3.50%, 6/10/16 | Ireland | | 8,147,012 | | 8,167,380 |
| CAMP International Holding Co., | | | | | |
| 2013 Replacement Term Loan, 4.75%, 5/31/19 | United States | | 24,580,913 | | 24,703,817 |
| Second Lien 2013 Replacement Term Loan, 9.50%, 11/30/19 | United States | | 7,995,636 | | 8,195,527 |
| Delos Finance S.A.R.L. (ILFC), Loans, 3.50%, 3/06/21 | United States | | 14,700,000 | | 14,675,495 |
| Doncasters U.S. Finance LLC, | | | | | |
| Second Lien Term Loan, 9.50%, 10/09/20 | United States | | 8,882,759 | | 8,927,173 |
| eTerm B Loans, 4.50%, 4/09/20 | United States | | 16,600,000 | | 16,669,172 |
| fErickson Inc., Purchase Price Notes, 6.00%, 11/02/20 | United States | | 810,222 | | 782,367 |
| Fly Funding II S.A.R.L., Loans, 4.50%, 8/09/19 | Luxembourg | | 21,887,544 | | 21,983,302 |
| TransDigm Inc., Tranche C Term Loan, 3.75%, 2/28/20 | United States | | 55,771,090 | | 55,574,999 |
| | | | | | 163,757,855 |
| Agricultural Products 0.2% | | | | | |
| Allflex Holdings III Inc., | | | | | |
| Initial Term Loan, 4.25%, 7/17/20 | United States | | 4,179,000 | | 4,186,835 |
| Second Lien Initial Term Loan, 8.00%, 7/17/21 | United States | | 6,160,000 | | 6,231,869 |
| | | | | | 10,418,704 |
| Airlines 1.4% | | | | | |
| Air Canada, Term Loan, 5.50%, 9/26/19 | Canada | | 16,521,818 | | 16,841,928 |
| American Airlines Inc., Class B Term Loan, 3.75%, 6/27/19 | United States | | 39,238,550 | | 39,201,783 |
| Delta Air Lines Inc., | | | | | |
| Term Loan B, 3.50%, 4/20/17 | United States | | 4,442,330 | | 4,433,979 |
| Term Loan B-1, 3.50%, 10/18/18 | United States | | 11,998,125 | | 11,968,130 |
| Flying Fortress Inc. (ILFC), New Loan, 3.50%, 6/30/17 | United States | | 6,933,333 | | 6,939,837 |
| | | | | | 79,385,657 |
| Aluminum 0.2% | | | | | |
| Novelis Inc., Term Loan, 3.75%, 3/10/17 | Canada | | 9,675,218 | | 9,669,171 |
| Apparel Retail 0.4% | | | | | |
| eThe Men’s Wearhouse Inc., Term Loan B, 5.75%, 4/15/21 | United States | | 20,845,000 | | 20,816,338 |
| Application Software 0.2% | | | | | |
| CCC Information Services Inc., Term Loan, 4.00%, 12/20/19 | United States | | 10,122,494 | | 10,099,212 |
| Auto Parts & Equipment 3.3% | | | | | |
| Affinia Group Inc., Tranche B-2 Term Loan, 4.75%, 4/25/20 | United States | | 27,465,796 | | 27,482,962 |
| ASP HHI Acquisition Co. Inc., Refinancing Term Loan, 5.00%, | | | | | |
| 10/05/18 | United States | | 11,936,067 | | 11,965,907 |
| |
| | | | Semiannual Report | 53 |
| | | | | |
| Franklin Investors Securities Trust | | | | |
| |
| Statement of Investments, April 30, 2014 (unaudited) (continued) | | | | |
| |
| |
| Franklin Floating Rate Daily Access Fund | Country | | Principal Amount* | | Value |
| c,dSenior Floating Rate Interests (continued) | | | | | |
| Auto Parts & Equipment (continued) | | | | | |
| August LuxUK Holding Co., | | | | | |
| Lux Second Lien, 10.50%, 4/27/19 | Luxembourg | $ | 3,045,163 | $ | 3,113,679 |
| Lux Term B-1 Loan, 5.00%, 4/27/18 | Luxembourg | | 5,323,454 | | 5,350,071 |
| August U.S. Holding Co. Inc., | | | | | |
| U.S. Second Lien, 10.50%, 4/27/19 | United States | | 997,089 | | 1,019,523 |
| U.S. Term B-1 Loan, 5.00%, 4/27/18 | United States | | 7,843,114 | | 7,882,330 |
| eCS Intermediate HoldCo 2 LLC, Term Loans, 5.25%, 4/04/21 | United States | | 11,550,000 | | 11,542,781 |
| eFederal-Mogul Holdings Corp., Term Loan C, 6.00%, 4/15/21 | United States | | 31,400,000 | | 31,203,750 |
| FRAM Group Holdings Inc. (Autoparts Holdings), | | | | | |
| Second Lien Term Loan, 10.50%, 1/29/18 | United States | | 1,014,035 | | 968,404 |
| Term Loan, 6.50%, 7/29/17 | United States | | 11,675,062 | | 11,684,788 |
| Key Safety Systems Inc., Initial Term Loan, 4.75%, 5/10/18 | United States | | 4,008,695 | | 4,025,399 |
| TI Group Automotive Systems LLC, Term Loan, 5.50%, 3/28/19 | United States | | 16,701,877 | | 16,801,053 |
| Tower Automotive Holdings USA LLC, Initial Term Loan, 4.00%, | | | | | |
| 4/23/20 | United States | | 25,503,550 | | 25,455,731 |
| UCI International Inc., Term Loan, 5.50%, 7/26/17 | United States | | 11,607,911 | | 11,658,696 |
| Veyance Technologies Inc. (Goodyear), Term Loan, 5.25%, 9/08/17 | United States | | 12,183,699 | | 12,210,272 |
| | | | | | 182,365,346 |
| Automobile Manufacturers 0.2% | | | | | |
| Chrysler Group LLC, Tranche B Term Loan, 3.50%, 5/24/17 | United States | | 12,741,143 | | 12,741,143 |
| Biotechnology 0.2% | | | | | |
| Alkermes Inc., 2019 Term Loan, 3.50%, 9/25/19 | Ireland | | 10,701,692 | | 10,692,777 |
| Broadcasting 5.3% | | | | | |
| Clear Channel Communications Inc., | | | | | |
| Tranche B Term Loan, 3.80%, 1/29/16 | United States | | 6,054,365 | | 6,009,781 |
| Tranche C Term Loan, 3.80%, 1/29/16 | United States | | 107,147 | | 106,075 |
| Tranche D Term Loan, 6.90%, 1/30/19 | United States | | 44,223,287 | | 43,924,779 |
| Tranche E Term Loan, 7.65%, 7/30/19 | United States | | 25,971,493 | | 26,049,044 |
| Cumulus Media Holdings Inc., Term Loans, 4.25%, 12/23/20 | United States | | 41,551,238 | | 41,551,238 |
| Entercom Radio LLC, Term Loan B-2, 4.00% - 5.25%, 11/23/18 | United States | | 6,908,826 | | 6,919,625 |
| Grande Communications Networks LLC, Initial Term Loan, 4.50%, | | | | | |
| 5/31/20 | United States | | 10,411,325 | | 10,417,832 |
| Gray Television Inc., Initial Term Loan, 4.50%, 10/12/19 | United States | | 9,682,475 | | 9,715,763 |
| LIN Television Corp., Tranche B Term Loan, 4.00%, 12/21/18 | United States | | 4,858,736 | | 4,876,169 |
| eMedia General Inc., Term B Loan, 4.25%, 7/31/20 | United States | | 30,263,842 | | 30,367,677 |
| Mission Broadcasting Inc., Term B-2 Loan, 3.75%, 10/01/20 | United States | | 6,509,818 | | 6,501,628 |
| Nexstar Broadcasting Inc., Term B-2 Loan, 3.75%, 10/01/20 | United States | | 7,382,236 | | 7,372,949 |
| Radio One Inc., Term Loan, 7.50%, 3/31/16 | United States | | 35,233,523 | | 35,806,068 |
| Raycom TV Broadcasting LLC, Tranche B Term Loan, 4.25%, 5/31/17 | United States | | 17,930,935 | | 18,014,996 |
| Univision Communications Inc., | | | | | |
| First-Lien Term Loan, Add-on, 4.00%, 3/01/20 | United States | | 12,089,735 | | 12,039,006 |
| Replacement First-Lien Term Loan, 4.00%, 3/01/20 | United States | | 35,824,619 | | 35,693,465 |
| | | | | | 295,366,095 |
54 | Semiannual Report
| | | | | |
| Franklin Investors Securities Trust | | | | |
| |
| Statement of Investments, April 30, 2014 (unaudited) (continued) | | | | |
| |
| |
| Franklin Floating Rate Daily Access Fund | Country | | Principal Amount* | | Value |
| c,dSenior Floating Rate Interests (continued) | | | | | |
| Building Products 1.0% | | | | | |
| Air Distribution Technologies (Tomkins Air Distr.), First Lien Initial Term | | | | | |
| Loan, 4.25%, 11/09/18 | United States | $ | 10,522,826 | $ | 10,544,744 |
| Air Distribution Technologies (Tomkins Air Distribution), Second Lien | | | | | |
| Initial Loan, 9.25%, 5/09/20 | United States | | 7,921,154 | | 8,030,070 |
| NCI Building Systems Inc., Tranche B Term Loan, 4.25%, 6/24/19 | United States | | 7,751,159 | | 7,751,159 |
| Quikrete Holdings Inc., | | | | | |
| First Lien Initial Loan, 4.00%, 9/26/20 | United States | | 27,004,990 | | 27,025,243 |
| Second Lien Initial Loan, 7.00%, 3/26/21 | United States | | 2,448,462 | | 2,512,734 |
| | | | | | 55,863,950 |
| Cable & Satellite 1.2% | | | | | |
| Cequel Communications LLC, Term Loan, 3.50%, 2/14/19 | United States | | 21,612,997 | | 21,557,625 |
| Midcontinent Communications, Term B Loan, 3.50% - 5.00%, | | | | | |
| 7/30/20 | United States | | 11,771,494 | | 11,761,688 |
| TWCC Holding Corp., Second Lien Term Loan, 7.00%, 6/26/20 | United States | | 16,350,250 | | 16,302,556 |
| Virgin Media Bristol LLC, B Facility, 3.50%, 6/07/20 | United States | | 17,260,000 | | 17,138,248 |
| | | | | | 66,760,117 |
| Casinos & Gaming 4.7% | | | | | |
| Affinity Gaming LLC, Initial Term Loan, 4.25%, 11/09/17 | United States | | 9,645,063 | | 9,596,837 |
| Boyd Gaming Corp., Term B Loan, 4.00%, 8/14/20 | United States | | 20,265,681 | | 20,278,347 |
| Caesars Entertainment Operating Co. Inc., | | | | | |
| Term Loan B-4, 9.50%, 10/31/16 | United States | | 13,968,491 | | 13,852,091 |
| Term Loan B-6, 5.402%, 1/28/18 | United States | | 16,145,981 | | 15,093,973 |
| Caesars Entertainment Resort Properties LLC, Term B Loans, 7.00%, | | | | | |
| 10/11/20 | United States | | 42,193,600 | | 42,331,320 |
| Cannery Casino Resorts LLC, Term Loan, 6.00%, 10/02/18 | United States | | 28,173,129 | | 27,691,847 |
| CCM Merger Inc. (MotorCity Casino), Term Loan, 5.00%, 3/01/17 | United States | | 8,965,641 | | 8,969,380 |
| CityCenter Holdings LLC, Term B Loan, 5.00%, 10/16/20 | United States | | 27,291,600 | | 27,466,430 |
| MGM Resorts International, Term B Loan, 3.50%, 12/20/19 | United States | | 10,244,607 | | 10,196,591 |
| Pinnacle Entertainment Inc., Tranche B-2 Term Loan, 3.75%, | | | | | |
| 8/13/20 | United States | | 11,043,148 | | 11,029,345 |
| ROC Finance LLC, Funded Term B Loans, 5.00%, 4/08/19 | United States | | 24,364,221 | | 23,618,067 |
| Scientific Games International Inc., Term Loan B, 4.25%, 10/18/20 | United States | | 36,309,000 | | 36,245,459 |
| Tropicana Entertainment Inc., Term Loans, 4.00%, 11/27/20 | United States | | 15,979,700 | | 16,019,649 |
| | | | | | 262,389,336 |
| Coal & Consumable Fuels 1.3% | | | | | |
| Bowie Resource Holdings LLC, Initial Term Loan, 6.75%, 8/16/20 | United States | | 4,946,013 | | 5,001,655 |
| eForesight Energy LLC, Term Loans, 5.50%, 8/23/20 | United States | | 28,276,454 | | 28,517,991 |
| Peabody Energy Corp., Term Loan, 4.25%, 9/24/20 | United States | | 41,717,183 | | 41,760,653 |
| | | | | | 75,280,299 |
| Commodity Chemicals 0.5% | | | | | |
| AI Chem & CY U.S. Acquico Inc., | | | | | |
| Second Lien Term Loan, 9.25%, 4/03/20 | United States | | 3,250,000 | | 3,323,125 |
| Tranche B-1 Term Loan, 4.50%, 10/03/19 | Luxembourg | | 2,947,078 | | 2,954,446 |
| Tranche B-2 Term Loan, 4.50%, 10/03/19 | Luxembourg | | 1,529,097 | | 1,532,920 |
Semiannual Report | 55
| | | | | |
| Franklin Investors Securities Trust | | | | |
| |
| Statement of Investments, April 30, 2014 (unaudited) (continued) | | | | |
| |
| |
| Franklin Floating Rate Daily Access Fund | Country | | Principal Amount* | | Value |
| c,dSenior Floating Rate Interests (continued) | | | | | |
| Commodity Chemicals (continued) | | | | | |
| Cyanco Intermediate Corp., Initial Term Loan, 5.50%, 5/01/20 | United States | $ | 22,828,835 | $ | 22,885,907 |
| | | | | | 30,696,398 |
| Communications Equipment 1.1% | | | | | |
| Alcatel-Lucent USA Inc., US Term Loan C (TLC), 4.50%, 1/30/19 | United States | | 29,392,297 | | 29,444,350 |
| Avaya Inc., Term B-6 Loan, 6.50%, 3/31/18 | United States | | 18,887,135 | | 18,843,846 |
| ePresidio Inc., Term Loan, 6.25%, 3/31/17 | United States | | 2,440,000 | | 2,455,250 |
| Telesat Canada/Telesat LLC, U.S. Term B-2 Loan, 3.50%, 3/28/19 | Canada | | 10,966,404 | | 10,947,553 |
| | | | | | 61,690,999 |
| Computer & Electronics Retail 0.6% | | | | | |
| Sungard Availability Services Capital Inc., Tranche B Term Loan, 6.00%, | | | | | |
| 3/31/19 | United States | | 33,310,000 | | 33,143,450 |
| Construction & Heavy Trucks 0.5% | | | | | |
| Allison Transmission Inc., Term B-3 Loans, 3.75%, 8/23/19 | United States | | 22,645,587 | | 22,611,618 |
| Terex Corp., Term Loan, 3.50%, 4/28/17 | United States | | 7,298,192 | | 7,332,406 |
| | | | | | 29,944,024 |
| Consumer Finance 0.6% | | | | | |
| Realogy Group LLC, Initial Term B Loan, 3.75%, 3/10/20 | United States | | 32,608,186 | | 32,567,425 |
| Containers & Packaging 0.1% | | | | | |
| ePrescrix Inc., | | | | | |
| 1st Lien Term B-1 Facility, 5.50%, 4/30/21 | United States | | 2,430,000 | | 2,428,481 |
| 2nd Lien Term Loan, 9.25%, 4/30/22 | United States | | 3,057,297 | | 3,062,076 |
| | | | | | 5,490,557 |
| Data Processing & Outsourced Services 1.5% | | | | | |
| MoneyGram International Inc., Term Loan, 4.25%, 3/28/20 | United States | | 42,426,028 | | 41,524,475 |
| Safenet Inc., | | | | | |
| First Lien Initial Term Loan, 5.50%, 2/24/20 | United States | | 11,730,000 | | 11,788,650 |
| Second Lien Initial Term Loan, 8.50%, 3/05/21 | United States | | 5,632,940 | | 5,661,105 |
| SunGard Data Systems Inc., Tranche E Term Loan, 4.00%, 3/08/20 | United States | | 5,698,803 | | 5,710,913 |
| Worldpay U.S. Inc., | | | | | |
| Additional Term Facility, 4.50%, 11/30/19 | United States | | 3,462,600 | | 3,479,913 |
| Facility B2A-II Loan, 5.25%, 11/30/19 | United States | | 6,910,000 | | 6,976,944 |
| Facility C2 Loan, 4.75%, 11/30/19 | United States | | 8,760,000 | | 8,844,867 |
| | | | | | 83,986,867 |
| Department Stores 0.5% | | | | | |
| Hudson’s Bay Co., First Lien Initial Term Loan, 4.75%, 11/04/20 | Canada | | 14,817,000 | | 14,948,960 |
| Sears Roebuck Acceptance Corp., Term Loan, 5.50%, 6/30/18 | United States | | 13,568,879 | | 13,693,618 |
| | | | | | 28,642,578 |
| Distributors 0.4% | | | | | |
| American Builders & Contractors Supply Co. Inc., Term B Loans, 3.50%, | | | | | |
| 4/16/20 | United States | | 20,183,450 | | 20,099,346 |
| Diversified Chemicals 2.5% | | | | | |
| Arysta Lifescience SPC LLC, | | | | | |
| Initial Term Loan, 4.50%, 5/29/20 | United States | | 28,817,050 | | 28,816,820 |
| Second Lien Initial Term Loan, 8.25%, 11/30/20 | United States | | 34,542,797 | | 35,298,421 |
| |
| 56 | Semiannual Report | | | | | |
| | | | | |
| Franklin Investors Securities Trust | | | | |
| |
| Statement of Investments, April 30, 2014 (unaudited) (continued) | | | | |
| |
| |
| Franklin Floating Rate Daily Access Fund | Country | | Principal Amount* | Value |
| c,dSenior Floating Rate Interests (continued) | | | | | |
| Diversified Chemicals (continued) | | | | | |
| Ineos U.S. Finance LLC, Dollar Term Loan, 3.75%, 5/04/18 | United States | $ | 15,590,441 | $ | 15,469,334 |
| OCI Beaumont LLC, Term B-3 Loan, 5.00%, 8/20/19 | United States | | 19,303,217 | | 19,520,378 |
| OXEA GmbH, | | | | | |
| First Lien Tranche B-2 Term Loan, 4.25%, 1/15/20 | Luxembourg | | 8,964,950 | | 8,976,156 |
| Second Lien Term Loan, 8.25%, 7/15/20 | Luxembourg | | 29,960,000 | | 30,521,750 |
| | | | | | 138,602,859 |
| Diversified Metals & Mining 1.4% | | | | | |
| eAtkore International Inc., | | | | | |
| Initial Term Loan, 5.75%, 4/09/21 | United States | | 9,790,000 | | 9,781,845 |
| Second Lien Initial Term Loan, 9.00%, 10/09/21 | United States | | 7,080,000 | | 7,110,975 |
| FMG America Finance Inc. (Fortescue Metals Group), Loans, 4.25%, | | | | | |
| 6/30/19 | United States | | 63,377,946 | | 63,422,501 |
| | | | | | 80,315,321 |
| Diversified Support Services 1.9% | | | | | |
| Acosta Inc., Term Loan B, 4.25% - 5.50%, 3/01/18 | United States | | 13,326,014 | | 13,387,087 |
| AlixPartners LLP, | | | | | |
| 2014 Jan Replacement Term B2 Loans, 4.00%, 7/10/20 | United States | | 21,902,102 | | 21,898,182 |
| eSecond Lien 2013 Recapitalization Term Loan, 9.00%, 7/10/21 | United States | | 11,548,950 | | 11,819,634 |
| Brock Holdings III Inc., Tranche B Term Loan, 6.00%, 3/16/17 | United States | | 5,672,847 | | 5,689,394 |
| Interactive Data Corp., | | | | | |
| Term B Loan, 3.75%, 2/11/18 | United States | | 6,828,910 | | 6,827,489 |
| Term Loan, 6.00%, 5/02/21 | United States | | 5,171,090 | | 5,175,129 |
| Pacific Industrial Services US Finco LLC (Spotless), | | | | | |
| First Lien Term B Loan, 5.00%, 10/02/18 | United States | | 25,001,732 | | 25,147,567 |
| Second Lien Initial Term Loan, 8.75%, 4/02/19 | United States | | 13,359,107 | | 13,701,434 |
| | | | | | 103,645,916 |
| Drug Retail 0.4% | | | | | |
| Rite Aid Corp., | | | | | |
| Tranche 1 Term Loan, 5.75%, 8/21/20 | United States | | 2,780,000 | | 2,844,635 |
| Tranche 2 Term Loan, 4.875%, 6/21/21 | United States | | 4,740,000 | | 4,801,227 |
| Rite AID Corp., Tranche 7 Term Loan, 3.50%, 2/21/20 | United States | | 12,048,950 | | 12,042,672 |
| | | | | | 19,688,534 |
| Education Services 0.6% | | | | | |
| Bright Horizons Family Solutions LLC, Term B Loan, 4.00% - 5.25%, | | | | | |
| 1/30/20 | United States | | 22,001,585 | | 22,015,336 |
| Laureate Education Inc., New Series 2018 Ext. Term Loan, 5.00%, | | | | | |
| 6/16/18 | United States | | 13,667,081 | | 13,509,062 |
| | | | | | 35,524,398 |
| Electric Utilities 0.5% | | | | | |
| Alinta Energy Finance Pty. Ltd., Term B Loans, 6.375%, 8/13/19 | Australia | | 25,488,991 | | 25,903,187 |
| Electrical Components & Equipment 0.1% | | | | | |
| Wesco Distribution Inc., Tranche B-1 Loan, 3.75%, 12/12/19 | United States | | 6,260,732 | | 6,260,694 |
| Electronic Equipment & Instruments 0.0%† | | | | | |
| Oberthur Technologies of America Corp., Tranche B-2 Term Loan, 4.50%, | | | | | |
| 10/18/19 | United States | | 1,317,498 | | 1,323,657 |
| |
| | | | Semiannual Report | 57 |
| | | | | |
| Franklin Investors Securities Trust | | | | |
| |
| Statement of Investments, April 30, 2014 (unaudited) (continued) | | | | |
| |
| |
| Franklin Floating Rate Daily Access Fund | Country | | Principal Amount* | | Value |
| c,dSenior Floating Rate Interests (continued) | | | | | |
| Environmental & Facilities Services 0.6% | | | | | |
| ADS Waste Holdings Inc., Tranche B-2 Term Loan, 3.75%, 10/09/19 | United States | $ | 31,957,878 | $ | 31,761,465 |
| Food Distributors 0.8% | | | | | |
| AdvancePierre Foods Inc., | | | | | |
| Loans, 5.75%, 7/10/17 | United States | | 8,778,825 | | 8,798,033 |
| Second Lien Term Loan, 9.50%, 10/10/17 | United States | | 16,780,000 | | 16,318,550 |
| U.S. Foods Inc., Term Loan, 4.50%, 3/31/19 | United States | | 19,850,000 | | 19,901,690 |
| | | | | | 45,018,273 |
| Food Retail 0.1% | | | | | |
| Pantry Inc., Term Loan, 4.75%, 8/03/19 | United States | | 3,137,337 | | 3,156,867 |
| Forest Products 0.8% | | | | | |
| Appvion Inc., Term Loan, 5.75%, 6/28/19 | United States | | 20,557,187 | | 20,758,483 |
| Caraustar Industries Inc., Initial Term Loan, 7.50%, 5/01/19 | United States | | 23,473,113 | | 23,847,227 |
| | | | | | 44,605,710 |
| Health Care Equipment 1.3% | | | | | |
| Biomet Inc., Dollar Term B-2 Loan, 3.65% - 3.733%, 7/25/17 | United States | | 21,150,175 | | 21,208,719 |
| Carestream Health Inc., | | | | | |
| Second Lien Loan, 9.50%, 12/07/19 | United States | | 16,729,461 | | 17,105,873 |
| Term Loan, 5.00%, 6/07/19 | United States | | 16,057,730 | | 16,121,287 |
| Kinetic Concepts Inc., Dollar Term E-1 Loan, 4.00%, 5/04/18 | United States | | 18,159,560 | | 18,185,510 |
| | | | | | 72,621,389 |
| Health Care Facilities 1.8% | | | | | |
| Community Health Systems Inc., | | | | | |
| 2017 Term E Loan, 3.447% - 3.483%, 1/25/17 | United States | | 7,399,968 | | 7,415,168 |
| 2021 Term D Loan, 4.25%, 1/27/21 | United States | | 52,541,116 | | 52,770,774 |
| Iasis Healthcare LLC, Term B-2 Loan, 4.50%, 5/03/18 | United States | | 28,209,599 | | 28,255,439 |
| United Surgical Partners International Inc., | | | | | |
| Extended Term Loan, 4.25%, 4/03/17 | United States | | 5,274,984 | | 5,279,863 |
| New Tranche B Term Loan, 4.75%, 4/03/19 | United States | | 5,096,803 | | 5,130,783 |
| | | | | | 98,852,027 |
| Health Care Services 3.9% | | | | | |
| DaVita HealthCare Partners Inc., | | | | | |
| Tranche B Term Loan, 4.50%, 10/20/16 | United States | | 2,449,367 | | 2,457,928 |
| Tranche B-2 Term Loan, 4.00%, 8/24/19 | United States | | 46,707,817 | | 46,895,162 |
| eDialysis Newco Inc., | | | | | |
| 2nd Lien Term Loan B, 9.00%, 10/22/21 | United States | | 3,806,667 | | 3,816,183 |
| Term Loan B, 6.00%, 4/23/21 | United States | | 5,924,667 | | 5,932,073 |
| Envision Healthcare Corp. (Emergency Medical), Initial Term Loan, | | | | | |
| 4.00%, 5/25/18 | United States | | 14,795,401 | | 14,804,648 |
| eMillennium Laboratories LLC, Tranche B Term Loan, 6.50%, 4/16/21 | United States | | 68,380,000 | | 68,101,762 |
| National Mentor Holdings Inc., Initial Tranche B Term Loan, 4.75%, | | | | | |
| 1/31/21 | United States | | 16,865,000 | | 16,917,703 |
58 | Semiannual Report
Franklin Investors Securities Trust
Statement of Investments, April 30, 2014 (unaudited) (continued)
| | | | | |
| Franklin Floating Rate Daily Access Fund | Country | | Principal Amount* | | Value |
| c,dSenior Floating Rate Interests (continued) | | | | | |
| Health Care Services (continued) | | | | | |
| Surgery Centers Holdings Inc., | | | | | |
| eFirst Lien Term Loan, 6.00%, 4/11/19 | United States | $ | 11,358,172 | $ | 11,414,963 |
| Incremental Second Lien Term Loan, 9.75%, 4/10/20 | United States | | 3,140,000 | | 3,135,095 |
| U.S. Renal Care Inc., | | | | | |
| Incremental Tranche B-1 Term Loan (Second), 9.75%, 1/03/20 | United States | | 1,165,714 | | 1,181,014 |
| eTranche B-2 Term Loan, 4.25%, 7/03/19 | United States | | 45,339,335 | | 45,396,009 |
| | | | | | 220,052,540 |
| Health Care Supplies 0.2% | | | | | |
| Alere Inc., B Term Loan, 4.25%, 6/30/17 | United States | | 11,411,571 | | 11,420,130 |
| Health Care Technology 0.4% | | | | | |
| IMS Health Inc., Term B Dollar Loans, 3.50% - 3.75%, 3/10/21 | United States | | 12,409,673 | | 12,365,073 |
| Truven Health Analytics Inc., New Tranche B Term Loan, 4.50%, | | | | | |
| 6/06/19 | United States | | 8,953,119 | | 8,902,757 |
| | | | | | 21,267,830 |
| Home Improvement Retail 0.4% | | | | | |
| Harbor Freight Tools USA Inc., Loans, 4.75%, 7/26/19 | United States | | 24,352,769 | | 24,468,322 |
| Hotels, Resorts & Cruise Lines 0.6% | | | | | |
| Diamond Resorts Corp., First Lien Term Loan, 6.75%, 5/09/21 | United States | | 9,672,745 | | 9,690,881 |
| Four Seasons Holdings Inc., Second Lien Term Loan, 6.25%, | | | | | |
| 12/27/20 | Canada | | 3,100,000 | | 3,154,250 |
| La Quinta Intermediate Holdings LLC, Initial Term Loans, 4.00%, | | | | | |
| 4/14/21 | United States | | 2,135,929 | | 2,130,589 |
| Station Casinos LLC, B Term Loan, 4.25%, 3/01/20 | United States | | 17,479,313 | | 17,484,784 |
| | | | | | 32,460,504 |
| Household Products 1.2% | | | | | |
| Apex Tool Group LLC, Term Loan, 4.50%, 2/01/20 | United States | | 18,385,588 | | 18,231,278 |
| Sun Products Corp., Tranche B Term Loan, 5.50% - 6.50%, 3/23/20 | United States | | 52,160,589 | | 50,400,169 |
| | | | | | 68,631,447 |
| Human Resource & Employment Services 1.0% | | | | | |
| Altegrity Inc., | | | | | |
| Tranche B Term Loan, 5.00%, 2/21/15 | United States | | 23,688,347 | | 23,207,189 |
| Tranche D Term Loan, 7.75%, 2/21/15 | United States | | 35,035,245 | | 34,480,532 |
| | | | | | 57,687,721 |
| Independent Power Producers & Energy Traders 0.8% | | | | | |
| The AES Corp., 2013 Other Term Loan, 3.75%, 6/01/18 | United States | | 7,220,057 | | 7,236,417 |
| Calpine Corp., | | | | | |
| Term Loan, 4.00%, 4/01/18 | United States | | 9,854,771 | | 9,879,407 |
| eTerm Loan B4, 4.00%, 10/31/20 | United States | | 19,679,161 | | 19,730,111 |
| Term Loans, 4.00%, 10/09/19 | United States | | 2,570,850 | | 2,577,478 |
| Dynegy Inc., Initial Tranche B-2 Term Loan, 4.00%, 4/23/20 | United States | | 6,896,212 | | 6,893,723 |
| | | | | | 46,317,136 |
Semiannual Report | 59
| | | | | |
| Franklin Investors Securities Trust | | | | |
| |
| Statement of Investments, April 30, 2014 (unaudited) (continued) | | | | |
| |
| |
| Franklin Floating Rate Daily Access Fund | Country | | Principal Amount* | | Value |
| c,dSenior Floating Rate Interests (continued) | | | | | |
| Industrial Conglomerates 0.8% | | | | | |
| Mirion Technologies Inc., Term Loan, 5.75%, 3/30/18 | United States | $ | 7,543,800 | $ | 7,572,089 |
| eSchaeffler AG, Facility C-USD, 4.25%, 1/27/17 | Germany | | 30,060,952 | | 30,173,561 |
| Unifrax I LLC, New Term Dollar Loans, 4.25%, 11/28/18 | United States | | 6,101,175 | | 6,093,548 |
| | | | | | 43,839,198 |
| Industrial Machinery 2.8% | | | | | |
| Douglas Dynamics LLC, Term Loan, 5.75%, 4/18/18 | United States | | 4,360,902 | | 4,341,714 |
| Generac Power Systems Inc., Term Loans, 3.25%, 5/31/20 | United States | | 7,745,374 | | 7,723,594 |
| Husky Injection Molding Systems Ltd., Term Loan, 4.25%, 6/30/18 | Canada | | 16,658,432 | | 16,715,704 |
| Milacron LLC, | | | | | |
| Term B Loan, 4.00%, 3/28/20 | United States | | 17,632,056 | | 17,676,137 |
| eTerm Loan B, 5.25%, 3/28/20 | United States | | 5,867,944 | | 5,882,613 |
| eNavistar Inc., Tranche B Term Loan, 5.75%, 8/17/17 | United States | | 18,117,567 | | 18,381,776 |
| RBS Global Inc. (Rexnord), Term B Loan, 4.00%, 8/21/20 | United States | | 21,949,700 | | 21,910,827 |
| Sensus USA Inc., | | | | | |
| First Lien Term Loan, 4.75%, 5/09/17 | United States | | 14,551,878 | | 14,557,946 |
| Second Lien Term Loan, 8.50%, 5/09/18 | United States | | 14,314,541 | | 14,395,061 |
| eSignode Industrial Group U.S. Inc., Term Loan B, 5.25%, 5/01/21 | United States | | 16,290,000 | | 16,251,816 |
| Spin Holdco Inc. (Coinmach), Initial Term Loan, 4.25%, 11/14/19 | United States | | 11,820,674 | | 11,804,421 |
| WireCo Worldgroup Inc., Term Loan, 6.00%, 2/15/17 | United States | | 5,923,979 | | 5,972,111 |
| | | | | | 155,613,720 |
| Insurance Brokers 0.3% | | | | | |
| eHUB International Ltd., Initial Term Loan, 4.25%, 10/02/20 | United States | | 17,360,249 | | 17,353,739 |
| Integrated Telecommunication Services 1.7% | | | | | |
| Genesys Telecom Holdings U.S. Inc., Dollar Term Loan, 4.00%, | | | | | |
| 2/08/20 | United States | | 13,756,224 | | 13,773,419 |
| Integra Telecom Holdings Inc., | | | | | |
| First Lien Term Loan, 5.25%, 2/22/19 | United States | | 6,712,200 | | 6,750,795 |
| Second Lien Initial Loan, 9.75%, 2/24/20 | United States | | 8,213,247 | | 8,418,579 |
| Intelsat Jackson Holdings SA, Tranche B-2 Term Loan, 3.75%, | | | | | |
| 6/30/19 | Luxembourg | | 14,207,201 | | 14,222,005 |
| LTS Buyer LLC, | | | | | |
| First Lien Term B Loan, 4.00%, 4/11/20 | United States | | 10,662,157 | | 10,648,829 |
| Second Lien Initial Loan, 8.00%, 4/11/21 | United States | | 4,887,489 | | 4,964,873 |
| Zayo Group LLC, Term Loan, 4.00%, 7/02/19 | United States | | 33,783,940 | | 33,755,799 |
| | | | | | 92,534,299 |
| Internet Software & Services 1.6% | | | | | |
| BMC Software Finance Inc., Initial U.S. Term Loans, 5.00%, 9/10/20 | United States | | 65,665,425 | | 65,644,937 |
| Web.com Group Inc., First Lien Term Loan, 4.50%, 10/27/17 | United States | | 25,244,761 | | 25,455,126 |
| | | | | | 91,100,063 |
| Investment Banking & Brokerage 0.4% | | | | | |
| Guggenheim Partners Investment Management Holdings LLC, Initial Term | | | | | |
| Loan, 4.25%, 7/22/20 | United States | | 21,924,916 | | 22,018,097 |
| IT Consulting & Other Services 0.2% | | | | | |
| Genpact International Inc., Domestic Term B-1 Loan, 3.50%, 8/30/19 | United States | | 9,123,616 | | 9,119,054 |
60 | Semiannual Report
| | | | | |
| Franklin Investors Securities Trust | | | | |
| |
| Statement of Investments, April 30, 2014 (unaudited) (continued) | | | | |
| |
| |
| Franklin Floating Rate Daily Access Fund | Country | | Principal Amount* | | Value |
| c,dSenior Floating Rate Interests (continued) | | | | | |
| Leisure Facilities 1.6% | | | | | |
| 24 Hour Fitness Worldwide Inc., New Tranche B Term Loan, 5.00%, | | | | | |
| 4/22/16 | United States | $ | 10,945,535 | $ | 11,005,736 |
| eClubCorp Club Operations Inc., Term B Loans, 4.00%, 7/24/20 | United States | | 26,194,113 | | 26,161,370 |
| ePlanet Fitness Holdings LLC, Term Loan, 6.00%, 3/31/21 | United States | | 14,410,000 | | 14,428,013 |
| Seven Seas Cruises S. De R.L. & SSC Finance Corp., Term B-2 Loan, | | | | | |
| 3.75%, 12/21/18 | Panama | | 10,988,475 | | 10,961,004 |
| Six Flags Theme Parks Inc., Tranche B Term Loan, 3.50% - 5.00%, | | | | | |
| 12/20/18 | United States | | 4,011,001 | | 4,024,161 |
| Town Sports International LLC, Initial Term Loan, 4.50%, 11/15/20 | United States | | 22,004,357 | | 21,399,237 |
| | | | | | 87,979,521 |
| Life & Health Insurance 0.2% | | | | | |
| CNO Financial Group Inc. (fka Conseco), Tranche B-2 Term Loan, 3.75%, | | | | | |
| 9/28/18 | United States | | 9,235,453 | | 9,269,855 |
| Life Sciences Tools & Services 0.7% | | | | | |
| Pharmaceutical Product Development LLC, Term Loan, 4.00%, | | | | | |
| 12/05/18 | United States | | 14,792,947 | | 14,789,249 |
| Quintiles Transnational Corp., Term B-3 Loan, 3.75%, 6/08/18 | United States | | 24,400,000 | | 24,387,678 |
| | | | | | 39,176,927 |
| Marine 0.5% | | | | | |
| eNavios Maritime Partners LP, Initial Term Loan, 5.25%, 6/27/18 | Marshall Islands | | 26,354,660 | | 26,749,980 |
| Metal & Glass Containers 0.2% | | | | | |
| BWAY Holding Co., Initial Term Loan, 4.50%, 8/06/17 | United States | | 9,458,978 | | 9,504,797 |
| Movies & Entertainment 3.1% | | | | | |
| AMC Entertainment Inc., Initial Term Loan, 3.50%, 4/30/20 | United States | | 8,474,400 | | 8,463,807 |
| Aufinco Pty. Ltd. and U.S. Finco LLC, | | | | | |
| Second Lien Initial Term Loan, 8.25%, 11/30/20 | Australia | | 4,500,000 | | 4,612,500 |
| Term B Loan, 4.00%, 5/30/20 | Australia | | 10,161,539 | | 10,145,667 |
| Delta 2 (Lux) S.A.R.L. (Formula One), New Facility B (USD), 4.50%, | | | | | |
| 4/30/19 | Luxembourg | | 32,806,835 | | 33,032,382 |
| IMG Worldwide Inc., Tranche B Term Loan, 6.50%, 6/16/16 | United States | | 8,390,218 | | 8,416,438 |
| eWilliam Morris Endeavor Entertainment LLC, | | | | | |
| Term Loans First Lien, 6.50%, 3/21/21 | United States | | 64,000,000 | | 63,968,000 |
| Term Loans Second Lien, 9.50%, 3/21/22 | United States | | 23,630,000 | | 23,858,927 |
| Zuffa LLC, Initial Term Loan, 3.75%, 2/25/20 | United States | | 17,765,467 | | 17,709,950 |
| | | | | | 170,207,671 |
| Oil & Gas Drilling 1.0% | | | | | |
| Drillships Financing Holding Inc., Tranche B-1 Term Loan, 6.00%, | | | | | |
| 3/31/21 | Marshall Islands | | 29,586,674 | | 30,011,983 |
| Offshore Group Investment Ltd. (Vantage Delaware), Loans, 5.75%, | | | | | |
| 3/28/19 | United States | | 13,711,500 | | 13,740,061 |
| Pacific Drilling SA, Term Loan, 4.50%, 6/03/18 | Luxembourg | | 14,031,471 | | 14,053,402 |
| | | | | | 57,805,446 |
| Oil & Gas Equipment & Services 0.5% | | | | | |
| McJunkin Red Man Corp., 2013 Term Loan, 4.75%, 11/11/19 | United States | | 25,137,991 | | 25,350,106 |
Semiannual Report | 61
| | | | | |
| Franklin Investors Securities Trust | | | | |
| |
| Statement of Investments, April 30, 2014 (unaudited) (continued) | | | | |
| |
| |
| Franklin Floating Rate Daily Access Fund | Country | | Principal Amount* | | Value |
| c,dSenior Floating Rate Interests (continued) | | | | | |
| Oil & Gas Exploration & Production 1.3% | | | | | |
| Fieldwood Energy LLC, Second Lien Closing Date Loans, 8.375%, | | | | | |
| 9/30/20 | United States | $ | 5,530,000 | $ | 5,718,020 |
| Obsidian Natural Gas Trust, Term Loan, 7.00%, 11/02/15 | United States | | 6,532,056 | | 6,621,872 |
| Quicksilver Resources Inc., Second Lien Loans, 7.00%, 6/21/19 | United States | | 11,242,071 | | 11,242,071 |
| Samson Investment Co., Second Lien Tranche I Term Loan, 5.00%, | | | | | |
| 9/25/18 | United States | | 27,720,000 | | 27,780,651 |
| Utex Industries Inc., | | | | | |
| First Lien Term Loan, 4.50%, 4/10/20 | United States | | 17,823,115 | | 17,860,241 |
| Second Lien Term Loan, 8.75%, 4/10/21 | United States | | 4,250,000 | | 4,292,500 |
| | | | | | 73,515,355 |
| Oil & Gas Storage & Transportation 0.2% | | | | | |
| Ruby Western Pipeline Holdings LLC, Loans, 3.50%, 3/27/20 | United States | | 26,312 | | 26,303 |
| Tallgrass Operations LLC, Term Loan, 4.25%, 11/13/18 | United States | | 8,540,000 | | 8,607,859 |
| | | | | | 8,634,162 |
| Other Diversified Financial Services 1.0% | | | | | |
| Asurion LLC, | | | | | |
| Incremental Tranche B-1 Term Loan, 5.00%, 5/24/19 | United States | | 29,090,800 | | 29,139,295 |
| Incremental Tranche B-2 Term Loans, 4.25%, 7/08/20 | United States | | 19,108,137 | | 18,896,591 |
| Second Lien Term Loan, 8.50%, 3/03/21 | United States | | 4,870,000 | | 4,993,781 |
| | | | | | 53,029,667 |
| Packaged Foods & Meats 1.1% | | | | | |
| Big Heart Pet Brands (Del Monte Pet), Initial Term Loans, 3.50%, | | | | | |
| 2/24/20 | United States | | 18,316,718 | | 18,193,080 |
| CSM Bakery Supplies LLC (U.S. Acquisition), Second Lien Term Loan, | | | | | |
| 8.50%, 7/03/21 | United States | | 13,583,362 | | 13,821,071 |
| eCSM Bakery Supplies LLC, Term Loans, 6.00%, 7/03/20 | United States | | 7,580,905 | | 7,633,971 |
| Dole Food Co. Inc., Tranche B Term Loan, 4.50% - 5.75%, 11/01/18 | United States | | 10,459,680 | | 10,464,910 |
| JBS USA LLC, | | | | | |
| Incremental Term Loan, 3.75%, 9/18/20 | United States | | 7,631,650 | | 7,618,531 |
| Initial Term Loan, 3.75%, 5/25/18 | United States | | 6,384,770 | | 6,388,601 |
| | | | | | 64,120,164 |
| Paper Packaging 2.0% | | | | | |
| Clondalkin Acquisition BV, | | | | | |
| Second Lien Term Loan, 10.00%, 11/30/20 | Netherlands | | 6,606,960 | | 6,639,995 |
| Other Term Loan, 4.50%, 5/29/20 | Netherlands | | 25,629,320 | | 25,629,320 |
| eExopack Holdings SA, USD Term Loan, 5.25%, 5/08/19 | Luxembourg | | 42,645,591 | | 43,125,354 |
| Reynolds Group Holdings Inc., U.S. Term Loan, 4.00%, 12/01/18 | United States | | 36,191,540 | | 36,262,222 |
| | | | | | 111,656,891 |
| Personal Products 1.6% | | | | | |
| eFGI Operating Co. LLC (Freedom Group), Term B Loans, 5.50%, | | | | | |
| 4/19/19 | United States | | 35,927,896 | | 36,421,905 |
| Otter Products LLC, Loans, 5.25%, 4/29/19 | United States | | 27,251,271 | | 27,262,634 |
62 | Semiannual Report
| | | | | |
| Franklin Investors Securities Trust | | | | |
| |
| Statement of Investments, April 30, 2014 (unaudited) (continued) | | | | |
| |
| |
| Franklin Floating Rate Daily Access Fund | Country | | Principal Amount* | | Value |
| c,dSenior Floating Rate Interests (continued) | | | | | |
| Personal Products (continued) | | | | | |
| Revlon Consumer Products Corp., | | | | | |
| Acquisition Term Loans, 4.00%, 10/09/19 | United States | $ | 18,703,125 | $ | 18,706,043 |
| Non-Contributed Loan, 8.50%, 10/08/14 | United States | | 5,500,000 | | 5,555,000 |
| | | | | | 87,945,582 |
| Pharmaceuticals 1.8% | | | | | |
| eAkorn Inc., Loans, 4.50%, 4/17/21 | United States | | 24,004,305 | | 24,079,126 |
| Mallinckrodt International Finance SA and Mallinckrodt CB LLC, | | | | | |
| Initial Term B Loan, 3.50%, 3/19/21 | United States | | 15,170,000 | | 15,064,523 |
| Par Pharmaceutical Cos. Inc., Term B-2 Loan, 4.00%, 9/30/19 | United States | | 24,850,622 | | 24,791,080 |
| Valeant Pharmaceuticals International Inc., | | | | | |
| Series C-2 Tranche B Term Loan, 3.75%, 12/11/19 | Canada | | 10,904,441 | | 10,896,655 |
| Series D-2 Tranche B Term Loan, 3.75%, 2/13/19 | Canada | | 20,272,372 | | 20,259,702 |
| Series E-1 Tranche B Term Loan, 3.75%, 8/05/20 | Canada | | 7,273,801 | | 7,280,370 |
| | | | | | 102,371,456 |
| Publishing 0.8% | | | | | |
| Cengage Learning Acquisitions Inc., Original Term Loans, 7.00%, | | | | | |
| 3/31/20 | United States | | 46,605,000 | | 47,321,552 |
| Restaurants 0.2% | | | | | |
| Burger King Corp., Tranche B Term Loan, 3.75%, 9/28/19 | United States | | 4,696,187 | | 4,720,307 |
| P.F. Chang’s China Bistro Inc., Term Loan, 4.25%, 6/22/19 | United States | | 8,440,885 | | 8,451,436 |
| | | | | | 13,171,743 |
| Retail REITs 0.1% | | | | | |
| Capital Automotive LP, | | | | | |
| Second Lien Term Loan, 6.00%, 4/30/20 | United States | | 4,896,250 | | 5,008,458 |
| Tranche B-1 Term Loan, 4.00%, 4/10/19 | United States | | 2,353,522 | | 2,356,953 |
| | | | | | 7,365,411 |
| Semiconductors 1.4% | | | | | |
| eAvago Technologies Cayman Ltd, Term Loans, 5.25%, 5/06/21 | Cayman Islands | | 33,240,000 | | 33,356,872 |
| Freescale Semiconductor Inc., | | | | | |
| Tranche B-4 Term Loan, 4.25%, 2/28/20 | United States | | 20,339,025 | | 20,339,025 |
| Tranche B-5 Term Loan, 5.00%, 1/15/21 | United States | | 23,401,687 | | 23,504,069 |
| | | | | | 77,199,966 |
| Specialized Consumer Services 0.5% | | | | | |
| Advantage Sales & Marketing Inc., | | | | | |
| 2013 Term Loan, 4.25%, 12/18/17 | United States | | 11,211,706 | | 11,236,933 |
| Second Lien 2013 Other Term Loan, 8.25%, 6/17/18 | United States | | 2,937,143 | | 2,959,171 |
| Koosharem LLC, Term Loans, 8.75%, 5/25/20 | United States | | 11,000,000 | | 11,055,000 |
| | | | | | 25,251,104 |
| Specialized Finance 0.5% | | | | | |
| Trans Union LLC, 2014 Replacement Term Loan, 4.00%, 4/09/21 | United States | | 25,330,000 | | 25,262,724 |
Semiannual Report | 63
| | | | | |
| Franklin Investors Securities Trust | | | | |
| |
| Statement of Investments, April 30, 2014 (unaudited) (continued) | | | | |
| |
| |
| Franklin Floating Rate Daily Access Fund | Country | | Principal Amount* | | Value |
| c,dSenior Floating Rate Interests (continued) | | | | | |
| Specialty Chemicals 3.1% | | | | | |
| Axalta Coating Systems U.S. Holdings Inc., 2014 Specified Refinancing | | | | | |
| Term, 4.00%, 2/01/20 | United States | $ | 40,663,890 | $ | 40,610,254 |
| CeramTec Acquisition Corp., Initial Dollar Term B-2 Loan, 4.25%, | | | | | |
| 8/30/20 | United States | | 1,253,457 | | 1,252,935 |
| CeramTec GmbH, Dollar Term B-3 Loan, 4.25%, 8/30/20 | Germany | | 3,871,967 | | 3,870,352 |
| Faenza Acquisition GmbH, Initial Dollar Term B-1 Loan, 4.25%, | | | | | |
| 8/30/20 | Germany | | 12,654,059 | | 12,648,782 |
| MacDermid Holdings LLC, First Lien Tranche B Term Loan, 4.00%, | | | | | |
| 6/07/20 | United States | | 18,362,091 | | 18,325,367 |
| Nexeo Solutions LLC, | | | | | |
| Term B-2 Loan, 5.00%, 9/09/17 | United States | | 6,491,150 | | 6,487,093 |
| Term B-3 Loan, 5.00%, 9/08/17 | United States | | 5,576,025 | | 5,576,025 |
| OMNOVA Solutions Inc., Term B-1 Loan, 4.25%, 5/31/18 | United States | | 4,420,051 | | 4,436,626 |
| Oxbow Carbon LLC, | | | | | |
| First Lien Tranche B Term Loan, 4.25%, 7/19/19 | United States | | 22,986,283 | | 23,058,115 |
| eSecond Lien Initial Term Loan, 8.00%, 1/19/20 | United States | | 16,364,314 | | 16,722,283 |
| Sonneborn LLC, Initial U.S. Term Loan, 6.50%, 3/30/18 | United States | | 6,802,380 | | 6,857,650 |
| Sonneborn Refined Products BV, Initial BV Term Loan, 6.50%, | | | | | |
| 3/30/18 | Netherlands | | 1,200,420 | | 1,210,173 |
| Tata Chemicals North America Inc., Term Loan, 3.75%, 8/09/20 | United States | | 10,867,875 | | 10,854,290 |
| Univar Inc., Term B Loan, 5.00%, 6/30/17 | United States | | 23,277,383 | | 23,269,073 |
| | | | | | 175,179,018 |
| Specialty Stores 2.7% | | | | | |
| 99 Cents Only Stores, Tranche B-2 Loan, 4.50%, 1/13/19 | United States | | 18,176,747 | | 18,239,238 |
| Academy Ltd., Initial Term Loans, 4.50%, 8/03/18 | United States | | 12,584,975 | | 12,601,688 |
| Bass Pro Group LLC, New Term Loan, 3.75%, 11/20/19 | United States | | 8,632,720 | | 8,643,424 |
| BJ’s Wholesale Club Inc., | | | | | |
| 2013 (Nov) Replacement Loans, 4.50%, 9/26/19 | United States | | 12,206,931 | | 12,210,325 |
| Second Lien 2013 (Nov) Replacement Loans, 9.75%, 3/26/20 | United States | | 11,090,476 | | 11,339,025 |
| Evergreen AcqCo. 1 LP (Savers), Term Loan, 5.00%, 7/09/19 | United States | | 11,820,000 | | 11,859,396 |
| Leslie’s Poolmart Inc., Tranche B Term Loan, 4.25%, 10/16/19 | United States | | 17,681,422 | | 17,698,007 |
| Michaels Stores Inc., Term B Loan, 3.75%, 1/28/20 | United States | | 14,355,000 | | 14,360,125 |
| The Neiman Marcus Group Ltd. Inc., Other Term Loan, 4.25%, | | | | | |
| 10/25/20 | United States | | 29,750,000 | | 29,725,218 |
| Party City Holdings Inc., 2014 Replacement Term Loan, 4.00%, | | | | | |
| 7/27/19 | United States | | 14,763,446 | | 14,731,159 |
| | | | | | 151,407,605 |
| Systems Software 1.0% | | | | | |
| Blue Coat Systems Inc., | | | | | |
| Second Lien Loans, 9.50%, 6/28/20 | United States | | 9,170,000 | | 9,410,713 |
| Term Loan, 4.00%, 5/31/19 | United States | | 9,454,703 | | 9,457,663 |
| Vertafore Inc., | | | | | |
| New Term Loan, 4.25%, 10/03/19 | United States | | 6,711,287 | | 6,716,877 |
| eSecond Lien Term Loan, 9.75%, 10/27/17 | United States | | 8,435,238 | | 8,585,495 |
64 | Semiannual Report
| | | | | |
| Franklin Investors Securities Trust | | | | |
| |
| Statement of Investments, April 30, 2014 (unaudited) (continued) | | | | |
| |
| |
| Franklin Floating Rate Daily Access Fund | Country | | Principal Amount* | | Value |
| c,dSenior Floating Rate Interests (continued) | | | | | |
| Systems Software (continued) | | | | | |
| Websense Inc., | | | | | |
| First Lien Term Loan, 4.50%, 6/25/20 | United States | $ | 8,456,100 | $ | 8,473,714 |
| Second Lien Term Loan, 8.25%, 12/24/20 | United States | | 10,776,597 | | 10,852,927 |
| | | | | | 53,497,389 |
| Technology Hardware, Storage & Peripherals 0.7% | | | | | |
| Dell International LLC, Term B Loan, 4.50%, 4/29/20 | United States | | 39,713,467 | | 39,619,704 |
| Tires & Rubber 0.4% | | | | | |
| The Goodyear Tire & Rubber Co., Second Lien Term Loan, 4.75%, | | | | | |
| 4/30/19 | United States | | 24,325,000 | | 24,401,016 |
| Trucking 1.1% | | | | | |
| eGlobal Tip Finance BV/Finance America LLC, Facility C Commitment, | | | | | |
| 6.50%, 10/16/20 | United States | | 20,200,000 | | 19,947,500 |
| Hertz Corp., | | | | | |
| Credit Linked Deposit, 3.75%, 3/11/18 | United States | | 18,350,000 | | 18,212,375 |
| Tranche B-1 Term Loan, 3.75%, 3/11/18 | United States | | 12,353,625 | | 12,340,752 |
| Swift Transportation Co. LLC, Tranche B-2 Term Loan, 4.00%, | | | | | |
| 12/21/17 | United States | | 8,557,653 | | 8,589,744 |
| | | | | | 59,090,371 |
| Wireless Telecommunication Services 0.4% | | | | | |
| NTELOS Inc., Term B Advance, 5.75%, 11/11/19 | United States | | 20,320,589 | | 20,345,989 |
| Total Senior Floating Rate Interests | | | | | |
| (Cost $4,823,994,686) | | | | | 4,849,462,913 |
| Asset-Backed Securities and Commercial Mortgage-Backed | | | | | |
| Securities 0.5% | | | | | |
| Other Diversified Financial Services 0.5% | | | | | |
| gApidos CDO, 2013-14A, C2, 144A, 4.85%, 4/15/25 | United States | | 3,540,000 | | 3,474,191 |
| d,gCatamaran CLO Ltd., 2013-1A, C, 144A, FRN, 2.828%, 1/27/25 | Cayman Islands | | 3,500,000 | | 3,396,782 |
| d,gCent CLO LP, 2013-17A, D, 144A, FRN, 3.236%, 1/30/25 | Cayman Islands | | 3,850,000 | | 3,853,750 |
| gEmerson Park CLO Ltd., 2013-1A, C2, 144A, 5.64%, 7/15/25 | United States | | 3,600,000 | | 3,622,860 |
| gHighbridge Loan Management Ltd., 2013-2A, B2, 144A, 5.80%, | | | | | |
| 10/20/24 | United States | | 3,500,000 | | 3,584,350 |
| d,gING Investment Management CLO Ltd., | | | | | |
| 2013-1A, B, 144A, FRN, 3.127%, 4/15/24 | Cayman Islands | | 3,850,000 | | 3,845,380 |
| 2013-1A, C, 144A, FRN, 3.727%, 4/15/24 | Cayman Islands | | 3,850,000 | | 3,729,880 |
| 2013-2A, B, 144A, FRN, 2.909%, 4/25/25 | United States | | 3,850,000 | | 3,809,094 |
| Total Asset-Backed Securities and Commercial | | | | | |
| Mortgage-Backed Securities (Cost $29,379,539) | | | | | 29,316,287 |
| Total Investments before Short Term Investments | | | | | |
| (Cost $4,855,457,002) | | | | | 4,881,144,970 |
Semiannual Report | 65
Franklin Investors Securities Trust
Statement of Investments, April 30, 2014 (unaudited) (continued)
| | | | | |
| Franklin Floating Rate Daily Access Fund | Country | Shares | | Value | |
| Short Term Investments (Cost $836,939,100) 15.1% | | | | | |
| Money Market Funds 15.1% | | | | | |
| a,hInstitutional Fiduciary Trust Money Market Portfolio | United States | 836,939,100 | $ | 836,939,100 | |
| Total Investments (Cost $5,692,396,102) 102.7% | | | | 5,718,084,070 | |
| Other Assets, less Liabilities (2.7)% | | | | (149,069,385 | ) |
| Net Assets 100.0% | | | $ | 5,569,014,685 | |
See Abbreviations on page 164.
*The principal amount is stated in U.S. dollars unless otherwise indicated.
†Rounds to less than 0.1% of net assets.
aNon-income producing.
bSee Note 8 regarding restricted securities.
cSee Note 1(j) regarding senior floating rate interests.
dThe coupon rate shown represents the rate at period end.
eA portion or all of the security purchased on a delayed delivery basis. See Note 1(d).
fSecurity has been deemed illiquid because it may not be able to be sold within seven days. At April 30, 2014, the value of this security was $782,367, representing 0.01% of
net assets.
gSecurity was purchased pursuant to Rule 144A under the Securities Act of 1933 and may be sold in transactions exempt from registration only to qualified institutional buyers or
in a public offering registered under the Securities Act of 1933. These securities have been deemed liquid under guidelines approved by the Trust’s Board of Trustees. At April 30,
2014, the aggregate value of these securities was $29,316,287, representing 0.53% of net assets.
hSee Note 3(f) regarding investments in the Institutional Fiduciary Trust Money Market Portfolio.
66 | The accompanying notes are an integral part of these financial statements. | Semiannual Report
| | | | | | | | | | | | | | | | | | |
| Franklin Investors Securities Trust | | | | | | | | | | |
| |
| Financial Highlights | | | | | | | | | | | | | | | | | | |
| |
| Franklin Low Duration Total Return Fund | | | | | | | | | | | | | | | | | | |
| | | Six Months Ended | | | | | | | | | | | | | |
| | | April 30, 2014 | | | | | | Year Ended October 31, | | | | |
| Class A | | (unaudited) | | | 2013 | | | 2012 | | | 2011 | | | 2010 | | | 2009 | |
| Per share operating performance | | | | | | | | | | | | | | | | | | |
| (for a share outstanding throughout the period) | | | | | | | | | | | | | | | | | | |
| Net asset value, beginning of period | $ | 10.16 | | $ | 10.29 | | $ | 10.27 | | $ | 10.44 | | $ | 10.19 | | $ | 9.58 | |
| Income from investment operationsa: | | | | | | | | | | | | | | | | | | |
| Net investment income | | 0.074 | | | 0.166 | | | 0.169 | | | 0.214 | | | 0.240 | | | 0.347 | |
| Net realized and unrealized gains (losses) | | 0.007 | | | (0.032 | ) | | 0.158 | | | (0.111 | ) | | 0.334 | | | 0.645 | |
| Total from investment operations | | 0.081 | | | 0.134 | | | 0.327 | | | 0.103 | | | 0.574 | | | 0.992 | |
| Less distributions from: | | | | | | | | | | | | | | | | | | |
| Net investment income and net foreign currency | | | | | | | | | | | | | | | | | | |
| gains | | (0.111 | ) | | (0.264 | ) | | (0.307 | ) | | (0.233 | ) | | (0.292 | ) | | (0.382 | ) |
| Net realized gains | | — | | | — | | | — | | | (0.040 | ) | | (0.032 | ) | | — | |
| Total distributions | | (0.111 | ) | | (0.264 | ) | | (0.307 | ) | | (0.273 | ) | | (0.324 | ) | | (0.382 | ) |
| Net asset value, end of period | $ | 10.13 | | $ | 10.16 | | $ | 10.29 | | $ | 10.27 | | $ | 10.44 | | $ | 10.19 | |
| |
| Total returnb | | 0.80 | % | | 1.32 | % | | 3.26 | % | | 0.99 | % | | 5.74 | % | | 10.55 | % |
| |
| Ratios to average net assetsc | | | | | | | | | | | | | | | | | | |
| Expenses before waiver and payments by | | | | | | | | | | | | | | | | | | |
| affiliates | | 0.92 | % | | 0.98 | % | | 1.01 | % | | 1.03 | % | | 1.06 | % | | 1.12 | % |
| Expenses net of waiver and payments by | | | | | | | | | | | | | | | | | | |
| affiliates | | 0.80 | %d | | 0.80 | %d | | 0.89 | % | | 0.90 | % | | 0.90 | %d | | 0.90 | %d |
| Net investment income | | 1.37 | % | | 1.25 | % | | 1.47 | % | | 1.95 | % | | 2.15 | % | | 3.04 | % |
| |
| Supplemental data | | | | | | | | | | | | | | | | | | |
| Net assets, end of period (000’s) | $ | 1,410,302 | | $ | 1,296,612 | | $ | 904,878 | | $ | 636,622 | | $ | 369,836 | | $ | 152,673 | |
| Portfolio turnover rate | | 46.28 | % | | 64.86 | % | | 51.42 | % | | 75.51 | % | | 49.84 | % | | 53.06 | % |
aThe amount shown for a share outstanding throughout the period may not correlate with the Statement of Operations for the period due to the timing of sales and repurchases of
the Fund shares in relation to income earned and/or fluctuating fair value of the investments of the Fund.
bTotal return does not reflect sales commissions or contingent deferred sales charges, if applicable, and is not annualized for periods less than one year.
cRatios are annualized for periods less than one year.
dBenefit of expense reduction rounds to less than 0.01%.
Semiannual Report | The accompanying notes are an integral part of these financial statements. | 67
| | | |
| Franklin Investors Securities Trust | | |
| |
| Financial Highlights (continued) | | | |
| |
| Franklin Low Duration Total Return Fund | | | |
| | Six Months Ended | Year Ended |
| | April 30, 2014 | October 31, |
| Class C | (unaudited) | 2013 | 2012a |
| Per share operating performance | | | |
| (for a share outstanding throughout the period) | | | |
| Net asset value, beginning of period | $10.16 | $10.29 | $10.29 |
| Income from investment operationsb: | | | |
| Net investment income | 0.053 | 0.189 | 0.013 |
| Net realized and unrealized gains (losses) | 0.011 | (0.090) | 0.005 |
| Total from investment operations | 0.064 | 0.099 | 0.018 |
| Less distributions from net investment income and net foreign currency gains | (0.094) | (0.229) | (0.018) |
| Net asset value, end of period | $10.13 | $10.16 | $10.29 |
| |
| Total returnc | 0.63% | 0.97% | 0.17% |
| |
| Ratios to average net assetsd | | | |
| Expenses before waiver and payments by affiliates | 1.32% | 1.38% | 1.41% |
| Expenses net of waiver and payments by affiliates | 1.20%e | 1.20%e | 1.29% |
| Net investment income | 0.97% | 0.84% | 1.07% |
| |
| Supplemental data | | | |
| Net assets, end of period (000’s) | $144,834 | $114,200 | $1,034 |
| Portfolio turnover rate | 46.28% | 64.86 | 51.42% |
aFor the period October 1, 2012 (effective date) to October 31, 2012.
bThe amount shown for a share outstanding throughout the period may not correlate with the Statement of Operations for the period due to the timing of sales and repurchases of
the Fund shares in relation to income earned and/or fluctuating fair value of the investments of the Fund.
cTotal return does not reflect sales commissions or contingent deferred sales charges, if applicable, and is not annualized for periods less than one year.
dRatios are annualized for periods less than one year.
eBenefit of expense reduction rounds to less than 0.01%.
68 | The accompanying notes are an integral part of these financial statements. | Semiannual Report
| | | | | | |
| Franklin Investors Securities Trust | | | | | | |
| |
| Financial Highlights (continued) | | | | | | |
| |
| Franklin Low Duration Total Return Fund | | | | | | |
| | | Six Months Ended | | | Year Ended | |
| | | April 30, 2014 | | | October 31, | |
| Class R6 | | (unaudited) | | | 2013a | |
| Per share operating performance | | | | | | |
| (for a share outstanding throughout the period) | | | | | | |
| Net asset value, beginning of period | $ | 10.19 | | $ | 10.27 | |
| Income from investment operationsb: | | | | | | |
| Net investment income | | 0.087 | | | 0.089 | |
| Net realized and unrealized gains (losses) | | 0.010 | | �� | (0.046 | ) |
| Total from investment operations | | 0.097 | | | 0.043 | |
| Less distributions from net investment income | | (0.127 | ) | | (0.123 | ) |
| Net asset value, end of period | $ | 10.16 | | $ | 10.19 | |
| |
| Total returnc | | 0.96 | % | | 0.43 | % |
| |
| Ratios to average net assetsd | | | | | | |
| Expenses before waiver and payments by affiliates | | 0.55 | % | | 0.62 | % |
| Expenses net of waiver and payments by affiliatese | | 0.43 | % | | 0.43 | % |
| Net investment income | | 1.74 | % | | 1.61 | % |
| |
| Supplemental data | | | | | | |
| Net assets, end of period (000’s) | $ | 413,763 | | $ | 943 | |
| Portfolio turnover rate | | 46.28 | % | | 64.86 | % |
aFor the period May 1, 2013 (effective date) to October 31, 2013.
bThe amount shown for a share outstanding throughout the period may not correlate with the Statement of Operations for the period due to the timing of sales and repurchases of
the Fund shares in relation to income earned and/or fluctuating fair value of the investments of the Fund.
cTotal return is not annualized for periods less than one year.
dRatios are annualized for periods less than one year.
eBenefit of expense reduction rounds to less than 0.01%.
Semiannual Report | The accompanying notes are an integral part of these financial statements. | 69
| | | | | | | | | | | | | | | | | | |
| Franklin Investors Securities Trust | | | | | | | | | | |
| |
| Financial Highlights (continued) | | | | | | | | | | | | | | | | | | |
| |
| Franklin Low Duration Total Return Fund | | | | | | | | | | | | | | | | | | |
| | | Six Months Ended | | | | | | | | | | | | | |
| | | April 30, 2014 | | | | | | Year Ended October 31, | | | | |
| Advisor Class | | (unaudited) | | | 2013 | | | 2012 | | | 2011 | | | 2010 | | | 2009 | |
| Per share operating performance | | | | | | | | | | | | | | | | | | |
| (for a share outstanding throughout the period) | | | | | | | | | | | | | | | | | | |
| Net asset value, beginning of period | $ | 10.19 | | $ | 10.31 | | $ | 10.29 | | $ | 10.46 | | $ | 10.20 | | $ | 9.59 | |
| Income from investment operationsa: | | | | | | | | | | | | | | | | | | |
| Net investment income | | 0.088 | | | 0.231 | | | 0.202 | | | 0.249 | | | 0.248 | | | 0.011 | |
| Net realized and unrealized gains (losses) | | 0.004 | | | (0.064 | ) | | 0.146 | | | (0.122 | ) | | 0.363 | | | 1.003 | |
| Total from investment operations | | 0.092 | | | 0.167 | | | 0.348 | | | 0.127 | | | 0.611 | | | 1.014 | |
| Less distributions from: | | | | | | | | | | | | | | | | | | |
| Net investment income and net foreign currency | | | | | | | | | | | | | | | | | | |
| gains | | (0.122 | ) | | (0.287 | ) | | (0.328 | ) | | (0.257 | ) | | (0.319 | ) | | (0.404 | ) |
| Net realized gains | | — | | | — | | | — | | | (0.040 | ) | | (0.032 | ) | | — | |
| Total distributions | | (0.122 | ) | | (0.287 | ) | | (0.328 | ) | | (0.297 | ) | | (0.351 | ) | | (0.404 | ) |
| Net asset value, end of period | $ | 10.16 | | $ | 10.19 | | $ | 10.31 | | $ | 10.29 | | $ | 10.46 | | $ | 10.20 | |
| |
| Total returnb | | 0.91 | % | | 1.64 | % | | 3.46 | % | | 1.22 | % | | 6.11 | % | | 10.80 | % |
| |
| Ratios to average net assetsc | | | | | | | | | | | | | | | | | | |
| Expenses before waiver and payments by | | | | | | | | | | | | | | | | | | |
| affiliates | | 0.67 | % | | 0.73 | % | | 0.76 | % | | 0.78 | % | | 0.81 | % | | 0.87 | % |
| Expenses net of waiver and payments by | | | | | | | | | | | | | | | | | | |
| affiliates | | 0.55 | %d | | 0.55 | %d | | 0.64 | % | | 0.65 | % | | 0.65 | %d | | 0.65 | %d |
| Net investment income | | 1.62 | % | | 1.50 | % | | 1.72 | % | | 2.20 | % | | 2.40 | % | | 3.29 | % |
| |
| Supplemental data | | | | | | | | | | | | | | | | | | |
| Net assets, end of period (000’s) | $ | 183,619 | | $ | 156,129 | | $ | 70,442 | | $ | 49,682 | | $ | 16,200 | | $ | 1,893 | |
| Portfolio turnover rate | | 46.28 | % | | 64.86 | % | | 51.42 | % | | 75.51 | % | | 49.84 | % | | 53.06 | % |
aThe amount shown for a share outstanding throughout the period may not correlate with the Statement of Operations for the period due to the timing of sales and repurchases of
the Fund shares in relation to income earned and/or fluctuating fair value of the investments of the Fund.
bTotal return is not annualized for periods less than one year.
cRatios are annualized for periods less than one year.
dBenefit of expense reduction rounds to less than 0.01%.
70 | The accompanying notes are an integral part of these financial statements. | Semiannual Report
| | | | |
| Franklin Investors Securities Trust | | | |
| |
| Statement of Investments, April 30, 2014 (unaudited) | | | |
| |
| |
| Franklin Low Duration Total Return Fund | Country | Shares/Units | | Value |
| Common Stocks and Exchange Traded Funds 0.8% | | | | |
| Diversified Financials 0.8% | | | | |
| PowerShares Senior Loan Portfolio, ETF | United States | 650,000 | | $ 16,081,000 |
| Materials 0.0%† | | | | |
| NewPage Holdings Inc. | United States | 1,000 | | 90,000 |
| Total Common Stocks and Exchange Traded Funds | | | | |
| (Cost $16,370,115) | | | | 16,171,000 |
| |
| | | Principal Amount* | | |
| Corporate Bonds 32.9% | | | | |
| Automobiles & Components 0.7% | | | | |
| Ford Motor Credit Co. LLC, senior note, | | | | |
| 7.00%, 4/15/15 | United States | 6,200,000 | | 6,567,821 |
| 2.375%, 1/16/18 | United States | 3,000,000 | | 3,045,345 |
| aHyundai Capital America, senior note, 144A, | | | | |
| 1.45%, 2/06/17 | South Korea | 4,000,000 | | 4,008,400 |
| 4.00%, 6/08/17 | South Korea | 700,000 | | 747,803 |
| | | | | 14,369,369 |
| Banks 7.2% | | | | |
| AIB Mortgage Bank, secured note, 2.625%, 7/29/16 | Ireland | 3,000,000 | EUR | 4,307,630 |
| aANZ National International Ltd. of New Zealand, senior note, | | | | |
| 144A, 1.40%, 4/27/17 | New Zealand | 2,500,000 | | 2,501,300 |
| Australia & New Zealand Banking Group Ltd., senior note, 1.25%, | | | | |
| 1/10/17 | Australia | 11,000,000 | | 11,048,510 |
| a,bBanco Bradesco SA/Cayman Islands, senior note, 144A, FRN, | | | | |
| 2.361%, 5/16/14 | Brazil | 3,000,000 | | 2,999,520 |
| cBanco Popolare SpA, senior note, Reg S, 4.75%, 3/31/16 | Italy | 3,000,000 | EUR | 4,436,557 |
| bBank of America Corp., senior note, FRN, 1.267%, 1/15/19 | United States | 12,671,000 | | 12,842,730 |
| Bank of Ireland Mortgage Bank, secured note, | | | | |
| 2.75%, 3/22/18 | Ireland | 5,200,000 | EUR | 7,626,229 |
| bFRN, 3.25%, 6/22/16 | Ireland | 2,500,000 | EUR | 3,560,162 |
| BB&T Corp., senior note, | | | | |
| 2.05%, 6/19/18 | United States | 1,000,000 | | 1,005,056 |
| bFRN, 0.897%, 2/01/19 | United States | 2,000,000 | | 2,012,558 |
| BNP Paribas SA, senior note, 2.70%, 8/20/18 | France | 3,500,000 | | 3,583,510 |
| CIT Group Inc., | | | | |
| 4.25%, 8/15/17 | United States | 500,000 | | 525,000 |
| senior note, 5.00%, 5/15/17 | United States | 500,000 | | 535,625 |
| senior note, 5.25%, 3/15/18 | United States | 2,000,000 | | 2,152,500 |
| senior note, 3.875%, 2/19/19 | United States | 3,100,000 | | 3,142,625 |
| bCitigroup Inc., sub. note, FRN, 0.505%, 6/09/16 | United States | 11,200,000 | | 11,095,034 |
| First Horizon National Corp., senior note, 5.375%, 12/15/15 | United States | 2,000,000 | | 2,126,534 |
| aHSBC Bank Brasil SA, senior note, 144A, 4.00%, 5/11/16 | Brazil | 3,000,000 | | 3,127,380 |
| a,bING Bank NV, senior note, 144A, FRN, 1.873%, 9/25/15 | Netherlands | 3,800,000 | | 3,872,048 |
| JPMorgan Chase & Co., senior note, | | | | |
| 3.70%, 1/20/15 | United States | 11,000,000 | | 11,255,068 |
| 4.75%, 3/01/15 | United States | 750,000 | | 776,435 |
| bFRN, 1.129%, 1/25/18 | United States | 8,000,000 | | 8,111,352 |
Semiannual Report | 71
| | | | | |
| Franklin Investors Securities Trust | | | | |
| |
| Statement of Investments, April 30, 2014 (unaudited) (continued) | | | | |
| |
| |
| Franklin Low Duration Total Return Fund | Country | Principal Amount* | | | Value |
| Corporate Bonds (continued) | | | | | |
| Banks (continued) | | | | | |
| PNC Bank NA, senior note, 1.125%, 1/27/17 | United States | 4,200,000 | | $ | 4,205,074 |
| PNC Funding Corp., senior note, 2.70%, 9/19/16 | United States | 1,200,000 | | | 1,248,008 |
| Regions Financial Corp., senior note, | | | | | |
| 7.75%, 11/10/14 | United States | 282,000 | | | 292,613 |
| 2.00%, 5/15/18 | United States | 4,500,000 | | | 4,451,945 |
| bRoyal Bank of Canada, senior note, FRN, 0.605%, 3/08/16 | Canada | 3,000,000 | | | 3,010,770 |
| The Royal Bank of Scotland PLC, | | | | | |
| asenior note, 144A, 4.875%, 8/25/14 | United Kingdom | 3,000,000 | | | 3,038,970 |
| sub. note, 6.934%, 4/09/18 | United Kingdom | 2,500,000 | EUR | | 3,981,697 |
| U.S. Bank NA, sub. note, 3.778% to 4/29/18, FRN thereafter, | | | | | |
| 4/29/20 | United States | 3,000,000 | | | 3,084,012 |
| UniCredit SpA, senior secured note, 3.375%, 10/31/17 | Italy | 2,700,000 | EUR | | 4,042,509 |
| bUnion Bank NA, senior note, FRN, 0.985%, 9/26/16 | United States | 2,400,000 | | | 2,427,170 |
| bWachovia Corp., sub. note, FRN, 0.597%, 10/15/16 | United States | 14,723,000 | | | 14,694,909 |
| b,cYorkshire Building Society, secured note, Reg S, FRN, 2.272%, | | | | | |
| 3/23/16 | United Kingdom | 4,868,000 | GBP | | 8,427,837 |
| | | | | | 155,548,877 |
| Capital Goods 0.6% | | | | | |
| The Boeing Co., senior note, 0.95%, 5/15/18 | United States | 1,500,000 | | | 1,455,300 |
| John Deere Capital Corp., senior note, | | | | | |
| 1.30%, 3/12/18 | United States | 1,700,000 | | | 1,681,077 |
| 1.95%, 12/13/18 | United States | 3,750,000 | | | 3,753,439 |
| USG Corp., senior note, 6.30%, 11/15/16 | United States | 5,000,000 | | | 5,425,000 |
| | | | | | 12,314,816 |
| Commercial & Professional Services 0.1% | | | | | |
| Republic Services Inc., senior note, 3.80%, 5/15/18 | United States | 1,035,000 | | | 1,103,894 |
| Consumer Durables & Apparel 0.4% | | | | | |
| Centex Corp., senior note, 6.50%, 5/01/16 | United States | 5,000,000 | | | 5,525,000 |
| D.R. Horton Inc., | | | | | |
| senior bond, 5.625%, 1/15/16 | United States | 2,400,000 | | | 2,568,000 |
| senior note, 4.75%, 5/15/17 | United States | 1,500,000 | | | 1,595,625 |
| | | | | | 9,688,625 |
| Consumer Services 0.2% | | | | | |
| Carnival Corp., senior note, 3.95%, 10/15/20 | United States | 3,400,000 | | | 3,525,518 |
| Yum! Brands Inc., senior note, 4.25%, 9/15/15 | United States | 750,000 | | | 785,377 |
| | | | | | 4,310,895 |
| Diversified Financials 4.2% | | | | | |
| cAmerican Express Credit Corp., senior note, Reg S, 5.375%, | | | | | |
| 10/01/14 | United States | 1,000,000 | GBP | | 1,720,022 |
| aAmerican Honda Finance Corp., senior note, 144A, 1.60%, | | | | | |
| 2/16/18 | Japan | 3,500,000 | | | 3,489,745 |
| Capital One Financial Corp., senior note, 2.15%, 3/23/15 | United States | 3,250,000 | | | 3,298,805 |
| bFifth Third Bank, senior note, FRN, 0.746%, 11/18/16 | United States | 11,000,000 | | | 11,071,049 |
| GE Capital European Funding, | | | | | |
| senior bond, 4.625%, 7/04/14 | United States | 3,000,000 | EUR | | 4,190,606 |
| csenior note, Reg S, 2.00%, 2/27/15 | United States | 3,000,000 | EUR | | 4,215,326 |
| |
| 72 | Semiannual Report | | | | | |
| | | | | |
| Franklin Investors Securities Trust | | | | |
| |
| Statement of Investments, April 30, 2014 (unaudited) (continued) | | | | |
| |
| |
| Franklin Low Duration Total Return Fund | Country | Principal Amount* | | | Value |
| Corporate Bonds (continued) | | | | | |
| Diversified Financials (continued) | | | | | |
| General Electric Capital Corp., senior note, 3.35%, 10/17/16 | United States | 2,000,000 | | $ | 2,116,498 |
| The Goldman Sachs Group Inc., senior note, | | | | | |
| 5.125%, 10/16/14 | United States | 3,000,000 | EUR | | 4,248,203 |
| 3.30%, 5/03/15 | United States | 1,000,000 | | | 1,026,629 |
| bFRN, 1.336%, 11/15/18 | United States | 5,000,000 | | | 5,056,300 |
| International Lease Finance Corp., senior note, 8.625%, | | | | | |
| 9/15/15 | United States | 8,325,000 | | | 9,157,500 |
| Irish Life & Permanent PLC, senior note, 4.00%, 3/10/15 | Ireland | 2,000,000 | EUR | | 2,846,104 |
| bJPMorgan Chase Bank NA, sub. note, FRN, 0.563%, 6/13/16 | United States | 1,500,000 | | | 1,493,670 |
| Morgan Stanley, senior note, | | | | | |
| 4.50%, 2/23/16 | United States | 2,000,000 | EUR | | 2,952,100 |
| bFRN, 1.509%, 4/25/18 | United States | 7,000,000 | | | 7,152,117 |
| aPricoa Global Funding I, 144A, 5.45%, 6/11/14 | United States | 500,000 | | | 502,548 |
| aPrudential Covered Trust, secured note, 144A, 2.997%, | | | | | |
| 9/30/15 | United States | 12,042,400 | | | 12,381,731 |
| SLM Corp., senior note, | | | | | |
| 8.45%, 6/15/18 | United States | 800,000 | | | 946,000 |
| 5.50%, 1/15/19 | United States | 2,500,000 | | | 2,655,758 |
| Springleaf Finance Corp., senior note, I, 5.40%, 12/01/15 | United States | 7,000,000 | | | 7,332,500 |
| aStone Street Trust, senior note, 144A, 5.902%, 12/15/15 | United States | 2,000,000 | | | 2,145,382 |
| | | | | | 89,998,593 |
| Energy 4.1% | | | | | |
| Anadarko Petroleum Corp., senior note, 5.75%, 6/15/14 | United States | 1,000,000 | | | 1,005,818 |
| aBG Energy Capital PLC, senior note, 144A, 2.875%, 10/15/16 | United Kingdom | 3,500,000 | | | 3,647,420 |
| BP Capital Markets PLC, senior note, 0.70%, 11/06/15 | United Kingdom | 4,000,000 | | | 4,010,640 |
| bCanadian Natural Resources Ltd., senior note, FRN, 0.609%, | | | | | |
| 3/30/16 | Canada | 6,000,000 | | | 6,015,039 |
| Chesapeake Energy Corp., senior note, | | | | | |
| 6.50%, 8/15/17 | United States | 1,000,000 | | | 1,126,250 |
| bFRN, 3.467%, 4/15/19 | United States | 2,500,000 | | | 2,526,562 |
| Chevron Corp., senior note, 1.104%, 12/05/17 | United States | 6,000,000 | | | 5,967,600 |
| CNOOC Nexen Finance 2014 ULC, senior note, 1.625%, | | | | | |
| 4/30/17 | China | 10,800,000 | | | 10,791,054 |
| aCNPC General Capital Ltd., senior note, 144A, 1.95%, | | | | | |
| 4/16/18 | Hong Kong | 1,500,000 | | | 1,475,843 |
| aCNPC HK Overseas Capital Ltd., senior note, 144A, 3.125%, | | | | | |
| 4/28/16 | China | 2,000,000 | | | 2,064,004 |
| EnLink Midstream Partners LP, senior note, 2.70%, 4/01/19 | United States | 2,700,000 | | | 2,722,040 |
| Ensco PLC, senior note, 3.25%, 3/15/16 | United States | 2,000,000 | | | 2,088,460 |
| Enterprise Products Operating LLC, senior note, 1.25%, | | | | | |
| 8/13/15 | United States | 3,800,000 | | | 3,825,483 |
| Kinder Morgan Energy Partners LP, senior note, 3.50%, | | | | | |
| 3/01/16 | United States | 2,000,000 | | | 2,089,326 |
| aKinder Morgan Finance Co. LLC, senior secured note, 144A, | | | | | |
| 6.00%, 1/15/18 | United States | 2,500,000 | | | 2,746,790 |
| aLUKOIL International Finance BV, senior note, 144A, 3.416%, | | | | | |
| 4/24/18 | Russia | 2,300,000 | | | 2,179,538 |
| cONGC Videsh Ltd., senior note, Reg S, 2.50%, 5/07/18 | India | 2,000,000 | | | 1,936,590 |
| |
| | | Semiannual Report | 73 |
| | | | | |
| | Franklin Investors Securities Trust | | | |
| |
| | Statement of Investments, April 30, 2014 (unaudited) (continued) | | | |
| |
| |
| | Franklin Low Duration Total Return Fund | Country | Principal Amount* | | Value |
| | Corporate Bonds (continued) | | | | |
| | Energy (continued) | | | | |
| | Peabody Energy Corp., senior note, 7.375%, 11/01/16 | United States | 3,000,000 | $ | 3,382,500 |
| | bPetrobras Global Finance BV, senior note, FRN, 3.114%, | | | | |
| | 3/17/20 | Brazil | 5,100,000 | | 5,184,609 |
| | aPetrofac Ltd., senior note, 144A, 3.40%, 10/10/18 | United Kingdom | 1,300,000 | | 1,339,598 |
| | Phillips 66, senior note, 1.95%, 3/05/15 | United States | 2,400,000 | | 2,430,120 |
| | a,bQuicksilver Resources Inc., secured note, second lien, 144A, FRN, | | | | |
| | 7.00%, 6/21/19 | United States | 1,500,000 | | 1,482,188 |
| | aSchlumberger Norge AS, 144A, 1.95%, 9/14/16 | United States | 2,500,000 | | 2,561,842 |
| | aSinopec Group Overseas Development 2013 Ltd., senior note, | | | | |
| | 144A, 2.50%, 10/17/18 | China | 2,800,000 | | 2,797,620 |
| | aSinopec Group Overseas Development 2014 Ltd., senior note, | | | | |
| | 144A, 1.75%, 4/10/17 | China | 4,300,000 | | 4,293,335 |
| | bStatoil ASA, senior note, FRN, 0.697%, 11/08/18 | Norway | 6,900,000 | | 6,955,062 |
| | aWoodside Finance Ltd., 144A, 4.50%, 11/10/14 | Australia | 1,000,000 | | 1,019,510 |
| | | | | | 87,664,841 |
| | Food & Staples Retailing 0.9% | | | | |
| | CVS Caremark Corp., senior note, 1.20%, 12/05/16 | United States | 10,000,000 | | 10,066,360 |
| | The Kroger Co., senior note, 1.20%, 10/17/16 | United States | 5,000,000 | | 5,009,715 |
| | aTesco PLC, senior note, 144A, 2.00%, 12/05/14 | United Kingdom | 3,800,000 | | 3,835,492 |
| | aWoolworths Ltd., senior note, 144A, 2.55%, 9/22/15 | Australia | 260,000 | | 266,272 |
| | | | | | 19,177,839 |
| | Food, Beverage & Tobacco 2.7% | | | | |
| | Anheuser-Busch InBev Worldwide Inc., senior note, 1.375%, | | | | |
| | 7/15/17 | Belgium | 1,200,000 | | 1,210,381 |
| | Bunge Ltd. Finance Corp., 4.10%, 3/15/16 | United States | 2,000,000 | | 2,107,954 |
| Coca-Cola Femsa SAB de CV, senior note, 2.375%, 11/26/18 | Mexico | 5,500,000 | | 5,543,560 |
| | Constellation Brands Inc., senior note, | | | | |
| | 8.375%, 12/15/14 | United States | 5,000,000 | | 5,225,000 |
| | 7.25%, 5/15/17 | United States | 6,600,000 | | 7,639,500 |
| | Dean Foods Co., senior note, 7.00%, 6/01/16 | United States | 6,864,000 | | 7,567,560 |
| | aHeineken NV, senior note, 144A, 0.80%, 10/01/15 | Netherlands | 4,500,000 | | 4,520,317 |
| | Ingredion Inc., senior note, 3.20%, 11/01/15 | United States | 1,500,000 | | 1,545,504 |
| | aJapan Tobacco Inc., senior note, 144A, 2.10%, 7/23/18 | Japan | 5,000,000 | | 5,047,925 |
| | Kraft Foods Group Inc., senior note, | | | | |
| | 1.625%, 6/04/15 | United States | 1,000,000 | | 1,011,897 |
| | 2.25%, 6/05/17 | United States | 7,000,000 | | 7,181,356 |
| | Lorillard Tobacco Co., senior note, 3.50%, 8/04/16 | United States | 8,000,000 | | 8,439,704 |
| | bMondelez International Inc., senior note, FRN, 0.757%, | | | | |
| | 2/01/19 | United States | 500,000 | | 499,884 |
| | Reynolds American Inc., senior note, 1.05%, 10/30/15 | United States | 1,000,000 | | 1,002,367 |
| | | | | | 58,542,909 |
| | Health Care Equipment & Services 0.6% | | | | |
| | Aetna Inc., senior note, 1.50%, 11/15/17 | United States | 1,000,000 | | 1,003,739 |
| | Baxter International Inc., senior note, 1.85%, 6/15/18 | United States | 4,200,000 | | 4,188,580 |
| | CareFusion Corp., senior note, 5.125%, 8/01/14 | United States | 750,000 | | 758,064 |
| | Edwards Lifesciences Corp., senior note, 2.875%, 10/15/18 | United States | 1,600,000 | | 1,622,451 |
74 | Semiannual Report
| | | | |
| Franklin Investors Securities Trust | | | |
| |
| Statement of Investments, April 30, 2014 (unaudited) (continued) | | | |
| |
| |
| Franklin Low Duration Total Return Fund | Country | Principal Amount* | | Value |
| Corporate Bonds (continued) | | | | |
| Health Care Equipment & Services (continued) | | | | |
| Laboratory Corp. of America Holdings, 2.20%, 8/23/17 | United States | 1,000,000 | $ | 1,016,662 |
| McKesson Corp., senior note, 1.40%, 3/15/18 | United States | 2,000,000 | | 1,965,208 |
| Medco Health Solutions Inc., senior note, 2.75%, 9/15/15 | United States | 1,500,000 | | 1,536,638 |
| | | | | 12,091,342 |
| Household & Personal Products 0.3% | | | | |
| Avon Products Inc., senior note, 2.375%, 3/15/16 | United States | 3,750,000 | | 3,810,709 |
| Colgate-Palmolive Co., senior note, 0.90%, 5/01/18 | United States | 2,200,000 | | 2,128,344 |
| | | | | 5,939,053 |
| Insurance 1.4% | | | | |
| aMetropolitan Life Global Funding I, secured note, 144A, 1.30%, | | | | |
| 4/10/17 | United States | 10,000,000 | | 10,021,178 |
| aNew York Life Global Funding, secured note, 144A, 2.10%, | | | | |
| 1/02/19 | United States | 10,000,000 | | 9,969,460 |
| bPrudential Financial Inc., senior note, FRN, 1.016%, 8/15/18 | United States | 10,000,000 | | 10,023,120 |
| | | | | 30,013,758 |
| Materials 1.4% | | | | |
| a,bAnglo American Capital PLC, senior note, 144A, FRN, 1.176%, | | | | |
| 4/15/16 | United Kingdom | 1,000,000 | | 1,004,245 |
| ArcelorMittal, senior note, | | | | |
| 4.25%, 3/01/16 | Luxembourg | 2,000,000 | | 2,080,000 |
| 5.00%, 2/25/17 | Luxembourg | 1,500,000 | | 1,590,000 |
| aCemex SAB de CV, senior secured note, 144A, 9.00%, | | | | |
| 1/11/18 | Mexico | 2,000,000 | | 2,167,500 |
| The Dow Chemical Co., senior note, 2.50%, 2/15/16 | United States | 2,000,000 | | 2,058,652 |
| aFMG Resources (August 2006) Pty. Ltd., senior note, 144A, | | | | |
| 6.00%, 4/01/17 | Australia | 800,000 | | 844,000 |
| 6.875%, 2/01/18 | Australia | 2,000,000 | | 2,115,000 |
| aGlencore Funding LLC, 144A, 3.125%, 4/29/19 | Switzerland | 5,000,000 | | 5,025,000 |
| aIncitec Pivot Ltd., senior note, 144A, 4.00%, 12/07/15 | Australia | 2,000,000 | | 2,085,542 |
| Reynolds Group Issuer Inc./LLC/SA, senior note, 8.50%, | | | | |
| 5/15/18 | United States | 3,000,000 | | 3,138,750 |
| Rio Tinto Finance USA PLC, senior note, 1.625%, 8/21/17 | United Kingdom | 2,500,000 | | 2,508,837 |
| Tenneco Packaging Inc., senior note, 8.125%, 6/15/17 | United States | 2,100,000 | | 2,341,500 |
| aXstrata Finance Canada Ltd., secured note, 144A, 2.05%, | | | | |
| 10/23/15 | Canada | 3,000,000 | | 3,038,208 |
| | | | | 29,997,234 |
| Media 0.5% | | | | |
| DIRECTV Holdings LLC/DIRECTV Financing Co. Inc., senior note, | | | | |
| 2.40%, 3/15/17 | United States | 2,900,000 | | 2,977,856 |
| The New York Times Co., senior note, 6.625%, 12/15/16 | United States | 2,000,000 | | 2,232,500 |
| Time Warner Inc., 3.15%, 7/15/15 | United States | 1,000,000 | | 1,031,036 |
| Viacom Inc., senior note, | | | | |
| 2.50%, 9/01/18 | United States | 2,500,000 | | 2,550,548 |
| 2.20%, 4/01/19 | United States | 3,200,000 | | 3,194,179 |
| | | | | 11,986,119 |
Semiannual Report | 75
| | | | | |
| Franklin Investors Securities Trust | | | | |
| |
| Statement of Investments, April 30, 2014 (unaudited) (continued) | | | | |
| |
| |
| Franklin Low Duration Total Return Fund | Country | Principal Amount* | | | Value |
| Corporate Bonds (continued) | | | | | |
| Pharmaceuticals, Biotechnology & Life Sciences 1.9% | | | | | |
| bAbbVie Inc., senior note, FRN, 0.997%, 11/06/15 | United States | 7,000,000 | | $ | 7,067,655 |
| Actavis Inc., senior note, 1.875%, 10/01/17 | United States | 3,000,000 | | | 3,028,365 |
| Amgen Inc., senior note, 2.125%, 5/15/17 | United States | 2,500,000 | | | 2,563,400 |
| Celgene Corp., senior note, | | | | | |
| 2.45%, 10/15/15 | United States | 2,000,000 | | | 2,046,148 |
| 2.30%, 8/15/18 | United States | 3,000,000 | | | 3,024,516 |
| Life Technologies Corp., senior note, 3.50%, 1/15/16 | United States | 2,000,000 | | | 2,086,562 |
| Mylan Inc., senior note, 1.35%, 11/29/16 | United States | 3,700,000 | | | 3,714,978 |
| cSanofi, senior note, Reg S, 3.125%, 10/10/14 | France | 2,000,000 | EUR | | 2,807,166 |
| Teva Pharmaceutical Finance II BV/III LLC, senior note, 3.00%, | | | | | |
| 6/15/15 | Israel | 1,500,000 | | | 1,542,316 |
| Thermo Fisher Scientific Inc., senior note, 1.30%, 2/01/17 | United States | 10,000,000 | | | 10,019,090 |
| Zoetis Inc., senior note, | | | | | |
| 1.15%, 2/01/16 | United States | 1,800,000 | | | 1,812,744 |
| 1.875%, 2/01/18 | United States | 1,200,000 | | | 1,198,525 |
| | | | | | 40,911,465 |
| Real Estate 0.9% | | | | | |
| American Tower Corp., senior note, 3.40%, 2/15/19 | United States | 5,100,000 | | | 5,263,756 |
| Boston Properties LP, senior note, 3.70%, 11/15/18 | United States | 4,900,000 | | | 5,223,606 |
| Duke Realty LP, senior note, 7.375%, 2/15/15 | United States | 400,000 | | | 420,410 |
| HCP Inc., senior note, 3.75%, 2/01/19 | United States | 5,500,000 | | | 5,843,370 |
| Hospitality Properties Trust, senior note, 5.625%, 3/15/17 | United States | 3,000,000 | | | 3,285,198 |
| | | | | | 20,036,340 |
| Retailing 0.5% | | | | | |
| Dollar General Corp., senior note, | | | | | |
| 4.125%, 7/15/17 | United States | 400,000 | | | 427,725 |
| 1.875%, 4/15/18 | United States | 2,000,000 | | | 1,986,124 |
| aEdcon Pty. Ltd., secured note, 144A, 9.50%, 3/01/18 | South Africa | 1,200,000 | EUR | | 1,662,251 |
| aExperian Finance PLC, 144A, 2.375%, 6/15/17 | United Kingdom | 1,000,000 | | | 1,014,005 |
| Home Depot Inc., senior note, 2.25%, 9/10/18 | United States | 4,900,000 | | | 4,998,417 |
| | | | | | 10,088,522 |
| Semiconductors & Semiconductor Equipment 0.2% | | | | | |
| Maxim Integrated Products Inc., senior note, 2.50%, 11/15/18 | United States | 5,200,000 | | | 5,229,084 |
| Software & Services 0.6% | | | | | |
| bOracle Corp., senior note, FRN, 0.807%, 1/15/19 | United States | 12,000,000 | | | 12,120,432 |
| Technology Hardware & Equipment 1.4% | | | | | |
| bApple Inc., FRN, 0.488%, 5/03/18 | United States | 13,000,000 | | | 13,018,005 |
| Cisco Systems Inc., senior note, 1.10%, 3/03/17 | United States | 7,500,000 | | | 7,525,327 |
| Juniper Networks Inc., senior note, 3.10%, 3/15/16 | United States | 2,000,000 | | | 2,060,756 |
| a,bNBCUniversal Enterprise Inc., 144A, FRN, 0.912%, 4/15/18 | United States | 7,500,000 | | | 7,588,170 |
| | | | | | 30,192,258 |
| Telecommunication Services 0.8% | | | | | |
| Embarq Corp., senior note, 7.082%, 6/01/16 | United States | 3,000,000 | | | 3,342,378 |
| Orange SA, senior note, 2.75%, 2/06/19 | France | 2,000,000 | | | 2,039,600 |
76 | Semiannual Report
| | | | |
| Franklin Investors Securities Trust | | | |
| |
| Statement of Investments, April 30, 2014 (unaudited) (continued) | | | |
| |
| |
| Franklin Low Duration Total Return Fund | Country | Principal Amount* | | Value |
| Corporate Bonds (continued) | | | | |
| Telecommunication Services (continued) | | | | |
| aSprint Nextel Corp., senior note, 144A, 9.00%, 11/15/18 | United States | 3,500,000 | $ | 4,274,375 |
| Telefonica Emisiones SAU, senior note, | | | | |
| 4.949%, 1/15/15 | Spain | 1,500,000 | | 1,542,282 |
| 3.192%, 4/27/18 | Spain | 2,300,000 | | 2,385,940 |
| aTelefonica Movil Chile SA, senior note, 144A, 2.875%, | | | | |
| 11/09/15 | Chile | 2,000,000 | | 2,048,780 |
| Verizon Communications Inc., senior note, | | | | |
| 0.70%, 11/02/15 | United States | 1,000,000 | | 1,002,087 |
| 3.65%, 9/14/18 | United States | 1,700,000 | | 1,816,567 |
| | | | | 18,452,009 |
| Transportation 0.2% | | | | |
| aAviation Capital Group Corp., senior note, 144A, 3.875%, | | | | |
| 9/27/16 | United States | 3,700,000 | | 3,823,895 |
| Utilities 1.1% | | | | |
| Duke Energy Corp., senior note, 2.10%, 6/15/18 | United States | 5,100,000 | | 5,136,297 |
| aGDF Suez, senior note, 144A, 1.625%, 10/10/17 | France | 1,000,000 | | 1,006,755 |
| Georgia Power Co., senior note, 12D, 0.625%, 11/15/15 | United States | 1,000,000 | | 1,000,086 |
| aKorea Western Power Co. Ltd., senior note, 144A, 3.125%, | | | | |
| 5/10/17 | South Korea | 5,200,000 | | 5,408,338 |
| The Southern Co., senior note, 2.45%, 9/01/18 | United States | 7,000,000 | | 7,156,331 |
| aState Grid Overseas Investment 2013 Ltd., senior note, 144A, | | | | |
| 1.75%, 5/22/18 | China | 2,000,000 | | 1,949,400 |
| a,dState Grid Overseas Investment 2014 Ltd., senior note, 144A, | | | | |
| 2.75%, 5/07/19 | China | 2,200,000 | | 2,192,762 |
| Virginia Electric & Power Co., senior note, 1.20%, 1/15/18 | United States | 900,000 | | 883,982 |
| | | | | 24,733,951 |
| Total Corporate Bonds (Cost $695,695,927) | | | | 708,336,120 |
| b,eSenior Floating Rate Interests 6.0% | | | | |
| Automobiles & Components 0.0%† | | | | |
| FRAM Group Holdings Inc. (Autoparts Holdings), Term Loan, | | | | |
| 6.50%, 7/29/17 | United States | 364,713 | | 365,017 |
| Capital Goods 0.5% | | | | |
| dDoncasters U.S. Finance LLC, Term B Loans, 5.75%, 4/09/20 | United States | 323,500 | | 324,848 |
| Quikrete Holdings Inc., First Lien Initial Loan, 4.00%, 9/26/20 | United States | 2,870,973 | | 2,873,126 |
| dSignode Industrial Group U.S. Inc., Term Loan B, 5.25%, | | | | |
| 5/01/21 | United States | 1,416,700 | | 1,413,380 |
| TransDigm Inc., Tranche C Term Loan, 3.75%, 2/28/20 | United States | 3,053,558 | | 3,042,822 |
| Wesco Distribution Inc., Tranche B-1 Loan, 3.75%, 12/12/19 | United States | 3,099,406 | | 3,099,387 |
| | | | | 10,753,563 |
| Commercial & Professional Services 0.2% | | | | |
| Interactive Data Corp., | | | | |
| Term B Loan, 3.75%, 2/11/18 | United States | 3,848,307 | | 3,847,506 |
| Term Loan, 6.00%, 5/05/21 | United States | 320,993 | | 321,244 |
| | | | | 4,168,750 |
Semiannual Report | 77
Franklin Investors Securities Trust
Statement of Investments, April 30, 2014 (unaudited) (continued)
| | | | |
| Franklin Low Duration Total Return Fund | Country | Principal Amount* | | Value |
| b,eSenior Floating Rate Interests (continued) | | | | |
| Consumer Services 0.1% | | | | |
| dClubCorp Club Operations Inc., Term B Loans, 5.25%, 7/24/20 | United States | 661,900 | $ | 661,072 |
| Diamond Resorts Corp., First Lien Term Loan, 6.75%, 5/09/21 | United States | 409,400 | | 410,168 |
| Hilton Worldwide Finance LLC, Initial Term Loan, 3.50%, | | | | |
| 10/25/20 | United States | 13,316 | | 13,289 |
| | | | | 1,084,529 |
| Diversified Financials 0.4% | | | | |
| Asurion LLC, Incremental Tranche B-1 Term Loan, 5.00%, | | | | |
| 5/24/19 | United States | 77,235 | | 77,363 |
| Guggenheim Partners Investment Management Holdings LLC, | | | | |
| Initial Term Loan, 4.25%, 7/22/20 | United States | 4,019,151 | | 4,036,233 |
| Trans Union LLC, 2014 Replacement Term Loan, 4.00%, | | | | |
| 4/09/21 | United States | 4,008,300 | | 3,997,654 |
| | | | | 8,111,250 |
| Energy 0.1% | | | | |
| Pacific Drilling SA, Term Loan, 4.50%, 6/03/18 | Luxembourg | 3,081,656 | | 3,086,472 |
| Food, Beverage & Tobacco 0.1% | | | | |
| Big Heart Pet Brands (Del Monte Pet), Initial Term Loans, 3.50%, | | | | |
| 2/24/20 | United States | 1,623,561 | | 1,612,602 |
| Health Care Equipment & Services 1.1% | | | | |
| Community Health Systems Inc., | | | | |
| 2017 Term E Loan, 3.447% - 3.483%, 1/25/17 | United States | 2,173,379 | | 2,177,843 |
| 2021 Term D Loan, 4.25%, 1/27/21 | United States | 6,192,273 | | 6,219,339 |
| DaVita HealthCare Partners Inc., | | | | |
| Tranche B Term Loan, 4.50%, 10/20/16 | United States | 1,360,678 | | 1,365,433 |
| Tranche B-2 Term Loan, 4.00%, 8/24/19 | United States | 5,001,922 | | 5,021,985 |
| dDialysis Newco Inc., First Lien Term Loan, 6.00%, 4/21/21 | United States | 555,700 | | 556,395 |
| dMillennium Laboratories LLC, Tranche B Term Loan, 6.50%, | | | | |
| 4/16/21 | United States | 4,614,600 | | 4,595,823 |
| dTruven Health Analytics Inc., New Tranche B Term Loan, 5.50%, | | | | |
| 6/06/19 | United States | 1,325,359 | | 1,317,904 |
| dU.S. Renal Care Inc., Tranche B-2 Term Loan, 4.25%, 7/03/19 | United States | 2,094,761 | | 2,097,379 |
| | | | | 23,352,101 |
| Household & Personal Products 0.4% | | | | |
| dFGI Operating Co. LLC (Freedom Group), Term B Loans, 5.50%, | | | | |
| 4/19/19 | United States | 4,345,670 | | 4,405,423 |
| Otter Products LLC, Loans, 5.25%, 4/29/19 | United States | 3,651,310 | | 3,652,833 |
| | | | | 8,058,256 |
| Insurance 0.0%† | | | | |
| dHUB International Ltd., Initial Term Loan, 5.50%, 10/02/20 | United States | 537,900 | | 537,698 |
| Materials 1.0% | | | | |
| dAmerican Rock Salt Co. LLC, Initial Loan, 6.00%, 4/25/17 | United States | 3,131,870 | | 3,138,723 |
| Arysta Lifescience SPC LLC, Initial Term Loan, 4.50%, | | | | |
| 5/29/20 | United States | 5,493,558 | | 5,493,514 |
78 | Semiannual Report
| | | | |
| Franklin Investors Securities Trust | | | |
| |
| Statement of Investments, April 30, 2014 (unaudited) (continued) | | | |
| |
| |
| Franklin Low Duration Total Return Fund | Country | Principal Amount* | Value |
| b,eSenior Floating Rate Interests (continued) | | | | |
| Materials (continued) | | | | |
| Axalta Coating Systems U.S. Holdings Inc., 2014 Specified | | | | |
| Refinancing Term, 4.00%, 2/01/20 | United States | 1,375,783 | $ | 1,373,968 |
| Exopack Holdings SA, USD Term Loan, 5.25%, 5/08/19 | Luxembourg | 471,562 | | 476,867 |
| FMG America Finance Inc. (Fortescue Metals Group), Loans, | | | | |
| 4.25%, 6/30/19 | United States | 1,307,171 | | 1,308,090 |
| MacDermid Holdings LLC, First Lien Tranche B Term Loan, 4.00%, | | | | |
| 6/07/20 | United States | 1,900,961 | | 1,897,159 |
| OCI Beaumont LLC, Term B-3 Loan, 5.00%, 8/20/19 | United States | 464,065 | | 469,286 |
| Oxbow Carbon LLC, First Lien Tranche B Term Loan, 4.25%, | | | | |
| 7/19/19 | United States | 2,614,774 | | 2,622,945 |
| Reynolds Group Holdings Inc., U.S. Term Loan, 4.00%, | | | | |
| 12/01/18 | United States | 3,940,449 | | 3,948,145 |
| Tronox Pigments (Netherlands) BV, Term Loan, 4.00%, | | | | |
| 3/19/20 | Netherlands | 1,854,875 | | 1,856,904 |
| | | | | 22,585,601 |
| Media 0.3% | | | | |
| Cumulus Media Holdings Inc., Term Loans, 4.25%, 12/23/20 | United States | 524,558 | | 524,558 |
| dWilliam Morris Endeavor Entertainment LLC, Term Loans First Lien, | | | | |
| 6.50%, 3/21/21 | United States | 6,133,100 | | 6,130,033 |
| Zuffa LLC, Initial Term Loan, 3.75%, 2/25/20 | United States | 331,071 | | 330,036 |
| | | | | 6,984,627 |
| Pharmaceuticals, Biotechnology & Life Sciences 0.1% | | | | |
| Valeant Pharmaceuticals International Inc., Series E-1 Tranche B | | | | |
| Term Loan, 3.75%, 8/05/20 | Canada | 2,089,228 | | 2,091,115 |
| Retailing 1.0% | | | | |
| BJ’s Wholesale Club Inc., 2013 (Nov) Replacement Loans, 4.50%, | | | | |
| 9/26/19 | United States | 3,759,922 | | 3,760,968 |
| Evergreen AcqCo. 1 LP (Savers), Term Loan, 5.00%, 7/09/19 | United States | 2,337,836 | | 2,345,628 |
| Harbor Freight Tools USA Inc., Loans, 4.75%, 7/26/19 | United States | 3,076,048 | | 3,090,643 |
| dThe Men’s Wearhouse Inc., Term Loan B, 5.75%, 4/15/21 | United States | 1,856,000 | | 1,853,448 |
| Party City Holdings Inc., 2014 Replacement Term Loan, 4.00%, | | | | |
| 7/27/19 | United States | 3,227,157 | | 3,220,099 |
| dSears Roebuck Acceptance Corp., Term Loan, 5.50%, 6/30/18 | United States | 5,475,404 | | 5,525,740 |
| Sungard Availability Services Capital Inc., Tranche B Term Loan, | | | | |
| 6.00%, 3/31/19 | United States | 2,632,179 | | 2,619,018 |
| | | | | 22,415,544 |
| Software & Services 0.4% | | | | |
| BMC Software Finance Inc., Initial U.S. Term Loans, 5.00%, | | | | |
| 9/10/20 | United States | 3,524,197 | | 3,523,098 |
| MoneyGram International Inc., Term Loan, 4.25%, 3/28/20 | United States | 4,143,015 | | 4,054,976 |
| | | | | 7,578,074 |
| Technology Hardware & Equipment 0.1% | | | | |
| Dell International LLC, Term B Loan, 4.50%, 4/29/20 | United States | 1,574,402 | | 1,570,685 |
| dPresidio Inc., Term Loan, 6.25%, 3/31/17 | United States | 983,674 | | 989,822 |
| | | | | 2,560,507 |
| |
| | | | Semiannual Report | 79 |
| | | | | |
| Franklin Investors Securities Trust | | | |
| |
| Statement of Investments, April 30, 2014 (unaudited) (continued) | | | |
| |
| |
| Franklin Low Duration Total Return Fund | Country | Principal Amount* | | | Value |
| b,eSenior Floating Rate Interests (continued) | | | | | |
| Telecommunication Services 0.1% | | | | | |
| Intelsat Jackson Holdings SA, Tranche B-2 Term Loan, 3.75%, | | | | | |
| 6/30/19 | Luxembourg | 1,900,449 | | $ | 1,902,429 |
| Transportation 0.1% | | | | | |
| Global Tip Finance BV/Finance America LLC, Facility C | | | | | |
| Commitment, 6.50%, 10/16/20 | United States | 1,141,689 | | | 1,127,418 |
| Total Senior Floating Rate Interests | | | | | |
| (Cost $128,287,088) | | | | | 128,375,553 |
| Foreign Government and Agency Securities 4.3% | | | | | |
| bThe Export-Import Bank of Korea, senior note, FRN, 0.977%, | | | | | |
| 1/14/17 | South Korea | 1,300,000 | | | 1,307,832 |
| Government of Hungary, | | | | | |
| 7.75%, 8/24/15 | Hungary | 4,100,000 | HUF | | 19,765 |
| 5.50%, 12/22/16 | Hungary | 750,880,000 | HUF | | 3,583,761 |
| A, 8.00%, 2/12/15 | Hungary | 12,870,000 | HUF | | 60,658 |
| A, 6.75%, 11/24/17 | Hungary | 3,910,000 | HUF | | 19,414 |
| A, 5.50%, 12/20/18 | Hungary | 428,710,000 | HUF | | 2,044,618 |
| cReg S, 6.75%, 7/28/14 | Hungary | 300,000 | EUR | | 421,882 |
| Government of Indonesia, FR51, 11.25%, 5/15/14 | Indonesia | 17,100,000,000 | IDR | | 1,483,801 |
| Government of Ireland, 4.60%, 4/18/16 | Ireland | 2,559,000 | EUR | | 3,836,548 |
| Government of Malaysia, | | | | | |
| 3.434%, 8/15/14 | Malaysia | 5,830,000 | MYR | | 1,789,475 |
| 3.741%, 2/27/15 | Malaysia | 7,255,000 | MYR | | 2,237,097 |
| 3.835%, 8/12/15 | Malaysia | 6,560,000 | MYR | | 2,028,825 |
| 4.72%, 9/30/15 | Malaysia | 16,150,000 | MYR | | 5,057,611 |
| 3.197%, 10/15/15 | Malaysia | 1,255,000 | MYR | | 384,944 |
| senior note, 3.172%, 7/15/16 | Malaysia | 1,250,000 | MYR | | 382,414 |
| Government of Mexico, | | | | | |
| 7.00%, 6/19/14 | Mexico | 706,500 | f MXN | | 5,425,361 |
| 9.50%, 12/18/14 | Mexico | 451,300 | f MXN | | 3,578,154 |
| 6.00%, 6/18/15 | Mexico | 4,060 | f MXN | | 31,815 |
| 8.00%, 12/17/15 | Mexico | 396,900 | f MXN | | 3,228,908 |
| 6.25%, 6/16/16 | Mexico | 42,500 | f MXN | | 339,408 |
| 7.25%, 12/15/16 | Mexico | 670,000 | f MXN | | 5,500,231 |
| Government of Poland, | | | | | |
| 5.50%, 4/25/15 | Poland | 1,754,000 | PLN | | 594,552 |
| 6.25%, 10/24/15 | Poland | 403,000 | PLN | | 139,686 |
| 5.00%, 4/25/16 | Poland | 16,225,000 | PLN | | 5,570,532 |
| bFRN, 2.72%, 1/25/17 | Poland | 1,338,000 | PLN | | 441,013 |
| bFRN, 2.72%, 1/25/21 | Poland | 1,356,000 | PLN | | 440,018 |
| Strip, 7/25/15 | Poland | 4,579,000 | PLN | | 1,463,540 |
| Strip, 1/25/16 | Poland | 11,786,000 | PLN | | 3,706,561 |
| aGovernment of Serbia, senior note, 144A, 5.25%, 11/21/17 | Serbia | 1,800,000 | | | 1,864,125 |
| Government of Singapore, senior note, 1.125%, 4/01/16 | Singapore | 10,000 | SGD | | 8,078 |
| Government of Sri Lanka, | | | | | |
| A, 11.25%, 7/15/14 | Sri Lanka | 11,700,000 | LKR | | 90,299 |
| A, 11.75%, 3/15/15 | Sri Lanka | 80,000 | LKR | | 636 |
| A, 6.50%, 7/15/15 | Sri Lanka | 2,060,000 | LKR | | 15,649 |
80 | Semiannual Report
| | | | | |
| Franklin Investors Securities Trust | | | |
| |
| Statement of Investments, April 30, 2014 (unaudited) (continued) | | | |
| |
| |
| Franklin Low Duration Total Return Fund | Country | Principal Amount* | | | Value |
| Foreign Government and Agency Securities (continued) | | | | | |
| Government of Sri Lanka, (continued) | | | | | |
| A, 11.00%, 8/01/15 | Sri Lanka | 13,400,000 | LKR | $ | 107,128 |
| A, 6.40%, 8/01/16 | Sri Lanka | 1,500,000 | LKR | | 11,201 |
| A, 8.00%, 11/15/18 | Sri Lanka | 3,780,000 | LKR | | 28,000 |
| A, 9.00%, 5/01/21 | Sri Lanka | 4,890,000 | LKR | | 35,816 |
| B, 6.60%, 6/01/14 | Sri Lanka | 500,000 | LKR | | 3,827 |
| C, 8.50%, 4/01/18 | Sri Lanka | 2,890,000 | LKR | | 21,943 |
| D, 8.50%, 6/01/18 | Sri Lanka | 1,960,000 | LKR | | 14,869 |
| Government of the Philippines, senior note, 1.625%, 4/25/16 | Philippines | 19,230,000 | PHP | | 424,991 |
| aGovernment of Ukraine, 144A, 9.25%, 7/24/17 | Ukraine | 3,800,000 | | | 3,436,625 |
| The Korea Development Bank, senior note, 3.00%, 3/17/19 | South Korea | 3,500,000 | | | 3,595,462 |
| Korea Monetary Stabilization Bond, | | | | | |
| senior bond, 2.47%, 4/02/15 | South Korea | 4,510,200,000 | KRW | | 4,358,318 |
| senior bond, 2.80%, 8/02/15 | South Korea | 6,330,230,000 | KRW | | 6,134,526 |
| senior bond, 2.81%, 10/02/15 | South Korea | 160,000,000 | KRW | | 155,037 |
| senior note, 3.28%, 6/02/14 | South Korea | 1,343,890,000 | KRW | | 1,301,539 |
| senior note, 2.82%, 8/02/14 | South Korea | 636,100,000 | KRW | | 616,074 |
| senior note, 2.78%, 10/02/14 | South Korea | 2,536,000,000 | KRW | | 2,456,429 |
| senior note, 2.84%, 12/02/14 | South Korea | 1,517,560,000 | KRW | | 1,470,763 |
| senior note, 2.74%, 2/02/15 | South Korea | 389,480,000 | KRW | | 377,275 |
| senior note, 2.76%, 6/02/15 | South Korea | 1,334,100,000 | KRW | | 1,292,496 |
| aKorea National Oil Corp., senior note, 144A, 2.875%, | | | | | |
| 11/09/15 | South Korea | 2,000,000 | | | 2,056,160 |
| Korea Treasury Bond, senior note, | | | | | |
| 3.25%, 12/10/14 | South Korea | 636,530,000 | KRW | | 618,430 |
| 3.25%, 6/10/15 | South Korea | 420,970,000 | KRW | | 409,981 |
| 2.75%, 12/10/15 | South Korea | 1,527,740,000 | KRW | | 1,478,904 |
| 3.00%, 12/10/16 | South Korea | 1,590,000,000 | KRW | | 1,544,702 |
| Letra Tesouro Nacional, Strip, 1/01/15 | Brazil | 10 | gBRL | | 4,176 |
| hNota Do Tesouro Nacional, Index Linked, 6.00%, | | | | | |
| 8/15/16 | Brazil | 789 | gBRL | | 864,675 |
| 5/15/17 | Brazil | 150 | gBRL | | 163,977 |
| 8/15/18 | Brazil | 1,810 | gBRL | | 1,964,703 |
| Total Foreign Government and Agency Securities | | | | | |
| (Cost $90,672,253) | | | | | 92,045,238 |
| U.S. Government and Agency Securities 8.4% | | | | | |
| U.S. Treasury Bond, | | | | | |
| 11.25%, 2/15/15 | United States | 3,000,000 | | | 3,265,077 |
| 4.50%, 2/15/16 | United States | 40,000,000 | | | 42,999,200 |
| U.S. Treasury Note, | | | | | |
| 4.125%, 5/15/15 | United States | 15,000,000 | | | 15,624,900 |
| 2.125%, 5/31/15 | United States | 44,200,000 | | | 45,156,532 |
| 1.875%, 6/30/15 | United States | 30,000,000 | | | 30,608,790 |
| 0.25%, 7/15/15 | United States | 5,000,000 | | | 5,006,445 |
| 4.25%, 8/15/15 | United States | 34,000,000 | | | 35,795,608 |
| iIndex Linked, 0.125%, 4/15/16 | United States | 3,190,582 | | | 3,283,559 |
| Total U.S. Government and Agency Securities | | | | | |
| (Cost $181,473,726) | | | | | 181,740,111 |
| |
| | | Semiannual Report | 81 |
| | | | |
| Franklin Investors Securities Trust | | | |
| |
| Statement of Investments, April 30, 2014 (unaudited) (continued) | | | |
| |
| |
| Franklin Low Duration Total Return Fund | Country | Principal Amount* | | Value |
| Asset-Backed Securities and Commercial | | | | |
| Mortgage-Backed Securities 18.8% | | | | |
| Banks 7.7% | | | | |
| Banc of America Commercial Mortgage Trust, | | | | |
| 2006-1, AJ, 5.46%, 9/10/45 | United States | 8,350,000 | $ | 8,913,583 |
| 2006-4, AJ, 5.695%, 7/10/46 | United States | 3,587,000 | | 3,778,899 |
| 2006-4, AM, 5.675%, 7/10/46 | United States | 710,000 | | 777,052 |
| Bear Stearns Commercial Mortgage Securities Inc., | | | | |
| b2006-PW11, AJ, FRN, 5.441%, 3/11/39 | United States | 3,641,000 | | 3,834,628 |
| b2006-PW12, AJ, FRN, 5.75%, 9/11/38 | United States | 1,770,000 | | 1,834,941 |
| 2006-PW13, AJ, 5.611%, 9/11/41 | United States | 7,000,000 | | 7,285,310 |
| b2007-PW16, AM, FRN, 5.707%, 6/11/40 | United States | 2,100,000 | | 2,345,188 |
| Bear Stearns Commercial Mortgage Securities Trust, | | | | |
| b2005-T20, A3, FRN, 5.136%, 10/12/42 | United States | 906,234 | | 914,784 |
| 2006-PW13, A4, 5.54%, 9/11/41 | United States | 3,600,000 | | 3,899,623 |
| b2007-PW16, A4, FRN, 5.707%, 6/11/40 | United States | 1,710,000 | | 1,915,082 |
| Capital One Multi-Asset Execution Trust, | | | | |
| 2006-A6, A3, 5.05%, 12/17/18 | United States | 6,100,000 | | 6,581,543 |
| b2007-A1, A1, FRN, 0.202%, 11/15/19 | United States | 5,470,000 | | 5,440,301 |
| bCD Commercial Mortgage Trust, 2005-CD1, AJ, FRN, 5.402%, | | | | |
| 7/15/44 | United States | 3,258,000 | | 3,430,602 |
| Citibank Credit Card Issuance Trust, | | | | |
| 2003-A7, A7, 4.15%, 7/07/17 | United States | 2,900,000 | | 3,027,635 |
| 2005-A9, A9, 5.10%, 11/20/17 | United States | 6,200,000 | | 6,637,419 |
| b2006-A3, A3, FRN, 5.30%, 3/15/18 | United States | 2,160,000 | | 2,344,425 |
| Citigroup Commercial Mortgage Trust, | | | | |
| 2006-C5, AJ, 5.482%, 10/15/49 | United States | 1,850,000 | | 1,859,627 |
| b2007-C6, AM, FRN, 5.71%, 6/10/17 | United States | 7,000,000 | | 7,733,243 |
| bCountrywide Asset-Backed Certificates, | | | | |
| 2001-BC3, A, FRN, 0.632%, 12/25/31 | United States | 1,851 | | 1,422 |
| 2002-3, 1A1, FRN, 0.892%, 5/25/32 | United States | 1,795 | | 1,706 |
| 2004-1, M1, FRN, 0.902%, 3/25/34 | United States | 604,274 | | 579,401 |
| 2004-7, MV3, FRN, 1.202%, 12/25/34 | United States | 1,012,874 | | 1,008,333 |
| 2004-14, M1, FRN, 0.662%, 6/25/35 | United States | 1,056,275 | | 1,043,408 |
| Credit Suisse First Boston Mortgage Securities Corp., | | | | |
| 2004-6, 3A1, 5.00%, 9/25/19 | United States | 2,488,193 | | 2,618,106 |
| b2004-AR3, 5A1, FRN, 2.514%, 4/25/34 | United States | 2,755,066 | | 2,847,995 |
| 2004-C5, A1A, 4.71%, 11/15/37 | United States | 7,191,550 | | 7,306,902 |
| bGranite Master Issuer PLC, 2006-3, A3, FRN, 0.232%, | | | | |
| 12/20/54 | United Kingdom | 1,492,338 | | 1,477,564 |
| bGreenwich Capital Commercial Funding Corp., 2006-GG7, | | | | |
| AJ, FRN, 5.82%, 7/10/38 | United States | 6,800,000 | | 7,080,286 |
| AM, FRN, 5.82%, 7/10/38 | United States | 660,000 | | 719,923 |
| JPMorgan Chase Commercial Mortgage Securities Corp., | | | | |
| 2004-LN2, A2, 5.115%, 7/15/41 | United States | 1,054,369 | | 1,057,223 |
| 2006-CB17, AM, 5.464%, 12/12/43 | United States | 2,350,000 | | 2,483,012 |
| b2006-LDP7, AJ, FRN, 6.025%, 4/15/45 | United States | 7,000,000 | | 7,231,973 |
82 | Semiannual Report
| | | | |
| Franklin Investors Securities Trust | | | |
| |
| Statement of Investments, April 30, 2014 (unaudited) (continued) | | | |
| |
| |
| Franklin Low Duration Total Return Fund | Country | Principal Amount* | | Value |
| Asset-Backed Securities and Commercial | | | | |
| Mortgage-Backed Securities (continued) | | | | |
| Banks (continued) | | | | |
| LB-UBS Commercial Mortgage Trust, | | | | |
| a,b2003-C7, L, 144A, FRN, 5.224%, 7/15/37 | United States | 352,536 | $ | 353,164 |
| 2005-C3, A5, 4.739%, 7/15/30 | United States | 3,299,890 | | 3,392,433 |
| 2006-C1, A4, 5.156%, 2/15/31 | United States | 1,500,000 | | 1,589,069 |
| b2006-C1, AJ, FRN, 5.276%, 2/15/41 | United States | 967,000 | | 992,548 |
| b2006-C4, AJ, FRN, 6.051%, 6/15/38 | United States | 4,000,000 | | 4,258,956 |
| bMerrill Lynch Mortgage Trust, 2005-CKI1, AJ, FRN, 5.281%, | | | | |
| 11/12/37 | United States | 1,750,000 | | 1,842,439 |
| bMLCC Mortgage Investors Inc., 2005-1, 2A2, FRN, 2.127%, | | | | |
| 4/25/35 | United States | 996,397 | | 970,234 |
| bMorgan Stanley ABS Capital I Inc. Trust, 2005-WMC, M2, FRN, | | | | |
| 0.887%, 1/25/35 | United States | 610,585 | | 589,195 |
| Morgan Stanley Capital I Trust, | | | | |
| 2005-T17, A5, 4.78%, 12/13/41 | United States | 5,674,894 | | 5,760,968 |
| b2006-HQ8, A4, FRN, 5.416%, 3/12/44 | United States | 3,392,824 | | 3,589,416 |
| b2006-HQ8, AJ, FRN, 5.496%, 3/12/44 | United States | 7,000,000 | | 7,182,547 |
| bWachovia Bank Commercial Mortgage Trust, | | | | |
| a2003-C7, F, 144A, FRN, 5.792%, 10/15/35 | United States | 1,500,000 | | 1,522,512 |
| 2005-C17, B, FRN, 5.287%, 3/15/42 | United States | 3,000,000 | | 3,088,383 |
| 2006-C23, AJ, FRN, 5.515%, 1/18/45 | United States | 8,000,000 | | 8,471,864 |
| 2006-C27, AM, FRN, 5.795%, 7/17/45 | United States | 2,755,000 | | 3,003,960 |
| 2006-C28, AM, FRN, 5.603%, 10/15/48 | United States | 330,000 | | 359,686 |
| bWachovia Commercial Mortgage Securities Inc. Pass-Through | | | | |
| Certificates, 2003-C9, D, FRN, 5.209%, 12/15/35 | United States | 23,938 | | 23,928 |
| bWells Fargo Mortgage Backed Securities Trust, | | | | |
| 04-I, 2A1, FRN, 2.633%, 6/25/34 | United States | 2,733,319 | | 2,725,608 |
| 04-V, 2A1, FRN, 2.631%, 10/25/34 | United States | 2,726,312 | | 2,779,585 |
| 04-W, A9, FRN, 2.616%, 11/25/34 | United States | 273,446 | | 283,394 |
| 05-AR, 1A1, FRN, 2.61%, 2/25/35 | United States | 3,317,454 | | 3,354,573 |
| 05-AR9, 2A2, FRN, 2.643%, 10/25/33 | United States | 361,761 | | 357,946 |
| 05-AR10, 2A3, FRN, 2.614%, 6/25/35 | United States | 1,518,757 | | 1,522,387 |
| | | | | 166,025,934 |
| Commercial & Professional Services 0.1% | | | | |
| aAnthracite CDO II Ltd., 2002-2A, D, 144A, 6.97%, 12/24/37 | United States | 1,162,783 | | 1,167,359 |
| bGreenpoint Mortgage Funding Trust, 2005-HE4, 2A4C, FRN, | | | | |
| 0.872%, 7/25/30 | United States | 339,005 | | 338,554 |
| | | | | 1,505,913 |
| Diversified Financials 10.9% | | | | |
| bAames Mortgage Investment Trust, 2005-4, M1, FRN, 0.857%, | | | | |
| 10/25/35 | United States | 520,706 | | 520,940 |
| aABSC Manufactured Housing Contract Resecuritization Trust, | | | | |
| 2004-0K1, A4, 144A, 5.019%, 4/16/30 | United States | 2,627,106 | | 2,679,694 |
| bAmerican Home Mortgage Investment Trust, 2004-3, 4A, FRN, | | | | |
| 1.837%, 10/25/34 | United States | 5,489,340 | | 5,423,630 |
Semiannual Report | 83
| | | | |
| Franklin Investors Securities Trust | | | |
| |
| Statement of Investments, April 30, 2014 (unaudited) (continued) | | | |
| |
| |
| Franklin Low Duration Total Return Fund | Country | Principal Amount* | | Value |
| Asset-Backed Securities and Commercial | | | | |
| Mortgage-Backed Securities (continued) | | | | |
| Diversified Financials (continued) | | | | |
| bAmeriquest Mortgage Securities Inc. Asset-Backed Pass-Through | | | | |
| Certificates, | | | | |
| 2004-R4, M1, FRN, 0.977%, 6/25/34 | United States | 1,827,238 | $ | 1,789,065 |
| 2004-R7, A1, FRN, 0.592%, 8/25/34 | United States | 1,668,377 | | 1,645,166 |
| aApidos CDO, 2013-14A, C2, 144A, 4.85%, 4/15/25 | United States | 1,900,000 | | 1,864,679 |
| a,bARCap Real Estate Investment Trust Inc., 2004-RR3, A2, 144A, | | | | |
| FRN, 4.76%, 9/21/45 | United States | 7,179,871 | | 7,271,709 |
| aARCap Resecuritization Trust, 2004-A1, A, 144A, 4.73%, | | | | |
| 4/21/24 | United States | 3,530,175 | | 3,593,044 |
| bArgent Securities Inc., 2005-W2, A2C, FRN, 0.512%, | | | | |
| 10/25/35 | United States | 1,155,000 | | 1,054,804 |
| bBayview Financial Acquisition Trust, 2004-D, M1, FRN, 0.782%, | | | | |
| 8/28/44 | United States | 1,294,273 | | 1,281,827 |
| bBear Stearns Alt-A Trust, | | | | |
| 2004-10, 1A3, FRN, 1.152%, 9/25/34 | United States | 4,448,801 | | 4,442,884 |
| 2004-13, A2, FRN, 1.032%, 11/25/34 | United States | 191,404 | | 181,641 |
| Chase Funding Mortgage Loan Asset-Backed Certificates, 2004-2, | | | | |
| 1A6, 5.351%, 2/25/35 | United States | 438,930 | | 443,131 |
| b2A2, FRN, 0.652%, 2/25/35 | United States | 13,246 | | 11,385 |
| bChase Issuance Trust, | | | | |
| 2007-A2, A2, FRN, 0.202%, 4/15/19 | United States | 4,468,000 | | 4,444,346 |
| 2007-B1, B1, FRN, 0.402%, 4/15/19 | United States | 9,400,000 | | 9,335,483 |
| 2007-C1, C1, FRN, 0.612%, 4/15/19 | United States | 3,800,000 | | 3,766,604 |
| a,bColony American Homes, 2014-1A, A, 144A, FRN, 1.40%, | | | | |
| 5/17/31 | United States | 4,090,000 | | 4,106,012 |
| bCommercial Mortgage Trust, 2007-C9, A1A, FRN, 5.795%, | | | | |
| 12/10/49 | United States | 8,886,520 | | 9,886,773 |
| aCountryplace Manufactured Housing Contract Trust, 2005-A3, | | | | |
| 144A, 4.80%, 12/15/35 | United States | 138,170 | | 142,023 |
| bCountrywide Home Loans, | | | | |
| 04-11, 2A1, FRN, 2.26%, 7/25/34 | United States | 5,069,703 | | 5,023,176 |
| 2004-6, 1A1, FRN, 2.661%, 5/25/34 | United States | 3,988,692 | | 4,010,091 |
| aCrest Ltd., | | | | |
| 2003-2A, C2, 144A, 5.709%, 12/28/38 | United States | 4,381,230 | | 4,424,963 |
| b2004-1A, A, 144A, FRN, 0.558%, 1/28/20 | United States | 198,454 | | 196,992 |
| b2004-1A, B1, 144A, FRN, 0.718%, 1/28/40 | United States | 5,606,650 | | 5,400,555 |
| aCT CDO III Ltd., 2005-3A, C, 144A, 5.471%, 6/25/35 | United States | 2,500,000 | | 2,505,750 |
| a,bCT CDO IV Ltd., 2006-4A, A1, 144A, FRN, 0.462%, 10/20/43 | United States | 3,015,489 | | 2,932,563 |
| bDiscover Card Execution Note Trust, 2010-A2, A2, FRN, 0.732%, | | | | |
| 3/15/18 | United States | 5,000,000 | | 5,031,265 |
| aEmerson Park CLO Ltd., 2013-1A, C2, 144A, 5.64%, 7/15/25 | United States | 630,000 | | 634,001 |
| bFirst Horizon Alternative Mortgage Securities Trust, 04-AA5, 2A1, | | | | |
| FRN, 2.092%, 12/25/34 | United States | 4,174,866 | | 4,080,967 |
| Ford Credit Auto Owner Trust, 2012-A, A4, 1.15%, 6/15/17 | United States | 3,470,000 | | 3,500,074 |
| a,bFosse Master Issuer PLC, 2011-1A, A2, 144A, FRN, 1.628%, | | | | |
| 10/18/54 | United Kingdom | 2,616,489 | | 2,623,760 |
84 | Semiannual Report
| | | | |
| Franklin Investors Securities Trust | | | |
| |
| Statement of Investments, April 30, 2014 (unaudited) (continued) | | | |
| |
| |
| Franklin Low Duration Total Return Fund | Country | Principal Amount* | | Value |
| Asset-Backed Securities and Commercial | | | | |
| Mortgage-Backed Securities (continued) | | | | |
| Diversified Financials (continued) | | | | |
| aG-Force LLC, | | | | |
| b2005-RR2, A3FL, FRN, 144A, 0.452%, 12/25/39 | United States | 2,694,393 | $ | 2,605,478 |
| 2005-RRA, A2, 144A, 4.83%, 8/22/36 | United States | 81,356 | | 81,365 |
| 2005-RRA, B, 144A, 5.09%, 8/22/36 | United States | 2,000,000 | | 2,016,500 |
| bGCCFC Commercial Mortgage Trust, 2006-GG7, A1A, FRN, 5.82%, | | | | |
| 7/10/38 | United States | 6,292,392 | | 6,791,995 |
| a,bGleneagles CLO Ltd., 2005-1A, A2, 144A, FRN, 0.638%, | | | | |
| 11/01/17 | United States | 2,000,000 | | 1,957,988 |
| GMAC Commercial Mortgage Securities Inc., 2005-C1, B, 4.936%, | | | | |
| 5/10/43 | United States | 1,615,000 | | 737,916 |
| Green Tree Financial Corp., 1999-3, A7, 6.74%, 2/01/31 | United States | 491,508 | | 495,286 |
| bGSAA Home Equity Trust, | | | | |
| 05-5, M3, FRN, 1.097%, 2/25/35 | United States | 5,950,000 | | 5,457,679 |
| FRN, 0.522%, 6/25/35 | United States | 881,638 | | 838,216 |
| bGSAMP Trust, 2005-HE3, M2, FRN, 1.157%, 6/25/35 | United States | 2,111,332 | | 2,035,683 |
| aHighbridge Loan Management Ltd., 2013-2A, B2, 144A, 5.80%, | | | | |
| 10/20/24 | United States | 570,000 | | 583,737 |
| a,bHilton USA Trust, 2013-HLF, AFL, 144A, FRN, 1.153%, | | | | |
| 11/05/30 | United States | 6,000,000 | | 6,008,154 |
| bJP Morgan Chase Commercial Mortgage Securities Corp., | | | | |
| 2005-LDP5, A, FRN, 5.56%, 12/15/44 | United States | 1,150,000 | | 1,167,999 |
| bJP Morgan Mortgage Trust, 2004-A1, 5A1, FRN, 2.556%, | | | | |
| 2/25/34 | United States | 165,211 | | 165,920 |
| bJPMorgan Chase Commercial Mortgage Securities Trust, | | | | |
| 2006-LDP7, A4, FRN, 6.025%, 4/15/45 | United States | 880,000 | | 956,537 |
| bJPMorgan Mortgage Acquisition Corp., 2006-ACC1, A4, FRN, | | | | |
| 0.302%, 5/25/36 | United States | 335,967 | | 330,110 |
| a,bKildare Securities Ltd., 2007-1A, A2, 144A, FRN, 0.355%, | | | | |
| 12/10/43 | Ireland | 2,428,048 | | 2,418,406 |
| a,bLB-UBS Commercial Mortgage Trust, 2004-C7, H, 144A, FRN, | | | | |
| 5.42%, 10/15/36 | United States | 980,000 | | 1,001,149 |
| a,bLNR CDO Ltd., 2003-1A, DFL, 144A, FRN, 2.255%, 7/23/36 | Cayman Islands | 1,350,000 | | 1,327,269 |
| bLong Beach Mortgage Loan Trust, 2005-WL2, M1, FRN, 0.624%, | | | | |
| 8/25/35 | United States | 1,603,858 | | 1,587,979 |
| a,bMach One Trust Commercial Mortgage-Backed, 2004-1A, | | | | |
| F, 144A, FRN, 5.889%, 5/28/40 | United States | 1,700,000 | | 1,742,500 |
| G, 144A, FRN, 6.209%, 5/28/40 | United States | 3,500,000 | | 3,504,287 |
| bMASTR Adjustable Rate Mortgage Trust, 2007-3, 12A2, FRN, | | | | |
| 0.352%, 5/25/47 | United States | 1,012,405 | | 993,736 |
| bMASTR Adjustable Rate Mortgages Trust, 2007-1, I2A2, FRN, | | | | |
| 0.312%, 1/25/47 | United States | 2,843,742 | | 2,789,612 |
| MASTR Alternative Loan Trust, | | | | |
| 2003-1, 3A1, 5.00%, 2/25/18 | United States | 1,174,460 | | 1,213,686 |
| 2003-6, 2A1, 5.00%, 8/25/18 | United States | 2,620,735 | | 2,735,106 |
| 2003-9, 1A1, 5.50%, 12/25/18 | United States | 1,128,680 | | 1,183,507 |
| 2004-4, 5A1, 5.50%, 4/25/19 | United States | 2,738,984 | | 2,876,370 |
| b2004-11, 2A1, FRN, 5.562%, 11/25/19 | United States | 2,592,514 | | 2,729,981 |
Semiannual Report | 85
| | | | | | |
| | Franklin Investors Securities Trust | | | | |
| |
| | Statement of Investments, April 30, 2014 (unaudited) (continued) | | | | |
| |
| |
| | Franklin Low Duration Total Return Fund | Country | Principal Amount* | | | Value |
| | Asset-Backed Securities and Commercial | | | | | |
| | Mortgage-Backed Securities (continued) | | | | | |
| | Diversified Financials (continued) | | | | | |
| | Mercedes-Benz Auto Lease Trust, 2013-A, A4, 0.72%, | | | | | |
| | 12/17/18 | United States | 1,150,000 | | $ | 1,152,769 |
| | bMerrill Lynch Mortgage Investors Trust Inc., | | | | | |
| | 2003-E, A1, FRN, 0.772%, 10/25/28 | United States | 1,831,211 | | | 1,805,812 |
| | 2003-G, A2, FRN, 1.027%, 1/25/29 | United States | 1,655,444 | | | 1,658,732 |
| bML-CFC Commercial Mortgage Trust, 2006-3, A1A, FRN, 5.409%, | | | | | |
| | 7/12/46 | United States | 3,058,937 | | | 3,325,892 |
| a,bN-Star Real Estate CDO Ltd., 2006-6A, A1, 144A, FRN, 0.563%, | | | | | |
| | 6/16/41 | Cayman Islands | 2,264,535 | | | 2,161,182 |
| | a,bNewcastle CDO Ltd., 2004-5A, 1, 144A, FRN, 0.574%, | | | | | |
| | 12/24/39 | United States | 2,253,840 | | | 2,182,853 |
| | bOwnit Mortgage Loan Asset-Backed Certificates, 2005-2, M4, | | | | | |
| | FRN, 1.082%, 3/25/36 | United States | 3,100,000 | | | 3,050,887 |
| | bPark Place Securities Inc. Asset-Backed Pass-Through Certificates, | | | | | |
| | 2004-MCW1, M1, FRN, 1.09%, 10/25/34 | United States | 537,604 | | | 535,038 |
| | 2004-WHQ2, M2, FRN, 1.097%, 2/25/35 | United States | 3,007,091 | | | 3,013,397 |
| | bPark Place Securities Inc., 2005-WCW1, M1, FRN, 0.602%, | | | | | |
| | 9/25/35 | United States | 1,895,000 | | | 1,824,985 |
| | a,bPegasus 2006-1 Ltd., 2006-1A, A1, 144A, FRN, 0.552%, | | | | | |
| | 7/25/49 | United States | 2,900,000 | | | 2,653,500 |
| | bRAAC, 04-SP1, AII, FRN, 0.852%, 3/25/34 | United States | 1,102,480 | | | 1,048,297 |
| | bResidential Funding Mortgage Securities II, 2004-HI3, A5, FRN, | | | | | |
| | 5.48%, 6/25/34 | United States | 731,035 | | | 761,583 |
| | a,bSeawall SPC, 2006-1A, C1, 144A, FRN, 1.402%, 4/15/46 | United States | 1,000,000 | | | 989,000 |
| | bSequoia Mortgage Trust, 2003-4, | | | | | |
| | 1A1, FRN, 0.772%, 7/20/33 | United States | 536,901 | | | 504,358 |
| | 1A2, FRN, 0.995%, 7/20/33 | United States | 470,722 | | | 442,341 |
| | bStructured Asset Investment Loan Trust, 2004-BNC2, A2, FRN, | | | | | |
| | 1.192%, 12/25/34 | United States | 3,925,562 | | | 3,864,785 |
| | bStructured Asset Mortgage Investments Trust, 2003-AR1, A1, FRN, | | | | | |
| | 0.892%, 10/19/33 | United States | 597,920 | | | 564,571 |
| | bStructured Asset Mortgage Investments II Trust, 04-AR6, A1A, | | | | | |
| | FRN, 0.852%, 2/19/35 | United States | 3,494,287 | | | 3,272,159 |
| | bStructured Asset Securities Corp., 2006-WF1, A5, FRN, 0.452%, | | | | | |
| | 2/25/36 | United States | 1,788,223 | | | 1,754,555 |
| | b,cTalisman 6 Finance, Reg S, FRN, 0.507%, 10/22/16 | Ireland | 2,371,092 | EUR | | 3,169,946 |
| | bThornburg Mortgage Securities Trust, 2007-4, 1A1, FRN, 2.346%, | | | | | |
| | 9/25/37 | United States | 1,352,809 | | | 1,327,230 |
| | a,bTrade MAPS Ltd., 2013-1A, A, 144A, FRN, 0.85%, 12/10/18 | Ireland | 8,500,000 | | | 8,526,520 |
| | a,bTurquoise Card Backed Securities PLC, 2011-1A, A, 144A, FRN, | | | | | |
| | 0.902%, 9/15/16 | United Kingdom | 3,600,000 | | | 3,606,642 |
| | Vanderbilt Acquisition Loan Trust, 2002-1, M1, 7.33%, | | | | | |
| | 5/07/32 | United States | 385,189 | | | 420,941 |
| | a,bVeritas CLO Ltd., 2006-2A, A2, 144A, FRN, 0.558%, 7/11/21 | United States | 2,000,000 | | | 1,927,000 |
| | WAMU Mortgage Pass-Through Certificates, | | | | | |
| | 05-AR13, A1A1, 0.442%, 10/25/45 | United States | 7,445,822 | | | 6,971,151 |
| | b2005-AR8, 2A1A, FRN, 0.442%, 7/25/45 | United States | 2,082,982 | | | 1,951,596 |
| | b2005-AR19, A1A1, FRN, 0.422%, 12/25/45 | United States | 5,518,668 | | | 5,197,365 |
| |
| | 86 | Semiannual Report | | | | | |
| | | | |
| Franklin Investors Securities Trust | | | |
| |
| Statement of Investments, April 30, 2014 (unaudited) (continued) | | | |
| |
| |
| Franklin Low Duration Total Return Fund | Country | Principal Amount* | | Value |
| Asset-Backed Securities and Commercial | | | | |
| Mortgage-Backed Securities (continued) | | | | |
| Diversified Financials (continued) | | | | |
| bWells Fargo Home Equity Trust Mortgage Pass-Through Certificates, | | | |
| 2004-1, A3, FRN, 0.522%, 4/25/34 | United States | 1,980,000 | $ | 1,874,769 |
| | | | | 234,123,004 |
| Real Estate 0.1% | | | | |
| bCitigroup Mortgage Loan Trust Inc., 2006-WFH3, A3, FRN, | | | | |
| 0.302%, 10/25/36 | United States | 806,174 | | 803,172 |
| bNovastar Home Equity Loan, 2004-4, M4, FRN, 1.802%, | | | | |
| 3/25/35 | United States | 2,000,000 | | 1,971,500 |
| | | | | 2,774,672 |
| Total Asset-Backed Securities and Commercial | | | | |
| Mortgage-Backed Securities (Cost $399,793,091) | | | | 404,429,523 |
| Mortgage-Backed Securities 4.5% | | | | |
| bFederal Home Loan Mortgage Corp. (FHLMC) Adjustable Rate 1.0% | | | |
| FHLMC, 1.78% - 6.345%, 11/01/17 – 9/01/41 | United States | 20,028,524 | | 21,319,468 |
| Federal Home Loan Mortgage Corp. (FHLMC) Fixed Rate 0.0%† | | | |
| FHLMC Gold 15 Year, 5.00%, 10/01/23 | United States | 311,216 | | 330,704 |
| FHLMC Gold 15 Year, 6.00%, 6/01/23 | United States | 113,420 | | 127,042 |
| FHLMC Gold 30 Year, 5.00%, 1/01/39 | United States | 439,781 | | 481,255 |
| | | | | 939,001 |
| bFederal National Mortgage Association (FNMA) Adjustable Rate 2.7% | | | |
| FNMA, 1.193% - 2.295%, 3/01/17 – 10/01/44 | United States | 20,349,965 | | 21,434,077 |
| FNMA, 2.297% - 2.528%, 9/01/19 – 5/01/38 | United States | 19,000,507 | | 20,123,878 |
| FNMA, 5.532% - 6.22%, 8/01/15 – 3/01/50 | United States | 15,698,717 | | 16,687,697 |
| | | | | 58,245,652 |
| Federal National Mortgage Association (FNMA) Fixed Rate 0.8% | | | |
| FNMA 15 Year, 3.50%, 10/01/25 | United States | 2,777,198 | | 2,931,057 |
| FNMA 15 Year, 4.00%, 12/01/25 | United States | 4,545,003 | | 4,844,309 |
| FNMA 15 Year, 4.50%, 5/01/16 - 6/01/25 | United States | 8,870,221 | | 9,407,552 |
| FNMA 30 Year, 5.00%, 3/01/38 | United States | 117,795 | | 129,105 |
| | | | | 17,312,023 |
| bGovernment National Mortgage Association (GNMA) | | | | |
| Adjustable Rate 0.0%† | | | | |
| GNMA, 1.625%, 4/20/26 - 9/20/26 | United States | 40,687 | | 42,325 |
| Total Mortgage-Backed Securities | | | | |
| (Cost $96,610,756) | | | | 97,858,469 |
| Municipal Bonds 1.2% | | | | |
| Acalanes UHSD, GO, Contra Costa County, Refunding, 1.427%, | | | |
| 8/01/18 | United States | 1,000,000 | | 977,910 |
| Alabama State Public School and College Authority Revenue, | | | | |
| Capital Improvement Bonds, 5.00%, 12/01/25 | United States | 1,500,000 | | 1,690,290 |
| Arkansas State GO, Four-Lane Highway Construction and | | | | |
| Improvement Bonds, 3.25%, 6/15/22 | United States | 3,000,000 | | 3,157,710 |
| |
| | | Semiannual Report | 87 |
| | | | | |
| Franklin Investors Securities Trust | | | | |
| |
| Statement of Investments, April 30, 2014 (unaudited) (continued) | | | | |
| |
| |
| Franklin Low Duration Total Return Fund | Country | Principal Amount* | | | Value |
| Municipal Bonds (continued) | | | | | |
| bCalifornia State Judgment Trust COP, FRN, 1.582%, 6/01/15 | United States | 1,535,000 | | $ | 1,508,061 |
| California State Public Works Board Lease Revenue, Various Capital | | | | | |
| Projects, Series E, 3.183%, 12/01/14 | United States | 3,035,000 | | | 3,059,280 |
| Colorado State ISD, GO, Mitchell and Scurry Counties, School | | | | | |
| Building, PSF Guarantee, 5.00%, 8/15/43 | United States | 350,000 | | | 383,422 |
| Florida Hurricane Catastrophe Fund Finance Corp. Revenue, | | | | | |
| Series A, 2.107%, 7/01/18 | United States | 2,000,000 | | | 2,004,420 |
| Illinois State GO, Build America Bonds, 4.55%, 7/01/14 | United States | 1,000,000 | | | 1,006,570 |
| Minnesota State GO, Series C, 2.50%, 8/01/18 | United States | 1,500,000 | | | 1,548,540 |
| Modesto Irrigation District Financing Authority Revenue, Domestic | | | | | |
| Water Project, Refunding, Series G, AGMC Insured, 5.00%, | | | | | |
| 9/01/21 | United States | 1,000,000 | | | 1,168,480 |
| Puerto Rico Sales Tax FICO Sales Tax Revenue, Refunding, | | | | | |
| Series A, NATL RE, FGIC Insured, zero cpn., 8/01/45 | United States | 4,305,000 | | | 551,040 |
| Rhode Island State and Providence Plantations GO, Consolidated | | | | | |
| Capital Development Loan of 2012, Refunding, Series A, 5.00%, | | | | | |
| 8/01/19 | United States | 2,500,000 | | | 2,926,825 |
| Riverside County RDA Tax Allocation, Housing, Series A-T, | | | | | |
| 5.00%, 10/01/14 | United States | 1,030,000 | | | 1,035,696 |
| 6.00%, 10/01/15 | United States | 1,075,000 | | | 1,105,089 |
| 6.25%, 10/01/16 | United States | 1,140,000 | | | 1,184,950 |
| University of California Revenues, General, Series AK, 5.00%, | | | | | |
| 5/15/48 | United States | 2,750,000 | | | 3,327,225 |
| Total Municipal Bonds (Cost $25,917,000) | | | | | 26,635,508 |
| |
| | | Shares | | | |
| Litigation Trusts (Cost $—) 0.0% | | | | | |
| j,kNewPage Corp., Litigation Trust | United States | 500,000 | | | — |
| |
| | Counterparty | Notional Amount* | | | |
| Options Purchased 0.0%† | | | | | |
| Calls – Over-the-Counter | | | | | |
| Credit Default Swaptions 0.0%† | | | | | |
| Buy protection on CDX.NA.HY.22, Premium Rate 0.56%, | | | | | |
| Strike Price $102, Expires 6/18/14 | FBCO | 10,600,000 | l | | 16,706 |
| Buy protection on CDX.NA.IG.22, Premium Rate 0.688%, | | | | | |
| Strike Price $100, Expires 6/18/14 | FBCO | 32,000,000 | l | | 1,760 |
| | | | | | 18,466 |
| Currency Options 0.0%† | | | | | |
| USD/KRW, October Strike Price 1,040 KRW, Expires 10/16/14 | BZWS | 3,500,000 | l | | 79,492 |
| | | | | | 97,958 |
88 | Semiannual Report
| | | | | |
| Franklin Investors Securities Trust | | | | |
| |
| Statement of Investments, April 30, 2014 (unaudited) (continued) | | | | |
| |
| |
| Franklin Low Duration Total Return Fund | Counterparty | Notional Amount* | | | Value |
| Options Purchased (continued) | | | | | |
| Puts – Over-the-Counter | | | | | |
| Currency Options 0.0%† | | | | | |
| EUR/PLN, October Strike Price 4.13 PLN, Expires 10/22/14 | BZWS | 3,870,831 | l EUR | $ | 29,270 |
| EUR/SEK, May Strike Price 8.955 SEK, Expires 5/23/14 | BZWS | 9,200,000 | l EUR | | 35,287 |
| | | | | | 64,557 |
| Total Options Purchased (Cost $475,627) | | | | | 162,515 |
| Total Investments before Short Term Investments | | | | | |
| (Cost $1,635,295,583) | | | | | 1,655,754,037 |
| |
| | | Principal Amount* | | | |
| Short Term Investments 23.3% | | | | | |
| Foreign Government and Agency Securities 0.5% | | | | | |
| mBank of Negara Monetary Notes, 5/15/14 - 11/06/14 | Malaysia | 10,356,000 | MYR | | 3,150,229 |
| mHungary Treasury Bill, 6/25/14 | Hungary | 10,370,000 | HUF | | 46,730 |
| Korea Monetary Stabilization Bond, | | | | | |
| senior bond, 2.55%, 5/09/14 | South Korea | 553,000,000 | KRW | | 535,281 |
| senior bond, 2.72%, 9/09/14 | South Korea | 64,000,000 | KRW | | 61,975 |
| senior note, 2.57%, 6/09/14 | South Korea | 63,000,000 | KRW | | 60,982 |
| mMalaysia Treasury Bill, 5/30/14 | Malaysia | 90,000 | MYR | | 27,523 |
| mPhilippine Treasury Bills, 7/02/14 - 11/05/14 | Philippines | 15,255,000 | PHP | | 341,167 |
| mSingapore Treasury Bills, 5/02/14 - 5/30/14 | Singapore | 8,143,000 | SGD | | 6,495,190 |
| Total Foreign Government and Agency Securities | | | | | |
| (Cost $10,751,207) | | | | | 10,719,077 |
| U.S. Government and Agency Securities 20.9% | | | | | |
| mU.S. Treasury Bill, | | | | | |
| 5/08/14 | United States | 95,000,000 | | | 94,999,715 |
| 5/15/14 | United States | 75,000,000 | | | 74,999,850 |
| 7/17/14 | United States | 25,000,000 | | | 24,999,125 |
| U.S. Treasury Note, | | | | | |
| 0.25%, 5/31/14 | United States | 85,000,000 | | | 85,014,960 |
| 0.25%, 6/30/14 | United States | 85,000,000 | | | 85,031,535 |
| 0.125%, 7/31/14 | United States | 85,000,000 | | | 85,021,590 |
| Total U.S. Government and Agency Securities | | | | | |
| (Cost $450,097,171) | | | | | 450,066,775 |
| Municipal Bonds 0.4% | | | | | |
| n University of California Revenues, | | | | | |
| Series Y-1, Monthly VRDN and Put, 0.653%, 7/01/41 | United States | 7,600,000 | | | 7,612,312 |
| Series Y-2, Monthly VRDN and Put, 0.653%, 7/01/41 | United States | 390,000 | | | 390,632 |
| Total Municipal Bonds (Cost $7,990,000) | | | | | 8,002,944 |
| Total Investments before Money Market Funds | | | | | |
| (Cost $2,104,133,961) | | | | | 2,124,542,833 |
Semiannual Report | 89
Franklin Investors Securities Trust
Statement of Investments, April 30, 2014 (unaudited) (continued)
| | | | | | |
| Franklin Low Duration Total Return Fund | Country | Shares | | | Value | |
| Short Term Investments (continued) | | | | | | |
| Money Market Funds (Cost $31,576,283) 1.5% | | | | | | |
| j,oInstitutional Fiduciary Trust Money Market Portfolio | United States | 31,576,283 | | $ | 31,576,283 | |
| Total Investments (Cost $2,135,710,244) 100.2% | | | | | 2,156,119,116 | |
| Options Written (0.0)%† | | | | | (29,736 | ) |
| Other Assets, less Liabilities (0.2)% | | | | | (3,570,672 | ) |
| Net Assets 100.0% | | | | $ | 2,152,518,708 | |
| |
| | Counterparty | Notional Amount* | | | | |
| pOptions Written (Premiums Received $35,151) (0.0)%† | | | | | | |
| Calls – Over-the-Counter | | | | | | |
| Currency Options (0.0)%† | | | | | | |
| USD/KRW, October Strike Price 1,100 KRW, Expires 10/16/14 | BZWS | 3,500,000 | l | $ | (29,736 | ) |
†Rounds to less than 0.1% of net assets.
*The principal/notional amount is stated in U.S. dollars unless otherwise indicated.
aSecurity was purchased pursuant to Rule 144A under the Securities Act of 1933 and may be sold in transactions exempt from registration only to qualified institutional buyers or
in a public offering registered under the Securities Act of 1933. These securities have been deemed liquid under guidelines approved by the Trust’s Board of Trustees. At April 30,
2014, the aggregate value of these securities was $239,400,602, representing 11.12% of net assets.
bThe coupon rate shown represents the rate at period end.
cSecurity was purchased pursuant to Regulation S under the Securities Act of 1933, which exempts from registration securities offered and sold outside of the United States. Such a
security cannot be sold in the United States without either an effective registration statement filed pursuant to the Securities Act of 1933, or pursuant to an exemption from regis-
tration.These securities have been deemed liquid under guidelines approved by the Trust’s Board of Trustees. At April 30, 2014, the aggregate value of these securities was
$27,135,326, representing 1.26% of net assets.
dA portion or all of the security purchased on a when-issued or delayed delivery basis. See Note 1(d).
eSee Note 1(j) regarding senior floating rate interests.
fPrincipal amount is stated in 100 Mexican Peso Units.
gPrincipal amount is stated in 1,000 Brazilian Real Units.
hRedemption price at maturity is adjusted for inflation. See Note 1(l).
iPrincipal amount of security is adjusted for inflation. See Note 1(l).
jNon-income producing.
kSecurity has been deemed illiquid because it may not be able to be sold within seven days.
lAmount represents notional amount under terms of the option.
mThe security is traded on a discount basis with no stated coupon rate.
nVariable rate demand notes (VRDNs) are tax-exempt obligations which contain a floating or variable interest rate adjustment formula and an unconditional right of demand to
receive payment of the principal balance plus accrued interest at specified dates. The coupon rate shown represents the rate at period end.
oSee Note 3(f) regarding investments in the Institutional Fiduciary Trust Money Market Portfolio.
pSee Note 1(e) regarding written options.
90 | Semiannual Report
| | | | | | | | | | | | |
| Franklin Investors Securities Trust | | | | | |
| |
| Statement of Investments, April 30, 2014 (unaudited) (continued) | | | | | |
| |
| |
| Franklin Low Duration Total Return Fund | | | | | | | | | | | |
| |
| At April 30, 2014, the fund had the following financial futures contracts outstanding. See Note 1(e). | | | |
| |
| Financial Futures Contracts | | | | | | | | | | | | |
| |
| | | | | Number of | | | Expiration | | Unrealized | | Unrealized | |
| Description | | | Type | Contracts | | Notional Value | Date | | Appreciation | | Depreciation | |
| Interest Rate Contracts | | | | | | | | | | | | |
| CME Ultra Long Term U.S. Treasury Bond | | Short | 17 | $ | 2,503,781 | 6/19/14 | $ | — | $ | (84,644 | ) |
| U.S. Treasury 5 Year Note | | | Short | 397 | | 47,422,891 | 6/30/14 | | 134,333 | | — | |
| U.S. Treasury 10 Year Note | | | Short | 474 | | 58,975,969 | 6/19/14 | | — | | (93,771 | ) |
| U.S. Treasury 30 Year Bond | | | Short | 5 | | 674,687 | 6/19/14 | | — | | (12,981 | ) |
| Unrealized appreciation (depreciation) | | | | | | | | 134,333 | | (191,396 | ) |
| Net unrealized appreciation (depreciation) | | | | | | | | | $ | (57,063 | ) |
| |
| |
| At April 30, 2014, the fund had the following forward exchange contracts outstanding. See Note 1(e). | | | |
| |
| Forward Exchange Contracts | | | | | | | | | | | | |
| |
| | | | | | | Contract | Settlement | | Unrealized | | Unrealized | |
| Currency | Counterparty a Type | | Quantity | | Amount | Date | | Appreciation | | Depreciation | |
| Euro | DBAB | Buy | | 200,000 | $ | 276,540 | 5/05/14 | $ | 897 | $ | — | |
| Euro | DBAB | Sell | | 200,000 | | 264,700 | 5/05/14 | | — | | (12,737 | ) |
| Japanese Yen | DBAB | Buy | 524,380,500 | | 5,123,405 | 5/07/14 | | 7,243 | | — | |
| Japanese Yen | DBAB | Sell | 524,380,500 | | 5,400,000 | 5/07/14 | | 269,352 | | — | |
| Euro | DBAB | Buy | | 500,000 | | 690,500 | 5/09/14 | | 3,085 | | — | |
| Euro | DBAB | Sell | | 500,000 | | 656,375 | 5/09/14 | | — | | (37,210 | ) |
| Euro | DBAB | Buy | | 2,750,000 | | 3,727,625 | 5/12/14 | | 87,064 | | — | |
| Euro | DBAB | Sell | | 2,750,000 | | 3,632,750 | 5/12/14 | | — | | (181,939 | ) |
| Euro | DBAB | Sell | | 316,000 | | 408,019 | 5/19/14 | | — | | (30,316 | ) |
| Japanese Yen | MSCO | Sell | 211,800,000 | | 2,078,427 | 5/19/14 | | 5,975 | | — | |
| Canadian Dollar | DBAB | Buy | | 1,250,640 | | 1,200,000 | 5/28/14 | | — | | (59,748 | ) |
| Euro | DBAB | Sell | | 920,219 | | 1,193,939 | 5/28/14 | | — | | (82,503 | ) |
| Euro | GSCO | Sell | | 420,000 | | 541,527 | 5/30/14 | | — | | (41,055 | ) |
| Euro | DBAB | Sell | | 715,423 | | 930,980 | 6/05/14 | | — | | (61,367 | ) |
| Euro | DBAB | Sell | | 1,962,500 | | 2,576,910 | 6/09/14 | | — | | (145,199 | ) |
| Japanese Yen | BZWS | Sell | | 93,460,000 | | 960,375 | 6/10/14 | | 45,752 | | — | |
| Japanese Yen | HSBC | Sell | | 99,540,000 | | 1,029,029 | 6/10/14 | | 54,906 | | — | |
| Japanese Yen | JPHQ | Sell | | 67,500,000 | | 686,000 | 6/10/14 | | 25,429 | | — | |
| Japanese Yen | DBAB | Sell | | 33,000,000 | | 343,407 | 6/11/14 | | 20,459 | | — | |
| Japanese Yen | JPHQ | Sell | | 92,220,000 | | 960,389 | 6/11/14 | | 57,896 | | — | |
| Japanese Yen | JPHQ | Sell | | 38,900,000 | | 411,706 | 6/17/14 | | 31,005 | | — | |
| Euro | DBAB | Sell | | 833,056 | | 1,112,630 | 6/18/14 | | — | | (42,843 | ) |
| Singapore Dollar | DBAB | Buy | | 461,900 | | 368,048 | 6/18/14 | | 413 | | — | |
| Euro | DBAB | Buy | | 12,100,000 | | 16,746,400 | 6/20/14 | | 36,554 | | — | |
| Euro | DBAB | Sell | | 12,786,000 | | 17,590,979 | 6/20/14 | | — | | (143,471 | ) |
| Singapore Dollar | HSBC | Buy | | 369,000 | | 293,090 | 6/20/14 | | 1,264 | | — | |
| Euro | DBAB | Sell | | 934,000 | | 1,226,211 | 6/27/14 | | — | | (69,242 | ) |
| Chilean Peso | DBAB | Buy | 371,700,000 | | 697,635 | 6/30/14 | | — | | (43,272 | ) |
| Chilean Peso | DBAB | Sell | 371,700,000 | | 692,888 | 6/30/14 | | 38,525 | | — | |
Semiannual Report | 91
| | | | | | | | | | | |
| Franklin Investors Securities Trust | | | | | |
| |
| Statement of Investments, April 30, 2014 (unaudited) (continued) | | | | | |
| |
| |
| Franklin Low Duration Total Return Fund | | | | | | | | | | |
| |
| Forward Exchange Contracts (continued) | | | | | | | | | | |
| |
| | | | | | Contract | Settlement | | Unrealized | | Unrealized | |
| Currency | Counterpartya Type | Quantity | | Amount | Date | | Appreciation | | Depreciation | |
| Euro | DBAB | Sell | 1,455,100 | $ | 1,900,943 | 7/03/14 | $ | — | $ | (117,254 | ) |
| Euro | DBAB | Sell | 3,463,648 | | 4,710,145 | 7/08/14 | | — | | (93,847 | ) |
| Euro | DBAB | Sell | 163,358 | | 210,781 | 7/09/14 | | — | | (15,792 | ) |
| Euro | DBAB | Buy | 1,058,505 | | 1,435,016 | 7/17/14 | | 33,090 | | — | |
| Euro | DBAB | Sell | 1,058,505 | | 1,393,734 | 7/17/14 | | — | | (74,372 | ) |
| Euro | BZWS | Sell | 1,692,000 | | 2,240,885 | 7/28/14 | | — | | (105,827 | ) |
| Chilean Peso | MSCO | Buy | 614,647,000 | | 1,161,574 | 7/29/14 | | — | | (82,716 | ) |
| Euro | DBAB | Sell | 330,000 | | 437,366 | 7/29/14 | | — | | (20,326 | ) |
| Euro | BZWS | Sell | 1,953,780 | | 2,594,327 | 8/04/14 | | — | | (115,443 | ) |
| Euro | CITI | Sell | 35,024 | | 46,627 | 8/08/14 | | — | | (1,948 | ) |
| Euro | DBAB | Sell | 549,468 | | 735,353 | 8/08/14 | | — | | (26,722 | ) |
| Euro | CITI | Sell | 4,238 | | 5,647 | 8/11/14 | | — | | (231 | ) |
| Euro | DBAB | Sell | 43,385 | | 57,595 | 8/15/14 | | — | | (2,577 | ) |
| Euro | MSCO | Sell | 150,593 | | 199,836 | 8/15/14 | | — | | (9,026 | ) |
| Euro | DBAB | Sell | 1,629,600 | | 2,173,932 | 8/20/14 | | — | | (86,190 | ) |
| Euro | BZWS | Sell | 12,954 | | 17,366 | 8/25/14 | | — | | (600 | ) |
| Euro | DBAB | Sell | 745,657 | | 1,000,000 | 8/27/14 | | — | | (34,159 | ) |
| Euro | JPHQ | Sell | 29,904 | | 39,989 | 8/27/14 | | — | | (1,486 | ) |
| Japanese Yen | DBAB | Sell | 137,620,000 | | 1,400,000 | 8/27/14 | | 52,555 | | — | |
| Malaysian Ringgit | JPHQ | Buy | 90,000 | | 26,799 | 8/27/14 | | 584 | | — | |
| Philippine Peso | JPHQ | Buy | 94,860,000 | | 2,137,449 | 8/29/14 | | — | | (10,936 | ) |
| Euro | DBAB | Sell | 282,500 | | 372,812 | 9/05/14 | | — | | (18,987 | ) |
| Euro | BZWS | Sell | 24,226 | | 32,366 | 9/19/14 | | — | | (1,233 | ) |
| Euro | BZWS | Sell | 16,837 | | 22,793 | 9/24/14 | | — | | (558 | ) |
| Euro | DBAB | Sell | 202,911 | | 274,660 | 9/29/14 | | — | | (6,751 | ) |
| British Pound | DBAB | Sell | 1,053,750 | | 1,642,796 | 10/01/14 | | — | | (133,745 | ) |
| Euro | DBAB | Sell | 2,187,500 | | 2,820,781 | 10/17/14 | | — | | (212,957 | ) |
| Euro | HSBC | Sell | 6,000 | | 8,148 | 10/20/14 | | — | | (173 | ) |
| Malaysian Ringgit | JPHQ | Buy | 108,000 | | 33,384 | 10/20/14 | | — | | (628 | ) |
| Chilean Peso | CITI | Buy | 47,586,000 | | 91,336 | 10/24/14 | | — | | (8,530 | ) |
| Japanese Yen | DBAB | Sell | 59,567,300 | | 613,976 | 10/29/14 | | 30,503 | | — | |
| Chilean Peso | DBAB | Buy | 457,429,000 | | 867,707 | 10/31/14 | | — | | (72,222 | ) |
| Euro | DBAB | Sell | 82,500 | | 110,938 | 11/03/14 | | — | | (3,477 | ) |
| Japanese Yen | JPHQ | Sell | 55,436,000 | | 560,582 | 11/13/14 | | 17,506 | | — | |
| Euro | MSCO | Sell | 150,590 | | 202,662 | 11/17/14 | | — | | (6,183 | ) |
| Singapore Dollar | MSCO | Buy | 2,682,949 | | 2,152,645 | 11/17/14 | | — | | (12,057 | ) |
| Euro | DBAB | Sell | 893,017 | | 1,210,752 | 11/18/14 | | — | | (27,721 | ) |
| Euro | JPHQ | Sell | 2,600,000 | | 3,531,032 | 11/18/14 | | — | | (74,758 | ) |
| Malaysian Ringgit | DBAB | Buy | 93,480 | | 28,686 | 11/19/14 | | — | | (380 | ) |
| Japanese Yen | JPHQ | Sell | 172,318,944 | | 1,727,482 | 11/20/14 | | 39,264 | | — | |
| Malaysian Ringgit | HSBC | Buy | 48,000 | | 14,742 | 11/20/14 | | — | | (208 | ) |
| Euro | DBAB | Sell | 761,324 | | 1,031,595 | 11/28/14 | | — | | (24,243 | ) |
| Euro | MSCO | Sell | 827,000 | | 1,120,387 | 12/04/14 | | — | | (26,534 | ) |
| Japanese Yen | DBAB | Sell | 340,400,000 | | 3,306,941 | 12/22/14 | | — | | (28,901 | ) |
| Malaysian Ringgit | DBAB | Buy | 134,200 | | 40,060 | 1/07/15 | | 473 | | — | |
| British Pound | DBAB | Sell | 3,387,851 | | 5,542,186 | 1/09/15 | | — | | (163,421 | ) |
92 | Semiannual Report
| | | | | | | | | | | |
| Franklin Investors Securities Trust | | | | | |
| |
| Statement of Investments, April 30, 2014 (unaudited) (continued) | | | | | |
| |
| |
| Franklin Low Duration Total Return Fund | | | | | | | | | | |
| |
| Forward Exchange Contracts (continued) | | | | | | | | | | |
| |
| | | | | | Contract | Settlement | | Unrealized | | Unrealized | |
| Currency | Counterpartya Type | Quantity | | Amount | Date | | Appreciation | | Depreciation | |
| Canadian Dollar | BZWS | Buy | 789,000 | $ | 713,923 | 1/09/15 | $ | 1,409 | $ | — | |
| Canadian Dollar | CITI | Buy | 259,000 | | 231,271 | 1/09/15 | | 3,547 | | — | |
| Canadian Dollar | DBAB | Buy | 977,000 | | 879,503 | 1/09/15 | | 6,275 | | — | |
| Chilean Peso | BZWS | Buy | 315,400,000 | | 544,262 | 1/09/15 | | 1,050 | | — | |
| Euro | BZWS | Sell | 140,843 | | 193,858 | 1/09/15 | | — | | (1,470 | ) |
| Euro | CITI | Sell | 352,000 | | 476,992 | 1/09/15 | | — | | (11,179 | ) |
| Euro | DBAB | Sell | 16,020,696 | | 21,778,193 | 1/09/15 | | — | | (440,082 | ) |
| Euro | JPHQ | Sell | 66,188 | | 91,066 | 1/09/15 | | — | | (726 | ) |
| Japanese Yen | BZWS | Sell | 76,810,000 | | 752,083 | 1/09/15 | | — | | (755 | ) |
| Japanese Yen | CITI | Sell | 153,390,000 | | 1,500,496 | 1/09/15 | | — | | (2,926 | ) |
| Japanese Yen | DBAB | Sell | 4,894,210,920 | | 47,145,998 | 1/09/15 | | 27,549 | | (851,190 | ) |
| Japanese Yen | GSCO | Sell | 51,310,000 | | 501,148 | 1/09/15 | | — | | (1,757 | ) |
| Japanese Yen | HSBC | Sell | 77,220,000 | | 764,577 | 1/09/15 | | 7,721 | | — | |
| Japanese Yen | JPHQ | Sell | 179,653,000 | | 1,766,988 | 1/09/15 | | 7,959 | | (1,805 | ) |
| Malaysian Ringgit | DBAB | Buy | 462,000 | | 136,699 | 1/09/15 | | 2,826 | | — | |
| Singapore Dollar | DBAB | Buy | 757,560 | | 600,523 | 1/09/15 | | 3,962 | | — | �� |
| Euro | DBAB | Sell | 1,727,000 | | 2,251,851 | 2/06/15 | | — | | (143,289 | ) |
| British Pound | DBAB | Sell | 1,615,576 | | 2,677,252 | 2/09/15 | | — | | (42,508 | ) |
| Canadian Dollar | BZWS | Buy | 165,000 | | 147,668 | 2/09/15 | | 1,814 | | — | |
| Canadian Dollar | HSBC | Buy | 276,000 | | 246,994 | 2/09/15 | | 3,048 | | — | |
| Chilean Peso | JPHQ | Buy | 191,826,250 | | 327,237 | 2/09/15 | | 3,579 | | — | |
| Euro | DBAB | Sell | 9,451,274 | | 13,104,439 | 2/09/15 | | 13,791 | | (17,189 | ) |
| Euro | JPHQ | Sell | 923,800 | | 1,284,486 | 2/09/15 | | 3,280 | | — | |
| Singapore Dollar | DBAB | Buy | 429,000 | | 338,729 | 2/09/15 | | 3,609 | | — | |
| Singapore Dollar | HSBC | Buy | 490,000 | | 386,934 | 2/09/15 | | 4,080 | | — | |
| Singapore Dollar | JPHQ | Buy | 304,000 | | 240,085 | 2/09/15 | | 2,504 | | — | |
| Chilean Peso | JPHQ | Buy | 29,522,000 | | 51,477 | 3/09/15 | | — | | (680 | ) |
| Chilean Peso | MSCO | Buy | 62,760,000 | | 111,025 | 3/09/15 | | — | | (3,038 | ) |
| Euro | DBAB | Sell | 774,863 | | 1,070,512 | 3/09/15 | | — | | (4,186 | ) |
| Japanese Yen | DBAB | Sell | 524,380,500 | | 5,133,436 | 3/09/15 | | — | | (9,276 | ) |
| Swiss Franc | DBAB | Buy | 462,938 | | 512,099 | 4/16/15 | | 15,814 | | — | |
| Swiss Franc | DBAB | Sell | 462,938 | | 521,150 | 4/16/15 | | — | | (6,763 | ) |
| Euro | DBAB | Sell | 4,600,000 | | 6,061,420 | 6/05/15 | | — | | (319,529 | ) |
| Euro | DBAB | Sell | 82,500 | | 110,798 | 11/03/15 | | — | | (3,673 | ) |
| Euro | DBAB | Sell | 1,727,000 | | 2,259,908 | 2/05/16 | | — | | (136,732 | ) |
| Euro | DBAB | Sell | 2,360,000 | | 3,106,468 | 3/01/16 | | — | | (168,758 | ) |
| Euro | DBAB | Sell | 2,300,000 | | 3,021,510 | 4/07/16 | | — | | (170,651 | ) |
| Euro | DBAB | Sell | 3,300,000 | | 4,453,350 | 8/05/16 | | — | | (127,654 | ) |
| Euro | DBAB | Buy | 2,082,500 | | 2,764,519 | 11/03/16 | | 126,823 | | — | |
| Euro | DBAB | Sell | 2,082,500 | | 2,795,756 | 11/03/16 | | — | | (95,583 | ) |
| Net unrealized appreciation (depreciation) | | | | | | | 1,100,434 | | (5,135,420 | ) |
| Unrealized appreciation (depreciation) | | | | | | | | $ | (4,034,986 | ) |
| |
| aMay be comprised of multiple contracts using the same currency and settlement date. | | | | | | | | |
Semiannual Report | 93
Franklin Investors Securities Trust
Statement of Investments, April 30, 2014 (unaudited) (continued)
| | | | | | | | | | | | | | | | | | |
| Franklin Low Duration Total Return Fund | | | | | | | | | | | | | | | | | |
| |
| At April 30, 2014, the fund had the following credit default swap contracts outstanding. See Note 1(e). | | |
| |
| Credit Default Swap Contracts | | | | | | | | | | | | | | | | | | |
| |
| | | | | | | | | Upfront | | | | | | | | | | |
| | | | | Periodic | | | | Premiums | | | | | | | | | | |
| | Counter- | Notional | | Payment | | Expiration | | Paid | | Unrealized | | Unrealized | | | Market | | |
| Description | party | Amounta | | Rate | | Date | | (Received) | | Appreciation | | Depreciation | | | Value | | Ratingb |
| OTC Swaps | | | | | | | | | | | | | | | | | | |
| Contracts to Buy Protection | | | | | | | | | | | | | | | | | | |
| Single Name | | | | | | | | | | | | | | | | | | |
| Bank of America Corp. | FBCO | 2,000,000 | | 1.00 | % | 9/20/17 | $ | 3,255 | | $ | — | $ | (35,893 | ) | $ | (32,638 | ) | |
| Centex Corp. | FBCO | 1,000,000 | | 5.00 | % | 6/20/16 | | (53,612 | ) | | — | | (51,207 | ) | | (104,819 | ) | |
| Centex Corp. | JPHQ | 4,000,000 | | 5.00 | % | 6/20/16 | | (256,689 | ) | | — | | (162,589 | ) | | (419,278 | ) | |
| Constellation Brands Inc. | DBAB | 6,600,000 | | 5.00 | % | 6/20/17 | | (751,313 | ) | | — | | (159,266 | ) | | (910,579 | ) | |
| Constellation Brands Inc. | GSCO | 5,000,000 | | 5.00 | % | 12/20/14 | | (139,807 | ) | | — | | (15,773 | ) | | (155,580 | ) | |
| Dean Foods Co. | DBAB | 4,255,000 | | 5.00 | % | 6/20/16 | | (294,441 | ) | | — | | (96,510 | ) | | (390,951 | ) | |
| Dean Foods Co. | JPHQ | 2,609,000 | | 5.00 | % | 6/20/16 | | (165,505 | ) | | — | | (74,211 | ) | | (239,716 | ) | |
| D.R. Horton Inc. | CITI | 1,500,000 | | 5.00 | % | 6/20/17 | | (128,673 | ) | | — | | (62,555 | ) | | (191,228 | ) | |
| D.R. Horton Inc. | JPHQ | 2,400,000 | | 5.00 | % | 3/20/16 | | (175,209 | ) | | — | | (30,433 | ) | | (205,642 | ) | |
| Embarq Corp. | BZWS | 3,000,000 | | 5.00 | % | 6/20/16 | | (165,969 | ) | | — | | (132,707 | ) | | (298,676 | ) | |
| First Data Corp. | BZWS | 2,450,000 | | 5.00 | % | 3/20/15 | | (53,189 | ) | | — | | (40,491 | ) | | (93,680 | ) | |
| First Data Corp. | DBAB | 650,000 | | 5.00 | % | 3/20/15 | | (13,931 | ) | | — | | (10,923 | ) | | (24,854 | ) | |
| Ford Motor Credit Co. | GSCO | 5,000,000 | | 5.00 | % | 6/20/15 | | (251,886 | ) | | — | | (22,919 | ) | | (274,805 | ) | |
| Government of Ireland | MSCO | 2,000,000 | EUR | 1.00 | % | 3/20/15 | | 119,307 | | | — | | (141,661 | ) | | (22,354 | ) | |
| Hospitality Properties Trust | BOFA | 3,000,000 | | 5.00 | % | 3/20/17 | | (334,858 | ) | | — | | (21,247 | ) | | (356,105 | ) | |
| International Lease Finance Corp. | DBAB | 8,325,000 | | 5.00 | % | 9/20/15 | | (499,401 | ) | | — | | (3,650 | ) | | (503,051 | ) | |
| Pactiv LLC | BZWS | 2,100,000 | | 5.00 | % | 6/20/17 | | (157,046 | ) | | — | | (66,896 | ) | | (223,942 | ) | |
| Springleaf Finance Corp. | GSCO | 7,000,000 | | 5.00 | % | 12/20/15 | | (195,201 | ) | | — | | (258,862 | ) | | (454,063 | ) | |
| Tenet Healthcare Corp. | BZWS | 5,600,000 | | 5.00 | % | 12/20/16 | | (447,657 | ) | | — | | (65,744 | ) | | (513,401 | ) | |
| The New York Times Co. | GSCO | 2,000,000 | | 5.00 | % | 12/20/16 | | (91,379 | ) | | — | | (146,524 | ) | | (237,903 | ) | |
| USG Corp. | GSCO | 5,000,000 | | 5.00 | % | 12/20/16 | | (242,868 | ) | | — | | (270,011 | ) | | (512,879 | ) | |
| Contracts to Sell Protectionc | | | | | | | | | | | | | | | | | | |
| Single Name | | | | | | | | | | | | | | | | | | |
| Anadarko Petroleum Corp. | JPHQ | 7,500,000 | | 1.00 | % | 3/20/19 | | — | | | 174,078 | | — | | | 174,078 | | BBB- |
| Bank of America Corp. | FBCO | 2,000,000 | | 1.00 | % | 9/20/15 | | (3,255 | ) | | 35,893 | | — | | | 32,638 | | A- |
| Berkshire Hathaway Inc. | BOFA | 2,700,000 | | 1.00 | % | 9/20/17 | | 18,756 | | | 14,412 | | — | | | 33,168 | | AA |
| Berkshire Hathaway Inc. | BZWS | 5,000,000 | | 1.00 | % | 9/20/17 | | (49,979 | ) | | 167,375 | | — | | | 117,396 | | AA |
| Berkshire Hathaway Inc. | GSCO | 1,400,000 | | 1.00 | % | 9/20/17 | | (455 | ) | | 33,326 | | — | | | 32,871 | | AA |
| First Data Corp. | BZWS | 2,600,000 | | 5.00 | % | 3/20/16 | | 28,920 | | | 137,688 | | — | | | 166,608 | | B- |
| First Data Corp. | DBAB | 500,000 | | 5.00 | % | 3/20/16 | | (1,665 | ) | | 33,710 | | — | | | 32,045 | | B- |
| Ford Motor Credit Co. LLC | BZWS | 4,000,000 | | 5.00 | % | 3/20/19 | | 771,845 | | | 4,179 | | — | | | 776,024 | | BBB- |
| Government of China | CITI | 3,000,000 | | 1.00 | % | 12/20/18 | | 40,149 | | | — | | (13,698 | ) | | 26,451 | | AA- |
| Government of China | JPHQ | 2,200,000 | | 1.00 | % | 3/20/19 | | (2,533 | ) | | 17,962 | | — | | | 15,429 | | AA- |
| Government of Indonesia | BZWS | 2,500,000 | | 1.00 | % | 3/20/19 | | (120,933 | ) | | 43,654 | | — | | | (77,279 | ) | BB+ |
| Government of Lithuania | FBCO | 250,000 | | 1.00 | % | 6/20/16 | | (4,805 | ) | | 6,718 | | — | | | 1,913 | | BB+ |
| Tenet Healthcare Corp. | BZWS | 4,000,000 | | 5.00 | % | 12/20/18 | | 249,052 | | | 91,248 | | — | | | 340,300 | | CCC+ |
94 | Semiannual Report
| | | | | | | | | | | | | | | | |
| Franklin Investors Securities Trust | | | | | | | |
| |
| Statement of Investments, April 30, 2014 (unaudited) (continued) | | | | | | | |
| |
| |
| Franklin Low Duration Total Return Fund | | | | | | | | | | | | | | | |
| |
| Credit Default Swap Contracts (continued) | | | | | | | | | | | | | | |
| |
| | | | | | | Upfront | | | | | | | | | | |
| | | | Periodic | | | Premiums | | | | | | | | | | |
| | Counter- | Notional | Payment | | Expiration | Paid | | | Unrealized | | Unrealized | | | Market | | |
| Description | party | Amounta | Rate | | Date | (Received) | | | Appreciation | | Depreciation | | | Value | | Ratingb |
| Traded Index | | | | | | | | | | | | | | | | |
| CMBX.NA.AJ.2 | FBCO | 1,450,000 | 1.09 | % | 3/15/49 | (209,752 | ) | $ | 95,564 | $ | — | | $ | (114,188 | ) | Non |
| | | | | | | | | | | | | | | | | Investment |
| | | | | | | | | | | | | | | | | Grade |
| CMBX.NA.AM.2 | FBCO | 8,000,000 | 0.50 | % | 3/15/49 | (114,009 | ) | | 24,009 | | — | | | (90,000 | ) | Investment |
| | | | | | | | | | | | | | | | | Grade |
| LCDX.NA.20 | FBCO | 2,178,000 | 2.50 | % | 6/20/18 | 45,423 | | | 54,729 | | — | | | 100,152 | | Non |
| | | | | | | | | | | | | | | | | Investment |
| | | | | | | | | | | | | | | | | Grade |
| LCDX.NA.21 | FBCO | 1,300,000 | 2.50 | % | 12/20/18 | 46,512 | | | 16,407 | | — | | | 62,919 | | Non |
| | | | | | | | | | | | | | | | | Investment |
| | | | | | | | | | | | | | | | | Grade |
| MCDX.NA.21 | CITI | 4,350,000 | 1.00 | % | 12/20/18 | (76,145 | ) | | 70,834 | | — | | | (5,311 | ) | Investment |
| | | | | | | | | | | | | | | | | Grade |
| OTC Swaps unrealized appreciation (depreciation) | | | | | | | | 1,021,786 | | (1,883,770 | ) | | | | |
| Net unrealized appreciation (depreciation) | | | | | | | | | $ | (861,984 | ) | | | | |
aIn U.S. dollars unless otherwise indicated. For contracts to sell protection, the notional amount is equal to the maximum potential amount of the future payments and no
recourse provisions have been entered into in association with the contracts.
bBased on Standard and Poor’s (S&P) Rating for single name swaps and internal ratings for index swaps. Internal ratings based on mapping into equivalent ratings from
external vendors.
cThe fund enters contracts to sell protection to create a long credit position. Performance triggers include default, bankruptcy or restructuring for single name swaps, and
failure to pay or bankruptcy of the underlying securities for traded index swaps.bIn U.S. dollars unless otherwise indicated. For contracts to sell protection, the notional
amount is equal to the maximum potential amount of the future payments and no recourse provisions have been entered into in association with the contracts.
| | | | | | | | | |
| At April 30, 2014, the fund had the following cross-currency swap contracts outstanding. See Note 1(e). | | | |
| |
| Cross Currency Swap Contracts | | | | | | | | | |
| | | | Notional | | | Unrealized | | Unrealized | |
| Description | Counterparty | Expiration Date | Amount | | | Appreciation | | Depreciation | |
| Receive Fixed semi-annual 4.50% | CITI | 1/01/16 | 2,747,819 | USD | $ | — | $ | (227,585 | ) |
| Pay Fixed annual 4.00% | | | 16,000,000 | DKK | | | | | |
| Receive Fixed semi-annual 2.47% | DBAB | 1/04/16 | 2,953,953 | USD | | — | | (199,614 | ) |
| Pay Fixed annual 2.00% | | | 17,000,000 | DKK | | | | | |
| Net unrealized appreciation (depreciation) | | | | | | | $ | (427,199 | ) |
| See Notes 1(e) and 10 regarding investment transactions and other derivative information, respectively. | | | | | | | | |
| |
| See Abbreviations on page 164. | | | | | | | | | |
Semiannual Report | The accompanying notes are an integral part of these financial statements. | 95
| | | | | | | | | | | | | | | | | | |
| Franklin Investors Securities Trust | | | | | | | |
| |
| Financial Highlights | | | | | | | | | | | | | | | | | | |
| |
| Franklin Total Return Fund | | | | | | | | | | | | | | | | | | |
| | | Six Months Ended | | | | | | | | | | | | | |
| | | April 30, 2014 | | | | | | | | | Year Ended October 31, | | | | |
| Class A | | (unaudited) | | | 2013 | | | 2012 | | | 2011 | | | 2010 | | | 2009 | |
| Per share operating performance | | | | | | | | | | | | | | | | | | |
| (for a share outstanding throughout | | | | | | | | | | | | | | | | | | |
| the period) | | | | | | | | | | | | | | | | | | |
| Net asset value, beginning of period | $ | 10.05 | | $ | 10.53 | | $ | 10.32 | | $ | 10.33 | | $ | 9.65 | | $ | 8.60 | |
| Income from investment operationsa: | | | | | | | | | | | | | | | | | | |
| Net investment income | | 0.137 | b | | 0.236 | | | 0.297 | | | 0.353 | | | 0.401 | | | 0.480 | |
| Net realized and unrealized gains | | | | | | | | | | | | | | | | | | |
| (losses) | | 0.088 | | | (0.205 | ) | | 0.472 | | | 0.074 | | | 0.710 | | | 1.190 | |
| Total from investment operations | | 0.225 | | | 0.031 | | | 0.769 | | | 0.427 | | | 1.111 | | | 1.670 | |
| Less distributions from: | | | | | | | | | | | | | | | | | | |
| Net investment income and net foreign | | | | | | | | | | | | | | | | | | |
| currency gains | | (0.225 | ) | | (0.351 | ) | | (0.447 | ) | | (0.380 | ) | | (0.431 | ) | | (0.620 | ) |
| Net realized gains | | — | | | (0.160 | ) | | (0.112 | ) | | (0.057 | ) | | — | | | — | |
| Total distributions | | (0.225 | ) | | (0.511 | ) | | (0.559 | ) | | (0.437 | ) | | (0.431 | ) | | (0.620 | ) |
| Net asset value, end of period | $ | 10.05 | | $ | 10.05 | | $ | 10.53 | | $ | 10.32 | | $ | 10.33 | | $ | 9.65 | |
| |
| Total returnc | | 2.29 | % | | 0.30 | % | | 7.74 | % | | 4.26 | % | | 11.81 | % | | 20.25 | % |
| |
| Ratios to average net assetsd | | | | | | | | | | | | | | | | | | |
| Expenses before waiver and payments | | | | | | | | | | | | | | | | | | |
| by affiliates | | 0.94 | % | | 0.91 | % | | 0.92 | % | | 0.93 | % | | 0.95 | % | | 1.01 | % |
| Expenses net of waiver and payments | | | | | | | | | | | | | | | | | | |
| by affiliates | | 0.88 | %e | | 0.88 | %e | | 0.88 | % | | 0.88 | %e | | 0.87 | %e | | 0.85 | %e |
| Net investment income | | 2.78 | % | | 2.36 | % | | 2.69 | % | | 3.45 | % | | 4.14 | % | | 4.75 | % |
| |
| Supplemental data | | | | | | | | | | | | | | | | | | |
| Net assets, end of period (000’s) | $ | 3,047,959 | | $ | 3,019,228 | | $ | 3,134,211 | | $ | 2,245,312 | | $ | 1,867,411 | | $ | 1,244,157 | |
| Portfolio turnover rate | | 123.69 | % | | 371.54 | % | | 314.62 | % | | 255.55 | % | | 131.91 | % | | 187.73 | % |
| Portfolio turnover rate excluding | | | | | | | | | | | | | | | | | | |
| mortgage dollar rollsf | | 41.05 | % | | 156.49 | % | | 122.04 | % | | 98.96 | % | | 53.26 | % | | 59.67 | % |
aThe amount shown for a share outstanding throughout the period may not correlate with the Statement of Operations for the period due to the timing of sales and repurchases of
the Fund shares in relation to income earned and/or fluctuating fair value of the investments of the Fund.
bBased on average daily shares outstanding.
cTotal return does not reflect sales commissions or contingent deferred sales charges, if applicable, and is not annualized for periods less than one year.
dRatios are annualized for periods less than one year.
eBenefit of expense reduction rounds to less than 0.01%.
fSee Note 1(i) regarding mortgage dollar rolls.
96 | The accompanying notes are an integral part of these financial statements. | Semiannual Report
| | | | | | | | | | | | | | | | | | |
| Franklin Investors Securities Trust | | | | | | | | | | |
| |
| Financial Highlights (continued) | | | | | | | | | | | | | | | | | | |
| |
| Franklin Total Return Fund | | | | | | | | | | | | | | | | | | |
| | | Six Months Ended | | | | | | | | | | | | | |
| | | April 30, 2014 | | | | | | Year Ended October 31, | | | | |
| Class C | | (unaudited) | | | 2013 | | | 2012 | | | 2011 | | | 2010 | | | 2009 | |
| Per share operating performance | | | | | | | | | | | | | | | | | | |
| (for a share outstanding throughout the period) | | | | | | | | | | | | | | | | | | |
| Net asset value, beginning of period | $ | 10.03 | | $ | 10.51 | | $ | 10.31 | | $ | 10.32 | | $ | 9.65 | | $ | 8.60 | |
| Income from investment operationsa: | | | | | | | | | | | | | | | | | | |
| Net investment income | | 0.117 | b | | 0.174 | | | 0.253 | | | 0.313 | | | 0.357 | | | 0.473 | |
| Net realized and unrealized gains (losses) | | 0.090 | | | (0.182 | ) | | 0.467 | | | 0.076 | | | 0.706 | | | 1.163 | |
| Total from investment operations | | 0.207 | | | (0.008 | ) | | 0.720 | | | 0.389 | | | 1.063 | | | 1.636 | |
| Less distributions from: | | | | | | | | | | | | | | | | | | |
| Net investment income and net foreign currency | | | | | | | | | | | | | | | | | | |
| gains | | (0.207 | ) | | (0.312 | ) | | (0.408 | ) | | (0.342 | ) | | (0.393 | ) | | (0.586 | ) |
| Net realized gains | | — | | | (0.160 | ) | | (0.112 | ) | | (0.057 | ) | | — | | | — | |
| Total distributions | | (0.207 | ) | | (0.472 | ) | | (0.520 | ) | | (0.399 | ) | | (0.393 | ) | | (0.586 | ) |
| Net asset value, end of period | $ | 10.03 | | $ | 10.03 | | $ | 10.51 | | $ | 10.31 | | $ | 10.32 | | $ | 9.65 | |
| |
| Total returnc | | 2.11 | % | | (0.08 | )% | | 7.25 | % | | 3.88 | % | | 11.40 | % | | 19.67 | % |
| |
| Ratios to average net assetsd | | | | | | | | | | | | | | | | | | |
| Expenses before waiver and payments by | | | | | | | | | | | | | | | | | | |
| affiliates | | 1.34 | % | | 1.31 | % | | 1.32 | % | | 1.33 | % | | 1.35 | % | | 1.41 | % |
| Expenses net of waiver and payments by | | | | | | | | | | | | | | | | | | |
| affiliates | | 1.28 | %e | | 1.28 | %e | | 1.28 | % | | 1.28 | %e | | 1.27 | %e | | 1.25 | %e |
| Net investment income | | 2.38 | % | | 1.96 | % | | 2.29 | % | | 3.05 | % | | 3.74 | % | | 4.35 | % |
| |
| Supplemental data | | | | | | | | | | | | | | | | | | |
| Net assets, end of period (000’s) | $ | 413,615 | | $ | 455,720 | | $ | 571,206 | | $ | 394,777 | | $ | 366,888 | | $ | 237,596 | |
| Portfolio turnover rate | | 123.69 | % | | 371.54 | % | | 314.62 | % | | 255.55 | % | | 131.91 | % | | 187.73 | % |
| Portfolio turnover rate excluding mortgage dollar | | | | | | | | | | | | | | | | | | |
| rollsf | | 41.05 | % | | 156.49 | % | | 122.04 | % | | 98.96 | % | | 53.26 | % | | 59.67 | % |
aThe amount shown for a share outstanding throughout the period may not correlate with the Statement of Operations for the period due to the timing of sales and repurchases of
the Fund shares in relation to income earned and/or fluctuating fair value of the investments of the Fund.
bBased on average daily shares outstanding.
cTotal return does not reflect sales commissions or contingent deferred sales charges, if applicable, and is not annualized for periods less than one year.
dRatios are annualized for periods less than one year.
eBenefit of expense reduction rounds to less than 0.01%.
fSee Note 1(i) regarding mortgage dollar rolls.
Semiannual Report | The accompanying notes are an integral part of these financial statements. | 97
| | | | | | | | | | | | | | | | | | |
| Franklin Investors Securities Trust | | | | | | | | | | |
| |
| Financial Highlights (continued) | | | | | | | | | | | | | | | | | | |
| |
| Franklin Total Return Fund | | | | | | | | | | | | | | | | | | |
| | | Six Months Ended | | | | | | | | | | | | | |
| | | April 30, 2014 | | | | | | Year Ended October 31, | | | | |
| Class R | | (unaudited) | | | 2013 | | | 2012 | | | 2011 | | | 2010 | | | 2009 | |
| Per share operating performance | | | | | | | | | | | | | | | | | | |
| (for a share outstanding throughout the period) | | | | | | | | | | | | | | | | | | |
| Net asset value, beginning of period | $ | 10.04 | | $ | 10.52 | | $ | 10.32 | | $ | 10.33 | | $ | 9.65 | | $ | 8.60 | |
| Income from investment operationsa: | | | | | | | | | | | | | | | | | | |
| Net investment income | | 0.125 | b | | 0.204 | | | 0.255 | | | 0.330 | | | 0.390 | | | 0.425 | |
| Net realized and unrealized gains (losses) | | 0.089 | | | (0.197 | ) | | 0.480 | | | 0.073 | | | 0.698 | | | 1.224 | |
| Total from investment operations | | 0.214 | | | 0.007 | | | 0.735 | | | 0.403 | | | 1.088 | | | 1.649 | |
| Less distributions from: | | | | | | | | | | | | | | | | | | |
| Net investment income and net foreign currency | | | | | | | | | | | | | | | | | | |
| gains | | (0.214 | ) | | (0.327 | ) | | (0.423 | ) | | (0.356 | ) | | (0.408 | ) | | (0.599 | ) |
| Net realized gains | | — | | | (0.160 | ) | | (0.112 | ) | | (0.057 | ) | | — | | | — | |
| Total distributions | | (0.214 | ) | | (0.487 | ) | | (0.535 | ) | | (0.413 | ) | | (0.408 | ) | | (0.599 | ) |
| Net asset value, end of period | $ | 10.04 | | $ | 10.04 | | $ | 10.52 | | $ | 10.32 | | $ | 10.33 | | $ | 9.65 | |
| |
| Total returnc | | 2.18 | % | | 0.06 | % | | 7.39 | % | | 4.02 | % | | 11.55 | % | | 19.97 | % |
| |
| Ratios to average net assetsd | | | | | | | | | | | | | | | | | | |
| Expenses before waiver and payments by | | | | | | | | | | | | | | | | | | |
| affiliates | | 1.19 | % | | 1.16 | % | | 1.17 | % | | 1.18 | % | | 1.20 | % | | 1.26 | % |
| Expenses net of waiver and payments by | | | | | | | | | | | | | | | | | | |
| affiliates | | 1.13 | %e | | 1.13 | %e | | 1.13 | % | | 1.13 | %e | | 1.12 | %e | | 1.10 | %e |
| Net investment income | | 2.53 | % | | 2.11 | % | | 2.44 | % | | 3.20 | % | | 3.89 | % | | 4.50 | % |
| |
| Supplemental data | | | | | | | | | | | | | | | | | | |
| Net assets, end of period (000’s) | $ | 55,629 | | $ | 65,601 | | $ | 87,235 | | $ | 84,708 | | $ | 86,750 | | $ | 85,024 | |
| Portfolio turnover rate | | 123.69 | % | | 371.54 | % | | 314.62 | % | | 255.55 | % | | 131.91 | % | | 187.73 | % |
| Portfolio turnover rate excluding mortgage dollar | | | | | | | | | | | | | | | | | | |
| rollsf | | 41.05 | % | | 156.49 | % | | 122.04 | % | | 98.96 | % | | 53.26 | % | | 59.67 | % |
aThe amount shown for a share outstanding throughout the period may not correlate with the Statement of Operations for the period due to the timing of sales and repurchases of
the Fund shares in relation to income earned and/or fluctuating fair value of the investments of the Fund.
bBased on average daily shares outstanding.
cTotal return is not annualized for periods less than one year.
dRatios are annualized for periods less than one year.
eBenefit of expense reduction rounds to less than 0.01%.
fSee Note 1(i) regarding mortgage dollar rolls.
98 | The accompanying notes are an integral part of these financial statements. | Semiannual Report
| | | | | | |
| Franklin Investors Securities Trust | | | | | | |
| |
| Financial Highlights (continued) | | | | | | |
| |
| Franklin Total Return Fund | | | | | | |
| | | Six Months Ended | | | Period Ended | |
| | | April 30, 2014 | | | October 31, | |
| Class R6 | | (unaudited) | | | 2013a | |
| Per share operating performance | | | | | | |
| (for a share outstanding throughout the period) | | | | | | |
| Net asset value, beginning of period | $ | 10.07 | | $ | 10.44 | |
| Income from investment operationsb: | | | | | | |
| Net investment income | | 0.169 | c | | 0.145 | |
| Net realized and unrealized gains (losses) | | 0.074 | | | (0.348 | ) |
| Total from investment operations | | 0.243 | | | (0.203 | ) |
| Less distributions from net investment income | | (0.243 | ) | | (0.167 | ) |
| Net asset value, end of period | $ | 10.07 | | $ | 10.07 | |
| |
| Total returnd | | 2.47 | % | | (1.92 | )% |
| |
| Ratios to average net assetse | | | | | | |
| Expenses before waiver and payments by affiliates | | 0.51 | % | | 0.50 | % |
| Expenses net of waiver and payments by affiliatesf | | 0.50 | % | | 0.49 | % |
| Net investment income | | 3.16 | % | | 2.75 | % |
| |
| Supplemental data | | | | | | |
| Net assets, end of period (000’s) | $ | 8,978 | | $ | 329,806 | |
| Portfolio turnover rate | | 123.69 | % | | 371.54 | % |
| Portfolio turnover rate excluding mortgage dollar rollsg | | 41.05 | % | | 156.49 | % |
aFor the period May 1, 2013 (effective date) to October 31, 2013.
bThe amount shown for a share outstanding throughout the period may not correlate with the Statement of Operations for the period due to the timing of sales and repurchases of
the Fund shares in relation to income earned and/or fluctuating fair value of the investments of the Fund.
cBased on average daily shares outstanding.
dTotal return is not annualized for periods less than one year.
eRatios are annualized for periods less than one year.
fBenefit of expense reduction rounds to less than 0.01%.
gSee Note 1(i) regarding mortgage dollar rolls.
Semiannual Report | The accompanying notes are an integral part of these financial statements. | 99
| | | | | | | | | | | | | | | | | | |
| Franklin Investors Securities Trust | | | | | | | |
| |
| Financial Highlights (continued) | | | | | | | | | | | | | | | | | | |
| |
| Franklin Total Return Fund | | | | | | | | | | | | | | | | | | |
| | | Six Months Ended | | | | | | | | | | | | | |
| | | April 30, 2014 | | | | | | | | | Year Ended October 31, | | | | |
| Advisor Class | | (unaudited) | | | 2013 | | | 2012 | | | 2011 | | | 2010 | | | 2009 | |
| Per share operating performance | | | | | | | | | | | | | | | | | | |
| (for a share outstanding throughout | | | | | | | | | | | | | | | | | | |
| the period) | | | | | | | | | | | | | | | | | | |
| Net asset value, beginning of period | $ | 10.07 | | $ | 10.55 | | $ | 10.34 | | $ | 10.35 | | $ | 9.67 | | $ | 8.61 | |
| Income from investment operationsa: | | | | | | | | | | | | | | | | | | |
| Net investment income | | 0.150 | b | | 0.242 | | | 0.319 | | | 0.380 | | | 0.431 | | | 0.517 | |
| Net realized and unrealized gains | | | | | | | | | | | | | | | | | | |
| (losses) | | 0.087 | | | (0.186 | ) | | 0.474 | | | 0.071 | | | 0.705 | | | 1.186 | |
| Total from investment operations | | 0.237 | | | 0.056 | | | 0.793 | | | 0.451 | | | 1.136 | | | 1.703 | |
| Less distributions from: | | | | | | | | | | | | | | | | | | |
| Net investment income and net foreign | | | | | | | | | | | | | | | | | | |
| currency gains | | (0.237 | ) | | (0.376 | ) | | (0.471 | ) | | (0.404 | ) | | (0.456 | ) | | (0.643 | ) |
| Net realized gains | | — | | | (0.160 | ) | | (0.112 | ) | | (0.057 | ) | | — | | | — | |
| Total distributions | | (0.237 | ) | | (0.536 | ) | | (0.583 | ) | | (0.461 | ) | | (0.456 | ) | | (0.643 | ) |
| Net asset value, end of period | $ | 10.07 | | $ | 10.07 | | $ | 10.55 | | $ | 10.34 | | $ | 10.35 | | $ | 9.67 | |
| |
| Total returnc | | 2.40 | % | | 0.54 | % | | 7.98 | % | | 4.50 | % | | 12.17 | % | | 20.52 | % |
| |
| Ratios to average net assetsd | | | | | | | | | | | | | | | | | | |
| Expenses before waiver and payments | | | | | | | | | | | | | | | | | | |
| by affiliates | | 0.69 | % | | 0.66 | % | | 0.67 | % | | 0.68 | % | | 0.70 | % | | 0.76 | % |
| Expenses net of waiver and payments | | | | | | | | | | | | | | | | | | |
| by affiliates | | 0.63 | %e | | 0.63 | %e | | 0.63 | % | | 0.63 | %e | | 0.62 | %e | | 0.60 | %e |
| Net investment income | | 3.03 | % | | 2.61 | % | | 2.94 | % | | 3.70 | % | | 4.39 | % | | 5.00 | % |
| |
| Supplemental data | | | | | | | | | | | | | | | | | | |
| Net assets, end of period (000’s) | $ | 1,171,924 | | $ | 1,148,451 | | $ | 1,482,994 | | $ | 1,158,243 | | $ | 972,218 | | $ | 668,955 | |
| Portfolio turnover rate | | 123.69 | % | | 371.54 | % | | 314.62 | % | | 255.55 | % | | 131.91 | % | | 187.73 | % |
| Portfolio turnover rate excluding | | | | | | | | | | | | | | | | | | |
| mortgage dollar rollsf | | 41.05 | % | | 156.49 | % | | 122.04 | % | | 98.96 | % | | 53.26 | % | | 59.67 | % |
aThe amount shown for a share outstanding throughout the period may not correlate with the Statement of Operations for the period due to the timing of sales and repurchases of
the Fund shares in relation to income earned and/or fluctuating fair value of the investments of the Fund.
bBased on average daily shares outstanding.
cTotal return is not annualized for periods less than one year.
dRatios are annualized for periods less than one year.
eBenefit of expense reduction rounds to less than 0.01%.
fSee Note 1(i) regarding mortgage dollar rolls.
100 | The accompanying notes are an integral part of these financial statements. | Semiannual Report
| | | | | |
| Franklin Investors Securities Trust | | | |
| |
| Statement of Investments, April 30, 2014 (unaudited) | | | | |
| |
| |
| Franklin Total Return Fund | Country | Shares/Warrants | | Value |
| Common Stocks and Other Equity Interests 0.1% | | | | | |
| Automobiles & Components 0.0%† | | | | | |
| General Motors Co. | United States | 4,667 | | $ | 160,918 |
| aGeneral Motors Co., wts., 7/10/16 | United States | 4,244 | | | 104,954 |
| aGeneral Motors Co., wts., 7/10/19 | United States | 4,244 | | | 72,530 |
| | | | | | 338,402 |
| Consumer Services 0.1% | | | | | |
| a,b,cTurtle Bay Resort | United States | 1,550,568 | | | 2,000,232 |
| Materials 0.0%† | | | | | |
| NewPage Holdings Inc. | United States | 5,000 | | | 450,000 |
| Total Common Stocks and Other Equity Interests | | | | | |
| (Cost $3,801,838) | | | | | 2,788,634 |
| Preferred Stocks 0.4% | | | | | |
| Banks 0.3% | | | | | |
| U.S. Bancorp, 6.00%, pfd., G | United States | 640,000 | | | 17,728,000 |
| Diversified Financials 0.1% | | | | | |
| Citigroup Capital XIII, 8.75%, pfd. | United States | 93,000 | | | 2,535,180 |
| Total Preferred Stocks (Cost $18,325,000) | | | | | 20,263,180 |
| |
| | | Principal Amount* | | |
| Corporate Bonds 34.5% | | | | | |
| Automobiles & Components 0.4% | | | | | |
| Ford Motor Credit Co. LLC, senior note, | | | | | |
| 5.00%, 5/15/18 | United States | 3,000,000 | | | 3,333,213 |
| 8.125%, 1/15/20 | United States | 5,000,000 | | | 6,365,265 |
| 5.75%, 2/01/21 | United States | 1,000,000 | | | 1,150,926 |
| 5.875%, 8/02/21 | United States | 1,175,000 | | | 1,363,638 |
| dHyundai Capital America, senior note, 144A, 4.00%, | | | | | |
| 6/08/17 | South Korea | 4,400,000 | | | 4,700,476 |
| | | | | | 16,913,518 |
| Banks 6.2% | | | | | |
| dBanco do Brasil SA, sub. note, 144A, 5.875%, 1/26/22 | Brazil | 8,500,000 | | | 8,723,125 |
| eBanco Popolare SpA, senior note, Reg S, 4.75%, | | | | | |
| 3/31/16 | Italy | 9,700,000 | EUR | | 14,344,867 |
| Bank of America Corp., | | | | | |
| fjunior sub. bond, M, 8.125% to 5/15/18, FRN thereafter, | | | | | |
| Perpetual | United States | 6,000,000 | | | 6,845,622 |
| senior note, 4.75%, 8/01/15 | United States | 8,000,000 | | | 8,396,912 |
| senior note, 5.625%, 10/14/16 | United States | 8,400,000 | | | 9,270,416 |
| Bank of Ireland Mortgage Bank, secured note, | | | | | |
| 2.75%, 3/22/18 | Ireland | 4,800,000 | EUR | | 7,039,596 |
| gFRN, 3.25%, 6/22/16 | Ireland | 12,000,000 | EUR | | 17,088,778 |
| Barclays Bank PLC, senior note, 5.125%, 1/08/20 | United Kingdom | 8,000,000 | | | 9,005,040 |
| BB&T Corp., | | | | | |
| sub. bond, 5.25%, 11/01/19 | United States | 6,800,000 | | | 7,705,454 |
| sub. note, 3.95%, 3/22/22 | United States | 10,000,000 | | | 10,375,100 |
Semiannual Report | 101
| | | | | | | |
| | Franklin Investors Securities Trust | | | |
| |
| | Statement of Investments, April 30, 2014 (unaudited) (continued) | | | |
| |
| |
| | Franklin Total Return Fund | | Country | Principal Amount* | | Value |
| Corporate Bonds (continued) | | | | | | |
| | Banks (continued) | | | | | | |
| | CIT Group Inc., senior note, 5.00%, | | | | | | |
| | 5/15/17 | | United States | 22,500,000 | | $ | 24,103,125 |
| | 8/15/22 | | United States | 6,000,000 | | | 6,157,500 |
| | Citigroup Inc., | | | | | | |
| | senior note, 8.125%, 7/15/39 | | United States | 4,400,000 | | | 6,469,874 |
| | sub. note, 3.50%, 5/15/23 | | United States | 20,000,000 | | | 19,104,620 |
| | Discover Bank, sub. note, 8.70%, 11/18/19 | | United States | 948,000 | | | 1,201,837 |
| | dHSBC Bank Brasil SA, senior note, 144A, 4.00%, | | | | | | |
| | 5/11/16 | | Brazil | 7,500,000 | | | 7,818,450 |
| | HSBC Holdings PLC, sub. note, 6.50%, 9/15/37 | | United Kingdom | 3,000,000 | | | 3,623,037 |
| eHSBK(Europe) BV, senior note, Reg S, 7.25%, 5/03/17 | | Kazakhstan | 3,850,000 | | | 4,102,425 |
| | d,gING Bank NV, senior note, 144A, FRN, 1.873%, | | | | | | |
| | 9/25/15 | | Netherlands | 14,000,000 | | | 14,265,440 |
| | JPMorgan Chase & Co., | | | | | | |
| | fjunior sub. note, 1, 7.90% to 4/30/19, FRN thereafter, | | | | | | |
| | Perpetual | | United States | 6,500,000 | | | 7,377,500 |
| | senior note, 4.25%, 10/15/20 | | United States | 9,000,000 | | | 9,688,041 |
| | senior note, 3.25%, 9/23/22 | | United States | 11,400,000 | | | 11,279,992 |
| | Merrill Lynch & Co. Inc., senior note, 6.875%, 4/25/18 | | United States | 12,000,000 | | | 14,148,144 |
| | dMizuho Financial Group Cayman 3 Ltd., sub. note, 144A, | | | | | | |
| | 4.60%, 3/27/24 | | Japan | 8,700,000 | | | 8,890,835 |
| | Oversea-Chinese Banking Corp. Ltd., sub. bond, 4.00% to, 10/15/24 | | | | | | |
| | 10/14/19, FRN thereafter | | Singapore | 9,300,000 | | | 9,270,519 |
| | Regions Financial Corp., senior note, 7.75%, 11/10/14 | | United States | 1,269,000 | | | 1,316,756 |
| | Royal Bank of Scotland Group PLC, sub. note, 6.125%, | | | | | | |
| | 12/15/22 | | United Kingdom | 1,100,000 | | | 1,171,500 |
| | The Royal Bank of Scotland PLC, sub. note, 6.934%, | | | | | | |
| | 4/09/18 | | United Kingdom | 4,000,000 | EUR | | 6,370,716 |
| | dShinhan Bank, senior note, 144A, 1.875%, 7/30/18 | | South Korea | 10,000,000 | | | 9,795,950 |
| | SVB Financial Group, senior note, 5.375%, 9/15/20 | | United States | 6,000,000 | | | 6,777,180 |
| | f,gWachovia Capital Trust III, junior sub. bond, FRN, 5.57%, | | | | | | |
| | Perpetual | | United States | 15,600,000 | | | 15,093,000 |
| | fWells Fargo & Co., S, junior sub. bond, 5.90% to 6/15/14, | | | | | | |
| | FRN thereafter, Perpetual | | United States | 5,500,000 | | | 5,649,061 |
| | | | | | | | 292,470,412 |
| | Capital Goods 0.8% | | | | | | |
| | General Electric Co., senior note, 2.70%, 10/09/22 | | United States | 7,600,000 | | | 7,437,808 |
| | NBCUniversal Media LLC, senior bond, 2.875%, 1/15/23 | | United States | 16,200,000 | | | 15,804,931 |
| | dSydney Airport Finance Co. Pty. Ltd., 144A, 3.90%, | | | | | | |
| | 3/22/23 | | Australia | 14,000,000 | | | 13,945,050 |
| | | | | | | | 37,187,789 |
| | Consumer Durables & Apparel 0.9% | | | | | | |
| | Centex Corp., senior note, 6.50%, 5/01/16 | | United States | 19,795,000 | | | 21,873,475 |
| | D.R. Horton Inc., senior bond, 5.625%, 1/15/16 | | United States | 7,000,000 | | | 7,490,000 |
| | Lennar Corp., senior note, 5.60%, 5/31/15 | | United States | 7,692,000 | | | 8,057,370 |
| | The Ryland Group Inc., senior note, 5.375%, 1/15/15 | | United States | 4,750,000 | | | 4,904,375 |
102 | Semiannual Report
| | | | | | |
| Franklin Investors Securities Trust | | | | |
| |
| Statement of Investments, April 30, 2014 (unaudited) (continued) | | | | |
| |
| |
| Franklin Total Return Fund | Country | Principal Amount* | | | Value |
| Corporate Bonds (continued) | | | | | | |
| Consumer Durables & Apparel (continued) | | | | | | |
| Toll Brothers Finance Corp., senior note, 5.15%, | | | | | | |
| 5/15/15 | United States | 2,010,000 | | | $ | 2,100,450 |
| | | | | | | 44,425,670 |
| Consumer Services 0.1% | | | | | | |
| Yum! Brands Inc., senior note, 5.30%, 9/15/19 | United States | 3,000,000 | | | | 3,330,000 |
| Diversified Financials 2.5% | | | | | | |
| American Express Centurion Bank, senior note, 5.95%, | | | | | | |
| 6/12/17 | United States | 800,000 | | | | 910,695 |
| eAmerican Express Credit Corp., senior note, Reg S, 5.375%, | | | | | | |
| 10/01/14 | United States | 4,400,000 | GBP | | | 7,568,096 |
| Capital One Bank USA NA, sub. bond, 3.375%, 2/15/23 | United States | 6,000,000 | | | | 5,935,398 |
| Commonwealth Edison Co., secured bond, 6.45%, | | | | | | |
| 1/15/38 | United States | 700,000 | | | | 915,394 |
| Deutsche Bank AG, sub. bond, 4.296% to 5/24/23, | | | | | | |
| FRN thereafter, 5/24/28 | Germany | 10,000,000 | | | | 9,582,500 |
| Discover Financial Services, senior note, 3.85%, | | | | | | |
| 11/21/22 | United States | 3,052,000 | | | | 3,070,059 |
| General Electric Capital Corp., senior note, | | | | | | |
| 5.625%, 5/01/18 | United States | 500,000 | | | | 573,524 |
| 6.00%, 8/07/19 | United States | 8,000,000 | | | | 9,448,872 |
| A, 8.50%, 4/06/18 | United States | 135,000,000 | MXN | | 11,413,696 |
| dHutchison Whampoa International 11 Ltd., senior note, | | | | | | |
| 144A, 3.50%, 1/13/17 | Hong Kong | 9,500,000 | | | | 9,994,190 |
| Irish Life & Permanent PLC, senior note, 4.00%, | | | | | | |
| 3/10/15 | Ireland | 10,000,000 | EUR | | | 14,230,522 |
| JPMorgan Chase Bank NA, sub. note, 6.00%, 10/01/17 | United States | 3,000,000 | | | | 3,423,048 |
| Morgan Stanley, senior note, | | | | | | |
| 6.00%, 4/28/15 | United States | 2,140,000 | | | | 2,252,166 |
| 5.50%, 1/26/20 | United States | 10,000,000 | | | | 11,339,990 |
| dPrudential Covered Trust, secured note, 144A, 2.997%, | | | | | | |
| 9/30/15 | United States | 13,504,000 | | | | 13,884,516 |
| SLM Corp., senior note, | | | | | | |
| 8.45%, 6/15/18 | United States | 3,400,000 | | | | 4,020,500 |
| 5.50%, 1/15/19 | United States | 1,400,000 | | | | 1,487,224 |
| Textron Financial Corp., senior note, 5.125%, 8/15/14 | United States | 5,126,000 | | | | 5,181,197 |
| | | | | | | 115,231,587 |
| Energy 5.8% | | | | | | |
| Anadarko Petroleum Corp., senior note, 6.45%, 9/15/36 | United States | 2,260,000 | | | | 2,798,242 |
| Apache Corp., senior bond, 4.25%, 1/15/44 | United States | 19,800,000 | | | | 19,103,416 |
| CGG SA, senior note, 6.50%, 6/01/21 | France | 3,000,000 | | | | 3,037,500 |
| Chesapeake Energy Corp., senior note, | | | | | | |
| 6.625%, 8/15/20 | United States | 2,000,000 | | | | 2,257,500 |
| 5.75%, 3/15/23 | United States | 3,000,000 | | | | 3,202,500 |
| CNOOC Finance 2013 Ltd., senior note, 3.00%, | | | | | | |
| 5/09/23 | China | 14,000,000 | | | | 12,807,060 |
Semiannual Report | 103
| | | | |
| Franklin Investors Securities Trust | | |
| |
| Statement of Investments, April 30, 2014 (unaudited) (continued) | | |
| |
| |
| Franklin Total Return Fund | Country | Principal Amount* | | Value |
| Corporate Bonds (continued) | | | | |
| Energy (continued) | | | | |
| CNOOC Nexen Finance 2014 ULC, senior note, 4.25%, | | | | |
| 4/30/24 | China | 11,100,000 | $ | 11,097,106 |
| dCNPC General Capital Ltd., senior bond, 144A, 3.95%, | | | | |
| 4/19/22 | Hong Kong | 14,000,000 | | 13,977,852 |
| El Paso Pipeline Partners Operating Co. LLC, senior note, | | | | |
| 4.30%, 5/01/24 | United States | 15,900,000 | | 16,013,764 |
| Energy Transfer Equity LP, senior note, 7.50%, | | | | |
| 10/15/20 | United States | 6,000,000 | | 6,945,000 |
| Energy Transfer Partners LP, senior note, 5.20%, | | | | |
| 2/01/22 | United States | 6,000,000 | | 6,568,248 |
| Enterprise Products Operating LLC, | | | | |
| junior sub. note, 7.034% to 1/15/18, FRN thereafter, | | | | |
| 1/15/68 | United States | 3,500,000 | | 3,967,016 |
| senior note, 3.35%, 3/15/23 | United States | 17,000,000 | | 16,770,738 |
| d,hGaz Capital SA (OJSC Gazprom), loan participation, | | | | |
| senior bond, 144A, 6.212%, 11/22/16 | Russia | 2,800,000 | | 2,915,500 |
| senior note, 144A, 3.85%, 2/06/20 | Russia | 10,000,000 | | 9,087,100 |
| Kinder Morgan Energy Partners LP, senior bond, 3.45%, | | | | |
| 2/15/23 | United States | 9,700,000 | | 9,309,216 |
| dKinder Morgan Finance Co. LLC, senior secured note, 144A, | | | | |
| 6.00%, 1/15/18 | United States | 5,000,000 | | 5,493,580 |
| dLinn Energy LLC/Finance Corp., senior note, 144A, 6.25%, | | | | |
| 11/01/19 | United States | 5,000,000 | | 5,193,750 |
| dLUKOIL International Finance BV, senior note, 144A, | | | | |
| 4.563%, 4/24/23 | Russia | 19,000,000 | | 16,925,770 |
| National Oilwell Varco Inc., senior bond, 2.60%, | | | | |
| 12/01/22 | United States | 27,000,000 | | 25,836,327 |
| Peabody Energy Corp., senior note, 6.25%, 11/15/21 | United States | 6,000,000 | | 6,120,000 |
| Petrobras Global Finance BV, senior note, FRN, 3/17/20 | Brazil | 14,400,000 | | 14,638,896 |
| dPetrofac Ltd., senior note, 144A, 3.40%, 10/10/18 | United Kingdom | 7,600,000 | | 7,831,496 |
| Plains All American Pipeline LP, senior note, 5.75%, | | | | |
| 1/15/20 | United States | 5,000,000 | | 5,791,455 |
| Plains Exploration & Production Co., senior note, | | | | |
| 6.125%, 6/15/19 | United States | 600,000 | | 664,500 |
| 6.625%, 5/01/21 | United States | 2,284,000 | | 2,538,095 |
| 6.75%, 2/01/22 | United States | 500,000 | | 560,625 |
| 6.875%, 2/15/23 | United States | 1,000,000 | | 1,125,000 |
| dSinopec Group Overseas Development 2014 Ltd., | | | | |
| senior note, 144A, 4.375%, 4/10/24 | China | 14,000,000 | | 14,173,740 |
| Sunoco Logistics Partners Operations LP, senior note, | | | | |
| 4.25%, 4/01/24 | United States | 9,300,000 | | 9,508,618 |
| Transcontinental Gas Pipe Line Corp., senior note, 6.05%, | | | | |
| 6/15/18 | United States | 550,000 | | 633,041 |
| Valero Energy Corp., senior note, 9.375%, 3/15/19 | United States | 9,000,000 | | 11,762,730 |
| Weatherford International Ltd., senior bond, 5.95%, | | | | |
| 4/15/42 | United States | 4,900,000 | | 5,523,569 |
| | | | | 274,178,950 |
104 | Semiannual Report
| | | | |
| Franklin Investors Securities Trust | | |
| |
| Statement of Investments, April 30, 2014 (unaudited) (continued) | | |
| |
| |
| Franklin Total Return Fund | Country | Principal Amount* | | Value |
| Corporate Bonds (continued) | | | | |
| Food & Staples Retailing 1.1% | | | | |
| dCencosud SA, senior note, 144A, 4.875%, 1/20/23 | Chile | 17,000,000 | $ | 16,592,765 |
| CVS Caremark Corp., | | | | |
| 2.75%, 12/01/22 | United States | 9,400,000 | | 8,997,445 |
| senior note, 5.75%, 6/01/17 | United States | 585,000 | | 662,606 |
| The Kroger Co., senior note, 4.00%, 2/01/24 | United States | 15,400,000 | | 15,818,634 |
| dSigma Alimentos SA, senior note, 144A, 5.625%, | | | | |
| 4/14/18 | Mexico | 7,200,000 | | 7,952,148 |
| | | | | 50,023,598 |
| Food, Beverage & Tobacco 1.7% | | | | |
| Altria Group Inc., | | | | |
| senior bond, 4.00%, 1/31/24 | United States | 4,000,000 | | 4,081,008 |
| senior note, 9.70%, 11/10/18 | United States | 1,879,000 | | 2,482,450 |
| Bunge Ltd. Finance Corp., | | | | |
| 4.10%, 3/15/16 | United States | 8,000,000 | | 8,431,816 |
| senior note, 5.10%, 7/15/15 | United States | 680,000 | | 712,516 |
| Constellation Brands Inc., senior note, 7.25%, 5/15/17 | United States | 7,000,000 | | 8,102,500 |
| Dean Foods Co., senior note, 7.00%, 6/01/16 | United States | 11,506,000 | | 12,685,365 |
| dHeineken NV, senior bond, 144A, 2.75%, 4/01/23 | Netherlands | 10,000,000 | | 9,515,050 |
| Kraft Foods Group Inc., senior bond, 3.50%, 6/06/22 | United States | 10,000,000 | | 10,177,630 |
| Lorillard Tobacco Co., senior note, 2.30%, 8/21/17 | United States | 16,000,000 | | 16,343,072 |
| Mondelez International Inc., senior bond, 4.00%, | | | | |
| 2/01/24 | United States | 8,400,000 | | 8,614,671 |
| | | | | 81,146,078 |
| Health Care Equipment & Services 1.4% | | | | |
| Baxter International Inc., senior bond, 3.20%, 6/15/23 | United States | 9,000,000 | | 8,819,523 |
| Coventry Health Care Inc., | | | | |
| senior bond, 5.45%, 6/15/21 | United States | 5,000,000 | | 5,817,950 |
| senior note, 6.30%, 8/15/14 | United States | 4,750,000 | | 4,827,634 |
| DENTSPLY International Inc., senior note, 4.125%, | | | | |
| 8/15/21 | United States | 15,000,000 | | 15,458,520 |
| Express Scripts Holding Co., senior note, 4.75%, | | | | |
| 11/15/21 | United States | 10,000,000 | | 10,974,720 |
| HCA Holdings Inc., senior note, 6.25%, 2/15/21 | United States | 2,000,000 | | 2,117,500 |
| HCA Inc., senior note, | | | | |
| 6.50%, 2/15/16 | United States | 5,054,000 | | 5,496,225 |
| 5.875%, 5/01/23 | United States | 5,000,000 | | 5,100,000 |
| Medco Health Solutions Inc., | | | | |
| 7.125%, 3/15/18 | United States | 4,500,000 | | 5,339,993 |
| senior note, 4.125%, 9/15/20 | United States | 3,500,000 | | 3,739,155 |
| | | | | 67,691,220 |
| Household & Personal Products 0.3% | | | | |
| Avon Products Inc., senior bond, 5.00%, 3/15/23 | United States | 12,000,000 | | 12,103,452 |
| Insurance 1.7% | | | | |
| Aflac Inc., | | | | |
| senior bond, 3.625%, 6/15/23 | United States | 17,500,000 | | 17,835,895 |
| senior note, 8.50%, 5/15/19 | United States | 6,000,000 | | 7,766,940 |
Semiannual Report | 105
| | | | |
| Franklin Investors Securities Trust | | |
| |
| Statement of Investments, April 30, 2014 (unaudited) (continued) | | |
| |
| |
| Franklin Total Return Fund | Country | Principal Amount* | | Value |
| Corporate Bonds (continued) | | | | |
| Insurance (continued) | | | | |
| The Allstate Corp., | | | | |
| junior sub. note, 5.75% to 8/14/23, FRN thereafter, | | | | |
| 8/15/53 | United States | 4,750,000 | $ | 5,091,406 |
| senior bond, 3.15%, 6/15/23 | United States | 4,000,000 | | 3,984,792 |
| CNA Financial Corp., senior note, 5.85%, 12/15/14 | United States | 10,000,000 | | 10,327,610 |
| dLiberty Mutual Group Inc., senior note, 144A, 4.95%, | | | | |
| 5/01/22 | United States | 12,000,000 | | 12,961,884 |
| MetLife Inc., junior sub. note, 6.40% to 12/15/36, | | | | |
| FRN thereafter, 12/15/66 | United States | 4,000,000 | | 4,360,000 |
| dMitsui Sumitomo Insurance Co. Ltd., junior sub. note, 144A, | | | | |
| 7.00% to 3/15/22, FRN thereafter, 3/15/72 | Japan | 3,400,000 | | 4,018,103 |
| Prudential Financial Inc., junior sub. note, 5.875%, | | | | |
| 9/15/42 | United States | 7,000,000 | | 7,402,500 |
| Reinsurance Group of America Inc., senior note, 6.45%, | | | | |
| 11/15/19 | United States | 5,700,000 | | 6,679,277 |
| | | | | 80,428,407 |
| Materials 2.2% | | | | |
| dAlpek SA de CV, senior note, 144A, 4.50%, 11/20/22 | Mexico | 10,500,000 | | 10,546,620 |
| ArcelorMittal, senior note, 6.00%, 3/01/21 | Luxembourg | 6,000,000 | | 6,420,120 |
| dCemex Finance LLC, senior secured note, 144A, 9.375%, | | | | |
| 10/12/22 | Mexico | 1,000,000 | | 1,157,500 |
| dCemex SAB de CV, senior secured note, 144A, 9.00%, | | | | |
| 1/11/18 | Mexico | 4,000,000 | | 4,335,000 |
| dFMG Resources (August 2006) Pty. Ltd., senior note, 144A, | | | | |
| 6.875%, 4/01/22 | Australia | 6,000,000 | | 6,442,500 |
| dGlencore Funding LLC, senior note, 144A, 4.125%, | | | | |
| 5/30/23 | Switzerland | 15,000,000 | | 14,575,590 |
| LYB International Finance BV, senior note, 4.00%, | | | | |
| 7/15/23 | Netherlands | 6,600,000 | | 6,830,043 |
| Lyondellbasell Industries NV, senior note, 5.75%, | | | | |
| 4/15/24 | United States | 11,800,000 | | 13,777,657 |
| dPTT Global Chemical PCL, senior bond, 144A, 4.25%, | | | | |
| 9/19/22 | Thailand | 4,600,000 | | 4,533,392 |
| Reliance Steel & Aluminum Co., senior note, 4.50%, | | | | |
| 4/15/23 | United States | 5,600,000 | | 5,669,210 |
| RPM International Inc., 6.50%, 2/15/18 | United States | 5,000,000 | | 5,741,990 |
| dRPM U.K. GP, 144A, 6.70%, 11/01/15 | United States | 1,000,000 | | 1,070,450 |
| Tenneco Packaging Inc., senior note, 8.125%, 6/15/17 | United States | 12,000,000 | | 13,380,000 |
| dXstrata Finance Canada Ltd., senior note, 144A, 4.95%, | | | | |
| 11/15/21 | Canada | 7,000,000 | | 7,355,040 |
| | | | | 101,835,112 |
| Media 1.4% | | | | |
| Clear Channel Communications Inc., senior secured bond, | | | | |
| first lien, 9.00%, 3/01/21 | United States | 3,500,000 | | 3,736,250 |
| DIRECTV Holdings LLC/DIRECTV Financing Co. Inc., | | | | |
| senior note, 3.80%, 3/15/22 | United States | 20,000,000 | | 20,042,260 |
106 | Semiannual Report
| | | | | |
| Franklin Investors Securities Trust | | | |
| |
| Statement of Investments, April 30, 2014 (unaudited) (continued) | | | |
| |
| |
| Franklin Total Return Fund | Country | Principal Amount* | | Value |
| Corporate Bonds (continued) | | | | | |
| Media (continued) | | | | | |
| The New York Times Co., senior note, 6.625%, | | | | | |
| 12/15/16 | United States | 11,700,000 | | $ | 13,060,125 |
| News America Inc., | | | | | |
| 3.00%, 9/15/22 | United States | 13,400,000 | | | 13,052,324 |
| senior bond, 7.90%, 12/01/95 | United States | 500,000 | | | 624,701 |
| senior deb., 7.25%, 5/18/18 | United States | 2,000,000 | | | 2,413,038 |
| senior note, 6.90%, 8/15/39 | United States | 1,800,000 | | | 2,301,440 |
| Time Warner Inc., | | | | | |
| 7.70%, 5/01/32 | United States | 550,000 | | | 758,366 |
| 6.10%, 7/15/40 | United States | 8,600,000 | | | 10,134,524 |
| Viacom Inc., senior bond, 4.25%, 9/01/23 | United States | 1,000,000 | | | 1,043,763 |
| | | | | | 67,166,791 |
| Pharmaceuticals, Biotechnology & Life Sciences 1.4% | | | | | |
| AbbVie Inc., senior note, 2.90%, 11/06/22 | United States | 15,000,000 | | | 14,636,520 |
| Gilead Sciences Inc., senior note, 4.50%, 4/01/21 | United States | 14,100,000 | | | 15,569,022 |
| PerkinElmer Inc., senior note, 5.00%, 11/15/21 | United States | 13,200,000 | | | 14,079,899 |
| Zoetis Inc., senior bond, 3.25%, 2/01/23 | United States | 20,000,000 | | | 19,525,160 |
| | | | | | 63,810,601 |
| Real Estate 1.4% | | | | | |
| American Tower Corp., senior bond, | | | | | |
| 3.50%, 1/31/23 | United States | 17,700,000 | | | 17,041,773 |
| 5.00%, 2/15/24 | United States | 4,400,000 | | | 4,687,553 |
| Digital Realty Trust LP, 5.875%, 2/01/20 | United States | 6,400,000 | | | 7,058,118 |
| ERP Operating LP, 5.75%, 6/15/17 | United States | 2,000,000 | | | 2,262,068 |
| Health Care REIT Inc., senior note, 4.125%, 4/01/19 | United States | 13,000,000 | | | 13,962,975 |
| Healthcare Realty Trust Inc., senior note, 6.50%, | | | | | |
| 1/17/17 | United States | 5,000,000 | | | 5,633,610 |
| Senior Housing Properties Trust, senior note, 6.75%, | | | | | |
| 12/15/21 | United States | 14,500,000 | | | 16,439,216 |
| | | | | | 67,085,313 |
| Retailing 0.1% | | | | | |
| dEdcon Pty. Ltd., secured note, 144A, 9.50%, 3/01/18 | South Africa | 3,500,000 | EUR | | 4,848,233 |
| dExperian Finance PLC, 144A, 2.375%, 6/15/17 | United Kingdom | 1,500,000 | | | 1,521,007 |
| | | | | | 6,369,240 |
| Semiconductors & Semiconductor Equipment 0.5% | | | | | |
| Maxim Integrated Products Inc., senior note, 3.375%, | | | | | |
| 3/15/23 | United States | 22,000,000 | | | 21,111,926 |
| Software & Services 0.1% | | | | | |
| dFirst Data Corp., senior secured bond, 144A, 8.25%, | | | | | |
| 1/15/21 | United States | 6,000,000 | | | 6,495,000 |
| Technology Hardware & Equipment 0.2% | | | | | |
| Apple Inc., senior note, 2.40%, 5/03/23 | United States | 4,600,000 | | | 4,304,657 |
| Juniper Networks Inc., senior note, 4.60%, 3/15/21 | United States | 5,000,000 | | | 5,308,200 |
| | | | | | 9,612,857 |
Semiannual Report | 107
| | | | |
| Franklin Investors Securities Trust | | |
| |
| Statement of Investments, April 30, 2014 (unaudited) (continued) | | |
| |
| |
| Franklin Total Return Fund | Country | Principal Amount* | | Value |
| Corporate Bonds (continued) | | | | |
| Telecommunication Services 1.9% | | | | |
| CenturyLink Inc., senior note, 5.80%, 3/15/22 | United States | 5,000,000 | $ | 5,150,000 |
| Embarq Corp., senior note, 7.082%, 6/01/16 | United States | 22,500,000 | | 25,067,835 |
| Frontier Communications Corp., senior note, | | | | |
| 8.75%, 4/15/22 | United States | 3,000,000 | | 3,435,000 |
| 7.125%, 1/15/23 | United States | 2,000,000 | | 2,075,000 |
| Intelsat Jackson Holdings SA, senior bond, 6.625%, | | | | |
| 12/15/22 | Luxembourg | 5,000,000 | | 5,146,875 |
| Sprint Nextel Corp., senior note, 6.00%, 11/15/22 | United States | 7,000,000 | | 7,078,750 |
| Telefonica Emisiones SAU, senior note, | | | | |
| 4.949%, 1/15/15 | Spain | 1,500,000 | | 1,542,282 |
| 4.57%, 4/27/23 | Spain | 9,000,000 | | 9,443,070 |
| Verizon Communications Inc., senior bond, 6.40%, | | | | |
| 9/15/33 | United States | 18,800,000 | | 22,711,829 |
| Verizon New York Inc., senior deb., B, 7.375%, 4/01/32 | United States | 1,000,000 | | 1,226,803 |
| dWind Acquisition Finance SA, senior secured note, 144A, | | | | |
| 7.375%, 4/23/21 | Italy | 4,000,000 | | 4,117,500 |
| | | | | 86,994,944 |
| Transportation 0.2% | | | | |
| dAviation Capital Group, 144A, 7.125%, 10/15/20 | United States | 6,000,000 | | 6,745,164 |
| Burlington Northern and Santa Fe 99-2 Trust, secured bond, | | | | |
| 7.57%, 1/02/21 | United States | 163,226 | | 189,952 |
| dDP World Ltd., 144A, 6.85%, 7/02/37 | United Arab Emirates | 3,700,000 | | 4,041,158 |
| Union Pacific Railroad Co. 1998 Pass Trust, 98-B, 6.85%, | | | | |
| 1/02/19 | United States | 357,993 | | 402,954 |
| Union Pacific Railroad Co. 2005 Pass Trust, 05-1, 5.082%, | | | | |
| 1/02/29 | United States | 224,681 | | 248,174 |
| | | | | 11,627,402 |
| Utilities 2.2% | | | | |
| Baltimore Gas & Electric Co., senior bond, 3.35%, | | | | |
| 7/01/23 | United States | 9,500,000 | | 9,515,979 |
| Dominion Resources Inc., senior note, 8.875%, 1/15/19 | United States | 3,650,000 | | 4,683,961 |
| d,fEDF SA, sub. note, 144A, 5.25% to 1/29/23, | | | | |
| FRN thereafter, Perpetual | France | 24,000,000 | | 24,570,000 |
| dEnogex LLC, senior note, 144A, 6.25%, 3/15/20 | United States | 5,000,000 | | 5,457,115 |
| Georgia Power Co., senior note, 4.30%, 3/15/42 | United States | 9,000,000 | | 8,949,384 |
| MidAmerican Energy Co., senior note, 5.95%, 7/15/17 | United States | 2,200,000 | | 2,509,483 |
| Pacific Gas & Electric Co., | | | | |
| 4.45%, 4/15/42 | United States | 10,000,000 | | 9,976,450 |
| senior bond, 3.25%, 6/15/23 | United States | 9,500,000 | | 9,382,941 |
| Sempra Energy, senior note, 2.875%, 10/01/22 | United States | 18,800,000 | | 18,179,449 |
| dState Grid Overseas Investment 2013 Ltd., senior note, | | | | |
| 144A, 3.125%, 5/22/23 | China | 10,400,000 | | 9,849,060 |
| | | | | 103,073,822 |
| Total Corporate Bonds (Cost $1,558,395,616) | | | | 1,620,313,689 |
108 | Semiannual Report
| | | | |
| Franklin Investors Securities Trust | | |
| |
| Statement of Investments, April 30, 2014 (unaudited) (continued) | | |
| |
| |
| Franklin Total Return Fund | Country | Principal Amount* | | Value |
| g,iSenior Floating Rate Interests 4.2% | | | | |
| Automobiles & Components 0.0%† | | | | |
| August LuxUK Holding Co., Lux Second Lien, 10.50%, | | | | |
| 4/27/19 | Luxembourg | 63,563 | $ | 64,992 |
| August U.S. Holding Co. Inc., U.S. Second Lien, 10.50%, | | | | |
| 4/27/19 | United States | 20,813 | | 21,281 |
| FRAM Group Holdings Inc. (Autoparts Holdings), | | | | |
| Second Lien Term Loan, 10.50%, 1/29/18 | United States | 725,116 | | 692,486 |
| | | | | 778,759 |
| Capital Goods 0.3% | | | | |
| Air Distribution Technologies (Tomkins Air Distribution), | | | | |
| Second Lien Initial Loan, 9.25%, 5/09/20 | United States | 251,298 | | 254,753 |
| jErickson Inc., Purchase Price Notes, 6.00%, 11/02/20 | United States | 15,682 | | 15,143 |
| Quikrete Holdings Inc., First Lien Initial Loan, 4.00%, | | | | |
| 9/26/20 | United States | 3,360,427 | | 3,362,947 |
| Sensus USA Inc., Second Lien Term Loan, 8.50%, | | | | |
| 5/09/18 | United States | 156,142 | | 157,020 |
| TransDigm Inc., Tranche C Term Loan, 3.75%, 2/28/20 | United States | 4,623,551 | | 4,607,295 |
| Wesco Distribution Inc., Tranche B-1 Loan, 3.75%, | | | | |
| 12/12/19 | United States | 3,486,140 | | 3,486,119 |
| | | | | 11,883,277 |
| Commercial & Professional Services 0.1% | | | | |
| Altegrity Inc., Tranche D Term Loan, 7.75%, 2/21/15 | United States | 1,461,504 | | 1,438,364 |
| Interactive Data Corp., Term B Loan, 3.75%, 2/11/18 | United States | 4,839,068 | | 4,838,061 |
| Pacific Industrial Services US Finco LLC (Spotless), | | | | |
| Second Lien Initial Term Loan, 8.75%, 4/02/19 | United States | 7,300 | | 7,487 |
| | | | | 6,283,912 |
| Consumer Services 0.1% | | | | |
| Hilton Worldwide Finance LLC, Initial Term Loan, 3.50%, | | | | |
| 10/25/20 | United States | 11,112 | | 11,089 |
| b,kTurtle Bay Holdings LLC, Term Loan B, PIK, 3.00%, | | | | |
| 6/30/16 | United States | 3,945,405 | | 3,738,272 |
| | | | | 3,749,361 |
| Diversified Financials 0.2% | | | | |
| Asurion LLC, Incremental Tranche B-1 Term Loan, 5.00%, | | | | |
| 5/24/19 | United States | 354,920 | | 355,512 |
| Guggenheim Partners Investment Management Holdings LLC, | | | | |
| Initial Term Loan, 4.25%, 7/22/20 | United States | 1,669,756 | | 1,676,853 |
| Trans Union LLC, 2014 Replacement Term Loan, 4.00%, | | | | |
| 4/09/21 | United States | 7,030,737 | | 7,012,063 |
| | | | | 9,044,428 |
| Energy 0.1% | | | | |
| Bowie Resource Holdings LLC, 2nd Lien Initial Term Loan, | | | | |
| 11.75%, 2/16/21 | United States | 337,415 | | 342,476 |
| Pacific Drilling SA, Term Loan, 4.50%, 6/03/18 | Luxembourg | 6,344,760 | | 6,354,677 |
| | | | | 6,697,153 |
Semiannual Report | 109
| | | | |
| Franklin Investors Securities Trust | | |
| |
| Statement of Investments, April 30, 2014 (unaudited) (continued) | | |
| |
| |
| Franklin Total Return Fund | Country | Principal Amount* | | Value |
| g,iSenior Floating Rate Interests (continued) | | | | |
| Food & Staples Retailing 0.0%† | | | | |
| AdvancePierre Foods Inc., Second Lien Term Loan, 9.50%, | | | | |
| 10/10/17 | United States | 226,800 | $ | 220,563 |
| Food, Beverage & Tobacco 0.1% | | | | |
| Allflex Holdings III Inc., Second Lien Initial Term Loan, | | | | |
| 8.00%, 7/17/21 | United States | 180,000 | | 182,100 |
| Big Heart Pet Brands (Del Monte Pet), Initial Term Loans, | | | | |
| 3.50%, 2/24/20 | United States | 4,552,097 | | 4,521,370 |
| | | | | 4,703,470 |
| Health Care Equipment & Services 0.5% | | | | |
| Carestream Health Inc., Second Lien Loan, 9.50%, | | | | |
| 12/07/19 | United States | 534,954 | | 546,990 |
| Community Health Systems Inc., | | | | |
| 2017 Term E Loan, 3.447% - 3.483%, 1/25/17 | United States | 2,481,724 | | 2,486,822 |
| 2021 Term D Loan, 4.25%, 1/27/21 | United States | 7,347,580 | | 7,379,696 |
| DaVita HealthCare Partners Inc., | | | | |
| Tranche B Term Loan, 4.50%, 10/20/16 | United States | 3,564,369 | | 3,576,827 |
| Tranche B-2 Term Loan, 4.00%, 8/24/19 | United States | 6,672,807 | | 6,699,572 |
| Surgery Centers Holdings Inc., Incremental Second Lien | | | | |
| Term Loan, 9.75%, 4/10/20 | United States | 3,700 | | 3,694 |
| U.S. Renal Care Inc., Tranche B-2 Term Loan, 4.25%, | | | | |
| 7/03/19 | United States | 2,507,574 | | 2,510,708 |
| | | | | 23,204,309 |
| Household & Personal Products 0.3% | | | | |
| FGI Operating Co. LLC (Freedom Group), Term B Loans, | | | | |
| 5.50%, 4/19/19 | United States | 7,706,064 | | 7,812,023 |
| Otter Products LLC, Loans, 5.25%, 4/29/19 | United States | 5,980,391 | | 5,982,885 |
| | | | | 13,794,908 |
| Materials 1.1% | | | | |
| American Rock Salt Co. LLC, Initial Loan, 6.00%, | | | | |
| 4/25/17 | United States | 4,897,149 | | 4,907,864 |
| Arysta Lifescience SPC LLC, | | | | |
| Initial Term Loan, 4.50%, 5/29/20 | United States | 8,373,244 | | 8,373,177 |
| Second Lien Initial Term Loan, 8.25%, 11/30/20 | United States | 1,568,007 | | 1,602,307 |
| Axalta Coating Systems U.S. Holdings Inc., 2014 Specified | | | | |
| Refinancing Term, 4.00%, 2/01/20 | United States | 3,861,364 | | 3,856,271 |
| Exopack Holdings SA, USD Term Loan, 5.25%, 5/08/19 | Luxembourg | 1,323,518 | | 1,338,408 |
| FMG America Finance Inc. (Fortescue Metals Group), Loans, | | | | |
| 4.25%, 6/30/19 | United States | 2,584,091 | | 2,585,908 |
| MacDermid Holdings LLC, First Lien Tranche B Term Loan, | | | | |
| 4.00%, 6/07/20 | United States | 5,284,560 | | 5,273,991 |
| OCI Beaumont LLC, Term B-3 Loan, 5.00%, 8/20/19 | United States | 1,085,143 | | 1,097,351 |
| Oxbow Carbon LLC, First Lien Tranche B Term Loan, 4.25%, | | | | |
| 7/19/19 | United States | 5,081,550 | | 5,097,429 |
| OXEA GmbH, Second Lien Term Loan, 8.25%, 7/15/20 | Luxembourg | 322,548 | | 328,596 |
| Reynolds Group Holdings Inc., U.S. Term Loan, 4.00%, | | | | |
| 12/01/18 | United States | 12,213,090 | | 12,236,942 |
110 | Semiannual Report
| | | | |
| Franklin Investors Securities Trust | | |
| |
| Statement of Investments, April 30, 2014 (unaudited) (continued) | | |
| |
| |
| Franklin Total Return Fund | Country | Principal Amount* | | Value |
| g,iSenior Floating Rate Interests (continued) | | | | |
| Materials (continued) | | | | |
| Tronox Pigments (Netherlands) BV, Term Loan, 4.00%, | | | | |
| 3/19/20 | Netherlands | 4,618,100 | $ | 4,623,152 |
| | | | | 51,321,396 |
| Media 0.0%† | | | | |
| Cumulus Media Holdings Inc., Term Loans, 4.25%, | | | | |
| 12/23/20 | United States | 961,473 | | 961,473 |
| NEP/NCP Holdco Inc., Second Lien Term Loan, 9.50%, | | | | |
| 7/22/20 | United States | 146,822 | | 150,952 |
| Radio One Inc., Term Loan, 7.50%, 3/31/16 | United States | 17,778 | | 18,066 |
| Zuffa LLC, Initial Term Loan, 3.75%, 2/25/20 | United States | 963,126 | | 960,116 |
| | | | | 2,090,607 |
| Pharmaceuticals, Biotechnology & Life Sciences 0.1% | | | | |
| Valeant Pharmaceuticals International Inc., Series E-1 | | | | |
| Tranche B Term Loan, 3.75%, 8/05/20 | Canada | 4,966,815 | | 4,971,301 |
| Retailing 0.6% | | | | |
| BJ’s Wholesale Club Inc., 2013 (Nov) Replacement Loans, | | | | |
| 4.50%, 9/26/19 | United States | 8,872,002 | | 8,874,469 |
| Evergreen AcqCo. 1 LP (Savers), Term Loan, 5.00%, | | | | |
| 7/09/19 | United States | 4,083,168 | | 4,096,777 |
| Harbor Freight Tools USA Inc., Loans, 4.75%, 7/26/19 | United States | 2,618,204 | | 2,630,627 |
| Party City Holdings Inc., 2014 Replacement Term Loan, | | | | |
| 4.00%, 7/27/19 | United States | 4,991,893 | | 4,980,976 |
| Sears Roebuck Acceptance Corp., Term Loan, 5.50%, | | | | |
| 6/30/18 | United States | 7,895,340 | | 7,967,922 |
| | | | | 28,550,771 |
| Software & Services 0.4% | | | | |
| BMC Software Finance Inc., Initial U.S. Term Loans, 5.00%, | | | | |
| 9/10/20 | United States | 9,891,249 | | 9,888,162 |
| MoneyGram International Inc., Term Loan, 4.25%, | | | | |
| 3/28/20 | United States | 7,971,734 | | 7,802,335 |
| Vertafore Inc., Second Lien Term Loan, 9.75%, | | | | |
| 10/27/17 | United States | 467,548 | | 475,876 |
| | | | | 18,166,373 |
| Technology Hardware & Equipment 0.1% | | | | |
| Dell International LLC, Term B Loan, 4.50%, 4/29/20 | United States | 4,418,823 | | 4,408,390 |
| Telecommunication Services 0.1% | | | | |
| Intelsat Jackson Holdings SA, Tranche B-2 Term Loan, | | | | |
| 3.75%, 6/30/19 | Luxembourg | 3,488,055 | | 3,491,690 |
| Transportation 0.1% | | | | |
| Global Tip Finance BV/Finance America LLC, Facility C | | | | |
| Commitment, 6.50%, 10/16/20 | United States | 3,011,980 | | 2,974,330 |
| Total Senior Floating Rate Interests | | | | |
| (Cost $195,961,602) | | | | 196,334,998 |
Semiannual Report | 111
| | | | | |
| Franklin Investors Securities Trust | | | |
| |
| Statement of Investments, April 30, 2014 (unaudited) (continued) | | | |
| |
| |
| Franklin Total Return Fund | Country | Principal Amount* | | Value |
| Foreign Government and Agency Securities 9.0% | | | | | |
| The Export-Import Bank of Korea, senior note, | | | | | |
| 1.25%, 11/20/15 | South Korea | 5,000,000 | | $ | 5,037,200 |
| 4.00%, 1/29/21 | South Korea | 6,500,000 | | | 6,839,398 |
| eGovernment of Ghana, Reg S, 8.50%, 10/04/17 | Ghana | 300,000 | | | 310,152 |
| Government of Hungary, | | | | | |
| 7.75%, 8/24/15 | Hungary | 28,900,000 | HUF | | 139,317 |
| 5.50%, 12/22/16 | Hungary | 3,092,050,000 | HUF | | 14,757,575 |
| 6.00%, 1/11/19 | Hungary | 1,820,000 | EUR | | 2,852,915 |
| A, 8.00%, 2/12/15 | Hungary | 91,860,000 | HUF | | 432,952 |
| A, 6.75%, 11/24/17 | Hungary | 1,457,960,000 | HUF | | 7,239,075 |
| A, 5.50%, 12/20/18 | Hungary | 205,390,000 | HUF | | 979,553 |
| eReg S, 6.75%, 7/28/14 | Hungary | 1,400,000 | EUR | | 1,968,784 |
| esenior note, Reg S, 3.50%, 7/18/16 | Hungary | 115,000 | EUR | | 165,111 |
| esenior note, Reg S, 4.375%, 7/04/17 | Hungary | 215,000 | EUR | | 315,367 |
| esenior note, Reg S, 5.75%, 6/11/18 | Hungary | 695,000 | EUR | | 1,070,155 |
| esenior note, Reg S, 3.875%, 2/24/20 | Hungary | 285,000 | EUR | | 409,743 |
| dGovernment of Iceland, 144A, 5.875%, 5/11/22 | Iceland | 2,640,000 | | | 2,878,326 |
| Government of Ireland, | | | | | |
| 5.90%, 10/18/19 | Ireland | 1,522,000 | EUR | | 2,604,628 |
| 4.50%, 4/18/20 | Ireland | 3,243,000 | EUR | | 5,206,558 |
| 5.00%, 10/18/20 | Ireland | 2,107,000 | EUR | | 3,482,260 |
| senior bond, 4.50%, 10/18/18 | Ireland | 269,000 | EUR | | 427,990 |
| senior bond, 4.40%, 6/18/19 | Ireland | 739,000 | EUR | | 1,180,245 |
| senior bond, 5.40%, 3/13/25 | Ireland | 10,374,640 | EUR | | 17,566,365 |
| dGovernment of Lithuania, 144A, | | | | | |
| 6.75%, 1/15/15 | Lithuania | 3,720,000 | | | 3,872,092 |
| 7.375%, 2/11/20 | Lithuania | 4,670,000 | | | 5,669,287 |
| Government of Malaysia, | | | | | |
| 3.434%, 8/15/14 | Malaysia | 65,965,000 | MYR | | 20,247,464 |
| 3.741%, 2/27/15 | Malaysia | 40,550,000 | MYR | | 12,503,693 |
| 3.835%, 8/12/15 | Malaysia | 16,200,000 | MYR | | 5,010,207 |
| 4.72%, 9/30/15 | Malaysia | 1,720,000 | MYR | | 538,643 |
| 3.197%, 10/15/15 | Malaysia | 14,200,000 | MYR | | 4,355,537 |
| Government of Mexico, | | | | | |
| 7.00%, 6/19/14 | Mexico | 970,800l MXN | | 7,454,977 |
| 9.50%, 12/18/14 | Mexico | 1,828,490l MXN | | 14,497,273 |
| 6.00%, 6/18/15 | Mexico | 43,520l MXN | | 341,029 |
| 8.00%, 12/17/15 | Mexico | 2,335,540l MXN | | 19,000,365 |
| 6.25%, 6/16/16 | Mexico | 501,510l MXN | | 4,005,089 |
| 7.25%, 12/15/16 | Mexico | 1,894,390l MXN | | 15,551,616 |
| Government of Peru, senior bond, 7.84%, 8/12/20 | Peru | 4,279,000 | PEN | | 1,700,278 |
| Government of Poland, | | | | | |
| 5.50%, 4/25/15 | Poland | 13,215,000 | PLN | | 4,479,481 |
| 5.00%, 4/25/16 | Poland | 3,390,000 | PLN | | 1,163,889 |
| gFRN, 2.72%, 1/25/17 | Poland | 859,000 | PLN | | 283,131 |
| gFRN, 2.72%, 1/25/21 | Poland | 871,000 | PLN | | 282,637 |
| senior note, 6.375%, 7/15/19 | Poland | 4,500,000 | | | 5,302,553 |
| Strip, 7/25/14 | Poland | 240,000 | PLN | | 78,854 |
| Strip, 1/25/16 | Poland | 102,440,000 | PLN | | 32,216,201 |
112 | Semiannual Report
Franklin Investors Securities Trust
Statement of Investments, April 30, 2014 (unaudited) (continued)
| | | | | |
| Franklin Total Return Fund | Country | Principal Amount* | | | Value |
| Foreign Government and Agency Securities (continued) | | | | | |
| Government of Russia, senior bond, | | | | | |
| d144A, 7.50%, 3/31/30 | Russia | 3,868,195 | | | $ 4,317,099 |
| eReg S, 7.50%, 3/31/30 | Russia | 6,384,200 | | | 7,125,086 |
| dGovernment of Serbia, senior note, 144A, 4.875%, | | | | | |
| 2/25/20 | Serbia | 6,000,000 | | | 5,977,500 |
| Government of Singapore, senior note, 1.125%, 4/01/16 | Singapore | 750,000 | SGD | | 605,871 |
| Government of Sri Lanka, | | | | | |
| A, 11.25%, 7/15/14 | Sri Lanka | 212,700,000 | LKR | | 1,641,587 |
| A, 11.75%, 3/15/15 | Sri Lanka | 1,400,000 | LKR | | 11,131 |
| A, 6.50%, 7/15/15 | Sri Lanka | 35,020,000 | LKR | | 266,029 |
| A, 11.00%, 8/01/15 | Sri Lanka | 241,800,000 | LKR | | 1,933,095 |
| A, 6.40%, 8/01/16 | Sri Lanka | 23,800,000 | LKR | | 177,719 |
| A, 8.00%, 11/15/18 | Sri Lanka | 86,100,000 | LKR | | 637,772 |
| A, 9.00%, 5/01/21 | Sri Lanka | 89,150,000 | LKR | | 652,957 |
| B, 6.60%, 6/01/14 | Sri Lanka | 8,600,000 | LKR | | 65,819 |
| B, 6.40%, 10/01/16 | Sri Lanka | 18,900,000 | LKR | | 140,048 |
| B, 8.50%, 7/15/18 | Sri Lanka | 18,990,000 | LKR | | 143,653 |
| C, 8.50%, 4/01/18 | Sri Lanka | 50,980,000 | LKR | | 387,080 |
| D, 8.50%, 6/01/18 | Sri Lanka | 65,480,000 | LKR | | 496,736 |
| Government of the Philippines, senior note, 1.625%, | | | | | |
| 4/25/16 | Philippines | 86,200,000 | PHP | | 1,905,054 |
| dGovernment of Ukraine, senior note, 144A, 7.95%, | | | | | |
| 2/23/21 | Ukraine | 2,370,000 | | | 2,030,794 |
| mGovernment of Uruguay, senior bond, Index Linked, | | | | | |
| 4.375%, 12/15/28 | Uruguay | 196,093,278 | UYU | | 9,142,221 |
| dGovernment of Vietnam, 144A, | | | | | |
| 6.875%, 1/15/16 | Vietnam | 150,000 | | | 162,028 |
| 6.75%, 1/29/20 | Vietnam | 5,120,000 | | | 5,761,510 |
| Korea Monetary Stabilization Bond, | | | | | |
| senior bond, 2.47%, 4/02/15 | South Korea | 4,101,900,000 | KRW | | 3,963,767 |
| senior bond, 2.80%, 8/02/15 | South Korea | 20,907,710,000 | KRW | | 20,261,334 |
| senior bond, 2.81%, 10/02/15 | South Korea | 1,442,000,000 | KRW | | 1,397,270 |
| senior note, 3.28%, 6/02/14 | South Korea | 11,910,090,000 | KRW | | 11,534,757 |
| senior note, 2.82%, 8/02/14 | South Korea | 681,200,000 | KRW | | 659,754 |
| senior note, 2.78%, 10/02/14 | South Korea | 2,715,600,000 | KRW | | 2,630,394 |
| senior note, 2.84%, 12/02/14 | South Korea | 2,278,170,000 | KRW | | 2,207,917 |
| senior note, 2.74%, 2/02/15 | South Korea | 3,530,680,000 | KRW | | 3,420,040 |
| senior note, 2.76%, 6/02/15 | South Korea | 24,098,900,000 | KRW | | 23,347,381 |
| Korea Treasury Bond, | | | | | |
| senior bond, 3.50%, 6/10/14 | South Korea | 1,761,420,000 | KRW | | 1,706,506 |
| senior note, 3.25%, 12/10/14 | South Korea | 3,998,620,000 | KRW | | 3,884,920 |
| senior note, 3.25%, 6/10/15 | South Korea | 3,634,290,000 | KRW | | 3,539,417 |
| senior note, 2.75%, 12/10/15 | South Korea | 2,942,150,000 | KRW | | 2,848,102 |
| senior note, 3.00%, 12/10/16 | South Korea | 36,270,000,000 | KRW | | 35,236,704 |
| Letra Tesouro Nacional, Strip, 1/01/15 | Brazil | 27 | n BRL | | 11,274 |
| oNota Do Tesouro Nacional, Index Linked, 6.00%, | | | | | |
| 5/15/15 | Brazil | 840 | n BRL | | 925,226 |
| 8/15/18 | Brazil | 13,695 | n BRL | | 14,865,528 |
Semiannual Report | 113
| | | | |
| Franklin Investors Securities Trust | | |
| |
| Statement of Investments, April 30, 2014 (unaudited) (continued) | | |
| |
| |
| Franklin Total Return Fund | Country | Principal Amount* | | Value |
| Foreign Government and Agency Securities (continued) | | | | |
| dPeru Enhanced Pass-Through Finance Ltd., | | | | |
| senior secured bond, A-1, 144A, zero cpn., 5/31/18 | Peru | 653,577 | $ | 611,239 |
| dTemasek Financial I Ltd., senior note, 144A, 2.375%, | | | | |
| 1/23/23 | Singapore | 9,500,000 | | 8,846,638 |
| Total Foreign Government and Agency Securities | | | | |
| (Cost $405,441,575) | | | | 419,896,922 |
| U.S. Government and Agency Securities 19.4% | | | | |
| U.S. Treasury Bond, | | | | |
| 4.50%, 5/15/17 | United States | 83,000,000 | | 91,997,034 |
| 2.75%, 2/15/19 | United States | 66,500,000 | | 70,025,032 |
| 5.00%, 5/15/37 | United States | 5,500,000 | | 7,003,046 |
| 4.625%, 2/15/40 | United States | 35,000,000 | | 42,615,230 |
| 4.75%, 2/15/41 | United States | 38,000,000 | | 47,253,608 |
| 4.375%, 5/15/41 | United States | 10,000,000 | | 11,756,250 |
| 3.125%, 11/15/41 | United States | 18,300,000 | | 17,299,210 |
| 3.00%, 5/15/42 | United States | 23,900,000 | | 21,986,136 |
| 2.875%, 5/15/43 | United States | 33,000,000 | | 29,380,296 |
| U.S. Treasury Note, | | | | |
| 4.875%, 8/15/16 | United States | 67,600,000 | | 74,288,682 |
| 4.625%, 11/15/16 | United States | 21,700,000 | | 23,880,177 |
| 4.625%, 2/15/17 | United States | 92,000,000 | | 101,803,704 |
| 4.75%, 8/15/17 | United States | 42,000,000 | | 47,092,500 |
| 4.25%, 11/15/17 | United States | 70,000,000 | | 77,590,660 |
| 3.75%, 11/15/18 | United States | 51,600,000 | | 56,701,537 |
| 3.625%, 8/15/19 | United States | 51,000,000 | | 55,837,044 |
| 3.625%, 2/15/20 | United States | 65,300,000 | | 71,508,593 |
| mIndex Linked, 2.00%, 1/15/16 | United States | 8,220,217 | | 8,720,812 |
| mIndex Linked, 0.125%, 4/15/16 | United States | 53,176,365 | | 54,725,977 |
| Total U.S. Government and Agency Securities | | | | |
| (Cost $912,414,235) | | | | 911,465,528 |
| Asset-Backed Securities and Commercial | | | | |
| Mortgage-Backed Securities 12.5% | | | | |
| Banks 7.7% | | | | |
| Banc of America Commercial Mortgage Trust, | | | | |
| 2006-4, AJ, 5.695%, 7/10/46 | United States | 20,562,000 | | 21,662,036 |
| 2006-4, AM, 5.675%, 7/10/46 | United States | 7,350,000 | | 8,044,134 |
| g2007-3, AM, FRN, 5.591%, 6/10/49 | United States | 17,730,000 | | 19,654,849 |
| Bear Stearns Commercial Mortgage Securities Inc., | | | | |
| g2006-PW11, AJ, FRN, 5.44%, 3/11/39 | United States | 19,594,000 | | 20,636,009 |
| g2006-PW12, AJ, FRN, 5.75%, 9/11/38 | United States | 3,286,000 | | 3,406,563 |
| 2006-PW13, AJ, 5.611%, 9/11/41 | United States | 18,023,000 | | 18,757,590 |
| g2007-PW16, AM, FRN, 5.707%, 6/11/40 | United States | 11,110,000 | | 12,407,159 |
| Bear Stearns Commercial Mortgage Securities Trust, | | | | |
| 2007-PW15, A4, 5.331%, 2/11/44 | United States | 9,784,183 | | 10,614,660 |
| g2007-PW16, A4, FRN, 5.707%, 6/11/40 | United States | 21,845,000 | | 24,464,893 |
| Citigroup Commercial Mortgage Trust, 2006-C5, AJ, | | | | |
| 5.482%, 10/15/49 | United States | 15,876,000 | | 15,958,619 |
114 | Semiannual Report
Franklin Investors Securities Trust
Statement of Investments, April 30, 2014 (unaudited) (continued)
| | | | |
| Franklin Total Return Fund | Country | Principal Amount* | | Value |
| Asset-Backed Securities and Commercial | | | | |
| Mortgage-Backed Securities (continued) | | | | |
| Banks (continued) | | | | |
| gCountrywide Asset-Backed Certificates, 2004-1, M1, FRN, | | | | |
| 0.902%, 3/25/34 | United States | 3,261,541 | $ | 3,127,289 |
| Credit Suisse First Boston Mortgage Securities Corp., | | | | |
| 2004-6, 3A1, 5.00%, 9/25/19 | United States | 1,807,672 | | 1,902,054 |
| d,g,pCredit Suisse Mortgage Capital Certificates, 2009-15R, | | | | |
| 3A1, 144A, FRN, 5.347%, 3/26/36 | United States | 9,375,854 | | 9,759,785 |
| FHLMC, 2643, OG, 5.00%, 7/15/32 | United States | 1,954,328 | | 1,980,053 |
| gFNMA, 2005-122, FN, FRN, 0.502%, 1/25/36 | United States | 1,235,028 | | 1,225,167 |
| Greenwich Capital Commercial Funding Corp., | | | | |
| g2006-GG7, AJ, FRN, 5.82%, 7/10/38 | United States | 18,910,000 | | 19,689,442 |
| g2006-GG7, AM, FRN, 5.82%, 7/10/38 | United States | 4,685,000 | | 5,110,360 |
| 2007-GG9, A4, 5.444%, 3/10/39 | United States | 22,885,000 | | 25,066,146 |
| gGS Mortgage Securities Corp. II, 1997-GL, X2, IO, FRN, | | | | |
| 0.29%, 7/13/30 | United States | 29,794 | | 7 |
| JPMorgan Chase Commercial Mortgage Securities Corp., | | | | |
| g,p2006-CB14, B, FRN, 5.53%, 12/12/44 | United States | 8,000,000 | | 3,653,400 |
| 2006-CB17, AM, 5.464%, 12/12/43 | United States | 16,790,000 | | 17,740,331 |
| g,p2006-LDP7, AJ, FRN, 6.025%, 4/15/45 | United States | 18,983,000 | | 19,612,078 |
| gLB-UBS Commercial Mortgage Trust, 2006-C4, AJ, FRN, | | | | |
| 6.051%, 6/15/38 | United States | 11,540,000 | | 12,287,088 |
| gMerrill Lynch Mortgage Investors Inc., 2003-A, 1A, FRN, | | | | |
| 0.892%, 3/25/28 | United States | 2,708,094 | | 2,657,810 |
| gMerrill Lynch Mortgage Trust, 2005-CKI1, AJ, FRN, | | | | |
| 5.281%, 11/12/37 | United States | 8,000,000 | | 8,422,580 |
| gMorgan Stanley ABS Capital I Inc. Trust, | | | | |
| 2003-HE1, M1, FRN, 1.352%, 5/25/33 | United States | 4,451,020 | | 4,175,412 |
| 2005-WMC, M2, FRN, 0.887%, 1/25/35 | United States | 3,663,509 | | 3,535,168 |
| Morgan Stanley Capital I Trust, | | | | |
| d2005-RR6, AJ, 144A, 5.233%, 5/24/43 | United States | 4,880,000 | | 4,891,151 |
| g2006-HQ8, AJ, FRN, 5.496%, 3/12/44 | United States | 14,956,000 | | 15,346,024 |
| g2007-IQ16, AM, FRN, 6.091%, 12/12/49 | United States | 21,470,000 | | 24,222,744 |
| gWachovia Bank Commercial Mortgage Trust, | | | | |
| 2006-C23, AJ, FRN, 5.515%, 1/18/45 | United States | 7,675,000 | | 8,127,695 |
| FRN, 5.908%, 5/15/16 | United States | 6,683,000 | | 6,487,992 |
| g,pWells Fargo Mortgage Backed Securities 2004-I Trust, 04-I, | | | | |
| 2A1, FRN, 2.633%, 6/25/34 | United States | 1,629,330 | | 1,624,734 |
| pWells Fargo Mortgage Backed Securities Trust, | | | | |
| g04-W, A9, FRN, 2.762%, 11/25/34 | United States | 2,877,609 | | 2,982,300 |
| 2007-3, 3A1, 5.50%, 4/25/37 | United States | 675,898 | | 701,153 |
| jWeyerhaeuser Mortgage Co., 1984-A, 7.43%, 1/01/24 | United States | 19,811 | | 19,811 |
| | | | | 359,954,286 |
| Diversified Financials 4.6% | | | | |
| gAames Mortgage Investment Trust, 2005-4, M1, FRN, | | | | |
| 0.857%, 10/25/35 | United States | 2,803,371 | | 2,804,627 |
| gAmerican Home Mortgage Investment Trust, 2004-3, 4A, | | | | |
| FRN, 1.837%, 10/25/34 | United States | 3,228,255 | | 3,189,611 |
Semiannual Report | 115
Franklin Investors Securities Trust
Statement of Investments, April 30, 2014 (unaudited) (continued)
| | | | |
| Franklin Total Return Fund | Country | Principal Amount* | | Value |
| Asset-Backed Securities and Commercial | | | | |
| Mortgage-Backed Securities (continued) | | | | |
| Diversified Financials (continued) | | | | |
| gAmeriquest Mortgage Securities Inc. Asset-Backed | | | | |
| Pass-Through Certificates, 2004-R4, M1, FRN, 0.977%, | United States | 9,839,733 | $ | 9,634,171 |
| 6/25/34 | | | | |
| gAmortizing Residential Collateral Trust, 2002-BC1, M1, | | | | |
| FRN, 1.427%, 1/25/32 | United States | 68,292 | | 46,915 |
| dApidos CDO, 2013-14A, C2, 144A, 4.85%, 4/15/25 | United States | 8,740,000 | | 8,577,523 |
| d,gARES CLO Funds, 2007-12A, B, 144A, FRN, 1.235%, | | | | |
| 11/25/20 | United States | 1,090,000 | | 1,058,281 |
| d,gARES CLO LTD, 2007-3RA, B, 144A, FRN, 0.599%, | | | | |
| 4/16/21 | United States | 2,000,000 | | 1,897,652 |
| gArgent Securities Inc., 2005-W2, A2C, FRN, 0.512%, | | | | |
| 10/25/35 | United States | 6,225,000 | | 5,684,981 |
| d,gAtrium CDO Corp., 10A, C, 144A, FRN, 2.829%, | | | | |
| 7/16/25 | United States | 4,650,000 | | 4,564,905 |
| g,pBayview Financial Acquisition Trust, 2004-D, M1, FRN, | | | | |
| 0.782%, 8/28/44 | United States | 6,958,084 | | 6,891,172 |
| gBear Stearns Alt-A Trust, 2004-13, A2, FRN, 1.032%, | | | | |
| 11/25/34 | United States | 1,759,139 | | 1,669,402 |
| d,gBridgeport CLO Ltd., 2006-1A, B, 144A, FRN, 0.878%, | | | | |
| 7/21/20 | United States | 2,000,000 | | 1,893,368 |
| d,gCent CDO Ltd., 2007-15A, | | | | |
| A2B, 144A, FRN, 0.576%, 3/11/21 | United States | 5,686,824 | | 5,336,664 |
| B, 144A, FRN, 0.956%, 3/11/21 | United States | 6,000,000 | | 5,562,912 |
| d,gCent CLO LP, 2013-20A, A, 144A, FRN, 1.709%, | | | | |
| 1/25/26 | United States | 3,000,000 | | 2,989,800 |
| g,pChase Funding Mortgage Loan Asset-Backed Certificates, | | | | |
| 2004-2, 2A2, FRN, 0.652%, 2/25/35 | United States | 675,545 | | 580,630 |
| d,gCIFC Funding Ltd., 2007-3A, A1J, 144A, FRN, 0.628%, | | | | |
| 7/26/21 | United States | 1,420,000 | | 1,354,396 |
| d,gColony American Homes, 2014-1A, A, 144A, FRN, 1.40%, | | | | |
| 5/17/31 | United States | 8,560,000 | | 8,593,512 |
| d,gColumbus Nova CLO Ltd., 2007-2A, A2, 144A, FRN, | | | | |
| 1.227%, 10/15/21 | United States | 690,000 | | 671,333 |
| dCountryplace Manufactured Housing Contract Trust, | | | | |
| 2005-A3, 144A, 4.80%, 12/15/35 | United States | 748,954 | | 769,835 |
| d,gCrest Ltd., 2004-1A, A, 144A, FRN, 0.558%, 1/28/20 | United States | 499,804 | | 496,123 |
| d,gCT CDO IV Ltd., 2006-4A, A1, 144A, FRN, 0.462%, | | | | |
| 10/20/43 | United States | 13,905,132 | | 13,522,741 |
| d,gDLJ Mortgage Acceptance Corp., 1997-CF1, S, 144A, IO, | | | | |
| FRN, 0.71%, 5/15/30 | United States | 2,164 | | 6 |
| dEmerson Park CLO Ltd., 2013-1A, C2, 144A, 5.64%, | | | | |
| 7/15/25 | United States | 2,920,000 | | 2,938,542 |
| dG-Force LLC, 2005-RRA, | | | | |
| A2, 144A, 4.83%, 8/22/36 | United States | 205,522 | | 205,544 |
| C, 144A, 5.20%, 8/22/36 | United States | 9,275,000 | | 8,622,040 |
| d,gGleneagles CLO Ltd., 2005-1A, A2, 144A, FRN, 0.625%, | | | | |
| 11/01/17 | United States | 4,700,000 | | 4,601,272 |
116 | Semiannual Report
Franklin Investors Securities Trust
Statement of Investments, April 30, 2014 (unaudited) (continued)
| | | | | |
| Franklin Total Return Fund | Country | Principal Amount* | | Value |
| Asset-Backed Securities and Commercial | | | | | |
| Mortgage-Backed Securities (continued) | | | | | |
| Diversified Financials (continued) | | | | | |
| pGMAC Commercial Mortgage Securities Inc., | | | | | |
| g2004-C3, D, FRN, 5.044%, 12/10/41 | United States | 2,300,000 | | $ | 1,799,858 |
| 2005-C1, B, 4.936%, 5/10/43 | United States | 10,285,000 | | | 4,699,362 |
| Green Tree Financial Corp., | | | | | |
| 1996-9, M1, 7.63%, 8/15/27 | United States | 4,355,078 | | | 4,809,796 |
| 1999-3, A7, 6.74%, 2/01/31 | United States | 1,844,589 | | | 1,858,769 |
| Greenpoint Manufactured Housing, 1999-3, 1A7, 7.27%, | | | | | |
| 6/15/29 | United States | 16,730,730 | | | 16,891,679 |
| gGSAA Home Equity Trust, 05-5, M3, FRN, 1.097%, | | | | | |
| 2/25/35 | United States | 3,550,000 | | | 3,256,262 |
| dHighbridge Loan Management Ltd., 2013-2A, B2, 144A, | | | | | |
| 5.80%, 10/20/24 | United States | 2,620,000 | | | 2,683,142 |
| gHome Equity Mortgage Trust, 2004-4, M3, FRN, 1.127%, | | | | | |
| 12/25/34 | United States | 3,775,334 | | | 3,398,208 |
| g,pJPMorgan Chase Commercial Mortgage Securities Trust, | | | | | |
| 2006-CB16, B, FRN, 5.672%, 5/12/45 | United States | 6,745,000 | | | 5,308,885 |
| gJPMorgan Mortgage Acquisition Corp., 2006-ACC1, A4, | | | | | |
| FRN, 0.302%, 5/25/36 | United States | 1,811,378 | | | 1,779,798 |
| d,gKatonah Ltd., 2007-IA, A2L, 144A, FRN, 1.726%, | | | | | |
| 4/23/22 | United States | 5,416,684 | | | 5,287,653 |
| dLegacy Benefits Insurance Settlements LLC, 2004-1, A, | | | | | |
| 144A, 5.35%, 2/10/39 | United States | 1,661,848 | | | 1,577,925 |
| Lehman ABS Corp., 2003-1, A1, 5.00%, 12/25/33 | United States | 4,341,729 | | | 4,471,655 |
| g,pLong Beach Mortgage Loan Trust, 2005-WL2, M1, FRN, | | | | | |
| 0.622%, 8/25/35 | United States | 2,295,271 | | | 2,272,548 |
| d,gMountain View CLO II Ltd., 2006-2A, C, 144A, FRN, | | | | | |
| 0.927%, 1/12/21 | United States | 4,000,000 | | | 3,760,540 |
| d,gNewcastle CDO Ltd., 2004-5A, 1, 144A, FRN, 0.574%, | | | | | |
| 12/24/39 | United States | 4,550,081 | | | 4,406,772 |
| e,gPacifica CDO Ltd., 2005-5X, A2, Reg S, FRN, 0.678%, | | | | | |
| 1/26/20 | United States | 5,000,000 | | | 4,887,345 |
| d,g,pPegasus 2006-1 Ltd., 2006-1A, A1, 144A, FRN, 0.552%, | | | | | |
| 7/25/49 | United States | 6,430,000 | | | 5,883,450 |
| Residential Asset Securities Corp., | | | | | |
| 2001-KS2, AI5, 7.514%, 6/25/31 | United States | 8,762 | | | 8,892 |
| 2004-KS1, AI4, 4.213%, 4/25/32 | United States | 208,487 | | | 208,446 |
| g2005-AHL2, A2, FRN, 0.412%, 10/25/35 | United States | 151,019 | | | 150,977 |
| gSLM Student Loan Trust, | | | | | |
| 2005-4, A2, FRN, 0.309%, 4/26/21 | United States | 103,700 | | | 103,606 |
| 2005-9, A4, FRN, 0.329%, 1/25/23 | United States | 62,071 | | | 62,038 |
| gStructured Asset Securities Corp., | | | | | |
| 2002-1A, 2A1, FRN, 1.743%, 2/25/32 | United States | 27,650 | | | 25,802 |
| 2006-WF1, A5, FRN, 0.452%, 2/25/36 | United States | 9,616,955 | | | 9,435,887 |
| e,gTalisman 6 Finance, Reg S, FRN, 0.507%, 10/22/16 | Ireland | 15,450,547 | EUR | | 20,656,052 |
| d,gVeritas CLO Ltd., 2006-2A, A2, 144A, FRN, 0.558%, | | | | | |
| 7/11/21 | United States | 1,300,000 | | | 1,252,550 |
Semiannual Report | 117
Franklin Investors Securities Trust
Statement of Investments, April 30, 2014 (unaudited) (continued)
| | | | |
| Franklin Total Return Fund | Country | Principal Amount* | | Value |
| Asset-Backed Securities and Commercial | | | | |
| Mortgage-Backed Securities (continued) | | | | |
| Diversified Financials (continued) | | | | |
| d,gWestchester CLO Ltd., 2007-1A, A1A, 144A, FRN, 0.463%, | | | | |
| 8/01/22 | United States | 3,492,539 | $ | 3,433,075 |
| | | | | 218,528,930 |
| Real Estate 0.2% | | | | |
| d,gCitigroup Mortgage Loan Trust Inc., 2013-A, A, 144A, FRN, | | | | |
| 3.00%, 5/25/42 | United States | 7,132,930 | | 7,193,481 |
| Total Asset-Backed Securities and Commercial | | | | |
| Mortgage-Backed Securities | | | | |
| (Cost $552,553,030) | | | | 585,676,697 |
| Mortgage-Backed Securities 19.9% | | | | |
| gFederal Home Loan Mortgage Corp. (FHLMC) | | | | |
| Adjustable Rate 0.1% | | | | |
| FHLMC, 2.018% - 3.275%, 3/01/25 - 10/01/36 | United States | 4,248,734 | | 4,501,497 |
| Federal Home Loan Mortgage Corp. (FHLMC) | | | | |
| Fixed Rate 4.1% | | | | |
| FHLMC 30 Year, 6.00%, 6/01/37 | United States | 132,410 | | 147,575 |
| FHLMC 30 Year, 6.50%, 8/01/25 - 11/01/31 | United States | 168,422 | | 190,011 |
| FHLMC 30 Year, 7.00%, 7/01/31 | United States | 7,509 | | 8,084 |
| FHLMC 30 Year, 8.00%, 2/01/30 | United States | 54,802 | | 65,828 |
| FHLMC 30 Year, 8.50%, 10/01/24 | United States | 8,923 | | 10,338 |
| FHLMC Gold 15 Year, 5.00%, 10/01/17 - 9/01/18 | United States | 104,822 | | 111,348 |
| FHLMC Gold 15 Year, 5.50%, 11/01/22 | United States | 382,398 | | 412,940 |
| FHLMC Gold 15 Year, 6.00%, 2/01/17 - 9/01/22 | United States | 900,186 | | 979,916 |
| qFHLMC Gold 30 Year, 3.00%, 5/01/43 | United States | 80,000,000 | | 77,903,128 |
| qFHLMC Gold 30 Year, 4.00%, 5/01/41 | United States | 55,000,000 | | 57,563,088 |
| FHLMC Gold 30 Year, 4.50%, 3/01/39 | United States | 4,210,196 | | 4,528,071 |
| FHLMC Gold 30 Year, 5.00%, 8/01/33 - 2/01/39 | United States | 34,638,018 | | 37,870,815 |
| FHLMC Gold 30 Year, 5.50%, 1/01/35 - 12/01/37 | United States | 3,843,364 | | 4,234,913 |
| FHLMC Gold 30 Year, 6.00%, 5/01/33 - 4/01/38 | United States | 3,619,755 | | 4,034,329 |
| FHLMC Gold 30 Year, 6.50%, 4/01/28 - 3/01/39 | United States | 2,794,641 | | 3,162,747 |
| FHLMC Gold 30 Year, 7.00%, 1/01/28 - 7/01/32 | United States | 178,156 | | 203,398 |
| FHLMC Gold 30 Year, 7.50%, 3/01/32 | United States | 34,516 | | 40,201 |
| FHLMC Gold 30 Year, 8.50%, 8/01/30 | United States | 5,044 | | 5,811 |
| FHLMC Gold 30 Year, 9.00%, 1/01/22 | United States | 15,749 | | 16,002 |
| FHLMC Gold 30 Year, 10.00%, 10/01/30 | United States | 26,768 | | 27,370 |
| | | | | 191,515,913 |
| gFederal National Mortgage Association (FNMA) | | | | |
| Adjustable Rate 0.2% | | | | |
| FNMA, 1.737% - 4.805%, 6/01/15 - 3/01/37 | United States | 10,244,819 | | 10,877,785 |
| Federal National Mortgage Association (FNMA) | | | | |
| Fixed Rate 14.4% | | | | |
| qFNMA 15 Year, 3.00%, 5/15/28 | United States | 235,000,000 | | 242,582,416 |
| FNMA 15 Year, 4.50%, 3/01/19 - 6/01/19 | United States | 269,329 | | 286,407 |
| FNMA 15 Year, 5.00%, 6/01/18 - 7/01/18 | United States | 218,333 | | 232,173 |
118 | Semiannual Report
| | | | |
| Franklin Investors Securities Trust | | |
| |
| Statement of Investments, April 30, 2014 (unaudited) (continued) | | |
| |
| |
| Franklin Total Return Fund | Country | Principal Amount* | | Value |
| Mortgage-Backed Securities (continued) | | | | |
| Federal National Mortgage Association (FNMA) | | | | |
| Fixed Rate (continued) | | | | |
| FNMA 15 Year, 5.50%, 6/01/16 - 12/01/23 | United States | 674,199 | $ | 733,298 |
| FNMA 15 Year, 6.00%, 5/01/17 - 9/01/22 | United States | 145,420 | | 155,836 |
| FNMA 15 Year, 6.50%, 4/01/16 - 9/01/16 | United States | 4,496 | | 4,643 |
| qFNMA 30 Year, 3.00%, 5/15/43 | United States | 100,000,000 | | 97,468,750 |
| qFNMA 30 Year, 3.50%, 5/01/42 | United States | 16,000,000 | | 16,243,750 |
| qFNMA 30 Year, 4.00%, 5/01/41 | United States | 257,000,000 | | 269,338,005 |
| FNMA 30 Year, 5.00%, 6/01/36 - 5/01/39 | United States | 4,665,656 | | 5,120,870 |
| FNMA 30 Year, 5.50%, 6/01/33 - 8/01/37 | United States | 15,413,315 | | 17,198,915 |
| FNMA 30 Year, 6.00%, 9/01/32 - 9/01/38 | United States | 22,657,316 | | 25,389,688 |
| FNMA 30 Year, 6.50%, 5/01/28 - 5/01/37 | United States | 539,534 | | 607,613 |
| FNMA 30 Year, 7.00%, 11/01/25 | United States | 4,772 | | 4,897 |
| FNMA 30 Year, 7.50%, 1/01/30 | United States | 22,006 | | 26,270 |
| FNMA 30 Year, 8.50%, 4/01/30 - 5/01/32 | United States | 133,184 | | 159,854 |
| FNMA 30 Year, 9.00%, 11/01/26 - 5/01/27 | United States | 138,487 | | 153,034 |
| | | | | 675,706,419 |
| gGovernment National Mortgage Association (GNMA) | | | | |
| Adjustable Rate 0.0%† | | | | |
| GNMA, 1.625%, 1/20/23 - 10/20/26 | United States | 73,981 | | 76,920 |
| Government National Mortgage Association (GNMA) | | | | |
| Fixed Rate 1.1% | | | | |
| GNMA I SF 30 Year, 6.00%, 1/15/39 | United States | 502,781 | | 563,651 |
| GNMA I SF 30 Year, 6.50%, 10/15/31 - 7/15/38 | United States | 102,182 | | 115,711 |
| GNMA I SF 30 Year, 7.00%, 10/15/27 - 6/15/31 | United States | 65,293 | | 74,933 |
| GNMA I SF 30 Year, 7.50%, 2/15/17 - 5/15/26 | United States | 195,552 | | 206,931 |
| GNMA I SF 30 Year, 8.00%, 8/15/16 - 5/15/17 | United States | 49,042 | | 49,646 |
| GNMA I SF 30 Year, 9.00%, 9/15/25 - 1/15/31 | United States | 2,300 | | 2,429 |
| qGNMA II SF 30 Year, 3.50%, 5/01/42 | United States | 50,000,000 | | 51,453,125 |
| GNMA II SF 30 Year, 6.00%, 5/20/31 | United States | 10,132 | | 11,433 |
| GNMA II SF 30 Year, 6.50%, 3/20/28 - 7/20/38 | United States | 1,134,590 | | 1,283,091 |
| GNMA II SF 30 Year, 7.50%, 8/20/30 - 1/20/33 | United States | 92,987 | | 109,568 |
| GNMA II SF 30 Year, 8.00%, 5/20/27 - 7/20/27 | United States | 123,616 | | 128,348 |
| | | | | 53,998,866 |
| Total Mortgage-Backed Securities | | | | |
| (Cost $921,552,148) | | | | 936,677,400 |
| Municipal Bonds 5.1% | | | | |
| Alabama Federal Aid Highway Finance Authority Federal | | | | |
| Highway Revenue, Grant Anticipation Bond, 5.00%, | | | | |
| 9/01/25 | United States | 14,000,000 | | 16,025,800 |
| Arkansas State GO, Four-Lane Highway Construction and | | | | |
| Improvement Bonds, 3.25%, 6/15/22 | United States | 18,500,000 | | 19,472,545 |
| California State GO, Various Purpose, 6.00%, 11/01/39 | United States | 2,385,000 | | 2,840,297 |
| gCalifornia State Judgment Trust COP, FRN, 1.582%, | | | | |
| 6/01/15 | United States | 1,000,000 | | 982,450 |
| California State Public Works Board Lease Revenue, | | | | |
| Various Capital Projects, Series E, 4.029%, 12/01/16 | United States | 8,850,000 | | 9,171,520 |
| |
| | | Semiannual Report | 119 |
| | | | |
| Franklin Investors Securities Trust | | |
| |
| Statement of Investments, April 30, 2014 (unaudited) (continued) | | |
| |
| |
| Franklin Total Return Fund | Country | Principal Amount* | | Value |
| Municipal Bonds (continued) | | | | |
| Chicago Transit Authority Sales and Transfer Tax Receipts | | | | |
| Revenue, Pension Funding, Series A, 6.899%, | | | | |
| 12/01/40 | United States | 800,000 | $ | 969,184 |
| Coachella Valley USD, GO, Riverside and Imperial Counties, | | | | |
| Election of 2005, Series D, AGMC Insured, 5.00%, | | | | |
| 8/01/37 | United States | 6,395,000 | | 6,697,867 |
| Colorado State ISD, GO, Mitchell and Scurry Counties, | | | | |
| School Building, PSF Guarantee, 5.00%, 8/15/38 | United States | 2,600,000 | | 2,884,804 |
| Connecticut State GO, Series B, 5.00%, 4/15/18 | United States | 650,000 | | 747,858 |
| Evansville Local Public Improvement Bond Bank Revenue, | | | | |
| Sewage Works Project, Series A, 5.00%, 7/01/36 | United States | 1,355,000 | | 1,470,487 |
| Florida Hurricane Catastrophe Fund Finance Corp. Revenue, | | | | |
| Series A, 2.995%, 7/01/20 | United States | 16,800,000 | | 16,842,840 |
| Hawaii State GO, Series EH, 5.00%, 8/01/30 | United States | 1,385,000 | | 1,591,337 |
| Illinois State GO, 5.877%, 3/01/19 | United States | 9,200,000 | | 10,355,888 |
| JobsOhio Beverage System Statewide Liquor Profits Revenue, | | | | |
| senior lien, Series A, 5.00%, 1/01/38 | United States | 10,150,000 | | 10,855,222 |
| Kansas State Development Finance Authority Revenue, | | | | |
| Wichita State University Union Corp. Student Housing | | | | |
| Project, Refunding, Series F-1, | | | | |
| 5.25%, 6/01/38 | United States | 3,720,000 | | 4,003,873 |
| 5.25%, 6/01/42 | United States | 3,700,000 | | 3,968,213 |
| 5.00%, 6/01/46 | United States | 4,400,000 | | 4,585,988 |
| Massachusetts State GO, Consolidated Loan of 2014, | | | | |
| Series A, 4.50%, 12/01/43 | United States | 4,950,000 | | 5,159,484 |
| Metropolitan Boston Transit Parking Corp. Systemwide | | | | |
| Parking Revenue, senior lien, 5.00%, 7/01/41 | United States | 3,500,000 | | 3,731,455 |
| Minnesota State GO, Various Purpose, Refunding, Series F, | | | | |
| 4.00%, 10/01/24 | United States | 5,760,000 | | 6,469,805 |
| Mississippi State GO, Series B, 5.00%, 12/01/31 | United States | 1,565,000 | | 1,795,650 |
| Nassau County GO, General Improvement Bonds, Series B, | | | | |
| 5.00%, | | | | |
| 4/01/39 | United States | 7,700,000 | | 8,153,453 |
| 4/01/43 | United States | 8,150,000 | | 8,555,788 |
| New Jersey EDA Revenue, School Facilities Construction, | | | | |
| Refunding, Series NN, 5.00%, 3/01/30 | United States | 3,300,000 | | 3,612,444 |
| New York City Municipal Water Finance Authority Water and | | | | |
| Sewer System Revenue, Second General Resolution, | | | | |
| Fiscal 2014, Refunding, Series BB, 5.00%, 6/15/46 | United States | 4,865,000 | | 5,229,388 |
| New York State Urban Development Corp. Revenue, State | | | | |
| Personal Income Tax, General Purpose, Series C, 5.00%, | | | | |
| 3/15/29 | United States | 20,725,000 | | 23,514,378 |
| Puerto Rico Electric Power Authority Power Revenue, | | | | |
| Series A, 6.75%, 7/01/36 | United States | 12,000,000 | | 7,863,960 |
| Puerto Rico Sales Tax FICO Sales Tax Revenue, | | | | |
| Capital Appreciation, Series A, zero cpn., 8/01/25 | United States | 7,450,000 | | 3,101,212 |
| first subordinate, Series A, 6.50%, 8/01/44 | United States | 13,200,000 | | 11,083,380 |
120 | Semiannual Report
| | | | | |
| Franklin Investors Securities Trust | | | |
| |
| Statement of Investments, April 30, 2014 (unaudited) (continued) | | | |
| |
| |
| Franklin Total Return Fund | Country | Principal Amount* | | | Value |
| Municipal Bonds (continued) | | | | | |
| South Carolina State Public Service Authority Revenue, | | | | | |
| Refunding, Series B, 5.00%, 12/01/38 | United States | 4,500,000 | | $ | 4,840,020 |
| University of California Revenues, General, Series AK, | | | | | |
| 5.00%, 5/15/48 | United States | 25,000,000 | | | 30,247,500 |
| Washington State GO, Various Purpose, | | | | | |
| Refunding, Series R-C, 5.00%, 7/01/24 | United States | 1,800,000 | | | 2,164,518 |
| Series D, 5.00%, 2/01/23 | United States | 1,600,000 | | | 1,902,112 |
| Total Municipal Bonds (Cost $235,572,993) | | | | | 240,890,720 |
| |
| | | Shares | | | |
| aEscrows and Litigation Trusts 0.0%† | | | | | |
| jComfort Co. Inc., Escrow Account | United States | 716 | | | — |
| Motors Liquidation Co., Escrow Account, cvt. pfd., C | United States | 43,500 | | | 435 |
| Motors Liquidation Co., GUC Trust, Escrow Account | United States | 1,113 | | | 30,663 |
| jNewPage Corp., Litigation Trust | United States | 2,500,000 | | | — |
| Total Escrows and Litigation Trusts | | | | | |
| (Cost $47,628) | | | | | 31,098 |
| |
| | Counterparty | Notional Amount* | | | |
| Options Purchased 0.0%† | | | | | |
| Calls – Over-the-Counter | | | | | |
| Credit Default Swaptions 0.0%† | | | | | |
| Buy protection on CDX.NA.HY.22, Premium rate 0.56%, | | | | | |
| Strike Price $102, Expires 6/18/14 | FBCO | 23,100,000 | r | $ | 36,406 |
| Buy protection on CDX.NA.IG.22, Premium Rate 0.688%, | | | | | |
| Strike Price $100, Expires 6/18/14 | FBCO | 70,000,000 | r | | 3,850 |
| | | | | | 40,256 |
| Currency Options 0.0%† | | | | | |
| USD/JPY, July Strike Price 102.50 JPY, Expires 7/25/14 | GSCO | 22,350,000 | r | | 288,248 |
| USD/KRW, October Strike Price 1,040 KRW, Expires | | | | | |
| 10/16/14 | BZWS | 19,000,000 | r | | 431,528 |
| | | | | | 719,776 |
| Puts – Over-the-Counter | | | | | |
| Currency Options 0.0%† | | | | | |
| EUR/PLN, October Strike Price 4.13 PLN, Expires | | | | | |
| 10/22/14 | BZWS | 33,347,129 | r EUR | | 252,159 |
| EUR/SEK, May Strike Price 8.955 SEK, Expires 5/23/14 | BZWS | 36,800,000 | r EUR | | 141,150 |
| | | | | | 393,309 |
| Total Options Purchased (Cost $2,640,143) | | | | | 1,153,341 |
| Total Investments before Short Term Investments | | | | | |
| (Cost $4,806,705,808) | | | | | 4,935,492,207 |
Semiannual Report | 121
Franklin Investors Securities Trust
Statement of Investments, April 30, 2014 (unaudited) (continued)
| | | | | | | |
| Franklin Total Return Fund | Country | Principal Amount* | | Value | |
| Short Term Investments 10.8% | | | | | | | |
| Foreign Government and Agency Securities 0.7% | | | | | | | |
| sBank of Negara Monetary Notes, 5/15/14 - 11/06/14 | Malaysia | 94,878,000 | | MYR | $ | 28,886,450 | |
| sHungary Treasury Bill, 6/25/14 | Hungary | 74,300,000 | | HUF | | 334,814 | |
| Korea Monetary Stabilization Bond, senior bond, 2.55%, | | | | | | | |
| 5/09/14 | South Korea | 4,899,700,000 | | KRW | | 4,742,707 | |
| sMalaysia Treasury Bill, 5/30/14 | Malaysia | 1,600,000 | | MYR | | 489,293 | |
| sPhilippine Treasury Bills, 7/02/14 - 11/05/14 | Philippines | 44,540,000 | | PHP | | 995,330 | |
| Total Foreign Government and Agency Securities | | | | | | | |
| (Cost $35,905,064) | | | | | | 35,448,594 | |
| Total Investments before Money Market Funds | | | | | | | |
| (Cost $4,842,610,872) | | | | | | 4,970,940,801 | |
| |
| | | Shares | | | | | |
| Money Market Funds (Cost $476,276,903) 10.1% | | | | | | | |
| a,tInstitutional Fiduciary Trust Money Market Portfolio | United States | 476,276,903 | | | | 476,276,903 | |
| Total Investments | | | | | | | |
| (Cost $5,318,887,775) 115.9% | | | | | | 5,447,217,704 | |
| Options Written (0.0)%† | | | | | | (173,605 | ) |
| Other Assets, less Liabilities (15.9)% | | | | | | (748,939,873 | ) |
| Net Assets 100.0% | | | | | $ | 4,698,104,226 | |
| |
| |
| |
| | Counterparty | Notional Amount* | | | |
| uOptions Written (0.0)%† | | | | | | | |
| Calls – Over-the-Counter | | | | | | | |
| Currency Options (0.0)%† | | | | | | | |
| USD/JPY, July Strike Price 109 JPY, Expires 7/25/14 | GSCO | 22,350,000 | r | | $ | (12,181 | ) |
| USD/KRW, October Strike Price 1,100 KRW, Expires | | | | | | | |
| 10/16/14 | BZWS | 19,000,000 | r | | | (161,424 | ) |
| Total Options Written | | | | | | | |
| (Premiums Received $351,737) | | | | | $ | (173,605 | ) |
†Rounds to less than 0.1% of net assets.
*The principal amount is stated in U.S. dollars unless otherwise indicated.
aNon-income producing.
bAt April 30, 2014, pursuant to the Fund’s policies and the requirements of applicable securities law, the Fund may be restricted from trading these securities for a limited or
extended period of time due to ownership limits and/or potential possession of material non-public information.
cThe security is owned by Delaware Corporation, a wholly-owned subsidiary of the Fund. See Note 1(h).
dSecurity was purchased pursuant to Rule 144A under the Securities Act of 1933 and may be sold in transactions exempt from registration only to qualified institutional buyers or
in a public offering registered under the Securities Act of 1933. These securities have been deemed liquid under guidelines approved by the Trust’s Board of Trustees. At April 30,
2014, the aggregate value of these securities was $500,229,585, representing 10.65% of net assets.
eSecurity was purchased pursuant to Regulation S under the Securities Act of 1933, which exempts from registration securities offered and sold outside of the United States. Such
a security cannot be sold in the United States without either an effective registration statement filed pursuant to the Securities Act of 1933, or pursuant to an exemption from
registration. These securities have been deemed liquid under guidelines approved by the Trust’s Board of Trustees. At April 30, 2014, the aggregate value of these securities was
$62,923,183, representing 1.34% of net assets.
122 | Semiannual Report
Franklin Investors Securities Trust
Statement of Investments, April 30, 2014 (unaudited) (continued)
|
| Franklin Total Return Fund |
fPerpetual security with no stated maturity date.
gThe coupon rate shown represents the rate at period end.
hSee Note 1(g) regarding loan participation notes.
iSee Note 1(j) regarding senior floating rate interests.
jSecurity has been deemed illiquid because it may not be able to be sold within seven days. At April 30, 2014, the aggregate value of these securities was $34,954, representing
less than 0.01% of net assets.
kIncome may be received in additional securities and/or cash.
lPrincipal amount is stated in 100 Mexican Peso Units.
mPrincipal amount of security is adjusted for inflation. See Note 1(l).
nPrincipal amount is stated in 1,000 Brazilian Real Units.
oRedemption price at maturity is adjusted for inflation. See Note 1(l).
pThe bond pays interest and/or principal based upon the issuer's ability to pay, which may be less than the stated interest rate or principal paydown.
qSecurity purchased on a to-be-announced (TBA) basis. See Note 1(d).
rAmount represents notional amount under the terms of the option.
sThe security is traded on a discount basis with no stated coupon rate.
tSee Note 3(f) regarding investments in the Institutional Fiduciary Trust Money Market Portfolio.
uSee Note 1(e) regarding written options.
At April 30, 2014, the fund had the following forward exchange contracts outstanding. See Note 1(e).
| | | | | | | | | | | |
| Forward Exchange Contracts | | | | | | | | | | | |
| |
| | | | | | Contract | Settlement | | Unrealized | | Unrealized | |
| Currency | Counterpartya Type | Quantity | | Amount | Date | | Appreciation | | Depreciation | |
| Swedish Krona | DBAB | Buy | 658,122,387 | $ | 100,033,803 | 5/06/14 | $ | 1,165,476 | $ | — | |
| Swedish Krona | DBAB | Sell | 658,122,387 | | 99,861,268 | 5/06/14 | | 34,037 | | (1,372,048 | ) |
| Japanese Yen | DBAB | Buy | 3,107,440,000 | | 30,479,931 | 5/07/14 | | 135,166 | | (211,256 | ) |
| Japanese Yen | DBAB | Sell | 3,107,440,000 | | 32,000,000 | 5/07/14 | | 1,596,159 | | — | |
| Singapore Dollar | MSCO | Buy | 13,200,000 | | 10,632,214 | 5/08/14 | | — | | (102,551 | ) |
| Singapore Dollar | MSCO | Sell | 13,200,000 | | 10,490,344 | 5/08/14 | | — | | (39,319 | ) |
| Euro | DBAB | Buy | 1,600,000 | | 2,198,088 | 5/09/14 | | 21,383 | | — | |
| Euro | DBAB | Sell | 1,600,000 | | 2,100,400 | 5/09/14 | | — | | (119,071 | ) |
| Euro | DBAB | Sell | 585,912 | | 756,530 | 5/19/14 | | — | | (56,210 | ) |
| Singapore Dollar | JPHQ | Buy | 21,730,000 | | 17,381,219 | 5/21/14 | | — | | (47,190 | ) |
| Singapore Dollar | JPHQ | Sell | 6,280,000 | | 5,006,777 | 5/21/14 | | — | | (2,782 | ) |
| Canadian Dollar | DBAB | Buy | 2,397,060 | | 2,300,000 | 5/28/14 | | — | | (114,516 | ) |
| Canadian Dollar | DBAB | Sell | 2,397,060 | | 2,168,500 | 5/28/14 | | — | | (16,984 | ) |
| Swedish Krona | DBAB | Buy | 19,384,470 | | 2,900,000 | 5/28/14 | | 79,514 | | — | |
| Swedish Krona | DBAB | Sell | 19,384,470 | | 2,984,614 | 5/28/14 | | 5,100 | | — | |
| Euro | GSCO | Sell | 1,024,000 | | 1,320,294 | 5/30/14 | | — | | (100,095 | ) |
| Euro | DBAB | Buy | 4,089,378 | | 5,618,234 | 6/05/14 | | 54,048 | | — | |
| Euro | DBAB | Sell | 4,231,115 | | 5,505,950 | 6/05/14 | | — | | (362,931 | ) |
| Euro | DBAB | Sell | 1,450,000 | | 1,903,959 | 6/09/14 | | — | | (107,281 | ) |
| Japanese Yen | BZWS | Sell | 425,100,000 | | 4,368,235 | 6/10/14 | | 208,103 | | — | |
| Japanese Yen | HSBC | Sell | 452,730,000 | | 4,680,251 | 6/10/14 | | 249,725 | | — | |
| Japanese Yen | JPHQ | Sell | 307,010,000 | | 3,120,133 | 6/10/14 | | 115,659 | | — | |
| Japanese Yen | DBAB | Sell | 149,900,000 | | 1,559,898 | 6/11/14 | | 92,932 | | — | |
Semiannual Report | 123
| | | | | | | | | | | |
| Franklin Investors Securities Trust | | | | | |
| |
| Statement of Investments, April 30, 2014 (unaudited) (continued) | | | | | |
| |
| |
| Franklin Total Return Fund | | | | | | | | | | | |
| |
| Forward Exchange Contracts (continued) | | | | | | | | | | |
| |
| | | | | | Contract | Settlement | | Unrealized | | Unrealized | |
| Currency | Counterpartya Type | Quantity | | Amount | Date | | Appreciation | | Depreciation | |
| Japanese Yen | JPHQ | Sell | 419,460,000 | $ | 4,368,301 | 6/11/14 | $ | 263,340 | $ | — | |
| Japanese Yen | JPHQ | Sell | 176,900,000 | | 1,872,255 | 6/17/14 | | 140,999 | | — | |
| Euro | DBAB | Buy | 2,667,574 | | 3,629,100 | 6/18/14 | | 70,900 | | — | |
| Euro | DBAB | Sell | 3,008,443 | | 4,018,076 | 6/18/14 | | — | | (154,719 | ) |
| Singapore Dollar | DBAB | Buy | 3,192,500 | | 2,543,825 | 6/18/14 | | 2,853 | | — | |
| Euro | DBAB | Buy | 16,345,000 | | 22,621,480 | 6/20/14 | | 49,378 | | — | |
| Euro | DBAB | Sell | 16,345,000 | | 22,487,451 | 6/20/14 | | — | | (183,407 | ) |
| Singapore Dollar | HSBC | Buy | 2,551,000 | | 2,026,211 | 6/20/14 | | 8,739 | | — | |
| Euro | DBAB | Buy | 3,326,267 | | 4,508,423 | 6/27/14 | | 105,093 | | — | |
| Euro | DBAB | Sell | 3,758,000 | | 4,933,728 | 6/27/14 | | — | | (278,599 | ) |
| Euro | DBAB | Buy | 2,078,700 | | 2,817,470 | 7/03/14 | | 65,649 | | — | |
| Euro | DBAB | Sell | 2,078,700 | | 2,715,614 | 7/03/14 | | — | | (167,505 | ) |
| Euro | DBAB | Buy | 10,304,280 | | 13,969,513 | 7/17/14 | | 322,126 | | — | |
| Euro | DBAB | Sell | 10,304,280 | | 13,567,646 | 7/17/14 | | — | | (723,993 | ) |
| Euro | DBAB | Sell | 242,213 | | 318,273 | 7/23/14 | | — | | (17,665 | ) |
| Euro | DBAB | Sell | 381,725 | | 505,785 | 7/25/14 | | — | | (23,648 | ) |
| Euro | BZWS | Buy | 1,781,670 | | 2,466,312 | 7/28/14 | | 4,767 | | — | |
| Euro | BZWS | Sell | 6,000,000 | | 7,946,400 | 7/28/14 | | — | | (375,272 | ) |
| Chilean Peso | MSCO | Buy | 3,670,729,000 | | 6,937,029 | 7/29/14 | | — | | (493,989 | ) |
| Euro | DBAB | Sell | 400,000 | | 530,140 | 7/29/14 | | — | | (24,638 | ) |
| Euro | BZWS | Buy | 8,373,330 | | 11,590,698 | 8/04/14 | | 22,583 | | — | |
| Euro | BZWS | Sell | 8,373,330 | | 11,118,526 | 8/04/14 | | — | | (494,755 | ) |
| Euro | JPHQ | Sell | 633,667 | | 838,153 | 8/06/14 | | — | | (40,701 | ) |
| Euro | CITI | Sell | 477,390 | | 635,549 | 8/08/14 | | — | | (26,558 | ) |
| Euro | CITI | Sell | 138,480 | | 184,523 | 8/11/14 | | — | | (7,539 | ) |
| Euro | DBAB | Buy | 3,700,000 | | 5,120,430 | 8/11/14 | | 11,207 | | — | |
| Euro | DBAB | Sell | 3,700,000 | | 4,933,395 | 8/11/14 | | — | | (198,242 | ) |
| Euro | DBAB | Sell | 1,480,000 | | 1,964,744 | 8/15/14 | | — | | (87,904 | ) |
| Euro | MSCO | Sell | 1,183,364 | | 1,570,312 | 8/15/14 | | — | | (70,924 | ) |
| Euro | DBAB | Buy | 3,800,000 | | 5,152,420 | 8/20/14 | | 117,870 | | — | |
| Euro | DBAB | Sell | 4,038,200 | | 5,387,326 | 8/20/14 | | — | | (213,329 | ) |
| Euro | BZWS | Sell | 1,056,192 | | 1,415,920 | 8/25/14 | | — | | (48,926 | ) |
| Euro | JPHQ | Sell | 3,445,999 | | 4,608,093 | 8/27/14 | | — | | (171,199 | ) |
| Malaysian Ringgit | JPHQ | Buy | 12,560,000 | | 3,739,987 | 8/27/14 | | 81,546 | | — | |
| Malaysian Ringgit | JPHQ | Sell | 9,890,000 | | 2,998,333 | 8/27/14 | | — | | (10,821 | ) |
| Euro | DBAB | Sell | 809,975 | | 1,071,354 | 8/28/14 | | — | | (52,008 | ) |
| Philippine Peso | JPHQ | Buy | 566,370,000 | | 12,761,830 | 8/29/14 | | — | | (65,291 | ) |
| Euro | BZWS | Sell | 267,947 | | 357,977 | 9/19/14 | | — | | (13,634 | ) |
| Euro | UBSW | Sell | 2,880,000 | | 3,849,408 | 9/22/14 | | — | | (144,808 | ) |
| Euro | BZWS | Sell | 649,831 | | 879,715 | 9/24/14 | | — | | (21,521 | ) |
| Euro | DBAB | Buy | 2,644,115 | | 3,641,740 | 9/30/14 | | 25,307 | | — | |
| Euro | DBAB | Sell | 9,457,000 | | 12,770,449 | 9/30/14 | | — | | (345,192 | ) |
124 | Semiannual Report
| | | | | | | | | | | |
| Franklin Investors Securities Trust | | | | | |
| |
| Statement of Investments, April 30, 2014 (unaudited) (continued) | | | | | |
| |
| |
| Franklin Total Return Fund | | | | | | | | | | | |
| |
| Forward Exchange Contracts (continued) | | | | | | | | | | |
| |
| | | | | | Contract | Settlement | | Unrealized | | Unrealized | |
| Currency | Counterpartya Type | Quantity | | Amount | Date | | Appreciation | | Depreciation | |
| British Pound | DBAB | Sell | 4,636,500 | $ | 7,228,304 | 10/01/14 | $ | — | $ | (588,476 | ) |
| Euro | DBAB | Sell | 10,525,238 | | 14,281,695 | 10/08/14 | | — | | (315,357 | ) |
| Euro | HSBC | Sell | 267,000 | | 362,594 | 10/20/14 | | — | | (7,694 | ) |
| Malaysian Ringgit | JPHQ | Buy | 1,626,000 | | 502,612 | 10/20/14 | | — | | (9,457 | ) |
| Euro | DBAB | Sell | 6,799,883 | | 9,315,364 | 10/22/14 | | — | | (115,025 | ) |
| Chilean Peso | CITI | Buy | 906,403,000 | | 1,739,737 | 10/24/14 | | — | | (162,477 | ) |
| Japanese Yen | DBAB | Sell | 117,763,200 | | 1,213,816 | 10/29/14 | | 60,304 | | — | |
| Euro | DBAB | Sell | 168,369 | | 227,323 | 10/30/14 | | — | | (6,178 | ) |
| Chilean Peso | DBAB | Buy | 651,808,600 | | 1,236,430 | 10/31/14 | | — | | (102,912 | ) |
| Euro | DBAB | Sell | 3,725,791 | | 5,085,781 | 10/31/14 | | — | | (81,296 | ) |
| Euro | DBAB | Sell | 961,000 | | 1,301,050 | 11/10/14 | | — | | (31,705 | ) |
| Euro | JPHQ | Sell | 78,316 | | 104,430 | 11/12/14 | | — | | (4,182 | ) |
| Japanese Yen | JPHQ | Sell | 857,065,000 | | 8,666,852 | 11/13/14 | | 270,650 | | — | |
| Euro | MSCO | Sell | 1,183,360 | | 1,592,548 | 11/17/14 | | — | | (48,586 | ) |
| Singapore Dollar | MSCO | Buy | 14,102,839 | | 11,315,312 | 11/17/14 | | — | | (63,377 | ) |
| Malaysian Ringgit | DBAB | Buy | 1,339,880 | | 411,170 | 11/19/14 | | — | | (5,448 | ) |
| Euro | DBAB | Sell | 233,000 | | 315,331 | 11/20/14 | | — | | (7,804 | ) |
| Euro | JPHQ | Sell | 888,264 | | 1,202,367 | 11/20/14 | | — | | (29,515 | ) |
| Japanese Yen | JPHQ | Sell | 2,236,935,360 | | 22,425,080 | 11/20/14 | | 509,705 | | — | |
| Malaysian Ringgit | HSBC | Buy | 790,000 | | 242,629 | 11/20/14 | | — | | (3,426 | ) |
| Euro | MSCO | Sell | 4,438,000 | | 6,012,425 | 12/04/14 | | — | | (142,390 | ) |
| Euro | DBAB | Sell | 159,550 | | 219,405 | 12/18/14 | | — | | (1,866 | ) |
| Malaysian Ringgit | DBAB | Buy | 2,028,100 | | 605,403 | 1/07/15 | | 7,149 | | — | |
| Canadian Dollar | BZWS | Buy | 8,841,000 | | 7,999,734 | 1/09/15 | | 15,792 | | — | |
| Canadian Dollar | CITI | Buy | 2,898,000 | | 2,587,731 | 1/09/15 | | 39,686 | | — | |
| Canadian Dollar | DBAB | Buy | 7,846,000 | | 7,077,107 | 1/09/15 | | 36,320 | | — | |
| Canadian Dollar | DBAB | Sell | 3,143,000 | | 2,827,710 | 1/09/15 | | — | | (21,831 | ) |
| Chilean Peso | BZWS | Buy | 1,862,800,000 | | 3,214,495 | 1/09/15 | | 6,204 | | — | |
| Euro | BZWS | Sell | 2,472,961 | | 3,403,808 | 1/09/15 | | — | | (25,813 | ) |
| Euro | CITI | Sell | 2,584,200 | | 3,501,824 | 1/09/15 | | — | | (82,070 | ) |
| Euro | DBAB | Sell | 22,752,696 | | 30,970,795 | 1/09/15 | | — | | (583,742 | ) |
| Euro | JPHQ | Sell | 1,062,724 | | 1,462,175 | 1/09/15 | | — | | (11,662 | ) |
| Japanese Yen | BZWS | Sell | 716,900,000 | | 7,019,508 | 1/09/15 | | — | | (7,046 | ) |
| Japanese Yen | CITI | Sell | 1,431,560,000 | | 14,003,848 | 1/09/15 | | — | | (27,304 | ) |
| Japanese Yen | DBAB | Sell | 14,747,964,120 | | 142,590,432 | 1/09/15 | | 150,165 | | (2,108,984 | ) |
| Japanese Yen | GSCO | Sell | 478,870,000 | | 4,677,150 | 1/09/15 | | — | | (16,400 | ) |
| Japanese Yen | HSBC | Sell | 720,750,000 | | 7,136,351 | 1/09/15 | | 72,062 | | — | |
| Japanese Yen | JPHQ | Sell | 1,676,801,000 | | 16,492,272 | 1/09/15 | | 74,285 | | (16,846 | ) |
| Malaysian Ringgit | DBAB | Buy | 21,721,000 | | 6,426,902 | 1/09/15 | | 132,868 | | — | |
| Singapore Dollar | DBAB | Buy | 12,305,600 | | 9,708,066 | 1/09/15 | | 111,028 | | — | |
| Euro | DBAB | Sell | 8,374,000 | | 10,924,894 | 2/06/15 | | — | | (688,828 | ) |
| Canadian Dollar | BZWS | Buy | 1,848,000 | | 1,653,884 | 2/09/15 | | 20,315 | | — | |
| Canadian Dollar | HSBC | Buy | 3,103,000 | | 2,776,897 | 2/09/15 | | 34,271 | | — | |
Semiannual Report | 125
| | | | | | | | | | | |
| Franklin Investors Securities Trust | | | | | |
| |
| Statement of Investments, April 30, 2014 (unaudited) (continued) | | | | | |
| |
| |
| Franklin Total Return Fund | | | | | | | | | | | |
| |
| Forward Exchange Contracts (continued) | | | | | | | | | | |
| |
| | | | | | Contract | Settlement | | Unrealized | | Unrealized | |
| Currency | Counterpartya Type | Quantity | | Amount | Date | | Appreciation | | Depreciation | |
| Chilean Peso | DBAB | Buy | 225,860,000 | $ | 390,761 | 2/09/15 | $ | — | $ | (1,252 | ) |
| Chilean Peso | JPHQ | Buy | 824,603,750 | | 1,406,694 | 2/09/15 | | 15,384 | | — | |
| Euro | DBAB | Sell | 53,496,190 | | 73,777,245 | 2/09/15 | | 4,680 | | (420,543 | ) |
| Euro | JPHQ | Sell | 6,587,400 | | 9,159,359 | 2/09/15 | | 23,387 | | — | |
| Singapore Dollar | DBAB | Buy | 2,965,200 | | 2,341,255 | 2/09/15 | | 24,942 | | — | |
| Singapore Dollar | HSBC | Buy | 3,390,000 | | 2,676,953 | 2/09/15 | | 28,230 | | — | |
| Singapore Dollar | JPHQ | Buy | 2,117,000 | | 1,671,905 | 2/09/15 | | 17,437 | | — | |
| Chilean Peso | JPHQ | Buy | 562,321,000 | | 980,507 | 3/09/15 | | — | | (12,958 | ) |
| Chilean Peso | MSCO | Buy | 1,195,400,000 | | 2,114,707 | 3/09/15 | | — | | (57,859 | ) |
| Euro | DBAB | Sell | 603,000 | | 831,838 | 3/09/15 | | — | | (4,494 | ) |
| Euro | JPHQ | Sell | 11,680,000 | | 16,112,151 | 3/09/15 | | — | | (87,456 | ) |
| Japanese Yen | DBAB | Sell | 1,040,440,000 | | 10,185,414 | 3/09/15 | | — | | (18,405 | ) |
| Singapore Dollar | MSCO | Buy | 8,200,000 | | 6,528,143 | 3/09/15 | | 15,757 | | — | |
| Swiss Franc | DBAB | Buy | 13,270,875 | | 14,680,171 | 4/16/15 | | 453,326 | | — | |
| Swiss Franc | DBAB | Sell | 13,270,875 | | 14,914,055 | 4/16/15 | | — | | (219,444 | ) |
| Euro | DBAB | Sell | 31,500,000 | | 41,507,550 | 6/05/15 | | — | | (2,188,079 | ) |
| Euro | DBAB | Sell | 1,710,278 | | 2,198,391 | 6/22/15 | | — | | (174,111 | ) |
| Euro | DBAB | Sell | 8,374,000 | | 10,963,814 | 2/05/16 | | — | | (657,188 | ) |
| Euro | DBAB | Sell | 10,260,000 | | 13,583,727 | 8/05/16 | | — | | (659,033 | ) |
| Unrealized appreciation (depreciation) | | | | | | | 7,173,606 | | (16,927,540 | ) |
| Net unrealized appreciation (depreciation) | | | | | | | | $ | (9,753,934 | ) |
aMay be comprised of multiple contracts using the same currency and settlement date.
At April 30, 2014, the fund had the following credit default swap contracts outstanding. See Note 1(e).
| | | | | | | | | | | | | | | | | |
| Credit Default Swap Contracts | | | | | | | | | | | | | | | | |
| |
| | | | | | | | Upfront | | | | | | | | | | |
| | | | Periodic | | | | Premiums | | | | | | | | | | |
| | Counterparty/ | Notional | Payment | | Expiration | | Paid | | | Unrealized | | Unrealized | | | | | |
| Description | Exchange | Amounta | Rate | | Date | | (Received) | | | Appreciation | | Depreciation | | | Value | | Ratingb |
| OTC Swaps | | | | | | | | | | | | | | | | | |
| Contracts to Buy Protection | | | | | | | | | | | | | | | | | |
| Single Name | | | | | | | | | | | | | | | | | |
| Centex Corp. | FBCO | 7,795,000 | 5.00 | % | 6/20/16 | $ | (417,907 | ) | $ | — | $ | (399,162 | ) | $ | (817,069 | ) | |
| Centex Corp. | JPHQ | 12,000,000 | 5.00 | % | 6/20/16 | | (770,068 | ) | | — | | (487,767 | ) | | (1,257,835 | ) | |
| CIT Group Inc. | GSCO | 22,500,000 | 5.00 | % | 6/20/17 | | (2,216,662 | ) | | — | | (490,736 | ) | | (2,707,398 | ) | |
| CNA Financial Corp. | GSCO | 10,000,000 | 5.00 | % | 12/20/14 | | (209,627 | ) | | — | | (108,486 | ) | | (318,113 | ) | |
| Constellation Brands Inc. | BZWS | 5,000,000 | 5.00 | % | 6/20/17 | | (480,387 | ) | | — | | (209,446 | ) | | (689,833 | ) | |
| Constellation Brands Inc. | DBAB | 2,000,000 | 5.00 | % | 6/20/17 | | (193,473 | ) | | — | | (82,460 | ) | | (275,933 | ) | |
| D.R. Horton Inc. | JPHQ | 7,000,000 | 5.00 | % | 3/20/16 | | (511,027 | ) | | — | | (88,762 | ) | | (599,789 | ) | |
| Dean Foods Co. | JPHQ | 11,506,000 | 5.00 | % | 6/20/16 | | (729,896 | ) | | — | | (327,279 | ) | | (1,057,175 | ) | |
126 | Semiannual Report
| | | | | | | | | | | | | | | | | | |
| Franklin Investors Securities Trust | | | | | | | |
| |
| Statement of Investments, April 30, 2014 (unaudited) (continued) | | | | | | | |
| |
| |
| Franklin Total Return Fund | | | | | | | | | | | | | | | | | |
| |
| Credit Default Swap Contracts (continued) | | | | | | | | | | | | | | | | |
| |
| | | | | | | | Upfront | | | | | | | | | | |
| | | | | Periodic | | | | Premiums | | | | | | | | | | |
| | Counterparty/ | Notional | | Payment | | Expiration | | Paid | | | Unrealized | | Unrealized | | | | | |
| Description | Exchange | Amounta | | Rate | | Date | | (Received) | | | Appreciation | | Depreciation | | | Value | | Ratingb |
| OTC Swaps (continued) | | | | | | | | | | | | | | | | | | |
| Contracts to Buy Protection (continued) | | | | | | | | | | | | | | | | | |
| Single Name (continued) | | | | | | | | | | | | | | | | | | |
| Embarq Corp. | BZWS | 8,500,000 | | 5.00 | % | 6/20/16 | $ | (470,246 | ) | $ | — | $ | (376,003 | ) | $ | (846,249 | ) | |
| Embarq Corp. | DBAB | 1,500,000 | | 5.00 | % | 6/20/16 | | (85,590 | ) | | — | | (63,748 | ) | | (149,338 | ) | |
| Embarq Corp. | GSCO | 10,000,000 | | 5.00 | % | 6/20/16 | | (625,843 | ) | | — | | (369,744 | ) | | (995,587 | ) | |
| First Data Corp. | BZWS | 13,100,000 | | 5.00 | % | 3/20/15 | | (280,633 | ) | | — | | (220,271 | ) | | (500,904 | ) | |
| First Data Corp. | DBAB | 3,900,000 | | 5.00 | % | 3/20/15 | | (83,584 | ) | | — | | (65,540 | ) | | (149,124 | ) | |
| Government of Ireland | MSCO | 10,000,000 | EUR | 1.00 | % | 3/20/15 | | 596,513 | | | — | | (708,283 | ) | | (111,770 | ) | |
| HCA Inc. | GSCO | 5,054,000 | | 5.00 | % | 3/20/16 | | (300,996 | ) | | — | | (110,660 | ) | | (411,656 | ) | |
| Lennar Corp. | GSCO | 7,692,000 | | 5.00 | % | 6/20/15 | | (25,858 | ) | | — | | (387,188 | ) | | (413,046 | ) | |
| Merrill Lynch & Co. Inc. | FBCO | 20,000,000 | | 1.00 | % | 9/20/17 | | 204,076 | | | — | | (530,456 | ) | | (326,380 | ) | |
| The New York Times Co. | GSCO | 11,700,000 | | 5.00 | % | 12/20/16 | | (556,157 | ) | | — | | (835,575 | ) | | (1,391,732 | ) | |
| The Ryland Group Inc. | GSCO | 4,750,000 | | 5.00 | % | 3/20/15 | | (9,213 | ) | | — | | (175,936 | ) | | (185,149 | ) | |
| Tenet Healthcare Corp | BZWS | 13,160,000 | | 5.00 | % | 12/20/16 | | (1,051,995 | ) | | — | | (154,498 | ) | | (1,206,493 | ) | |
| Tenneco Packaging Inc. | UBSW | 12,000,000 | | 5.00 | % | 6/20/17 | | 550,550 | | | — | | (1,830,219 | ) | | (1,279,669 | ) | |
| Textron Financial Corp. | MSCO | 5,126,000 | | 5.00 | % | 9/20/14 | | (85,432 | ) | | — | | (15,723 | ) | | (101,155 | ) | |
| Toll Brothers Inc. | FBCO | 2,010,000 | | 5.00 | % | 6/20/15 | | (64,665 | ) | | — | | (43,496 | ) | | (108,161 | ) | |
| Contracts to Sell Protectionc | | | | | | | | | | | | | | | | | | |
| Single Name | | | | | | | | | | | | | | | | | | |
| Bank of America Corp. | FBCO | 20,000,000 | | 1.00 | % | 9/20/17 | | (204,076 | ) | | 530,456 | | — | | | 326,380 | | A- |
| Berkshire Hathaway Finance | | | | | | | | | | | | | | | | | | |
| Corp. | FBCO | 14,300,000 | | 1.00 | % | 3/20/18 | | (65,957 | ) | | 421,729 | | — | | | 355,772 | | AA |
| Berkshire Hathaway Inc. | DBAB | 10,000,000 | | 1.00 | % | 9/20/17 | | (67,641 | ) | | 302,432 | | — | | | 234,791 | | AA |
| Citigroup Inc. | FBCO | 2,500,000 | | 1.00 | % | 9/20/20 | | 13,017 | | | 545 | | — | | | 13,562 | | A- |
| First Data Corp. | BZWS | 14,000,000 | | 5.00 | % | 3/20/16 | | 149,856 | | | 747,264 | | — | | | 897,120 | | B- |
| First Data Corp. | DBAB | 3,000,000 | | 5.00 | % | 3/20/16 | | (9,993 | ) | | 202,260 | | — | | | 192,267 | | B- |
| Freeport-McMoRan Copper | | | | | | | | | | | | | | | | | | |
| & Gold Inc. | DBAB | 6,500,000 | | 1.00 | % | 3/20/23 | | (417,136 | ) | | — | | (109,515 | ) | | (526,651 | ) | BBB |
| Government of China | BOFA | 2,500,000 | | 1.00 | % | 3/20/19 | | 5,778 | | | 11,755 | | — | | | 17,533 | | AA- |
| Government of China | JPHQ | 2,500,000 | | 1.00 | % | 3/20/19 | | (2,878 | ) | | 20,411 | | — | | | 17,533 | | AA- |
| Government of Indonesia | BZWS | 46,000,000 | | 1.00 | % | 3/20/19 | | (2,225,282 | ) | | 803,340 | | — | | | (1,421,942 | ) | BB+ |
| Prudential Financial Inc. | BOFA | 8,800,000 | | 1.00 | % | 12/20/21 | | (198,920 | ) | | 297,483 | | — | | | 98,563 | | A |
| Tenet Healthcare Corp. | BZWS | 9,400,000 | | 5.00 | % | 12/20/18 | | 585,272 | | | 214,433 | | — | | | 799,705 | | CCC+ |
Semiannual Report | 127
| | | | | | | | | | | | | | | | |
| Franklin Investors Securities Trust | | | | | | | |
| |
| Statement of Investments, April 30, 2014 (unaudited) (continued) | | | | | | | |
| |
| |
| Franklin Total Return Fund | | | | | | | | | | | | | | | |
| |
| Credit Default Swap Contracts (continued) | | | | | | | | | | | | | | |
| |
| | | | | | | Upfront | | | | | | | | | | |
| | | | Periodic | | | Premiums | | | | | | | | | | |
| | Counterparty/ | Notional | Payment | | Expiration | Paid | | | Unrealized | | Unrealized | | | | | |
| Description | Exchange | Amounta | Rate | | Date | (Received) | | | Appreciation Depreciation | | | Value | | Ratingb |
| OTC Swaps (continued) | | | | | | | | | | | | | | | | |
| Traded Index | | | | | | | | | | | | | | | | |
| CMBX.NA.AJ.2 | FBCO | 6,955,000 | 1.09 | % | 3/15/49 | (1,003,933 | ) | $ | 456,226 | $ | — | | $ | (547,707 | ) | Non |
| | | | | | | | | | | | | | | | | Investment |
| | | | | | | | | | | | | | | | | Grade |
| CMBX.NA.AM.2 | FBCO | 17,080,000 | 0.50 | % | 3/15/49 | (243,409 | ) | | 51,259 | | — | | | (192,150 | ) | Investment |
| | | | | | | | | | | | | | | | | Grade |
| LCDX.NA.20 | BZWS | 11,880,000 | 2.50 | % | 6/20/18 | 382,997 | | | 163,305 | | — | | | 546,302 | | Non |
| | | | | | | | | | | | | | | | | Investment |
| | | | | | | | | | | | | | | | | Grade |
| LCDX.NA.20 | FBCO | 18,562,500 | 2.50 | % | 6/20/18 | 428,719 | | | 424,878 | | — | | | 853,597 | | Non |
| | | | | | | | | | | | | | | | | Investment |
| | | | | | | | | | | | | | | | | Grade |
| LCDX.NA.21 | FBCO | 7,100,000 | 2.50 | % | 12/20/18 | 254,026 | | | 89,607 | | — | | | 343,633 | | Non |
| | | | | | | | | | | | | | | | | Investment |
| | | | | | | | | | | | | | | | | Grade |
| MCDX.NA.22 | GSCO | 19,100,000 | 1.00 | % | 6/20/24 | (476,659 | ) | | 170,910 | | — | | | (305,749 | ) | Investment |
| | | | | | | | | | | | | | | | | Grade |
| OTC Swaps unrealized appreciation (depreciation) | | | | | | | 4,908,293 | | (8,190,953 | ) | | | | |
| Net unrealized appreciation (depreciation) | | | | | | | | | $ | (3,282,660 | ) | | | | |
aIn U.S. dollars unless otherwise indicated. For contracts to sell protection, the notional amount is equal to the maximum potential amount of the future payments and no
recourse provisions have been entered into in association with the contracts.
bBased on Standard and Poor’s (S&P) Rating for single name swaps and internal ratings for index swaps. Internal ratings based on mapping into equivalent ratings from
external vendors.
cThe fund enters contracts to sell protection to create a long credit position. Performance triggers include default, bankruptcy or restructuring for single name swaps, and
failure to pay or bankruptcy of the underlying securities for traded index swaps.
At April 30, 2014, the fund had the following cross-currency swap contracts outstanding. See Note 1(e).
| | | | | | | | | |
| Cross Currency Swap Contracts | | | | | | | | | |
| | | | Notional | | | Unrealized | | Unrealized | |
| Description | Counterparty | Expiration Date | Amount | | | Appreciation | | Depreciation | |
| Receive Fixed semi-annual 4.50% | CITI | 1/01/16 | 15,456,481 | USD | $ | — | $ | (1,280,162 | ) |
| Pay Fixed annual 4.00% | | | 90,000,000 | DKK | | | | | |
| Receive Fixed semi-annual 2.47% | DBAB | 1/04/16 | 15,638,575 | USD | | — | | (1,056,782 | ) |
| Pay Fixed annual 2.00% | | | 90,000,000 | DKK | | | | | |
| Net unrealized appreciation (depreciation) | | | | | | | $ | (2,336,944 | ) |
| See Notes 1(e) and 10 regarding investment transactions and other derivative information, respectively. | | | | | | | | |
| |
| See Abbreviations on page 164. | | | | | | | | | |
128 | The accompanying notes are an integral part of these financial statements. | Semiannual Report
| | | | | | | | |
| Franklin Investors Securities Trust | | | | |
| |
| Financial Statements | | | | | | | | |
| |
| |
| Statements of Assets and Liabilities | | | | | | | | |
| April 30, 2014 (unaudited) | | | | | | | | |
| |
| | | Franklin | | Franklin | | Franklin | | |
| | | Adjustable | | Floating Rate | | Low Duration | | Franklin |
| | | U.S. Government | | Daily Access | | Total Return | | Total Return |
| | | Securities Fund | | Fund | | Fund | | Fund |
| Assets: | | | | | | | | |
| Investments in securities: | | | | | | | | |
| Cost - Unaffiliated issuers | $ | 1,711,024,637 | $ | 4,855,457,002 | $ | 2,104,133,961 | $ | 4,842,610,872 |
| Cost - Sweep Money Fund (Note 3f) | | 92,746,279 | | 836,939,100 | | 31,576,283 | | 476,276,903 |
| Cost - Repurchase agreements | | 10,244,802 | | — | | — | | — |
| Total cost of investments | $ | 1,814,015,718 | $ | 5,692,396,102 | $ | 2,135,710,244 | $ | 5,318,887,775 |
| Value - Unaffiliated issuers | $ | 1,745,758,292 | $ | 4,881,144,970 | $ | 2,124,542,833 | $ | 4,970,940,801 |
| Value - Sweep Money Fund (Note 3f) | | 92,746,279 | | 836,939,100 | | 31,576,283 | | 476,276,903 |
| Value - Repurchase agreements | | 10,244,802 | | — | | — | | — |
| Total value of investments | | 1,848,749,373 | | 5,718,084,070 | | 2,156,119,116 | | 5,447,217,704 |
| Cash | | — | | 6,463,397 | | 942,473 | | 797,162 |
| Restricted cash (Note 1f) | | — | | — | | — | | 2,930,000 |
| Foreign currency, at value (cost $–, $–, | | | | | | | | |
| $6,007,800 and $18,907,749) | | — | | — | | 6,044,087 | | 19,064,482 |
| Receivables: | | | | | | | | |
| Investment securities sold | | 6,308,586 | | 435,360,663 | | 12,125,405 | | 24,271,821 |
| Capital shares sold | | 2,362,461 | | 8,957,397 | | 8,034,014 | | 11,924,737 |
| Interest | | 3,952,157 | | 15,760,456 | | 9,911,316 | | 40,191,520 |
| Affiliates | | — | | — | | — | | 800,315 |
| Due from brokers | | — | | — | | 9,639,799 | | 26,645,000 |
| Prepaid expense | | — | | 300,296 | | — | | — |
| OTC swaps (premiums paid $–, $–, $1,471,302 | | | | | | | | |
| and $5,657,101) | | — | | — | | 1,323,219 | | 3,170,804 |
| Unrealized appreciation on forward exchange | | | | | | | | |
| contracts | | — | | — | | 1,100,434 | | 7,173,606 |
| Unrealized appreciation on OTC swap contracts | | — | | — | | 1,021,786 | | 4,908,293 |
| Unrealized appreciation on unfunded loan | | | | | | | | |
| commitments (Note 9) | | — | | 83,157 | | — | | — |
| Other assets | | 1,145 | | 2,965 | | 1,220 | | 2,696 |
| Total assets | | 1,861,373,722 | | 6,185,012,401 | | 2,206,262,869 | | 5,589,098,140 |
Semiannual Report | The accompanying notes are an integral part of these financial statements. | 129
| | | | | | | | | | | | | |
| Franklin Investors Securities Trust | | | | | | | |
| |
| Financial Statements (continued) | | | | | | | | | | | | | |
| |
| |
| Statements of Assets and Liabilities (continued) | | | | | | | | | | | | | |
| April 30, 2014 (unaudited) | | | | | | | | | | | | | |
| |
| | | | Franklin | | | Franklin | | | Franklin | | | | |
| | | | Adjustable | | | Floating Rate | | | Low Duration | | | Franklin | |
| | | U.S. Government | | | Daily Access | | | Total Return | | | Total Return | |
| | | Securities Fund | | | Fund | | | Fund | | | Fund | |
| Liabilities: | | | | | | | | | | | | | |
| Payables: | | | | | | | | | | | | | |
| Investment securities purchased | | $ | — | | $ | 587,500,775 | | $ | 31,820,056 | | $ | 833,038,329 | |
| Capital shares redeemed | | | 5,439,220 | | | 18,666,685 | | | 7,830,227 | | | 9,001,427 | |
| Management fees | | | 762,128 | | | 2,115,999 | | | 676,457 | | | 1,737,156 | |
| Distribution fees | | | 475,166 | | | 866,070 | | | 363,326 | | | 864,574 | |
| Transfer agent fees | | | 290,947 | | | 258,309 | | | 216,318 | | | 406,563 | |
| Distributions to shareholders | | | 183,874 | | | 6,362,030 | | | 282,879 | | | 686,646 | |
| Trustees’ fees and expenses | | | 2,823 | | | — | | | — | | | 7,127 | |
| Variation margin | | | — | | | — | | | 53,892 | | | — | |
| OTC Swaps (premiums received $–, $–, | | | | | | | | | | | | | |
| $5,473,451 and $21,383,794) | | | — | | | — | | | 5,002,165 | | | 14,085,143 | |
| Options written, at value (premiums received $–, | | | | | | | | | | | | | |
| $–, $35,151 and $351,737) | | | — | | | — | | | 29,736 | | | 173,605 | |
| Due to brokers | | | — | | | — | | | — | | | 3,210,000 | |
| Unrealized depreciation on forward exchange | | | | | | | | | | | | | |
| contracts | | | — | | | — | | | 5,135,420 | | | 16,927,540 | |
| Unrealized depreciation on OTC swap contracts | | | — | | | — | | | 2,310,969 | | | 10,527,897 | |
| Unrealized depreciation on unfunded loan | | | | | | | | | | | | | |
| commitments (Note 9) | | | — | | | — | | | — | | | 2,692 | |
| Accrued expenses and other liabilities | | | 238,559 | | | 227,848 | | | 22,716 | | | 325,215 | |
| Total liabilities | | | 7,392,717 | | | 615,997,716 | | | 53,744,161 | | | 890,993,914 | |
| Net assets, at value | $ | 1,853,981,005 | | $ | 5,569,014,685 | | $ | 2,152,518,708 | | $ | 4,698,104,226 | |
| Net assets consist of: | | | | | | | | | | | | | |
| Paid-in capital | $ | 1,931,591,500 | | $ | 5,776,723,883 | | $ | 2,167,264,372 | | $ | 4,668,245,403 | |
| Undistributed net investment income (distributions | | | | | | | | | | | | | |
| in excess of net investment income) | | | (6,543,046 | ) | | 1,191,176 | | | (14,607,116 | ) | | (64,289,257 | ) |
| Net unrealized appreciation (depreciation) | | | 34,733,655 | | | 25,771,125 | | | 15,038,554 | | | 113,199,218 | |
| Accumulated net realized gain (loss) | | | (105,801,104 | ) | | (234,671,499 | ) | | (15,177,102 | ) | | (19,051,138 | ) |
| Net assets, at value | $ | 1,853,981,005 | | $ | 5,569,014,685 | | $ | 2,152,518,708 | | $ | 4,698,104,226 | |
130 | The accompanying notes are an integral part of these financial statements. | Semiannual Report
| | | | | | | | | | | | | |
| Franklin Investors Securities Trust | | | | | | |
| |
| Financial Statements (continued) | | | | | | | | | | | | | |
| |
| |
| Statements of Assets and Liabilities (continued) | | | | | | | | | | | | | |
| April 30, 2014 (unaudited) | | | | | | | | | | | | | |
| |
| | | | Franklin | | | | Franklin | | | Franklin | | | |
| | | | Adjustable | | | | Floating Rate | | | Low Duration | | | Franklin |
| | U.S. Government | | | | Daily Access | | | Total Return | | | Total Return |
| | Securities Fund | | | | Fund | | | Fund | | | Fund |
| Class A: | | | | | | | | | | | | | |
| Net assets, at value | $ | | 992,054,290 | $ | 2,088,190,478 | $ | | 1,410,302,156 | $ | | 3,047,958,653 |
| Shares outstanding | | | 114,104,829 | | | | 227,871,232 | | | 139,184,701 | | | 303,383,303 |
| Net asset value per sharea | | $ | 8.69 | | | $ | 9.16 | | $ | 10.13 | | $ | 10.05 |
| Maximum offering price per share (net asset value | | | | | | | | | | | | | |
| per share ÷ 97.75%, 97.75%, 97.75% and | | | | | | | | | | | | | |
| 95.75%, respectively) | | $ | 8.89 | | | $ | 9.37 | | $ | 10.36 | | $ | 10.50 |
| Class C: | | | | | | | | | | | | | |
| Net assets, at value | $ | | 499,139,819 | | $ | | 812,289,806 | $ | | 144,834,304 | $ | | 413,614,562 |
| Shares outstanding | | | 57,448,719 | | | | 88,620,529 | | | 14,302,873 | | | 41,252,724 |
| Net asset value and maximum offering price per | | | | | | | | | | | | | |
| sharea | | $ | 8.69 | | | $ | 9.17 | | $ | 10.13 | | $ | 10.03 |
| Class R: | | | | | | | | | | | | | |
| Net assets, at value | | | — | | | | — | | | — | $ | | 55,628,918 |
| Shares outstanding | | | — | | | | — | | | — | | | 5,541,914 |
| Net asset value and maximum offering price per | | | | | | | | | | | | | |
| share | | | — | | | | — | | | — | | $ | 10.04 |
| Class R6: | | | | | | | | | | | | | |
| Net assets, at value | $ | | 544,025 | | $ | | 908,862 | $ | | 413,763,106 | $ | | 8,977,974 |
| Shares outstanding | | | 62,476 | | | | 99,131 | | | 40,733,776 | | | 891,668 |
| Net asset value and maximum offering price per | | | | | | | | | | | | | |
| share | | $ | 8.71 | | | $ | 9.17 | | $ | 10.16 | | $ | 10.07 |
| Advisor Class: | | | | | | | | | | | | | |
| Net assets, at value | $ | | 362,242,871 | $ | 2,667,625,539 | $ | | 183,619,142 | $ | | 1,171,924,119 |
| Shares outstanding | | | 41,624,073 | | | | 290,959,926 | | | 18,072,025 | | | 116,381,731 |
| Net asset value and maximum offering price per | | | | | | | | | | | | | |
| share | | $ | 8.70 | | | $ | 9.17 | | $ | 10.16 | | $ | 10.07 |
| |
| |
| aRedemption price is equal to net asset value less contingent deferred sales charges, if applicable. | | | | | | | | | | |
Semiannual Report | The accompanying notes are an integral part of these financial statements. | 131
| | | | | | | | | | | | |
| Franklin Investors Securities Trust | | | | | | | |
| |
| Financial Statements (continued) | | | | | | | | | | | | |
| |
| |
| Statements of Operations | | | | | | | | | | | | |
| for the six months ended April 30, 2014 (unaudited) | | | | | | | | | | | | |
| |
| | | Franklin | | | Franklin | | | Franklin | | | | |
| | Adjustable | | | Floating Rate | | | Low Duration | | | Franklin | |
| | U.S. Government | | | Daily Access | | | Total Return | | | Total Return | |
| | Securities Fund | | | Fund | | | Fund | | | Fund | |
| Investment income: | | | | | | | | | | | | |
| Dividends | $ | — | | $ | — | | $ | 316,744 | | $ | 508,217 | |
| Interest | | 21,111,527 | | 115,489,580 | | | 21,446,615 | | | 82,792,957 | |
| Paydown gain (loss) | | (6,250,447 | ) | | — | | | (162,986 | ) | | 967,512 | |
| Total investment income | | 14,861,080 | | 115,489,580 | | | 21,600,373 | | | 84,268,686 | |
| Expenses: | | | | | | | | | | | | |
| Management fees (Note 3a) | | 4,863,985 | | | 12,983,454 | | | 5,158,036 | | | 10,832,688 | |
| Distribution fees: (Note 3c) | | | | | | | | | | | | |
| Class A | | 1,279,190 | | | 2,568,120 | | | 1,677,616 | | | 3,684,018 | |
| Class C | | 1,763,009 | | | 2,579,130 | | | 423,857 | | | 1,371,264 | |
| Class R | | — | | | — | | | — | | | 144,141 | |
| Transfer agent fees: (Note 3e) | | | | | | | | | | | | |
| Class A | | 493,334 | | | 664,702 | | | 828,814 | | | 2,657,906 | |
| Class C | | 261,474 | | | 256,826 | | | 80,549 | | | 380,585 | |
| Class R | | — | | | — | | | — | | | 52,005 | |
| Class R6 | | 51 | | | 52 | | | 89 | | | 95 | |
| Advisor Class | | 181,804 | | | 822,363 | | | 106,140 | | | 1,025,577 | |
| Custodian fees (Note 4) | | 8,429 | | | 19,770 | | | 38,929 | | | 155,540 | |
| Reports to shareholders | | 94,990 | | | 128,956 | | | 67,868 | | | 347,451 | |
| Registration and filing fees | | 135,113 | | | 185,325 | | | 108,144 | | | 173,343 | |
| Professional fees | | 29,088 | | | 56,973 | | | 40,826 | | | 63,226 | |
| Trustees’ fees and expenses | | 15,178 | | | 24,088 | | | 9,007 | | | 34,971 | |
| Other | | 523,990 | | | 47,354 | | | 70,377 | | | 100,470 | |
| Total expenses | | 9,649,635 | | | 20,337,113 | | | 8,610,252 | | | 21,023,280 | |
| Expense reductions (Note 4) | | (94 | ) | | (983 | ) | | (1,260 | ) | | (2,301 | ) |
| Expenses waived/paid by affiliates | | | | | | | | | | | | |
| (Note 3f and 3g) | | (16,775 | ) | | (547,614 | ) | | (1,281,723 | ) | | (1,339,053 | ) |
| Net expenses | | 9,632,766 | | | 19,788,516 | | | 7,327,269 | | | 19,681,926 | |
| Net investment income | | 5,228,314 | | | 95,701,064 | | | 14,273,104 | | | 64,586,760 | |
132 | The accompanying notes are an integral part of these financial statements. | Semiannual Report
| | | | | | | | | | | | |
| Franklin Investors Securities Trust | | | | | | | |
| |
| Financial Statements (continued) | | | | | | | | | | | | |
| |
| |
| Statements of Operations (continued) | | | | | | | | | | | | |
| for the six months ended April 30, 2014 (unaudited) | | | | | | | | | | | | |
| |
| | | Franklin | | | Franklin | | | Franklin | | | | |
| | | Adjustable | | | Floating Rate | | | Low Duration | | | Franklin | |
| | | U.S. Government | | | Daily Access | | | Total Return | | | Total Return | |
| | | Securities Fund | | | Fund | | | Fund | | | Fund | |
| Realized and unrealized gains (losses): | | | | | | | | | | | | |
| Net realized gain (loss) from: | | | | | | | | | | | | |
| Investments | $ | 2,838,853 | | $ | (2,899,824 | ) | $ | 3,309,548 | | $ | 37,994,295 | |
| Written options | | — | | | — | | | 58,890 | | | 206,115 | |
| Foreign currency transactions | | — | | | — | | | (1,869,381 | ) | | (223,781 | ) |
| Futures contracts | | — | | | — | | | (1,357,146 | ) | | (505,560 | ) |
| Swap contracts | | — | | | — | | | (15,344 | ) | | 787,769 | |
| Net realized gain (loss) | | 2,838,853 | | | (2,899,824 | ) | | 126,567 | | | 38,258,838 | |
| Net change in unrealized appreciation (depreciation) on: | | | | | | | | | | | | |
| Investments | | (2,289,831 | ) | | (19,565,390 | ) | | 3,050,904 | | | 4,839,549 | |
| Translation of other assets and liabilities denominated in | | | | | | | | | | | | |
| foreign currencies | | — | | | — | | | (1,114,134 | ) | | (6,838,814 | ) |
| Net change in unrealized appreciation | | | | | | | | | | | | |
| (depreciation) | | (2,289,831 | ) | | (19,565,390 | ) | | 1,936,770 | | | (1,999,265 | ) |
| Net realized and unrealized gain (loss) | | 549,022 | | | (22,465,214 | ) | | 2,063,337 | | | 36,259,573 | |
| Net increase (decrease) in net assets resulting from | | | | | | | | | | | | |
| operations | $ | 5,777,336 | | $ | 73,235,850 | | $ | 16,336,441 | | $ | 100,846,333 | |
Semiannual Report | The accompanying notes are an integral part of these financial statements. | 133
| | | | | | | | | | | | | |
| Franklin Investors Securities Trust | | | | | | | |
| |
| Financial Statements (continued) | | | | | | | | | | | | | |
| |
| |
| Statements of Changes in Net Assets | | | | | | | | | | | | | |
| |
| |
| | | | Franklin Adjustable | | | Franklin Floating Rate | |
| | | | U.S. Government Securities Fund | | | Daily Access Fund | |
| | | Six Months Ended | | | | | | Six Months Ended | | | | |
| | | April 30, 2014 | | | Year Ended | | | April 30, 2014 | | | Year Ended | |
| | | | (unaudited) | | | October 31, 2013 | | | (unaudited) | | | October 31, 2013 | |
| Increase (decrease) in net assets: | | | | | | | | | | | | | |
| Operations: | | | | | | | | | | | | | |
| Net investment income | | $ | 5,228,314 | | $ | 13,269,907 | | $ | 95,701,064 | | $ | 128,558,953 | |
| Net realized gain (loss) from investments, and | | | | | | | | | | | | | |
| foreign currency transactions, futures | | | | | | | | | | | | | |
| contracts and swap contracts | | | 2,838,853 | | | 110,010 | | | (2,899,824 | ) | | 12,460,763 | |
| Net change in unrealized appreciation | | | | | | | | | | | | | |
| (depreciation) on investments, translation | | | | | | | | | | | | | |
| of other assets and liabilities denominated | | | | | | | | | | | | | |
| in foreign currencies and deferred taxes | | | (2,289,831 | ) | | (29,487,215 | ) | | (19,565,390 | ) | | 19,570,761 | |
| Net increase (decrease) in net assets | | | | | | | | | | | | | |
| resulting from operations | | | 5,777,336 | | | (16,107,298 | ) | | 73,235,850 | | | 160,590,477 | |
| Distributions to shareholders from: | | | | | | | | | | | | | |
| Net investment income: | | | | | | | | | | | | | |
| Class A | | | (6,517,858 | ) | | (18,086,171 | ) | | (35,893,274 | ) | | (55,556,299 | ) |
| Class B | | | — | | | — | | | — | | | (5,580 | ) |
| Class C | | | (2,373,283 | ) | | (7,767,042 | ) | | (12,276,711 | ) | | (17,521,045 | ) |
| Class R6 | | | (2,675 | ) | | (923 | ) | | (24,984 | ) | | (22,904 | ) |
| Advisor Class | | | (2,873,268 | ) | | (7,625,283 | ) | | (47,505,223 | ) | | (54,186,611 | ) |
| Total distributions to shareholders | | | (11,767,084 | ) | | (33,479,419 | ) | | (95,700,192 | ) | | (127,292,439 | ) |
| Capital share transactions: (Note 2) | | | | | | | | | | | | | |
| Class A | | | (110,462,428 | ) | | (177,843,919 | ) | | 105,470,496 | | | 680,448,978 | |
| Class B | | | — | | | — | | | — | | | (982,012 | ) |
| Class C | | | (102,267,823 | ) | | (176,136,786 | ) | | 49,738,419 | | | 328,563,566 | |
| Class R6 | | | 209,594 | | | 335,003 | | | (424,598 | ) | | 1,338,251 | |
| Advisor Class | | | (47,812,987 | ) | | (17,175,253 | ) | | 303,464,432 | | | 1,622,626,406 | |
| Total capital share transactions | | | (260,333,644 | ) | | (370,820,955 | ) | | 458,248,749 | | | 2,631,995,189 | |
| Net increase (decrease) in net assets | | | (266,323,392 | ) | | (420,407,672 | ) | | 435,784,407 | | | 2,665,293,227 | |
| Net assets: | | | | | | | | | | | | | |
| Beginning of period | | | 2,120,304,397 | | | 2,540,712,069 | | | 5,133,230,278 | | | 2,467,937,051 | |
| End of period | $ | 1,853,981,005 | | $ | 2,120,304,397 | | $ | 5,569,014,685 | | $ | 5,133,230,278 | |
| Undistributed net investment income | | | | | | | | | | | | | |
| (distributions in excess of net investment | | | | | | | | | | | | | |
| income) included in net assets: | | | | | | | | | | | | | |
| End of period | | $ | (6,543,046 | ) | $ | (4,276 | ) | $ | 1,191,176 | | $ | 1,190,304 | |
134 | The accompanying notes are an integral part of these financial statements. | Semiannual Report
| | | | | | | | | | | | |
| Franklin Investors Securities Trust | | | | | | | |
| |
| Financial Statements (continued) | | | | | | | | | | | | |
| |
| |
| Statements of Changes in Net Assets (continued) | | | | | | | | | | |
| |
| |
| | | Franklin Low Duration | | | Franklin | |
| | | Total Return Fund | | | Total Return Fund | |
| | | Six Months Ended | | | | | | Six Months Ended | | | | |
| | | April 30, 2014 | | | Year Ended | | | April 30, 2014 | | | Year Ended | |
| | | (unaudited) | | | October 31, 2013 | | | (unaudited) | | | October 31, 2013 | |
| Increase (decrease) in net assets: | | | | | | | | | | | | |
| Operations: | | | | | | | | | | | | |
| Net investment income | $ | 14,273,104 | | $ | 15,257,459 | | $ | 64,586,760 | | $ | 129,524,067 | |
| Net realized gain (loss) from investments, | | | | | | | | | | | | |
| written options, foreign currency transactions, | | | | | | | | | | |
| futures contracts and swap contracts | | 126,567 | | | 4,558,920 | | | 38,258,838 | | | (16,844,640 | ) |
| Net change in unrealized appreciation | | | | | | | | | | | | |
| (depreciation) on investments and translation | | | | | | | | | | |
| of other assets and liabilities denominated in | | | | | | | | | | |
| foreign currencies and deferred taxes | | 1,936,770 | | | (2,001,605 | ) | | (1,999,265 | ) | | (109,352,294 | ) |
| Net increase (decrease) in net assets | | | | | | | | | | | | |
| resulting from operations | | 16,336,441 | | | 17,814,774 | | | 100,846,333 | | | 3,327,133 | |
| Distributions to shareholders from: | | | | | | | | | | | | |
| Net investment income: | | | | | | | | | | | | |
| Class A | | (14,726,744 | ) | | (27,565,094 | ) | | (66,934,096 | ) | | (110,647,887 | ) |
| Class B | | — | | | — | | | — | | | (18,270 | ) |
| Class C | | (1,200,692 | ) | | (859,335 | ) | | (8,941,533 | ) | | (17,086,352 | ) |
| Class R | | — | | | — | | | (1,299,829 | ) | | (2,380,507 | ) |
| Class R6 | | (4,612,902 | ) | | (9,638 | ) | | (922,662 | ) | | (6,378,823 | ) |
| Advisor Class | | (2,058,120 | ) | | (2,487,587 | ) | | (27,167,289 | ) | | (50,711,612 | ) |
| Net realized gains: | | | | | | | | | | | | |
| Class A | | — | | | — | | | — | | | (49,900,210 | ) |
| Class B | | — | | | — | | | — | | | (20,442 | ) |
| Class C | | — | | | — | | | — | | | (9,134,397 | ) |
| Class R | | — | | | — | | | — | | | (1,213,587 | ) |
| Advisor Class | | — | | | — | | | — | | | (22,947,325 | ) |
| Total distributions to shareholders | | (22,598,458 | ) | | (30,921,654 | ) | | (105,265,409 | ) | | (270,439,412 | ) |
| Capital share transactions: (Note 2) | | | | | | | | | | | | |
| Class A | | 117,764,294 | | | 403,766,790 | | | 29,737,696 | | | 43,627,860 | |
| Class B | | — | | | — | | | — | | | (2,386,299 | ) |
| Class C | | 31,061,087 | | | 113,372,096 | | | (41,442,806 | ) | | (86,547,995 | ) |
| Class R | | — | | | — | | | (9,772,284 | ) | | (18,039,553 | ) |
| Class R6 | | 414,118,861 | | | 947,088 | | | (318,468,261 | ) | | 347,214,126 | |
| Advisor Class | | 27,952,284 | | | 86,552,020 | | | 23,663,436 | | | (276,012,050 | ) |
| Total capital share transactions | | 590,896,526 | | | 604,637,994 | | | (316,282,219 | ) | | 7,856,089 | |
| Net increase (decrease) in net assets | | 584,634,509 | | | 591,531,114 | | | (320,701,295 | ) | | (259,256,190 | ) |
| Net assets: | | | | | | | | | | | | |
| Beginning of period | | 1,567,884,199 | | | 976,353,085 | | | 5,018,805,521 | | | 5,278,061,711 | |
| End of period | $ | 2,152,518,708 | | $ | 1,567,884,199 | | $ | 4,698,104,226 | | $ | 5,018,805,521 | |
| Distributions in excess of net investment income | | | | | | | | | | |
| included in net assets: | | | | | | | | | | | | |
| End of period | $ | (14,607,116 | ) | $ | (6,281,762 | ) | $ | (64,289,257 | ) | $ | (23,610,608 | ) |
| |
| Semiannual Report | | | The accompanying notes are an integral part of these financial statements. | 135 | |
Franklin Investors Securities Trust
Notes to Financial Statements (unaudited)
1. ORGANIZATION AND SIGNIFICANT ACCOUNTING POLICIES
Franklin Investors Securities Trust (Trust) is registered under the Investment Company Act of 1940, as amended, (1940 Act) as an open-end management investment company, consisting of nine separate funds, four of which are included in this report (Funds). The financial statements of the remaining funds in the Trust are presented separately. The classes of shares offered within each of the Funds are indicated below. Effective March 1, 2013, all Class B shares were converted to Class A. Each class of shares differs by its initial sales load, contingent deferred sales charges, voting rights on matters affecting a single class, its exchange privilege and fees primarily due to differing arrangements for distribution and transfer agent fees.
| |
| Class A, Class C, Class R6 & Advisor Class | Class A, Class C, Class R, Class R6 & Advisor Class |
| Franklin Adjustable U.S. Government Securities Fund | Franklin Total Return Fund |
| Franklin Floating Rate Daily Access Fund | |
| Franklin Low Duration Total Return Fund | |
The following summarizes the Funds’ significant accounting policies.
a. Financial Instrument Valuation
The Funds’ investments in financial instruments are carried at fair value daily. Fair value is the price that would be received to sell an asset or paid to transfer a liability in an orderly transaction between market participants on the measurement date. The Funds’ calculate the net asset value (NAV) per share at the close of the New York Stock Exchange (NYSE), generally at 4 p.m. Eastern time (NYSE close) on each day the NYSE is open for trading. Under procedures approved by the Trust’s Board of Trustees (the Board), the Funds’ administrator, investment manager and other affiliates have formed the Valuation and Liquidity Oversight Committee (VLOC). The VLOC provides administration and oversight of the Funds’ valuation policies and procedures, which are approved annually by the Board. Among other things, these procedures allow the Funds to utilize independent pricing services, quotations from securities and financial instrument dealers, and other market sources to determine fair value.
Equity securities, exchange traded funds and derivative financial instruments (derivatives) listed on an exchange or on the NASDAQ National Market System are valued at the last quoted sale price or the official closing price of the day, respectively. Over-the-counter (OTC) securities are valued within the range of the most recent quoted bid and ask prices. Securities that trade in multiple markets or on multiple exchanges are valued according to the broadest and most representative market. Certain equity securities are valued based upon fundamental characteristics or relationships to similar securities. Investments in open-end mutual funds are valued at the closing NAV. Repurchase agreements are valued at cost, which approximates fair value.
Debt securities generally trade in the OTC market rather than on a securities exchange. The Funds’ pricing services use multiple valuation techniques to determine fair value. In instances where sufficient market activity exists, the pricing services may utilize a market-based approach
136 | Semiannual Report
Franklin Investors Securities Trust
Notes to Financial Statements (unaudited)
| 1. | ORGANIZATION AND SIGNIFICANT ACCOUNTING POLICIES (continued) |
| a. | Financial Instrument Valuation (continued) |
through which quotes from market makers are used to determine fair value. In instances where sufficient market activity may not exist or is limited, the pricing services also utilize proprietary valuation models which may consider market characteristics such as benchmark yield curves, credit spreads, estimated default rates, anticipated market interest rate volatility, coupon rates, anticipated timing of principal repayments, underlying collateral, and other unique security features in order to estimate the relevant cash flows, which are then discounted to calculate the fair value. Securities denominated in a foreign currency are converted into their U.S. dollar equivalent at the foreign exchange rate in effect at the NYSE close on the date that the values of the foreign debt securities are determined.
Certain derivatives trade in the OTC market. The Funds’ pricing services use various techniques including industry standard option pricing models and proprietary discounted cash flow models to determine the fair value of those instruments. The Funds’ net benefit or obligation under the derivative contract, as measured by the fair value of the contract, is included in net assets.
The Funds have procedures to determine the fair value of financial instruments for which market prices are not reliable or readily available. Under these procedures, the VLOC convenes on a regular basis to review such financial instruments and considers a number of factors, including significant unobservable valuation inputs, when arriving at fair value. The VLOC primarily employs a market-based approach which may use related or comparable assets or liabilities, recent transactions, market multiples, book values, and other relevant information for the investment to determine the fair value of the investment. An income-based valuation approach may also be used in which the anticipated future cash flows of the investment are discounted to calculate fair value. Discounts may also be applied due to the nature or duration of any restrictions on the disposition of the investments. Due to the inherent uncertainty of valuations of such investments, the fair values may differ significantly from the values that would have been used had an active market existed. The VLOC employs various methods for calibrating these valuation approaches including a regular review of key inputs and assumptions, transactional back-testing or disposition analysis, and reviews of any related market activity.
b. Foreign Currency Translation
Portfolio securities and other assets and liabilities denominated in foreign currencies are translated into U.S. dollars based on the exchange rate of such currencies against U.S. dollars on the date of valuation. The Funds may enter into foreign currency exchange contracts to facilitate transactions denominated in a foreign currency. Purchases and sales of securities, income and expense items denominated in foreign currencies are translated into U.S. dollars at the exchange rate in effect on the transaction date. Portfolio securities and assets and liabilities denominated in foreign currencies contain risks that those currencies will decline in value relative to the U.S. dollar. Occasionally, events may impact the availability or reliability of foreign exchange rates
Semiannual Report | 137
Franklin Investors Securities Trust
Notes to Financial Statements (unaudited) (continued)
| 1. | ORGANIZATION AND SIGNIFICANT ACCOUNTING POLICIES (continued) |
| b. | Foreign Currency Translation (continued) |
used to convert the U.S. dollar equivalent value. If such an event occurs, the foreign exchange rate will be valued at fair value using procedures established and approved by the Board.
The Funds do not separately report the effect of changes in foreign exchange rates from changes in market prices on securities held. Such changes are included in net realized and unrealized gain or loss from investments on the Statements of Operations.
Realized foreign exchange gains or losses arise from sales of foreign currencies, currency gains or losses realized between the trade and settlement dates on securities transactions and the difference between the recorded amounts of dividends, interest, and foreign withholding taxes and the U.S. dollar equivalent of the amounts actually received or paid. Net unrealized foreign exchange gains and losses arise from changes in foreign exchange rates on foreign denominated assets and liabilities other than investments in securities held at the end of the reporting period.
c. Joint Repurchase Agreement
The Franklin Adjustable U.S. Government Securities Fund entered into a joint repurchase agreement whereby its uninvested cash balance is deposited into a joint cash account with other funds managed by the investment manager or an affiliate of the investment manager and is used to invest in one or more repurchase agreements. The value and face amount of the joint repurchase agreement are allocated to the funds based on their pro-rata interest. A repurchase agreement is accounted for as a loan by the fund to the seller, collateralized by securities which are delivered to the funds’ custodian. The fair value, including accrued interest, of the initial collateralization is required to be at least 102% of the dollar amount invested by the funds, with the value of the underlying securities marked to market daily to maintain coverage of at least 100%. Repurchase agreements are subject to the terms of Master Repurchase Agreements (MRAs) with approved counterparties (sellers). The MRAs contain various provisions, including but not limited to events of default and maintenance of collateral for repurchase agreements. The fund may sell securities it holds as collateral and apply the proceeds towards the repurchase price and any other amounts owed by the seller to the fund in the event of default by the seller. This could involve costs or delays in addition to a loss on the securities if their value falls below the repurchase price owed by the seller. The joint repurchase agreement held by the fund at period end, as indicated in the Statement of Investments, had been entered into on April 30, 2014.
d. Securities Purchased on a When-Issued, Delayed Delivery and TBA Basis
The Funds purchase securities on a when-issued, delayed delivery, and to-be-announced (TBA) basis, with payment and delivery scheduled for a future date. These transactions are subject to market fluctuations and are subject to the risk that the value at delivery may be more or less than the trade date purchase price. Although the Funds will generally purchase these securities
138 | Semiannual Report
Franklin Investors Securities Trust
Notes to Financial Statements (unaudited) (continued)
| 1. | ORGANIZATION AND SIGNIFICANT ACCOUNTING POLICIES (continued) |
| d. | Securities Purchased on a When-Issued, Delayed Delivery and TBA Basis (continued) |
with the intention of holding the securities, they may sell the securities before the settlement date. Sufficient assets have been segregated for these securities and collateral has been pledged and/or received for open TBA trades.
e. Derivative Financial Instruments
The Franklin Low Duration Total Return Fund and Franklin Total Return Fund invested in derivatives in order to manage risk or gain exposure to various other investments or markets. Derivatives are financial contracts based on an underlying or notional amount, require no initial investment or an initial net investment that is smaller than would normally be required to have a similar response to changes in market factors, and require or permit net settlement. Derivatives contain various risks including the potential inability of the counterparty to fulfill their obligations under the terms of the contract, the potential for an illiquid secondary market, and/or the potential for market movements which expose the fund to gains or losses in excess of the amounts shown on the Statements of Assets and Liabilities. Realized gain and loss and unrealized appreciation and depreciation on these contracts for the period are included in the Statements of Operations.
Derivative counterparty credit risk is managed through a formal evaluation of the creditwor-thiness of all potential counterparties. The Franklin Low Duration Total Return Fund and Franklin Total Return Fund attempt to reduce its exposure to counterparty credit risk on OTC derivatives, whenever possible, by entering into International Swaps and Derivatives Association (ISDA) master agreements with certain counterparties. These agreements contain various provisions, including but not limited to collateral requirements, events of default, or early termination. Termination events applicable to the counterparty include certain deteriorations in the credit quality of the counterparty. Termination events applicable to the funds include failure of the funds to maintain certain net asset levels and/or limit the decline in net assets over various periods of time. In the event of default or early termination, the ISDA master agreement gives the non-defaulting party the right to net and close-out all transactions traded, whether or not arising under the ISDA agreement, to one net amount payable by one counterparty to the other. However, absent an event of default or early termination, OTC derivative assets and liabilities are presented gross and not offset in the Statement of Assets and Liabilities. Early termination by the counterparty may result in an immediate payment by the funds of any net liability owed to that counterparty under the ISDA agreement.
Collateral requirements differ by type of derivative. Collateral or initial margin requirements are set by the broker or exchange clearing house for exchange traded. Initial margin deposited is held at the exchange and can be in the form of cash and/or securities. For OTC derivatives traded under an ISDA master agreement, posting of collateral is required by either the fund or the applicable counterparty if the total net exposure of all OTC derivatives with the applicable
Semiannual Report | 139
Franklin Investors Securities Trust
Notes to Financial Statements (unaudited) (continued)
| 1. | ORGANIZATION AND SIGNIFICANT ACCOUNTING POLICIES (continued) |
| e. | Derivative Financial Instruments (continued) |
counterparty exceeds the minimum transfer amount, which typically ranges from $100,000 to $250,000, and can vary depending on the counterparty and the type of the agreement. Generally, collateral is determined at the close of fund business each day and any additional collateral required due to changes in derivative values may be delivered by the fund or the counterparty within a few business days. Collateral pledged and/or received by the fund for OTC derivatives, if any, is held in segregated accounts with the fund’s custodian/counterparty broker and can be in the form of cash and/or securities. Unrestricted cash may be invested according to the funds investment objectives.
At April 30, 2014, the Franklin Total Return Fund received $438,860 in United Kingdom Treasury Bonds and U.S. Treasury Bonds and Notes as collateral for derivatives.
The Franklin Low Duration Total Return Fund and Franklin Total Return Fund entered into exchange traded financial futures contracts primarily to manage and/or gain exposure to interest rate risk. A futures contract is an agreement between the fund and a counterparty to buy or sell an asset for a specified price on a future date. Required initial margins are pledged by the fund, and the daily change in fair value is accounted for as a variation margin payable or receivable on the Statements of Assets and Liabilities.
The Franklin Low Duration Total Return Fund and Franklin Total Return Fund entered into OTC forward exchange contracts primarily to manage and/or gain exposure to certain foreign currencies. A forward exchange contract is an agreement between the fund and a counterparty to buy or sell a foreign currency at a specific exchange rate on a future date.
The Franklin Low Duration Total Return Fund and Franklin Total Return Fund entered into credit default swap contracts primarily to manage and/or gain exposure to credit risk. A credit default swap is an agreement between the fund and a counterparty whereby the buyer of the contract receives credit protection and the seller of the contract guarantees the credit worthiness of a referenced debt obligation. These agreements may be privately negotiated in the over-the-counter market (“OTC credit default swaps”) or may be executed in a multilateral trade facility platform, such as a registered exchange (“centrally cleared credit default swaps”). The underlying referenced debt obligation may be a single issuer of corporate or sovereign debt, a credit index, or a tranche of a credit index. In the event of a default of the underlying referenced debt obligation, the buyer is entitled to receive the notional amount of the credit default swap contract from the seller in exchange for the referenced debt obligation, a net settlement amount equal to the notional amount of the credit default swap less the recovery value of the referenced debt obligation, or other agreed upon amount. For centrally cleared credit default swaps, required initial margins are pledged by the fund, and the daily change in fair value is accounted for as a variation margin payable or receivable on the Statements of Assets and Liabilities. Over the term of the contract, the buyer pays the seller a periodic stream of payments, provided that no event of default has occurred. Such periodic payments are accrued daily as an unrealized appreciation
140 | Semiannual Report
Franklin Investors Securities Trust
Notes to Financial Statements (unaudited) (continued)
| 1. | ORGANIZATION AND SIGNIFICANT ACCOUNTING POLICIES (continued) |
| e. | Derivative Financial Instruments (continued) |
or depreciation until the payments are made, at which time they are realized. Payments received or paid to initiate a credit default swap contract are reflected on the Statements of Assets and Liabilities and represent compensating factors between stated terms of the credit default swap agreement and prevailing market conditions (credit spreads and other relevant factors). These upfront payments are amortized over the term of the contract as a realized gain or loss on the Statements of Operations.
The Franklin Low Duration Total Return Fund and Franklin Total Return Fund entered into OTC cross currency swap contracts primarily to manage and/or gain exposure to interest rate risk and certain foreign currencies. A cross currency swap is an agreement between the fund and a counterparty to exchange cash flows (determined using either a fixed or floating rate) based on the notional amounts of two different currencies. The notional amounts are typically determined based on the spot exchange rates at the opening of the contract. Cross currency swaps may require the exchange of notional amounts at the opening and/or closing of the contract. Over the term of the contract, contractually required payments to be paid and to be received are accrued daily and recorded as unrealized depreciation and appreciation until the payments are made, at which time they are realized. Payments received or paid to initiate a cross currency swap contract are reflected on the Statements of Assets and Liabilities and represent compensating factors between stated terms of the cross currency swap contract and prevailing market conditions (interest rate spreads and other relevant factors). These upfront payments are amortized over the term of the contract as a realized gain or loss on the Statements of Operations.
The Franklin Low Duration Total Return Fund and Franklin Total Return Fund purchased or wrote OTC option contracts primarily to manage and/or gain exposure to foreign exchange rate and credit risk. An option is a contract entitling the holder to purchase or sell a specific amount of shares or units of an asset or notional amount of a swap (swaption), at a specified price. Options purchased are recorded as an asset while options written are recorded as a liability. Upon exercise of an option, the acquisition cost or sales proceeds of the underlying investment is adjusted by any premium received or paid. Upon expiration of an option, any premium received or paid is recorded as a realized gain or loss. Upon closing an option other than through expiration or exercise, the difference between the premium and the cost to close the position is recorded as a realized gain or loss.
See Notes 6 and 10 regarding investment transactions and other derivative information, respectively.
f. Restricted Cash
At April 30, 2014, the Franklin Total Return Fund received restricted cash in connection with investments in certain derivative securities. Restricted cash is held in a segregated account with the fund s custodian and is reflected in the Statement of Assets and Liabilities.
Semiannual Report | 141
Franklin Investors Securities Trust
Notes to Financial Statements (unaudited) (continued)
| 1. | ORGANIZATION AND SIGNIFICANT ACCOUNTING POLICIES (continued) |
| g. | Loan Participation Notes |
The Franklin Total Return Fund invests in loan participation notes (“Participations”). Participations are loans originally issued to a borrower by one or more financial institutions (the “Lender”) and subsequently sold to other investors, such as the fund. Participations typically result in the fund having a contractual relationship only with the Lender and not with the borrower. The fund has the right to receive from the Lender any payments of principal, interest and fees which the Lender received from the borrower. The fund generally has no rights to either enforce compliance by the borrower with the terms of the loan agreement or to any collateral relating to the original loan. As a result, the fund assumes the credit risk of both the borrower and the Lender that is selling the Participation. The Participations may also involve interest rate risk and liquidity risk, including the potential default or insolvency of the borrower and/or the Lender.
h. FT Holdings Corporation I (FT Subsidiary)
The Franklin Total Return Fund invests in certain financial instruments through its investment in the FT Subsidiary. The FT Subsidiary is a Delaware Corporation, is a wholly-owned subsidiary of the fund, and is able to invest in certain financial instruments consistent with the investment objective of the fund. At April 30, 2014, the FT Subsidiary’s investment, Turtle Bay Resort, as well as any other assets and liabilities of the FT Subsidiary are reflected in the fund’s Statement of Investments and Statement of Assets and Liabilities. The financial statements have been consolidated and include the accounts of the fund and the FT Subsidiary. All intercompany transactions and balances have been eliminated.
i. Mortgage Dollar Rolls
The Franklin Total Return Fund enters into mortgage dollar rolls, typically on a TBA basis. Mortgage dollar rolls are agreements between the fund and a financial institution to simultaneously sell and repurchase mortgage-backed securities at a future date. Gains or losses are realized on the initial sale, and the difference between the repurchase price and the sale price is recorded as an unrealized gain or loss to the fund upon entering into the mortgage dollar roll. In addition, the fund may invest the cash proceeds that are received from the initial sale. During the period between the sale and repurchase, the fund is not entitled to principal and interest paid on the mortgage backed securities. The risks of mortgage dollar roll transactions include the potential inability of the counterparty to fulfill its obligations.
j. Senior Floating Rate Interests
The Funds except Franklin Adjustable U.S. Government Securities Fund, invest in senior secured corporate loans that pay interest at rates which are periodically reset by reference to a base lending rate plus a spread. These base lending rates are generally the prime rate offered by a designated U.S. bank or the London InterBank Offered Rate (LIBOR). Senior secured corporate loans often require prepayment of principal from excess cash flows or at the discretion of the borrower. As a result, actual maturity may be substantially less than the stated maturity.
142 | Semiannual Report
Franklin Investors Securities Trust
Notes to Financial Statements (unaudited) (continued)
| 1. | ORGANIZATION AND SIGNIFICANT ACCOUNTING POLICIES (continued) |
| j. | Senior Floating Rate Interests (continued) |
Senior secured corporate loans in which the funds invest are generally readily marketable, but may be subject to certain restrictions on resale.
k. Income and Deferred Taxes
It is each fund’s policy to qualify as a regulated investment company under the Internal Revenue Code. Each fund intends to distribute to shareholders substantially all of its taxable income and net realized gains to relieve it from federal income and excise taxes. As a result, no provision for U.S. federal income taxes is required.
The Funds may be subject to foreign taxation related to income received, capital gains on the sale of securities and certain foreign currency transactions in the foreign jurisdictions in which it invests. Foreign taxes, if any, are recorded based on the tax regulations and rates that exist in the foreign markets in which the Funds invest. When a capital gain tax is determined to apply the Funds record an estimated deferred tax liability in an amount that would be payable if the securities were disposed of on the valuation date.
Each fund recognizes the tax benefits of uncertain tax positions only when the position is “more likely than not” to be sustained upon examination by the tax authorities based on the technical merits of the tax position. As of April 30, 2014, and for all open tax years, each fund has determined that no liability for unrecognized tax benefits is required in each fund’s financial statements related to uncertain tax positions taken on a tax return (or expected to be taken on future tax returns). Open tax years are those that remain subject to examination and are based on each tax jurisdiction statute of limitation.
l. Security Transactions, Investment Income, Expenses and Distributions
Security transactions are accounted for on trade date. Realized gains and losses on security transactions are determined on a specific identification basis. Interest income and estimated expenses are accrued daily. Amortization of premium and accretion of discount on debt securities are included in interest income. Paydown gains and losses are recorded separately on the Statements of Operations. Facility fees are recognized as income over the expected term of the loan. Dividend income is recorded on the ex-dividend date. Dividends from net investment income are normally declared daily; these dividends may be reinvested or paid monthly to shareholders. Distributions from realized capital gains and other distributions, if any, are recorded on the ex-dividend date. Distributions to shareholders are determined according to income tax regulations (tax basis). Distributable earnings determined on a tax basis may differ from earnings recorded in accordance with accounting principles generally accepted in the United States of America. These differences may be permanent or temporary. Permanent differences are reclassified among capital accounts to reflect their tax character. These reclassifications have no impact on net assets or the results of operations. Temporary differences are not reclassified, as they may reverse in subsequent periods.
Semiannual Report | 143
Franklin Investors Securities Trust
Notes to Financial Statements (unaudited) (continued)
| 1. | ORGANIZATION AND SIGNIFICANT ACCOUNTING POLICIES (continued) |
| l. | Security Transactions, Investment Income, Expenses and Distributions (continued) |
Common expenses incurred by the Trust are allocated among the funds based on the ratio of net assets of each fund to the combined net assets of the Trust. Fund specific expenses are charged directly to the fund that incurred the expense.
Net investment income, not including class specific expenses, is allocated daily to each class of shares based upon the relative value of the settled shares of each class. Realized and unrealized gains and losses are allocated daily to each class of shares based upon the relative proportion of net assets of each class. Differences in per share distributions, by class, are generally due to differences in class specific expenses.
Inflation-indexed bonds are adjusted for inflation through periodic increases or decreases in the security’s interest accruals, face amount, or principal redemption value, by amounts corresponding to the rate of inflation as measured by an index. Any increase or decrease in the face amount or principal redemption value will be included as interest income on the Statements of Operations.
m. Accounting Estimates
The preparation of financial statements in accordance with accounting principles generally accepted in the United States of America requires management to make estimates and assumptions that affect the reported amounts of assets and liabilities at the date of the financial statements and the amounts of income and expenses during the reporting period. Actual results could differ from those estimates.
n. Guarantees and Indemnifications
Under the Trust’s organizational documents, its officers and trustees are indemnified by the Trust against certain liabilities arising out of the performance of their duties to the Trust. Additionally, in the normal course of business, the Trust, on behalf of the Funds, enters into contracts with service providers that contain general indemnification clauses. The Trust’s maximum exposure under these arrangements is unknown as this would involve future claims that may be made against the Trust that have not yet occurred. Currently, the Trust expects the risk of loss to be remote.
144 | Semiannual Report
Franklin Investors Securities Trust
Notes to Financial Statements (unaudited) (continued)
2. SHARES OF BENEFICIAL INTEREST
At April 30, 2014, there were an unlimited number of shares authorized (without par value).
Transactions in the Funds’ shares were as follows:
| Franklin Adjustable | | | |
| | U.S. Government | | Franklin Floating Rate | |
| | Securities Fund | | Daily Access Fund | |
| | Shares | | | Amount | | Shares | | | | Amount | |
| Class A Shares: | | | | | | | | | | | |
| Six Months ended April 30, 2014 | | | | | | | | | | | |
| Shares sold | 20,876,502 | | $ | 181,747,807 | | 39,956,137 | | $ | 367,661,833 | |
| Shares issued in reinvestment of | | | | | | | | | | | |
| distributions | 693,087 | | | 6,033,419 | | 3,438,265 | | | | 31,620,536 | |
| Shares redeemed | (34,255,798 | ) | | (298,243,654 | ) | (31,939,252 | ) | | | (293,811,873 | ) |
| Net increase (decrease) | (12,686,209 | ) | $ | (110,462,428 | ) | 11,455,150 | | $ | 105,470,496 | |
| Year ended October 31, 2013 | | | | | | | | | | | |
| Shares sold | 58,683,667 | | $ | 516,864,025 | | 111,771,482 | | $ | 1,025,150,562 | |
| Shares issued in reinvestment of | | | | | | | | | | | |
| distributions | 1,873,818 | | | 16,478,937 | | 5,384,136 | | | | 49,375,120 | |
| Shares redeemed | (80,814,990 | ) | | (711,186,881 | ) | (42,975,982 | ) | | | (394,076,704 | ) |
| Net increase (decrease) | (20,257,505 | ) | $ | (177,843,919 | ) | 74,179,636 | | $ | 680,448,978 | |
| Class B Shares: | | | | | | | | | | | |
| Year ended October 31, 2013a | | | | | | | | | | | |
| Shares sold | | | | | | 105 | | | $ | 968 | |
| Shares issued in reinvestment of | | | | | | | | | | | |
| distributions | | | | | | 514 | | | | 4,688 | |
| Shares redeemed | | | | | | (108,136 | ) | | | (987,668 | ) |
| Net increase (decrease) | | | | | | (107,517 | ) | | $ | (982,012 | ) |
| Class C Shares: | | | | | | | | | | | |
| Six Months ended April 30, 2014 | | | | | | | | | | | |
| Shares sold | 3,071,294 | | $ | 26,726,859 | | 16,278,167 | | $ | 149,843,737 | |
| Shares issued in reinvestment of | | | | | | | | | | | |
| distributions | 250,439 | | | 2,178,062 | | 1,188,859 | | | | 10,937,614 | |
| Shares redeemed | (15,073,128 | ) | | (131,172,744 | ) | (12,066,881 | ) | | | (111,042,932 | ) |
| Net increase (decrease) | (11,751,395 | ) | $ | (102,267,823 | ) | 5,400,145 | | | $ | 49,738,419 | |
| Year ended October 31, 2013 | | | | | | | | | | | |
| Shares sold | 18,407,162 | | $ | 161,947,362 | | 49,309,560 | | $ | 452,404,650 | |
| Shares issued in reinvestment of | | | | | | | | | | | |
| distributions | 804,967 | | | 7,077,571 | | 1,690,332 | | | | 15,505,956 | |
| Shares redeemed | (39,286,186 | ) | | (345,161,719 | ) | (15,191,334 | ) | | | (139,347,040 | ) |
| Net increase (decrease) | (20,074,057 | ) | $ | (176,136,786 | ) | 35,808,558 | | $ | 328,563,566 | |
Semiannual Report | 145
Franklin Investors Securities Trust
Notes to Financial Statements (unaudited) (continued)
| | | | | | | | | | | | |
| 2. SHARES OF BENEFICIAL INTEREST (continued) | | | | | | | | | | | |
| Franklin Adjustable | | | |
| | U.S. Government | | Franklin Floating Rate | |
| | Securities Fund | | Daily Access Fund | |
| | Shares | | | | Amount | | Shares | | | | Amount | |
| Class R6 Shares: | | | | | | | | | | | | |
| Six Months ended April 30, 2014 | | | | | | | | | | | | |
| Shares sold | 23,761 | | | $ | 206,959 | | 45 | | | $ | 420 | |
| Shares issued on reinvestment of | | | | | | | | | | | | |
| distributions | 302 | | | | 2,635 | | 2,715 | | | | 24,984 | |
| Shares redeemed | — | | | | — | | (49,055 | ) | | | (450,002 | ) |
| Net increase (decrease) | 24,063 | | | $ | 209,594 | | (46,295 | ) | | $ | (424,598 | ) |
| Year ended October 31, 2013b,c | | | | | | | | | | | | |
| Shares soldd | 61,218 | | | $ | 534,089 | | 143,480 | | | $ | 1,320,392 | |
| Shares issued in reinvestment of | | | | | | | | | | | | |
| distributions | 105 | | | | 914 | | 2,490 | | | | 22,856 | |
| Shares redeemed | (22,910 | ) | | | (200,000 | ) | (544 | ) | | | (4,997 | ) |
| Net increase (decrease) | 38,413 | | | $ | 335,003 | | 145,426 | | | $ | 1,338,251 | |
| Advisor Class Shares: | | | | | | | | | | | | |
| Six Months ended April 30, 2014 | | | | | | | | | | | | |
| Shares sold | 8,620,070 | | | $ | 75,122,625 | | 77,961,661 | | | $ | 717,714,146 | |
| Shares issued in reinvestment of | | | | | | | | | | | | |
| distributions | 265,616 | | | | 2,314,481 | | 1,598,589 | | | | 14,709,433 | |
| Shares redeemedd | (14,370,937 | ) | | | (125,250,093 | ) | (46,605,041 | ) | | | (428,959,147 | ) |
| Net increase (decrease) | (5,485,251 | ) | | $ | (47,812,987 | ) | 32,955,209 | | | $ | 303,464,432 | |
| Year ended October 31, 2013 | | | | | | | | | | | | |
| Shares sold | 32,961,207 | | $ | 290,617,087 | | 218,350,995 | | $ | 2,004,137,448 | |
| Shares issued in reinvestment of | | | | | | | | | | | | |
| distributions | 710,814 | | | | 6,256,791 | | 2,052,234 | | | | 18,830,897 | |
| Shares redeemed | (35,664,185 | ) | | | (314,049,131 | ) | (43,625,153 | ) | | | (400,341,939 | ) |
| Net increase (decrease) | (1,992,164 | ) | | $ | (17,175,253 | ) | 176,778,076 | | $ | 1,622,626,406 | |
aEffective March 1, 2013, all Class B shares were converted to Class A.
bFor the period May 1, 2013 (effective date) to October 31, 2013 for the Franklin Floating Rate Daily Access Fund.
cFor the period September 20, 2013 (effective date) to October 31, 2013 for the Franklin Adjustable U.S. Government Securities Fund.
dEffective September 20, 2013, a portion of Advisor Class shares were exchanged into Class R6 for the Franklin Adjustable U.S. Government
Securities Fund.
146 | Semiannual Report
Franklin Investors Securities Trust
Notes to Financial Statements (unaudited) (continued)
| | | | | | | | | | | |
| 2. SHARES OF BENEFICIAL INTEREST (continued) | | | | | | | | | | |
| |
| | Franklin Low Duration | | | | | | |
| | Total Return Fund | | Franklin Total Return Fund | |
| | Shares | | | | Amount | | Shares | | | Amount | |
| Class A Shares: | | | | | | | | | | | |
| Six Months ended April 30, 2014 | | | | | | | | | | | |
| Shares sold | 33,900,147 | | $ | 343,805,514 | | 38,082,530 | | $ | 379,402,022 | |
| Shares issued in reinvestment of | | | | | | | | | | | |
| distributions | 1,381,302 | | | | 13,999,218 | | 6,239,145 | | | 61,911,148 | |
| Shares redeemed | (23,668,738 | ) | | (240,040,438 | ) | (41,325,200 | ) | | (411,575,474 | ) |
| Net increase (decrease) | 11,612,711 | | $ | 117,764,294 | | 2,996,475 | | $ | 29,737,696 | |
| Year ended October 31, 2013 | | | | | | | | | | | |
| Shares sold | 93,059,954 | | $ | 948,807,053 | | 104,353,356 | | $ | 1,070,043,749 | |
| Shares issued in reinvestment of | | | | | | | | | | | |
| distributions | 2,556,783 | | | | 26,081,916 | | 14,537,885 | | | 148,833,317 | |
| Shares redeemed | (56,020,675 | ) | | (571,122,179 | ) | (116,163,430 | ) | | (1,175,249,206 | ) |
| Net increase (decrease) | 39,596,062 | | $ | 403,766,790 | | 2,727,811 | | $ | 43,627,860 | |
| Class B Shares: | | | | | | | | | | | |
| Year ended October 31, 2013a | | | | | | | | | | | |
| Shares sold | | | | | | | 10,042 | | $ | 105,055 | |
| Shares issued in reinvestment of | | | | | | | | | | | |
| distributions | | | | | | | 3,034 | | | 31,389 | |
| Shares redeemed | | | | | | | (242,685 | ) | | (2,522,743 | ) |
| Net increase (decrease) | | | | | | | (229,609 | ) | $ | (2,386,299 | ) |
| Class C Shares: | | | | | | | | | | | |
| Six Months ended April 30, 2014 | | | | | | | | | | | |
| Shares sold | 5,633,915 | | | $ | 57,114,990 | | 3,526,454 | | $ | 35,059,231 | |
| Shares issued in reinvestment of | | | | | | | | | | | |
| distributions | 105,876 | | | | 1,072,705 | | 816,734 | | | 8,084,807 | |
| Shares redeemed | (2,676,731 | ) | | | (27,126,608 | ) | (8,512,243 | ) | | (84,586,844 | ) |
| Net increase (decrease) | 3,063,060 | | | $ | 31,061,087 | | (4,169,055 | ) | $ | (41,442,806 | ) |
| Year ended October 31, 2013 | | | | | | | | | | | |
| Shares sold | 12,828,853 | | $ | 130,531,803 | | 16,149,279 | | $ | 166,169,898 | |
| Shares issued in reinvestment of | | | | | | | | | | | |
| distributions | 79,814 | | | | 811,175 | | 2,278,059 | | | 23,306,939 | |
| Shares redeemed | (1,769,298 | ) | | | (17,970,882 | ) | (27,335,243 | ) | | (276,024,832 | ) |
| Net increase (decrease) | 11,139,369 | | $ | 113,372,096 | | (8,907,905 | ) | $ | (86,547,995 | ) |
| Class R Shares: | | | | | | | | | | | |
| Six Months ended April 30, 2014 | | | | | | | | | | | |
| Shares sold | | | | | | | 729,491 | | $ | 7,260,166 | |
| Shares issued in reinvestment of | | | | | | | | | | | |
| distributions | | | | | | | 124,260 | | | 1,231,084 | |
| Shares redeemed | | | | | | | (1,842,937 | ) | | (18,263,534 | ) |
| Net increase (decrease) | | | | | | | (989,186 | ) | $ | (9,772,284 | ) |
| Year ended October 31, 2013 | | | | | | | | | | | |
| Shares sold | | | | | | | 1,804,973 | | $ | 18,449,066 | |
| Shares issued in reinvestment of | | | | | | | | | | | |
| distributions | | | | | | | 332,414 | | | 3,404,066 | |
| Shares redeemed | | | | | | | (3,895,041 | ) | | (39,892,685 | ) |
| Net increase (decrease) | | | | | | | (1,757,654 | ) | $ | (18,039,553 | ) |
| |
| Semiannual Report |147 | | | | | | | | | | | |
Franklin Investors Securities Trust
Notes to Financial Statements (unaudited) (continued)
| | | | | | | | | | | |
| 2. SHARES OF BENEFICIAL INTEREST (continued) | | | | | | | | | | |
| Franklin Low Duration | | | |
| | Total Return Fund | | Franklin Total Return Fund | |
| | Shares | | | | Amount | | Shares | | | Amount | |
| Class R6 Shares: | | | | | | | | | | | |
| Six Months ended April 30, 2014 | | | | | | | | | | | |
| Shares sold | 41,120,716 | | $ | 418,988,060 | | 981,275 | | $ | 9,726,776 | |
| Shares issued on reinvestment of | | | | | | | | | | | |
| distributions | 454,296 | | | | 4,612,849 | | 91,285 | | | 921,725 | |
| Shares redeemed | (933,770 | ) | | | (9,482,048 | ) | (32,920,669 | ) | | (329,116,762 | ) |
| Net increase (decrease) | 40,641,242 | | $ | 414,118,861 | | (31,848,109 | ) | $ | (318,468,261 | ) |
| Year ended October 31, 2013b | | | | | | | | | | | |
| Shares soldc | 91,591 | | | $ | 937,500 | | 43,110,952 | | $ | 449,289,948 | |
| Shares issued in reinvestment of | | | | | | | | | | | |
| distributions | 943 | | | | 9,588 | | 637,392 | | | 6,378,894 | |
| Shares redeemed | — | | | | — | | (11,008,567 | ) | | (108,454,716 | ) |
| Net increase (decrease) | 92,534 | | | $ | 947,088 | | 32,739,777 | | $ | 347,214,126 | |
| Advisor Class Shares: | | | | | | | | | | | |
| Six Months ended April 30, 2014 | | | | | | | | | | | |
| Shares sold | 6,104,950 | | | $ | 62,052,038 | | 13,907,473 | | $ | 138,889,145 | |
| Shares issued in reinvestment of | | | | | | | | | | | |
| distributions | 143,238 | | | | 1,455,750 | | 2,423,747 | | | 24,103,041 | |
| Shares redeemed | (3,498,468 | ) | | | (35,555,504 | ) | (13,964,227 | ) | | (139,328,750 | ) |
| Net increase (decrease) | 2,749,720 | | | $ | 27,952,284 | | 2,366,993 | | $ | 23,663,436 | |
| Year ended October 31, 2013 | | | | | | | | | | | |
| Shares sold | 12,660,371 | | $ | 129,188,243 | | 39,027,914 | | $ | 400,656,520 | |
| Shares issued in reinvestment of | | | | | | | | | | | |
| distributions | 149,750 | | | | 1,530,372 | | 6,500,478 | | | 66,796,194 | |
| Shares redeemedc | (4,321,381 | ) | | | (44,166,595 | ) | (72,073,519 | ) | | (743,464,764 | ) |
| Net increase (decrease) | 8,488,740 | | | $ | 86,552,020 | | (26,545,127 | ) | $ | (276,012,050 | ) |
aEffective March 1, 2013, all Class B shares were converted to Class A.
bFor the period May 1, 2013 (effective date) to October 31, 2013.
cEffective May 1, 2013, a portion of Advisor Class shares were exchanged into Class R6 for the Franklin Total Return Fund.
3. TRANSACTIONS WITH AFFILIATES
Franklin Resources, Inc. is the holding company for various subsidiaries that together are referred to as Franklin Templeton Investments. Certain officers and trustees of the Trust are also officers and/or directors of the following subsidiaries:
| |
| Subsidiary | Affiliation |
| Franklin Advisers, Inc. (Advisers) | Investment manager |
| Franklin Templeton Institutional, LLC (FT Institutional) | Investment manager |
| Franklin Advisers, Inc. (Advisers) | Administrative manager |
| Franklin Templeton Services, LLC (FT Services) | Administrative manager |
| Franklin Templeton Distributors, Inc. (Distributors) | Principal underwriter |
| Franklin Templeton Investor Services, LLC (Investor Services) | Transfer agent |
148 | Semiannual Report
Franklin Investors Securities Trust
Notes to Financial Statements (unaudited) (continued)
| 3. | TRANSACTIONS WITH AFFILIATES (continued) |
| a. | Management Fees |
The Franklin Adjustable U.S. Government Securities Fund pays an investment management fee to Advisers based on the average daily net assets of the fund as follows:
| | |
| Annualized Fee Rate | | Net Assets |
| 0.500 | % | Up to and including $5 billion |
| 0.440 | % | Over $5 billion, up to and including $10 billion |
| 0.410 | % | Over $10 billion, up to and including $15 billion |
| 0.380 | % | In excess of $15 billion |
The Franklin Floating Rate Daily Access Fund pays an investment management fee to Advisers based on the average daily net assets of the fund as follows:
| | |
| Annualized Fee Rate | | Net Assets |
| 0.650 | % | Up to and including $500 million |
| 0.550 | % | Over $500 million, up to and including $1 billion |
| 0.500 | % | Over $1 billion, up to and including $1.5 billion |
| 0.450 | % | Over $1.5 billion, up to and including $6.5 billion |
| 0.425 | % | Over $6.5 billion, up to and including $11.5 billion |
| 0.400 | % | Over $11.5 billion, up to and including $16.5 billion |
| 0.390 | % | Over $16.5 billion, up to and including $19 billion |
| 0.380 | % | Over $19 billion, up to and including $21.5 billion |
| 0.370 | % | In excess of $21.5 billion |
The Franklin Low Duration Total Return Fund and Franklin Total Return Fund pay an investment management fee to Advisers based on the average daily net assets of the funds as follows:
| | |
| Annualized Fee Rate | | Net Assets |
| 0.625 | % | Up to and including $500 million |
| 0.525 | % | Over $500 million, up to and including $1 billion |
| 0.480 | % | Over $1 billion, up to and including $1.5 billion |
| 0.435 | % | Over $1.5 billion, up to and including $6.5 billion |
| 0.415 | % | Over $6.5 billion, up to and including $11.5 billion |
| 0.400 | % | Over $11.5 billion, up to and including $16.5 billion |
| 0.390 | % | Over $16.5 billion, up to and including $19 billion |
| 0.380 | % | Over $19 billion, up to and including $21.5 billion |
| 0.370 | % | In excess of $21.5 billion |
Under a subadvisory agreement, FT Institutional, an affiliate of Advisers, provides subadvisory services to the Franklin Total Return Fund. The subadvisory fee is paid by Advisers based on average daily net assets, and is not an additional expense of the fund.
Semiannual Report | 149
Franklin Investors Securities Trust
Notes to Financial Statements (unaudited) (continued)
| 3. | TRANSACTIONS WITH AFFILIATES (continued) |
| b. | Administrative Fees |
Under an agreement with Advisers, FT Services provides administrative services to the Funds. The fee is paid by Advisers based on the Funds’ average daily net assets, and is not an additional expense of the Funds.
c. Distribution Fees
The Board has adopted distribution plans for each share class, with the exception of Class R6 and Advisor Class shares, pursuant to Rule 12b-1 under the 1940 Act. Distribution fees are not charged on shares held by affiliates. Under the Funds’ Class A reimbursement distribution plans, the Funds reimburse Distributors for costs incurred in connection with the servicing, sale and distribution of each fund’s shares up to the maximum annual plan rate for each class. Under the Class A reimbursement distribution plans, costs exceeding the maximum for the current plan year cannot be reimbursed in subsequent periods. In addition, under the funds’ Class C and R compensation distribution plans, the funds pays Distributors for costs incurred in connection with the servicing, sale and distribution of each fund’s shares up to the maximum annual plan rate for each class. The plan year, for purposes of monitoring compliance with the maximum annual plan rates, is February 1 through January 31 for each fund.
The maximum annual plan rates, based on the average daily net assets, for each class, are as follows:
| | | | | | | | |
| | Franklin | | Franklin | | Franklin | | | |
| | Adjustable | | Floating | | Low Duration | | Franklin | |
| | U.S. Government | | Rate Daily | | Total Return | | Total Return | |
| | Securities Fund | | Access Fund | | Fund | | Fund | |
| Reimbursement Plans: | | | | | | | | |
| Class A | 0.25 | % | 0.25 | % | 0.25 | % | 0.25 | % |
| Compensation Plans: | | | | | | | | |
| Class C | 0.65 | % | 0.65 | % | 0.65 | % | 0.65 | % |
| Class R | — | | — | | — | | 0.50 | % |
d. Sales Charges/Underwriting Agreements
Front-end sales charges and contingent deferred sales charges (CDSC) do not represent expenses of the Funds. These charges are deducted from the proceeds of sales of fund shares prior to invest ment or from redemption proceeds prior to remittance, as applicable. Distributors has advised the Funds of the following commission transactions related to the sales and redemptions of the Funds’ shares for the period:
| | | | | | | | |
| | | Franklin | | Franklin | | Franklin | | |
| | | Adjustable | | Floating | | Low Duration | | Franklin |
| | | U.S. Government | | Rate Daily | | Total Return | | Total Return |
| | | Securities Fund | | Access Fund | | Fund | | Fund |
| Sales charges retained net of commissions | | | | | | | | |
| paid to unaffiliated broker/dealers | $ | 66,558 | $ | 183,080 | $ | 313,215 | $ | 1,029,492 |
| CDSC retained | $ | 42,937 | $ | 118,955 | $ | 58,044 | $ | 39,665 |
| |
| 150 | Semiannual Report | | | | | | | | |
Franklin Investors Securities Trust
Notes to Financial Statements (unaudited) (continued)
| 3. | TRANSACTIONS WITH AFFILIATES (continued) |
| e. | Transfer Agent Fees |
Each class of shares, except for Class R6, pays transfer agent fees to Investor Services for its performance of shareholder servicing obligations and reimburses Investor Services for out of pocket expenses incurred, including shareholding servicing fees paid to third parties. These fees are allocated daily based upon their relative proportion of such classes’ aggregate net assets. Class R6 pays Investor Services transfer agent fees specific to that class.
For the period ended April 30, 2014, the Funds paid transfer agent fees as noted in the Statements of Operations of which the following amounts were retained by Investor Services:
| | | | | | | | |
| | | Franklin | | Franklin | | Franklin | | |
| | | Adjustable | | Floating | | Low Duration | | Franklin |
| | | U.S. Government | | Rate Daily | | Total Return | | Total Return |
| | | Securities Fund | | Access Fund | | Fund | | Fund |
| Transfer agent fees | $ | 364,411 | $ | 700,153 | $ | 344,142 | $ | 1,537,107 |
f. Investment in Institutional Fiduciary Trust Money Market Portfolio
The Funds invest in the Institutional Fiduciary Trust Money Market Portfolio (Sweep Money Fund), an affiliated open-end management investment company. Management fees paid by the Funds are waived on assets invested in the Sweep Money Fund, in an amount not to exceed the management and administrative fees paid directly or indirectly by the Sweep Money Fund, as noted on the Statements of Operations. Prior to November 1, 2013, the waiver was accounted for as a reduction to management fees.
g. Waiver and Expense Reimbursements
Advisers and Investor Services have contractually agreed in advance to waive or limit their respective fees and to assume as their own expense certain expenses otherwise payable by the Franklin Low Duration Total Return Fund and Franklin Total Return Fund so that the expenses (excluding distribution fees, and acquired fund fees and expenses) for Class A, Class C, Class R and Advisor Class of the funds do not exceed 0.55% and 0.63%, respectively, and Class R6 does not exceed 0.43% and 0.47%, respectively based on the average net assets of each class (other than certain non-routine expenses or costs, including those relating to litigation, indemnification, reorganizations, and liquidations) until February 28, 2015.
Investor Services has contractually agreed in advance to waive or limit its fees so that the Class R6 transfer agent fees for the funds do not exceed 0.01% until February 28, 2015.
Semiannual Report | 151
Franklin Investors Securities Trust
Notes to Financial Statements (unaudited) (continued)
| 3. | TRANSACTIONS WITH AFFILIATES (continued) |
| g. | Waiver and Expense Reimbursements (continued) |
Additionally, effective November 1, 2012, Advisers has voluntarily agreed to waive or limit a portion of its investment management fees for the Franklin Floating Rate Daily Access Fund and Franklin Total Return Fund based based on the average daily net assets of each of the funds as follows:
| | |
| Annualized Waiver Rate | | Net Assets |
| 0.015 | % | Over $2.5 billion, up to and including $5 billion |
| 0.025 | % | In excess of $5 billion |
Advisers may discontinue this waiver at any time.
h. Other Affiliated Transactions
At April 30, 2014, one or more of the funds in the Franklin Templeton Fund Allocator Series owned a percentage of each fund’s outstanding shares as follows:
| | |
| Franklin | Franklin | Franklin |
| Adjustable | Floating Rate | Low Duration |
| U.S. Government | Daily Access | Total Return |
| Securities Fund | Fund | Fund |
| 0.02% | 0.02% | 19.14% |
4. EXPENSE OFFSET ARRANGEMENT
The Funds have entered into an arrangement with their custodian whereby credits realized as a result of uninvested cash balances are used to reduce a portion of the Funds’ custodian expenses. During the period ended April 30, 2014, the custodian fees were reduced as noted in the Statements of Operations.
5. INCOME TAXES
For tax purposes, capital losses may be carried over to offset future capital gains. Capital loss carryforwards with no expiration, if any, must be fully utilized before those losses with expiration dates.
152 | Semiannual Report
Franklin Investors Securities Trust
Notes to Financial Statements (unaudited) (continued)
5. INCOME TAXES (continued)
At October 31, 2013, capital loss carryforwards were as follows:
| | | | | | | | |
| | Franklin | | Franklin | | Franklin | | |
| | | Adjustable | | Floating | | Low Duration | | Franklin |
| | | U.S. Government | | Rate Daily | | Total Return | | Total Return |
| | | Securities Fund | | Access Fund | | Fund | | Fund |
| Capital loss carryforwards subject to | | | | | | | | |
| expiration: | | | | | | | | |
| 2014 | $ | 3,962,538 | $ | — | $ | — | $ | — |
| 2015 | | 2,492,027 | | 15,803,418 | | — | | — |
| 2016 | | 1,492,446 | | 91,562,953 | | — | | 1,260,827 |
| 2017 | | 4,398,245 | | 113,325,538 | | — | | — |
| 2018 | | 39,052,647 | | — | | — | | — |
| 2019 | | 21,934,757 | | 10,282,409 | | 5,327,487 | | — |
| Capital loss carryforwards not subject | | | | | | | | |
| to expiration: | | | | | | | | |
| Short term | | 7,494,248 | | — | | 3,307,400 | | 56,199,682 |
| Long term | | 27,813,025 | | — | | 7,672,257 | | — |
| Total capital loss carryforwards | $ | 108,639,933 | $ | 230,974,318 | $ | 16,307,144 | $ | 57,460,509 |
At April 30, 2014, the cost of investments and net unrealized appreciation (depreciation) for income tax purposes were as follows:
| | | | | | | | | | | | |
| | Franklin | | | Franklin | | | Franklin | | | | |
| | | Adjustable | | | Floating | | | Low Duration | | | Franklin | |
| | | U.S. Government | | | Rate Daily | | | Total Return | | | Total Return | |
| | | Securities Fund | | | Access Fund | | | Fund | | | Fund | |
| Cost of investments | $ | 1,814,015,718 | | $ | 5,692,527,603 | | $ | 2,145,560,132 | | $ | 5,364,913,648 | |
| |
| Unrealized appreciation | $ | 36,144,437 | | $ | 33,059,052 | | $ | 25,560,814 | | $ | 163,638,765 | |
| Unrealized depreciation | | (1,410,782 | ) | | (7,502,585 | ) | | (15,001,830 | ) | | (81,334,709 | ) |
| Net unrealized appreciation | | | | | | | | | | | | |
| (depreciation) | $ | 34,733,655 | | $ | 25,556,467 | | $ | 10,558,984 | | $ | 82,304,056 | |
Differences between income and/or capital gains as determined on a book basis and a tax basis are primarily due to differing treatment of foreign currency transactions, mortgage dollar rolls, passive foreign investment company shares, foreign capital gains tax, pass-through entity income, pay down losses, payments-in-kind, bond discounts and premiums, swaps, tax straddles and wash sales.
Semiannual Report | 153
Franklin Investors Securities Trust
Notes to Financial Statements (unaudited) (continued)
6. INVESTMENT TRANSACTIONS
Purchases and sales (excluding short term securities) for the period ended April 30, 2014, were as follows:
| | | | | | | | |
| | | Franklin | | Franklin | | Franklin | | |
| | | Adjustable | | Floating Rate | | Low Duration | | Franklin |
| | | U.S. Government | | Daily Access | | Total Return | | Total Return |
| | | Securities Fund | | Fund | | Fund | | Fund |
| Purchases | $ | 647,977 | $ | 2,211,446,936 | $ | 1,079,079,164 | $ | 6,407,655,095 |
| Sales | $ | 354,698,407 | $ | 1,959,705,694 | $ | 884,856,577 | $ | 7,357,669,032 |
Transactions in options written during the period ended April 30, 2014, were as follows:
| | | | | | | | | | | |
| | Franklin Low Duration | | Franklin | |
| | Total Return Fund | | Total Return Fund | |
| | Notional | | Premiums | | Notional | | | Premiums | |
| | Amount* | | Received | | Amount* | | | Received | |
| Options outstanding at October 31, 2013 | — | | $ | — | | — | | | $ | — | |
| Options written | 13,500,000 | | | 141,041 | | 76,350,000 | | | | 722,352 | |
| Options expired | — | | | — | | — | | | | — | |
| Options exercised | — | | | — | | — | | | | — | |
| Options closed | (10,000,000 | ) | | (105,890 | ) | (35,000,000 | ) | | | (370,615 | ) |
| Options outstanding at April 30, 2014 | 3,500,000 | | $ | 35,151 | | 41,350,000 | | $ | 351,737 | |
| |
| *The notional amount is stated in U.S. dollars unless otherwise indicated. | | | | | | | | | | |
See Notes 1(e) and 10 regarding derivative financial instruments and other derivative information, respectively.
7. CREDIT RISK
At April 30, 2014, the Franklin Floating Rate Daily Access Fund, Franklin Low Duration Total Return Fund and the Franklin Total Return Fund had 83.15%, 19.53%and 15.58%, respectively, of their portfolio invested in high yield, senior secured floating rate notes, or other securities rated below investment grade. These securities may be more sensitive to economic conditions causing greater price volatility and are potentially subject to a greater risk of loss due to default than higher rated securities.
8. RESTRICTED SECURITIES
The Franklin Floating Rate Daily Access Fund invests in securities that are restricted under the Securities Act of 1933 (1933 Act) or which are subject to legal, contractual, or other agreed upon restrictions on resale. Restricted securities are often purchased in private placement transactions, and cannot be sold without prior registration unless the sale is pursuant to an exemption under the 1933 Act. Disposal of these securities may require greater effort and expense, and prompt sale at an acceptable price may be difficult. The Fund may have registration rights for restricted securities. The issuer generally incurs all registration costs.
154 | Semiannual Report
Franklin Investors Securities Trust
Notes to Financial Statements (unaudited) (continued)
8. RESTRICTED SECURITIES (continued)
At April 30, 2014, the Franklin Floating Rate Daily Access Fund held investments in restricted securities, excluding certain securities exempt from registration under the 1933 Act deemed to be liquid, as follows:
| | | | | | |
| Principal | | Acquisition | | | | |
| Amount/Shares | Issuer | Date | | Cost | | Value |
| 26,267 | RoTech Medical Corp. | | | | | |
| | (Value is 0.00% of Net Assets)a | 12/03/10 | $ | — | $ | — |
| |
| aRounds to less than 0.01% of net assets. | | | | | |
9. UNFUNDED LOAN COMMITMENTS
The Franklin Floating Rate Daily Access Fund and Franklin Total Return Fund enter into certain credit agreements, all or a portion of which may be unfunded. The funds are obligated to fund these loan commitments at the borrowers’ discretion. Funded portions of credit agreements are presented on the Statements of Investments.
At April 30, 2014, unfunded commitments were as follows:
| | |
| | | Unfunded |
| Borrower | | Commitment |
| Franklin Floating Rate Daily Access Fund | | |
| Alinta Energy Finance Pty. Ltd., Delayed Draw Term Commitments | $ | 1,673,209 |
| Franklin Total Return Fund | | |
| Patriot Coal Corp., Reimbursement Obligation | $ | 27,837 |
Unfunded loan commitments and funded portions of credit agreements are marked to market daily and any unrealized appreciation or depreciation is included in the Statements of Assets and Liabilities and the Statements of Operations.
Semiannual Report | 155
Franklin Investors Securities Trust
Notes to Financial Statements (unaudited) (continued)
10. OTHER DERIVATIVE INFORMATION
At April 30, 2014, the funds’ investments in derivative contracts are reflected on the Statements of Assets and Liabilities as follows:
| | | | | | | |
| | Asset Derivatives | | Liability Derivatives | |
| |
| Derivative Contracts | | | | | | | |
| Not Accounted for as | Statement of Assets and | Fair Value | Statement of Assets and | | Fair Value | |
| Hedging Instruments | Liabilities Location | | Amount | Liabilities Location | | Amount | |
| |
| Franklin Low Duration Total Return Fund | | | | | | |
| Interest rate contracts | Unrealized appreciation | | | Unrealized depreciation on | | | |
| | on swap contracts / Net | | | swap contracts / Variation | | | |
| | assets consist of – net | | | margin / Net assets | | | |
| | unrealized appreciation | | | consist of – net unrealized | | | |
| | (depreciation) | $ | 134,333 | appreciation (depreciation) | $ | 618,595 | a |
| Foreign exchange | | | | | | | |
| contracts | Unrealized appreciation on | | | Unrealized depreciation on | | | |
| | forward exchange contracts / | | | forward exchange contracts / | | | |
| | Net assets consist of – net | | | Net assets consist of – net | | | |
| | unrealized appreciation | | | unrealized appreciation | | | |
| | (depreciation) | | 1,244,483 | (depreciation) | | 5,165,156 | |
| Credit contracts | Unrealized appreciation on | | | Unrealized depreciation on | | | |
| | swap contracts / Net assets | | | swap contracts / Net assets | | | |
| | consist of – net unrealized | | | consist of – net unrealized | | | |
| | appreciation (depreciation) | | 1,040,252 | appreciation (depreciation) | | 1,883,770 | |
| |
| Franklin Total Return Fund | | | | | | | |
| Interest rate contracts | Unrealized appreciation on | | | Unrealized depreciation on | | | |
| | swap contracts / Net assets | | | swap contracts / Net assets | | | |
| | consist of – net unrealized | | | consist of – net unrealized | | | |
| | appreciation (depreciation) | $ | — | appreciation (depreciation) | $ | 2,336,944 | a |
| Foreign exchange | | | | | | | |
| contracts | Unrealized appreciation on | | | Unrealized depreciation on | | | |
| | forward exchange contracts / | | | forward exchange contracts / | | | |
| | Net assets consist of – net | | | Net assets consist of – net | | | |
| | unrealized appreciation | | | unrealized appreciation | | | |
| | (depreciation) | | 8,286,691 | (depreciation) | | 17,101,145 | |
| Credit contracts | Unrealized appreciation on | | | Unrealized depreciation on | | | |
| | swap contracts / Net assets | | | swap contracts / Net assets | | | |
| | consist of – net unrealized | | | consist of – net unrealized | | | |
| | appreciation (depreciation) | | 4,948,549 | appreciation (depreciation) | | 8,190,953 | |
aIncludes cumulative appreciation (depreciation) of futures and cross currency swaps as reported in the Statements of Investments. Only current
day’s variation margin is separately reported within the Statement of Assets and Liabilities.
156 | Semiannual Report
Franklin Investors Securities Trust
Notes to Financial Statements (unaudited) (continued)
10. OTHER DERIVATIVE INFORMATION (continued)
For the period ended April 30, 2014, the effect of derivative contracts on the funds’ Statements of Operations was as follows:
| | | | | | | |
| | | | | | | Change in | |
| | | | | | | Unrealized | |
| Derivative Contracts | | | Realized | | | Appreciation | |
| Not Accounted for as | Statement of | | Gain (Loss) | | | (Depreciation) | |
| Hedging Instruments | Operations Locations | | for the Period | | | for the Period | |
| |
| Franklin Low Duration Total Return Fund | | | | | | |
| Interest rate contracts | Net realized gain (loss) from futures / swap contracts / | | | | | | |
| | Net change in unrealized appreciation (depreciation) | | | | | | |
| | on investments | $ | (1,637,460 | ) | $ | 745,053 | |
| Foreign exchange contracts | Net realized gain (loss) from foreign currency | | | | | | |
| transactions / Net change in unrealized appreciation |
| (depreciation) on translation of other assets and |
| | liabilities denominated in foreign currencies | | (2,333,459 | ) | | (1,033,253 | ) |
| Credit contracts | Net realized gain (loss) from swap contracts / Net | | | | | | |
| change in unrealized appreciation (depreciation) |
| | on investments | | (7,030 | ) | | 110,705 | |
| Franklin Total Return Fund | | | | | | | |
| Interest rate contracts | Net realized gain (loss) from futures / swap contracts / | | | | | | |
| | Net change in unrealized appreciation (depreciation) | | | | | | |
| | on investments | $ | (747,771 | ) | $ | (848,915 | ) |
| Foreign exchange contracts | Net realized gain (loss) from foreign currency | | | | | | |
| transactions / Net change in unrealized appreciation |
| (depreciation) on translation of other assets and |
| | liabilities denominated in foreign currencies | | (3,221,653 | ) | | (6,154,585 | ) |
| Credit contracts | Net realized gain (loss) from swap contracts / Net | | | | | | |
| change in unrealized appreciation (depreciation) |
| | on investments | | (793,520 | ) | | 2,190,369 | |
For the period ended April 30, 2014, the average month end fair value of derivatives represented 0.46% and 0.92% of average month end net assets. The average month end number of open derivative contracts for the period was 226 and 251, respectively.
Semiannual Report | 157
Franklin Investors Securities Trust
Notes to Financial Statements (unaudited) (continued)
10. OTHER DERIVATIVE INFORMATION (continued)
At April 30, 2014, the funds’ OTC derivative assets and liabilities are as follows:
| | | | |
| | | Gross and Net Amounts of Assets and Liabilities |
| | | Presented in the |
| | | Statement of Assets and Liabilities |
| | | Assetsa | | Liabilitiesa |
| Derivatives | | | | |
| Franklin Low Duration Total Return Fund | | | | |
| Forward exchange contracts | $ | 1,100,434 | $ | 5,135,420 |
| Options purchased | | 162,515 | | — |
| Options written | | — | | 29,736 |
| Swap contracts | | 2,345,005 | | 7,313,134 |
| Total | $ | 3,607,954 | $ | 12,478,290 |
| Franklin Total Return Fund | | | | |
| Forward exchange contracts | $ | 7,173,606 | $ | 16,927,540 |
| Options purchased | | 1,153,341 | | — |
| Options written | | — | | 173,605 |
| Swap contracts | | 8,079,097 | | 24,613,040 |
| Total | $ | 16,406,044 | $ | 41,714,185 |
aAbsent an event of default or early termination, OTC derivative assets and liabilities are presented gross and not offset in the Statements of Assets and Liabilities.
At April 30, 2014, the funds’ OTC derivative assets which may be offset against the funds’ OTC derivative liabilities and collateral received from the counterparty, is as follows:
| | | | | | | | | | | | | |
| | | | | Amounts Not Offset in the | | | |
| | | | | Statement of Assets and Liabilities | | | |
| | | Gross and | | | | | | | | | | | |
| | | Net Amounts of | | | | | | | | | | | |
| | | Assets Presented | | Financial | | Financial | | | | | | |
| | | in the Statement | | Instruments | | Instruments | | | Cash | | | Net Amount |
| | | of Assets and | | Available for | | Collateral | | Collateral | | | (Not less |
| | | Liabilities | | Offset | | Receiveda,b | | Receivedb | | | than zero) |
| Franklin Low Duration | | | | | | | | | | | | | |
| Total Return Fund | | | | | | | | | | | | | |
| Counterparty | | | | | | | | | | | | | |
| BOFA | $ | 33,168 | $ | (33,168 | ) | $ | — | | $ | — | | $ | — |
| BZWS | | 1,688,037 | | (1,556,233 | ) | | — | | | (131,804 | ) | | — |
| CITI | | 114,529 | | (114,529 | ) | | — | | | — | | | — |
| DBAB | | 814,569 | | (814,569 | ) | | — | | | — | | | — |
| FBCO | | 346,976 | | (346,976 | ) | | — | | | — | | | — |
| GSCO | | 33,326 | | (33,326 | ) | | — | | | — | | | — |
| HSBC | | 71,019 | | (381 | ) | | — | | | — | | | 70,638 |
| JPHQ | | 381,048 | | (381,048 | ) | | — | | | — | | | — |
| MSCO | | 125,282 | | (125,282 | ) | | — | | | — | | | — |
| Total | $ | 3,607,954 | $ | (3,405,512 | ) | $ | — | $ | (131,804 | ) | $ | 70,638 |
158 | Semiannual Report
Franklin Investors Securities Trust
Notes to Financial Statements (unaudited) (continued)
| | | | | | | | | | | | |
| 10. OTHER DERIVATIVE INFORMATION (continued) | | | | | | | | | | |
| |
| | | | | Amounts Not Offset in the | | | |
| | | | | Statement of Assets and Liabilities | | | |
| | | Gross and | | | | | | | | | | |
| | | Net Amounts of | | | | | | | | | | |
| | | Assets Presented | | Financial | | | Financial | | | | | |
| | | in the Statement | | Instruments | | | Instruments | | Cash | | | Net Amount |
| | | of Assets and | | Available for | | | Collateral | | Collateral | | (Not less |
| | | Liabilities | | Offset | | | Receiveda,b | | Receivedb | | than zero) |
| Franklin Total Return Fund | | | | | | | | | | | | |
| Counterparty | | | | | | | | | | | | |
| BOFA | $ | 315,016 | $ | (198,920 | ) | $ | (116,096 | ) | $ | — | $ | — |
| BZWS | | 4,149,068 | | (4,149,068 | ) | | — | | | — | | — |
| CITI | | 39,686 | | (39,686 | ) | | — | | | — | | — |
| DBAB | | 5,439,672 | | (5,439,672 | ) | | — | | | — | | — |
| FBCO | | 2,914,794 | | (2,914,794 | ) | | — | | | — | | — |
| GSCO | | 459,158 | | (459,158 | ) | | — | | | — | | — |
| HSBC | | 393,027 | | (11,120 | ) | | (321,748 | ) | | — | | 60,159 |
| JPHQ | | 1,532,803 | | (1,532,803 | ) | | — | | | — | | — |
| MSCO | | 612,270 | | (612,270 | ) | | — | | | — | | — |
| UBSW | | 550,550 | | (550,550 | ) | | — | | | — | | — |
| Total | $ | 16,406,044 | $ | (15,908,041 | ) | $ | (437,844 | ) | $ | — | $ | 60,159 |
aAt April 30, 2014, the Fund received U.S. Treasury Bonds and U.K. Treasury Bonds as collateral for derivatives.
bIn some instances, the collateral amounts disclosed in the table above were adjusted due to the requirement to limit collateral amounts to avoid the
effect of overcollateralization. Actual collateral received and/or pledged may be more than the amount disclosed herein.
At April 30, 2014, the funds’ OTC derivative liabilities which may be offset against the funds’ OTC derivative assets and collateral pledged to the counterparty, is as follows:
| | | | | | | | | | | | | | |
| | | | | Amounts Not Offset in the | | | | | |
| | | | | Statement of Assets and Liabilities | | | | | |
| | | Gross and | | | | | | | | | | | | |
| | | Net Amounts | | | | | | | | | | | | |
| | | of Liabilities | | | | | | | | | | | | |
| | | Presented in | | Financial | | | Financial | | | | | | | |
| | | the Statement | | Instruments | | | Instruments | | Cash | | | Net Amount | | |
| | | of Assets and | | Available for | | | Collateral | | Collateral | | | (Not less | | |
| | | Liabilities | | Offset | | | Pledged | | Pledgeda | | | than zero) | | |
| Franklin Low Duration | | | | | | | | | | | | | | |
| Total Return Fund | | | | | | | | | | | | | | |
| Counterparty | | | | | | | | | | | | | | |
| BOFA | $ | 356,105 | $ | (33,168 | ) | $ | — | $ | (322,937 | ) | $ | — | | |
| BZWS | | 1,556,233 | | (1,556,233 | ) | | — | | — | | | — | | |
| CITI | | 533,469 | | (114,529 | ) | | — | | (418,940 | ) | | — | | |
| DBAB | | 6,641,670 | | (814,569 | ) | | — | | (5,580,000 | ) | | 247,101 | | |
| FBCO | | 472,533 | | (346,976 | ) | | — | | (90,000 | ) | | 35,557 | | |
| GSCO | | 1,678,497 | | (33,326 | ) | | — | | (1,645,171 | ) | | — | | |
| HSBC | | 381 | | (381 | ) | | — | | — | | | — | | |
| JPHQ | | 958,188 | | (381,048 | ) | | — | | (560,000 | ) | | 17,140 | | |
| MSCO | | 281,214 | | (125,282 | ) | | — | | (40,000 | ) | | 115,932 | | |
| Total | $ | 12,478,290 | $ | (3,405,512 | ) | $ | — | $ | (8,657,048 | ) | $ | 415,730 | | |
| |
| | | | | | | | | | | | | Semiannual Report | | | 159 |
Franklin Investors Securities Trust
Notes to Financial Statements (unaudited) (continued)
| | | | | | | | | | | | | |
| 10. OTHER DERIVATIVE INFORMATION (continued) | | | | | | | | | | | |
| |
| | | | | Amounts Not Offset in the | | | |
| | | | | Statement of Assets and Liabilities | | | |
| | | Gross and | | | | | | | | | | | |
| | | Net Amounts | | | | | | | | | | | |
| | | of Liabilities | | | | | | | | | | | |
| | | Presented in | | Financial | | | Financial | | | | | | |
| | | the Statement | | Instruments | | | Instruments | | | Cash | | | Net Amount |
| | | of Assets and | | Available for | | | Collateral | | | Collateral | | | (Not less |
| | | Liabilities | | Offset | | | Pledged | | | Pledgeda | | | than zero) |
| Franklin Total Return Fund | | | | | | | | | | | | | |
| Counterparty | | | | | | | | | | | | | |
| BOFA | $ | 198,920 | $ | (198,920 | ) | $ | — | | $ | — | | $ | — |
| BZWS | | 6,617,152 | | (4,149,068 | ) | | — | | | (2,468,084 | ) | | — |
| CITI | | 1,586,110 | | (39,686 | ) | | — | | | (1,546,424 | ) | | — |
| DBAB | | 16,068,609 | | (5,439,672 | ) | | — | | | (9,820,000 | ) | | 808,937 |
| FBCO | | 2,973,061 | | (2,914,794 | ) | | — | | | — | | | 58,267 |
| GSCO | | 7,028,016 | | (459,158 | ) | | — | | | (6,568,858 | ) | | — |
| HSBC | | 11,120 | | (11,120 | ) | | — | | | — | | | — |
| JPHQ | | 3,427,737 | | (1,532,803 | ) | | — | | | (1,894,934 | ) | | — |
| MSCO | | 1,828,433 | | (612,270 | ) | | — | | | (1,216,163 | ) | | — |
| UBSW | | 1,975,027 | | (550,550 | ) | | — | | | (1,385,000 | ) | | 39,477 |
| Total | $ | 41,714,185 | $ | (15,908,041 | ) | $ | — | $ | (24,899,463 | ) | $ | 906,681 |
aIn some instances, the collateral amounts disclosed in the table above were adjusted due to the requirement to limit collateral amounts to avoid the
effect of overcollateralization. Actual collateral received and/or pledged may be more than the amount disclosed herein.
See Note 1(e) and 6 regarding derivative financial instruments and Investment Transactions.
11. CREDIT FACILITY
The Funds, together with other U.S. registered and foreign investment funds (collectively, Borrowers), managed by Franklin Templeton Investments, are borrowers in a joint syndicated senior unsecured credit facility totaling $1.5 billion (Global Credit Facility) which matures on February 14, 2015. This Global Credit Facility provides a source of funds to the Borrowers for temporary and emergency purposes, including the ability to meet future unanticipated or unusually large redemption requests.
Under the terms of the Global Credit Facility, the Funds shall, in addition to interest charged on any borrowings made by the Funds and other costs incurred by the Funds, pay their share of fees and expenses incurred in connection with the implementation and maintenance of the Global Credit Facility, based upon their relative share of the aggregate net assets of all of the Borrowers, including an annual commitment fee of 0.07% based upon the unused portion of the Global Credit Facility. These fees are reflected in other expenses on the Statements of Operations. During the period ended April 30, 2014, the Funds did not use the Global Credit Facility.
160 | Semiannual Report
Franklin Investors Securities Trust
Notes to Financial Statements (unaudited) (continued)
12. FAIR VALUE MEASUREMENTS
The Funds follow a fair value hierarchy that distinguishes between market data obtained from independent sources (observable inputs) and the Funds’ own market assumptions (unobservable inputs). These inputs are used in determining the value of the Funds’ financial instruments and are summarized in the following fair value hierarchy:
- Level 1 – quoted prices in active markets for identical financial instruments
- Level 2 – other significant observable inputs (including quoted prices for similar financial instruments, interest rates, prepayment speed, credit risk, etc.)
- Level 3 – significant unobservable inputs (including the Funds’ own assumptions in determining the fair value of financial instruments)
The input levels are not necessarily an indication of the risk or liquidity associated with financial instruments at that level.
For movements between the levels within the fair value hierarchy, the Funds have adopted a policy of recognizing the transfers as of the date of the underlying event which caused the movement.
A summary of inputs used as of April 30, 2014, in valuing the Funds’ assets and liabilities carried at fair value, is as follows:
| | | | | | | | | |
| | | | Level 1 | | Level 2 | | Level 3 | | Total |
| |
| Franklin Adjustable U.S. Government Securities Fund | | | | | | |
| Assets: | | | | | | | | | |
| Investments in Securities: | | | | | | | | | |
| Asset-Backed Securities and | | | | | | | | | |
| Commercial Mortgage-Backed | | | | | | | | | |
| Securities | | $ | — | $ | — | $ | 22,887 | $ | 22,887 |
| Mortgage-Backed Securities | | | — | | 1,745,735,405 | | — | | 1,745,735,405 |
| Short Term Investments. | | | 92,746,279 | | 10,244,802 | | — | | 102,991,081 |
| Total Investments in Securities | | $ | 92,746,279 | $ | 1,755,980,207 | $ | 22,887 | $ | 1,848,749,373 |
| |
| Franklin Floating Rate Daily Access Fund | | | | | | | | | |
| Assets: | | | | | | | | | |
| Investments in Securities: | | | | | | | | | |
| Equity Investments: | | | | | | | | | |
| Health Care Distributors | | $ | — | $ | — | $ | —a | $ | — |
| Corporate Bonds | | | — | | 2,365,770 | | — | | 2,365,770 |
| Senior Floating Rate Interests | | | — | | 4,848,680,546 | | 782,367 | | 4,849,462,913 |
| Asset-Backed Securities and | | | | | | | | | |
| Commercial Mortgage-Backed | | | | | | | | | |
| Securities | | | — | | 29,316,287 | | — | | 29,316,287 |
| Short Term Investments. | | | 836,939,100 | | — | | — | | 836,939,100 |
| Total Investments in Securities | $ | 836,939,100 | $ | 4,880,362,603 | $ | 782,367 | $ | 5,718,084,070 |
| Other Financial Instruments | | | | | | | | | |
| Unfunded Loan Commitments | | $ | — | $ | 83,157 | $ | — | $ | 83,157 |
Semiannual Report | 161
Franklin Investors Securities Trust
Notes to Financial Statements (unaudited) (continued)
| | | | | | | | | |
| 12. FAIR VALUE MEASUREMENTS (continued) | | | | | | | |
| |
| | | | Level 1 | | Level 2 | | Level 3 | | Total |
| Franklin Low Duration Total Return Fund | | | | | | | | | |
| Assets: | | | | | | | | | |
| Investments in Securities: | | | | | | | | | |
| Equity Investments: | | | | | | | | | |
| Materials | | $ | — | $ | 90,000 | $ | — | $ | 90,000 |
| Exchange Traded Fundsc | | | 16,081,000 | | — | | — | | 16,081,000 |
| Corporate Bonds | | | — | | 708,336,120 | | — | | 708,336,120 |
| Senior Floating Rate Interests | | | — | | 128,375,553 | | — | | 128,375,553 |
| Foreign Government and Agency | | | | | | | | | |
| Securities | | | — | | 92,045,238 | | — | | 92,045,238 |
| U.S. Government and Agency | | | | | | | | | |
| Securities | | | — | | 181,740,111 | | — | | 181,740,111 |
| Asset-Backed Securities and | | | | | | | | | |
| Commercial Mortgage-Backed | | | | | | | | | |
| Securities | | | — | | 404,429,523 | | — | | 404,429,523 |
| Mortgage-Backed Securities | | | — | | 97,858,469 | | — | | 97,858,469 |
| Municipal Bonds | | | — | | 26,635,508 | | — | | 26,635,508 |
| Options Purchased | | | — | | 162,515 | | — | | 162,515 |
| Litigation Trusts | | | — | | — | | —a | | — |
| Short Term Investments. | | | 226,574,973 | | 273,790,106 | | — | | 500,365,079 |
| Total Investments in Securities | $ | 242,655,973 | $ | 1,913,463,143 | $ | — | $ | 2,156,119,116 |
| Other Financial Instruments | | | | | | | | | |
| Futures Contracts | | $ | 134,333 | $ | — | $ | — | $ | 134,333 |
| Forward Exchange Contracts. | | | — | | 1,100,434 | | — | | 1,100,434 |
| Swap Contracts | | | — | | 1,021,786 | | — | | 1,021,786 |
| Total Investments in Securities | | $ | 134,333 | $ | 2,122,220 | $ | — | $ | 2,256,553 |
| Liabilities: | | | | | | | | | |
| Other Financial Instruments | | | | | | | | | |
| Options Written. | | $ | — | $ | 29,736 | $ | — | $ | 29,736 |
| Futures Contracts | | | 191,396 | | — | | — | | 191,396 |
| Forward Exchange Contracts. | | | — | | 5,135,420 | | — | | 5,135,420 |
| Swap Contracts | | | — | | 2,310,969 | | — | | 2,310,969 |
| Total Investments in Securities | | $ | 191,396 | $ | 7,476,125 | $ | — | $ | 7,667,521 |
162 | Semiannual Report
Franklin Investors Securities Trust
Notes to Financial Statements (unaudited) (continued)
| | | | | | | | | | |
| 12. FAIR VALUE MEASUREMENTS (continued) | | | | | | | | |
| |
| | | | Level 1 | | Level 2 | | Level 3 | | | Total |
| Franklin Total Return Fund | | | | | | | | | | |
| Assets: | | | | | | | | | | |
| Investments in Securities: | | | | | | | | | | |
| Equity Investments:b | | | | | | | | | | |
| Consumer Services | | $ | — | $ | 2,000,232 | $ | — | | $ | 2,000,232 |
| Materials | | | — | | 450,000 | | — | | | 450,000 |
| All Other Equity Investmentsc | | | 20,601,582 | | — | | — | | | 20,601,582 |
| Corporate Bonds | | | — | | 1,620,313,689 | | — | | | 1,620,313,689 |
| Senior Floating Rate Interests | | | — | | 196,319,855 | | 15,143 | | | 196,334,998 |
| Foreign Government and Agency | | | | | | | | | | |
| Securities | | | — | | 419,896,922 | | — | | | 419,896,922 |
| U.S. Government and Agency | | | | | | | | | | |
| Securities | | | — | | 911,465,528 | | — | | | 911,465,528 |
| Asset-Backed Securities and | | | | | | | | | | |
| Commercial Mortgage-Backed | | | | | | | | | | |
| Securities | | | — | | 584,078,961 | | 1,597,736 | | | 585,676,697 |
| Mortgage-Backed Securities | | | — | | 936,677,400 | | — | | | 936,677,400 |
| Municipal Bonds | | | — | | 240,890,720 | | — | | | 240,890,720 |
| Escrows and Litigation Trusts | | | 30,663 | | — | | 435 | a | | 31,098 |
| Options Purchased | | | — | | 1,153,341 | | — | | | 1,153,341 |
| Short Term Investments | | | 476,276,903 | | 35,448,594 | | — | | | 511,725,497 |
| Total Investments in Securities | $ | 496,909,148 | $ | 4,948,695,242 | $ | 1,613,314 | | $ | 5,447,217,704 |
| Other Financial Instruments | | | | | | | | | | |
| Forward Exchange Contracts. | | $ | — | $ | 7,173,606 | $ | — | | $ | 7,173,606 |
| Swap Contracts | | | — | | 4,908,293 | | — | | | 4,908,293 |
| Total Investments in Securities | | $ | — | $ | 12,081,899 | $ | — | | $ | 12,081,899 |
| Liabilities: | | | | | | | | | | |
| Other Financial Instruments | | | | | | | | | | |
| Options Written. | | $ | — | $ | 173,605 | $ | — | | $ | 173,605 |
| Forward Exchange Contracts. | | | — | | 16,927,540 | | — | | | 16,927,540 |
| Swap Contracts | | | — | | 10,527,897 | | — | | | 10,527,897 |
| Unfunded Loan Commitments | | | — | | 2,692 | | — | | | 2,692 |
| Total Investments in Securities | | $ | — | $ | 27,631,734 | $ | — | | $ | 27,631,734 |
aIncludes securities determined to have no value at April 30, 2014.
bIncludes common, preferred and convertible preferred stocks as well as other equity investments.
cFor detailed categories, see the accompanying Statements of Investments.
A reconciliation of assets in which Level 3 inputs are used in determining fair value is presented when there are significant Level 3 financial instruments at the end of the period.
13. NEW ACCOUNTING PRONOUNCEMENTS
In June 2013, the Financial Accounting Standards Board issued Accounting Standards Update (ASU) No. 2013-08, Investment Companies (Topic 946): Amendments to the Scope, Measurement, and Disclosure Requirements. The ASU modifies the criteria used in defining an investment company under U.S. Generally Accepted Accounting Principles and also sets
Semiannual Report | 163
Franklin Investors Securities Trust
Notes to Financial Statements (unaudited) (continued)
13. NEW ACCOUNTING PRONOUNCEMENTS (continued)
forth certain measurement and disclosure requirements. Under the ASU, an entity that is registered under the 1940 Act automatically qualifies as an investment company. The ASU is effective for interim and annual reporting periods beginning after December 15, 2013. Management has reviewed the requirements and believes the adoption of this ASU will not have a material impact on the financial statements.
14. SUBSEQUENT EVENTS
The Funds have evaluated subsequent events through the issuance of the financial statements and determined that no events have occurred that require disclosure other than those already disclosed in the financial statements, except for the following:
On May 30, 2014, shareholders of the Franklin Limited Maturity U.S. Government Securities Fund approved a proposal to reorganize the fund with and into the Franklin Adjustable U.S. Government Securities Fund on or about June 18, 2014. In connection with the reorganization, effective June 18, 2014, the Franklin Adjustable U.S. Government Securities Fund will launch a new class of shares, Class A1.
ABBREVIATIONS
Counterparty
BOFA -Bank of America, N.A.
BZWS - Barclays Bank PLC
CITI - Citigroup, Inc.
DBAB -Deutsche Bank AG
FBCO - Credit Suisse Group AG
GSCO - The Goldman Sachs Group, Inc.
HSBC - HSBC Bank USA, N.A.
JPHQ - JP Morgan Chase & Co.
MSCO - Morgan Stanley
UBSW - UBS AG
Currency
BRL - Brazilian Real
DKK -Danish Krone
EUR -Euro
GBP - British Pound
HUF -Hungarian Forint
IDR -Indonesian Rupiah
KRW -South Korean Won
LKR - Sri Lankan Rupee
MXN - Mexican Peso
MYR - Malaysian Ringgit
PEN - Peruvian Nuevo
PHP - Philippine Peso
PLN - Polish Zloty
SGD -Singapore Dollar
UYU -Uruguayan Peso
Selected Portfolio
AGMC - Assured Guaranty Municipal Corp.
CD - Certificate of Deposit
CDO - Collateralized Debt Obligation
CLO - Collateralized Loan Obligation
COP - Certificate of Participation
EDA - Economic Development Authority
ETF - Exchange Traded Fund
FGIC -Financial Guaranty Insurance Co.
FICO -Financing Corp.
FRN - Floating Rate Note
GL - Government Loan
GO -General Obligation
GP - Graduated Payment
IO -Interest Only
ISD -Independent School District
NATL - National Public Financial Guarantee Corp.
NATL RE - National Public Financial Guarantee Corp.
Reinsured
NCI - National Median Cost of Funds Index
PIK - Payment-In-Kind
PSF - Permanent School Fund
RDA - Redevelopment Agency/Authority
REIT - Real Estate Investment Trust
SF -Single Family
UHSD -Unified/Union High School District
164 | Semiannual Report
Franklin Investors Securities Trust
Shareholder Information
Board Review of Investment Management Agreement
At a meeting held February 25, 2014, the Board of Trustees (Board), including a majority of non-interested or independent Trustees, approved renewal of the investment management agreement for each of the separate funds within Franklin Investors Securities Trust (Fund(s)). In reaching this decision, the Board took into account information furnished throughout the year at regular Board meetings, as well as information prepared specifically in connection with the annual renewal review process. Information furnished and discussed throughout the year included investment performance reports and related financial information for each Fund, along with periodic reports on expenses, shareholder services, legal and compliance matters, pricing, brokerage commissions and execution and other services provided by the Investment Manager (Manager) and its affiliates. Information furnished specifically in connection with the renewal process included a report for each Fund prepared by Lipper, Inc. (Lipper), an independent organization, as well as additional material, including a Fund profitability analysis prepared by management. The Lipper reports compared each Fund’s investment performance and expenses with those of other mutual funds deemed comparable to the Fund as selected by Lipper. The Fund profitability analysis discussed the profitability to Franklin Templeton Investments from its overall U.S. fund operations, as well as on an individual fund-by-fund basis. Additional material accompanying such profitability analysis included information on a fund-by-fund basis listing portfolio managers and other accounts they manage, as well as information on management fees charged by the Manager and its affiliates to U.S. mutual funds and other accounts, including management’s explanation of differences where relevant. Such material also included a memorandum prepared by management describing project initiatives and capital investments relating to the services provided to the Funds by the Franklin Templeton Investments organization, as well as a memorandum relating to economies of scale and an analysis concerning transfer agent fees charged by an affiliate of the Manager.
In considering such materials, the independent Trustees received assistance and advice from and met separately with independent counsel. While the investment management agreements for all Funds were considered at the same Board meeting, the Board dealt with each Fund separately. In approving continuance of the investment management agreement for each Fund, the Board, including a majority of independent Trustees, determined that the existing management fee structure was fair and reasonable and that continuance of the investment management agreement was in the best interests of each Fund and its shareholders. While attention was given to all information furnished, the following discusses some primary factors relevant to the Board’s decision.
NATURE, EXTENT AND QUALITY OF SERVICES. The Board was satisfied with the nature and quality of the overall services provided by the Manager and its affiliates to the Funds and their shareholders. In addition to investment performance and expenses discussed later, the Board’s opinion was based, in part, upon periodic reports furnished it showing that the investment policies and restrictions for each Fund were consistently complied with as well as other reports periodically furnished the Board covering matters such as the compliance of portfolio managers and other
Semiannual Report | 165
Franklin Investors Securities Trust
Shareholder Information (continued)
Board Review of Investment Management Agreement (continued)
management personnel with the code of ethics adopted throughout the Franklin Templeton fund complex, the adherence to fair value pricing procedures established by the Board, and the accuracy of net asset value calculations. The Board also noted the extent of benefits provided Fund shareholders from being part of the Franklin Templeton family of funds, including the right to exchange investments between the same class of funds without a sales charge, the ability to reinvest Fund dividends into other funds and the right to combine holdings in other funds to obtain a reduced sales charge. Favorable consideration was given to management’s continual efforts and expenditures in establishing back-up systems and recovery procedures to function in the event of a natural disaster, it being noted that such systems and procedures had functioned well during the Florida hurricanes and blackouts experienced in previous years, and that those operations in the New York/New Jersey area ran smoothly during the period of the 2012 Hurricane Sandy. Among other factors taken into account by the Board were the Manager’s best execution trading policies, including a favorable report by an independent portfolio trading analytical firm, which also covered FOREX transactions. Consideration was also given to the experience of each Fund’s portfolio management team, the number of accounts managed and general method of compensation. In this latter respect, the Board noted that a primary factor in management’s determination of a portfolio manager’s bonus compensation was the relative investment performance of the funds he or she managed and that a portion of such bonus was required to be invested in a predesignated list of funds within such person’s fund management area so as to be aligned with the interests of shareholders. The Board also took into account the quality of transfer agent and shareholder services provided Fund shareholders by an affiliate of the Manager and the continual enhancements to the Franklin Templeton website. Particular attention was given to management’s conservative approach and diligent risk management procedures, including continual monitoring of counterparty credit risk and attention given to derivative and other complex instruments including expanded collateralization requirements. The Board also took into account, among other things, management’s efforts in establishing a global credit facility for the benefit of the Funds and other accounts managed by Franklin Templeton Investments to provide a source of cash for temporary and emergency purposes or to meet unusual redemption requests as well as the strong financial position of the Manager’s parent company and its commitment to the mutual fund business as evidenced by its subsidization of money market funds.
INVESTMENT PERFORMANCE. The Board placed significant emphasis on the investment performance of each Fund in view of its importance to shareholders. While consideration was given to performance reports and discussions with portfolio managers at Board meetings during the year, particular attention in assessing performance was given to the Lipper reports furnished for the agreement renewals. The Lipper reports prepared for each individual Fund showed the investment performance of its Class A shares in comparison with its selected performance universe during 2013 and during the previous 10 years ended December 31, 2013, unless otherwise noted. Performance on a total return basis was shown by Lipper for all Funds with performance on an income return basis being shown for those Funds having income return as an element of their investment objective. The following summarizes the performance results for each Fund.
166 | Semiannual Report
Franklin Investors Securities Trust
Shareholder Information (continued)
Board Review of Investment Management Agreement (continued)
Franklin Adjustable U.S. Government Securities Fund – The Fund’s investment performance was shown in comparison with a performance universe consisting of all retail and institutional ultra-short obligation funds as selected by Lipper. The Lipper report showed the Fund’s income return in 2013 to be in the highest or best performing quintile of such performance universe, and on an annualized basis to also be in the highest quintile of such universe during each of the previous three-, five- and 10-year periods. The Lipper report showed the Fund’s total return during 2013 to be in the lowest performing quintile of its performance universe, but on an annualized basis to be in the middle performing quintile, but upper half, of its performance universe for each of the previous three- and five-year periods, and in the highest performing quintile of such universe for the previous 10-year period. The Board found the Fund’s comparative performance as set forth in the Lipper report to be satisfactory and noted the Fund’s income oriented investment objective.
Franklin Floating Rate Daily Access Fund – The Fund’s investment performance was shown in comparison with a performance universe consisting of all retail and institutional loan participation funds as selected by Lipper. The Lipper report showed its income return during 2013 to be in the next to lowest performing quintile of its performance universe, and its income return on an annualized basis during the previous three-, five- and 10-year periods to also be in the second-lowest performing quintile of its performance universe. The Lipper report showed the Fund’s total return during 2013 to be in the second-lowest performing quintile of its performance universe and on an annualized basis for the previous three-, five- and 10-year periods to be in either the lowest or second-lowest performing quintile of such universe. In discussing such performance, management pointed out, among other things, that the Fund’s returns should be viewed on a risk-adjusted basis, and reflected its conservative approach to investing and commensurate underweighting in high yield, lower rated bank loan investments. Management also expressed its belief that the Fund’s performance was favorable in comparison to other similarly managed funds within its Lipper performance universe. While not satisfied with the Fund’s comparative performance as set forth in the Lipper report, the Board found such performance to be acceptable in view of management’s explanation and the Fund’s stated strategy of investing primarily in senior secured floating rate loans.
Franklin Low Duration Total Return Fund – The Fund’s investment performance was shown in comparison to a performance universe consisting of all retail and institutional short investment-grade debt funds as selected by Lipper. The Fund has been in operation for less than 10 years, and the Lipper report showed its income return for 2013 to be in the highest or best performing quin-tile of its performance universe, and on an annualized basis to be in either the highest performing quintile or second-highest performing quintile of such universe for the previous three- and five-year periods. The Lipper report showed the Fund’s total return for 2013 to be in the highest performing quintile of its performance universe, and on an annualized basis to be in the middle performing quintile, but upper half, of such universe for the previous three- and five-year periods. The Board was satisfied with the Fund’s comparative performance as shown in the Lipper report.
Semiannual Report | 167
Franklin Investors Securities Trust
Shareholder Information (continued)
Board Review of Investment Management Agreement (continued)
Franklin Total Return Fund – The Fund’s investment performance was shown in comparison to a performance universe consisting of all retail and institutional core plus bond funds as selected by Lipper. The Lipper report showed the Fund’s income return to be in the highest or best performing quintile of its performance universe during 2013 and to be in either the highest or second-highest performing quintile of such universe for the previous three-, five- and 10-year periods on an annualized basis. The Lipper report showed the Fund’s total return during 2013 to be in the middle performing quintile of its performance universe, and on an annualized basis to also be in the middle performing quintile of such universe for the previous three- and 10-year periods, and the second-highest performing quintile of such universe for the previous five-year period. The Board found the Fund’s comparative performance as set forth in the Lipper report to be satisfactory.
COMPARATIVE EXPENSES. Consideration was given to a comparative analysis of the management fees and total expense ratio of each Fund compared with those of a group of other funds selected by Lipper as constituting its appropriate Lipper expense group. Lipper expense data is based upon information taken from each fund’s most recent annual report, which reflects historical asset levels that may be quite different from those currently existing, particularly in a period of market volatility. While recognizing such inherent limitation and the fact that expense ratios generally increase as assets decline and decrease as assets grow, the Board believed the independent analysis conducted by Lipper to be an appropriate measure of comparative expenses. In reviewing comparative costs, Lipper provides information on each Fund’s contractual investment management fee in comparison with the contractual investment management fee that would have been charged by other funds within its Lipper expense group assuming they were similar in size to the Fund, as well as the actual total expense ratio of the Fund in comparison with those of its expense group. The Lipper contractual investment management fee analysis includes within such fee any separate administrative fees, and Lipper total expenses, for comparative consistency, are shown by Lipper for Fund Class A shares. The results of such expense comparisons showed that the contractual investment management fee rate and actual total expense ratio for Franklin Floating Rate Daily Access Fund were below the median of its Lipper expense group. The Board was satisfied with the comparative contractual investment management fee rate and actual total expense ratio of the Fund as shown in the Lipper reports. The contractual investment management fee rate of Franklin Adjustable U.S. Government Securities Fund was at the median of its Lipper expense group, while its actual total expense ratio was less than two basis points above the median for such group. The Board found the comparative contractual investment fee rate and actual total expense ratio of the Fund as shown in the Lipper reports to be satisfactory. The contractual investment management fee rate of Franklin Low Duration Total Return Fund was above the median of its Lipper expense group, while its actual total expense ratio was below the median of such group. The contractual investment management fee rate for Franklin Total Return Fund was above the median of its Lipper expense group, and the actual total expense ratio was within nine basis points above the median of its expense group. The Board found the contractual management fees and total expense ratios of these Funds to be acceptable, noting that their expenses were subsidized by management.
168 | Semiannual Report
Franklin Investors Securities Trust
Shareholder Information (continued)
Board Review of Investment Management Agreement (continued)
MANAGEMENT PROFITABILITY. The Board also considered the level of profits realized by the Manager and its affiliates in connection with the operation of each Fund. In this respect, the Board reviewed the Fund profitability analysis that addresses the overall profitability of Franklin Templeton’s U.S. fund business, as well as its profits in providing management and other services to each of the individual funds during the 12-month period ended September 30, 2013, being the most recent fiscal year-end for Franklin Resources, Inc., the Manager’s parent. In reviewing the analysis, the Board recognized that allocation methodologies are inherently subjective and various allocation methodologies may be reasonable while producing different results. In this respect, the Board noted that while management continually makes refinements to its methodologies in response to organizational and product related changes, the overall approach as defined by the primary drivers and activity measurements has remained consistent with that used in the Funds’ profitability report presentations from prior years. Additionally, the Funds’ independent registered public accounting firm had been engaged by the Manager to periodically review the reasonableness of the allocation methodologies to be used solely by the Funds’ Board in reference to the profitability analysis. In reviewing and discussing such analysis, management discussed with the Board its belief that costs incurred in establishing the infrastructure necessary for the type of mutual fund operations conducted by the Manager and its affiliates may not be fully reflected in the expenses allocated to each Fund in determining its profitability, as well as the fact that the level of profits, to a certain extent, reflected operational cost savings and efficiencies initiated by management. The Board also took into account management’s expenditures in improving shareholder services provided the Funds, as well as the need to implement systems and meet additional regulatory and compliance requirements resulting from statutes such as the Sarbanes-Oxley and Dodd-Frank Acts and recent SEC and other regulatory requirements. In addition, the Board considered a third-party study comparing the profitability of the Manager’s parent on an overall basis to other publicly held managers broken down to show profitability from management operations exclusive of distribution expenses, as well as profitability including distribution expenses. The Board also considered the extent to which the Manager and its affiliates might derive ancillary benefits from fund operations, including revenues generated from transfer agent services and potential benefits resulting from allocation of fund brokerage and the use of commission dollars to pay for research. Based upon its consideration of all these factors, the Board determined that the level of profits realized by the Manager and its affiliates from providing services to each Fund was not excessive in view of the nature, quality and extent of services provided.
ECONOMIES OF SCALE. The Board also considered whether economies of scale are realized by the Manager as the Funds grow larger and the extent to which this is reflected in the level of management fees charged. While recognizing that any precise determination is inherently subjective, the Board noted that based upon the Fund profitability analysis, it appears that as some funds get larger, at some point economies of scale do result in the Manager realizing a larger profit margin on management services provided such a fund. The Board also noted that economies of scale are shared with each Fund and its shareholders through management fee breakpoints so that as a Fund
Semiannual Report | 169
Franklin Investors Securities Trust
Shareholder Information (continued)
Board Review of Investment Management Agreement (continued)
grows in size, its effective management fee rate declines. The management fee for Franklin Adjustable U.S. Government Securities Fund provides a fee of 0.50% on the first $5 billion of assets, with breakpoints continuing at stages thereafter. In discussing such fee, management expressed the view that this initial rate anticipated economies of scale. In support of this position, management pointed to the competitive contractual management fee rate and expense ratio of this Fund, which had assets of approximately $1.97 billion at year-end, with those of its Lipper expense group. The Board believed that to the extent economies of scale may be realized by the Manager and its affiliates, such initial rate did reflect economies of scale benefiting this Fund and its shareholders. Based on their year-end asset levels, all of the other Funds benefited from breakpoints contained in their management fee structures with additional breakpoints continuing beyond such asset levels. The Board believed that to the extent economies of scale may be realized by the Manager and its affiliates, the schedule of fees under the investment management agreement for each of such Funds provides a sharing of benefits with the Fund and its shareholders.
Proxy Voting Policies and Procedures
The Trust’s investment manager has established Proxy Voting Policies and Procedures (Policies) that the Trust uses to determine how to vote proxies relating to portfolio securities. Shareholders may view the Trust’s complete Policies online at franklintempleton.com. Alternatively, shareholders may request copies of the Policies free of charge by calling the Proxy Group collect at (954) 527-7678 or by sending a written request to: Franklin Templeton Companies, LLC, 300 S.E. 2nd Street, Fort Lauderdale, FL 33301, Attention: Proxy Group. Copies of the Trust’s proxy voting records are also made available online at franklintempleton.com and posted on the U.S. Securities and Exchange Commission’s website at sec.gov and reflect the most recent 12-month period ended June 30.
Quarterly Statement of Investments
The Trust files a complete statement of investments with the U.S. Securities and Exchange Commission for the first and third quarters for each fiscal year on Form N-Q. Shareholders may view the filed Form N-Q by visiting the Commission’s website at sec.gov. The filed form may also be viewed and copied at the Commission’s Public Reference Room in Washington, DC. Information regarding the operations of the Public Reference Room may be obtained by calling (800) SEC-0330.
170 | Semiannual Report
This page intentionally left blank.
This page intentionally left blank.

Item 2. Code of Ethics.
(a) The Registrant has adopted a code of ethics that applies to its principal executive officers and principal financial and accounting officer.
(c) N/A
(d) N/A
(f) Pursuant to Item 12(a)(1), the Registrant is attaching as an exhibit a copy of its code of ethics that applies to its principal executive officers and principal financial and accounting officer.
Item 3. Audit Committee Financial Expert.
(a)(1) The Registrant has an audit committee financial expert serving on its audit committee.
(2) The audit committee financial expert is John B. Wilson and he is "independent" as defined under the relevant Securities and Exchange Commission Rules and Releases.
Item 4. Principal Accountant Fees and Services. N/A
Item 5. Audit Committee of Listed Registrants. N/A
Item 6. Schedule of Investments. N/A
Item 7. Disclosure of Proxy Voting Policies and Procedures for Closed-End Management Investment Companies. N/A
Item 8. Portfolio Managers of Closed-End Management Investment Companies. N/A
Item 9. Purchases of Equity Securities by Closed-End Management Investment Company and Affiliated Purchasers. N/A
Item 10. Submission of Matters to a Vote of Security Holders.
There have been no changes to the procedures by which shareholders may recommend nominees to the Registrant's Board of Trustees that would require disclosure herein.
Item 11. Controls and Procedures.
(a) Evaluation of Disclosure Controls and Procedures. The Registrant maintains disclosure controls and procedures that are designed to ensure that information required to be disclosed in the Registrant’s filings under the Securities Exchange Act of 1934 and the Investment Company Act of 1940 is recorded, processed, summarized and reported within the periods specified in the rules and forms of the Securities and Exchange Commission. Such information is accumulated and communicated to the Registrant’s management, including its principal executive officer and principal financial officer, as appropriate, to allow timely decisions regarding required disclosure. The Registrant’s management, including the principal executive officer and the principal financial officer, recognizes that any set of controls and procedures, no matter how well designed and operated, can provide only reasonable assurance of achieving the desired control objectives.
Within 90 days prior to the filing date of this Shareholder Report on Form N-CSR, the Registrant had carried out an evaluation, under the supervision and with the participation of the Registrant’s management, including the Registrant’s principal executive officer and the Registrant’s principal financial officer, of the effectiveness of the design and operation of the Registrant’s disclosure controls and procedures. Based on such evaluation, the Registrant’s principal executive officer and principal financial officer concluded that the Registrant’s disclosure controls and procedures are effective.
(b) Changes in Internal Controls. There have been no changes in the Registrant’s internal controls or in other factors that could materially affect the internal controls over financial reporting subsequent to the date of their evaluation in connection with the preparation of this Shareholder Report on Form N-CSR.
Item 12. Exhibits.
(a)(1) Code of Ethics
(a)(2) Certifications pursuant to Section 302 of the Sarbanes-Oxley Act of 2002 of Laura F. Fergerson, Chief Executive Officer - Finance and Administration, and Gaston Gardey, Chief Financial Officer and Chief Accounting Officer
(b) Certifications pursuant to Section 906 of the Sarbanes-Oxley Act of 2002 of Laura F. Fergerson, Chief Executive Officer - Finance and Administration, and Gaston Gardey, Chief Financial Officer and Chief Accounting Officer
SIGNATURES
Pursuant to the requirements of the Securities Exchange Act of 1934 and the Investment Company Act of 1940, the registrant has duly caused this report to be signed on its behalf by the undersigned, thereunto duly authorized.
FRANKLIN INVESTORS SECURITIES TRUST
By /s/Laura F. Fergerson
Laura F. Fergerson
Chief Executive Officer –
Finance and Administration
Date June 26, 2014
Pursuant to the requirements of the Securities Exchange Act of 1934 and the Investment Company Act of 1940, this report has been signed below by the following persons on behalf of the registrant and in the capacities and on the dates indicated.
By /s/Laura F. Fergerson
Laura F. Fergerson
Chief Executive Officer –
Finance and Administration
Date June 26, 2014
By /s/Gaston Gardey
Gaston Gardey
Chief Financial Officer and
Chief Accounting Officer
Date June 26, 2014