UNITED STATES
SECURITIES AND EXCHANGE COMMISSION
Washington, D.C. 20549
FORM N-CSR
CERTIFIED SHAREHOLDER REPORT OF REGISTERED
MANAGEMENT INVESTMENT COMPANIES
Investment Company Act file number: 811-04995
Sit U.S. Government Securities Fund, Inc.
(Exact name of Registrant as specified in charter)
3300 IDS Center
80 South Eighth Street
Minneapolis, MN 55402
(Address of principal executive offices)
Paul E. Rasmussen, VP
Sit Mutual Funds
3300 IDS Center
80 South Eighth Street
Minneapolis, MN 55402
(Name and address of agent for service)
Registrant’s telephone number, including area code: (612) 332-3223
Date of fiscal year end: March 31, 2024
Date of reporting period: September 30, 2024
Item 1: Reports to Stockholders.
Sit U.S. Government Securities Fund
Semi-Annual Shareholder Report
September 30, 2024
This semi-annual shareholder report contains important information about Sit U.S. Government Securities Fund for the period of April 1, 2024 to September 30, 2024. You can find additional information about the Fund at www.sitfunds.com/documents. You can also request this information by contacting us at 1-800-332-5580.
What were the Fund’s costs for the last six months?
(based on a hypothetical $10,000 investment)
| Class Name | Costs of a $10,000 investment | Costs paid as a percentage of a $10,000 investment |
|---|
| Sit U.S. Government Securities Fund - Class S | $41 | 0.80% |
How did the Fund perform over the last 10 years?
Total Return Based on $10,000 Investment
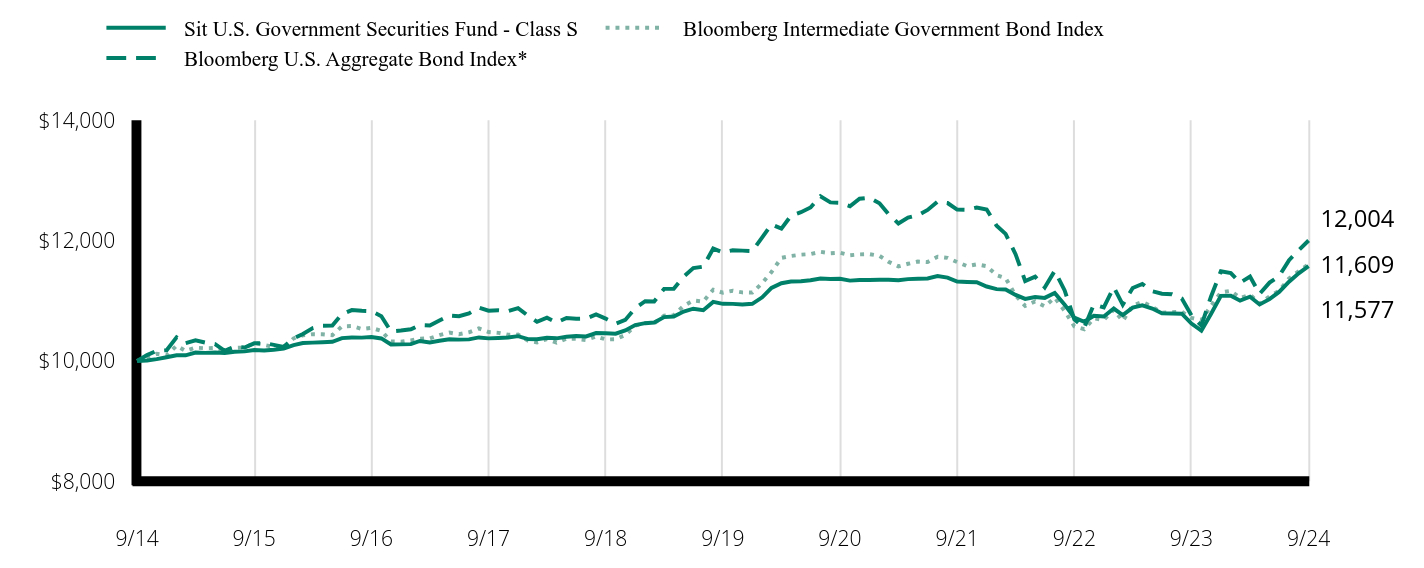
| Sit U.S. Government Securities Fund - Class S | Bloomberg U.S. Aggregate Bond Index* | Bloomberg Intermediate Government Bond Index |
|---|
| 9/14 | $10,000 | $10,000 | $10,000 |
| 10/14 | 10,008 | 10,098 | 10,070 |
| 11/14 | 10,031 | 10,170 | 10,121 |
| 12/14 | 10,062 | 10,179 | 10,095 |
| 1/15 | 10,095 | 10,393 | 10,255 |
| 2/15 | 10,094 | 10,295 | 10,167 |
| 3/15 | 10,141 | 10,343 | 10,221 |
| 4/15 | 10,135 | 10,306 | 10,212 |
| 5/15 | 10,141 | 10,281 | 10,217 |
| 6/15 | 10,132 | 10,169 | 10,177 |
| 7/15 | 10,155 | 10,240 | 10,218 |
| 8/15 | 10,160 | 10,225 | 10,224 |
| 9/15 | 10,183 | 10,294 | 10,300 |
| 10/15 | 10,174 | 10,296 | 10,267 |
| 11/15 | 10,187 | 10,269 | 10,233 |
| 12/15 | 10,205 | 10,235 | 10,214 |
| 1/16 | 10,264 | 10,376 | 10,376 |
| 2/16 | 10,300 | 10,450 | 10,427 |
| 3/16 | 10,306 | 10,546 | 10,447 |
| 4/16 | 10,311 | 10,586 | 10,444 |
| 5/16 | 10,319 | 10,589 | 10,429 |
| 6/16 | 10,381 | 10,779 | 10,577 |
| 7/16 | 10,391 | 10,847 | 10,581 |
| 8/16 | 10,389 | 10,835 | 10,533 |
| 9/16 | 10,400 | 10,829 | 10,551 |
| 10/16 | 10,375 | 10,746 | 10,501 |
| 11/16 | 10,274 | 10,492 | 10,324 |
| 12/16 | 10,276 | 10,506 | 10,321 |
| 1/17 | 10,280 | 10,527 | 10,342 |
| 2/17 | 10,333 | 10,598 | 10,372 |
| 3/17 | 10,309 | 10,592 | 10,377 |
| 4/17 | 10,337 | 10,674 | 10,431 |
| 5/17 | 10,362 | 10,756 | 10,472 |
| 6/17 | 10,355 | 10,745 | 10,445 |
| 7/17 | 10,360 | 10,792 | 10,478 |
| 8/17 | 10,392 | 10,888 | 10,542 |
| 9/17 | 10,376 | 10,836 | 10,481 |
| 10/17 | 10,384 | 10,843 | 10,468 |
| 11/17 | 10,390 | 10,829 | 10,436 |
| 12/17 | 10,413 | 10,879 | 10,439 |
| 1/18 | 10,364 | 10,753 | 10,339 |
| 2/18 | 10,363 | 10,651 | 10,309 |
| 3/18 | 10,387 | 10,720 | 10,363 |
| 4/18 | 10,377 | 10,640 | 10,304 |
| 5/18 | 10,402 | 10,716 | 10,370 |
| 6/18 | 10,417 | 10,703 | 10,369 |
| 7/18 | 10,408 | 10,705 | 10,349 |
| 8/18 | 10,464 | 10,774 | 10,410 |
| 9/18 | 10,461 | 10,705 | 10,358 |
| 10/18 | 10,454 | 10,620 | 10,362 |
| 11/18 | 10,509 | 10,683 | 10,433 |
| 12/18 | 10,597 | 10,880 | 10,587 |
| 1/19 | 10,629 | 10,995 | 10,633 |
| 2/19 | 10,641 | 10,989 | 10,625 |
| 3/19 | 10,730 | 11,200 | 10,755 |
| 4/19 | 10,741 | 11,203 | 10,760 |
| 5/19 | 10,822 | 11,402 | 10,917 |
| 6/19 | 10,870 | 11,545 | 11,007 |
| 7/19 | 10,845 | 11,570 | 10,988 |
| 8/19 | 10,983 | 11,870 | 11,186 |
| 9/19 | 10,951 | 11,807 | 11,136 |
| 10/19 | 10,950 | 11,842 | 11,169 |
| 11/19 | 10,941 | 11,836 | 11,141 |
| 12/19 | 10,951 | 11,828 | 11,138 |
| 1/20 | 11,059 | 12,056 | 11,295 |
| 2/20 | 11,215 | 12,273 | 11,481 |
| 3/20 | 11,294 | 12,201 | 11,715 |
| 4/20 | 11,323 | 12,417 | 11,747 |
| 5/20 | 11,326 | 12,475 | 11,769 |
| 6/20 | 11,343 | 12,554 | 11,779 |
| 7/20 | 11,373 | 12,741 | 11,816 |
| 8/20 | 11,365 | 12,638 | 11,793 |
| 9/20 | 11,368 | 12,632 | 11,802 |
| 10/20 | 11,337 | 12,575 | 11,759 |
| 11/20 | 11,348 | 12,699 | 11,773 |
| 12/20 | 11,348 | 12,716 | 11,777 |
| 1/21 | 11,352 | 12,625 | 11,749 |
| 2/21 | 11,352 | 12,443 | 11,652 |
| 3/21 | 11,344 | 12,287 | 11,574 |
| 4/21 | 11,362 | 12,384 | 11,617 |
| 5/21 | 11,369 | 12,425 | 11,654 |
| 6/21 | 11,372 | 12,512 | 11,645 |
| 7/21 | 11,412 | 12,652 | 11,735 |
| 8/21 | 11,387 | 12,628 | 11,716 |
| 9/21 | 11,323 | 12,518 | 11,645 |
| 10/21 | 11,315 | 12,515 | 11,578 |
| 11/21 | 11,309 | 12,552 | 11,608 |
| 12/21 | 11,239 | 12,520 | 11,577 |
| 1/22 | 11,195 | 12,250 | 11,429 |
| 2/22 | 11,190 | 12,114 | 11,378 |
| 3/22 | 11,099 | 11,777 | 11,092 |
| 4/22 | 11,033 | 11,330 | 10,916 |
| 5/22 | 11,065 | 11,403 | 10,990 |
| 6/22 | 11,050 | 11,224 | 10,909 |
| 7/22 | 11,132 | 11,499 | 11,053 |
| 8/22 | 10,938 | 11,174 | 10,833 |
| 9/22 | 10,721 | 10,691 | 10,576 |
| 10/22 | 10,652 | 10,552 | 10,528 |
| 11/22 | 10,751 | 10,940 | 10,708 |
| 12/22 | 10,739 | 10,891 | 10,683 |
| 1/23 | 10,872 | 11,226 | 10,853 |
| 2/23 | 10,765 | 10,936 | 10,665 |
| 3/23 | 10,889 | 11,214 | 10,924 |
| 4/23 | 10,926 | 11,282 | 10,982 |
| 5/23 | 10,873 | 11,159 | 10,901 |
| 6/23 | 10,795 | 11,119 | 10,801 |
| 7/23 | 10,790 | 11,111 | 10,813 |
| 8/23 | 10,787 | 11,040 | 10,819 |
| 9/23 | 10,622 | 10,760 | 10,717 |
| 10/23 | 10,504 | 10,590 | 10,681 |
| 11/23 | 10,783 | 11,069 | 10,915 |
| 12/23 | 11,084 | 11,493 | 11,142 |
| 1/24 | 11,087 | 11,462 | 11,167 |
| 2/24 | 11,003 | 11,300 | 11,049 |
| 3/24 | 11,068 | 11,404 | 11,103 |
| 4/24 | 10,941 | 11,116 | 10,953 |
| 5/24 | 11,029 | 11,304 | 11,075 |
| 6/24 | 11,149 | 11,412 | 11,168 |
| 7/24 | 11,319 | 11,678 | 11,373 |
| 8/24 | 11,463 | 11,846 | 11,496 |
| 9/24 | 11,577 | 12,004 | 11,609 |
Average Annual Total Returns (as of 09/30/24)
| 6 Months | 1 Year | 5 Years | 10 Years |
|---|
| Sit U.S. Government Securities Fund - Class S | 4.60% | 8.99% | 1.12% | 1.48% |
| Bloomberg U.S. Aggregate Bond Index* | 5.26% | 11.57% | 0.33% | 1.84% |
| Bloomberg Intermediate Government Bond Index | 4.56% | 8.33% | 0.84% | 1.50% |
The line graph above shows the value of a hypothetical $10,000 investment in the Fund over the past 10 fiscal years (or since inception if shorter). The graph and table above are total returns, which assume the reinvestment of dividends and capital gains, if any. Neither the Fund’s returns nor the index returns reflect the deduction of taxes a shareholder would pay on Fund distributions or the redemption of Fund shares. The Fund’s past performance is not a good predictor of the Fund’s future performance. Updated performance information is available at www.sitfunds.com/documents.
Effective with this report, and pursuant to new regulatory requirements, the Bloomberg U.S. Aggregate Bond Index replaced the Bloomberg Intermediate Government Bond Index as the Fund's primary benchmark to represent a broad-based securities market index. The Fund continues to use the Bloomberg Intermediate Government Bond Index as an additional benchmark.
What did the Fund invest in?
The Fund exclusively invested in U.S. government securities, focusing on high current income relative to market yields. The tables reflect the investment makeup of the Fund as of September 30, 2024. Portfolio holdings are subject to change.
Fund Statistics (as of 09/30/24)
| Total Net Assets | $227,989,425 |
| # of Portfolio Holdings | 188 |
| Portfolio Turnover Rate | 11.64% |
| Investment Advisory Fees Paid | $234,766 |
| Average Maturity | 23.9 Years |
Effective DurationFootnote Reference1 | 3.6 Years |
| Footnote | Description |
Footnote1 | Duration is a measure of estimated price sensitivity relative to changes in interest rates. Portfolios with longer durations are typically more sensitive to changes in interest rates. For example, if interest rates rise by 1%, the fair value of a security with an effective duration of 5 years would decrease by 5%, with all other factors being constant. The correlation between duration and price sensitivity is greater for securities rated investment-grade than it is for securities rated below investment-grade. Duration estimates are based on assumptions by Sit Investment Associates, Inc. (the "Adviser") and are subject to a number of limitations. Effective duration is calculated based on historical price changes of securities held by the Fund, and therefore is a more accurate estimate of price sensitivity provided interest rates remain within their historical range. |
| 0-1 Year | 1.2% |
| 1-5 Years | 93.4 |
| 5-10 Years | 4.3 |
| 10-20 Years | 1.1 |
| Total | 100.0% |
The table represents the Adviser’s estimates of the dollar weighted average life of the portfolio’s securities, which differ from their stated maturities.
Portfolio Composition (% of Net Assets)
| Collateralized Mortgage Obligations | 70.1% |
| Government National Mortgage Association | 9.6 |
| Federal National Mortgage Association | 8.0 |
| Federal Home Loan Mortgage Corporation | 7.9 |
| U.S. Treasury / Federal Agency Securities | 2.5 |
| Asset-Backed Securities | 0.7 |
| Cash & Other Net Assets | 1.2 |
| Total | 100.0% |
There were no material changes to the Fund during the six-month period ended September 30, 2024.
Additional Information is available on the Fund’s website at www.sitfunds.com/documents, including its prospectus, financial information, holdings, and proxy voting information.
The SEC permits funds to deliver only one copy of shareholder documents, including prospectuses, proxy statements and shareholder reports, to fund investors with multiple accounts at the same residential or post office box address. The Sit Funds, or your financial intermediary, may household the mailing of your documents indefinitely unless you instruct the Sit Funds, or your financial intermediary, otherwise. If you would prefer that your Sit Fund documents not be householded, please contact the Sit Funds at 1-800-332-5580, or contact your financial intermediary. Your instructions that householding not apply to delivery Fund documents will typically be effective within 30 days of receipt by the Fund or your financial intermediary.
Sit U.S. Government Securities Fund
Semi-Annual Shareholder Report
September 30, 2024
Sit U.S. Government Securities Fund
Semi-Annual Shareholder Report
September 30, 2024
This semi-annual shareholder report contains important information about Sit U.S. Government Securities Fund for the period of April 1, 2024 to September 30, 2024. You can find additional information about the Fund at www.sitfunds.com/documents. You can also request this information by contacting us at 1-800-332-5580.
What were the Fund’s costs for the last six months?
(based on a hypothetical $10,000 investment)
| Class Name | Costs of a $10,000 investment | Costs paid as a percentage of a $10,000 investment |
|---|
| Sit U.S. Government Securities Fund - Class Y | $28 | 0.55% |
How did the Fund perform over the last 10 years?
Total Return Based on $10,000 Investment
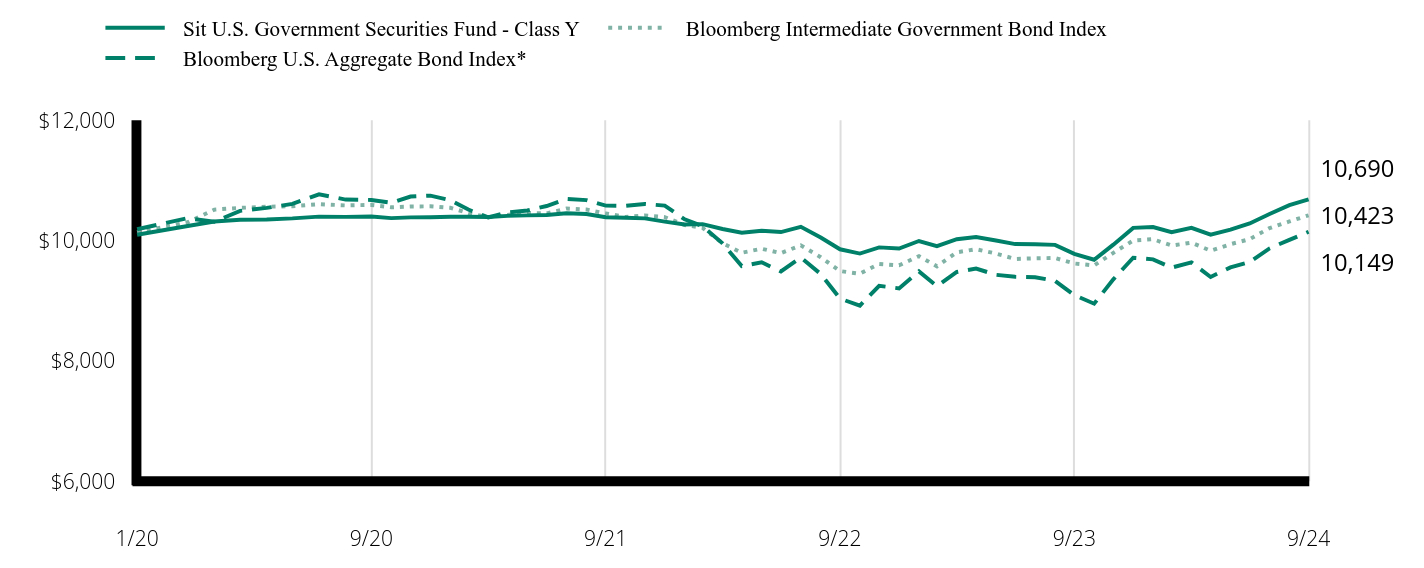
| Sit U.S. Government Securities Fund - Class Y | Bloomberg U.S. Aggregate Bond Index* | Bloomberg Intermediate Government Bond Index |
|---|
| 1/20 | 10,101 | 10,192 | 10,141 |
| 2/20 | 10,246 | 10,376 | 10,307 |
| 3/20 | 10,320 | 10,315 | 10,518 |
| 4/20 | 10,349 | 10,498 | 10,547 |
| 5/20 | 10,354 | 10,547 | 10,566 |
| 6/20 | 10,372 | 10,614 | 10,575 |
| 7/20 | 10,401 | 10,772 | 10,609 |
| 8/20 | 10,397 | 10,685 | 10,588 |
| 9/20 | 10,403 | 10,679 | 10,596 |
| 10/20 | 10,377 | 10,632 | 10,557 |
| 11/20 | 10,389 | 10,736 | 10,570 |
| 12/20 | 10,392 | 10,751 | 10,573 |
| 1/21 | 10,398 | 10,674 | 10,548 |
| 2/21 | 10,400 | 10,519 | 10,462 |
| 3/21 | 10,395 | 10,388 | 10,391 |
| 4/21 | 10,414 | 10,470 | 10,430 |
| 5/21 | 10,422 | 10,504 | 10,463 |
| 6/21 | 10,428 | 10,578 | 10,455 |
| 7/21 | 10,457 | 10,696 | 10,536 |
| 8/21 | 10,446 | 10,676 | 10,519 |
| 9/21 | 10,390 | 10,584 | 10,455 |
| 10/21 | 10,384 | 10,581 | 10,395 |
| 11/21 | 10,372 | 10,612 | 10,422 |
| 12/21 | 10,318 | 10,585 | 10,394 |
| 1/22 | 10,270 | 10,357 | 10,262 |
| 2/22 | 10,277 | 10,241 | 10,215 |
| 3/22 | 10,196 | 9,957 | 9,959 |
| 4/22 | 10,133 | 9,579 | 9,801 |
| 5/22 | 10,165 | 9,641 | 9,867 |
| 6/22 | 10,145 | 9,489 | 9,794 |
| 7/22 | 10,231 | 9,721 | 9,924 |
| 8/22 | 10,055 | 9,447 | 9,726 |
| 9/22 | 9,858 | 9,038 | 9,495 |
| 10/22 | 9,787 | 8,921 | 9,452 |
| 11/22 | 9,890 | 9,250 | 9,614 |
| 12/22 | 9,871 | 9,208 | 9,591 |
| 1/23 | 9,996 | 9,491 | 9,744 |
| 2/23 | 9,909 | 9,246 | 9,575 |
| 3/23 | 10,025 | 9,481 | 9,808 |
| 4/23 | 10,061 | 9,538 | 9,860 |
| 5/23 | 10,004 | 9,434 | 9,787 |
| 6/23 | 9,945 | 9,400 | 9,697 |
| 7/23 | 9,943 | 9,394 | 9,708 |
| 8/23 | 9,932 | 9,334 | 9,713 |
| 9/23 | 9,782 | 9,097 | 9,622 |
| 10/23 | 9,685 | 8,953 | 9,590 |
| 11/23 | 9,935 | 9,359 | 9,799 |
| 12/23 | 10,214 | 9,717 | 10,004 |
| 1/24 | 10,229 | 9,690 | 10,026 |
| 2/24 | 10,144 | 9,553 | 9,920 |
| 3/24 | 10,216 | 9,641 | 9,969 |
| 4/24 | 10,101 | 9,398 | 9,834 |
| 5/24 | 10,185 | 9,557 | 9,943 |
| 6/24 | 10,288 | 9,648 | 10,027 |
| 7/24 | 10,446 | 9,873 | 10,211 |
| 8/24 | 10,592 | 10,015 | 10,321 |
| 9/24 | 10,690 | 10,149 | 10,423 |
Average Annual Total Returns (as of 09/30/24)
| 6 Months | 1 Year | Since Inception 1/1/2020 |
|---|
| Sit U.S. Government Securities Fund - Class Y | 4.63% | 9.28% | 1.41% |
| Bloomberg U.S. Aggregate Bond Index* | 5.26% | 11.57% | 0.31% |
| Bloomberg Intermediate Government Bond Index | 4.56% | 8.33% | 0.88% |
The line graph above shows the value of a hypothetical $10,000 investment in the Fund over the past 10 fiscal years (or since inception if shorter). The graph and table above are total returns, which assume the reinvestment of dividends and capital gains, if any. Neither the Fund’s returns nor the index returns reflect the deduction of taxes a shareholder would pay on Fund distributions or the redemption of Fund shares. The Fund’s past performance is not a good predictor of the Fund’s future performance. Updated performance information is available at www.sitfunds.com/documents.
Effective with this report, and pursuant to new regulatory requirements, the Bloomberg U.S. Aggregate Bond Index replaced the Bloomberg Intermediate Government Bond Index as the Fund's primary benchmark to represent a broad-based securities market index. The Fund continues to use the Bloomberg Intermediate Government Bond Index as an additional benchmark.
What did the Fund invest in?
The Fund exclusively invested in U.S. government securities, focusing on high current income relative to market yields. The tables reflect the investment makeup of the Fund as of September 30, 2024. Portfolio holdings are subject to change.
Fund Statistics (as of 09/30/24)
| Total Net Assets | $227,989,425 |
| # of Portfolio Holdings | 188 |
| Portfolio Turnover Rate | 11.64% |
| Investment Advisory Fees Paid | $234,766 |
| Average Maturity | 23.9 Years |
Effective DurationFootnote Reference1 | 3.6 Years |
| Footnote | Description |
Footnote1 | Duration is a measure of estimated price sensitivity relative to changes in interest rates. Portfolios with longer durations are typically more sensitive to changes in interest rates. For example, if interest rates rise by 1%, the fair value of a security with an effective duration of 5 years would decrease by 5%, with all other factors being constant. The correlation between duration and price sensitivity is greater for securities rated investment-grade than it is for securities rated below investment-grade. Duration estimates are based on assumptions by Sit Investment Associates, Inc. (the "Adviser") and are subject to a number of limitations. Effective duration is calculated based on historical price changes of securities held by the Fund, and therefore is a more accurate estimate of price sensitivity provided interest rates remain within their historical range. |
| 0-1 Year | 1.2% |
| 1-5 Years | 93.4 |
| 5-10 Years | 4.3 |
| 10-20 Years | 1.1 |
| Total | 100.0% |
The table represents the Adviser’s estimates of the dollar weighted average life of the portfolio’s securities, which differ from their stated maturities.
Portfolio Composition (% of Net Assets)
| Collateralized Mortgage Obligations | 70.1% |
| Government National Mortgage Association | 9.6 |
| Federal National Mortgage Association | 8.0 |
| Federal Home Loan Mortgage Corporation | 7.9 |
| U.S. Treasury / Federal Agency Securities | 2.5 |
| Asset-Backed Securities | 0.7 |
| Cash & Other Net Assets | 1.2 |
| Total | 100.0% |
There were no material changes to the Fund during the six-month period ended September 30, 2024.
Additional Information is available on the Fund’s website at www.sitfunds.com/documents, including its prospectus, financial information, holdings, and proxy voting information.
The SEC permits funds to deliver only one copy of shareholder documents, including prospectuses, proxy statements and shareholder reports, to fund investors with multiple accounts at the same residential or post office box address. The Sit Funds, or your financial intermediary, may household the mailing of your documents indefinitely unless you instruct the Sit Funds, or your financial intermediary, otherwise. If you would prefer that your Sit Fund documents not be householded, please contact the Sit Funds at 1-800-332-5580, or contact your financial intermediary. Your instructions that householding not apply to delivery Fund documents will typically be effective within 30 days of receipt by the Fund or your financial intermediary.
Sit U.S. Government Securities Fund
Semi-Annual Shareholder Report
September 30, 2024
Item 2: Code of Ethics.
The Registrant has adopted a Code of Ethics that applies to the Registrant’s principal executive officer, principal financial officer, principal accounting officer or controller, or persons performing similar functions. The Registrant has not made any amendment to its code of ethics during the period covered by this report which must be described herein pursuant to Item 2. The Registrant has not granted any waivers from any provisions of the code of ethics during the period covered by this report.
A copy of the Registrant’s code of ethics is available without charge upon request by calling the Registrant at 612-332-3223 or 1-800-332-5580, or by mail at Sit Mutual Funds, 3300 IDS Center, 80 South Eighth Street, Minneapolis, MN 55402.
Item 3: Audit Committee Financial Expert.
Not applicable. The information required by this Item 3 is only required in an annual report on Form N-CSR. This is the Registrant’s semi-annual report.
Item 4: Principal Accountant Fees and Services.
Not applicable. The information required by this Item 4 is only required in an annual report on Form N-CSR. This is the Registrant’s semi-annual report.
Item 5: Audit Committee of Listed Registrants.
Not applicable to open-end investment companies.
Item 6: Investments.
(a) The schedule of investments is included as part of the material filed under Item 7 of this Form.
(b) Not applicable.
Item 7: Financial Statements and Financial Highlights for Open-End Management Investment Companies.
|
Sit Bond Funds FINANCIAL STATEMENTS AND OTHER INFORMATION TABLE OF CONTENTS |
This document must be preceded or accompanied by a Prospectus.
SCHEDULE OF INVESTMENTS (Unaudited)
September 30, 2024
Sit U.S. Government Securities Fund
| | | | | | | | | | |
Principal Amount ($) | | Coupon Rate (%) | | Maturity
Date | | Fair Value ($) | |
|
Mortgage Pass-Through Securities - 25.5% | |
|
Federal Home Loan Mortgage Corporation - 7.9% | |
| | | |
| 230,202 | | 2.00 | | | 8/1/41 | | | | 200,777 | |
| 1,009,276 | | 4.50 | | | 7/1/52 | | | | 999,962 | |
| 309,218 | | 5.00 | | | 7/1/35 | | | | 317,317 | |
| 301,077 | | 5.00 | | | 5/1/42 | | | | 307,063 | |
| 480,425 | | 5.50 | | | 9/1/52 | | | | 488,407 | |
| 42,885 | | 5.82 | | | 10/1/37 | | | | 45,026 | |
| 4,521,606 | | 6.00 | | | 11/1/38 | | | | 4,651,925 | |
| 335,296 | | 6.00 | | | 6/1/52 | | | | 344,824 | |
| 994,733 | | 6.00 | | | 2/1/54 | | | | 1,007,235 | |
| 218,190 | | 6.50 | | | 12/1/34 | | | | 224,011 | |
| 2,173,725 | | 6.50 | | | 11/1/53 | | | | 2,243,687 | |
| 96,030 | | 6.88 | | | 2/17/31 | | | | 98,454 | |
| 937 | | 7.00 | | | 8/1/27 | | | | 934 | |
| 2,158,969 | | 7.00 | | | 10/1/37 | | | | 2,299,337 | |
| 1,213,361 | | 7.00 | | | 10/1/38 | | | | 1,292,075 | |
| 1,155,522 | | 7.00 | | | 3/1/39 | | | | 1,229,452 | |
| 2,079,137 | | 7.00 | | | 11/1/53 | | | | 2,160,148 | |
| 125,068 | | 7.50 | | | 1/1/32 | | | | 130,767 | |
| 44,111 | | 8.50 | | | 3/1/31 | | | | 46,550 | |
| 1,454 | | 9.00 | | | 5/1/31 | | | | 1,462 | |
| | | | | | | | | | |
| | | |
| | | | | | | | | 18,089,413 | |
| | | | | | | | | | |
| |
Federal National Mortgage Association - 8.0% | | | | | |
| | | |
| 180,798 | | 3.50 | | | 10/1/34 | | | | 175,984 | |
| 4,629,378 | | 4.50 | | | 7/1/52 | | | | 4,549,537 | |
| 4,666,436 | | 4.50 | | | 9/1/52 | | | | 4,588,266 | |
| 341,566 | | 5.00 | | | 6/1/51 | | | | 359,410 | |
| 1,800,651 | | 5.00 | | | 7/1/52 | | | | 1,783,297 | |
| 430,920 | | 5.50 | | | 4/1/50 | | | | 443,103 | |
| 715,638 | | 5.93 | | | 5/1/35 | | | | 713,089 | |
| 55,392 | | 6.00 | | | 5/1/37 | | | | 57,487 | |
| 38,614 | | 6.00 | | | 9/1/37 | | | | 38,834 | |
| 1,276,460 | | 6.00 | | | 11/1/38 | | | | 1,313,249 | |
| 1,977,190 | | 6.00 | | | 2/1/54 | | | | 2,002,039 | |
| 12,372 | | 6.50 | | | 8/1/34 | | | | 12,544 | |
| 1,412,086 | | 6.50 | | | 10/1/53 | | | | 1,444,367 | |
| 58,244 | | 7.00 | | | 7/1/33 | | | | 58,979 | |
| 9,546 | | 7.00 | | | 12/1/37 | | | | 9,621 | |
| 421,508 | | 7.00 | | | 9/1/47 | | | | 422,003 | |
| 67,560 | | 7.50 | | | 1/1/34 | | | | 69,820 | |
| 151 | | 8.00 | | | 8/20/25 | | | | 151 | |
| 39,504 | | 8.00 | | | 11/1/37 | | | | 39,839 | |
| 2,136 | | 8.06 | | | 7/20/30 | | | | 2,138 | |
| 21,977 | | 8.17 | | | 11/15/31 | | | | 22,628 | |
| 69 | | 9.00 | | | 6/15/25 | | | | 69 | |
| 9,345 | | 9.00 | | | 5/15/28 | | | | 9,338 | |
| 14,443 | | 9.00 | | | 7/1/31 | | | | 14,447 | |
| | | | | | | | | | |
| | | |
| | | | | | | | | 18,130,239 | |
| | | | | | | | | | |
|
Government National Mortgage Association - 9.6% | |
| | | |
| 4,119 | | 4.00 | | | 12/15/24 | | | | 4,108 | |
| 396,479 | | 5.00 | | | 7/20/49 | | | | 399,002 | |
| 12,225 | | 5.50 | | | 9/15/25 | | | | 12,234 | |
| 323,041 | | 5.50 | | | 5/20/40 | | | | 333,952 | |
| 657,847 | | 5.50 | | | 7/20/62 | | | | 659,683 | |
| 7,790,323 | | 5.50 | | | 8/20/62 | | | | 7,822,598 | |
| 239,137 | | 6.00 | | | 7/20/29 | | | | 245,347 | |
| 307,226 | | 6.00 | | | 10/20/32 | | | | 319,814 | |
| 342,460 | | 6.00 | | | 8/20/38 | | | | 359,441 | |
| | | | | | | | | | |
Principal Amount ($) | | Coupon Rate (%) | | Maturity
Date | | Fair Value ($) | |
| | | |
| 1,027,284 | | 6.00 | | | 1/20/39 | | | | 1,083,193 | |
| 128,313 | | 6.00 | | | 2/20/47 | | | | 134,648 | |
| 1,517,126 | | 6.00 | | | 7/20/47 | | | | 1,592,042 | |
| 5,843,591 | | 6.00 | | | 8/20/62 | | | | 5,902,990 | |
| 14,600 | | 6.50 | | | 12/20/38 | | | | 14,519 | |
| 122,263 | | 6.50 | | | 1/20/39 | | | | 125,466 | |
| 147,945 | | 6.50 | | | 6/20/39 | | | | 154,249 | |
| 305,998 | | 6.50 | | | 8/20/39 | | | | 323,482 | |
| 153,286 | | 6.50 | | | 4/20/43 | | | | 159,059 | |
| 1,008,378 | | 7.00 | | | 12/20/52 | | | | 1,037,394 | |
| 174,350 | | 7.50 | | | 4/15/34 | | | | 181,946 | |
| 784,874 | | 8.00 | | | 10/20/48 | | | | 821,412 | |
| 237,265 | | 8.00 | | | 10/20/53 | | | | 248,448 | |
| | | | | | | | | | |
| | | |
| | | | | | | | | 21,935,027 | |
| | | | | | | | | | |
| |
Total Mortgage Pass-Through Securities | | | | 58,154,679 | |
| | | | | | | | | | |
(cost: $58,311,177) | | | | | | | | |
|
U.S. Treasury / Federal Agency Securities - 2.5% | |
U.S. Treasury Bonds: | | | | | | | | |
| | | |
| 2,850,000 | | 3.63 | | | 2/15/53 | | | | 2,587,488 | |
| 2,300,000 | | 4.13 | | | 3/31/29 | | | | 2,350,942 | |
| 600,000 | | 4.38 | | | 5/15/34 | | | | 627,656 | |
| | | | | | | | | | |
| |
Total U.S. Treasury / Federal Agency Securities | | | | 5,566,086 | |
| | | | | | | | | | |
(cost: $5,568,411) | | | | | |
|
Collateralized Mortgage Obligations - 70.1% | |
|
Federal Home Loan Mortgage Corporation - 13.8% | |
| 718,498 | | 4.72 | | | 7/25/32 | 1 | | | 680,147 | |
| 1,438,769 | | 5.00 | | | 10/25/48 | | | | 1,446,718 | |
| 1,556,851 | | 5.00 | | | 2/25/51 | | | | 1,562,365 | |
| 5,079,262 | | 5.00 | | | 11/25/50 | 1 | | | 5,026,016 | |
| 1,394,345 | | 5.50 | | | 6/25/48 | | | | 1,424,063 | |
| 2,278,166 | | 5.50 | | | 11/25/50 | | | | 2,313,063 | |
| 4,497,810 | | 5.50 | | | 6/25/51 | | | | 4,661,786 | |
| 480,079 | | 6.00 | | | 4/15/30 | | | | 494,058 | |
| 635,618 | | 6.00 | | | 6/15/37 | | | | 678,811 | |
| 881,052 | | 6.00 | | | 9/15/42 | | | | 911,312 | |
| 2,542,867 | | 6.00 | | | 9/25/52 | | | | 2,655,239 | |
| 253,228 | | 6.50 | | | 6/25/32 | | | | 259,513 | |
| 211,771 | | 6.50 | | | 8/15/39 | | | | 227,631 | |
| 793,197 | | 6.50 | | | 2/25/43 | | | | 821,277 | |
| 780,230 | | 6.50 | | | 10/25/43 | | | | 806,855 | |
| 1,471,317 | | 6.50 | | | 8/15/45 | | | | 1,635,944 | |
| 600,000 | | 7.00 | | | 12/15/40 | | | | 668,434 | |
| 1,463,177 | | 7.00 | | | 3/25/43 | | | | 1,555,416 | |
| 2,032,660 | | 7.00 | | | 7/25/43 | | | | 2,160,361 | |
| 912,754 | | 7.00 | | | 3/15/49 | | | | 992,817 | |
| 521,737 | | 7.50 | | | 9/25/43 | | | | 543,114 | |
| | | | | | | | | | |
| | | |
| | | | | | | | | 31,524,940 | |
| | | | | | | | | | |
|
Federal National Mortgage Association - 17.5% | |
| 1,672,544 | | 5.00 | | | 7/25/33 | | | | 1,680,862 | |
| 3,074,320 | | 5.00 | | | 11/25/50 | | | | 3,071,657 | |
| 3,393,030 | | 5.00 | | | 12/25/50 | | | | 3,484,826 | |
| 375,486 | | 5.00 | | | 1/25/51 | | | | 380,471 | |
| 1,761,439 | | 5.25 | | | 8/25/49 | | | | 1,774,407 | |
| 1,733,274 | | 5.25 | | | 12/25/42 | 1 | | | 1,746,578 | |
| 391,754 | | 5.36 | | | 6/25/42 | | | | 402,962 | |
| 568,448 | | 5.50 | | | 6/25/40 | | | | 592,646 | |
| 920,949 | | 5.50 | | | 1/25/49 | | | | 931,678 | |
| 1,251,920 | | 5.62 | | | 11/25/33 | | | | 1,257,455 | |
| | |
See accompanying notes to financial statements. | | |
| |
| 2 | | FINANCIAL STATEMENTS AND OTHER INFORMATION |
| | | | | | | | | | |
Principal Amount ($) | | Coupon Rate (%) | | Maturity
Date | | Fair Value ($) | |
| | | |
| 230,208 | | 5.75 | | | 8/25/33 | | | | 234,313 | |
| 90,045 | | 6.00 | | | 11/25/32 | | | | 94,157 | |
| 464,577 | | 6.00 | | | 9/25/35 | | | | 493,155 | |
| 511,260 | | 6.00 | | | 10/25/36 | | | | 538,219 | |
| 1,227,780 | | 6.00 | | | 11/25/43 | | | | 1,267,352 | |
| 1,621,407 | | 6.00 | | | 6/25/44 | | | | 1,676,171 | |
| 405,753 | | 6.00 | | | 8/25/44 | | | | 417,047 | |
| 639,213 | | 6.00 | | | 2/25/48 | | | | 683,631 | |
| 1,450,000 | | 6.00 | | | 10/25/53 | | | | 1,556,674 | |
| 1,948,044 | | 6.50 | | | 11/25/41 | | | | 1,995,873 | |
| 1,055,424 | | 6.50 | | | 7/25/42 | | | | 1,113,944 | |
| 1,931,594 | | 6.50 | | | 12/25/43 | | | | 1,996,600 | |
| 830,626 | | 6.55 | | | 9/25/37 | 1 | | | 827,608 | |
| 288,453 | | 6.65 | | | 8/25/37 | 1 | | | 292,323 | |
| 284,190 | | 6.75 | | | 4/25/37 | | | | 288,545 | |
| 762,789 | | 7.00 | | | 12/25/33 | | | | 801,243 | |
| 647,337 | | 7.00 | | | 6/19/41 | 1 | | | 655,663 | |
| 871,913 | | 7.00 | | | 12/25/41 | | | | 910,955 | |
| 666,401 | | 7.00 | | | 7/25/42 | | | | 701,026 | |
| 525,788 | | 7.00 | | | 2/25/44 | | | | 546,699 | |
| 659,292 | | 7.00 | | | 4/25/49 | | | | 717,061 | |
| 246,662 | | 7.50 | | | 10/25/40 | | | | 248,950 | |
| 836,710 | | 7.50 | | | 11/25/40 | | | | 830,122 | |
| 893,156 | | 7.50 | | | 7/25/41 | | | | 910,870 | |
| 290,061 | | 7.50 | | | 1/25/42 | | | | 303,757 | |
| 518,104 | | 7.50 | | | 5/25/42 | | | | 553,387 | |
| 608,093 | | 7.50 | | | 2/25/44 | | | | 627,426 | |
| 393,730 | | 7.50 | | | 5/25/44 | | | | 419,717 | |
| 2,589,402 | | 7.50 | | | 1/25/48 | | | | 2,757,980 | |
| 24,600 | | 8.35 | | | 10/25/42 | 1 | | | 26,632 | |
| 16 | | 8.50 | | | 1/25/25 | | | | 16 | |
| 146,771 | | 8.50 | | | 6/25/30 | | | | 158,515 | |
| 8,152 | | 20.22 | | | 3/25/39 | 1 | | | 10,639 | |
| | | | | | | | | | |
| | | |
| | | | | | | | | 39,979,812 | |
| | | | | | | | | | |
|
| Government National Mortgage Association - 38.6% | |
| 2,035,720 | | 4.77 | | | 5/20/51 | 1 | | | 2,024,542 | |
| 2,082,363 | | 4.80 | | | 5/20/51 | 1 | | | 2,074,765 | |
| 4,533,777 | | 4.83 | | | 8/20/51 | 1 | | | 4,523,793 | |
| 1,703,588 | | 5.00 | | | 8/20/48 | | | | 1,705,428 | |
| 3,671,658 | | 5.00 | | | 1/20/51 | | | | 3,710,393 | |
| 6,524,506 | | 5.00 | | | 2/20/51 | | | | 6,576,883 | |
| 915,628 | | 5.00 | | | 6/20/52 | | | | 918,791 | |
| 988,783 | | 5.50 | | | 12/20/49 | | | | 995,103 | |
| 3,438,555 | | 5.50 | | | 12/20/50 | | | | 3,579,465 | |
| 2,881,515 | | 5.50 | | | 1/20/51 | | | | 3,004,815 | |
| 1,655,307 | | 5.50 | | | 4/20/51 | | | | 1,735,015 | |
| 12,129,971 | | 5.50 | | | 5/20/51 | | | | 12,637,524 | |
| 12,332,325 | | 5.50 | | | 6/20/51 | | | | 12,743,807 | |
| 14,421,749 | | 5.50 | | | 7/20/51 | | | | 14,930,384 | |
| 454,167 | | 5.50 | | | 10/20/51 | | | | 473,333 | |
| 1,585,899 | | 5.50 | | | 12/20/51 | | | | 1,617,938 | |
| 6,940,122 | | 5.87 | | | 2/20/51 | 1 | | | 7,321,204 | |
| 273,483 | | 6.00 | | | 12/20/35 | | | | 285,859 | |
| 167,774 | | 6.00 | | | 3/20/42 | | | | 176,332 | |
| 247,269 | | 6.00 | | | 3/20/48 | | | | 259,771 | |
| 1,281,976 | | 6.00 | | | 3/20/49 | | | | 1,322,068 | |
| 376,416 | | 6.00 | | | 5/20/49 | | | | 394,949 | |
| 1,964,947 | | 6.50 | | | 8/20/48 | | | | 2,054,523 | |
| 854,713 | | 6.50 | | | 10/20/48 | | | | 923,248 | |
| 814,669 | | 6.50 | | | 1/20/49 | | | | 877,838 | |
| 704,738 | | 7.00 | | | 11/20/48 | | | | 749,190 | |
| | | | | | | | | | |
Principal Amount ($) | | Coupon Rate (%) | | Maturity Date | | Fair Value ($) | |
| | | |
| 290,777 | | 7.07 | | | 2/20/45 | 1 | | | 313,095 | |
| | | | | | | | | | |
| | | |
| | | | | | | | | 87,930,056 | |
| | | | | | | | | | |
|
Vendee Mortgage Trust - 0.2% | |
| 379,497 | | 6.46 | | | 7/15/30 | 1 | | | 390,813 | |
| | | | | | | | | | |
| | | |
| | | | | | | | | 390,813 | |
| | | | | | | | | | |
| |
Total Collateralized Mortgage Obligations
| | | | 159,825,621 | |
| | | | | | | | | | |
(cost: $168,231,013) | | | | | |
|
Asset-Backed Securities - 0.7% | |
| |
Federal Home Loan Mortgage Corporation - 0.1% | | | | | |
| 183 | | 6.09 | | | 9/25/29 | 1 | | | 178 | |
| 262,566 | | 7.16 | | | 7/25/29 | | | | 268,174 | |
| | | | | | | | | | |
| | | |
| | | | | | | | | 268,352 | |
| | | | | | | | | | |
|
Federal National Mortgage Association - 0.6% | |
| 291,201 | | 4.39 | | | 9/26/33 | 14 | | | 284,327 | |
| 67,355 | | 4.86 | | | 10/25/33 | 14 | | | 69,051 | |
| 5,444 | | SOFRRATE 30 Day Average + 0.28%, 5.56 | | | 11/25/32 | 1 | | | 5,322 | |
| 994,928 | | 5.75 | | | 2/25/33 | 14 | | | 1,013,951 | |
| 542 | | 6.00 | | | 5/25/32 | 14 | | | 546 | |
| 445 | | 7.36 | | | 6/25/26 | 1 | | | 447 | |
| | | | | | | | | | |
| | | |
| | | | | | | | | 1,373,644 | |
| | | | | | | | | | |
| |
Total Asset-Backed Securities | | | | 1,641,996 | |
| | | | | | | | | | |
(cost: $1,652,143) | | | | | |
| |
Put Options Purchased 19 - 0.0% | | | | 18,844 | |
| | | | | | | | | | |
(cost: $52,222) | | | | | | | | |
| | | | | | | | | | |
| |
| Quantity | | Name of Issuer | | | | Fair Value ($) | |
| |
| | |
Short-Term Securities - 1.0% | | | | | | | | |
| 2,246,978 | | Fidelity Inst. Money Mkt. Gvt. Fund, 4.87% | | | | 2,246,978 | |
| | | | | | | | | | |
| | |
| (cost: $2,246,978) | | | | | | | | |
| |
Total Investments in Securities - 99.8%
(cost: $236,061,944) | | | | 227,454,204 | |
| | | | | | | | | | |
| | |
Other Assets and Liabilities - 0.2% | | | | | | | 535,221 | |
| | | | | | | | | | |
| | |
Net Assets - 100.0% | | | | | | $ | 227,989,425 | |
| | | | | | | | | | |
| 1 | Variable rate security. Rate disclosed is as of September 30, 2024. Certain variable rate securities are not based on a published reference rate and spread but are determined by the issuer or agent and are based on current market conditions, or, for mortgage-backed securities, are impacted by the individual mortgages which are paying off over time. These securities do not indicate a reference rate and spread in their descriptions. |
| 14 | Step Coupon: A bond that pays a coupon rate that increases on a specified date(s). Rate disclosed is as of September 30, 2024. |
Numeric footnotes not disclosed are not applicable to this Schedule of Investments.
| | |
See accompanying notes to financial statements. | | |
| |
SEPTEMBER 30, 2024 | | 3 |
SCHEDULE OF INVESTMENTS (Unaudited)
September 30, 2024
Sit U.S. Government Securities Fund (Continued)
19 Options outstanding as of September 30, 2024 were as follows:
| | | | | | | | | | | | | | | | | | | | | | | | | | |
| Description | | Contracts | | Exercise Price ($) | | | Expiration Date | | | Counterparty | | | Notional Amount ($) | | | Cost/ Premiums ($) | | | Value ($) | |
| | | | |
Put Options Purchased - U.S. Treasury Futures: | | | | | | | | | | | | | | | | | |
| | | | | | | |
5-Year | | 67 | | | 108.50 | | | | November 2024 | | | | StoneX Financial, Inc. | | | | 7,269,500 | | | | 52,222 | | | | 18,844 | |
A summary of the levels for the Fund’s investments as of September 30, 2024 is as follows (see Note 2 - significant accounting policies in the notes to financial statements):
| | | | | | | | | | | | | | | | |
| | | | | | Investment in Securities |
| | | | |
| | | | |
| | | Level 1 Quoted Prices ($) | | | Level 2 Other significant observable inputs ($) | | Level 3 Significant unobservable inputs ($) | | Total ($) | |
| | | | |
Mortgage Pass-Through Securities | | | — | | | | 58,154,679 | | | | — | | | | 58,154,679 | |
U.S. Treasury / Federal Agency Securities | | | — | | | | 5,566,086 | | | | — | | | | 5,566,086 | |
Collateralized Mortgage Obligations | | | — | | | | 159,825,621 | | | | — | | | | 159,825,621 | |
Asset-Backed Securities | | | — | | | | 1,641,996 | | | | — | | | | 1,641,996 | |
Put Options Purchased | | | 18,844 | | | | — | | | | — | | | | 18,844 | |
Short-Term Securities | | | 2,246,978 | | | | — | | | | — | | | | 2,246,978 | |
| | | | |
Total: | | | 2,265,822 | | | | 225,188,382 | | | | — | | | | 227,454,204 | |
| | | | |
There were no transfers into or out of level 3 during the reporting period.
| | |
See accompanying notes to financial statements. | | |
| |
| 4 | | FINANCIAL STATEMENTS AND OTHER INFORMATION |
[This page is intentionally left blank.]
SCHEDULE OF INVESTMENTS (Unaudited)
September 30, 2024
Sit Quality Income Fund
| | | | | | | | | | | | | | | | |
| | | | | |
| Name of Issuer | | Principal Amount ($) | | | Coupon Rate (%) | | | Maturity Date | | | Fair Value ($) | |
| | | | |
Asset-Backed Securities - 3.6% | | | | | | | | | | | | | | | | |
| | | | |
Agency - 0.4% | | | | | | | | | | | | | | | | |
| | | | |
FNMA Grantor Trust, Series 2004-T5, Class A11 1 | | | 342,773 | | | | 4.47 | | | | 5/28/35 | | | | 340,985 | |
Small Business Administration, Series 2006-20D, Class 1 | | | 33,954 | | | | 5.64 | | | | 4/1/26 | | | | 33,922 | |
Small Business Administration, Series 2007-20B, Class 1 | | | 28,520 | | | | 5.49 | | | | 2/1/27 | | | | 28,432 | |
Small Business Administration, Series 2007-20J, Class 1 | | | 67,905 | | | | 5.57 | | | | 10/1/27 | | | | 67,936 | |
| | | | | | | | | | | | | | | | |
| | | | |
| | | | | | | | | | | | | | | 471,275 | |
| | | | | | | | | | | | | | | | |
| | | | |
Non-Agency - 3.2% | | | | | | | | | | | | | | | | |
| | | | |
Centex Home Equity Loan Trust, Series 2004-A, Class AF4 14 | | | 95,233 | | | | 5.01 | | | | 8/25/32 | | | | 94,679 | |
RCKT Mortgage Trust, Series 2023-CES3, Class A1A 1, 4 | | | 854,345 | | | | 7.11 | | | | 11/25/43 | | | | 874,518 | |
RCKT Mortgage Trust, Series 2024-CES3, Class A1A 1, 4 | | | 1,713,108 | | | | 6.59 | | | | 5/25/44 | | | | 1,742,771 | |
RCKT Mortgage Trust, Series 2024-CES4, Class A1A 4, 14 | | | 626,988 | | | | 6.15 | | | | 6/25/44 | | | | 636,907 | |
Towd Point Mortgage Trust, Series 2019-MH1, Class A2 1, 4 | | | 41,749 | | | | 3.00 | | | | 11/25/58 | | | | 41,603 | |
Towd Point Mortgage Trust, Series 2020-MH1, Class A1A 1, 4 | | | 234,837 | | | | 2.18 | | | | 2/25/60 | | | | 227,195 | |
Towd Point Mortgage Trust, Series 2023-CES2, Class A1A 1, 4 | | | 411,973 | | | | 7.29 | | | | 10/25/63 | | | | 421,872 | |
| | | | | | | | | | | | | | | | |
| | | | |
| | | | | | | | | | | | | | | 4,039,545 | |
| | | | | | | | | | | | | | | | |
| | | | |
Total Asset-Backed Securities
(cost: $4,452,828) | | | | | | | | | | | | | | | 4,510,820 | |
| | | | | | | | | | | | | | | | |
| | | | |
Collateralized Mortgage Obligations - 28.4% | | | | | | | | | | | | | | | | |
| | | | |
Agency - 21.9% | | | | | | | | | | | | | | | | |
| | | | |
FHLMC REMICS, Series 3104, Class BY | | | 8,252 | | | | 5.50 | | | | 1/15/26 | | | | 8,238 | |
FHLMC REMICS, Series 3418, Class DF | | | 339,790 | | | | 6.00 | | | | 3/15/32 | | | | 355,066 | |
FHLMC REMICS, Series 3756, Class PZ | | | 2,466,986 | | | | 4.00 | | | | 11/15/40 | | | | 2,431,136 | |
FHLMC REMICS, Series 4246, Class PT | | | 175,334 | | | | 6.50 | | | | 2/15/36 | | | | 183,539 | |
FHLMC REMICS, Series 4390, Class CA | | | 520,113 | | | | 3.50 | | | | 6/15/50 | | | | 516,716 | |
FHLMC REMICS, Series 4717, Class KV | | | 555,483 | | | | 3.50 | | | | 8/15/40 | | | | 551,992 | |
FHLMC REMICS, Series 5226, Class D | | | 380,808 | | | | 3.50 | | | | 12/15/45 | | | | 369,618 | |
FHLMC REMICS, Series 5252, Class BT | | | 847,622 | | | | 6.00 | | | | 9/25/52 | | | | 885,080 | |
FHLMC REMICS, Series 5391, Class EA | | | 1,756,265 | | | | 5.50 | | | | 5/25/49 | | | | 1,767,496 | |
FHLMC REMICS, Series 5417, Class HA | | | 2,222,909 | | | | 5.50 | | | | 11/25/51 | | | | 2,247,105 | |
FHLMC REMICS, Series 5452, Class CB | | | 1,480,418 | | | | 5.00 | | | | 8/25/51 | | | | 1,479,464 | |
FHLMC Structured Pass-Through Certificates, Series T-60, Class 1A2 | | | 445,682 | | | | 7.00 | | | | 3/25/44 | | | | 468,667 | |
FNMA REMICS, Series 2002-W1, Class 2A 1 | | | 742,108 | | | | 4.56 | | | | 2/25/42 | | | | 744,967 | |
FNMA REMICS, Series 2004-W5, Class A1 | | | 1,449,192 | | | | 6.00 | | | | 2/25/47 | | | | 1,524,341 | |
FNMA REMICS, Series 2010-68, Class W 1 | | | 185,003 | | | | 1.82 | | | | 7/25/37 | | | | 163,866 | |
FNMA REMICS, Series 2011-10, Class AC | | | 1,486,291 | | | | 3.00 | | | | 2/25/41 | | | | 1,440,606 | |
FNMA REMICS, Series 2011-146, Class LX | | | 720,560 | | | | 3.50 | | | | 10/25/40 | | | | 714,219 | |
FNMA REMICS, Series 2015-61, Class VB | | | 871,000 | | | | 3.50 | | | | 6/25/34 | | | | 857,705 | |
FNMA REMICS, Series 2017-97, Class DP | | | 4,633 | | | | 3.50 | | | | 10/25/46 | | | | 4,608 | |
FNMA REMICS, Series 2018-25, Class AG | | | 142,784 | | | | 3.50 | | | | 4/25/47 | | | | 140,365 | |
FNMA REMICS, Series 2023-64, Class HA | | | 3,204,749 | | | | 5.50 | | | | 9/25/50 | | | | 3,238,865 | |
FNMA Trust, Series 2004-W9, Class 1A3 | | | 778,306 | | | | 6.05 | | | | 2/25/44 | | | | 812,518 | |
FRESB Mortgage Trust, Series 2018-SB45, Class A5H, SOFRRATE 30 Day Average + 0.81% 1 | | | 148,020 | | | | 6.16 | | | | 11/25/37 | | | | 147,274 | |
FRESB Mortgage Trust, Series 2018-SB46, Class A5H, SOFRRATE 30 Day Average + 0.81% 1 | | | 511,048 | | | | 4.98 | | | | 12/25/37 | | | | 509,978 | |
Government National Mortgage Association, Series 2004-11, Class QG | | | 208,749 | | | | 5.00 | | | | 2/16/34 | | | | 208,351 | |
Government National Mortgage Association, Series 2020-149, Class AW | | | 1,529,323 | | | | 5.50 | | | | 10/20/50 | | | | 1,579,550 | |
Government National Mortgage Association, Series 2024-4, Class GK | | | 957,035 | | | | 5.00 | | | | 3/20/52 | | | | 962,852 | |
Government National Mortgage Association, Series 2024-79, Class MC | | | 1,388,683 | | | | 5.50 | | | | 10/20/49 | | | | 1,410,436 | |
Seasoned Credit Risk Transfer Trust, Series 2019-4, Class M55D | | | 226,758 | | | | 4.00 | | | | 2/25/59 | | | | 215,878 | |
Seasoned Credit Risk Transfer Trust, Series 2022-2, Class M5TU | | | 1,267,232 | | | | 4.00 | | | | 4/25/62 | | | | 1,204,506 | |
| | | | | | | | | | | | | | | | |
| | | | |
| | | | | | | | | | | | | | | 27,145,002 | |
| | | | | | | | | | | | | | | | |
| | | | |
Non-Agency - 6.5% | | | | | | | | | | | | | | | | |
| | | | |
Chase Home Lending Mortgage Trust, Series 2024-3, Class A4 1, 4 | | | 688,001 | | | | 6.00 | | | | 2/25/55 | | | | 695,853 | |
Chase Home Lending Mortgage Trust, Series 2024-4, Class A6 1, 4 | | | 926,688 | | | | 6.00 | | | | 3/25/55 | | | | 935,188 | |
JP Morgan Mortgage Trust, Series 2021-1, Class A4 1, 4 | | | 542,910 | | | | 2.50 | | | | 6/25/51 | | | | 496,786 | |
| | |
See accompanying notes to financial statements. | | |
| |
| 6 | | FINANCIAL STATEMENTS AND OTHER INFORMATION |
| | | | | | | | | | | | | | | | |
| | | | | |
| Name of Issuer | | Principal Amount ($) | | | Coupon Rate (%) | | | Maturity Date | | | Fair Value ($) | |
| | | | |
JP Morgan Mortgage Trust, Series 2021-14, Class A4 1, 4 | | | 725,100 | | | | 2.50 | | | | 5/25/52 | | | | 648,384 | |
JP Morgan Mortgage Trust, Series 2021-6, Class A4 1, 4 | | | 1,292,390 | | | | 2.50 | | | | 10/25/51 | | | | 1,157,062 | |
JP Morgan Mortgage Trust, Series 2021-7, Class A4 1, 4 | | | 448,159 | | | | 2.50 | | | | 11/25/51 | | | | 401,698 | |
JP Morgan Mortgage Trust, Series 2024-4, Class A4A 1, 4 | | | 874,158 | | | | 6.00 | | | | 10/25/54 | | | | 885,600 | |
New Residential Mortgage Loan Trust, Series 2017-2A, Class A4 1, 4 | | | 175,305 | | | | 4.00 | | | | 3/25/57 | | | | 169,714 | |
New Residential Mortgage Loan Trust, Series 2017-3A, Class A1 1, 4 | | | 189,255 | | | | 4.00 | | | | 4/25/57 | | | | 184,459 | |
New Residential Mortgage Loan Trust, Series 2017-5A, Class A1, TSFR1M + 1.61% 1, 4 | | | 59,717 | | | | 6.47 | | | | 6/25/57 | | | | 60,483 | |
New Residential Mortgage Loan Trust, Series 2018-1A, Class A1A 1, 4 | | | 137,564 | | | | 4.00 | | | | 12/25/57 | | | | 134,210 | |
New Residential Mortgage Loan Trust, Series 2018-4A, Class A1S, TSFR1M + 0.86% 1, 4 | | | 153,559 | | | | 5.72 | | | | 1/25/48 | | | | 150,054 | |
Sequoia Mortgage Trust, Series 2020-4, Class A5 1, 4 | | | 220,105 | | | | 2.50 | | | | 11/25/50 | | | | 204,435 | |
Sequoia Mortgage Trust, Series 2023-4, Class A10 1, 4 | | | 745,379 | | | | 6.00 | | | | 11/25/53 | | | | 750,623 | |
Sequoia Mortgage Trust, Series 2024-9, Class A11 1, 4 | | | 1,000,000 | | | | 5.50 | | | | 10/25/54 | | | | 1,004,444 | |
Wells Fargo Mortgaged Backed Securities Trust, Series 2020-5, Class A3 1, 4 | | | 206,775 | | | | 2.50 | | | | 9/25/50 | | | | 191,181 | |
| | | | | | | | | | | | | | | | |
| | | | |
| | | | | | | | | | | | | | | 8,070,174 | |
| | | | | | | | | | | | | | | | |
| | | | |
Total Collateralized Mortgage Obligations
(cost: $35,126,910) | | | | | | | | | | | | | | | 35,215,176 | |
| | | | | | | | | | | | | | | | |
| | | | |
Corporate Bonds - 15.2% | | | | | | | | | | | | | | | | |
| | | | |
American Tower Trust 4 | | | 1,300,000 | | | | 5.49 | | | | 3/15/28 | | | | 1,324,738 | |
BGC Group, Inc. | | | 900,000 | | | | 4.38 | | | | 12/15/25 | | | | 891,545 | |
Cadence Bank (Subordinated), 3 Mo. Libor + 2.47% 1 | | | 1,565,000 | | | | 4.13 | | | | 11/20/29 | | | | 1,549,350 | |
Comerica, Inc. 1 | | | 1,350,000 | | | | 5.98 | | | | 1/30/30 | | | | 1,390,760 | |
CVS Pass-Through Trust Series 2009 4 | | | 722,689 | | | | 8.35 | | | | 7/10/31 | | | | 788,160 | |
Delta Air Lines 2015-1 Class AA Pass Through Trust | | | 303,814 | | | | 3.63 | | | | 7/30/27 | | | | 294,240 | |
DTE Electric Securitization Funding II, LLC | | | 856,251 | | | | 5.97 | | | | 3/1/32 | | | | 908,551 | |
F&G Global Funding 4 | | | 850,000 | | | | 5.15 | | | | 7/7/25 | | | | 849,672 | |
First-Citizens Bank & Trust Co. (Subordinated), US Treasury + 2.37% 1 | | | 1,500,000 | | | | 4.13 | | | | 11/13/29 | | | | 1,486,221 | |
ITT, LLC 17 | | | 1,225,000 | | | | 7.40 | | | | 11/15/25 | | | | 1,235,964 | |
KeyBank National Association of Ohio (Subordinated) | | | 1,300,000 | | | | 6.95 | | | | 2/1/28 | | | | 1,376,819 | |
Minnesota Life Insurance Co. (Subordinated) 4 | | | 1,020,000 | | | | 8.25 | | | | 9/15/25 | | | | 1,044,060 | |
Nationwide Mutual Insurance Co. (Subordinated), 3 Mo. Libor + 2.29% 1, 4 | | | 1,400,000 | | | | 7.50 | | | | 12/15/24 | | | | 1,402,382 | |
Prudential Insurance Co. of America (Subordinated) 4 | | | 1,075,000 | | | | 8.30 | | | | 7/1/25 | | | | 1,099,655 | |
Regions Financial Corp. 1 | | | 700,000 | | | | 5.72 | | | | 6/6/30 | | | | 724,538 | |
SBA Tower Trust 4 | | | 1,300,000 | | | | 6.60 | | | | 1/15/28 | | | | 1,352,659 | |
SouthState Corp. (Subordinated), TSFR3M + 5.62% 1 | | | 650,000 | | | | 5.75 | | | | 6/1/30 | | | | 644,763 | |
Truist Financial Corp. 1 | | | 500,000 | | | | 7.16 | | | | 10/30/29 | | | | 547,633 | |
| | | | | | | | | | | | | | | | |
| | | | |
Total Corporate Bonds
(cost: $18,734,219) | | | | | | | | | | | | | | | 18,911,710 | |
| | | | | | | | | | | | | | | | |
| | | | |
Mortgage Pass-Through Securities - 28.4% | | | | | | | | | | | | | | | | |
| | | | |
Federal Home Loan Mortgage Corporation - 5.1% | | | | | | | | | | | | | | | | |
| | | | |
Freddie Mac | | | 1,876,712 | | | | 2.50 | | | | 8/1/30 | | | | 1,807,587 | |
Freddie Mac | | | 20,924 | | | | 3.00 | | | | 9/1/27 | | | | 20,588 | |
Freddie Mac | | | 2,188,252 | | | | 3.00 | | | | 3/1/31 | | | | 2,132,194 | |
Freddie Mac | | | 2,901 | | | | 3.50 | | | | 7/1/26 | | | | 2,875 | |
Freddie Mac | | | 18,421 | | | | 4.00 | | | | 7/1/26 | | | | 18,308 | |
Freddie Mac | | | 21,968 | | | | 4.00 | | | | 1/1/27 | | | | 21,832 | |
Freddie Mac | | | 390,262 | | | | 4.00 | | | | 4/1/29 | | | | 389,711 | |
Freddie Mac | | | 95,315 | | | | 4.00 | | | | 10/1/31 | | | | 94,972 | |
Freddie Mac | | | 212 | | | | 4.50 | | | | 7/1/26 | | | | 212 | |
Freddie Mac | | | 367,496 | | | | 4.50 | | | | 6/1/39 | | | | 369,498 | |
Freddie Mac | | | 861 | | | | 5.00 | | | | 10/1/25 | | | | 861 | |
Freddie Mac | | | 1,068,790 | | | | 5.00 | | | | 8/1/38 | | | | 1,083,214 | |
Freddie Mac | | | 347,895 | | | | 5.00 | | | | 3/1/39 | | | | 352,165 | |
| | | | | | | | | | | | | | | | |
| | | | |
| | | | | | | | | | | | | | | 6,294,017 | |
| | | | | | | | | | | | | | | | |
| | | | |
Federal National Mortgage Association - 20.1% | | | | | | | | | | | | | | | | |
Fannie Mae | | | 286,456 | | | | 3.00 | | | | 10/1/27 | | | | 283,221 | |
| | |
See accompanying notes to financial statements. | | |
| |
SEPTEMBER 30, 2024 | | 7 |
SCHEDULE OF INVESTMENTS (Unaudited)
September 30, 2024
Sit Quality Income Fund (Continued)
| | | | | | | | | | | | | | | | |
| | | | | |
| Name of Issuer | | Principal Amount ($) | | | Coupon Rate (%) | | | Maturity Date | | | Fair Value ($) | |
| | | | |
Fannie Mae | | | 27,869 | | | | 3.00 | | | | 8/1/28 | | | | 27,413 | |
Fannie Mae | | | 404,107 | | | | 3.00 | | | | 5/1/30 | | | | 393,845 | |
Fannie Mae | | | 275,758 | | | | 3.00 | | | | 11/1/31 | | | | 271,074 | |
Fannie Mae | | | 36,115 | | | | 3.50 | | | | 1/1/26 | | | | 35,780 | |
Fannie Mae | | | 1,456,258 | | | | 3.50 | | | | 4/1/32 | | | | 1,429,617 | |
Fannie Mae | | | 346,294 | | | | 3.50 | | | | 11/1/38 | | | | 338,727 | |
Fannie Mae | | | 4,656 | | | | 4.00 | | | | 6/1/25 | | | | 4,630 | |
Fannie Mae | | | 5,750 | | | | 4.00 | | | | 10/1/31 | | | | 5,721 | |
Fannie Mae | | | 355,662 | | | | 4.00 | | | | 10/1/34 | | | | 355,133 | |
Fannie Mae | | | 802,806 | | | | 4.00 | | | | 6/1/38 | | | | 798,463 | |
Fannie Mae | | | 1,340 | | | | 4.50 | | | | 4/1/25 | | | | 1,343 | |
Fannie Mae | | | 340,874 | | | | 4.50 | | | | 3/1/29 | | | | 341,642 | |
Fannie Mae | | | 80,262 | | | | 4.50 | | | | 7/1/31 | | | | 80,999 | |
Fannie Mae | | | 1,612,369 | | | | 4.50 | | | | 4/1/39 | | | | 1,627,341 | |
Fannie Mae | | | 2,208,805 | | | | 4.50 | | | | 9/1/53 | | | | 2,170,599 | |
Fannie Mae | | | 2,087,539 | | | | 4.50 | | | | 8/1/54 | | | | 2,051,428 | |
Fannie Mae | | | 2,200,438 | | | | 5.00 | | | | 6/1/53 | | | | 2,199,629 | |
Fannie Mae | | | 468,155 | | | | 5.50 | | | | 12/1/35 | | | | 485,244 | |
Fannie Mae | | | 933,410 | | | | 5.50 | | | | 12/1/38 | | | | 953,285 | |
Fannie Mae | | | 315,084 | | | | 5.50 | | | | 8/1/40 | | | | 338,769 | |
Fannie Mae | | | 532,599 | | | | 5.50 | | | | 2/1/42 | | | | 549,877 | |
Fannie Mae | | | 769,523 | | | | 5.50 | | | | 5/1/49 | | | | 790,867 | |
Fannie Mae | | | 490,103 | | | | 5.50 | | | | 9/1/49 | | | | 504,416 | |
Fannie Mae | | | 1,718,902 | | | | 5.50 | | | | 8/1/56 | | | | 1,790,502 | |
Fannie Mae | | | 847,150 | | | | 6.00 | | | | 9/1/29 | | | | 865,849 | |
Fannie Mae | | | 512,868 | | | | 6.00 | | | | 7/1/37 | | | | 538,186 | |
Fannie Mae | | | 777,540 | | | | 6.00 | | | | 11/1/38 | | | | 799,950 | |
Fannie Mae | | | 1,192,157 | | | | 6.00 | | | | 10/1/53 | | | | 1,223,459 | |
Fannie Mae | | | 546,268 | | | | 6.50 | | | | 5/1/40 | | | | 568,031 | |
Fannie Mae | | | 517,413 | | | | 7.00 | | | | 1/1/40 | | | | 540,414 | |
Fannie Mae | | | 623,633 | | | | 7.00 | | | | 1/1/40 | | | | 651,670 | |
Fannie Mae | | | 1,874,777 | | | | 7.50 | | | | 10/1/38 | | | | 1,961,589 | |
| | | | | | | | | | | | | | | | |
| | | | |
| | | | | | | | | | | | | | | 24,978,713 | |
| | | | | | | | | | | | | | | | |
| | | | |
Government National Mortgage Association - 2.8% | | | | | | | | | | | | | | | | |
Ginnie Mae | | | 305,052 | | | | 4.00 | | | | 7/20/26 | | | | 302,382 | |
Ginnie Mae, US Treasury + 1.50% 1 | | | 12,588 | | | | 4.88 | | | | 4/20/33 | | | | 12,631 | |
Ginnie Mae, US Treasury + 1.50% 1 | | | 4,162 | | | | 4.88 | | | | 4/20/42 | | | | 4,191 | |
Ginnie Mae | | | 925 | | | | 5.00 | | | | 6/20/26 | | | | 920 | |
Ginnie Mae | | | 413,912 | | | | 6.00 | | | | 2/20/34 | | | | 429,732 | |
Ginnie Mae | | | 318,039 | | | | 6.00 | | | | 7/20/37 | | | | 341,956 | |
Ginnie Mae | | | 1,404,817 | | | | 6.00 | | | | 9/20/38 | | | | 1,442,588 | |
Ginnie Mae | | | 901,147 | | | | 6.00 | | | | 9/20/38 | | | | 973,021 | |
| | | | | | | | | | | | | | | | |
| | | | |
| | | | | | | | | | | | | | | 3,507,421 | |
| | | | | | | | | | | | | | | | |
| | | | |
Other Federal Agency Securities - 0.4% | | | | | | | | | | | | | | | | |
Small Business Administration Pools, PRIME - 2.50% 1 | | | 113,158 | | | | 6.00 | | | | 5/25/43 | | | | 112,740 | |
Small Business Administration Pools, PRIME + 0.79% 1 | | | 213,332 | | | | 9.29 | | | | 2/25/28 | | | | 219,290 | |
Small Business Administration Pools, PRIME + 0.84% 1 | | | 94,256 | | | | 9.34 | | | | 3/25/30 | | | | 97,806 | |
| | | | | | | | | | | | | | | | |
| | | | |
| | | | | | | | | | | | | | | 429,836 | |
| | | | | | | | | | | | | | | | |
| | | | |
Total Mortgage Pass-Through Securities
(cost: $35,016,698) | | | | | | | | | | | | | | | 35,209,987 | |
| | | | | | | | | | | | | | | | |
| | | | |
Taxable Municipal Bonds - 21.0% | | | | | | | | | | | | | | | | |
City of Miami FL | | | 1,000,000 | | | | 5.14 | | | | 1/1/30 | | | | 1,047,190 | |
City of San Francisco CA | | | 105,000 | | | | 5.50 | | | | 11/1/25 | | | | 105,572 | |
Colorado Housing & Finance Authority | | | 725,000 | | | | 6.50 | | | | 5/1/48 | | | | 770,624 | |
Columbus Metropolitan Housing Authority | | | 500,000 | | | | 5.38 | | | | 9/1/28 | | | | 512,315 | |
Connecticut Housing Finance Authority | | | 1,000,000 | | | | 5.75 | | | | 11/15/54 | | | | 1,032,511 | |
County of Yamhill OR | | | 370,000 | | | | 4.50 | | | | 10/1/30 | | | | 363,033 | |
| | |
See accompanying notes to financial statements. | | |
| |
| 8 | | FINANCIAL STATEMENTS AND OTHER INFORMATION |
| | | | | | | | | | | | | | | | |
| | | | | |
| Name of Issuer | | Principal Amount ($) | | | Coupon Rate (%) | | | Maturity Date | | | Fair Value ($) | |
| | | | |
Florida Capital Projects Finance Authority | | | 250,000 | | | | 4.00 | | | | 10/1/24 | | | | 250,000 | |
Florida Housing Finance Corp. | | | 995,000 | | | | 6.50 | | | | 1/1/55 | | | | 1,058,998 | |
Idaho Housing & Finance Association | | | 975,000 | | | | 6.00 | | | | 1/1/48 | | | | 1,021,069 | |
Idaho Housing & Finance Association | | | 975,000 | | | | 6.50 | | | | 7/1/53 | | | | 1,040,384 | |
Illinois Housing Development Authority | | | 1,000,000 | | | | 6.00 | | | | 4/1/54 | | | | 1,045,150 | |
Illinois Housing Development Authority | | | 980,000 | | | | 6.50 | | | | 4/1/54 | | | | 1,042,377 | |
Iowa Finance Authority | | | 1,000,000 | | | | 6.25 | | | | 7/1/54 | | | | 1,060,750 | |
Kentucky Higher Education Student Loan Corp. 8 | | | 905,000 | | | | 2.52 | | | | 6/1/35 | | | | 829,288 | |
Kentucky Housing Corp. | | | 1,000,000 | | | | 6.25 | | | | 1/1/55 | | | | 1,058,000 | |
Maine Municipal Bond Bank | | | 500,000 | | | | 6.12 | | | | 11/1/26 | | | | 517,480 | |
Maryland Community Development Administration | | | 965,000 | | | | 6.00 | | | | 9/1/53 | | | | 1,009,120 | |
Massachusetts Educational Financing Authority | | | 180,000 | | | | 4.41 | | | | 7/1/34 | | | | 176,620 | |
Massachusetts Educational Financing Authority | | | 845,000 | | | | 2.64 | | | | 7/1/37 | | | | 780,256 | |
Massachusetts Educational Financing Authority | | | 750,000 | | | | 6.07 | | | | 7/1/33 | | | | 787,432 | |
Massachusetts Housing Finance Agency | | | 990,000 | | | | 6.50 | | | | 12/1/52 | | | | 1,055,102 | |
Massachusetts State College Building Authority | | | 500,000 | | | | 5.83 | | | | 5/1/30 | | | | 524,115 | |
Minnesota Housing Finance Agency | | | 670,000 | | | | 4.80 | | | | 8/1/29 | | | | 687,869 | |
Minnesota Housing Finance Agency | | | 270,000 | | | | 4.17 | | | | 1/1/25 | | | | 269,708 | |
North Carolina Housing Finance Agency | | | 500,000 | | | | 6.50 | | | | 1/1/55 | | | | 532,735 | |
Oklahoma Development Finance Authority | | | 418,737 | | | | 3.88 | | | | 5/1/37 | | | | 410,371 | |
Rhinelander School District G.O. | | | 770,000 | | | | 5.00 | | | | 3/1/25 | | | | 770,231 | |
Rhode Island Housing & Mortgage Finance Corp. | | | 500,000 | | | | 6.50 | | | | 10/1/52 | | | | 525,055 | |
Rhode Island Student Loan Authority | | | 1,000,000 | | | | 4.00 | | | | 12/1/38 | | | | 974,460 | |
Somis Union School District G.O. | | | 535,000 | | | | 2.06 | | | | 8/1/30 | | | | 487,299 | |
State of Connecticut Special Tax Revenue | | | 1,000,000 | | | | 5.74 | | | | 12/1/29 | | | | 1,035,530 | |
State of Oregon Housing & Community Services Department | | | 990,000 | | | | 6.25 | | | | 7/1/53 | | | | 1,043,955 | |
Utah Housing Corp. | | | 990,000 | | | | 6.25 | | | | 1/1/54 | | | | 1,042,213 | |
Washington State Housing Finance Commission | | | 1,000,000 | | | | 6.25 | | | | 6/1/54 | | | | 1,057,670 | |
Wisconsin Housing & Economic Development Authority 8 | | | 100,000 | | | | 3.50 | | | | 3/1/46 | | | | 99,328 | |
| | | | | | | | | | | | | | | | |
| | | | |
Total Taxable Municipal Bonds
(cost: $25,591,290) | | | | | | | | | | | | | | | 26,023,810 | |
| | | | | |
| Name of Issuer | | Quantity | | | | | | | | | Fair Value ($) | |
| | | | |
Short-Term Securities - 2.6% | | | | | | | | | | | | | | | | |
Fidelity Inst. Money Mkt. Gvt. Fund, 4.87%
(cost: $3,203,742) | | | 3,203,742 | | | | | | | | | | | | 3,203,742 | |
| | | | | | | | | | | | | | | | |
| | | | |
Total Investments in Securities - 99.2%
(cost: $122,125,687) | | | | | | | | | | | | | | | 123,075,245 | |
| | | | | | | | | | | | | | | | |
| | | | |
Other Assets and Liabilities, net - 0.8% | | | | | | | | | | | | | | | 1,044,495 | |
| | | | | | | | | | | | | | | | |
| | | | |
Net Assets - 100.0% | | | | | | | | | | | | | | | $124,119,740 | |
| | | | | | | | | | | | | | | | |
| 1 | Variable rate security. Rate disclosed is as of September 30, 2024. Certain variable rate securities are not based on a published reference rate and spread but are determined by the issuer or agent and are based on current market conditions, or, for mortgage-backed securities, are impacted by the individual mortgages which are paying off over time. These securities do not indicate a reference rate and spread in their descriptions. |
| 4 | 144A Restricted Security. The total value of such securities as of September 30, 2024 was $19,876,366 and represented 16.0% of net assets. These securities have been determined to be liquid by the Adviser in accordance with guidelines established by the Board of Directors. |
| 8 | Securities the income from which is treated as a tax preference that is included in alternative minimum taxable income for purposes of computing federal alternative minimum tax (AMT). At September 30, 2024, 0.7% of net assets in the Fund was invested in such securities. |
| 14 | Step Coupon: A bond that pays a coupon rate that increases on a specified date(s). Rate disclosed is as of September 30, 2024. |
| 17 | Security that is either an absolute and unconditional obligation of the United States Government or is collateralized by securities, loans, or leases guaranteed by the U.S. Government or its agencies or instrumentalities. |
| | |
See accompanying notes to financial statements. | | |
| |
SEPTEMBER 30, 2024 | | 9 |
SCHEDULE OF INVESTMENTS (Unaudited)
September 30, 2024
Sit Quality Income Fund (Continued)
Numeric footnotes not disclosed are not applicable to this Schedule of Investments.
A summary of the levels for the Fund’s investments as of September 30, 2024 is as follows (see Note 2 - significant accounting policies in the notes to financial statements):
| | | | | | | | | | | | | | | | |
| | | Investment in Securities | |
| | | | |
| | | Level 1 Quoted Prices ($) | | | Level 2 Other significant observable inputs ($) | | Level 3 Significant unobservable inputs ($) | | | Total ($) | |
| | | | |
Asset-Backed Securities | | | — | | | | 4,510,820 | | | | — | | | | 4,510,820 | |
Collateralized Mortgage Obligations | | | — | | | | 35,215,176 | | | | — | | | | 35,215,176 | |
Corporate Bonds | | | — | | | | 18,911,710 | | | | — | | | | 18,911,710 | |
Mortgage Pass-Through Securities | | | — | | | | 35,209,987 | | | | — | | | | 35,209,987 | |
Taxable Municipal Bonds | | | — | | | | 26,023,810 | | | | — | | | | 26,023,810 | |
Short-Term Securities | | | 3,203,742 | | | | — | | | | — | | | | 3,203,742 | |
| | | | |
Total: | | | 3,203,742 | | | | 119,871,503 | | | | — | | | | 123,075,245 | |
| | | | |
There were no transfers into or out of level 3 during the reporting period.
| | |
See accompanying notes to financial statements. | | |
| |
| 10 | | FINANCIAL STATEMENTS AND OTHER INFORMATION |
[This page is intentionally left blank.]
SCHEDULE OF INVESTMENTS (Unaudited)
September 30, 2024
Sit Tax-Free Income Fund
| | | | | | | | | | | | | | | | |
| | | | | |
| Name of Issuer | | Principal Amount ($) | | | Coupon Rate (%) | | | Maturity Date | | | Fair Value ($) | |
| | | | |
Municipal Bonds - 86.1% | | | | | | | | | | | | | | | | |
| | | | |
Alabama - 1.0% | | | | | | | | | | | | | | | | |
| | | | |
AL Hsg. Finance Auth. Rev. (GNMA/FNMA/FHLMC Collateralized) | | | 500,000 | | | | 4.63 | | | | 10/1/49 | | | | 508,195 | |
| | | | |
AL Hsg. Finance Auth. Rev. (GNMA/FNMA/FHLMC Collateralized) | | | 500,000 | | | | 4.70 | | | | 10/1/54 | | | | 509,280 | |
| | | | |
Mobile Co. Limited Obligation Warrants Rev. (Gomesa Proj.) 4 | | | 500,000 | | | | 4.00 | | | | 11/1/45 | | | | 479,485 | |
| | | | | | | | | | | | | | | | |
| | | | |
| | | | | | | | | | | | | | | 1,496,960 | |
| | | | | | | | | | | | | | | | |
| | | | |
Alaska - 0.3% | | | | | | | | | | | | | | | | |
| | | | |
AK Industrial Dev. & Export Auth. Rev. (Boys & Girls Home) 2, 5, 15 | | | 250,000 | | | | 5.50 | | | | N/A | | | | 6,550 | |
| | | | |
AK Industrial Dev. & Export Auth. Rev. (GTR Fairbanks Community Hospital Foundation) | | | 250,000 | | | | 5.00 | | | | 4/1/33 | | | | 250,485 | |
| | | | |
AK Industrial Dev. & Export Auth. Rev. (Tanana Chiefs Conference Proj.) | | | 300,000 | | | | 4.00 | | | | 10/1/49 | | | | 282,561 | |
| | | | | | | | | | | | | | | | |
| | | | |
| | | | | | | | | | | | | | | 539,596 | |
| | | | | | | | | | | | | | | | |
| | | | |
Arizona - 0.4% | | | | | | | | | | | | | | | | |
| | | | |
AZ Industrial Dev. Auth. Rev. (Legacy Cares, Inc. Proj.) 2, 4, 5 | | | 750,000 | | | | 6.75 | | | | 7/1/30 | | | | 30,000 | |
| | | | |
AZ Industrial Dev. Auth. Rev. (Legacy Cares, Inc. Proj.) 2, 4, 5 | | | 100,000 | | | | 5.50 | | | | 7/1/31 | | | | 4,000 | |
| | | | |
AZ Industrial Dev. Auth. Rev. (Legacy Cares, Inc. Proj.) 2, 4, 5 | | | 750,000 | | | | 7.75 | | | | 7/1/50 | | | | 30,000 | |
| | | | |
AZ Industrial Dev. Auth. Rev. (Legacy Cares, Inc. Proj.) 2, 4, 5 | | | 200,000 | | | | 6.00 | | | | 7/1/51 | | | | 8,000 | |
| | | | |
AZ Industrial Dev. Auth. Rev. (Mirabella ST ASU Proj.) 1, 4 | | | 160,000 | | | | 4.70 | | | | 10/1/28 | | | | 146,690 | |
| | | | |
Pima Co. Industrial Dev. Auth. Rev. (LA Posada at Pusch Ridge Proj.) 4 | | | 350,000 | | | | 6.25 | | | | 11/15/35 | | | | 383,449 | |
| | | | | | | | | | | | | | | | |
| | | | |
| | | | | | | | | | | | | | | 602,139 | |
| | | | | | | | | | | | | | | | |
| | | | |
Arkansas - 0.2% | | | | | | | | | | | | | | | | |
| | | | |
Mountain Home City Sales & Use Tax Rev. | | | 440,000 | | | | 2.00 | | | | 9/1/38 | | | | 338,694 | |
| | | | | | | | | | | | | | | | |
| | | | |
California - 4.0% | | | | | | | | | | | | | | | | |
| | | | |
CA Enterprise Dev. Auth. Rev. (Castilleja School Foundation Proj.) | | | 300,000 | | | | 4.00 | | | | 6/1/54 | | | | 297,216 | |
| | | | |
CA Municipal Finance Auth. Rev. (Aldersly Proj.) | | | 300,000 | | | | 5.00 | | | | 5/15/43 | | | | 326,190 | |
| | | | |
CA Municipal Finance Auth. Rev. (Caritas Proj.) | | | 250,000 | | | | 4.00 | | | | 8/15/56 | | | | 226,030 | |
| | | | |
CA Pollution Control Financing Auth. Rev. (Poseidon Resources) 4 | | | 300,000 | | | | 5.00 | | | | 7/1/38 | | | | 330,456 | |
| | | | |
CA Public Finance Auth. Rev. (Enso Village Proj.) 4 | | | 350,000 | | | | 3.13 | | | | 5/15/29 | | | | 345,499 | |
| | | | |
Encinitas Union School District G.O. Capital Appreciation 6 | | | 500,000 | | | | 6.75 | | | | 8/1/35 | | | | 649,685 | |
| | | | |
Irvine Facs. Financing Auth. Rev. (Gateway Preserve Land Acquisition Proj.) 9 | | | 300,000 | | | | 5.25 | | | | 5/1/48 | | | | 307,098 | |
| | | | |
Los Alamitos Unified School District Capital Appreciation C.O.P. 6 | | | 1,100,000 | | | | 5.95 | | | | 8/1/34 | | | | 1,259,236 | |
| | | | |
Orange Co. Community Facs. District No. 2017-1 Special Assessment (Village of Esencia) | | | 500,000 | | | | 4.00 | | | | 8/15/45 | | | | 484,040 | |
| | | | |
Sacramento Co. Water Financing Auth. Rev. (NATL-RE FGIC Insured) 1 | | | 500,000 | | | | 4.11 | | | | 6/1/39 | | | | 461,540 | |
| | | | |
San Jose Financing Auth. Rev. (Civic Center Garage Proj.) 9 | | | 400,000 | | | | 5.00 | | | | 6/1/39 | | | | 400,412 | |
| | | | |
Tracy Joint Unified School District G.O. Capital Appreciation 6 | | | 600,000 | | | | 7.00 | | | | 8/1/41 | | | | 635,796 | |
| | | | |
Val Verde Unified School District G.O. Capital Appreciation (AGM Insured) 6 | | | 500,000 | | | | 6.13 | | | | 8/1/34 | | | | 604,035 | |
| | | | | | | | | | | | | | | | |
| | | | |
| | | | | | | | | | | | | | | 6,327,233 | |
| | | | | | | | | | | | | | | | |
| | | | |
Colorado - 1.9% | | | | | | | | | | | | | | | | |
| | | | |
CO Educational & Cultural Facs. Auth. Rev. (CO Springs Charter Academy Proj.) | | | 250,000 | | | | 5.60 | | | | 7/1/34 | | | | 250,488 | |
| | | | |
CO Educational & Cultural Facs. Auth. Rev. (Mountain Phoenix Community Proj.) 4 | | | 500,000 | | | | 6.00 | | | | 7/1/43 | | | | 514,315 | |
| | | | |
CO Health Facs. Auth. Rev. (Aberdeen Ridge) | | | 400,000 | | | | 3.50 | | | | 5/15/30 | | | | 382,680 | |
| | | | |
CO Health Facs. Auth. Rev. (Aberdeen Ridge) | | | 415,000 | | | | 5.00 | | | | 5/15/44 | | | | 312,993 | |
| | | | |
CO Health Facs. Auth. Rev. (Aberdeen Ridge) | | | 850,000 | | | | 5.00 | | | | 5/15/58 | | | | 573,019 | |
| | | | |
Reunion Metropolitan District Rev. | | | 576,230 | | | | 3.63 | | | | 12/1/44 | | | | 442,210 | |
| | | | |
Rudolph Farms Metropolitan District No. 6 G.O. | | | 500,000 | | | | 6.50 | | | | 6/1/52 | | | | 508,335 | |
| | | | | | | | | | | | | | | | |
| | | | |
| | | | | | | | | | | | | | | 2,984,040 | |
| | | | | | | | | | | | | | | | |
| | |
See accompanying notes to financial statements. | | |
| |
| 12 | | FINANCIAL STATEMENTS AND OTHER INFORMATION |
| | | | | | | | | | | | | | | | |
| | | | | |
| Name of Issuer | | Principal Amount ($) | | | Coupon Rate (%) | | | Maturity Date | | | Fair Value ($) | |
| | | | |
Connecticut - 0.2% | | | | | | | | | | | | | | | | |
| | | | |
Stamford Hsg. Auth. Rev. (Dogwoods Proj.) 4 | | | 350,000 | | | | 11.00 | | | | 12/1/27 | | | | 350,000 | |
| | | | | | | | | | | | | | | | |
| | | | |
Florida - 17.6% | | | | | | | | | | | | | | | | |
| | | | |
Artisan Lakes East Community Dev. District Special Assessment | | | 450,000 | | | | 4.00 | | | | 5/1/51 | | | | 388,463 | |
| | | | |
Ave Maria Stewardship Community District Special Assessment (Phase 4 Master IMPT Proj.) 4 | | | 500,000 | | | | 5.50 | | | | 5/1/53 | | | | 515,590 | |
| | | | |
Blackburn Creek Community Dev. District Special Assessment (Grand Palm Proj.) | | | 100,000 | | | | 6.25 | | | | 5/1/35 | | | | 103,948 | |
| | | | |
Broward Co. FL Airport System Rev. | | | 500,000 | | | | 5.00 | | | | 10/1/45 | | | | 503,285 | |
| | | | |
Capital Trust Agency Rev. (Tallahassee Tapestry) 2, 4, 5 | | | 550,000 | | | | 6.75 | | | | 12/1/35 | | | | 148,500 | |
| | | | |
Capital Trust Agency Rev. (Tapestry Walden Senior Hsg. Proj.) 2, 4, 5 | | | 250,000 | | | | 6.75 | | | | 7/1/37 | | | | 25,000 | |
| | | | |
Capital Trust Agency Rev. (Tuscan Gardens Senior Living Center) 2, 5 | | | 250,000 | | | | 7.00 | | | | 4/1/35 | | | | 145,000 | |
| | | | |
CFM Community Dev. District Special Assessment | | | 500,000 | | | | 4.00 | | | | 5/1/51 | | | | 431,210 | |
| | | | |
Collier Co. Industrial Dev. Auth. Rev. (Arlington of Naples Proj.) 2, 4, 5 | | | 186,423 | | | | 7.25 | | | | 5/15/26 | | | | 5,033 | |
| | | | |
Collier Co. Industrial Dev. Auth. Rev. (Arlington of Naples Proj.) 2, 4, 5 | | | 559,270 | | | | 8.13 | | | | 5/15/44 | | | | 15,100 | |
| | | | |
East Nassau Stewardship District Special Assessment (Wildlight Village Phase 3 Proj.) | | | 500,000 | | | | 5.50 | | | | 5/1/55 | | | | 503,925 | |
| | | | |
Elevation Pointe Community Dev. District Special Assessment | | | 500,000 | | | | 4.40 | | | | 5/1/32 | | | | 503,210 | |
| | | | |
Entrada Community Dev. District Special Assessment Rev. 4 | | | 400,000 | | | | 4.00 | | | | 5/1/52 | | | | 355,020 | |
| | | | |
FL Dev. Finance Corp. Rev. (Jensen Dunes Proj.) 4 | | | 500,000 | | | | 5.00 | | | | 11/15/30 | | | | 475,975 | |
| | | | |
FL Hsg. Finance Corp. (GNMA/FNMA/FHLMC Collateralized) | | | 765,000 | | | | 5.05 | | | | 7/1/47 | | | | 800,703 | |
| | | | |
FL Hsg. Finance Corp. (GNMA/FNMA/FHLMC Collateralized) | | | 500,000 | | | | 4.60 | | | | 7/1/49 | | | | 507,100 | |
| | | | |
FL Hsg. Finance Corp. (GNMA/FNMA/FHLMC Collateralized) | | | 705,000 | | | | 2.75 | | | | 7/1/50 | | | | 526,367 | |
| | | | |
FL Hsg. Finance Corp. (GNMA/FNMA/FHLMC Collateralized) | | | 1,355,000 | | | | 2.30 | | | | 1/1/52 | | | | 907,999 | |
| | | | |
FL Hsg. Finance Corp. (GNMA/FNMA/FHLMC Collateralized) | | | 490,000 | | | | 4.75 | | | | 1/1/54 | | | | 499,834 | |
| | | | |
FRERC Community Dev. District Special Assessment 2, 5 | | | 965,000 | | | | 5.38 | | | | 11/1/40 | | | | 887,395 | |
| | | | |
Gardens at Hammock Beach Community Dev. District Special Assessment | | | 345,000 | | | | 5.88 | | | | 5/1/55 | | | | 349,023 | |
| | | | |
Gramercy Farms Community Dev. District Special Assessment 6 | | | 240,000 | | | | 3.24 | | | | 5/1/39 | | | | 124,800 | |
| | | | |
Grande Pines Community Dev. District Special Assessment | | | 635,000 | | | | 4.00 | | | | 5/1/51 | | | | 544,360 | |
| | | | |
Hacienda North Community Dev. District Special Assessment | | | 500,000 | | | | 6.30 | | | | 5/1/43 | | | | 545,055 | |
| | | | |
Harbor Bay Community Dev. District Special Assessment | | | 280,000 | | | | 4.10 | | | | 5/1/48 | | | | 248,231 | |
| | | | |
Heritage Harbour North Community Dev. District Special Assessment | | | 200,000 | | | | 5.00 | | | | 5/1/34 | | | | 208,890 | |
| | | | |
Hillsborough Co. Aviation Auth. Rev. (Tampa International Airport) | | | 750,000 | | | | 5.50 | | | | 10/1/49 | | | | 844,995 | |
| | | | |
Hobe-St Lucie Conservancy District Special Assessment | | | 350,000 | | | | 5.60 | | | | 5/1/44 | | | | 366,160 | |
| | | | |
Hyde Park Community Dev. District No. 1 Special Assessment | | | 500,000 | | | | 5.25 | | | | 5/1/34 | | | | 506,240 | |
| | | | |
Hyde Park Community Dev. District No. 1 Special Assessment | | | 500,000 | | | | 4.00 | | | | 5/1/52 | | | | 429,330 | |
| | | | |
Lakes of Sarasota Community Dev. District Special Assessment | | | 125,000 | | | | 3.88 | | | | 5/1/31 | | | | 124,395 | |
| | | | |
Lakes of Sarasota Community Dev. District Special Assessment | | | 500,000 | | | | 4.13 | | | | 5/1/31 | | | | 501,000 | |
| | | | |
Lakes of Sarasota Community Dev. District Special Assessment | | | 265,000 | | | | 4.10 | | | | 5/1/51 | | | | 232,074 | |
| | | | |
Lakewood Ranch Stewardship District Cap. Improvement Special Assessment Rev. (Azario Proj.) | | | 580,000 | | | | 4.00 | | | | 5/1/40 | | | | 548,848 | |
| | | | |
Lakewood Ranch Stewardship District Cap. Improvement Special Assessment Rev. (Lakewood National) | | | 300,000 | | | | 5.25 | | | | 5/1/37 | | | | 307,119 | |
| | | | |
Lakewood Ranch Stewardship District Cap. Improvement Special Assessment Rev. (Lakewood National) | | | 300,000 | | | | 5.38 | | | | 5/1/47 | | | | 306,288 | |
| | | | |
Lakewood Ranch Stewardship District Cap. Improvement Special Assessment Rev. (Lakewood Ranch) | | | 400,000 | | | | 5.00 | | | | 5/1/36 | | | | 405,440 | |
| | | | |
Lakewood Ranch Stewardship District Cap. Improvement Special Assessment Rev. (Lakewood Ranch) | | | 430,000 | | | | 3.00 | | | | 5/1/41 | | | | 351,955 | |
| | | | |
Lakewood Ranch Stewardship District Cap. Improvement Special Assessment Rev. (Lakewood Ranch) | | | 530,000 | | | | 5.55 | | | | 5/1/54 | | | | 542,100 | |
| | | | |
Lakewood Ranch Stewardship District Cap. Improvement Special Assessment Rev. (Lorraine Lakes Proj.) 4 | | | 500,000 | | | | 3.63 | | | | 5/1/40 | | | | 452,820 | |
| | | | |
Lakewood Ranch Stewardship District Cap. Improvement Special Assessment Rev. (NE Sector Proj.) | | | 300,000 | | | | 5.00 | | | | 5/1/38 | | | | 306,624 | |
| | | | |
Lakewood Ranch Stewardship District Cap. Improvement Special Assessment Rev. (Sweetwater Proj.) | | | 490,000 | | | | 3.10 | | | | 5/1/41 | | | | 404,093 | |
| | | | |
Lakewood Ranch Stewardship District Cap. Improvement Special Assessment Rev. (Webb Proj.) 4 | | | 320,000 | | | | 5.00 | | | | 5/1/37 | | | | 325,891 | |
| | |
See accompanying notes to financial statements. | | |
| |
SEPTEMBER 30, 2024 | | 13 |
SCHEDULE OF INVESTMENTS (Unaudited)
September 30, 2024
Sit Tax-Free Income Fund (Continued)
| | | | | | | | | | | | | | | | |
| | | | | |
| Name of Issuer | | Principal Amount ($) | | | Coupon Rate (%) | | | Maturity Date | | | Fair Value ($) | |
| | | | |
Lakewood Ranch Stewardship District Special Assessment (Lake Club Phase 4 Proj.) | | | 215,000 | | | | 4.50 | | | | 5/1/49 | | | | 206,284 | |
| | | | |
Lakewood Ranch Stewardship District Utility Rev. (System Acquisition Proj.) (AGM Insured) | | | 500,000 | | | | 5.25 | | | | 10/1/53 | | | | 546,890 | |
| | | | |
Laurel Road Community Dev. District Special Assessment | | | 315,000 | | | | 3.13 | | | | 5/1/31 | | | | 291,844 | |
| | | | |
LT Ranch Community Dev. District Special Assessment | | | 300,000 | | | | 5.90 | | | | 5/1/53 | | | | 314,451 | |
| | | | |
Marshall Creek Community Dev. District Cap. Improvement Special Assessment Rev. | | | 150,000 | | | | 5.00 | | | | 5/1/32 | | | | 150,717 | |
| | | | |
Meadow View at Twin Creeks Community Dev. District Special Assessment | | | 220,000 | | | | 3.75 | | | | 5/1/52 | | | | 180,382 | |
| | | | |
Meadow View at Twin Creeks Community Dev. District Special Assessment | | | 245,000 | | | | 4.00 | | | | 5/1/52 | | | | 210,357 | |
| | | | |
New River Community Dev. District Cap. Improvement Special Assessment Rev. 2, 5, 15 | | | 230,000 | | | | 5.00 | | | | N/A | | | | 2 | |
| | | | |
North River Ranch Community Dev. District Cap. Improvement Special Assessment Rev. | | | 150,000 | | | | 4.20 | | | | 5/1/35 | | | | 147,614 | |
| | | | |
North River Ranch Improvement Stewardship District Special Assessment Rev. | | | 490,000 | | | | 5.75 | | | | 5/1/33 | | | | 511,050 | |
| | | | |
North River Ranch Improvement Stewardship District Special Assessment Rev. | | | 250,000 | | | | 6.80 | | | | 5/1/35 | | | | 250,180 | |
| | | | |
North River Ranch Improvement Stewardship District Special Assessment Rev. | | | 500,000 | | | | 6.50 | | | | 5/1/44 | | | | 545,230 | |
| | | | |
Palm Beach Co. Health Facs. Auth. Rev. (ACTS Retirement-Life Community, Inc.) | | | 500,000 | | | | 5.00 | | | | 11/15/32 | | | | 515,225 | |
| | | | |
Palm Beach Co. Health Facs. Auth. Rev. (Green Cay Life Plan Village Proj.) 4 | | | 500,000 | | | | 11.50 | | | | 7/1/27 | | | | 500,000 | |
| | | | |
Palm Beach Co. Health Facs. Auth. Rev. (Lifespace Communities, Inc.) | | | 500,000 | | | | 4.00 | | | | 5/15/53 | | | | 428,235 | |
| | | | |
Palm Coast Park Community Dev. District Special Assessment | | | 500,000 | | | | 4.00 | | | | 5/1/52 | | | | 426,990 | |
| | | | |
Palm Coast Park Community Dev. District Special Assessment Rev. | | | 275,000 | | | | 5.40 | | | | 5/1/43 | | | | 286,008 | |
| | | | |
Parker Road Community Dev. District Special Assessment | | | 500,000 | | | | 4.10 | | | | 5/1/50 | | | | 406,390 | |
| | | | |
Parkview at Long Lake Ranch Community Dev. District Special Assessment | | | 270,000 | | | | 4.00 | | | | 5/1/51 | | | | 232,853 | |
| | | | |
Poitras East Community Dev. District Special Assessment | | | 335,000 | | | | 5.25 | | | | 5/1/52 | | | | 344,672 | |
| | | | |
River Landing Community Dev. District Special Assessment | | | 75,000 | | | | 4.25 | | | | 11/1/35 | | | | 72,617 | |
| | | | |
Rolling Hills Community Dev. District Special Assessment | | | 215,000 | | | | 3.65 | | | | 5/1/32 | | | | 205,504 | |
| | | | |
Sawyers Landing Community Dev. District Special Assessment Rev. | | | 500,000 | | | | 4.13 | | | | 5/1/41 | | | | 451,460 | |
| | | | |
Sawyers Landing Community Dev. District Special Assessment Rev. | | | 750,000 | | | | 4.25 | | | | 5/1/53 | | | | 653,138 | |
| | | | |
Southern Groves Community Dev. District No. 5 Special Assessment | | | 280,000 | | | | 4.00 | | | | 5/1/48 | | | | 250,387 | |
| | | | |
Sunbridge Stewardship District Special Assessment (Weslyn Park Proj.) | | | 350,000 | | | | 5.20 | | | | 5/1/42 | | | | 358,614 | |
| | | | |
Tolomato Community Dev. District Special Assessment 2, 5 | | | 120,000 | | | | 6.61 | | | | 5/1/40 | | | | 1 | |
| | | | |
Tolomato Community Dev. District Special Assessment 6 | | | 110,000 | | | | 7.00 | | | | 5/1/40 | | | | 109,848 | |
| | | | |
Trout Creek Community Dev. District Special Assessment | | | 300,000 | | | | 5.38 | | | | 5/1/38 | | | | 307,662 | |
| | | | |
Viera Stewardship District Special Assessment | | | 250,000 | | | | 4.00 | | | | 5/1/53 | | | | 210,525 | |
| | | | |
Viera Stewardship District Special Assessment | | | 300,000 | | | | 5.50 | | | | 5/1/54 | | | | 310,716 | |
| | | | |
Waterset South Community Dev. District Special Assessment | | | 500,000 | | | | 5.90 | | | | 5/1/42 | | | | 532,130 | |
| | | | |
Windward at Lakewood Ranch Community Dev. District Special Assessment | | | 250,000 | | | | 4.25 | | | | 5/1/52 | | | | 218,230 | |
| | | | |
Wiregrass Community Dev. District Special Assessment | | | 240,000 | | | | 5.38 | | | | 5/1/35 | | | | 241,586 | |
| | | | | | | | | | | | | | | | |
| | | | |
| | | | | | | | | | | | | | | 27,642,180 | |
| | | | | | | | | | | | | | | | |
| | | | |
Georgia - 1.3% | | | | | | | | | | | | | | | | |
| | | | |
Clarke Co. Hospital Auth. Rev. (Piedmont Healthcare) | | | 350,000 | | | | 5.00 | | | | 7/1/46 | | | | 356,367 | |
| | | | |
Fulton Co. Dev. Auth. Rev. (Woodruff Arts Center) | | | 500,000 | | | | 5.00 | | | | 3/15/44 | | | | 523,585 | |
| | | | |
Gainesville & Hall Co. Dev. Auth. Rev. (Lanier Christian Academy, inc. Proj.) 4 | | | 640,000 | | | | 6.25 | | | | 9/1/44 | | | | 612,870 | |
| | | | |
Gainesville Hospital Auth. Rev. (Northeast Georgia Health System, Inc. Proj.) | | | 500,000 | | | | 5.00 | | | | 2/15/37 | | | | 522,055 | |
| | | | | | | | | | | | | | | | |
| | | | |
| | | | | | | | | | | | | | | 2,014,877 | |
| | | | | | | | | | | | | | | | |
| | | | |
Idaho - 0.6% | | | | | | | | | | | | | | | | |
| | | | |
ID Health Facs. Authority Rev. (Terraces Boise Proj.) | | | 100,000 | | | | 8.00 | | | | 10/1/28 | | | | 99,006 | |
| | | | |
ID Health Facs. Authority Rev. (Terraces Boise Proj.) | | | 290,000 | | | | 3.80 | | | | 10/1/31 | | | | 268,543 | |
| | | | |
ID Health Facs. Authority Rev. (Terraces Boise Proj.) | | | 250,000 | | | | 4.00 | | | | 10/1/33 | | | | 227,497 | |
| | |
See accompanying notes to financial statements. | | |
| |
| 14 | | FINANCIAL STATEMENTS AND OTHER INFORMATION |
| | | | | | | | | | | | | | | | |
| | | | | |
| Name of Issuer | | Principal Amount ($) | | | Coupon Rate (%) | | | Maturity Date | | | Fair Value ($) | |
| | | | |
ID Health Facs. Authority Rev. (Terraces Boise Proj.) | | | 500,000 | | | | 4.50 | | | | 10/1/50 | | | | 411,515 | |
| | | | | | | | | | | | | | | | |
| | | | |
| | | | | | | | | | | | | | | 1,006,561 | |
| | | | | | | | | | | | | | | | |
| | | | |
Illinois - 3.8% | | | | | | | | | | | | | | | | |
| | | | |
Burbank Educational Facs. Rev. (Intercultural Montessori Language School) 4 | | | 500,000 | | | | 6.00 | | | | 9/1/35 | | | | 503,145 | |
| | | | |
Chicago O’Hare International Airport Rev. (Senior Lien) | | | 500,000 | | | | 5.25 | | | | 1/1/48 | | | | 545,520 | |
| | | | |
Chicago O’Hare International Airport Rev. (Senior Lien) (AGM Insured) | | | 500,000 | | | | 5.50 | | | | 1/1/53 | | | | 541,445 | |
| | | | |
IL Fin. Auth. Rev. (Christian Homes, Inc.) | | | 500,000 | | | | 5.00 | | | | 5/15/36 | | | | 200,000 | |
| | | | |
IL Fin. Auth. Rev. (Edward Elmhurst Healthcare) | | | 1,000,000 | | | | 5.00 | | | | 1/1/44 | | | | 1,078,850 | |
| | | | |
IL Fin. Auth. Sports Facs. Rev. (North Shore Ice Arena Proj.) | | | 1,000,000 | | | | 6.25 | | | | 12/1/38 | | | | 676,160 | |
| | | | |
IL Hsg. Dev. Auth. Rev. | | | 750,000 | | | | 4.75 | | | | 10/1/48 | | | | 766,305 | |
| | | | |
IL Sports Facilities Auth. Rev. (State Tax Supported) (AGM Insured) | | | 1,000,000 | | | | 5.25 | | | | 6/15/31 | | | | 1,005,500 | |
| | | | |
Malta Tax Allocation Rev. 2, 5 | | | 1,921,000 | | | | 5.75 | | | | 12/30/25 | | | | 441,830 | |
| | | | |
Southwestern IL Dev. Auth. Tax Allocation Ref. (Local Govt. Program) 2, 15 | | | 313,173 | | | | 7.00 | | | | N/A | | | | 250,538 | |
| | | | | | | | | | | | | | | | |
| | | | |
| | | | | | | | | | | | | | | 6,009,293 | |
| | | | | | | | | | | | | | | | |
| | | | |
Indiana - 1.2% | | | | | | | | | | | | | | | | |
| | | | |
IN Hsg. & Community Dev. Auth. Rev. (GNMA/FNMA/FHLMC Collateralized) | | | 1,500,000 | | | | 4.80 | | | | 7/1/54 | | | | 1,537,320 | |
| | | | |
Merrillville Industry Economic Dev. Rev. (Belvedere Housing Proj.) | | | 300,000 | | | | 5.75 | | | | 4/1/36 | | | | 282,828 | |
| | | | | | | | | | | | | | | | |
| | | | |
| | | | | | | | | | | | | | | 1,820,148 | |
| | | | | | | | | | | | | | | | |
| | | | |
Iowa - 0.9% | | | | | | | | | | | | | | | | |
| | | | |
IA Fin. Auth. Rev. (GNMA/FNMA/FHLMC Collateralized) | | | 480,000 | | | | 5.50 | | | | 7/1/53 | | | | 515,731 | |
| | | | |
IA Fin. Auth. Rev. (Lifespace Communities, Inc.) | | | 500,000 | | | | 4.00 | | | | 5/15/53 | | | | 428,235 | |
| | | | |
IA Fin. Auth. Rev. (Lifespace Communities, Inc.) | | | 530,000 | | | | 4.00 | | | | 5/15/55 | | | | 449,387 | |
| | | | | | | | | | | | | | | | |
| | | | |
| | | | | | | | | | | | | | | 1,393,353 | |
| | | | | | | | | | | | | | | | |
| | | | |
Kentucky - 0.4% | | | | | | | | | | | | | | | | |
| | | | |
Boyle Co. Educational Facs. Auth. Rev. (Centre College) | | | 600,000 | | | | 5.25 | | | | 6/1/49 | | | | 642,618 | |
| | | | | | | | | | | | | | | | |
| | | | |
Louisiana - 2.8% | | | | | | | | | | | | | | | | |
| | | | |
Capital Area Finance Auth. Rev. (GNMA/FNMA/FHLMC Collateralized) | | | 500,000 | | | | 5.50 | | | | 10/1/53 | | | | 535,340 | |
| | | | |
LA Hsg. Fin. Agy. Single Family Mtg. Rev. (Home Ownership Prog.) (GNMA/FHLMC Collateralized) | | | 385,000 | | | | 2.50 | | | | 12/1/45 | | | | 293,309 | |
| | | | |
LA Hsg. Fin. Agy. Single Family Mtg. Rev. (Home Ownership Prog.) (GNMA/FHLMC Collateralized) | | | 495,000 | | | | 5.75 | | | | 6/1/54 | | | | 542,312 | |
| | | | |
LA Local Government Environmental Facilities & Community Development Auth. | | | 500,000 | | | | 6.00 | | | | 11/15/30 | | | | 504,180 | |
| | | | |
LA Local Government Environmental Facilities & Community Development Auth. Rev. 4 | | | 300,000 | | | | 5.65 | | | | 11/1/37 | | | | 322,767 | |
| | | | |
LA Local Government Environmental Facilities & Community Development Auth. Rev. 4 | | | 200,000 | | | | 5.50 | | | | 11/1/39 | | | | 212,492 | |
| | | | |
LA Local Government Environmental Facilities & Community Development Auth. Rev. 4 | | | 410,000 | | | | 4.00 | | | | 11/1/44 | | | | 394,752 | |
| | | | |
LA Local Government Environmental Facilities & Community Development Auth. Rev. 4 | | | 390,000 | | | | 4.40 | | | | 11/1/44 | | | | 393,939 | |
| | | | |
LA Local Government Environmental Facilities & Community Development Auth. Rev. 4 | | | 715,000 | | | | 4.00 | | | | 11/1/46 | | | | 686,793 | |
| | | | |
LA Public Facs. Auth. Rev. (Tulane Univ. Proj.) (NATL-RE Insured) 1 | | | 465,000 | | | | 4.30 | | | | 2/15/36 | | | | 445,698 | |
| | | | | | | | | | | | | | | | |
| | | | |
| | | | | | | | | | | | | | | 4,331,582 | |
| | | | | | | | | | | | | | | | |
| | | | |
Maryland - 0.3% | | | | | | | | | | | | | | | | |
| | | | |
MD Community Dev. Administration Rev. | | | 500,000 | | | | 2.55 | | | | 9/1/44 | | | | 391,435 | |
| | | | | | | | | | | | | | | | |
| | | | |
Massachusetts - 1.1% | | | | | | | | | | | | | | | | |
| | | | |
MA Dev. Finance Agy. Rev. (Orchard Cove, Inc.) | | | 400,000 | | | | 5.00 | | | | 10/1/49 | | | | 408,244 | |
| | | | |
MA Education Finance Auth. Education Rev. | | | 250,000 | | | | 4.25 | | | | 7/1/32 | | | | 253,433 | |
| | | | |
MA Education Finance Auth. Education Rev. | | | 1,000,000 | | | | 3.00 | | | | 7/1/51 | | | | 734,700 | |
| | | | |
MA Housing Finance Agy. Rev. | | | 400,000 | | | | 3.85 | | | | 12/1/47 | | | | 385,176 | |
| | | | | | | | | | | | | | | | |
| | | | |
| | | | | | | | | | | | | | | 1,781,553 | |
| | | | | | | | | | | | | | | | |
| | |
See accompanying notes to financial statements. | | |
| |
SEPTEMBER 30, 2024 | | 15 |
SCHEDULE OF INVESTMENTS (Unaudited)
September 30, 2024
Sit Tax-Free Income Fund (Continued)
| | | | | | | | | | | | | | | | |
| | | | | |
| Name of Issuer | | Principal Amount ($) | | | Coupon Rate (%) | | | Maturity Date | | | Fair Value ($) | |
| | | | |
Michigan - 5.1% | | | | | | | | | | | | | | | | |
| | | | |
City of Allen Park G.O. (BAM Insured) | | | 300,000 | | | | 3.25 | | | | 5/1/34 | | | | 296,832 | |
| | | | |
MI Finance Auth. Rev. (Holly Academy Proj.) | | | 400,000 | | | | 3.00 | | | | 12/1/31 | | | | 363,916 | |
| | | | |
MI Finance Auth. Rev. (Madison Academy Proj.) | | | 255,000 | | | | 4.25 | | | | 12/1/39 | | | | 215,835 | |
| | | | |
MI Hsg. Dev. Auth. Rev. | | | 500,000 | | | | 4.90 | | | | 12/1/48 | | | | 515,740 | |
| | | | |
MI Hsg. Dev. Auth. Rev. | | | 1,000,000 | | | | 4.65 | | | | 12/1/49 | | | | 1,014,680 | |
| | | | |
MI Hsg. Dev. Auth. Rev. | | | 210,000 | | | | 3.15 | | | | 6/1/50 | | | | 192,129 | |
| | | | |
MI Hsg. Dev. Auth. Rev. | | | 2,000,000 | | | | 2.75 | | | | 6/1/51 | | | | 1,454,060 | |
| | | | |
MI Hsg. Dev. Auth. Rev. | | | 3,500,000 | | | | 2.50 | | | | 6/1/52 | | | | 2,429,245 | |
| | | | |
MI Hsg. Dev. Auth. Rev. | | | 1,000,000 | | | | 4.95 | | | | 12/1/53 | | | | 1,029,830 | |
| | | | |
MI Public Educational Facs. Auth. Rev. (Chandler Park Academy) | | | 175,000 | | | | 6.35 | | | | 11/1/28 | | | | 175,164 | |
| | | | |
MI Strategic Fund. Rev. (United Methodist Retirement Facs.) | | | 415,000 | | | | 5.00 | | | | 11/15/49 | | | | 382,555 | |
| | | | | | | | | | | | | | | | |
| | | | |
| | | | | | | | | | | | | | | 8,069,986 | |
| | | | | | | | | | | | | | | | |
| | | | |
Minnesota - 0.2% | | | | | | | | | | | | | | | | |
| | | | |
Apple Valley Rev. (Senior Living, LLC Proj.) | | | 475,000 | | | | 5.00 | | | | 1/1/47 | | | | 289,479 | |
| | | | | | | | | | | | | | | | |
| | | | |
Mississippi - 0.8% | | | | | | | | | | | | | | | | |
| | | | |
MS Development Bank Rev. (Green Bond-Hancock County) 4 | | | 900,000 | | | | 4.55 | | | | 11/1/39 | | | | 919,737 | |
| | | | |
MS Development Bank Rev. (Jackson Co. Gomesa Proj.) 4 | | | 400,000 | | | | 3.63 | | | | 11/1/36 | | | | 387,112 | |
| | | | | | | | | | | | | | | | |
| | | | |
| | | | | | | | | | | | | | | 1,306,849 | |
| | | | | | | | | | | | | | | | |
| | | | |
Missouri - 2.2% | | | | | | | | | | | | | | | | |
| | | | |
Joplin Industrial Dev. Auth. Rev. (32nd Street Place Community Improvement Dist. Proj.) | | | 170,000 | | | | 3.50 | | | | 11/1/40 | | | | 159,178 | |
| | | | |
Kansas City Industrial Dev. Auth. Rev. (United Methodist Retirement Home, Inc.) 2, 5 | | | 118,010 | | | | 2.00 | | | | 11/15/46 | | | | 5,543 | |
| | | | |
Kansas City Industrial Dev. Auth. Rev. (United Methodist Retirement Home, Inc.) | | | 264,421 | | | | 5.00 | | | | 11/15/46 | | | | 192,667 | |
| | | | |
MO Hsg. Dev. Commission Rev. (GNMA/FNMA/FHLMC Collateralized) | | | 1,000,000 | | | | 5.00 | | | | 11/1/48 | | | | 1,022,890 | |
| | | | |
MO Hsg. Dev. Commission Rev. (GNMA/FNMA/FHLMC Collateralized) | | | 435,000 | | | | 2.50 | | | | 5/1/50 | | | | 308,102 | |
| | | | |
MO Hsg. Dev. Commission Rev. (GNMA/FNMA/FHLMC Collateralized) | | | 350,000 | | | | 2.40 | | | | 11/1/51 | | | | 242,361 | |
| | | | |
MO Hsg. Dev. Commission Rev. (GNMA/FNMA/FHLMC Collateralized) | | | 985,000 | | | | 4.70 | | | | 11/1/53 | | | | 1,003,764 | |
| | | | |
MO Hsg. Dev. Commission Rev. (GNMA/FNMA/FHLMC Collateralized) | | | 500,000 | | | | 4.70 | | | | 11/1/54 | | | | 509,335 | |
| | | | | | | | | | | | | | | | |
| | | | |
| | | | | | | | | | | | | | | 3,443,840 | |
| | | | | | | | | | | | | | | | |
| | | | |
Montana - 0.2% | | | | | | | | | | | | | | | | |
| | | | |
MT Board of Housing Single Family Rev. | | | 410,000 | | | | 2.40 | | | | 12/1/45 | | | | 305,417 | |
| | | | | | | | | | | | | | | | |
| | | | |
Nebraska - 0.0% | | | | | | | | | | | | | | | | |
| | | | |
Mead Village Tax Allocation Rev. (E3 Biofuels - Mead LLC Proj.) 2, 5, 15 | | | 410,000 | | | | 5.13 | | | | N/A | | | | 17,015 | |
| | | | | | | | | | | | | | | | |
| | | | |
Nevada - 0.8% | | | | | | | | | | | | | | | | |
| | | | |
Las Vegas NV Special Improvement District No 817 Summerlin Village 29 Special Assessment | | | 300,000 | | | | 6.00 | | | | 6/1/48 | | | | 318,552 | |
| | | | |
NV Hsg. Division Rev. (GNMA/FNMA/FHLMC Collateralized) | | | 750,000 | | | | 2.60 | | | | 4/1/46 | | | | 577,770 | |
| | | | |
NV Hsg. Division Rev. (GNMA/FNMA/FHLMC Collateralized) | | | 495,000 | | | | 2.45 | | | | 10/1/51 | | | | 347,545 | |
| | | | | | | | | | | | | | | | |
| | | | |
| | | | | | | | | | | | | | | 1,243,867 | |
| | | | | | | | | | | | | | | | |
| | | | |
New Hampshire - 0.3% | | | | | | | | | | | | | | | | |
| | | | |
New Hampshire Business Finance Auth. Rev. (Pennichuck Water Works, Inc.) | | | 450,000 | | | | 5.50 | | | | 4/1/54 | | | | 461,426 | |
| | | | | | | | | | | | | | | | |
| | | | |
New Jersey - 1.3% | | | | | | | | | | | | | | | | |
| | | | |
NJ Hsg. & Mtg. Finance Agy. Single Family Mtg. Rev. | | | 735,000 | | | | 2.30 | | | | 10/1/46 | | | | 514,919 | |
| | | | |
NJ Hsg. & Mtg. Finance Agy. Single Family Mtg. Rev. | | | 795,000 | | | | 2.45 | | | | 10/1/50 | | | | 560,960 | |
| | | | |
NJ Hsg. & Mtg. Finance Agy. Single Family Mtg. Rev. | | | 1,000,000 | | | | 4.80 | | | | 10/1/53 | | | | 1,024,370 | |
| | | | | | | | | | | | | | | | |
| | | | |
| | | | | | | | | | | | | | | 2,100,249 | |
| | | | | | | | | | | | | | | | |
| | |
See accompanying notes to financial statements. | | |
| |
| 16 | | FINANCIAL STATEMENTS AND OTHER INFORMATION |
| | | | | | | | | | | | | | | | |
| | | | | |
| Name of Issuer | | Principal Amount ($) | | | Coupon Rate (%) | | | Maturity Date | | | Fair Value ($) | |
| | | | |
New Mexico - 1.1% | | | | | | | | | | | | | | | | |
| | | | |
NM Mtg. Fin. Auth. Single Family Mtg. Rev. (GNMA/FNMA/FHLMC Collateralized) | | | 360,000 | | | | 2.70 | | | | 9/1/47 | | | | 276,678 | |
| | | | |
NM Mtg. Fin. Auth. Single Family Mtg. Rev. (GNMA/FNMA/FHLMC Collateralized) | | | 495,000 | | | | 2.35 | | | | 7/1/51 | | | | 338,971 | |
| | | | |
NM Mtg. Fin. Auth. Single Family Mtg. Rev. (GNMA/FNMA/FHLMC Collateralized) | | | 600,000 | | | | 2.63 | | | | 7/1/51 | | | | 429,288 | |
| | | | |
NM Mtg. Fin. Auth. Single Family Mtg. Rev. (GNMA/FNMA/FHLMC Collateralized) | | | 985,000 | | | | 2.80 | | | | 9/1/52 | | | | 715,849 | |
| | | | | | | | | | | | | | | | |
| | | | |
| | | | | | | | | | | | | | | 1,760,786 | |
| | | | | | | | | | | | | | | | |
| | | | |
New York - 5.0% | | | | | | | | | | | | | | | | |
| | | | |
Hempstead Town Local Development Corp. Rev. (Hofstra University Proj.) | | | 350,000 | | | | 4.00 | | | | 7/1/33 | | | | 350,252 | |
| | | | |
New York City Housing Development Corp. Multifamily Mtg. Rev. | | | 300,000 | | | | 4.05 | | | | 11/1/41 | | | | 297,069 | |
| | | | |
New York Transportation Dev. Corp. Rev. | | | 500,000 | | | | 5.50 | | | | 6/30/60 | | | | 534,460 | |
| | | | |
New York Transportation Dev. Corp. Rev. (AGM Insured) | | | 300,000 | | | | 5.50 | | | | 6/30/44 | | | | 328,632 | |
| | | | |
NY State Dormitory Auth. Rev. Ref. (N. Shore-Long Island Jewish Obligation) | | | 300,000 | | | | 5.00 | | | | 5/1/33 | | | | 302,859 | |
| | | | |
NY State Mortgage Agency Homeowner Mortgage Rev. | | | 580,000 | | | | 2.20 | | | | 4/1/36 | | | | 480,843 | |
| | | | |
NY State Mortgage Agency Homeowner Mortgage Rev. | | | 995,000 | | | | 4.70 | | | | 10/1/38 | | | | 1,039,905 | |
| | | | |
NY State Mortgage Agency Homeowner Mortgage Rev. | | | 1,000,000 | | | | 2.45 | | | | 10/1/45 | | | | 754,380 | |
| | | | |
NY State Mortgage Agency Homeowner Mortgage Rev. | | | 980,000 | | | | 2.50 | | | | 10/1/46 | | | | 736,411 | |
| | | | |
NY State Mortgage Agency Homeowner Mortgage Rev. | | | 975,000 | | | | 3.30 | | | | 10/1/47 | | | | 833,713 | |
| | | | |
NY State Mortgage Agency Homeowner Mortgage Rev. | | | 500,000 | | | | 4.80 | | | | 10/1/48 | | | | 509,890 | |
| | | | |
NY State Mortgage Agency Homeowner Mortgage Rev. | | | 1,625,000 | | | | 2.55 | | | | 4/1/50 | | | | 1,135,176 | |
| | | | |
NY State Mortgage Agency Homeowner Mortgage Rev. | | | 595,000 | | | | 4.90 | | | | 10/1/53 | | | | 610,583 | |
| | | | | | | | | | | | | | | | |
| | | | |
| | | | | | | | | | | | | | | 7,914,173 | |
| | | | | | | | | | | | | | | | |
| | | | |
North Carolina - 1.0% | | | | | | | | | | | | | | | | |
| | | | |
Mecklenburg Co. Rev. (Little Rock Apts) | | | 450,000 | | | | 5.38 | | | | 1/1/36 | | | | 451,008 | |
| | | | |
NC Housing Finance Agency Rev. (GNMA/FNMA/FHLMC Collateralized) | | | 500,000 | | | | 5.00 | | | | 7/1/46 | | | | 524,675 | |
| | | | |
NC Housing Finance Agency Rev. (GNMA/FNMA/FHLMC Collateralized) | | | 550,000 | | | | 4.80 | | | | 1/1/55 | | | | 559,878 | |
| | | | | | | | | | | | | | | | |
| | | | |
| | | | | | | | | | | | | | | 1,535,561 | |
| | | | | | | | | | | | | | | | |
| | | | |
North Dakota - 0.8% | | | | | | | | | | | | | | | | |
| | | | |
ND Housing Finance Agency Rev. | | | 925,000 | | | | 2.50 | | | | 7/1/44 | | | | 717,421 | |
| | | | |
ND Housing Finance Agency Rev. | | | 500,000 | | | | 5.10 | | | | 7/1/48 | | | | 516,050 | |
| | | | | | | | | | | | | | | | |
| | | | |
| | | | | | | | | | | | | | | 1,233,471 | |
| | | | | | | | | | | | | | | | |
| | | | |
Ohio - 3.9% | | | | | | | | | | | | | | | | |
| | | | |
Euclid Public Library G.O. | | | 300,000 | | | | 5.00 | | | | 12/1/49 | | | | 313,017 | |
| | | | |
Lake Co. Port & Economic Dev. Auth. Rev. (Tapestry Wickliffe Proj.) 2, 4, 5 | | | 250,000 | | | | 6.50 | | | | 12/1/37 | | | | 10,000 | |
| | | | |
North Ridgeville City School District G.O. | | | 300,000 | | | | 5.25 | | | | 12/1/54 | | | | 318,933 | |
| | | | |
OH Housing Finance Agency Rev. | | | 1,800,000 | | | | 2.45 | | | | 9/1/51 | | | | 1,244,358 | |
| | | | |
OH Housing Finance Agency Rev. (GNMA/FNMA/FHLMC Collateralized) | | | 1,460,000 | | | | 2.85 | | | | 9/1/46 | | | | 1,140,421 | |
| | | | |
OH Housing Finance Agency Rev. (GNMA/FNMA/FHLMC Collateralized) | | | 1,355,000 | | | | 5.10 | | | | 9/1/47 | | | | 1,424,159 | |
| | | | |
OH Housing Finance Agency Rev. (GNMA/FNMA/FHLMC Collateralized) | | | 500,000 | | | | 4.65 | | | | 9/1/49 | | | | 509,130 | |
| | | | |
OH Housing Finance Agency Rev. (GNMA/FNMA/FHLMC Collateralized) | | | 965,000 | | | | 2.75 | | | | 9/1/51 | | | | 718,568 | |
| | | | |
OH Housing Finance Agency Rev. (Middletown Phase Two Proj.) 4 | | | 500,000 | | | | 6.25 | | | | 3/1/26 | | | | 503,030 | |
| | | | | | | | | | | | | | | | |
| | | | |
| | | | | | | | | | | | | | | 6,181,616 | |
| | | | | | | | | | | | | | | | |
| | | | |
Oklahoma - 0.3% | | | | | | | | | | | | | | | | |
| | | | |
OK Hsg. Finance Agency Rev. (Home Ownership Prog.) (GNMA/FNMA/FHLMC Collateralized) | | | 480,000 | | | | 4.60 | | | | 9/1/49 | | | | 486,614 | |
| | | | | | | | | | | | | | | | |
| | | | |
Oregon - 0.7% | | | | | | | | | | | | | | | | |
| | | | |
OR Hsg. & Community Services Dept. Rev. (Single Family Mtg. Program) | | | 500,000 | | | | 2.35 | | | | 1/1/44 | | | | 363,670 | |
| | |
See accompanying notes to financial statements. | | |
| |
SEPTEMBER 30, 2024 | | 17 |
SCHEDULE OF INVESTMENTS (Unaudited)
September 30, 2024
Sit Tax-Free Income Fund (Continued)
| | | | | | | | | | | | | | | | |
| | | | | |
| Name of Issuer | | Principal Amount ($) | | | Coupon Rate (%) | | | Maturity Date | | | Fair Value ($) | |
| | | | |
OR Hsg. & Community Services Dept. Rev. (Single Family Mtg. Program) | | | 1,000,000 | | | | 2.38 | | | | 1/1/45 | | | | 729,350 | |
| | | | | | | | | | | | | | | | |
| | | | |
| | | | | | | | | | | | | | | 1,093,020 | |
| | | | | | | | | | | | | | | | |
| | | | |
Pennsylvania - 1.4% | | | | | | | | | | | | | | | | |
| | | | |
Butler Co. General Authority Rev. (School District Proj.) (AGM G.O. of District) 1 | | | 460,000 | | | | 4.45 | | | | 10/1/34 | | | | 444,406 | |
| | | | |
PA Higher Educational Assistance Agy. Rev. | | | 370,000 | | | | 2.63 | | | | 6/1/42 | | | | 320,376 | |
| | | | |
PA Hsg. Finance Agency Rev. | | | 1,000,000 | | | | 5.00 | | | | 10/1/50 | | | | 1,042,820 | |
| | | | |
PA Hsg. Finance Agency Rev. | | | 5,000 | | | | 6.25 | | | | 10/1/53 | | | | 5,536 | |
| | | | |
Philadelphia Industrial Dev. Auth. Rev. (Charter School Proj.) | | | 350,000 | | | | 5.63 | | | | 8/1/36 | | | | 358,970 | |
| | | | | | | | | | | | | | | | |
| | | | |
| | | | | | | | | | | | | | | 2,172,108 | |
| | | | | | | | | | | | | | | | |
| | | | |
South Carolina - 2.0% | | | | | | | | | | | | | | | | |
| | | | |
Berkeley Co. Nexton Improvement District Special Assessment | | | 350,000 | | | | 4.25 | | | | 11/1/40 | | | | 326,648 | |
| | | | |
SC Jobs-Economic Dev. Auth. Rev. (Bishop Gadsden Episcopal Retirement Community) | | | 500,000 | | | | 4.00 | | | | 4/1/54 | | | | 434,955 | |
| | | | |
SC Jobs-Economic Dev. Auth. Rev. (River Academy Proj.) 4 | | | 325,000 | | | | 7.00 | | | | 6/15/43 | | | | 344,669 | |
| | | | |
SC Jobs-Economic Dev. Auth. Rev. (Seafields at Kiawah Island Proj.) | | | 500,000 | | | | 7.50 | | | | 11/15/53 | | | | 525,800 | |
| | | | |
SC State Hsg. Finance & Dev. Auth. Rev. | | | 5,000 | | | | 3.05 | | | | 7/1/45 | | | | 4,271 | |
| | | | |
SC State Hsg. Finance & Dev. Auth. Rev. | | | 975,000 | | | | 4.95 | | | | 7/1/53 | | | | 1,007,906 | |
| | | | |
SC State Hsg. Finance & Dev. Auth. Rev. | | | 500,000 | | | | 4.63 | | | | 7/1/54 | | | | 507,865 | |
| | | | | | | | | | | | | | | | |
| | | | |
| | | | | | | | | | | | | | | 3,152,114 | |
| | | | | | | | | | | | | | | | |
| | | | |
South Dakota - 0.5% | | | | | | | | | | | | | | | | |
| | | | |
SD Hsg. Dev. Auth. Rev. (GNMA/FNMA/FHLMC Collateralized) | | | 750,000 | | | | 4.80 | | | | 11/1/48 | | | | 762,915 | |
| | | | | | | | | | | | | | | | |
| | | | |
Tennessee - 4.1% | | | | | | | | | | | | | | | | |
| | | | |
Metropolitan Govt. Nashville & Davidson County Health & Edu. Facs. Board Rev. (Blakford at Green Hills) | | | 895,000 | | | | 4.00 | | | | 11/1/45 | | | | 791,753 | |
| | | | |
Metropolitan Nashville Airport Auth. Rev. | | | 300,000 | | | | 5.00 | | | | 7/1/49 | | | | 312,528 | |
| | | | |
Nashville Metropolitan Dev. & Hsg. Agency Tax Allocation 4 | | | 300,000 | | | | 5.13 | | | | 6/1/36 | | | | 307,482 | |
| | | | |
Shelby Co. Health, Education & Hsg. Facs. Rev. (CME Memphis Apts. Proj.) 2, 5, 15 | | | 1,850,000 | | | | 5.35 | | | | N/A | | | | 185 | |
| | | | |
Shelby Co. Health, Education & Hsg. Facs. Rev. (CME Memphis Apts. Proj.) 2, 5 | | | 7,875,000 | | | | 5.55 | | | | 1/1/29 | | | | 788 | |
| | | | |
Shelby Co. Health, Education & Hsg. Facs. Rev. (CME Memphis Apts. Proj.) 2, 5 | | | 1,630,000 | | | | 6.00 | | | | 1/1/29 | | | | 16 | |
| | | | |
TN Hsg. Dev. Agency Rev. | | | 815,000 | | | | 2.55 | | | | 1/1/45 | | | | 631,918 | |
| | | | |
TN Hsg. Dev. Agency Rev. | | | 1,485,000 | | | | 2.38 | | | | 7/1/46 | | | | 1,061,389 | |
| | | | |
TN Hsg. Dev. Agency Rev. | | | 385,000 | | | | 2.55 | | | | 7/1/46 | | | | 292,796 | |
| | | | |
TN Hsg. Dev. Agency Rev. | | | 495,000 | | | | 4.70 | | | | 7/1/48 | | | | 499,519 | |
| | | | |
TN Hsg. Dev. Agency Rev. | | | 730,000 | | | | 5.05 | | | | 7/1/48 | | | | 748,411 | |
| | | | |
TN Hsg. Dev. Agency Rev. | | | 990,000 | | | | 2.50 | | | | 7/1/51 | | | | 705,306 | |
| | | | |
TN Hsg. Dev. Agency Rev. | | | 500,000 | | | | 4.80 | | | | 7/1/54 | | | | 512,440 | |
| | | | |
TN Hsg. Dev. Agency Rev. (GNMA/FNMA/FHLMC Collateralized) | | | 500,000 | | | | 5.35 | | | | 7/1/48 | | | | 528,005 | |
| | | | | | | | | | | | | | | | |
| | | | |
| | | | | | | | | | | | | | | 6,392,536 | |
| | | | | | | | | | | | | | | | |
| | | | |
Texas - 9.7% | | | | | | | | | | | | | | | | |
| | | | |
Arlington Higher Education Finance Corp., Education Rev. (Pineywoods Community Academy) | | | 750,000 | | | | 2.38 | | | | 8/15/51 | | | | 501,277 | |
| | | | |
Brazos Higher Education Auth., Inc. Rev. (Subordinate Student Loan) | | | 1,000,000 | | | | 3.00 | | | | 4/1/40 | | | | 850,580 | |
| | | | |
Dallas Special Tax (Fair Park Venue Proj.) 1, 4 | | | 250,000 | | | | 6.25 | | | | 8/15/53 | | | | 251,227 | |
| | | | |
Houston Airport System Rev. (AGM Insured) | | | 1,000,000 | | | | 5.25 | | | | 7/1/48 | | | | 1,086,930 | |
| | | | |
New Hope Cultural Education Fac. Corp. Rev. (Cardinal Bay) 2, 15 | | | 260,000 | | | | 4.00 | | | | N/A | | | | 145,600 | |
| | | | |
New Hope Cultural Education Fac. Corp. Rev. (Cardinal Bay) 2 | | | 460,000 | | | | 4.00 | | | | 7/1/26 | | | | 257,600 | |
| | | | |
New Hope Cultural Education Facs. Finance Corp. Rev. (Buckingham Senior Living Community, Inc.) 1 | | | 525,069 | | | | 2.00 | | | | 11/15/61 | | | | 194,990 | |
| | | | |
New Hope Cultural Education Facs. Finance Corp. Rev. (Cityscape Schools, Inc.) 4 | | | 300,000 | | | | 5.00 | | | | 8/15/39 | | | | 302,556 | |
| | | | |
New Hope Cultural Education Facs. Finance Corp. Rev. (Wesleyan Homes, Inc. Proj.) | | | 750,000 | | | | 5.00 | | | | 1/1/55 | | | | 625,703 | |
| | |
See accompanying notes to financial statements. | | |
| |
| 18 | | FINANCIAL STATEMENTS AND OTHER INFORMATION |
| | | | | | | | | | | | | | | | |
| | | | | |
| Name of Issuer | | Principal Amount ($) | | | Coupon Rate (%) | | | Maturity Date | | | Fair Value ($) | |
| | | | |
New Hope Cultural Education Facs. Finance Corp. Rev. (Windhaven Proj.) | | | 500,000 | | | | 5.50 | | | | 10/1/27 | | | | 499,980 | |
| | | | |
New Hope Cultural Education Facs. Finance Corp. Rev. (Windhaven Proj.) | | | 500,000 | | | | 6.50 | | | | 10/1/33 | | | | 524,875 | |
| | | | |
North Central Texas Health Facility Development Corp. (CC Young Memorial Home) 5 | | | 204,000 | | | | 5.38 | | | | 2/15/25 | | | | 112,200 | |
| | | | |
TX Affordable Hsg. Corp. Rev. (GNMA Collateralized) | | | 500,000 | | | | 5.00 | | | | 3/1/49 | | | | 512,365 | |
| | | | |
TX Affordable Hsg. Corp. Rev. (GNMA Collateralized) | | | 1,000,000 | | | | 4.88 | | | | 3/1/53 | | | | 1,032,170 | |
| | | | |
TX Department of Housing & Community Affairs (GNMA Collateralized) | | | 500,000 | | | | 3.00 | | | | 9/1/45 | | | | 422,565 | |
| | | | |
TX Department of Housing & Community Affairs (GNMA Collateralized) | | | 985,000 | | | | 2.50 | | | | 7/1/51 | | | | 701,744 | |
| | | | |
TX Department of Housing & Community Affairs (GNMA Collateralized) | | | 1,750,000 | | | | 3.13 | | | | 1/1/52 | | | | 1,390,777 | |
| | | | |
TX Department of Housing & Community Affairs (GNMA Collateralized) | | | 500,000 | | | | 5.00 | | | | 1/1/49 | | | | 518,370 | |
| | | | |
TX Department of Housing & Community Affairs (GNMA Collateralized) | | | 500,000 | | | | 3.00 | | | | 3/1/50 | | | | 390,680 | |
| | | | |
TX Department of Housing & Community Affairs (GNMA Collateralized) | | | 750,000 | | | | 5.25 | | | | 9/1/52 | | | | 789,840 | |
| | | | |
TX Department of Housing & Community Affairs (GNMA Collateralized) | | | 1,500,000 | | | | 5.25 | | | | 1/1/53 | | | | 1,579,920 | |
| | | | |
TX Department of Housing & Community Affairs (GNMA Collateralized) | | | 1,000,000 | | | | 5.25 | | | | 9/1/53 | | | | 1,054,680 | |
| | | | |
TX Department of Housing & Community Affairs (GNMA Collateralized) | | | 1,500,000 | | | | 5.13 | | | | 1/1/54 | | | | 1,561,230 | |
| | | | | | | | | | | | | | | | |
| | | | |
| | | | | | | | | | | | | | | 15,307,859 | |
| | | | | | | | | | | | | | | | |
| | | | |
Utah - 2.8% | | | | | | | | | | | | | | | | |
| | | | |
Black Desert Public Infrastructure District G.O. 4 | | | 500,000 | | | | 4.00 | | | | 3/1/51 | | | | 434,295 | |
| | | | |
Fields Estates Public Infrastructure District Special Assessment (Fields Estates Assessment Area) 4 | | | 500,000 | | | | 5.25 | | | | 12/1/53 | | | | 508,710 | |
| | | | |
Jordanelle Ridge Public Infrastructure District No. 2 G.O. 4 | | | 500,000 | | | | 7.75 | | | | 3/1/54 | | | | 512,980 | |
| | | | |
Military Installation Dev. Auth. Rev. | | | 1,000,000 | | | | 4.00 | | | | 6/1/52 | | | | 867,310 | |
| | | | |
Olympia Public Infrastructure District No. 1 G.O. 4 | | | 500,000 | | | | 6.38 | | | | 3/1/55 | | | | 516,960 | |
| | | | |
UT Charter School Finance Auth. Rev. (Mountain Sunrise Academy) 4 | | | 515,000 | | | | 3.50 | | | | 12/15/31 | | | | 459,328 | |
| | | | |
UT Hsg. Corp. Single Family Mtg. Rev. | | | 5,000 | | | | 5.75 | | | | 1/1/33 | | | | 5,009 | |
| | | | |
UT Hsg. Corp. Single Family Mtg. Rev. (GNMA/FNMA/FHLMC Collateralized) | | | 500,000 | | | | 4.70 | | | | 1/1/54 | | | | 509,020 | |
| | | | |
UT Hsg. Corp. Single Family Mtg. Rev. (GNMA/FNMA/FHLMC Collateralized) | | | 500,000 | | | | 5.00 | | | | 1/1/54 | | | | 517,990 | |
| | | | | | | | | | | | | | | | |
| | | | |
| | | | | | | | | | | | | | | 4,331,602 | |
| | | | | | | | | | | | | | | | |
| | | | |
Virginia - 1.0% | | | | | | | | | | | | | | | | |
| | | | |
Botetourt Co. Glebe Inc. Rev. | | | 500,000 | | | | 6.00 | | | | 7/1/44 | | | | 500,315 | |
| | | | |
VA Beach Dev. Auth. Rev. (Westminster Canterbury Proj.) | | | 320,000 | | | | 6.25 | | | | 9/1/30 | | | | 333,226 | |
| | | | |
VA Hsg. Dev. Auth. Rev. (Commonwealth Mortgage Bonds) | | | 700,000 | | | | 4.70 | | | | 7/1/55 | | | | 715,477 | |
| | | | | | | | | | | | | | | | |
| | | | |
| | | | | | | | | | | | | | | 1,549,018 | |
| | | | | | | | | | | | | | | | |
| | | | |
Washington - 0.3% | | | | | | | | | | | | | | | | |
| | | | |
WA State Hsg. Finance Commission Rev. (Parkshore Juanita Bay Proj.) 4 | | | 500,000 | | | | 5.50 | | | | 1/1/44 | | | | 501,260 | |
| | | | | | | | | | | | | | | | |
| | | | |
West Virginia - 1.1% | | | | | | | | | | | | | | | | |
| | | | |
WV Hsg. Dev. Fund Rev. | | | 945,000 | | | | 2.50 | | | | 11/1/51 | | | | 671,876 | |
| | | | |
WV Hsg. Dev. Fund Rev. | | | 1,000,000 | | | | 4.90 | | | | 11/1/54 | | | | 1,026,350 | |
| | | | | | | | | | | | | | | | |
| | | | |
| | | | | | | | | | | | | | | 1,698,226 | |
| | | | | | | | | | | | | | | | |
| | | | |
Wisconsin - 1.5% | | | | | | | | | | | | | | | | |
| | | | |
Public Finance Auth. Rev. (Grand Hyatt San Antonio Hotel Acquisition Proj.) | | | 500,000 | | | | 5.00 | | | | 2/1/52 | | | | 516,515 | |
| | | | |
Public Finance Auth. Rev. (Grand Hyatt San Antonio Hotel Acquisition Proj.) 4 | | | 500,000 | | | | 6.00 | | | | 2/1/62 | | | | 532,310 | |
| | | | |
WI Health & Educational Facs. Auth. Rev. (Benevolent Corp. Cedar Community) | | | 300,000 | | | | 5.00 | | | | 6/1/37 | | | | 300,933 | |
| | | | |
WI Public Finance Auth. Rev. (Delray Beach Radiation Therapy) 2, 4, 5 | | | 750,000 | | | | 6.25 | | | | 11/1/28 | | | | 412,500 | |
| | | | |
WI Public Finance Auth. Rev. (Lombard Public Facilities Corp.) 2, 4, 5 | | | 16,520 | | | | 9.00 | | | | 1/1/46 | | | | 507 | |
| | | | |
WI Public Finance Auth. Rev. (Lombard Public Facilities Corp.) 2, 4, 5 | | | 16,287 | | | | 9.00 | | | | 1/1/47 | | | | 464 | |
| | | | |
WI Public Finance Auth. Rev. (Lombard Public Facilities Corp.) 2, 4, 5 | | | 447 | | | | 12.00 | | | | 1/1/47 | | | | 13 | |
| | | | |
WI Public Finance Auth. Rev. (Lombard Public Facilities Corp.) 2, 4, 5 | | | 16,171 | | | | 9.00 | | | | 1/1/48 | | | | 436 | |
| | |
See accompanying notes to financial statements. | | |
| |
SEPTEMBER 30, 2024 | | 19 |
SCHEDULE OF INVESTMENTS (Unaudited)
September 30, 2024
Sit Tax-Free Income Fund (Continued)
| | | | | | | | | | | | | | | | |
| | | | | |
| Name of Issuer | | Principal Amount ($) | | | Coupon Rate (%) | | | Maturity Date | | | Fair Value ($) | |
| | | | |
WI Public Finance Auth. Rev. (Lombard Public Facilities Corp.) 2, 4, 5 | | | 390 | | | | 12.00 | | | | 1/1/48 | | | | 11 | |
| | | | |
WI Public Finance Auth. Rev. (Lombard Public Facilities Corp.) 2, 4, 5 | | | 16,055 | | | | 9.00 | | | | 1/1/49 | | | | 409 | |
| | | | |
WI Public Finance Auth. Rev. (Lombard Public Facilities Corp.) 2, 4, 5 | | | 384 | | | | 11.00 | | | | 1/1/49 | | | | 10 | |
| | | | |
WI Public Finance Auth. Rev. (Lombard Public Facilities Corp.) 2, 4, 5 | | | 15,822 | | | | 9.00 | | | | 1/1/50 | | | | 374 | |
| | | | |
WI Public Finance Auth. Rev. (Lombard Public Facilities Corp.) 2, 4, 5 | | | 372 | | | | 11.00 | | | | 1/1/50 | | | | 9 | |
| | | | |
WI Public Finance Auth. Rev. (Lombard Public Facilities Corp.) 2, 4, 5 | | | 17,334 | | | | 9.00 | | | | 1/1/51 | | | | 389 | |
| | | | |
WI Public Finance Auth. Rev. (Lombard Public Facilities Corp.) 2, 4, 5 | | | 365 | | | | 11.00 | | | | 1/1/51 | | | | 8 | |
| | | | |
WI Public Finance Auth. Rev. (Lombard Public Facilities Corp.) 1, 2, 4, 5 | | | 446,246 | | | | 3.75 | | | | 7/1/51 | | | | 326,429 | |
| | | | |
WI Public Finance Auth. Rev. (Lombard Public Facilities Corp.) 2, 4, 5 | | | 17,218 | | | | 9.00 | | | | 1/1/52 | | | | 360 | |
| | | | |
WI Public Finance Auth. Rev. (Lombard Public Facilities Corp.) 2, 4, 5 | | | 475 | | | | 10.00 | | | | 1/1/52 | | | | 10 | |
| | | | |
WI Public Finance Auth. Rev. (Lombard Public Facilities Corp.) 2, 4, 5 | | | 16,985 | | | | 9.00 | | | | 1/1/53 | | | | 337 | |
| | | | |
WI Public Finance Auth. Rev. (Lombard Public Facilities Corp.) 2, 4, 5 | | | 469 | | | | 10.00 | | | | 1/1/53 | | | | 9 | |
| | | | |
WI Public Finance Auth. Rev. (Lombard Public Facilities Corp.) 2, 4, 5 | | | 16,869 | | | | 9.00 | | | | 1/1/54 | | | | 315 | |
| | | | |
WI Public Finance Auth. Rev. (Lombard Public Facilities Corp.) 2, 4, 5 | | | 453 | | | | 10.00 | | | | 1/1/54 | | | | 8 | |
| | | | |
WI Public Finance Auth. Rev. (Lombard Public Facilities Corp.) 2, 4, 5 | | | 16,636 | | | | 9.00 | | | | 1/1/55 | | | | 295 | |
| | | | |
WI Public Finance Auth. Rev. (Lombard Public Facilities Corp.) 2, 4, 5 | | | 444 | | | | 9.00 | | | | 1/1/55 | | | | 8 | |
| | | | |
WI Public Finance Auth. Rev. (Lombard Public Facilities Corp.) 2, 4, 5 | | | 16,404 | | | | 9.00 | | | | 1/1/56 | | | | 277 | |
| | | | |
WI Public Finance Auth. Rev. (Lombard Public Facilities Corp.) 2, 4, 5 | | | 434 | | | | 9.00 | | | | 1/1/56 | | | | 7 | |
| | | | |
WI Public Finance Auth. Rev. (Lombard Public Facilities Corp.) 2, 4, 5 | | | 23,656 | | | | 5.50 | | | | 7/1/56 | | | | 18,416 | |
| | | | |
WI Public Finance Auth. Rev. (Lombard Public Facilities Corp.) 2, 4, 5 | | | 481 | | | | 9.00 | | | | 1/1/57 | | | | 8 | |
| | | | |
WI Public Finance Auth. Rev. (Lombard Public Facilities Corp.) 2, 4, 5 | | | 16,287 | | | | 9.00 | | | | 1/1/57 | | | | 259 | |
| | | | |
WI Public Finance Auth. Rev. (Lombard Public Facilities Corp.) 2, 4, 5 | | | 16,055 | | | | 9.00 | | | | 1/1/58 | | | | 242 | |
| | | | |
WI Public Finance Auth. Rev. (Lombard Public Facilities Corp.) 2, 4, 5 | | | 469 | | | | 9.00 | | | | 1/1/58 | | | | 7 | |
| | | | |
WI Public Finance Auth. Rev. (Lombard Public Facilities Corp.) 2, 4, 5 | | | 456 | | | | 9.00 | | | | 1/1/59 | | | | 7 | |
| | | | |
WI Public Finance Auth. Rev. (Lombard Public Facilities Corp.) 2, 4, 5 | | | 15,938 | | | | 9.00 | | | | 1/1/59 | | | | 229 | |
| | | | |
WI Public Finance Auth. Rev. (Lombard Public Facilities Corp.) 2, 4, 5 | | | 447 | | | | 8.00 | | | | 1/1/60 | | | | 6 | |
| | | | |
WI Public Finance Auth. Rev. (Lombard Public Facilities Corp.) 2, 4, 5 | | | 15,822 | | | | 9.00 | | | | 1/1/60 | | | | 214 | |
| | | | |
WI Public Finance Auth. Rev. (Lombard Public Facilities Corp.) 2, 4, 5 | | | 440 | | | | 8.00 | | | | 1/1/61 | | | | 6 | |
| | | | |
WI Public Finance Auth. Rev. (Lombard Public Facilities Corp.) 2, 4, 5 | | | 15,589 | | | | 9.00 | | | | 1/1/61 | | | | 199 | |
| | | | |
WI Public Finance Auth. Rev. (Lombard Public Facilities Corp.) 2, 4, 5 | | | 428 | | | | 8.00 | | | | 1/1/62 | | | | 5 | |
| | | | |
WI Public Finance Auth. Rev. (Lombard Public Facilities Corp.) 2, 4, 5 | | | 15,473 | | | | 9.00 | | | | 1/1/62 | | | | 187 | |
| | | | |
WI Public Finance Auth. Rev. (Lombard Public Facilities Corp.) 2, 4, 5 | | | 419 | | | | 8.00 | | | | 1/1/63 | | | | 5 | |
| | | | |
WI Public Finance Auth. Rev. (Lombard Public Facilities Corp.) 2, 4, 5 | | | 15,240 | | | | 9.00 | | | | 1/1/63 | | | | 175 | |
| | | | |
WI Public Finance Auth. Rev. (Lombard Public Facilities Corp.) 2, 4, 5 | | | 409 | | | | 8.00 | | | | 1/1/64 | | | | 4 | |
| | | | |
WI Public Finance Auth. Rev. (Lombard Public Facilities Corp.) 2, 4, 5 | | | 15,124 | | | | 9.00 | | | | 1/1/64 | | | | 166 | |
| | | | |
WI Public Finance Auth. Rev. (Lombard Public Facilities Corp.) 2, 4, 5 | | | 403 | | | | 7.00 | | | | 1/1/65 | | | | 4 | |
| | | | |
WI Public Finance Auth. Rev. (Lombard Public Facilities Corp.) 2, 4, 5 | | | 15,008 | | | | 9.00 | | | | 1/1/65 | | | | 155 | |
| | | | |
WI Public Finance Auth. Rev. (Lombard Public Facilities Corp.) 2, 4, 5 | | | 434 | | | | 7.00 | | | | 1/1/66 | | | | 4 | |
| | | | |
WI Public Finance Auth. Rev. (Lombard Public Facilities Corp.) 2, 4, 5 | | | 14,775 | | | | 9.00 | | | | 1/1/66 | | | | 142 | |
| | | | |
WI Public Finance Auth. Rev. (Lombard Public Facilities Corp.) 2, 4, 5 | | | 5,235 | | | | 5.00 | | | | 1/1/67 | | | | 46 | |
| | | | |
WI Public Finance Auth. Rev. (Lombard Public Facilities Corp.) 2, 4, 5 | | | 192,429 | | | | 9.00 | | | | 1/1/67 | | | | 1,677 | |
| | | | |
WI Public Finance Auth. Rev. (MD Proton Treatment Center) 4 | | | 500,000 | | | | 6.13 | | | | 1/1/33 | | | | 225,000 | |
| | | | | | | | | | | | | | | | |
| | | | |
| | | | | | | | | | | | | | | 2,340,106 | |
| | | | | | | | | | | | | | | | |
| | | | |
Total Municipal Bonds
(Cost: $165,191,958) | | | | | | | | | | | | | | | 135,323,375 | |
| | | | | | | | | | | | | | | | |
| | |
See accompanying notes to financial statements. | | |
| |
| 20 | | FINANCIAL STATEMENTS AND OTHER INFORMATION |
| | | | | | | | |
| | | |
| Name of Issuer | | Quantity | | | Fair Value ($) | |
| | |
Investment Companies - 5.4% | | | | | | | | |
| | |
BlackRock Municipal Income Fund, Inc. (MUI) | | | 32,166 | | | | 404,648 | |
| | |
BlackRock MuniHoldings Fund, Inc. (MHD) | | | 33,512 | | | | 423,927 | |
| | |
BlackRock MuniHoldings Quality Fund II, Inc. (MUE) | | | 30,464 | | | | 325,660 | |
| | |
BlackRock MuniYield Quality Fund III, Inc. (MYI) | | | 43,083 | | | | 516,996 | |
| | |
DWS Municipal Income Trust (KTF) | | | 76,592 | | | | 763,622 | |
| | |
DWS Strategic Municipal Income Trust (KSM) | | | 29,351 | | | | 299,087 | |
| | |
Invesco Advantage Municipal Income Trust II (VKI) | | | 55,874 | | | | 520,187 | |
| | |
Invesco Municipal Opportunity Trust (VMO) | | | 62,240 | | | | 639,205 | |
| | |
Invesco Municipal Trust (VKQ) | | | 67,772 | | | | 695,341 | |
| | |
Invesco Pennsylvania Value Municipal Income Trust (VPV) | | | 31,500 | | | | 356,265 | |
| | |
Invesco Quality Municipal Income Trust (IQI) | | | 78,114 | | | | 815,510 | |
| | |
Invesco Trust for Investment Grade Municipals (VGM) | | | 56,447 | | | | 596,080 | |
| | |
Nuveen AMT-Free Municipal Credit Income Fund (NVG) | | | 32,623 | | | | 436,822 | |
| | |
Nuveen AMT-Free Quality Municipal Income Fund (NEA) | | | 75,639 | | | | 905,399 | |
| | |
Nuveen Quality Municipal Income Fund (NAD) | | | 61,295 | | | | 758,832 | |
| | | | | | | | |
| | |
Total Investment Companies
(cost: $9,793,586) | | | | | | | 8,457,581 | |
| | | | | | | | |
| | |
Total Investments in Securities - 91.5%
(cost: $174,985,544) | | | | | | | 143,780,956 | |
| | | | | | | | |
| | |
Other Assets and Liabilities, net - 8.5% | | | | | | | 13,439,670 | |
| | | | | | | | |
| | |
Net Assets - 100.0% | | | | | | | $157,220,626 | |
| | | | | | | | |
| 1 | Variable rate security. Rate disclosed is as of September 30, 2024. Certain variable rate securities are not based on a published reference rate and spread but are determined by the issuer or agent and are based on current market conditions, or, for mortgage-backed securities, are impacted by the individual mortgages which are paying off over time. These securities do not indicate a reference rate and spread in their descriptions. |
| 2 | Security considered illiquid by the Investment Adviser. The total value of such securities as of September 30, 2024 was $3,199,044 and represented 2.0% of net assets. |
| 4 | 144A Restricted Security. The total value of such securities as of September 30, 2024 was $16,049,585 and represented 10.2% of net assets. These securities have been determined to be liquid by the Adviser in accordance with guidelines established by the Board of Directors. |
| 5 | The issuer is in default of interest or principal payments, or other debt covenants. Income is not being accrued. The total value of such securities as of September 30, 2024 was $2,657,506 and represented 1.7% of net assets. |
| 6 | Zero coupon or convertible capital appreciation bond, for which the rate disclosed is either the effective yield on purchase date or the coupon rate to be paid upon conversion to coupon paying. |
| 9 | Municipal Lease Security. The total value of such securities as of September 30, 2024 was $707,510 and represented 0.5% of net assets. These securities have been determined to be liquid by the Adviser in accordance with guidelines established by the Board of Directors. |
| 15 | Securities with a “N/A” maturity date have passed their stated maturity date and have pending restructuring arrangements. |
Numeric footnotes not disclosed are not applicable to this Schedule of Investments.
| | |
See accompanying notes to financial statements. | | |
| |
SEPTEMBER 30, 2024 | | 21 |
SCHEDULE OF INVESTMENTS (Unaudited)
September 30, 2024
Sit Tax-Free Income Fund (Continued)
Short futures contracts outstanding as of September 30, 2024 were as follows:
| | | | | | | | | | | | | | | | | | | | |
| Type | | Contracts | | | Expiration Date | | | Notional Amount ($) | | | Value/ Unrealized Appreciation (Depreciation) ($) | |
Short Futures: 10 | | | | | | | | | | | | | | | | | | | | |
U.S. Treasury Long Bond | | | 37 | | | | December 2024 | | | | (4,594,938 | ) | | | (3,120 | ) | | | | |
U.S. Treasury 5-Year | | | 77 | | | | December 2024 | | | | (8,460,976 | ) | | | (16,567 | ) | | | | |
U.S. Treasury 10-Year | | | 126 | | | | December 2024 | | | | (14,399,437 | ) | | | (34,187 | ) | | | | |
| | | | | | | | | | | | | | | | |
| | | | | |
| | | | | | | | | | | | | | | (53,874 | ) | | | | |
| | | | | | | | | | | | | | | | |
| 10 | The amount of $6,000,000 in cash was segregated with the broker to cover margin requirements for derivative transactions as of September 30, 2024. |
A summary of the levels for the Fund’s investments as of September 30, 2024 is as follows (see Note 2 - significant accounting policies in the notes to financial statements):
| | | | | | | | | | | | | | | | |
| | | Investment in Securities | |
| | | | |
| | | Level 1 Quoted Prices ($) | | | Level 2 Other significant observable inputs ($) | | Level 3 Significant unobservable inputs ($) | | | Total ($) |
| | | | |
Assets | | | | | | | | | | | | | | | | |
Municipal Bonds | | | — | | | | 135,323,375 | | | | — | | | | 135,323,375 | |
Investment Companies | | | 8,457,581 | | | | — | | | | — | | | | 8,457,581 | |
| | | | |
Total: | | | 8,457,581 | | | | 135,323,375 | | | | — | | | | 143,780,956 | |
| | | | |
Liabilities | | | | | | | | | | | | | | | | |
Futures | | | (53,874 | ) | | | — | | | | — | | | | (53,874) | |
| | | | |
There were no transfers into or out of level 3 during the reporting period.
| | |
See accompanying notes to financial statements. | | |
| |
| 22 | | FINANCIAL STATEMENTS AND OTHER INFORMATION |
[This page is intentionally left blank.]
SCHEDULE OF INVESTMENTS (Unaudited)
September 30, 2024
Sit Minnesota Tax-Free Income Fund
| | | | | | | | | | | | | | | | |
| | | | | |
| Name of Issuer | | Principal Amount ($) | | | Coupon Rate (%) | | | Maturity Date | | | Fair Value ($) | |
| | | | |
Municipal Bonds - 94.3% | | | | | | | | | | | | | | | | |
| | | | |
Education/Student Loan - 17.2% | | | | | | | | | | | | | | | | |
| | | | |
Baytown Township Rev. (St. Croix Prep) | | | 1,000,000 | | | | 4.00 | | | | 8/1/36 | | | | 963,840 | |
| | | | |
Bethel Charter School Lease Rev. (Spectrum High School Proj.) | | | 1,100,000 | | | | 4.00 | | | | 7/1/37 | | | | 1,064,206 | |
| | | | |
Bethel Charter School Lease Rev. (Spectrum High School Proj.) | | | 1,750,000 | | | | 4.25 | | | | 7/1/47 | | | | 1,619,520 | |
| | | | |
Brooklyn Park Charter School Lease Rev. (Athlos Leadership Academy Proj.) | | | 605,000 | | | | 5.25 | | | | 7/1/30 | | | | 586,420 | |
| | | | |
Cologne Charter School Lease Rev. (Cologne Academy Proj.) | | | 575,000 | | | | 5.00 | | | | 7/1/29 | | | | 575,293 | |
| | | | |
Deephaven Charter School Lease Rev. (Eagle Ridge Academy Proj.) | | | 1,255,000 | | | | 5.25 | | | | 7/1/37 | | | | 1,265,705 | |
| | | | |
Deephaven Charter School Lease Rev. (Eagle Ridge Academy Proj.) | | | 600,000 | | | | 5.25 | | | | 7/1/40 | | | | 604,068 | |
| | | | |
Deephaven Charter School Lease Rev. (Eagle Ridge Academy Proj.) | | | 1,000,000 | | | | 5.50 | | | | 7/1/50 | | | | 1,005,370 | |
| | | | |
Duluth Hsg. & Redevelopment Auth. Rev. (Public School Academy Proj.) | | | 1,100,000 | | | | 5.00 | | | | 11/1/38 | | | | 1,054,405 | |
| | | | |
Duluth Hsg. & Redevelopment Auth. Rev. (Public School Academy Proj.) | | | 350,000 | | | | 5.00 | | | | 11/1/48 | | | | 313,005 | |
| | | | |
Forest Lake Charter School Lease Rev. (Lake International Language Academy) | | | 850,000 | | | | 5.50 | | | | 8/1/36 | | | | 850,833 | |
| | | | |
Ham Lake Charter School Lease Rev. (Davinci Academy Proj.) | | | 875,000 | | | | 5.00 | | | | 7/1/31 | | | | 878,631 | |
| | | | |
Ham Lake Charter School Lease Rev. (Parnassus Prep. Sch. Proj.) | | | 625,000 | | | | 4.00 | | | | 11/1/26 | | | | 623,294 | |
| | | | |
Ham Lake Charter School Lease Rev. (Parnassus Prep. Sch. Proj.) | | | 2,720,000 | | | | 5.00 | | | | 11/1/36 | | | | 2,754,490 | |
| | | | |
Hugo Charter School Lease Rev. (Noble Academy Proj.) | | | 750,000 | | | | 5.00 | | | | 7/1/29 | | | | 750,442 | |
| | | | |
Hugo Charter School Lease Rev. (Noble Academy Proj.) | | | 1,000,000 | | | | 5.00 | | | | 7/1/34 | | | | 1,000,540 | |
| | | | |
Independence Charter School Lease Rev. (Beacon Academy Proj.) | | | 160,000 | | | | 4.25 | | | | 7/1/26 | | | | 158,326 | |
| | | | |
Independence Charter School Lease Rev. (Beacon Academy Proj.) | | | 750,000 | | | | 4.75 | | | | 7/1/31 | | | | 736,148 | |
| | | | |
Independence Charter School Lease Rev. (Beacon Academy Proj.) | | | 1,200,000 | | | | 5.00 | | | | 7/1/36 | | | | 1,181,628 | |
| | | | |
Independence Charter School Lease Rev. (Paladin High School Proj.) | | | 225,000 | | | | 3.25 | | | | 6/1/31 | | | | 202,363 | |
| | | | |
Independence Charter School Lease Rev. (Paladin High School Proj.) | | | 1,410,000 | | | | 4.00 | | | | 6/1/51 | | | | 1,073,644 | |
| | | | |
Minneapolis School Lease Rev. (Friendship Academy of the Arts) 4 | | | 560,000 | | | | 4.00 | | | | 12/1/31 | | | | 519,708 | |
| | | | |
Minneapolis School Lease Rev. (Friendship Academy of the Arts) 4 | | | 1,385,000 | | | | 5.25 | | | | 12/1/43 | | | | 1,283,563 | |
| | | | |
Minneapolis School Lease Rev. (Twin Cities International School) 4 | | | 825,000 | | | | 4.25 | | | | 12/1/27 | | | | 828,448 | |
| | | | |
Minneapolis School Lease Rev. (Twin Cities International School) 4 | | | 1,000,000 | | | | 5.00 | | | | 12/1/37 | | | | 1,012,350 | |
| | | | |
MN Higher Education Fac. Auth. Rev. (Augsburg College) | | | 2,950,000 | | | | 4.25 | | | | 5/1/40 | | | | 2,593,492 | |
| | | | |
MN Higher Education Fac. Auth. Rev. (Bethel Univ.) | | | 1,500,000 | | | | 5.00 | | | | 5/1/47 | | | | 1,383,570 | |
| | | | |
MN Higher Education Fac. Auth. Rev. (College of St. Benedict) | | | 1,900,000 | | | | 5.00 | | | | 3/1/37 | | | | 1,923,294 | |
| | | | |
MN Higher Education Fac. Auth. Rev. (College of St. Olaf) | | | 2,530,000 | | | | 3.00 | | | | 10/1/41 | | | | 2,217,849 | |
| | | | |
MN Higher Education Fac. Auth. Rev. (Univ. of St. Thomas) | | | 2,000,000 | | | | 5.00 | | | | 10/1/47 | | | | 2,135,160 | |
| | | | |
MN Higher Education Fac. Auth. Rev. (Univ. of St. Thomas) | | | 4,000,000 | | | | 5.00 | | | | 10/1/47 | | | | 4,268,080 | |
| | | | |
MN Higher Education Fac. Auth. Rev. (Univ. of St. Thomas) | | | 750,000 | | | | 5.00 | | | | 4/1/35 | | | | 767,430 | |
| | | | |
MN Higher Education Fac. Auth. Rev. (Univ. of St. Thomas) | | | 1,150,000 | | | | 4.00 | | | | 4/1/39 | | | | 1,152,001 | |
| | | | |
MN Higher Education Fac. Auth. Rev. (Univ. of St. Thomas) | | | 850,000 | | | | 5.00 | | | | 10/1/40 | | | | 903,371 | |
| | | | |
MN Higher Education Fac. Auth. Rev. (Univ. of St. Thomas) | | | 4,000,000 | | | | 4.00 | | | | 10/1/44 | | | | 3,946,560 | |
| | | | |
MN Higher Education Fac. Auth. Rev. (Univ. of St. Thomas) | | | 3,650,000 | | | | 5.00 | | | | 10/1/49 | | | | 3,933,386 | |
| | | | |
MN Office of Higher Education Rev. 8 | | | 2,000,000 | | | | 4.00 | | | | 11/1/42 | | | | 1,952,040 | |
| | | | |
MN Office of Higher Education Rev. 8 | | | 2,260,000 | | | | 2.65 | | | | 11/1/38 | | | | 2,030,520 | |
| | | | |
MN Office of Higher Education Rev. 8 | | | 990,000 | | | | 4.00 | | | | 11/1/37 | | | | 991,237 | |
| | | | |
Moorhead Educational Fac. Rev. (Concordia College Corp. Proj.) | | | 1,250,000 | | | | 5.00 | | | | 12/1/40 | | | | 1,259,150 | |
| | | | |
Savage Charter School Lease Rev. (Aspen Academy) | | | 325,000 | | | | 4.00 | | | | 10/1/26 | | | | 322,189 | |
| | | | |
St. Cloud Charter School Lease Rev. (Stride Academy Proj.) | | | 1,850,000 | | | | 5.00 | | | | 4/1/36 | | | | 1,747,122 | |
| | | | |
St. Paul Hsg. & Redev. Auth. | | | 700,000 | | | | 5.00 | | | | 12/1/30 | | | | 700,994 | |
| | | | |
St. Paul Hsg. & Redev. Auth. | | | 1,150,000 | | | | 5.00 | | | | 12/1/37 | | | | 1,150,725 | |
| | |
See accompanying notes to financial statements. | | |
| |
| 24 | | FINANCIAL STATEMENTS AND OTHER INFORMATION |
| | | | | | | | | | | | | | | | |
| | | | | |
| Name of Issuer | | Principal Amount ($) | | | Coupon Rate (%) | | | Maturity Date | | | Fair Value ($) | |
| | | | |
St. Paul Hsg. & Redev. Auth. | | | 705,000 | | | | 5.00 | | | | 12/1/46 | | | | 704,944 | |
| | | | |
St. Paul Hsg. & Redev. Auth. (German Immersion School) | | | 775,000 | | | | 5.00 | | | | 7/1/33 | | | | 775,372 | |
| | | | |
St. Paul Hsg. & Redev. Auth. (Hope Community Academy Proj.) | | | 720,000 | | | | 4.50 | | | | 12/1/29 | | | | 669,542 | |
| | | | |
St. Paul Hsg. & Redev. Auth. (Math & Science Academy) 4 | | | 800,000 | | | | 3.00 | | | | 6/1/31 | | | | 709,144 | |
| | | | |
St. Paul Hsg. & Redev. Auth. (Math & Science Academy) 4 | | | 1,225,000 | | | | 4.00 | | | | 6/1/51 | | | | 899,530 | |
| | | | |
St. Paul Hsg. & Redev. Auth. (Nova Classical Academy Proj.) | | | 175,000 | | | | 2.00 | | | | 9/1/26 | | | | 168,236 | |
| | | | |
St. Paul Hsg. & Redev. Auth. (Nova Classical Academy Proj.) | | | 350,000 | | | | 4.00 | | | | 9/1/31 | | | | 349,461 | |
| | | | |
St. Paul Hsg. & Redev. Auth. (St. Paul Conservatory for Performing Artists) | | | 1,135,000 | | | | 4.63 | | | | 3/1/43 | | | | 1,030,410 | |
| | | | |
St. Paul Hsg. & Redev. Auth. (Twin Cities Academy Proj.) | | | 255,000 | | | | 4.00 | | | | 7/1/25 | | | | 254,674 | |
| | | | |
St. Paul Hsg. & Redev. Auth. (Twin Cities Academy Proj.) | | | 955,000 | | | | 5.00 | | | | 7/1/35 | | | | 957,884 | |
| | | | |
St. Paul Hsg. & Redev. Auth. Rev. (Community of Peace Academy Proj.) | | | 880,000 | | | | 3.00 | | | | 12/1/29 | | | | 837,593 | |
| | | | |
St. Paul Hsg. & Redev. Auth. Rev. (Community of Peace Academy Proj.) | | | 600,000 | | | | 4.00 | | | | 12/1/39 | | | | 549,444 | |
| | | | |
St. Paul Hsg. & Redev. Auth. Rev. (Community of Peace Academy Proj.) | | | 1,000,000 | | | | 4.00 | | | | 12/1/49 | | | | 857,590 | |
| | | | |
St. Paul Hsg. & Redev. Auth. Rev. (Metro Deaf School Proj.) 4 | | | 700,000 | | | | 5.00 | | | | 6/15/38 | | | | 701,029 | |
| | | | |
St. Paul Hsg. & Redev. Auth. Rev. (Nova Classical Academy Proj.) | | | 1,000,000 | | | | 4.13 | | | | 9/1/47 | | | | 915,710 | |
| | | | |
Woodbury Charter School Lease Rev. | | | 400,000 | | | | 4.00 | | | | 12/1/40 | | | | 362,100 | |
| | | | |
Woodbury Charter School Lease Rev. | | | 555,000 | | | | 4.00 | | | | 12/1/50 | | | | 468,642 | |
| | | | | | | | | | | | | | | | |
| | | | |
| | | | | | | | | | | | | | | 69,495,715 | |
| | | | | | | | | | | | | | | | |
| | | | |
Escrowed To Maturity/Prerefunded - 0.3% | | | | | | | | | | | | | | | | |
| | | | |
Lakeville Hsg. & Redev. Auth. Parking Rev. (Ice Arena. Proj.) | | | 1,250,000 | | | | 4.00 | | | | 2/1/32 | | | | 1,268,625 | |
| | | | | | | | | | | | | | | | |
| | | | |
General Obligation - 9.4% | | | | | | | | | | | | | | | | |
| | | | |
Blooming Prairie Independent School District No. 756 | | | 1,300,000 | | | | 2.25 | | | | 2/1/45 | | | | 909,883 | |
| | | | |
Itasca County Independent School District No. 318 | | | 4,050,000 | | | | 2.00 | | | | 2/1/39 | | | | 2,994,327 | |
| | | | |
Itasca County Independent School District No. 318 | | | 4,250,000 | | | | 2.00 | | | | 2/1/40 | | | | 3,074,153 | |
| | | | |
Itasca G.O. | | | 2,500,000 | | | | 2.38 | | | | 2/1/45 | | | | 1,816,925 | |
| | | | |
Itasca G.O. | | | 4,000,000 | | | | 2.50 | | | | 2/1/50 | | | | 2,755,440 | |
| | | | |
Madison Lake G.O. | | | 590,000 | | | | 2.13 | | | | 2/1/42 | | | | 419,726 | |
| | | | |
Minnetonka Independent School District No. 276 | | | 1,900,000 | | | | 5.00 | | | | 2/1/41 | | | | 1,908,930 | |
| | | | |
Moorhead G.O. | | | 510,000 | | | | 2.13 | | | | 2/1/42 | | | | 357,092 | |
| | | | |
Morrison Co. Education District No. 6979 | | | 1,000,000 | | | | 4.50 | | | | 2/1/34 | | | | 1,002,730 | |
| | | | |
Norwood Young America Independent School District No. 108 | | | 1,400,000 | | | | 2.13 | | | | 2/1/42 | | | | 1,014,762 | |
| | | | |
Norwood Young America Independent School District No. 108 | | | 1,500,000 | | | | 2.25 | | | | 2/1/45 | | | | 1,059,240 | |
| | | | |
Richfield Independent School District No. 280 | | | 1,000,000 | | | | 4.00 | | | | 2/1/37 | | | | 1,015,140 | |
| | | | |
Robbinsdale Independent School District No. 281 | | | 1,000,000 | | | | 2.25 | | | | 2/1/41 | | | | 763,100 | |
| | | | |
Roseau Independent School District No. 682 | | | 400,000 | | | | 2.25 | | | | 2/1/46 | | | | 274,184 | |
| | | | |
Sauk Centre Independent School District No. 743 | | | 1,000,000 | | | | 2.00 | | | | 2/1/40 | | | | 744,070 | |
| | | | |
St. Cloud G.O. | | | 1,090,000 | | | | 2.00 | | | | 2/1/41 | | | | 826,405 | |
| | | | |
St. Paul Independent School District No. 625 | | | 2,475,000 | | | | 2.00 | | | | 2/1/40 | | | | 1,810,908 | |
| | | | |
State of Minnesota G.O. | | | 5,550,000 | | | | 2.00 | | | | 9/1/41 | | | | 3,936,004 | |
| | | | |
Virginia G.O. | | | 825,000 | | | | 5.00 | | | | 2/1/41 | | | | 845,881 | |
| | | | |
White Bear Lake Independent School District No. 624 | | | 10,850,000 | | | | 3.00 | | | | 2/1/43 | | | | 9,565,577 | |
| | | | |
Zumbrota-Mazeppa Independent School District No. 2805 | | | 1,500,000 | | | | 2.50 | | | | 2/1/44 | | | | 1,115,460 | |
| | | | | | | | | | | | | | | | |
| | | | |
| | | | | | | | | | | | | | | 38,209,937 | |
| | | | | | | | | | | | | | | | |
| | | | |
Hospital/Health Care - 12.3% | | | | | | | | | | | | | | | | |
| | | | |
Center City Heath Care Facs. Rev. (Hazelden Betty Ford Foundation Proj.) | | | 500,000 | | | | 5.00 | | | | 11/1/44 | | | | 500,240 | |
| | |
See accompanying notes to financial statements. | | |
| |
SEPTEMBER 30, 2024 | | 25 |
SCHEDULE OF INVESTMENTS (Unaudited)
September 30, 2024
Sit Minnesota Tax-Free Income Fund (Continued)
| | | | | | | | | | | | | | | | |
| | | | | |
| Name of Issuer | | Principal Amount ($) | | | Coupon Rate (%) | | | Maturity Date | | | Fair Value ($) | |
| | | | |
Chatfield Health Care and Hsg. Facs. Rev. (Chosen Valley Care Center) | | | 1,225,000 | | | | 5.00 | | | | 9/1/52 | | | | 1,085,289 | |
| | | | |
Crookston Health Care Facs. Rev. (Riverview Health Care Proj.) | | | 1,000,000 | | | | 4.00 | | | | 5/1/32 | | | | 763,570 | |
| | | | |
Cuyuna Range Hospital District Health Care Facs. Rev. | | | 1,000,000 | | | | 5.50 | | | | 5/1/48 | | | | 1,038,380 | |
| | | | |
Dakota Co. Community Dev. Agy. (Sanctuary at W. St. Paul Proj.) | | | 1,100,000 | | | | 5.75 | | | | 8/1/30 | | | | 857,252 | |
| | | | |
Dakota Co. Community Dev. Agy. (Sanctuary at W. St. Paul Proj.) | | | 1,050,000 | | | | 6.00 | | | | 8/1/35 | | | | 748,713 | |
| | | | |
Duluth Economic Dev. Auth. Rev. (St. Luke Hospital of Duluth) | | | 170,000 | | | | 4.00 | | | | 6/15/36 | | | | 176,951 | |
| | | | |
Duluth Economic Dev. Auth. Rev. (St. Luke Hospital of Duluth) | | | 350,000 | | | | 4.00 | | | | 6/15/37 | | | | 367,612 | |
| | | | |
Duluth Economic Dev. Auth. Rev. (St. Luke Hospital of Duluth) | | | 170,000 | | | | 4.00 | | | | 6/15/37 | | | | 176,462 | |
| | | | |
Duluth Economic Dev. Auth. Rev. (St. Luke Hospital of Duluth) | | | 150,000 | | | | 4.00 | | | | 6/15/38 | | | | 154,752 | |
| | | | |
Duluth Economic Dev. Auth. Rev. (St. Luke Hospital of Duluth) | | | 150,000 | | | | 4.00 | | | | 6/15/39 | | | | 153,627 | |
| | | | |
Duluth Economic Dev. Auth. Rev. (St. Luke Hospital of Duluth) | | | 850,000 | | | | 3.00 | | | | 6/15/44 | | | | 737,910 | |
| | | | |
Hayward Hsg. & Health Care Fac. Rev. (St. Johns Lutheran Home of Albert Lea Proj.) | | | 1,900,000 | | | | 5.00 | | | | 10/1/34 | | | | 1,159,000 | |
| | | | |
Maple Grove Health Care System Rev. (Maple Grove Hospital Corp.) | | | 825,000 | | | | 5.00 | | | | 5/1/32 | | | | 848,446 | |
| | | | |
Maple Grove Health Care System Rev. (Maple Grove Hospital Corp.) | | | 2,175,000 | | | | 4.00 | | | | 5/1/37 | | | | 2,084,607 | |
| | | | |
Minneapolis Health Care System Rev. (Fairview Health Services) | | | 2,590,000 | | | | 5.00 | | | | 11/15/34 | | | | 2,607,016 | |
| | | | |
Minneapolis Health Care System Rev. (Fairview Health Services) | | | 2,500,000 | | | | 5.00 | | | | 11/15/49 | | | | 2,532,725 | |
| | | | |
MN Agricultural & Economic Dev. Board Rev. (HealthPartners Oblig. Group Proj.) | | | 2,000,000 | | | | 5.25 | | | | 1/1/54 | | | | 2,204,040 | |
| | | | |
Moorhead Economic Dev. Auth. Rev. | | | 550,000 | | | | 4.60 | | | | 9/1/25 | | | | 545,661 | |
| | | | |
Oak Park Heights Nursing Home Rev. (Boutwells Landing Care Center) | | | 1,500,000 | | | | 5.50 | | | | 8/1/28 | | | | 1,500,165 | |
| | | | |
Oak Park Heights Nursing Home Rev. (Boutwells Landing Care Center) | | | 1,000,000 | | | | 6.00 | | | | 8/1/36 | | | | 1,000,140 | |
| | | | |
Puerto Rico Industrial Tourist Educational Medical & Environmental Ctl. Facs. Fin. Auth. Rev. 11 | | | 175,000 | | | | 4.00 | | | | 7/1/37 | | | | 169,540 | |
| | | | |
Puerto Rico Industrial Tourist Educational Medical & Environmental Ctl. Facs. Fin. Auth. Rev. 11 | | | 200,000 | | | | 4.00 | | | | 7/1/39 | | | | 192,272 | |
| | | | |
Puerto Rico Industrial Tourist Educational Medical & Environmental Ctl. Facs. Fin. Auth. Rev. 11 | | | 220,000 | | | | 4.00 | | | | 7/1/41 | | | | 207,654 | |
| | | | |
Rochester Health Care Facs. Rev. (Mayo Clinic) | | | 7,500,000 | | | | 4.00 | | | | 11/15/48 | | | | 7,430,100 | |
| | | | |
Rochester Health Care Facs. Rev. (Mayo Clinic) | | | 3,000,000 | | | | 5.00 | | | | 11/15/34 | | | | 3,579,120 | |
| | | | |
St. Cloud Health Care Rev. (CentraCare Health System Proj.) | | | 4,500,000 | | | | 5.00 | | | | 5/1/46 | | | | 4,561,830 | |
| | | | |
St. Cloud Health Care Rev. (CentraCare Health System Proj.) | | | 500,000 | | | | 5.00 | | | | 5/1/48 | | | | 522,020 | |
| | | | |
St. Louis Park Health Care Facs. Rev. (Mount Olivet Careview Home Health Proj.) 1 | | | 2,250,000 | | | | 4.60 | | | | 6/1/41 | | | | 2,134,238 | |
| | | | |
St. Paul Hsg. & Redev. Auth. Health Care Rev. (HealthPartners Oblig. Group Proj.) | | | 4,800,000 | | | | 5.00 | | | | 7/1/32 | | | | 4,851,072 | |
| | | | |
St. Paul Hsg. & Redev. Auth. Health Care Rev. (HealthPartners Oblig. Group Proj.) | | | 2,000,000 | | | | 5.00 | | | | 7/1/33 | | | | 2,021,080 | |
| | | | |
St. Paul Hsg. & Redev. Auth. Health Care Rev. (Senior Episcopal Homes Proj.) | | | 2,150,000 | | | | 5.00 | | | | 5/1/38 | | | | 2,037,727 | |
| | | | |
Wadena Rev. (Wadena Cancer Center Proj.) | | | 1,000,000 | | | | 5.00 | | | | 12/1/45 | | | | 1,088,910 | |
| | | | | | | | | | | | | | | | |
| | | | |
| | | | | | | | | | | | | | | 50,038,121 | |
| | | | | | | | | | | | | | | | |
| | | | |
Industrial/Pollution Control - 0.5% 8 | | | | | | | | | | | | | | | | |
| | | | |
St. Paul Port Auth. Rev. | | | 1,000,000 | | | | 4.00 | | | | 10/1/40 | | | | 930,920 | |
| | | | |
St. Paul Port Auth. Solid Waste Disposal Rev. (Gerdau St. Paul Steel Mill Proj.) 4 | | | 1,000,000 | | | | 4.50 | | | | 10/1/37 | | | | 992,770 | |
| | | | | | | | | | | | | | | | |
| | | | |
| | | | | | | | | | | | | | | 1,923,690 | |
| | | | | | | | | | | | | | | | |
| | | | |
Multifamily Mortgage - 22.0% | | | | | | | | | | | | | | | | |
| | | | |
Anoka Hsg. Rev. (Homestead at Anoka, Inc. Proj.) | | | 1,000,000 | | | | 5.50 | | | | 11/1/46 | | | | 1,001,850 | |
| | | | |
Apple Valley Rev. (Orchard Path Phase II Proj.) | | | 300,000 | | | | 4.00 | | | | 9/1/36 | | | | 293,502 | |
| | | | |
Apple Valley Rev. (Orchard Path Phase II Proj.) | | | 440,000 | | | | 4.00 | | | | 9/1/41 | | | | 411,149 | |
| | | | |
Apple Valley Rev. (Orchard Path Phase II Proj.) | | | 830,000 | | | | 4.00 | | | | 9/1/51 | | | | 724,548 | |
| | | | |
Apple Valley Rev. (Orchard Path Phase II Proj.) | | | 750,000 | | | | 4.00 | | | | 9/1/61 | | | | 627,495 | |
| | | | |
Apple Valley Senior Hsg. Rev. (Orchard Path Proj.) | | | 2,000,000 | | | | 5.00 | | | | 9/1/58 | | | | 2,000,960 | |
| | | | |
Apple Valley Senior Hsg. Rev. (Presbyterian Homes) | | | 1,500,000 | | | | 5.00 | | | | 9/1/43 | | | | 1,504,455 | |
| | |
See accompanying notes to financial statements. | | |
| |
| 26 | | FINANCIAL STATEMENTS AND OTHER INFORMATION |
| | | | | | | | | | | | | | | | |
| | | | | |
| Name of Issuer | | Principal Amount ($) | | | Coupon Rate (%) | | | Maturity Date | | | Fair Value ($) | |
| | | | |
Apple Valley Senior Living Rev. (Senior Living LLC Proj.) | | | 1,045,000 | | | | 4.00 | | | | 1/1/25 | | | | 1,040,674 | |
| | | | |
Apple Valley Senior Living Rev. (Senior Living LLC Proj.) | | | 475,000 | | | | 4.00 | | | | 1/1/25 | | | | 469,761 | |
| | | | |
Apple Valley Senior Living Rev. (Senior Living LLC Proj.) | | | 1,175,000 | | | | 4.00 | | | | 1/1/26 | | | | 1,154,320 | |
| | | | |
Apple Valley Senior Living Rev. (Senior Living LLC Proj.) | | | 680,000 | | | | 6.75 | | | | 1/1/27 | | | | 585,256 | |
| | | | |
Apple Valley Senior Living Rev. (Senior Living LLC Proj.) | | | 950,000 | | | | 4.00 | | | | 1/1/30 | | | | 885,856 | |
| | | | |
Apple Valley Senior Living Rev. (Senior Living LLC Proj.) | | | 1,430,000 | | | | 4.25 | | | | 1/1/37 | | | | 1,232,417 | |
| | | | |
Apple Valley Senior Living Rev. (Senior Living LLC Proj.) | | | 950,000 | | | | 7.00 | | | | 1/1/37 | | | | 610,461 | |
| | | | |
Apple Valley Senior Living Rev. (Senior Living LLC Proj.) | | | 1,640,000 | | | | 4.38 | | | | 1/1/47 | | | | 1,248,368 | |
| | | | |
Apple Valley Senior Living Rev. (Senior Living LLC Proj.) | | | 2,850,000 | | | | 5.00 | | | | 1/1/47 | | | | 1,736,876 | |
| | | | |
Bethel Hsg. and Health Care Facs. Rev. (Ecumen Obligated Group) | | | 2,000,000 | | | | 6.13 | | | | 3/1/44 | | | | 2,086,320 | |
| | | | |
Bethel Rev. (Grandview Christian Home Proj.) | | | 1,500,000 | | | | 5.00 | | | | 10/1/41 | | | | 1,509,855 | |
| | | | |
Blaine Senior Hsg. & Health Care Fac. Rev. (Crest View Senior Community Proj.) 2 | | | 1,250,000 | | | | 5.13 | | | | 7/1/25 | | | | 687,500 | |
| | | | |
Blaine Senior Hsg. & Health Care Fac. Rev. (Crest View Senior Community Proj.) 2 | | | 1,645,000 | | | | 5.75 | | | | 7/1/35 | | | | 904,750 | |
| | | | |
Blaine Senior Hsg. & Health Care Fac. Rev. (Crest View Senior Community Proj.) 2 | | | 2,000,000 | | | | 6.13 | | | | 7/1/45 | | | | 1,100,000 | |
| | | | |
Chisago Hsg. and Health Care Rev. (CDL Homes LLC) | | | 750,000 | | | | 6.00 | | | | 8/1/33 | | | | 750,517 | |
| | | | |
Cloquet Rev. (HADC Cloquet, LLC Proj.) | | | 180,000 | | | | 2.20 | | | | 8/1/28 | | | | 164,147 | |
| | | | |
Cloquet Rev. (HADC Cloquet, LLC Proj.) | | | 250,000 | | | | 2.60 | | | | 8/1/30 | | | | 221,865 | |
| | | | |
Cloquet Rev. (HADC Cloquet, LLC Proj.) | | | 200,000 | | | | 2.80 | | | | 8/1/31 | | | | 175,996 | |
| | | | |
Cloquet Rev. (HADC Cloquet, LLC Proj.) | | | 200,000 | | | | 3.20 | | | | 8/1/34 | | | | 171,780 | |
| | | | |
Cloquet Rev. (HADC Cloquet, LLC Proj.) | | | 500,000 | | | | 4.00 | | | | 8/1/41 | | | | 409,590 | |
| | | | |
Cloquet Rev. (HADC Cloquet, LLC Proj.) | | | 500,000 | | | | 4.00 | | | | 8/1/48 | | | | 379,115 | |
| | | | |
Dakota Co. Community Dev. Agy. Multifamily Hsg. Rev. | | | 3,500,000 | | | | 4.00 | | | | 1/1/42 | | | | 3,500,140 | |
| | | | |
Dakota Co. Community Dev. Agy. Multifamily Hsg. Rev. (FNMA) | | | 1,050,000 | | | | 4.20 | | | | 5/1/43 | | | | 1,050,157 | |
| | | | |
Dakota Co. Community Dev. Agy. Multifamily Hsg. Rev. (The Quill Proj.) 4 | | | 2,500,000 | | | | 3.55 | | | | 4/1/39 | | | | 2,103,975 | |
| | | | |
Duluth Hsg. & Redevelopment Auth. Rev. (Pennel Park Proj.) | | | 1,249,439 | | | | 4.50 | | | | 8/1/41 | | | | 1,285,926 | |
| | | | |
Fridley Multifamily Hsg. Rev. (Village Green Apartments Proj.) | | | 3,248,394 | | | | 3.75 | | | | 11/1/34 | | | | 3,258,269 | |
| | | | |
Hayward Health Care Fac. Rev. (American Baptist Homes Midwest Proj.) | | | 1,350,000 | | | | 5.38 | | | | 8/1/34 | | | | 1,214,757 | |
| | | | |
Hayward Health Care Fac. Rev. (American Baptist Homes Midwest Proj.) | | | 500,000 | | | | 5.75 | | | | 2/1/44 | | | | 419,775 | |
| | | | |
Lauderdale Multifamily Hsg. Rev. (The Fern Senior Affordable Housing Proj.) | | | 2,000,000 | | | | 5.13 | | | | 1/1/40 | | | | 2,008,500 | |
| | | | |
Minneapolis & St. Paul Hsg. & Redev. Auth. Multifamily Hsg. Rev. (GNMA Collateralized) 8 | | | 2,765,000 | | | | 4.75 | | | | 1/20/42 | | | | 2,766,300 | |
| | | | |
Minneapolis Multifamily Hsg. Rev. (14th & Central LLLP Proj.) (FNMA Collateralized) | | | 4,603,281 | | | | 2.35 | | | | 2/1/38 | | | | 3,735,056 | |
| | | | |
Minneapolis Multifamily Hsg. Rev. (Greenway Heights Family Housing) | | | 1,015,000 | | | | 5.75 | | | | 7/15/31 | | | | 1,015,254 | |
| | | | |
Minneapolis Senior Hsg. & Health Care Rev. (Ecumen Mill City Quarter) | | | 375,000 | | | | 4.75 | | | | 11/1/28 | | | | 369,945 | |
| | | | |
Minneapolis Senior Hsg. & Health Care Rev. (Ecumen Mill City Quarter) | | | 1,500,000 | | | | 5.00 | | | | 11/1/35 | | | | 1,458,255 | |
| | | | |
Minneapolis Senior Hsg. & Health Care Rev. (Ecumen Mill City Quarter) | | | 575,000 | | | | 4.00 | | | | 11/1/25 | | | | 569,164 | |
| | | | |
Minnetonka MF Hsg. Rev. (Elmbrooke & Golden Valley Townhome Proj.) (FNMA Collateralized) | | | 1,810,448 | | | | 3.00 | | | | 11/1/34 | | | | 1,707,198 | |
| | | | |
MN Hsg. Fin. Agy. Rental Hsg. Rev. | | | 1,000,000 | | | | 5.20 | | | | 8/1/43 | | | | 1,001,080 | |
| | | | |
Moorhead Economic Dev. Auth. Rev. Ref. (EverCare Sr. Living LLC) | | | 280,000 | | | | 4.65 | | | | 9/1/26 | | | | 275,523 | |
| | | | |
Moorhead Health Care Rev. Ref. (EverCare Sr. Living LLC) | | | 1,000,000 | | | | 5.00 | | | | 9/1/32 | | | | 941,620 | |
| | | | |
Moorhead Health Care Rev. Ref. (EverCare Sr. Living LLC) | | | 250,000 | | | | 5.13 | | | | 9/1/37 | | | | 227,540 | |
| | | | |
New Ulm Economic Dev. Auth. Rev. (HADC Ridgeway Proj.) | | | 1,500,000 | | | | 5.00 | | | | 8/1/39 | | | | 1,284,915 | |
| | | | |
North Oaks Rev. (Waverly Gardens Proj.) | | | 150,000 | | | | 4.25 | | | | 10/1/41 | | | | 146,587 | |
| | | | |
North Oaks Senior Hsg. Rev. (Waverly Gardens Proj.) | | | 2,000,000 | | | | 4.00 | | | | 10/1/33 | | | | 1,976,700 | |
| | | | |
North Oaks Senior Hsg. Rev. (Waverly Gardens Proj.) | | | 1,500,000 | | | | 5.00 | | | | 10/1/35 | | | | 1,529,850 | |
| | | | |
North Oaks Senior Hsg. Rev. (Waverly Gardens Proj.) | | | 1,000,000 | | | | 5.00 | | | | 10/1/47 | | | | 1,008,660 | |
| | | | |
Rochester Health Care & Hsg. Rev. (Homestead Rochester, Inc.) | | | 1,950,000 | | | | 5.00 | | | | 12/1/30 | | | | 1,879,059 | |
| | |
See accompanying notes to financial statements. | | |
| |
SEPTEMBER 30, 2024 | | 27 |
SCHEDULE OF INVESTMENTS (Unaudited)
September 30, 2024
Sit Minnesota Tax-Free Income Fund (Continued)
| | | | | | | | | | | | | | | | |
| | | | | |
| Name of Issuer | | Principal Amount ($) | | | Coupon Rate (%) | | | Maturity Date | | | Fair Value ($) | |
| | | | |
Rochester Health Care & Hsg. Rev. (The Homestead at Rochester) | | | 720,000 | | | | 6.38 | | | | 12/1/33 | | | | 720,504 | |
| | | | |
Rochester Health Care & Hsg. Rev. (The Homestead at Rochester) | | | 2,500,000 | | | | 6.50 | | | | 12/1/35 | | | | 2,501,775 | |
| | | | |
Rochester Health Care & Hsg. Rev. (The Homestead at Rochester) | | | 250,000 | | | | 6.88 | | | | 12/1/48 | | | | 250,078 | |
| | | | |
Sartell Health Care & Hsg. Fac. Rev. (Country Manor Campus LLC Proj.) | | | 2,150,000 | | | | 5.30 | | | | 9/1/37 | | | | 2,150,795 | |
| | | | |
Sartell Health Care & Hsg. Fac. Rev. (Country Manor Campus LLC Proj.) | | | 500,000 | | | | 5.00 | | | | 9/1/35 | | | | 505,715 | |
| | | | |
Sauk Rapids Health Care & Hsg. Facs. Rev. (Good Shepherd Lutheran Home Proj.) | | | 1,715,000 | | | | 5.13 | | | | 1/1/39 | | | | 1,560,187 | |
| | | | |
St. Anthony Multifamily Hsg. Rev. (Silver Lake Village Hsg.) | | | 250,000 | | | | 5.75 | | | | 12/1/28 | | | | 250,145 | |
| | | | |
St. Anthony Multifamily Hsg. Rev. (Silver Lake Village Hsg.) | | | 2,000,000 | | | | 6.00 | | | | 12/1/30 | | | | 2,001,080 | |
| | | | |
St. Joseph Senior Hsg. & Health Care Rev. (Woodcrest of Country Manor Proj.) | | | 1,500,000 | | | | 5.00 | | | | 7/1/55 | | | | 1,376,355 | |
| | | | |
St. Paul Hsg. & Redev. Auth. (Higher Ground Academy Proj.) | | | 1,000,000 | | | | 5.50 | | | | 12/1/38 | | | | 1,064,130 | |
| | | | |
St. Paul Hsg. & Redev. Auth. Health Care Rev. (Carondelet Village Proj.) | | | 2,400,000 | | | | 4.25 | | | | 12/1/27 | | | | 2,426,520 | |
| | | | |
St. Paul Hsg. & Redev. Auth. Health Care Rev. (Carondelet Village Proj.) | | | 2,400,000 | | | | 5.00 | | | | 12/1/47 | | | | 2,421,288 | |
| | | | |
St. Paul Hsg. & Redev. Auth. Multifamily Housing Rev. (Marian Center Proj.) | | | 840,000 | | | | 5.30 | | | | 11/1/30 | | | | 839,958 | |
| | | | |
St. Paul Hsg. & Redev. Auth. Multifamily Housing Rev. (Marian Center Proj.) | | | 2,590,000 | | | | 5.38 | | | | 5/1/43 | | | | 2,423,748 | |
| | | | |
St. Paul Park Senior Hsg. Rev. (Presbyterian Homes Bloomin Proj.) | | | 1,500,000 | | | | 5.00 | | | | 9/1/42 | | | | 1,500,405 | |
| | | | |
Vergas Hsg. & Healthcare Facs. Rev. (CDL Homes Proj.) | | | 1,000,000 | | | | 4.25 | | | | 8/1/43 | | | | 825,730 | |
| | | | |
Vergas Rev. (CDL Homes Proj.) | | | 80,000 | | | | 4.00 | | | | 8/1/25 | | | | 79,383 | |
| | | | |
Wayzata Senior Hsg. Rev. (Folkestone Senior Living Community) | | | 1,500,000 | | | | 4.00 | | | | 8/1/44 | | | | 1,436,025 | |
| | | | |
Wayzata Senior Hsg. Rev. (Folkestone Senior Living Community) | | | 1,000,000 | | | | 5.00 | | | | 8/1/49 | | | | 1,010,010 | |
| | | | |
Wayzata Senior Hsg. Rev. (Folkestone Senior Living Community) | | | 2,750,000 | | | | 5.00 | | | | 8/1/54 | | | | 2,772,687 | |
| | | | | | | | | | | | | | | | |
| | | | |
| | | | | | | | | | | | | | | 88,940,106 | |
| | | | | | | | | | | | | | | | |
| | | | |
Municipal Lease - 2.4% 9 | | | | | | | | | | | | | | | | |
| | | | |
Lake Agassiz Education Cooperative No. 0397-52 | | | 645,000 | | | | 2.50 | | | | 2/1/32 | | | | 569,845 | |
| | | | |
Minnetonka Independent School District No. 276 | | | 1,410,000 | | | | 2.25 | | | | 2/1/44 | | | | 1,004,343 | |
| | | | |
Minnetonka Independent School District No. 276 | | | 1,000,000 | | | | 2.13 | | | | 2/1/41 | | | | 737,120 | |
| | | | |
Minnetonka Independent School District No. 276 | | | 750,000 | | | | 2.38 | | | | 7/1/51 | | | | 493,905 | |
| | | | |
MN Hsg. Fin. Agy. Rev. | | | 2,065,000 | | | | 3.00 | | | | 8/1/43 | | | | 1,733,526 | |
| | | | |
MN Hsg. Fin. Agy. Rev. (State Appropriation) | | | 2,000,000 | | | | 5.00 | | | | 8/1/34 | | | | 2,002,480 | |
| | | | |
Northeastern Metropolitan Intermediate School District No. 916 | | | 1,000,000 | | | | 5.00 | | | | 2/1/34 | | | | 1,006,570 | |
| | | | |
Pine Island Independent School District No. 255 | | | 525,000 | | | | 2.00 | | | | 2/1/40 | | | | 385,366 | |
| | | | |
Pine Island Independent School District No. 255 | | | 1,110,000 | | | | 2.20 | | | | 2/1/44 | | | | 776,367 | |
| | | | |
Pine Island Independent School District No. 255 | | | 895,000 | | | | 2.25 | | | | 2/1/47 | | | | 600,983 | |
| | | | |
Waconia Independent School District No. 110 | | | 500,000 | | | | 5.00 | | | | 2/1/37 | | | | 500,860 | |
| | | | | | | | | | | | | | | | |
| | | | |
| | | | | | | | | | | | | | | 9,811,365 | |
| | | | | | | | | | | | | | | | |
| | | | |
Other Revenue Bonds - 2.8% | | | | | | | | | | | | | | | | |
| | | | |
Crystal Governmental Fac. Rev. | | | 148,959 | | | | 5.10 | | | | 12/15/26 | | | | 144,333 | |
| | | | |
Mound Hsg. & Redev. Auth. Tax Increment Rev. Ref. (Metroplain Proj.) | | | 103,000 | | | | 5.00 | | | | 2/15/27 | | | | 102,831 | |
| | | | |
Northeastern Metropolitan Intermediate School District No. 916 | | | 2,500,000 | | | | 4.00 | | | | 2/1/38 | | | | 2,502,800 | |
| | | | |
St. Paul Hsg. & Redev. Auth. Rev. (Amherst H Wilder Foundation Proj.) | | | 1,750,000 | | | | 5.00 | | | | 12/1/36 | | | | 1,857,170 | |
| | | | |
St. Paul Hsg. & Redev. Auth. Tax Increment Rev. (9th St. Lofts Proj.) | | | 244,000 | | | | 6.38 | | | | 2/15/28 | | | | 244,486 | |
| | | | |
St. Paul Hsg. & Redev. Auth. Tax Increment Rev. (Emerald Gardens Proj.) | | | 405,000 | | | | 6.50 | | | | 3/1/29 | | | | 405,296 | |
| | | | |
St. Paul Hsg. & Redev. Auth. Tax Increment Rev. (North Quadrant Owner Occupied Proj.) | | | 588,000 | | | | 7.00 | | | | 2/15/28 | | | | 590,381 | |
| | | | |
St. Paul Hsg. & Redev. Auth. Tax Increment Rev. (North Quadrant Owner Occupied Proj.) | | | 285,000 | | | | 7.50 | | | | 2/15/28 | | | | 285,185 | |
| | | | |
St. Paul Port Auth. Lease Rev. (Regions Hospital Parking Ramp Proj.) | | | 3,310,000 | | | | 5.00 | | | | 8/1/36 | | | | 3,312,251 | |
| | |
See accompanying notes to financial statements. | | |
| |
| 28 | | FINANCIAL STATEMENTS AND OTHER INFORMATION |
| | | | | | | | | | | | | | | | |
| | | | | |
| Name of Issuer | | Principal Amount ($) | | | Coupon Rate (%) | | | Maturity Date | | | Fair Value ($) | |
| | | | |
Virgin Islands Public Fin. Auth. (Gross Receipts Taxes Loan Note) 11 | | | 2,000,000 | | | | 5.00 | | | | 10/1/42 | | | | 1,771,400 | |
| | | | | | | | | | | | | | | | |
| | | | |
| | | | | | | | | | | | | | | 11,216,133 | |
| | | | | | | | | | | | | | | | |
| | | | |
Sales Tax Revenue - 1.2% 11 | | | | | | | | | | | | | | | | |
| | | | |
American Samoa Economic Development Authority Rev. | | | 2,000,000 | | | | 6.25 | | | | 9/1/29 | | | | 2,044,900 | |
| | | | |
Guam Govt. Business Privilege Tax Rev. | | | 2,750,000 | | | | 5.00 | | | | 11/15/35 | | | | 2,782,808 | |
| | | | | | | | | | | | | | | | |
| | | | |
| | | | | | | | | | | | | | | 4,827,708 | |
| | | | | | | | | | | | | | | | |
| | | | |
Single Family Mortgage - 23.2% | | | | | | | | | | | | | | | | |
| | | | |
Dakota Co. Community Dev. Agy. Single Family Mtg. Rev. (GNMA) | | | 485,000 | | | | 4.45 | | | | 12/1/32 | | | | 485,121 | |
| | | | |
Dakota Co. Community Dev. Agy. Single Family Mtg. Rev. (GNMA) | | | 20,000 | | | | 4.63 | | | | 12/1/30 | | | | 20,007 | |
| | | | |
Dakota Co. Community Dev. Agy. Single Family Mtg. Rev. (GNMA-FNMA-FHLMC) | | | 235,000 | | | | 4.88 | | | | 12/1/33 | | | | 235,085 | |
| | | | |
Minneapolis St. Paul Hsg. Fin. Board Single Family Mtg. Rev. (GNMA-FNMA) | | | 35,000 | | | | 4.45 | | | | 12/1/27 | | | | 35,005 | |
| | | | |
MN Hsg. Fin. Agy. Homeownership Fin. | | | 7,295,000 | | | | 2.25 | | | | 7/1/41 | | | | 5,432,732 | |
| | | | |
MN Hsg. Fin. Agy. Homeownership Fin. | | | 8,270,000 | | | | 2.40 | | | | 7/1/46 | | | | 6,078,037 | |
| | | | |
MN Hsg. Fin. Agy. Homeownership Fin. (GNMA-FNMA-FHLMC) | | | 3,130,000 | | | | 2.45 | | | | 7/1/45 | | | | 2,365,685 | |
| | | | |
MN Hsg. Fin. Agy. Homeownership Fin. (GNMA-FNMA-FHLMC) | | | 4,985,000 | | | | 2.45 | | | | 7/1/46 | | | | 3,706,198 | |
| | | | |
MN Hsg. Fin. Agy. Homeownership Fin. (GNMA-FNMA-FHLMC) | | | 1,581,169 | | | | 3.30 | | | | 5/1/48 | | | | 1,467,547 | |
| | | | |
MN Hsg. Fin. Agy. Homeownership Fin. (GNMA-FNMA-FHLMC) | | | 505,187 | | | | 3.75 | | | | 11/1/48 | | | | 482,635 | |
| | | | |
MN Hsg. Fin. Agy. Homeownership Fin. (GNMA-FNMA-FHLMC) | | | 504,669 | | | | 3.60 | | | | 1/1/49 | | | | 479,622 | |
| | | | |
MN Hsg. Fin. Agy. Homeownership Fin. (GNMA-FNMA-FHLMC) | | | 512,260 | | | | 3.45 | | | | 3/1/49 | | | | 483,573 | |
| | | | |
MN Hsg. Fin. Agy. Homeownership Fin. (GNMA-FNMA-FHLMC) | | | 882,064 | | | | 3.15 | | | | 6/1/49 | | | | 808,394 | |
| | | | |
MN Hsg. Fin. Agy. Homeownership Fin. (GNMA-FNMA-FHLMC) | | | 922,978 | | | | 2.47 | | | | 1/1/50 | | | | 762,777 | |
| | | | |
MN Hsg. Fin. Agy. Homeownership Fin. (GNMA-FNMA-FHLMC) | | | 8,585,000 | | | | 2.55 | | | | 1/1/51 | | | | 6,116,898 | |
| | | | |
MN Hsg. Fin. Agy. Homeownership Fin. (GNMA-FNMA-FHLMC) | | | 4,290,000 | | | | 2.50 | | | | 7/1/51 | | | | 3,019,988 | |
| | | | |
MN Hsg. Fin. Agy. Homeownership Fin. (GNMA-FNMA-FHLMC) | | | 475,000 | | | | 2.38 | | | | 7/1/46 | | | | 339,502 | |
| | | | |
MN Hsg. Fin. Agy. Homeownership Fin. (GNMA-FNMA-FHLMC) | | | 9,340,000 | | | | 2.45 | | | | 1/1/52 | | | | 6,518,106 | |
| | | | |
MN Hsg. Fin. Agy. Homeownership Fin. (GNMA-FNMA-FHLMC) | | | 3,440,000 | | | | 2.40 | | | | 1/1/35 | | | | 2,969,477 | |
| | | | |
MN Hsg. Fin. Agy. Homeownership Fin. (GNMA-FNMA-FHLMC) | | | 3,410,000 | | | | 2.75 | | | | 7/1/42 | | | | 2,814,580 | |
| | | | |
MN Hsg. Fin. Agy. Homeownership Fin. (GNMA-FNMA-FHLMC) | | | 1,270,000 | | | | 2.90 | | | | 1/1/45 | | | | 1,017,283 | |
| | | | |
MN Hsg. Fin. Agy. Homeownership Fin. (GNMA-FNMA-FHLMC) | | | 2,300,000 | | | | 3.00 | | | | 7/1/43 | | | | 1,993,847 | |
| | | | |
MN Hsg. Fin. Agy. Residential Hsg. Rev. (GNMA-FNMA-FHLMC) | | | 32,000 | | | | 3.80 | | | | 7/1/38 | | | | 31,972 | |
| | | | |
MN Hsg. Fin. Agy. Residential Hsg. Rev. (GNMA-FNMA-FHLMC) | | | 4,290,000 | | | | 2.55 | | | | 7/1/39 | | | | 3,603,085 | |
| | | | |
MN Hsg. Fin. Agy. Residential Hsg. Rev. (GNMA-FNMA-FHLMC) | | | 2,885,000 | | | | 2.80 | | | | 1/1/44 | | | | 2,362,267 | |
| | | | |
MN Hsg. Fin. Agy. Residential Hsg. Rev. (GNMA-FNMA-FHLMC) | | | 2,775,000 | | | | 2.70 | | | | 7/1/44 | | | | 2,220,194 | |
| | | | |
MN Hsg. Fin. Agy. Residential Hsg. Rev. (GNMA-FNMA-FHLMC) | | | 3,130,000 | | | | 2.75 | | | | 7/1/44 | | | | 2,529,729 | |
| | | | |
MN Hsg. Fin. Agy. Rev. 8 | | | 1,000,000 | | | | 5.35 | | | | 7/1/36 | | | | 1,059,360 | |
| | | | |
MN Hsg. Fin. Agy. Rev. 8 | | | 1,000,000 | | | | 4.60 | | | | 7/1/39 | | | | 1,050,180 | |
| | | | |
MN Hsg. Fin. Agy. Rev. | | | 3,482,811 | | | | 2.05 | | | | 12/1/51 | | | | 2,830,620 | |
| | | | |
MN Hsg. Fin. Agy. Rev. | | | 3,165,000 | | | | 2.00 | | | | 7/1/40 | | | | 2,295,954 | |
| | | | |
MN Hsg. Fin. Agy. Rev. | | | 3,850,000 | | | | 2.15 | | | | 7/1/45 | | | | 2,638,136 | |
| | | | |
MN Hsg. Fin. Agy. Rev. | | | 6,205,000 | | | | 2.20 | | | | 1/1/51 | | | | 4,069,425 | |
| | | | |
MN Hsg. Fin. Agy. Rev. | | | 9,360,000 | | | | 2.35 | | | | 7/1/41 | | | | 7,342,171 | |
| | | | |
MN Hsg. Fin. Agy. Rev. | | | 5,580,000 | | | | 2.55 | | | | 1/1/46 | | | | 4,258,712 | |
| | | | |
MN Hsg. Fin. Agy. Rev. | | | 2,280,000 | | | | 5.00 | | | | 7/1/53 | | | | 2,390,329 | |
| | | | |
MN Hsg. Fin. Agy. Rev. | | | 985,000 | | | | 6.00 | | | | 7/1/53 | | | | 1,078,358 | |
| | | | |
MN Hsg. Fin. Agy. Rev. | | | 1,000,000 | | | | 6.25 | | | | 1/1/54 | | | | 1,112,770 | |
| | |
See accompanying notes to financial statements. | | |
| |
SEPTEMBER 30, 2024 | | 29 |
SCHEDULE OF INVESTMENTS (Unaudited)
September 30, 2024
Sit Minnesota Tax-Free Income Fund (Continued)
| | | | | | | | | | | | | | | | |
| | | | | |
| Name of Issuer | | Principal Amount ($) | | | Coupon Rate (%) | | | Maturity Date | | | Fair Value ($) | |
| | | | |
MN Hsg. Fin. Agy. Rev. | | | 1,250,000 | | | | 5.10 | | | | 7/1/42 | | | | 1,333,863 | |
| | | | |
MN Hsg. Fin. Agy. Rev. | | | 1,715,000 | | | | 5.15 | | | | 7/1/45 | | | | 1,815,105 | |
| | | | |
MN Hsg. Fin. Agy. Rev. | | | 1,380,000 | | | | 6.00 | | | | 1/1/53 | | | | 1,492,235 | |
| | | | |
MN Hsg. Fin. Agy. Rev. (GNMA-FNMA-FHLMC) | | | 1,000,000 | | | | 4.60 | | | | 7/1/45 | | | | 1,017,950 | |
| | | | | | | | | | | | | | | | |
| | | | |
| | | | | | | | | | | | | | | 94,164,514 | |
| | | | | | | | | | | | | | | | |
| | | | |
Transportation - 1.5% | | | | | | | | | | | | | | | | |
| | | | |
Minneapolis & St. Paul Metro Airport Commission Sub. Rev. 8 | | | 2,500,000 | | | | 5.25 | | | | 1/1/49 | | | | 2,726,500 | |
| | | | |
Minneapolis & St. Paul Metro Airport Commission Sub. Rev. 8 | | | 1,000,000 | | | | 5.00 | | | | 1/1/47 | | | | 1,047,970 | |
| | | | |
Minneapolis & St. Paul Metro Airport Commission Sub. Rev. 8 | | | 500,000 | | | | 5.25 | | | | 1/1/47 | | | | 538,835 | |
| | | | |
Minneapolis & St. Paul Metro Airport Commission Sub. Rev. | | | 1,750,000 | | | | 4.00 | | | | 1/1/54 | | | | 1,726,725 | |
| | | | | | | | | | | | | | | | |
| | | | |
| | | | | | | | | | | | | | | 6,040,030 | |
| | | | | | | | | | | | | | | | |
| | | | |
Utility - 1.5% | | | | | | | | | | | | | | | | |
| | | | |
Guam Govt. Waterworks Auth. Rev. 11 | | | 2,000,000 | | | | 5.00 | | | | 1/1/46 | | | | 2,033,120 | |
| | | | |
Rochester Electric Utility Rev. | | | 500,000 | | | | 5.00 | | | | 12/1/42 | | | | 516,075 | |
| | | | |
Southern Minnesota Municipal Power Agency | | | 1,000,000 | | | | 5.00 | | | | 1/1/41 | | | | 1,019,790 | |
| | | | |
Southern Minnesota Municipal Power Agency | | | 650,000 | | | | 5.00 | | | | 1/1/46 | | | | 660,861 | |
| | | | |
St. Paul Port Auth. Rev. 8 | | | 750,000 | | | | 5.25 | | | | 10/1/42 | | | | 782,625 | |
| | | | |
Western MN Municipal Power Agy. Rev. | | | 550,000 | | | | 5.00 | | | | 1/1/25 | | | | 552,420 | |
| | | | |
Western MN Municipal Power Agy. Rev. | | | 600,000 | | | | 5.00 | | | | 1/1/35 | | | | 614,376 | |
| | | | | | | | | | | | | | | | |
| | | | |
| | | | | | | | | | | | | | | 6,179,267 | |
| | | | | | | | | | | | | | | | |
| | | | |
Total Municipal Bonds
(cost: $427,754,631) | | | | | | | | | | | | | | | 382,115,211 | |
| | | | | | | | | | | | | | | | |
| | | | | | | | | | | | | | | | |
| | | | | |
| | | Quantity | | | | | | | | | | |
| | | | |
Investment Companies - 0.4% | | | | | | | | | | | | | | | | |
| | | | |
Nuveen Minnesota Quality Municipal Income Fund (NMS) | | | 122,032 | | | | | | | | | | | | 1,575,372 | |
| | | | | | | | | | | | | | | | |
| | | | |
Total Investment Companies
(cost: $1,692,304) | | | | | | | | | | | | | | | 1,575,372 | |
| | | | | | | | | | | | | | | | |
| | | | |
Total Investments in Securities - 94.7%
(cost: $429,446,935) | | | | | | | | | | | | | | | 383,690,583 | |
| | | | | | | | | | | | | | | | |
| | | | |
Other Assets and Liabilities, net - 5.3% | | | | | | | | | | | | | | | 21,446,046 | |
| | | | | | | | | | | | | | | | |
| | | | |
Net Assets - 100.0% | | | | | | | | | | | | | | | $405,136,629 | |
| | | | | | | | | | | | | | | | |
| 1 | Variable rate security. Rate disclosed is as of September 30, 2024. Certain variable rate securities are not based on a published reference rate and spread but are determined by the issuer or agent and are based on current market conditions, or, for mortgage-backed securities, are impacted by the individual mortgages which are paying off over time. These securities do not indicate a reference rate and spread in their descriptions. |
| 2 | Security considered illiquid by the Investment Adviser. The total value of such securities as of September 30, 2024 was $2,692,250 and represented 0.7% of net assets. |
| 4 | 144A Restricted Security. The total value of such securities as of September 30, 2024 was $9,050,517 and represented 2.2% of net assets. These securities have been determined to be liquid by the Adviser in accordance with guidelines established by the Board of Directors. |
| 8 | Securities the income from which is treated as a tax preference that is included in alternative minimum taxable income for purposes of computing federal alternative minimum tax (AMT). At September 30, 2024, 4.2% of net assets in the Fund was invested in such securities. |
| 9 | Municipal Lease Security. The total value of such securities as of September 30, 2024 was $9,811,365 and represented 2.4% of net assets. These securities have been determined to be liquid by the Adviser in accordance with guidelines established by the Board of Directors. |
| 11 | The Fund may invest in obligations issued by U.S. territories, for example Guam, Puerto Rico, and Virgin Islands. The total value of such securities as of September 30, 2024 was $9,201,694 and represented 2.3% of net assets. |
| | |
See accompanying notes to financial statements. | | |
| |
| 30 | | FINANCIAL STATEMENTS AND OTHER INFORMATION |
Numeric footnotes not disclosed are not applicable to this Schedule of Investments.
Short futures contracts outstanding as of September 30, 2024 were as follows:
| | | | | | | | | | | | | | | | |
| Type | | Contracts | | | Expiration Date | | | Notional Amount ($) | | | Value/ Unrealized Appreciation (Depreciation) ($) |
Short Futures: 10 | | | | | | | | | | | | | | | | |
U.S. Treasury Long Bond | | | 111 | | | | December 2024 | | | | (13,784,813 | ) | | | (9,361 | ) |
U.S. Treasury 5-Year | | | 233 | | | | December 2024 | | | | (25,602,695 | ) | | | (50,132 | ) |
U.S. Treasury 10-Year | | | 382 | | | | December 2024 | | | | (43,655,437 | ) | | | (103,644 | ) |
| | | | | | | | | | | | | | | | |
| | | | |
| | | | | | | | | | | | | | | (163,137 | ) |
| | | | | | | | | | | | | | | | |
| 10 | The amount of $8,000,000 in cash was segregated with the broker to cover margin requirements for derivative transactions as of September 30, 2024. |
A summary of the levels for the Fund’s investments as of September 30, 2024 is as follows (see Note 2 - significant accounting policies in the notes to financial statements):
| | | | | | | | | | | | | | | | |
| | | Investment in Securities | |
| | | Level 1 Quoted Prices ($) | | | Level 2 Other significant observable inputs ($) | | Level 3 Significant unobservable inputs ($) | | | Total ($) | |
| | | | |
Assets | | | | | | | | | | | | | | | | |
Municipal Bonds | | | — | | | | 382,115,211 | | | | — | | | | 382,115,211 | |
Investment Companies | | | 1,575,372 | | | | — | | | | — | | | | 1,575,372 | |
| | | | |
Total: | | | 1,575,372 | | | | 382,115,211 | | | | — | | | | 383,690,583 | |
| | | | |
Liabilities | | | | | | | | | | | | | | | | |
Futures | | | (163,137 | ) | | | — | | | | — | | | | (163,137) | |
| | | | |
There were no transfers into or out of level 3 during the reporting period.
| | |
See accompanying notes to financial statements. | | |
| |
SEPTEMBER 30, 2024 | | 31 |
STATEMENTS OF ASSETS AND LIABILITIES (Unaudited)
September 30, 2024
| | | | | | | | | | | | | | | | |
| | | Sit U.S.
Government
Securities
Fund | | | Sit Quality
Income
Fund | | | Sit Tax-Free
Income
Fund | | | Sit
Minnesota
Tax-Free
Income
Fund | |
ASSETS | | | | | | | | | | | | | | | | |
Investments in securities, at identified cost | | | $236,061,944 | | | | $122,125,687 | | | | $174,985,544 | | | | $429,446,935 | |
| | | | | | | | | | | | | | | | |
| | | | |
Investments in securities, at fair value - see accompanying schedule for detail | | | $227,454,204 | | | | $123,075,245 | | | | $143,780,956 | | | | $383,690,583 | |
Cash in bank on demand deposit | | | — | | | | — | | | | 6,579,773 | | | | 9,666,006 | |
Cash collateral held at broker | | | — | | | | — | | | | 6,000,000 | | | | 8,000,000 | |
Accrued interest and dividends receivable | | | 1,027,222 | | | | 946,228 | | | | 2,054,228 | | | | 4,522,595 | |
Receivable for investment securities sold | | | — | | | | 14,881 | | | | — | | | | — | |
Receivable for Fund shares sold | | | 25,638 | | | | 173,561 | | | | 189,502 | | | | 443,517 | |
| | | | | | | | | | | | | | | | |
| | | | |
Total assets | | | 228,507,064 | | | | 124,209,915 | | | | 158,604,459 | | | | 406,322,701 | |
| | | | | | | | | | | | | | | | |
| | | | |
LIABILITIES | | | | | | | | | | | | | | | | |
Disbursements in excess of cash balances | | | — | | | | 1,284 | | | | — | | | | — | |
Payable for investment securities purchased | | | — | | | | — | | | | 296,898 | | | | — | |
Payable for Fund shares redeemed | | | 336,428 | | | | 26,032 | | | | 815,420 | | | | 632,153 | |
Cash portion of dividends payable to shareholders | | | 41,630 | | | | 1,211 | | | | 124,978 | | | | 127,650 | |
Variation margin on futures contracts | | | — | | | | — | | | | 53,394 | | | | 161,685 | |
Accrued supervisory and administrative fees | | | 101,713 | | | | 41,347 | | | | 66,529 | | | | 198,438 | |
Accrued investment management fees | | | 37,868 | | | | 20,301 | | | | 26,614 | | | | 66,146 | |
| | | | | | | | | | | | | | | | |
| | | | |
Total liabilities | | | 517,639 | | | | 90,175 | | | | 1,383,833 | | | | 1,186,072 | |
| | | | | | | | | | | | | | | | |
| | | | |
Net assets applicable to outstanding capital stock | | | $227,989,425 | | | | $124,119,740 | | | | $157,220,626 | | | | $405,136,629 | |
| | | | | | | | | | | | | | | | |
| | | | |
Net assets consist of: | | | | | | | | | | | | | | | | |
Capital (par value and paid-in surplus) | | | $266,425,463 | | | | $129,674,306 | | | | $213,394,829 | | | | $462,995,235 | |
Total distributable earnings (loss), including unrealized appreciation (depreciation) | | | (38,436,038) | | | | (5,554,566) | | | | (56,174,203) | | | | (57,858,606) | |
| | | | | | | | | | | | | | | | |
| | | | |
| | | $227,989,425 | | | | $124,119,740 | | | | $157,220,626 | | | | $405,136,629 | |
| | | | | | | | | | | | | | | | |
| | | | |
Outstanding shares: | | | | | | | | | | | | | | | | |
Class S Shares (Class S)* | | | 16,339,855 | | | | 2,946,178 | | | | 11,110,198 | | | | 41,967,117 | |
| | | | | | | | | | | | | | | | |
Class Y Shares (Class Y)* | | | 5,507,751 | | | | 9,921,197 | | | | 6,630,106 | | | | — | |
| | | | | | | | | | | | | | | | |
| | | | |
Net assets applicable to outstanding shares: | | | | | | | | | | | | | | | | |
Net Assets (Class S)* | | | $170,536,586 | | | | $28,389,995 | | | | $98,466,048 | | | | $405,136,629 | |
| | | | | | | | | | | | | | | | |
Net Assets (Class Y)* | | | 57,452,839 | | | | 95,729,745 | | | | 58,754,578 | | | | — | |
| | | | | | | | | | | | | | | | |
| | | | |
Net asset value per share of outstanding capital stock: | | | | | | | | | | | | | | | | |
Net Assets Value (Class S)* | | | $10.44 | | | | $9.64 | | | | $8.86 | | | | $9.65 | |
| | | | | | | | | | | | | | | | |
Net Assets Value (Class Y)* | | | 10.43 | | | | 9.65 | | | | 8.86 | | | | — | |
| | | | | | | | | | | | | | | | |
| * | Sit U.S. Government Securities Fund, Sit Quality Income Fund and Sit Tax-Free Income Fund offer multiple share classes (S and Y). Sit Minnesota Tax-Free Income Fund offers a single share class. |
| | |
See accompanying notes to financial statements. | | |
| |
| 32 | | FINANCIAL STATEMENTS AND OTHER INFORMATION |
STATEMENTS OF OPERATIONS (Unaudited)
Six Months Ended September 30, 2024
| | | | | | | | | | | | | | | | |
| | | Sit U.S.
Government
Securities
Fund | | | Sit Quality
Income
Fund | | | Sit Tax-Free
Income
Fund | | | Sit
Minnesota
Tax-Free
Income
Fund | |
Investment income: | | | | | | | | | | | | | | | | |
Income: | | | | | | | | | | | | | | | | |
Dividends | | | — | | | | — | | | | $277,480 | | | | $51,453 | |
Interest | | | $5,287,802 | | | | $3,198,799 | | | | 3,486,811 | | | | 7,975,192 | |
| | | | | | | | | | | | | | | | |
| | | | |
Total income | | | 5,287,802 | | | | 3,198,799 | | | | 3,764,291 | | | | 8,026,645 | |
| | | | | | | | | | | | | | | | |
| | | | |
Expenses (note 4): | | | | | | | | | | | | | | | | |
Investment management fee | | | 234,766 | | | | 141,613 | | | | 162,461 | | | | 401,988 | |
Supervisory and administrative fee | | | 629,842 | | | | 259,045 | | | | 406,551 | | | | 1,205,965 | |
| | | | | | | | | | | | | | | | |
| | | | |
Total expenses | | | 864,608 | | | | 400,658 | | | | 569,012 | | | | 1,607,953 | |
| | | | | | | | | | | | | | | | |
| | | | |
Less fees and expenses waived by investment adviser | | | — | | | | (14,963) | | | | — | | | | — | |
| | | | | | | | | | | | | | | | |
| | | | |
Total net expenses | | | 864,608 | | | | 385,695 | | | | 569,012 | | | | 1,607,953 | |
| | | | | | | | | | | | | | | | |
| | | | |
Net investment income | | | 4,423,194 | | | | 2,813,104 | | | | 3,195,279 | | | | 6,418,692 | |
| | | | | | | | | | | | | | | | |
| | | | |
Realized and unrealized gain (loss): | | | | | | | | | | | | | | | | |
Net realized gain (loss) on investments | | | (3,580,239) | | | | (579,879) | | | | (2,647,662) | | | | (1,112,069) | |
Net realized gain (loss) on futures | | | — | | | | (85,678) | | | | (676,193) | | | | (2,067,220) | |
| | | | |
Net change in unrealized appreciation (depreciation) on investments | | | 9,404,427 | | | | 2,819,264 | | | | 7,182,397 | | | | 10,507,929 | |
Net change in unrealized appreciation (depreciation) on futures | | | — | | | | 15,636 | | | | 160,879 | | | | 531,672 | |
| | | | | | | | | | | | | | | | |
| | | | |
Net gain (loss) | | | 5,824,188 | | | | 2,169,343 | | | | 4,019,421 | | | | 7,860,312 | |
| | | | | | | | | | | | | | | | |
| | | | |
Net increase (decrease) in net assets resulting from operations | | | $10,247,382 | | | | $4,982,447 | | | | $7,214,700 | | | | $14,279,004 | |
| | | | | | | | | | | | | | | | |
| | |
| | | See accompanying notes to financial statements. |
| |
SEPTEMBER 30, 2024 | | 33 |
STATEMENTS OF CHANGES IN NET ASSETS
September 30, 2024
| | | | | | | | | | | | | | | | |
| | | Sit U.S. Government
Securities Fund | |
| | | Six Months Ended
September 30, 2024
(Unaudited) | | | Year
Ended
March 31, 2024 | |
Operations: | | | | | | | | | | | | | | | | |
Net investment income | | | $4,423,194 | | | | | | | | $10,079,946 | | | | | |
Net realized gain (loss) on investments and futures | | | (3,580,239) | | | | | | | | (11,190,435) | | | | | |
Net change in unrealized appreciation of investments and futures | | | 9,404,427 | | | | | | | | 4,712,885 | | | | | |
| | | | | | | | | | | | | | | | |
| | | | |
Net increase (decrease) in net assets resulting from operations | | | 10,247,382 | | | | | | | | 3,602,396 | | | | | |
| | | | | | | | | | | | | | | | |
| | | | |
Distributions from: | | | | | | | | | | | | | | | | |
Net investment income and net realized gains | | | | | | | | | | | | | | | | |
Common shares (Class S) | | | (3,238,469) | | | | | | | | (7,293,135) | | | | | |
Common shares (Class Y) | | | (1,184,749) | | | | | | | | (2,829,577) | | | | | |
| | | | | | | | | | | | | | | | |
| | | | |
Total distributions | | | (4,423,218) | | | | | | | | (10,122,712) | | | | | |
| | | | | | | | | | | | | | | | |
| | | | |
Capital share transactions: | | | | | | | | | | | | | | | | |
Proceeds from shares sold | | | | | | | | | | | | | | | | |
Class S Shares | | | 7,811,396 | | | | | | | | 20,177,580 | | | | | |
Class Y Shares | | | 4,529,764 | | | | | | | | 11,876,193 | | | | | |
Reinvested distributions | | | | | | | | | | | | | | | | |
Class S Shares | | | 2,997,529 | | | | | | | | 6,807,918 | | | | | |
Class Y Shares | | | 1,184,749 | | | | | | | | 2,828,929 | | | | | |
Payments for shares redeemed | | | | | | | | | | | | | | | | |
Class S Shares | | | (26,825,132) | | | | | | | | (106,055,986) | | | | | |
Class Y Shares | | | (14,937,983) | | | | | | | | (39,415,212) | | | | | |
| | | | | | | | | | | | | | | | |
| | | | |
Decrease in net assets from capital transactions | | | (25,239,677) | | | | | | | | (103,780,578) | | | | | |
| | | | | | | | | | | | | | | | |
| | | | |
Total increase (decrease) in net assets | | | (19,415,513) | | | | | | | | (110,300,894) | | | | | |
| | | | |
Net assets: | | | | | | | | | | | | | | | | |
Beginning of period | | | 247,404,938 | | | | | | | | 357,705,832 | | | | | |
| | | | | | | | | | | | | | | | |
| | | | |
End of period | | | $227,989,425 | | | | | | | | $247,404,938 | | | | | |
| | | | | | | | | | | | | | | | |
| | | | |
Capital transactions in shares: | | | | | | | | | | | | | | | | |
Sold | | | | | | | | | | | | | | | | |
Class S Shares | | | 761,163 | | | | | | | | 1,985,070 | | | | | |
Class Y Shares | | | 442,993 | | | | | | | | 1,164,099 | | | | | |
Reinvested distributions | | | | | | | | | | | | | | | | |
Class S Shares | | | 293,403 | | | | | | | | 671,102 | | | | | |
Class Y Shares | | | 116,048 | | | | | | | | 279,148 | | | | | |
Redeemed | | | | | | | | | | | | | | | | |
Class S Shares | | | (2,619,875) | | | | | | | | (10,448,210) | | | | | |
Class Y Shares | | | (1,469,177) | | | | | | | | (3,880,008) | | | | | |
| | | | | | | | | | | | | | | | |
| | | | |
Net increase (decrease) | | | (2,475,445) | | | | | | | | (10,228,799) | | | | | |
| | | | | | | | | | | | | | | | |
| | |
See accompanying notes to financial statements. | | |
| |
| 34 | | FINANCIAL STATEMENTS AND OTHER INFORMATION |
| | | | | | | | | | | | | | | | | | | | | | | | | | | | | | | | | | | | | | | | | | | | | | | | | | | | | | | | | | | | | | | | | | | | | | |
Sit Quality
Income Fund | | | Sit Tax-Free
Income Fund | | | Sit Minnesota Tax-Free
Income Fund | |
Six Months Ended
September 30, 2024
(Unaudited) | | | | | | Year
Ended
March 31, 2024 | | | | | | Six Months Ended
September 30, 2024
(Unaudited) | | | | | | | | | Year
Ended
March 31, 2024 | | | | | | Six Months Ended
September 30, 2024
(Unaudited) | | | | | | Year
Ended
March 31, 2024 | |
| | | | | | | | | | | | | | | | | |
| | $2,813,104 | | | | | | | | | | | | $5,652,404 | | | | | | | | | | | | $3,195,279 | | | | | | | | | | | | | | | | $6,465,550 | | | | | | | | | | | | $6,418,692 | | | | | | | | | | | | $13,594,838 | | | | | |
| | (665,557) | | | | | | | | | | | | (1,608,587) | | | | | | | | | | | | (3,323,855) | | | | | | | | | | | | | | | | (12,060,494) | | | | | | | | | | | | (3,179,289) | | | | | | | | | | | | (5,018,438) | | | | | |
| | 2,834,900 | | | | | | | | | | | | 1,626,823 | | | | | | | | | | | | 7,343,276 | | | | | | | | | | | | | | | | 13,778,368 | | | | | | | | | | | | 11,039,601 | | | | | | | | | | | | 5,021,073 | | | | | |
| | | | | | | | | | | | | | | | | | | | | | | | | | | | | | | | | | | | | | | | | | | | | | | | | | | | | | | | | | | | | | | | | | | | | | |
| | | | | | | | | | | | | | | | | |
| | 4,982,447 | | | | | | | | | | | | 5,670,640 | | | | | | | | | | | | 7,214,700 | | | | | | | | | | | | | | | | 8,183,424 | | | | | | | | | | | | 14,279,004 | | | | | | | | | | | | 13,597,473 | | | | | |
| | | | | | | | | | | | | | | | | | | | | | | | | | | | | | | | | | | | | | | | | | | | | | | | | | | | | | | | | | | | | | | | | | | | | | |
| | | | | | | | | | | | | | | | | |
| | (636,479) | | | | | | | | | | | | (1,342,313) | | | | | | | | | | | | (1,820,294) | | | | | | | | | | | | | | | | (4,014,442) | | | | | | | | | | | | (6,418,688) | | | | | | | | | | | | (13,592,526) | | | | | |
| | (2,176,782) | | | | | | | | | | | | (4,307,744) | | | | | | | | | | | | (1,286,456) | | | | | | | | | | | | | | | | (2,578,845) | | | | | | | | | | | | — | | | | | | | | | | | | — | | | | | |
| | | | | | | | | | | | | | | | | | | | | | | | | | | | | | | | | | | | | | | | | | | | | | | | | | | | | | | | | | | | | | | | | | | | | | |
| | | | | | | | | | | | | | | | | |
| | (2,813,261) | | | | | | | | | | | | (5,650,057) | | | | | | | | | | | | (3,106,750) | | | | | | | | | | | | | | | | (6,593,287) | | | | | | | | | | | | (6,418,688) | | | | | | | | | | | | (13,592,526) | | | | | |
| | | | | | | | | | | | | | | | | | | | | | | | | | | | | | | | | | | | | | | | | | | | | | | | | | | | | | | | | | | | | | | | | | | | | | |
| | | | | | | | | | | | | | | | | |
| | 7,057,106 | | | | | | | | | | | | 33,030,170 | | | | | | | | | | | | 4,650,969 | | | | | | | | | | | | | | | | 19,018,981 | | | | | | | | | | | | 32,908,412 | | | | | | | | | | | | 69,229,675 | | | | | |
| | 20,767,636 | | | | | | | | | | | | 35,603,788 | | | | | | | | | | | | 3,963,726 | | | | | | | | | | | | | | | | 12,714,745 | | | | | | | | | | | | — | | | | | | | | | | | | — | | | | | |
| | 629,063 | | | | | | | | | | | | 1,302,057 | | | | | | | | | | | | 1,642,471 | | | | | | | | | | | | | | | | 3,668,309 | | | | | | | | | | | | 5,636,231 | | | | | | | | | | | | 11,949,011 | | | | | |
| | 2,176,783 | | | | | | | | | | | | 4,276,482 | | | | | | | | | | | | 630,772 | | | | | | | | | | | | | | | | 1,566,067 | | | | | | | | | | | | — | | | | | | | | | | | | — | | | | | |
| | (11,380,320) | | | | | | | | | | | | (37,138,682) | | | | | | | | | | | | (10,470,440) | | | | | | | | | | | | | | | | (49,436,791) | | | | | | | | | | | | (47,252,025) | | | | | | | | | | | | (142,194,612) | | | | | |
| | (30,624,939) | | | | | | | | | | | | (48,452,739) | | | | | | | | | | | | (11,195,326) | | | | | | | | | | | | | | | | (68,386,288) | | | | | | | | | | | | — | | | | | | | | | | | | — | | | | | |
| | | | | | | | | | | | | | | | | | | | | | | | | | | | | | | | | | | | | | | | | | | | | | | | | | | | | | | | | | | | | | | | | | | | | | |
| | | | | | | | | | | | | | | | | |
| | (11,374,671) | | | | | | | | | | | | (11,378,924) | | | | | | | | | | | | (10,777,828) | | | | | | | | | | | | | | | | (80,854,977) | | | | | | | | | | | | (8,707,382) | | | | | | | | | | | | (61,015,926) | | | | | |
| | | | | | | | | | | | | | | | | | | | | | | | | | | | | | | | | | | | | | | | | | | | | | | | | | | | | | | | | | | | | | | | | | | | | | |
| | | | | | | | | | | | | | | | | |
| | (9,205,485) | | | | | | | | | | | | (11,358,341) | | | | | | | | | | | | (6,669,878) | | | | | | | | | | | | | | | | (79,264,840) | | | | | | | | | | | | (847,066) | | | | | | | | | | | | (61,010,979) | | | | | |
| | | | | | | | | | | | | | | | | |
| | 133,325,225 | | | | | | | | | | | | 144,683,566 | | | | | | | | | | | | 163,890,504 | | | | | | | | | | | | | | | | 243,155,344 | | | | | | | | | | | | 405,983,695 | | | | | | | | | | | | 466,994,674 | | | | | |
| | | | | | | | | | | | | | | | | | | | | | | | | | | | | | | | | | | | | | | | | | | | | | | | | | | | | | | | | | | | | | | | | | | | | | |
| | | | | | | | | | | | | | | | | |
| | $124,119,740 | | | | | | | | | | | | $133,325,225 | | | | | | | | | | | | $157,220,626 | | | | | | | | | | | | | | | | $163,890,504 | | | | | | | | | | | | $405,136,629 | | | | | | | | | | | | $405,983,695 | | | | | |
| | | | | | | | | | | | | | | | | | | | | | | | | | | | | | | | | | | | | | | | | | | | | | | | | | | | | | | | | | | | | | | | | | | | | | |
| | | | | | | | | | | | | | | | | |
| | 744,656 | | | | | | | | | | | | 3,508,914 | | | | | | | | | | | | 534,555 | | | | | | | | | | | | | | | | 2,258,896 | | | | | | | | | | | | 3,467,067 | | | | | | | | | | | | 7,424,302 | | | | | |
| | 2,182,849 | | | | | | | | | | | | 3,784,819 | | | | | | | | | | | | 457,670 | | | | | | | | | | | | | | | | 1,508,593 | | | | | | | | | | | | — | | | | | | | | | | | | — | | | | | |
| | | | | | | | | | | | | | | | | |
| | 66,263 | | | | | | | | | | | | 138,480 | | | | | | | | | | | | 189,253 | | | | | | | | | | | | | | | | 434,225 | | | | | | | | | | | | 594,700 | | | | | | | | | | | | 1,282,330 | | | | | |
| | 228,868 | | | | | | | | | | | | 454,099 | | | | | | | | | | | | 72,637 | | | | | | | | | | | | | | | | 185,619 | | | | | | | | | | | | — | | | | | | | | | | | | — | | | | | |
| | | | | | | | | | | | | | | | | |
| | (1,201,174) | | | | | | | | | | | | (3,949,930) | | | | | | | | | | | | (1,209,975) | | | | | | | | | | | | | | | | (5,850,712) | | | | | | | | | | | | (4,985,206) | | | | | | | | | | | | (15,362,397) | | | | | |
| | (3,227,977) | | | | | | | | | | | | (5,135,746) | | | | | | | | | | | | (1,274,553) | | | | | | | | | | | | | | | | (8,030,855) | | | | | | | | | | | | — | | | | | | | | | | | | — | | | | | |
| | | | | | | | | | | | | | | | | | | | | | | | | | | | | | | | | | | | | | | | | | | | | | | | | | | | | | | | | | | | | | | | | | | | | | |
| | | | | | | | | | | | | | | | | |
| | (1,206,515) | | | | | | | | | | | | (1,199,364) | | | | | | | | | | | | (1,230,413) | | | | | | | | | | | | | | | | (9,494,234) | | | | | | | | | | | | (923,439) | | | | | | | | | | | | (6,655,765) | | | | | |
| | | | | | | | | | | | | | | | | | | | | | | | | | | | | | | | | | | | | | | | | | | | | | | | | | | | | | | | | | | | | | | | | | | | | | |
FINANCIAL HIGHLIGHTS
Per share income and capital changes for a share outstanding throughout the period. See accompanying notes to financial statements.
Sit U.S. Government Securities Fund
| | | | | | | | | | | | | | | | | | | | | | | | | | | | | | | | | | | | | | | | | | | | | | | | |
| | | |
| Class S | | Six Months Ended September 30, 2024 | | | Year Ended March 31, | |
| | | (Unaudited) | | | 2024 | | | 2023 | | | 2022 | | | 2021 | | | 2020 | |
| | | | | | | | | | | | |
Net Asset Value: | | | | | | | | | | | | | | | | | | | | | | | | | | | | | | | | | | | | | | | | | | | | | | | | |
Beginning of period | | | $10.17 | | | | | | | | $10.35 | | | | | | | | $10.83 | | | | | | | | $11.17 | | | | | | | | $11.26 | | | | | | | | $10.92 | | | | | |
| | | | | | | | | | | | |
Operations: | | | | | | | | | | | | | | | | | | | | | | | | | | | | | | | | | | | | | | | | | | | | | | | | |
Net investment income 1 | | | 0.19 | | | | | | | | 0.33 | | | | | | | | 0.27 | | | | | | | | 0.10 | | | | | | | | 0.14 | | | | | | | | 0.22 | | | | | |
Net realized and unrealized gains (losses) on investments and written options | | | 0.27 | | | | | | | | (0.17 | ) | | | | | | | (0.48 | ) | | | | | | | (0.34 | ) | | | | | | | (0.09 | ) | | | | | | | 0.34 | | | | | |
| | | | | | | | | | | | |
Total from operations | | | 0.46 | | | | | | | | 0.16 | | | | | | | | (0.21 | ) | | | | | | | (0.24 | ) | | | | | | | 0.05 | | | | | | | | 0.56 | | | | | |
Distributions from: | | | | | | | | | | | | | | | | | | | | | | | | | | | | | | | | | | | | | | | | | | | | | | | | |
Net investment income | | | (0.19 | ) | | | | | | | (0.34 | ) | | | | | | | (0.27 | ) | | | | | | | (0.10 | ) | | | | | | | (0.14 | ) | | | | | | | (0.22 | ) | | | | |
| | | | | | | | | | | | |
Net Asset Value | | | | | | | | | | | | | | | | | | | | | | | | | | | | | | | | | | | | | | | | | | | | | | | | |
End of period | | | $10.44 | | | | | | | | $10.17 | | | | | | | | $10.35 | | | | | | | | $10.83 | | | | | | | | $11.17 | | | | | | | | $11.26 | | | | | |
| | | | | | | | | | | | |
Total investment return 2 | | | 4.60 | % | | | | | | | 1.64 | % | | | | | | | (1.89 | %) | | | | | | | (2.16 | %) | | | | | | | 0.44 | % | | | | | | | 5.25 | % | | | | |
| | | | | | | | | | | | |
Net assets at end of period (000’s omitted) | | | $170,537 | | | | | | | | $182,150 | | | | | | | | $266,067 | | | | | | | | $318,439 | | | | | | | | $398,821 | | | | | | | | $404,985 | | | | | |
| | | | | | | | | | | | |
Ratios: 3 | | | | | | | | | | | | | | | | | | | | | | | | | | | | | | | | | | | | | | | | | | | | | | | | |
Expenses | | | 0.80 | % | | | | | | | 0.80 | % | | | | | | | 0.80 | % | | | | | | | 0.80 | % | | | | | | | 0.80 | % | | | | | | | 0.80 | % | | | | |
Net investment income | | | 3.70 | % | | | | | | | 3.29 | % | | | | | | | 2.55 | % | | | | | | | 0.90 | % | | | | | | | 1.25 | % | | | | | | | 2.06 | % | | | | |
| | | | | | | | | | | | |
Portfolio turnover rate (excluding short-term securities) | | | 11.64 | %4 | | | | | | | 18.08 | % | | | | | | | 56.81 | % | | | | | | | 40.96 | % | | | | | | | 39.29 | % | | | | | | | 29.91 | % | | | | |
| 1 | The net investment income per share is based on average shares outstanding for the period. |
| 2 | Total investment return is based on the change in net asset value of a share during the period (not annualized) and assumes reinvestment of distributions at net asset value. |
| 3 | Ratios are annualized for periods less than one year. In addition to fees and expenses which the Fund bears directly, the Fund indirectly bears a pro rata share of the fees and expenses of the acquired funds in which it invests. Such indirect expenses are not included in the above reported expense ratios. |
| | |
| | | |
| |
| 36 | | FINANCIAL STATEMENTS AND OTHER INFORMATION |
FINANCIAL HIGHLIGHTS
Per share income and capital changes for a share outstanding throughout the period. See accompanying notes to financial statements.
Sit U.S. Government Securities Fund
| | | | | | | | | | | | | | | | | | | | | | | | | | | | | | | | | | | | | | | | | | | | | | | | |
| | | | | |
| | | Six Months Ended September 30, 2024 | | | Year Ended March 31, | | | | | | | |
| Class Y | | | | | | | | | | | Period Ended | |
| | | (Unaudited) | | | 2024 | | | 2023 | | | 2022 | | | 2021 | | | March 31, 2020 1 | |
| | | | | | | | | | | | |
Net Asset Value: | | | | | | | | | | | | | | | | | | | | | | | | | | | | | | | | | | | | | | | | | | | | | | | | |
Beginning of period | | | $10.17 | | | | | | | | $10.35 | | | | | | | | $10.83 | | | | | | | | $11.17 | | | | | | | | $11.26 | | | | | | | | $10.97 | | | | | |
| | | | | | | | | | | | |
Operations: | | | | | | | | | | | | | | | | | | | | | | | | | | | | | | | | | | | | | | | | | | | | | | | | |
Net investment income 2 | | | 0.20 | | | | | | | | 0.36 | | | | | | | | 0.29 | | | | | | | | 0.13 | | | | | | | | 0.17 | | | | | | | | 0.06 | | | | | |
Net realized and unrealized gains (losses) on investments and written options | | | 0.27 | | | | | | | | (0.17 | ) | | | | | | | (0.47 | ) | | | | | | | (0.34 | ) | | | | | | | (0.09 | ) | | | | | | | 0.29 | | | | | |
| | | | | | | | | | | | |
Total from operations | | | 0.47 | | | | | | | | 0.19 | | | | | | | | (0.18 | ) | | | | | | | (0.21 | ) | | | | | | | 0.08 | | | | | | | | 0.35 | | | | | |
Distributions from: | | | | | | | | | | | | | | | | | | | | | | | | | | | | | | | | | | | | | | | | | | | | | | | | |
Net investment income | | | (0.21 | ) | | | | | | | (0.37 | ) | | | | | | | (0.30 | ) | | | | | | | (0.13 | ) | | | | | | | (0.17 | ) | | | | | | | (0.06 | ) | | | | |
| | | | | | | | | | | | |
Net Asset Value | | | | | | | | | | | | | | | | | | | | | | | | | | | | | | | | | | | | | | | | | | | | | | | | |
End of period | | | $10.43 | | | | | | | | $10.17 | | | | | | | | $10.35 | | | | | | | | $10.83 | | | | | | | | $11.17 | | | | | | | | $11.26 | | | | | |
| | | | | | | | | | | | |
Total investment return 3 | | | 4.63 | % | | | | | | | 1.91 | % | | | | | | | (1.67 | %) | | | | | | | (1.91 | %) | | | | | | | 0.72 | % | | | | | | | 3.20 | % | | | | |
| | | | | | | | | | | | |
Net assets at end of period (000’s omitted) | | | $57,453 | | | | | | | | $65,255 | | | | | | | | $91,639 | | | | | | | | $109,305 | | | | | | | | $128,449 | | | | | | | | $13,085 | | | | | |
| | | | | | | | | | | | |
Ratios: 4 | | | | | | | | | | | | | | | | | | | | | | | | | | | | | | | | | | | | | | | | | | | | | | | | |
Expenses | | | 0.55 | % | | | | | | | 0.55 | % | | | | | | | 0.55 | % | | | | | | | 0.55 | % | | | | | | | 0.55 | % | | | | | | | 0.55 | % | | | | |
Net investment income | | | 3.95 | % | | | | | | | 3.54 | % | | | | | | | 2.80 | % | | | | | | | 1.14 | % | | | | | | | 1.44 | % | | | | | | | 2.19 | % | | | | |
| | | | | | | | | | | | |
Portfolio turnover rate (excluding short-term securities) | | | 11.64 | %5 | | | | | | | 18.08 | % | | | | | | | 56.81 | % | | | | | | | 40.96 | % | | | | | | | 39.29 | % | | | | | | | 29.91 | % | | | | |
| 1 | The inception date of Class Y shares was January 1, 2020. |
| 2 | The net investment income per share is based on average shares outstanding for the period. |
| 3 | Total investment return is based on the change in net asset value of a share during the period (not annualized) and assumes reinvestment of distributions at net asset value. |
| 4 | Ratios are annualized for periods less than one year. In addition to fees and expenses which the Fund bears directly, the Fund indirectly bears a pro rata share of the fees and expenses of the acquired funds in which it invests. Such indirect expenses are not included in the above reported expense ratios. |
FINANCIAL HIGHLIGHTS
Per share income and capital changes for a share outstanding throughout the period. See accompanying notes to financial statements.
Sit Quality Income Fund
| | | | | | | | | | | | | | | | | | | | | | | | | | | | | | | | | | | | | | | | | | | | | | | | |
| | | | |
| | | Six Months Ended | | | Year Ended March 31, | | | | |
| Class S | | September 30, 2024 | | | | | | | | | | |
| | | (Unaudited) | | | 2024 | | | 2023 | | | 2022 | | | 2021 | | | 2020 | |
| | | | | | | | | | | | |
Net Asset Value: | | | | | | | | | | | | | | | | | | | | | | | | | | | | | | | | | | | | | | | | | | | | | | | | |
Beginning of period | | | $9.46 | | | | | | | | $9.46 | | | | | | | | $9.98 | | | | | | | | $10.04 | | | | | | | | $9.82 | | | | | | | | $9.80 | | | | | |
| | | | | | | | | | | | |
Operations: | | | | | | | | | | | | | | | | | | | | | | | | | | | | | | | | | | | | | | | | | | | | | | | | |
Net investment income 1 | | | 0.20 | | | | | | | | 0.37 | | | | | | | | 0.28 | | | | | | | | 0.15 | | | | | | | | 0.10 | | | | | | | | 0.18 | | | | | |
Net realized and unrealized gains (losses) on investments, written options and futures | | | 0.18 | | | | | | | | 0.01 | | | | | | | | (0.33 | ) | | | | | | | (0.05 | ) | | | | | | | 0.22 | | | | | | | | 0.02 | | | | | |
| | | | | | | | | | | | |
Total from operations | | | 0.38 | | | | | | | | 0.38 | | | | | | | | (0.05 | ) | | | | | | | 0.10 | | | | | | | | 0.32 | | | | | | | | 0.20 | | | | | |
Distributions from: | | | | | | | | | | | | | | | | | | | | | | | | | | | | | | | | | | | | | | | | | | | | | | | | |
Net investment income | | | (0.20 | ) | | | | | | | (0.38 | ) | | | | | | | (0.29 | ) | | | | | | | (0.15 | ) | | | | | | | (0.10 | ) | | | | | | | (0.18 | ) | | | | |
From net realized gains | | | — | | | | | | | | — | | | | | | | | (0.18 | ) | | | | | | | (0.01 | ) | | | | | | | — | | | | | | | | — | | | | | |
| | | | | | | | | | | | |
Total distributions | | | (0.20 | ) | | | | | | | (0.38 | ) | | | | | | | (0.47 | ) | | | | | | | (0.16 | ) | | | | | | | (0.10 | ) | | | | | | | (0.18 | ) | | | | |
| | | | | | | | | | | | |
Net Asset Value | | | | | | | | | | | | | | | | | | | | | | | | | | | | | | | | | | | | | | | | | | | | | | | | |
End of period | | | $9.64 | | | | | | | | $9.46 | | | | | | | | $9.46 | | | | | | | | $9.98 | | | | | | | | $10.04 | | | | | | | | $9.82 | | | | | |
| | | | | | | | | | | | |
Total investment return 2 | | | 4.10 | % | | | | | | | 4.05 | % | | | | | | | (0.47 | %) | | | | | | | 0.92 | % | | | | | | | 3.32 | % | | | | | | | 2.04 | % | | | | |
| | | | | | | | | | | | |
Net assets at end of period (000’s omitted) | | | $28,390 | | | | | | | | $31,574 | | | | | | | | $34,440 | | | | | | | | $135,246 | | | | | | | | $108,794 | | | | | | | | $90,273 | | | | | |
| | | | | | | | | | | | |
Ratios: 3 | | | | | | | | | | | | | | | | | | | | | | | | | | | | | | | | | | | | | | | | | | | | | | | | |
Expenses (without waiver) | | | 0.90 | %4 | | | | | | | 0.90 | %4 | | | | | | | 0.90 | % | | | | | | | 0.90 | % | | | | | | | 0.90 | % | | | | | | | 0.90 | % | | | | |
Expenses (with waiver) | | | 0.80 | %4 | | | | | | | 0.80 | %4 | | | | | | | 0.80 | % | | | | | | | — | | | | | | | | — | | | | | | | | — | | | | | |
Net investment income (without waiver) | | | 4.15 | % | | | | | | | 3.87 | % | | | | | | | 2.76 | % | | | | | | | 1.51 | % | | | | | | | 1.05 | % | | | | | | | 1.80 | % | | | | |
Net investment income (with waiver) | | | 4.25 | % | | | | | | | 3.97 | % | | | | | | | 2.86 | % | | | | | | | — | | | | | | | | — | | | | | | | | — | | | | | |
| | | | | | | | | | | | |
Portfolio turnover rate (excluding short-term securities) | | | 30.77 | %5 | | | | | | | 89.98 | % | | | | | | | 109.93 | % | | | | | | | 63.03 | % | | | | | | | 77.96 | % | | | | | | | 117.52 | % | | | | |
| 1 | The net investment income per share is based on average shares outstanding for the period. |
| 2 | Total investment return is based on the change in net asset value of a share during the period (not annualized) and assumes reinvestment of distributions at net asset value. |
| 3 | Ratios are annualized for periods less than one year. In addition to fees and expenses which the Fund bears directly, the Fund indirectly bears a pro rata share of the fees and expenses of the acquired funds in which it invests. Such indirect expenses are not included in the above reported expense ratios. |
| 4 | Total Fund expenses are limited to 0.90% of average daily net assets. However, during the period above, the investment adviser voluntarily absorbed expenses that were otherwise payable by the Fund. |
| | |
| | | |
| |
| 38 | | FINANCIAL STATEMENTS AND OTHER INFORMATION |
FINANCIAL HIGHLIGHTS
Per share income and capital changes for a share outstanding throughout the period. See accompanying notes to financial statements.
Sit Quality Income Fund
| | | | | | | | | | | | | | | | | | | | | | | | |
| | | | |
| Class Y | | Six Months Ended September 30, 2024 (Unaudited) | | | Year Ended March 31, 2024 | | | Year Ended March 31, 2023 1 | |
| | | | | | |
Net Asset Value: | | | | | | | | | | | | | | | | | | | | | | | | |
Beginning of period | | | $9.48 | | | | | | | | $9.48 | | | | | | | | $9.97 | | | | | |
| | | | | | |
Operations: | | | | | | | | | | | | | | | | | | | | | | | | |
Net investment income 2 | | | 0.21 | | | | | | | | 0.40 | | | | | | | | 0.32 | | | | | |
Net realized and unrealized gains (losses) on investments, written options and futures | | | 0.17 | | | | | | | | — | | | | | | | | (0.32 | ) | | | | |
| | | | | | |
Total from operations | | | 0.38 | | | | | | | | 0.40 | | | | | | | | – | | | | | |
| | | | | | |
Distributions from: | | | | | | | | | | | | | | | | | | | | | | | | |
Net investment income | | | (0.21 | ) | | | | | | | (0.40 | ) | | | | | | | (0.31 | ) | | | | |
From net realized gains | | | — | | | | | | | | — | | | | | | | | (0.18 | ) | | | | |
| | | | | | |
Total distributions | | | (0.21 | ) | | | | | | | (0.40 | ) | | | | | | | (0.49 | ) | | | | |
| | | | | | |
Net Asset Value | | | | | | | | | | | | | | | | | | | | | | | | |
End of period | | | $9.65 | | | | | | | | $9.48 | | | | | | | | $9.48 | | | | | |
| | | | | | |
Total investment return 3 | | | 4.11 | % | | | | | | | 4.42 | % | | | | | | | (0.11 | %) | | | | |
| | | | | | |
Net assets at end of period (000’s omitted) | | | $95,730 | | | | | | | | $101,751 | | | | | | | | $110,243 | | | | | |
| | | | | | |
Ratios: 4 | | | | | | | | | | | | | | | | | | | | | | | | |
Expenses | | | 0.55 | % | | | | | | | 0.55 | % | | | | | | | 0.55 | % | | | | |
Net investment income | | | 4.50 | % | | | | | | | 4.24 | % | | | | | | | 3.28 | % | | | | |
| | | | | | |
Portfolio turnover rate (excluding short-term securities) | | | 30.77 | %5 | | | | | | | 89.98 | % | | | | | | | 109.93 | % | | | | |
| 1 | The inception date of Class Y shares was March 31, 2022. |
| 2 | The net investment income per share is based on average shares outstanding for the period. |
| 3 | Total investment return is based on the change in net asset value of a share during the period (not annualized) and assumes reinvestment of distributions at net asset value. |
| 4 | Ratios are annualized for periods less than one year. In addition to fees and expenses which the Fund bears directly, the Fund indirectly bears a pro rata share of the fees and expenses of the acquired funds in which it invests. Such indirect expenses are not included in the above reported expense ratios. |
FINANCIAL HIGHLIGHTS
Per share income and capital changes for a share outstanding throughout the period. See accompanying notes to financial statements.
Sit Tax-Free Income Fund
| | | | | | | | | | | | | | | | | | | | | | | | | | | | | | | | | | | | | | | | | | | | | | | | |
| | | | | | | |
| Class S | | Six Months Ended September 30, 2024 (Unaudited) | | | | | | | | | Year Ended March 31, | | | | | | | |
| | | 2024 | | | 2023 | | | 2022 | | | 2021 | | | 2020 | |
| | | | | | | | | | | | |
Net Asset Value: | | | | | | | | | | | | | | | | | | | | | | | | | | | | | | | | | | | | | | | | | | | | | | | | |
Beginning of period | | | $8.64 | | | | | | | | $8.54 | | | | | | | | $9.20 | | | | | | | | $9.91 | | | | | | | | $9.56 | | | | | | | | $9.69 | | | | | |
Operations: | | | | | | | | | | | | | | | | | | | | | | | | | | | | | | | | | | | | | | | | | | | | | | | | |
Net investment income 1 | | | 0.17 | | | | | | | | 0.30 | | | | | | | | 0.27 | | | | | | | | 0.27 | | | | | | | | 0.29 | | | | | | | | 0.29 | | | | | |
Net realized and unrealized gains (losses) on investments and futures | | | 0.21 | | | | | | | | 0.10 | | | | | | | | (0.66 | ) | | | | | | | (0.71 | ) | | | | | | | 0.35 | | | | | | | | (0.13 | ) | | | | |
| | | | | | | | | | | | |
Total from operations | | | 0.38 | | | | | | | | 0.40 | | | | | | | | (0.39 | ) | | | | | | | (0.44 | ) | | | | | | | 0.64 | | | | | | | | 0.16 | | | | | |
Distributions from: | | | | | | | | | | | | | | | | | | | | | | | | | | | | | | | | | | | | | | | | | | | | | | | | |
Net investment income | | | (0.16 | ) | | | | | | | (0.30 | ) | | | | | | | (0.27 | ) | | | | | | | (0.27 | ) | | | | | | | (0.29 | ) | | | | | | | (0.29 | ) | | | | |
| | | | | | | | | | | | |
Net Asset Value | | | | | | | | | | | | | | | | | | | | | | | | | | | | | | | | | | | | | | | | | | | | | | | | |
End of period | | | $8.86 | | | | | | | | $8.64 | | | | | | | | $8.54 | | | | | | | | $9.20 | | | | | | | | $9.91 | | | | | | | | $9.56 | | | | | |
| | | | | | | | | | | | |
Total investment return 2 | | | 4.47 | % | | | | | | | 4.88 | % | | | | | | | (4.17 | %) | | | | | | | (4.62 | %) | | | | | | | 6.73 | % | | | | | | | 1.66 | % | | | | |
| | | | | | | | | | | | |
Net assets at end of period (000’s omitted) | | | $98,466 | | | | | | | | $100,185 | | | | | | | | $126,041 | | | | | | | | $185,151 | | | | | | | | $348,230 | | | | | | | | $313,296 | | | | | |
| | | | | | | | | | | | |
Ratios: 3 | | | | | | | | | | | | | | | | | | | | | | | | | | | | | | | | | | | | | | | | | | | | | | | | |
Expenses | | | 0.80 | % | | | | | | | 0.80 | % | | | | | | | 0.80 | % | | | | | | | 0.80 | % | | | | | | | 0.80 | % | | | | | | | 0.80 | % | | | | |
Net investment income | | | 3.84 | % | | | | | | | 3.54 | % | | | | | | | 3.18 | % | | | | | | | 2.68 | % | | | | | | | 2.92 | % | | | | | | | 2.95 | % | | | | |
| | | | | | | | | | | | |
Portfolio turnover rate (excluding short-term securities) | | | 13.14 | %4 | | | | | | | 21.77 | % | | | | | | | 15.05 | % | | | | | | | 20.78 | % | | | | | | | 21.22 | % | | | | | | | 14.33 | % | | | | |
| 1 | The net investment income per share is based on average shares outstanding for the period. |
| 2 | Total investment return is based on the change in net asset value of a share during the period (not annualized) and assumes reinvestment of distributions at net asset value. |
| 3 | Ratios are annualized for periods less than one year. In addition to fees and expenses which the Fund bears directly, the Fund indirectly bears a pro rata share of the fees and expenses of the acquired funds in which it invests. Such indirect expenses are not included in the above reported expense ratios. |
| | |
| | | |
| |
| 40 | | FINANCIAL STATEMENTS AND OTHER INFORMATION |
FINANCIAL HIGHLIGHTS
Per share income and capital changes for a share outstanding throughout the period. See accompanying notes to financial statements.
Sit Tax-Free Income Fund
| | | | | | | | | | | | | | | | | | | | | | | | | | | | | | | | |
| | | | |
| Class Y | | Six Months Ended September 30, 2024 (Unaudited) | | | Year Ended March 31, | | | Period Ended March 31, 2022 1 | |
| | | 2024 | | | 2023 | |
| | | | | | | | |
Net Asset Value: | | | | | | | | | | | | | | | | | | | | | | | | | | | | | | | | |
Beginning of period | | | $8.64 | | | | | | | | $8.54 | | | | | | | | $9.20 | | | | | | | | $10.04 | | | | | |
| | | | | | | | |
Operations: | | | | | | | | | | | | | | | | | | | | | | | | | | | | | | | | |
Net investment income 2 | | | 0.18 | | | | | | | | 0.32 | | | | | | | | 0.30 | | | | | | | | 0.24 | | | | | |
Net realized and unrealized gains (losses) on investments and futures | | | 0.21 | | | | | | | | 0.11 | | | | | | | | (0.67 | ) | | | | | | | (0.84 | ) | | | | |
| | | | | | | | |
Total from operations | | | 0.39 | | | | | | | | 0.43 | | | | | | | | (0.37 | ) | | | | | | | (0.60 | ) | | | | |
Distributions from: | | | | | | | | | | | | | | | | | | | | | | | | | | | | | | | | |
Net investment income | | | (0.17 | ) | | | | | | | (0.33 | ) | | | | | | | (0.29 | ) | | | | | | | (0.24 | ) | | | | |
| | | | | | | | |
Net Asset Value | | | | | | | | | | | | | | | | | | | | | | | | | | | | | | | | |
End of period | | | $8.86 | | | | | | | | $8.64 | | | | | | | | $8.54 | | | | | | | | $9.20 | | | | | |
| | | | | | | | |
Total investment return 3 | | | 4.61 | % | | | | | | | 5.13 | % | | | | | | | (3.93 | %) | | | | | | | (6.06 | %) | | | | |
| | | | | | | | |
Net assets at end of period (000’s omitted) | | | $58,755 | | | | | | | | $63,705 | | | | | | | | $117,115 | | | | | | | | $169,263 | | | | | |
| | | | | | | | |
Ratios: 4 | | | | | | | | | | | | | | | | | | | | | | | | | | | | | | | | |
Expenses | | | 0.55 | % | | | | | | | 0.55 | % | | | | | | | 0.55 | % | | | | | | | 0.55 | % | | | | |
Net investment income | | | 4.08 | % | | | | | | | 3.79 | % | | | | | | | 3.43 | % | | | | | | | 3.57 | % | | | | |
| | | | | | | | |
Portfolio turnover rate (excluding short-term securities) | | | 13.14 | %5 | | | | | | | 21.77 | % | | | | | | | 15.05 | % | | | | | | | 20.78 | % | | | | |
| 1 | The inception date of Class Y shares was June 1, 2021. |
| 2 | The net investment income per share is based on average shares outstanding for the period. |
| 3 | Total investment return is based on the change in net asset value of a share during the period (not annualized) and assumes reinvestment of distributions at net asset value. |
| 4 | Ratios are annualized for periods less than one year. In addition to fees and expenses which the Fund bears directly, the Fund indirectly bears a pro rata share of the fees and expenses of the acquired funds in which it invests. Such indirect expenses are not included in the above reported expense ratios. |
FINANCIAL HIGHLIGHTS
Per share income and capital changes for a share outstanding throughout the period. See accompanying notes to financial statements.
Sit Minnesota Tax-Free Income Fund
| | | | | | | | | | | | | | | | | | | | | | | | | | | | | | | | | | | | | | | | | | | | | | | | |
| | | | | | | | | | |
| | | Six Months Ended September 30, 2024 (Unaudited) | | | | | | | | | | | | Year Ended March 31, | | | | | | | | | | | | | |
| | | 2024 | | | 2023 | | | 2022 | | | 2021 | | | 2020 | |
| | | | | | | | | | | | |
Net Asset Value: | | | | | | | | | | | | | | | | | | | | | | | | | | | | | | | | | | | | | | | | | | | | | | | | |
Beginning of period | | | $9.47 | | | | | | | | $9.43 | | | | | | | | $9.94 | | | | | | | | $10.68 | | | | | | | | $10.37 | | | | | | | | $10.49 | | | | | |
| | | | | | | | | | | | |
Operations: | | | | | | | | | | | | | | | | | | | | | | | | | | | | | | | | | | | | | | | | | | | | | | | | |
Net investment income 1 | | | 0.15 | | | | | | | | 0.29 | | | | | | | | 0.27 | | | | | | | | 0.27 | | | | | | | | 0.30 | | | | | | | | 0.30 | | | | | |
Net realized and unrealized gains (losses) on investments and futures | | | 0.18 | | | | | | | | 0.04 | | | | | | | | (0.49 | ) | | | | | | | (0.74 | ) | | | | | | | 0.31 | | | | | | | | (0.12 | ) | | | | |
| | | | | | | | | | | | |
Total from operations | | | 0.33 | | | | | | | | 0.33 | | | | | | | | (0.22 | ) | | | | | | | (0.47 | ) | | | | | | | 0.61 | | | | | | | | 0.18 | | | | | |
Distributions from: | | | | | | | | | | | | | | | | | | | | | | | | | | | | | | | | | | | | | | | | | | | | | | | | |
Net investment income | | | (0.15 | ) | | | | | | | (0.29 | ) | | | | | | | (0.27 | ) | | | | | | | (0.27 | ) | | | | | | | (0.30 | ) | | | | | | | (0.30 | ) | | | | |
From net realized gains | | | — | | | | | | | | — | | | | | | | | (0.02 | ) | | | | | | | — | | | | | | | | — | | | | | | | | — | | | | | |
| | | | | | | | | | | | |
Total distributions | | | (0.15 | ) | | | | | | | (0.29 | ) | | | | | | | (0.29 | ) | | | | | | | (0.27 | ) | | | | | | | (0.30 | ) | | | | | | | (0.30 | ) | | | | |
Net Asset Value | | | | | | | | | | | | | | | | | | | | | | | | | | | | | | | | | | | | | | | | | | | | | | | | |
End of period | | | $9.65 | | | | | | | | $9.47 | | | | | | | | $9.43 | | | | | | | | $9.94 | | | | | | | | $10.68 | | | | | | | | $10.37 | | | | | |
| | | | | | | | | | | | |
Total investment return 2 | | | 3.54 | % | | | | | | | 3.64 | % | | | | | | | (2.08 | %) | | | | | | | (4.56 | %) | | | | | | | 5.94 | % | | | | | | | 1.46 | % | | | | |
| | | | | | | | | | | | |
Net assets at end of period (000’s omitted) | | | $405,137 | | | | | | | | $405,984 | | | | | | | | $466,995 | | | | | | | | $628,164 | | | | | | | | $680,301 | | | | | | | | $642,022 | | | | | |
| | | | | | | | | | | | |
Ratios: 3 | | | | | | | | | | | | | | | | | | | | | | | | | | | | | | | | | | | | | | | | | | | | | | | | |
Expenses | | | 0.80 | % | | | | | | | 0.80 | % | | | | | | | 0.80 | % | | | | | | | 0.80 | % | | | | | | | 0.80 | % | | | | | | | 0.80 | % | | | | |
Net investment income | | | 3.19 | % | | | | | | | 3.15 | % | | | | | | | 2.90 | % | | | | | | | 2.50 | % | | | | | | | 2.83 | % | | | | | | | 2.80 | % | | | | |
| | | | | | | | | | | | |
Portfolio turnover rate (excluding short-term securities) | | | 3.23 | %4 | | | | | | | 5.34 | % | | | | | | | 8.50 | % | | | | | | | 20.82 | % | | | | | | | 12.04 | % | | | | | | | 10.05 | % | | | | |
| 1 | The net investment income per share is based on average shares outstanding for the period. |
| 2 | Total investment return is based on the change in net asset value of a share during the period (not annualized) and assumes reinvestment of distributions at net asset value. |
| 3 | Ratios are annualized for periods less than one year. In addition to fees and expenses which the Fund bears directly, the Fund indirectly bears a pro rata share of the fees and expenses of the acquired funds in which it invests. Such indirect expenses are not included in the above reported expense ratios. |
| | |
| | | |
| |
| 42 | | FINANCIAL STATEMENTS AND OTHER INFORMATION |
[This page is intentionally left blank.]
NOTES TO FINANCIAL STATEMENTS (Unaudited)
Six Months Ended September 30, 2024
The Sit Mutual Funds covered by this report are Sit U.S. Government Securities Fund, Sit Quality Income Fund, Sit Tax-Free Income Fund and Sit Minnesota Tax-Free Income Fund (each a “Fund” and collectively, the “Funds”). The Funds are no-load funds, and are registered under the Investment Company Act of 1940 (as amended) as diversified (except Sit Minnesota Tax-Free Income Fund which is non-diversified), open-end management investment companies, or series thereof. The Sit Quality Income Fund, Sit Tax-Free Income Fund and Sit Minnesota Tax-Free Income Fund are series funds of Sit Mutual Funds II, Inc. Each Fund has 10 billion authorized shares of capital stock. Shares in the Sit U.S. Government Securities Fund have a par value of $0.01, and shares in other Funds have a par value of $0.001. This report covers the bond funds of the Sit Mutual Funds.
The investment objective for each Fund is as follows:
| | |
| |
| Fund | | Investment Objective |
U.S. Government Securities Fund | | High current income and safety of principal. |
Quality Income Fund | | High current income and safety of principal. |
Tax-Free Income Fund | | High current income that is exempt from federal income tax, consistent with the preservation of capital. |
Minnesota Tax-Free Income Fund | | High current income that is exempt from federal regular income tax and Minnesota regular personal income tax, consistent with the preservation of capital. |
The U.S. Government Securities Fund, Quality Income Fund and Tax-Free Income Fund offer Class S and Class Y shares. Both classes of shares have identical voting, dividend and liquidation rights. Income, expenses (other than class specific expenses) and realized and unrealized gains or losses on investments are allocated to each class of shares based upon its relative net assets.
| (2) | Significant Accounting Policies |
The Funds are investment companies and follow accounting and reporting guidance under Financial Accounting Standards Board (“FASB”) Accounting Standards Codification (“ASC”) Topic 946, “Financial Services-Investment Companies”. The following is a summary of significant accounting policies consistently followed by the Funds in the preparation of their financial statements in conformity with U.S. generally accepted accounting principles (“GAAP”).
Investments in Securities
Investment securities are carried at fair value based upon closing market quotations on the last business day of the period. Investments in securities traded on national or international securities exchanges are valued at the last reported sales price prior to the time when assets are valued. Equity securities traded on the over-the-counter market are valued at the last reported sales price or if the last sales price is not available, at the last reported bid price. The sale and bid prices or prices deemed best to reflect fair value quoted by dealers who make markets in these securities are obtained from independent pricing services. Consistent with the Funds’ valuation policies and procedures, the current fair value of certain fixed income securities is provided by an independent pricing service. Fixed income securities for which prices are not available from an independent pricing service but where an active market exists are valued using market quotations obtained from broker-dealers or quotation systems. Securities for which market quotations are not available, such as private placement securities, are valued at fair value according to methods selected in good faith by Sit Investment Associates, Inc. (the “Adviser” or “SIA”) and may include dealer-supplied valuations or other inputs and assumptions that pricing services would typically utilize. Short-term investments of sufficient credit quality with maturities of 60 days or less when acquired, or which subsequently are within 60 days of maturity, are valued at amortized cost, which approximates fair value. Options and futures contracts entered into and held by the Funds are valued at the close of the securities and commodities exchange on which they are traded.
Security transactions are accounted for on the date the securities are purchased or sold. Gains and losses are calculated on the identified cost basis. Interest, including level-yield amortization of long-term bond premium and discount, is recorded on the accrual basis. Amortization of long-term bond premium and discount is calculated using the effective interest rate method. Dividends received from closed-end fund holdings are included in Dividend Income and distributions from capital gains, if any, are included in Net Realized Gain (Loss).
| | |
| | | |
| |
| 44 | | FINANCIAL STATEMENTS AND OTHER INFORMATION |
Delivery and payment for securities which have been purchased by the Funds on a forward commitment or when-issued basis can take place two weeks or more after the transaction date. During this period, such securities are subject to market fluctuations and may increase or decrease in value prior to delivery.
The Minnesota Tax-Free Income Fund concentrates its investments in Minnesota, and therefore may have more credit risk related to the economic conditions in the state of Minnesota than a portfolio with broader geographical diversification.
Derivative Instruments
The Funds apply derivative instrument disclosure standards in order to enable investors to understand how and why the Funds use derivatives, how derivatives are accounted for, and how derivative instruments affect the Funds’ financial statements.
To hedge interest rate risk, the Funds used Treasury options and futures traded on a U.S. exchange. Risks of entering into futures and options contracts include the possibility of an illiquid market and that a change in the value of the option may not correlate with changes in the value of the underlying securities.
The premiums paid for the options represent the cost of the investment and the options are valued daily at their closing price. The Funds recognize a realized gain or loss when the option is sold or expired. Option holdings within the Funds, which may include put options and call options, are subject to loss of value with the passage of time, and may experience a total loss of value upon expiration. With options, there is minimal counterparty risk to the Funds since they are exchange traded.
Upon entering into a futures contract, a Fund is required to deposit either cash or securities in an amount (initial margin) equal to a certain percentage of the contract value. Subsequent payments (variation margin) are made or received by the Fund each day. The variation margin payments are equal to the daily changes in the contract value and are recorded as unrealized gains and losses. The Fund recognizes a realized gain or loss when the contract is closed or expired. With futures contracts, there is minimal counterparty risk to the Fund since futures are exchange traded and the exchange’s clearinghouse, as counterparty to all exchange-traded futures, guarantees the futures against default.
During the six months ended September 30, 2024, the average volume of derivative activity, calculated on a quarterly basis, was as follows:
| | | | | | | | | | | | |
| | | Average Cost | | | Average Premium Received | | | Average Notional Amount | |
U.S. Government Securities Fund | | | | | | | | | | | | |
Purchased put options | | | $427,516 | | | | $248,336 | | | | $58,571,167 | |
Quality Income Fund | | | | | | | | | | | | |
Purchased put options | | | 29,544 | | | | 17,344 | | | | 3,940,500 | |
Treasury futures - short | | | — | | | | — | | | | 12,846,776 | |
Tax-Free Income Fund | | | | | | | | | | | | |
Treasury futures - short | | | — | | | | — | | | | 31,075,050 | |
Minnesota Tax-Free Income Fund | | | | | | | | | | | | |
Treasury futures - short | | | — | | | | — | | | | 97,514,781 | |
The number of open option contracts and open futures contracts outstanding as of September 30, 2024 also serve as indicators of the volume of activity for the Funds throughout the period.
NOTES TO FINANCIAL STATEMENTS (Unaudited)
Six Months Ended September 30, 2024 (Continued)
Statement of Assets and Liabilities – Values of derivatives as of September 30, 2024:
| | | | | | | | |
| | | Asset Derivatives Value | | | Liability Derivatives Value | |
| | | | |
Interest rate risk: | | | | | | | | |
U.S. Government Securities Fund | | | | | | | | |
Put Options Purchased | | | $18,8441 | | | | — | |
Tax-Free Income Fund | | | | | | | | |
Treasury futures | | | — | | | | $53,3942 | |
Minnesota Tax-Free Income Fund | | | | | | | | |
Treasury futures | | | — | | | | 161,6852 | |
| 1 | Statement of Assets and Liabilities location: Investments in Securities, at fair value. |
| 2 | Statement of Assets and Liabilities location: Variation margin receivable/payable. Includes cumulative appreciation (depreciation) of futures as reported in the Schedule of Investments. |
The effect of derivative instruments on the Statement of Operations for the six months ended September 30, 2024:
| | | | | | | | | | | | |
| | | Amount of Realized Gain (Loss) on Derivatives 3 | | | Change in Unrealized Appreciation (Depreciation) on Derivatives 4 | | | |
| | | | |
Interest rate risk: | | | | | | | | |
U.S. Government Securities Fund | | | | | | | | |
Purchased put options | | | ($912,614) | | | | $252,834 | |
Quality Income Fund | | | | | | | | |
Purchased put options | | | (179,372) | | | | 36,601 | |
Treasury futures | | | (85,678) | | | | 15,636 | |
Tax-Free Income Fund | | | | | | | | |
Treasury futures | | | (676,193) | | | | 160,879 | |
Minnesota Tax-Free Income Fund | | | | | | | | | | | | |
Treasury futures | | | (2,067,220) | | | | 531,672 | | | | | |
| 3 | Statement of Operations location: Net realized gain (loss) on investments and net realized gain (loss) on futures, respectively. |
| 4 | Statement of Operations location: Net change in unrealized appreciation (depreciation) on investments and net change in unrealized appreciation (depreciation) on futures, respectively. |
Fair Value Measurements
The inputs and valuation techniques used to measure fair value of the Funds’ net assets are summarized into three levels as described in the hierarchy below:
• Level 1 – quoted prices in active markets for identical securities. An active market for the security is a market in which transactions occur with sufficient frequency and volume to provide pricing information on an ongoing basis. A quoted price in an active market provides the most reliable evidence of fair value.
• Level 2 – debt securities are valued based on evaluated prices received from independent pricing services or from dealers who make markets in such securities. For corporate bonds, U.S. government and government agency obligations, and municipal securities the pricing services utilize matrix pricing which considers yield or price of bonds of comparable quality, coupon, maturity, and type as well as dealer supplied prices. For asset-backed securities and mortgage-backed securities, the pricing services utilize matrix pricing which considers prepayment speed assumptions, attributes of the collateral, yield or price of bonds of comparable quality, coupon, maturity, and type as well as dealer supplied prices. All of these inputs are derived principally from or corroborated by observable market data. An adjustment to any observable input that is significant to the fair value may render the measurement a Level 3 measurement.
• Level 3 – significant unobservable inputs, including the Adviser’s own assumptions in determining the fair value of investments.
| | |
| | | |
| |
| 46 | | FINANCIAL STATEMENTS AND OTHER INFORMATION |
The inputs or methodology used for valuing securities are not necessarily an indication of the risk associated with investing in those securities.
At the end of each calendar quarter, management evaluates the Level 2 and 3 assets and liabilities for changes in liquidity, including but not limited to: whether a broker is willing to execute at the quoted price, the depth and consistency of prices from third party services, and the existence of contemporaneous, observable trades in the market. Additionally, management evaluates the Level 1 and 2 assets and liabilities on a quarterly basis for changes in listings or delistings on national exchanges. Due to the inherent uncertainty of determining the fair value of investments that do not have a readily available market value, the fair value of the Funds’ investments may fluctuate from period to period. Additionally, the fair value of investments may differ significantly from the values that would have been used had a ready market existed for such investments and may differ materially from the values the Fund may ultimately realize. Further, such investments may be subject to legal and other restrictions on resale or otherwise are less liquid than publicly traded securities.
A summary of the levels for the Funds’ investments as of September 30, 2024 is included with the Funds’ schedules of investments.
Federal Taxes
The Funds’ policy is to comply with the requirements of the Internal Revenue Code applicable to regulated investment companies and to distribute all of their taxable income to shareholders. The Funds have recorded in their financial statements the full benefit of their tax positions taken in connection with the Registered Investment Company (RIC) qualification and distribution requirements of the Internal Revenue Code. Therefore, no income tax provision is required. Also, in order to avoid the payment of any federal excise taxes, the Funds will distribute substantially all of their net investment income and net realized gains on a calendar year basis.
Management has analyzed the Funds’ tax positions taken in federal tax returns for all open tax years and has concluded that as of September 30, 2024, no provision for income tax would be required in the Funds’ financial statements. The Funds’ federal and state income and federal excise tax returns remain subject to examination by the Internal Revenue Service and state departments of revenue until such time as the applicable statute of limitations for audit has expired. For example, U.S. tax returns are generally subject to audit for three years from the date they are filed.
At September 30, 2024, the gross unrealized appreciation (depreciation) on investments and cost of investments on a tax basis for federal income tax purposes were as follows:
| | | | | | | | | | | | | | | | |
| | | Unrealized Appreciation | | | Unrealized Depreciation | | | Net Unrealized Appreciation (Depreciation) | | | Cost (Proceeds) of Investments on a Tax Basis | |
U.S. Government Securities Fund - Investments | | | $1,601,678 | | | | ($10,209,418) | | | | ($8,607,740) | | | | $236,061,944 | |
Quality Income Fund - Investments | | | 1,838,267 | | | | (888,709) | | | | 949,558 | | | | 122,125,687 | |
Tax-Free Income Fund - Investments | | | 2,437,039 | | | | (33,641,627) | | | | (31,204,588) | | | | 174,985,544 | |
Minnesota Tax-Free Income Fund - Investments | | | 3,948,708 | | | | (49,705,060) | | | | (45,756,352) | | | | 429,446,935 | |
Net investment income and net realized gains (losses) may differ for financial statement and tax purposes. The character of distributions made during the year from net investment income or net realized gains (losses) may also differ from its ultimate characterization for tax purposes. The tax character of distributions paid during the fiscal years ended March 31, 2024 and 2023 was as follows:
NOTES TO FINANCIAL STATEMENTS (Unaudited)
Six Months Ended September 30, 2024 (Continued)
| | | | | | | | | | | | | | | | |
Year Ended March 31, 2024: | | | | | | | | | | | | | | | | |
| | | Ordinary Income | | | Tax-Exempt Income | | | Long Term Capital Gain | | | Total | |
U.S. Government Securities Fund | | | $10,122,712 | | | | — | | | | — | | | | $10,122,712 | |
Quality Income Fund | | | 5,650,057 | | | | — | | | | — | | | | 5,650,057 | |
Tax-Free Income Fund* | | | 32,379 | | | | $6,718,290 | | | | — | | | | 6,750,669 | |
Minnesota Tax-Free Income Fund* | | | 139,205 | | | | 13,459,633 | | | | — | | | | 13,598,838 | |
|
*99.5% and 99.0% of dividends were derived from interest on tax-exempt securities for the Tax-Free Income and Minnesota Tax-Free Income Funds, respectively. | |
| | | | |
Year Ended March 31, 2023: | | | | | | | | | | | | | | | | |
| | | Ordinary Income | | | Tax-Exempt Income | | | Long Term Capital Gain | | | Total | |
U.S. Government Securities Fund | | | $10,557,075 | | | | — | | | | — | | | | $10,557,075 | |
Quality Income Fund | | | 5,260,552 | | | | — | | | | $1,898,896 | | | | 7,159,448 | |
Tax-Free Income Fund* | | | 37,474 | | | | $8,984,449 | | | | — | | | | 9,021,923 | |
Minnesota Tax-Free Income Fund* | | | 1,213,125 | | | | 14,910,072 | | | | — | | | | 16,123,197 | |
*99.6% and 92.5% of dividends were derived from interest on tax-exempt securities for the Tax-Free Income and Minnesota Tax-Free Income Funds, respectively.
As of March 31, 2024, the components of distributable earnings on a tax basis were as follows:
| | | | | | | | | | | | | | | | |
| | | Undistributed Ordinary Income | | | Undistributed Tax-Exempt Income | | | Accumulated Gain (Loss) | | | Unrealized Appreciation (Depreciation) | |
U.S. Government Securities Fund | | | — | | | | — | | | | ($26,275,064) | | | | ($17,944,715) | |
Quality Income Fund | | | $2,749 | | | | — | | | | (5,888,486) | | | | (1,837,235) | |
Tax-Free Income Fund | | | — | | | | $91,173 | | | | (21,767,613) | | | | (38,503,002) | |
Minnesota Tax-Free Income Fund | | | — | | | | — | | | | (9,415,429) | | | | (56,161,198) | |
Net capital loss carryovers and late year losses, if any, as of March 31, 2024, are available to offset future realized capital gains and thereby reduce future capital gains distributions. The Funds are permitted to carry forward capital losses for an unlimited period. Capital losses that are carried forward retain their character as either short-term or long-term capital losses. The net capital loss carryovers and the late year losses deferred as of March 31, 2024, were as follows:
| | | | | | | | | | | | | | | | |
| | | Unlimited Period of Net Capital Loss Carryover | | | Late Year Losses | | | Accumulated Capital and | |
| | | Short-Term | | | Long-Term | | | Deferred | | | Other Losses | |
U.S. Government Securities Fund | | | $5,656,698 | | | | $20,618,366 | | | | — | | | | $26,275,064 | |
Quality Income Fund | | | 2,304,742 | | | | 3,583,744 | | | | — | | | | 5,888,486 | |
Tax-Free Income Fund | | | 2,776,508 | | | | 18,991,105 | | | | — | | | | 21,767,613 | |
Minnesota Tax-Free Income Fund | | | — | | | | 9,415,429 | | | | — | | | | 9,415,429 | |
| | |
| | | |
| |
| 48 | | FINANCIAL STATEMENTS AND OTHER INFORMATION |
Distributions
Distributions to shareholders are recorded as of the close of business on the record date. Such distributions are payable in cash or reinvested in additional shares of the Funds’ capital stock. Distributions from net investment income are declared daily and paid monthly for the Funds. Distributions from net realized gains, if any, will be made annually for each of the Funds.
Use of Estimates
The preparation of financial statements in conformity with U.S. generally accepted accounting principles requires management to make certain estimates and assumptions that affect the reported amounts of assets and liabilities and disclosure of contingent assets and liabilities at the date of the financial statements and the reported results for the respective periods. Actual results could differ from those estimates.
Guarantees and Indemnifications
Under each Fund’s organizational documents, its officers and directors are indemnified against certain liability arising out of the performance of their duties to each Fund. In addition, certain of each Fund’s contracts with its service providers contain general indemnification clauses. Each Fund’s maximum exposure under these arrangements is unknown since the amount of any future claims that may be made against each Fund cannot be determined and each Fund has no historical basis for predicting the likelihood of any such claims.
| (3) | Investment Security Transactions |
The cost of purchases and proceeds from sales and maturities of investment securities, other than short-term securities, for the six months ended September 30, 2024, were as follows:
| | | | | | | | | | | | | | | | |
| | | Purchases | | | Proceeds | |
| | | | |
| | | | |
| | | U.S. Government | | | Other | | | U.S. Government | | | Other | |
| | | | |
U.S. Government Securities Fund | | | $26,875,049 | | | | — | | | | $49,674,442 | | | | $1,423,419 | |
Quality Income Fund | | | 16,303,240 | | | | $20,866,125 | | | | 19,932,504 | | | | 25,984,218 | |
Tax-Free Income Fund | | | — | | | | 19,403,768 | | | | — | | | | 30,358,546 | |
Minnesota Tax-Free Income Fund | | | — | | | | 12,293,031 | | | | — | | | | 23,790,466 | |
| (4) | Affiliated Fees and Transactions |
Investment Adviser
The Funds each have entered into an investment management agreement with Sit Investment Associates Inc., under which SIA manages the Funds’ assets and provides research, statistical and advisory services, and pays related office rental, executive expenses and executive salaries. In addition, the Funds have entered into separate supervision and administration agreements with SIA. SIA also is obligated to pay all of the Funds’ expenses (excluding extraordinary expenses, stock transfer taxes, interest, brokerage commissions, and other transaction charges relating to investing activities). The fees charged to each Fund by SIA are based on the average daily net assets of the Funds at the annual rate of:
NOTES TO FINANCIAL STATEMENTS (Unaudited)
Six Months Ended September 30, 2024 (Continued)
| | | | | | |
| | | Advisory Fees | | Supervisory and Administrative Fees | | Total Management Fees |
U.S. Government Securities Fund Class S | | 0.20% | | 0.60% | | 0.80% |
U.S. Government Securities Fund Class Y | | 0.20% | | 0.35% | | 0.55% |
Quality Income Fund Class S1 | | 0.20% | | 0.60% | | 0.80% |
Quality Income Fund Class Y1 | | 0.20% | | 0.35% | | 0.55% |
Tax-Free Income Fund Class S | | 0.20% | | 0.60% | | 0.80% |
Tax-Free Income Fund Class Y | | 0.20% | | 0.35% | | 0.55% |
Minnesota Tax-Free Income Fund | | 0.20% | | 0.60% | | 0.80% |
| 1 | Effective April 1, 2022, the advisory fee for Sit Quality Income Fund was voluntarily reduced from 0.30% to 0.20%; the fees presented reflect the fees net of the Adviser’s voluntary fee waiver. |
Transactions with affiliates
The Adviser, affiliates of the Adviser, directors and officers of the Funds as a whole owned the following shares as of September 30, 2024:
| | | | | | | | |
| | | Shares | | | % Shares Outstanding | |
U.S. Government Securities Fund Class S | | | 148,096 | | | | 0.9 | |
U.S. Government Securities Fund Class Y | | | 1,075,384 | | | | 19.5 | |
Quality Income Fund Class S | | | 957,255 | | | | 32.5 | |
Quality Income Fund Class Y | | | 9,245,487 | | | | 93.2 | |
Tax-Free Income Fund Class S | | | 232,438 | | | | 2.1 | |
Tax-Free Income Fund Class Y | | | 958,606 | | | | 14.5 | |
Minnesota Tax-Free Income Fund | | | 1,320,841 | | | | 3.1 | |
The Funds, together with the 10 equity Sit Mutual Funds managed by SIA, are borrowers in a $20 million credit facility (Credit Facility) maturing November 28, 2024. The Credit Facility provides a source of funds to the Borrowers for temporary and emergency purposes, including the ability to meet future unanticipated or unusually large redemption requests. Under the terms of the Credit Facility, each Fund shall pay interest charged on any borrowings made by the Fund. During the six months ended September 30, 2024, the Funds did not use the Credit Facility.
| | |
| | | |
| |
| 50 | | FINANCIAL STATEMENTS AND OTHER INFORMATION |
ADDITIONAL INFORMATION
PROXY VOTING
A description of the policies and procedures that the Adviser uses to vote proxies related to the Funds’ portfolio securities is set forth in the Funds’ Statement of Additional Information, which is available on the Funds’ website at www.sitfunds.com, without charge by calling 800-332-5580 and on the Securities and Exchange Commission’s (SEC) website at www.sec.gov. The Funds’ proxy voting record is available without charge by calling 800-332-5580 and on the SEC’s website at www.sec.gov no later than August 31 for the prior 12 months ending June.
QUARTERLY SCHEDULES OF INVESTMENTS
Each Fund files a complete schedule of investments with the SEC for the first and third quarters of each fiscal year on Form N-PORT. The Funds’ Form N-PORT is available on the SEC’s website at www.sec.gov. Each Fund’s complete schedule of investments, as filed on Form N-PORT, is also available on its website at www.sitfunds.com, or without charge by calling 800-332-5580.
[This page is intentionally left blank.]
| | |
| | | |
| |
| 52 | | FINANCIAL STATEMENTS AND OTHER INFORMATION |
Item 8: Changes in and Disagreements with Accountants for Open-End Management Investment Companies.
None.
Item 9: Proxy Disclosures for Open-End Management Investment Companies.
None.
Item 10: Remuneration Paid to Directors, Officers, and Others of Open-End Management Investment Companies.
Six Months ended September 30, 2024
| | | | |
Name of Director | | Aggregate Renumeration Paid
by all 14 of the Sit Mutual Funds | |
Edward M. Giles | | $ | 24,000 | |
Sidney L. Jones | | $ | 24,000 | |
Bruce C. Lueck | | $ | 24,000 | |
Donald W. Phillips | | $ | 24,000 | |
Barry N. Winslow | | $ | 24,000 | |
Item 11: Statement Regarding Basis for Approval of Investment Advisory Contract.
None. The Board of Directors did not approve the investment advisory contracts during the Registrant’s most recent fiscal half-year ended September 30, 2024. Investment advisory contracts were approved by the Board of Directors on October 30, 2023.
Item 12: Disclosure of Proxy Voting Policies and Procedures for Closed-End Management Investment Companies.
Not applicable to open-end investment companies.
Item 13: Portfolio Managers of Closed-End Management Investment Companies.
Not applicable to open-end investment companies.
Item 14: Purchases of Equity Securities by Closed-End Management Investment Company and Affiliated Purchasers.
Not applicable to open-end investment companies.
Item 15: Submission of Matters to a Vote of Security Holders.
There have been no material changes to the procedures by which shareholders may recommend nominees to the Registrant’s board of directors since the Registrant last submitted a proxy statement to its shareholders.
Item 16: Controls and Procedures.
(a) The Registrant’s principal executive officer and principal financial officer have concluded, based on their evaluation of the Registrant’s disclosure controls and procedures (as such term in defined in Rule 30a-3 under the Investment Company Act of 1940), that such controls and procedures are adequate and reasonably designed to achieve the purposes described in paragraph (c) of such rule.
(b) There were no changes in the Registrant’s internal controls over financial reporting (as defined in Rule 30a-3(d) under the Investment Company Act of 1940) that occurred during the period covered by this report that has materially affected, or is reasonably likely to materially affect, the Registrant’s internal control over financial reporting.
Item 17: Disclosure of Securities Lending Activities for Closed-End Management Investment Companies.
Not applicable to open-end investment companies.
Item 18: Recovery of Erroneously Awarded Compensation.
None.
Item 19: Exhibits.
(a)(1) None.
(a)(2) Not applicable.
(a)(3) A separate certification from the principal executive officer and principal financial officer of the Registrant as required by Rule 30a-2(a) under the Investment Company Act of 1940 (certification required by Section 302 of the Sarbanes-Oxley Act of 2002) are attached as an exhibit hereto.
(b) The certification required by Rule 30a-2(b) under the Investment Company Act of 1940 (certification required by Section 906 of the Sarbanes-Oxley Act of 2002) is attached as an exhibit hereto.
SIGNATURES
Pursuant to the requirements of the Securities Exchange Act of 1934 and the Investment Company Act of 1940, the Registrant has duly caused this report to be signed on its behalf by the undersigned, thereunto duly authorized.
Sit U.S. Government Securities Fund, Inc.
| | | | |
| By (Signature and Title) | | /s/ Paul E. Rasmussen | | |
| | Paul E. Rasmussen | | |
| | VP, Treasurer, CCO & Secretary | | |
| | Principal Financial Officer | | |
| |
| Date November 21, 2024 | | |
Pursuant to the requirements of the Securities Exchange Act of 1934 and the Investment Company Act of 1940, this report has been signed below by the following persons on behalf of the Registrant and in the capacities and on the dates indicated.
| | | | |
| By (Signature and Title) | | /s/ Paul E. Rasmussen | | |
| | Paul E. Rasmussen | | |
| | VP, Treasurer, CCO & Secretary | | |
| | Principal Financial Officer | | |
|
| Date November 21, 2024 |
| | |
| By (Signature and Title) | | /s/ Roger J. Sit | | |
| | Roger J. Sit | | |
| | Chairman and President | | |
| | Principal Executive Officer | | |
|
| Date November 21, 2024 |