UNITED STATES
SECURITIES AND EXCHANGE COMMISSION
Washington, D.C. 20549
FORM N-CSR
CERTIFIED SHAREHOLDER REPORT OF REGISTERED
MANAGEMENT INVESTMENT COMPANIES
Investment Company Act file number 811-5017
Ivy Variable Insurance Portfolios
(Exact name of registrant as specified in charter)
6300 Lamar Avenue, Overland Park, Kansas 66202
(Address of principal executive offices) (Zip code)
Wendy J. Hills
6300 Lamar Avenue
Overland Park, Kansas 66202
(Name and address of agent for service)
Registrant’s telephone number, including area code: 913-236-2000
Date of fiscal year end: December 31
Date of reporting period: December 31, 2016
ITEM 1. REPORTS TO STOCKHOLDERS.
| | |
 | | Annual Report DECEMBER 31, 2016 |
|
| Ivy Variable Insurance Portfolios |
| Pathfinder Aggressive |
| Pathfinder Conservative |
| Pathfinder Moderate |
| Pathfinder Moderately Aggressive |
| Pathfinder Moderately Conservative |
| Pathfinder Moderate — Managed Volatility |
| Pathfinder Moderately Aggressive — Managed Volatility |
| Pathfinder Moderately Conservative — Managed Volatility |
| Asset Strategy |
| Balanced |
| Bond |
| Core Equity |
| Dividend Opportunities |
| Energy |
| Global Bond |
| Global Growth |
| Global Natural Resources |
| Government Money Market |
| Growth |
| High Income |
| International Core Equity |
| Limited — Term Bond |
| Micro Cap Growth |
| Mid Cap Growth |
| Real Estate Securities |
| Science and Technology |
| Small Cap Growth |
| Small Cap Value |
| Value |
| | |
| PRESIDENT’S LETTER | | IVY VIP |
| | |

| | DECEMBER 31, 2016 (UNAUDITED) |
| Philip J. Sanders, CFA | | |
Dear Shareholder,
The 12 months of 2016 were one of the most unusual in recent memory, bringing market volatility, political surprises and, by year-end, a strong upswing in the equity markets. Across the fiscal year, investors endured concerns about global economic growth, the level of interest rates, fluctuation in oil prices and the outcome of the U.S. presidential election. As 2016 closed, the domestic equity markets had risen by double digits and the bond market had seen a moderate rise. See the table for a year-over-year comparison in some common market metrics.
Many investors may be unsettled by the prospect that continued change — in leadership of key countries around the world, in government policy, in interest rate levels — will cause market volatility and general uncertainty. While that may be true in the short term, we believe it is important to stay focused on the fundamentals and merits of sectors, industries and companies when making investment decisions. Those fundamentals historically have tended to outweigh external factors such as government policies and regulations. While government policies can affect every business and investor, we think the innovation and skill of individual companies ultimately drives long-term success.
At year-end 2016, the U.S. economy remained fundamentally sound. The U.S. remains a relative bright spot in the world, supported primarily by the U.S. consumer, who is benefitting from lower energy prices, lower inflation in general and an improved labor market. Demand for cars, homes and furnishings has been healthy.
The Federal Reserve raised interest rates in December, with an indication that two to three more increases may be executed in 2017. We believe that job growth and inflation will be the most important determinants in the direction of long-term central bank policy. Overseas, the European Central Bank and Bank of Japan are actively engaged in aggressive easing. As yet, these steps are not leading to any notable strengthening of economic activity.
China, in the face of economic softening, has turned toward more aggressive stimulus. We believe economic growth in China is likely to hold steady, which should support broader global growth.
While challenges remain, we do see potential catalysts for growth in several areas and industries and our team continues to seek investment opportunities around the globe.
Economic Snapshot
| | | | | | | | |
| | | 12/31/16 | | | 12/31/15 | |
S&P 500 Index | | | 2,238.83 | | | | 2,043.94 | |
MSCI EAFE Index | | | 1,684.00 | | | | 1,716.28 | |
10-Year Treasury Yield | | | 2.45 | % | | | 2.27 | % |
U.S. unemployment rate | | | 4.7 | % | | | 5.0 | % |
30-year fixed mortgage rate | | | 4.32 | % | | | 4.01 | % |
Oil price per barrel | | | $53.72 | | | | $37.04 | |
Sources: Bloomberg, U.S. Department of Labor, MBA, CME
All government statistics shown are subject to periodic revision. The S&P 500 Index is an unmanaged index that tracks the stocks of 500 primarily large-cap U.S. companies. MSCI EAFE Index is an unmanaged index comprised of securities that represent the securities markets in Europe, Australasia and the Far East. It is not possible to invest directly in any of these indexes. Mortgage rates are from BankRate and reflect the overnight national average rate on a conventional 30-year fixed loan. Oil prices reflect the market price of West Texas intermediate grade crude.
Respectfully,

Philip J. Sanders, CFA
President
The opinions expressed in this letter are those of the President of the Ivy Variable Insurance Portfolios and are current only through the end of the period of the report, as stated on the cover. The President’s views are subject to change at any time, based on market and other conditions, and no forecasts can be guaranteed.
| | |
| ILLUSTRATION OF PORTFOLIO EXPENSES | | IVY VIP |
(UNAUDITED)
Expense Example
As a shareholder of a Portfolio, you incur ongoing costs, including management fees, distribution and service fees, and other Portfolio expenses. The following table is intended to help you understand your ongoing costs (in dollars) of investing in a Portfolio and to compare these costs with the ongoing costs of investing in other mutual funds. As a shareholder in the underlying Ivy VIP Portfolios, the Pathfinder Aggressive, Pathfinder Conservative, Pathfinder Moderate, Pathfinder Moderately Aggressive and Pathfinder Moderately Conservative Portfolios (collectively, the “Pathfinder Portfolios”) and the Pathfinder Moderate — Managed Volatility, Pathfinder Moderately Aggressive — Managed Volatility and Pathfinder Moderately Conservative — Managed Volatility Portfolios (collectively, the “Managed Volatility Portfolios”) will indirectly bear their pro rata share of the expenses incurred by the underlying funds. These expenses are not included in the Pathfinder Portfolios or Managed Volatility Portfolios annualized expense ratios or the expenses paid during the period. These expenses are, however, included in the effective expenses paid during the period. The example is based on an investment of $1,000 invested at the beginning of the period and held for the six-month period ended December 31, 2016.
Actual Expenses
The first section in the following table provides information about actual investment values and actual expenses. You may use the information in this section, together with your initial investment in Portfolio shares, to estimate the expenses that you paid over the period. Simply divide the value of that investment by $1,000 (for example, a $7,500 initial investment divided by $1,000 = 7.5), then multiply the result by the number in the first section under the heading entitled “Expenses Paid During Period” to estimate the expenses you paid on your investment during this period. In addition, there are fees and expenses imposed under the variable annuity or variable life insurance contract through which shares of the Portfolio are held. Additional fees have the effect of reducing investment returns.
Hypothetical Example for Comparison Purposes
The second section in the following table provides information about hypothetical investment values and hypothetical expenses based on the Portfolio’s actual expense ratio and an assumed rate of return of five percent per year before expenses, which is not the Portfolio’s actual return. The hypothetical investment values and expenses may not be used to estimate the actual investment value at the end of the period or expenses you paid for the period. You may use this information to compare the ongoing costs of investing in the Portfolio and other funds. To do so, compare this five percent hypothetical example with the five percent hypothetical examples that appear in the shareholder reports of the other funds.
Please note that the expenses shown in the table are meant to highlight your ongoing costs as a shareholder of the Portfolio and do not reflect any fees and expenses imposed under the variable annuity or variable life insurance contract through which shares of the Portfolio are held.
Expenses paid may be impacted by expense reduction arrangements. If those arrangements had not been in place, expenses paid would have been higher. See Note 7 to the Financial Statements for further information.
| | |
| ILLUSTRATION OF PORTFOLIO EXPENSES | | IVY VIP |
(UNAUDITED)
| | | | | | | | | | | | | | | | | | | | | | | | | | | | |
| | | Actual(1) | | | Hypothetical(2) | | | | |
| Portfolio | | Beginning
Account
Value
6-30-16 | | | Ending
Account
Value
12-31-16 | | | Expenses
Paid During
Period* | | | Beginning
Account
Value
6-30-16 | | | Ending
Account
Value
12-31-16 | | | Expenses
Paid During
Period* | | | Annualized
Expense Ratio
Based on the
Six-Month
Period | |
Pathfinder Aggressive | | $ | 1,000 | | | $ | 1,064.60 | | | $ | 0.31 | | | $ | 1,000 | | | $ | 1,024.87 | | | $ | 0.30 | | | | 0.07% | |
Pathfinder Conservative | | $ | 1,000 | | | $ | 1,030.00 | | | $ | 0.30 | | | $ | 1,000 | | | $ | 1,024.92 | | | $ | 0.30 | | | | 0.06% | |
Pathfinder Moderate | | $ | 1,000 | | | $ | 1,044.60 | | | $ | 0.20 | | | $ | 1,000 | | | $ | 1,025.04 | | | $ | 0.20 | | | | 0.03% | |
Pathfinder Moderately Aggressive | | $ | 1,000 | | | $ | 1,053.20 | | �� | $ | 0.21 | | | $ | 1,000 | | | $ | 1,025.03 | | | $ | 0.20 | | | | 0.03% | |
Pathfinder Moderately Conservative | | $ | 1,000 | | | $ | 1,037.00 | | | $ | 0.20 | | | $ | 1,000 | | | $ | 1,025.01 | | | $ | 0.20 | | | | 0.04% | |
Pathfinder Moderate — Managed Volatility | | $ | 1,000 | | | $ | 1,033.50 | | | $ | 1.22 | | | $ | 1,000 | | | $ | 1,024.01 | | | $ | 1.21 | | | | 0.24% | |
Pathfinder Moderately Aggressive — Managed Volatility | | $ | 1,000 | | | $ | 1,053.20 | | | $ | 1.54 | | | $ | 1,000 | | | $ | 1,023.68 | | | $ | 1.52 | | | | 0.30% | |
Pathfinder Moderately Conservative — Managed Volatility | | $ | 1,000 | | | $ | 1,025.50 | | | $ | 1.42 | | | $ | 1,000 | | | $ | 1,023.82 | | | $ | 1.42 | | | | 0.27% | |
Asset Strategy | | $ | 1,000 | | | $ | 1,001.20 | | | $ | 5.00 | | | $ | 1,000 | | | $ | 1,020.17 | | | $ | 5.05 | | | | 1.00% | |
Balanced | | $ | 1,000 | | | $ | 1,023.00 | | | $ | 5.16 | | | $ | 1,000 | | | $ | 1,020.15 | | | $ | 5.15 | | | | 1.00% | |
Bond | | $ | 1,000 | | | $ | 980.00 | | | $ | 3.86 | | | $ | 1,000 | | | $ | 1,021.29 | | | $ | 3.94 | | | | 0.78% | |
Core Equity | | $ | 1,000 | | | $ | 1,042.70 | | | $ | 4.90 | | | $ | 1,000 | | | $ | 1,020.39 | | | $ | 4.85 | | | | 0.96% | |
Dividend Opportunities | | $ | 1,000 | | | $ | 1,044.10 | | | $ | 5.21 | | | $ | 1,000 | | | $ | 1,020.15 | | | $ | 5.15 | | | | 1.00% | |
Energy | | $ | 1,000 | | | $ | 1,159.90 | | | $ | 6.37 | | | $ | 1,000 | | | $ | 1,019.29 | | | $ | 5.96 | | | | 1.17% | |
Global Bond | | $ | 1,000 | | | $ | 1,020.40 | | | $ | 2.12 | | | $ | 1,000 | | | $ | 1,023.15 | | | $ | 2.12 | | | | 0.41% | |
Global Growth | | $ | 1,000 | | | $ | 1,031.50 | | | $ | 5.79 | | | $ | 1,000 | | | $ | 1,019.48 | | | $ | 5.76 | | | | 1.14% | |
Global Natural Resources | | $ | 1,000 | | | $ | 1,113.00 | | | $ | 7.08 | | | $ | 1,000 | | | $ | 1,018.47 | | | $ | 6.76 | | | | 1.34% | |
Government Money Market | | $ | 1,000 | | | $ | 1,000.90 | | | $ | 2.30 | | | $ | 1,000 | | | $ | 1,022.87 | | | $ | 2.33 | | | | 0.46% | |
Growth | | $ | 1,000 | | | $ | 1,056.80 | | | $ | 5.04 | | | $ | 1,000 | | | $ | 1,020.27 | | | $ | 4.95 | | | | 0.98% | |
High Income | | $ | 1,000 | | | $ | 1,080.70 | | | $ | 4.68 | | | $ | 1,000 | | | $ | 1,020.70 | | | $ | 4.55 | | | | 0.89% | |
International Core Equity | | $ | 1,000 | | | $ | 1,069.10 | | | $ | 6.00 | | | $ | 1,000 | | | $ | 1,019.39 | | | $ | 5.86 | | | | 1.15% | |
Limited-Term Bond | | $ | 1,000 | | | $ | 991.80 | | | $ | 3.98 | | | $ | 1,000 | | | $ | 1,021.18 | | | $ | 4.04 | | | | 0.80% | |
Micro Cap Growth | | $ | 1,000 | | | $ | 1,172.50 | | | $ | 7.17 | | | $ | 1,000 | | | $ | 1,018.65 | | | $ | 6.66 | | | | 1.30% | |
Mid Cap Growth | | $ | 1,000 | | | $ | 1,040.50 | | | $ | 5.61 | | | $ | 1,000 | | | $ | 1,019.66 | | | $ | 5.55 | | | | 1.10% | |
Real Estate Securities | | $ | 1,000 | | | $ | 940.80 | | | $ | 5.73 | | | $ | 1,000 | | | $ | 1,019.29 | | | $ | 5.96 | | | | 1.17% | |
Science and Technology | | $ | 1,000 | | | $ | 1,116.90 | | | $ | 6.14 | | | $ | 1,000 | | | $ | 1,019.44 | | | $ | 5.86 | | | | 1.14% | |
Small Cap Growth | | $ | 1,000 | | | $ | 1,065.00 | | | $ | 5.89 | | | $ | 1,000 | | | $ | 1,019.47 | | | $ | 5.76 | | | | 1.14% | |
Small Cap Value | | $ | 1,000 | | | $ | 1,163.60 | | | $ | 6.27 | | | $ | 1,000 | | | $ | 1,019.40 | | | $ | 5.86 | | | | 1.15% | |
Value | | $ | 1,000 | | | $ | 1,131.30 | | | $ | 5.33 | | | $ | 1,000 | | | $ | 1,020.17 | | | $ | 5.05 | | | | 1.00% | |
| * | Portfolio expenses are equal to the Portfolio’s annualized expense ratio (provided in the table), multiplied by the average account value over the period, multiplied by 184 days in the six-month period ended December 31, 2016, and divided by 366. |
| (1) | This section uses the Portfolio’s actual total return and actual Portfolio expenses. It is a guide to the actual expenses paid by the Portfolio in the period. The “Ending Account Value” shown is computed using the Portfolio’s actual return and the “Expenses Paid During Period” column shows the dollar amount that would have been paid by an investor who started with $1,000 in the Portfolio. A shareholder may use the information here, together with the dollar amount invested, to estimate the expenses that were paid over the period. For every thousand dollars a shareholder has invested, the expenses are listed in the last column of this section. |
| (2) | This section uses a hypothetical five percent annual return and actual Portfolio expenses. It helps to compare the Portfolio’s ongoing costs with other mutual funds. A shareholder can compare the Portfolio’s ongoing costs by comparing this hypothetical example with the hypothetical examples that appear in shareholder reports of other Portfolios. |
The above illustrations are based on ongoing costs only.
| | |
| MANAGEMENT DISCUSSION | | PATHFINDER PORTFOLIOS |
(UNAUDITED)

Chace Brundige

Cynthia P. Prince-Fox

Aaron Young
Below, Cynthia Prince-Fox, F. Chace Brundige, CFA, and Aaron Young, portfolio managers of each of the five Ivy VIP Pathfinder Portfolios and the three Ivy VIP Pathfinder Managed Volatility Portfolios, discuss positioning, performance and results for the fiscal year ended December 31, 2016. Ms. Prince-Fox, who has 33 years of industry experience, and Mr. Brundige, who has 23 years of industry experience, have managed each VIP Pathfinder Portfolio and VIP Pathfinder Managed Volatility Portfolio since June 2016. Mr. Young, who has 11 years of industry experience, joined the team as a co-portfolio manager on October 2016. The VIP Pathfinder Portfolios and VIP Pathfinder Managed Volatility Portfolios previously were managed by Michael Avery, who retired effective June 30, 2016. Since the Ivy VIP Pathfinder Managed Volatility Portfolios’ inception, Advantus Capital Management, Inc., has served as the subadvisor for the volatility management strategy of the Ivy VIP Pathfinder Managed Volatility Portfolios through portfolio managers David Kuplic, CFA, FRM and Craig Stapleton, CFA. Mr. Kuplic has 33 years of industry experience and Mr. Stapleton has 15 years of industry experience.
Fiscal Year Performance
| | | | |
For the 12 Months Ended December 31, 2016 | |
Ivy VIP Pathfinder Aggressive | | | 4.80% | |
Ivy VIP Pathfinder Conservative | | | 2.84% | |
Ivy VIP Pathfinder Moderate | | | 3.65% | |
Ivy VIP Pathfinder Moderately Aggressive | | | 4.52% | |
Ivy VIP Pathfinder Moderately Conservative | | | 3.10% | |
Ivy VIP Pathfinder Moderate — Managed Volatility | | | 1.81% | |
Ivy VIP Pathfinder Moderately Aggressive — Managed Volatility | | | 2.36% | |
Ivy VIP Pathfinder Moderately Conservative — Managed Volatility | | | 1.21% | |
Benchmarks For the 12 Months Ended December 31, 2016 | |
S&P 500 Index | | | 11.96% | |
(generally reflects the performance of large-capitalization U.S. stocks) | |
Barclays U.S. Aggregate Bond Index | | | 2.65% | |
(generally reflects the performance of most U.S.-traded investment grade bonds) | |
Barclays U.S. Treasury Bills: 1-3 Month Index | | | 0.26% | |
(generally reflects the performance of investment-grade Treasury bills, representing cash) | | | | |
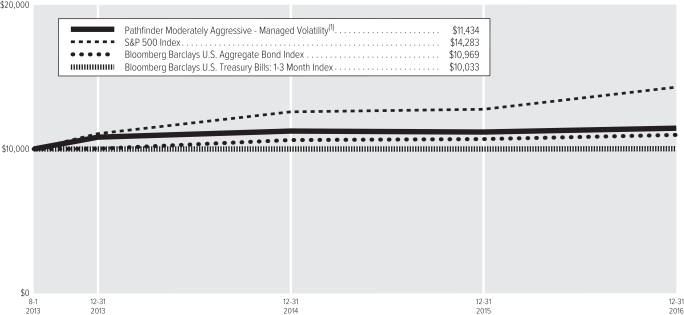
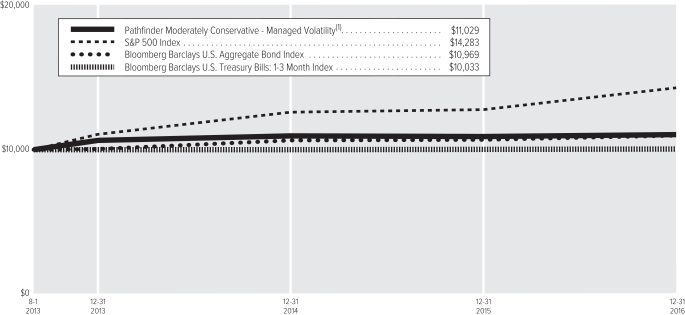
Past performance is not a guarantee of future results. For additional performance information for each Portfolio, please see the Comparison of Change in Value of a $10,000 Investment and the Average Annual Total Return information for each Portfolio found in this report.
Please note that the Portfolio returns include applicable investment fees and expenses, whereas the index returns do not include any such fees. Also, each Portfolio’s performance data does not take into account any product expenses or charges associated with owning a variable life or annuity policy, which is invested in Ivy Variable Insurance Portfolios.
Macro events drive volatile year
“Risk-off” seemed to be the operative term in global fixed income, equity and currency markets during the first half of the fiscal year. China devalued its currency in January 2016 following the U.S. Federal Reserve’s (Fed) 0.25-percentage-point interest rate hike in December 2015, and voters in the U.K. on June 23 approved a proposal to leave the European Union — the so-called “Brexit.” By the fourth quarter, and especially after the surprise U.S. presidential election victory of Donald Trump, a general “risk-on” environment had taken hold in financial markets and both business and consumer sentiment improved.
U.S. Treasury 10-year yields began the year around 2.27% and then declined to a post-Brexit low of about 1.36% before rebounding steadily through the third quarter. In the days immediately following the U.S. elections, most global developed market yields moved higher and the U.S. Treasury 10-year securities closed the year around 2.44%.
The S&P 500 index declined almost 10% to start the year, moving from 2,012 on January 4 to 1,829 in mid-February. Except for some volatility around the Brexit vote and the U.S. elections, equities subsequently climbed higher and ended the year around 2,238.
The value of the broad, trade-weighted U.S. dollar began the year in a softer trend versus both developed and emerging market currencies. That continued through April before the U.S. dollar unevenly strengthened and accelerated after the U.S. elections. The Fed raised short-term rates by 0.25 percentage point in December 2016. With continued improvements in the labor market and wages finally turning higher, the Fed indicated that it anticipates three more interest rate hikes in 2017.
The Bank of Japan announced in September that its target for the 10-year Japanese government bond would be “around zero,” while it continued its asset purchase program. The European Central Bank (ECB) cut rates in March and expanded its quantitative easing facility. It also announced its Corporate Sector Purchase Program — moving beyond suppression of the “risk-free” rate in the euro and into compression of credit spreads. In December, the ECB announced a nine-month extension to the asset purchase program and, conversely, a reduction in the amount purchased each month.
We expect the final global gross domestic product growth rate to be about 3% for 2016. For 2017, we think there will be acceleration to 3.6% as economic growth prospects in the U.S., Japan and India are likely to improve.
We believe the U.S. labor market is likely to continue to improve, as initial jobless claims hover around the lows of the cycle and job openings are at record highs. U.S. consumers are getting support from wage growth at last. This situation is likely to support consumer spending, particularly in an environment in which inflation remains in check. Consumer sentiment, as measured by the University of Michigan index, reached 98.2 as of fiscal year end, the highest level since 2004.
Adjusting equity exposure during year
Each Portfolio completed the fiscal year with a positive return. The Portfolios overall trailed the performance of the all-equities benchmark index, but most outperformed the Barclays U.S. Aggregate Bond Index.
We made reallocations in the Pathfinder Portfolios at the end of the third quarter and again at the end of the fourth quarter. In general, the reallocations were done to add exposure to Europe and Japan, which we think will benefit from reacceleration of global growth and inflation, and add duration at year-end from cash.
The reallocations to all Pathfinder Portfolios in the third quarter were intended to make the allocations to the underlying Ivy VIP Global Growth and Ivy VIP International Core Equity consistent across all Portfolios.
The reallocations to all Pathfinder Portfolios in the fourth quarter added exposure to Ivy VIP Bond and reduced exposure to Ivy VIP Government Money Market (except in the Ivy VIP Pathfinder Aggressive Portfolio, which reduced exposure to Ivy VIP Limited Term Bond), given the sell-off in fixed income and duration positioning of the Pathfinder Portfolios overall. In addition, we made small reallocations from Ivy VIP Global Growth to Ivy VIP International Core Equity based on relative global equity valuations and the gains in the U.S. markets during the year, and on the allocation percentages to U.S. equities in the Pathfinder Portfolios overall.
The Pathfinder Managed Volatility Portfolios trailed the performance of the Pathfinder Portfolios during the fiscal year, largely because of the cost of applying the managed volatility strategy.
Assessing risks for 2017
We anticipate uncertainty around fiscal policy implementation and potential regulatory changes from President-elect Trump, including corporate and personal tax reform, border-adjusted taxation, infrastructure spending, renegotiating of trade agreements, and repeal/replacement of the Affordable Care Act, also known as “Obamacare.”
The housing market has been a contributor to economic growth in the U.S. as households worked to repair their balance sheets after the global financial crisis and inventories were cleared, supporting increases in home prices. Mortgage rates had already begun to rise in the fourth quarter, with the 30-year fixed rate exceeding 4% by year end — a level not seen in 18 months. This still is a relatively low interest rate, but if rates move higher — especially if they outpace wage gains — we think home sales and the wealth effect from them could be diminished.
As of the end of the fiscal year, we think commodity prices looked more stable at their higher levels. If the U.S. embarks upon a large infrastructure program or demand from China remains or accelerates on government policy, we believe those prices could move higher again. While that is likely to help commodity-producing companies and regions, a strong move higher could impinge on households and businesses as input costs rise.
Past performance is not a guarantee of future results. As with any mutual fund, the value of each Portfolio’s shares will change, and you could lose money on your investment.
The ability of each Portfolio to meet its investment objective depends both on the allocation of its assets among the Underlying Funds and the ability of those funds to meet their respective investment objectives. Each Portfolio’s
share price will likely change daily based on the performance of the Underlying Funds in which it invests. In general, each Portfolio is subject to the same risks as those of the Underlying Funds it holds. Because the Portfolios are weighted toward Underlying Funds that invest in stocks, both U.S. and foreign, including mid cap and small cap stocks, as well as bonds and short-term instruments, the Portfolios are more subject to the risks associated with those investments.
Advantus Capital may be unsuccessful in managing volatility, and there is a risk that the Ivy VIP Managed Volatility Portfolios may experience a high level of volatility in their returns. The Portfolios’ holdings are subject to price volatility, and the Portfolios may not be any less volatile than the market as a whole and could be more volatile. In addition, there can be no guarantee that the Portfolios will achieve their goal of managing the volatility of their equity returns. Furthermore, while the management of volatility seeks competitive returns with more consistent volatility, the management of volatility does not ensure that the Portfolios will deliver competitive returns. Additionally, even if successful, the Portfolios’ management of volatility may also generally result in the Portfolios’ NAV increasing to a lesser degree than the markets (for example, in a rising market with relatively high volatility) or decreasing to a greater degree than the market (for example, in a declining market with relatively low volatility). The Portfolios’ managed volatility strategy may expose the Portfolios to losses (some of which may be sudden) to which it would not have otherwise been exposed if invested only in Underlying Funds. Additionally, the derivatives used by Advantus Capital to hedge the value of the Portfolios are not identical to the Underlying Funds, and as a result, the Portfolios’ investment in derivatives may decline in value at the same time as the Portfolios’ investment in Underlying Funds. Advantus Capital does not intend to attempt to manage the volatility of the Portfolios’ fixed-income returns. It is possible that the fixed-income portion of the Portfolios, whose volatility would not be managed by the volatility management strategy, could become more volatile than the equity portion of the Portfolios.
The opinions expressed in this report are those of the portfolio managers and are current only through the end of the period of the report as stated on the cover. The managers’ views are subject to change at any time based on market and other conditions, and no forecasts can be guaranteed.
The indexes noted are unmanaged and include reinvested dividends. One cannot invest directly in an index, nor is an index representative of any Ivy VIP Pathfinder Portfolio or Ivy VIP Pathfinder Managed Volatility Portfolio.
| | |
| PORTFOLIO HIGHLIGHTS | | PATHFINDER PORTFOLIOS |
ALL DATA IS AS OF DECEMBER 31, 2016 (UNAUDITED)
Pathfinder Aggressive – Asset Allocation
| | |
Ivy VIP Growth | | 19.7% |
Ivy VIP International Core Equity | | 17.1% |
Ivy VIP Global Growth | | 12.2% |
Ivy VIP Mid Cap Growth | | 9.9% |
Ivy VIP Value | | 9.9% |
Ivy VIP Small Cap Growth | | 9.8% |
Ivy VIP Small Cap Value | | 9.8% |
Ivy VIP Limited-Term Bond | | 5.8% |
Ivy VIP Bond | | 5.0% |
Cash and Other Assets (Net of Liabilities), and Cash Equivalents+ | | 0.8% |
Pathfinder Conservative – Asset Allocation
| | |
Ivy VIP Government Money Market | | 30.0% |
Ivy VIP Limited-Term Bond | | 15.8% |
Ivy VIP Growth | | 12.8% |
Ivy VIP Dividend Opportunities | | 12.8% |
Ivy VIP International Core Equity | | 5.3% |
Ivy VIP Bond | | 5.0% |
Ivy VIP Small Cap Growth | | 4.9% |
Ivy VIP Global Growth | | 4.0% |
Ivy VIP Value | | 3.9% |
Ivy VIP Mid Cap Growth | | 3.0% |
Ivy VIP Small Cap Value | | 2.0% |
Cash and Other Assets (Net of Liabilities), and Cash Equivalents+ | | 0.5% |
Pathfinder Moderate – Asset Allocation
| | |
Ivy VIP Government Money Market | | 15.1% |
Ivy VIP Dividend Opportunities | | 14.9% |
Ivy VIP Growth | | 13.9% |
Ivy VIP International Core Equity | | 11.1% |
Ivy VIP Limited-Term Bond | | 10.8% |
Ivy VIP Global Growth | | 8.3% |
Ivy VIP Small Cap Growth | | 6.9% |
Ivy VIP Bond | | 5.1% |
Ivy VIP Value | | 5.0% |
Ivy VIP Small Cap Value | | 4.9% |
Ivy VIP Mid Cap Growth | | 4.0% |
Cash and Other Assets (Net of Liabilities), and Cash Equivalents+ | | 0.0% |
Pathfinder Moderately Aggressive – Asset Allocation
| | |
Ivy VIP Dividend Opportunities | | 14.9% |
Ivy VIP International Core Equity | | 13.9% |
Ivy VIP Growth | | 13.9% |
Ivy VIP Limited-Term Bond | | 10.8% |
Ivy VIP Global Growth | | 10.5% |
Ivy VIP Small Cap Growth | | 7.9% |
Ivy VIP Small Cap Value | | 7.9% |
Ivy VIP Bond | | 5.1% |
Ivy VIP Value | | 5.0% |
Ivy VIP Government Money Market | | 5.0% |
Ivy VIP Mid Cap Growth | | 5.0% |
Cash and Other Assets (Net of Liabilities), and Cash Equivalents+ | | 0.1% |
Pathfinder Moderately Conservative – Asset Allocation
| | |
Ivy VIP Government Money Market | | 20.0% |
Ivy VIP Limited-Term Bond | | 15.8% |
Ivy VIP Growth | | 13.8% |
Ivy VIP Dividend Opportunities | | 12.9% |
Ivy VIP International Core Equity | | 8.3% |
Ivy VIP Global Growth | | 6.0% |
Ivy VIP Small Cap Growth | | 5.9% |
Ivy VIP Bond | | 5.0% |
Ivy VIP Value | | 4.9% |
Ivy VIP Mid Cap Growth | | 4.0% |
Ivy VIP Small Cap Value | | 3.0% |
Cash and Other Assets (Net of Liabilities), and Cash Equivalents+ | | 0.4% |
Pathfinder Moderate – Managed Volatility – Asset Allocation
| | |
Ivy VIP Government Money Market | | 14.6% |
Ivy VIP Dividend Opportunities | | 14.5% |
Ivy VIP Growth | | 13.4% |
Ivy VIP International Core Equity | | 10.8% |
Ivy VIP Limited-Term Bond | | 10.5% |
Ivy VIP Global Growth | | 8.0% |
Ivy VIP Small Cap Growth | | 6.7% |
Ivy VIP Bond | | 4.9% |
Ivy VIP Small Cap Value | | 4.8% |
Ivy VIP Value | | 4.8% |
Ivy VIP Mid Cap Growth | | 3.9% |
Cash and Other Assets (Net of Liabilities), and Cash Equivalents+ | | 3.1% |
| | |
| PORTFOLIO HIGHLIGHTS | | PATHFINDER PORTFOLIOS |
ALL DATA IS AS OF DECEMBER 31, 2016 (UNAUDITED)
Pathfinder Moderately Aggressive – Managed Volatility – Asset Allocation
| | |
Ivy VIP Dividend Opportunities | | 14.6% |
Ivy VIP International Core Equity | | 13.5% |
Ivy VIP Growth | | 13.5% |
Ivy VIP Limited-Term Bond | | 10.6% |
Ivy VIP Global Growth | | 10.2% |
Ivy VIP Small Cap Growth | | 7.7% |
Ivy VIP Small Cap Value | | 7.7% |
Ivy VIP Government Money Market | | 4.9% |
Ivy VIP Bond | | 4.9% |
Ivy VIP Mid Cap Growth | | 4.9% |
Ivy VIP Value | | 4.8% |
Cash and Other Assets (Net of Liabilities), and Cash Equivalents+ | | 2.7% |
Pathfinder Moderately Conservative – Managed Volatility – Asset Allocation
| | |
Ivy VIP Government Money Market | | 19.8% |
Ivy VIP Limited-Term Bond | | 15.6% |
Ivy VIP Growth | | 13.7% |
Ivy VIP Dividend Opportunities | | 12.8% |
Ivy VIP International Core Equity | | 8.2% |
Ivy VIP Global Growth | | 5.9% |
Ivy VIP Small Cap Growth | | 5.9% |
Ivy VIP Bond | | 5.0% |
Ivy VIP Value | | 4.9% |
Ivy VIP Mid Cap Growth | | 3.9% |
Ivy VIP Small Cap Value | | 2.9% |
Cash and Other Assets (Net of Liabilities), and Cash Equivalents+ | | 1.4% |
The percentages of investments in the underlying funds may not currently be within the target allocation ranges disclosed in the Portfolios’ prospectus due to market movements; these percentages are expected to change over time, and deviation from the target allocation ranges due to market movements is permitted by the prospectus.
+Cash equivalents are defined as highly liquid securities with maturities of less than three months. Cash equivalents may include U.S. Government Treasury bills, bank certificates of deposit, bankers’ acceptances, corporate commercial paper and other money market instruments.
| | |
| COMPARISON OF CHANGE IN VALUE OF $10,000 INVESTMENT | | PATHFINDER PORTFOLIOS |
(UNAUDITED)
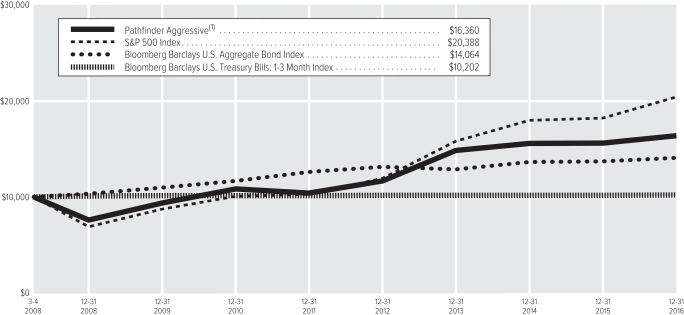
| (1) | The value of the investment in the Portfolio is impacted by the ongoing expenses of the Portfolio and assumes reinvestment of dividends and distributions. |
| | |
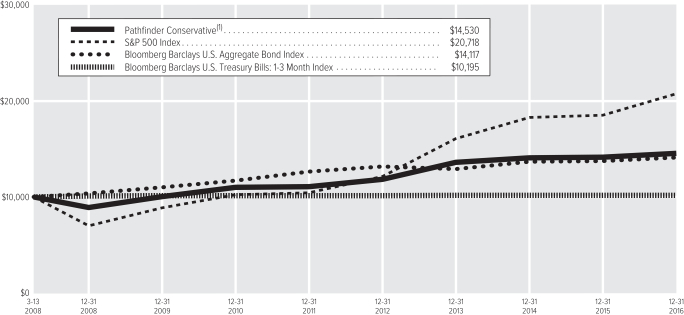
| COMPARISON OF CHANGE IN VALUE OF $10,000 INVESTMENT | | PATHFINDER PORTFOLIOS |
(UNAUDITED)

| (1) | The value of the investment in the Portfolio is impacted by the ongoing expenses of the Portfolio and assumes reinvestment of dividends and distributions. |
| | |
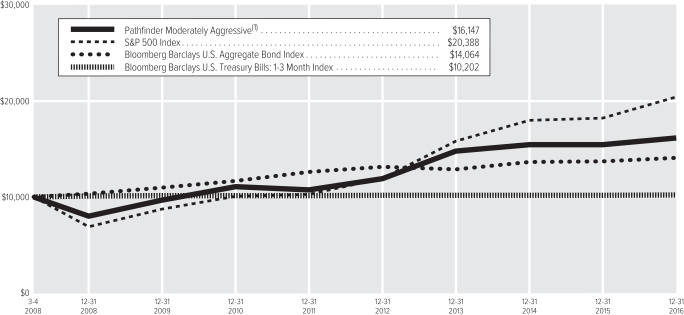
| COMPARISON OF CHANGE IN VALUE OF $10,000 INVESTMENT | | PATHFINDER PORTFOLIOS |
(UNAUDITED)

| (1) | The value of the investment in the Portfolio is impacted by the ongoing expenses of the Portfolio and assumes reinvestment of dividends and distributions. |
| | | | | | | | | | | | | | | | | | | | |
| Average Annual Total Return(2) | | Pathfinder
Aggressive | | | Pathfinder
Conservative | | | Pathfinder
Moderate | | | Pathfinder
Moderately
Aggressive | | | Pathfinder
Moderately
Conservative | |
1-year period ended 12-31-16 | | | 4.80% | | | | 2.84% | | | | 3.65% | | | | 4.52% | | | | 3.10% | |
5-year period ended 12-31-16 | | | 9.48% | | | | 5.56% | | | | 7.48% | | | | 8.46% | | | | 6.52% | |
10-year period ended 12-31-16 | | | — | | | | — | | | | — | | | | — | | | | — | |
Since inception of Portfolio(3) through 12-31-16 | | | 5.73% | | | | 4.34% | | | | 4.90% | | | | 5.58% | | | | 4.79% | |
| (2) | Data quoted is past performance and current performance may be lower or higher. Past performance is no guarantee of future results. Investment return and principal value of an investment will fluctuate and shares, when redeemed, may be worth more or less than their original cost. Please call 1.888.WADDELL for the Portfolio’s most recent month-end performance. Performance data quoted does not reflect any expenses or charges associated with owning a variable life insurance policy or variable annuity contract that invests in the Portfolio’s shares. When such charges are deducted, actual investment performance in a variable policy or contract will be lower. |
| (3) | 3-4-08 Pathfinder Aggressive, 3-4-08 Pathfinder Moderate, 3-4-08 Pathfinder Moderately Aggressive, 3-12-08 Pathfinder Moderately Conservative and 3-13-08 Pathfinder Conservative (the date on which shares were first acquired by shareholders). |
Past performance is not necessarily indicative of future performance. Indexes are unmanaged. The performance graph and table do not reflect the deduction of taxes that a shareholder would pay on Portfolio distributions or on the redemption of Portfolio shares. Performance results may include the effect of expense reduction arrangements for some or all of the periods shown. If those arrangements had not been in place, the performance results for those periods would have been lower.
| | |
| COMPARISON OF CHANGE IN VALUE OF $10,000 INVESTMENT | | PATHFINDER PORTFOLIOS |
(UNAUDITED)
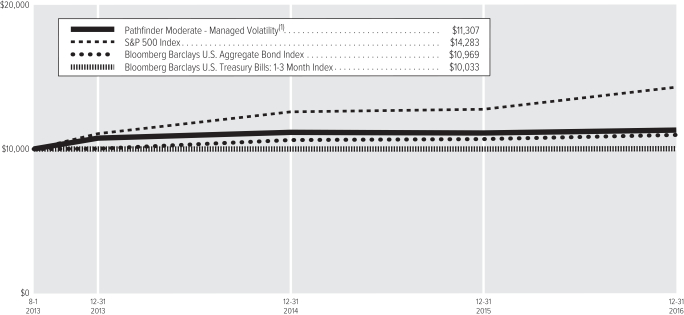
| (1) | The value of the investment in the Portfolio is impacted by the ongoing expenses of the Portfolio and assumes reinvestment of dividends and distributions. |
| | |
| COMPARISON OF CHANGE IN VALUE OF $10,000 INVESTMENT | | PATHFINDER PORTFOLIOS |
(UNAUDITED)
| (1) | The value of the investment in the Portfolio is impacted by the ongoing expenses of the Portfolio and assumes reinvestment of dividends and distributions. |
| | | | | | | | | | | | |
| Average Annual Total Return(2) | | Pathfinder Moderate – Managed Volatility | | | Pathfinder Moderately
Aggressive – Managed
Volatility | | | Pathfinder Moderately
Conservative – Managed
Volatility | |
1-year period ended 12-31-16 | | | 1.81% | | | | 2.36% | | | | 1.21% | |
5-year period ended 12-31-16 | | | — | | | | — | | | | — | |
10-year period ended 12-31-16 | | | — | | | | — | | | | — | |
Since inception of Portfolio(3) through 12-31-16 | | | 3.66% | | | | 4.00% | | | | 2.91% | |
| (2) | Data quoted is past performance and current performance may be lower or higher. Past performance is no guarantee of future results. Investment return and principal value of an investment will fluctuate and shares, when redeemed, may be worth more or less than their original cost. Please call 1.888.WADDELL for the Portfolio’s most recent month-end performance. Performance data quoted does not reflect any expenses or charges associated with owning a variable life insurance policy or variable annuity contract that invests in the Portfolio’s shares. When such charges are deducted, actual investment performance in a variable policy or contract will be lower. |
| (3) | 8-1-13 Pathfinder Moderate — Managed Volatility, 8-1-13 Pathfinder Moderately Aggressive — Managed Volatility and 8-1-13 Pathfinder Moderately Conservative — Managed Volatility (the date on which shares were first acquired by shareholders). |
Past performance is not necessarily indicative of future performance. Indexes are unmanaged. The performance graph and table do not reflect the deduction of taxes that a shareholder would pay on Portfolio distributions or on the redemption of Portfolio shares. Performance results may include the effect of expense reduction arrangements for some or all of the periods shown. If those arrangements had not been in place, the performance results for those periods would have been lower.
| | |
| SCHEDULE OF INVESTMENTS | | PATHFINDER PORTFOLIOS (in thousands) |
DECEMBER 31, 2016
Pathfinder Aggressive
| | | | | | | | |
| AFFILIATED MUTUAL FUNDS | | Shares | | | Value | |
Ivy VIP Bond | | | 713 | | | $ | 3,753 | |
Ivy VIP Global Growth | | | 1,118 | | | | 9,109 | |
Ivy VIP Growth | | | 1,428 | | | | 14,710 | |
Ivy VIP International Core Equity | | | 833 | | | | 12,748 | |
Ivy VIP Limited-Term Bond | | | 881 | | | | 4,305 | |
Ivy VIP Mid Cap Growth | | | 784 | | | | 7,398 | |
Ivy VIP Small Cap Growth | | | 759 | | | | 7,349 | |
Ivy VIP Small Cap Value | | | 400 | | | | 7,343 | |
Ivy VIP Value | | | 1,241 | | | | 7,352 | |
| | | | | | | | |
| |
TOTAL AFFILIATED MUTUAL FUNDS – 99.2% | | | $ | 74,067 | |
(Cost: $81,183) | | | | | | | | |
| | |
| SHORT-TERM SECURITIES | | Principal | | | | |
| |
Master Note – 0.8% | |
Toyota Motor Credit Corp., | | | | | | | | |
0.860%, 1-4-17 (A) | | $ | 579 | | | | 579 | |
| | | | | | | | |
| |
TOTAL SHORT-TERM SECURITIES – 0.8% | | | $ | 579 | |
(Cost: $579) | | | | | | | | |
| |
TOTAL INVESTMENT SECURITIES – 100.0% | | | $ | 74,646 | |
(Cost: $81,762) | | | | | | | | |
| |
CASH AND OTHER ASSETS, NET OF LIABILITIES – 0.0% | | | | 10 | |
| |
NET ASSETS – 100.0% | | | $ | 74,656 | |
Notes to Schedule of Investments
| (A) | Variable rate security. Interest rate disclosed is that which is in effect at December 31, 2016. Date shown represents the date that the variable rate resets. |
The following table is a summary of the valuation of the Portfolio’s investments by the fair value hierarchy levels as of December 31, 2016. See Note 3 to the Financial Statements for further information regarding fair value measurement.
| | | | | | | | | | | | |
| | | Level 1 | | | Level 2 | | | Level 3 | |
Assets | | | | | | | | | | | | |
Investments in Securities | | | | | | | | | | | | |
Affiliated Mutual Funds | | $ | 74,067 | | | $ | — | | | $ | — | |
Short-Term Securities | | | — | | | | 579 | | | | — | |
| | | | |
Total | | $ | 74,067 | | | $ | 579 | | | $ | — | |
| | | | |
During the year ended December 31, 2016, there were no transfers between Level 1 and 2.
Pathfinder Conservative
| | | | | | | | |
| AFFILIATED MUTUAL FUNDS | | Shares | | | Value | |
Ivy VIP Bond | | | 1,090 | | | $ | 5,739 | |
Ivy VIP Dividend Opportunities | | | 1,888 | | | | 14,697 | |
Ivy VIP Global Growth | | | 558 | | | | 4,549 | |
Ivy VIP Government Money Market | | | 34,266 | | | | 34,266 | |
Ivy VIP Growth | | | 1,419 | | | | 14,622 | |
Ivy VIP International Core Equity | | | 393 | | | | 6,020 | |
Ivy VIP Limited-Term Bond | | | 3,688 | | | | 18,033 | |
Ivy VIP Mid Cap Growth | | | 360 | | | | 3,394 | |
Ivy VIP Small Cap Growth | | | 580 | | | | 5,619 | |
Ivy VIP Small Cap Value | | | 122 | | | | 2,246 | |
Ivy VIP Value | | | 759 | | | | 4,497 | |
| | | | | | | | |
| |
TOTAL AFFILIATED MUTUAL FUNDS – 99.5% | | | $ | 113,682 | |
(Cost: $118,561) | | | | | | | | |
| | |
| SHORT-TERM SECURITIES | | Principal | | | | |
| |
Master Note – 0.5% | |
Toyota Motor Credit Corp., | | | | | | | | |
0.860%, 1-4-17 (A) | | $ | 575 | | | | 575 | |
| | | | | | | | |
| |
TOTAL SHORT-TERM SECURITIES – 0.5% | | | $ | 575 | |
(Cost: $575) | | | | | | | | |
| |
TOTAL INVESTMENT SECURITIES – 100.0% | | | $ | 114,257 | |
(Cost: $119,136) | | | | | | | | |
| |
CASH AND OTHER ASSETS, NET OF LIABILITIES – 0.0% | | | | 2 | |
| |
NET ASSETS – 100.0% | | | $ | 114,259 | |
Notes to Schedule of Investments
| (A) | Variable rate security. Interest rate disclosed is that which is in effect at December 31, 2016. Date shown represents the date that the variable rate resets. |
The following table is a summary of the valuation of the Portfolio’s investments by the fair value hierarchy levels as of December 31, 2016. See Note 3 to the Financial Statements for further information regarding fair value measurement.
| | | | | | | | | | | | |
| | | Level 1 | | | Level 2 | | | Level 3 | |
Assets | | | | | | | | | | | | |
Investments in Securities | | | | | | | | | | | | |
Affiliated Mutual Funds | | $ | 113,682 | | | $ | — | | | $ | — | |
Short-Term Securities | | | — | | | | 575 | | | | — | |
| | | | |
Total | | $ | 113,682 | | | $ | 575 | | | $ | — | |
| | | | |
During the year ended December 31, 2016, there were no transfers between Level 1 and 2.
Pathfinder Moderate
| | | | | | | | |
| AFFILIATED MUTUAL FUNDS | | Shares | | | Value | |
Ivy VIP Bond | | | 8,256 | | | $ | 43,477 | |
Ivy VIP Dividend Opportunities | | | 16,500 | | | | 128,480 | |
Ivy VIP Global Growth | | | 8,726 | | | | 71,074 | |
Ivy VIP Government Money Market | | | 129,802 | | | | 129,802 | |
Ivy VIP Growth | | | 11,578 | | | | 119,295 | |
Ivy VIP International Core Equity | | | 6,246 | | | | 95,564 | |
Ivy VIP Limited-Term Bond | | | 19,071 | | | | 93,249 | |
Ivy VIP Mid Cap Growth | | | 3,633 | | | | 34,283 | |
Ivy VIP Small Cap Growth | | | 6,152 | | | | 59,602 | |
Ivy VIP Small Cap Value | | | 2,319 | | | | 42,537 | |
Ivy VIP Value | | | 7,186 | | | | 42,588 | |
| | | | | | | | |
| |
TOTAL AFFILIATED MUTUAL FUNDS – 100.0% | | | $ | 859,951 | |
(Cost: $892,598) | | | | | | | | |
| | |
| SHORT-TERM SECURITIES | | Principal | | | | |
| |
Master Note – 0.0% | |
Toyota Motor Credit Corp., | | | | | | | | |
0.860%, 1-4-17 (A) | | $ | 415 | | | | 415 | |
| | | | | | | | |
| |
TOTAL SHORT-TERM SECURITIES – 0.0% | | | $ | 415 | |
(Cost: $415) | | | | | | | | |
| |
TOTAL INVESTMENT SECURITIES – 100.0% | | | $ | 860,366 | |
(Cost: $893,013) | | | | | | | | |
| |
CASH AND OTHER ASSETS, NET OF LIABILITIES – 0.0% | | | | 105 | |
| |
NET ASSETS – 100.0% | | | $ | 860,471 | |
Notes to Schedule of Investments
| (A) | Variable rate security. Interest rate disclosed is that which is in effect at December 31, 2016. Date shown represents the date that the variable rate resets. |
The following table is a summary of the valuation of the Portfolio’s investments by the fair value hierarchy levels as of December 31, 2016. See Note 3 to the Financial Statements for further information regarding fair value measurement.
| | | | | | | | | | | | |
| | | Level 1 | | | Level 2 | | | Level 3 | |
Assets | | | | | | | | | | | | |
Investments in Securities | | | | | | | | | | | | |
Affiliated Mutual Funds | | $ | 859,951 | | | $ | — | | | $ | — | |
Short-Term Securities | | | — | | | | 415 | | | | — | |
| | | | |
Total | | $ | 859,951 | | | $ | 415 | | | $ | — | |
| | | | |
During the year ended December 31, 2016, there were no transfers between Level 1 and 2.
| | |
| SCHEDULE OF INVESTMENTS | | PATHFINDER PORTFOLIOS (in thousands) |
DECEMBER 31, 2016
Pathfinder Moderately Aggressive
| | | | | | | | |
| AFFILIATED MUTUAL FUNDS | | Shares | | | Value | |
Ivy VIP Bond | | | 9,796 | | | $ | 51,586 | |
Ivy VIP Dividend Opportunities | | | 19,578 | | | | 152,443 | |
Ivy VIP Global Growth | | | 13,178 | | | | 107,329 | |
Ivy VIP Government Money Market | | | 51,342 | | | | 51,342 | |
Ivy VIP Growth | | | 13,738 | | | | 141,547 | |
Ivy VIP International Core Equity | | | 9,264 | | | | 141,736 | |
Ivy VIP Limited-Term Bond | | | 22,628 | | | | 110,642 | |
Ivy VIP Mid Cap Growth | | | 5,388 | | | | 50,847 | |
Ivy VIP Small Cap Growth | | | 8,343 | | | | 80,821 | |
Ivy VIP Small Cap Value | | | 4,402 | | | | 80,754 | |
Ivy VIP Value | | | 8,527 | | | | 50,531 | |
| | | | | | | | |
| |
TOTAL AFFILIATED MUTUAL FUNDS – 99.9% | | | $ | 1,019,578 | |
(Cost: $1,059,919) | | | | | | | | |
| | |
| SHORT-TERM SECURITIES | | Principal | | | | |
| |
Master Note – 0.1% | |
Toyota Motor Credit Corp., | | | | | | | | |
0.860%, 1-4-17 (A) | | $ | 555 | | | | 555 | |
| | | | | | | | |
| |
TOTAL SHORT-TERM SECURITIES – 0.1% | | | $ | 555 | |
(Cost: $555) | | | | | | | | |
| |
TOTAL INVESTMENT SECURITIES – 100.0% | | | $ | 1,020,133 | |
(Cost: $1,060,474) | | | | | | | | |
| |
LIABILITIES, NET OF CASH AND OTHER ASSETS – 0.0% | | | | (264 | ) |
| |
NET ASSETS – 100.0% | | | $ | 1,019,869 | |
Notes to Schedule of Investments
| (A) | Variable rate security. Interest rate disclosed is that which is in effect at December 31, 2016. Date shown represents the date that the variable rate resets. |
The following table is a summary of the valuation of the Portfolio’s investments by the fair value hierarchy levels as of December 31, 2016. See Note 3 to the Financial Statements for further information regarding fair value measurement.
| | | | | | | | | | | | |
| | | Level 1 | | | Level 2 | | | Level 3 | |
Assets | | | | | | | | | | | | |
Investments in Securities | | | | | | | | | | | | |
Affiliated Mutual Funds | | $ | 1,019,578 | | | $ | — | | | $ | — | |
Short-Term Securities | | | — | | | | 555 | | | | — | |
| | | | |
Total | | $ | 1,019,578 | | | $ | 555 | | | $ | — | |
| | | | |
During the year ended December 31, 2016, there were no transfers between Level 1 and 2.
Pathfinder Moderately Conservative
| | | | | | | | |
| AFFILIATED MUTUAL FUNDS | | Shares | | | Value | |
Ivy VIP Bond | | | 2,495 | | | $ | 13,137 | |
Ivy VIP Dividend Opportunities | | | 4,321 | | | | 33,645 | |
Ivy VIP Global Growth | | | 1,918 | | | | 15,618 | |
Ivy VIP Government Money Market | | | 52,294 | | | | 52,294 | |
Ivy VIP Growth | | | 3,498 | | | | 36,046 | |
Ivy VIP International Core Equity | | | 1,415 | | | | 21,657 | |
Ivy VIP Limited-Term Bond | | | 8,443 | | | | 41,281 | |
Ivy VIP Mid Cap Growth | | | 1,098 | | | | 10,359 | |
Ivy VIP Small Cap Growth | | | 1,593 | | | | 15,436 | |
Ivy VIP Small Cap Value | | | 420 | | | | 7,712 | |
Ivy VIP Value | | | 2,171 | | | | 12,868 | |
| | | | | | | | |
| |
TOTAL AFFILIATED MUTUAL FUNDS – 99.6% | | | $ | 260,053 | |
(Cost: $271,457) | | | | | | | | |
| | |
| SHORT-TERM SECURITIES | | Principal | | | | |
| |
Master Note – 0.2% | |
Toyota Motor Credit Corp., | | | | | | | | |
0.860%, 1-4-17 (A) | | $ | 563 | | | | 563 | |
| | | | | | | | |
| |
TOTAL SHORT-TERM SECURITIES – 0.2% | | | $ | 563 | |
(Cost: $563) | | | | | | | | |
| |
TOTAL INVESTMENT SECURITIES – 99.8% | | | $ | 260,616 | |
(Cost: $272,020) | | | | | | | | |
| |
CASH AND OTHER ASSETS, NET OF LIABILITIES – 0.2% | | | | 434 | |
| |
NET ASSETS – 100.0% | | | $ | 261,050 | |
Notes to Schedule of Investments
| (A) | Variable rate security. Interest rate disclosed is that which is in effect at December 31, 2016. Date shown represents the date that the variable rate resets. |
The following table is a summary of the valuation of the Portfolio’s investments by the fair value hierarchy levels as of December 31, 2016. See Note 3 to the Financial Statements for further information regarding fair value measurement.
| | | | | | | | | | | | |
| | | Level 1 | | | Level 2 | | | Level 3 | |
Assets | | | | | | | | | | | | |
Investments in Securities | | | | | | | | | | | | |
Affiliated Mutual Funds | | $ | 260,053 | | | $ | — | | | $ | — | |
Short-Term Securities | | | — | | | | 563 | | | | — | |
| | | | |
Total | | $ | 260,053 | | | $ | 563 | | | $ | — | |
| | | | |
During the year ended December 31, 2016, there were no transfers between Level 1 and 2.
Pathfinder Moderate – Managed Volatility
| | | | | | | | |
| AFFILIATED MUTUAL FUNDS | | Shares | | | Value | |
Ivy VIP Bond | | | 4,759 | | | $ | 25,061 | |
Ivy VIP Dividend Opportunities | | | 9,511 | | | | 74,061 | |
Ivy VIP Global Growth | | | 5,030 | | | | 40,969 | |
Ivy VIP Government Money Market | | | 74,822 | | | | 74,822 | |
Ivy VIP Growth | | | 6,674 | | | | 68,767 | |
Ivy VIP International Core Equity | | | 3,600 | | | | 55,086 | |
Ivy VIP Limited-Term Bond | | | 10,993 | | | | 53,751 | |
Ivy VIP Mid Cap Growth | | | 2,094 | | | | 19,762 | |
Ivy VIP Small Cap Growth | | | 3,547 | | | | 34,357 | |
Ivy VIP Small Cap Value | | | 1,337 | | | | 24,521 | |
Ivy VIP Value | | | 4,143 | | | | 24,550 | |
| | | | | | | | |
| |
TOTAL AFFILIATED MUTUAL FUNDS – 96.9% | | | $ | 495,707 | |
(Cost: $524,374) | | | | | | | | |
| | |
| SHORT-TERM SECURITIES | | Principal | | | | |
| |
Commercial Paper (A) – 1.6% | |
PacifiCorp, | | | | | | | | |
0.970%, 1-10-17 | | $ | 8,000 | | | | 7,998 | |
| | | | | | | | |
| |
Master Note – 1.4% | |
Toyota Motor Credit Corp., | | | | | | | | |
0.860%, 1-4-17 (B) | | | 7,184 | | | | 7,184 | |
| | | | | | | | |
| |
TOTAL SHORT-TERM SECURITIES – 3.0% | | | $ | 15,182 | |
(Cost: $15,182) | | | | | | | | |
| |
TOTAL INVESTMENT SECURITIES – 99.9% | | | $ | 510,889 | |
(Cost: $539,556) | | | | | | | | |
| |
CASH AND OTHER ASSETS, NET OF LIABILITIES (C) – 0.1% | | | | 468 | |
| |
NET ASSETS – 100.0% | | | $ | 511,357 | |
Notes to Schedule of Investments
| (A) | Rate shown is the yield to maturity at December 31, 2016. |
| (B) | Variable rate security. Interest rate disclosed is that which is in effect at December 31, 2016. Date shown represents the date that the variable rate resets. |
| (C) | Cash of $492 has been pledged as collateral on open futures contracts. |
The following futures contracts were outstanding at December 31, 2016 (contracts unrounded):
| | | | | | | | | | | | | | | | | | | | |
| Description | | Type | | Expiration
Date | | Number
of
Contracts | | | Value | | | Unrealized
Depreciation | | | | |
S&P 500 Index | | Short | | 3-16-17 | | | 16 | | | $ | (8,945 | ) | | $ | (150 | ) | | | | |
E-mini Russell 2000 Index | | Short | | 3-17-17 | | | 34 | | | | (2,307 | ) | | | (34 | ) | | | | |
| | | | | | | | | | | | |
| | | | | | | | | | $ | (11,252 | ) | | $ | (184 | ) | | | | |
| | | | | | | | | | | | |
| | |
| SCHEDULE OF INVESTMENTS | | PATHFINDER PORTFOLIOS (in thousands) |
DECEMBER 31, 2016
The following table is a summary of the valuation of the Portfolio’s investments by the fair value hierarchy levels as of December 31, 2016. See Note 3 to the Financial Statements for further information regarding fair value measurement.
| | | | | | | | | | | | |
| | | Level 1 | | | Level 2 | | | Level 3 | |
Assets | | | | | | | | | | | | |
Investments in Securities | | | | | | | | | | | | |
Affiliated Mutual Funds | | $ | 495,707 | | | $ | — | | | $ | — | |
Short-Term Securities | | | — | | | | 15,182 | | | | — | |
| | | | |
Total | | $ | 495,707 | | | $ | 15,182 | | | $ | — | |
| | | | |
Liabilities | | | | | | | | | | | | |
Futures Contracts | | $ | 184 | | | $ | — | | | $ | — | |
| | | | |
During the year ended December 31, 2016, there were no transfers between Level 1 and 2.
Pathfinder Moderately Aggressive – Managed Volatility
| | | | | | | | |
| AFFILIATED MUTUAL FUNDS | | Shares | | | Value | |
Ivy VIP Bond | | | 726 | | | $ | 3,821 | |
Ivy VIP Dividend Opportunities | | | 1,450 | | | | 11,292 | |
Ivy VIP Global Growth | | | 976 | | | | 7,950 | |
Ivy VIP Government Money Market | | | 3,803 | | | | 3,803 | |
Ivy VIP Growth | | | 1,018 | | | | 10,484 | |
Ivy VIP International Core Equity | | | 686 | | | | 10,498 | |
Ivy VIP Limited-Term Bond | | | 1,676 | | | | 8,195 | |
Ivy VIP Mid Cap Growth | | | 399 | | | | 3,766 | |
Ivy VIP Small Cap Growth | | | 618 | | | | 5,986 | |
Ivy VIP Small Cap Value | | | 326 | | | | 5,982 | |
Ivy VIP Value | | | 632 | | | | 3,743 | |
| | | | | | | | |
| |
TOTAL AFFILIATED MUTUAL FUNDS – 97.3% | | | $ | 75,520 | |
(Cost: $81,986) | | | | | | | | |
| | |
| SHORT-TERM SECURITIES | | Principal | | | | |
| |
Master Note – 2.8% | |
Toyota Motor Credit Corp., | | | | | | | | |
0.860%, 1-4-17 (A) | | $ | 2,138 | | | | 2,138 | |
| | | | | | | | |
| |
TOTAL SHORT-TERM SECURITIES – 2.8% | | | $ | 2,138 | |
(Cost: $2,138) | | | | | | | | |
| |
TOTAL INVESTMENT SECURITIES – 100.1% | | | $ | 77,658 | |
(Cost: $84,124) | | | | | | | | |
| |
LIABILITIES, NET OF CASH AND OTHER ASSETS (B) – (0.1)% | | | | (108 | ) |
| |
NET ASSETS – 100.0% | | | $ | 77,550 | |
Notes to Schedule of Investments
| (A) | Variable rate security. Interest rate disclosed is that which is in effect at December 31, 2016. Date shown represents the date that the variable rate resets. |
| (B) | Cash of $57 has been pledged as collateral on open futures contracts. |
The following futures contracts were outstanding at December 31, 2016 (contracts unrounded):
| | | | | | | | | | | | | | | | | | | | |
| Description | | Type | | Expiration
Date | | Number
of
Contracts | | | Value | | | Unrealized
Depreciation | | | | |
S&P 500 Index | | Short | | 3-16-17 | | | 2 | | | $ | (1,118 | ) | | $ | (19 | ) | | | | |
E-mini Russell 2000 Index | | Short | | 3-17-17 | | | 3 | | | | (204 | ) | | | (3 | ) | | | | |
| | | | | | | | | | | | |
| | | | | | | | | | $ | (1,322 | ) | | $ | (22 | ) | | | | |
| | | | | | | | | | | | |
The following table is a summary of the valuation of the Portfolio’s investments by the fair value hierarchy levels as of December 31, 2016. See Note 3 to the Financial Statements for further information regarding fair value measurement.
| | | | | | | | | | | | |
| | | Level 1 | | | Level 2 | | | Level 3 | |
Assets | | | | | | | | | | | | |
Investments in Securities | | | | | | | | | | | | |
Affiliated Mutual Funds | | $ | 75,520 | | | $ | — | | | $ | — | |
Short-Term Securities | | | — | | | | 2,138 | | | | — | |
| | | | |
Total | | $ | 75,520 | | | $ | 2,138 | | | $ | — | |
| | | | |
Liabilities | | | | | | | | | | | | |
Futures Contracts | | $ | 22 | | | $ | — | | | $ | — | |
| | | | |
During the year ended December 31, 2016, there were no transfers between Level 1 and 2.
| | |
| SCHEDULE OF INVESTMENTS | | PATHFINDER PORTFOLIOS (in thousands) |
DECEMBER 31, 2016
Pathfinder Moderately Conservative – Managed Volatility
| | | | | | | | |
| AFFILIATED MUTUAL FUNDS | | Shares | | | Value | |
Ivy VIP Bond | | | 634 | | | $ | 3,341 | |
Ivy VIP Dividend Opportunities | | | 1,099 | | | | 8,556 | |
Ivy VIP Global Growth | | | 488 | | | | 3,972 | |
Ivy VIP Government Money Market | | | 13,298 | | | | 13,298 | |
Ivy VIP Growth | | | 890 | | | | 9,167 | |
Ivy VIP International Core Equity | | | 360 | | | | 5,507 | |
Ivy VIP Limited-Term Bond | | | 2,147 | | | | 10,498 | |
Ivy VIP Mid Cap Growth | | | 279 | | | | 2,634 | |
Ivy VIP Small Cap Growth | | | 405 | | | | 3,926 | |
Ivy VIP Small Cap Value | | | 107 | | | | 1,961 | |
Ivy VIP Value | | | 552 | | | | 3,272 | |
| | | | | | | | |
| |
TOTAL AFFILIATED MUTUAL FUNDS – 98.6% | | | $ | 66,132 | |
(Cost: $69,688) | | | | | | | | |
| | |
| SHORT-TERM SECURITIES | | Principal | | | | |
| |
Master Note – 1.3% | |
Toyota Motor Credit Corp., | | | | | | | | |
0.860%, 1-4-17 (A) | | $ | 899 | | | | 899 | |
| | | | | | | | |
| |
TOTAL SHORT-TERM SECURITIES – 1.3% | | | $ | 899 | |
(Cost: $899) | | | | | | | | |
| |
TOTAL INVESTMENT SECURITIES – 99.9% | | | $ | 67,031 | |
(Cost: $70,587) | | | | | | | | |
| |
CASH AND OTHER ASSETS, NET OF LIABILITIES (B) – 0.1% | | | | 87 | |
| |
NET ASSETS – 100.0% | | | $ | 67,118 | |
Notes to Schedule of Investments
| (A) | Variable rate security. Interest rate disclosed is that which is in effect at December 31, 2016. Date shown represents the date that the variable rate resets. |
| (B) | Cash of $88 has been pledged as collateral on open futures contracts. |
The following futures contracts were outstanding at December 31, 2016 (contracts unrounded):
| | | | | | | | | | | | | | | | | | | | |
| Description | | Type | | Expiration
Date | | Number
of
Contracts | | | Value | | | Unrealized
Depreciation | | | | |
S&P 500 Index | | Short | | 3-16-17 | | | 3 | | | $ | (1,677 | ) | | $ | (28 | ) | | | | |
E-mini Russell 2000 Index | | Short | | 3-17-17 | | | 5 | | | | (339 | ) | | | (5 | ) | | | | |
| | | | | | | | | | | | |
| | | | | | | | | | $ | (2,016 | ) | | $ | (33 | ) | | | | |
| | | | | | | | | | | | |
The following table is a summary of the valuation of the Portfolio’s investments by the fair value hierarchy levels as of December 31, 2016. See Note 3 to the Financial Statements for further information regarding fair value measurement.
| | | | | | | | | | | | |
| | | Level 1 | | | Level 2 | | | Level 3 | |
Assets | | | | | | | | | | | | |
Investments in Securities | | | | | | | | | | | | |
Affiliated Mutual Funds | | $ | 66,132 | | | $ | — | | | $ | — | |
Short-Term Securities | | | — | | | | 899 | | | | — | |
| | | | |
Total | | $ | 66,132 | | | $ | 899 | | | $ | — | |
| | | | |
Liabilities | | | | | | | | | | | | |
Futures Contracts | | $ | 33 | | | $ | — | | | $ | — | |
| | | | |
During the year ended December 31, 2016, there were no transfers between Level 1 and 2.
See Accompanying Notes to Financial Statements.
| | |
| MANAGEMENT DISCUSSION | | ASSET STRATEGY |
(UNAUDITED)
|
Chace Brundige
Cynthia P. Prince-Fox |
Below, Cynthia P. Prince-Fox and F. Chace Brundige, CFA, portfolio managers of Ivy VIP Asset Strategy, discuss positioning, performance and results for the fiscal year ended December 31, 2016. Ms. Prince-Fox has managed the Portfolio since 2014 and has 33 years of industry experience. Mr. Brundige has managed the Portfolio since 2014 and has 23 years of industry experience. Michael L. Avery previously was a co-portfolio manager on the Portfolio. He retired effective June 30, 2016.
Fiscal Year Performance
| | | | |
For the 12 Months Ended December 31, 2016 | | | | |
Ivy VIP Asset Strategy | | | -2.57% | |
Benchmark(s) and/or Lipper Category | | | | |
S&P 500 Index | | | 11.96% | |
(generally reflects the performance of large-capitalization U.S. stocks) | | | | |
Barclays U.S. Aggregate Bond Index | | | 2.65% | |
(generally reflects the performance of most U.S.-traded investment grade bonds) | | | | |
Barclays U.S. Treasury Bills: 1-3 Month Index | | | 0.26% | |
(generally reflects the performance of investment-grade Treasury bills, representing cash) | | | | |
Lipper Variable Annuity Alternative Other Universe Average | | | 6.29% | |
(generally reflects the performance of the universe of funds with similar investment objectives) | | | | |
Please note that the Portfolio returns include applicable investment fees and expense, whereas the index returns do not include any such fees. Also, the Portfolio’s performance data does not take into account any product expenses or charges associated with owning a variable life or annuity policy, which is invested in Ivy Variable Insurance Portfolios. Multiple indexes are shown because the Portfolio invests in multiple asset classes.
From risk-off to euphoria
“Risk-off” seemed to be the operative term in global fixed income, equity and currency markets during the first half of the fiscal year. China devalued its currency again in January 2016 following the U.S. Federal Reserve’s (Fed) 0.25-percentage-point interest rate hike and voters in the U.K. on June 23 approved a proposal to leave the European Union — the so-called “Brexit.” By the fourth quarter, and especially after the surprise U.S. presidential election victory of Donald Trump, a general “risk-on” environment had taken hold in financial markets and both business and consumer sentiment improved.
U.S. Treasury 10-year yields began the year around 2.27% and then declined to a post-Brexit low of about 1.36% before rebounding steadily through the third quarter. In the days immediately following the U.S. elections, most global developed market yields moved higher and the U.S. Treasury closed the year around 2.44%.
The S&P 500 index declined almost 10% to start the year, moving from 2,012 on January 4 to 1,829 in mid-February. Except for some volatility around the Brexit vote and the U.S. elections, equities subsequently climbed higher and ended the year around 2,238.
The value of the broad, trade-weighted U.S. dollar began the year in a softer trend versus both developed and emerging market currencies. That continued through April before the U.S. dollar unevenly strengthened and accelerated after the U.S. elections. The Fed did not raise interest rates at its September meeting, then raised short-term rates by 0.25 percentage point in December. With continued improvements in the labor market and wages finally turning higher, the Fed said it anticipates three more interest rate hikes in 2017.
The Japanese yen rallied during the first half of the year, even going below 100 briefly in August, before the “risk-on” trade sent it weaker through the fourth quarter. The Bank of Japan announced in September its target for the 10-year Japanese government bond would be “around zero” while it continued its asset purchase program. The euro traveled a fairly choppy path for most of the first half of the year before settling into a weaker trend during the final months of 2016. The European Central Bank (ECB) cut rates in March and expanded its quantitative easing facility. It also announced its Corporate Sector Purchase Program — moving beyond suppression of the “risk-free” rate in the euro and into compression of credit spreads. In December, the ECB announced a nine-month extension to the asset purchase program and a reduction in the amount purchased each month.
Commodity prices started the year lower along with the broader market volatility, but moved off those lows during the year and accelerated after the U.S. elections. West Texas Intermediate crude oil prices (the benchmark for oil prices in the U.S.) were below $30 per barrel in February, but moved higher on reduced supply expectations and continued growth in demand, closing the year around $53 per barrel.
We expect the final global gross domestic product growth rate to be about 3% for 2016. For 2017, we think there will be acceleration to 3.6% as economic growth prospects in the U.S., Japan and India are likely to significantly improve. We also think the coming fiscal year will be the first time developed and emerging economies accelerate together since 2010, as global trade continues to improve from its recent lull.
We believe the U.S. labor market will likely continue to improve, as initial jobless claims hover around the lows of the cycle and job openings are at record highs. U.S. consumers are getting support from wage growth at last. This situation is likely to support consumer spending, particularly in an environment in which inflation remains in check. Consumer sentiment, as measured by the University of Michigan index, reached 98.2 as of fiscal year end, the highest since 2004.
Business confidence and manufacturing struggled during the year’s early months, but showed signs of improvement after the U.S. elections. The ISM Manufacturing Index reached a two-year high in November. In our view, a combination of stronger confidence, inventory correction, higher oil prices and better global demand contributed to the increase.
Adjustments as year progressed
The Portfolio had a small negative return for the fiscal year, underperforming the positive returns of its benchmark indexes and Lipper Universe Average.
The Portfolio ended the fiscal year with about 64% of net assets allocated to equities, about 15% to fixed-income securities, roughly 6% to gold bullion and nearly 15% in cash and cash equivalents.
As the year began, we had maintained a somewhat cautious outlook on the markets. This was broadly based on the belief that we remained in a challenging environment of global overcapacity and low demand as well as uncertainty on how markets would react to the potential for higher rates. Areas of focus during the year included:
| • | | better-positioned U.S. consumers with cleaner personal balance sheets; |
| • | | the benefit to consumers of lower energy prices and an improving labor market; |
| • | | an improving housing market helped by marginally improved confidence among Millennials; |
| • | | growing numbers of emerging market consumers and where they would spend; |
| • | | technology that provided companies with improving efficiencies and productivity, as well as selected vendors with improved long-term returns because of the “Cloud” model. |
Relative to the S&P 500 Index benchmark, the top sector contributors within the Portfolio’s public equity holdings were energy, consumer staples and materials, as well as a lack of exposure to the real estate and utilities sectors.
The largest detractor to relative performance in the public equities was in the health care sector, followed by financials, consumer discretionary and information technology. Maintaining an allocation to pharmaceuticals and biotechnology during the fiscal year falls into the “lessons learned” category. We held on too long and did not adequately factor in the continuing negative effects of political headwinds combined with the overweight positioning of the active investor community. Several of the Portfolio’s private investments also were detractors from relative performance. In addition, we sold a small private credit in the first quarter.
Within fixed income, the Portfolio primarily held long-duration U.S. Treasury securities and Treasury Inflation Protected Securities (TIPS) during the first half of the year as part of our desire to own more liquid securities (in addition to cash and gold bullion) and assets that provided yield. By the third quarter, we began to sell some of the Treasuries and purchase more TIPS, as we could no longer ignore increasing inflation within wage indicators and other prices. We also began to invest in local currency debt within emerging markets, specifically Mexico and Brazil, as a way of benefitting from relatively high real yields when compared with developed markets, undervalued currencies and improving current account balances and/or economic growth prospects. Emerging market currencies were mostly weaker after the U.S. elections and the Mexican peso was one of the worst performers. Overall, our fixed income holdings detracted from relative performance for the year.
Gold bullion has been a long-term holding in the Portfolio and one we view as a currency with a stable “printing press,” especially relative to fiat currencies we may seek to hedge at times. We added to the gold position early in the year, but reduced the position in September and again in December. Gold rose during the first six months of the year, but turned lower in the fourth quarter. In the long run, we believe gold should reflect inflation expectations and asset prices, but in the final months of the year gold prices were lower as yields on fixed income securities rose and inflation remained relatively benign. Despite mounting leverage, the “fear” value faded as economic growth improved. The gold holdings were a detractor from relative performance for the year.
The Portfolio’s allocation weighting to cash and cash equivalents was higher during the first half of the year than the second half as we put it to work in more equities and emerging market sovereign debt. Holding cash with equity markets moving higher detracted from relative performance in the year.
Assessing risks for 2017
Looking ahead, we anticipate uncertainty around fiscal policy implementation and potential regulatory changes from President-elect Trump. There has been much discussion, and many tweets, about corporate and personal tax reform, border-adjusted taxation, infrastructure spending, renegotiating of trade agreements, and repeal and replacement of the Affordable Care Act, also known as “Obamacare.” As the politics play out, we expect continued sector volatility in the coming year.
The housing market has been a contributor to economic growth in the U.S. as households worked to repair their balance sheets after the global financial crisis and inventories were cleared, supporting increases in home prices. Mortgage rates had already begun to rise in the fourth quarter, with the 30-year fixed rate exceeding 4% by year end — a level not seen in 18 months. This still is a relatively low interest rate, but if rates move higher — especially if they outpace wage gains — we think home sales and the wealth effect from them could be diminished.
As of the end of the fiscal year, we think commodity prices looked more stable at their higher levels. If the U.S. embarks upon a large infrastructure program or demand from China remains or accelerates on government policy, we believe those prices could move higher again. While that is likely to help commodity-producing companies and regions, a strong move higher could impinge on households and businesses as input costs rise.
We remain focused on where we think growth will occur in the world. Many of our holdings from 2015 remained core holdings in 2016. Our highest conviction names fall into the secular growth category with strong balance sheets and attractive free cash flow generation that offer the optionality of share repurchases, dividends or acquisitions. We remain overweight the energy sector via oil service and exploration and production companies that we believe are well-positioned for renewed growth in U.S. onshore production.
We increased exposure to banks in the U.S. and Europe, as we believe this sector of the market remains attractively valued as interest rates begin to normalize. While industrial fundamentals have begun to improve, the shares have moved well ahead of the news, leaving less room for relative appreciation. Still, we have added exposure in certain sub-industries in which the market has not yet discounted the potential of the developing cycle.
Investments related to emerging market consumers had held a prominent role within the Portfolio since the financial crisis — particularly related to China — and we continue to believe in their long-term growth. We still think the rise in their discretionary income is likely to continue to eclipse that of developed market counterparts. However, we believe the growth rate for consumption will be slower and, from here, more dependent on structural reforms. In addition, multinationals are seeing increased competition from local companies as quality improves.
The Portfolio changes as the market environment in which we invest changes; it is the hallmark of its flexible mandate. What remains steadfast is the process we utilize to manage investor money.
Past performance is not a guarantee of future results. The value of the Portfolio’s shares will change, and you could lose money on your investment.
The Portfolio may allocate from 0-100% of its assets between stocks, bonds and short-term instruments of issuers around the globe and investments with exposure to various foreign securities. Subject to diversification limits, the Portfolio also may invest up to 25% of its total assets in precious metals.
International investing involves additional risks including currency fluctuations, political or economic conditions affecting the foreign country, and differences in accounting standards and foreign regulations. These risks are magnified in emerging markets.
Fixed-income securities are subject to interest-rate risk and, as such, the net asset value of the Portfolio may fall as interest rates rise. Investing in high-income securities may carry a greater risk of nonpayment of interest or principal than higher-rated bonds.
The Portfolio may focus its investments in certain regions or industries, thereby increasing its potential vulnerability to market volatility.
Investing in commodities is generally considered speculative because of the significant potential for investment loss due to cyclical economic conditions, sudden political events, and adverse international monetary policies. Markets for commodities are likely to be volatile and the Portfolio may pay more to store and accurately value its commodity holdings than it does with other holdings.
The Portfolio may seek to hedge market risk on various securities, manage and/or increase exposure to certain securities, companies, sectors, markets, foreign currencies and/or precious metals and seek to hedge certain event risks on positions held by the Portfolio via the use of derivative instruments. Such investments involve additional risks, as the fluctuations in the values of the derivatives may not correlate perfectly with the overall securities markets or with the underlying asset from which the derivative’s value is derived.
These and other risks are more fully described in the Portfolio’s prospectus.
The opinions expressed in this report are those of the portfolio managers and are current only through the end of the period of the report as stated on the cover. The managers’ views are subject to change at any time based on market and other conditions, and no forecasts can be guaranteed.
The indexes noted are unmanaged and include reinvested dividends. One cannot invest directly in an index, nor is an index representative of Ivy VIP Asset Strategy.
| | |
| PORTFOLIO HIGHLIGHTS | | ASSET STRATEGY |
ALL DATA IS AS OF DECEMBER 31, 2016 (UNAUDITED)
Asset Allocation
| | | | |
Stocks | | | 64.1% | |
Financials | | | 12.4% | |
Information Technology | | | 11.0% | |
Energy | | | 9.2% | |
Consumer Discretionary | | | 8.7% | |
Consumer Staples | | | 7.7% | |
Health Care | | | 6.5% | |
Industrials | | | 5.6% | |
Materials | | | 2.1% | |
Telecommunication Services | | | 0.9% | |
Bullion (Gold) | | | 6.0% | |
Bonds | | | 15.0% | |
Corporate Debt Securities | | | 6.5% | |
Other Government Securities | | | 5.4% | |
United States Government and Government Agency Obligations | | | 3.1% | |
Cash and Other Assets (Net of Liabilities), and Cash Equivalents+ | | | 14.9% | |
Country Weightings
| | | | |
North America | | | 55.2% | |
United States | | | 50.9% | |
Mexico | | | 4.3% | |
Europe | | | 15.2% | |
United Kingdom | | | 8.7% | |
Other Europe | | | 6.5% | |
Pacific Basin | | | 6.7% | |
Bullion (Gold) | | | 6.0% | |
South America | | | 2.0% | |
Cash and Other Assets (Net of Liabilities), and Cash Equivalents+ | | | 14.9% | |
Top 10 Equity Holdings
| | | | | | |
| Company | | Country | | Sector | | Industry |
JPMorgan Chase & Co. | | United States | | Financials | | Other Diversified Financial Services |
Kraft Foods Group, Inc. | | United States | | Consumer Staples | | Packaged Foods & Meats |
Halliburton Co. | | United States | | Energy | | Oil & Gas Equipment & Services |
Citigroup, Inc. | | United States | | Financials | | Other Diversified Financial Services |
Microsoft Corp. | | United States | | Information Technology | | Systems Software |
EOG Resources, Inc. | | United States | | Energy | | Oil & Gas Exploration & Production |
Pfizer, Inc. | | United States | | Health Care | | Pharmaceuticals |
Coca-Cola Co. (The) | | United States | | Consumer Staples | | Soft Drinks |
Lockheed Martin Corp. | | United States | | Industrials | | Aerospace & Defense |
AIA Group Ltd. | | Hong Kong | | Financials | | Life & Health Insurance |
See your advisor for more information on the Portfolio’s most recent published Top 10 Equity Holdings.
+ Cash equivalents are defined as highly liquid securities with maturities of less than three months. Cash equivalents may include U.S. Government Treasury bills, bank certificates of deposit, bankers’ acceptances, corporate commercial paper and other money market instruments.
| | |
| COMPARISON OF CHANGE IN VALUE OF $10,000 INVESTMENT | | ASSET STRATEGY |
(UNAUDITED)
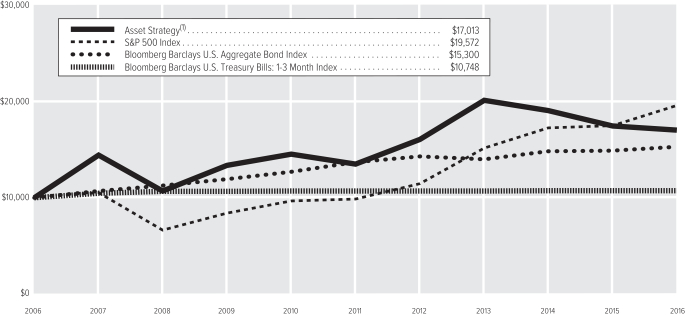
| (1) | The value of the investment in the Portfolio is impacted by the ongoing expenses of the Portfolio and assumes reinvestment of dividends and distributions. |
| | | | |
| Average Annual Total Return(2) | | | |
1-year period ended 12-31-16 | | | -2.57% | |
5-year period ended 12-31-16 | | | 4.76% | |
10-year period ended 12-31-16 | | | 5.46% | |
| (2) | Data quoted is past performance and current performance may be lower or higher. Past performance is no guarantee of future results. Investment return and principal value of an investment will fluctuate and shares, when redeemed, may be worth more or less than their original cost. Please call 1.888.WADDELL for the Portfolio’s most recent month-end performance. Performance data quoted does not reflect any expenses or charges associated with owning a variable life insurance policy or variable annuity contract that invests in the Portfolio’s shares. When such charges are deducted, actual investment performance in a variable policy or contract will be lower. |
Past performance is not necessarily indicative of future performance. Indexes are unmanaged. The performance graph and table do not reflect the deduction of taxes that a shareholder would pay on Portfolio distributions or on the redemption of Portfolio shares. Performance results may include the effect of expense reduction arrangements for some or all of the periods shown. If those arrangements had not been in place, the performance results for those periods would have been lower.
| | |
| CONSOLIDATED SCHEDULE OF INVESTMENTS | | ASSET STRATEGY (in thousands) |
DECEMBER 31, 2016
| | | | | | | | |
| COMMON STOCKS | | Shares | | | Value | |
Consumer Discretionary | |
| |
Auto Parts & Equipment – 1.9% | |
Continental AG (A) | | | 45 | | | $ | 8,644 | |
Delphi Automotive plc | | | 140 | | | | 9,402 | |
| | | | | | | | |
| | | | | | | 18,046 | |
| | | | | | | | |
| |
Automobile Manufacturers – 0.7% | |
Suzuki Motor Corp. (A) | | | 198 | | | | 6,986 | |
| | | | | | | | |
| |
Cable & Satellite – 1.2% | |
Comcast Corp., Class A | | | 168 | | | | 11,593 | |
| | | | | | | | |
| |
Footwear – 0.5% | |
NIKE, Inc., Class B | | | 97 | | | | 4,936 | |
| | | | | | | | |
| |
Home Improvement Retail – 1.1% | |
Home Depot, Inc. (The) | | | 75 | | | | 10,002 | |
| | | | | | | | |
| |
Internet & Direct Marketing Retail – 1.0% | |
Amazon.com, Inc. (B) | | | 13 | | | | 9,411 | |
| | | | | | | | |
| |
Leisure Facilities – 0.0% | |
Circuit of the Americas LLC, Class B (B) | | | — | * | | | — | |
| | | | | | | | |
| |
Leisure Products – 0.5% | |
Media Group Holdings LLC, Series H (B)(C)(D) | | | 32 | | | | 293 | |
Media Group Holdings LLC, Series I (B)(C)(D) | | | 19 | | | | 1,878 | |
Media Group Holdings LLC, Series T (B)(C)(D) | | | 4 | | | | 2,302 | |
| | | | | | | | |
| | | | | | | 4,473 | |
| | | | | | | | |
| |
Movies & Entertainment – 0.1% | |
Delta Topco Ltd. (B)(C) | | | 56,728 | | | | 1,255 | |
| | | | | | | | |
| |
Restaurants – 1.1% | |
Chipotle Mexican Grill, Inc., Class A (B) | | | 28 | | | | 10,376 | |
| | | | | | | | |
| |
Tires & Rubber – 0.6% | |
Bridgestone Corp. (A) | | | 157 | | | | 5,647 | |
| | | | | | | | |
| |
Total Consumer Discretionary – 8.7% | | | | 82,725 | |
Consumer Staples | |
| |
Brewers – 1.1% | |
InBev N.V. (A) | | | 101 | | | | 10,701 | |
| | | | | | | | |
| |
Packaged Foods & Meats – 3.5% | |
Kraft Foods Group, Inc. | | | 254 | | | | 22,162 | |
Mondelez International, Inc., Class A | | | 249 | | | | 11,051 | |
| | | | | | | | |
| | | | | | | 33,213 | |
| | | | | | | | |
| |
Soft Drinks – 1.5% | |
Coca-Cola Co. (The) | | | 358 | | | | 14,830 | |
| | | | | | | | |
| | | | | | | | |
| COMMON STOCKS (Continued) | | Shares | | | Value | |
Tobacco – 1.6% | |
ITC Ltd. (A) | | | 842 | | | $ | 2,999 | |
Philip Morris International, Inc. | | | 130 | | | | 11,848 | |
| | | | | | | | |
| | | | | | | 14,847 | |
| | | | | | | | |
| |
Total Consumer Staples – 7.7% | | | | 73,591 | |
Energy | |
| |
Oil & Gas Equipment & Services – 3.6% | |
Halliburton Co. | | | 388 | | | | 20,998 | |
Schlumberger Ltd. | | | 164 | | | | 13,742 | |
| | | | | | | | |
| | | | | | | 34,740 | |
| | | | | | | | |
| |
Oil & Gas Exploration & Production – 4.5% | |
Cabot Oil & Gas Corp. | | | 219 | | | | 5,121 | |
EOG Resources, Inc. | | | 156 | | | | 15,812 | |
Noble Energy, Inc. | | | 359 | | | | 13,671 | |
Pioneer Natural Resources Co. | | | 46 | | | | 8,247 | |
| | | | | | | | |
| | | | | | | 42,851 | |
| | | | | | | | |
| |
Oil & Gas Refining & Marketing – 1.1% | |
Phillips 66 | | | 119 | | | | 10,322 | |
| | | | | | | | |
| |
Total Energy – 9.2% | | | | 87,913 | |
Financials | |
| |
Diversified Banks – 2.6% | |
Axis Bank Ltd. (A) | | | 997 | | | | 6,609 | |
Banca Intesa S.p.A. (A) | | | 3,271 | | | | 8,353 | |
Wells Fargo & Co. | | | 183 | | | | 10,080 | |
| | | | | | | | |
| | | | | | | 25,042 | |
| | | | | | | | |
| |
Life & Health Insurance – 2.5% | |
AIA Group Ltd. (A) | | | 2,455 | | | | 13,850 | |
MetLife, Inc. | | | 179 | | | | 9,625 | |
| | | | | | | | |
| | | | | | | 23,475 | |
| | | | | | | | |
| |
Multi-Line Insurance – 1.0% | |
Axa S.A. (A) | | | 383 | | | | 9,660 | |
| | | | | | | | |
| |
Other Diversified Financial Services – 4.5% | |
Citigroup, Inc. | | | 325 | | | | 19,317 | |
JPMorgan Chase & Co. | | | 266 | | | | 22,946 | |
| | | | | | | | |
| | | | | | | 42,263 | |
| | | | | | | | |
| |
Property & Casualty Insurance – 0.7% | |
Berkshire Hathaway, Inc., Class B (B) | | | 42 | | | | 6,812 | |
| | | | | | | | |
| |
Regional Banks – 1.1% | |
PNC Financial Services Group, Inc. (The) | | | 90 | | | | 10,521 | |
| | | | | | | | |
| |
Total Financials – 12.4% | | | | 117,773 | |
Health Care | |
| |
Biotechnology – 2.3% | |
Alexion Pharmaceuticals, Inc. (B) | | | 72 | | | | 8,752 | |
| | | | | | | | |
| COMMON STOCKS (Continued) | | Shares | | | Value | |
Biotechnology (Continued) | |
Shire Pharmaceuticals Group plc ADR | | | 79 | | | $ | 13,462 | |
| | | | | | | | |
| | | | | | | 22,214 | |
| | | | | | | | |
| |
Health Care Equipment – 0.9% | |
Medtronic plc | | | 126 | | | | 8,953 | |
| | | | | | | | |
| |
Health Care Facilities – 0.8% | |
HCA Holdings, Inc. (B) | | | 101 | | | | 7,455 | |
| | | | | | | | |
| |
Pharmaceuticals – 2.5% | |
Bristol-Myers Squibb Co. | | | 142 | | | | 8,304 | |
Pfizer, Inc. | | | 472 | | | | 15,324 | |
| | | | | | | | |
| | | | | | | 23,628 | |
| | | | | | | | |
| |
Total Health Care – 6.5% | | | | 62,250 | |
Industrials | |
| |
Aerospace & Defense – 1.4% | |
Lockheed Martin Corp. | | | 56 | | | | 13,997 | |
| | | | | | | | |
| |
Construction & Engineering – 0.7% | |
Larsen & Toubro Ltd. (A) | | | 328 | | | | 6,510 | |
| | | | | | | | |
| |
Construction Machinery & Heavy Trucks – 1.1% | |
PACCAR, Inc. | | | 164 | | | | 10,455 | |
| | | | | | | | |
| |
Industrial Conglomerates – 1.4% | |
General Electric Co. | | | 413 | | | | 13,054 | |
| | | | | | | | |
| |
Industrial Machinery – 0.2% | |
Parker Hannifin Corp. | | | 12 | | | | 1,680 | |
| | | | | | | | |
| |
Railroads – 0.8% | |
Union Pacific Corp. | | | 74 | | | | 7,704 | |
| | | | | | | | |
| |
Total Industrials – 5.6% | | | | 53,400 | |
Information Technology | |
| |
Application Software – 2.4% | |
Adobe Systems, Inc. (B) | | | 130 | | | | 13,364 | |
Intuit, Inc. | | | 88 | | | | 10,040 | |
| | | | | | | | |
| | | | | | | 23,404 | |
| | | | | | | | |
| |
Data Processing & Outsourced Services – 1.7% | |
FleetCor Technologies, Inc. (B) | | | 39 | | | | 5,477 | |
Visa, Inc., Class A | | | 135 | | | | 10,517 | |
| | | | | | | | |
| | | | | | | 15,994 | |
| | | | | | | | |
| |
Electronic Equipment & Instruments – 0.3% | |
Keyence Corp. (A) | | | 4 | | | | 2,882 | |
| | | | | | | | |
| |
Internet Software & Services – 3.4% | |
Alibaba Group Holding Ltd. ADR (B) | | | 105 | | | | 9,229 | |
Alphabet, Inc., Class A (B) | | | 16 | | | | 12,362 | |
Facebook, Inc., Class A (B) | | | 20 | | | | 2,272 | |
MercadoLibre, Inc. | | | 54 | | | | 8,411 | |
| | | | | | | | |
| | | | | | | 32,274 | |
| | | | | | | | |
| | |
| CONSOLIDATED SCHEDULE OF INVESTMENTS | | ASSET STRATEGY (in thousands) |
DECEMBER 31, 2016
| | | | | | | | |
| COMMON STOCKS (Continued) | | Shares | | | Value | |
Semiconductor Equipment – 0.3% | |
ASML Holding N.V., Ordinary Shares (A) | | | 24 | | | $ | 2,674 | |
| | | | | | | | |
| |
Semiconductors – 1.0% | |
QUALCOMM, Inc. | | | 146 | | | | 9,493 | |
| | | | | | | | |
| |
Systems Software – 1.9% | |
Microsoft Corp. | | | 300 | | | | 18,636 | |
| | | | | | | | |
| |
Total Information
Technology – 11.0% | | | | 105,357 | |
Materials | |
| |
Diversified Chemicals – 0.2% | |
PPG Industries, Inc. | | | 26 | | | | 2,473 | |
| | | | | | | | |
| |
Diversified Metals & Mining – 1.3% | |
BHP Billiton plc (A) | | | 288 | | | | 4,630 | |
Rio Tinto plc (A) | | | 196 | | | | 7,639 | |
| | | | | | | | |
| | | | | | | 12,269 | |
| | | | | | | | |
Paper Packaging – 0.6% | |
International Paper Co. | | | 108 | | | | 5,731 | |
| | | | | | | | |
| |
Total Materials – 2.1% | | | | 20,473 | |
Telecommunication Services | |
| |
Integrated Telecommunication Services – 0.9% | |
Nippon Telegraph and Telephone Corp. (A) | | | 194 | | | | 8,167 | |
| | | | | | | | |
| |
Total Telecommunication
Services – 0.9% | | | | 8,167 | |
| |
TOTAL COMMON STOCKS – 64.1% | | | $ | 611,649 | |
(Cost: $653,466) | | | | | | | | |
| | |
| CORPORATE DEBT SECURITIES | | Principal | | | | |
| |
Consumer Discretionary | | | | | |
| |
Leisure Facilities – 0.2% | |
Circuit of the Americas LLC, Series D, | | | | | | | | |
0.000%, 12-31-20 (E) | | $ | 3,642 | | | | 1,310 | |
| | | | | | | | |
| |
Movies & Entertainment – 6.0% | |
Delta Topco Ltd., | | | | | | | | |
10.000%,
11-24-60 (C)(F) | | | 57,563 | | | | 57,563 | |
| | | | | | | | |
| |
Total Consumer Discretionary – 6.2% | | | | 58,873 | |
Financials | |
| |
Diversified Banks – 0.3% | |
Royal Bank of Scotland Group plc (The): | | | | | | | | |
7.500%, 12-29-49 | | | 2,195 | | | | 2,080 | |
| | | | | | | | |
CORPORATE DEBT
SECURITIES (Continued) | | Principal | | | Value | |
Diversified Banks (Continued) | |
Royal Bank of Scotland Group plc (The): (Continued) | | | | | | | | |
8.625%, 12-29-49 | | $ | 970 | | | $ | 989 | |
| | | | | | | | |
| | | | | | | 3,069 | |
| | | | | | | | |
| |
Total Financials – 0.3% | | | | 3,069 | |
| |
TOTAL CORPORATE DEBT SECURITIES – 6.5% | | | $ | 61,942 | |
(Cost: $63,819) | | | | | | | | |
| | |
OTHER GOVERNMENT
SECURITIES (G) | | | | | | |
Brazil – 1.1% | |
Brazil Notas do Tesouro Nacional, | | | | | | | | |
10.000%, 1-1-21 (H) | | | BRL35,225 | | | | 10,423 | |
| | | | | | | | |
| |
Mexico – 4.3% | |
Mexican Bonos: | | | | | | | | |
8.000%, 6-11-20 (H) | | | MXN279,834 | | | | 13,893 | |
6.500%, 6-10-21 (H) | | | 194,676 | | | | 9,157 | |
10.000%, 12-5-24 (H) | | | 160,287 | | | | 8,948 | |
5.750%, 3-5-26 (H) | | | 205,686 | | | | 8,804 | |
| | | | | | | | |
| | | | | | | 40,802 | |
| | | | | | | | |
| |
TOTAL OTHER GOVERNMENT SECURITIES – 5.4% | | | $ | 51,225 | |
(Cost: $59,621) | | | | | | | | |
| | |
UNITED STATES
GOVERNMENT AGENCY
OBLIGATIONS | | | | | | |
Mortgage-Backed
Obligations – 0.0% | | | | | |
Federal Home Loan Mortgage Corp. Agency REMIC/CMO: | | | | | | | | |
5.500%, 3-15-23 (I) | | $ | 34 | | | | 2 | |
5.500%, 10-15-25 (I) | | | 175 | | | | 23 | |
6.000%, 11-15-35 (I) | | | 111 | | | | 26 | |
Federal National Mortgage Association Agency REMIC/CMO: | | | | | | | | |
5.500%, 6-25-23 (I) | | | 70 | | | | 9 | |
5.500%, 8-25-33 (I) | | | 120 | | | | 22 | |
5.500%, 4-25-34 (I) | | | 186 | | | | 39 | |
5.500%, 11-25-36 (I) | | | 232 | | | | 47 | |
Government National Mortgage Association Agency REMIC/CMO, | | | | | | | | |
5.500%, 7-20-35 (I) | | | 99 | | | | 24 | |
| | | | | | | | |
| | | | | | | 192 | |
| | | | | | | | |
| |
TOTAL UNITED STATES GOVERNMENT AGENCY OBLIGATIONS – 0.0% | | | $ | 192 | |
(Cost: $197) | | | | | | | | |
| | | | | | | | |
UNITED STATES GOVERNMENT
OBLIGATIONS | | Principal | | | Value | |
Treasury Inflation Protected Obligations – 3.1% | |
U.S. Treasury Notes: | | | | | | | | |
0.125%, 4-15-21 | | $ | 4,300 | | | $ | 4,324 | |
0.625%, 1-15-26 | | | 7,977 | | | | 8,046 | |
0.125%, 7-15-26 | | | 7,765 | | | | 7,508 | |
1.000%, 2-15-46 | | | 9,488 | | | | 9,524 | |
| | | | | | | | |
| | | | | | | 29,402 | |
| | | | | | | | |
| |
TOTAL UNITED STATES GOVERNMENT
OBLIGATIONS – 3.1% | | | $ | 29,402 | |
(Cost: $30,320) | | | | | | | | |
| | |
| BULLION – 6.0% | | Troy
Ounces | | | | |
Gold | | | 50 | | | | 57,465 | |
| | | | | | | | |
(Cost: $60,953) | | | | | | | | |
| | |
| SHORT-TERM SECURITIES | | Principal | | | | |
Commercial Paper (J) – 6.5% | | | | | |
CVS Health Corp., | | | | | | | | |
0.890%, 1-17-17 | | $ | 9,000 | | | | 8,996 | |
Danaher Corp., | | | | | | | | |
0.700%, 1-4-17 | | | 6,000 | | | | 5,999 | |
Harley-Davidson Funding Corp. (GTD by Harley-Davidson, Inc.), | | | | | | | | |
0.940%, 1-24-17 | | | 5,000 | | | | 4,997 | |
Kroger Co. (The), | | | | | | | | |
0.880%, 1-3-17 | | | 1,226 | | | | 1,226 | |
Medtronic Global Holdings SCA, | | | | | | | | |
0.811%, 1-9-17 | | | 15,000 | | | | 14,997 | |
NBCUniversal Enterprise, Inc., | | | | | | | | |
0.880%, 1-10-17 | | | 5,000 | | | | 4,999 | |
Northern Illinois Gas Co.: | | | | | | | | |
0.801%, 1-4-17 | | | 6,000 | | | | 5,999 | |
0.880%, 1-10-17 | | | 5,000 | | | | 4,999 | |
0.880%, 1-11-17 | | | 5,000 | | | | 4,999 | |
PacifiCorp, | | | | | | | | |
0.870%, 1-12-17 | | | 5,000 | | | | 4,998 | |
| | | | | | | | |
| | | | | | | 62,209 | |
| | | | | | | | |
| | |
Master Note – 0.4% | | | | | | | | |
Toyota Motor Credit Corp., | | | | | | | | |
0.860%, 1-4-17 (K) | | | 3,490 | | | | 3,490 | |
| | | | | | | | |
| | |
Municipal
Obligations – 7.4% | | | | | | | | |
CA Statewide Cmnty Dev Auth, Multifam Hsng Rev Bonds (The Crossings Sr Apts/Phase I), Ser 2005 I (GTD by FNMA), | | | | | | | | |
0.580%, 1-7-17 (K) | | | 4,000 | | | | 4,000 | |
MI Strategic Fund, Var Rate Demand Ltd. Oblig Rev Bonds (Air Prods and Chemicals, Inc. Proj), Ser 2007 (GTD by Air Prods and Chemicals, Inc.), | | | | | | | | |
0.700%, 1-1-17 (K) | | | 23,077 | | | | 23,077 | |
| | |
| CONSOLIDATED SCHEDULE OF INVESTMENTS | | ASSET STRATEGY (in thousands) |
DECEMBER 31, 2016
| | | | | | | | |
SHORT-TERM SECURITIES (Continued) | | Principal | | | Value | |
Municipal Obligations (Continued) | | | | | | | | |
MS Business Fin Corp., Gulf Opp Zone Indl Dev Rev Bonds (Chevron USA, Inc. Proj), Ser 2007D (GTD by Chevron Corp.), | | | | | | | | |
0.680%, 1-1-17 (K) | | $ | 31,100 | | | $ | 31,100 | |
NY State Hsng Fin Agy, Maestro West Chelsea Hsng Rev Bonds, Ser 2013A (GTD by Wells Fargo Bank N.A.), | | | | | | | | |
0.780%, 1-7-17 (K) | | | 10,000 | | | | 10,000 | |
The Regents of the Univ of CA, Gen Rev Bonds, Ser AL, | | | | | | | | |
0.700%, 1-7-17 (K) | | | 2,000 | | | | 2,000 | |
| | | | | | | | |
| | | | | | | 70,177 | |
| | | | | | | | |
| |
TOTAL SHORT-TERM
SECURITIES – 14.3% | | | $ | 135,876 | |
(Cost: $135,876) | | | | | | | | |
| | | | | | | | |
| | | | | | | |
TOTAL INVESTMENT
SECURITIES – 99.4% | | | $ | 947,751 | |
(Cost: $1,004,252) | | | | | | | | |
| |
CASH AND OTHER ASSETS, NET OF LIABILITIES – 0.6% | | | | 5,749 | |
| |
NET ASSETS – 100.0% | | | $ | 953,500 | |
Notes to Consolidated Schedule of Investments
| * | Not shown due to rounding. |
| (A) | Listed on an exchange outside the United States. |
| (B) | No dividends were paid during the preceding 12 months. |
| (C) | Restricted securities. At December 31, 2016, the Portfolio owned the following restricted securities: |
| | | | | | | | | | | | | | | | | | | | |
| Security | | Acquisition Date(s) | | | Shares | | | Cost | | | Market Value | | | | |
Delta Topco Ltd. | | | 1-23-12 to 6-15-12 | | | | 56,728 | | | $ | 26,773 | | | $ | 1,255 | | | | | |
Media Group Holdings LLC, Series H | | | 8-29-13 to 10-31-13 | | | | 32 | | | | 22,374 | | | | 293 | | | | | |
Media Group Holdings LLC, Series I | | | 4-23-13 to 11-8-13 | | | | 19 | | | | 6,252 | | | | 1,878 | | | | | |
Media Group Holdings LLC, Series T | | | 7-2-13 to 1-23-15 | | | | 4 | | | | 8,613 | | | | 2,302 | | | | | |
| | | | | |
| | | | | | Principal | | | | | | | | | | |
Delta Topco Ltd., 10.000%, 11-24-60 | | | 4-1-12 to 1-1-15 | | | $ | 57,563 | | | | 58,053 | | | | 57,563 | | | | | |
| | | | | | | | | | | | |
| | | | | | | | | | $ | 122,065 | | | $ | 63,291 | | | | | |
| | | | | | | | | | | | |
| | The total value of these securities represented 6.6% of net assets at December 31, 2016. |
| (D) | Investment is owned by an entity that is treated as a corporation for U.S. tax purposes and is owned by the Portfolio and consolidated as described in Note 6 of the Notes to Financial Statements. |
| (F) | Payment-in-kind bonds. |
| (G) | Other Government Securities may include emerging markets sovereign, quasi-sovereign, corporate and supranational agency and organization debt securities. |
| (H) | Principal amount and exercise prices are denominated in the indicated foreign currency, where applicable (BRL—Brazilian Real and MXN—Mexican Peso). |
| (I) | Interest-only security. Amount shown as principal represents notional amount for computation of interest. |
| (J) | Rate shown is the yield to maturity at December 31, 2016. |
| (K) | Variable rate security. Interest rate disclosed is that which is in effect at December 31, 2016. Date shown represents the date that the variable rate resets. |
The following forward foreign currency contracts were outstanding at December 31, 2016:
| | | | | | | | | | | | | | | | | | | | | | | | | | | | |
| | | Currency to be
Delivered | | | | | Currency to be
Received | | | Settlement
Date | | | Counterparty | | Unrealized
Appreciation | | | Unrealized
Depreciation | | | | |
British Pound | | | 5,067 | | | U.S. Dollar | | | 6,294 | | | | 1-25-17 | | | State Street Global Markets | | $ | 44 | | | $ | — | | | | | |
Euro | | | 19,064 | | | U.S. Dollar | | | 20,214 | | | | 1-25-17 | | | State Street Global Markets | | | 124 | | | | — | | | | | |
| | | | | | | | | | | | | | | | | | | | |
| | | | | | | | | | | | | | | | | | $ | 168 | | | $ | — | | | | | |
| | | | | | | | | | | | | | | | | | | | |
| | |
| CONSOLIDATED SCHEDULE OF INVESTMENTS | | ASSET STRATEGY (in thousands) |
DECEMBER 31, 2016
The following total return swap agreements were outstanding at December 31, 2016:
| | | | | | | | | | | | | | | | | | | | | | | | | | |
| Counterparty | | Number of
Shares | | | Underlying Security | | Termination
Date | | | Notional
Amount | | | Financing Fee(1)(2) | | | Unrealized
Appreciation
(Depreciation) | | | | |
Morgan Stanley International | | | 156,379 | | | Euro STOXX Bank Index | | | 12/08/2017 | | | $ | 19,370 | | | | 3M Euribor plus 40 bps | | | $ | 80 | | | | | |
| (1) | The Portfolio pays the financing fee multiplied by the notional amount each month. |
| (2) | At the termination date, a net cash flow is exchanged where the market-linked total return is equivalent to the return of the underlying security less a financing rate, if any. The Portfolio would receive payments on any net positive total return, and would owe payments in the event of a negative total return. |
The following table is a summary of the valuation of the Portfolio’s investments by the fair value hierarchy levels as of December 31, 2016. See Note 3 to the Financial Statements for further information regarding fair value measurement.
| | | | | | | | | | | | |
| | | Level 1 | | | Level 2 | | | Level 3 | |
Assets | | | | | | | | | | | | |
Investments in Securities | | | | | | | | | | | | |
Common Stocks | | | | | | | | | | | | |
Consumer Discretionary | | $ | 76,997 | | | $ | — | | | $ | 5,728 | |
Consumer Staples | | | 73,591 | | | | — | | | | — | |
Energy | | | 87,913 | | | | — | | | | — | |
Financials | | | 117,773 | | | | — | | | | — | |
Health Care | | | 62,250 | | | | — | | | | — | |
Industrials | | | 53,400 | | | | — | | | | — | |
Information Technology | | | 105,357 | | | | — | | | | — | |
Materials | | | 20,473 | | | | — | | | | — | |
Telecommunication Services | | | 8,167 | | | | — | | | | — | |
Total Common Stocks | | | 605,921 | | | | — | | | | 5,728 | |
Corporate Debt Securities | | | — | | | | 4,379 | | | | 57,563 | |
Other Government Securities | | �� | — | | | | 51,225 | | | | — | |
United States Government Agency Obligations | | | — | | | | 192 | | | | — | |
United States Government Obligations | | | — | | | | 29,402 | | | | — | |
Bullion | | | 57,465 | | | | — | | | | — | |
Short-Term Securities | | | — | | | | 135,876 | | | | — | |
Total | | $ | 663,386 | | | $ | 221,074 | | | $ | 63,291 | |
Forward Foreign Currency Contracts | | $ | — | | | $ | 168 | | | $ | — | |
Total Return Swaps | | $ | — | | | $ | 80 | | | $ | — | |
During the year ended December 31, 2016, there were no transfers between any levels.
The following table is a reconciliation of Level 3 investments for which significant unobservable inputs were used to determine fair value:
| | | | | | | | |
| | | Common
Stocks | | | Corporate Debt
Securities | |
Beginning Balance 1-1-16 | | $ | 43,715 | | | $ | 52,330 | |
Net realized gain (loss) | | | — | | | | — | |
Net change in unrealized appreciation (depreciation) | | | (31,237 | ) | | | — | * |
Purchases | | | — | | | | 5,233 | |
Sales | | | (6,750 | ) | | | — | |
Amortization/Accretion of premium/discount | | | — | | | | — | |
Transfers into Level 3 during the period | | | — | | | | — | |
Transfers out of Level 3 during the period | | | — | | | | — | |
Ending Balance 12-31-16 | | $ | 5,728 | | | $ | 57,563 | |
Net change in unrealized appreciation (depreciation) for all Level 3 investments still held as of 12-31-16 | | $ | (31,237 | ) | | $ | — | * |
| | |
| CONSOLIDATED SCHEDULE OF INVESTMENTS | | ASSET STRATEGY (in thousands) |
DECEMBER 31, 2016
Information about Level 3 fair value measurements:
| | | | | | | | | | | | |
| | | Fair Value at 12-31-16 | | | Valuation Technique(s) | | Unobservable Input(s) | | Input Value(s) | |
Assets | | | | | | | | | | | | |
| | | | |
Common Stocks | | $ | 2,302 | | | Discounted cash flows model | | Long-term growth rate | | | 2.50% | |
| | | | | | | | Weighted average cost of capital | | | 15.56% | |
| | | | | | | | Illiquidity discount | | | 10% | |
| | | 1,878 | | | Discounted cash flows model | | Long-term growth rate | | | 2.50% | |
| | | | | | | | Weighted average cost of capital | | | 14.41% | |
| | | | | | | | Illiquidity discount | | | 10% | |
| | | | | | | | Methodology weighting | | | 67% | |
| | | | | | Transaction | | Price | | | $344 | |
| | | | | | | | Illiquidity discount | | | 2.5% to 10% | |
| | | | | | | | Methodology weighting | | | 33% | |
| | | 1,255 | | | Transaction | | Price | | | $0.06 | |
| | | | | | | | Illiquidity discount | | | 1 to 7% | |
| | | 293 | | | Discounted cash flows model | | Long-term growth rate | | | 2.50% | |
| | | | | | | | Weighted average cost of capital | | | 40% | |
| | | | | | | | Illiquidity discount | | | 10% | |
| | | | | | | | Methodology weighting | | | 52% | |
| | | | | | Discounted book value | | Discount factor | | | 100% | |
| | | | | | | | Methodology weighting | | | 48% | |
| | | | |
Corporate Debt Securities | | | 57,563 | | | Transaction | | Price | | | $100 | |
| | | | | | | | Illiquidity discount | | | 1 to 7% | |
Significant increases (decreases) in long-term growth rate inputs could result in a higher (lower) fair value measurement. However, significant increases (decreases) in weighted average cost of capital, discount factors, or illiquidity discount inputs could result in a (lower) higher fair value measurement.
During the year ended December 31, 2016, securities totaling $7,651 changed valuation techniques from discounted cash flows model to a blended methodology of discounted cash flows model and a transaction approach. The change in valuation techniques is primarily due to the blended methodology more closely reflecting current market participant assumptions.
During the year ended December 31, 2016, securities totaling $73,319 changed valuation techniques from discounted cash flows model to a transaction approach. The change in valuation techniques is primarily due to the discounted cash flows model no longer reflecting current market participant assumptions.
During the year ended December 31, 2016, securities totaling $3,533 changed valuation techniques from discounted cash flows model to a blended methodology of discounted cash flows model and discounted book value. The change in valuation techniques is primarily due to the blended methodology more closely reflecting current market participant assumptions.
The following acronyms are used throughout this schedule:
ADR = American Depositary Receipts
CMO = Collateralized Mortgage Obligation
GTD = Guaranteed
REMIC = Real Estate Mortgage Investment Conduit
Country Diversification
| | | | |
(as a % of net assets) | |
United States | | | 50.9% | |
United Kingdom | | | 8.7% | |
Mexico | | | 4.3% | |
Japan | | | 2.5% | |
Ireland | | | 2.3% | |
Brazil | | | 2.0% | |
Country Diversification (Continued)
| | | | |
India | | | 1.7% | |
Hong Kong | | | 1.5% | |
Belgium | | | 1.1% | |
France | | | 1.0% | |
China | | | 1.0% | |
Other Countries | | | 2.1% | |
Other+ | | | 20.9% | |
+Includes gold bullion, options, cash and other assets (net of liabilities), and cash equivalents
See Accompanying Notes to Financial Statements.
| | |
| MANAGEMENT DISCUSSION | | BALANCED |
(UNAUDITED)

Matthew A. Hekman
Below, Matthew A. Hekman, portfolio manager of Ivy VIP Balanced, discusses positioning, performance and results for the fiscal year ended December 31, 2016. He has managed the Portfolio since August 2014 and has 18 years of industry experience.
Fiscal Year Performance
| | | | |
For the 12 Months Ended December 31, 2016 | | | | |
Ivy VIP Balanced | | | 2.03% | |
Benchmark(s) and/or Lipper Category | | | | |
S&P 500 Index | | | 11.96% | |
(generally reflects the performance of large- and medium-sized U.S. stocks) | | | | |
Lipper Variable Annuity Mixed-Asset Target Allocation Growth Funds Universe Average | | | 6.93% | |
(generally reflects the performance of the universe of funds with similar investment objectives) | | | | |
Bloomberg Barclays U.S. Government/Credit Index | | | 3.05% | |
(generally reflects the performance of securities in the bond market) | | | | |
Please note that Portfolio returns include applicable fees and expenses, whereas the index returns do not include any such fees. Also, the Portfolio’s performance data does not take into account any product expenses or charges associated with owning a variable life or annuity policy, which is invested in Ivy Variable Insurance Portfolios. Multiple indexes are shown because the Portfolio invests in multiple asset classes.
Key drivers
The year ended December 31, 2016 began with the equity market experiencing its largest decline in the first two weeks of a new year on record, finishing that period down approximately 8%. Fixed-income markets saw credit spreads expand during the first six weeks of 2016 to levels typically associated with economic recessions. The revenue and earnings of the S&P 500 Index at a consolidated level posted year-over-year declines in the first and second quarters. This was unusually weak performance in the midst of an economic expansion that is now entering its eighth year. However, as energy prices stabilized and began to recover on the back of global production cuts, global central banks continued to extend unprecedented levels of monetary stimulus, investors searched for yield vehicles to meet their investment requirements, and asset markets stabilized and advanced modestly.
Late in calendar year 2016, a surprising U.S. election result produced optimism that economic growth could be resuscitated as beneficial tax reforms for consumers and businesses, along with reduced regulatory burdens and the possibility of fiscal stimulus, ignited animal spirits. As a result, equity markets outperformed fixed income markets over the remainder of the year with traditionally pro-cyclical sectors such as technology, financials, energy and industrials leading the advance.
Contributors and detractors
The Portfolio underperformed its peers in the Lipper Variable Annuity Mixed-Asset Target Allocation Growth Universe, posting a total return of 2.03% for the fiscal year ended December 31, 2016. Relative underperformance was driven by the allocation decision to adjust the Portfolio’s positioning to a more defensive posture to protect against downside risk, which did not materialize. The Portfolio’s equity exposure was reduced to approximately 50% with a bias toward less cyclically sensitive names, and cash was maintained at an elevated level to protect against downside risk in a time period when asset markets rose. The Portfolio’s equity benchmark, the S&P 500 Index, was up 11.96% for the fiscal year ended 2016 and its fixed-income benchmark, the Bloomberg Barclays U.S. Government/Credit Index, was up 3.04% for the fiscal year ended 2016.
The equity portion of the Portfolio was up 8.7% for the fiscal year. This underperformed the S&P 500 Index due to the Portfolio’s overweight to the health care sector, which underperformed the benchmark, and the Portfolio’s underweight to the financials sector, which outperformed the benchmark. Poor stock selection in health care, financials and industrials also negatively affected the Portfolio’s relative performance. The Portfolio’s return in the technology and energy sectors supported the Portfolio’s relative performance but was insufficient to make up the negative performance resulting from the Portfolio’s investments in other sectors.
Put options were purchased during the year to reduce downside exposure to the equity market in the event of a drop in the S&P 500 Index, which expired worthless as markets rose throughout 2016. (A put option offers the right to sell a stock or index back to the investor who sold the put option at a specific price, on or before a specified date.) In addition, an elevated cash position was a drag on relative performance. These two decisions together were a 2.94% drag on relative Portfolio performance.
The fixed-income portion of the Portfolio was up 3.5% for the fiscal year. It outperformed the Bloomberg Barclays U.S. Government/Credit Index due to a longstanding, short-duration position relative to the index as well as a significant overweight of corporate credit and strong security selection. The Portfolio was significantly underweight to Treasuries given the good health of corporate balance sheets and abundant liquidity available to corporate borrowers, which was a strong tailwind to relative performance during the period. In particular, investments in debt securities issued by energy and industrials companies were a significant contributor to the performance of the fixed-income portion of the Portfolio.
Top contributors to Portfolio performance came from the technology, financials, energy and consumer discretionary sectors. Specifically, Applied Materials Inc., JPMorgan Chase, Broadcom Corp. (no longer a holding), Newfield Exploration Co., Las Vegas Sands, Comcast Corp., Autodesk Inc., Hess Corp. and PNC Financial Services Group were notable contributors. In most cases, we feel that the outlook for these companies continues to be promising.
At Applied Materials Inc., the semiconductor equipment industry has seen significant consolidation and new technologies in memory and display end-markets are driving accelerating revenue growth for companies with expertise in these emerging areas. At JP Morgan Chase and PNC Financial Services Group, rising interest rates, coupled with optimism over the possibility of reduced tax rates and a less onerous regulatory environment have expanded valuation multiples as investors anticipate improved profitability and earnings growth. At Newfield Exploration Co. and Hess Corp., rising oil prices resulting from global supply reductions and optimism for improved demand growth have resulted in dramatic revaluations of companies exposed to these trends. At Las Vegas Sands, Macau gaming trends have stabilized after several years of decline with growth anticipated in 2017. In particular, resorts that appeal to the mass market, which is interested in both gaming and non-gaming activities, are expected to benefit. Finally, at Comcast Corp., persistently strong trends in its cable business plus optimism for domestic tax reform have driven positive earnings revisions, which we expect to continue.
Detractors to performance were Allergan plc, Teva Pharmaceutical, Citicorp Inc., Alliance Data Systems Corp. and Energy Transfer Partners LP (Citicorp, Alliance Data Systems and Energy Transfer Partners LP are no longer portfolio holdings). Health care stocks were under pressure in 2016 due to regulatory inquiries into pricing methodologies and disappointing earnings results in part related to price concessions. Both Allergan plc and Teva Pharmaceutical declined in value as merger and acquisition transactions failed or proved less positive than originally expected. The core business at each company also disappointed relative to more robust expectations for growth and profitability. While 2016 was certainly a disappointing year for both companies, in our view, the outlook is stabilizing for each company and the valuation multiplies are quite attractive. Citicorp and Alliance Data Systems were sold early in 2016 when concerns over corporate and consumer credit were at their climax. Energy Transfer Partners LP was also sold early in 2016 when concerns over excess pipeline capacity in North America raised liquidity concerns for highly leveraged companies.
Outlook
As we look ahead to 2017, the optimism of the past several months is enticing and persuasive in many respects. We think individual and corporate tax reform is a meaningful positive for the domestic economy which, along with the potential for less regulatory oversight and a generally more business-friendly political climate, should be supportive for the growth outlook. However, the uncertainties, which at present are not an area of emphasis for asset markets, are significant. In addition, we believe benefits associated with many of the proposed political changes are more likely to be recognized in 2018, which further leads us to believe that volatility is likely to remain elevated in the near term. The Portfolio’s strategy was adjusted slightly in the last two calendar quarters of 2016 in reaction to the more optimistic outlook for corporate earnings and cash flows. The targeted equity allocation was increased to 60%, with the balance allocated to fixed income and cash.
We believe global growth should improve modestly as clarity around fiscal and monetary policy progresses, balance sheets (corporate and consumer) strengthen and confidence readings translate into higher spending, and the lagged effect of historical stimulus continues to provide a persistent tailwind to growth.
We are closely watching inflation rates and inflation expectations, which have been modest and must remain so in order to allow global central banks to provide support to their local economies as needed. As the domestic economy gradually improves, we expect the Federal Reserve to raise interest rates at a very modest pace. While we continue to monitor macroeconomic forces and trends, we maintain an emphasis on finding high-quality, growing companies whose securities are trading at a reasonable valuation with visible catalysts that we believe will help drive relative outperformance over the next 12 months. This approach has served investors well over time, and our confidence in it has not waned.
Past performance is not a guarantee of future results. The value of the Portfolio’s shares will change, and you could lose money on your investment.
The use of derivatives presents several risks, including the risk that these instruments may change in value in a manner that adversely affects the Portfolio’s NAV and the risk that fluctuations in the value of the derivatives may not correlate with securities markets or the underlying asset upon which the derivative’s value is based. Fixed-income securities are subject to interest rate risk and, as such, the Portfolio’s net asset value may fall as interest rates rise. These and other risks are more fully described in the Portfolio’s prospectus.
The opinions expressed in this report are those of the portfolio manager and are current only through the end of the period of the report as stated on the cover. The portfolio manager’s views are subject to change at any time based on market and other conditions, and no forecasts can be guaranteed.
The indexes noted are unmanaged and include reinvested dividends. One cannot invest directly in an index, nor is an index representative of the Ivy VIP Balanced.
| | |
| PORTFOLIO HIGHLIGHTS | | BALANCED |
ALL DATA IS AS OF DECEMBER 31, 2016 (UNAUDITED)
Asset Allocation
| | | | |
Stocks | | | 60.6% | |
Health Care | | | 13.9% | |
Consumer Discretionary | | | 9.5% | |
Information Technology | | | 8.8% | |
Financials | | | 7.2% | |
Consumer Staples | | | 6.9% | |
Energy | | | 5.8% | |
Industrials | | | 3.4% | |
Materials | | | 3.3% | |
Real Estate | | | 1.4% | |
Telecommunication Services | | | 0.4% | |
Bonds | | | 33.5% | |
Corporate Debt Securities | | | 27.6% | |
United States Government and Government Agency Obligations | | | 5.7% | |
Loans | | | 0.2% | |
Cash and Other Assets (Net of Liabilities),
and Cash Equivalents+ | | | 5.9% | |
Top 10 Equity Holdings
| | | | |
| Company | | Sector | | Industry |
Carnival Corp. | | Consumer Discretionary | | Hotels, Resorts & Cruise Lines |
JPMorgan Chase & Co. | | Financials | | Other Diversified Financial Services |
Apple, Inc. | | Information Technology | | Technology Hardware, Storage & Peripherals |
Shire Pharmaceuticals Group plc ADR | | Health Care | | Biotechnology |
Applied Materials, Inc. | | Information Technology | | Semiconductor Equipment |
Comcast Corp., Class A | | Consumer Discretionary | | Cable & Satellite |
Johnson & Johnson | | Health Care | | Pharmaceuticals |
PNC Financial Services Group, Inc. (The) | | Financials | | Regional Banks |
Intercontinental Exchange, Inc. | | Financials | | Financial Exchanges & Data |
Johnson Controls, Inc. | | Consumer Discretionary | | Auto Parts & Equipment |
See your advisor for more information on the Portfolio’s most recently published Top 10 Equity Holdings.
+Cash equivalents are defined as highly liquid securities with maturities of less than three months. Cash equivalents may include U.S. Government Treasury bills, bank certificates of deposit, bankers’ acceptances, corporate commercial paper and other money market instruments.
| | |
| COMPARISON OF CHANGE IN VALUE OF $10,000 INVESTMENT | | BALANCED |
(UNAUDITED)
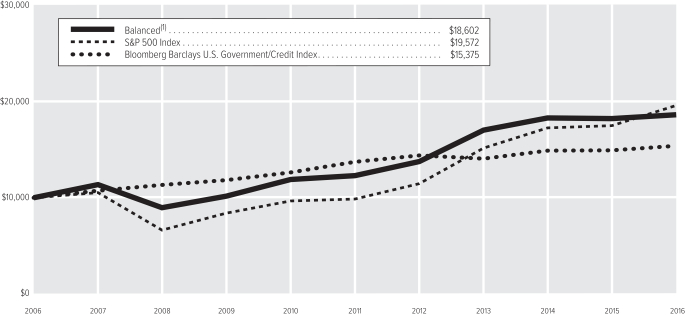
| (1) | The value of the investment in the Portfolio is impacted by the ongoing expenses of the Portfolio and assumes reinvestment of dividends and distributions. |
| | | | |
| Average Annual Total Return(2) | | | |
1-year period ended 12-31-16 | | | 2.03% | |
5-year period ended 12-31-16 | | | 8.62% | |
10-year period ended 12-31-16 | | | 6.40% | |
| (2) | Data quoted is past performance and current performance may be lower or higher. Past performance is no guarantee of future results. Investment return and principal value of an investment will fluctuate and shares, when redeemed, may be worth more or less than their original cost. Please call 1.888.WADDELL for the Portfolio’s most recent month-end performance. Performance data quoted does not reflect any expenses or charges associated with owning a variable life insurance policy or variable annuity contract that invests in the Portfolio’s shares. When such charges are deducted, actual investment performance in a variable policy or contract will be lower. |
Past performance is not necessarily indicative of future performance. Indexes are unmanaged. The performance graph and table do not reflect the deduction of taxes that a shareholder would pay on Portfolio distributions or on the redemption of Portfolio shares. Performance results may include the effect of expense reduction arrangements for some or all of the periods shown. If those arrangements had not been in place, the performance results for those periods would have been lower.
| | |
| SCHEDULE OF INVESTMENTS | | BALANCED (in thousands) |
DECEMBER 31, 2016
| | | | | | | | |
| COMMON STOCKS | | Shares | | | Value | |
Consumer Discretionary | |
| |
Auto Parts & Equipment – 1.5% | |
Johnson Controls, Inc. | | | 129 | | | $ | 5,333 | |
| | | | | | | | |
| |
Cable & Satellite – 1.7% | |
Comcast Corp., Class A | | | 90 | | | | 6,200 | |
| | | | | | | | |
| |
Casinos & Gaming – 1.0% | |
Las Vegas Sands, Inc. | | | 67 | | | | 3,589 | |
| | | | | | | | |
| |
General Merchandise Stores – 1.2% | |
Dollar General Corp. | | | 24 | | | | 1,766 | |
Target Corp. | | | 39 | | | | 2,784 | |
| | | | | | | | |
| | | | | | | 4,550 | |
| | | | | | | | |
| |
Hotels, Resorts & Cruise Lines – 2.2% | |
Carnival Corp. | | | 152 | | | | 7,890 | |
| | | | | | | | |
| |
Movies & Entertainment – 1.1% | |
Twenty-First Century Fox, Inc. | | | 146 | | | | 3,966 | |
| | | | | | | | |
| |
Restaurants – 0.8% | |
YUM! Brands, Inc. | | | 45 | | | | 2,848 | |
| | | | | | | | |
| |
Total Consumer Discretionary – 9.5% | | | | 34,376 | |
Consumer Staples | |
| |
Brewers – 1.0% | |
Anheuser-Busch InBev S.A. ADR | | | 33 | | | | 3,507 | |
| | | | | | | | |
| |
Drug Retail – 1.3% | |
CVS Caremark Corp. | | | 62 | | | | 4,870 | |
| | | | | | | | |
| |
Packaged Foods & Meats – 3.5% | |
J.M. Smucker Co. (The) | | | 35 | | | | 4,475 | |
Kraft Foods Group, Inc. | | | 38 | | | | 3,287 | |
Mead Johnson Nutrition Co. | | | 67 | | | | 4,720 | |
| | | | | | | | |
| | | | | | | 12,482 | |
| | | | | | | | |
| |
Soft Drinks – 1.1% | |
Coca-Cola Co. (The) | | | 101 | | | �� | 4,174 | |
| | | | | | | | |
| |
Total Consumer Staples – 6.9% | | | | 25,033 | |
Energy | |
| |
Integrated Oil & Gas – 0.9% | |
Chevron Corp. | | | 26 | | | | 3,062 | |
| | | | | | | | |
| |
Oil & Gas Equipment & Services – 1.1% | |
Schlumberger Ltd. | | | 48 | | | | 4,037 | |
| | | | | | | | |
| |
Oil & Gas Exploration & Production – 2.4% | |
Newfield Exploration Co. (A) | | | 102 | | | | 4,149 | |
Noble Energy, Inc. | | | 122 | | | | 4,627 | |
| | | | | | | | |
| | | | | | | 8,776 | |
| | | | | | | | |
| |
Oil & Gas Refining & Marketing – 0.5% | |
Phillips 66 | | | 22 | | | | 1,891 | |
| | | | | | | | |
| |
Total Energy – 4.9% | | | | 17,766 | |
| | | | | | | | |
| COMMON STOCKS (Continued) | | Shares | | | Value | |
Financials | |
| |
Asset Management & Custody Banks – 0.5% | |
Northern Trust Corp. | | | 23 | | | $ | 2,022 | |
| | | | | | | | |
| |
Financial Exchanges & Data – 1.5% | |
Intercontinental Exchange, Inc. | | | 96 | | | | 5,421 | |
| | | | | | | | |
| |
Investment Banking & Brokerage – 0.6% | |
Goldman Sachs Group, Inc. (The) | | | 9 | | | | 2,064 | |
| | | | | | | | |
| |
Life & Health Insurance – 0.5% | |
MetLife, Inc. | | | 33 | | | | 1,755 | |
| | | | | | | | |
| |
Other Diversified Financial Services – 2.1% | |
JPMorgan Chase & Co. | | | 86 | | | | 7,454 | |
| | | | | | | | |
| |
Regional Banks – 1.6% | |
PNC Financial Services Group, Inc. (The) | | | 49 | | | | 5,770 | |
| | | | | | | | |
| |
Total Financials – 6.8% | | | | 24,486 | |
Health Care | |
| |
Biotechnology – 2.8% | |
Biogen, Inc. (A) | | | 13 | | | | 3,603 | |
Shire Pharmaceuticals Group plc ADR | | | 39 | | | | 6,614 | |
| | | | | | | | |
| | | | | | | 10,217 | |
| | | | | | | | |
| |
Health Care Equipment – 1.2% | |
Medtronic plc | | | 62 | | | | 4,426 | |
| | | | | | | | |
| |
Health Care Services – 0.9% | |
Laboratory Corp. of America Holdings (A) | | | 26 | | | | 3,395 | |
| | | | | | | | |
| |
Managed Health Care – 2.0% | |
Anthem, Inc. | | | 21 | | | | 2,996 | |
UnitedHealth Group, Inc. | | | 25 | | | | 4,072 | |
| | | | | | | | |
| | | | | | | 7,068 | |
| | | | | | | | |
| |
Pharmaceuticals – 3.8% | |
Allergan plc (A) | | | 19 | | | | 3,902 | |
Johnson & Johnson | | | 53 | | | | 6,082 | |
Teva Pharmaceutical Industries Ltd. ADR | | | 98 | | | | 3,569 | |
| | | | | | | | |
| | | | | | | 13,553 | |
| | | | | | | | |
| |
Total Health Care – 10.7% | | | | 38,659 | |
Industrials | |
| |
Construction Machinery & Heavy Trucks – 0.8% | |
Allison Transmission Holdings, Inc. | | | 56 | | | | 1,893 | |
PACCAR, Inc. | | | 17 | | | | 1,062 | |
| | | | | | | | |
| | | | | | | 2,955 | |
| | | | | | | | |
| |
Railroads – 1.1% | |
Union Pacific Corp. | | | 38 | | | | 3,949 | |
| | | | | | | | |
| | | | | | | | |
| COMMON STOCKS (Continued) | | Shares | | | Value | |
Trucking – 0.8% | |
Knight Transportation, Inc. | | | 83 | | | $ | 2,741 | |
| | | | | | | | |
| |
Total Industrials – 2.7% | | | | 9,645 | |
Information Technology | |
| |
Application Software – 1.4% | |
Autodesk, Inc. (A) | | | 70 | | | | 5,156 | |
| | | | | | | | |
| |
Communications Equipment – 0.5% | |
Harris Corp. | | | 17 | | | | 1,706 | |
| | | | | | | | |
| |
Data Processing & Outsourced Services – 0.8% | |
FleetCor Technologies, Inc. (A) | | | 21 | | | | 2,947 | |
| | | | | | | | |
| |
IT Consulting & Other Services – 1.1% | |
Cognizant Technology Solutions Corp., Class A (A) | | | 74 | | | | 4,132 | |
| | | | | | | | |
| |
Semiconductor Equipment – 1.8% | |
Applied Materials, Inc. | | | 203 | | | | 6,559 | |
| | | | | | | | |
| |
Systems Software – 1.2% | |
Symantec Corp. | | | 175 | | | | 4,190 | |
| | | | | | | | |
| |
Technology Hardware, Storage &
Peripherals – 2.0% | |
Apple, Inc. | | | 61 | | | | 7,045 | |
| | | | | | | | |
| |
Total Information Technology – 8.8% | | | | 31,735 | |
Materials | |
| |
Commodity Chemicals – 0.8% | |
Valvoline, Inc. | | | 131 | | | | 2,807 | |
| | | | | | | | |
| |
Diversified Chemicals – 1.3% | |
PPG Industries, Inc. | | | 48 | | | | 4,558 | |
| | | | | | | | |
| |
Specialty Chemicals – 0.5% | |
LyondellBasell Industries N.V., Class A | | | 22 | | | | 1,893 | |
| | | | | | | | |
| |
Total Materials – 2.6% | | | | 9,258 | |
Real Estate | |
| |
Specialized REITs – 1.4% | |
Crown Castle International Corp. | | | 58 | | | | 5,062 | |
| | | | | | | | |
| |
Total Real Estate – 1.4% | | | | 5,062 | |
| |
TOTAL COMMON STOCKS – 54.3% | | | $ | 196,020 | |
(Cost: $177,236) | |
| | |
PREFERRED STOCKS | | | | | | | | |
Energy | |
| |
Integrated Oil & Gas – 0.9% | |
Hess Corp., Convertible, 8.000% | | | 47 | | | | 3,457 | |
| | | | | | | | |
| |
Total Energy – 0.9% | | | | 3,457 | |
| | |
| SCHEDULE OF INVESTMENTS | | BALANCED (in thousands) |
DECEMBER 31, 2016
| | | | | | | | |
| PREFERRED STOCKS (Continued) | | Shares | | | Value | |
Financials | |
| |
Diversified Banks – 0.1% | |
First Republic Bank, Series G, 5.500% | | | 15 | | | $ | 342 | |
| | | | | | | | |
| |
Other Diversified Financial Services – 0.3% | |
Citigroup, Inc., 6.300% | | | 48 | | | | 1,216 | |
| | | | | | | | |
| |
Total Financials – 0.4% | | | | 1,558 | |
Health Care | |
| |
Managed Health Care – 0.7% | |
Anthem, Inc., 5.250% | | | 49 | | | | 2,305 | |
| | | | | | | | |
| |
Pharmaceuticals – 2.5% | |
Allergan plc, Convertible Series A, 5.500% | | | 6 | | | | 4,879 | |
Teva Pharmaceutical Industries Ltd., Convertible, 7.000% | | | 7 | | | | 4,225 | |
| | | | | | | | |
| | | | | | | 9,104 | |
| | | | | | | | |
| |
Total Health Care – 3.2% | | | | 11,409 | |
Industrials | |
| |
Environmental & Facilities Services – 0.7% | |
Stericycle, Inc., 5.250% | | | 40 | | | | 2,531 | |
| | | | | | | | |
| |
Total Industrials – 0.7% | | | | 2,531 | |
Materials | |
| |
Commodity Chemicals – 0.7% | |
A. Schulman, Inc., Convertible, 6.000% | | | 3 | | | | 2,418 | |
| | | | | | | | |
| |
Total Materials – 0.7% | | | | 2,418 | |
Telecommunication Services | |
| |
Integrated Telecommunication Services – 0.4% | |
Frontier Communications Corp., Convertible Series A, 11.125% | | | 21 | | | | 1,464 | |
| | | | | | | | |
| |
Total Telecommunication Services – 0.4% | | | | 1,464 | |
| | |
TOTAL PREFERRED STOCKS – 6.3% | | | | | | $ | 22,837 | |
(Cost: $26,808) | |
| | |
| CORPORATE DEBT SECURITIES | | Principal | | | | |
Consumer Discretionary | |
| |
Apparel, Accessories & Luxury Goods – 0.4% | |
Under Armour, Inc., | | | | | | | | |
3.250%, 6-15-26 | | $ | 1,600 | | | | 1,509 | |
| | | | | | | | |
| |
Automobile Manufacturers – 0.2% | |
General Motors Co., | | | | | | | | |
6.600%, 4-1-36 | | | 790 | | | | 902 | |
| | | | | | | | |
| |
Automotive Retail – 0.1% | |
AutoZone, Inc., | | | | | | | | |
3.125%, 4-21-26 | | | 350 | | | | 336 | |
| | | | | | | | |
| | | | | | | | |
CORPORATE DEBT SECURITIES
(Continued) | | Principal | | | Value | |
Broadcasting – 0.1% | |
Discovery Communications LLC, | | | | | | | | |
3.300%, 5-15-22 | | $ | 200 | | | $ | 199 | |
| | | | | | | | |
| |
Cable & Satellite – 0.4% | |
Comcast Corp. (GTD by Comcast Cable Communications and NBCUniversal), | | | | | | | | |
3.150%, 3-1-26 | | | 642 | | | | 633 | |
Pearson Funding Five plc, | | | | | | | | |
3.250%, 5-8-23 (B) | | | 300 | | | | 280 | |
Viacom, Inc., | | | | | | | | |
2.750%, 12-15-19 | | | 500 | | | | 499 | |
| | | | | | | | |
| | | | | | | 1,412 | |
| | | | | | | | |
| |
General Merchandise Stores – 0.1% | |
Dollar General Corp., | | | | | | | | |
1.875%, 4-15-18 | | | 250 | | | | 250 | |
| | | | | | | | |
| |
Homebuilding – 0.1% | |
Toll Brothers Finance Corp., | | | | | | | | |
4.375%, 4-15-23 | | | 500 | | | | 499 | |
| | | | | | | | |
| |
Hotels, Resorts & Cruise Lines – 0.1% | |
Hyatt Hotels Corp., | | | | | | | | |
3.375%, 7-15-23 | | | 200 | | | | 197 | |
| | | | | | | | |
| |
Housewares & Specialties – 0.2% | |
Newell Rubbermaid, Inc., | | | | | | | | |
4.200%, 4-1-26 | | | 810 | | | | 844 | |
| | | | | | | | |
| |
Publishing – 0.1% | |
Thomson Reuters Corp., | | | | | | | | |
3.350%, 5-15-26 | | | 245 | | | | 238 | |
| | | | | | | | |
| |
Total Consumer Discretionary – 1.8% | | | | 6,386 | |
Consumer Staples | |
| |
Brewers – 0.2% | |
Molson Coors Brewing Co., | | | | | | | | |
3.000%, 7-15-26 | | | 175 | | | | 165 | |
SABMiller Holdings, Inc., | | | | | | | | |
2.200%, 8-1-18 | | | 500 | | | | 504 | |
| | | | | | | | |
| | | | | | | 669 | |
| | | | | | | | |
| |
Distillers & Vintners – 0.1% | |
Beam, Inc., | | | | | | | | |
1.750%, 6-15-18 | | | 250 | | | | 249 | |
| | | | | | | | |
| |
Food Distributors – 0.1% | |
Campbell Soup Co., | | | | | | | | |
2.500%, 8-2-22 | | | 300 | | | | 296 | |
| | | | | | | | |
| |
Household Products – 0.1% | |
Church & Dwight Co., Inc., | | | | | | | | |
2.875%, 10-1-22 | | | 250 | | | | 247 | |
| | | | | | | | |
| |
Packaged Foods & Meats – 0.0% | |
Mead Johnson Nutrition Co., | | | | | | | | |
3.000%, 11-15-20 | | | 200 | | | | 202 | |
| | | | | | | | |
| | | | | | | | |
CORPORATE DEBT SECURITIES
(Continued) | | Principal | | | Value | |
Personal Products – 0.1% | |
Estee Lauder Co., Inc. (The), | | | | | | | | |
2.350%, 8-15-22 | | $ | 300 | | | $ | 295 | |
| | | | | | | | |
| |
Soft Drinks – 0.3% | |
Coca-Cola Co. (The), | | | | | | | | |
2.250%, 9-1-26 | | | 1,200 | | | | 1,129 | |
| | | | | | | | |
| |
Tobacco – 0.1% | |
BAT International Finance plc, | | | | | | | | |
2.750%, 6-15-20 (B) | | | 600 | | | | 603 | |
| | | | | | | | |
| |
Total Consumer Staples – 1.0% | | | | 3,690 | |
Energy | |
| |
Integrated Oil & Gas – 0.5% | |
Chevron Corp., | | | | | | | | |
2.954%, 5-16-26 | | | 700 | | | | 687 | |
Hess Corp., | | | | | | | | |
4.300%, 4-1-27 | | | 1,200 | | | | 1,193 | |
| | | | | | | | |
| | | | | | | 1,880 | |
| | | | | | | | |
| |
Oil & Gas Equipment & Services – 0.1% | |
Schlumberger Holding Corp., | | | | | | | | |
2.350%, 12-21-18 (B) | | | 500 | | | | 504 | |
| | | | | | | | |
| |
Oil & Gas Exploration & Production – 0.8% | |
BP Capital Markets plc (GTD by BP plc): | | | | | | | | |
2.241%, 9-26-18 | | | 400 | | | | 403 | |
2.315%, 2-13-20 | | | 500 | | | | 500 | |
Concho Resources, Inc., | | | | | | | | |
4.375%, 1-15-25 | | | 1,025 | | | | 1,023 | |
Occidental Petroleum Corp., | | | | | | | | |
2.600%, 4-15-22 | | | 400 | | | | 398 | |
ONEOK Partners L.P., | | | | | | | | |
3.200%, 9-15-18 | | | 500 | | | | 511 | |
| | | | | | | | |
| | | | | | | 2,835 | |
| | | | | | | | |
| |
Oil & Gas Storage & Transportation – 1.5% | |
Buckeye Partners L.P., | | | | | | | | |
2.650%, 11-15-18 | | | 400 | | | | 403 | |
Colorado Interstate Gas Co., | | | | | | | | |
4.150%, 8-15-26 (B) | | | 800 | | | | 776 | |
Hornbeck Offshore Services, Inc., Convertible, | | | | | | | | |
1.500%, 9-1-19 | | | 1,708 | | | | 1,212 | |
Kinder Morgan Energy Partners L.P., | | | | | | | | |
2.650%, 2-1-19 | | | 500 | | | | 503 | |
Plains All American Pipeline L.P. and PAA Finance Corp., | | | | | | | | |
4.650%, 10-15-25 | | | 500 | | | | 516 | |
Southern Natural Gas Co., | | | | | | | | |
5.900%, 4-1-17 (B) | | | 1,000 | | | | 1,010 | |
Williams Partners L.P., | | | | | | | | |
3.600%, 3-15-22 | | | 1,000 | | | | 1,004 | |
| | | | | | | | |
| | | | | | | 5,424 | |
| | | | | | | | |
| |
Total Energy – 2.9% | | | | 10,643 | |
| | |
| SCHEDULE OF INVESTMENTS | | BALANCED (in thousands) |
DECEMBER 31, 2016
| | | | | | | | |
CORPORATE DEBT SECURITIES
(Continued) | | Principal | | | Value | |
Financials | |
| |
Asset Management & Custody Banks – 0.9% | |
Ares Capital Corp.: | | | | | | | | |
4.875%, 11-30-18 | | $ | 1,200 | | | $ | 1,244 | |
3.875%, 1-15-20 | | | 1,950 | | | | 1,976 | |
| | | | | | | | |
| | | | | | | 3,220 | |
| | | | | | | | |
| |
Consumer Finance – 0.9% | |
American Express Co., | | | | | | | | |
4.900%, 12-29-49 | | | 800 | | | | 759 | |
Capital One Bank USA N.A.: | | | | | | | | |
2.150%, 11-21-18 | | | 500 | | | | 501 | |
2.250%, 2-13-19 | | | 500 | | | | 502 | |
General Motors Financial Co., Inc. (GTD by AmeriCredit Financial Services, Inc.), | | | | | | | | |
3.700%, 5-9-23 | | | 175 | | | | 172 | |
Hyundai Capital America, | | | | | | | | |
2.875%, 8-9-18 (B) | | | 250 | | | | 253 | |
Total System Services, Inc., | | | | | | | | |
2.375%, 6-1-18 | | | 1,100 | | | | 1,105 | |
| | | | | | | | |
| | | | | | | 3,292 | |
| | | | | | | | |
| |
Diversified Banks – 5.5% | |
ABN AMRO Bank N.V., | | | | | | | | |
2.500%, 10-30-18 (B) | | | 800 | | | | 806 | |
Australia & New Zealand Banking Group Ltd., | | | | | | | | |
4.400%, 5-19-26 (B) | | | 1,050 | | | | 1,062 | |
Bank of America Corp.: | | | | | | | | |
2.000%, 1-11-18 | | | 400 | | | | 401 | |
8.000%, 7-29-49 | | | 1,552 | | | | 1,595 | |
Bank of New York Mellon Corp. (The), | | | | | | | | |
2.100%, 1-15-19 | | | 500 | | | | 502 | |
Bank of Nova Scotia (The): | | | | | | | | |
1.450%, 4-25-18 | | | 500 | | | | 499 | |
2.050%, 10-30-18 | | | 200 | | | | 201 | |
Barclays plc, | | | | | | | | |
5.200%, 5-12-26 | | | 700 | | | | 712 | |
BNP Paribas S.A., | | | | | | | | |
2.450%, 3-17-19 | | | 900 | | | | 907 | |
Commonwealth Bank of Australia, | | | | | | | | |
2.250%, 3-13-19 | | | 700 | | | | 702 | |
DBS Group Holdings Ltd., | | | | | | | | |
2.246%, 7-16-19 (B) | | | 1,000 | | | | 1,005 | |
HSBC Holdings plc, | | | | | | | | |
3.400%, 3-8-21 | | | 625 | | | | 635 | |
ING Bank N.V., | | | | | | | | |
2.500%, 10-1-19 (B) | | | 1,100 | | | | 1,107 | |
KeyBank N.A., | | | | | | | | |
2.500%, 12-15-19 | | | 500 | | | | 505 | |
Mizuho Bank Ltd., | | | | | | | | |
2.650%, 9-25-19 (B) | | | 1,300 | | | | 1,308 | |
Royal Bank of Scotland Group plc (The), | | | | | | | | |
7.640%, 3-29-49 | | | 800 | | | | 742 | |
Skandinaviska Enskilda Banken AB, | | | | | | | | |
2.375%, 3-25-19 (B) | | | 500 | | | | 501 | |
Societe Generale S.A.: | | | | | | | | |
4.250%, 4-14-25 (B) | | | 500 | | | | 484 | |
5.922%, 4-29-49 (B) | | | 1,000 | | | | 992 | |
Standard Chartered plc, | | | | | | | | |
2.250%, 4-17-20 (B) | | | 1,400 | | | | 1,371 | |
| | | | | | | | |
CORPORATE DEBT SECURITIES
(Continued) | | Principal | | | Value | |
Diversified Banks (Continued) | |
Sumitomo Mitsui Banking Corp., | | | | | | | | |
2.450%, 1-16-20 | | $ | 600 | | | $ | 598 | |
U.S. Bancorp, | | | | | | | | |
3.100%, 4-27-26 | | | 420 | | | | 408 | |
Wells Fargo & Co., | | | | | | | | |
7.980%, 3-29-49 | | | 1,600 | | | | 1,672 | |
Westpac Banking Corp., | | | | | | | | |
2.250%, 7-30-18 | | | 1,000 | | | | 1,006 | |
| | | | | | | | |
| | | | | | | 19,721 | |
| | | | | | | | |
| |
Financial Exchanges & Data – 0.0% | |
Intercontinental Exchange, Inc., | | | | | | | | |
2.500%, 10-15-18 | | | 100 | | | | 101 | |
| | | | | | | | |
| |
Investment Banking & Brokerage – 1.1% | |
BGC Partners, Inc., | | | | | | | | |
5.375%, 12-9-19 | | | 500 | | | | 521 | |
Charles Schwab Corp. (The), | | | | | | | | |
2.200%, 7-25-18 | | | 300 | | | | 302 | |
Credit Suisse Group Funding (Guernsey) Ltd., | | | | | | | | |
2.750%, 3-26-20 | | | 500 | | | | 496 | |
Goldman Sachs Group, Inc. (The): | | | | | | | | |
2.900%, 7-19-18 | | | 450 | | | | 456 | |
2.625%, 1-31-19 | | | 500 | | | | 505 | |
2.600%, 4-23-20 | | | 400 | | | | 400 | |
Morgan Stanley: | | | | | | | | |
2.125%, 4-25-18 | | | 500 | | | | 502 | |
2.650%, 1-27-20 | | | 850 | | | | 854 | |
| | | | | | | | |
| | | | | | | 4,036 | |
| | | | | | | | |
| |
Life & Health Insurance – 0.7% | |
AIA Group Ltd., | | | | | | | | |
2.250%, 3-11-19 (B) | | | 800 | | | | 802 | |
Citizens Financial Group, Inc., | | | | | | | | |
3.750%, 7-1-24 | | | 1,500 | | | | 1,450 | |
Prudential Financial, Inc., | | | | | | | | |
8.875%, 6-15-38 | | | 245 | | | | 265 | |
| | | | | | | | |
| | | | | | | 2,517 | |
| | | | | | | | |
| |
Multi-Line Insurance – 0.4% | |
American International Group, Inc., | | | | | | | | |
2.300%, 7-16-19 | | | 300 | | | | 301 | |
Aon plc (GTD by Aon Corp.), | | | | | | | | |
2.800%, 3-15-21 | | | 500 | | | | 499 | |
Loews Corp., | | | | | | | | |
3.750%, 4-1-26 | | | 643 | | | | 653 | |
| | | | | | | | |
| | | | | | | 1,453 | |
| | | | | | | | |
| |
Other Diversified Financial Services – 2.2% | |
Citigroup, Inc.: | | | | | | | | |
5.800%, 11-29-49 | | | 1,400 | | | | 1,412 | |
5.950%, 12-29-49 | | | 1,400 | | | | 1,387 | |
Fidelity National Financial, Inc., | | | | | | | | |
6.600%, 5-15-17 | | | 300 | | | | 305 | |
Fidelity National Information Services, Inc.: | | | | | | | | |
2.000%, 4-15-18 | | | 250 | | | | 251 | |
2.850%, 10-15-18 | | | 300 | | | | 305 | |
Fifth Street Finance Corp., | | | | | | | | |
4.875%, 3-1-19 | | | 1,300 | | | | 1,312 | |
| | | | | | | | |
CORPORATE DEBT SECURITIES
(Continued) | | Principal | | | Value | |
Other Diversified Financial Services (Continued) | |
JPMorgan Chase & Co.: | | | | | | | | |
7.900%, 4-29-49 | | $ | 750 | | | $ | 777 | |
5.000%, 12-29-49 | | | 750 | | | | 748 | |
PennantPark Investment Corp., | | | | | | | | |
4.500%, 10-1-19 | | | 1,000 | | | | 1,003 | |
Total Capital, | | | | | | | | |
2.125%, 8-10-18 | | | 300 | | | | 302 | |
| | | | | | | | |
| | | | | | | 7,802 | |
| | | | | | | | |
| |
Property & Casualty Insurance – 0.2% | |
Berkshire Hathaway Finance Corp., | | | | | | | | |
2.200%, 3-15-21 | | | 250 | | | | 249 | |
Hanover Insurance Group, Inc. (The), | | | | | | | | |
4.500%, 4-15-26 | | | 560 | | | | 562 | |
| | | | | | | | |
| | | | | | | 811 | |
| | | | | | | | |
| |
Regional Banks – 0.6% | |
PNC Bank N.A.: | | | | | | | | |
2.200%, 1-28-19 | | | 750 | | | | 754 | |
3.250%, 6-1-25 | | | 650 | | | | 648 | |
SunTrust Banks, Inc.: | | | | | | | | |
2.350%, 11-1-18 | | | 500 | | | | 504 | |
5.625%, 12-29-49 | | | 400 | | | | 410 | |
| | | | | | | | |
| | | | | | | 2,316 | |
| | | | | | | | |
| |
Specialized Finance – 0.3% | |
Diamond 1 Finance Corp. and Diamond 2 Finance Corp., | | | | | | | | |
5.450%, 6-15-23 (B) | | | 945 | | | | 1,001 | |
| | | | | | | | |
| |
Total Financials – 12.8% | | | | 46,270 | |
Health Care | |
| |
Biotechnology – 0.4% | |
Amgen, Inc.: | | | | | | | | |
2.200%, 5-22-19 | | | 500 | | | | 504 | |
2.125%, 5-1-20 | | | 1,000 | | | | 990 | |
| | | | | | | | |
| | | | | | | 1,494 | |
| | | | | | | | |
| |
Health Care Equipment – 0.1% | |
Zimmer Holdings, Inc., | | | | | | | | |
2.700%, 4-1-20 | | | 350 | | | | 350 | |
| | | | | | | | |
| |
Health Care Facilities – 0.4% | |
Surgery Center Holdings, Inc., | | | | | | | | |
8.875%, 4-15-21 (B) | | | 1,200 | | | | 1,278 | |
| | | | | | | | |
| |
Health Care Services – 0.3% | |
Quest Diagnostics, Inc.: | | | | | | | | |
2.500%, 3-30-20 | | | 500 | | | | 500 | |
3.450%, 6-1-26 | | | 780 | | | | 768 | |
| | | | | | | | |
| | | | | | | 1,268 | |
| | | | | | | | |
| |
Health Care Supplies – 0.6% | |
Cardinal Health, Inc., | | | | | | | | |
2.400%, 11-15-19 | | | 700 | | | | 705 | |
Shire Acquisitions Investments Ireland Designated Activity Co., | | | | | | | | |
2.875%, 9-23-23 | | | 1,600 | | | | 1,519 | |
| | | | | | | | |
| | | | | | | 2,224 | |
| | | | | | | | |
| | |
| SCHEDULE OF INVESTMENTS | | BALANCED (in thousands) |
DECEMBER 31, 2016
| | | | | | | | |
CORPORATE DEBT SECURITIES
(Continued) | | Principal | | | Value | |
Managed Health Care – 0.5% | |
Aetna, Inc., | | | | | | | | |
2.200%, 3-15-19 | | $ | 400 | | | $ | 401 | |
UnitedHealth Group, Inc., | | | | | | | | |
2.700%, 7-15-20 | | | 300 | | | | 304 | |
WellPoint, Inc., | | | | | | | | |
1.875%, 1-15-18 | | | 1,000 | | | | 1,000 | |
| | | | | | | | |
| | | | | | | 1,705 | |
| | | | | | | | |
| |
Pharmaceuticals – 0.5% | |
AbbVie, Inc., | | | | | | | | |
3.200%, 5-14-26 | | | 490 | | | | 465 | |
Forest Laboratories, Inc., | | | | | | | | |
5.000%, 12-15-21 (B) | | | 1,258 | | | | 1,359 | |
| | | | | | | | |
| | | | | | | 1,824 | |
| | | | | | | | |
| |
Total Health Care – 2.8% | | | | 10,143 | |
Industrials | |
| |
Aerospace & Defense – 0.7% | |
BAE Systems Holdings, Inc., | | | | | | | | |
2.850%, 12-15-20 (B) | | | 400 | | | | 400 | |
Huntington Ingalls Industries, Inc., | | | | | | | | |
5.000%, 11-15-25 (B) | | | 1,545 | | | | 1,605 | |
TransDigm, Inc. (GTD by TransDigm Group, Inc.), | | | | | | | | |
6.000%, 7-15-22 | | | 470 | | | | 489 | |
| | | | | | | | |
| | | | | | | 2,494 | |
| | | | | | | | |
| |
Airlines – 0.1% | |
Southwest Airlines Co., | | | | | | | | |
2.650%, 11-5-20 | | | 375 | | | | 376 | |
| | | | | | | | |
| |
Railroads – 0.1% | |
Kansas City Southern de Mexico S.A. de C.V., | | | | | | | | |
2.350%, 5-15-20 | | | 291 | | | | 287 | |
| | | | | | | | |
| |
Total Industrials – 0.9% | | | | 3,157 | |
Information Technology | |
| |
Data Processing & Outsourced Services – 0.1% | |
Fiserv, Inc., | | | | | | | | |
2.700%, 6-1-20 | | | 300 | | | | 301 | |
| | | | | | | | |
| |
Electronic Equipment & Instruments – 0.1% | |
FLIR Systems, Inc., | | | | | | | | |
3.125%, 6-15-21 | | | 450 | | | | 451 | |
| | | | | | | | |
| |
Semiconductors – 1.6% | |
Micron Technology, Inc., | | | | | | | | |
5.500%, 2-1-25 | | | 1,426 | | | | 1,419 | |
Micron Technology, Inc., Convertible, | | | | | | | | |
3.000%, 11-15-43 | | | 4,500 | | | | 4,469 | |
| | | | | | | | |
| | | | | | | 5,888 | |
| | | | | | | | |
| |
Systems Software – 0.3% | |
Oracle Corp., | | | | | | | | |
2.250%, 10-8-19 | | | 1,000 | | | | 1,011 | |
| | | | | | | | |
| |
Total Information Technology – 2.1% | | | | 7,651 | |
| | | | | | | | |
CORPORATE DEBT SECURITIES
(Continued) | | Principal | | | Value | |
Materials | |
| |
Construction Materials – 0.5% | |
Hillman Group, Inc. (The), | | | | | | | | |
6.375%, 7-15-22 (B) | | $ | 2,060 | | | $ | 1,936 | |
| | | | | | | | |
| |
Diversified Metals & Mining – 0.1% | |
Anglo American plc, | | | | | | | | |
4.125%, 4-15-21 (B) | | | 500 | | | | 509 | |
| | | | | | | | |
| |
Specialty Chemicals – 0.1% | |
RPM International, Inc., | | | | | | | | |
3.450%, 11-15-22 | | | 250 | | | | 248 | |
| | | | | | | | |
| |
Total Materials – 0.7% | | | | 2,693 | |
Real Estate | |
| |
Specialized REITs – 0.2% | |
Crown Castle International Corp.: | | | | | | | | |
5.250%, 1-15-23 | | | 200 | | | | 215 | |
3.700%, 6-15-26 | | | 350 | | | | 343 | |
| | | | | | | | |
| | | | | | | 558 | |
| | | | | | | | |
| |
Total Real Estate – 0.2% | | | | 558 | |
Telecommunication Services | |
| |
Integrated Telecommunication Services – 0.6% | |
AT&T, Inc.: | | | | | | | | |
2.300%, 3-11-19 | | | 1,200 | | | | 1,204 | |
4.125%, 2-17-26 | | | 980 | | | | 991 | |
Verizon Communications, Inc., | | | | | | | | |
2.625%, 2-21-20 | | | 107 | | | | 108 | |
| | | | | | | | |
| | | | | | | 2,303 | |
| | | | | | | | |
| |
Wireless Telecommunication Service – 0.6% | |
American Tower Corp.: | | | | | | | | |
2.250%, 1-15-22 | | | 1,200 | | | | 1,148 | |
4.700%, 3-15-22 | | | 195 | | | | 208 | |
3.375%, 10-15-26 | | | 455 | | | | 430 | |
Virgin Media Finance plc, | | | | | | | | |
4.875%, 2-15-22 | | | 200 | | | | 180 | |
| | | | | | | | |
| | | | | | | 1,966 | |
| | | | | | | | |
| |
Total Telecommunication Services – 1.2% | | | | 4,269 | |
Utilities | |
| |
Electric Utilities – 0.6% | |
Electricite de France S.A., | | | | | | | | |
2.150%, 1-22-19 (B) | | | 500 | | | | 501 | |
Entergy Texas, Inc., | | | | | | | | |
2.550%, 6-1-21 | | | 325 | | | | 324 | |
Exelon Corp., | | | | | | | | |
2.450%, 4-15-21 | | | 480 | | | | 474 | |
PPL Energy Supply LLC, | | | | | | | | |
4.600%, 12-15-21 | | | 100 | | | | 79 | |
Southern Co. (The), | | | | | | | | |
2.950%, 7-1-23 | | | 700 | | | | 690 | |
| | | | | | | | |
| | | | | | | 2,068 | |
| | | | | | | | |
| | | | | | | | |
CORPORATE DEBT SECURITIES
(Continued) | | Principal | | | Value | |
Independent Power Producers & Energy
Traders – 0.4% | |
Canadian Solar, Inc., Convertible, | | | | | | | | |
4.250%, 2-15-19 | | $ | 1,500 | | | $ | 1,391 | |
| | | | | | | | |
Multi-Utilities – 0.2% | |
Dominion Resources, Inc., | | | | | | | | |
2.500%, 12-1-19 | | | 500 | | | | 505 | |
Public Service Electric and Gas Co., | | | | | | | | |
2.250%, 9-15-26 | | | 245 | | | | 227 | |
| | | | | | | | |
| | | | | | | 732 | |
| | | | | | | | |
| |
Total Utilities – 1.2% | | | | 4,191 | |
| |
TOTAL CORPORATE DEBT SECURITIES – 27.6% | | | $ | 99,651 | |
(Cost: $99,412) | |
| | |
LOANS (C) | | | | | | | | |
Industrials | |
| |
Industrial Machinery – 0.2% | |
Dynacast International LLC, | | | | | | | | |
9.500%, 1-30-23 | | | 800 | | | | 780 | |
| | | | | | | | |
| |
Total Industrials – 0.2% | | | | 780 | |
| | |
TOTAL LOANS – 0.2% | | | | | | $ | 780 | |
(Cost: $786) | |
| | |
UNITED STATES GOVERNMENT
AGENCY OBLIGATIONS | | | | | | |
Mortgage-Backed Obligations – 1.7% | |
Federal Home Loan Mortgage Corp. Fixed Rate Participation Certificates: | | | | | | | | |
4.500%, 6-1-44 | | | 1,021 | | | | 1,103 | |
3.000%, 6-15-45 | | | 1,055 | | | | 1,086 | |
Federal National Mortgage Association Fixed Rate Pass-Through Certificates: | | | | | | | | |
6.000%, 9-1-17 | | | 10 | | | | 10 | |
5.000%, 1-1-18 | | | 6 | | | | 6 | |
5.000%, 5-1-18 | | | 5 | | | | 6 | |
4.500%, 7-1-18 | | | 113 | | | | 116 | |
6.500%, 10-1-28 | | | 96 | | | | 109 | |
6.500%, 2-1-29 | | | 45 | | | | 52 | |
3.500%, 6-25-29 | | | 578 | | | | 605 | |
7.500%, 4-1-31 | | | 41 | | | | 44 | |
7.000%, 7-1-31 | | | 59 | | | | 69 | |
7.000%, 9-1-31 | | | 116 | | | | 133 | |
6.500%, 2-1-32 | | | 241 | | | | 279 | |
7.000%, 2-1-32 | | | 147 | | | | 170 | |
7.000%, 3-1-32 | | | 56 | | | | 67 | |
7.000%, 7-1-32 | | | 94 | | | | 106 | |
5.500%, 5-1-33 | | | 56 | | | | 63 | |
5.500%, 6-1-33 | | | 58 | | | | 65 | |
4.500%, 11-1-43 | | | 832 | | | | 904 | |
3.000%, 10-25-46 | | | 1,032 | | | | 1,052 | |
| | |
| SCHEDULE OF INVESTMENTS | | BALANCED (in thousands) |
DECEMBER 31, 2016
| | | | | | | | |
UNITED STATES GOVERNMENT
AGENCY OBLIGATIONS (Continued) | | Principal | | | Value | |
Mortgage-Backed Obligations (Continued) | |
U.S. Department of Veterans Affairs, Guaranteed REMIC Pass-Through Certificates, Vendee Mortgage Trust 1997-A, Class 3-A, | | | | | | | | |
8.293%, 12-15-26 | | $ | 42 | | | $ | 49 | |
| | | | | | | | |
| | | | | | | 6,094 | |
| | | | | | | | |
TOTAL UNITED STATES GOVERNMENT AGENCY OBLIGATIONS – 1.7% | | | $ | 6,094 | |
(Cost: $6,060) | |
| | |
UNITED STATES GOVERNMENT
OBLIGATIONS | | | | | | |
Treasury Inflation Protected Obligations – 3.0% | |
U.S. Treasury Notes: | | | | | | | | |
0.125%, 7-15-26 | | | 4,034 | | | | 3,900 | |
2.125%, 2-15-40 | | | 3,579 | | | | 4,431 | |
1.000%, 2-15-46 | | | 2,448 | | | | 2,458 | |
| | | | | | | | |
| | | | | | | 10,789 | |
| | | | | | | | |
| | | | | | | | |
UNITED STATES GOVERNMENT
OBLIGATIONS (Continued) | | Principal | | | Value | |
Treasury Obligations – 1.0% | |
U.S. Treasury Notes, | | | | | | | | |
1.500%, 8-15-26 | | $ | 4,000 | | | $ | 3,673 | |
| | | | | | | | |
TOTAL UNITED STATES GOVERNMENT
OBLIGATIONS – 4.0% | | | $ | 14,462 | |
(Cost: $15,198) | |
| | |
SHORT-TERM SECURITIES | | | | | | | | |
Commercial Paper (D) – 1.7% | |
Northern Illinois Gas Co.: | | | | | | | | |
0.900%, 1-3-17 | | | 3,546 | | | | 3,546 | |
0.870%, 1-12-17 | | | 2,500 | | | | 2,499 | |
| | | | | | | | |
| | | | | | | 6,045 | |
| | | | | | | | |
| |
Master Note – 0.8% | |
Toyota Motor Credit Corp., | | | | | | | | |
0.860%, 1-4-17 (E) | | | 2,840 | | | | 2,840 | |
| | | | | | | | |
| | | | | | | | |
SHORT-TERM SECURITIES
(Continued) | | Principal | | | Value | |
Municipal Obligations – 3.2% | |
The Regents of the Univ of CA, Gen Rev Bonds, Ser AL, | | | | | | | | |
0.700%, 1-7-17 (E) | | $ | 11,600 | | | $ | 11,600 | |
| | | | | | | | |
| |
TOTAL SHORT-TERM
SECURITIES – 5.7% | | | $ | 20,485 | |
(Cost: $20,485) | |
| |
TOTAL INVESTMENT
SECURITIES – 99.8% | | | $ | 360,329 | |
(Cost: $345,985) | |
| |
CASH AND OTHER ASSETS, NET OF LIABILITIES – 0.2% | | | | 696 | |
| |
NET ASSETS – 100.0% | | | $ | 361,025 | |
Notes to Schedule of Investments
| (A) | No dividends were paid during the preceding 12 months. |
| (B) | Securities were purchased pursuant to an exemption from registration available under Rule 144A under the Securities Act of 1933 and may only be resold in transactions exempt from registration, normally to qualified institutional buyers. At December 31, 2016 the total value of these securities amounted to $21,453 or 6.0% of net assets. |
| (C) | Variable rate security. Interest rate disclosed is that which is in effect at December 31, 2016. |
| (D) | Rate shown is the yield to maturity at December 31, 2016. |
| (E) | Variable rate security. Interest rate disclosed is that which is in effect at December 31, 2016. Date shown represents the date that the variable rate resets. |
The following table is a summary of the valuation of the Portfolio’s investments by the fair value hierarchy levels as of December 31, 2016. See Note 3 to the Financial Statements for further information regarding fair value measurement.
| | | | | | | | | | | | |
| | | Level 1 | | | Level 2 | | | Level 3 | |
Assets | | | | | | | | | | | | |
Investments in Securities | | | | | | | | | | | | |
Common Stocks | | $ | 196,020 | | | $ | — | | | $ | — | |
Preferred Stocks | | | 20,419 | | | | 2,418 | | | | — | |
Corporate Debt Securities | | | — | | | | 99,651 | | | | — | |
Loans | | | — | | | | — | | | | 780 | |
United States Government Agency Obligations | | | — | | | | 6,094 | | | | — | |
United States Government Obligations | | | — | | | | 14,462 | | | | — | |
Short-Term Securities | | | — | | | | 20,485 | | | | — | |
Total | | $ | 216,439 | | | $ | 143,110 | | | $ | 780 | |
During the year ended December 31, 2016, there were no transfers between any levels.
The following acronyms are used throughout this schedule:
ADR = American Depositary Receipts
GTD = Guaranteed
REMIC = Real Estate Mortgage Investment Conduit
REIT = Real Estate Investment Trust
See Accompanying Notes to Financial Statements.
| | |
| MANAGEMENT DISCUSSION | | BOND |
(UNAUDITED)

Rick Perry
Below, Rick Perry, portfolio manager of Ivy VIP Bond, discuss positioning, performance and results for the fiscal year ended December 31, 2016. He has managed the Portfolio since 2015 and has 24 years industry experience.
Fiscal Year Performance
| | | | |
For the 12 months ended December 31, 2016 | | | | |
Ivy VIP Bond | | | 4.03% | |
Benchmark(s) and/or Lipper Category | | | | |
Bloomberg Barclays U.S. Aggregate Bond Index | | | 2.65% | |
(generally reflects the performance of securities representing U.S. traded investment grade bonds. | | | | |
Lipper Variable Annuity Corporate Debt Funds A Funds Universe Average | | | 3.36% | |
(generally reflects the performance of the universe of funds with similar investment objectives) | | | | |
Please note that the Portfolio returns include applicable investment fees and expenses, whereas the index returns do not include any such fees. Also, the Portfolio’s performance data does not take into account any product expenses or charges associated with owning a variable life or annuity policy, which is invested in Ivy Variable Insurance Portfolios.
The year 2016 could be called the “year of the unexpected.” The year began with soft financial markets as a result of considerable weakness in commodities, particularly energy prices. By the end of the second quarter, oil prices had largely recovered, calming the financial markets. The middle part of the year produced the unexpected vote of the United Kingdom to leave the European Union (Brexit), which seemed to be a low probability event right up until the actual referendum. The market’s reaction after Brexit was very surprising as well. After some very short-term pain, the global financial market largely shrugged off Brexit. The fourth quarter produced the surprising victory of Donald Trump in the U.S. presidential election. Market expectations were that a Trump win would cause extreme weakness in equities and potential softness in the bond market. The actual market reaction was a significant rally in the equity market and profound weakness in the bond market, particularly Treasuries. In summary, 2016 was a year in which very few things worked out to be consistent with expectations. Despite the uncertainty and volatility, both equites and bonds produced positive total returns for the year.
Portfolio Performance
The Portfolio outperformed its benchmark (Bloomberg Barclays U.S. Aggregate Bond Index) by 138 basis points in 2016. The primary reason for the excess return was the significant overweight to the corporate credit asset class. The corporate credit asset class significantly outperformed other fixed income classes during 2016. Within this asset class, the Portfolio was overweight in financials, which was a drag on relative performance as the financial sector underperformed the broader market. Securitized assets (commercial mortgage-backed securities, residential mortgage-backed securities, asset-backed securities) were marginally underweight in the Portfolio throughout the year. Despite the underweight positioning, the Portfolio’s securitized assets did outperform the benchmark’s components. The Portfolio’s relative performance also benefited from a material underweight to Treasuries, which underperformed most other fixed income asset classes. The Portfolio’s overall duration was held relatively constant throughout the year, essentially neutral to the benchmark. Given the market uncertainties in 2016, taking significant bets on duration and yield curve positioning did not seem prudent most of the year.
Portfolio Positioning
The Portfolio experienced a material cash inflow two days before year-end. The timing of the inflow had a significant impact on year-end asset allocation, as it was impossible to get fully invested in a prudent manner in such a short time frame. Corporate credit continues to be a material overweight relative to the benchmark, with financials being the largest sector overweight. Financials are believed to provide the best risk-reward relationship within the credit asset class. We believe Treasuries will continue to be significantly underweight, as we expect interest rates to move higher during 2017. The unwind of the Federal Reserve’s (Fed) previous zero interest rate policy is expected to create some volatility during the year ahead. We will seek to keep the Portfolio’s overall duration neutral to slightly underweight as a result of the uncertainty. Yield curve positioning is expected to favor a flattening trend in early 2017.
Outlook
As we enter 2017, the uncertainty and optimism associated with the upcoming Trump presidency seems to be the dominant theme in the financial markets. The substantial equity market rally in late 2016 was at least partially due to higher expected
economic growth in the U.S. We believe that expectations that the Trump administration will be able to reduce regulation and lower taxes are valid reasons for optimism. However, the market may be anticipating a quicker and smoother path to these pro-growth policies than will be reality. The higher growth expectations (and possibly higher inflation) were also the drivers of the bond market’s weakness in late 2016. It seems at least reasonably possible that reality will fall short of expectations and that equities will show weakness and bonds strength at some point in 2017.
The financial markets are expecting the Fed will raise short-term rates two to three times in 2017. Central Bank policies outside of the U.S. — specifically, those in Europe, Japan and China — continue to impact the U.S. fixed income market, both in Treasuries and credit. As long as interest rates outside of the U.S. remain significantly lower than U.S. rates, we believe it is unlikely that Treasury yields will go materially higher in the near term. The demand for positive yield from foreign investors is providing an opportunity for U.S. companies to borrow (issue bonds) at very attractive rates. Although the foreign demand for yield provides a short-term boost to the credit market, it is highly uncertain how stable this demand will prove to be over the longer term. Credit metrics, such as leverage and interest coverage, for U.S. companies have been eroding for several quarters as more corporate bonds are issued to meet demand. Should foreign investors reduce their appetite for U.S. credit, we believe the market could potentially experience some volatility.
We believe the unexpected results of the U.S. presidential election and the resulting boost in positive investor sentiment could extend the duration of the credit cycle. Prior to the U.S. presidential election, there were clear indications that the market was in the very late stages of the credit cycle. The new optimism about higher economic growth was supportive to the credit market in late 2016. We anticipate that whether this increased economic growth actually materializes in 2017 will be a key determinant of the credit market’s performance in 2017 and beyond. Should reality fall short of the optimistic expectations that are reflected in current market valuations, we believe it is likely that some periods of weakness and volatility will be experienced in credit. Other key market risk factors as we enter 2017 are inconsistent global central bank policies and execution, and geopolitical concerns, particularly in Europe and the Middle East. How the low/negative interest rate environment in Japan and parts of Europe plays out continues to be a concern for global financial markets.
Past performance is not a guarantee of future results. As with any mutual fund, the value of the Portfolio’s shares will change, and you could lose money on your investment.
Certain U.S. government securities in which the Portfolio may invest, such as Treasury securities and securities issued by the Government National Mortgage Association (Ginnie Mae), are backed by the full faith and credit of the U.S. government. However, other U.S. government securities in which the Portfolio may invest, such as securities issued by the Federal National Mortgage Association (Fannie Mae), the Federal Home Loan Mortgage Corporation (Freddie Mac) and the Federal Home Loan Banks (FHLB), are not backed by the full faith and credit of the U.S. government, are not insured or guaranteed by the U.S. government and, instead, may be supported only by the right of the issuer to borrow from the U.S. Treasury or by the credit of the issuer.
Fixed income securities are subject to interest rate risk and, as such, the net asset value of the Portfolio may fall as interest rates rise. These and other risks are more fully described in the Portfolio’s prospectus.
The opinions expressed in this report are those of the portfolio manager and are current only through the end of the period of the report as stated on the cover. The manager’s views are subject to change at any time based on market and other conditions, and no forecasts can be guaranteed.
The index noted is unmanaged and includes reinvested dividends. One cannot invest directly in an index, nor is an index representative of Ivy VIP Bond.
| | |
| PORTFOLIO HIGHLIGHTS | | BOND |
ALL DATA IS AS OF DECEMBER 31, 2016 (UNAUDITED)
Asset Allocation
| | | | |
Bonds | | | 91.3% | |
Corporate Debt Securities | | | 53.0% | |
United States Government and Government Agency Obligations | | | 33.9% | |
Municipal Bonds – Taxable | | | 2.5% | |
Asset-Backed Securities | | | 1.0% | |
Other Government Securities | | | 0.8% | |
Mortgage-Backed Securities | | | 0.1% | |
Cash and Other Assets (Net of Liabilities), and Cash Equivalents+ | | | 8.7% | |
Quality Weightings
| | | | |
Investment Grade | | | 85.6% | |
AAA | | | 1.3% | |
AA | | | 37.9% | |
A | | | 17.4% | |
BBB | | | 29.0% | |
Non-Investment Grade | | | 5.7% | |
BB | | | 1.2% | |
Non-rated | | | 4.5% | |
Cash and Other Assets (Net of Liabilities), and Cash Equivalents+ | | | 8.7% | |
Our preference is to always use ratings obtained from Standard & Poor’s. For securities not rated by Standard & Poor’s, ratings are obtained from Moody’s. We do not evaluate these ratings, but simply assign them to the appropriate credit quality category as determined by the rating agency.
+Cash equivalents are defined as highly liquid securities with maturities of less than three months. Cash equivalents may include U.S. Government Treasury bills, bank certificates of deposit, bankers’ acceptances, corporate commercial paper and other money market instruments.
| | |
| COMPARISON OF CHANGE IN VALUE OF $10,000 INVESTMENT | | BOND |
(UNAUDITED)
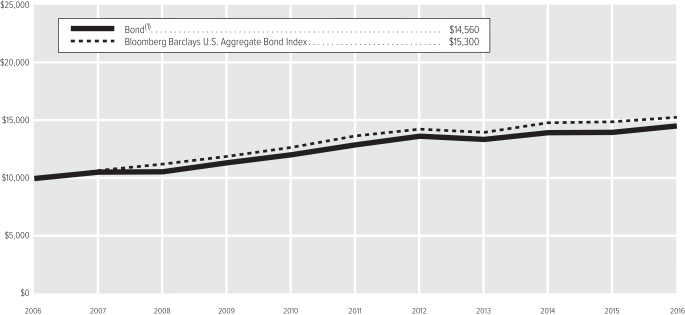
| (1) | The value of the investment in the Portfolio is impacted by the ongoing expenses of the Portfolio and assumes reinvestment of dividends and distributions. |
| | | | |
| Average Annual Total Return(2) | | | |
1-year period ended 12-31-16 | | | 4.03% | |
5-year period ended 12-31-16 | | | 2.41% | |
10-year period ended 12-31-16 | | | 3.83% | |
| (2) | Data quoted is past performance and current performance may be lower or higher. Past performance is no guarantee of future results. Investment return and principal value of an investment will fluctuate and shares, when redeemed, may be worth more or less than their original cost. Please call 1.888. WADDELL for the Portfolio’s most recent month-end performance. Performance data quoted does not reflect any expenses or charges associated with owning a variable life insurance policy or variable annuity contract that invests in the Portfolio’s shares. When such charges are deducted, actual investment performance in a variable policy or contract will be lower. |
Past performance is not necessarily indicative of future performance. Indexes are unmanaged. The performance graph and table do not reflect the deduction of taxes that a shareholder would pay on Portfolio distributions or on the redemption of Portfolio shares. Performance results may include the effect of expense reduction arrangements for some or all of the periods shown. If those arrangements had not been in place, the performance results for those periods would have been lower.
| | |
| SCHEDULE OF INVESTMENTS | | BOND (in thousands) |
DECEMBER 31, 2016
| | | | | | | | |
| ASSET-BACKED SECURITIES | | Principal | | | Value | |
Air Canada Enhanced Equipment Trust, Series 2015-2, Class AA, | | | | | | | | |
3.750%, 12-15-27 (A) | | $ | 976 | | | $ | 1,022 | |
American Airlines Class AA Pass Through Certificates, Series 2016-2, | | | | | | | | |
3.200%, 6-15-28 | | | 1,000 | | | | 972 | |
American Airlines, Inc., Class AA Pass Through Certificates, Series 2016-1, | | | | | | | | |
3.575%, 1-15-28 | | | 998 | | | | 998 | |
United Airlines Pass-Through Certificates, Series 2016-AA, | | | | | | | | |
3.100%, 7-7-28 | | | 1,000 | | | | 965 | |
| | | | | | | | |
| |
TOTAL ASSET-BACKED SECURITIES – 1.0% | | | $ | 3,957 | |
(Cost: $3,973) | | | | | | | | |
| |
| CORPORATE DEBT SECURITIES | | | | |
Consumer Discretionary | |
| |
Advertising – 0.2% | |
Omnicom Group, Inc., | | | | | | | | |
3.600%, 4-15-26 | | | 1,000 | | | | 988 | |
| | | | | | | | |
| |
Cable & Satellite – 1.3% | |
Comcast Corp. (GTD by Comcast Cable Communications and NBCUniversal), | | | | | | | | |
2.350%, 1-15-27 | | | 500 | | | | 461 | |
DIRECTV Holdings LLC and DIRECTV Financing Co., Inc.: | | | | | | | | |
3.800%, 3-15-22 | | | 1,619 | | �� | | 1,658 | |
3.950%, 1-15-25 | | | 815 | | | | 816 | |
Time Warner, Inc. (GTD by Historic TW, Inc.), | | | | | | | | |
2.950%, 7-15-26 | | | 1,500 | | | | 1,395 | |
Viacom, Inc., | | | | | | | | |
2.250%, 2-4-22 | | | 1,000 | | | | 939 | |
| | | | | | | | |
| | | | | | | 5,269 | |
| | | | | | | | |
| |
Education Services – 0.2% | |
President and Fellows of Harvard College, | | | | | | | | |
3.150%, 7-15-46 | | | 500 | | | | 447 | |
University of Southern California, | | | | | | | | |
3.028%, 10-1-39 | | | 500 | | | | 443 | |
| | | | | | | | |
| | | | | | | 890 | |
| | | | | | | | |
| |
Footwear – 1.1% | |
NIKE, Inc.: | | | | | | | | |
2.375%, 11-1-26 | | | 1,000 | | | | 942 | |
3.875%, 11-1-45 | | | 3,500 | | | | 3,443 | |
| | | | | | | | |
| | | | | | | 4,385 | |
| | | | | | | | |
| |
Homebuilding – 0.3% | |
Toll Brothers Finance Corp., | | | | | | | | |
4.375%, 4-15-23 | | | 1,055 | | | | 1,052 | |
| | | | | | | | |
| |
Hotels, Resorts & Cruise Lines – 0.2% | |
Marriott International, Inc., Series R, | | | | | | | | |
3.125%, 6-15-26 | | | 1,000 | | | | 945 | |
| | | | | | | | |
| | | | | | | | |
CORPORATE DEBT SECURITIES
(Continued) | | Principal | | | Value | |
Internet & Direct Marketing Retail – 0.1% | |
Amazon.com, Inc., | | | | | | | | |
4.800%, 12-5-34 | | $ | 370 | | | $ | 407 | |
| | | | | | | | |
| |
Movies & Entertainment – 0.5% | |
Walt Disney Co. (The), | | | | | | | | |
4.125%, 6-1-44 | | | 2,000 | | | | 2,063 | |
| | | | | | | | |
| |
Publishing – 0.1% | |
Thomson Reuters Corp., | | | | | | | | |
3.350%, 5-15-26 | | | 500 | | | | 485 | |
| | | | | | | | |
| |
Total Consumer Discretionary – 4.0% | | | | 16,484 | |
Consumer Staples | |
| |
Brewers – 1.2% | |
Anheuser-Busch Inbev Finance, Inc. (GTD by AB INBEV/BBR/COB), | | | | | | | | |
3.650%, 2-1-26 | | | 2,000 | | | | 2,027 | |
Molson Coors Brewing Co.: | | | | | | | | |
3.000%, 7-15-26 | | | 2,500 | | | | 2,360 | |
4.200%, 7-15-46 | | | 500 | | | | 465 | |
| | | | | | | | |
| | | | | | | 4,852 | |
| | | | | | | | |
| |
Drug Retail – 0.3% | |
CVS Health Corp.: | | | | | | | | |
2.800%, 7-20-20 | | | 75 | | | | 76 | |
2.125%, 6-1-21 | | | 450 | | | | 442 | |
Walgreens Boots Alliance, Inc., | | | | | | | | |
3.100%, 6-1-23 | | | 500 | | | | 497 | |
| | | | | | | | |
| | | | | | | 1,015 | |
| | | | | | | | |
| |
Food Distributors – 0.2% | |
Sysco Corp., | | | | | | | | |
3.300%, 7-15-26 | | | 1,000 | | | | 980 | |
| | | | | | | | |
| |
Food Retail – 0.6% | |
Kroger Co. (The), | | | | | | | | |
6.800%, 12-15-18 | | | 2,245 | | | | 2,457 | |
| | | | | | | | |
| |
Household Products – 1.4% | |
Kimberly-Clark Corp.: | | | | | | | | |
2.750%, 2-15-26 | | | 1,000 | | | | 973 | |
3.200%, 7-30-46 | | | 3,500 | | | | 3,036 | |
Procter & Gamble Co. (The), | | | | | | | | |
2.700%, 2-2-26 | | | 2,000 | | | | 1,964 | |
| | | | | | | | |
| | | | | | | 5,973 | |
| | | | | | | | |
| |
Packaged Foods & Meats – 1.9% | |
General Mills, Inc., | | | | | | | | |
1.400%, 10-20-17 | | | 700 | | | | 701 | |
Hershey Co. (The), | | | | | | | | |
2.300%, 8-15-26 | | | 1,500 | | | | 1,393 | |
Kraft Heinz Foods Co.: | | | | | | | | |
3.000%, 6-1-26 | | | 3,000 | | | | 2,812 | |
4.375%, 6-1-46 | | | 2,000 | | | | 1,878 | |
Mead Johnson Nutrition Co., | | | | | | | | |
4.125%, 11-15-25 | | | 1,000 | | | | 1,021 | |
| | | | | | | | |
| | | | | | | 7,805 | |
| | | | | | | | |
| | | | | | | | |
CORPORATE DEBT SECURITIES
(Continued) | | Principal | | | Value | |
Soft Drinks – 1.5% | |
Coca-Cola Co. (The): | | | | | | | | |
1.550%, 9-1-21 | | $ | 1,500 | | | $ | 1,456 | |
2.875%, 10-27-25 | | | 2,000 | | | | 1,971 | |
2.250%, 9-1-26 | | | 1,000 | | | | 940 | |
PepsiCo, Inc.: | | | | | | | | |
1.700%, 10-6-21 | | | 1,000 | | | | 972 | |
2.850%, 2-24-26 | | | 1,000 | | | | 984 | |
| | | | | | | | |
| | | | | | | 6,323 | |
| | | | | | | | |
| |
Total Consumer Staples – 7.1% | | | | 29,405 | |
Energy | |
| |
Oil & Gas Equipment & Services – 0.5% | |
Enterprise Products Operating LLC (GTD by Enterprise Products Partners L.P.), | | | | | | | | |
6.500%, 1-31-19 | | | 2,000 | | | | 2,179 | |
| | | | | | | | |
| |
Oil & Gas Exploration & Production – 1.3% | |
BP Capital Markets plc (GTD by BP plc), | | | | | | | | |
1.674%, 2-13-18 | | | 500 | | | | 500 | |
ConocoPhillips Co. (GTD by ConocoPhillips), | | | | | | | | |
4.150%, 11-15-34 | | | 850 | | | | 830 | |
EQT Corp., | | | | | | | | |
8.125%, 6-1-19 | | | 3,494 | | | | 3,930 | |
| | | | | | | | |
| | | | | | | 5,260 | |
| | | | | | | | |
| |
Oil & Gas Storage & Transportation – 1.5% | |
Buckeye Partners L.P., | | | | | | | | |
3.950%, 12-1-26 | | | 950 | | | | 925 | |
Colorado Interstate Gas Co., | | | | | | | | |
4.150%, 8-15-26(A) | | | 1,000 | | | | 970 | |
Plains All American Pipeline L.P. and PAA Finance Corp.: | | | | | | | | |
3.600%, 11-1-24 | | | 1,031 | | | | 986 | |
4.500%, 12-15-26 | | | 500 | | | | 507 | |
Sunoco Logistics Partners Operations L.P. (GTD by Sunoco Logistics Partners L.P.), | | | | | | | | |
4.400%, 4-1-21 | | | 500 | | | | 526 | |
Tennessee Gas Pipeline Co., | | | | | | | | |
7.000%, 3-15-27 | | | 2,000 | | | | 2,325 | |
| | | | | | | | |
| | | | | | | 6,239 | |
| | | | | | | | |
| |
Total Energy – 3.3% | | | | 13,678 | |
Financials | |
| |
Asset Management & Custody Banks – 1.3% | |
Ares Capital Corp., | | | | | | | | |
3.875%, 1-15-20 | | | 2,780 | | | | 2,817 | |
Legg Mason, Inc., | | | | | | | | |
4.750%, 3-15-26 | | | 1,500 | | | | 1,551 | |
State Street Corp., | | | | | | | | |
2.650%, 5-19-26 | | | 1,000 | | | | 947 | |
| | | | | | | | |
| | | | | | | 5,315 | |
| | | | | | | | |
| | |
| SCHEDULE OF INVESTMENTS | | BOND (in thousands) |
DECEMBER 31, 2016
| | | | | | | | |
CORPORATE DEBT SECURITIES
(Continued) | | Principal | | | Value | |
Consumer Finance – 2.4% | |
American Express Credit Corp., | | | | | | | | |
1.875%, 11-5-18 | | $ | 1,000 | | | $ | 1,001 | |
Capital One Financial Corp.: | | | | | | | | |
4.200%, 10-29-25 | | | 1,500 | | | | 1,503 | |
3.750%, 7-28-26 | | | 1,000 | | | | 968 | |
Discover Financial Services, | | | | | | | | |
3.950%, 11-6-24 | | | 1,500 | | | | 1,485 | |
General Motors Financial Co., Inc. (GTD by AmeriCredit Financial Services, Inc.): | | | | | | | | |
3.500%, 7-10-19 | | | 800 | | | | 814 | |
3.200%, 7-6-21 | | | 500 | | | | 495 | |
3.700%, 5-9-23 | | | 3,000 | | | | 2,949 | |
4.000%, 10-6-26 | | | 1,000 | | | | 961 | |
| | | | | | | | |
| | | | | | | 10,176 | |
| | | | | | | | |
| |
Diversified Banks – 6.7% | |
Bank of America Corp.: | | | | | | | | |
6.000%, 9-1-17 | | | 1,000 | | | | 1,029 | |
2.625%, 4-19-21 | | | 1,000 | | | | 992 | |
2.503%, 10-21-22 | | | 4,000 | | | | 3,864 | |
4.200%, 8-26-24 | | | 500 | | | | 509 | |
3.875%, 8-1-25 | | | 2,500 | | | | 2,539 | |
Bank of Montreal, | | | | | | | | |
2.100%, 12-12-19 | | | 500 | | | | 500 | |
Bank of New York Mellon Corp. (The), | | | | | | | | |
2.200%, 8-16-23 | | | 3,000 | | | | 2,859 | |
Bank of Nova Scotia (The), | | | | | | | | |
1.250%, 4-11-17 | | | 1,000 | | | | 1,000 | |
BB&T Corp., | | | | | | | | |
2.050%, 5-10-21 | | | 1,000 | | | | 981 | |
Commonwealth Bank of Australia, | | | | | | | | |
2.000%, 9-6-21(A) | | | 1,500 | | | | 1,456 | |
Fifth Third Bank N.A., | | | | | | | | |
2.250%, 6-14-21 | | | 500 | | | | 494 | |
Huntington Bancshares, Inc., | | | | | | | | |
2.300%, 1-14-22 | | | 500 | | | | 484 | |
Sumitomo Mitsui Financial Group, Inc., | | | | | | | | |
2.058%, 7-14-21 | | | 1,000 | | | | 966 | |
U.S. Bancorp, | | | | | | | | |
3.100%, 4-27-26 | | | 2,500 | | | | 2,430 | |
U.S. Bank N.A., | | | | | | | | |
1.350%, 1-26-18 | | | 2,000 | | | | 1,996 | |
Wells Fargo & Co.: | | | | | | | | |
2.100%, 7-26-21 | | | 1,000 | | | | 972 | |
3.000%, 10-23-26 | | | 1,000 | | | | 951 | |
4.400%, 6-14-46 | | | 1,500 | | | | 1,433 | |
4.750%, 12-7-46 | | | 500 | | | | 505 | |
Westpac Banking Corp.: | | | | | | | | |
2.000%, 8-19-21 | | | 1,000 | | | | 970 | |
4.322%, 11-23-31 | | | 1,000 | | | | 998 | |
| | | | | | | | |
| | | | | | | 27,928 | |
| | | | | | | | |
| |
Investment Banking & Brokerage – 3.7% | |
Credit Suisse Group Funding (Guernsey) Ltd., | | | | | | | | |
3.125%, 12-10-20 | | | 1,500 | | | | 1,494 | |
Goldman Sachs Group, Inc. (The): | | | | | | | | |
4.250%, 10-21-25 | | | 500 | | | | 507 | |
| | | | | | | | |
CORPORATE DEBT SECURITIES
(Continued) | | Principal | | | Value | |
Investment Banking & Brokerage (Continued) | |
3.750%, 2-25-26 | | $ | 1,000 | | | $ | 1,001 | |
3.500%, 11-16-26 | | | 2,000 | | | | 1,959 | |
2.634%, 10-28-27(B) | | | 2,000 | | | | 2,039 | |
Morgan Stanley: | | | | | | | | |
2.625%, 11-17-21 | | | 4,000 | | | | 3,948 | |
2.282%, 10-24-23(B) | | | 1,500 | | | | 1,517 | |
3.875%, 1-27-26 | | | 1,000 | | | | 1,009 | |
3.125%, 7-27-26 | | | 2,000 | | | | 1,908 | |
| | | | | | | | |
| | | | | | | 15,382 | |
| | | | | | | | |
| |
Life & Health Insurance – 0.7% | |
MetLife Global Funding I, | | | | | | | | |
1.950%, 9-15-21(A) | | | 2,000 | | | | 1,942 | |
Principal Life Global Funding II, | | | | | | | | |
3.000%, 4-18-26(A) | | | 1,000 | | | | 971 | |
| | | | | | | | |
| | | | | | | 2,913 | |
| | | | | | | | |
| |
Other Diversified Financial Services – 4.9% | |
Citigroup, Inc.: | | | | | | | | |
2.700%, 3-30-21 | | | 3,000 | | | | 2,991 | |
4.450%, 9-29-27 | | | 3,000 | | | | 3,050 | |
JPMorgan Chase & Co.: | | | | | | | | |
2.000%, 8-15-17 | | | 1,000 | | | | 1,004 | |
2.295%, 8-15-21 | | | 3,000 | | | | 2,942 | |
2.700%, 5-18-23 | | | 3,000 | | | | 2,932 | |
3.625%, 12-1-27 | | | 1,500 | | | | 1,453 | |
4.950%, 6-1-45 | | | 1,000 | | | | 1,064 | |
TIAA Asset Management
Finance Co. LLC, | | | | | | | | |
4.125%, 11-1-24(A) | | | 2,400 | | | | 2,421 | |
USAA Capital Corp., | | | | | | | | |
2.450%, 8-1-20(A) | | | 2,360 | | | | 2,365 | |
| | | | | | | | |
| | | | | | | 20,222 | |
| | | | | | | | |
| |
Property & Casualty Insurance – 0.4% | |
Berkshire Hathaway, Inc., | | | | | | | | |
3.125%, 3-15-26 | | | 1,500 | | | | 1,488 | |
| | | | | | | | |
| |
Regional Banks – 0.4% | |
PNC Bank N.A.: | | | | | | | | |
1.700%, 12-7-18 | | | 500 | | | | 499 | |
2.450%, 11-5-20 | | | 264 | | | | 264 | |
3.300%, 10-30-24 | | | 1,000 | | | | 1,004 | |
| | | | | | | | |
| | | | | | | 1,767 | |
| | | | | | | | |
| |
Specialized Finance – 0.4% | |
Diamond 1 Finance Corp. and
Diamond 2 Finance Corp.: | | | | | | | | |
4.420%, 6-15-21(A) | | | 500 | | | | 517 | |
5.450%, 6-15-23(A) | | | 500 | | | | 530 | |
8.100%, 7-15-36(A) | | | 500 | | | | 594 | |
| | | | | | | | |
| | | | | | | 1,641 | |
| | | | | | | | |
| |
Total Financials – 20.9% | | | | 86,832 | |
Health Care | |
| |
Biotechnology – 0.5% | |
Amgen, Inc., | | | | | | | | |
1.250%, 5-22-17 | | | 1,955 | | | | 1,955 | |
| | | | | | | | |
| | | | | | | | |
CORPORATE DEBT SECURITIES
(Continued) | | Principal | | | Value | |
Health Care Services – 0.3% | |
Quest Diagnostics, Inc., | | | | | | | | |
3.450%, 6-1-26 | | $ | 1,500 | | | $ | 1,477 | |
| | | | | | | | |
| |
Health Care Supplies – 0.9% | |
Abbott Laboratories, | | | | | | | | |
3.400%, 11-30-23 | | | 1,000 | | | | 995 | |
Medtronic, Inc., | | | | | | | | |
4.375%, 3-15-35 | | | 1,752 | | | | 1,851 | |
Shire Acquisitions Investments Ireland Designated Activity Co., | | | | | | | | |
2.400%, 9-23-21 | | | 1,000 | | | | 965 | |
| | | | | | | | |
| | | | | | | 3,811 | |
| | | | | | | | |
| |
Pharmaceuticals – 0.6% | |
AbbVie, Inc., | | | | | | | | |
4.500%, 5-14-35 | | | 1,400 | | | | 1,373 | |
Perrigo Finance Unlimited Co. (GTD by Perrigo Co. plc), | | | | | | | | |
3.500%, 3-15-21 | | | 1,000 | | | | 1,010 | |
| | | | | | | | |
| | | | | | | 2,383 | |
| | | | | | | | |
| |
Total Health Care – 2.3% | | | | 9,626 | |
Industrials | |
| |
Aerospace & Defense – 1.1% | |
BAE Systems Finance, Inc., | | | | | | | | |
7.500%, 7-1-27(A) | | | 1,522 | | | | 1,967 | |
BAE Systems Holdings, Inc., | | | | | | | | |
4.750%, 10-7-44(A) | | | 1,000 | | | | 1,010 | |
Boeing Co. (The), | | | | | | | | |
1.650%, 10-30-20 | | | 500 | | | | 490 | |
General Dynamics Corp., | | | | | | | | |
1.875%, 8-15-23 | | | 1,000 | | | | 950 | |
| | | | | | | | |
| | | | | | | 4,417 | |
| | | | | | | | |
| |
Air Freight & Logistics – 0.5% | |
FedEx Corp.: | | | | | | | | |
3.250%, 4-1-26 | | | 1,000 | | | | 992 | |
4.750%, 11-15-45 | | | 1,000 | | | | 1,033 | |
| | | | | | | | |
| | | | | | | 2,025 | |
| | | | | | | | |
| |
Airlines – 0.8% | |
Norwegian Air Shuttle 2016-1, Class A, | | | | | | | | |
4.875%, 5-10-28(A) | | | 1,000 | | | | 1,020 | |
Southwest Airlines Co., | | | | | | | | |
5.125%, 3-1-17 | | | 1,180 | | | | 1,187 | |
Sydney Airport Finance, | | | | | | | | |
3.625%, 4-28-26(A) | | | 1,000 | | | | 982 | |
| | | | | | | | |
| | | | | | | 3,189 | |
| | | | | | | | |
| |
Building Products – 0.5% | |
WESCO Distribution, Inc. (GTD by WESCO International, Inc.), | | | | | | | | |
5.375%, 12-15-21 | | | 1,875 | | | | 1,936 | |
| | | | | | | | |
| |
Environmental & Facilities Services – 0.6% | |
Republic Services, Inc., | | | | | | | | |
3.800%, 5-15-18 | | | 1,000 | | | | 1,028 | |
| | |
| SCHEDULE OF INVESTMENTS | | BOND (in thousands) |
DECEMBER 31, 2016
| | | | | | | | |
CORPORATE DEBT SECURITIES
(Continued) | | Principal | | | Value | |
Environmental & Facilities Services (Continued) | |
Waste Management, Inc. (GTD by Waste Management Holdings, Inc.): | | | | | | | | |
2.400%, 5-15-23 | | $ | 1,000 | | | $ | 969 | |
7.100%, 8-1-26 | | | 565 | | | | 716 | |
| | | | | | | | |
| | | | | | | 2,713 | |
| | | | | | | | |
| |
Heavy Electrical Equipment – 0.2% | |
Honeywell International, Inc., | | | | | | | | |
1.850%, 11-1-21 | | | 1,000 | | | | 976 | |
| | | | | | | | |
| |
Railroads – 0.2% | |
Burlington Northern Santa Fe LLC, | | | | | | | | |
3.400%, 9-1-24 | | | 1,000 | | | | 1,028 | |
| | | | | | | | |
| |
Total Industrials – 3.9% | | | | 16,284 | |
Information Technology | |
| |
Communications Equipment – 0.1% | |
L-3 Communications Corp., | | | | | | | | |
3.850%, 12-15-26 | | | 500 | | | | 496 | |
| | | | | | | | |
| |
Data Processing & Outsourced Services – 2.1% | |
Alliance Data Systems Corp., | | | | | | | | |
5.250%, 12-1-17(A) | | | 4,500 | | | | 4,562 | |
Visa, Inc.: | | | | | | | | |
2.800%, 12-14-22 | | | 3,000 | | | | 3,010 | |
3.150%, 12-14-25 | | | 1,000 | | | | 1,003 | |
| | | | | | | | |
| | | | | | | 8,575 | |
| | | | | | | | |
| |
Home Entertainment Software – 0.2% | |
Activision Blizzard, Inc., | | | | | | | | |
2.300%, 9-15-21(A) | | | 1,000 | | | | 975 | |
| | | | | | | | |
| |
Internet Software & Services – 0.7% | |
Alphabet, Inc., | | | | | | | | |
3.375%, 2-25-24 | | | 2,950 | | | | 3,055 | |
| | | | | | | | |
| |
Semiconductors – 0.5% | |
Intel Corp., | | | | | | | | |
3.100%, 7-29-22 | | | 1,000 | | | | 1,027 | |
Micron Technology, Inc., | | | | | | | | |
7.500%, 9-15-23(A) | | | 713 | | | | 790 | |
| | | | | | | | |
| | | | | | | 1,817 | |
| | | | | | | | |
| |
Systems Software – 0.9% | |
CA, Inc., | | | | | | | | |
5.375%, 12-1-19 | | | 1,080 | | | | 1,166 | |
Microsoft Corp.: | | | | | | | | |
2.650%, 11-3-22 | | | 2,000 | | | | 2,009 | |
2.000%, 8-8-23 | | | 500 | | | | 478 | |
| | | | | | | | |
| | | | | | | 3,653 | |
| | | | | | | | |
| |
Total Information Technology – 4.5% | | | | 18,571 | |
Materials | |
| |
Specialty Chemicals – 0.3% | |
Methanex Corp., | | | | | | | | |
5.250%, 3-1-22 | | | 1,404 | | | | 1,447 | |
| | | | | | | | |
| |
Total Materials – 0.3% | | | | 1,447 | |
| | | | | | | | |
CORPORATE DEBT SECURITIES
(Continued) | | Principal | | | Value | |
Real Estate | |
| |
Health Care REITs – 0.3% | |
Health Care REIT, Inc., | | | | | | | | |
4.000%, 6-1-25 | | $ | 1,300 | | | $ | 1,327 | |
| | | | | | | | |
| |
Industrial REITs – 0.1% | |
Aircastle Ltd., | | | | | | | | |
5.500%, 2-15-22 | | | 598 | | | | 634 | |
| | | | | | | | |
| |
Specialized REITs – 0.4% | |
Crown Castle International Corp.: | | | | | | | | |
2.250%, 9-1-21 | | | 500 | | | | 483 | |
5.250%, 1-15-23 | | | 1,027 | | | | 1,105 | |
| | | | | | | | |
| | | | | | | 1,588 | |
| | | | | | | | |
| |
Total Real Estate – 0.8% | | | | 3,549 | |
Telecommunication Services | |
| |
Integrated Telecommunication Services – 1.0% | |
AT&T, Inc.: | | | | | | | | |
3.600%, 2-17-23 | | | 500 | | | | 504 | |
5.650%, 2-15-47 | | | 1,000 | | | | 1,071 | |
Telefonos de Mexico S.A.B de C.V. (GTD by America Movil S.A.B. de C.V.), | | | | | | | | |
5.500%, 11-15-19 | | | 1,500 | | | | 1,619 | |
Verizon Communications, Inc.: | | | | | | | | |
5.150%, 9-15-23 | | | 500 | | | | 552 | |
2.625%, 8-15-26 | | | 500 | | | | 460 | |
| | | | | | | | |
| | | | | | | 4,206 | |
| | | | | | | | |
| |
Wireless Telecommunication Service – 1.6% | |
American Tower Corp.: | | | | | | | | |
4.400%, 2-15-26 | | | 1,000 | | | | 1,020 | |
3.125%, 1-15-27 | | | 4,000 | | | | 3,698 | |
Crown Castle Towers LLC, | | | | | | | | |
3.663%, 5-15-25(A) | | | 1,000 | | | | 1,003 | |
Sprint Spectrum L.P., | | | | | | | | |
3.360%, 9-20-21(A) | | | 1,000 | | | | 1,002 | |
| | | | | | | | |
| | | | | | | 6,723 | |
| | | | | | | | |
| |
Total Telecommunication Services – 2.6% | | | | 10,929 | |
Utilities | |
| |
Electric Utilities – 1.2% | |
Commonwealth Edison Co., | | | | | | | | |
3.650%, 6-15-46 | | | 500 | | | | 469 | |
Edison International, | | | | | | | | |
2.950%, 3-15-23 | | | 2,000 | | | | 1,977 | |
Kansas City Power & Light Co., | | | | | | | | |
6.375%, 3-1-18 | | | 1,500 | | | | 1,576 | |
Sierra Pacific Power Co., | | | | | | | | |
2.600%, 5-1-26 | | | 1,000 | | | | 955 | |
| | | | | | | | |
| | | | | | | 4,977 | |
| | | | | | | | |
Multi-Utilities – 1.6% | |
Duke Energy Carolinas LLC, | | | | | | | | |
3.750%, 6-1-45 | | | 3,000 | | | | 2,850 | |
Duke Energy Indiana LLC, | | | | | | | | |
3.750%, 5-15-46 | | | 1,000 | | | | 938 | |
| | | | | | | | |
CORPORATE DEBT SECURITIES
(Continued) | | Principal | | | Value | |
Multi-Utilities (Continued) | |
NorthWestern Corp., | | | | | | | | |
6.340%, 4-1-19 | | $ | 2,400 | | | $ | 2,617 | |
| | | | | | | | |
| | | | | | | 6,405 | |
| | | | | | | | |
| |
Water Utilities – 0.5% | |
California Water Service Co., | | | | | | | | |
5.875%, 5-1-19 | | | 2,000 | | | | 2,164 | |
| | | | | | | | |
| |
Total Utilities – 3.3% | | | | 13,546 | |
| |
TOTAL CORPORATE DEBT
SECURITIES – 53.0% | | | $ | 220,351 | |
(Cost: $220,981) | | | | | | | | |
| | |
| MORTGAGE-BACKED SECURITIES | | | | | | |
| |
Non-Agency REMIC/CMO – 0.1% | |
MASTR Adjustable Rate Mortgage Trust 2005-1, | | | | | | | | |
2.780%, 3-25-35 (B) | | | 1,271 | | | | 410 | |
Structured Adjustable Rate Mortgage Loan Trust, Mortgage Pass-Through Certificates, Series 2004-1, | | | | | | | | |
3.060%, 2-25-34 (B) | | | 167 | | | | 13 | |
Structured Adjustable Rate Mortgage Loan Trust, Mortgage Pass-Through Certificates, Series 2004-3AC, | | | | | | | | |
2.943%, 3-25-34 (B) | | | 360 | | | | 19 | |
| | | | | | | | |
| | | | | | | 442 | |
| | | | | | | | |
| | |
TOTAL MORTGAGE-BACKED SECURITIES – 0.1% | | | | | | $ | 442 | |
(Cost: $1,796) | | | | | | | | |
| | |
| MUNICIPAL BONDS - TAXABLE | | | | | | |
| |
Massachusetts – 0.6% | |
Cmnwlth of MA, Fed Hwy Grant Anticipation Notes (Accelerated Bridge Prog), Ser 2010A, | | | | | | | | |
4.285%, 12-15-18 | | | 2,500 | | | | 2,632 | |
| | | | | | | | |
| |
New York – 1.2% | |
NYC Indl Dev Agy, Rental Rev Bonds (Yankee Stadium Proj), Ser 2009, | | | | | | | | |
11.000%, 3-1-29 (A) | | | 3,600 | | | | 4,976 | |
| | | | | | | | |
| |
Ohio – 0.5% | |
OH State Univ, Gen Receipts Bonds (Multiyear Debt Issuance Prog), Ser 2016A, | | | | | | | | |
3.798%, 12-1-46 | | | 2,000 | | | | 1,941 | |
| | | | | | | | |
| | |
| SCHEDULE OF INVESTMENTS | | BOND (in thousands) |
DECEMBER 31, 2016
| | | | | | | | |
MUNICIPAL BONDS - TAXABLE
(Continued) | | Principal | | | Value | |
Pennsylvania - 0.2% | |
Cmnwlth of PA, GO Bonds, Third Ser B of 2010 (Federally Taxable - Build America Bonds), | | | | | | | | |
4.750%, 7-15-22 | | $ | 750 | | | $ | 806 | |
| | | | | | | | |
| |
TOTAL MUNICIPAL BONDS -
TAXABLE – 2.5% | | | $ | 10,355 | |
(Cost: $8,935) | | | | | | | | |
| | |
OTHER GOVERNMENT
SECURITIES(C) | | | | | | |
| |
Canada – 0.8% | |
Province de Quebec, | | | | | | | | |
7.140%, 2-27-26 | | | 2,500 | | | | 3,200 | |
| | | | | | | | |
| | |
TOTAL OTHER GOVERNMENT SECURITIES – 0.8% | | | | | | $ | 3,200 | |
(Cost: $2,775) | | | | | | | | |
| | |
UNITED STATES GOVERNMENT
AGENCY OBLIGATIONS | | | | | | |
| |
Mortgage-Backed Obligations – 13.9% | |
Federal Home Loan Mortgage Corp. Agency REMIC/CMO: | | | | | | | | |
4.000%, 6-15-26 | | | 3,913 | | | | 4,144 | |
4.000%, 11-15-36 | | | 774 | | | | 797 | |
4.500%, 8-15-39 | | | 552 | | | | 567 | |
4.881%, 7-25-44(A)(B) | | | 2,200 | | | | 2,277 | |
4.342%, 12-25-44(A)(B) | | | 5,000 | | | | 5,285 | |
4.255%, 1-25-45(A)(B) | | | 3,000 | | | | 3,153 | |
3.869%, 5-25-45(A)(B) | | | 1,000 | | | | 1,031 | |
3.656%, 10-25-45(A)(B) | | | 2,000 | | | | 2,023 | |
3.502%, 11-25-45(A)(B) | | | 2,500 | | | | 2,524 | |
4.595%, 11-25-46(A)(B) | | | 2,055 | | | | 2,193 | |
4.286%, 7-25-48(A)(B) | | | 2,350 | | | | 2,384 | |
4.423%, 12-25-48(A)(B) | | | 1,000 | | | | 1,057 | |
Federal Home Loan Mortgage Corp. Fixed Rate Participation Certificates: | | | | | | | | |
3.000%, 8-1-28 | | | 3,377 | | | | 3,469 | |
3.500%, 10-1-28 | | | 3,922 | | | | 4,100 | |
3.000%, 1-1-33 | | | 678 | | | | 688 | |
Federal National Mortgage Association Agency REMIC/CMO: | | | | | | | | |
2.717%, 2-25-22 | | | 780 | | | | 785 | |
2.640%, 6-1-22 | | | 1,460 | | | | 1,480 | |
| | | | | | | | |
UNITED STATES GOVERNMENT
AGENCY OBLIGATIONS (Continued) | | Principal | | | Value | |
| |
Mortgage-Backed Obligations (Continued) | |
3.000%, 2-25-25 | | $ | 3,047 | | | $ | 3,140 | |
2.390%, 6-1-25 | | | 1,305 | | | | 1,316 | |
5.500%, 11-25-36(D) | | | 913 | | | | 183 | |
4.500%, 6-25-40 | | | 339 | | | | 358 | |
Federal National Mortgage Association Fixed Rate Pass-Through Certificates: | | | | | | | | |
4.503%, 12-1-19 | | | 6,197 | | | | 6,580 | |
5.500%, 10-1-21 | | | 632 | | | | 664 | |
2.759%, 4-1-22 | | | 1,595 | | | | 1,627 | |
6.000%, 7-1-22 | | | 527 | | | | 568 | |
6.000%, 9-1-22 | | | 824 | | | | 880 | |
2.706%, 4-1-23 | | | 659 | | | | 664 | |
5.500%, 2-1-35 | | | 676 | | | | 768 | |
Government National Mortgage Association Agency REMIC/CMO: | | | | | | | | |
2.000%, 3-16-42 | | | 3,231 | | | | 3,145 | |
0.009%, 6-17-45(B)(D) | | | 24 | | | | – | * |
| | | | | | | | |
| | | | | | | 57,850 | |
| | | | | | | | |
| |
TOTAL UNITED STATES GOVERNMENT AGENCY OBLIGATIONS – 13.9% | | | $ | 57,850 | |
(Cost: $58,462) | | | | | | | | |
| |
UNITED STATES GOVERNMENT
OBLIGATIONS | | | | |
| |
Treasury Obligations – 20.0% | |
U.S. Treasury Bonds: | | | | | | | | |
2.500%, 5-15-46 | | | 2,500 | | | | 2,216 | |
2.875%, 11-15-46 | | | 6,000 | | | | 5,779 | |
U.S. Treasury Notes: | | | | | | | | |
1.375%, 12-15-19 | | | 20,000 | | | | 19,942 | |
1.750%, 11-30-21 | | | 30,000 | | | | 29,746 | |
1.250%, 7-31-23 | | | 500 | | | | 470 | |
2.125%, 11-30-23 | | | 20,000 | | | | 19,843 | |
2.000%, 11-15-26 | | | 5,500 | | | | 5,283 | |
| | | | | | | | |
| | | | | | | 83,279 | |
| | | | | | | | |
| |
TOTAL UNITED STATES GOVERNMENT OBLIGATIONS – 20.0% | | | $ | 83,279 | |
(Cost: $82,928) | |
| | | | | | | | |
| SHORT-TERM SECURITIES | | Principal | | | Value | |
Commercial Paper(E) – 4.9% | |
Clorox Co. (The), | | | | | | | | |
0.530%, 1-3-17 | | $ | 1,795 | | | $ | 1,795 | |
Danaher Corp., | | | | | | | | |
0.700%, 1-4-17 | | | 8,000 | | | | 8,000 | |
PacifiCorp, | | | | | | | | |
0.970%, 1-10-17 | | | 10,750 | | | | 10,747 | |
| | | | | | | | |
| | | | | | | 20,542 | |
| | | | | | | | |
| |
Master Note – 2.5% | |
Toyota Motor Credit Corp., | | | | | | | | |
0.860%, 1-4-17 (F) | | | 10,460 | | | | 10,460 | |
| | | | | | | | |
| |
Municipal Obligations – 3.6% | |
NYC Hsng Dev Corp., Multi-Fam Mtg Rev Bonds (Spring Creek Apt I and II), Ser 2006A (GTD by FHLMC), | | | | | | | | |
0.650%, 1-7-17 (F) | | | 15,000 | | | | 15,000 | |
| | | | | | | | |
| |
United States Government Agency
Obligations – 2.9% | |
Overseas Private Investment Corp. (GTD by U.S. Government), | | | | | | | | |
0.720%, 1-7-17 (F) | | | 12,000 | | | | 12,000 | |
| | | | | | | | |
| |
TOTAL SHORT-TERM SECURITIES – 13.9% | | | $ | 58,002 | |
(Cost: $58,002) | | | | | | | | |
| |
TOTAL INVESTMENT SECURITIES – 105.2% | | | $ | 437,436 | |
(Cost: $437,852) | | | | | | | | |
| |
LIABILITIES, NET OF CASH AND OTHER ASSETS – (5.2)% | | | | (21,626 | ) |
| |
NET ASSETS – 100.0% | | | $ | 415,810 | |
| | |
| SCHEDULE OF INVESTMENTS | | BOND (in thousands) |
DECEMBER 31, 2016
Notes to Schedule of Investments
| * | Not shown due to rounding. |
| (A) | Securities were purchased pursuant to an exemption from registration available under Rule 144A under the Securities Act of 1933 and may only be resold in transactions exempt from registration, normally to qualified institutional buyers. At December 31, 2016 the total value of these securities amounted to $53,002 or 12.7% of net assets. |
| (B) | Variable rate security. Interest rate disclosed is that which is in effect at December 31, 2016. |
| (C) | Other Government Securities may include emerging markets sovereign, quasi-sovereign, corporate and supranational agency and organization debt securities. |
| (D) | Interest-only security. Amount shown as principal represents notional amount for computation of interest. |
| (E) | Rate shown is the yield to maturity at December 31, 2016. |
| (F) | Variable rate security. Interest rate disclosed is that which is in effect at December 31, 2016. Date shown represents the date that the variable rate resets. |
The following table is a summary of the valuation of the Portfolio’s investments by the fair value hierarchy levels as of December 31, 2016. See Note 3 to the Financial Statements for further information regarding fair value measurement.
| | | | | | | | | | | | |
| | | Level 1 | | | Level 2 | | | Level 3 | |
Assets | | | | | | | | | | | | |
Investments in Securities | | | | | | | | | | | | |
Asset-Backed Securities | | $ | — | | | $ | 3,957 | | | $ | — | |
Corporate Debt Securities | | | — | | | | 220,351 | | | | — | |
Mortgage-Backed Securities | | | — | | | | 442 | | | | — | |
Municipal Bonds | | | — | | | | 10,355 | | | | — | |
Other Government Securities | | | — | | | | 3,200 | | | | — | |
United States Government Agency Obligations | | | — | | | | 57,850 | | | | — | |
United States Government Obligations | | | — | | | | 83,279 | | | | — | |
Short-Term Securities | | | — | | | | 58,002 | | | | — | |
Total | | $ | — | | | $ | 437,436 | | | $ | — | |
During the year ended December 31, 2016, there were no transfers between Level 1 and 2.
The following acronyms are used throughout this schedule:
CMO = Collateralized Mortgage Obligation
FHLMC = Federal Home Loan Mortgage Corp.
GTD = Guaranteed
REITS = Real Estate Investment Trusts
REMIC = Real Estate Mortgage Investment Conduit
See Accompanying Notes to Financial Statements.
| | |
| MANAGEMENT DISCUSSION | | CORE EQUITY |
(UNAUDITED)
Erik R. Becker
|
|

Gustaf C. Zinn |
Below, Erik R. Becker, CFA, and Gustaf C. Zinn, CFA, portfolio managers of Ivy VIP Core Equity, discuss positioning, performance and results for the fiscal year ended December 31, 2016. They have co-managed the Portfolio since 2006. Both have 18 years of industry experience.
Fiscal Year Performance
| | | | |
For the 12 Months Ended December 31, 2016 | | | | |
Ivy VIP Core Equity | | | 3.74% | |
Benchmark(s) and/or Lipper Category | | | | |
S&P 500 Index | | | 11.96% | |
(generally reflects the performance of large- and medium-sized U.S. stocks) | | | | |
Lipper Variable Annuity Large-Cap Core Funds Universe Average | | | 9.96% | |
(generally reflects the performance of the universe of funds with similar investment objectives) | | | | |
Please note that Portfolio returns include applicable fees and expenses while index returns do not include any such fees. Also, the Portfolio’s performance data does not take into account any product expenses or charges associated with owning a variable life or annuity policy, which is invested in Ivy Variable Insurance Portfolios.
Key drivers
2016 was a strong year for the equity market with the S&P 500 Index (the Portfolio’s benchmark) returning 12%. The year started on a weak note with early fears around Federal Reserve (Fed) interest rate increases leading to a sharp rise of the U.S. dollar versus other major currencies. Concerns of a Chinese currency devaluation and the sharp drop in oil to $26 per barrel led to an 11% drop in the market by mid-February. As oil began to stabilize at a low level, the equity market followed until the June 23rd vote in which citizens of the United Kingdom opted to leave the European Union (Brexit) in a highly anticipated referendum.
Events of the first half of 2016 led to a sharp drop in 10-year U.S. Government yields in early July. Defensive issues led the U.S. market through June with strong performance within the telecommunications services and utilities sectors. U.S. economic growth accelerated through the year, with marginal growth in the first quarter followed by increased annualized growth in the second and third quarters. Earnings growth proved to be anemic in 2016, with strong dollar effects, lagging effects of $26 per barrel oil, and weak industrial earnings the main culprits. Following the “Brexit” vote, markets began to recover along with growth prospects in many parts of the world. It became evident that policymakers in China had succeeded in improving growth through rapid lending and infrastructure spend. The Eurozone also showed continued strength, defying those who thought Brexit would have a broad economic fallout. A weakening of the U.S. dollar and higher energy prices renewed hope that prospects were improving in the United States. The U.S. election in November further elevated hopes of a stronger U.S. economy ahead. Cyclical shares led during a strong fourth quarter rally with the financials and industrials sectors leading. Value stocks sharply outperformed more growth-oriented names.
Contributors and detractors
The Portfolio underperformed the benchmark in the period ended December 31, 2016. The Portfolio’s relative performance deteriorated following the U.S. election, as our bias toward companies that would perform well in a slow-growth environment (rather than an accelerating one) and an underweighting of financials proved costly. Health care, an area of great emphasis for the Portfolio as we entered 2016, suffered throughout the 12-month period with negative earnings revisions and heightened political concerns, leading to sharply lower valuation levels. Nearly 70% of the Portfolio’s relative underperformance for the year was driven by poor stock selection within health care. The largest individual detractor allocation was Teva Pharmaceuticals (no longer a holding), which was down more than 40% for the 12-month period. Being underweight, or absent, from dividend-heavy, defensive sectors in the first half of the year also hurt Portfolio performance for the year. The telecommunications services and utilities sectors were among the market leaders due to investors’ appetite for defensive stocks, and the Portfolio maintained an underweight position in those sectors. The energy sector was the Portfolio’s top contributor, as an overweight allocation and strong stock selection contributed to performance. Halliburton Co., Cimarex Energy Co. and EOG Resources were the top equity holdings within the Portfolio’s energy allocation for the year.
Outlook
Time will tell whether the Republican sweep in the U.S. elections in November will indeed lead to a re-acceleration in growth for the U.S. economy. For the previous eight years, financial markets performed quite well under a regime of low but stable economic growth and extremely low interest rates. Washington gridlock for six of President Obama’s eight years produced no substantial policies aimed at accelerating growth, so it was no surprise that gross domestic product (GDP) growth averaged just over 2% in the post-recession years of 2010–2016.
Prior to November, it seemed likely that the economic cycle was entering its later stages, that profit margins were peaking, and that S&P 500 Index earnings growth would continue on a moderate path. Today, we have to consider the upside to growth on the likelihood of comprehensive tax reform (both personal and corporate), decreased regulatory burden (particularly in areas such as energy investment), and a yet-to-be-sized infrastructure bill that could stimulate job growth at a time of tightening labor conditions. Though much remains to be finalized over the next 12 months, our best guess is that a combination of these pro-growth policies could accelerate GDP in the United States. In short, we believe that the economic environment has indeed changed. We are surprised by the growing optimism by key conditions of this economy in such a short time following the U.S. election. Small business optimism has surged, consumer confidence has risen, auto sales reached a new cycle high in December, and confidence among the chief executive officers of management teams with which we regularly speak has notably improved. All this has happened despite the fact that more than 50% of voters in the U.S. presidential election saw their candidate lose in November.
With the expectation that pro-growth policies will succeed at accelerating growth in the U.S., we have made some notable changes in the composition of the Portfolio, the most substantial being an overweighting of the financials sector for the first time since 2010. We believe the acceleration of growth in the later stages of the business cycle is likely to be somewhat inflationary as labor conditions have tightened and commodity costs are on the rise. The Organization of the Petroleum Exporting Countries’ (OPEC) “Thanksgiving surprise” that it will reduce supply in a coordinated manner to drive oil prices higher adds fuel to the thought that inflationary pressures will rise over the coming year or two. We believe Fed policy is likely to be more proactive, and for the first time since 2010, banks have an earnings catalyst in the form of wider lending spreads, accelerating capital markets activity, and lower corporate tax rates. Our largest Portfolio additions in this area include Wells Fargo, Morgan Stanley, and Chicago Mercantile Exchange.
We continue to be optimistic around energy investment in the United States, particularly following OPEC’s decision to cut production. We believe U.S. companies with low-cost positions in key shale basins and/or service technology are in a prime position to accelerate growth with a backdrop of an easing regulatory burden. Halliburton Co. continues to be our favorite energy holding, along with Cimarex Energy Co. and EOG Resources in this area. We believe the robust growth in the energy sector over the coming years will also be of benefit to key industrial holdings such as Union Pacific and Canadian Pacific. Paccar is a recent addition on the thesis of a resurgent truck market globally over the next three years. In addition, we are looking more at reasonably valued U.S.-centric companies that pay high tax rates as being disproportionate beneficiaries of changing corporate tax policy. Media and health insurance companies are current examples of names we like under a scenario of corporate tax reform. A reduction in the Portfolio’s holdings within consumer staples and health care, particularly those companies with large international exposures, has helped fund the areas of increased investment. Finally, we remain optimistic that the current regime of accelerated growth and higher interest rates will provide a more target-rich opportunity set of companies for our highly active style of investing which has always focused on future earnings catalysts.
As always, the current environment is not without risks, which we will continue to monitor closely. Among these is the threat of recession, and one can argue that any acceleration in domestic GDP growth will only pull forward inflationary pressures and the ultimate end of the business cycle. We agree with this notion, but inflation measures, while rising, remain relatively tame. Growth in average hourly earnings, for example, has moved from 2.4% in February to the most recent reading. While certainly higher, wages are well below the 4-5% growth normally associated with more aggressive Fed policy and inflation concerns. Another risk will likely be greater unpredictability in Washington, given the unconventional nature of Donald Trump’s policies, communication tactics, and lack of political experience. We expect political concerns to influence the market throughout 2017, and we look forward to earning your continued trust over the coming year.
Past performance is not a guarantee of future results. The value of the Portfolio’s shares will change, and you could lose money on your investment. These and other risks are more fully described in the Portfolio’s prospectus.
The opinions expressed in this report are those of the portfolio managers and are current only through the end of the period of the report as stated on the cover. The portfolio managers’ views are subject to change at any time based on market and other conditions, and no forecasts can be guaranteed.
The index noted is unmanaged and includes reinvested dividends. One cannot invest directly in an index, nor is an index representative of Ivy VIP Core Equity.
| | |
| PORTFOLIO HIGHLIGHTS | | CORE EQUITY |
ALL DATA IS AS OF DECEMBER 31, 2016 (UNAUDITED)
Asset Allocation
| | | | |
Stocks | | | 97.9% | |
Information Technology | | | 20.9% | |
Financials | | | 17.7% | |
Consumer Discretionary | | | 14.0% | |
Energy | | | 13.5% | |
Industrials | | | 10.9% | |
Health Care | | | 9.9% | |
Consumer Staples | | | 8.8% | |
Real Estate | | | 1.2% | |
Materials | | | 1.0% | |
Cash and Other Assets (Net of Liabilities), and Cash Equivalents+ | | | 2.1% | |
Top 10 Equity Holdings
| | | | |
| Company | | Sector | | Industry |
Halliburton Co. | | Energy | | Oil & Gas Equipment & Services |
Shire Pharmaceuticals Group plc ADR | | Health Care | | Biotechnology |
Wells Fargo & Co. | | Financials | | Diversified Banks |
JPMorgan Chase & Co. | | Financials | | Other Diversified Financial Services |
Union Pacific Corp. | | Industrials | | Railroads |
Alphabet, Inc., Class A | | Information Technology | | Internet Software & Services |
Morgan Stanley | | Financials | | Investment Banking & Brokerage |
Cimarex Energy Co. | | Energy | | Oil & Gas Exploration & Production |
Kraft Foods Group, Inc. | | Consumer Staples | | Packaged Foods & Meats |
Microsoft Corp. | | Information Technology | | Systems Software |
See your advisor for more information on the Portfolio’s most recently published Top 10 Equity Holdings.
+ Cash equivalents are defined as highly liquid securities with maturities of less than three months. Cash equivalents may include U.S. Government Treasury bills, bank certificates of deposit, bankers’ acceptances, corporate commercial paper and other money market instruments.
| | |
| COMPARISON OF CHANGE IN VALUE OF $10,000 INVESTMENT | | CORE EQUITY |
(UNAUDITED)
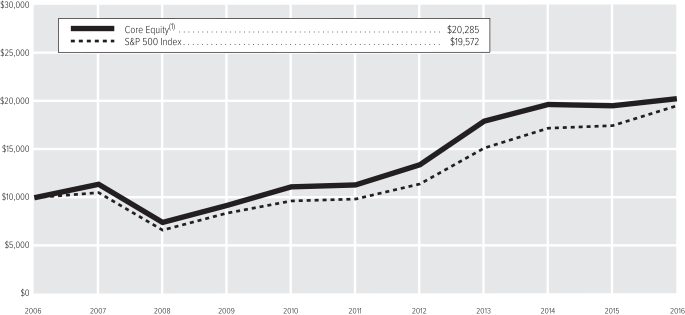
| (1) | The value of the investment in the Portfolio is impacted by the ongoing expenses of the Portfolio and assumes reinvestment of dividends and distributions. |
| | | | |
| Average Annual Total Return(2) | | | |
1-year period ended 12-31-16 | | | 3.74% | |
5-year period ended 12-31-16 | | | 12.34% | |
10-year period ended 12-31-16 | | | 7.33% | |
| (2) | Data quoted is past performance and current performance may be lower or higher. Past performance is no guarantee of future results. Investment return and principal value of an investment will fluctuate and shares, when redeemed, may be worth more or less than their original cost. Please call 1.888.WADDELL for the Portfolio’s most recent month-end performance. Performance data quoted does not reflect any expenses or charges associated with owning a variable life insurance policy or variable annuity contract that invests in the Portfolio’s shares. When such charges are deducted, actual investment performance in a variable policy or contract will be lower. |
Past performance is not necessarily indicative of future performance. Indexes are unmanaged. The performance graph and table do not reflect the deduction of taxes that a shareholder would pay on Portfolio distributions or on the redemption of Portfolio shares. Performance results may include the effect of expense reduction arrangements for some or all of the periods shown. If those arrangements had not been in place, the performance results for those periods would have been lower.
| | |
| SCHEDULE OF INVESTMENTS | | CORE EQUITY (in thousands) |
DECEMBER 31, 2016
| | | | | | | | |
| COMMON STOCKS | | Shares | | | Value | |
Consumer Discretionary | |
| |
Auto Parts & Equipment – 4.9% | |
Johnson Controls, Inc. | | | 246 | | | $ | 10,134 | |
Magna International, Inc. | | | 243 | | | | 10,564 | |
| | | | | | | | |
| | | | | | | 20,698 | |
| | | | | | | | |
Broadcasting – 1.5% | |
CBS Corp., Class B | | | 98 | | | | 6,247 | |
| | | | | | | | |
| |
Cable & Satellite – 2.4% | |
Comcast Corp., Class A | | | 143 | | | | 9,902 | |
| | | | | | | | |
| |
Home Improvement Retail – 1.5% | |
Home Depot, Inc. (The) | | | 46 | | | | 6,109 | |
| | | | | | | | |
| |
Housewares & Specialties – 2.0% | |
Newell Rubbermaid, Inc. | | | 191 | | | | 8,533 | |
| | | | | | | | |
| |
Movies & Entertainment – 1.7% | |
Twenty-First Century Fox, Inc., Class A | | | 253 | | | | 7,102 | |
| | | | | | | | |
| |
Total Consumer Discretionary – 14.0% | | | | 58,591 | |
Consumer Staples | |
| |
Brewers – 2.6% | |
Molson Coors Brewing Co., Class B | | | 111 | | | | 10,821 | |
| | | | | | | | |
| |
Hypermarkets & Super Centers – 1.2% | |
Costco Wholesale Corp. | | | 32 | | | | 5,102 | |
| | | | | | | | |
| |
Packaged Foods & Meats – 3.1% | |
Kraft Foods Group, Inc. | | | 150 | | | | 13,107 | |
| | | | | | | | |
| |
Tobacco – 1.9% | |
Philip Morris International, Inc. | | | 85 | | | | 7,755 | |
| | | | | | | | |
| |
Total Consumer Staples – 8.8% | | | | 36,785 | |
Energy | |
| |
Oil & Gas Drilling – 1.3% | |
Helmerich & Payne, Inc. | | | 71 | | | | 5,457 | |
| | | | | | | | |
| |
Oil & Gas Equipment & Services – 3.7% | |
Halliburton Co. | | | 292 | | | | 15,783 | |
| | | | | | | | |
| |
Oil & Gas Exploration & Production – 8.5% | |
Anadarko Petroleum Corp. | | | 48 | | | | 3,319 | |
Cabot Oil & Gas Corp. | | | 363 | | | | 8,470 | |
Cimarex Energy Co. | | | 98 | | | | 13,323 | |
EOG Resources, Inc. | | | 104 | | | | 10,474 | |
| | | | | | | | |
| | | | | | | 35,586 | |
| | | | | | | | |
| |
Total Energy – 13.5% | | | | 56,826 | |
Financials | |
| |
Asset Management & Custody Banks – 0.9% | |
Blackstone Group L.P. (The) | | | 146 | | | | 3,933 | |
| | | | | | | | |
| | | | | | | | |
COMMON STOCKS (Continued) | | Shares | | | Value | |
Diversified Banks – 4.4% | |
Bank of America Corp. | | | 180 | | | $ | 3,975 | |
Wells Fargo & Co. | | | 260 | | | | 14,345 | |
| | | | | | | | |
| | | | | | | 18,320 | |
| | | | | | | | |
| |
Financial Exchanges & Data – 2.5% | |
CME Group, Inc. | | | 91 | | | | 10,543 | |
| | | | | | | | |
| |
Investment Banking & Brokerage – 3.2% | |
Morgan Stanley | | | 316 | | | | 13,330 | |
| | | | | | | | |
| |
Life & Health Insurance – 1.0% | |
MetLife, Inc. | | | 78 | | | | 4,225 | |
| | | | | | | | |
| |
Multi-Line Insurance – 2.3% | |
American International Group, Inc. | | | 148 | | | | 9,653 | |
| | | | | | | | |
| |
Other Diversified Financial Services – 3.4% | |
JPMorgan Chase & Co. | | | 164 | | | | 14,169 | |
| | | | | | | | |
| |
Total Financials – 17.7% | | | | 74,173 | |
Health Care | |
| |
Biotechnology – 5.9% | |
Alexion Pharmaceuticals, Inc. (A) | | | 85 | | | | 10,349 | |
Shire Pharmaceuticals Group
plc ADR | | | 85 | | | | 14,442 | |
| | | | | | | | |
| | | | | | | 24,791 | |
| | | | | | | | |
| |
Health Care Equipment – 1.2% | |
Medtronic plc | | | 73 | | | | 5,178 | |
| | | | | | | | |
| |
Health Care Facilities – 1.6% | |
HCA Holdings, Inc. (A) | | | 91 | | | | 6,751 | |
| | | | | | | | |
| |
Pharmaceuticals – 1.2% | |
Bristol-Myers Squibb Co. | | | 84 | | | | 4,893 | |
| | | | | | | | |
| |
Total Health Care – 9.9% | | | | 41,613 | |
Industrials | |
| |
Aerospace & Defense – 1.3% | |
Lockheed Martin Corp. | | | 22 | | | | 5,399 | |
| | | | | | | | |
| |
Construction Machinery & Heavy Trucks – 1.9% | |
Caterpillar, Inc. | | | 33 | | | | 3,079 | |
PACCAR, Inc. | | | 82 | | | | 5,221 | |
| | | | | | | | |
| | | | | | | 8,300 | |
| | | | | | | | |
| |
Railroads – 6.5% | |
Canadian Pacific Railway Ltd. | | | 42 | | | | 6,016 | |
Kansas City Southern | | | 88 | | | | 7,441 | |
Union Pacific Corp. | | | 133 | | | | 13,792 | |
| | | | | | | | |
| | | | | | | 27,249 | |
| | | | | | | | |
| | | | | | | | |
COMMON STOCKS (Continued) | | Shares | | | Value | |
Trucking – 1.2% | |
J.B. Hunt Transport Services, Inc. | | | 51 | | | $ | 4,970 | |
| | | | | | | | |
| |
Total Industrials – 10.9% | | | | 45,918 | |
Information Technology | |
| |
Application Software – 2.5% | |
Adobe Systems, Inc. (A) | | | 101 | | | | 10,398 | |
| | | | | | | | |
| |
Data Processing & Outsourced Services – 3.9% | |
MasterCard, Inc., Class A | | | 81 | | | | 8,408 | |
Visa, Inc., Class A | | | 103 | | | | 7,997 | |
| | | | | | | | |
| | | | | | | 16,405 | |
| | | | | | | | |
| |
Internet Software & Services – 6.5% | |
Alibaba Group Holding
Ltd. ADR (A) | | | 69 | | | | 6,015 | |
Alphabet, Inc., Class A (A) | | | 17 | | | | 13,392 | |
Facebook, Inc., Class A (A) | | | 70 | | | | 8,032 | |
| | | | | | | | |
| | | | | | | 27,439 | |
| | | | | | | | |
| |
Semiconductor Equipment – 2.7% | |
Applied Materials, Inc. | | | 350 | | | | 11,301 | |
| | | | | | | | |
| |
Semiconductors – 2.2% | |
Analog Devices, Inc. | | | 124 | | | | 8,976 | |
| | | | | | | | |
| |
Systems Software – 3.1% | |
Microsoft Corp. | | | 210 | | | | 13,025 | |
| | | | | | | | |
| |
Total Information Technology – 20.9% | | | | 87,544 | |
Materials | |
| |
Specialty Chemicals – 1.0% | |
LyondellBasell Industries N.V., Class A | | | 48 | | | | 4,135 | |
| | | | | | | | |
| |
Total Materials – 1.0% | | | | 4,135 | |
Real Estate | |
| |
Specialized REITs – 1.2% | |
American Tower Corp., Class A | | | 50 | | | | 5,242 | |
| | | | | | | | |
| |
Total Real Estate – 1.2% | | | | 5,242 | |
| | |
TOTAL COMMON STOCKS – 97.9% | | | | | | $ | 410,827 | |
(Cost: $379,372) | |
| | |
| SCHEDULE OF INVESTMENTS | | CORE EQUITY (in thousands) |
DECEMBER 31, 2016
| | | | | | | | |
| | |
| SHORT-TERM SECURITIES | | Principal | | | Value | |
Master Note – 0.9% | | | | | |
Toyota Motor Credit Corp., | | | | | | | | |
0.860%, 1-4-17 (B) | | $ | 4,026 | | | $ | 4,026 | |
| | | | | | | | |
Municipal Obligations – 1.1% | |
CA Statewide Cmnty Dev Auth, Multifam Hsng Rev Bonds (The Crossings Sr Apts/Phase I), Ser 2005 I (GTD by FNMA), | | | | | | | | |
0.580%, 1-7-17 (B) | | | 4,460 | | | | 4,460 | |
| | | | | | | | |
| |
TOTAL SHORT-TERM SECURITIES – 2.0% | | | $ | 8,486 | |
(Cost: $8,486) | | | | | | | | |
| |
TOTAL INVESTMENT SECURITIES – 99.9% | | | $ | 419,313 | |
(Cost: $387,858) | | | | | | | | |
| |
CASH AND OTHER ASSETS, NET OF LIABILITIES – 0.1% | | | | 369 | |
| | |
NET ASSETS – 100.0% | | | | | | $ | 419,682 | |
Notes to Schedule of Investments
| (A) | No dividends were paid during the preceding 12 months. |
| (B) | Variable rate security. Interest rate disclosed is that which is in effect at December 31, 2016. Date shown represents the date that the variable rate resets. |
The following table is a summary of the valuation of the Portfolio’s investments by the fair value hierarchy levels as of December 31, 2016. See Note 3 to the Financial Statements for further information regarding fair value measurement.
| | | | | | | | | | | | |
| | | Level 1 | | | Level 2 | | | Level 3 | |
Assets | | | | | | | | | | | | |
Investments in Securities | | | | | | | | | | | | |
Common Stocks | | $ | 410,827 | | | $ | — | | | $ | — | |
Short-Term Securities | | | — | | | | 8,486 | | | | — | |
Total | | $ | 410,827 | | | $ | 8,486 | | | $ | — | |
During the year ended December 31, 2016, there were no transfers between Level 1 and 2.
The following acronyms are used throughout this schedule:
ADR = American Depositary Receipts
FNMA = Federal National Mortgage Association
GTD = Guaranteed
REIT = Real Estate Investment Trusts
See Accompanying Notes to Financial Statements.
| | |
| MANAGEMENT DISCUSSION | | DIVIDEND OPPORTUNITIES |
(UNAUDITED)

Christopher J. Parker
Below, Christopher J. Parker, CFA, portfolio manager of Ivy VIP Dividend Opportunities, discusses positioning, performance and results for the fiscal year ended December 31, 2016. He has managed the Portfolio since August 2014 and has 21 years of industry experience.
Fiscal Year Performance
| | | | |
For the 12 Months Ended December 31, 2016 | | | | |
Ivy VIP Dividend Opportunities | | | 6.95% | |
Benchmark(s) and/or Lipper Category | | | | |
Russell 1000 Index | | | 12.05% | |
(generally reflects the performance of stocks that represent the equity market) | | | | |
Lipper Variable Annuity Equity Income Funds Universe Average | | | 14.21% | |
(generally reflects the performance of the universe of funds with similar investment objectives) | | | | |
Please note that Portfolio returns include applicable fees and expenses while index returns do not include any such fees. Also, the Portfolio’s performance data does not take into account any product expenses or charges associated with owning a variable life or annuity policy, which is invested in Ivy Variable Insurance Portfolios.
Key drivers
The year ended December 31, 2016 was a solid period for equities, as the Russell 1000 Index (the Portfolio’s benchmark) increased by 12% and the Lipper Variable Annuity Equity Income Funds Universe Average rose by a robust 14%. The path to those returns was characterized by more than the usual number of twists, turns and unexpected events. More so than most years in recent history, 2016 served to highlight the manic nature of financial markets and the sheer capriciousness of the world at large.
The mood at the start of 2016 was bleak to put it mildly. Equity markets had come under significant pressure in early January as plummeting energy prices and dislocations in the financial markets fueled a sense of dread, causing one of the weakest starts to a year for equities in recent history. The narrative at the time was a blend of looming global recession, an energy fueled credit cycle unfolding in the banking system and a possible emerging market currency crisis sparked by a Federal Reserve interest rate hike that seemed at the time to be a clear mistake. The high-yield market was seizing, energy equities had been decimated, cyclical and financial stocks traded to levels reflective of a global recession (though not a global financial crisis), and globally bond yields plummeted to record lows. Investors had convinced themselves calamity was on the way, then something unexpected occurred. Energy prices stabilized as supply and demand elasticity began the process of normalization, the impact of the stabilization on the financials sector was far more limited than expected, the global economy withstood the impact of this turbulence and financials markets bounced back to finish the first quarter roughly flat. Riskier assets underperformed, but assets characterized by income and predictability performed well overall and some positive momentum was developing.
Early 2016 reinforced that the future is exceedingly difficult to foresee, and what seems certain is often anything but. This is true on any given day in financial markets, but 2016 taught us that this is especially true when polls and politics enter the calculations. In late June, United Kingdom (UK) voted to decide if the country would stay in or leave the European Union. Heading into the vote, polls showed a decisive win for those voting to stay in the European Union. As the vote approached, the gap narrowed though the widely held view was that “stay” would carry the day. However, to the surprise and shock of political pundits and financial markets the “leave” vote prevailed. The knee jerk reaction was a severe sell-off and predictions of a sharp and immediate recession in the UK and a chill to growth across Europe. Growth in the UK has been tempered, and will likely experience a drag due to uncertainty around the impact of Brexit. However, predictions of calamity failed to unfold.
After the “impossible” Brexit outcome, one should have expected the unexpected in the U.S. presidential election. Statistically speaking, Donald Trump had a slim chance of winning based on pre-election polling. Pundits and financial markets were discounting a Clinton victory and viewed a Trump victory as a source of fear and uncertainty. Trump, however, won the election and the financial markets quickly pivoted from a narrative of fear to thoughts and dreams of what might be. Within 48 hours of the election, the script had flipped entirely. The narrative had changed to discussions of cutting taxes, eliminating the Patient Protection and Affordable Care Act, undoing what was viewed as eight years of smothering regulations. This shift to optimism and a sense of certainty fueled a post-election surge in financial markets through year-end. The financials, industrials and energy sectors experienced especially strong performance post-election on expectations of faster growth and a less onerous regulatory environment. After the confounding unpredictability of 2016, we are skeptical it will all play out as we expect.
Contributors and detractors
The Portfolio underperformed its benchmark and Lipper peer group for the period ended December 31, 2016. Generally speaking, more cyclically oriented sectors were the strongest performers over the course of the past year. This was due in part to attractive valuations at the start of 2016 or in some instances it was based on optimism for a vastly improved operating environment in 2017.
Health care saw the weakest performance and was the only sector to decline during the period. Real estate, consumer staples and consumer discretionary sectors also underperformed during the period. Energy, telecommunications, financials, materials and industrials were the strongest performing sectors.
From a sector allocation perspective, the Portfolio was aided by overweight positions in energy, materials and industrials. Underweight positions in consumer staples and consumer discretionary also helped performance. An underweight in telecommunications and technology hurt the Portfolio’s relative performance.
Performance was helped by stock selection in technology with positions in Harris Corp., Analog Devices, Applied Materials and Texas Instruments standing out favorably. Applied Materials and Texas Instruments are no longer holdings. The Portfolio’s position in Nokia was a drag on stock selection within technology. Stock selection in consumer discretionary also aided performance, with Comcast being a noteworthy positive. The Portfolio’s position in Limited Brands was a drag on stock selection in consumer discretionary.
Stock selection in health care had a significant adverse impact on Portfolio performance as Teva Pharmaceuticals underperformed. Stock selection in energy also hurt relative performance as holdings in Devon Energy, Energy Transfer Equity and Anadarko were detractors to performance. Holdings in Suncor Energy, Noble Energy and Chevron Corp. contributed positively to stock selection within the energy sector. Stock selection within industrials was also negative. Positions in Union Pacific, Eaton Corp. and PACCAR, Inc. provided some performance help, but stock selection was hurt by positions in Boeing and Johnson Controls. Teva Pharmaceuticals, Devon Energy, Anadarko and Boeing are no longer holdings.
Strategy and outlook
We believe there are numerous reasons to be optimistic about 2017. Underlying economic growth in the U.S. has remained fairly steady in spite of fear surrounding the twists and turns previously referenced. More so, economic growth in Europe and key emerging markets appears to be stabilizing, if not improving slightly. In our view, the pump is primed for the more pro-growth policy environment the incoming president has promised. The Trump administration has outlined a broad set of objectives that read like a corporate America wish list … corporate tax reform, a substantially reduced regulatory burden, infrastructure investment and reform of the individual tax code. There is a clear sense of buoyancy amongst business leaders predicated on the realization of many of these objectives. More importantly, there exists a ready willingness to increase investment and pursue growth in the event the large pieces of this wish list come to fruition. If this scenario unfolds, we may see acceleration in economic growth, an unlocking of cash and cash flow trapped overseas that could funnel to buybacks and dividends, and increasing consumer spending power and optimism. Blended together, we believe this could lead to rising corporate earnings and a rising stock market.
However, the rosiness of this outlook is tempered by a handful of key unknowns. First, details surrounding many of these pro-growth policies are a mystery and in many cases not yet fully determined by the incoming administration. The details will be enormously important in assessing the overall impact on the economy and corporate profits, as well as the winners and losers at an industry and company level. Second, several policy positions on which President-elect Trump campaigned are not particularly conducive to growth and could complicate global trade and dampen global growth. Principle among these is President-elect Trump’s views on China and the North American Free Trade Agreement, and his associated threats to impose tariffs on goods produced in those nations. Third, the ultimate composition and timing of the new administration’s pro-growth agenda may not live up to current elevated expectations, particularly considering that Washington D.C. is not known for its expediency. Finally, valuations for many of the sectors expected to benefit the most from a more pro-growth environment have levitated since the U.S. presidential election.
We are optimistic that a legislative agenda more oriented toward improving economic growth will, over time, achieve that objective. We also firmly believe the ride will be bumpy and encounter surprises, potholes and roadblocks along the way. We believe this is likely to translate to another year of volatility and unpredictability. Our objective is to use this volatility to seek attractive fundamental investment opportunities that execute on the Portfolio’s core strategy of providing favorable current income and overall returns.
Past performance is not a guarantee of future results. The value of the Portfolio’s shares will change, and you could lose money on your investments.
Dividend-paying instruments may not experience the same price appreciation as non-dividend paying investments. There is no guarantee that the companies in which the Portfolio invests will declare dividends in the future or that dividends, if declared, will remain at current levels or increase over time. The amount of any dividend paid by the company may fluctuate significantly. These and other risks are more fully described in the Portfolio’s prospectus.
The opinions expressed in this report are those of the portfolio manager and are current only through the end of the period of the report as stated on the cover. The portfolio manager’s views are subject to change at any time based on market and other conditions, and no forecasts can be guaranteed.
The index noted is unmanaged and include reinvested dividends. One cannot invest directly in an index, nor is an index representative of Ivy VIP Dividend Opportunities.
| | |
| PORTFOLIO HIGHLIGHTS | | DIVIDEND OPPORTUNITIES |
ALL DATA IS AS OF DECEMBER 31, 2016 (UNAUDITED)
Asset Allocation
| | | | |
Stocks | | | 95.0% | |
Financials | | | 18.3% | |
Information Technology | | | 15.3% | |
Consumer Discretionary | | | 12.2% | |
Energy | | | 11.1% | |
Industrials | | | 9.8% | |
Health Care | | | 6.5% | |
Consumer Staples | | | 6.4% | |
Materials | | | 6.3% | |
Real Estate | | | 5.8% | |
Utilities | | | 3.3% | |
Cash and Other Assets (Net of Liabilities), and Cash Equivalents+ | | | 5.0% | |
Top 10 Equity Holdings
| | | | |
| Company | | Sector | | Industry |
JPMorgan Chase & Co. | | Financials | | Other Diversified Financial Services |
Microsoft Corp. | | Information Technology | | Systems Software |
Pfizer, Inc. | | Health Care | | Pharmaceuticals |
Chevron Corp. | | Energy | | Integrated Oil & Gas |
Exelon Corp. | | Utilities | | Electric Utilities |
MetLife, Inc. | | Financials | | Life & Health Insurance |
Wells Fargo & Co. | | Financials | | Diversified Banks |
Philip Morris International, Inc. | | Consumer Staples | | Tobacco |
Suncor Energy, Inc. | | Energy | | Integrated Oil & Gas |
Enterprise Products Partners L.P. | | Energy | | Oil & Gas Storage & Transportation |
See your advisor for more information on the Portfolio’s most recently published Top 10 Equity Holdings.
+ Cash equivalents are defined as highly liquid securities with maturities of less than three months. Cash equivalents may include U.S. Government Treasury bills, bank certificates of deposit, bankers’ acceptances, corporate commercial paper and other money market instruments.
| | |
COMPARISON OF CHANGE IN VALUE OF $10,000 INVESTMENT | | DIVIDEND OPPORTUNITIES |
(UNAUDITED)
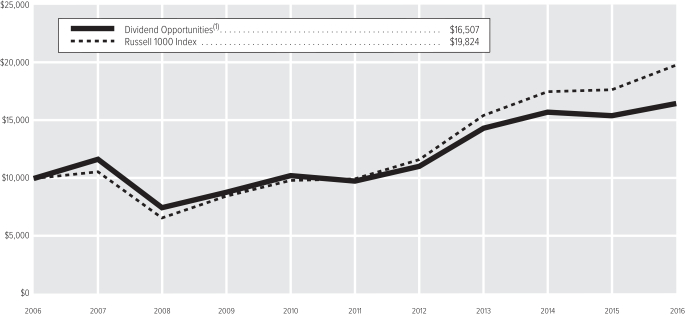
| (1) | The value of the investment in the Portfolio is impacted by the ongoing expenses of the Portfolio and assumes reinvestment of dividends and distributions. |
| | | | |
| Average Annual Total Return(2) | | | |
1-year period ended 12-31-16 | | | 6.95% | |
5-year period ended 12-31-16 | | | 11.04% | |
10-year period ended 12-31-16 | | | 5.14% | |
| (2) | Data quoted is past performance and current performance may be lower or higher. Past performance is no guarantee of future results. Investment return and principal value of an investment will fluctuate and shares, when redeemed, may be worth more or less than their original cost. Please call 1.888.WADDELL for the Portfolio’s most recent month-end performance. Performance data quoted does not reflect any expenses or charges associated with owning a variable life insurance policy or variable annuity contract that invests in the Portfolio’s shares. When such charges are deducted, actual investment performance in a variable policy or contract will be lower. |
Past performance is not necessarily indicative of future performance. Indexes are unmanaged. The performance graph and table do not reflect the deduction of taxes that a shareholder would pay on Portfolio distributions or on the redemption of Portfolio shares. Performance results may include the effect of expense reduction arrangements for some or all of the periods shown. If those arrangements had not been in place, the performance results for those periods would have been lower.
| | |
| SCHEDULE OF INVESTMENTS | | DIVIDEND OPPORTUNITIES (in thousands) |
DECEMBER 31, 2016
| | | | | | | | |
| COMMON STOCKS | | Shares | | | Value | |
Consumer Discretionary | |
| |
Advertising – 1.5% | |
Omnicom Group, Inc. | | | 91 | | | $ | 7,715 | |
| | | | | | | | |
| |
Apparel Retail – 0.7% | |
Limited Brands, Inc. | | | 52 | | | | 3,401 | |
| | | | | | | | |
| |
Auto Parts & Equipment – 2.3% | |
Johnson Controls, Inc. | | | 288 | | | | 11,857 | |
| | | | | | | | |
| |
Cable & Satellite – 2.6% | |
Comcast Corp., Class A | | | 190 | | | | 13,109 | |
| | | | | | | | |
| |
Casinos & Gaming – 0.7% | |
International Game Technology plc | | | 138 | | | | 3,532 | |
| | | | | | | | |
| |
Home Improvement Retail – 2.3% | |
Home Depot, Inc. (The) | | | 90 | | | | 12,054 | |
| | | | | | | | |
| |
Housewares & Specialties – 1.0% | |
Newell Rubbermaid, Inc. | | | 112 | | | | 4,992 | |
| | | | | | | | |
| |
Restaurants – 1.1% | |
McDonalds Corp. | | | 45 | | | | 5,471 | |
| | | | | | | | |
| |
Total Consumer
Discretionary – 12.2% | | | | 62,131 | |
Consumer Staples | |
| |
Brewers – 1.3% | |
Anheuser-Busch InBev S.A. ADR | | | 64 | | | | 6,706 | |
| | | | | | | | |
| |
Drug Retail – 0.9% | |
CVS Caremark Corp. | | | 57 | | | | 4,501 | |
| | | | | | | | |
| |
Packaged Foods & Meats – 1.2% | |
Unilever plc (A) | | | 144 | | | | 5,825 | |
| | | | | | | | |
| |
Tobacco – 3.0% | |
Philip Morris International, Inc. | | | 168 | | | | 15,394 | |
| | | | | | | | |
| |
Total Consumer Staples – 6.4% | | | | 32,426 | |
Energy | |
| |
Integrated Oil & Gas – 6.9% | |
Chevron Corp. | | | 172 | | | | 20,197 | |
Suncor Energy, Inc. | | | 449 | | | | 14,691 | |
| | | | | | | | |
| | | | | | | 34,888 | |
| | | | | | | | |
| |
Oil & Gas Storage & Transportation – 4.2% | |
Energy Transfer Partners L.P. | | | 183 | | | | 6,562 | |
Enterprise Products Partners L.P. | | | 536 | | | | 14,503 | |
Noble Midstream Partners L.P. (B) | | | 14 | | | | 496 | |
| | | | | | | | |
| | | | | | | 21,561 | |
| | | | | | | | |
| |
Total Energy – 11.1% | | | | 56,449 | |
Financials | |
| |
Diversified Banks – 3.1% | |
Wells Fargo & Co. | | | 286 | | | | 15,786 | |
| | | | | | | | |
| | | | | | | | |
COMMON STOCKS (Continued) | | Shares | | | Value | |
Investment Banking & Brokerage – 1.2% | |
Morgan Stanley | | | 142 | | | $ | 6,000 | |
| | | | | | | | |
| |
Life & Health Insurance – 3.2% | |
MetLife, Inc. | | | 308 | | | | 16,622 | |
| | | | | | | | |
| |
Multi-Line Insurance – 2.7% | |
American International Group, Inc. | | | 209 | | | | 13,650 | |
| | | | | | | | |
| |
Other Diversified Financial Services – 4.9% | |
JPMorgan Chase & Co. | | | 290 | | | | 25,004 | |
| | | | | | | | |
| |
Property & Casualty Insurance – 1.3% | |
ACE Ltd. | | | 50 | | | | 6,553 | |
| | | | | | | | |
| |
Regional Banks – 1.9% | |
KeyCorp | | | 540 | | | | 9,858 | |
| | | | | | | | |
| |
Total Financials – 18.3% | | | | 93,473 | |
Health Care | |
| |
Health Care Equipment – 1.3% | |
Medtronic plc | | | 89 | | | | 6,316 | |
| | | | | | | | |
| |
Pharmaceuticals – 5.2% | |
Bristol-Myers Squibb Co. | | | 78 | | | | 4,575 | |
Pfizer, Inc. | | | 677 | | | | 21,991 | |
| | | | | | | | |
| | | | | | | 26,566 | |
| | | | | | | | |
| |
Total Health Care – 6.5% | | | | 32,882 | |
Industrials | |
| |
Aerospace & Defense – 1.3% | |
BAE Systems plc (A) | | | 945 | | | | 6,888 | |
| | | | | | | | |
| |
Construction Machinery & Heavy Trucks – 2.7% | |
PACCAR, Inc. | | | 216 | | | | 13,790 | |
| | | | | | | | |
| |
Heavy Electrical Equipment – 1.0% | |
Honeywell International, Inc. | | | 44 | | | | 5,091 | |
| | | | | | | | |
| |
Industrial Conglomerates – 1.3% | |
General Electric Co. | | | 216 | | | | 6,811 | |
| | | | | | | | |
| |
Industrial Machinery – 1.1% | |
Eaton Corp. | | | 83 | | | | 5,538 | |
| | | | | | | | |
| |
Railroads – 2.4% | |
Union Pacific Corp. | | | 116 | | | | 12,026 | |
| | | | | | | | |
| |
Total Industrials – 9.8% | | | | 50,144 | |
Information Technology | |
| |
Communications Equipment – 4.8% | |
Harris Corp. | | | 117 | | | | 12,010 | |
Nokia Corp., Series A ADR | | | 2,595 | | | | 12,483 | |
| | | | | | | | |
| | | | | | | 24,493 | |
| | | | | | | | |
| |
Data Processing & Outsourced Services – 1.3% | |
Paychex, Inc. | | | 105 | | | | 6,377 | |
| | | | | | | | |
| | | | | | | | |
COMMON STOCKS (Continued) | | Shares | | | Value | |
Semiconductors – 4.6% | |
Analog Devices, Inc. | | | 193 | | | $ | 13,983 | |
Cypress Semiconductor Corp. | | | 841 | | | | 9,625 | |
| | | | | | | | |
| | | | | | | 23,608 | |
| | | | | | | | |
| |
Systems Software – 4.6% | |
Microsoft Corp. | | | 379 | | | | 23,570 | |
| | | | | | | | |
| |
Total Information Technology – 15.3% | | | | 78,048 | |
Materials | |
| |
Diversified Chemicals – 2.3% | |
Dow Chemical Co. (The) | | | 206 | | | | 11,802 | |
| | | | | | | | |
| |
Industrial Gases – 1.7% | |
Air Products and Chemicals, Inc. | | | 58 | | | | 8,374 | |
| | | | | | | | |
| |
Paper Packaging – 2.3% | |
International Paper Co. | | | 222 | | | | 11,755 | |
| | | | | | | | |
| |
Total Materials – 6.3% | | | | 31,931 | |
Real Estate | |
| |
Industrial REITs – 0.8% | |
ProLogis | | | 74 | | | | 3,890 | |
| | | | | | | | |
| |
Specialized REITs – 5.0% | |
Communications Sales & Leasing, Inc. | | | 179 | | | | 4,545 | |
Crown Castle International Corp. | | | 85 | | | | 7,402 | |
Life Storage, Inc. | | | 161 | | | | 13,684 | |
| | | | | | | | |
| | | | | | | 25,631 | |
| | | | | | | | |
| |
Total Real Estate – 5.8% | | | | 29,521 | |
Utilities | |
| |
Electric Utilities – 3.3% | |
Exelon Corp. | | | 480 | | | | 17,023 | |
| | | | | | | | |
| |
Total Utilities – 3.3% | | | | 17,023 | |
| |
TOTAL COMMON STOCKS – 95.0% | | | $ | 484,028 | |
(Cost: $419,676) | |
| | |
| SHORT-TERM SECURITIES | | Principal | | | | |
Commercial Paper (C) – 3.3% | |
BMW U.S. Capital LLC (GTD by BMW AG), | | | | | | | | |
0.570%, 1-12-17 | | $ | 5,000 | | | | 4,999 | |
Caterpillar Financial Services Corp. (GTD by Caterpillar, Inc.), | | | | | | | | |
0.810%, 1-4-17 | | | 2,000 | | | | 2,000 | |
Northern Illinois Gas Co., | | | | | | | | |
0.801%, 1-4-17 | | | 5,000 | | | | 5,000 | |
Wisconsin Gas LLC, | | | | | | | | |
0.640%, 1-5-17 | | | 5,000 | | | | 4,999 | |
| | | | | | | | |
| | | | | | | 16,998 | |
| | | | | | | | |
| | |
| SCHEDULE OF INVESTMENTS | | DIVIDEND OPPORTUNITIES (in thousands) |
DECEMBER 31, 2016
| | | | | | | | |
SHORT-TERM SECURITIES (Continued) | | Principal | | | Value | |
Master Note – 0.3% | |
Toyota Motor Credit Corp., | | | | | | | | |
0.860%, 1-4-17 (D) | | $ | 1,525 | | | $ | 1,525 | |
| | | | | | | | |
| |
Municipal Obligations – 1.2% | |
Santa Clara Cnty Fin Auth, Var Rate Rev Bonds, El Camino Hosp, Ser 2009A (GTD by Wells Fargo Bank N.A.), | | | | | | | | |
0.690%, 1-7-17 (D) | | | 6,000 | | | | 6,000 | |
| | | | | | | | |
| |
TOTAL SHORT-TERM SECURITIES – 4.8% | | | $ | 24,523 | |
(Cost: $24,523) | | | | | | | | |
| |
TOTAL INVESTMENT SECURITIES – 99.8% | | | $ | 508,551 | |
(Cost: $444,199) | | | | | | | | |
| |
CASH AND OTHER ASSETS, NET OF LIABILITIES – 0.2% | | | | 773 | |
| |
NET ASSETS – 100.0% | | | $ | 509,324 | |
Notes to Schedule of Investments
| (A) | Listed on an exchange outside the United States. |
| (B) | No dividends were paid during the preceding 12 months. |
| (C) | Rate shown is the yield to maturity at December 31, 2016. |
| (D) | Variable rate security. Interest rate disclosed is that which is in effect at December 31, 2016. Date shown represents the date that the variable rate resets. |
The following table is a summary of the valuation of the Portfolio’s investments by the fair value hierarchy levels as of December 31, 2016. See Note 3 to the Financial Statements for further information regarding fair value measurement.
| | | | | | | | | | | | |
| | | Level 1 | | | Level 2 | | | Level 3 | |
Assets | | | | | | | | | | | | |
Investments in Securities | | | | | | | | | | | | |
Common Stocks | | $ | 484,028 | | | $ | — | | | $ | — | |
Short-Term Securities | | | — | | | | 24,523 | | | | — | |
Total | | $ | 484,028 | | | $ | 24,523 | | | $ | — | |
During the year ended December 31, 2016, there were no transfers between Level 1 and 2.
The following acronyms are used throughout this schedule:
ADR = American Depositary Receipts
GTD = Guaranteed
REIT = Real Estate Investment Trust
See Accompanying Notes to Financial Statements.
| | |
| MANAGEMENT DISCUSSION | | ENERGY |
(UNAUDITED)

David P. Ginther

Michael T. Wolverton
Below, David P. Ginther, CPA, and Michael T. Wolverton, CFA, portfolio managers of Ivy VIP Energy, discuss positioning, performance and results for the fiscal year ended December 31, 2016. Mr. Ginther has managed the Portfolio since its inception in 2006 and has 21 years of industry experience. Mr. Wolverton was named a portfolio manager on the Portfolio on October 1, 2016. He previously had been assistant portfolio manager since 2013. He has 12 years of industry experience.
Fiscal year Performance
| | | | |
For the 12 Months Ended December 31, 2016 | | | | |
Ivy VIP Energy | | | 34.55% | |
Benchmark(s) and/or Lipper Category | | | | |
S&P 1500 Energy Sector Index | | | 27.31% | |
(generally reflects the performance of stocks that represent the energy market) | | | | |
Lipper Variable Annuity Natural Resources Funds Universe Average | | | 31.56% | |
(generally reflects the performance of the universe of funds with similar investment objectives) | | | | |
Please note that Portfolio returns include applicable fees and expenses while index returns do not include any such fees. Also, the Portfolio’s performance data does not take into account any product expenses or charges associated with owning a variable life or annuity policy, which is invested in Ivy Variable Insurance Portfolios.
Steady rise in oil prices
U.S. and global equities markets closed the fiscal year in positive territory and the energy sector posted gains overall. Crude oil prices continued to recover during the year. The price of oil reached a bottom in mid-February at about $26 per barrel but peaked around $54 per barrel by year end, based on West Texas Intermediate crude oil, the benchmark for oil prices in the U.S.
The Organization of Petroleum Exporting Countries (OPEC) in November agreed to reduce crude oil production quotas by 1.2 million barrels per day (bpd) — the first cut in eight years. OPEC set the new target at 32.5 million bpd, which we think is a meaningful reduction in supply. The reduction prompted an energy rally and gains in most commodity-related currencies. OPEC had announced in September that it would reduce its output to a range of 32.5-33.5 million bpd but delayed a final agreement until its November meeting. Markets and prices were somewhat volatile in the interim because of uncertainty about OPEC’s ultimate decision.
The U.S. Federal Reserve (Fed) on December 14 announced a 0.25-percentage-point hike in the fed funds rate to 0.75%, marking the first interest rate increase since December 2015. The Fed also issued a statement indicating economic improvements could mean a faster pace of rate hikes in 2017 than had previously been expected, with perhaps as many as three increases during the year.
The U.S. presidential election was a key factor for the markets during the year, both in the uncertainty it created prior to election day and in the ultimate result. President-elect Donald Trump’s victory surprised global markets and carried the Republican Party to control of both houses of the U.S. Congress. Trump’s stated plans on fiscal stimulus, tax reforms and reduced financial regulation prompted global interest rates and global markets to rise. The potential impact of Trump’s pro-growth agenda also drove a move into more economically sensitive equity sectors and market segments through year-end.
Oil price advance boosts performance
The Portfolio had a strong positive return for the fiscal year, outperforming both its benchmark index and Lipper Universe Average.
The Portfolio’s outperformance came primarily from strong stock selection within the energy sector. The Portfolio has a heavier allocation to “upstream” energy companies — those that focus on exploration and production — when compared to its benchmark, which holds what the portfolio managers consider to be an outsized exposure to large integrated oil companies. The Portfolio has underweighted the integrated oil companies this year compared to the Portfolio’s benchmark. Historically, integrated companies often have underperformed when the energy sector performs well as a whole, as it did in 2016.
The Portfolio’s five greatest contributors to performance relative to the benchmark in the year were Continental Resources, U.S. Silica Holdings, Parsley Energy, Oasis Petroleum and RSP Permian. The five greatest detractors relative to the
benchmark were MPLX LP, Chevron Corp., Weatherford International, Energy Transfer Equity LP and C&J Energy Services. Weatherford International and C&J Energy Services were not holdings in the Portfolio at year end.
Supply/demand still key
We forecast global oil demand in 2017 will grow annually at an average rate of about 1.2 million bpd, on top of the current total demand of 95 million bpd. The increase continues to be driven mostly by emerging markets growth. As new supplies are needed to meet these requirements in the coming years, we believe new investments by energy companies will be required.
We think OPEC’s action in November effectively set a floor for oil prices at about $50 per barrel. We think it is unlikely that oil will fall below that floor price for any prolonged period. However, we think the move will cause existing inventories to be drawn down more quickly than they otherwise may have been.
We believe oil prices will trend higher in the longer term, with production slow to recover and stable demand growth leading to a market balance in the first half of 2017. A slight supply deficit could drive oil prices incrementally higher in coming years.
We think global economic growth will remain slow but will pick up in 2017 and 2018. We think strength in the U.S. dollar will depend on a variety of factors, including the potential for the Fed to become more hawkish while other central banks are on the sidelines, and potential for major fiscal stimulus and regulatory rollbacks in the U.S.
We believe U.S. shale oil continues to offer opportunities, with much of our focus on the Permian Basin for production growth. Companies there continue to improve efficiency and productivity, and manage costs effectively.
Past performance is not a guarantee of future results. The value of the Portfolio’s shares will change, and you could lose money on your investment.
Investing in companies involved in one specified sector may be more risky and volatile than an investment with greater sector diversification. Investing in the energy sector can be riskier than other types of investment activities because of a range of factors, including price fluctuation caused by real and perceived inflationary trends and political developments, and the cost assumed by energy companies in complying with environmental safety regulations. These and other risks are more fully described in the Portfolio’s prospectus.
The opinions expressed in this report are those of the portfolio managers and are current only through the end of the period of the report as stated on the cover. The managers’ views are subject to change at any time based on market and other conditions, and no forecasts can be guaranteed.
The index noted is unmanaged and includes reinvested dividends. One cannot invest directly in an index, nor is an index representative of Ivy VIP Energy.
| | |
| PORTFOLIO HIGHLIGHTS | | ENERGY |
ALL DATA IS AS OF DECEMBER 31, 2016 (UNAUDITED)
Asset Allocation
| | | | |
Stocks | | | 96.8% | |
Energy | | | 94.2% | |
Information Technology | | | 1.6% | |
Materials | | | 1.0% | |
Cash and Other Assets (Net of Liabilities), and Cash Equivalents+ | | | 3.2% | |
Country Weightings
| | | | |
North America | | | 91.6% | |
United States | | | 89.9% | |
Other North America | | | 1.7% | |
Europe | | | 3.2% | |
Bahamas/Caribbean | | | 2.0% | |
Cash and Other Assets (Net of Liabilities),
and Cash Equivalents+ | | | 3.2% | |
Top 10 Equity Holdings
| | | | | | |
| Company | | Country | | Sector | | Industry |
U.S. Silica Holdings, Inc. | | United States | | Energy | | Oil & Gas Equipment & Services |
Halliburton Co. | | United States | | Energy | | Oil & Gas Equipment & Services |
Schlumberger Ltd. | | United States | | Energy | | Oil & Gas Equipment & Services |
Continental Resources, Inc. | | United States | | Energy | | Oil & Gas Exploration & Production |
Parsley Energy, Inc., Class A | | United States | | Energy | | Oil & Gas Exploration & Production |
Anadarko Petroleum Corp. | | United States | | Energy | | Oil & Gas Exploration & Production |
Baker Hughes, Inc. | | United States | | Energy | | Oil & Gas Equipment & Services |
Pioneer Natural Resources Co. | | United States | | Energy | | Oil & Gas Exploration & Production |
EOG Resources, Inc. | | United States | | Energy | | Oil & Gas Exploration & Production |
Cimarex Energy Co. | | United States | | Energy | | Oil & Gas Exploration & Production |
See your advisor for more information on the Portfolio’s most recent published Top 10 Equity Holdings.
+ Cash equivalents are defined as highly liquid securities with maturities of less than three months. Cash equivalents may include U.S. Government Treasury bills, bank certificates of deposit, bankers’ acceptances, corporate commercial paper and other money market instruments.
| | |
| COMPARISON OF CHANGE IN VALUE OF $10,000 INVESTMENT | | ENERGY |
(UNAUDITED)
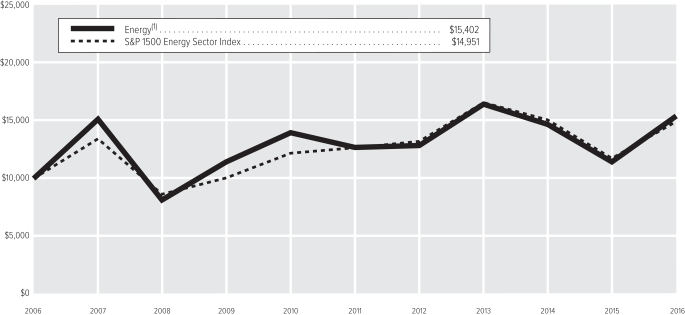
| (1) | The value of the investment in the Portfolio is impacted by the ongoing expenses of the Portfolio and assumes reinvestment of dividends and distributions. |
| | | | |
| Average Annual Total Return(2) | | | |
1-year period ended 12-31-16 | | | 34.55% | |
5-year period ended 12-31-16 | | | 3.95% | |
10-year period ended 12-31-16 | | | 4.41% | |
| (2) | Data quoted is past performance and current performance may be lower or higher. Past performance is no guarantee of future results. Investment return and principal value of an investment will fluctuate and shares, when redeemed, may be worth more or less than their original cost. Please call 1.888.WADDELL for the Portfolio’s most recent month-end performance. Performance data quoted does not reflect any expenses or charges associated with owning a variable life insurance policy or variable annuity contract that invests in the Portfolio’s shares. When such charges are deducted, actual investment performance in a variable policy or contract will be lower. |
Past performance is not necessarily indicative of future performance. Indexes are unmanaged. The performance graph and table do not reflect the deduction of taxes that a shareholder would pay on Portfolio distributions or on the redemption of Portfolio shares. Performance results may include the effect of expense reduction arrangements for some or all of the periods shown. If those arrangements had not been in place, the performance results for those periods would have been lower.
| | |
| SCHEDULE OF INVESTMENTS | | ENERGY (in thousands) |
DECEMBER 31, 2016
| | | | | | | | |
| COMMON STOCKS | | Shares | | | Value | |
Energy | |
| |
Integrated Oil & Gas – 3.9% | |
Chevron Corp. | | | 26 | | | $ | 3,037 | |
Royal Dutch Shell plc, Class A (A) | | | 105 | | | | 2,865 | |
Suncor Energy, Inc. | | | 57 | | | | 1,853 | |
| | | | | | | | |
| | | | | | | 7,755 | |
| | | | | | | | |
| |
Oil & Gas Drilling – 4.5% | |
Nabors Industries Ltd. | | | 238 | | | | 3,896 | |
Patterson-UTI Energy, Inc. | | | 182 | | | | 4,911 | |
| | | | | | | | |
| | | | | | | 8,807 | |
| | | | | | | | |
| |
Oil & Gas Equipment & Services – 27.5% | |
Baker Hughes, Inc. | | | 112 | | | | 7,251 | |
Core Laboratories N.V. | | | 28 | | | | 3,367 | |
FMC Technologies, Inc. (B) | | | 28 | | | | 989 | |
Forum Energy
Technologies, Inc. (B) | | | 259 | | | | 5,705 | |
Halliburton Co. | | | 162 | | | | 8,771 | |
RPC, Inc. | | | 232 | | | | 4,595 | |
Schlumberger Ltd. | | | 99 | | | | 8,286 | |
Superior Energy Services, Inc. | | | 339 | | | | 5,726 | |
U.S. Silica Holdings, Inc. | | | 164 | | | | 9,290 | |
| | | | | | | | |
| | | | | | | 53,980 | |
| | | | | | | | |
| |
Oil & Gas Exploration & Production – 49.7% | |
Anadarko Petroleum Corp. | | | 105 | | | | 7,353 | |
Cimarex Energy Co. | | | 51 | | | | 6,972 | |
Concho Resources, Inc. (B) | | | 45 | | | | 5,960 | |
Continental Resources, Inc. (B) | | | 158 | | | | 8,164 | |
Devon Energy Corp. | | | 104 | | | | 4,743 | |
Diamondback Energy, Inc. (B) | | | 46 | | | | 4,684 | |
EOG Resources, Inc. | | | 70 | | | | 7,082 | |
Extraction Oil & Gas, Inc. (B) | | | 95 | | | | 1,911 | |
| | | | | | | | |
COMMON STOCKS
(Continued) | | Shares | | | Value | |
Oil & Gas Exploration & Production (Continued) | |
Exxon Mobil Corp. | | | 11 | | | $ | 979 | |
Gulfport Energy Corp. (B) | | | 14 | | | | 308 | |
Laredo Petroleum Holdings, Inc. (B) | | | 232 | | | | 3,287 | |
Marathon Oil Corp. | | | 230 | | | | 3,979 | |
Newfield Exploration Co. (B) | | | 142 | | | | 5,733 | |
Oasis Petroleum LLC (B) | | | 425 | | | | 6,435 | |
Parsley Energy, Inc., Class A (B) | | | 226 | | | | 7,958 | |
Pioneer Natural Resources Co. | | | 40 | | | | 7,167 | |
RSP Permian, Inc. (B) | | | 136 | | | | 6,086 | |
Whiting Petroleum Corp. (B) | | | 380 | | | | 4,572 | |
WPX Energy, Inc. (B) | | | 280 | | | | 4,073 | |
| | | | | | | | |
| | | | | | | 97,446 | |
| | | | | | | | |
Oil & Gas Refining & Marketing – 2.5% | |
Marathon Petroleum Corp. | | | 40 | | | | 1,994 | |
MPLX L.P. | | | 26 | | | | 889 | |
Phillips 66 | | | 23 | | | | 1,956 | |
| | | | | | | | |
| | | | | | | 4,839 | |
| | | | | | | | |
| |
Oil & Gas Storage & Transportation – 6.1% | |
Enbridge, Inc. | | | 38 | | | | 1,598 | |
Energy Transfer Partners L.P. | | | 34 | | | | 1,219 | |
Enterprise Products Partners L.P. | | | 100 | | | | 2,704 | |
Phillips 66 Partners L.P. | | | 17 | | | | 837 | |
Plains GP Holdings L.P., Class A | | | 62 | | | | 2,161 | |
Tallgrass Energy GP L.P., Class A | | | 128 | | | | 3,432 | |
| | | | | | | | |
| | | | | | | 11,951 | |
| | | | | | | | |
| |
Total Energy – 94.2% | | | | 184,778 | |
| | | | | | | | |
COMMON STOCKS
(Continued) | | Shares | | | Value | |
Information Technology | |
| |
Data Processing & Outsourced Services – 1.6% | |
Wright Express Corp. (B) | | | 27 | | | $ | 3,047 | |
| | | | | | | | |
| |
Total Information Technology – 1.6% | | | | 3,047 | |
Materials | |
| |
Specialty Chemicals – 1.0% | |
Flotek Industries, Inc. (B)(C) | | | 44 | | | | 413 | |
Flotek Industries, Inc. (B) | | | 176 | | | | 1,648 | |
| | | | | | | | |
| | | | | | | 2,061 | |
| | | | | | | | |
| |
Total Materials – 1.0% | | | | 2,061 | |
| |
TOTAL COMMON STOCKS – 96.8% | | | $ | 189,886 | |
(Cost: $156,453) | | | | | | | | |
| | |
| SHORT-TERM SECURITIES | | Principal | | | | |
Master Note – 3.1% | |
Toyota Motor Credit Corp., | | | | | | | | |
0.860%, 1-4-17 (D) | | $ | 6,013 | | | | 6,013 | |
| | | | | | | | |
| |
TOTAL SHORT-TERM SECURITIES – 3.1% | | | $ | 6,013 | |
(Cost: $6,013) | | | | | | | | |
| |
| TOTAL INVESTMENT SECURITIES – 99.9% | | | $195,899 | |
(Cost: $162,466) | | | | | | | | |
| |
CASH AND OTHER ASSETS, NET OF
LIABILITIES – 0.1% | | | 198 | |
| |
NET ASSETS – 100.0% | | | $ | 196,097 | |
Notes to Schedule of Investments
| (A) | Listed on an exchange outside the United States. |
| (B) | No dividends were paid during the preceding 12 months. |
| (C) | Securities were purchased pursuant to an exemption from registration available under Rule 144A under the Securities Act of 1933 and may only be resold in transactions exempt from registration, normally to qualified institutional buyers. At December 31, 2016 the total value of these securities amounted to $413 or 0.2% of net assets. |
| (D) | Variable rate security. Interest rate disclosed is that which is in effect at December 31, 2016. Date shown represents the date that the variable rate resets. |
The following table is a summary of the valuation of the Portfolio’s investments by the fair value hierarchy levels as of December 31, 2016. See Note 3 to the Financial Statements for further information regarding fair value measurement.
| | | | | | | | | | | | |
| | | Level 1 | | | Level 2 | | | Level 3 | |
Assets | | | | | | | | | | | | |
Investments in Securities | | | | | | | | | | | | |
Common Stocks | | $ | 189,886 | | | $ | — | | | $ | — | |
Short-Term Securities | | | — | | | | 6,013 | | | | — | |
Total | | $ | 189,886 | | | $ | 6,013 | | | $ | — | |
During the year ended December 31, 2016, there were no transfers between Level 1 and 2.
| | |
| SCHEDULE OF INVESTMENTS | | ENERGY (in thousands) |
DECEMBER 31, 2016
Country Diversification
| | | | |
(as a % of net assets) | |
United States | | | 89.9% | |
Bermuda | | | 2.0% | |
Canada | | | 1.7% | |
Netherlands | | | 1.7% | |
United Kingdom | | | 1.5% | |
Other+ | | | 3.2% | |
+Includes cash and other assets (net of liabilities), and cash equivalents
See Accompanying Notes to Financial Statements.
| | |
| MANAGEMENT DISCUSSION | | GLOBAL BOND |
(UNAUDITED)

Mark G. Beischel
Below, Mark G. Beischel, CFA, portfolio manager of Ivy VIP Global Bond, discusses positioning, performance and results for the fiscal year ended December 31, 2016. Mr. Beischel has been a manager of the Portfolio since the Portfolio’s inception in 2010 and has 23 years of industry experience.
Fiscal Year Performance
| | | | |
For the 12 months ended December 31, 2016 | | | | |
Ivy VIP Global Bond | | | 7.04% | |
Benchmark(s) and/or Lipper Category | | | | |
Bloomberg Barclays Capital Multiverse Index | | | 2.84% | |
(generally reflects the performance of the global bond market) | | | | |
Lipper Variable Annuity Global Income Funds Universe Average | | | 4.44% | |
(generally reflects the performance of the universe of funds with similar investment objectives) | | | | |
Please note that the Portfolio returns include applicable investment fees and expenses, whereas the index returns do not include any such fees. Also, the Portfolio’s performance data does not take into account any product expenses or charges associated with owning a variable life or annuity policy, which is invested in Ivy Funds Variable Insurance Portfolios.
Performance
Ivy VIP Global Bond return of 7.04% outperformed its Lipper average of 4.44% and the Bloomberg Barclays Capital Multiverse Index of 2.84% for the year ended December 31, 2016. The outperformance was due to the large weighting in the U.S. dollar. The Portfolio had a 94% weighting in the U.S. dollar that strengthened over the course of the year versus the British pound and euro. The Portfolio benefited from not having exposure to these two currencies. This enhanced the Portfolio’s absolute performance as the sterling depreciated 16.3% versus the U.S. dollar from pressure from Brexit, the vote of the United Kingdom to exit the European Union (EU), and the euro depreciated 3% from its own quantitative easing program. The Portfolio’s shorter effective duration relative to the index and Lipper group helped the Portfolio’s relative performance. Donald Trump’s presidential victory caused global interest rates to rise significantly with the renewed expectations of fiscal stimulus, tax reforms, and reduced regulations. Finally, the Portfolio’s overweight exposure to credit enhanced its relative and absolute performance, with credit spreads compressing over the course of the year.
Emerging market currencies had a mixed influence on the relative and absolute performance of the Portfolio versus its Lipper average. The Columbian peso and Russian ruble were the two outperformers in the Portfolio, as oil stabilized following an agreement on production levels from the Organization of Petroleum Export Companies. The Mexican peso underperformed emerging market currencies generally after Trump’s surprise election. The decline was due to the new administration’s policy on “America First” and the potential elimination of NAFTA.
Trump’s Victory a Game Changer
The global recovery has continued to gradually heal. President-elect Trump’s surprise victory in the U.S. presidential election sent major reverberations throughout the capital markets. Global interest rates rose substantially higher with renewed expectations on his policies on fiscal stimulus, tax reforms and reduced regulations. The Federal Open Market Committee (FOMC) started the normalization process of raising interest rates in December 2015 and did so again in December 2016. The first rate hike in 2015 led to a tightening in the global financial conditions in January and February of 2016. The U.S. dollar strengthened, credit spreads widened, and equity prices fell. The market rebounded as the FOMC moved to a more dovish interpretation of the incoming data. The most recent hike was largely priced in to the market and did not have the same tightening effect in financial conditions as a year ago. There is widespread uncertainty about President-elect Trump’s new policies in the FOMC and most members see upside to their economic forecasts.
The Brexit could well turn out to be one of the most significant geopolitical events in the past decade. For now it is only a political event but it could very well turn into an economic event, as the slowdown in the United Kingdom could spill over into the global economic activity. For now, the devaluation of the British pound has taken most of the pain from Brexit, and those industries that export their goods and services have benefited from the weaker pound. It remains to be seen how the United Kingdom is able to manage this process over the next couple of years.
In the euro area, the European Central Bank (ECB) struggled with weaker-than-expected growth and failing inflation expectations. President Draghi’s most recent announcement of purchasing corporate credit and deemphasizing a negative interest rate policy allowed the ECB to move away from the controversial “beggar thy neighbors” policies. The ECB revised
its current policy of buying €80B securities a month by reducing the amount to €60B and extending the program to December 2017 and allocating the purchases via the capital key.
The Bank of Japan (BOJ) introduced a new policy framework in which the BOJ will not only control the short-term policy rate at -0.1%, but also the 10-year Japanese government bond yield at 0.0%. This new policy regime underscores the BOJ’s reduction of its dependence on large-scale asset purchases which will have proven to have a technical limit over time. The new policy framework, along with the global reflation trade, has incentivized Japanese investors to sell yen-denominated assets and reinvest into higher yielding U.S. Treasuries.
And finally, the economic and political situation in Brazil seems to have stabilized. Economic activity bottomed in the second half of 2016; however, given the constraints, the economic recovery is positioned to be the softest recovery when compared to other upturns. Following President Rousseff’s impeachment, the new administration has indicated its intention to commence with a pro-growth fiscal agenda.
Seeking low volatility
Amid this volatility, we are currently maintaining a low duration in the Portfolio and have built in what we believe to be plenty of liquidity. We believe shorter duration will enable the Portfolio to focus on higher yielding corporate bonds, while greater liquidity will allow us to be more responsive to changing market environments.
We continue to focus on maintaining what we believe to be proper diversification for the Portfolio. The Portfolio has the opportunity to invest in different securities, sectors, countries and currencies. This flexibility allows us to seek less volatility with a reasonable yield that we believe will reward investors over the longer term.
Given the extreme volatility and uncertainty in global markets, the Portfolio’s currency exposure remains overwhelmingly in the U.S. dollar. We believe there will be better opportunities to add foreign currency bonds to the portfolio going forward, especially in emerging markets.
We continue to search for value in the corporate bond space. Some of the best returns have been, and we think will continue to be, from emerging market bonds. We believe there will be more opportunities to redeploy liquidity due to the volatility associated with U.S. politics and the Federal Reserve’s normalization of interest rates.
Looking ahead
We believe global growth will continue to surprise to the upside in 2017, led by the United States. This will put some additional upward pressure on global inflation, as developed markets are operating close to full employment. Inflation expectations likely will continue to grind higher in the U.S. on the back of faster economic growth and slowly rising wage pressures. Faster global economic growth should help support corporate profits and boost risk appetite for growth-sensitive assets. Central bankers were the main drivers of market volatility over the past twelve months. Less-than-dovish body language from the ECB, as well as speculation that the BOJ maybe reaching the limits of its large scale asset purchase program, has just recently pushed up global interest rates.
The Eurozone’s growth outlook has stabilized. Macroeconomic adjustments are still underway and the debt overhang remains a major impediment to economic activities. The euro area is still dependent on the global economic environment and remains vulnerable to any external shock. Geopolitical risks remain elevated; terrorist attacks in Paris, Luxembourg, and Germany have brought the surging refugee situation into question and could lead to more discussions about the open border environment, which is one of the benefits of being a member in the EU. Brexit has demonstrated how populism can come to the forefront with major political and economic effects. With elections coming up in France, Germany, the Netherlands and potentially Italy in 2017, political risks are rising in the EU.
Growth in emerging market economies remains generally lackluster, albeit with large regional differences. Despite China’s loss of momentum, the rest of emerging market Asia is holding up well, while Latin America remains below trend and Europe, the Middle East and Africa suffer from weaker trade and geopolitics. We believe the wild card will be the price of commodities going forward. Brazil has been confronting a major scandal with the August 2016 impeachment of President Rousseff, the trial of the former President Lula and the scandal of the government owned oil and gas company, Petrobras, that has left investors questioning the government’s transparency and corporate governance. We believe Russia could benefit from the lifting of economic sanctions and better U.S./Russian relationships. Mexico, on the other hand, is facing stiffer competition as President-elect Trump’s pro-domestic manufacturing policies could put pressure on exports into the United States.
Past performance is no guarantee of future results. As with any mutual fund, the value of the Portfolio’s shares will change, and you could lose money on your investment. These and other risks are more fully described in the Portfolio’s prospectus.
Certain U.S. government securities in which the Portfolio may invest, such as Treasury securities and securities issued by the Government National Mortgage Association (GinnieMae), are backed by the full faith and credit of the U.S. government. However, other U.S. government securities in which the Portfolio may invest, such as securities issued by the Federal National Mortgage Association (Fannie Mae), the Federal Home Loan Mortgage Corporation (Freddie Mac) and the Federal Home Loan Banks (FHLB), are not backed by the full faith and credit of the U.S. government, are not insured or guaranteed by the U.S. government and, instead, may be supported only by the right of the issuer to borrow from the U.S. Treasury or by the credit of the issuer.
International investing involves additional risks including currency fluctuations, political or economic conditions affecting the foreign country, and differences in accounting standards and foreign regulations. Fixed income securities are subject to interest rate risk and, as such, the net asset value of the Fund may fall as interest rates rise. These and other risks are more fully described in the fund’s prospectus.
The opinions expressed in this report are those of the portfolio managers and are current only through the end of the period of the report as stated on the cover. The managers’ views are subject to change at any time based on market and other conditions, and no forecasts can be guaranteed.
The index (indexes) noted is unmanaged and includes reinvested dividends. One cannot invest directly in an index, nor is an index representative of the Ivy VIP Global Bond.
| | |
| PORTFOLIO HIGHLIGHTS | | GLOBAL BOND |
ALL DATA IS AS OF DECEMBER 31, 2016 (UNAUDITED)
Asset Allocation
| | | | |
Stocks | | | 3.6% | |
Utilities | | | 1.2% | |
Financials | | | 1.1% | |
Information Technology | | | 0.7% | |
Energy | | | 0.6% | |
Bonds | | | 94.1% | |
Corporate Debt Securities | | | 70.7% | |
United States Government and Government Agency Obligations | | | 18.7% | |
Other Government Securities | | | 3.0% | |
Loans | | | 1.7% | |
Cash and Other Assets (Net of Liabilities),
and Cash Equivalents+ | | | 2.3% | |
Quality Weightings
| | | | |
Investment Grade | | | 55.9% | |
AA | | | 19.8% | |
A | | | 14.0% | |
BBB | | | 22.1% | |
Non-Investment Grade | | | 38.2% | |
BB | | | 20.8% | |
B | | | 13.3% | |
CCC | | | 1.6% | |
Non-rated | | | 2.5% | |
Cash and Other Assets (Net of Liabilities),
Cash Equivalents+ and Equities | | | 5.9% | |
Our preference is to always use ratings obtained from Standard & Poor’s. For securities not rated by Standard & Poor’s, ratings are obtained from Moody’s. We do not evaluate these ratings, but simply assign them to the appropriate credit quality category as determined by the rating agency.
Country Weightings
| | | | |
North America | | | 46.6% | |
United States | | | 38.8% | |
Mexico | | | 4.8% | |
Other North America | | | 3.0% | |
Europe | | | 22.3% | |
United Kingdom | | | 7.8% | |
Netherlands | | | 5.8% | |
Luxembourg | | | 3.9% | |
Other Europe | | | 4.8% | |
South America | | | 13.2% | |
Brazil | | | 4.2% | |
Chile | | | 3.7% | |
Other South America | | | 5.3% | |
Pacific Basin | | | 7.5% | |
Bahamas/Caribbean | | | 4.4% | |
Other | | | 2.6% | |
Middle East | | | 1.1% | |
Cash and Other Assets (Net of Liabilities),
and Cash Equivalents+ | | | 2.3% | |
+ Cash equivalents are defined as highly liquid securities with maturities of less than three months. Cash equivalents may include U.S. Government Treasury bills, bank certificates of deposit, bankers’ acceptances, corporate commercial paper and other money market instruments.
| | |
| COMPARISON OF CHANGE IN VALUE OF $10,000 INVESTMENT | | GLOBAL BOND |
(UNAUDITED)
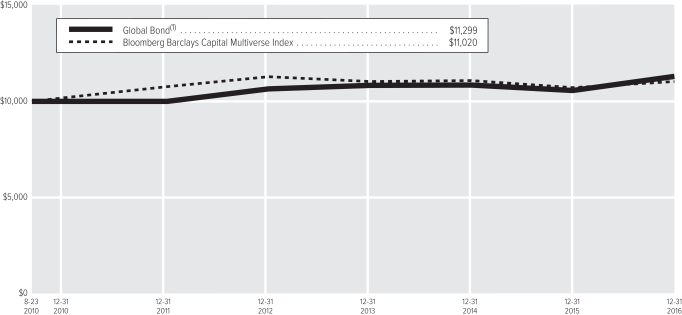
| (1) | The value of the investment in the Portfolio is impacted by the ongoing expenses of the Portfolio and assumes reinvestment of dividends and distributions. |
| | | | |
| Average Annual Total Return(2) | | | |
1-year period ended 12-31-16 | | | 7.04% | |
5-year period ended 12-31-16 | | | 2.48% | |
10-year period ended 12-31-16 | | | — | |
Since inception of Portfolio(3) through 12-31-16 | | | 1.94% | |
| (2) | Data quoted is past performance and current performance may be lower or higher. Past performance is no guarantee of future results. Investment return and principal value of an investment will fluctuate and shares, when redeemed, may be worth more or less than their original cost. Please call 1.888.WADDELL for the Portfolio’s most recent month-end performance. Performance data quoted does not reflect any expenses or charges associated with owning a variable life insurance policy or variable annuity contract that invests in the Portfolio’s shares. When such charges are deducted, actual investment performance in a variable policy or contract will be lower. |
| (3) | 8-23-10 (the date on which shares were first acquired by shareholders). |
Past performance is not necessarily indicative of future performance. Indexes are unmanaged. The performance graph and table do not reflect the deduction of taxes that a shareholder would pay on Portfolio distributions or on the redemption of Portfolio shares. Performance results may include the effect of expense reduction arrangements for some or all of the periods shown. If those arrangements had not been in place, the performance results for those periods would have been lower.
| | |
| SCHEDULE OF INVESTMENTS | | GLOBAL BOND (in thousands) |
DECEMBER 31, 2016
| | | | | | | | |
| COMMON STOCKS | | Shares | | | Value | |
Brazil | |
| |
Utilities – 0.6% | |
Alupar Investimento S.A. | | | 12 | | | $ | 62 | |
Transmissora Alianca de Energia Eletrica S.A. | | | 10 | | | | 65 | |
| | | | | | | | |
| | | | | | | 127 | |
| | | | | | | | |
| |
Total Brazil – 0.6% | | | $ | 127 | |
Chile | |
| |
Utilities – 0.1% | |
Aguas Andinas S.A. | | | 34 | | | | 18 | |
| | | | | | | | |
| |
Total Chile – 0.1% | | | $ | 18 | |
Panama | |
| |
Financials – 1.1% | |
Banco Latinoamericano de Comercio Exterior S.A. | | | 8 | | | | 234 | |
| | | | | | | | |
| |
Total Panama – 1.1% | | | $ | 234 | |
United Kingdom | |
| |
Energy – 0.6% | |
Royal Dutch Shell plc, Class A | | | 5 | | | | 129 | |
Seadrill Partners LLC | | | 4 | | | | 16 | |
| | | | | | | | |
| | | | | | | 145 | |
| | | | | | | | |
| |
Total United Kingdom – 0.6% | | | $ | 145 | |
United States | |
| |
Information Technology – 0.7% | |
Intel Corp. | | | 4 | | | | 149 | |
| | | | | | | | |
| |
Utilities – 0.5% | |
PPL Corp. | | | 4 | | | | 123 | |
| | | | | | | | |
| |
Total United States – 1.2% | | | $ | 272 | |
| |
TOTAL COMMON STOCKS – 3.6% | | | $ | 796 | |
(Cost: $852) | |
| | |
| CORPORATE DEBT SECURITIES | | Principal | | | | |
Argentina | |
| |
Energy – 0.9% | |
Pan American Energy LLC, | | | | | | | | |
7.875%, 5-7-21 | | $ | 100 | | | | 105 | |
YPF Sociedad Anonima, | | | | | | | | |
8.875%, 12-19-18 (A) | | | 80 | | | | 87 | |
| | | | | | | | |
| | | | | | | 192 | |
| | | | | | | | |
| |
Industrials – 0.1% | |
Aeropuertos Argentina 2000 S.A., | | | | | | | | |
10.750%, 12-1-20 (A) | | | 32 | | | | 35 | |
| | | | | | | | |
| |
Total Argentina – 1.0% | | | $ | 227 | |
| | | | | | | | |
CORPORATE DEBT SECURITIES
(Continued) | | Principal | | | Value | |
Bahrain | |
| |
Financials – 1.1% | |
HDFC Bank Ltd., | | | | | | | | |
3.000%, 3-6-18 | | $ | 250 | | | $ | 252 | |
| | | | | | | | |
| |
Total Bahrain – 1.1% | | | $ | 252 | |
Brazil | |
| |
Energy – 0.0% | |
Lancer Finance Co. (SPV) Ltd., | | | | | | | | |
5.850%, 12-12-16 (B) | | | 15 | | | | — | * |
| | | | | | | | |
| |
Financials – 0.0% | |
Banco Cruzeiro do Sul S.A., | | | | | | | | |
7.000%, 7-8-13 (B) | | | 96 | | | | 5 | |
| | | | | | | | |
| |
Industrials – 1.2% | |
Embraer Overseas Ltd., | | | | | | | | |
6.375%, 1-24-17 | | | 225 | | | | 225 | |
Odebrecht Drilling Norbe VII/IX Ltd., | | | | | | | | |
6.350%, 6-30-21 (A) | | | 89 | | | | 40 | |
| | | | | | | | |
| | | | | | | 265 | |
| | | | | | | | |
| |
Materials – 1.4% | |
Suzano Trading Ltd., | | | | | | | | |
5.875%, 1-23-21 (A) | | | 200 | | | | 207 | |
Vale Overseas Ltd.: | | | | | | | | |
4.625%, 9-15-20 | | | 50 | | | | 51 | |
6.250%, 8-10-26 | | | 50 | | | | 52 | |
| | | | | | | | |
| | | | | | | 310 | |
| | | | | | | | |
| |
Total Brazil – 2.6% | | | $ | 580 | |
British Virgin Islands | |
| |
Energy – 0.3% | |
QGOG Atlantic/Alaskan Rigs Ltd., | | | | | | | | |
5.250%, 7-30-18 (A) | | | 83 | | | | 78 | |
| | | | | | | | |
| |
Financials – 1.4% | |
Horsepower Finance Ltd., | | | | | | | | |
2.100%, 3-3-17 | | | 300 | | | | 300 | |
| | | | | | | | |
| |
Total British Virgin Islands – 1.7% | | | $ | 378 | |
Canada | |
| |
Financials – 0.5% | |
Bank of Montreal, | | | | | | | | |
1.800%, 7-31-18 | | | 100 | | | | 100 | |
| | | | | | | | |
| |
Total Canada – 0.5% | | | $ | 100 | |
Cayman Islands | |
| |
Financials – 0.9% | |
Banco Bradesco S.A., | | | | | | | | |
4.500%, 1-12-17 (A) | | | 200 | | | | 200 | |
| | | | | | | | |
| |
Telecommunication Services – 1.0% | |
Sable International Finance Ltd., | | | | | | | | |
6.875%, 8-1-22 (A) | | | 200 | | | | 208 | |
| | | | | | | | |
| |
Total Cayman Islands – 1.9% | | | $ | 408 | |
| | | | | | | | |
CORPORATE DEBT SECURITIES
(Continued) | | Principal | | | Value | |
Chile | |
| |
Industrials – 1.9% | |
Guanay Finance Ltd., | | | | | | | | |
6.000%, 12-15-20 (A) | | $ | 206 | | | $ | 208 | |
LATAM Airlines Group S.A., | | | | | | | | |
7.250%, 6-9-20 (A) | | | 200 | | | | 205 | |
| | | | | | | | |
| | | | | | | 413 | |
| | | | | | | | |
| |
Materials – 1.7% | |
Inversiones CMPC S.A. (GTD by Empresas CMPC S.A.): | | | | | | | | |
4.750%, 1-19-18 (A) | | | 175 | | | | 178 | |
4.375%, 5-15-23 (A) | | | 200 | | | | 201 | |
| | | | | | | | |
| | | | | | | 379 | |
| | | | | | | | |
| |
Total Chile – 3.6% | | | $ | 792 | |
China | |
| |
Information Technology – 2.3% | |
Alibaba Group Holding Ltd., | |
1.625%, 11-28-17 | | | 500 | | | | 499 | |
| | | | | | | | |
| |
Total China – 2.3% | | | $ | 499 | |
Columbia | |
| |
Financials – 1.8% | |
Banco de Bogota S.A.: | | | | | | | | |
5.000%, 1-15-17 (A) | | | 200 | | | | 200 | |
5.375%, 2-19-23 (A) | | | 200 | | | | 203 | |
| | | | | | | | |
| | | | | | | 403 | |
| | | | | | | | |
| |
Utilities – 0.9% | |
Emgesa S.A. E.S.P., | | | | | | | | |
8.750%, 1-25-21 (C) | | | COP302,000 | | | | 100 | |
Empresas Publicas de Medellin E.S.P., | | | | | | | | |
8.375%, 2-1-21 (C) | | | 274,000 | | | | 89 | |
| | | | | | | | |
| | | | | | | 189 | |
| | | | | | | | |
| |
Total Columbia – 2.7% | | | $ | 592 | |
France | |
| |
Financials – 0.5% | |
Societe Generale S.A., | | | | | | | | |
5.922%, 4-29-49 (A) | | | 100 | | | | 99 | |
| | | | | | | | |
| |
Total France – 0.5% | | | $ | 99 | |
Hong Kong | |
| |
Telecommunication Services – 0.9% | |
Hutchison Whampoa Ltd., | | | | | | | | |
1.625%, 10-31-17 (A) | | | 200 | | | | 199 | |
| | | | | | | | |
| |
Total Hong Kong – 0.9% | | | $ | 199 | |
| | |
| SCHEDULE OF INVESTMENTS | | GLOBAL BOND (in thousands) |
DECEMBER 31, 2016
| | | | | | | | |
CORPORATE DEBT SECURITIES
(Continued) | | Principal | | | Value | |
India | |
| |
Industrials – 0.9% | |
Adani Ports and Special Economic Zone Ltd., | | | | | | | | |
3.500%, 7-29-20 (A) | | $ | 200 | | | $ | 199 | |
| | | | | | | | |
| |
Total India – 0.9% | | | $ | 199 | |
Indonesia | |
| |
Financials – 0.9% | |
Bank Rakyat Indonesia, | | | | | | | | |
2.950%, 3-28-18 | | | 200 | | | | 200 | |
| | | | | | | | |
| |
Total Indonesia – 0.9% | | | $ | 200 | |
Ireland | |
| |
Financials – 1.6% | |
MTS International Funding Ltd., | | | | | | | | |
5.000%, 5-30-23 (A) | | | 350 | | | | 358 | |
| | | | | | | | |
| |
Total Ireland – 1.6% | | | $ | 358 | |
Jamaica | |
| |
Telecommunication Services – 0.8% | |
Digicel Group Ltd., | | | | | | | | |
6.000%, 4-15-21 (A) | | | 200 | | | | 181 | |
| | | | | | | | |
| |
Total Jamaica – 0.8% | | | $ | 181 | |
Luxembourg | |
| |
Consumer Staples – 0.9% | |
Minerva Luxembourg S.A., | | | | | | | | |
6.500%, 9-20-26 (A) | | | 200 | | | | 193 | |
| | | | | | | | |
| |
Financials – 0.9% | |
OJSC Russian Agricultural Bank, | | | | | | | | |
5.100%, 7-25-18 (A) | | | 200 | | | | 204 | |
| | | | | | | | |
| |
Information Technology – 1.6% | |
BC Luxco 1 S.A.: | | | | | | | | |
7.375%, 1-29-20 | | | 150 | | | | 151 | |
7.375%, 1-29-20 (A) | | | 200 | | | | 201 | |
| | | | | | | | |
| | | | | | | 352 | |
| | | | | | | | |
| |
Materials – 0.5% | |
Steel Capital S.A., | | | | | | | | |
6.700%, 10-25-17 | | | 100 | | | | 103 | |
| | | | | | | | |
| |
Total Luxembourg – 3.9% | | | $ | 852 | |
Mexico | |
| |
Consumer Staples – 0.7% | |
Sigma Alimentos S.A. de C.V., | | | | | | | | |
5.625%, 4-14-18 (A) | | | 150 | | | | 156 | |
| | | | | | | | |
| |
Financials – 0.9% | |
Unifin Financiera S.A.B. de C.V. SOFOM E.N.R., | | | | | | | | |
7.250%, 9-27-23 (A) | | | 200 | | | | 195 | |
| | | | | | | | |
| | | | | | | | |
CORPORATE DEBT SECURITIES
(Continued) | | Principal | | | Value | |
Materials – 3.2% | |
C5 Capital (SPV) Ltd., | | | | | | | | |
5.115%, 12-29-49 (A)(D) | | $ | 150 | | | $ | 124 | |
CEMEX S.A.B. de C.V., | | | | | | | | |
6.500%, 12-10-19 (A) | | | 550 | | | | 582 | |
| | | | | | | | |
| | | | | | | 706 | |
| | | | | | | | |
| |
Total Mexico – 4.8% | | | $ | 1,057 | |
Netherlands | |
| |
Consumer Discretionary – 3.3% | |
Myriad International Holdings B.V., | | | | | | | | |
6.375%, 7-28-17 (A) | | | 500 | | | | 510 | |
VTR Finance B.V., | | | | | | | | |
6.875%, 1-15-24 (A) | | | 200 | | | | 207 | |
| | | | | | | | |
| | | | | | | 717 | |
| | | | | | | | |
| |
Energy – 0.9% | |
Petrobras Global Finance B.V. (GTD by Petroleo Brasileiro S.A.): | | | | | | | | |
4.875%, 3-17-20 | | | 125 | | | | 123 | |
8.375%, 5-23-21 | | | 60 | | | | 65 | |
| | | | | | | | |
| | | | | | | 188 | |
| | | | | | | | |
| |
Materials – 0.7% | |
Cimpor Financial Operations B.V. (GTD by InterCement Participacoes S.A. and InterCement Brasil S.A.), | | | | | | | | |
5.750%, 7-17-24 (A) | | | 200 | | | | 166 | |
| | | | | | | | |
| |
Telecommunication Services – 0.4% | |
VimpleCom Holdings B.V., | | | | | | | | |
9.000%, 2-13-18 (A)(C) | | | RUB5,000 | | | | 81 | |
| | | | | | | | |
| |
Utilities – 0.5% | |
Majapahit Holding B.V., | | | | | | | | |
7.750%, 1-20-20 (A) | | | 100 | | | | 112 | |
| | | | | | | | |
| |
Total Netherlands – 5.8% | | | $ | 1,264 | |
Panama | |
| |
Financials – 1.4% | |
Banco Latinoamericano de Comercio Exterior S.A., | | | | | | | | |
3.750%, 4-4-17 (A) | | | 300 | | | | 301 | |
| | | | | | | | |
| |
Total Panama – 1.4% | | | $ | 301 | |
Peru | |
| |
Real Estate – 0.5% | |
InRetail Shopping Malls, | | | | | | | | |
5.250%, 10-10-21 (A) | | | 100 | | | | 102 | |
| | | | | | | | |
| |
Total Peru – 0.5% | | | $ | 102 | |
| | | | | | | | |
CORPORATE DEBT SECURITIES
(Continued) | | Principal | | | Value | |
Russia | |
| |
Materials – 0.9% | |
Uralkali Finance Ltd., | | | | | | | | |
3.723%, 4-30-18 (A) | | $ | 200 | | | $ | 199 | |
| | | | | | | | |
| |
Total Russia – 0.9% | | | $ | 199 | |
Singapore | |
| |
Consumer Staples – 0.5% | |
Olam International Ltd., | | | | | | | | |
7.500%, 8-12-20 | | | 100 | | | | 108 | |
| |
Telecommunication Services – 0.9% | |
TBG Global Pte. Ltd., | | | | | | | | |
4.625%, 4-3-18 (A) | | | 200 | | | | 202 | |
| | | | | | | | |
| |
Total Singapore – 1.4% | | | $ | 310 | |
South Korea | |
| |
Financials – 1.1% | |
Woori Bank, | | | | | | | | |
2.625%, 7-20-21 (A) | | | 250 | | | | 246 | |
| | | | | | | | |
| |
Total South Korea – 1.1% | | | $ | 246 | |
Spain | |
| |
Financials – 0.9% | |
Banco Bilbao Vizcaya Argentaria S.A., | | | | | | | | |
9.000%, 5-29-49 (E) | | | 200 | | | | 208 | |
| | | | | | | | |
| |
Total Spain – 0.9% | | | $ | 208 | |
United Arab Emirates | |
| |
Financials – 1.5% | |
ICICI Bank Ltd., | | | | | | | | |
3.500%, 3-18-20 (A) | | | 325 | | | | 330 | |
| | | | | | | | |
| |
Total United Arab Emirates – 1.5% | | | $ | 330 | |
United Kingdom | |
| |
Consumer Staples – 1.7% | |
BAT International Finance plc, | | | | | | | | |
1.850%, 6-15-18 (A) | | | 375 | | | | 375 | |
| | | | | | | | |
| |
Financials – 4.6% | |
Barclays plc, | | | | | | | | |
8.250%, 12-29-49 (E) | | | 200 | | | | 208 | |
HSBC Holdings plc, | | | | | | | | |
5.625%, 12-29-49 (E) | | | 200 | | | | 197 | |
Royal Bank of Scotland Group plc (The), | | | | | | | | |
7.640%, 3-29-49 | | | 200 | | | | 186 | |
State Bank of India: | | | | | | | | |
3.250%, 4-18-18 (A) | | | 200 | | | | 202 | |
3.622%, 4-17-19 (A) | | | 200 | | | | 205 | |
| | | | | | | | |
| | | | | | | 998 | |
| | | | | | | | |
| | |
| SCHEDULE OF INVESTMENTS | | GLOBAL BOND (in thousands) |
DECEMBER 31, 2016
| | | | | | | | |
CORPORATE DEBT SECURITIES
(Continued) | | Principal | | | Value | |
Materials – 0.9% | |
Vedanta Resources plc, | | | | | | | | |
6.000%, 1-31-19(A) | | $ | 200 | | | $ | 201 | |
| | | | | | | | |
| |
Total United Kingdom – 7.2% | | | $ | 1,574 | |
United States | |
| |
Consumer Staples – 4.4% | |
Anheuser-Busch InBev S.A./N.V., | | | | | | | | |
2.650%, 2-1-21 | | | 500 | | | | 502 | |
Bunge Ltd. Finance Corp., | | | | | | | | |
3.500%, 11-24-20 | | | 250 | | | | 254 | |
SABMiller Holdings, Inc., | | | | | | | | |
2.200%, 8-1-18 | | | 200 | | | | 202 | |
| | | | | | | | |
| | | | | | | 958 | |
| | | | | | | | |
| |
Energy – 0.7% | |
PBF Holding Co. LLC and PBF Finance Corp., | | | | | | | | |
8.250%, 2-15-20 | | | 150 | | | | 154 | |
| | | | | | | | |
| |
Financials – 3.5% | |
Citigroup, Inc., | | | | | | | | |
8.400%, 4-29-49 (E) | | | 75 | | | | 80 | |
Daimler Finance North America LLC, | | | | | | | | |
2.950%, 1-11-17 (A) | | | 200 | | | | 200 | |
Diamond 1 Finance Corp. and Diamond 2 Finance Corp., | | | | | | | | |
3.480%, 6-1-19 (A) | | | 50 | | | | 51 | |
General Motors Financial Co., Inc. (GTD by AmeriCredit Financial Services, Inc.), | | | | | | | | |
3.000%, 9-25-17 | | �� | 100 | | | | 101 | |
Hyundai Capital America, | | | | | | | | |
2.000%, 3-19-18 (A) | | | 200 | | | | 200 | |
Wells Fargo & Co., | | | | | | | | |
7.980%, 3-29-49 | | | 125 | | | | 131 | |
| | | | | | | | |
| | | | | | | 763 | |
| | | | | | | | |
| |
Health Care – 0.8% | |
Fresenius U.S. Finance II, Inc.: | | | | | | | | |
4.250%, 2-1-21 (A) | | | 100 | | | | 104 | |
4.500%, 1-15-23 (A) | | | 75 | | | | 77 | |
| | | | | | | | |
| | | | | | | 181 | |
| | | | | | | | |
| |
Industrials – 0.4% | |
TransDigm, Inc. (GTD by TransDigm Group, Inc.), | | | | | | | | |
6.000%, 7-15-22 | | | 82 | | | | 85 | |
| | | | | | | | |
| |
Information Technology – 1.6% | |
Alliance Data Systems Corp., | | | | | | | | |
5.250%, 12-1-17 (A) | | | 250 | | | | 254 | |
Micron Technology, Inc., | | | | | | | | |
5.875%, 2-15-22 | | | 100 | | | | 104 | |
| | | | | | | | |
| | | | | | | 358 | |
| | | | | | | | |
| | | | | | | | |
CORPORATE DEBT SECURITIES
(Continued) | | Principal | | | Value | |
Materials – 0.7% | |
BakerCorp International, Inc., | | | | | | | | |
8.250%, 6-1-19 | | $ | 50 | | | $ | 42 | |
Hillman Group, Inc. (The), | | | | | | | | |
6.375%, 7-15-22 (A) | | | 110 | | | | 104 | |
| | | | | | | | |
| | | | | | | 146 | |
| | | | | | | | |
| |
Real Estate – 1.1% | |
Aircastle Ltd., | | | | | | | | |
4.625%, 12-15-18 | | | 235 | | | | 245 | |
| | | | | | | | |
| |
Telecommunication Services – 2.9% | |
American Tower Corp., | | | | | | | | |
3.400%, 2-15-19 | | | 170 | | | | 173 | |
T-Mobile USA, Inc., | | | | | | | | |
6.000%, 3-1-23 | | | 230 | | | | 243 | |
Verizon Communications, Inc., | | | | | | | | |
2.625%, 2-21-20 | | | 214 | | | | 216 | |
| | | | | | | | |
| | | | | | | 632 | |
| | | | | | | | |
| |
Utilities – 1.1% | |
Sempra Energy, | | | | | | | | |
2.850%, 11-15-20 | | | 250 | | | | 252 | |
| | | | | | | | |
| |
Total United States – 17.2% | | | $ | 3,774 | |
Venezuela | |
| |
Financials – 1.1% | |
Corporacion Andina de Fomento, | | | | | | | | |
1.500%, 8-8-17 | | | 250 | | | | 250 | |
| | | | | | | | |
| |
Total Venezuela – 1.1% | | | $ | 250 | |
| |
TOTAL CORPORATE DEBT
SECURITIES – 70.7% | | | $ | 15,531 | |
(Cost: $15,853) | |
| |
| OTHER GOVERNMENT SECURITIES (F) | | | | |
Brazil – 1.0% | |
Federative Republic of Brazil, | | | | | | | | |
4.875%, 1-22-21 | | | 200 | | | | 206 | |
| | | | | | | | |
| |
Russia – 0.9% | |
Russian Federation, | | | | | | | | |
3.500%, 1-16-19 (A) | | | 200 | | | | 203 | |
| | | | | | | | |
| |
Saudi Arabia – 1.1% | |
Saudi Arabia Government Bond, | | | | | | | | |
2.375%, 10-26-21 (A) | | | 250 | | | | 243 | |
| | | | | | | | |
| |
TOTAL OTHER GOVERNMENT
SECURITIES – 3.0% | | | $ | 652 | |
(Cost: $658) | |
| | | | | | | | |
| LOANS(D) | | Principal | | | Value | |
United States | |
Industrials – 1.1% | |
TransDigm, Inc.: | | | | | | | | |
3.770%, 2-28-20 | | $ | 44 | | | $ | 44 | |
3.998%, 2-28-20 | | | 195 | | | | 197 | |
| | | | | | | | |
| | | | | | | 241 | |
| | | | | | | | |
| |
Information Technology – 0.3% | |
Magic Newco LLC, | | | | | | | | |
5.000%, 12-12-18 | | | 49 | | | | 50 | |
| | | | | | | | |
| |
Materials – 0.3% | |
BakerCorp International, Inc., | | | | | | | | |
4.250%, 2-7-20 | | | 73 | | | | 69 | |
| |
Total United States – 1.7% | | | $ | 360 | |
| |
TOTAL LOANS – 1.7% | | | $ | 360 | |
(Cost: $360) | |
| |
| UNITED STATES GOVERNMENT OBLIGATIONS | | | | |
| |
United States – 18.7% | |
U.S. Treasury Bonds, | | | | | | | | |
2.250%, 11-15-25 | | | 450 | | | | 443 | |
U.S. Treasury Notes: | | | | | | | | |
0.625%, 8-31-17 | | | 600 | | | | 599 | |
0.750%, 12-31-17 | | | 1,250 | | | | 1,248 | |
1.125%, 1-15-19 | | | 1,000 | | | | 998 | |
1.250%, 10-31-21 | | | 200 | | | | 194 | |
1.750%, 11-30-21 | | | 300 | | | | 297 | |
1.750%, 5-15-22 | | | 145 | | | | 143 | |
1.500%, 8-15-26 | | | 200 | | | | 184 | |
| | | | | | | | |
| | | | | | | 4,106 | |
| | | | | | | | |
| |
TOTAL UNITED STATES GOVERNMENT OBLIGATIONS – 18.7% | | | $ | 4,106 | |
(Cost: $4,145) | |
| | |
| SHORT-TERM SECURITIES | | | | | | |
Master Note – 1.2% | |
Toyota Motor Credit Corp., | | | | | | | | |
0.860%, 1-4-17 (E) | | | 268 | | | | 268 | |
| | | | | | | | |
| |
TOTAL SHORT-TERM SECURITIES – 1.2% | | | $ | 268 | |
(Cost: $268) | |
| |
TOTAL INVESTMENT SECURITIES – 98.9% | | | $ | 21,713 | |
(Cost: $22,136) | |
| |
CASH AND OTHER ASSETS, NET OF LIABILITIES – 1.1% | | | | 243 | |
| |
NET ASSETS – 100.0% | | | $ | 21,956 | |
| | |
| SCHEDULE OF INVESTMENTS | | GLOBAL BOND (in thousands) |
DECEMBER 31, 2016
Notes to Schedule of Investments
| * | Not shown due to rounding. |
| (A) | Securities were purchased pursuant to an exemption from registration available under Rule 144A under the Securities Act of 1933 and may only be resold in transactions exempt from registration, normally to qualified institutional buyers. At December 31, 2016 the total value of these securities amounted to $9,616 or 43.8% of net assets. |
| (B) | Non-income producing as the issuer has either missed its most recent interest payment or declared bankruptcy. |
| (C) | Principal amounts are denominated in the indicated foreign currency, where applicable (COP—Columbian Peso and RUB—Russian Ruble). |
| (D) | Variable rate security. Interest rate disclosed is that which is in effect at December 31, 2016. |
| (E) | Variable rate security. Interest rate disclosed is that which is in effect at December 31, 2016. Date shown represents the date that the variable rate resets. |
| (F) | Other Government Securities may include emerging markets sovereign, quasi-sovereign, corporate and supranational agency and organization debt securities. |
The following forward foreign currency contracts were outstanding at December 31, 2016:
| | | | | | | | | | | | | | | | | | | | | | | | |
| | | Currency to be
Delivered | | | | | Currency to be
Received | | | Settlement
Date | | | Counterparty | | Unrealized
Appreciation | | | Unrealized
Depreciation | |
British Pound | | | 81 | | | U.S. Dollar | | | 100 | | | | 1-25-17 | | | Barclays Capital, Inc. | | $ | 1 | | | $ | — | |
The following table is a summary of the valuation of the Portfolio’s investments by the fair value hierarchy levels as of December 31, 2016. See Note 3 to the Financial Statements for further information regarding fair value measurement.
| | | | | | | | | | | | |
| | | Level 1 | | | Level 2 | | | Level 3 | |
Assets | | | | | | | | | | | | |
Investments in Securities | | | | | | | | | | | | |
Common Stocks | | $ | 796 | | | $ | — | | | $ | — | |
Corporate Debt Securities | | | — | | | | 15,531 | | | | — | |
Other Government Securities | | | — | | | | 652 | | | | — | |
Loans | | | — | | | | 360 | | | | — | |
United States Government Obligations | | | — | | | | 4,106 | | | | — | |
Short-Term Securities | | | — | | | | 268 | | | | — | |
Total | | $ | 796 | | | $ | 20,917 | | | $ | — | |
Forward Foreign Currency Contracts | | $ | — | | | $ | 1 | | | $ | — | |
During the year ended December 31, 2016, securities totaling $63 were transferred from Level 3 to Level 2 due to increased availability of observable market data due to increased market activity or information for these securities. Transfers out of Level 3 represent the values as of the beginning of the reporting period. There were no transfers between Level 1 and 2 during the year.
The following acronym is used throughout this schedule:
GTD = Guaranteed
| | |
| SCHEDULE OF INVESTMENTS | | GLOBAL BOND (in thousands) |
DECEMBER 31, 2016
Country Diversification
| | | | |
(as a % of net assets) | | | | |
United States | | | 38.8% | |
United Kingdom | | | 7.8% | |
Netherlands | | | 5.8% | |
Mexico | | | 4.8% | |
Brazil | | | 4.2% | |
Luxembourg | | | 3.9% | |
Chile | | | 3.7% | |
Columbia | | | 2.7% | |
Panama | | | 2.5% | |
China | | | 2.3% | |
Cayman Islands | | | 1.9% | |
Country Diversification (Continued)
| | | | |
Russia | | | 1.8% | |
British Virgin Islands | | | 1.7% | |
Ireland | | | 1.6% | |
United Arab Emirates | | | 1.5% | |
Singapore | | | 1.4% | |
Bahrain | | | 1.1% | |
Venezuela | | | 1.1% | |
South Korea | | | 1.1% | |
Saudi Arabia | | | 1.1% | |
Argentina | | | 1.0% | |
Other Countries | | | 5.9% | |
Other+ | | | 2.3% | |
+Includes cash and other assets (net of liabilities), and cash equivalents
See Accompanying Notes to Financial Statements.
| | |
| MANAGEMENT DISCUSSION | | GLOBAL GROWTH |
(UNAUDITED)

Sarah C. Ross
Below, Sarah C. Ross, CFA, portfolio manager of Ivy VIP Global Growth, discusses positioning, performance and results for the fiscal year ended December 31, 2016. Ms. Ross has 21 years of industry experience and has managed the Portfolio since August 2014.
Fiscal Year Performance
| | | | |
For the 12 Months Ended December 31, 2016 | | | | |
Ivy VIP Global Growth | | | -3.04% | |
Benchmark(s) and/or Lipper Category | | | | |
MSCI World Index | | | 7.51% | |
(generally reflects the performance of securities markets around the world) | | | | |
Lipper Variable Annuity Global Large-Cap Growth Funds Universe Average | | | 1.13% | |
(generally reflects the performance of the universe of funds with similar investment objectives) | | | | |
Please note that Portfolio returns include applicable fees and expenses while index returns do not include any such fees. Also, the Portfolio’s performance data does not take into account any product expenses or charges associated with owning a variable life or annuity policy, which is invested in Ivy Variable Insurance Portfolios.
Global equity markets ended the year with higher investor optimism for improving global economic growth. Value outperformed growth globally by the widest margin in the last 10 years. As the year progressed, drivers of outperformance changed as investors’ risk appetite transitioned from a bias of defensive, dividend-paying stocks towards riskier assets as the second half of 2016 progressed. Market fluctuation as a result of politics was a challenge for equity investors during the year. Investors grappled with several key issues, including the impact of Britain’s decision to exit the European Union (EU), Italy’s solution for their struggling banking system and the uncertainty of Trump in the White House. The U.S. presidential election had a positive impact on risk appetite and ultimately drove a material increase in U.S. Treasury yields and global yields generally. This was driven by the expectation that Trump’s platform of lower corporate tax rates and less regulation could lead to more capital expenditures and improving growth.
For the fiscal year ended Dec. 31, 2016, the U.S. outperformed most developed markets, with Japan underperforming along with most of Europe. Russia and Latin America (excluding Mexico, which had negative returns due to fears around a protectionist Trump presidency) were strong outperformers in emerging markets. China and India also underperformed. Pro-cyclical sectors generally outperformed for the fiscal year with energy, materials, industrials, information technology and financials all performing well. Health care was the big underperformer stemming from pricing fears and political pressure, the only sector with negative returns.
Performance for the year
Performance for the fiscal year was disappointing as the Portfolio materially underperformed its benchmark index. One factor contributing to roughly half the underperformance was the Portfolio’s bias towards growth stocks relative to the benchmark. Value stocks globally outperformed growth by more than 10% in the period, resulting in a material drag. The remainder of the underperformance was poor stock selection, with the largest drag in the health care sector. We entered the year overweight health care with the idea that valuations looked attractive on solid earnings growth, particularly for innovators in biotechnology and pharmaceuticals. We underestimated the negative impact of politics and pricing pressure during an election cycle that created significant underperformance in the group. Consumer discretionary stocks underperformed as well, with JD.com (China internet retailer) having a negative impact (the Portfolio no longer holds JD.com). Top positive contributors to Portfolio performance in the period include Halliburton Co. and JB Hunt Transport Services, Inc.
Outlook
Exiting what was a particularly challenging fiscal year for quality growth stocks, we do think a better environment lies ahead. Low quality cyclical stocks have rallied off low levels on investors’ hope of a better global growth environment, but we still expect relatively modest growth assumptions. While parts of emerging markets have had strong performing equity markets, much of emerging-market economic growth remains weak. We expect modest stable economic growth from Europe and Japan and are cautiously optimistic about the U.S. in light of the uncertain political environment. Populist political movements continue to pose risks in many parts of the world. Europe still has to manage through the process of Britain’s exit from the EU, as well as elections in many countries where populism could gain traction (including France and Italy). Discussion surrounding the U.S. exiting or renegotiating global trade agreements and possibly implementing a border
tax on imported goods could have far reaching implications. Despite uncertainties in the market, we believe our portfolio of strong global growers with sustainable competitive advantages and unique products that serve large end markets can drive shareholder value over time.
As we enter 2017, a handful of portfolio changes have occurred. The most notable is in health care, where the overweight to the sector has been materially reduced and reallocated to financials, which had been a significant underweight. In areas where we view the political environment as having an unpredictable impact on business fundamentals, we have made an effort to move sector weightings closer to benchmark weight than in the past, while maintaining significant active allocations in individual holdings. We continue to focus on markets we believe have continued secular growth, as well as managements that we believe have created unique barriers to entry and sustainable competitive advantages. Some areas of exposure currently include online retailers that continue to gain share from brick and mortar, productivity enhancing software companies, and energy firms benefiting from an increase in North American production.
Past performance is not a guarantee of future results. The value of the Portfolio’s shares will change, and you could lose money on your investment.
International investing involves additional risks including currency fluctuations, political or economic conditions affecting the foreign country, and differences in accounting standards and foreign regulations. These and other risks are more fully described in the Portfolio’s prospectus.
The opinions expressed in this report are those of the portfolio manager and are current only through the end of the period of the report as stated on the cover. The manager’s views are subject to change at any time based on market and other conditions, and no forecasts can be guaranteed.
The index (indexes) noted are unmanaged and include reinvested dividends. One cannot invest directly in an index, nor is an index representative of the Ivy VIP Global Growth.
| | |
| PORTFOLIO HIGHLIGHTS | | GLOBAL GROWTH |
ALL DATA IS AS OF DECEMBER 31, 2016 (UNAUDITED)
Asset Allocation
| | | | |
Stocks | | | 98.8% | |
Information Technology | | | 23.0% | |
Consumer Discretionary | | | 19.5% | |
Health Care | | | 14.3% | |
Financials | | | 12.7% | |
Industrials | | | 11.2% | |
Energy | | | 9.7% | |
Consumer Staples | | | 8.4% | |
Cash and Other Assets (Net of Liabilities) | | | 1.2% | |
Country Weightings
| | | | |
North America | | | 57.4 | % |
United States | | | 56.2 | % |
Other North America | | | 1.2 | % |
Europe | | | 25.0 | % |
United Kingdom | | | 7.4 | % |
France | | | 7.3 | % |
Germany | | | 5.9 | % |
Other Europe | | | 4.4 | % |
Pacific Basin | | | 12.9 | % |
China | | | 5.6 | % |
Japan | | | 5.4 | % |
Other Pacific Basin | | | 1.9 | % |
Other | | | 1.8 | % |
South America | | | 1.7 | % |
Cash and Other Assets (Net of Liabilities) | | | 1.2 | % |
Top 10 Equity Holdings
| | | | | | |
| Company | | Country | | Sector | | Industry |
Halliburton Co. | | United States | | Energy | | Oil & Gas Equipment & Services |
MasterCard, Inc., Class A | | United States | | Information Technology | | Data Processing & Outsourced Services |
Alibaba Group Holding Ltd. ADR | | China | | Information Technology | | Internet Software & Services |
Facebook, Inc., Class A | | United States | | Information Technology | | Internet Software & Services |
J.B. Hunt Transport Services, Inc. | | United States | | Industrials | | Trucking |
Amazon.com, Inc. | | United States | | Consumer Discretionary | | Internet & Direct Marketing Retail |
Prudential plc | | United Kingdom | | Financials | | Life & Health Insurance |
Visa, Inc., Class A | | United States | | Information Technology | | Data Processing & Outsourced Services |
Tencent Holdings Ltd. | | China | | Information Technology | | Internet Software & Services |
European Aeronautic Defence and Space Co. | | France | | Industrials | | Aerospace & Defense |
See your advisor for more information on the Portfolio’s most recent published Top 10 Equity Holdings.
| | |
| COMPARISON OF CHANGE IN VALUE OF $10,000 INVESTMENT | | GLOBAL GROWTH |
(UNAUDITED)
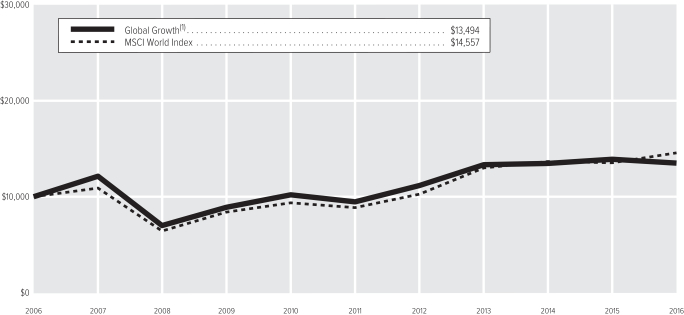
| (1) | The value of the investment in the Portfolio is impacted by the ongoing expenses of the Portfolio and assumes reinvestment of dividends and distributions. |
| | | | |
| Average Annual Total Return(2) | | | |
1-year period ended 12-31-16 | | | -3.04% | |
5-year period ended 12-31-16 | | | 7.33% | |
10-year period ended 12-31-16 | | | 3.04% | |
| (2) | Data quoted is past performance and current performance may be lower or higher. Past performance is no guarantee of future results. Investment return and principal value of an investment will fluctuate and shares, when redeemed, may be worth more or less than their original cost. Please call 1.888.WADDELL for the Portfolio’s most recent month-end performance. Performance data quoted does not reflect any expenses or charges associated with owning a variable life insurance policy or variable annuity contract that invests in the Portfolio’s shares. When such charges are deducted, actual investment performance in a variable policy or contract will be lower. |
Past performance is not necessarily indicative of future performance. Indexes are unmanaged. The performance graph and table do not reflect the deduction of taxes that a shareholder would pay on Portfolio distributions or on the redemption of Portfolio shares. Performance results may include the effect of expense reduction arrangements for some or all of the periods shown. If those arrangements had not been in place, the performance results for those periods would have been lower.
| | |
| SCHEDULE OF INVESTMENTS | | GLOBAL GROWTH (in thousands) |
DECEMBER 31, 2016
| | | | | | | | |
| COMMON STOCKS | | Shares | | | Value | |
Brazil | |
| |
Information Technology – 1.7% | |
MercadoLibre, Inc. | | | 44 | | | $ | 6,943 | |
| | | | | | | | |
| |
Total Brazil – 1.7% | | | $ | 6,943 | |
Canada | |
| |
Industrials – 0.4% | |
Canadian Pacific Railway Ltd. | | | 12 | | | | 1,655 | |
| | | | | | | | |
| |
Total Canada – 0.4% | | | $ | 1,655 | |
China | |
| |
Information Technology – 5.6% | |
Alibaba Group Holding Ltd. ADR (A) | | | 149 | | | | 13,074 | |
Tencent Holdings Ltd. | | | 409 | | | | 10,005 | |
| | | | | | | | |
| | | | | | | 23,079 | |
| | | | | | | | |
| |
Total China – 5.6% | | | $ | 23,079 | |
France | |
| |
Consumer Staples – 1.2% | |
Pernod Ricard | | | 46 | | | | 4,983 | |
| | | | | | | | |
| |
Energy – 1.5% | |
Total S.A. ADR | | | 122 | | | | 6,230 | |
| | | | | | | | |
| |
Financials – 1.1% | |
Axa S.A. | | | 171 | | | | 4,306 | |
| | | | | | | | |
| |
Industrials – 3.5% | |
European Aeronautic Defence and Space Co. | | | 139 | | | | 9,174 | |
Safran | | | 71 | | | | 5,105 | |
| | | | | | | | |
| | | | | | | 14,279 | |
| | | | | | | | |
| |
Total France – 7.3% | | | $ | 29,798 | |
Germany | |
| |
Consumer Discretionary – 2.5% | |
Continental AG | | | 19 | | | | 3,651 | |
ProSiebenSat. 1 Media SE | | | 175 | | | | 6,758 | |
| | | | | | | | |
| | | | | | | 10,409 | |
| | | | | | | | |
| |
Health Care – 1.8% | |
Fresenius SE & Co. KGaA | | | 93 | | | | 7,231 | |
| | | | | | | | |
| |
Industrials – 1.6% | |
Siemens AG | | | 53 | | | | 6,559 | |
| | | | | | | | |
| |
Total Germany – 5.9% | | | $ | 24,199 | |
Israel | |
| |
Health Care – 1.8% | |
Teva Pharmaceutical Industries Ltd. ADR | | | 203 | | | | 7,354 | |
| | | | | | | | |
| |
Total Israel – 1.8% | | | $ | 7,354 | |
| | | | | | | | |
| COMMON STOCKS (Continued) | | Shares | | | Value | |
Japan | |
| |
Consumer Discretionary – 1.7% | |
Isuzu Motors Ltd. | | | 544 | | | $ | 6,893 | |
| | | | | | | | |
| |
Financials – 1.4% | |
Dai-ichi Mutual Life Insurance Co. (The) | | | 334 | | | | 5,563 | |
| | | | | | | | |
| |
Industrials – 1.2% | |
Dakin Industries Ltd. | | | 56 | | | | 5,098 | |
| | | | | | | | |
| |
Information Technology – 1.1% | |
Yahoo Japan Corp. | | | 1,138 | | | | 4,372 | |
| | | | | | | | |
| |
Total Japan – 5.4% | | | $ | 21,926 | |
Mexico | |
| |
Consumer Staples – 0.8% | |
Wal-Mart de Mexico S.A.B. de C.V. | | | 1,732 | | | | 3,099 | |
| | | | | | | | |
| |
Total Mexico – 0.8% | | | $ | 3,099 | |
Netherlands | |
| |
Consumer Discretionary – 1.2% | |
Koninklijke Philips Electronics N.V., Ordinary Shares | | | 154 | | | | 4,715 | |
| | | | | | | | |
| |
Information Technology – 1.6% | |
ASML Holding N.V., NY Registry Shares | | | 59 | | | | 6,656 | |
| | | | | | | | |
| |
Total Netherlands – 2.8% | | | $ | 11,371 | |
South Korea | |
| |
Information Technology – 1.9% | |
Samsung Electronics Co. Ltd. | | | 5 | | | | 7,803 | |
| | | | | | | | |
| |
Total South Korea – 1.9% | | | $ | 7,803 | |
Switzerland | |
| |
Industrials – 1.6% | |
Adecco S.A. | | | 99 | | | | 6,506 | |
| | | | | | | | |
| |
Total Switzerland – 1.6% | | | $ | 6,506 | |
United Kingdom | |
| |
Consumer Discretionary – 1.1% | |
Compass Group plc | | | 250 | | | | 4,626 | |
| | | | | | | | |
| |
Consumer Staples – 2.0% | |
British American Tobacco plc | | | 76 | | | | 4,356 | |
Coca-Cola European Partners plc | | | 121 | | | | 3,809 | |
| | | | | | | | |
| | | | | | | 8,165 | |
| | | | | | | | |
| |
Financials – 2.7% | |
Prudential plc | | | 541 | | | | 10,846 | |
| | | | | | | | |
| |
Health Care – 1.6% | |
Smith & Nephew plc | | | 449 | | | | 6,754 | |
| | | | | | | | |
| |
Total United Kingdom – 7.4% | | | $ | 30,391 | |
| | | | | | | | |
| COMMON STOCKS (Continued) | | Shares | | | Value | |
United States | |
| |
Consumer Discretionary – 13.0% | |
Amazon.com, Inc. (A) | | | 14 | | | $ | 10,871 | |
Dollar General Corp. | | | 122 | | | | 9,039 | |
Home Depot, Inc. (The) | | | 64 | | | | 8,568 | |
Johnson Controls, Inc. | | | 220 | | | | 9,050 | |
Marriott International, Inc., Class A | | | 97 | | | | 7,982 | |
Newell Rubbermaid, Inc. | | | 46 | | | | 2,070 | |
O’Reilly Automotive, Inc. (A) | | | 20 | | | | 5,460 | |
| | | | | | | | |
| | | | | | | 53,040 | |
| | | | | | | | |
| |
Consumer Staples – 4.4% | |
Coca-Cola Co. (The) | | | 139 | | | | 5,751 | |
Kraft Foods Group, Inc. | | | 77 | | | | 6,721 | |
Philip Morris International, Inc. | | | 59 | | | | 5,369 | |
| | | | | | | | |
| | | | | | | 17,841 | |
| | | | | | | | |
| |
Energy – 8.2% | |
EOG Resources, Inc. | | | 87 | | | | 8,802 | |
Halliburton Co. | | | 313 | | | | 16,917 | |
Schlumberger Ltd. | | | 91 | | | | 7,621 | |
| | | | | | | | |
| | | | | | | 33,340 | |
| | | | | | | | |
| |
Financials – 7.5% | |
CME Group, Inc. | | | 36 | | | | 4,119 | |
Discover Financial Services | | | 121 | | | | 8,741 | |
Goldman Sachs Group, Inc. (The) | | | 18 | | | | 4,374 | |
MetLife, Inc. | | | 113 | | | | 6,086 | |
Wells Fargo & Co. | | | 132 | | | | 7,266 | |
| | | | | | | | |
| | | | | | | 30,586 | |
| | | | | | | | |
| |
Health Care – 9.1% | |
Allergan plc (A) | | | 34 | | | | 7,071 | |
Celgene Corp. (A) | | | 63 | | | | 7,242 | |
Gilead Sciences, Inc. | | | 44 | | | | 3,151 | |
HCA Holdings, Inc. (A) | | | 120 | | | | 8,896 | |
Incyte Corp. (A) | | | 40 | | | | 3,997 | |
Thermo Fisher Scientific, Inc. | | | 48 | | | | 6,791 | |
| | | | | | | | |
| | | | | | | 37,148 | |
| | | | | | | | |
| |
Industrials – 2.9% | |
J.B. Hunt Transport Services, Inc. | | | 124 | | | | 12,041 | |
| | | | | | | | |
| |
Information Technology – 11.1% | |
Alphabet, Inc., Class C (A) | | | 11 | | | | 8,777 | |
Facebook, Inc., Class A (A) | | | 105 | | | | 12,048 | |
MasterCard, Inc., Class A | | | 138 | | | | 14,237 | |
Visa, Inc., Class A | | | 132 | | | | 10,318 | |
| | | | | | | | |
| | | | | | | 45,380 | |
| | | | | | | | |
| |
Total United States – 56.2% | | | $ | 229,376 | |
| |
TOTAL COMMON STOCKS – 98.8% | | | $ | 403,500 | |
(Cost: $383,534) | | | | | | | | |
| |
TOTAL INVESTMENT SECURITIES – 98.8% | | | $ | 403,500 | |
(Cost: $383,534) | | | | | | | | |
| |
CASH AND OTHER ASSETS, NET OF LIABILITIES – 1.2% | | | | 4,771 | |
| |
NET ASSETS – 100.0% | | | $ | 408,271 | |
| | |
| SCHEDULE OF INVESTMENTS | | GLOBAL GROWTH (in thousands) |
DECEMBER 31, 2016
Notes to Schedule of Investments
| (A) | No dividends were paid during the preceding 12 months. |
The following table is a summary of the valuation of the Portfolio’s investments by the fair value hierarchy levels as of December 31, 2016. See Note 3 to the Financial Statements for further information regarding fair value measurement.
| | | | | | | | | | | | |
| | | Level 1 | | | Level 2 | | | Level 3 | |
Assets | | | | | | | | | | | | |
Investments in Securities | | | | | | | | | | | | |
Common Stocks | | $ | 403,500 | | | $ | — | | | $ | — | |
Total | | $ | 403,500 | | | $ | — | | | $ | — | |
During the year ended December 31, 2016, there were no transfers between Level 1 and 2.
The following acronym is used throughout this schedule:
ADR = American Depositary Receipts
Market Sector Diversification
| | | | |
(as a % of net assets) | |
Information Technology | | | 23.0% | |
Consumer Discretionary | | | 19.5% | |
Health Care | | | 14.3% | |
Financials | | | 12.7% | |
Industrials | | | 11.2% | |
Energy | | | 9.7% | |
Consumer Staples | | | 8.4% | |
Other+ | | | 1.2% | |
+Includes cash and other assets (net of liabilities)
See Accompanying Notes to Financial Statements.
| | |
| MANAGEMENT DISCUSSION | | GLOBAL NATURAL RESOURCES |
(UNAUDITED)
David P. Ginther
Michael T. Wolverton
Below, David P. Ginther, CPA, and Michael T. Wolverton, CFA, portfolio managers of Ivy VIP Global Natural Resources discuss positioning, performance and results for the fiscal year ended December 31, 2016. Mr. Ginther has managed the Portfolio for three years and has 21 years of industry experience. Mr. Wolverton was named a portfolio manager on the Portfolio on October 1, 2016. He previously had been assistant portfolio manager since 2013. He has 12 years of industry experience.
Fiscal year performance
| | | | |
For the 12 Months Ended December 31, 2016 | | | | |
Ivy VIP Global Natural Resources | | | 23.81% | |
Benchmark(s) and/or Lipper Category | | | | |
MSCI AC World IMI 55% Energy + 45% Materials Index | | | 26.70% | |
MSCI AC World IMI Energy Index | | | 28.44% | |
MSCI AC World IMI Materials Index | | | 24.43% | |
(generally reflects the performance of the energy and materials stocks in developed and emerging markets.) | | | | |
Lipper Variable Annuity Natural Resources Funds Universe Average | | | 31.56% | |
(generally reflects the performance of the universe of funds with similar investment objectives) | | | | |
Please note that the Portfolio returns include applicable investment fees and expenses, whereas the index returns do not include any such fees. Also, the Portfolio’s performance data does not take into account any product expenses or charges associated with owning a variable life or annuity policy, which is invested in Ivy Variable Insurance Portfolios.
Steady rise in oil prices
U.S. and global equity markets closed the fiscal year in positive territory and the energy sector posted gains overall. Crude oil prices continued to recover during the year. The price of oil reached a bottom in mid-February at about $26 per barrel but peaked around $54 per barrel by year end, based on West Texas Intermediate crude oil, the benchmark for oil prices in the U.S.
The Organization of Petroleum Exporting Countries (OPEC) in November agreed to reduce crude oil production quotas by 1.2 million barrels per day (bpd) — the first cut in eight years. OPEC set the new target at 32.5 million bpd, which we think is a meaningful reduction in supply. The reduction prompted an energy rally and gains in most commodity-related currencies. OPEC had announced in September that it would reduce its output to a range of 32.5-33.5 million bpd but delayed a final agreement until its November meeting. Markets and prices were somewhat volatile in the interim because of uncertainty about OPEC’s ultimate decision.
The U.S. Federal Reserve (Fed) on December 14 announced a 0.25-percentage-point hike in the fed funds rate to 0.75%, marking the first interest rate increase since December 2015. The Fed in a statement indicated economic improvements could mean a faster pace of rate hikes in 2017 than had previously been expected, with perhaps as many as three increases during the year.
The U.S. presidential election was a key factor for the markets during the year, both in the uncertainty it created prior to election day and in the ultimate result. President-elect Donald Trump’s victory surprised global markets and carried the Republican Party to control of both houses of the U.S. Congress. Trump’s stated plans on fiscal stimulus, tax reforms and reduced financial regulation prompted global interest rates and global markets to rise. The potential impact of Trump’s pro-growth agenda also drove a move into more economically sensitive equity sectors and market segments through year-end.
Oil price advance boosts Portfolio performance
The Portfolio had a strong positive return for the fiscal year but trailed the returns of its benchmark index and Lipper Universe Average.
The Portfolio’s positive performance came primarily from strong stock selection within the energy sector. Currency contracts in place throughout the year also performed well. The Portfolio typically attempts to mitigate the effect of foreign currencies through the use of derivatives, and the contracts effectively made the Portfolio “neutral” to changes in exchange rates. The Portfolio performed better relative to its benchmark in these two areas. However, underperformance from the Portfolio’s exposure to the materials, financials and industrials sectors impacted the Portfolio greater than the
outperformance of the Portfolio’s exposure to the energy sector. An average allocation during the fiscal year of nearly 6% to cash and cash equivalents in a sharply rising market also detracted from performance. That allocation had dropped to about 3.5% by year end. It is worth noting that the Portfolio’s exposure to the materials and industrials sectors was significantly positive on an absolute return basis, but each area trailed the benchmark’s strong return.
The Portfolio’s positive performance within the energy sector was largely due to a heavier allocation to “upstream” energy companies — those focused on exploration and production — when compared to its benchmark, which holds what the portfolio managers consider to be an outsized exposure to large integrated oil companies. The Portfolio underweighted the integrated oil companies throughout the year. Historically, integrated companies often have underperformed when the energy sector performs well as a whole, as it did in 2016.
The Portfolio’s five greatest contributors to performance relative to the benchmark in the year were Continental Resources, Inc.; Halliburton Co.; Patterson-UTI Energy, Inc.; Concho Resources, Inc.; and Cimarex Energy Co. The five greatest relative detractors were Energy Transfer Equity LP, LyondellBasell Industries, Weatherford International Ltd., Freeport-McMoRan Inc. and Dow Chemical Co. The Portfolio no longer held Energy Transfer Equity LP, LyondellBasell Industries, Weatherford International Ltd. or Freeport-McMoRan Inc. at the end of the fiscal year.
Oil supply/demand still key
We forecast global oil demand in 2017 will grow annually at an average rate of about 1.2 million bpd, on top of the current total demand of 95 million bpd. The increase continues to be driven mostly by emerging markets growth. As new supplies are needed to meet these requirements in the coming years, we believe new investments by energy companies will be required.
We think OPEC’s action in November effectively set a floor for oil prices at about $50 per barrel. We think it is unlikely that oil will fall below that floor price for any prolonged period. However, we think the move will cause existing inventories to be drawn down more quickly than they otherwise may have been.
We believe oil prices will trend higher in the longer term, with production slow to recover and stable demand growth leading to a market balance in the first half of 2017. A slight supply deficit could drive oil prices incrementally higher in coming years.
We think global economic growth will remain slow but will pick up in 2017 and 2018. We think strength in the U.S. dollar will depend on a variety of factors, including the potential for the Fed to become more hawkish while other central banks are on the sidelines, and potential for major fiscal stimulus and regulatory rollbacks in the U.S.
We believe U.S. shale oil continues to offer opportunities, with much of our focus on the Permian Basin for production growth. Companies there continue to improve efficiency and productivity, and manage costs effectively.
Past performance is not a guarantee of future results. The value of the Portfolio’s shares will change, and you could lose money on your investment.
Investing in companies involved in one specified sector may be more risky and volatile than an investment with greater diversification. Investing in natural resources can be riskier than other types of investment activities because of a range of factors, including price fluctuation caused by real and perceived inflationary trends and political developments; and the cost assumed by natural resource companies in complying with environmental and safety regulations. International investing involves additional risks, including currency fluctuations, political or economic conditions affecting the foreign country, and differences in accounting standards and foreign regulations. These risks are magnified in emerging markets. Commodity trading, including trading in precious metals, is generally considered speculative because of the significant potential for investment loss. Markets for commodities are likely to be volatile and there may be sharp price fluctuations even during periods when prices overall are rising. These and other risks are more fully described in the Portfolio’s prospectus.
The opinions expressed in this report are those of the portfolio managers and are current only through the end of the period of the report as stated on the cover. The managers’ views are subject to change at any time based on market and other conditions, and no forecasts can be guaranteed.
The index noted is unmanaged and includes reinvested dividends. One cannot invest directly in an index, nor is an index representative of Ivy VIP Global Natural Resources.
| | |
| PORTFOLIO HIGHLIGHTS | | GLOBAL NATURAL RESOURCES |
ALL DATA IS AS OF DECEMBER 31, 2016 (UNAUDITED)
Asset Allocation
| | | | |
Stocks | | | 96.5% | |
Energy | | | 71.1% | |
Materials | | | 20.6% | |
Industrials | | | 4.8% | |
Utilities | | | 0.0% | |
Cash and Other Assets (Net of Liabilities), and Cash Equivalents+ | | | 3.5% | |
Country Weightings
| | | | |
North America | | | 86.2% | |
United States | | | 80.1% | |
Canada | | | 6.1% | |
Europe | | | 10.3% | |
United Kingdom | | | 8.8% | |
Other Europe | | | 1.5% | |
Pacific Basin | | | 0.0% | |
Cash and Other Assets (Net of Liabilities), and Cash Equivalents+ | | | 3.5% | |
Top 10 Equity Holdings
| | | | | | |
| Company | | Country | | Sector | | Industry |
Halliburton Co. | | United States | | Energy | | Oil & Gas Equipment & Services |
Schlumberger Ltd. | | United States | | Energy | | Oil & Gas Equipment & Services |
EOG Resources, Inc. | | United States | | Energy | | Oil & Gas Exploration & Production |
Chevron Corp. | | United States | | Energy | | Integrated Oil & Gas |
BHP Billiton plc | | United Kingdom | | Materials | | Diversified Metals & Mining |
Concho Resources, Inc. | | United States | | Energy | | Oil & Gas Exploration & Production |
Pioneer Natural Resources Co. | | United States | | Energy | | Oil & Gas Exploration & Production |
Rio Tinto plc | | United Kingdom | | Materials | | Diversified Metals & Mining |
Phillips 66 | | United States | | Energy | | Oil & Gas Refining & Marketing |
Magellan Midstream Partners L.P. | | United States | | Energy | | Oil & Gas Storage & Transportation |
See your advisor for more information on the Portfolio’s most recent published Top 10 Equity Holdings.
+Cash equivalents are defined as highly liquid securities with maturities of less than three months. Cash equivalents may include U.S. Government Treasury bills, bank certificates of deposit, bankers’ acceptances, corporate commercial paper and other money market instruments.
| | |
COMPARISON OF CHANGE IN VALUE
OF $10,000 INVESTMENT | | GLOBAL NATURAL RESOURCES |
(UNAUDITED)
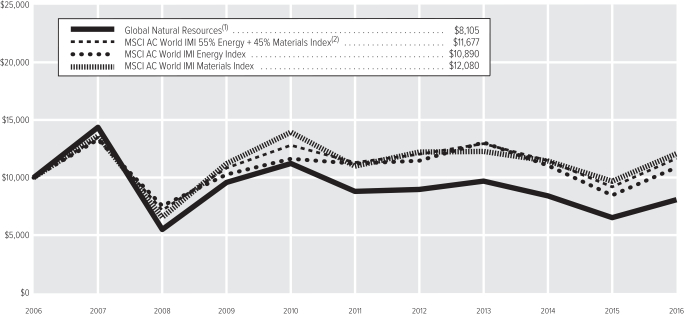
| (1) | The value of the investment in the Portfolio is impacted by the ongoing expenses of the Portfolio and assumes reinvestment of dividends and distributions. |
| (2) | Blended index is represented by 55% of the MSCI AC World IMI Energy and 45% of the MSCI AC World IMI Materials Index. |
| | | | |
| Average Annual Total Return(3) | | | |
1-year period ended 12-31-16 | | | 23.81% | |
5-year period ended 12-31-16 | | | -1.70% | |
10-year period ended 12-31-16 | | | -2.08% | |
| (3) | Data quoted is past performance and current performance may be lower or higher. Past performance is no guarantee of future results. Investment return and principal value of an investment will fluctuate and shares, when redeemed, may be worth more or less than their original cost. Please call 1.888.WADDELL for the Portfolio’s most recent month-end performance. Performance data quoted does not reflect any expenses or charges associated with owning a variable life insurance policy or variable annuity contract that invests in the Portfolio’s shares. When such charges are deducted, actual investment performance in a variable policy or contract will be lower. |
Past performance is not necessarily indicative of future performance. Indexes are unmanaged. The performance graph and table do not reflect the deduction of taxes that a shareholder would pay on Portfolio distributions or on the redemption of Portfolio shares. Performance results may include the effect of expense reduction arrangements for some or all of the periods shown. If those arrangements had not been in place, the performance results for those periods would have been lower.
| | |
| SCHEDULE OF INVESTMENTS | | GLOBAL NATURAL RESOURCES (in thousands) |
DECEMBER 31, 2016
| | | | | | | | |
| COMMON STOCKS | | Shares | | | Value | |
Canada | |
| |
Energy – 2.3% | |
Suncor Energy, Inc. | | | 101 | | | $ | 3,294 | |
| | | | | | | | |
Materials – 3.8% | |
Potash Corp. of Saskatchewan, Inc. | | | 224 | | | | 4,049 | |
West Fraser Timber Co. Ltd. | | | 42 | | | | 1,513 | |
| | | | | | | | |
| | | | | | | 5,562 | |
| | | | | | | | |
| |
Total Canada – 6.1% | | | $ | 8,856 | |
China | |
| |
Materials – 0.0% | |
China Metal Recycling (Holdings) Ltd. (A) | | | 1,900 | | | | — | |
| | | | | | | | |
| |
Total China – 0.0% | | | $ | — | |
Netherlands | |
| |
Energy – 1.5% | |
Core Laboratories N.V. | | | 18 | | | | 2,185 | |
| | | | | | | | |
| |
Total Netherlands – 1.5% | | | $ | 2,185 | |
United Kingdom | |
| |
Materials – 8.8% | |
BHP Billiton plc | | | 316 | | | | 5,090 | |
Randgold Resources Ltd. ADR | | | 41 | | | | 3,138 | |
Rio Tinto plc | | | 114 | | | | 4,424 | |
| | | | | | | | |
| | | | | | | 12,652 | |
| | | | | | | | |
| |
Total United Kingdom – 8.8% | | | $ | 12,652 | |
United States | |
| |
Energy – 67.3% | |
Cabot Oil & Gas Corp. | | | 157 | | | | 3,671 | |
Chevron Corp. | | | 51 | | | | 6,003 | |
Cimarex Energy Co. | | | 31 | | | | 4,233 | |
Concho Resources, Inc. (A) | | | 36 | | | | 4,794 | |
Continental Resources, Inc. (A) | | | 54 | | | | 2,788 | |
Diamondback Energy, Inc. (A) | | | 28 | | | | 2,815 | |
Enterprise Products Partners L.P. | | | 143 | | | | 3,878 | |
EOG Resources, Inc. | | | 67 | | | | 6,723 | |
EQT Midstream Partners L.P. | | | 21 | | | | 1,580 | |
Exxon Mobil Corp. | | | 41 | | | | 3,687 | |
Halliburton Co. | | | 190 | | | | 10,269 | |
Helmerich & Payne, Inc. | | | 36 | | | | 2,813 | |
Magellan Midstream Partners L.P. | | | 58 | | | | 4,364 | |
Marathon Petroleum Corp. | | | 66 | | | | 3,343 | |
MPLX L.P. | | | 46 | | | | 1,590 | |
Noble Energy, Inc. | | | 87 | | | | 3,326 | |
Patterson-UTI Energy, Inc. | | | 134 | | | | 3,615 | |
Phillips 66 | | | 51 | | | | 4,372 | |
Pioneer Natural Resources Co. | | | 26 | | | | 4,601 | |
Plains All American Pipeline L.P. | | | 77 | | | | 2,490 | |
Rice Energy, Inc. (A) | | | 69 | | | | 1,471 | |
RPC, Inc. | | | 194 | | | | 3,845 | |
RSP Permian, Inc. (A) | | | 16 | | | | 730 | |
Schlumberger Ltd. | | | 105 | | | | 8,785 | |
U.S. Silica Holdings, Inc. | | | 21 | | | | 1,179 | |
| | | | | | | | |
| | | | | | | 96,965 | |
| | | | | | | | |
| | | | | | | | |
| COMMON STOCKS (Continued) | | Shares | | | Value | |
Industrials – 4.8% | |
Flowserve Corp. | | | 80 | | | $ | 3,851 | |
Union Pacific Corp. | | | 30 | | | | 3,116 | |
| | | | | | | | |
| | | | | | | 6,967 | |
| | | | | | | | |
Materials – 5.9% | | | | | | | | |
Air Products and Chemicals, Inc. | | | 21 | | | | 3,006 | |
Dow Chemical Co. (The) | | | 66 | | | | 3,779 | |
Southern Copper Corp. | | | 54 | | | | 1,715 | |
| | | | | | | | |
| | | | | | | 8,500 | |
| | | | | | | | |
| |
Total United States – 78.0% | | | $ | 112,432 | |
| |
TOTAL COMMON STOCKS – 94.4% | | | $ | 136,125 | |
(Cost: $131,540) | | | | | | | | |
| |
| INVESTMENT FUNDS | | | | |
United States – 2.1% | |
SPDR Gold Trust (A) | | | 27 | | | | 2,992 | |
| | | | | | | | |
| |
TOTAL INVESTMENT FUNDS – 2.1% | | | $ | 2,992 | |
(Cost: $3,194) | | | | | | | | |
| |
| PREFERRED STOCKS | | | | |
United States | |
| |
Utilities – 0.0% | |
Konarka Technologies, Inc., 8.000%, Convertible (A)(B) | | | 68 | | | | — | |
| | | | | | | | |
| |
Total United States – 0.0% | | | $ | — | |
| |
TOTAL PREFERRED STOCKS – 0.0% | | | $ | — | |
(Cost: $211) | | | | | | | | |
| | |
| SHORT-TERM SECURITIES | | Principal | | | | |
Commercial Paper (C) – 1.8% | |
Wisconsin Electric Power Co. | | | | | | | | |
0.770%, 1-3-17 | | $ | 2,693 | | | | 2,693 | |
| | | | | | | | |
| |
Master Note – 1.6% | |
Toyota Motor Credit Corp. | | | | | | | | |
0.860%, 1-4-17 (D) | | | 2,243 | | | | 2,243 | |
| | | | | | | | |
| |
TOTAL SHORT-TERM SECURITIES – 3.4% | | | $ | 4,936 | |
(Cost: $4,936) | | | | | | | | |
| |
TOTAL INVESTMENT SECURITIES – 99.9% | | | $ | 144,053 | |
(Cost: $139,881) | | | | | | | | |
| |
CASH AND OTHER ASSETS, NET OF LIABILITIES – 0.1% | | | | 136 | |
| |
NET ASSETS – 100.0% | | | $ | 144,189 | |
| | |
| SCHEDULE OF INVESTMENTS | | GLOBAL NATURAL RESOURCES (in thousands) |
DECEMBER 31, 2016
Notes to Schedule of Investments
| (A) | No dividends were paid during the preceding 12 months. |
| (B) | Restricted security. At December 31, 2016, the Portfolio owned the following restricted security: |
| | | | | | | | | | | | | | | | | | | | |
| Security | | Acquisition Date(s) | | | Shares | | | Cost | | | Market Value | | | | |
Konarka Technologies, Inc., 8.000%, Convertible | | | 8-31-07 | | | | 68 | | | $ | 211 | | | $ | — | | | | | |
| | | | | | | | | | | | |
| | The total value of this security represented 0.0% of net assets at December 31, 2016. |
| (C) | Rate shown is the yield to maturity at December 31, 2016. |
| (D) | Variable rate security. Interest rate disclosed is that which is in effect at December 31, 2016. Date shown represents the date that the variable rate resets. |
The following forward foreign currency contracts were outstanding at December 31, 2016:
| | | | | | | | | | | | | | | | | | | | | | | | | | | | |
| | | Currency to be
Delivered | | | | | Currency to be
Received | | | Settlement
Date | | | Counterparty | | Unrealized
Appreciation | | | Unrealized
Depreciation | | | | |
British Pound | | | 7,316 | | | U.S. Dollar | | | 9,085 | | | | 1-25-17 | | | UBS AG | | $ | 64 | | | $ | — | | | | | |
Canadian Dollar | | | 5,832 | | | U.S. Dollar | | | 4,330 | | | | 1-25-17 | | | UBS AG | | | — | | | | 15 | | | | | |
| | | | | | | | | | | | | | | | | | | | |
| | | | | | | | | | | | | | | | | | $ | 64 | | | $ | 15 | | | | | |
| | | | | | | | | | | | | | | | | | | | |
The following table is a summary of the valuation of the Portfolio’s investments by the fair value hierarchy levels as of December 31, 2016. See Note 3 to the Financial Statements for further information regarding fair value measurement.
| | | | | | | | | | | | |
| | | Level 1 | | | Level 2 | | | Level 3 | |
Assets | | | | | | | | | | | | |
Investments in Securities | | | | | | | | | | | | |
Common Stocks | | $ | 136,125 | | | $ | — | | | $ | — | |
Investment Funds | | | 2,992 | | | | — | | | | — | |
Preferred Stocks | | | — | | | | — | | | | — | |
Short-Term Securities | | | — | | | | 4,936 | | | | — | |
Total | | $ | 139,117 | | | $ | 4,936 | | | $ | — | |
Forward Foreign Currency Contracts | | $ | — | | | $ | 64 | | | $ | — | |
Liabilities | | | | | | | | | | | | |
Forward Foreign Currency Contracts | | $ | — | | | $ | 15 | | | $ | — | |
During the year ended December 31, 2016, there were no transfers between Level 1 and 2.
The following acronym is used throughout this schedule:
ADR = American Depositary Receipts
Market Sector Diversification
| | | | |
(as a % of net assets) | |
Energy | | | 71.1% | |
Materials | | | 20.6% | |
Industrials | | | 4.8% | |
Utilities | | | 0.0% | |
Other+ | | | 3.5% | |
+Includes cash and other assets (net of liabilities), and cash equivalents
See Accompanying Notes to Financial Statements.
| | |
| MANAGEMENT DISCUSSION | | GOVERNMENT MONEY MARKET |
(UNAUDITED)

Mira Stevovich
Below, Mira Stevovich, CFA, portfolio manager of Ivy VIP Government Money Market, discusses positioning, performance and results for the fiscal year ended December 31, 2016. She has managed the Portfolio for 18 years and has 30 years of industry experience.
The Portfolio’s fiscal year ended on December 31, 2016 with short-term rates higher than the prior fiscal year-end as a result of the 0.25% rate increase by the Federal Reserve (Fed) on December 14, 2016, as well as the anticipation of future interest rate increases by the Fed. The Fed continued to drain liquidity from the economy, a process that began in December 2015, albeit at a gradual pace. The economy showed signs of improvement and there was anticipation that the Fed would continue to increase short-term rates during 2017. During the fiscal year, the money markets continued to be affected by low rates, as well as regulatory changes, which took place in October. The Portfolio changed its name and converted to a “government money market fund” (as defined in Rule 2a-7) on October 14, 2016, which included a change in the Portfolio’s allowable investments.
Lower rates, conversion to a government money market fund
The fiscal year started with the federal funds rate at between 0.25% and 0.50%, which the Fed increased to a rate between 0.50% and 0.75% at their December 14, 2016 meeting. The Fed has been using the reverse repo program (RRP) as an integral part of managing the federal funds rate. The RRP had been capped at $300 billion, but with the first rate increase the cap on this program was lifted to allow for better management of short-term rates. Although it is anticipated that the Fed will continue to increase the funds rate in 2017, it is also expected that the process will remain gradual. As a result, we will manage the Portfolio based on the interest rate environment, closely monitoring any potential rate changes and adjusting investments accordingly.
The transformation of the money market fund industry by the final amendments to Rule 2a-7 under the Investment Company Act of 1940, which became effective October 14, 2016, affected the Portfolio and money market rates. The Portfolio, along with a substantial portion of prime fund assets, converted to “government money market funds” throughout the fiscal year. Additionally, institutional tax-exempt money market funds, which were required to float net-asset-values, had asset decreases. To continue attracting investors to corporate and tax-exempt money market securities, interest rates increased on longer bank paper, as well as short-term floating rate tax-exempt securities. Prior to conversion to a “government money market fund,” we took advantage of this situation, when possible, to increase yield. With the shift in money market assets, government short-term assets had rates shift lower, while corporate and bank securities had an upward movement in rates.
Credit quality remained an important factor in the management and performance of the Portfolio early in the year. We select investments that we believe to be of the highest credit quality, although this higher-quality bias can hold down yield. The Portfolio’s move to a “government money market fund” in October has changed the way it is managed, with credit quality generally not factoring into the equation.
The low rates of interest during the fiscal year somewhat restrained the performance of the Portfolio and rates on money market investments. Reforms to Rule 2a-7 regarding the percentage of the Portfolio’s total assets invested in “weekly liquid assets” affected returns, because very short maturities tend to carry the lowest interest rates. The shift from corporate and bank securities to short-term government securities further depressed the Portfolio’s yield because government securities generally are the lowest yielding securities due to their low risk.
Earlier in the Portfolio’s fiscal year we invested in floating rate notes based on the one or three-month London Interbank Offered Rate (LIBOR). These notes carry an attractive rate of interest, while allowing us to maintain a modest “weighted average maturity.” Over the past several months, LIBOR rates increased in anticipation of a rate increase by the Fed. The upward movement in LIBOR rates continued to increase following the December rate move by the Fed in anticipation of additional rate increases. The one-month LIBOR rate began the fiscal year at 0.42250% and ended the fiscal year considerably higher at 0.77333%. The three-month LIBOR rate began the fiscal year at 0.61170 % and moved upward, ending the fiscal year at 0.99872%.
Staying the course
This past fiscal year, we have emphasized investments of the highest credit quality from many industries and sectors. Since October 14, 2016, we have invested a minimum of 99.5% of the Portfolio’s total assets in government securities, cash, and/or repurchase agreements that are collateralized fully , per U.S. Securities and Exchange Commission (SEC) regulations. We intend to continue using floating-rate securities in the coming fiscal year, in anticipation of future rate increases.
We have managed the Portfolio to comply with all SEC regulations that apply to “government money market funds”, since the conversion of the Portfolio on October 14, 2016. The SEC reformed money fund regulations in 2010 and further modified those regulations in July 2014 in an effort to provide money market investors with greater protection and more timely information about the fund in which they invest. To this end, we seek to maintain daily and weekly liquidity levels according to those regulations, to provide for the liquidity needs of our shareholders. We intend to manage the Portfolio in a prudent manner and in accordance with SEC regulations for “government money market funds”.
You could lose money by investing in Ivy VIP Government Money Market. Although the Portfolio seeks to preserve the value of your investment at $1.00 per share, it cannot guarantee it will do so. An investment in the Portfolio is not insured or guaranteed by the Federal Deposit Insurance Corporation or any other government agency. The Portfolio’s sponsor has no legal obligation to provide financial support to the Portfolio, and you should not expect that the sponsor will provide financial support to the Portfolio at any time.
The opinions expressed in this report are those of the portfolio manager and are current only through the end of the period of the report as stated on the cover. The manager’s views are subject to change at any time based on market and other conditions, and no forecasts can be guaranteed.
Risk Factors: Interest rate increases can cause the price of a money market security to decrease. A decline in the credit quality of an issuer or a provider of credit support or a maturity-shortening structure for a security can cause the price of a money market security to decrease. Portfolio shares are not guaranteed by the U.S. Government.
Prior to October 14, 2016, the Ivy VIP Government Money Market was known as the Ivy VIP Money Market. Effective October 14, 2016, the Portfolio changed its name and investment strategy to reflect that it is classified as a “government money market fund.” Performance prior to October 14, 2016 reflects the Portfolio’s former investment strategy as a prime money market fund, which permitted investments in certain types of securities that, as a government money market fund, the Portfolio no longer is permitted to hold.
| | |
| PORTFOLIO HIGHLIGHTS | | GOVERNMENT MONEY MARKET(a) |
ALL DATA IS AS OF DECEMBER 31, 2016 (UNAUDITED)
Asset Allocation
| | | | |
Corporate Obligations | | | 0.2% | |
Master Note | | | 0.2% | |
United States Government and Government Agency Obligations | | | 91.8% | |
Municipal Obligations | | | 7.8% | |
Cash and Other Assets (Net of Liabilities) | | | 0.2% | |
(a)Effective October 14, 2016, the name of Money Market has changed to Government Money Market.
| | |
| SCHEDULE OF INVESTMENTS | | GOVERNMENT MONEY MARKET (in thousands) |
DECEMBER 31, 2016
| | | | | | | | |
| CORPORATE OBLIGATIONS | | Principal | | | Value | |
Master Note | |
Toyota Motor Credit Corp., 0.860%, 1-4-17 (A) | | $ | 705 | | | $ | 705 | |
| | | | | | | | |
| |
Total Master Note – 0.2% | | | | 705 | |
| |
TOTAL CORPORATE
OBLIGATIONS – 0.2% | | | $ | 705 | |
(Cost: $705) | | | | | | | | |
| | |
| MUNICIPAL OBLIGATIONS | | | | | | |
California – 1.2% | |
Redev Agy of the City and Cnty of San Francisco, Taxable Multi-Fam Hsng Rev Bonds (Related – Third and Mission), Ser 1999D (GTD by FNMA), 0.630%, 1-7-17 (A) | | | 2,490 | | | | 2,490 | |
San Diego, CA, Hsng Auth, Var Rate Demand Multi-Fam Hsng Rev Rfdg Bonds (Hillside Garden Apt), Ser 2004C (GTD by FNMA), 0.580%, 1-7-17 (A) | | | 2,480 | | | | 2,480 | |
| | | | | | | | |
| | | | | | | 4,970 | |
| | | | | | | | |
| |
Florida – 0.8% | |
Volusia Cnty, FL, Hsng Fin Auth, Multi-Fam Hsng Rev Rfdg Bonds (Fisherman’s Landing Apt), Ser 2002 (GTD by FNMA), 0.760%, 1-7-17 (A) | | | 3,215 | | | | 3,215 | |
| | | | | | | | |
| |
Minnesota – 0.2% | |
Minneapolis, MN, Hsng Dev, Rfdg Rev Bonds (One Ten Grant Proj), Ser 1989 (GTD by FNMA), 0.690%, 1-7-17 (A) | | | 1,000 | | | | 1,000 | |
| | | | | | | | |
| |
New York – 5.2% | |
NY State Hsng Fin Agy, Related 42nd and 10th Hsng Rev Bonds, Ser 2008A (GTD by FHLMC), 0.680%, 1-7-17 (A) | | | 7,000 | | | | 7,000 | |
NY State Hsng Fin Agy, Related 42nd and 10th Hsng Rev Bonds, Ser 2010A (GTD by FHLMC), 0.680%, 1-7-17 (A) | | | 7,500 | | | | 7,500 | |
NYC Hsng Dev Corp., Multi-Fam Mtg Rev Bonds (Markham Gardens Apt), Ser 2006A (GTD by FHLMC), 0.650%, 1-7-17 (A) | | | 4,000 | | | | 4,000 | |
NYC Hsng Dev Corp., Multi-Fam Mtg Rev Bonds (Spring Creek Apt I and II), Ser 2006A (GTD by FHLMC), 0.650%, 1-7-17 (A) | | | 3,000 | | | | 3,000 | |
| | | | | | | | |
| | | | | | | 21,500 | |
| | | | | | | | |
| | | | | | | | |
MUNICIPAL OBLIGATIONS
(Continued) | | Principal | | | Value | |
Rhode Island – 0.4% | |
RI Hsng and Mtg Fin Corp., Multi-Fam Mtg Rev Bonds (The Groves at Johnson Proj), Ser 2006 (GTD by FHLMC), 0.650%, 1-7-17 (A) | | $ | 1,700 | | | $ | 1,700 | |
| | | | | | | | |
| |
TOTAL MUNICIPAL
OBLIGATIONS – 7.8% | | | $ | 32,385 | |
(Cost: $32,385) | | | | | | | | |
| | |
UNITED STATES GOVERNMENT
AND GOVERNMENT AGENCY
OBLIGATIONS | | | | | | |
Treasury Bills – 14.5% | |
U.S. Treasury Bills: | | | | | | | | |
0.320%, 1-19-17 | | | 5,000 | | | | 4,999 | |
0.430%, 2-9-17 | | | 2,000 | | | | 1,999 | |
0.470%, 3-9-17 | | | 26,500 | | | | 26,476 | |
0.490%, 3-23-17 | | | 7,500 | | | | 7,492 | |
0.490%, 4-13-17 | | | 17,100 | | | | 17,076 | |
0.530%, 5-11-17 | | | 2,000 | | | | 1,996 | |
| | | | | | | | |
| | | | | | | 60,038 | |
| | | | | | | | |
| |
Treasury Notes – 7.9% | |
U.S. Treasury Notes: | | | | | | | | |
0.720%, 1-2-17 (A) | | | 8,000 | | | | 7,989 | |
0.730%, 1-2-17 (A) | | | 24,700 | | | | 24,699 | |
| | | | | | | | |
| | | | | | | 32,688 | |
| | | | | | | | |
| |
United States Government Agency
Obligations – 69.4% | |
Federal Home Loan Bank: | | | | | | | | |
0.570%, 4-20-17 | | | 18,600 | | | | 18,568 | |
0.650%, 5-23-17 | | | 7,700 | | | | 7,680 | |
0.690%, 7-26-17 | | | 14,500 | | | | 14,500 | |
0.750%, 8-23-17 | | | 11,000 | | | | 11,000 | |
Overseas Private Investment Corp. (GTD by U.S. Government): | | | | | | | | |
0.700%, 1-3-17 (A) | | | 23,626 | | | | 23,626 | |
0.690%, 1-4-17 (A) | | | 2,800 | | | | 2,800 | |
0.700%, 1-4-17 (A) | | | 48,174 | | | | 48,175 | |
0.720%, 1-4-17 (A) | | | 2,625 | | | | 2,625 | |
0.690%, 1-7-17 (A) | | | 19,800 | | | | 19,800 | |
0.700%, 1-7-17 (A) | | | 75,041 | | | | 75,042 | |
0.720%, 1-7-17 (A) | | | 51,864 | | | | 51,864 | |
0.560%, 1-12-17 (A) | | | 11,750 | | | | 11,750 | |
| | | | | | | | |
| | | | | | | 287,430 | |
| | | | | | | | |
| |
TOTAL UNITED STATES GOVERNMENT
AND GOVERNMENT AGENCY OBLIGATIONS – 91.8% | | | $ | 380,156 | |
(Cost: $380,156) | | | | | | | | |
| |
TOTAL INVESTMENT SECURITIES – 99.8% | | | $ | 413,246 | |
(Cost: $413,246) | | | | | | | | |
| |
CASH AND OTHER ASSETS, NET OF LIABILITIES – 0.2% | | | | 624 | |
| |
NET ASSETS – 100.0% | | | $ | 413,870 | |
| | |
| SCHEDULE OF INVESTMENTS | | GOVERNMENT MONEY MARKET (in thousands) |
DECEMBER 31, 2016
Notes to Schedule of Investments
| (A) | Variable rate security. Interest rate disclosed is that which is in effect at December 31, 2016. Date shown represents the date that the variable rate resets. |
The following table is a summary of the valuation of the Portfolio’s investments by the fair value hierarchy levels as of December 31, 2016. See Note 3 to the Financial Statements for further information regarding fair value measurement.
| | | | | | | | | | | | |
| | | Level 1 | | | Level 2 | | | Level 3 | |
Assets | | | | | | | | | | | | |
Investments in Securities | | | | | | | | | | | | |
Corporate Obligations | | $ | — | | | $ | 705 | | | $ | — | |
Municipal Obligations | | | — | | | | 32,385 | | | | — | |
United States Government and Government Agency Obligations | | | — | | | | 380,156 | | | | — | |
Total | | $ | — | | | $ | 413,246 | | | $ | — | |
During the year ended December 31, 2016, there were no transfers between Level 1 and 2.
The following acronyms are used throughout this schedule:
FHLMC = Federal Home Loan Mortgage Corp.
FNMA = Federal National Mortgage Association
GTD = Guaranteed
See Accompanying Notes to Financial Statements.
| | |
| MANAGEMENT DISCUSSION | | GROWTH |
(UNAUDITED)

Daniel P. Becker

Bradley M. Klapmeyer
Below, Daniel P. Becker, CFA, and Bradley M. Klapmeyer, CFA, portfolio managers of Ivy VIP Growth, discuss positioning, performance and results for the fiscal year ended December 31, 2016. Mr. Becker has managed the Portfolio since 2006 and he has 28 years of industry experience. Mr. Klapmeyer has managed the Portfolio since August 2016, replacing Philip J. Sanders, CFA. Mr. Klapmeyer has 17 years of industry experience.
Fiscal Year Performance
| | | | |
For the 12 Months Ended December 31, 2016 | | | | |
Ivy VIP Growth | | | 1.22% | |
Benchmark(s) and/or Lipper Category | | | | |
Russell 1000 Growth Index | | | 7.08% | |
(generally reflects the performance of securities that represent the large-cap growth market) | | | | |
Lipper Variable Annuity Large-Cap Growth Funds Universe Average | | | 2.23% | |
(generally reflects the performance of the universe of funds with similar investment objectives) | | | | |
Please note that Portfolio returns include applicable fees and expenses while index returns do not include any such fees. Also, the Portfolio’s performance data does not take into account any product expenses or charges associated with owning a variable life or annuity policy, which is invested in Ivy Variable Insurance Portfolios.
Key drivers
2016 will be remembered as another year in a recent string of volatile years within a generally strong market cycle, now in its 8th year since the start of the Great Recession. While most parts of the equity market produced generally strong results, several small periods of market volatility generated disruption in the growth stock areas of the equity market throughout the 12-month period.
Coming into early 2016, growth stocks were continuing to experience yet another year of strong performance. Interest rates were very low in the U.S. and global central banks were in the midst of aggressive monetary policy accommodation in an effort to stabilize economic growth in international economies and devalue specific currencies versus the U.S. dollar. Simultaneously, the Federal Reserve (Fed) was indicating a desire to increase interest rates as it wrongly believed the U.S. economy was strengthening. The combination of these divergent monetary policies around the world produced a very strong response in the foreign exchange market causing the value of the U.S. dollar to soar. These macroeconomic events once again produced a very disruptive period for most stock markets around the world early in the year. Growth stocks experienced some of the greatest pain during the month of February as these stocks had been some of the best performers over the past several years.
Several months after such divergent monetary policies’ negative impact on growth stocks in early 2016, the United Kingdom surprised global capital markets when its constituents voted to leave the European Union, catalyzing another sharp global equity market disruption. Later in 2016, capital markets experienced a third volatility shock when the U.S. presidential election produced a result contrary to what many people expected. Having been some of the best performing equity market styles over the past four years, growth stocks were disproportionally hurt by each and every one of the shocks in 2016. Within the growth stocks universe, health care stocks were some of the poorest performers, as both major party U.S. presidential candidates campaigned on, and pursued policies, that may affect long-term profit margins in the industry. Contrary to past years, small stocks performed much better than large stocks (as measured by the Russell 2000 Growth Index and Russell 1000 Growth Index), and value styles performed significantly better than growth styles (as measured by the Russell 1000 Value Index and Russell 1000 Growth Index).
Contributors and detractors
The Portfolio returned 1.22% in the period ended December 31, 2016, underperforming the Russell 1000 Growth Index (Portfolio’s benchmark) and peers.
When growth stocks perform poorly versus value stocks and small stocks perform better than large stocks, large-cap growth investors usually do not do well. In 2016, over 90% of active large-growth portfolios underperformed the benchmark, which makes 2016 the worst year on record for active management. In general, value, and specifically small-value styles, performed well. Defensive styles and industries performed especially well early in the year, and stocks with high-dividend yields and slow or negligible revenue growth rates performed well around the world.
Several of the Portfolio’s health care holdings, such as Allergan, Biogen, Shire Pharmaceuticals Group, Bristol-Myers Squibb Co and DexCom, did not perform well and negatively impacted Portfolio performance over the period. The Portfolio experienced strong results in areas such as financials, energy and industrials, with companies such as CME Group, Inc., Charles Schwab Corp., Goldman Sachs Group, Inc., Union Pacific Corp., and EOG Resources Inc. all performing well.
Outlook
As we look ahead into 2017, we believe the recent U.S. Presidential election may create some significant changes in how many view the potential rate of domestic economic growth. Our country’s economic output last peaked sometime in 2007, resulting in nearly nine years of slow, stagnant and underwhelming growth. The slow rate of growth in output, jobs and wages, affected the U.S. election, as well as future policies meant to counteract the disappointing growth. Despite the low gross domestic product growth rate over that time, many growth stocks performed well, as these stocks were able to grow through the tough times. However, a newly elected Congress and administration whose report card will be measured on job growth, wages and prosperity, may change how various types of stocks are viewed in the market. Better economic growth may improve conditions for financial, energy and industrial companies. Our investments in these more cyclical areas reflect the possibility that these areas may grow much faster in the years ahead. As we look at the financial industry, we are finding a significant amount of new investment opportunities and have moved the Portfolio to emphasize companies such as Charles Schwab Corp., Goldman Sachs Group, Inc., and CME Group, Inc. We believe these businesses may experience growth rates in the future much different than that of the past few years.
Over the past one to two years, we have been more cautious on the outlook for the stocks of companies that have slower growth, higher-dividend yields and, in general, perform better when interest rates move lower. These stocks have appreciated to the point where very few of them meet our strategy’s quality, growth and valuation criteria, even as they generally operate in very good long-term industries.
With our view that the economy may accelerate, interest rates may have bottomed, and attractive stocks can be found elsewhere in the market, we have moved further away from stocks that are characterized by stability, defensiveness, negligible revenue growth and high valuation. These “stable” businesses have been the market leaders over the past few years when global economic growth was disappointing, and may be hurt as the economy appears to finally be accelerating. Our emphasis continues to be focused on stocks of companies that we believe maintain unique, highly profitable, growing businesses that are not easy to replicate. As the of the end of the fiscal year, the Portfolio’s five largest holdings were Goldman Sachs Group, Inc., Microsoft Corp., Lam Research Corp., MasterCard, Inc. and Celgene Corp.
Past performance is not a guarantee of future results. The value of the Portfolio’s shares will change, and you could lose money on your investment. Prices of growth stocks may be more sensitive to changes in current or expected earnings than the prices of other stocks. Growth stocks may not perform as well as value stocks or the stock market in general. These and other risks are more fully described in the Portfolio’s prospectus.
The opinions expressed in this report are those of the portfolio managers and are current only through the end of the period of the report as stated on the cover. The managers’ views are subject to change at any time based on market and other conditions, and no forecasts can be guaranteed.
The index (indexes) noted are unmanaged and include reinvested dividends. One cannot invest directly in an index, nor is an index representative of Ivy VIP Growth.
| | |
| PORTFOLIO HIGHLIGHTS | | GROWTH |
ALL DATA IS AS OF DECEMBER 31, 2016 (UNAUDITED)
Asset Allocation
| | | | |
Stocks | | | 98.9% | |
Information Technology | | | 39.0% | |
Consumer Discretionary | | | 17.2% | |
Health Care | | | 12.2% | |
Financials | | | 10.9% | |
Industrials | | | 9.8% | |
Energy | | | 6.3% | |
Consumer Staples | | | 2.8% | |
Materials | | | 0.7% | |
Cash and Other Assets (Net of Liabilities), and Cash Equivalents+ | | | 1.1% | |
Top 10 Equity Holdings
| | | | |
| Company | | Sector | | Industry |
Goldman Sachs Group, Inc. (The) | | Financials | | Investment Banking & Brokerage |
Microsoft Corp. | | Information Technology | | Systems Software |
Lam Research Corp. | | Information Technology | | Semiconductor Equipment |
MasterCard, Inc., Class A | | Information Technology | | Data Processing & Outsourced Services |
Celgene Corp. | | Health Care | | Biotechnology |
Home Depot, Inc. (The) | | Consumer Discretionary | | Home Improvement Retail |
Facebook, Inc., Class A | | Information Technology | | Internet Software & Services |
Microchip Technology, Inc. | | Information Technology | | Semiconductors |
EOG Resources, Inc. | | Energy | | Oil & Gas Exploration & Production |
Alphabet, Inc., Class A | | Information Technology | | Internet Software & Services |
See your advisor for more information on the Portfolio’s most recently published Top 10 Equity Holdings.
+ Cash equivalents are defined as highly liquid securities with maturities of less than three months. Cash equivalents may include U.S. Government Treasury bills, bank certificates of deposit, bankers’ acceptances, corporate commercial paper and other money market instruments.
| | |
| COMPARISON OF CHANGE IN VALUE OF $10,000 INVESTMENT | | GROWTH |
(UNAUDITED)
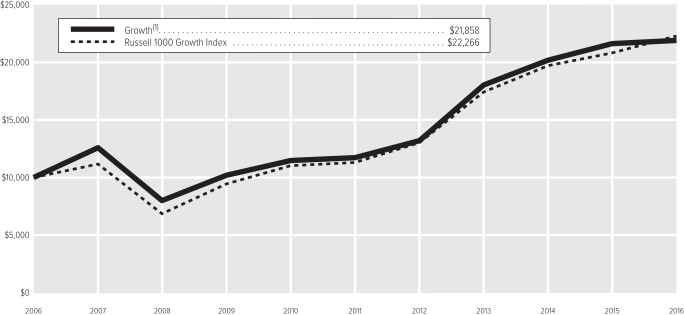
| (1) | The value of the investment in the Portfolio is impacted by the ongoing expenses of the Portfolio and assumes reinvestment of dividends and distributions. |
| | | | |
| Average Annual Total Return(2) | | | |
1-year period ended 12-31-16 | | | 1.22% | |
5-year period ended 12-31-16 | | | 13.29% | |
10-year period ended 12-31-16 | | | 8.13% | |
| (2) | Data quoted is past performance and current performance may be lower or higher. Past performance is no guarantee of future results. Investment return and principal value of an investment will fluctuate and shares, when redeemed, may be worth more or less than their original cost. Please call 1.888.WADDELL for the Portfolio’s most recent month-end performance. Performance data quoted does not reflect any expenses or charges associated with owning a variable life insurance policy or variable annuity contract that invests in the Portfolio’s shares. When such charges are deducted, actual investment performance in a variable policy or contract will be lower. |
Past performance is not necessarily indicative of future performance. Indexes are unmanaged. The performance graph and table do not reflect the deduction of taxes that a shareholder would pay on Portfolio distributions or on the redemption of Portfolio shares. Performance results may include the effect of expense reduction arrangements for some or all of the periods shown. If those arrangements had not been in place, the performance results for those periods would have been lower.
| | |
| SCHEDULE OF INVESTMENTS | | GROWTH (in thousands) |
DECEMBER 31, 2016
| | | | | | | | |
| COMMON STOCKS | | Shares | | | Value | |
Consumer Discretionary | |
| |
Apparel Retail – 0.5% | |
Limited Brands, Inc. | | | 61 | | | $ | 4,016 | |
| | | | | | | | |
| |
Automotive Retail – 3.2% | |
AutoZone, Inc. (A) | | | 15 | | | | 12,084 | |
O’Reilly Automotive, Inc. (A) | | | 54 | | | | 15,090 | |
| | | | | | | | |
| | | | | | | 27,174 | |
| | | | | | | | |
| |
Cable & Satellite – 2.1% | |
Comcast Corp., Class A | | | 255 | | | | 17,601 | |
| | | | | | | | |
| |
Casinos & Gaming – 1.2% | |
MGM Resorts International (A) | | | 354 | | | | 10,206 | |
| | | | | | | | |
| |
Footwear – 0.4% | |
NIKE, Inc., Class B | | | 66 | | | | 3,375 | |
| | | | | | | | |
| |
Home Improvement Retail – 3.9% | |
Home Depot, Inc. (The) | | | 245 | | | | 32,863 | |
| | | | | | | | |
| |
Internet & Direct Marketing Retail – 4.5% | |
Amazon.com, Inc. (A) | | | 34 | | | | 25,303 | |
priceline.com, Inc. (A) | | | 8 | | | | 12,168 | |
| | | | | | | | |
| | | | | | | 37,471 | |
| | | | | | | | |
| |
Restaurants – 0.6% | |
Starbucks Corp. | | | 85 | | | | 4,703 | |
| | | | | | | | |
| |
Specialty Stores – 0.8% | |
Ulta Salon, Cosmetics & Fragrance, Inc. (A) | | | 25 | | | | 6,373 | |
| | | | | | | | |
| |
Total Consumer Discretionary – 17.2% | | | | 143,782 | |
Consumer Staples | |
| |
Tobacco – 2.8% | |
Philip Morris International, Inc. | | | 258 | | | | 23,595 | |
| | | | | | | | |
| |
Total Consumer Staples – 2.8% | | | | 23,595 | |
Energy | |
| |
Oil & Gas Equipment & Services – 3.0% | |
Halliburton Co. | | | 386 | | | | 20,857 | |
Schlumberger Ltd. | | | 52 | | | | 4,366 | |
| | | | | | | | |
| | | | | | | 25,223 | |
| | | | | | | | |
| |
Oil & Gas Exploration & Production – 3.3% | |
EOG Resources, Inc. | | | 273 | | | | 27,590 | |
| | | | | | | | |
| |
Total Energy – 6.3% | | | | 52,813 | |
Financials | |
| |
Financial Exchanges & Data – 4.0% | |
CME Group, Inc. | | | 224 | | | | 25,804 | |
S&P Global, Inc. | | | 74 | | | | 7,932 | |
| | | | | | | | |
| | | | | | | 33,736 | |
| | | | | | | | |
| | | | | | | | |
| COMMON STOCKS (Continued) | | Shares | | | Value | |
Investment Banking & Brokerage – 6.9% | |
Charles Schwab Corp. (The) | | | 512 | | | $ | 20,220 | |
Goldman Sachs Group, Inc. (The) | | | 155 | | | | 37,155 | |
| | | | | | | | |
| | | | | | | 57,375 | |
| | | | | | | | |
| |
Total Financials – 10.9% | | | | 91,111 | |
Health Care | |
| |
Biotechnology – 7.8% | |
Alexion Pharmaceuticals, Inc. (A) | | | 35 | | | | 4,295 | |
Biogen, Inc. (A) | | | 22 | | | | 6,295 | |
Celgene Corp. (A) | | | 284 | | | | 32,919 | |
Shire Pharmaceuticals Group plc ADR | | | 108 | | | | 18,316 | |
Vertex Pharmaceuticals, Inc. (A) | | | 47 | | | | 3,477 | |
| | | | | | | | |
| | | | | | | 65,302 | |
| | | | | | | | |
| |
Health Care Equipment – 2.3% | |
DexCom, Inc. (A) | | | 106 | | | | 6,340 | |
Edwards Lifesciences Corp. (A) | | | 135 | | | | 12,695 | |
| | | | | | | | |
| | | | | | | 19,035 | |
| | | | | | | | |
| |
Pharmaceuticals – 2.1% | |
Allergan plc (A) | | | 40 | | | | 8,404 | |
Bristol-Myers Squibb Co. | | | 149 | | | | 8,713 | |
| | | | | | | | |
| | | | | | | 17,117 | |
| | | | | | | | |
| |
Total Health Care – 12.2% | | | | 101,454 | |
Industrials | |
| |
Aerospace & Defense – 3.4% | |
Lockheed Martin Corp. | | | 96 | | | | 24,044 | |
Northrop Grumman Corp. | | | 17 | | | | 3,977 | |
| | | | | | | | |
| | | | | | | 28,021 | |
| | | | | | | | |
| |
Industrial Conglomerates – 1.6% | |
Danaher Corp. | | | 172 | | | | 13,350 | |
| | | | | | | | |
| |
Railroads – 4.8% | |
Canadian Pacific Railway Ltd. | | | 138 | | | | 19,702 | |
Union Pacific Corp. | | | 198 | | | | 20,487 | |
| | | | | | | | |
| | | | | | | 40,189 | |
| | | | | | | | |
| |
Total Industrials – 9.8% | | | | 81,560 | |
Information Technology | |
| |
Application Software – 3.9% | |
Adobe Systems, Inc. (A) | | | 196 | | | | 20,157 | |
salesforce.com, Inc. (A) | | | 176 | | | | 12,063 | |
| | | | | | | | |
| | | | | | | 32,220 | |
| | | | | | | | |
| |
Data Processing & Outsourced Services – 8.8% | |
FleetCor Technologies, Inc. (A) | | | 43 | | | | 6,128 | |
MasterCard, Inc., Class A | | | 348 | | | | 35,972 | |
Visa, Inc., Class A | | | 324 | | | | 25,302 | |
Wright Express Corp. (A) | | | 55 | | | | 6,183 | |
| | | | | | | | |
| | | | | | | 73,585 | |
| | | | | | | | |
| | | | | | | | |
| COMMON STOCKS (Continued) | | Shares | | | Value | |
Home Entertainment Software – 1.9% | |
Electronic Arts, Inc. (A) | | | 206 | | | $ | 16,240 | |
| | | | | | | | |
| |
Internet Software & Services – 8.8% | |
Alphabet, Inc., Class A (A) | | | 35 | | | | 27,387 | |
Alphabet, Inc., Class C (A) | | | 24 | | | | 18,329 | |
Facebook, Inc., Class A (A) | | | 245 | | | | 28,153 | |
| | | | | | | | |
| | | | | | | 73,869 | |
| | | | | | | | |
| |
Semiconductor Equipment – 5.5% | |
Applied Materials, Inc. | | | 286 | | | | 9,236 | |
Lam Research Corp. | | | 344 | | | | 36,336 | |
| | | | | | | | |
| | | | | | | 45,572 | |
| | | | | | | | |
| |
Semiconductors – 3.3% | |
Microchip Technology, Inc. | | | 433 | | | | 27,751 | |
| | | | | | | | |
| |
Systems Software – 4.4% | |
Microsoft Corp. | | | 590 | | | | 36,669 | |
| | | | | | | | |
| |
Technology Hardware, Storage & Peripherals – 2.4% | |
Apple, Inc. | | | 171 | | | | 19,862 | |
| | | | | | | | |
| |
Total Information Technology – 39.0% | | | | 325,768 | |
Materials | |
| |
Diversified Chemicals – 0.7% | |
PPG Industries, Inc. | | | 64 | | | | 6,093 | |
| | | | | | | | |
| |
Total Materials – 0.7% | | | | 6,093 | |
| |
TOTAL COMMON STOCKS – 98.9% | | | $ | 826,176 | |
(Cost: $676,338) | | | | | | | | |
| | |
| SHORT-TERM SECURITIES | | Principal | | | | |
Master Note – 0.4% | |
Toyota Motor Credit Corp., | | | | | | | | |
0.860%, 1-4-17 (B) | | $ | 3,558 | | | | 3,558 | |
| | | | | | | | |
| | |
| SCHEDULE OF INVESTMENTS | | GROWTH (in thousands) |
DECEMBER 31, 2016
| | | | | | | | |
SHORT-TERM SECURITIES
(Continued) | | Principal | | | Value | |
United States Government Agency Obligations – 0.6% | |
Overseas Private Investment Corp. (GTD by U.S. Government), | | | | | | | | |
0.720%, 1-4-17 (B) | | $ | 5,000 | | | $ | 5,000 | |
| | | | | | | | |
| |
TOTAL SHORT-TERM SECURITIES – 1.0% | | | $ | 8,558 | |
(Cost: $8,558) | | | | | | | | |
| |
TOTAL INVESTMENT SECURITIES – 99.9% | | | $ | 834,734 | |
(Cost: $684,896) | | | | | | | | |
| |
CASH AND OTHER ASSETS, NET OF LIABILITIES – 0.1% | | | | 678 | |
| |
NET ASSETS – 100.0% | | | $ | 835,412 | |
Notes to Schedule of Investments
| (A) | No dividends were paid during the preceding 12 months. |
| (B) | Variable rate security. Interest rate disclosed is that which is in effect at December 31, 2016. Date shown represents the date that the variable rate resets. |
The following table is a summary of the valuation of the Portfolio’s investments by the fair value hierarchy levels as of December 31, 2016. See Note 3 to the Financial Statements for further information regarding fair value measurement.
| | | | | | | | | | | | |
| | | Level 1 | | | Level 2 | | | Level 3 | |
Assets | | | | | | | | | | | | |
Investments in Securities | | | | | | | | | | | | |
Common Stocks | | $ | 826,176 | | | $ | — | | | $ | — | |
Short-Term Securities | | | — | | | | 8,558 | | | | — | |
Total | | $ | 826,176 | | | $ | 8,558 | | | $ | — | |
During the year ended December 31, 2016, there were no transfers between Level 1 and 2.
The following acronyms are used throughout this schedule:
ADR = American Depositary Receipts
GTD = Guaranteed
See Accompanying Notes to Financial Statements.
| | |
| MANAGEMENT DISCUSSION | | HIGH INCOME |
(UNAUDITED)

Chad A. Gunther
Below, Chad Gunther, portfolio manager of Ivy VIP High Income, discusses positioning, performance and results for the fiscal year ended December 31, 2016. Mr. Gunther has been manager of the Portfolio since 2014 and has 19 years industry experience.
Fiscal Year Performance
| | | | |
For the 12 months ended December 31, 2016 | | | | |
Ivy VIP High Income | | | 16.19% | |
Benchmark(s) and/or Lipper Category | | | | |
BofA Merrill Lynch US High Yield Index | | | 17.49% | |
(generally reflects the performance of securities representing the high yield sector of the U.S. bond market) | | | | |
Lipper Variable Annuity High Yield Funds Universe Average | | | 13.08% | |
(generally reflects the performance of the universe of funds with similar investment objectives) | | | | |
Please note that the Portfolio returns include applicable investment fees and expenses, whereas the index returns do not include any such fees. Also, the Portfolio’s performance data does not take into account any product expenses or charges associated with owning a variable life or annuity policy, which is invested in Ivy Variable Insurance Portfolios.
Investment environment
The fiscal year started off in tumultuous times with the aftermath of a high-yield fund halting redemptions in December 2015 and the U.S. Federal Reserve (Fed) raising the Fed Funds Rate by 25 basis points in the face of very slow global economic growth. In particular, high yield was being touted as the canary in the coal mine in relation to a global slow down and pending recession. These events, along with volatility in China at the beginning of the calendar year, led to the 10-year Treasury dropping below 2% in January and staying below that mark for the vast majority of the year. Post the U.S. presidential election, the 10-year Treasury rate started to rise, exceeding 2.60% in December 2016.
The bottom in oil prices (approximately $26 a barrel) occurred on February 11, which also coincided with both spreads and yields reaching their peaks for the year. The yield and spread on the BofA Merrill Lynch High Yield Index began the calendar year at 8.09% and 662 basis points, respectively, before widening to a peak of 10.07% and 887 basis points on February 11. Since then, the high-yield market has seen one of the more impressive rallies in recent memory. The rally was led by the implementation of more quantitative easing by the European Central Bank (ECB), very dovish talk by the Fed and oil prices rising off the lows which benefitted commodity sectors. The BofA Merrill Lynch High Yield Index ended the fiscal year at a yield and spread of 6.47% and 476 basis points, respectively.
Fund flows into the high-yield asset class were close to $8.4 billion for the fiscal year. Notably, 2016 experienced the first annual year of inflows to the asset class since 2012. For comparison sake, the previous three years (2013, 2014 and 2015) combined for a total of $45 billion in outflows. Loans also participated in positive inflows for the fiscal year totaling $9.2 billion — a strong rebound from $21.7 billion in outflows during the fiscal year ended 2015. New issue volume for the fiscal year declined to $280 billion from $293 billion the previous year.
Defaults increased this fiscal year and at fiscal year-end stood at 4.7% for bonds and 1.7% for loans. The vast majority of defaults were concentrated in the energy and metals and mining sectors, representing approximately 84% of the total defaults. The majority of the defaults occurred in the first half of the fiscal year as there was consistent improvement for commodity companies during the second half of the year. We continue to expect little spillover from the energy and metals and mining sectors, reflecting the strong “business cycle” component in the behavior of high-yield defaults. Additionally, we believe a risk of a U.S. recession remains low, further limiting the risk of a spillover from these sectors to the broader market.
Investment performance
During the fiscal year, the Portfolio underperformed its benchmark index, the BofA Merrill Lynch US High Yield Index. Underperformance was driven by the Portfolio’s allocation to loans (a sector not represented in the benchmark index). The Portfolio’s allocation to loans averaged 14.94% and returned 10.62% over the year. In addition, the Portfolio’s cash allocation, which averaged 9% for the fiscal year, detracted in a rising market. Positive contributors to performance included overweights in the services and information technology sectors. Individual credit selection in the retail and media sectors also drove performance.
Outlook
Since the peak in yields and spreads on February 11, which coincided with a year-over-year market low of -5.13%, the high-yield asset class has rallied more than 400 basis points and is up approximately 17.50% for 2016, the strongest performance for the asset class since 2009. At fiscal year end, the BofA Merrill Lynch US High Yield Index sits at a yield of 6.47% and a spread of 476 basis points. Although this is roughly at the 20-year historical average spread for the index (implying the market is close to fair value), we believe there is strong relative value in high-yield spreads if defaults continue on their downward trajectory and a U.S. post-election, pro-growth environment results in stronger corporate earnings.
It is our view that finding value in the high-yield market has become increasingly more difficult, and considerable caution is warranted in making new investments. As such, we believe our continued process of bottom-up, in-depth fundamental research and analysis will guide us to those investments where the risk/reward is in our favor. We also think with the potential of a continuation of rising interest rates accompanied by the possibility of a more active Fed, the ability to continue to invest in loans will be an attractive differentiator for the Portfolio. We believe our relative underweight to bonds may prove beneficial as we believe bonds (especially those long in duration) may have more downside risk on average over the next 12 months.
Past performance is not a guarantee of future results. The value of the Portfolio’s shares will change, and you could lose money on your investment.
Fixed-income securities are subject to interest rate risk and, as such, the Portfolio’s net asset value may fall as interest rates rise. Investing in below investment grade securities may carry a greater risk of nonpayment of interest or principal than higher-rated bonds. Loans (including loan assignments, loan participations and other loan instruments) carry other risks, including the risk of insolvency of the lending bank or other intermediary. Loans may be unsecured or not fully collateralized may be subject to restrictions on resale and sometimes trade infrequently on the secondary market.
The use of swap agreements entails certain risks that may be different from, or possibly greater than, the risks associated with investing directly in the referenced assets that underlie the swap agreement. Swap agreements also may have a leverage component, and adverse changes in the value or level of the underlying asset, reference rate or index can result in gains or losses that are substantially greater than the amount invested in the swap itself.
International investing involves additional risks including currency fluctuations, political or economic conditions affecting the foreign country, and differences in accounting standards and foreign regulations. These and other risks are more fully described in the Portfolio’s prospectus.
The opinions expressed in this report are those of the portfolio manager and are current only through the end of the period of the report as stated on the cover. The manager’s views are subject to change at any time based on market and other conditions, and no forecasts can be guaranteed.
The index (indexes) noted are unmanaged and include reinvested dividends. One cannot invest directly in an index, nor is an index representative of the Ivy VIP High Income.
| | |
| PORTFOLIO HIGHLIGHTS | | HIGH INCOME |
ALL DATA IS AS OF DECEMBER 31, 2016 (UNAUDITED)
Asset Allocation
| | | | |
Stocks | | | 0.6% | |
Warrants | | | 0.0% | |
Bonds | | | 85.6% | |
Corporate Debt Securities | | | 71.7% | |
Loans | | | 13.9% | |
Cash and Other Assets (Net of Liabilities), and Cash Equivalents+ | | | 13.8% | |
Quality Weightings
| | | | |
Investment Grade | | | 1.2% | |
BBB | | | 1.2% | |
Non-Investment Grade | | | 84.4% | |
BB | | | 13.5% | |
B | | | 37.3% | |
CCC | | | 29.4% | |
Below CCC | | | 0.8% | |
Non-rated | | | 3.4% | |
Cash and Other Assets (Net of Liabilities), Cash Equivalents+ and Equities | | | 14.4% | |
Our preference is to always use ratings obtained from Standard & Poor’s. For securities not rated by Standard & Poor’s, ratings are obtained from Moody’s. We do not evaluate these ratings, but simply assign them to the appropriate credit quality category as determined by the rating agency.
+Cash equivalents are defined as highly liquid securities with maturities of less than three months. Cash equivalents may include U.S. Government Treasury bills, bank certificates of deposit, bankers’ acceptances, corporate commercial paper and other money market instruments.
| | |
| COMPARISON OF CHANGE IN VALUE IN $10,000 INVESTMENT | | HIGH INCOME |
(UNAUDITED)
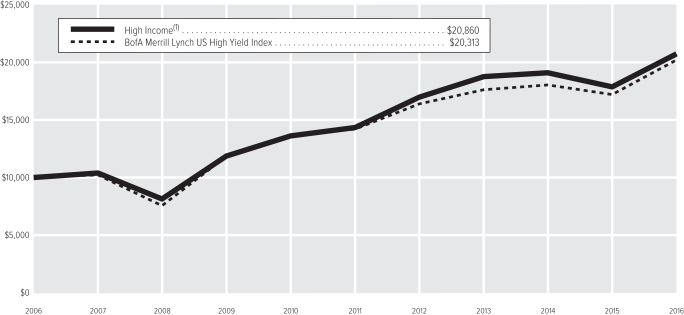
| (1) | The value of the investment in the Portfolio is impacted by the ongoing expenses of the Portfolio and assumes reinvestment of dividends and distributions. |
| | | | |
| Average Annual Total Return(2) | | | |
1-year period ended 12-31-16 | | | 16.19% | |
5-year period ended 12-31-16 | | | 7.73% | |
10-year period ended 12-31-16 | | | 7.63% | |
| (2) | Data quoted is past performance and current performance may be lower or higher. Past performance is no guarantee of future results. Investment return and principal value of an investment will fluctuate and shares, when redeemed, may be worth more or less than their original cost. Please call 1.888.WADDELL for the Portfolio’s most recent month-end performance. Performance data quoted does not reflect any expenses or charges associated with owning a variable life insurance policy or variable annuity contract that invests in the Portfolio’s shares. When such charges are deducted, actual investment performance in a variable policy or contract will be lower. |
Past performance is not necessarily indicative of future performance. Indexes are unmanaged. The performance graph and table do not reflect the deduction of taxes that a shareholder would pay on Portfolio distributions or on the redemption of Portfolio shares. Performance results may include the effect of expense reduction arrangements for some or all of the periods shown. If those arrangements had not been in place, the performance results for those periods would have been lower.
| | |
| SCHEDULE OF INVESTMENTS | | HIGH INCOME (in thousands) |
DECEMBER 31, 2016
| | | | | | | | |
| COMMON STOCKS | | Shares | | | Value | |
Consumer Discretionary | |
| |
Cable & Satellite – 0.2% | |
Altice N.V., Class A (A)(B) | | | 78 | | | $ | 1,538 | |
| | | | | | | | |
| |
Casinos & Gaming – 0.0% | |
New Cotai Participation Corp., Class B (A) | | | — | * | | | 53 | |
| | | | | | | | |
| |
Total Consumer Discretionary – 0.2% | | | | 1,591 | |
Energy | |
| |
Oil & Gas Equipment & Services – 0.1% | |
Key Energy Services, Inc. (A) | | | 10 | | | | 323 | |
Larchmont Resources LLC (A)(L) | | | 1 | | | | 340 | |
| | | | | | | | |
| | | | | | | 663 | |
| | | | | | | | |
| |
Oil & Gas Exploration & Production – 0.1% | |
Midstates Petroleum Co., Inc. (A) | | | 64 | | | | 1,323 | |
Sabine Oil & Gas Corp. (A)(B)(L) | | | — | * | | | 9 | |
| | | | | | | | |
| | | | | | | 1,332 | |
| | | | | | | | |
| | |
Total Energy – 0.2% | | | | | | | 1,995 | |
| |
TOTAL COMMON STOCKS – 0.4% | | | $ | 3,586 | |
(Cost: $3,118) | | | | | | | | |
| | |
| PREFERRED STOCKS | | | | | | |
Telecommunication Services | |
| |
Integrated Telecommunication Services – 0.2% | |
Frontier Communications Corp., Convertible Series A, 11.125% | | | 28 | | | | 1,958 | |
| | | | | | | | |
| |
Total Telecommunication
Services – 0.2% | | | | 1,958 | |
| |
TOTAL PREFERRED STOCKS – 0.2% | | | $ | 1,958 | |
(Cost: $2,785) | | | | | | | | |
| | |
| WARRANTS | | | | | | |
Agricultural Products – 0.0% | |
ASG Consolidated LLC,
expires 5-15-18 (C) | | | 1 | | | | — | |
| | | | | | | | |
| |
Commodity Chemicals – 0.0% | |
Foresight Energy L.P.,
expires 10-3-27 (C) | | | 4 | | | | — | |
| | | | | | | | |
| |
Oil & Gas Exploration & Production – 0.0% | |
Sabine Oil & Gas Corp.,
expires 12-29-29 (C)(L) | | | 1 | | | | 7 | |
| | | | | | | | |
| |
TOTAL WARRANTS – 0.0% | | | $ | 7 | |
(Cost: $79) | | | | | | | | |
| | | | | | | | |
| CORPORATE DEBT SECURITIES | | Principal | | | Value | |
Consumer Discretionary | |
| |
Advertising – 0.7% | |
Acosta, Inc., | | | | | | | | |
7.750%, 10-1-22 (D) | | $ | 4,985 | | | $ | 4,187 | |
Lamar Media Corp., | | | | | | | | |
5.375%, 1-15-24 | | | 959 | | | | 993 | |
Outfront Media Capital LLC and Outfront Media Capital Corp., | | | | | | | | |
5.625%, 2-15-24 | | | 573 | | | | 597 | |
| | | | | | | | |
| | | | | | | 5,777 | |
| | | | | | | | |
| |
Apparel Retail – 1.1% | |
Hot Topic, Inc., | | | | | | | | |
9.250%, 6-15-21 (D) | | | 5,002 | | | | 5,265 | |
HT Intermediate Holdings Corp., | | | | | | | | |
12.000%,
5-15-19 (D)(E) | | | 1,527 | | | | 1,557 | |
Neiman Marcus Group Ltd., Inc., | | | | | | | | |
8.000%, 10-15-21 (D) | | | 3,764 | | | | 2,795 | |
| | | | | | | | |
| | | | | | | 9,617 | |
| | | | | | | | |
| |
Automotive Retail – 0.6% | |
Allison Transmission, Inc., | | | | | | | | |
5.000%, 10-1-24 (D) | | | 691 | | | | 698 | |
Group 1 Automotive, Inc., | | | | | | | | |
5.000%, 6-1-22 | | | 855 | | | | 844 | |
Penske Automotive Group, Inc., | | | | | | | | |
5.500%, 5-15-26 | | | 474 | | | | 468 | |
Sonic Automotive, Inc., | | | | | | | | |
5.000%, 5-15-23 | | | 2,928 | | | | 2,848 | |
| | | | | | | | |
| | | | | | | 4,858 | |
| | | | | | | | |
| |
Broadcasting – 1.3% | |
Clear Channel Outdoor Holdings, Inc., | | | | | | | | |
6.500%, 11-15-22 | | | 6,185 | | | | 6,296 | |
Clear Channel Worldwide Holdings, Inc., Series A, | | | | | | | | |
7.625%, 3-15-20 | | | 101 | | | | 97 | |
Clear Channel Worldwide Holdings, Inc., Series B, | | | | | | | | |
7.625%, 3-15-20 | | | 1,780 | | | | 1,779 | |
Cumulus Media, Inc., | | | | | | | | |
7.750%, 5-1-19 | | | 4,115 | | | | 1,684 | |
iHeartCommunications, Inc. (GTD by iHeartMedia Capital I LLC), | | | | | | | | |
10.625%, 3-15-23 | | | 1,094 | | | | 826 | |
| | | | | | | | |
| | | | | | | 10,682 | |
| | | | | | | | |
| |
Cable & Satellite – 9.1% | |
Altice Financing S.A.: | | | | | | | | |
6.625%, 2-15-23 (D) | | | 1,725 | | | | 1,772 | |
7.500%, 5-15-26 (D) | | | 3,224 | | | | 3,353 | |
Altice S.A.: | | | | | | | | |
7.250%,
5-15-22 (D)(F) | | EUR | 256 | | | | 288 | |
7.750%,
5-15-22 (D) | | $ | 11,215 | | | | 11,972 | |
6.250%,
2-15-25 (D)(F) | | EUR | 354 | | | | 389 | |
7.625%, 2-15-25 (D) | | $ | 1,969 | | | | 2,067 | |
Altice U.S. Finance I Corp., | | | | | | | | |
5.500%, 5-15-26 (D) | | | 1,927 | | | | 1,965 | |
Cablevision Systems Corp., | | | | | | | | |
5.875%, 9-15-22 | | | 2,098 | | | | 2,045 | |
| | | | | | | | |
CORPORATE DEBT SECURITIES
(Continued) | | Principal | | | Value | |
Cable & Satellite (Continued) | |
CCO Holdings LLC and CCO Holdings Capital Corp., | | | | | | | | |
5.500%, 5-1-26 (D) | | $ | 94 | | | $ | 96 | |
Columbus International, Inc., | | | | | | | | |
7.375%, 3-30-21 (D) | | | 517 | | | | 550 | |
DISH DBS Corp.: | | | | | | | | |
6.750%, 6-1-21 | | | 1,936 | | | | 2,101 | |
5.875%, 7-15-22 | | | 910 | | | | 958 | |
5.000%, 3-15-23 | | | 418 | | | | 416 | |
5.875%, 11-15-24 | | | 454 | | | | 467 | |
7.750%, 7-1-26 | | | 1,432 | | | | 1,615 | |
Neptune Finco Corp.: | | | | | | | | |
10.125%,
1-15-23 (D) | | | 2,523 | | | | 2,914 | |
6.625%,
10-15-25 (D) | | | 788 | | | | 861 | |
10.875%,
10-15-25 (D) | | | 1,946 | | | | 2,316 | |
Numericable - SFR S.A., | | | | | | | | |
7.375%, 5-1-26 (D) | | | 9,297 | | | | 9,495 | |
Sirius XM Radio, Inc.: | | | | | | | | |
4.625%, 5-15-23 (D) | | | 4,936 | | | | 4,887 | |
6.000%, 7-15-24 (D) | | | 8,000 | | | | 8,360 | |
VTR Finance B.V., | | | | | | | | |
6.875%, 1-15-24 (D) | | | 8,235 | | | | 8,503 | |
Wave Holdco LLC and Wave Holdco Corp., | | | | | | | | |
8.250%,
7-15-19 (D)(E) | | | 505 | | | | 513 | |
WaveDivision Escrow LLC and WaveDivision Escrow Corp., | | | | | | | | |
8.125%, 9-1-20 (D) | | | 8,549 | | | | 8,891 | |
| | | | | | | | |
| | | | | | | 76,794 | |
| | | | | | | | |
| |
Casinos & Gaming – 1.8% | |
Gateway Casinos & Entertainment Ltd., | | | | | | | | |
8.500%,
11-26-20 (D)(F) | | CAD | 3,540 | | | | 2,639 | |
MCE Finance Ltd., | | | | | | | | |
5.000%, 2-15-21 (D) | | $ | 600 | | | | 596 | |
Studio City Finance Ltd., | | | | | | | | |
8.500%, 12-1-20 (D) | | | 4,598 | | | | 4,770 | |
Wynn Macau Ltd., | | | | | | | | |
5.250%,
10-15-21 (D) | | | 7,398 | | | | 7,454 | |
| | | | | | | | |
| | | | | | | 15,459 | |
| | | | | | | | |
| |
Department Stores – 0.2% | |
Bon-Ton Stores, Inc. (The), | | | | | | | | |
8.000%, 6-15-21 | | | 4,420 | | | | 2,122 | |
| | | | | | | | |
| |
Distributors – 0.5% | |
Pinnacle Operating Corp., | | | | | | | | |
9.000%,
11-15-20 (D) | | | 8,833 | | | | 3,887 | |
| | | | | | | | |
| |
Education Services – 2.2% | |
Laureate Education, Inc., | | | | | | | | |
10.000%, 9-1-19 (D)(I) | | | 18,312 | | | | 18,701 | |
| | | | | | | | |
| |
Homefurnishing Retail – 0.6% | |
Restoration Hardware Holdings, Inc., Convertible: | | | | | | | | |
0.000%,
6-15-19 (D)(G) | | | 3,544 | | | | 3,023 | |
0.000%,
7-15-20 (D)(G) | | | 2,968 | | | | 2,380 | |
| | | | | | | | |
| | | | | | | 5,403 | |
| | | | | | | | |
| | |
| SCHEDULE OF INVESTMENTS | | HIGH INCOME (in thousands) |
DECEMBER 31, 2016
| | | | | | | | |
CORPORATE DEBT SECURITIES
(Continued) | | Principal | | | Value | |
Hotels, Resorts & Cruise Lines – 0.2% | |
Carlson Travel, Inc., | | | | | | | | |
6.750%, 12-15-23 (D) | | $ | 1,980 | | | $ | 2,059 | |
| | | | | | | | |
| |
Leisure Facilities – 0.1% | |
AMC Entertainment Holdings, Inc., | | | | | | | | |
5.875%, 11-15-26 (D) | | | 499 | | | | 510 | |
| | | | | | | | |
| |
Movies & Entertainment – 1.6% | |
AMC Entertainment, Inc., | | | | | | | | |
5.750%, 6-15-25 | | | 3,111 | | | | 3,181 | |
Cinemark USA, Inc.: | | | | | | | | |
5.125%, 12-15-22 | | | 208 | | | | 214 | |
4.875%, 6-1-23 | | | 2,900 | | | | 2,936 | |
EMI Music Publishing Group North America Holdings, | | | | | | | | |
7.625%, 6-15-24 (D) | | | 1,145 | | | | 1,237 | |
WMG Acquisition Corp., | | | | | | | | |
6.750%, 4-15-22 (D) | | | 5,314 | | | | 5,593 | |
| | | | | | | | |
| | | | | | | 13,161 | |
| | | | | | | | |
| |
Publishing – 0.2% | |
MDC Partners, Inc., | | | | | | | | |
6.500%, 5-1-24 (D) | | | 1,975 | | | | 1,778 | |
| | | | | | | | |
| |
Specialized Consumer Services – 0.8% | |
Nielsen Co. Luxembourg S.a.r.l. (The), | | | | | | | | |
5.500%, 10-1-21 (D) | | | 2,371 | | | | 2,466 | |
Nielsen Finance LLC and Nielsen Finance Co., | | | | | | | | |
5.000%, 4-15-22 (D) | | | 3,885 | | | | 3,953 | |
| | | | | | | | |
| | | | | | | 6,419 | |
| | | | | | | | |
| |
Specialty Stores – 1.3% | |
Jo-Ann Stores Holdings, Inc., | | | | | | | | |
9.750%,
10-15-19 (D)(E) | | | 11,107 | | | | 10,579 | |
Jo-Ann Stores, Inc., | | | | | | | | |
8.125%, 3-15-19 (D) | | | 445 | | | | 443 | |
| | | | | | | | |
| | | | | | | 11,022 | |
| | | | | | | | |
| |
Total Consumer
Discretionary – 22.3% | | | | 188,249 | |
Consumer Staples | |
| |
Food Distributors – 1.6% | |
Performance Food Group, Inc., | | | | | | | | |
5.500%, 6-1-24 (D) | | | 1,874 | | | | 1,888 | |
Simmons Foods, Inc., | | | | | | | | |
7.875%, 10-1-21 (D) | | | 8,112 | | | | 8,355 | |
U.S. Foods, Inc., | | | | | | | | |
5.875%, 6-15-24 (D) | | | 2,864 | | | | 2,957 | |
| | | | | | | | |
| | | | | | | 13,200 | |
| | | | | | | | |
| |
Packaged Foods & Meats – 1.4% | |
AdvancePierre Foods Holdings, Inc., | | | | | | | | |
5.500%, 12-15-24 (D) | | | 306 | | | | 309 | |
Bumble Bee Foods LLC, | | | | | | | | |
9.625%, 3-15-18 (D)(E) | | | 1,149 | | | | 1,117 | |
| | | | | | | | |
CORPORATE DEBT SECURITIES
(Continued) | | Principal | | | Value | |
Packaged Foods & Meats (Continued) | |
JBS Investments GmbH (GTD by JBS S.A. and JBS Hungary Holdings Kft.), | | | | | | | | |
7.750%, 10-28-20 (D) | | $ | 400 | | | $ | 425 | |
JBS USA LLC and JBS USA Finance, Inc.: | | | | | | | | |
5.875%, 7-15-24 (D) | | | 4,261 | | | | 4,399 | |
5.750%, 6-15-25 (D) | | | 1,588 | | | | 1,608 | |
Post Holdings, Inc.: | | | | | | | | |
7.750%, 3-15-24 (D) | | | 1,696 | | | | 1,883 | |
8.000%, 7-15-25 (D) | | | 1,079 | | | | 1,208 | |
5.000%, 8-15-26 (D) | | | 972 | | | | 931 | |
| | | | | | | | |
| | | | | | | 11,880 | |
| | | | | | | | |
| |
Personal Products – 0.2% | |
Revlon Consumer Products Corp., | | | | | | | | |
5.750%, 2-15-21 | | | 780 | | | | 784 | |
Revlon Escrow Corp., | | | | | | | | |
6.250%, 8-1-24 | | | 486 | | | | 498 | |
| | | | | | | | |
| | | | | | | 1,282 | |
| | | | | | | | |
| |
Tobacco – 0.4% | |
Prestige Brands, Inc., | | | | | | | | |
5.375%, 12-15-21 (D) | | | 3,658 | | | | 3,768 | |
| | | | | | | | |
| |
Total Consumer Staples – 3.6% | | | | 30,130 | |
Energy | |
| |
Coal & Consumable Fuels – 0.5% | |
Foresight Energy LLC and Foresight Energy Finance Corp., | | | | | | | | |
10.000%,
8-15-21 (D)(E)(I) | | | 2,836 | | | | 2,765 | |
Foresight Energy LLC and Foresight Energy Finance Corp., Convertible, | | | | | | | | |
15.000%, 10-3-17 (E)(I) | | | 1,018 | | | | 1,011 | |
| | | | | | | | |
| | | | | | | 3,776 | |
| | | | | | | | |
| |
Oil & Gas Drilling – 0.9% | |
Globe Luxembourg SCA, | | | | | | | | |
9.625%, 5-1-18 (D)(I) | | | 2,471 | | | | 2,440 | |
KCA DEUTAG UK Finance plc, | | | | | | | | |
7.250%, 5-15-21 (D) | | | 1,981 | | | | 1,758 | |
Noble Holding International Ltd., | | | | | | | | |
7.750%, 1-15-24 | | | 1,028 | | | | 967 | |
Offshore Drilling Holding S.A., | | | | | | | | |
8.375%, 9-20-20 (D)(I) | | | 4,601 | | | | 2,002 | |
Offshore Group Investment Ltd., | | | | | | | | |
7.500%, 11-1-19 | | | 1,693 | | | | — | |
Rowan Cos., Inc. (GTD by Rowan plc), | | | | | | | | |
7.375%, 6-15-25 | | | 618 | | | | 630 | |
| | | | | | | | |
| | | | | | | 7,797 | |
| | | | | | | | |
| |
Oil & Gas Exploration & Production – 3.2% | |
Bellatrix Exploration Ltd., | | | | | | | | |
8.500%, 5-15-20 (D) | | | 2,247 | | | | 2,208 | |
California Resources Corp., | | | | | | | | |
8.000%, 12-15-22 (D) | | | 1,159 | | | | 1,032 | |
Clayton Williams Energy, Inc., | | | | | | | | |
7.750%, 4-1-19 | | | 7,756 | | | | 7,795 | |
| | | | | | | | |
CORPORATE DEBT SECURITIES
(Continued) | | Principal | | | Value | |
Oil & Gas Exploration & Production (Continued) | |
Crownrock L.P., | | | | | | | | |
7.750%, 2-15-23 (D) | | $ | 715 | | | $ | 772 | |
EnCana Corp., | | | | | | | | |
6.500%, 8-15-34 | | | 1,094 | | | | 1,178 | |
Endeavor Energy Resources L.P.: | | | | | | | | |
7.000%, 8-15-21 (D) | | | 4,385 | | | | 4,560 | |
8.125%, 9-15-23 (D) | | | 682 | | | | 728 | |
Gulfport Energy Corp., | | | | | | | | |
6.625%, 5-1-23 | | | 221 | | | | 231 | |
Laredo Petroleum, Inc., | | | | | | | | |
7.375%, 5-1-22 | | | 3,284 | | | | 3,403 | |
Whiting Petroleum Corp., | | | | | | | | |
6.500%, 10-1-18 | | | 5,182 | | | | 5,156 | |
| | | | | | | | |
| | | | | | | 27,063 | |
| | | | | | | | |
| |
Oil & Gas Refining & Marketing – 1.3% | |
Callon Petroleum Co. (GTD by Callon Petroleum Operating Co.), | | | | | | | | |
6.125%, 10-1-24 (D) | | | 493 | | | | 508 | |
PBF Holding Co. LLC and PBF Finance Corp., | | | | | | | | |
7.000%, 11-15-23 (D) | | | 1,949 | | | | 1,939 | |
PDC Energy, Inc., | | | | | | | | |
6.125%, 9-15-24 (D) | | | 394 | | | | 403 | |
Seven Generations Energy Ltd.: | | | | | | | | |
8.250%, 5-15-20 (D) | | | 3,177 | | | | 3,367 | |
6.750%, 5-1-23 (D) | | | 4,505 | | | | 4,798 | |
| | | | | | | | |
| | | | | | | 11,015 | |
| | | | | | | | |
| |
Oil & Gas Storage & Transportation – 0.1% | |
Access Midstream Partners L.P., | | | | | | | | |
4.875%, 5-15-23 | | | 1,191 | | | | 1,212 | |
| | | | | | | | |
| |
Total Energy – 6.0% | | | | 50,863 | |
Financials | |
| |
Consumer Finance – 1.2% | |
Creditcorp, | | | | | | | | |
12.000%, 7-15-18 (D) | | | 4,228 | | | | 3,340 | |
Quicken Loans, Inc., | | | | | | | | |
5.750%, 5-1-25 (D) | | | 3,346 | | | | 3,254 | |
Speedy Cash Intermediate Holdings Corp., | | | | | | | | |
10.750%, 5-15-18 (D) | | | 2,366 | | | | 2,266 | |
Speedy Group Holdings Corp., | | | | | | | | |
12.000%, 11-15-17 (D) | | | 986 | | | | 838 | |
| | | | | | | | |
| | | | | | | 9,698 | |
| | | | | | | | |
| |
Diversified Capital Markets – 1.2% | |
Patriot Merger Corp., | | | | | | | | |
9.000%, 7-15-21 (D) | | | 9,406 | | | | 9,923 | |
| | | | | | | | |
| |
Investment Banking & Brokerage – 0.1% | |
E*TRADE Financial Corp., | | | | | | | | |
5.875%, 12-29-49 | | | 686 | | | | 681 | |
GFI Group, Inc., | | | | | | | | |
8.375%, 7-19-18 (I) | | | 431 | | | | 463 | |
| | | | | | | | |
| | | | | | | 1,144 | |
| | | | | | | | |
| | |
| SCHEDULE OF INVESTMENTS | | HIGH INCOME (in thousands) |
DECEMBER 31, 2016
| | | | | | | | |
CORPORATE DEBT SECURITIES
(Continued) | | Principal | | | Value | |
Other Diversified Financial Services – 2.9% | |
AAF Holdings LLC and AAF Finance Co., | | | | | | | | |
12.000%, 7-1-19 (D)(E) | | $ | 1,711 | | | $ | 1,766 | |
Balboa Merger Sub, Inc., | | | | | | | | |
11.375%, 12-1-21 (D) | | | 9,982 | | | | 9,982 | |
Greektown Holdings LLC and Greektown Mothership Corp., | | | | | | | | |
8.875%, 3-15-19 (D) | | | 2,672 | | | | 2,809 | |
New Cotai LLC and New Cotai Capital Corp., | | | | | | | | |
10.625%, 5-1-19 (D)(E) | | | 12,720 | | | | 9,540 | |
| | | | | | | | |
| | | | | | | 24,097 | |
| | | | | | | | |
| |
Property & Casualty Insurance – 1.6% | |
Hub International Ltd., | | | | | | | | |
7.875%, 10-1-21 (D) | | | 3,563 | | | | 3,764 | |
Onex USI Acquisition Corp., | | | | | | | | |
7.750%, 1-15-21 (D) | | | 9,862 | | | | 10,059 | |
| | | | | | | | |
| | | | | | | 13,823 | |
| | | | | | | | |
| |
Specialized Finance – 1.3% | |
Diamond 1 Finance Corp. and Diamond 2 Finance Corp.: | | | | | | | | |
5.875%, 6-15-21 (D) | | | 667 | | | | 710 | |
5.450%, 6-15-23 (D) | | | 475 | | | | 503 | |
7.125%, 6-15-24 (D) | | | 667 | | | | 740 | |
6.020%, 6-15-26 (D) | | | 950 | | | | 1,028 | |
Flexi-Van Leasing, Inc., | | | | | | | | |
7.875%, 8-15-18 (D) | | | 1,254 | | | | 1,141 | |
TMX Finance LLC and TitleMax Finance Corp., | | | | | | | | |
8.500%, 9-15-18 (D) | | | 7,798 | | | | 6,804 | |
| | | | | | | | |
| | | | | | | 10,926 | |
| | | | | | | | |
| |
Thrifts & Mortgage Finance – 0.6% | |
Provident Funding Associates L.P. and PFG Finance Corp., | | | | | | | | |
6.750%, 6-15-21 (D) | | | 5,373 | | | | 5,400 | |
| | | | | | | | |
| |
Total Financials – 8.9% | | | | 75,011 | |
Health Care | |
| |
Health Care Facilities – 2.1% | |
DaVita HealthCare Partners, Inc., | | | | | | | | |
5.125%, 7-15-24 | | | 310 | | | | 309 | |
Greatbatch Ltd., | | | | | | | | |
9.125%, 11-1-23 (D) | | | 3,608 | | | | 3,599 | |
HCA, Inc. (GTD by HCA Holdings, Inc.), | | | | | | | | |
5.250%, 6-15-26 | | | 386 | | | | 399 | |
MPH Acquisition Holdings LLC, | | | | | | | | |
7.125%, 6-1-24 (D) | | | 1,906 | | | | 2,006 | |
Surgery Center Holdings, Inc., | | | | | | | | |
8.875%, 4-15-21 (D) | | | 5,147 | | | | 5,481 | |
Tenet Healthcare Corp.: | | | | | | | | |
6.750%, 2-1-20 | | | 1,408 | | | | 1,345 | |
7.500%, 1-1-22 (D) | | | 356 | | | | 371 | |
8.125%, 4-1-22 | | | 4,662 | | | | 4,399 | |
| | | | | | | | |
| | | | | | | 17,909 | |
| | | | | | | | |
| | | | | | | | |
CORPORATE DEBT SECURITIES
(Continued) | | Principal | | | Value | |
Health Care Supplies – 1.4% | |
Chiron Merger Sub, Inc., | | | | | | | | |
12.500%, 11-1-21 (D) | | $ | 465 | | | $ | 487 | |
Kinetic Concepts, Inc. and KCI USA, Inc., | | | | | | | | |
9.625%, 10-1-21 (D) | | | 9,360 | | | | 9,898 | |
Universal Hospital Services, Inc., | | | | | | | | |
7.625%, 8-15-20 | | | 1,579 | | | | 1,563 | |
| | | | | | | | |
| | | | | | | 11,948 | |
| | | | | | | | |
| |
Pharmaceuticals – 1.2% | |
Concordia Healthcare Corp.: | | | | | | | | |
9.500%, 10-21-22 (D) | | | 10,096 | | | | 3,584 | |
7.000%, 4-15-23 (D) | | | 1,144 | | | | 361 | |
IMS Health, Inc., | | | | | | | | |
5.000%, 10-15-26 (D) | | | 1,155 | | | | 1,158 | |
Jaguar Holding Co. II and Pharmaceutical Product Development LLC, | | | | | | | | |
6.375%, 8-1-23 (D) | | | 2,117 | | | | 2,265 | |
VPII Escrow Corp., | | | | | | | | |
7.500%, 7-15-21 (D) | | | 1,750 | | | | 1,483 | |
VRX Escrow Corp., | | | | | | | | |
5.375%, 3-15-20 (D) | | | 1,574 | | | | 1,330 | |
| | | | | | | | |
| | | | | | | 10,181 | |
| | | | | | | | |
| |
Total Health Care – 4.7% | | | | 40,038 | |
Industrials | |
| |
Aerospace & Defense – 2.5% | |
KLX, Inc., | | | | | | | | |
5.875%, 12-1-22 (D) | | | 5,404 | | | | 5,566 | |
Silver II Borrower SCA and Silver II U.S. Holdings, | | | | | | | | |
7.750%, 12-15-20 (D) | | | 4,381 | | | | 3,647 | |
TransDigm, Inc. (GTD by TransDigm Group, Inc.): | | | | | | | | |
6.000%, 7-15-22 | | | 5,075 | | | | 5,278 | |
6.500%, 7-15-24 | | | 3,655 | | | | 3,824 | |
6.375%, 6-15-26 (D) | | | 2,490 | | | | 2,558 | |
| | | | | | | | |
| | | | | | | 20,873 | |
| | | | | | | | |
| |
Air Freight & Logistics – 0.2% | |
XPO Logistics, Inc.: | | | | | | | | |
6.500%, 6-15-22 (D) | | | 1,255 | | | | 1,318 | |
6.125%, 9-1-23 (D) | | | 686 | | | | 717 | |
| | | | | | | | |
| | | | | | | 2,035 | |
| | | | | | | | |
| |
Building Products – 1.1% | |
Alcoa Nederland Holding B.V.: | | | | | | | | |
6.750%, 9-30-24 (D) | | | 511 | | | | 555 | |
7.000%, 9-30-26 (D) | | | 511 | | | | 560 | |
Ply Gem Industries, Inc., | | | | | | | | |
6.500%, 2-1-22 | | | 5,467 | | | | 5,663 | |
Summit Materials LLC and Summit Materials Finance Corp.: | | | | | | | | |
8.500%, 4-15-22 | | | 373 | | | | 412 | |
6.125%, 7-15-23 | | | 777 | | | | 797 | |
WESCO Distribution, Inc. (GTD by WESCO International, Inc.), | | | | | | | | |
5.375%, 6-15-24 (D) | | | 953 | | | | 955 | |
| | | | | | | | |
| | | | | | | 8,942 | |
| | | | | | | | |
| | | | | | | | |
CORPORATE DEBT SECURITIES
(Continued) | | Principal | | | Value | |
Diversified Support Services – 0.2% | |
Ritchie Bros. Auctioneers, Inc., | | | | | | | | |
5.375%, 1-15-25 (D) | | $ | 1,025 | | | $ | 1,045 | |
United Rentals (North America), Inc. (GTD by United Rentals, Inc.), | | | | | | | | |
5.875%, 9-15-26 | | | 472 | | | | 486 | |
| | | | | | | | |
| | | | | | | 1,531 | |
| | | | | | | | |
| |
Environmental & Facilities Services – 0.5% | |
GFL Environmental, Inc.: | | | | | | | | |
7.875%, 4-1-20 (D) | | | 3,259 | | | | 3,418 | |
9.875%, 2-1-21 (D) | | | 851 | | | | 936 | |
| | | | | | | | |
| | | | | | | 4,354 | |
| | | | | | | | |
| |
Railroads – 0.7% | |
Florida East Coast Holdings Corp. and Florida East Coast Industries LLC: | | | | | | | | |
6.750%, 5-1-19 (D) | | | 4,949 | | | | 5,122 | |
9.750%, 5-1-20 (D) | | | 1,017 | | | | 1,045 | |
| | | | | | | | |
| | | | | | | 6,167 | |
| | | | | | | | |
| |
Security & Alarm Services – 0.7% | |
Prime Security Services Borrower LLC, | | | | | | | | |
9.250%, 5-15-23 (D) | | | 5,258 | | | | 5,725 | |
| | | | | | | | |
| |
Trading Companies & Distributors – 0.2% | |
HD Supply, Inc., | | | | | | | | |
5.750%, 4-15-24 (D) | | | 1,640 | | | | 1,731 | |
| | | | | | | | |
| |
Total Industrials – 6.1% | | | | 51,358 | |
Information Technology | |
| |
Application Software – 1.4% | |
Ensemble S Merger Sub, Inc., | | | | | | | | |
9.000%, 9-30-23 (D) | | | 1,261 | | | | 1,337 | |
Kronos Acquisition Holdings, Inc., | | | | | | | | |
9.000%, 8-15-23 (D) | | | 10,806 | | | | 10,779 | |
| | | | | | | | |
| | | | | | | 12,116 | |
| | | | | | | | |
| |
Communications Equipment – 0.7% | |
West Corp., | | | | | | | | |
5.375%, 7-15-22 (D) | | | 5,972 | | | | 5,770 | |
| | | | | | | | |
| |
Data Processing & Outsourced Services – 2.0% | |
Alliance Data Systems Corp.: | | | | | | | | |
6.375%, 4-1-20 (D) | | | 3,362 | | | | 3,412 | |
5.875%, 11-1-21 (D) | | | 1,346 | | | | 1,366 | |
5.375%, 8-1-22 (D) | | | 4,224 | | | | 4,076 | |
Italics Merger Sub, Inc., | | | | | | | | |
7.125%, 7-15-23 (D) | | | 8,200 | | | | 7,811 | |
| | | | | | | | |
| | | | | | | 16,665 | |
| | | | | | | | |
| |
Electronic Manufacturing Services – 0.3% | |
KEMET Corp., | | | | | | | | |
10.500%, 5-1-18 | | | 2,639 | | | | 2,636 | |
| | | | | | | | |
| | |
| SCHEDULE OF INVESTMENTS | | HIGH INCOME (in thousands) |
DECEMBER 31, 2016
| | | | | | | | |
CORPORATE DEBT SECURITIES
(Continued) | | Principal | | | Value | |
IT Consulting & Other Services – 0.7% | |
NCR Escrow Corp.: | | | | | | | | |
5.875%, 12-15-21 | | $ | 2,509 | | | $ | 2,628 | |
6.375%, 12-15-23 | | | 3,346 | | | | 3,597 | |
| | | | | | | | |
| | | | | | | 6,225 | |
| | | | | | | | |
| |
Semiconductors – 1.1% | |
Micron Technology, Inc.: | | | | | | | | |
5.875%, 2-15-22 | | | 4,282 | | | | 4,464 | |
7.500%, 9-15-23 (D) | | | 1,931 | | | | 2,138 | |
5.500%, 2-1-25 | | | 3,064 | | | | 3,049 | |
| | | | | | | | |
| | | | | | | 9,651 | |
| | | | | | | | |
| |
Technology Hardware, Storage & Peripherals – 0.9% | |
Inception Parent, Inc., Inception Merger Sub, Inc. and Rackspace Hosting, Inc., | | | | | | | | |
8.625%, 11-15-24 (D) | | | 3,990 | | | | 4,223 | |
Western Digital Corp.: | | | | | | | | |
7.375%, 4-1-23 (D) | | | 468 | | | | 515 | |
10.500%, 4-1-24 (D) | | | 2,103 | | | | 2,487 | |
| | | | | | | | |
| | | | | | | 7,225 | |
| | | | | | | | |
| |
Total Information Technology – 7.1% | | | | 60,288 | |
Materials | |
| |
Aluminum – 1.3% | |
Constellium N.V.: | | | | | | | | |
8.000%, 1-15-23 (D) | | | 3,774 | | | | 3,925 | |
5.750%, 5-15-24 (D) | | | 1,851 | | | | 1,731 | |
Kaiser Aluminum Corp., | | | | | | | | |
5.875%, 5-15-24 | | | 379 | | | | 392 | |
Novelis Corp. (GTD by Novelis, Inc.): | | | | | | | | |
6.250%, 8-15-24 (D) | | | 1,471 | | | | 1,559 | |
5.875%, 9-30-26 (D) | | | 985 | | | | 995 | |
Wise Metals Group LLC, | | | | | | | | |
8.750%, 12-15-18 (D) | | | 2,473 | | | | 2,572 | |
| | | | | | | | |
| | | | | | | 11,174 | |
| | | | | | | | |
| |
Construction Materials – 0.8% | |
Eagle Materials, Inc., | | | | | | | | |
4.500%, 8-1-26 | | | 391 | | | | 390 | |
Hillman Group, Inc. (The), | | | | | | | | |
6.375%, 7-15-22 (D) | | | 6,615 | | | | 6,218 | |
| | | | | | | | |
| | | | | | | 6,608 | |
| | | | | | | | |
| |
Diversified Chemicals – 0.4% | |
PSPC Escrow Corp., | | | | | | | | |
6.500%, 2-1-22 (D) | | | 1,923 | | | | 1,937 | |
PSPC Escrow II Corp., | | | | | | | | |
10.375%, 5-1-21 (D) | | | 981 | | | | 1,087 | |
| | | | | | | | |
| | | | | | | 3,024 | |
| | | | | | | | |
| |
Diversified Metals & Mining – 1.0% | |
Artsonig Pty Ltd., | | | | | | | | |
11.500%, 4-1-19 (D)(E) | | | 5,153 | | | | 155 | |
Crystal Merger Sub, Inc., | | | | | | | | |
7.625%, 10-15-21 (D) | | | 636 | | | | 607 | |
FMG Resources Pty Ltd., | | | | | | | | |
6.875%, 4-1-22 (D) | | | 5,144 | | | | 5,337 | |
| | | | | | | | |
CORPORATE DEBT SECURITIES
(Continued) | | Principal | | | Value | |
Diversified Metals & Mining (Continued) | |
Lundin Mining Corp.: | | | | | | | | |
7.500%, 11-1-20 (D) | | $ | 1,326 | | | $ | 1,411 | |
7.875%, 11-1-22 (D) | | | 1,091 | | | | 1,186 | |
| | | | | | | | |
| | | | | | | 8,696 | |
| | | | | | | | |
| |
Metal & Glass Containers – 1.6% | |
ARD Finance S.A., | | | | | | | | |
7.125%, 9-15-23 (D) | | | 548 | | | | 541 | |
BakerCorp International, Inc., | | | | | | | | |
8.250%, 6-1-19 | | | 10,903 | | | | 9,213 | |
HudBay Minerals, Inc.: | | | | | | | | |
7.250%, 1-15-23 (D) | | | 408 | | | | 422 | |
7.625%, 1-15-25 (D) | | | 611 | | | | 635 | |
Signode Industrial Group, | | | | | | | | |
6.375%, 5-1-22 (D) | | | 2,865 | | | | 2,880 | |
| | | | | | | | |
| | | | | | | 13,691 | |
| | | | | | | | |
| |
Paper Packaging – 0.3% | |
Coveris Holdings S.A., | | | | | | | | |
7.875%, 11-1-19 (D) | | | 610 | | | | 605 | |
Reynolds Group Issuer, Inc., Reynolds Group Issuer LLC and Reynolds Group Issuer (Luxembourg) S.A., | | | | | | | | |
5.125%, 7-15-23 (D) | | | 2,209 | | | | 2,245 | |
| | | | | | | | |
| | | | | | | 2,850 | |
| | | | | | | | |
| |
Steel – 0.1% | |
U.S. Steel Corp., | | | | | | | | |
8.375%, 7-1-21 (D) | | | 661 | | | | 731 | |
| | | | | | | | |
| |
Total Materials – 5.5% | | | | 46,774 | |
Real Estate | |
| |
Health Care REITs – 0.1% | |
MPT Operating Partnership L.P. and MPT Finance Corp. (GTD by Medical Properties Trust, Inc.), | | | | | | | | |
5.250%, 8-1-26 | | | 486 | | | | 476 | |
| | | | | | | | |
| |
Industrial REITs – 1.0% | |
Aircastle Ltd.: | | | | | | | | |
5.125%, 3-15-21 | | | 5,883 | | | | 6,266 | |
5.500%, 2-15-22 | | | 1,532 | | | | 1,624 | |
5.000%, 4-1-23 | | | 1,015 | | | | 1,035 | |
| | | | | | | | |
| | | | | | | 8,925 | |
| | | | | | | | |
| |
Real Estate Development – 0.3% | |
Hub Holdings LLC and Hub Holdings Finance, Inc., | | | | | | | | |
8.125%, 7-15-19 (D)(E) | | | 2,440 | | | | 2,434 | |
| | | | | | | | |
| |
Total Real Estate – 1.4% | | | | 11,835 | |
Telecommunication Services | |
| |
Alternative Carriers – 0.8% | |
Consolidated Communications Finance II Co., | | | | | | | | |
6.500%, 10-1-22 | | | 1,880 | | | | 1,866 | |
Level 3 Communications, Inc., | | | | | | | | |
5.750%, 12-1-22 | | | 1,317 | | | | 1,353 | |
| | | | | | | | |
CORPORATE DEBT SECURITIES
(Continued) | | Principal | | | Value | |
Alternative Carriers (Continued) | |
Level 3 Escrow II, Inc., | | | | | | | | |
5.375%, 8-15-22 | | $ | 3,015 | | | $ | 3,113 | |
Zayo Group LLC and Zayo Capital, Inc., | | | | | | | | |
6.000%, 4-1-23 | | | 679 | | | | 706 | |
| | | | | | | | |
| | | | | | | 7,038 | |
| | | | | | | | |
| |
Integrated Telecommunication Services – 3.6% | |
BCP (Singapore) VI Cayman Financing Co. Ltd., | | | | | | | | |
8.000%, 4-15-21 (D) | | | 377 | | | | 370 | |
Frontier Communications Corp.: | | | | | | | | |
8.875%, 9-15-20 | | | 2,664 | | | | 2,837 | |
6.250%, 9-15-21 | | | 1,501 | | | | 1,422 | |
10.500%, 9-15-22 | | | 1,567 | | | | 1,647 | |
7.125%, 1-15-23 | | | 367 | | | | 332 | |
6.875%, 1-15-25 | | | 1,041 | | | | 882 | |
11.000%, 9-15-25 | | | 3,246 | | | | 3,352 | |
GCI, Inc., | | | | | | | | |
6.875%, 4-15-25 | | | 2,958 | | | | 3,002 | |
Sprint Corp.: | | | | | | | | |
7.250%, 9-15-21 | | | 8,023 | | | | 8,524 | |
7.875%, 9-15-23 | | | 5,563 | | | | 5,939 | |
7.125%, 6-15-24 | | | 2,049 | | | | 2,111 | |
| | | | | | | | |
| | | | | | | 30,418 | |
| | | | | | | | |
| |
Wireless Telecommunication Service – 1.7% | |
Sable International Finance Ltd., | | | | | | | | |
6.875%, 8-1-22 (D) | | | 3,844 | | | | 3,998 | |
Sprint Nextel Corp.: | | | | | | | | |
9.125%, 3-1-17 | | | 466 | | | | 471 | |
8.375%, 8-15-17 | | | 1,762 | | | | 1,828 | |
9.000%, 11-15-18 (D) | | | 569 | | | | 627 | |
7.000%, 8-15-20 | | | 466 | | | | 494 | |
11.500%, 11-15-21 | | | 389 | | | | 478 | |
T-Mobile USA, Inc.: | | | | | | | | |
6.464%, 4-28-19 | | | 1,350 | | | | 1,374 | |
6.731%, 4-28-22 | | | 196 | | | | 205 | |
6.000%, 4-15-24 | | | 1,683 | | | | 1,773 | |
6.500%, 1-15-26 | | | 2,713 | | | | 2,933 | |
| | | | | | | | |
| | | | | | | 14,181 | |
| | | | | | | | |
| |
Total Telecommunication
Services – 6.1% | | | | 51,637 | |
| |
TOTAL CORPORATE DEBT SECURITIES – 71.7% | | | $ | 606,183 | |
(Cost: $622,049) | | | | | | | | |
| | |
| LOANS (I) | | | | | | |
Consumer Discretionary | |
| |
Advertising – 0.2% | |
Advantage Sales & Marketing, Inc., | | | | | | | | |
7.500%, 7-25-22 | | | 1,943 | | | | 1,891 | |
| | | | | | | | |
| |
Apparel Retail – 1.1% | |
Talbots, Inc. (The): | | | | | | | | |
5.500%, 3-19-20 | | | 2,319 | | | | 2,250 | |
9.500%, 3-19-21 | | | 6,489 | | | | 5,851 | |
| | |
| SCHEDULE OF INVESTMENTS | | HIGH INCOME (in thousands) |
DECEMBER 31, 2016
| | | | | | | | |
| LOANS (I) (Continued) | | Principal | | | Value | |
Apparel Retail (Continued) | |
True Religion Apparel, Inc., | | | | | | | | |
5.875%, 7-30-19 | | $ | 5,447 | | | $ | 1,112 | |
| | | | | | | | |
| | | | | | | 9,213 | |
| | | | | | | | |
| |
Casinos & Gaming – 0.2% | |
Gateway Casinos & Entertainment Ltd.: | | | | | | | | |
5.250%, 11-26-19 (F) | | CAD | 1,911 | | | | 1,409 | |
5.950%, 11-26-19 (F) | | | 5 | | | | 4 | |
| | | | | | | | |
| | | | | | | 1,413 | |
| | | | | | | | |
| |
Department Stores – 0.7% | |
Belk, Inc., | | | | | | | | |
5.750%, 12-10-22 | | $ | 6,734 | | | | 5,786 | |
| | | | | | | | |
| |
General Merchandise Stores – 0.9% | |
BJ’s Wholesale Club, Inc., | | | | | | | | |
8.500%, 3-31-20 | | | 4,257 | | | | 4,303 | |
Orchard Acquisition Co. LLC, | | | | | | | | |
7.000%, 2-8-19 | | | 6,634 | | | | 3,449 | |
| | | | | | | | |
| | | | | | | 7,752 | |
| | | | | | | | |
| |
Home Furnishings – 0.6% | |
Serta Simmons Bedding LLC, | | | | | | | | |
9.000%, 11-8-24 | | | 4,958 | | | | 4,974 | |
| | | | | | | | |
| |
Housewares & Specialties – 0.2% | |
KIK Custom Products, Inc., | | | | | | | | |
6.000%, 8-26-22 | | | 1,536 | | | | 1,547 | |
| | | | | | | | |
| |
Specialty Stores – 0.3% | |
Jo-Ann Stores, Inc., | | | | | | | | |
6.256%, 9-29-23 | | | 2,669 | | | | 2,687 | |
| | | | | | | | |
| |
Total Consumer Discretionary – 4.2% | | | | 35,263 | |
Consumer Staples | |
| |
Food Distributors – 0.2% | |
Chefs’ Warehouse, Inc. (The), | | | | | | | | |
6.750%, 6-22-22 | | | 1,952 | | | | 1,958 | |
| | | | | | | | |
| |
Hypermarkets & Super Centers – 0.2% | |
GOBP Holdings, Inc., | | | | | | | | |
9.250%, 10-21-22 | | | 1,807 | | | | 1,805 | |
| | | | | | | | |
| |
Packaged Foods & Meats – 0.2% | |
Shearer’s Foods LLC, | | | | | | | | |
7.750%, 6-30-22 | | | 1,386 | | | | 1,282 | |
| | | | | | | | |
| |
Total Consumer Staples – 0.6% | | | | 5,045 | |
Energy | |
| |
Coal & Consumable Fuels – 0.2% | |
Westmoreland Coal Co., | | | | | | | | |
7.500%, 12-16-20 | | | 1,925 | | | | 1,723 | |
| | | | | | | | |
| |
Oil & Gas Drilling – 0.4% | |
KCA Deutag Alpha Ltd., | | | | | | | | |
6.250%, 5-16-20 | | | 4,240 | | | | 3,751 | |
| | | | | | | | |
| | | | | | | | |
| LOANS (I) (Continued) | | Principal | | | Value | |
Oil & Gas Equipment & Services – 0.2% | |
Larchmont Resources LLC: | | | | | | | | |
10.000%, 8-7-20 | | $ | 800 | | | $ | 776 | |
5.250%, 10-27-22 | | | 695 | | | | 698 | |
| | | | | | | | |
| | | | | | | 1,474 | |
| | | | | | | | |
| |
Oil & Gas Exploration & Production – 1.1% | |
Chesapeake Energy Corp., | | | | | | | | |
8.500%, 8-23-21 | | | 8,491 | | | | 9,230 | |
| | | | | | | | |
| |
Oil & Gas Storage & Transportation – 0.2% | |
Bowie Resources Holdings LLC: | | | | | | | | |
6.750%, 8-12-20 | | | 852 | | | | 738 | |
11.750%, 2-16-21 | | | 857 | | | | 716 | |
| | | | | | | | |
| | | | | | | 1,454 | |
| | | | | | | | |
| |
Total Energy – 2.1% | | | | 17,632 | |
Financials | |
| |
Insurance Brokers – 0.1% | |
NFP Corp., | | | | | | | | |
0.000%, 12-9-23 (J) | | | 1,023 | | | | 1,030 | |
| | | | | | | | |
| |
Total Financials – 0.1% | | | | 1,030 | |
Health Care | |
| |
Life Sciences Tools & Services – 0.4% | |
Atrium Innovations, Inc., | | | | | | | | |
7.750%, 8-10-21 | | | 2,893 | | | | 2,835 | |
| | | | | | | | |
| |
Total Health Care – 0.4% | | | | 2,835 | |
Industrials | |
| |
Building Products – 0.2% | |
Hampton Rubber Co. & SEI Holding Corp., | | | | | | | | |
9.000%, 3-27-22 | | | 1,785 | | | | 1,428 | |
| | | | | | | | |
| |
Construction & Engineering – 0.1% | |
Tensar International Corp., | | | | | | | | |
9.500%, 7-10-22 | | | 1,122 | | | | 842 | |
| | | | | | | | |
| |
Industrial Conglomerates – 0.7% | |
Crosby Worldwide Ltd., | | | | | | | | |
7.000%, 11-22-21 | | | 2,072 | | | | 1,595 | |
PAE Holding Corp.: | | | | | | | | |
6.500%, 10-20-22 | | | 3,963 | | | | 3,983 | |
10.500%, 10-20-23 | | | 495 | | | | 495 | |
| | | | | | | | |
| | | | | | | 6,073 | |
| | | | | | | | |
| |
Industrial Machinery – 0.6% | |
Dynacast International LLC, | | | | | | | | |
9.500%, 1-30-23 | | | 5,443 | | | | 5,307 | |
| | | | | | | | |
| |
Total Industrials – 1.6% | | | | 13,650 | |
Information Technology | |
| |
Application Software – 3.4% | |
Applied Systems, Inc., | | | | | | | | |
7.500%, 1-23-22 | | | 2,286 | | | | 2,306 | |
| | | | | | | | |
| LOANS (I) (Continued) | | Principal | | | Value | |
Application Software (Continued) | |
Misys plc and Magic Newco LLC, | | | | | | | | |
12.000%, 6-12-19 | | $ | 21,429 | | | $ | 22,723 | |
TIBCO Software, Inc., | | | | | | | | |
6.500%, 12-4-20 | | | 4,205 | | | | 4,218 | |
| | | | | | | | |
| | | | | | | 29,247 | |
| | | | | | | | |
| |
Internet Software & Services – 0.8% | |
Ancestry.com LLC, | | | | | | | | |
9.250%, 10-19-24 | | | 1,489 | | | | 1,519 | |
TravelCLICK, Inc. & TCH-2 Holdings LLC: | | | | | | | | |
5.500%, 5-12-21 | | | 2,185 | | | | 2,188 | |
8.750%, 11-12-21 | | | 2,827 | | | | 2,774 | |
| | | | | | | | |
| | | | | | | 6,481 | |
| | | | | | | | |
| |
IT Consulting & Other Services – 0.2% | |
Triple Point Group Holdings, Inc., | | | | | | | | |
5.250%, 7-13-20 | | | 1,930 | | | | 1,702 | |
| | | | | | | | |
| |
Total Information Technology – 4.4% | | | | 37,430 | |
Materials | |
| |
Diversified Metals & Mining – 0.1% | |
EP Minerals LLC, | | | | | | | | |
8.500%, 8-20-21 | | | 996 | | | | 962 | |
| | | | | | | | |
| |
Paper Packaging – 0.4% | |
FPC Holdings, Inc., | | | | | | | | |
9.250%, 5-27-20 | | | 1,740 | | | | 1,465 | |
Ranpak (Rack Merger), | | | | | | | | |
8.250%, 10-1-22 | | | 1,982 | | | | 1,903 | |
| | | | | | | | |
| | | | | | | 3,368 | |
| | | | | | | | |
| |
Total Materials – 0.5% | | | | 4,330 | |
| |
TOTAL LOANS – 13.9% | | | $ | 117,215 | |
(Cost: $125,730) | | | | | | | | |
| | |
| SHORT-TERM SECURITIES | | | | | | |
Commercial Paper (K) – 11.4% | |
Becton Dickinson & Co., | | | | | | | | |
0.870%, 1-12-17 | | | 13,000 | | | | 12,996 | |
Campbell Soup Co., | | | | | | | | |
0.890%, 1-17-17 | | | 7,300 | | | | 7,297 | |
Caterpillar Financial Services Corp. (GTD by Caterpillar, Inc.), | | | | | | | | |
0.930%, 1-3-17 | | | 5,000 | | | | 5,000 | |
Clorox Co. (The), | | | | | | | | |
0.870%, 1-12-17 | | | 5,000 | | | | 4,999 | |
CVS Health Corp., | | | | | | | | |
0.870%, 1-12-17 | | | 3,000 | | | | 2,999 | |
DTE Gas Co., | | | | | | | | |
0.870%, 1-5-17 | | | 4,000 | | | | 4,000 | |
Hewlett Packard Enterprise Co., | | | | | | | | |
0.871%, 1-9-17 | | | 5,000 | | | | 4,999 | |
J.M. Smucker Co. (The), | | | | | | | | |
0.850%, 1-3-17 | | | 7,500 | | | | 7,499 | |
Kroger Co. (The): | | | | | | | | |
0.880%, 1-3-17 | | | 2,903 | | | | 2,903 | |
0.900%, 1-4-17 | | | 5,000 | | | | 4,999 | |
0.940%, 1-5-17 | | | 5,000 | | | | 4,999 | |
| | |
| SCHEDULE OF INVESTMENTS | | HIGH INCOME (in thousands) |
DECEMBER 31, 2016
| | | | | | | | |
SHORT-TERM SECURITIES
(Continued) | | Principal | | | Value | |
Commercial Paper (K) (Continued) | |
L Air Liquide S.A., | | | | | | | | |
0.570%, 1-13-17 | | $ | 4,000 | | | $ | 3,999 | |
McDonalds Corp., | | | | | | | | |
0.900%, 1-10-17 | | | 2,000 | | | | 1,999 | |
NBCUniversal Enterprise, Inc.: | | | | | | | | |
0.861%, 1-5-17 | | | 7,000 | | | | 6,999 | |
0.901%, 1-9-17 | | | 5,000 | | | | 4,999 | |
PacifiCorp: | | | | | | | | |
0.970%, 1-10-17 | | | 5,000 | | | | 4,999 | |
0.870%, 1-12-17 | | | 2,000 | | | | 1,999 | |
Sysco Corp.: | | | | | | | | |
0.950%, 1-3-17 | | | 4,000 | | | | 4,000 | |
1.100%, 1-4-17 | | | 4,425 | | | | 4,425 | |
| | | | | | | | |
| | | | | | | 96,109 | |
| | | | | | | | |
| |
Master Note – 0.5% | |
Toyota Motor Credit Corp., | | | | | | | | |
0.860%, 1-4-17 (H) | | | 4,454 | | | | 4,454 | |
| | | | | | | | |
| | | | | | | | |
SHORT-TERM SECURITIES
(Continued) | | Principal | | | Value | |
Municipal Obligations – 0.3% | |
MI Strategic Fund, Var Rate Demand Ltd. Oblig Rev Bonds (Air Prods and Chemicals, Inc. Proj), Ser 2007 (GTD by Air Prods and Chemicals, Inc.), | | | | | | | | |
0.700%, 1-1-17 (H) | | $ | 2,293 | | | $ | 2,293 | |
| | | | | | | | |
| |
TOTAL SHORT-TERM
SECURITIES – 12.2% | | | $ | 102,856 | |
(Cost: $102,857) | | | | | | | | |
| |
TOTAL INVESTMENT
SECURITIES – 98.4% | | | $ | 831,805 | |
(Cost: $856,618) | | | | | | | | |
| |
CASH AND OTHER ASSETS, NET OF LIABILITIES – 1.6% | | | | 13,414 | |
| |
NET ASSETS – 100.0% | | | $ | 845,219 | |
Notes to Schedule of Investments
| * | Not shown due to rounding. |
| (A) | No dividends were paid during the preceding 12 months. |
| (B) | Listed on an exchange outside the United States. |
| (C) | Warrants entitle the Portfolio to purchase a predetermined number of shares of common stock and are non-income producing. The purchase price and number of shares are subject to adjustment under certain conditions until the expiration date, if any. |
| (D) | Securities were purchased pursuant to an exemption from registration available under Rule 144A under the Securities Act of 1933 and may only be resold in transactions exempt from registration, normally to qualified institutional buyers. At December 31, 2016 the total value of these securities amounted to $442,800 or 52.4% of net assets. |
| (E) | Payment-in-kind bonds. |
| (F) | Principal amounts are denominated in the indicated foreign currency, where applicable (CAD—Canadian Dollar and EUR—Euro). |
| (H) | Variable rate security. Interest rate disclosed is that which is in effect at December 31, 2016. Date shown represents the date that the variable rate resets. |
| (I) | Variable rate security. Interest rate disclosed is that which is in effect at December 31, 2016. |
| (J) | All or a portion of this position has not settled. Full contract rates do not take effect until settlement date. |
| (K) | Rate shown is the yield to maturity at December 31, 2016. |
| (L) | Restricted securities. At December 31, 2016, the Portfolio owned the following restricted securities: |
| | | | | | | | | | | | | | | | | | | | |
| Security | | Acquisition Date(s) | | | Shares | | | Cost | | | Market Value | | | | |
Larchmont Resources LLC | | | 12-8-16 | | | | 1 | | | $ | 340 | | | $ | 340 | | | | | |
Sabine Oil & Gas Corp. | | | 12-7-16 | | | | — | * | | | 12 | | | | 9 | | | | | |
Sabine Oil & Gas Corp., expires 12-29-29 | | | 12-7-16 | | | | 1 | | | | 7 | | | | 7 | | | | | |
| | | | | | | | | | | | |
| | | | | | | | | | $ | 359 | | | $ | 356 | | | | | |
| | | | | | | | | | | | |
| | The total value of these securities represented 0.0% of net assets at December 31, 2016. |
The following forward foreign currency contracts were outstanding at December 31, 2016:
| | | | | | | | | | | | | | | | | | | | | | | | | | | | |
| | | Currency to be
Delivered | | | | | Currency to be
Received | | | Settlement
Date | | | Counterparty | | Unrealized
Appreciation | | | Unrealized
Depreciation | | | | |
Canadian Dollar | | | 5,176 | | | U.S. Dollar | | | 3,841 | | | | 1-25-17 | | | Morgan Stanley International | | $ | — | | | $ | 16 | | | | | |
Euro | | | 1,867 | | | U.S. Dollar | | | 1,973 | | | | 1-25-17 | | | Morgan Stanley International | | | 6 | | | | — | | | | | |
| | | | | | | | | | | | | | | | | | | | |
| | | | | | | | | | | | | | | | | | $ | 6 | | | $ | 16 | | | | | |
| | | | | | | | | | | | | | | | | | | | |
| | |
| SCHEDULE OF INVESTMENTS | | HIGH INCOME (in thousands) |
DECEMBER 31, 2016
The following table is a summary of the valuation of the Portfolio’s investments by the fair value hierarchy levels as of December 31, 2016. See Note 3 to the Financial Statements for further information regarding fair value measurement.
| | | | | | | | | | | | |
| | | Level 1 | | | Level 2 | | | Level 3 | |
Assets | | | | | | | | | | | | |
Investments in Securities | | | | | | | | | | | | |
Common Stocks | | | | | | | | | | | | |
Consumer Discretionary | | $ | 1,538 | | | $ | — | | | $ | 53 | |
Energy | | | 1,646 | | | | 9 | | | | 340 | |
Total Common Stocks | | $ | 3,184 | | | $ | 9 | | | $ | 393 | |
Preferred Stocks | | | 1,958 | | | | — | | | | — | |
Warrants | | | — | | | | 7 | | | | — | |
Corporate Debt Securities | | | — | | | | 606,183 | | | | — | |
Loans | | | — | | | | 90,875 | | | | 26,340 | |
Short-Term Securities | | | — | | | | 102,856 | | | | — | |
Total | | $ | 5,142 | | | $ | 799,930 | | | $ | 26,733 | |
Forward Foreign Currency Contracts | | $ | — | | | $ | 6 | | | $ | — | |
Liabilities | | | | | | | | | | | | |
Forward Foreign Currency Contracts | | $ | — | | | $ | 16 | | | $ | — | |
The following table is a reconciliation of Level 3 investments for which significant unobservable inputs were used to determine fair value:
| | | | | | | | | | | | |
| | | Common
Stocks | | | Warrants | | | Loans | |
Beginning Balance 1-1-16 | | $ | 62 | | | $ | — | | | $ | 40,479 | |
Net realized gain (loss) | | | — | | | | — | | | | (1,822 | ) |
Net change in unrealized appreciation (depreciation) | | | (9 | ) | | | (2 | ) | | | 3,055 | |
Purchases | | | 340 | | | | — | | | | 4,364 | |
Sales | | | — | | | | — | | | | (20,626 | ) |
Amortization/Accretion of premium/discount | | | — | | | | — | | | | (131 | ) |
Transfers into Level 3 during the period | | | — | | | | 2 | | | | 9,117 | |
Transfers out of Level 3 during the period | | | — | | | | — | | | | (8,096 | ) |
Ending Balance 12-31-16 | | $ | 393 | | | $ | — | | | $ | 26,340 | |
Net change in unrealized appreciation (depreciation) for all Level 3 investments still held as of 12-31-16 | | $ | (9 | ) | | $ | (2 | ) | | $ | 1,498 | |
Transfers from Level 2 to Level 3 occurred primarily due to the lack of observable market data due to decreased market activity or information for these securities. Transfers from Level 3 to Level 2 occurred primarily due to the increased availability of observable market data due to increased market activity or information. As shown above, transfers in and out of Level 3 represent the values as of the beginning of the reporting period. During the year ended December 31, 2016, there were no transfers between Levels 1 and 2.
Information about Level 3 fair value measurements:
| | | | | | | | |
| | | Fair Value at 12-31-16 | | | Valuation Technique(s) | | Unobservable Input(s) |
Assets | | | | | | | | |
| | | |
Common Stocks | | $ | 393 | | | Broker | | Broker quotes |
| | | |
Loans | | | 26,340 | | | Third-party valuation service | | Broker quotes |
The following acronyms are used throughout this schedule:
GTD = Guaranteed
REITS = Real Estate Investment Trusts
See Accompanying Notes to Financial Statements.
| | |
| MANAGEMENT DISCUSSION | | INTERNATIONAL CORE EQUITY |
(UNAUDITED)

John C. Maxwell
Below, John C. Maxwell, CFA, portfolio manager of Ivy VIP International Core Equity, discusses positioning, performance and results for the fiscal year ended December 31, 2016. Mr. Maxwell has managed the Portfolio since May 2009 and has 24 years of industry experience.
Fiscal Year Performance
| | | | |
For the 12 Months Ended December 31, 2016 | | | | |
Ivy VIP International Core Equity | | | 1.08% | |
Benchmark(s) and/or Lipper Category | | | | |
MSCI EAFE Index | | | 1.00% | |
(generally reflects the performance of securities in Europe, Australasia and the Far East) | | | | |
Lipper Variable Annuity International Large-Cap Core Funds Universe Average | | | -0.59% | |
(generally reflects the performance of the universe of funds with similar investment objectives) | | | | |
Please note that Portfolio returns include applicable fees and expenses while index returns do not include any such fees. Also, the Portfolio’s performance data does not take into account any product expenses or charges associated with owning a variable life or annuity policy, which is invested in Ivy Variable Insurance Portfolios.
International markets posted slightly positive gains
2016 was a roller coaster year that ended the fiscal year about where it started, with the benchmark index returning 1.00% and the Portfolio up 1.08%. Markets were relatively volatile and behaved very differently than in recent years. In the end, it was the first market since the second half of 2012 where value cyclicals performed better than stable defensives. The fiscal year began much differently as the decline in already low oil prices drove fear of a debt contagion, spiking concerns of a global recession. From the market bottom on February 12, value cyclicals strongly outperformed stable defensives and, in our opinion, have rebalanced valuations across the market to more normal levels.
Geographically, performance abroad was generally positive in local currency, but the strong U.S. dollar offset those returns. As we went through the year, three big events occurred that were supportive of the market — first, economic growth stabilized globally and, in the last quarter, we saw synchronized improvement off of a stable base; second, inflation primarily driven by commodities increased; and third, earnings revisions substantially improved.
Around the world
As mentioned above, the year started with fears of a debt debacle driven by the precipitous decline in the price of oil. It was a year where perceived negative outcomes surprisingly led to better stock market performance — Britain’s vote to leave the European Union (Brexit), the U.S. presidential election outcome and the Italian referendum, to name a few. Brexit aided markets (at least in the short term) as the weaker currency helped the U.K. economy and central banks and governments added stimulus to thwart the perceived threat of exit. As a result, European economic data improved in the second half of the year. The surprise outcome of the U.S. presidential election benefited markets, as many believe President-elect Trump will lower taxes, increase infrastructure spending, decrease regulation and renegotiate trade deals, and bring manufacturing home. We believe the result of the Italian constitutional referendum poses long-term risks, but over the short term a government led bailout of troubled Italian banks likely will aid the Italian economy.
Chinese economic data improved through the year and the yuan weakened. The Chinese government was generally accurate with pegging the yuan to the basket. Fortunately, this time around, the weaker yuan did not hurt global markets. Chinese equity markets, however, generally performed poorly.
The European Central Bank (ECB) pushed interest rates further negative and increased bond purchases in the first quarter. Like Japan, the moves had little currency impact, whereas dovish actions by the Federal Reserve (Fed) had a greater impact. In the fourth quarter, the ECB reduced monthly bond purchases but extended the time period for purchases, which we view as a minor taper. The Bank of Japan (BoJ) surprisingly went to negative rates in the first quarter and the Japanese yen strengthened. In September, the BoJ increased the stakes by targeting its 10-year Treasury yield at approximately zero. The BoJ is now the most aggressive bond purchaser and the first to target rates out the curve.
With 10-year rates rising across the globe and the 10-year U.S. Treasury ending 2016 at a yield of 2.44% (up 84 basis points during the fourth quarter), the Japanese yen absorbed the interest rate differential and weakened from 101 yen/U.S. dollar to 117 through the fourth quarter. This has been positive for the local market and we believe should help fuel much needed inflation.
Actions in the Portfolio during the year
The Portfolio was positioned for low economic growth throughout the year, and was similarly balanced relative to the benchmark index for both defensive and cyclical sectors. From a sector standpoint, top contributors to performance were telecommunications, energy and consumer staples, while financials, industrials and health care detracted from performance the most. Stock selection in Japan was particularly strong, and currency hedges provided nice support to Portfolio performance along with the weighting in emerging markets. Early in the year, we increased the Portfolio’s weighting to energy which worked well. Stock selection in financials was a top detractor to performance, though towards the latter part of the fiscal year (post U.S. election), we believe we have positioned financials to benefit from greater inflation and a steepening yield curve. Within defensives, the Portfolio’s largest weighting was to health care, which proved problematic as pricing pressure and political rhetoric stemming from the U.S. presidential election resulted in the sector being the worst performing in the benchmark index.
The Portfolio’s weighting to emerging markets remained relatively stable through the year as well as the Portfolio’s large weighting in internet-related names — part of our infrastructure theme. Post U.S. election, we increased the Portfolio’s weighting to infrastructure names, while reducing exposure to companies that export to the United States. With the sell-off in defensives, we believe relative value for the highest quality constituents has become attractive, so we materially improved the quality profile of our stable defensives throughout the second half of the year.
What we seek
As we move forward, we are looking for good companies we believe are underpriced relative to their prospects in both the growth and value parts of the market. We expect to keep the Portfolio balanced between defensives and cyclicals, though if the defensive sell off continues, we will consider increasing the Portfolio’s allocation to defensive-oriented companies. Within defensives, we are looking to upgrade quality as these companies generally have better pricing power to offset rising nominal costs. In value cyclicals, we are increasing exposure to companies we believe will benefit from the new macro environment — those exposed to the drivers of nominal growth and a steepening yield curve.
Through the past fiscal year, our key investment themes did not change. We continue to seek exposure to:
| • | | Disproportionate growth of emerging-market consumers, particularly in the Asia-Pacific region |
| • | | Strong growth in infrastructure — including the internet |
| • | | Strong and believable dividend yields |
| • | | Stocks that we think will benefit from increased mergers and acquisition activity |
Outlook
We believe real economic growth will remain muted for the longer term. That said, we believe inflation will drive greater nominal growth this year and President-elect Trump’s perceived aggressive stance on fiscal spending (infrastructure spending and tax cuts) will push out the risk of a global recession. We believe global monetary policy remains at the extremes of easy and we do not see that changing materially unless inflation accelerates at a higher pace than expected. It seems further central bank easing is unlikely, while tapering and tightening is likely to occur through the year. The Fed has already started down the path of tightening from low levels.
We think relative valuation remains supportive for international equities, while absolute valuations are less attractive. Equities, outside emerging markets, are trading at valuation levels above their historic averages (over the last 25 years), while bonds are trading at a dramatic historic premium to long-term averages. Emerging market equities are trading at reasonable valuation levels.
Long term, we believe emerging market countries will try to improve their populations’ standards of living. To accomplish this feat, the countries will require solid real economic growth, which currently is not being achieved. There are increasing signs of stress in these developing countries, though in many cases their growth remains ahead of their developed market counterparts. In the end, we believe maintaining some exposure to developing markets makes sense.
Past performance is not a guarantee of future results. The value of the Portfolio’s shares will change, and you could lose money on your investment.
International investing involves additional risks, including currency fluctuations, political or economic conditions affecting the foreign country, and differences in accounting standards and foreign regulations. Investments in countries with emerging economies or securities markets may carry greater risk than investments in more
developed countries. Political and economic structures in many such countries may be undergoing significant evolution and rapid development, and such countries may lack the social, political and economic stability characteristics of more developed countries. Investments in securities issued in these countries may be more volatile and less liquid than securities issued in more developed countries. These and other risks are more fully described in the Portfolio’s prospectus.
The opinions expressed in this report are those of the portfolio manager and are current only through the end of the period of the report as stated on the cover. The manager’s views are subject to change at any time based on market and other conditions, and no forecasts can be guaranteed.
The index (indexes) noted are unmanaged and include reinvested dividends. One cannot invest directly in an index, nor is an index representative of the Ivy VIP International Core Equity.
| | |
| PORTFOLIO HIGHTLIGHTS | | INTERNATIONAL CORE EQUITY |
ALL DATA IS AS OF DECEMBER 31, 2016 (UNAUDITED)
Asset Allocation
| | | | |
Stocks | | | 96.6% | |
Financials | | | 17.4% | |
Industrials | | | 13.9% | |
Consumer Discretionary | | | 12.7% | |
Health Care | | | 12.3% | |
Consumer Staples | | | 12.0% | |
Energy | | | 8.9% | |
Information Technology | | | 7.7% | |
Materials | | | 5.3% | |
Telecommunication Services | | | 5.2% | |
Real Estate | | | 1.2% | |
Cash and Other Assets (Net of Liabilities), and Cash Equivalents+ | | | 3.4% | |
Country Weightings
| | | | |
Europe | | | 64.5% | |
United Kingdom | | | 17.4% | |
France | | | 15.9% | |
Switzerland | | | 9.3% | |
Germany | | | 8.5% | |
Ireland | | | 3.9% | |
Other Europe | | | 9.5% | |
Pacific Basin | | | 26.1% | |
Japan | | | 14.7% | |
China | | | 4.2% | |
Other Pacific Basin | | | 7.2% | |
Other | | | 3.3% | |
North America | | | 1.5% | |
South America | | | 1.2% | |
Cash and Other Assets (Net of Liabilities), and Cash Equivalents+ | | | 3.4% | |
Top 10 Equity Holdings
| | | | | | |
| Company | | Country | | Sector | | Industry |
Total S.A. | | France | | Energy | | Integrated Oil & Gas |
Bridgestone Corp. | | Japan | | Consumer Discretionary | | Tires & Rubber |
Vinci | | France | | Industrials | | Construction & Engineering |
Adecco S.A. | | Switzerland | | Industrials | | Human Resource & Employment Services |
Nestle S.A., Registered Shares | | Switzerland | | Consumer Staples | | Packaged Foods & Meats |
Teva Pharmaceutical Industries Ltd. ADR | | Israel | | Health Care | | Pharmaceuticals |
Shire Pharmaceuticals Group plc ADR | | Ireland | | Health Care | | Biotechnology |
Deutsche Post AG | | Germany | | Industrials | | Air Freight & Logistics |
Isuzu Motors Ltd. | | Japan | | Consumer Discretionary | | Automobile Manufacturers |
Bayer AG | | Germany | | Health Care | | Pharmaceuticals |
See your advisor for more information on the Portfolio’s most recent published Top 10 Equity Holdings.
+Cash equivalents are defined as highly liquid securities with maturities of less than three months. Cash equivalents may include U.S. Government Treasury bills, bank certificates of deposit, bankers’ acceptances, corporate commercial paper and other money market instruments.
| | |
| COMPARISON OF CHANGE IN VALUE OF $10,000 INVESTMENT | | INTERNATIONAL CORE EQUITY |
(UNAUDITED)
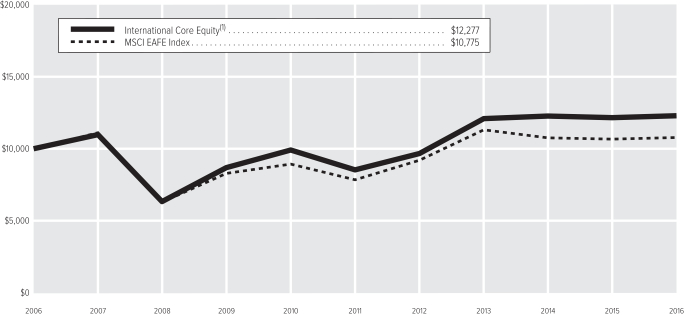
| (1) | The value of the investment in the Portfolio is impacted by the ongoing expenses of the Portfolio and assumes reinvestment of dividends and distributions. |
| | | | |
| Average Annual Total Return(2) | | | |
1-year period ended 12-31-16 | | | 1.08% | |
5-year period ended 12-31-16 | | | 7.54% | |
10-year period ended 12-31-16 | | | 2.07% | |
| (2) | Data quoted is past performance and current performance may be lower or higher. Past performance is no guarantee of future results. Investment return and principal value of an investment will fluctuate and shares, when redeemed, may be worth more or less than their original cost. Please call 1.888.WADDELL for the Portfolio’s most recent month-end performance. Performance data quoted does not reflect any expenses or charges associated with owning a variable life insurance policy or variable annuity contract that invests in the Portfolio’s shares. When such charges are deducted, actual investment performance in a variable policy or contract will be lower. |
Past performance is not necessarily indicative of future performance. Indexes are unmanaged. The performance graph and table do not reflect the deduction of taxes that a shareholder would pay on Portfolio distributions or on the redemption of Portfolio shares. Performance results may include the effect of expense reduction arrangements for some or all of the periods shown. If those arrangements had not been in place, the performance results for those periods would have been lower.
| | |
| SCHEDULE OF INVESTMENTS | | INTERNATIONAL CORE EQUITY (in thousands) |
DECEMBER 31, 2016
| | | | | | | | |
| COMMON STOCKS | | Shares | | | Value | |
Australia | |
| |
Energy – 1.4% | |
Oil Search Ltd. | | | 2,021 | | | $ | 10,458 | |
| | | | | | | | |
| |
Financials – 1.1% | |
Westpac Banking Corp. | | | 324 | | | | 7,634 | |
| | | | | | | | |
| |
Total Australia – 2.5% | | | $ | 18,092 | |
Brazil | |
| |
Information Technology – 1.2% | |
MercadoLibre, Inc. | | | 59 | | | | 9,165 | |
| | | | | | | | |
| |
Total Brazil – 1.2% | | | $ | 9,165 | |
Canada | |
| |
Energy – 1.1% | |
Suncor Energy, Inc. | | | 238 | | | | 7,793 | |
| | | | | | | | |
| |
Total Canada – 1.1% | | | $ | 7,793 | |
China | |
| |
Consumer Discretionary – 1.2% | |
JD.com, Inc. ADR(A) | | | 355 | | | | 9,034 | |
| | | | | | | | |
| |
Consumer Staples – 0.9% | |
Wuliangye Yibin Co. Ltd., A Shares | | | 1,262 | | | | 6,262 | |
| | | | | | | | |
| |
Industrials – 0.9% | |
China Communications Construction Co. Ltd., H Shares | | | 3,340 | | | | 3,842 | |
China Railway Construction Corp. Ltd., A Shares | | | 1,049 | | | | 1,798 | |
China Railway Construction Corp. Ltd., H Shares | | | 839 | | | | 1,079 | |
| | | | | | | | |
| | | | | | | 6,719 | |
| | | | | | | | |
| |
Information Technology – 1.2% | |
Alibaba Group Holding Ltd. ADR(A) | | | 100 | | | | 8,816 | |
| | | | | | | | |
| |
Total China – 4.2% | | | $ | 30,831 | |
Finland | |
| |
Information Technology – 1.8% | |
Nokia Corp., Series A ADR | | | 804 | | | | 3,867 | |
Nokia OYJ | | | 1,899 | | | | 9,174 | |
| | | | | | | | |
| | | | | | | 13,041 | |
| | | | | | | | |
| |
Total Finland – 1.8% | | | $ | 13,041 | |
France | |
| |
Consumer Discretionary – 1.0% | |
Publicis Groupe S.A. | | | 109 | | | | 7,542 | |
| | | | | | | | |
| |
Consumer Staples – 3.1% | |
Danone S.A. | | | 154 | | | | 9,772 | |
Pernod Ricard | | | 117 | | | | 12,647 | |
| | | | | | | | |
| | | | | | | 22,419 | |
| | | | | | | | |
| | | | | | | | |
| COMMON STOCKS (Continued) | | Shares | | | Value | |
Energy – 2.3% | |
Total S.A. | | | 336 | | | $ | 17,231 | |
| | | | | | | | |
| |
Financials – 1.2% | |
Axa S.A. | | | 360 | | | | 9,094 | |
| | | | | | | | |
| |
Industrials – 4.6% | |
Bouygues S.A. | | | 227 | | | | 8,148 | |
European Aeronautic Defence and Space Co. | | | 140 | | | | 9,261 | |
Vinci | | | 235 | | | | 16,026 | |
| | | | | | | | |
| | | | | | | 33,435 | |
| | | | | | | | |
| |
Materials – 1.4% | |
L Air Liquide S.A. | | | 92 | | | | 10,227 | |
| | | | | | | | |
| |
Telecommunication Services – 2.3% | |
Orange S.A. | | | 618 | | | | 9,386 | |
Vivendi Universal | | | 412 | | | | 7,832 | |
| | | | | | | | |
| | | | | | | 17,218 | |
| | | | | | | | |
| |
Total France – 15.9% | | | $ | 117,166 | |
Germany | |
| |
Consumer Discretionary – 2.3% | |
Continental AG | | | 42 | | | | 8,083 | |
ProSiebenSat. 1 Media SE | | | 243 | | | | 9,359 | |
| | | | | | | | |
| | | | | | | 17,442 | |
| | | | | | | | |
| |
Financials – 1.0% | |
Deutsche Boerse AG(A) | | | 89 | | | | 7,278 | |
| | | | | | | | |
| |
Health Care – 3.3% | |
Bayer AG | | | 132 | | | | 13,747 | |
Fresenius Medical Care AG & Co. KGaA | | | 123 | | | | 10,442 | |
| | | | | | | | |
| | | | | | | 24,189 | |
| | | | | | | | |
| |
Industrials – 1.9% | |
Deutsche Post AG | | | 427 | | | | 14,043 | |
| | | | | | | | |
| |
Total Germany – 8.5% | | | $ | 62,952 | |
Hong Kong | |
| |
Financials – 1.4% | |
AIA Group Ltd. | | | 1,813 | | | | 10,231 | |
| | | | | | | | |
| |
Real Estate – 1.2% | |
Cheung Kong (Holdings) Ltd. | | | 818 | | | | 9,275 | |
| | | | | | | | |
| |
Total Hong Kong – 2.6% | | | $ | 19,506 | |
Ireland | |
| |
Health Care – 1.9% | |
Shire Pharmaceuticals Group plc ADR | | | 83 | | | | 14,105 | |
| | | | | | | | |
| | | | | | | | |
| COMMON STOCKS (Continued) | | Shares | | | Value | |
Materials – 2.0% | |
CRH plc | | | 300 | | | $ | 10,454 | |
James Hardie Industries plc, Class C | | | 245 | | | | 3,892 | |
| | | | | | | | |
| | | | | | | 14,346 | |
| | | | | | | | |
| |
Total Ireland – 3.9% | | | $ | 28,451 | |
Israel | |
| |
Health Care – 2.0% | |
Teva Pharmaceutical Industries Ltd. ADR | | | 407 | | | | 14,755 | |
| | | | | | | | |
| |
Total Israel – 2.0% | | | $ | 14,755 | |
Italy | |
| |
Financials – 1.2% | |
Banca Intesa S.p.A. | | | 3,467 | | | | 8,854 | |
| | | | | | | | |
| |
Total Italy – 1.2% | | | $ | 8,854 | |
Japan | |
| |
Consumer Discretionary – 5.8% | |
Bridgestone Corp. | | | 468 | | | | 16,863 | |
Honda Motor Co. Ltd. | | | 256 | | | | 7,492 | |
Isuzu Motors Ltd. | | | 1,100 | | | | 13,939 | |
Nissin Kogyo Co. Ltd. | | | 278 | | | | 4,403 | |
| | | | | | | | |
| | | | | | | 42,697 | |
| | | | | | | | |
| |
Energy – 1.4% | |
Inpex Corp. | | | 1,000 | | | | 10,014 | |
| | | | | | | | |
| |
Financials – 1.8% | |
Dai-ichi Mutual Life Insurance Co. (The) | | | 467 | | | | 7,776 | |
Tokio Marine Holdings, Inc. | | | 123 | | | | 5,031 | |
| | | | | | | | |
| | | | | | | 12,807 | |
| | | | | | | | |
| |
Industrials – 1.2% | |
Komatsu Ltd. | | | 392 | | | | 8,875 | |
| | | | | | | | |
| |
Information Technology – 1.4% | |
Fujitsu Ltd. | | | 292 | | | | 1,623 | |
Yahoo Japan Corp. | | | 2,334 | | | | 8,967 | |
| | | | | | | | |
| | | | | | | 10,590 | |
| | | | | | | | |
| |
Materials – 0.2% | |
Taiheiyo Cement Corp. | | | 546 | | | | 1,728 | |
| | | | | | | | |
| |
Telecommunication Services – 2.9% | |
Nippon Telegraph and Telephone Corp. | | | 185 | | | | 7,779 | |
SoftBank Group Corp. | | | 203 | | | | 13,454 | |
| | | | | | | | |
| | | | | | | 21,233 | |
| | | | | | | | |
| |
Total Japan – 14.7% | | | $ | 107,944 | |
| | |
| SCHEDULE OF INVESTMENTS | | INTERNATIONAL CORE EQUITY (in thousands) |
DECEMBER 31, 2016
| | | | | | | | |
| COMMON STOCKS (Continued) | | Shares | | | Value | |
Luxembourg | |
| |
Energy – 1.1% | |
Tenaris S.A. | | | 237 | | | $ | 4,236 | |
Tenaris S.A. ADR | | | 114 | | | | 4,053 | |
| | | | | | | | |
| | | | | | | 8,289 | |
| | | | | | | | |
| |
Total Luxembourg – 1.1% | | | $ | 8,289 | |
Netherlands | |
| |
Energy – 0.3% | |
Royal Dutch Petroleum Co., New York Shares | | | 45 | | | | 2,420 | |
| | | | | | | | |
| |
Financials – 1.4% | |
ING Groep N.V., Certicaaten Van Aandelen | | | 717 | | | | 10,090 | |
| | | | | | | | |
| |
Total Netherlands – 1.7% | | | $ | 12,510 | |
Norway | |
| |
Financials – 1.1% | |
DNB ASA | | | 553 | | | | 8,221 | |
| | | | | | | | |
| |
Total Norway – 1.1% | | | $ | 8,221 | |
South Africa | |
| |
Consumer Discretionary – 1.3% | |
Naspers Ltd., Class N | | | 66 | | | | 9,738 | |
| | | | | | | | |
| |
Total South Africa – 1.3% | | | $ | 9,738 | |
South Korea | |
| |
Information Technology – 1.1% | |
Samsung Electronics Co. Ltd. | | | 5 | | | | 7,863 | |
| | | | | | | | |
| |
Total South Korea – 1.1% | | | $ | 7,863 | |
Spain | |
| |
Financials – 2.6% | |
Banco Bilbao Vizcaya
Argentaria S.A. | | | 1,786 | | | | 12,056 | |
Banco Santander S.A. | | | 1,426 | | | | 7,443 | |
| | | | | | | | |
| | | | | | | 19,499 | |
| | | | | | | | |
| |
Total Spain – 2.6% | | | $ | 19,499 | |
Switzerland | |
| |
Consumer Staples – 2.0% | |
Nestle S.A., Registered Shares | | | 206 | | | | 14,778 | |
| | | | | | | | |
| |
Financials – 1.2% | |
UBS Group AG | | | 577 | | | | 9,042 | |
| | | | | | | | |
| |
Health Care – 2.6% | |
Novartis AG, Registered Shares | | | 137 | | | | 9,962 | |
Roche Holdings AG, Genusscheine | | | 39 | | | | 8,840 | |
| | | | | | | | |
| | | | | | | 18,802 | |
| | | | | | | | |
| | | | | | | | |
| COMMON STOCKS (Continued) | | Shares | | | Value | |
Industrials – 3.5% | |
Adecco S.A. | | | 232 | | | $ | 15,178 | |
Wolseley plc | | | 169 | | | | 10,323 | |
| | | | | | | | |
| | | | | | | 25,501 | |
| | | | | | | | |
| |
Total Switzerland – 9.3% | | | $ | 68,123 | |
Taiwan | |
| |
Information Technology – 1.0% | |
Hon Hai Precision Industry Co. Ltd. | | | 2,869 | | | | 7,496 | |
| | | | | | | | |
Total Taiwan – 1.0% | | | $ | 7,496 | |
United Kingdom | |
| |
Consumer Discretionary – 1.1% | |
WPP Group plc | | | 376 | | | | 8,404 | |
| | | | | | | | |
| |
Consumer Staples – 6.0% | |
British American Tobacco plc | | | 197 | | | | 11,198 | |
Imperial Tobacco Group plc | | | 246 | | | | 10,740 | |
Reckitt Benckiser Group plc | | | 105 | | | | 8,894 | |
Unilever plc | | | 325 | | | | 13,185 | |
| | | | | | | | |
| | | | | | | 44,017 | |
| | | | | | | | |
| |
Energy – 1.3% | |
BP plc | | | — | * | | | — | * |
Royal Dutch Shell plc, Class A | | | 335 | | | | 9,155 | |
| | | | | | | | |
| | | | | | | 9,155 | |
| | | | | | | | |
| |
Financials – 3.0% | |
Aviva plc | | | 520 | | | | 3,116 | |
Prudential plc | | | 539 | | | | 10,809 | |
Standard Chartered plc | | | 994 | | | | 8,090 | |
| | | | | | | | |
| | | | | | | 22,015 | |
| | | | | | | | |
| |
Health Care – 2.5% | |
Shire plc | | | 116 | | | | 6,719 | |
Smith & Nephew plc | | | 789 | | | | 11,870 | |
| | | | | | | | |
| | | | | | | 18,589 | |
| | | | | | | | |
| |
Industrials – 1.8% | |
BAE Systems plc | | | 1,799 | | | | 13,111 | |
| | | | | | | | |
| |
Materials – 1.7% | |
Rio Tinto plc | | | 246 | | | | 9,564 | |
Rio Tinto plc ADR | | | 79 | | | | 3,038 | |
| | | | | | | | |
| | | | | | | 12,602 | |
| | | | | | | | |
| |
Total United Kingdom – 17.4% | | | $ | 127,893 | |
| |
TOTAL COMMON STOCKS – 96.2% | | | $ | 708,182 | |
(Cost: $724,655) | |
| | | | | | | | |
| PREFERRED STOCKS | | Shares | | | Value | |
United States | |
| |
Financials – 0.4% | |
Mandatory Exchangeable Trust, 5.750% (B) | | | 29 | | | $ | 3,172 | |
| | | | | | | | |
| |
Total United States – 0.4% | | | $ | 3,172 | |
| |
TOTAL PREFERRED STOCKS – 0.4% | | | $ | 3,172 | |
(Cost: $2,900) | |
| | |
SHORT-TERM SECURITIES | | | Principal | | | | | |
Commercial Paper (C) – 5.3% | | | | | |
Danaher Corp. | | | | | | | | |
0.700%, 1-4-17 | | $ | 24,000 | | | | 23,998 | |
PacifiCorp | | | | | | | | |
0.880%, 1-11-17 | | | 12,000 | | | | 11,997 | |
Wisconsin Electric Power Co. | | | | | | | | |
0.870%, 1-5-17 | | | 3,000 | | | | 2,999 | |
| | | | | | | | |
| | | | | | | 38,994 | |
| | | | | | | | |
| |
Master Note – 0.5% | | | | | |
Toyota Motor Credit Corp. | | | | | | | | |
0.860%, 1-4-17 (D) | | | 3,503 | | | | 3,503 | |
| | | | | | | | |
| |
TOTAL SHORT-TERM
SECURITIES – 5.8% | | | $ | 42,497 | |
(Cost: $42,498) | |
| | |
TOTAL INVESTMENT
SECURITIES – 102.4% | | | | | | $ | 753,851 | |
(Cost: $770,053) | |
| |
LIABILITIES, NET OF CASH AND
OTHER ASSETS – (2.4)% | | | | (17,808 | ) |
| |
NET ASSETS – 100.0% | | | $ | 736,043 | |
| | |
| SCHEDULE OF INVESTMENTS | | INTERNATIONAL CORE EQUITY (in thousands) |
DECEMBER 31, 2016
Notes to Schedule of Investments
| * | Not shown due to rounding. |
| (A) | No dividends were paid during the preceding 12 months. |
| (B) | Securities were purchased pursuant to an exemption from registration available under Rule 144A under the Securities Act of 1933 and may only be resold in transactions exempt from registration, normally to qualified institutional buyers. At December 31, 2016 the total value of these securities amounted to $3,172 or 0.4% of net assets. |
| (C) | Rate shown is the yield to maturity at December 31, 2016. |
| (D) | Variable rate security. Interest rate disclosed is that which is in effect at December 31, 2016. Date shown represents the date that the variable rate resets. |
The following forward foreign currency contracts were outstanding at December 31, 2016:
| | | | | | | | | | | | | | | | | | | | | | | | |
| | | Currency to be
Delivered | | | | Currency to be
Received | | | Settlement
Date | | | Counterparty | | | Unrealized
Appreciation | | | Unrealized
Depreciation | |
Euro | | 31,421 | | U.S. Dollar | | | 33,802 | | | | 1-25-17 | | | | Deutsche Bank AG | | | $ | 688 | | | $ | — | |
The following table is a summary of the valuation of the Portfolio’s investments by the fair value hierarchy levels as of December 31, 2016. See Note 3 to the Financial Statements for further information regarding fair value measurement.
| | | | | | | | | | | | |
| | | Level 1 | | | Level 2 | | | Level 3 | |
Assets | | | | | | | | | | | | |
Investments in Securities | | | | | | | | | | | | |
Common Stocks | | $ | 708,182 | | | $ | — | | | $ | — | |
Preferred Stocks | | | — | | | | 3,172 | | | | — | |
Short-Term Securities | | | — | | | | 42,497 | | | | — | |
Total | | $ | 708,182 | | | $ | 45,669 | | | $ | — | |
Forward Foreign Currency Contracts | | $ | — | | | $ | 688 | | | $ | — | |
During the year ended December 31, 2016, there were no transfers between Level 1 and 2.
The following acronym is used throughout this schedule:
ADR = American Depositary Receipts
Market Sector Diversification
| | | | |
(as a % of net assets) | |
Financials | | | 17.4% | |
Industrials | | | 13.9% | |
Consumer Discretionary | | | 12.7% | |
Health Care | | | 12.3% | |
Consumer Staples | | | 12.0% | |
Energy | | | 8.9% | |
Information Technology | | | 7.7% | |
Materials | | | 5.3% | |
Telecommunication Services | | | 5.2% | |
Real Estate | | | 1.2% | |
Other+ | | | 3.4% | |
+Includes cash and other assets (net of liabilities), and cash equivalents
See Accompanying Notes to Financial Statements.
| | |
| MANAGEMENT DISCUSSION | | LIMITED-TERM BOND |
(UNAUDITED)

Susan Regan
Below, Susan K. Regan, portfolio manager of Ivy VIP Limited-Term Bond, discusses positioning, performance and results for the fiscal year ended December 31, 2016. She has managed the Portfolio since 2014 and has 29 years industry experience.
Fiscal Year Performance
| | | | |
For the 12 months ended December 31, 2016 | | | | |
Ivy VIP Limited-Term Bond | | | 1.94% | |
Benchmark(s) and/or Lipper Category | | | | |
Bloomberg Barclays 1-5 Year U.S. Government/Credit Index | | | 1.56% | |
(generally reflects the performance of securities representing the bond market that have maturities between 1 and 5 years.) | | | | |
Lipper Variable Annuity Short-Intermediate Investment Grade Debt Funds Universe Average | | | 2.33% | |
(generally reflects the performance of the universe of funds with similar investment objectives) | | | | |
Please note that the Portfolio returns include applicable investment fees and expenses, whereas the index returns do not include any such fees. Also, the Portfolio’s performance data does not take into account any product expenses or charges associated with owning a variable life or annuity policy, which is invested in Ivy Variable Insurance Portfolios.
Key drivers
Shortly after 2016 began, just weeks after the first Federal Reserve (Fed) rate hike seen in seven years, the bottom seemed to drop out of the commodities markets. Especially affected were oil and all things related to the energy sector. Both the equity and high yield bond markets saw prices drop dramatically and it looked as if the Fed had possibly made a colossal mistake in raising rates just 25 basis points. Treasuries, however, began a nice rally from day one of 2016. Oil saw its low around $26 per barrel in February, but began recovering nicely in March and spent the majority of the year nestled between $40 and $50 per barrel. While the oil industry was not hugely profitable at those prices, the situation was no longer “dire” and consumers benefitted from low prices at the pump for the duration of 2016.
The U.S. Treasury rally continued, although with volatility, for more than half the year. The Fed had hinted that a rate hike would be forthcoming at their June meeting, but a very weak May nonfarm payroll report of just 38,000 jobs, combined with a potentially unsettling outcome of the vote by the United Kingdom to exit the European Union (Brexit), kept the Fed at bay. The result of Brexit caused a huge flight-to-quality, which only lasted a few weeks. The ten-year U.S. Treasury note found its low for the year at 1.36% in early July, nearly 125 basis points below its starting point for 2016. As a new British government was put in place and details were shared of a very slow, orderly exit from the European Union, the bond market recovered from the early July lows.
Members of the Fed started banging the drum for a rate hike in August, with that sentiment also being echoed by Chair Janet Yellen at her much anticipated speech in late August at Jackson Hole, Wyoming. Even though rates rose in anticipation of a rate hike, no such hike was delivered at the September meeting, leaving only the prospect of a lone December rate hike, just as was seen a year earlier.
While the market was expecting a December rate hike, it was not expecting the results of the U.S. presidential election. The victory of President-elect Trump, along with the Republican sweep of both the House of Representatives and Senate, sent yields soaring. The Fed rate hike in December 2016 sent Treasury yields even higher, especially after the announcement that the Fed expected the pace of hikes to increase and anticipated three hikes in 2017. This caused the ten-year note to reach its high for the year at 2.60%, just one day after the rate hike. Yields receded a bit before year-end, when participants realized it’s not uncommon for the Fed to over-anticipate and under deliver on rate hikes. A year ago, the Fed expected four hikes in 2016 and only delivered one.
Investment grade credit was the best performing asset class in our universe for 2016 and the Portfolio had an overweight relative to the benchmark. The lower quality credits outperformed higher quality and the Portfolio had an overweight there also. Corporate bond issuance has been robust the past few years and we have seen balance sheets deteriorate and leverage ratios rise as a result. This will come home to roost at some point and we believe will likely be detrimental to credit spreads, but most feel this credit boom still has a lot of life, and the end is still well into the foreseeable future. We intend to lighten up on credit when we see things turn, but for now, we are comfortable with this overweight.
Outlook
We have a barbell strategy in place which we began in late 2014 and continue today. We are overweight the front part of the curve relative to the benchmark, underweight the 2–5 year duration buckets and have a small allocation beyond five years, while maintaining an overall duration slightly below the benchmark. This barbell helped the Portfolio outperform the Bloomberg Barclays benchmark in the first three quarters of the year, while matching the benchmark in the fourth quarter as rates rose very quickly. A barbell is generally much more effective in an environment where rates are falling, holding steady and/or not rising rapidly. While the Portfolio outperformed the Bloomberg Barclays benchmark for 2016, the barbell combined with the rapid rise in rates seen following the Trump victory contributed to the Portfolio’s underperformance versus the Lipper benchmark.
While we did reduce exposure to the longer maturities in the fourth quarter, we will be monitoring this and determining whether this barbell strategy is one to continue or if we should get closer to the benchmark weightings in the different maturity buckets. The key to whether we will continue this strategy will be the speed in which interest rates rise. We are not convinced rates will rise as quickly as the Fed has suggested and are being cautious in changing strategies too quickly.
We are fully aware that preservation of capital is of the highest importance in a portfolio of this type and will continue to seek to manage the risks involved in a prudent manner, while trying to earn a fair and reasonable return.
Past performance is not a guarantee of future results. As with any mutual fund, the value of the Portfolio’s shares will change, and you could lose money on your investment.
Certain U.S. government securities in which the Portfolio may invest, such as Treasury securities and securities issued by the Government National Mortgage Association (Ginnie Mae), are backed by the full faith and credit of the U.S. government. However, other government securities in which the Portfolio may invest, such as securities issued by the Federal National Mortgage Association (Fannie Mae), the Federal Home Loan Mortgage Corporation (Freddie Mac) and the Federal Home Loan Banks (FHLB), are not backed by the full faith and credit of the U.S. government, are not insured or guaranteed by the U.S. government and, instead, may be supported only by the right of the issuer to borrow from the U.S. Treasury or by the credit of the issuer.
Fixed-income securities are subject to interest rate risk and, as such, the Portfolio’s net asset value may fall as interest rates rise. These and other risks are more fully described in the Portfolio’s prospectus.
The opinions expressed in this report are those of the portfolio manager and are current only through the end of the period of the report as stated on the cover. The manager’s views are subject to change at any time based on market and other conditions, and no forecasts can be guaranteed.
The index (indexes) noted is unmanaged and includes reinvested dividends. One cannot invest directly in an index, nor is an index representative of the Ivy VIP Limited-Term Bond.
| | |
| PORTFOLIO HIGHLIGHTS | | LIMITED-TERM BOND |
ALL DATA IS AS OF DECEMBER 31, 2016 (UNAUDITED)
Asset Allocation
| | | | |
Bonds | | | 95.0% | |
Corporate Debt Securities | | | 60.2% | |
United States Government and Government Agency Obligations | | | 31.8% | |
Municipal Bonds – Taxable | | | 1.6% | |
Asset-Backed Securities | | | 1.0% | |
Mortgage-Backed Securities | | | 0.4% | |
Cash and Other Assets (Net of Liabilities), and Cash Equivalents+ | | | 5.0% | |
Quality Weightings
| | | | |
Investment Grade | | | 89.5% | |
AAA | | | 0.5% | |
AA | | | 36.8% | |
A | | | 25.3% | |
BBB | | | 26.9% | |
Non-Investment Grade | | | 5.5% | |
BB | | | 0.9% | |
Non-rated | | | 4.6% | |
Cash and Other Assets (Net of Liabilities), and Cash Equivalents+ | | | 5.0% | |
Our preference is to always use ratings obtained from Standard & Poor’s. For securities not rated by Standard & Poor’s, ratings are obtained from Moody’s. We do not evaluate these ratings, but simply assign them to the appropriate credit quality category as determined by the rating agency.
+ Cash equivalents are defined as highly liquid securities with maturities of less than three months. Cash equivalents may include U.S. Government Treasury bills, bank certificates of deposit, bankers’ acceptances, corporate commercial paper and other money market instruments.
| | |
COMPARISON OF CHANGE IN VALUE OF $10,000 INVESTMENT | | LIMITED-TERM BOND |
(UNAUDITED)
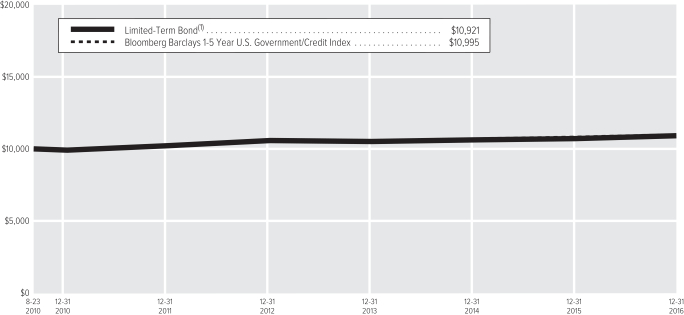
| (1) | The value of the investment in the Portfolio is impacted by the ongoing expenses of the Portfolio and assumes reinvestment of dividends and distributions. |
| | | | |
| Average Annual Total Return(2) | | | | |
1-year period ended 12-31-16 | | | 1.94% | |
5-year period ended 12-31-16 | | | 1.32% | |
10-year period ended 12-31-16 | | | — | |
Since inception of Portfolio(3) through 12-31-16 | | | 1.40% | |
| (2) | Data quoted is past performance and current performance may be lower or higher. Past performance is no guarantee of future results. Investment return and principal value of an investment will fluctuate and shares, when redeemed, may be worth more or less than their original cost. Please call 1.888.WADDELL for the Portfolio’s most recent month-end performance. Performance data quoted does not reflect any expenses or charges associated with owning a variable life insurance policy or variable annuity contract that invests in the Portfolio’s shares. When such charges are deducted, actual investment performance in a variable policy or contract will be lower. |
| (3) | 8-23-10 (the date on which shares were first acquired by shareholders). |
Past performance is not necessarily indicative of future performance. Indexes are unmanaged. The performance graph and table do not reflect the deduction of taxes that a shareholder would pay on Portfolio distributions or on the redemption of Portfolio shares. Performance results may include the effect of expense reduction arrangements for some or all of the periods shown. If those arrangements had not been in place, the performance results for those periods would have been lower.
| | |
| SCHEDULE OF INVESTMENTS | | LIMITED-TERM BOND (in thousands) |
DECEMBER 31,��2016
| | | | | | | | |
| ASSET-BACKED SECURITIES | | Principal | | | Value | |
American Airlines Class AA Pass Through Certificates, Series 2016-2, | | | | | | | | |
3.200%, 6-15-28 | | $ | 1,000 | | | $ | 973 | |
SBA Tower Trust, Series 2013-1C (GTD by SBA Guarantor LLC and SBA Holdings LLC), | | | | | | | | |
2.240%, 4-16-18 (A) | | | 1,900 | | | | 1,904 | |
SBA Tower Trust, Series 2016-1 (GTD by SBA Guarantor LLC and SBA Holdings LLC), | | | | | | | | |
2.877%, 7-15-21 (A) | | | 1,000 | | | | 991 | |
| | | | | | | | |
| |
TOTAL ASSET-BACKED
SECURITIES – 1.0% | | | $ | 3,868 | |
(Cost: $3,908) | | | | | | | | |
| | |
| CORPORATE DEBT SECURITIES | | | | | | |
Consumer Discretionary | |
| |
Apparel Retail – 0.3% | |
TJX Cos., Inc. (The), | | | | | | | | |
2.750%, 6-15-21 | | | 1,000 | | | | 1,016 | |
| | | | | | | | |
| |
Apparel, Accessories & Luxury Goods – 0.4% | |
LVMH Moet Hennessy - Louis Vuitton, | | | | | | | | |
1.625%, 6-29-17 (A) | | | 1,725 | | | | 1,727 | |
| | | | | | | | |
| |
Auto Parts & Equipment – 0.6% | |
BorgWarner Automotive, Inc., | | | | | | | | |
8.000%, 10-1-19 | | | 2,000 | | | | 2,270 | |
| | | | | | | | |
| |
Automobile Manufacturers – 1.0% | |
Toyota Motor Credit Corp., | | | | | | | | |
2.000%, 10-24-18 | | | 4,000 | | | | 4,023 | |
| | | | | | | | |
| |
Cable & Satellite – 2.1% | |
Comcast Corp. (GTD by Comcast Cable Communications and NBCUniversal), | | | | | | | | |
1.625%, 1-15-22 | | | 750 | | | | 718 | |
DIRECTV Holdings LLC and DIRECTV Financing Co., Inc., | | | | | | | | |
4.450%, 4-1-24 | | | 1,190 | | | | 1,239 | |
Lender Processing Services, Inc. and Black Knight Lending Solutions, Inc., | | | | | | | | |
5.750%, 4-15-23 | | | 1,076 | | | | 1,127 | |
Time Warner Cable, Inc., | | | | | | | | |
5.850%, 5-1-17 | | | 1,901 | | | | 1,928 | |
Time Warner Co., Inc. (GTD by Time Warner, Inc.), | | | | | | | | |
7.250%, 10-15-17 | | | 3,337 | | | | 3,486 | |
| | | | | | | | |
| | | | | | | 8,498 | |
| | | | | | | | |
| |
General Merchandise Stores – 1.0% | |
Dollar General Corp., | | | | | | | | |
4.125%, 7-15-17 | | | 4,000 | | | | 4,058 | |
| | | | | | | | |
| |
Home Improvement Retail – 0.3% | |
Home Depot, Inc. (The), | | | | | | | | |
3.750%, 2-15-24 | | | 1,000 | | | | 1,052 | |
| | | | | | | | |
| | | | | | | | |
CORPORATE DEBT SECURITIES
(Continued) | | Principal | | | Value | |
Internet & Direct Marketing Retail – 0.9% | |
Amazon.com, Inc.: | | | | | | | | |
1.200%, 11-29-17 | | $ | 2,000 | | | $ | 2,001 | |
3.800%, 12-5-24 | | | 1,520 | | | | 1,595 | |
| | | | | | | | |
| | | | | | | 3,596 | |
| | | | | | | | |
| |
Total Consumer Discretionary – 6.6% | | | | 26,240 | |
Consumer Staples | |
| |
Brewers – 0.8% | |
Anheuser-Busch InBev S.A./N.V., | | | | | | | | |
3.300%, 2-1-23 | | | 3,085 | | | | 3,136 | |
| | | | | | | | |
| |
Distillers & Vintners – 0.7% | |
Beam, Inc., | | | | | | | | |
1.875%, 5-15-17 | | | 2,672 | | | | 2,676 | |
| | | | | | | | |
| |
Drug Retail – 0.5% | |
CVS Health Corp., | | | | | | | | |
2.250%, 12-5-18 | | | 2,000 | | | | 2,017 | |
| | | | | | | | |
| |
Food Distributors – 0.7% | |
Bestfoods, | | | | | | | | |
7.000%, 10-15-17 | | | 2,500 | | | | 2,612 | |
| | | | | | | | |
| |
Food Retail – 0.5% | |
Kroger Co. (The): | | | | | | | | |
6.800%, 12-15-18 | | | 1,245 | | | | 1,363 | |
1.500%, 9-30-19 | | | 750 | | | | 738 | |
| | | | | | | | |
| | | | | | | 2,101 | |
| | | | | | | | |
| |
Hypermarkets & Super Centers – 0.5% | |
Costco Wholesale Corp., | | | | | | | | |
1.125%, 12-15-17 | | | 1,900 | | | | 1,898 | |
| | | | | | | | |
| |
Packaged Foods & Meats – 1.5% | |
Hershey Co. (The), | | | | | | | | |
1.600%, 8-21-18 | | | 2,000 | | | | 2,009 | |
Kraft Heinz Foods Co., | | | | | | | | |
4.875%, 2-15-25 (A) | | | 1,500 | | | | 1,617 | |
Tyson Foods, Inc. (GTD by Tyson Fresh Meats, Inc.), | | | | | | | | |
2.650%, 8-15-19 | | | 2,459 | | | | 2,482 | |
| | | | | | | | |
| | | | | | | 6,108 | |
| | | | | | | | |
| | |
Total Consumer
Staples – 5.2% | | | | | | | 20,548 | |
Energy | |
| |
Integrated Oil & Gas – 0.7% | |
Pemex Project Funding Master Trust (GTD by Petroleos Mexicanos), | | | | | | | | |
4.607%, 3-11-22 (A)(B) | | | 1,000 | | | | 1,031 | |
Statoil ASA (GTD by Statoil Petroleum AS), | | | | | | | | |
1.950%, 11-8-18 | | | 1,500 | | | | 1,505 | |
| | | | | | | | |
| | | | | | | 2,536 | |
| | | | | | | | |
| |
Oil & Gas Equipment & Services – 0.9% | |
Enterprise Products Operating LLC (GTD by Enterprise Products Partners L.P.), | | | | | | | | |
6.500%, 1-31-19 | | | 1,850 | | | | 2,016 | |
| | | | | | | | |
CORPORATE DEBT SECURITIES
(Continued) | | Principal | | | Value | |
Oil & Gas Equipment & Services (Continued) | |
Schlumberger Norge A.S. (GTD by Schlumberger Ltd.), | | | | | | | | |
1.250%, 8-1-17 (A) | | $ | 1,500 | | | $ | 1,498 | |
| | | | | | | | |
| | | | | | | 3,514 | |
| | | | | | | | |
| |
Oil & Gas Exploration & Production – 2.2% | |
BP Capital Markets plc (GTD by BP plc), | | | | | | | | |
1.674%, 2-13-18 | | | 3,750 | | | | 3,753 | |
ConocoPhillips Co. (GTD by ConocoPhillips), | | | | | | | | |
3.350%, 11-15-24 | | | 1,000 | | | | 993 | |
EQT Corp., | | | | | | | | |
8.125%, 6-1-19 | | | 2,650 | | | | 2,981 | |
Exxon Mobil Corp., | | | | | | | | |
1.003%, 3-15-17 (B) | | | 1,100 | | | | 1,100 | |
| | | | | | | | |
| | | | | | | 8,827 | |
| | | | | | | | |
| |
Oil & Gas Refining & Marketing – 1.0% | |
PBF Holding Co. LLC and PBF Finance Corp., | | | | | | | | |
8.250%, 2-15-20 | | | 1,300 | | | | 1,333 | |
Shell International Finance B.V. (GTD by Royal Dutch Shell plc), | | | | | | | | |
2.000%, 11-15-18 | | | 2,625 | | | | 2,642 | |
| | | | | | | | |
| | | | | | | 3,975 | |
| | | | | | | | |
| |
Oil & Gas Storage & Transportation – 1.0% | |
El Paso Corp., | | | | | | | | |
7.000%, 6-15-17 | | | 2,000 | | | | 2,046 | |
EnLink Midstream Partners L.P., | | | | | | | | |
4.850%, 7-15-26 | | | 1,000 | | | | 1,007 | |
Sunoco Logistics Partners Operations L.P. (GTD by Sunoco Logistics Partners L.P.), | | | | | | | | |
4.400%, 4-1-21 | | | 800 | | | | 842 | |
| | | | | | | | |
| | | | | | | 3,895 | |
| | | | | | | | |
| |
Total Energy – 5.8% | | | | 22,747 | |
Financials | |
| |
Asset Management & Custody Banks – 0.7% | |
Ares Capital Corp., | | | | | | | | |
3.875%, 1-15-20 | | | 2,820 | | | | 2,858 | |
| | | | | | | | |
| |
Consumer Finance – 4.3% | |
American Honda Finance Corp.: | | | | | | | | |
7.625%, 10-1-18 (A) | | | 1,000 | | | | 1,099 | |
2.125%, 10-10-18 | | | 3,000 | | | | 3,023 | |
1.186%, 11-19-18 (B) | | | 1,540 | | | | 1,541 | |
Capital One Financial Corp., | | | | | | | | |
6.750%, 9-15-17 | | | 1,000 | | | | 1,036 | |
Discover Financial Services, | | | | | | | | |
3.950%, 11-6-24 | | | 2,000 | | | | 1,980 | |
Ford Motor Credit Co. LLC, | | | | | | | | |
5.000%, 5-15-18 | | | 1,126 | | | | 1,170 | |
General Motors Financial Co., Inc. (GTD by AmeriCredit Financial Services, Inc.): | | | | | | | | |
2.400%, 5-9-19 | | | 3,000 | | | | 2,991 | |
4.200%, 3-1-21 | | | 1,000 | | | | 1,028 | |
| | |
| SCHEDULE OF INVESTMENTS | | LIMITED-TERM BOND (in thousands) |
DECEMBER 31, 2016
| | | | | | | | |
CORPORATE DEBT SECURITIES
(Continued) | | Principal | | | Value | |
Consumer Finance (Continued) | |
Hyundai Capital America, | | | | | | | | |
2.875%, 8-9-18 (A) | | $ | 1,000 | | | $ | 1,011 | |
Synchrony Financial, | | | | | | | | |
2.287%, 11-9-17 (B) | | | 2,114 | | | | 2,128 | |
| | | | | | | | |
| | | | | | | 17,007 | |
| | | | | | | | |
| |
Diversified Banks – 6.6% | |
Ally Financial, Inc., | | | | | | | | |
5.500%, 2-15-17 | | | 1,630 | | | | 1,636 | |
Banco del Estado de Chile, | | | | | | | | |
1.270%, 3-13-17 (B) | | | 1,500 | | | | 1,501 | |
Bank of America Corp., | | | | | | | | |
2.625%, 4-19-21 | | | 1,500 | | | | 1,488 | |
Bank of Montreal, | | | | | | | | |
1.247%, 6-6-17 (B) | | | 1,500 | | | | 1,502 | |
Bank of New York Mellon Corp. (The), | | | | | | | | |
2.300%, 9-11-19 | | | 2,550 | | | | 2,570 | |
BB&T Corp., | | | | | | | | |
2.050%, 5-10-21 | | | 1,150 | | | | 1,128 | |
Bear Stearns Co., Inc. (The), | | | | | | | | |
6.400%, 10-2-17 | | | 2,000 | | | | 2,072 | |
Branch Banking and Trust Co., | | | | | | | | |
1.450%, 5-10-19 | | | 2,000 | | | | 1,977 | |
Mitsubishi UFJ Financial Group, Inc., | | | | | | | | |
2.190%, 9-13-21 | | | 2,000 | | | | 1,943 | |
Mizuho Financial Group, Inc., | | | | | | | | |
2.273%, 9-13-21 | | | 3,100 | | | | 3,007 | |
Royal Bank of Canada, | | | | | | | | |
1.114%, 4-4-17 (B) | | | 2,000 | | | | 2,002 | |
Sumitomo Mitsui Financial Group, Inc., | | | | | | | | |
2.058%, 7-14-21 | | | 750 | | | | 725 | |
Wachovia Corp., | | | | | | | | |
5.750%, 2-1-18 | | | 1,500 | | | | 1,564 | |
Wells Fargo & Co., | | | | | | | | |
3.000%, 2-19-25 | | | 995 | | | | 955 | |
Wells Fargo Bank N.A., | | | | | | | | |
1.217%, 2-15-17 (B) | | | 2,000 | | | | 2,001 | |
| | | | | | | | |
| | | | | | | 26,071 | |
| | | | | | | | |
| |
Investment Banking & Brokerage – 2.3% | |
Goldman Sachs Group, Inc. (The): | | | | | | | | |
2.375%, 1-22-18 | | | 1,000 | | | | 1,006 | |
2.750%, 9-15-20 | | | 800 | | | | 803 | |
2.350%, 11-15-21 | | | 1,000 | | | | 971 | |
4.000%, 3-3-24 | | | 800 | | | | 829 | |
Merrill Lynch & Co., Inc., | | | | | | | | |
6.400%, 8-28-17 | | | 2,000 | | | | 2,061 | |
Morgan Stanley: | | | | | | | | |
2.800%, 6-16-20 | | | 1,000 | | | | 1,007 | |
2.500%, 4-21-21 | | | 1,000 | | | | 988 | |
3.000%, 5-31-23 (B) | | | 300 | | | | 302 | |
2.282%, 10-24-23 (B) | | | 1,000 | | | | 1,011 | |
| | | | | | | | |
| | | | | | | 8,978 | |
| | | | | | | | |
| |
Life & Health Insurance – 1.5% | |
Athene Global Funding, | | | | | | | | |
2.875%, 10-23-18 (A) | | | 2,550 | | | | 2,549 | |
New York Life Global Funding, | | | | | | | | |
1.550%, 11-2-18 (A) | | | 1,500 | | | | 1,495 | |
| | | | | | | | |
CORPORATE DEBT SECURITIES
(Continued) | | Principal | | | Value | |
Life & Health Insurance (Continued) | |
Principal Life Global Funding II, | | | | | | | | |
2.625%, 11-19-20 (A) | | $ | 2,000 | | | $ | 1,997 | |
| | | | | | | | |
| | | | | | | 6,041 | |
| | | | | | | | |
| |
Other Diversified Financial Services – 3.9% | |
Citigroup, Inc.: | | | | | | | | |
2.650%, 10-26-20 | | | 1,000 | | | | 1,000 | |
2.700%, 3-30-21 | | | 1,000 | | | | 997 | |
2.028%, 12-8-21 (B) | | | 2,500 | | | | 2,510 | |
Fidelity National Financial, Inc., | | | | | | | | |
6.600%, 5-15-17 | | | 1,000 | | | | 1,017 | |
Fidelity National Information Services, Inc., | | | | | | | | |
2.850%, 10-15-18 | | | 1,100 | | | | 1,119 | |
JPMorgan Chase & Co.: | | | | | | | | |
6.000%, 1-15-18 | | | 1,316 | | | | 1,373 | |
2.295%, 8-15-21 | | | 2,000 | | | | 1,961 | |
3.000%, 2-27-30 (B) | | | 850 | | | | 812 | |
JPMorgan Chase Bank N.A., | | | | | | | | |
1.444%, 9-21-18 (B) | | | 1,500 | | | | 1,502 | |
USAA Capital Corp., | | | | | | | | |
2.450%, 8-1-20 (A) | | | 3,245 | | | | 3,252 | |
| | | | | | | | |
| | | | | | | 15,543 | |
| | | | | | | | |
| |
Property & Casualty Insurance – 1.4% | |
ACE INA Holdings, Inc. (GTD by ACE Ltd.), | | | | | | | | |
2.300%, 11-3-20 | | | 1,500 | | | | 1,498 | |
Berkshire Hathaway, Inc.: | | | | | | | | |
2.100%, 8-14-19 | | | 3,000 | | | | 3,026 | |
2.750%, 3-15-23 | | | 1,000 | | | | 995 | |
| | | | | | | | |
| | | | | | | 5,519 | |
| | | | | | | | |
| |
Regional Banks – 0.4% | |
PNC Funding Corp. (GTD by PNC Financial Services Group, Inc.), | | | | | | | | |
6.700%, 6-10-19 | | | 1,447 | | | | 1,605 | |
| | | | | | | | |
| |
Specialized Finance – 0.8% | |
ADOP Co., | | | | | | | | |
6.625%, 10-1-17 (A) | | | 1,000 | | | | 1,032 | |
Diamond 1 Finance Corp. and Diamond 2 Finance Corp., | | | | | | | | |
3.480%, 6-1-19 (A) | | | 1,875 | | | | 1,913 | |
| | | | | | | | |
| | | | | | | 2,945 | |
| | | | | | | | |
| |
Total Financials – 21.9% | | | | 86,567 | |
Health Care | |
| |
Biotechnology – 0.6% | |
Amgen, Inc., | | | | | | | | |
5.850%, 6-1-17 | | | 2,373 | | | | 2,416 | |
| | | | | | | | |
| |
Health Care Supplies – 1.9% | |
Abbott Laboratories, | | | | | | | | |
2.350%, 11-22-19 | | | 1,150 | | | | 1,151 | |
Catholic Health Initiatives, | | | | | | | | |
2.600%, 8-1-18 | | | 3,575 | | | | 3,609 | |
Medtronic, Inc., | | | | | | | | |
3.500%, 3-15-25 | | | 1,750 | | | | 1,800 | |
| | | | | | | | |
CORPORATE DEBT SECURITIES
(Continued) | | Principal | | | Value | |
Health Care Supplies (Continued) | |
Stryker Corp., | | | | | | | | |
2.625%, 3-15-21 | | $ | 1,000 | | | $ | 1,003 | |
| | | | | | | | |
| | | | | | | 7,563 | |
| | | | | | | | |
| |
Managed Health Care – 0.7% | |
Aetna, Inc., | | | | | | | | |
1.500%, 11-15-17 | | | 2,475 | | | | 2,473 | |
| | | | | | | | |
| |
Pharmaceuticals – 0.3% | |
AbbVie, Inc., | | | | | | | | |
2.500%, 5-14-20 | | | 1,200 | | | | 1,199 | |
| | | | | | | | |
| |
Total Health Care – 3.5% | | | | 13,651 | |
Industrials | |
| |
Aerospace & Defense – 1.1% | |
BAE Systems Holdings, Inc.: | | | | | | | | |
6.375%, 6-1-19 (A) | | | 941 | | | | 1,026 | |
3.850%, 12-15-25 (A) | | | 1,500 | | | | 1,528 | |
BAE Systems plc, | | | | | | | | |
4.750%, 10-11-21 (A) | | | 748 | | | | 808 | |
Exelis, Inc., | | | | | | | | |
5.550%, 10-1-21 | | | 460 | | | | 507 | |
General Dynamics Corp., | | | | | | | | |
1.875%, 8-15-23 | | | 500 | | | | 475 | |
| | | | | | | | |
| | | | | | | 4,344 | |
| | | | | | | | |
| |
Air Freight & Logistics – 0.6% | |
FedEx Corp., | | | | | | | | |
8.000%, 1-15-19 | | | 2,252 | | | | 2,520 | |
| | | | | | | | |
| |
Airlines – 1.0% | |
Southwest Airlines Co.: | | | | | | | | |
5.125%, 3-1-17 | | | 2,263 | | | | 2,276 | |
2.650%, 11-5-20 | | | 1,500 | | | | 1,503 | |
| | | | | | | | |
| | | | | | | 3,779 | |
| | | | | | | | |
| |
Environmental & Facilities Services – 1.9% | |
Republic Services, Inc., | | | | | | | | |
3.800%, 5-15-18 | | | 4,000 | | | | 4,111 | |
Waste Management, Inc. (GTD by Waste Management Holdings, Inc.): | | | | | | | | |
6.100%, 3-15-18 | | | 2,540 | | | | 2,675 | |
7.100%, 8-1-26 | | | 550 | | | | 697 | |
| | | | | | | | |
| | | | | | | 7,483 | |
| | | | | | | | |
| |
Heavy Electrical Equipment – 0.7% | |
Honeywell International, Inc., | | | | | | | | |
1.850%, 11-1-21 | | | 2,945 | | | | 2,875 | |
| | | | | | | | |
| |
Industrial Conglomerates – 0.7% | |
General Electric Capital Corp., | | | | | | | | |
5.012%, 1-1-24 | | | 2,586 | | | | 2,738 | |
| | | | | | | | |
| |
Railroads – 0.7% | |
Burlington Northern Santa Fe Corp., | | | | | | | | |
5.750%, 3-15-18 | | | 2,750 | | | | 2,890 | |
| | | | | | | | |
| |
Total Industrials – 6.7% | | | | 26,629 | |
| | |
| SCHEDULE OF INVESTMENTS | | LIMITED-TERM BOND (in thousands) |
DECEMBER 31, 2016
| | | | | | | | |
CORPORATE DEBT SECURITIES
(Continued) | | Principal | | | Value | |
Information Technology | |
| |
Application Software – 0.4% | |
NVIDIA Corp., | | | | | | | | |
2.200%, 9-16-21 | | $ | 1,500 | | | $ | 1,463 | |
| | | | | | | | |
| |
Communications Equipment – 0.7% | |
Cisco Systems, Inc., | | | | | | | | |
2.200%, 2-28-21 | | | 2,000 | | | | 1,994 | |
L-3 Communications Corp., | | | | | | | | |
3.850%, 12-15-26 | | | 750 | | | | 744 | |
| | | | | | | | |
| | | | | | | 2,738 | |
| | | | | | | | |
| |
Data Processing & Outsourced Services – 0.8% | |
Alliance Data Systems Corp., | | | | | | | | |
6.375%, 4-1-20 (A) | | | 1,000 | | | | 1,015 | |
Visa, Inc., | | | | | | | | |
2.800%, 12-14-22 | | | 2,000 | | | | 2,007 | |
| | | | | | | | |
| | | | | | | 3,022 | |
| | | | | | | | |
| |
Home Entertainment Software – 0.3% | |
Activision Blizzard, Inc., | | | | | | | | |
2.300%, 9-15-21 (A) | | | 1,000 | | | | 975 | |
| | | | | | | | |
| |
Semiconductors – 0.6% | |
Intel Corp., | | | | | | | | |
2.450%, 7-29-20 | | | 1,000 | | | | 1,013 | |
Samsung Electronics America, Inc. (GTD by Samsung Electronics Co. Ltd.), | | | | | | | | |
1.750%, 4-10-17 (A) | | | 1,500 | | | | 1,501 | |
| | | | | | | | |
| | | | | | | 2,514 | |
| | | | | | | | |
| |
Systems Software – 0.9% | |
CA, Inc., | | | | | | | | |
5.375%, 12-1-19 | | | 1,500 | | | | 1,619 | |
Microsoft Corp., | | | | | | | | |
2.000%, 11-3-20 | | | 2,000 | | | | 2,001 | |
| | | | | | | | |
| | | | | | | 3,620 | |
| | | | | | | | |
| |
Technology Hardware, Storage &
Peripherals – 0.6% | |
Apple, Inc., | | | | | | | | |
1.550%, 2-7-20 | | | 2,500 | | | | 2,468 | |
| | | | | | | | |
| |
Total Information Technology – 4.3% | | | | 16,800 | |
Materials | |
| |
Diversified Chemicals – 0.2% | |
Dow Chemical Co. (The), | | | | | | | | |
4.250%, 11-15-20 | | | 724 | | | | 766 | |
| | | | | | | | |
Specialty Chemicals – 0.5% | |
Methanex Corp., | | | | | | | | |
3.250%, 12-15-19 | | | 2,000 | | | | 1,968 | |
| | | | | | | | |
| |
Total Materials – 0.7% | | | | 2,734 | |
| | | | | | | | |
CORPORATE DEBT SECURITIES
(Continued) | | Principal | | | Value | |
Real Estate | |
| |
Specialized REITs – 0.4% | |
Crown Castle International Corp.: | | | | | | | | |
2.250%, 9-1-21 | | $ | 500 | | | $ | 483 | |
4.875%, 4-15-22 | | | 1,000 | | | | 1,065 | |
| | | | | | | | |
| | | | | | | 1,548 | |
| | | | | | | | |
| |
Total Real Estate – 0.4% | | | | 1,548 | |
Telecommunication Services | |
| |
Integrated Telecommunication Services – 0.7% | |
AT&T, Inc., | | | | | | | | |
5.875%, 10-1-19 | | | 2,592 | | | | 2,831 | |
| | | | | | | | |
| |
Wireless Telecommunication Service – 1.9% | |
American Tower Corp.: | | | | | | | | |
3.300%, 2-15-21 | | | 2,500 | | | | 2,526 | |
5.900%, 11-1-21 | | | 800 | | | | 895 | |
2.250%, 1-15-22 | | | 2,165 | | | | 2,072 | |
3.375%, 10-15-26 | | | 1,000 | | | | 945 | |
Crown Castle Towers LLC, | | | | | | | | |
3.222%, 5-15-22 (A) | | | 1,000 | | | | 1,017 | |
| | | | | | | | |
| | | | | | | 7,455 | |
| | | | | | | | |
| |
Total Telecommunication
Services – 2.6% | | | | 10,286 | |
Utilities | |
| |
Electric Utilities – 1.5% | |
Emera U.S. Finance L.P. (GTD by Emera U.S. Holdings, Inc.), | | | | | | | | |
2.150%, 6-15-19 (A) | | | 1,000 | | | | 998 | |
Entergy Mississippi, Inc., | | | | | | | | |
2.850%, 6-1-28 | | | 1,050 | | | | 995 | |
Entergy Texas, Inc., | | | | | | | | |
2.550%, 6-1-21 | | | 1,275 | | | | 1,270 | |
MidAmerican Energy Co., | | | | | | | | |
3.700%, 9-15-23 | | | 1,545 | | | | 1,616 | |
National Rural Utilities Cooperative Finance Corp., | | | | | | | | |
1.650%, 2-8-19 | | | 1,000 | | | | 999 | |
| | | | | | | | |
| | | | | | | 5,878 | |
| | | | | | | | |
| |
Multi-Utilities – 1.0% | |
Dominion Resources, Inc., | | | | | | | | |
6.400%, 6-15-18 | | | 3,000 | | | | 3,181 | |
Dominion Resources, Inc., Series A, | | | | | | | | |
1.400%, 9-15-17 | | | 1,000 | | | | 999 | |
| | | | | | | | |
| | | | | | | 4,180 | |
| | | | | | | | |
| |
Total Utilities – 2.5% | | | | 10,058 | |
| |
TOTAL CORPORATE DEBT SECURITIES – 60.2% | | | $ | 237,808 | |
(Cost: $237,875) | | | | | | | | |
| | | | | | | | |
| MORTGAGE-BACKED SECURITIES | | Principal | | | Value | |
Non-Agency REMIC/CMO – 0.4% | |
Bear Stearns Deutsche Bank Trust, Commercial Mortgage Pass-Through Certificates, Series 2005-AFR1, Class C, | | | | | | | | |
5.097%, 9-15-27 (A) | | $ | 640 | | | $ | 689 | |
CFCRE Commercial Mortgage Trust, Series 2015-RUM, Class B, | | | | | | | | |
2.854%, 7-15-30 (A)(B) | | | 870 | | | | 854 | |
| | | | | | | | |
| | | | | | | 1,543 | |
| | | | | | | | |
| |
TOTAL MORTGAGE-BACKED SECURITIES – 0.4% | | | $ | 1,543 | |
(Cost: $1,569) | | | | | | | | |
| |
| MUNICIPAL BONDS – TAXABLE | | | | |
California – 1.2% | |
Alameda Corridor Trans Auth, Taxable Sr Lien Rev Bonds, Ser 1999C, | | | | | | | | |
6.500%, 10-1-19 | | | 980 | | | | 1,057 | |
CA Various Purp GO Bonds, | | | | | | | | |
7.700%, 11-1-30 | | | 1,750 | | | | 2,093 | |
The Regents of the Univ of CA, Gen Rev Bonds, Ser 2013AH, | | | | | | | | |
1.796%, 7-1-19 | | | 1,500 | | | | 1,505 | |
| | | | | | | | |
| | | | | | | 4,655 | |
| | | | | | | | |
| |
New York – 0.4% | |
NYC GO Bonds, Fiscal 2017 Ser A-2, | | | | | | | | |
2.460%, 8-1-26 | | | 1,750 | | | | 1,639 | |
| | | | | | | | |
| |
TOTAL MUNICIPAL BONDS – TAXABLE – 1.6% | | | $ | 6,294 | |
(Cost: $6,454) | | | | | | | | |
| | |
UNITED STATES GOVERNMENT
AGENCY OBLIGATIONS | | | | | | |
Agency Obligations – 1.6% | |
Federal Home Loan Bank: | | | | | | | | |
2.500%, 4-27-26 | | | 2,000 | | | | 1,942 | |
1.750%, 7-21-31 | | | 1,640 | | | | 1,606 | |
1.700%, 7-25-31 | | | 1,500 | | | | 1,442 | |
2.000%, 11-25-31 | | | 200 | | | | 192 | |
U.S. Department of Transportation, | | | | | | | | |
6.001%, 12-7-21 (A) | | | 1,000 | | | | 1,131 | |
| | | | | | | | |
| | | | | | | 6,313 | |
| | | | | | | | |
| |
Mortgage-Backed Obligations – 20.7% | |
Federal Home Loan Mortgage Corp. Agency REMIC/CMO: | | | | | | | | |
2.699%, 5-25-18 | | | 1,037 | | | | 1,052 | |
5.449%, 4-25-20 (A)(B) | | | 880 | | | | 955 | |
3.842%, 6-25-21 (A)(B) | | | 1,286 | | | | 1,299 | |
3.547%, 2-25-22 (A)(B) | | | 1,000 | | | | 986 | |
4.000%, 6-15-26 | | | 3,913 | | | | 4,144 | |
2.125%, 8-28-31 | | | 725 | | | | 689 | |
4.881%, 7-25-44 (A)(B) | | | 1,100 | | | | 1,138 | |
4.948%, 8-25-44 (A)(B) | | | 1,000 | | | | 1,078 | |
4.160%, 9-25-44 (A)(B) | | | 2,000 | | | | 2,061 | |
4.342%, 12-25-44 (A)(B) | | | 3,047 | | | | 3,220 | |
3.751%, 2-25-45 (A)(B) | | | 1,906 | | | | 1,954 | |
| | |
| SCHEDULE OF INVESTMENTS | | LIMITED-TERM BOND (in thousands) |
DECEMBER 31, 2016
| | | | | | | | |
UNITED STATES GOVERNMENT
AGENCY OBLIGATIONS (Continued) | | Principal | | | Value | |
Mortgage-Backed Obligations (Continued) | |
4.344%, 1-25-46 (A)(B) | | $ | 1,000 | | | $ | 1,052 | |
3.980%, 2-25-46 (A)(B) | | | 70 | | | | 73 | |
4.595%, 11-25-46 (A)(B) | | | 1,557 | | | | 1,661 | |
3.565%, 11-25-47 (A)(B) | | | 365 | | | | 356 | |
4.286%, 7-25-48 (A)(B) | | | 1,275 | | | | 1,281 | |
4.423%, 12-25-48 (A)(B) | | | 3,625 | | | | 3,831 | |
Federal Home Loan Mortgage Corp. Fixed Rate Participation Certificates: | | | | | | | | |
3.000%, 8-1-28 | | | 3,377 | | | | 3,469 | |
3.000%, 9-1-28 | | | 3,386 | | | | 3,493 | |
3.500%, 10-1-28 | | | 3,921 | | | | 4,098 | |
3.000%, 11-1-29 | | | 1,498 | | | | 1,538 | |
4.500%, 8-1-30 | | | 1,011 | | | | 1,086 | |
3.000%, 1-15-42 | | | 955 | | | | 961 | |
2.500%, 5-15-44 | | | 896 | | | | 900 | |
Federal National Mortgage Association Agency REMIC/CMO: | | | | | | | | |
2.990%, 11-1-18 | | | 1,698 | | | | 1,736 | |
3.000%, 2-25-25 | | | 2,238 | | | | 2,307 | |
3.510%, 4-25-29 | | | 2,500 | | | | 2,502 | |
2.375%, 2-24-31 | | | 1,500 | | | | 1,460 | |
2.000%, 4-25-39 | | | 1,011 | | | | 1,003 | |
2.000%, 6-25-39 | | | 3,374 | | | | 3,368 | |
2.000%, 4-25-40 | | | 986 | | | | 979 | |
1.750%, 2-25-41 | | | 2,100 | | | | 2,106 | |
2.500%, 11-25-45 | | | 3,010 | | | | 3,022 | |
Federal National Mortgage Association Fixed Rate Pass-Through Certificates: | | | | | | | | |
4.580%, 6-1-19 | | | 3,530 | | | | 3,738 | |
4.647%, 7-1-20 | | | 2,255 | | | | 2,408 | |
3.680%, 2-1-21 | | | 1,152 | | | | 1,183 | |
| | | | | | | | |
UNITED STATES GOVERNMENT
AGENCY OBLIGATIONS (Continued) | | Principal | | | Value | |
Mortgage-Backed Obligations (Continued) | |
4.381%, 6-1-21 | | $ | 1,778 | | | $ | 1,921 | |
5.500%, 10-1-21 | | | 493 | | | | 517 | |
3.000%, 9-1-28 | | | 1,677 | | | | 1,723 | |
4.000%, 12-1-31 | | | 2,386 | | | | 2,530 | |
2.000%, 10-25-41 | | | 2,202 | | | | 2,158 | |
2.500%, 12-25-45 | | | 3,146 | | | | 3,171 | |
Government National Mortgage Association Agency REMIC/CMO, | | | | | | | | |
2.000%, 3-16-42 | | | 1,385 | | | | 1,348 | |
| | | | | | | | |
| | | | | | | 81,555 | |
| | | | | | | | |
| |
TOTAL UNITED STATES GOVERNMENT AGENCY OBLIGATIONS – 22.3% | | | $ | 87,868 | |
(Cost: $88,421) | | | | | | | | |
| | |
UNITED STATES GOVERNMENT
OBLIGATIONS | | | | | | |
Treasury Obligations – 9.5% | |
U.S. Treasury Notes: | | | | | | | | |
0.625%, 9-30-17 | | | 7,500 | | | | 7,489 | |
0.750%, 10-31-17 | | | 5,000 | | | | 4,995 | |
2.750%, 2-28-18 | | | 9,000 | | | | 9,180 | |
1.750%, 10-31-20 | | | 8,000 | | | | 8,010 | |
2.000%, 12-31-21 | | | 8,000 | | | | 8,021 | |
| | | | | | | | |
| | | | | | | 37,695 | |
| | | | | | | | |
| |
TOTAL UNITED STATES GOVERNMENT
OBLIGATIONS – 9.5% | | | $ | 37,695 | |
(Cost: $37,702) | | | | | | | | |
| | | | | | | | |
| SHORT-TERM SECURITIES | | Principal | | | Value | |
Commercial Paper (C) – 4.5% | |
Danaher Corp., | | | | | | | | |
0.700%, 1-4-17 | | $ | 6,000 | | | $ | 6,000 | |
Kroger Co. (The), | | | | | | | | |
0.880%, 1-3-17 | | | 5,000 | | | | 5,000 | |
McDonalds Corp., | | | | | | | | |
0.900%, 1-10-17 | | | 4,000 | | | | 3,999 | |
Wisconsin Gas LLC, | | | | | | | | |
0.680%, 1-6-17 | | | 3,000 | | | | 2,999 | |
| | | | | | | | |
| | | | | | | 17,998 | |
| | | | | | | | |
| |
Master Note – 0.6% | |
Toyota Motor Credit Corp., | | | | | | | | |
0.860%, 1-4-17 (D) | | | 2,275 | | | | 2,275 | |
| | | | | | | | |
| |
Municipal Obligations – 1.3% | |
NYC GO Bonds, Fiscal 2008 Ser L-4 (GTD by U.S. Bank N.A.), | | | | | | | | |
0.710%, 1-1-17 (D) | | | 5,000 | | | | 5,000 | |
| | | | | | | | |
| |
TOTAL SHORT-TERM
SECURITIES – 6.4% | | | $ | 25,273 | |
(Cost: $25,273) | | | | | | | | |
| |
TOTAL INVESTMENT
SECURITIES – 101.4% | | | $ | 400,349 | |
(Cost: $401,202) | | | | | | | | |
| |
LIABILITIES, NET OF CASH AND OTHER ASSETS – (1.4)% | | | | (5,582 | ) |
| |
NET ASSETS – 100.0% | | | $ | 394,767 | |
Notes to Schedule of Investments
| (A) | Securities were purchased pursuant to an exemption from registration available under Rule 144A under the Securities Act of 1933 and may only be resold in transactions exempt from registration, normally to qualified institutional buyers. At December 31, 2016 the total value of these securities amounted to $55,603 or 14.1% of net assets. |
| (B) | Variable rate security. Interest rate disclosed is that which is in effect at December 31, 2016. |
| (C) | Rate shown is the yield to maturity at December 31, 2016. |
| (D) | Variable rate security. Interest rate disclosed is that which is in effect at December 31, 2016. Date shown represents the date that the variable rate resets. |
The following table is a summary of the valuation of the Portfolio’s investments by the fair value hierarchy levels as of December 31, 2016. See Note 3 to the Financial Statements for further information regarding fair value measurement.
| | | | | | | | | | | | |
| | | Level 1 | | | Level 2 | | | Level 3 | |
Assets | | | | | | | | | | | | |
Investments in Securities | | | | | | | | | | | | |
Asset-Backed Securities | | $ | — | | | $ | 3,868 | | | $ | — | |
Corporate Debt Securities | | | — | | | | 237,808 | | | | — | |
Mortgage-Backed Securities | | | — | | | | 1,543 | | | | — | |
Municipal Bonds | | | — | | | | 6,294 | | | | — | |
United States Government Agency Obligations | | | — | | | | 87,868 | | | | — | |
United States Government Obligations | | | — | | | | 37,695 | | | | — | |
Short-Term Securities | | | — | | | | 25,273 | | | | — | |
Total | | $ | — | | | $ | 400,349 | | | $ | — | |
During the year ended December 31, 2016, there were no transfers between Level 1 and 2.
The following acronyms are used throughout this schedule:
CMO = Collateralized Mortgage Obligation
GTD = Guaranteed
REIT = Real Estate Investment Trust
REMIC = Real Estate Mortgage Investment Conduit
See Accompanying Notes to Financial Statements.
| | |
| MANAGEMENT DISCUSSION | | MICRO CAP GROWTH |
(UNAUDITED)

John Bichelmeyer
Below, John P. Bichelmeyer, CFA, portfolio manager of Ivy VIP Micro Cap Growth, discusses positioning, performance and results for the fiscal year ended December 31, 2016. He has managed the Portfolio since 2015 and has 20 years of industry experience.
Fiscal Year Performance
| | | | |
For the 12 Months Ended December 31, 2016 | | | | |
Ivy VIP Micro Cap Growth | | | 13.29% | |
Benchmark(s) and/or Lipper Category | | | | |
Russell 2000 Growth Index | | | 11.32% | |
(generally reflects the performance of smaller market cap company stocks within the growth market) | | | | |
Russell Microcap Growth Index | | | 6.79% | |
(generally reflects the performance of stocks in the smallest category of publicly traded companies within the growth market) | | | | |
Lipper Variable Annuity Small-Cap Growth Funds Universe Average | | | 9.97% | |
(generally reflects the performance of the universe of funds with similar investment objectives) | | | | |
Please note that Portfolio returns include applicable fees and expenses while index returns do not include any such fees. Also, the Portfolio’s performance data does not take into account any product expenses or charges associated with owning a variable life or annuity policy, which is invested in Ivy Variable Insurance Portfolios.
Multiple indexes are shown because the Portfolio’s management team expects to typically invest in companies within a wider range of market capitalization.
Key Drivers
The investment landscape at the end of 2016 looked quite different than it did at the beginning of the trading year. As a reminder, the start to the year was memorable for all the wrong reasons in that U.S. equites collapsed due to fears such as a failed U.S. monetary policy and a growth slowdown in China and other emerging markets. As a result, U.S. equities generated one of the worst starts to any year on record. Fast forward 12 months to the end of 2016 and not only did equities recover from their losses, but also, in most cases, equities generated double-digit annual increases based on broad market results.
So what happened? How was it that equites were able to power higher in light of major unexpected events such as the vote by the United Kingdom to exit the European Union and a political outsider being elected to the White House? Simplistically, as 2016 progressed, economic data started to improve despite the doom and gloom prognostications with which some started the year. With the U.S. economy performing significantly better than the feared, confidence slowly re-emerged. Then, the surprise U.S. presidential election outcome triggered a sharp increase in both consumer and business confidence. Thus far, investors have embraced ideas such as a globally competitive tax rate, less regulation and faster economic growth, and as result, the broader equity market raced to new all-time highs at the end of the year.
Performance
For the year ended December 31, 2016, the Portfolio’s benchmarks, the Russell 2000 Growth Index returned 11.3% and the Russell Microcap Growth Index rose 6.8%. Ivy VIP Micro Cap Growth returned 13.3%.
The technology, industrial and energy sectors were the biggest contributors to the Portfolio’s absolute performance in 2016. Various fundamental drivers caused each of these areas of the market to move sharply higher. Within technology, some of the specific drivers included exponential growth of internet bandwidth, rising demand for semiconductor capital equipment and a robust merger and acquisition environment. Positive trends in industrials included an improving spending environment for both defense and telecommunications infrastructure. Lastly, the collapse in oil prices in early 2016 provided an opportunistic entry point in oil service and exploration and production (E&P) companies. At year end, oil prices had nearly doubled from the February lows, and as a result most of the Portfolio’s oil-related stocks rose significantly.
For the calendar year, the most significant factor that contributed to the Portfolio’s relative performance versus the Russell Microcap Growth Index was the meaningful underweight in the health care sector, especially biotechnology and pharmaceutical companies. This was the only sector to negatively perform for the year in the Russell Microcap Growth Index, with a drop of nearly 14%. In comparison, the Portfolio’s health care holdings were up approximately 1%. The combination of an underweight to the worst performing sector in the Russell Microcap Growth Index and strong performance from a few key holdings had a sizable positive impact on the Portfolio’s performance.
The primary area of weakness in the Portfolio on an absolute and relative basis was the consumer discretionary sector. This area of the market has proven difficult to navigate given a variety of headwinds, such as Amazon taking market share, higher labor costs and excess industry capacity in both the retail and restaurant industries.
Portfolio positioning
While benchmark weights are considered, the Portfolio is constructed on a name by name basis. This means it is not uncommon to have sector weights that deviate from the indexes. The technology, health care and consumer discretionary sectors are the areas that generally have some of the best long-term, structural growth opportunities. As a result, the Portfolio’s largest absolute weightings typically fall within these three sectors.
On a relative basis, when compared to the Russell Micro Cap Growth Index, the Portfolio is meaningfully overweight the technology sector. Exposure is centered on some of the most attractive growth areas of the market — unified communications, security, optical components, semiconductor capital equipment and financial technology. Despite the headwinds mentioned above, the Portfolio is slightly over indexed to the consumer discretionary sector. The Portfolio’s exposure is concentrated on business models that have the ability to be successful despite the sector’s difficulties. Energy is another overweight sector in the Portfolio. While small in terms of the overall percentage of the Portfolio, we believe the dramatic decline in E&P capital spending over the past couple years and corresponding OPEC supply reductions have the potential to create a prolonged energy upcycle.
In terms of sector underweights, health care exposure remains significantly below the Russell Micro Cap Growth Index. This stems from the fact that health care has a large weighting in unprofitable, cash flow negative biotechnology and pharmaceutical companies. As a reminder, our investment process tends to shy away from business models where the probability of a success is difficult to ascertain and dependent upon the approval of a single product. Financials and industrials are also underweighted; however, these areas appear to be an increasingly attractive segment of the market given the prospects for less regulation, higher interest rates and accelerating economic growth.
Outlook
Looking forward, we believe the transition to “Trumponomics” is inevitably going to involve major changes that have the potential to significantly impact 2017’s investment landscape. Thus far, investors seem supportive of this unconventional administration’s broad proposals based on the sharp rise in equities post the election; however, we believe that actually passing and implementing these proposals will most likely cause consternation in the marketplace throughout the upcoming year. While we can’t control the impact macroeconomic issues have on the market, we can control what companies are included in the Portfolio and that is where our focus will remain.
Past performance is not a guarantee of future results. The value of the Portfolio’s shares will change, and you could lose money on your investment
Investing in micro-cap stocks may carry more risk than investing in stocks of larger, more established companies. Prices of growth stocks may be more sensitive to changes in current or expected earnings than the prices of other stocks. Growth stocks may not perform as well as value stocks or the stock market in general. These and other risks are more fully described in the Portfolio’s prospectus.
The opinions expressed in this report are those of the portfolio manager and are current only through the end of the period of the report as stated on the cover. The manager’s view is subject to change at any time based on market and other conditions, and no forecasts can be guaranteed.
The index (indexes) noted are unmanaged and include reinvested dividends. One cannot invest directly in an index, nor is an index representative of Ivy VIP Micro Cap Growth.
| | |
| PORTFOLIO HIGHLIGHTS | | MICRO CAP GROWTH |
ALL DATA IS AS OF DECEMBER 31, 2016 (UNAUDITED)
Asset Allocation
| | | | |
Stocks | | | 93.6% | |
Information Technology | | | 25.8% | |
Health Care | | | 23.6% | |
Consumer Discretionary | | | 14.8% | |
Industrials | | | 8.1% | |
Telecommunication Services | | | 6.7% | |
Energy | | | 5.1% | |
Consumer Staples | | | 3.3% | |
Materials | | | 2.6% | |
Real Estate | | | 1.5% | |
Utilities | | | 1.1% | |
Financials | | | 1.0% | |
Cash and Other Assets (Net of Liabilities), and Cash Equivalents+ | | | 6.4% | |
Top 10 Equity Holdings
| | | | |
| Company | | Sector | | Industry |
Tile Shop Holdings, Inc. | | Consumer Discretionary | | Home Improvement Retail |
8x8, Inc. | | Telecommunication Services | | Integrated Telecommunication Services |
SPS Commerce, Inc. | | Information Technology | | Internet Software & Services |
MYR Group, Inc. | | Industrials | | Construction & Engineering |
PDF Solutions, Inc. | | Information Technology | | Semiconductor Equipment |
Aerie Pharmaceuticals, Inc. | | Health Care | | Pharmaceuticals |
GTT Communications, Inc. | | Telecommunication Services | | Integrated Telecommunication Services |
Nautilus Group, Inc. (The) | | Consumer Discretionary | | Leisure Products |
K2M Group Holdings, Inc. | | Health Care | | Health Care Equipment |
Cornerstone OnDemand, Inc. | | Information Technology | | Internet Software & Services |
See your advisor for more information on the Portfolio’s most recently published Top 10 Equity Holdings.
+Cash equivalents are defined as highly liquid securities with maturities of less than three months. Cash equivalents may include U.S. Government Treasury bills, bank certificates of deposit, bankers’ acceptances, corporate commercial paper and other money market instruments.
| | |
COMPARISON OF CHANGE IN VALUE OF $10,000 INVESTMENT | | MICRO CAP GROWTH |
(UNAUDITED)
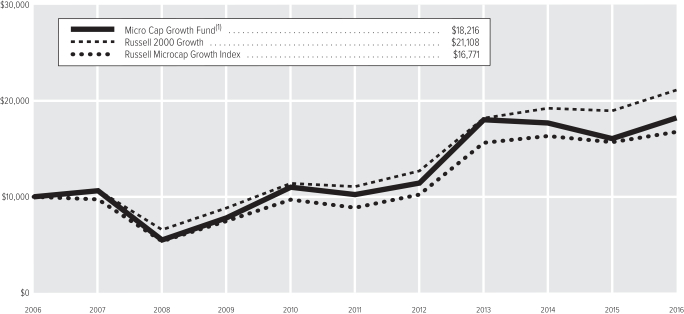
| (1) | The value of the investment in the Portfolio is impacted by the ongoing expenses of the Portfolio and assumes reinvestment of dividends and distributions. |
| | | | |
| Average Annual Total Return(2) | | | |
1-year period ended 12-31-16 | | | 13.29% | |
5-year period ended 12-31-16 | | | 12.21% | |
10-year period ended 12-31-16 | | | 6.18% | |
| (2) | Data quoted is past performance and current performance may be lower or higher. Past performance is no guarantee of future results. Investment return and principal value of an investment will fluctuate and shares, when redeemed, may be worth more or less than their original cost. Please call 1.888.WADDELL for the Portfolio’s most recent month-end performance. Performance data quoted does not reflect any expenses or charges associated with owning a variable life insurance policy or variable annuity contract that invests in the Portfolio’s shares. When such charges are deducted, actual investment performance in a variable policy or contract will be lower. |
Past performance is not necessarily indicative of future performance. Indexes are unmanaged. The performance graph and table do not reflect the deduction of taxes that a shareholder would pay on Portfolio distributions or on the redemption of Portfolio shares. Performance results may include the effect of expense reduction arrangements for some or all of the periods shown. If those arrangements had not been in place, the performance results for those periods would have been lower.
| | |
| SCHEDULE OF INVESTMENTS | | MICRO CAP GROWTH (in thousands) |
DECEMBER 31, 2016
| | | | | | | | |
| COMMON STOCKS | | Shares | | | Value | |
Consumer Discretionary | |
| |
Auto Parts & Equipment – 2.6% | |
Motorcar Parts of America, Inc. (A) | | | 60 | | | $ | 1,602 | |
| | | | | | | | |
| |
Broadcasting – 1.4% | |
Entravision Communications Corp. | | | 130 | | | | 909 | |
| | | | | | | | |
| |
Home Improvement Retail – 4.0% | |
Tile Shop Holdings, Inc. (A) | | | 129 | | | | 2,512 | |
| | | | | | | | |
| |
Leisure Products – 2.9% | |
Nautilus Group, Inc. (The) (A) | | | 99 | | | | 1,824 | |
| | | | | | | | |
| |
Restaurants – 1.8% | |
Kona Grill, Inc. (A) | | | 88 | | | | 1,101 | |
| | | | | | | | |
| |
Specialty Stores – 2.1% | |
Sportsman’s Warehouse Holdings, Inc. (A) | | | 143 | | | | 1,341 | |
| | | | | | | | |
| |
Total Consumer Discretionary – 14.8% | | | | 9,289 | |
Consumer Staples | |
| |
Distillers & Vintners – 1.5% | |
MGP Ingredients, Inc. | | | 19 | | | | 945 | |
| | | | | | | | |
| |
Packaged Foods & Meats – 1.8% | |
Inventure Foods, Inc. (A) | | | 114 | | | | 1,125 | |
| | | | | | | | |
| |
Total Consumer Staples – 3.3% | | | | 2,070 | |
Energy | |
| |
Oil & Gas Equipment & Services – 1.7% | |
Natural Gas Services Group, Inc. (A) | | | 35 | | | | 1,109 | |
| | | | | | | | |
| |
Oil & Gas Exploration & Production – 3.4% | |
Clayton Williams Energy, Inc. (A) | | | 1 | | | | 83 | |
Earthstone Energy, Inc. (A) | | | 33 | | | | 455 | |
Resolute Energy Corp. (A) | | | 11 | | | | 437 | |
Rice Energy, Inc. (A) | | | 89 | | | | 1,156 | |
| | | | | | | | |
| | | | | | | 2,131 | |
| | | | | | | | |
| |
Total Energy – 5.1% | | | | 3,240 | |
Financials | |
| |
Mortgage REITs – 0.5% | |
American Capital Mortgage Investment Corp. | | | 20 | | | | 306 | |
| | | | | | | | |
| |
Regional Banks – 0.5% | |
State Bank Financial Corp. | | | 13 | | | | 336 | |
| | | | | | | | |
| |
Total Financials – 1.0% | | | | 642 | |
Health Care | |
| |
Biotechnology – 1.0% | |
Natera, Inc. (A) | | | 56 | | | | 653 | |
| | | | | | | | |
| |
Health Care Equipment – 9.0% | |
AxoGen, Inc. (A) | | | 96 | | | | 860 | |
Entellus Medical, Inc. (A) | | | 29 | | | | 548 | |
K2M Group Holdings, Inc. (A) | | | 89 | | | | 1,774 | |
| | | | | | | | |
| COMMON STOCKS | | Shares | | | Value | |
Obalon Therapeutics, Inc. (A) | | | 54 | | | $ | 476 | |
Oxford Immunotec Global plc (A) | | | 62 | | | | 930 | |
Tactile Systems Technology, Inc. (A) | | | 65 | | | | 1,072 | |
| | | | | | | | |
| | | | | | | 5,660 | |
| | | | | | | | |
Health Care Supplies – 3.8% | |
Endologix, Inc. (A) | | | 119 | | | | 683 | |
ICU Medical, Inc. (A) | | | 12 | | | | 1,709 | |
| | | | | | | | |
| | | | | | | 2,392 | |
| | | | | | | | |
| |
Health Care Technology – 3.5% | |
Evolent Health, Inc., Class A (A) | | | 69 | | | | 1,018 | |
Omnicell, Inc. (A) | | | 35 | | | | 1,187 | |
| | | | | | | | |
| | | | | | | 2,205 | |
| | | | | | | | |
| |
Pharmaceuticals – 6.3% | |
Aerie Pharmaceuticals, Inc. (A) | | | 52 | | | | 1,961 | |
Intersect ENT, Inc. (A) | | | 42 | | | | 512 | |
Novan, Inc. (A) | | | 43 | | | | 1,148 | |
Revance Therapeutics, Inc. (A) | | | 16 | | | | 327 | |
| | | | | | | | |
| | | | | | | 3,948 | |
| | | | | | | | |
| |
Total Health Care – 23.6% | | | | 14,858 | |
Industrials | |
| |
Building Products – 2.9% | |
American Woodmark Corp. (A) | | | 10 | | | | 768 | |
PGT, Inc. (A) | | | 94 | | | | 1,077 | |
| | | | | | | | |
| | | | | | | 1,845 | |
| | | | | | | | |
| |
Construction & Engineering – 3.5% | |
MYR Group, Inc. (A) | | | 58 | | | | 2,174 | |
| | | | | | | | |
| |
Industrial Machinery – 1.1% | |
Kornit Digital Ltd. (A) | | | 52 | | | | 660 | |
| | | | | | | | |
| |
Trucking – 0.6% | |
YRC Worldwide, Inc. (A) | | | 30 | | | | 404 | |
| | | | | | | | |
| |
Total Industrials – 8.1% | | | | 5,083 | |
Information Technology | |
| |
Application Software – 2.1% | |
BlackLine, Inc. (A) | | | 24 | | | | 674 | |
Zix Corp. (A) | | | 131 | | | | 647 | |
| | | | | | | | |
| | | | | | | 1,321 | |
| | | | | | | | |
| |
Communications Equipment – 2.0% | |
Oclaro, Inc. (A) | | | 142 | | | | 1,266 | |
| | | | | | | | |
| |
Electronic Manufacturing Services – 2.2% | |
Mercury Computer Systems, Inc. (A) | | | 45 | | | | 1,357 | |
| | | | | | | | |
| |
Internet Software & Services – 11.9% | |
2U, Inc. (A) | | | 17 | | | | 525 | |
Cornerstone OnDemand, Inc. (A) | | | 41 | | | | 1,739 | |
Mimecast Ltd. (A) | | | 81 | | | | 1,449 | |
Q2 Holdings, Inc. (A) | | | 56 | | | | 1,627 | |
SPS Commerce, Inc. (A) | | | 31 | | | | 2,188 | |
| | | | | | | | |
| | | | | | | 7,528 | |
| | | | | | | | |
| | | | | | | | |
| COMMON STOCKS | | Shares | | | Value | |
IT Consulting & Other Services – 0.7% | |
Unisys Corp. (A) | | | 31 | | | $ | 458 | |
| | | | | | | | |
| |
Semiconductor Equipment – 3.2% | |
PDF Solutions, Inc. (A) | | | 88 | | | | 1,991 | |
| | | | | | | | |
Semiconductors – 2.6% | |
NVE Corp. | | | 23 | | | | 1,621 | |
| | | | | | | | |
| |
Systems Software – 1.1% | |
SecureWorks Corp., Class A (A) | | | 66 | | | | 697 | |
| | | | | | | | |
| |
Total Information Technology – 25.8% | | | | 16,239 | |
Materials | |
| |
Aluminum – 0.5% | |
Century Aluminum Co. (A) | | | 38 | | | | 324 | |
| | | | | | | | |
| |
Specialty Chemicals – 2.1% | |
Flotek Industries, Inc. (A)(B) | | | 13 | | | | 122 | |
Flotek Industries, Inc. (A) | | | 126 | | | | 1,181 | |
| | | | | | | | |
| | | | | | | 1,303 | |
| | | | | | | | |
| |
Total Materials – 2.6% | | | | 1,627 | |
Real Estate | |
| |
Health Care REITs – 1.5% | |
Community Healthcare Trust, Inc. | | | 42 | | | | 959 | |
| | | | | | | | |
| |
Total Real Estate – 1.5% | | | | 959 | |
Telecommunication Services | |
| |
Integrated Telecommunication Services – 6.7% | |
8x8, Inc. (A) | | | 165 | | | | 2,360 | |
GTT Communications, Inc. (A) | | | 65 | | | | 1,877 | |
| | | | | | | | |
| | | | | | | 4,237 | |
| | | | | | | | |
| |
Total Telecommunication Services – 6.7% | | | | 4,237 | |
Utilities | |
| |
Water Utilities – 1.1% | |
AquaVenture Holdings Ltd. (A) | | | 27 | | | | 660 | |
| | | | | | | | |
| |
Total Utilities – 1.1% | | | | 660 | |
| |
TOTAL COMMON STOCKS – 93.6% | | | $ | 58,904 | |
(Cost: $47,894) | | | | | | | | |
| | |
| SHORT-TERM SECURITIES | | Principal | | | | |
Master Note – 6.4% | |
Toyota Motor Credit Corp., | | | | | | | | |
0.860%, 1-4-17 (C) | | $ | 4,058 | | | | 4,058 | |
| | | | | | | | |
| |
TOTAL SHORT-TERM SECURITIES – 6.4% | | | $ | 4,058 | |
(Cost: $4,058) | | | | | | | | |
| |
TOTAL INVESTMENT SECURITIES – 100.0% | | | $ | 62,962 | |
(Cost: $51,952) | | | | | | | | |
| |
CASH AND OTHER ASSETS, NET OF LIABILITIES – 0.0% | | | | 14 | |
| | |
NET ASSETS – 100.0% | | | | | | $ | 62,976 | |
| | |
| SCHEDULE OF INVESTMENTS | | MICRO CAP GROWTH (in thousands) |
DECEMBER 31, 2016
Notes to Schedule of Investments
| (A) | No dividends were paid during the preceding 12 months. |
| (B) | Securities were purchased pursuant to an exemption from registration available under Rule 144A under the Securities Act of 1933 and may only be resold in transactions exempt from registration, normally to qualified institutional buyers. At December 31, 2016 the total value of these securities amounted to $122 or 0.2% of net assets. |
| (C) | Variable rate security. Interest rate disclosed is that which is in effect at December 31, 2016. Date shown represents the date that the variable rate resets. |
The following table is a summary of the valuation of the Portfolio’s investments by the fair value hierarchy levels as of December 31, 2016. See Note 3 to the Financial Statements for further information regarding fair value measurement.
| | | | | | | | | | | | |
| | | Level 1 | | | Level 2 | | | Level 3 | |
Assets | | | | | | | | | | | | |
Investments in Securities | | | | | | | | | | | | |
Common Stocks | | $ | 58,904 | | | $ | — | | | $ | — | |
Short-Term Securities | | | — | | | | 4,058 | | | | — | |
Total | | $ | 58,904 | | | $ | 4,058 | | | $ | — | |
During the year ended December 31, 2016, there were no transfers between Level 1 and 2.
The following acronym is used throughout this schedule:
REIT = Real Estate Investment Trust
See Accompanying Notes to Financial Statements.
| | |
| MANAGEMENT DISCUSSION | | MID CAP GROWTH |
(UNAUDITED)

Kimberly A. Scott

Nathan A. Brown
Below, Nathan A. Brown, CFA, and Kimberly A. Scott, CFA, co-portfolio managers of Ivy VIP Mid Cap Growth, discuss positioning, performance and results for the fiscal year ended December 31, 2016. Mr. Brown became co-portfolio manager in October 2016 and has 17 years of industry experience. Ms. Scott has managed the Portfolio since its inception in 2005 and has 29 years of industry experience.
Fiscal Year Performance
| | | | |
For the 12 Months Ended December 31, 2016 | | | | |
Ivy VIP Mid Cap Growth | | | 6.12% | |
Benchmark(s) and/or Lipper Category | | | | |
Russell Midcap Growth Index | | | 7.33% | |
(generally reflects the performance of securities that represent the mid-cap sector of the stock market) | | | | |
Lipper Variable Annuity Mid-Cap Growth Funds Universe Average | | | 6.61% | |
(generally reflects the performance of the universe of funds with similar investment objectives) | | | | |
Please note that Portfolio returns include applicable fees and expenses while index returns do not include any such fees. Also, the Portfolio’s performance data does not take into account any product expenses or charges associated with owning a variable life or annuity policy, which is invested in Ivy Variable Insurance Portfolios.
The mid-cap growth sector of the market as measured by the Russell Midcap Growth Index (the Portfolio’s benchmark), gained 7.3% in the 12-month period ended December 31, 2016, while Ivy VIP Mid Cap Growth gained 6.1%, underperforming the index by 121 basis points.
Contributors and detractors over the period
Portfolio performance was essentially in line with that of the index, but the path to performance had a number of puts and takes relative to that of the index. Sectors that contributed positively to Portfolio performance were energy, industrials, materials, health care, real estate and telecommunications. Those sectors that made a negative contribution were technology, consumer discretionary and consumer staples. Cash and equity options detracted from the Portfolio’s performance by 42 basis points and seven basis points, respectively.
The sector allocation effect was an important factor for performance, particularly given our overweight position in the energy sector, which was a very strong outperformer in both the Portfolio and the index. Stock selection was a detractor, especially in the Portfolio’s holdings in the technology sector, where not owning NVIDIA Corporation, which returned 134% for the year and contributed 116 basis points of the index’s 734 basis points of performance, was a significant opportunity cost. The currency effect on the Portfolio was a negative 20 basis points, primarily related to the Portfolio’s ownership of Burberry Group and the weakness of the British pound following the vote of the United Kingdom to exit the European Union (Brexit). Burberry Group made an overall small positive contribution to Portfolio’s performance in 2016, as the performance of the stock more than offset the currency impact.
Our energy exposure made a strong positive contribution to the Portfolio’s performance — 161 basis points. We were overweight this outperforming sector, and the names held by the Portfolio significantly outperformed the group in the index. Continental Resources, Inc. led the group’s performance, with a gain of 125% for the year. Cimarex Energy Co. and Cabot Oil & Gas Corp. also strongly outperformed. Noble Energy was a group laggard yet it outperformed the overall index and contributed 11 basis points to Portfolio performance.
The financials names held by the Portfolio performed well. We were overweight this outperforming sector, and benefitted from bank exposure relative to the benchmark. First Republic Bank and Northern Trust Corp. turned in very strong performances, while Signature Bank lagged somewhat. All three banks had strong gains following the U.S. presidential election when interest rates rose, widening the yield curve and portending better earnings ahead for much of the financial services sector. CME Group Inc. was another strong performer in the Portfolio’s holdings in the financials sector, as CME Group Inc.’s business benefits from hedging activities in the fixed income, equities, and commodities markets. Greater activity and volatility across the board in capital markets is generally good for CME Group Inc.’s business.
Our materials exposure strongly outperformed this outperforming group within the benchmark on the back of a takeout in Valspar Corporation, which is being acquired by Sherwin-Williams. Scotts Miracle-Gro Corp. was another solid performer in the materials sector thanks to strength in its iconic lawn and garden business.
Industrials stocks were another source of strength for the Portfolio last year, with recoveries in many names that had been weak for the past two years related to soft industrial demand out of their energy, mining and agriculture customers. Fastenal Co., IDEX Corp. and Generac Holdings, Inc. were all beneficiaries of improving business outlooks. Woodward, Inc., which provides aerospace and energy products, and A.O. Smith, which manufactures water heater, also exhibited very strong performances.
The Portfolio’s lack of exposure to the underperforming real estate sector contributed 13 basis points to Portfolio performance.
The Portfolio’ lack of exposure to the telecommunications and utilities sectors contributed two basis points to the Portfolio’s performance. The Portfolio utilized equity index options as a portfolio hedge to protect against key macro events in the spring and fall, including the election in November. Put options were used as an alternative to raising cash, allowing the Portfolio to be protected without sacrificing potential upside. Portfolio hedging negatively impacted the Portfolio by 29 basis points. The Portfolio also utilized equity options on individual stocks as a means to gain exposure and generate premium income. This strategy included both written puts and purchased call options on a variety of stocks and impacted the Portfolio by 22 basis points to the positive.
Our technology sector exposure made the greatest negative contribution to Portfolio performance for the year. We were overweight this outperforming sector, but the absence of NVIDIA Corp. in the portfolio accounted for most of the Portfolio’s sector underperformance, as previously described. Other weak names in the group were Red Hat, Inc., CoStar Group, Inc. and ServiceNow, Inc., all software names that struggled in the second half of the year as part of a broad sell-off of software stocks within the technology sector. Alliance Data Systems, Corp., which we sold mid-year over concern about the company’s ability to deliver on its growth plan, was weak, as well. Names of notable strength within our technology exposure included Microchip Technology, Inc., a longstanding core holding in the portfolio that benefitted from general strength of demand within the semiconductor industry, and also from the successful integration of recent acquisitions at the company; Trimble Navigation Ltd., an unrecognized growth name within the Portfolio that has begun to level set its business and is taking advantage of the demand for logistics expertise across the many economic verticals it serves; GrubHub, Inc., the online restaurant food ordering and delivery company; and Maxim Integrated Products, Inc., another semiconductor name.
Our consumer discretionary names were broadly weak over the past year. We were underweight this underperforming sector, but our exposure to retail and related sectors was a liability for the year when e-commerce activity accelerated, taking market share and requiring many retailers to step up investment to try to maintain competitiveness and relevance to consumers. These costs and higher labor expenses pressured the profitability of many companies held by the Portfolio, including Bed Bath and Beyond, Inc., Williams-Sonoma, Inc. and DSW, Inc. Other key factors impacting retailers in the past year were weak demand in emerging markets and appreciation of the U.S. dollar, which hurt many retailers based both on currency exchange effects and the ultimate negative impact on travel to the United States and the related demand for goods in flagship stores in markets such as New York City. The dollar appreciation impact began to fade somewhat mid-year, giving relief to some companies held by the Portfolio, such as Tiffany & Company, which saw its business begin to improve. Other notably weak stocks in our consumer discretionary group were Tractor Supply, which experienced weaker than expected sales last year related to unusually warm weather early in the year; and Trip Advisor, which has not been able to translate innovations in its online travel brands to growth in its business. We retain Tractor Supply in the Portfolio, as we see a clear opportunity for the company to continue to grow it store base, sales and earnings over the next three to five years. We sold Trip Advisor as we are unconvinced of the company’s ability to effectively monetize its travel information and search offerings.
Dunkin’ Brands Group, Inc. and Mattel, Inc., which posted a very strong return after a prolonged period of weakness, were two notably strong consumer discretionary names held by the Portfolio last year.
Our consumer staples exposure made a negative contribution to Portfolio performance in 2016, with Mead Johnson, Inc., the maker of Enfamil infant formula, the weakest of our names. Mead Johnson, Inc. is a high quality consumer products company that has experienced difficulty moving its business forward as it confronts competitive and distribution challenges in one of its biggest markets, China, in addition to slow growth in the United States. Given these challenges, we sold the stock. Whole Foods Market, Inc. and Hain Celestial Group, Inc. also delivered weak performance, as both faced competitive pressures and food deflation that impacted sales growth. Both Whole Foods Market, Inc. and Hain Celestial Group, Inc. have been highly successful leaders in the growth of the organic and natural foods industry, setting a pace and an example that has fostered competition. We believe these companies will continue to lead in this robust sector, which the stocks will once again reflect as management teams address the near term dislocations and questions about their positions in the marketplace. Hain Celestial Group, Inc. also announced that it had to undergo a review of its financial statements related to a revenue recognition matter surrounding the accounting for promotions to distributors. Independent counsel has found no evidence of wrongdoing on Hain Celestial Group Inc.’s part and the stock has begun to recover.
Outlook
The benchmark’s point-to-point performance of 7.33% for 2016 belies a considerably tumultuous year, punctuated by a steep sell-off from early December 2015 to early February 2016 in the wake of the Federal Reserve’s first interest rate move higher, followed by a recovery into late June, only to sell off swiftly over a few days after Brexit. A strong move higher by the benchmark into early September rolled into an orderly sell-off in advance of the U.S. election in early November. A strong positive reaction to the election of Donald Trump as president of the United States and his policy intentions carried the market to highs into the close of the year, and near levels first seen in the spring of 2015.
We expect the market to deliver positive returns in 2017 based on accelerating economic growth around the globe, vastly improved corporate profits in the United States as compared to the past two years, and the potential benefits of pro-growth, pro-cyclical policies from a Trump administration that can enhance an already positive environment. Economic activity in the United States continues at a low but stable pace, with the potential for stronger growth as the energy industry gets back to work, housing demand continues to improve, and consumption in general remains firm tied to ongoing strength in jobs and wage gains.
Global industrial production is accelerating, as evidenced by production manufacturing index readings in many countries. Interest rates, while increasing, still seem supportive of investment and growth, as does the credit environment. The valuation on the market has expanded with last year’s gains, but levels are reasonable to support further market appreciation as we discount corporate profits ahead. The factor that should provide underlying support for a profit and market outlook that was encouraging even pre-election is the pro-growth stance of the incoming Trump administration. We further believe that a more supportive regulatory and taxation environment and a drive to invest in the United States could lift an already improving economic and profit picture to a higher level. The response from the credit markets will be important to monitor, as higher interest rates could have a dampening impact on a stronger growth scenario. Finally, the trajectory of the market’s response is unlikely to be cleanly up and to the right, but, rather, we believe is likely to unfold in more fits and starts, as the negotiations around what will likely be drastically changed policies begin.
The Portfolio continues to express a more economically constructive and optimistic view, with a more assertive pro-growth, less defensive stance. The Portfolio is overweight the energy, technology, financials and health care sectors. Health care, while often considered defensive, remains one of the higher growth sectors in the mid-cap growth universe. We are slightly underweight the industrials sector, but intend to continue to allocate additional weight within the Portfolio to this sector, as we see an opportunity for many companies to benefit from a recovery in industrials demand as the energy patch recovers, in addition to benefitting from fiscal spend initiatives of the Trump administration. We are underweight the consumer discretionary, consumer staples, and materials sectors. We believe the consumer discretionary sector should be a key beneficiary of firmer economic growth and consumption, but secular structural issues for many of the companies, particularly in retail and related areas, limit our enthusiasm for much of the consumer discretionary sector at this time.
Past performance is not a guarantee of future results. The value of the Portfolio’s shares will change, and you could lose money on your investment.
Investing in mid-cap stocks may carry more risk than investing in stocks of larger, more-established companies. Prices of growth stocks may be more sensitive to changes in current or expected earnings than the prices of other stocks. Growth stocks may not perform as well as value stocks or the stock market in general. The use of derivatives presents several risks, including the risk that these instruments may change in value in a manner that adversely affects the Portfolio’s value and the risk that fluctuations in the value of the derivatives may not correlate with securities markets or the underlying asset upon which the derivative’s value is based. These and other risks are more fully described in the Portfolio’s prospectus.
The opinions expressed in this report are those of the portfolio managers and are current only through the end of the period of the report as stated on the cover. The managers’ views are subject to change at any time based on market and other conditions, and no forecasts can be guaranteed.
The index noted is unmanaged and include reinvested dividends. One cannot invest directly in an index, nor is an index representative of Ivy VIP Mid Cap Growth.
| | |
| PORTFOLIO HIGHLIGHTS | | MID CAP GROWTH |
ALL DATA IS AS OF DECEMBER 31, 2016 (UNAUDITED)
Asset Allocation
| | | | |
Stocks | | | 97.5% | |
Information Technology | | | 24.0% | |
Consumer Discretionary | | | 19.4% | |
Health Care | | | 16.8% | |
Industrials | | | 15.7% | |
Financials | | | 10.1% | |
Consumer Staples | | | 5.9% | |
Energy | | | 4.5% | |
Materials | | | 1.1% | |
Cash and Other Assets (Net of Liabilities), and Cash Equivalents+ | | | 2.5% | |
Top 10 Equity Holdings
| | | | |
| Company | | Sector | | Industry |
Fastenal Co. | | Industrials | | Trading Companies & Distributors |
Zoetis, Inc. | | Health Care | | Pharmaceuticals |
CME Group, Inc. | | Financials | | Financial Exchanges & Data |
Microchip Technology, Inc. | | Information Technology | | Semiconductors |
Intuitive Surgical, Inc. | | Health Care | | Health Care Equipment |
Electronic Arts, Inc. | | Information Technology | | Home Entertainment Software |
CoStar Group, Inc. | | Industrials | | Research & Consulting Services |
Northern Trust Corp. | | Financials | | Asset Management & Custody Banks |
Trimble Navigation Ltd. | | Information Technology | | Electronic Manufacturing Services |
Dunkin’ Brands Group, Inc. | | Consumer Discretionary | | Restaurants |
See your advisor for more information on the Portfolio’s most recently published Top 10 Equity Holdings.
+Cash equivalents are defined as highly liquid securities with maturities of less than three months. Cash equivalents may include U.S. Government Treasury bills, bank certificates of deposit, bankers’ acceptances, corporate commercial paper and other money market instruments.
| | |
COMPARISON OF CHANGE IN VALUE OF $10,000 INVESTMENT | | MID CAP GROWTH |
(UNAUDITED)
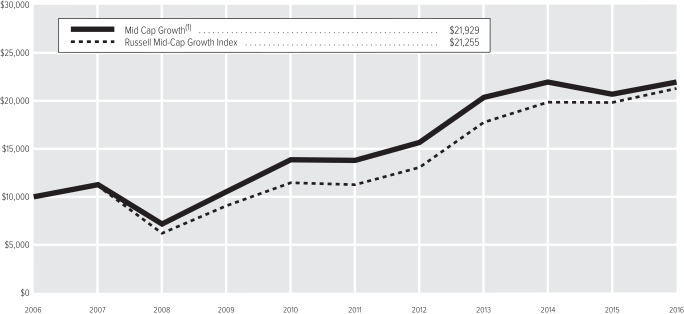
| (1) | The value of the investment in the Portfolio is impacted by the ongoing expenses of the Portfolio and assumes reinvestment of dividends and distributions. |
| | | | |
| Average Annual Total Return(2) | | | |
1-year period ended 12-31-16 | | | 6.12% | |
5-year period ended 12-31-16 | | | 9.74% | |
10-year period ended 12-31-16 | | | 8.17% | |
| (2) | Data quoted is past performance and current performance may be lower or higher. Past performance is no guarantee of future results. Investment return and principal value of an investment will fluctuate and shares, when redeemed, may be worth more or less than their original cost. Please call 1.888.WADDELL for the Portfolio’s most recent month-end performance. Performance data quoted does not reflect any expenses or charges associated with owning a variable life insurance policy or variable annuity contract that invests in the Portfolio’s shares. When such charges are deducted, actual investment performance in a variable policy or contract will be lower. |
Past performance is not necessarily indicative of future performance. Indexes are unmanaged. The performance graph and table do not reflect the deduction of taxes that a shareholder would pay on Portfolio distributions or on the redemption of Portfolio shares. Performance results may include the effect of expense reduction arrangements for some or all of the periods shown. If those arrangements had not been in place, the performance results for those periods would have been lower.
| | |
| SCHEDULE OF INVESTMENTS | | MID CAP GROWTH (in thousands) |
DECEMBER 31, 2016
| | | | | | | | |
| COMMON STOCKS | | Shares | | | Value | |
Consumer Discretionary | |
| |
Apparel Retail – 1.6% | |
DSW, Inc., Class A | | | 312 | | | $ | 7,056 | |
Duluth Holdings, Inc.,
Class B (A) | | | 108 | | | | 2,737 | |
| | | | | | | | |
| | | | | | | 9,793 | |
| | | | | | | | |
| |
Apparel, Accessories & Luxury Goods – 3.9% | |
Burberry Group plc (B) | | | 390 | | | | 7,202 | |
Kate Spade & Co. (A) | | | 370 | | | | 6,909 | |
lululemon athletica, Inc. (A) | | | 150 | | | | 9,754 | |
| | | | | | | | |
| | | | | | | 23,865 | |
| | | | | | | | |
| |
Auto Parts & Equipment – 1.8% | |
BorgWarner, Inc. | | | 278 | | | | 10,966 | |
| | | | | | | | |
| |
Homefurnishing Retail – 2.5% | |
Bed Bath & Beyond, Inc. | | | 208 | | | | 8,452 | |
Williams-Sonoma, Inc. | | | 144 | | | | 6,967 | |
| | | | | | | | |
| | | | | | | 15,419 | |
| | | | | | | | |
| |
Leisure Products – 3.2% | |
Mattel, Inc. | | | 290 | | | | 7,992 | |
Polaris Industries, Inc. | | | 147 | | | | 12,122 | |
| | | | | | | | |
| | | | | | | 20,114 | |
| | | | | | | | |
| |
Restaurants – 2.2% | |
Dunkin’ Brands Group, Inc. | | | 257 | | | | 13,487 | |
| | | | | | | | |
| |
Specialty Stores – 4.2% | |
Tiffany & Co. | | | 167 | | | | 12,896 | |
Tractor Supply Co. | | | 170 | | | | 12,879 | |
| | | | | | | | |
| | | | | | | 25,775 | |
| | | | | | | | |
| |
Total Consumer Discretionary – 19.4% | | | | 119,419 | |
Consumer Staples | |
| |
Food Retail – 2.1% | |
Whole Foods Market, Inc. | | | 413 | | | | 12,719 | |
| | | | | | | | |
| |
Packaged Foods & Meats – 3.8% | |
Blue Buffalo Pet Products, Inc. (A) | | | 287 | | | | 6,905 | |
Hain Celestial Group, Inc. (The) (A) | | | 248 | | | | 9,698 | |
Lance, Inc. | | | 178 | | | | 6,806 | |
| | | | | | | | |
| | | | | | | 23,409 | |
| | | | | | | | |
| |
Total Consumer Staples – 5.9% | | | | 36,128 | |
Energy | |
| |
Oil & Gas Exploration & Production – 4.5% | |
Cabot Oil & Gas Corp. | | | 266 | | | | 6,217 | |
Cimarex Energy Co. | | | 43 | | | | 5,885 | |
Continental Resources, Inc. (A) | | | 159 | | | | 8,189 | |
Noble Energy, Inc. | | | 202 | | | | 7,680 | |
| | | | | | | | |
| | | | | | | 27,971 | |
| | | | | | | | |
| |
Total Energy – 4.5% | | | | 27,971 | |
Financials | |
| |
Asset Management & Custody Banks – 3.0% | |
Northern Trust Corp. | | | 159 | | | | 14,126 | |
Oaktree Capital Group LLC | | | 122 | | | | 4,561 | |
| | | | | | | | |
| | | | | | | 18,687 | |
| | | | | | | | |
| | | | | | | | |
| COMMON STOCKS (Continued) | | Shares | | | Value | |
Financial Exchanges & Data – 3.3% | |
CME Group, Inc. | | | 146 | | | $ | 16,853 | |
MarketAxess Holdings, Inc. | | | 22 | | | | 3,201 | |
| | | | | | | | |
| | | | | | | 20,054 | |
| | | | | | | | |
| |
Regional Banks – 3.8% | |
First Republic Bank | | | 132 | | | | 12,193 | |
Signature Bank (A) | | | 73 | | | | 10,932 | |
| | | | | | | | |
| | | | | | | 23,125 | |
| | | | | | | | |
| |
Total Financials – 10.1% | | | | 61,866 | |
Health Care | |
| |
Biotechnology – 4.6% | |
ACADIA Pharmaceuticals, Inc. (A) | | | 278 | | | | 8,011 | |
Alkermes plc (A) | | | 212 | | | | 11,804 | |
BioMarin Pharmaceutical, Inc. (A) | | | 106 | | | | 8,783 | |
| | | | | | | | |
| | | | | | | 28,598 | |
| | | | | | | | |
| |
Health Care Equipment – 4.8% | |
Edwards Lifesciences Corp. (A) | | | 136 | | | | 12,788 | |
Intuitive Surgical, Inc. (A) | | | 26 | | | | 16,549 | |
| | | | | | | | |
| | | | | | | 29,337 | |
| | | | | | | | |
| |
Health Care Facilities – 0.5% | |
Acadia Healthcare Co., Inc. (A) | | | 99 | | | | 3,270 | |
| | | | | | | | |
| |
Health Care Services – 1.9% | |
Diplomat Pharmacy, Inc. (A) | | | 165 | | | | 2,085 | |
Laboratory Corp. of America Holdings (A) | | | 74 | | | | 9,494 | |
| | | | | | | | |
| | | | | | | 11,579 | |
| | | | | | | | |
| |
Health Care Supplies – 1.5% | |
Align Technology, Inc. (A) | | | 97 | | | | 9,311 | |
| | | | | | | | |
| |
Pharmaceuticals – 3.5% | |
Pacira Pharmaceuticals, Inc. (A) | | | 47 | | | | 1,533 | |
Zoetis, Inc. | | | 371 | | | | 19,873 | |
| | | | | | | | |
| | | | | | | 21,406 | |
| | | | | | | | |
| |
Total Health Care – 16.8% | | | | 103,501 | |
Industrials | |
| |
Air Freight & Logistics – 2.1% | |
Expeditors International of Washington, Inc. | | | 239 | | | | 12,659 | |
| | | | | | | | |
| |
Building Products – 2.4% | |
A. O. Smith Corp. | | | 133 | | | | 6,307 | |
Fortune Brands Home & Security, Inc. | | | 161 | | | | 8,608 | |
| | | | | | | | |
| | | | | | | 14,915 | |
| | | | | | | | |
| |
Construction Machinery & Heavy Trucks – 1.1% | |
Westinghouse Air Brake Technologies Corp. | | | 85 | | | | 7,065 | |
| | | | | | | | |
| |
Electrical Components & Equipment – 1.0% | |
Generac Holdings, Inc. (A) | | | 159 | | | | 6,468 | |
| | | | | | | | |
| | | | | | | | |
| COMMON STOCKS (Continued) | | Shares | | | Value | |
Industrial Machinery – 1.8% | |
IDEX Corp. | | | 103 | | | $ | 9,280 | |
Woodward, Inc. | | | 25 | | | | 1,713 | |
| | | | | | | | |
| | | | | | | 10,993 | |
| | | | | | | | |
| |
Research & Consulting Services – 3.9% | |
CoStar Group, Inc. (A) | | | 76 | | | | 14,245 | |
Verisk Analytics, Inc., Class A (A) | | | 117 | | | | 9,461 | |
| | | | | | | | |
| | | | | | | 23,706 | |
| | | | | | | | |
| |
Trading Companies & Distributors – 3.4% | |
Fastenal Co. | | | 440 | | | | 20,657 | |
| | | | | | | | |
| |
Total Industrials – 15.7% | | | | 96,463 | |
Information Technology | |
| |
Application Software – 5.0% | |
ANSYS, Inc.(A) | | | 95 | | | | 8,807 | |
Ellie Mae, Inc.(A) | | | 61 | | | | 5,087 | |
Guidewire Software, Inc. (A) | | | 115 | | | | 5,650 | |
Mobileye N.V.(A) | | | 220 | | | | 8,374 | |
Tyler Technologies, Inc. (A) | | | 22 | | | | 3,082 | |
| | | | | | | | |
| | | | | | | 31,000 | |
| | | | | | | | |
| |
Communications Equipment – 1.5% | |
Harris Corp. | | | 87 | | | | 8,949 | |
| | | | | | | | |
| |
Electronic Manufacturing Services – 2.2% | |
Trimble Navigation Ltd. (A) | | | 458 | | | | 13,806 | |
| | | | | | | | |
| |
Home Entertainment Software – 2.4% | |
Electronic Arts, Inc.(A) | | | 191 | | | | 15,071 | |
| | | | | | | | |
| |
Internet Software & Services – 5.3% | |
GrubHub, Inc. (A) | | | 338 | | | | 12,709 | |
MercadoLibre, Inc. | | | 57 | | | | 8,963 | |
Pandora Media, Inc. (A) | | | 858 | | | | 11,184 | |
| | | | | | | | |
| | | | | | | 32,856 | |
| | | | | | | | |
| |
Semiconductors – 4.0% | |
Maxim Integrated Products, Inc. | | | 196 | | | | 7,562 | |
Microchip Technology, Inc. | | | 261 | | | | 16,756 | |
| | | | | | | | |
| | | | | | | 24,318 | |
| | | | | | | | |
| |
Systems Software – 3.6% | |
Red Hat, Inc. (A) | | | 140 | | | | 9,787 | |
ServiceNow, Inc. (A) | | | 163 | | | | 12,096 | |
| | | | | | | | |
| | | | | | | 21,883 | |
| | | | | | | | |
| |
Total Information Technology – 24.0% | | | | 147,883 | |
Materials | |
| |
Fertilizers & Agricultural Chemicals – 1.1% | |
Scotts Miracle-Gro Co. (The) | | | 69 | | | | 6,603 | |
| | | | | | | | |
| |
Total Materials – 1.1% | | | | 6,603 | |
| |
TOTAL COMMON STOCKS – 97.5% | | | $ | 599,834 | |
(Cost: $564,436) | | | | | | | | |
| | |
| SCHEDULE OF INVESTMENTS | | MID CAP GROWTH (in thousands) |
DECEMBER 31, 2016
| | | | | | | | |
| SHORT-TERM SECURITIES | | Principal | | | Value | |
Commercial Paper (C) – 1.8% | |
Medtronic Global Holdings SCA, | | | | | | | | |
0.811%, 1-9-17 | | $ | 5,000 | | | $ | 4,999 | |
Pricoa Short Term Funding LLC, | | | | | | | | |
0.590%, 1-17-17 | | | 4,000 | | | | 3,999 | |
Washington Gas Light Co., | | | | | | | | |
0.600%, 1-3-17 | | | 2,079 | | | | 2,079 | |
| | | | | | | | |
| | | | | | | 11,077 | |
| | | | | | | | |
| |
Master Note – 0.5% | |
Toyota Motor Credit Corp., | | | | | | | | |
0.860%, 1-4-17 (D) | | | 2,902 | | | | 2,902 | |
| | | | | | | | |
| |
United States Government Agency Obligations – 0.3% | |
Overseas Private Investment Corp. (GTD by U.S. Government), | | | | | | | | |
0.720%, 1-4-17 (D) | | | 2,000 | | | | 2,000 | |
| | | | | | | | |
| |
TOTAL SHORT-TERM SECURITIES – 2.6% | | | $ | 15,979 | |
(Cost: $15,979) | | | | | | | | |
| |
TOTAL INVESTMENT SECURITIES – 100.1% | | | $ | 615,813 | |
(Cost: $580,415) | | | | | | | | |
| |
LIABILITIES, NET OF CASH AND OTHER ASSETS – (0.1)% | | | | (370 | ) |
| | |
NET ASSETS – 100.0% | | | | | | $ | 615,443 | |
Notes to Schedule of Investments
| (A) | No dividends were paid during the preceding 12 months. |
| (B) | Listed on an exchange outside the United States. |
| (C) | Rate shown is the yield to maturity at December 31, 2016. |
| (D) | Variable rate security. Interest rate disclosed is that which is in effect at December 31, 2016. Date shown represents the date that the variable rate resets. |
The following table is a summary of the valuation of the Portfolio’s investments by the fair value hierarchy levels as of December 31, 2016. See Note 3 to the Financial Statements for further information regarding fair value measurement.
| | | | | | | | | | | | |
| | | Level 1 | | | Level 2 | | | Level 3 | |
Assets | | | | | | | | | | | | |
Investments in Securities | | | | | | | | | | | | |
Common Stocks | | $ | 599,834 | | | $ | — | | | $ | — | |
Short-Term Securities | | | — | | | | 15,979 | | | | — | |
Total | | $ | 599,834 | | | $ | 15,979 | | | $ | — | |
During the year ended December 31, 2016, there were no transfers between Level 1 and 2.
The following acronym is used throughout this schedule:
GTD = Guaranteed
See Accompanying Notes to Financial Statements.
| | |
| MANAGEMENT DISCUSSION | | REAL ESTATE SECURITIES |
(UNAUDITED)

Matthew K. Richmond

Lowell R. Bolken
Ivy VIP Real Estate Securities is subadvised by Advantus Capital Management, Inc. Below, Matthew K. Richmond and Lowell R. Bolken, portfolio managers of Ivy VIP Real Estate Securities, discuss positioning, performance and results for the fiscal year ended December 31, 2016. Mr. Richmond has managed the Portfolio since 2014 and has 22 years of industry experience. Mr. Bolken has managed the Portfolio since 2006 and has 27 years of industry experience.
Fiscal year Performance
| | | | |
For the 12 Months Ended December 31, 2016 | | | | |
Ivy VIP Real Estate Securities | | | 4.26% | |
Benchmark(s) and/or Lipper Category | | | | |
Wilshire U.S. Real Estate Securities Index | | | 7.60% | |
(generally reflects the performance of U.S. publicly traded real estate securities) | | | | |
Lipper Variable Annuity Real Estate Funds Universe Average | | | 6.30% | |
(generally reflects the performance of the universe of funds with similar investment objectives) | | | | |
Please note that Portfolio returns include applicable fees and expenses while index returns do not include any such fees. Also, the Portfolio’s performance data does not take into account any product expenses or charges associated with owning a variable life or annuity policy, which is invested in Ivy Variable Insurance Portfolios.
Volatility, uncertainty across markets
Real estate stocks delivered positive returns again in 2016, but the intra-year price action among the stocks was unusually volatile. Macro events like the surprise decision by voters in the U.K. to leave the European Union, “Brexit”; the uncertainty of the U.S. presidential election; and severe swings in the 10-year U.S. Treasury yield drove stock prices more than did property fundamentals.
After an initial panic to start the year, real estate investment trusts (REITs) rallied throughout the summer months to new highs. But a series of headwinds — ranging from political uncertainty to questions about U.S. Federal Reserve (Fed) policy to the impending U.S. presidential election — led to a sharp pullback in stock prices during the balance of the year. While events across the economy and capital markets often were met with short-term, knee-jerk reactions by investors, the fundamentals of commercial real estate ultimately determined the long-term direction of share prices.
U.S. commercial real estate conditions continued to improve although the pace of improvement slowed. Most property types maintained pricing power with solid occupancy and rent increases. Occupancies across all major property types improved at least marginally, with both apartments and industrial REITs reaching all-time high occupancy levels. In the latter half of the year, we began to see weakening pricing power in some sectors — notably apartments, hotels and storage — with disruptive levels of new supply being delivered (or anticipated) in several major markets. In industrial properties, trends again improved, as they have for several years, on the back of an improving economy and the increased demand for e-commerce-related distribution space.
Positioning across sectors
The Portfolio delivered a positive total return for the fiscal year, but trailed its benchmark index and peer group.
Common themes among Portfolio holdings were investment in companies we believe own well-located, high-quality properties; feature stable balance sheets; exhibit improving property fundamentals; and have above-average cash-flow growth prospects. Those characteristics, which often in the past have driven above-average stock price performance, were out of favor in 2016. The Portfolio maintained its bias toward large-capitalization companies that focus on major urban, coastal and Sunbelt markets. This positioning was a significant detractor to performance as small- and mid-capitalization REITs widely outperformed large-capitalization REITs, particularly in the second half of the year. Dividend yield was another hallmark of performance across the sector. Investors’ thirst for yield-oriented investments benefitted the highest yielding REIT stocks, which generally feature lower growth prospects and below-average portfolio quality compared with investments in the Portfolio.
Significant contributors to performance included overweight positions relative to the benchmark within industrial, manufactured home and student housing REITs — each of which experienced strong demand and rental rate growth. Favorable stock selection in office REITs, particular central business district office owners, also contributed to performance. The decision to underweight shopping center stocks, where a series of tenant closures negatively impacted near-term growth, also contributed to performance but was offset by unfavorable stock selection within the sector.
An underweight position relative to the benchmark index to hotel REITs was the largest detractor from relative performance versus the benchmark. Despite slowing fundamentals across the hotel sector, it rallied strongly following the U.S. presidential election on investors’ belief that the fiscal policies of President-elect Donald Trump’s administration will support stronger economic growth.
From a property-type perspective, the Portfolio was overweight in owners of warehouses, urban-centric office buildings and data centers, and we limited holdings in health care and lodging REITs.
Outlook for 2017
Steady economic and employment growth coupled with disciplined lending and construction activity have propelled the current real estate recovery into its seventh year. While the recent presidential election results have injected a healthy degree of optimism into the capital markets and business community, the potential for Trump’s economic agenda is largely unknown at this time. We think 2017 is likely to be a pivotal year for this cycle as investors look for tangible evidence that policy changes can have a material impact on the trajectory of gross domestic product and employment growth. At a minimum, we think a more pro-business posture is likely to spur improved business confidence and thus maintain the prospect of continued favorable real estate demand.
We believe REIT fundamentals are likely to continue to benefit from an improving economy, although the pace of growth is being muted by new supply in certain sectors such as apartments, hotels, and self-storage. Despite signs of decelerating growth in cash flow, we think the landscape for commercial real estate and REITs remains constructive. We do not believe that moving into the later stages of the real estate recovery will necessarily mean the real estate sector’s fundamentals will turn negative. Rather, we think the real estate sector is moving from great to good. We are expecting cash flow growth for the sector to decelerate slightly to 5% in 2017, which we think also can lead to another year of solid dividend growth, although such growth cannot be guaranteed.
Capitalization rates for private market transactions continue to support REIT valuations, suggesting REITs currently trade at a discount to their net asset values, while REIT pricing compared to broader fixed income and equity markets also looks attractive to us compared to historic averages. That said, it is hard to argue that Fed monetary policy hasn’t boosted financial asset valuations, including real estate. Although we see valuations today as quite justifiable, a sustained reversal in record-low interest rates (particularly in the long-end of the curve) would be likely to pressure REIT share prices. We saw evidence of this relationship in the second half of 2016 when the yield on 10-year U.S. Treasury securities rose sharply.
Past performance is not a guarantee of future results. As with any mutual fund, the value of the Portfolio’s shares will change, and you could lose money on your investment. Investment risks associated with real estate securities, in addition to other risks, include rental income fluctuation, depreciation, property tax value changes and differences in real estate market values. Real estate securities are subject to interest-rate risk and, as such, the Portfolio’s net asset value may fall as interest rates rise. Investing in companies involved in one specified sector may be more risky and volatile than an investment with greater diversification. These and other risks are more fully described in the Portfolio’s prospectus.
The opinions expressed in this report are those of the portfolio managers and are current only through the end of the period of the report as stated on the cover. The managers’ views are subject to change at any time based on market and other conditions, and no forecasts can be guaranteed.
The index noted is unmanaged and includes reinvested dividends. One cannot invest directly in an index, nor is an index representative of Ivy VIP Real Estate Securities.
| | |
| PORTFOLIO HIGHLIGHTS | | REAL ESTATE SECURITIES |
ALL DATA IS AS OF DECEMBER 31, 2016 (UNAUDITED)
Asset Allocation
| | | | |
Stocks | | | 97.0% | |
Real Estate | | | 97.0% | |
Cash and Other Assets (Net of Liabilities), and Cash Equivalents+ | | | 3.0% | |
Top 10 Equity Holdings
| | | | |
| Company | | Sector | | Industry |
Simon Property Group, Inc. | | Real Estate | | Retail REITs |
ProLogis | | Real Estate | | Industrial REITs |
Public Storage, Inc. | | Real Estate | | Specialized REITs |
Welltower, Inc. | | Real Estate | | Health Care REITs |
Vornado Realty Trust | | Real Estate | | Office REITs |
Equinix, Inc. | | Real Estate | | Specialized REITs |
AvalonBay Communities, Inc. | | Real Estate | | Residential REITs |
Alexandria Real Estate Equities, Inc. | | Real Estate | | Office REITs |
Host Hotels & Resorts, Inc. | | Real Estate | | Hotel & Resort REITs |
General Growth Properties, Inc. | | Real Estate | | Retail REITs |
See your advisor for more information on the Portfolio’s most recently published Top 10 Equity Holdings.
+Cash equivalents are defined as highly liquid securities with maturities of less than three months. Cash equivalents may include U.S. Government Treasury bills, bank certificates of deposit, bankers’ acceptances, corporate commercial paper and other money market instruments.
| | |
COMPARISON OF CHANGE IN VALUE
OF $10,000 INVESTMENT | | REAL ESTATE SECURITIES |
(UNAUDITED)
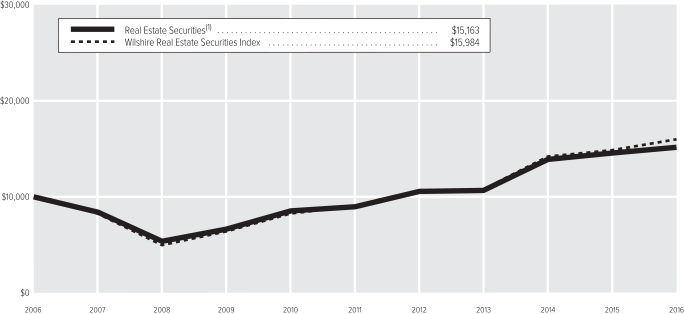
| (1) | The value of the investment in the Portfolio is impacted by the ongoing expenses of the Portfolio and assumes reinvestment of dividends and distributions. |
| | | | |
| Average Annual Total Return(2) | | | |
1-year period ended 12-31-16 | | | 4.26% | |
5-year period ended 12-31-16 | | | 11.10% | |
10-year period ended 12-31-16 | | | 4.25% | |
| (2) | Data quoted is past performance and current performance may be lower or higher. Past performance is no guarantee of future results. Investment return and principal value of an investment will fluctuate and shares, when redeemed, may be worth more or less than their original cost. Please call 1.888.WADDELL for the Portfolio’s most recent month-end performance. Performance data quoted does not reflect any expenses or charges associated with owning a variable life insurance policy or variable annuity contract that invests in the Portfolio’s shares. When such charges are deducted, actual investment performance in a variable policy or contract will be lower. |
Past performance is not necessarily indicative of future performance. Indexes are unmanaged. The performance graph and table do not reflect the deduction of taxes that a shareholder would pay on Portfolio distributions or on the redemption of Portfolio shares. Performance results may include the effect of expense reduction arrangements for some or all of the periods shown. If those arrangements had not been in place, the performance results for those periods would have been lower.
| | |
| SCHEDULE OF INVESTMENTS | | REAL ESTATE SECURITIES (in thousands) |
DECEMBER 31, 2016
| | | | | | | | |
| COMMON STOCKS | | Shares | | | Value | |
Real Estate | |
| |
Diversified REITs – 2.7% | |
Liberty Property Trust | | | 25 | | | $ | 995 | |
STORE Capital Corp. | | | 12 | | | | 304 | |
| | | | | | | | |
| | | | | | | 1,299 | |
| | | | | | | | |
Health Care REITs – 10.3% | |
HCP, Inc. | | | 28 | | | | 841 | |
Healthcare Trust of America, Inc., Class A | | | 16 | | | | 463 | |
Omega Healthcare Investors, Inc. | | | 18 | | | | 550 | |
Physicians Realty Trust | | | 29 | | | | 544 | |
Ventas, Inc. | | | 15 | | | | 938 | |
Welltower, Inc. | | | 26 | | | | 1,707 | |
| | | | | | | | |
| | | | | | | 5,043 | |
| | | | | | | | |
Hotel & Resort REITs – 6.1% | |
Apple Hospitality REIT, Inc. | | | 12 | | | | 242 | |
Host Hotels & Resorts, Inc. | | | 69 | | | | 1,295 | |
LaSalle Hotel Properties | | | 7 | | | | 201 | |
Pebblebrook Hotel Trust | | | 8 | | | | 247 | |
RLJ Lodging Trust | | | 20 | | | | 482 | |
Sunstone Hotel Investors, Inc. | | | 34 | | | | 515 | |
| | | | | | | | |
| | | | | | | 2,982 | |
| | | | | | | | |
Industrial REITs – 8.7% | |
Duke Realty Corp. | | | 40 | | | | 1,052 | |
First Industrial Realty Trust, Inc. | | | 30 | | | | 842 | |
ProLogis | | | 44 | | | | 2,334 | |
| | | | | | | | |
| | | | | | | 4,228 | |
| | | | | | | | |
Office REITs – 17.8% | |
Alexandria Real Estate Equities, Inc. | | | 13 | | | | 1,400 | |
Boston Properties, Inc. | | | 10 | | | | 1,220 | |
Brandywine Realty Trust | | | 52 | | | | 852 | |
Corporate Office Properties Trust | | | 25 | | | | 774 | |
| | | | | | | | |
| COMMON STOCKS (Continued) | | Shares | | | Value | |
Office REITs – (Continued) | |
Highwoods Properties, Inc. | | | 19 | | | $ | 949 | |
HRPT Properties Trust (A) | | | 7 | | | | 197 | |
Kilroy Realty Corp. | | | 16 | | | | 1,164 | |
SL Green Realty Corp. | | | 4 | | | | 441 | |
Vornado Realty Trust | | | 16 | | | | 1,680 | |
| | | | | | | | |
| | | | | | | 8,677 | |
| | | | | | | | |
Residential REITs – 17.1% | |
American Campus Communities, Inc. | | | 12 | | | | 617 | |
Apartment Investment and Management Co., Class A | | | 16 | | | | 749 | |
AvalonBay Communities, Inc. | | | 9 | | | | 1,641 | |
Education Realty Trust, Inc. | | | 18 | | | | 753 | |
Equity Lifestyle Properties, Inc. | | | 8 | | | | 562 | |
Equity Residential | | | 12 | | | | 761 | |
Essex Property Trust, Inc. | | | 3 | | | | 803 | |
Mid-America Apartment Communities, Inc. | | | 12 | | | | 1,165 | |
Sun Communities, Inc. | | | 11 | | | | 812 | |
UDR, Inc. | | | 14 | | | | 514 | |
| | | | | | | | |
| | | | | | | 8,377 | |
| | | | | | | | |
Retail REITs – 20.1% | |
Agree Realty Corp. | | | 9 | | | | 424 | |
Brixmor Property Group, Inc. | | | 39 | | | | 945 | |
Federal Realty Investment Trust | | | 4 | | | | 582 | |
General Growth Properties, Inc. | | | 51 | | | | 1,280 | |
Kimco Realty Corp. | | | 46 | | | | 1,145 | |
Pennsylvania Real Estate Investment Trust | | | 12 | | | | 235 | |
Regency Centers Corp. | | | 17 | | | | 1,186 | |
Simon Property Group, Inc. | | | 19 | | | | 3,400 | |
Weingarten Realty Investors | | | 18 | | | | 630 | |
| | | | | | | | |
| | | | | | | 9,827 | |
| | | | | | | | |
| | | | | | | | |
| COMMON STOCKS (Continued) | | Shares | | | Value | |
Specialized REITs – 14.2% | |
CubeSmart | | | 13 | | | $ | 348 | |
CyrusOne, Inc. | | | 15 | | | | 689 | |
Digital Realty Trust, Inc. | | | 6 | | | | 629 | |
DuPont Fabros Technology, Inc. | | | 14 | | | | 615 | |
Equinix, Inc. | | | 5 | | | | 1,676 | |
Extra Space Storage, Inc. | | | 15 | | | | 1,135 | |
Public Storage, Inc. | | | 8 | | | | 1,833 | |
| | | | | | | | |
| | | | | | | 6,925 | |
| | | | | | | | |
| |
Total Real Estate – 97.0% | | | | 47,358 | |
| |
TOTAL COMMON STOCKS – 97.0% | | | $ | 47,358 | |
(Cost: $46,016) | | | | | | | | |
| | |
| SHORT-TERM SECURITIES | | Principal | | | | |
Master Note – 3.9% | |
Toyota Motor Credit Corp., | | | | | | | | |
0.860%, 1-4-17 (B) | | $ | 1,893 | | | | 1,893 | |
| | | | | | | | |
| |
TOTAL SHORT-TERM SECURITIES – 3.9% | | | $ | 1,893 | |
(Cost: $1,893) | | | | | | | | |
| |
TOTAL INVESTMENT SECURITIES – 100.9% | | | $ | 49,251 | |
(Cost: $47,909) | | | | | | | | |
| |
LIABILITIES, NET OF CASH AND OTHER ASSETS – (0.9)% | | | | (433 | ) |
| | |
NET ASSETS – 100.0% | | | | | | $ | 48,818 | |
Notes to Schedule of Investments
| (A) | No dividends were paid during the preceding 12 months. |
| (B) | Variable rate security. Interest rate disclosed is that which is in effect at December 31, 2016. Date shown represents the date that the variable rate resets. |
The following table is a summary of the valuation of the Portfolio’s investments by the fair value hierarchy levels as of December 31, 2016. See Note 3 to the Financial Statements for further information regarding fair value measurement.
| | | | | | | | | | | | |
| | | Level 1 | | | Level 2 | | | Level 3 | |
Assets | | | | | | | | | | | | |
Investments in Securities | | | | | | | | | | | | |
Common Stocks | | $ | 47,358 | | | $ | — | | | $ | — | |
Short-Term Securities | | | — | | | | 1,893 | | | | — | |
Total | | $ | 47,358 | | | $ | 1,893 | | | $ | — | |
During the year ended December 31, 2016, there were no transfers between Level 1 and 2.
The following acronym is used throughout this schedule:
REIT = Real Estate Investment Trust
See Accompanying Notes to Financial Statements.
| | |
| MANAGEMENT DISCUSSION | | SCIENCE AND TECHNOLOGY |
(UNAUDITED)

Zachary H. Shafran

Bradley J. Warden
Below, Zachary Shafran and Bradley Warden, portfolio managers of Ivy VIP Science and Technology, discuss positioning, performance and results for the fiscal year ended December 31, 2016. Mr. Shafran has managed the Portfolio since 2001 and has 28 years of industry experience. Mr. Warden was named portfolio manager to the Portfolio in October 2016 and has 19 years of industry experience.
Fiscal Year Performance
| | | | |
For the 12 Months Ended December 31, 2016 | | | | |
Ivy VIP Science and Technology | | | 1.54% | |
Benchmark(s) and/or Lipper Category | | | | |
S&P North American Technology Sector Index | | | 13.55% | |
(generally reflects the performance of U.S. science and technology stocks) | | | | |
Lipper Variable Annuity Science and Technology Funds Universe Average | | | 11.18% | |
(generally reflects the performance of the universe of funds with similar investment objectives) | | | | |
Please note that Portfolio returns include applicable fees and expenses while index returns do not include any such fees. Also, the Portfolio’s performance data does not take into account any product expenses or charges associated with owning a variable life or annuity policy, which is invested in Ivy Variable Insurance Portfolios.
Increasing optimism with continued volatility
Equity and fixed-income markets were volatile in the fiscal year ended December 31, 2016. The global recovery experienced setbacks throughout the year, though we believe the gradual recovery should continue. Global growth for 2016 was relatively weak and more uneven than forecasts, with the U.S. emerging as the main driver for growth. After many false starts, in the fourth quarter of 2015, the U.S. Federal Reserve (Fed) raised rates for the first time since June 2006 and then again in December 2016. The Fed has indicated that up to three additional rate increases are expected in the upcoming year. Inflation generally remained in check through the year, but early signs of increasing inflation expectations began in the final months of the year. On the international front, economic growth remained sluggish despite a continued policy of central bank easing.
In rather shocking display, the U.K. voted to leave the European Union (EU) by a 52% to 48% margin. The global market place had been fairly nervous about a “Brexit,” though the ultimate impact on the markets has been fairly muted. While the stock markets saw short-term volatility, the situation now has more clarity despite the fact that uncertainty about U.K. economic growth remains.
The election of Donald Trump as the next U.S. President in November sent initial shockwaves through global markets. But, initial shock and concern quickly turned to optimism as hope that pragmatic government fiscal policy, including tax reform and large-scale capital spending, might lead to broad economic growth. Concern about trade policy and protectionism remains high, as Trump utilizes Twitter as his preferred method of communication, often injecting uncertainty into markets on a daily basis. Additionally, Trump’s tweets concerning government drug pricing negotiations have added volatility to the health care sector. We believe this policy-related volatility will likely continue until the new administration’s policy is more clearly defined.
On the year, information technology stocks performed well, with the Portfolio’s benchmark index advancing 13.6%. The semiconductor subsector provided the most significant portion of outperformance, with the semiconductor index advancing 37% in 2016. We believe consolidation, operating leverage, balance sheet strength, increases in dividend payments and strong management were key in providing stability and growth to this sector. On the health care front, stocks across the sector performed relatively poorly, primarily due to concern on pricing pressure as a result of political rhetoric. While we believe this rhetoric should subside once Trump lays out his health care plans, it remains a risk for the sector.
Health care tells the story of 2016
The Portfolio significantly underperformed its benchmark and its peer group average during the fiscal year. Virtually all of the underperformance was a result of the Portfolio’s exposure to health care, with health care accounting for approximately 10.7% of the Portfolio’s 10.9% underperformance relative to the benchmark. Health care is not represented in the benchmark, so the Portfolio’s allocation to health care is an important distinction when comparing performance metrics. In terms of specific holdings, four of the five worst performers in the Portfolio were in the health care sector, including Vertex Pharmaceuticals, Inc., Teva Pharmaceuticals Inc. ADR, Tenet Healthcare Corp. and Cerner Corp. Company specific issues
did impact these stocks, but the underlying political rhetoric and sector pressure contributed to the significant negative performance of these stocks. The only other name in the five worst performers was Alliance Data Systems Corp., which was adversely impacted by slower growth from recent acquisitions as well as poorer-than-expected management execution in its core businesses. On the other hand, the semiconductor names in the Portfolio, including Microsemi Corp., Micron Technology, Inc. and Semtech Corp., outperformed both the benchmark and semiconductor index by a significant margin.
Portfolio positioning
While we recognize the challenges of the world economic backdrop, we are excited about the innovation and growth that is taking place within certain companies. We believe many of the stocks in the information technology space remain relatively inexpensive and are well-positioned going forward. We strongly believe that confidence is being restored in the economy with the potential for major tax reform and capital expenditures in the U.S. and markets around the world. Company management teams are showing signs of optimism about economic growth, which should drive a positive reinforcing market environment, where companies begin to see renewed topline growth. The Portfolio had approximately 67% of its equity exposure in the information technology sector as of December 31, 2016.
The Portfolio’s relative exposure to health care names over the year decreased as a result of underperformance, and as of the fiscal year end, about 17% of the Portfolio’s equity holdings were in the health care sector. In developing markets, as the standard of living increases, we believe the demand for quality health care should increase. In our view, biotechnology, healthcare information technology systems and pharmaceuticals are among the greatest innovators and early adopters of new science and technology, so we are paying particularly close attention to companies in those areas. Even with the rhetoric around drug pricing, we believe biotechnology and pharmaceutical companies that bring economic value to the market (fewer hospitalizations, better patient productivity, etc.) will see significant returns and appreciating stock prices. We have opportunistically increased the Portfolio’s exposure to these names as the stocks pulled back.
The “applied science and technology” holdings span several industries and sectors and make up the remainder of the Portfolio’s equity composition, totaling approximately 10%. The Portfolio’s cash position as of December 31, 2016 was approximately 6%. We almost always have some cash on hand in an effort to take advantage of opportunities that may present themselves or to use as a defensive measure to protect the Portfolio in adverse market conditions.
Seeking opportunities in an improving market
Global economic growth has been fragile and buoyed by extremely aggressive global monetary policy, but we feel signs are percolating of underlying organic growth due to improving confidence. The Fed has recognized some of this early improvement and has moved in the direction of gradual tighter monetary policy. We think this improvement in economic growth will lead to tighter (normal) monetary policy as growth becomes more self-sustaining across the globe.
For the upcoming fiscal year, we believe the prospect for growth is to the upside. That said, we will continue to be prudent in balancing growth with valuations as we believe there are many potential investment opportunities — especially in biotechnology, data and health care — around the world. As we look at the securities of such companies, we are focused on what we believe are good growth prospects and sound capital structures. We believe there will be improvement in capital spending trends, and we are looking for a continuation of an active mergers-and-acquisition environment. As always, we will carefully monitor the macroeconomic environment, but our focus remains primarily on security-specific fundamental research. Going forward, we believe this attention to bottom-up research, coupled with the innovation and transformation under way across the globe, will continue to provide investment opportunities for the Portfolio.
Past performance is not a guarantee of future results. The value of the Portfolio’s shares will change, and you could lose money on your investment.
Because the Portfolio invests more than 25% of its total assets in the science and technology industry, the Portfolio’s performance may be more susceptible to a single economic, regulatory or technological occurrence than a fund that does not concentrate its investments in this industry. Securities of companies within specific industries or sectors of the economy may periodically perform differently than the overall market. In addition, the Portfolio’s performance may be more volatile than an investment in a portfolio of broad market securities and may underperform the market as a whole, due to the relatively limited number of issuers of science and technology related securities. Investment risks associated with investing in science and technology securities, in addition to other risks, include: operating in rapidly changing fields, abrupt or erratic market movements, limited product lines, markets or financial resources, management that is dependent on a limited number of people, short product cycles, aggressive pricing of products and services, new market entrants and obsolescence of existing technology. International investing involves additional risks, including currency fluctuations, political or economic conditions affecting the foreign country, and differences in accounting standards and foreign regulations. Dividend-paying
stocks may fall out of favor with investors and underperform non-dividend paying stocks and the market as a whole. In addition, dividend-paying companies may not pay dividends in the future; such dividends, if declared, may not remain at current levels or increase over time. The amount of any dividend the company may pay may fluctuate significantly. Dividend-paying stocks can decline in value when interest rates rise; this risk may be greater during the current period of historically low interest rates. These and other risks are more fully described in the Portfolio’s prospectus.
The opinions expressed in this report are those of the portfolio manager and are current only through the end of the period of the report as stated on the cover. The manager’s views are subject to change at any time based on market and other conditions, and no forecasts can be guaranteed.
The index (indexes) noted are unmanaged and include reinvested dividends. One cannot invest directly in an index, nor is an index representative of the Ivy VIP Science and Technology.
| | |
| PORTFOLIO HIGHLIGHTS | | SCIENCE AND TECHNOLOGY |
|
| ALL DATA AS OF DECEMBER 31, 2016 (UNAUDITED) |
Asset Allocation
| | | | |
Stocks | | | 91.8% | |
Information Technology | | | 69.4% | |
Health Care | | | 15.2% | |
Telecommunication Services | | | 2.1% | |
Consumer Discretionary | | | 1.7% | |
Real Estate | | | 1.5% | |
Utilities | | | 1.1% | |
Materials | | | 0.6% | |
Consumer Staples | | | 0.1% | |
Industrials | | | 0.1% | |
Warrants | | | 0.0% | |
Bonds | | | 0.5% | |
Corporate Debt Securities | | | 0.5% | |
Cash and Other Assets (Net of Liabilities), and Cash Equivalents+ | | | 7.7% | |
Country Weightings
| | | | |
North America | | | 78.3% | |
United States | | | 78.3% | |
Pacific Basin | | | 5.7% | |
Other | | | 3.7% | |
Israel | | | 3.7% | |
Europe | | | 3.1% | |
Bahamas/Caribbean | | | 1.5% | |
Cash and Other Assets (Net of Liabilities), and Cash Equivalents+ | | | 7.7% | |
Top 10 Equity Holdings
| | | | | | |
| Company | | Country | | Sector | | Industry |
Micron Technology, Inc. | | United States | | Information Technology | | Semiconductors |
Microsemi Corp. | | United States | | Information Technology | | Semiconductors |
Alliance Data Systems Corp. | | United States | | Information Technology | | Data Processing & Outsourced Services |
Microsoft Corp. | | United States | | Information Technology | | Systems Software |
Euronet Worldwide, Inc. | | United States | | Information Technology | | Data Processing & Outsourced Services |
Aspen Technology, Inc. | | United States | | Information Technology | | Application Software |
Facebook, Inc., Class A | | United States | | Information Technology | | Internet Software & Services |
WNS (Holdings) Ltd. ADR | | India | | Information Technology | | Data Processing & Outsourced Services |
Ionis Pharmaceuticals, Inc. | | United States | | Health Care | | Biotechnology |
ACI Worldwide, Inc. | | United States | | Information Technology | | Application Software |
See your advisor for more information on the Portfolio’s most recent published Top 10 Equity Holdings.
+Cash equivalents are defined as highly liquid securities with maturities of less than three months. Cash equivalents may include U.S. Government Treasury bills, bank certificates of deposit, bankers’ acceptances, corporate commercial paper and other money market instruments.
| | |
COMPARISON OF CHANGE IN VALUE
OF $10,000 INVESTMENT | | SCIENCE AND TECHNOLOGY |
(UNAUDITED)
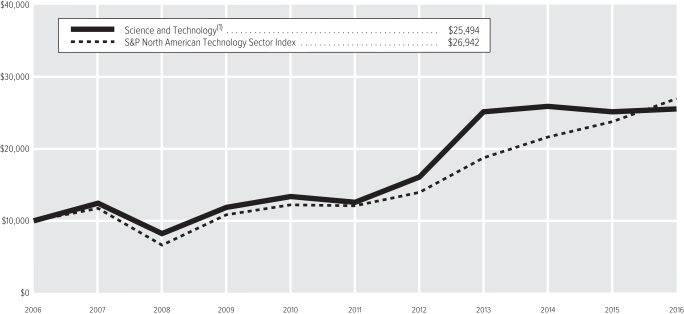
| (1) | The value of the investment in the Portfolio is impacted by the ongoing expenses of the Portfolio and assumes reinvestment of dividends and distributions. |
| | | | |
| Average Annual Total Return(2) | | | |
1-year period ended 12-31-16 | | | 1.54% | |
5-year period ended 12-31-16 | | | 15.20% | |
10-year period ended 12-31-16 | | | 9.81% | |
| (2) | Data quoted is past performance and current performance may be lower or higher. Past performance is no guarantee of future results. Investment return and principal value of an investment will fluctuate and shares, when redeemed, may be worth more or less than their original cost. Please call 1.888.WADDELL for the Portfolio’s most recent month-end performance. Performance data quoted does not reflect any expenses or charges associated with owning a variable life insurance policy or variable annuity contract that invests in the Portfolio’s shares. When such charges are deducted, actual investment performance in a variable policy or contract will be lower. |
Past performance is not necessarily indicative of future performance. Indexes are unmanaged. The performance graph and table do not reflect the deduction of taxes that a shareholder would pay on Portfolio distributions or on the redemption of Portfolio shares. Performance results may include the effect of expense reduction arrangements for some or all of the periods shown. If those arrangements had not been in place, the performance results for those periods would have been lower.
| | |
| SCHEDULE OF INVESTMENTS | | SCIENCE AND TECHNOLOGY (in thousands) |
DECEMBER 31, 2016
| | | | | | | | |
| COMMON STOCKS | | Shares | | | Value | |
Consumer Discretionary | | | | | | | | |
| | |
Consumer Electronics – 1.7% | | | | | | | | |
Garmin Ltd. | | | 184 | | | $ | 8,913 | |
| | | | | | | | |
| |
Total Consumer Discretionary – 1.7% | | | | 8,913 | |
Consumer Staples | | | | | | | | |
| |
Agricultural Products – 0.1% | | | | | |
Arcadia Biosciences, Inc. (A) | | | 273 | | | | 251 | |
| | | | | | | | |
| |
Total Consumer Staples – 0.1% | | | | 251 | |
Health Care | | | | | | | | |
| | |
Biotechnology – 7.5% | | | | | | | | |
Alexion Pharmaceuticals, Inc. (A) | | | 22 | | | | 2,631 | |
Evogene Ltd. (A) | | | 175 | | | | 893 | |
Ionis Pharmaceuticals, Inc. (A) | | | 360 | | | | 17,195 | |
Kite Pharma, Inc. (A) | | | 47 | | | | 2,098 | |
Vertex Pharmaceuticals, Inc. (A) | | | 216 | | | | 15,942 | |
| | | | | | | | |
| | | | | | | 38,759 | |
| | | | | | | | |
| |
Health Care Equipment – 0.3% | | | | | |
Avinger, Inc. (A) | | | 433 | | | | 1,604 | |
| | | | | | | | |
| |
Health Care Facilities – 1.5% | | | | | |
Hologic, Inc. (A) | | | 65 | | | | 2,612 | |
Tenet Healthcare Corp. (A) | | | 326 | | | | 4,836 | |
| | | | | | | | |
| | | | | | | 7,448 | |
| | | | | | | | |
| | |
Health Care Technology – 2.8% | | | | | | | | |
Cerner Corp. (A) | | | 308 | | | | 14,571 | |
| | | | | | | | |
| |
Managed Health Care – 1.0% | | | | | |
Cigna Corp. | | | 39 | | | | 5,216 | |
| | | | | | | | |
| |
Pharmaceuticals – 2.1% | | | | | |
Teva Pharmaceutical Industries Ltd. ADR | | | 295 | | | | 10,708 | |
| | | | | | | | |
| |
Total Health Care – 15.2% | | | | 78,306 | |
Industrials | | | | | | | | |
| | |
Building Products – 0.1% | | | | | | | | |
Advanced Drainage Systems, Inc. | | | 20 | | | | 412 | |
| | | | | | | | |
| |
Total Industrials – 0.1% | | | | 412 | |
Information Technology | | | | | | | | |
| |
Application Software – 10.2% | | | | | |
ACI Worldwide, Inc. (A) | | | 886 | | | | 16,084 | |
Aspen Technology, Inc. (A) | | | 360 | | | | 19,663 | |
Globant S.A. (A) | | | 71 | | | | 2,362 | |
Mobileye N.V. (A) | | | 188 | | | | 7,163 | |
Silver Spring Networks, Inc. (A) | | | 552 | | | | 7,351 | |
| | | | | | | | |
| | | | | | | 52,623 | |
| | | | | | | | |
| |
Data Processing & Outsourced Services – 12.7% | |
Alliance Data Systems Corp. | | | 112 | | | | 25,683 | |
Euronet Worldwide, Inc. (A) | | | 274 | | | | 19,870 | |
| | | | | | | | |
| COMMON STOCKS (Continued) | | Shares | | | Value | |
Data Processing & Outsourced Services (Continued) | |
QIWI plc ADR | | | 161 | | | $ | 2,054 | |
WNS (Holdings) Ltd. ADR (A) | | | 637 | | | | 17,549 | |
| | | | | | | | |
| | | | | | | 65,156 | |
| | | | | | | | |
| |
Electronic Components – 2.0% | | | | | |
Universal Display Corp. (A) | | | 183 | | | | 10,275 | |
| | | | | | | | |
| |
Internet Software & Services – 11.2% | |
Alibaba Group Holding Ltd. ADR (A) | | | 132 | | | | 11,608 | |
Alphabet, Inc., Class A (A) | | | 13 | | | | 10,619 | |
Alphabet, Inc., Class C (A) | | | 18 | | | | 13,765 | |
Facebook, Inc., Class A (A) | | | 154 | | | | 17,683 | |
Pandora Media, Inc. (A) | | | 280 | | | | 3,647 | |
| | | | | | | | |
| | | | | | | 57,322 | |
| | | | | | | | |
| |
IT Consulting & Other Services – 3.9% | |
Acxiom Corp. (A) | | | 503 | | | | 13,478 | |
CSRA, Inc. | | | 213 | | | | 6,769 | |
| | | | | | | | |
| | | | | | | 20,247 | |
| | | | | | | | |
| |
Semiconductor Equipment – 1.3% | | | | | |
Nanometrics, Inc. (A) | | | 78 | | | | 1,957 | |
Photronics, Inc. (A) | | | 432 | | | | 4,886 | |
| | | | | | | | |
| | | | | | | 6,843 | |
| | | | | | | | |
| | |
Semiconductors – 22.0% | | | | | | | | |
Cypress Semiconductor Corp. | | | 919 | | | | 10,515 | |
Dialog Semiconductor
plc (A)(B) | | | 139 | | | | 5,860 | |
Intel Corp. | | | 212 | | | | 7,689 | |
Marvell Technology Group Ltd. | | | 540 | | | | 7,495 | |
Micron Technology, Inc. (A) | | | 1,414 | | | | 30,999 | |
Microsemi Corp. (A) | | | 533 | | | | 28,772 | |
Rambus, Inc. (A) | | | 765 | | | | 10,527 | |
Semtech Corp. (A) | | | 363 | | | | 11,440 | |
| | | | | | | | |
| | | | | | | 113,297 | |
| | | | | | | | |
| | |
Systems Software – 4.6% | | | | | | | | |
Microsoft Corp. | | | 381 | | | | 23,694 | |
| | | | | | | | |
| |
Technology Hardware, Storage & Peripherals – 1.5% | |
Hewlett-Packard Co. | | | 515 | | | | 7,649 | |
| | | | | | | | |
| |
Total Information Technology – 69.4% | | | | 357,106 | |
Materials | | | | | | | | |
| |
Commodity Chemicals – 0.5% | | | | | |
BioAmber, Inc. (A) | | | 480 | | | | 2,641 | |
| | | | | | | | |
| |
Fertilizers & Agricultural Chemicals – 0.1% | |
Marrone Bio Innovations, Inc. (A) | | | 280 | | | | 598 | |
| | | | | | | | |
| |
Total Materials – 0.6% | | | | 3,239 | |
Real Estate | | | | | | | | |
| | |
Specialized REITs – 1.5% | | | | | | | | |
QTS Realty Trust, Inc., Class A | | | 159 | | | | 7,879 | |
| | | | | | | | |
| |
Total Real Estate – 1.5% | | | | 7,879 | |
| | | | | | | | |
| COMMON STOCKS (Continued) | | Shares | | | Value | |
Telecommunication Services | | | | | | | | |
| | |
Alternative Carriers – 2.1% | | | | | | | | |
Zayo Group Holdings, Inc. (A) | | | 324 | | | $ | 10,630 | |
| | | | | | | | |
| |
Total Telecommunication Services – 2.1% | | | | 10,630 | |
Utilities | | | | | | | | |
| |
Independent Power Producers & Energy
Traders – 1.1% | |
Atlantica Yield plc | | | 283 | | | | 5,478 | |
| | | | | | | | |
| |
Total Utilities – 1.1% | | | | 5,478 | |
| |
TOTAL COMMON STOCKS – 91.8% | | | $ | 472,214 | |
(Cost: $328,740) | | | | | | | | |
| | |
| WARRANTS | | | | | | |
Commodity Chemicals – 0.0% | |
BioAmber, Inc., expires 5-9-17 (C) | | | 201 | | | | 123 | |
| | | | | | | | |
| |
Fertilizers & Agricultural Chemicals – 0.0% | |
Marrone Bio Innovations, Inc.,
expires 8-20-23 (C)(D) | | | 230 | | | | 53 | |
| | | | | | | | |
| |
TOTAL WARRANTS – 0.0% | | | $ | 176 | |
(Cost: $24) | | | | | | | | |
| | |
| CORPORATE DEBT SECURITIES | | Principal | | | | |
Materials | | | | | | | | |
| |
Fertilizers & Agricultural Chemicals – 0.5% | |
Marrone Bio Innovations, Inc., | | | | | | | | |
8.000%, 8-20-20 (D) | | $ | 2,300 | | | | 2,305 | |
| | | | | | | | |
| |
Total Materials – 0.5% | | | | 2,305 | |
| |
TOTAL CORPORATE DEBT SECURITIES – 0.5% | | | $ | 2,305 | |
(Cost: $2,300) | | | | | | | | |
| | |
| SHORT-TERM SECURITIES | | | | | | |
Commercial Paper (E) – 5.5% | | | | | | | | |
BMW U.S. Capital LLC
(GTD by BMW AG), | | | | | | | | |
0.650%, 1-6-17 | | | 4,328 | | | | 4,328 | |
Caterpillar Financial Services Corp. (GTD by Caterpillar, Inc.), | | | | | | | | |
0.550%, 1-26-17 | | | 10,000 | | | | 9,996 | |
Danaher Corp., | | | | | | | | |
0.700%, 1-4-17 | | | 6,000 | | | | 6,000 | |
PacifiCorp, | | | | | | | | |
0.880%, 1-11-17 | | | 4,000 | | | | 3,999 | |
Sysco Corp., | | | | | | | | |
1.100%, 1-4-17 | | | 4,000 | | | | 3,999 | |
| | | | | | | | |
| | | | | | | 28,322 | |
| | | | | | | | |
| | |
| SCHEDULE OF INVESTMENTS | | SCIENCE AND TECHNOLOGY (in thousands) |
DECEMBER 31, 2016
| | | | | | | | |
| | |
SHORT-TERM SECURITIES
(Continued) | | Principal | | | Value | |
Master Note – 1.0% | | | | | | | | |
Toyota Motor Credit Corp., | | | | | | | | |
0.860%, 1-4-17 (F) | | $ | 5,195 | | | $ | 5,195 | |
| | | | | | | | |
| |
Municipal Obligations – 1.2% | | | | | |
Santa Clara Cnty Fin Auth, Var Rate Rev Bonds, El Camino Hosp, Ser 2009A (GTD by Wells Fargo Bank N.A.), | | | | | | | | |
0.690%, 1-7-17 (F) | | | 6,049 | | | | 6,049 | |
| | | | | | | | |
| |
TOTAL SHORT-TERM SECURITIES – 7.7% | | | $ | 39,566 | |
(Cost: $39,563) | | | | | | | | |
| |
TOTAL INVESTMENT
SECURITIES – 100.0% | | | $ | 514,261 | |
(Cost: $370,627) | | | | | | | | |
| |
CASH AND OTHER ASSETS, NET OF LIABILITIES – 0.0% | | | | 199 | |
| | |
NET ASSETS – 100.0% | | | | | | $ | 514,460 | |
Notes to Schedule of Investments
| (A) | No dividends were paid during the preceding 12 months. |
| (B) | Listed on an exchange outside the United States. |
| (C) | Warrants entitle the Portfolio to purchase a predetermined number of shares of common stock and are non-income producing. The purchase price and number of shares are subject to adjustment under certain conditions until the expiration date, if any. |
| (D) | Restricted securities. At December 31, 2016, the Portfolio owned the following restricted securities: |
| | | | | | | | | | | | | | | | | | | | |
| Security | | Acquisition Date(s) | | | Principal | | | Cost | | | Market Value | | | | |
Marrone Bio Innovations, Inc., 8.000%, 08-20-20 | | | 8-20-15 | | | $ | 2,300 | | | $ | 2,300 | | | $ | 2,305 | | | | | |
Marrone Bio Innovations, Inc., expires 8-20-23 | | | 8-20-15 | | | | 230 | | | $ | — | | | $ | 53 | | | | | |
| | | | | | | | | | | | |
| | | | | | | | | | $ | 2,300 | | | $ | 2,358 | | | | | |
| | | | | | | | | | | | |
| | The total value of these securities represented 0.5% of net assets at December 31, 2016. |
| (E) | Rate shown is the yield to maturity at December 31, 2016. |
| (F) | Variable rate security. Interest rate disclosed is that which is in effect at December 31, 2016. Date shown represents the date that the variable rate resets. |
The following table is a summary of the valuation of the Portfolio’s investments by the fair value hierarchy levels as of December 31, 2016. See Note 3 to the Financial Statements for further information regarding fair value measurement.
| | | | | | | | | | | | |
| | | Level 1 | | | Level 2 | | | Level 3 | |
Assets | | | | | | | | | | | | |
Investments in Securities | | | | | | | | | | | | |
Common Stocks | | $ | 472,214 | | | $ | — | | | $ | — | |
Warrants | | | 123 | | | | 53 | | | | — | |
Corporate Debt Securities | | | — | | | | 2,305 | | | | — | |
Short-Term Securities | | | — | | | | 39,566 | | | | — | |
Total | | $ | 472,337 | | | $ | 41,924 | | | $ | — | |
During the year ended December 31, 2016, there were no transfers between Level 1 and 2.
The following acronyms are used throughout this schedule:
ADR = American Depositary Receipts
GTD = Guaranteed
REIT= Real Estate Investment Trust
| | |
| SCHEDULE OF INVESTMENTS | | SCIENCE AND TECHNOLOGY (in thousands) |
DECEMBER 31, 2016
Country Diversification
| | | | |
(as a % of net assets) | |
United States | | | 78.3% | |
Israel | | | 3.7% | |
India | | | 3.4% | |
China | | | 2.3% | |
Bermuda | | | 1.5% | |
Germany | | | 1.1% | |
Spain | | | 1.1% | |
Other Countries | | | 0.9% | |
Other+ | | | 7.7% | |
+ Includes cash and other assets (net of liabilities), and cash equivalents
See Accompanying Notes to Financial Statements.
| | |
| MANAGEMENT DISCUSSION | | SMALL CAP GROWTH |
(UNAUDITED)

Kenneth G. McQuade

Timothy J. Miller

Brad Halverson
Below, Bradley P. Halverson, CFA, Kenneth G. McQuade and Timothy J. Miller, CFA, co-portfolio managers of Ivy VIP Small Cap Growth, discuss positioning, performance and results for the fiscal year ended December 31, 2016. Mr. McQuade has managed the Portfolio since 2006 and has 21 years of investment experience. Mr. Halverson and Mr. Miller assumed co-manager responsibility in October 2016 and they have 15 years and 37 years of industry experience, respectively.
Fiscal Year Performance
| | | | |
For the 12 Months Ended December 31, 2016 | | | | |
Ivy VIP Small Cap Growth | | | 2.92% | |
Benchmark(s) and/or Lipper Category | | | | |
Russell 2000 Growth Index | | | 11.32% | |
(generally reflects the performance of small-capitalization growth stocks) | | | | |
Lipper Variable Annuity Small-Cap Growth Funds Universe Average | | | 9.97% | |
(generally reflects the performance of the universe of funds with similar investment objectives) | | | | |
Please note that Portfolio returns include applicable fees and expenses while index returns do not include any such fees. Also, the Portfolio’s performance data does not take into account any product expenses or charges associated with owning a variable life or annuity policy, which is invested in Ivy Variable Insurance Portfolios.
Key drivers
The small-cap growth space experienced another strong year was realized in 2016. The Russell 2000 Growth Index, the Portfolio’s benchmark, which represents small-capitalization growth stocks, maintained its overall positive momentum in the year, ending the 12-month period with a return of 11.3%. The latest rally occurred post-election day, fueled by hopes for more business-friendly policies from President-elect Trump. Sector leadership changed significantly based on the general surprise of a Trump win, along with a Republican sweep in the U.S. elections, which caused a significant level of volatility in the U.S. During the last quarter of the year, the Portfolio underperformed, which also caused the Portfolio to underperform for the 12-month period ended December 31, 2016.
Contributors and detractors
The financials sector was the clear leader for the market in the fourth quarter, led by regional banks that initially benefited from higher interest rates. The sector increased in the fourth quarter, mostly within regional banks that depend on loan growth and the interest rate spread within their loan portfolios. The Portfolio was overweight financials, but slightly underweight regional banks, which caused quarterly underperformance. Generally, industrials-related names also led fourth quarter based on the continuing improvement in the U.S. economy, promises of less regulation and the potential for pockets of domestic protectionism. The industrials sector led, followed by related sectors, materials and energy. The materials sector was up in the fourth quarter and the energy sector, on the back of improving oil prices, posted a solid quarterly return.
The Portfolio was significantly underweight core cyclical industrials names and, therefore, significantly underperformed the industrials sector. The Portfolio was much more weighted to housing-related names, which, in total, produced a positive absolute return, but did not compare to the huge spike industrial cyclicals experienced on the hopes of more business-friendly policies and domestic spend increases. The Portfolio also slightly underperformed materials and energy for similar reasons. Health care was the sole declining sector in the fourth quarter. Fears of a repealed Patient Protection and Affordable Care Act (ACA) health program hurt the outlook for health care providers, including hospitals, nursing and surgery centers. The Portfolio remained underweight healthcare due to regulatory fears and also had less exposure to ACA-related names.
Based on the surge of less growthier bank stock and industrials in the fourth quarter of 2016, quality metrics were quite volatile relative to earlier in the year. Many of the largest but slowest growing stocks outperformed. The worst growing quintile of stocks were positive while the best growing stocks declined. Investors apparently sold their winning high-flyers for more Trump-benefiting cyclical companies. The Portfolio gravitated toward faster growing secular growth stories, which were not favorable following the U.S. election.
Outlook
Looking forward, the U.S. economic expansion has remained steadfast enough that the Federal Reserve has begun the process of renormalizing interest rates. The economy continues on its trajectory of low but sustainable growth with more economic upside projected in the United States than anywhere else in the world. U.S. consumers could benefit from reasonable energy prices, interest rates, inflation and strong employment confidence, although all these metrics are rising. Thus, owning the beneficiaries of a strong domestic consumer is an increasing strategy of the Portfolio.
We think a big risk post many positive quarters and record annual returns is that stock prices have outpaced economic and earnings growth, making valuations less attractive. Periods of catch up and volatility are likely to continue. The Portfolio’s long-term strategy of owning high-quality companies also usually is associated with owning higher valued stocks, which has more risk during times of corrections, but we believe over time, earnings growth matters. In addition, we think the benefits of a better employment environment with reasonable inflation, open credit markets and less regulation may continue to help some cyclical growth segments relative to secular growth. Domestic industrials-related names may be bigger beneficiaries of the economic environment going forward. Although the Portfolio remains disciplined to holding more consistent secular growth in companies that should be ultimate winners in their respective market segments, we believe valuation sensitivity and an eye toward cyclical beneficiaries will increase. However, the Portfolio remains quite focused in the search for companies with stronger revenue growth, greater profitability and cleaner balance sheets that can reinvest in their own businesses and could benefit from improved corporate and consumer spending.
Past performance is not a guarantee of future results. The value of the Portfolio’s shares will change, and you could lose money on your investment.
Investing in small-cap stocks may carry more risk than investing in stocks of larger, more well-established companies. Prices of growth stocks may be more sensitive to changes in current or expected earnings than the prices of other stocks. Growth stocks may not perform as well as value stocks or the stock market in general. These and other risks are more fully described in the Portfolio’s prospectus.
The opinions expressed in this report are those of the portfolio managers and are current only through the end of the period of the report as stated on the cover. The managers’ views are subject to change at any time based on market and other conditions, and no forecasts can be guaranteed.
The index noted is unmanaged, includes reinvested dividends and does not include fees. One cannot invest directly in an index, nor is an index representative of the Ivy VIP Small Cap Growth performance.
| | |
| PORTFOLIO HIGHLIGHTS | | SMALL CAP GROWTH |
ALL DATA AS OF DECEMBER 31, 2016 (UNAUDITED)
Asset Allocation
| | | | |
Stocks | | | 95.3% | |
Information Technology | | | 31.1% | |
Health Care | | | 17.9% | |
Consumer Discretionary | | | 17.0% | |
Industrials | | | 11.0% | |
Financials | | | 8.0% | |
Energy | | | 4.5% | |
Materials | | | 2.5% | |
Consumer Staples | | | 1.7% | |
Real Estate | | | 1.6% | |
Bonds | | | 1.4% | |
United States Government Agency Obligations | | | 1.4% | |
Cash and Other Assets (Net of Liabilities), and Cash Equivalents+ | | | 3.3% | |
Top 10 Equity Holdings
| | | | |
| Company | | Sector | | Industry |
AMN Healthcare Services, Inc. | | Health Care | | Health Care Services |
Watsco, Inc. | | Industrials | | Trading Companies & Distributors |
Dycom Industries, Inc. | | Information Technology | | Communications Equipment |
K2M Group Holdings, Inc. | | Health Care | | Health Care Equipment |
Nautilus Group, Inc. (The) | | Consumer Discretionary | | Leisure Products |
Booz Allen Hamilton Holding Corp. | | Information Technology | | IT Consulting & Other Services |
LendingTree, Inc. | | Financials | | Thrifts & Mortgage Finance |
Pool Corp. | | Consumer Discretionary | | Distributors |
SVB Financial Group | | Financials | | Regional Banks |
Home BancShares, Inc. | | Financials | | Regional Banks |
See your advisor for more information on the Portfolio’s most recently published Top 10 Equity Holdings.
+Cash equivalents are defined as highly liquid securities with maturities of less than three months. Cash equivalents may include U.S. Government Treasury bills, bank certificates of deposit, bankers’ acceptances, corporate commercial paper and other money market instruments.
| | |
COMPARISON OF CHANGE IN VALUE
OF $10,000 INVESTMENT | | SMALL CAP GROWTH |
(UNAUDITED)
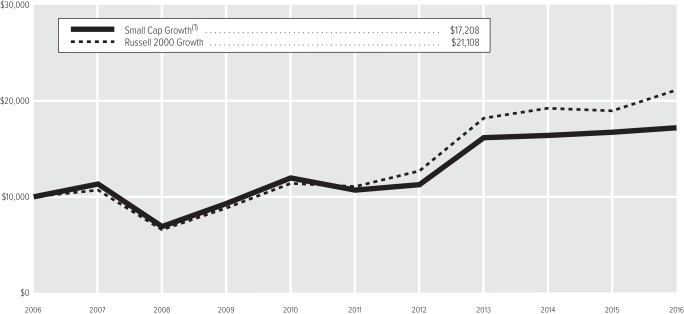
| (1) | The value of the investment in the Portfolio is impacted by the ongoing expenses of the Portfolio and assumes reinvestment of dividends and distributions. |
| | | | |
| Average Annual Total Return(2) | | | |
1-year period ended 12-31-16 | | | 2.92% | |
5-year period ended 12-31-16 | | | 9.94% | |
10-year period ended 12-31-16 | | | 5.58% | |
| (2) | Data quoted is past performance and current performance may be lower or higher. Past performance is no guarantee of future results. Investment return and principal value of an investment will fluctuate and shares, when redeemed, may be worth more or less than their original cost. Please call 1.888.WADDELL for the Portfolio’s most recent month-end performance. Performance data quoted does not reflect any expenses or charges associated with owning a variable life insurance policy or variable annuity contract that invests in the Portfolio’s shares. When such charges are deducted, actual investment performance in a variable policy or contract will be lower. |
Past performance is not necessarily indicative of future performance. Indexes are unmanaged. The performance graph and table do not reflect the deduction of taxes that a shareholder would pay on Portfolio distributions or on the redemption of Portfolio shares. Performance results may include the effect of expense reduction arrangements for some or all of the periods shown. If those arrangements had not been in place, the performance results for those periods would have been lower.
| | |
| SCHEDULE OF INVESTMENTS | | SMALL CAP GROWTH (in thousands) |
DECEMBER 31, 2016
| | | | | | | | |
| COMMON STOCKS | | Shares | | | Value | |
Consumer Discretionary | |
| |
Apparel Retail – 1.6% | |
Burlington Stores, Inc. (A) | | | 82 | | | $ | 6,934 | |
| | | | | | | | |
| |
Apparel, Accessories & Luxury Goods – 0.5% | |
Oxford Industries, Inc. | | | 35 | | | �� | 2,097 | |
| | | | | | | | |
| |
Automotive Retail – 2.2% | |
Lithia Motors, Inc. | | | 37 | | | | 3,612 | |
Monro Muffler Brake, Inc. | | | 95 | | | | 5,455 | |
| | | | | | | | |
| | | | | | | 9,067 | |
| | | | | | | | |
| |
Distributors – 2.2% | |
Pool Corp. | | | 91 | | | | 9,457 | |
| | | | | | | | |
| |
Homebuilding – 2.1% | |
Installed Building Products, Inc. (A) | | | 113 | | | | 4,651 | |
LGI Homes, Inc. (A) | | | 142 | | | | 4,090 | |
| | | | | | | | |
| | | | | | | 8,741 | |
| | | | | | | | |
| |
Leisure Facilities – 1.5% | |
Vail Resorts, Inc. (B) | | | 40 | | | | 6,438 | |
| | | | | | | | |
| |
Leisure Products – 2.6% | |
Nautilus Group, Inc. (The) (A) | | | 605 | | | | 11,194 | |
| | | | | | | | |
| |
Restaurants – 2.4% | |
Dave & Buster’s Entertainment, Inc. (A) | | | 100 | | | | 5,652 | |
Wingstop, Inc. | | | 152 | | | | 4,498 | |
| | | | | | | | |
| | | | | | | 10,150 | |
| | | | | | | | |
| |
Specialty Stores – 1.9% | |
Five Below, Inc. (A) | | | 116 | | | | 4,652 | |
Party City Holdco, Inc. (A) | | | 250 | | | | 3,545 | |
| | | | | | | | |
| | | | | | | 8,197 | |
| | | | | | | | |
| |
Total Consumer Discretionary – 17.0% | | | | 72,275 | |
Consumer Staples | |
| |
Packaged Foods & Meats – 1.7% | |
Lance, Inc. (B) | | | 188 | | | | 7,201 | |
| | | | | | | | |
| |
Total Consumer Staples – 1.7% | | | | 7,201 | |
Energy | |
| |
Oil & Gas Equipment & Services – 2.0% | |
Forum Energy Technologies, Inc. (A) | | | 94 | | | | 2,063 | |
RPC, Inc. | | | 164 | | | | 3,258 | |
Superior Energy Services, Inc. | | | 172 | | | | 2,897 | |
U.S. Silica Holdings, Inc. | | | 11 | | | | 641 | |
| | | | | | | | |
| | | | | | | 8,859 | |
| | | | | | | | |
| |
Oil & Gas Exploration & Production – 2.5% | |
Parsley Energy, Inc.,
Class A (A) | | | 193 | | | | 6,816 | |
RSP Permian, Inc. (A) | | | 84 | | | | 3,756 | |
| | | | | | | | |
| | | | | | | 10,572 | |
| | | | | | | | |
| |
Total Energy – 4.5% | | | | 19,431 | |
| | | | | | | | |
| COMMON STOCKS (Continued) | | Shares | | | Value | |
Financials | |
| |
Regional Banks – 5.8% | |
Ameris Bancorp | | | 59 | | | $ | 2,564 | |
Cathay General Bancorp | | | 69 | | | | 2,625 | |
Home BancShares, Inc. | | | 325 | | | | 9,037 | |
SVB Financial Group (A) | | | 55 | | | | 9,455 | |
Western Alliance Bancorp. (A) | | | 17 | | | | 843 | |
| | | | | | | | |
| | | | | | | 24,524 | |
| | | | | | | | |
| |
Thrifts & Mortgage Finance – 2.2% | |
LendingTree, Inc. (A)(B) | | | 94 | | | | 9,510 | |
| | | | | | | | |
| |
Total Financials – 8.0% | | | | 34,034 | |
Health Care | |
| |
Health Care Equipment – 9.2% | |
Inogen, Inc. (A) | | | 107 | | | | 7,159 | |
iRhythm Technologies, Inc. (A) | | | 72 | | | | 2,150 | |
K2M Group Holdings, Inc. (A) | | | 574 | | | | 11,495 | |
Nevro Corp. (A) | | | 93 | | | | 6,750 | |
NuVasive, Inc. (A) | | | 66 | | | | 4,412 | |
NxStage Medical, Inc. (A) | | | 177 | | | | 4,650 | |
Penumbra, Inc. (A) | | | 41 | | | | 2,589 | |
| | | | | | | | |
| | | | | | | 39,205 | |
| | | | | | | | |
| |
Health Care Facilities – 1.2% | |
Surgical Care Affiliates, Inc. (A) | | | 113 | | | | 5,235 | |
| | | | | | | | |
| |
Health Care Services – 4.9% | |
AMN Healthcare Services, Inc. (A) | | | 370 | | | | 14,211 | |
Envision Healthcare Holdings, Inc. (A) | | | 102 | | | | 6,443 | |
| | | | | | | | |
| | | | | | | 20,654 | |
| | | | | | | | |
| |
Life Sciences Tools & Services – 1.2% | |
Cambrex Corp. (A) | | | 99 | | | | 5,315 | |
| | | | | | | | |
| |
Managed Health Care – 1.4% | |
HealthEquity, Inc. (A) | | | 148 | | | | 5,995 | |
| | | | | | | | |
| |
Total Health Care – 17.9% | | | | 76,404 | |
Industrials | |
| |
Aerospace & Defense – 0.8% | |
HEICO Corp. | | | 46 | | | | 3,531 | |
| | | | | | | | |
| |
Air Freight & Logistics – 1.0% | |
XPO Logistics, Inc. (A) | | | 97 | | | | 4,183 | |
| | | | | | | | |
| |
Diversified Support Services – 0.8% | |
Ritchie Bros. Auctioneers, Inc. | | | 100 | | | | 3,413 | |
| | | | | | | | |
| |
Industrial Machinery – 3.1% | |
John Bean Technologies Corp. | | | 85 | | | | 7,323 | |
Woodward, Inc. | | | 83 | | | | 5,731 | |
| | | | | | | | |
| | | | | | | 13,054 | |
| | | | | | | | |
| |
Trading Companies & Distributors – 4.1% | |
Beacon Roofing Supply, Inc. (A) | | | 100 | | | | 4,607 | |
Watsco, Inc. (B) | | | 87 | | | | 12,956 | |
| | | | | | | | |
| | | | | | | 17,563 | |
| | | | | | | | |
| | | | | | | | |
| COMMON STOCKS (Continued) | | Shares | | | Value | |
Trucking – 1.2% | |
Knight Transportation, Inc. | | | 153 | | | $ | 5,063 | |
| | | | | | | | |
| |
Total Industrials – 11.0% | | | | 46,807 | |
Information Technology | |
| |
Application Software – 10.7% | |
BroadSoft, Inc. (A) | | | 205 | | | | 8,471 | |
Ellie Mae, Inc. (A) | | | 52 | | | | 4,326 | |
HubSpot, Inc. (A) | | | 112 | | | | 5,283 | |
Manhattan Associates, Inc. (A) | | | 137 | | | | 7,267 | |
Paycom Software, Inc. (A) | | | 141 | | | | 6,393 | |
Tyler Technologies, Inc. (A) | | | 39 | | | | 5,566 | |
Ultimate Software Group, Inc. (The) (A)(B) | | | 46 | | | | 8,437 | |
| | | | | | | | |
| | | | | | | 45,743 | |
| | | | | | | | |
| |
Communications Equipment – 3.8% | |
Dycom Industries, Inc. (A) | | | 146 | | | | 11,750 | |
Lumentum Holdings, Inc. (A) | | | 114 | | | | 4,406 | |
| | | | | | | | |
| | | | | | | 16,156 | |
| | | | | | | | |
| |
Electronic Manufacturing Services – 2.7% | |
Fabrinet (A) | | | 152 | | | | 6,112 | |
MACOM Technology Solutions Holdings, Inc. (A) | | | 119 | | | | 5,512 | |
| | | | | | | | |
| | | | | | | 11,624 | |
| | | | | | | | |
| |
Internet Software & Services – 2.4% | |
Five9, Inc. (A) | | | 156 | | | | 2,216 | |
LogMeIn, Inc. | | | 32 | | | | 3,071 | |
Shopify, Inc., Class A (A) | | | 112 | | | | 4,806 | |
| | | | | | | | |
| | | | | | | 10,093 | |
| | | | | | | | |
| |
IT Consulting & Other Services – 3.1% | |
Booz Allen Hamilton Holding Corp. | | | 308 | | | | 11,099 | |
InterXion Holding N.V. (A) | | | 65 | | | | 2,282 | |
| | | | | | | | |
| | | | | | | 13,381 | |
| | | | | | | | |
| |
Semiconductor Equipment – 0.4% | |
MaxLinear, Inc., Class A (A) | | | 83 | | | | 1,818 | |
| | | | | | | | |
| |
Semiconductors – 4.4% | |
Mellanox Technologies Ltd. (A) | | | 132 | | | | 5,419 | |
Monolithic Power Systems, Inc. | | | 78 | | | | 6,394 | |
Power Integrations, Inc. (B) | | | 100 | | | | 6,776 | |
| | | | | | | | |
| | | | | | | 18,589 | |
| | | | | | | | |
| |
Systems Software – 3.6% | |
Gigamon, Inc. (A) | | | 178 | | | | 8,117 | |
Proofpoint, Inc. (A) | | | 101 | | | | 7,141 | |
| | | | | | | | |
| | | | | | | 15,258 | |
| | | | | | | | |
| |
Total Information Technology – 31.1% | | | | 132,662 | |
Materials | |
| |
Construction Materials – 2.5% | |
Eagle Materials, Inc. | | | 44 | | | | 4,346 | |
Summit Materials, Inc., Class A (A) | | | 191 | | | | 4,538 | |
U.S. Concrete, Inc. (A) | | | 26 | | | | 1,728 | |
| | | | | | | | |
| | | | | | | 10,612 | |
| | | | | | | | |
| |
Total Materials – 2.5% | | | | 10,612 | |
| | |
| SCHEDULE OF INVESTMENTS | | SMALL CAP GROWTH (in thousands) |
DECEMBER 31, 2016
| | | | | | | | |
| COMMON STOCKS (Continued) | | Shares | | | Value | |
Real Estate | |
| |
Real Estate Services – 1.6% | |
RE/MAX Holdings, Inc., Class A | | | 120 | | | $ | 6,692 | |
| | | | | | | | |
| |
Total Real Estate – 1.6% | | | | 6,692 | |
| |
TOTAL COMMON STOCKS – 95.3% | | | $ | 406,118 | |
(Cost: $353,537) | | | | | | | | |
| | |
UNITED STATES GOVERNMENT
AGENCY OBLIGATIONS | | Principal | | | | |
Mortgage-Backed Obligations – 1.4% | |
Federal Home Loan Mortgage Corp. Agency REMIC/CMO, | | | | | | | | |
2.538%, 9-25-22 (C)(D) | | $ | 5,975 | | | | 5,979 | |
| | | | | | | | |
| |
TOTAL UNITED STATES GOVERNMENT AGENCY OBLIGATIONS – 1.4% | | | $ | 5,979 | |
(Cost: $5,997) | | | | | | | | |
| | | | | | | | |
| SHORT-TERM SECURITIES | | Principal | | | Value | |
Commercial Paper (E) – 1.2% | |
BMW U.S. Capital LLC
(GTD by BMW AG), | | | | | | | | |
0.650%, 1-6-17 | | $ | 4,000 | | | $ | 3,999 | |
Kroger Co. (The), | | | | | | | | |
0.880%, 1-3-17 | | | 1,215 | | | | 1,215 | |
| | | | | | | | |
| | | | | | | 5,214 | |
| | | | | | | | |
| |
Master Note – 0.6% | |
Toyota Motor Credit Corp., | | | | | | | | |
0.860%, 1-4-17 (F) | | | 2,450 | | | | 2,450 | |
| | | | | | | | |
| |
Municipal Obligations – 0.5% | |
The Regents of the Univ of CA, Gen Rev Bonds, Ser AL, | | | | | | | | |
0.700%, 1-7-17 (F) | | | 2,000 | | | | 2,000 | |
| | | | | | | | |
| |
TOTAL SHORT-TERM SECURITIES – 2.3% | | | $ | 9,664 | |
(Cost: $9,664) | | | | | | | | |
| | | | | | | | |
| | | | | | Value | |
TOTAL INVESTMENT
SECURITIES – 99.0% | | | $ | 421,761 | |
(Cost: $369,198) | | | | | | | | |
| |
CASH AND OTHER ASSETS, NET OF
LIABILITIES – 1.0% | | | | 4,087 | |
| | |
NET ASSETS – 100.0% | | | | | | $ | 425,848 | |
Notes to Schedule of Investments
| (A) | No dividends were paid during the preceding 12 months. |
| (B) | All or a portion of securities with an aggregate value of $997 are held in collateralized accounts for OTC derivatives collateral and is governed by International Swaps and Derivatives Association, Inc. Master Agreements. |
| (C) | Securities were purchased pursuant to an exemption from registration available under Rule 144A under the Securities Act of 1933 and may only be resold in transactions exempt from registration, normally to qualified institutional buyers. At December 31, 2016 the total value of these securities amounted to $5,979 or 1.4% of net assets. |
| (D) | Variable rate security. Interest rate disclosed is that which is in effect at December 31, 2016. |
| (E) | Rate shown is the yield to maturity at December 31, 2016. |
| (F) | Variable rate security. Interest rate disclosed is that which is in effect at December 31, 2016. Date shown represents the date that the variable rate resets. |
The following total return swap agreements were outstanding at December 31, 2016:
| | | | | | | | | | | | | | | | | | | | | | |
| Counterparty | | Number of
Shares | | | Underlying Security | | Termination
Date | | | Notional
Amount | | | Financing
Fee(1)(2) | | | Unrealized
Depreciation | |
JPMorgan Chase Bank N.A. | | | 87,968 | | | Biotech Custom Index | | | 09/06/2017 | | | $ | 8,536 | | | | 1M LIBOR less 50 bps | | | $ | (946 | ) |
| (1) | The Portfolio pays the financing fee multiplied by the notional amount each month. |
| (2) | At the termination date, a net cash flow is exchanged where the market-linked total return is equivalent to the return of the underlying security less a financing rate, if any. The Portfolio would receive payments on any net positive total return, and would owe payments in the event of a negative total return. |
The following table is a summary of the valuation of the Portfolio’s investments by the fair value hierarchy levels as of December 31, 2016. See Note 3 to the Financial Statements for further information regarding fair value measurement.
| | | | | | | | | | | | |
| | | Level 1 | | | Level 2 | | | Level 3 | |
Assets | | | | | | | | | | | | |
Investments in Securities | | | | | | | | | | | | |
Common Stocks | | $ | 406,118 | | | $ | — | | | $ | — | |
United States Government Agency Obligations | | | — | | | | 5,979 | | | | — | |
Short-Term Securities | | | — | | | | 9,664 | | | | — | |
Total | | $ | 406,118 | | | $ | 15,643 | | | $ | — | |
Liabilities | | | | | | | | | | | | |
Total Return Swaps | | $ | — | | | $ | 946 | | | $ | — | |
During the year ended December 31, 2016, there were no transfers between Level 1 and 2.
The following acronyms are used throughout this schedule:
CMO = Collateralized Mortgage Obligation
GTD = Guaranteed
OTC = Over the Counter
REMIC = Real Estate Mortgage Investment Conduit
See Accompanying Notes to Financial Statements.
| | |
| MANAGEMENT DISCUSSION | | SMALL CAP VALUE |
(UNAUDITED)

Below, Kenneth G. Gau, portfolio manager of Ivy VIP Small Cap Value, discusses positioning, performance and results for the fiscal year ended December 31, 2016. Mr. Gau has managed the portfolio since August 2014 and has 22 years of industry experience.
Fiscal Year Performance
| | | | |
For the 12 Months Ended December 31, 2016 | | | | |
Ivy VIP Small Cap Value | | | 28.88% | |
Benchmark(s) and/or Lipper Category | | | | |
Russell 2000 Value Index | | | 31.74% | |
(generally reflects the performance of small-company value style stocks) | | | | |
Lipper Variable Annuity Small-Cap Value Funds Universe Average | | | 27.76% | |
(generally reflects the performance of the universe of funds with similar investment objectives) | | | | |
Please note that Portfolio returns include applicable fees and expenses while index returns do not include any such fees. Also, the Portfolio’s performance data does not take into account any product expenses or charges associated with owning a variable life or annuity policy, which is invested in Ivy Variable Insurance Portfolios.
Key factors, contributors and detractors
2016 went into the books as being quite a strong year for the Russell 2000 Value Index, the Portfolio’s benchmark, as not only did every quarter experience a positive return, but for the year, the index was up 31.7%. How it got there was quite a journey with many twists and turns that few managers traversed well, as only 10.2% of active managers in the small-cap value category outperformed (the average manager underperformed by 536 basis points per Jefferies 2016 Performance Review). In the first part of 2016, defensive and bond like proxies were rewarded as it seemed like the small-capitalization value market was stuck in a lower for longer environment where interest rates and growth grinded along at low levels. In the second part of 2016, especially after the U.S. election, there was a massive rotation toward cyclicals and financials as animal spirits awoke believing that the actions of the new Trump administration might be able to accelerate what had seemed by historic standards a more tepid recovery. After a strong start to the year, the Portfolio succumbed to the performance struggle in the fourth quarter and finished the 12-month period at 28.9%. We never would have imagined that generating roughly 29% return would be so frustrating and disappointing, but it was, considering how strongly the Portfolio started off the first two quarters of 2016.
Because the Portfolio had such strong relative performance in the first two quarters of the year, relatively neutral performance in the third quarter, and a substantial shortfall in the fourth quarter, we think that it is worth discussing what went well in the first portion of the year (first quarter through third quarter), explain the short comings of fourth quarter, and then tie it all together. During the first three quarters, we built a tremendous lead on the benchmark due to positive stock selection and sector allocation. Most importantly, we had minimal consequential stock mistakes (two stocks that cost 100 basis points or more), and solid performance at the top of the Portfolio. In the fourth quarter, we trailed the benchmark by roughly 700 basis points as we were unable to keep up with the rapid ascent of the index, which was up 14.1% in the quarter (and up 17.4% since the U.S. election).
Four factors weighed on relative performance in the fourth quarter, two of which were stylistic (we view these as more structural, and likely to reoccur in similar market conditions), and two that are hopefully more transitory in nature. Stylistically smaller stocks and stocks with higher betas massively outperformed in the fourth quarter, which was directly related to substantial inflows into small capitalization financial products after the U.S. election. Due to our philosophy and process in how we manage the Portfolio, we consistently have lower beta and a higher average market capitalization than our benchmark. In periods such as this where smaller stocks and higher betas outperform, we would expect that the Portfolio very likely might struggle to keep up. Obviously, we would like to outperform in all market scenarios, but we remain committed to our philosophy and process, which is designed to participate in up markets while protecting on the downside, and which we believe should win over complete market cycles. We consciously have a lower average beta within the Portfolio to provide less volatility in return, and we consciously have a greater average market capitalization to allow us to hold more concentrated positions so that our best ideas can have greater contribution to performance without being liquidity constrained. Depending upon the market, these factors can work for us or against us, and sometimes tremendous stock picking can overcome performance drag due to style factors. In fourth quarter, unfortunately, both style factors and stock picking worked against the Portfolio.
In terms of stock picking, we had three big relative detractors from the Portfolio’s performance in the fourth quarter of 2016, and all of which resided among the Portfolio’s top 15 holdings (Communications Sales & Leasing, Flotek and Nu Skin, each
of underperformed by 125 basis points or more). In each of the cases, there was not a dramatic fundamental swing, one had a short report attacking it (Flotek), and the other two had been huge winners in previous quarters but got caught up in the rotation from defense to offense. All together, we believe that roughly half of the Portfolio’s relative performance shortfall in the quarter was related to style factors and about half was related to sector positioning and stock-specific factors. Put all together, the outperformance from the first part of the year was not able to overcome the lack of ability to keep up with the torrid pace of the market in the fourth quarter. While we are not satisfied with these results, we remain confident that the Portfolio’s philosophy and process is sound and believe it should perform well over a full market cycle.
Outlook
Heading into first quarter of 2017, we are hopeful that the new Trump administration will deliver on its promises to spur economic growth, but fully recognize that political promises often fall short. We also believe that 2017 could see some additional volatility as investors continue to get comfortable with a very unconventional outsider in the White House, who has proven to be somewhat unpredictable. We are also hopeful for another year of positive, yet likely more modest, returns. Regardless of how the market finishes in 2017, we remain committed to the Portfolio’s process of identifying quality undervalued companies, and believe we have good balance in the Portfolio’s construction that should stand to perform well versus our peers and benchmark regardless of the environment over time.
Past performance is not a guarantee of future results. The value of the Portfolio’s shares will change, and you could lose money on your investment.
Investing in small-cap stocks may carry more risk than investing in stocks of larger, more established companies. Value stocks are stocks of companies that may have experienced adverse business or industry developments; or may be subject to special risks that have caused the stocks to be out of favor and, in the opinion of the Portfolio’s manager, undervalued. The value of a security believed by the Portfolio’s manager to be undervalued may never reach what the manager believes to be its full value, or such security’s value may decrease. These and other risks are more fully described in the Portfolio’s prospectus.
The opinions expressed in this report are those of the portfolio manager and are current only through the end of the period of the report as stated on the cover. The manager’s views are subject to change at any time based on market and other conditions, and no forecasts can be guaranteed.
The index noted is unmanaged and include reinvested dividends. One cannot invest directly in an index, nor is an index representative of Ivy VIP Small Cap Value.
| | |
| PORTFOLIO HIGHLIGHTS | | SMALL CAP VALUE |
ALL DATA AS OF DECEMBER 31, 2016 (UNAUDITED)
Asset Allocation
| | | | |
Stocks | | | 99.4% | |
Financials | | | 25.7% | |
Industrials | | | 20.4% | |
Consumer Discretionary | | | 10.1% | |
Information Technology | | | 8.2% | |
Consumer Staples | | | 7.5% | |
Real Estate | | | 6.6% | |
Energy | | | 6.4% | |
Materials | | | 6.4% | |
Health Care | | | 3.7% | |
Utilities | | | 2.5% | |
Telecommunication Services | | | 1.9% | |
Cash and Other Assets (Net of Liabilities), and Cash Equivalents+ | | | 0.6% | |
Top 10 Equity Holdings
| | | | |
| Company | | Sector | | Industry |
Take-Two Interactive Software, Inc. | | Information Technology | | Home Entertainment Software |
Webster Financial Corp. | | Financials | | Regional Banks |
Laredo Petroleum Holdings, Inc. | | Energy | | Oil & Gas Exploration & Production |
Pinnacle Foods, Inc. | | Consumer Staples | | Packaged Foods & Meats |
Communications Sales & Leasing, Inc. | | Real Estate | | Specialized REITs |
AMC Entertainment Holdings, Inc., Class A | | Consumer Discretionary | | Movies & Entertainment |
Woodward, Inc. | | Industrials | | Industrial Machinery |
Monro Muffler Brake, Inc. | | Consumer Discretionary | | Automotive Retail |
Sensient Technologies Corp. | | Materials | | Specialty Chemicals |
Western Alliance Bancorp. | | Financials | | Regional Banks |
See your advisor for more information on the Portfolio’s most recently published Top 10 Equity Holdings.
+ Cash equivalents are defined as highly liquid securities with maturities of less than three months. Cash equivalents may include U.S. Government Treasury bills, bank certificates of deposit, bankers’ acceptances, corporate commercial paper and other money market instruments.
| | |
COMPARISON OF CHANGE IN VALUE OF $10,000 INVESTMENT | | SMALL CAP VALUE |
(UNAUDITED)
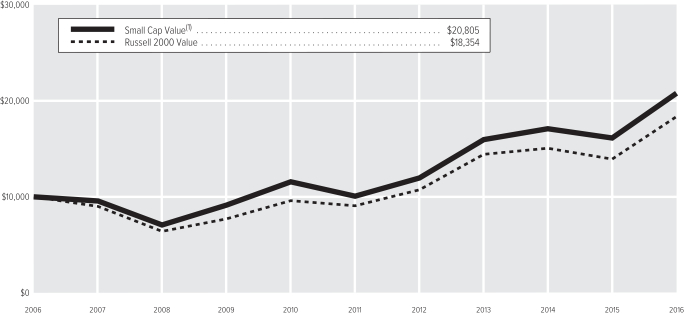
| (1) | The value of the investment in the Portfolio is impacted by the ongoing expenses of the Portfolio and assumes reinvestment of dividends and distributions. |
| | | | |
| Average Annual Total Return(2) | | | |
1-year period ended 12-31-16 | | | 28.88% | |
5-year period ended 12-31-16 | | | 15.59% | |
10-year period ended 12-31-16 | | | 7.60% | |
| (2) | Data quoted is past performance and current performance may be lower or higher. Past performance is no guarantee of future results. Investment return and principal value of an investment will fluctuate and shares, when redeemed, may be worth more or less than their original cost. Please call 1.888.WADDELL for the Portfolio’s most recent month-end performance. Performance data quoted does not reflect any expenses or charges associated with owning a variable life insurance policy or variable annuity contract that invests in the Portfolio’s shares. When such charges are deducted, actual investment performance in a variable policy or contract will be lower. |
Past performance is not necessarily indicative of future performance. Indexes are unmanaged. The performance graph and table do not reflect the deduction of taxes that a shareholder would pay on Portfolio distributions or on the redemption of Portfolio shares. Performance results may include the effect of expense reduction arrangements for some or all of the periods shown. If those arrangements had not been in place, the performance results for those periods would have been lower.
| | |
| SCHEDULE OF INVESTMENTS | | SMALL CAP VALUE (in thousands) |
DECEMBER 31, 2016
| | | | | | | | |
| COMMON STOCKS | | Shares | | | Value | |
Consumer Discretionary | |
| |
Auto Parts & Equipment – 0.8% | |
Visteon Corp. | | | 36 | | | $ | 2,924 | |
| | | | | | | | |
| |
Automotive Retail – 3.1% | |
Monro Muffler Brake, Inc. | | | 189 | | | | 10,836 | |
| | | | | | | | |
| |
Homebuilding – 0.8% | |
TRI Pointe Group, Inc. (A) | | | 239 | | | | 2,738 | |
| | | | | | | | |
| |
Homefurnishing Retail – 1.3% | |
Restoration Hardware Holdings, Inc. (A) | | | 141 | | | | 4,323 | |
| | | | | | | | |
| |
Movies & Entertainment – 4.1% | |
AMC Entertainment Holdings, Inc., Class A | | | 427 | | | | 14,359 | |
| | | | | | | | |
| |
Total Consumer Discretionary – 10.1% | | | | 35,180 | |
Consumer Staples | |
| |
Packaged Foods & Meats – 5.5% | |
Pinnacle Foods, Inc. | | | 297 | | | | 15,891 | |
Post Holdings, Inc. (A) | | | 43 | | | | 3,424 | |
| | | | | | | | |
| | | | | | | 19,315 | |
| | | | | | | | |
| |
Soft Drinks – 2.0% | |
Coca-Cola Bottling Co. Consolidated | | | 39 | | | | 6,965 | |
| | | | | | | | |
| |
Total Consumer Staples – 7.5% | | | | 26,280 | |
Energy | |
| |
Oil & Gas Exploration & Production – 5.9% | |
Laredo Petroleum Holdings, Inc. (A) | | | 1,153 | | | | 16,305 | |
Petroleum Development Corp. (A) | | | 61 | | | | 4,420 | |
| | | | | | | | |
| | | | | | | 20,725 | |
| | | | | | | | |
| |
Oil & Gas Refining & Marketing – 0.5% | |
CVR Energy, Inc. | | | 63 | | | | 1,599 | |
| | | | | | | | |
| |
Total Energy – 6.4% | | | | 22,324 | |
Financials | |
| |
Investment Banking & Brokerage – 0.7% | |
Stifel Financial Corp. (A) | | | 51 | | | | 2,553 | |
| | | | | | | | |
| |
Life & Health Insurance – 1.5% | |
American Equity Investment Life Holding Co. | | | 240 | | | | 5,407 | |
| | | | | | | | |
| |
Regional Banks – 21.9% | |
BancorpSouth, Inc. | | | 55 | | | | 1,708 | |
BankUnited, Inc. | | | 180 | | | | 6,781 | |
Chemical Financial Corp. | | | 41 | | | | 2,194 | |
FCB Financial Holdings, Inc., Class A (A) | | | 144 | | | | 6,869 | |
First Horizon National Corp. | | | 327 | | | | 6,545 | |
| | | | | | | | |
| COMMON STOCKS (Continued) | | Shares | | | Value | |
Regional Banks – 21.9% (Continued) | |
MB Financial, Inc. | | | 80 | | | $ | 3,783 | |
Pinnacle Financial Partners, Inc. | | | 44 | | | | 3,049 | |
SVB Financial Group(A) | | | 47 | | | | 7,999 | |
Tompkins Financial Corp. | | | 21 | | | | 2,023 | |
UMB Financial Corp. | | | 45 | | | | 3,443 | |
Webster Financial Corp. | | | 326 | | | | 17,684 | |
Western Alliance Bancorp. (A) | | | 209 | | | | 10,164 | |
Wintrust Financial Corp. | | | 54 | | | | 3,890 | |
| | | | | | | | |
| | | | | | | 76,132 | |
| | | | | | | | |
| |
Reinsurance – 1.6% | |
Reinsurance Group of America, Inc. | | | 43 | | | | 5,449 | |
| | | | | | | | |
| |
Total Financials – 25.7% | | | | 89,541 | |
Health Care | |
| |
Health Care Services – 2.5% | |
Healthways, Inc. (A) | | | 381 | | | | 8,669 | |
| | | | | | | | |
| |
Health Care Supplies – 1.2% | |
ICU Medical, Inc. (A) | | | 29 | | | | 4,244 | |
| | | | | | | | |
| |
Total Health Care – 3.7% | | | | 12,913 | |
Industrials | |
| |
Aerospace & Defense – 2.6% | |
Orbital ATK, Inc. | | | 103 | | | | 9,061 | |
| | | | | | | | |
| |
Building Products – 2.0% | |
Continental Building Products, Inc. (A) | | | 296 | | | | 6,836 | |
| | | | | | | | |
| |
Commercial Printing – 1.3% | |
Multi-Color Corp. | | | 57 | | | | 4,415 | |
| | | | | | | | |
| |
Construction Machinery & Heavy Trucks – 1.3% | |
Allison Transmission Holdings, Inc. | | | 99 | | | | 3,328 | |
Oshkosh Corp. | | | 21 | | | | 1,370 | |
| | | | | | | | |
| | | | | | | 4,698 | |
| | | | | | | | |
| |
Industrial Machinery – 4.9% | |
Actuant Corp., Class A | | | 217 | | | | 5,626 | |
Woodward, Inc. | | | 163 | | | | 11,287 | |
| | | | | | | | |
| | | | | | | 16,913 | |
| | | | | | | | |
| |
Trading Companies & Distributors – 3.9% | |
Beacon Roofing Supply, Inc. (A) | | | 207 | | | | 9,539 | |
Univar, Inc. (A) | | | 143 | | | | 4,054 | |
| | | | | | | | |
| | | | | | | 13,593 | |
| | | | | | | | |
| |
Trucking – 4.4% | |
Saia, Inc. (A) | | | 171 | | | | 7,551 | |
YRC Worldwide, Inc. (A) | | | 591 | | | | 7,848 | |
| | | | | | | | |
| | | | | | | 15,399 | |
| | | | | | | | |
| |
Total Industrials – 20.4% | | | | 70,915 | |
| | | | | | | | |
| COMMON STOCKS (Continued) | | Shares | | | Value | |
Information Technology | |
| |
Home Entertainment Software – 5.2% | |
Take-Two Interactive Software, Inc. (A) | | | 365 | | | $ | 17,971 | |
| | | | | | | | |
| |
IT Consulting & Other Services – 3.0% | |
Science Applications International Corp. | | | 37 | | | | 3,121 | |
Unisys Corp. (A) | | | 494 | | | | 7,387 | |
| | | | | | | | |
| | | | | | | 10,508 | |
| | | | | | | | |
| |
Total Information Technology – 8.2% | | | | 28,479 | |
Materials | |
| |
Specialty Chemicals – 6.4% | |
Flotek Industries, Inc. (A) | | | 217 | | | | 2,036 | |
Flotek Industries, Inc. (A)(B) | | | 127 | | | | 1,189 | |
Innospec, Inc. | | | 85 | | | | 5,809 | |
Methanex Corp. | | | 65 | | | | 2,847 | |
Sensient Technologies Corp. | | | 130 | | | | 10,230 | |
| | | | | | | | |
| | | | | | | 22,111 | |
| | | | | | | | |
| |
Total Materials – 6.4% | | | | 22,111 | |
Real Estate | |
| |
Industrial REITs – 0.8% | |
STAG Industrial, Inc. | | | 117 | | | | 2,802 | |
| | | | | | | | |
| |
Office REITs – 0.7% | |
Highwoods Properties, Inc. | | | 49 | | | | 2,515 | |
| | | | | | | | |
| |
Specialized REITs – 5.1% | |
Communications Sales & Leasing, Inc. | | | 567 | | | | 14,419 | |
Entertainment Properties Trust | | | 45 | | | | 3,215 | |
| | | | | | | | |
| | | | | | | 17,634 | |
| | | | | | | | |
| |
Total Real Estate – 6.6% | | | | 22,951 | |
Telecommunication Services | |
| |
Alternative Carriers – 1.7% | |
Vonage Holdings Corp. (A) | | | 889 | | | | 6,087 | |
| | | | | | | | |
| |
Integrated Telecommunication Services – 0.2% | |
8x8, Inc. (A) | | | 42 | | | | 602 | |
| | | | | | | | |
| |
Total Telecommunication Services – 1.9% | | | | 6,689 | |
Utilities | |
| |
Electric Utilities – 1.2% | |
ALLETE, Inc. | | | 65 | | | | 4,160 | |
| | | | | | | | |
| |
Gas Utilities – 1.3% | |
New Jersey Resources Corp. | | | 43 | | | | 1,528 | |
South Jersey Industries, Inc. | | | 93 | | | | 3,126 | |
| | | | | | | | |
| | | | | | | 4,654 | |
| | | | | | | | |
| |
Total Utilities - 2.5% | | | | 8,814 | |
| | |
| SCHEDULE OF INVESTMENTS | | SMALL CAP VALUE (in thousands) |
DECEMBER 31, 2016
| | | | | | | | |
| | | | | | Value | |
| | |
TOTAL COMMON STOCKS – 99.4% | | | | | | $ | 346,197 | |
(Cost: $298,390) | |
| |
TOTAL INVESTMENT SECURITIES – 99.4% | | | $ | 346,197 | |
(Cost: $298,390) | |
| |
CASH AND OTHER ASSETS, NET OF LIABILITIES – 0.6% | | | | 2,135 | |
| |
NET ASSETS – 100.0% | | | $ | 348,332 | |
Notes to Schedule of Investments
| (A) | No dividends were paid during the preceding 12 months. |
| (B) | Securities were purchased pursuant to an exemption from registration available under Rule 144A under the Securities Act of 1933 and may only be resold in transactions exempt from registration, normally to qualified institutional buyers. At December 31, 2016 the total value of these securities amounted to $1,189 or 0.4% of net assets. |
The following table is a summary of the valuation of the Portfolio’s investments by the fair value hierarchy levels as of December 31, 2016. See Note 3 to the Financial Statements for further information regarding fair value measurement.
| | | | | | | | | | | | |
| | | Level 1 | | | Level 2 | | | Level 3 | |
Assets | | | | | | | | | | | | |
Investments in Securities | | | | | | | | | | | | |
Common Stocks | | $ | 346,197 | | | $ | — | | | $ | — | |
Total | | $ | 346,197 | | | $ | — | | | $ | — | |
During the year ended December 31, 2016, there were no transfers between Level 1 and 2.
The following acronym is used throughout this schedule:
REIT = Real Estate Investment Trust
See Accompanying Notes to Financial Statements.
| | |
| MANAGEMENT DISCUSSION | | VALUE |
(UNAUDITED)

Matthew T. Norris
Below, Matthew T. Norris, CFA, portfolio manager of Ivy VIP Value, discusses positioning, performance and results for the fiscal year ended December 31, 2016. He has managed the Portfolio since 2003 and has 25 years of industry experience.
Fiscal Year Performance
| | | | |
For the 12 Months Ended December 31, 2016 | | | | |
Ivy VIP Value | | | 11.14% | |
Benchmark(s) and/or Lipper Category | | | | |
Russell 1000 Value Index | | | 17.34% | |
(generally reflects the performance of large-company value style stocks) | | | | |
Lipper Variable Annuity Large-Cap Value Funds Universe Average | | | 15.59% | |
(generally reflects the performance of the universe of funds with similar investment objectives) | | | | |
Please note that Portfolio returns include applicable fees and expenses while index returns do not include any such fees. Also, the Portfolio’s performance data does not take into account any product expenses or charges associated with owning a variable life or annuity policy, which is invested in Ivy Variable Insurance Portfolios.
Key drivers
The U.S. economy continues to grow and has shown some signs of acceleration recently. A recovering energy sector, strong employment and manufacturing sectors have raised expectations for gross domestic product (GDP) growth. Corporate earnings are strong with many companies at historically high margins and equities have roughly tripled from their low in March 2009. The Federal Reserve (Fed) has employed many forms of loose monetary policy to stimulate this recovery, and now that approach is changing. The Fed has raised rates once since January 1, 2016 and has indicated it could increase rates three more times in 2017. Raising interest rates to prevent inflation, but maintain economic growth is a delicate operation, and history shows it is easy to overshoot. Heightened volatility is anticipated around these interest rate increases, and is also anticipated around President-elect Trump’s administration’s policies. Volatility is not a given negative, as it generally tends to create opportunities for investment.
Contributors and detractors
The Portfolio underperformed the Russell 1000 Value Index, its benchmark, for the year ended December 31, 2016. It was a good 12-month period for value, with the index up 17.3%, and a large part of that coming late in the year. The backdrop for value investing has greatly improved over the last three months of the Portfolio’s fiscal year end, with higher interest rates and increasing volatility leading to more chances for investment. The investing public has noticed, and money flows are emphasizing more value than growth recently.
The Portfolio’s underperformance during the period was due to the poor performance of a select number of individual holdings. The Portfolio underperformed during the first two quarters of the year, and then outperformed for the final six months, but not quite enough to end ahead for the 12-month period. Two of the worst performing stocks for the period were VTTI Energy Partners, an oil storage company, and Teva Pharmaceutical Industries, a generic drug maker.
On the brighter side, previously poor performing Micron Technology and Western Digital staged big comebacks over the year and added to performance. Some may recall that in last year’s annual letter we highlighted these two names, and our reasons for buying more at lower prices. Value investing requires patience, and if you are investing in quality companies at attractive prices, you have good odds of winning in the long run. We continue to hold and increase our positions in both VTTI Energy Partners and Teva Pharmaceutical Industries and we believe investors should be rewarded in time.
While the Portfolio performed very well in technology and consumer cyclicals, the energy and health care sectors were a major drag on performance for the 12-month period.
Outlook
Growth investing has outperformed value investing for much of the past four years, but that situation changed sharply during fall 2016. Higher interest rates and an expectation for even higher rates in 2017 has damped enthusiasm for high-growth names. We still remain cautiously constructive on the equity markets, especially with individual names we find compelling. The Fed’s tightening cycle is not to be taken lightly, and must be watched and anticipated carefully. Higher interest rates are historically not supportive of higher equity prices.
On a macro level, we are anticipating a supportive backdrop with continued GDP growth and lower unemployment. The energy risk appears lower today than last year, as that sector has recovered, and is hiring and spending money on new projects.
Historically, the Portfolio has had a strong long-term performance record, but it has been affected by short-term periods of volatility from quarter to quarter. As long-term investors, we typically view these bouts of volatility as opportunities and not threats. The Portfolio will continue to seek what we think are high-quality companies whose stock prices are below what we believe to be fair value and be sellers of those same names when they reach what we believe to be appropriate valuation levels. We believe bottom up, company-by-company analysis can help produce solid returns over the long haul.
Past performance is not a guarantee of future results. The value of the Portfolio’s shares will change, and you could lose money on your investment.
Value stocks are stocks of companies that may have experienced adverse business or industry developments; or may be subject to special risks that have caused the stocks to be out of favor and, in the opinion of the Portfolio’s manager, undervalued. The value of a security believed by the Portfolio’s manager to be undervalued may never reach what the manager believes to be its full value, or such security’s value may decrease. These and other risks are more fully described in the Portfolio’s prospectus.
The opinions expressed in this report are those of the portfolio manager and are current only through the end of the period of the report as stated on the cover. The manager’s views are subject to change at any time based on market and other conditions, and no forecasts can be guaranteed.
The index noted is unmanaged and include reinvested dividends. One cannot invest directly in an index, nor is an index representative of Ivy VIP Value.
| | |
| PORTFOLIO HIGHLIGHTS | | VALUE |
ALL DATA AS OF DECEMBER 31, 2016 (UNAUDITED)
Asset Allocation
| | | | |
Stocks | | | 99.3% | |
Financials | | | 29.5% | |
Energy | | | 15.1% | |
Health Care | | | 14.9% | |
Information Technology | | | 11.7% | |
Consumer Discretionary | | | 8.4% | |
Consumer Staples | | | 7.4% | |
Industrials | | | 3.7% | |
Materials | | | 3.0% | |
Utilities | | | 3.0% | |
Real Estate | | | 2.6% | |
Cash and Other Assets (Net of Liabilities), and Cash Equivalents+ | | | 0.7% | |
Top 10 Equity Holdings
| | | | |
| Company | | Sector | | Industry |
JPMorgan Chase & Co. | | Financials | | Other Diversified Financial Services |
Citigroup, Inc. | | Financials | | Other Diversified Financial Services |
Synchrony Financial | | Financials | | Consumer Finance |
American International Group, Inc. | | Financials | | Multi-Line Insurance |
Capital One Financial Corp. | | Financials | | Consumer Finance |
Micron Technology, Inc. | | Information Technology | | Semiconductors |
Hess Corp. | | Energy | | Integrated Oil & Gas |
Energy Transfer Partners L.P. | | Energy | | Oil & Gas Storage & Transportation |
Western Digital Corp. | | Information Technology | | Technology Hardware, Storage & Peripherals |
MetLife, Inc. | | Financials | | Life & Health Insurance |
See your advisor for more information on the Portfolio’s most recently published Top 10 Equity Holdings.
+ Cash equivalents are defined as highly liquid securities with maturities of less than three months. Cash equivalents may include U.S. Government Treasury bills, bank certificates of deposit, bankers’ acceptances, corporate commercial paper and other money market instruments.
| | |
| COMPARISON OF CHANGE IN VALUE OF $10,000 INVESTMENT | | VALUE |
(UNAUDITED)
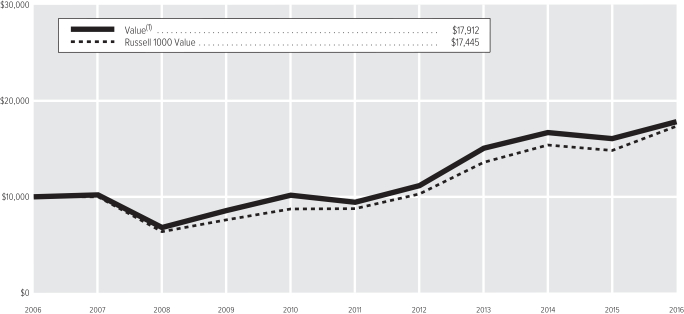
| (1) | The value of the investment in the Portfolio is impacted by the ongoing expenses of the Portfolio and assumes reinvestment of dividends and distributions. |
| | | | |
| Average Annual Total Return(2) | | | |
1-year period ended 12-31-16 | | | 11.14% | |
5-year period ended 12-31-16 | | | 13.77% | |
10-year period ended 12-31-16 | | | 6.00% | |
| (2) | Data quoted is past performance and current performance may be lower or higher. Past performance is no guarantee of future results. Investment return and principal value of an investment will fluctuate and shares, when redeemed, may be worth more or less than their original cost. Please call 1.888.WADDELL for the Portfolio’s most recent month-end performance. Performance data quoted does not reflect any expenses or charges associated with owning a variable life insurance policy or variable annuity contract that invests in the Portfolio’s shares. When such charges are deducted, actual investment performance in a variable policy or contract will be lower. |
Past performance is not necessarily indicative of future performance. Indexes are unmanaged. The performance graph and table do not reflect the deduction of taxes that a shareholder would pay on Portfolio distributions or on the redemption of Portfolio shares. Performance results may include the effect of expense reduction arrangements for some or all of the periods shown. If those arrangements had not been in place, the performance results for those periods would have been lower.
| | |
| SCHEDULE OF INVESTMENTS | | VALUE (in thousands) |
DECEMBER 31, 2016
| | | | | | | | |
| COMMON STOCKS | | Shares | | | Value | |
Consumer Discretionary | |
| |
Cable & Satellite – 2.6% | |
Comcast Corp., Class A | | | 144 | | | $ | 9,964 | |
| | | | | | | | |
| |
Casinos & Gaming – 0.5% | |
Las Vegas Sands, Inc. | | | 35 | | | | 1,891 | |
| | | | | | | | |
| |
General Merchandise Stores – 2.9% | |
Target Corp. | | | 150 | | | | 10,856 | |
| | | | | | | | |
| |
Housewares & Specialties – 2.4% | |
Newell Rubbermaid, Inc. (A) | | | 202 | | | | 9,028 | |
| | | | | | | | |
| |
Total Consumer Discretionary – 8.4% | | | | 31,739 | |
Consumer Staples | |
| |
Agricultural Products – 2.5% | |
Ingredion, Inc. | | | 75 | | | | 9,310 | |
| | | | | | | | |
| |
Drug Retail – 2.1% | |
CVS Caremark Corp. | | | 103 | | | | 8,096 | |
| | | | | | | | |
| |
Tobacco – 2.8% | |
Philip Morris International, Inc. | | | 116 | | | | 10,622 | |
| | | | | | | | |
| |
Total Consumer Staples – 7.4% | | | | 28,028 | |
Energy | |
| |
Integrated Oil & Gas – 4.2% | |
Chevron Corp. | | | 36 | | | | 4,249 | |
Hess Corp. | | | 189 | | | | 11,748 | |
| | | | | | | | |
| | | | | | | 15,997 | |
| | | | | | | | |
| |
Oil & Gas Refining & Marketing – 3.0% | |
Marathon Petroleum Corp. (A) | | | 221 | | | | 11,122 | |
| | | | | | | | |
| |
Oil & Gas Storage & Transportation – 7.9% | |
Energy Transfer Partners L.P. | | | 327 | | | | 11,721 | |
Enterprise Products Partners L.P. | | | 363 | | | | 9,821 | |
VTTI Energy Partners L.P. | | | 523 | | | | 8,448 | |
| | | | | | | | |
| | | | | | | 29,990 | |
| | | | | | | | |
| |
Total Energy – 15.1% | | | | 57,109 | |
Financials | |
| |
Consumer Finance – 7.1% | |
Capital One Financial Corp. | | | 140 | | | | 12,205 | |
Synchrony Financial | | | 408 | | | | 14,798 | |
| | | | | | | | |
| | | | | | | 27,003 | |
| | | | | | | | |
| |
Life & Health Insurance – 3.1% | |
MetLife, Inc. | | | 216 | | | | 11,629 | |
| | | | | | | | |
| |
Mortgage REITs – 2.4% | |
American Capital Agency Corp. | | | 508 | | | | 9,212 | |
| | | | | | | | |
| | | | | | | | |
| COMMON STOCKS | | Shares | | | Value | |
Multi-Line Insurance – 3.3% | |
American International Group, Inc. | | | 190 | | | $ | 12,396 | |
| | | | | | | | |
Other Diversified Financial Services – 10.0% | |
Citigroup, Inc.(A) | | | 286 | | | | 16,979 | |
JPMorgan Chase & Co. (A) | | | 243 | | | | 21,003 | |
| | | | | | | | |
| | | | | | | 37,982 | |
| | | | | | | | |
| |
Property & Casualty Insurance – 2.2% | |
Allstate Corp. (The) | | | 111 | | | | 8,205 | |
| | | | | | | | |
| |
Reinsurance – 1.4% | |
Reinsurance Group of America, Inc. | | | 44 | | | | 5,499 | |
| | | | | | | | |
| |
Total Financials – 29.5% | | | | 111,926 | |
Health Care | |
| |
Biotechnology – 2.6% | |
Amgen, Inc. | | | 67 | | | | 9,723 | |
| | | | | | | | |
| |
Health Care Facilities – 2.7% | |
HCA Holdings, Inc. (B) | | | 136 | | | | 10,074 | |
| | | | | | | | |
| |
Managed Health Care – 5.3% | |
Aetna, Inc. | | | 83 | | | | 10,330 | |
Cigna Corp. | | | 49 | | | | 6,536 | |
Humana, Inc. | | | 16 | | | | 3,244 | |
| | | | | | | | |
| | | | | | | 20,110 | |
| | | | | | | | |
| |
Pharmaceuticals – 2.2% | |
Teva Pharmaceutical Industries Ltd. ADR | | | 233 | | | | 8,443 | |
| | | | | | | | |
| |
Total Health Care – 12.8% | | | | 48,350 | |
Industrials | |
| |
Airlines – 1.4% | |
Delta Air Lines, Inc. (A) | | | 111 | | | | 5,450 | |
| | | | | | | | |
| |
Industrial Machinery – 2.3% | |
Eaton Corp. | | | 130 | | | | 8,735 | |
| | | | | | | | |
| |
Total Industrials – 3.7% | | | | 14,185 | |
Information Technology | |
| |
IT Consulting & Other Services – 0.8% | |
Computer Sciences Corp. | | | 54 | | | | 3,232 | |
| | | | | | | | |
| |
Semiconductor Equipment – 0.6% | |
Lam Research Corp. | | | 22 | | | | 2,294 | |
| | | | | | | | |
| | | | | | | | |
| COMMON STOCKS | | Shares | | | Value | |
Semiconductors – 4.7% | |
Micron Technology, Inc. (A)(B) | | | 536 | | | $ | 11,749 | |
NXP Semiconductors N.V. (B) | | | 19 | | | | 1,882 | |
QUALCOMM, Inc. | | | 63 | | | | 4,108 | |
| | | | | | | | |
| | | | | | | 17,739 | |
| | | | | | | | |
Systems Software – 2.5% | |
Microsoft Corp. | | | 155 | | | | 9,607 | |
| | | | | | | | |
| |
Technology Hardware, Storage & Peripherals –3.1% | |
Western Digital Corp. | | | 171 | | | | 11,633 | |
| | | | | | | | |
| |
Total Information Technology – 11.7% | | | | 44,505 | |
Materials | |
| |
Diversified Chemicals – 3.0% | |
Dow Chemical Co. (The) | | | 201 | | | | 11,507 | |
| | | | | | | | |
| |
Total Materials – 3.0% | | | | 11,507 | |
Real Estate | |
| |
Specialized REITs – 2.6% | |
Communications Sales & Leasing, Inc. | | | 382 | | | | 9,707 | |
| | | | | | | | |
| |
Total Real Estate – 2.6% | | | | 9,707 | |
Utilities | |
| |
Electric Utilities – 3.0% | |
Duke Energy Corp. | | | 148 | | | | 11,488 | |
| | | | | | | | |
| |
Total Utilities – 3.0% | | | | 11,488 | |
| | |
TOTAL COMMON STOCKS – 97.2% | | | | | | $ | 368,544 | |
(Cost: $342,557) | |
| | |
PREFERRED STOCKS | | | | | | | | |
Health Care | |
| |
Pharmaceuticals – 2.1% | |
Teva Pharmaceutical Industries Ltd., Convertible, 7.000% | | | 12 | | | | 7,869 | |
| | | | | | | | |
| |
Total Health Care – 2.1% | | | | 7,869 | |
| | |
TOTAL PREFERRED STOCKS – 2.1% | | | | | | $ | 7,869 | |
(Cost: $7,887) | |
| |
TOTAL INVESTMENT SECURITIES – 99.3% | | | $ | 376,413 | |
(Cost: $350,444) | |
| |
CASH AND OTHER ASSETS, NET OF LIABILITIES – 0.7% | | | | 2,819 | |
| |
NET ASSETS – 100.0% | | | $ | 379,232 | |
| | |
| SCHEDULE OF INVESTMENTS | | VALUE (in thousands) |
DECEMBER 31, 2016
Notes to Schedule of Investments
| (A) | All or a portion of securities with an aggregate value of $25,339 are held in collateralized accounts to cover potential obligations with respect to outstanding written options. |
| (B) | No dividends were paid during the preceding 12 months. |
The following written options were outstanding at December 31, 2016 (contracts and exercise prices unrounded):
| | | | | | | | | | | | | | | | | | | | | | | | | | | | |
| Underlying Security | | Counterparty, if OTC | | Type | | Number of
Contracts | | | Expiration Month | | | Exercise Price | | | Premium
Received | | | Value | | | | |
Delta Air Lines, Inc. | | N/A | | Call | | | 1,108 | | | | January 2017 | | | $ | 55.00 | | | $ | 59 | | | $ | (12 | ) | | | | |
JPMorgan Chase & Co. | | N/A | | Call | | | 133 | | | | February 2017 | | | | 92.50 | | | | 10 | | | | (8 | ) | | | | |
Micron Technology, Inc. | | N/A | | Call | | | 972 | | | | January 2017 | | | | 24.00 | | | | 20 | | | | (17 | ) | | | | |
Newell Rubbermaid, Inc. | | N/A | | Put | | | 393 | | | | March 2017 | | | | 38.00 | | | | 23 | | | | (18 | ) | | | | |
| | N/A | | Call | | | 393 | | | | June 2017 | | | | 60.00 | | | | 21 | | | | (10 | ) | | | | |
| | | | | | | | | | | | | | | | | | | | |
| | | | | | | | | | | | | | | | | | $ | 133 | | | $ | (65 | ) | | | | |
| | | | | | | | | | | | | | | | | | | | |
The following table is a summary of the valuation of the Portfolio’s investments by the fair value hierarchy levels as of December 31, 2016. See Note 3 to the Financial Statements for further information regarding fair value measurement.
| | | | | | | | | | | | |
| | | Level 1 | | | Level 2 | | | Level 3 | |
Assets | | | | | | | | | | | | |
Investments in Securities | | | | | | | | | | | | |
Common Stocks | | $ | 368,544 | | | $ | — | | | $ | — | |
Preferred Stocks | | | 7,869 | | | | — | | | | — | |
Total | | $ | 376,413 | | | $ | — | | | $ | — | |
Liabilities | | | | | | | | | | | | |
Written Options | | $ | 47 | | | $ | 18 | | | $ | — | |
During the year ended December 31, 2016, there were no transfers between Level 1 and 2.
The following acronyms are used throughout this schedule:
ADR = American Depositary Receipts
OTC = Over the Counter
REIT = Real Estate Investment Trust
See Accompanying Notes to Financial Statements.
| | |
| STATEMENTS OF ASSETS AND LIABILITIES | | IVY VIP |
AS OF DECEMBER 31, 2016
| | | | | | | | | | | | | | | | | | | | | | | | | | | | | | | | | | | |
| (In thousands, except per share amounts) | | Pathfinder
Aggressive | | Pathfinder
Conservative | | Pathfinder
Moderate | | Pathfinder
Moderately
Aggressive | | Pathfinder
Moderately
Conservative | | Pathfinder
Moderate -
Managed
Volatility | | Pathfinder
Moderately
Aggressive -
Managed
Volatility |
ASSETS | | | | | | | | | | | | | | | | | | | | | | | | | | | | | | | | | | | |
Investments in unaffiliated securities at value+ | | | $ | 579 | | | | $ | 575 | | | | $ | 415 | | | | $ | 555 | | | | $ | 563 | | | | $ | 15,182 | | | | $ | 2,138 | |
Investments in affiliated securities at market value+ | | | | 74,067 | | | | | 113,682 | | | | | 859,951 | | | | | 1,019,578 | | | | | 260,053 | | | | | 495,707 | | | | | 75,520 | |
Investments at Market Value | | | | 74,646 | | | | | 114,257 | | | | | 860,366 | | | | | 1,020,133 | | | | | 260,616 | | | | | 510,889 | | | | | 77,658 | |
Cash | | | | 1 | | | | | 1 | | | | | 1 | | | | | 1 | | | | | — | * | | | | 1 | | | | | 1 | |
Restricted cash | | | | — | | | | | — | | | | | — | | | | | — | | | | | — | | | | | 492 | | | | | 57 | |
Investment securities sold receivable | | | | 20 | | | | | 24 | | | | | 184 | | | | | 44 | | | | | 36 | | | | | — | | | | | — | |
Dividends and interest receivable | | | | — | * | | | | — | * | | | | — | * | | | | — | * | | | | 11 | | | | | 19 | | | | | 2 | |
Capital shares sold receivable | | | | 4 | | | | | — | * | | | | — | * | | | | — | * | | | | 423 | | | | | 118 | | | | | 47 | |
Variation margin receivable | | | | — | | | | | — | | | | | — | | | | | — | | | | | — | | | | | 45 | | | | | 5 | |
Prepaid and other assets | | | | 1 | | | | | 1 | | | | | 3 | | | | | 11 | | | | | — | * | | | | 4 | | | | | 9 | |
Total Assets | | | | 74,672 | | | | | 114,283 | | | | | 860,554 | | | | | 1,020,189 | | | | | 261,086 | | | | | 511,568 | | | | | 77,779 | |
| | | | | | | |
LIABILITIES | | | | | | | | | | | | | | | | | | | | | | | | | | | | | | | | | | | |
Investment securities purchased payable | | | | — | | | | | — | | | | | — | | | | | — | | | | | 11 | | | | | 16 | | | | | — | |
Capital shares redeemed payable | | | | 7 | | | | | 13 | | | | | 21 | | | | | 246 | | | | | 4 | | | | | 171 | | | | | 223 | |
Independent Trustees and Chief Compliance Officer fees payable | | | | 6 | | | | | 6 | | | | | 43 | | | | | 51 | | | | | 14 | | | | | 5 | | | | | 1 | |
Shareholder servicing payable | | | | — | * | | | | 1 | | | | | 4 | | | | | 5 | | | | | 1 | | | | | 2 | | | | | — | * |
Investment management fee payable | | | | — | | | | | — | | | | | — | | | | | — | | | | | — | | | | | 6 | | | | | 1 | |
Accounting services fee payable | | | | 2 | | | | | 3 | | | | | 12 | | | | | 15 | | | | | 5 | | | | | 8 | | | | | 2 | |
Other liabilities | | | | 1 | | | | | 1 | | | | | 3 | | | | | 3 | | | | | 1 | | | | | 3 | | | | | 2 | |
Total Liabilities | | | | 16 | | | | | 24 | | | | | 83 | | | | | 320 | | | | | 36 | | | | | 211 | | | | | 229 | |
Total Net Assets | | | $ | 74,656 | | | | $ | 114,259 | | | | $ | 860,471 | | | | $ | 1,019,869 | | | | $ | 261,050 | | | | $ | 511,357 | | | | $ | 77,550 | |
| | | | | | | |
NET ASSETS | | | | | | | | | | | | | | | | | | | | | | | | | | | | | | | | | | | |
Capital paid in (shares authorized – unlimited) | | | $ | 75,793 | | | | $ | 113,754 | | | | $ | 838,707 | | | | $ | 988,869 | | | | $ | 258,207 | | | | $ | 522,802 | | | | $ | 81,190 | |
Undistributed net investment income | | | | 680 | | | | | 806 | | | | | 6,699 | | | | | 8,633 | | | | | 2,084 | | | | | 2,473 | | | | | 365 | |
Accumulated net realized gain | | | | 5,299 | | | | | 4,578 | | | | | 47,712 | | | | | 62,708 | | | | | 12,163 | | | | | 14,933 | | | | | 2,483 | |
Net unrealized depreciation | | | | (7,116 | ) | | | | (4,879 | ) | | | | (32,647 | ) | | | | (40,341 | ) | | | | (11,404 | ) | | | | (28,851 | ) | | | | (6,488 | ) |
Total Net Assets | | | $ | 74,656 | | | | $ | 114,259 | | | | $ | 860,471 | | | | $ | 1,019,869 | | | | $ | 261,050 | | | | $ | 511,357 | | | | $ | 77,550 | |
| | | | | | | |
CAPITAL SHARES OUTSTANDING | | | | 15,957 | | | | | 23,303 | | | | | 171,572 | | | | | 198,522 | | | | | 52,305 | | | | | 97,459 | | | | | 15,335 | |
| | | | | | | |
NET ASSET VALUE PER SHARE | | | $ | 4.68 | | | | $ | 4.90 | | | | $ | 5.02 | | | | $ | 5.14 | | | | $ | 4.99 | | | | $ | 5.25 | | | | $ | 5.06 | |
| | | | | | | |
+COST | | | | | | | | | | | | | | | | | | | | | | | | | | | | | | | | | | | |
Investments in unaffiliated securities at cost | | | $ | 579 | | | | $ | 575 | | | | $ | 415 | | | | $ | 555 | | | | $ | 563 | | | | $ | 15,182 | | | | $ | 2,138 | |
Investments in affiliated securities at cost | | | | 81,183 | | | | | 118,561 | | | | | 892,598 | | | | | 1,059,919 | | | | | 271,457 | | | | | 524,374 | | | | | 81,986 | |
*Not shown due to rounding.
See Accompanying Notes to Financial Statements.
| | |
| STATEMENTS OF ASSETS AND LIABILITIES | | IVY VIP |
AS OF DECEMBER 31, 2016
| | | | | | | | | | | | | | | | | | | | | | | | | | | | | | | | | | | |
| (In thousands, except per share amounts) | | Pathfinder
Moderately
Conservative -
Managed
Volatility | | Asset
Strategy(1) | | Balanced | | Bond | | Core
Equity | | Dividend
Opportunities | | Energy |
ASSETS | | | | | | | | | | | | | | | | | | | | | | | | | | | | | | | | | | | |
Investments in unaffiliated securities at value+ | | | $ | 899 | | | | $ | 890,286 | | | | $ | 360,329 | | | | $ | 437,436 | | | | $ | 419,313 | | | | $ | 508,551 | | | | $ | 195,899 | |
Investments in affiliated securities at market value+ | | | | 66,132 | | | | | — | | | | | — | | | | | — | | | | | — | | | | | — | | | | | — | |
Bullion at value+ | | | | — | | | | | 57,465 | | | | | — | | | | | — | | | | | — | | | | | — | | | | | — | |
Investments at Market Value | | | | 67,031 | | | | | 947,751 | | | | | 360,329 | | | | | 437,436 | | | | | 419,313 | | | | | 508,551 | | | | | 195,899 | |
Cash | | | | 1 | | | | | 513 | | | | | 1 | | | | | 1 | | | | | 1 | | | | | 1 | | | | | 1 | |
Cash denominated in foreign currencies at value+ | | | | — | | | | | 836 | | | | | — | | | | | — | | | | | — | | | | | — | | | | | — | |
Restricted cash | | | | 88 | | | | | — | | | | | — | | | | | — | | | | | — | | | | | — | | | | | — | |
Dividends and interest receivable | | | | 4 | | | | | 5,419 | | | | | 1,220 | | | | | 2,514 | | | | | 693 | | | | | 951 | | | | | 77 | |
Capital shares sold receivable | | | | 174 | | | | | 111 | | | | | 2 | | | | | 9 | | | | | 1 | | | | | 2 | | | | | 240 | |
Receivable from affiliates | | | | — | | | | | — | | | | | — | | | | | — | | | | | 55 | | | | | — | | | | | — | |
Unrealized appreciation on forward foreign currency contracts | | | | — | | | | | 168 | | | | | — | | | | | — | | | | | — | | | | | — | | | | | — | |
Unrealized appreciation on swap agreements | | | | — | | | | | 80 | | | | | — | | | | | — | | | | | — | | | | | — | | | | | — | |
Variation margin receivable | | | | 8 | | | | | — | | | | | — | | | | | — | | | | | — | | | | | — | | | | | — | |
Prepaid and other assets | | | | — | * | | | | 11 | | | | | 4 | | | | | 3 | | | | | 5 | | | | | 1 | | | | | 1 | |
Total Assets | | | | 67,306 | | | | | 954,889 | | | | | 361,556 | | | | | 439,963 | | | | | 420,068 | | | | | 509,506 | | | | | 196,218 | |
| | | | | | | |
LIABILITIES | | | | | | | | | | | | | | | | | | | | | | | | | | | | | | | | | | | |
Investment securities purchased payable | | | | 2 | | | | | 2 | | | | | 281 | | | | | 23,746 | | | | | — | | | | | — | | | | | — | |
Capital shares redeemed payable | | | | 181 | | | | | 1,159 | | | | | 138 | | | | | 130 | | | | | 192 | | | | | 107 | | | | | 94 | |
Independent Trustees and Chief Compliance Officer fees payable | | | | 1 | | | | | 139 | | | | | 79 | | | | | 74 | | | | | 156 | | | | | 29 | | | | | 6 | |
Distribution and service fees payable | | | | — | | | | | 13 | | | | | 5 | | | | | 6 | | | | | 6 | | | | | 7 | | | | | 3 | |
Shareholder servicing payable | | | | — | * | | | | 6 | | | | | 2 | | | | | 1 | | | | | 2 | | | | | 2 | | | | | — | * |
Investment management fee payable | | | | 1 | | | | | 37 | | | | | 14 | | | | | 11 | | | | | 16 | | | | | 20 | | | | | 9 | |
Accounting services fee payable | | | | 2 | | | | | 18 | | | | | 10 | | | | | 9 | | | | | 10 | | | | | 11 | | | | | 6 | |
Other liabilities | | | | 1 | | | | | 15 | | | | | 2 | | | | | 176 | | | | | 4 | | | | | 6 | | | | | 3 | |
Total Liabilities | | | | 188 | | | | | 1,389 | | | | | 531 | | | | | 24,153 | | | | | 386 | | | | | 182 | | | | | 121 | |
Total Net Assets | | | $ | 67,118 | | | | $ | 953,500 | | | | $ | 361,025 | | | | $ | 415,810 | | | | $ | 419,682 | | | | $ | 509,324 | | | | $ | 196,097 | |
| | | | | | | |
NET ASSETS | | | | | | | | | | | | | | | | | | | | | | | | | | | | | | | | | | | |
Capital paid in (shares authorized – unlimited) | | | $ | 68,928 | | | | $ | 1,042,805 | | | | $ | 330,868 | | | | $ | 406,523 | | | | $ | 369,534 | | | | $ | 421,152 | | | | $ | 184,213 | |
Undistributed net investment income | | | | 276 | | | | | 25,287 | | | | | 4,105 | | | | | 6,728 | | | | | 1,752 | | | | | 6,063 | | | | | 165 | |
Accumulated net realized gain (loss) | | | | 1,503 | | | | | (58,255 | ) | | | | 11,708 | | | | | 2,975 | | | | | 16,941 | | | | | 17,757 | | | | | (21,714 | ) |
Net unrealized appreciation (depreciation) | | | | (3,589 | ) | | | | (56,337 | ) | | | | 14,344 | | | | | (416 | ) | | | | 31,455 | | | | | 64,352 | | | | | 33,433 | |
Total Net Assets | | | $ | 67,118 | | | | $ | 953,500 | | | | $ | 361,025 | | | | $ | 415,810 | | | | $ | 419,682 | | | | $ | 509,324 | | | | $ | 196,097 | |
| | | | | | | |
CAPITAL SHARES OUTSTANDING | | | | 13,172 | | | | | 118,590 | | | | | 48,305 | | | | | 78,956 | | | | | 39,337 | | | | | 65,412 | | | | | 28,956 | |
| | | | | | | |
NET ASSET VALUE PER SHARE | | | $ | 5.10 | | | | $ | 8.04 | | | | $ | 7.47 | | | | $ | 5.27 | | | | $ | 10.67 | | | | $ | 7.79 | | | | $ | 6.77 | |
| | | | | | | |
+COST | | | | | | | | | | | | | | | | | | | | | | | | | | | | | | | | | | | |
Investments in unaffiliated securities at cost | | | $ | 899 | | | | $ | 943,299 | | | | $ | 345,985 | | | | $ | 437,852 | | | | $ | 387,858 | | | | $ | 444,199 | | | | $ | 162,466 | |
Investments in affiliated securities at cost | | | | 69,688 | | | | | — | | | | | — | | | | | — | | | | | — | | | | | — | | | | | — | |
Bullion at cost | | | | — | | | | | 60,953 | | | | | — | | | | | — | | | | | — | | | | | — | | | | | — | |
Cash denominated in foreign currencies at cost | | | | — | | | | | 841 | | | | | — | | | | | — | | | | | — | | | | | — | | | | | — | |
| * | Not shown due to rounding. |
| (1) | Consolidated Statement of Assets and Liabilities (See Note 6 in Notes to Financial Statements). |
See Accompanying Notes to Financial Statements.
| | |
| STATEMENTS OF ASSETS AND LIABILITIES | | IVY VIP |
AS OF DECEMBER 31, 2016
| | | | | | | | | | | | | | | | | | | | | | | | | | | | | | | | | | | |
| (In thousands, except per share amounts) | | Global
Bond | | Global
Growth | | Global
Natural
Resources | | Government
Money
Market(1) | | Growth | | High
Income | | International
Core Equity |
ASSETS | | | | | | | | | | | | | | | | | | | | | | | | | | | | | | | | | | | |
Investments in unaffiliated securities at value+ | | | $ | 21,713 | | | | $ | 403,500 | | | | $ | 144,053 | | | | $ | 413,246 | | | | $ | 834,734 | | | | $ | 831,805 | | | | $ | 753,851 | |
Investments at Market Value | | | | 21,713 | | | | | 403,500 | | | | | 144,053 | | | | | 413,246 | | | | | 834,734 | | | | | 831,805 | | | | | 753,851 | |
Cash | | | | 14 | | | | | — | | | | | 1 | | | | | — | * | | | | 1 | | | | | 740 | | | | | 1 | |
Cash denominated in foreign currencies at value+ | | | | — | | | | | — | | | | | — | | | | | — | | | | | — | | | | | 6 | | | | | 18,896 | |
Restricted cash | | | | — | | | | | — | | | | | — | | | | | — | | | | | — | | | | | — | | | | | 19 | |
Investment securities sold receivable | | | | — | | | | | 11,509 | | | | | — | | | | | — | | | | | — | | | | | 943 | | | | | — | |
Dividends and interest receivable | | | | 239 | | | | | 671 | | | | | 120 | | | | | 463 | | | | | 1,328 | | | | | 13,537 | | | | | 1,260 | |
Capital shares sold receivable | | | | — | * | | | | 1 | | | | | 83 | | | | | 409 | | | | | 1 | | | | | 214 | | | | | 12 | |
Receivable from affiliates | | | | — | | | | | 22 | | | | | — | | | | | — | | | | | — | | | | | — | | | | | — | |
Unrealized appreciation on forward foreign currency contracts | | | | 1 | | | | | — | | | | | 64 | | | | | — | | | | | — | | | | | 6 | | | | | 688 | |
Prepaid and other assets | | | | — | * | | | | 1 | | | | | 1 | | | | | 1 | | | | | 5 | | | | | 8 | | | | | 4 | |
Total Assets | | | | 21,967 | | | | | 415,704 | | | | | 144,322 | | | | | 414,119 | | | | | 836,069 | | | | | 847,259 | | | | | 774,731 | |
| | | | | | | |
LIABILITIES | | | | | | | | | | | | | | | | | | | | | | | | | | | | | | | | | | | |
Investment securities purchased payable | | | | — | | | | | — | | | | | — | | | | | — | | | | | — | | | | | 1,687 | | | | | 38,392 | |
Capital shares redeemed payable | | | | 8 | | | | | 80 | | | | | 84 | | | | | 58 | | | | | 357 | | | | | 181 | | | | | 154 | |
Distributions payable | | | | — | | | | | — | | | | | — | | | | | 84 | | | | | — | | | | | — | | | | | — | |
Independent Trustees and Chief Compliance Officer fees payable | | | | 1 | | | | | 56 | | | | | 16 | | | | | 37 | | | | | 229 | | | | | 55 | | | | | 70 | |
Overdraft due to custodian | | | | — | | | | | 7,255 | | | | | — | | | | | — | | | | | — | | | | | — | | | | | — | |
Distribution and service fees payable | | | | — | * | | | | 6 | | | | | 2 | | | | | — | | | | | 12 | | | | | 12 | | | | | 10 | |
Shareholder servicing payable | | | | — | * | | | | 2 | | | | | 1 | | | | | 3 | | | | | 4 | | | | | 4 | | | | | 3 | |
Investment management fee payable | | | | — | | | | | 19 | | | | | 8 | | | | | 9 | | | | | 32 | | | | | 28 | | | | | 34 | |
Accounting services fee payable | | | | 1 | | | | | 10 | | | | | 5 | | | | | 11 | | | | | 17 | | | | | 17 | | | | | 14 | |
Unrealized depreciation on forward foreign currency contracts | | | | — | | | | | — | | | | | 15 | | | | | — | | | | | — | | | | | 16 | | | | | — | |
Other liabilities | | | | 1 | | | | | 5 | | | | | 2 | | | | | 47 | | | | | 6 | | | | | 40 | | | | | 11 | |
Total Liabilities | | | | 11 | | | | | 7,433 | | | | | 133 | | | | | 249 | | | | | 657 | | | | | 2,040 | | | | | 38,688 | |
Total Net Assets | | | $ | 21,956 | | | | $ | 408,271 | | | | $ | 144,189 | | | | $ | 413,870 | | | | $ | 835,412 | | | | $ | 845,219 | | | | $ | 736,043 | |
| | | | | | | |
NET ASSETS | | | | | | | | | | | | | | | | | | | | | | | | | | | | | | | | | | | |
Capital paid in (shares authorized – unlimited) | | | $ | 22,752 | | | | $ | 377,297 | | | | $ | 187,578 | | | | $ | 413,846 | | | | $ | 604,360 | | | | $ | 866,614 | | | | $ | 751,719 | |
Undistributed net investment income | | | | 625 | | | | | 153 | | | | | 121 | | | | | — | | | | | 1,996 | | | | | 53,976 | | | | | 10,431 | |
Accumulated net realized gain (loss) | | | | (1,000 | ) | | | | 10,894 | | | | | (47,731 | ) | | | | 24 | | | | | 79,218 | | | | | (50,547 | ) | | | | (10,571 | ) |
Net unrealized appreciation (depreciation) | | | | (421 | ) | | | | 19,927 | | | | | 4,221 | | | | | — | | | | | 149,838 | | | | | (24,824 | ) | | | | (15,536 | ) |
Total Net Assets | | | $ | 21,956 | | | | $ | 408,271 | | | | $ | 144,189 | | | | $ | 413,870 | | | | $ | 835,412 | | | | $ | 845,219 | | | | $ | 736,043 | |
| | | | | | | |
CAPITAL SHARES OUTSTANDING | | | | 4,491 | | | | | 50,128 | | | | | 32,015 | | | | | 413,849 | | | | | 81,082 | | | | | 234,233 | | | | | 48,108 | |
| | | | | | | |
NET ASSET VALUE PER SHARE | | | $ | 4.89 | | | | $ | 8.14 | | | | $ | 4.50 | | | | $ | 1.00 | | | | $ | 10.30 | | | | $ | 3.61 | | | | $ | 15.30 | |
| | | | | | | |
+COST | | | | | | | | | | | | | | | | | | | | | | | | | | | | | | | | | | | |
Investments in unaffiliated securities at cost | | | $ | 22,136 | | | | $ | 383,534 | | | | $ | 139,881 | | | | $ | 413,246 | | | | $ | 684,896 | | | | $ | 856,618 | | | | $ | 770,053 | |
Cash denominated in foreign currencies at cost | | | | — | | | | | — | | | | | — | | | | | — | | | | | — | | | | | 6 | | | | | 18,820 | |
| * | Not shown due to rounding. |
| (1) | Effective October 14, 2016, the Portfolio’s name changed from Money Market to Government Money Market. |
See Accompanying Notes to Financial Statements.
| | |
| STATEMENTS OF ASSETS AND LIABILITIES | | IVY VIP |
AS OF DECEMBER 31, 2016
| | | | | | | | | | | | | | | | | | | | | | | | | | | | | | | | | | | |
| (In thousands, except per share amounts) | | Limited-
Term Bond | | Micro Cap
Growth | | Mid Cap
Growth | | Real Estate
Securities | | Science and
Technology | | Small Cap
Growth | | Small Cap
Value |
ASSETS | | | | | | | | | | | | | | | | | | | | | | | | | | | | | | | | | | | |
Investments in unaffiliated securities at value+ | | | $ | 400,349 | | | | $ | 62,962 | | | | $ | 615,813 | | | | $ | 49,251 | | | | $ | 514,261 | | | | $ | 421,761 | | | | $ | 346,197 | |
Investments at Market Value | | | | 400,349 | | | | | 62,962 | | | | | 615,813 | | | | | 49,251 | | | | | 514,261 | | | | | 421,761 | | | | | 346,197 | |
Cash | | | | 1 | | | | | 1 | | | | | 1 | | | | | 1 | | | | | 1 | | | | | 1 | | | | | �� | |
Investment securities sold receivable | | | | — | | | | | 16 | | | | | 19 | | | | | — | | | | | 911 | | | | | 5,451 | | | | | 9,132 | |
Dividends and interest receivable | | | | 2,547 | | | | | 9 | | | | | 702 | | | | | 254 | | | | | 349 | | | | | 67 | | | | | 574 | |
Capital shares sold receivable | | | | — | * | | | | 18 | | | | | 83 | | | | | — | * | | | | 253 | | | | | 23 | | | | | 66 | |
Receivable from affiliates | | | | — | | | | | — | | | | | 114 | | | | | — | | | | | — | | | | | 17 | | | | | — | |
Prepaid and other assets | | | | — | * | | | | — | * | | | | 5 | | | | | — | * | | | | 5 | | | | | 2 | | | | | 1 | |
Total Assets | | | | 402,897 | | | | | 63,006 | | | | | 616,737 | | | | | 49,506 | | | | | 515,780 | | | | | 427,322 | | | | | 355,970 | |
| | | | | | | |
LIABILITIES | | | | | | | | | | | | | | | | | | | | | | | | | | | | | | | | | | | |
Investment securities purchased payable | | | | 8,009 | | | | | — | | | | | 926 | | | | | 599 | | | | | 475 | | | | | 140 | | | | | 5,427 | |
Capital shares redeemed payable | | | | 74 | | | | | 14 | | | | | 290 | | | | | 77 | | | | | 724 | | | | | 252 | | | | | 36 | |
Independent Trustees and Chief Compliance Officer fees payable | | | | 15 | | | | | 7 | | | | | 21 | | | | | 5 | | | | | 71 | | | | | 95 | | | | | 28 | |
Overdraft due to custodian | | | | — | | | | | — | | | | | — | | | | | — | | | | | — | | | | | — | | | | | 2,111 | |
Distribution and service fees payable | | | | 5 | | | | | 1 | | | | | 8 | | | | | 1 | | | | | 7 | | | | | 6 | | | | | 5 | |
Shareholder servicing payable | | | | 2 | | | | | — | * | | | | 3 | | | | | — | * | | | | 3 | | | | | 2 | | | | | 1 | |
Investment management fee payable | | | | 11 | | | | | 3 | | | | | 29 | | | | | 2 | | | | | 24 | | | | | 20 | | | | | 16 | |
Accounting services fee payable | | | | 10 | | | | | 3 | | | | | 13 | | | | | 2 | | | | | 11 | | | | | 10 | | | | | 8 | |
Unrealized depreciation on swap agreements | | | | — | | | | | — | | | | | — | | | | | — | | | | | — | | | | | 946 | | | | | — | |
Other liabilities | | | | 4 | | | | | 2 | | | | | 4 | | | | | 2 | | | | | 5 | | | | | 3 | | | | | 6 | |
Total Liabilities | | | | 8,130 | | | | | 30 | | | | | 1,294 | | | | | 688 | | | | | 1,320 | | | | | 1,474 | | | | | 7,638 | |
Total Net Assets | | | $ | 394,767 | | | | $ | 62,976 | | | | $ | 615,443 | | | | $ | 48,818 | | | | $ | 514,460 | | | | $ | 425,848 | | | | $ | 348,332 | |
| | | | | | | |
NET ASSETS | | | | | | | | | | | | | | | | | | | | | | | | | | | | | | | | | | | |
Capital paid in (shares authorized—unlimited) | | | $ | 392,615 | | | | $ | 52,080 | | | | $ | 560,736 | | | | $ | 41,299 | | | | $ | 343,051 | | | | $ | 363,626 | | | | $ | 262,251 | |
Undistributed (distributions in excess of) net investment income | | | | 6,252 | | | | | (7 | ) | | | | (21 | ) | | | | 717 | | | | | (14 | ) | | | | 372 | | | | | 347 | |
Accumulated net realized gain (loss) | | | | (3,247 | ) | | | | (107 | ) | | | | 19,330 | | | | | 5,460 | | | | | 27,789 | | | | | 10,232 | | | | | 37,927 | |
Net unrealized appreciation (depreciation) | | | | (853 | ) | | | | 11,010 | | | | | 35,398 | | | | | 1,342 | | | | | 143,634 | | | | | 51,618 | | | | | 47,807 | |
Total Net Assets | | | $ | 394,767 | | | | $ | 62,976 | | | | $ | 615,443 | | | | $ | 48,818 | | | | $ | 514,460 | | | | $ | 425,848 | | | | $ | 348,332 | |
| | | | | | | |
CAPITAL SHARES OUTSTANDING | | | | 80,732 | | | | | 3,048 | | | | | 65,213 | | | | | 5,815 | | | | | 23,030 | | | | | 43,960 | | | | | 18,989 | |
| | | | | | | |
NET ASSET VALUE PER SHARE | | | $ | 4.89 | | | | $ | 20.66 | | | | $ | 9.44 | | | | $ | 8.39 | | | | $ | 22.34 | | | | $ | 9.69 | | | | $ | 18.34 | |
| | | | | | | |
+COST | | | | | | | | | | | | | | | | | | | | | | | | | | | | | | | | | | | |
Investments in unaffiliated securities at cost | | | $ | 401,202 | | | | $ | 51,952 | | | | $ | 580,415 | | | | | 47,909 | | | | $ | 370,627 | | | | $ | 369,198 | | | | $ | 298,390 | |
*Not shown due to rounding.
See Accompanying Notes to Financial Statements.
| | |
| STATEMENTS OF ASSETS AND LIABILITIES | | IVY VIP |
AS OF DECEMBER 31, 2016
| | | | | |
| (In thousands, except per share amounts) | | Value |
ASSETS | | | | | |
Investments in unaffiliated securities at value+ | | | $ | 376,413 | |
Investments at Market Value | | | | 376,413 | |
Investment securities sold receivable | | | | 3,465 | |
Dividends and interest receivable | | | | 759 | |
Capital shares sold receivable | | | | 51 | |
Prepaid and other assets | | | | 2 | |
Total Assets | | | | 380,690 | |
| |
LIABILITIES | | | | | |
Capital shares redeemed payable | | | | 89 | |
Independent Trustees and Chief Compliance Officer fees payable | | | | 49 | |
Overdraft due to custodian | | | | 1,218 | |
Distribution and service fees payable | | | | 5 | |
Shareholder servicing payable | | | | 2 | |
Investment management fee payable | | | | 15 | |
Accounting services fee payable | | | | 10 | |
Written options at value+ | | | | 65 | |
Other liabilities | | | | 5 | |
Total Liabilities | | | | 1,458 | |
Total Net Assets | | | $ | 379,232 | |
| |
NET ASSETS | | | | | |
Capital paid in (shares authorized – unlimited) | | | $ | 341,232 | |
Undistributed net investment income | | | | 4,813 | |
Accumulated net realized gain | | | | 7,150 | |
Net unrealized appreciation | | | | 26,037 | |
Total Net Assets | | | $ | 379,232 | |
| |
CAPITAL SHARES OUTSTANDING | | | | 63,994 | |
| |
NET ASSET VALUE PER SHARE | | | $ | 5.93 | |
| |
+COST | | | | | |
Investments in unaffiliated securities at cost | | | $ | 350,444 | |
Written options premiums received at cost | | | | 133 | |
See Accompanying Notes to Financial Statements.
| | |
| STATEMENTS OF OPERATIONS | | IVY VIP |
FOR THE YEAR ENDED DECEMBER 31, 2016
| | | | | | | | | | | | | | | | | | | | | | | | | | | | | | | | | | | |
| (In thousands) | | Pathfinder
Aggressive | | Pathfinder
Conservative | | Pathfinder
Moderate | | Pathfinder
Moderately
Aggressive | | Pathfinder
Moderately
Conservative | | Pathfinder
Moderate -
Managed
Volatility | | Pathfinder
Moderately
Aggressive -
Managed
Volatility |
INVESTMENT INCOME | | | | | | | | | | | | | | | | | | | | | | | | | | | | | | | | | | | |
Dividends from affiliated securities | | | $ | 744 | | | | $ | 887 | | | | $ | 7,045 | | | | $ | 9,044 | | | | $ | 2,220 | | | | $ | 3,535 | | | | $ | 594 | |
Interest and amortization from unaffiliated securities | | | | 3 | | | | | 3 | | | | | 2 | | | | | 2 | | | | | 3 | | | | | 82 | | | | | 11 | |
Total Investment Income | | | | 747 | | | | | 890 | | | | | 7,047 | | | | | 9,046 | | | | | 2,223 | | | | | 3,617 | | | | | 605 | |
| | | | | | | |
EXPENSES | | | | | | | | | | | | | | | | | | | | | | | | | | | | | | | | | | | |
Investment management fee | | | | — | | | | | — | | | | | — | | | | | — | | | | | — | | | | | 917 | | | | | 139 | |
Shareholder servicing | | | | 1 | | | | | 2 | | | | | 12 | | | | | 15 | | | | | 4 | | | | | 7 | | | | | 1 | |
Custodian fees | | | | 2 | | | | | 2 | | | | | 2 | | | | | 3 | | | | | 2 | | | | | 3 | | | | | 2 | |
Independent Trustees and Chief Compliance Officer fees | | | | 5 | | | | | 6 | | | | | 48 | | | | | 57 | | | | | 15 | | | | | 21 | | | | | 3 | |
Accounting services fee | | | | 26 | | | | | 36 | | | | | 147 | | | | | 172 | | | | | 58 | | | | | 87 | | | | | 25 | |
Professional fees | | | | 16 | | | | | 17 | | | | | 46 | | | | | 59 | | | | | 28 | | | | | 35 | | | | | 21 | |
Other | | | | 13 | | | | | 14 | | | | | 45 | | | | | 62 | | | | | 18 | | | | | 45 | | | | | 25 | |
Total Expenses | | | | 63 | | | | | 77 | | | | | 300 | | | | | 368 | | | | | 125 | | | | | 1,115 | | | | | 216 | |
Net Investment Income | | | | 684 | | | | | 813 | | | | | 6,747 | | | | | 8,678 | | | | | 2,098 | | | | | 2,502 | | | | | 389 | |
| | | | | | | |
REALIZED AND UNREALIZED GAIN (LOSS) | | | | | | | | | | | | | | | | | | | | | | | | | | | | | | | | | | | |
Net realized gain (loss) on: | | | | | | | | | | | | | | | | | | | | | | | | | | | | | | | | | | | |
Investments in affiliated securities | | | | 581 | | | | | 735 | | | | | 8,324 | | | | | 11,628 | | | | | 1,624 | | | | | 2,273 | | | | | 341 | |
Distributions of realized capital gains from affiliated securities | | | | 4,726 | | | | | 3,849 | | | | | 39,407 | | | | | 51,096 | | | | | 10,550 | | | | | 19,737 | | | | | 3,349 | |
Futures contracts | | | | — | | | | | — | | | | | — | | | | | — | | | | | — | | | | | (6,879 | ) | | | | (1,169 | ) |
Net change in unrealized appreciation (depreciation) on: | | | | | | | | | | | | | | | | | | | | | | | | | | | | | | | | | | | |
Investments in affiliated securities | | | | (2,662 | ) | | | | (2,240 | ) | | | | (23,999 | ) | | | | (26,765 | ) | | | | (6,375 | ) | | | | (6,078 | ) | | | | (979 | ) |
Futures contracts | | | | — | | | | | — | | | | | — | | | | | — | | | | | — | | | | | (378 | ) | | | | (59 | ) |
Net Realized and Unrealized Gain | | | | 2,645 | | | | | 2,344 | | | | | 23,732 | | | | | 35,959 | | | | | 5,799 | | | | | 8,675 | | | | | 1,483 | |
Net Increase in Net Assets Resulting from Operations | | | $ | 3,329 | | | | $ | 3,157 | | | | $ | 30,479 | | | | $ | 44,637 | | | | $ | 7,897 | | | | $ | 11,177 | | | | $ | 1,872 | |
See Accompanying Notes to Financial Statements.
| | |
| STATEMENTS OF OPERATIONS | | IVY VIP |
FOR THE YEAR ENDED DECEMBER 31, 2016
| | | | | | | | | | | | | | | | | | | | | | | | | | | | | | | | | | | |
| (In thousands) | | Pathfinder
Moderately
Conservative -
Managed
Volatility | | Asset
Strategy(1) | | Balanced | | Bond | | Core
Equity | | Dividend
Opportunities | | Energy |
INVESTMENT INCOME | | | | | | | | | | | | | | | | | | | | | | | | | | | | | | | | | | | |
Dividends from unaffiliated securities | | | $ | — | | | | $ | 9,547 | | | | $ | 4,977 | | | | $ | — | | | | $ | 6,085 | | | | $ | 12,089 | | | | $ | 1,387 | |
Dividends from affiliated securities | | | | 473 | | | | | — | | | | | — | | | | | — | | | | | — | | | | | — | | | | | — | |
Foreign dividend withholding tax | | | | — | | | | | (191 | ) | | | | (97 | ) | | | | — | | | | | (94 | ) | | | | (139 | ) | | | | (29 | ) |
Interest and amortization from unaffiliated securities | | | | 10 | | | | | 9,285 | | | | | 4,465 | | | | | 8,272 | | | | | 32 | | | | | 279 | | | | | 29 | |
Foreign interest withholding tax | | | | — | | | | | — | * | | | | — | | | | | — | | | | | — | | | | | — | | | | | — | |
Total Investment Income | | | | 483 | | | | | 18,641 | | | | | 9,345 | | | | | 8,272 | | | | | 6,023 | | | | | 12,229 | | | | | 1,387 | |
| | | | | | | |
EXPENSES | | | | | | | | | | | | | | | | | | | | | | | | | | | | | | | | | | | |
Investment management fee | | | | 122 | | | | | 7,616 | | | | | 2,582 | | | | | 1,330 | | | | | 3,012 | | | | | 3,532 | | | | | 1,279 | |
Service fee | | | | — | | | | | 2,737 | | | | | 922 | | | | | 700 | | | | | 1,076 | | | | | 1,261 | | | | | 376 | |
Shareholder servicing | | | | 1 | | | | | 19 | | | | | 5 | | | | | 4 | | | | | 6 | | | | | 7 | | | | | 2 | |
Custodian fees | | | | 3 | | | | | 74 | | | | | 8 | | | | | 8 | | | | | 11 | | | | | 13 | | | | | 7 | |
Independent Trustees and Chief Compliance Officer fees | | | | 3 | | | | | 75 | | | | | 28 | | | | | 22 | | | | | 40 | | | | | 28 | | | | | 7 | |
Accounting services fee | | | | 24 | | | | | 244 | | | | | 119 | | | | | 92 | | | | | 125 | | | | | 133 | | | | | 63 | |
Professional fees | | | | 18 | | | | | 133 | | | | | 32 | | | | | 31 | | | | | 30 | | | | | 33 | | | | | 21 | |
Other | | | | 12 | | | | | 184 | | | | | 29 | | | | | 18 | | | | | 33 | | | | | 50 | | | | | 32 | |
Total Expenses | | | | 183 | | | | | 11,082 | | | | | 3,725 | | | | | 2,205 | | | | | 4,333 | | | | | 5,057 | | | | | 1,787 | |
Less: | | | | | | | | | | | | | | | | | | | | | | | | | | | | | | | | | | | |
Expenses in excess of limit | | | | — | | | | | (75 | ) | | | | — | | | | | — | | | | | (216 | ) | | | | — | | | | | — | |
Total Net Expenses | | | | 183 | | | | | 11,007 | | | | | 3,725 | | | | | 2,205 | | | | | 4,117 | | | | | 5,057 | | | | | 1,787 | |
Net Investment Income (Loss) | | | | 300 | | | | | 7,634 | | | | | 5,620 | | | | | 6,067 | | | | | 1,906 | | | | | 7,172 | | | | | (400 | ) |
| | | | | | | |
REALIZED AND UNREALIZED GAIN (LOSS) | | | | | | | | | | | | | | | | | | | | | | | | | | | | | | | | | | | |
Net realized gain (loss) on: | | | | | | | | | | | | | | | | | | | | | | | | | | | | | | | | | | | |
Investments in unaffiliated securities | | | | — | | | | | (10,770 | ) | | | | 9,173 | | | | | 3,730 | | | | | 17,184 | | | | | 14,575 | | | | | (6,613 | ) |
Investments in affiliated securities | | | | 241 | | | | | — | | | | | — | | | | | — | | | | | — | | | | | — | | | | | — | |
Distributions of realized capital gains from affiliated securities | | | | 2,238 | | | | | — | | | | | — | | | | | — | | | | | — | | | | | — | | | | | — | |
Futures contracts | | | | (941 | ) | | | | 1,689 | | | | | — | | | | | — | | | | | — | | | | | — | | | | | — | |
Written options | | | | — | | | | | 1,726 | | | | | 1,029 | | | | | — | | | | | — | | | | | — | | | | | — | |
Swap agreements | | | | — | | | | | — | * | | | | — | | | | | — | | | | | — | | | | | — | | | | | — | |
Forward foreign currency contracts | | | | — | | | | | 368 | | | | | — | | | | | — | | | | | — | | | | | — | | | | | — | |
Foreign currency exchange transactions | | | | — | | | | | (91 | ) | | | | — | | | | | — | | | | | — | | | | | 2 | | | | | — | * |
Net change in unrealized appreciation (depreciation) on: | | | | | | | | | | | | | | | | | | | | | | | | | | | | | | | | | | | |
Investments in unaffiliated securities | | | | — | | | | | (51,719 | ) | | | | (8,778 | ) | | | | 2,129 | | | | | (3,912 | ) | | | | 12,700 | | | | | 54,012 | |
Investments in affiliated securities | | | | (810 | ) | | | | 18,739 | | | | | — | | | | | — | | | | | — | | | | | — | | | | | — | |
Futures contracts | | | | (66 | ) | | | | — | | | | | — | | | | | — | | | | | — | | | | | — | | | | | — | |
Written options | | | | — | | | | | (1,117 | ) | | | | — | | | | | — | | | | | — | | | | | — | | | | | — | |
Swap agreements | | | | — | | | | | 80 | | | | | — | | | | | — | | | | | — | | | | | — | | | | | — | |
Forward foreign currency contracts | | | | — | | | | | (40 | ) | | | | — | | | | | — | | | | | — | | | | | — | | | | | — | |
Foreign currency exchange transactions | | | | — | | | | | (13 | ) | | | | — | | | | | — | | | | | — | | | | | — | | | | | — | * |
Net Realized and Unrealized Gain (Loss) | | | | 662 | | | | | (41,148 | ) | | | | 1,424 | | | | | 5,859 | | | | | 13,272 | | | | | 27,277 | | | | | 47,399 | |
Net Increase (Decrease) in Net Assets Resulting from Operations | | | $ | 962 | | | | $ | (33,514 | ) | | | $ | 7,044 | | | | $ | 11,926 | | | | $ | 15,178 | | | | $ | 34,449 | | | | $ | 46,999 | |
| * | Not shown due to rounding. |
| (1) | Consolidated Statement of Operations (See Note 6 in Notes to Financial Statements). |
See Accompanying Notes to Financial Statements.
| | |
| STATEMENTS OF OPERATIONS | | IVY VIP |
FOR THE YEAR ENDED DECEMBER 31, 2016
| | | | | | | | | | | | | | | | | | | | | | | | | | | | | | | | | | | |
| (In thousands) | | Global
Bond | | Global
Growth | | Global
Natural
Resources | | Government
Money
Market(1) | | Growth | | High
Income | | International
Core Equity |
INVESTMENT INCOME | | | | | | | | | | | | | | | | | | | | | | | | | | | | | | | | | | | |
Dividends from unaffiliated securities | | | $ | 48 | | | | $ | 5,927 | | | | $ | 1,961 | | | | $ | — | | | | $ | 10,445 | | | | $ | 422 | | | | $ | 19,278 | |
Foreign dividend withholding tax | | | | (1 | ) | | | | (316 | ) | | | | (49 | ) | | | | — | | | | | (61 | ) | | | | — | | | | | (1,281 | ) |
Interest and amortization from unaffiliated securities | | | | 743 | | | | | 151 | | | | | 41 | | | | | 3,138 | | | | | 92 | | | | | 60,539 | | | | | 87 | |
Foreign interest withholding tax | | | | — | | | | | — | * | | | | — | | | | | — | | | | | — | | | | | — | | | | | (1 | ) |
Total Investment Income | | | | 790 | | | | | 5,762 | | | | | 1,953 | | | | | 3,138 | | | | | 10,476 | | | | | 60,961 | | | | | 18,083 | |
| | | | | | | |
EXPENSES | | | | | | | | | | | | | | | | | | | | | | | | | | | | | | | | | | | |
Investment management fee | | | | 131 | | | | | 4,018 | | | | | 1,253 | | | | | 2,185 | | | | | 5,925 | | | | | 4,791 | | | | | 5,579 | |
Service fee | | | | 52 | | | | | 1,182 | | | | | 313 | | | | | — | | | | | 2,116 | | | | | 1,944 | | | | | 1,641 | |
Shareholder servicing | | | | — | * | | | | 7 | | | | | 2 | | | | | 8 | | | | | 12 | | | | | 11 | | | | | 9 | |
Custodian fees | | | | 4 | | | | | 42 | | | | | 7 | | | | | 16 | | | | | 18 | | | | | 14 | | | | | 85 | |
Independent Trustees and Chief Compliance Officer fees | | | | 1 | | | | | 30 | | | | | 8 | | | | | 30 | | | | | 70 | | | | | 44 | | | | | 41 | |
Accounting services fee | | | | 14 | | | | | 129 | | | | | 61 | | | | | 140 | | | | | 206 | | | | | 191 | | | | | 162 | |
Professional fees | | | | 21 | | | | | 43 | | | | | 26 | | | | | 40 | | | | | 47 | | | | | 59 | | | | | 47 | |
Other | | | | 11 | | | | | 39 | | | | | 28 | | | | | 68 | | | | | 48 | | | | | 58 | | | | | 65 | |
Total Expenses | | | | 234 | | | | | 5,490 | | | | | 1,698 | | | | | 2,487 | | | | | 8,442 | | | | | 7,112 | | | | | 7,629 | |
Less: | | | | | | | | | | | | | | | | | | | | | | | | | | | | | | | | | | | |
Expenses in excess of limit | | | | (131 | ) | | | | (130 | ) | | | | — | | | | | (31 | ) | | | | (190 | ) | | | | (187 | ) | | | | — | |
Total Net Expenses | | | | 103 | | | | | 5,360 | | | | | 1,698 | | | | | 2,456 | | | | | 8,252 | | | | | 6,925 | | | | | 7,629 | |
Net Investment Income | | | | 687 | | | | | 402 | | | | | 255 | | | | | 682 | | | | | 2,224 | | | | | 54,036 | | | | | 10,454 | |
| | | | | | | |
REALIZED AND UNREALIZED GAIN (LOSS) | | | | | | | | | | | | | | | | | | | | | | | | | | | | | | | | | | | |
Net realized gain (loss) on: | | | | | | | | | | | | | | | | | | | | | | | | | | | | | | | | | | | |
Investments in unaffiliated securities | | | | (247 | ) | | | | 9,530 | | | | | (10,849 | ) | | | | 24 | | | | | 79,242 | | | | | (29,197 | ) | | | | (15,217 | ) |
Written options | | | | — | | | | | — | | | | | — | | | | | — | | | | | — | | | | | — | | | | | (25 | ) |
Swap agreements | | | | — | | | | | — | | | | | — | | | | | — | | | | | — | | | | | 277 | | | | | — | |
Forward foreign currency contracts | | | | 22 | | | | | 1,373 | | | | | 1,421 | | | | | — | | | | | — | | | | | 45 | | | | | 6,198 | |
Foreign currency exchange transactions | | | | (3 | ) | | | | (194 | ) | | | | 2 | | | | | — | | | | | — | | | | | (1 | ) | | | | (187 | ) |
Net change in unrealized appreciation (depreciation) on: | | | | | | | | | | | | | | | | | | | | | | | | | | | | | | | | | | | |
Investments in unaffiliated securities | | | | 950 | | | | | (24,799 | ) | | | | 36,924 | | | | | — | | | | | (72,102 | ) | | | | 91,603 | | | | | 6,328 | |
Swap agreements | | | | — | | | | | — | | | | | — | | | | | — | | | | | — | | | | | 27 | | | | | — | |
Forward foreign currency contracts | | | | (2 | ) | | | | — | | | | | (162 | ) | | | | — | | | | | — | | | | | (65 | ) | | | | (334 | ) |
Foreign currency exchange transactions | | | | 3 | | | | | 38 | | | | | — | * | | | | — | | | | | — | | | | | — | * | | | | 46 | |
Net Realized and Unrealized Gain (Loss) | | | | 723 | | | | | (14,052 | ) | | | | 27,336 | | | | | 24 | | | | | 7,140 | | | | | 62,689 | | | | | (3,191 | ) |
Net Increase (Decrease) in Net Assets Resulting from Operations | | | $ | 1,410 | | | | $ | (13,650 | ) | | | $ | 27,591 | | | | $ | 706 | | | | $ | 9,364 | | | | $ | 116,725 | | | | $ | 7,263 | |
| * | Not shown due to rounding. |
| (1) | Effective October 14, 2016, the Portfolio’s name changed from Money Market to Government Money Market. |
See Accompanying Notes to Financial Statements.
| | |
| STATEMENTS OF OPERATIONS | | IVY VIP |
FOR THE YEAR ENDED DECEMBER 31, 2016
| | | | | | | | | | | | | | | | | | | | | | | | | | | | | | | | | | | |
| (In thousands) | | Limited-Term
Bond | | Micro Cap
Growth | | Mid Cap
Growth | | Real Estate
Securities | | Science and
Technology | | Small Cap
Growth | | Small Cap
Value |
INVESTMENT INCOME | | | | | | | | | | | | | | | | | | | | | | | | | | | | | | | | | | | |
Dividends from unaffiliated securities | | | $ | — | | | | $ | 164 | | | | $ | 5,908 | | | | $ | 1,179 | | | | $ | 2,905 | | | | $ | 1,336 | | | | $ | 4,053 | |
Foreign dividend withholding tax | | | | — | | | | | — | | | | | — | | | | | — | | | | | (61 | ) | | | | — | | | | | — | * |
Interest and amortization from unaffiliated securities | | | | 9,078 | | | | | 21 | | | | | 96 | | | | | 6 | | | | | 370 | | | | | 150 | | | | | 52 | |
Total Investment Income | | | | 9,078 | | | | | 185 | | | | | 6,004 | | | | | 1,185 | | | | | 3,214 | | | | | 1,486 | | | | | 4,105 | |
| | | | | | | |
EXPENSES | | | | | | | | | | | | | | | | | | | | | | | | | | | | | | | | | | | |
Investment management fee | | | | 1,947 | | | | | 542 | | | | | 5,055 | | | | | 435 | | | | | 4,407 | | | | | 3,548 | | | | | 2,826 | |
Service fee | | | | 973 | | | | | 142 | | | | | 1,487 | | | | | 121 | | | | | 1,296 | | | | | 1,044 | | | | | 831 | |
Shareholder servicing | | | | 6 | | | | | 1 | | | | | 9 | | | | | 1 | | | | | 9 | | | | | 6 | | | | | 5 | |
Custodian fees | | | | 9 | | | | | 4 | | | | | 14 | | | | | 6 | | | | | 30 | | | | | 16 | | | | | 19 | |
Independent Trustees and Chief Compliance Officer fees | | | | 21 | | | | | 4 | | | | | 31 | | | | | 3 | | | | | 35 | | | | | 32 | | | | | 20 | |
Accounting services fee | | | | 121 | | | | | 40 | | | | | 153 | | | | | 31 | | | | | 134 | | | | | 124 | | | | | 96 | |
Professional fees | | | | 35 | | | | | 14 | | | | | 35 | | | | | 14 | | | | | 31 | | | | | 27 | | | | | 24 | |
Other | | | | 18 | | | | | 12 | | | | | 56 | | | | | 11 | | | | | 86 | | | | | 42 | | | | | 23 | |
Total Expenses | | | | 3,130 | | | | | 759 | | | | | 6,840 | | | | | 622 | | | | | 6,028 | | | | | 4,839 | | | | | 3,844 | |
Less: | | | | | | | | | | | | | | | | | | | | | | | | | | | | | | | | | | | |
Expenses in excess of limit | | | | — | | | | | — | | | | | (298 | ) | | | | (44 | ) | | | | (78 | ) | | | | (79 | ) | | | | — | |
Total Net Expenses | | | | 3,130 | | | | | 759 | | | | | 6,542 | | | | | 578 | | | | | 5,950 | | | | | 4,760 | | | | | 3,844 | |
Net Investment Income (Loss) | | | | 5,948 | | | | | (574 | ) | | | | (538 | ) | | | | 607 | | | | | (2,736 | ) | | | | (3,274 | ) | | | | 261 | |
| | | | | | | |
REALIZED AND UNREALIZED GAIN (LOSS) | | | | | | | | | | | | | | | | | | | | | | | | | | | | | | | | | | | |
Net realized gain (loss) on: | | | | | | | | | | | | | | | | | | | | | | | | | | | | | | | | | | | |
Investments in unaffiliated securities | | | | 1,731 | | | | | (102 | ) | | | | 18,340 | | | | | 5,605 | | | | | 28,089 | | | | | 10,437 | | | | | 38,909 | |
Written options | | | | — | | | | | — | | | | | 1,382 | | | | | — | | | | | (235 | ) | | | | — | | | | | — | |
Swap agreements | | | | — | | | | | — | | | | | — | | | | | — | | | | | — | | | | | (249 | ) | | | | — | |
Foreign currency exchange transactions | | | | — | | | | | — | | | | | — | * | | | | — | | | | | — | * | | | | — | | | | | — | |
Net change in unrealized appreciation (depreciation) on: | | | | | | | | | | | | | | | | | | | | | | | | | | | | | | | | | | | |
Investments in unaffiliated securities | | | | (285 | ) | | | | 8,208 | | | | | 19,269 | | | | | (4,351 | ) | | | | (21,098 | ) | | | | 7,789 | | | | | 46,578 | |
Written options | | | | — | | | | | — | | | | | (1,086 | ) | | | | — | | | | | (173 | ) | | | | — | | | | | — | |
Swap agreements | | | | — | | | | | — | | | | | — | | | | | — | | | | | — | | | | | (946 | ) | | | | — | |
Foreign currency exchange transactions | | | | — | | | | | — | | | | | 1 | | | | | — | | | | | — | * | | | | — | | | | | — | |
Net Realized and Unrealized Gain | | | | 1,446 | | | | | 8,106 | | | | | 37,906 | | | | | 1,254 | | | | | 6,583 | | | | | 17,031 | | | | | 85,487 | |
Net Increase in Net Assets Resulting from Operations | | | $ | 7,394 | | | | $ | 7,532 | | | | $ | 37,368 | | | | $ | 1,861 | | | | $ | 3,847 | | | | $ | 13,757 | | | | $ | 85,748 | |
*Not shown due to rounding.
See Accompanying Notes to Financial Statements.
| | |
| STATEMENTS OF OPERATIONS | | IVY VIP |
FOR THE YEAR ENDED DECEMBER 31, 2016
| | | | | |
| (In thousands) | | Value |
INVESTMENT INCOME | | | | | |
Dividends from unaffiliated securities | | | $ | 8,895 | |
Foreign dividend withholding tax | | | | (42 | ) |
Interest and amortization from unaffiliated securities | | | | 102 | |
Total Investment Income | | | | 8,955 | |
| |
EXPENSES | | | | | |
Investment management fee | | | | 2,618 | |
Service fee | | | | 935 | |
Shareholder servicing | | | | 5 | |
Custodian fees | | | | 9 | |
Independent Trustees and Chief Compliance Officer fees | | | | 25 | |
Accounting services fee | | | | 118 | |
Professional fees | | | | 30 | |
Other | | | | 108 | |
Total Expenses | | | | 3,848 | |
Less: | | | | | |
Expenses in excess of limit | | | | (28 | ) |
Total Net Expenses | | | | 3,820 | |
Net Investment Income | | | | 5,135 | |
| |
REALIZED AND UNREALIZED GAIN (LOSS) | | | | | |
Net realized gain (loss) on: | | | | | |
Investments in unaffiliated securities | | | | 6,307 | |
Written options | | | | 579 | |
Net change in unrealized appreciation (depreciation) on: | | | | | |
Investments in unaffiliated securities | | | | 28,499 | |
Written options | | | | (191 | ) |
Net Realized and Unrealized Gain | | | | 35,194 | |
Net Increase in Net Assets Resulting from Operations | | | $ | 40,329 | |
See Accompanying Notes to Financial Statements.
| | |
| STATEMENTS OF CHANGES IN NET ASSETS | | IVY VIP |
| | | | | | | | | | | | | | | | | | | | | | | | | | | | | | |
| | | Pathfinder Aggressive | | Pathfinder Conservative | | Pathfinder Moderate |
| (In thousands) | | Year ended
12-31-16 | | Year ended
12-31-15 | | Year ended
12-31-16 | | Year ended
12-31-15 | | Year ended
12-31-16 | | Year ended
12-31-15 |
INCREASE (DECREASE) IN NET ASSETS | | | | | | | | | | | | | | | | | | | | | | | | | | | | | | |
Operations: | | | | | | | | | | | | | | | | | | | | | | | | | | | | | | |
Net investment income | | | $ | 684 | | | | $ | 1,185 | | | | $ | 813 | | | | $ | 1,311 | | | | $ | 6,747 | | | | $ | 11,297 | |
Net realized gain on investments | | | | 5,307 | | | | | 7,754 | | | | | 4,584 | | | | | 7,057 | | | | | 47,731 | | | | | 68,307 | |
Net change in unrealized depreciation | | | | (2,662 | ) | | | | (8,650 | ) | | | | (2,240 | ) | | | | (7,776 | ) | | | | (23,999 | ) | | | | (75,994 | ) |
Net Increase in Net Assets Resulting from Operations | | | | 3,329 | | | | | 289 | | | | | 3,157 | | | | | 592 | | | | | 30,479 | | | | | 3,610 | |
| | | | | | |
Distributions to Shareholders From: | | | | | | | | | | | | | | | | | | | | | | | | | | | | | | |
Net investment income | | | | (1,183 | ) | | | | (2,349 | ) | | | | (1,313 | ) | | | | (1,383 | ) | | | | (11,308 | ) | | | | (15,558 | ) |
Net realized gains | | | | (7,759 | ) | | | | (8,641 | ) | | | | (7,061 | ) | | | | (7,709 | ) | | | | (68,309 | ) | | | | (74,025 | ) |
Total Distributions to Shareholders | | | | (8,942 | ) | | | | (10,990 | ) | | | | (8,374 | ) | | | | (9,092 | ) | | | | (79,617 | ) | | | | (89,583 | ) |
Capital Share Transactions | | | | (4,867 | ) | | | | 11,001 | | | | | 2,049 | | | | | 3,649 | | | | | 17,015 | | | | | 50,072 | |
Net Increase (Decrease) in Net Assets | | | | (10,480 | ) | | | | 300 | | | | | (3,168 | ) | | | | (4,851 | ) | | | | (32,123 | ) | | | | (35,901 | ) |
Net Assets, Beginning of Period | | | | 85,136 | | | | | 84,836 | | | | | 117,427 | | | | | 122,278 | | | | | 892,594 | | | | | 928,495 | |
Net Assets, End of Period | | | $ | 74,656 | | | | $ | 85,136 | | | | $ | 114,259 | | | | $ | 117,427 | | | | $ | 860,471 | | | | $ | 892,594 | |
Undistributed net investment income | | | $ | 680 | | | | $ | 1,179 | | | | $ | 806 | | | | $ | 1,306 | | | | $ | 6,699 | | | | $ | 11,260 | |
| | | |
| | | Pathfinder Moderately
Aggressive | | Pathfinder Moderately
Conservative | | Pathfinder Moderate -
Managed Volatility |
| (In thousands) | | Year ended
12-31-16 | | Year ended
12-31-15 | | Year ended
12-31-16 | | Year ended
12-31-15 | | Year ended
12-31-16 | | Year ended
12-31-15 |
INCREASE (DECREASE) IN NET ASSETS | | | | | | | | | | | | | | | | | | | | | | | | | | | | | | |
Operations: | | | | | | | | | | | | | | | | | | | | | | | | | | | | | | |
Net investment income | | | $ | 8,678 | | | | $ | 16,512 | | | | $ | 2,098 | | | | $ | 3,420 | | | | $ | 2,502 | | | | $ | 2,609 | |
Net realized gain on investments | | | | 62,724 | | | | | 90,384 | | | | | 12,174 | | | | | 19,158 | | | | | 15,131 | | | | | 15,146 | |
Net change in unrealized depreciation | | | | (26,765 | ) | | | | (105,515 | ) | | | | (6,375 | ) | | | | (21,368 | ) | | | | (6,456 | ) | | | | (22,003 | ) |
Net Increase (Decrease) in Net Assets Resulting from Operations | | | | 44,637 | | | | | 1,381 | | | | | 7,897 | | | | | 1,210 | | | | | 11,177 | | | | | (4,248 | ) |
| | | | | | |
Distributions to Shareholders From: | | | | | | | | | | | | | | | | | | | | | | | | | | | | | | |
Net investment income | | | | (16,506 | ) | | | | (25,209 | ) | | | | (3,418 | ) | | | | (4,238 | ) | | | | (2,612 | ) | | | | — | |
Net realized gains | | | | (90,370 | ) | | | | (92,919 | ) | | | | (19,162 | ) | | | | (22,167 | ) | | | | (15,290 | ) | | | | — | |
Total Distributions to Shareholders | | | | (106,876 | ) | | | | (118,128 | ) | | | | (22,580 | ) | | | | (26,405 | ) | | | | (17,902 | ) | | | | — | |
Capital Share Transactions | | | | 27,683 | | | | | 73,240 | | | | | 4,041 | | | | | 5,539 | | | | | 122,582 | | | | | 196,636 | |
Net Increase (Decrease) in Net Assets | | | | (34,556 | ) | | | | (43,507 | ) | | | | (10,642 | ) | | | | (19,656 | ) | | | | 115,857 | | | | | 192,388 | |
Net Assets, Beginning of Period | | | | 1,054,425 | | | | | 1,097,932 | | | | | 271,692 | | | | | 291,348 | | | | | 395,500 | | | | | 203,112 | |
Net Assets, End of Period | | | $ | 1,019,869 | | | | $ | 1,054,425 | | | | $ | 261,050 | | | | $ | 271,692 | | | | $ | 511,357 | | | | $ | 395,500 | |
Undistributed net investment income | | | $ | 8,633 | | | | $ | 16,461 | | | | $ | 2,084 | | | | $ | 3,404 | | | | $ | 2,473 | | | | $ | 2,583 | |
See Accompanying Notes to Financial Statements.
| | |
| STATEMENTS OF CHANGES IN NET ASSETS | | IVY VIP |
| | | | | | | | | | | | | | | | | | | | | | | | | | | | | | |
| | | Pathfinder Moderately
Aggressive - Managed
Volatility | | Pathfinder Moderately
Conservative - Managed
Volatility | | Asset Strategy(1) |
| (In thousands) | | Year ended
12-31-16 | | Year ended
12-31-15 | | Year ended
12-31-16 | | Year ended
12-31-15 | | Year ended
12-31-16 | | Year ended
12-31-15 |
INCREASE (DECREASE) IN NET ASSETS | | | | | | | | | | | | | | | | | | | | | | | | | | | | | | |
Operations: | | | | | | | | | | | | | | | | | | | | | | | | | | | | | | |
Net investment income | | | $ | 389 | | | | $ | 625 | | | | $ | 300 | | | | $ | 323 | | | | $ | 7,634 | | | | $ | 11,864 | |
Net realized gain (loss) on investments | | | | 2,521 | | | | | 3,401 | | | | | 1,538 | | | | | 1,804 | | | | | (7,078 | ) | | | | (67,184 | ) |
Net change in unrealized depreciation | | | | (1,038 | ) | | | | (4,904 | ) | | | | (876 | ) | | | | (2,659 | ) | | | | (34,070 | ) | | | | (65,940 | ) |
Net Increase (Decrease) in Net Assets Resulting from Operations | | | | 1,872 | | | | | (878 | ) | | | | 962 | | | | | (532 | ) | | | | (33,514 | ) | | | | (121,260 | ) |
| | | | | | |
Distributions to Shareholders From: | | | | | | | | | | | | | | | | | | | | | | | | | | | | | | |
Net investment income | | | | (624 | ) | | | | — | | | | | (322 | ) | | | | — | | | | | (6,389 | ) | | | | (5,385 | ) |
Net realized gains | | | | (3,420 | ) | | | | — | | | | | (1,837 | ) | | | | (102 | ) | | | | — | | | | | (258,552 | ) |
Total Distributions to Shareholders | | | | (4,044 | ) | | | | — | | | | | (2,159 | ) | | | | (102 | ) | | | | (6,389 | ) | | | | (263,937 | ) |
Capital Share Transactions | | | | 12,862 | | | | | 24,847 | | | | | 14,530 | | | | | 23,315 | | | | | (274,863 | ) | | | | 53,860 | |
Net Increase (Decrease) in Net Assets | | | | 10,690 | | | | | 23,969 | | | | | 13,333 | | | | | 22,681 | | | | | (314,766 | ) | | | | (331,337 | ) |
Net Assets, Beginning of Period | | | | 66,860 | | | | | 42,891 | | | | | 53,785 | | | | | 31,104 | | | | | 1,268,266 | | | | | 1,599,603 | |
Net Assets, End of Period | | | $ | 77,550 | | | | $ | 66,860 | | | | $ | 67,118 | | | | $ | 53,785 | | | | $ | 953,500 | | | | $ | 1,268,266 | |
Undistributed net investment income | | | $ | 365 | | | | $ | 600 | | | | $ | 276 | | | | $ | 298 | | | | $ | 25,287 | | | | $ | 24,012 | |
| | | |
| | | Balanced | | Bond | | Core Equity |
| (In thousands) | | Year ended
12-31-16 | | Year ended
12-31-15 | | Year ended
12-31-16 | | Year ended
12-31-15 | | Year ended
12-31-16 | | Year ended
12-31-15 |
INCREASE (DECREASE) IN NET ASSETS | | | | | | | | | | | | | | | | | | | | | | | | | | | | | | |
Operations: | | | | | | | | | | | | | | | | | | | | | | | | | | | | | | |
Net investment income | | | $ | 5,620 | | | | $ | 5,164 | | | | $ | 6,067 | | | | $ | 5,615 | | | | $ | 1,906 | | | | $ | 1,829 | |
Net realized gain on investments | | | | 10,202 | | | | | 54,582 | | | | | 3,730 | | | | | 3,195 | | | | | 17,184 | | | | | 51,913 | |
Net change in unrealized appreciation (depreciation) | | | | (8,778 | ) | | | | (60,752 | ) | | | | 2,129 | | | | | (8,039 | ) | | | | (3,912 | ) | | | | (56,495 | ) |
Net Increase (Decrease) in Net Assets Resulting from Operations | | | | 7,044 | | | | | (1,006 | ) | | | | 11,926 | | | | | 771 | | | | | 15,178 | | | | | (2,753 | ) |
| | | | | | |
Distributions to Shareholders From: | | | | | | | | | | | | | | | | | | | | | | | | | | | | | | |
Net investment income | | | | (5,061 | ) | | | | (3,687 | ) | | | | (6,593 | ) | | | | (8,715 | ) | | | | (1,938 | ) | | | | (1,727 | ) |
Net realized gains | | | | (54,663 | ) | | | | (54,222 | ) | | | | (742 | ) | | | | — | | | | | (51,884 | ) | | | | (80,819 | ) |
Total Distributions to Shareholders | | | | (59,724 | ) | | | | (57,909 | ) | | | | (7,335 | ) | | | | (8,715 | ) | | | | (53,822 | ) | | | | (82,546 | ) |
Capital Share Transactions | | | | 30,463 | | | | | 27,469 | | | | | 131,419 | | | | | (21,808 | ) | | | | 4,387 | | | | | 33,897 | |
Net Increase (Decrease) in Net Assets | | | | (22,217 | ) | | | | (31,446 | ) | | | | 136,010 | | | | | (29,752 | ) | | | | (34,257 | ) | | | | (51,402 | ) |
Net Assets, Beginning of Period | | | | 383,242 | | | | | 414,688 | | | | | 279,800 | | | | | 309,552 | | | | | 453,939 | | | | | 505,341 | |
Net Assets, End of Period | | | $ | 361,025 | | | | $ | 383,242 | | | | $ | 415,810 | | | | $ | 279,800 | | | | $ | 419,682 | | | | $ | 453,939 | |
Undistributed net investment income | | | $ | 4,105 | | | | $ | 5,159 | | | | $ | 6,728 | | | | $ | 6,515 | | | | $ | 1,752 | | | | $ | 787 | |
| (1) | Consolidated Statements of Changes in Net Assets (See Note 6 in Notes to Financial Statements). |
See Accompanying Notes to Financial Statements.
| | |
| STATEMENTS OF CHANGES IN NET ASSETS | | IVY VIP |
| | | | | | | | | | | | | | | | | | | | | | | | | | | | | | |
| | | Dividend Opportunities | | Energy | | Global Bond |
| (In thousands) | | Year ended
12-31-16 | | Year ended
12-31-15 | | Year ended
12-31-16 | | Year ended
12-31-15 | | Year ended
12-31-16 | | Year ended
12-31-15 |
INCREASE (DECREASE) IN NET ASSETS | | | | | | | | | | | | | | | | | | | | | | | | | | | | | | |
Operations: | | | | | | | | | | | | | | | | | | | | | | | | | | | | | | |
Net investment income (loss) | | | $ | 7,172 | | | | $ | 5,832 | | | | $ | (400 | ) | | | $ | 100 | | | | $ | 687 | | | | $ | 741 | |
Net realized gain (loss) on investments | | | | 14,577 | | | | | 30,204 | | | | | (6,613 | ) | | | | (10,628 | ) | | | | (228 | ) | | | | (730 | ) |
Net change in unrealized appreciation (depreciation) | | | | 12,700 | | | | | (46,306 | ) | | | | 54,012 | | | | | (21,184 | ) | | | | 951 | | | | | (560 | ) |
Net Increase (Decrease) in Net Assets Resulting from Operations | | | | 34,449 | | | | | (10,270 | ) | | | | 46,999 | | | | | (31,712 | ) | | | | 1,410 | | | | | (549 | ) |
| | | | | | |
Distributions to Shareholders From: | | | | | | | | | | | | | | | | | | | | | | | | | | | | | | |
Net investment income | | | | (6,264 | ) | | | | (6,503 | ) | | | | (203 | ) | | | | (72 | ) | | | | (731 | ) | | | | (701 | ) |
Net realized gains | | | | (28,123 | ) | | | | (55,662 | ) | | | | — | | | | | (654 | ) | | | | — | | | | | — | |
Total Distributions to Shareholders | | | | (34,387 | ) | | | | (62,165 | ) | | | | (203 | ) | | | | (726 | ) | | | | (731 | ) | | | | (701 | ) |
Capital Share Transactions | | | | (5,250 | ) | | | | 75,723 | | | | | 32,142 | | | | | 31,630 | | | | | 1,405 | | | | | 1,843 | |
Net Increase (Decrease) in Net Assets | | | | (5,188 | ) | | | | 3,288 | | | | | 78,938 | | | | | (808 | ) | | | | 2,084 | | | | | 593 | |
Net Assets, Beginning of Period | | | | 514,512 | | | | | 511,224 | | | | | 117,159 | | | | | 117,967 | | | | | 19,872 | | | | | 19,279 | |
Net Assets, End of Period | | | $ | 509,324 | | | | $ | 514,512 | | | | $ | 196,097 | | | | $ | 117,159 | | | | $ | 21,956 | | | | $ | 19,872 | |
Undistributed net investment income | | | $ | 6,063 | | | | $ | 6,176 | | | | $ | 165 | | | | $ | 82 | | | | $ | 625 | | | | $ | 725 | |
| | | |
| | | Global Growth | | Global Natural Resources | | Government Money Market(1) |
| (In thousands) | | Year ended
12-31-16 | | Year ended
12-31-15 | | Year ended
12-31-16 | | Year ended
12-31-15 | | Year ended
12-31-16 | | Year ended
12-31-15 |
INCREASE (DECREASE) IN NET ASSETS | | | | | | | | | | | | | | | | | | | | | | | | | | | | | | |
Operations: | | | | | | | | | | | | | | | | | | | | | | | | | | | | | | |
Net investment income | | | $ | 402 | | | | $ | 1,122 | | | | $ | 255 | | | | $ | 749 | | | | $ | 682 | | | | $ | 107 | |
Net realized gain (loss) on investments | | | | 10,709 | | | | | 15,626 | | | | | (9,426 | ) | | | | (12,647 | ) | | | | 24 | | | | | 14 | |
Net change in unrealized appreciation (depreciation) | | | | (24,761 | ) | | | | (2,978 | ) | | | | 36,762 | | | | | (20,514 | ) | | | | — | | | | | — | |
Net Increase (Decrease) in Net Assets Resulting from Operations | | | | (13,650 | ) | | | | 13,770 | | | | | 27,591 | | | | | (32,412 | ) | | | | 706 | | | | | 121 | |
| | | | | | |
Distributions to Shareholders From: | | | | | | | | | | | | | | | | | | | | | | | | | | | | | | |
Net investment income | | | | (1,039 | ) | | | | (2,105 | ) | | | | (875 | ) | | | | (137 | ) | | | | (682 | ) | | | | (107 | ) |
Net realized gains | | | | (14,220 | ) | | | | (24,394 | ) | | | | — | | | | | — | | | | | (17 | ) | | | | — | |
Total Distributions to Shareholders | | | | (15,259 | ) | | | | (26,499 | ) | | | | (875 | ) | | | | (137 | ) | | | | (699 | ) | | | | (107 | ) |
Capital Share Transactions | | | | (69,429 | ) | | | | 87,875 | | | | | 3,534 | | | | | 806 | | | | | (125,479 | ) | | | | 27,804 | |
Net Increase (Decrease) in Net Assets | | | | (98,338 | ) | | | | 75,146 | | | | | 30,250 | | | | | (31,743 | ) | | | | (125,472 | ) | | | | 27,818 | |
Net Assets, Beginning of Period | | | | 506,609 | | | | | 431,463 | | | | | 113,939 | | | | | 145,682 | | | | | 539,342 | | | | | 511,524 | |
Net Assets, End of Period | | | $ | 408,271 | | | | $ | 506,609 | | | | $ | 144,189 | | | | $ | 113,939 | | | | $ | 413,870 | | | | $ | 539,342 | |
Undistributed net investment income | | | $ | 153 | | | | $ | 984 | | | | $ | 121 | | | | $ | 803 | | | | $ | — | | | | $ | — | |
| (1) | Effective October 14, 2016, the Portfolio’s name changed from Money Market to Government Money Market. |
See Accompanying Notes to Financial Statements.
| | |
| STATEMENTS OF CHANGES IN NET ASSETS | | IVY VIP |
| | | | | | | | | | | | | | | | | | | | | | | | | | | | | | |
| | | Growth | | High Income | | International Core Equity |
| (In thousands) | | Year ended
12-31-16 | | Year ended
12-31-15 | | Year ended
12-31-16 | | Year ended
12-31-15 | | Year ended
12-31-16 | | Year ended
12-31-15 |
INCREASE (DECREASE) IN NET ASSETS | | | | | | | | | | | | | | | | | | | | | | | | | | | | | | |
Operations: | | | | | | | | | | | | | | | | | | | | | | | | | | | | | | |
Net investment income | | | $ | 2,224 | | | | $ | 219 | | | | $ | 54,036 | | | | $ | 57,486 | | | | $ | 10,454 | | | | $ | 8,183 | |
Net realized gain (loss) on investments | | | | 79,242 | | | | | 89,855 | | | | | (28,876 | ) | | | | (22,456 | ) | | | | (9,231 | ) | | | | 9,958 | |
Net change in unrealized appreciation (depreciation) | | | | (72,102 | ) | | | | (28,957 | ) | | | | 91,565 | | | | | (86,526 | ) | | | | 6,040 | | | | | (28,472 | ) |
Net Increase (Decrease) in Net Assets Resulting from Operations | | | | 9,364 | | | | | 61,117 | | | | | 116,725 | | | | | (51,496 | ) | | | | 7,263 | | | | | (10,331 | ) |
| | | | | | |
Distributions to Shareholders From: | | | | | | | | | | | | | | | | | | | | | | | | | | | | | | |
Net investment income | | | | (205 | ) | | | | (949 | ) | | | | (56,542 | ) | | | | (51,203 | ) | | | | (8,905 | ) | | | | (8,590 | ) |
Net realized gains | | | | (89,838 | ) | | | | (104,978 | ) | | | | — | | | | | (8,693 | ) | | | | (7,190 | ) | | | | (84,858 | ) |
Total Distributions to Shareholders | | | | (90,043 | ) | | | | (105,927 | ) | | | | (56,542 | ) | | | | (59,896 | ) | | | | (16,095 | ) | | | | (93,448 | ) |
Capital Share Transactions | | | | 19,184 | | | | | 70,362 | | | | | 59,537 | | | | | 18,446 | | | | | 70,237 | | | | | 122,044 | |
Net Increase (Decrease) in Net Assets | | | | (61,495 | ) | | | | 25,552 | | | | | 119,720 | | | | | (92,946 | ) | | | | 61,405 | | | | | 18,265 | |
Net Assets, Beginning of Period | | | | 896,907 | | | | | 871,355 | | | | | 725,499 | | | | | 818,445 | | | | | 674,638 | | | | | 656,373 | |
Net Assets, End of Period | | | $ | 835,412 | | | | $ | 896,907 | | | | $ | 845,219 | | | | $ | 725,499 | | | | $ | 736,043 | | | | $ | 674,638 | |
Undistributed (distributions in excess of) net investment income | | | $ | 1,996 | | | | $ | (23 | ) | | | $ | 53,976 | | | | $ | 56,511 | | | | $ | 10,431 | | | | $ | 8,809 | |
| | | |
| | | Limited-Term Bond | | Micro Cap Growth | | Mid Cap Growth |
| (In thousands) | | Year ended
12-31-16 | | Year ended
12-31-15 | | Year ended
12-31-16 | | Year ended
12-31-15 | | Year ended
12-31-16 | | Year ended
12-31-15 |
INCREASE (DECREASE) IN NET ASSETS | | | | | | | | | | | | | | | | | | | | | | | | | | | | | | |
Operations: | | | | | | | | | | | | | | | | | | | | | | | | | | | | | | |
Net investment income (loss) | | | $ | 5,948 | | | | $ | 5,550 | | | | $ | (574 | ) | | | $ | (740 | ) | | | $ | (538 | ) | | | $ | (397 | ) |
Net realized gain (loss) on investments | | | | 1,731 | | | | | 988 | | | | | (102 | ) | | | | 6,307 | | | | | 19,722 | | | | | 33,638 | |
Net change in unrealized appreciation (depreciation) | | | | (285 | ) | | | | (2,394 | ) | | | | 8,208 | | | | | (11,508 | ) | | | | 18,184 | | | | | (68,573 | ) |
Net Increase (Decrease) in Net Assets Resulting from Operations | | | | 7,394 | | | | | 4,144 | | | | | 7,532 | | | | | (5,941 | ) | | | | 37,368 | | | | | (35,332 | ) |
| | | | | | |
Distributions to Shareholders From: | | | | | | | | | | | | | | | | | | | | | | | | | | | | | | |
Net investment income | | | | (5,755 | ) | | | | (6,695 | ) | | | | — | | | | | — | | | | | — | | | | | — | |
Net realized gains | | | | — | | | | | — | | | | | (6,098 | ) | | | | (10,594 | ) | | | | (32,997 | ) | | | | (46,460 | ) |
Total Distributions to Shareholders | | | | (5,755 | ) | | | | (6,695 | ) | | | | (6,098 | ) | | | | (10,594 | ) | | | | (32,997 | ) | | | | (46,460 | ) |
Capital Share Transactions | | | | 8,372 | | | | | (87,130 | ) | | | | 2,645 | | | | | 3,776 | | | | | 24,626 | | | | | 111,257 | |
Net Increase (Decrease) in Net Assets | | | | 10,011 | | | | | (89,681 | ) | | | | 4,079 | | | | | (12,759 | ) | | | | 28,997 | | | | | 29,465 | |
Net Assets, Beginning of Period | | | | 384,756 | | | | | 474,437 | | | | | 58,897 | | | | | 71,656 | | | | | 586,446 | | | | | 556,981 | |
Net Assets, End of Period | | | $ | 394,767 | | | | $ | 384,756 | | | | $ | 62,976 | | | | $ | 58,897 | | | | $ | 615,443 | | | | $ | 586,446 | |
Undistributed (distributions in excess of) net investment income | | | $ | 6,252 | | | | $ | 5,735 | | | | $ | (7 | ) | | | $ | 8 | | | | $ | (21 | ) | | | $ | (65 | ) |
See Accompanying Notes to Financial Statements.
| | |
| STATEMENTS OF CHANGES IN NET ASSETS | | IVY VIP |
| | | | | | | | | | | | | | | | | | | | | | | | | | | | | | |
| | | Real Estate Securities | | Science and Technology | | Small Cap Growth |
| (In thousands) | | Year ended
12-31-16 | | Year ended
12-31-15 | | Year ended
12-31-16 | | Year ended
12-31-15 | | Year ended
12-31-16 | | Year ended
12-31-15 |
INCREASE (DECREASE) IN NET ASSETS | | | | | | | | | | | | | | | | | | | | | | | | | | | | | | |
Operations: | | | | | | | | | | | | | | | | | | | | | | | | | | | | | | |
Net investment income (loss) | | | $ | 607 | | | | $ | 550 | | | | $ | (2,736 | ) | | | $ | (3,618 | ) | | | $ | (3,274 | ) | | | $ | (3,414 | ) |
Net realized gain on investments | | | | 5,605 | | | | | 4,304 | | | | | 27,854 | | | | | 22,858 | | | | | 10,188 | | | | | 45,756 | |
Net change in unrealized appreciation (depreciation) | | | | (4,351 | ) | | | | (2,654 | ) | | | | (21,271 | ) | | | | (37,682 | ) | | | | 6,843 | | | | | (34,254 | ) |
Net Increase (Decrease) in Net Assets Resulting from Operations | | | | 1,861 | | | | | 2,200 | | | | | 3,847 | | | | | (18,442 | ) | | | | 13,757 | | | | | 8,088 | |
| | | | | | |
Distributions to Shareholders From: | | | | | | | | | | | | | | | | | | | | | | | | | | | | | | |
Net investment income | | | | (516 | ) | | | | (518 | ) | | | | — | | | | | — | | | | | — | | | | | — | |
Net realized gains | | | | (4,360 | ) | | | | (4,943 | ) | | | | (20,982 | ) | | | | (34,801 | ) | | | | (45,145 | ) | | | | (66,812 | ) |
Total Distributions to Shareholders | | | | (4,876 | ) | | | | (5,461 | ) | | | | (20,982 | ) | | | | (34,801 | ) | | | | (45,145 | ) | | | | (66,812 | ) |
Capital Share Transactions | | | | 4,399 | | | | | (1,585 | ) | | | | (50,693 | ) | | | | 49,502 | | | | | 27,620 | | | | | 62,775 | |
Net Increase (Decrease) in Net Assets | | | | 1,384 | | | | | (4,846 | ) | | | | (67,828 | ) | | | | (3,741 | ) | | | | (3,768 | ) | | | | 4,051 | |
Net Assets, Beginning of Period | | | | 47,434 | | | | | 52,280 | | | | | 582,288 | | | | | 586,029 | | | | | 429,616 | | | | | 425,565 | |
Net Assets, End of Period | | | $ | 48,818 | | | | $ | 47,434 | | | | $ | 514,460 | | | | $ | 582,288 | | | | $ | 425,848 | | | | $ | 429,616 | |
Undistributed (distributions in excess of) net investment income | | | $ | 717 | | | | $ | 626 | | | | $ | (14 | ) | | | $ | 110 | | | | $ | 372 | | | | $ | (92 | ) |
| | | |
| | | Small Cap Value | | Value | | |
| (In thousands) | | Year ended
12-31-16 | | Year ended
12-31-15 | | Year ended
12-31-16 | | Year ended
12-31-15 | | | | |
INCREASE (DECREASE) IN NET ASSETS | | | | | | | | | | | | | | | | | | | | | | | | | | | | | | |
Operations: | | | | | | | | | | | | | | | | | | | | | | | | | | | | | | |
Net investment income | | | $ | 261 | | | | $ | 893 | | | | $ | 5,135 | | | | $ | 3,649 | | | | | | | | | | | |
Net realized gain on investments | | | | 38,909 | | | | | 27,471 | | | | | 6,886 | | | | | 41,111 | | | | | | | | | | | |
Net change in unrealized appreciation (depreciation) | | | | 46,578 | | | | | (47,149 | ) | | | | 28,308 | | | | | (60,576 | ) | | | | | | | | | | |
Net Increase (Decrease) in Net Assets Resulting from Operations | | | | 85,748 | | | | | (18,785 | ) | | | | 40,329 | | | | | (15,816 | ) | | | | | | | | | | |
| | | | | | |
Distributions to Shareholders From: | | | | | | | | | | | | | | | | | | | | | | | | | | | | | | |
Net investment income | | | | (1,333 | ) | | | | (294 | ) | | | | (4,581 | ) | | | | (3,133 | ) | | | | | | | | | | |
Net realized gains | | | | (28,403 | ) | | | | (26,881 | ) | | | | (44,339 | ) | | | | (52,275 | ) | | | | | | | | | | |
Total Distributions to Shareholders | | | | (29,736 | ) | | | | (27,175 | ) | | | | (48,920 | ) | | | | (55,408 | ) | | | | | | | | | | |
Capital Share Transactions | | | | (25,336 | ) | | | | 9,878 | | | | | 3,755 | | | | | 39,099 | | | | | | | | | | | |
Net Increase (Decrease) in Net Assets | | | | 30,675 | | | | | (36,082 | ) | | | | (4,836 | ) | | | | (32,125 | ) | | | | | | | | | | |
Net Assets, Beginning of Period | | | | 317,656 | | | | | 353,738 | | | | | 384,068 | | | | | 416,193 | | | | | | | | | | | |
Net Assets, End of Period | | | $ | 348,332 | | | | $ | 317,656 | | | | $ | 379,232 | | | | $ | 384,068 | | | | | | | | | | | |
Undistributed (distributions in excess of) net investment income | | | $ | 347 | | | | $ | 259 | | | | $ | 4,813 | | | | $ | (49 | ) | | | | | | | | | | |
See Accompanying Notes to Financial Statements.
| | |
| FINANCIAL HIGHLIGHTS | | IVY VIP |
FOR A SHARE OF CAPITAL STOCK OUTSTANDING THROUGHOUT EACH PERIOD
| | | | | | | | | | | | | | | | | | | | | | | | | | | | | | | | | | | |
| | | Net Asset
Value,
Beginning of
Period | | Net
Investment
Income
(Loss)(1) | | Net Realized
and Unrealized
Gain (Loss) on
Investments | | Total from
Investment
Operations | | Distributions
From Net
Investment
Income | | Distributions
From Net
Realized
Gains | | Total
Distributions |
Pathfinder Aggressive | | | | | | | | | | | | | | | | | | | | | | | | | | | | | | | | | | | |
Year ended 12-31-2016 | | | $ | 5.05 | | | | $ | 0.04 | | | | $ | 0.15 | | | | $ | 0.19 | | | | $ | (0.07 | ) | | | $ | (0.49 | ) | | | $ | (0.56 | ) |
Year ended 12-31-2015 | | | | 5.73 | | | | | 0.07 | | | | | (0.01 | ) | | | | 0.06 | | | | | (0.16 | ) | | | | (0.58 | ) | | | | (0.74 | ) |
Year ended 12-31-2014 | | | | 5.95 | | | | | 0.16 | | | | | 0.10 | | | | | 0.26 | | | | | (0.05 | ) | | | | (0.43 | ) | | | | (0.48 | ) |
Year ended 12-31-2013 | | | | 5.04 | | | | | 0.05 | | | | | 1.27 | | | | | 1.32 | | | | | (0.07 | ) | | | | (0.34 | ) | | | | (0.41 | ) |
Year ended 12-31-2012 | | | | 4.77 | | | | | 0.07 | | | | | 0.48 | | | | | 0.55 | | | | | (0.05 | ) | | | | (0.23 | ) | | | | (0.28 | ) |
| | | | | | | |
Pathfinder Conservative | | | | | | | | | | | | | | | | | | | | | | | | | | | | | | | | | | | |
Year ended 12-31-2016 | | | | 5.15 | | | | | 0.04 | | | | | 0.09 | | | | | 0.13 | | | | | (0.06 | ) | | | | (0.32 | ) | | | | (0.38 | ) |
Year ended 12-31-2015 | | | | 5.54 | | | | | 0.06 | | | | | (0.03 | ) | | | | 0.03 | | | | | (0.06 | ) | | | | (0.36 | ) | | | | (0.42 | ) |
Year ended 12-31-2014 | | | | 5.77 | | | | | 0.06 | | | | | 0.12 | | | | | 0.18 | | | | | (0.06 | ) | | | | (0.35 | ) | | | | (0.41 | ) |
Year ended 12-31-2013 | | | | 5.33 | | | | | 0.06 | | | | | 0.70 | | | | | 0.76 | | | | | (0.08 | ) | | | | (0.24 | ) | | | | (0.32 | ) |
Year ended 12-31-2012 | | | | 5.18 | | | | | 0.08 | | | | | 0.27 | | | | | 0.35 | | | | | (0.05 | ) | | | | (0.15 | ) | | | | (0.20 | ) |
| | | | | | | |
Pathfinder Moderate | | | | | | | | | | | | | | | | | | | | | | | | | | | | | | | | | | | |
Year ended 12-31-2016 | | | | 5.34 | | | | | 0.04 | | | | | 0.13 | | | | | 0.17 | | | | | (0.07 | ) | | | | (0.42 | ) | | | | (0.49 | ) |
Year ended 12-31-2015 | | | | 5.87 | | | | | 0.07 | | | | | (0.02 | ) | | | | 0.05 | | | | | (0.10 | ) | | | | (0.48 | ) | | | | (0.58 | ) |
Year ended 12-31-2014 | | | | 6.14 | | | | | 0.10 | | | | | 0.14 | | | | | 0.24 | | | | | (0.07 | ) | | | | (0.44 | ) | | | | (0.51 | ) |
Year ended 12-31-2013 | | | | 5.33 | | | | | 0.07 | | | | | 1.02 | | | | | 1.09 | | | | | (0.07 | ) | | | | (0.21 | ) | | | | (0.28 | ) |
Year ended 12-31-2012 | | | | 5.06 | | | | | 0.07 | | | | | 0.40 | | | | | 0.47 | | | | | (0.05 | ) | | | | (0.15 | ) | | | | (0.20 | ) |
| | | | | | | |
Pathfinder Moderately Aggressive | | | | | | | | | | | | | | | | | | | | | | | | | | | | | | | | | | | |
Year ended 12-31-2016 | | | | 5.50 | | | | | 0.04 | | | | | 0.17 | | | | | 0.21 | | | | | (0.09 | ) | | | | (0.48 | ) | | | | (0.57 | ) |
Year ended 12-31-2015 | | | | 6.14 | | | | | 0.09 | | | | | (0.06 | ) | | | | 0.03 | | | | | (0.14 | ) | | | | (0.53 | ) | | | | (0.67 | ) |
Year ended 12-31-2014 | | | | 6.38 | | | | | 0.14 | | | | | 0.14 | | | | | 0.28 | | | | | (0.07 | ) | | | | (0.45 | ) | | | | (0.52 | ) |
Year ended 12-31-2013 | | | | 5.45 | | | | | 0.07 | | | | | 1.19 | | | | | 1.26 | | | | | (0.07 | ) | | | | (0.26 | ) | | | | (0.33 | ) |
Year ended 12-31-2012 | | | | 5.09 | | | | | 0.08 | | | | | 0.46 | | | | | 0.54 | | | | | (0.04 | ) | | | | (0.14 | ) | | | | (0.18 | ) |
| | | | | | | |
Pathfinder Moderately Conservative | | | | | | | | | | | | | | | | | | | | | | | | | | | | | | | | | | | |
Year ended 12-31-2016 | | | | 5.30 | | | | | 0.04 | | | | | 0.10 | | | | | 0.14 | | | | | (0.07 | ) | | | | (0.38 | ) | | | | (0.45 | ) |
Year ended 12-31-2015 | | | | 5.80 | | | | | 0.07 | | | | | (0.03 | ) | | | | 0.04 | | | | | (0.09 | ) | | | | (0.45 | ) | | | | (0.54 | ) |
Year ended 12-31-2014 | | | | 6.03 | | | | | 0.08 | | | | | 0.14 | | | | | 0.22 | | | | | (0.06 | ) | | | | (0.39 | ) | | | | (0.45 | ) |
Year ended 12-31-2013 | | | | 5.41 | | | | | 0.06 | | | | | 0.87 | | | | | 0.93 | | | | | (0.08 | ) | | | | (0.23 | ) | | | | (0.31 | ) |
Year ended 12-31-2012 | | | | 5.19 | | | | | 0.08 | | | | | 0.34 | | | | | 0.42 | | | | | (0.05 | ) | | | | (0.15 | ) | | | | (0.20 | ) |
| | | | | | | |
Pathfinder Moderate – Managed Volatility | | | | | | | | | | | | | | | | | | | | | | | | | | | | | | | | | | | |
Year ended 12-31-2016 | | | | 5.37 | | | | | 0.03 | | | | | 0.06 | | | | | 0.09 | | | | | (0.03 | ) | | | | (0.18 | ) | | | | (0.21 | ) |
Year ended 12-31-2015 | | | | 5.39 | | | | | 0.05 | | | | | (0.07 | ) | | | | (0.02 | ) | | | | — | | | | | — | | | | | — | |
Year ended 12-31-2014 | | | | 5.37 | | | | | 0.06 | | | | | 0.14 | | | | | 0.20 | | | | | (0.03 | ) | | | | (0.15 | ) | | | | (0.18 | ) |
Year ended 12-31-2013(3) | | | | 5.00 | | | | | (0.01 | ) | | | | 0.38 | | | | | 0.37 | | | | | — | | | | | — | * | | | | — | * |
| | | | | |
Pathfinder Moderately Aggressive – Managed Volatility | | | | | | | | | | | | | | | | | | | | | | | | | | |
Year ended 12-31-2016 | | | | 5.25 | | | | | 0.03 | | | | | 0.09 | | | | | 0.12 | | | | | (0.05 | ) | | | | (0.26 | ) | | | | (0.31 | ) |
Year ended 12-31-2015 | | | | 5.29 | | | | | 0.06 | | | | | (0.10 | ) | | | | (0.04 | ) | | | | — | | | | | — | | | | | — | |
Year ended 12-31-2014 | | | | 5.41 | | | | | 0.09 | | | | | 0.11 | | | | | 0.20 | | | | | (0.07 | ) | | | | (0.25 | ) | | | | (0.32 | ) |
Year ended 12-31-2013(3) | | | | 5.00 | | | | | (0.02 | ) | | | | 0.43 | | | | | 0.41 | | | | | — | | | | | — | * | | | | — | * |
| | | | | |
Pathfinder Moderately Conservative – Managed Volatility | | | | | | | | | | | | | | | | | | | | | | | | | | |
Year ended 12-31-2016 | | | | 5.23 | | | | | 0.02 | | | | | 0.04 | | | | | 0.06 | | | | | (0.03 | ) | | | | (0.16 | ) | | | | (0.19 | ) |
Year ended 12-31-2015 | | | | 5.27 | | | | | 0.04 | | | | | (0.07 | ) | | | | (0.03 | ) | | | | — | | | | | (0.01 | ) | | | | (0.01 | ) |
Year ended 12-31-2014 | | | | 5.31 | | | | | 0.04 | | | | | 0.11 | | | | | 0.15 | | | | | (0.03 | ) | | | | (0.16 | ) | | | | (0.19 | ) |
Year ended 12-31-2013(3) | | | | 5.00 | | | | | (0.02 | ) | | | | 0.33 | | | | | 0.31 | | | | | — | | | | | — | * | | | | — | * |
| | * | Not shown due to rounding. |
| (1) | Based on average weekly shares outstanding. |
| (2) | Based on net asset value. Total returns do not reflect a sales charge or contingent deferred sales charge, if applicable. Total returns for periods less than one year are not annualized. |
| (3) | For the period from August 1, 2013 (commencement of operations of the Portfolio) through December 31, 2013. |
| (5) | Ratios of expenses to average net assets excluding offering cost was 0.26%. |
| (6) | Ratios of expenses to average net assets excluding offering cost was 0.29%. |
| (7) | Ratios of expenses to average net assets excluding offering cost was 0.33%. |
| (8) | Ratios of expenses to average net assets excluding offering cost was 0.36%. |
| (9) | Ratios of expenses to average net assets excluding offering cost was 0.35%. |
| | | | | | | | | | | | | | | | | | | | | | | | | | | | | | |
| | | Net Asset
Value, End of Period | | Total
Return(2) | | Net Assets,
End of Period
(in millions) | | Ratio of
Expenses to
Average Net
Assets | | Ratio of Net
Investment
Income
(Loss) to
Average
Net Assets | | Portfolio
Turnover
Rate |
Pathfinder Aggressive | |
Year ended 12-31-2016 | | | $ | 4.68 | | | | | 4.80 | % | | | $ | 75 | | | | | 0.08 | % | | | | 0.88 | % | | | | 23 | % |
Year ended 12-31-2015 | | | | 5.05 | | | | | 0.34 | | | | | 85 | | | | | 0.07 | | | | | 1.36 | | | | | 13 | |
Year ended 12-31-2014 | | | | 5.73 | | | | | 4.86 | | | | | 85 | | | | | 0.07 | | | | | 2.73 | | | | | 28 | |
Year ended 12-31-2013 | | | | 5.95 | | | | | 27.13 | | | | | 86 | | | | | 0.07 | | | | | 0.96 | | | | | 38 | |
Year ended 12-31-2012 | | | | 5.04 | | | | | 12.18 | | | | | 69 | | | | | 0.08 | | | | | 1.41 | | | | | 38 | |
|
Pathfinder Conservative | |
Year ended 12-31-2016 | | | | 4.90 | | | | | 2.84 | | | | | 114 | | | | | 0.07 | | | | | 0.71 | | | | | 26 | |
Year ended 12-31-2015 | | | | 5.15 | | | | | 0.45 | | | | | 117 | | | | | 0.06 | | | | | 1.09 | | | | | 17 | |
Year ended 12-31-2014 | | | | 5.54 | | | | | 3.39 | | | | | 122 | | | | | 0.06 | | | | | 1.13 | | | | | 30 | |
Year ended 12-31-2013 | | | | 5.77 | | | | | 14.75 | | | | | 121 | | | | | 0.07 | | | | | 1.15 | | | | | 66 | |
Year ended 12-31-2012 | | | | 5.33 | | | | | 6.95 | | | | | 107 | | | | | 0.07 | | | | | 1.57 | | | | | 36 | |
|
Pathfinder Moderate | |
Year ended 12-31-2016 | | | | 5.02 | | | | | 3.65 | | | | | 860 | | | | | 0.03 | | | | | 0.78 | | | | | 19 | |
Year ended 12-31-2015 | | | | 5.34 | | | | | 0.32 | | | | | 893 | | | | | 0.03 | | | | | 1.22 | | | | | 13 | |
Year ended 12-31-2014 | | | | 5.87 | | | | | 4.24 | | | | | 928 | | | | | 0.03 | | | | | 1.69 | | | | | 24 | |
Year ended 12-31-2013 | | | | 6.14 | | | | | 20.83 | | | | | 922 | | | | | 0.03 | | | | | 1.15 | | | | | 39 | |
Year ended 12-31-2012 | | | | 5.33 | | | | | 9.53 | | | | | 733 | | | | | 0.04 | | | | | 1.43 | | | | | 24 | |
|
Pathfinder Moderately Aggressive | |
Year ended 12-31-2016 | | | | 5.14 | | | | | 4.52 | | | | | 1,020 | | | | | 0.04 | | | | | 0.85 | | | | | 17 | |
Year ended 12-31-2015 | | | | 5.50 | | | | | 0.06 | | | | | 1,054 | | | | | 0.03 | | | | | 1.50 | | | | | 12 | |
Year ended 12-31-2014 | | | | 6.14 | | | | | 4.61 | | | | | 1,098 | | | | | 0.03 | | | | | 2.30 | | | | | 23 | |
Year ended 12-31-2013 | | | | 6.38 | | | | | 23.81 | | | | | 1,089 | | | | | 0.03 | | | | | 1.15 | | | | | 33 | |
Year ended 12-31-2012 | | | | 5.45 | | | | | 10.82 | | | | | 873 | | | | | 0.04 | | | | | 1.42 | | | | | 25 | |
|
Pathfinder Moderately Conservative | |
Year ended 12-31-2016 | | | | 4.99 | | | | | 3.10 | | | | | 261 | | | | | 0.05 | | | | | 0.80 | | | | | 16 | |
Year ended 12-31-2015 | | | | 5.30 | | | | | 0.33 | | | | | 272 | | | | | 0.04 | | | | | 1.20 | | | | | 16 | |
Year ended 12-31-2014 | | | | 5.80 | | | | | 3.88 | | | | | 291 | | | | | 0.04 | | | | | 1.43 | | | | | 27 | |
Year ended 12-31-2013 | | | | 6.03 | | | | | 17.71 | | | | | 300 | | | | | 0.05 | | | | | 1.09 | | | | | 46 | |
Year ended 12-31-2012 | | | | 5.41 | | | | | 8.41 | | | | | 240 | | | | | 0.05 | | | | | 1.57 | | | | | 26 | |
|
Pathfinder Moderate – Managed Volatility | |
Year ended 12-31-2016 | | | | 5.25 | | | | | 1.81 | | | | | 511 | | | | | 0.24 | | | | | 0.55 | | | | | 14 | |
Year ended 12-31-2015 | | | | 5.37 | | | | | -0.43 | | | | | 396 | | | | | 0.24 | | | | | 0.88 | | | | | 7 | |
Year ended 12-31-2014 | | | | 5.39 | | | | | 3.75 | | | | | 203 | | | | | 0.28 | (5) | | | | 1.06 | | | | | 23 | |
Year ended 12-31-2013(3) | | | | 5.37 | | | | | 7.50 | | | | | 34 | | | | | 0.58 | (4)(6) | | | | -0.57 | (4) | | | | 18 | |
|
Pathfinder Moderately Aggressive – Managed Volatility | |
Year ended 12-31-2016 | | | | 5.06 | | | | | 2.36 | | | | | 78 | | | | | 0.31 | | | | | 0.56 | | | | | 12 | |
Year ended 12-31-2015 | | | | 5.25 | | | | | -0.71 | | | | | 67 | | | | | 0.30 | | | | | 1.13 | | | | | 7 | |
Year ended 12-31-2014 | | | | 5.29 | | | | | 3.91 | | | | | 43 | | | | | 0.41 | (7) | | | | 1.74 | | | | | 32 | |
Year ended 12-31-2013(3) | | | | 5.41 | | | | | 8.27 | | | | | 10 | | | | | 1.04 | (4)(8) | | | | -1.03 | (4) | | | | 15 | |
|
Pathfinder Moderately Conservative – Managed Volatility | |
Year ended 12-31-2016 | | | | 5.10 | | | | | 1.21 | | | | | 67 | | | | | 0.30 | | | | | 0.49 | | | | | 11 | |
Year ended 12-31-2015 | | | | 5.23 | | | | | -0.52 | | | | | 54 | | | | | 0.30 | | | | | 0.78 | | | | | 9 | |
Year ended 12-31-2014 | | | | 5.27 | | | | | 3.06 | | | | | 31 | | | | | 0.47 | (8) | | | | 0.76 | | | | | 36 | |
Year ended 12-31-2013(3) | | | | 5.31 | | | | | 6.29 | | | | | 10 | | | | | 0.98 | (4)(9) | | | | -0.97 | (4) | | | | 21 | |
See Accompanying Notes to Financial Statements.
| | |
| FINANCIAL HIGHLIGHTS | | IVY VIP |
FOR A SHARE OF CAPITAL STOCK OUTSTANDING THROUGHOUT EACH PERIOD
| | | | | | | | | | | | | | | | | | | | | | | | | | | | | | | | | | | |
| | | | | | | |
| | | Net Asset
Value,
Beginning of
Period | | Net
Investment
Income
(Loss)(1) | | Net Realized
and Unrealized
Gain (Loss) on
Investments | | Total from
Investment
Operations | | Distributions
From Net
Investment
Income | | Distributions
From Net
Realized
Gains | | Total
Distributions |
Asset Strategy | |
Year ended 12-31-2016 | | | $ | 8.30 | | | | $ | 0.06 | | | | $ | (0.27 | ) | | | $ | (0.21 | ) | | | $ | (0.05 | ) | | | $ | — | | | | $ | (0.05 | ) |
Year ended 12-31-2015 | | | | 10.87 | | | | | 0.08 | | | | | (0.77 | ) | | | | (0.69 | ) | | | | (0.04 | ) | | | | (1.84 | ) | | | | (1.88 | ) |
Year ended 12-31-2014 | | | | 13.25 | | | | | 0.11 | | | | | (0.78 | ) | | | | (0.67 | ) | | | | (0.06 | ) | | | | (1.65 | ) | | | | (1.71 | ) |
Year ended 12-31-2013 | | | | 10.73 | | | | | 0.10 | | | | | 2.57 | | | | | 2.67 | | | | | (0.15 | ) | | | | — | | | | | (0.15 | ) |
Year ended 12-31-2012 | | | | 9.11 | | | | | 0.18 | | | | | 1.55 | | | | | 1.73 | | | | | (0.11 | ) | | | | — | | | | | (0.11 | ) |
| | | | | | | |
Balanced | | | | | | | | | | | | | | | | | | | | | | | | | | | | | | | | | | | |
Year ended 12-31-2016 | | | | 8.76 | | | | | 0.11 | | | | | 0.00 | * | | | | 0.11 | | | | | (0.12 | ) | | | | (1.28 | ) | | | | (1.40 | ) |
Year ended 12-31-2015 | | | | 10.19 | | | | | 0.12 | | | | | (0.09 | ) | | | | 0.03 | | | | | (0.09 | ) | | | | (1.37 | ) | | | | (1.46 | ) |
Year ended 12-31-2014 | | | | 10.46 | | | | | 0.09 | | | | | 0.64 | | | | | 0.73 | | | | | (0.10 | ) | | | | (0.90 | ) | | | | (1.00 | ) |
Year ended 12-31-2013 | | | | 9.37 | | | | | 0.10 | | | | | 2.01 | | | | | 2.11 | | | | | (0.15 | ) | | | | (0.87 | ) | | | | (1.02 | ) |
Year ended 12-31-2012 | | | | 9.01 | | | | | 0.14 | | | | | 0.88 | | | | | 1.02 | | | | | (0.14 | ) | | | | (0.52 | ) | | | | (0.66 | ) |
| | | | | | | |
Bond | | | | | | | | | | | | | | | | | | | | | | | | | | | | | | | | | | | |
Year ended 12-31-2016 | | | | 5.20 | | | | | 0.12 | | | | | 0.09 | | | | | 0.21 | | | | | (0.13 | ) | | | | (0.01 | ) | | | | (0.14 | ) |
Year ended 12-31-2015 | | | | 5.34 | | | | | 0.10 | | | | | (0.09 | ) | | | | 0.01 | | | | | (0.15 | ) | | | | — | | | | | (0.15 | ) |
Year ended 12-31-2014 | | | | 5.49 | | | | | 0.13 | | | | | 0.10 | | | | | 0.23 | | | | | (0.21 | ) | | | | (0.17 | ) | | | | (0.38 | ) |
Year ended 12-31-2013 | | | | 5.90 | | | | | 0.14 | | | | | (0.26 | ) | | | | (0.12 | ) | | | | (0.20 | ) | | | | (0.09 | ) | | | | (0.29 | ) |
Year ended 12-31-2012 | | | | 5.80 | | | | | 0.15 | | | | | 0.18 | | | | | 0.33 | | | | | (0.18 | ) | | | | (0.05 | ) | | | | (0.23 | ) |
| | | | | | | |
Core Equity | | | | | | | | | | | | | | | | | | | | | | | | | | | | | | | | | | | |
Year ended 12-31-2016 | | | | 11.75 | | | | | 0.05 | | | | | 0.32 | | | | | 0.37 | | | | | (0.05 | ) | | | | (1.40 | ) | | | | (1.45 | ) |
Year ended 12-31-2015 | | | | 14.18 | | | | | 0.05 | | | | | (0.06 | ) | | | | (0.01 | ) | | | | (0.05 | ) | | | | (2.37 | ) | | | | (2.42 | ) |
Year ended 12-31-2014 | | | | 15.13 | | | | | 0.05 | | | | | 1.24 | | | | | 1.29 | | | | | (0.08 | ) | | | | (2.16 | ) | | | | (2.24 | ) |
Year ended 12-31-2013 | | | | 12.38 | | | | | 0.07 | | | | | 3.88 | | | | | 3.95 | | | | | (0.07 | ) | | | | (1.13 | ) | | | | (1.20 | ) |
Year ended 12-31-2012 | | | | 11.70 | | | | | 0.07 | | | | | 1.96 | | | | | 2.03 | | | | | (0.08 | ) | | | | (1.27 | ) | | | | (1.35 | ) |
| | | | | | | |
Dividend Opportunities | | | | | | | | | | | | | | | | | | | | | | | | | | | | | | | | | | | |
Year ended 12-31-2016 | | | | 7.82 | | | | | 0.11 | | | | | 0.40 | | | | | 0.51 | | | | | (0.10 | ) | | | | (0.44 | ) | | | | (0.54 | ) |
Year ended 12-31-2015 | | | | 9.05 | | | | | 0.09 | | | | | (0.23 | ) | | | | (0.14 | ) | | | | (0.11 | ) | | | | (0.98 | ) | | | | (1.09 | ) |
Year ended 12-31-2014 | | | | 9.04 | | | | | 0.12 | | | | | 0.71 | | | | | 0.83 | | | | | (0.10 | ) | | | | (0.72 | ) | | | | (0.82 | ) |
Year ended 12-31-2013 | | | | 7.24 | | | | | 0.10 | | | | | 2.01 | | | | | 2.11 | | | | | (0.13 | ) | | | | (0.18 | ) | | | | (0.31 | ) |
Year ended 12-31-2012 | | | | 6.47 | | | | | 0.14 | | | | | 0.71 | | | | | 0.85 | | | | | (0.08 | ) | | | | — | | | | | (0.08 | ) |
| | | | | | | |
Energy | | | | | | | | | | | | | | | | | | | | | | | | | | | | | | | | | | | |
Year ended 12-31-2016 | | | | 5.04 | | | | | (0.02 | ) | | | | 1.76 | | | | | 1.74 | | | | | (0.01 | ) | | | | — | | | | | (0.01 | ) |
Year ended 12-31-2015 | | | | 6.51 | | | | | 0.00 | * | | | | (1.44 | ) | | | | (1.44 | ) | | | | — | * | | | | (0.03 | ) | | | | (0.03 | ) |
Year ended 12-31-2014 | | | | 7.50 | | | | | (0.01 | ) | | | | (0.73 | ) | | | | (0.74 | ) | | | | — | | | | | (0.25 | ) | | | | (0.25 | ) |
Year ended 12-31-2013 | | | | 5.89 | | | | | (0.02 | ) | | | | 1.65 | | | | | 1.63 | | | | | — | | | | | (0.02 | ) | | | | (0.02 | ) |
Year ended 12-31-2012 | | | | 5.81 | | | | | (0.01 | ) | | | | 0.09 | | | | | 0.08 | | | | | — | | | | | — | | | | | — | |
| | | | | | | |
Global Bond | | | | | | | | | | | | | | | | | | | | | | | | | | | | | | | | | | | |
Year ended 12-31-2016 | | | | 4.74 | | | | | 0.16 | | | | | 0.17 | | | | | 0.33 | | | | | (0.18 | ) | | | | — | | | | | (0.18 | ) |
Year ended 12-31-2015 | | | | 5.05 | | | | | 0.19 | | | | | (0.31 | ) | | | | (0.12 | ) | | | | (0.19 | ) | | | | — | | | | | (0.19 | ) |
Year ended 12-31-2014 | | | | 5.16 | | | | | 0.19 | | | | | (0.18 | ) | | | | 0.01 | | | | | (0.12 | ) | | | | — | | | | | (0.12 | ) |
Year ended 12-31-2013 | | | | 5.07 | | | | | 0.15 | | | | | (0.06 | ) | | | | 0.09 | | | | | — | | | | | — | | | | | — | |
Year ended 12-31-2012 | | | | 4.90 | | | | | 0.15 | | | | | 0.16 | | | | | 0.31 | | | | | (0.14 | ) | | | | — | * | | | | (0.14 | ) |
| | * | Not shown due to rounding. |
| (1) | Based on average weekly shares outstanding. |
| (2) | Based on net asset value. Total returns do not reflect a sales charge or contingent deferred sales charge, if applicable. Total returns for periods less than one year are not annualized. |
| (3) | Ratios excluding expense waivers are included only for periods in which the Portfolio had waived or reimbursed expenses. |
| | | | | | | | | | | | | | | | | | | | | | | | | | | | | | | | | | | | | | | | |
| | | Net Asset
Value,
End of Period | | Total
Return(2) | | Net Assets,
End of Period
(in millions) | | Ratio of Expenses
to Average Net
Assets Including
Expense Waiver | | Ratio of Net
Investment
Income
(Loss) to
Average
Net Assets
Including
Expense
Waiver | | Ratio of
Expenses to
Average
Net Assets
Excluding
Expense
Waiver(3) | | Ratio of Net
Investment
Income to
Average
Net Assets
Excluding
Expense
Waiver(3) | | Portfolio
Turnover
Rate |
Asset Strategy | |
Year ended 12-31-2016 | | | $ | 8.04 | | | | | -2.57 | % | | | $ | 954 | | | | | 1.01 | % | | | | 0.70 | % | | | | 1.02 | % | | | | 0.69 | % | | | | 68 | % |
Year ended 12-31-2015 | | | | 8.30 | | | | | -8.35 | | | | | 1,268 | | | | | 0.98 | | | | | 0.81 | | | | | 0.99 | | | | | 0.80 | | | | | 70 | |
Year ended 12-31-2014 | | | | 10.87 | | | | | -5.26 | | | | | 1,600 | | | | | 0.97 | | | | | 0.94 | | | | | 0.98 | | | | | 0.93 | | | | | 130 | |
Year ended 12-31-2013 | | | | 13.25 | | | | | 25.13 | | | | | 1,704 | | | | | 0.97 | | | | | 0.82 | | | | | 0.98 | | | | | 0.81 | | | | | 64 | |
Year ended 12-31-2012 | | | | 10.73 | | | | | 19.18 | | | | | 1,345 | | | | | 1.00 | | | | | 1.83 | | | | | 1.01 | | | | | 1.82 | | | | | 49 | |
| | | | | | | | |
Balanced | | | | | | | | | | | | | | | | | | | | | | | | | | | | | | | | | | | | | | | | |
Year ended 12-31-2016 | | | | 7.47 | | | | | 2.03 | | | | | 361 | | | | | 1.01 | | | | | 1.53 | | | | | — | | | | | — | | | | | 54 | |
Year ended 12-31-2015 | | | | 8.76 | | | | | -0.32 | | | | | 383 | | | | | 1.00 | | | | | 1.28 | | | | | — | | | | | — | | | | | 44 | |
Year ended 12-31-2014 | | | | 10.19 | | | | | 7.57 | | | | | 415 | | | | | 1.01 | | | | | 0.90 | | | | | — | | | | | — | | | | | 43 | |
Year ended 12-31-2013 | | | | 10.46 | | | | | 23.70 | | | | | 418 | | | | | 1.01 | | | | | 0.99 | | | | | — | | | | | — | | | | | 38 | |
Year ended 12-31-2012 | | | | 9.37 | | | | | 11.75 | | | | | 355 | | | | | 1.01 | | | | | 1.55 | | | | | — | | | | | — | | | | | 43 | |
| | | | | | | | |
Bond | | | | | | | | | | | | | | | | | | | | | | | | | | | | | | | | | | | | | | | | |
Year ended 12-31-2016 | | | | 5.27 | | | | | 4.03 | | | | | 416 | | | | | 0.79 | | | | | 2.17 | | | | | — | | | | | — | | | | | 84 | |
Year ended 12-31-2015 | | | | 5.20 | | | | | 0.20 | | | | | 280 | | | | | 0.78 | | | | | 1.87 | | | | | — | | | | | — | | | | | 59 | |
Year ended 12-31-2014 | | | | 5.34 | | | | | 4.34 | | | | | 310 | | | | | 0.78 | | | | | 2.43 | | | | | — | | | | | — | | | | | 28 | |
Year ended 12-31-2013 | | | | 5.49 | | | | | -2.09 | | | | | 314 | | | | | 0.78 | | | | | 2.50 | | | | | — | | | | | — | | | | | 48 | |
Year ended 12-31-2012 | | | | 5.90 | | | | | 5.78 | | | | | 511 | | | | | 0.78 | | | | | 2.62 | | | | | — | | | | | — | | | | | 33 | |
| | | | | | | | |
Core Equity | | | | | | | | | | | | | | | | | | | | | | | | | | | | | | | | | | | | | | | | |
Year ended 12-31-2016 | | | | 10.67 | | | | | 3.74 | | | | | 420 | | | | | 0.95 | | | | | 0.45 | | | | | 1.01 | | | | | 0.39 | | | | | 75 | |
Year ended 12-31-2015 | | | | 11.75 | | | | | -0.69 | | | | | 454 | | | | | 0.95 | | | | | 0.38 | | | | | 1.00 | | | | | 0.33 | | | | | 60 | |
Year ended 12-31-2014 | | | | 14.18 | | | | | 9.68 | | | | | 505 | | | | | 0.95 | | | | | 0.34 | | | | | 1.00 | | | | | 0.29 | | | | | 57 | |
Year ended 12-31-2013 | | | | 15.13 | | | | | 33.51 | | | | | 500 | | | | | 0.96 | | | | | 0.55 | | | | | 1.01 | | | | | 0.50 | | | | | 70 | |
Year ended 12-31-2012 | | | | 12.38 | | | | | 18.60 | | | | | 391 | | | | | 0.97 | | | | | 0.60 | | | | | 1.02 | | | | | 0.55 | | | | | 53 | |
| | | | | | | | |
Dividend Opportunities | | | | | | | | | | | | | | | | | | | | | | | | | | | | | | | | | | | | | | | | |
Year ended 12-31-2016 | | | | 7.79 | | | | | 6.95 | | | | | 509 | | | | | 1.01 | | | | | 1.43 | | | | | — | | | | | — | | | | | 59 | |
Year ended 12-31-2015 | | | | 7.82 | | | | | -2.06 | | | | | 515 | | | | | 1.00 | | | | | 1.14 | | | | | — | | | | | — | | | | | 50 | |
Year ended 12-31-2014 | | | | 9.05 | | | | | 9.84 | | | | | 511 | | | | | 1.00 | | | | | 1.33 | | | | | — | | | | | — | | | | | 42 | |
Year ended 12-31-2013 | | | | 9.04 | | | | | 29.61 | | | | | 484 | | | | | 1.00 | | | | | 1.23 | | | | | — | | | | | — | | | | | 53 | |
Year ended 12-31-2012 | | | | 7.24 | | | | | 13.18 | | | | | 386 | | | | | 1.01 | | | | | 1.95 | | | | | — | | | | | — | | | | | 43 | |
| | | | | | | | |
Energy | | | | | | | | | | | | | | | | | | | | | | | | | | | | | | | | | | | | | | | | |
Year ended 12-31-2016 | | | | 6.77 | | | | | 34.55 | | | | | 196 | | | | | 1.19 | | | | | -0.27 | | | | | — | | | | | — | | | | | 31 | |
Year ended 12-31-2015 | | | | 5.04 | | | | | -22.14 | | | | | 117 | | | | | 1.20 | | | | | 0.08 | | | | | — | | | | | — | | | | | 34 | |
Year ended 12-31-2014 | | | | 6.51 | | | | | -10.56 | | | | | 118 | | | | | 1.18 | | | | | -0.10 | | | | | — | | | | | — | | | | | 21 | |
Year ended 12-31-2013 | | | | 7.50 | | | | | 27.76 | | | | | 99 | | | | | 1.23 | | | | | -0.24 | | | | | — | | | | | — | | | | | 33 | |
Year ended 12-31-2012 | | | | 5.89 | | | | | 1.38 | | | | | 67 | | | | | 1.25 | | | | | -0.18 | | | | | — | | | | | — | | | | | 38 | |
| | | | | | | | |
Global Bond | | | | | | | | | | | | | | | | | | | | | | | | | | | | | | | | | | | | | | | | |
Year ended 12-31-2016 | | | | 4.89 | | | | | 7.04 | | | | | 22 | | | | | 0.50 | | | | | 3.28 | | | | | 1.13 | | | | | 2.65 | | | | | 18 | |
Year ended 12-31-2015 | | | | 4.74 | | | | | -2.65 | | | | | 20 | | | | | 0.51 | | | | | 3.80 | | | | | 1.14 | | | | | 3.17 | | | | | 26 | |
Year ended 12-31-2014 | | | | 5.05 | | | | | 0.18 | | | | | 19 | | | | | 0.48 | | | | | 3.69 | | | | | 1.11 | | | | | 3.06 | | | | | 37 | |
Year ended 12-31-2013 | | | | 5.16 | | | | | 1.74 | | | | | 16 | | | | | 0.63 | | | | | 3.00 | | | | | 1.26 | | | | | 2.37 | | | | | 26 | |
Year ended 12-31-2012 | | | | 5.07 | | | | | 6.41 | | | | | 11 | | | | | 0.67 | | | | | 3.01 | | | | | 1.29 | | | | | 2.39 | | | | | 28 | |
See Accompanying Notes to Financial Statements.
| | |
| FINANCIAL HIGHLIGHTS | | IVY VIP |
FOR A SHARE OF CAPITAL STOCK OUTSTANDING THROUGHOUT EACH PERIOD
| | | | | | | | | | | | | | | | | | | | | | | | | | | | | | | | | | | |
| | | | | | | |
| | | Net Asset
Value,
Beginning of
Period | | Net
Investment
Income
(Loss)(1) | | Net Realized
and Unrealized
Gain (Loss) on
Investments | | Total from
Investment
Operations | | Distributions
From Net
Investment
Income | | Distributions
From Net
Realized
Gains | | Total
Distributions |
Global Growth | |
Year ended 12-31-2016 | | | $ | 8.68 | | | | $ | 0.01 | | | | $ | (0.28 | ) | | | $ | (0.27 | ) | | | $ | (0.02 | ) | | | $ | (0.25 | ) | | | $ | (0.27 | ) |
Year ended 12-31-2015 | | | | 8.84 | | | | | 0.02 | | | | | 0.31 | | | | | 0.33 | | | | | (0.04 | ) | | | | (0.45 | ) | | | | (0.49 | ) |
Year ended 12-31-2014 | | | | 9.81 | | | | | 0.09 | | | | | 0.01 | | | | | 0.10 | | | | | (0.21 | ) | | | | (0.86 | ) | | | | (1.07 | ) |
Year ended 12-31-2013 | | | | 8.46 | | | | | 0.09 | | | | | 1.51 | | | | | 1.60 | | | | | (0.08 | ) | | | | (0.17 | ) | | | | (0.25 | ) |
Year ended 12-31-2012 | | | | 7.86 | | | | | 0.09 | | | | | 1.22 | | | | | 1.31 | | | | | (0.17 | ) | | | | (0.54 | ) | | | | (0.71 | ) |
| | | | | | | |
Global Natural Resources | | | | | | | | | | | | | | | | | | | | | | | | | | | | | | | | | | | |
Year ended 12-31-2016 | | | | 3.66 | | | | | 0.01 | | | | | 0.86 | | | | | 0.87 | | | | | (0.03 | ) | | | | — | | | | | (0.03 | ) |
Year ended 12-31-2015 | | | | 4.72 | | | | | 0.02 | | | | | (1.08 | ) | | | | (1.06 | ) | | | | — | * | | | | — | | | | | — | * |
Year ended 12-31-2014 | | | | 5.43 | | | | | 0.01 | | | | | (0.72 | ) | | | | (0.71 | ) | | | | — | | | | | — | | | | | — | |
Year ended 12-31-2013 | | | | 5.04 | | | | | 0.00 | * | | | | 0.39 | | | | | 0.39 | | | | | — | | | | | — | | | | | — | |
Year ended 12-31-2012 | | | | 5.29 | | | | | (0.01 | ) | | | | 0.07 | | | | | 0.06 | | | | | — | | | | | (0.31 | ) | | | | (0.31 | ) |
| | | | | | | |
Government Money Market | | | | | | | | | | | | | | | | | | | | | | | | | | | | | | | | | | | |
Year ended 12-31-2016 | | | | 1.00 | | | | | 0.00 | * | | | | 0.00 | * | | | | 0.00 | * | | | | — | * | | | | — | * | | | | — | * |
Year ended 12-31-2015 | | | | 1.00 | | | | | 0.00 | * | | | | 0.00 | * | | | | 0.00 | * | | | | — | * | | | | — | | | | | — | * |
Year ended 12-31-2014 | | | | 1.00 | | | | | 0.00 | * | | | | 0.00 | * | | | | 0.00 | * | | | | — | * | | | | — | | | | | — | * |
Year ended 12-31-2013 | | | | 1.00 | | | | | 0.00 | * | | | | 0.00 | * | | | | 0.00 | * | | | | — | * | | | | — | | | | | — | * |
Year ended 12-31-2012 | | | | 1.00 | | | | | 0.00 | * | | | | 0.00 | * | | | | 0.00 | * | | | | — | * | | | | — | | | | | — | * |
| | | | | | | |
Growth | | | | | | | | | | | | | | | | | | | | | | | | | | | | | | | | | | | |
Year ended 12-31-2016 | | | | 11.42 | | | | | 0.03 | | | | | 0.03 | | | | | 0.06 | | | | | — | * | | | | (1.18 | ) | | | | (1.18 | ) |
Year ended 12-31-2015 | | | | 12.08 | | | | | 0.00 | * | | | | 0.85 | | | | | 0.85 | | | | | (0.01 | ) | | | | (1.50 | ) | | | | (1.51 | ) |
Year ended 12-31-2014 | | | | 13.33 | | | | | 0.01 | | | | | 1.28 | | | | | 1.29 | | | | | (0.06 | ) | | | | (2.48 | ) | | | | (2.54 | ) |
Year ended 12-31-2013 | | | | 10.63 | | | | | 0.03 | | | | | 3.65 | | | | | 3.68 | | | | | (0.05 | ) | | | | (0.93 | ) | | | | (0.98 | ) |
Year ended 12-31-2012 | | | | 10.19 | | | | | 0.05 | | | | | 1.20 | | | | | 1.25 | | | | | (0.01 | ) | | | | (0.80 | ) | | | | (0.81 | ) |
| | | | | | | |
High Income | | | | | | | | | | | | | | | | | | | | | | | | | | | | | | | | | | | |
Year ended 12-31-2016 | | | | 3.35 | | | | | 0.24 | | | | | 0.28 | | | | | 0.52 | | | | | (0.26 | ) | | | | — | | | | | (0.26 | ) |
Year ended 12-31-2015 | | | | 3.85 | | | | | 0.26 | | | | | (0.48 | ) | | | | (0.22 | ) | | | | (0.24 | ) | | | | (0.04 | ) | | | | (0.28 | ) |
Year ended 12-31-2014 | | | | 4.00 | | | | | 0.25 | | | | | (0.17 | ) | | | | 0.08 | | | | | (0.20 | ) | | | | (0.03 | ) | | | | (0.23 | ) |
Year ended 12-31-2013 | | | | 3.80 | | | | | 0.27 | | | | | 0.12 | | | | | 0.39 | | | | | (0.19 | ) | | | | — | | | | | (0.19 | ) |
Year ended 12-31-2012 | | | | 3.42 | | | | | 0.29 | | | | | 0.33 | | | | | 0.62 | | | | | (0.24 | ) | | | | — | | | | | (0.24 | ) |
| | | | | | | |
International Core Equity | | | | | | | | | | | | | | | | | | | | | | | | | | | | | | | | | | | |
Year ended 12-31-2016 | | | | 15.53 | | | | | 0.24 | | | | | (0.11 | ) | | | | 0.13 | | | | | (0.20 | ) | | | | (0.16 | ) | | | | (0.36 | ) |
Year ended 12-31-2015 | | | | 18.00 | | | | | 0.20 | | | | | (0.06 | ) | | | | 0.14 | | | | | (0.24 | ) | | | | (2.37 | ) | | | | (2.61 | ) |
Year ended 12-31-2014 | | | | 19.75 | | | | | 0.24 | | | | | 0.10 | | | | | 0.34 | | | | | (0.51 | ) | | | | (1.58 | ) | | | | (2.09 | ) |
Year ended 12-31-2013 | | | | 16.07 | | | | | 0.27 | | | | | 3.70 | | | | | 3.97 | | | | | (0.29 | ) | | | | — | | | | | (0.29 | ) |
Year ended 12-31-2012 | | | | 14.67 | | | | | 0.25 | | | | | 1.64 | | | | | 1.89 | | | | | (0.36 | ) | | | | (0.13 | ) | | | | (0.49 | ) |
| | | | | | | |
Limited-Term Bond | | | | | | | | | | | | | | | | | | | | | | | | | | | | | | | | | | | |
Year ended 12-31-2016 | | | | 4.87 | | | | | 0.08 | | | | | 0.01 | | | | | 0.09 | | | | | (0.07 | ) | | | | — | | | | | (0.07 | ) |
Year ended 12-31-2015 | | | | 4.90 | | | | | 0.06 | | | | | (0.02 | ) | | | | 0.04 | | | | | (0.07 | ) | | | | — | | | | | (0.07 | ) |
Year ended 12-31-2014 | | | | 4.89 | | | | | 0.07 | | | | | (0.02 | ) | | | | 0.05 | | | | | (0.03 | ) | | | | (0.01 | ) | | | | (0.04 | ) |
Year ended 12-31-2013 | | | | 4.92 | | | | | 0.05 | | | | | (0.08 | ) | | | | (0.03 | ) | | | | — | | | | | — | * | | | | — | * |
Year ended 12-31-2012 | | | | 5.03 | | | | | 0.07 | | | | | 0.10 | | | | | 0.17 | | | | | (0.15 | ) | | | | (0.13 | ) | | | | (0.28 | ) |
| | * | Not shown due to rounding. |
| (1) | Based on average weekly shares outstanding. |
| (2) | Based on net asset value. Total returns do not reflect a sales charge or contingent deferred sales charge, if applicable. Total returns for periods less than one year are not annualized. |
| (3) | Ratios excluding expense waivers are included only for periods in which the Portfolio had waived or reimbursed expenses. |
| | | | | | | | | | | | | | | | | | | | | | | | | | | | | | | | | | | | | | | | |
| | | Net Asset
Value,
End of Period | | Total
Return(2) | | Net Assets,
End of Period
(in millions) | | Ratio of Expenses
to Average Net
Assets Including
Expense Waiver | | Ratio of Net
Investment
Income
(Loss) to
Average
Net Assets
Including
Expense
Waiver | | Ratio of
Expenses to
Average
Net Assets
Excluding
Expense
Waiver(3) | | Ratio of Net
Investment
Income
(Loss) to
Average
Net Assets
Excluding
Expense
Waiver(3) | | Portfolio
Turnover
Rate |
Global Growth | |
Year ended 12-31-2016 | | | $ | 8.14 | | | | | -3.04 | % | | | $ | 408 | | | | | 1.13 | % | | | | 0.09 | % | | | | 1.16 | % | | | | 0.06 | % | | | | 71 | % |
Year ended 12-31-2015 | | | | 8.68 | | | | | 3.39 | | | | | 507 | | | | | 1.14 | | | | | 0.23 | | | | | 1.17 | | | | | 0.20 | | | | | 54 | |
Year ended 12-31-2014 | | | | 8.84 | | | | | 0.96 | | | | | 431 | | | | | 1.13 | | | | | 0.93 | | | | | 1.16 | | | | | 0.90 | | | | | 65 | |
Year ended 12-31-2013 | | | | 9.81 | | | | | 19.23 | | | | | 419 | | | | | 1.14 | | | | | 1.06 | | | | | 1.17 | | | | | 1.03 | | | | | 49 | |
Year ended 12-31-2012 | | | | 8.46 | | | | | 18.05 | | | | | 478 | | | | | 1.15 | | | | | 1.09 | | | | | 1.18 | | | | | 1.06 | | | | | 44 | |
| | | | | | | | |
Global Natural Resources | | | | | | | | | | | | | | | | | | | | | | | | | | | | | | | | | | | | | | | | |
Year ended 12-31-2016 | | | | 4.50 | | | | | 23.81 | | | | | 144 | | | | | 1.36 | | | | | 0.20 | | | | | — | | | | | — | | | | | 67 | |
Year ended 12-31-2015 | | | | 3.66 | | | | | -22.39 | | | | | 114 | | | | | 1.35 | | | | | 0.54 | | | | | — | | | | | — | | | | | 34 | |
Year ended 12-31-2014 | | | | 4.72 | | | | | -13.04 | | | | | 146 | | | | | 1.33 | | | | | 0.12 | | | | | — | | | | | — | | | | | 31 | |
Year ended 12-31-2013 | | | | 5.43 | | | | | 7.80 | | | | | 173 | | | | | 1.35 | | | | | -0.02 | | | | | — | | | | | — | | | | | 134 | |
Year ended 12-31-2012 | | | | 5.04 | | | | | 1.89 | | | | | 180 | | | | | 1.36 | | | | | -0.13 | | | | | — | | | | | — | | | | | 102 | |
| | | | | | | | |
Government Money Market | | | | | | | | | | | | | | | | | | | | | | | | | | | | | | | | | | | | | | | | |
Year ended 12-31-2016 | | | | 1.00 | | | | | 0.13 | | | | | 414 | | | | | 0.45 | | | | | 0.13 | | | | | 0.46 | | | | | 0.12 | | | | | — | |
Year ended 12-31-2015 | | | | 1.00 | | | | | 0.02 | | | | | 539 | | | | | 0.20 | | | | | 0.02 | | | | | 0.45 | | | | | -0.23 | | | | | — | |
Year ended 12-31-2014 | | | | 1.00 | | | | | 0.02 | | | | | 512 | | | | | 0.15 | | | | | 0.02 | | | | | 0.45 | | | | | -0.28 | | | | | — | |
Year ended 12-31-2013 | | | | 1.00 | | | | | 0.02 | | | | | 605 | | | | | 0.19 | | | | | 0.02 | | | | | 0.45 | | | | | -0.24 | | | | | — | |
Year ended 12-31-2012 | | | | 1.00 | | | | | 0.02 | | | | | 245 | | | | | 0.30 | | | | | 0.02 | | | | | 0.47 | | | | | -0.15 | | | | | — | |
| | | | | | | | |
Growth | | | | | | | | | | | | | | | | | | | | | | | | | | | | | | | | | | | | | | | | |
Year ended 12-31-2016 | | | | 10.30 | | | | | 1.22 | | | | | 835 | | | | | 0.98 | | | | | 0.26 | | | | | 1.00 | | | | | 0.24 | | | | | 53 | |
Year ended 12-31-2015 | | | | 11.42 | | | | | 7.17 | | | | | 897 | | | | | 0.96 | | | | | 0.03 | | | | | 0.99 | | | | | 0.00 | | | | | 30 | |
Year ended 12-31-2014 | | | | 12.08 | | | | | 11.81 | | | | | 871 | | | | | 0.96 | | | | | 0.10 | | | | | 0.99 | | | | | 0.07 | | | | | 26 | |
Year ended 12-31-2013 | | | | 13.33 | | | | | 36.46 | | | | | 1,201 | | | | | 0.96 | | | | | 0.30 | | | | | 0.99 | | | | | 0.27 | | | | | 43 | |
Year ended 12-31-2012 | | | | 10.63 | | | | | 12.75 | | | | | 992 | | | | | 0.97 | | | | | 0.47 | | | | | 1.00 | | | | | 0.44 | | | | | 47 | |
| | | | | | | | |
High Income | | | | | | | | | | | | | | | | | | | | | | | | | | | | | | | | | | | | | | | | |
Year ended 12-31-2016 | | | | 3.61 | | | | | 16.19 | | | | | 845 | | | | | 0.89 | | | | | 6.97 | | | | | 0.92 | | | | | 6.94 | | | | | 36 | |
Year ended 12-31-2015 | | | | 3.35 | | | | | -6.50 | | | | | 725 | | | | | 0.89 | | | | | 7.01 | | | | | 0.92 | | | | | 6.98 | | | | | 44 | |
Year ended 12-31-2014 | | | | 3.85 | | | | | 1.90 | | | | | 818 | | | | | 0.88 | | | | | 6.31 | | | | | 0.91 | | | | | 6.28 | | | | | 55 | |
Year ended 12-31-2013 | | | | 4.00 | | | | | 10.50 | | | | | 689 | | | | | 0.88 | | | | | 6.99 | | | | | 0.93 | | | | | 6.94 | | | | | 84 | |
Year ended 12-31-2012 | | | | 3.80 | | | | | 18.64 | | | | | 449 | | | | | 0.89 | | | | | 7.86 | | | | | 0.94 | | | | | 7.81 | | | | | 91 | |
| | | | | | | | |
International Core Equity | | | | | | | | | | | | | | | | | | | | | | | | | | | | | | | | | | | | | | | | |
Year ended 12-31-2016 | | | | 15.30 | | | | | 1.08 | | | | | 736 | | | | | 1.17 | | | | | 1.60 | | | | | — | | | | | — | | | | | 77 | |
Year ended 12-31-2015 | | | | 15.53 | | | | | -0.94 | | | | | 675 | | | | | 1.16 | | | | | 1.18 | | | | | — | | | | | — | | | | | 87 | |
Year ended 12-31-2014 | | | | 18.00 | | | | | 1.44 | | | | | 656 | | | | | 1.16 | | | | | 1.28 | | | | | — | | | | | — | | | | | 102 | |
Year ended 12-31-2013 | | | | 19.75 | | | | | 24.91 | | | | | 672 | | | | | 1.16 | | | | | 1.51 | | | | | — | | | | | — | | | | | 92 | |
Year ended 12-31-2012 | | | | 16.07 | | | | | 13.33 | | | | | 622 | | | | | 1.17 | | | | | 1.64 | | | | | — | | | | | — | | | | | 85 | |
| | | | | | | | |
Limited-Term Bond | | | | | | | | | | | | | | | | | | | | | | | | | | | | | | | | | | | | | | | | |
Year ended 12-31-2016 | | | | 4.89 | | | | | 1.94 | | | | | 395 | | | | | 0.81 | | | | | 1.53 | | | | | — | | | | | — | | | | | 60 | |
Year ended 12-31-2015 | | | | 4.87 | | | | | 0.87 | | | | | 385 | | | | | 0.80 | | | | | 1.31 | | | | | — | | | | | — | | | | | 44 | |
Year ended 12-31-2014 | | | | 4.90 | | | | | 0.97 | | | | | 474 | | | | | 0.80 | | | | | 1.38 | | | | | — | | | | | — | | | | | 34 | |
Year ended 12-31-2013 | | | | 4.89 | | | | | -0.54 | | | | | 437 | | | | | 0.82 | | | | | 1.14 | | | | | — | | | | | — | | | | | 25 | |
Year ended 12-31-2012 | | | | 4.92 | | | | | 3.37 | | | | | 123 | | | | | 0.81 | | | | | 1.33 | | | | | 0.82 | | | | | 1.32 | | | | | 60 | |
See Accompanying Notes to Financial Statements.
| | |
| FINANCIAL HIGHLIGHTS | | IVY VIP |
FOR A SHARE OF CAPITAL STOCK OUTSTANDING THROUGHOUT EACH PERIOD
| | | | | | | | | | | | | | | | | | | | | | | | | | | | | | | | | | | |
| | | | | | | |
| | | Net Asset
Value,
Beginning of
Period | | Net
Investment
Income
(Loss)(1) | | Net Realized
and Unrealized
Gain (Loss) on
Investments | | Total from
Investment
Operations | | Distributions
From Net
Investment
Income | | Distributions
From Net
Realized
Gains | | Total
Distributions |
Micro Cap Growth | |
Year ended 12-31-2016 | | | $ | 20.62 | | | | $ | (0.19 | ) | | | $ | 2.37 | | | | $ | 2.18 | | | | $ | — | | | | $ | (2.14 | ) | | | $ | (2.14 | ) |
Year ended 12-31-2015 | | | | 26.73 | | | | | (0.26 | ) | | | | (1.69 | ) | | | | (1.95 | ) | | | | — | | | | | (4.16 | ) | | | | (4.16 | ) |
Year ended 12-31-2014 | | | | 31.78 | | | | | (0.32 | ) | | | | (0.66 | ) | | | | (0.98 | ) | | | | — | | | | | (4.07 | ) | | | | (4.07 | ) |
Year ended 12-31-2013 | | | | 21.13 | | | | | (0.31 | ) | | | | 12.05 | | | | | 11.74 | | | | | — | | | | | (1.09 | ) | | | | (1.09 | ) |
Year ended 12-31-2012 | | | | 20.56 | | | | | (0.20 | ) | | | | 2.57 | | | | | 2.37 | | | | | — | | | | | (1.80 | ) | | | | (1.80 | ) |
| | | | | | | |
Mid Cap Growth | | | | | | | | | | | | | | | | | | | | | | | | | | | | | | | | | | | |
Year ended 12-31-2016 | | | | 9.42 | | | | | (0.01 | ) | | | | 0.55 | | | | | 0.54 | | | | | — | | | | | (0.52 | ) | | | | (0.52 | ) |
Year ended 12-31-2015 | | | | 10.84 | | | | | (0.01 | ) | | | | (0.52 | ) | | | | (0.53 | ) | | | | — | | | | | (0.89 | ) | | | | (0.89 | ) |
Year ended 12-31-2014 | | | | 10.72 | | | | | (0.04 | ) | | | | 0.82 | | | | | 0.78 | | | | | — | | | | | (0.66 | ) | | | | (0.66 | ) |
Year ended 12-31-2013 | | | | 8.54 | | | | | (0.04 | ) | | | | 2.54 | | | | | 2.50 | | | | | — | | | | | (0.32 | ) | | | | (0.32 | ) |
Year ended 12-31-2012 | | | | 8.37 | | | | | (0.02 | ) | | | | 1.07 | | | | | 1.05 | | | | | — | | | | | (0.88 | ) | | | | (0.88 | ) |
| | | | | | | |
Real Estate Securities | | | | | | | | | | | | | | | | | | | | | | | | | | | | | | | | | | | |
Year ended 12-31-2016 | | | | 8.98 | | | | | 0.10 | | | | | 0.25 | | | | | 0.35 | | | | | (0.10 | ) | | | | (0.84 | ) | | | | (0.94 | ) |
Year ended 12-31-2015 | | | | 9.59 | | | | | 0.10 | | | | | 0.31 | | | | | 0.41 | | | | | (0.10 | ) | | | | (0.92 | ) | | | | (1.02 | ) |
Year ended 12-31-2014 | | | | 7.90 | | | | | 0.10 | | | | | 2.20 | | | | | 2.30 | | | | | (0.09 | ) | | | | (0.52 | ) | | | | (0.61 | ) |
Year ended 12-31-2013 | | | | 7.89 | | | | | 0.08 | | | | | 0.02 | | | | | 0.10 | | | | | (0.09 | ) | | | | — | | | | | (0.09 | ) |
Year ended 12-31-2012 | | | | 6.75 | | | | | 0.08 | | | | | 1.11 | | | | | 1.19 | | | | | (0.05 | ) | | | | — | | | | | (0.05 | ) |
| | | | | | | |
Science and Technology | | | | | | | | | | | | | | | | | | | | | | | | | | | | | | | | | | | |
Year ended 12-31-2016 | | | | 22.96 | | | | | (0.11 | ) | | | | 0.34 | | | | | 0.23 | | | | | — | | | | | (0.85 | ) | | | | (0.85 | ) |
Year ended 12-31-2015 | | | | 25.02 | | | | | (0.15 | ) | | | | (0.41 | ) | | | | (0.56 | ) | | | | — | | | | | (1.50 | ) | | | | (1.50 | ) |
Year ended 12-31-2014 | | | | 26.58 | | | | | (0.13 | ) | | | | 0.74 | | | | | 0.61 | | | | | — | | | | | (2.17 | ) | | | | (2.17 | ) |
Year ended 12-31-2013 | | | | 18.10 | | | | | (0.11 | ) | | | | 9.89 | | | | | 9.78 | | | | | — | | | | | (1.30 | ) | | | | (1.30 | ) |
Year ended 12-31-2012 | | | | 15.25 | | | | | (0.12 | ) | | | | 4.22 | | | | | 4.10 | | | | | — | | | | | (1.25 | ) | | | | (1.25 | ) |
| | | | | | | |
Small Cap Growth | | | | | | | | | | | | | | | | | | | | | | | | | | | | | | | | | | | |
Year ended 12-31-2016 | | | | 10.60 | | | | | (0.07 | ) | | | | 0.23 | | | | | 0.16 | | | | | — | | | | | (1.07 | ) | | | | (1.07 | ) |
Year ended 12-31-2015 | | | | 12.15 | | | | | (0.09 | ) | | | | 0.51 | | | | | 0.42 | | | | | — | | | | | (1.97 | ) | | | | (1.97 | ) |
Year ended 12-31-2014 | | | | 13.76 | | | | | (0.10 | ) | | | | 0.11 | | | | | 0.01 | | | | | — | | | | | (1.62 | ) | | | | (1.62 | ) |
Year ended 12-31-2013 | | | | 9.60 | | | | | (0.10 | ) | | | | 4.26 | | | | | 4.16 | | | | | — | | | | | — | | | | | — | |
Year ended 12-31-2012 | | | | 9.34 | | | | | (0.08 | ) | | | | 0.57 | | | | | 0.49 | | | | | — | | | | | (0.23 | ) | | | | (0.23 | ) |
| | | | | | | |
Small Cap Value | | | | | | | | | | | | | | | | | | | | | | | | | | | | | | | | | | | |
Year ended 12-31-2016 | | | | 15.66 | | | | | 0.01 | | | | | 4.17 | | | | | 4.18 | | | | | (0.07 | ) | | | | (1.43 | ) | | | | (1.50 | ) |
Year ended 12-31-2015 | | | | 17.98 | | | | | 0.05 | | | | | (0.95 | ) | | | | (0.90 | ) | | | | (0.02 | ) | | | | (1.40 | ) | | | | (1.42 | ) |
Year ended 12-31-2014 | | | | 19.90 | | | | | (0.01 | ) | | | | 1.19 | | | | | 1.18 | | | | | (0.02 | ) | | | | (3.08 | ) | | | | (3.10 | ) |
Year ended 12-31-2013 | | | | 16.04 | | | | | (0.01 | ) | | | | 5.20 | | | | | 5.19 | | | | | (0.16 | ) | | | | (1.17 | ) | | | | (1.33 | ) |
Year ended 12-31-2012 | | | | 14.57 | | | | | 0.12 | | | | | 2.44 | | | | | 2.56 | | | | | (0.07 | ) | | | | (1.02 | ) | | | | (1.09 | ) |
| | | | | | | |
Value | | | | | | | | | | | | | | | | | | | | | | | | | | | | | | | | | | | |
Year ended 12-31-2016 | | | | 6.15 | | | | | 0.08 | | | | | 0.49 | | | | | 0.57 | | | | | (0.07 | ) | | | | (0.72 | ) | | | | (0.79 | ) |
Year ended 12-31-2015 | | | | 7.39 | | | | | 0.06 | | | | | (0.30 | ) | | | | (0.24 | ) | | | | (0.06 | ) | | | | (0.94 | ) | | | | (1.00 | ) |
Year ended 12-31-2014 | | | | 7.82 | | | | | 0.05 | | | | | 0.71 | | | | | 0.76 | | | | | (0.09 | ) | | | | (1.10 | ) | | | | (1.19 | ) |
Year ended 12-31-2013 | | | | 5.97 | | | | | 0.05 | | | | | 2.03 | | | | | 2.08 | | | | | (0.05 | ) | | | | (0.18 | ) | | | | (0.23 | ) |
Year ended 12-31-2012 | | | | 5.57 | | | | | 0.07 | | | | | 0.91 | | | | | 0.98 | | | | | (0.08 | ) | | | | (0.50 | ) | | | | (0.58 | ) |
| (1) | Based on average weekly shares outstanding. |
| (2) | Based on net asset value. Total returns do not reflect a sales charge or contingent deferred sales charge, if applicable. Total returns for periods less than one year are not annualized. |
| (3) | Ratios excluding expense waivers are included only for periods in which the Portfolio had waived or reimbursed expenses. |
.
| | | | | | | | | | | | | | | | | | | | | | | | | | | | | | | | | | | | | | | | |
| | | Net Asset
Value,
End of Period | | Total
Return(2) | | Net Assets,
End of Period
(in millions) | | Ratio of Expenses
to Average Net
Assets Including
Expense Waiver | | Ratio of Net
Investment
Income
(Loss) to
Average
Net Assets
Including
Expense
Waiver | | Ratio of
Expenses to
Average
Net Assets
Excluding
Expense
Waiver(3) | | Ratio of Net
Investment
Income
(Loss) to
Average
Net Assets
Excluding
Expense
Waiver(3) | | Portfolio
Turnover
Rate |
Micro Cap Growth | |
Year ended 12-31-2016 | | | $ | 20.66 | | | | | 13.29 | % | | | $ | 63 | | | | | 1.34 | % | | | | -1.01 | % | | | | — | % | | | | — | % | | | | 45 | % |
Year ended 12-31-2015 | | | | 20.62 | | | | | -9.16 | | | | | 59 | | | | | 1.33 | | | | | -1.11 | | | | | — | | | | | — | | | | | 79 | |
Year ended 12-31-2014 | | | | 26.73 | | | | | -1.74 | | | | | 72 | | | | | 1.32 | | | | | -1.16 | | | | | — | | | | | — | | | | | 51 | |
Year ended 12-31-2013 | | | | 31.78 | | | | | 57.28 | | | | | 79 | | | | | 1.34 | | | | | -1.19 | | | | | — | | | | | — | | | | | 61 | |
Year ended 12-31-2012 | | | | 21.13 | | | | | 11.84 | | | | | 49 | | | | | 1.35 | | | | | -0.91 | | | | | — | | | | | — | | | | | 52 | |
| | | | | | | | |
Mid Cap Growth | | | | | | | | | | | | | | | | | | | | | | | | | | | | | | | | | | | | | | | | |
Year ended 12-31-2016 | | | | 9.44 | | | | | 6.12 | | | | | 615 | | | | | 1.10 | | | | | -0.09 | | | | | 1.15 | | | | | -0.14 | | | | | 33 | |
Year ended 12-31-2015 | | | | 9.42 | | | | | -5.78 | | | | | 586 | | | | | 1.10 | | | | | -0.07 | | | | | 1.15 | | | | | -0.12 | | | | | 42 | |
Year ended 12-31-2014 | | | | 10.84 | | | | | 7.87 | | | | | 557 | | | | | 1.10 | | | | | -0.34 | | | | | 1.15 | | | | | -0.39 | | | | | 43 | |
Year ended 12-31-2013 | | | | 10.72 | | | | | 29.94 | | | | | 426 | | | | | 1.10 | | | | | -0.36 | | | | | 1.16 | | | | | -0.42 | | | | | 35 | |
Year ended 12-31-2012 | | | | 8.54 | | | | | 13.56 | | | | | 264 | | | | | 1.12 | | | | | -0.27 | | | | | 1.17 | | | | | -0.32 | | | | | 35 | |
| | | | | | | | |
Real Estate Securities | | | | | | | | | | | | | | | | | | | | | | | | | | | | | | | | | | | | | | | | |
Year ended 12-31-2016 | | | | 8.39 | | | | | 4.26 | | | | | 49 | | | | | 1.20 | | | | | 1.26 | | | | | 1.29 | | | | | 1.17 | | | | | 79 | |
Year ended 12-31-2015 | | | | 8.98 | | | | | 4.78 | | | | | 47 | | | | | 1.19 | | | | | 1.10 | | | | | 1.28 | | | | | 1.01 | | | | | 57 | |
Year ended 12-31-2014 | | | | 9.59 | | | | | 30.17 | | | | | 52 | | | | | 1.21 | | | | | 1.16 | | | | | 1.30 | | | | | 1.07 | | | | | 81 | |
Year ended 12-31-2013 | | | | 7.90 | | | | | 1.13 | | | | | 40 | | | | | 1.24 | | | | | 1.01 | | | | | 1.33 | | | | | 0.92 | | | | | 43 | |
Year ended 12-31-2012 | | | | 7.89 | | | | | 17.72 | | | | | 40 | | | | | 1.33 | | | | | 1.03 | | | | | 1.34 | | | | | 1.02 | | | | | 47 | |
| | | | | | | | |
Science and Technology | | | | | | | | | | | | | | | | | | | | | | | | | | | | | | | | | | | | | | | | |
Year ended 12-31-2016 | | | | 22.34 | | | | | 1.54 | | | | | 514 | | | | | 1.15 | | | | | -0.52 | | | | | 1.17 | | | | | -0.54 | | | | | 16 | |
Year ended 12-31-2015 | | | | 22.96 | | | | | -2.88 | | | | | 582 | | | | | 1.13 | | | | | -0.60 | | | | | 1.15 | | | | | -0.62 | | | | | 25 | |
Year ended 12-31-2014 | | | | 25.02 | | | | | 2.91 | | | | | 586 | | | | | 1.13 | | | | | -0.51 | | | | | 1.15 | | | | | -0.53 | | | | | 29 | |
Year ended 12-31-2013 | | | | 26.58 | | | | | 56.39 | | | | | 570 | | | | | 1.14 | | | | | -0.49 | | | | | 1.16 | | | | | -0.51 | | | | | 51 | |
Year ended 12-31-2012 | | | | 18.10 | | | | | 27.83 | | | | | 334 | | | | | 1.15 | | | | | -0.67 | | | | | 1.17 | | | | | -0.69 | | | | | 44 | |
| | | | | | | | |
Small Cap Growth | | | | | | | | | | | | | | | | | | | | | | | | | | | | | | | | | | | | | | | | |
Year ended 12-31-2016 | | | | 9.69 | | | | | 2.92 | | | | | 426 | | | | | 1.14 | | | | | -0.79 | | | | | 1.16 | | | | | -0.81 | | | | | 107 | |
Year ended 12-31-2015 | | | | 10.60 | | | | | 1.88 | | | | | 430 | | | | | 1.13 | | | | | -0.76 | | | | | 1.15 | | | | | -0.78 | | | | | 102 | |
Year ended 12-31-2014 | | | | 12.15 | | | | | 1.59 | | | | | 426 | | | | | 1.14 | | | | | -0.80 | | | | | 1.16 | | | | | -0.82 | | | | | 85 | |
Year ended 12-31-2013 | | | | 13.76 | | | | | 43.36 | | | | | 560 | | | | | 1.14 | | | | | -0.84 | | | | | 1.16 | | | | | -0.86 | | | | | 74 | |
Year ended 12-31-2012 | | | | 9.60 | | | | | 5.17 | | | | | 448 | | | | | 1.14 | | | | | -0.80 | | | | | 1.16 | | | | | -0.82 | | | | | 85 | |
| | | | | | | | |
Small Cap Value | | | | | | | | | | | | | | | | | | | | | | | | | | | | | | | | | | | | | | | | |
Year ended 12-31-2016 | | | | 18.34 | | | | | 28.88 | | | | | 348 | | | | | 1.16 | | | | | 0.08 | | | | | — | | | | | — | | | | | 182 | |
Year ended 12-31-2015 | | | | 15.66 | | | | | -5.58 | | | | | 318 | | | | | 1.15 | | | | | 0.26 | | | | | — | | | | | — | | | | | 142 | |
Year ended 12-31-2014 | | | | 17.98 | | | | | 7.05 | | | | | 354 | | | | | 1.15 | | | | | -0.10 | | | | | — | | | | | — | | | | | 81 | |
Year ended 12-31-2013 | | | | 19.90 | | | | | 33.53 | | | | | 289 | | | | | 1.16 | | | | | -0.09 | | | | | — | | | | | — | | | | | 54 | |
Year ended 12-31-2012 | | | | 16.04 | | | | | 18.63 | | | | | 246 | | | | | 1.17 | | | | | 0.78 | | | | | — | | | | | — | | | | | 64 | |
| | | | | | | | |
Value | | | | | | | | | | | | | | | | | | | | | | | | | | | | | | | | | | | | | | | | |
Year ended 12-31-2016 | | | | 5.93 | | | | | 11.14 | | | | | 379 | | | | | 1.02 | | | | | 1.38 | | | | | 1.03 | | | | | 1.37 | | | | | 54 | |
Year ended 12-31-2015 | | | | 6.15 | | | | | -3.91 | | | | | 384 | | | | | 0.99 | | | | | 0.91 | | | | | 1.00 | | | | | 0.90 | | | | | 74 | |
Year ended 12-31-2014 | | | | 7.39 | | | | | 10.94 | | | | | 416 | | | | | 1.00 | | | | | 0.72 | | | | | 1.01 | | | | | 0.71 | | | | | 76 | |
Year ended 12-31-2013 | | | | 7.82 | | | | | 35.34 | | | | | 372 | | | | | 1.00 | | | | | 0.76 | | | | | 1.01 | | | | | 0.75 | | | | | 63 | |
Year ended 12-31-2012 | | | | 5.97 | | | | | 18.88 | | | | | 308 | | | | | 1.00 | | | | | 1.20 | | | | | 1.02 | | | | | 1.18 | | | | | 67 | |
See Accompanying Notes to Financial Statements.
| | |
| NOTES TO FINANCIAL STATEMENTS | | IVY VIP |
DECEMBER 31, 2016
1. ORGANIZATION
Ivy Variable Insurance Portfolios, a Delaware statutory trust (the “Trust”), is registered under the Investment Company Act of 1940, as amended (the “1940 Act”), as an open-end management investment company. The Trust is divided into 29 series (each a “Portfolio”). Effective October 14, 2016, Money Market changed its name to Government Money Market and its investment strategy to reflect that it is classified as a “government money market fund” as such term is defined in or interpreted under Rule 2a-7. The assets belonging to each Portfolio, except Pathfinder Aggressive, Pathfinder Conservative, Pathfinder Moderate, Pathfinder Moderately Aggressive and Pathfinder Moderately Conservative (collectively, the “Pathfinder Portfolios”) and Pathfinder Moderate — Managed Volatility, Pathfinder Moderately Aggressive — Managed Volatility and Pathfinder Moderately Conservative — Managed Volatility (collectively, the “Managed Volatility Portfolios”), are held separately by the custodian. The assets belonging to each Pathfinder Portfolio and Managed Volatility Portfolio are held separately by the transfer agent for the underlying funds and the custodian. The investment objective, policies and risk factors of each Portfolio are described more fully in the Prospectus and Statement of Additional Information (“SAI”). Each Portfolio’s investment adviser is Ivy Investment Management Company (“IICO”).
2. SIGNIFICANT ACCOUNTING POLICIES
The following is a summary of significant accounting policies consistently followed by each Portfolio.
Security Transactions and Related Investment Income. Security transactions are accounted for on the trade date (date the order to buy or sell is executed). Realized gains and losses are calculated on the identified cost basis. Interest income is recorded on the accrual basis and includes paydown gain (loss) and accretion of discounts and amortization of premiums. Dividend income is recorded on the ex-dividend date, except certain dividends from foreign securities where the ex-dividend date may have passed, which are recorded as soon as the Portfolio is informed of the ex-dividend date. All or a portion of the distributions received from a real estate investment trust or publicly traded partnership may be designated as a reduction of cost of the related investment or realized gain.
Foreign Currency Translation. Each Portfolio’s accounting records are maintained in U.S. dollars. All assets and liabilities denominated in foreign currencies are translated into U.S. dollars daily, using foreign exchange rates obtained from an independent pricing service approved by the Board of Trustees of the Trust (the “Board”). Purchases and sales of investment securities and accruals of income and expenses are translated at the rate of exchange prevailing on the date of the transaction. For assets and liabilities other than investments in securities, net realized and unrealized gains and losses from foreign currency translation arise from changes in currency exchange rates. Each Portfolio combines fluctuations from currency exchange rates and fluctuations in value when computing net realized gain (loss) and net change in unrealized appreciation (depreciation) on investments. Foreign exchange rates are typically valued as of the close of the New York Stock Exchange (“NYSE”), normally 4:00 P.M. Eastern time, on each day the NYSE is open for trading.
Dividends and Distributions to Shareholders. Dividends and distributions to shareholders are recorded by each Portfolio on the business day following record date. Net investment income dividends and capital gains distributions are determined in accordance with income tax regulations which may differ from accounting principles generally accepted in the United States of America (“U.S. GAAP”). If the total dividends and distributions made in any tax year exceeds net investment income and accumulated realized capital gains, a portion of the total distribution may be treated as a tax return of capital.
Income Taxes. It is the policy of each Portfolio to distribute all of its taxable income and capital gains to its shareholders and to otherwise qualify as a regulated investment company under Subchapter M of the Internal Revenue Code. In addition, each Portfolio intends to pay distributions as required to avoid imposition of excise tax. Accordingly, no provision has been made for Federal income taxes. The Portfolios file income tax returns in U.S. federal and applicable state jurisdictions. The Portfolios’ tax returns are subject to examination by the relevant taxing authority until expiration of the applicable statute of limitations, which is generally three years after the filing of the tax returns. Management of the Trust periodically reviews all tax positions to assess whether it is more likely than not that the position would be sustained upon examination by the relevant tax authority based on the technical merits of each position. As of the date of these financial statements, management believes that no liability for unrecognized tax positions is required.
Segregation and Collateralization. In cases in which the 1940 Act and the interpretive positions of the Securities and Exchange Commission (“SEC”), the Dodd Frank Wall Street Reform and Consumer Protection Act, or the interpretive rules and regulations of the U.S. Commodities Futures Trading Commission require that a Portfolio either deliver collateral or segregate assets in connection with certain investments (e.g., dollar rolls, financial futures contracts, foreign currency exchange contracts, options written, securities with extended settlement periods, and swaps), the Portfolio will segregate collateral or designate on its books and records, cash or other liquid securities having a value at least equal to the amount that is required to be physically segregated for the benefit of the counterparty. Furthermore, based on requirements and agreements with certain exchanges and third party broker-dealers, each party has requirements to deliver/deposit cash or
securities as collateral for certain investments. Certain countries require that cash reserves be held while investing in companies incorporated in that country. These cash reserves and cash collateral that has been pledged to cover obligations of the Portfolios under derivative contracts, if any, will be reported separately on the Statement of Assets and Liabilities as “Restricted cash”. Securities collateral pledged for the same purpose, if any, is noted on the Schedule of Investments.
Concentration of Market and Credit Risk. In the normal course of business, the Portfolios invest in securities and enter into transactions where risks exist due to fluctuations in the market (market risk) or failure of the issuer of a security to meet all its obligations (issuer credit risk). The value of securities held by the Portfolios may decline in response to certain events, including those directly involving the issuers whose securities are owned by the Portfolios; conditions affecting the general economy; overall market changes; local, regional or global political, social or economic instability; and currency and interest rate and price fluctuations. Similar to issuer credit risk, the Portfolios may be exposed to counterparty credit risk, or the risk that an entity with which the Portfolios have unsettled or open transactions may fail to or be unable to perform on its commitments. The Portfolios manage counterparty credit risk by entering into transactions only with counterparties that they believe have the financial resources to honor their obligations and by monitoring the financial stability of those counterparties. Financial assets, which potentially expose the Portfolios to market, issuer and counterparty credit risks, consist principally of financial instruments and receivables due from counterparties. The extent of the Portfolios’ exposure to market, issuer and counterparty credit risks with respect to these financial assets is generally approximated by their value recorded on the Portfolios’ Statement of Assets and Liabilities, less any collateral held by the Portfolios.
Certain Portfolios may hold high-yield or non-investment-grade bonds, that may be subject to a greater degree of credit risk. Credit risk relates to the ability of the issuer to meet interest or principal payments or both as they become due. The Portfolios may acquire securities in default and are not obligated to dispose of securities whose issuers subsequently default.
Certain Portfolios may enter into financial instrument transactions (such as swaps, futures, options and other derivatives) that may have off-balance sheet market risk. Off-balance sheet market risk exists when the maximum potential loss on a particular financial instrument is greater than the value of such financial instrument, as reflected on the Statement of Assets and Liabilities.
If a Portfolio invests directly in foreign currencies or in securities that trade in, and receive revenues in, foreign currencies, or in financial derivatives that provide exposure to foreign currencies, it will be subject to the risk that those currencies will decline in value relative to the base currency of the Portfolio, or, in the case of hedging positions, that the Portfolio’s base currency will decline in value relative to the currency being hedged. Currency rates in foreign countries may fluctuate significantly over short periods of time for a number of reasons, including changes in interest rates, intervention (or the failure to intervene) by U.S. or foreign governments, central banks or supranational entities such as the International Monetary Fund, or by the imposition of currency controls or other political developments in the United States or abroad.
Inflation-Indexed Bonds. Certain Portfolios may invest in inflation-indexed bonds. Inflation-indexed bonds are fixed-income securities whose principal value is periodically adjusted to the rate of inflation. The interest rate on these bonds is generally fixed at issuance at a rate lower than typical bonds. Over the life of an inflation-indexed bond, however, interest will be paid based on a principal value, which is adjusted for inflation. Any increase or decrease in the principal amount of an inflation-indexed bond will be included as interest income on the Statement of Operations, even though investors do not receive their principal until maturity.
Interest Only Obligations. These securities entitle the owner to receive only the interest portion from a bond, Treasury note or pool of mortgages. These securities are generally created by a third party separating a bond or pool of mortgages into distinct interest-only and principal-only securities. As the principal (par) amount of a bond or pool of mortgages is paid down, the amount of interest income earned by the owner will decline as well.
Loans. Certain Portfolios may invest in loans, the interest rates of which float or adjust periodically based upon a specified adjustment schedule, benchmark indicator, or prevailing interest rates, the debtor of which may be a domestic or foreign corporation, partnership or other entity (“Borrower”). Loans generally pay interest at rates which are periodically redetermined by reference to a base lending rate plus a premium. These base lending rates generally include prime rates of one or more major U.S. banks, the London Interbank Offered Rate (“LIBOR”) or certificates of deposit rates. Loans often require prepayments from excess cash flow or permit the Borrower to repay at its election. The degree to which Borrowers repay cannot be predicted with accuracy. As a result, the actual maturity may be substantially less than the stated maturities. Loans are exempt from registration under the Securities Act of 1933, as amended, may contain certain restrictions on resale, and cannot be sold publicly. A Portfolio’s investments in loans may be in the form of participations in loans or assignments of all or a portion of loans from third parties.
When a Portfolio purchases assignments, it acquires all the rights and obligations under the loan agreement of the assigning lender. Assignments may, however, be arranged through private negotiations between potential assignees and potential assignors, and the rights and obligations acquired by the purchaser of an assignment may differ from, and be more limited than those held by the assigning lender. When a Portfolio purchases a participation of a loan interest, the Portfolio typically
enters into a contractual agreement with the lender or other third party selling the participation. A participation interest in loans includes the right to receive payments of principal, interest and any fees to which it is entitled from the lender and only upon receipt by the lender of payments from the Borrower, but not from the Borrower directly. When investing in a participation interest, if a Borrower is unable to meet its obligations under a loan agreement, a Portfolio generally has no direct right to enforce compliance with the terms of the loan agreement. As a result, the Portfolio assumes the credit risk of the Borrower, the selling participant, and any other persons that are interpositioned between the Portfolio and the Borrower. If the lead lender in a typical lending syndicate becomes insolvent, enters Federal Deposit Insurance Corporation (“FDIC”) receivership or, if not FDIC insured, enters into bankruptcy, the Portfolio may incur certain costs and delays in receiving payment or may suffer a loss of principal and interest.
Payment In-Kind Securities. Certain Portfolios may invest in payment in-kind securities (“PIKs”). PIKs give the issuer the option at each interest payment date of making interest payments in cash or in additional debt securities. Those additional debt securities usually have the same terms, including maturity dates and interest rates, and associated risks as the original bonds. The daily market quotations of the original bonds may include the accrued interest (referred to as a dirty price) and require a pro-rata adjustment from the unrealized appreciation or depreciation on investments to interest receivable on the Statement of Assets and Liabilities.
Securities on a When-Issued or Delayed Delivery Basis. Certain Portfolios may purchase securities on a “when-issued” basis, and may purchase or sell securities on a “delayed delivery” basis. “When-issued” or “delayed delivery” refers to securities whose terms and indenture are available and for which a market exists, but which are not available for immediate delivery. Delivery and payment for securities that have been purchased by a Portfolio on a when-issued basis normally take place within six months and possibly as long as two years or more after the trade date. During this period, such securities do not earn interest, are subject to market fluctuation and may increase or decrease in value prior to their delivery. The purchase of securities on a when-issued basis may increase the volatility of a Portfolio’s net asset value (“NAV”) to the extent the Portfolio executes such transactions while remaining substantially fully invested. When a Portfolio engages in when-issued or delayed delivery transactions, it relies on the buyer or seller, as the case may be, to complete the transaction. Their failure to do so may cause the Portfolio to lose the opportunity to obtain or dispose of the security at a price and yield IICO, or the Portfolio’s investment subadviser, as applicable, consider advantageous. The Portfolio maintains internally designated assets with a value equal to or greater than the amount of its purchase commitments. The Portfolio may also sell securities that it purchased on a when-issued or delayed delivery basis prior to settlement of the original purchase.
Custodian Fees. “Custodian fees” on the Statement of Operations may include interest expense incurred by a Portfolio on any cash overdrafts of its custodian account during the period. Such cash overdrafts may result from the effects of failed trades in portfolio securities and from cash outflows resulting from unanticipated shareholder redemption activity. A Portfolio pays interest to its custodian on such cash overdrafts, to the extent they are not offset by positive cash balances maintained by that Portfolio. The “Earnings credit” line item, if shown, represents earnings on cash balances maintained by that Portfolio during the period. Such interest expense and other custodian fees may be paid with these earnings.
Independent Trustees and Chief Compliance Officer Fees. Fees paid to the Independent Trustees can be paid in cash or deferred to a later date, at the election of the Trustees according to the Deferred Fee Agreement entered into between the Trust and the Trustee(s). Each Portfolio records its portion of the deferred fees as a liability on the Statement of Assets and Liabilities. All fees paid in cash plus any appreciation (depreciation) in the underlying deferred plan are shown on the Statement of Operations. Additionally, fees paid to the Chief Compliance Officer of the Portfolios are shown on the Statement of Operations.
Indemnification. The Trust’s organizational documents provide current and former Trustees and Officers with a limited indemnification against liabilities arising in connection with the performance of their duties to the Trust. In the normal course of business, the Trust may also enter into contracts that provide general indemnification. The Trust’s maximum exposure under these arrangements is unknown and is dependent on future claims that may be made against the Trust. The risk of material loss from such claims is considered remote.
Basis of Preparation. Each Portfolio is an investment company and follows accounting and reporting guidance in the Financial Accounting Standards Board (“FASB”) Accounting Standards Codification Topic 946 (“ASC 946”). The accompanying financial statements were prepared in accordance with U.S. GAAP, including but not limited to ASC 946. U.S. GAAP requires the use of estimates made by management. Management believes that estimates and valuations are appropriate; however, actual results may differ from those estimates, and the valuations reflected in the accompanying financial statements may differ from the value ultimately realized upon sale or maturity.
Subsequent Events. Management has performed a review for subsequent events through the date this report was issued.
3. INVESTMENT VALUATION AND FAIR VALUE MEASUREMENTS
Each Portfolio’s investments are reported at fair value. Fair value is defined as the price that each Portfolio would receive upon selling an asset or would pay upon satisfying a liability in an orderly transaction between market participants at the measurement date. Each Portfolio calculates the NAV of its shares as of the close of the NYSE, normally 4:00 P.M. Eastern time, on each day the NYSE is open for trading.
For purposes of calculating the NAV, the portfolio securities and financial instruments are valued on each business day using pricing and valuation methods as adopted by the Board. Where market quotes are readily available, fair value is generally determined on the basis of the last reported sales price, or if no sales are reported, based on quotes obtained from a quotation reporting system, established market makers, or pricing services.
Prices for fixed-income securities are typically based on quotes that are obtained from an independent pricing service approved by the Board. To determine values of fixed-income securities, the independent pricing service utilizes such factors as current quotations by broker/dealers, coupon, maturity, quality, type of issue, trading characteristics, and other yield and risk factors it deems relevant in determining valuations. Securities that cannot be valued by the independent pricing service may be valued using quotes obtained from dealers that make markets in the securities.
Investments in Government Money Market are valued on the basis of amortized cost (which approximates value), whereby a portfolio security is valued at its cost initially, and thereafter valued to reflect a constant amortization to maturity of any discount or premium. Short-term securities with maturities of 60 days or less held in all Portfolios (with the exception of Government Money Market) are valued based on quotes that are obtained from an independent pricing service approved by the Board as described in the preceding paragraph above.
Because many foreign markets close before the NYSE, events may occur between the close of the foreign market and the close of the NYSE that could have a material impact on the valuation of foreign securities. Waddell & Reed Services Company (“WRSCO”), pursuant to procedures adopted by the Board, evaluates the impact of these events and may adjust the valuation of foreign securities to reflect the fair value as of the close of the NYSE. In addition, all securities for which values are not readily available or are deemed unreliable are appraised at fair value as determined in good faith under the supervision of the Board.
Where market quotes are not readily available, portfolio securities or financial instruments are valued at fair value, as determined in good faith by the Board or Valuation Committee pursuant to procedures approved by the Board.
Market quotes are considered not readily available in circumstances where there is an absence of current or reliable market-based data (e.g., trade information or broker quotes), including where events occur after the close of the relevant market, but prior to the NYSE close, that materially affect the values of a Portfolio’s securities or financial instruments. In addition, market quotes are considered not readily available when, due to extraordinary circumstances, the exchanges or markets on which the securities trade do not open for trading for the entire day and no other market prices are available.
The Board has delegated to WRSCO the responsibility for monitoring significant events that may materially affect the values of a Portfolio’s securities or financial instruments and for determining whether the value of the applicable securities or financial instruments should be re-evaluated in light of such significant events. The Board has established a Valuation Committee to administer and oversee the valuation process, including the use of third party pricing vendors.
The Board has adopted methods for valuing securities and financial instruments in circumstances where market quotes are not readily available. For instances in which daily market quotes are not readily available, investments may be valued, pursuant to procedures established by the Board, with reference to other securities or indices. In the event that the security or financial instrument cannot be valued pursuant to one of the valuation methods established by the Board, the value of the security or financial instrument will be determined in good faith by the Valuation Committee in accordance with the procedures adopted by the Board.
When a Portfolio uses these fair valuation methods applied by WRSCO that use significant unobservable inputs to determine its NAV, securities will be priced by a method that the Board or persons acting at its direction believe accurately reflects fair value and are categorized as Level 3 of the fair value hierarchy. These methods may require subjective determinations about the value of a security. The prices used by a Portfolio may differ from the value that will ultimately be realized at the time the securities are sold.
WRSCO is responsible for monitoring the implementation of the pricing and valuation policies through a series of activities to provide reasonable comfort of the accuracy of prices including: 1) periodic vendor due diligence meetings to review methodologies, new developments, and process at vendors, 2) daily and monthly multi-source pricing comparisons reviewed and submitted to the Valuation Committee, and 3) daily review of unpriced, stale, and variance reports with exceptions reviewed by management and the Valuation Committee.
Accounting standards establish a framework for measuring fair value and a three-level hierarchy for fair value measurements based upon the transparency of inputs to the valuation of an asset or liability. Inputs may be observable or unobservable and refer broadly to the assumptions that market participants would use in pricing the asset or liability. Observable inputs reflect the assumptions market participants would use in pricing the asset or liability based on market data obtained from sources independent of the reporting entity. Unobservable inputs reflect the reporting entity’s own assumptions about the factors that market participants would use in pricing the asset or liability developed based on the best information available in the circumstances.
An individual investment’s fair value measurement is assigned a level based upon the observability of the inputs which are significant to the overall valuation.
The three-tier hierarchy of inputs is summarized as follows:
| • | | Level 1 – Observable input such as quoted prices, available in active markets, for identical assets or liabilities. |
| • | | Level 2 – Significant other observable inputs, which may include, but are not limited to, quoted prices for similar assets or liabilities in markets that are active, quoted prices for identical or similar assets or liabilities in markets that are not active, inputs other than quoted prices that are observable for the assets or liabilities (such as interest rates, yield curves, volatilities, prepayment speeds, loss severities, credit risks and default rates) or other market corroborated inputs. |
| • | | Level 3 – Significant unobservable inputs based on the best information available in the circumstances, to the extent observable inputs are not available, which may include assumptions made by the Board or persons acting at its direction that are used in determining the fair value of investments. |
A description of the valuation techniques applied to the Portfolios’ major classes of assets and liabilities measured at fair value on a recurring basis follows:
Asset-Backed Securities and Mortgage-Backed Securities. The fair value of asset-backed securities and mortgage-backed securities are estimated using recently executed transactions and based on models that consider the estimated cash flows of each debt tranche of the issuer, establish a benchmark yield, and develop an estimated tranche specific spread to the benchmark yield based on the unique attributes of the tranche including, but not limited to, the prepayment speed assumptions and attributes of the collateral. To the extent the inputs are observable and timely, the values would be categorized in Level 2 of the fair value hierarchy, and otherwise they would be categorized as Level 3.
Bullion. The fair value of bullion is at the last settlement price at the end of each day on the board of trade or exchange upon which they are traded and are categorized in Level 1 of the fair value hierarchy.
Corporate Bonds. The fair value of corporate bonds, as obtained from an independent pricing service, is estimated using various techniques, which consider recently executed transactions in securities of the issuer or comparable issuers, market price quotations (where observable), bond spreads, fundamental data relating to the issuer, and credit default swap spreads adjusted for any basis difference between cash and derivative instruments. While most corporate bonds are categorized in Level 2 of the fair value hierarchy, in instances where lower relative weight is placed on transaction prices, quotations, or similar observable inputs, they are categorized in Level 3 of the fair value hierarchy.
Derivative Instruments. Forward foreign currency contracts are valued based upon the closing prices of the forward currency rates determined at the close of the NYSE, are provided by an independent pricing service. Swaps derive their value from underlying asset prices, indices, reference rates and other inputs or a combination of these factors. Swaps are valued by an independent pricing service unless the price is unavailable, in which case they are valued at the price provided by a dealer in that security. Futures contracts traded on an exchange are generally valued at the settlement price. Listed options are ordinarily valued at the mean of the last bid and ask price provided by an independent pricing service unless the price is unavailable, in which case they are valued at a quotation obtained from a broker-dealer. Over the counter (“OTC”) options are ordinarily valued at the mean of the last bid and ask price provided by an independent pricing service for a comparable listed option unless such a price is unavailable, in which case they are valued at a quotation obtained from a broker-dealer. If no comparable listed option exists from which to obtain a price from an independent pricing service and a quotation cannot be obtained from a broker-dealer, the OTC option will be valued using a model reasonably designed to provide a current market price.
Listed derivatives that are actively traded are valued based on quoted prices from the exchange and are categorized in Level 1 of the fair value hierarchy. OTC derivative contracts include forward foreign currency contracts, swap agreements, and option contracts related to interest rates, foreign currencies, credit standing of reference entities, equity prices, or commodity prices. Depending on the product and the terms of the transaction, the fair value of the OTC derivative products are modeled taking into account the counterparties’ creditworthiness and using a series of techniques, including simulation models. Many pricing models do not entail material subjectivity because the methodologies employed do not necessitate significant judgments and the pricing inputs are observed from actively quoted markets, as is the case with interest rate
swap and option contracts. OTC derivative products valued using pricing models with significant observable inputs are categorized within Level 2 of the fair value hierarchy.
Equity Securities. Equity securities traded on U.S. or foreign securities exchanges or included in a national market system are valued at the official closing price at the close of each business day unless otherwise stated below. OTC equity securities and listed securities for which no price is readily available are valued at the average of the last bid and ask prices.
Mutual funds, including investment funds, typically are valued at the NAV reported as of the valuation date.
Securities that are stated at the last reported sales price or closing price on the day of valuation taken from the primary exchange where the security is principally traded and to the extent these securities are actively traded and valuation adjustments are not applied, they are categorized in Level 1 of the fair value hierarchy.
Foreign securities, for which the primary trading market closes at the same time or after the NYSE, are valued based on quotations from the primary market in which they are traded and categorized in Level 1. Because many foreign securities markets and exchanges close prior to the close of the NYSE, closing prices for foreign securities in those markets or on those exchanges do not reflect the events that occur after that close. Certain foreign securities may be fair valued using a pricing service that considers the correlation of the trading patterns of the foreign security to the intra-day trading in the U.S. markets for investments such as American Depositary Receipts, financial futures, exchange-traded funds, and the movement of certain indices of securities based on a statistical analysis of their historical relationship; such valuations generally are categorized in Level 2.
Preferred stock, repurchase agreements, and other equities traded on inactive markets or valued by reference to similar instruments are also generally categorized in Level 2.
Loans. Loans are valued using a price or composite price from one or more brokers or dealers as obtained from an independent pricing service. The fair value of loans is estimated using recently executed transactions, market price quotations, credit/market events, and cross-asset pricing. Inputs are generally observable market inputs obtained from independent sources. Loans are generally categorized in Level 2 of the fair value hierarchy, unless key inputs are unobservable in which case they would be categorized as Level 3.
Municipal Bonds. Municipal bonds are fair valued based on pricing models used by and obtained from an independent pricing service that take into account, among other factors, information received from market makers and broker-dealers, current trades, bid-wants lists, offerings, market movements, the callability of the bond, state of issuance, benchmark yield curves, and bond insurance. To the extent that these inputs are observable and timely, the fair values of municipal bonds would be categorized as Level 2; otherwise the fair values would be categorized as Level 3.
Overdraft Due to Custodian. Due to the short-term nature of overdraft due to custodian, the carrying value approximates fair value and the liability is categorized as Level 2 in the fair value hierarchy.
Restricted Securities. Restricted securities that are deemed to be Rule 144A securities and illiquid, as well as restricted securities held in non-public entities, are included in Level 3 of the fair value hierarchy to the extent that significant inputs to valuation are unobservable, because they trade infrequently, if at all and, therefore, the inputs are unobservable. Restricted securities that are valued at a discount to similar publicly traded securities may be categorized as Level 2 of the fair value hierarchy to the extent that the discount is considered to be insignificant to the fair value measurement in its entirety; otherwise they may be categorized as Level 3.
U.S. Government and Agency Securities. U.S. government and agency securities are normally valued using a model that incorporates market observable data such as reported sales of similar securities, broker quotes, yields, bids, offers, quoted market prices, and reference data. Accordingly, U.S. government and agency securities are normally categorized in Level 2 of the fair value hierarchy depending on the liquidity and transparency of the market.
Transfers from Level 2 to Level 3 occurred primarily due to the lack of observable market data due to decreased market activity or information for these securities. Transfers from Level 3 to Level 2 occurred primarily due to the increased availability of observable market data due to increased market activity or information. Transfers between levels represent the values as of the beginning of the reporting period.
For fair valuations using unobservable inputs, U.S. GAAP requires a reconciliation of the beginning to ending balances for reported fair values that presents changes attributable to total realized and unrealized gains or losses, purchases and sales, and transfers in or out of the Level 3 category during the period. In accordance with the requirements of U.S. GAAP, a fair value hierarchy and Level 3 reconciliation, if any, have been included in the Notes to the Schedule of Investments for each respective Portfolio.
Net realized gain (loss) and net unrealized appreciation (depreciation), shown on the reconciliation of Level 3 investments, if applicable, are included on the Statement of Operations in net realized gain (loss) on investments in unaffiliated and/or affiliated securities and in net change in unrealized appreciation (depreciation) on investments in unaffiliated and/or
affiliated securities, respectively. Additionally, the net change in unrealized appreciation (depreciation) for all Level 3 investments still held as of December 31, 2016, if applicable, is included on the Statement of Operations in net change in unrealized appreciation (depreciation) on investments in unaffiliated and/or affiliated securities.
4. DERIVATIVE INSTRUMENTS ($ amounts in thousands unless indicated otherwise)
The following disclosures contain information on why and how the Portfolios use derivative instruments, the associated risks of investing in derivative instruments, and how derivative instruments affect the Portfolios’ financial positions and results of operations when presented by primary underlying risk exposure.
Forward Foreign Currency Contracts. Each Portfolio, other than Government Money Market and the Pathfinder Portfolios, may enter into forward foreign currency contracts (“forward contracts”) for the purchase or sale of a foreign currency at a negotiated rate at a future date. Forward contracts are reported on a schedule following the Schedule of Investments. Forward contracts will be valued daily based upon the closing prices of the forward currency rates provided by an independent pricing service determined at the close of the NYSE as provided by a bank, dealer or independent pricing service. The resulting unrealized appreciation and depreciation is reported on the Statement of Assets and Liabilities as a receivable or payable and on the Statement of Operations within the change in unrealized appreciation (depreciation). At contract close, the difference between the original cost of the contract and the value at the close date is recorded as a realized gain (loss) on the Statement of Operations.
Risks to a Portfolio related to the use of such contracts include both market and credit risk. Market risk is the risk that the value of the forward contract will depreciate due to unfavorable changes in the exchange rates. Credit risk arises from the possibility that the counterparty will default. If the counterparty defaults, a Portfolio’s maximum loss will consist of the aggregate unrealized gain on appreciated contracts that is not collateralized.
Asset Strategy, Global Bond, Global Growth, Global Natural Resources, High Income and International Core Equity enter into forward foreign currency exchange contracts as an economic hedge against either specific transactions or portfolio instruments or to obtain exposure to, or hedge exposure away from foreign currencies (foreign currency exchange rate risk).
Futures Contracts. Each Portfolio, other than Government Money Market and the Pathfinder Portfolios, may engage in buying and selling futures contracts. Upon entering into a futures contract, the Portfolio is required to deposit, in a segregated account, an amount equal to a varying specified percentage of the contract amount. This amount is known as the initial margin. Subsequent payments (variation margins) are made or received by the Portfolio each day, dependent on the daily fluctuations in the value of the underlying debt security or index.
Futures contracts are reported on a schedule following the Schedule of Investments. Securities held in collateralized accounts to cover initial margin requirements on open futures contracts are identified on the Schedule of Investments. Cash held by the broker to cover initial margin requirements on open futures contracts and the receivable and/or payable for the daily mark to market for the variation margin are noted on the Statement of Assets and Liabilities. The net change in unrealized appreciation (depreciation) is reported on the Statement of Operations. Realized gains (losses) are reported on the Statement of Operations at the closing or expiration of futures contracts.
Risks of entering into futures contracts include the possibility of loss of securities or cash held as collateral, that there may be an illiquid market where the Portfolio is unable to close the contract or enter into an offsetting position and, if used for hedging purposes, the risk that the price of the contract will correlate imperfectly with the prices of the Portfolio’s securities.
Pathfinder Moderate — Managed Volatility, Pathfinder Moderately Aggressive — Managed Volatility, Pathfinder Moderately Conservative — Managed Volatility and Asset Strategy invest in long and/or short positions in futures contracts to gain exposure to, or economically hedge against, changes in interest rates (interest rate risk), changes in the value of equity securities (equity risk) or foreign currencies (foreign currency exchange rate risk).
Option Contracts. Options purchased by a Portfolio are accounted for in the same manner as portfolio securities. The cost of instruments acquired through the exercise of call options is increased by the premium paid to purchase the call. The proceeds from instruments sold through the exercise of put options are decreased by the premium paid to purchase the put.
When a Portfolio writes (sells) an option, an amount equal to the premium received by the Portfolio is recorded as a liability. The amount of the liability is subsequently adjusted to reflect the current value of the option written. When an option expires on its stipulated expiration date or a Portfolio enters into a closing purchase transaction, the Portfolio realizes a gain (or loss if the cost of a closing purchase transaction exceeds the premium received when the call option was sold), and the liability related to such option is extinguished. When a written call option is exercised, the premium is added to the proceeds from the sale of the underlying instrument in determining whether a Portfolio has realized a gain or loss. When a written put is exercised, the cost basis of the instruments purchased by a Portfolio is reduced by the amount of the premium received.
Investments in options, whether purchased or written, involve certain risks. Writing put options and purchasing call options may increase a Portfolio’s exposure to the underlying instrument. With written options, there may be times when a Portfolio will be required to purchase or sell instruments to meet its obligation under the option contract where the required action is not beneficial to the Portfolio, due to unfavorable movement of the market price of the underlying instrument. Additionally, to the extent a Portfolio enters into OTC option transactions with counterparties, the Portfolio will be exposed to the risk that counterparties to these OTC transactions will be unable to meet their obligations under the terms of the transaction.
Asset Strategy, Balanced, International Core Equity, Mid Cap Growth, Science and Technology and Value purchase and write call and put options to increase or decrease hedging exposure to underlying instruments (which include credit risk, equity risk, foreign currency exchange rate risk, event risk and/or interest rate risk), increase exposure to various equity markets or certain sectors, gain exposure to or facilitate trading in certain securities and/or, in the case of options written, to generate returns from options premiums.
Swap Agreements. Each Portfolio, other than Government Money Market and the Pathfinder Portfolios, may invest in swap agreements. Swaps are marked to market daily and changes in value are recorded as unrealized appreciation (depreciation) on the Statement of Operations. Payments received or made by the Portfolio are recorded as realized gain or loss on the Statement of Operations. Any upfront premiums paid are recorded as assets and any upfront fees received are recorded as liabilities and are shown as swap premiums paid and swap premiums received, respectively, if any, on the Statement of Assets and Liabilities and amortized over the term of the swap. A liquidation payment received or made at the termination or maturity of the swap is recorded as realized gain or loss on the Statement of Operations.
Total return swaps involve a commitment to pay or receive periodic interest payments in exchange for a market-linked return based on a security or a basket of securities including a variety of securities or representing a particular index. To the extent the total return of the security, index or other financial measure underlying the transaction exceeds or falls short of the offsetting interest rate obligation, the Portfolio will receive a payment from or make a payment to the counterparty.
Asset Strategy and Small Cap Growth entered into total return swaps during the fiscal year to take directional exposure to a security or sector within the market. High Income entered into total return swaps to both hedge and take directional exposure to a security or sector within the market.
The creditworthiness of the counterparty with which a Portfolio enters into a swap agreement is monitored by IICO. If a firm’s creditworthiness declines, the value of the agreement would likely decline, potentially resulting in losses. If a default occurs by the counterparty to such a transaction, the Portfolio will have contractual remedies pursuant to the agreement related to the transaction. The maximum loss a Portfolio may incur consists of the aggregate unrealized gain on appreciated contracts that is not collateralized.
Collateral and rights of offset. A Portfolio may mitigate credit risk with respect to OTC derivative counterparties through credit support annexes (“CSA”) included with an International Swaps and Derivatives Association, Inc. (“ISDA”) Master Agreement which is the standard contract governing most derivative transactions between the Portfolio and each of its counterparties. The CSA allows the Portfolio and its counterparty to offset certain derivative financial instruments’ payables and/or receivables against each other with collateral, which is generally held by the Portfolio’s custodian or broker. The amount of collateral moved to/from applicable counterparties is based upon minimum transfer amounts specified in the CSA. To the extent amounts due to the Portfolio from its counterparties are not fully collateralized contractually or otherwise, the Portfolio bears the risk of loss from counterparty non-performance. See Note 2 “Segregation and Collateralization” for additional information with respect to collateral practices.
Offsetting of Assets and Liabilities. The following tables present financial instruments that are either (1) offset or (2) subject to an enforceable master netting arrangement or similar agreement as of December 31, 2016:
Assets
| | | | | | | | | | | | | | | | | | | | | | | | | | | | |
| | | | | | | | | | | | Gross Amounts Not Offset on the
Statement of Assets and Liabilities | |
| Portfolio | | Gross
Amounts of
Recognized
Assets | | | Gross
Amounts
Offset on the
Statement of
Assets and
Liabilities | | | Net Amounts
of Assets
Presented on
the Statement
of Assets and
Liabilities | | | Financial
Instruments
and
Derivatives
Available
for Offset | | | Non-Cash
Collateral
Received | | | Cash
Collateral
Received | | | Net
Amount
Receivable | |
Asset Strategy | | | | | | | | | | | | | | | | | | | | | | | | | | | | |
Unrealized appreciation on forward foreign currency contracts | | $ | 168 | | | $ | — | | | $ | 168 | | | $ | (3 | ) | | $ | — | | | $ | (165 | ) | | $ | — | |
Unrealized appreciation on swap agreements | | | 80 | | | | — | | | | 80 | | | | — | | | | — | | | | (80 | ) | | | — | |
Total | | $ | 248 | | | $ | — | | | $ | 248 | | | $ | (3 | ) | | $ | — | | | $ | (245 | ) | | $ | — | |
Global Bond | | | | | | | | | | | | | | | | | | | | | | | | | | | | |
Unrealized appreciation on forward foreign currency contracts | | $ | 1 | | | $ | — | | | $ | 1 | | | $ | — | | | $ | — | | | $ | — | | | $ | 1 | |
Global Natural Resources | | | | | | | | | | | | | | | | | | | | | | | | | | | | |
Unrealized appreciation on forward foreign currency contracts | | $ | 64 | | | $ | — | | | $ | 64 | | | $ | (15 | ) | | $ | — | | | $ | — | | | $ | 49 | |
High Income | | | | | | | | | | | | | | | | | | | | | | | | | | | | |
Unrealized appreciation on forward foreign currency contracts(1) | | $ | 375 | | | $ | — | | | $ | 375 | | | $ | (6 | ) | | $ | — | | | $ | (338 | ) | | $ | 31 | |
International Core Equity | | | | | | | | | | | | | | | | | | | | | | | | | | | | |
Unrealized appreciation on forward foreign currency contracts | | $ | 688 | | | $ | — | | | $ | 688 | | | $ | — | | | $ | — | | | $ | (688 | ) | | $ | — | |
| (1) | Amounts include forward contracts that have an offset to an open and close contract, but have not settled. These amounts are included on the Statement of Assets and Liabilities line item for Investment securities sold receivable. |
Liabilities
| | | | | | | | | | | | | | | | | | | | | | | | | | | | |
| | | | | | | | | | | | Gross Amounts Not Offset on the
Statement of Assets and Liabilities | |
| Portfolio | | Gross
Amounts of
Recognized
Liabilities | | | Gross
Amounts
Offset on the
Statement of
Assets and
Liabilities | | | Net Amounts
of Liabilities
Presented on
the Statement
of Assets and
Liabilities | | | Financial
Instruments
and
Derivatives
Available for
Offset | | | Non-Cash
Collateral
Pledged | | | Cash
Collateral
Pledged | | | Net Amount
Payable | |
Asset Strategy | | | | | | | | | | | | | | | | | | | | | | | | | | | | |
Unrealized depreciation on forward foreign currency contracts(1) | | $ | 3 | | | $ | — | | | $ | 3 | | | $ | (3 | ) | | $ | — | | | $ | — | | | $ | — | |
Global Natural Resources | | | | | | | | | | | | | | | | | | | | | | | | | | | | |
Unrealized depreciation on forward foreign currency contracts | | $ | 15 | | | $ | — | | | $ | 15 | | | $ | (15 | ) | | $ | — | | | $ | — | | | $ | — | |
High Income | | | | | | | | | | | | | | | | | | | | | | | | | | | | |
Unrealized depreciation on forward foreign currency contracts | | $ | 16 | | | $ | — | | | $ | 16 | | | $ | (6 | ) | | $ | — | | | $ | — | | | $ | 10 | |
Small Cap Growth | | | | | | | | | | | | | | | | | | | | | | | | | | | | |
Unrealized depreciation on swap agreements | | $ | 946 | | | $ | — | | | $ | 946 | | | $ | — | | | $ | (946 | ) | | $ | — | | | $ | — | |
| (1) | Amounts include forward contracts that have an offset to an open and close contract, but have not settled. These amounts are included on the Statement of Assets and Liabilities line item for Investment securities purchased payable. |
Additional Disclosure Related to Derivative Instruments
Fair values of derivative instruments as of December 31, 2016:
| | | | | | | | | | | | | | | | | | |
| | | | | Assets | | | | | | Liabilities | |
| Portfolio | | Type of Risk
Exposure | | Statement of Assets & Liabilities
Location | | Value | | | | | | Statement of Assets & Liabilities
Location | | Value | |
| Pathfinder Moderate – Managed Volatility | | Equity | | | | $ | — | | | | | | | Unrealized depreciation on futures contracts* | | $ | 184 | |
| Pathfinder Moderately Aggressive – Managed Volatility | | Equity | | | | | — | | | | | | | Unrealized depreciation on futures contracts* | | | 22 | |
| Pathfinder Moderately Conservative – Managed Volatility | | Equity | | | | | — | | | | | | | Unrealized depreciation on futures contracts* | | | 33 | |
| Asset Strategy | | Equity | | Unrealized appreciation on swap agreements | | | 80 | | | | | | | | | | — | |
| | | Foreign currency | | Unrealized appreciation on forward foreign currency contracts | | | 168 | | | | | | | | | | — | |
| Global Bond | | Foreign currency | | Unrealized appreciation on forward foreign currency contracts | | | 1 | | | | | | | | | | — | |
| Global Natural Resources | | Foreign currency | | Unrealized appreciation on forward foreign currency contracts | | | 64 | | | | | | | Unrealized depreciation on forward foreign currency contracts | | | 15 | |
| High Income | | Foreign currency | | Unrealized appreciation on forward foreign currency contracts | | | 6 | | | | | | | Unrealized depreciation on forward foreign currency contracts | | | 16 | |
| International Core Equity | | Foreign currency | | Unrealized appreciation on forward foreign currency contracts | | | 688 | | | | | | | | | | — | |
| Small Cap Growth | | Equity | | | | | — | | | | | | | Unrealized depreciation on swap agreements | | | 946 | |
| Value | | Equity | | | | | — | | | | | | | Written options at value | | | 65 | |
*The value presented includes cumulative gain (loss) on open futures contracts; however, the value reflected on the accompanying Statement of Assets and Liabilities is only the unsettled variation margin receivable (payable) as of December 31, 2016.
Amount of realized gain (loss) on derivatives recognized on the Statement of Operations for the year ended December 31, 2016:
| | | | | | | | | | | | | | | | | | | | | | | | | | |
| | | | | Net realized gain (loss) on: | | | | |
| Portfolio | | Type of Risk
Exposure | | Investments in
unaffiliated
securities* | | | Swap
agreements | | | Futures
contracts | | | Written
options | | | Forward
foreign
currency
contracts | | | Total | |
| Pathfinder Moderate – Managed Volatility | | Equity | | $ | — | | | $ | — | | | $ | (6,879 | ) | | $ | — | | | $ | — | | | $ | (6,879 | ) |
| Pathfinder Moderately Aggressive – Managed Volatility | | Equity | | | — | | | | — | | | | (1,169 | ) | | | — | | | | — | | | | (1,169 | ) |
| Pathfinder Moderately Conservative – Managed Volatility | | Equity | | | — | | | | — | | | | (941 | ) | | | — | | | | — | | | | (941 | ) |
| Asset Strategy | | Equity | | | 3,068 | | | | — | ** | | | 1,689 | | | | 1,726 | | | | — | | | | 6,483 | |
| | | Foreign currency | | | — | | | | — | | | | — | | | | — | | | | 368 | | | | 368 | |
| Balanced | | Equity | | | (6,551 | ) | | | — | | | | — | | | | 1,029 | | | | — | | | | (5,522 | ) |
| Global Bond | | Foreign currency | | | — | | | | — | | | | — | | | | — | | | | 22 | | | | 22 | |
| Global Growth | | Foreign currency | | | — | | | | — | | | | — | | | | — | | | | 1,373 | | | | 1,373 | |
| Global Natural Resources | | Foreign currency | | | — | | | | — | | | | — | | | | — | | | | 1,421 | | | | 1,421 | |
| High Income | | Foreign currency | | | — | | | | — | | | | — | | | | — | | | | 45 | | | | 45 | |
| | | Interest rate | | | — | | | | 277 | | | | — | | | | — | | | | — | | | | 277 | |
| International Core Equity | | Equity | | | — | | | | — | | | | — | | | | (25 | ) | | | — | | | | (25 | ) |
| | | Foreign currency | | | — | | | | — | | | | — | | | | — | | | | 6,198 | | | | 6,198 | |
| Mid Cap Growth | | Equity | | | (2,122 | ) | | | — | | | | — | | | | 1,382 | | | | — | | | | (740 | ) |
| Science and Technology | | Equity | | | (424 | ) | | | — | | | | — | | | | (235 | ) | | | — | | | | (659 | ) |
| Small Cap Growth | | Equity | | | — | | | | (249 | ) | | | — | | | | — | | | | — | | | | (249 | ) |
| Value | | Equity | | | (90 | ) | | | — | | | | — | | | | 579 | | | | — | | | | 489 | |
* Purchased options are reported as investments in unaffiliated securities and are reflected on the accompanying Schedule of Investments.
** Not shown due to rounding.
Change in unrealized appreciation (depreciation) on derivatives recognized on the Statement of Operations for the year ended December 31, 2016:
| | | | | | | | | | | | | | | | | | | | | | | | | | |
| | | | | Net change in unrealized appreciation (depreciation) on: | | | | |
| Portfolio | | Type of Risk
Exposure | | Investments in
unaffiliated
securities* | | | Swap
agreements | | | Futures
contracts | | | Written
options | | | Forward
foreign
currency
contracts | | | Total | |
Pathfinder Moderate – Managed Volatility | | Equity | | | $— | | | | $— | | | | $(378) | | | | $— | | | | $— | | | | $(378) | |
Pathfinder Moderately Aggressive – Managed Volatility | | Equity | | | — | | | | — | | | | (59) | | | | — | | | | — | | | | (59) | |
Pathfinder Moderately Conservative – Managed Volatility | | Equity | | | — | | | | — | | | | (66) | | | | — | | | | — | | | | (66) | |
| Asset Strategy | | Equity | | | 3,149 | | | | 80 | | | | — | | | | (1,117 | ) | | | — | | | | 2,112 | |
| | | Foreign currency | | | — | | | | — | | | | — | | | | — | | | | (40 | ) | | | (40) | |
Global Bond | | Foreign currency | | | — | | | | — | | | | — | | | | — | | | | (2 | ) | | | (2) | |
Global Natural Resources | | Foreign currency | | | — | | | | — | | | | — | | | | — | | | | (162 | ) | | | (162) | |
| High Income | | Foreign currency | | | — | | | | — | | | | — | | | | — | | | | (65 | ) | | | (65 | ) |
| | | Interest rate | | | — | | | | 27 | | | | — | | | | — | | | | — | | | | 27 | |
International Core Equity | | Foreign currency | | | — | | | | — | | | | — | | | | — | | | | (334 | ) | | | (334) | |
Mid Cap Growth | | Equity | | | — | | | | — | | | | — | | | | (1,086 | ) | | | — | | | | (1,086) | |
Science and Technology | | Equity | | | 33 | | | | — | | | | — | | | | (173 | ) | | | — | | | | (140) | |
Small Cap Growth | | Equity | | | — | | | | (946 | ) | | | — | | | | — | | | | — | | | | (946) | |
| Value | | Equity | | | — | | | | — | | | | — | | | | (191 | ) | | | — | | | | (191 | ) |
* Purchased options are reported as investments in unaffiliated securities and are reflected on the accompanying Schedule of Investments.
During the year ended December 31, 2016, the average derivative volume was as follows:
| | | | | | | | | | | | | | | | | | | | | | | | |
| Portfolio | | Forward foreign
currency contracts(1) | | | Long futures
contracts(1) | | | Short futures
contracts(1) | | | Swap
agreements(2) | | | Purchased
options(1) | | | Written
options(1) | |
Pathfinder Moderate – Managed Volatility | | $ | — | | | $ | 42 | | | $ | 24,357 | | | $ | — | | | $ | — | | | $ | — | |
Pathfinder Moderately Aggressive – Managed Volatility | | | — | | | | — | | | | 4,147 | | | | — | | | | — | | | | — | |
Pathfinder Moderately Conservative – Managed Volatility | | | — | | | | — | | | | 3,737 | | | | — | | | | — | | | | — | |
Asset Strategy | | | 50 | | | | — | | | | 2,784 | | | | 1,410 | | | | 931 | | | | 638 | |
Balanced | | | — | | | | — | | | | — | | | | — | | | | 347 | | | | 39 | |
Global Bond | | | 1 | | | | — | | | | — | | | | — | | | | — | | | | — | |
Global Growth | | | 20 | | | | — | | | | — | | | | — | | | | — | | | | — | |
Global Natural Resources | | | 90 | | | | — | | | | — | | | | — | | | | — | | | | — | |
High Income | | | — | * | | | — | | | | — | | | | 923 | | | | — | | | | — | |
International Core Equity | | | 397 | | | | — | | | | — | | | | — | | | | — | | | | 3 | |
Mid Cap Growth | | | — | | | | — | | | | — | | | | — | | | | 256 | | | | 1,309 | |
Science and Technology | | | — | | | | — | | | | — | | | | — | | | | 59 | | | | 203 | |
Small Cap Growth | | | — | | | | — | | | | — | | | | 1,760 | | | | — | | | | — | |
Value | | | — | | | | — | | | | — | | | | — | | | | — | * | | | 555 | |
| * | Not shown due to rounding. |
| (1) | Average value outstanding during the period. |
| (2) | Average notional amount outstanding during the period. |
5. WRITTEN OPTION ACTIVITY ($ amounts in thousands)
Transactions in written options were as follows:
| | | | | | | | | | | | | | | | | | | | | | | | | | | | | | |
| Portfolio | | Outstanding
at 12-31-15 | | Options
written | | Options
closed | | Options
exercised | | Options
expired | | Outstanding
at 12-31-16 |
Asset Strategy | | | | | | | | | | | | | | | | | | | | | | | | | | | | | | |
Number of Contracts | | | | 9,397 | | | | | 18,341 | | | | | (8,820 | ) | | | | (4,744 | ) | | | | (14,174 | ) | | | | N/A | |
Premium Received | | | $ | 2,599 | | | | $ | 8,055 | | | | $ | (4,328 | ) | | | $ | (3,112 | ) | | | $ | (3,214 | ) | | | | N/A | |
Balanced | | | | | | | | | | | | | | | | | | | | | | | | | | | | | | |
Number of Contracts | | | | N/A | | | | | 1,660 | | | | | (129 | ) | | | | — | | | | | (1,531 | ) | | | | N/A | |
Premium Received | | | | N/A | | | | $ | 1,030 | | | | $ | (76 | ) | | | $ | — | | | | $ | (954 | ) | | | | N/A | |
International Core Equity | | | | | | | | | | | | | | | | | | | | | | | | | | | | | | |
Number of Contracts | | | | N/A | | | | | 124,000 | | | | | (124,000 | ) | | | | — | | | | | — | | | | | N/A | |
Premium Received | | | | N/A | | | | $ | 22 | | | | $ | (22 | ) | | | $ | — | | | | $ | — | | | | | N/A | |
Mid Cap Growth | | | | | | | | | | | | | | | | | | | | | | | | | | | | | | |
Number of Contracts | | | | 329 | | | | | 17,917 | | | | | (14,488 | ) | | | | (888 | ) | | | | (2,870 | ) | | | | N/A | |
Premium Received | | | $ | 1,376 | | | | $ | 6,480 | | | | $ | (5,772 | ) | | | $ | (1,423 | ) | | | $ | (661 | ) | | | | N/A | |
Science and Technology | | | | | | | | | | | | | | | | | | | | | | | | | | | | | | |
Number of Contracts | | | | 3,889 | | | | | 11,415 | | | | | (10,244 | ) | | | | (531 | ) | | | | (4,529 | ) | | | | N/A | |
Premium Received | | | $ | 358 | | | | $ | 2,134 | | | | $ | (2,294 | ) | | | $ | (53 | ) | | | $ | (145 | ) | | | | N/A | |
Value | | | | | | | | | | | | | | | | | | | | | | | | | | | | | | |
Number of Contracts | | | | 7,610 | | | | | 19,961 | | | | | (4,063 | ) | | | | (7,321 | ) | | | | (13,188 | ) | | | | 2,999 | |
Premium Received | | | $ | 522 | | | | $ | 3,371 | | | | $ | (1,179 | ) | | | $ | (1,299 | ) | | | $ | (1,282 | ) | | | $ | 133 | |
6. BASIS FOR CONSOLIDATION OF THE ASSET STRATEGY PORTFOLIO
Ivy VIP ASF II, Ltd. (the “Subsidiary”), a Cayman Islands exempted company, was incorporated as a wholly owned subsidiary acting as an investment vehicle for Ivy VIP Asset Strategy Portfolio (referred to as “the Portfolio” in this subsection). VIP ASF III (SBP), LLC (the “Company”), a Delaware limited liability company, was incorporated as a wholly owned company acting as an investment vehicle for the Portfolio. The Subsidiary and the Company act as an investment vehicle for the Portfolio, in order to effect certain investments for the Portfolio consistent with the Portfolio’s investment objectives and policies as specified in its prospectus and SAI.
The Portfolio’s investment portfolio has been consolidated and includes the portfolio holdings of the Portfolio, its Subsidiary and the Company. The consolidated financial statements include the accounts of the Portfolio, its Subsidiary and the Company. All inter-company transactions and balances have been eliminated. A subscription agreement was entered into between the Portfolio and its Subsidiary and the Company comprising the entire issued share capital of the Subsidiary and the Company with the intent that the Portfolio will remain the sole shareholder and retain all rights. Under the Articles of Association, shares issued by the Subsidiary and the Company confer upon a shareholder the right to receive notice of, to attend and to vote at general meetings of the Subsidiary and the Company and shall confer upon the shareholder rights in a winding-up or repayment of capital and the right to participate in the profits or assets of the Subsidiary and the Company.
See the table below for details regarding the structure, incorporation and relationship as of December 31, 2016 of the Subsidiary and the Company to the Portfolio (amounts in thousands).
| | | | | | | | | | | | | | | | | | | | |
| Subsidiary/Company | | Date of
Incorporation | | | Subscription
Agreement | | | Portfolio Net
Assets | | | Subsidiary
Net Assets | | | Percentage
of Portfolio
Net Assets | |
Ivy VIP ASF II, Ltd. | | | 1-31-13 | | | | 4-10-13 | | | $ | 953,500 | | | $ | 57,869 | | | | 6.07 | % |
VIP ASF III (SBP), LLC | | | 4-9-13 | | | | 4-23-13 | | | | 953,500 | | | | 4,582 | | | | 0.48 | |
7. INVESTMENT MANAGEMENT AND PAYMENTS TO AFFILIATED PERSONS ($ amounts in thousands unless indicated otherwise)
Management Fees. Effective September 30, 2016, IICO, an affiliate of WRIMCO, entered into investment management agreements to provide investment advisory services to each Portfolio and WRIMCO terminated each Portfolio’s Management Agreement. IICO also entered into investment subadvisory agreements with the subadvisor with respect to certain Portfolios and WRIMCO terminated its investment subadvisory agreements with the subadvisor. There were no changes in the investment processes employed by any Portfolio, the nature or level of services provided to any Portfolio, or the fees paid under each Portfolio’s Management Agreement. In addition, the services provided by the subadvisor to certain Portfolios remained unchanged.
IICO, a wholly owned subsidiary of Waddell & Reed, Inc. (“W&R”), serves as each Portfolio’s investment adviser. The management fee is accrued daily by each Portfolio, except the Pathfinder Portfolios, at the following annual rates as a percentage of average daily net assets:
| | | | | | | | | | | | | | | | | | | | | | | | |
| Portfolio (M – Millions) | | $0 to
$500M | | | $500 to
$1,000M | | | $1,000 to
$1,500M | | | $1,500 to
$2,000M | | | $2,000 to
$3,000M | | | Over
$3,000M | |
Asset Strategy | | | 0.700 | % | | | 0.700 | % | | | 0.650 | % | | | 0.650 | % | | | 0.600 | % | | | 0.550 | % |
Balanced | | | 0.700 | | | | 0.700 | | | | 0.650 | | | | 0.650 | | | | 0.600 | | | | 0.550 | |
Bond | | | 0.525 | | | | 0.500 | | | | 0.450 | | | | 0.400 | | | | 0.400 | | | | 0.400 | |
Core Equity | | | 0.700 | | | | 0.700 | | | | 0.650 | | | | 0.650 | | | | 0.600 | | | | 0.550 | |
Dividend Opportunities | | | 0.700 | | | | 0.700 | | | | 0.650 | | | | 0.650 | | | | 0.600 | | | | 0.550 | |
Energy | | | 0.850 | | | | 0.850 | | | | 0.830 | | | | 0.830 | | | | 0.800 | | | | 0.760 | |
Global Bond | | | 0.625 | | | | 0.600 | | | | 0.550 | | | | 0.500 | | | | 0.500 | | | | 0.500 | |
Global Growth | | | 0.850 | | | | 0.850 | | | | 0.830 | | | | 0.830 | | | | 0.800 | | | | 0.760 | |
Global Natural Resources | | | 1.000 | | | | 0.850 | | | | 0.830 | | | | 0.830 | | | | 0.800 | | | | 0.760 | |
Government Money Market | | | 0.400 | | | | 0.400 | | | | 0.400 | | | | 0.400 | | | | 0.400 | | | | 0.400 | |
Growth | | | 0.700 | | | | 0.700 | | | | 0.650 | | | | 0.650 | | | | 0.600 | | | | 0.550 | |
High Income | | | 0.625 | | | | 0.600 | | | | 0.550 | | | | 0.500 | | | | 0.500 | | | | 0.500 | |
International Core Equity | | | 0.850 | | | | 0.850 | | | | 0.830 | | | | 0.830 | | | | 0.800 | | | | 0.760 | |
Limited-Term Bond | | | 0.500 | | | | 0.450 | | | | 0.400 | | | | 0.350 | | | | 0.350 | | | | 0.350 | |
Micro Cap Growth | | | 0.950 | | | | 0.950 | | | | 0.930 | | | | 0.930 | | | | 0.900 | | | | 0.860 | |
Mid Cap Growth | | | 0.850 | | | | 0.850 | | | | 0.830 | | | | 0.830 | | | | 0.800 | | | | 0.760 | |
Real Estate Securities | | | 0.900 | | | | 0.900 | | | | 0.870 | | | | 0.870 | | | | 0.840 | | | | 0.800 | |
Science and Technology | | | 0.850 | | | | 0.850 | | | | 0.830 | | | | 0.830 | | | | 0.800 | | | | 0.760 | |
Small Cap Growth | | | 0.850 | | | | 0.850 | | | | 0.830 | | | | 0.830 | | | | 0.800 | | | | 0.760 | |
Small Cap Value | | | 0.850 | | | | 0.850 | | | | 0.830 | | | | 0.830 | | | | 0.800 | | | | 0.760 | |
Value | | | 0.700 | | | | 0.700 | | | | 0.650 | | | | 0.650 | | | | 0.600 | | | | 0.550 | |
Each Managed Volatility Portfolio pays a management fee to IICO for providing investment advice and supervising its investments at the following annual rates as a percentage of average daily net assets:
| | | | | | | | | | | | |
| Portfolio (M – Millions) | | $0 to
$500M | | | $500 to
$1,000M | | | Over
$1,000M | |
Pathfinder Moderate – Managed Volatility | | | 0.200 | % | | | 0.170 | % | | | 0.150 | % |
Pathfinder Moderately Aggressive – Managed Volatility | | | 0.200 | | | | 0.170 | | | | 0.150 | |
Pathfinder Moderately Conservative – Managed Volatility | | | 0.200 | | | | 0.170 | | | | 0.150 | |
IICO uses all of the management fee it receives from the Managed Volatility Portfolios to pay Advantus Capital Management Inc. (“Advantus Capital”). Accordingly, Advantus Capital receives a fee based on the average daily net assets of the Managed Volatility Portfolios.
Effective October 1, 2006, under terms of a settlement agreement, the fee is payable at the following annual rates for those Portfolios included in the settlement agreement until September 30, 2016:
| | | | | | | | | | | | | | | | | | | | | | | | |
| Portfolio (M – Millions) | | $0 to
$500M | | | $500 to
$1,000M | | | $1,000 to
$1,500M | | | $1,500 to
$2,000M | | | $2,000 to
$3,000M | | | Over
$3,000M | |
Asset Strategy | | | 0.690 | % | | | 0.690 | % | | | 0.650 | % | | | 0.650 | % | | | 0.600 | % | | | 0.550 | % |
Bond(1) | | | 0.485 | | | | 0.500 | | | | 0.450 | | | | 0.400 | | | | 0.400 | | | | 0.400 | |
Core Equity | | | 0.650 | | | | 0.650 | | | | 0.650 | | | | 0.650 | | | | 0.600 | | | | 0.550 | |
Global Growth | | | 0.820 | | | | 0.820 | | | | 0.830 | | | | 0.830 | | | | 0.800 | | | | 0.760 | |
Growth | | | 0.670 | | | | 0.670 | | | | 0.650 | | | | 0.650 | | | | 0.600 | | | | 0.550 | |
High Income | | | 0.575 | | | | 0.600 | | | | 0.550 | | | | 0.500 | | | | 0.500 | | | | 0.500 | |
Mid Cap Growth | | | 0.830 | | | | 0.830 | | | | 0.830 | | | | 0.830 | | | | 0.800 | | | | 0.760 | |
Science and Technology | | | 0.830 | | | | 0.830 | | | | 0.830 | | | | 0.830 | | | | 0.800 | | | | 0.760 | |
Small Cap Growth | | | 0.830 | | | | 0.830 | | | | 0.830 | | | | 0.830 | | | | 0.800 | | | | 0.760 | |
Value | | | 0.690 | | | | 0.690 | | | | 0.650 | | | | 0.650 | | | | 0.600 | | | | 0.550 | |
| (1) | Effective August 6, 2007, after completion of the merger between a former Limited-Term Bond Portfolio and Bond Portfolio, the fee is contractually payable by Bond Portfolio as follows: |
| | | | | | | | | | | | | | | | | | | | | | | | |
| Portfolio (M – Millions) | | $0 to
$500M | | | $500 to
$1,000M | | | $1,000 to
$1,500M | | | $1,500 to
$2,000M | | | $2,000 to
$3,000M | | | Over
$3,000M | |
Bond | | | 0.475 | % | | | 0.475 | % | | | 0.450 | % | | | 0.400 | % | | | 0.400 | % | | | 0.400 | % |
The Pathfinder Portfolios pay no management fees; however, IICO receives management fees from the underlying funds.
IICO has agreed to waive a Portfolio’s investment management fee on any Portfolio, except the Pathfinder Portfolios and Managed Volatility Portfolios, that is not subadvised on any day that the Portfolio’s net assets are less than $25 million, subject to IICO’s right to change or modify this waiver. See Expense Reimbursements and/or Waivers for more information.
IICO has entered into Subadvisory Agreements with the following entities on behalf of certain Portfolios:
Advantus Capital serves as subadvisor to Real Estate Securities and the Managed Volatility Portfolios. The subadvisor makes investment decisions in accordance with the Portfolio’s investment objectives, policies and restrictions under the supervision of IICO and the Board of Trustees. IICO pays all applicable costs of the subadvisor.
Accounting Services Fees. The Trust has an Accounting and Administrative Services Agreement with Waddell & Reed Services Company (“WRSCO”), doing business as WI Services Company (“WISC”), an affiliate of W&R. Under the agreement, WISC acts as the agent in providing bookkeeping and accounting services and assistance to the Trust, including maintenance of Portfolio records, pricing of Portfolio shares and preparation of certain shareholder reports. For these services, each Portfolio (excluding Pathfinder Portfolios and Managed Volatility Portfolios) pays WISC a monthly fee of one-twelfth of the annual fee based on the average net asset levels shown in the following table:
| | | | | | | | | | | | | | | | | | | | | | | | | | | | | | | | | | | | | | | | |
| (M – Millions) | | $0 to
$10M | | | $10 to
$25M | | | $25 to
$50M | | | $50 to
$100M | | | $100 to
$200M | | | $200 to
$350M | | | $350 to
$550M | | | $550 to
$750M | | | $750 to
$1,000M | | | Over
$1,000M | |
Annual Fee Rate | | $ | 0.00 | | | $ | 11.50 | | | $ | 23.10 | | | $ | 35.50 | | | $ | 48.40 | | | $ | 63.20 | | | $ | 82.50 | | | $ | 96.30 | | | $ | 121.60 | | | $ | 148.50 | |
Under the Accounting Services Agreement, each Pathfinder Portfolio and Managed Volatility Portfolio pays WISC a monthly fee of one-twelfth of the annual fee shown in the following table:
| | | | | | | | | | | | | | | | | | | | | | | | | | | | | | | | | | | | | | | | |
| (M – Millions) | | $0 to
$10M | | | $10 to
$25M | | | $25 to
$50M | | | $50 to
$100M | | | $100 to
$200M | | | $200 to
$350M | | | $350 to
$550M | | | $550 to
$750M | | | $750 to
$1,000M | | | Over
$1,000M | |
Annual Fee Rate | | $ | 0.00 | | | $ | 5.75 | | | $ | 11.55 | | | $ | 17.75 | | | $ | 24.20 | | | $ | 31.60 | | | $ | 41.25 | | | $ | 48.15 | | | $ | 60.80 | | | $ | 74.25 | |
Each Portfolio also pays WISC a monthly administrative fee at the annual rate of 0.01%, or one basis point, for the first $1 billion of net assets with no fee charged for net assets in excess of $1 billion. This fee is voluntarily waived by WISC until a Portfolio’s net assets are at least $10 million and is included in “Accounting services fee” on the Statement of Operations.
Shareholder Servicing. Under the Transfer Agency Agreement between the Trust and WISC, each Portfolio reimburses WISC for certain out-of-pocket costs.
Service Plan. Under a Service Plan adopted by the Trust pursuant to Rule 12b–1 under the 1940 Act, each Portfolio, except Government Money Market, the Pathfinder Portfolios and the Managed Volatility Portfolios, may pay a service fee to W&R in an amount not to exceed 0.25% of the Portfolio’s average annual net assets. The fee is to be paid to compensate W&R for amounts it expends in connection with the provision of personal services to Policyowners and/or maintenance of Policyowner accounts.
Expense Reimbursements and/or Waivers. During the year ended December 31, 2016, the following amounts were waived as a result of the reduced management fees related to the settlement agreement:
| | | | |
Asset Strategy | | $ | 75 | |
Core Equity | | | 161 | |
Global Growth | | | 108 | |
Growth | | | 190 | |
High Income | | | 187 | |
Mid Cap Growth | | | 88 | |
Science and Technology | | | 78 | |
Small Cap Growth | | | 62 | |
Value | | | 28 | |
Effective October 14, 2016, IICO has voluntarily agreed to reimburse sufficient expenses of Government Money Market to maintain a minimum annualized yield of 0.01%. For the period from January 28, 2010 through October 14, 2016, IICO voluntarily agreed to reimburse sufficient expenses of Government Money Market to maintain a minimum annualized yield of 0.02%. For the year ended December 31, 2016, expenses in the amount of $31 were reimbursed. This reimbursement serves to reduce shareholder servicing.
For the period from August 23, 2010 through August 31, 2011, W&R and/or WRSCO have contractually agreed to reimburse sufficient expenses of Limited-Term Bond to cap the expenses for the Portfolio at 0.76%. For the period from September 1, 2011 through January 31, 2012, W&R and/or WRSCO have voluntarily agreed to reimburse sufficient expenses of Limited-Term Bond to cap the expenses for the Portfolio at 0.76%. This reimbursement serves to reduce 12b-1 fees and/or accounting services fees.
Effective May 1, 2012, IICO and/or Ivy Distributors, Inc. (“IDI”) have voluntarily agreed to reimburse sufficient expenses of Mid Cap Growth to cap the expenses for the Portfolio at 1.10%. For the year ended December 31, 2016, expenses in the amount of $210 were reimbursed. This reimbursement serves to reduce 12b-1 fees and/or accounting services fees.
Effective December 3, 2012, IICO has contractually agreed to reduce the management fee computed and paid by Real Estate Securities Portfolio each day on NAV by 0.09% on an annualized basis. For the year ended December 31, 2016, expenses in the amount of $44 were reimbursed.
Effective October 1, 2016, IICO and/or IDI have contractually agreed to reimburse sufficient expenses of Core Equity to cap the expenses for the Portfolio at 0.95%. For the year ended December 31, 2016, expenses in the amount of $55 were reimbursed. This reimbursement serves to reduce 12b-1 fees and/or shareholder servicing fees.
Effective October 1, 2016, IICO and/or IDI have contractually agreed to reimburse sufficient expenses of Global Growth to cap the expenses for the Portfolio at 1.13%. For the year ended December 31, 2016, expenses in the amount of $22 were reimbursed. This reimbursement serves to reduce 12b-1 fees and/or shareholder servicing fees.
Effective October 1, 2016, IICO and/or IDI have contractually agreed to reimburse sufficient expenses of Small Cap Growth to cap the expenses for the Portfolio at 1.14%. For the year ended December 31, 2016, expenses in the amount of $17 were reimbursed. This reimbursement serves to reduce 12b-1 fees and/or shareholder servicing fees.
During the year ended December 31, 2016, the following amounts were waived as a result of the reduced management fees related to the voluntary waiver of management fee to any Portfolio, excluding Pathfinder Portfolios and Managed Volatility Portfolios, having less than $25 million in net assets:
Any amounts due to the Portfolios as a reimbursement but not paid as of December 31, 2016 are shown as a receivable from affiliates on the Statement of Assets and Liabilities.
8. RELATED PARTY TRANSACTIONS
Certain Portfolios are permitted to purchase or sell securities from or to certain affiliated funds under specified conditions outlined in procedures adopted by the Board. The procedures have been designed to ensure that any purchase or sale of securities by the Portfolios from or to another fund or portfolio that are, or could be, considered an affiliate by virtue of having a common investment adviser (or affiliated investment advisers), common Trustees or common officers, complies with Rule 17a-7 under the Act. Further, as defined under such procedures, each transaction is effected at the current market
price. During the year ended December 31, 2016, the Portfolios below engaged in purchases and sales of securities pursuant to Rule 17a-7 under the Act (amounts in thousands):
| | | | | | | | |
| Portfolio | | Purchases | | | Sales | |
Balanced | | $ | — | | | $ | 1,879 | |
High Income | | | 25,681 | | | | — | |
International Core Equity | | | 1,421 | | | | 989 | |
Limited-Term Bond | | | 1,491 | | | | — | |
Small Cap Growth | | | — | | | | 569 | |
9. INTERFUND LENDING PROGRAM
Pursuant to an exemptive order issued by the SEC (“Order”), the Trust and the Advisors Fund Complex (Waddell & Reed Advisors Funds, Ivy Funds and InvestEd Portfolios; referred to with the Funds for purposes of this section as Funds) have the ability to lend money to, and borrow money from, each other pursuant to a master interfund lending agreement (“Interfund Lending Program”). Under the Interfund Lending Program, the Funds may lend or borrow money for temporary purposes directly to or from one another (each an “Interfund Loan”), subject to meeting the conditions of the Order. The
interest rate to be charged on an Interfund Loan is the average of the overnight repurchase agreement rate and the short-term bank loan rate. The Funds made no Interfund Loans under the Interfund Lending Program during the year ended December 31, 2016.
10. AFFILIATED COMPANY TRANSACTIONS (All amounts in thousands)
A summary of the transactions in affiliated companies during the year ended December 31, 2016 follows:
| | | | | | | | | | | | | | | | | | | | | | | | | | | | | | | | | | | |
| Portfolio | | 12-31-15
Share Balance | | Purchases
at cost | | Sales at Cost | | Realized
Gain/(Loss)(1) | | Distributions
Received | | 12-31-16
Share Balance | | 12-31-16
Value |
Pathfinder Aggressive | | | | | | | | | | | | | | | | | | | | | | | | | | | | | | | | | | | |
Ivy VIP Bond | | | | N/A | | | | $ | 3,745 | | | | $ | 11 | | | | $ | — | * | | | $ | — | | | | | 713 | | | | $ | 3,753 | |
Ivy VIP Global Growth | | | | 1,720 | | | | | 1,250 | | | | | 6,412 | | | | | 203 | | | | | 45 | | | | | 1,118 | | | | | 9,109 | |
Ivy VIP Growth | | | | 1,533 | | | | | 2,562 | | | | | 3,707 | | | | | 1,659 | | | | | 95 | | | | | 1,428 | | | | | 14,710 | |
Ivy VIP International Core Equity | | | | 651 | | | | | 4,836 | | | | | 2,071 | | | | | 59 | | | | | 128 | | | | | 833 | | | | | 12,748 | |
Ivy VIP Limited-Term Bond | | | | 1,843 | | | | | 780 | | | | | 5,493 | | | | | (7 | ) | | | | 124 | | | | | 881 | | | | | 4,305 | |
Ivy VIP Mid Cap Growth | | | | 886 | | | | | 816 | | | | | 1,593 | | | | | 545 | | | | | 62 | | | | | 784 | | | | | 7,398 | |
Ivy VIP Small Cap Growth | | | | 767 | | | | | 1,866 | | | | | 1,957 | | | | | 899 | | | | | — | | | | | 759 | | | | | 7,349 | |
Ivy VIP Small Cap Value | | | | 522 | | | | | 922 | | | | | 2,618 | | | | | 1,108 | | | | | 33 | | | | | 400 | | | | | 7,343 | |
Ivy VIP Value | | | | 1,363 | | | | | 1,362 | | | | | 2,103 | | | | | 841 | | | | | 257 | | | | | 1,241 | | | | | 7,352 | |
| | | | | | | | | | | | | | | | | | | | | | | | | | | | | | | | | | | |
| | | | | | | | | | | | | | | | | | $ | 5,307 | | | | $ | 744 | | | | | | | | | $ | 74,067 | |
| | | | | | | | | | | | | | | | | | | | | | | | | | | | | | | | | | | |
| | | | | | | | | | | | | | | | | | | | | | | | | | | | | | | | | | | |
| Portfolio | | 12-31-15
Share Balance | | Purchases
at cost | | Sales at Cost | | Realized
Gain/(Loss)(1) | | Distributions
Received | | 12-31-16
Share Balance | | 12-31-16
Value |
Pathfinder Conservative | | | | | | | | | | | | | | | | | | | | | | | | | | | | | | | | | | | |
Ivy VIP Bond | | | | N/A | | | | $ | 5,729 | | | | $ | 18 | | | | $ | — | * | | | $ | — | | | | | 1,090 | | | | $ | 5,739 | |
Ivy VIP Dividend Opportunities | | | | 1,986 | | | | | 2,443 | | | | | 3,033 | | | | | 1,053 | | | | | 183 | | | | | 1,888 | | | | | 14,697 | |
Ivy VIP Global Growth | | | | 311 | | | | | 2,947 | | | | | 875 | | | | | 64 | | | | | 9 | | | | | 558 | | | | | 4,549 | |
Ivy VIP Government Money Market | | | | 40,626 | | | | | 4,630 | | | | | 10,990 | | | | | — | | | | | 51 | | | | | 34,266 | | | | | 34,266 | |
Ivy VIP Growth | | | | 1,379 | | | | | 3,112 | | | | | 2,742 | | | | | 1,580 | | | | | 89 | | | | | 1,419 | | | | | 14,622 | |
Ivy VIP International Core Equity | | | | 375 | | | | | 4,049 | | | | | 3,775 | | | | | 207 | | | | | 108 | | | | | 393 | | | | | 6,020 | |
Ivy VIP Limited-Term Bond | | | | 4,212 | | | | | 2,518 | | | | | 5,053 | | | | | 58 | | | | | 264 | | | | | 3,688 | | | | | 18,033 | |
Ivy VIP Mid Cap Growth | | | | 368 | | | | | 507 | | | | | 583 | | | | | 171 | | | | | 27 | | | | | 360 | | | | | 3,394 | |
Ivy VIP Small Cap Growth | | | | 531 | | | | | 1,681 | | | | | 1,201 | | | | | 685 | | | | | — | | | | | 580 | | | | | 5,619 | |
Ivy VIP Small Cap Value | | | | 145 | | | | | 392 | | | | | 760 | | | | | 238 | | | | | 9 | | | | | 122 | | | | | 2,246 | |
Ivy VIP Value | | | | 754 | | | | | 1,090 | | | | | 1,063 | | | | | 528 | | | | | 147 | | | | | 759 | | | | | 4,497 | |
| | | | | | | | | | | | | | | | | | | | | | | | | | | | | | | | | | | |
| | | | | | | | | | | | | | | | | | $ | 4,584 | | | | $ | 887 | | | | | | | | | $ | 113,682 | |
| | | | | | | | | | | | | | | | | | | | | | | | | | | | | | | | | | | |
| | | | | | | | | | | | | | | | | | | | | | | | | | | | | | | | | | | |
| Portfolio | | 12-31-15
Share Balance | | Purchases
at cost | | Sales at Cost | | Realized
Gain/(Loss)(1) | | Distributions
Received | | 12-31-16
Share Balance | | 12-31-16
Value |
Pathfinder Moderate | | | | | | | | | | | | | | | | | | | | | | | | | | | | | | | | | | | |
Ivy VIP Bond | | | | N/A | | | | $ | 43,303 | | | | $ | 45 | | | | $ | — | * | | | $ | — | | | | | 8,256 | | | | $ | 43,477 | |
Ivy VIP Dividend Opportunities | | | | 17,413 | | | | | 13,436 | | | | | 16,470 | | | | | 11,716 | | | | | 1,630 | | | | | 16,500 | | | | | 128,480 | |
Ivy VIP Global Growth | | | | 12,850 | | | | | 7,935 | | | | | 42,480 | | | | | 2,912 | | | | | 358 | | | | | 8,726 | | | | | 71,074 | |
Ivy VIP Government Money Market | | | | 176,442 | | | | | 9,623 | | | | | 56,263 | | | | | — | | | | | 221 | | | | | 129,802 | | | | | 129,802 | |
Ivy VIP Growth | | | | 11,287 | | | | | 17,515 | | | | | 14,910 | | | | | 12,851 | | | | | 738 | | | | | 11,578 | | | | | 119,295 | |
Ivy VIP International Core Equity | | | | 3,994 | | | | | 39,724 | | | | | 5,351 | | | | | 755 | | | | | 837 | | | | | 6,246 | | | | | 95,564 | |
Ivy VIP Limited-Term Bond | | | | 19,388 | | | | | 7,599 | | | | | 9,098 | | | | | 87 | | | | | 1,384 | | | | | 19,071 | | | | | 93,249 | |
Ivy VIP Mid Cap Growth | | | | 3,727 | | | | | 2,628 | | | | | 3,311 | | | | | 1,922 | | | | | 273 | | | | | 3,633 | | | | | 34,283 | |
Ivy VIP Small Cap Growth | | | | 5,648 | | | | | 13,564 | | | | | 8,633 | | | | | 7,319 | | | | | — | | | | | 6,152 | | | | | 59,602 | |
Ivy VIP Small Cap Value | | | | 2,746 | | | | | 4,339 | | | | | 10,741 | | | | | 5,205 | | | | | 181 | | | | | 2,319 | | | | | 42,537 | |
Ivy VIP Value | | | | 7,167 | | | | | 7,167 | | | | | 7,021 | | | | | 4,964 | | | | | 1,423 | | | | | 7,186 | | | | | 42,588 | |
| | | | | | | | | | | | | | | | | | | | | | | | | | | | | | | | | | | |
| | | | | | | | | | | | | | | | | | $ | 47,731 | | | | $ | 7,045 | | | | | | | | | $ | 859,951 | |
| | | | | | | | | | | | | | | | | | | | | | | | | | | | | | | | | | | |
| | | | | | | | | | | | | | | | | | | | | | | | | | | | | | | | | | | |
| Portfolio | | 12-31-15
Share Balance | | Purchases
at cost | | Sales at Cost | | Realized
Gain/(Loss)(1) | | Distributions
Received | | 12-31-16
Share Balance | | 12-31-16
Value |
Pathfinder Moderately Aggressive | | | | | | | | | | | | | | | | | | | | | | | | | | | | | | | | | | | |
Ivy VIP Bond | | | | N/A | | | | $ | 51,381 | | | | $ | 54 | | | | $ | — | * | | | $ | — | | | | | 9,796 | | | | $ | 51,586 | |
Ivy VIP Dividend Opportunities | | | | 20,606 | | | | | 16,047 | | | | | 19,473 | | | | | 13,606 | | | | | 1,912 | | | | | 19,578 | | | | | 152,443 | |
Ivy VIP Global Growth | | | | 15,206 | | | | | 9,199 | | | | | 26,352 | | | | | 3,298 | | | | | 420 | | | | | 13,178 | | | | | 107,329 | |
Ivy VIP Government Money Market | | | | 104,404 | | | | | 6,223 | | | | | 59,285 | | | | | — | | | | | 129 | | | | | 51,342 | | | | | 51,342 | |
Ivy VIP Growth | | | | 13,356 | | | | | 20,708 | | | | | 17,380 | | | | | 15,056 | | | | | 866 | | | | | 13,738 | | | | | 141,547 | |
Ivy VIP International Core Equity | | | | 8,102 | | | | | 27,584 | | | | | 9,917 | | | | | 1,590 | | | | | 1,684 | | | | | 9,264 | | | | | 141,736 | |
Ivy VIP Limited-Term Bond | | | | 22,944 | | | | | 9,784 | | | | | 11,264 | | | | | 119 | | | | | 1,624 | | | | | 22,628 | | | | | 110,642 | |
Ivy VIP Mid Cap Growth | | | | 5,513 | | | | | 3,747 | | | | | 4,418 | | | | | 3,040 | | | | | 401 | | | | | 5,388 | | | | | 50,847 | |
Ivy VIP Small Cap Growth | | | | 7,639 | | | | | 17,700 | | | | | 10,820 | | | | | 9,851 | | | | | — | | | | | 8,343 | | | | | 80,821 | |
Ivy VIP Small Cap Value | | | | 5,200 | | | | | 7,755 | | | | | 19,037 | | | | | 10,393 | | | | | 339 | | | | | 4,402 | | | | | 80,754 | |
Ivy VIP Value | | | | 8,482 | | | | | 8,158 | | | | | 7,947 | | | | | 5,771 | | | | | 1,669 | | | | | 8,527 | | | | | 50,531 | |
| | | | | | | | | | | | | | | | | | | | | | | | | | | | | | | | | | | |
| | | | | | | | | | | | | | | | | | $ | 62,724 | | | | $ | 9,044 | | | | | | | | | $ | 1,019,578 | |
| | | | | | | | | | | | | | | | | | | | | | | | | | | | | | | | | | | |
| | | | | | | | | | | | | | | | | | | | | | | | | | | | | | | | | | | |
| Portfolio | | 12-31-15
Share Balance | | Purchases
at cost | | Sales at Cost | | Realized
Gain/(Loss)(1) | | Distributions
Received | | 12-31-16
Share Balance | | 12-31-16
Value |
Pathfinder Moderately Conservative | | | | | | | | | | | | | | | | | | | | | | | | | | | | | | | | | | | |
Ivy VIP Bond | | | | N/A | | | | $ | 13,099 | | | | $ | 28 | | | | $ | — | * | | | $ | — | | | | | 2,495 | | | | $ | 13,137 | |
Ivy VIP Dividend Opportunities | | | | 4,597 | | | | | 3,533 | | | | | 4,932 | | | | | 2,760 | | | | | 429 | | | | | 4,321 | | | | | 33,645 | |
Ivy VIP Global Growth | | | | 2,317 | | | | | 1,498 | | | | | 4,898 | | | | | 452 | | | | | 65 | | | | | 1,918 | | | | | 15,618 | |
Ivy VIP Government Money Market | | | | 67,168 | | | | | 3,568 | | | | | 18,442 | | | | | — | * | | | | 84 | | | | | 52,294 | | | | | 52,294 | |
Ivy VIP Growth | | | | 3,438 | | | | | 5,352 | | | | | 4,868 | | | | | 3,901 | | | | | 224 | | | | | 3,498 | | | | | 36,046 | |
Ivy VIP International Core Equity | | | | 1,216 | | | | | 4,579 | | | | | 1,562 | | | | | 223 | | | | | 254 | | | | | 1,415 | | | | | 21,657 | |
Ivy VIP Limited-Term Bond | | | | 8,650 | | | | | 3,257 | | | | | 4,251 | | | | | 42 | | | | | 616 | | | | | 8,443 | | | | | 41,281 | |
Ivy VIP Mid Cap Growth | | | | 1,135 | | | | | 838 | | | | | 1,163 | | | | | 548 | | | | | 83 | | | | | 1,098 | | | | | 10,359 | |
Ivy VIP Small Cap Growth | | | | 1,474 | | | | | 3,594 | | | | | 2,432 | | | | | 1,906 | | | | | — | | | | | 1,593 | | | | �� | 15,436 | |
Ivy VIP Small Cap Value | | | | 502 | | | | | 829 | | | | | 2,169 | | | | | 838 | | | | | 33 | | | | | 420 | | | | | 7,712 | |
Ivy VIP Value | | | | 2,183 | | | | | 2,245 | | | | | 2,308 | | | | | 1,504 | | | | | 432 | | | | | 2,171 | | | | | 12,868 | |
| | | | | | | | | | | | | | | | | | | | | | | | | | | | | | | | | | | |
| | | | | | | | | | | | | | | | | | $ | 12,174 | | | | $ | 2,220 | | | | | | | | | $ | 260,053 | |
| | | | | | | | | | | | | | | | | | | | | | | | | | | | | | | | | | | |
| | | | | | | | | | | | | | | | | | | | | | | | | | | | | | | | | | | |
| Portfolio | | 12-31-15
Share Balance | | Purchases
at cost | | Sales at Cost | | Realized
Gain/(Loss)(1) | | Distributions
Received | | 12-31-16
Share Balance | | 12-31-16
Value |
Pathfinder Moderate – Managed Volatility | | | | | | | | | | | | | | | | | | | | | | | | | | | | | | | | | | | |
Ivy VIP Bond | | | | N/A | | | | $ | 24,935 | | | | $ | — | | | | $ | — | | | | $ | — | | | | | 4,759 | | | | $ | 25,061 | |
Ivy VIP Dividend Opportunities | | | | 7,460 | | | | | 20,446 | | | | | 5,005 | | | | | 4,007 | | | | | 816 | | | | | 9,511 | | | | | 74,061 | |
Ivy VIP Global Growth | | | | 5,503 | | | | | 14,822 | | | | | 18,737 | | | | | 1,961 | | | | | 179 | | | | | 5,030 | | | | | 40,969 | |
Ivy VIP Government Money Market | | | | 75,886 | | | | | 23,059 | | | | | 24,124 | | | | | — | | | | | 118 | | | | | 74,822 | | | | | 74,822 | |
Ivy VIP Growth | | | | 4,824 | | | | | 21,517 | | | | | 2,580 | | | | | 6,303 | | | | | 370 | | | | | 6,674 | | | | | 68,767 | |
Ivy VIP International Core Equity | | | | 1,715 | | | | | 28,360 | | | | | — | | | | | 338 | | | | | 419 | | | | | 3,600 | | | | | 55,086 | |
Ivy VIP Limited-Term Bond | | | | 8,341 | | | | | 13,800 | | | | | 747 | | | | | 12 | | | | | 693 | | | | | 10,993 | | | | | 53,751 | |
Ivy VIP Mid Cap Growth | | | | 1,602 | | | | | 4,843 | | | | | 366 | | | | | 875 | | | | | 137 | | | | | 2,094 | | | | | 19,762 | |
Ivy VIP Small Cap Growth | | | | 2,430 | | | | | 12,615 | | | | | 2,114 | | | | | 3,555 | | | | | — | | | | | 3,547 | | | | | 34,357 | |
Ivy VIP Small Cap Value | | | | 1,182 | | | | | 6,699 | | | | | 4,122 | | | | | 2,530 | | | | | 90 | | | | | 1,337 | | | | | 24,521 | |
Ivy VIP Value | | | | 3,078 | | | | | 8,031 | | | | | 2,102 | | | | | 2,429 | | | | | 713 | | | | | 4,143 | | | | | 24,550 | |
| | | | | | | | | | | | | | | | | | | | | | | | | | | | | | | | | | | |
| | | | | | | | | | | | | | | | | | $ | 22,010 | | | | $ | 3,535 | | | | | | | | | $ | 495,707 | |
| | | | | | | | | | | | | | | | | | | | | | | | | | | | | | | | | | | |
| | | | | | | | | | | | | | | | | | | | | | | | | | | | | | | | | | | |
| Portfolio | | 12-31-15
Share Balance | | Purchases
at cost | | Sales at Cost | | Realized
Gain/(Loss)(1) | | Distributions
Received | | 12-31-16
Share Balance | | 12-31-16
Value |
Pathfinder Moderately Aggressive – Managed Volatility | | | | | | | | | | | | | | | | | | | | | | | | | | | | | | | | | | | |
Ivy VIP Bond | | | | N/A | | | | $ | 3,802 | | | | $ | — | | | | $ | — | | | | $ | — | | | | | 726 | | | | $ | 3,821 | |
Ivy VIP Dividend Opportunities | | | | 1,263 | | | | | 2,166 | | | | | 748 | | | | | 612 | | | | | 125 | | | | | 1,450 | | | | | 11,292 | |
Ivy VIP Global Growth | | | | 932 | | | | | 1,494 | | | | | 1,127 | | | | | 271 | | | | | 28 | | | | | 976 | | | | | 7,950 | |
Ivy VIP Government Money Market | | | | 6,419 | | | | | 1,151 | | | | | 3,766 | | | | | — | | | | | 9 | | | | | 3,803 | | | | | 3,803 | |
Ivy VIP Growth | | | | 817 | | | | | 2,395 | | | | | 377 | | | | | 964 | | | | | 57 | | | | | 1,018 | | | | | 10,484 | |
Ivy VIP International Core Equity | | | | 497 | | | | | 2,826 | | | | | 12 | | | | | 91 | | | | | 110 | | | | | 686 | | | | | 10,498 | |
Ivy VIP Limited-Term Bond | | | | 1,411 | | | | | 1,460 | | | | | 158 | | | | | 2 | | | | | 107 | | | | | 1,676 | | | | | 8,195 | |
Ivy VIP Mid Cap Growth | | | | 339 | | | | | 607 | | | | | 54 | | | | | 166 | | | | | 26 | | | | | 399 | | | | | 3,766 | |
Ivy VIP Small Cap Growth | | | | 470 | | | | | 1,706 | | | | | 315 | | | | | 616 | | | | | — | | | | | 618 | | | | | 5,986 | |
Ivy VIP Small Cap Value | | | | 320 | | | | | 1,098 | | | | | 950 | | | | | 600 | | | | | 22 | | | | | 326 | | | | | 5,982 | |
Ivy VIP Value | | | | 521 | | | | | 898 | | | | | 282 | | | | | 368 | | | | | 110 | | | | | 632 | | | | | 3,743 | |
| | | | | | | | | | | | | | | | | | | | | | | | | | | | | | | | | | | |
| | | | | | | | | | | | | | | | | | $ | 3,690 | | | | $ | 594 | | | | | | | | | $ | 75,520 | |
| | | | | | | | | | | | | | | | | | | | | | | | | | | | | | | | | | | |
| | | | | | | | | | | | | | | | | | | | | | | | | | | | | | | | | | | |
| Portfolio | | 12-31-15
Share Balance | | Purchases
at cost | | Sales at Cost | | Realized
Gain/(Loss)(1) | | Distributions
Received | | 12-31-16
Share Balance | | 12-31-16
Value |
Pathfinder Moderately Conservative – Managed Volatility | | | | | | | | | | | | | | | | | | | | | | | | | | | | | | | | | | | |
Ivy VIP Bond | | | | N/A | | | | $ | 3,324 | | | | $ | — | | | | $ | — | | | | $ | — | | | | | 634 | | | | $ | 3,341 | |
Ivy VIP Dividend Opportunities | | | | 876 | | | | | 2,270 | | | | | 601 | | | | | 450 | | | | | 91 | | | | | 1,099 | | | | | 8,556 | |
Ivy VIP Global Growth | | | | 441 | | | | | 1,156 | | | | | 769 | | | | | 142 | | | | | 14 | | | | | 488 | | | | | 3,972 | |
Ivy VIP Government Money Market | | | | 12,849 | | | | | 3,689 | | | | | 3,240 | | | | | — | | | | | 20 | | | | | 13,298 | | | | | 13,298 | |
Ivy VIP Growth | | | | 654 | | | | | 2,763 | | | | | 373 | | | | | 815 | | | | | 47 | | | | | 890 | | | | | 9,167 | |
Ivy VIP International Core Equity | | | | 232 | | | | | 1,896 | | | | | — | | | | | 44 | | | | | 54 | | | | | 360 | | | | | 5,507 | |
Ivy VIP Limited-Term Bond | | | | 1,655 | | | | | 2,575 | | | | | 155 | | | | | 3 | | | | | 131 | | | | | 2,147 | | | | | 10,498 | |
Ivy VIP Mid Cap Growth | | | | 217 | | | | | 630 | | | | | 61 | | | | | 114 | | | | | 17 | | | | | 279 | | | | | 2,634 | |
Ivy VIP Small Cap Growth | | | | 282 | | | | | 1,414 | | | | | 262 | | | | | 396 | | | | | — | | | | | 405 | | | | | 3,926 | |
Ivy VIP Small Cap Value | | | | 96 | | | | | 522 | | | | | 340 | | | | | 198 | | | | | 7 | | | | | 107 | | | | | 1,961 | |
Ivy VIP Value | | | | 417 | | | | | 1,047 | | | | | 303 | | | | | 317 | | | | | 92 | | | | | 552 | | | | | 3,272 | |
| | | | | | | | | | | | | | | | | | | | | | | | | | | | | | | | | | | |
| | | | | | | | | | | | | | | | | | $ | 2,479 | | | | $ | 473 | | | | | | | | | $ | 66,132 | |
| | | | | | | | | | | | | | | | | | | | | | | | | | | | | | | | | | | |
| * | Not shown due to rounding. |
| (1) | Included in Realized Gain/Loss, if applicable, are distributions from capital gains from the underlying securities. |
11. INVESTMENT SECURITIES TRANSACTIONS ($ amounts in thousands)
The cost of purchases and the proceeds from maturities and sales of investment securities (excluding short-term securities) for the year ended December 31, 2016, were as follows:
| | | | | | | | | | | | | | | | |
| | | Purchases | | | Sales | |
| | | U.S. Government | | | Other Issuers | | | U.S. Government | | | Other Issuers | |
Pathfinder Aggressive | | $ | — | | | $ | 18,139 | | | $ | — | | | $ | 26,545 | |
Pathfinder Conservative | | | — | | | | 29,098 | | | | — | | | | 30,828 | |
Pathfinder Moderate | | | — | | | | 166,833 | | | | — | | | | 182,646 | |
Pathfinder Moderately Aggressive | | | — | | | | 178,286 | | | | — | | | | 197,575 | |
Pathfinder Moderately Conservative | | | — | | | | 42,392 | | | | — | | | | 48,677 | |
Pathfinder Moderate – Managed Volatility | | | — | | | | 179,127 | | | | — | | | | 62,170 | |
Pathfinder Moderately Aggressive – Managed Volatility | | | — | | | | 19,603 | | | | — | | | | 8,131 | |
Pathfinder Moderately Conservative – Managed Volatility | | | — | | | | 21,286 | | | | — | | | | 6,345 | |
Asset Strategy | | | 118,357 | | | | 423,388 | | | | 157,115 | | | | 533,870 | |
Balanced | | | 20,061 | | | | 155,339 | | | | 392 | | | | 186,194 | |
Bond | | | 106,251 | | | | 230,562 | | | | 49,298 | | | | 183,506 | |
Core Equity | | | — | | | | 317,594 | | | | — | | | | 367,210 | |
Dividend Opportunities | | | — | | | | 268,228 | | | | — | | | | 278,644 | |
Energy | | | — | | | | 78,014 | | | | — | | | | 45,775 | |
Global Bond | | | 2,151 | | | | 3,432 | | | | — | | | | 3,522 | |
Global Growth | | | — | | | | 316,441 | | | | — | | | | 373,580 | |
Global Natural Resources | | | — | | | | 86,585 | | | | — | | | | 78,856 | |
Government Money Market | | | — | | | | — | | | | — | | | | — | |
Growth | | | — | | | | 443,077 | | | | — | | | | 497,393 | |
High Income | | | — | | | | 256,676 | | | | — | | | | 248,376 | |
International Core Equity | | | — | | | | 548,869 | | | | — | | | | 492,736 | |
Limited-Term Bond | | | 67,225 | | | | 153,583 | | | | 52,504 | | | | 168,785 | |
Micro Cap Growth | | | — | | | | 24,187 | | | | — | | | | 28,673 | |
Mid Cap Growth | | | — | | | | 192,297 | | | | — | | | | 198,434 | |
Real Estate Securities | | | — | | | | 37,916 | | | | — | | | | 37,683 | |
Science and Technology | | | — | | | | 77,654 | | | | — | | | | 156,929 | |
Small Cap Growth | | | 7,216 | | | | 416,962 | | | | 1,214 | | | | 433,635 | |
Small Cap Value | | | — | | | | 584,299 | | | | — | | | | 631,910 | |
Value | | | — | | | | 190,158 | | | | — | | | | 216,439 | |
12. CAPITAL SHARE TRANSACTIONS (All amounts in thousands)
The Trust has authorized an unlimited number of no par value shares of beneficial interest. Transactions in shares of beneficial interest were as follows:
| | | | | | | | | | | | | | | | | | | | | | | | | | | | | | | | | | | | |
| | | Pathfinder Aggressive | | | | | | Pathfinder Conservative | |
| | | Year ended
12-31-16 | | | Year ended
12-31-15 | | | | | | Year ended
12-31-16 | | | Year ended
12-31-15 | |
| | | Shares | | | Value | | | Shares | | | Value | | | | | | Shares | | | Value | | | Shares | | | Value | |
Shares issued from sale of shares | | | 759 | | | $ | 3,513 | | | | 1,273 | | | $ | 6,939 | | | | | | | | 2,147 | | | $ | 10,506 | | | | 1,600 | | | $ | 8,521 | |
Shares issued in reinvestment of distributions to shareholders | | | 2,081 | | | | 8,942 | | | | 2,058 | | | | 10,990 | | | | | | | | 1,785 | | | | 8,374 | | | | 1,720 | | | | 9,092 | |
Shares redeemed | | | (3,745 | ) | | | (17,322 | ) | | | (1,276 | ) | | | (6,928 | ) | | | | | | | (3,412 | ) | | | (16,831 | ) | | | (2,610 | ) | | | (13,964 | ) |
| | | | | | | | | | | | |
Net increase (decrease) | | | (905 | ) | | $ | (4,867 | ) | | | 2,055 | | | $ | 11,001 | | | | | | | | 520 | | | $ | 2,049 | | | | 710 | | | $ | 3,649 | |
| | | | | | | | | | | | |
| | | | | | | | | | | | | | | | | | | | | | | | | | | | | | | | | | | | |
| | | Pathfinder Moderate | | | | | | Pathfinder Moderately Aggressive | |
| | | Year ended
12-31-16 | | | Year ended
12-31-15 | | | | | | Year ended
12-31-16 | | | Year ended
12-31-15 | |
| | | Shares | | | Value | | | Shares | | | Value | | | | | | Shares | | | Value | | | Shares | | | Value | |
Shares issued from sale of shares | | | 1,862 | | | $ | 9,418 | | | | 3,072 | | | $ | 17,232 | | | | | | | | 1,473 | | | $ | 7,586 | | | | 2,132 | | | $ | 12,563 | |
Shares issued in reinvestment of distributions to shareholders | | | 16,894 | | | | 79,617 | | | | 16,149 | | | | 89,583 | | | | | | | | 22,396 | | | | 106,876 | | | | 20,436 | | | | 118,128 | |
Shares redeemed | | | (14,455 | ) | | | (72,020 | ) | | | (10,104 | ) | | | (56,743 | ) | | | | | | | (16,989 | ) | | | (86,779 | ) | | | (9,864 | ) | | | (57,451 | ) |
| | | | | | | | | | | | |
Net increase | | | 4,301 | | | $ | 17,015 | | | | 9,117 | | | $ | 50,072 | | | | | | | | 6,880 | | | $ | 27,683 | | | | 12,704 | | | $ | 73,240 | |
| | | | | | | | | | | | |
| | | |
| | | Pathfinder Moderately Conservative | | | | | | Pathfinder Moderate – Managed Volatility | |
| | | Year ended
12-31-16 | | | Year ended
12-31-15 | | | | | | Year ended
12-31-16 | | | Year ended
12-31-15 | |
| | | Shares | | | Value | | | Shares | | | Value | | | | | | Shares | | | Value | | | Shares | | | Value | |
Shares issued from sale of shares | | | 1,086 | | | $ | 5,387 | | | | 652 | | | $ | 3,641 | | | | | | | | 23,992 | | | $ | 124,080 | | | | 37,109 | | | $ | 202,767 | |
Shares issued in reinvestment of distributions to shareholders | | | 4,770 | | | | 22,580 | | | | 4,818 | | | | 26,405 | | | | | | | | 3,573 | | | | 17,902 | | | | — | | | | — | |
Shares redeemed | | | (4,799 | ) | | | (23,926 | ) | | | (4,416 | ) | | | (24,507 | ) | | | | | | | (3,748 | ) | | | (19,400 | ) | | | (1,125 | ) | | | (6,131 | ) |
| | | | | | | | | | | | |
Net increase | | | 1,057 | | | $ | 4,041 | | | | 1,054 | | | $ | 5,539 | | | | | | | | 23,817 | | | $ | 122,582 | | | | 35,984 | | | $ | 196,636 | |
| | | | | | | | | | | | |
| | | |
| | | Pathfinder Moderately Aggressive –
Managed Volatility | | | | | | Pathfinder Moderately Conservative –
Managed Volatility | |
| | | Year ended
12-31-16 | | | Year ended
12-31-15 | | | | | | Year ended
12-31-16 | | | Year ended
12-31-15 | |
| | | Shares | | | Value | | | Shares | | | Value | | | | | | Shares | | | Value | | | Shares | | | Value | |
Shares issued from sale of shares | | | 3,206 | | | $ | 16,035 | | | | 5,175 | | | $ | 27,839 | | | | | | | | 3,824 | | | $ | 19,320 | | | | 5,000 | | | $ | 26,624 | |
Shares issued in reinvestment of distributions to shareholders | | | 846 | | | | 4,044 | | | | — | | | | — | | | | | | | | 439 | | | | 2,159 | | | | 19 | | | | 102 | |
Shares redeemed | | | (1,442 | ) | | | (7,217 | ) | | | (556 | ) | | | (2,992 | ) | | | | | | | (1,371 | ) | | | (6,949 | ) | | | (638 | ) | | | (3,411 | ) |
| | | | | | | | | | | | |
Net increase | | | 2,610 | | | $ | 12,862 | | | | 4,619 | | | $ | 24,847 | | | | | | | | 2,892 | | | $ | 14,530 | | | | 4,381 | | | $ | 23,315 | |
| | | | | | | | | | | | |
| | | |
| | | Asset Strategy | | | | | | Balanced | |
| | | Year ended
12-31-16 | | | Year ended
12-31-15 | | | | | | Year ended
12-31-16 | | | Year ended
12-31-15 | |
| | | Shares | | | Value | | | Shares | | | Value | | | | | | Shares | | | Value | | | Shares | | | Value | |
Shares issued from sale of shares | | | 5,629 | | | $ | 45,205 | | | | 13,800 | | | $ | 130,966 | | | | | | | | 2,781 | | | $ | 21,795 | | | | 3,009 | | | $ | 28,391 | |
Shares issued in reinvestment of distributions to shareholders | | | 806 | | | | 6,389 | | | | 27,988 | | | | 263,937 | | | | | | | | 8,348 | | | | 59,724 | | | | 6,352 | | | | 57,909 | |
Shares redeemed | | | (40,578 | ) | | | (326,457 | ) | | | (36,228 | ) | | | (341,043 | ) | | | | | | | (6,576 | ) | | | (51,056 | ) | | | (6,287 | ) | | | (58,831 | ) |
| | | | | | | | | | | | |
Net increase (decrease) | | | (34,143 | ) | | $ | (274,863 | ) | | | 5,560 | | | $ | 53,860 | | | | | | | | 4,553 | | | $ | 30,463 | | | | 3,074 | | | $ | 27,469 | |
| | | | | | | | | | | | |
| | | |
| | | Bond | | | | | | Core Equity | |
| | | Year ended
12-31-16 | | | Year ended
12-31-15 | | | | | | Year ended
12-31-16 | | | Year ended
12-31-15 | |
| | | Shares | | | Value | | | Shares | | | Value | | | | | | Shares | | | Value | | | Shares | | | Value | |
Shares issued from sale of shares | | | 32,481 | | | $ | 170,660 | | | | 2,695 | | | $ | 14,334 | | | | | | | | 1,042 | | | $ | 11,235 | | | | 1,417 | | | $ | 18,006 | |
Shares issued in reinvestment of distributions to shareholders | | | 1,396 | | | | 7,335 | | | | 1,671 | | | | 8,715 | | | | | | | | 5,295 | | | | 53,822 | | | | 6,758 | | | | 82,546 | |
Shares redeemed | | | (8,739 | ) | | | (46,576 | ) | | | (8,499 | ) | | | (44,857 | ) | | | | | | | (5,630 | ) | | | (60,670 | ) | | | (5,192 | ) | | | (66,655 | ) |
| | | | | | | | | | | | |
Net increase (decrease) | | | 25,138 | | | $ | 131,419 | | | | (4,133 | ) | | $ | (21,808 | ) | | | | | | | 707 | | | $ | 4,387 | | | | 2,983 | | | $ | 33,897 | |
| | | | | | | | | | | | |
| | | | | | | | | | | | | | | | | | | | | | | | | | | | | | | | | | | | |
| | | Dividend Opportunities | | | | | | Energy | |
| | | Year ended
12-31-16 | | | Year ended
12-31-15 | | | | | | Year ended
12-31-16 | | | Year ended
12-31-15 | |
| | | Shares | | | Value | �� | | Shares | | | Value | | | | | | Shares | | | Value | | | Shares | | | Value | |
Shares issued from sale of shares | | | 5,081 | | | $ | 38,180 | | | | 6,749 | | | $ | 55,031 | | | | | | | | 11,367 | | | $ | 64,632 | | | | 8,439 | | | $ | 51,692 | |
Shares issued in reinvestment of distributions to shareholders | | | 4,735 | | | | 34,387 | | | | 7,592 | | | | 62,165 | | | | | | | | 36 | | | | 203 | | | | 106 | | | | 726 | |
Shares redeemed | | | (10,229 | ) | | | (77,817 | ) | | | (5,028 | ) | | | (41,473 | ) | | | | | | | (5,692 | ) | | | (32,693 | ) | | | (3,427 | ) | | | (20,788 | ) |
| | | | | | | | | | | | |
Net increase (decrease) | | | (413 | ) | | $ | (5,250 | ) | | | 9,313 | | | $ | 75,723 | | | | | | | | 5,711 | | | $ | 32,142 | | | | 5,118 | | | $ | 31,630 | |
| | | | | | | | | | | | |
| | | |
| | | Global Bond | | | | | | Global Growth | |
| | | Year ended
12-31-16 | | | Year ended
12-31-15 | | | | | | Year ended
12-31-16 | | | Year ended
12-31-15 | |
| | | Shares | | | Value | | | Shares | | | Value | | | | | | Shares | | | Value | | | Shares | | | Value | |
Shares issued from sale of shares | | | 905 | | | $ | 4,350 | | | | 1,122 | | | $ | 5,516 | | | | | | | | 4,632 | | | $ | 37,345 | | | | 12,256 | | | $ | 111,878 | |
Shares issued in reinvestment of distributions to shareholders | | | 154 | | | | 731 | | | | 140 | | | | 701 | | | | | | | | 1,910 | | | | 15,259 | | | | 2,920 | | | | 26,499 | |
Shares redeemed | | | (764 | ) | | | (3,676 | ) | | | (885 | ) | | | (4,374 | ) | | | | | | | (14,793 | ) | | | (122,033 | ) | | | (5,578 | ) | | | (50,502 | ) |
| | | | | | | | | | | | |
Net increase (decrease) | | | 295 | | | $ | 1,405 | | | | 377 | | | $ | 1,843 | | | | | | | | (8,251 | ) | | $ | (69,429 | ) | | | 9,598 | | | $ | 87,875 | |
| | | | | | | | | | | | |
| | | |
| | | Global Natural Resources | | | | | | Government Money Market | |
| | | Year ended
12-31-16 | | | Year ended
12-31-15 | | | | | | Year ended
12-31-16 | | | Year ended
12-31-15 | |
| | | Shares | | | Value | | | Shares | | | Value | | | | | | Shares | | | Value | | | Shares | | | Value | |
Shares issued from sale of shares | | | 8,519 | | | $ | 34,004 | | | | 7,712 | | | $ | 34,497 | | | | | | | | 93,521 | | | $ | 93,521 | | | | 116,187 | | | $ | 116,187 | |
Shares issued in reinvestment of distributions to shareholders | | | 225 | | | | 875 | | | | 28 | | | | 137 | | | | | | | | 699 | | | | 699 | | | | 107 | | | | 107 | |
Shares redeemed | | | (7,831 | ) | | | (31,345 | ) | | | (7,472 | ) | | | (33,828 | ) | | | | | | | (219,699 | ) | | | (219,699 | ) | | | (88,490 | ) | | | (88,490 | ) |
| | | | | | | | | | | | |
Net increase (decrease) | | | 913 | | | $ | 3,534 | | | | 268 | | | $ | 806 | | | | | | | | (125,479 | ) | | $ | (125,479 | ) | | | 27,804 | | | $ | 27,804 | |
| | | | | | | | | | | | |
| | | |
| | | Growth | | | | | | High Income | |
| | | Year ended
12-31-16 | | | Year ended
12-31-15 | | | | | | Year ended
12-31-16 | | | Year ended
12-31-15 | |
| | | Shares | | | Value | | | Shares | | | Value | | | | | | Shares | | | Value | | | Shares | | | Value | |
Shares issued from sale of shares | | | 3,987 | | | $ | 40,969 | | | | 5,911 | | | $ | 69,171 | | | | | | | | 38,641 | | | $ | 132,978 | | | | 47,114 | | | $ | 175,293 | |
Shares issued in reinvestment of distributions to shareholders | | | 9,263 | | | | 90,043 | | | | 9,363 | | | | 105,927 | | | | | | | | 17,143 | | | | 56,542 | | | | 16,178 | | | | 59,896 | |
Shares redeemed | | | (10,722 | ) | | | (111,828 | ) | | | (8,835 | ) | | | (104,736 | ) | | | | | | | (38,034 | ) | | | (129,983 | ) | | | (59,362 | ) | | | (216,743 | ) |
| | | | | | | | | | | | |
Net increase | | | 2,528 | | | $ | 19,184 | | | | 6,439 | | | $ | 70,362 | | | | | | | | 17,750 | | | $ | 59,537 | | | | 3,930 | | | $ | 18,446 | |
| | | | | | | | | | | | |
| | | |
| | | International Core Equity | | | | | | Limited-Term Bond | |
| | | Year ended
12-31-16 | | | Year ended
12-31-15 | | | | | | Year ended
12-31-16 | | | Year ended
12-31-15 | |
| | | Shares | | | Value | | | Shares | | | Value | | | | | | Shares | | | Value | | | Shares | | | Value | |
Shares issued from sale of shares | | | 8,381 | | | $ | 125,962 | | | | 6,726 | | | $ | 114,451 | | | | | | | | 10,035 | | | $ | 49,390 | | | | 13,679 | | | $ | 67,397 | |
Shares issued in reinvestment of distributions to shareholders | | | 1,129 | | | | 16,095 | | | | 5,314 | | | | 93,448 | | | | | | | | 1,180 | | | | 5,755 | | | | 1,372 | | | | 6,695 | |
Shares redeemed | | | (4,852 | ) | | | (71,820 | ) | | | (5,061 | ) | | | (85,855 | ) | | | | | | | (9,502 | ) | | | (46,773 | ) | | | (32,834 | ) | | | (161,222 | ) |
| | | | | | | | | | | | |
Net increase (decrease) | | | 4,658 | | | $ | 70,237 | | | | 6,979 | | | $ | 122,044 | | | | | | | | 1,713 | | | $ | 8,372 | | | | (17,783 | ) | | $ | (87,130 | ) |
| | | | | | | | | | | | |
| | | | | | | | | | | | | | | | | | | | | | | | | | | | | | | | | | | | |
| | | Micro Cap Growth | | | | | | Mid Cap Growth | |
| | | Year ended
12-31-16 | | | Year ended
12-31-15 | | | | | | Year ended
12-31-16 | | | Year ended
12-31-15 | |
| | | Shares | | | Value | | | Shares | | | Value | | | | | | Shares | | | Value | | | Shares | | | Value | |
Shares issued from sale of shares | | | 331 | | | $ | 6,257 | | | | 313 | | | $ | 7,336 | | | | | | | | 7,009 | | | $ | 63,137 | | | | 11,113 | | | $ | 113,296 | |
Shares issued in reinvestment of distributions to shareholders | | | 372 | | | | 6,098 | | | | 452 | | | | 10,594 | | | | | | | | 3,739 | | | | 32,997 | | | | 4,426 | | | | 46,460 | |
Shares redeemed | | | (511 | ) | | | (9,710 | ) | | | (590 | ) | | | (14,154 | ) | | | | | | | (7,778 | ) | | | (71,508 | ) | | | (4,656 | ) | | | (48,499 | ) |
| | | | | | | | | | | | |
Net increase | | | 192 | | | $ | 2,645 | | | | 175 | | | $ | 3,776 | | | | | | | | 2,970 | | | $ | 24,626 | | | | 10,883 | | | $ | 111,257 | |
| | | | | | | | | | | | |
| | | |
| | | Real Estate Securities | | | | | | Science and Technology | |
| | | Year ended
12-31-16 | | | Year ended
12-31-15 | | | | | | Year ended
12-31-16 | | | Year ended
12-31-15 | |
| | | Shares | | | Value | | | Shares | | | Value | | | | | | Shares | | | Value | | | Shares | | | Value | |
Shares issued from sale of shares | | | 1,205 | | | $ | 10,470 | | | | 1,189 | | | $ | 10,940 | | | | | | | | 2,503 | | | $ | 52,402 | | | | 5,144 | | | $ | 126,625 | |
Shares issued in reinvestment of distributions to shareholders | | | 594 | | | | 4,876 | | | | 634 | | | | 5,461 | | | | | | | | 1,068 | | | | 20,982 | | | | 1,358 | | | | 34,801 | |
Shares redeemed | | | (1,267 | ) | | | (10,947 | ) | | | (1,994 | ) | | | (17,986 | ) | | | | | | | (5,907 | ) | | | (124,077 | ) | | | (4,555 | ) | | | (111,924 | ) |
| | | | | | | | | | | | |
Net increase (decrease) | | | 532 | | | $ | 4,399 | | | | (171 | ) | | $ | (1,585 | ) | | | | | | | (2,336 | ) | | $ | (50,693 | ) | | | 1,947 | | | $ | 49,502 | |
| | | | | | | | | | | | |
| | | |
| | | Small Cap Growth | | | | | | Small Cap Value | |
| | | Year ended
12-31-16 | | | Year ended
12-31-15 | | | | | | Year ended
12-31-16 | | | Year ended
12-31-15 | |
| | | Shares | | | Value | | | Shares | | | Value | | | | | | Shares | | | Value | | | Shares | | | Value | |
Shares issued from sale of shares | | | 4,709 | | | $ | 45,243 | | | | 4,808 | | | $ | 56,961 | | | | | | | | 1,412 | | | $ | 23,322 | | | | 1,421 | | | $ | 23,905 | |
Shares issued in reinvestment of distributions to shareholders | | | 5,356 | | | | 45,145 | | | | 5,677 | | | | 66,812 | | | | | | | | 1,981 | | | | 29,736 | | | | 1,621 | | | | 27,175 | |
Shares redeemed | | | (6,616 | ) | | | (62,768 | ) | | | (4,993 | ) | | | (60,998 | ) | | | | | | | (4,695 | ) | | | (78,394 | ) | | | (2,425 | ) | | | (41,202 | ) |
| | | | | | | | | | | | |
Net increase (decrease) | | | 3,449 | | | $ | 27,620 | | | | 5,492 | | | $ | 62,775 | | | | | | | | (1,302 | ) | | $ | (25,336 | ) | | | 617 | | | $ | 9,878 | |
| | | | | | | | | | | | |
| | | |
| | | Value | | | | | | | |
| | | Year ended
12-31-16 | | | Year ended
12-31-15 | | | | | | | | | | |
| | | Shares | | | Value | | | Shares | | | Value | | | | | | | | | | | | | | | | |
Shares issued from sale of shares | | | 3,630 | | | $ | 20,436 | | | | 5,375 | | | $ | 36,040 | | | | | | | | | | | | | | | | | | | | | |
Shares issued in reinvestment of distributions to shareholders | | | 9,469 | | | | 48,920 | | | | 8,521 | | | | 55,408 | | | | | | | | | | | | | | | | | | | | | |
Shares redeemed | | | (11,533 | ) | | | (65,601 | ) | | | (7,811 | ) | | | (52,349 | ) | | | | | | | | | | | | | | | | | | | | |
| | | | | | | | | | | | |
Net increase | | | 1,566 | | | $ | 3,755 | | | | 6,085 | | | $ | 39,099 | | | | | | | | | | | | | | | | | | | | | |
| | | | | | | | | | | | |
13. COMMITMENTS
Bridge loan commitments may obligate a Portfolio to furnish temporary financing to a borrower until permanent financing can be arranged. In connection with these commitments, the Portfolio earns a commitment fee, typically set as a percentage of the commitment amount. Such fee income is included in interest income on the Statements of Operations. At December 31, 2016, there were no outstanding bridge loan commitments.
14. FEDERAL INCOME TAX MATTERS ($ amounts in thousands)
For Federal income tax purposes, cost of investments owned at December 31, 2016 and the related unrealized appreciation (depreciation) were as follows:
| | | | | | | | | | | | | | | | |
Portfolio | | Cost of Investments | | | Gross Appreciation | | | Gross Depreciation | | | Net Unrealized
Appreciation
(Depreciation) | |
Pathfinder Aggressive | | $ | 81,768 | | | $ | 446 | | | $ | 7,568 | | | $ | (7,122 | ) |
Pathfinder Conservative | | | 119,143 | | | | 136 | | | | 5,022 | | | | (4,886 | ) |
Pathfinder Moderate | | | 893,045 | | | | 8,512 | | | | 41,191 | | | | (32,679 | ) |
Pathfinder Moderately Aggressive | | | 1,060,486 | | | | 13,326 | | | | 53,679 | | | | (40,353 | ) |
Pathfinder Moderately Conservative | | | 272,036 | | | | 978 | | | | 12,398 | | | | (11,420 | ) |
Pathfinder Moderate – Managed Volatility | | | 539,557 | | | | 1,658 | | | | 30,326 | | | | (28,668 | ) |
Pathfinder Moderately Aggressive – Managed Volatility | | | 84,126 | | | | 213 | | | | 6,681 | | | | (6,468 | ) |
Pathfinder Moderately Conservative –
Managed Volatility | | | 70,587 | | | | 140 | | | | 3,696 | | | | (3,556 | ) |
Asset Strategy | | | 983,042 | | | | 50,447 | | | | 85,738 | | | | (35,291 | ) |
Balanced | | | 346,062 | | | | 30,752 | | | | 16,485 | | | | 14,267 | |
Bond | | | 437,860 | | | | 5,012 | | | | 5,436 | | | | (424 | ) |
Core Equity | | | 388,177 | | | | 45,945 | | | | 14,809 | | | | 31,136 | |
Dividend Opportunities | | | 444,202 | | | | 69,068 | | | | 4,719 | | | | 64,349 | |
Energy | | | 162,327 | | | | 36,709 | | | | 3,137 | | | | 33,572 | |
Global Bond | | | 22,136 | | | | 331 | | | | 754 | | | | (423 | ) |
Global Growth | | | 383,996 | | | | 32,455 | | | | 12,951 | | | | 19,504 | |
Global Natural Resources | | | 140,358 | | | | 14,146 | | | | 10,451 | | | | 3,695 | |
Government Money Market | | | 413,246 | | | | — | | | | — | | | | — | |
Growth | | | 685,023 | | | | 175,876 | | | | 26,165 | | | | 149,711 | |
High Income | | | 856,690 | | | | 23,964 | | | | 48,849 | | | | (24,885 | ) |
International Core Equity | | | 770,664 | | | | 22,366 | | | | 39,179 | | | | (16,813 | ) |
Limited-Term Bond | | | 401,319 | | | | 1,350 | | | | 2,320 | | | | (970 | ) |
Micro Cap Growth | | | 51,952 | | | | 14,538 | | | | 3,528 | | | | 11,010 | |
Mid Cap Growth | | | 580,735 | | | | 89,094 | | | | 54,016 | | | | 35,078 | |
Real Estate Securities | | | 48,054 | | | | 2,603 | | | | 1,406 | | | | 1,197 | |
Science and Technology | | | 371,123 | | | | 173,749 | | | | 30,611 | | | | 143,138 | |
Small Cap Growth | | | 369,715 | | | | 57,084 | | | | 5,038 | | | | 52,046 | |
Small Cap Value | | | 299,720 | | | | 51,707 | | | | 5,230 | | | | 46,477 | |
Value | | | 350,442 | | | | 39,889 | | | | 13,918 | | | | 25,971 | |
For Federal income tax purposes, the Portfolios’ distributed and undistributed earnings and profit for the year ended December 31, 2016 and the post-October and late-year ordinary activity updated with information available through the date of this report were as follows:
| | | | | | | | | | | | | | | | | | | | |
Portfolio | | Undistributed
Ordinary Income | | | Undistributed
Long-Term
Capital Gains | | | Tax Return of
Capital | | | Post-October
Capital Losses
Deferred | | | Late-Year
Ordinary
Losses
Deferred | |
Pathfinder Aggressive | | $ | 1,056 | | | $ | 4,935 | | | $ | — | | | $ | — | | | $ | — | |
Pathfinder Conservative | | | 1,227 | | | | 4,170 | | | | — | | | | — | | | | — | |
Pathfinder Moderate | | | 9,614 | | | | 44,870 | | | | — | | | | — | | | | — | |
Pathfinder Moderately Aggressive | | | 12,968 | | | | 58,436 | | | | — | | | | — | | | | — | |
Pathfinder Moderately Conservative | | | 2,861 | | | | 11,415 | | | | — | | | | — | | | | — | |
Pathfinder Moderate – Managed Volatility | | | 2,500 | | | | 14,749 | | | | — | | | | — | | | | — | |
Pathfinder Moderately Aggressive – Managed Volatility | | | 386 | | | | 2,462 | | | | — | | | | — | | | | — | |
Pathfinder Moderately Conservative – Managed Volatility | | | 298 | | | | 1,469 | | | | — | | | | — | | | | — | |
Asset Strategy | | | 3,718 | | | | — | | | | — | | | | — | | | | — | |
Balanced | | | 4,124 | | | | 11,843 | | | | — | | | | — | | | | — | |
Bond | | | 8,755 | | | | 1,029 | | | | — | | | | — | | | | — | |
Core Equity | | | 1,907 | | | | 17,260 | | | | — | | | | — | | | | — | |
Dividend Opportunities | | | 5,771 | | | | 17,759 | | | | — | | | | — | | | | — | |
Energy | | | — | | | | — | | | | — | | | | — | | | | — | |
| | | | | | | | | | | | | | | | | | | | |
Portfolio | | Undistributed
Ordinary Income | | | Undistributed
Long-Term
Capital Gains | | | Tax Return of
Capital | | | Post-October
Capital Losses
Deferred | | | Late-Year
Ordinary
Losses
Deferred | |
Global Bond | | $ | 630 | | | $ | — | | | $ | — | | | $ | — | | | $ | — | |
Global Growth | | | 209 | | | | 11,357 | | | | — | | | | — | | | | — | |
Global Natural Resources | | | 56 | | | | — | | | | — | | | | — | | | | — | |
Government Money Market | | | 61 | | | | — | | | | — | | | | — | | | | — | |
Growth | | | 2,224 | | | | 79,345 | | | | — | | | | — | | | | — | |
High Income | | | 54,031 | | | | — | | | | — | | | | — | | | | — | |
International Core Equity | | | 10,925 | | | | — | | | | — | | | | — | | | | — | |
Limited-Term Bond | | | 6,271 | | | | — | | | | — | | | | — | | | | — | |
Micro Cap Growth | | | — | | | | — | | | | — | | | | — | | | | — | |
Mid Cap Growth | | | — | | | | 19,649 | | | | — | | | | — | | | | — | |
Real Estate Securities | | | 689 | | | | 5,525 | | | | — | | | | — | | | | — | |
Science and Technology | | | — | | | | 28,285 | | | | — | | | | — | | | | — | |
Small Cap Growth | | | — | | | | 10,748 | | | | — | | | | — | | | | 478 | |
Small Cap Value | | | 34,481 | | | | 4,777 | | | | — | | | | — | | | | — | |
Value | | | 5,818 | | | | 5,871 | | | | — | | | | — | | | | — | |
Internal Revenue Code regulations permit each Portfolio to elect to defer into its next fiscal year capital losses and certain specified ordinary items incurred between each November 1 and the end of its fiscal year. Each Portfolio is also permitted to defer into its next fiscal certain ordinary losses that generated between each January 1 and the end of its fiscal year.
The tax character of dividends and distributions paid during the two fiscal years ended December 31, 2016 and 2015 were as follows:
| | | | | | | | | | | | | | | | |
| | | December 31, 2016 | | | December 31, 2015 | |
| Portfolio | | Distributed
Ordinary
Income(1) | | | Distributed
Long-Term
Capital Gains | | | Distributed
Ordinary
Income(1) | | | Distributed
Long-Term
Capital Gains | |
Pathfinder Aggressive | | $ | 1,209 | | | $ | 7,733 | | | $ | 2,388 | | | $ | 8,602 | |
Pathfinder Conservative | | | 1,341 | | | | 7,033 | | | | 1,393 | | | | 7,699 | |
Pathfinder Moderate | | | 11,309 | | | | 68,308 | | | | 15,573 | | | | 74,010 | |
Pathfinder Moderately Aggressive | | | 16,506 | | | | 90,370 | | | | 25,250 | | | | 92,878 | |
Pathfinder Moderately Conservative | | | 3,428 | | | | 19,152 | | | | 4,252 | | | | 22,153 | |
Pathfinder Moderate – Managed Volatility | | | 2,612 | | | | 15,290 | | | | — | | | | — | |
Pathfinder Moderately Aggressive – Managed Volatility | | | 624 | | | | 3,420 | | | | — | | | | — | |
Pathfinder Moderately Conservative – Managed Volatility | | | 327 | | | | 1,832 | | | | 80 | | | | 22 | |
Asset Strategy | | | 6,389 | | | | — | | | | 14,374 | | | | 249,563 | |
Balanced | | | 10,433 | | | | 49,291 | | | | 4,735 | | | | 53,174 | |
Bond | | | 6,593 | | | | 742 | | | | 8,715 | | | | — | |
Core Equity | | | 8,956 | | | | 44,866 | | | | 12,264 | | | | 70,282 | |
Dividend Opportunities | | | 6,264 | | | | 28,123 | | | | 13,525 | | | | 48,640 | |
Energy | | | 203 | | | | — | | | | 74 | | | | 652 | |
Global Bond | | | 731 | | | | — | | | | 701 | | | | — | |
Global Growth | | | 1,644 | | | | 13,615 | | | | 2,105 | | | | 24,394 | |
Global Natural Resources | | | 875 | | | | — | | | | 137 | | | | — | |
Government Money Market | | | 699 | | | | — | | | | 107 | | | | — | |
Growth | | | 5,166 | | | | 84,877 | | | | 6,353 | | | | 99,574 | |
High Income | | | 56,542 | | | | — | | | | 53,397 | | | | 6,499 | |
International Core Equity | | | 8,908 | | | | 7,187 | | | | 33,624 | | | | 59,824 | |
Limited-Term Bond | | | 5,755 | | | | — | | | | 6,695 | | | | — | |
Micro Cap Growth | | | — | | | | 6,098 | | | | — | | | | 10,594 | |
Mid Cap Growth | | | 4,666 | | | | 28,331 | | | | 4,693 | | | | 41,767 | |
Real Estate Securities | | | 516 | | | | 4,360 | | | | 1,690 | | | | 3,771 | |
Science and Technology | | | — | | | | 20,982 | | | | — | | | | 34,801 | |
Small Cap Growth | | | — | | | | 45,145 | | | | — | | | | 66,812 | |
Small Cap Value | | | 1,333 | | | | 28,403 | | | | 2,833 | | | | 24,342 | |
Value | | | 12,259 | | | | 36,661 | | | | 14,536 | | | | 40,872 | |
| (1) | Includes short-term capital gains distributed, if any. |
Dividends from net investment income and short-term capital gains are treated as ordinary income dividends for federal income tax purposes.
Accumulated capital losses represent net capital loss carryovers as of December 31, 2016 that may be available to offset future realized capital gains and thereby reduce future capital gains distributions. Under the Regulated Investment Company Modernization Act of 2010 (the “Modernization Act”), the Portfolio is permitted to carry forward capital losses incurred in taxable years beginning after December 22, 2010 for an unlimited period. Any losses incurred during those future taxable years will be required to be utilized prior to any losses incurred in pre-enactment taxable years which have only an eight year carryforward period. As a result of this ordering rule, pre-enactment capital loss carryovers may expire unused. Additionally, post-enactment capital losses that are carried forward will retain their character as either short-term or long-term capital losses rather than being considered all short-term as under the previous law. The Portfolio’s first fiscal year end subject to the Modernization Act was December 31, 2011. The following table shows the expiration dates for capital loss carryovers from pre-enactment taxable years and the amounts of capital loss carryovers, if any, by each of the applicable portfolios electing to be taxed as a regulated investment company during the period end December 31, 2016:
| | | | | | | | | | | | | | | | |
| | | Pre-Enactment | | | Post-Enactment | |
| Portfolio | | 2017 | | | 2018 | | | Short-Term
Capital Loss
Carryover | | | Long-Term
Capital Loss
Carryover | |
Pathfinder Aggressive | | $ | — | | | $ | — | | | $ | — | | | $ | — | |
Pathfinder Conservative | | | — | | | | — | | | | — | | | | — | |
Pathfinder Moderate | | | — | | | | — | | | | — | | | | — | |
Pathfinder Moderately Aggressive | | | — | | | | — | | | | — | | | | — | |
Pathfinder Moderately Conservative | | | — | | | | — | | | | — | | | | — | |
Pathfinder Moderate—Managed Volatility | | | — | | | | — | | | | — | | | | — | |
Pathfinder Moderately Aggressive—Managed Volatility | | | — | | | | — | | | | — | | | | — | |
Pathfinder Moderately Conservative—Managed Volatility | | | — | | | | — | | | | — | | | | — | |
Asset Strategy | | | — | | | | — | | | | 56,168 | | | | 1,328 | |
Balanced | | | — | | | | — | | | | — | | | | — | |
Bond | | | — | | | | — | | | | — | | | | — | |
Core Equity | | | — | | | | — | | | | — | | | | — | |
Dividend Opportunities | | | — | | | | — | | | | — | | | | — | |
Energy | | | 1,950 | | | | 432 | | | | 6,826 | | | | 12,475 | |
Global Bond | | | — | | | | — | | | | 296 | | | | 704 | |
Global Growth | | | — | | | | — | | | | — | | | | — | |
Global Natural Resources | | | — | | | | — | | | | 4,944 | | | | 42,180 | |
Government Money Market | | | — | | | | — | | | | — | | | | — | |
Growth | | | — | | | | — | | | | — | | | | — | |
High Income | | | — | | | | — | | | | 3,435 | | | | 47,048 | |
International Core Equity | | | — | | | | — | | | | 9,697 | | | | — | |
Limited-Term Bond | | | — | | | | — | | | | 333 | | | | 2,796 | |
Micro Cap Growth | | | — | | | | — | | | | 109 | | | | — | |
Mid Cap Growth | | | — | | | | — | | | | — | | | | — | |
Real Estate Securities | | | — | | | | — | | | | — | | | | — | |
Science and Technology | | | — | | | | — | | | | — | | | | — | |
Small Cap Growth | | | — | | | | — | | | | — | | | | — | |
Small Cap Value | | | — | | | | — | | | | — | | | | — | |
Value | | | — | | | | — | | | | — | | | | — | |
Net investment income dividends and capital gains distributions are determined in accordance with income tax regulations which may differ from U.S. GAAP. These differences are due to differing treatments for items such as deferral of wash sales, post-October losses, late-year ordinary losses, foreign currency transactions, net operating losses, income from passive foreign investment companies (PFICs), investments held within the wholly-owned subsidiary and companies, partnership transactions, and expiring capital loss carryovers. At December 31, 2016, the following reclassifications were made:
| | | | | | | | | | | | | | | | |
| Portfolio | | Undistributed
Net Investment
Income | | | Accumulated
Net Realized
Gain (Loss) | | | Paid-In
Capital | | | Unrealized Depreciation | |
Pathfinder Aggressive | | $ | — | | | $ | — | | | $ | — | | | $ | — | |
Pathfinder Conservative | | | — | | | | — | | | | — | | | | — | |
Pathfinder Moderate | | | — | | | | — | | | | — | | | | — | |
Pathfinder Moderately Aggressive | | | — | | | | — | | | | — | | | | — | |
Pathfinder Moderately Conservative | | | — | | | | — | | | | — | | | | — | |
| | | | | | | | | | | | | | | | |
| Portfolio | | Undistributed
Net Investment
Income | | | Accumulated
Net Realized
Gain (Loss) | | | Paid-In
Capital | | | Unrealized Depreciation | |
Pathfinder Moderate – Managed Volatility | | $ | — | | | $ | — | | | $ | — | | | $ | — | |
Pathfinder Moderately Aggressive – Managed Volatility | | | — | | | | — | | | | — | | | | — | |
Pathfinder Moderately Conservative – Managed Volatility | | | — | | | | — | | | | — | | | | — | |
Asset Strategy | | | 29 | | | | 727 | | | | (757 | ) | | | 1 | |
Balanced | | | (1,613 | ) | | | 1,614 | | | | (1 | ) | | | — | |
Bond | | | 739 | | | | (739 | ) | | | — | | | | — | |
Core Equity | | | 997 | | | | (997 | ) | | | — | * | | | — | |
Dividend Opportunities | | | (1,021 | ) | | | 1,022 | | | | (1 | ) | | | — | |
Energy | | | 686 | | | | 498 | | | | (1,184 | ) | | | — | |
Global Bond | | | (55 | ) | | | 55 | | | | — | | | | — | |
Global Growth | | | (194 | ) | | | 194 | | | | — | | | | — | |
Global Natural Resources | | | (63 | ) | | | 63 | | | | — | * | | | — | |
Government Money Market | | | — | | | | — | | | | — | | | | — | |
Growth | | | — | | | | — | | | | — | | | | — | |
High Income | | | (29 | ) | | | 29 | | | | — | * | | | — | |
International Core Equity | | | 73 | | | | (73 | ) | | | — | | | | — | |
Limited-Term Bond | | | 324 | | | | (324 | ) | | | — | | | | — | |
Micro Cap Growth | | | 559 | | | | 1 | | | | (560 | ) | | | — | |
Mid Cap Growth | | | 582 | | | | 116 | | | | (698 | ) | | | — | |
Real Estate Securities | | | — | | | | — | | | | — | | | | — | |
Science and Technology | | | 2,612 | | | | — | * | | | (2,612 | ) | | | — | |
Small Cap Growth | | | 3,738 | | | | 175 | | | | (3,912 | ) | | | (1 | ) |
Small Cap Value | | | 1,160 | | | | (1,160 | ) | | | — | * | | | — | |
Value | | | 4,308 | | | | (4,305 | ) | | | (3 | ) | | | — | |
| * | Not shown due to rounding. |
15. REGULATORY AND LITIGATION MATTERS
On July 24, 2006, WRIMCO, W&R and WRSCO (collectively, “Waddell & Reed”) reached a settlement with the SEC to resolve proceedings brought in connection with its investigation of frequent trading and market timing in certain Waddell & Reed Advisors Funds.
Under the terms of the SEC’s cease-and desist order (the “SEC Order”), pursuant to which Waddell & Reed neither admitted nor denied any of the findings contained therein, among other provisions Waddell & Reed agreed to pay $40 million in disgorgement and $10 million in civil money penalties.
Pursuant to the terms of the SEC order, the $50 million in disgorgement and civil penalties, plus accrued interest (the “Fair Fund”), must be distributed in accordance with a distribution plan developed by an independent distribution consultant, in consultation with W&R and as approved by the SEC, using a distribution methodology acceptable to the Funds’ Disinterested Trustees. The SEC Order also required that the independent distribution consultant develop the distribution methodology pursuant to which Fund shareholders shall receive their proportionate share of losses, if any, suffered by the Funds due to market timing. On July 15, 2014, the SEC ordered that the Fair Fund be distributed to investors as provided for in the distribution plan.
The foregoing is only a summary of the SEC Order. A copy of the SEC Order and the distribution plan are available on the SEC’s website at www.sec.gov.
| | |
| REPORT OF INDEPENDENT REGISTERED PUBLIC ACCOUNTING FIRM | | IVY VIP |
To the Shareholders and Board of Trustees of Ivy Variable Insurance Portfolios:
We have audited the accompanying statements of assets and liabilities, including the schedules of investments, of Ivy Variable Insurance Portfolios (the “Funds”), comprising Ivy VIP Pathfinder Aggressive, Ivy VIP Pathfinder Conservative, Ivy VIP Pathfinder Moderate, Ivy VIP Pathfinder Moderately Aggressive, Ivy VIP Pathfinder Moderately Conservative, Ivy VIP Pathfinder Moderate – Managed Volatility, Ivy VIP Pathfinder Moderately Aggressive – Managed Volatility, Ivy VIP Pathfinder Moderately Conservative – Managed Volatility, Ivy VIP Asset Strategy, Ivy VIP Balanced, Ivy VIP Bond, Ivy VIP Core Equity, Ivy VIP Dividend Opportunities, Ivy VIP Energy, Ivy VIP Global Bond, Ivy VIP Global Growth, Ivy VIP Global Natural Resources, Ivy VIP Government Money Market (formerly, Ivy Funds VIP Money Market), Ivy VIP Growth, Ivy VIP High Income, Ivy VIP International Core Equity, Ivy VIP Limited-Term Bond, Ivy VIP Micro Cap Growth, Ivy VIP Mid Cap Growth, Ivy VIP Real Estate Securities, Ivy VIP Science and Technology, Ivy VIP Small Cap Growth, Ivy VIP Small Cap Value, and Ivy VIP Value Portfolios, as of December 31, 2016, and the related statements of operations for the year then ended, the statements of changes in net assets for each of the two years in the period then ended, and the financial highlights for each of the periods presented. These financial statements and financial highlights are the responsibility of the Funds’ management. Our responsibility is to express an opinion on these financial statements and financial highlights based on our audits.
We conducted our audits in accordance with the standards of the Public Company Accounting Oversight Board (United States). Those standards require that we plan and perform the audit to obtain reasonable assurance about whether the financial statements and financial highlights are free of material misstatement. The Funds are not required to have, nor were we engaged to perform, an audit of their internal control over financial reporting. Our audits included consideration of internal control over financial reporting as a basis for designing audit procedures that are appropriate in the circumstances, but not for the purpose of expressing an opinion on the effectiveness of the Funds’ internal control over financial reporting. Accordingly, we express no such opinion. An audit also includes examining, on a test basis, evidence supporting the amounts and disclosures in the financial statements, assessing the accounting principles used and significant estimates made by management, as well as evaluating the overall financial statement presentation. Our procedures included confirmation of securities owned as of December 31, 2016, by correspondence with the custodian, transfer agent, agent banks, and brokers; when replies were not received from brokers and agent banks, we performed other auditing procedures. We believe that our audits provide a reasonable basis for our opinion.
In our opinion, the financial statements and financial highlights referred to above present fairly, in all material respects, the financial position of each of the portfolios constituting Ivy Variable Insurance Portfolios as of December 31, 2016, the results of their operations for the year then ended, the changes in their net assets for each of the two years in the period then ended, and the financial highlights for each of the periods presented, in conformity with accounting principles generally accepted in the United States of America.
Kansas City, Missouri
February 17, 2017
| | |
| INCOME TAX INFORMATION | | IVY VIP |
AMOUNTS NOT ROUNDED (UNAUDITED)
The Portfolios hereby designate the following amounts of dividends paid from net ordinary income as dividends qualifying for the 70% dividends received deduction for corporations for the tax period ended December 31, 2016:
| | | | |
| | | Dividends
Received
Deduction for
Corporations | |
Pathfinder Aggressive | | $ | 371,325 | |
Pathfinder Conservative | | | 514,330 | |
Pathfinder Moderate | | | 4,845,264 | |
Pathfinder Moderately Aggressive | | | 6,063,132 | |
Pathfinder Moderately Conservative | | | 1,339,636 | |
Pathfinder Moderate — Managed Volatility | | | 1,388,717 | |
Pathfinder Moderately Aggressive — Managed Volatility | | | 282,849 | |
Pathfinder Moderately Conservative — Managed Volatility | | | 167,552 | |
Asset Strategy | | | 6,388,992 | |
Balanced | | | 4,533,609 | |
Bond | | | — | |
Core Equity | | | 5,161,857 | |
Dividend Opportunities | | | 6,263,807 | |
Energy | | | 202,753 | |
Global Bond | | | — | |
Global Growth | | | 1,644,210 | |
Global Natural Resources | | | 874,569 | |
Government Money Market | | | — | |
Growth | | | 5,165,750 | |
High Income | | | — | |
International Core Equity | | | — | |
Limited-Term Bond | | | — | |
Micro Cap Growth | | | — | |
Mid Cap Growth | | | 4,665,612 | |
Real Estate Securities | | | — | |
Science and Technology | | | — | |
Small Cap Growth | | | — | |
Small Cap Value | | | 1,332,275 | |
Value | | | 6,827,116 | |
The Portfolios hereby designate the following amounts as distributions of long-term capital gains:
| | | | |
Pathfinder Aggressive | | $ | 7,733,351 | |
Pathfinder Conservative | | | 7,032,805 | |
Pathfinder Moderate | | | 68,307,704 | |
Pathfinder Moderately Aggressive | | | 90,369,802 | |
Pathfinder Moderately Conservative | | | 19,151,715 | |
Pathfinder Moderate — Managed Volatility | | | 15,290,407 | |
Pathfinder Moderately Aggressive — Managed Volatility | | | 3,420,362 | |
Pathfinder Moderately Conservative — Managed Volatility | | | 1,831,567 | |
Asset Strategy | | | — | |
Balanced | | | 49,290,492 | |
Bond | | | 741,708 | |
Core Equity | | | 44,866,463 | |
Dividend Opportunities | | | 28,122,820 | |
Energy | | | — | |
Global Bond | | | — | |
Global Growth | | | 13,614,388 | |
Global Natural Resources | | | — | |
Government Money Market | | | — | |
Growth | | | 84,877,555 | |
High Income | | | — | |
International Core Equity | | | 7,187,390 | |
Limited-Term Bond | | | — | |
Micro Cap Growth | | | 6,098,003 | |
Mid Cap Growth | | | 28,331,484 | |
Real Estate Securities | | | 4,359,977 | |
Science and Technology | | | 20,982,317 | |
Small Cap Growth | | | 45,145,317 | |
Small Cap Value | | | 28,402,955 | |
Value | | | 36,660,483 | |
Internal Revenue Code regulations permit each qualifying Portfolio to elect to pass through a foreign tax credit to shareholders with respect to foreign taxes paid by the Portfolio. Each Portfolio elected to pass the following amounts of creditable foreign taxes through to their shareholders:
| | | | | | | | |
| | | Foreign
Tax Credit | | | Foreign
Derived
Income | |
Pathfinder Aggressive | | $ | 19,814 | | | $ | 149,295 | |
Pathfinder Conservative | | | 16,605 | | | | 125,121 | |
Pathfinder Moderate | | | 128,080 | | | | 965,082 | |
Pathfinder Moderately Aggressive | | | 257,615 | | | | 1,941,129 | |
Pathfinder Moderately Conservative | | | 38,890 | | | | 293,040 | |
Pathfinder Moderate — Managed Volatility | | | 64,123 | | | | 483,166 | |
Pathfinder Moderately Aggressive —Managed Volatility | | | 16,882 | | | | 127,204 | |
Pathfinder Moderately Conservative —Managed Volatility | | | 8,246 | | | | 62,130 | |
International Core Equity | | | 1,546,233 | | | | 19,402,944 | |
| | |
| BOARD OF TRUSTEES AND OFFICERS | | IVY VIP |
Each of the individuals listed below serves as a trustee for the Trust (29 portfolios), and for the portfolios within the Waddell & Reed Advisors Funds (20 portfolios) and InvestEd Portfolios (3 portfolios) (collectively, the “Advisors Fund Complex”). The Advisors Fund Complex, together with the Ivy Funds, comprises the Waddell & Reed/Ivy Fund Complex (the “Fund Complex”). The Ivy Funds consist of the portfolios in the Ivy Funds (39 portfolios) and the Ivy High Income Opportunities Fund (a closed-end fund) (“IVH”). Jarold Boettcher, Joseph Harroz, Jr., and Henry J. Herrmann also serve as trustees of each of the funds in the Ivy Funds.
Board members who are not “interested persons” of the Funds as defined in Section 2(a)(19) of the 1940 Act (Disinterested Trustees) constitute at least 75% of the Board.
Joseph Harroz, Jr. serves as the Independent Chairman of the Trust’s Board and of the board of trustees of the other funds in the Advisors Fund Complex. Subject to the Trustee Emeritus and Retirement Policy, a Trustee serves until his or her successor is elected and qualified or until his or her earlier death, resignation or removal.
The Statement of Additional Information (the “SAI”) for the Trust includes additional information about the Trust’s trustees. The SAI is available without charge, upon request, by calling 1.888.WADDELL. It is also available on the Waddell & Reed website, www.waddell.com.
Disinterested Trustees
| | | | | | | | |
Name, Address and
Year of Birth | | Position(s) Held with
the Trust and
Fund Complex | | Trustee Since* | | Principal Occupation(s)
During Past 5 Years | | Other Directorships Held |
Jarold W. Boettcher 6300 Lamar Avenue Overland Park, KS 66202 1940 | | Trustee | | Trust: 2009 Fund Complex: 2007 | | President of Boettcher Enterprises, Inc. (agricultural products and services) (1979 to present), Boettcher Supply, Inc. (electrical and plumbing supplies distributor) (1979 to present); Boettcher Aerial, Inc. (Aerial AG Applicator) (1982 to present). | | Director, Guaranty State Bank & Trust Co. (financial services) (1981 to present); Director, Guaranty, Inc. (financial services) (1981 to present); Member, Kansas Board of Regents (2007 to 2011); Member, Kansas State University Foundation (1981 to present); Director, Kansas Bioscience Authority (2009 to 2016); Committee Member, Kansas Foundation for Medical Care (2001 to 2011); Trustee, Ivy Funds (39 portfolios overseen); Trustee, Ivy High Income Opportunities Fund (1 portfolio overseen). |
James M. Concannon 6300 Lamar Avenue Overland Park, KS 66202 1947 | | Trustee | | Trust: 2009 Fund Complex: 1997 | | Professor of Law, Washburn University School of Law (1973 to present). | | Director, Kansas Legal Services for Prisoners, Inc. (non-profit community service); Director, U.S. Alliance Corporation (Insurance) (2009 to present); Director, Kansas Appleseed, Inc. (non-profit community service) (2007 to present). |
John A. Dillingham 6300 Lamar Avenue Overland Park, KS 66202 1939 | | Trustee | | Trust: 2009 Fund Complex: 1997 | | President and Trustee, JoDill Corp. (1997 to present) and Dillingham Enterprises, Inc. (1997 to present), both farming enterprises. | | Former Advisory Director, UMB Northland Board (financial services) (1995 to 2012); Trustee, Liberty Memorial Association (WWI National Museum) (1998 to 2013), National Advisory Board, (2014 to present); Trustee, Harry S. Truman Library Institute (education) (2007 to 2016); Chairman (2005 to 2013) and current Trustee, Freedoms Frontier National Heritage Area (education); Trustee, CGSC Foundation (government) (2004 to 2012); Chairman, Kansas City Municipal Assistance Corporation (bond issuance) (1980 to present); Director, Metropolitan Comm. College Found. (1980 to 2014). |
Joseph Harroz, Jr. 6300 Lamar Avenue Overland Park, KS 66202 1967 | | Trustee Independent Chairman | | Trust: 2009 Fund Complex: 1998 Trust: 2015 Fund Complex: 2015 | | Dean, Professor and University Vice President, The University of Oklahoma College of Law (2010 to present); Managing Member, Harroz Investments, LLC (commercial enterprise investments) (1998 to present). | | Director and Shareholder, Valliance Bank, N.A. (2007 to present); Director, Foundation HealthCare (2008 to present); Trustee, The Mewbourne Family Support Organization (non-profit) (2006 to present); Independent Director, LSQ Manager, Inc. (Real Estate) (2007 to 2016); Director, OK Foundation for Excellence (non-profit) (2008 to present);Trustee/Independent Chairman, Ivy Funds (37 portfolios overseen); Trustee/Independent Chairman , Ivy High Income Opportunities Fund (1 portfolio overseen). |
| | | | | | | | |
Name, Address and
Year of Birth | | Position(s) Held with
the Trust and
Fund Complex | | Trustee Since* | | Principal Occupation(s)
During Past 5 Years | | Other Directorships Held |
Frank J. Ross, Jr. Polsinelli PC 900 West 48th Place, Suite 900 Kansas City, MO 64112 1953 | | Trustee | | Trust: 2009 Fund Complex: 1996 | | Shareholder/Director, Polsinelli PC, (law firm) (1980 to present). | | Director, American Red Cross (community service) (2003-2010); Director, Rockhurst University (education) (2003-2009); Director, March of Dimes Birth Defects Foundation, Greater Kansas City Chapter (2001-2009). |
Interested Trustees
Mr. Herrmann is “interested” by virtue of his current or former engagement as an officer of Waddell & Reed Financial, Inc. (“WDR”) or its wholly owned subsidiaries, including the Fund’s investment manager, Waddell & Reed Investment Management Company (“WRIMCO”), each Fund’s principal underwriter, Waddell & Reed, Inc. (“Waddell & Reed”), and each Fund’s shareholder servicing and accounting services agent, Waddell & Reed Services Company, doing business as WI Services Company (“WISC”), as well as by virtue of his personal ownership of shares of WDR. The address for each Interested Trustee and each of the officers in the following tables is 6300 Lamar Avenue, Overland Park, KS 66202.
| | | | | | | | |
| Name and Year of Birth | | Position(s) Held With
The Trust And
Fund Complex | | Trustee/Officer Since* | | Principal Occupation(s) During Past 5 Years | | Other Directorships Held |
Henry J. Herrmann 1942 | | Trustee | | Trust: 2009 Fund Complex: 1998 | | Chairman of WDR (2010 to present); CEO of WDR (2005 to 2016); President, CEO and Chairman of WRIMCO (1993 to 2016); President, CEO and Chairman of IICO (2002 to 2016); President of each of the funds in the Fund Complex (2001 to 2016).Trustee of each of the funds in the Fund Complex. | | Director of WDR (1998 to present), IICO (2002 to 2016), WRIMCO (1991 to 2016), WISC (2001 to 2016), W&R Capital Management Group, Inc. (2008 to 2016) and Waddell & Reed, Inc. (1993 to 2016); Director, Blue Cross Blue Shield of Kansas City, 2007 to present); Trustee, Ivy Funds (39 portfolios overseen); Trustee, Ivy High Income Opportunities Fund (1 portfolio overseen). |
*Each Trustee became a Trustee (and, as applicable, an officer) in 2009, as reflected by the first date shown. The second date shows when the Trustee first became a director (and, as applicable, an officer) of one or more Predecessor Fund.
Officers
The Board has appointed officers who are responsible for the day-to-day business decisions based on policies it has established. The officers serve at the pleasure of the Board. The Trust’s principal officers are:
| | | | | | | | |
Name and
Year of Birth | | Position(s) Held with the
Trust and Fund Complex | | Officer of
Trust Since | | Officer of Fund
Complex Since* | | Principal Occupation(s) During Past 5 Years |
Wendy J. Hills 1970 | | Vice President General Counsel Secretary | | 2014 2014 2016 | | 2014 2014 2014 | | Senior Vice President and General Counsel of WDR, Waddell & Reed, WRIMCO and WISC (2014 to present); Senior Vice President and General Counsel of IICO (2014 to present); Vice President and General Counsel for each of the funds in the Fund Complex (2014 to present); Assistant Secretary for each of the funds in the Funds Complex (2014 to 2016); Secretary for each of the funds in the Funds Complex (2016 to present). |
Joseph W. Kauten 1969 | | Vice President Treasurer Principal Financial Officer Principal Accounting Officer | | 2009 2009 2009 2009 | | 2006 2006 2007 2006 | | Principal Financial Officer of each of the funds in the Fund Complex (2007 to present); Vice President, Treasurer and Principal Accounting Officer of each of the funds in the Fund Complex (2006 to present). |
Philip J. Sanders 6300 Lamar Avenue Overland Park, KS 66202 1959 | | President | | 2016 | | 2006 | | CEO, WDR (2016 to present); Chief Investment Officer, WDR (2011 to present); Senior Vice President, WDR (2011 to 2016); President, CEO and Chairman, IICO (2016 to present); Senior Vice President, IICO (2010 to 2016); President, CEO and Chairman, WRIMCO (2016 to present); Senior Vice President WRIMCO (2010 to 2016); President of each of the funds in the Funds Complex (2016 to present). |
Scott J. Schneider 1968 | | Vice President Chief Compliance Officer | | 2009 2009 | | 2006 2004 | | Chief Compliance Officer (2004 to present) and Vice President (2006 to present) of each of the funds in the Fund Complex. |
Philip A. Shipp 1969 | | Assistant Secretary | | 2012 | | 2012 | | Assistant Secretary of each of the funds in the Fund Complex (2012 to present); Vice President of Waddell & Reed, Inc. and IDI (2010 to present). |
*This is the date when the Officer first became an officer of one or more Predecessor Funds.
| | |
| RENEWAL OF INVESTMENT MANAGEMENT AGREEMENT | | IVY VIP |
At its meeting on August 9 and 10, 2016, the Trust’s Board of Trustees, including all of the Disinterested Trustees, considered and approved the continuance of the existing Investment Management Agreement between WRIMCO and the Trust as to each of its Portfolios (“Management Agreement”), and, for certain Portfolios, of the Investment Subadvisory Agreement (each, a “Subadvisory Agreement”) between WRIMCO and the Portfolio subadvisor pursuant to which the subadvisor provides investment advisory services. The Disinterested Trustees were assisted in their review by independent legal counsel and met with such counsel separately from representatives of WRIMCO. The Disinterested Trustees also received and considered a memorandum from their independent legal counsel regarding the Disinterested Trustees’ responsibilities in evaluating the Management Agreement and, if applicable, the Subadvisory Agreement, for each Portfolio. This memorandum explained the regulatory requirements pertaining to the Disinterested Trustees’ evaluation of the Management Agreement and the Subadvisory Agreements. In addition, the Disinterested Trustees engaged a fee consultant whose responsibilities included managing the process by which the proposed management fees under the Management Agreement were negotiated with WRIMCO.
Prior to the Board meeting, independent legal counsel sent to WRIMCO and, as applicable, to the subadvisor, a request letter for information to be provided to the Trustees in connection with their consideration of the continuance of the Management Agreement with respect to each Portfolio and of the Subadvisory Agreements, as applicable. WRIMCO and the subadvisor provided materials to the Trustees that included responses to the request letter and other information WRIMCO and the subadvisor, as applicable, believed was useful in evaluating the continuation of the Management Agreement and the Subadvisory Agreements (“Initial Response”). Thereafter, independent legal counsel sent to WRIMCO a supplemental request letter for certain additional information, and WRIMCO provided additional information in response to this request letter. The Trustees also received reports prepared by an independent third party, Broadridge Inc. (“Broadridge”), relating to performance and expenses of each Portfolio compared to the performance of the universe of comparable mutual funds selected by Broadridge (the “Performance Universe”) and to the expenses of a peer group of comparable funds selected by Broadridge (the “Peer Group”), respectively. Further, the Trustees received a written evaluation from the fee consultant. At their meeting, the Trustees received a presentation from representatives of WRIMCO regarding services provided by it and its affiliates (collectively, “W&R”) to each Portfolio. In connection with its deliberations, the Trustees also considered the broad range of information relevant to the Trustees’ consideration of the continuance of the Management Agreement and Subadvisory Agreements, as applicable, with respect to each Portfolio that is provided by W&R to the Trustees (including its various standing committees) at meetings throughout the year.
Nature, Extent and Quality of Services
Provided to the Portfolios
The Trustees considered the nature, extent and quality of the services provided to each Portfolio pursuant to the Management Agreement and by the subadvisor pursuant to the Subadvisory Agreements.
The Trustees considered WRIMCO’s and, as applicable, the subadvisor’s research and portfolio management capabilities and that W&R also provides oversight of day-to-day portfolio operations, including but not limited to portfolio accounting and administration and assistance in meeting legal and regulatory requirements. The Trustees also considered WRIMCO’s and, as applicable, the subadvisor’s practices regarding the selection and compensation of brokers and dealers that execute portfolio transactions for each Portfolio and, as applicable, those brokers’ and dealers’ provision of brokerage and research services to WRIMCO, and the benefits derived by each Portfolio and the other funds in the Advisors Fund Complex and by other clients of WRIMCO from such services. The Trustees considered the information provided by WRIMCO and, as applicable, the subadvisor regarding its compliance program and compliance matters, if any, over the past year. The Trustees also considered the favorable history, reputation, qualification and background of WRIMCO and W&R’s extensive administrative, accounting and compliance infrastructure, as well as WRIMCO’s supervisory activities over the subadvisor.
Portfolio Performance, Management Fee and Expense Ratio.
The Trustees considered each Portfolio’s performance, both on an absolute basis and in relation to the performance of its Performance Universe. The Trustees factored into its evaluation of each Portfolio’s performance the limitations inherent in the methodology for constructing a peer group and determining which investment companies should be included in a peer group. Each Portfolio’s performance was also compared to relevant market indices and to a Lipper index, as applicable. In this regard, the Trustees noted that performance, especially short-term performance, is only one of factors that it deems relevant to its consideration of the continuance of the Management Agreement and the Subadvisory Agreements, and that, after considering all relevant factors, it may be appropriate to approve the continuance of the Management Agreement and Subadvisory Agreement with respect to a Portfolio notwithstanding the Portfolio’s performance.
The Trustees considered the management fees and total expenses of each Portfolio and also considered each Portfolio’s management fees and total expenses in relation to the management fees and total expenses, respectively, of its Peer Group. The Trustees’ review also included consideration of each Portfolio’s management fees at various asset levels in relation to the management fees at those asset levels of funds within a peer group of comparable mutual funds selected by and as shown in the reports from Broadridge (“Broadridge Group”). They also considered each Portfolio’s non-management fees in
relation to the non-management fees of its Peer Group, the amount of assets in each Portfolio, and factors affecting the Portfolios’ expense ratios. In addition, the Trustees considered, for each Portfolio, the management fees, if any, paid to WRIMCO (or its affiliate) by other mutual funds managed by WRIMCO (or its affiliate) with a similar investment objective (or objectives) and similar investment policies and strategies as the Portfolio (“Similar Funds”). The Trustees also considered, for each Portfolio, the subadvisory fees, if any, paid to WRIMCO or the subadvisor, as applicable, (or their respective affiliates) by other mutual funds advised by WRIMCO or the subadvisor (or their respective affiliates), as well as the management fees, if any, paid by other client accounts managed by WRIMCO or the subadvisor (or their respective affiliates), with a similar investment objective (or objectives) and similar investment policies and strategies as the Portfolio (each of such accounts, an “Other Account”).
Additional Considerations with Respect to Each Portfolio
Asset Strategy
The Trustees considered that Asset Strategy’s total return performance was lower than the Performance Universe median for the one-, three-, five- and seven-year periods and was higher than the Performance Universe median for the ten-year period. They noted that information for a Lipper index was not provided. They also considered the information provided by WRIMCO in its Initial Response explaining that, among other factors, security selection, exposure to gold and emerging markets, sector allocation and a large cash position had adversely affected the Portfolio’s performance over the three-year period. They further considered the year-to-date performance information through May 31, 2016, provided by WRIMCO in its Initial Response.
The Trustees considered the range and average of the management fees and expense ratios of the Peer Group. They considered that the Portfolio’s management fee and overall expense ratio were lower than the Peer Group medians. They also considered that, with the breakpoints in the fee schedule, the Portfolio’s effective management fees at various asset levels were lower than the medians for its Lipper Group.
The Trustees also considered that the Similar Funds had advisory fee schedules that were the same as the Portfolio’s advisory fee schedule, except that one Similar Fund’s advisory fee had additional breakpoints at higher asset levels, and that the Other Accounts had average advisory fees that were lower than the management fee of the Portfolio. The Trustees considered the relevance of the fee information provided for the Similar Funds and Other Accounts to evaluate the appropriateness and reasonableness of the Portfolio’s management fee. The Trustees recognized that, among other factors, differences in fees paid by the Other Accounts were consistent with the additional management and other services provided by WRIMCO to the Portfolio.
Balanced
The Trustees considered that Balanced’s total return performance was higher than the Performance Universe median for the three-, five-, and ten-year periods and was higher than the Lipper index for the three-, five-, seven-, and ten-year periods.
The Trustees considered the range and average of the management fees and expense ratios of the Peer Group. They considered that the Portfolio’s management fee and overall expense ratio were higher than the Peer Group medians. They also considered that, with the breakpoints in the fee schedule, the Portfolio’s effective management fees at various asset levels were higher than the medians for its Lipper Group, except for two asset levels at which the Portfolio’s effective management fees were lower than the medians for its Lipper Group.
The Trustees also considered that the Similar Funds had advisory fee schedules that were the same as the Portfolio’s advisory fee schedule, except that one Similar Fund’s advisory fee had additional breakpoints at higher asset levels, and that the Other Accounts had average advisory fees that were lower than the management fee of the Portfolio. The Trustees considered the relevance of the fee information provided for the Similar Funds and Other Accounts to evaluate the appropriateness and reasonableness of the Portfolio’s management fee. The Trustees recognized that, among other factors, differences in fees paid by the Other Accounts were consistent with the additional management and other services provided by WRIMCO to the Portfolio.
Bond
The Trustees considered that Bond’s total return performance was lower than the Performance Universe median and the Lipper index for the three-, five-, seven-, and ten-year periods. They also considered the information provided by WRIMCO in its Initial Response explaining that, among other factors, the Portfolio’s duration management, overweighting in corporate bonds and exposure to energy sensitive credits had adversely affected the Portfolio’s performance over the three-year period. They further considered the year-to-date performance information through May 31, 2016, provided by WRIMCO in its Initial Response and noted that, despite the Portfolio’s underperformance for the three-year and longer periods ended March 31, 2016, the Portfolio’s performance relative to its Performance Universe appeared to be improving and was good for the one-year period. In addition, the Trustees considered the recent changes to the Portfolio’s portfolio management team.
The Trustees considered the range and average of the management fees and expense ratios of the Peer Group. They considered that the Portfolio’s management fee was higher than the Peer Group median and that the Portfolio’s overall expense ratio was lower than the Peer Group median. They also considered that, with the breakpoints in the fee schedule, the Portfolio’s effective management fees at various asset levels were higher than the medians for its Lipper Group, except for one asset level at which the Portfolio’s effective management fee was lower than the median for its Lipper Group.
The Trustees also considered that the Similar Funds had advisory fee schedules that were the same as the Portfolio’s advisory fee schedule, except that one Similar Fund’s advisory fee was higher for certain asset levels and had additional breakpoints at higher asset levels, and that the Other Account had an advisory fee that was lower than the management fee of the Portfolio. The Trustees considered the relevance of the fee information provided for the Similar Funds and Other Account to evaluate the appropriateness and reasonableness of the Portfolio’s management fee. The Trustees recognized that, among other factors, differences in fees paid by the Other Account were consistent with the additional management and other services provided by WRIMCO to the Portfolio.
Core Equity
The Trustees considered that Core Equity’s total return performance was lower than the Performance Universe median and the Lipper index for the one-, three- and five-year periods and was higher than the Performance Universe median and the Lipper index for the seven- and ten-year periods. They also considered the information provided by WRIMCO in its Initial Response explaining that, among other factors, security selection and an underweighting in the telecommunications and utilities sectors had adversely affected the Portfolio’s performance over the three-year period. They further considered the year-to-date performance information through May 31, 2016, provided by WRIMCO in its Initial Response.
The Trustees considered the range and average of the management fees and expense ratios of the Peer Group. They considered that the Portfolio’s management fee and overall expense ratio were higher than the Peer Group medians. They also considered that, with the breakpoints in the fee schedule, the Portfolio’s effective management fees at certain asset levels were equal to, and at other asset levels were lower or higher than, the medians for its Lipper Group.
The Trustees also considered that the Similar Funds had advisory fee schedules that were the same as the Portfolio’s advisory fee schedule, except that the Similar Funds’ advisory fees had additional breakpoints at higher asset levels, and that the Other Accounts had average advisory fees that were lower than the management fee of the Portfolio. The Trustees considered the relevance of the fee information provided for the Similar Funds and Other Accounts to evaluate the appropriateness and reasonableness of the Portfolio’s management fee. The Trustees recognized that, among other factors, differences in fees paid by the Other Accounts were consistent with the additional management and other services provided by WRIMCO to the Portfolio.
Dividend Opportunities
The Trustees considered that Dividend Opportunities’ total return performance was lower than the Performance Universe median for the one-, five-, seven- and ten-year periods and was lower than the Lipper index for the one-, three-, five-, seven- and ten-year periods.
The Trustees considered the range and average of the management fees and expense ratios of the Peer Group. They considered that the Portfolio’s management fee was equal to the Peer Group median and that the Portfolio’s overall expense ratio was higher than the Peer Group median. They also considered that, with the breakpoints in the fee schedule, the Portfolio’s effective management fees at various asset levels were lower than the medians for its Lipper Group, except for one asset level at which the Portfolio’s effective management fee was equal to the median for its Lipper Group.
The Trustees also considered that the Similar Funds had advisory fee schedules that were the same as the Portfolio’s advisory fee schedule, except that one Similar Fund’s advisory fee had additional breakpoints at higher asset levels, and that there were no Other Accounts managed by WRIMCO or its affiliates with a similar investment objective and similar investment policies and strategies as the Portfolio. The Trustees considered the relevance of the fee information provided for the Similar Funds to evaluate the appropriateness and reasonableness of the Portfolio’s management fee.
Energy
The Trustees considered that Energy’s total return performance was higher than the Performance Universe median and the Lipper index for the three-, five-, and seven-year periods for which information was provided, since the Portfolio did not have a ten-year performance record as of March 31, 2016.
The Trustees considered the range and average of the management fees and expense ratios of the Peer Group. They considered that the Portfolio’s management fee was higher than the Peer Group median and that the Portfolio’s overall expense ratio was equal to the Peer Group median. They also considered that, with the breakpoints in the fee schedule, the Portfolio’s effective management fees at various asset levels were higher than the medians for its Lipper Group.
The Trustees also considered that the Similar Funds had advisory fee schedules that were the same as the Portfolio’s advisory fee schedule, except that one Similar Fund’s advisory fee had additional breakpoints at higher asset levels, and that there were no Other Accounts managed by WRIMCO or its affiliates with a similar investment objective and similar investment policies and strategies as the Portfolio. The Trustees considered the relevance of the fee information provided for the Similar Funds to evaluate the appropriateness and reasonableness of the Portfolio’s management fee.
Global Bond
The Trustees considered that Global Bond’s total return performance was higher than the Performance Universe median and the Lipper index for the three-year period and was lower than the Performance Universe median and the Lipper index for the one- and five-year periods for which information was provided, since the Portfolio did not have a seven-year performance record as of March 31, 2016.
The Trustees considered the range and average of the management fees and expense ratios of the Peer Group. They considered that the Portfolio’s management fee and overall expense ratio were lower than the Peer Group medians. They also considered that, with the breakpoints in the fee schedule, the Portfolio’s effective management fees at various asset levels were lower than the medians for its Lipper Group. The Trustees considered that WRIMCO had voluntarily agreed to waive the management fee if Portfolio assets totaled less than $25 million, which resulted in a fee waiver for the fiscal year ended December 31, 2015.
The Trustees also considered that the Similar Funds had advisory fee schedules that were the same as the Portfolio’s advisory fee schedule, except that one Similar Fund’s advisory fee had additional breakpoints at higher asset levels, and that there were no Other Accounts managed by WRIMCO or its affiliates with a similar investment objective and similar investment policies and strategies as the Portfolio. The Trustees considered the relevance of the fee information provided for the Similar Funds to evaluate the appropriateness and reasonableness of the Portfolio’s management fee.
Global Growth
The Trustees considered that Global Growth’s total return performance was lower than the Performance Universe median for the three-, five-, seven-, and ten-year periods. They noted that information for a Lipper index was not provided. They also considered the information provided by WRIMCO in its Initial Response explaining that, among other factors, security selection had adversely affected the Portfolio’s performance over the three-year period. The Trustees considered that, although the Portfolio was managed as an international large-cap growth fund for a majority of the three-year period, it is now ranked against funds in the global large-cap growth category, which outperformed the international large-cap growth category for the three-year period. They further considered the year-to-date performance information through May 31, 2016, provided by WRIMCO in its Initial Response.
The Trustees considered the range and average of the management fees and expense ratios of the Peer Group. They considered that the Portfolio’s management fee and overall expense ratio were higher than the Peer Group medians. They also considered that, with the breakpoints in the fee schedule, the Portfolio’s effective management fees at various asset levels were equal to the medians for its Lipper Group, except for one asset level at which the Portfolio’s effective management fee was higher than the median for its Lipper Group.
The Trustees also considered that the Similar Funds had advisory fee schedules that were the same as the Portfolio’s advisory fee schedule, except that one Similar Fund’s advisory fee was lower for certain asset levels and had additional breakpoints at higher asset levels, and that there were no Other Accounts managed by WRIMCO or its affiliates with a similar investment objective and similar investment policies and strategies as the Portfolio. The Trustees considered the relevance of the fee information provided for the Similar Funds to evaluate the appropriateness and reasonableness of the Portfolio’s management fee.
Global Natural Resources
The Trustees considered that Global Natural Resources’ total return performance was lower than the Performance Universe median and the Lipper index for the one-, three-, five-, seven-, and ten-year periods. They also considered the information provided by WRIMCO in its Initial Response explaining that, among other factors, security selection and an overweighting in the energy sector had adversely affected the Portfolio’s performance over the three-year period. They further considered the year-to-date performance information through May 31, 2016, provided by WRIMCO in its Initial Response.
The Trustees considered the range and average of the management fees and expense ratios of the Peer Group. They considered that the Portfolio’s management fee and overall expense ratio were higher than the Peer Group medians. They also considered that, with the breakpoints in the fee schedule, the Portfolio’s effective management fees at various asset levels were higher than the medians for its Lipper Group.
The Trustees also considered that there was a Similar Fund that had an advisory fee schedule that was the same as the Portfolio’s advisory fee schedule, except that the Similar Fund’s advisory fee had additional breakpoints at higher asset
levels, and that there were no Other Accounts managed by WRIMCO or its affiliates with a similar investment objective and similar investment policies and strategies as the Portfolio. The Trustees considered the relevance of the fee information provided for the Similar Fund to evaluate the appropriateness and reasonableness of the Portfolio’s management fee.
Growth
The Trustees considered that Growth’s total return performance was higher than the Performance Universe median and the Lipper index for the three-, five-, and ten-year periods.
The Trustees considered the range and average of the management fees and expense ratios of the Peer Group. They considered that the Portfolio’s management fee and overall expense ratio were lower than the Peer Group medians. They also considered that, with the breakpoints in the fee schedule, the Portfolio’s effective management fees at various asset levels were lower than the medians for its Lipper Group.
The Trustees also considered that the Similar Funds had advisory fee schedules that were the same as the Portfolio’s advisory fee schedule, except that one Similar Fund’s advisory fee had additional breakpoints at higher asset levels, and that the Other Accounts had average advisory fees that were lower than the management fee of the Portfolio. The Trustees considered the relevance of the fee information provided for the Similar Funds and Other Accounts to evaluate the appropriateness and reasonableness of the Portfolio’s management fee. The Trustees recognized that, among other factors, differences in fees paid by the Other Accounts were consistent with the additional management and other services provided by WRIMCO to the Portfolio.
High Income
The Trustees considered that High Income’s total return performance was lower than the Performance Universe median and the Lipper index for the one- and three-year periods and was higher than the Performance Universe median and the Lipper index for the five-, seven-, and ten-year periods. They also considered the information provided by WRIMCO in its Initial Response explaining that, among other factors, overweighting to credit exposure and second lien loans had adversely affected the Portfolio’s performance over the three-year period. They further considered the year-to-date performance information through May 31, 2016, provided by WRIMCO in its Initial Response and noted that, despite the Portfolio’s underperformance for the one- and three-year periods ended March 31, 2016, the Portfolio’s performance relative to its Performance Universe appeared to be improving and was good for the five-year and longer periods.
The Trustees considered the range and average of the management fees and expense ratios of the Peer Group. They considered that the Portfolio’s management fee and overall expense ratio were lower than the Peer Group medians. They also considered that, with the breakpoints in the fee schedule, the Portfolio’s effective management fees at various asset levels were lower than the medians for its Lipper Group.
The Trustees also considered that the Similar Funds had advisory fee schedules that were the same as the Portfolio’s advisory fee schedule, except that one Similar Fund’s advisory fee had additional breakpoints at higher asset levels, and that there were no Other Accounts managed by WRIMCO or its affiliates with a similar investment objective and similar investment policies and strategies as the Portfolio. The Trustees considered the relevance of the fee information provided for the Similar Funds to evaluate the appropriateness and reasonableness of the Portfolio’s management fee.
International Core Equity
The Trustees considered that Core Equity’s total return performance was higher than the Performance Universe median for the three-, five-, seven-, and ten-year periods and was higher than the Lipper index for the one-, three-, five-, and seven-year periods. They noted that information for a Lipper index was not provided for the ten-year period.
The Trustees considered the range and average of the management fees and expense ratios of the Peer Group. They considered that the Portfolio’s management fee was higher than the Peer Group median and that the Portfolio’s overall expense ratio was lower than the Peer Group median. They also considered that, with the breakpoints in the fee schedule, the Portfolio’s effective management fees at certain asset levels were lower than, and at other asset levels were higher than, the medians for its Lipper Group.
The Trustees also considered that there was a Similar Fund that had an advisory fee schedule that was the same as the Portfolio’s advisory fee schedule, except that the Similar Fund’s advisory fee was lower for certain asset levels and had additional breakpoints at higher asset levels, and that the Other Account had an advisory fee that was lower than the management fee of the Portfolio. The Trustees considered the relevance of the fee information provided for the Similar Fund and Other Account to evaluate the appropriateness and reasonableness of the Portfolio’s management fee. The Trustees recognized that, among other factors, differences in fees paid by the Other Account were consistent with the additional management and other services provided by WRIMCO to the Portfolio.
Limited-Term Bond
The Trustees considered that Limited-Term Bond’s total return performance was higher than the Performance Universe median for the one-, three-, and five-year periods, was higher than the Lipper index for the one- and five-year periods, and was equal to the Lipper index for the three-year period for which information was provided, since the Portfolio did not have a seven-year performance record as of March 31, 2016.
The Trustees considered the range and average of the management fees and expense ratios of the Peer Group. They considered that the Portfolio’s management fee was higher than the Peer Group median and that the Portfolio’s overall expense ratio was equal to the Peer Group median. They also considered that, with the breakpoints in the fee schedule, the Portfolio’s effective management fees at certain asset levels were lower than, and at other asset levels were higher than, the medians for its Lipper Group.
The Trustees also considered that there was a Similar Fund that had an advisory fee schedule that was the same as the Portfolio’s advisory fee schedule, except that the Similar Fund’s advisory fee was lower for certain asset levels, and that there were no Other Accounts managed by WRIMCO or its affiliates with a similar investment objective and similar investment policies and strategies as the Portfolio. The Trustees considered the relevance of the fee information provided for the Similar Fund to evaluate the appropriateness and reasonableness of the Portfolio’s management fee.
Micro Cap Growth
The Trustees considered that Micro Cap Growth’s total return performance was lower than the Performance Universe median and the Lipper index for the one-, three-, five-, seven-, and ten-year periods. They also considered the information provided by WRIMCO in its Initial Response explaining that, among other factors, security selection had adversely affected the Portfolio’s performance over the three-year period. They further considered the year-to-date performance information through May 31, 2016, provided by WRIMCO in its Initial Response. The Trustees also noted that, effective July 1, 2015, WRIMCO had terminated the Sub-Advisory Agreement with Wall Street Associates, the Portfolio’s prior sub-adviser, and had assumed direct investment management responsibilities for the Portfolio.
The Trustees considered the range and average of the management fees and expense ratios of the Peer Group. They considered that the Portfolio’s management fee and overall expense ratio were higher than the Peer Group medians. They also considered that, with the breakpoints in the fee schedule, the Portfolio’s effective management fees at various asset levels were higher than the medians for its Lipper Group.
The Trustees also considered that there was a Similar Fund that had an advisory fee schedule that was the same as the Portfolio’s advisory fee schedule, except that the Similar Fund’s advisory fee had additional breakpoints at higher asset levels, and that there were no Other Accounts managed by WRIMCO or its affiliates with a similar investment objective and similar investment policies and strategies as the Portfolio. The Trustees considered the relevance of the fee information provided for the Similar Fund to evaluate the appropriateness and reasonableness of the Portfolio’s management fee.
Mid Cap Growth
The Trustees considered that Mid Cap Growth’s total return performance was lower than the Performance Universe median and the Lipper index for the one, three-, five- and seven-year periods and was higher than the Performance Universe median and the Lipper index for the ten-year period. They also considered the information provided by WRIMCO in its Initial Response explaining that, among other factors, security selection had adversely affected the Portfolio’s performance over the three-year period. They further considered the year-to-date performance information through May 31, 2016, provided by WRIMCO in its Initial Response and noted that, despite the Portfolio’s underperformance for the one-, three-, five-, and seven-year periods ended March 31, 2016, the Portfolio’s performance relative to its Performance Universe appeared to be improving.
The Trustees considered the range and average of the management fees and expense ratios of the Peer Group. They considered that the Portfolio’s management fee and overall expense ratio were higher than the Peer Group medians. They also considered that, with the breakpoints in the fee schedule, the Portfolio’s effective management fees at various asset levels were higher than the medians for its Lipper Group, except for two asset levels at which the Portfolio’s effective management fees were equal to the medians for its Lipper Group.
The Trustees also considered that the Similar Funds had advisory fee schedules that were the same as the Portfolio’s advisory fee schedule, except that one Similar Fund’s advisory fee had additional breakpoints at higher asset levels, and that the Other Accounts had average advisory fees that were lower than the management fee of the Portfolio. The Trustees considered the relevance of the fee information provided for the Similar Funds and Other Accounts to evaluate the appropriateness and reasonableness of the Portfolio’s management fee. The Trustees recognized that, among other factors, differences in fees paid by the Other Accounts were consistent with the additional management and other services provided by WRIMCO to the Portfolio.
Money Market
The Trustees considered that Money Market’s total return performance was higher than the Performance Universe median and the Lipper index for the one-, three-, five-, seven-, and ten-year periods.
The Trustees considered the range and average of the management fees and expense ratios of the Peer Group. They considered that the Portfolio’s management fee was equal to the Peer Group median and that the Portfolio’s overall expense ratio was higher than the Peer Group median. They also considered that the Portfolio’s effective management fees at certain asset levels were equal to, and at other asset levels were higher than, the medians for its Lipper Group. The Trustees also considered the expenses incurred by WRIMCO to maintain the yield of the Portfolio at a minimum of at least two basis points.
The Trustees also considered that one Similar Fund had an advisory fee schedule that was the same as the Portfolio’s advisory fee schedule and another Similar Fund had an advisory fee schedule that was lower than the Portfolio’s advisory fee schedule, and that there were no Other Accounts managed by WRIMCO or its affiliates with a similar investment objective and similar investment policies and strategies as the Portfolio. The Trustees considered the relevance of the fee information provided for the Similar Funds to evaluate the appropriateness and reasonableness of the Portfolio’s management fee.
Pathfinder Aggressive
The Trustees considered that Pathfinder Aggressive’s total return performance was higher than the Performance Universe for the three-year period, was lower than the Performance Universe median for the one-, five- and seven-year periods and was higher than the Lipper index for the three-, five-, and seven-year periods for which information was provided, since the Portfolio did not have a ten-year performance record as of March 31, 2016.
The Trustees considered the range and average of the management fees and expense ratios of the Peer Group. They considered that the Portfolio did not have a management fee and that the Portfolio’s overall expense ratio was higher than the Peer Group median.
Pathfinder Conservative
The Trustees considered that Pathfinder Conservative’s total return performance was higher than the Performance Universe median and the Lipper index for the three- and five-year periods and was lower than the Performance Universe median and the Lipper index for the one- and seven-year periods for which information was provided, since the Portfolio did not have a ten-year performance record as of March 31, 2016.
The Trustees considered the range and average of the management fees and expense ratios of the Peer Group. They considered that the Portfolio did not have a management fee and that the Portfolio’s overall expense ratio was lower than the Peer Group median.
Pathfinder Moderate
The Trustees considered that Pathfinder Moderate’s total return performance was higher than the Performance Universe for the three-year period, was lower than the Performance Universe median for the one-, five- and seven-year periods, was higher than the Lipper index for the three- and five-year periods, and was lower than the Lipper index for the one- and seven-year periods for which information was provided, since the Portfolio did not have a ten-year performance record as of March 31, 2016.
The Trustees considered the range and average of the management fees and expense ratios of the Peer Group. They considered that the Portfolio did not have a management fee and that the Portfolio’s overall expense ratio was equal to the Peer Group median.
Pathfinder Moderately Aggressive
The Trustees considered that Pathfinder Moderately Aggressive’s total return performance was higher than the Performance Universe median for the three- and five-year periods and was higher than the Lipper index for the three-, five- and seven-year periods for which information was provided, since the Portfolio did not have a ten-year performance record as of March 31, 2016.
The Trustees considered the range and average of the management fees and expense ratios of the Peer Group. They considered that the Portfolio did not have a management fee and that the Portfolio’s overall expense ratio was higher than the Peer Group median.
Pathfinder Moderately Conservative
The Trustees considered that Pathfinder Moderately Conservative’s total return performance was equal to the Performance Universe median for the three-year period, was higher than the Lipper index for the three-year period, and was lower than the Performance Universe median and the Lipper index for the one-, five-, and seven-year periods for which information was provided, since the Portfolio did not have a ten-year performance record as of March 31, 2016.
The Trustees considered the range and average of the management fees and expense ratios of the Peer Group. They considered that the Portfolio did not have a management fee and that the Portfolio’s overall expense ratio was lower than the Peer Group median.
Pathfinder Moderate — Managed Volatility
The Trustees considered that Pathfinder Moderate — Managed Volatility’s total return performance was lower than the Performance Universe median and the Lipper index for the one-year period for which information was provided, since the Portfolio did not have a three-year performance record as of March 31, 2016. The Trustees noted that WRIMCO recommended the continuance of the Sub-Advisory Agreement with Advantus Capital Management, Inc. (“Advantus”), the Portfolio’s sub-adviser.
The Trustees considered the range and average of the management fees and expense ratios of the Peer Group. They considered that the Portfolio’s management fee was lower than the Peer Group median and that the Portfolio’s overall expense ratio was higher than the Peer Group median. They also considered that the Portfolio’s effective management fees at various asset levels were lower than the medians for its Lipper Group. The Trustees also considered that the Portfolio’s management fee paid to WRIMCO is paid to Advantus as a subadvisory fee.
Pathfinder Moderately Aggressive — Managed Volatility
The Trustees considered that Pathfinder Moderately Aggressive — Managed Volatility’s total return performance was lower than the Performance Universe median and the Lipper index for the one-year period for which information was provided, since the Portfolio did not have a three-year performance record as of March 31, 2016. The Trustees noted that WRIMCO recommended the continuance of the Sub-Advisory Agreement with Advantus, the Portfolio’s sub-adviser.
The Trustees considered the range and average of the management fees and expense ratios of the Peer Group. They considered that the Portfolio’s management fee was lower than the Peer Group median and that the Portfolio’s overall expense ratio was higher than the Peer Group median. They also considered that the Portfolio’s effective management fees at various asset levels were lower than the medians for its Lipper Group. The Trustees also considered that the Portfolio’s management fee paid to WRIMCO is paid to Advantus as a subadvisory fee.
Pathfinder Moderately Conservative — Managed Volatility
The Trustees considered that Pathfinder Moderately Conservative — Managed Volatility’s total return performance was lower than the Performance Universe median and the Lipper index for the one-year period for which information was provided, since the Portfolio did not have a three-year performance record as of March 31, 2016. The Trustees noted that WRIMCO recommended the continuance of the Sub-Advisory Agreement with Advantus, the Portfolio’s sub-adviser.
The Trustees considered the range and average of the management fees and expense ratios of the Peer Group. They considered that the Portfolio’s management fee was lower than the Peer Group median and that the Portfolio’s overall expense ratio was higher than the Peer Group median. They also considered that the Portfolio’s effective management fees at various asset levels were lower than the medians for its Lipper Group. The Trustees also considered that the Portfolio’s management fee paid to WRIMCO is paid to Advantus as a subadvisory fee.
Real Estate Securities
The Trustees considered that Real Estate Securities’ total return performance was higher than the Performance Universe median for the one- and three-year periods, was lower than the Performance Universe for the five-, seven-, and ten-year periods, and was higher than the Lipper index for the one-, three-, five-, seven-, and ten-year periods. The Trustees noted that WRIMCO recommended the continuance of the Sub-Advisory Agreement with Advantus, the Portfolio’s sub-adviser.
The Trustees considered the range and average of the management fees and expense ratios of the Peer Group. They considered that the Portfolio’s management fee and overall expense ratio were higher than the Peer Group medians. They also considered that, with the breakpoints in the fee schedule, the Portfolio’s effective management fees at various asset levels were higher than the medians for its Lipper Group. The Trustees considered that WRIMCO had contractually agreed to reduce the management fee by an annual rate of 0.09% of average daily net assets until April 30, 2017.
The Trustees also considered that there was a Similar Fund that had an advisory fee schedule that was the same as the Portfolio’s advisory fee schedule (including a sub-advisory fee to the sub-adviser that was the same as the Portfolio’s),
except that the Similar Fund’s advisory fee had additional breakpoints at higher asset levels, and that there were no Other Accounts managed by WRIMCO or its affiliates with a similar investment objective and similar investment policies and strategies as the Portfolio. The Trustees also considered that the Other Accounts of a similar size managed by the sub-adviser had advisory fees that were close to or higher than the sub-advisory fees for the Portfolio. The Trustees considered the relevance of the fee information provided for the Similar Fund and Other Accounts to evaluate the appropriateness and reasonableness of the Portfolio’s management fee.
Science and Technology
The Trustees considered that Science and Technology’s total return performance was lower than the Performance Universe median and the Lipper index for the one-, three-, five-, and seven-year periods and was higher than the Performance Universe median and the Lipper index for the ten-year period. They also considered the information provided by WRIMCO in its Initial Response explaining that, among other factors, security selection and sector allocations had adversely affected the Portfolio’s performance over the three-year period. They further considered the year-to-date performance information through May 31, 2016, provided by WRIMCO in its Initial Response.
The Trustees considered the range and average of the management fees and expense ratios of the Peer Group. They considered that the Portfolio’s management fee was equal to the Peer Group median and that the Portfolio’s overall expense ratio was lower than the Peer Group median. They also considered that, with the breakpoints in the fee schedule, the Portfolio’s effective management fees at various asset levels were lower than the medians for its Lipper Group.
The Trustees also considered that the Similar Funds had advisory fee schedules that were the same as the Portfolio’s advisory fee schedule, except that one Similar Fund’s advisory fee had additional breakpoints at higher asset levels, and that the Other Account had an advisory fee that was lower than the management fee of the Portfolio. The Trustees considered the relevance of the fee information provided for the Similar Fund and Other Account to evaluate the appropriateness and reasonableness of the Portfolio’s management fee. The Trustees recognized that, among other factors, differences in fees paid by the Other Account were consistent with the additional management and other services provided by WRIMCO to the Portfolio.
Small Cap Growth
The Trustees considered that Small Cap Growth’s total return performance was higher than the Performance Universe for the three-year period, was higher than the Lipper index for the one- and three-year periods, was lower than the Performance Universe median for the one-, five-, seven- and ten-year periods and was lower than the Lipper index for the five-, seven-, and ten-year periods.
The Trustees considered the range and average of the management fees and expense ratios of the Peer Group. They considered that the Portfolio’s management fee was lower than the Peer Group median and that the Portfolio’s overall expense ratio was higher than the Peer Group median. They also considered that, with the breakpoints in the fee schedule, the Portfolio’s effective management fees at various asset levels were higher than the medians for its Lipper Group, except for two asset levels at which the Portfolio’s effective management fees were lower than the median for its Lipper Group.
The Trustees also considered that the Similar Funds had advisory fee schedules that were the same as the Portfolio’s advisory fee schedule, except that one Similar Fund’s advisory fee had additional breakpoints at higher asset levels, and that the Other Accounts had average advisory fees that were lower than the management fee of the Portfolio. The Trustees considered the relevance of the fee information provided for the Similar Funds and Other Accounts to evaluate the appropriateness and reasonableness of the Portfolio’s management fee. The Trustees recognized that, among other factors, differences in fees paid by the Other Accounts were consistent with the additional management and other services provided by WRIMCO to the Portfolio.
Small Cap Value
The Trustees considered that Small Cap Value’s total return performance was higher than the Performance Universe median for the one- and ten-year periods, was equal to the Performance Universe median for the three-year period, and was higher than the Lipper index for the one-, three-, and ten-year periods.
The Trustees considered the range and average of the management fees and expense ratios of the Peer Group. They considered that the Portfolio’s management fee was equal to the Peer Group median and that the Portfolio’s overall expense ratio was higher than the Peer Group median. They also considered that, with the breakpoints in the fee schedule, the Portfolio’s effective management fees at various asset levels were higher than the medians for its Lipper Group.
The Trustees also considered that there was a Similar Fund that had an advisory fee schedule that was the same as the Portfolio’s advisory fee schedule, except that the Similar Fund’s advisory fee had additional breakpoints at higher asset levels, and that there were no Other Accounts managed by WRIMCO or its affiliates with a similar investment objective and similar investment policies and strategies as the Portfolio. The Trustees considered the relevance of the fee information provided for the Similar Fund to evaluate the appropriateness and reasonableness of the Portfolio’s management fee.
Value
The Trustees considered that Value’s total return performance was higher than the Performance Universe median for the one-, seven- and ten-year periods, was higher than the Lipper index for the seven- and ten-year periods, was lower than the Performance Universe median for the three- and five-year periods, and was lower than the Lipper index for the one-, three- and five-year periods. They also considered the information provided by WRIMCO in its Initial Response explaining that, among other factors, the Portfolio’s security selection, overweighting in the energy sector and underweighting in the industrials sector had adversely affected the Portfolio’s performance over the three-year period. They further considered the year-to-date performance information through May 31, 2016, provided by WRIMCO in its Initial Response.
The Trustees considered the range and average of the management fees and expense ratios of the Peer Group. They considered that the Portfolio’s management fee and overall expense ratio were higher than the Peer Group medians. They also considered that, with the breakpoints in the fee schedule, the Portfolio’s effective management fees at various asset levels were lower than the medians for its Lipper Group.
The Trustees also considered that the Similar Funds had advisory fee schedules that were the same as the Portfolio’s advisory fee schedule, except that one Similar Fund’s advisory fee had additional breakpoints at higher asset levels, and that the Other Accounts had average advisory fees that were lower than the management fee of the Portfolio. The Trustees considered the relevance of the fee information provided for the Similar Funds and Other Accounts to evaluate the appropriateness and reasonableness of the Portfolio’s management fee. The Trustees recognized that, among other factors, differences in fees paid by the Other Accounts were consistent with the additional management and other services provided by WRIMCO to the Portfolio.
Profitability and Economies of Scale
The Trustees also considered that the management fee structure of each Portfolio (except Money Market, which has a single management fee rate, and Pathfinder Aggressive, Pathfinder Conservative, Pathfinder Moderate, Pathfinder Moderately Aggressive and Pathfinder Moderately Conservative (each, a “Pathfinder Portfolio”), which have no management fee) includes breakpoints that provide for a reduction of payments to reflect anticipated economies of scale. The Trustees also considered that WRIMCO had proposed to limit contractually expenses of Asset Strategy, Core Equity, Global Growth, Growth, High Income, Mid Cap Growth, Science and Technology, Small Cap Growth and Value and certain other funds in the Advisors Fund Complex. In concluding that the benefits accruing to WRIMCO and its affiliates by virtue of their relationship to each Portfolio were reasonable in comparison with the costs of providing the investment management services and the benefits accruing to the Portfolio, the Trustees considered specific data as to WRIMCO’s profit, if any, with respect to the Portfolio for a recent period. The Trustees also considered WRIMCO’s methodology for determining this data. In addition, the Trustees considered the soft dollar arrangements with respect to Portfolio portfolio transactions, as applicable.
In determining whether to approve the proposed continuance of the Management Agreement as to a Portfolio and, as applicable, a Portfolio’s Subadvisory Agreement, the Trustees considered the best interests of the Portfolio, the reasonableness of the management fee paid under the Management Agreement, and, as applicable, the subadvisory fee paid under the Subadvisory Agreement, and the overall fairness of the Management Agreement, and, as applicable, the Subadvisory Agreement. The Trustees considered the following factors to be of primary importance to their approval of the continuance of the Management Agreement as to a Portfolio and, as applicable, its Subadvisory Agreement, without any one factor being dispositive:
| • | | the performance of the Portfolio compared with the performance of its Performance Universe and with relevant indices; |
| • | | the Portfolio’s investment management fees and total expenses compared with the management fees and total expenses of its Peer Group; |
| • | | the existence or appropriateness of breakpoints in the Portfolio’s management fees (except for the Pathfinder Portfolios); |
| • | | the Portfolio’s investment management fees compared with the management fees of Similar Funds or Other Accounts managed by WRIMCO (or its affiliate), as applicable, and the Portfolio’s subadvisory fees compared with the subadvisory fees of Other Accounts managed by the subadvisor, as applicable; |
| • | | the cost/profitability to WRIMCO and any actual or anticipated economies of scale in relation to the services it provides to the Portfolio; |
| • | | the other benefits that accrue to WRIMCO as a result of its relationship with the Portfolio; and |
| • | | the favorable history, reputation, qualification and background of WRIMCO as well as the qualifications of its personnel. |
Based on the discussions, considerations and information described generally above, including the evaluation provided by the fee consultant, the Board determined that each Portfolio’s Management Agreement and, as applicable, its Subadvisory
Agreement, are fair and reasonable and that continuance of the Management Agreement and, as applicable, the Subadvisory Agreement, is in the best interests of the Portfolio. In reaching these determinations as to each Portfolio, the Board concluded that: the nature, extent and quality of the services provided by WRIMCO for the Portfolio are adequate and appropriate; except as described above, the performance of the Portfolio was satisfactory; it retained confidence in WRIMCO’s and, as applicable, the subadvisor’s overall ability to manage the Portfolio; and the management fee paid to WRIMCO is reasonable in light of comparative management fee information, the breakpoints in the management fee for the Portfolio (other than Money Market and the Pathfinder Portfolios), the services provided by WRIMCO, the costs of the services provided, and the profits realized, if any, and other benefits likely to be derived by WRIMCO from its relationship with the Portfolio. In the case of certain Portfolios that underperformed their respective Performance Universe medians and Lipper indices for certain periods of time, based on the assessment and information WRIMCO provided, including as to relevant market conditions and/or actions that WRIMCO had taken or planned to take, such response was satisfactory to the Board.
Effective September 30, 2016, Ivy Investment Management Company (IICO), an affiliate of WRIMCO, entered into investment management agreements to provide investment advisory services to each Portfolio and WRIMCO terminated each Portfolio’s Management Agreement. IICO also entered into investment subadvisory agreements with the subadvisor with respect to certain Portfolios and WRIMCO terminated its investment subadvisory agreements with the subadvisor. There were no changes in the investment processes employed by any Portfolio, the nature or level of services provided to any Portfolio, or the fees paid under each Portfolio’s Management Agreement. In addition, the services provided by the subadvisor to certain Portfolios remained unchanged.
| | |
| ANNUAL PRIVACY NOTICE | | IVY VIP |
Waddell & Reed, Inc., the Waddell & Reed Advisors Funds, the Ivy Variable Insurance Portfolios and the InvestEd Portfolios (“Waddell & Reed”) are committed to ensuring their clients have access to a broad range of products and services to help them achieve their personal financial goals. Accurate information lies at the heart of our pledge to provide these products and services, and we strive to protect your personal nonpublic information. In the course of doing business with Waddell & Reed, clients are requested to share financial information and they may be asked to provide other personal details. Clients can be assured that Waddell & Reed is diligent in its efforts to keep such information confidential.
Recognition of a Client’s Expectation of Privacy
At Waddell & Reed, we believe the confidentiality and protection of client information is one of our fundamental responsibilities. And while information is critical to providing quality service, we recognize that one of our most important assets is our clients’ trust. Thus, the safekeeping of client information is a priority for Waddell & Reed.
Information Collected
In order to tailor available financial products to your specific needs, Waddell & Reed may request that you complete a variety of forms that require nonpublic personal information about your financial history and other personal details, including but not limited to, your name, address, social security number, assets, income and investments. Waddell & Reed may also gather information about your transactions with us, our affiliates and others.
Categories of Information that may be Disclosed
While Waddell & Reed may disclose information it collects from applications and other forms, as described above, we at Waddell & Reed also want to assure all of our clients that whenever information is used, it is done with discretion. The safeguarding of client information is an issue we take seriously.
Categories of Parties to whom we disclose nonpublic personal information
Waddell & Reed may disclose nonpublic personal information about you to selectively chosen financial service providers, whom we believe have valuable products or services that could benefit you. Whenever we do this, we carefully review the company and the product or service to make sure that it provides value to our clients. We share the minimum amount of information necessary for that company to offer its product or service. We may also share information with unaffiliated companies that assist us in providing our products and services to our clients; in the normal course of our business (for example, with consumer reporting agencies and government agencies); when legally required or permitted in connection with fraud investigations and litigation; and at the request or with the permission of a client.
In addition, Waddell & Reed, Inc. has entered into a Protocol with a number of other brokerage firms intended to further our clients’ freedom of choice in connection with the movement of their financial advisors to new firms. In the event your account is maintained through Waddell & Reed, Inc. and your financial advisor leaves Waddell & Reed to join a firm that has likewise entered the Protocol, Waddell & Reed may disclose your name, address and telephone number to the departed advisor’s new firm.
Opt Out Right
If you prefer that we not disclose nonpublic personal information about you to nonaffiliated third parties, you may opt out of those disclosures; that is, you may direct us not to make those disclosures (other than disclosures permitted by law). If you wish to opt out of disclosures to nonaffiliated third parties, you may make this request in writing to: Waddell & Reed, Attn: Opt Out Notices, P.O. Box 29220, Shawnee Mission, KS 66201, or you may call 1.888.WADDELL and a Client Services Representative will assist you.
Confidentiality and Security
We restrict access to nonpublic personal information about you to those employees who need to know that information to provide products and services to you. We maintain physical, electronic, and procedural safeguards that comply with federal standards to guard your nonpublic personal information. If you decide to close your account(s) or become an inactive client, we will adhere to the privacy policies and practices as described in this notice.
| | |
| PROXY VOTING INFORMATION | | IVY VIP |
Proxy Voting Guidelines
A description of the policies and procedures Ivy Variable Insurance Portfolios uses to determine how to vote proxies relating to portfolio securities is available (i) without charge, upon request, by calling 1.888.WADDELL and (ii) on the Securities and Exchange Commission’s (“SEC”) website at www.sec.gov.
Proxy Voting Records
Information regarding how the Portfolio voted proxies relating to portfolio securities during the most recent 12-month period ended June 30 is available on Form N-PX through Waddell & Reed’s website at www.waddell.com and on the SEC’s website at www.sec.gov.
| | |
| QUARTERLY PORTFOLIO SCHEDULE INFORMATION | | IVY VIP |
Portfolio holdings can be found on the Trust’s website at www.waddell.com. Alternatively, a complete schedule of portfolio holdings of each Portfolio for the first and third quarters of each fiscal year is filed with the SEC and can be found on the Trust’s Form N-Q. These holdings may be viewed in the following ways:
| • | | On the SEC’s website at www.sec.gov. |
| • | | For review and copy at the SEC’s Public Reference Room in Washington, DC. Information on the operations of the Public Reference Room may be obtained by calling 1.800.SEC.0330. |
This page has been intentionally left blank
| | |
| THE IVY VARIABLE INSURANCE PORTFOLIOS FAMILY | | |
Global/International Portfolios
Global Growth
International Core Equity
Domestic Equity Portfolios
Core Equity
Dividend Opportunities
Growth
Micro Cap Growth
Mid Cap Growth
Small Cap Growth
Small Cap Value
Value
Fixed Income Portfolios
Bond
Global Bond
High Income
Limited-Term Bond
Money Market Portfolio
Government Money Market
Specialty Portfolios
Asset Strategy
Balanced
Energy
Global Natural Resources
Pathfinder Aggressive
Pathfinder Conservative
Pathfinder Moderate
Pathfinder Moderately Aggressive
Pathfinder Moderately Conservative
Pathfinder Moderate - Managed Volatility
Pathfinder Moderately Aggressive - Managed Volatility
Pathfinder Moderately Conservative - Managed Volatility
Real Estate Securities
Science and Technology
The underlying portfolios discussed in this report are only available as investment options in variable annuity and variable life insurance contracts issued by life insurance companies. They are not offered or made available directly to the general public.
This report is submitted for the general information of the shareholders of Ivy Variable Insurance Portfolios. It is not authorized for distribution to prospective investors in a Portfolio unless accompanied with or preceded by the current Portfolio prospectus as well as the variable product prospectus.
ANN-IVYVIP (12-16)
ITEM 2. CODE OF ETHICS
| (a) | As of December 31, 2016, the Registrant has adopted a code of ethics (the Code), as defined in Item 2 of Form N-CSR, that applies to the Principal Executive Officer and Principal Financial Officer or persons performing similar functions, regardless of whether these individuals are employed by the registrant or a third party. A copy of this code of ethics is filed as an exhibit to this Form N-CSR. |
| (b) | There have been no amendments, during the period covered by this report, to a provision of the Code that applies to the registrant’s Principal Executive Officer, Principal Financial Officer, Principal Accounting Officer or Controller, or persons performing similar functions, regardless of whether these individuals are employed by the registrant or a third party, and that relates to any element of the Code. |
| (c) | During the period covered by this report, the registrant did not grant any waivers, including an implicit waiver, from a provision of the Code that applies to the registrant’s Principal Executive Officer, Principal Financial Officer, Principal Accounting Officer or Controller, or persons performing similar functions, regardless of whether those individuals were employed by the registrant or a third party, that related to one or more of the items set forth in paragraph (b) of this item’s instructions. |
ITEM 3. AUDIT COMMITTEE FINANCIAL EXPERT
The Board of Trustees of the Registrant has determined that Albert W. Herman is an audit committee financial expert, as defined in Item 3 of Form N-CSR, serving on its audit committee. Mr. Herman is independent for purposes of Item 3 of Form N-CSR.
ITEM 4. PRINCIPAL ACCOUNTANT FEES AND SERVICES.
The aggregate fees billed for professional services rendered by the principal accountant for the audit of the registrant’s annual financial statements or services that are normally provided by the accountant in connection with statutory and regulatory filings or engagements for each of the last two fiscal years are as follows:
| | | | |
2015 | | $ | 351,000 | |
2016 | | | 384,200 | |
The aggregate fees billed for assurance and related services by the principal accountant that are reasonably related to the performance of the audit of the registrant’s annual financial statements and are not reported under paragraph (a) of this Item are as follows:
These fees are related to the review of Form N-1A.
The aggregate fees billed for professional services rendered by the principal accountant for tax compliance, tax advice and tax planning are as follows:
| | | | |
2015 | | $ | 161,382 | |
2016 | | | 193,463 | |
These fees are related to the review of the registrant’s tax returns.
The aggregate fees billed for products and services provided by the principal accountant, other than the services reported in paragraphs (a) through (c) of this item are as follows:
These fees are related to the review of internal control.
| | | | |
| (e) | | (1) | | Registrant’s audit committee considers with the principal accountants all audit services to be provided by the principal accountants and pre-approves all such audit services. |
| | |
| | | | The audit committee shall pre-approve all non-audit services to be provided by the principal accountants to the registrant; provided that the pre-approval requirement does not apply to non-audit services that (i) were not identified as such at the time of the pre-approval and (ii) do not aggregate more than 5% of total fees paid to the principal accountants by the registrant during the fiscal year in which the services are provided, if the audit committee approves the provision of such non-audit services prior to the completion of the audit. |
| | |
| | | | The audit committee shall pre-approve all non-audit services to be provided by the principal accountants to the investment adviser (not including any subadvisor whose role is primarily portfolio management and is subcontracted and overseen by the investment advisor) or any entity controlling, controlled by, or under common control with the investment adviser that provides ongoing services to the registrant if the engagement relates directly to the operations or financial reporting of the registrant; provided that the pre-approval requirement does not apply to non-audit services that (i) were not identified as such |
| | | | |
| | | | at the time of the pre-approval and (ii) do not aggregate more than 5% of total fees paid to the principal accountants by the registrant for all services and by the registrant’s investment adviser for non-audit services if the engagement relates directly to the operations or financial reporting of the registrant during the fiscal year in which those services are provided, if the audit committee approves the provision of such non-audit services prior to the completion of the audit. |
| | |
| (e) | | (2) | | None of the services described in each of paragraphs (b) through (d) of this Item were approved by the audit committee pursuant to the waiver provisions of paragraph (c)(7)(i)(C) of Rule 2-01 of Regulation S-X. |
| (g) | $175,508 and $223,987 are the aggregate non-audit fees billed in each of the last two fiscal years for services rendered by the principal accountant to the registrant. $42,690 and $152,450 are the aggregate non-audit fees billed in each of the last two fiscal years for services rendered by the principal accountant to the investment adviser (not including any sub-adviser whose role is primarily portfolio management and is subcontracted with or overseen by another investment adviser) and any entity controlling, controlled by, or under common control with the adviser that provides ongoing services to the registrant. |
ITEM 5. AUDIT COMMITTEE OF LISTED REGISTRANTS
Not applicable.
ITEM 6. SCHEDULE OF INVESTMENTS.
| (a) | See Item 1 Shareholder Report. |
ITEM 7. DISCLOSURE OF PROXY VOTING POLICIES AND PROCEDURES FOR CLOSED-END MANAGEMENT INVESTMENT COMPANIES
Not applicable.
ITEM 8. PORTFOLIO MANAGERS OF CLOSED-END MANAGEMENT INVESTMENT COMPANIES.
Not applicable.
ITEM 9. PURCHASES OF EQUITY SECURITIES BY CLOSED-END MANAGEMENT INVESTMENT COMPANIES AND AFFILIATED PURCHASERS
Not applicable.
ITEM 10. SUBMISSION OF MATTERS TO A VOTE OF SECURITY HOLDERS
There have been no material changes to the procedures by which shareholders may recommend nominees to the Registrant’s board of trustees.
ITEM 11. CONTROLS AND PROCEDURES.
| (a) | The Registrant’s Principal Executive Officer and Principal Financial Officer, or persons performing similar functions, based on their evaluation of the Registrant’s disclosure controls and procedures as of a date within 90 days of the filing date of this report, have concluded that such controls and procedures (as defined in Rule 30a-3(c) under the Investment Company Act of 1940, as amended) are effective and adequately designed to ensure that information required to be disclosed by the Registrant in its reports that it files or submits is accumulated and communicated to the Registrant’s management, including the Principal Executive Officer and Principal Financial Officer, or persons performing similar functions, as appropriate, to allow timely decisions regarding required disclosure. |
| (b) | There were no significant changes in the registrant’s internal controls over financial reporting (as defined in Rule 30a-3(d) under the Investment Company Act of 1940, as amended) that occurred during the registrant’s second fiscal quarter of the period covered by this report that has materially affected, or is reasonably likely to materially affect, the registrant’s internal control over financial reporting. |
ITEM 12. EXHIBITS.
(a)(1) The Code described in Item 2 of this Form N-CSR.
Attached hereto as Exhibit 99.CODE.
(a)(2) A separate certification for each principal executive officer and principal financial officer of the registrant as required by Rule 30a-2(a) under the Investment Company Act of 1940 (17 CFR 270.30a-2(a)).
Attached hereto as Exhibit 99.CERT.
(b) A separate certification for each principal executive officer and principal financial officer of the registrant as required by Rule 30a-2(b) under the Investment Company Act of 1940 (17 CFR 270.30a-2(b)).
Attached hereto as Exhibit 99.906CERT.
SIGNATURES
Pursuant to the requirements of the Securities Exchange Act of 1934 and the Investment Company Act of 1940, the registrant has duly caused this report to be signed on its behalf by the undersigned, thereunto duly authorized.
| | |
| IVY VARIABLE INSURANCE PORTFOLIOS |
| (Registrant) |
| |
| By | | /s/ Wendy J. Hills |
| | Wendy J. Hills, Vice President and Secretary |
| |
| Date: | | March 10, 2017 |
Pursuant to the requirements of the Securities Exchange Act of 1934 and the Investment Company Act of 1940, this report has been signed below by the following persons on behalf of the registrant and in the capacities and on the dates indicated.
| | |
| By | | /s/ Philip J. Sanders |
| | Philip J. Sanders, Principal Executive Officer |
| |
| Date: | | March 10, 2017 |
| |
| By | | /s/ Joseph W. Kauten |
| | Joseph W. Kauten, Principal Financial Officer |
| |
| Date: | | March 10, 2017 |