UNITED STATES
SECURITIES AND EXCHANGE COMMISSION
Washington, D.C. 20549
FORMN-CSR
CERTIFIED SHAREHOLDER REPORT OF REGISTERED
MANAGEMENT INVESTMENT COMPANIES
Investment Company Act file number811-5017
Ivy Variable Insurance Portfolios
(Exact name of registrant as specified in charter)
6300 Lamar Avenue, Overland Park, Kansas 66202
(Address of principal executive offices) (Zip code)
Jennifer K. Dulski
6300 Lamar Avenue
Overland Park, Kansas 66202
(Name and address of agent for service)
Registrant’s telephone number, including area code: (913)236-2000
Date of fiscal year end: December 31
Date of reporting period: December 31, 2018
ITEM 1. REPORTS TO STOCKHOLDERS.
| | |

VARIABLE INSURANCE PORTFOLIOS | | Annual Report DECEMBER 31, 2018 |
| | | | | | | | |
| IVY Variable Insurance Portfolios | | | | | | | | |
| | |
| Asset Strategy | | | Class I | | | | Class II | |
| | |
| Balanced | | | | | | | Class II | |
| | |
| Energy | | | Class I | | | | Class II | |
| | |
| Growth | | | | | | | Class II | |
| | |
| High Income | | | Class I | | | | Class II | |
| | |
| International Core Equity | | | | | | | Class II | |
| | |
| Mid Cap Growth | | | Class I | | | | Class II | |
| | |
| Natural Resources | | | | | | | Class II | |
| | |
| Science and Technology | | | Class I | | | | Class II | |
| | |
| Small Cap Core | | | | | | | Class II | |
| | |
| Small Cap Growth | | | Class I | | | | Class II | |
Beginning on January 1, 2021, as permitted by regulations adopted by the U.S. Securities and Exchange Commission (SEC), you may not be receiving paper copies of the Fund’s annual or semi-annual shareholder reports by mail, unless you specifically request paper copies of the reports from the insurance company that offers your variable annuity or variable life insurance contract or from your financial intermediary. Instead of delivering paper copies of the report, the insurance company may choose to make the reports available on a website, and will notify you by mail each time a shareholder report is posted and provide you with a website link to access the report. Instructions for requesting paper copies will be provided by your insurance company.
If you already elected to receive shareholder reports electronically, you will not be affected by this change and you need not take any action. You may elect to receive shareholder reports and other communications from the insurance company or your financial intermediary electronically by following the instructions provided by the insurance company or by contacting your financial intermediary.
You may elect to receive all future Fund shareholder reports in paper free of charge from the insurance company. You can inform the insurance company or your financial intermediary that you wish to continue receiving paper copies of your shareholder reports by following the instructions provided by the insurance company or by contacting your financial intermediary. Your election to receive reports in paper will apply to all portfolio companies available under your contract with the insurance company.
| | |
| PRESIDENT’S LETTER | | IVY VIP |
| | |

| | DECEMBER 31, 2018 (UNAUDITED) |
| Philip J. Sanders, CFA | | |
Dear Shareholder,
While most of the fiscal year remained relatively calm, dramatic market volatility returned in the final quarter of 2018. The U.S. stock market, which had hit record highs during 2018, concluded the year with the worst quarter for U.S. equities since 2011 and the S&P 500 Index was down 6.24% over the12-month period. As the year progressed, trade disputes, geopolitical tensions and uncertain global growth rates provided a choppy ride for investors.
The U.S. economy is likely to finish 2018 with the strongest growth rate since the Great Recession that began 10 years ago. Our optimism is tempered somewhat for 2019 as we forecast U.S. gross domestic product (GDP) growth stabilizing around 2.5% with the possibility of further deceleration during the year.
The U.S. Federal Reserve (Fed) has indicated that short-term interest rates are close to what it believes to be neutral, meaning that policy is neither loose nor restrictive. We believe slower economic growth and lower oil prices will keep inflation well contained in early 2019, which is why the Fed decided to take a more dovish tone and ease its pace of quarterly rate hikes. Our base case belief is the Fed will raise rates once, possibly twice, in 2019.
The deterioration in eurozone economic data seems to be waning following an agreement between the U.S. and European Union (EU) to discuss a reduction in tariffs on industrial goods. Brexit negotiations between the U.K. and EU continue to be choppy, which has caused some delays in anticipated capital spending for the eurozone. While we believe the two parties will come to a resolution for the U.K.’s exit from the EU, the ongoing negotiations may cause lingering economic tumult until a deal can be reached.
Emerging markets faced multiple headwinds over the year, namely a strong dollar, China’s focus on deleveraging and regulations, trade wars, volatile energy prices and increased geopolitical risks. By comparison, U.S. equities benefitted from a more attractive growth rate, which was the result of tax reform, lower regulatory pressures and repatriation of overseas earnings.
The U.S.-China trade negotiations remain front and center for many emerging market economies. Any resolution to trade disputes would be critical not just for China, but also its Asian trading counterparts like South Korea and Taiwan. As such, we are cautiously optimistic for a status quo on the trade war without further escalations. We believe China has started loosening policy on the domestic front and we anticipate an easing of regulatory, monetary and fiscal policy as well, which should be supportive of the domestic economy. We believe emerging markets continue to offer a sound longer term fundamental outlook; however, market volatility is likely to persist until there is more clarity surrounding potential risks.
Overall, volatility was the name of the game across the fiscal year. Several forces conspired to create this environment, including macro events like the global trade slowdown and tightening monetary policy, as well as the staggering of the FAANG (Facebook, Apple, Amazon, Netflix and Google-parent Alphabet) stocks, which have been a major equities catalyst over the past couple of years.
Looking ahead, we believe the markets are likely to remain choppy for some time, although the landscape should present more selective opportunities, with greater emphasis on the fundamentals and quality of asset classes and sectors.
We believe it is important to stay focused on the fundamentals and merits of individual market sectors, industries and companies when making investment decisions. Those fundamentals historically have tended to outweigh external factors such as government policies and regulations. While those can affect every business and investor, we think the innovation and management skill within individual companies ultimately drive long-term stock prices.
Economic Snapshot
| | | | | | | | |
| | |
| | | 12/31/18 | | | 12/31/17 | |
S&P 500 Index | | | 2,506.85 | | | | 2,673.61 | |
MSCI EAFE Index | | | 1,719.88 | | | | 2,050.79 | |
10-Year Treasury Yield | | | 2.69 | % | | | 2.40 | % |
U.S. unemployment rate | | | 3.9 | % | | | 4.1 | % |
30-year fixed mortgage rate | | | 4.55 | % | | | 3.99 | % |
Oil price per barrel | | | $45.41 | | | | $60.42 | |
Sources: Bloomberg, U.S. Department of Labor, MBA, CME
All government statistics shown are subject to periodic revision. The S&P 500 Index is an unmanaged index that tracks the stocks of 500 primarilylarge-cap U.S. companies. MSCI EAFE Index is an unmanaged index comprised of securities that represent the securities markets in Europe, Australasia and the Far East. It is not possible to invest directly in any of these indexes. Mortgage rates are from BankRate and reflect the overnight national average rate on a conventional30-year fixed loan. Oil prices reflect the market price of West Texas intermediate grade crude.
Respectfully,

Philip J. Sanders, CFA
President
The opinions expressed in this letter are those of the President of the Ivy Variable Insurance Portfolios and are current only through the end of the period of the report, as stated on the cover. The President’s views are subject to change at any time, based on market and other conditions, and no forecasts can be guaranteed.
| | |
ILLUSTRATION OF PORTFOLIO EXPENSES | | IVY VIP |
(UNAUDITED)
Expense Example
As a shareholder of a Portfolio, you incur ongoing costs, including management fees, distribution and service fees, and other Portfolio expenses. The following table is intended to help you understand your ongoing costs (in dollars) of investing in a Portfolio and to compare these costs with the ongoing costs of investing in other mutual funds. The example is based on an investment of $1,000 invested at the beginning of the period and held for thesix-month period ended December 31, 2018.
Actual Expenses
The first section in the following table provides information about actual investment values and actual expenses for each share class. You may use the information in this section, together with your initial investment in Portfolio shares, to estimate the expenses that you paid over the period. Simply divide the value of that investment by $1,000 (for example, a $7,500 initial investment divided by $1,000 = 7.5), then multiply the result by the number in the first section under the heading entitled “Expenses Paid During Period” to estimate the expenses you paid on your investment during this period. In addition, there are fees and expenses imposed under the variable annuity or variable life insurance contract through which shares of the Portfolio are held. Additional fees have the effect of reducing investment returns.
Hypothetical Example for Comparison Purposes
The second section in the following table provides information about hypothetical investment values and hypothetical expenses for each share class based on the Portfolio’s actual expense ratio and an assumed rate of return of five percent per year before expenses, which is not the Portfolio’s actual return. The hypothetical investment values and expenses may not be used to estimate the actual investment value at the end of the period or expenses you paid for the period. You may use this information to compare the ongoing costs of investing in the Portfolio and other funds. To do so, compare this five percent hypothetical example with the five percent hypothetical examples that appear in the shareholder reports of the other funds.
Please note that the expenses shown in the table are meant to highlight your ongoing costs as a shareholder of the Portfolio and do not reflect any fees and expenses imposed under the variable annuity or variable life insurance contract through which shares of the Portfolio are held.
Expenses paid may be impacted by expense reduction arrangements. If those arrangements had not been in place, expenses paid would have been higher. See Note 6 to the Financial Statements for further information.
| | |
ILLUSTRATION OF PORTFOLIO EXPENSES | | IVY VIP |
(UNAUDITED)
| | | | | | | | | | | | | | | | | | | | | | | | | | | | |
| | | |
| | | Actual(1) | | | Hypothetical(2) | | | | |
| | | | | | | |
| Portfolio | | Beginning
Account
Value
6-30-18 | | | Ending
Account
Value
12-31-18 | | | Expenses
Paid During
Period* | | | Beginning
Account
Value
6-30-18 | | | Ending
Account
Value
12-31-18 | | | Expenses
Paid During
Period* | | | Annualized
Expense Ratio
Based on the
Six-Month
Period | |
Asset Strategy | |
Class I | | $ | 1,000 | | | $ | 930.80 | | | $ | 3.77 | | | $ | 1,000 | | | $ | 1,021.26 | | | $ | 3.94 | | | | 0.78% | |
Class II | | $ | 1,000 | | | $ | 929.60 | | | $ | 5.02 | | | $ | 1,000 | | | $ | 1,020.01 | | | $ | 5.25 | | | | 1.03% | |
Balanced | |
Class II | | $ | 1,000 | | | $ | 952.30 | | | $ | 4.98 | | | $ | 1,000 | | | $ | 1,020.15 | | | $ | 5.15 | | | | 1.00% | |
Energy | |
Class I | | $ | 1,000 | | | $ | 635.00 | | | $ | 3.76 | | | $ | 1,000 | | | $ | 1,020.63 | | | $ | 4.65 | | | | 0.94% | |
Class II | | $ | 1,000 | | | $ | 634.20 | | | $ | 4.90 | | | $ | 1,000 | | | $ | 1,019.19 | | | $ | 6.06 | | | | 1.19% | |
Growth | |
Class II | | $ | 1,000 | | | $ | 926.90 | | | $ | 4.82 | | | $ | 1,000 | | | $ | 1,020.19 | | | $ | 5.05 | | | | 1.00% | |
High Income | |
Class I | | $ | 1,000 | | | $ | 965.30 | | | $ | 3.24 | | | $ | 1,000 | | | $ | 1,021.90 | | | $ | 3.34 | | | | 0.66% | |
Class II | | $ | 1,000 | | | $ | 964.10 | | | $ | 4.52 | | | $ | 1,000 | | | $ | 1,020.64 | | | $ | 4.65 | | | | 0.91% | |
International Core Equity | |
Class II | | $ | 1,000 | | | $ | 845.00 | | | $ | 5.35 | | | $ | 1,000 | | | $ | 1,019.38 | | | $ | 5.86 | | | | 1.16% | |
Mid Cap Growth | |
Class I | | $ | 1,000 | | | $ | 898.70 | | | $ | 4.08 | | | $ | 1,000 | | | $ | 1,020.90 | | | $ | 4.34 | | | | 0.85% | |
Class II | | $ | 1,000 | | | $ | 897.50 | | | $ | 5.31 | | | $ | 1,000 | | | $ | 1,019.65 | | | $ | 5.66 | | | | 1.10% | |
Natural Resources | |
Class II | | $ | 1,000 | | | $ | 784.40 | | | $ | 5.44 | | | $ | 1,000 | | | $ | 1,019.14 | | | $ | 6.16 | | | | 1.20% | |
Science and Technology | |
Class I | | $ | 1,000 | | | $ | 871.00 | | | $ | 4.21 | | | $ | 1,000 | | | $ | 1,020.68 | | | $ | 4.55 | | | | 0.90% | |
Class II | | $ | 1,000 | | | $ | 869.90 | | | $ | 5.42 | | | $ | 1,000 | | | $ | 1,019.41 | | | $ | 5.86 | | | | 1.15% | |
Small Cap Core | |
Class II | | $ | 1,000 | | | $ | 830.40 | | | $ | 5.40 | | | $ | 1,000 | | | $ | 1,019.34 | | | $ | 5.96 | | | | 1.16% | |
Small Cap Growth | |
Class��I** | | $ | 1,000 | | | $ | 877.60 | | | $ | 5.15 | | | $ | 1,000 | | | $ | 1,019.81 | | | $ | 5.54 | | | | 1.07% | (3) |
Class II | | $ | 1,000 | | | $ | 857.00 | | | $ | 5.20 | | | $ | 1,000 | | | $ | 1,019.62 | | | $ | 5.65 | | | | 1.11% | |
| * | Portfolio expenses are equal to the Portfolio’s annualized expense ratio (provided in the table), multiplied by the average account value over the period, multiplied by 184 days in thesix-month period ended December 31, 2018, and divided by 365. |
| ** | Actual inception date for this share class is11-5-18 (the date on which shares were first acquired by shareholders). The calculations are based on 57 days in the period ended December 31, 2018. |
| (1) | This section uses the Portfolio’s actual total return and actual Portfolio expenses. It is a guide to the actual expenses paid by the Portfolio in the period. The “Ending Account Value” shown is computed using the Portfolio’s actual return and the “Expenses Paid During Period” column shows the dollar amount that would have been paid by an investor who started with $1,000 in the Portfolio. A shareholder may use the information here, together with the dollar amount invested, to estimate the expenses that were paid over the period. For every thousand dollars a shareholder has invested, the expenses are listed in the last column of this section. |
| (2) | This section uses a hypothetical five percent annual return and actual Portfolio expenses. It helps to compare the Portfolio’s ongoing costs with other mutual funds. A shareholder can compare the Portfolio’s ongoing costs by comparing this hypothetical example with the hypothetical examples that appear in shareholder reports of other Portfolios. |
| (3) | Annualized expense ratio based on the period excluding reorganization expense was 0.86%. |
The above illustrations are based on ongoing costs only.
| | |
| MANAGEMENT DISCUSSION | | ASSET STRATEGY |
(UNAUDITED)
|

F. Chace Brundige 
W. Jeffery Surles |
Below, F. Chace Brundige, CFA, W. Jeffery Surles, CFA, portfolio managers of Ivy VIP Asset Strategy, discuss positioning, performance and results for the fiscal year ended December 31, 2018. Mr. Brundige has managed the Portfolio since 2014 and has 25 years of industry experience. Mr. Surles was named a co-portfolio manager on the Portfolio in February 2018. He has 17 years of industry experience. Cynthia Prince-Fox previously was a co-portfolio manager of the Portfolio. She retired effective April 30, 2018.
Fiscal Year Performance
| | | | |
For the 12 Months Ended December 31, 2018 | | | | |
Ivy VIP Asset Strategy(Class II shares at net asset value) | | | -5.44% | |
Benchmark(s) and/or Morningstar and Lipper Categories | | | | |
MSCI All Country World Index (ACWI) | | | -9.42% | |
(generally reflects the performance of stocks in 46 developed and emerging markets) | | | | |
S&P 500 Index | | | -4.38% | |
(generally reflects the performance of large-capitalization U.S. stocks) | | | | |
Bloomberg Barclays U.S. Aggregate Bond Index | | | 0.01% | |
(generally reflects the performance of most U.S.-traded investment grade bonds) | | | | |
Bloomberg Barclays U.S. Treasury Bills: 1-3 Month Index | | | 1.83% | |
(generally reflects the performance of investment-grade Treasury bills, representing cash) | | | | |
Morningstar World Allocation Universe Average | | | -8.01% | |
(generally reflects the performance of the universe of funds with similar investment objectives) | | | | |
Lipper Variable Annuity Alternative Other Universe Average | | | -5.15% | |
(generally reflects the performance of the universe of funds with similar investment objectives) | | | | |
Multiple indexes are shown because the Portfolio invests in multiple asset classes. The MSCI All Country World Index (ACWI) benchmark replaced the previous benchmarks shown above effective February 5, 2018, because the Portfolio’s adviser believes that this index is more representative of the types of securities that the Portfolio purchases.
Please note that the Portfolio returns include applicable investment fees and expense, whereas the index returns do not include any such fees. Also, the Portfolio’s performance data does not take into account any product expenses or charges associated with owning a variable life or annuity policy, which is invested in Ivy Variable Insurance Portfolios. Multiple indexes are shown because the Portfolio invests in multiple asset classes.
A year of significant change
2018 proved to be an eventful year both for both the Portfolio and financial markets. In February, the Portfolio’s investment process changed as we started operating with a defined risk budget; at the same time, the Portfolio’s benchmark changed to an all-equity index, the MSCI ACWI. We aim to generate MSCI ACWI-like returns over an investment cycle with 70-90% of that index’s expected risk.
Financial markets experienced the most challenging year for asset prices globally in 10 years. Negative returns persisted across all the major asset classes we track, including equities, fixed income and commodity markets. After 10 years of largely positive catalysts for riskier asset prices, a confluence of factors came to the surface during the fourth quarter of 2018 and led to a ferocious drawdown in asset prices. Fears that the U.S. Federal Reserve (Fed) would overtighten monetary policy, global trade wars, government shutdowns and the outcome of Brexit negotiations led to the largest repricing of risk assets since the global financial crisis.
While global economic growth largely held steady during the year, several leading indicators began to show cracks in the final quarter of the fiscal year. Purchasing manager index data globally started to slow, profit warnings began to appear from several bellwether companies, European consumer data weakened and commodity prices collapsed. The few remaining areas of positive returns were quickly wiped out as the year drew to a close, with U.S. equities falling and credit spreads widening aggressively.
Sharp reversal late in fiscal year
The Portfolio had a negative return for the fiscal year; however, it outperformed on a relative basis, exceeding the return of the MSCI ACWI and was competitive with the return of its Lipper Universe Average.
For the first eight months of the fiscal year, the Portfolio was positioned more aggressively and operated near the top end of its defined risk budget of 70-90% of the predicted risk of the benchmark index. The Portfolio was able to keep pace with and even exceed the benchmark while it was experiencing positive returns. The Portfolio reduced the risk level toward the end
of the third quarter to below the midpoint (<80% predicted total risk) of the risk target because of a growing number of macro headwinds. With hindsight, we believe it would have been appropriate to have taken risk down further ahead of the volatility experienced in the fourth quarter, but the risk reduction did help the Portfolio’s aggregate performance versus the MSCI ACWI.
Given the risk position early in the fiscal year, the Portfolio maintained heavy equity weightings though most of the first three quarters. The equity weighting was in the mid-70% area at the start of the year and remained near that level until we reduced risk near the end of the third quarter. For the rest of the year, the weighting was in the high-60% area. Fixed income comprised about 20% of assets early in the year but rose to just over 25% as we reduced risk. The gold allocation held fairly stable at 4.5-5% of assets.
The equity portfolio started off the year strong, held firm through the middle part of the year and, despite giving up some performance in the volatility of the fourth quarter, was the largest single contributor to the Portfolio’s relative outperformance against the benchmark. Our credit-heavy fixed income portfolio spent most of the year in positive territory despite major credit indices being firmly negative. It also gave up performance in the fourth quarter and finished the year in slightly negative territory.
During the fourth quarter we had the first real test of our new risk budget process during a drawdown in asset prices. For most of that quarter, we were operating at 77-78% of the total predicted risk versus the benchmark index. During the quarter, we actually experienced 81% of the downside to the benchmark. While not precise, it was well within our expected error range and a good test of our ability to deliver on our new process. While our diversifying sleeve will often hold diversifying assets that are risky on a standalone basis — such as high yield and emerging market debt — we are building the Portfolio on an asset-by-asset basis. These assets have certain diversifying traits that help control the risk profile on a Portfolio-wide basis while still providing potential for total return.
The equity portfolio in isolation outperformed the benchmark index for the year, despite lagging the index return during the final quarter of the year. That performance was driven largely by stock selection, as we would expect. Names in the technology sector led performance, as the Portfolio received strong contributions from long-held issues including Microsoft Corp., Adobe Systems, Inc., and Intuit, Inc., all of which were reduced from peak weightings during the summer and early fall.
Semiconductor and hardware-related stocks, such as Apple, Inc., detracted from performance somewhat for the year. Stock selection in the health care sector helped performance, across biotechnology, pharmaceuticals and hospitals. A shift into a higher consumer staples weighting midway through the year helped primarily via allocation effect, especially during the fourth quarter. We finally found relative value in certain areas of consumer staples at a time when they began to perform better — but of course relative value is often a driver of relative performance and we are always on the lookout.
On the negative front, our energy stocks underperformed the sector, with oilfield services the weakest. The majority of that weakness was experienced during the fourth quarter’s drawdown in crude oil prices. Our lack of an allocation to utilities also provided a bit of a headwind relative to the benchmark index, again most prominent in the fourth quarter.
Our fixed income portfolio, which comprised the bulk of our diversifying assets, held up well until the fourth quarter. The credit-heavy portfolio was not able to fully withstand the onslaught of negative macro data and lost about 3% during that quarter. Many of our fixed income positions contained optionality to higher interest rates either through floating interest rate structures or fixed-to-floating coupons. Those characteristics did not hold up as well as we would have liked during the fourth quarter as interest rates rallied aggressively and the market started pricing in a reduced probability of additional Fed rate hikes. Despite those headwinds, the fixed income portfolio generally served its purpose well throughout the year, dampening portfolio volatility while generating positive return against the benchmark in a down market.
On a security basis, the Portfolio’s high yield positions in telecommunications & oil services were particularly poor performers, as were our emerging market positions in Argentina. Positives were emerging market debt positions in Brazil, which in sharp contrast to Argentina were some of our best performing positions and showed the bifurcation that happened across emerging markets. Holdings in subordinated debt under European banks also performed well, along with select U.S. Treasury positions. Gold struggled early in the year as interest rates rose but it showed why we own it during the volatility in the fourth quarter, becoming the best-performing asset at up more than 7.5%.
Clouded outlook
Our outlook for the future is quite clouded. Negatives continue to stack up as a slew of additional profit warnings since the end of the calendar year have added to the already sour macro backdrop. But asset prices have corrected meaningfully and a number of potential positive catalysts exist through the potential for trade resolution, reopening of the U.S. government from its shutdown late in 2018, and additional stimulus which could positively impact asset prices. Most of these events are binary and very hard to predict.
In addition, we feel we have little edge in trying to determine if or when a trade deal gets struck with China. Our edge lies more in security selection and portfolio construction. Given that situation, we have been operating with a fairly cautious risk stance, limiting the size of our commitments and keeping our predicted total risk slightly below the midpoint of our target range.
The Portfolio’s focus has been on bottom-up security selections, with our sector weights showing less deviation from the benchmark than at any time in the past year. Our large technology overweight relative to the benchmark index has been reduced and more defensive sectors, such as consumer staples, have come into focus as we manage equity portfolio risk from a bottom-up perspective.
With the diversifying portfolio, we continue to seek individual securities that can provide risk diversification with an element of total return. We have taken a more neutral stance on interest rates, as we feel the Fed is in a bind with no good answers. Interest rate hikes have clearly slowed the economy and balance sheet runoff has tightened liquidity. Yet despite the rate hikes, employment remains strong and wage growth continues to build slowly. We expect this to cause the Fed to pause its rate increases as it reassesses the macro situation.
We expect to remain in this reduced risk mode until either the macro picture becomes clearer or valuation spreads compress to levels that provide more potential reward for the risk. While we have seen some compression in valuations, it still has not gotten near levels we feel will merit attention, given the starting points of relatively high equity valuations and corporate operating margins, as well as historically tight credit spreads. Until we get clarity on these issues, we expect to remain focused on bottom-up portfolio construction through security selection and on limiting the Portfolio’s risk profile.
Past performance is not a guarantee of future results. The value of the Portfolio’s shares will change, and you could lose money on your investment.
The Portfolio may allocate its assets among different asset classes of varying correlation around the globe.
International investing involves additional risks, including currency fluctuations, political or economic conditions affecting the foreign country, and differences in accounting standards and foreign regulations. These risks are magnified in emerging markets.
Fixed-income securities are subject to interest-rate risk and, as such, the net asset value of the Portfolio may fall as interest rates rise. Investing in high-income securities may carry a greater risk of nonpayment of interest or principal than higher-rated bonds.
The Portfolio may seek to hedge market risk via the use of derivative instruments. Such investments involve additional risks.
Investing in commodities is generally considered speculative because of the significant potential for investment loss. Markets for commodities are likely to be volatile and there may be sharp price fluctuations even during periods when prices overall are rising.
These and other risks are more fully described in the Portfolio’s prospectus.
The opinions expressed in this report are those of the portfolio managers and are current only through the end of the period of the report as stated on the cover. The managers’ views are subject to change at any time based on market and other conditions, and no forecasts can be guaranteed.
The indexes noted are unmanaged and include reinvested dividends. One cannot invest directly in an index, nor is an index representative of Ivy VIP Asset Strategy.
| | |
| PORTFOLIO HIGHLIGHTS | | ASSET STRATEGY |
ALL DATA IS AS OF DECEMBER 31, 2018 (UNAUDITED)
Asset Allocation
| | | | |
Stocks | | | 67.4% | |
Information Technology | | | 14.1% | |
Financials | | | 11.9% | |
Industrials | | | 9.5% | |
Consumer Staples | | | 8.8% | |
Health Care | | | 8.7% | |
Consumer Discretionary | | | 6.0% | |
Energy | | | 4.5% | |
Communication Services | | | 3.1% | |
Materials | | | 0.8% | |
Bullion (Gold) | | | 5.6% | |
Bonds | | | 24.5% | |
Corporate Debt Securities | | | 12.7% | |
Loans | | | 5.8% | |
United States Government and Government Agency Obligations | | | 4.1% | |
Other Government Securities | | | 1.9% | |
Cash and Other Assets (Net of Liabilities), and Cash Equivalents+ | | | 2.5% | |
Country Weightings
| | | | |
North America | | | 52.2% | |
United States | | | 51.3% | |
Other North America | | | 0.9% | |
Europe | | | 25.4% | |
France | | | 6.4% | |
United Kingdom | | | 4.8% | |
Switzerland | | | 4.3% | |
Netherlands | | | 3.5% | |
Other Europe | | | 6.4% | |
Pacific Basin | | | 12.9% | |
Japan | | | 3.5% | |
Other Pacific Basin | | | 9.4% | |
Bullion (Gold) | | | 5.6% | |
South America | | | 1.4% | |
Cash and Other Assets (Net of Liabilities), and Cash Equivalents+ | | | 2.5% | |
Top 10 Equity Holdings
| | | | | | |
| | | |
| Company | | Country | | Sector | | Industry |
Microsoft Corp. | | United States | | Information Technology | | Systems Software |
Pfizer, Inc. | | United States | | Health Care | | Pharmaceuticals |
Visa, Inc., Class A | | United States | | Information Technology | | Data Processing & Outsourced Services |
Coca-Cola Co. (The) | | United States | | Consumer Staples | | Soft Drinks |
Amazon.com, Inc. | | United States | | Consumer Discretionary | | Internet & Direct Marketing Retail |
AIA Group Ltd. | | Hong Kong | | Financials | | Life & Health Insurance |
Wal-Mart Stores, Inc. | | United States | | Consumer Staples | | Hypermarkets & Super Centers |
QUALCOMM, Inc. | | United States | | Information Technology | | Semiconductors |
Airbus SE | | France | | Industrials | | Aerospace & Defense |
Nestle S.A., Registered Shares | | Switzerland | | Consumer Staples | | Packaged Foods & Meats |
See your advisor or www.ivyinvestments.com for more information on the Portfolio’s most recently published Top 10 Equity Holdings.
+Cash equivalents are defined as highly liquid securities with maturities of less than three months. Cash equivalents may include U.S. Government Treasury bills, bank certificates of deposit, bankers’ acceptances, corporate commercial paper and other money market instruments.
| | |
| COMPARISON OF CHANGE IN VALUE OF $10,000 INVESTMENT | | ASSET STRATEGY |
(UNAUDITED)
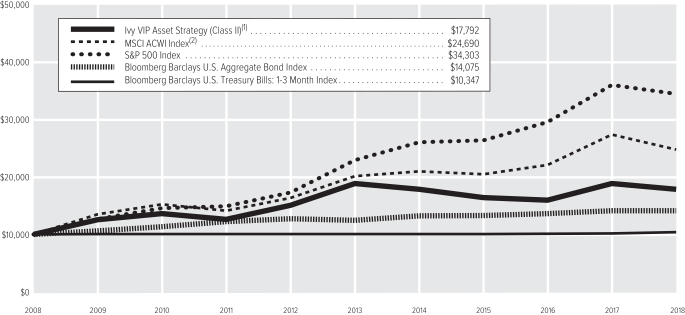
| (1) | The value of the investment in the Portfolio is impacted by the ongoing expenses of the Portfolio and assumes reinvestment of dividends and distributions. |
| (2) | Effective February 6, 2018, the MSCI ACWI Index is the Portfolio’s new benchmark index. IICO believes that this index is a more representative index for the types of securities that the Portfolio purchases than the three indexes listed. |
| | | | | | | | |
| | |
| Average Annual Total Return(3) | | Class I | | | Class II | |
1-year period ended12-31-18 | | | -5.20% | | | | -5.44% | |
5-year period ended12-31-18 | | | — | | | | -1.10% | |
10-year period ended12-31-18 | | | — | | | | 5.93% | |
Since Inception of Class through12-31-18(4) | | | 3.17% | | | | — | |
| (3) | Data quoted is past performance and current performance may be lower or higher. Past performance is no guarantee of future results. Investment return and principal value of an investment will fluctuate and shares, when redeemed, may be worth more or less than their original cost. Please visit www.ivyinvestments.com for the Portfolio’s most recentmonth-end performance. Performance data quoted does not reflect any expenses or charges associated with owning a variable life insurance policy or variable annuity contract that invests in the Portfolio’s shares. When such charges are deducted, actual investment performance in a variable policy or contract will be lower. |
| (4) | 4-28-17 (the date on which shares were first acquired by shareholders). |
Past performance is not necessarily indicative of future performance. Indexes are unmanaged. The performance graph and table do not reflect the deduction of taxes that a shareholder would pay on Portfolio distributions or on the redemption of Portfolio shares. Performance results may include the effect of expense reduction arrangements for some or all of the periods shown. If those arrangements had not been in place, the performance results for those periods would have been lower.
| | |
| CONSOLIDATED SCHEDULE OF INVESTMENTS | | ASSET STRATEGY (in thousands) |
DECEMBER 31, 2018
| | | | | | | | |
| COMMON STOCKS | | Shares | | | Value | |
Communication Services | |
| |
Broadcasting – 1.0% | |
Discovery Holding Co., Class A (A)(B) | | | 314 | | | $ | 7,765 | |
| | | | | | | | |
| |
Integrated Telecommunication Services – 1.0% | |
China Unicom Ltd. (C) | | | 6,860 | | | | 7,309 | |
| | | | | | | | |
| |
Interactive Media & Services – 1.1% | |
Alphabet, Inc., Class A (A) | | | 8 | | | | 8,068 | |
| | | | | | | | |
| |
Total Communication Services – 3.1% | | | | 23,142 | |
Consumer Discretionary | |
| |
Auto Parts & Equipment – 0.9% | |
Magna International, Inc. (C) | | | 147 | | | | 6,663 | |
| | | | | | | | |
| |
Automobile Manufacturers – 1.3% | |
Suzuki Motor Corp. (C) | | | 203 | | | | 10,217 | |
| | | | | | | | |
| |
Home Improvement Retail – 1.0% | |
Home Depot, Inc. (The) | | | 43 | | | | 7,363 | |
| | | | | | | | |
| |
Internet & Direct Marketing Retail – 1.8% | |
Amazon.com, Inc. (A) | | | 9 | | | | 13,698 | |
| | | | | | | | |
| |
Leisure Facilities – 0.0% | |
COTA Racing & Entertainment LLC, Class B (A) | | | — | * | | | — | |
| | | | | | | | |
| |
Leisure Products – 0.0% | |
Media Group Holdings LLC,
Series H (A)(D)(E)(F) | | | 32 | | | | — | * |
Media Group Holdings LLC,
Series T (A)(D)(E)(F) | | | 4 | | | | 287 | |
| | | | | | | | |
| | | | | | | 287 | |
| | | | | | | | |
| |
Restaurants – 1.0% | |
Compass Group plc (C) | | | 346 | | | | 7,286 | |
| | | | | | | | |
| |
Total Consumer Discretionary – 6.0% | | | | 45,514 | |
Consumer Staples | |
| |
Household Products – 1.3% | |
Procter & Gamble Co. (The) | | | 104 | | | | 9,547 | |
| | | | | | | | |
| |
Hypermarkets & Super Centers – 1.6% | |
Wal-Mart Stores, Inc. | | | 130 | | | | 12,149 | |
| | | | | | | | |
| |
Packaged Foods & Meats – 2.5% | |
Danone S.A. (C) | | | 98 | | | | 6,907 | |
Nestle S.A., Registered Shares (C) | | | 144 | | | | 11,699 | |
| | | | | | | | |
| | | | | | | 18,606 | |
| | | | | | | | |
| |
Soft Drinks – 1.8% | |
Coca-Cola Co. (The) | | | 293 | | | | 13,859 | |
| | | | | | | | |
| |
Tobacco – 1.6% | |
ITC Ltd.(C) | | | 861 | | | | 3,473 | |
| | | | | | | | |
| COMMON STOCKS(Continued) | | Shares | | | Value | |
Tobacco(Continued) | |
Philip Morris International, Inc. | | | 130 | | | $ | 8,652 | |
| | | | | | | | |
| | | | | | | 12,125 | |
| | | | | | | | |
| |
Total Consumer Staples – 8.8% | | | | 66,286 | |
Energy | |
| |
Integrated Oil & Gas – 1.5% | |
Royal Dutch Shell plc, Class A (C) | | | 384 | | | | 11,328 | |
| | | | | | | | |
| |
Oil & Gas Equipment & Services – 1.2% | |
Halliburton Co. | | | 165 | | | | 4,383 | |
Schlumberger Ltd. | | | 121 | | | | 4,357 | |
| | | | | | | | |
| | | | | | | 8,740 | |
| | | | | | | | |
| |
Oil & Gas Exploration & Production – 1.8% | |
Cabot Oil & Gas Corp. | | | 185 | | | | 4,137 | |
EOG Resources, Inc. | | | 71 | | | | 6,213 | |
Noble Energy, Inc. | | | 184 | | | | 3,458 | |
| | | | | | | | |
| | | | | | | 13,808 | |
| | | | | | | | |
| |
Total Energy – 4.5% | | | | 33,876 | |
Financials | |
| |
Consumer Finance – 0.8% | |
ORIX Corp. (C) | | | 425 | | | | 6,205 | |
| | | | | | | | |
| |
Diversified Banks – 5.4% | |
Axis Bank Ltd. (C) | | | 1,019 | | | | 9,035 | |
BNP Paribas S.A. (C) | | | 141 | | | | 6,372 | |
China Construction Bank Corp. (C) | | | 8,937 | | | | 7,319 | |
Industrial and Commercial Bank of China Ltd., H Shares (C) | | | 10,458 | | | | 7,438 | |
Kabushiki Kaisha Mitsubishi Tokyo Financial Group (C) | | | 1,270 | | | | 6,231 | |
UniCredit S.p.A. (C) | | | 397 | | | | 4,502 | |
| | | | | | | | |
| | | | | | | 40,897 | |
| | | | | | | | |
| |
Life & Health Insurance – 1.7% | |
AIA Group Ltd. (C) | | | 1,572 | | | | 13,057 | |
| | | | | | | | |
| |
Multi-Line Insurance – 1.1% | |
Sampo plc, A Shares (C) | | | 179 | | | | 7,931 | |
| | | | | | | | |
| |
Multi-Sector Holdings – 1.2% | |
Berkshire Hathaway, Inc., Class B (A) | | | 43 | | | | 8,719 | |
| | | | | | | | |
| |
Regional Banks – 1.7% | |
KeyCorp | | | 420 | | | | 6,214 | |
PNC Financial Services Group, Inc. (The) | | | 57 | | | | 6,675 | |
| | | | | | | | |
| | | | | | | 12,889 | |
| | | | | | | | |
| |
Total Financials – 11.9% | | | | 89,698 | |
Health Care | |
| |
Biotechnology – 2.1% | |
BioMarin Pharmaceutical, Inc. (A) | | | 95 | | | | 8,105 | |
Sarepta Therapeutics, Inc. (A) | | | 69 | | | | 7,530 | |
| | | | | | | | |
| | | | | | | 15,635 | |
| | | | | | | | |
| | | | | | | | |
| COMMON STOCKS(Continued) | | Shares | | | Value | |
Health Care Equipment – 1.5% | |
Medtronic plc | | | 121 | | | $ | 11,001 | |
| | | | | | | | |
| |
Managed Health Care – 0.8% | |
UnitedHealth Group, Inc. | | | 24 | | | | 6,095 | |
| | | | | | | | |
| |
Pharmaceuticals – 4.3% | |
Merck KGaA (C) | | | 58 | | | | 5,974 | |
Pfizer, Inc. | | | 482 | | | | 21,043 | |
Zoetis, Inc. | | | 65 | | | | 5,564 | |
| | | | | | | | |
| | | | | | �� | 32,581 | |
| | | | | | | | |
| |
Total Health Care – 8.7% | | | | 65,312 | |
Industrials | |
| |
Aerospace & Defense – 3.2% | |
Airbus SE (C) | | | 123 | | | | 11,767 | |
Lockheed Martin Corp. | | | 21 | | | | 5,368 | |
Northrop Grumman Corp. | | | 28 | | | | 6,830 | |
| | | | | | | | |
| | | | | | | 23,965 | |
| | | | | | | | |
| |
Construction & Engineering – 2.3% | |
Larsen & Toubro Ltd. (C) | | | 502 | | | | 10,331 | |
Vinci (C) | | | 86 | | | | 7,033 | |
| | | | | | | | |
| | | | | | | 17,364 | |
| | | | | | | | |
| |
Construction Machinery & Heavy Trucks – 1.0% | |
Caterpillar, Inc. | | | 57 | | | | 7,239 | |
| | | | | | | | |
| |
Electrical Components & Equipment – 0.8% | |
Schneider Electric S.A. (C) | | | 91 | | | | 6,190 | |
| | | | | | | | |
| |
Railroads – 1.5% | |
Kansas City Southern | | | 58 | | | | 5,527 | |
Union Pacific Corp. | | | 44 | | | | 6,031 | |
| | | | | | | | |
| | | | | | | 11,558 | |
| | | | | | | | |
| |
Trading Companies & Distributors – 0.7% | |
Ferguson plc (C) | | | 78 | | | | 5,011 | |
| | | | | | | | |
| |
Total Industrials – 9.5% | | | | 71,327 | |
Information Technology | |
| |
Application Software – 2.5% | |
Adobe, Inc. (A) | | | 42 | | | | 9,440 | |
Intuit, Inc. | | | 49 | | | | 9,634 | |
| | | | | | | | |
| | | | | | | 19,074 | |
| | | | | | | | |
| |
Data Processing & Outsourced Services – 1.8% | |
Visa, Inc., Class A | | | 106 | | | | 13,935 | |
| | | | | | | | |
| |
Electronic Equipment & Instruments – 0.6% | |
Keyence Corp. (C) | | | 9 | | | | 4,498 | |
| | | | | | | | |
| |
Semiconductor Equipment – 1.7% | |
Applied Materials, Inc. | | | 199 | | | | 6,503 | |
ASML Holding N.V., Ordinary Shares (C) | | | 41 | | | | 6,366 | |
| | | | | | | | |
| | | | | | | 12,869 | |
| | | | | | | | |
| | |
| CONSOLIDATED SCHEDULE OF INVESTMENTS | | ASSET STRATEGY (in thousands) |
DECEMBER 31, 2018
| | | | | | | | |
| COMMON STOCKS(Continued) | | Shares | | | Value | |
Semiconductors – 2.7% | |
QUALCOMM, Inc. | | | 210 | | | $ | 11,953 | |
Taiwan Semiconductor Manufacturing Co. Ltd. (C) | | | 1,099 | | | | 7,981 | |
| | | | | | | | |
| | | | | | | 19,934 | |
| | | | | | | | |
| |
Systems Software – 3.1% | |
Microsoft Corp. | | | 228 | | | | 23,133 | |
| | | | | | | | |
| |
Technology Hardware, Storage & Peripherals – 1.7% | |
Apple, Inc. | | | 47 | | | | 7,383 | |
Samsung Electronics Co. Ltd. (C) | | | 154 | | | | 5,376 | |
| | | | | | | | |
| | | | | | | 12,759 | |
| | | | | | | | |
| |
Total Information Technology – 14.1% | | | | 106,202 | |
Materials | |
| |
Diversified Metals & Mining – 0.8% | |
Glencore International plc (C) | | | 1,713 | | | | 6,367 | |
| | | | | | | | |
| | |
Total Materials – 0.8% | | | | | | | 6,367 | |
| |
TOTAL COMMON STOCKS – 67.4% | | | $ | 507,724 | |
(Cost: $528,269) | | | | | | | | |
| | |
| CORPORATE DEBT SECURITIES | | Principal | | | | |
Communication Services | |
| |
Cable & Satellite – 1.7% | |
Altice France S.A.,8.125%, 2-1-27 (G) | | $ | 2,600 | | | | 2,450 | |
Altice S.A.: | | | | | | | | |
7.750%,5-15-22 (B)(G) | | | 6,448 | | | | 5,868 | |
7.625%,2-15-25 (G) | | | 4,656 | | | | 3,480 | |
Comcast Corp. (GTD by Comcast Cable Communications and NBCUniversal)(3-Month U.S. LIBOR plus 63 bps), 3.064%,4-15-24 (H) | | | 1,528 | | | | 1,493 | |
| | | | | | | | |
| | | | | | | 13,291 | |
| | | | | | | | |
| |
Integrated Telecommunication Services – 0.9% | |
Frontier Communications Corp.: | | | | | | | | |
7.625%,4-15-24 | | | 2,119 | | | | 1,091 | |
6.875%,1-15-25 | | | 4,337 | | | | 2,201 | |
11.000%,9-15-25 (B) | | | 3,180 | | | | 1,980 | |
9.000%,8-15-31 | | | 2,119 | | | | 1,134 | |
| | | | | | | | |
| | | | | | | 6,406 | |
| | | | | | | | |
| |
Total Communication Services – 2.6% | | | | 19,697 | |
Consumer Discretionary | |
| |
Leisure Facilities – 0.3% | |
Circuit of the Americas LLC,
Series D, 0.000%,12-31-20 (I) | | | 3,642 | | | | 2,023 | |
| | | | | | | | |
| |
Total Consumer Discretionary – 0.3% | | | | 2,023 | |
| | | | | | | | |
CORPORATE DEBT SECURITIES
(Continued) | | Principal | | | Value | |
Energy | |
| |
Integrated Oil & Gas – 0.5% | |
Petrobras Global Finance B.V. (GTD by Petroleo Brasileiro S.A.), 8.750%,5-23-26 | | $ | 3,219 | | | $ | 3,610 | |
| | | | | | | | |
| |
Oil & Gas Equipment & Services – 0.2% | |
SESI LLC, 7.125%,12-15-21 | | | 1,963 | | | | 1,669 | |
| | | | | | | | |
| |
Total Energy – 0.7% | | | | 5,279 | |
Financials | |
| |
Diversified Banks – 6.1% | |
Barclays plc,7.875%, 12-29-49 (B) | | | 10,192 | | | | 10,192 | |
BNP Paribas S.A., 7.625%,12-29-49 (G) | | | 2,810 | | | | 2,863 | |
HSBC Holdings plc, 6.875%,12-29-49 | | | 3,865 | | | | 3,972 | |
ING Groep N.V., Certicaaten Van Aandelen, 6.000%,10-16-66 | | | 4,280 | | | | 4,158 | |
Intesa Sanpaolo S.p.A., 5.710%,1-15-26 (G) | | | 2,830 | | | | 2,595 | |
Royal Bank of Scotland Group plc (The): | | | | | | | | |
7.500%,12-29-49 | | | 1,181 | | | | 1,169 | |
8.625%,12-29-49 (B) | | | 10,193 | | | | 10,550 | |
Societe Generale Group, 7.375%,12-29-49 (G) | | | 5,723 | | | | 5,573 | |
Standard Chartered plc, 7.500%,12-29-49 (G) | | | 2,481 | | | | 2,487 | |
UniCredit S.p.A., 5.861%,6-19-32 (G) | | | 2,700 | | | | 2,370 | |
| | | | | | | | |
| | | | | | | 45,929 | |
| | | | | | | | |
| |
Diversified Capital Markets – 1.2% | |
Credit Suisse Group AG: | | | | | | | | |
7.125%,7-29-66 (B) | | | 4,889 | | | | 4,828 | |
7.500%,6-11-67 (G) | | | 3,950 | | | | 4,015 | |
| | | | | | | | |
| | | | | | | 8,843 | |
| | | | | | | | |
| |
Investment Banking & Brokerage – 0.6% | |
Goldman Sachs Group, Inc. (The)(3-Month U.S. LIBOR plus 117 bps), 3.786%,5-15-26 (H) | | | 4,330 | | | | 4,156 | |
| | | | | | | | |
| |
Specialized Finance – 0.1% | |
Syngenta Finance N.V.: | | | | | | | | |
4.441%,4-24-23 (G) | | | 321 | | | | 309 | |
5.182%,4-24-28 (G) | | | 480 | | | | 446 | |
| | | | | | | | |
| | | | | | | 755 | |
| | | | | | | | |
| |
Total Financials – 8.0% | | | | 59,683 | |
Industrials | |
| |
Security & Alarm Services – 0.8% | |
Prime Security Services Borrower LLC, 9.250%,5-15-23 (G) | | | 5,762 | | | | 5,942 | |
| | | | | | | | |
| |
Total Industrials – 0.8% | | | | 5,942 | |
| | | | | | | | |
CORPORATE DEBT SECURITIES
(Continued) | | Principal | | | Value | |
Information Technology | |
| |
Data Processing & Outsourced Services – 0.3% | |
Alliance Data Systems Corp., 5.375%,8-1-22 (G) | | $ | 2,189 | | | $ | 2,134 | |
| | | | | | | | |
| |
Total Information Technology – 0.3% | | | | 2,134 | |
| |
TOTAL CORPORATE DEBT SECURITIES – 12.7% | | | $ | 94,758 | |
(Cost: $101,954) | | | | | | | | |
| | |
OTHER GOVERNMENT
SECURITIES(J) | | | | | | |
Argentina – 1.4% | |
Province of Mendoza, 8.375%,5-19-24 | | | 4,362 | | | | 3,533 | |
Republic of Argentina: | | | | | | | | |
4.625%,1-11-23 | | | 6,531 | | | | 5,160 | |
5.875%,1-11-28 | | | 2,100 | | | | 1,509 | |
| | | | | | | | |
| | | | | | | 10,202 | |
| | | | | | | | |
| |
Luxembourg – 0.5% | |
Rumo Luxembourg S.a.r.l., 7.375%,2-9-24 (G) | | | 3,651 | | | | 3,806 | |
| | | | | | | | |
| |
TOTAL OTHER GOVERNMENT SECURITIES – 1.9% | | | $ | 14,008 | |
(Cost: $16,284) | | | | | | | | |
| |
| LOANS(H) | | | | |
Communication Services | |
| |
Integrated Telecommunication Services – 0.7% | |
West Corp.(3-Month ICE LIBOR plus 400 bps), 6.527%,10-10-24 | | | 6,156 | | | | 5,636 | |
| | | | | | | | |
| |
Total Communication Services – 0.7% | | | | 5,636 | |
Consumer Staples | |
| |
Hypermarkets & Super Centers – 0.1% | |
GOBP Holdings, Inc. (ICE LIBOR plus 375 bps), 6.553%,10-22-25 | | | 680 | | | | 662 | |
| | | | | | | | |
| |
Total Consumer Staples – 0.1% | | | | 662 | |
Financials | |
| |
Financial Exchanges & Data – 0.4% | |
Financial & Risk U.S. Holdings, Inc. (ICE LIBOR plus 375 bps), 6.272%,10-1-25 | | | 3,276 | | | | 3,112 | |
| | | | | | | | |
| |
Investment Banking & Brokerage – 0.4% | |
Jane Street Group LLC (ICE LIBOR plus 375 bps), 5.527%,8-25-22 | | | 3,267 | | | | 3,171 | |
| | | | | | | | |
| | |
| CONSOLIDATED SCHEDULE OF INVESTMENTS | | ASSET STRATEGY (in thousands) |
DECEMBER 31, 2018
| | | | | | | | |
| LOANS(H)(Continued) | | Principal | | | Value | |
Property & Casualty Insurance – 1.4% | |
Hub International Ltd. (ICE LIBOR plus 300 bps), 5.240%,4-25-25 | | $ | 527 | | | $ | 497 | |
Mayfield Agency Borrower, Inc. (ICE LIBOR plus 450 bps), 6.522%,2-28-25 | | | 3,514 | | | | 3,417 | |
USI, Inc. (ICE LIBOR plus 300 bps), 5.803%,5-16-24 | | | 7,360 | | | | 6,927 | |
| | | | | | | | |
| | | | | | | 10,841 | |
| | | | | | | | |
| |
Total Financials – 2.2% | | | | 17,124 | |
Health Care | |
| |
Health Care Facilities – 0.7% | |
RegionalCare Hospital Partners Holdings, Inc. (ICE LIBOR plus 450 bps), 7.129%,11-16-25 | | | 2,943 | | | | 2,785 | |
Surgery Center Holdings, Inc. (ICE LIBOR plus 325 bps), 5.780%,8-31-24 | | | 2,848 | | | | 2,704 | |
| | | | | | | | |
| | | | | | | 5,489 | |
| | | | | | | | |
| |
Health Care Services – 0.3% | |
Heartland Dental LLC, 0.000%,4-30-25 (K) | | | 1,191 | | | | 1,139 | |
Heartland Dental LLC (ICE LIBOR plus 375 bps), 6.272%,4-30-25 | | | 1,453 | | | | 1,390 | |
| | | | | | | | |
| | | | | | | 2,529 | |
| | | | | | | | |
| |
Health Care Technology – 0.4% | |
Verscend Holding Corp. (ICE LIBOR plus 450 bps), 7.022%,8-27-25 | | | 2,990 | | | | 2,885 | |
| | | | | | | | |
| |
Total Health Care – 1.4% | | | | 10,903 | |
Industrials | |
| |
Construction & Engineering – 0.3% | |
McDermott Technology (Americas), Inc. (ICE LIBOR plus 500 bps), 7.522%,5-10-25 | | | 2,646 | | | | 2,463 | |
| | | | | | | | |
| |
Total Industrials – 0.3% | | | | 2,463 | |
Information Technology | |
| |
Application Software – 0.4% | |
Avaya, Inc. (ICE LIBOR plus 425 bps): | | | | | | | | |
6.694%,12-15-24 | | | 1,191 | | | | 1,148 | |
6.705%,12-15-24 | | | 1,957 | | | | 1,886 | |
| | | | | | | | |
| | | | | | | 3,034 | |
| | | | | | | | |
| |
Total Information Technology – 0.4% | | | | 3,034 | |
| | | | | | | | |
| LOANS(H)(Continued) | | Principal | | | Value | |
Materials | |
| |
Construction Materials – 0.7% | |
Hillman Group, Inc. (The) (ICE LIBOR plus 350 bps), 6.803%,5-31-25 | | $ | 5,358 | | | $ | 5,077 | |
| | | | | | | | |
| |
Total Materials – 0.7% | | | | 5,077 | |
| |
TOTAL LOANS – 5.8% | | | $ | 44,899 | |
(Cost: $47,207) | | | | | | | | |
| | |
UNITED STATES GOVERNMENT
OBLIGATIONS | | | | | | |
| |
Treasury Inflation Protected Obligations – 2.8% | |
U.S. Treasury Notes: | | | | | | | | |
0.125%,4-15-21 | | | 7,486 | | | | 7,279 | |
0.625%,1-15-26 | | | 8,345 | | | | 8,124 | |
0.125%,7-15-26 | | | 6,225 | | | | 5,844 | |
| | | | | | | | |
| | | | | | | 21,247 | |
| | | | | | | | |
| |
Treasury Obligations – 1.3% | |
U.S. Treasury Bonds, 2.750%,8-15-47 | | | 9,928 | | | | 9,419 | |
| | | | | | | | |
| |
TOTAL UNITED STATES GOVERNMENT OBLIGATIONS – 4.1% | | | $ | 30,666 | |
(Cost: $31,906) | | | | | | | | |
| | |
| BULLION – 5.6% | | Troy
Ounces | | | | |
Gold | | | 33 | | | | 42,280 | |
| | | | | | | | |
(Cost: $40,896) | | | | | | | | |
| | |
| SHORT-TERM SECURITIES | | Principal | | | | |
| |
Commercial Paper(L) – 0.9% | |
DTE Gas Co., 2.852%,1-3-19 | | $ | 3,000 | | | | 2,999 | |
J.M. Smucker Co. (The), 2.750%,1-2-19 | | | 3,468 | | | | 3,468 | |
| | | | | | | | |
| | | | | | | 6,467 | |
| | | | | | | | |
| |
Master Note – 0.5% | |
Toyota Motor Credit Corp.(1-Month U.S. LIBOR plus 15 bps), 2.720%,1-7-19 (M) | | | 3,719 | | | | 3,719 | |
| | | | | | | | |
| |
Money Market Funds – 0.7% | |
Dreyfus Institutional Preferred Government Money Market Fund – Institutional Shares, 2.400%, (N)(O) | | | 5,602 | | | | 5,602 | |
| | | | | | | | |
| | | | | | | | |
SHORT-TERM SECURITIES
(Continued) | | Principal | | | Value | |
United States Government Agency Obligations – 1.0% | |
Overseas Private Investment Corp. (GTD by U.S. Government)(3-Month U.S. TB Rate): | | | | | | | | |
2.470%,1-7-19 (M) | | $ | 7,500 | | | $ | 7,500 | |
| | | | | | | | |
| | | | | | | 7,500 | |
| | | | | | | | |
| |
TOTAL SHORT-TERM SECURITIES – 3.1% | | | $ | 23,288 | |
(Cost: $23,288) | | | | | | | | |
| |
TOTAL INVESTMENT SECURITIES – 100.6% | | | $ | 757,623 | |
(Cost: $789,804) | | | | | | | | |
| |
LIABILITIES, NET OF CASH AND OTHER ASSETS – (0.6)% | | | | (4,281 | ) |
| |
NET ASSETS – 100.0% | | | $ | 753,342 | |
| | |
| CONSOLIDATED SCHEDULE OF INVESTMENTS | | ASSET STRATEGY (in thousands) |
DECEMBER 31, 2018
Notes to Consolidated Schedule of Investments
| * | Not shown due to rounding. |
| (A) | No dividends were paid during the preceding 12 months. |
| (B) | All or a portion of securities with an aggregate value of $14,700 are on loan. |
| (C) | Listed on an exchange outside the United States. |
| (D) | Restricted securities. At December 31, 2018, the Portfolio owned the following restricted securities: |
| | | | | | | | | | | | | | | | | | | | |
| Security | | Acquisition Date(s) | | | Shares | | | Cost | | | Market Value | | | | |
Media Group Holdings LLC, Series H | | | 8-29-13 to 10-31-13 | | | | 32 | | | $ | 22,374 | | | $ | – | * | | | | |
Media Group Holdings LLC, Series T | | | 7-2-13 to 1-23-15 | | | | 4 | | | | 8,413 | | | | 287 | | | | | |
| | | | | | | | | | | | |
| | | | | | | | | | $ | 30,787 | | | $ | 287 | | | | | |
| | | | | | | | | | | | |
| | The total value of these securities represented 0.0% of net assets at December 31, 2018. |
| (E) | Investment is owned by an entity that is treated as a corporation for U.S. tax purposes and is owned by the Portfolio and consolidated as described in Note 5 of the Notes to Financial Statements. |
| (F) | Securities whose value was determined using significant unobservable inputs. |
| (G) | Securities were purchased pursuant to an exemption from registration available under Rule 144A under the Securities Act of 1933 and may only be resold in transactions exempt from registration, normally to qualified institutional buyers. At December 31, 2018 the total value of these securities amounted to $44,338 or 5.9% of net assets. |
| (H) | Variable rate security. Interest rate disclosed is that which is in effect at December 31, 2018. Description of the reference rate and spread, if applicable, are included in the security description. |
| (J) | Other Government Securities may include emerging markets sovereign, quasi-sovereign, corporate and supranational agency and organization debt securities. |
| (K) | All or a portion of this position has not settled. Full contract rates do not take effect until settlement date. |
| (L) | Rate shown is the yield to maturity at December 31, 2018. |
| (M) | Variable rate security. Interest rate disclosed is that which is in effect at December 31, 2018. Date shown represents the date that the variable rate resets. Description of the reference rate and spread, if applicable, are included in the security description. |
| (N) | Investment made with cash collateral received from securities on loan. |
| (O) | Rate shown is the annualized7-day yield at December 31, 2018. |
The following table is a summary of the valuation of the Portfolio’s investments by the fair value hierarchy levels as of December 31, 2018. See Note 3 to the Financial Statements for further information regarding fair value measurement.
| | | | | | | | | | | | |
| | | Level 1 | | | Level 2 | | | Level 3 | |
Assets | | | | | | | | | | | | |
Investments in Securities | | | | | | | | | | | | |
Common Stocks | | | | | | | | | | | | |
Communication Services | | $ | 15,833 | | | $ | 7,309 | | | $ | — | |
Consumer Discretionary | | | 27,724 | | | | 17,503 | | | | 287 | |
Consumer Staples | | | 44,207 | | | | 22,079 | | | | — | |
Energy | | | 22,548 | | | | 11,328 | | | | — | |
Financials | | | 21,608 | | | | 68,090 | | | | — | |
Health Care | | | 59,338 | | | | 5,974 | | | | — | |
Industrials | | | 30,995 | | | | 40,332 | | | | — | |
Information Technology | | | 81,981 | | | | 24,221 | | | | — | |
Materials | | | — | | | | 6,367 | | | | — | |
Total Common Stocks | | $ | 304,234 | | | $ | 203,203 | | | $ | 287 | |
Corporate Debt Securities | | | — | | | | 94,758 | | | | — | |
Other Government Securities | | | — | | | | 14,008 | | | | — | |
Loans | | | — | | | | 44,899 | | | | — | |
United States Government Obligations | | | — | | | | 30,666 | | | | — | |
Bullion | | | 42,280 | | | | — | | | | — | |
Short-Term Securities | | | 5,602 | | | | 17,686 | | | | — | |
Total | | $ | 352,116 | | | $ | 405,220 | | | $ | 287 | |
During the year ended December 31, 2018, there were no transfers in or out of Level 3.
| | |
| CONSOLIDATED SCHEDULE OF INVESTMENTS | | ASSET STRATEGY (in thousands) |
DECEMBER 31, 2018
The following acronyms are used throughout this schedule:
GTD = Guaranteed
ICE = Intercontinental Exchange
LIBOR = London Interbank Offered Rate
TB = Treasury Bill
Country Diversification
| | | | |
(as a % of net assets) | | | | |
United States | | | 51.3% | |
France | | | 6.4% | |
United Kingdom | | | 4.8% | |
Switzerland | | | 4.3% | |
Japan | | | 3.5% | |
Netherlands | | | 3.5% | |
India | | | 3.1% | |
China | | | 3.0% | |
Country Diversification(Continued)
| | | | |
Luxembourg | | | 1.8% | |
Hong Kong | | | 1.7% | |
Ireland | | | 1.5% | |
Argentina | | | 1.4% | |
Italy | | | 1.2% | |
Finland | | | 1.1% | |
Taiwan | | | 1.0% | |
Other Countries | | | 2.3% | |
Other+ | | | 8.1% | |
+Includes gold bullion, cash and other assets (net of liabilities), and cash equivalents
See Accompanying Notes to Financial Statements.
| | |
| MANAGEMENT DISCUSSION | | BALANCED |
(UNAUDITED)

Matthew A. Hekman

Mark G. Beischel

Susan K. Regan
Below, Matthew A. Hekman, Susan K. Regan and Mark G. Beischel, CPA, the co-portfolio managers of Ivy VIP Balanced during the fiscal year ended December 31, 2018, discuss positioning, performance and results for the fiscal year. Mr. Hekman has managed the Portfolio since 2014, and has 20 years of industry experience. In April 2018, Rick Perry resigned his position as a portfolio manager. Mr. Beischel and Ms. Regan joined Mr. Hekman as co-portfolio managers of the Portfolio at that time. Mr. Beischel has 25 years of industry experience. Ms. Regan has 31 years of industry experience.
Fiscal year Performance
| | | | |
For the 12 Months Ended December 31, 2018 | | | | |
Ivy VIP Balanced(Class II shares at net asset value) | | | -3.24% | |
Benchmark(s) and/or Morningstar and Lipper Categories | | | | |
S&P 500 Index | | | -4.38% | |
(generally reflects the performance of large- and medium-sized U.S. stocks) | | | | |
Bloomberg Barclays U.S. Government/Credit Index | | | -0.42% | |
(generally reflects the performance of securities in the bond market) | | | | |
Morningstar Allocation 50% to 70% Equity Universe Average | | | -5.76% | |
(generally reflects the performance of the universe of funds with similar investment objectives) | | | | |
Lipper Variable Annuity Mixed-Asset Target Allocation Growth Universe Average | | | -6.64% | |
(generally reflects the performance of the universe of strategies with similar investment objectives) | | | | |
Please note that Portfolio returns include applicable fees and expenses, whereas the index returns do not include any such fees. Also, the Portfolio’s performance data does not take into account any product expenses or charges associated with owning a variable life or annuity policy, which is invested in Ivy Variable Insurance Portfolios. Multiple indexes are shown because the Portfolio invests in multiple asset classes.
Key Drivers
The year ended December 31, 2018 was disappointing for most investors as a volatile fourth quarter erased the gains experienced in the first three quarters, pushing most asset classes to a loss for the trailing year. Equity markets in particular exhibited elevated levels of volatility, culminating with the S&P 500 Index, the Portfolio’s equity benchmark, which declined 4.38% for the year.
The year was unusual in many respects, but quite notable was the divergence between earnings growth for the constituents of the S&P 500, which rose approximately 24%, juxtaposed against the index’s year-end performance. Also noteworthy was the benchmark’s particularly weak performance in December, with the benchmark’s 9.03% decline, representing the worst December since 1931.
It is important to note the context of 2018, which followed nine consecutive years of gains for the S&P 500 Index and occurred on the heels of a year which produced a 21.83% total return with just 6% realized volatility and twelve consecutive months of positive returns. In addition, markets are forward-looking, and the indications of decelerating economic growth are prevalent. However, even against that backdrop, the intensity of the decline to end 2018 was surprising. Within the equity market, the health care, utilities, consumer discretionary and information technology sectors produced positive returns for the year, while the traditionally pro-cyclical sectors of energy, materials, industrials and financials posted sharp declines.
Fixed income markets also experienced declines, though they were more modest in nature. The Portfolio’s fixed income benchmark, the Bloomberg Barclays U.S. Government /Credit Index, was down 0.42% for the period. Within the fixed income market, the U.S. Treasury yield curve flattened, benefiting longer duration positioning. While short-term Treasury yields rose as the U.S. Federal Reserve (Fed) increased the federal funds rate, longer-dated Treasury yields declined over the course of 2018, due to moderate growth expectations, modest inflation rates and global demand for the relatively attractive yield of U.S. Treasuries. Credit spreads widened over the course of the year as economic growth prospects moderated and leverage on corporate balance sheets increased.
Contributors and detractors
The Portfolio declined 2.26% for the fiscal year ended December 31, 2018. However, the Portfolio split its two asset class indexes, outperforming the equity benchmark and peer group, but trailing the fixed income benchmark. The Portfolio’s equity exposure averaged about 67% for the year, with 32% on average invested in fixed income securities and the balance in cash.
The equity component of the Portfolio declined 3.56% for the year, outperforming the S&P 500 Index. Relative performance versus that index was driven by strong security selection in the information technology and communication services sectors. The fixed income component of the Portfolio was down 0.84% for the year, underperforming the Bloomberg Barclays U.S. Government /Credit Index. Our longstanding short-duration position relative to that benchmark our underweight of Treasuries negatively impacted relative performance.
Top contributors to performance included Twenty-First Century Fox, Autodesk, Inc., O’Reilly Automotive, Mastercard, Inc. and Integrated Device Technology. Both Twenty-First Century Fox and Integrated Device Technology were acquired at significant premiums to their unaffected equity values in 2018 and are no longer held by the Portfolio. We believe the outlook for Autodesk, Inc. and Mastercard, Inc. continue to be promising for 2019. At Autodesk, Inc., a transition in revenue recognition from sale of product to recurring subscription fees coupled with strong demand for the company’s products have driven a re-rating for its stock, which we believe is durable. We believe that the secular shift to electronic payment and emerging opportunities in business-to-business payments at Mastercard, Inc. are compelling and meaningful drivers of growth well into the next decade. However, we are mindful of the company’s premium valuation and harvested some profits in the stock in 2018. Finally, at O’Reilly Automotive, strong management execution and a favorable outlook for its automotive parts business drove a re-rating of the company’s stock, which fully values the equity in our view and resulted in the position being closed.
Detractors to performance were Knight Transportation, Inc., Goldman Sachs Group, Inc., Philip Morris International, Inc., Apple, Inc., and Cimarex Energy Co. Knight Transportation, Inc. has been a frustrating investment as near-term earnings strength has been overcome by long-term cyclical worries, which resulted in a dramatic de-rating of the equity multiple. We believe the degree of cyclical concern and subsequent de-rating has been excessive. Goldman Sachs Group, Inc. weathered a difficult 2018 marked by poor management of its fixed income, currency and commodities trading businesses; growing concern over a legal liability along with management culpability related to a misguided financial transaction in a foreign country; and concerns over the company’s exposure to a decelerating global economy. We believe the stock has been unduly punished and represents good value for long-term investors. Philip Morris International, Inc. has struggled to transition its global tobacco business from combustible cigarettes to a non-combustible, reduced-risk product. While the transition has been bumpy, we believe the R&D and marketing investment currently expensed in the company’s financials will bear fruit as units and revenues of the new product ramp in future periods. Apple, Inc. had a difficult 2018 as its new iPhone products have been less popular than expected. However, the company’s services business continues to grow with attractive returns which we suspect will prove durable and supportive to valuation in the year ahead. Finally, the energy sector, and Cimarex Energy Co. in particular, declined in value in 2018 as budding enthusiasm for a recovery in the price of crude oil was stymied by a surprising political decision to exempt several countries from Iranian export sanctions and relentless gains in well productivity for U.S. shale formations drove supply growth in excess of demand. However, we think there are encouraging signs that a balanced crude oil market will occur later in 2019 and we are focused on companies with strong competitive positions that we believe can thrive in a modestly improved commodity price environment. The Portfolio held positions in these companies at the end of the fiscal year.
Outlook
As we look ahead, we think that global economic growth is very likely to decelerate over the next twelve months but we expect it to remain positive. As we have previously highlighted, individual and corporate tax reform was a meaningful positive for the domestic economy which, along with lighter regulation and a generally more business-friendly political climate is supportive of growth.
However, the uncertainties around political, monetary and trade policies have been stubbornly persistent and in our view are likely to linger for most of this year. While we believe domestic economic growth will continue, the lagged effects of tighter monetary policy and waning benefits from fiscal stimulus will be a headwind. As a result, we are closely watching inflation rates and inflation expectations which have been modest, and must remain so, in order to allow our central bank to respond to slower growth and adjust the pace of monetary policy normalization.
As the domestic economy grows, we expect the Fed to raise interest rates at a very modest pace and continue the process of winding down its balance sheet. While we continue to monitor macroeconomic forces and trends, we maintain an emphasis on finding high quality, growing companies whose securities are trading at a reasonable valuation with visible catalysts to drive relative outperformance over the next twelve months. This approach has served investors well over time, and our confidence in it has not waned.
Past performance is not a guarantee of future results. The value of the Portfolio’s shares will change, and you could lose money on your investment.
Fixed-income securities are subject to interest rate risk and, as such, the Portfolio’s net asset value may fall as interest rates rise. These and other risks are more fully described in the Portfolio’s prospectus.
The opinions expressed in this report are those of the Portfolio managers and are current only through the end of the period of the report as stated on the cover. The managers’ views are subject to change at any time based on market and other conditions, and no forecasts can be guaranteed.
The indexes noted are unmanaged, include reinvested dividends, and do not include fees. One cannot invest directly in an index, nor is an index representative of Ivy VIP Balanced.
| | |
| PORTFOLIO HIGHLIGHTS | | BALANCED |
ALL DATA IS AS OF DECEMBER 31, 2018 (UNAUDITED)
Asset Allocation
| | | | |
Stocks | | | 61.0% | |
Information Technology | | | 11.5% | |
Health Care | | | 10.4% | |
Financials | | | 9.9% | |
Industrials | | | 8.5% | |
Consumer Discretionary | | | 8.0% | |
Energy | | | 4.8% | |
Consumer Staples | | | 4.3% | |
Materials | | | 2.6% | |
Communication Services | | | 1.0% | |
Bonds | | | 37.3% | |
United States Government and Government Agency Obligations | | | 19.4% | |
Corporate Debt Securities | | | 17.6% | |
Loans | | | 0.3% | |
Cash and Other Assets (Net of Liabilities),
and Cash Equivalents+ | | | 1.7% | |
Top 10 Equity Holdings
| | | | |
| | |
| Company | | Sector | | Industry |
Broadcom Corp., Class A | | Information Technology | | Semiconductors |
Lowe’s Co., Inc. | | Consumer Discretionary | | Home Improvement Retail |
Microsoft Corp. | | Information Technology | | Systems Software |
Union Pacific Corp. | | Industrials | | Railroads |
PNC Financial Services Group, Inc. (The) | | Financials | | Regional Banks |
Autodesk, Inc. | | Information Technology | | Application Software |
UnitedHealth Group, Inc. | | Health Care | | Managed Health Care |
Chevron Corp. | | Energy | | Integrated Oil & Gas |
Las Vegas Sands, Inc. | | Consumer Discretionary | | Casinos & Gaming |
Northern Trust Corp. | | Financials | | Diversified Banks |
See your advisor or www.ivyinvestments.com for more information on the Portfolio’s most recently published Top 10 Equity Holdings.
+ Cash equivalents are defined as highly liquid securities with maturities of less than three months. Cash equivalents may include U.S. Government Treasury bills, bank certificates of deposit, bankers’ acceptances, corporate commercial paper and other money market instruments.
| | |
| COMPARISON OF CHANGE IN VALUE OF $10,000 INVESTMENT | | BALANCED |
(UNAUDITED)
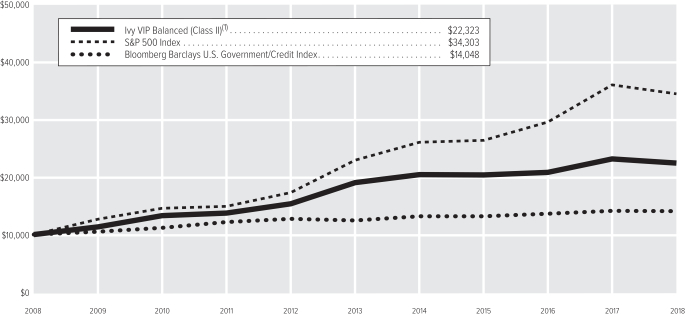
| (1) | The value of the investment in the Portfolio is impacted by the ongoing expenses of the Portfolio and assumes reinvestment of dividends and distributions. |
| | | | |
| |
| Average Annual Total Return(2) | | Class II | |
1-year period ended12-31-18 | | | -3.24% | |
5-year period ended12-31-18 | | | 3.35% | |
10-year period ended12-31-18 | | | 8.36% | |
| (2) | Data quoted is past performance and current performance may be lower or higher. Past performance is no guarantee of future results. Investment return and principal value of an investment will fluctuate and shares, when redeemed, may be worth more or less than their original cost. Please visit www.ivyinvestments.com for the Portfolio’s most recentmonth-end performance. Performance data quoted does not reflect any expenses or charges associated with owning a variable life insurance policy or variable annuity contract that invests in the Portfolio’s shares. When such charges are deducted, actual investment performance in a variable policy or contract will be lower. |
Past performance is not necessarily indicative of future performance. Indexes are unmanaged. The performance graph and table do not reflect the deduction of taxes that a shareholder would pay on Portfolio distributions or on the redemption of Portfolio shares. Performance results may include the effect of expense reduction arrangements for some or all of the periods shown. If those arrangements had not been in place, the performance results for those periods would have been lower.
| | |
| SCHEDULE OF INVESTMENTS | | BALANCED (in thousands) |
DECEMBER 31, 2018
| | | | | | | | |
| COMMON STOCKS | | Shares | | | Value | |
Communication Services | |
| |
Integrated Telecommunication Services – 1.0% | |
Verizon Communications, Inc. | | | 56 | | | $ | 3,134 | |
| | | | | | | | |
| |
Total Communication Services – 1.0% | | | | 3,134 | |
Consumer Discretionary | |
| |
Apparel, Accessories & Luxury Goods – 1.2% | |
Coach, Inc. | | | 113 | | | | 3,818 | |
| | | | | | | | |
| |
Casinos & Gaming – 1.8% | |
Las Vegas Sands, Inc. | | | 106 | | | | 5,527 | |
| | | | | | | | |
| |
General Merchandise Stores – 1.6% | |
Dollar General Corp. | | | 46 | | | | 5,014 | |
| | | | | | | | |
| |
Home Improvement Retail – 2.0% | |
Lowe’s Co., Inc. | | | 65 | | | | 5,997 | |
| | | | | | | | |
| |
Restaurants – 1.4% | |
YUM! Brands, Inc. | | | 47 | | | | 4,319 | |
| | | | | | | | |
| |
Total Consumer Discretionary – 8.0% | | | | 24,675 | |
Consumer Staples | |
| |
Brewers – 0.4% | |
Anheuser-Busch InBev S.A. ADR(A) | | | 17 | | | | 1,151 | |
| | | | | | | | |
| |
Household Products – 1.3% | |
Procter & Gamble Co. (The) | | | 45 | | | | 4,140 | |
| | | | | | | | |
| |
Packaged Foods & Meats – 1.4% | |
General Mills, Inc. | | | 114 | | | | 4,452 | |
| | | | | | | | |
| |
Tobacco – 1.2% | |
Philip Morris International, Inc. | | | 55 | | | | 3,694 | |
| | | | | | | | |
| |
Total Consumer Staples – 4.3% | | | | 13,437 | |
Energy | |
| |
Integrated Oil & Gas – 1.8% | |
Chevron Corp. | | | 51 | | | | 5,530 | |
| | | | | | | | |
| |
Oil & Gas Exploration & Production – 0.7% | |
Cimarex Energy Co. | | | 35 | | | | 2,132 | |
| | | | | | | | |
| |
Oil & Gas Storage & Transportation – 1.3% | |
Enterprise Products Partners L.P. | | | 161 | | | | 3,961 | |
| | | | | | | | |
| |
Total Energy – 3.8% | | | | 11,623 | |
Financials | |
| |
Asset Management & Custody Banks – 1.4% | |
Blackstone Group L.P. (The) | | | 140 | | | | 4,181 | |
| | | | | | | | |
| |
Diversified Banks – 2.8% | |
Northern Trust Corp. | | | 65 | | | | 5,415 | |
U.S. Bancorp | | | 69 | | | | 3,143 | |
| | | | | | | | |
| | | | | | | 8,558 | |
| | | | | | | | |
| | | | | | | | |
| COMMON STOCKS(Continued) | | Shares | | | Value | |
Financial Exchanges & Data – 1.3% | |
Intercontinental Exchange, Inc. | | | 55 | | | $ | 4,145 | |
| | | | | | | | |
| |
Investment Banking & Brokerage – 1.2% | |
Goldman Sachs Group, Inc. (The) | | | 22 | | | | 3,630 | |
| | | | | | | | |
| |
Other Diversified Financial Services – 1.4% | |
JPMorgan Chase & Co. | | | 45 | | | | 4,414 | |
| | | | | | | | |
| |
Regional Banks – 1.8% | |
PNC Financial Services Group, Inc. (The) | | | 48 | | | | 5,666 | |
| | | | | | | | |
| |
Total Financials – 9.9% | | | | 30,594 | |
Health Care | |
| |
Biotechnology – 2.0% | |
Biogen, Inc. (B) | | | 10 | | | | 3,034 | |
BioMarin Pharmaceutical, Inc. (B) | | | 37 | | | | 3,156 | |
| | | | | | | | |
| | | | | | | 6,190 | |
| | | | | | | | |
| |
Health Care Equipment – 2.8% | |
Medtronic plc | | | 53 | | | | 4,838 | |
Zimmer Holdings, Inc. | | | 36 | | | | 3,727 | |
| | | | | | | | |
| | | | | | | 8,565 | |
| | | | | | | | |
| |
Health Care Services – 0.3% | |
Laboratory Corp. of America Holdings (B) | | | 8 | | | | 1,017 | |
| | | | | | | | |
| |
Managed Health Care – 3.1% | |
Anthem, Inc. | | | 16 | | | | 4,094 | |
UnitedHealth Group, Inc. | | | 22 | | | | 5,587 | |
| | | | | | | | |
| | | | | | | 9,681 | |
| | | | | | | | |
| |
Pharmaceuticals – 2.2% | |
Jazz Pharmaceuticals plc (B) | | | 20 | | | | 2,499 | |
Pfizer, Inc. | | | 102 | | | | 4,443 | |
| | | | | | | | |
| | | | | | | 6,942 | |
| | | | | | | | |
| |
Total Health Care – 10.4% | | | | 32,395 | |
Industrials | |
| |
Aerospace & Defense – 2.2% | |
Boeing Co. (The) | | | 14 | | | | 4,608 | |
United Technologies Corp. | | | 21 | | | | 2,233 | |
| | | | | | | | |
| | | | | | | 6,841 | |
| | | | | | | | |
| |
Agricultural & Farm Machinery – 1.2% | |
Deere & Co. | | | 25 | | | | 3,768 | |
| | | | | | | | |
| |
Airlines – 1.2% | |
Delta Air Lines, Inc. | | | 75 | | | | 3,744 | |
| | | | | | | | |
| |
Electrical Components & Equipment – 1.2% | |
Emerson Electric Co. | | | 61 | | | | 3,661 | |
| | | | | | | | |
| |
Railroads – 1.8% | |
Union Pacific Corp. | | | 41 | | | | 5,709 | |
| | | | | | | | |
| | | | | | | | |
| COMMON STOCKS(Continued) | | Shares | | | Value | |
Trucking – 0.9% | |
Knight Transportation, Inc. | | | 108 | | | $ | 2,702 | |
| | | | | | | | |
| |
Total Industrials – 8.5% | | | | 26,425 | |
Information Technology | |
| |
Application Software – 1.8% | |
Autodesk, Inc. (B) | | | 44 | | | | 5,664 | |
| | | | | | | | |
| |
Data Processing & Outsourced Services – 0.6% | |
MasterCard, Inc., Class A | | | 10 | | | | 1,877 | |
| | | | | | | | |
| |
Semiconductor Equipment – 0.7% | |
Applied Materials, Inc. | | | 70 | | | | 2,305 | |
| | | | | | | | |
| |
Semiconductors – 5.0% | |
Broadcom Corp., Class A | | | 24 | | | | 5,999 | |
Intel Corp. | | | 104 | | | | 4,890 | |
QUALCOMM, Inc. | | | 78 | | | | 4,456 | |
| | | | | | | | |
| | | | | | | 15,345 | |
| | | | | | | | |
| |
Systems Software – 1.9% | |
Microsoft Corp. | | | 57 | | | | 5,822 | |
| | | | | | | | |
| |
Technology Hardware, Storage & Peripherals – 1.5% | |
Apple, Inc. | | | 31 | | | | 4,843 | |
| | | | | | | | |
| |
Total Information Technology – 11.5% | | | | 35,856 | |
Materials | |
| |
Commodity Chemicals – 0.2% | |
LyondellBasell Industries N.V., Class A | | | 9 | | | | 736 | |
| | | | | | | | |
| |
Specialty Chemicals – 2.4% | |
Ecolab, Inc. | | | 16 | | | | 2,291 | |
PPG Industries, Inc. | | | 52 | | | | 5,266 | |
| | | | | | | | |
| | | | | | | 7,557 | |
| | | | | | | | |
| |
Total Materials – 2.6% | | | | 8,293 | |
| |
TOTAL COMMON STOCKS – 60.0% | | | $ | 186,432 | |
(Cost: $181,407) | |
| | |
| PREFERRED STOCKS | | | | | | |
Energy | |
| |
Integrated Oil & Gas – 1.0% | |
Hess Corp., Convertible, 8.000% | | | 65 | | | | 3,227 | |
| | | | | | | | |
| |
Total Energy – 1.0% | | | | 3,227 | |
| |
TOTAL PREFERRED STOCKS – 1.0% | | | $ | 3,227 | |
(Cost: $3,564) | |
| | |
| SCHEDULE OF INVESTMENTS | | BALANCED (in thousands) |
DECEMBER 31, 2018
| | | | | | | | |
| CORPORATE DEBT SECURITIES | | Principal | | | Value | |
Communication Services | |
| |
Cable & Satellite – 0.3% | |
Comcast Corp. (GTD by Comcast Cable Communications and NBCUniversal): | | | | | | | | |
4.250%,10-15-30 | | $ | 450 | | | $ | 455 | |
4.700%,10-15-48 | | | 450 | | | | 458 | |
| | | | | | | | |
| | | | | | | 913 | |
| | | | | | | | |
Integrated Telecommunication Services – 0.5% | |
AT&T, Inc., | | | | | | | | |
4.900%,8-15-37 | | | 1,000 | | | | 933 | |
Sprint Spectrum Co. LLC and Sprint Spectrum Co. II LLC, | | | | | | | | |
4.738%,3-20-25 (C) | | | 500 | | | | 491 | |
| | | | | | | | |
| | | | | | | 1,424 | |
| | | | | | | | |
| |
Total Communication Services – 0.8% | | | | 2,337 | |
Consumer Discretionary | |
| |
Hotels, Resorts & Cruise Lines – 0.3% | |
Marriott International, Inc., | | | | | | | | |
4.000%,4-15-28 | | | 1,000 | | | | 962 | |
| | | | | | | | |
| |
Internet & Direct Marketing Retail – 0.3% | |
Amazon.com, Inc., | | | | | | | | |
2.800%,8-22-24 | | | 1,000 | | | | 972 | |
| | | | | | | | |
| |
Total Consumer Discretionary – 0.6% | | | | 1,934 | |
Consumer Staples | |
| |
Distillers & Vintners – 0.1% | |
Bacardi Ltd., | | | | | | | | |
4.450%,5-15-25 (C) | | | 350 | | | | 345 | |
| | | | | | | | |
| |
Household Products – 1.0% | |
Clorox Co. (The), | | | | | | | | |
3.100%,10-1-27 | | | 525 | | | | 499 | |
Colgate-Palmolive Co., | | | | | | | | |
3.700%,8-1-47 (A) | | | 2,500 | | | | 2,380 | |
| | | | | | | | |
| | | | | | | 2,879 | |
| | | | | | | | |
| |
Tobacco – 0.2% | |
BAT International Finance plc, | | | | | | | | |
2.750%,6-15-20 (C) | | | 600 | | | | 590 | |
| | | | | | | | |
| |
Total Consumer Staples – 1.3% | | | | 3,814 | |
Energy | |
| |
Integrated Oil & Gas – 0.1% | |
Hess Corp., | | | | | | | | |
4.300%,4-1-27 | | | 425 | | | | 389 | |
| | | | | | | | |
| |
Oil & Gas Drilling – 0.7% | |
Nabors Industries Ltd., Convertible, | | | | | | | | |
0.750%,1-15-24 | | | 3,600 | | | | 2,213 | |
| | | | | | | | |
| |
Oil & Gas Exploration & Production – 0.3% | |
Concho Resources, Inc., | | | | | | | | |
4.375%,1-15-25 | | | 993 | | | | 981 | |
| | | | | | | | |
| |
Oil & Gas Storage & Transportation – 1.0% | |
Colorado Interstate Gas Co., | | | 800 | | | | 782 | |
4.150%,8-15-26 (C) | | | | | | | | |
| | | | | | | | |
CORPORATE DEBT SECURITIES
(Continued) | | Principal | | | Value | |
Oil & Gas Storage & Transportation(Continued) | |
Hornbeck Offshore Services, Inc., Convertible, | | | | | | | | |
1.500%,9-1-19 | | $ | 1,789 | | | $ | 1,311 | |
Williams Partners L.P., | | | | | | | | |
3.600%,3-15-22 | | | 1,000 | | | | 982 | |
| | | | | | | | |
| | | | | | | 3,075 | |
| | | | | | | | |
| |
Total Energy – 2.1% | | | | 6,658 | |
Financials | |
| |
Consumer Finance – 0.4% | |
General Motors Financial Co., Inc. (GTD by AmeriCredit Financial Services, Inc.): | | | | | | | | |
3.450%,4-10-22 | | | 250 | | | | 242 | |
3.700%,5-9-23 | | | 150 | | | | 142 | |
3.500%,11-7-24 | | | 500 | | | | 455 | |
Hyundai Capital America, | | | | | | | | |
2.550%,4-3-20(C) | | | 500 | | | | 494 | |
| | | | | | | | |
| | | | | | | 1,333 | |
| | | | | | | | |
| |
Diversified Banks – 1.9% | |
Bank of Montreal, | | | | | | | | |
3.803%,12-15-32 | | | 1,000 | | | | 926 | |
DBS Group Holdings Ltd., | | | | | | | | |
2.246%,7-16-19 (C) | | | 1,000 | | | | 996 | |
HSBC Holdings plc, | | | | | | | | |
3.400%,3-8-21 | | | 625 | | | | 623 | |
ING Bank N.V., | | | | | | | | |
2.500%,10-1-19 (C) | | | 500 | | | | 498 | |
Mizuho Bank Ltd., | | | | | | | | |
2.650%,9-25-19 (C) | | | 1,300 | | | | 1,295 | |
Standard Chartered plc, | | | | | | | | |
2.250%,4-17-20 (C) | | | 1,400 | | | | 1,372 | |
U.S. Bancorp, | | | | | | | | |
3.100%,4-27-26 | | | 400 | | | | 379 | |
| | | | | | | | |
| | | | | | | 6,089 | |
| | | | | | | | |
| |
Investment Banking & Brokerage – 1.3% | |
Credit Suisse Group Funding (Guernsey) Ltd., | | | | | | | | |
2.750%,3-26-20 | | | 500 | | | | 494 | |
Goldman Sachs Group, Inc. (The): | | | | | | | | |
2.905%,7-24-23 | | | 2,000 | | | | 1,905 | |
3.272%,9-29-25 | | | 1,000 | | | | 937 | |
5.700%,12-29-49 | | | 245 | | | | 239 | |
Morgan Stanley, | | | | | | | | |
3.591%,7-22-28 | | | 500 | | | | 473 | |
| | | | | | | | |
| | | | | | | 4,048 | |
| | | | | | | | |
| |
Life & Health Insurance – 0.6% | |
Northwestern Mutual Life Insurance Co. (The), | | | | | | | | |
3.850%,9-30-47 (C) | | | 1,000 | | | | 907 | |
Sumitomo Life Insurance Co., | | | | | | | | |
4.000%,9-14-77 (C) | | | 1,000 | | | | 923 | |
| | | | | | | | |
| | | | | | | 1,830 | |
| | | | | | | | |
| |
Multi-Line Insurance – 0.2% | |
Aon plc (GTD by Aon Corp.), | | | | | | | | |
2.800%,3-15-21 | | | 500 | | | | 495 | |
| | | | | | | | |
| | | | | | | | |
CORPORATE DEBT SECURITIES
(Continued) | | Principal | | | Value | |
| |
Other Diversified Financial Services – 1.6% | |
Citigroup, Inc.: | | | | | | | | |
5.950%,12-29-49 | | $ | 1,400 | | | $ | 1,276 | |
6.250%,12-29-49 | | | 750 | | | | 718 | |
JPMorgan Chase & Co.: | | | | | | | | |
5.000%,12-29-49 | | | 750 | | | | 724 | |
5.300%,11-1-65 | | | 250 | | | | 247 | |
JPMorgan Chase & Co.(3-Month U.S. LIBOR plus 347 bps), | | | | | | | | |
5.990%,4-29-49 (D) | | | 1,076 | | | | 1,064 | |
PennantPark Investment Corp., | | | | | | | | |
4.500%,10-1-19 | | | 1,000 | | | | 998 | |
| | | | | | | | |
| | | | | | | 5,027 | |
| | | | | | | | |
| |
Property & Casualty Insurance – 0.1% | |
Berkshire Hathaway Finance Corp. (GTD by Berkshire Hathaway, Inc.), | | | | | | | | |
2.200%,3-15-21 | | | 200 | | | | 197 | |
| | | | | | | | |
| |
Regional Banks – 0.3% | |
PNC Bank N.A., | | | | | | | | |
3.250%,6-1-25 | | | 600 | | | | 583 | |
SunTrust Banks, Inc., | | | | | | | | |
5.625%,12-29-49 (A) | | | 400 | | | | 396 | |
| | | | | | | | |
| | | | | | | 979 | |
| | | | | | | | |
| |
Specialized Finance – 0.3% | |
Diamond 1 Finance Corp. and Diamond 2 Finance Corp., | | | | | | | | |
5.450%,6-15-23 (C) | | | 940 | | | | 957 | |
| | | | | | | | |
| |
Total Financials – 6.7% | | | | 20,955 | |
Health Care | |
| |
Biotechnology – 0.3% | |
Amgen, Inc., | | | | | | | | |
2.125%,5-1-20 | | | 1,000 | | | | 986 | |
| | | | | | | | |
| |
Health Care Equipment – 0.1% | |
Zimmer Holdings, Inc., | | | | | | | | |
2.700%,4-1-20 | | | 350 | | | | 347 | |
| | | | | | | | |
| |
Health Care Services – 0.3% | |
Quest Diagnostics, Inc., | | | | | | | | |
3.450%,6-1-26 | | | 780 | | | | 749 | |
| | | | | | | | |
| |
Health Care Supplies – 0.3% | |
Shire Acquisitions Investments Ireland Designated Activity Co., | | | | | | | | |
2.875%,9-23-23 | | | 1,000 | | | | 945 | |
| | | | | | | | |
| |
Pharmaceuticals – 0.9% | |
Celgene Corp., | | | | | | | | |
3.450%,11-15-27 | | | 500 | | | | 455 | |
Forest Laboratories, Inc., | | | | | | | | |
5.000%,12-15-21 (C) | | | 1,258 | | | | 1,294 | |
Johnson & Johnson, | | | | | | | | |
3.400%,1-15-38 | | | 1,000 | | | | 932 | |
| | | | | | | | |
| | | | | | | 2,681 | |
| | | | | | | | |
| |
Total Health Care – 1.9% | | | | 5,708 | |
| | |
| SCHEDULE OF INVESTMENTS | | BALANCED (in thousands) |
DECEMBER 31, 2018
| | | | | | | | |
CORPORATE DEBT SECURITIES
(Continued) | | Principal | | | Value | |
Industrials | |
| |
Aerospace & Defense – 0.8% | |
Huntington Ingalls Industries, Inc., 3.483%,12-1-27 | | $ | 1,000 | | | $ | 931 | |
Northrop Grumman Corp., | | | | | | | | |
3.250%,1-15-28 | | | 1,500 | | | | 1,403 | |
| | | | | | | | |
| | | | | | | 2,334 | |
| | | | | | | | |
| |
Airlines – 0.2% | |
Aviation Capital Group LLC, | | | | | | | | |
3.500%,11-1-27 (C) | | | 250 | | | | 226 | |
Southwest Airlines Co., | | | | | | | | |
2.650%,11-5-20 | | | 375 | | | | 370 | |
| | | | | | | | |
| | | | | | | 596 | |
| | | | | | | | |
| |
Electrical Components & Equipment – 0.1% | |
Hubbell, Inc., | | | | | | | | |
3.500%,2-15-28 | | | 500 | | | | 469 | |
| | | | | | | | |
| |
Environmental & Facilities Services – 0.3% | |
Waste Management, Inc. (GTD by Waste Management Holdings, Inc.), | | | | | | | | |
3.150%,11-15-27 (A) | | | 1,000 | | | | 955 | |
| | | | | | | | |
| |
Railroads – 0.1% | |
Kansas City Southern de Mexico S.A. de C.V., | | | | | | | | |
2.350%,5-15-20 | | | 291 | | | | 287 | |
| | | | | | | | |
| |
Total Industrials – 1.5% | | | | 4,641 | |
Information Technology | |
| |
IT Consulting & Other Services – 0.2% | |
Keysight Technologies, Inc., | | | | | | | | |
4.600%,4-6-27 | | | 500 | | | | 502 | |
| | | | | | | | |
| |
Technology Hardware, Storage & Peripherals – 0.1% | |
Western Digital Corp., Convertible, | | | | | | | | |
1.500%,2-1-24 (C) | | | 300 | | | | 243 | |
| | | | | | | | |
| |
Total Information Technology – 0.3% | | | | 745 | |
Materials | |
| |
Diversified Metals & Mining – 0.5% | |
Anglo American Capital plc, | | | | | | | | |
3.625%,9-11-24 (C) | | | 1,000 | | | | 944 | |
Anglo American plc, | | | | | | | | |
4.125%,4-15-21 (C) | | | 500 | | | | 499 | |
| | | | | | | | |
| | | | | | | 1,443 | |
| | | | | | | | |
| |
Fertilizers & Agricultural Chemicals – 0.3% | |
Mosaic Co. (The), | | | | | | | | |
4.050%,11-15-27 | | | 1,000 | | | | 949 | |
| | | | | | | | |
| |
Specialty Chemicals – 0.3% | |
Ecolab, Inc., | | | | | | | | |
3.250%,12-1-27 | | | 1,000 | | | | 966 | |
| | | | | | | | |
| |
Total Materials – 1.1% | | | | 3,358 | |
| | | | | | | | |
CORPORATE DEBT SECURITIES
(Continued) | | Principal | | | Value | |
Real Estate | |
| |
Specialized REITs – 0.9% | |
American Tower Corp.: | | | | | | | | |
2.250%,1-15-22 | | $ | 1,200 | | | $ | 1,148 | |
4.700%,3-15-22 | | | 195 | | | | 200 | |
3.375%,10-15-26 | | | 455 | | | | 424 | |
Crown Castle International Corp.: | | | | | | | | |
5.250%,1-15-23 | | | 200 | | | | 208 | |
3.200%,9-1-24 | | | 500 | | | | 473 | |
3.700%,6-15-26 | | | 300 | | | | 286 | |
| | | | | | | | |
| | | | | | | 2,739 | |
| | | | | | | | |
| |
Total Real Estate – 0.9% | | | | 2,739 | |
Utilities | |
| |
Electric Utilities – 0.4% | |
Duke Energy Corp., | | | | | | | | |
3.150%,8-15-27 | | | 500 | | | | 468 | |
Entergy Texas, Inc., | | | | | | | | |
2.550%,6-1-21 | | | 300 | | | | 295 | |
Exelon Corp., | | | | | | | | |
2.450%,4-15-21 | | | 400 | | | | 391 | |
| | | | | | | | |
| | | | | | | 1,154 | |
| | | | | | | | |
| |
Total Utilities – 0.4% | | | | 1,154 | |
| |
TOTAL CORPORATE DEBT SECURITIES – 17.6% | | | $ | 54,043 | |
(Cost: $57,256) | |
| | |
| LOANS(D) | | | | | | |
Industrials | |
| |
Industrial Machinery – 0.3% | |
Dynacast International LLC (ICE LIBOR plus 850 bps), | | | | | | | | |
11.303%,1-30-23 (E) | | | 1,100 | | | | 1,023 | |
| | | | | | | | |
| |
Total Industrials – 0.3% | | | | 1,023 | |
| |
TOTAL LOANS – 0.3% | | | $ | 1,023 | |
(Cost: $1,086) | |
| | |
UNITED STATES GOVERNMENT
AGENCY OBLIGATIONS | | | | | | |
Mortgage-Backed Obligations – 1.4% | |
Federal Home Loan Mortgage Corp. Fixed Rate Participation Certificates: | | | | | | | | |
4.500%,6-1-44 | | | 657 | | | | 682 | |
3.000%,6-15-45 | | | 841 | | | | 844 | |
Federal National Mortgage Association Fixed Rate Pass-Through Certificates: | | | | | | | | |
6.500%,10-1-28 | | | 62 | | | | 67 | |
6.500%,2-1-29 | | | 33 | | | | 36 | |
3.500%,6-25-29 | | | 501 | | | | 513 | |
7.500%,4-1-31 | | | 29 | | | | 32 | |
7.000%,7-1-31 | | | 42 | | | | 48 | |
7.000%,9-1-31 | | | 75 | | | | 84 | |
6.500%,2-1-32 | | | 172 | | | | 195 | |
7.000%,2-1-32 | | | 108 | | | | 121 | |
| | | | | | | | |
UNITED STATES GOVERNMENT
AGENCY OBLIGATIONS(Continued) | | Principal | | | Value | |
Mortgage-Backed Obligations(Continued) | |
7.000%,3-1-32 | | $ | 39 | | | $ | 45 | |
7.000%,7-1-32 | | | 73 | | | | 82 | |
5.500%,5-1-33 | | | 39 | | | | 42 | |
5.500%,6-1-33 | | | 38 | | | | 41 | |
4.500%,11-1-43 | | | 542 | | | | 569 | |
3.000%,10-25-46 | | | 842 | | | | 839 | |
U.S. Department of Veterans Affairs, Guaranteed REMIC Pass-Through Certificates, Vendee Mortgage Trust1997-A,Class 3-A, | | | | | | | | |
8.293%,12-15-26 | | | 29 | | | | 33 | |
| | | | | | | | |
| | | | | | | 4,273 | |
| | | | | | | | |
| |
TOTAL UNITED STATES GOVERNMENT AGENCY OBLIGATIONS – 1.4% | | | $ | 4,273 | |
(Cost: $4,362) | |
| | |
UNITED STATES GOVERNMENT
OBLIGATIONS | | | | | | |
Treasury Inflation Protected Obligations – 3.5% | |
U.S. Treasury Notes: | | | | | | | | |
0.125%,7-15-26 | | | 4,220 | | | | 3,962 | |
2.125%,2-15-40 | | | 3,744 | | | | 4,401 | |
1.000%,2-15-46 | | | 2,561 | | | | 2,429 | |
| | | | | | | | |
| | | | | | | 10,792 | |
| | | | | | | | |
| |
Treasury Obligations – 14.5% | |
U.S. Treasury Bonds: | | | | | | | | |
2.250%,11-15-25 | | | 3,240 | | | | 3,170 | |
3.875%,8-15-40 | | | 225 | | | | 259 | |
3.750%,8-15-41 | | | 650 | | | | 734 | |
3.000%,2-15-48 | | | 250 | | | | 249 | |
3.000%,8-15-48 (A) | | | 3,060 | | | | 3,051 | |
U.S. Treasury Notes: | | | | | | | | |
2.625%,8-31-20 | | | 1,250 | | | | 1,252 | |
2.875%,10-31-20 | | | 4,720 | | | | 4,749 | |
2.750%,11-30-20 | | | 750 | | | | 753 | |
2.875%,10-15-21 | | | 13,195 | | | | 13,333 | |
2.875%,11-15-21 | | | 750 | | | | 758 | |
1.875%,4-30-22 | | | 200 | | | | 196 | |
2.000%,7-31-22 | | | 1,045 | | | | 1,028 | |
1.875%,10-31-22 | | | 1,000 | | | | 978 | |
2.000%,10-31-22 | | | 480 | | | | 472 | |
2.125%,12-31-22 | | | 1,800 | | | | 1,775 | |
2.875%,9-30-23 | | | 2,000 | | | | 2,032 | |
2.875%,10-31-23 | | | 600 | | | | 610 | |
2.750%,11-15-23 | | | 500 | | | | 505 | |
2.875%,4-30-25 | | | 1,000 | | | | 1,018 | |
2.875%,5-31-25 | | | 900 | | | | 916 | |
3.000%,9-30-25 | | | 900 | | | | 923 | |
2.250%,2-15-27 | | | 2,250 | | | | 2,186 | |
2.750%,2-15-28 | | | 1,150 | | | | 1,157 | |
2.875%,5-15-28 | | | 575 | | | | 584 | |
2.875%,8-15-28 | | | 1,987 | | | | 2,019 | |
3.125%,11-15-28 | | | 250 | | | | 259 | |
| | | | | | | | |
| | | | | | | 44,966 | |
| | | | | | | | |
| |
TOTAL UNITED STATES GOVERNMENT OBLIGATIONS – 18.0% | | | $ | 55,758 | |
(Cost: $55,759) | |
| | |
| SCHEDULE OF INVESTMENTS | | BALANCED (in thousands) |
DECEMBER 31, 2018
| | | | | | | | |
| SHORT-TERM SECURITIES | | Principal | | | Value | |
| |
Master Note – 1.5% | |
Toyota Motor Credit Corp.(1-Month U.S. LIBOR plus 15 bps), | | | | | | | | |
2.720%,1-7-19(F) | | $ | 4,806 | | | $ | 4,806 | |
| | | | | | | | |
| |
Money Market Funds – 0.6% | |
Dreyfus Institutional Preferred Government Money Market Fund – Institutional Shares, 2.400%, (G)(H) | | | 1,917 | | | | 1,917 | |
| | | | | | | | |
| |
TOTAL SHORT-TERM SECURITIES – 2.1% | | | $ | 6,723 | |
(Cost: $6,723) | | | | | | | | |
| |
TOTAL INVESTMENT SECURITIES – 100.4% | | | $ | 311,479 | |
(Cost: $310,157) | | | | | | | | |
| | |
LIABILITIES, NET OF CASH AND OTHER ASSETS – (0.4)% | | | | | | | (1,161) | |
| |
NET ASSETS – 100.0% | | | $ | 310,318 | |
Notes to Schedule of Investments
| (A) | All or a portion of securities with an aggregate value of $1,923 are on loan. |
| (B) | No dividends were paid during the preceding 12 months. |
| (C) | Securities were purchased pursuant to an exemption from registration available under Rule 144A under the Securities Act of 1933 and may only be resold in transactions exempt from registration, normally to qualified institutional buyers. At December 31, 2018 the total value of these securities amounted to $12,856 or 4.1% of net assets. |
| (D) | Variable rate security. Interest rate disclosed is that which is in effect at December 31, 2018. Description of the reference rate and spread, if applicable, are included in the security description. |
| (E) | Securities whose value was determined using significant unobservable inputs. |
| (F) | Variable rate security. Interest rate disclosed is that which is in effect at December 31, 2018. Date shown represents the date that the variable rate resets. Description of the reference rate and spread, if applicable, are included in the security description. |
| (G) | Investment made with cash collateral received from securities on loan. |
| (H) | Rate shown is the annualized7-day yield at December 31, 2018. |
The following table is a summary of the valuation of the Portfolio’s investments by the fair value hierarchy levels as of December 31, 2018. See Note 3 to the Financial Statements for further information regarding fair value measurement.
| | | | | | | | | | | | |
| | | Level 1 | | | Level 2 | | | Level 3 | |
Assets | | | | | | | | | | | | |
Investments in Securities | | | | | | | | | | | | |
Common Stocks | | $ | 186,432 | | | $ | — | | | $ | — | |
Preferred Stocks | | | 3,227 | | | | — | | | | — | |
Corporate Debt Securities | | | — | | | | 54,043 | | | | — | |
Loans | | | — | | | | — | | | | 1,023 | |
United States Government Agency Obligations | | | — | | | | 4,273 | | | | — | |
United States Government Obligations | | | — | | | | 55,758 | | | | — | |
Short-Term Securities | | | 1,917 | | | | 4,806 | | | | — | |
Total | | $ | 191,576 | | | $ | 118,880 | | | $ | 1,023 | |
During the year ended December 31, 2018, there were no transfers in or out of Level 3.
The following acronyms are used throughout this schedule:
ADR = American Depositary Receipts
GTD = Guaranteed
ICE = Intercontinental Exchange
LIBOR = London Interbank Offered Rate
REMIC = Real Estate Mortgage Investment Conduit
REIT = Real Estate Investment Trust
See Accompanying Notes to Financial Statements.
| | |
| MANAGEMENT DISCUSSION | | ENERGY |
(UNAUDITED)

David P. Ginther

Michael T. Wolverton
Below, David P. Ginther, CPA, and Michael T. Wolverton, CFA, portfolio managers of Ivy VIP Energy, discuss positioning, performance and results for the fiscal year ended December 31, 2018. Mr. Ginther has managed the Portfolio since its inception in 2006 and has 23 years of industry experience. Mr. Wolverton has managed the Portfolio since 2016 and has 14 years of industry experience.
Fiscal year Performance
| | | | |
For the 12 Months Ended December 31, 2018 | | | | |
Ivy VIP Energy (Class II shares at net asset value) | | | -34.14% | |
Benchmark(s) and/or Morningstar and Lipper Categories | | | | |
S&P 1500 Energy Sector Index | | | -19.31% | |
(generally reflects the performance of stocks that represent the energy market) | | | | |
Morningstar Equity Energy Universe Average | | | -27.55% | |
(generally reflects the performance of the universe of funds with similar investment objectives) | | | | |
Lipper Variable Annuity Natural Resources Funds Universe Average | | | -23.16% | |
(generally reflects the performance of the universe of funds with similar investment objectives) | | | | |
Please note that Portfolio returns include applicable fees and expenses while index returns do not include any such fees. Also, the Portfolio’s performance data does not take into account any product expenses or charges associated with owning a variable life or annuity policy, which is invested in Ivy Variable Insurance Portfolios.
Volatility in oil market
Volatility returned to the oil markets during the fiscal year with oil prices rising to a four-year high in October before collapsing more than $30 per barrel in the fourth quarter of the year. Strong supply and demand fundamentals started to deteriorate in the second half of 2018, with concerns about slower global economic growth and its effect on demand; oversupply from OPEC and other producing countries; and stronger-than-expected growth in U.S. shale oil production.
The year began with oil prices moving higher as OPEC’s compliance with its production cutback agreement was high. Member countries were successful in cutting oil output production, leading to lower oil inventories worldwide. OPEC in late June 2018 announced an agreement to gradually increase production levels by about 1 million barrels per day (bpd).
Oil prices moved higher, with Brent crude oil – the international market benchmark – moving above $80 per barrel, despite Saudi Arabia and Russia increasing their production to near all-time highs to help offset lower production from Iran – following U.S. sanctions – and Venezuela. The volatility that hit oil late in the year then took prices from the October high through a sharp decline by year-end.
The U.S. sanctions against Iran were scheduled to take effect in November 2018 and OPEC anticipated a significant reduction of supply would follow the phase out of Iran oil exports. However, OPEC and the rest of the market were surprised when the U.S. granted waivers to allow Iran to continue selected exports for another six months. The waivers and stronger-than-expected U.S. production growth then led to the market oversupply.
OPEC and non-OPEC partners then decided in December 2018 to cut production starting in January 2019 by 1.2 million bpd for a period of six months.
Challenging year
The Portfolio had a negative return for the fiscal year and underperformed the negative returns of its benchmark index and category averages.
At the end of the fiscal year, about 43% of the Portfolio was allocated to holdings in the Oil & Gas Exploration & Production industry segment, followed by about 25% to Oil & Gas Equipment & Services. Those industry segments underperformed the benchmark index, which had heavier weighting to integrated oil companies.
The Portfolio’s five greatest detractors from performance relative to the benchmark in the year were overweight positions in Parsley Energy, Inc., Concho Resources, Inc., Patterson-UTI Energy, Inc., Ensco plc and C&J Energy Services, Inc.
The Portfolio’s five greatest contributors to relative performance were ExxonMobil, Williams Companies Inc. and Occidental Petroleum Corp. (none were in the Portfolio but are underperforming benchmark index components), Chevron Corp. and Schlumberger Ltd.
The focus of the energy strategy remains on investing in companies that can create value over the full course of the energy cycle. We identify those as companies that are low-cost operators, have strong balance sheets, have the ability to grow profitably and have strong return on capital.
Outlook for recovery
The energy market enters 2019 looking to recover from a tumultuous exit to 2018. OPEC has stated its intent to balance the market and we think its announced production cuts will help achieve that outcome. We also think the cyclical recovery that began in 2018 is likely to resume after being interrupted at the end of the fiscal year. However, the recovery will also be dependent on worldwide demand and the pace of production from the U.S.
We believe oil demand will continue to grow despite slower global economic growth and the production cuts by OPEC and partner states. We also think the reversal of some of the Iran sanction waivers will help rebalance the world oil market and support oil prices in 2019. We believe OPEC took a positive and necessary step toward rebalancing the world oil market with its production cut decision and think the move will help support prices in 2019.
We think volatility in the oil markets will continue in 2019. The oil markets are concerned about a wide range of market and geopolitical issues, including demand growth because of slower worldwide economic growth and the effect of the U.S.-China trade dispute; greater supply growth because of U.S. shale oil production and uncertainty about whether U.S. shale companies will demonstrate capital discipline in an environment of lower oil prices; uncertainty about how much OPEC and Russia will cut production, based on the recent agreement, as well as OPEC’s long-term viability as a production cartel; and general unease about geopolitical tensions in Venezuela and across the Middle East.
U.S. oil production was greater than expected in 2018 and remains a concern in the coming year. The market is urging capital discipline on the part of U.S. producers, but not enough companies have made a clear commitment to this idea yet. We think lower oil prices mean more producers will take a cautious approach to capital expenditures in the coming year. This is likely to help cause a deceleration in supply growth, but we think production growth will remain above 1 million barrels per day.
Past performance is not a guarantee of future results. The value of the Portfolio’s shares will change, and you could lose money on your investment.
Investing in companies involved in one specified sector may be more risky and volatile than an investment with greater sector diversification. Investing in the energy sector can be riskier than other types of investment activities because of a range of factors, including price fluctuation caused by real and perceived inflationary trends and political developments, and the cost assumed by energy companies in complying with environmental safety regulations. These and other risks are more fully described in the Portfolio’s prospectus.
The opinions expressed in this report are those of the portfolio managers and are current only through the end of the period of the report as stated on the cover. The managers’ views are subject to change at any time based on market and other conditions, and no forecasts can be guaranteed.
The index noted is unmanaged and includes reinvested dividends. One cannot invest directly in an index, nor is an index representative of Ivy VIP Energy.
| | |
| PORTFOLIO HIGHLIGHTS | | ENERGY |
ALL DATA IS AS OF DECEMBER 31, 2018 (UNAUDITED)
| | | | |
Asset Allocation | |
Stocks | | | 94.8% | |
Energy | | | 91.1% | |
Information Technology | | | 2.4% | |
Industrials | | | 1.3% | |
Cash and Other Assets (Net of Liabilities), and Cash Equivalents+ | | | 5.2% | |
| | | | |
Country Weightings | |
North America | | | 87.0% | |
United States | | | 84.9% | |
Other North America | | | 2.1% | |
Europe | | | 7.8% | |
United Kingdom | | | 3.7% | |
Other Europe | | | 4.1% | |
Cash and Other Assets (Net of Liabilities),
and Cash Equivalents+ | | | 5.2% | |
Top 10 Equity Holdings
| | | | | | |
| | | |
| Company | | Country | | Sector | | Industry |
Concho Resources, Inc. | | United States | | Energy | | Oil & Gas Exploration & Production |
Continental Resources, Inc. | | United States | | Energy | | Oil & Gas Exploration & Production |
EOG Resources, Inc. | | United States | | Energy | | Oil & Gas Exploration & Production |
Pioneer Natural Resources Co. | | United States | | Energy | | Oil & Gas Exploration & Production |
Diamondback Energy, Inc. | | United States | | Energy | | Oil & Gas Exploration & Production |
Phillips 66 | | United States | | Energy | | Oil & Gas Refining & Marketing |
Marathon Petroleum Corp. | | United States | | Energy | | Oil & Gas Refining & Marketing |
Halliburton Co. | | United States | | Energy | | Oil & Gas Equipment & Services |
WPX Energy, Inc. | | United States | | Energy | | Oil & Gas Exploration & Production |
Valero Energy Corp. | | United States | | Energy | | Oil & Gas Refining & Marketing |
See your advisor or www.ivyinvestments.com for more information on the Portfolio’s most recently published Top 10 Equity Holdings.
+ Cash equivalents are defined as highly liquid securities with maturities of less than three months. Cash equivalents may include U.S. Government Treasury bills, bank certificates of deposit, bankers’ acceptances, corporate commercial paper and other money market instruments.
| | |
| COMPARISON OF CHANGE IN VALUE OF $10,000 INVESTMENT | | ENERGY |
(UNAUDITED)
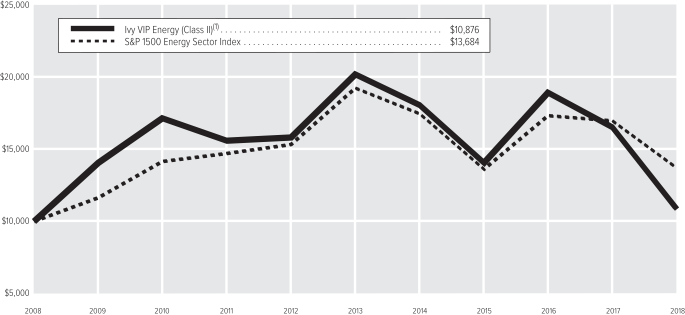
| (1) | The value of the investment in the Portfolio is impacted by the ongoing expenses of the Portfolio and assumes reinvestment of dividends and distributions. |
| | | | | | | | |
| | |
| Average Annual Total Return(2) | | Class I | | | Class II | |
1-year period ended12-31-18 | | | -33.96% | | | | -34.14% | |
5-year period ended12-31-18 | | | — | | | | -11.62% | |
10-year period ended12-31-18 | | | — | | | | 0.84% | |
Since Inception of Class through12-31-18(3) | | | -21.21% | | | | — | |
| (2) | Data quoted is past performance and current performance may be lower or higher. Past performance is no guarantee of future results. Investment return and principal value of an investment will fluctuate and shares, when redeemed, may be worth more or less than their original cost. Please visit www.ivyinvestments.com for the Portfolio’s most recentmonth-end performance. Performance data quoted does not reflect any expenses or charges associated with owning a variable life insurance policy or variable annuity contract that invests in the Portfolio’s shares. When such charges are deducted, actual investment performance in a variable policy or contract will be lower. |
| (3) | 4-28-17 (the date on which shares were first acquired by shareholders). |
Past performance is not necessarily indicative of future performance. Indexes are unmanaged. The performance graph and table do not reflect the deduction of taxes that a shareholder would pay on Portfolio distributions or on the redemption of Portfolio shares. Performance results may include the effect of expense reduction arrangements for some or all of the periods shown. If those arrangements had not been in place, the performance results for those periods would have been lower.
| | |
| SCHEDULE OF INVESTMENTS | | ENERGY (in thousands) |
DECEMBER 31, 2018
| | | | | | | | |
| COMMON STOCKS | | Shares | | | Value | |
Energy | |
| |
Integrated Oil & Gas – 3.9% | |
Chevron Corp. | | | 7 | | | $ | 707 | |
Suncor Energy, Inc. | | | 30 | | | | 838 | |
| | | | | | | | |
| | | | | | | 1,545 | |
| | | | | | | | |
| |
Oil & Gas Drilling – 6.4% | |
Ensco plc (A) | | | 199 | | | | 709 | |
Patterson-UTI Energy, Inc. | | | 82 | | | | 846 | |
Transocean, Inc. (B) | | | 137 | | | | 953 | |
| | | | | | | | |
| | | | | | | 2,508 | |
| | | | | | | | |
| |
Oil & Gas Equipment & Services – 24.0% | |
Baker Hughes, Inc. | | | 20 | | | | 436 | |
C&J Energy Services, Inc. (B) | | | 50 | | | | 671 | |
Cactus, Inc., Class A (B) | | | 38 | | | | 1,040 | |
Core Laboratories N.V. | | | 11 | | | | 644 | |
Dril-Quip, Inc. (B) | | | 22 | | | | 658 | |
FMC Technologies, Inc. | | | 38 | | | | 753 | |
Frank’s International N.V. (B) | | | 62 | | | | 322 | |
FTS International, Inc. (B) | | | 62 | | | | 443 | |
Halliburton Co. | | | 51 | | | | 1,353 | |
Helix Energy Solutions Group, Inc. (B) | | | 88 | | | | 474 | |
Liberty Oilfield Services, Inc., Class A (A) | | | 34 | | | | 435 | |
National Oilwell Varco, Inc. | | | 14 | | | | 369 | |
ProPetro Holding Corp. (B) | | | 52 | | | | 640 | |
Schlumberger Ltd. | | | 32 | | | | 1,147 | |
| | | | | | | | |
| | | | | | | 9,385 | |
| | | | | | | | |
| |
Oil & Gas Exploration & Production – 40.5% | |
Anadarko Petroleum Corp. | | | 24 | | | | 1,061 | |
Centennial Resource Development, Inc., Class A (B) | | | 53 | | | | 583 | |
Concho Resources, Inc. (B) | | | 23 | | | | 2,350 | |
Continental Resources, Inc. (B) | | | 45 | | | | 1,815 | |
Diamondback Energy, Inc. | | | 16 | | | | 1,497 | |
EOG Resources, Inc. | | | 18 | | | | 1,578 | |
Marathon Oil Corp. | | | 82 | | | | 1,170 | |
Oasis Petroleum LLC (B) | | | 147 | | | | 811 | |
Parsley Energy, Inc., Class A (B) | | | 74 | | | | 1,188 | |
Pioneer Natural Resources Co. | | | 12 | | | | 1,559 | |
Whiting Petroleum Corp. (B) | | | 40 | | | | 917 | |
WPX Energy, Inc. (B) | | | 118 | | | | 1,336 | |
| | | | | | | | |
| | | | | | | 15,865 | |
| | | | | | | | |
| |
Oil & Gas Refining & Marketing – 12.3% | |
Marathon Petroleum Corp. | | | 23 | | | | 1,360 | |
PBF Energy, Inc., Class A | | | 24 | | | | 797 | |
Phillips 66 | | | 16 | | | | 1,421 | |
Valero Energy Corp. | | | 17 | | | | 1,237 | |
| | | | | | | | |
| | | | | | | 4,815 | |
| | | | | | | | |
| |
Oil & Gas Storage & Transportation – 4.0% | |
Energy Transfer L.P. | | | 41 | | | | 535 | |
Enterprise Products Partners L.P. | | | 32 | | | | 784 | |
MPLX L.P. | | | 8 | | | | 254 | |
| | | | | | | | |
| | | | | | | 1,573 | |
| | | | | | | | |
Total Energy – 91.1% | | | | 35,691 | |
| | | | | | | | |
| COMMON STOCKS(Continued) | | Shares | | | Value | |
Industrials | |
| |
Industrial Machinery – 1.3% | |
Dover Corp. (B) | | | 19 | | | $ | 512 | |
| | | | | | | | |
| |
Total Industrials – 1.3% | | | | 512 | |
Information Technology | |
| |
Data Processing & Outsourced Services – 2.4% | |
Wright Express Corp. (B) | | | 7 | | | | 946 | |
| | | | | | | | |
| |
Total Information Technology – 2.4% | | | | 946 | |
| |
TOTAL COMMON STOCKS – 94.8% | | | $ | 37,149 | |
(Cost: $58,656) | |
| | |
| SHORT-TERM SECURITIES | | Principal | | | | |
Master Note – 4.5% | |
Toyota Motor Credit Corp.(1-Month U.S. LIBOR plus 15 bps), | | | | | | | | |
2.720%,1-7-19 (C) | | $ | 1,755 | | | | 1,755 | |
| | | | | | | | |
Money Market Funds – 1.0% | |
Dreyfus Institutional Preferred Government Money Market Fund – Institutional Shares, | | | | | | | | |
2.400%, (D)(E) | | | 401 | | | | 401 | |
| | | | | | | | |
| |
TOTAL SHORT-TERM SECURITIES – 5.5% | | | $ | 2,156 | |
(Cost: $2,156) | |
| |
TOTAL INVESTMENT SECURITIES – 100.3% | | | $ | 39,305 | |
(Cost: $60,812) | |
| |
LIABILITIES, NET OF CASH AND OTHER ASSETS – (0.3)% | | | | (107 | ) |
| |
NET ASSETS – 100.0% | | | $ | 39,198 | |
| | |
| SCHEDULE OF INVESTMENTS | | ENERGY (in thousands) |
DECEMBER 31, 2018
Notes to Schedule of Investments
| (A) | All or a portion of securities with an aggregate value of $1,057 are on loan. |
| (B) | No dividends were paid during the preceding 12 months. |
| (C) | Variable rate security. Interest rate disclosed is that which is in effect at December 31, 2018. Date shown represents the date that the variable rate resets. Description of the reference rate and spread, if applicable, are included in the security description. |
| (D) | Investment made with cash collateral received from securities on loan. |
| (E) | Rate shown is the annualized7-day yield at December 31, 2018. |
The following table is a summary of the valuation of the Portfolio’s investments by the fair value hierarchy levels as of December 31, 2018. See Note 3 to the Financial Statements for further information regarding fair value measurement.
| | | | | | | | | | | | |
| | | Level 1 | | | Level 2 | | | Level 3 | |
Assets | | | | | | | | | | | | |
Investments in Securities | | | | | | | | | | | | |
Common Stocks | | $ | 37,149 | | | $ | — | | | $ | — | |
Short-Term Securities | | | 401 | | | | 1,755 | | | | — | |
Total | | $ | 37,550 | | | $ | 1,755 | | | $ | — | |
The following acronym is used throughout this schedule:
LIBOR = London Interbank Offered Rate
Country Diversification
| | | | |
(as a % of net assets) | | | | |
United States | | | 84.9% | |
United Kingdom | | | 3.7% | |
Switzerland | | | 2.4% | |
Canada | | | 2.1% | |
Netherlands | | | 1.7% | |
Other+ | | | 5.2% | |
+Includes cash and other assets (net of liabilities), and cash equivalents
See Accompanying Notes to Financial Statements.
| | |
| MANAGEMENT DISCUSSION | | GROWTH |
(UNAUDITED)

Bradley M. Klapmeyer
Below, Bradley M. Klapmeyer, CFA, portfolio manager of Ivy VIP Growth, discusses positioning, performance and results for the fiscal year ended December 31, 2018. Mr. Klapmeyer has managed the Portfolio since August 2016 and he has 19 years of industry experience. Co-portfolio Manager Daniel P. Becker, CFA, left the firm effective April 12, 2018.
Fiscal Year Performance
| | | | |
For the 12 Months Ended December 31, 2018 | | | | |
Ivy VIP Growth(Class II shares at net asset value) | | | 2.28% | |
Benchmark(s) and/or Morningstar and Lipper Categories | | | | |
Russell 1000 Growth Index | | | -1.51% | |
(generally reflects the performance of securities that represent the large-cap growth market) | | | | |
Morningstar Large Growth Universe Average | | | -1.98% | |
(generally reflects the performance of the universe of funds with similar investment objectives) | | | | |
Lipper Variable Annuity Large-Cap Growth Funds Universe Average | | | -0.60% | |
(generally reflects the performance of the universe of funds with similar investment objectives) | | | | |
Please note that Portfolio returns include applicable fees and expenses while index returns do not include any such fees. Also, the Portfolio’s performance data does not take into account any product expenses or charges associated with owning a variable life or annuity policy, which is invested in Ivy Variable Insurance Portfolios.
Market conditions
The Russell 1000 Growth Index, the Portfolio’s benchmark, declined a modest 1.5%, which would indicate the possibility of a tame year. Unfortunately, that assessment belies the actual outcome, as the market was posting strong results up until the fourth quarter. Specifically, year-to-date through month-end September, the index was up a remarkable 17%, seemingly ready to post another strong year of gains.
Despite this slight negative return for the index in 2018, it is important not to lose sight of the strong gains realized from growth indices since the end of the financial crisis in 2009. Starting in March 2009, the point at which the markets bottomed, the Russell 1000 Growth index increased more than 300% cumulative over the next nine years. Investors having exposure to growth style equity investments during the last decade have experienced exceptional returns.
Turning attention back to calendar year 2018, sentiment evolved notably from the beginning until the end. During the early months of 2018, investors were exuberant as hopes remained elevated that the corporate and personal tax reform passed late in calendar year 2017 would drive a sustainable acceleration in economic growth. Given this enthusiasm for growth, there began to surface concern from the market that inflation was on the cusp of inflecting higher, that the Federal Reserve (Fed) was behind the curve, and the Fed needed to move quickly to slow the U.S. economy from overheating. Also coming into view during this period was the realization that the Trump Administration was going to push forward on its protectionist agenda. The exuberance quickly shifted to caution, volatility spiked, short-term interest rates continued to climb, and the markets weakened.
During the middle part of the calendar year, economic growth remained strong while inflation remained within reasonable bounds, giving investors comfort that concerns expressed early in the year were hopefully unfounded. Economic growth likely benefited from the tax cuts but also saw an uplift as global businesses began to pull forward export demand from the U.S. to front run tariffs as trade war rhetoric further escalated. The Fed comfortably moved interest rates higher in March and June, marking the second and third rates of the year. Volatility cooled off and market returns improved.
Flash forward to year-end 2018 and one would think the wheels are off. There was carnage in the markets during fourth quarter 2018. The Fed moved forward with the ninth interest rate hike of the cycle, fourth of the year, and carefully signaled to the market it is tiptoeing and is willing to pause, maybe for an extended period. The equity markets still screamed “policy error” as they worried about a list of concerning data points: Weakening growth in the U.S., eurozone and China; Brexit risk back to a boil; U.S. government shutdown over a border wall funding impasse; presidential attacks on Fed Chairman Powell; and the realization that the temporary trade truce was anything but clear. Oh, and don’t forget that “minor” issue – duration of the cycle. There has been a lot to digest heading into a new year.
Looking at the return by the index, factor performance showed that momentum and quality factors (Return on Capital and Return on Equity) were key variables in driving performance during the fiscal year. Value and cash deployment were the key out-of-favor factors, with low valuation stocks and high-dividend yielding stocks generally underperforming the benchmark. With that said, the fourth quarter of 2018 saw momentum performance significantly underperform while quality and cash deployment proved to be more resilient during the year-end market weakness.
Strategies employed, contributors and detractors
In the 12-month period ended December 31, 2018, the Portfolio outperformed relative to its benchmark. Portfolio performance was mainly driven by information technology stocks, with additional strong positive contributions from the health care and financials sectors. Despite the very strong absolute and relative performance, industrials and consumer staples were detractors of performance.
Information technology stocks, especially mega-cap technology stocks, once again proved to be fuel for the markets for most of the calendar year. The Portfolio was overweight the sector and benefited from individual security overweight positions in salesforce.com, Adobe, Inc., MasterCard, Inc. and Visa, Inc. Investors were attracted to the strong end-markets in technology, such as digital marketing initiatives, cloud computing and software-as-a-service approaches. The payment stocks continued to post solid transaction volume gains and likely benefited from the year-end rotation to higher quality and more defensive positioning.
Another notable contributor to the Portfolio’s strong relative performance was the health care sector. A new overweight position in Pfizer, Inc. contributed meaningfully to performance as investors started to believe the company could accelerate growth in the coming years. Intuitive Surgical, Inc., the leader in robotic surgery, was a benefit to Portfolio performance as the company continued to post strong procedure growth due to penetration of its technology to surgery procedures in Japan and China.
The Portfolio benefited from a significant overweight to CME Group, Inc. within the financials sector. As a leading exchange in futures trading, such as interest rate and commodity futures, CME saw a strong increase in volumes as volatility in the markets increased during calendar year 2018.
Despite good overall strong absolute and relative performance, industrials and consumer staples were two call-out detractors from performance. Underperformance in industrials came mainly from positions that are more exposed to the economic cycle, such as Stanley Black & Decker, Inc. and Caterpillar, Inc. These positions weakened on the back of trade war concerns, rising input prices and slowing global economic activity.
Consumer staples underperformance was the results of stock-specific misses, such as Philip Morris and Monster Beverage Corp., but also a rotation into the sector later in the calendar year. Investors view the stability of consumer staples names as safe places to hide during periods of market or economic stress and given the Portfolio’s underweight position to the sector, there was a negative performance hit.
Outlook and Portfolio positioning
Anxiety is clearly high in the markets, and we would expect this to remain because investors seem to be bouncing between optimism about modest 2% economic growth and nervousness about the graying economic cycle. Time will determine whether the Fed’s last rate hike was justified, but it is important to remember how quickly sentiment turned from October to December. In our view, the markets overreacted to the December hike, as we think a couple events falling in the right direction (e.g. a real trade war truce, and more accommodative Fed language) could easily shift sentiment back to risk-on, at least temporarily.
With that said, we believe the script is largely written as we are three years into a Fed tightening cycle. The interest rate increases since 2015 have resulted in a more neutral Fed policy, regardless of what policy tweaks the Fed may make in 2019. This view formed the basis for the material changes made to the complexion of the Portfolio during 2018. The more notable changes include reducing information technology exposure by exiting positions in semiconductor capital equipment and semiconductor stocks. Positions in Applied Materials and Lam Research, which had been good performers for the Portfolio, were eliminated. We also reduced exposure to the financials sector as those stocks became too highly correlated with changes in the yield curve versus stock-specific drivers.
These reductions were repositioned in consumer discretionary where we saw growth opportunities in strong consumer brands that we felt had successfully bridged the Amazon risk chasm and were set for more sustainable growth regardless of the market environment. Names added to this sector during the year included NIKE, Inc., V.F. Corp. and Ulta Beauty, Inc. We also added to health care with multi-year accelerating growth stories, such as Pfizer, Inc., along with massive open-ended growth opportunities, such as Illumina, Inc.
Very often, in these volatile periods, stock correlations spike, and investors dump stocks irrespective of fundamentals. Therefore, growth stocks with durable, sustainable competitive positions often get thrown out with the bath water, and this presents a welcome opportunity for long-term investors. During the calendar year, we found such opportunities with names like Estee Lauder Co., Inc., Intuit, Inc., CoStar Group, Inc. and Verisk Analytics, Inc. The net result of these changes was to skew the Portfolio more toward earnings quality and profitability while maintaining a focus on strong growth. As
experienced in the fourth quarter of 2018, these improvements in quality have allowed the Portfolio to better withstand choppy markets. We will continue to strategically position the Portfolio to accentuate stock selection over factor bets, but whereas we can’t eliminate factors bets we will skew the Portfolio toward these characteristics that align with our philosophy and process. For more radical changes to occur from this point forward we would need to become even more concerned about the economic backdrop, or inversely feel better about the sustainable strength of the economy.
We don’t believe a recession is imminent, however. Despite the aging cycle, many of the excesses that often precede a recession are hard to find. These include consumer debt, surplus inventories, corporate debt, and excess business investment, which were very muted this cycle. It’s possible we could even see a growth deceleration with a shallow recession or no recession.
The trade war remains a wild card as it is putting a dent in business and consumer confidence. There is currently no sign of a trajectory change on the issue, which bodes poorly for the durability of economic growth. The Trump Administration may react to the softening economic growth with more progress on a trade war resolution, but there is little indication of that right now.
Barring a legitimate economic recession, we think that the current modest growth environment remains supportive of durable, long-term growers. We believe a slowdown in growth would likely narrow investors’ focus on stocks with these characteristics, hopefully driving continued outperformance for growth styles.
As of calendar year end 2018, the Portfolio’s largest positions Microsoft Corp., Amazon.com, Inc., Apple, Inc., Visa, Inc., CME Group, Inc., Alphabet, Inc., MasterCard, Inc., Verisk Analytics, Inc., UnitedHealth Group, Inc. and Adobe, Inc. Thank you for your continued interest and support.
Past performance is not a guarantee of future results. The value of the Portfolio’s shares will change, and you could lose money on your investment. Prices of growth stocks may be more sensitive to changes in current or expected earnings than the prices of other stocks. Growth stocks may not perform as well as value stocks or the stock market in general. These and other risks are more fully described in the Portfolio’s prospectus.
The opinions expressed in this report are those of the portfolio managers and are current only through the end of the period of the report as stated on the cover. The managers’ views are subject to change at any time based on market and other conditions, and no forecasts can be guaranteed.
The index (indexes) noted are unmanaged and include reinvested dividends. One cannot invest directly in an index, nor is an index representative of Ivy VIP Growth.
| | |
| PORTFOLIO HIGHLIGHTS | | GROWTH |
ALL DATA IS AS OF DECEMBER 31, 2018 (UNAUDITED)
| | | | |
Asset Allocation | |
Stocks | | | 99.7% | |
Information Technology | | | 34.3% | |
Consumer Discretionary | | | 17.2% | |
Health Care | | | 16.1% | |
Industrials | | | 11.9% | |
Communication Services | | | 9.5% | |
Financials | | | 6.7% | |
Consumer Staples | | | 2.4% | |
Real Estate | | | 1.6% | |
Cash and Other Assets (Net of Liabilities), and Cash Equivalents+ | | | 0.3% | |
Top 10 Equity Holdings
| | | | |
| | |
| Company | | Sector | | Industry |
Microsoft Corp. | | Information Technology | | Systems Software |
Amazon.com, Inc. | | Consumer Discretionary | | Internet & Direct Marketing Retail |
Apple, Inc. | | Information Technology | | Technology Hardware, Storage & Peripherals |
Visa, Inc., Class A | | Information Technology | | Data Processing & Outsourced Services |
CME Group, Inc. | | Financials | | Financial Exchanges & Data |
Alphabet, Inc., Class A | | Communication Services | | Interactive Media & Services |
MasterCard, Inc., Class A | | Information Technology | | Data Processing & Outsourced Services |
Verisk Analytics, Inc., Class A | | Industrials | | Research & Consulting Services |
UnitedHealth Group, Inc. | | Health Care | | Managed Health Care |
Adobe, Inc. | | Information Technology | | Application Software |
See your advisor or www.ivyinvestments.com for more information on the Portfolio’s most recently published Top 10 Equity Holdings.
+ Cash equivalents are defined as highly liquid securities with maturities of less than three months. Cash equivalents may include U.S. Government Treasury bills, bank certificates of deposit, bankers’ acceptances, corporate commercial paper and other money market instruments.
| | |
| COMPARISON OF CHANGE IN VALUE OF $10,000 INVESTMENT | | GROWTH |
(UNAUDITED)
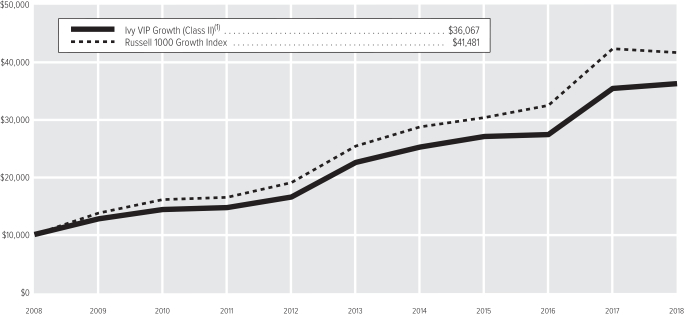
| (1) | The value of the investment in the Portfolio is impacted by the ongoing expenses of the Portfolio and assumes reinvestment of dividends and distributions. |
| | | | |
| |
| Average Annual Total Return(2) | | Class II | |
1-year period ended12-31-18 | | | 2.28% | |
5-year period ended12-31-18 | | | 9.92% | |
10-year period ended12-31-18 | | | 13.69% | |
| (2) | Data quoted is past performance and current performance may be lower or higher. Past performance is no guarantee of future results. Investment return and principal value of an investment will fluctuate and shares, when redeemed, may be worth more or less than their original cost. Please visit www.ivyinvestments.com for the Portfolio’s most recentmonth-end performance. Performance data quoted does not reflect any expenses or charges associated with owning a variable life insurance policy or variable annuity contract that invests in the Portfolio’s shares. When such charges are deducted, actual investment performance in a variable policy or contract will be lower. |
Past performance is not necessarily indicative of future performance. Indexes are unmanaged. The performance graph and table do not reflect the deduction of taxes that a shareholder would pay on Portfolio distributions or on the redemption of Portfolio shares. Performance results may include the effect of expense reduction arrangements for some or all of the periods shown. If those arrangements had not been in place, the performance results for those periods would have been lower.
| | |
| SCHEDULE OF INVESTMENTS | | GROWTH (in thousands) |
DECEMBER 31, 2018
| | | | | | | | |
| COMMON STOCKS | | Shares | | | Value | |
Communication Services | |
| |
Cable & Satellite – 0.7% | |
Comcast Corp., Class A | | | 137 | | | $ | 4,648 | |
| | | | | | | | |
| |
Interactive Home Entertainment – 1.4% | |
Electronic Arts, Inc. (A) | | | 120 | | | | 9,501 | |
| | | | | | | | |
| |
Interactive Media & Services – 7.4% | |
Alphabet, Inc., Class A (A) | | | 26 | | | | 27,232 | |
Alphabet, Inc., Class C (A) | | | 12 | | | | 12,666 | |
Facebook, Inc., Class A (A) | | | 73 | | | | 9,530 | |
| | | | | | | | |
| | | | | | | 49,428 | |
| | | | | | | | |
| |
Total Communication Services – 9.5% | | | | 63,577 | |
Consumer Discretionary | |
| |
Apparel, Accessories & Luxury Goods – 2.9% | |
V.F. Corp. | | | 271 | | | | 19,347 | |
| | | | | | | | |
| |
Footwear – 2.9% | |
NIKE, Inc., Class B | | | 263 | | | | 19,462 | |
| | | | | | | | |
| |
Home Improvement Retail – 2.6% | |
Home Depot, Inc. (The) | | | 103 | | | | 17,663 | |
| | | | | | | | |
| |
Internet & Direct Marketing Retail – 7.4% | |
Amazon.com, Inc. (A) | | | 25 | | | | 37,854 | |
Booking Holdings, Inc. (A) | | | 7 | | | | 11,368 | |
| | | | | | | | |
| | | | | | | 49,222 | |
| | | | | | | | |
| |
Specialty Stores – 1.4% | |
Ulta Beauty, Inc. (A) | | | 39 | | | | 9,500 | |
| | | | | | | | |
| |
Total Consumer Discretionary – 17.2% | | | | 115,194 | |
Consumer Staples | |
| |
Personal Products – 2.0% | |
Estee Lauder Co., Inc. (The), Class A | | | 102 | | | | 13,244 | |
| | | | | | | | |
| |
Soft Drinks – 0.4% | |
Monster Beverage Corp. (A) | | | 62 | | | | 3,027 | |
| | | | | | | | |
| |
Total Consumer Staples – 2.4% | | | | 16,271 | |
Financials | |
| |
Financial Exchanges & Data – 5.7% | |
CME Group, Inc. | | | 155 | | | | 29,159 | |
S&P Global, Inc. | | | 52 | | | | 8,795 | |
| | | | | | | | |
| | | | | | | 37,954 | |
| | | | | | | | |
| |
Investment Banking & Brokerage – 1.0% | |
Charles Schwab Corp. (The) | | | 170 | | | | 7,047 | |
| | | | | | | | |
| |
Total Financials – 6.7% | | | | 45,001 | |
Health Care | |
| |
Health Care Equipment – 5.7% | |
Abiomed, Inc. (A) | | | 22 | | | | 7,216 | |
Danaher Corp. | | | 159 | | | | 16,386 | |
| | | | | | | | |
| COMMON STOCKS(Continued) | | Shares | | | Value | |
Health Care Equipment(Continued) | |
Intuitive Surgical, Inc. (A) | | | 31 | | | $ | 14,942 | |
| | | | | | | | |
| | | | | | | 38,544 | |
| | | | | | | | |
| |
Life Sciences Tools & Services – 1.5% | |
Illumina, Inc. (A) | | | 33 | | | | 9,868 | |
| | | | | | | | |
| |
Managed Health Care – 3.1% | |
UnitedHealth Group, Inc. | | | 84 | | | | 20,826 | |
| | | | | | | | |
| |
Pharmaceuticals – 5.8% | |
Elanco Animal Health, Inc. (A) | | | 23 | | | | 732 | |
Pfizer, Inc. | | | 415 | | | | 18,097 | |
Zoetis, Inc. | | | 232 | | | | 19,820 | |
| | | | | | | | |
| | | | | | | 38,649 | |
| | | | | | | | |
| |
Total Health Care – 16.1% | | | | 107,887 | |
Industrials | |
| |
Aerospace & Defense – 2.3% | |
Lockheed Martin Corp. | | | 23 | | | | 6,074 | |
Northrop Grumman Corp. | | | 38 | | | | 9,331 | |
| | | | | | | | |
| | | | | | | 15,405 | |
| | | | | | | | |
| |
Construction Machinery & Heavy Trucks – 1.1% | |
Caterpillar, Inc. | | | 54 | | | | 6,900 | |
| | | | | | | | |
| |
Industrial Machinery – 0.9% | |
Stanley Black & Decker, Inc. | | | 52 | | | | 6,203 | |
| | | | | | | | |
| |
Railroads – 1.1% | |
Union Pacific Corp. | | | 54 | | | | 7,409 | |
| | | | | | | | |
| |
Research & Consulting Services – 4.9% | |
CoStar Group, Inc. (A) | | | 34 | | | | 11,537 | |
Verisk Analytics, Inc., Class A (A) | | | 196 | | | | 21,372 | |
| | | | | | | | |
| | | | | | | 32,909 | |
| | | | | | | | |
| |
Trucking – 1.6% | |
J.B. Hunt Transport Services, Inc. | | | 112 | | | | 10,393 | |
| | | | | | | | |
| |
Total Industrials – 11.9% | | | | 79,219 | |
Information Technology | |
| |
Application Software – 7.8% | |
Adobe, Inc. (A) | | | 89 | | | | 20,158 | |
Intuit, Inc. | | | 83 | | | | 16,319 | |
salesforce.com, Inc. (A) | | | 116 | | | | 15,847 | |
| | | | | | | | |
| | | | | | | 52,324 | |
| | | | | | | | |
| |
Data Processing & Outsourced Services – 11.6% | |
FleetCor Technologies, Inc. (A) | | | 36 | | | | 6,742 | |
MasterCard, Inc., Class A | | | 117 | | | | 21,980 | |
PayPal, Inc. (A) | | | 229 | | | | 19,285 | |
Visa, Inc., Class A | | | 226 | | | | 29,752 | |
| | | | | | | | |
| | | | | | | 77,759 | |
| | | | | | | | |
| |
Internet Services & Infrastructure – 2.1% | |
VeriSign, Inc. (A) | | | 93 | | | | 13,821 | |
| | | | | | | | |
| | | | | | | | |
| COMMON STOCKS(Continued) | | Shares | | | Value | |
Systems Software – 8.1% | |
Microsoft Corp. | | | 535 | | | $ | 54,381 | |
| | | | | | | | |
| |
Technology Hardware, Storage & Peripherals – 4.7% | |
Apple, Inc. | | | 197 | | | | 31,037 | |
| | | | | | | | |
| |
Total Information Technology – 34.3% | | | | 229,322 | |
Real Estate | |
| |
Specialized REITs – 1.6% | |
American Tower Corp., Class A | | | 69 | | | | 10,915 | |
| | | | | | | | |
| |
Total Real Estate – 1.6% | | | | 10,915 | |
| |
TOTAL COMMON STOCKS – 99.7% | | | $ | 667,386 | |
(Cost: $539,860) | | | | | | | | |
| | |
| SHORT-TERM SECURITIES | | Principal | | | | |
Master Note – 0.3% | |
Toyota Motor Credit Corp.(1-Month U.S. LIBOR plus 15 bps), 2.720%,1-7-19 (B) | | $ | 1,994 | | | | 1,994 | |
| | | | | | | | |
| |
TOTAL SHORT-TERM SECURITIES – 0.3% | | | $ | 1,994 | |
(Cost: $1,994) | |
| |
TOTAL INVESTMENT SECURITIES – 100.0% | | | $ | 669,380 | |
(Cost: $541,854) | |
| |
LIABILITIES, NET OF CASH AND OTHER ASSETS – 0.0% | | | | (189 | ) |
| |
NET ASSETS – 100.0% | | | $ | 669,191 | |
| | |
| SCHEDULE OF INVESTMENTS | | GROWTH (in thousands) |
DECEMBER 31, 2018
Notes to Schedule of Investments
| (A) | No dividends were paid during the preceding 12 months. |
| (B) | Variable rate security. Interest rate disclosed is that which is in effect at December 31, 2018. Date shown represents the date that the variable rate resets. Description of the reference rate and spread, if applicable, are included in the security description. |
The following table is a summary of the valuation of the Portfolio’s investments by the fair value hierarchy levels as of December 31, 2018. See Note 3 to the Financial Statements for further information regarding fair value measurement.
| | | | | | | | | | | | |
| | | Level 1 | | | Level 2 | | | Level 3 | |
Assets | | | | | | | | | | | | |
Investments in Securities | | | | | | | | | | | | |
Common Stocks | | $ | 667,386 | | | $ | — | | | $ | — | |
Short-Term Securities | | | — | | | | 1,994 | | | | — | |
Total | | $ | 667,386 | | | $ | 1,994 | | | $ | — | |
The following acronyms are used throughout this schedule:
LIBOR = London Interbank Offered Rate
REIT = Real Estate Investment Trust
See Accompanying Notes to Financial Statements.
| | |
| MANAGEMENT DISCUSSION | | HIGH INCOME |
(UNAUDITED)

Below, Chad Gunther, portfolio manager of Ivy VIP High Income, discusses positioning, performance and results for the fiscal year ended December 31, 2018. Mr. Gunther has managed the Portfolio since July 2014, and has 21 years of industry experience.
Fiscal Year Performance
| | | | |
For the 12 Months Ended December 31, 2018 | | | | |
Ivy VIP High Income(Class II shares at net asset value) | | | -2.11% | |
Benchmark(s) and/or Lipper Category | | | | |
ICE Bank of America Merrill Lynch US High Yield Index | | | -2.27% | |
(generally reflects the performance of securities representing the high-yield sector of the bond market) | | | | |
Morningstar High Yield Bond Universe Average | | | -2.81% | |
(generally reflects the performance of the universe of funds with similar investment objectives) | | | | |
Lipper Variable Annuity High Yield Funds Universe Average | | | -2.63% | |
(generally reflects the performance of the universe of funds with similar investment objectives) | | | | |
Please note that Portfolio returns include applicable fees and expenses while index returns do not include any such fees. The performance discussion below is based on net asset value. Also, the Portfolio’s performance data does not take into account any product expenses or charges associated with owning a variable life or annuity policy, which is invested in Ivy Variable Insurance Portfolios.
Market overview
A number of factors began in the fourth quarter that led to a sharp sell-off in both equities and credit to end the year. Concerns around the Federal Reserve (Fed), trade tensions with China, declines in energy and a flattening yield curve all left the markets in a state of uncertainty and kept investors worried about the domestic and global outlooks.
The risk-off environment in credit towards the end of the year resulted in higher quality bonds outperforming for 2018. Broadly, high yield bonds ended the year returning -2.45%, only the fourth loss in the last 25 years. Broken down by credit quality, B and BB credits returned -1.6% and -2.5%, respectively, while CCC credits ended down -2.9%. In 2018, leveraged loans were among the top performing asset classes by posting a 1% gain, outperforming investment grade and high yield. Additionally, credit spreads widened more than 200 basis points in the final quarter of 2018, a reversal from the decade low spreads reached in the third quarter. At the end of the year, yields in the high yield asset class increased by 170 bps to 8.23%, a level not seen since April 2016, while yields in the leveraged loan asset class increased by 75 bps 7.5%.
During the year, the high yield asset class experienced the largest retail withdrawals on record at -$45.1 billion. In contrast, leveraged loans experienced inflows of $737 million, even after taking into account record outflows in the fourth quarter, which included -$9.9 billion in outflows in the month of December, the largest monthly outflow on record. In terms of new issue activity, the high yield market saw $187.4 billion in 2018, while full-year volume decreased 43% compared to $328 billion in 2017. Notably, zero deals priced in December, which was the first time that happened since November 2008 and only the second time since 1990. Leveraged loan new issue volume was $704 billion for the year, which was the second highest on record, only behind last year’s $974 billion.
Portfolio discussion
The Portfolio outperformed its benchmark and its Lipper and Morningstar categories for the fiscal year. The Portfolio’s underweight to the energy sector and overweight allocation to leverage loans contributed positively to relative performance. Detracting from performance during the year was a credit event in the gaming sector, as well as the broader risk-off environment in the market which disproportionately impacted the prices of some of our larger holdings.
Given the Portfolio’s philosophy of finding credits that we believe can outperform throughout a credit cycle, when bouts of extreme volatility occur, such as during the latter part of the year, we tend to stay the course on current investments and scour the markets for additional opportunities that may occur as a result of the volatility.
The Portfolio composition between bonds and leverage loans was 67% and 20% respectively at year end. While leverage loans saw higher than normal outflows in Q4 and experienced negative returns, especially in December, our 20% exposure still outperformed the benchmark for 2018. In contrast, the Portfolio’s bond allocation underperformed the index for 2018.
The Portfolio’s weighting in CCC-rated bonds started the year at 26%, but ended the year with a 23% allocation in CCC, as measured by Standard & Poor’s ratings. Towards the end of the year, CCC credits came under pressure and are now averaging distressed spread levels (1,100 bps). Given the nearly -9% return that CCC credits experienced in the final quarter of 2018, the lack of compensation (spread) prior to the quarter vanished and caught our attention as a possible opportunity to find CCC credits at attractive valuations.
Outlook
We believe the high yield market has moved to fair value following the more than 200 bps widening in the final quarter of the year. We are cautiously optimistic that over the next 12 months potential returns in the high yield market may improve. However, we are closely monitoring potential areas of concern, including slowing earnings growth, flattening yield curve, the government shutdown, Brexit vote, possible Fed policy mistake and a yet-to-be-seen China trade deal. On the flip side, after the recent pull back in the market, most asset classes, including high yield, seem to have priced in the majority of negative headwinds.
We have already seen the Fed take a more dovish tone with a “wait and see” attitude towards further rate hikes. Oil prices have stabilized after the OPEC meeting where an agreement to cut production was reached, and talks between the U.S. and China on a new trade pact seems to be progressing. Details are few, but clarity would be a welcome outcome to the market.
We think there is favorable probability that several uncertainties plaguing the market may come to resolution giving investors and company executives more clarity on the macro environment. We believe this should lead to tighter spreads and positive returns versus wider spreads and a full-blown recession in 2019.
As always, our focus when evaluating investments is to focus on a company’s business model and competitive advantages in order to weather a recession and perform throughout the cycle. We will continue to focus on the fundamentals of our investments as that has served us well in the past and we expect should do so in the future.
Past performance is not a guarantee of future results. As with any investment, the value of the Portfolio’s shares will change, and you could lose money on your investment.
International investing involves additional risks including currency fluctuations, political or economic conditions affecting the foreign country, and differences in accounting standards and foreign regulations.
Fixed-income securities are subject to interest rate risk and, as such, the Fund’s net asset value may fall as interest rates rise. Investing in high-income securities may carry a greater risk of non-payment of interest or principal than higher-rated bonds. In addition to the risks typically associated with fixed-income securities, loan participations in which the fund may invest carry other risks including the risk of insolvency of the lending bank or other intermediary. Loan participations may be unsecured or not fully collateralized, may be subject to restrictions on resale and sometimes trade infrequently on the secondary market. These and other risks are more fully described in the Portfolio’s prospectus.
The opinions expressed in this report are those of the portfolio manager and are current only through the end of the period of the report as stated on the cover. The manager’s views are subject to change at any time based on market and other conditions, and no forecasts can be guaranteed.
The index noted is unmanaged, includes reinvested dividends, and does not include fees. One cannot invest directly in an index, nor is an index representative of the Ivy VIP High Income.
| | |
| PORTFOLIO HIGHLIGHTS | | HIGH INCOME |
ALL DATA IS AS OF DECEMBER 31, 2018 (UNAUDITED)
Asset Allocation
| | | | |
Stocks | | | 5.8% | |
Financials | | | 3.2% | |
Consumer Discretionary | | | 1.5% | |
Energy | | | 1.0% | |
Health Care | | | 0.1% | |
Communication Services | | | 0.0% | |
Consumer Staples | | | 0.0% | |
Industrials | | | 0.0% | |
Warrants | | | 0.0% | |
Bonds | | | 87.4% | |
Corporate Debt Securities | | | 67.3% | |
Loans | | | 20.1% | |
Cash and Other Assets (Net of Liabilities),
and Cash Equivalents+ | | | 6.8% | |
Quality Weightings
| | | | |
Non-Investment Grade | | | 87.4 | % |
BB | | | 10.4 | % |
B | | | 44.4 | % |
CCC | | | 28.7 | % |
Below CCC | | | 1.1 | % |
Non-rated | | | 2.8 | % |
Cash and Other Assets (Net of Liabilities),
Cash Equivalents+ and Equities | | | 12.6 | % |
Our preference is to always use ratings obtained from Standard & Poor’s, Moody’s, and Fitch. It is each Portfolio’s general policy to classify such security at the lower rating level if only two ratings are available. If more than two ratings are available and a median exists, the median is used. If more than two ratings exist without a median, the lower of the two middle ratings is used. We do not evaluate these ratings, but simply assign them to the appropriate credit quality category as determined by the rating agency.
+ Cash equivalents are defined as highly liquid securities with maturities of less than three months. Cash equivalents may include U.S. Government Treasury bills, bank certificates of deposit, bankers’ acceptances, corporate commercial paper and other money market instruments.
| | |
| COMPARISON OF CHANGE IN VALUE IN $10,000 INVESTMENT | | HIGH INCOME |
(UNAUDITED)
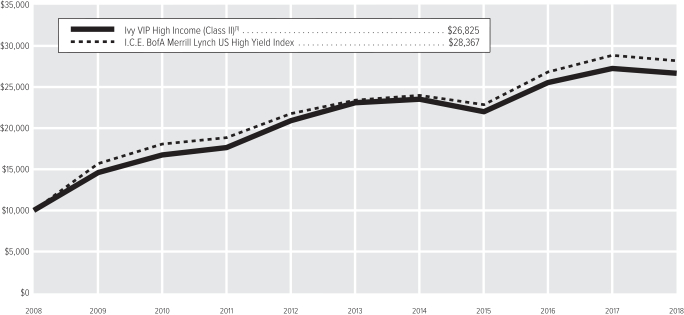
| (1) | The value of the investment in the Portfolio is impacted by the ongoing expenses of the Portfolio and assumes reinvestment of dividends and distributions. |
| | | | | | | | |
| | |
| Average Annual Total Return(2) | | Class I | | | Class II | |
1-year period ended12-31-18 | | | -1.86% | | | | -2.11% | |
5-year period ended12-31-18 | | | — | | | | 2.94% | |
10-year period ended12-31-18 | | | — | | | | 10.37% | |
Since Inception of Class through12-31-18(3) | | | 0.89% | | | | — | |
| (2) | Data quoted is past performance and current performance may be lower or higher. Past performance is no guarantee of future results. Investment return and principal value of an investment will fluctuate and shares, when redeemed, may be worth more or less than their original cost. Please visit www.ivyinvestments.com for the Portfolio’s most recentmonth-end performance. Performance data quoted does not reflect any expenses or charges associated with owning a variable life insurance policy or variable annuity contract that invests in the Portfolio’s shares. When such charges are deducted, actual investment performance in a variable policy or contract will be lower. |
| (3) | 4-28-17 (the date on which shares were first acquired by shareholders). |
Past performance is not necessarily indicative of future performance. Indexes are unmanaged. The performance graph and table do not reflect the deduction of taxes that a shareholder would pay on Portfolio distributions or on the redemption of Portfolio shares. Performance results may include the effect of expense reduction arrangements for some or all of the periods shown. If those arrangements had not been in place, the performance results for those periods would have been lower.
| | |
| SCHEDULE OF INVESTMENTS | | HIGH INCOME (in thousands) |
DECEMBER 31, 2018
| | | | | | | | |
| COMMON STOCKS | | Shares | | | Value | |
Communication Services | |
| |
Broadcasting – 0.0% | |
Cumulus Media, Inc., Class A (A) | | | 20 | | | $ | 215 | |
| | | | | | | | |
| |
Cable & Satellite – 0.0% | |
Altice N.V., Class A (A)(B)(C) | | | 78 | | | | 151 | |
Altice USA, Inc., Class A | | | 32 | | | | 534 | |
| | | | | | | | |
| | | | | | | 685 | |
| | | | | | | | |
| |
Total Communication Services – 0.0% | | | | 900 | |
Consumer Discretionary | |
| |
Apparel Retail – 0.0% | |
True Religion Apparel, Inc. (A)(D) | | | 13 | | | | 216 | |
| | | | | | | | |
| |
Casinos & Gaming – 0.0% | |
New Cotai Participation Corp.,
Class B (A)(D)(E) | | | — | * | | | — | |
| | | | | | | | |
| |
Education Services – 0.8% | |
Laureate Education, Inc.,
Class A (A) | | | 443 | | | | 6,746 | |
| | | | | | | | |
| |
Hotels, Resorts & Cruise Lines – 0.7% | |
Studio City International Holdings Ltd. ADR (A) | | | 343 | | | | 5,737 | |
| | | | | | | | |
| |
Total Consumer Discretionary – 1.5% | | | | 12,699 | |
Consumer Staples | |
| |
Agricultural Products – 0.0% | |
ASG Warrant Corp. (A)(D) | | | 1 | | | | — | |
| | | | | | | | |
| |
Total Consumer Staples – 0.0% | | | | 0 | |
Energy | |
| |
Oil & Gas Equipment & Services – 0.0% | |
Larchmont Resources
LLC (A)(D)(E)(F) | | | 1 | | | | 252 | |
| | | | | | | | |
| |
Oil & Gas Exploration & Production – 0.1% | |
Midstates Petroleum Co., Inc. (A) | | | 64 | | | | 479 | |
Sabine Oil & Gas Corp. (A)(E) | | | — | * | | | 12 | |
| | | | | | | | |
| | | | | | | 491 | |
| | | | | | | | |
| |
Total Energy – 0.1% | | | | 743 | |
Financials | |
| |
Other Diversified Financial Services – 0.4% | |
J.G. Wentworth Co. (The) (D)(E) | | | 364 | | | | 3,645 | |
| | | | | | | | |
| |
Total Financials – 0.4% | | | | 3,645 | |
Health Care | |
| |
Pharmaceuticals – 0.1% | |
Concordia International Corp. (A)(B) | | | 35 | | | | 651 | |
| | | | | | | | |
| |
Total Health Care – 0.1% | | | | 651 | |
| | | | | | | | |
| COMMON STOCKS(Continued) | | Shares | | | Value | |
Industrials | |
| |
Air Freight & Logistics – 0.0% | |
BIS Industries Ltd. (D)(E) | | | 1,605 | | | $ | 31 | |
| | | | | | | | |
| | |
Total Industrials – 0.0% | | | | | | | 31 | |
| |
TOTAL COMMON STOCKS – 2.1% | | | $ | 18,669 | |
(Cost: $18,453) | |
| |
INVESTMENT FUNDS | | | | | |
Registered Investment Companies – 2.8% | |
iShares iBoxx $ High Yield Corporate Bond ETF (C) | | | 290 | | | | 23,519 | |
| | | | | | | | |
| |
TOTAL INVESTMENT FUNDS – 2.8% | | | $ | 23,519 | |
(Cost: $25,202) | |
| |
PREFERRED STOCKS | | | | | |
Consumer Staples | |
| |
Agricultural Products – 0.0% | |
Pinnacle Agriculture Enterprises
LLC (A)(D)(E) | | | 4,583 | | | | 410 | |
| | | | | | | | |
| |
Total Consumer Staples – 0.0% | | | | 410 | |
Energy | |
| |
Oil & Gas Exploration & Production – 0.9% | |
Targa Resources Corp.,
9.500% (A)(E) | | | 8 | | | | 8,079 | |
| | | | | | | | |
| |
Total Energy – 0.9% | | | | 8,079 | |
| |
TOTAL PREFERRED STOCKS – 0.9% | | | $ | 8,489 | |
(Cost: $10,499) | |
| | |
WARRANTS | | | | | | | | |
Oil & Gas Exploration & Production – 0.0% | |
Sabine Oil & Gas Corp., expires12-29-29 (E)(G) | | | 1 | | | | 6 | |
| | | | | | | | |
| | | | | | | 6 | |
| | | | | | | | |
| |
TOTAL WARRANTS – 0.0% | | | $ | 6 | |
(Cost: $7) | |
| | |
| CORPORATE DEBT SECURITIES | | Principal | | | | |
Communication Services | |
| |
Advertising – 0.2% | |
Acosta, Inc., | | | | | | | | |
7.750%,10-1-22 (H) | | $ | 5,709 | | | | 1,056 | |
Outfront Media Capital LLC and Outfront Media Capital Corp., | | | | | | | | |
5.625%,2-15-24 | | | 573 | | | | 565 | |
| | | | | | | | |
| | | | | | | 1,621 | |
| | | | | | | | |
| | | | | | | | |
CORPORATE DEBT SECURITIES
(Continued) | | Principal | | | Value | |
Alternative Carriers – 0.2% | |
Consolidated Communications Finance II Co., | | | | | | | | |
6.500%,10-1-22 | | $ | 2,433 | | | $ | 2,141 | |
| | | | | | | | |
| |
Broadcasting – 2.9% | |
Clear Channel International B.V., | | | | | | | | |
8.750%,12-15-20 (H) | | | 725 | | | | 730 | |
Clear Channel Outdoor Holdings, Inc., | | | | | | | | |
6.500%,11-15-22 | | | 9,435 | | | | 9,406 | |
Clear Channel Worldwide Holdings, Inc., Series A, | | | | | | | | |
7.625%,3-15-20 | | | 101 | | | | 99 | |
Clear Channel Worldwide Holdings, Inc., Series B, | | | | | | | | |
7.625%,3-15-20 | | | 4,089 | | | | 3,987 | |
Sirius XM Radio, Inc.: | | | | | | | | |
4.625%,5-15-23 (H) | | | 2,524 | | | | 2,417 | |
6.000%,7-15-24 (H) | | | 8,000 | | | | 8,020 | |
| | | | | | | | |
| | | | | | | 24,659 | |
| | | | | | | | |
| |
Cable & Satellite – 9.4% | |
Altice Financing S.A.: | | | | | | | | |
6.625%,2-15-23 (H) | | | 1,725 | | | | 1,656 | |
7.500%,5-15-26 (H) | | | 4,462 | | | | 4,072 | |
Altice France S.A.: | | | | | | | | |
7.375%,5-1-26 (H) | | | 7,396 | | | | 6,786 | |
8.125%,2-1-27 (H) | | | 6,013 | | | | 5,667 | |
Altice S.A.: | | | | | | | | |
7.250%,5-15-22 (H)(I) | | | EUR256 | | | | 272 | |
7.750%,5-15-22 (C)(H) | | $ | 16,145 | | | | 14,692 | |
6.250%,2-15-25 (H)(I) | | | EUR354 | | | | 322 | |
7.625%,2-15-25 (C)(H) | | $ | 7,307 | | | | 5,462 | |
Altice U.S. Finance I Corp.: | | | | | | | | |
5.375%,7-15-23 (H) | | | 3,161 | | | | 3,085 | |
5.500%,5-15-26 (H) | | | 2,745 | | | | 2,587 | |
Block Communications, Inc., | | | | | | | | |
6.875%,2-15-25 (H) | | | 609 | | | | 610 | |
CCO Holdings LLC and CCO Holdings Capital Corp.: | | | | | | | | |
5.500%,5-1-26 (H) | | | 1,187 | | | | 1,141 | |
5.000%,2-1-28 (H) | | | 4,233 | | | | 3,894 | |
CSC Holdings LLC, | | | | | | | | |
5.375%,2-1-28 (H) | | | 4,930 | | | | 4,534 | |
DISH DBS Corp.: | | | | | | | | |
5.875%,7-15-22 | | | 2,310 | | | | 2,125 | |
5.875%,11-15-24 | | | 1,724 | | | | 1,388 | |
7.750%,7-1-26 | | | 2,821 | | | | 2,334 | |
Neptune Finco Corp.: | | | | | | | | |
10.125%,1-15-23 (H) | | | 4,123 | | | | 4,435 | |
6.625%,10-15-25 (H) | | | 788 | | | | 798 | |
10.875%,10-15-25 (H) | | | 2,746 | | | | 3,084 | |
VTR Finance B.V., | | | | | | | | |
6.875%,1-15-24 (H) | | | 10,196 | | | | 10,196 | |
| | | | | | | | |
| | | | | | | 79,140 | |
| | | | | | | | |
| |
Integrated Telecommunication Services – 4.7% | |
Frontier Communications Corp.: | | | | | | | | |
6.875%,1-15-25 | | | 5,773 | | | | 2,930 | |
11.000%,9-15-25 (C) | | | 8,236 | | | | 5,127 | |
8.500%,4-1-26 (H) | | | 3,126 | | | | 2,735 | |
| | |
| SCHEDULE OF INVESTMENTS | | HIGH INCOME (in thousands) |
DECEMBER 31, 2018
| | | | | | | | |
CORPORATE DEBT SECURITIES
(Continued) | | Principal | | | Value | |
Integrated Telecommunication Services (Continued) | |
GCI, Inc., | | | | | | | | |
6.875%,4-15-25 | | $ | 4,808 | | | $ | 4,664 | |
Olympus Merger Sub, Inc., | | | | | | | | |
8.500%,10-15-25 (H) | | | 15,487 | | | | 12,157 | |
Sprint Corp.: | | | | | | | | |
7.250%,9-15-21 | | | 4,315 | | | | 4,416 | |
7.875%,9-15-23 | | | 3,652 | | | | 3,748 | |
7.125%,6-15-24 | | | 2,049 | | | | 2,031 | |
7.625%,3-1-26 | | | 1,879 | | | | 1,855 | |
| | | | | | | | |
| | | | | | | 39,663 | |
| | | | | | | | |
| |
Movies & Entertainment – 0.2% | |
WMG Acquisition Corp., | | | | | | | | |
5.500%,4-15-26 (H) | | | 1,878 | | | | 1,793 | |
| | | | | | | | |
| |
Publishing – 0.4% | |
E.W. Scripps Co., | | | | | | | | |
5.125%,5-15-25 (H) | | | 351 | | | | 322 | |
MDC Partners, Inc., | | | | | | | | |
6.500%,5-1-24 (H) | | | 3,426 | | | | 3,118 | |
| | | | | | | | |
| | | | | | | 3,440 | |
| | | | | | | | |
| |
Wireless Telecommunication Service – 0.6% | |
Digicel Group Ltd.: | | | | | | | | |
8.250%,9-30-20 (H) | | | 1,566 | | | | 1,057 | |
7.125%,4-1-22 (H) | | | 1,280 | | | | 595 | |
Digicel Ltd., | | | | | | | | |
6.750%,3-1-23 (H) | | | 1,655 | | | | 1,309 | |
Sable International Finance Ltd., | | | | | | | | |
6.875%,8-1-22 (H) | | | 1,571 | | | | 1,603 | |
Sprint Nextel Corp., | | | | | | | | |
11.500%,11-15-21 | | | 389 | | | | 441 | |
| | | | | | | | |
| | | | | | | 5,005 | |
| | | | | | | | |
| |
Total Communication Services – 18.6% | | | | 157,462 | |
Consumer Discretionary | |
| |
Automotive Retail – 0.5% | |
Allison Transmission, Inc., | | | | | | | | |
5.000%,10-1-24 (H) | | | 781 | | | | 750 | |
Penske Automotive Group, Inc., | | | | | | | | |
5.500%,5-15-26 (C) | | | 474 | | | | 441 | |
Sonic Automotive, Inc., | | | | | | | | |
5.000%,5-15-23 | | | 3,603 | | | | 3,269 | |
| | | | | | | | |
| | | | | | | 4,460 | |
| | | | | | | | |
| |
Casinos & Gaming – 2.4% | |
Everi Payments, Inc., | | | | | | | | |
7.500%,12-15-25 (H) | | | 4,320 | | | | 4,088 | |
Gateway Casinos & Entertainment Ltd., 8.250%,3-1-24 (H) | | | 2,588 | | | | 2,627 | |
Golden Nugget, Inc.: | | | | | | | | |
6.750%,10-15-24 (H) | | | 6,150 | | | | 5,796 | |
8.750%,10-1-25 (H) | | | 1,021 | | | | 983 | |
Stars Group Holdings B.V. and Stars Group (U.S.)Co-Borrower LLC, | | | | | | | | |
7.000%,7-15-26 (H) | | | 2,529 | | | | 2,459 | |
Studio City Finance Ltd., | | | | | | | | |
8.500%,12-1-20 (H) | | | 1,276 | | | | 1,276 | |
| | | | | | | | |
CORPORATE DEBT SECURITIES
(Continued) | | Principal | | | Value | |
Casinos & Gaming(Continued) | |
Wynn Macau Ltd.: | | | | | | | | |
4.875%,10-1-24 (H) | | $ | 855 | | | $ | 761 | |
5.500%,10-1-27 (H) | | | 2,301 | | | | 2,002 | |
| | | | | | | | |
| | | | | | | 19,992 | |
| | | | | | | | |
| |
Education Services – 2.4% | |
Laureate Education, Inc., | | | | | | | | |
8.250%,5-1-25 (H) | | | 19,228 | | | | 20,189 | |
| | | | | | | | |
| |
Hotels, Resorts & Cruise Lines – 0.3% | |
Boyne USA, Inc., | | | | | | | | |
7.250%,5-1-25 (H) | | | 2,468 | | | | 2,548 | |
| | | | | | | | |
| |
Leisure Facilities – 0.2% | |
Cedar Fair L.P., Magnum Management Corp., Canada’s Wonderland Co. and Millennium Operations LLC, | | | | | | | | |
5.375%,4-15-27 | | | 2,137 | | | | 2,019 | |
| | | | | | | | |
| |
Restaurants – 0.5% | |
1011778 B.C. Unlimited Liability Co. and New Red Finance, Inc., | | | | | | | | |
5.000%,10-15-25 (H) | | | 4,838 | | | | 4,451 | |
| | | | | | | | |
| |
Specialized Consumer Services – 0.4% | |
Nielsen Co. (Luxembourg) S.a.r.l. (The), | | | | | | | | |
5.500%,10-1-21 (H) | | | 2,371 | | | | 2,347 | |
Nielsen Finance LLC and Nielsen Finance Co., | | | | | | | | |
5.000%,4-15-22 (H) | | | 896 | | | | 856 | |
| | | | | | | | |
| | | | | | | 3,203 | |
| | | | | | | | |
| |
Specialty Stores – 1.2% | |
Arch Merger Sub, Inc., | | | | | | | | |
8.500%,9-15-25 (H) | | | 7,241 | | | | 6,533 | |
Cumberland Farms, Inc., | | | | | | | | |
6.750%,5-1-25 (H) | | | 1,904 | | | | 1,923 | |
Party City Holdings, Inc., | | | | | | | | |
6.625%,8-1-26 (C)(H) | | | 1,912 | | | | 1,740 | |
| | | | | | | | |
| | | | | | | 10,196 | |
| | | | | | | | |
| |
Total Consumer Discretionary – 7.9% | | | | 67,058 | |
Consumer Staples | |
| |
Food Distributors – 0.7% | |
Performance Food Group, Inc., | | | | | | | | |
5.500%,6-1-24 (H) | | | 2,754 | | | | 2,665 | |
U.S. Foods, Inc., | | | | | | | | |
5.875%,6-15-24 (H) | | | 2,910 | | | | 2,830 | |
| | | | | | | | |
| | | | | | | 5,495 | |
| | | | | | | | |
| |
Packaged Foods & Meats – 3.9% | |
JBS USA LLC and JBS USA Finance, Inc.: | | | | | | | | |
5.875%,7-15-24 (H) | | | 5,436 | | | | 5,327 | |
5.750%,6-15-25 (C)(H) | | | 4,378 | | | | 4,181 | |
| | | | | | | | |
CORPORATE DEBT SECURITIES
(Continued) | | Principal | | | Value | |
Packaged Foods & Meats(Continued) | |
JBS USA Lux S.A. and JBS USA Finance, Inc., | | | | | | | | |
6.750%,2-15-28 (H) | | $ | 3,115 | | | $ | 3,037 | |
Pilgrim’s Pride Corp.: | | | | | | | | |
5.750%,3-15-25 (H) | | | 881 | | | | 826 | |
5.875%,9-30-27 (H) | | | 3,082 | | | | 2,797 | |
Post Holdings, Inc.: | | | | | | | | |
5.500%,3-1-25 (H) | | | 781 | | | | 750 | |
5.000%,8-15-26 (H) | | | 1,267 | | | | 1,153 | |
5.750%,3-1-27 (H) | | | 5,618 | | | | 5,267 | |
Simmons Foods, Inc.: | | | | | | | | |
7.750%,1-15-24 (C)(H) | | | 1,656 | | | | 1,664 | |
5.750%,11-1-24 (C)(H) | | | 10,900 | | | | 7,739 | |
| | | | | | | | |
| | | | | | | 32,741 | |
| | | | | | | | |
| |
Total Consumer Staples – 4.6% | | | | 38,236 | |
Energy | |
| |
Oil & Gas Drilling – 1.2% | |
Ensco plc, | | | | | | | | |
7.750%,2-1-26 | | | 2,484 | | | | 1,838 | |
KCA Deutag UK Finance plc, | | | | | | | | |
7.250%,5-15-21 (H) | | | 5,209 | | | | 4,220 | |
Offshore Drilling Holding S.A., | | | | | | | | |
8.375%,9-20-20 (H)(J) | | | 8,682 | | | | 4,395 | |
Offshore Group Investment Ltd., | | | | | | | | |
0.000%,11-1-19 (D)(K) | | | 1,693 | | | | — | * |
| | | | | | | | |
| | | | | | | 10,453 | |
| | | | | | | | |
| |
Oil & Gas Equipment & Services – 0.9% | |
Brand Energy & Infrastructure Services, Inc., | | | | | | | | |
8.500%,7-15-25 (H) | | | 3,292 | | | | 2,807 | |
McDermott Escrow 1, Inc. and McDermott Escrow 2, Inc., | | | | | | | | |
10.625%,5-1-24 (H) | | | 2,193 | | | | 1,850 | |
Nine Energy Service, Inc., | | | | | | | | |
8.750%,11-1-23 (H) | | | 1,917 | | | | 1,821 | |
SESI LLC, | | | | | | | | |
7.125%,12-15-21 | | | 906 | | | | 770 | |
| | | | | | | | |
| | | | | | | 7,248 | |
| | | | | | | | |
| |
Oil & Gas Exploration & Production – 3.8% | |
Bellatrix Exploration Ltd., | | | | | | | | |
8.500%,5-15-20 (H) | | | 2,965 | | | | 1,660 | |
Chesapeake Energy Corp.: | | | | | | | | |
7.000%,10-1-24 (C) | | | 4,475 | | | | 3,871 | |
8.000%,1-15-25 (C) | | | 377 | | | | 332 | |
Crownrock L.P., | | | | | | | | |
5.625%,10-15-25 (H) | | | 7,521 | | | | 6,769 | |
Endeavor Energy Resources L.P.: | | | | | | | | |
5.500%,1-30-26 (H) | | | 2,453 | | | | 2,514 | |
5.750%,1-30-28 (H) | | | 1,789 | | | | 1,825 | |
Extraction Oil & Gas, Inc., | | | | | | | | |
5.625%,2-1-26 (H) | | | 3,370 | | | | 2,460 | |
Laredo Petroleum, Inc., | | | | | | | | |
6.250%,3-15-23 | | | 821 | | | | 737 | |
Parsley Energy LLC and Parsley Finance Corp., | | | | | | | | |
5.625%,10-15-27 (H) | | | 1,752 | | | | 1,592 | |
| | |
| SCHEDULE OF INVESTMENTS | | HIGH INCOME (in thousands) |
DECEMBER 31, 2018
| | | | | | | | |
CORPORATE DEBT SECURITIES
(Continued) | | Principal | | | Value | |
Oil & Gas Exploration & Production(Continued) | |
Sanchez Energy Corp., | | | | | | | | |
7.250%,2-15-23 (C)(H) | | $ | 622 | | | $ | 507 | |
Seven Generations Energy Ltd.: | | | | | | | | |
6.750%,5-1-23 (H) | | | 5,646 | | | | 5,590 | |
5.375%,9-30-25 (H) | | | 2,523 | | | | 2,258 | |
Ultra Resources, Inc., | | | | | | | | |
6.875%,4-15-22 (H) | | | 1,396 | | | | 489 | |
Whiting Petroleum Corp., | | | | | | | | |
6.625%,1-15-26 | | | 1,239 | | | | 1,062 | |
| | | | | | | | |
| | | | | | | 31,666 | |
| | | | | | | | |
| |
Oil & Gas Refining & Marketing – 1.7% | |
Callon Petroleum Co. (GTD by Callon Petroleum Operating Co.): | | | | | | | | |
6.125%,10-1-24 | | | 1,081 | | | | 1,005 | |
6.375%,7-1-26 | | | 386 | | | | 359 | |
Comstock Escrow Corp., | | | | | | | | |
9.750%,8-15-26 (H) | | | 10,817 | | | | 9,140 | |
EP Energy LLC and Everest Acquisition Finance, Inc.: | | | | | | | | |
9.375%,5-1-24 (H) | | | 652 | | | | 290 | |
8.000%,2-15-25 (H) | | | 1,386 | | | | 572 | |
7.750%,5-15-26 (H) | | | 1,933 | | | | 1,711 | |
QEP Resources, Inc., | | | | | | | | |
5.625%,3-1-26 (C) | | | 1,599 | | | | 1,327 | |
| | | | | | | | |
| | | | | | | 14,404 | |
| | | | | | | | |
| |
Total Energy – 7.6% | | | | 63,771 | |
Financials | |
| |
Consumer Finance – 0.9% | |
CURO Group Holdings Corp., | | | | | | | | |
8.250%,9-1-25 (H) | | | 3,179 | | | | 2,495 | |
Quicken Loans, Inc., | | | | | | | | |
5.750%,5-1-25 (H) | | | 5,176 | | | | 4,840 | |
| | | | | | | | |
| | | | | | | 7,335 | |
| | | | | | | | |
Financial Exchanges & Data – 1.2% | |
Financial & Risk U.S. Holdings, Inc.: | | | | | | | | |
6.250%,5-15-26 (H) | | | 2,561 | | | | 2,472 | |
8.250%,11-15-26 (H) | | | 8,449 | | | | 7,720 | |
| | | | | | | | |
| | | | | | | 10,192 | |
| | | | | | | | |
Insurance Brokers – 1.1% | |
NFP Corp., | | | | | | | | |
6.875%,7-15-25 (H) | | | 10,370 | | | | 9,281 | |
| | | | | | | | |
Investment Banking & Brokerage – 0.1% | |
VHF Parent LLC, | | | | | | | | |
6.750%,6-15-22 (H) | | | 824 | | | | 800 | |
| | | | | | | | |
Other Diversified Financial Services – 3.4% | |
Balboa Merger Sub, Inc., | | | | | | | | |
11.375%,12-1-21 (H) | | | 9,982 | | | | 10,456 | |
Icahn Enterprises L.P. and Icahn Enterprises Finance Corp.: | | | | | | | | |
6.250%,2-1-22 | | | 3,681 | | | | 3,635 | |
6.375%,12-15-25 | | | 1,227 | | | | 1,181 | |
| | | | | | | | |
CORPORATE DEBT SECURITIES
(Continued) | | Principal | | | Value | |
Other Diversified Financial Services(Continued) | |
New Cotai LLC and New Cotai Capital Corp. (10.625% Cash or 10.625% PIK), | | | | | | | | |
10.625%,5-1-19 (H)(L) | | $ | 24,779 | | | $ | 13,628 | |
| | | | | | | | |
| | | | | | | 28,900 | |
| | | | | | | | |
Property & Casualty Insurance – 1.0% | |
Amwins Group, Inc., | | | | | | | | |
7.750%,7-1-26 (H) | | | 3,153 | | | | 2,980 | |
Hub International Ltd., | | | | | | | | |
7.000%,5-1-26 (H) | | | 6,394 | | | | 5,802 | |
| | | | | | | | |
| | | | | | | 8,782 | |
| | | | | | | | |
Specialized Finance – 1.3% | |
Compass Group Diversified Holdings LLC, | | | | | | | | |
8.000%,5-1-26 (H) | | | 2,534 | | | | 2,509 | |
Hadrian Merger Sub, Inc., | | | | | | | | |
8.500%,5-1-26 (H) | | | 4,714 | | | | 4,242 | |
Tervita Escrow Corp., | | | | | | | | |
7.625%,12-1-21 (H) | | | 1,289 | | | | 1,228 | |
TMX Finance LLC and TitleMax Finance Corp., | | | | | | | | |
11.125%,4-1-23 (H) | | | 3,903 | | | | 3,141 | |
| | | | | | | | |
| | | | | | | 11,120 | |
| | | | | | | | |
Thrifts & Mortgage Finance – 0.3% | |
Provident Funding Associates L.P. and PFG Finance Corp., | | | | | | | | |
6.375%,6-15-25 (H) | | | 2,943 | | | | 2,649 | |
| | | | | | | | |
| |
Total Financials – 9.3% | | | | 79,059 | |
Health Care | |
| |
Health Care Facilities – 2.2% | |
DaVita HealthCare Partners, Inc., | | | | | | | | |
5.125%,7-15-24 | | | 548 | | | | 514 | |
MPH Acquisition Holdings LLC, | | | | | | | | |
7.125%,6-1-24 (H) | | | 1,906 | | | | 1,777 | |
RegionalCare Hospital Partners Holdings, Inc. and Legend Merger Sub, Inc., | | | | | | | | |
9.750%,12-1-26 (H) | | | 12,908 | | | | 12,230 | |
Surgery Center Holdings, Inc., | | | | | | | | |
8.875%,4-15-21(C) (H) | | | 4,607 | | | | 4,596 | |
| | | | | | | | |
| | | | | | | 19,117 | |
| | | | | | | | |
Health Care Supplies – 0.2% | |
Kinetic Concepts, Inc. and KCI USA, Inc., | | | | | | | | |
12.500%,11-1-21 (H) | | | 465 | | | | 498 | |
Universal Hospital Services, Inc., | | | | | | | | |
7.625%,8-15-20 | | | 797 | | | | 791 | |
| | | | | | | | |
| | | | | | | 1,289 | |
| | | | | | | | |
Health Care Technology – 1.1% | |
Verscend Holding Corp., | | | | | | | | |
9.750%,8-15-26 (H) | | | 9,914 | | | | 9,319 | |
| | | | | | | | |
| | | | | | | | |
CORPORATE DEBT SECURITIES
(Continued) | | Principal | | | Value | |
Life Sciences Tools & Services – 1.1% | |
Avantor, Inc.: | | | | | | | | |
6.000%,10-1-24 (H) | | $ | 2,149 | | | $ | 2,111 | |
9.000%,10-1-25 (H) | | | 6,976 | | | | 6,976 | |
| | | | | | | | |
| | | | | | | 9,087 | |
| | | | | | | | |
Pharmaceuticals – 1.6% | |
Advanz Pharma Corp., | | | | | | | | |
8.000%,9-6-24 (C) | | | 430 | | | | 409 | |
HLF Financing S.a.r.l. LLC and Herbalife International, Inc., | | | | | | | | |
7.250%,8-15-26 (H) | | | 891 | | | | 877 | |
Jaguar Holding Co. II and Pharmaceutical Product Development LLC, | | | | | | | | |
6.375%,8-1-23 (H) | | | 2,117 | | | | 2,023 | |
Valeant Pharmaceuticals International, Inc.: | | | | | | | | |
5.500%,3-1-23 (H) | | | 117 | | | | 107 | |
5.500%,11-1-25 (H) | | | 1,252 | | | | 1,167 | |
9.000%,12-15-25 (H) | | | 855 | | | | 851 | |
9.250%,4-1-26 (H) | | | 2,515 | | | | 2,515 | |
8.500%,1-31-27 (H) | | | 1,934 | | | | 1,876 | |
VRX Escrow Corp.: | | | | | | | | |
5.875%,5-15-23 (H) | | | 1,882 | | | | 1,741 | |
6.125%,4-15-25 (H) | | | 1,727 | | | | 1,507 | |
| | | | | | | | |
| | | | | | | 13,073 | |
| | | | | | | | |
| |
Total Health Care – 6.2% | | | | 51,885 | |
Industrials | |
| |
Aerospace & Defense – 1.9% | |
TransDigm UK Holdings plc, | | | | | | | | |
6.875%,5-15-26 (H) | | | 2,171 | | | | 2,068 | |
TransDigm, Inc. (GTD by TransDigm Group, Inc.): | | | | | | | | |
6.000%,7-15-22 | | | 5,075 | | | | 4,954 | |
6.500%,7-15-24 | | | 6,077 | | | | 5,910 | |
6.500%,5-15-25 | | | 1,162 | | | | 1,110 | |
6.375%,6-15-26 | | | 2,490 | | | | 2,316 | |
| | | | | | | | |
| | | | | | | 16,358 | |
| | | | | | | | |
Building Products – 0.1% | |
WESCO Distribution, Inc. (GTD by WESCO International, Inc.), | | | | | | | | |
5.375%,6-15-24 | | | 953 | | | | 898 | |
| | | | | | | | |
Diversified Support Services – 0.5% | |
Ahern Rentals, Inc., | | | | | | | | |
7.375%,5-15-23 (H) | | | 3,901 | | | | 3,121 | |
United Rentals (North America), Inc. (GTD by United Rentals, Inc.), | | | | | | | | |
5.875%,9-15-26 | | | 472 | | | | 445 | |
| | | | | | | | |
| | | | | | | 3,566 | |
| | | | | | | | |
Environmental & Facilities Services – 1.0% | |
GFL Environmental, Inc.: | | | | | | | | |
5.625%,5-1-22 (H) | | | 820 | | | | 757 | |
5.375%,3-1-23 (H) | | | 4,399 | | | | 3,849 | |
7.000%,6-1-26 (H) | | | 3,835 | | | | 3,346 | |
| | |
| SCHEDULE OF INVESTMENTS | | HIGH INCOME (in thousands) |
DECEMBER 31, 2018
| | | | | | | | |
CORPORATE DEBT SECURITIES (Continued) | | Principal | | | Value | |
Environmental & Facilities Services(Continued) | |
Waste Pro USA, Inc., | | | | | | | | |
5.500%,2-15-26 (H) | | $ | 482 | | | $ | 443 | |
| | | | | | | | |
| | | | | | | 8,395 | |
| | | | | | | | |
Industrial Machinery – 0.1% | |
Apex Tool Group LLC and BC Mountain Finance, Inc., | | | | | | | | |
9.000%,2-15-23 (H) | | | 1,245 | | | | 1,052 | |
| | | | | | | | |
Security & Alarm Services – 0.9% | |
Prime Security Services Borrower LLC, | | | | | | | | |
9.250%,5-15-23 (H) | | | 7,504 | | | | 7,738 | |
| | | | | | | | |
| |
Total Industrials – 4.5% | | | | 38,007 | |
Information Technology | |
| |
Application Software – 1.3% | |
Kronos Acquisition Holdings, Inc., | | | | | | | | |
9.000%,8-15-23 (H) | | | 13,902 | | | | 10,670 | |
| | | | | | | | |
Data Processing & Outsourced Services – 2.3% | |
Alliance Data Systems Corp., | | | | | | | | |
5.375%,8-1-22 (H) | | | 6,395 | | | | 6,235 | |
Italics Merger Sub, Inc., | | | | | | | | |
7.125%,7-15-23 (H) | | | 12,951 | | | | 12,613 | |
j2 Cloud Services LLC and j2 Global, Inc., | | | | | | | | |
6.000%,7-15-25 (H) | | | 1,192 | | | | 1,165 | |
| | | | | | | | |
| | | | | | | 20,013 | |
| | | | | | | | |
IT Consulting & Other Services – 1.5% | |
Cardtronics, Inc. and Cardtronics USA, Inc., | | | | | | | | |
5.500%,5-1-25 (H) | | | 687 | | | | 635 | |
NCR Escrow Corp.: | | | | | | | | |
5.875%,12-15-21 | | | 4,719 | | | | 4,601 | |
6.375%,12-15-23 | | | 4,266 | | | | 4,135 | |
Pioneer Holding Corp., | | | | | | | | |
9.000%,11-1-22 (H) | | | 3,739 | | | | 3,758 | |
| | | | | | | | |
| | | | | | | 13,129 | |
| | | | | | | | |
| |
Total Information Technology – 5.1% | | | | 43,812 | |
Materials | |
| |
Aluminum – 1.4% | |
Constellium N.V.: | | | | | | | | |
5.750%,5-15-24 (H) | | | 3,551 | | | | 3,267 | |
6.625%,3-1-25 (H) | | | 4,140 | | | | 3,840 | |
5.875%,2-15-26 (H) | | | 2,322 | | | | 2,066 | |
Novelis Corp. (GTD by Novelis, Inc.): | | | | | | | | |
6.250%,8-15-24 (H) | | | 1,471 | | | | 1,383 | |
5.875%,9-30-26 (H) | | | 985 | | | | 872 | |
| | | | | | | | |
| | | | | | | 11,428 | |
| | | | | | | | |
| | | | | | | | |
CORPORATE DEBT
SECURITIES (Continued) | | Principal | | | Value | |
Commodity Chemicals – 0.5% | |
NOVA Chemicals Corp.: | | | | | | | | |
4.875%,6-1-24 (H) | | $ | 2,943 | | | $ | 2,656 | |
5.250%,6-1-27 (H) | | | 1,177 | | | | 1,042 | |
| | | | | | | | |
| | | | | | | 3,698 | |
| | | | | | | | |
Construction Materials – 0.6% | |
Hillman Group, Inc. (The), | | | | | | | | |
6.375%,7-15-22 (H) | | | 6,615 | | | | 5,358 | |
| | | | | | | | |
Fertilizers & Agricultural Chemicals – 0.5% | |
Pinnacle Operating Corp., | | | | | | | | |
9.000%,5-15-23 (H) | | | 6,601 | | | | 4,291 | |
| | | | | | | | |
Metal & Glass Containers – 0.3% | |
ARD Finance S.A. (7.125% Cash or 7.875% PIK), | | | | | | | | |
7.125%,9-15-23 (L) | | | 548 | | | | 492 | |
ARD Securities Finance S.a.r.l. (8.750% Cash or 8.750% PIK), | | | | | | | | |
8.750%,1-31-23 (H)(L) | | | 1,516 | | | | 1,281 | |
HudBay Minerals, Inc.: | | | | | | | | |
7.250%,1-15-23 (H) | | | 408 | | | | 403 | |
7.625%,1-15-25 (H) | | | 611 | | | | 597 | |
| | | | | | | | |
| | | | | | | 2,773 | |
| | | | | | | | |
Paper Packaging – 0.1% | |
Flex Acquisition Co., Inc., | | | | | | | | |
6.875%,1-15-25 (H) | | | 727 | | | | 647 | |
| | | | | | | | |
Specialty Chemicals – 0.1% | |
Kraton Polymers LLC and Kraton Polymers Capital Corp., | | | | | | | | |
7.000%,4-15-25 (C)(H) | | | 1,082 | | | | 995 | |
| | | | | | | | |
| |
Total Materials – 3.5% | | | | 29,190 | |
| |
TOTAL CORPORATE DEBT SECURITIES – 67.3% | | | $ | 568,480 | |
(Cost: $634,187) | |
| | |
| LOANS(M) | | | | | | |
Communication Services | |
| |
Advertising – 0.4% | |
Advantage Sales & Marketing, Inc. (ICE LIBOR plus 325 bps), | | | | | | | | |
5.772%,7-25-21 | | | 798 | | | | 703 | |
Advantage Sales & Marketing, Inc. (ICE LIBOR plus 650 bps), | | | | | | | | |
9.022%,7-25-22 | | | 3,371 | | | | 2,629 | |
| | | | | | | | |
| | | | | | | 3,332 | |
| | | | | | | | |
Broadcasting – 0.1% | |
MLN U.S. Holdco LLC, | | | | | | | | |
0.000%,11-30-26 (N) | | | 529 | | | | 515 | |
| | | | | | | | |
| | | | | | | | |
LOANS(M) (Continued) | | Principal | | | Value | |
Cable & Satellite – 0.0% | |
Liberty Cablevision of Puerto Rico LLC (ICE LIBOR plus 350 bps), | | | | | | | | |
5.936%,1-7-22 | | $ | 96 | | | $ | 92 | |
| | | | | | | | |
Integrated Telecommunication Services – 0.9% | |
West Corp.(3-Month ICE LIBOR plus 400 bps), | | | | | | | | |
6.527%,10-10-24 | | | 8,296 | | | | 7,597 | |
| | | | | | | | |
Publishing – 0.1% | |
Recorded Books, Inc. (ICE LIBOR plus 450 bps), | | | | | | | | |
7.303%,8-31-25 | | | 1,141 | | | | 1,121 | |
| | | | | | | | |
Wireless Telecommunication Service – 0.1% | |
Digicel International Finance Ltd. (ICE LIBOR plus 325 bps), | | | | | | | | |
5.960%,5-10-24 | | | 653 | | | | 591 | |
| | | | | | | | |
| |
Total Communication Services – 1.6% | | | | 13,248 | |
Consumer Discretionary | |
| |
Apparel Retail – 1.1% | |
Talbots, Inc. (The) (ICE LIBOR plus 700 bps), | | | | | | | | |
9.506%,11-28-22 (D) | | | 7,763 | | | | 7,647 | |
TRLG Intermediate Holdings LLC, | | | | | | | | |
10.000%,10-27-22 | | | 1,537 | | | | 1,465 | |
| | | | | | | | |
| | | | | | | 9,112 | |
| | | | | | | | |
Education Services – 0.7% | |
Laureate Education, Inc. (ICE LIBOR plus 350 bps), | | | | | | | | |
6.027%,4-26-24 | | | 6,451 | | | | 6,313 | |
| | | | | | | | |
Housewares & Specialties – 0.3% | |
KIK Custom Products, Inc. (ICE LIBOR plus 400 bps), | | | | | | | | |
6.552%,5-15-23 | | | 2,573 | | | | 2,420 | |
| | | | | | | | |
Restaurants – 0.5% | |
NPC International, Inc. (ICE LIBOR plus 350 bps), | | | | | | | | |
6.022%,4-20-24 | | | 799 | | | | 745 | |
NPC International, Inc. (ICE LIBOR plus 750 bps), | | | | | | | | |
10.022%,4-18-25 | | | 3,326 | | | | 3,110 | |
| | | | | | | | |
| | | | | | | 3,855 | |
| | | | | | | | |
Specialized Consumer Services – 0.2% | |
Asurion LLC (ICE LIBOR plus 600 bps), | | | | | | | | |
9.022%,8-4-25 | | | 1,861 | | | | 1,837 | |
| | | | | | | | |
Specialty Stores – 0.9% | |
Jo-Ann Stores, Inc. (ICE LIBOR plus 500 bps), | | | | | | | | |
7.477%,10-16-23 | | | 2,661 | | | | 2,524 | |
Jo-Ann Stores, Inc. (ICE LIBOR plus 925 bps), | | | | | | | | |
11.727%,5-21-24 | | | 5,394 | | | | 5,205 | |
| | | | | | | | |
| | | | | | | 7,729 | |
| | | | | | | | |
| | |
| SCHEDULE OF INVESTMENTS | | HIGH INCOME (in thousands) |
DECEMBER 31, 2018
| | | | | | | | |
| LOANS(M)(Continued) | | Principal | | | Value | |
Textiles – 0.4% | |
SIWF Holdings, Inc. (ICE LIBOR plus 425 bps), | | | | | | | | |
6.720%,6-15-25 | | $ | 3,850 | | | $ | 3,732 | |
| | | | | | | | |
| |
Total Consumer Discretionary – 4.1% | | | | 34,998 | |
Consumer Staples | |
Hypermarkets & Super Centers – 0.4% | |
GOBP Holdings, Inc. (ICE LIBOR plus 375 bps), 6.553%,10-22-25 | | | 2,110 | | | | 2,054 | |
GOBP Holdings, Inc. (ICE LIBOR plus 725 bps), 10.053%,10-22-26 | | | 1,406 | | | | 1,381 | |
| | | | | | | | |
| | | | | | | 3,435 | |
| | | | | | | | |
| |
Total Consumer Staples – 0.4% | | | | 3,435 | |
Energy | |
| |
Coal & Consumable Fuels – 1.1% | |
Foresight Energy LLC (ICE LIBOR plus 725 bps), | | | | | | | | |
8.277%,3-28-22 | | | 7,134 | | | | 6,970 | |
Westmoreland Coal Co., | | | | | | | | |
0.000%,5-22-19 (N) | | | 144 | | | | 144 | |
Westmoreland Coal Co. (ICE LIBOR plus 650 bps), | | | | | | | | |
8.834%,12-16-20 (O) | | | 3,865 | | | | 1,477 | |
Westmoreland Coal Co. (ICE LIBOR plus 825 bps), | | | | | | | | |
10.896%,5-21-19 | | | 650 | | | | 647 | |
| | | | | | | | |
| | | | | | | 9,238 | |
| | | | | | | | |
Oil & Gas Equipment & Services – 0.1% | |
Larchmont Resources LLC (9.770% Cash or 9.770% PIK), | | | | | | | | |
9.770%,8-7-20 (D)(F)(L) | | | 817 | | | | 792 | |
| | | | | | | | |
Oil & Gas Exploration & Production – 0.2% | |
California Resources Corp. (ICE LIBOR plus 475 bps), | | | | | | | | |
7.256%,12-31-22 | | | 1,928 | | | | 1,864 | |
| | | | | | | | |
Oil & Gas Storage & Transportation – 0.6% | |
Bowie Resources Holdings LLC (ICE LIBOR plus 1,075 bps), | | | | | | | | |
13.457%,2-16-21 | | | 1,911 | | | | 1,799 | |
Bowie Resources Holdings LLC (ICE LIBOR plus 575 bps), | | | | | | | | |
8.457%,8-12-20 | | | 3,327 | | | | 3,227 | |
| | | | | | | | |
| | | | | | | 5,026 | |
| | | | | | | | |
| |
Total Energy – 2.0% | | | | 16,920 | |
Financials | |
| |
Asset Management & Custody Banks – 0.5% | |
Edelman Financial Holdings II, Inc. (ICE LIBOR plus 675 bps), | | | | | | | | |
9.186%,7-20-26 (D) | | | 4,048 | | | | 3,845 | |
| | | | | | | | |
Financial Exchanges & Data – 0.3% | |
Hudson River Trading LLC(3-Month U.S. LIBOR plus 350 bps), | | | | | | | | |
6.006%,4-3-25 (D) | | | 2,704 | | | | 2,643 | |
| | | | | | | | |
| | | | | | | | |
| LOANS(M)(Continued) | | Principal | | | Value | |
Insurance Brokers – 0.3% | |
NFP Corp. (ICE LIBOR plus 300 bps), | | | | | | | | |
5.522%,1-8-24 | | $ | 2,525 | | | $ | 2,383 | |
| | | | | | | | |
Investment Banking & Brokerage – 0.6% | |
Jane Street Group LLC (ICE LIBOR plus 375 bps), | | | | | | | | |
5.527%,8-25-22 | | | 5,071 | | | | 4,923 | |
| | | | | | | | |
Property & Casualty Insurance – 1.2% | |
Hub International Ltd. (ICE LIBOR plus 300 bps), | | | | | | | | |
5.240%,4-25-25 | | | 1,595 | | | | 1,503 | |
Mayfield Agency Borrower, Inc. (ICE LIBOR plus 450 bps), | | | | | | | | |
6.522%,2-28-25 | | | 8,458 | | | | 8,225 | |
| | | | | | | | |
| | | | | | | 9,728 | |
| | | | | | | | |
Specialized Finance – 0.3% | |
Mayfield Agency Borrower, Inc. (ICE LIBOR plus 850 bps), | | | | | | | | |
11.022%,2-28-26 (D) | | | 2,807 | | | | 2,751 | |
| | | | | | | | |
| |
Total Financials – 3.2% | | | | 26,273 | |
Health Care | |
| |
Health Care Equipment – 0.1% | |
LifeScan Global Corp. (ICE LIBOR plus 950 bps), | | | | | | | | |
11.896%,10-1-25 (D) | | | 632 | | | | 581 | |
| | | | | | | | |
Health Care Facilities – 1.8% | |
Gentiva Health Services, Inc. (ICE LIBOR plus 375 bps), | | | | | | | | |
6.313%,7-2-25 (D) | | | 7,397 | | | | 7,156 | |
Gentiva Health Services, Inc. (ICE LIBOR plus 700 bps), | | | | | | | | |
9.563%,7-2-26 (D) | | | 1,897 | | | | 1,888 | |
RegionalCare Hospital Partners Holdings, Inc. (ICE LIBOR plus 450 bps), | | | | | | | | |
7.129%,11-16-25 | | | 6,454 | | | | 6,107 | |
| | | | | | | | |
| | | | | | | 15,151 | |
| | | | | | | | |
Health Care Services – 0.5% | |
Heartland Dental LLC, | | | | | | | | |
0.000%,4-30-25 (N) | | | 400 | | | | 383 | |
Heartland Dental LLC (ICE LIBOR plus 375 bps), | | | | | | | | |
6.272%,4-30-25 | | | 4,373 | | | | 4,181 | |
| | | | | | | | |
| | | | | | | 4,564 | |
| | | | | | | | |
Health Care Technology – 1.0% | |
Verscend Holding Corp. (ICE LIBOR plus 450 bps), | | | | | | | | |
7.022%,8-27-25 | | | 9,030 | | | | 8,714 | |
| | | | | | | | |
Pharmaceuticals – 0.1% | |
Concordia International Corp. (ICE LIBOR plus 550 bps), | | | | | | | | |
7.887%,9-6-24 | | | 1,188 | | | | 1,130 | |
| | | | | | | | |
| |
Total Health Care – 3.5% | | | | 30,140 | |
| | | | | | | | |
| LOANS(M)(Continued) | | Principal | | | Value | |
Industrials | |
| |
Building Products – 0.2% | |
Hampton Rubber Co. & SEI Holding Corp. (ICE LIBOR plus 800 bps), | | | | | | | | |
10.522%,3-27-22 | | $ | 1,784 | | | $ | 1,597 | |
| | | | | | | | |
Construction & Engineering – 1.0% | |
McDermott Technology (Americas), Inc. (ICE LIBOR plus 500 bps), | | | | | | | | |
7.522%,5-10-25 | | | 8,492 | | | | 7,905 | |
Tensar International Corp. (ICE LIBOR plus 850 bps), | | | | | | | | |
11.303%,7-10-22 (D) | | | 1,119 | | | | 1,030 | |
| | | | | | | | |
| | | | | | | 8,935 | |
| | | | | | | | |
Diversified Support Services – 0.1% | |
USS Ultimate Holdings, Inc. (ICE LIBOR plus 775 bps), | | | | | | | | |
10.272%,8-25-25 | | | 1,208 | | | | 1,150 | |
| | | | | | | | |
Industrial Conglomerates – 0.7% | |
PAE Holding Corp. (ICE LIBOR plus 550 bps), | | | | | | | | |
8.119%,10-20-22 (D) | | | 5,184 | | | | 5,081 | |
PAE Holding Corp. (ICE LIBOR plus 950 bps), | | | | | | | | |
12.119%,10-20-23 (D) | | | 798 | | | | 778 | |
| | | | | | | | |
| | | | | | | 5,859 | |
| | | | | | | | |
Industrial Machinery – 1.5% | |
Dynacast International LLC (ICE LIBOR plus 850 bps): | | | | | | | | |
0.000%,1-30-23 (D)(N) | | | 5,491 | | | | 5,106 | |
11.303%,1-30-23 (D) | | | 7,863 | | | | 7,313 | |
| | | | | | | | |
| | | | | | | 12,419 | |
| | | | | | | | |
| |
Total Industrials – 3.5% | | | | 29,960 | |
Information Technology | |
| |
Application Software – 0.2% | |
Applied Systems, Inc. (ICE LIBOR plus 700 bps), | | | | | | | | |
9.522%,9-19-25 | | | 1,954 | | | | 1,900 | |
| | | | | | | | |
Communications Equipment – 0.4% | |
MLN U.S. Holdco LLC (ICE LIBOR plus 450 bps), | | | | | | | | |
7.022%,11-30-25 | | | 1,900 | | | | 1,837 | |
MLN U.S. Holdco LLC (ICE LIBOR plus 875 bps), | | | | | | | | |
11.272%,11-30-26 | | | 1,267 | | | | 1,232 | |
| | | | | | | | |
| | | | | | | 3,069 | |
| | | | | | | | |
Data Processing & Outsourced Services – 0.6% | |
Colorado Buyer, Inc. (ICE LIBOR plus 300 bps), | | | | | | | | |
9.630%,5-1-25 | | | 2,171 | | | | 1,986 | |
Great Dane Merger Sub, Inc. (ICE LIBOR plus 375 bps), | | | | | | | | |
6.272%,5-21-25 (D) | | | 3,177 | | | | 3,090 | |
| | | | | | | | |
| | | | | | | 5,076 | |
| | | | | | | | |
| |
Total Information Technology – 1.2% | | | | 10,045 | |
| | |
| SCHEDULE OF INVESTMENTS | | HIGH INCOME (in thousands) |
DECEMBER 31, 2018
| | | | | | | | |
| LOANS(M)(Continued) | | Principal | | | Value | |
Materials | |
| |
Construction Materials – 0.5% | |
Hillman Group, Inc. (The) (ICE LIBOR plus 350 bps), | | | | | | | | |
6.803%,5-31-25 | | $ | 4,341 | | | $ | 4,114 | |
| | | | | | | | |
Paper Packaging – 0.1% | |
Ranpak (Rack Merger) (ICE LIBOR plus 725 bps), | | | | | | | | |
9.705%,10-1-22(D) | | | 1,182 | | | | 1,173 | |
| | | | | | | | |
| |
Total Materials – 0.6% | | | | 5,287 | |
| |
TOTAL LOANS – 20.1% | | | $ | 170,306 | |
(Cost: $178,778) | |
| | |
SHORT-TERM SECURITIES | | | | | | | | |
Commercial Paper(P) – 5.1% | |
CVS Health Corp., | | | | | | | | |
2.700%,1-2-19 | | | 4,864 | | | | 4,863 | |
DTE Electric Co., | | | | | | | | |
2.955%,1-9-19 | | | 5,000 | | | | 4,997 | |
J.M. Smucker Co. (The), | | | | | | | | |
2.750%,1-2-19 | | | 5,482 | | | | 5,481 | |
McCormick & Co., Inc., | | | | | | | | |
2.733%,1-4-19 | | | 5,000 | | | | 4,999 | |
Walgreens Boots Alliance, Inc.: | | | | | | | | |
2.906%,1-9-19 | | | 15,000 | | | | 14,990 | |
2.730%,1-10-19 | | | 5,000 | | | | 4,996 | |
Wisconsin Electric Power Co., | | | | | | | | |
2.754%,1-7-19 | | | 3,000 | | | | 2,998 | |
| | | | | | | | |
| | | | | | | 43,324 | |
| | | | | | | | |
Master Note – 0.3% | |
Toyota Motor Credit Corp.(1-Month U.S. LIBOR plus 15 bps), | | | | | | | | |
2.720%,1-7-19(Q) | | | 2,620 | | | | 2,620 | |
| | | | | | | | |
Money Market Funds – 3.4% | |
Dreyfus Institutional Preferred Government Money Market Fund - Institutional Shares, | | | | | | | | |
2.400%, (R)(S) | | | 28,480 | | | | 28,480 | |
| | | | | | | | |
| |
TOTAL SHORT-TERM SECURITIES – 8.8% | | | $ | 74,424 | |
(Cost: $74,426) | |
| |
TOTAL INVESTMENT SECURITIES – 102.0% | | | $ | 863,893 | |
(Cost: $941,552) | |
| |
LIABILITIES, NET OF CASH AND OTHER ASSETS – (2.0)% | | | | (16,839 | ) |
| |
NET ASSETS – 100.0% | | | $ | 847,054 | |
| | |
| SCHEDULE OF INVESTMENTS | | HIGH INCOME (in thousands) |
DECEMBER 31, 2018
Notes to Schedule of Investments
| * | Not shown due to rounding. |
| (A) | No dividends were paid during the preceding 12 months. |
| (B) | Listed on an exchange outside the United States. |
| (C) | All or a portion of securities with an aggregate value of $31,361 are on loan. |
| (D) | Securities whose value was determined using significant unobservable inputs. |
| (E) | Restricted securities. At December 31, 2018, the Portfolio owned the following restricted securities: |
| | | | | | | | | | | | | | | | |
| Security | | Acquisition Date(s) | | | Shares | | | Cost | | | Market Value | |
BIS Industries Ltd. | | | 12-22-17 | | | | 1,605 | | | $ | 151 | | | $ | 31 | |
J.G. Wentworth Co. (The) | | | 1-25-18 | | | | 364 | | | | 3,211 | | | | 3,645 | |
Larchmont Resources LLC | | | 12-8-16 | | | | 1 | | | | 340 | | | | 252 | |
New Cotai Participation Corp., Class B | | | 4-12-13 | | | | – | * | | | 62 | | | | – | |
Sabine Oil & Gas Corp. | | | 12-7-16 | | | | – | * | | | 11 | | | | 12 | |
Pinnacle Agriculture Enterprises LLC | | | 3-10-17 | | | | 4,583 | | | | 2,083 | | | | 410 | |
Targa Resources Corp., 9.500% | | | 10-24-17 | | | | 8 | | | | 8,416 | | | | 8,079 | |
Sabine Oil & Gas Corp., expires12-29-29 | | | 12-7-16 | | | | 1 | | | | 7 | | | | 6 | |
| | | | | | | | | | | | |
| | | | | | | | | | $ | 14,281 | | | $ | 12,435 | |
| | | | | | | | | | | | |
| | The total value of these securities represented 1.5% of net assets at December 31, 2018. |
| (F) | Deemed to be an affiliate due to the Portfolio owning at least 5% of the voting securities. |
| (G) | Warrants entitle the Portfolio to purchase a predetermined number of shares of common stock and arenon-income producing. The purchase price and number of shares are subject to adjustment under certain conditions until the expiration date, if any. |
| (H) | Securities were purchased pursuant to an exemption from registration available under Rule 144A under the Securities Act of 1933 and may only be resold in transactions exempt from registration, normally to qualified institutional buyers. At December 31, 2018 the total value of these securities amounted to $472,802 or 55.8% of net assets. |
| (I) | Principal amounts are denominated in the indicated foreign currency, where applicable (EUR – Euro). |
| (J) | Step bond that pays an initial coupon rate for the first period and then a higher or lower coupon rate for the following periods. Interest rate disclosed is that which is in effect at December 31, 2018. |
| (L) | Payment-in-kind bond which may pay interest in additional par and/or in cash. Rates shown are the current rate and possible payment rates. |
| (M) | Variable rate security. Interest rate disclosed is that which is in effect at December 31, 2018. Description of the reference rate and spread, if applicable, are included in the security description. |
| (N) | All or a portion of this position has not settled. Full contract rates do not take effect until settlement date. |
| (O) | Non-income producing as the issuer has either missed its most recent interest payment or declared bankruptcy. |
| (P) | Rate shown is the yield to maturity at December 31, 2018. |
| (Q) | Variable rate security. Interest rate disclosed is that which is in effect at December 31, 2018. Date shown represents the date that the variable rate resets. Description of the reference rate and spread, if applicable, are included in the security description. |
| (R) | Investment made with cash collateral received from securities on loan. |
| (S) | Rate shown is the annualized7-day yield at December 31, 2018. |
The following forward foreign currency contracts were outstanding at December 31, 2018:
| | | | | | | | | | | | | | | | | | | | | | |
| | | Currency to be
Delivered | | | | Currency to be
Received | | | Settlement
Date | | | Counterparty | | Unrealized
Appreciation | | | Unrealized
Depreciation | |
Euro | | 680 | | U.S. Dollar | | | 793 | | | | 1-7-19 | | | Morgan Stanley International | | $ | 14 | | | $ | — | |
| | |
| SCHEDULE OF INVESTMENTS | | HIGH INCOME (in thousands) |
DECEMBER 31, 2018
The following table is a summary of the valuation of the Portfolio’s investments by the fair value hierarchy levels as of December 31, 2018. See Note 3 to the Financial Statements for further information regarding fair value measurement.
| | | | | | | | | | | | |
| | | Level 1 | | | Level 2 | | | Level 3 | |
Assets | | | | | | | | | | | | |
Investments in Securities | | | | | | | | | | | | |
Common Stocks | | | | | | | | | | | | |
Communication Services | | $ | 749 | | | $ | 151 | | | $ | — | |
Consumer Discretionary | | | 12,483 | | | | — | | | | 216 | |
Energy | | | 479 | | | | 12 | | | | 252 | |
Financials | | | — | | | | — | | | | 3,645 | |
Health Care | | | 651 | | | | — | | | | — | |
Industrials | | | — | | | | — | | | | 31 | |
Total Common Stocks | | $ | 14,362 | | | $ | 163 | | | $ | 4,144 | |
Investment Funds | | | 23,519 | | | | — | | | | — | |
Preferred Stocks | | | — | | | | 8,079 | | | | 410 | |
Warrants | | | — | | | | 6 | | | | — | |
Corporate Debt Securities | | | — | | | | 568,480 | | | | — | * |
Loans | | | — | | | | 119,432 | | | | 50,874 | |
Short-Term Securities | | | 28,480 | | | | 45,944 | | | | — | |
Total | | $ | 66,361 | | | $ | 742,104 | | | $ | 55,428 | |
Forward Foreign Currency Contracts | | $ | — | | | $ | 14 | | | $ | — | |
The following table is a reconciliation of Level 3 investments for which significant unobservable inputs were used to determine fair value:
| | | | | | | | | | | | |
| | | Common
Stocks | | | Preferred
Stocks | | | Loans | |
Beginning Balance 1-1-18 | | $ | 1,041 | | | $ | 3,753 | | | $ | 15,721 | |
Net realized gain (loss) | | | — | | | | — | | | | 34 | |
Net change in unrealized appreciation (depreciation) | | | (595 | ) | | | (3,343 | ) | | | (1,864 | ) |
Purchases | | | 3,363 | | | | — | | | | 35,453 | |
Sales | | | — | | | | — | | | | (5,923 | ) |
Amortization/Accretion of premium/discount | | | — | | | | — | | | | 46 | |
Transfers into Level 3 during the period | | | 335 | | | | — | | | | 7,407 | |
Transfers out of Level 3 during the period | | | — | | | | — | | | | — | |
Ending Balance 12-31-18 | | $ | 4,144 | | | $ | 410 | | | $ | 50,874 | |
Net change in unrealized appreciation (depreciation) for all Level 3 investments still held as of 12-31-18 | | $ | (595 | ) | | $ | (3,343 | ) | | $ | (1,307 | ) |
Information about Level 3 fair value measurements:
| | | | | | | | | | | | |
| | | Fair Value at 12-31-18 | | | Valuation Technique(s) | | Unobservable Input(s) | | Input Value(s) | |
Assets | | | | | | | | | | | | |
| | | | |
Common Stocks | | $ | 247 | | | Market Approach | | Adjusted EBITDA multiple | | | 4.26x and 6.84x | |
| | | | |
| | | 252 | | | Third-party valuation service | | Broker quote | | | N/A | |
| | | | |
| | | | 3,645 | | | Transaction | | Price | | | $10 per share | |
| | | | |
Preferred Stocks | | | 410 | | | Market Comparable Approach | | Adjusted EBITDA multiple | | | 9.27x | |
| | | | |
| | | | | | | | | Illiquidity discount | | | 10% | |
| | | | |
Loans | | | 50,874 | | | Third-party valuation service | | Broker quote | | | N/A | |
Significant increases (decreases) in the adjusted EBITDA multiple inputs as of the reporting date would result in a higher (lower) fair value measurement. However, significant increases (decreases) in the illiquidity discount input as of the reporting date would result in a lower (higher) fair value measurement.
The following acronyms are used throughout this schedule:
GTD = Guaranteed
ICE = Intercontinental Exchange
PIK = Payment In Kind
LIBOR = London Interbank Offered Rate
See Accompanying Notes to Financial Statements.
| | |
| MANAGEMENT DISCUSSION | | INTERNATIONAL CORE EQUITY |
(UNAUDITED)
|

John Maxwell 
Catherine Murray |
Below, John Maxwell, CFA, and Catherine Murray, portfolio managers of Ivy VIP International Core Equity, discuss positioning, performance and results for the fiscal year ended December 31, 2018. Mr. Maxwell has managed the Portfolio since May 2009 and has 27 years of industry experience. Ms. Murray was named portfolio manager in January 2017 and was previously an assistant portfolio manager on the Portfolio since 2014. She has 28 years of industry experience.
Fiscal Year Performance
| | | | |
For the 12 Months Ended December 31, 2018 | | | | |
Ivy VIP International Core Equity(Class II shares at net asset value) | | | -17.81% | |
Benchmark(s) and/or Morningstar and Lipper Categories | | | | |
MSCI EAFE Index | | | -13.79% | |
(generally reflects the performance of securities in Europe, Australasia and the Far East) | | | | |
Morningstar Foreign Large Blend Universe Average | | | -14.59% | |
(generally reflects the performance of the universe of funds with similar investment objectives) | | | | |
Lipper Variable Annuity International Large-Cap Core Funds Universe Average | | | -15.44% | |
(generally reflects the performance of the universe of funds with similar investment objectives) | | | | |
Please note that Portfolio returns include applicable fees and expenses while index returns do not include any such fees. Also, the Portfolio’s performance data does not take into account any product expenses or charges associated with owning a variable life or annuity policy, which is invested in Ivy Variable Insurance Portfolios.
International markets posted poor returns
During the fiscal year, global economic growth disappointed and desynchronized, with the MSCI EAFE Index posting a double-digit decline. Europe and Japan began to see weaker growth early in the year followed by China. Growth in the U.S. remained relatively robust until the fourth quarter. Geopolitics weighed heavily across markets as nationalism/populism continued its rise – most apparent in China, Europe and the U.S. The ongoing trade war between the U.S. and China was a detriment to the Portfolio’s holdings in China and holdings with trade-reliant revenues. That said, in early December, the U.S. and China agreed to trade negotiations rather than ratcheting up tariffs. We believe additional agreements will be reached, though a comprehensive trade pact seems unlikely given many conflicting issues between the two nations.
Despite slowing global gross domestic product (GDP) growth, the U.S. Federal Reserve (Fed) continued to normalize its policy rate, hiking four times over the year. The Federal Funds Rate stood at 2.5% at December’s end. In currency markets, the trade-weighted U.S. dollar strengthened throughout the fiscal year but stabilized towards year end as the market anticipated a more dovish Fed in 2019. The 10-year U.S. Treasury yield closed the year at approximately 2.7%, a significant move from the 3.2% levels of November. At the end of the year, the European Central Bank (ECB) ceased their asset purchase program, while the Swedish Central Bank, often considered a harbinger for the ECB, raised rates 25 basis points. China’s Central Bank stated a desire to maintain prudent monetary policy and keep the yuan stable while offering “reasonably ample” liquidity to the market. In China, income-tax cuts, lower bank reserve rate requirements and lower borrowing rates have so far not been able to drive an economic reacceleration amid greater than and faster than expected deleveraging.
Portfolio review
For the fiscal year ended December 31, 2018, the Portfolio struggled with stock selection and underperformed its benchmark, the MSCI EAFE Index, and category peers. Stock selection was poorest in the energy and health care sectors. In energy, our stocks were particularly sensitive to the fourth quarter crude oil swoon (Brent crude finished the year at $53.80, down almost 40% from its early October high) while our health care stocks were negatively impacted by company specific issues. Within health care, top detractors included Bayer AG, Fresenius SE & Co. KGaA and Fresenius Medical Care AG & Co. On the positive side, our allocation weightings and stock selection in the financials and consumer discretionary sectors aided performance.
Geographically, stock selection in emerging markets, Japan and the U.K. hurt performance while selection was positive in Europe and developed Asia, ex-Japan. The Portfolio decreased exposure to Japan and Australia due to the inability to find stable, domestic-oriented stocks with attractive relative valuations.
Actions in the Portfolio during the year
Through most of the fiscal year, the Portfolio had a slight tilt to defensive sectors, though that defensive tilt was eliminated during the third quarter. As a result, the Portfolio was balanced relative to defensive/cyclical sectors. Despite increasing our
overall exposure to cyclicals, we made an effort to reduce positioning in more economically sensitive cyclical industries such as materials, autos and retailing, while adding to less sensitive industries including software & services, consumer services, media & entertainment and real estate. Despite the recent decline in the energy sector, the Portfolio maintained an approximate double weight to the sector at fiscal year end. We continue to believe the supply/demand relationship will drive the crude price and energy stocks higher as we move through 2019.
In an effort to provide support in down markets, we maintained our forward currency contract to the Japanese yen, neutralizing our stock underweight allocation on a currency basis. Additionally, we hedged our direct exposure to the Chinese yuan, and modestly increased the Portfolio’s cash allocation.
Our themes are unchanged from last year though we continue to refine how we employ the disruption theme.
Current Portfolio themes are:
| • | | Disproportionate growth of emerging-market consumers, particularly in the Asia-Pacific region |
| • | | Strong growth in infrastructure |
| • | | Solid and believable dividend yields |
| • | | Forces of market disruption |
What we seek
As we move forward, we continue to seek companies we believe are underpriced relative to their prospects and peers in both the growth and value parts of the market. We are seeking less economically sensitive and less leveraged stocks in both the cyclical and defensive parts of the market. With disruptive forces that seem more concentrated in the defensive part of the market, the Portfolio’s defensive/cyclical weighting is balanced. We are also increasingly focused on companies with sustainable competitive advantages or improving industry dynamics that are not appreciated by the market – a strategy we believe to be effective at the end of an economic cycle.
Outlook
There are a number of factors we are carefully monitoring in the current economic environment. Shift in central bank policy, the rise of nationalism and ongoing trade negotiations between the U.S. and China warrant close attention. Going forward, we believe geopolitics is likely to have a greater impact on asset performance than monetary policy. The question remains: How much longer will the cycle extend uninterrupted by looming risks? As a result, we are watching closely for signs of change and continue to seek stocks that should better withstand an economic downturn. While we think U.S.-China trade tensions will persist, we expect some positive agreements in 2019 that will provide relief to the markets.
In much of the world, global monetary policy remains at the extremes of easy and we do not see that changing materially unless inflation accelerates at a higher-than-expected rate. Virtually all countries are struggling with high levels of debt. As a result, we believe central banks will attempt to keep rates below nominal gross domestic product growth in order to monetize the debt and continue to stimulate their economies. As such, we believe there is a long-term cap on how high rates can go. Our base case is continued slow, deliberate exiting of quantitative easing and narrowing of negative interest rate policy globally. Unfortunately, this may result in many economies heading into the next economic downturn with very easy monetary policies.
We believe relative valuation remains supportive for international equities. We see relative value opportunities in emerging markets (especially China), energy, internet-related companies and in many cyclicals that we view as more stable than average.
Past performance is not a guarantee of future results. The value of the Portfolio’s shares will change, and you could lose money on your investment.
International investing involves additional risks, including currency fluctuations, political or economic conditions affecting the foreign country, and differences in accounting standards and foreign regulations. Investments in countries with emerging economies or securities markets may carry greater risk than investments in more developed countries. Political and economic structures in many such countries may be undergoing significant evolution and rapid development, and such countries may lack the social, political and economic stability characteristics of more developed countries. Investments in securities issued in these countries may be more volatile and less liquid than securities issued in more developed countries. These and other risks are more fully described in the Portfolio’s prospectus.
The opinions expressed in this report are those of the Portfolio’s portfolio managers and are current only through the end of the period of the report as stated on the cover. The portfolio managers’ views are subject to change at any time based on market and other conditions, and no forecasts can be guaranteed.
The index noted is unmanaged and include reinvested dividends. One cannot invest directly in an index, nor is an index representative of the Ivy VIP International Core Equity.
| | |
| PORTFOLIO HIGHLIGHTS | | INTERNATIONAL CORE EQUITY |
ALL DATA IS AS OF DECEMBER 31, 2018 (UNAUDITED)
Asset Allocation
| | | | |
Stocks | | | 94.4% | |
Financials | | | 15.5% | |
Industrials | | | 12.7% | |
Consumer Staples | | | 12.6% | |
Consumer Discretionary | | | 10.6% | |
Energy | | | 10.3% | |
Health Care | | | 9.4% | |
Information Technology | | | 9.0% | |
Communication Services | | | 8.0% | |
Materials | | | 5.2% | |
Real Estate | | | 1.1% | |
Cash and Other Assets (Net of Liabilities), and Cash Equivalents+ | | | 5.6% | |
Country Weightings
| | | | |
Europe | | | 58.1 | % |
United Kingdom | | | 13.6 | % |
Switzerland | | | 11.0 | % |
France | | | 10.7 | % |
Germany | | | 10.3 | % |
Other Europe | | | 12.5 | % |
Pacific Basin | | | 32.0 | % |
Japan | | | 14.0 | % |
China | | | 8.1 | % |
Other Pacific Basin | | | 9.9 | % |
North America | | | 4.3 | % |
Cash and Other Assets (Net of Liabilities), and Cash Equivalents+ | | | 5.6 | % |
Top 10 Equity Holdings
| | | | | | |
| | | |
| Company | | Country | | Sector | | Industry |
Nestle S.A., Registered Shares | | Switzerland | | Consumer Staples | | Packaged Foods & Meats |
Roche Holdings AG, Genusscheine | | Switzerland | | Health Care | | Pharmaceuticals |
Total S.A. | | France | | Energy | | Integrated Oil & Gas |
SAP AG | | Germany | | Information Technology | | Application Software |
Danone S.A. | | France | | Consumer Staples | | Packaged Foods & Meats |
Isuzu Motors Ltd. | | Japan | | Consumer Discretionary | | Automobile Manufacturers |
Swedbank AB | | Sweden | | Financials | | Diversified Banks |
Airbus SE | | France | | Industrials | | Aerospace & Defense |
Nippon Telegraph and Telephone Corp. | | Japan | | Communication Services | | Integrated Telecommunication Services |
Unilever plc | | United Kingdom | | Consumer Staples | | Personal Products |
See your advisor or www.ivyinvestments.com for more information on the Portfolio’s most recently published Top 10 Equity Holdings.
+ Cash equivalents are defined as highly liquid securities with maturities of less than three months. Cash equivalents may include U.S. Government Treasury bills, bank certificates of deposit, bankers’ acceptances, corporate commercial paper and other money market instruments.
| | |
| COMPARISON OF CHANGE IN VALUE OF $10,000 INVESTMENT | | INTERNATIONAL CORE EQUITY |
(UNAUDITED)
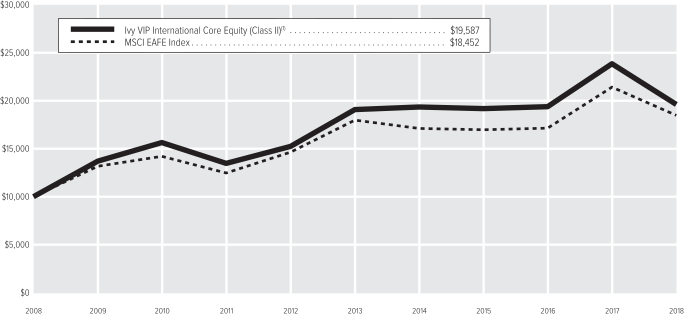
| (1) | The value of the investment in the Portfolio is impacted by the ongoing expenses of the Portfolio and assumes reinvestment of dividends and distributions. |
| | | | |
| |
| Average Annual Total Return(2) | | Class II | |
1-year period ended12-31-18 | | | -17.81% | |
5-year period ended12-31-18 | | | 0.56% | |
10-year period ended12-31-18 | | | 6.95% | |
| (2) | Data quoted is past performance and current performance may be lower or higher. Past performance is no guarantee of future results. Investment return and principal value of an investment will fluctuate and shares, when redeemed, may be worth more or less than their original cost. Please visit www.ivyinvestments.com for the Portfolio’s most recentmonth-end performance. Performance data quoted does not reflect any expenses or charges associated with owning a variable life insurance policy or variable annuity contract that invests in the Portfolio’s shares. When such charges are deducted, actual investment performance in a variable policy or contract will be lower. |
Past performance is not necessarily indicative of future performance. Indexes are unmanaged. The performance graph and table do not reflect the deduction of taxes that a shareholder would pay on Portfolio distributions or on the redemption of Portfolio shares. Performance results may include the effect of expense reduction arrangements for some or all of the periods shown. If those arrangements had not been in place, the performance results for those periods would have been lower.
| | |
| SCHEDULE OF INVESTMENTS | | INTERNATIONAL CORE EQUITY (in thousands) |
DECEMBER 31, 2018
| | | | | | | | |
| COMMON STOCKS | | Shares | | | Value | |
Australia | |
| |
Energy – 0.4% | |
Oil Search Ltd. | | | 587 | | | $ | 2,955 | |
| | | | | | | | |
Materials – 2.8% | |
BHP Group plc | | | 246 | | | | 5,188 | |
BHP Group plc ADR | | | 101 | | | | 4,247 | |
Newcrest Mining Ltd. | | | 627 | | | | 9,635 | |
| | | | | | | | |
| | | | | | | 19,070 | |
| | | | | | | | |
| |
Total Australia – 3.2% | | | $ | 22,025 | |
Canada | |
| |
Energy – 3.2% | |
Canadian Natural Resources Ltd. | | | 325 | | | | 7,851 | |
Seven Generations Energy Ltd., Class A(A) | | | 704 | | | | 5,748 | |
Suncor Energy, Inc. | | | 270 | | | | 7,549 | |
| | | | | | | | |
| | | | | | | 21,148 | |
| | | | | | | | |
| |
Total Canada – 3.2% | | | $ | 21,148 | |
China | |
| |
Communication Services – 1.3% | |
China Unicom Ltd. | | | 7,862 | | | | 8,376 | |
| | | | | | | | |
Consumer Discretionary – 2.2% | |
Alibaba Group Holding Ltd. ADR (A) | | | 55 | | | | 7,580 | |
Huayu Automotive Systems Co. Ltd., A Shares | | | 2,918 | | | | 7,833 | |
| | | | | | | | |
| | | | | | | 15,413 | |
| | | | | | | | |
Consumer Staples – 1.3% | |
Wuliangye Yibin Co. Ltd., A Shares | | | 1,235 | | | | 9,176 | |
| | | | | | | | |
Financials – 1.4% | |
China Construction Bank Corp. | | | 11,688 | | | | 9,571 | |
| | | | | | | | |
Industrials – 0.8% | |
Han’s Laser Technology Industry Group Co. Ltd., A Shares | | | 1,158 | | | | 5,142 | |
| | | | | | | | |
Information Technology – 1.1% | |
Baidu.com, Inc. ADR (A) | | | 49 | | | | 7,756 | |
| | | | | | | | |
| |
Total China – 8.1% | | | $ | 55,434 | |
Denmark | |
| |
Industrials – 1.2% | |
A.P. Moller - Maersk A/S | | | 6 | | | | 7,891 | |
| | | | | | | | |
| |
Total Denmark – 1.2% | | | $ | 7,891 | |
France | |
| |
Communication Services – 2.5% | |
Criteo S.A. ADR (A) | | | 339 | | | | 7,693 | |
Orange S.A. | | | 586 | | | | 9,498 | |
| | | | | | | | |
| | | | | | | 17,191 | |
| | | | | | | | |
Consumer Staples – 2.0% | |
Danone S.A. | | | 194 | | | | 13,684 | |
| | | | | | | | |
Energy – 2.5% | |
Total S.A. | | | 315 | | | | 16,602 | |
| | | | | | | | |
| | | | | | | | |
| COMMON STOCKS(Continued) | | Shares | | | Value | |
Financials – 1.0% | |
Societe Generale S.A. | | | 222 | | | $ | 7,042 | |
| | | | | | | | |
Industrials – 2.7% | |
Airbus SE | | | 126 | | | | 11,975 | |
Schneider Electric S.A. | | | 104 | | | | 7,048 | |
| | | | | | | | |
| | | | | | | 19,023 | |
| | | | | | | | |
| |
Total France – 10.7% | | | $ | 73,542 | |
Germany | |
| |
Consumer Discretionary – 2.0% | |
adidas AG | | | 45 | | | | 9,363 | |
Continental AG | | | 27 | | | | 3,801 | |
| | | | | | | | |
| | | | | | | 13,164 | |
| | | | | | | | |
Health Care – 5.0% | |
Bayer AG | | | 162 | | | | 11,289 | |
Fresenius Medical Care AG & Co. KGaA | | | 121 | | | | 7,811 | |
Fresenius SE & Co. KGaA | | | 147 | | | | 7,110 | |
Merck KGaA | | | 72 | | | | 7,432 | |
| | | | | | | | |
| | | | | | | 33,642 | |
| | | | | | | | |
Information Technology – 2.2% | |
SAP AG | | | 147 | | | | 14,578 | |
| | | | | | | | |
Real Estate – 1.1% | |
Deutsche Wohnen AG | | | 171 | | | | 7,829 | |
| | | | | | | | |
| |
Total Germany – 10.3% | | | $ | 69,213 | |
Hong Kong | |
| |
Consumer Discretionary – 0.1% | |
Galaxy Entertainment Group | | | 65 | | | | 411 | |
| | | | | | | | |
Financials – 2.8% | |
AIA Group Ltd. | | | 1,270 | | | | 10,546 | |
Hong Kong Exchanges and Clearing Ltd. | | | 297 | | | | 8,599 | |
| | | | | | | | |
| | | | | | | 19,145 | |
| | | | | | | | |
| |
Total Hong Kong – 2.9% | | | $ | 19,556 | |
India | |
| |
Financials – 1.4% | |
Axis Bank Ltd. | | | 1,045 | | | | 9,270 | |
| | | | | | | | |
| |
Total India – 1.4% | | | $ | 9,270 | |
Ireland | |
| |
Materials – 1.3% | |
CRH plc | | | 334 | | | | 8,851 | |
| | | | | | | | |
| |
Total Ireland – 1.3% | | | $ | 8,851 | |
Italy | |
| |
Financials – 1.1% | |
UniCredit S.p.A. | | | 639 | | | | 7,241 | |
| | | | | | | | |
| |
Total Italy – 1.1% | | | $ | 7,241 | |
| | | | | | | | |
| COMMON STOCKS(Continued) | | Shares | | | Value | |
Japan | |
| |
Communication Services – 2.8% | |
Nippon Telegraph and Telephone Corp. | | | 286 | | | $ | 11,648 | |
Yahoo Japan Corp. | | | 2,925 | | | | 7,277 | |
| | | | | | | | |
| | | | | | | 18,925 | |
| | | | | | | | |
Consumer Discretionary – 3.5% | |
Isuzu Motors Ltd. | | | 901 | | | | 12,640 | |
Subaru Corp. | | | 529 | | | | 11,290 | |
| | | | | | | | |
| | | | | | | 23,930 | |
| | | | | | | | |
Consumer Staples – 1.3% | |
Seven & i Holdings Co. Ltd. | | | 197 | | | | 8,552 | |
| | | | | | | | |
Energy – 1.0% | |
Inpex Corp. | | | 762 | | | | 6,754 | |
| | | | | | | | |
Financials – 2.9% | |
Kabushiki Kaisha Mitsubishi Tokyo Financial Group | | | 1,814 | | | | 8,904 | |
Tokio Marine Holdings, Inc. | | | 223 | | | | 10,571 | |
| | | | | | | | |
| | | | | | | 19,475 | |
| | | | | | | | |
Industrials – 1.5% | |
SMC Corp. | | | 34 | | | | 10,116 | |
| | | | | | | | |
Information Technology – 1.0% | |
Tokyo Electron Ltd. | | | 61 | | | | 6,845 | |
| | | | | | | | |
| |
Total Japan – 14.0% | | | $ | 94,597 | |
Luxembourg | |
| |
Energy – 1.0% | |
Tenaris S.A. | | | 322 | | | | 3,459 | |
Tenaris S.A. ADR | | | 151 | | | | 3,219 | |
| | | | | | | | |
| | | | | | | 6,678 | |
| | | | | | | | |
Materials – 1.1% | |
ArcelorMittal | | | 346 | | | | 7,170 | |
| | | | | | | | |
| |
Total Luxembourg – 2.1% | | | $ | 13,848 | |
Netherlands | |
| |
Energy – 1.5% | |
Royal Dutch Petroleum Co., New York Shares | | | 29 | | | | 1,695 | |
Royal Dutch Shell plc, Class A | | | 298 | | | | 8,783 | |
| | | | | | | | |
| | | | | | | 10,478 | |
| | | | | | | | |
Industrials – 1.0% | |
Koninklijke Philips Electronics N.V., Ordinary Shares | | | 200 | | | | 7,026 | |
| | | | | | | | |
| |
Total Netherlands – 2.5% | | | $ | 17,504 | |
Norway | |
| |
Financials – 1.3% | |
DNB ASA | | | 534 | | | | 8,565 | |
| | | | | | | | |
| |
Total Norway – 1.3% | | | $ | 8,565 | |
| | |
| SCHEDULE OF INVESTMENTS | | INTERNATIONAL CORE EQUITY (in thousands) |
DECEMBER 31, 2018
| | | | | | | | |
| COMMON STOCKS(Continued) | | Shares | | | Value | |
South Korea | |
Information Technology – 1.4% | |
Samsung Electronics Co. Ltd. | | | 270 | | | $ | 9,413 | |
| | | | | | | | |
| |
Total South Korea – 1.4% | | | $ | 9,413 | |
Spain | |
Industrials – 0.6% | |
ACS Actividades de Construccion y Servicios S.A. | | | 104 | | | | 4,015 | |
| | | | | | | | |
| |
Total Spain – 0.6% | | | $ | 4,015 | |
Sweden | |
Financials – 2.4% | |
Svenska Handelsbanken AB, Class A | | | 316 | | | | 3,511 | |
Swedbank AB | | | 565 | | | | 12,631 | |
| | | | | | | | |
| | | | | | | 16,142 | |
| | | | | | | | |
| |
Total Sweden – 2.4% | | | $ | 16,142 | |
Switzerland | |
Consumer Staples – 2.7% | |
Nestle S.A., Registered Shares | | | 222 | | | | 18,026 | |
| | | | | | | | |
Financials – 1.2% | |
UBS Group AG | | | 650 | | | | 8,107 | |
| | | | | | | | |
Health Care – 4.4% | |
Lonza Group Ltd., Registered Shares | | | 16 | | | | 4,055 | |
Novartis AG ADR | | | 52 | | | | 4,448 | |
Novartis AG, Registered Shares | | | 56 | | | | 4,830 | |
Roche Holdings AG, Genusscheine | | | 68 | | | | 16,956 | |
| | | | | | | | |
| | | | | | | 30,289 | |
| | | | | | | | |
Industrials – 2.7% | |
Adecco S.A. | | | 171 | | | | 8,028 | |
Ferguson plc | | | 160 | | | | 10,195 | |
| | | | | | | | |
| | | | | | | 18,223 | |
| | | | | | | | |
| |
Total Switzerland – 11.0% | | | $ | 74,645 | |
Taiwan | |
Information Technology – 1.0% | |
MediaTek, Inc. | | | 912 | | | | 6,784 | |
| | | | | | | | |
| |
Total Taiwan – 1.0% | | | $ | 6,784 | |
United Kingdom | |
Communication Services – 1.4% | |
BT Group plc | | | 3,128 | | | | 9,510 | |
| | | | | | | | |
Consumer Discretionary – 2.8% | |
Compass Group plc | | | 403 | | | | 8,481 | |
Whitbread plc | | | 180 | | | | 10,535 | |
| | | | | | | | |
| | | | | | | 19,016 | |
| | | | | | | | |
Consumer Staples – 5.3% | |
British American Tobacco plc | | | 250 | | | | 7,943 | |
Imperial Tobacco Group plc | | | 290 | | | | 8,812 | |
Reckitt Benckiser Group plc | | | 98 | | | | 7,489 | |
| | | | | | | | |
| COMMON STOCKS(Continued) | | Shares | | | Value | |
Consumer Staples(Continued) | |
Unilever plc | | | 215 | | | $ | 11,304 | |
| | | | | | | | |
| | | | | | | 35,548 | |
| | | | | | | | |
Energy – 0.7% | |
FMC Technologies, Inc. | | | 241 | | | | 4,727 | |
| | | | | | | | |
Industrials – 2.2% | |
Babcock International Group plc | | | 931 | | | | 5,806 | |
BAE Systems plc | | | 1,477 | | | | 8,640 | |
| | | | | | | | |
| | | | | | | 14,446 | |
| | | | | | | | |
Information Technology – 1.2% | |
Amdocs Ltd. | | | 136 | | | | 7,937 | |
| | | | | | | | |
| |
Total United Kingdom – 13.6% | | | $ | 91,184 | |
United States | |
Information Technology – 1.1% | |
Cognizant Technology Solutions Corp., Class A (B) | | | 116 | | | | 7,345 | |
| | | | | | | | |
| |
Total United States – 1.1% | | | $ | 7,345 | |
| |
TOTAL COMMON STOCKS – 94.4% | | | $ | 638,213 | |
(Cost: $749,589) | | | | | | | | |
| | |
| SHORT-TERM SECURITIES | | Principal | | | | |
Commercial Paper (C) – 4.2% | |
EssilorLuxottica S.A. | | | | | | | | |
2.461%,1-4-19 | | $ | 6,000 | | | | 5,999 | |
J.M. Smucker Co. (The) | | | | | | | | |
2.750%,1-2-19 | | | 5,370 | | | | 5,369 | |
Walgreens Boots Alliance, Inc. 2.906%,1-9-19 | | | 10,000 | | | | 9,993 | |
Wisconsin Gas LLC | | | | | | | | |
2.520%,1-10-19 | | | 7,000 | | | | 6,995 | |
| | | | | | | | |
| | | | | | | 28,356 | |
| | | | | | | | |
Master Note – 0.4% | |
Toyota Motor Credit Corp.(1-Month U.S. LIBOR plus 15 bps) | | | | | | | | |
2.720%,1-7-19 (D) | | | 2,459 | | | | 2,459 | |
| | | | | | | | |
Municipal Obligations – 0.5% | |
CA Statewide Cmnty Dev Auth, Multifam Hsng Rev Bonds (The Crossings Sr Apts/Phase I), Ser 2005 I (GTD by FNMA) (BVAL plus 10 bps) | | | | | | | | |
1.760%,1-7-19 (D) | | | 3,285 | | | | 3,285 | |
| | | | | | | | |
| |
TOTAL SHORT-TERM SECURITIES – 5.1% | | | $ | 34,100 | |
(Cost: $34,101) | | | | | | | | |
| |
TOTAL INVESTMENT SECURITIES – 99.5% | | | $ | 672,313 | |
(Cost: $783,690) | | | | | | | | |
| |
CASH AND OTHER ASSETS, NET OF LIABILITIES (E) – 0.5% | | | | 3,563 | |
| |
NET ASSETS – 100.0% | | | $ | 675,876 | |
| | |
| SCHEDULE OF INVESTMENTS | | INTERNATIONAL CORE EQUITY (in thousands) |
DECEMBER 31, 2018
Notes to Schedule of Investments
| (A) | No dividends were paid during the preceding 12 months. |
| (B) | All or a portion of securities with an aggregate value of $546 are held in collateralized accounts for OTC foreign forward currency contracts collateral. |
| (C) | Rate shown is the yield to maturity at December 31, 2018. |
| (D) | Variable rate security. Interest rate disclosed is that which is in effect at December 31, 2018. Date shown represents the date that the variable rate resets. Description of the reference rate and spread, if applicable, are included in the security description. |
| (E) | Cash of $260 has been pledged as collateral on open OTC swap agreements. |
| (F) | Notional amounts are denominated in the indicated foreign currency, where applicable (EUR – Euro). |
The following total return swap agreements were outstanding at December 31, 2018:
| | | | | | | | | | | | | | | | | | | | | | | | | | | | | | |
| Underlying Security | | Long/Short | | Counterparty | | Maturity
Date | | | Notional
Amount(F) | | | Financing Fee(1)(2) | | Value | | | Upfront
Payments/
(Receipts) | | | Unrealized
Appreciation | | | | |
TechnipFMC plc | | Long | | Goldman Sachs International | | | 09/28/2020 | | | | EUR 886 | | | 1-Month EURIBOR less 30 bps | | $ | 46 | | | $ | — | | | $ | 46 | | | | | |
| | | | | | | | | | | | | | | | | | |
| (1) | The Portfolio pays the financing fee multiplied by the notional amount if long on the swap agreement. If the Portfolio is short on the swap agreement, the Portfolio receives the financing fee multiplied by the notional amount. |
| (2) | At the termination date, a net cash flow is exchanged where the market-linked total return is equivalent to the return of the underlying security less a financing rate, if any. If the Portfolio is long on the swap agreement, the Portfolio would receive payments on any net positive total return, and would owe payments in the event of a negative total return. If the Portfolio is short on the swap agreement, the Portfolio would owe payments on any net positive total return, and would receive payments in the event of a negative total return. |
The following forward foreign currency contracts were outstanding at December 31, 2018:
| | | | | | | | | | | | | | | | | | | | | | | | | | | | |
| | | Currency to be
Delivered | | | | | Currency to be
Received | | | Settlement
Date | | | Counterparty | | Unrealized
Appreciation | | | Unrealized
Depreciation | | | | |
U.S. Dollar | | | 46,929 | | | Japanese Yen | | | 5,262,012 | | | | 1-7-19 | | | Deutsche Bank AG | | $ | 1,096 | | | $ | — | | | | | |
Chinese Yuan Renminbi Offshore | | | 393,023 | | | U.S. Dollar | | | 55,754 | | | | 11-1-19 | | | Deutsche Bank AG | | | — | | | | 1,444 | | | | | |
| | | | | | | | | | | | | | | | | | | | |
| | | | | | | | | | | | | | | | | | $ | 1,096 | | | $ | 1,444 | | | | | |
| | | | | | | | | | | | | | | | | | | | |
The following table is a summary of the valuation of the Portfolio’s investments by the fair value hierarchy levels as of December 31, 2018. See Note 3 to the Financial Statements for further information regarding fair value measurement.
| | | | | | | | | | | | |
| | | Level 1 | | | Level 2 | | | Level 3 | |
Assets | | | | | | | | | | | | |
Investments in Securities | | | | | | | | | | | | |
Common Stocks | | | | | | | | | | | | |
Communication Services | | $ | 7,693 | | | $ | 46,309 | | | $ | — | |
Consumer Discretionary | | | 7,580 | | | | 64,354 | | | | — | |
Consumer Staples | | | — | | | | 84,986 | | | | — | |
Energy | | | 30,789 | | | | 38,553 | | | | — | |
Financials | | | — | | | | 104,558 | | | | — | |
Health Care | | | 4,448 | | | | 59,483 | | | | — | |
Industrials | | | — | | | | 85,882 | | | | — | |
Information Technology | | | 23,038 | | | | 37,620 | | | | — | |
Materials | | | 4,247 | | | | 30,844 | | | | — | |
Real Estate | | | — | | | | 7,829 | | | | — | |
Total Common Stocks | | $ | 77,795 | | | $ | 560,418 | | | $ | — | |
Short-Term Securities | | | — | | | | 34,100 | | | | — | |
Total | | $ | 77,795 | | | $ | 594,518 | | | $ | — | |
Forward Foreign Currency Contracts | | $ | — | | | $ | 1,096 | | | $ | — | |
Total Return Swaps | | $ | — | | | $ | 46 | | | $ | — | |
Liabilities | | | | | | | | | | | | |
Forward Foreign Currency Contracts | | $ | — | | | $ | 1,444 | | | $ | — | |
| | |
| SCHEDULE OF INVESTMENTS | | INTERNATIONAL CORE EQUITY (in thousands) |
DECEMBER 31, 2018
The following acronyms are used throughout this schedule:
ADR = American Depositary Receipts
BVAL = Bloomberg Valuation Municipal AAA Benchmark
FNMA = Federal National Mortgage Association
GTD = Guaranteed
LIBOR = London Interbank Offered Rate
OTC = Over The Counter
Market Sector Diversification
| | | | |
(as a % of net assets) | | | | |
Financials | | | 15.5 | % |
Industrials | | | 12.7 | % |
Consumer Staples | | | 12.6 | % |
Consumer Discretionary | | | 10.6 | % |
Energy | | | 10.3 | % |
Health Care | | | 9.4 | % |
Information Technology | | | 9.0 | % |
Communication Services | | | 8.0 | % |
Materials | | | 5.2 | % |
Real Estate | | | 1.1 | % |
Other+ | | | 5.6 | % |
+ Includes cash and other assets (net of liabilities), and cash equivalents
See Accompanying Notes to Financial Statements.
| | |
| MANAGEMENT DISCUSSION | | MID CAP GROWTH |
(UNAUDITED)

Kimberly A. Scott

Nathan A. Brown
Below, Kimberly A. Scott, CFA, and Nathan A. Brown, CFA, co-portfolio managers of Ivy VIP Mid Cap Growth, discuss positioning, performance and results for the fiscal year ended December 31, 2018. Ms. Scott has managed the Portfolio since its inception in 2005 and has 31 years of industry experience. Mr. Brown became co-portfolio manager in October 2016 and has 19 years of industry experience.
Fiscal Year Performance
| | | | |
For the 12 Months Ended December 31, 2018 | | | | |
Ivy VIP Mid Cap Growth(Class II shares at net asset value) | | | -0.06% | |
Benchmark(s) and/or Morningstar and Lipper Categories | | | | |
Russell Midcap Growth Index | | | -4.75% | |
(generally reflects the performance of securities that represent the mid-cap sector of the stock market) | | | | |
Morningstar Mid-Cap Growth Universe Average | | | -6.01% | |
(generally reflects the performance of the universe of Portfolios with similar investment objectives) | | | | |
Lipper Variable Annuity Mid-Cap Growth Portfolios Universe Average | | | -4.27% | |
(generally reflects the performance of the universe of Portfolios with similar investment objectives) | | | | |
Please note that Portfolio returns include applicable fees and expenses while index returns do not include any such fees. Also, the Portfolio’s performance data does not take into account any product expenses or charges associated with owning a variable life or annuity policy, which is invested in Ivy Variable Insurance Portfolios.
Mid-cap growth stocks, as represented by the Portfolio’s benchmark, the Russell Midcap Growth Index, lost 4.75% in the 12-month period ended December 31, 2018. Ivy VIP Mid Cap Growth posted a slight loss for the year, but soundly outperformed its benchmark and peer universe averages.
Contributors and detractors
Very strong results in the health care and consumer discretionary sectors drove the positive return relative to the benchmark for the Portfolio in 2018, with stock selection key to the outperformance. Industrials, financials, communications services and materials also made solid positive contributions to performance based on a combination of strong stock selection, in the case of industrials, financials and communication services, and sector allocation, in the case of materials. The Portfolio also benefited from not holding positions in the underperforming utilities and real estate sectors. Those sectors that made a negative contribution to relative performance were consumer staples and energy, as well as an underweight allocation to the outperforming information technology sector. Cash was 0.16% to the positive, while equity options were 0.02% to the negative.
Any derivatives usage during the measurement period did not have a specific impact on performance and was based primarily on individual issues (for example, selling puts to potentially gain access to a holding at a target price or selling calls to exit a holding).
Our health care sector exposure made the greatest positive contribution to the Portfolio’s return for the calendar year. We were overweight in this outperforming sector, and our names far outperformed the health care stocks in the index, gaining almost 18% on average against a less than 0.5% gain for the health care sector overall. Limited exposure to biotechnology stocks was a benefit to our Portfolio, as those names really struggled in 2018, mostly delivering steep declines, often as much as one-third to one-half their value. However, the vast outperformance for our health care exposure came from solid positive returns across the calendar year from most of our holdings, including Intuitive Surgical, Inc., Abiomed, Inc., Edwards Lifesciences Corp., Zoetis, Inc., DexCom, Inc., and Glaukos Corp. These stocks represent a group of very innovative medical technology companies (and animal health companies, in the case of Zoetis) that are growing revenue and earnings at impressive rates. These stocks did have high valuation levels, which became somewhat of a liability as market weakness developed in the fourth quarter, but they still managed to outperform the health care sector within the index during that difficult period. Other positives for the Portfolio last year included exiting several names at opportune times, including Align Technology, which sold off significantly as the year progressed, and Jazz Pharmaceuticals. We also benefited from participating in the initial public offering of Elanco Animal Health, which was a spin-off from Eli Lilly. We sold this name shortly after purchase, as the stock reach full valuation very quickly. One name that detracted from our performance was Dentsply Sirona, which manufactures and sells dental consumables and equipment. The company has had difficulty assimilating acquisitions made in the last few years, and other parts of its business seem to be at competitive risk. We lost confidence that the growth we expected from the business would materialize, and instead became concerned that there was more deterioration ahead. We sold the stock from our portfolio.
Solid performance from our consumer discretionary names was another important factor in the Portfolio’s relative outperformance in 2018. We were overweight in this underperforming group, with much of the excess weight in our
strongest names, most of which delivered positive performance last calendar year. The list of winners is long and diverse, including lululemon athletica, Inc., where demand for their athletic wear is strong from both women and men; Chipotle Mexican Grill, Inc., which has an inspired new management team that is working to improve the business operationally and to put the spark of the brand back in the imagination of the consumer; GrubHub, Inc., the fast-growing online restaurant food ordering and delivery platform; and O’Reilly Automotive, Inc., Tractor Supply Co., Duluth Holdings, Inc., Carters, Inc. (no longer a holding), the children’s clothing retailer, Dunkin’ Brands Group, Inc., and Ulta Beauty, Inc. The stocks all posted strong performances as investors realized that not only were consumers employed, earning money and spending it, but these companies had reached a point of beginning to reap the benefits of their investments into their businesses to compete in an omnichannel shopping world. Much like in the health care sector holdings in the Portfolio, these strong consumer discretionary performers saw some weakness in the fourth quarter as investors broadly began to worry about global economic growth. However, we continue to believe that the consumer remains in great shape and that demand for the products at most of these companies remains strong. A few weak links in our consumer discretionary exposure included BorgWarner, Inc., whose stock suffered due to concerns related to auto demand around the globe. That company continues to perform well, its stock performance notwithstanding. Weakness at both Polaris Industries and Mohawk Industries is so persistent that we have decided to sell these stocks.
Our industrials exposure contributed positively to the Portfolio’s relative outperformance in 2018, led by CoStar Group, Inc., the online commercial real estate information and marketing platform, Expeditors International of Washington, Inc., which provides global logistics services, Trex Co., which makes high quality wood-alternative decking material, and TransUnion, which provides information and risk management primarily associated with credit. A.O. Smith Corp. was notably weak. This company sells products associated with water – including water heaters and water purification systems – and air filtration. China has been an important growth market for the company, but A.O. Smith saw demand weakness there in 2018 related to the soft China economy and a heightened competitive environment. Nevertheless, we believe A.O. Smith is a high-quality company; as such, it remains a core holding in the Portfolio, and a position that we have added exposure to as the stock was weak.
The financials sector was a source of outperformance for the Portfolio given strong results from our exchange stocks, CME Group, Inc. and MarketAxess Holdings, Inc. The performance of our bank holdings was more split, with good performance from First Republic Bank and Northern Trust, which we sold at mid-calendar year, but weak performance from Western Alliance, Signature Bank, and SVB Financial Group, the last of which weakened with the technology stocks in the fourth quarter, and also related to unexpectedly higher levels of spending projected for 2019. We have sold both Western Alliance and Signature Bank from the Portfolio, but retain SVB Financial.
Communications services was a source of alpha generation, primarily related to a strong showing from Pandora, the streaming music service, which agreed to be purchased by Sirius XM Holdings. Outside of Pandora, Electronic Arts, Inc. was quite weak for the year after many years of sound performance. The company saw a deceleration in the near term growth of its live services business, and also announced the delay in the launch of an important video game.
We had no exposure to the real estate and utilities sectors, which contributed 0.13% and 0.02% to Portfolio performance, respectively.
Our information technology exposure produced the biggest negative contribution to relative performance last calendar year, largely related to sector allocation, as we were significantly underweight in this outperforming sector. Changes in the classification of stocks and the composition of the Russell Midcap Growth Index in 2018 largely drove our underweight stance, as names in the Portfolio previously classified as information technology stocks were strong relative performers in other sectors, namely GrubHub in consumer discretionary, Pandora in communications services, and CoStar Group in industrials. Collectively, these three names outperformed and represented better than 5% of the Portfolio. We had a number of very strong performers in the sector last calendar year, including Square, Inc., ServiceNow, Inc., a longstanding holding and strong performer in the Portfolio, Guidewire Software, Inc. and Autodesk, Inc. Weaker names included Trimble and IPG Photonics, neither of which are currently held in the Portfolio.
Our consumer staples exposure contributed negatively to relative performance, primarily related to the weakness in Hain Celestial Group, whose natural and organic food business was struggling both competitively and related to acquisitions that were not additive to their businesses. Two of our consumer staples names, Blue Buffalo Pet Products and Snyder’s-Lance, were bought last year, by General Mills and Campbell’s Soup Company, respectively.
Our energy exposure also contributed negatively to relative performance. While our stocks performed largely in line with the sector within the index, down slightly more than 20%, and we had no exposure to the energy sector after March 2018. The lack of a position in the energy sector detracted from overall performance by 0.11%. The utilities sector, which is a tiny part of the index, gained 9%. Our zero exposure had an impact of 0.01% to the positive on the relative performance of the Portfolio.
Outlook
The market’s temperament changed dramatically in 2018 as the first quarter developed, moving from impressive strength throughout 2017 and early 2018, to greater volatility and tortuous returns post the near-term peak in late January. The index sold off in January and then stayed level until early May, only to rise to new highs in September before a dramatic 16% swoon through the fourth quarter.
Concerns about higher interest rates and worldwide trade wars rattled the markets, and investors careened between near-term confidence in the economy and corporate profits, and fear of the unknown related to interest rates and tariffs. Strong corporate earnings borne of the ongoing recovery post the energy sector-led downturn in 2014 and 2015, buoyant business and consumer confidence, and economic growth worldwide underpinned the market’s movement throughout 2017 and early 2018. Tax reform was the turbo booster. But the strong economic growth and buoyant job market in the U.S. and worldwide beget fear of inflation.
The Fed has raised rates nine times in three years in a bid to begin to normalize the interest rate environment and to head-off anticipated inflation. These interest rate increases came alongside a shrinking Fed balance sheet and we are unsure the Fed has been fairly modeling the combined tightening impact of these factors on the economy and the market. Markets typically get a bit of indigestion as the tightening cycle ensues, and this time the tariff posturing of the Trump Administration has brought added concern as trade wars and the associated risk to free trade and corporate profitability can potentially impact investment returns. The uncertainty these factors bring can also negatively affect the level of business confidence, which is an important aspect behind economic growth or lack thereof. The investor revolt was dramatic and indiscriminate. The drawdown in the fourth quarter saw the Russell Midcap Growth, Core and Value Indices all fall between 15% and 16%.
It is not unusual to see a significant market correction during economic expansions, particularly as the economic cycle ages and growth may be downshifting from a higher rate, often as the Fed is tightening – and potentially overtightening – to get ahead of what it sees as inflationary trends. We see this as the case today, and the recent contraction in the valuation of the market, alongside the Fed’s more conciliatory tone, give investors headroom for gains in the stocks of companies that are still growing in a buoyant economy. The consumer is benefitting from a healthy job market and solid wage gains, more discretionary income related to tax reform, and much lower energy prices than at this time last year. Corporations continue to invest in innovation and efficiency. All of this underpins healthy demand in the economy, and an intact corporate profits cycle. We must be wary of weakness in other economies around the world, namely China and the eurozone, and the potential impact that weakness could have on the U.S. economy. We see the U.S. as not immune, but somewhat insulated from economic weakness in these other regions, given our stronger demographics and regulatory and tax law changes that have enhanced the business prospects in the U.S., specifically.
Our portfolio continues to express a more economically constructive and optimistic view, with a more assertive pro-growth, less defensive stance – although slightly less so than in 2017 or early 2018. While our portfolio represents an economically constructive point of view, our approach is essentially balanced based on stock selection as opposed to overt sector allocations. From a broader macroeconomic factor perspective, we expect a stable-to-rising rate environment to be generally positive for our approach, related to our focus on very profitable business models and sound capital structures. The time of quantitative easing was a challenge to our returns, as lower and lower interest rates played to the benefit of the stocks of companies with lesser quality business models and/or capital structures. We expect the change in trend to favor our investment style.
Past performance is not a guarantee of future results. The value of the Portfolio’s shares will change, and you could lose money on your investment.
Investing in mid-cap stocks may carry more risk than investing in stocks of larger, more-established companies. Prices of growth stocks may be more sensitive to changes in current or expected earnings than the prices of other stocks. Growth stocks may not perform as well as value stocks or the stock market in general. The use of derivatives presents several risks, including the risk that these instruments may change in value in a manner that adversely affects the Portfolio’s value and the risk that fluctuations in the value of the derivatives may not correlate with securities markets or the underlying asset upon which the derivative’s value is based. These and other risks are more fully described in the Portfolio’s prospectus.
The opinions expressed in this report are those of the portfolio managers and are current only through the end of the period of the report as stated on the cover. The managers’ views are subject to change at any time based on market and other conditions, and no forecasts can be guaranteed.
The index noted is unmanaged and include reinvested dividends. One cannot invest directly in an index, nor is an index representative of Ivy VIP Mid Cap Growth.
| | |
PORTFOLIO HIGHLIGHTS | | MID CAP GROWTH |
ALL DATA IS AS OF DECEMBER 31, 2018 (UNAUDITED)
| | | | |
Asset Allocation | |
Stocks | | | 98.2% | |
Information Technology | | | 22.4% | |
Consumer Discretionary | | | 22.4% | |
Industrials | | | 19.0% | |
Health Care | | | 18.4% | |
Financials | | | 6.7% | |
Materials | | | 3.7% | |
Consumer Staples | | | 3.0% | |
Communication Services | | | 2.6% | |
Cash and Other Assets (Net of Liabilities), and Cash Equivalents+ | | | 1.8% | |
Top 10 Equity Holdings
| | | | |
| | |
| Company | | Sector | | Industry |
Chipotle Mexican Grill, Inc., Class A | | Consumer Discretionary | | Restaurants |
Zoetis, Inc. | | Health Care | | Pharmaceuticals |
CoStar Group, Inc. | | Industrials | | Research & Consulting Services |
Tractor Supply Co. | | Consumer Discretionary | | Specialty Stores |
Electronic Arts, Inc. | | Communication Services | | Interactive Home Entertainment |
ServiceNow, Inc. | | Information Technology | | Systems Software |
Ulta Beauty, Inc. | | Consumer Discretionary | | Specialty Stores |
Edwards Lifesciences Corp. | | Health Care | | Health Care Equipment |
Intuitive Surgical, Inc. | | Health Care | | Health Care Equipment |
O’Reilly Automotive, Inc. | | Consumer Discretionary | | Automotive Retail |
See your advisor or www.ivyinvestments.com for more information on the Portfolio’s most recently published Top 10 Equity Holdings.
+ Cash equivalents are defined as highly liquid securities with maturities of less than three months. Cash equivalents may include U.S. Government Treasury bills, bank certificates of deposit, bankers’ acceptances, corporate commercial paper and other money market instruments.
| | |
COMPARISON OF CHANGE IN VALUE
OF $10,000 INVESTMENT | | MID CAP GROWTH |
(UNAUDITED)
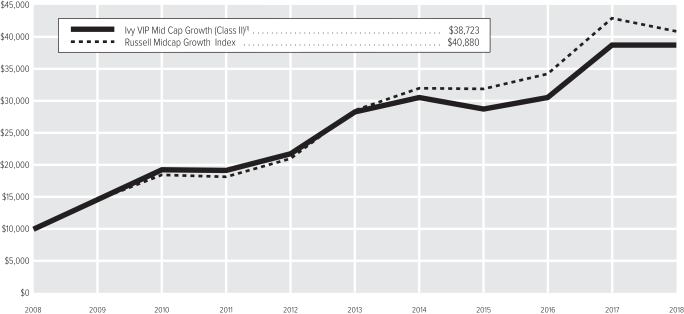
| (1) | The value of the investment in the Portfolio is impacted by the ongoing expenses of the Portfolio and assumes reinvestment of dividends and distributions. |
| | | | | | | | |
| | |
| Average Annual Total Return(2) | | Class I | | | Class II | |
1-year period ended12-31-18 | | | 0.20% | | | | -0.06% | |
5-year period ended12-31-18 | | | — | | | | 6.46% | |
10-year period ended12-31-18 | | | — | | | | 14.50% | |
Since Inception of Class through12-31-18(3) | | | 9.64% | | | | — | |
| (2) | Data quoted is past performance and current performance may be lower or higher. Past performance is no guarantee of future results. Investment return and principal value of an investment will fluctuate and shares, when redeemed, may be worth more or less than their original cost. Please visit www.ivyinvestments.com for the Portfolio’s most recentmonth-end performance. Performance data quoted does not reflect any expenses or charges associated with owning a variable life insurance policy or variable annuity contract that invests in the Portfolio’s shares. When such charges are deducted, actual investment performance in a variable policy or contract will be lower. |
| (3) | 4-28-17 (the date on which shares were first acquired by shareholders). |
Past performance is not necessarily indicative of future performance. Indexes are unmanaged. The performance graph and table do not reflect the deduction of taxes that a shareholder would pay on Portfolio distributions or on the redemption of Portfolio shares. Performance results may include the effect of expense reduction arrangements for some or all of the periods shown. If those arrangements had not been in place, the performance results for those periods would have been lower.
| | |
| SCHEDULE OF INVESTMENTS | | MID CAP GROWTH (in thousands) |
DECEMBER 31, 2018
| | | | | | | | |
| COMMON STOCKS | | Shares | | | Value | |
Communication Services | |
| |
Interactive Home Entertainment – 2.3% | |
Electronic Arts, Inc. (A) | | | 122 | | | $ | 9,645 | |
| | | | | | | | |
| |
Interactive Media & Services – 0.3% | |
Twitter, Inc. (A) | | | 36 | | | | 1,043 | |
| | | | | | | | |
| |
Total Communication Services – 2.6% | | | | 10,688 | |
Consumer Discretionary | |
| |
Apparel, Accessories & Luxury Goods – 3.2% | |
Burberry Group plc (B) | | | 268 | | | | 5,891 | |
lululemon athletica, Inc. (A) | | | 61 | | | | 7,423 | |
| | | | | | | | |
| | | | | | | 13,314 | |
| | | | | | | | |
| |
Auto Parts & Equipment – 1.4% | |
BorgWarner, Inc. | | | 167 | | | | 5,815 | |
| | | | | | | | |
| |
Automotive Retail – 2.0% | |
O’Reilly Automotive, Inc. (A) | | | 24 | | | | 8,340 | |
| | | | | | | | |
| |
Internet & Direct Marketing Retail – 4.2% | |
Duluth Holdings, Inc., Class B (A)(C) | | | 82 | | | | 2,074 | |
GrubHub, Inc. (A) | | | 96 | | | | 7,384 | |
MercadoLibre, Inc. | | | 27 | | | | 7,885 | |
| | | | | | | | |
| | | | | | | 17,343 | |
| | | | | | | | |
| |
Restaurants – 5.0% | |
Chipotle Mexican Grill, Inc.,
Class A (A) | | | 30 | | | | 12,857 | |
Dunkin Brands Group, Inc. | | | 119 | | | | 7,652 | |
| | | | | | | | |
| | | | | | | 20,509 | |
| | | | | | | | |
| |
Specialty Stores – 6.6% | |
Tiffany & Co. | | | 83 | | | | 6,663 | |
Tractor Supply Co. | | | 138 | | | | 11,553 | |
Ulta Beauty, Inc. (A) | | | 38 | | | | 9,205 | |
| | | | | | | | |
| | | | | | | 27,421 | |
| | | | | | | | |
| |
Total Consumer Discretionary – 22.4% | | | | 92,742 | |
Consumer Staples | |
| |
Food Retail – 1.8% | |
Sprouts Farmers Market, Inc. (A) | | | 318 | | | | 7,468 | |
| | | | | | | | |
| |
Packaged Foods & Meats – 1.2% | |
Hershey Foods Corp. | | | 48 | | | | 5,110 | |
| | | | | | | | |
| |
Total Consumer Staples – 3.0% | | | | 12,578 | |
Financials | |
| |
Asset Management & Custody Banks – 0.9% | |
Oaktree Capital Group LLC | | | 93 | | | | 3,682 | |
| | | | | | | | |
| |
Financial Exchanges & Data – 3.2% | |
CME Group, Inc. | | | 34 | | | | 6,442 | |
MarketAxess Holdings, Inc. | | | 32 | | | | 6,850 | |
| | | | | | | | |
| | | | | | | 13,292 | |
| | | | | | | | |
| | | | | | | | |
| COMMON STOCKS (Continued) | | Shares | | | Value | |
Regional Banks – 2.6% | |
First Republic Bank | | | 85 | | | $ | 7,422 | |
SVB Financial Group (A) | | | 18 | | | | 3,484 | |
| | | | | | | | |
| | | | | | | 10,906 | |
| | | | | | | | |
| |
Total Financials – 6.7% | | | | 27,880 | |
Health Care | |
| |
Biotechnology – 2.1% | |
BioMarin Pharmaceutical, Inc. (A) | | | 69 | | | | 5,875 | |
Seattle Genetics, Inc. (A) | | | 54 | | | | 3,036 | |
| | | | | | | | |
| | | | | | | 8,911 | |
| | | | | | | | |
Health Care Equipment – 8.9% | |
Abiomed, Inc. (A) | | | 25 | | | | 8,105 | |
DexCom, Inc. (A) | | | 60 | | | | 7,222 | |
Edwards Lifesciences Corp. (A) | | | 57 | | | | 8,724 | |
Glaukos Corp. (A) | | | 79 | | | | 4,439 | |
Intuitive Surgical, Inc. (A) | | | 18 | | | | 8,493 | |
| | | | | | | | |
| | | | | | | 36,983 | |
| | | | | | | | |
| |
Health Care Services – 1.2% | |
Laboratory Corp. of America Holdings (A) | | | 38 | | | | 4,778 | |
| | | | | | | | |
| |
Health Care Supplies – 0.8% | |
National Vision Holdings, Inc. (A) | | | 115 | | | | 3,239 | |
| | | | | | | | |
| |
Health Care Technology – 1.1% | |
Cerner Corp. (A) | | | 73 | | | | 3,841 | |
Veeva Systems, Inc., Class A (A) | | | 7 | | | | 639 | |
| | | | | | | | |
| | | | | | | 4,480 | |
| | | | | | | | |
| |
Life Sciences Tools & Services – 1.3% | |
Agilent Technologies, Inc. | | | 77 | | | | 5,194 | |
| | | | | | | | |
| |
Pharmaceuticals – 3.0% | |
Zoetis, Inc. | | | 146 | | | | 12,487 | |
| | | | | | | | |
| |
Total Health Care – 18.4% | | | | 76,072 | |
Industrials | |
| |
Aerospace & Defense – 1.9% | |
Harris Corp. | | | 45 | | | | 6,008 | |
Spirit AeroSystems Holdings, Inc. | | | 29 | | | | 2,061 | |
| | | | | | | | |
| | | | | | | 8,069 | |
| | | | | | | | |
| |
Air Freight & Logistics – 1.9% | |
Expeditors International of Washington, Inc. | | | 114 | | | | 7,765 | |
| | | | | | | | |
| |
Building Products – 2.5% | |
A. O. Smith Corp. | | | 141 | | | | 6,010 | |
Trex Co., Inc. (A) | | | 76 | | | | 4,505 | |
| | | | | | | | |
| | | | | | | 10,515 | |
| | | | | | | | |
| |
Construction Machinery & Heavy Trucks – 1.2% | |
Westinghouse Air Brake Technologies Corp. | | | 68 | | | | 4,797 | |
| | | | | | | | |
| |
Industrial Conglomerates – 1.6% | |
Fortive Corp. | | | 96 | | | | 6,482 | |
| | | | | | | | |
| | | | | | | | |
| COMMON STOCKS (Continued) | | Shares | | | Value | |
Industrial Machinery – 3.2% | |
IDEX Corp. | | | 56 | | | $ | 7,081 | |
Middleby Corp. (A) | | | 61 | | | | 6,263 | |
| | | | | | | | |
| | | | | | | 13,344 | |
| | | | | | | | |
| |
Research & Consulting Services – 4.7% | |
CoStar Group, Inc. (A) | | | 36 | | | | 12,229 | |
TransUnion | | | 129 | | | | 7,319 | |
| | | | | | | | |
| | | | | | | 19,548 | |
| | | | | | | | |
| |
Trading Companies & Distributors – 2.0% | |
Fastenal Co. | | | 157 | | | | 8,225 | |
| | | | | | | | |
| |
Total Industrials – 19.0% | | | | 78,745 | |
Information Technology | |
| |
Application Software – 4.7% | |
Autodesk, Inc. (A) | | | 43 | | | | 5,572 | |
DocuSign, Inc. (A) | | | 26 | | | | 1,023 | |
Guidewire Software, Inc. (A) | | | 103 | | | | 8,227 | |
Tyler Technologies, Inc. (A) | | | 24 | | | | 4,443 | |
| | | | | | | | |
| | | | | | | 19,265 | |
| | | | | | | | |
| |
Communications Equipment – 2.8% | |
Arista Networks, Inc. (A) | | | 30 | | | | 6,340 | |
Palo Alto Networks, Inc. (A) | | | 28 | | | | 5,313 | |
| | | | | | | | |
| | | | | | | 11,653 | |
| | | | | | | | |
| |
Data Processing & Outsourced Services – 2.3% | |
Jack Henry & Associates, Inc. | | | 16 | | | | 2,063 | |
Square, Inc., Class A (A) | | | 132 | | | | 7,383 | |
| | | | | | | | |
| | | | | | | 9,446 | |
| | | | | | | | |
| |
Electronic Components – 2.3% | |
Maxim Integrated Products, Inc. | | | 136 | | | | 6,911 | |
Universal Display Corp. (C) | | | 29 | | | | 2,704 | |
| | | | | | | | |
| | | | | | | 9,615 | |
| | | | | | | | |
| |
Electronic Equipment & Instruments – 0.6% | |
Coherent, Inc. (A) | | | 22 | | | | 2,305 | |
| | | | | | | | |
| |
Internet Services & Infrastructure – 0.9% | |
Twilio, Inc., Class A (A) | | | 43 | | | | 3,827 | |
| | | | | | | | |
| |
IT Consulting & Other Services – 1.6% | |
Keysight Technologies, Inc. (A) | | | 106 | | | | 6,601 | |
| | | | | | | | |
| |
Semiconductor Equipment – 1.0% | |
Teradyne, Inc. | | | 134 | | | | 4,199 | |
| | | | | | | | |
| |
Semiconductors – 3.2% | |
Microchip Technology, Inc. | | | 98 | | | | 7,041 | |
Monolithic Power Systems, Inc. | | | 55 | | | | 6,356 | |
| | | | | | | | |
| | | | | | | 13,397 | |
| | | | | | | | |
| |
Systems Software – 3.0% | |
Proofpoint, Inc. (A) | | | 36 | | | | 3,024 | |
ServiceNow, Inc. (A) | | | 53 | | | | 9,373 | |
| | | | | | | | |
| | | | | | | 12,397 | |
| | | | | | | | |
| |
Total Information Technology – 22.4% | | | | 92,705 | |
| | |
| SCHEDULE OF INVESTMENTS | | MID CAP GROWTH (in thousands) |
DECEMBER 31, 2018
| | | | | | | | |
| COMMON STOCKS (Continued) | | Shares | | | Value | |
| |
Materials | |
| |
Fertilizers & Agricultural Chemicals – 0.9% | |
ScottsMiracle-Gro Co. (The) | | | 61 | | | $ | 3,757 | |
| | | | | | | | |
| |
Specialty Chemicals – 2.8% | |
Axalta Coating Systems Ltd.(A) | | | 255 | | | | 5,962 | |
RPM International, Inc. | | | 95 | | | | 5,612 | |
| | | | | | | | |
| | | | | | | 11,574 | |
| | | | | | | | |
| |
Total Materials – 3.7% | | | | 15,331 | |
| |
TOTAL COMMON STOCKS – 98.2% | | | $ | 406,741 | |
(Cost: $376,886) | | | | | | | | |
| | |
SHORT-TERM SECURITIES | | | Principal | | | | | |
| |
Commercial Paper(D) – 0.9% | |
J.M. Smucker Co. (The),2.750%, 1-2-19 | | $ | 3,718 | | | | 3,717 | |
| | | | | | | | |
| |
Master Note – 0.8% | |
Toyota Motor Credit Corp.(1-Month U.S. LIBOR plus
15 bps),
2.720%,1-7-19(E) | | | 3,264 | | | | 3,264 | |
| | | | | | | | |
| |
Money Market Funds – 0.3% | |
Dreyfus Institutional Preferred Government Money Market Fund - Institutional Shares, 2.400%, (F)(G) | | | 1,150 | | | | 1,150 | |
| | | | | | | | |
| |
TOTAL SHORT-TERM SECURITIES – 2.0% | | | $ | 8,131 | |
(Cost: $8,132) | | | | | | | | |
| |
TOTAL INVESTMENT SECURITIES – 100.2% | | | $ | 414,872 | |
(Cost: $385,018) | | | | | | | | |
| |
LIABILITIES, NET OF CASH AND OTHER ASSETS – (0.2)% | | | | (858 | ) |
| |
NET ASSETS – 100.0% | | | $ | 414,014 | |
Notes to Schedule of Investments
| (A) | No dividends were paid during the preceding 12 months. |
| (B) | Listed on an exchange outside the United States. |
| (C) | All or a portion of securities with an aggregate value of $3,518 are on loan. |
| (D) | Rate shown is the yield to maturity at December 31, 2018. |
| (E) | Variable rate security. Interest rate disclosed is that which is in effect at December 31, 2018. Date shown represents the date that the variable rate resets. Description of the reference rate and spread, if applicable, are included in the security description. |
| (F) | Investment made with cash collateral received from securities on loan. |
| (G) | Rate shown is the annualized7-day yield at December 31, 2018. |
| | |
| SCHEDULE OF INVESTMENTS | | MID CAP GROWTH (in thousands) |
DECEMBER 31, 2018
The following table is a summary of the valuation of the Portfolio’s investments by the fair value hierarchy levels as of December 31, 2018. See Note 3 to the Financial Statements for further information regarding fair value measurement.
| | | | | | | | | | | | |
| | | Level 1 | | | Level 2 | | | Level 3 | |
Assets | | | | | | | | | | | | |
Investments in Securities | | | | | | | | | | | | |
Common Stocks | | | | | | | | | | | | |
Communication Services | | $ | 10,688 | | | $ | — | | | $ | — | |
Consumer Discretionary | | | 86,851 | | | | 5,891 | | | | — | |
Consumer Staples | | | 12,578 | | | | — | | | | — | |
Financials | | | 27,880 | | | | — | | | | — | |
Health Care | | | 76,072 | | | | — | | | | — | |
Industrials | | | 78,745 | | | | — | | | | — | |
Information Technology | | | 92,705 | | | | — | | | | — | |
Materials | | | 15,331 | | | | — | | | | — | |
Total Common Stocks | | $ | 400,850 | | | $ | 5,891 | | | $ | — | |
Short-Term Securities | | | 1,150 | | | | 6,981 | | | | — | |
Total | | $ | 402,000 | | | $ | 12,872 | | | $ | — | |
The following acronym is used throughout this schedule:
LIBOR = London Interbank Offered Rate
See Accompanying Notes to Financial Statements.
| | |
| MANAGEMENT DISCUSSION | | NATURAL RESOURCES |
(UNAUDITED)
David P. Ginther

Michael T. Wolverton
Below, David P. Ginther, CPA, and Michael T. Wolverton, CFA, portfolio managers of Ivy VIP Natural Resources, discuss positioning, performance and results for the fiscal year ended December 31, 2018. Mr. Ginther has managed the Portfolio for since 2013 and 23 years of industry experience. Mr. Wolverton has managed the Portfolio since 2016 and has 14 years of industry experience.
Fiscal year performance
| | | | |
For the 12 Months Ended December 31, 2018 | | | | |
Ivy VIP Natural Resources(Class II shares at net asset value) | | | -23.23% | |
Benchmark(s) and/or Morningstar and Lipper Categories | | | | |
S&P North American Natural Resources Sector Index | | | -21.07% | |
(generally reflects the performance of the energy and materials stocks in North America) | | | | |
MSCI ACWI IMI 55% Energy + 45% Materials Index | | | -15.81% | |
(generally reflects the performance of the energy and materials stocks in developed and emerging markets) | | | | |
MSCI ACWI IMI Energy Index | | | -14.96% | |
(generally reflects the performance of energy stocks in developed and emerging markets) | | | | |
MSCI ACWI IMI Materials Index | | | -17.33% | |
(generally reflects the performance of materials stocks in developed and emerging markets) | | | | |
Morningstar Natural Resources Universe Average | | | -20.36% | |
(generally reflects the performance of the universe of funds with similar investment objectives) | | | | |
Lipper Variable Annuity Natural Resources Funds Universe Average | | | -23.16% | |
(generally reflects the performance of the universe of funds with similar investment objectives) | | | | |
Please note that the Portfolio returns include applicable investment fees and expenses, whereas the index returns do not include any such fees. Also, the Portfolio’s performance data does not take into account any product expenses or charges associated with owning a variable life or annuity policy, which is invested in Ivy Variable Insurance Portfolios. Effective April 30, 2018, the Portfolio’s benchmark changed from the MSCI ACWI (All Country World Index) 55% Energy and 45% Materials to the S&P North American Natural Resources Sector Index.
Oil volatility
After bottoming in June of 2017, oil prices entered 2018 on an upward trend that continued for most of the year. Strong economic growth, rationed supply from Organization of Petroleum Exporting Countries (OPEC) and falling global inventories created the positive backdrop for oil prices to move higher. For the first 10 months of the calendar and fiscal year, the West Texas Intermediate oil price – the U.S. benchmark price – ranged from $59 to $75 per barrel.
Because of the strong underlying supply/demand fundamentals, OPEC decided to change its production quotas to begin bringing more supply onto the market. Another factor in this decision was the resumption by the U.S. of Iran economic sanctions that were scheduled to take effect in November 2018. Members of OPEC anticipated a significant reduction of supply when oil exports from Iran were phased out. However, OPEC and the rest of the market were surprised when the U.S. granted waivers for recipients of Iranian oil to continue doing so for another six months.
The combination of acceleration in the U.S. oil supply, increased OPEC supply, waivers for Iranian exports and decelerating global demand led to a precipitous drop in oil prices in the fourth quarter of 2018. With the market once again pushed into oversupply, oil prices plunged more than 40% in the final three months of the year. Because of the dramatic negative swing in fundamentals, OPEC reversed course in November and announced a reduction in supply once again. Most of these reductions were scheduled to come in early 2019 and we believe they will help improve the supply/demand balance.
Portfolio positioning
The Portfolio had a negative return for the fiscal year and trailed the return of its benchmark index and category averages. The Portfolio in general was underweight the energy sector and overweight the materials sector compared to its benchmark. The Portfolio increased its allocation to energy throughout the year and finished at about 64% of equity assets allocated to that sector.
Globally, the energy sector slightly outperformed the materials sector during the fiscal year, but both sectors were among the worst-performing sectors in the market. Generally, more defensive names outperformed in those two groups, as did companies with high-quality balance sheets. The Portfolio is underweight the Integrated Oil industry segment compared to the benchmark and its peers, which showed more defensive qualities in a declining energy equity market.
The Portfolio’s five greatest contributors to performance relative to the benchmark in the year were overweight positions in BHP Billiton plc, Union Pacific, Rio Tinto plc, Canadian Pacific Railway Ltd. and Air Products and Chemicals, Inc.
The five greatest relative detractors were the lack of an allocation in the Portfolio to ConocoPhillips, as well as overweight positions in RPC, Inc., Halliburton Co., Cimarex Energy Co. and Core Laboratories N.V.
Outlook for a recovery
The energy market enters the coming year looking to recover from a tumultuous exit to 2018. OPEC has stated its intent to balance the market and we think its announced production cuts will help achieve that outcome. We also think the cyclical recovery that began in 2018 is likely to resume after being interrupted at the end of the fiscal year. However, the recovery will also depend on worldwide demand and the pace of production from the U.S.
On the demand side, signs have emerged of an economic slowdown in many parts of the world, including China. Both the energy and materials sectors are quite sensitive to the level of demand for commodities in emerging markets, especially China. This outlook is likely to be influenced by the outcome of trade negotiations between the U.S. and China. This issue has yet to be resolved, so the demand picture is somewhat uncertain. Absent a significant move lower in demand, we think supply side fundamentals are healthy enough to drive a recovery in most commodity markets.
U.S. oil production surprised to the upside in 2018 and remains a concern in the coming year. The market is urging capital discipline on the part of U.S. producers, but not enough companies have made a clear commitment to this idea yet. We think oil prices mean more producers will take a cautious approach to capital expenditures in the coming year. This is likely to help cause a deceleration in supply growth, but we think production will remain above 1 million barrels per day.
Past performance is not a guarantee of future results. The value of the Portfolio’s shares will change, and you could lose money on your investment.
Investing in companies involved in one specified sector may be more risky and volatile than an investment with greater diversification. Investing in natural resources can be riskier than other types of investment activities because of a range of factors, including price fluctuation caused by real and perceived inflationary trends and political developments; and the cost assumed by natural resource companies in complying with environmental and safety regulations.
International investing involves additional risks, including currency fluctuations, political or economic conditions affecting the foreign country, and differences in accounting standards and foreign regulations. These risks are magnified in emerging markets.
Commodity trading, including trading in precious metals, is generally considered speculative because of the significant potential for investment loss. Markets for commodities are likely to be volatile and there may be sharp price fluctuations even during periods when prices overall are rising.
These and other risks are more fully described in the Portfolio’s prospectus.
The opinions expressed in this report are those of the portfolio managers and are current only through the end of the period of the report as stated on the cover. The managers’ views are subject to change at any time based on market and other conditions, and no forecasts can be guaranteed.
The index noted is unmanaged and includes reinvested dividends. One cannot invest directly in an index, nor is an index representative of Ivy VIP Natural Resources.
| | |
| PORTFOLIO HIGHLIGHTS | | NATURAL RESOURCES |
ALL DATA IS AS OF DECEMBER 31, 2018 (UNAUDITED)
Asset Allocation
| | | | |
Stocks | | | 95.3 | % |
Energy | | | 60.6 | % |
Materials | | | 28.2 | % |
Industrials | | | 6.5 | % |
Cash and Other Assets (Net of Liabilities), and Cash Equivalents+ | | | 4.7 | % |
Country Weightings
| | | | |
North America | | | 75.8 | % |
United States | | | 67.8 | % |
Canada | | | 8.0 | % |
Europe | | | 14.0 | % |
United Kingdom | | | 10.9 | % |
Other Europe | | | 3.1 | % |
Pacific Basin | | | 3.9 | % |
Australia | | | 3.9 | % |
Other Pacific Basin | | | 0.0 | % |
Other | | | 1.6 | % |
Cash and Other Assets (Net of Liabilities), and Cash Equivalents+ | | | 4.7 | % |
Top 10 Equity Holdings
| | | | | | |
| | | |
| Company | | Country | | Sector | | Industry |
Chevron Corp. | | United States | | Energy | | Integrated Oil & Gas |
Halliburton Co. | | United States | | Energy | | Oil & Gas Equipment & Services |
Phillips 66 | | United States | | Energy | | Oil & Gas Refining & Marketing |
Concho Resources, Inc. | | United States | | Energy | | Oil & Gas Exploration & Production |
EOG Resources, Inc. | | United States | | Energy | | Oil & Gas Exploration & Production |
BHP Group plc | | Australia | | Materials | | Diversified Metals & Mining |
Rio Tinto plc | | United Kingdom | | Materials | | Diversified Metals & Mining |
Canadian Pacific Railway Ltd. | | Canada | | Industrials | | Railroads |
Marathon Petroleum Corp. | | United States | | Energy | | Oil & Gas Refining & Marketing |
Valero Energy Corp. | | United States | | Energy | | Oil & Gas Refining & Marketing |
See your advisor or www.ivyinvestments.com for more information on the Portfolio’s most recently published Top 10 Equity Holdings.
+ Cash equivalents are defined as highly liquid securities with maturities of less than three months. Cash equivalents may include U.S. Government Treasury bills, bank certificates of deposit, bankers’ acceptances, corporate commercial paper and other money market instruments.
| | |
COMPARISON OF CHANGE IN VALUE
OF $10,000 INVESTMENT | | NATURAL RESOURCES |
(UNAUDITED)
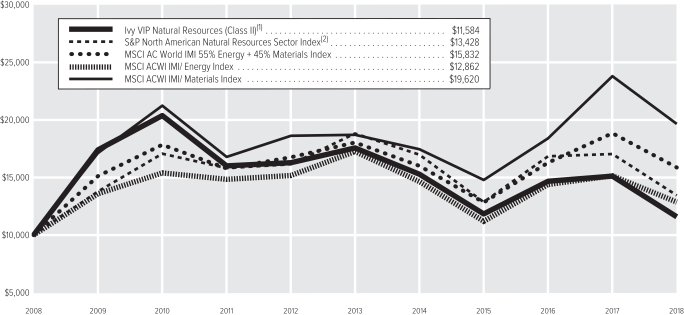
| (1) | The value of the investment in the Portfolio is impacted by the ongoing expenses of the Portfolio and assumes reinvestment of dividends and distributions. |
| (2) | The Portfolio’s benchmark changed effective April 30, 2018. IICO believes that the S&P North American Natural Resources Sector Index is more reflective of the types of securities in which the Portfolio invests than the three indexes noted. |
| | | | |
| |
| Average Annual Total Return(3) | | Class II | |
1-year period ended12-31-18 | | | -23.23% | |
5-year period ended12-31-18 | | | -7.96% | |
10-year period ended12-31-18 | | | 1.48% | |
| (3) | Data quoted is past performance and current performance may be lower or higher. Past performance is no guarantee of future results. Investment return and principal value of an investment will fluctuate and shares, when redeemed, may be worth more or less than their original cost. Please visit www.ivyinvestments.com for the Portfolio’s most recentmonth-end performance. Performance data quoted does not reflect any expenses or charges associated with owning a variable life insurance policy or variable annuity contract that invests in the Portfolio’s shares. When such charges are deducted, actual investment performance in a variable policy or contract will be lower. |
Past performance is not necessarily indicative of future performance. Indexes are unmanaged. The performance graph and table do not reflect the deduction of taxes that a shareholder would pay on Portfolio distributions or on the redemption of Portfolio shares. Performance results may include the effect of expense reduction arrangements for some or all of the periods shown. If those arrangements had not been in place, the performance results for those periods would have been lower.
| | |
| SCHEDULE OF INVESTMENTS | | NATURAL RESOURCES (in thousands) |
DECEMBER 31, 2018
| | | | | | | | |
| COMMON STOCKS | | Shares | | | Value | |
Australia | |
| |
Materials – 3.9% | |
BHP Group plc | | | 163 | | | $ | 3,449 | |
| | | | | | | | |
| |
Total Australia – 3.9% | | | $ | 3,449 | |
Canada | |
| |
Industrials – 3.6% | |
Canadian Pacific Railway Ltd. | | | 18 | | | | 3,188 | |
| | | | | | | | |
| |
Materials – 4.4% | |
Nutrien Ltd. | | | 57 | | | | 2,693 | |
West Fraser Timber Co. Ltd. | | | 24 | | | | 1,200 | |
| | | | | | | | |
| | | | | | | 3,893 | |
| | | | | | | | |
| |
Total Canada – 8.0% | | | $ | 7,081 | |
Hong Kong | |
| |
Materials – 0.0% | |
China Metal Recycling
(Holdings) Ltd. (A)(B) | | | 1,900 | | | | — | * |
| | | | | | | | |
| |
Total Hong Kong – 0.0% | | | $ | — | * |
Netherlands | |
| |
Energy – 1.9% | |
Core Laboratories N.V. | | | 28 | | | | 1,649 | |
| | | | | | | | |
| |
Total Netherlands – 1.9% | | | $ | 1,649 | |
Portugal | |
| |
Energy – 1.2% | |
Galp Energia SGPS S.A., Class B | | | 67 | | | | 1,051 | |
| | | | | | | | |
| |
Total Portugal – 1.2% | | | $ | 1,051 | |
South Africa | |
| |
Materials – 1.6% | |
Mondi plc | | | 66 | | | | 1,379 | |
| | | | | | | | |
| |
Total South Africa – 1.6% | | | $ | 1,379 | |
United Kingdom | |
| |
Energy – 2.7% | |
BP plc | | | 383 | | | | 2,418 | |
| | | | | | | | |
| |
Materials – 8.2% | |
Croda International plc | | | 24 | | | | 1,424 | |
Randgold Resources Ltd. ADR | | | 32 | | | | 2,629 | |
Rio Tinto plc | | | 67 | | | | 3,221 | |
| | | | | | | | |
| | | | | | | 7,274 | |
| | | | | | | | |
| |
Total United Kingdom – 10.9% | | | $ | 9,692 | |
United States | |
| |
Energy – 54.8% | |
Cabot Oil & Gas Corp. | | | 113 | | | | 2,514 | |
Centennial Resource Development, Inc., Class A (A) | | | 97 | | | | 1,073 | |
| | | | | | | | |
| COMMON STOCKS(Continued) | | Shares | | | Value | |
Energy(Continued) | |
Chevron Corp. | | | 42 | | | $ | 4,559 | |
Cimarex Energy Co. | | | 29 | | | | 1,806 | |
Concho Resources, Inc. (A) | | | 35 | | | | 3,644 | |
Continental Resources, Inc. (A) | | | 28 | | | | 1,113 | |
Diamondback Energy, Inc. | | | 30 | | | | 2,749 | |
Enterprise Products Partners L.P. | | | 87 | | | | 2,127 | |
EOG Resources, Inc. | | | 41 | | | | 3,580 | |
Halliburton Co. | | | 169 | | | | 4,498 | |
Kosmos Energy Ltd. (A) | | | 61 | | | | 247 | |
Magellan Midstream Partners L.P. | | | 38 | | | | 2,140 | |
Marathon Petroleum Corp. | | | 52 | | | | 3,069 | |
Noble Energy, Inc. | | | 62 | | | | 1,170 | |
Parsley Energy, Inc., Class A (A) | | | 117 | | | | 1,867 | |
Phillips 66 | | | 43 | | | | 3,661 | |
RPC, Inc. (C) | | | 194 | | | | 1,919 | |
Schlumberger Ltd. | | | 53 | | | | 1,903 | |
Valero Energy Corp. | | | 38 | | | | 2,849 | |
WPX Energy, Inc. (A) | | | 178 | | | | 2,019 | |
| | | | | | | | |
| | | | | | | 48,507 | |
| | | | | | | | |
| |
Industrials – 2.9% | |
Union Pacific Corp. | | | 18 | | | | 2,523 | |
| | | | | | | | |
| |
Materials – 10.1% | |
Air Products and Chemicals, Inc. | | | 14 | | | | 2,273 | |
Dow Chemical Co. (The) | | | 15 | | | | 808 | |
Ecolab, Inc. | | | 12 | | | | 1,717 | |
International Flavors & Fragrances, Inc. | | | 8 | | | | 1,092 | |
Packaging Corp. of America | | | 5 | | | | 422 | |
PPG Industries, Inc. | | | 18 | | | | 1,830 | |
WestRock Co. (A) | | | 10 | | | | 796 | |
| | | | | | | | |
| | | | | | | 8,938 | |
| | | | | | | | |
| |
Total United States – 67.8% | | | $ | 59,968 | |
| |
TOTAL COMMON STOCKS – 95.3% | | | $ | 84,269 | |
(Cost: $110,332) | | | | | | | | |
| | |
| SHORT-TERM SECURITIES | | Principal | | | | |
Master Note – 4.0% | |
Toyota Motor Credit Corp.(1-Month U.S. LIBOR plus 15 bps)
2.720%,1-7-19 (D) | | $ | 3,533 | | | | 3,533 | |
| | | | | | | | |
| |
Money Market Funds – 0.1% | |
Dreyfus Institutional Preferred Government Money Market Fund - Institutional Shares
2.400%, (E)(F) | | | 108 | | | | 108 | |
| | | | | | | | |
| |
TOTAL SHORT-TERM SECURITIES – 4.1% | | | $ | 3,641 | |
(Cost: $3,641) | | | | | | | | |
| |
TOTAL INVESTMENT SECURITIES – 99.4% | | | $ | 87,910 | |
(Cost: $113,973) | | | | | | | | |
| |
CASH AND OTHER ASSETS, NET OF LIABILITIES – 0.6% | | | | 530 | |
| |
NET ASSETS – 100.0% | | | $ | 88,440 | |
| | |
| SCHEDULE OF INVESTMENTS | | NATURAL RESOURCES (in thousands) |
DECEMBER 31, 2018
Notes to Schedule of Investments
| * | Not shown due to rounding. |
| (A) | No dividends were paid during the preceding 12 months. |
| (B) | Securities whose value was determined using significant unobservable inputs. |
| (C) | All or a portion of securities with an aggregate value of $1,737 are on loan. |
| (D) | Variable rate security. Interest rate disclosed is that which is in effect at December 31, 2018. Date shown represents the date that the variable rate resets. Description of the reference rate and spread, if applicable, are included in the security description. |
| (E) | Rate shown is the annualized7-day yield at December 31, 2018. |
| (F) | Investment made with cash collateral received from securities on loan. |
The following forward foreign currency contracts were outstanding at December 31, 2018:
| | | | | | | | | | | | | | | | | | | | | | | | | | | | |
| | | Currency to be
Delivered | | | | | Currency to be
Received | | | Settlement
Date | | | Counterparty | | Unrealized
Appreciation | | | Unrealized
Depreciation | | | | |
Euro | | | 921 | | | U.S. Dollar | | | 1,074 | | | | 1-7-19 | | | Morgan Stanley International | | $ | 18 | | | $ | — | | | | | |
British Pound | | | 9,365 | | | U.S. Dollar | | | 12,267 | | | | 1-7-19 | | | UBS AG | | | 328 | | | | — | | | | | |
Canadian Dollar | | | 1,615 | | | U.S. Dollar | | | 1,263 | | | | 1-7-19 | | | UBS AG | | | 80 | | | | — | | | | | |
| | | | | | | | | | | | | | | | | | | | |
| | | | | | | | | | | | | | | | | | $ | 426 | | | $ | — | | | | | |
| | | | | | | | | | | | | | | | | | | | |
| | | | | | | | | | | | |
The following table is a summary of the valuation of the Portfolio’s investments by the fair value hierarchy levels as of December 31, 2018. See Note 3 to the Financial Statements for further information regarding fair value measurement. | |
| | | Level 1 | | | Level 2 | | | Level 3 | |
Assets | | | | | | | | | | | | |
Investments in Securities | | | | | | | | | | | | |
Common Stocks | | | | | | | | | | | | |
Energy | | $ | 50,156 | | | $ | 3,469 | | | $ | — | |
Industrials | | | 5,711 | | | | — | | | | — | |
Materials | | | 12,831 | | | | 12,102 | | | | — | * |
Total Common Stocks | | $ | 68,698 | | | $ | 15,571 | | | $ | — | * |
Short-Term Securities | | | 108 | | | | 3,533 | | | | — | |
Total | | $ | 68,806 | | | $ | 19,104 | | | $ | — | * |
Forward Foreign Currency Contracts | | $ | — | | | $ | 426 | | | $ | — | |
During the year ended December 31, 2018, there were no transfers in or out of Level 3.
The following acronyms are used throughout this schedule:
ADR = American Depositary Receipts
LIBOR = London Interbank Offered Rate
Market Sector Diversification
| | | | |
(as a % of net assets) | | | | |
Energy | | | 60.6 | % |
Materials | | | 28.2 | % |
Industrials | | | 6.5 | % |
Other+ | | | 4.7 | % |
+ Includes cash and other assets (net of liabilities), and cash equivalents
See Accompanying Notes to Financial Statements.
| | |
| MANAGEMENT DISCUSSION | | SCIENCE AND TECHNOLOGY |
(UNAUDITED)
|

Zachary Shafran 
Bradley Warden |
Below, Zachary Shafran and Bradley Warden, portfolio managers of Ivy VIP Science and Technology, discuss positioning, performance and results for the fiscal year ended December 31, 2018. Mr. Shafran has managed the Portfolio since 2001 and has 30 years of industry experience. Mr. Warden was named portfolio manager in October 2016 and was previously an assistant portfolio manager on the Portfolio since 2014. He has 21 years of industry experience.
Fiscal Year Performance
| | | | |
For the 12 Months Ended December 31, 2018 | | | | |
Ivy VIP Science and Technology(Class II shares at net asset value) | | | -5.23% | |
Benchmark(s) and/or Morningstar and Lipper Categories | | | | |
S&P North American Technology Sector Index | | | 2.88% | |
(generally reflects the performance of U.S. science and technology stocks) | | | | |
Morningstar Technology Universe Average | | | -2.81% | |
(generally reflects the performance of the universe of funds with similar investment objectives) | | | | |
Lipper Variable Annuity Science & Technology Funds Universe Average | | | -3.07% | |
(generally reflects the performance of the universe of funds with similar investment objectives) | | | | |
Please note that Portfolio returns include applicable fees and expenses while index returns do not include any such fees. Also, the Portfolio’s performance data does not take into account any product expenses or charges associated with owning a variable life or annuity policy, which is invested in Ivy Variable Insurance Portfolios.
Volatile markets with increasing macroeconomic and political concerns
Equity and fixed-income markets were volatile in the fiscal year ended December 31, 2018. U.S. growth continued through 2018, driven by a strong job market and supportive economy, while some key global economies, like China, began to struggle under the weight and negative sentiment of increasing tariffs. Despite underlying economic strength in the U.S., domestic markets also began to fear the longer-term impacts of trade policy and a potential policy mistake by the Federal Reserve (Fed). The consistent monetary policy tightening in the U.S. over the course of the year began impacting sentiment and asset prices, especially in the fourth quarter. The Fed raised rates four times in 2018, increasing the federal funds rate to a range of 2.25-2.50% over the course of the year. Markets became particularly worried with the final rate increase in December, as concerns about the domestic housing market and trade-related slowdowns were already on investors’ minds. Following the December rate increase, the Fed expressed a more dovish outlook on monetary policy in 2019, suggesting the Fed sees the need to slow down the monetary tightening process. Inflation generally remained in check through the fiscal year even with stronger wage growth data being offset by both energy and housing pricing relief.
The Fed’s actions were clearly in focus, but the trade war between the U.S. and China created the greatest uncertainty for the markets in 2018. China’s economy and markets saw significant weakening over the course of 2018. Towards the end of the year concerns crept into the U.S. markets as it appeared that trade negotiations were proving more challenging. President Trump continued to tweet about the trade situation, but the market began to react less to each new tweet. A negotiated solution is in the best interest of each country, but the relative uncertainty of a conclusion unsettled the markets.
Beyond the global challenges, the Democrats gained control of the House of Representatives which makes policy more complicated. The government shutdown towards the end of the year presents one additional near-term risk to domestic growth, though typical shutdowns are short-lived and have relatively minor economic consequences. We believe health care policy and drug pricing likely gets additional focus with the Democrats sharing congressional control, though major health care policy changes seem unlikely given the current government composition.
During the fiscal year, information technology stocks were relatively flat, with the Portfolio’s benchmark index advancing 2.88%. Within technology, the software subsector performed relatively well, while the semiconductor subsector reversed its strong performance last year with a weaker 2018, particularly in the final months of the year. We continue to believe that semiconductors are key to future innovation within technology and that consolidation, operating leverage, balance sheet strength, increases in dividend payments and strong management will provide stability and growth to this subsector. On the health care front, stocks performed relatively in line, primarily due to waning concerns on political rhetoric around drug pricing pressure and policy uncertainty. We believe broader political talk may continue, but health care should not be a primary target.
Reduced risk tolerance drives underperformance
The Portfolio underperformed its benchmark and its peer group average during the fiscal year. Health care is not represented in the benchmark, so the Portfolio’s allocation to the sector is an important distinction when comparing performance metrics. In 2018, the health care portion of the Portfolio detracted from relative performance, largely due to underperformance in biotechnology as the increase in market volatility impacted overall risk tolerance. Within biotechnology, Vertex Pharmaceuticals, Inc. and Ionis Pharmaceuticals, Inc. were the greatest positive contributors.
Underperformance in the Portfolio’s technology exposure was primarily driven by the relative underweight in Amazon.com, Inc. and overweight position in Universal Display Corp. On the other hand, overweight positions in Microsemi Corp., Aspen Technology, Inc., and ACI Worldwide, Inc. positively contributed to the Portfolio’s relative performance. Microsemi was no longer a holding in the Portfolio as of December 31, 2018. Additionally, an underweight position in Facebook Inc. was an incremental positive contributor.
The Portfolio used derivatives over the reporting period, but the usage of derivatives had no material impact on Portfolio performance.
Portfolio positioning
While we recognize the challenges of the world economic backdrop, we are excited about the innovation and growth that is taking place within certain companies. We believe many of the stocks in the information technology space remain relatively well-positioned going forward. Despite risks due to trade and tighter monetary policy, we remain cautiously optimistic on the broader macroeconomy. Core to this optimism is an expectation of easing in the trade war in 2019. This action is in the long-term best interests of both the U.S. and China and we believe that progress towards negotiations should be supportive of financial markets. Company management teams express varying levels of optimism about economic growth, though recent events have caused a pause in growth in different areas within technology. The Portfolio had approximately 63% of its equity exposure in the information technology sector as of December 31, 2018.
As of the fiscal year end, roughly 18% of the Portfolio’s equity holdings were in the health care sector. In developing markets, as the standard of living increases, we believe the demand for quality health care should increase. In our view, biotechnology, health care information technology systems and pharmaceuticals are among the greatest innovators and early adopters of new science and technology, so we are paying particularly close attention to companies in those areas. Even with rhetoric around drug pricing, we believe biotechnology and pharmaceutical companies that bring economic value to the market (e.g. fewer hospitalizations and better patient productivity) should see significant returns and appreciating stock prices. We believe the next few years should be particularly constructive for biotechnology company stocks and we have added several names in this area, as we expect significant innovation and economic returns.
The Portfolio’s “applied science and technology” holdings span several industries and sectors and make up the remainder of the Portfolio’s equity composition. The Portfolio’s cash position as of December 31, 2018 was approximately 1.80%. We almost always have some cash on hand in an effort to take advantage of opportunities that may present themselves, or to use as a defensive measure to protect the Portfolio in adverse market conditions.
Seeking opportunities in a volatile market
Global economic growth is being questioned as extremely aggressive global monetary easing has ended and global trade policy questions remain unanswered. The Fed recently shifted to a data-driven dovish view of the markets just as these trade war issues are impacting growth. With this backdrop, we expect continued volatility in underlying financial markets. This volatility provides opportunity for positioning in key innovation-led names that fit our process and long-term holding strategy.
For the upcoming fiscal year, we believe growth may be lower than 2018, though asset prices largely reflect this expectation. That said, we intend to continue to be prudent in balancing growth with valuations, as we believe there are many potential investment opportunities – especially in biotechnology, data and semiconductors – around the world. As we look at the securities of such companies, we are focused on what we believe are good growth prospects and sound capital structures. We believe there will be improvement in capital spending trends, and we are looking for a continuation of an active mergers-and-acquisition environment. As always, we continue to carefully monitor the macroeconomic environment, but our focus remains primarily on security-specific fundamental research. Going forward, we believe this attention to bottom-up research, coupled with the innovation and transformation under way across the globe, should continue to provide investment opportunities for the Portfolio.
Past performance is not a guarantee of future results. The value of the Portfolio’s shares will change, and you could lose money on your investment.
Because the Portfolio invests more than 25% of its total assets in the science and technology industry, the Portfolio’s performance may be more susceptible to a single economic, regulatory or technological occurrence than a fund that does not concentrate its investments in this industry. Securities of companies within specific industries or sectors of the economy may periodically perform differently than the overall market. In addition, the Portfolio’s performance may be more volatile than an investment in a portfolio of broad market securities and may underperform the market as a whole, due to the relatively limited number of issuers of science and technology related securities. Investment risks associated with investing in science and technology securities, in addition to other risks, include: operating in rapidly changing fields, abrupt or erratic market movements, limited product lines, markets or financial resources, management that is dependent on a limited number of people, short product cycles, aggressive pricing of products and services, new market entrants and obsolescence of existing technology.
International investing involves additional risks, including currency fluctuations, political or economic conditions affecting the foreign country, and differences in accounting standards and foreign regulations.
Dividend-paying stocks may fall out of favor with investors and underperform non-dividend paying stocks and the market as a whole. In addition, dividend-paying companies may not pay dividends in the future; such dividends, if declared, may not remain at current levels or increase over time. The amount of any dividend the company may pay may fluctuate significantly. Dividend-paying stocks can decline in value when interest rates rise; this risk may be greater during the current period of historically low interest rates. These and other risks are more fully described in the Portfolio’s prospectus.
The opinions expressed in this report are those of the portfolio managers and are current only through the end of the period of the report as stated on the cover. The managers’ views are subject to change at any time based on market and other conditions, and no forecasts can be guaranteed.
The index noted is unmanaged and includes reinvested dividends. One cannot invest directly in an index, nor is an index representative of Ivy VIP Science and Technology.
| | |
| PORTFOLIO HIGHLIGHTS | | SCIENCE AND TECHNOLOGY |
ALL DATA IS AS OF DECEMBER 31, 2018 (UNAUDITED)
Asset Allocation
| | | | |
Stocks | | | 98.2% | |
Information Technology | | | 61.4% | |
Health Care | | | 17.8% | |
Communication Services | | | 12.4% | |
Consumer Discretionary | | | 4.6% | |
Real Estate | | | 1.3% | |
Materials | | | 0.4% | |
Industrials | | | 0.3% | |
Warrants | | | 0.0% | |
Bonds | | | 0.1% | |
Corporate Debt Securities | | | 0.1% | |
Cash and Other Assets (Net of Liabilities), and Cash Equivalents+ | | | 1.7% | |
Country Weightings
| | | | |
North America | | | 85.7% | |
United States | | | 85.7% | |
Pacific Basin | | | 8.7% | |
India | | | 4.5% | |
China | | | 3.9% | |
Other Pacific Basin | | | 0.3% | |
Europe | | | 3.8% | |
Other | | | 0.1% | |
Cash and Other Assets (Net of Liabilities),
and Cash Equivalents+ | | | 1.7% | |
Top 10 Equity Holdings
| | | | | | |
| | | |
| Company | | Country | | Sector | | Industry |
Microsoft Corp. | | United States | | Information Technology | | Systems Software |
Euronet Worldwide, Inc. | | United States | | Information Technology | | Data Processing & Outsourced Services |
Vertex Pharmaceuticals, Inc. | | United States | | Health Care | | Biotechnology |
Aspen Technology, Inc. | | United States | | Information Technology | | Application Software |
Apple, Inc. | | United States | | Information Technology | | Technology Hardware, Storage & Peripherals |
ACI Worldwide, Inc. | | United States | | Information Technology | | Application Software |
WNS (Holdings) Ltd. ADR | | India | | Information Technology | | Data Processing & Outsourced Services |
Micron Technology, Inc. | | United States | | Information Technology | | Semiconductors |
Alibaba Group Holding Ltd. ADR | | China | | Consumer Discretionary | | Internet & Direct Marketing Retail |
Cypress Semiconductor Corp. | | United States | | Information Technology | | Semiconductors |
See your advisor or www.ivyinvestments.com for more information on the Portfolio’s most recently published Top 10 Equity Holdings.
+ Cash equivalents are defined as highly liquid securities with maturities of less than three months. Cash equivalents may include U.S. Government Treasury bills, bank certificates of deposit, bankers’ acceptances, corporate commercial paper and other money market instruments.
| | |
COMPARISON OF CHANGE IN VALUE
OF $10,000 INVESTMENT | | SCIENCE AND TECHNOLOGY |
(UNAUDITED)
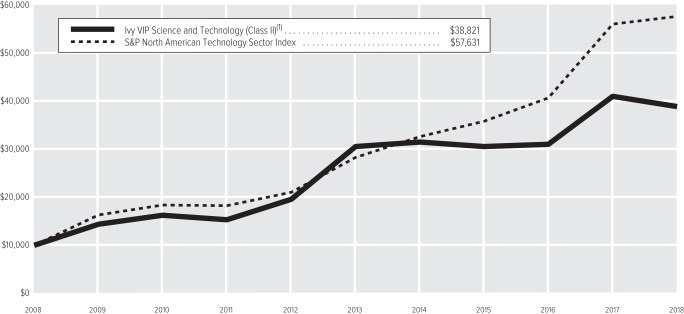
| (1) | The value of the investment in the Portfolio is impacted by the ongoing expenses of the Portfolio and assumes reinvestment of dividends and distributions. |
| | | | | | | | |
| | |
| Average Annual Total Return(2) | | Class I | | | Class II | |
1-year period ended12-31-18 | | | -5.00% | | | | -5.23% | |
5-year period ended12-31-18 | | | — | | | | 4.91% | |
10-year period ended12-31-18 | | | — | | | | 14.53% | |
Since Inception of Class through12-31-18(3) | | | 6.64% | | | | — | |
| (2) | Data quoted is past performance and current performance may be lower or higher. Past performance is no guarantee of future results. Investment return and principal value of an investment will fluctuate and shares, when redeemed, may be worth more or less than their original cost. Please visit www.ivyinvestments.com for the Portfolio’s most recentmonth-end performance. Performance data quoted does not reflect any expenses or charges associated with owning a variable life insurance policy or variable annuity contract that invests in the Portfolio’s shares. When such charges are deducted, actual investment performance in a variable policy or contract will be lower. |
| (3) | 4-28-17 (the date on which shares were first acquired by shareholders). |
Past performance is not necessarily indicative of future performance. Indexes are unmanaged. The performance graph and table do not reflect the deduction of taxes that a shareholder would pay on Portfolio distributions or on the redemption of Portfolio shares. Performance results may include the effect of expense reduction arrangements for some or all of the periods shown. If those arrangements had not been in place, the performance results for those periods would have been lower.
| | |
| SCHEDULE OF INVESTMENTS | | SCIENCE AND TECHNOLOGY (in thousands) |
DECEMBER 31, 2018
| | | | | | | | |
| COMMON STOCKS | | Shares | | | Value | |
Communication Services | |
Alternative Carriers – 1.5% | |
Zayo Group Holdings, Inc. (A) | | | 280 | | | $ | 6,393 | |
| | | | | | | | |
| |
Interactive Home Entertainment – 0.2% | |
HUYA, Inc. ADR (A)(B) | | | 42 | | | | 653 | |
| | | | | | | | |
| |
Interactive Media & Services – 8.2% | |
Alphabet, Inc., Class A (A) | | | 11 | | | | 11,703 | |
Alphabet, Inc., Class C (A) | | | 15 | | | | 15,259 | |
Facebook, Inc., Class A (A) | | | 64 | | | | 8,442 | |
| | | | | | | | |
| | | | | | | 35,404 | |
| | | | | | | | |
| |
Movies & Entertainment – 2.5% | |
Netflix, Inc. (A) | | | 40 | | | | 10,814 | |
| | | | | | | | |
| |
Total Communication Services – 12.4% | | | | 53,264 | |
Consumer Discretionary | |
| |
Internet & Direct Marketing Retail – 4.6% | |
Alibaba Group Holding Ltd. ADR (A) | | | 117 | | | | 16,078 | |
Amazon.com, Inc. (A) | | | 3 | | | | 3,755 | |
| | | | | | | | |
| | | | | | | 19,833 | |
| | | | | | | | |
| |
Total Consumer Discretionary – 4.6% | | | | 19,833 | |
Health Care | |
| |
Biotechnology – 13.3% | |
Allogene Therapeutics, Inc. (A)(B) | | | 62 | | | | 1,666 | |
BioMarin Pharmaceutical, Inc. (A) | | | 70 | | | | 5,978 | |
CRISPR Therapeutics AG (A) | | | 61 | | | | 1,734 | |
Evogene Ltd. (A) | | | 137 | | | | 274 | |
Gilead Sciences, Inc. | | | 48 | | | | 3,002 | |
Immunomedics, Inc. (A) | | | 129 | | | | 1,837 | |
Ionis Pharmaceuticals, Inc. (A) | | | 218 | | | | 11,801 | |
Moderna, Inc. (A)(B) | | | 91 | | | | 1,392 | |
Sage Therapeutics, Inc. (A) | | | 18 | | | | 1,696 | |
Sarepta Therapeutics, Inc. (A) | | | 51 | | | | 5,544 | |
Vertex Pharmaceuticals, Inc. (A) | | | 134 | | | | 22,155 | |
| | | | | | | | |
| | | | | | | 57,079 | |
| | | | | | | | |
| |
Health Care Equipment – 1.2% | |
Medtronic plc | | | 57 | | | | 5,148 | |
| | | | | | | | |
| |
Health Care Services – 0.1% | |
Guardant Health, Inc. (A) | | | 11 | | | | 411 | |
| | | | | | | | |
| |
Health Care Technology – 3.2% | |
Cerner Corp. (A) | | | 266 | | | | 13,939 | |
| | | | | | | | |
| | |
Total Health Care – 17.8% | | | | | | | 76,577 | |
Industrials | |
| |
Human Resource & Employment Services – 0.3% | |
Upwork, Inc. (A) | | | 66 | | | | 1,195 | |
| | | | | | | | |
| |
Total Industrials – 0.3% | | | | 1,195 | |
Information Technology | |
| |
Application Software – 9.6% | |
ACI Worldwide, Inc. (A) | | | 717 | | | | 19,828 | |
Aspen Technology, Inc. (A) | | | 262 | | | | 21,507 | |
| | | | | | | | |
| | | | | | | 41,335 | |
| | | | | | | | |
| | | | | | | | |
| COMMON STOCKS(Continued) | | Shares | | | Value | |
Data Processing & Outsourced Services – 11.6% | |
Alliance Data Systems Corp. | | | 44 | | | $ | 6,603 | |
Euronet Worldwide, Inc. (A) | | | 234 | | | | 23,919 | |
WNS (Holdings) Ltd. ADR (A) | | | 472 | | | | 19,479 | |
| | | | | | | | |
| | | | | | | 50,001 | |
| | | | | | | | |
| |
Electronic Components – 3.2% | |
Universal Display Corp. (B) | | | 145 | | | | 13,577 | |
| | | | | | | | |
| |
IT Consulting & Other Services – 0.9% | |
Endava plc ADR (A) | | | 18 | | | | 431 | |
Teradata Corp. (A) | | | 89 | | | | 3,416 | |
| | | | | | | | |
| | | | | | | 3,847 | |
| | | | | | | | |
| |
Semiconductor Equipment – 2.1% | |
ASML Holding N.V., NY Registry Shares | | | 59 | | | | 9,166 | |
| | | | | | | | |
| |
Semiconductors – 16.5% | |
Cypress Semiconductor Corp. | | | 1,235 | | | | 15,709 | |
Marvell Technology Group Ltd. | | | 462 | | | | 7,473 | |
Microchip Technology, Inc. (B) | | | 83 | | | | 5,977 | |
Micron Technology, Inc. (A) | | | 524 | | | | 16,616 | |
QUALCOMM, Inc. | | | 192 | | | | 10,916 | |
Rambus, Inc. (A) | | | 530 | | | | 4,061 | |
Semtech Corp. (A) | | | 198 | | | | 9,064 | |
Taiwan Semiconductor Manufacturing Co. Ltd. ADR | | | 31 | | | | 1,138 | |
| | | | | | | | |
| | | | | | | 70,954 | |
| | | | | | | | |
| |
Systems Software – 9.4% | |
Ceridian HCM Holding, Inc. (A) | | | 38 | | | | 1,303 | |
Microsoft Corp. | | | 384 | | | | 39,033 | |
| | | | | | | | |
| | | | | | | 40,336 | |
| | | | | | | | |
| |
Technology Hardware, Storage & Peripherals – 8.1% | |
Apple, Inc. | | | 135 | | | | 21,263 | |
Hewlett-Packard Co. | | | 656 | | | | 13,426 | |
| | | | | | | | |
| | | | | | | 34,689 | |
| | | | | | | | |
| |
Total Information Technology – 61.4% | | | | 263,905 | |
Materials | |
| |
Fertilizers & Agricultural Chemicals – 0.4% | |
Marrone Bio Innovations, Inc. (A)(B) | | | 1,116 | | | | 1,641 | |
| | | | | | | | |
| |
Total Materials – 0.4% | | | | 1,641 | |
Real Estate | |
| |
Specialized REITs – 1.3% | |
QTS Realty Trust, Inc., Class A | | | 156 | | | $ | 5,769 | |
| | | | | | | | |
| |
Total Real Estate – 1.3% | | | | 5,769 | |
| |
TOTAL COMMON STOCKS – 98.2% | | | $ | 422,184 | |
(Cost: $287,417) | | | | | | | | |
| | | | | | | | |
| WARRANTS | | Shares | | | Value | |
Fertilizers & Agricultural Chemicals – 0.0% | |
Marrone Bio Innovations, Inc., expires12-31-20 (C)(D) | | | 230 | | | $ | 51 | |
Marrone Bio Innovations, Inc., expires8-20-23 (C)(D) | | | 230 | | | | — | * |
| | | | | | | | |
| | | | | | | 51 | |
| | | | | | | | |
| |
TOTAL WARRANTS – 0.0% | | | $ | 51 | |
(Cost: $—) | | | | | | | | |
| | |
| CORPORATE DEBT SECURITIES | | Principal | | | | |
Materials | |
| |
Fertilizers & Agricultural Chemicals – 0.1% | |
Marrone Bio Innovations, Inc., | | | | | | | | |
8.000%,8-20-20 (C) | | $ | 288 | | | | 276 | |
| | | | | | | | |
| |
Total Materials – 0.1% | | | | 276 | |
| |
TOTAL CORPORATE DEBT SECURITIES – 0.1% | | | $ | 276 | |
(Cost: $288) | | | | | | | | |
| | |
| SHORT-TERM SECURITIES | | | | | | |
Master Note – 0.8% | |
Toyota Motor Credit Corp.(1-Month U.S. LIBOR plus 15 bps), | | | | | | | | |
2.720%,1-7-19 (E) | | | 3,256 | | | | 3,256 | |
| | | | | | | | |
| |
Money Market Funds – 0.7% | |
Dreyfus Institutional Preferred Government Money Market Fund —Institutional Shares, | | | | | | | | |
2.400%, (F)(G) | | | 2,990 | | | | 2,990 | |
| | | | | | | | |
| |
United States Government Agency Obligations – 0.4% | |
Overseas Private Investment Corp. (GTD by U.S. Government)(3-Month U.S. TB Rate), | | | | | | | | |
2.470%,1-7-19 (E) | | | 1,835 | | | | 1,835 | |
| | | | | | | | |
| |
TOTAL SHORT-TERM SECURITIES – 1.9% | | | $ | 8,081 | |
(Cost: $8,081) | |
| |
TOTAL INVESTMENT SECURITIES – 100.2% | | | $ | 430,592 | |
(Cost: $295,786) | |
| |
LIABILITIES, NET OF CASH AND OTHER ASSETS – (0.2)% | | | | (926 | ) |
| |
NET ASSETS – 100.0% | | | $ | 429,666 | |
| | |
| SCHEDULE OF INVESTMENTS | | SCIENCE AND TECHNOLOGY (in thousands) |
DECEMBER 31, 2018
Notes to Schedule of Investments
| * | Not shown due to rounding. |
| (A) | No dividends were paid during the preceding 12 months. |
| (B) | All or a portion of securities with an aggregate value of $18,534 are on loan. |
| (C) | Restricted securities. At December 31, 2018, the Portfolio owned the following restricted securities: |
| | | | | | | | | | | | | | | | | | | | |
| Security | | Acquisition Date(s) | | | Principal | | | Cost | | | Market Value | | | | |
Marrone Bio Innovations, Inc., 8.000%, 8-20-20 | | | 8-20-15 | | | $ | 288 | | | $ | 288 | | | $ | 276 | | | | | |
| | | | | |
| | | | | | Shares | | | | | | | | | | |
Marrone Bio Innovations, Inc., expires12-31-20 | | | 2-6-18 | | | | 230 | | | | — | | | | 51 | | | | | |
Marrone Bio Innovations, Inc., expires8-20-23 | | | 8-20-15 | | | | 230 | | | | — | | | | — | * | | | | |
| | | | | | | | | | | | |
| | | | | | | | | | $ | 288 | | | $ | 327 | | | | | |
| | | | | | | | | | | | |
| | The total value of these securities represented 0.1% of net assets at December 31, 2018. |
| (D) | Warrants entitle the Portfolio to purchase a predetermined number of shares of common stock and arenon-income producing. The purchase price and number of shares are subject to adjustment under certain conditions until the expiration date, if any. |
| (E) | Variable rate security. Interest rate disclosed is that which is in effect at December 31, 2018. Date shown represents the date that the variable rate resets. Description of the reference rate and spread, if applicable, are included in the security description. |
| (F) | Investment made with cash collateral received from securities on loan. |
| (G) | Rate shown is the annualized7-day yield at December 31, 2018. |
The following table is a summary of the valuation of the Portfolio’s investments by the fair value hierarchy levels as of December 31, 2018. See Note 3 to the Financial Statements for further information regarding fair value measurement.
| | | | | | | | | | | | |
| | | Level 1 | | | Level 2 | | | Level 3 | |
Assets | | | | | | | | | | | | |
Investments in Securities | | | | | | | | | | | | |
Common Stocks | | | | | | | | | | | | |
Communication Services | | $ | 53,264 | | | $ | — | | | $ | — | |
Consumer Discretionary | | | 19,833 | | | | — | | | | — | |
Health Care | | | 76,577 | | | | — | | | | — | |
Industrials | | | 1,195 | | | | — | | | | — | |
Information Technology | | | 263,905 | | | | — | | | | — | |
Materials | | | 1,641 | | | | — | | | | — | |
Real Estate | | | 5,769 | | | | — | | | | — | |
Total Common Stocks | | $ | 422,184 | | | $ | — | | | $ | — | |
Warrants | | | — | | | | 51 | | | | — | |
Corporate Debt Securities | | | — | | | | 276 | | | | — | |
Short-Term Securities | | | 2,990 | | | | 5,091 | | | | — | |
Total | | $ | 425,174 | | | $ | 5,418 | | | $ | — | |
The following acronyms are used throughout this schedule:
ADR = American Depositary Receipts
GTD = Guaranteed
LIBOR = London Interbank Offered Rate
REIT= Real Estate Investment Trust
TB = Treasury Bill
| | |
| SCHEDULE OF INVESTMENTS | | SCIENCE AND TECHNOLOGY (in thousands) |
DECEMBER 31, 2018
Country Diversification
| | | | |
(as a % of net assets) | |
United States | | | 85.7% | |
India | | | 4.5% | |
China | | | 3.9% | |
Netherlands | | | 2.1% | |
Ireland | | | 1.2% | |
Other Countries | | | 0.9% | |
Other+ | | | 1.7% | |
+Includes cash and other assets (net of liabilities), and cash equivalents
See Accompanying Notes to Financial Statements.
| | |
| MANAGEMENT DISCUSSION | | SMALL CAP CORE |
(UNAUDITED)

Kenneth G. Gau
Below, Kenneth G. Gau, portfolio manager of Ivy VIP Small Cap Core, discusses positioning, performance and results for the fiscal year ended December 31, 2018. Mr. Gau has managed the Fund since 2014, and has 24 years of industry experience. In May 2018, Scott Sullivan resigned his position as a portfolio manager.
Fiscal year Performance
| | | | |
For the 12 Months Ended December 31, 2018 | | | | |
Ivy VIP Small Cap Core(Class II shares at net asset value) | | | -10.49% | |
Benchmark(s) and/or Morningstar and Lipper Categories | | | | |
Russell 2000 Index | | | -11.01% | |
(generally reflects the performance of small-company stocks) | | | | |
Morningstar Small Blend Universe Average | | | -12.84% | |
(generally reflects the performance of the universe of funds with similar investment objectives) | | | | |
Lipper Variable Annuity Small-Cap Core Funds Universe Average | | | -12.68% | |
(generally reflects the performance of the universe of funds with similar investment objectives) | | | | |
Please note that Portfolio returns include applicable fees and expenses while index returns do not include any such fees. Also, the Portfolio’s performance data does not take into account any product expenses or charges associated with owning a variable life or annuity policy, which is invested in Ivy Variable Insurance Portfolios.
Key factors, contributors and detractors
For small capitalization companies, 2018 came out of the gates like it was going to be another strong year. The Russell 2000 Index, the Portfolio’s benchmark, was up 14.2% through the end of August. It moderated some through September and really sold off hard into year-end to finish down -11% for the year. At its worst, the drawdown was -27.2% from its peak (August 31, 2018 until the day before Christmas), before we saw a little recovery during the last week of 2018. What led to this selloff was pretty clear: decelerating global growth, and fear that it ultimately might lead to a recession. This fear was driven by a combination of tightening monetary policy, trade tensions and general uncertainty from Washington. In addition, geopolitical concerns (Brexit, yellow vests in France and budget concerns in Italy) have done nothing to allay these concerns.
The midyear downward inflection triggered a pretty sizeable change in the leading market sectors, as investors took a risk-off approach. Through August, health care (+29.8%), information technology (+24.3%) and consumer discretionary (+15.1%) led, but when the year finished, utilities (+2.9%) was the only positive sector, followed by information technology (-.6%) and communication services (-3.8%). A perfect example of the aversion to risk can be seen by the performance of higher beta stocks versus lower beta stocks in the fourth quarter. For that period, stocks in the Russell 2000 Index with the top quintile of beta (-33.7%) trailed those in the bottom quintile of beta (-9.4%) by greater than 2,400 basis points (bps.)
The Portfolio slightly outperformed its benchmark for the measurement period ended December 31, 2018, and was in the top third of its peer group, as only 30% of managers beat the index in 2018. While the year turned out better than average in comparison to the benchmark, we were somewhat disappointed in that we could have delivered even greater relative upside had our stock selection had been a little better, especially in the top 10 biggest weights, which were just over a 400 bps detractor to attribution. With only three of the top 10 holdings delivering positive returns, our batting percentage was .300 in our highest conviction holdings for the period. We believe this performance was atypical and this headwind at the top of the Portfolio led to stock selection only being a marginal positive contributor for the year, with allocation being the majority.
With a concentrated strategy, having poor stock selection at the top of the Portfolio can clearly be magnified. However, the good news is our Portfolio construction still allowed for us to overcome this shortfall. Looking at the holdings that seemed to cause the greatest consternation for us in 2018, they did seem to have some commonality in that their business models all had some sort of controversy, or at least perceived inability to handle to current uncertain environment. Whether it was exposure to China, tariffs, leverage or some other concern, the market was highly punitive to uncertainty. This observation is hardly ground breaking, but the magnitude and speed at which this change in perception worked its way into the market was notable. While we have often talked about quality of the business models in which we invest, we expect our tolerance for quality will tighten further at this latter stage of the business cycle based on what we have most recently experienced.
Outlook
Looking ahead at 2019, we believe the market drawdown already experienced makes it difficult to become much more defensive, and generally believe a majority of the absolute pain has already been felt. That stated, we do not believe there is
any easy resolution to what has been put into motion, and it will require some time to work out. While we could easily see a market snap back due to the recent dramatic selloff, we also believe that more choppiness lies ahead. This is very common late in economic cycles, as we grapple with slowing global economic growth, tightening in monetary policy and in this particular cycle, seeing whether we can move past the trade tensions with China.
Even if this current global slowdown moderates, the U.S. brokers a deal with China, and we avoid a near-term recession, it is important not to lose sight of the fact that we are 118 months into this bull market, and the current economic cycle is not young. We do not believe we are going into a recession, but the idea that we see a substantial reacceleration in economic growth seems rather unlikely to us. Therefore, expectations for returns should likely be more measured. Regardless of how the market performs in 2019, we remain committed to the Portfolio’s process of identifying quality underappreciated companies. In addition, we believe the construction of the Portfolio is well balanced so as to perform well versus our peers and benchmark, regardless of the environment over time.
Past performance is not a guarantee of future results. The value of the Portfolio’s shares will change, and you could lose money on your investment.
Investing in small-cap growth and value stocks may carry more risk than investing in stocks of larger, more well-established companies. Growth stocks may be more volatile or not perform as well as value stocks or the stock market in general. Value stocks are stocks of companies that may have experienced adverse developments or may be subject to special risks that have caused the stocks to be out of favor and, in the opinion of the Portfolio’s manager, undervalued. Such security may never reach what the manager believes to be its full value, or such security’s value may decrease. These and other risks are more fully described in the Portfolio’s prospectus.
The opinions expressed in this report are those of the Portfolio manager and are current only through the end of the period of the report as stated on the cover. The manager’s views are subject to change at any time based on market and other conditions, and no forecasts can be guaranteed.
The index noted is unmanaged and includes reinvested dividends. One cannot invest directly in an index, nor is an index representative of Ivy VIP Small Cap Core.
| | |
| PORTFOLIO HIGHLIGHTS | | SMALL CAP CORE |
ALL DATA AS OF DECEMBER 31, 2018 (UNAUDITED)
Asset Allocation
| | | | |
Stocks | | | 96.4% | |
Financials | | | 18.5% | |
Information Technology | | | 18.3% | |
Industrials | | | 14.5% | |
Health Care | | | 10.2% | |
Consumer Staples | | | 7.2% | |
Consumer Discretionary | | | 7.1% | |
Utilities | | | 5.8% | |
Real Estate | | | 4.9% | |
Communication Services | | | 3.9% | |
Materials | | | 3.6% | |
Energy | | | 2.4% | |
Cash and Other Assets (Net of Liabilities), and Cash Equivalents+ | | | 3.6% | |
Top 10 Equity Holdings
| | | | |
| | |
| Company | | Sector | | Industry |
Webster Financial Corp. | | Financials | | Regional Banks |
Green Dot Corp., Class A | | Financials | | Consumer Finance |
Vonage Holdings Corp. | | Communication Services | | Alternative Carriers |
Grand Canyon Education, Inc. | | Consumer Discretionary | | Education Services |
Post Holdings, Inc. | | Consumer Staples | | Packaged Foods & Meats |
Cabot Corp. | | Materials | | Commodity Chemicals |
Nomad Foods Ltd. | | Consumer Staples | | Packaged Foods & Meats |
Everbridge, Inc. | | Information Technology | | Application Software |
Kemper Corp. | | Financials | | Multi-Line Insurance |
Cubic Corp. | | Industrials | | Aerospace & Defense |
See your advisor or www.ivyinvestments.com for more information on the Portfolio’s most recently published Top 10 Equity Holdings.
+ Cash equivalents are defined as highly liquid securities with maturities of less than three months. Cash equivalents may include U.S. Government Treasury bills, bank certificates of deposit, bankers’ acceptances, corporate commercial paper and other money market instruments.
| | |
| COMPARISON OF CHANGE IN VALUE OF $10,000 INVESTMENT | | SMALL CAP CORE |
(UNAUDITED)
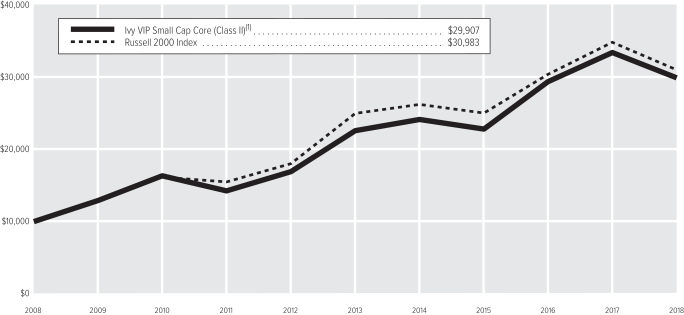
| (1) | The value of the investment in the Portfolio is impacted by the ongoing expenses of the Portfolio and assumes reinvestment of dividends and distributions. |
| | | | |
| |
| Average Annual Total Return(2) | | Class II | |
1-year period ended12-31-18 | | | -10.49% | |
5-year period ended12-31-18 | | | 5.81% | |
10-year period ended12-31-18 | | | 11.58% | |
| (2) | Data quoted is past performance and current performance may be lower or higher. Past performance is no guarantee of future results. Investment return and principal value of an investment will fluctuate and shares, when redeemed, may be worth more or less than their original cost. Please visit www.ivyinvestments.com for the Portfolio’s most recentmonth-end performance. Performance data quoted does not reflect any expenses or charges associated with owning a variable life insurance policy or variable annuity contract that invests in the Portfolio’s shares. When such charges are deducted, actual investment performance in a variable policy or contract will be lower. |
Past performance is not necessarily indicative of future performance. Indexes are unmanaged. The performance graph and table do not reflect the deduction of taxes that a shareholder would pay on Portfolio distributions or on the redemption of Portfolio shares. Performance results may include the effect of expense reduction arrangements for some or all of the periods shown. If those arrangements had not been in place, the performance results for those periods would have been lower.
| | |
| SCHEDULE OF INVESTMENTS | | SMALL CAP CORE (in thousands) |
DECEMBER 31, 2018
| | | | | | | | |
| COMMON STOCKS | | Shares | | | Value | |
Communication Services | |
| |
Alternative Carriers – 3.9% | |
Vonage Holdings Corp. (A) | | | 788 | | | $ | 6,883 | |
| | | | | | | | |
| |
Total Communication Services – 3.9% | | | | 6,883 | |
Consumer Discretionary | |
| |
Apparel Retail – 1.6% | |
Boot Barn Holdings, Inc. (A) | | | 171 | | | | 2,909 | |
| | | | | | | | |
| |
Auto Parts & Equipment – 0.5% | |
Visteon Corp. (A) | | | 15 | | | | 892 | |
| | | | | | | | |
| |
Casinos & Gaming – 1.8% | |
Red Rock Resorts, Inc., Class A | | | 153 | | | | 3,109 | |
| | | | | | | | |
| |
Education Services – 3.2% | |
Grand Canyon Education, Inc. (A) | | | 58 | | | | 5,605 | |
| | | | | | | | |
| |
Total Consumer Discretionary – 7.1% | | | | 12,515 | |
Consumer Staples | |
| |
Packaged Foods & Meats – 7.2% | |
Nomad Foods Ltd. (A) | | | 298 | | | | 4,976 | |
Post Holdings, Inc. (A) | | | 57 | | | | 5,036 | |
TreeHouse Foods, Inc. (A) | | | 52 | | | | 2,621 | |
| | | | | | | | |
| | | | | | | 12,633 | |
| | | | | | | | |
| |
Total Consumer Staples – 7.2% | | | | 12,633 | |
Energy | |
| |
Oil & Gas Equipment & Services – 0.7% | |
Cactus, Inc., Class A (A) | | | 29 | | | | 789 | |
Liberty Oilfield Services, Inc., Class A (B) | | | 41 | | | | 526 | |
| | | | | | | | |
| | | | | | | 1,315 | |
| | | | | | | | |
| |
Oil & Gas Exploration & Production – 1.7% | |
Callon Petroleum Co. (A) | | | 227 | | | | 1,475 | |
Magnolia Oil & Gas Corp. (A) | | | 138 | | | | 1,542 | |
| | | | | | | | |
| | | | | | | 3,017 | |
| | | | | | | | |
| |
Total Energy – 2.4% | | | | 4,332 | |
Financials | |
| |
Consumer Finance – 4.9% | |
Green Dot Corp., Class A (A) | | | 108 | | | | 8,556 | |
| | | | | | | | |
| |
Multi-Line Insurance – 2.6% | |
Kemper Corp. | | | 69 | | | | 4,600 | |
| | | | | | | | |
| |
Property & Casualty Insurance – 2.0% | |
Old Republic International Corp. | | | 172 | | | | 3,528 | |
| | | | | | | | |
| |
Regional Banks – 6.7% | |
Chemical Financial Corp. | | | 84 | | | | 3,079 | |
Webster Financial Corp. | | | 177 | | | | 8,709 | |
| | | | | | | | |
| | | | | | | 11,788 | |
| | | | | | | | |
| | | | | | | | |
| COMMON STOCKS(Continued) | | Shares | | | Value | |
Thrifts & Mortgage Finance – 2.3% | |
MGIC Investment Corp. (A) | | | 375 | | | $ | 3,925 | |
| | | | | | | | |
| |
Total Financials – 18.5% | | | | 32,397 | |
Health Care | |
| |
Health Care Equipment – 3.1% | |
Insulet Corp. (A) | | | 40 | | | | 3,165 | |
Tandem Diabetes Care, Inc. (A) | | | 57 | | | | 2,172 | |
| | | | | | | | |
| | | | | | | 5,337 | |
| | | | | | | | |
| |
Health Care Facilities – 1.5% | |
HealthSouth Corp. | | | 43 | | | | 2,659 | |
| | | | | | | | |
| |
Health Care Services – 1.4% | |
Chemed Corp. | | | 9 | | | | 2,521 | |
| | | | | | | | |
| |
Health Care Supplies – 2.4% | |
Cerus Corp. (A) | | | 170 | | | | 861 | |
ICU Medical, Inc. (A) | | | 8 | | | | 1,837 | |
Sientra, Inc. (A) | | | 124 | | | | 1,580 | |
| | | | | | | | |
| | | | | | | 4,278 | |
| | | | | | | | |
| |
Health Care Technology – 1.8% | |
Evolent Health, Inc., Class A (A) | | | 153 | | | | 3,052 | |
| | | | | | | | |
| |
Total Health Care – 10.2% | | | | 17,847 | |
Industrials | |
| |
Aerospace & Defense – 3.6% | |
Cubic Corp. | | | 83 | | | | 4,439 | |
Curtiss-Wright Corp. | | | 18 | | | | 1,848 | |
| | | | | | | | |
| | | | | | | 6,287 | |
| | | | | | | | |
| |
Diversified Support Services – 1.9% | |
Healthcare Services Group, Inc. (B) | | | 85 | | | | 3,415 | |
| | | | | | | | |
| |
Environmental & Facilities Services – 1.5% | |
Clean Harbors, Inc. (A) | | | 52 | | | | 2,576 | |
| | | | | | | | |
| |
Industrial Machinery – 6.1% | |
Crane Co. | | | 54 | | | | 3,876 | |
ITT, Inc. | | | 5 | | | | 261 | |
RBC Bearings, Inc. (A) | | | 22 | | | | 2,884 | |
Rexnord Corp. (A) | | | 160 | | | | 3,679 | |
| | | | | | | | |
| | | | | | | 10,700 | |
| | | | | | | | |
| |
Office Services & Supplies – 1.4% | |
MSA Safety, Inc. | | | 26 | | | | 2,461 | |
| | | | | | | | |
| |
Total Industrials – 14.5% | | | | 25,439 | |
Information Technology | |
| |
Application Software – 7.0% | |
Everbridge, Inc. (A) | | | 84 | | | | 4,745 | |
Pluralsight, Inc., Class A (A) | | | 181 | | | | 4,262 | |
Q2 Holdings, Inc. (A) | | | 65 | | | | 3,236 | |
| | | | | | | | |
| | | | | | | 12,243 | |
| | | | | | | | |
| | | | | | | | |
| COMMON STOCKS(Continued) | | Shares | | | Value | |
Data Processing & Outsourced Services – 1.9% | |
Cardtronics plc, Class A (A) | | | 77 | | | $ | 1,997 | |
EVERTEC, Inc. | | | 46 | | | | 1,326 | |
| | | | | | | | |
| | | | | | | 3,323 | |
| | | | | | | | |
| |
Electronic Equipment & Instruments – 1.8% | |
FLIR Systems, Inc. | | | 74 | | | | 3,239 | |
| | | | | | | | |
| |
IT Consulting & Other Services – 3.5% | |
Booz Allen Hamilton Holding Corp. | | | 71 | | | | 3,204 | |
CACI International, Inc., Class A (A) | | | 20 | | | | 2,895 | |
| | | | | | | | |
| | | | | | | 6,099 | |
| | | | | | | | |
| |
Semiconductor Equipment – 0.5% | |
Teradyne, Inc. | | | 28 | | | | 891 | |
| | | | | | | | |
| |
Systems Software – 2.2% | |
PROS Holdings, Inc. (A) | | | 123 | | | | 3,868 | |
| | | | | | | | |
| |
Technology Distributors – 1.4% | |
Avnet, Inc. | | | 67 | | | | 2,401 | |
| | | | | | | | |
| |
Total Information Technology – 18.3% | | | | 32,064 | |
Materials | |
| |
Commodity Chemicals – 3.6% | |
Cabot Corp. | | | 117 | | | | 5,029 | |
Orion Engineered Carbons S.A. | | | 51 | | | | 1,279 | |
| | | | | | | | |
| | | | | | | 6,308 | |
| | | | | | | | |
| |
Total Materials – 3.6% | | | | 6,308 | |
Real Estate | |
| |
Hotel & Resort REITs – 1.0% | |
Gaylord Entertainment Co. | | | 27 | | | | 1,814 | |
| | | | | | | | |
| |
Industrial REITs – 1.6% | |
STAG Industrial, Inc. | | | 111 | | | | 2,769 | |
| | | | | | | | |
| |
Retail REITs – 2.3% | |
Agree Realty Corp. | | | 67 | | | | 3,987 | |
| | | | | | | | |
| |
Total Real Estate – 4.9% | | | | 8,570 | |
Utilities | |
| |
Electric Utilities – 3.3% | |
ALLETE, Inc. | | | 36 | | | | 2,729 | |
IDACORP, Inc. | | | 32 | | | | 3,015 | |
| | | | | | | | |
| | | | | | | 5,744 | |
| | | | | | | | |
| |
Gas Utilities – 1.9% | |
ONE Gas, Inc. | | | 42 | | | | 3,334 | |
| | | | | | | | |
| |
Water Utilities – 0.6% | |
Aqua America, Inc. | | | 33 | | | | 1,135 | |
| | | | | | | | |
| |
Total Utilities – 5.8% | | | | 10,213 | |
| |
TOTAL COMMON STOCKS – 96.4% | | | $ | 169,201 | |
(Cost: $184,342) | |
| | |
| SCHEDULE OF INVESTMENTS | | SMALL CAP CORE (in thousands) |
DECEMBER 31, 2018
| | | | | | | | |
| SHORT-TERM SECURITIES | | Principal | | | Value | |
Master Note – 4.1% | |
Toyota Motor Credit Corp.(1-Month U.S. LIBOR plus 15 bps), | | | | | | | | |
2.720%,1-7-19 (C) | | $ | 7,166 | | | $ | 7,166 | |
Money Market Funds – 0.4% | |
Dreyfus Institutional Preferred Government Money Market Fund – Institutional Shares, 2.400%, (D)(E) | | | 628 | | | | 628 | |
| | | | | | | | |
| | |
TOTAL SHORT-TERM SECURITIES – 4.5% | | | | | | $ | 7,794 | |
(Cost: $7,794) | | | | | | | | |
| |
TOTAL INVESTMENT SECURITIES – 100.9% | | | $ | 176,995 | |
(Cost: $192,136) | | | | | | | | |
| |
LIABILITIES, NET OF CASH AND OTHER ASSETS – (0.9)% | | | | (1,638 | ) |
| |
NET ASSETS – 100.0% | | | $ | 175,357 | |
Notes to Schedule of Investments
| (A) | No dividends were paid during the preceding 12 months. |
| (B) | All or a portion of securities with an aggregate value of $3,614 are on loan. |
| (C) | Variable rate security. Interest rate disclosed is that which is in effect at December 31, 2018. Date shown represents the date that the variable rate resets. Description of the reference rate and spread, if applicable, are included in the security description. |
| (D) | Investment made with cash collateral received from securities on loan. |
| (E) | Rate shown is the annualized7-day yield at December 31, 2018. |
The following table is a summary of the valuation of the Portfolio’s investments by the fair value hierarchy levels as of December 31, 2018. See Note 3 to the Financial Statements for further information regarding fair value measurement.
| | | | | | | | | | | | |
| | | Level 1 | | | Level 2 | | | Level 3 | |
Assets | | | | | | | | | | | | |
Investments in Securities | | | | | | | | | | | | |
Common Stocks | | $ | 169,201 | | | $ | — | | | $ | — | |
Short-Term Securities | | | 628 | | | | 7,166 | | | | — | |
Total | | $ | 169,829 | | | $ | 7,166 | | | $ | — | |
The following acronyms are used throughout this schedule:
LIBOR = London Interbank Offered Rate
REIT = Real Estate Investment Trust
See Accompanying Notes to Financial Statements.
| | |
| MANAGEMENT DISCUSSION | | SMALL CAP GROWTH |
(UNAUDITED)

Kenneth G. McQuade

Timothy J. Miller

Bradley P. Halverson
Below, Bradley P. Halverson, CFA, Kenneth G. McQuade and Timothy J. Miller, CFA, co-portfolio managers of Ivy VIP Small Cap Growth, discuss positioning, performance and results for the fiscal year ended December 31, 2018. Mr. McQuade has managed the Portfolio since 2006 and has 23 years of investment experience. Mr. Halverson and Mr. Miller assumed co-manager responsibility in 2016 and they have 17 years and 39 years of industry experience, respectively.
Fiscal Year Performance
| | | | |
For the 12 Months Ended December 31, 2018 | | | | |
Ivy VIP Small Cap Growth(Class II shares at net asset value) | | | -4.11% | |
Benchmark(s) and/or Morningstar and Lipper Categories | | | | |
Russell 2000 Growth Index | | | -9.31% | |
(generally reflects the performance of small-capitalization growth stocks) | | | | |
Morningstar Small Growth Universe Average | | | -5.59% | |
(generally reflects the performance of the universe of funds with similar investment objectives) | | | | |
Lipper Variable Annuity Small-Cap Growth Funds Universe Average | | | -5.99% | |
(generally reflects the performance of the universe of funds with similar investment objectives) | | | | |
Please note that Portfolio returns include applicable fees and expenses while index returns do not include any such fees. Also, the Portfolio’s performance data does not take into account any product expenses or charges associated with owning a variable life or annuity policy, which is invested in Ivy Variable Insurance Portfolios.
Key drivers
2018 was a year of two tales. The first nine months of the year exhibited a nice consistent uptrend with strong economic activity, healthy profits, and another double-digit gain in the small-cap market. The bond market was adjusting to Federal Reserve rate hikes, with the 10-year Treasury yield bouncing between 2.50% and 3.0% for most of the period. Concerns over a yield curve inversion (which historically has led to economic recessions) were building throughout the period, but the market mostly dismissed it. Crude oil prices were moving upward as well, reaching $75 per barrel for West Texas Intermediate Crude by October 2018. The dollar was also holding up well reflecting rising short rates, the healthy economy, and signs of weakness in Europe and China. However, as discussed below, the final three months of the year were a different story.
Contributors and detractors
While the portfolio had a negative absolute return, it outperformed its benchmark and peers for the measurement period.
On a sector basis, the Portfolio’s relative outperformance was driven by our two largest sector weights, health care and information technology. The Portfolio’s health care strategy has been to emphasize higher quality, high growth medical device and technology stocks as a partial offset to deal with the high beta biotechnology weighting in our benchmark. The Portfolio also holds a smaller relative position in a diversified biotechnology swap that gives us less risky exposure to that industry. The Fund invests in derivative instruments, primarily total return swaps, futures on domestic equity indexes and options, both written and purchased, in an attempt to increase exposure to various equity sectors and markets or to hedge market risk on individual equity securities. Such investments involve additional risks, as the fluctuations in the values of the derivatives may not correlate perfectly with the overall securities markets or with the underlying asset from which the derivative’s value is derived. The strategy worked well in the first nine months, as large gains were generated from derivatives on securities of medical technology companies such as Tactile Systems Technology, Inc., Inogen, Inc., Teladoc Health, Inc. and HealthEquity, Inc. The combination of these gains and others, as well as the contribution from the biotechnology swap, led to strong performance.
The second primary positive contributor to the Portfolio’s relative performance was the information technology sector, and nearly all of this contribution was derived from the software industry. The Portfolio has historically held a large overweight
in software, specifically targeting the cloud-based software-as-a-service (SaaS) group. The fundamental growth trends in this sector continue to shine as business enterprise systems migrate from an on-premise location to the more efficient cloud — a multi-year trend that shows no signs of slowdown. The information technology sector contributors during the measurement period included Paycom Software, Inc., Zendesk, Inc., Five9, Inc. and HubSpot, Inc. SaaS penetration with a company’s enterprise has migrated from sales to human resources, financials, marketing, information technology systems management and cyber security. The Portfolio’s strategy is to identify the category leaders in these segments and emphasize those companies that can translate high-sales growth to strong earnings and cash flow growth. The poster-child for this success has been Ultimate Software, a stock we have owned for many years and one that has “graduated” to the mid-cap space, hence the Portfolio sold the stock in 2018.
The sectors previously mentioned drove all of the Portfolio’s performance in the first nine months; such performance was dragged down a bit by underperformance in the industrials and energy sectors. The disappointments in the industrials sector were stock-specific situations, some of which have been sold. Beacon Roofing and Dycom were two of those situations where the earnings recovery did not materialize; consequently, the Portfolio subsequently sold those holdings. Other industrial companies’ weakness tended to be more sentiment driven, in groups such as the transportation and distribution, over fears of an economic slowdown. In the energy sector, the stocks did not respond to the rising oil prices of the first nine months, and we discovered why in the fourth quarter. Energy is a very small sector for the Portfolio, so the impact was not large.
Overall, the first nine months were a strong period for the Portfolio leading into the second tale, which was the fourth quarter. A sharp correction was the story of fourth quarter 2018, a time frame that spared few asset classes or sectors in the equity market. Size mattered, which meant small caps fell the most and large caps the least based on broad market metrics. Volatility surged, with daily and inter-day swings reaching perplexing levels. Fear and uncertainty were driving the decline, as rising short-term interest rates and a tariff fight with China cast a cloud over the near-term direction of the economy and corporate profits. Amid this uncertainty it seemed that the downward momentum of the markets may have been magnified by quantitative, algorithmic trading systems, which were “piling on” the fear factor.
Portfolio performance held up well through mid-November 2018 but eventually succumbed to the sharp market declines in early December 2018. On a sector basis, our largest weight — information technology — was the best performer for the quarter. Investors tended to have more confidence in the forward sales and earnings growth for many of the small software and services companies, hence the better performance from those stocks in spite of higher valuations.
The fear in the market during the last quarter of the calendar year largely seemed to be a cyclical/recession fear, hence sectors like energy, materials and industrials lagged. The worst performing sector in the fourth quarter was energy, but given the sector’s very small weighting in the Portfolio, the impact was contained. In the industrials sector, the Portfolio is overexposed to industrials services and aerospace/defense stocks, which also outperformed. Finally, in the consumer discretionary sector, the Portfolio’s outperformance of the benchmark in the quarter was driven by solid restaurant companies like Wingstop Inc. and Texas Roadhouse, Inc.; Pool Corp. among distributors; and Etsy, Inc. in the internet space.
During this period of severe uncertainly at the end of calendar year 2018, the Portfolio’s core focus on high-quality growth companies served us well, and we added to a number of these positions during periods of weakness. Alternatively, the Portfolio disposed of cyclically exposed companies in the energy, industrials and semiconductor industries and also harvested a few of our multi-year winners whose market caps had moved into the mid-cap space.
Outlook
We believe the Portfolio’s core stock selection discipline and strategy will be able to navigate the current volatile markets without resorting to any market timing or sector rotation vulnerabilities. In this current market environment, we are placing extra emphasis on quality and earnings predictability for 2019, enhancing a process that is already part of the growth criteria that we scrutinize.
We believe there will likely be a slowdown in economic growth in 2019, but not a recession in the near-term, so innovative companies serving large-market opportunities should be able to continue to deliver. Most of these opportunities are found in the small-cap technology and health care sectors, the two largest weights in the portfolio.
The consumer discretionary and industrials sectors are the next largest weights in the portfolio and areas where we find service-oriented businesses and companies with strong product cycles having the best outlooks for 2019. Heading into 2019, we’ve reduced exposure to the financials and energy sectors.
Past performance is not a guarantee of future results. The value of the Portfolio’s shares will change, and you could lose money on your investment.
Investing in small-cap stocks may carry more risk than investing in stocks of larger, more well-established companies. Prices of growth stocks may be more sensitive to changes in current or expected earnings than the prices of other stocks. Growth stocks may not perform as well as value stocks or the stock market in general.
The use of derivatives presents several risks, including the risk that these instruments may change in value in a manner that adversely affects the Portfolio’s value and the risk that fluctuations in the value of the derivatives may
not correlate with securities markets or the underlying asset upon which the derivative’s value is based. The use of swap agreements entails certain risks that may be different from, or possibly greater than, the risks associated with investing directly in the referenced assets that underlie the swap agreement. Swap agreements also may have a leverage component, and adverse changes in the value or level of the underlying asset, reference rate or index can result in gains or losses that are substantially greater than the amount invested in the swap itself.
These and other risks are more fully described in the Portfolio’s prospectus.
The opinions expressed in this report are those of the portfolio managers and are current only through the end of the period of the report as stated on the cover. The managers’ views are subject to change at any time based on market and other conditions, and no forecasts can be guaranteed.
The index noted is unmanaged, includes reinvested dividends and does not include fees. One cannot invest directly in an index, nor is an index representative of Ivy VIP Small Cap Growth.
| | |
| PORTFOLIO HIGHLIGHTS | | SMALL CAP GROWTH |
ALL DATA IS AS OF DECEMBER 31, 2018 (UNAUDITED)
Asset Allocation
| | | | |
Stocks | | | 93.7% | |
Information Technology | | | 29.0% | |
Health Care | | | 22.9% | |
Consumer Discretionary | | | 16.0% | |
Industrials | | | 15.0% | |
Financials | | | 5.0% | |
Consumer Staples | | | 1.9% | |
Communication Services | | | 1.8% | |
Energy | | | 1.5% | |
Real Estate | | | 0.6% | |
Cash and Other Assets (Net of Liabilities), and Cash Equivalents+ | | | 6.3% | |
Top 10 Equity Holdings
| | | | |
| | |
| Company | | Sector | | Industry |
Five9, Inc. | | Information Technology | | Application Software |
Mercury Computer Systems, Inc. | | Industrials | | Aerospace & Defense |
Teladoc Health, Inc. | | Health Care | | Health Care Services |
Mimecast Ltd. | | Information Technology | | Application Software |
Grand Canyon Education, Inc. | | Consumer Discretionary | | Education Services |
Booz Allen Hamilton Holding Corp. | | Information Technology | | IT Consulting & Other Services |
Proofpoint, Inc. | | Information Technology | | Systems Software |
AMN Healthcare Services, Inc. | | Health Care | | Health Care Services |
Texas Roadhouse, Inc., Class A | | Consumer Discretionary | | Restaurants |
InterXion Holding N.V. | | Information Technology | | IT Consulting & Other Services |
See your advisor or www.ivyinvestments.com for more information on the Portfolio’s most recently published Top 10 Equity Holdings.
+ Cash equivalents are defined as highly liquid securities with maturities of less than three months. Cash equivalents may include U.S. Government Treasury bills, bank certificates of deposit, bankers’ acceptances, corporate commercial paper and other money market instruments.
| | |
COMPARISON OF CHANGE IN VALUE
OF $10,000 INVESTMENT | | SMALL CAP GROWTH |
(UNAUDITED)
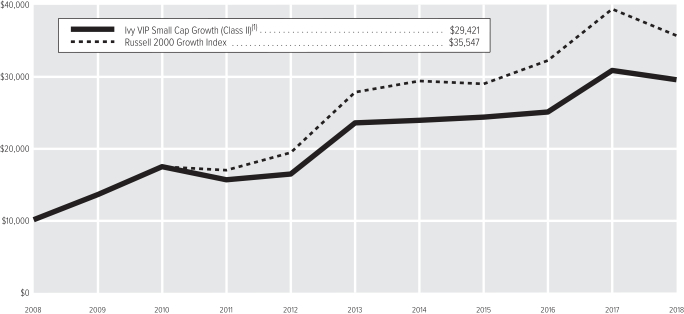
| (1) | The value of the investment in the Portfolio is impacted by the ongoing expenses of the Portfolio and assumes reinvestment of dividends and distributions. |
| | | | | | | | |
| | |
| Average Annual Total Return(2) | | Class I | | | Class II | |
1-year period ended12-31-18 | | | — | | | | -4.11% | |
5-year period ended12-31-18 | | | — | | | | 4.69% | |
10-year period ended12-31-18 | | | — | | | | 11.40% | |
Since Inception of Class through12-31-18(3) | | | -12.24% | | | | — | |
| (2) | Data quoted is past performance and current performance may be lower or higher. Past performance is no guarantee of future results. Investment return and principal value of an investment will fluctuate and shares, when redeemed, may be worth more or less than their original cost. Please visit www.ivyinvestments.com for the Portfolio’s most recentmonth-end performance. Performance data quoted does not reflect any expenses or charges associated with owning a variable life insurance policy or variable annuity contract that invests in the Portfolio’s shares. When such charges are deducted, actual investment performance in a variable policy or contract will be lower. |
| (3) | 11-5-18 (the date on which shares were first acquired by shareholders). |
Past performance is not necessarily indicative of future performance. Indexes are unmanaged. The performance graph and table do not reflect the deduction of taxes that a shareholder would pay on Portfolio distributions or on the redemption of Portfolio shares. Performance results may include the effect of expense reduction arrangements for some or all of the periods shown. If those arrangements had not been in place, the performance results for those periods would have been lower.
| | |
| SCHEDULE OF INVESTMENTS | | SMALL CAP GROWTH (in thousands) |
DECEMBER 31, 2018
| | | | | | | | |
| COMMON STOCKS | | Shares | | | Value | |
Communication Services | |
| |
Broadcasting – 1.4% | |
Nexstar Broadcasting Group, Inc. | | | 62 | | | $ | 4,841 | |
| | | | | | | | |
| |
Interactive Media & Services – 0.4% | |
Yelp, Inc. (A) | | | 39 | | | | 1,358 | |
| | | | | | | | |
| |
Total Communication Services – 1.8% | | | | 6,199 | |
Consumer Discretionary | |
| |
Apparel Retail – 2.0% | |
Children’s Place Retail Stores, Inc. (The) | | | 28 | | | | 2,550 | |
Urban Outfitters, Inc. (A) | | | 134 | | | | 4,438 | |
| | | | | | | | |
| | | | | | | 6,988 | |
| | | | | | | | |
| |
Automotive Retail – 0.7% | |
Carvana Co. (A)(B) | | | 71 | | | | 2,329 | |
| | | | | | | | |
| |
Casinos & Gaming – 0.7% | |
PlayAGS, Inc. (A) | | | 112 | | | | 2,584 | |
| | | | | | | | |
| |
Distributors – 1.4% | |
Pool Corp. | | | 33 | | | | 4,836 | |
| | | | | | | | |
| |
Education Services – 2.0% | |
Grand Canyon Education, Inc. (A) | | | 74 | | | | 7,099 | |
| | | | | | | | |
| |
General Merchandise Stores – 1.1% | |
Ollie’s Bargain Outlet Holdings, Inc. (A) | | | 58 | | | | 3,883 | |
| | | | | | | | |
| |
Homebuilding – 0.9% | |
Installed Building Products, Inc. (A) | | | 89 | | | | 3,014 | |
| | | | | | | | |
| |
Homefurnishing Retail – 0.7% | |
At Home Group, Inc. (A) | | | 141 | | | | 2,630 | |
| | | | | | | | |
| |
Hotels, Resorts & Cruise Lines – 1.0% | |
Hilton Grand Vacations, Inc. (A) | | | 133 | | | | 3,508 | |
| | | | | | | | |
| |
Internet & Direct Marketing Retail – 1.5% | |
Etsy, Inc. (A) | | | 110 | | | | 5,249 | |
| | | | | | | | |
| |
Restaurants – 3.1% | |
Texas Roadhouse, Inc., Class A | | | 102 | | | | 6,079 | |
Wingstop, Inc. | | | 76 | | | | 4,891 | |
| | | | | | | | |
| | | | | | | 10,970 | |
| | | | | | | | |
| |
Specialty Stores – 0.9% | |
Five Below, Inc. (A) | | | 31 | | | | 3,213 | |
| | | | | | | | |
| |
Total Consumer Discretionary – 16.0% | | | | 56,303 | |
Consumer Staples | |
| |
Distillers & Vintners – 0.4% | |
MGP Ingredients, Inc. (B) | | | 25 | | | | 1,436 | |
| | | | | | | | |
| |
Food Retail – 1.1% | |
Sprouts Farmers Market, Inc. (A) | | | 161 | | | | 3,792 | |
| | | | | | | | |
| | | | | | | | |
| COMMON STOCKS(Continued) | | Shares | | | Value | |
Packaged Foods & Meats – 0.4% | |
Calavo Growers, Inc. | | | 8 | | | $ | 554 | |
J&J Snack Foods Corp. | | | 7 | | | | 985 | |
| | | | | | | | |
| | | | | | | 1,539 | |
| | | | | | | | |
| |
Total Consumer Staples – 1.9% | | | | 6,767 | |
Energy | |
| |
Oil & Gas Exploration & Production – 1.5% | |
Centennial Resource Development, Inc., Class A (A) | | | 193 | | | | 2,123 | |
Magnolia Oil & Gas Corp. (A) | | | 107 | | | | 1,197 | |
Matador Resources Co. (A) | | | 129 | | | | 1,999 | |
| | | | | | | | |
| | | | | | | 5,319 | |
| | | | | | | | |
| |
Total Energy – 1.5% | | | | 5,319 | |
Financials | |
| |
Consumer Finance – 0.7% | |
Green Dot Corp., Class A (A) | | | 32 | | | | 2,523 | |
| | | | | | | | |
| |
Investment Banking & Brokerage – 2.3% | |
Evercore Partners, Inc. | | | 47 | | | | 3,371 | |
LPL Investment Holdings, Inc. | | | 76 | | | | 4,650 | |
| | | | | | | | |
| | | | | | | 8,021 | |
| | | | | | | | |
| |
Regional Banks – 2.0% | |
Ameris Bancorp | | | 31 | | | | 992 | |
Heritage Financial Corp. | | | 62 | | | | 1,844 | |
Seacoast Banking Corp. of Florida (A) | | | 88 | | | | 2,291 | |
Western Alliance Bancorp. (A) | | | 53 | | | | 2,086 | |
| | | | | | | | |
| | | | | | | 7,213 | |
| | | | | | | | |
| |
Total Financials – 5.0% | | | | 17,757 | |
Health Care | |
| |
Biotechnology – 0.5% | |
Immunomedics, Inc. (A) | | | 70 | | | | 995 | |
Natera, Inc. (A) | | | 54 | | | | 755 | |
| | | | | | | | |
| | | | | | | 1,750 | |
| | | | | | | | |
| |
Health Care Distributors – 0.7% | |
PetIQ, Inc. (A) | | | 106 | | | | 2,498 | |
| | | | | | | | |
| |
Health Care Equipment – 7.9% | |
AxoGen, Inc. (A) | | | 71 | | | | 1,450 | |
Inogen, Inc. (A) | | | 34 | | | | 4,263 | |
Insulet Corp. (A) | | | 58 | | | | 4,616 | |
iRhythm Technologies, Inc. (A) | | | 68 | | | | 4,707 | |
NovoCure Ltd. (A) | | | 139 | | | | 4,647 | |
Penumbra, Inc. (A) | | | 30 | | | | 3,619 | |
Tactile Systems Technology, Inc. (A) | | | 96 | | | | 4,378 | |
| | | | | | | | |
| | | | | | | 27,680 | |
| | | | | | | | |
| |
Health Care Facilities – 0.4% | |
Acadia Healthcare Co., Inc. (A) | | | 52 | | | | 1,339 | |
| | | | | | | | |
| | | | | | | | |
| COMMON STOCKS(Continued) | | Shares | | | Value | |
Health Care Services – 5.4% | |
AMN Healthcare Services, Inc. (A) | | | 111 | | | $ | 6,282 | |
LHC Group, Inc. (A) | | | 53 | | | | 5,001 | |
Teladoc Health, Inc. (A) | | | 154 | | | | 7,628 | |
| | | | | | | | |
| | | | | | | 18,911 | |
| | | | | | | | |
| |
Health Care Supplies – 1.8% | |
Merit Medical Systems, Inc. (A) | | | 67 | | | | 3,725 | |
Sientra, Inc. (A) | | | 203 | | | | 2,577 | |
| | | | | | | | |
| | | | | | | 6,302 | |
| | | | | | | | |
| |
Health Care Technology – 3.2% | |
CareDx, Inc. (A) | | | 116 | | | | 2,919 | |
Evolent Health, Inc., Class A (A) | | | 240 | | | | 4,778 | |
Tabula Rasa HealthCare, Inc. (A) | | | 58 | | | | 3,686 | |
| | | | | | | | |
| | | | | | | 11,383 | |
| | | | | | | | |
| |
Managed Health Care – 1.1% | |
HealthEquity, Inc. (A) | | | 63 | | | | 3,768 | |
| | | | | | | | |
| |
Pharmaceuticals – 1.9% | |
Aerie Pharmaceuticals, Inc. (A) | | | 122 | | | | 4,389 | |
Intersect ENT, Inc. (A) | | | 61 | | | | 1,719 | |
OptiNose, Inc. (A)(B) | | | 112 | | | | 693 | |
| | | | | | | | |
| | | | | | | 6,801 | |
| | | | | | | | |
| |
Total Health Care – 22.9% | | | | 80,432 | |
Industrials | |
| |
Aerospace & Defense – 2.4% | |
Kratos Defense & Security Solutions, Inc. (A) | | | 46 | | | | 647 | |
Mercury Computer Systems, Inc. (A) | | | 162 | | | | 7,669 | |
| | | | | | | | |
| | | | | | | 8,316 | |
| | | | | | | | |
| |
Air Freight & Logistics – 1.0% | |
Air Transport Services Group, Inc. (A) | | | 157 | | | | 3,575 | |
| | | | | | | | |
| |
Building Products – 0.4% | |
PGT Innovations, Inc. (A) | | | 91 | | | | 1,441 | |
| | | | | | | | |
| |
Diversified Support Services – 1.1% | |
Healthcare Services Group, Inc. (B) | | | 96 | | | | 3,841 | |
| | | | | | | | |
| |
Electrical Components & Equipment – 0.6% | |
EnerSys | | | 29 | | | | 2,218 | |
| | | | | | | | |
| |
Environmental & Facilities Services – 0.6% | |
Clean Harbors, Inc. (A) | | | 44 | | | | 2,163 | |
| | | | | | | | |
| |
Industrial Machinery – 6.1% | |
Crane Co. | | | 36 | | | | 2,599 | |
John Bean Technologies Corp. | | | 60 | | | | 4,316 | |
RBC Bearings, Inc. (A) | | | 34 | | | | 4,507 | |
Timken Co. (The) | | | 130 | | | | 4,848 | |
Woodward, Inc. | | | 69 | | | | 5,089 | |
| | | | | | | | |
| | | | | | | 21,359 | |
| | | | | | | | |
| | |
| SCHEDULE OF INVESTMENTS | | SMALL CAP GROWTH (in thousands) |
DECEMBER 31, 2018
| | | | | | | | |
| COMMON STOCKS(Continued) | | Shares | | | Value | |
Research & Consulting Services – 0.2% | |
Willdan Group, Inc. (A) | | | 25 | | | $ | 875 | |
| | | | | | | | |
| |
Security & Alarm Services – 1.1% | |
Brink’s Co. (The) | | | 60 | | | | 3,871 | |
| | | | | | | | |
| |
Trading Companies & Distributors – 0.6% | |
Watsco, Inc. | | | 15 | | | | 2,052 | |
| | | | | | | | |
| |
Trucking – 0.9% | |
Knight Transportation, Inc. | | | 120 | | | | 2,997 | |
| | | | | | | | |
| |
Total Industrials – 15.0% | | | | 52,708 | |
Information Technology | |
| |
Application Software – 17.9% | |
8x8, Inc. (A) | | | 238 | | | | 4,290 | |
Apptio, Inc., Class A (A) | | | 85 | | | | 3,226 | |
Cornerstone OnDemand, Inc. (A) | | | 52 | | | | 2,638 | |
Envestnet, Inc. (A) | | | 73 | | | | 3,570 | |
Five9, Inc. (A) | | | 176 | | | | 7,679 | |
Globant S.A. (A) | | | 54 | | | | 3,021 | |
HubSpot, Inc. (A) | | | 42 | | | | 5,232 | |
Mimecast Ltd. (A) | | | 212 | | | | 7,139 | |
New Relic, Inc. (A) | | | 45 | | | | 3,659 | |
Paycom Software, Inc. (A) | | | 46 | | | | 5,623 | |
Pluralsight, Inc., Class A (A) | | | 144 | | | | 3,385 | |
Q2 Holdings, Inc. (A) | | | 99 | | | | 4,893 | |
RealPage, Inc. (A) | | | 45 | | | | 2,153 | |
SendGrid, Inc. (A) | | | 41 | | | | 1,776 | |
Zendesk, Inc. (A) | | | 84 | | | | 4,880 | |
| | | | | | | | |
| | | | | | | 63,164 | |
| | | | | | | | |
| |
Communications Equipment – 0.7% | |
Viavi Solutions, Inc. (A) | | | 228 | | | | 2,291 | |
| | | | | | | | |
| |
Data Processing & Outsourced Services – 0.9% | |
EVO Payments, Inc., Class A (A) | | | 134 | | | | 3,308 | |
| | | | | | | | |
| |
IT Consulting & Other Services – 4.1% | |
Booz Allen Hamilton Holding Corp. | | | 153 | | | | 6,888 | |
Chegg, Inc. (A) | | | 30 | | | | 841 | |
ForeScout Technologies, Inc. (A) | | | 40 | | | | 1,043 | |
InterXion Holding N.V. (A) | | | 104 | | | | 5,633 | |
| | | | | | | | |
| | | | | | | 14,405 | |
| | | | | | | | |
| |
Semiconductors – 1.4% | |
Monolithic Power Systems, Inc. | | | 44 | | | | 5,100 | |
| | | | | | | | |
| |
Systems Software – 4.0% | |
Proofpoint, Inc. (A) | | | 75 | | | | 6,323 | |
SailPoint Technologies Holdings, Inc. (A) | | | 63 | | | | 1,481 | |
Varonis Systems, Inc. (A) | | | 90 | | | | 4,772 | |
Zscaler, Inc. (A) | | | 35 | | | | 1,388 | |
| | | | | | | | |
| | | | | | | 13,964 | |
| | | | | | | | |
| |
Total Information Technology – 29.0% | | | | 102,232 | |
| | | | | | | | |
| COMMON STOCKS(Continued) | | Shares | | | Value | |
Real Estate | |
| |
Health Care REITs – 0.6% | |
Community Healthcare Trust, Inc. | | | 77 | | | $ | 2,213 | |
| | | | | | | | |
| |
Total Real Estate – 0.6% | | | | 2,213 | |
| |
TOTAL COMMON STOCKS – 93.7% | | | $ | 329,930 | |
(Cost: $300,188) | | | | | | | | |
| | |
| SHORT-TERM SECURITIES | | Principal | | | | |
Commercial Paper (C) – 4.6% | |
E.I. du Pont de Nemours and Co., | | | | | | | | |
2.720%,1-10-19 | | $ | 4,000 | | | | 3,997 | |
Sysco Corp., | | | | | | | | |
2.500%,1-2-19 | | | 6,000 | | | | 5,999 | |
Wisconsin Electric Power Co., | | | | | | | | |
2.754%,1-7-19 | | | 6,123 | | | | 6,120 | |
| | | | | | | | |
| | | | | | | 16,116 | |
| | | | | | | | |
| |
Master Note – 1.7% | |
Toyota Motor Credit Corp.(1-Month U.S. LIBOR plus 15 bps), | | | | | | | | |
2.720%,1-7-19 (D) | | | 6,036 | | | | 6,036 | |
| | | | | | | | |
| |
Money Market Funds – 1.8% | |
Dreyfus Institutional Preferred Government Money Market Fund – Institutional Shares, | | | | | | | | |
2.400%, (E)(F) | | | 6,194 | | | | 6,194 | |
| | | | | | | | |
| |
TOTAL SHORT-TERM SECURITIES – 8.1% | | | $ | 28,346 | |
(Cost: $28,347) | | | | | | | | |
| |
TOTAL INVESTMENT SECURITIES – 101.8% | | | $ | 358,276 | |
(Cost: $328,535) | | | | | | | | |
| |
LIABILITIES, NET OF CASH AND OTHER ASSETS (G) – (1.8)% | | | | (6,249 | ) |
| |
NET ASSETS – 100.0% | | | $ | 352,027 | |
| | |
| SCHEDULE OF INVESTMENTS | | SMALL CAP GROWTH (in thousands) |
DECEMBER 31, 2018
Notes to Schedule of Investments
| * | Not shown due to rounding. |
| (A) | No dividends were paid during the preceding 12 months. |
| (B) | All or a portion of securities with an aggregate value of $7,002 are on loan. |
| (C) | Rate shown is the yield to maturity at December 31, 2018. |
| (D) | Variable rate security. Interest rate disclosed is that which is in effect at December 31, 2018. Date shown represents the date that the variable rate resets. Description of the reference rate and spread, if applicable, are included in the security description. |
| (E) | Investment made with cash collateral received from securities on loan. |
| (F) | Rate shown is the annualized7-day yield at December 31, 2018. |
| (G) | Cash of $1,540 has been pledged as collateral on open OTC swap agreements. |
The following total return swap agreements were outstanding at December 31, 2018:
| | | | | | | | | | | | | | | | | | | | | | | | | | | | | | | | |
| Underlying Security | | Long/Short | | Counterparty | | Maturity
Date | | | Notional
Amount | | | Financing
Fee(1)(2) | | | Value | | | Upfront
Payments/
(Receipts) | | | Unrealized
Depreciation | | | | |
Biotech Custom Index | | Long | | Goldman Sachs International | | | 07/01/2019 | | | $ | 10,154 | | | | 1-Month LIBOR less 15 bps | | | $ | (1,314 | ) | | $ | — | | | $ | (1,314 | ) | | | | |
| | | | | | | | | | | | | | | | | | | | |
| (1) | The Portfolio pays the financing fee multiplied by the notional amount if long on the swap agreement. If the Portfolio is short on the swap agreement, the Portfolio receives the financing fee multiplied by the notional amount. |
| (2) | At the termination date, a net cash flow is exchanged where the market-linked total return is equivalent to the return of the underlying security less a financing rate, if any. If the Portfolio is long on the swap agreement, the Portfolio would receive payments on any net positive total return, and would owe payments in the event of a negative total return. If the Portfolio is short on the swap agreement, the Portfolio would owe payments on any net positive total return, and would receive payments in the event of a negative total return. |
The following table represents security positions within the total return basket swap as of December 31, 2018:
| | | | | | | | | | | | | | | | |
| Reference Entity | | Shares | | | Notional
Amount | | | Value | | | % of
Value | |
Loxo Oncology, Inc. | | | — | * | | $ | 370 | | | $ | (48 | ) | | | 3.6 | % |
FibroGen, Inc. | | | 1 | | | | 346 | | | | (45 | ) | | | 3.4 | |
Horizon Pharma plc | | | 2 | | | | 321 | | | | (42 | ) | | | 3.2 | |
Array BioPharma, Inc. | | | 3 | | | | 290 | | | | (38 | ) | | | 2.9 | |
Ligand Pharmaceuticals, Inc. | | | — | * | | | 283 | | | | (37 | ) | | | 2.8 | |
Emergent BioSolutions, Inc. | | | 1 | | | | 262 | | | | (34 | ) | | | 2.6 | |
Blueprint Medicines Corp. | | | 1 | | | | 221 | | | | (29 | ) | | | 2.2 | |
Intercept Pharmaceuticals, Inc. | | | — | * | | | 216 | | | | (28 | ) | | | 2.1 | |
Global Blood Therapeutics, Inc. | | | 1 | | | | 208 | | | | (27 | ) | | | 2.0 | |
Repligen Corp. | | | 1 | | | | 207 | | | | (27 | ) | | | 2.0 | |
Ultragenyx Pharmaceutical, Inc. | | | 1 | | | | 202 | | | | (26 | ) | | | 2.0 | |
Amicus Therapeutics, Inc. | | | 2 | | | | 182 | | | | (24 | ) | | | 1.8 | |
Halozyme Therapeutics, Inc. | | | 2 | | | | 179 | | | | (23 | ) | | | 1.8 | |
Pacira Pharmaceuticals, Inc. | | | 1 | | | | 171 | | | | (22 | ) | | | 1.7 | |
Immunomedics, Inc. | | | 2 | | | | 168 | | | | (22 | ) | | | 1.7 | |
Myriad Genetics, Inc. | | | 1 | | | | 166 | | | | (21 | ) | | | 1.6 | |
Xencor, Inc. | | | 1 | | | | 164 | | | | (21 | ) | | | 1.6 | |
Heron Therapeutics, Inc. | | | 1 | | | | 163 | | | | (21 | ) | | | 1.6 | |
Supernus Pharmaceuticals, Inc. | | | 1 | | | | 161 | | | | (20 | ) | | | 1.6 | |
PTC Therapeutics, Inc. | | | 1 | | | | 155 | | | | (20 | ) | | | 1.5 | |
| | | | | | | | | | | | | | | | |
| Reference Entity | | Shares | | | Notional
Amount | | | Value | | | % of
Value | |
Arena Pharmaceuticals, Inc. | | | 1 | | | $ | 153 | | | $ | (19 | ) | | | 1.5 | |
MyoKardia, Inc. | | | — | * | | | 150 | | | | (19 | ) | | | 1.5 | |
Ironwood Pharmaceuticals, Inc. | | | 2 | | | | 144 | | | | (19 | ) | | | 1.4 | |
ACADIA Pharmaceuticals, Inc. | | | 1 | | | | 144 | | | | (18 | ) | | | 1.4 | |
Endocyte, Inc. | | | 1 | | | | 142 | | | | (18 | ) | | | 1.4 | |
Atara Biotherapeutics, Inc. | | | 1 | | | | 141 | | | | (17 | ) | | | 1.4 | |
Vanda Pharmaceuticals, Inc. | | | 1 | | | | 133 | | | | (17 | ) | | | 1.3 | |
Genomic Health, Inc. | | | — | * | | | 131 | | | | (17 | ) | | | 1.3 | |
Corcept Therapeutics, Inc. | | | 1 | | | | 131 | | | | (17 | ) | | | 1.3 | |
Aerie Pharmaceuticals, Inc. | | | — | * | | | 128 | | | | (17 | ) | | | 1.3 | |
Spark Therapeutics, Inc. | | | — | * | | | 123 | | | | (16 | ) | | | 1.2 | |
Innoviva, Inc. | | | 1 | | | | 121 | | | | (16 | ) | | | 1.2 | |
REGENXBIO, Inc. | | | * | | | | 120 | | | | (16 | ) | | | 1.2 | |
Medicines Co. (The) | | | 1 | | | | 120 | | | | (16 | ) | | | 1.2 | |
AnaptysBio, Inc. | | | — | * | | | 118 | | | | (15 | ) | | | 1.2 | |
Portola Pharmaceuticals, Inc. | | | 1 | | | | 117 | | | | (15 | ) | | | 1.2 | |
Enanta Pharmaceuticals, Inc. | | | — | * | | | 116 | | | | (15 | ) | | | 1.1 | |
Amneal Pharmaceuticals, Inc. | | | 1 | | | | 116 | | | | (15 | ) | | | 1.1 | |
Sangamo Therapeutics, Inc. | | | 1 | | | | 115 | | | | (15 | ) | | | 1.1 | |
| | | | | | | | | | | | | | | | |
| Reference Entity | | Shares | | | Notional
Amount | | | Value | | | % of
Value | |
Theravance Biopharma, Inc. | | | 1 | | | $ | 107 | | | $ | (14 | ) | | | 1.1 | |
Arrowhead Pharmaceuticals, Inc. | | | 1 | | | | 107 | | | | (14 | ) | | | 1.1 | |
Acceleron Pharma, Inc. | | | — | * | | | 107 | | | | (14 | ) | | | 1.1 | |
Esperion Therapeutics, Inc. | | | — | * | | | 106 | | | | (14 | ) | | | 1.0 | |
Aimmune Therapeutics, Inc. | | | 1 | | | | 103 | | | | (13 | ) | | | 1.0 | |
Editas Medicine, Inc. | | | 1 | | | | 103 | | | | (13 | ) | | | 1.0 | |
Biohaven Pharmaceutical Holding Co. Ltd. | | | — | * | | | 101 | | | | (13 | ) | | | 1.0 | |
Insmed, Inc. | | | 1 | | | | 100 | | | | (13 | ) | | | 1.0 | |
Zogenix, Inc. | | | — | * | | | 95 | | | | (12 | ) | | | 0.9 | |
Reata Pharmaceuticals, Inc. | | | — | * | | | 89 | | | | (11 | ) | | | 0.9 | |
Retrophin, Inc. | | | 1 | | | | 88 | | | | (11 | ) | | | 0.9 | |
Clovis Oncology, Inc. | | | 1 | | | | 85 | | | | (11 | ) | | | 0.8 | |
Codexis, Inc. | | | 1 | | | | 84 | | | | (11 | ) | | | 0.8 | |
Momenta Pharmaceuticals, Inc. | | | 1 | | | | 84 | | | | (11 | ) | | | 0.8 | |
Spectrum Pharmaceuticals, Inc. | | | 1 | | | | 80 | | | | (10 | ) | | | 0.8 | |
Mirati Therapeutics, Inc. | | | — | * | | | 77 | | | | (10 | ) | | | 0.8 | |
WaVe Life Sciences Ltd. | | | — | * | | | 74 | | | | (10 | ) | | | 0.7 | |
Iovance Biotherapeutics, Inc. | | | 1 | | | | 72 | | | | (9 | ) | | | 0.7 | |
Radius Health, Inc. | | | 1 | | | | 66 | | | | (9 | ) | | | 0.6 | |
| | |
| SCHEDULE OF INVESTMENTS | | SMALL CAP GROWTH (in thousands) |
DECEMBER 31, 2018
| | | | | | | | | | | | | | | | |
| Reference Entity | | Shares | | | Notional
Amount | | | Value | | | % of
Value | |
Revance Therapeutics, Inc. | | | — | * | | $ | 65 | | | $ | (9 | ) | | | 0.6 | |
Madrigal Pharmaceuticals, Inc. | | | — | * | | | 65 | | | | (8 | ) | | | 0.6 | |
Audentes Therapeutics, Inc. | | | — | * | | | 63 | | | | (8 | ) | | | 0.6 | |
TherapeuticsMD, Inc. | | | 2 | | | | 63 | | | | (8 | ) | | | 0.6 | |
ImmunoGen, Inc. | | | 2 | | | | 63 | | | | (8 | ) | | | 0.6 | |
Fate Therapeutics, Inc. | | | 1 | | | | 62 | | | | (8 | ) | | | 0.6 | |
Phibro Animal Health Corp. | | | — | * | | | 61 | | | | (8 | ) | | | 0.6 | |
CytomX Therapeutics, Inc. | | | — | * | | | 58 | | | | (8 | ) | | | 0.6 | |
Puma Biotechnology, Inc. | | | — | * | | | 58 | | | | (8 | ) | | | 0.6 | |
Heska Corp. | | | — | * | | | 58 | | | | (7 | ) | | | 0.6 | |
Cambrex Corp. | | | — | * | | | 54 | | | | (7 | ) | | | 0.5 | |
Athenex, Inc. | | | 1 | | | | 52 | | | | (7 | ) | | | 0.5 | |
Omeros Corp. | | | 1 | | | | 51 | | | | (7 | ) | | | 0.5 | |
| | | | | | | | | | | | | | | | |
| Reference Entity | | Shares | | | Notional
Amount | | | Value | | | % of
Value | |
Dynavax Technologies Corp. | | | 1 | | | $ | 51 | | | $ | (7 | ) | | | 0.5 | |
Collegium Pharmaceutical, Inc. | | | — | * | | | 51 | | | | (7 | ) | | | 0.5 | |
MacroGenics, Inc. | | | 1 | | | | 49 | | | | (6 | ) | | | 0.5 | |
Apellis Pharmaceuticals, Inc. | | | — | * | | | 48 | | | | (6 | ) | | | 0.5 | |
Alder Biopharmaceuticals, Inc. | | | 1 | | | | 47 | | | | (6 | ) | | | 0.5 | |
Intellia Therapeutics, Inc. | | | — | * | | | 45 | | | | (6 | ) | | | 0.4 | |
Intrexon Corp. | | | 1 | | | | 42 | | | | (6 | ) | | | 0.4 | |
Eagle Pharmaceuticals, Inc. | | | — | * | | | 42 | | | | (5 | ) | | | 0.4 | |
Coherus Biosciences, Inc. | | | 1 | | | | 42 | | | | (5 | ) | | | 0.4 | |
Karyopharm Therapeutics, Inc. | | | 1 | | | | 41 | | | | (5 | ) | | | 0.4 | |
G1 Therapeutics, Inc. | | | — | * | | | 39 | | | | (5 | ) | | | 0.4 | |
| | | | | | | | | | | | | | | | |
| Reference Entity | | Shares | | | Notional
Amount | | | Value | | | % of
Value | |
Assembly Biosciences, Inc. | | | — | * | | $ | 39 | | | $ | (5 | ) | | | 0.4 | |
Flexion Therapeutics, Inc. | | | — | * | | | 38 | | | | (5 | ) | | | 0.4 | |
Cymabay Therapeutics, Inc. | | | 1 | | | | 36 | | | | (5 | ) | | | 0.4 | |
Progenics Pharmaceuticals, Inc. | | | 1 | | | | 31 | | | | (4 | ) | | | 0.3 | |
Accelerate Diagnostics, Inc. | | | — | * | | | 30 | | | | (4 | ) | | | 0.3 | |
TG Therapeutics, Inc. | | | 1 | | | | 24 | | | | (3 | ) | | | 0.2 | |
Sorrento Therapeutics, Inc. | | | 1 | | | | 21 | | | | (3 | ) | | | 0.2 | |
La Jolla Pharmaceutical Co. | | | — | * | | | 20 | | | | (3 | ) | | | 0.2 | |
MiMedx Group, Inc. | | | 1 | | | | 19 | | | | (2 | ) | | | 0.2 | |
| | | | | | | | | | | | | | | | |
| | | | | | | | | | $ | (1,314 | ) | | | | |
| | | | | | | | | | | | | | | | |
The following table is a summary of the valuation of the Portfolio’s investments by the fair value hierarchy levels as of December 31, 2018. See Note 3 to the Financial Statements for further information regarding fair value measurement.
| | | | | | | | | | | | |
| | | Level 1 | | | Level 2 | | | Level 3 | |
Assets | | | | | | | | | | | | |
Investments in Securities | | | | | | | | | | | | |
Common Stocks | | $ | 329,930 | | | $ | — | | | $ | — | |
Short-Term Securities | | | 6,194 | | | | 22,152 | | | | — | |
Total | | $ | 336,124 | | | $ | 22,152 | | | $ | — | |
Liabilities | | | | | | | | | | | | |
Total Return Swaps | | $ | — | | | $ | 1,314 | | | $ | — | |
The following acronyms are used throughout this schedule:
LIBOR = London Interbank Offered Rate
OTC = Over the Counter
REIT = Real Estate Investment Trust
See Accompanying Notes to Financial Statements.
| | |
| STATEMENTS OF ASSETS AND LIABILITIES | | IVY VIP |
AS OF DECEMBER 31, 2018
| | | | | | | | | | | | | | | | | | | | | | | | | | | | | | | | | | | |
| (In thousands, except per share amounts) | | Asset
Strategy(1) | | Balanced | | Energy | | Growth | | High
Income | | International
Core Equity | | Mid Cap
Growth |
ASSETS | |
Investments in unaffiliated securities at value+^ | | | $ | 715,343 | | | | $ | 311,479 | | | | $ | 39,305 | | | | $ | 669,380 | | | | $ | 862,849 | | | | $ | 672,313 | | | | $ | 414,872 | |
Investments in affiliated securities at value+ | | | | — | | | | | — | | | | | — | | | | | — | | | | | 1,044 | | | | | — | | | | | — | |
Bullion at value+ | | | | 42,280 | | | | | — | | | | | — | | | | | — | | | | | — | | | | | — | | | | | — | |
Investments at Value | | | | 757,623 | | | | | 311,479 | | | | | 39,305 | | | | | 669,380 | | | | | 863,893 | | | | | 672,313 | | | | | 414,872 | |
Cash | | | | 381 | | | | | 32 | | | | | 1 | | | | | 1 | | | | | 1,417 | | | | | 1 | | | | | 1 | |
Cash denominated in foreign currencies at value+ | | | | 287 | | | | | — | | | | | — | | | | | — | | | | | — | | | | | 56 | | | | | — | |
Restricted cash | | | | — | | | | | — | | | | | — | | | | | — | | | | | — | | | | | 279 | | | | | — | |
Investment securities sold receivable | | | | — | | | | | — | | | | | — | | | | | — | | | | | 2,869 | | | | | 1,819 | | | | | — | |
Dividends and interest receivable | | | | 2,717 | | | | | 1,042 | | | | | 18 | | | | | 441 | | | | | 14,009 | | | | | 2,087 | | | | | 183 | |
Capital shares sold receivable | | | | 160 | | | | | 6 | | | | | 313 | | | | | 12 | | | | | 328 | | | | | 22 | | | | | 349 | |
Receivable from affiliates | | | | — | * | | | | — | | | | | — | * | | | | — | | | | | — | * | | | | — | | | | | 141 | |
Unrealized appreciation on forward foreign currency contracts | | | | — | | | | | — | | | | | — | | | | | — | | | | | 14 | | | | | 1,096 | | | | | — | |
Swap agreements, at value | | | | — | | | | | — | | | | | — | | | | | — | | | | | — | | | | | 46 | | | | | — | |
Receivable from securities lending income – net | | | | 5 | | | | | 3 | | | | | — | * | | | | 1 | | | | | 32 | | | | | 49 | | | | | 3 | |
Prepaid and other assets | | | | 10 | | | | | 4 | | | | | 2 | | | | | 7 | | | | | 11 | | | | | 5 | | | | | 7 | |
Total Assets | | | | 761,183 | | | | | 312,566 | | | | | 39,639 | | | | | 669,842 | | | | | 882,573 | | | | | 677,773 | | | | | 415,556 | |
| | | | | | | |
LIABILITIES | | | | | | | | | | | | | | | | | | | | | | | | | | | | | | | | | | | |
Cash collateral on securities loaned at value | | | | 5,602 | | | | | 1,917 | | | | | 401 | | | | | — | | | | | 28,480 | | | | | — | | | | | 1,150 | |
Investment securities purchased payable | | | | 1,192 | | | | | — | | | | | — | | | | | — | | | | | 6,313 | | | | | — | | | | | — | |
Capital shares redeemed payable | | | | 830 | | | | | 220 | | | | | 26 | | | | | 333 | | | | | 603 | | | | | 319 | | | | | 329 | |
Independent Trustees and Chief Compliance Officer fees payable | | | | 164 | | | | | 92 | | | | | 9 | | | | | 282 | | | | | 80 | | | | | 82 | | | | | 35 | |
Distribution and service fees payable | | | | 5 | | | | | 2 | | | | | — | * | | | | 5 | | | | | 6 | | | | | 5 | | | | | 2 | |
Shareholder servicing payable | | | | 1 | | | | | — | * | | | | — | * | | | | 1 | | | | | 1 | | | | | 1 | | | | | 1 | |
Investment management fee payable | | | | 14 | | | | | 6 | | | | | 1 | | | | | 13 | | | | | 14 | | | | | 16 | | | | | 10 | |
Accounting services fee payable | | | | 19 | | | | | 8 | | | | | 2 | | | | | 13 | | | | | 18 | | | | | 13 | | | | | 10 | |
Unrealized depreciation on forward foreign currency contracts | | | | — | | | | | — | | | | | — | | | | | — | | | | | — | | | | | 1,444 | | | | | — | |
Other liabilities | | | | 14 | | | | | 3 | | | | | 2 | | | | | 4 | | | | | 4 | | | | | 17 | | | | | 5 | |
Total Liabilities | | | | 7,841 | | | | | 2,248 | | | | | 441 | | | | | 651 | | | | | 35,519 | | | | | 1,897 | | | | | 1,542 | |
Commitments and Contingencies
(See Note 2 and Note 14) | | | | | | | | | | | | | | | | | | | | | | | | | | | | | | | | | | | |
Total Net Assets | | | $ | 753,342 | | | | $ | 310,318 | | | | $ | 39,198 | | | | $ | 669,191 | | | | $ | 847,054 | | | | $ | 675,876 | | | | $ | 414,014 | |
| | | | | | | |
NET ASSETS | | | | | | | | | | | | | | | | | | | | | | | | | | | | | | | | | | | |
Capital paid in (shares authorized – unlimited) | | | $ | 788,774 | | | | $ | 277,641 | | | | $ | 91,198 | | | | $ | 355,036 | | | | $ | 938,486 | | | | $ | 717,186 | | | | $ | 302,305 | |
Accumulated distributable earnings gain (loss) | | | | (35,432 | ) | | | | 32,677 | | | | | (52,000 | ) | | | | 314,155 | | | | | (91,432 | ) | | | | (41,310 | ) | | | | 111,709 | |
Total Net Assets | | | $ | 753,342 | | | | $ | 310,318 | | | | $ | 39,198 | | | | $ | 669,191 | | | | $ | 847,054 | | | | $ | 675,876 | | | | $ | 414,014 | |
| | | | | | | |
CAPITAL SHARES OUTSTANDING: | | | | | | | | | | | | | | | | | | | | | | | | | | | | | | | | | | | |
Class I | | | | 33 | | | | | N/A | | | | | 51 | | | | | N/A | | | | | 13,293 | | | | | N/A | | | | | 16,607 | |
Class II | | | | 90,821 | | | | | 41,624 | | | | | 10,090 | | | | | 60,718 | | | | | 240,613 | | | | | 46,110 | | | | | 20,738 | |
| | | | | | | |
NET ASSET VALUE PER SHARE: | | | | | | | | | | | | | | | | | | | | | | | | | | | | | | | | | | | |
Class I | | | $ | 8.29 | | | | | N/A | | | | $ | 3.88 | | | | | N/A | | | | $ | 3.35 | | | | | N/A | | | | $ | 11.10 | |
Class II | | | $ | 8.29 | | | | $ | 7.46 | | | | $ | 3.87 | | | | $ | 11.02 | | | | $ | 3.34 | | | | $ | 14.66 | | | | $ | 11.07 | |
| | | | | | | |
+COST | | | | | | | | | | | | | | | | | | | | | | | | | | | | | | | | | | | |
Investments in unaffiliated securities at cost | | | $ | 748,908 | | | | $ | 310,157 | | | | $ | 60,812 | | | | $ | 541,854 | | | | $ | 940,414 | | | | $ | 783,690 | | | | $ | 385,018 | |
Investments in affiliated securities at cost | | | | — | | | | | — | | | | | — | | | | | — | | | | | 1,138 | | | | | — | | | | | — | |
Bullion at cost | | | | 40,896 | | | | | — | | | | | — | | | | | — | | | | | — | | | | | — | | | | | — | |
Cash denominated in foreign currencies at cost | | | | 313 | | | | | — | | | | | — | | | | | — | | | | | — | | | | | 56 | | | | | — | |
| | | | | | | |
^Securities loaned at value | | | | 14,700 | | | | | 1,923 | | | | | 1,057 | | | | | — | | | | | 31,361 | | | | | — | | | | | 3,518 | |
| * | Not shown due to rounding. |
| (1) | Consolidated Statement of Assets and Liabilities (See Note 5 in Notes to Financial Statements). |
See Accompanying Notes to Financial Statements.
| | |
| STATEMENTS OF ASSETS AND LIABILITIES | | IVY VIP |
AS OF DECEMBER 31, 2018
| | | | | | | | | | | | | | | | | | | | |
| (In thousands, except per share amounts) | | Natural
Resources | | Science
and
Technology | | Small Cap
Core | | Small Cap
Growth |
ASSETS | |
Investments in unaffiliated securities at value+^ | | | $ | 87,910 | | | | $ | 430,592 | | | | $ | 176,995 | | | | $ | 358,276 | |
Investments at Value | | | | 87,910 | | | | | 430,592 | | | | | 176,995 | | | | | 358,276 | |
Cash | | | | 2 | | | | | 12 | | | | | 1 | | | | | 1 | |
Restricted cash | | | | — | | | | | — | | | | | — | | | | | 1,540 | |
Investment securities sold receivable | | | | 20 | | | | | 1,973 | | | | | 2,061 | | | | | — | |
Dividends and interest receivable | | | | 103 | | | | | 406 | | | | | 114 | | | | | 25 | |
Capital shares sold receivable | | | | 222 | | | | | 254 | | | | | 11 | | | | | 73 | |
Receivable from affiliates | | | | — | | | | | — | | | | | — | | | | | 19 | |
Unrealized appreciation on forward foreign currency contracts | | | | 426 | | | | | — | | | | | — | | | | | — | |
Receivable from securities lending income – net | | | | 1 | | | | | 13 | | | | | 1 | | | | | 3 | |
Prepaid and other assets | | | | 1 | | | | | 8 | | | | | 2 | | | | | 4 | |
Total Assets | | | | 88,685 | | | | | 433,258 | | | | | 179,185 | | | | | 359,941 | |
| | | | |
LIABILITIES | | | | | | | | | | | | | | | | | | | | |
Cash collateral on securities loaned at value | | | | 108 | | | | | 2,990 | | | | | 628 | | | | | 6,194 | |
Investment securities purchased payable | | | | — | | | | | — | | | | | 3,045 | | | | | — | |
Capital shares redeemed payable | | | | 111 | | | | | 479 | | | | | 106 | | | | | 231 | |
Independent Trustees and Chief Compliance Officer fees payable | | | | 18 | | | | | 93 | | | | | 34 | | | | | 124 | |
Distribution and service fees payable | | | | 1 | | | | | 3 | | | | | 1 | | | | | 2 | |
Shareholder servicing payable | | | | — | * | | | | 1 | | | | | — | * | | | | 1 | |
Investment management fee payable | | | | 2 | | | | | 10 | | | | | 4 | | | | | 8 | |
Accounting services fee payable | | | | 5 | | | | | 11 | | | | | 6 | | | | | 10 | |
Swap agreements, at value | | | | — | | | | | — | | | | | — | | | | | 1,314 | |
Other liabilities | | | | — | * | | | | 5 | | | | | 4 | | | | | 30 | |
Total Liabilities | | | | 245 | | | | | 3,592 | | | | | 3,828 | | | | | 7,914 | |
Commitments and Contingencies (See Note 2 and Note 14) | | | | | | | | | | | | | | | | | | | | |
Total Net Assets | | | $ | 88,440 | | | | $ | 429,666 | | | | $ | 175,357 | | | | $ | 352,027 | |
| | | | |
NET ASSETS | | | | | | | | | | | | | | | | | | | | |
Capital paid in (shares authorized – unlimited) | | | $ | 156,459 | | | | $ | 295,288 | | | | $ | 154,227 | | | | $ | 317,191 | |
Accumulated distributable earnings gain (loss) | | | | (68,019 | ) | | | | 134,378 | | | | | 21,130 | | | | | 34,836 | |
Total Net Assets | | | $ | 88,440 | | | | $ | 429,666 | | | | $ | 175,357 | | | | $ | 352,027 | |
| | | | |
CAPITAL SHARES OUTSTANDING: | | | | | | | | | | | | | | | | | | | | |
Class I | | | | N/A | | | | | 25 | | | | | N/A | | | | | 6,778 | |
Class II | | | | 24,946 | | | | | 19,650 | | | | | 12,984 | | | | | 39,042 | |
| | | | |
NET ASSET VALUE PER SHARE: | | | | | | | | | | | | | | | | | | | | |
Class I | | | | N/A | | | | $ | 21.91 | | | | | N/A | | | | $ | 7.69 | |
Class II | | | $ | 3.55 | | | | $ | 21.84 | | | | $ | 13.51 | | | | $ | 7.68 | |
| | | | |
+COST | | | | | | | | | | | | | | | | | | | | |
Investments in unaffiliated securities at cost | | | $ | 113,973 | | | | $ | 295,786 | | | | $ | 192,136 | | | | $ | 328,535 | |
| | | | |
^Securities loaned at value | | | | 1,737 | | | | | 18,534 | | | | | 3,614 | | | | | 7,002 | |
| * | Not shown due to rounding. |
See Accompanying Notes to Financial Statements.
| | |
| STATEMENTS OF OPERATIONS | | IVY VIP |
FOR THE YEAR ENDED DECEMBER 31, 2018
| | | | | | | | | | | | | | | | | | | | | | | | | | | | | | | | | | | |
| (In thousands) | | Asset
Strategy(1) | | Balanced | | Energy | | Growth | | High
Income | | International
Core Equity | | Mid Cap
Growth |
INVESTMENT INCOME | |
Dividends from unaffiliated securities | | | $ | 14,254 | | | | $ | 4,588 | | | | $ | 1,094 | | | | $ | 7,940 | | | | $ | 1,856 | | | | $ | 23,979 | | | | $ | 4,265 | |
Foreign dividend withholding tax | | | | (754 | ) | | | | (16 | ) | | | | (35 | ) | | | | (25 | ) | | | | — | | | | | (2,138 | ) | | | | — | |
Interest and amortization from unaffiliated securities | | | | 9,943 | | | | | 4,308 | | | | | 52 | | | | | 122 | | | | | 63,878 | | | | | 343 | | | | | 283 | |
Interest and amortization from affiliated securities | | | | — | | | | | — | | | | | — | | | | | — | | | | | 91 | | | | | — | | | | | — | |
Foreign interest withholding tax | | | | — | | | | | — | | | | | — | | | | | — | | | | | — | | | | | (3 | ) | | | | — | |
Securities lending income – net | | | | 63 | | | | | 18 | | | | | 28 | | | | | 3 | | | | | 245 | | | | | 233 | | | | | 79 | |
Total Investment Income | | | | 23,506 | | | | | 8,898 | | | | | 1,139 | | | | | 8,040 | | | | | 66,070 | | | | | 22,414 | | | | | 4,627 | |
| | | | | | | |
EXPENSES | | | | | | | | | | | | | | | | | | | | | | | | | | | | | | | | | | | |
Investment management fee | | | | 6,143 | | | | | 2,434 | | | | | 1,241 | | | | | 5,785 | | | | | 5,648 | | | | | 6,661 | | | | | 5,745 | |
Distribution and service fees: | | | | | | | | | | | | | | | | | | | | | | | | | | | | | | | | | | | |
Class II | | | | 2,193 | | | | | 869 | | | | | 364 | | | | | 2,065 | | | | | 2,172 | | | | | 1,959 | | | | | 1,241 | |
Shareholder servicing: | | | | | | | | | | | | | | | | | | | | | | | | | | | | | | | | | | | |
Class I | | | | — | * | | | | N/A | | | | | — | * | | | | N/A | | | | | 1 | | | | | N/A | | | | | 1 | |
Class II | | | | 7 | | | | | 3 | | | | | 1 | | | | | 6 | | | | | 5 | | | | | 6 | | | | | 4 | |
Custodian fees | | | | 54 | | | | | 6 | | | | | 6 | | | | | 16 | | | | | 11 | | | | | 96 | | | | | 17 | |
Independent Trustees and Chief Compliance Officer fees | | | | 78 | | | | | 36 | | | | | 10 | | | | | 98 | | | | | 60 | | | | | 56 | | | | | 42 | |
Accounting services fee | | | | 214 | | | | | 109 | | | | | 60 | | | | | 200 | | | | | 216 | | | | | 194 | | | | | 172 | |
Professional fees | | | | 80 | | | | | 24 | | | | | 20 | | | | | 25 | | | | | 59 | | | | | 41 | | | | | 23 | |
Other | | | | 229 | | | | | 32 | | | | | 38 | | | | | 45 | | | | | 73 | | | | | 59 | | | | | 56 | |
Total Expenses | | | | 8,998 | | | | | 3,513 | | | | | 1,740 | | | | | 8,240 | | | | | 8,245 | | | | | 9,072 | | | | | 7,301 | |
Less: | | | | | | | | | | | | | | | | | | | | | | | | | | | | | | | | | | | |
Expenses in excess of limit | | | | — | * | | | | — | | | | | — | * | | | | — | | | | | — | * | | | | — | | | | | (310 | ) |
Total Net Expenses | | | | 8,998 | | | | | 3,513 | | | | | 1,740 | | | | | 8,240 | | | | | 8,245 | | | | | 9,072 | | | | | 6,991 | |
Net Investment Income (Loss) | | | | 14,508 | | | | | 5,385 | | | | | (601 | ) | | | | (200 | ) | | | | 57,825 | | | | | 13,342 | | | | | (2,364 | ) |
| | | | | | | |
REALIZED AND UNREALIZED GAIN (LOSS) | | | | | | | | | | | | | | | | | | | | | | | | | | | | | | | | | | | |
Net realized gain (loss) on: | | | | | | | | | | | | | | | | | | | | | | | | | | | | | | | | | | | |
Investments in unaffiliated securities | | | | 84,269 | | | | | 26,007 | | | | | (10,132 | ) | | | | 187,073 | | | | | (24,152 | ) | | | | 60,252 | | | | | 82,606 | |
In-kind redemptions in unaffiliated securities | | | | — | | | | | — | | | | | 16,243 | | | | | — | | | | | — | | | | | — | | | | | 77,714 | |
Investments in affiliated securities | | | | — | | | | | — | | | | | — | | | | | — | | | | | 2 | | | | | — | | | | | — | |
Written options | | | | 133 | | | | | — | | | | | — | | | | | — | | | | | — | | | | | — | | | | | 322 | |
Swap agreements | | | | (282 | ) | | | | — | | | | | — | | | | | — | | | | | — | | | | | (597 | ) | | | | (2,209 | ) |
Forward foreign currency contracts | | | | — | | | | | — | | | | | — | | | | | — | | | | | 48 | | | | | — | | | | | — | |
Foreign currency exchange transactions | | | | (128 | ) | | | | — | | | | | (3 | ) | | | | — | | | | | (5 | ) | | | | (919 | ) | | | | 4 | |
Net change in unrealized appreciation (depreciation) on: | | | | | | | | | | | | | | | | | | | | | | | | | | | | | | | | | | | |
Investments in unaffiliated securities | | | | (139,539 | ) | | | | (40,922 | ) | | | | (28,418 | ) | | | | (147,341 | ) | | | | (50,998 | ) | | | | (216,096 | ) | | | | (136,379 | ) |
Investments in affiliated securities | | | | — | | | | | — | | | | | — | | | | | — | | | | | (109 | ) | | | | — | | | | | — | |
Written options | | | | (90 | ) | | | | — | | | | | — | | | | | — | | | | | — | | | | | — | | | | | 39 | |
Swap agreements | | | | 537 | | | | | — | | | | | — | | | | | — | | | | | — | | | | | 46 | | | | | — | |
Forward foreign currency contracts | | | | — | | | | | — | | | | | — | | | | | — | | | | | 34 | | | | | (348 | ) | | | | — | |
Foreign currency exchange transactions | | | | (22 | ) | | | | — | | | | | — | | | | | — | | | | | — | * | | | | (237 | ) | | | | — | * |
Net Realized and Unrealized Gain (Loss) | | | | (55,122 | ) | | | | (14,915 | ) | | | | (22,310 | ) | | | | 39,732 | | | | | (75,180 | ) | | | | (157,899 | ) | | | | 22,097 | |
Net Increase (Decrease) in Net Assets Resulting from Operations | | | $ | (40,614 | ) | | | $ | (9,530 | ) | | | $ | (22,911 | ) | | | $ | 39,532 | | | | $ | (17,355 | ) | | | $ | (144,557 | ) | | | $ | 19,733 | |
| * | Not shown due to rounding. |
| (1) | Consolidated Statement of Operations (See Note 5 in Notes to Financial Statements). |
See Accompanying Notes to Financial Statements.
| | |
| STATEMENTS OF OPERATIONS | | IVY VIP |
FOR THE YEAR ENDED DECEMBER 31, 2018
| | | | | | | | | | | | | | | | | | | | |
| (In thousands) | | Natural
Resources | | Science
and
Technology | | Small Cap
Core | | Small Cap
Growth |
INVESTMENT INCOME | |
Dividends from unaffiliated securities | | | $ | 2,193 | | | | $ | 4,338 | | | | $ | 1,912 | | | | $ | 1,930 | |
Foreign dividend withholding tax | | | | (38 | ) | | | | (19 | ) | | | | (18 | ) | | | | — | |
Interest and amortization from unaffiliated securities | | | | 67 | | | | | 419 | | | | | 192 | | | | | 370 | |
Securities lending income – net | | | | 21 | | | | | 170 | | | | | 7 | | | | | 62 | |
Total Investment Income | | | | 2,243 | | | | | 4,908 | | | | | 2,093 | | | | | 2,362 | |
| | | | |
EXPENSES | | | | | | | | | | | | | | | | | | | | |
Investment management fee | | | | 987 | | | | | 5,388 | | | | | 2,152 | | | | | 3,082 | |
Distribution and service fees: | | | | | | | | | | | | | | | | | | | | |
Class II | | | | 290 | | | | | 1,583 | | | | | 632 | | | | | 889 | |
Shareholder servicing: | | | | | | | | | | | | | | | | | | | | |
Class I | | | | N/A | | | | | — | * | | | | N/A | | | | | — | * |
Class II | | | | 2 | | | | | 19 | | | | | 2 | | | | | 3 | |
Custodian fees | | | | 7 | | | | | 28 | | | | | 13 | | | | | 14 | |
Independent Trustees and Chief Compliance Officer fees | | | | 10 | | | | | 50 | | | | | 20 | | | | | 42 | |
Accounting services fee | | | | 60 | | | | | 159 | | | | | 86 | | | | | 111 | |
Professional fees | | | | 24 | | | | | 33 | | | | | 20 | | | | | 21 | |
Other | | | | 26 | | | | | 73 | | | | | 25 | | | | | 111 | |
Total Expenses | | | | 1,406 | | | | | 7,333 | | | | | 2,950 | | | | | 4,273 | |
Less: | | | | | | | | | | | | | | | | | | | | |
Expenses in excess of limit | | | | — | | | | | — | * | | | | — | | | | | (75 | ) |
Total Net Expenses | | | | 1,406 | | | | | 7,333 | | | | | 2,950 | | | | | 4,198 | |
Net Investment Income (Loss) | | | | 837 | | | | | (2,425 | ) | | | | (857 | ) | | | | (1,836 | ) |
| | | | |
REALIZED AND UNREALIZED GAIN (LOSS) | | | | | | | | | | | | | | | | | | | | |
Net realized gain (loss) on: | | | | | | | | | | | | | | | | | | | | |
Investments in unaffiliated securities | | | | 1,761 | | | | | 60,695 | | | | | 37,094 | | | | | 67,829 | |
In-kind redemptions in unaffiliated securities | | | | — | | | | | 75,782 | | | | | — | | | | | — | |
Futures contracts | | | | — | | | | | — | | | | | 497 | | | | | — | |
Written options | | | | — | | | | | 456 | | | | | — | | | | | (99 | ) |
Swap agreements | | | | — | | | | | — | | | | | — | | | | | (373 | ) |
Forward foreign currency contracts | | | | 327 | | | | | — | | | | | — | | | | | — | |
Foreign currency exchange transactions | | | | 4 | | | | | — | * | | | | — | | | | | — | |
Net change in unrealized appreciation (depreciation) on: | | | | | | | | | | | | | | | | | | | | |
Investments in unaffiliated securities | | | | (31,027 | ) | | | | (144,970 | ) | | | | (48,670 | ) | | | | (76,220 | ) |
Swap agreements | | | | — | | | | | — | | | | | — | | | | | (1,672 | ) |
Forward foreign currency contracts | | | | 622 | | | | | — | | | | | — | | | | | — | |
Foreign currency exchange transactions | | | | — | * | | | | — | | | | | — | | | | | — | |
Net Realized and Unrealized Loss | | | | (28,313 | ) | | | | (8,037 | ) | | | | (11,079 | ) | | | | (10,535 | ) |
Net Decrease in Net Assets Resulting from Operations | | | $ | (27,476 | ) | | | $ | (10,462 | ) | | | $ | (11,936 | ) | | | $ | (12,371 | ) |
| * | Not shown due to rounding. |
See Accompanying Notes to Financial Statements.
| | |
| STATEMENTS OF CHANGES IN NET ASSETS | | IVY VIP |
| | | | | | | | | | | | | | | | | | | | | | | | | | | | | | |
| | | Asset Strategy(1) | | Balanced | | Energy |
| (In thousands) | | Year ended
12-31-18 | | Year ended
12-31-17 | | Year ended
12-31-18 | | Year ended
12-31-17 | | Year ended
12-31-18 | | Year ended
12-31-17 |
INCREASE (DECREASE) IN NET ASSETS | | | | | | | | | | | | | | | | | | | | | | | | | | | | | | |
Operations: | | | | | | | | | | | | | | | | | | | | | | | | | | | | | | |
Net investment income (loss) | | | $ | 14,508 | | | | $ | 3,256 | | | | $ | 5,385 | | | | $ | 5,568 | | | | $ | (601 | ) | | | $ | 1,232 | |
Net realized gain (loss) on investments | | | | 83,992 | | | | | (8,524 | ) | | | | 26,007 | | | | | 5,417 | | | | | 6,108 | | | | | 92 | |
Net change in unrealized appreciation (depreciation) | | | | (139,114 | ) | | | | 163,252 | | | | | (40,922 | ) | | | | 27,900 | | | | | (28,418 | ) | | | | (26,522 | ) |
Net Increase (Decrease) in Net Assets Resulting from Operations | | | | (40,614 | ) | | | | 157,984 | | | | | (9,530 | ) | | | | 38,885 | | | | | (22,911 | ) | | | | (25,198 | ) |
| | | | | | |
Distributions to Shareholders From: | | | | | | | | | | | | | | | | | | | | | | | | | | | | | | |
Net investment income: | | | | | | | | | | | | | | | | | | | | | | | | | | | | | | |
Class I | | | | | | | | | (4 | ) | | | | | | | | | N/A | | | | | | | | | | (2 | ) |
Class II | | | | | | | | | (14,367 | ) | | | | | | | | | (5,768 | ) | | | | | | | | | (1,270 | ) |
Net realized gains: | | | | | | | | | | | | | | | | | | | | | | | | | | | | | | |
Class I | | | | | | | | | — | | | | | | | | | | N/A | | | | | | | | | | — | |
Class II | | | | | | | | | — | | | | | | | | | | (10,204 | ) | | | | | | | | | — | |
Accumulated earnings: | | | | | | | | | | | | | | | | | | | | | | | | | | | | | | |
(combined net investment income and net realized gains) | | | | | | | | | | | | | | | | | | | | | | | | | | | | | | |
Class I | | | | (18 | ) | | | | | | | | | N/A | | | | | | | | | | — | | | | | | |
Class II | | | | (49,202 | ) | | | | | | | | | (10,863 | ) | | | | | | | | | — | | | | | | |
Total Distributions to Shareholders | | | | (49,220 | ) | | | | (14,371 | ) | | | | (10,863 | ) | | | | (15,972 | ) | | | | — | | | | | (1,272 | ) |
Capital Share Transactions | | | | (92,730 | ) | | | | (161,207 | ) | | | | (31,749 | ) | | | | (21,478 | ) | | | | (106,411 | ) | | | | (1,107 | ) |
Net Increase (Decrease) in Net Assets | | | | (182,564 | ) | | | | (17,594 | ) | | | | (52,142 | ) | | | | 1,435 | | | | | (129,322 | ) | | | | (27,577 | ) |
Net Assets, Beginning of Period | | | | 935,906 | | | | | 953,500 | | | | | 362,460 | | | | | 361,025 | | | | | 168,520 | | | | | 196,097 | |
Net Assets, End of Period | | | $ | 753,342 | | | | $ | 935,906 | | | | $ | 310,318 | | | | $ | 362,460 | | | | $ | 39,198 | | | | $ | 168,520 | |
Undistributed (distributions in excess of) net investment income | | | | | | | | $ | 1,566 | | | | | | | | | $ | 5,605 | | | | | | | | | $ | 464 | |
| | | |
| | | Growth | | High Income | | International Core Equity |
| (In thousands) | | Year ended
12-31-18 | | Year ended
12-31-17 | | Year ended
12-31-18 | | Year ended
12-31-17 | | Year ended
12-31-18 | | Year ended
12-31-17 |
INCREASE (DECREASE) IN NET ASSETS | | | | | | | | | | | | | | | | | | | | | | | | | | | | | | |
Operations: | | | | | | | | | | | | | | | | | | | | | | | | | | | | | | |
Net investment income (loss) | | | $ | (200 | ) | | | $ | 418 | | | | $ | 57,825 | | | | $ | 60,140 | | | | $ | 13,342 | | | | $ | 10,487 | |
Net realized gain (loss) on investments | | | | 187,073 | | | | | 99,533 | | | | | (24,107 | ) | | | | 2,619 | | | | | 58,736 | | | | | 31,845 | |
Net change in unrealized appreciation (depreciation) | | | | (147,341 | ) | | | | 125,029 | | | | | (51,073 | ) | | | | (1,748 | ) | | | | (216,635 | ) | | | | 120,497 | |
Net Increase (Decrease) in Net Assets Resulting from Operations | | | | 39,532 | | | | | 224,980 | | | �� | | (17,355 | ) | | | | 61,011 | | | | | (144,557 | ) | | | | 162,829 | |
Distributions to Shareholders From: | | | | | | | | | | | | | | | | | | | | | | | | | | | | | | |
Net investment income: | | | | | | | | | | | | | | | | | | | | | | | | | | | | | | |
Class I | | | | | | | | | N/A | | | | | | | | | | (3,461 | ) | | | | | | | | | N/A | |
Class II | | | | | | | | | (2,229 | ) | | | | | | | | | (50,714 | ) | | | | | | | | | (10,926 | ) |
Net realized gains: | | | | | | | | | | | | | | | | | | | | | | | | | | | | | | |
Class I | | | | | | | | | N/A | | | | | | | | | | — | | | | | | | | | | N/A | |
Class II | | | | | | | | | (79,352 | ) | | | | | | | | | — | | | | | | | | | | — | |
Accumulated earnings: | | | | | | | | | | | | | | | | | | | | | | | | | | | | | | |
(combined net investment income and net realized gains) | | | | | | | | | | | | | | | | | | | | | | | | | | | | | | |
Class I | | | | N/A | | | | | | | | | | (3,506 | ) | | | | | | | | | N/A | | | | | | |
Class II | | | | (99,828 | ) | | | | | | | | | (56,012 | ) | | | | | | | | | (32,980 | ) | | | | | |
Total Distributions to Shareholders | | | | (99,828 | ) | | | | (81,581 | ) | | | | (59,518 | ) | | | | (54,175 | ) | | | | (32,980 | ) | | | | (10,926 | ) |
Capital Share Transactions | | | | (153,936 | ) | | | | (95,388 | ) | | | | (19,488 | ) | | | | 91,360 | | | | | 18,832 | | | | | (53,365 | ) |
Net Increase (Decrease) in Net Assets | | | | (214,232 | ) | | | | 48,011 | | | | | (96,361 | ) | | | | 98,196 | | | | | (158,705 | ) | | | | 98,538 | |
Net Assets, Beginning of Period | | | | 883,423 | | | | | 835,412 | | | | | 943,415 | | | | | 845,219 | | | | | 834,581 | | | | | 736,043 | |
Net Assets, End of Period | | | $ | 669,191 | | | | $ | 883,423 | | | | $ | 847,054 | | | | $ | 943,415 | | | | $ | 675,876 | | | | $ | 834,581 | |
Undistributed (distributions in excess of) net investment income | | | | | | | | $ | 185 | | | | | | | | | $ | 59,568 | | | | | | | | | $ | 10,398 | |
| (1) | Consolidated Statements of Changes in Net Assets (See Note 5 in Notes to Financial Statements). |
See Accompanying Notes to Financial Statements.
| | |
| STATEMENTS OF CHANGES IN NET ASSETS | | IVY VIP |
| | | | | | | | | | | | | | | | | | | | | | | | |
| | | Mid Cap Growth | | | Natural Resources | | | Science and Technology | |
| (In thousands) | | Year ended
12-31-18 | | | Year ended
12-31-17 | | | Year ended
12-31-18 | | | Year ended
12-31-17 | | | Year ended
12-31-18 | | | Year ended
12-31-17 | |
INCREASE (DECREASE) IN NET ASSETS | | | | | | | | | | | | | | | | | | | | | | | | |
Operations: | | | | | | | | | | | | | | | | | | | | | | | | |
Net investment income (loss) | | $ | (2,364 | ) | | $ | (2,225 | ) | | $ | 837 | | | $ | 148 | | | $ | (2,425 | ) | | $ | (3,028 | ) |
Net realized gain on investments | | | 158,437 | | | | 31,071 | | | | 2,092 | | | | 2,677 | | | | 136,933 | | | | 27,092 | |
Net change in unrealized appreciation (depreciation) | | | (136,340 | ) | | | 130,796 | | | | (30,405 | ) | | | 547 | | | | (144,970 | ) | | | 136,142 | |
Net Increase (Decrease) in Net Assets Resulting from Operations | | | 19,733 | | | | 159,642 | | | | (27,476 | ) | | | 3,372 | | | | (10,462 | ) | | | 160,206 | |
| | | | | | |
Distributions to Shareholders From: | | | | | | | | | | | | | | | | | | | | | | | | |
Net investment income: | | | | | | | | | | | | | | | | | | | | | | | | |
Class I | | | | | | | — | | | | | | | | N/A | | | | | | | | — | |
Class II | | | | | | | — | | | | | | | | (179 | ) | | | | | | | — | |
Net realized gains: | | | | | | | | | | | | | | | | | | | | | | | | |
Class I | | | | | | | (3,997 | ) | | | | | | | N/A | | | | | | | | (29 | ) |
Class II | | | | | | | (15,653 | ) | | | | | | | — | | | | | | | | (50,952 | ) |
Accumulated earnings: | | | | | | | | | | | | | | | | | | | | | | | | |
(combined net investment income and net realized gains) | | | | | | | | | | | | | | | | | | | | | | | | |
Class I | | | (6,483 | ) | | | | | | | N/A | | | | | | | | (85 | ) | | | | |
Class II | | | (23,180 | ) | | | | | | | (351 | ) | | | | | | | (65,600 | ) | | | | |
Total Distributions to Shareholders | | | (29,663 | ) | | | (19,650 | ) | | | (351 | ) | | | (179 | ) | | | (65,685 | ) | | | (50,981 | ) |
Capital Share Transactions | | | (291,936 | ) | | | (39,555 | ) | | | (15,129 | ) | | | (15,986 | ) | | | (138,951 | ) | | | 21,079 | |
Net Increase (Decrease) in Net Assets | | | (301,866 | ) | | | 100,437 | | | | (42,956 | ) | | | (12,793 | ) | | | (215,098 | ) | | | 130,304 | |
Net Assets, Beginning of Period | | | 715,880 | | | | 615,443 | | | | 131,396 | | | | 144,189 | | | | 644,764 | | | | 514,460 | |
Net Assets, End of Period | | $ | 414,014 | | | $ | 715,880 | | | $ | 88,440 | | | $ | 131,396 | | | $ | 429,666 | | | $ | 644,764 | |
Undistributed (distributions in excess of) net investment income | | | | | | $ | (586 | ) | | | | | | $ | 327 | | | | | | | $ | (723 | ) |
| | | | | | | | | | | | | | | | |
| | | Small Cap Core | | | Small Cap Growth | |
| (In thousands) | | Year ended
12-31-18 | | | Year ended
12-31-17 | | | Year ended
12-31-18 | | | Year ended
12-31-17 | |
INCREASE (DECREASE) IN NET ASSETS | | | | | | | | | | | | | | | | |
Operations: | | | | | | | | | | | | | | | | |
Net investment income (loss) | | $ | (857 | ) | | $ | 32 | | | $ | (1,836 | ) | | $ | (2,844 | ) |
Net realized gain on investments | | | 37,591 | | | | 56,731 | | | | 67,357 | | | | 61,757 | |
Net change in unrealized appreciation (depreciation) | | | (48,670 | ) | | | (14,278 | ) | | | (77,892 | ) | | | 27,162 | |
Net Increase (Decrease) in Net Assets Resulting from Operations | | | (11,936 | ) | | | 42,485 | | | | (12,371 | ) | | | 86,075 | |
Distributions to Shareholders From: | | | | | | | | | | | | | | | | |
Net investment income: | | | | | | | | | | | | | | | | |
Class I | | | | | | | N/A | | | | | | | | N/A | |
Class II | | | | | | | — | | | | | | | | — | |
Net realized gains: | | | | | | | | | | | | | | | | |
Class I | | | | | | | N/A | | | | | | | | N/A | |
Class II | | | | | | | (39,265 | ) | | | | | | | (10,680 | ) |
Accumulated earnings: | | | | | | | | | | | | | | | | |
(combined net investment income and net realized gains) | | | | | | | | | | | | | | | | |
Class I | | | N/A | | | | | | | | — | | | | | |
Class II | | | (56,235 | ) | | | | | | | (117,993 | ) | | | | |
Total Distributions to Shareholders | | | (56,235 | ) | | | (39,265 | ) | | | (117,993 | ) | | | (10,680 | ) |
Capital Share Transactions | | | (72,013 | ) | | | (36,011 | ) | | | 105,572 | | | | (124,424 | ) |
Net Decrease in Net Assets | | | (140,184 | ) | | | (32,791 | ) | | | (24,792 | ) | | | (49,029 | ) |
Net Assets, Beginning of Period | | | 315,541 | | | | 348,332 | | | | 376,819 | | | | 425,848 | |
Net Assets, End of Period | | $ | 175,357 | | | $ | 315,541 | | | $ | 352,027 | | | $ | 376,819 | |
Undistributed (distributions in excess of) net investment income | | | | | | $ | 376 | | | | | | | $ | 1,043 | |
See Accompanying Notes to Financial Statements.
This page intentionally left blank.
| | |
| FINANCIAL HIGHLIGHTS | | IVY VIP |
FOR A SHARE OF CAPITAL STOCK OUTSTANDING THROUGHOUT EACH PERIOD
| | | | | | | | | | | | | | | | | | | | | | | | | | | | |
| | | | | | | |
| | | Net Asset
Value,
Beginning
of Period | | | Net
Investment
Income
(Loss)(1) | | | Net Realized
and Unrealized
Gain (Loss) on
Investments | | | Total from
Investment
Operations | | | Distributions From
Net Investment
Income | | | Distributions
From Net
Realized
Gains | | | Total
Distributions | |
Asset Strategy | |
Class I Shares | |
Year ended12-31-2018 | | $ | 9.37 | | | $ | 0.18 | | | $ | (0.67 | ) | | $ | (0.49 | ) | | $ | (0.20 | ) | | $ | (0.39 | ) | | $ | (0.59 | ) |
Year ended12-31-2017(4) | | | 8.57 | | | | 0.08 | | | | 0.88 | | | | 0.96 | | | | (0.16 | ) | | | — | | | | (0.16 | ) |
Class II Shares | |
Year ended12-31-2018 | | | 9.37 | | | | 0.16 | | | | (0.67 | ) | | | (0.51 | ) | | | (0.18 | ) | | | (0.39 | ) | | | (0.57 | ) |
Year ended12-31-2017 | | | 8.04 | | | | 0.03 | | | | 1.44 | | | | 1.47 | | | | (0.14 | ) | | | — | | | | (0.14 | ) |
Year ended12-31-2016 | | | 8.30 | | | | 0.06 | | | | (0.27 | ) | | | (0.21 | ) | | | (0.05 | ) | | | — | | | | (0.05 | ) |
Year ended12-31-2015 | | | 10.87 | | | | 0.08 | | | | (0.77 | ) | | | (0.69 | ) | | | (0.04 | ) | | | (1.84 | ) | | | (1.88 | ) |
Year ended12-31-2014 | | | 13.25 | | | | 0.11 | | | | (0.78 | ) | | | (0.67 | ) | | | (0.06 | ) | | | (1.65 | ) | | | (1.71 | ) |
Balanced | |
Class II Shares | |
Year ended12-31-2018 | | | 7.95 | | | | 0.12 | | | | (0.36 | ) | | | (0.24 | ) | | | (0.13 | ) | | | (0.12 | ) | | | (0.25 | ) |
Year ended12-31-2017 | | | 7.47 | | | | 0.12 | | | | 0.70 | | | | 0.82 | | | | (0.12 | ) | | | (0.22 | ) | | | (0.34 | ) |
Year ended12-31-2016 | | | 8.76 | | | | 0.11 | | | | 0.00 | * | | | 0.11 | | | | (0.12 | ) | | | (1.28 | ) | | | (1.40 | ) |
Year ended12-31-2015 | | | 10.19 | | | | 0.12 | | | | (0.09 | ) | | | 0.03 | | | | (0.09 | ) | | | (1.37 | ) | | | (1.46 | ) |
Year ended12-31-2014 | | | 10.46 | | | | 0.09 | | | | 0.64 | | | | 0.73 | | | | (0.10 | ) | | | (0.90 | ) | | | (1.00 | ) |
Energy | |
Class I Shares | |
Year ended12-31-2018 | | | 5.87 | | | | 0.00 | * | | | (1.99 | ) | | | (1.99 | ) | | | — | | | | — | | | | — | |
Year ended12-31-2017(4) | | | 5.84 | | | | 0.06 | | | | 0.02 | | | | 0.08 | | | | (0.05 | ) | | | — | | | | (0.05 | ) |
Class II Shares | |
Year ended12-31-2018 | | | 5.87 | | | | (0.02 | ) | | | (1.98 | ) | | | (2.00 | ) | | | — | | | | — | | | | — | |
Year ended12-31-2017 | | | 6.77 | | | | 0.04 | | | | (0.90 | ) | | | (0.86 | ) | | | (0.04 | ) | | | — | | | | (0.04 | ) |
Year ended12-31-2016 | | | 5.04 | | | | (0.02 | ) | | | 1.76 | | | | 1.74 | | | | (0.01 | ) | | | — | | | | (0.01 | ) |
Year ended12-31-2015 | | | 6.51 | | | | 0.00 | * | | | (1.44 | ) | | | (1.44 | ) | | | — | * | | | (0.03 | ) | | | (0.03 | ) |
Year ended12-31-2014 | | | 7.50 | | | | (0.01 | ) | | | (0.73 | ) | | | (0.74 | ) | | | — | | | | (0.25 | ) | | | (0.25 | ) |
Growth | |
Class II Shares | |
Year ended12-31-2018 | | | 12.09 | | | | 0.00 | * | | | 0.36 | | | | 0.36 | | | | — | * | | | (1.43 | ) | | | (1.43 | ) |
Year ended12-31-2017 | | | 10.30 | | | | 0.01 | | | | 2.84 | | | | 2.85 | | | | (0.03 | ) | | | (1.03 | ) | | | (1.06 | ) |
Year ended12-31-2016 | | | 11.42 | | | | 0.03 | | | | 0.03 | | | | 0.06 | | | | — | * | | | (1.18 | ) | | | (1.18 | ) |
Year ended12-31-2015 | | | 12.08 | | | | 0.00 | * | | | 0.85 | | | | 0.85 | | | | (0.01 | ) | | | (1.50 | ) | | | (1.51 | ) |
Year ended12-31-2014 | | | 13.33 | | | | 0.01 | | | | 1.28 | | | | 1.29 | | | | (0.06 | ) | | | (2.48 | ) | | | (2.54 | ) |
High Income | |
Class I Shares | |
Year ended12-31-2018 | | | 3.65 | | | | 0.23 | | | | (0.29 | ) | | | (0.06 | ) | | | (0.24 | ) | | | — | | | | (0.24 | ) |
Year ended12-31-2017(4) | | | 3.73 | | | | 0.16 | | | | (0.03 | ) | | | 0.13 | | | | (0.21 | ) | | | — | | | | (0.21 | ) |
Class II Shares | |
Year ended12-31-2018 | | | 3.64 | | | | 0.22 | | | | (0.29 | ) | | | (0.07 | ) | | | (0.23 | ) | | | — | | | | (0.23 | ) |
Year ended12-31-2017 | | | 3.61 | | | | 0.23 | | | | 0.01 | | | | 0.24 | | | | (0.21 | ) | | | — | | | | (0.21 | ) |
Year ended12-31-2016 | | | 3.35 | | | | 0.24 | | | | 0.28 | | | | 0.52 | | | | (0.26 | ) | | | — | | | | (0.26 | ) |
Year ended12-31-2015 | | | 3.85 | | | | 0.26 | | | | (0.48 | ) | | | (0.22 | ) | | | (0.24 | ) | | | (0.04 | ) | | | (0.28 | ) |
Year ended12-31-2014 | | | 4.00 | | | | 0.25 | | | | (0.17 | ) | | | 0.08 | | | | (0.20 | ) | | | (0.03 | ) | | | (0.23 | ) |
International Core Equity | |
Class II Shares | |
Year ended12-31-2018 | | | 18.58 | | | | 0.30 | | | | (3.45 | ) | | | (3.15 | ) | | | (0.28 | ) | | | (0.49 | ) | | | (0.77 | ) |
Year ended12-31-2017 | | | 15.30 | | | | 0.23 | | | | 3.29 | | | | 3.52 | | | | (0.24 | ) | | | — | | | | (0.24 | ) |
Year ended12-31-2016 | | | 15.53 | | | | 0.24 | | | | (0.11 | ) | | | 0.13 | | | | (0.20 | ) | | | (0.16 | ) | | | (0.36 | ) |
Year ended12-31-2015 | | | 18.00 | | | | 0.20 | | | | (0.06 | ) | | | 0.14 | | | | (0.24 | ) | | | (2.37 | ) | | | (2.61 | ) |
Year ended12-31-2014 | | | 19.75 | | | | 0.24 | | | | 0.10 | | | | 0.34 | | | | (0.51 | ) | | | (1.58 | ) | | | (2.09 | ) |
| * | Not shown due to rounding. |
| (1) | Based on average weekly shares outstanding. |
| (2) | Based on net asset value. Total returns do not reflect a sales charge or contingent deferred sales charge, if applicable. Total returns for periods less than one year are not annualized. |
| (3) | Ratios excluding expense waivers are included only for periods in which the class had waived or reimbursed expenses. |
| (4) | For the period from April 28, 2017 (commencement of operations of the class) through December 31, 2017. |
| (6) | Portfolio turnover is calculated at the fund level. Percentage indicated was calculated for the period ended December 31, 2017. |
| | | | | | | | | | | | | | | | | | | | | | | | | | | | | | | | |
| | | Net Asset
Value,
End of Period | | | Total
Return(2) | | | Net Assets,
End of Period
(in millions) | | | Ratio of Expenses
to Average Net
Assets Including Expense Waiver | | | Ratio of Net
Investment
Income (Loss) to Average
Net Assets
Including
Expense Waiver | | | Ratio of
Expenses to
Average Net Assets
Excluding
Expense
Waiver(3) | | | Ratio of Net
Investment
Income (Loss) to Average Net Assets
Excluding
Expense
Waiver(3) | | | Portfolio
Turnover
Rate | |
Asset Strategy | |
Class I Shares | |
Year ended12-31-2018 | | $ | 8.29 | | | | -5.20 | % | | $ | — | * | | | 0.78 | % | | | 1.91 | % | | | 0.78 | % | | | 1.91 | % | | | 58 | % |
Year ended12-31-2017(4) | | | 9.37 | | | | 11.16 | | | | — | * | | | 0.74 | (5) | | | 1.30 | (5) | | | — | | | | — | | | | 39 | (6) |
Class II Shares | |
Year ended12-31-2018 | | | 8.29 | | | | -5.44 | | | | 753 | | | | 1.03 | | | | 1.65 | | | | — | | | | — | | | | 58 | |
Year ended12-31-2017 | | | 9.37 | | | | 18.27 | | | | 936 | | | | 1.02 | | | | 0.35 | | | | — | | | | — | | | | 39 | |
Year ended12-31-2016 | | | 8.04 | | | | -2.57 | | | | 954 | | | | 1.01 | | | | 0.70 | | | | 1.02 | | | | 0.69 | | | | 68 | |
Year ended12-31-2015 | | | 8.30 | | | | -8.35 | | | | 1,268 | | | | 0.98 | | | | 0.81 | | | | 0.99 | | | | 0.80 | | | | 70 | |
Year ended12-31-2014 | | | 10.87 | | | | -5.26 | | | | 1,600 | | | | 0.97 | | | | 0.94 | | | | 0.98 | | | | 0.93 | | | | 130 | |
Balanced | |
Class II Shares | |
Year ended12-31-2018 | | | 7.46 | | | | -3.24 | | | | 310 | | | | 1.01 | | | | 1.55 | | | | — | | | | — | | | | 54 | |
Year ended12-31-2017 | | | 7.95 | | | | 11.37 | | | | 362 | | | | 1.01 | | | | 1.54 | | | | — | | | | — | | | | 48 | |
Year ended12-31-2016 | | | 7.47 | | | | 2.03 | | | | 361 | | | | 1.01 | | | | 1.53 | | | | — | | | | — | | | | 54 | |
Year ended12-31-2015 | | | 8.76 | | | | -0.32 | | | | 383 | | | | 1.00 | | | | 1.28 | | | | — | | | | — | | | | 44 | |
Year ended12-31-2014 | | | 10.19 | | | | 7.57 | | | | 415 | | | | 1.01 | | | | 0.90 | | | | — | | | | — | | | | 43 | |
Energy | |
Class I Shares | |
Year ended12-31-2018 | | | 3.88 | | | | -33.96 | | | | — | * | | | 0.94 | | | | -0.09 | | | | 0.94 | | | | -0.09 | | | | 37 | |
Year ended12-31-2017(4) | | | 5.87 | | | | 1.55 | | | | — | * | | | 0.92 | (5) | | | 1.70 | (5) | | | — | | | | — | | | | 22 | (6) |
Class II Shares | |
Year ended12-31-2018 | | | 3.87 | | | | -34.14 | | | | 39 | | | | 1.19 | | | | -0.41 | | | | — | | | | — | | | | 37 | |
Year ended12-31-2017 | | | 5.87 | | | | -12.64 | | | | 169 | | | | 1.19 | | | | 0.75 | | | | — | | | | — | | | | 22 | |
Year ended12-31-2016 | | | 6.77 | | | | 34.55 | | | | 196 | | | | 1.19 | | | | -0.27 | | | | — | | | | — | | | | 31 | |
Year ended12-31-2015 | | | 5.04 | | | | -22.14 | | | | 117 | | | | 1.20 | | | | 0.08 | | | | — | | | | — | | | | 34 | |
Year ended12-31-2014 | | | 6.51 | | | | -10.56 | | | | 118 | | | | 1.18 | | | | -0.10 | | | | — | | | | — | | | | 21 | |
Growth | |
Class II Shares | |
Year ended12-31-2018 | | | 11.02 | | | | 2.28 | | | | 669 | | | | 1.00 | | | | -0.02 | | | | — | | | | — | | | | 37 | |
Year ended12-31-2017 | | | 12.09 | | | | 29.34 | | | | 883 | | | | 0.99 | | | | 0.05 | | | | — | | | | — | | | | 41 | |
Year ended12-31-2016 | | | 10.30 | | | | 1.22 | | | | 835 | | | | 0.98 | | | | 0.26 | | | | 1.00 | | | | 0.24 | | | | 53 | |
Year ended12-31-2015 | | | 11.42 | | | | 7.17 | | | | 897 | | | | 0.96 | | | | 0.03 | | | | 0.99 | | | | — | | | | 30 | |
Year ended12-31-2014 | | | 12.08 | | | | 11.81 | | | | 871 | | | | 0.96 | | | | 0.10 | | | | 0.99 | | | | 0.07 | | | | 26 | |
High Income | |
Class I Shares | |
Year ended12-31-2018 | | | 3.35 | | | | -1.86 | | | | 44 | | | | 0.66 | | | | 6.50 | | | | 0.66 | | | | 6.50 | | | | 42 | |
Year ended12-31-2017(4) | | | 3.65 | | | | 3.42 | | | | 56 | | | | 0.66 | (5) | | | 6.53 | (5) | | | — | | | | — | | | | 52 | (6) |
Class II Shares | |
Year ended12-31-2018 | | | 3.34 | | | | -2.11 | | | | 803 | | | | 0.91 | | | | 6.27 | | | | — | | | | — | | | | 42 | |
Year ended12-31-2017 | | | 3.64 | | | | 6.68 | | | | 887 | | | | 0.91 | | | | 6.22 | | | | — | | | | — | | | | 52 | |
Year ended12-31-2016 | | | 3.61 | | | | 16.19 | | | | 845 | | | | 0.89 | | | | 6.97 | | | | 0.92 | | | | 6.94 | | | | 36 | |
Year ended12-31-2015 | | | 3.35 | | | | -6.50 | | | | 725 | | | | 0.89 | | | | 7.01 | | | | 0.92 | | | | 6.98 | | | | 44 | |
Year ended12-31-2014 | | | 3.85 | | | | 1.90 | | | | 818 | | | | 0.88 | | | | 6.31 | | | | 0.91 | | | | 6.28 | | | | 55 | |
International Core Equity | |
Class II Shares | |
Year ended12-31-2018 | | | 14.66 | | | | -17.81 | | | | 676 | | | | 1.16 | | | | 1.70 | | | | — | | | | — | | | | 51 | |
Year ended12-31-2017 | | | 18.58 | | | | 23.16 | | | | 835 | | | | 1.16 | | | | 1.33 | | | | — | | | | — | | | | 59 | |
Year ended12-31-2016 | | | 15.30 | | | | 1.08 | | | | 736 | | | | 1.17 | | | | 1.60 | | | | — | | | | — | | | | 77 | |
Year ended12-31-2015 | | | 15.53 | | | | -0.94 | | | | 675 | | | | 1.16 | | | | 1.18 | | | | — | | | | — | | | | 87 | |
Year ended12-31-2014 | | | 18.00 | | | | 1.44 | | | | 656 | | | | 1.16 | | | | 1.28 | | | | — | | | | — | | | | 102 | |
See Accompanying Notes to Financial Statements.
| | |
| FINANCIAL HIGHLIGHTS | | IVY VIP |
FOR A SHARE OF CAPITAL STOCK OUTSTANDING THROUGHOUT EACH PERIOD
| | | | | | | | | | | | | | | | | | | | | | | | | | | | | | | | | | | |
| | | | | | | |
| | | Net Asset
Value,
Beginning of
Period | | Net
Investment
Income
(Loss)(1) | | Net Realized
and Unrealized
Gain (Loss) on
Investments | | Total from
Investment
Operations | | Distributions
From Net
Investment
Income | | Distributions
From Net
Realized
Gains | | Total
Distributions |
Mid Cap Growth | | | | | | | | | | | | | | | | | | | | | | | | | | | | | | | | | | | |
Class I Shares | | | | | | | | | | | | | | | | | | | | | | | | | | | | | | | | | | | |
Year ended12-31-2018 | | | $ | 11.63 | | | | $ | (0.02 | ) | | | $ | 0.09 | | | | $ | 0.07 | | | | $ | — | | | | $ | (0.60 | ) | | | $ | (0.60 | ) |
Year ended12-31-2017(4) | | | | 10.30 | | | | | 0.00 | * | | | | 1.64 | | | | | 1.64 | | | | | — | | | | | (0.31 | ) | | | | (0.31 | ) |
| | | | | | | |
Class II Shares | | | | | | | | | | | | | | | | | | | | | | | | | | | | | | | | | | | |
Year ended12-31-2018 | | | | 11.61 | | | | | (0.05 | ) | | | | 0.09 | | | | | 0.04 | | | | | — | | | | | (0.58 | ) | | | | (0.58 | ) |
Year ended12-31-2017 | | | | 9.44 | | | | | (0.04 | ) | | | | 2.52 | | | | | 2.48 | | | | | — | | | | | (0.31 | ) | | | | (0.31 | ) |
Year ended12-31-2016 | | | | 9.42 | | | | | (0.01 | ) | | | | 0.55 | | | | | 0.54 | | | | | — | | | | | (0.52 | ) | | | | (0.52 | ) |
Year ended12-31-2015 | | | | 10.84 | | | | | (0.01 | ) | | | | (0.52 | ) | | | | (0.53 | ) | | | | — | | | | | (0.89 | ) | | | | (0.89 | ) |
Year ended12-31-2014 | | | | 10.72 | | | | | (0.04 | ) | | | | 0.82 | | | | | 0.78 | | | | | — | | | | | (0.66 | ) | | | | (0.66 | ) |
| | | | | | | |
Natural Resources | | | | | | | | | | | | | | | | | | | | | | | | | | | | | | | | | | | |
Class II Shares | | | | | | | | | | | | | | | | | | | | | | | | | | | | | | | | | | | |
Year ended12-31-2018 | | | | 4.63 | | | | | 0.03 | | | | | (1.10 | ) | | | | (1.07 | ) | | | | (0.01 | ) | | | | — | | | | | (0.01 | ) |
Year ended12-31-2017 | | | | 4.50 | | | | | 0.00 | * | | | | 0.14 | | | | | 0.14 | | | | | (0.01 | ) | | | | — | | | | | (0.01 | ) |
Year ended12-31-2016 | | | | 3.66 | | | | | 0.01 | | | | | 0.86 | | | | | 0.87 | | | | | (0.03 | ) | | | | — | | | | | (0.03 | ) |
Year ended12-31-2015 | | | | 4.72 | | | | | 0.02 | | | | | (1.08 | ) | | | | (1.06 | ) | | | | — | * | | | | — | | | | | — | * |
Year ended12-31-2014 | | | | 5.43 | | | | | 0.01 | | | | | (0.72 | ) | | | | (0.71 | ) | | | | — | | | | | — | | | | | — | |
| | | | | | | |
Science and Technology | | | | | | | | | | | | | | | | | | | | | | | | | | | | | | | | | | | |
Class I Shares | | | | | | | | | | | | | | | | | | | | | | | | | | | | | | | | | | | |
Year ended12-31-2018 | | | | 27.04 | | | | | (0.03 | ) | | | | (1.24 | ) | | | | (1.27 | ) | | | | — | | | | | (3.86 | ) | | | | (3.86 | ) |
Year ended12-31-2017(4) | | | | 25.22 | | | | | (0.04 | ) | | | | 4.16 | | | | | 4.12 | | | | | — | | | | | (2.30 | ) | | | | (2.30 | ) |
| | | | | | | |
Class II Shares | | | | | | | | | | | | | | | | | | | | | | | | | | | | | | | | | | | |
Year ended12-31-2018 | | | | 27.04 | | | | | (0.11 | ) | | | | (1.23 | ) | | | | (1.34 | ) | | | | — | | | | | (3.86 | ) | | | | (3.86 | ) |
Year ended12-31-2017 | | | | 22.34 | | | | | (0.13 | ) | | | | 7.08 | | | | | 6.95 | | | | | — | | | | | (2.25 | ) | | | | (2.25 | ) |
Year ended12-31-2016 | | | | 22.96 | | | | | (0.11 | ) | | | | 0.34 | | | | | 0.23 | | | | | — | | | | | (0.85 | ) | | | | (0.85 | ) |
Year ended12-31-2015 | | | | 25.02 | | | | | (0.15 | ) | | | | (0.41 | ) | | | | (0.56 | ) | | | | — | | | | | (1.50 | ) | | | | (1.50 | ) |
Year ended12-31-2014 | | | | 26.58 | | | | | (0.13 | ) | | | | 0.74 | | | | | 0.61 | | | | | — | | | | | (2.17 | ) | | | | (2.17 | ) |
| | | | | | | |
Small Cap Core | | | | | | | | | | | | | | | | | | | | | | | | | | | | | | | | | | | |
Class II Shares | | | | | | | | | | | | | | | | | | | | | | | | | | | | | | | | | | | |
Year ended12-31-2018 | | | | 18.32 | | | | | (0.06 | ) | | | | (1.37 | ) | | | | (1.43 | ) | | | | (0.02 | ) | | | | (3.36 | ) | | | | (3.38 | ) |
Year ended12-31-2017 | | | | 18.34 | | | | | 0.00 | * | | | | 2.21 | | | | | 2.21 | | | | | — | | | | | (2.23 | ) | | | | (2.23 | ) |
Year ended12-31-2016 | | | | 15.66 | | | | | 0.01 | | | | | 4.17 | | | | | 4.18 | | | | | (0.07 | ) | | | | (1.43 | ) | | | | (1.50 | ) |
Year ended12-31-2015 | | | | 17.98 | | | | | 0.05 | | | | | (0.95 | ) | | | | (0.90 | ) | | | | (0.02 | ) | | | | (1.40 | ) | | | | (1.42 | ) |
Year ended12-31-2014 | | | | 19.90 | | | | | (0.01 | ) | | | | 1.19 | | | | | 1.18 | | | | | (0.02 | ) | | | | (3.08 | ) | | | | (3.10 | ) |
| | | | | | | |
Small Cap Growth | | | | | | | | | | | | | | | | | | | | | | | | | | | | | | | | | | | |
Class I Shares | | | | | | | | | | | | | | | | | | | | | | | | | | | | | | | | | | | |
Year ended12-31-2018(5) | | | | 8.76 | | | | | 0.00 | * | | | | (1.07 | ) | | | | (1.07 | ) | | | | — | | | | | — | | | | | — | |
| | | | | | | |
Class II Shares | | | | | | | | | | | | | | | | | | | | | | | | | | | | | | | | | | | |
Year ended12-31-2018 | | | | 11.63 | | | | | (0.06 | ) | | | | 0.03 | | | | | (0.03 | ) | | | | (0.05 | ) | | | | (3.87 | ) | | | | (3.92 | ) |
Year ended12-31-2017 | | | | 9.69 | | | | | (0.07 | ) | | | | 2.27 | | | | | 2.20 | | | | | — | | | | | (0.26 | ) | | | | (0.26 | ) |
Year ended12-31-2016 | | | | 10.60 | | | | | (0.07 | ) | | | | 0.23 | | | | | 0.16 | | | | | — | | | | | (1.07 | ) | | | | (1.07 | ) |
Year ended12-31-2015 | | | | 12.15 | | | | | (0.09 | ) | | | | 0.51 | | | | | 0.42 | | | | | — | | | | | (1.97 | ) | | | | (1.97 | ) |
Year ended12-31-2014 | | | | 13.76 | | | | | (0.10 | ) | | | | 0.11 | | | | | 0.01 | | | | | — | | | | | (1.62 | ) | | | | (1.62 | ) |
| * | Not shown due to rounding. |
| (1) | Based on average weekly shares outstanding. |
| (2) | Based on net asset value. Total returns do not reflect a sales charge or contingent deferred sales charge, if applicable. Total returns for periods less than one year are not annualized. |
| (3) | Ratios excluding expense waivers are included only for periods in which the class had waived or reimbursed expenses. |
| (4) | For the period from April 28, 2017 (commencement of operations of the class) through December 31, 2017. |
| (5) | For the period from November 5, 2018 (commencement of operations of the class) through December 31, 2018. |
| (7) | Portfolio turnover is calculated at the fund level. Percentage indicated was calculated for the period ended December 31, 2017. |
| (8) | Portfolio turnover is calculated at the fund level. Percentage indicated was calculated for the period ended December 31, 2018. |
| (9) | Expense ratio based on the period excluding reorganization expenses was 0.89%. |
| (10) | Expense ratio based on the period excluding reorganization expenses was 1.14%. |
.
| | | | | | | | | | | | | | | | | | | | | | | | | | | | | | | | | | | | | | | | |
| | | | | | | | |
| | | Net Asset
Value,
End of Period | | Total
Return(2) | | Net Assets,
End of Period
(in millions) | | Ratio of Expenses
to Average Net
Assets Including
Expense Waiver | | Ratio of Net
Investment
Income
(Loss) to
Average
Net Assets
Including
Expense
Waiver | | Ratio of
Expenses to
Average
Net Assets
Excluding
Expense
Waiver(3) | | Ratio of Net
Investment
Income
(Loss) to
Average
Net Assets
Excluding
Expense
Waiver(3) | | Portfolio
Turnover
Rate |
Mid Cap Growth | | | | | | | | | | | | | | | | | | | | | | | | | | | | | | | | | | | | | | | | |
Class I Shares | | | | | | | | | | | | | | | | | | | | | | | | | | | | | | | | | | | | | | | | |
Year ended12-31-2018 | | | $ | 11.10 | | | | | 0.20 | % | | | $ | 184 | | | | | 0.85 | % | | | | -0.14 | % | | | | 0.90 | % | | | | -0.19 | % | | | | 53 | % |
Year ended12-31-2017(4) | | | | 11.63 | | | | | 16.44 | | | | | 131 | | | | | 0.85 | (6) | | | | 0.05 | (6) | | | | 0.89 | (6) | | | | 0.01 | (6) | | | | 25 | (7) |
| | | | | | | | | |
Class II Shares | | | | | | | | | | | | | | | | | | | | | | | | | | | | | | | | | | | | | | | | |
Year ended12-31-2018 | | | | 11.07 | | | | | -0.06 | | | | | 230 | | | | | 1.10 | | | | | -0.42 | | | | | 1.15 | | | | | -0.47 | | | | | 53 | |
Year ended12-31-2017 | | | | 11.61 | | | | | 26.89 | | | | | 585 | | | | | 1.11 | | | | | -0.39 | | | | | 1.15 | | | | | -0.43 | | | | | 25 | |
Year ended12-31-2016 | | | | 9.44 | | | | | 6.12 | | | | | 615 | | | | | 1.10 | | | | | -0.09 | | | | | 1.15 | | | | | -0.14 | | | | | 33 | |
Year ended12-31-2015 | | | | 9.42 | | | | | -5.78 | | | | | 586 | | | | | 1.10 | | | | | -0.07 | | | | | 1.15 | | | | | -0.12 | | | | | 42 | |
Year ended12-31-2014 | | | | 10.84 | | | | | 7.87 | | | | | 557 | | | | | 1.10 | | | | | -0.34 | | | | | 1.15 | | | | | -0.39 | | | | | 43 | |
| | | | | | | | |
Natural Resources | | | | | | | | | | | | | | | | | | | | | | | | | | | | | | | | | | | | | | | | |
Class II Shares | | | | | | | | | | | | | | | | | | | | | | | | | | | | | | | | | | | | | | | | |
Year ended12-31-2018 | | | | 3.55 | | | | | -23.23 | | | | | 88 | | | | | 1.21 | | | | | 0.72 | | | | | — | | | | | — | | | | | 33 | |
Year ended12-31-2017 | | | | 4.63 | | | | | 2.97 | | | | | 131 | | | | | 1.36 | | | | | 0.11 | | | | | — | | | | | — | | | | | 44 | |
Year ended12-31-2016 | | | | 4.50 | | | | | 23.81 | | | | | 144 | | | | | 1.36 | | | | | 0.20 | | | | | — | | | | | — | | | | | 67 | |
Year ended12-31-2015 | | | | 3.66 | | | | | -22.39 | | | | | 114 | | | | | 1.35 | | | | | 0.54 | | | | | — | | | | | — | | | | | 34 | |
Year ended12-31-2014 | | | | 4.72 | | | | | -13.04 | | | | | 146 | | | | | 1.33 | | | | | 0.12 | | | | | — | | | | | — | | | | | 31 | |
| | | | | | | | |
Science and Technology | | | | | | | | | | | | | | | | | | | | | | | | | | | | | | | | | | | | | | | | |
Class I Shares | | | | | | | | | | | | | | | | | | | | | | | | | | | | | | | | | | | | | | | | |
Year ended12-31-2018 | | | | 21.91 | | | | | -5.00 | | | | | 1 | | | | | 0.91 | | | | | -0.11 | | | | | 0.91 | | | | | -0.11 | | | | | 17 | |
Year ended12-31-2017(4) | | | | 27.04 | | | | | 17.24 | | | | | — | * | | | | 0.90 | (6) | | | | -0.25 | (6) | | | | — | | | | | — | | | | | 27 | (7) |
| | | | | | | | | |
Class II Shares | | | | | | | | | | | | | | | | | | | | | | | | | | | | | | | | | | | | | | | | |
Year ended12-31-2018 | | | | 21.84 | | | | | -5.23 | | | | | 429 | | | | | 1.16 | | | | | -0.38 | | | | | — | | | | | — | | | | | 17 | |
Year ended12-31-2017 | | | | 27.04 | | | | | 32.12 | | | | | 645 | | | | | 1.15 | | | | | -0.51 | | | | | — | | | | | — | | | | | 27 | |
Year ended12-31-2016 | | | | 22.34 | | | | | 1.54 | | | | | 514 | | | | | 1.15 | | | | | -0.52 | | | | | 1.17 | | | | | -0.54 | | | | | 16 | |
Year ended12-31-2015 | | | | 22.96 | | | | | -2.88 | | | | | 582 | | | | | 1.13 | | | | | -0.60 | | | | | 1.15 | | | | | -0.62 | | | | | 25 | |
Year ended12-31-2014 | | | | 25.02 | | | | | 2.91 | | | | | 586 | | | | | 1.13 | | | | | -0.51 | | | | | 1.15 | | | | | -0.53 | | | | | 29 | |
| | | | | | | | |
Small Cap Core | | | | | | | | | | | | | | | | | | | | | | | | | | | | | | | | | | | | | | | | |
Class II Shares | | | | | | | | | | | | | | | | | | | | | | | | | | | | | | | | | | | | | | | | |
Year ended12-31-2018 | | | | 13.51 | | | | | -10.49 | | | | | 175 | | | | | 1.17 | | | | | -0.34 | | | | | — | | | | | — | | | | | 112 | |
Year ended12-31-2017 | | | | 18.32 | | | | | 13.73 | | | | | 316 | | | | | 1.15 | | | | | 0.01 | | | | | — | | | | | — | | | | | 112 | |
Year ended12-31-2016 | | | | 18.34 | | | | | 28.88 | | | | | 348 | | | | | 1.16 | | | | | 0.08 | | | | | — | | | | | — | | | | | 182 | |
Year ended12-31-2015 | | | | 15.66 | | | | | -5.58 | | | | | 318 | | | | | 1.15 | | | | | 0.26 | | | | | — | | | | | — | | | | | 142 | |
Year ended12-31-2014 | | | | 17.98 | | | | | 7.05 | | | | | 354 | | | | | 1.15 | | | | | -0.10 | | | | | — | | | | | — | | | | | 81 | |
| | | | | | | | |
Small Cap Growth | | | | | | | | | | | | | | | | | | | | | | | | | | | | | | | | | | | | | | | | |
Class I Shares | | | | | | | | | | | | | | | | | | | | | | | | | | | | | | | | | | | | | | | | |
Year ended12-31-2018(5) | | | | 7.69 | | | | | -12.24 | | | | | 52 | | | | | 1.05 | (6)(9) | | | | 0.15 | (6) | | | | 1.07 | (6) | | | | 0.13 | (6) | | | | 52 | (8) |
| | | | | | | | | |
Class II Shares | | | | | | | | | | | | | | | | | | | | | | | | | | | | | | | | | | | | | | | | |
Year ended12-31-2018 | | | | 7.68 | | | | | -4.11 | | | | | 300 | | | | | 1.16 | (10) | | | | -0.52 | | | | | 1.18 | | | | | -0.54 | | | | | 52 | |
Year ended12-31-2017 | | | | 11.63 | | | | | 23.12 | | | | | 377 | | | | | 1.15 | | | | | -0.69 | | | | | 1.17 | | | | | -0.71 | | | | | 55 | |
Year ended12-31-2016 | | | | 9.69 | | | | | 2.92 | | | | | 426 | | | | | 1.14 | | | | | -0.79 | | | | | 1.16 | | | | | -0.81 | | | | | 107 | |
Year ended12-31-2015 | | | | 10.60 | | | | | 1.88 | | | | | 430 | | | | | 1.13 | | | | | -0.76 | | | | | 1.15 | | | | | -0.78 | | | | | 102 | |
Year ended12-31-2014 | | | | 12.15 | | | | | 1.59 | | | | | 426 | | | | | 1.14 | | | | | -0.80 | | | | | 1.16 | | | | | -0.82 | | | | | 85 | |
See Accompanying Notes to Financial Statements. .
| | |
| NOTES TO FINANCIAL STATEMENTS | | IVY VIP |
DECEMBER 31, 2018
Ivy Variable Insurance Portfolios, a Delaware statutory trust (the “Trust”), is registered under the Investment Company Act of 1940, as amended (the “1940 Act”), as anopen-end management investment company. Asset Strategy, Balanced, Energy, Growth, High Income, International Core Equity, Mid Cap Growth, Natural Resources, Science and Technology, Small Cap Core and Small Cap Growth (each, a “Portfolio”) are eleven series of the Trust and are the only series of the Trust included in these financial statements. The assets belonging to each Portfolio are held separately by the custodian. The investment objective, policies and risk factors of each Portfolio are described more fully in the Prospectus and Statement of Additional Information (“SAI”). Each Portfolio’s investment adviser is Ivy Investment Management Company (“IICO”).
Each Portfolio offers Class II shares. Asset Strategy, Energy, High Income, Mid Cap Growth, Science and Technology and Small Cap Growth also offer Class I shares. All classes of shares have identical rights and voting privileges with respect to the Portfolio in general and exclusive voting rights on matters that affect that class alone. Net investment income, net assets and net asset value per share (“NAV”) may differ due to each class having its own expenses, such as transfer agent and shareholder servicing fees, directly attributable to that class. Class II shares have a distribution and service plan. Class I shares are not included in the plan.
| 2. | | SIGNIFICANT ACCOUNTING POLICIES |
The following is a summary of significant accounting policies consistently followed by each Portfolio.
Security Transactions and Related Investment Income. Security transactions are accounted for on the trade date (date the order to buy or sell is executed). Realized gains and losses are calculated on the identified cost basis. Interest income is recorded on the accrual basis and includes paydown gain (loss) and accretion of discounts and amortization of premiums. Dividend income is recorded on theex-dividend date, except certain dividends from foreign securities where theex-dividend date may have passed, which are recorded as soon as the Portfolio is informed of theex-dividend date. All or a portion of the distributions received from a real estate investment trust or publicly traded partnership may be designated as a reduction of cost of the related investment or realized gain.
Foreign Currency Translation. Each Portfolio’s accounting records are maintained in U.S. dollars. All assets and liabilities denominated in foreign currencies are translated into U.S. dollars daily, using foreign exchange rates obtained from an independent pricing service approved by the Board of Trustees of the Trust (the “Board”). Purchases and sales of investment securities and accruals of income and expenses are translated at the rate of exchange prevailing on the date of the transaction. For assets and liabilities other than investments in securities, net realized and unrealized gains and losses from foreign currency translation arise from changes in currency exchange rates. Each Portfolio combines fluctuations from currency exchange rates and fluctuations in value when computing net realized gain (loss) and net change in unrealized appreciation (depreciation) on investments. Foreign exchange rates are typically valued as of the close of the New York Stock Exchange (“NYSE”), normally 4:00 P.M. Eastern time, on each day the NYSE is open for trading.
Allocation of Income, Expenses, Gains and Losses. Income, expenses (other than those attributable to a specific class), gains and losses are allocated on a daily basis to each class of shares based upon the relative proportion of net assets represented by such class. Operating expenses directly attributable to a specific class are charged against the operations of that class.
Dividends and Distributions to Shareholders.Dividends and distributions to shareholders are recorded by each Portfolio on the business day following record date. Net investment income dividends and capital gains distributions are determined in accordance with income tax regulations which may differ from accounting principles generally accepted in the United States of America (“U.S. GAAP”). If the total dividends and distributions made in any tax year exceeds net investment income and accumulated realized capital gains, a portion of the total distribution may be treated as a tax return of capital.
Income Taxes.It is the policy of each Portfolio to distribute all of its taxable income and capital gains to its shareholders and to otherwise qualify as a regulated investment company under Subchapter M of the Internal Revenue Code. In addition, each Portfolio intends to pay distributions as required to avoid imposition of excise tax. Accordingly, no provision has been made for Federal income taxes. The Portfolios file income tax returns in U.S. federal and applicable state jurisdictions. The Portfolios’ tax returns are subject to examination by the relevant taxing authority until expiration of the applicable statute of limitations, which is generally three years after the filing of the tax returns. Management of the Trust periodically reviews all tax positions to assess whether it is more likely than not that the position would be sustained upon examination by the relevant tax authority based on the technical merits of each position. As of the date of these financial statements, management believes that no liability for unrecognized tax positions is required.
Segregation and Collateralization.In cases in which the 1940 Act and the interpretive positions of the Securities and Exchange Commission (“SEC”), the Dodd Frank Wall Street Reform and Consumer Protection Act, or the interpretive rules and regulations of the U.S. Commodities Futures Trading Commission require that a Portfolio either deliver collateral or
segregate assets in connection with certain investments (e.g., dollar rolls, financial futures contracts, foreign currency exchange contracts, options written, securities with extended settlement periods, and swaps), the Portfolio will segregate collateral or designate on its books and records, cash or other liquid securities having a value at least equal to the amount that is required to be physically segregated for the benefit of the counterparty. Furthermore, based on requirements and agreements with certain exchanges and third party broker-dealers, each party has requirements to deliver/deposit cash or securities as collateral for certain investments. Certain countries require that cash reserves be held while investing in companies incorporated in that country. These cash reserves and cash collateral that has been pledged to cover obligations of the Portfolios under derivative contracts, if any, will be reported separately on the Statement of Assets and Liabilities as “Restricted cash”. Securities collateral pledged for the same purpose, if any, is noted on the Schedule of Investments.
Concentration of Market and Credit Risk.In the normal course of business, the Portfolios invest in securities and enter into transactions where risks exist due to fluctuations in the market (market risk) or failure of the issuer of a security to meet all its obligations (issuer credit risk). The value of securities held by the Portfolios may decline in response to certain events, including those directly involving the issuers whose securities are owned by the Portfolios; conditions affecting the general economy; overall market changes; local, regional or global political, social or economic instability; and currency and interest rate and price fluctuations. Similar to issuer credit risk, the Portfolios may be exposed to counterparty credit risk, or the risk that an entity with which the Portfolios have unsettled or open transactions may fail to or be unable to perform on its commitments. The Portfolios manage counterparty credit risk by entering into transactions only with counterparties that they believe have the financial resources to honor their obligations and by monitoring the financial stability of those counterparties. Financial assets, which potentially expose the Portfolios to market, issuer and counterparty credit risks, consist principally of financial instruments and receivables due from counterparties. The extent of the Portfolios’ exposure to market, issuer and counterparty credit risks with respect to these financial assets is generally approximated by their value recorded on the Portfolios’ Statement of Assets and Liabilities, less any collateral held by the Portfolios.
Certain Portfolios may hold high-yield ornon-investment-grade bonds, that may be subject to a greater degree of credit risk. Credit risk relates to the ability of the issuer to meet interest or principal payments or both as they become due. The Portfolios may acquire securities in default and are not obligated to dispose of securities whose issuers subsequently default.
Certain Portfolios may enter into financial instrument transactions (such as swaps, futures, options and other derivatives) that may haveoff-balance sheet market risk.Off-balance sheet market risk exists when the maximum potential loss on a particular financial instrument is greater than the value of such financial instrument, as reflected on the Statement of Assets and Liabilities.
If a Portfolio invests directly in foreign currencies or in securities that trade in, and receive revenues in, foreign currencies, or in financial derivatives that provide exposure to foreign currencies, it will be subject to the risk that those currencies will decline in value relative to the base currency of the Portfolio, or, in the case of hedging positions, that the Portfolio’s base currency will decline in value relative to the currency being hedged. Currency rates in foreign countries may fluctuate significantly over short periods of time for a number of reasons, including changes in interest rates, intervention (or the failure to intervene) by U.S. or foreign governments, central banks or supranational entities such as the International Monetary Fund, or by the imposition of currency controls or other political developments in the United States or abroad.
Inflation-Indexed Bonds.Certain Portfolios may invest in inflation-indexed bonds. Inflation-indexed bonds are fixed-income securities whose principal value is periodically adjusted to the rate of inflation. The interest rate on these bonds is generally fixed at issuance at a rate lower than typical bonds. Over the life of an inflation-indexed bond, however, interest will be paid based on a principal value, which is adjusted for inflation. Any increase or decrease in the principal amount of an inflation-indexed bond will be included as interest income on the Statement of Operations, even though investors do not receive their principal until maturity.
Interest Only Obligations.These securities entitle the owner to receive only the interest portion from a bond, Treasury note or pool of mortgages. These securities are generally created by a third party separating a bond or pool of mortgages into distinct interest-only and principal-only securities. As the principal (par) amount of a bond or pool of mortgages is paid down, the amount of interest income earned by the owner will decline as well.
Loans. Certain Portfolios may invest in loans, the interest rates of which float or adjust periodically based upon a specified adjustment schedule, benchmark indicator, or prevailing interest rates, the debtor of which may be a domestic or foreign corporation, partnership or other entity (“Borrower”). Loans generally pay interest at rates which are periodically redetermined by reference to a base lending rate plus a premium. These base lending rates generally include prime rates of one or more major U.S. banks, the London Interbank Offered Rate (“LIBOR”) or certificates of deposit rates. Loans often require prepayments from excess cash flow or permit the Borrower to repay at its election. The degree to which Borrowers repay cannot be predicted with accuracy. As a result, the actual maturity may be substantially less than the stated maturities. Loans are exempt from registration under the Securities Act of 1933, as amended, may contain certain restrictions on resale, and cannot be sold publicly. A Portfolio’s investments in loans may be in the form of participations in loans or assignments of all or a portion of loans from third parties.
When a Portfolio purchases assignments, it acquires all the rights and obligations under the loan agreement of the assigning lender. Assignments may, however, be arranged through private negotiations between potential assignees and potential assignors, and the rights and obligations acquired by the purchaser of an assignment may differ from, and be more limited than those held by the assigning lender. When a Portfolio purchases a participation of a loan interest, the Portfolio typically enters into a contractual agreement with the lender or other third party selling the participation. A participation interest in loans includes the right to receive payments of principal, interest and any fees to which it is entitled from the lender and only upon receipt by the lender of payments from the Borrower, but not from the Borrower directly. When investing in a participation interest, if a Borrower is unable to meet its obligations under a loan agreement, a Portfolio generally has no direct right to enforce compliance with the terms of the loan agreement. As a result, the Portfolio assumes the credit risk of the Borrower, the selling participant, and any other persons that are interpositioned between the Portfolio and the Borrower. If the lead lender in a typical lending syndicate becomes insolvent, enters Federal Deposit Insurance Corporation (“FDIC”) receivership or, if not FDIC insured, enters into bankruptcy, the Portfolio may incur certain costs and delays in receiving payment or may suffer a loss of principal and interest.
PaymentIn-Kind Securities.Certain Portfolios may invest in paymentin-kind securities (“PIKs”). PIKs give the issuer the option at each interest payment date of making interest payments in cash or in additional debt securities. Those additional debt securities usually have the same terms, including maturity dates and interest rates, and associated risks as the original bonds. The daily market quotations of the original bonds may include the accrued interest (referred to as a dirty price) and require apro-rata adjustment from the unrealized appreciation or depreciation on investments to interest receivable on the Statement of Assets and Liabilities.
Securities on a When-Issued or Delayed Delivery Basis. Certain Portfolios may purchase securities on a “when-issued” basis, and may purchase or sell securities on a “delayed delivery” basis. “When-issued” or “delayed delivery” refers to securities whose terms and indenture are available and for which a market exists, but which are not available for immediate delivery. Delivery and payment for securities that have been purchased by a Portfolio on a when-issued basis normally take place within six months and possibly as long as two years or more after the trade date. During this period, such securities do not earn interest, are subject to market fluctuation and may increase or decrease in value prior to their delivery. The purchase of securities on a when-issued basis may increase the volatility of a Portfolio’s NAV to the extent the Portfolio executes such transactions while remaining substantially fully invested. When a Portfolio engages in when-issued or delayed delivery transactions, it relies on the buyer or seller, as the case may be, to complete the transaction. Their failure to do so may cause the Portfolio to lose the opportunity to obtain or dispose of the security at a price and yield IICO, or the Portfolio’s investment subadviser, as applicable, consider advantageous. The Portfolio maintains internally designated assets with a value equal to or greater than the amount of its purchase commitments. The Portfolio may also sell securities that it purchased on a when-issued or delayed delivery basis prior to settlement of the original purchase.
Custodian Fees. “Custodian fees” on the Statement of Operations may include interest expense incurred by a Portfolio on any cash overdrafts of its custodian account during the period. Such cash overdrafts may result from the effects of failed trades in portfolio securities and from cash outflows resulting from unanticipated shareholder redemption activity. A Portfolio pays interest to its custodian on such cash overdrafts, to the extent they are not offset by positive cash balances maintained by that Portfolio. The “Earnings credit” line item, if shown, represents earnings on cash balances maintained by that Portfolio during the period. Such interest expense and other custodian fees may be paid with these earnings.
Indemnification.The Trust’s organizational documents provide current and former Trustees and Officers with a limited indemnification against liabilities arising in connection with the performance of their duties to the Trust. In the normal course of business, the Trust may also enter into contracts that provide general indemnification. The Trust’s maximum exposure under these arrangements is unknown and is dependent on future claims that may be made against the Trust. The risk of material loss from such claims is considered remote.
Basis of Preparation.Each Portfolio is an investment company and follows accounting and reporting guidance in the Financial Accounting Standards Board (“FASB”) Accounting Standards Codification Topic 946 (“ASC 946”). The accompanying financial statements were prepared in accordance with U.S. GAAP, including but not limited to ASC 946. U.S. GAAP requires the use of estimates made by management. Management believes that estimates and valuations are appropriate; however, actual results may differ from those estimates, and the valuations reflected in the accompanying financial statements may differ from the value ultimately realized upon sale or maturity.
New Rule Issuance.In March 2017, the Financial Accounting Standards Board (“FASB”) issued Accounting Standards Update (“ASU”)No. 2017-08 (“ASU2017-08”), “Receivables—Nonrefundable Fees and Other Costs (Subtopic310-20): Premium Amortization on Purchased Callable Debt Securities.” ASU2017-08 changed the amortization period for certain callable debt securities held at a premium. Specifically, it required the premium to be amortized to the earliest call date. The adoption of ASU2017-08 had no impact on beginning net assets, the current period results from operations, or any prior period information presented in the financial statements.
In August 2018, the FASB issued ASU2018-13, Fair Value Measurement (Topic 820). The amendments in the ASU impact disclosure requirements for fair value measurement. It is anticipated that this change will enhance the effectiveness of
disclosures in the notes to the financial statements. This ASU is effective for fiscal years beginning after December 15, 2019. Early adoption is permitted and can include the entire standard or certain provisions that exclude or amend disclosures. For the year ended December 31, 2018, the Portfolios have chosen to adopt the standard. The adoption of this ASU is reflected in the disclosures of the financial statements.
In August 2018, U.S. Securities and Exchange Commission (“SEC”) adopted amendments to certain financial statement disclosure requirements to conform them to GAAP for investment companies. These amendments made certain removals from, changes to and additions to existing disclosure requirements under RegulationS-X. These amendments became effective for filings made with the SEC after November 5, 2018. The Portfolios’ adoption of these amendments, effective with the financial statements prepared as of December 31, 2018, required modified disclosures reflected herein, but had no effect on the Portfolios’ net assets or results of operations.
Subsequent Events. Management has performed a review for subsequent events through the date this report was issued.
| 3. | | INVESTMENT VALUATION AND FAIR VALUE MEASUREMENTS |
Each Portfolio’s investments are reported at fair value. Fair value is defined as the price that each Portfolio would receive upon selling an asset or would pay upon satisfying a liability in an orderly transaction between market participants at the measurement date. Each Portfolio calculates the NAV of its shares as of the close of the NYSE, normally 4:00 P.M. Eastern time, on each day the NYSE is open for trading.
For purposes of calculating the NAV, the portfolio securities and financial instruments are valued on each business day using pricing and valuation methods as adopted by the Board. Where market quotes are readily available, fair value is generally determined on the basis of the last reported sales price, or if no sales are reported, based on quotes obtained from a quotation reporting system, established market makers, or pricing services.
Prices for fixed-income securities are typically based on quotes that are obtained from an independent pricing service approved by the Board. To determine values of fixed-income securities, the independent pricing service utilizes such factors as current quotations by broker/dealers, coupon, maturity, quality, type of issue, trading characteristics, and other yield and risk factors it deems relevant in determining valuations. Securities that cannot be valued by the independent pricing service may be valued using quotes obtained from dealers that make markets in the securities.
Short-term securities with maturities of 60 days or less are valued based on quotes that are obtained from an independent pricing service approved by the Board as described in the preceding paragraph above.
Because many foreign markets close before the NYSE, events may occur between the close of the foreign market and the close of the NYSE that could have a material impact on the valuation of foreign securities. Waddell & Reed Services Company (“WRSCO”), pursuant to procedures adopted by the Board, evaluates the impact of these events and may adjust the valuation of foreign securities to reflect the fair value as of the close of the NYSE. In addition, all securities for which values are not readily available or are deemed unreliable are appraised at fair value as determined in good faith under the supervision of the Board.
Where market quotes are not readily available, portfolio securities or financial instruments are valued at fair value, as determined in good faith by the Board or Valuation Committee pursuant to procedures approved by the Board.
Market quotes are considered not readily available in circumstances where there is an absence of current or reliable market-based data (e.g., trade information or broker quotes), including where events occur after the close of the relevant market, but prior to the NYSE close, that materially affect the values of a Portfolio’s securities or financial instruments. In addition, market quotes are considered not readily available when, due to extraordinary circumstances, the exchanges or markets on which the securities trade do not open for trading for the entire day and no other market prices are available.
The Board has delegated to WRSCO the responsibility for monitoring significant events that may materially affect the values of a Portfolio’s securities or financial instruments and for determining whether the value of the applicable securities or financial instruments should bere-evaluated in light of such significant events. The Board has established a Valuation Committee to administer and oversee the valuation process, including the use of third party pricing vendors.
The Board has adopted methods for valuing securities and financial instruments in circumstances where market quotes are not readily available. For instances in which daily market quotes are not readily available, investments may be valued, pursuant to procedures established by the Board, with reference to other securities or indices. In the event that the security or financial instrument cannot be valued pursuant to one of the valuation methods established by the Board, the value of the security or financial instrument will be determined in good faith by the Valuation Committee in accordance with the procedures adopted by the Board.
When a Portfolio uses these fair valuation methods applied by WRSCO that use significant unobservable inputs to determine its NAV, securities will be priced by a method that the Board or persons acting at its direction believe accurately reflects fair value and are categorized as Level 3 of the fair value hierarchy. These methods may require subjective
determinations about the value of a security. The prices used by a Portfolio may differ from the value that will ultimately be realized at the time the securities are sold.
WRSCO is responsible for monitoring the implementation of the pricing and valuation policies through a series of activities to provide reasonable comfort of the accuracy of prices including: 1) periodic vendor due diligence meetings to review methodologies, new developments, and process at vendors, 2) daily and monthly multi-source pricing comparisons reviewed and submitted to the Valuation Committee, and 3) daily review of unpriced, stale, and variance reports with exceptions reviewed by management and the Valuation Committee.
Accounting standards establish a framework for measuring fair value and a three-level hierarchy for fair value measurements based upon the transparency of inputs to the valuation of an asset or liability. Inputs may be observable or unobservable and refer broadly to the assumptions that market participants would use in pricing the asset or liability. Observable inputs reflect the assumptions market participants would use in pricing the asset or liability based on market data obtained from sources independent of the reporting entity. Unobservable inputs reflect the reporting entity’s own assumptions about the factors that market participants would use in pricing the asset or liability developed based on the best information available in the circumstances.
An individual investment’s fair value measurement is assigned a level based upon the observability of the inputs which are significant to the overall valuation.
The three-tier hierarchy of inputs is summarized as follows:
| • | | Level 1 – Observable input such as quoted prices, available in active markets, for identical assets or liabilities. |
| • | | Level 2 – Significant other observable inputs, which may include, but are not limited to, quoted prices for similar assets or liabilities in markets that are active, quoted prices for identical or similar assets or liabilities in markets that are not active, inputs other than quoted prices that are observable for the assets or liabilities (such as interest rates, yield curves, volatilities, prepayment speeds, loss severities, credit risks and default rates) or other market corroborated inputs. |
| • | | Level 3 – Significant unobservable inputs based on the best information available in the circumstances, to the extent observable inputs are not available, which may include assumptions made by the Board or persons acting at its direction that are used in determining the fair value of investments. |
A description of the valuation techniques applied to the Portfolios’ major classes of assets and liabilities measured at fair value on a recurring basis follows:
Asset-Backed Securities and Mortgage-Backed Securities. The fair value of asset-backed securities and mortgage-backed securities are estimated using recently executed transactions and based on models that consider the estimated cash flows of each debt tranche of the issuer, establish a benchmark yield, and develop an estimated tranche specific spread to the benchmark yield based on the unique attributes of the tranche including, but not limited to, the prepayment speed assumptions and attributes of the collateral. To the extent the inputs are observable and timely, the values would be categorized in Level 2 of the fair value hierarchy, and otherwise they would be categorized as Level 3.
Bullion. The fair value of bullion is at the last settlement price at the end of each day on the board of trade or exchange upon which they are traded and are categorized in Level 1 of the fair value hierarchy.
Corporate Bonds. The fair value of corporate bonds, as obtained from an independent pricing service, is estimated using various techniques, which consider recently executed transactions in securities of the issuer or comparable issuers, market price quotations (where observable), bond spreads, fundamental data relating to the issuer, and credit default swap spreads adjusted for any basis difference between cash and derivative instruments. While most corporate bonds are categorized in Level 2 of the fair value hierarchy, in instances where lower relative weight is placed on transaction prices, quotations, or similar observable inputs, they are categorized in Level 3 of the fair value hierarchy.
Derivative Instruments. Forward foreign currency contracts are valued based upon the closing prices of the forward currency rates determined at the close of the NYSE, which are provided by an independent pricing service. Swaps derive their value from underlying asset prices, indices, reference rates and other inputs or a combination of these factors. Swaps are valued by an independent pricing service unless the price is unavailable, in which case they are valued at the price provided by a dealer in that security. Exchange-traded futures contracts are generally valued at the settlement price. Listed options are ordinarily valued at the mean of the last bid and ask price provided by an independent pricing service unless the price is unavailable, in which case they are valued at a quotation obtained from a broker-dealer. Over the counter (“OTC”) options are ordinarily valued at the mean of the last bid and ask price for a comparable listed option provided by an independent pricing service unless such a price is unavailable, in which case they are valued at a quotation obtained from a broker-dealer.
Listed derivatives that are actively traded are valued based on quoted prices from the exchange and are categorized in Level 1 of the fair value hierarchy. OTC derivative contracts include forward foreign currency contracts, swap agreements,
and option contracts related to interest rates, foreign currencies, credit standing of reference entities, equity prices, or commodity prices. Depending on the product and the terms of the transaction, the fair value of the OTC derivative products are modeled taking into account the counterparties’ creditworthiness and using a series of techniques, including simulation models. Many pricing models do not entail material subjectivity because the methodologies employed do not necessitate significant judgments and the pricing inputs are observed from actively quoted markets, as is the case with interest rate swap and option contracts. OTC derivative products valued using pricing models with significant observable inputs are categorized within Level 2 of the fair value hierarchy.
Equity Securities.Equity securities traded on U.S. or foreign securities exchanges or included in a national market system are valued at the official closing price at the close of each business day unless otherwise stated below. OTC equity securities and listed securities for which no price is readily available are valued at the average of the last bid and ask prices.
Mutual funds, including investment funds, typically are valued at the NAV reported as of the valuation date.
Securities that are stated at the last reported sales price or closing price on the day of valuation taken from the primary exchange where the security is principally traded and to the extent these securities are actively traded and valuation adjustments are not applied, they are categorized in Level 1 of the fair value hierarchy.
Foreign securities, for which the primary trading market closes at the same time or after the NYSE, are valued based on quotations from the primary market in which they are traded and categorized in Level 1. Because many foreign securities markets and exchanges close prior to the close of the NYSE, closing prices for foreign securities in those markets or on those exchanges do not reflect the events that occur after that close. Certain foreign securities may be fair valued using a pricing service that considers the correlation of the trading patterns of the foreign security to theintra-day trading in the U.S. markets for investments such as American Depositary Receipts, financial futures, exchange-traded funds, and the movement of certain indices of securities based on a statistical analysis of their historical relationship; such valuations generally are categorized in Level 2.
Preferred stock, repurchase agreements, and other equities traded on inactive markets or valued by reference to similar instruments are also generally categorized in Level 2.
Loans. Loans are valued using a price or composite price from one or more brokers or dealers as obtained from an independent pricing service. The fair value of loans is estimated using recently executed transactions, market price quotations, credit/market events, and cross-asset pricing. Inputs are generally observable market inputs obtained from independent sources. Loans are generally categorized in Level 2 of the fair value hierarchy, unless key inputs are unobservable in which case they would be categorized as Level 3.
Municipal Bonds. Municipal bonds are fair valued based on pricing models used by and obtained from an independent pricing service that take into account, among other factors, information received from market makers and broker-dealers, current trades,bid-wants lists, offerings, market movements, the callability of the bond, state of issuance, benchmark yield curves, and bond insurance. To the extent that these inputs are observable and timely, the fair values of municipal bonds would be categorized as Level 2; otherwise the fair values would be categorized as Level 3.
Restricted Securities. Restricted securities that are deemed to be Rule 144A securities and illiquid, as well as restricted securities held innon-public entities, are included in Level 3 of the fair value hierarchy to the extent that significant inputs to valuation are unobservable, because they trade infrequently, if at all and, therefore, the inputs are unobservable. Restricted securities that are valued at a discount to similar publicly traded securities may be categorized as Level 2 of the fair value hierarchy to the extent that the discount is considered to be insignificant to the fair value measurement in its entirety; otherwise they may be categorized as Level 3.
U.S. Government and Agency Securities. U.S. government and agency securities are normally valued using a model that incorporates market observable data such as reported sales of similar securities, broker quotes, yields, bids, offers, quoted market prices, and reference data. Accordingly, U.S. government and agency securities are normally categorized in Level 2 of the fair value hierarchy depending on the liquidity and transparency of the market.
Transfers from Level 2 to Level 3 occurred primarily due to the lack of observable market data due to decreased market activity or information for these securities. Transfers from Level 3 to Level 2 occurred primarily due to the increased availability of observable market data due to increased market activity or information. Transfers between levels represent the values as of the beginning of the reporting period.
For fair valuations using unobservable inputs, U.S. GAAP requires a reconciliation of the beginning to ending balances for reported fair values that presents changes attributable to total realized and unrealized gains or losses, purchases and sales, and transfers in or out of the Level 3 category during the period. In accordance with the requirements of U.S. GAAP, a fair value hierarchy and Level 3 reconciliation, if any, have been included in the Notes to the Schedule of Investments for each respective Portfolio.
Net realized gain (loss) and net unrealized appreciation (depreciation), shown on the reconciliation of Level 3 investments, if applicable, are included on the Statement of Operations in net realized gain (loss) on investments in unaffiliated and/or
affiliated securities and in net change in unrealized appreciation (depreciation) on investments in unaffiliated and/or affiliated securities, respectively. Additionally, the net change in unrealized appreciation (depreciation) for all Level 3 investments still held as of December 31, 2018, if applicable, is included on the Statement of Operations in net change in unrealized appreciation (depreciation) on investments in unaffiliated and/or affiliated securities.
| 4. | | DERIVATIVE INSTRUMENTS($ amounts in thousands unless indicated otherwise) |
The following disclosures contain information on why and how the Portfolios use derivative instruments, the associated risks of investing in derivative instruments, and how derivative instruments affect the Portfolios’ financial positions and results of operations.
Forward Foreign Currency Contracts. All Portfolios are authorized to enter into forward foreign currency contracts (“forward contracts”) for the purchase or sale of a foreign currency at a negotiated rate at a future date. Forward contracts are reported on a schedule following the Schedule of Investments. Forward contracts are valued daily based upon the closing prices of the forward currency rates provided by an independent pricing service determined at the close of the NYSE. The resulting unrealized appreciation and depreciation is reported on the Statement of Assets and Liabilities as a receivable or payable and on the Statement of Operations within the change in unrealized appreciation (depreciation). At contract close, the difference between the original cost of the contract and the value at the close date is recorded as a realized gain (loss) on the Statement of Operations.
Risks to a Portfolio related to the use of such contracts include both market and credit risk. Market risk is the risk that the value of the forward contract will depreciate due to unfavorable changes in the exchange rates. Credit risk arises from the possibility that the counterparty will default. If the counterparty defaults, a Portfolio’s maximum loss will consist of the aggregate unrealized gain on appreciated contracts that is not collateralized.
High Income, International Core Equity and Natural Resources enter into forward foreign currency exchange contracts as an economic hedge against either specific transactions or portfolio instruments or to obtain exposure to, or hedge exposure away from foreign currencies (foreign currency exchange rate risk).
Futures Contracts. All Portfolios are authorized to engage in buying and selling futures contracts. Upon entering into a futures contract, a Portfolio is required to deposit, in a segregated account, an amount equal to a varying specified percentage of the contract amount. This amount is known as the initial margin. Subsequent amounts, known as variation margin, are paid or received by the Portfolio each day, dependent on the daily fluctuations in the value of the underlying debt security or index. Options on futures contracts may also be purchased or sold by a Portfolio.
Futures contracts are reported on a schedule following the Schedule of Investments. Securities held in collateralized accounts to cover initial margin requirements on open futures contracts are identified on the Schedule of Investments. Cash held by the broker to cover initial margin requirements on open futures contracts and the receivable and/or payable for the daily mark to market for the variation margin are noted on the Statement of Assets and Liabilities. The net change in unrealized appreciation (depreciation) is reported on the Statement of Operations. Realized gains (losses) are reported on the Statement of Operations at the closing or expiration of futures contracts.
Risks of entering into futures contracts include the possibility of loss of securities or cash held as collateral, that there may be an illiquid market where the Portfolio is unable to close the contract or enter into an offsetting position and, if used for hedging purposes, the risk that the price of the contract will correlate imperfectly with the prices of the Portfolio’s securities.
Small Cap Core invests in long and/or short positions in futures contracts to gain exposure to, or economically hedge against, changes in interest rates (interest rate risk), changes in the value of equity securities (equity risk) or foreign currencies (foreign currency exchange rate risk).
Option Contracts.Options purchased by a Portfolio are accounted for in the same manner as portfolio securities. The cost of the underlying instruments acquired through the exercise of call options is increased by the premium paid to purchase the call. The proceeds from instruments sold through the exercise of put options are decreased by the premium paid to purchase the put.
When a Portfolio writes (sells) an option, an amount equal to the premium received by the Portfolio is recorded as a liability. The amount of the liability is subsequently adjusted to reflect the current value of the option written. When an option expires on its stipulated expiration date or a Portfolio enters into a closing purchase transaction, the Portfolio realizes a gain (or loss if the cost of a closing purchase transaction exceeds the premium received when the call option was sold), and the liability related to such option is extinguished. When a written call option is exercised, the premium is added to the proceeds from the sale of the underlying instrument in determining whether a Portfolio has realized a gain or loss. When a written put is exercised, the cost basis of the instruments purchased by a Portfolio is reduced by the amount of the premium received.
Investments in options, whether purchased or written, involve certain risks. Writing put options and purchasing call options may increase a Portfolio’s exposure to the underlying instrument. With written options, there may be times when a Portfolio will be required to purchase or sell instruments to meet its obligation under the option contract where the required action is not beneficial to the Portfolio, due to unfavorable movement of the market price of the underlying instrument.
Option contracts can be traded on a regulated exchange or traded OTC. Unlike the trades on a regulated exchange where the clearinghouse guarantees the performances of both the buyer and the seller, to the extent a Portfolio enters into OTC option transactions with counterparties, the Portfolio will be exposed to the risk that counterparties to these OTC transactions will be unable to meet their obligations under the terms of the transaction.
Asset Strategy, Mid Cap Growth, Science and Technology and Small Cap Growth purchase and write call and put options to increase or decrease hedging exposure to underlying instruments (which include credit risk, equity risk, foreign currency exchange rate risk, event risk and/or interest rate risk), increase exposure to various equity markets or certain sectors, gain exposure to or facilitate trading in certain securities and/or, in the case of options written, to generate returns from options premiums.
Swap Agreements. All Portfolios are authorized to invest in swap agreements. Swap agreements are bilateraly negotiated agreements between a Portfolio and counterparty to exchange or swap investment cash flows, assets, foreign currencies or market-linked returns at specified, future intervals. Swap agreements are privately negotiated in the over-the-counter market (“OTC swaps”). If the OTC swap entered is one of the swaps identified by a relevant regulator as a swap that is required to be cleared, then it will be cleared through a third party, known as a central counterparty or derivatives clearing organization (“centrally cleared swaps”).
Swaps are marked to market daily and changes in value are recorded as unrealized appreciation (depreciation) on the Statement of Operations. Payments received or made by the Portfolio are recorded as realized gain or loss on the Statement of Operations. Any upfront premiums paid are recorded as assets and any upfront fees received are recorded as liabilities and are shown as swap premiums paid and swap premiums received, respectively, if any, on the Statement of Assets and Liabilities and amortized over the term of the swap. An early termination payment received or made at an early termination or a final payment made at the maturity of the swap is recorded as realized gain or loss on the Statement of Operations.
After a centrally cleared swap is accepted for clearing, a Portfolio may be required to deposit initial margin with a Clearing Member in the form of cash or securities. Securities deposited as initial margin, if any, are designated on the Schedule of Investments. Cash deposited as initial margin is identified on the Schedule of Investments and is recorded as restricted cash on the Statement of Assets and Liabilities.
Total return swaps involve a commitment of one party to pay periodic interest payments in exchange for a market-linked return based on a security or a basket of securities including a variety of securities or representing a particular index. To the extent the total return of the security, a basket of securities, or an index exceeds or falls short of the offsetting interest rate obligation, the Portfolio will receive a payment from or make a payment to the counterparty.
Asset Strategy, International Core Equity, Mid Cap Growth and Small Cap Growth enter into total return swaps to hedge exposure to a security or market.
The creditworthiness of the counterparty with which a Portfolio enters into a swap agreement is monitored by IICO. If a counterparty creditworthiness declines, the value of the agreement would likely decline, potentially resulting in losses. If a default occurs by the counterparty to such a transaction, the Portfolio will have contractual remedies pursuant to the agreement related to the transaction. The maximum loss a Portfolio may incur consists of the aggregate unrealized gain on appreciated contracts that is not collateralized due to facts specific to certain situations (i.e., collateral may not have been posted by the counterparty due to the required collateral amount being less than thepre-agreed thresholds. Additionally, regulatory developments called stay resolutions and the ensuing required contractual amendments to the transactional documentation, including derivatives, permit the relevant regulators to preclude parties to a transaction from terminating trades, among other rights it may have in the trade agreements should a counterparty that it regulates experience financial distress. A relevant regulator also has the authority to reduce the value of certain liabilities owed by the counterparty to a Fund and/or convert cash liabilities of a regulated entity into equity holdings. The power given to the relevant regulators includes the ability to amend transactional agreements unilaterally, modify the maturity of eligible liabilities, reduce the amount of interest payable or change the date on which interest becomes payable, among other powers.
To prevent incurring losses due to the counterparty credit risk, IICO actively monitors the creditworthiness of the counterparties with which it has entered financial transactions. IICO consistently and frequently risk manages the credit risk of the counterparties it faces in transactions.
Collateral and rights of offset. A Portfolio mitigates credit risk with respect to OTC derivative counterparties through credit support annexes (“CSA”) included with an International Swaps and Derivatives Association, Inc. (“ISDA”) Master Agreement which is the standard contract governing all OTC derivative transactions between the Portfolio and each of its
counterparties. Although it is not possible to eliminate credit risk entirely, the CSA allows the Portfolio and its counterparty to reduce their exposure to the risk of payment default by the other party by holding an amount in collateral equivalent to the realized and unrealized amount of exposure to the counterparty, which is generally held by the Portfolio’s custodian. An amount of collateral is moved to/from applicable counterparties only if the amount of collateral required to be posted surpasses both the threshold and the minimum transfer amount pre-agreed in the CSA between the Portfolio and the counterparty. See Note 2 “Segregation and Collateralization” for additional information with respect to collateral practices.
Offsetting of Assets and Liabilities. The following tables present financial instruments that are either (1) offset or (2) subject to an enforceable master netting arrangement or similar agreement as of December 31, 2018:
Assets
| | | | | | | | | | | | | | | | | | | | | | | | | | | | |
| | | | Gross Amounts Not Offset on the
Statement of Assets and Liabilities | |
| Portfolio | | Gross
Amounts of
Recognized
Assets | | | Gross
Amounts
Offset on the
Statement of
Assets and
Liabilities | | | Net Amounts
of Assets
Presented on
the Statement
of Assets and
Liabilities | | | Financial
Instruments
and
Derivatives
Available
for Offset | | | Non-Cash
Collateral
Received | | | Cash
Collateral
Received | | | Net
Amount
Receivable | |
High Income | | | | | | | | | | | | | | | | | | | | | | | | | | | | |
Unrealized appreciation on forward foreign currency contracts(1) | | $ | 202 | | | $ | — | | | $ | 202 | | | $ | — | | | $ | — | | | $ | (186 | ) | | $ | 16 | |
International Core Equity | | | | | | | | | | | | | | | | | | | | | | | | | | | | |
Swap agreements, at value | | $ | 46 | | | $ | — | | | $ | 46 | | | $ | — | | | $ | — | | | $ | — | | | $ | 46 | |
Unrealized appreciation on forward foreign currency contracts | | | 1,096 | | | | — | | | | 1,096 | | | | (1,096 | ) | | | — | | | | — | | | | — | |
Total | | $ | 1,142 | | | $ | — | | | $ | 1,142 | | | $ | (1,096 | ) | | $ | — | | | $ | — | | | $ | 46 | |
Natural Resources | | | | | | | | | | | | | | | | | | | | | | | | | | | | |
Unrealized appreciation on forward foreign currency contracts(1) | | $ | 446 | | | $ | — | | | $ | 446 | | | $ | — | | | $ | (426 | ) | | $ | — | | | $ | 20 | |
| (1) | Amounts include forward contracts that have an offset to an open and close contract, but have not settled. These amounts are included on the Statement of Assets and Liabilities line item for Investment securities sold receivable. |
Liabilities
| | | | | | | | | | | | | | | | | | | | | | | | | | | | |
| | | | | | | | | | | | Gross Amounts Not Offset on the
Statement of Assets and Liabilities | |
| Portfolio | | Gross
Amounts of
Recognized
Liabilities | | | Gross
Amounts
Offset on the
Statement of
Assets and
Liabilities | | | Net Amounts
of Liabilities
Presented on
the Statement
of Assets and
Liabilities | | | Financial
Instruments
and
Derivatives
Available
for Offset | | | Non-Cash
Collateral
Pledged | | | Cash
Collateral
Pledged | | | Net
Amount
Payable | |
International Core Equity | | | | | | | | | | | | | | | | | | | | | | | | | | | | |
Unrealized depreciation on forward foreign currency contracts | | $ | 1,444 | | | $ | — | | | $ | 1,444 | | | $ | (1,096 | ) | | $ | (348 | ) | | $ | — | | | $ | — | |
Small Cap Growth | | | | | | | | | | | | | | | | | | | | | | | | | | | | |
Swap agreements, at value | | $ | 1,314 | | | $ | — | | | $ | 1,314 | | | $ | — | | | $ | — | | | $ | (1,314 | ) | | $ | — | |
Additional Disclosure Related to Derivative Instruments
Fair values of derivative instruments as of December 31, 2018:
| | | | | | | | | | | | | | | | | | |
| | | | | Assets | | | | | | Liabilities | |
| Portfolio | | Type of Risk
Exposure | | Statement of Assets & Liabilities
Location | | Value | | | | | | Statement of Assets & Liabilities
Location | | Value | |
| High Income | | Foreign currency | | Unrealized appreciation on forward foreign currency contracts | | $ | 14 | | | | | | | | | | — | |
| International Core Equity | | Equity | | Swap agreements, at value | | | 46 | | | | | | | | | | — | |
| | | Foreign currency | | Unrealized appreciation on forward foreign currency contracts | | | 1,096 | | | | | | | Unrealized depreciation on forward foreign currency contracts | | | 1,444 | |
| Natural Resources | | Foreign currency | | Unrealized appreciation on forward foreign currency contracts | | | 426 | | | | | | | | | | — | |
| Small Cap Growth | | Equity | | | | | — | | | | | | | Swap agreements, at value | | | 1,314 | |
Amount of realized gain (loss) on derivatives recognized on the Statement of Operations for the year ended December 31, 2018:
| | | | | | | | | | | | | | | | | | | | | | | | | | |
| | | | | Net realized gain (loss) on: | | | | |
| Portfolio | | Type of Risk
Exposure | | Investments in
unaffiliated
securities* | | | Swap
agreements | | | Futures
contracts | | | Written
options | | | Forward
foreign
currency
contracts | | | Total | |
| Asset Strategy | | Equity | | $ | (280 | ) | | $ | (282 | ) | | $ | — | | | $ | 133 | | | $ | — | | | $ | (429 | ) |
| High Income | | Foreign currency | | | — | | | | — | | | | — | | | | — | | | | 48 | | | | 48 | |
| International Core Equity | | Equity | | | — | | | | (597 | ) | | | — | | | | — | | | | — | | | | (597 | ) |
| Mid Cap Growth | | Equity | | | (632 | ) | | | (2,209 | ) | | | — | | | | 322 | | | | — | | | | (2,519 | ) |
| Natural Resources | | Foreign currency | | | — | | | | — | | | | — | | | | — | | | | 327 | | | | 327 | |
| Science and Technology | | Equity | | | (1,103 | ) | | | — | | | | — | | | | 456 | | | | — | | | | (647 | ) |
| Small Cap Core | | Equity | | | — | | | | — | | | | 497 | | | | — | | | | — | | | | 497 | |
| Small Cap Growth | | Equity | | | 168 | | | | (373 | ) | | | — | | | | (99 | ) | | | — | | | | (304 | ) |
*Purchased options are reported as investments in unaffiliated securities and are reflected on the accompanying Schedule of Investments.
Change in unrealized appreciation (depreciation) on derivatives recognized on the Statement of Operations for the year ended December 31, 2018:
| | | | | | | | | | | | | | | | | | | | | | | | | | |
| | | | | Net change in unrealized appreciation (depreciation) on: | | | | |
| Portfolio | | Type of Risk
Exposure | | Investments in
unaffiliated
securities* | | | Swap
agreements | | | Futures
contracts | | | Written
options | | | Forward
foreign
currency
contracts | | | Total | |
| Asset Strategy | | Equity | | $ | 232 | | | $ | 537 | | | $ | — | | | $ | (90 | ) | | $ | — | | | $ | 679 | |
| High Income | | Foreign currency | �� | | — | | | | — | | | | — | | | | — | | | | 34 | | | | 34 | |
| International Core Equity | | Equity | | | — | | | | 46 | | | | — | | | | — | | | | — | | | | 46 | |
| | | Foreign currency | | | — | | | | — | | | | — | | | | — | | | | (348 | ) | | | (348 | ) |
| Mid Cap Growth | | Equity | | | 53 | | | | — | | | | — | | | | 39 | | | | — | | | | 92 | |
| Natural Resources | | Foreign currency | | | — | | | | — | | | | — | | | | — | | | | 622 | | | | 622 | |
| Small Cap Growth | | Equity | | | — | | | | (1,672 | ) | | | — | | | | — | | | | — | | | | (1,672 | ) |
* Purchased options are reported as investments in unaffiliated securities and are reflected on the accompanying Schedule of Investments.
During the year ended December 31, 2018, the average derivative volume was as follows:
| | | | | | | | | | | | | | | | | | | | | | | | |
| Portfolio | | Forward foreign
currency contracts(1) | | | Long futures
contracts(2) | | | Short futures
contracts(2) | | | Swap
agreements(3) | | | Purchased
options(2) | | | Written
options(2) | |
| Asset Strategy | | $ | — | | | $ | — | | | $ | — | | | $ | 2,292 | | | $ | 4 | | | $ | 3 | |
| High Income | | | 11 | | | | — | | | | — | | | | — | | | | — | | | | — | |
| International Core Equity | | | 84 | | | | — | | | | — | | | | 393 | | | | — | | | | — | |
| Mid Cap Growth | | | — | | | | — | | | | — | | | | — | | | | 48 | | | | 15 | |
| Natural Resources | | | 149 | | | | — | | | | — | | | | — | | | | — | | | | — | |
| Science and Technology | | | — | | | | — | | | | — | | | | — | | | | 371 | | | | 236 | |
| Small Cap Growth | | | — | | | | — | | | | — | | | | 10,877 | | | | 16 | | | | 3 | |
| (1) | Average absolute value of unrealized appreciation/depreciation during the period. |
| (2) | Average value outstanding during the period. |
| (3) | Average notional amount outstanding during the period. |
| 5. | | BASIS FOR CONSOLIDATION OF THE ASSET STRATEGY PORTFOLIO ($ amounts in thousands) |
Ivy VIP ASF II, Ltd. (the “Subsidiary”), a Cayman Islands exempted company, was incorporated as a wholly owned subsidiary acting as an investment vehicle for Ivy VIP Asset Strategy Portfolio (referred to as “the Portfolio” in this subsection). VIP ASF III (SBP), LLC (the “Company”), a Delaware limited liability company, was incorporated as a wholly owned company acting as an investment vehicle for the Portfolio. The Subsidiary and the Company act as an investment vehicle for the Portfolio, in order to effect certain investments for the Portfolio consistent with the Portfolio’s investment objectives and policies as specified in its prospectus and SAI.
The Portfolio’s investment portfolio has been consolidated and includes the portfolio holdings of the Portfolio, its Subsidiary and the Company. The consolidated financial statements include the accounts of the Portfolio, its Subsidiary and the Company. All inter-company transactions and balances have been eliminated. A subscription agreement was entered into between the Portfolio and its Subsidiary and the Company comprising the entire issued share capital of the Subsidiary and the Company with the intent that the Portfolio will remain the sole shareholder and retain all rights. Under the Articles of Association, shares issued by the Subsidiary and the Company confer upon a shareholder the right to receive notice of, to attend and to vote at general meetings of the Subsidiary and the Company and shall confer upon the shareholder rights in awinding-up or repayment of capital and the right to participate in the profits or assets of the Subsidiary and the Company.
See the table below for details regarding the structure, incorporation and relationship as of December 31, 2018 of the Subsidiary and the Company to the Portfolio (amounts in thousands).
| | | | | | | | | | | | | | | | | | | | | | | | | |
| Subsidiary/Company | | Date of
Incorporation | | Subscription
Agreement | | Portfolio Net
Assets | | Subsidiary/Company
Net Assets | | Percentage
of Portfolio
Net Assets |
Ivy VIP ASF II, Ltd. | | | | 1-31-13 | | | | | 4-10-13 | | | | $ | 753,342 | | | | $ | 42,288 | | | | | 5.61 | % |
VIP ASF III (SBP), LLC | | | | 4-9-13 | | | | | 4-23-13 | | | | | 753,342 | | | | | 338 | | | | | 0.04 | |
| 6. | | INVESTMENT MANAGEMENT AND PAYMENTS TO AFFILIATED PERSONS($ amounts in thousands unless indicated otherwise) |
Management Fees. IICO, a wholly owned subsidiary of Waddell & Reed, Inc. (“W&R”), serves as each Portfolio’s investment adviser. The management fee is accrued daily by each Portfolio at the following annual rates as a percentage of average daily net assets:
| | | | | | | | | | | | | | | | | | | | | | | | |
| Portfolio (M – Millions) | | $0 to
$500M | | | $500 to
$1,000M | | | $1,000 to
$1,500M | | | $1,500 to
$2,000M | | | $2,000 to
$3,000M | | | Over
$3,000M | |
Asset Strategy | | | 0.700 | | | | 0.700 | | | | 0.650 | | | | 0.650 | | | | 0.600 | | | | 0.550 | |
Balanced | | | 0.700 | | | | 0.700 | | | | 0.650 | | | | 0.650 | | | | 0.600 | | | | 0.550 | |
Energy | | | 0.850 | | | | 0.850 | | | | 0.830 | | | | 0.830 | | | | 0.800 | | | | 0.760 | |
Growth | | | 0.700 | | | | 0.700 | | | | 0.650 | | | | 0.650 | | | | 0.600 | | | | 0.550 | |
High Income | | | 0.625 | | | | 0.600 | | | | 0.550 | | | | 0.500 | | | | 0.500 | | | | 0.500 | |
International Core Equity | | | 0.850 | | | | 0.850 | | | | 0.830 | | | | 0.830 | | | | 0.800 | | | | 0.760 | |
Mid Cap Growth | | | 0.850 | | | | 0.850 | | | | 0.830 | | | | 0.830 | | | | 0.800 | | | | 0.760 | |
Natural Resources | | | 0.850 | | | | 0.850 | | | | 0.830 | | | | 0.830 | | | | 0.800 | | | | 0.760 | |
Science and Technology | | | 0.850 | | | | 0.850 | | | | 0.830 | | | | 0.830 | | | | 0.800 | | | | 0.760 | |
Small Cap Core | | | 0.850 | | | | 0.850 | | | | 0.830 | | | | 0.830 | | | | 0.800 | | | | 0.760 | |
Small Cap Growth | | | 0.850 | | | | 0.850 | | | | 0.830 | | | | 0.830 | | | | 0.800 | | | | 0.760 | |
IICO has voluntarily agreed to waive a Portfolio’s investment management fee on any Portfolio that is not subadvised on any day that the Portfolio’s net assets are less than $25 million, subject to IICO’s right to change or modify this waiver. See Expense Reimbursements and/or Waivers for more information.
Independent Trustees and Chief Compliance Officer Fees. Fees paid to the Independent Trustees can be paid in cash or deferred to a later date, at the election of the Trustees according to the Deferred Fee Agreement entered into between the Trust and the Trustee(s). Each Portfolio records its portion of the deferred fees as a liability on the Statement of Assets and Liabilities. All fees paid in cash plus any appreciation (depreciation) in the underlying deferred plan are shown on the Statement of Operations. Additionally, fees paid to the Chief Compliance Officer of the Portfolios are shown on the Statement of Operations.
Accounting Services Fees. The Trust has an Accounting and Administrative Services Agreement with Waddell & Reed Services Company (“WRSCO”), doing business as WI Services Company (“WISC”), an affiliate of W&R. Under the agreement, WISC acts as the agent in providing bookkeeping and accounting services and assistance to the Trust, including maintenance of Portfolio records, pricing of Portfolio shares and preparation of certain shareholder reports. For these services, each Portfolio pays WISC a monthly fee ofone-twelfth of the annual fee based on the average net asset levels shown in the following table:
| | | | | | | | | | | | | | | | | | | | | | | | | | | | | | | | | | | | | | | | |
| (M – Millions) | | $0 to
$10M | | | $10 to
$25M | | | $25 to
$50M | | | $50 to
$100M | | | $100 to
$200M | | | $200 to
$350M | | | $350 to
$550M | | | $550 to
$750M | | | $750 to
$1,000M | | | Over
$1,000M | |
Annual Fee Rate | | $ | 0.00 | | | $ | 11.50 | | | $ | 23.10 | | | $ | 35.50 | | | $ | 48.40 | | | $ | 63.20 | | | $ | 82.50 | | | $ | 96.30 | | | $ | 121.60 | | | $ | 148.50 | |
Each Portfolio also pays WISC a monthly administrative fee at the annual rate of 0.01%, or one basis point, for the first $1 billion of net assets with no fee charged for net assets in excess of $1 billion. This fee is voluntarily waived by WISC until a Portfolio’s net assets are at least $10 million and is included in “Accounting services fee” on the Statement of Operations.
Shareholder Servicing. Under the Transfer Agency Agreement between the Trust and WISC, each Portfolio reimburses WISC for certainout-of-pocket costs.
Service Plan. Class II. Under a Service Plan adopted by the Trust pursuant to Rule 12b–1 under the 1940 Act, each Portfolio may pay a service fee to W&R for Class II shares in an amount not to exceed 0.25% of the Portfolio’s average annual net assets. The fee is to be paid to compensate W&R for amounts it expends in connection with the provision of personal services to Policyowners and/or maintenance of Policyowner accounts.
Expense Reimbursements and/or Waivers.IICO, the Portfolios’ investment manager, IDI, the Portfolios’ distributor, and/or Waddell & Reed Services Company, doing business as WISC, the Portfolios’ transfer agent, have contractually agreed to reimburse sufficient management fees,12b-1 fees and/or shareholder servicing fees to cap the total annual ordinary fund operating expenses (which would exclude interest, taxes, brokerage commissions, acquired fund fees and expenses, and extraordinary expenses, if any). Portfolio and class expense limitations and related waivers/reimbursements for the year ended December 31, 2018 were as follows:
| | | | | | | | | | | | | | |
| Fund Name | | Share
Class Name | | Type of
Expense Limit | | Commencement
Date | | End Date | | Expense Limit | | Amount of
Expense Waiver/
Reimbursement | | Expense
Reduced |
| Asset Strategy | | Class I | | Contractual | | 4-28-2017 | | 4-30-2019 | | Class II less 0.25% | | $—* | | Shareholder
Servicing |
| Energy | | Class I | | Contractual | | 4-28-2017 | | 4-30-2019 | | Class II less 0.25% | | $—* | | Shareholder
Servicing |
| High Income | | Class I | | Contractual | | 4-28-2017 | | 4-30-2019 | | Class II less 0.25% | | $—* | | Shareholder
Servicing |
| Mid Cap Growth | | All Classes | | Contractual | | 4-28-2017 | | 4-30-2019 | | N/A | | $304(1) | | Investment
Management
Fee |
| | Class I | | Contractual | | 4-28-2017 | | 4-30-2019 | | 0.85% | | $2 | | Shareholder
Servicing |
| | | Class II | | Contractual | | 5-1-2012 | | 4-30-2019 | | 1.10% | | $4 | | 12b-1 Fees
and/or
Shareholder
Servicing |
| Science and Technology | | Class I | | Contractual | | 4-28-2017 | | 4-30-2019 | | Class II less 0.25% | | $—* | | Shareholder
Servicing |
| | | | | | | | | | | | | | |
| Fund Name | | Share
Class Name | | Type of
Expense Limit | | Commencement
Date | | End Date | | Expense Limit | | Amount of
Expense Waiver/
Reimbursement | | Expense
Reduced |
| Small Cap Growth | | All Classes | | Contractual | | 4-28-2017 | | 4-30-2020 | | N/A | | $73(1) | | Investment
Management
Fee |
| | Class I | | Contractual | | 11-5-2018 | | 4-30-2020 | | Class II less 0.25% | | $—* | | Shareholder
Servicing |
| | Class II | | Contractual | | 10-1-2016 | | 4-30-2020 | | 1.14% | | $2 | | 12b-1 Fees
and/or
Shareholder
Servicing |
| * | Not shown due to rounding. |
| (1) | Due to Class I and/or Class II contractual expense limits, investment management fees were waived for all share classes. |
Any amounts due to the Portfolios as a reimbursement but not paid as of December 31, 2018 are shown as a receivable from affiliates on the Statement of Assets and Liabilities.
| 7. | | INTERFUND LENDING PROGRAM |
Pursuant to an exemptive order issued by the SEC (“Order”), the Ivy Funds, Ivy Variable Insurance Portfolios and InvestEd Portfolios (collectively, the “Funds” only for purposes of this footnote 7) have the ability to lend money to, and borrow money from, each other pursuant to a master interfund lending agreement (“Interfund Lending Program”). Under the Interfund Lending Program, the Funds may lend or borrow money for temporary purposes directly to or from one another (each an “Interfund Loan”), subject to meeting the conditions of the Order. The interest rate to be charged on an Interfund Loan is the average of the overnight repurchase agreement rate and the short-term bank loan rate. The Funds made no Interfund Loans under the Interfund Lending Program during the year ended December 31, 2018.
| 8. | | AFFILIATED COMPANY TRANSACTIONS(All amounts in thousands) |
A summary of the transactions in affiliated companies during the year ended December 31, 2018 follows:
| | | | | | | | | | | | | | | | | | | | | | | | | | | | | | | | | | | | | | | | |
| | | 12-31-17
Share Balance | | Gross
Additions | | Gross
Reductions | | Realized
Gain/
(Loss) | | Distributions
Received | | 12-31-18
Share
Balance | | 12-31-18
Value | | Net Change
in Unrealized
Depreciation |
High Income | | | | | | | | | | | | | | | | | | | | | | | | | | | | | | | | | | | | | | | | |
Larchmont Resources LLC(1) | | | | 1 | | | | | $— | | | | | $— | | | | $ | — | | | | | $— | | | | | 1 | | | | $ | 252 | | | | $ | (83 | ) |
| | | | | | | | |
| | | 12-31-17
Principal
Balance | | | | | | | | Interest
Received | | 12-31-18
Principal
Balance | | | | Net Change
in Unrealized
Depreciation |
Larchmont Resources LLC (9.770% Cash or 9.770% PIK), 9.770%,8-7-20 | | | $ | 863 | | | | $ | 49 | | | | $ | (90 | ) | | | $ | 2 | | | | | $91 | | | | $ | 817 | | | | $ | 792 | | | | $ | (26 | ) |
| (1) | No dividends were paid during the preceding 12 months. |
| 9. | | INVESTMENT SECURITIES TRANSACTIONS($ amounts in thousands) |
The cost of purchases and the proceeds from maturities and sales of investment securities (excluding short-term securities) for the year ended December 31, 2018, were as follows:
| | | | | | | | | | | | | | | | |
| | | Purchases | | | Sales | |
| | | U.S. Government | | | Other Issuers | | | U.S. Government | | | Other Issuers | |
Asset Strategy | | $ | 5,987 | | | $ | 457,957 | | | $ | 12,296 | | | $ | 511,389 | |
Balanced | | | 44,875 | | | | 140,616 | | | | 9,073 | | | | 212,925 | |
Energy | | | — | | | | 51,840 | | | | — | | | | 54,417 | |
Growth | | | — | | | | 301,178 | | | | — | | | | 553,407 | |
High Income | | | — | | | | 353,245 | | | | — | | | | 348,982 | |
International Core Equity | | | — | | | | 386,305 | | | | — | | | | 412,519 | |
Mid Cap Growth | | | — | | | | 344,866 | | | | — | | | | 405,086 | |
Natural Resources | | | — | | | | 37,518 | | | | — | | | | 52,892 | |
Science and Technology | | | — | | | | 100,007 | | | | — | | | | 152,709 | |
Small Cap Core | | | — | | | | 275,625 | | | | — | | | | 409,119 | |
Small Cap Growth(1) | | | — | | | | 200,078 | | | | — | | | | 298,006 | |
| (1) | Due to differences between the investment strategies and policies of Micro Cap Growth and Small Cap Growth, IICO purchased $22,123 and sold $29,112 securities, producing a net gain of $2,850 post-Reorganization in Small Cap Growth. These transactions occurred after the closing of the Reorganization on November 5, 2018 as part of a portfolio repositioning and separate from normal portfolio turnover. (See Note 12 Business Combinations). |
| 10. | | LOANS OF PORTFOLIO SECURITIES($ amounts in thousands) |
The Portfolios may lend their portfolio securities only to borrowers that are approved by the Portfolio’s securities lending agent, The Bank of New York Mellon (“BNYM”). The borrower pledges and maintains with the Portfolio collateral consisting of cash or securities issued or guaranteed by the U.S. government. The initial collateral received by the Portfolio is required to have a value of at least 102% of the market value of the loaned securities for securities traded on U.S. exchanges and a value of at least 105% of the market value for all other securities. The collateral is maintained thereafter, at a market value equal to no less than 100% of the current value of the securities on loan. The market value of the loaned securities is determined at the close of each business day and any additional required collateral is delivered to the Portfolio and any excess collateral is returned by the Portfolio on the next business day. During the term of the loan, the Portfolio is entitled to all distributions made on or in respect of the loaned securities but does not receive interest income on securities received as collateral. Loans of securities are terminable at any time and the borrower, after notice, is required to return borrowed securities within the standard time period for settlement of securities transactions.
Cash received as collateral for securities on loan may be reinvested in the Dreyfus Institutional Preferred Government Money Market Fund—Institutional Shares or certain other registered money market funds and are disclosed in the Portfolio’s Schedule of Investments and are reflected in the Statement of Assets and Liabilities as cash collateral on securities loaned at value.Non-cash collateral, in the form of securities issued or guaranteed by the U.S. government or its agencies or instrumentalities, is not disclosed in the Portfolio’s Statement of Assets and Liabilities as it is held by the lending agent on behalf of the Portfolio and the Portfolio does not have the ability tore-hypothecate these securities. The securities on loan for each Portfolio are also disclosed in its Schedule of Investments. The total value of any securities on loan as of December 31, 2018 and the total value of the related cash collateral are disclosed in the Statement of Assets and Liabilities. Income earned by the Portfolios from securities lending activity is disclosed in the Statements of Operations.
The following is a summary of each Portfolio’s securities lending positions and related cash andnon-cash collateral received as of December 31, 2018:
| | | | | | | | | | | | | | | | | | | | |
| Portfolio | | Market Value of
Securities on Loan | | Cash Collateral
Received | | Non-Cash Collateral
Received | | Total Collateral
Received |
Asset Strategy | | | $ | 14,700 | | | | $ | 5,602 | | | | $ | 9,418 | | | | $ | 15,020 | |
Balanced | | | | 1,923 | | | | | 1,917 | | | | | 55 | | | | | 1,972 | |
Energy | | | | 1,057 | | | | | 401 | | | | | 683 | | | | | 1,084 | |
High Income | | | | 31,361 | | | | | 28,480 | | | | | 3,581 | | | | | 32,061 | |
Mid Cap Growth | | | | 3,518 | | | | | 1,150 | | | | | 2,483 | | | | | 3,633 | |
Natural Resources | | | | 1,737 | | | | | 108 | | | | | 1,666 | | | | | 1,774 | |
Science and Technology | | | | 18,534 | | | | | 2,990 | | | | | 16,138 | | | | | 19,128 | |
Small Cap Core | | | | 3,614 | | | | | 628 | | | | | 3,073 | | | | | 3,701 | |
Small Cap Growth | | | | 7,002 | | | | | 6,194 | | | | | 977 | | | | | 7,171 | |
The cash collateral received amounts presented in the table above are transactions accounted for as secured borrowings and have an overnight and continuous maturity. The proceeds from the cash collateral received is invested in registered money market funds.
The risks of securities lending include the risk that the borrower may not provide additional collateral when required or may not return the securities when due. To mitigate these risks, the Portfolios benefit from a borrower indemnity provided by BNYM. BNYM’s indemnity allows for full replacement of securities lent wherein BNYM will purchase the unreturned loaned securities on the open market by applying the proceeds of the collateral or to the extent such proceeds are insufficient or the collateral is unavailable, BNYM will purchase the unreturned loan securities at BNYM’s expense. However, the Portfolio could suffer a loss if the value of the investments purchased with cash collateral falls below the value of the cash collateral received.
| 11. | | IN-KIND REDEMPTIONS ($ amounts in thousands) |
In certain circumstances, a Portfolio may distribute portfolio securities rather than cash as payment for redemption of Portfolio shares(”in-kind redemption”). For financial reporting purposes, a Portfolio recognizes a gain on thein-kind redemptions to the extent the value of the distributed securities on the date of redemption exceeds the cost of those securities; a Portfolio recognizes a loss if cost exceeds value. Gains and losses realized on thein-kind redemptions are not recognized for tax purposes, and are reclassified from accumulated net realized gains (losses) topaid-in capital. During the year ended December 31, 2018, the following Portfolios realized gains or losses fromin-kind redemptions ($ amounts in thousands) of approximately:
| | | | | | | | | | |
| Portfolio | | Realized
Gains | | Realized
Losses |
Energy | | | $ | 21,681 | | | | $ | 5,438 | |
Mid Cap Growth | | | | 81,697 | | | | | 3,983 | |
Science and Technology | | | | 76,896 | | | | | 1,114 | |
| 12. | | BUSINESS COMBINATIONS(All amounts in thousands) |
On November 5, 2018, Small Cap Growth acquired all assets and liabilities of Micro Cap Growth pursuant to a plan of reorganization approved by the Board of Trustees on November 1, 2018. The purpose of the transaction was to combine two portfolios with comparable investment objectives and strategies. The acquisition was accomplished by atax-free exchange of shares of Micro Cap Growth, valued at $85,133 in total, for shares of Small Cap Growth as follows:
| | | | | | | | | | |
| Shares Exchanged | | Micro Cap Growth | | Small Cap Growth |
Class I | | | | 19 | | | | | 56 | |
Class II | | | | 3,302 | | | | | 9,666 | |
The investment portfolio of Micro Cap Growth, with a fair value of $85,119 and identified cost of $57,587 at November 5, 2018, was the principal asset acquired by Small Cap Growth. For financial reporting purposes, assets received and shares issued by Small Cap Growth were recorded at fair value; however, the cost basis of the investments received from Micro Cap Growth was carried forward to align ongoing reporting of Small Cap Growth’s realized and unrealized gains and losses with amounts distributable to shareholders for tax purposes. Micro Cap Growth had net assets of $85,133, including $27,532 of net unrealized appreciation in value of investments and $326 of accumulated net realized losses on investments, which were combined with those of Small Cap Growth. The aggregate net assets of Small Cap Growth and Micro Cap Growth immediately before the acquisition were $313,248 and $85,133, respectively. The aggregate net assets of Small Cap Growth and Micro Cap Growth immediately following the acquisition were $398,381 and $0, respectively.
Assuming the reorganization had been completed on January 1, 2018, the beginning of the annual reporting period for Small Cap Growth, the pro forma results of operations for the year ended December 31, 2018, were as follows:
| | | | |
Net investment income (loss) | | $ | (2,548 | ) |
Net realized gain (loss) | | | 70,787 | |
Net change in unrealized appreciation (depreciation) | | | (67,238 | ) |
| | | | |
Net increase (decrease) in net assets resulting from operations | | $ | 1,001 | |
| | | | |
Because the combined investment portfolios have been managed as a single integrated portfolio since the acquisition was completed, it is not practicable to separate the amounts of revenue and earnings of Micro Cap Growth that have been included in Small Cap Growth’s Statement of Operations since November 5, 2018.
| 13. | | CAPITAL SHARE TRANSACTIONS(All amounts in thousands) |
The Trust has authorized an unlimited number of no par value shares of beneficial interest. Transactions in shares of beneficial interest were as follows:
| | | | | | | | | | | | | | | | | | | | | | | | | | | | | | | | | | | | |
| | | Asset Strategy | | | | | | Balanced | |
| | | Year ended
12-31-18 | | | Year ended
12-31-17 | | | | | | Year ended
12-31-18 | | | Year ended
12-31-17 | |
| | | Shares | | | Value | | | Shares | | | Value | | | | | | Shares | | | Value | | | Shares | | | Value | |
Shares issued from sale of shares: | |
Class I | | | 1 | | | $ | 9 | | | | 29 | | | $ | 249 | | | | | | | | N/A | | | | N/A | | | | N/A | | | | N/A | |
Class II | | | 3,140 | | | | 29,977 | | | | 2,831 | | | | 24,438 | | | | | | | | 1,416 | | | $ | 11,226 | | | | 1,784 | | | $ | 13,737 | |
Shares issued in reinvestment of distributions to shareholders: | | | | | | | | | | | | | | | | | | | | | | | | | | | | | | | | | | | | |
Class I | | | 2 | | | | 18 | | | | — | * | | | 4 | | | | | | | | N/A | | | | N/A | | | | N/A | | | | N/A | |
Class II | | | 5,872 | | | | 49,202 | | | | 1,579 | | | | 14,367 | | | | | | | | 1,388 | | | | 10,863 | | | | 2,160 | | | | 15,972 | |
Shares redeemed: | |
Class I | | | — | * | | | — | * | | | — | | | | — | | | | | | | | N/A | | | | N/A | | | | N/A | | | | N/A | |
Class II | | | (18,070 | ) | | | (171,936 | ) | | | (23,120 | ) | | | (200,265 | ) | | | | | | | (6,760 | ) | | | (53,838 | ) | | | (6,669 | ) | | | (51,187 | ) |
| | | | | | | | | | | | |
Net decrease | | | (9,055 | ) | | $ | (92,730 | ) | | | (18,681 | ) | | $ | (161,207 | ) | | | | | | | (3,956 | ) | | $ | (31,749 | ) | | | (2,725 | ) | | $ | (21,478 | ) |
| | | | | | | | | | | | |
| | | |
| | | Energy | | | | | | Growth | |
| | | Year ended
12-31-18 | | | Year ended
12-31-17 | | | | | | Year ended
12-31-18 | | | Year ended
12-31-17 | |
| | | Shares | | | Value | | | Shares | | | Value | | | | | | Shares | | | Value | | | Shares | | | Value | |
Shares issued from sale of shares: | |
Class I | | | 8 | | | $ | 32 | | | | 43 | | | $ | 250 | | | | | | | | N/A | | | | N/A | | | | N/A | | | | N/A | |
Class II | | | 5,435 | | | | 31,159 | | | | 6,707 | | | | 38,703 | | | | | | | | 1,679 | | | $ | 20,421 | | | | 2,141 | | | $ | 24,866 | |
Shares issued in reinvestment of distributions to shareholders: | | | | | | | | | | | | | | | | | | | | | | | | | | | | | | | | | | | | |
Class I | | | — | | | | — | | | | — | * | | | 2 | | | | | | | | N/A | | | | N/A | | | | N/A | | | | N/A | |
Class II | | | — | | | | — | | | | 230 | | | | 1,270 | | | | | | | | 8,478 | | | | 99,828 | | | | 7,846 | | | | 81,581 | |
Shares redeemed: | |
Class I | | | — | * | | | — | * | | | — | | | | — | | | | | | | | N/A | | | | N/A | | | | N/A | | | | N/A | |
Class II | | | (24,018 | ) | | | (137,602 | ) | | | (7,220 | ) | | | (41,332 | ) | | | | | | | (22,501 | ) | | | (274,185 | ) | | | (18,007 | ) | | | (201,835 | ) |
| | | | | | | | | | | | |
Net decrease | | | (18,575 | ) | | $ | (106,411 | ) | | | (240 | ) | | $ | (1,107 | ) | | | | | | | (12,344 | ) | | $ | (153,936 | ) | | | (8,020 | ) | | $ | (95,388 | ) |
| | | | | | | | | | | | |
| | | |
| | | High Income | | | | | | International Core Equity | |
| | | Year ended
12-31-18 | | | Year ended
12-31-17 | | | | | | Year ended
12-31-18 | | | Year ended
12-31-17 | |
| | | Shares | | | Value | | | Shares | | | Value | | | | | | Shares | | | Value | | | Shares | | | Value | |
Shares issued from sale of shares: | |
Class I | | | 1,713 | | | $ | 5,956 | | | | 32,570 | | | $ | 119,198 | | | | | | | | N/A | | | | N/A | | | | N/A | | | | N/A | |
Class II | | | 32,626 | | | | 116,310 | | | | 63,565 | | | | 232,237 | | | | | | | | 4,963 | | | $ | 83,359 | | | | 2,462 | | | $ | 43,379 | |
Shares issued in reinvestment of distributions to shareholders: | | | | | | | | | | | | | | | | | | | | | | | | | | | | | | | | | | | | |
Class I | | | 1,015 | | | | 3,506 | | | | 978 | | | | 3,461 | | | | | | | | N/A | | | | N/A | | | | N/A | | | | N/A | |
Class II | | | 16,234 | | | | 56,012 | | | | 14,324 | | | | 50,714 | | | | | | | | 1,813 | | | | 32,980 | | | | 640 | | | | 10,926 | |
Shares redeemed: | |
Class I | | | (4,836 | ) | | | (16,926 | ) | | | (18,146 | ) | | | (65,535 | ) | | | | | | | N/A | | | | N/A | | | | N/A | | | | N/A | |
Class II | | | (52,101 | ) | | | (184,346 | ) | | | (68,269 | ) | | | (248,715 | ) | | | | | | | (5,580 | ) | | | (97,507 | ) | | | (6,296 | ) | | | (107,670 | ) |
| | | | | | | | | | | | |
Net increase (decrease) | | | (5,349 | ) | | $ | (19,488 | ) | | | 25,022 | | | $ | 91,360 | | | | | | | | 1,196 | | | $ | 18,832 | | | | (3,194 | ) | | $ | (53,365 | ) |
| | | | | | | | | | | | |
* Not shown due to rounding.
| | | | | | | | | | | | | | | | | | | | | | | | | | | | | | | | | | | | |
| | | Mid Cap Growth | | | | | | Natural Resources | |
| | | Year ended
12-31-18 | | | Year ended
12-31-17 | | | | | | Year ended
12-31-18 | | | Year ended
12-31-17 | |
| | | Shares | | | Value | | | Shares | | | Value | | | | | | Shares | | | Value | | | Shares | | | Value | |
Shares issued from sale of shares: | |
Class I | | | 7,297 | | | $ | 90,379 | | | | 13,724 | | | $ | 141,656 | | | | | | | | N/A | | | | N/A | | | | N/A | | | | N/A | |
Class II | | | 7,032 | | | | 87,767 | | | | 2,996 | | | | 31,343 | | | | | | | | 3,428 | | | $ | 15,087 | | | | 4,910 | | | $ | 20,925 | |
Shares issued in reinvestment of distributions to shareholders: | | | | | | | | | | | | | | | | | | | | | | | | | | | | | | | | | | | | |
Class I | | | 534 | | | | 6,483 | | | | 404 | | | | 3,997 | | | | | | | | N/A | | | | N/A | | | | N/A | | | | N/A | |
Class II | | | 1,911 | | | | 23,180 | | | | 1,582 | | | | 15,653 | | | | | | | | 75 | | | | 351 | | | | 43 | | | | 179 | |
Shares redeemed: | |
Class I | | | (2,531 | ) | | | (31,811 | ) | | | (2,821 | ) | | | (31,392 | ) | | | | | | | N/A | | | | N/A | | | | N/A | | | | N/A | |
Class II | | | (38,548 | ) | | | (467,934 | ) | | | (19,448 | ) | | | (200,812 | ) | | | | | | | (6,932 | ) | | | (30,567 | ) | | | (8,593 | ) | | | (37,090 | ) |
| | | | | | | | | | | | |
Net decrease | | | (24,305 | ) | | $ | (291,936 | ) | | | (3,563 | ) | | $ | (39,555 | ) | | | | | | | (3,429 | ) | | $ | (15,129 | ) | | | (3,640 | ) | | $ | (15,986 | ) |
| | | | | | | | | | | | |
| | | |
| | | Science and Technology | | | | | | Small Cap Core | |
| | | Year ended
12-31-18 | | | Year ended
12-31-17 | | | | | | Year ended
12-31-18 | | | Year ended
12-31-17 | |
| | | Shares | | | Value | | | Shares | | | Value | | | | | | Shares | | | Value | | | Shares | | | Value | |
Shares issued from sale of shares: | |
Class I | | | 6 | | | $ | 184 | | | | 17 | | | $ | 430 | | | | | | | | N/A | | | | N/A | | | | N/A | | | | N/A | |
Class II | | | 2,736 | | | | 79,209 | | | | 3,393 | | | | 87,491 | | | | | | | | 841 | | | $ | 13,662 | | | | 1,738 | | | $ | 30,054 | |
Shares issued in reinvestment of distributions to shareholders: | | | | | | | | | | | | | | | | | | | | | | | | | | | | | | | | | | | | |
Class I | | | 4 | | | | 85 | | | | 1 | | | | 16 | | | | | | | | N/A | | | | N/A | | | | N/A | | | | N/A | |
Class II | | | 2,937 | | | | 65,600 | | | | 2,024 | | | | 50,952 | | | | | | | | 3,561 | | | | 56,235 | | | | 2,444 | | | | 39,265 | |
Shares redeemed: | |
Class I | | | (1 | ) | | | (26 | ) | | | (1 | ) | | | (29 | ) | | | | | | | N/A | | | | N/A | | | | N/A | | | | N/A | |
Class II | | | (9,856 | ) | | | (284,003 | ) | | | (4,615 | ) | | | (117,781 | ) | | | | | | | (8,646 | ) | | | (141,910 | ) | | | (5,943 | ) | | | (105,330 | ) |
| | | | | | | | | | | | |
Net increase (decrease) | | | (4,174 | ) | | $ | (138,951 | ) | | | 819 | | | $ | 21,079 | | | | | | | | (4,244 | ) | | $ | (72,013 | ) | | | (1,761 | ) | | $ | (36,011 | ) |
| | | | | | | | | | | | |
| | | | | | |
| | | Small Cap Growth | | | | | | | | | | | | | | | | |
| | | Year ended
12-31-18 | | | Year ended
12-31-17 | | | | | | | | | | | | | | | | |
| | | Shares | | | Value | | | Shares | | | Value | | | | | | | | | | | | | | | | |
Shares issued from sale of shares: | | | | | | | | | | | | | | | | | | | | | |
Class I | | | 6,845 | | | $ | 58,514 | | | | N/A | | | | N/A | | | | | | | | | | | | | | | | | | | | | |
Class II | | | 3,202 | | | | 32,902 | | | | 1,483 | | | | 15,659 | | | | | | | | | | | | | | | | | | | | | |
Shares issued in connection with merger: | | | | | | | | | | | | | | | | | | | | | |
Class I | | | 56 | | | | 487 | | | | N/A | | | | N/A | | | | | | | | | | | | | | | | | | | | | |
Class II | | | 9,666 | | | | 84,646 | | | | — | | | | — | | | | | | | | | | | | | | | | | | | | | |
Shares issued in reinvestment of distributions to shareholders: | | | | | | | | | | | | | | | | | | | | | | | | | | | | | | | | | | | | |
Class I | | | — | | | | — | | | | N/A | | | | N/A | | | | | | | | | | | | | | | | | | | | | |
Class II | | | 12,302 | | | | 117,993 | | | | 1,060 | | | | 10,680 | | | | | | | | | | | | | | | | | | | | | |
Shares redeemed: | | | | | | | | | | | | | | | | | | | | | |
Class I | | | (123 | ) | | | (980 | ) | | | N/A | | | | N/A | | | | | | | | | | | | | | | | | | | | | |
Class II | | | (18,536 | ) | | | (187,990 | ) | | | (14,095 | ) | | | (150,763 | ) | | | | | | | | | | | | | | | | | | | | |
| | | | | | | | | | | | | | | | | | | | | | | | |
Net increase (decrease) | | | 13,412 | | | $ | 105,572 | | | | (11,552 | ) | | $ | (124,424 | ) | | | | | | | | | | | | | | | | | | | | |
| | | | | | | | | | | | | | | | | | | | | | | | |
| *Not | shown due to rounding. |
Bridge loan commitments may obligate a Portfolio to furnish temporary financing to a borrower until permanent financing can be arranged. In connection with these commitments, the Portfolio earns a commitment fee, typically set as a percentage of the commitment amount. Such fee income is included in interest income on the Statements of Operations. At December 31, 2018, there were no outstanding bridge loan commitments.
| 15. | | FEDERAL INCOME TAX MATTERS($ amounts in thousands) |
For Federal income tax purposes, cost of investments owned at December 31, 2018 and the related unrealized appreciation (depreciation) were as follows:
| | | | | | | | | | | | | | | | |
| Portfolio | | Cost of Investments | | | Gross Appreciation | | | Gross Depreciation | | | Net Unrealized
Appreciation
(Depreciation) | |
Asset Strategy | | $ | 790,074 | | | $ | 65,327 | | | $ | 97,778 | | | $ | (32,451 | ) |
Balanced | | | 310,220 | | | | 21,768 | | | | 20,509 | | | | 1,259 | |
Energy | | | 60,898 | | | | 599 | | | | 22,192 | | | | (21,593 | ) |
Growth | | | 541,873 | | | | 146,988 | | | | 19,481 | | | | 127,507 | |
High Income | | | 956,633 | | | | 3,893 | | | | 96,633 | | | | (92,740 | ) |
International Core Equity | | | 783,912 | | | | 14,703 | | | | 126,302 | | | | (111,599 | ) |
Mid Cap Growth | | | 385,173 | | | | 57,362 | | | | 27,663 | | | | 29,699 | |
Natural Resources | | | 113,871 | | | | 1,731 | | | | 27,692 | | | | (25,961 | ) |
Science and Technology | | | 295,893 | | | | 150,547 | | | | 15,848 | | | | 134,699 | |
Small Cap Core | | | 192,532 | | | | 4,857 | | | | 20,394 | | | | (15,537 | ) |
Small Cap Growth | | | 328,838 | | | | 59,024 | | | | 29,586 | | | | 29,438 | |
For Federal income tax purposes, the Portfolios’ distributed and undistributed earnings and profit for the year ended December 31, 2018 and the post-October and late-year ordinary activity updated with information available through the date of this report were as follows:
| | | | | | | | | | | | | | | | | | | | |
| Portfolio | | Undistributed
Ordinary
Income | | | Undistributed
Long-Term
Capital Gains | | | Tax Return
of Capital | | | Post-
October
Capital
Losses
Deferred | | | Late-Year
Ordinary
Losses
Deferred | |
Asset Strategy | | $ | 108 | | | $ | 1,205 | | | $ | — | | | $ | — | | | $ | — | |
Balanced | | | 6,219 | | | | 25,290 | | | | — | | | | — | | | | — | |
Energy | | | — | | | | — | | | | — | | | | — | | | | — | |
Growth | | | 4,138 | | | | 182,791 | | | | — | | | | — | | | | — | |
High Income | | | 58,145 | | | | — | | | | — | | | | — | | | | — | |
International Core Equity | | | 13,997 | | | | 56,369 | | | | — | | | | — | | | | — | |
Mid Cap Growth | | | — | | | | 82,045 | | | | — | | | | — | | | | — | |
Natural Resources | | | 241 | | | | — | | | | — | | | | — | | | | — | |
Science and Technology | | | — | | | | — | | | | — | | | | 292 | | | | — | |
Small Cap Core | | | 12,735 | | | | 23,952 | | | | — | | | | — | | | | — | |
Small Cap Growth | | | — | | | | 5,911 | | | | — | | | | — | | | | 390 | |
Internal Revenue Code regulations permit each Portfolio to elect to defer into its next fiscal year capital losses and certain specified ordinary items incurred between each November 1 and the end of its fiscal year. Each Portfolio is also permitted to defer into its next fiscal certain ordinary losses that generated between each January 1 and the end of its fiscal year.
The tax character of dividends and distributions paid during the two fiscal years ended December 31, 2018 and 2017 were as follows:
| | | | | | | | | | | | | | | | |
| | | December 31, 2018 | | | December 31, 2017 | |
| Portfolio | | Distributed
Ordinary
Income(1) | | | Distributed
Long-Term
Capital Gains | | | Distributed
Ordinary
Income(1) | | | Distributed
Long-Term
Capital Gains | |
Asset Strategy | | $ | 15,495 | | | $ | 33,725 | | | $ | 14,371 | | | $ | — | |
Balanced | | | 5,473 | | | | 5,390 | | | | 5,768 | | | | 10,204 | |
Energy | | | — | | | | — | | | | 1,272 | | | | — | |
Growth | | | 811 | | | | 99,017 | | | | 2,229 | | | | 79,352 | |
High Income | | | 59,518 | | | | — | | | | 54,175 | | | | — | |
International Core Equity | | | 28,472 | | | | 4,508 | | | | 10,926 | | | | — | |
Mid Cap Growth | | | 2,816 | | | | 26,847 | | | | — | | | | 19,650 | |
Natural Resources | | | 351 | | | | — | | | | 179 | | | | — | |
Science and Technology | | | — | | | | 65,685 | | | | 3,112 | | | | 47,869 | |
Small Cap Core | | | 27,706 | | | | 28,529 | | | | 34,485 | | | | 4,780 | |
Small Cap Growth | | | 20,961 | | | | 97,032 | | | | — | | | | 10,680 | |
| (1) | Includes short-term capital gains, if any. |
Dividends from net investment income and short-term capital gains are treated as ordinary income dividends for federal income tax purposes.
Accumulated capital losses represent net capital loss carryovers as of December 31, 2018 that may be available to offset future realized capital gains and thereby reduce future capital gains distributions. As of December 31, 2018, the capital loss carryovers were as follows:
| | | | | | | | |
| Portfolio | | Short-Term
Capital Loss
Carryover | | | Long-Term
Capital Loss
Carryover | |
Asset Strategy | | $ | — | | | $ | — | |
Balanced | | | — | | | | — | |
Energy | | | 10,337 | (1) | | | 20,061 | (1) |
Growth | | | — | | | | — | |
High Income | | | 280 | | | | 56,478 | |
International Core Equity | | | — | | | | — | |
Mid Cap Growth | | | — | | | | — | |
Natural Resources | | | 6,122 | | | | 36,157 | |
Science and Technology | | | — | | | | — | |
Small Cap Core | | | — | | | | — | |
Small Cap Growth | | | — | | | | — | |
| (1) | $29,427 of these Capital Loss Carryovers are subject to an annual limitation of $3,708 plus any unused limitation from prior years. |
Net investment income dividends and capital gains distributions are determined in accordance with income tax regulations which may differ from U.S. GAAP. These differences are due to differing treatments for items such as deferral of wash sales, post-October losses, late-year ordinary losses, foreign currency transactions, net operating losses, income from passive foreign investment companies (PFICs), investments held within the wholly-owned subsidiary and companies, partnership
transactions, in-kind redemptions and expiring capital loss carryovers. At December 31, 2018, the following reclassifications were made:
| | | | | | | | |
| Portfolio | | Accumulated Distributable
Earnings Gain (Loss) | | | Paid-In Capital | |
Asset Strategy | | $ | (17,206 | ) | | $ | 17,206 | |
Balanced | | | — | | | | — | |
Energy | | | (15,705 | ) | | | 15,705 | |
Growth | | | — | | | | — | |
High Income | | | — | * | | | — | * |
International Core Equity | | | — | | | | — | |
Mid Cap Growth | | | (72,882 | ) | | | 72,882 | |
Natural Resources | | | 3 | | | | (3 | ) |
Science and Technology | | | (70,109 | ) | | | 70,109 | |
Small Cap Core | | | — | | | | — | |
Small Cap Growth | | | 1,111 | | | | (1,111 | ) |
* Not shown due to rounding.
| | |
| REPORT OF INDEPENDENT REGISTERED PUBLIC ACCOUNTING FIRM | | IVY VIP |
To the Shareholders and Board of Trustees of Ivy Variable Insurance Portfolios:
Opinion on the Financial Statements and Financial Highlights
We have audited the accompanying statements of assets and liabilities of Ivy VIP Asset Strategy, Ivy VIP Balanced, Ivy VIP Energy, Ivy VIP Growth, Ivy VIP High Income, Ivy VIP International Core Equity, Ivy VIP Mid Cap Growth, Ivy VIP Natural Resources, Ivy VIP Science and Technology, Ivy VIP Small Cap Core, and Ivy VIP Small Cap Growth (the “Funds”), eleven of the series constituting the Ivy Variable Insurance Portfolios, including the schedules of investments, as of December 31, 2018; the related statements of operations for the year then ended, the statements of changes in net assets for each of the two years in the period then ended, the financial highlights for each of the five years in the period then ended, and the related notes. In our opinion, the financial statements and financial highlights present fairly, in all material respects, the financial position of the Funds, as of December 31, 2018, and the results of their operations for the year then ended, the changes in their net assets for each of the two years in the period then ended, and the financial highlights for each of the five years in the period then ended in conformity with accounting principles generally accepted in the United States of America.
Basis for Opinion
These financial statements and financial highlights are the responsibility of the Funds’ management. Our responsibility is to express an opinion on the Funds’ financial statements and financial highlights based on our audits. We are a public accounting firm registered with the Public Company Accounting Oversight Board (United States) (PCAOB) and are required to be independent with respect to the Funds in accordance with the U.S. federal securities laws and the applicable rules and regulations of the Securities and Exchange Commission and the PCAOB.
We conducted our audits in accordance with the standards of the PCAOB. Those standards require that we plan and perform the audit to obtain reasonable assurance about whether the financial statements and financial highlights are free of material misstatement, whether due to error or fraud. The Funds are not required to have, nor were we engaged to perform, an audit of their internal control over financial reporting. As part of our audits we are required to obtain an understanding of internal control over financial reporting but not for the purpose of expressing an opinion on the effectiveness of the Funds’ internal control over financial reporting. Accordingly, we express no such opinion.
Our audits included performing procedures to assess the risks of material misstatement of the financial statements and financial highlights, whether due to error or fraud, and performing procedures that respond to those risks. Such procedures included examining, on a test basis, evidence regarding the amounts and disclosures in the financial statements and financial highlights. Our audits also included evaluating the accounting principles used and significant estimates made by management, as well as evaluating the overall presentation of the financial statements and financial highlights. Our procedures included confirmation of securities owned as of December 31, 2018, by correspondence with the custodian, agent banks, and brokers; when replies were not received from brokers, we performed other auditing procedures. We believe that our audits provide a reasonable basis for our opinion.

Kansas City, Missouri
February 15, 2019
We have served as the auditor of one or more Waddell & Reed investment companies since 1997.
| | |
| INCOME TAX INFORMATION | | IVY VIP |
AMOUNTS NOT ROUNDED (UNAUDITED)
The Portfolios hereby designate the following amounts of dividends paid from net ordinary income as dividends qualifying for the 70% dividends received deduction for corporations for the tax period ended December 31, 2018:
| | | | |
| | | Dividends
Received
Deduction for
Corporations | |
Asset Strategy | | $ | 6,899,966 | |
Balanced | | | 3,828,974 | |
Energy | | | — | |
Growth | | | 811,671 | |
High Income | | | 4,050 | |
International Core Equity | | | — | |
Mid Cap Growth | | | 2,816,468 | |
Natural Resources | | | 350,964 | |
Science and Technology | | | — | |
Small Cap Core | | | 3,418,666 | |
Small Cap Growth | | | 3,458,509 | |
The Portfolios hereby designate the following amounts as distributions of long-term capital gains:
| | | | |
Asset Strategy | | $ | 33,725,106 | |
Balanced | | | 5,390,454 | |
Energy | | | — | |
Growth | | | 99,016,870 | |
High Income | | | — | |
International Core Equity | | | 4,508,287 | |
Mid Cap Growth | | | 26,846,766 | |
Natural Resources | | | — | |
Science and Technology | | | 65,684,514 | |
Small Cap Core | | | 28,528,307 | (1) |
Small Cap Growth | | | 97,032,334 | |
| (1) | Of this amount $8,940 is Unrecaptured 1250 Gain. |
Internal Revenue Code regulations permit each qualifying Portfolio to elect to pass through a foreign tax credit to shareholders with respect to foreign taxes paid by the Portfolio. Each Portfolio elected to pass the following amounts of creditable foreign taxes through to their shareholders:
| | | | | | | | |
| | | Foreign
Tax Credit | | | Foreign
Derived
Income | |
International Core Equity | | $ | 1,694,256 | | | $ | 20,964,781 | |
| | |
| BOARD OF TRUSTEES AND OFFICERS | | IVY VIP |
(UNAUDITED)
Each of the individuals listed below serves as a trustee for the Trust (28 portfolios), and for the rest of the funds within the Fund Complex, which also includes, in addition to the Trust, the Ivy Funds (45 portfolios), the Ivy High Income Opportunities Fund (aclosed-end fund) (“IVH”), Ivy NextShares (“NextShares”) (3 portfolios) and InvestEd Portfolios (“InvestEd”) (6 portfolios).
Board members who are not “interested persons” of the Funds as defined in Section 2(a)(19) of the 1940 Act (Disinterested Trustees) constitute at least 75% of the Board.
Joseph Harroz, Jr. serves as the Independent Chairman of the Trust’s Board and of the Board of Trustees of the other funds in the Fund Complex. Subject to the Trustee Emeritus and Retirement Policy, a Trustee serves until his or her successor is elected and qualified or until his or her earlier death, resignation or removal.
The Statement of Additional Information (the “SAI”) for the Trust includes additional information about the Trust’s trustees. The SAI is available without charge, upon request, by calling 1.888.923.3355. It is also available on the Ivy Investments website, www.ivyinvestments.com.
Disinterested Trustees
| | | | | | | | |
Name, Address and
Year of Birth | | Position(s) Held with
the Trust | | Trustee Since* | | Principal Occupation(s)
During Past 5 Years | | Other Directorships Held |
James M. Concannon 6300 Lamar Avenue Overland Park, KS 66202 1947 | | Trustee | | 1997 | | Professor of Law, Washburn University School of Law (1973 to present). | | Director, Kansas Legal Services for Prisoners, Inc.(non-profit community service); Director, U.S. Alliance Corporation and wholly-owned subsidiaries: U.S. Alliance Life and Security Company and Dakota Capital Life Insurance Company (Insurance) (2009 to present); Director, Kansas Appleseed, Inc.(non-profit community service) (2007 to present); Trustee, Waddell & Reed Advisors Funds (WRA Funds) (1997-2018); Trustee, Ivy Funds; Trustee, IVH; Trustee, NextShares; Trustee, InvestEd. |
James D. Gressett 6300 Lamar Avenue Overland Park, KS 66202 1950 | | Trustee | | Trust: 2017 Fund Complex: 2002 | | Chief Executive Officer (CEO) of CalPac Pizza LLC (2011 to present); CEO of CalPac Pizza II LLC (2012 to present); CEO of PacPizza LLC (Pizza Hut franchise) (2000 to present); Member/CEO, Southern Pac Pizza LLC (2013 to present); Partner, Century Bridge Partners (real estate investments) (2007 to present); Manager, Hartley Ranch Angus Beef, LLC (2013 to present); President, Penn Capital Corp. (1995 to present); Partner, Penn Capital Partners (1999 to present). | | Member/Secretary, The Metochoi Group LLC (1999 to present); Member/Chairman, Idea Homes LLC (homebuilding and development) (2013 to present); Trustee, WRA Funds (2017-2018); Trustee, Ivy Funds; Trustee; IVH; Trustee, NextShares; Trustee, InvestEd. |
Joseph Harroz, Jr. 6300 Lamar Avenue Overland Park, KS 66202 1967 | | Trustee Independent Chairman | | 1998 2015 | | Dean, College of Law, Vice President, University of Oklahoma (2010 to present); Managing Member, Harroz Investments, LLC, (commercial enterprises) (1998 to present). | | Director and Shareholder, Valliance Bank (2007 to present); Director, Foundation Healthcare (formerly Graymark HealthCare) (2008-2017); Trustee, The Mewbourne Family Support Organization (2006 to present)(non-profit); Independent Director, LSQ Manager, Inc. (real estate) (2007-2016); Director, Oklahoma Foundation for Excellence(non-profit) (2008 to present); Trustee/Independent Chairman, WRA Funds (Independent Chairman: 2015-2018; Trustee: 1998-2018); Trustee/ Independent Chairman, Ivy Funds; Trustee/ Independent Chairman, IVH; Trustee/ Independent Chairman, NextShares; Trustee/ Independent Chairman, InvestEd. |
Glendon E. Johnson, Jr. 6300 Lamar Avenue Overland Park, KS 66202 1951 | | Trustee | | Trust: 2017 Fund Complex: 2002 | | Of Counsel, Lee & Smith, PC (law firm, emphasis on finance, securities, mergers and acquisitions law) (1996 to present); Owner and Manager, Castle Valley Ranches, LLC (ranching) and Castle Valley Outdoors, LLC (outdoor recreation) (1995 to present); Formerly, Partner, Kelly, Drye & Warren LLP (law firm) (1989-1996); Partner, Lane & Edson PC (law firm) (1987-1989). | | Director, Thomas Foundation for Cancer Research(non-profit) (2005 to present); Director, Warriors Afield Legacy Foundation(non-profit) (2014 to present); Trustee, WRA Funds (2017-2018); Trustee, Ivy Funds; Trustee, IVH; Trustee, NextShares; Trustee, InvestEd. |
| | | | | | | | |
Name, Address and
Year of Birth | | Position(s) Held with
the Trust | | Trustee Since* | | Principal Occupation(s)
During Past 5 Years | | Other Directorships Held |
Frank J. Ross, Jr. Polsinelli PC 900 West 48th Place, Suite 900 Kansas City, MO 64112 1953 | | Trustee | | 1996 | | Shareholder/Director, Polsinelli PC (law firm) (1980 to present). | | Trustee, WRA Funds (1996-2018); Trustee, Ivy Funds; Trustee, IVH; Trustee, NextShares; Trustee, InvestEd. |
Michael G. Smith 6300 Lamar Avenue Overland Park, KS 66202 1944 | | Trustee | | Trust: 2017 Fund Complex: 2002 | | Retired; formerly, with Merrill Lynch as Managing Director of Global Investor Client Strategy (1996-1998), Head of Regional Institutional Sales (1995-1996) and of U.S. Central Region (1986-1995, 1999). | | Director, Executive Board, Cox Business School, Southern Methodist University (1998 to present); Lead Director, Northwestern Mutual Funds (2003-2017); Director, CTMG, Inc. (clinical testing) (2008-2015); Trustee, WRA Funds (2017-2018); Trustee, Ivy Funds; Trustee, IVH; Trustee, NextShares; Trustee, InvestEd. |
Edward M. Tighe 6300 Lamar Avenue Overland Park, KS 66202 1942 | | Trustee | | Trust: 2017 Fund Complex: 1999 | | Retired; formerly, CEO and Director of Asgard Holdings, LLC (computer network and security services) (2002-2004); President, Citco Technology Management (1995-2000); CEO, Global Mutual Fund Services (1993-2000); Sr. Vice President, Templeton Global Investors (1988-1992). | | Director, The Research Coast Principium Foundation, Inc.(non-profit) (2012-2015); Trustee, WRA Funds (2017-2018); Trustee, Ivy Funds; Trustee, IVH; Trustee, NextShares; Trustee, InvestEd. |
*Each noted Trustee became a Trustee (and, as applicable, an officer) in the year reflected by the first date shown. The second date shows when the Trustee first became a director (and, as applicable, an officer) of one or more of the funds that are the predecessors to current funds within the Fund Complex (if applicable).
Interested Trustee
Mr. Herrmann is “interested” by virtue of his former engagement as an officer of Waddell & Reed Financial, Inc. (“WDR”) or its wholly owned subsidiaries, including each Fund’s investment manager, Ivy Investment Management Company (“IICO”), each Fund’s principal underwriter, Ivy Distributors, Inc. (“IDI”), and each Fund’s shareholder servicing and accounting services agent, Waddell & Reed Services Company, doing business as WI Services Company (“WISC”), a subsidiary of Waddell & Reed, Inc. (Waddell & Reed), as well as by virtue of his personal ownership of shares of WDR. The address for each Interested Trustee and each of the officers in the following tables is 6300 Lamar Avenue, Overland Park, KS 66202.
| | | | | | | | |
| Name and Year of Birth | | Position(s) Held with
the Trust | | Trustee/Officer Since | | Principal Occupation(s) During Past 5 Years | | Other Directorships Held |
Henry J. Herrmann 1942 | | Trustee | | 1998 | | Retired,Non-Executive Chairman of the Board, WDR (2016-2018); Formerly Chairman, WDR (2010-2018); CEO, WDR (2005-2016); President, CEO and Chairman, IICO (2002-2016); President, CEO and Chairman, Waddell & Reed Investment Management Company (WRIMCO) (1993-2016); President of each of the funds in the Fund Complex (2001-2016). | | Director, WDR, (1998 to present), IICO (2002-2016), WRIMCO (1991-2016), WISC (2001-2016), W&R Capital Management Group, Inc. (2008-2016) and WRI (1993-2016); Director, Blue Cross Blue Shield of Kansas City (2007-2017); Trustee, WRA Funds (1998-2018); Trustee, Ivy Funds; Trustee, IVH; Trustee, NextShares; Trustee, InvestEd. |
Officers
The Board has appointed officers who are responsible for theday-to-day business decisions based on policies it has established. The officers serve at the pleasure of the Board. The Trust’s principal officers are:
| | | | | | | | |
Name and
Year of Birth | | Position(s) Held with the
Trust and Fund Complex | | Officer of
Trust Since | | Officer of Fund
Complex Since* | | Principal Occupation(s) During Past 5 Years |
Jennifer K. Dulski 1980 | | Secretary | | 2017 | | 2017 | | Secretary for each of the funds in the Fund Complex (2017 to present); Senior Vice President and Associate General Counsel of Waddell & Reed and IDI (2018 to present). |
Joseph W. Kauten 1969 | | Vice President Treasurer Principal Financial Officer | | 2009 2009 2009 | | 2006 2006 2007 | | Principal Financial Officer of each of the funds in the Fund Complex (2007 to present); Vice President and Treasurer of each of the funds in the Fund Complex (2006 to present); Principal Accounting Officer of each of the funds in the Fund Complex (2006-2017); Assistant Treasurer of each of the funds in the Fund Complex (2003-2006); Vice President of Waddell & Reed Services Company (WRSCO) (2007 to present). |
Philip J. Sanders 1959 | | President | | 2016 | | 2006 | | CEO of WDR (2016 to present); President, CEO and Chairman of IICO and WRIMCO (2016 to present); President of each of the funds in the Fund Complex (2016 to present); CIO of WDR (2011 to present); CIO of IICO and WRIMCO (2010 to present). |
Scott J. Schneider 1968 | | Vice President Chief Compliance Officer | | 2009 2009 | | 2006 2004 | | Chief Compliance Officer (2004 to present) and Vice President (2006 to present) of each of the funds in the Fund Complex; Vice President of IICO and WRIMCO (2006 to present). |
Philip A. Shipp 1969 | | Assistant Secretary | | 2012 | | 2012 | | Assistant Secretary of each of the funds in the Fund Complex (2012 to present); Vice President of Waddell & Reed and IDI (2010-present). |
John E. Sundeen, Jr. 1960 | | Vice President | | 2009 | | 2006 | | Senior Vice President (1999 to present) and Chief Administrative Officer (2006 to present) of WDR; Executive Vice President and Chief Administrative Officer of IICO and WRIMCO (2004 to present); Executive Vice President of WRSCO (2016 to present). |
*This is the date when the Officer first became an officer of one or more of the funds that are the predecessors to current funds within the Fund Complex (if applicable).
| | |
| RENEWAL OF INVESTMENT MANAGEMENT AGREEMENT | | IVY VIP |
At a meeting of the Board of Trustees (the “Board”) for the Ivy Variable Insurance Portfolios (the “Trust”) held on August 14th and 15th, 2018, the Board, including all of the trustees who are not “interested persons” (the “Independent Trustees”), as defined in Section 2(a)(19) of the Investment Company Act of 1940, as amended (the “1940 Act”), unanimously approved the continuance of the Investment Management Agreement (the “Management Agreement”) between Ivy Investment Management Company (“IICO”) and the Trust and the continuance of the Investment Subadvisory Agreement between IICO and Securian Asset Management, Inc. (the “Subadviser”) with respect to Ivy VIP Securian Real Estate Securities, Ivy VIP Pathfinder Moderate – Managed Volatility, Ivy VIP Pathfinder Moderately Aggressive – Managed Volatility, Ivy VIP Pathfinder Moderately Conservative – Managed Volatility. The Management Agreement and the Investment Subadvisory Agreement are referred to collectively herein as the “Agreements.”
The Board’s Independent Trustees were assisted in their review by independent legal counsel, and met with such counsel separately from representatives of IICO. Independent legal counsel explained the factors that the Board should consider as part of its review of the Agreements, all as outlined in a memorandum it had provided to the Board prior to the meeting, including, among other things, the nature and the quality of the services provided by IICO and the Subadviser, profitability (including anyfall-out benefits) from IICO’s and the Subadviser’s relationships with each series of the Trust (each, a “Fund” and together, the “Funds”), economies of scale, the role played by the Independent Trustees, and information on comparative fees and expenses. The Independent Trustees also considered the written responses and materials produced by IICO and the Subadviser in response to 15(c) due diligence request lists submitted by the Independent Trustees’ legal counsel prior to the meeting, as well as materials produced in response to afollow-up request list sent to IICO by independent legal counsel on behalf of the Independent Trustees. Included in those responses, which had been provided to the Board prior to the meeting, was aFund-by-Fund profitability analysis prepared by IICO, as well as an explanation of the methodology by which the profitability analysis was calculated. The Board also received extensive materials on performance, expenses and comparable fund information from Broadridge, Inc. (“Broadridge”), an independent mutual fund rating service. Finally, the Independent Trustees received and reviewed a considerable amount of information that their independent fee consultant had provided to them. The Independent Trustees previously had reviewed and discussed these materials during a telephonic meeting in July 2018. They further reviewed these materials extensively among themselves, with their independent legal counsel and the independent fee consultant, and with the other Board members at executive sessions of the Independent Trustees at the August14-15, 2018 Board meeting, during which the Board considered various factors described below, none of which by itself was considered dispositive. However, the material factors and conclusions that formed the basis for the Board’s determination to approve the Agreements are discussed separately below.
Nature, Extent and Quality of Services
The Board considered the nature, extent and quality of services provided to the Funds by IICO and the Subadviser, taking into account the large amount of materials produced by IICO and the Subadviser in response to the 15(c) due diligence requests submitted on its behalf by independent legal counsel to the Independent Trustees.
The Board also took into account the report from its Investment Oversight Committee (the “IOC”), in light of that committee’s duties to assist the Board in the 15(c) process. The IOC had reported to the Board on its review of the performance of the Funds, IICO’s investment risk management function, and theon-going changes IICO has been undertaking for itself, the Trust and the overall fund complex. As such, the Board examined all of IICO’s activities in light of performance and expense structure, as well as the proposed overall rationalization of the fund complex, which is designed to provide economies of scale to the shareholders, reduce the Funds’ expenses and enhance the performance of the Funds, particularly in the context of substantial industry change and regulatory developments.
The Board likewise considered the knowledge it had received from its regular meetings, including from the materials provided in connection with those meetings, such as the resources and key personnel of IICO and the Subadviser, as well as the other services provided to the Funds by IICO and the Subadviser (such as managing the quality of execution of portfolio transactions and the selection of broker-dealers for those transactions, monitoring adherence to each Fund’s investment restrictions, producing reports, providing support services for the Board and Board committees, communicating with shareholders and overseeing the activities of other service providers, including monitoring compliance with various Fund policies and procedures and with applicable laws and regulations). The Board also took into account the compliance environment at IICO and the Subadviser, noting the resources that each has dedicated towards compliance. The Board concluded that the nature and extent of the services provided by IICO and the Subadviser were appropriate, that the quality of those services had been consistent with quality norms in the industry and that the Funds were likely to benefit from the continued provision of those services.
Benefits from the Relationship with the Funds
The Board next discussed whether IICO or the Subadviser derives any other direct or indirect benefit from serving the Funds. In that regard, the Board discussed the transfer agency/shareholder servicing fees that Waddell & Reed Services Company, an affiliate of IICO, provides the Funds. The Board took note of the caps that management previously had agreed to on shareholder servicing costs. The Board also considered the benefits that accrue to each service provider organization from its respective relationship with the Funds, including the fact that a variety of services are provided by affiliates of IICO,
including distribution, administrative and Fund accounting services, and, as discussed above, shareholder servicing. After full consideration of these and other factors, the Board concluded that none of IICO, the Subadviser or any of their affiliates receives any additional direct or indirect benefits that would preclude the Board from approving the continuation of the Management Agreement with IICO or the Investment Subadvisory Agreement with the Subadviser.
Economies of Scale
The Board discussed whether economies of scale are being realized by the Funds and whether fee levels reflect those economies of scale for the benefit of the Funds’ shareholders. The Board considered the fact that as a Fund’s assets have grown, the expenses of that Fund generally have fallen, although the Board took into account that the overall assets of the Funds have fallen during the prior year. Additionally, in that regard, the Board considered the significant number of initiatives that IICO is undertaking to seek to rationalize the fund complex, reduce expenses and enhance performance.
Performance of the Funds and Costs of Services Provided
The Board considered the performance of each Fund and the costs of the services provided, focusing in particular on a number of Funds that the independent fee consultant had identified. Specifically, the Board examined the investment performance of each Fund, including the percentile ranking of each Fund over various periods of time. The Board also examined the performance of each Fund against its respective Lipper index for the same periods. After extensively reviewing all of the performance information provided, the Board concluded that the Funds’ performance in each asset class was acceptable. Although the performance of some of the focus Funds identified by the independent fee consultant lagged that of their peers or respective Lipper index, the Board recognized that IICO, or the Subadviser, had taken, or was taking, steps to address that underperformance, and determined to continue to monitor closely the performance of those Funds.
The Board also considered the expenses and expense ratio of each Fund, and the expense limitation and fee reduction arrangements entered into by IICO in light of the services provided by IICO and the Subadviser. The Board also compared each Fund’s expenses, including advisory, distribution and shareholder servicing fees, with the expenses and advisory fees of other investment advisers managing similarly situated funds, as well as the advisory fees that IICO (or an affiliate) charges for providing advisory services to other accounts in the same asset class for certain Funds. In that regard, the Board noted that IICO performs significant additional services for the Funds as compared to those other accounts. The Board also took into account the information on IICO’s profitability in managing the Funds, including the methodology used to calculate profitability. The Board finally considered the amount of assets in each Fund, each Fund’s average account size and how those factors affect the Funds’ expense ratios, noting that, as the Funds’ assets have increased or decreased over time, the expense ratios of the Funds generally have fallen or risen, respectively. After completing this examination, the Board concluded that each Fund’s expenses are appropriate at the current time.
Independent Fee Consultant Review
Independent legal counsel, on behalf of the Independent Trustees, engaged an independent fee consultant to assist them in evaluating the reasonableness of the management fees charged by IICO to the Funds. The independent fee consultant’s review addressed the followingfee-related factors:
| 1. | The nature, extent and quality of IICO’s services to the Funds; |
| 2. | Management fees and expenses in the context of performance; |
| 3. | Product category expenses, including peers; |
| 4. | Profit margins of IICO’s parent from supplying such services; |
| 5. | Subadviser and institutional fee analyses; and |
| 6. | Possible economies of scale as a Fund grows larger. |
The following summarizes the findings of the independent fee consultant retained by the Independent Trustees.
Summary Findings
The report stated that IICO delivered reasonable levels of performance in the longer-term periods and reasonable levels of service to the Funds in relation to its management fees as compared to the investment advisers of comparable funds. For the 36 months ended March 31, 2018, approximately 15% of the funds in the Fund Complex (including the Funds) were in the top quartile of performance and 33% of such funds were in the top two quartiles of performance and that short-term performance of such funds were showing signs of improvement. Specifically, the report noted that 49% of such funds were in the top two quartiles in theone-year period, and that 31% of all such funds had improving performance in theirone-year period. The independent fee consultant noted that the funds’ performance appeared to be grounded in a number of institutional competitive advantages at IICO including economic analysis, investment management depth, ability to attract top talent, strategic vision, performance-focused culture, and an effective trading infrastructure.
The report further indicated that total expenses of the funds, on average, were 4% below the average total expenses of their respective Broadridge Expense Group peers and flat compared to the average total expenses for their Broadridge Expense Universes. The management fees for the funds were 4% over the average management fees of their respective Broadridge Expense Group peers and 6% over the average management fees for their Broadridge Expense Universes.
The report also stated that the management fees IICO charges to the funds are reasonable in relation to the management fees it charges to its institutional account clients. The report noted that these institutional account clients have different service and infrastructure needs and in addition, the average spread between management fees IICO charged to the funds and those it charges to institutional account clients is reasonable relative to the average fee spreads computed from industry surveys.
The report stated that while it was difficult to confirm overall economies of scale, it was clear that the funds’ shareholders generally are benefitting from lower expenses as the funds’ assets grow through management fee breakpoints, decline in transfer agency expenses, decline in custody contract rates and declines in othernon-management expenses.
The report also noted that the overall profitability of IICO’s parent relative to other complexes is reasonable. Finally, the report noted that IICO has continued to invest in AUM growth, which is designed to help drive down fund expenses and attract top investment management talent, as well as in fund mergers, which could help drive down expenses, both of which can benefit the funds’ investors.
Finally, the report also examined the fees that IICO retains on funds that are subadvised by unaffiliated subadvisers, and indicated that those fees are reasonable relative to the industry. The report also stated that the subadvisory fees that IICO earns for serving as a subadviser to an unaffiliated fund when compared to fees of similar funds likewise are reasonable relative to the industry.
Conclusions
The independent fee consultant’s report concluded that it believes that the services provided by IICO and its affiliates and expenses incurred by the Funds in the previous 12 months are reasonable and provide adequate justification for renewal of the Funds’ existing Agreements.
| | |
| ANNUAL PRIVACY NOTICE | | IVY VIP |
(UNAUDITED)
Ivy Distributors, Inc., the Ivy Variable Insurance Portfolios and the InvestEd Portfolios (“Ivy”) are committed to ensuring their clients have access to a broad range of products and services to help them achieve their personal financial goals. Accurate information lies at the heart of our pledge to provide these products and services, and we strive to protect your personal nonpublic information. In the course of doing business with Ivy, clients are requested to share financial information and they may be asked to provide other personal details. Clients can be assured that Ivy is diligent in its efforts to keep such information confidential.
Recognition of a Client’s Expectation of Privacy
At Ivy, we believe the confidentiality and protection of client information is one of our fundamental responsibilities. And while information is critical to providing quality service, we recognize that one of our most important assets is our clients’ trust. Thus, the safekeeping of client information is a priority for Ivy.
Information Collected
In order to tailor available financial products to your specific needs, Ivy may request that you complete a variety of forms that require nonpublic personal information about your financial history and other personal details, including but not limited to, your name, address, social security number, assets, income and investments. Ivy may also gather information about your transactions with us, our affiliates and others.
Categories of Information that may be Disclosed
While Ivy may disclose information it collects from applications and other forms, as described above, we at Ivy also want to assure all of our clients that whenever information is used, it is done with discretion. The safeguarding of client information is an issue we take seriously.
Categories of Parties to whom we disclose nonpublic personal information
Ivy may disclose nonpublic personal information about you to selectively chosen financial service providers, whom we believe have valuable products or services that could benefit you. Whenever we do this, we carefully review the company and the product or service to make sure that it provides value to our clients. We share the minimum amount of information necessary for that company to offer its product or service. We may also share information with unaffiliated companies that assist us in providing our products and services to our clients; in the normal course of our business (for example, with consumer reporting agencies and government agencies); when legally required or permitted in connection with fraud investigations and litigation; and at the request or with the permission of a client.
In addition, Ivy has entered into a Protocol with a number of other brokerage firms intended to further our clients’ freedom of choice in connection with the movement of their financial advisors to new firms. In the event your account is maintained through Ivy and your financial advisor leaves Ivy to join a firm that has likewise entered the Protocol, Ivy may disclose your name, address and telephone number to the departed advisor’s new firm.
Opt Out Right
If you prefer that we not disclose nonpublic personal information about you to nonaffiliated third parties, you may opt out of those disclosures; that is, you may direct us not to make those disclosures (other than disclosures permitted by law). If you wish to opt out of disclosures to nonaffiliated third parties, you may make this request in writing to: Ivy, Attn: Opt Out Notices, P.O. Box 29220, Shawnee Mission, KS 66201, or you may call 1-888-923-3355 and a Client Services Representative will assist you.
Confidentiality and Security
We restrict access to nonpublic personal information about you to those employees who need to know that information to provide products and services to you. We maintain physical, electronic, and procedural safeguards that comply with federal standards to guard your nonpublic personal information. If you decide to close your account(s) or become an inactive client, we will adhere to the privacy policies and practices as described in this notice.
| | |
| PROXY VOTING INFORMATION | | IVY VIP |
(UNAUDITED)
Proxy Voting Guidelines
A description of the policies and procedures Ivy Variable Insurance Portfolios uses to determine how to vote proxies relating to portfolio securities is available (i) without charge, upon request, by calling 1.888.923.3355 and (ii) on the Securities and Exchange Commission’s (“SEC”) website at www.sec.gov.
Proxy Voting Records
Information regarding how the Portfolio voted proxies relating to portfolio securities during the most recent12-month period ended June 30 is available on FormN-PX at www.ivyinvestments.com and on the SEC’s website at www.sec.gov.
| | |
| QUARTERLY PORTFOLIO SCHEDULE INFORMATION | | IVY VIP |
(UNAUDITED)
Portfolio holdings can be found on the Trust’s website at www.ivyinvestments.com. Alternatively, a complete schedule of portfolio holdings of each Portfolio for the first and third quarters of each fiscal year is filed with the SEC and can be found on the Trust’s FormN-Q. These holdings may be viewed in the following ways:
| • | | On the SEC’s website at www.sec.gov. |
| • | | For review and copy at the SEC’s Public Reference Room in Washington, DC. Information on the operations of the Public Reference Room may be obtained by calling 1.800.SEC.0330. |
This page has been intentionally left blank
This page has been intentionally left blank
| | |
| THE IVY VARIABLE INSURANCE PORTFOLIOS FAMILY | | |
Global/International Portfolios
Global Equity Income
Global Growth
International Core Equity
Domestic Equity Portfolios
Core Equity
Growth
Mid Cap Growth
Small Cap Core
Small Cap Growth
Value
Fixed Income Portfolios
Corporate Bond
Global Bond
High Income
Limited-Term Bond
Money Market Portfolio
Government Money Market
Specialty Portfolios
Asset Strategy
Balanced
Energy
Natural Resources
Pathfinder Aggressive
Pathfinder Conservative
Pathfinder Moderate
Pathfinder Moderately Aggressive
Pathfinder Moderately Conservative
Pathfinder Moderate – Managed Volatility
Pathfinder Moderately Aggressive – Managed Volatility
Pathfinder Moderately Conservative – Managed Volatility
Science and Technology
Securian Real Estate Securities
The underlying portfolios discussed in this report are only available as investment options in variable annuity and variable life insurance contracts issued by life insurance companies. They are not offered or made available directly to the general public.
This report is submitted for the general information of the shareholders of Ivy Variable Insurance Portfolios. It is not authorized for distribution to prospective investors in a Portfolio unless accompanied with or preceded by the current Portfolio prospectus as well as the variable product prospectus.
ANN-VIP1 (12/18)
| | |

VARIABLE INSURANCE PORTFOLIOS | | Annual Report DECEMBER 31, 2018 |
| | | | | | | | |
| Ivy Variable Insurance Portfolios | | | | | | | | |
| | |
| Core Equity | | | | | | | Class II | |
| | |
| Corporate Bond | | | | | | | Class II | |
| | |
| Global Bond | | | | | | | Class II | |
| | |
| Global Equity Income | | | | | | | Class II | |
| | |
| Global Growth | | | | | | | Class II | |
| | |
| Limited-Term Bond | | | | | | | Class II | |
| | |
| Securian Real Estate Securities | | | | | | | Class II | |
| | |
| Value | | | | | | | Class II | |
Beginning on January 1, 2021, as permitted by regulations adopted by the U.S. Securities and Exchange Commission (SEC), you may not be receiving paper copies of the Fund’s annual or semi-annual shareholder reports by mail, unless you specifically request paper copies of the reports from the insurance company that offers your variable annuity or variable life insurance contract or from your financial intermediary. Instead of delivering paper copies of the report, the insurance company may choose to make the reports available on a website, and will notify you by mail each time a shareholder report is posted and provide you with a website link to access the report. Instructions for requesting paper copies will be provided by your insurance company.
If you already elected to receive shareholder reports electronically, you will not be affected by this change and you need not take any action. You may elect to receive shareholder reports and other communications from the insurance company or your financial intermediary electronically by following the instructions provided by the insurance company or by contacting your financial intermediary.
You may elect to receive all future Fund shareholder reports in paper free of charge from the insurance company. You can inform the insurance company or your financial intermediary that you wish to continue receiving paper copies of your shareholder reports by following the instructions provided by the insurance company or by contacting your financial intermediary. Your election to receive reports in paper will apply to all portfolio companies available under your contract with the insurance company.
| | |
| PRESIDENT’S LETTER | | IVY VIP |
| | |

| | DECEMBER 31, 2018 (UNAUDITED) |
| Philip J. Sanders, CFA | | |
Dear Shareholder,
While most of the fiscal year remained relatively calm, dramatic market volatility returned in the final quarter of 2018. The U.S. stock market, which had hit record highs during 2018, concluded the year with the worst quarter for U.S. equities since 2011 and the S&P 500 Index was down 6.24% over the12-month period. As the year progressed, trade disputes, geopolitical tensions and uncertain global growth rates provided a choppy ride for investors.
The U.S. economy is likely to finish 2018 with the strongest growth rate since the Great Recession that began 10 years ago. Our optimism is tempered somewhat for 2019 as we forecast U.S. gross domestic product (GDP) growth stabilizing around 2.5% with the possibility of further deceleration during the year.
The U.S. Federal Reserve (Fed) has indicated that short-term interest rates are close to what it believes to be neutral, meaning that policy is neither loose nor restrictive. We believe slower economic growth and lower oil prices will keep inflation well contained in early 2019, which is why the Fed decided to take a more dovish tone and ease its pace of quarterly rate hikes. Our base case belief is the Fed will raise rates once, possibly twice, in 2019.
The deterioration in eurozone economic data seems to be waning following an agreement between the U.S. and European Union (EU) to discuss a reduction in tariffs on industrial goods. Brexit negotiations between the U.K. and EU continue to be choppy, which has caused some delays in anticipated capital spending for the eurozone. While we believe the two parties will come to a resolution for the U.K.’s exit from the EU, the ongoing negotiations may cause lingering economic tumult until a deal can be reached.
Emerging markets faced multiple headwinds over the year, namely a strong dollar, China’s focus on deleveraging and regulations, trade wars, volatile energy prices and increased geopolitical risks. By comparison, U.S. equities benefitted from a more attractive growth rate, which was the result of tax reform, lower regulatory pressures and repatriation of overseas earnings.
The U.S.-China trade negotiations remain front and center for many emerging market economies. Any resolution to trade disputes would be critical not just for China, but also its Asian trading counterparts like South Korea and Taiwan. As such, we are cautiously optimistic for a status quo on the trade war without further escalations. We believe China has started loosening policy on the domestic front and we anticipate an easing of regulatory, monetary and fiscal policy as well, which should be supportive of the domestic economy. We believe emerging markets continue to offer a sound longer term fundamental outlook; however, market volatility is likely to persist until there is more clarity surrounding potential risks.
Overall, volatility was the name of the game across the fiscal year. Several forces conspired to create this environment, including macro events like the global trade slowdown and tightening monetary policy, as well as the staggering of the FAANG (Facebook, Apple, Amazon, Netflix and Google-parent Alphabet) stocks, which have been a major equities catalyst over the past couple of years.
Looking ahead, we believe the markets are likely to remain choppy for some time, although the landscape should present more selective opportunities, with greater emphasis on the fundamentals and quality of asset classes and sectors.
We believe it is important to stay focused on the fundamentals and merits of individual market sectors, industries and companies when making investment decisions. Those fundamentals historically have tended to outweigh external factors such as government policies and regulations. While those can affect every business and investor, we think the innovation and management skill within individual companies ultimately drive long-term stock prices.
Economic Snapshot
| | | | | | | | |
| | |
| | | 12/31/18 | | | 12/31/17 | |
S&P 500 Index | | | 2,506.85 | | | | 2,673.61 | |
MSCI EAFE Index | | | 1,719.88 | | | | 2,050.79 | |
10-Year Treasury Yield | | | 2.69 | % | | | 2.40 | % |
U.S. unemployment rate | | | 3.9 | % | | | 4.1 | % |
30-year fixed mortgage rate | | | 4.55 | % | | | 3.99 | % |
Oil price per barrel | | | $45.41 | | | | $60.42 | |
Sources: Bloomberg, U.S. Department of Labor, MBA, CME
All government statistics shown are subject to periodic revision. The S&P 500 Index is an unmanaged index that tracks the stocks of 500 primarilylarge-cap U.S. companies. MSCI EAFE Index is an unmanaged index comprised of securities that represent the securities markets in Europe, Australasia and the Far East. It is not possible to invest directly in any of these indexes. Mortgage rates are from BankRate and reflect the overnight national average rate on a conventional30-year fixed loan. Oil prices reflect the market price of West Texas intermediate grade crude.
Respectfully,

Philip J. Sanders, CFA
President
The opinions expressed in this letter are those of the President of the Ivy Variable Insurance Portfolios and are current only through the end of the period of the report, as stated on the cover. The President’s views are subject to change at any time, based on market and other conditions, and no forecasts can be guaranteed.
| | |
| ILLUSTRATION OF PORTFOLIO EXPENSES | | IVY VIP |
(UNAUDITED)
Expense Example
As a shareholder of a Portfolio, you incur ongoing costs, including management fees, distribution and service fees, and other Portfolio expenses. The following table is intended to help you understand your ongoing costs (in dollars) of investing in a Portfolio and to compare these costs with the ongoing costs of investing in other mutual funds. The example is based on an investment of $1,000 invested at the beginning of the period and held for thesix-month period ended December 31, 2018.
Actual Expenses
The first section in the following table provides information about actual investment values and actual expenses for each share class. You may use the information in this section, together with your initial investment in Portfolio shares, to estimate the expenses that you paid over the period. Simply divide the value of that investment by $1,000 (for example, a $7,500 initial investment divided by $1,000 = 7.5), then multiply the result by the number in the first section under the heading entitled “Expenses Paid During Period” to estimate the expenses you paid on your investment during this period. In addition, there are fees and expenses imposed under the variable annuity or variable life insurance contract through which shares of the Portfolio are held. Additional fees have the effect of reducing investment returns.
Hypothetical Example for Comparison Purposes
The second section in the following table provides information about hypothetical investment values and hypothetical expenses for each share class based on the Portfolio’s actual expense ratio and an assumed rate of return of five percent per year before expenses, which is not the Portfolio’s actual return. The hypothetical investment values and expenses may not be used to estimate the actual investment value at the end of the period or expenses you paid for the period. You may use this information to compare the ongoing costs of investing in the Portfolio and other funds. To do so, compare this five percent hypothetical example with the five percent hypothetical examples that appear in the shareholder reports of the other funds.
Please note that the expenses shown in the table are meant to highlight your ongoing costs as a shareholder of the Portfolio and do not reflect any fees and expenses imposed under the variable annuity or variable life insurance contract through which shares of the Portfolio are held.
Expenses paid may be impacted by expense reduction arrangements. If those arrangements had not been in place, expenses paid would have been higher. See Note 5 to the Financial Statements for further information.
| | | | | | | | | | | | | | | | | | | | | | | | | | | | |
| | | |
| | | Actual(1) | | | Hypothetical(2) | | | | |
| | | | | | | |
| Portfolio | | Beginning
Account
Value
6-30-18 | | | Ending
Account
Value
12-31-18 | | | Expenses
Paid During
Period* | | | Beginning
Account
Value
6-30-18 | | | Ending
Account
Value
12-31-18 | | | Expenses
Paid During
Period* | | | Annualized
Expense Ratio
Based on the
Six-Month
Period | |
Core Equity | |
Class II | | $ | 1,000 | | | $ | 906.70 | | | $ | 4.58 | | | $ | 1,000 | | | $ | 1,020.38 | | | $ | 4.85 | | | | 0.95% | |
Corporate Bond | |
Class II | | $ | 1,000 | | | $ | 1,010.30 | | | $ | 3.92 | | | $ | 1,000 | | | $ | 1,021.34 | | | $ | 3.94 | | | | 0.77% | |
Global Bond | |
Class II | | $ | 1,000 | | | $ | 1,015.00 | | | $ | 2.02 | | | $ | 1,000 | | | $ | 1,023.23 | | | $ | 2.02 | | | | 0.39% | |
Global Equity Income | |
Class II | | $ | 1,000 | | | $ | 918.40 | | | $ | 4.99 | | | $ | 1,000 | | | $ | 1,020.05 | | | $ | 5.25 | | | | 1.02% | |
Global Growth | |
Class II | | $ | 1,000 | | | $ | 885.90 | | | $ | 5.37 | | | $ | 1,000 | | | $ | 1,019.46 | | | $ | 5.76 | | | | 1.13% | |
Limited-Term Bond | |
Class II | | $ | 1,000 | | | $ | 1,012.70 | | | $ | 3.92 | | | $ | 1,000 | | | $ | 1,021.26 | | | $ | 3.94 | | | | 0.78% | |
Securian Real Estate Securities | |
Class II | | $ | 1,000 | | | $ | 946.90 | | | $ | 5.74 | | | $ | 1,000 | | | $ | 1,019.26 | | | $ | 5.96 | | | | 1.18% | |
Value | |
Class II | | $ | 1,000 | | | $ | 930.10 | | | $ | 4.83 | | | $ | 1,000 | | | $ | 1,020.21 | | | $ | 5.05 | | | | 0.99% | |
| | |
| ILLUSTRATION OF PORTFOLIO EXPENSES | | IVY VIP |
(UNAUDITED)
| * | Portfolio expenses are equal to the Portfolio’s annualized expense ratio (provided in the table), multiplied by the average account value over the period, multiplied by 184 days in thesix-month period ended December 31, 2018, and divided by 365. |
| (1) | This section uses the Portfolio’s actual total return and actual Portfolio expenses. It is a guide to the actual expenses paid by the Portfolio in the period. The “Ending Account Value” shown is computed using the Portfolio’s actual return and the “Expenses Paid During Period” column shows the dollar amount that would have been paid by an investor who started with $1,000 in the Portfolio. A shareholder may use the information here, together with the dollar amount invested, to estimate the expenses that were paid over the period. For every thousand dollars a shareholder has invested, the expenses are listed in the last column of this section. |
| (2) | This section uses a hypothetical five percent annual return and actual Portfolio expenses. It helps to compare the Portfolio’s ongoing costs with other mutual funds. A shareholder can compare the Portfolio’s ongoing costs by comparing this hypothetical example with the hypothetical examples that appear in shareholder reports of other Portfolios. |
The above illustrations are based on ongoing costs only.
| | |
| MANAGEMENT DISCUSSION | | CORE EQUITY |
(UNAUDITED)

Erik R. Becker
Erik R. Becker, CFA, portfolio manager of Ivy VIP Core Equity, discusses positioning, performance and results for the fiscal year ended December 31, 2018. Gustav C. Zinn, CFA, served as aco-portfolio manager on the strategy until December 3, 2018. Mr. Becker has managed the Portfolio since 2006 and has 20 years of industry experience.
Fiscal year Performance
| | | | |
For the 12 Months Ended December 31, 2018 | | | | |
Ivy VIP Core Equity (Class II shares at net asset value) | | | -4.51% | |
Benchmark(s) and/or Morningstar and Lipper Categories | | | | |
S&P 500 Index | | | -4.38% | |
(generally reflects the performance of large- andmedium-sized U.S. stocks) | | | | |
Morningstar Large Growth Universe Average | | | -1.98% | |
(generally reflects the performance of the universe of funds with similar investment objectives) | | | | |
Lipper Variable AnnuityLarge-Cap Core Funds Universe Average | | | -5.07% | |
(generally reflects the performance of the universe of strategies with similar investment objectives) | | | | |
Please note that Portfolio returns include applicable fees and expenses, whereas the index returns do not include any such fees. Also, the Portfolio’s performance data does not take into account any product expenses or charges associated with owning a variable life or annuity policy, which is invested in Ivy Variable Insurance Portfolios.
Key drivers
The fiscal year ended December 31, 2018, was marked by a significant dichotomy between the performance and earnings growth for equities of the S&P 500 Index, the Portfolio’s benchmark. From a performance perspective, the year was disappointing as a highly volatile fourth quarter wiped out all gains experienced in the previous three quarters, culminating with the S&P 500 Index declining 4.38% for the year. For context, the benchmark’s particularly weak performance in December produced an intense 9% decline for the month, representing the worst December performance since 1931. By comparison,earnings-per-share growth of S&P 500 Index constituents rose approximately 24%, creating a uniqueyear-end scenario when taking into account that 2018 followed nine consecutive years of gains for the benchmark.
From an economic perspective, U.S. gross domestic product grew close to 3% in 2018, amid conflicting factors. Tailwinds of stimulus from the 2017 U.S. Tax and Jobs Act, record-high business confidence indicators, a strong labor market and wage growth were countered by idiosyncratic risks of weakening economic data from China, a prolonged trade dispute, plummeting energy prices, widening credit spreads and the lagging effect of a series of Federal Reserve (Fed) interest rate hikes.
Amid this backdrop, investors shifted to“risk-off” mode during the year. Within the equity market, the health care, utilities, consumer discretionary and information technology sectors produced positive returns for the year, while the traditionallypro-cyclical sectors of energy, materials, industrials and financials posted sharp declines.
Contributors and detractors
The Portfolio underperformed both its benchmark and Lipper peer group for the period ending December 31, 2018. Three of the 11 sectors represented in the Portfolio – health care, utilities and information technology – produced positive returns for the Portfolio. All remaining sectors were negative for the period, with materials, energy, and industrials seeing the worst performance. Relative to the S&P 500 Index, the Portfolio was hampered by sector allocation – an overweight in information technology, which was one of the better performing sectors, could not compensate for the overweight in materials and industrials – two of the worst performing sectors. Pockets of strength relative to the S&P 500 Index came from better stock selection within the health care and financials sectors, as Microsoft Corp., Adobe Systems, Inc. (no longer a holding at the end of the fiscal year), Eli Lilly and Company, CME Group, Inc., and PayPal Holdings, Inc. were the top contributors. Conversely, holdings in Citigroup, Inc., Philip Morris International, Inc., Applied Materials, Inc., Morgan Stanley, and FedEx Corp. were the greatest detractors to the Portfolio. Currency forwards added modestly to performance as we opted to hedge the currency position associated with our investment in Airbus SE, which led to a gain as the Euro depreciated against the U.S. dollar. Our modest cash position had a de minimis impact on performance relative to the benchmark for the year.
Outlook
Since the December decline, the Fed has sought to calm markets, resulting in a more dovish tone with regard to future rate hikes. In January 2019, Fed Chairman Jerome Powell said the central bank can be more patient and flexible with interest rates as it assesses how global risks impact the U.S. economy. Equity markets responded with a late December rally and credit markets improved. In addition, there were signs of progress in the U.S.-China trade disputes in the final weeks of 2018. President Donald Trump and Chinese President Xi Jinping agreed to postpone escalation of the trade war, with Trump agreeing to postpone the planned increase in tariff rates on Chinese goods while Xi agreed to increase imports of U.S. goods and begin a dialogue with the U.S. on key issues. To date, the U.S. economy has just begun to see signs of moderation, particularly with respect to manufacturing, which can be expected with slowing international economies and trade uncertainty.
Our outlook for the equity market over the next year is highly uncertain given a litany of moving parts that may or may not be resolved favorably. We believe the next major move upward in the equity market will be to discount a bottoming and eventualre-acceleration in economic activity here and abroad. Considering emerging markets, namely China, led the current downturn, we anticipate China bottoms before the U.S. Policymakers in China take a “whatever it takes” mantra to stabilizing economic growth and implement numerous measures (e.g., record consumer tax cuts and reductions in bank reserves) to this end. Clearly, the trade spat with the U.S. is a key unknown variable, though most observers expect some sort of agreement during the first quarter of 2019.
Historically, the U.S. is nine months behind other economies in showing signs of weakness, which supports our belief that domestic data is likely to get somewhat worse before it gets better. To date, housing and industrial activity has shown signs of weakness, while employment and wage trends, consumer confidence, and consumer spending data all remain at or near cycle highs. Some recent data on capital expenditure plans seem to foretell a further deceleration in economic activity. According to the Duke Fuqua School of Business/CFO Magazine Global Business Outlook, the expected12-month forward growth in capital expenditures fell to 1% in December 2018. This compares to 5.7% in September and 8.3% in June. We believe the uptick in capital expenditures, coupled with corporate and personal tax cuts, were the underpinning for the acceleration in economic growth in 2018. Likewise, we expect the favorabletax-related stimulus will be largely complete after the upcoming tax season.
Our current Portfolio strategy is to take a conservative posture while building positions in companies that have been unduly punished by other market participants. We firmly believe that during times of market stress, investors with longer time horizons can take advantage of dislocations in valuations of good companies. For good reason, cyclical names appear the most attractive when considering atwo- or three-year time horizon, with many constituents arguably discounting the possibility of a near-term recession (not our base case assumption at the moment.) We have selectively increased our weighting in semiconductors with the belief in long-term secular growth and highly defensible business models. We have modestly increased the weighting in financials to take advantage of the current slowdown in capital market activities. Finally, we believe volatility creates opportunity and are looking at holdings in severalhard-hit areas, including industrials, information technology, financials and energy with a longer-term eye on earnings and business model strength.
Past performance is not a guarantee of future results. The value of the Portfolio’s shares will change, and you could lose money on your investment. This risk and other risks are more fully described in the Portfolio’s prospectus.
The use of derivatives presents several risks, including the risk that these instruments may change in value in a manner that adversely affects the Portfolio’s value and the risk that fluctuations in the value of the derivatives may not correlate with securities markets or the underlying asset upon which the derivative’s value is based.
The opinions expressed in this report are those of the Portfolio manager and are current only through the end of the period of the report as stated on the cover. The manager’s views are subject to change at any time based on market and other conditions, and no forecasts can be guaranteed.
The index noted is unmanaged, includes reinvested dividends, and does not include fees. One cannot invest directly in an index, nor is an index representative of Ivy VIP Core Equity.
| | |
| PORTFOLIO HIGHLIGHTS | | CORE EQUITY |
ALL DATA IS AS OF DECEMBER 31, 2018 (UNAUDITED)
| | | | |
Asset Allocation | |
Stocks | | | 92.9 | % |
Information Technology | | | 23.3 | % |
Health Care | | | 13.3 | % |
Communication Services | | | 12.2 | % |
Industrials | | | 11.2 | % |
Financials | | | 10.3 | % |
Consumer Staples | | | 8.5 | % |
Consumer Discretionary | | | 7.4 | % |
Materials | | | 3.3 | % |
Energy | | | 2.1 | % |
Utilities | | | 1.3 | % |
Cash and Other Assets (Net of Liabilities),
and Cash Equivalents+ | | | 7.1 | % |
Top 10 Equity Holdings
| | | | |
| | |
| Company | | Sector | | Industry |
Microsoft Corp. | | Information Technology | | Systems Software |
UnitedHealth Group, Inc. | | Health Care | | Managed Health Care |
Alphabet, Inc., Class A | | Communication Services | | Interactive Media & Services |
Medtronic plc | | Health Care | | Health Care Equipment |
Coca-Cola Co. (The) | | Consumer Staples | | Soft Drinks |
Verizon Communications, Inc. | | Communication Services | | Integrated Telecommunication Services |
Lockheed Martin Corp. | | Industrials | | Aerospace & Defense |
Citigroup, Inc. | | Financials | | Other Diversified Financial Services |
Apple, Inc. | | Information Technology | | Technology Hardware, Storage & Peripherals |
Visa, Inc., Class A | | Information Technology | | Data Processing & Outsourced Services |
See your advisor or www.ivyinvestments.com for more information on the Portfolio’s most recently published Top 10 Equity Holdings.
+ Cash equivalents are defined as highly liquid securities with maturities of less than three months. Cash equivalents may include U.S. Government Treasury bills, bank certificates of deposit, bankers’ acceptances, corporate commercial paper and other money market instruments.
| | |
| COMPARISON OF CHANGE IN VALUE OF $10,000 INVESTMENT | | CORE EQUITY |
ALL DATA IS AS OF DECEMBER 31, 2018 (UNAUDITED)
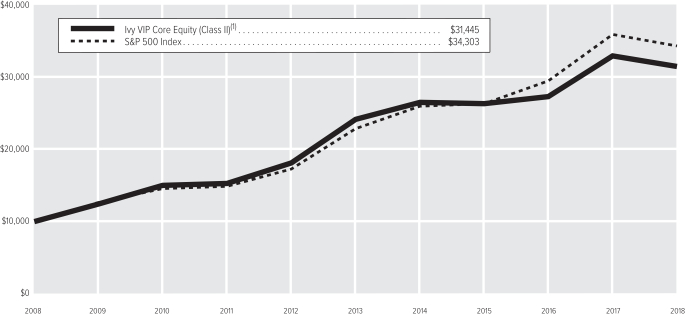
| (1) | The value of the investment in the Portfolio is impacted by the ongoing expenses of the Portfolio and assumes reinvestment of dividends and distributions. |
| | | | |
| |
| Average Annual Total Return(2) | | Class II | |
1-year period ended12-31-18 | | | -4.51% | |
5-year period ended12-31-18 | | | 5.43% | |
10-year period ended12-31-18 | | | 12.14% | |
| (2) | Data quoted is past performance and current performance may be lower or higher. Past performance is no guarantee of future results. Investment return and principal value of an investment will fluctuate and shares, when redeemed, may be worth more or less than their original cost. Please visit www.ivyinvestments.com for the Portfolio’s most recentmonth-end performance. Performance data quoted does not reflect any expenses or charges associated with owning a variable life insurance policy or variable annuity contract that invests in the Portfolio’s shares. When such charges are deducted, actual investment performance in a variable policy or contract will be lower. |
Past performance is not necessarily indicative of future performance. Indexes are unmanaged. The performance graph and table do not reflect the deduction of taxes that a shareholder would pay on Portfolio distributions or on the redemption of Portfolio shares. Performance results may include the effect of expense reduction arrangements for some or all of the periods shown. If those arrangements had not been in place, the performance results for those periods would have been lower.
| | |
| SCHEDULE OF INVESTMENTS | | CORE EQUITY (in thousands) |
DECEMBER 31, 2018
| | | | | | | | |
| COMMON STOCKS | | Shares | | | Value | |
| |
Communication Services | |
| |
Broadcasting – 1.1% | |
Discovery Holding Co., Class A (A)(B) | | | 280 | | | $ | 6,920 | |
| | | | | | | | |
| |
Cable & Satellite – 1.8% | |
Charter Communications, Inc., Class A (A) | | | 40 | | | | 11,285 | |
| | | | | | | | |
| |
Integrated Telecommunication Services – 2.5% | |
Verizon Communications, Inc. | | | 284 | | | | 15,950 | |
| | | | | | | | |
| |
Interactive Home Entertainment – 2.7% | |
Electronic Arts, Inc. (A) | | | 40 | | | | 3,148 | |
Take-Two Interactive Software, Inc. (A) | | | 131 | | | | 13,441 | |
| | | | | | | | |
| | | | | | | 16,589 | |
| | | | | | | | |
| |
Interactive Media & Services – 4.1% | |
Alphabet, Inc., Class A (A) | | | 24 | | | | 25,392 | |
| | | | | | | | |
| |
Total Communication Services – 12.2% | | | | 76,136 | |
Consumer Discretionary | |
| |
Casinos & Gaming – 1.2% | |
Las Vegas Sands, Inc. | | | 149 | | | | 7,761 | |
| | | | | | | | |
| |
Footwear – 2.2% | |
NIKE, Inc., Class B | | | 182 | | | | 13,523 | |
| | | | | | | | |
| |
Home Improvement Retail – 1.0% | |
Home Depot, Inc. (The) | | | 38 | | | | 6,511 | |
| | | | | | | | |
| |
Internet & Direct Marketing Retail – 2.0% | |
Amazon.com, Inc. (A) | | | 8 | | | | 12,466 | |
| | | | | | | | |
| |
Leisure Facilities – 1.0% | |
Vail Resorts, Inc. | | | 29 | | | | 6,177 | |
| | | | | | | | |
| |
Total Consumer Discretionary – 7.4% | | | | 46,438 | |
Consumer Staples | |
| |
Household Products – 2.0% | |
Procter & Gamble Co. (The) | | | 133 | | | | 12,216 | |
| | | | | | | | |
| |
Hypermarkets & Super Centers – 2.2% | |
Costco Wholesale Corp. | | | 45 | | | | 9,171 | |
Wal-Mart Stores, Inc. | | | 51 | | | | 4,714 | |
| | | | | | | | |
| | | | | | | 13,885 | |
| | | | | | | | |
| |
Soft Drinks – 2.8% | |
Coca-Cola Co. (The) | | | 368 | | | | 17,406 | |
| | | | | | | | |
| |
Tobacco – 1.5% | |
Philip Morris International, Inc. | | | 143 | | | | 9,544 | |
| | | | | | | | |
| |
Total Consumer Staples – 8.5% | | | | 53,051 | |
| | | | | | | | |
| COMMON STOCKS (Continued) | | Shares | | | Value | |
| |
Energy | |
| |
Oil & Gas Exploration & Production – 0.7% | |
ConocoPhillips | | | 72 | | | $ | 4,514 | |
| | | | | | | | |
| |
Oil & Gas Refining & Marketing – 1.4% | |
Marathon Petroleum Corp. | | | 146 | | | | 8,639 | |
| | | | | | | | |
| |
Total Energy – 2.1% | | | | 13,153 | |
Financials | |
| |
Asset Management & Custody Banks – 1.6% | |
Blackstone Group L.P. (The) | | | 345 | | | | 10,276 | |
| | | | | | | | |
| |
Financial Exchanges & Data – 2.0% | |
CME Group, Inc. | | | 67 | | | | 12,566 | |
| | | | | | | | |
| |
Investment Banking & Brokerage – 1.8% | |
Morgan Stanley | | | 287 | | | | 11,395 | |
| | | | | | | | |
| |
Other Diversified Financial Services – 4.9% | |
Citigroup, Inc. | | | 297 | | | | 15,457 | |
JPMorgan Chase & Co. | | | 152 | | | | 14,879 | |
| | | | | | | | |
| | | | | | | 30,336 | |
| | | | | | | | |
| |
Total Financials – 10.3% | | | | 64,573 | |
Health Care | |
| |
Health Care Equipment – 4.0% | |
Danaher Corp. | | | 61 | | | | 6,321 | |
Medtronic plc | | | 206 | | | | 18,765 | |
| | | | | | | | |
| | | | | | | 25,086 | |
| | | | | | | | |
| |
Managed Health Care – 4.1% | |
UnitedHealth Group, Inc. | | | 103 | | | | 25,585 | |
| | | | | | | | |
| |
Pharmaceuticals – 5.2% | |
Elanco Animal Health, Inc. (A) | | | 275 | | | | 8,675 | |
Eli Lilly and Co. | | | 111 | | | | 12,845 | |
Zoetis, Inc. | | | 133 | | | | 11,334 | |
| | | | | | | | |
| | | | | | | 32,854 | |
| | | | | | | | |
| |
Total Health Care – 13.3% | | | | 83,525 | |
Industrials | |
| |
Aerospace & Defense – 7.7% | |
Airbus SE(C) | | | 71 | | | | 6,779 | |
Boeing Co. (The) | | | 44 | | | | 14,287 | |
Lockheed Martin Corp. | | | 61 | | | | 15,841 | |
United Technologies Corp. | | | 105 | | | | 11,212 | |
| | | | | | | | |
| | | | | | | 48,119 | |
| | | | | | | | |
| |
Air Freight & Logistics – 0.8% | |
FedEx Corp. | | | 32 | | | | 5,114 | |
| | | | | | | | |
| |
Environmental & Facilities Services – 1.1% | |
Republic Services, Inc., Class A | | | 98 | | | | 7,087 | |
| | | | | | | | |
| |
Railroads – 0.8% | |
Norfolk Southern Corp. | | | 31 | | | | 4,621 | |
| | | | | | | | |
| | | | | | | | |
| COMMON STOCKS (Continued) | | Shares | | | Value | |
| |
Trucking – 0.8% | |
J.B. Hunt Transport Services, Inc. | | | 53 | | | $ | 4,968 | |
| | | | | | | | |
| |
Total Industrials – 11.2% | | | | 69,909 | |
Information Technology | |
| |
Application Software – 1.2% | |
Intuit, Inc. | | | 38 | | | | 7,480 | |
| | | | | | | | |
| |
Data Processing & Outsourced Services – 7.0% | |
First Data Corp., Class A (A) | | | 411 | | | | 6,957 | |
MasterCard, Inc., Class A | | | 66 | | | | 12,476 | |
PayPal, Inc. (A) | | | 115 | | | | 9,679 | |
Visa, Inc., Class A | | | 113 | | | | 14,953 | |
| | | | | | | | |
| | | | | | | 44,065 | |
| | | | | | | | |
| |
Electronic Manufacturing Services – 2.3% | |
IPG Photonics Corp. (A) | | | 24 | | | | 2,685 | |
TE Connectivity Ltd. | | | 153 | | | | 11,541 | |
| | | | | | | | |
| | | | | | | 14,226 | |
| | | | | | | | |
| |
Semiconductor Equipment – 1.0% | |
Applied Materials, Inc. | | | 197 | | | | 6,460 | |
| | | | | | | | |
| |
Semiconductors – 4.3% | |
Analog Devices, Inc. | | | 115 | | | | 9,896 | |
QUALCOMM, Inc. | | | 156 | | | | 8,895 | |
Texas Instruments, Inc. | | | 88 | | | | 8,335 | |
| | | | | | | | |
| | | | | | | 27,126 | |
| | | | | | | | |
| |
Systems Software – 5.0% | |
Microsoft Corp. | | | 309 | | | | 31,385 | |
| | | | | | | | |
| |
Technology Hardware, Storage & Peripherals – 2.5% | |
Apple, Inc. | | | 97 | | | | 15,314 | |
| | | | | | | | |
| |
Total Information Technology – 23.3% | | | | 146,056 | |
Materials | |
| |
Commodity Chemicals – 1.5% | |
LyondellBasell Industries N.V., Class A | | | 110 | | | | 9,106 | |
| | | | | | | | |
| |
Specialty Chemicals – 1.8% | |
Sherwin-Williams Co. (The) | | | 29 | | | | 11,450 | |
| | | | | | | | |
| |
Total Materials – 3.3% | | | | 20,556 | |
Utilities | |
| |
Electric Utilities – 1.3% | |
NextEra Energy, Inc. | | | 47 | | | | 8,135 | |
| | | | | | | | |
| |
Total Utilities – 1.3% | | | | 8,135 | |
| |
TOTAL COMMON STOCKS – 92.9% | | | $ | 581,532 | |
(Cost: $620,729) | |
| | |
| SCHEDULE OF INVESTMENTS | | CORE EQUITY (in thousands) |
DECEMBER 31, 2018
| | | | | | | | |
| SHORT-TERM SECURITIES | | Principal | | | Value | |
Commercial Paper (D) – 5.7% | |
J.M. Smucker Co. (The), | | | | | | | | |
2.750%,1-2-19 | | $ | 8,506 | | | $ | 8,505 | |
Rockwell Automation, Inc., | | | | | | | | |
2.610%,1-10-19 | | | 4,725 | | | | 4,722 | |
Virginia Electric and Power Co., | | | | | | | | |
2.660%,1-10-19 | | | 5,000 | | | | 4,996 | |
Wisconsin Gas LLC: | | | | | | | | |
2.605%,1-8-19 | | | 11,000 | | | | 10,994 | |
2.520%,1-10-19 | | | 6,350 | | | | 6,345 | |
| | | | | | | | |
| | | | | | | 35,562 | |
| | | | | | | | |
| |
Master Note – 1.1% | |
Toyota Motor Credit Corp.(1-Month U.S. LIBOR plus 15 bps), | | | | | | | | |
2.720%,1-7-19 (E) | | | 6,995 | | | | 6,995 | |
| | | | | | | | |
| |
Money Market Funds – 0.6% | |
Dreyfus Institutional Preferred Government Money Market Fund – Institutional Shares, | | | | | | | | |
2.400%, (F)(G) | | | 4,003 | | | | 4,003 | |
| | | | | | | | |
| |
United States Government Agency Obligations – 0.8% | |
Overseas Private Investment Corp. (GTD by U.S. Government)(3-Month U.S. TB Rate), | | | | | | | | |
2.430%,1-7-19 (E) | | | 5,000 | | | | 5,000 | |
| | | | | | | | |
| |
TOTAL SHORT-TERM SECURITIES – 8.2% | | | $ | 51,560 | |
(Cost: $51,562) | | | | | | | | |
| |
TOTAL INVESTMENT SECURITIES – 101.1% | | | $ | 633,092 | |
(Cost: $672,291) | | | | | | | | |
| |
LIABILITIES, NET OF CASH AND OTHER ASSETS – (1.1)% | | | | (6,659 | ) |
| | |
NET ASSETS – 100.0% | | | | | | $ | 626,433 | |
Notes to Schedule of Investments
| (A) | No dividends were paid during the preceding 12 months. |
| (B) | All or a portion of securities with an aggregate value of $7,003 are on loan. |
| (C) | Listed on an exchange outside the United States. |
| (D) | Rate shown is the yield to maturity at December 31, 2018. |
| (E) | Variable rate security. Interest rate disclosed is that which is in effect at December 31, 2018. Date shown represents the date that the variable rate resets. Description of the reference rate and spread, if applicable, are included in the security description. |
| (F) | Investment made with cash collateral received from securities on loan. |
| (G) | Rate shown is the annualized7-day yield at December 31, 2018. |
The following forward foreign currency contracts were outstanding at December 31, 2018:
| | | | | | | | | | | | | | | | | | | | | | | | |
| | | Currency to be Delivered | | | | | Currency to be Received | | | Settlement Date | | | Counterparty | | Unrealized Appreciation | | | Unrealized Depreciation | |
Euro | | | 5,859 | | | U.S. Dollar | | | 6,842 | | | | 1-7-19 | | | Citibank N.A. | | $ | 127 | | | $ | — | |
| | |
| SCHEDULE OF INVESTMENTS | | CORE EQUITY (in thousands) |
DECEMBER 31, 2018
The following table is a summary of the valuation of the Portfolio’s investments by the fair value hierarchy levels as of December 31, 2018. See Note 3 to the Financial Statements for further information regarding fair value measurement.
| | | | | | | | | | | | |
| | | Level 1 | | | Level 2 | | | Level 3 | |
Assets | | | | | | | | | | | | |
Investments in Securities | | | | | | | | | | | | |
Common Stocks | | | | | | | | | | | | |
Communication Services | | $ | 76,136 | | | $ | — | | | $ | — | |
Consumer Discretionary | | | 46,438 | | | | — | | | | — | |
Consumer Staples | | | 53,051 | | | | — | | | | — | |
Energy | | | 13,153 | | | | — | | | | — | |
Financials | | | 64,573 | | | | — | | | | — | |
Health Care | | | 83,525 | | | | — | | | | — | |
Industrials | | | 63,130 | | | | 6,779 | | | | — | |
Information Technology | | | 146,056 | | | | — | | | | — | |
Materials | | | 20,556 | | | | — | | | | — | |
Utilities | | | 8,135 | | | | — | | | | — | |
Total Common Stocks | | $ | 574,753 | | | $ | 6,779 | | | $ | — | |
Short-Term Securities | | | 4,003 | | | | 47,557 | | | | — | |
Total | | $ | 578,756 | | | $ | 54,336 | | | $ | — | |
Forward Foreign Currency Contracts | | $ | — | | | $ | 127 | | | $ | — | |
The following acronyms are used throughout this schedule:
GTD = Guaranteed
LIBOR = London Interbank Offered Rate
TB = Treasury Bill
See Accompanying Notes to Financial Statements.
| | |
| MANAGEMENT DISCUSSION | | CORPORATE BOND |
(UNAUDITED)

Mark G. Beischel

Susan Regan
Below, Mark G. Beischel, CFA and Susan Regan,co-portfolio managers of Ivy VIP Corporate Bond, discuss positioning, performance and results for the fiscal year ended December 31, 2018. Mr. Beischel has managed the Portfolio since April 2018 and has 25 years of industry experience. Ms. Regan has managed the Portfolio since April 2018 and has 31 years of industry experience. Rick Perry served as portfolio manager of the Portfolio until April 12, 2018.
Fiscal Year Performance
| | | | |
For the 12 Months Ended December 31, 2018 | | | | |
Ivy VIP Corporate Bond (Class II shares at net asset value) | | | -1.90% | |
Benchmark(s) and/or Morningstar and Lipper Categories | | | | |
Bloomberg Barclays U.S. Aggregate Bond Index | | | 0.01% | |
(generally reflects the performance of securities representing the bond market) | | | | |
Bloomberg Barclays U.S. Credit Index | | | -2.11% | |
(generally reflects the performance of securities representing the U.S. credit market) | | | | |
Morningstar Corporate Bond Universe Average | | | -2.80% | |
(generally reflects the performance of the universe of funds with similar investment objectives) | | | | |
Lipper Corporate Debt FundsA-Rated Funds Universe Average | | | -1.22% | |
(generally reflects the performance of the universe of funds with similar investment objectives) | | | | |
Please note that Portfolio returns include applicable fees and expenses while index returns do not include any such fees. Also, the Portfolio’s performance data does not take into account any product expenses or charges associated with owning a variable life or annuity policy, which is invested in Ivy Variable Insurance Portfolios. The performance discussion below is based on net asset value (NAV).
A year of transition
The past year was a transition period for the Portfolio, as its name, benchmark and strategy changed in April 2018. At its previous fiscal year end, the Portfolio was named Ivy VIP Bond and the Bloomberg Barclays U.S. Aggregate Bond Index was its benchmark. The Ivy VIP Bond portfolio had a strong overweight in corporate credit, helping to make it a relatively smooth conversion to a corporate bond strategy.
Market Perspective
Fixed income investors had the challenge of investing in a rising interest rate environment for most of 2018. The Federal Reserve (Fed) engaged in four interest rate hikes, raising the federal funds rate by0.25-percentage point at its March, June, September and December meetings. During the calendar year, the10-year U.S. Treasury note yield hit a low of 2.45% on January 3, climbed to a high of 3.24% on November 8, and then fell again to end the year at 2.69%.
U.S. Treasury securities were not the only fixed income investments to experience periods of volatility in 2018. The Bloomberg Barclays U.S. Credit Index showed that across the entire maturity spectrum investment grade credit generated an excess return of negative 280 basis points (bps) for the year. In comparison, the excess return of the index was positive 442 and 335 bps in 2016 and 2017, respectively. Excess return is that which one would earn over and above a similar maturity U.S. Treasury.
Several factors contributed to widening credit spreads in 2018. Trade policy, tax policy, tariffs and tweets from President Trump impacted the overall market and individual corporations in 2018. Uncertainty about the trade policy with China has been a dominant concern. We saw reduced foreign demand for corporate bonds during the year. Corporations with significant profits overseas invested much of that profit in short-dated corporate bonds. Tax policy changes are enabling companies to bring profits back to the U.S., which has contributed to their reduced demand for corporate bonds.
The yield curve also was a major focus of the market in 2018. There are many measures of the yield curve, but the one referenced the most is the difference in yields between the10-year U.S. Treasury note and the2-year U.S. Treasury note. At the start of 2018, the difference between the two notes was 52 bps. At the end of the year, the difference was just less than 20 bps after it reached as low as 11 bps in early December. Atyear-end, one section of the yield curve became slightly inverted (i.e., long-term debt had a lower yield than short-term debt), when the yield on the3-year U.S. Treasury note was 2.46%, three bps lower than the yield on the2-year note.
Portfolio Positioning
The Bloomberg Barclays U.S. Credit Index, the new benchmark for the Portfolio, has a longer duration than the Bloomberg Barclays U.S. Aggregate Bond Index. As a result, we worked throughout the year on getting the Portfolio’s duration closer to that of its new benchmark. Atyear-end 2017, the Portfolio’s duration was 6.16. We increased duration throughout the year and ended 2018 at 6.91, very near the duration of the new benchmark.
In addition to extending duration, we made minor adjustments, improving both the quality and liquidity of the Portfolio. We believe the credit cycle is in the later stages, but since we do not know when the cycle will end, we reduced exposure toBBB-minus rated bonds and increased the allocation toBBB-plus-and-higher rated bonds. We expect that the higher quality bonds should outperform when the cycle turns.
Outlook
Recent indications suggest that the Fed may consider more rate hikes in 2019. However, it is quite possible the Fed will be more cautious and more patient in 2019, allowing more time for the previous hikes to affect the economy and waiting on a greater amount of incoming data as a guide. Many individuals, both inside and outside the Fed, believe the neutral federal funds rate is 3% or lower. With the current range at 2.25% to 2.50%, we think that neutral is probably close to the current levels. The Fed has also been systematically reducing the size of its balance sheet. The process began in 2017 and consists of continually reducing the amount of maturing bonds being replaced in the portfolio. We expect this process to continue throughout most, if not all, of 2019.
We expect the volatility seen in the markets in 2018 to continue in 2019 due to the great deal of uncertainty regarding trade and economic growth. We think this situation could contribute to further widening in corporate credit spreads in 2019. We are always looking for opportunities to improve the credit quality of the Portfolio, as we believe we are in the later stages of the credit cycle.
The yield curve should continue to be a focus of the market in 2019. We will watch the yield curve closely as we seek to ascertain its indications about the economy. Generally speaking, when the yield curve inverts, recession follows in the next12-24 months.
Past performance is not a guarantee of future results. As with any mutual fund, the value of the Portfolio’s shares will change, and you could lose money on your investment.
Certain U.S. government securities in which the Portfolio may invest, such as Treasury securities and securities issued by the Government National Mortgage Association (Ginnie Mae), are backed by the full faith and credit of the U.S. government. However, other U.S. government securities in which the Portfolio may invest, such as securities issued by the Federal National Mortgage Association (Fannie Mae), the Federal Home Loan Mortgage Corporation (Freddie Mac) and the Federal Home Loan Banks (FHLB), are not backed by the full faith and credit of the U.S. government, are not insured or guaranteed by the U.S. government and, instead, may be supported only by the right of the issuer to borrow from the U.S. Treasury or by the credit of the issuer.
Fixed income securities are subject to interest rate risk and, as such, the net asset value of the Portfolio may fall as interest rates rise. These and other risks are more fully described in the Portfolio’s prospectus.
The opinions expressed in this report are those of the portfolio manager and are current only through the end of the period of the report as stated on the cover. The manager’s views are subject to change at any time based on market and other conditions, and no forecasts can be guaranteed.
The index noted is unmanaged and includes reinvested dividends. One cannot invest directly in an index, nor is an index representative of Ivy VIP Corporate Bond.
| | |
| PORTFOLIO HIGHLIGHTS | | CORPORATE BOND(a) |
ALL DATA IS AS OF DECEMBER 31, 2018 (UNAUDITED)
Asset Allocation
| | | | |
Stocks | | | 0.4% | |
Bonds | | | 97.0% | |
Corporate Debt Securities | | | 92.0% | |
Asset-Backed Securities | | | 1.8% | |
Municipal Bonds – Taxable | | | 1.3% | |
United States Government Agency Obligations | | | 1.2% | |
Other Government Securities | | | 0.6% | |
Mortgage-Backed Securities | | | 0.1% | |
Cash and Other Assets (Net of Liabilities), and Cash Equivalents+ | | | 2.6% | |
Quality Weightings
| | | | |
Investment Grade | | | 96.9% | |
AAA | | | 3.0% | |
AA | | | 13.7% | |
A | | | 35.8% | |
BBB | | | 44.4% | |
Non-Investment Grade | | | 0.1% | |
Non-rated | | | 0.1% | |
Cash and Other Assets (Net of Liabilities), and Cash Equivalents+ and Equities | | | 3.0% | |
Our preference is to always use ratings obtained from Standard & Poor’s, Moody’s, and Fitch. It is each Portfolio’s general policy to classify such security at the lower rating level if only two ratings are available. If more than two ratings are available and a median exists, the median is used. If more than two ratings exist without a median, the lower of the two middle ratings is used. We do not evaluate these ratings, but simply assign them to the appropriate credit quality category as determined by the rating agency.
+ Cash equivalents are defined as highly liquid securities with maturities of less than three months. Cash equivalents may include U.S. Government Treasury bills, bank certificates of deposit, bankers’ acceptances, corporate commercial paper and other money market instruments.
(a) Effective April 30, 2018, the name of Bond changed to Corporate Bond.
| | |
| COMPARISON OF CHANGE IN VALUE OF $10,000 INVESTMENT | | CORPORATE BOND |
(UNAUDITED)

| (1) | The value of the investment in the Portfolio is impacted by the ongoing expenses of the Portfolio and assumes reinvestment of dividends and distributions. |
| (2) | The Portfolio’s benchmark changed from Bloomberg Barclays U.S. Aggregate Bond Index, effective April 30, 2018. IICO believes that the Bloomberg Barclays U.S.Credit Index is more reflective of the types of securities in which the Portfolio invests than the Bloomberg Barclays U.S.Aggregate Bond Index. |
| | | | |
| |
| Average Annual Total Return(3) | | Class II | |
1-year period ended12-31-18 | | | -1.90% | |
5-year period ended12-31-18 | | | 2.10% | |
10-year period ended12-31-18 | | | 3.43% | |
| (3) | Data quoted is past performance and current performance may be lower or higher. Past performance is no guarantee of future results. Investment return and principal value of an investment will fluctuate and shares, when redeemed, may be worth more or less than their original cost. Please visit www.ivyinvestments.com for the Portfolio’s most recentmonth-end performance. Performance data quoted does not reflect any expenses or charges associated with owning a variable life insurance policy or variable annuity contract that invests in the Portfolio’s shares. When such charges are deducted, actual investment performance in a variable policy or contract will be lower. |
Past performance is not necessarily indicative of future performance. Indexes are unmanaged. The performance graph and table do not reflect the deduction of taxes that a shareholder would pay on Portfolio distributions or on the redemption of Portfolio shares. Performance results may include the effect of expense reduction arrangements for some or all of the periods shown. If those arrangements had not been in place, the performance results for those periods would have been lower.
| | |
| SCHEDULE OF INVESTMENTS | | CORPORATE BOND (in thousands) |
DECEMBER 31, 2018
| | | | | | | | |
| PREFERRED STOCKS | | Shares | | | Value | |
| |
Financials | |
| |
Investment Banking & Brokerage – 0.4% | |
Morgan Stanley, 5.850% (A) | | | 100 | | | $ | 2,428 | |
| | | | | | | | |
| |
Total Financials – 0.4% | | | | 2,428 | |
| |
TOTAL PREFERRED STOCKS – 0.4% | | | $ | 2,428 | |
(Cost: $2,500) | |
| | |
ASSET-BACKED SECURITIES | | | Principal | | | | | |
AerCap Ireland Capital Ltd. and AerCap Global Aviation Trust, | | | | | | | | |
3.500%,5-26-22 | | $ | 1,320 | | | | 1,280 | |
Air Canada Enhanced Equipment Trust, Series2015-2, Class AA, | | | | | | | | |
3.750%,12-15-27 (B) | | | 879 | | | | 854 | |
American Airlines Class AA Pass Through Certificates, Series2016-2, | | | | | | | | |
3.200%,6-15-28 | | | 1,700 | | | | 1,598 | |
American Airlines, Inc., Class AA Pass Through Certificates, Series2016-1, | | | | | | | | |
3.575%,1-15-28 | | | 904 | | | | 888 | |
American Airlines, Inc., Class AA Pass Through Certificates, Series2017-1, | | | | | | | | |
3.650%,2-15-29 | | | 2,309 | | | | 2,273 | |
United Airlines Pass-Through Certificates, Series2016-AA, | | | | | | | | |
3.100%,7-7-28 | | | 2,794 | | | | 2,692 | |
| | | | | | | | |
| |
TOTAL ASSET-BACKED
SECURITIES – 1.8% | | | $ | 9,585 | |
(Cost: $9,774) | |
| | |
CORPORATE DEBT SECURITIES | | | | | | | | |
Communication Services | |
| |
Cable & Satellite – 1.5% | |
Charter Communications Operating LLC and Charter Communications Operating Capital Corp.: | | | | | | | | |
4.464%,7-23-22 | | | 1,000 | | | | 1,009 | |
5.375%,5-1-47 | | | 500 | | | | 454 | |
Comcast Corp. (GTD by Comcast Cable Communications and NBCUniversal): | | | | | | | | |
2.350%,1-15-27 | | | 1,500 | | | | 1,343 | |
3.900%,3-1-38 | | | 500 | | | | 463 | |
4.600%,10-15-38 | | | 3,000 | | | | 3,033 | |
DIRECTV Holdings LLC and DIRECTV Financing Co., Inc., | | | | | | | | |
3.950%,1-15-25 | | | 815 | | | | 797 | |
Time Warner, Inc. (GTD by Historic TW, Inc.), | | | | | | | | |
2.950%,7-15-26 | | | 1,000 | | | | 895 | |
| | | | | | | | |
| | | | | | | 7,994 | |
| | | | | | | | |
| |
Integrated Telecommunication Services – 1.8% | |
AT&T, Inc., | | | | | | | | |
3.600%,2-17-23 | | | 3,500 | | | | 3,482 | |
| | | | | | | | |
CORPORATE DEBT SECURITIES
(Continued) | | Principal | | | Value | |
| |
Integrated Telecommunication Services (Continued) | |
Sprint Spectrum Co. LLC and Sprint Spectrum Co. II LLC, | | | | | | | | |
4.738%,3-20-25 (B) | | $ | 500 | | | $ | 491 | |
Verizon Communications, Inc.: | | | | | | | | |
2.625%,8-15-26 | | | 500 | | | | 453 | |
4.500%,8-10-33 | | | 3,500 | | | | 3,458 | |
4.812%,3-15-39 | | | 559 | | | | 550 | |
5.012%,4-15-49 | | | 1,250 | | | | 1,247 | |
| | | | | | | | |
| | | | | | | 9,681 | |
| | | | | | | | |
| |
Interactive Home Entertainment – 0.3% | |
Activision Blizzard, Inc., | | | | | | | | |
2.300%,9-15-21 | | | 1,750 | | | | 1,704 | |
| | | | | | | | |
| |
Interactive Media & Services – 0.5% | |
Alphabet, Inc., | | | | | | | | |
3.375%,2-25-24 | | | 2,950 | | | | 2,993 | |
| | | | | | | | |
| |
Movies & Entertainment – 0.5% | |
Walt Disney Co. (The), | | | | | | | | |
4.125%,6-1-44 (A) | | | 2,574 | | | | 2,553 | |
| | | | | | | | |
| |
Publishing – 0.1% | |
Thomson Reuters Corp., | | | | | | | | |
3.350%,5-15-26 | | | 500 | | | | 464 | |
| | | | | | | | |
| |
Wireless Telecommunication Service – 1.2% | |
Crown Castle Towers LLC, | | | | | | | | |
3.663%,5-15-25 (B) | | | 2,450 | | | | 2,380 | |
Sprint Spectrum L.P., | | | | | | | | |
3.360%,9-20-21 (B) | | | 2,406 | | | | 2,376 | |
Vodafone Group plc, | | | | | | | | |
4.125%,5-30-25 | | | 2,000 | | | | 1,977 | |
| | | | | | | | |
| | | | | | | 6,733 | |
| | | | | | | | |
| |
Total Communication Services – 5.9% | | | | 32,122 | |
Consumer Discretionary | | | | | | | | |
| |
Auto Parts & Equipment – 0.4% | |
Lear Corp., | | | | | | | | |
3.800%,9-15-27 | | | 2,500 | | | | 2,285 | |
| | | | | | | | |
| |
Automobile Manufacturers – 0.6% | |
BMW U.S. Capital LLC, | | | | | | | | |
2.700%,4-6-22 (B) | | | 3,500 | | | | 3,399 | |
| | | | | | | | |
| |
Education Services – 0.2% | |
President and Fellows of Harvard College, | | | | | | | | |
3.150%,7-15-46 | | | 500 | | | | 447 | |
University of Southern California, | | | | | | | | |
3.028%,10-1-39 | | | 500 | | | | 454 | |
| | | | | | | | |
| | | | | | | 901 | |
| | | | | | | | |
| |
Footwear – 0.8% | |
NIKE, Inc., | | | | | | | | |
3.875%,11-1-45 | | | 4,500 | | | | 4,310 | |
| | | | | | | | |
| |
Home Improvement Retail – 0.5% | |
Home Depot, Inc. (The), | | | | | | | | |
4.200%,4-1-43 | | | 2,800 | | | | 2,756 | |
| | | | | | | | |
| | | | | | | | |
CORPORATE DEBT SECURITIES
(Continued) | | Principal | | | Value | |
| |
Hotels, Resorts & Cruise Lines – 0.9% | |
Marriott International, Inc., | | | | | | | | |
4.000%,4-15-28 | | $ | 1,000 | | | $ | 962 | |
Marriott International, Inc., Series R, | | | | | | | | |
3.125%,6-15-26 | | | 1,000 | | | | 908 | |
Royal Caribbean Cruises Ltd., | | | | | | | | |
3.700%,3-15-28 | | | 3,500 | | | | 3,221 | |
| | | | | | | | |
| | | | | | | 5,091 | |
| | | | | | | | |
| |
Internet & Direct Marketing Retail – 0.6% | |
Amazon.com, Inc., | | | | | | | | |
4.800%,12-5-34 | | | 2,870 | | | | 3,077 | |
| | | | | | | | |
| |
Restaurants – 0.3% | |
Starbucks Corp., | | | | | | | | |
4.000%,11-15-28 | | | 1,500 | | | | 1,482 | |
| | | | | | | | |
| |
Total Consumer Discretionary – 4.3% | | | | 23,301 | |
Consumer Staples | | | | | | | | |
| |
Agricultural Products – 0.2% | |
Archer Daniels Midland Co., | | | | | | | | |
3.375%,3-15-22 | | | 1,000 | | | | 1,005 | |
| | | | | | | | |
| |
Brewers – 1.7% | |
Anheuser-Busch Inbev Finance, Inc. (GTD by AB INBEV/BBR/COB): | | | | | | | | |
3.650%,2-1-26 (B) | | | 665 | | | | 629 | |
4.700%,2-1-36 (B) | | | 4,000 | | | | 3,725 | |
4.900%,2-1-46 (B) | | | 2,000 | | | | 1,857 | |
Heineken N.V., | | | | | | | | |
3.500%,1-29-28 (B) | | | 2,000 | | | | 1,930 | |
Molson Coors Brewing Co., | | | | | | | | |
2.250%,3-15-20 | | | 1,000 | | | | 986 | |
| | | | | | | | |
| | | | | | | 9,127 | |
| | | | | | | | |
| |
Distillers & Vintners – 0.7% | |
Bacardi Ltd., | | | | | | | | |
4.450%,5-15-25 (B) | | | 2,700 | | | | 2,665 | |
Constellation Brands, Inc.: | | | | | | | | |
2.650%,11-7-22 | | | 1,000 | | | | 957 | |
4.500%,5-9-47 | | | 500 | | | | 457 | |
| | | | | | | | |
| | | | | | | 4,079 | |
| | | | | | | | |
| |
Drug Retail – 0.2% | |
CVS Health Corp.: | | | | | | | | |
2.800%,7-20-20 | | | 75 | | | | 75 | |
4.100%,3-25-25 | | | 1,000 | | | | 991 | |
| | | | | | | | |
| | | | | | | 1,066 | |
| | | | | | | | |
| |
Household Products – 1.4% | |
Clorox Co. (The), | | | | | | | | |
3.100%,10-1-27 | | | 4,000 | | | | 3,801 | |
Procter & Gamble Co. (The): | | | | | | | | |
2.700%,2-2-26 | | | 2,000 | | | | 1,915 | |
3.500%,10-25-47 | | | 2,000 | | | | 1,889 | |
| | | | | | | | |
| | | | | | | 7,605 | |
| | | | | | | | |
| |
Hypermarkets & Super Centers – 0.5% | |
Walmart, Inc., | | | | | | | | |
3.700%,6-26-28 | | | 2,500 | | | | 2,538 | |
| | | | | | | | |
| | |
| SCHEDULE OF INVESTMENTS | | CORPORATE BOND (in thousands) |
DECEMBER 31, 2018
| | | | | | | | |
CORPORATE DEBT SECURITIES
(Continued) | | Principal | | | Value | |
| |
Packaged Foods & Meats – 1.6% | |
General Mills, Inc., | | | | | | | | |
4.200%,4-17-28 | | $ | 2,250 | | | $ | 2,204 | |
Mead Johnson Nutrition Co., | | | | | | | | |
4.125%,11-15-25 | | | 548 | | | | 562 | |
Nestle Holdings, Inc., | | | | | | | | |
4.000%,9-24-48(B) | | | 3,500 | | | | 3,438 | |
Smithfield Foods, Inc.: | | | | | | | | |
2.650%,10-3-21(B) | | | 1,250 | | | | 1,195 | |
3.350%,2-1-22(B) | | | 1,500 | | | | 1,434 | |
| | | | | | | | |
| | | | | | | 8,833 | |
| | | | | | | | |
| |
Personal Products – 0.6% | |
Kimberly-Clark Corp., | | | | | | | | |
3.200%,7-30-46 | | | 3,500 | | | | 3,053 | |
| | | | | | | | |
Soft Drinks – 1.5% | | | | | | | | |
Coca-Cola Co. (The): | | | | | | | | |
1.550%,9-1-21(A) | | | 1,500 | | | | 1,454 | |
2.875%,10-27-25(A) | | | 3,000 | | | | 2,890 | |
2.250%,9-1-26 | | | 1,000 | | | | 916 | |
PepsiCo, Inc.: | | | | | | | | |
1.700%,10-6-21 | | | 1,000 | | | | 967 | |
3.450%,10-6-46 | | | 2,500 | | | | 2,222 | |
| | | | | | | | |
| | | | | | | 8,449 | |
| | | | | | | | |
| |
Total Consumer Staples – 8.4% | | | | 45,755 | |
Energy | | | | | | | | |
| |
Oil & Gas Equipment & Services – 0.9% | |
Baker Hughes, a GE Co. LLC and Baker HughesCo-Obligor, Inc.: | | | | | | | | |
2.773%,12-15-22(A) | | | 3,000 | | | | 2,878 | |
3.337%,12-15-27 | | | 2,000 | | | | 1,841 | |
| | | | | | | | |
| | | | | | | 4,719 | |
| | | | | | | | |
| |
Oil & Gas Exploration & Production – 2.5% | |
BP Capital Markets plc (GTD by BP plc): | | | | | | | | |
3.216%,11-28-23 | | | 1,500 | | | | 1,478 | |
3.814%,2-10-24 | | | 3,000 | | | | 3,028 | |
Canadian Natural Resources Ltd., | | | | | | | | |
3.850%,6-1-27 | | | 3,500 | | | | 3,303 | |
ConocoPhillips Co. (GTD by ConocoPhillips), | | | | | | | | |
4.150%,11-15-34 | | | 218 | | | | 208 | |
EQT Corp.: | | | | | | | | |
8.125%,6-1-19 | | | 1,575 | | | | 1,602 | |
3.000%,10-1-22 | | | 4,250 | | | | 4,030 | |
| | | | | | | | |
| | | | | | | 13,649 | |
| | | | | | | | |
| |
Oil & Gas Refining & Marketing – 0.3% | |
Phillips 66 (GTD by Phillips 66 Co.)(3-Month U.S. LIBOR plus 60 bps), | | | | | | | | |
3.289%,2-26-21(C) | | | 2,000 | | | | 1,978 | |
| | | | | | | | |
| |
Oil & Gas Storage & Transportation – 4.7% | |
Boardwalk Pipelines L.P. (GTD by Boardwalk Pipeline Partners L.P.), | | | | | | | | |
4.450%,7-15-27 | | | 2,000 | | | | 1,848 | |
Colonial Pipeline Co., | | | | | | | | |
4.250%,4-15-48(B) | | | 1,000 | | | | 960 | |
Colorado Interstate Gas Co., | | | | | | | | |
4.150%,8-15-26(B) | | | 1,000 | | | | 977 | |
Enbridge, Inc., | | | | | | | | |
2.900%,7-15-22 | | | 2,000 | | | | 1,935 | |
| | | | | | | | |
CORPORATE DEBT SECURITIES
(Continued) | | Principal | | | Value | |
| |
Oil & Gas Storage & Transportation (Continued) | |
Energy Transfer Partners L.P.: | | | | | | | | |
4.200%,4-15-27 | | $ | 2,000 | | | $ | 1,867 | |
4.950%,6-15-28 | | | 1,000 | | | | 980 | |
Plains All American Pipeline L.P. and PAA Finance Corp.: | | | | | | | | |
3.600%,11-1-24 | | | 1,031 | | | | 981 | |
4.500%,12-15-26 | | | 1,750 | | | | 1,687 | |
Sabal Trail Transmission LLC, | | | | | | | | |
4.246%,5-1-28(B) | | | 2,500 | | | | 2,463 | |
Sabine Pass Liquefaction LLC, | | | | | | | | |
4.200%,3-15-28 | | | 1,500 | | | | 1,436 | |
Sunoco Logistics Partners Operations L.P. (GTD by Energy Transfer Partners L.P.), | | | | | | | | |
4.000%,10-1-27 | | | 2,000 | | | | 1,835 | |
Sunoco Logistics Partners Operations L.P. (GTD by Sunoco Logistics Partners L.P.), | | | | | | | | |
4.400%,4-1-21 | | | 500 | | | | 505 | |
Tennessee Gas Pipeline Co., | | | | | | | | |
7.000%,3-15-27 | | | 2,000 | | | | 2,267 | |
TransCanada PipeLines Ltd., | | | | | | | | |
5.100%,3-15-49 | | | 3,000 | | | | 2,983 | |
Transcontinental Gas Pipe Line Co. LLC, | | | | | | | | |
4.600%,3-15-48 | | | 1,000 | | | | 936 | |
Williams Partners L.P.: | | | | | | | | |
3.750%,6-15-27 | | | 500 | | | | 474 | |
4.850%,3-1-48 | | | 1,500 | | | | 1,366 | |
| | | | | | | | |
| | | | | | | 25,500 | |
| | | | | | | | |
| |
Total Energy – 8.4% | | | | 45,846 | |
Financials | | | | | | | | |
| |
Asset Management & Custody Banks – 0.8% | |
Ares Capital Corp.: | | | | | | | | |
3.875%,1-15-20 | | | 280 | | | | 281 | |
4.250%,3-1-25 | | | 2,000 | | | | 1,905 | |
State Street Corp.: | | | | | | | | |
4.375%,3-7-21(A) | | | 1,250 | | | | 1,283 | |
2.650%,5-19-26 | | | 1,000 | | | | 936 | |
| | | | | | | | |
| | | | | | | 4,405 | |
| | | | | | | | |
| |
Consumer Finance – 2.1% | |
American Express Credit Corp., | | | | | | | | |
2.200%,3-3-20 | | | 2,000 | | | | 1,978 | |
Capital One Financial Corp.: | | | | | | | | |
4.200%,10-29-25 | | | 1,500 | | | | 1,449 | |
3.750%,7-28-26 | | | 1,000 | | | | 917 | |
Discover Financial Services, | | | | | | | | |
3.950%,11-6-24 | | | 1,500 | | | | 1,480 | |
Ford Motor Credit Co. LLC: | | | | | | | | |
5.875%,8-2-21 | | | 1,500 | | | | 1,538 | |
3.810%,1-9-24 | | | 1,500 | | | | 1,384 | |
General Motors Financial Co., Inc. (GTD by AmeriCredit Financial Services, Inc.): | | | | | | | | |
3.200%,7-6-21 | | | 500 | | | | 488 | |
3.700%,5-9-23 | | | 2,500 | | | | 2,379 | |
| | | | | | | | |
| | | | | | | 11,613 | |
| | | | | | | | |
| | | | | | | | |
CORPORATE DEBT SECURITIES
(Continued) | | Principal | | | Value | |
| |
Diversified Banks – 12.5% | |
Australia and New Zealand Banking Group Ltd., | | | | | | | | |
2.125%,8-19-20 | | $ | 1,000 | | | $ | 984 | |
Banco Santander S.A., | | | | | | | | |
3.500%,4-11-22 | | | 1,250 | | | | 1,227 | |
Bank of America Corp.: | | | | | | | | |
2.503%,10-21-22(A) | | | 4,000 | | | | 3,851 | |
4.244%,4-24-38 | | | 2,000 | | | | 1,905 | |
Bank of America Corp.(3-Month U.S. LIBOR plus 77 bps), | | | | | | | | |
3.352%,2-5-26(C) | | | 4,000 | | | | 3,781 | |
Bank of Montreal, | | | | | | | | |
2.100%,12-12-19 | | | 500 | | | | 495 | |
Bank of New York Mellon Corp. (The): | | | | | | | | |
3.550%,9-23-21 | | | 1,250 | | | | 1,264 | |
2.200%,8-16-23 | | | 3,000 | | | | 2,849 | |
Barclays plc, | | | | | | | | |
3.684%,1-10-23 | | | 4,400 | | | | 4,227 | |
BB&T Corp.: | | | | | | | | |
2.050%,5-10-21 | | | 1,000 | | | | 974 | |
2.750%,4-1-22 | | | 3,500 | | | | 3,440 | |
Commonwealth Bank of Australia, | | | | | | | | |
2.000%,9-6-21(B) | | | 1,500 | | | | 1,445 | |
Danske Bank A.S., | | | | | | | | |
2.700%,3-2-22(B) | | | 1,500 | | | | 1,437 | |
Fifth Third Bank N.A.: | | | | | | | | |
2.250%,6-14-21 | | | 500 | | | | 488 | |
3.350%,7-26-21 | | | 1,500 | | | | 1,503 | |
HSBC Holdings plc, | | | | | | | | |
4.583%,6-19-29 | | | 2,250 | | | | 2,232 | |
Huntington Bancshares, Inc., | | | | | | | | |
2.300%,1-14-22(A) | | | 500 | | | | 483 | |
Lloyds Banking Group plc, | | | | | | | | |
3.000%,1-11-22 | | | 2,000 | | | | 1,935 | |
Mitsubishi UFJ Financial Group, Inc., | | | | | | | | |
2.998%,2-22-22 | | | 500 | | | | 493 | |
Mizuho Financial Group, Inc., | | | | | | | | |
2.953%,2-28-22 | | | 3,000 | | | | 2,941 | |
Royal Bank of Canada, | | | | | | | | |
3.200%,4-30-21 | | | 3,000 | | | | 2,999 | |
Santander Holdings USA, Inc., | | | | | | | | |
3.400%,1-18-23 | | | 7,500 | | | | 7,207 | |
Svenska Handelsbanken AB, | | | | | | | | |
3.900%,11-20-23 | | | 1,500 | | | | 1,513 | |
Swedbank AB, | | | | | | | | |
2.800%,3-14-22(B) | | | 3,000 | | | | 2,952 | |
U.S. Bank N.A., | | | | | | | | |
3.450%,11-16-21 | | | 7,000 | | | | 7,052 | |
Wells Fargo & Co.: | | | | | | | | |
2.100%,7-26-21 | | | 1,000 | | | | 969 | |
3.069%,1-24-23(A) | | | 1,500 | | | | 1,461 | |
3.900%,5-1-45 | | | 1,000 | | | | 919 | |
4.750%,12-7-46 | | | 500 | | | | 482 | |
Westpac Banking Corp.: | | | | | | | | |
2.150%,3-6-20 | | | 2,500 | | | | 2,473 | |
2.000%,8-19-21 | | | 1,000 | | | | 968 | |
4.322%,11-23-31 | | | 1,000 | | | | 945 | |
| | | | | | | | |
| | | | | | | 67,894 | |
| | | | | | | | |
| | |
| SCHEDULE OF INVESTMENTS | | CORPORATE BOND (in thousands) |
DECEMBER 31, 2018
| | | | | | | | |
CORPORATE DEBT SECURITIES
(Continued) | | Principal | | | Value | |
| |
Diversified Capital Markets – 0.7% | |
Credit Suisse Group AG, | | | | | | | | |
3.574%,1-9-23(B) | | $ | 2,000 | | | $ | 1,951 | |
Deutsche Bank AG(3-Month U.S. LIBOR plus 123 bps), | | | | | | | | |
3.921%,2-27-23(C) | | | 2,000 | | | | 1,847 | |
| | | | | | | | |
| | | | | | | 3,798 | |
| | | | | | | | |
| |
Financial Exchanges & Data – 0.5% | |
Intercontinental Exchange, Inc., | | | | | | | | |
4.250%,9-21-48 | | | 2,750 | | | | 2,714 | |
| | | | | | | | |
| |
Insurance Brokers – 0.4% | |
Marsh & McLennan Cos., Inc., | | | | | | | | |
2.750%,1-30-22 | | | 2,000 | | | | 1,960 | |
| | | | | | | | |
| |
Investment Banking & Brokerage – 2.6% | |
Credit Suisse Group Funding (Guernsey) Ltd., | | | | | | | | |
3.125%,12-10-20 | | | 1,000 | | | | 990 | |
Daiwa Securities Group, Inc., | | | | | | | | |
3.129%,4-19-22(B) | | | 1,000 | | | | 984 | |
Goldman Sachs Group, Inc. (The): | | | | | | | | |
3.000%,4-26-22 | | | 1,000 | | | | 969 | |
2.905%,7-24-23 | | | 1,000 | | | | 952 | |
3.272%,9-29-25 | | | 2,500 | | | | 2,343 | |
3.750%,2-25-26 | | | 1,000 | | | | 946 | |
3.500%,11-16-26 | | | 2,000 | | | | 1,848 | |
4.017%,10-31-38 | | | 500 | | | | 440 | |
Goldman Sachs Group, Inc. (The)(3-Month U.S. LIBOR plus 175 bps), | | | | | | | | |
4.259%,10-28-27(C) | | | 2,000 | | | | 1,921 | |
Morgan Stanley, | | | | | | | | |
3.875%,1-27-26 | | | 1,000 | | | | 976 | |
Morgan Stanley(3-Month U.S. LIBOR plus 140 bps), | | | | | | | | |
3.887%,10-24-23(C) | | | 1,500 | | | | 1,493 | |
| | | | | | | | |
| | | | | | | 13,862 | |
| | | | | | | | |
| |
Life & Health Insurance – 5.2% | |
Aflac, Inc., | | | | | | | | |
4.750%,1-15-49 | | | 2,750 | | | | 2,807 | |
Athene Holding Ltd., | | | | | | | | |
4.125%,1-12-28 | | | 3,000 | | | | 2,727 | |
MetLife Global Funding I, | | | | | | | | |
1.950%,9-15-21(B) | | | 2,000 | | | | 1,931 | |
MetLife, Inc., | | | | | | | | |
4.050%,3-1-45 | | | 2,500 | | | | 2,317 | |
Metropolitan Life Global Funding I, | | | | | | | | |
3.450%,10-9-21(B) | | | 3,000 | | | | 3,012 | |
New York Life Global Funding, | | | | | | | | |
2.900%,1-17-24(B) | | | 5,500 | | | | 5,354 | |
Northwestern Mutual Life Insurance Co. (The), | | | | | | | | |
3.850%,9-30-47(B) | | | 3,000 | | | | 2,721 | |
Principal Life Global Funding II, | | | | | | | | |
3.000%,4-18-26(B) | | | 1,000 | | | | 960 | |
Protective Life Global Funding: | | | | | | | | |
2.262%,4-8-20(B) | | | 2,500 | | | | 2,472 | |
2.700%,11-25-20(B) | | | 1,000 | | | | 988 | |
Sumitomo Life Insurance Co., | | | | | | | | |
4.000%,9-14-77(B) | | | 1,000 | | | | 923 | |
| | | | | | | | |
CORPORATE DEBT SECURITIES
(Continued) | | Principal | | | Value | |
| |
Life & Health Insurance (Continued) | |
Teachers Insurance & Annuity Association of America, | | | | | | | | |
4.270%,5-15-47(B) | | $ | 2,000 | | | $ | 1,917 | |
| | | | | | | | |
| | | | | | | 28,129 | |
| | | | | | | | |
| |
Other Diversified Financial Services – 3.9% | |
Citigroup, Inc.: | | | | | | | | |
2.700%,3-30-21 | | | 3,000 | | | | 2,954 | |
3.500%,5-15-23 | | | 2,000 | | | | 1,963 | |
JPMorgan Chase & Co.: | | | | | | | | |
2.295%,8-15-21 | | | 6,000 | | | | 5,854 | |
2.700%,5-18-23 | | | 3,000 | | | | 2,881 | |
3.625%,12-1-27 | | | 1,500 | | | | 1,397 | |
4.950%,6-1-45 | | | 1,000 | | | | 1,015 | |
TIAA Asset Management Finance Co. LLC, | | | | | | | | |
4.125%,11-1-24(B) | | | 3,000 | | | | 3,056 | |
USAA Capital Corp., | | | | | | | | |
2.450%,8-1-20(B) | | | 2,360 | | | | 2,337 | |
| | | | | | | | |
| | | | | | | 21,457 | |
| | | | | | | | |
| |
Property & Casualty Insurance – 1.6% | |
Berkshire Hathaway Finance Corp. (GTD by Berkshire Hathaway, Inc.), | | | | | | | | |
4.200%,8-15-48 | | | 2,000 | | | | 1,990 | |
Berkshire Hathaway Finance Corp. (GTD by Berkshire Hathaway, Inc.)(3-Month ICE LIBOR plus 32 bps), | | | | | | | | |
2.734%,1-10-20(C) | | | 3,500 | | | | 3,499 | |
Progressive Corp. (The), | | | | | | | | |
4.000%,3-1-29 | | | 3,000 | | | | 3,088 | |
| | | | | | | | |
| | | | | | | 8,577 | |
| | | | | | | | |
| |
Regional Banks – 0.2% | |
PNC Bank N.A.: | | | | | | | | |
2.450%,11-5-20 | | | 264 | | | | 261 | |
3.300%,10-30-24 | | | 1,000 | | | | 990 | |
| | | | | | | | |
| | | | | | | 1,251 | |
| | | | | | | | |
| |
Specialized Finance – 0.9% | |
Diamond 1 Finance Corp. and Diamond 2 Finance Corp.: | | | | | | | | |
4.420%,6-15-21(B) | | | 3,000 | | | | 2,997 | |
5.450%,6-15-23(B) | | | 1,500 | | | | 1,526 | |
8.100%,7-15-36(B) | | | 500 | | | | 540 | |
| | | | | | | | |
| | | | | | | 5,063 | |
| | | | | | | | |
| |
Total Financials – 31.4% | | | | 170,723 | |
Health Care | | | | | | | | |
| |
Biotechnology – 1.4% | |
Amgen, Inc.: | | | | | | | | |
2.200%,5-11-20 | | | 2,000 | | | | 1,975 | |
3.875%,11-15-21 | | | 2,500 | | | | 2,533 | |
3.625%,5-22-24 | | | 1,500 | | | | 1,495 | |
4.950%,10-1-41 | | | 1,500 | | | | 1,530 | |
| | | | | | | | |
| | | | | | | 7,533 | |
| | | | | | | | |
| |
Health Care Distributors – 0.5% | |
McKesson Corp., | | | | | | | | |
3.650%,11-30-20 | | | 2,500 | | | | 2,511 | |
| | | | | | | | |
| | | | | | | | |
CORPORATE DEBT SECURITIES
(Continued) | | Principal | | | Value | |
| |
Health Care Distributors (Continued) | |
| |
Health Care Equipment – 0.5% | |
Becton Dickinson & Co., | | | | | | | | |
3.700%,6-6-27 | | $ | 3,000 | | | $ | 2,836 | |
| | | | | | | | |
| |
Health Care Services – 0.6% | |
Cardinal Health, Inc., | | | | | | | | |
3.079%,6-15-24 | | | 2,500 | | | | 2,348 | |
Quest Diagnostics, Inc., | | | | | | | | |
3.450%,6-1-26 | | | 1,000 | | | | 960 | |
| | | | | | | | |
| | | | | | | 3,308 | |
| | | | | | | | |
| |
Health Care Supplies – 1.2% | |
Abbott Laboratories: | | | | | | | | |
3.400%,11-30-23 | | | 700 | | | | 698 | |
4.750%,11-30-36 | | | 3,000 | | | | 3,132 | |
Medtronic, Inc. (GTD by Medtronic Global Holdings SCA and Medtronic plc), | | | | | | | | |
4.375%,3-15-35 | | | 1,752 | | | | 1,796 | |
Shire Acquisitions Investments Ireland Designated Activity Co., | | | | | | | | |
2.400%,9-23-21 | | | 1,000 | | | | 967 | |
| | | | | | | | |
| | | | | | | 6,593 | |
| | | | | | | | |
| |
Managed Health Care – 1.6% | |
Halfmoon Parent, Inc., | | | | | | | | |
3.400%,9-17-21(B) | | | 2,500 | | | | 2,494 | |
Humana, Inc., | | | | | | | | |
2.900%,12-15-22 | | | 5,000 | | | | 4,861 | |
UnitedHealth Group, Inc., | | | | | | | | |
3.500%,2-15-24 | | | 1,500 | | | | 1,509 | |
| | | | | | | | |
| | | | | | | 8,864 | |
| | | | | | | | |
| |
Pharmaceuticals – 2.1% | |
Bayer U.S. Finance II LLC, | | | | | | | | |
4.375%,12-15-28(B) | | | 2,500 | | | | 2,388 | |
Bayer U.S. Finance LLC, | | | | | | | | |
3.000%,10-8-21(B) | | | 1,500 | | | | 1,467 | |
Perrigo Finance Unlimited Co. (GTD by Perrigo Co. plc), | | | | | | | | |
3.500%,3-15-21 | | | 1,000 | | | | 983 | |
Takeda Pharmaceutical Co. Ltd., | | | | | | | | |
4.400%,11-26-23(B) | | | 3,000 | | | | 3,033 | |
Zoetis, Inc., | | | | | | | | |
3.900%,8-20-28 | | | 3,500 | | | | 3,431 | |
| | | | | | | | |
| | | | | | | 11,302 | |
| | | | | | | | |
| |
Total Health Care – 7.9% | | | | 42,947 | |
Industrials | | | | | | | | |
| |
Aerospace & Defense – 2.4% | |
BAE Systems Holdings, Inc.: | | | | | | | | |
3.850%,12-15-25(B) | | | 1,500 | | | | 1,488 | |
4.750%,10-7-44(B) | | | 1,000 | | | | 1,005 | |
Boeing Co. (The), | | | | | | | | |
1.650%,10-30-20 | | | 500 | | | | 489 | |
General Dynamics Corp., | | | | | | | | |
1.875%,8-15-23 | | | 3,000 | | | | 2,826 | |
Huntington Ingalls Industries, Inc., | | | | | | | | |
3.483%,12-1-27 | | | 1,000 | | | | 932 | |
Northrop Grumman Corp.: | | | | | | | | |
3.250%,1-15-28 | | | 2,250 | | | | 2,104 | |
4.030%,10-15-47 | | | 3,000 | | | | 2,732 | |
| | |
| SCHEDULE OF INVESTMENTS | | CORPORATE BOND (in thousands) |
DECEMBER 31, 2018
| | | | | | | | |
CORPORATE DEBT SECURITIES
(Continued) | | Principal | | | Value | |
| |
Aerospace & Defense (Continued) | |
Rockwell Collins, Inc., | | | | | | | | |
2.800%,3-15-22 | | $ | 1,500 | | | $ | 1,458 | |
| | | | | | | | |
| | | | | | | 13,034 | |
| | | | | | | | |
| |
Agricultural & Farm Machinery – 0.2% | |
CNH Industrial N.V., | | | | | | | | |
3.850%,11-15-27 | | | 1,000 | | | | 910 | |
| | | | | | | | |
| |
Air Freight & Logistics – 0.3% | |
FedEx Corp., | | | | | | | | |
3.300%,3-15-27 | | | 2,000 | | | | 1,903 | |
| | | | | | | | |
| |
Airlines – 1.0% | |
Aviation Capital Group Corp., | | | | | | | | |
2.875%,1-20-22 (A)(B) | | | 3,000 | | | | 2,903 | |
Aviation Capital Group LLC, | | | | | | | | |
3.500%,11-1-27 (B) | | | 2,000 | | | | 1,807 | |
Sydney Airport Finance, | | | | | | | | |
3.625%,4-28-26 (B) | | | 1,000 | | | | 957 | |
| | | | | | | | |
| | | | | | | 5,667 | |
| | | | | | | | |
| |
Electrical Components & Equipment – 0.2% | |
Hubbell, Inc., | | | | | | | | |
3.500%,2-15-28 | | | 1,000 | | | | 938 | |
| | | | | | | | |
| |
Environmental & Facilities Services – 0.6% | |
Waste Management, Inc. (GTD by Waste Management Holdings, Inc.): | | | | | | | | |
2.400%,5-15-23 | | | 1,000 | | | | 959 | |
4.100%,3-1-45 | | | 2,500 | | | | 2,417 | |
| | | | | | | | |
| | | | | | | 3,376 | |
| | | | | | | | |
| |
Industrial Conglomerates – 0.4% | |
3M Co., | | | | | | | | |
2.875%,10-15-27 | | | 2,000 | | | | 1,921 | |
| | | | | | | | |
| |
Railroads – 0.2% | |
Burlington Northern Santa Fe LLC, | | | | | | | | |
4.550%,9-1-44 | | | 1,000 | | | | 1,032 | |
| | | | | | | | |
| |
Total Industrials – 5.3% | | | | 28,781 | |
Information Technology | | | | | | | | |
| |
Communications Equipment – 0.1% | |
L-3 Communications Corp., | | | | | | | | |
3.850%,12-15-26 | | | 500 | | | | 484 | |
| | | | | | | | |
| |
Data Processing & Outsourced Services – 0.7% | |
Visa, Inc.: | | | | | | | | |
2.800%,12-14-22 | | | 3,000 | | | | 2,962 | |
4.300%,12-14-45 | | | 1,000 | | | | 1,041 | |
| | | | | | | | |
| | | | | | | 4,003 | |
| | | | | | | | |
| |
Electronic Components – 1.0% | |
Amphenol Corp., | | | | | | | | |
3.200%,4-1-24 | | | 2,500 | | | | 2,424 | |
Maxim Integrated Products, Inc., | | | | | | | | |
3.450%,6-15-27 | | | 3,500 | | | | 3,266 | |
| | | | | | | | |
| | | | | | | 5,690 | |
| | | | | | | | |
| |
It Consulting & Other Services – 0.7% | |
IBM Credit LLC, | | | | | | | | |
3.600%,11-30-21 | | | 3,500 | | | | 3,531 | |
| | | | | | | | |
| | | | | | | | |
CORPORATE DEBT SECURITIES
(Continued) | | Principal | | | Value | |
| |
IT Consulting & Other Services – 0.3% | |
Keysight Technologies, Inc., | | | | | | | | |
4.600%,4-6-27 | | $ | 1,500 | | | $ | 1,506 | |
| | | | | | | | |
| |
Semiconductors – 1.9% | |
Intel Corp.: | | | | | | | | |
3.100%,7-29-22 | | | 1,000 | | | | 1,001 | |
4.000%,12-15-32 | | | 1,500 | | | | 1,546 | |
4.100%,5-19-46 | | | 3,000 | | | | 2,942 | |
QUALCOMM, Inc.: | | | | | | | | |
2.900%,5-20-24 | | | 3,000 | | | | 2,856 | |
4.800%,5-20-45 | | | 500 | | | | 477 | |
4.300%,5-20-47 | | | 1,500 | | | | 1,334 | |
| | | | | | | | |
| | | | | | | 10,156 | |
| | | | | | | | |
| |
Systems Software – 1.4% | |
CA, Inc., | | | | | | | | |
5.375%,12-1-19 | | | 1,080 | | | | 1,094 | |
Microsoft Corp.: | | | | | | | | |
2.650%,11-3-22 | | | 2,000 | | | | 1,986 | |
4.250%,2-6-47 | | | 4,500 | | | | 4,731 | |
| | | | | | | | |
| | | | | | | 7,811 | |
| | | | | | | | |
| |
Technology Hardware, Storage & Peripherals – 1.0% | |
Apple, Inc.: | | | | | | | | |
2.400%,5-3-23 | | | 4,000 | | | | 3,868 | |
4.650%,2-23-46 | | | 1,500 | | | | 1,595 | |
| | | | | | | | |
| | | | | | | 5,463 | |
| | | | | | | | |
| |
Total Information Technology – 7.1% | | | | 38,644 | |
Materials | | | | | | | | |
| |
Diversified Chemicals – 0.2% | |
DowDuPont, Inc., | | | | | | | | |
3.766%,11-15-20 | | | 1,250 | | | | 1,262 | |
| | | | | | | | |
| |
Diversified Metals & Mining – 0.6% | |
Anglo American Capital plc: | | | | | | | | |
3.750%,4-10-22 (B) | | | 1,500 | | | | 1,466 | |
3.625%,9-11-24 (B) | | | 1,000 | | | | 944 | |
4.500%,3-15-28 (B) | | | 750 | | | | 696 | |
| | | | | | | | |
| | | | | | | 3,106 | |
| | | | | | | | |
| |
Fertilizers & Agricultural Chemicals – 0.4% | |
Mosaic Co. (The), | | | | | | | | |
3.250%,11-15-22 | | | 2,500 | | | | 2,441 | |
| | | | | | | | |
| |
Specialty Chemicals – 0.3% | |
Methanex Corp., | | | | | | | | |
5.250%,3-1-22 | | | 1,404 | | | | 1,416 | |
| | | | | | | | |
| |
Total Materials – 1.5% | | | | 8,225 | |
Real Estate | | | | | | | | |
| |
Health Care REITs – 0.5% | |
Health Care REIT, Inc., | | | | | | | | |
4.000%,6-1-25 | | | 1,300 | | | | 1,283 | |
Senior Housing Properties Trust, | | | | | | | | |
4.750%,2-15-28 | | | 1,500 | | | | 1,416 | |
| | | | | | | | |
| | | | | | | 2,699 | |
| | | | | | | | |
| | | | | | | | |
CORPORATE DEBT SECURITIES
(Continued) | | Principal | | | Value | |
| |
Hotel & Resort REITs – 0.6% | |
Hospitality Properties Trust, | | | | | | | | |
3.950%,1-15-28 | | $ | 3,700 | | | $ | 3,337 | |
| | | | | | | | |
| |
Industrial REITs – 0.1% | |
Aircastle Ltd., | | | | | | | | |
5.500%,2-15-22 | | | 598 | | | | 612 | |
| | | | | | | | |
| |
Specialized REITs – 2.1% | |
American Tower Corp.: | | | | | | | | |
3.070%,3-15-23 (B) | | | 1,500 | | | | 1,477 | |
3.000%,6-15-23 | | | 2,500 | | | | 2,405 | |
4.400%,2-15-26 | | | 1,000 | | | | 999 | |
3.125%,1-15-27 | | | 1,000 | | | | 906 | |
American Tower Trust I, | | | | | | | | |
3.652%,3-23-28 (B) | | | 1,000 | | | | 999 | |
Crown Castle International Corp.: | | | | | | | | |
2.250%,9-1-21 | | | 500 | | | | 483 | |
5.250%,1-15-23 | | | 1,027 | | | | 1,067 | |
3.200%,9-1-24 | | | 1,250 | | | | 1,183 | |
4.000%,3-1-27 | | | 2,000 | | | | 1,915 | |
| | | | | | | | |
| | | | | | | 11,434 | |
| | | | | | | | |
| |
Total Real Estate – 3.3% | | | | 18,082 | |
Utilities | | | | | | | | |
| |
Electric Utilities – 5.5% | |
AEP Transmission Co. LLC, | | | | | | | | |
4.250%,9-15-48 | | | 3,000 | | | | 3,027 | |
CenterPoint Energy, Inc., | | | | | | | | |
4.250%,11-1-28 | | | 5,000 | | | | 5,070 | |
Commonwealth Edison Co., | | | | | | | | |
3.650%,6-15-46 | | | 3,000 | | | | 2,720 | |
Consumers Energy Co., | | | | | | | | |
4.350%,4-15-49 | | | 1,500 | | | | 1,560 | |
Duke Energy Carolinas LLC, | | | | | | | | |
3.750%,6-1-45 | | | 5,500 | | | | 5,076 | |
Duke Energy Indiana LLC, | | | | | | | | |
3.750%,5-15-46 | | | 1,000 | | | | 923 | |
Edison International: | | | | | | | | |
2.125%,4-15-20 | | | 1,000 | | | | 973 | |
2.950%,3-15-23 | | | 2,000 | | | | 1,889 | |
Entergy Arkansas, Inc., | | | | | | | | |
4.000%,6-1-28 | | | 1,800 | | | | 1,838 | |
Kansas City Power & Light Co., | | | | | | | | |
4.200%,3-15-48 | | | 1,000 | | | | 971 | |
MidAmerican Energy Co., | | | | | | | | |
3.950%,8-1-47 | | | 1,000 | | | | 970 | |
National Rural Utilities Cooperative Finance Corp., | | | | | | | | |
4.400%,11-1-48 | | | 2,000 | | | | 2,086 | |
Virginia Electric and Power Co., Series B, | | | | | | | | |
4.600%,12-1-48 | | | 1,500 | | | | 1,567 | |
Wisconsin Electric Power Co.: | | | | | | | | |
4.250%,6-1-44 | | | 250 | | | | 248 | |
4.300%,10-15-48 | | | 1,250 | | | | 1,289 | |
| | | | | | | | |
| | | | | | | 30,207 | |
| | | | | | | | |
| |
Gas Utilities – 0.3% | |
Southern California Gas Co., | | | | | | | | |
4.300%,1-15-49 | | | 1,500 | | | | 1,537 | |
| | | | | | | | |
| | |
| SCHEDULE OF INVESTMENTS | | CORPORATE BOND (in thousands) |
DECEMBER 31, 2018
| | | | | | | | |
CORPORATE DEBT SECURITIES
(Continued) | | Principal | | | Value | |
| |
Independent Power Producers & Energy
Traders – 0.4% | |
Black Hills Corp., | | | | | | | | |
4.350%,5-1-33 | | $ | 2,000 | | | $ | 2,006 | |
| | | | | | | | |
| |
Multi-Utilities – 1.9% | |
Baltimore Gas and Electric Co., | | | | | | | | |
4.250%,9-15-48 | | | 1,500 | | | | 1,492 | |
Berkshire Hathaway Energy Co., | | | | | | | | |
2.800%,1-15-23 | | | 1,500 | | | | 1,466 | |
Dominion Resources, Inc., | | | | | | | | |
2.750%,1-15-22 | | | 3,000 | | | | 2,922 | |
Pacific Gas and Electric Co.: | | | | | | | | |
3.300%,12-1-27 | | | 500 | | | | 408 | |
3.950%,12-1-47 | | | 1,000 | | | | 760 | |
Public Service Electric and Gas Co.: | | | | | | | | |
1.900%,3-15-21 | | | 2,000 | | | | 1,953 | |
2.250%,9-15-26 | | | 1,500 | | | | 1,371 | |
| | | | | | | | |
| | | | | | | 10,372 | |
| | | | | | | | |
| |
Water Utilities – 0.4% | |
California Water Service Co., | | | | | | | | |
5.875%,5-1-19 | | | 2,000 | | | | 2,018 | |
| | | | | | | | |
| |
Total Utilities – 8.5% | | | | 46,140 | |
| |
TOTAL CORPORATE DEBT
SECURITIES – 92.0% | | | $ | 500,566 | |
(Cost: $511,998) | |
| |
MORTGAGE-BACKED SECURITIES | | | | | |
| |
Non-Agency REMIC/CMO – 0.1% | |
MASTR Adjustable Rate Mortgage Trust2005-1 (Mortgage spread to10-year U.S. Treasury index), | | | | | | | | |
4.234%,3-25-35 (C) | | | 1,003 | | | | 741 | |
Structured Adjustable Rate Mortgage Loan Trust, Mortgage Pass-Through Certificates, Series2004-1 (Mortgage spread to3-year U.S. Treasury index), | | | | | | | | |
4.290%,2-25-34 (C) | | | 13 | | | | – | * |
| | | | | | | | |
| | | | | | | 741 | |
| | | | | | | | |
| |
TOTAL MORTGAGE-BACKED
SECURITIES – 0.1% | | | $ | 741 | |
(Cost: $1,010) | |
| |
MUNICIPAL BONDS – TAXABLE | | | | | |
| |
New York – 0.8% | |
NYC Indl Dev Agy, Rental Rev Bonds (Yankee Stadium Proj), Ser 2009, | | | | | | | | |
11.000%,3-1-29 (B) | | | 3,205 | | | | 4,227 | |
| | | | | | | | |
| |
Ohio – 0.4% | |
OH State Univ, Gen Receipts Bonds (Multiyear Debt Issuance Prog), Ser 2016A, | | | | | | | | |
3.798%,12-1-46 | | | 2,000 | | | | 1,979 | |
| | | | | | | | |
| | | | | | | | |
MUNICIPAL BONDS – TAXABLE
(Continued) | | Principal | | | Value | |
| |
Pennsylvania – 0.1% | |
Cmnwlth of PA, GO Bonds, Third Ser B of 2010 (Federally Taxable – Build America Bonds), | | | | | | | | |
4.750%,7-15-22 | | $ | 750 | | | $ | 771 | |
| | | | | | | | |
| |
TOTAL MUNICIPAL BONDS –
TAXABLE – 1.3% | | | $ | 6,977 | |
(Cost: $5,977) | |
| |
OTHER GOVERNMENT SECURITIES (D) | | | | | |
| |
Canada – 0.6% | |
Province de Quebec, | | | | | | | | |
7.140%,2-27-26 | | | 2,500 | | | | 3,063 | |
| | | | | | | | |
| |
TOTAL OTHER GOVERNMENT
SECURITIES – 0.6% | | | $ | 3,063 | |
(Cost: $2,723) | |
| |
UNITED STATES GOVERNMENT AGENCY OBLIGATIONS | | | | | |
| |
Agency Obligations – 0.2% | |
Tennessee Valley Authority, | | | | | | | | |
2.875%,2-1-27 | | | 1,000 | | | | 990 | |
| | | | | | | | |
| |
Mortgage-Backed Obligations – 1.0% | |
Federal Home Loan Mortgage Corp. Agency REMIC/CMO (Mortgage spread to5-year U.S. Treasury index), | | | | | | | | |
4.336%,12-25-44 (B)(C) | | | 5,000 | | | | 5,164 | |
Government National Mortgage Association Agency REMIC/CMO, | | | | | | | | |
0.017%,6-17-45 (E) | | | 13 | | | | – | * |
| | | | | | | | |
| | | | | | | 5,164 | |
| | | | | | | | |
| |
TOTAL UNITED STATES GOVERNMENT AGENCY OBLIGATIONS – 1.2% | | | $ | 6,154 | |
(Cost: $6,250) | |
| |
SHORT-TERM SECURITIES | | | | | |
| |
Commercial Paper (F) – 0.9% | |
J.M. Smucker Co. (The), | | | | | | | | |
2.750%,1-2-19 | | | 5,011 | | | | 5,010 | |
| | | | | | | | |
| |
Master Note – 0.9% | |
Toyota Motor Credit Corp.(1-Month U.S. LIBOR plus 15 bps), | | | | | | | | |
2.720%,1-7-19 (G) | | | 4,953 | | | | 4,953 | |
| | | | | | | | |
Money Market Funds – 0.0% | |
Dreyfus Institutional Preferred Government Money Market Fund – Institutional Shares, | | | | | | | | |
2.400%, (H)(I) | | | 112 | | | | 112 | |
| | | | | | | | |
| |
TOTAL SHORT-TERM SECURITIES – 1.8% | | | $ | 10,075 | |
(Cost: $10,076) | | | | | | | | |
| | | | | | |
| | | | | Value | |
| |
TOTAL INVESTMENT
SECURITIES – 99.2% | | $ | 539,589 | |
(Cost: $550,308) | |
| |
CASH AND OTHER ASSETS, NET OF LIABILITIES – 0.8% | | | 4,319 | |
| |
NET ASSETS – 100.0% | | $ | 543,908 | |
| | |
| SCHEDULE OF INVESTMENTS | | CORPORATE BOND (in thousands) |
DECEMBER 31, 2018
Notes to Schedule of Investments
| * | Not shown due to rounding. |
| (A) | All or a portion of securities with an aggregate value of $434 are on loan. |
| (B) | Securities were purchased pursuant to an exemption from registration available under Rule 144A under the Securities Act of 1933 and may only be resold in transactions exempt from registration, normally to qualified institutional buyers. At December 31, 2018 the total value of these securities amounted to $102,791 or 18.9% of net assets. |
| (C) | Variable rate security. Interest rate disclosed is that which is in effect at December 31, 2018. Description of the reference rate and spread, if applicable, are included in the security description. |
| (D) | Other Government Securities may include emerging markets sovereign, quasi-sovereign, corporate and supranational agency and organization debt securities. |
| (E) | Interest-only security. Amount shown as principal represents notional amount for computation of interest. |
| (F) | Rate shown is the yield to maturity at December 31, 2018. |
| (G) | Variable rate security. Interest rate disclosed is that which is in effect at December 31, 2018. Date shown represents the date that the variable rate resets. Description of the reference rate and spread, if applicable, are included in the security description. |
| (H) | Investment made with cash collateral received from securities on loan. |
| (I) | Rate shown is the annualized7-day yield at December 31, 2018. |
The following table is a summary of the valuation of the Portfolio’s investments by the fair value hierarchy levels as of December 31, 2018. See Note 3 to the Financial Statements for further information regarding fair value measurement.
| | | | | | | | | | | | |
| | | Level 1 | | | Level 2 | | | Level 3 | |
Assets | | | | | | | | | | | | |
Investments in Securities | | | | | | | | | | | | |
Preferred Stocks | | $ | 2,428 | | | $ | — | | | $ | — | |
Asset-Backed Securities | | | — | | | | 9,585 | | | | — | |
Corporate Debt Securities | | | — | | | | 500,566 | | | | — | |
Mortgage-Backed Securities | | | — | | | | 741 | | | | — | |
Municipal Bonds | | | — | | | | 6,977 | | | | — | |
Other Government Securities | | | — | | | | 3,063 | | | | — | |
United States Government Agency Obligations | | | — | | | | 6,154 | | | | — | |
Short-Term Securities | | | 112 | | | | 9,963 | | | | — | |
Total | | $ | 2,540 | | | $ | 537,049 | | | $ | — | |
The following acronyms are used throughout this schedule:
CMO = Collateralized Mortgage Obligation
GTD = Guaranteed
LIBOR = London Interbank Offered Rate
REIT = Real Estate Investment Trust
REMIC = Real Estate Mortgage Investment Conduit
See Accompanying Notes to Financial Statements.
| | |
| MANAGEMENT DISCUSSION | | GLOBAL BOND |
(UNAUDITED)
Mark G. Beischel
Below, Mark G. Beischel, CFA, portfolio manager of Ivy VIP Global Bond, discusses positioning, performance and results for the fiscal year ended December 31, 2018. Mr. Beischel has managed the Portfolio since its inception in 2010 and has 25 years of industry experience.
Fiscal Year Performance
| | | | |
For the 12 months ended December 31, 2018 | | | | |
Ivy VIP Global Bond (Class II shares at net asset value) | | | -0.18% | |
Benchmark(s) and/or Morningstar and Lipper Categories | | | | |
Bloomberg Barclays Global Credit1-10 Year Hedged Index* | | | 0.34% | |
| (generally reflects the performance of the global investment grade local currency corporate and government-related bond markets with a maturity greater than 1 year and less than 10 years) | | | | |
Bloomberg Barclays Multiverse Index | | | -1.36% | |
(generally reflects the performance of the global bond market) | | | | |
Morningstar Multisector Bond Universe Average | | | -1.52% | |
(generally reflects the performance of the universe of funds with similar investment objectives) | | | | |
Lipper Variable Annuity Global Income Funds Universe Average | | | -1.99% | |
(generally reflects the performance of the universe of funds with similar investment objectives) | | | | |
*Effective April 30, 2018, the Portfolio’s benchmark changed from the Bloomberg Barclays Multiverse Index to the Bloomberg Barclays Global Credit1-10 Year Hedged Index, because the Bloomberg Barclays Global Credit1-10 Year Hedged Index is more reflective of the types of securities in which the Portfolio invests.
Please note that the Portfolio returns include applicable investment fees and expenses, whereas the index returns do not include any such fees. Also, the Portfolio’s performance data does not take into account any product expenses or charges associated with owning a variable life or annuity policy, which is invested in Ivy Funds Variable Insurance Portfolios.
Slowing global climate
Following a high-water-mark growth rate of 4.2% in the second quarter of 2018, which was buoyed by tax stimulus and increased government spending, growth slowed during the second half of the fiscal year. Despite slowing growth, the U.S. Federal Reserve (Fed) continued to normalize its policy rate, initiating four rate hikes over the fiscal year. The Federal Funds Rate stood at 2.5% at fiscal year end. In currency markets, the trade-weighted U.S. dollar strengthened throughout the fiscal year but stabilized towards year end as the market anticipated a more dovish Fed in 2019. Credit spreads and interest rates remained relatively stable, though the market started pricing in slower growth towards the end of the third quarter. The10-year U.S. Treasury yield closed the year at approximately 2.7%, a significant move from the yield rates of 3.2% experienced in November.
The European Central Bank (ECB) completed its quantitative easing by December and is expected to continue to reinvest its balance sheet throughout 2019. Expectations are for the ECB to raise rates by the summer of 2019. During the fourth quarter, political concerns emerged from elections as Italy’s new government brought the European Union’s sustainability back into the spotlight. The new government’s targeted budget deficit was more aggressive than market expectations which resulted in the euro weakening and Italian government rates increasing.
The Bank of Japan (BoJ) stood idle and did not provide any future guidance in a change in direction with its monetary policy of targeting interest rates. Inflation forecasts suggest that while the BoJ might have overcome deflation, the 2% goal is still not on the horizon.
The Trump Administration’s focus on trade with China has led people to speculate that tariffs are likely to rise over the next year. Although China policymakers appear intent to ease tensions with the purchases of U.S. soybeans, rescinding retaliatory tariffs on U.S. autos and backing away from “made in China 2025”, it is unclear if that is enough to satisfy the White House.
Performance
Ivy VIP Global Bond outperformed its Lipper and Morningstar peer averages, however the Portfolio underperformed its benchmark, the Bloomberg Barclays Global Credit1-10 Year Hedged Index, for the fiscal year ended December 31, 2018. The Portfolio’s higher credit quality was a detriment to performance relative to the benchmark as lower-quality bonds outperformed their higher-quality counterparts for the vast majority of the fiscal year. That said, therisk-off environment that started in October reversed this trend and benefitted the Fund’s relative performance during the fourth quarter. The Portfolio’s performance also was positively impacted by the large weighting to U.S. dollar credit. The U.S. dollar
(UNAUDITED)
strengthened over the course of the fiscal year versus other major currencies. The Portfolio had a 99% weighting to the U.S. dollar and its lack of exposure to the euro, British pound and Canadian dollar enhanced its performance as those currencies depreciated 4.5%, 5.6%, and 7.8%, respectively to the U.S. dollar. The Portfolio’s large weighting in corporate credit enhanced relative performance despite credit spreads widening through the year. The carry in yield was enough to offset the widening in spreads.
Seeking low volatility
Amid market volatility, we have maintained a low duration strategy and have increased the Portfolio’s liquidity profile. We believe a shorter duration strategy will enable the Portfolio to focus on higher yielding corporate bonds, while greater liquidity will allow us to be more responsive to changing market environments.
We continue to focus on maintaining what we believe to be proper diversification for the Portfolio. The Portfolio has the opportunity to invest in different securities, sectors, countries and currencies. This flexibility allows us to seek less volatility with a reasonable yield that we believe will reward investors over the longer term.
We continue to search for value in the corporate bond space. Some of the best returns have been, and we think will continue to be, from emerging-market bonds. We believe there will be more opportunities to redeploy liquidity due to the volatility associated with Washington’s politics and the Fed’s normalization of interest rates.
Looking ahead
On the back of lower growth in the first half of 2019, we believe the Federal Open Market Committee (FOMC) will raise rates no more than once this year. Labor markets continue to grow and beat expectations, which has kept consumer confidence near cycle highs and supported strong spending growth. U.S. growth is still above trend with healthy real income growth and an elevated personal savings rate that we believe should insulate against the impact from the drop that the stock market experienced during the fourth quarter.
We believe trade will continue to be a risk factor going forward. There is the potential for more tariffs, followed by retaliatory action that might impact companies’ capital investment plans. A negative feedback loop might impact markets, stocks and ultimately consumer confidence.
The balance sheet runoff has proceeded smoothly and has not been disruptive to the markets. The FOMC reiterated its intension to use interest policy rather than the balance sheet as its active pool. We expect the balance sheet to continue to runoff until it reaches$3.0-$3.5 trillion.
The federal budget deficit is expected to rise to $1.0 trillion (4.7% GDP) in 2019 from structural forces which have deteriorated by a much greater amount than the offsetting cyclical improvement.
Past performance is not a guarantee of future results. The value of the Portfolio’s shares will change, and you could lose money on your investment.
Certain U.S. government securities in which the Portfolio may invest, such as Treasury securities and securities issued by the Government National Mortgage Association (GinnieMae), are backed by the full faith and credit of the U.S. government. However, other U.S. government securities in which the Portfolio may invest, such as securities issued by the Federal National Mortgage Association (Fannie Mae), the Federal Home Loan Mortgage Corporation (Freddie Mac) and the Federal Home Loan Banks (FHLB), are not backed by the full faith and credit of the U.S. government, are not insured or guaranteed by the U.S. government and, instead, may be supported only by the right of the issuer to borrow from the U.S. Treasury or by the credit of the issuer.
International investing involves additional risks including currency fluctuations, political or economic conditions affecting the foreign country, and differences in accounting standards and foreign regulations. Fixed income securities are subject to interest rate risk and, as such, the net asset value of the Fund may fall as interest rates rise. These and other risks are more fully described in the Fund’s prospectus.
Diversification and asset allocation are investment strategies that attempt to manage risk within the Portfolio but they do not guarantee profits or protect against loss in declining markets.
The opinions expressed in this report are those of the portfolio manager and are current only through the end of the period of the report as stated on the cover. The manager’s views are subject to change at any time based on market and other conditions, and no forecasts can be guaranteed.
The index noted is unmanaged and includes reinvested dividends. One cannot invest directly in an index, nor is an index representative of the Ivy VIP Global Bond.
| | |
| PORTFOLIO HIGHLIGHTS | | GLOBAL BOND |
ALL DATA IS AS OF DECEMBER 31, 2018 (UNAUDITED)
Asset Allocation
| | | | |
Stocks | | | 0.6% | |
Bonds | | | 90.4% | |
Corporate Debt Securities | | | 63.3% | |
Other Government Securities | | | 13.6% | |
United States Government Obligations | | | 13.5% | |
Cash and Other Assets (Net of Liabilities), and Cash Equivalents+ | | | 9.0% | |
Quality Weightings
| | | | |
Investment Grade | | | 66.5% | |
AAA | | | 13.5% | |
AA | | | 3.3% | |
A | | | 12.4% | |
BBB | | | 37.3% | |
Non-Investment Grade | | | 23.9% | |
BB | | | 16.8% | |
B | | | 6.4% | |
CCC | | | 0.2% | |
Non-rated | | | 0.5% | |
Cash and Other Assets (Net of Liabilities), and Cash Equivalents+ and Equities | | | 9.6% | |
Our preference is to always use ratings obtained from Standard & Poor’s, Moody’s, and Fitch. It is each Portfolio’s general policy to classify such security at the lower rating level if only two ratings are available. If more than two ratings are available and a median exists, the median is used. If more than two ratings exist without a median, the lower of the two middle ratings is used. We do not evaluate these ratings, but simply assign them to the appropriate credit quality category as determined by the rating agency.
Country Weightings
| | | | |
North America | | | 36.9 | % |
United States | | | 28.9 | % |
Mexico | | | 6.8 | % |
Other North America | | | 1.2 | % |
Europe | | | 20.9 | % |
United Kingdom | | | 5.4 | % |
Netherlands | | | 4.1 | % |
Other Europe | | | 11.4 | % |
Pacific Basin | | | 13.0 | % |
Indonesia | | | 3.8 | % |
Other Pacific Basin | | | 9.2 | % |
South America | | | 12.7 | % |
Brazil | | | 3.7 | % |
Other South America | | | 9.0 | % |
Bahamas/Caribbean | | | 2.8 | % |
Middle East | | | 4.7 | % |
Cash and Other Assets (Net of Liabilities), and Cash Equivalents+ | | | 9.0 | % |
+ Cash equivalents are defined as highly liquid securities with maturities of less than three months. Cash equivalents may include U.S. Government Treasury bills, bank certificates of deposit, bankers’ acceptances, corporate commercial paper and other money market instruments.
| | |
| COMPARISON OF CHANGE IN VALUE OF $10,000 INVESTMENT | | GLOBAL BOND |
(UNAUDITED)
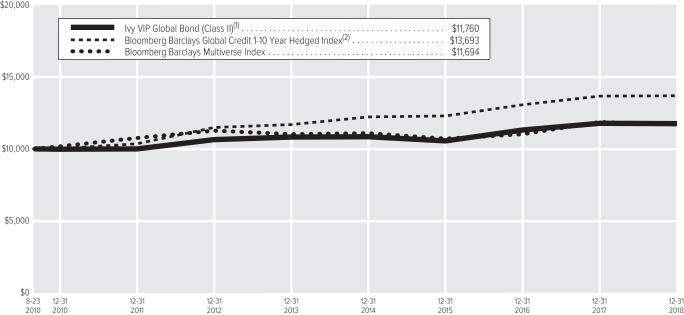
| (1) | The value of the investment in the Portfolio is impacted by the ongoing expenses of the Portfolio and assumes reinvestment of dividends and distributions. |
| (2) | The Portfolio’s benchmark changed from Bloomberg Barclays Multiverse Index, effective April 30, 2018. IICO believes that the Bloomberg Barclays Global Credit1-10 Year Hedged Index is more reflective of the types of securities in which the Portfolio invests than the Bloomberg Barclays Multiverse Index. |
| | | | |
| |
| Average Annual Total Return(3) | | Class II | |
1-year period ended12-31-18 | | | -0.18% | |
5-year period ended12-31-18 | | | 1.67% | |
10-year period ended12-31-18 | | | — | |
Since Inception of Class through12-31-18(4) | | | 1.96% | |
| (3) | Data quoted is past performance and current performance may be lower or higher. Past performance is no guarantee of future results. Investment return and principal value of an investment will fluctuate and shares, when redeemed, may be worth more or less than their original cost. Please visit www.ivyinvestments.com for the Portfolio’s most recentmonth-end performance. Performance data quoted does not reflect any expenses or charges associated with owning a variable life insurance policy or variable annuity contract that invests in the Portfolio’s shares. When such charges are deducted, actual investment performance in a variable policy or contract will be lower. |
| (4) | 8-23-10 (the date on which shares were first acquired by shareholders). |
Past performance is not necessarily indicative of future performance. Indexes are unmanaged. The performance graph and table do not reflect the deduction of taxes that a shareholder would pay on Portfolio distributions or on the redemption of Portfolio shares. Performance results may include the effect of expense reduction arrangements for some or all of the periods shown. If those arrangements had not been in place, the performance results for those periods would have been lower.
| | |
| SCHEDULE OF INVESTMENTS | | GLOBAL BOND (in thousands) |
DECEMBER 31, 2018
| | | | | | | | |
| COMMON STOCKS | | Shares | | | Value | |
Panama | |
| |
Financials – 0.6% | |
Banco Latinoamericano de Comercio Exterior S.A. | | | 8 | | | $ | 132 | |
| | | | | | | | |
| |
Total Panama – 0.6% | | | $ | 132 | |
| |
TOTAL COMMON STOCKS – 0.6% | | | $ | 132 | |
(Cost: $194) | | | | | | | | |
| | |
| CORPORATE DEBT SECURITIES | | Principal | | | | |
Argentina | |
| |
Energy – 1.1% | |
Pampa Energia S.A. | | | | | | | | |
7.500%,1-24-27 (A) | | $ | 150 | | | | 126 | |
Pan American Energy LLC | | | | | | | | |
7.875%,5-7-21 | | | 100 | | | | 100 | |
| | | | | | | | |
| | | | | | | 226 | |
| | | | | | | | |
| |
Total Argentina –1.1% | | | $ | 226 | |
Australia | |
| |
Utilities – 0.9% | |
Ausgrid Finance Pty Ltd. | | | | | | | | |
3.850%,5-1-23 (A) | | | 200 | | | | 200 | |
| | | | | | | | |
| |
Total Australia – 0.9% | | | $ | 200 | |
| |
Austria | |
| |
Consumer Staples – 0.9% | |
ESAL GmbH (GTD by JBS S.A. and JBS Hungary Holdings Kft.) | | | | | | | | |
6.250%,2-5-23 (A) | | | 200 | | | | 198 | |
| | | | | | | | |
| |
Total Austria – 0.9% | | | $ | 198 | |
Bermuda | |
| |
Consumer Staples – 0.5% | |
Bacardi Ltd. | | | | | | | | |
4.450%,5-15-25 (A) | | | 100 | | | | 99 | |
| | | | | | | | |
| |
Total Bermuda – 0.5% | | | $ | 99 | |
Brazil | |
| |
Consumer Staples – 0.9% | |
Cosan Ltd. | | | | | | | | |
5.950%,9-20-24 (A) | | | 200 | | | | 197 | |
| | | | | | | | |
| |
Energy – 0.0% | |
Lancer Finance Co. (SPV) Ltd. | | | | | | | | |
5.850%,12-12-16 (A)(B) | | | 15 | | | | — | * |
| | | | | | | | |
| |
Financials – 0.0% | |
Banco Cruzeiro do Sul S.A. | | | | | | | | |
7.000%,7-8-13 (B) | | | 96 | | | | — | * |
| | | | | | | | |
| |
Materials – 1.0% | |
Fibria Overseas Finance Ltd. | | | | | | | | |
4.000%,1-14-25 (C) | | | 150 | | | | 142 | |
Vale Overseas Ltd. | | | | | | | | |
6.250%,8-10-26 | | | 50 | | | | 54 | |
| | | | | | | | |
| | | | | | | 196 | |
| | | | | | | | |
| | | | | | | | |
CORPORATE DEBT SECURITIES
(Continued) | | Principal | | | Value | |
Utilities – 0.9% | |
Aegea Finance S.a.r.l. | | | | | | | | |
5.750%,10-10-24 (A) | | $ | 200 | | | $ | 190 | |
| | | | | | | | |
| |
Total Brazil – 2.8% | | | $ | 583 | |
Canada | |
| |
Energy – 0.4% | |
TransCanada PipeLines Ltd. | | | | | | | | |
4.250%,5-15-28 | | | 100 | | | | 99 | |
| | | | | | | | |
| |
Financials – 0.2% | |
Royal Bank of Canada | | | | | | | | |
4.650%,1-27-26 | | | 50 | | | | 52 | |
| | | | | | | | |
| |
Total Canada – 0.6% | | | $ | 151 | |
Cayman Islands | |
| |
Industrials – 0.5% | |
Guanay Finance Ltd. | | | | | | | | |
6.000%,12-15-20 (A) | | | 109 | | | | 109 | |
| | | | | | | | |
| |
Materials – 1.8% | |
Braskem Finance Ltd. (GTD by Braskem S.A.) | | | | | | | | |
5.750%,4-15-21 (A) | | | 200 | | | | 205 | |
Inversiones CMPC S.A. (GTD by Empresas CMPC S.A.) | | | | | | | | |
4.375%,5-15-23 (A) | | | 200 | | | | 198 | |
| | | | | | | | |
| | | | | | | 403 | |
| | | | | | | | |
| |
Total Cayman Islands – 2.3% | | | $ | 512 | |
Chile | |
| |
Financials – 0.7% | |
Banco Santander Chile | | | | | | | | |
2.500%,12-15-20 (A) | | | 150 | | | | 146 | |
| | | | | | | | |
| |
Industrials – 0.9% | |
LATAM Airlines Group S.A. | | | | | | | | |
7.250%,6-9-20 (A) | | | 200 | | | | 204 | |
| | | | | | | | |
| |
Materials – 0.9% | |
Celulosa Arauco y Constitucion S.A. | | | | | | | | |
4.500%,8-1-24 (C) | | | 200 | | | | 198 | |
| | | | | | | | |
| |
Utilities – 0.4% | |
Enel Chile S.A. | | | | | | | | |
4.875%,6-12-28 | | | 80 | | | | 80 | |
| | | | | | | | |
| |
Total Chile – 2.9% | | | $ | 628 | |
China | |
| |
Communication Services – 0.9% | |
Tencent Holdings Ltd. | | | | | | | | |
2.985%,1-19-23 (A) | | | 200 | | | | 194 | |
| | | | | | | | |
Energy – 0.9% | |
Sinopec Group Overseas Development (2018) Ltd. | | | | | | | | |
4.125%,9-12-25 (A) | | | 200 | | | | 200 | |
| | | | | | | | |
| |
Total China – 1.8% | | | $ | 394 | |
| | | | | | | | |
CORPORATE DEBT SECURITIES
(Continued) | | Principal | | | Value | |
Columbia | |
| |
Financials – 0.9% | |
Banco de Bogota S.A. | | | | | | | | |
5.375%,2-19-23 (A) | | $ | 200 | | | $ | 199 | |
| | | | | | | | |
| |
Utilities – 0.8% | |
Emgesa S.A. E.S.P. | | | | | | | | |
8.750%,1-25-21 (D) | | | COP302,000 | | | | 97 | |
Empresas Publicas de Medellin E.S.P. | | | | | | | | |
8.375%,2-1-21 (D) | | | 274,000 | | | | 85 | |
| | | | | | | | |
| | | | | | | 182 | |
| | | | | | | | |
| |
Total Columbia – 1.7% | | | $ | 381 | |
Denmark | |
| |
Financials – 0.9% | |
Danske Bank A.S. | | | | | | | | |
2.700%,3-2-22 (A) | | $ | 200 | | | | 192 | |
| | | | | | | | |
| |
Total Denmark – 0.9% | | | $ | 192 | |
France | |
| |
Financials – 0.9% | |
BNP Paribas S.A. | | | | | | | | |
7.625%,12-29-49 (A) | | | 200 | | | | 204 | |
| | | | | | | | |
| |
Total France – 0.9% | | | $ | 204 | |
Hong Kong | |
| |
Financials – 0.9% | |
Bangkok Bank Public Co. Ltd. | | | | | | | | |
4.050%,3-19-24 (A) | | | 200 | | | | 201 | |
| | | | | | | | |
| |
Total Hong Kong – 0.9% | | | $ | 201 | |
India | |
| |
Industrials – 0.9% | |
Adani Ports and Special Economic Zone Ltd. | | | | | | | | |
3.500%,7-29-20 (A) | | | 200 | | | | 198 | |
| | | | | | | | |
| |
Materials – 0.8% | |
Vedanta Resources plc | | | | | | | | |
6.375%,7-30-22 (A) | | | 200 | | | | 179 | |
| | | | | | | | |
| |
Total India—1.7% | | | $ | 377 | |
Indonesia | |
| |
Utilities – 0.9% | |
Perusahaan Listrik Negara | | | | | | | | |
5.450%,5-21-28 (A) | | | 200 | | | | 202 | |
| | | | | | | | |
| |
Total Indonesia—0.9% | | | $ | 202 | |
Ireland | |
| |
Financials – 1.6% | |
MTS International Funding Ltd. | | | | | | | | |
5.000%,5-30-23 (A) | | | 350 | | | | 341 | |
| | | | | | | | |
| |
Total Ireland—1.6% | | | $ | 341 | |
| | |
| SCHEDULE OF INVESTMENTS | | GLOBAL BOND (in thousands) |
DECEMBER 31, 2018
| | | | | | | | |
CORPORATE DEBT SECURITIES
(Continued) | | Principal | | | Value | |
Japan | |
| |
Financials – 1.4% | |
Mitsubishi UFJ Financial Group, Inc. | | | | | | | | |
3.287%,7-25-27 | | $ | 100 | | | $ | 95 | |
Sumitomo Mitsui Financial Group, Inc.: | | | | | | | | |
3.748%,7-19-23 | | | 110 | | | | 110 | |
3.936%,10-16-23 | | | 100 | | | | 102 | |
| | | | | | | | |
| | | | | | | 307 | |
| | | | | | | | |
| |
Total Japan – 1.4% | | | $ | 307 | |
Luxembourg | |
| |
Consumer Staples – 0.8% | |
Minerva Luxembourg S.A. | | | | | | | | |
5.875%,1-19-28(A) | | | 200 | | | | 174 | |
| | | | | | | | |
| |
Information Technology – 0.8% | |
Atento Luxco 1 S.A. | | | | | | | | |
6.125%,8-10-22 (A) | | | 175 | | | | 170 | |
| | | | | | | | |
| |
Total Luxembourg – 1.6% | | | $ | 344 | |
Mexico | |
| |
Consumer Discretionary – 0.9% | |
Nemak S.A.B. de C.V. | | | | | | | | |
4.750%,1-23-25 (A) | | | 200 | | | | 187 | |
| | | | | | | | |
| |
Consumer Staples – 0.9% | |
Grupo Bimbo S.A.B. de C.V. | | | | | | | | |
4.875%,6-30-20 (A) | | | 200 | | | | 204 | |
| | | | | | | | |
| |
Financials – 2.3% | |
Banco Santander S.A. | | | | | | | | |
4.125%,11-9-22(A) | | | 300 | | | | 296 | |
Unifin Financiera S.A.B. de C.V. SOFOM E.N.R. | | | | | | | | |
7.250%,9-27-23 (A) | | | 200 | | | | 184 | |
| | | | | | | | |
| | | | | | | 480 | |
| | | | | | | | |
| |
Materials – 1.6% | |
C5 Capital (SPV) Ltd.(3-Month U.S. LIBOR plus 428 bps) | | | | | | | | |
7.080%,12-29-49 (A)(E) | | | 150 | | | | 146 | |
CEMEX S.A.B. de C.V. | | | | | | | | |
7.750%,4-16-26 (A)(C) | | | 200 | | | | 210 | |
| | | | | | | | |
| | | | | | | 356 | |
| | | | | | | | |
| |
Total Mexico – 5.7% | | | $ | 1,227 | |
Netherlands | |
| |
Communication Services – 0.9% | |
VTR Finance B.V. | | | | | | | | |
6.875%,1-15-24 (A) | | | 200 | | | | 200 | |
| | | | | | | | |
| |
Energy – 0.1% | |
Petrobras Global Finance B.V. (GTD by Petroleo Brasileiro S.A.) | | | | | | | | |
8.375%,5-23-21 | | | 16 | | | | 17 | |
| | | | | | | | |
| |
Financials – 3.1% | |
Cooperatieve Rabobank U.A. | | | | | | | | |
3.875%,2-8-22 | | | 75 | | | | 76 | |
| | | | | | | | |
CORPORATE DEBT SECURITIES
(Continued) | | Principal | | | Value | |
Financials (Continued) | |
Enel Finance International N.V. | | | | | | | | |
4.625%,9-14-25 (A) | | $ | 200 | | | $ | 192 | |
Sigma Finance, Inc. | | | | | | | | |
4.875%,3-27-28 (A) | | | 200 | | | | 190 | |
Syngenta Finance N.V. | | | | | | | | |
5.182%,4-24-28 (A) | | | 200 | | | | 186 | |
| | | | | | | | |
| | | | | | | 644 | |
| | | | | | | | |
| |
Total Netherlands – 4.1% | | | $ | 861 | |
Norway | |
| |
Energy – 0.7% | |
Aker BP ASA | | | | | | | | |
6.000%,7-1-22 (A) | | | 150 | | | | 151 | |
| | | | | | | | |
| |
Total Norway – 0.7% | | | $ | 151 | |
Peru | |
| |
Financials – 0.7% | |
Banco de Credito del Peru | | | | | | | | |
4.250%,4-1-23 (A) | | | 150 | | | | 149 | |
| | | | | | | | |
| |
Total Peru – 0.7% | | | $ | 149 | |
Qatar | |
| |
Energy – 0.3% | |
Ras Laffan Liquefied Natural Gas Co. Ltd. II | | | | | | | | |
5.298%,9-30-20(A) | | | 55 | | | | 56 | |
| | | | | | | | |
| |
Total Qatar – 0.3% | | | $ | 56 | |
Singapore | |
| |
Consumer Staples – 0.5% | |
Olam International Ltd. | | | | | | | | |
7.500%,8-12-20 | | | 100 | | | | 104 | |
| | | | | | | | |
| |
Total Singapore – 0.5% | | | $ | 104 | |
South Korea | |
| |
Financials – 2.0% | |
Hyundai Capital Services, Inc. | | | | | | | | |
3.017%,8-29-22 (A) | | | 210 | | | | 203 | |
Woori Bank | | | | | | | | |
2.625%,7-20-21 (A) | | | 250 | | | | 244 | |
| | | | | | | | |
| | | | | | | 447 | |
| | | | | | | | |
| |
Total South Korea – 2.0% | | | $ | 447 | |
Switzerland | |
| |
Financials – 1.1% | |
Credit Suisse Group AG | | | | | | | | |
4.282%,1-9-28 (A) | | | 250 | | | | 241 | |
| | | | | | | | |
| |
Total Switzerland – 1.1% | | | $ | 241 | |
United Arab Emirates | |
| |
Energy – 0.9% | |
Abu Dhabi National Energy Co. | | | | | | | | |
4.375%,4-23-25 (A) | | | 200 | | | | 198 | |
| | | | | | | | |
| | | | | | | | |
CORPORATE DEBT SECURITIES
(Continued) | | Principal | | | Value | |
Financials – 1.5% | |
ICICI Bank Ltd. | | | | | | | | |
3.500%,3-18-20 (A) | | $ | 325 | | | $ | 323 | |
| | | | | | | | |
| |
Total United Arab Emirates – 2.4% | | | $ | 521 | |
United Kingdom | |
| |
Consumer Staples – 0.9% | |
Imperial Tobacco Finance plc | | | | | | | | |
3.750%,7-21-22 (A) | | | 200 | | | | 198 | |
| | | | | | | | |
| |
Financials – 4.5% | |
ANZ New Zealand International Ltd. | | | | | | | | |
3.450%,1-21-28 (A) | | | 200 | | | | 191 | |
HSBC Holdings plc: | | | | | | | | |
4.583%,6-19-29 | | | 300 | | | | 297 | |
5.625%,12-29-49 | | | 200 | | | | 194 | |
Royal Bank of Scotland Group plc (The) | | | | | | | | |
6.000%,12-19-23 | | | 100 | | | | 101 | |
State Bank of India | | | | | | | | |
4.875%,4-17-24 (A) | | | 200 | | | | 205 | |
| | | | | | | | |
| | | | | | | 988 | |
| | | | | | | | |
| |
Total United Kingdom – 5.4% | | | $ | 1,186 | |
United States | |
| |
Communication Services – 1.1% | |
T-Mobile USA, Inc. | | | | | | | | |
6.000%,3-1-23 | | | 230 | | | | 231 | |
| | | | | | | | |
| |
Consumer Discretionary – 0.9% | |
| |
Volkswagen Group of America, Inc. | |
4.250%,11-13-23 (A) | | | 200 | | | | 198 | |
| | | | | | | | |
| |
Consumer Staples – 2.8% | |
Anheuser-Busch Inbev S.A./N.V. (GTD by AB INBEV/BBR/COB) | | | | | | | | |
2.650%,2-1-21 | | | 245 | | | | 241 | |
Bunge Ltd. Finance Corp. | | | | | | | | |
3.500%,11-24-20 | | | 250 | | | | 249 | |
Maple Escrow Subsidiary, Inc. | | | | | | | | |
4.597%,5-25-28 (A) | | | 125 | | | | 124 | |
| | | | | | | | |
| | | | | | | 614 | |
| | | | | | | | |
| |
Energy – 0.2% | |
Brand Energy & Infrastructure Services, Inc. | | | | | | | | |
8.500%,7-15-25 (A) | | | 58 | | | | 50 | |
| | | | | | | | |
| |
Financials – 5.3% | |
Bank of America Corp. | | | | | | | | |
3.593%,7-21-28 | | | 125 | | | | 119 | |
BBVA Bancomer S.A. | | | | | | | | |
6.500%,3-10-21 (A) | | | 150 | | | | 156 | |
Citigroup, Inc. | | | | | | | | |
3.520%,10-27-28 | | | 125 | | | | 117 | |
Cooperatieve Rabobank U.A. | | | | | | | | |
3.125%,4-26-21 | | | 250 | | | | 249 | |
Diamond 1 Finance Corp. and Diamond 2 Finance Corp. | | | | | | | | |
3.480%,6-1-19 (A) | | | 50 | | | | 50 | |
Goldman Sachs Group, Inc. (The) | | | | | | | | |
3.814%,4-23-29 | | | 100 | | | | 93 | |
| | |
| SCHEDULE OF INVESTMENTS | | GLOBAL BOND (in thousands) |
DECEMBER 31, 2018
| | | | | | | | |
CORPORATE DEBT SECURITIES
(Continued) | | Principal | | | Value | |
Financials (Continued) | |
JPMorgan Chase & Co. | | | | | | | | |
3.540%,5-1-28 | | $ | 118 | | | $ | 112 | |
TerraForm Global Operating LLC (GTD by Terra Form Global LLC) | | | | | | | | |
6.125%,3-1-26 (A) | | | 50 | | | | 47 | |
Wells Fargo & Co. | | | | | | | | |
4.300%,7-22-27 | | | 125 | | | | 123 | |
Wells Fargo & Co.(3-Month U.S. LIBOR plus 377 bps) | | | | | | | | |
6.558%,3-29-49 (E) | | | 125 | | | | 124 | |
| | | | | | | | |
| | | | | | | 1,190 | |
| | | | | | | | |
| |
Health Care – 0.8% | |
Fresenius U.S. Finance II, Inc.: | | | | | | | | |
4.250%,2-1-21 (A) | | | 100 | | | | 100 | |
4.500%,1-15-23 (A) | | | 75 | | | | 76 | |
| | | | | | | | |
| | | | | | | 176 | |
| | | | | | | | |
| |
Industrials – 1.6% | |
Azul Investments LLP | | | | | | | | |
5.875%,10-26-24 (A) | | | 200 | | | | 187 | |
BAE Systems Holdings, Inc. | | | | | | | | |
2.850%,12-15-20 (A) | | | 75 | | | | 74 | |
TransDigm, Inc. (GTD by TransDigm Group, Inc.) | | | | | | | | |
6.000%,7-15-22 | | | 82 | | | | 80 | |
| | | | | | | | |
| | | | | | | 341 | |
| | | | | | | | |
| |
Real Estate – 1.2% | |
Aircastle Ltd. | | | | | | | | |
4.400%,9-25-23 | | | 100 | | | | 98 | |
American Tower Corp. | | | | | | | | |
3.400%,2-15-19 | | | 170 | | | | 170 | |
| | | | | | | | |
| | | | | | | 268 | |
| | | | | | | | |
| |
Utilities – 1.1% | |
Sempra Energy | | | | | | | | |
2.850%,11-15-20 | | | 250 | | | | 246 | |
| | | | | | | | |
| |
Total United States – 15.0% | | | $ | 3,314 | |
| |
TOTAL CORPORATE DEBT SECURITIES – 63.3% | | | $ | 13,797 | |
(Cost: $14,312) | | | | | | | | |
| | |
OTHER GOVERNMENT
SECURITIES (F) | | | | | | |
Argentina – 1.4% | |
Republic of Argentina | | | | | | | | |
6.875%,4-22-21 | | | 350 | | | | 316 | |
| | | | | | | | |
| |
Brazil – 0.9% | |
Federative Republic of Brazil | | | | | | | | |
4.875%,1-22-21 | | | 200 | | | | 205 | |
| | | | | | | | |
| |
Columbia – 1.2% | |
Republic of Colombia | | | | | | | | |
4.375%,7-12-21 | | | 250 | | | | 254 | |
| | | | | | | | |
| |
Indonesia – 2.9% | |
Perusahaan Listrik Negara | | | | | | | | |
5.375%,1-25-29 (A) | | | 200 | | | | 200 | |
| | | | | | | | |
OTHER GOVERNMENT
SECURITIES (F) (Continued) | | Principal | | | Value | |
Indonesia (Continued) | |
Republic of Indonesia: | | | | | | | | |
3.750%,4-25-22 (A) | | $ | 250 | | | $ | 248 | |
2.950%,1-11-23 | | | 200 | | | | 191 | |
| | | | | | | | |
| | | | | | | 639 | |
| | | | | | | | |
| |
Luxembourg – 1.0% | |
Rumo Luxembourg S.a.r.l. | | | | | | | | |
7.375%,2-9-24 (A) | | | 200 | | | | 208 | |
| | | | | | | | |
| |
Mexico – 1.1% | |
United Mexican States | | | | | | | | |
3.625%,3-15-22 | | | 250 | | | | 247 | |
| | | | | | | | |
| |
Qatar – 0.9% | |
Qatar Government Bond | |
2.375%,6-2-21 (A) | | | 200 | | | | 195 | |
| | | | | | | | |
| |
Russia – 0.9% | |
Russian Federation | |
3.500%,1-16-19 (A) | | | 200 | | | | 200 | |
| | | | | | | | |
| |
Saudi Arabia – 1.1% | |
Saudi Arabia Government Bond | |
2.375%,10-26-21 (A) | | | 250 | | | | 241 | |
| | | | | | | | |
| |
Turkey – 1.8% | |
Turkey Government Bond: | | | | | | | | |
5.125%,3-25-22 | | | 200 | | | | 195 | |
6.250%,9-26-22 | | | 200 | | | | 201 | |
| | | | | | | | |
| | | | | | | 396 | |
| | | | | | | | |
| |
United States – 0.4% | |
Republic of Argentina | |
5.625%,1-26-22 | | | 100 | | | | 84 | |
| | | | | | | | |
| |
TOTAL OTHER GOVERNMENT SECURITIES – 13.6% | | | $ | 2,985 | |
(Cost: $3,071) | | | | | | | | |
| | |
UNITED STATES GOVERNMENT
OBLIGATIONS | | | | | | |
United States – 13.5% | |
U.S. Treasury Bonds | |
2.250%,11-15-25 | | | 450 | | | | 440 | |
U.S. Treasury Notes: | | | | | | | | |
1.250%,10-31-21 | | | 200 | | | | 193 | |
1.750%,11-30-21 | | | 50 | | | | 49 | |
1.875%,10-31-22 | | | 100 | | | | 98 | |
1.375%,6-30-23 | | | 375 | | | | 357 | |
1.625%,10-31-23 | | | 500 | | | | 480 | |
2.125%,9-30-24 | | | 450 | | | | 440 | |
1.500%,8-15-26 | | | 310 | | | | 286 | |
2.375%,5-15-27 | | | 625 | | | | 613 | |
| | | | | | | | |
| | | | | | | 2,956 | |
| | | | | | | | |
| |
TOTAL UNITED STATES GOVERNMENT OBLIGATIONS – 13.5% | | | $ | 2,956 | |
(Cost: $3,024) | | | | | | | | |
| | | | | | | | |
SHORT-TERM SECURITIES | | Principal | | | Value | |
Master Note – 8.0% | |
Toyota Motor Credit Corp.(1-Month U.S. LIBOR plus 15 bps) | | | | | | | | |
2.720%,1-7-19 (G) | | $ | 1,756 | | | $ | 1,756 | |
| | | | | | | | |
| |
Money Market Funds – 0.7% | |
Dreyfus Institutional Preferred Government Money Market Fund – Institutional Shares | | | | | | | | |
2.400%, (H)(I) | | | 144 | | | | 144 | |
| | | | | | | | |
| |
TOTAL SHORT-TERM SECURITIES – 8.7% | | | $ | 1,900 | |
(Cost: $1,900) | | | | | | | | |
| |
TOTAL INVESTMENT SECURITIES – 99.7% | | | $ | 21,770 | |
(Cost: $22,501) | | | | | | | | |
| |
CASH AND OTHER ASSETS, NET OF LIABILITIES – 0.3% | | | | 72 | |
| |
NET ASSETS – 100.0% | | | $ | 21,842 | |
| | |
| SCHEDULE OF INVESTMENTS | | GLOBAL BOND (in thousands) |
DECEMBER 31, 2018
Notes to Schedule of Investments
| * | Not shown due to rounding. |
| (A) | Securities were purchased pursuant to an exemption from registration available under Rule 144A under the Securities Act of 1933 and may only be resold in transactions exempt from registration, normally to qualified institutional buyers. At December 31, 2018 the total value of these securities amounted to $10,834 or 49.6% of net assets. |
| (B) | Non-income producing as the issuer has either missed its most recent interest payment or declared bankruptcy. |
| (C) | All or a portion of securities with an aggregate value of $141 are on loan. |
| (D) | Principal amounts are denominated in the indicated foreign currency, where applicable (COP – Columbian Peso). |
| (E) | Variable rate security. Interest rate disclosed is that which is in effect at December 31, 2018. Description of the reference rate and spread, if applicable, are included in the security description. |
| (F) | Other Government Securities may include emerging markets sovereign, quasi-sovereign, corporate and supranational agency and organization debt securities. |
| (G) | Variable rate security. Interest rate disclosed is that which is in effect at December 31, 2018. Date shown represents the date that the variable rate resets. Description of the reference rate and spread, if applicable, are included in the security description. |
| (H) | Rate shown is the annualized7-day yield at December 31, 2018. |
| (I) | Investment made with cash collateral received from securities on loan. |
The following table is a summary of the valuation of the Portfolio’s investments by the fair value hierarchy levels as of December 31, 2018. See Note 3 to the Financial Statements for further information regarding fair value measurement.
| | | | | | | | | | | | |
| | | Level 1 | | | Level 2 | | | Level 3 | |
Assets | | | | | | | | | | | | |
Investments in Securities | | | | | | | | | | | | |
Common Stocks | | $ | 132 | | | $ | — | | | $ | — | |
Corporate Debt Securities | | | — | | | | 13,797 | | | | — | |
Other Government Securities | | | — | | | | 2,985 | | | | — | |
United States Government Obligations | | | — | | | | 2,956 | | | | — | |
Short-Term Securities | | | 144 | | | | 1,756 | | | | — | |
Total | | $ | 276 | | | $ | 21,494 | | | $ | — | |
The following acronyms are used throughout this schedule:
GTD = Guaranteed
LIBOR = London Interbank Offered Rate
| | |
| SCHEDULE OF INVESTMENTS | | GLOBAL BOND (in thousands) |
DECEMBER 31, 2018
Country Diversification
| | | | |
(as a % of net assets) | | | | |
United States | | | 28.9% | |
Mexico | | | 6.8% | |
United Kingdom | | | 5.4% | |
Netherlands | | | 4.1% | |
Indonesia | | | 3.8% | |
Brazil | | | 3.7% | |
Columbia | | | 2.9% | |
Chile | | | 2.9% | |
Luxembourg | | | 2.6% | |
Argentina | | | 2.5% | |
United Arab Emirates | | | 2.4% | |
Country Diversification(Continued)
| | | | |
Cayman Islands | | | 2.3% | |
South Korea | | | 2.0% | |
Turkey | | | 1.8% | |
China | | | 1.8% | |
India | | | 1.7% | |
Ireland | | | 1.6% | |
Japan | | | 1.4% | |
Qatar | | | 1.2% | |
Saudi Arabia | | | 1.1% | |
Switzerland | | | 1.1% | |
Other Countries | | | 9.0% | |
Other+ | | | 9.0% | |
+ Includes cash and other assets (net of liabilities), and cash equivalents
See Accompanying Notes to Financial Statements.
| | |
| MANAGEMENT DISCUSSION | | GLOBAL EQUITY INCOME |
(UNAUDITED)

Christopher Parker

Robert E. Nightingale
Below, Christopher Parker, CFA, and Robert E. Nightingale, portfolio managers of Ivy VIP Global Equity Income, discuss positioning, performance and results for the fiscal year ended December 31, 2018. Effective April 30, 2018, Ivy VIP Dividend Opportunities was renamed Ivy VIP Global Equity Income. At that time, the Portfolio expanded its investment strategy to include stocks in international markets and the benchmark was changed from the Russell 1000 Index to the FTSEAll-World High Dividend Yield Index. Mr. Parker has managed the Portfolio since 2014, and has 23 years of industry experience. Mr. Nightingale was named portfolio manager to the Portfolio in April 2018 and has 23 years of industry experience.
Fiscal Year Performance
| | | | |
For the 12 Months Ended December 31, 2018 | | | | |
Ivy VIP Global Equity Income | | | -11.68% | |
Benchmark(s) and/or Morningstar and Lipper Categories | | | | |
FTSEAll-World High Dividend Yield Index | | | -11.56% | |
(generally reflects the performance of securities with higher-than-average dividend yields in the global market) | | | | |
Russell 1000 Index | | | -4.78% | |
(generally reflects the performance of securities that represent thelarge-cap market) | | | | |
Morningstar Large Blend Universe Average | | | -6.27% | |
(generally reflects the performance of the universe of funds with similar investment objectives) | | | | |
Lipper Variable Annuity Equity Income Funds Universe Average | | | -7.90% | |
(generally reflects the performance of the universe of funds with similar investment objectives) | | | | |
Please note that Portfolio returns include applicable fees and expenses, whereas the index returns do not include any such fees. Also, the Portfolio’s performance data does not take into account any product expenses or charges associated with owning a variable life or annuity policy, which is invested in Ivy Variable Insurance Portfolios.
A year in review
During the fiscal year, global economic growth disappointed and desynchronized, with the FTSEAll-World High Dividend Yield Index posting a double-digit decline. Europe and Japan began to see weaker growth early in the year followed by China. Growth in the U.S. remained relatively robust until the fourth quarter. Geopolitics weighed heavily across markets as nationalism/populism continued its rise — most apparent in China, Europe and the U.S. The Trump Administration’s focus on trade with China has led people to speculate that tariffs are likely to rise over the next year. Although China policymakers appear intent to ease tensions with the purchases of U.S. soybeans, rescinding retaliatory tariffs on U.S. autos and backing away from “made in China 2025”, it is unclear if that is enough to satisfy the White House.
Despite increasing concerns about future growth in U.S. gross domestic product (GDP), the U.S. Federal Reserve (Fed) continued to normalize its policy rate, hiking interest rates four times over the year. The Federal Funds Rate stood at2.25-2.50% at December’s end. In currency markets, the trade-weighted U.S. dollar strengthened throughout the fiscal year but stabilized towards year end as the market anticipated a more dovish Fed in 2019. The10-year U.S. Treasury yield closed the year at approximately 2.7%, a significant move from the 3.2% levels of November. At the end of the year, the European Central Bank (ECB) ceased their asset purchase program, while the Swedish Central Bank, often considered a harbinger for the ECB, raised rates 25 basis points. China’s Central Bank stated a desire to maintain prudent monetary policy and keep the yuan stable while offering “reasonably ample” liquidity to the market.
Portfolio strategy — hits and misses
For the fiscal year ended December 31, 2018, the Portfolio underperformed its benchmark, the FTSEAll-World High Dividend Yield Index, and category peers.
First quarter of 2018
The Portfolio underperformed its previous benchmark, the Russell 1000 Index, for the quarter. Stock and sector selection were both drags to relative performance, though a portion of this was due to the headwind fromnon-dividend paying technology stocks in the benchmark that had strong performance in the quarter. The Portfolio’s underweight position in
information technology and overweight in materials were both drags on relative performance, while being underweight consumer staples and telecommunication services helped from a sector allocation perspective.
Second quarter of 2018
During the quarter, the Portfolio expanded its investment strategy to include international stocks and changed its benchmark to the FTSEAll-World High Dividend Yield Index. For the quarter, the Portfolio outperformed its new benchmark, led by strong sector allocation and currency effects. Of note, an overweight allocation to the strong-performing energy sector and underweight allocation to the poor-performing financials sector aided performance. From a currency standpoint, hedges stemming from the U.S. dollar strengthening versus the euro aided performance. Additionally, the Portfolio’s overweight allocation to the U.S. (a relative overweight to U.S. dollar-denominated securities) benefitted performance due to U.S. dollar strength.
At the country level, stock selection in the U.S. detracted from performance, though this underperformance was partially offset by strong selection in Europe and Asia-Pacific ex Japan. The Portfolio’s underweight allocation to emerging markets benefitted performance for the period.
Third quarter of 2018
The Portfolio outperformed its benchmark for the quarter, led by solid sector allocation. Of note, an overweight allocation to the strong-performing health care sector and underweight allocation to the poor-performing consumer discretionary sector aided performance. Stock selection in industrials, health care and energy helped relative performance. Stock selection in information technology, materials and communication services were each a drag on performance.
From a geographic perspective, stock selection in North America, Europe and Asia-Pacificex-Japan aided relative performance. Stock selection in Japan was a drag on relative performance. The Portfolio’s overweight position in North America helped relative performance, while being overweight Europe was a headwind to relative results during the period. The Portfolio’s underweight allocation to emerging markets benefitted performance for the period. At quarter end, the Portfolio maintained no currency hedges.
Fourth quarter of 2018
The Portfolio underperformed its benchmark during the period with sector allocation and stock selection drags on relative performance. Overweight positions in energy and industrials detracted as these two areas were the worst performing sectors in the benchmark. Underweight allocations in communication services and utilities were a headwind to relative performance as these less economically sensitive sectors outperformed during the recentsell-off. On the other hand, country allocation benefitted performance as did the Portfolio’s overweight allocation to health care.
The Portfolio’s underweight in emerging markets adversely impacted performance as many of these countries exhibited strong performance during the period. In particular, Brazil was a drag as both equities and the currency appreciated during the quarter following favorable election results. The Portfolio’s overweight in France hurt performance as this market underperformed as a result of increasing domestic instability and challenges in implementing President Emmanuel Macron’s reformist agenda. Underweight positions in Japan and Germany helped results, while being overweight the U.S. also helped.
Stock selection in utilities, health care, energy, communication services and information technology were positive, while stock selection in industrials and financials had a negative effect on relative performance.
Portfolio positioning
Our investment approach remains steadfastly focused on investing in high-quality businesses with favorable near and intermediate fundamentals with generally rising dividends when they are available at perceived attractive valuations. This approach is consistent across sectors and regions.
We are still fairly early on in the process of rationalizing consensus earnings expectations for a slower growth environment. Additionally, as we have previously mentioned, hard economic data is only beginning to show evidence of slowing. However, at this point an enormous amount of pain has been inflicted upon many of the stocks that are considered most sensitive to a slowdown in global industrial activity. These companies have seen their share prices decline in excess of the market as a whole. In many cases, these stocks are beginning to embed a contraction in earnings that looks far more severe than our baseline view. That is to say, for the first time in a few years, we think large groups of stocks are beginning to look substantially undervalued. At this point, the positioning of the Portfolio remains fairly balanced given we are still quite early on in the discovery process of this slowdown. However, within that neutral positioning we are taking advantage of some of the displacements that are occurring to acquire shares in companies that we believe are poised to outperform as the nature and scope of the global slowdown unfolds.
Outlook — Opportunities exist, but issues remain
We expect global economic growth to slow appreciably and expect corporate earnings growth to decelerate substantially from the robust 2018 levels. However, at this point we do not see conditions that would be consistent with either an economic recession or a corporate earnings recession in the foreseeable future. We believe growth in China should stabilize as the negative impulse from prior tightening actions and global trade drag is offset by numerouspro-growth reforms that are being implemented. Growth in U.S. gross domestic product and corporate earnings will slow from levels that were boosted by the impact of tax reforms, but we are of the view that this is a growth slowdown and not a recession (economic or earnings) in the U.S. The eurozone is the one area that could come closest to a technical economic recession and corporate earnings recession in the coming year in our view, though this is not our base case. The punchline bears repeating — we think we are in the midst of an industrial slowdown, not a recession.
Valuation levels in numerous markets have collapsed on concerns on growth. Forward earnings multiples in U.S. markets havede-rated by roughly 4 points over the past year as these concerns have mushroomed, and investors begin discounting slower growth. Thatde-rating is even more notable for several world stock indices. Our point is thatfair-to-excessively optimistic valuation levels have now given way tofair-to-overly pessimistic valuation levels. Realistically markets couldde-rate further as hard economic and earnings data confirms a slowdown. However, based on our growth outlook, we are not of the view that a potentialde-rating would be excessive from here.
As you can likely discern, we are not overly bullish at this juncture. However, we are not especially bearish either given lowered expectations. We continue to expect substantial volatility as data is more likely to get worse before it gets better. We expect to use this volatility to add to or establish perceived attractive long-term positions that fit our investment process.
Past performance is not a guarantee of future results. The value of the Portfolio’s shares will change, and you could lose money on your investment.
International investing involves additional risks including currency fluctuations, political or economic conditions affecting the foreign country, and differences in accounting standards and foreign regulations. The value of the Portfolio’s investments, as measured in U.S. dollars, may be unfavorably affected by changes in foreign currency exchange rates and exchange control regulations. Focusing on a single geographic region involves increased currency, political, regulatory and other risks. These risks are magnified in emerging markets.
Dividend-paying stocks may fall out of favor with investors and underperformnon-dividend paying stocks and the market as a whole. In addition, dividend-paying companies may not pay dividends in the future; such dividends, if declared, may not remain at current levels or increase over time. The amount of any dividend the company may pay may fluctuate significantly. Dividend-paying stocks can decline in value when interest rates rise; this risk may be greater during the current period of historically low interest rates. These and other risks are more fully described in the Portfolio’s prospectus.
The opinions expressed in this report are those of the Portfolio’s portfolio managers and are current only through the end of the period of the report as stated on the cover. The portfolio managers’ views are subject to change at any time based on market and other conditions, and no forecasts can be guaranteed.
The index (indexes) noted are unmanaged and include reinvested dividends. One cannot invest directly in an index, nor is an index representative of the Ivy VIP Global Equity Income.
| | |
| PORTFOLIO HIGHLIGHTS | | GLOBAL EQUITY INCOME(a) |
ALL DATA IS AS OF DECEMBER 31, 2018 (UNAUDITED)
| | | | |
Asset Allocation | |
Stocks | | | 95.8% | |
Financials | | | 15.9% | |
Energy | | | 13.5% | |
Consumer Staples | | | 13.4% | |
Health Care | | | 13.2% | |
Industrials | | | 11.8% | |
Information Technology | | | 7.8% | |
Materials | | | 6.4% | |
Utilities | | | 5.9% | |
Communication Services | | | 4.6% | |
Consumer Discretionary | | | 3.3% | |
Cash and Other Assets (Net of Liabilities), and Cash Equivalents+ | | | 4.2% | |
Top 10 Equity Holdings
| | | | |
| | |
| Company | | Sector | | Industry |
Pfizer, Inc. | | Health Care | | Pharmaceuticals |
Royal Dutch Shell plc, Class A | | Energy | | Integrated Oil & Gas |
Nestle S.A., Registered Shares | | Consumer Staples | | Packaged Foods & Meats |
Chevron Corp. | | Energy | | Integrated Oil & Gas |
Intel Corp. | | Information Technology | | Semiconductors |
Roche Holdings AG, Genusscheine | | Health Care | | Pharmaceuticals |
Total S.A. | | Energy | | Integrated Oil & Gas |
Lockheed Martin Corp. | | Industrials | | Aerospace & Defense |
Procter & Gamble Co. (The) | | Consumer Staples | | Household Products |
AstraZeneca plc | | Health Care | | Pharmaceuticals |
See your advisor or www.ivyinvestments.com for more information on the Portfolio’s most recently published Top 10 Equity Holdings.
+ Cash equivalents are defined as highly liquid securities with maturities of less than three months. Cash equivalents may include U.S. Government Treasury bills, bank certificates of deposit, bankers’ acceptances, corporate commercial paper and other money market instruments.
(a) Effective April 30, 2018, the name of Dividend Opportunities changed to Global Equity Income.
| | |
| COMPARISON OF CHANGE IN VALUE OF $10,000 INVESTMENT | | GLOBAL EQUITY INCOME |
(UNAUDITED)
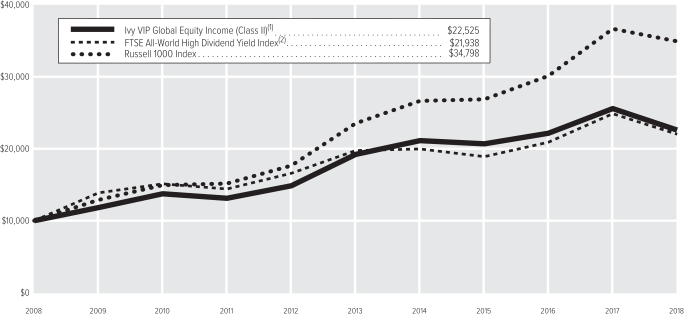
| (1) | The value of the investment in the Portfolio is impacted by the ongoing expenses of the Portfolio and assumes reinvestment of dividends and distributions. |
| (2) | The Portfolio’s benchmark changed from the Russell 1000 Index, effective April 30, 2018. IICO believes that the FTSEAll-World High Dividend Yield Index is more reflective of the types of securities in which the Portfolio invests than the Russell 1000 Index. |
| | | | |
| |
| Average Annual Total Return(3) | | Class II | |
1-year period ended12-31-18 | | | -11.68% | |
5-year period ended12-31-18 | | | 3.27% | |
10-year period ended12-31-18 | | | 8.46% | |
| (3) | Data quoted is past performance and current performance may be lower or higher. Past performance is no guarantee of future results. Investment return and principal value of an investment will fluctuate and shares, when redeemed, may be worth more or less than their original cost. Please visit www.ivyinvestments.com for the Portfolio’s most recentmonth-end performance. Performance data quoted does not reflect any expenses or charges associated with owning a variable life insurance policy or variable annuity contract that invests in the Portfolio’s shares. When such charges are deducted, actual investment performance in a variable policy or contract will be lower. |
Past performance is not necessarily indicative of future performance. Indexes are unmanaged. The performance graph and table do not reflect the deduction of taxes that a shareholder would pay on Portfolio distributions or on the redemption of Portfolio shares. Performance results may include the effect of expense reduction arrangements for some or all of the periods shown. If those arrangements had not been in place, the performance results for those periods would have been lower.
| | |
| SCHEDULE OF INVESTMENTS | | GLOBAL EQUITY INCOME (in thousands) |
DECEMBER 31, 2018
| | | | | | | | |
| COMMON STOCKS | | Shares | | | Value | |
Canada | |
| |
Energy – 1.4% | |
Suncor Energy, Inc. | | | 143 | | | $ | 4,010 | |
| | | | | | | | |
| |
Financials – 1.9% | |
Bank of Montreal | | | 81 | | | | 5,318 | |
| | | | | | | | |
| |
Total Canada – 3.3% | | | $ | 9,328 | |
China | |
| |
Consumer Discretionary – 0.4% | |
ANTA Sports Products Ltd. | | | 259 | | | | 1,240 | |
| | | | | | | | |
| |
Energy – 1.1% | |
CNOOC Ltd. | | | 1,992 | | | | 3,069 | |
| | | | | | | | |
| |
Total China – 1.5% | | | $ | 4,309 | |
France | |
| |
Communication Services – 2.3% | |
Orange S.A. | | | 393 | | | | 6,374 | |
| | | | | | | | |
| |
Consumer Discretionary – 1.1% | |
LVMH Moet Hennessy – Louis Vuitton | | | 10 | | | | 2,972 | |
| | | | | | | | |
| |
Energy – 3.0% | |
Total S.A. | | | 162 | | | | 8,521 | |
| | | | | | | | |
| |
Financials – 1.9% | |
BNP Paribas S.A. | | | 117 | | | | 5,297 | |
| | | | | | | | |
| |
Industrials – 3.0% | |
Compagnie de Saint-Gobain | | | 89 | | | | 2,938 | |
Vinci | | | 70 | | | | 5,756 | |
| | | | | | | | |
| | | | | | | 8,694 | |
| | | | | | | | |
| |
Total France – 11.3% | | | $ | 31,858 | |
Hong Kong | |
| |
Financials – 1.7% | |
BOC Hong Kong (Holdings) Ltd. | | | 1,350 | | | | 5,011 | |
| | | | | | | | |
| |
Utilities – 1.4% | |
Guangdong Investment Ltd. | | | 1,948 | | | | 3,764 | |
| | | | | | | | |
| |
Total Hong Kong – 3.1% | | | $ | 8,775 | |
Ireland | |
| |
Health Care – 1.9% | |
Medtronic plc | | | 59 | | | | 5,396 | |
| | | | | | | | |
| |
Materials – 0.9% | |
CRH plc | | | 100 | | | | 2,646 | |
| | | | | | | | |
| |
Total Ireland – 2.8% | | | $ | 8,042 | |
Italy | |
| |
Utilities – 2.3% | |
ENEL S.p.A. | | | 1,109 | | | | 6,428 | |
| | | | | | | | |
| |
Total Italy – 2.3% | | | $ | 6,428 | |
| | | | | | | | |
| COMMON STOCKS | | Shares | | | Value | |
Japan | |
| |
Financials – 2.4% | |
Tokio Marine Holdings, Inc. | | | 142 | | | $ | 6,737 | |
| | | | | | | | |
| |
Information Technology – 1.0% | |
Tokyo Electron Ltd. | | | 26 | | | | 2,871 | |
| | | | | | | | |
| |
Total Japan – 3.4% | | | $ | 9,608 | |
Malaysia | |
| |
Financials – 1.2% | |
Bumiputra-Commerce Holdings Berhad | | | 2,501 | | | | 3,453 | |
| | | | | | | | |
| |
Total Malaysia – 1.2% | | | $ | 3,453 | |
Netherlands | |
| |
Energy – 3.8% | |
Royal Dutch Shell plc, Class A | | | 364 | | | | 10,722 | |
| | | | | | | | |
| |
Financials – 1.1% | |
ING Groep N.V., Certicaaten Van Aandelen | | | 291 | | | | 3,129 | |
| | | | | | | | |
| |
Industrials – 1.7% | |
Koninklijke Philips Electronics N.V., Ordinary Shares | | | 138 | | | | 4,836 | |
| | | | | | | | |
| |
Total Netherlands – 6.6% | | | $ | 18,687 | |
Norway | |
| |
Consumer Staples – 1.0% | |
Marine Harvest ASA | | | 133 | | | | 2,799 | |
| | | | | | | | |
| |
Total Norway – 1.0% | | | $ | 2,799 | |
Russia | |
| |
Energy – 1.2% | |
PJSC LUKOIL ADR | | | 47 | | | | 3,359 | |
| | | | | | | | |
| |
Total Russia – 1.2% | | | $ | 3,359 | |
Singapore | |
| |
Financials – 1.3% | |
DBS Group Holdings Ltd. | | | 210 | | | | 3,654 | |
| | | | | | | | |
| |
Total Singapore – 1.3% | | | $ | 3,654 | |
South Africa | |
| |
Materials – 1.0% | |
Mondi plc | | | 140 | | | | 2,924 | |
| | | | | | | | |
| |
Total South Africa – 1.0% | | | $ | 2,924 | |
South Korea | |
| |
Information Technology – 1.9% | |
Samsung Electronics Co. Ltd. | | | 152 | | | | 5,300 | |
| | | | | | | | |
| |
Total South Korea – 1.9% | | | $ | 5,300 | |
| | | | | | | | |
| COMMON STOCKS(Continued) | | Shares | | | Value | |
Spain | |
| |
Financials – 1.5% | |
Banco Santander S.A. | | | 927 | | | $ | 4,211 | |
| | | | | | | | |
| |
Total Spain – 1.5% | | | $ | 4,211 | |
Switzerland | |
| |
Consumer Staples – 3.2% | |
Nestle S.A., Registered Shares | | | 112 | | | | 9,058 | |
| | | | | | | | |
| |
Health Care – 3.0% | |
Roche Holdings AG, Genusscheine | | | 35 | | | | 8,577 | |
| | | | | | | | |
| |
Total Switzerland – 6.2% | | | $ | 17,635 | |
United Kingdom | |
| |
Consumer Discretionary – 0.8% | |
Bellway plc | | | 73 | | | | 2,329 | |
| | | | | | | | |
| |
Consumer Staples – 3.5% | |
British American Tobacco plc | | | 110 | | | | 3,505 | |
Unilever plc | | | 120 | | | | 6,292 | |
| | | | | | | | |
| | | | | | | 9,797 | |
| | | | | | | | |
| |
Financials – 1.0% | |
3i Group plc | | | 293 | | | | 2,895 | |
| | | | | | | | |
| |
Health Care – 2.5% | |
AstraZeneca plc | | | 95 | | | | 7,088 | |
| | | | | | | | |
| |
Industrials – 1.7% | |
BAE Systems plc | | | 838 | | | | 4,900 | |
| | | | | | | | |
| |
Materials – 1.7% | |
Anglo American plc(A) | | | 217 | | | | 4,850 | |
| | | | | | | | |
| |
Total United Kingdom – 11.2% | | | $ | 31,859 | |
United States | |
| |
Communication Services – 2.3% | |
Verizon Communications, Inc. | | | 116 | | | | 6,524 | |
| | | | | | | | |
| |
Consumer Discretionary – 1.0% | |
Home Depot, Inc. (The) | | | 17 | | | | 2,895 | |
| | | | | | | | |
| |
Consumer Staples – 5.7% | |
Philip Morris International, Inc. | | | 61 | | | | 4,049 | |
Procter & Gamble Co. (The) | | | 77 | | | | 7,115 | |
Wal-Mart Stores, Inc. | | | 55 | | | | 5,086 | |
| | | | | | | | |
| | | | | | | 16,250 | |
| | | | | | | | |
| |
Energy – 3.0% | |
Chevron Corp. | | | 80 | | | | 8,698 | |
| | | | | | | | |
| |
Financials – 1.9% | |
JPMorgan Chase & Co. | | | 28 | | | | 2,754 | |
KeyCorp | | | 185 | | | | 2,728 | |
| | | | | | | | |
| | | | | | | 5,482 | |
| | | | | | | | |
| | |
| SCHEDULE OF INVESTMENTS | | GLOBAL EQUITY INCOME (in thousands) |
DECEMBER 31, 2018
| | | | | | | | |
| COMMON STOCKS(Continued) | | Shares | | | Value | |
| |
Health Care – 5.8% | |
AbbVie, Inc. | | | 55 | | | $ | 5,052 | |
Pfizer, Inc. | | | 257 | | | | 11,196 | |
| | | | | | | | |
| | | | | | | 16,248 | |
| | | | | | | | |
| |
Industrials – 5.4% | |
Eaton Corp. | | | 45 | | | | 3,066 | |
Lockheed Martin Corp. | | | 29 | | | | 7,489 | |
United Technologies Corp. | | | 43 | | | | 4,552 | |
| | | | | | | | |
| | | | | | | 15,107 | |
| | | | | | | | |
| |
Information Technology – 4.9% | |
Intel Corp. | | | 185 | | | | 8,673 | |
Microsoft Corp. | | | 52 | | | | 5,276 | |
| | | | | | | | |
| | | | | | | 13,949 | |
| | | | | | | | |
| |
Materials – 2.8% | |
Dow Chemical Co. (The) | | | 51 | | | | 2,739 | |
Eastman Chemical Co. | | | 70 | | | | 5,081 | |
| | | | | | | | |
| | | | | | | 7,820 | |
| | | | | | | | |
| |
Utilities – 2.2% | |
Exelon Corp. | | | 141 | | | | 6,357 | |
| | | | | | | | |
| |
Total United States – 35.0% | | | $ | 99,330 | |
| |
TOTAL COMMON STOCKS – 95.8% | | | $ | 271,559 | |
(Cost: $301,860) | | | | | | | | |
| | | | | | | | |
| SHORT-TERM SECURITIES | | Principal | | | Value | |
Commercial Paper (B) – 2.0% | |
J.M. Smucker Co. (The) | | | | | | | | |
2.750%,1-2-19 | | $ | 5,624 | | | $ | 5,623 | |
| | | | | | | | |
| |
Master Note – 2.1% | |
Toyota Motor Credit Corp.(1-Month U.S. LIBOR plus 15 bps) | | | | | | | | |
2.720%,1-7-19 (C) | | | 6,059 | | | | 6,059 | |
| | | | | | | | |
| |
TOTAL SHORT-TERM SECURITIES – 4.1% | | | $ | 11,682 | |
(Cost: $11,683) | | | | | | | | |
| |
TOTAL INVESTMENT
SECURITIES – 99.9% | | | $ | 283,241 | |
(Cost: $313,543) | | | | | | | | |
| |
CASH AND OTHER ASSETS, NET OF LIABILITIES – 0.1% | | | | 395 | |
| |
NET ASSETS – 100.0% | | | $ | 283,636 | |
Notes to Schedule of Investments
| (A) | All or a portion of securities with an aggregate value of $294 are on loan. |
| (B) | Rate shown is the yield to maturity at December 31, 2018. |
| (C) | Variable rate security. Interest rate disclosed is that which is in effect at December 31, 2018. Date shown represents the date that the variable rate resets. Description of the reference rate and spread, if applicable, are included in the security description. |
The following table is a summary of the valuation of the Portfolio’s investments by the fair value hierarchy levels as of December 31, 2018. See Note 3 to the Financial Statements for further information regarding fair value measurement.
| | | | | | | | | | | | |
| | | Level 1 | | | Level 2 | | | Level 3 | |
Assets | | | | | | | | | | | | |
Investments in Securities | | | | | | | | | | | | |
Common Stocks | | | | | | | | | | | | |
Communication Services | | $ | 6,524 | | | $ | 6,374 | | | $ | — | |
Consumer Discretionary | | | 2,895 | | | | 6,541 | | | | — | |
Consumer Staples | | | 16,250 | | | | 21,654 | | | | — | |
Energy | | | 12,708 | | | | 25,671 | | | | — | |
Financials | | | 10,800 | | | | 34,387 | | | | — | |
Health Care | | | 21,644 | | | | 15,665 | | | | — | |
Industrials | | | 15,107 | | | | 18,430 | | | | — | |
Information Technology | | | 13,949 | | | | 8,171 | | | | — | |
Materials | | | 7,820 | | | | 10,420 | | | | — | |
Utilities | | | 6,357 | | | | 10,192 | | | | — | |
Total Common Stocks | | $ | 114,054 | | | $ | 157,505 | | | $ | — | |
Short-Term Securities | | | — | | | | 11,682 | | | | — | |
Total | | $ | 114,054 | | | $ | 169,187 | | | $ | — | |
The following acronyms are used throughout this schedule:
ADR = American Depositary Receipts
LIBOR = London Interbank Offered Rate
See Accompanying Notes to Financial Statements.
| | |
| MANAGEMENT DISCUSSION | | GLOBAL GROWTH |
(UNAUDITED)

Sarah C. Ross
Below, Sarah C. Ross, CFA, portfolio manager of Ivy VIP Global Growth, discusses positioning, performance and results for the fiscal year ended December 31, 2018. Ms. Ross has 23 years of industry experience and has managed the Portfolio since August 2014.
Fiscal Year Performance
| | | | |
For the 12 Months Ended December 31, 2018 | | | | |
Ivy VIP Global Growth (Class II shares at net asset value) | | | -6.27% | |
Benchmark(s) and/or Morningstar and Lipper Categories | | | | |
MSCI World Index | | | -8.71% | |
(generally reflects the performance of securities markets around the world) | | | | |
Morningstar World Large Stock Universe Average | | | -9.64% | |
(generally reflects the performance of the universe of funds with similar investment objectives) | | | | |
Lipper Variable Annuity GlobalLarge-Cap Growth Funds Universe Average | | | -9.51% | |
(generally reflects the performance of the universe of funds with similar investment objectives) | | | | |
Please note that Portfolio returns include applicable fees and expenses while index returns do not include any such fees. Also, the Portfolio’s performance data does not take into account any product expenses or charges associated with owning a variable life or annuity policy, which is invested in Ivy Variable Insurance Portfolios.
A year in review
The fiscal year ended December 31, 2018, was a challenging one with global equity markets down high single digits. The MSCI World Index was relatively flat for much of the year until a notable fourth quarter sell off as concerns of slowing global growth heightened. Fears the U.S. Federal Reserve (Fed) would continue to raise rates despite signs of a slowing economy played a role in early market declines. As the fourth quarter progressed, other concerns continued to mount. Growth in China was already weakening in early 2018, resulting from deleveraging. As the U.S. and China trade war escalated without resolution, the impact of higher import tariffs further weakened Chinese consumption. In the U.S., weaker consumer confidence, trade concerns and the U.S. government shutdown added greater uncertainty. Europe felt the effects of slowing China import demand, weaker industrial production and uncertainty surrounding Brexit. From a developed market standpoint, Japan was a bright spot although coming from a low growth base.
In a continuation of recent trends, growth stocks outperformed value in the year but by a smaller margin than in 2017. The U.S. outperformed most developed markets during the period. As economic uncertainty increased, the U.S. dollar and Japanese yen strengthened against other currencies. Europe was generally weak with Germany and Italy posting particularly poor returns in the period. Weak auto production hit Germany hard, while political uncertainty and increased deficit spending negatively impacted the Italian equity market. Emerging markets were mixed during the period with China down more than 20% for the year. Efforts by the Chinese government to stimulate the economy were not enough to offset the negative impacts from deleveraging and the trade war. On the other hand, Brazil outperformed following the fall presidential election that increased the likelihood ofpro-business reforms. At the sector level, health care, utilities and information technology were all strong performers. The weakest performing sectors were financials, materials, energy and industrials.
Performance for the year
The Portfolio outperformed its benchmark, the MSCI World Index, for the fiscal year ended December 31, 2018. Both sector allocation and stock selection aided performance. Stock selection in information technology, consumer discretionary and financials were standout performers. In information technology, Visa, Inc., Class A, MasterCard, Inc. Class A and PayPal, Inc. performed well, as did a handful of software holdings. Within consumer discretionary, Amazon.com, Inc. was the top performer which continued to take share frombrick-and-mortar retailers. Dollar General Corp. was also strong, benefiting fromlow-end consumer strength. In financials, the Portfolio benefited from exposure to CME Group, Inc. and AIA Group Ltd. and its underweight allocation to developed market banks. At the sector level, overweight allocations to information technology, health care and consumer discretionary as well as an underweight allocation to utilities helped performance. Detractors in the period included stock selection in energy and consumer staples. The use of derivatives had little impact on Portfolio performance for the fiscal year.
At fiscal year end, the largest sector overweight in the Portfolio was to health care, which is a notable change from a year ago. As economic data worsened and trade war concerns mounted, we reduced the magnitude of our overweight in information technology stocks (particularly the most cyclical parts of the sector). We increased the Portfolio’s exposure to
consumer staples and primarily added to health care holdings with a focus on the services sector. Additionally, we reduced exposure to some of the most vulnerable exporters favoring services companies less reliant on trade, and focused on companies with solid earnings growth. Geographically, we reduced our geographic exposure to emerging markets throughout the year, particularly China given the country’s vulnerability to a slowing economy and the ongoing trade war with the U.S.
Outlook
In our view, one of the biggest drivers of equity markets going forward will be the outcome of the ongoing trade war, which in our opinion is unlikely to be resolved quickly. The risks are high given thefar-reaching significance of global trade on capital allocation, raw material sourcing, manufacturing footprints and the resulting impact on employment, wage growth and consumer spending. In addition to trade, we believe the U.S., Europe and China will all have slowing corporate earnings growth in 2019.
Given this uncertainty, we are focusing the Portfolio on holdings we believe can succeed under a range of scenarios. Services companies that do not face the same trade risks as manufacturers are one area of increased exposure along with more defensive holdings in consumer staples. While we have yet to increase the Portfolio’s exposure to companies that have been negatively impacted by trade issues, we continue to look for opportunities where secular growth stocks have been oversold on fears and are pricing in unrealistically negative scenarios. We are focused on competitively advantaged growth stocks that we believe can outperform in this environment of uncertainty.
Past performance is not a guarantee of future results. The value of the Portfolio’s shares will change, and you could lose money on your investment.
International investing involves additional risks including currency fluctuations, political or economic conditions affecting the foreign country, and differences in accounting standards and foreign regulations. These and other risks are more fully described in the Portfolio’s prospectus.
The opinions expressed in this report are those of the Portfolio’s portfolio manager and are current only through the end of the period of the report as stated on the cover. The portfolio manager’s views are subject to change at any time based on market and other conditions, and no forecasts can be guaranteed.
The index (indexes) noted are unmanaged and include reinvested dividends. One cannot invest directly in an index, nor is an index representative of Ivy VIP Global Growth.
| | |
| PORTFOLIO HIGHLIGHTS | | GLOBAL GROWTH |
ALL DATA IS AS OF DECEMBER 31, 2018 (UNAUDITED)
Asset Allocation
| | | | |
Stocks | | | 95.5% | |
Health Care | | | 18.8% | |
Information Technology | | | 17.9% | |
Consumer Discretionary | | | 14.9% | |
Financials | | | 14.8% | |
Industrials | | | 12.5% | |
Consumer Staples | | | 8.4% | |
Energy | | | 5.9% | |
Communication Services | | | 2.3% | |
Cash and Other Assets (Net of Liabilities), and Cash Equivalents+ | | | 4.5% | |
Country Weightings
| | | | |
North America | | | 60.4% | |
United States | | | 56.7% | |
Canada | | | 3.7% | |
Europe | | | 25.7% | |
France | | | 8.9% | |
United Kingdom | | | 7.7% | |
Netherlands | | | 3.9% | |
Other Europe | | | 5.2% | |
Pacific Basin | | | 9.4% | |
Cash and Other Assets (Net of Liabilities),and Cash Equivalents+ | | | 4.5% | |
Top 10 Equity Holdings
| | | | | | |
| | | |
| Company | | Country | | Sector | | Industry |
Microsoft Corp. | | United States | | Information Technology | | Systems Software |
Airbus SE | | France | | Industrials | | Aerospace & Defense |
Amazon.com, Inc. | | United States | | Consumer Discretionary | | Internet & Direct Marketing Retail |
UnitedHealth Group, Inc. | | United States | | Health Care | | Managed Health Care |
CME Group, Inc. | | United States | | Financials | | Financial Exchanges & Data |
Visa, Inc., Class A | | United States | | Information Technology | | Data Processing & Outsourced Services |
Cigna Corp. | | United States | | Health Care | | Health Care Services |
HCA Holdings, Inc. | | United States | | Health Care | | Health Care Facilities |
Dollar General Corp. | | United States | | Consumer Discretionary | | General Merchandise Stores |
Cognizant Technology Solutions Corp., Class A | | United States | | Information Technology | | IT Consulting & Other Services |
See your advisor or www.ivyinvestments.com for more information on the Portfolio’s most recently published Top 10 Equity Holdings.
+ Cash equivalents are defined as highly liquid securities with maturities of less than three months. Cash equivalents may include U.S. Government Treasury bills, bank certificates of deposit, bankers’ acceptances, corporate commercial paper and other money market instruments.
| | |
| COMPARISON OF CHANGE IN VALUE OF $10,000 INVESTMENT | | GLOBAL GROWTH |
(UNAUDITED)
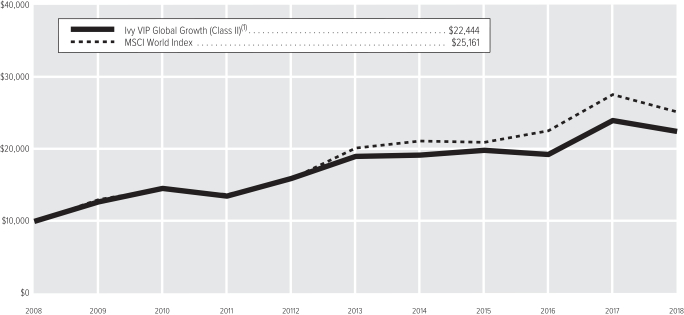
| (1) | The value of the investment in the Portfolio is impacted by the ongoing expenses of the Portfolio and assumes reinvestment of dividends and distributions. |
| | | | |
| |
| Average Annual Total Return(2) | | Class II | |
1-year period ended12-31-18 | | | -6.27% | |
5-year period ended12-31-18 | | | 3.39% | |
10-year period ended12-31-18 | | | 8.42% | |
| (2) | Data quoted is past performance and current performance may be lower or higher. Past performance is no guarantee of future results. Investment return and principal value of an investment will fluctuate and shares, when redeemed, may be worth more or less than their original cost. Please visit www.ivyinvestments.com for the Portfolio’s most recentmonth-end performance. Performance data quoted does not reflect any expenses or charges associated with owning a variable life insurance policy or variable annuity contract that invests in the Portfolio’s shares. When such charges are deducted, actual investment performance in a variable policy or contract will be lower. |
Past performance is not necessarily indicative of future performance. Indexes are unmanaged. The performance graph and table do not reflect the deduction of taxes that a shareholder would pay on Portfolio distributions or on the redemption of Portfolio shares. Performance results may include the effect of expense reduction arrangements for some or all of the periods shown. If those arrangements had not been in place, the performance results for those periods would have been lower.
| | |
| SCHEDULE OF INVESTMENTS | | GLOBAL GROWTH (in thousands) |
DECEMBER 31, 2018
| | | | | | | | |
| COMMON STOCKS | | Shares | | | Value | |
| |
Canada | |
| |
Consumer Staples – 1.9% | |
Alimentation Couche-Tard, Inc., Class B | | | 51 | | | $ | 2,537 | |
| | | | | | | | |
| |
Energy – 1.8% | |
Canadian Natural Resources Ltd. | | | 52 | | | | 1,259 | |
Seven Generations Energy Ltd.,
Class A (A) | | | 137 | | | | 1,114 | |
| | | | | | | | |
| | | | | | | 2,373 | |
| | | | | | | | |
| |
Total Canada – 3.7% | | | $ | 4,910 | |
China | |
| |
Communication Services – 0.2% | |
Tencent Music Entertainment Group ADR (A)(B) | | | 17 | | | | 220 | |
| | | | | | | | |
| |
Financials – 2.1% | |
Ping An Insurance (Group) Co. of China Ltd., H Shares | | | 323 | | | | 2,845 | |
| | | | | | | | |
| |
Total China – 2.3% | | | $ | 3,065 | |
France | |
| |
Communication Services – 1.1% | |
Ubisoft Entertainment S.A. (A) | | | 19 | | | | 1,521 | |
| | | | | | | | |
| |
Consumer Discretionary – 0.4% | |
LVMH Moet Hennessy—Louis Vuitton | | | 2 | | | | 574 | |
| | | | | | | | |
| |
Energy – 1.9% | |
Total S.A. ADR | | | 48 | | | | 2,518 | |
| | | | | | | | |
| |
Industrials – 5.5% | |
Airbus SE | | | 63 | | | | 6,009 | |
Schneider Electric S.A. | | | 19 | | | | 1,296 | |
| | | | | | | | |
| | | | | | | 7,305 | |
| | | | | | | | |
| |
Total France – 8.9% | | | $ | 11,918 | |
Germany | |
| |
Health Care – 1.5% | |
Fresenius SE & Co. KGaA | | | 40 | | | | 1,921 | |
| | | | | | | | |
| |
Total Germany – 1.5% | | | $ | 1,921 | |
Hong Kong | |
| |
Consumer Discretionary – 0.9% | |
Galaxy Entertainment Group | | | 191 | | | | 1,206 | |
| | | | | | | | |
| |
Financials – 2.0% | |
AIA Group Ltd. | | | 324 | | | | 2,693 | |
| | | | | | | | |
| |
Total Hong Kong – 2.9% | | | $ | 3,899 | |
India | |
| |
Financials – 1.1% | |
HDFC Bank Ltd. | | | 48 | | | | 1,460 | |
| | | | | | | | |
| | | | | | | | |
| COMMON STOCKS(Continued) | | Shares | | | Value | |
Total India – 1.1% | | | $ | 1,460 | |
Italy | |
| |
Consumer Discretionary – 0.9% | |
Ferrari N.V. | | | 12 | | | | 1,190 | |
| | | | | | | | |
| |
Total Italy – 0.9% | | | $ | 1,190 | |
Japan | |
| |
Consumer Discretionary – 1.1% | |
Isuzu Motors Ltd. | | | 108 | | | | 1,515 | |
| | | | | | | | |
| |
Industrials – 2.0% | |
Dakin Industries Ltd. | | | 7 | | | | 776 | |
Recruit Holdings Co. Ltd. | | | 80 | | | | 1,938 | |
| | | | | | | | |
| | | | | | | 2,714 | |
| | | | | | | | |
| |
Total Japan – 3.1% | | | $ | 4,229 | |
Netherlands | |
| |
Consumer Staples – 1.3% | |
Heineken N.V. | | | 19 | | | | 1,702 | |
| | | | | | | | |
| |
Energy – 1.0% | |
Royal Dutch Shell plc, Class B | | | 46 | | | | 1,373 | |
| | | | | | | | |
| |
Industrials – 1.3% | |
Koninklijke Philips Electronics N.V., Ordinary Shares | | | 52 | | | | 1,809 | |
| | | | | | | | |
| |
Information Technology – 0.3% | |
ASML Holding N.V., NY Registry Shares | | | 3 | | | | 420 | |
| | | | | | | | |
| |
Total Netherlands – 3.9% | | | $ | 5,304 | |
Sweden | |
| |
Information Technology – 0.9% | |
Hexagon AB, Class B | | | 28 | | | | 1,289 | |
| | | | | | | | |
| |
Total Sweden – 0.9% | | | $ | 1,289 | |
Switzerland | |
| |
Consumer Staples – 1.0% | |
Nestle S.A., Registered Shares | | | 16 | | | | 1,330 | |
| | | | | | | | |
| |
Industrials – 0.9% | |
Ferguson plc | | | 20 | | | | 1,283 | |
| | | | | | | | |
| |
Total Switzerland – 1.9% | | | $ | 2,613 | |
United Kingdom | |
| |
Consumer Discretionary – 1.2% | |
Compass Group plc | | | 76 | | | | 1,600 | |
| | | | | | | | |
| |
Consumer Staples – 4.2% | |
British American Tobacco plc | | | 43 | | | | 1,364 | |
Diageo plc | | | 48 | | | | 1,731 | |
| | | | | | | | |
| COMMON STOCKS(Continued) | | Shares | | | Value | |
| |
Consumer Discretionary (Continued) | |
Imperial Tobacco Group plc | | | 86 | | | $ | 2,597 | |
| | | | | | | | |
| | | | | | | 5,692 | |
| | | | | | | | |
| |
Financials – 2.3% | |
Prudential plc | | | 169 | | | | 3,012 | |
| | | | | | | | |
| |
Total United Kingdom – 7.7% | | | $ | 10,304 | |
United States | |
| |
Communication Services – 1.0% | |
Facebook, Inc., Class A (A) | | | 10 | | | | 1,306 | |
| | | | | | | | |
| |
Consumer Discretionary – 10.4% | |
Amazon.com, Inc. (A) | | | 4 | | | | 5,700 | |
Dollar General Corp. | | | 37 | | | | 3,995 | |
Home Depot, Inc. (The) | | | 20 | | | | 3,390 | |
Lowe’s Co., Inc. | | | 9 | | | | 841 | |
| | | | | | | | |
| | | | | | | 13,926 | |
| | | | | | | | |
| |
Energy – 1.2% | |
Halliburton Co. | | | 30 | | | | 804 | |
Schlumberger Ltd. | | | 24 | | | | 849 | |
| | | | | | | | |
| | | | | | | 1,653 | |
| | | | | | | | |
| |
Financials – 7.3% | |
CME Group, Inc. | | | 28 | | | | 5,235 | |
Goldman Sachs Group, Inc. (The) | | | 9 | | | | 1,505 | |
KeyCorp | | | 115 | | | | 1,692 | |
SVB Financial Group (A) | | | 8 | | | | 1,434 | |
| | | | | | | | |
| | | | | | | 9,866 | |
| | | | | | | | |
| |
Health Care – 17.3% | |
Abbott Laboratories | | | 35 | | | | 2,497 | |
Alexion Pharmaceuticals, Inc. (A) | | | 5 | | | | 478 | |
Cigna Corp. | | | 23 | | | | 4,336 | |
HCA Holdings, Inc. | | | 34 | | | | 4,213 | |
Johnson & Johnson | | | 26 | | | | 3,350 | |
Thermo Fisher Scientific, Inc. | | | 14 | | | | 3,075 | |
UnitedHealth Group, Inc. | | | 21 | | | | 5,348 | |
| | | | | | | | |
| | | | | | | 23,297 | |
| | | | | | | | |
| |
Industrials – 2.8% | |
Eaton Corp. | | | 22 | | | | 1,477 | |
FedEx Corp. | | | 3 | | | | 486 | |
Northrop Grumman Corp. | | | 7 | | | | 1,724 | |
| | | | | | | | |
| | | | | | | 3,687 | |
| | | | | | | | |
| |
Information Technology – 16.7% | |
Adobe, Inc. (A) | | | 9 | | | | 2,138 | |
Applied Materials, Inc. | | | 17 | | | | 556 | |
Arista Networks, Inc. (A) | | | 7 | | | | 1,521 | |
Cognizant Technology Solutions Corp., Class A | | | 54 | | | | 3,444 | |
MasterCard, Inc., Class A | | | 9 | | | | 1,774 | |
Microsoft Corp. | | | 62 | | | | 6,334 | |
PayPal, Inc. (A) | | | 26 | | | | 2,225 | |
Visa, Inc., Class A | | | 34 | | | | 4,425 | |
| | | | | | | | |
| | | | | | | 22,417 | |
| | | | | | | | |
| | |
| SCHEDULE OF INVESTMENTS | | GLOBAL GROWTH (in thousands) |
DECEMBER 31, 2018
| | | | | | | | |
| COMMON STOCKS(Continued) | | Shares | | | Value | |
Total United States – 56.7% | | | $ | 76,152 | |
| |
TOTAL COMMON STOCKS – 95.5% | | | $ | 128,254 | |
(Cost: $125,847) | |
| | |
| SHORT-TERM SECURITIES | | Principal | | | | |
| |
Master Note – 4.2% | |
Toyota Motor Credit Corp.(1-Month U.S. LIBOR plus 15 bps) | | | | | | | | |
2.720%,1-7-19 (C) | | $ | 5,700 | | | | 5,700 | |
| | | | | | | | |
| |
Money Market Funds – 0.2% | |
Dreyfus Institutional Preferred Government Money Market Fund – Institutional Shares | | | | | | | | |
2.400%, (D)(E) | | | 206 | | | | 206 | |
| | | | | | | | |
| |
TOTAL SHORT-TERM SECURITIES – 4.4% | | | $ | 5,906 | |
(Cost: $5,906) | | | | | | | | |
| |
TOTAL INVESTMENT SECURITIES – 99.9% | | | $ | 134,160 | |
(Cost: $131,753) | | | | | | | | |
| |
CASH AND OTHER ASSETS, NET OF LIABILITIES – 0.1% | | | | 114 | |
| |
NET ASSETS – 100.0% | | | $ | 134,274 | |
Notes to Schedule of Investments
| (A) | No dividends were paid during the preceding 12 months. |
| (B) | All or a portion of securities with an aggregate value of $201 are on loan. |
| (C) | Variable rate security. Interest rate disclosed is that which is in effect at December 31, 2018. Date shown represents the date that the variable rate resets. Description of the reference rate and spread, if applicable, are included in the security description. |
| (D) | Rate shown is the annualized7-day yield at December 31, 2018. |
| (E) | Investment made with cash collateral received from securities on loan. |
The following table is a summary of the valuation of the Portfolio’s investments by the fair value hierarchy levels as of December 31, 2018. See Note 3 to the Financial Statements for further information regarding fair value measurement.
| | | | | | | | | | | | |
| | | Level 1 | | | Level 2 | | | Level 3 | |
Assets | | | | | | | | | | | | |
Investments in Securities | | | | | | | | | | | | |
Common Stocks | | | | | | | | | | | | |
Communication Services | | $ | 1,526 | | | $ | 1,521 | | | $ | — | |
Consumer Discretionary | | | 13,926 | | | | 6,085 | | | | — | |
Consumer Staples | | | 2,537 | | | | 8,724 | | | | — | |
Energy | | | 6,544 | | | | 1,373 | | | | — | |
Financials | | | 9,866 | | | | 10,010 | | | | — | |
Health Care | | | 23,297 | | | | 1,921 | | | | — | |
Industrials | | | 3,687 | | | | 13,111 | | | | — | |
Information Technology | | | 22,837 | | | | 1,289 | | | | — | |
Total Common Stocks | | $ | 84,220 | | | $ | 44,034 | | | $ | — | |
Short-Term Securities | | | 206 | | | | 5,700 | | | | — | |
Total | | $ | 84,426 | | | $ | 49,734 | | | $ | — | |
| | |
| SCHEDULE OF INVESTMENTS | | GLOBAL GROWTH (in thousands) |
DECEMBER 31, 2018
The following acronyms are used throughout this schedule:
ADR = American Depositary Receipts
LIBOR = London Interbank Offered Rate
| | | | |
| Market Sector Diversification | |
(as a % of net assets) | |
Health Care | | | 18.8% | |
Information Technology | | | 17.9% | |
Consumer Discretionary | | | 14.9% | |
Financials | | | 14.8% | |
Industrials | | | 12.5% | |
Consumer Staples | | | 8.4% | |
Energy | | | 5.9% | |
Communication Services | | | 2.3% | |
Other+ | | | 4.5% | |
| |
+ Includes cash and other assets (net of liabilities), and cash equivalents
See Accompanying Notes to Financial Statements.
| | |
| MANAGEMENT DISCUSSION | | LIMITED-TERM BOND |
(UNAUDITED)
Susan K. Regan
Below, Susan K. Regan, portfolio manager of Ivy VIP Limited-Term Bond, discusses positioning, performance and results for the fiscal year ended December 31, 2018. She has managed the Portfolio since 2014 and has 31 years industry experience.
Fiscal Year Performance
| | | | |
For the 12 Months Ended December 31, 2018 | | | | |
Ivy VIP Limited-Term Bond (Class II shares at net asset value) | | | 0.78% | |
| Benchmark(s) and/or Morningstar and Lipper Categories | | | | |
Bloomberg Barclays1-5 Year U.S. Government/Credit Index | | | 1.38% | |
| (generally reflects the performance of securities representing the bond market that have maturities between 1 and 5 years) | | | | |
Morningstar Short-Term Bond Universe Average | | | 0.86% | |
(generally reflects the performance of the universe of funds with similar investment objectives) | | | | |
Lipper Variable Annuity Short-Intermediate Investment Grade Debt Funds Universe Average | | | 0.58% | |
(generally reflects the performance of the universe of funds with similar investment objectives) | | | | |
Please note that the Portfolio returns include applicable investment fees and expenses, whereas the index returns do not include any such fees. Also, the Portfolio’s performance data does not take into account any product expenses or charges associated with owning a variable life or annuity policy, which is invested in Ivy Variable Insurance Portfolios.
Performance
For the period ended December 31, 2018, the Portfolio underperformed versus its Bloomberg Barclays benchmark, but outperformed relative to the average of its Lipper peer group.
Market Perspective
Fixed income investors had the challenge of investing in a rising interest rate environment for most of 2018. The Federal Reserve (Fed) engaged in four interest rate hikes, raising the federal funds rate by0.25-percentage point at its March, June, September and December meetings. During the calendar year, the2-year U.S. Treasury note yield hit a low of 1.92% on January 2, climbed to a high of 2.97% on November 8, and then fell again to end the year at 2.49%.
U.S. Treasury securities were not the only fixed income investments to experience periods of volatility in 2018. The Bloomberg Barclays U.S. Credit Index showed that across the entire maturity spectrum, investment grade credit generated an excess return of negative 280 basis points (bps) for the year. In comparison, the excess return of the index was positive 442 and 335 bps in 2016 and 2017, respectively. We began reducing the Portfolio’s overweight in investment grade credit during the second quarter as we believed credit performance in 2018 was not going to repeat the strong returns from the previous two years. We began the year with a strong overweight in credit and ended the year with a credit allocation similar to the benchmark.
We increased our allocations to both U.S. Treasuries and commercial paper of corporations. Commercial paper rates became attractive in early 2018 as the Fed continued hiking rates and the yield curve flattened.
Several factors contributed to widening credit spreads in 2018. Trade policy, tax policy, tariffs and tweets from President Trump impacted the overall market and individual corporations in 2018. Uncertainty about the trade policy with China has been a dominant concern. We saw reduced foreign demand for corporate bonds during the year. Corporations with significant profits overseas invested much of that profit in short-dated corporate bonds. Tax policy changes are enabling companies to bring profits back to the U.S., which has contributed to their reduced demand for corporate bonds.
The flattening of the yield curve also was a major focus of the market in 2018. While there are many measures of the yield curve, the one referenced the most in relation to an inverted yield curve is the difference in yields between the10-year U.S. Treasury note and the2-year U.S. Treasury note. At the start of 2018, the difference between the two notes was 52 bps. At the end of the year, the difference was just less than 20 bps after it reached as low as 11 bps in early December. At year end, one section of the yield curve became slightly inverted (i.e., long-term debt had a lower yield than short-term debt), when the yield on the3-year U.S. Treasury note was 2.46%, three bps lower than the yield on the2-year note.
Outlook
Recent indications suggest that the Fed may consider more rate hikes in 2019. However, it is quite possible the Fed will be more cautious and more patient in 2019, allowing more time for the previous hikes to affect the economy and waiting on a
greater amount of incoming data as a guide. Many individuals, both inside and outside the Fed, believe the neutral federal funds rate is 3% or lower. With the current range at 2.25% to 2.50%, we think that neutral is probably close to the current levels. The Fed has also been systematically reducing the size of its balance sheet. The process began in 2017 and consists of continually reducing the amount of maturing bonds being replaced in the portfolio. We expect this process to continue throughout most, if not all, of 2019.
We expect the volatility seen in the markets in 2018 to continue in 2019 due to the great deal of uncertainty regarding trade and economic growth. We think this situation could contribute to further widening in corporate credit spreads in 2019. We are always looking for opportunities to improve the credit quality of the Portfolio, as we believe we are in the later stages of the credit cycle.
The yield curve should continue to be a focus of the market in 2019. We will watch the yield curve closely as we seek to ascertain its indications about the economy. Generally speaking, when the yield curve inverts, recession follows in the next12-24 months.
We are fully aware that preservation of capital is of the highest importance in a portfolio of this type and we will continue to seek to manage the risks involved in a prudent manner, while aiming to earn a fair and reasonable return.
Past performance is not a guarantee of future results. As with any mutual fund, the value of the Portfolio’s shares will change, and you could lose money on your investment. Certain U.S. government securities in which the Portfolio may invest, such as Treasury securities and securities issued by the Government National Mortgage Association (Ginnie Mae), are backed by the full faith and credit of the U.S. government. However, other government securities in which the Portfolio may invest, such as securities issued by the Federal National Mortgage Association (Fannie Mae), the Federal Home Loan Mortgage Corporation (Freddie Mac) and the Federal Home Loan Banks (FHLB), are not backed by the full faith and credit of the U.S. government, are not insured or guaranteed by the U.S. government and, instead, may be supported only by the right of the issuer to borrow from the U.S. Treasury or by the credit of the issuer.
Fixed-income securities are subject to interest rate risk and, as such, the Portfolio’s net asset value may fall as interest rates rise. These and other risks are more fully described in the Portfolio’s prospectus.
The opinions expressed in this report are those of the portfolio manager and are current only through the end of the period of the report as stated on the cover. The manager’s views are subject to change at any time based on market and other conditions, and no forecasts can be guaranteed.
The index noted is unmanaged and includes reinvested dividends. One cannot invest directly in an index, nor is an index representative of the Ivy VIP Limited-Term Bond.
| | |
| PORTFOLIO HIGHLIGHTS | | LIMITED-TERM BOND |
ALL DATA IS AS OF DECEMBER 31, 2018 (UNAUDITED)
| | | | |
| Asset Allocation | |
| |
Bonds | | | 91.1 | % |
United States Government and Government Agency Obligations | | | 55.9 | % |
Corporate Debt Securities | | | 31.5 | % |
Municipal Bonds – Taxable | | | 2.5 | % |
Mortgage-Backed Securities | | | 0.8 | % |
Asset-Backed Securities | | | 0.4 | % |
Cash and Other Assets (Net of Liabilities),and Cash Equivalents+ | | | 8.9 | % |
| | | | |
| Quality Weightings | |
| |
Investment Grade | | | 88.8 | % |
AAA | | | 47.7 | % |
AA | | | 6.7 | % |
A | | | 12.7 | % |
BBB | | | 21.7 | % |
Non-Investment Grade | | | 2.3 | % |
BB | | | 1.2 | % |
Non-rated | | | 1.1 | % |
Cash and Other Assets (Net of Liabilities),
and Cash Equivalents+ | | | 8.9 | % |
Our preference is to always use ratings obtained from Standard & Poor’s, Moody’s, and Fitch. It is each Portfolio’s general policy to classify such security at the lower rating level if only two ratings are available. If more than two ratings are available and a median exists, the median is used. If more than two ratings exist without a median, the lower of the two middle ratings is used. We do not evaluate these ratings, but simply assign them to the appropriate credit quality category as determined by the rating agency. | |
+ Cash equivalents are defined as highly liquid securities with maturities of less than three months. Cash equivalents may include U.S. Government Treasury bills, bank certificates of deposit, bankers’ acceptances, corporate commercial paper and other money market instruments.
| | |
| COMPARISON OF CHANGE IN VALUE OF $10,000 INVESTMENT | | LIMITED-TERM BOND |
(UNAUDITED)
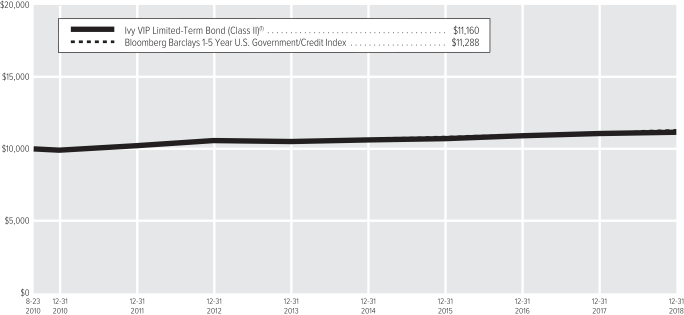
| (1) | The value of the investment in the Portfolio is impacted by the ongoing expenses of the Portfolio and assumes reinvestment of dividends and distributions. |
| | | | |
| |
| Average Annual Total Return(2) | | Class II | |
1-year period ended12-31-18 | | | 0.78% | |
5-year period ended12-31-18 | | | 1.19% | |
10-year period ended12-31-18 | | | — | |
Since Inception of Class through12-31-18(3) | | | 1.32% | |
| (2) | Data quoted is past performance and current performance may be lower or higher. Past performance is no guarantee of future results. Investment return and principal value of an investment will fluctuate and shares, when redeemed, may be worth more or less than their original cost. Please visit www.ivyinvestments.com for the Portfolio’s most recentmonth-end performance. Performance data quoted does not reflect any expenses or charges associated with owning a variable life insurance policy or variable annuity contract that invests in the Portfolio’s shares. When such charges are deducted, actual investment performance in a variable policy or contract will be lower. |
| (3) | 8-23-10 (the date on which shares were first acquired by shareholders). |
Past performance is not necessarily indicative of future performance. Indexes are unmanaged. The performance graph and table do not reflect the deduction of taxes that a shareholder would pay on Portfolio distributions or on the redemption of Portfolio shares. Performance results may include the effect of expense reduction arrangements for some or all of the periods shown. If those arrangements had not been in place, the performance results for those periods would have been lower.
| | |
| SCHEDULE OF INVESTMENTS | | LIMITED-TERM BOND (in thousands) |
DECEMBER 31, 2018
| | | | | | | | |
| ASSET-BACKED SECURITIES | | Principal | | | Value | |
American Airlines Class AA Pass Through Certificates, Series | | | | | | | | |
2016-2, 3.200%,6-15-28 | | $ | 900 | | | $ | 846 | |
SBA Tower Trust, Series2016-1 (GTD by SBA Guarantor LLC and SBA Holdings LLC), | | | | | | | | |
2.877%,7-9-21 (A) | | | 1,000 | | | | 981 | |
| | | | | | | | |
| |
TOTAL ASSET-BACKED SECURITIES – 0.4% | | | $ | 1,827 | |
(Cost: $1,904) | |
| | |
CORPORATE DEBT SECURITIES | | | | | | | | |
Communication Services | |
| |
Cable & Satellite – 0.6% | |
Comcast Corp. (GTD by Comcast Cable Communications and NBCUniversal): | | | | | | | | |
3.300%,10-1-20 | | | 1,400 | | | | 1,405 | |
3.450%,10-1-21 | | | 1,000 | | | | 1,010 | |
DIRECTV Holdings LLC and DIRECTV Financing Co., Inc., | | | | | | | | |
4.450%,4-1-24 | | | 1,190 | | | | 1,210 | |
| | | | | | | | |
| | | | | | | 3,625 | |
| | | | | | | | |
Wireless Telecommunication Service – 0.2% | |
Crown Castle Towers LLC, | | | | | | | | |
3.222%,5-15-22 (A) | | | 1,000 | | | | 983 | |
| | | | | | | | |
| |
Total Communication Services – 0.8% | | | | 4,608 | |
Consumer Discretionary | |
| |
Auto Parts & Equipment – 0.6% | |
BorgWarner Automotive, Inc., | | | | | | | | |
8.000%,10-1-19 | | | 2,000 | | | | 2,073 | |
Lear Corp., | | | | | | | | |
5.375%,3-15-24 (B) | | | 1,257 | | | | 1,293 | |
| | | | | | | | |
| | | | | | | 3,366 | |
| | | | | | | | |
| |
Automobile Manufacturers – 0.4% | |
BMW U.S. Capital LLC, | | | | | | | | |
2.150%,4-6-20 (A) | | | 2,000 | | | | 1,976 | |
| | | | | | | | |
| |
General Merchandise Stores – 0.8% | |
Dollar General Corp., | | | | | | | | |
3.250%,4-15-23 | | | 1,000 | | | | 978 | |
Family Dollar Stores, Inc., | | | | | | | | |
5.000%,2-1-21 | | | 3,500 | | | | 3,561 | |
| | | | | | | | |
| | | | | | | 4,539 | |
| | | | | | | | |
| |
Internet & Direct Marketing Retail – 0.5% | |
Alibaba Group Holding Ltd., | | | | | | | | |
2.800%,6-6-23 | | | 2,500 | | | | 2,420 | |
| | | | | | | | |
| |
Total Consumer Discretionary – 2.3% | | | | 12,301 | |
Consumer Staples | |
| |
Brewers – 0.1% | |
Molson Coors Brewing Co., | | | | | | | | |
2.250%,3-15-20 (B) | | | 750 | | | | 739 | |
| | | | | | | | |
| | | | | | | | |
CORPORATE DEBT SECURITIES
(Continued) | | Principal | | | Value | |
| |
Distillers & Vintners – 1.3% | |
Constellation Brands, Inc.: | | | | | | | | |
3.875%,11-15-19 | | $ | 3,950 | | | $ | 3,965 | |
2.250%,11-6-20 | | | 3,000 | | | | 2,942 | |
| | | | | | | | |
| | | | | | | 6,907 | |
| | | | | | | | |
| |
Packaged Foods & Meats – 0.5% | |
Smithfield Foods, Inc., | | | | | | | | |
2.700%,1-31-20 (A) | | | 2,800 | | | | 2,762 | |
| | | | | | | | |
| |
Total Consumer Staples – 1.9% | | | | 10,408 | |
Energy | |
| |
Oil & Gas Equipment & Services – 0.7% | |
Enterprise Products Operating LLC (GTD by Enterprise Products Partners L.P.): | | | | | | | | |
2.800%,2-15-21 | | | 1,800 | | | | 1,780 | |
3.500%,2-1-22 | | | 2,000 | | | | 2,006 | |
| | | | | | | | |
| | | | | | | 3,786 | |
| | | | | | | | |
| |
Oil & Gas Exploration & Production – 0.8% | |
Aker BP ASA, | | | | | | | | |
6.000%,7-1-22 (A) | | | 1,000 | | | | 1,005 | |
EQT Corp., | | | | | | | | |
8.125%,6-1-19 | | | 2,650 | | | | 2,695 | |
Exxon Mobil Corp., | | | | | | | | |
2.397%,3-6-22 (B) | | | 1,000 | | | | 981 | |
| | | | | | | | |
| | | | | | | 4,681 | |
| | | | | | | | |
| |
Oil & Gas Storage & Transportation – 2.4% | |
Enbridge, Inc., | | | | | | | | |
2.900%,7-15-22 | | | 2,470 | | | | 2,390 | |
Energy Transfer Partners L.P., | | | | | | | | |
4.150%,10-1-20 | | | 3,860 | | | | 3,883 | |
EQT Midstream Partners L.P., | | | | | | | | |
4.750%,7-15-23 | | | 1,500 | | | | 1,493 | |
Kinder Morgan Energy Partners L.P.: | | | | | | | | |
3.500%,3-1-21 | | | 1,000 | | | | 997 | |
3.450%,2-15-23 | | | 1,646 | | | | 1,607 | |
Plains All American Pipeline L.P. and PAA Finance Corp., | | | | | | | | |
3.850%,10-15-23 | | | 1,800 | | | | 1,761 | |
Sunoco Logistics Partners Operations L.P. (GTD by Sunoco Logistics Partners L.P.), | | | | | | | | |
4.400%,4-1-21 | | | 800 | | | | 809 | |
| | | | | | | | |
| | | | | | | 12,940 | |
| | | | | | | | |
| |
Total Energy – 3.9% | | | | 21,407 | |
Financials | |
| |
Asset Management & Custody Banks – 0.4% | |
Ares Capital Corp., | | | | | | | | |
3.875%,1-15-20 | | | 2,055 | | | | 2,059 | |
| | | | | | | | |
| | | | | | | | |
CORPORATE DEBT SECURITIES
(Continued) | | Principal | | | Value | |
| |
Consumer Finance – 3.2% | |
Ally Financial, Inc., | | | | | | | | |
4.125%,3-30-20 | | $ | 3,932 | | | $ | 3,891 | |
Capital One Bank USA N.A., | | | | | | | | |
2.300%,6-5-19 | | | 1,950 | | | | 1,943 | |
Capital One N.A., | | | | | | | | |
2.350%,1-31-20 | | | 2,000 | | | | 1,974 | |
Discover Bank, | | | | | | | | |
3.100%,6-4-20 | | | 2,500 | | | | 2,483 | |
Ford Motor Credit Co. LLC: | | | | | | | | |
2.681%,1-9-20 | | | 1,000 | | | | 983 | |
2.459%,3-27-20 | | | 3,066 | | | | 3,001 | |
General Motors Financial Co., Inc. (GTD by AmeriCredit Financial Services, Inc.): | | | | | | | | |
3.200%,7-6-21 | | | 1,000 | | | | 977 | |
3.700%,5-9-23 | | | 2,450 | | | | 2,331 | |
| | | | | | | | |
| | | | | | | 17,583 | |
| | | | | | | | |
| |
Diversified Banks – 4.3% | |
Bank of America Corp.: | | | | | | | | |
3.499%,5-17-22 | | | 1,000 | | | | 1,000 | |
4.100%,7-24-23 | | | 1,666 | | | | 1,689 | |
BB&T Corp., | | | | | | | | |
2.050%,5-10-21 | | | 1,150 | | | | 1,120 | |
KeyBank N.A., | | | 2,000 | | | | 1,925 | |
2.300%,9-14-22 | | | | | | | | |
Mitsubishi UFJ Financial Group, Inc.: | | | | | | | | |
3.535%,7-26-21 | | | 1,450 | | | | 1,454 | |
2.998%,2-22-22 | | | 500 | | | | 493 | |
Mizuho Financial Group, Inc., | | | | | | | | |
2.953%,2-28-22 | | | 2,100 | | | | 2,059 | |
Nordea Bank AB(3-Month U.S. LIBOR plus 94 bps), | | | | | | | | |
3.647%,8-30-23 (A)(C) | | | 3,000 | | | | 2,967 | |
Northern Trust Corp., | | | | | | | | |
2.375%,8-2-22 (B) | | | 2,269 | | | | 2,205 | |
Royal Bank of Canada, | | | | | | | | |
2.350%,10-30-20 | | | 5,000 | | | | 4,938 | |
U.S. Bancorp, | | | | | | | | |
5.125%,1-15-67 | | | 3,580 | | | | 3,544 | |
| | | | | | | | |
| | | | | | | 23,394 | |
| | | | | | | | |
| |
Diversified Capital Markets – 0.3% | |
Deutsche Bank AG, | | | | | | | | |
4.250%,10-14-21 | | | 1,500 | | | | 1,466 | |
| | | | | | | | |
| |
Investment Banking & Brokerage – 1.5% | |
Daiwa Securities Group, Inc., | | | | | | | | |
3.129%,4-19-22 (A) | | | 2,000 | | | | 1,968 | |
Goldman Sachs Group, Inc. (The): | | | | | | | | |
2.350%,11-15-21 | | | 1,000 | | | | 964 | |
5.700%,12-29-49 | | | 1,500 | | | | 1,463 | |
Morgan Stanley: | | | | | | | | |
5.750%,1-25-21 | | | 1,000 | | | | 1,044 | |
4.875%,11-1-22 | | | 2,250 | | | | 2,318 | |
Morgan Stanley(3-Month U.S. LIBOR plus 110 bps), | | | | | | | | |
3.807%,5-31-23 (C) | | | 300 | | | | 293 | |
| | | | | | | | |
| | | | | | | 8,050 | |
| | | | | | | | |
| | |
| SCHEDULE OF INVESTMENTS | | LIMITED-TERM BOND (in thousands) |
DECEMBER 31, 2018
| | | | | | | | |
CORPORATE DEBT SECURITIES
(Continued) | | Principal | | | Value | |
| |
Life & Health Insurance – 0.5% | |
Athene Global Funding, | | | | | | | | |
2.750%,4-20-20 (A) | | $ | 1,000 | | | $ | 991 | |
Principal Life Global Funding II, | | | | | | | | |
2.625%,11-19-20 (A) | | | 2,000 | | | | 1,977 | |
| | | | | | | | |
| | | | | | | 2,968 | |
| | | | | | | | |
| |
Other Diversified Financial Services – 1.5% | |
Citigroup, Inc.: | | | | | | | | |
2.650%,10-26-20 | | | 1,000 | | | | 987 | |
2.700%,3-30-21 | | | 1,000 | | | | 985 | |
2.750%,4-25-22 | | | 2,000 | | | | 1,939 | |
JPMorgan Chase & Co.: | | | | | | | | |
4.250%,10-15-20 | | | 1,000 | | | | 1,018 | |
2.972%,1-15-23 | | | 1,500 | | | | 1,462 | |
3.000%,2-27-30 (D) | | | 850 | | | | 790 | |
USAA Capital Corp., | | | | | | | | |
2.450%,8-1-20 (A) | | | 795 | | | | 787 | |
| | | | | | | | |
| | | | | | | 7,968 | |
| | | | | | | | |
| |
Property & Casualty Insurance – 0.5% | |
ACE INA Holdings, Inc. (GTD by ACE Ltd.), | | | | | | | | |
2.300%,11-3-20 | | | 2,543 | | | | 2,507 | |
| | | | | | | | |
| |
Regional Banks – 0.5% | |
PNC Bank N.A., | | | | | | | | |
2.550%,12-9-21 | | | 1,000 | | | | 976 | |
Sumitomo Mitsui Banking Corp.(3-Month U.S. LIBOR plus 35 bps), | | | | | | | | |
2.799%,1-17-20 (C) | | | 1,000 | | | | 999 | |
Sumitomo Mitsui Trust Bank Ltd., | | | | | | | | |
2.050%,3-6-19 (A) | | | 500 | | | | 499 | |
| | | | | | | | |
| | | | | | | 2,474 | |
| | | | | | | | |
| |
Specialized Finance – 1.1% | |
Diamond 1 Finance Corp. and Diamond 2 Finance Corp., | | | | | | | | |
3.480%,6-1-19 (A) | | | 1,875 | | | | 1,870 | |
International Lease Finance Corp., | | | | | | | | |
6.250%,5-15-19 | | | 3,500 | | | | 3,531 | |
Syngenta Finance N.V., | | | | | | | | |
3.698%,4-24-20 (A) | | | 750 | | | | 744 | |
| | | | | | | | |
| | | | | | | 6,145 | |
| | | | | | | | |
| |
Total Financials – 13.8% | | | | 74,614 | |
Health Care | |
| |
Biotechnology – 0.8% | |
Amgen, Inc., | | | | | | | | |
2.200%,5-11-20 (B) | | | 4,625 | | | | 4,566 | |
| | | | | | | | |
| |
Health Care Supplies – 0.2% | |
Stryker Corp., | | | | | | | | |
2.625%,3-15-21 (B) | | | 1,000 | | | | 988 | |
| | | | | | | | |
| |
Managed Health Care – 0.5% | |
Halfmoon Parent, Inc., | | | | | | | | |
3.200%,9-17-20 (A) | | | 2,500 | | | | 2,489 | |
| | | | | | | | |
| | | | | | | | |
CORPORATE DEBT SECURITIES
(Continued) | | Principal | | | Value | |
| |
Pharmaceuticals – 0.3% | |
Bayer U.S. Finance II LLC, | | | | | | | | |
3.875%,12-15-23 (A) | | $ | 1,500 | | | $ | 1,473 | |
| | | | | | | | |
| |
Total Health Care – 1.8% | | | | 9,516 | |
Industrials | |
| |
Aerospace & Defense – 0.1% | |
Northrop Grumman Corp., | | | | | | | | |
3.250%,8-1-23 | | | 680 | | | | 669 | |
| | | | | | | | |
| |
Airlines – 0.3% | |
Aviation Capital Group Corp., | | | | | | | | |
2.875%,1-20-22 (A) | | | 1,000 | | | | 968 | |
Delta Air Lines, Inc., | | | | | | | | |
3.400%,4-19-21 | | | 625 | | | | 620 | |
| | | | | | | | |
| | | | | | | 1,588 | |
| | | | | | | | |
| |
Industrial Conglomerates – 0.2% | |
General Electric Capital Corp., | | | | | | | | |
5.012%,1-1-24 | | | 995 | | | | 992 | |
| | | | | | | | |
| |
Total Industrials – 0.6% | | | | 3,249 | |
Information Technology | |
| |
Application Software – 0.3% | |
salesforce.com, Inc., | | | | | | | | |
3.250%,4-11-23 | | | 1,475 | | | | 1,482 | |
| | | | | | | | |
| |
Communications Equipment – 0.3% | |
L-3 Communications Corp., | | | | | | | | |
3.950%,5-28-24 | | | 2,000 | | | | 1,996 | |
| | | | | | | | |
| |
Data Processing & Outsourced Services – 0.7% | |
Visa, Inc., | | | | | | | | |
2.800%,12-14-22 | | | 3,750 | | | | 3,703 | |
| | | | | | | | |
| |
Semiconductors – 0.4% | |
Broadcom Corp. and Broadcom Cayman Finance Ltd. (GTD by Broadcom Ltd.), | | | | | | | | |
2.375%,1-15-20 | | | 2,250 | | | | 2,222 | |
| | | | | | | | |
| |
Systems Software – 0.6% | |
CA, Inc., | | | | | | | | |
5.375%,12-1-19 | | | 1,500 | | | | 1,519 | |
Microsoft Corp., | | | | | | | | |
2.875%,2-6-24 | | | 1,750 | | | | 1,734 | |
| | | | | | | | |
| | | | | | | 3,253 | |
| | | | | | | | |
| |
Total Information Technology – 2.3% | | | | 12,656 | |
Materials | |
| |
Specialty Chemicals – 0.8% | |
Methanex Corp., | | | | | | | | |
3.250%,12-15-19 | | | 4,500 | | | | 4,466 | |
| | | | | | | | |
| |
Total Materials – 0.8% | | | | 4,466 | |
| | | | | | | | |
CORPORATE DEBT SECURITIES
(Continued) | | Principal | | | Value | |
Real Estate | |
| |
Industrial REITs – 0.2% | |
Air Lease Corp., | | | | | | | | |
2.500%,3-1-21 | | $ | 1,300 | | | $ | 1,267 | |
| | | | | | | | |
| |
Specialized REITs – 1.2% | |
American Tower Corp.: | | | | | | | | |
3.300%,2-15-21 | | | 2,000 | | | | 1,989 | |
5.900%,11-1-21 | | | 800 | | | | 845 | |
2.250%,1-15-22 | | | 2,165 | | | | 2,072 | |
Crown Castle International Corp.: | | | | | | | | |
2.250%,9-1-21 | | | 500 | | | | 483 | |
4.875%,4-15-22 | | | 1,000 | | | | 1,029 | |
| | | | | | | | |
| | | | | | | 6,418 | |
| | | | | | | | |
| |
Total Real Estate – 1.4% | | | | 7,685 | |
Utilities | |
| |
Electric Utilities – 1.9% | |
CenterPoint Energy, Inc., | | | | | | | | |
2.500%,9-1-22 | | | 3,000 | | | | 2,869 | |
Duke Energy Carolinas LLC, | | | | | | | | |
2.500%,3-15-23 | | | 2,500 | | | | 2,415 | |
Entergy Texas, Inc., | | | | | | | | |
2.550%,6-1-21 | | | 1,275 | | | | 1,255 | |
MidAmerican Energy Co., | | | | | | | | |
3.700%,9-15-23 | | | 1,045 | | | | 1,057 | |
National Rural Utilities Cooperative Finance Corp., | | | | | | | | |
2.400%,4-25-22 | | | 2,000 | | | | 1,946 | |
Virginia Electric and Power Co., Series C, | | | | | | | | |
2.750%,3-15-23 | | | 1,000 | | | | 975 | |
| | | | | | | | |
| | | | | | | 10,517 | |
| | | | | | | | |
| |
Total Utilities – 1.9% | | | | 10,517 | |
| |
TOTAL CORPORATE DEBT SECURITIES – 31.5% | | | $ | 171,427 | |
(Cost: $174,280) | | | | | | | | |
| | |
MORTGAGE-BACKED SECURITIES | | | | | | | | |
Commercial Mortgage-Backed Securities – 0.8% | |
Bear Stearns Deutsche Bank Trust, Commercial Mortgage Pass-Through Certificates, Series 2005-AFR1, Class C, | | | | | | | | |
5.097%,9-15-27 (A) | | | 640 | | | | 649 | |
Citigroup Commercial Mortgage Trust, Commercial Mortgage Pass-Through Certificates, Series2004-C2 (Mortgage spread to2-year U.S. Treasury index), | | | | | | | | |
6.310%,10-15-41 (A)(C) | | | 3,500 | | | | 3,536 | |
| | | | | | | | |
| | | | | | | 4,185 | |
| | | | | | | | |
| |
TOTAL MORTGAGE-BACKED SECURITIES – 0.8% | | | $ | 4,185 | |
(Cost: $4,454) | |
| | |
| SCHEDULE OF INVESTMENTS | | LIMITED-TERM BOND (in thousands) |
DECEMBER 31, 2018
| | | | | | | | |
| | |
| MUNICIPAL BONDS – TAXABLE | | Principal | | | Value | |
| |
Alabama – 0.4% | |
Board of Trustees of the Univ of AL, Univ of AL Gen Rev Bonds (Taxable Build America Bonds),Ser 2010-C, | | | | | | | | |
6.100%,7-1-38 | | $ | 1,840 | | | $ | 1,916 | |
| | | | | | | | |
| |
California – 1.2% | |
Alameda Corridor Trans Auth, Taxable Sr Lien Rev Bonds, Ser 1999C, | | | | | | | | |
6.500%,10-1-19 | | | 390 | | | | 400 | |
CA Various Purp GO Bonds, | | | | | | | | |
7.700%,11-1-30 | | | 3,355 | | | | 3,631 | |
CA Various Purp GO Rfdg Bonds, | | | | | | | | |
7.950%,3-1-36 | | | 2,380 | | | | 2,513 | |
| | | | | | | | |
| | | | | | | 6,544 | |
| | | | | | | | |
| |
Florida – 0.3% | |
FL Dept of Mgmt Svc, Cert of Part, Ser 2009C, | | | | | | | | |
5.586%,8-1-20 | | | 1,440 | | | | 1,463 | |
| | | | | | | | |
| |
Texas – 0.6% | |
Dallas Independent Sch Dist, Unlimited Tax Sch Bldg Bonds, Ser 2010C, | | | | | | | | |
6.450%,2-15-35 | | | 1,900 | | | | 2,030 | |
Katy Independent Sch Dist (Fort Bend, Harris and Waller Cntys, TX), Unlimited Tax Sch Bldg Bonds, Ser 2010D, | | | | | | | | |
6.349%,2-15-41 | | | 1,150 | | | | 1,195 | |
| | | | | | | | |
| | | | | | | 3,225 | |
| | | | | | | | |
| |
TOTAL MUNICIPAL BONDS - TAXABLE –2.5% | | | $ | 13,148 | |
(Cost: $13,252) | |
| | |
UNITED STATES GOVERNMENT AGENCY OBLIGATIONS | | | | | | | | |
| |
Agency Obligations – 0.8% | |
Federal Home Loan Bank: | | | | | | | | |
2.250%,7-21-31 | | | 1,640 | | | | 1,578 | |
2.000%,11-25-31 | | | 200 | | | | 188 | |
U.S. Department of Transportation, | | | | | | | | |
6.001%,12-7-21 (A) | | | 2,500 | | | | 2,730 | |
| | | | | | | | |
| | | | | | | 4,496 | |
| | | | | | | | |
| |
Mortgage-Backed Obligations – 8.7% | |
Federal Home Loan Mortgage Corp. Agency REMIC/CMO(1-Month U.S. LIBOR plus 250 bps), | | | | | | | | |
4.847%,11-25-24 (A)(C) | | | 785 | | | | 794 | |
Federal Home Loan Mortgage Corp. Agency REMIC/CMO(1-Month U.S. LIBOR plus 255 bps), | | | | | | | | |
4.897%,6-25-27 (A)(C) | | | 1,179 | | | | 1,206 | |
| | | | | | | | |
UNITED STATES GOVERNMENT
AGENCY OBLIGATIONS
(Continued) | | Principal | | | Value | |
Mortgage-Backed Obligations(Continued) | |
Federal Home Loan Mortgage Corp. Agency REMIC/CMO(1-Month U.S. LIBOR plus 435 bps), | | | | | | | | |
6.697%,11-25-21 (A)(C) | | $ | 2,923 | | | $ | 3,013 | |
Federal Home Loan Mortgage Corp. Agency REMIC/CMO(3-Year U.S. Treasury index plus 315 bps), | | | | | | | | |
4.622%,11-25-49 (A)(C) | | | 2,120 | | | | 2,166 | |
Federal Home Loan Mortgage Corp. Agency REMIC/CMO(5-Year U.S. Treasury index plus 300 bps), | | | | | | | | |
5.180%,2-25-47 (A)(C) | | | 170 | | | | 177 | |
Federal Home Loan Mortgage Corp. Agency REMIC/CMO (Mortgage spread to1-Month U.S. LIBOR): | | | | | | | | |
5.597%,6-25-21 (A)(C) | | | 593 | | | | 597 | |
6.347%,9-25-22 (A)(C) | | | 359 | | | | 364 | |
Federal Home Loan Mortgage Corp. Agency REMIC/CMO (Mortgage spread to2-year U.S. Treasury index), | | | | | | | | |
3.718%,2-25-45 (A)(C) | | | 1,906 | | | | 1,901 | |
Federal Home Loan Mortgage Corp. Agency REMIC/CMO (Mortgage spread to3-year U.S. Treasury index): | | | | | | | | |
5.501%,4-25-20 (A)(C) | | | 880 | | | | 903 | |
3.978%,2-25-46 (A)(C) | | | 70 | | | | 71 | |
4.416%,12-25-48 (A)(C) | | | 1,125 | | | | 1,154 | |
Federal Home Loan Mortgage Corp. Agency REMIC/CMO (Mortgage spread to5-year U.S. Treasury index): | | | | | | | | |
4.336%,12-25-44 (A)(C) | | | 6,047 | | | | 6,245 | |
3.870%,5-25-45 (A)(C) | | | 600 | | | | 612 | |
3.500%,8-25-46 (A)(C) | | | 2,370 | | | | 2,353 | |
4.604%,11-25-46 (A)(C) | | | 1,557 | | | | 1,614 | |
3.565%,11-25-47 (A)(C) | | | 2,724 | | | | 2,717 | |
3.539%,2-25-48 (A)(C) | | | 1,000 | | | | 1,002 | |
3.880%,2-25-50 (A)(C) | | | 2,014 | | | | 2,032 | |
Federal Home Loan Mortgage Corp. Agency REMIC/CMO (Mortgage spread to5-year U.S. Tresaury index), | | | | | | | | |
3.580%,11-25-23 (A)(C) | | | 1,500 | | | | 1,456 | |
Federal Home Loan Mortgage Corp. Agency REMIC/CMO (Mortgage spread to7-year U.S. Treasury index): | | | | | | | | |
4.055%,5-25-25 (A)(C) | | | 225 | | | | 225 | |
3.779%,10-25-48 (A)(C) | | | 1,125 | | | | 1,116 | |
3.675%,11-25-49 (A)(C) | | | 1,900 | | | | 1,872 | |
3.647%,11-25-50 (A)(C) | | | 800 | | | | 796 | |
Federal Home Loan Mortgage Corp. Fixed Rate Participation Certificates: | | | | | | | | |
3.000%,9-1-28 | | | 2,252 | | | | 2,251 | |
4.500%,8-1-30 | | | 634 | | | | 663 | |
2.500%,5-15-44 | | | 628 | | | | 615 | |
Federal National Mortgage Association Agency REMIC/CMO, | | | | | | | | |
2.000%,6-25-39 | | | 1,936 | | | | 1,887 | |
| | | | | | | | |
UNITED STATES GOVERNMENT
AGENCY OBLIGATIONS
(Continued) | | Principal | | | Value | |
Mortgage-Backed Obligations(Continued) | |
Federal National Mortgage Association Fixed Rate Pass-Through Certificates: | | | | | | | | |
2.210%,10-1-19 | | $ | 2,201 | | | $ | 2,199 | |
4.646%,7-1-20 | | | 905 | | | | 914 | |
3.680%,2-1-21 | | | 627 | | | | 627 | |
4.381%,6-1-21 | | | 1,127 | | | | 1,164 | |
2.000%,10-25-41 | | | 1,601 | | | | 1,534 | |
Government National Mortgage Association Agency REMIC/CMO, | | | | | | | | |
2.000%,3-16-42 | | | 886 | | | | 858 | |
| | | | | | | | |
| | | | | | | 47,098 | |
| | | | | | | | |
| |
TOTAL UNITED STATES GOVERNMENT AGENCY OBLIGATIONS – 9.5% | | | $ | 51,594 | |
(Cost: $52,257) | |
| | |
UNITED STATES GOVERNMENT
OBLIGATIONS | | | | | | |
| |
Treasury Obligations – 46.4% | |
U.S. Treasury Notes: | | | | | | | | |
1.250%,5-31-19 | | | 8,000 | | | | 7,959 | |
1.500%,5-31-19 | | | 2,500 | | | | 2,490 | |
1.625%,7-31-19 | | | 12,500 | | | | 12,433 | |
1.750%,11-30-19 | | | 15,000 | | | | 14,882 | |
2.375%,4-30-20 | | | 15,500 | | | | 15,458 | |
2.500%,5-31-20 | | | 10,000 | | | | 9,990 | |
2.125%,8-31-20 | | | 1,000 | | | | 993 | |
2.625%,8-31-20 | | | 2,000 | | | | 2,003 | |
1.750%,10-31-20 | | | 25,000 | | | | 24,654 | |
2.625%,11-15-20 | | | 10,000 | | | | 10,017 | |
2.625%,5-15-21 | | | 21,500 | | | | 21,565 | |
2.750%,9-15-21 | | | 1,000 | | | | 1,007 | |
2.875%,10-15-21 | | | 18,400 | | | | 18,593 | |
2.000%,12-31-21 | | | 8,000 | | | | 7,890 | |
2.125%,12-31-21 | | | 16,000 | | | | 15,842 | |
1.875%,2-28-22 | | | 15,000 | | | | 14,727 | |
1.750%,5-31-22 | | | 2,750 | | | | 2,685 | |
2.000%,7-31-22 | | | 24,000 | | | | 23,605 | |
2.125%,12-31-22 | | | 11,000 | | | | 10,845 | |
2.375%,1-31-23 | | | 10,000 | | | | 9,954 | |
2.750%,4-30-23 | | | 8,000 | | | | 8,082 | |
2.750%,5-31-23 | | | 10,000 | | | | 10,109 | |
2.875%,9-30-23 | | | 4,000 | | | | 4,065 | |
2.875%,10-31-23 | | | 1,500 | | | | 1,525 | |
| | | | | | | | |
| | | | | | | 251,373 | |
| | | | | | | | |
| |
TOTAL UNITED STATES GOVERNMENT OBLIGATIONS – 46.4% | | | $ | 251,373 | |
(Cost: $250,457) | |
| | |
| SHORT-TERM SECURITIES | | | | | | |
Commercial Paper(E) – 7.7% | |
AT&T, Inc., | | | | | | | | |
3.200%,5-30-19 | | | 6,000 | | | | 5,921 | |
Energy Transfer L.P.: | | | | | | | | |
3.202%,1-4-19 | | | 3,000 | | | | 2,999 | |
2.910%,1-10-19 | | | 20,000 | | | | 19,984 | |
2.950%,1-14-19 | | | 3,200 | | | | 3,196 | |
| | |
| SCHEDULE OF INVESTMENTS | | LIMITED-TERM BOND (in thousands) |
DECEMBER 31, 2018
| | | | | | | | |
SHORT-TERM SECURITIES
(Continued) | | Principal | | | Value | |
Commercial Paper(E) (Continued) | |
General Motors Financial Co., Inc., | | | | | | | | |
2.915%,1-8-19 | | $ | 1,495 | | | $ | 1,494 | |
International Paper Co., | | | | | | | | |
2.852%,1-3-19 | | | 2,000 | | | | 1,999 | |
Sherwin-Williams Co. (The), | | | | | | | | |
2.410%,1-10-19 | | | 5,000 | | | | 4,997 | |
United Technologies Corp., | | | | | | | | |
2.870%,1-25-19 | | | 1,000 | | | | 998 | |
| | | | | | | | |
| | | | | | | 41,588 | |
| | | | | | | | |
| |
Master Note – 0.6% | |
Toyota Motor Credit Corp.(1-Month U.S. LIBOR plus 15 bps), | | | | | | | | |
2.720%,1-7-19(F) | | | 3,132 | | | | 3,132 | |
| | | | | | | | |
Money Market Funds — 0.0% | |
Dreyfus Institutional Preferred Government Money Market Fund - Institutional Shares, | | | | | | | | |
2.400%, (G)(H) | | | 243 | | | | 243 | |
| | | | | | | | |
| | | | |
SHORT-TERM SECURITIES
(Continued) | | Value | |
| |
TOTAL SHORT-TERM SECURITIES –8.3% | | $ | 44,963 | |
(Cost: $44,968) | |
| |
TOTAL INVESTMENT SECURITIES –99.4% | | $ | 538,517 | |
(Cost: $541,572) | |
| |
CASH AND OTHER ASSETS, NET OF LIABILITIES – 0.6% | | | 3,145 | |
| |
NET ASSETS – 100.0% | | $ | 541,662 | |
Notes to Schedule of Investments
| (A) | Securities were purchased pursuant to an exemption from registration available under Rule 144A under the Securities Act of 1933 and may only be resold in transactions exempt from registration, normally to qualified institutional buyers. At December 31, 2018 the total value of these securities amounted to $65,741 or 12.1% of net assets. |
| (B) | All or a portion of securities with an aggregate value of $237 are on loan. |
| (C) | Variable rate security. Interest rate disclosed is that which is in effect at December 31, 2018. Description of the reference rate and spread, if applicable, are included in the security description. |
| (D) | Step bond that pays an initial coupon rate for the first period and then a higher or lower coupon rate for the following periods. Interest rate disclosed is that which is in effect at December 31, 2018. |
| (E) | Rate shown is the yield to maturity at December 31, 2018. |
| (F) | Variable rate security. Interest rate disclosed is that which is in effect at December 31, 2018. Date shown represents the date that the variable rate resets. Description of the reference rate and spread, if applicable, are included in the security description. |
| (G) | Investment made with cash collateral received from securities on loan. |
| (H) | Rate shown is the annualized7-day yield at December 31, 2018. |
The following table is a summary of the valuation of the Portfolio’s investments by the fair value hierarchy levels as of December 31, 2018. See Note 3 to the Financial Statements for further information regarding fair value measurement.
| | | | | | | | | | | | |
| | | Level 1 | | | Level 2 | | | Level 3 | |
Assets | | | | | | | | | | | | |
Investments in Securities | | | | | | | | | | | | |
Asset-Backed Securities | | $ | — | | | $ | 1,827 | | | $ | — | |
Corporate Debt Securities | | | — | | | | 171,427 | | | | — | |
Mortgage-Backed Securities | | | — | | | | 4,185 | | | | — | |
Municipal Bonds | | | — | | | | 13,148 | | | | — | |
United States Government Agency Obligations | | | — | | | | 51,594 | | | | — | |
United States Government Obligations | | | — | | | | 251,373 | | | | — | |
Short-Term Securities | | | 243 | | | | 44,720 | | | | — | |
Total | | $ | 243 | | | $ | 538,274 | | | $ | — | |
The following acronyms are used throughout this schedule:
CMO = Collateralized Mortgage Obligation
GTD = Guaranteed
LIBOR = London Interbank Offered Rate
REIT = Real Estate Investment Trust
REMIC = Real Estate Mortgage Investment Conduit
See Accompanying Notes to Financial Statements.
| | |
| MANAGEMENT DISCUSSION | | SECURIAN REAL ESTATE SECURITIES |
(UNAUDITED)
|

Matthew K. Richmond 
|
Lowell R. Bolken 
Joshua M. Klaetsch |
Ivy VIP Securian Real Estate Securities issub-advised by Securian Asset Management, Inc. Below, Matthew K. Richmond, Lowell R. Bolken, CFA, and Joshua M. Klaetsch,co-portfolio managers of Ivy VIP Securian Real Estate Securities, discuss positioning, performance and results for the fiscal year ended December 31, 2018. Mr. Richmond has managed the Portfolio since 2014 and has 24 years of industry experience. Mr. Bolken has managed the Portfolio since 2006 and has 28 years of industry experience. Mr. Klaetsch has managed the Portfolio since 2018 and has 12 years of industry experience.
Fiscal year Performance
| | | | |
For the 12 Months Ended December 31, 2018 | | | | |
Ivy VIP Securian Real Estate Securities (Class II shares at net asset value) | | | -5.57% | |
Benchmark(s) and/or Morningstar and Lipper Categories | | | | |
FTSE NAREIT Equity REITs Index | | | -4.62% | |
(generally reflects the performance of securities representing the commercial real estate market) | | | | |
Wilshire U.S. Real Estate Securities Index | | | -4.80% | |
(generally reflects the performance of U.S. publicly traded real estate securities) | | | | |
Morningstar Real Estate Universe Average | | | -6.24% | |
(Generally reflects the performance of the universe of funds with similar investment objectives) | | | | |
Lipper Variable Annuity Real Estate Funds Universe Average | | | -5.84% | |
(Generally reflects the performance of the universe of funds with similar investment objectives) | | | | |
The FTSE NAREIT Equity REITs Index replaced the Wilshire U.S. Real Estate Securities Index as the Portfolio’s benchmark effective April 30, 2018, as the FTSE Nareit Equity REITs Index is more reflective of the types of securities in which the Portfolio invests.
Please note that Portfolio returns include applicable fees and expenses while index returns do not include any such fees. Also, the Portfolio’s performance data does not take into account any product expenses or charges associated with owning a variable life or annuity policy, which is invested in Ivy Variable Insurance Portfolios.
Key Drivers
Real estate stocks delivered negative returns for only the fifth time in 20 years for the period ended December 31, 2018, while performing approximatelyin-line with the broader S&P 500 Index. The Portfolio posted a negative return for the fiscal year and underperformed the index but finished in the top half of the Lipper category. Real estate investment trusts (REITs)see-sawed along with the broader market throughout the year, but proved to be a relative safe haven amid tremendous volatility during the fourth quarter. Macro-economic conditions remain favorable for real estate operators, although the current cycle has moved into its 10th year of expansion. Tailwinds from U.S. tax reform, business expansion and positive consumer sentiment created a solid backdrop for much of 2018, allowing real estate owners to improve occupancies and command higher rental rates. The recent market tumult driven by fears of atrade-war induced economic slowdown, coupled with potential for political turmoil in the U.S., have created a cloud of uncertainty over the equity (and real estate) markets. The Federal Reserve policy decisions also remained a wildcard, and it is reasonable to assume that REITs are less well positioned than other sectors for a prolonged rising rate cycle.
Despite the macro uncertainty, real estate owners are in better financial condition to weather adversity than has been the case historically. Most REITs have fortified their balance sheets through property sales and debt repayment and are carrying below average debt today. Occupancies across most every property sector are at historically high levels, and speculative construction continues to be held in check with few exceptions. Industrial REITs continued to recordall-time high occupancy levels in 2018 on the back of an improving economy and increased demand fore-commerce distribution space. Apartment owners also enjoyed another year of favorable operating conditions. Household formation and job creation –two of the primary demand drivers for apartment rentals– both surprised to the upside and helped counteract market jitters regarding overbuilding within the sector. Office occupancies remain relatively stable, but have not reached prior peak levels. This is one sector where new, speculative construction has been fairly broad-based, but successfully leased. Today’s office tenants are flocking to modern, more functional space that affords a more enjoyable and efficient environment for their employees. Retail REITs continued to fight what is becoming a secular decline in fundamentals for traditional “bricks & mortar” storefronts. Another year of significant store closures and bankruptcy filings resulted in a weak 2018 for mall and shopping center owners, both operationally and in stock prices. Unprecedented demand for datacenter space shows no signs of diminishing, driven by increased cloud usage and virtualization and artificial intelligence needs.
Contributors and detractors
The Portfolio delivered a negative total return for the year, but finished in the top half of its peer group.
A consistent theme among Portfolio holdings has been a focus on companies we believe own well-located, high-quality properties that feature stable balance sheets; exhibit improving property fundamentals; and have above-average cash-flow growth prospects. Those general characteristics held true throughout 2018, but we increased the Portfolio’s holdings in more “defensively” oriented companies in the latter stages of the year. Most notably, we increased exposure to owners of both net lease and healthcare properties. These types of companies tend to offer above-average dividends and feature very low, but stable cash flow growth.
From a property-type perspective, the Portfolio was overweight its benchmark index in owners of warehouses, data centers, single family homes and medical office/life science properties. The Portfolio was consistently underweight in shopping center and mall REITs, as well as hotel owners.
Significant contributors to performance included stock selection within the owners of net lease properties. The holdings within this sector were those who possessed above-average growth prospects, strong balance sheets, and attractive dividend growth forecasts. Avoidance of regional malls also contributed favorably to performance. Retail owners fared particularly poorly in 2018. An underweight to healthcare facilities owners was the primary detractor from performance. Despite persistently rising interest rates throughout much of the year, a supportive regulatory pronouncement for skilled nursing and surprisingly low impact from resolutions of troubled tenant leases ameliorated investor angst around weakening fundamentals. Ownership of a cell tower stock also constrained performance relative to the benchmark. Finally, being overweight single family home REITs throughout the year was a detractor from relative performance versus the benchmark, as companies within that sector struggled to contain rising operating costs.
Outlook
Entering 2019, the markets are clearly rattled. Higher volatility is intensifying the tightening of financial conditions and risks to growth are to the downside. The deceleration already in place is being amplified by lower market liquidity and the slowing pace of global gross domestic product (GDP) growth. Concerns of recession, coupled with continued worries about trade and tighter credit, could prompt companies and consumers to pull back, creating the downturn they fear. In spite of the obstacles facing the economy, we believe the expansion will continue through 2019, albeit more measured. The ingredients for a slowdown exist, but we do not think the conditions for a recession are in place. We believe employment is too robust and consumer spending too strong for the economy to contract in the next several quarters.
With regard to the current commercial real estate cycle, we continue to see stable operating conditions across the sector with few material concerns on the horizon. Bank lending, commercial construction, equity allocations, and overall pricing metrics remain much healthier than was often the case in previous cycle peaks. Simply moving into the later stages of this recovery does not mean sector fundamentals will turn negative. In fact, the prospect forre-acceleration of earnings growth for 2019 appears quite plausible if we avoid a sharp downturn in economic growth and corporate earnings materialize as expected.
The “bondification” of real estate has been bemoaned by many market participants as irrational, but has become current reality. Higher U.S. Treasury rates have finally materialized, and while share price gains for REITs have been muted, the results are far from the catastrophe many have predicted. We continue to believe that share price performance will be heavily influenced by macro events, with support coming from further employment gains and GDP growth while potentially rising borrowing costs, such as a rising10-year U.S. Treasury yield, or a steepening yield curve could offer resistance. Should expectations for economic growth continue to further push U.S. Treasury rates higher, REIT stock prices will likely struggle.
Valuations of private market transactions continue to support REIT valuations, suggesting REITs currently trade at a discount to net asset value. REIT pricing compared to broader fixed income markets also looks attractive compared to historic averages, though in the context of broader equities REITs are more fairly priced compared to historic averages. We think that significant fund raising in real estate private equity funds suggests further support for real estate valuations.
Past performance is not a guarantee of future results. The value of the Portfolio’s shares will change, and you could lose money on your investment.
Investment risks associated with real estate securities, in addition to other risks, include rental income fluctuation, depreciation, property tax value changes and differences in real estate market values. Real estate securities are subject to interest-rate risk and, as such, the Portfolio’s net asset value may fall as interest rates rise. Investing in companies involved in one specified sector may be more risky and volatile than an investment with greater diversification. These and other risks are more fully described in the Portfolio’s prospectus.
The opinions expressed in this report are those of the portfolio managers and are current only through the end of the period of the report as stated on the cover. The managers’ views are subject to change at any time based on market and other conditions, and no forecasts can be guaranteed.
The index noted is unmanaged and includes reinvested dividends. One cannot invest directly in an index, nor is an index representative of Ivy VIP Securian Real Estate Securities.
| | |
| PORTFOLIO HIGHLIGHTS | | SECURIAN REAL ESTATE SECURITIES(a) |
ALL DATA IS AS OF DECEMBER 31, 2018 (UNAUDITED)
| | | | |
| Asset Allocation | |
| |
Stocks | | | 95.5% | |
Real Estate | | | 95.5% | |
Cash and Other Assets (Net of Liabilities), and Cash Equivalents+ | | | 4.5% | |
| | | | |
Top 10 Equity Holdings |
| | |
| Company | | Sector | | Industry |
Simon Property Group, Inc. | | Real Estate | | Retail REITs |
Alexandria Real Estate Equities, Inc. | | Real Estate | | Office REITs |
AvalonBay Communities, Inc. | | Real Estate | | Residential REITs |
Equinix, Inc. | | Real Estate | | Specialized REITs |
Digital Realty Trust, Inc. | | Real Estate | | Specialized REITs |
ProLogis, Inc. | | Real Estate | | Industrial REITs |
Boston Properties, Inc. | | Real Estate | | Office REITs |
HCP, Inc. | | Real Estate | | Health Care REITs |
Camden Property Trust | | Real Estate | | Residential REITs |
Sun Communities, Inc. | | Real Estate | | Residential REITs |
See your advisor or www.ivyinvestments.com for more information on the Portfolio’s most recently published Top 10 Equity Holdings. |
+Cash equivalents are defined as highly liquid securities with maturities of less than three months. Cash equivalents may include U.S. Government Treasury bills, bank certificates of deposit, bankers’ acceptances, corporate commercial paper and other money market instruments.
(a) Effective April 30, 2018, the name of Advantus Real Estate Securities changed to Securian Real Estate Securities.
| | |
COMPARISON OF CHANGE IN VALUE
OF $10,000 INVESTMENT | | SECURIAN REAL ESTATE SECURITIES |
(UNAUDITED)
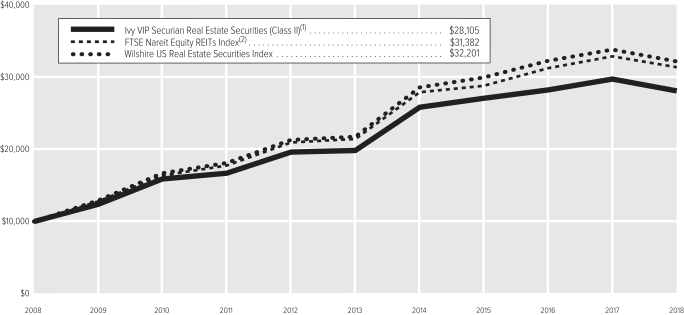
| (1) | The value of the investment in the Portfolio is impacted by the ongoing expenses of the Portfolio and assumes reinvestment of dividends and distributions. |
| (2) | The Portfolio’s benchmark changed from Wilshire US Real Estate Securities Index, effective April 30, 2018. IICO believes that the FTSE Nareit Equity REITs Index is more reflective of the types of securities in which the Portfolio invests than the Wilshire US Real Estate Securities Index. |
| | | | |
| |
| Average Annual Total Return(3) | | Class II | |
1-year period ended12-31-18 | | | -5.57% | |
5-year period ended12-31-18 | | | 7.19% | |
10-year period ended12-31-18 | | | 10.89% | |
| (3) | Data quoted is past performance and current performance may be lower or higher. Past performance is no guarantee of future results. Investment return and principal value of an investment will fluctuate and shares, when redeemed, may be worth more or less than their original cost. Please visit www.ivyinvestments.com for the Portfolio’s most recentmonth-end performance. Performance data quoted does not reflect any expenses or charges associated with owning a variable life insurance policy or variable annuity contract that invests in the Portfolio’s shares. When such charges are deducted, actual investment performance in a variable policy or contract will be lower. |
Past performance is not necessarily indicative of future performance. Indexes are unmanaged. The performance graph and table do not reflect the deduction of taxes that a shareholder would pay on Portfolio distributions or on the redemption of Portfolio shares. Performance results may include the effect of expense reduction arrangements for some or all of the periods shown. If those arrangements had not been in place, the performance results for those periods would have been lower.
| | |
| SCHEDULE OF INVESTMENTS | | SECURIAN REAL ESTATE SECURITIES (in thousands) |
DECEMBER 31, 2018
| | | | | | | | |
| COMMON STOCKS | | Shares | | | Value | |
Real Estate | |
| |
Diversified REITs – 3.8% | |
Liberty Property Trust | | | 15 | | | $ | 645 | |
STORE Capital Corp. | | | 24 | | | | 668 | |
| | | | | | | | |
| | | | | | | 1,313 | |
| | | | | | | | |
| |
Health Care REITs – 10.9% | |
HCP, Inc. | | | 42 | | | | 1,173 | |
Healthcare Trust of America, Inc., Class A | | | 26 | | | | 658 | |
Physicians Realty Trust | | | 20 | | | | 322 | |
Ventas, Inc. | | | 13 | | | | 756 | |
Welltower, Inc. | | | 12 | | | | 819 | |
| | | | | | | | |
| | | | | | | 3,728 | |
| | | | | | | | |
| |
Hotel & Resort REITs – 4.0% | |
Hilton Worldwide Holdings, Inc. | | | 3 | | | | 244 | |
Host Hotels & Resorts, Inc. | | | 52 | | | | 866 | |
Sunstone Hotel Investors, Inc. | | | 20 | | | | 255 | |
| | | | | | | | |
| | | | | | | 1,365 | |
| | | | | | | | |
| |
Industrial REITs – 6.9% | |
Duke Realty Corp. | | | 34 | | | | 883 | |
ProLogis, Inc. | | | 25 | | | | 1,464 | |
| | | | | | | | |
| | | | | | | 2,347 | |
| | | | | | | | |
| |
Office REITs – 12.9% | |
Alexandria Real Estate Equities, Inc. | | | 15 | | | | 1,694 | |
Boston Properties, Inc. | | | 11 | | | | 1,283 | |
Cousins Properties, Inc. | | | 18 | | | | 141 | |
Douglas Emmett, Inc. | | | 19 | | | | 655 | |
Kilroy Realty Corp. | | | 9 | | | | 560 | |
SL Green Realty Corp. | | | 1 | | | | 87 | |
| | | | | | | | |
| | | | | | | 4,420 | |
| | | | | | | | |
| |
Residential REITs – 21.1% | |
AvalonBay Communities, Inc. | | | 9 | | | | 1,612 | |
Camden Property Trust | | | 13 | | | | 1,118 | |
Equity Lifestyle Properties, Inc. | | | 3 | | | | 311 | |
Equity Residential | | | 15 | | | | 958 | |
Essex Property Trust, Inc. | | | 4 | | | | 945 | |
Invitation Homes, Inc. | | | 16 | | | | 317 | |
Sun Communities, Inc. | | | 11 | | | | 1,109 | |
UDR, Inc. | | | 21 | | | | 840 | |
| | | | | | | | |
| | | | | | | 7,210 | |
| | | | | | | | |
| |
Retail REITs – 16.8% | |
Agree Realty Corp. | | | 12 | | | | 733 | |
Kite Realty Group Trust(A) | | | 16 | | | | 221 | |
Macerich Co. (The) | | | 19 | | | | 827 | |
National Retail Properties, Inc. | | | 8 | | | | 383 | |
Realty Income Corp. | | | 12 | | | | 769 | |
Regency Centers Corp. | | | 9 | | | | 509 | |
Simon Property Group, Inc. | | | 11 | | | | 1,871 | |
Weingarten Realty Investors | | | 18 | | | | 456 | |
| | | | | | | | |
| | | | | | | 5,769 | |
| | | | | | | | |
| |
Specialized REITs – 19.1% | |
CubeSmart | | | 15 | | | | 442 | |
CyrusOne, Inc. | | | 15 | | | | 798 | |
| | | | | | | | |
| COMMON STOCKS(Continued) | | Shares | | | Value | |
Specialized REITs (Continued) | |
Digital Realty Trust, Inc. | | | 14 | | | $ | 1,492 | |
Equinix, Inc. | | | 4 | | | | 1,549 | |
Extra Space Storage, Inc. | | | 9 | | | | 787 | |
Four Corners Property Trust, Inc. | | | 21 | | | | 550 | |
Public Storage, Inc. | | | 5 | | | | 932 | |
| | | | | | | | |
| | | | | | | 6,550 | |
| | | | | | | | |
| |
Total Real Estate – 95.5% | | | | 32,702 | |
| |
TOTAL COMMON STOCKS – 95.5% | | | $ | 32,702 | |
(Cost: $35,130) | | | | | | | | |
| | |
| SHORT-TERM SECURITIES | | Principal | | | | |
| |
Master Note – 4.2% | |
Toyota Motor Credit Corp.(1-Month U.S. LIBOR plus 15 bps), | | | | | | | | |
2.720%,1-7-19(B) | | $ | 1,449 | | | | 1,449 | |
| | | | | | | | |
| |
TOTAL SHORT-TERM SECURITIES – 4.2% | | | $ | 1,449 | |
(Cost: $1,449) | | | | | | | | |
| |
TOTAL INVESTMENT SECURITIES – 99.7% | | | $ | 34,151 | |
(Cost: $36,579) | |
| |
CASH AND OTHER ASSETS, NET OF LIABILITIES – 0.3% | | | | 112 | |
| |
NET ASSETS – 100.0% | | | $ | 34,263 | |
| | |
| SCHEDULE OF INVESTMENTS | | SECURIAN REAL ESTATE SECURITIES (in thousands) |
DECEMBER 31, 2018
Notes to Schedule of Investments
| (A) | No dividends were paid during the preceding 12 months. |
| (B) | Variable rate security. Interest rate disclosed is that which is in effect at December 31, 2018. Date shown represents the date that the variable rate resets. Description of the reference rate and spread, if applicable, are included in the security description. |
The following table is a summary of the valuation of the Portfolio’s investments by the fair value hierarchy levels as of December 31, 2018. See Note 3 to the Financial Statements for further information regarding fair value measurement.
| | | | | | | | | | | | |
| | | Level 1 | | | Level 2 | | | Level 3 | |
Assets | | | | | | | | | | | | |
Investments in Securities | | | | | | | | | | | | |
Common Stocks | | $ | 32,702 | | | $ | — | | | $ | — | |
Short-Term Securities | | | — | | | | 1,449 | | | | — | |
Total | | $ | 32,702 | | | $ | 1,449 | | | $ | — | |
The following acronyms are used throughout this schedule:
LIBOR = London Interbank Offered Rate
REIT = Real Estate Investment Trust
See Accompanying Notes to Financial Statements.
| | |
| MANAGEMENT DISCUSSION | | VALUE |
(UNAUDITED)

Matthew T. Norris
Below, Matthew T. Norris, CFA, portfolio manager of Ivy VIP Value, discusses positioning, performance and results for the fiscal year ended December 31, 2018. He has managed the Fund since 2003 and has 27 years of industry experience.
Fiscal Year Performance
| | | | |
For the 12 Months Ended December 31, 2018 | | | | |
Ivy VIP Value (Class II shares at net asset value) | | | -7.24% | |
Benchmark(s) and/or Morningstar and Lipper Categories | | | | |
Russell 1000 Value Index | | | -8.27% | |
(generally reflects the performance of large-company value style stocks) | | | | |
Morningstar Large Value Universe Average | | | -8.80% | |
(generally reflects the performance of the universe of funds with similar investment objectives) | | | | |
Lipper Variable AnnuityLarge-Cap Value Funds Universe Average | | | -9.78% | |
(generally reflects the performance of the universe of funds with similar investment objectives) | | | | |
Please note that Portfolio returns include applicable fees and expenses while index returns do not include any such fees. Also, the Portfolio’s performance data does not take into account any product expenses or charges associated with owning a variable life or annuity policy, which is invested in Ivy Variable Insurance Portfolios.
Key drivers
Calendar year 2018 saw the return of stock volatility punctuated by a sharp decline in the equity markets to close the year. Following a complacent 2017, large market swings returned and elevated fear amongst investors. While the economy, jobs and corporate earnings seemed to be holding fine, there were several contributing factors for this fear. The trade discussions with China seemed to lack direction, the Federal Reserve (Fed) Chairman Jerome Powell’s hawkish pivot caused continued angst and the recent government shutdown added more clouds to an already stormy environment.
Looking forward, the question on investors’ minds likely will be: how deep is the pullback? Are we simply slowing back down to normal after a year in which corporate profits rose 24%, or are we headed into something more severe such as a recession? We are carefully watching job creation and interest rates as clues to answer these questions.
The Russell 1000 Value Index, the Portfolio’s benchmark, was down-8.27% for the calendar year. By comparison, Ivy VIP Value was down-7.24%. Value investing, while still lagging, has begun performing better relative to the growth indices. As usual, we try to ignore short-term fluctuations and keep our focus on the longer term.
Contributors and detractors
The Portfolio’s best relative sector was health care, led by our investments in HCA Holdings, Inc., Humana, Inc. and Amgen, Inc. The next best sector was energy, where selective stock picking and a lack of compelling names led to a meaningful underweight, which proved beneficial. Our investment in Welltower, Inc., a medical office focused Real Estate Investment Trust (REIT), followed the health care stocks’ lead and significantly outperformed the REIT sector.
The financials sector was the largest detractor, as four financial stocks cost the Portfolio nearly 0.03% of relative performance. The four underperforming holdings were Synchrony Financial and Capital One Financial Corp., in the credit card space, and State Street Corp. and Citigroup, Inc., in banking. There were very few spots to hide in financials as the sector underperformed the broad market by more than 0.05%.
The Portfolio does not attempt to make sector calls, but rather focuses primarily on stock selection. We seek to overweight or underweight sectors based on individual stock opportunity, with some limits to control risk or volatility. The Portfolio is currently overweight financials and consumer discretionary, where we find value and yield. We believe these sectors provide the greatest current opportunity to find good companies with repeatable business models generating high rates of free cash flow, and low stock prices relative to our estimation of each company’s true intrinsic value. However, these were some of the weakest areas in 2018, particularly in the fourth quarter. The Portfolio is underweight consumer staples and telecommunications services, simply due to lack of compelling ideas.
Outlook
The U.S. economy has enjoyed a long successful run since the end of the 2008 recession. There was an additional boost with the tax cut in early 2018. Once you are at the top of the mountain sometimes the only way to go is down. Recent economic data supports the idea of a slowing economy but does not support the concept of a shrinking economy (recession). The
current challenge will be for the Fed to tighten money policy back up, yet not slow the economy into contraction. The Fed has slowed its projection to indicate a likelihood of two interest rate hikes in 2019. Slowing the economy and inflation via interest rate hikes is a difficult job. We liken it to stepping on a rolling egg to stop it without breaking it. History shows a high probability of failure if interest rates rise too much thus helping create a recession. This is something we will watch carefully.
While the economic forces listed above are clearly important factors, our first approach is at the company level. We seek to find quality, growing companies whose stocks are trading below what we consider their intrinsic value. Oftentimes this is due to short-term negative factors, and we become larger owners of a company if we feel those negatives are about to dissipate. We continue to search for and make investments one company at a time and seek to benefit clients over the long run.
Past performance is no guarantee of future results. The value of the Portfolio’s shares will change, and you could lose money on your investment.
Value stocks are stocks of companies that may have experienced adverse business or industry developments, or may be subject to special risks that have caused the stocks to be out of favor and, in the opinion of the Portfolio’s manager, undervalued. The value of a security believed by the Portfolio’s manager to be undervalued may never reach what the manager believes to be its full value, or such security’s value may decrease. These and other risks are more fully described in the Portfolio’s prospectus.
The use of swap agreements entails certain risks that may be different from, or possibly greater than, the risks associated with investing directly in the referenced assets that underlie the swap agreement. Swap agreements also may have a leverage component, and adverse changes in the value or level of the underlying asset, reference rate or index can result in gains or losses that are substantially greater than the amount invested in the swap itself.
The opinions expressed in this report are those of the portfolio manager and are current only through the end of the period of the report as stated on the cover. The manager’s views are subject to change at any time based on market and other conditions, and no forecasts can be guaranteed.
The index noted is unmanaged and includes reinvested dividends. One cannot invest directly in an index, nor is an index representative of Ivy VIP Value.
| | |
| PORTFOLIO HIGHLIGHTS | | VALUE |
ALL DATA IS AS OF DECEMBER 31, 2018 (UNAUDITED)
Asset Allocation
| | | | |
Stocks | | | 95.5% | |
Financials | | | 24.9% | |
Health Care | | | 12.0% | |
Information Technology | | | 10.9% | |
Consumer Discretionary | | | 8.3% | |
Energy | | | 8.2% | |
Utilities | | | 8.2% | |
Consumer Staples | | | 8.1% | |
Industrials | | | 7.3% | |
Communication Services | | | 4.0% | |
Real Estate | | | 3.6% | |
Cash and Other Assets (Net of Liabilities), and Cash Equivalents+ | | | 4.5% | |
Top 10 Equity Holdings
| | | | |
| | |
| Company | | Sector | | Industry |
Citigroup, Inc. | | Financials | | Other Diversified Financial Services |
Wal-Mart Stores, Inc. | | Consumer Staples | | Hypermarkets & Super Centers |
Comcast Corp., Class A | | Communication Services | | Cable & Satellite |
Broadcom Corp., Class A | | Information Technology | | Semiconductors |
JPMorgan Chase & Co. | | Financials | | Other Diversified Financial Services |
Pfizer, Inc. | | Health Care | | Pharmaceuticals |
CVS Caremark Corp. | | Consumer Staples | | Drug Retail |
Welltower, Inc. | | Real Estate | | Health Care REITs |
Energy Transfer L.P. | | Energy | | Oil & Gas Storage & Transportation |
American Capital Agency Corp. | | Financials | | Mortgage REITs |
See your advisor or www.ivyinvestments.com for more information on the Portfolio’s most recently published Top 10 Equity Holdings.
+ Cash equivalents are defined as highly liquid securities with maturities of less than three months. Cash equivalents may include U.S. Government Treasury bills, bank certificates of deposit, bankers’ acceptances, corporate commercial paper and other money market instruments.
| | |
COMPARISON OF CHANGE IN VALUE
OF $10,000 INVESTMENT | | VALUE |
(UNAUDITED)
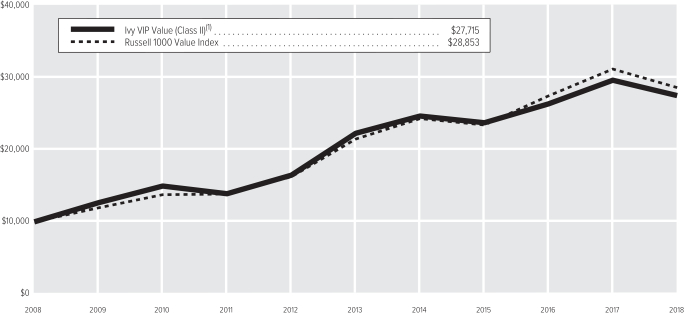
| (1) | The value of the investment in the Portfolio is impacted by the ongoing expenses of the Portfolio and assumes reinvestment of dividends and distributions. |
| | | | |
| |
| Average Annual Total Return(2) | | Class II | |
1-year period ended12-31-18 | | | -7.24% | |
5-year period ended12-31-18 | | | 4.33% | |
10-year period ended12-31-18 | | | 10.73% | |
| (2) | Data quoted is past performance and current performance may be lower or higher. Past performance is no guarantee of future results. Investment return and principal value of an investment will fluctuate and shares, when redeemed, may be worth more or less than their original cost. Please visit www.ivyinvestments.com for the Portfolio’s most recentmonth-end performance. Performance data quoted does not reflect any expenses or charges associated with owning a variable life insurance policy or variable annuity contract that invests in the Portfolio’s shares. When such charges are deducted, actual investment performance in a variable policy or contract will be lower. |
Past performance is not necessarily indicative of future performance. Indexes are unmanaged. The performance graph and table do not reflect the deduction of taxes that a shareholder would pay on Portfolio distributions or on the redemption of Portfolio shares. Performance results may include the effect of expense reduction arrangements for some or all of the periods shown. If those arrangements had not been in place, the performance results for those periods would have been lower.
| | |
| SCHEDULE OF INVESTMENTS | | VALUE (in thousands) |
DECEMBER 31, 2018
| | | | | | | | |
| COMMON STOCKS | | Shares | | | Value | |
Communication Services | |
| |
Cable & Satellite – 4.0% | |
Comcast Corp., Class A | | | 528 | | | $ | 17,961 | |
| | | | | | | | |
| |
Total Communication Services – 4.0% | | | | 17,961 | |
Consumer Discretionary | |
| |
Apparel Retail – 0.7% | |
Limited Brands, Inc. | | | 126 | | | | 3,237 | |
| | | | | | | | |
| |
Auto Parts & Equipment – 2.4% | |
Magna International, Inc. | | | 232 | | | | 10,526 | |
| | | | | | | | |
| |
General Merchandise Stores – 2.6% | |
Target Corp. | | | 179 | | | | 11,797 | |
| | | | | | | | |
| |
Home Improvement Retail – 2.6% | |
Lowe’s Co., Inc. | | | 124 | | | | 11,407 | |
| | | | | | | | |
| |
Total Consumer Discretionary – 8.3% | | | | 36,967 | |
Consumer Staples | |
| |
Drug Retail – 3.6% | |
CVS Caremark Corp. | | | 249 | | | | 16,301 | |
| | | | | | | | |
| |
Hypermarkets & Super Centers – 4.5% | |
Wal-Mart Stores, Inc. | | | 214 | | | | 19,897 | |
| | | | | | | | |
| |
Total Consumer Staples – 8.1% | | | | 36,198 | |
Energy | |
| |
Integrated Oil & Gas – 1.9% | |
BP plc ADR | | | 219 | | | | 8,305 | |
| | | | | | | | |
| |
Oil & Gas Refining & Marketing – 2.8% | |
Marathon Petroleum Corp. | | | 213 | | | | 12,569 | |
| | | | | | | | |
| |
Oil & Gas Storage & Transportation – 3.5% | |
Energy Transfer L.P. | | | 1,190 | | | | 15,722 | |
| | | | | | | | |
| |
Total Energy – 8.2% | | | | 36,596 | |
Financials | |
| |
Asset Management & Custody Banks – 2.7% | |
State Street Corp. | | | 193 | | | | 12,160 | |
| | | | | | | | |
| |
Consumer Finance – 5.4% | |
Capital One Financial Corp. | | | 182 | | | | 13,750 | |
Synchrony Financial | | | 434 | | | | 10,191 | |
| | | | | | | | |
| | | | | | | 23,941 | |
| | | | | | | | |
| |
Life & Health Insurance – 2.9% | |
MetLife, Inc. | | | 313 | | | | 12,864 | |
| | | | | | | | |
| |
Mortgage REITs – 3.3% | |
American Capital Agency Corp. | | | 850 | | | | 14,905 | |
| | | | | | | | |
| | | | | | | | |
| COMMON STOCKS(Continued) | | Shares | | | Value | |
| |
Other Diversified Financial Services – 8.4% | |
Citigroup, Inc. | | | 389 | | | $ | 20,241 | |
JPMorgan Chase & Co. | | | 177 | | | | 17,230 | |
| | | | | | | | |
| | | | | | | 37,471 | |
| | | | | | | | |
Regional Banks – 2.2% | |
KeyCorp | | | 658 | | | | 9,718 | |
| | | | | | | | |
| |
Total Financials – 24.9% | | | | 111,059 | |
Health Care | |
| |
Biotechnology – 2.8% | |
Amgen, Inc. | | | 65 | | | | 12,615 | |
| | | | | | | | |
| |
Health Care Facilities – 2.8% | |
HCA Holdings, Inc. | | | 101 | | | | 12,544 | |
| | | | | | | | |
| |
Managed Health Care – 2.7% | |
Humana, Inc. | | | 41 | | | | 11,774 | |
| | | | | | | | |
| |
Pharmaceuticals – 3.7% | |
Pfizer, Inc. | | | 380 | | | | 16,574 | |
| | | | | | | | |
| |
Total Health Care – 12.0% | | | | 53,507 | |
Industrials | |
| |
Aerospace & Defense – 2.3% | |
Spirit AeroSystems Holdings, Inc. | | | 143 | | | | 10,280 | |
| | | | | | | | |
| |
Airlines – 2.4% | |
Southwest Airlines Co. | | | 228 | | | | 10,588 | |
| | | | | | | | |
| |
Electrical Components & Equipment – 2.6% | |
Eaton Corp. | | | 169 | | | | 11,583 | |
| | | | | | | | |
| |
Total Industrials – 7.3% | | | | 32,451 | |
Information Technology | |
| |
Semiconductor Equipment – 2.7% | |
Lam Research Corp. | | | 86 | | | | 11,765 | |
| | | | | | | | |
| |
Semiconductors – 5.9% | |
Broadcom Corp., Class A | | | 70 | | | | 17,749 | |
QUALCOMM, Inc. | | | 152 | | | | 8,627 | |
| | | | | | | | |
| | | | | | | 26,376 | |
| | | | | | | | |
| |
Systems Software – 2.3% | |
Microsoft Corp. | | | 103 | | | | 10,411 | |
| | | | | | | | |
| |
Total Information Technology – 10.9% | | | | 48,552 | |
Real Estate | |
| |
Health Care REITs – 3.6% | |
Welltower, Inc. | | | 231 | | | | 16,062 | |
| | | | | | | | |
| |
Total Real Estate – 3.6% | | | | 16,062 | |
| | | | | | | | |
| COMMON STOCKS (Continued) | | Shares | | | Value | |
Utilities | |
| |
Electric Utilities – 8.2% | |
Duke Energy Corp. | | | 118 | | | $ | 10,209 | |
Exelon Corp. | | | 283 | | | | 12,782 | |
Great Plains Energy, Inc. | | | 236 | | | | 13,425 | |
| | | | | | | | |
| | | | | | | 36,416 | |
| | | | | | | | |
| |
Total Utilities – 8.2% | | | | 36,416 | |
| |
TOTAL COMMON STOCKS – 95.5% | | | $ | 425,769 | |
(Cost: $440,835) | |
| | |
| SHORT-TERM SECURITIES | | Principal | | | | |
Commercial Paper(A) – 3.1% | |
E.I. du Pont de Nemours and Co., | | | | | | | | |
2.720%,1-10-19 | | $ | 5,000 | | | | 4,996 | |
Sysco Corp., | | | | | | | | |
2.500%,1-2-19 | | | 4,000 | | | | 3,999 | |
Virginia Electric and Power Co., | | | | | | | | |
2.700%,1-14-19 | | | 5,000 | | | | 4,995 | |
| | | | | | | | |
| | | | | | | 13,990 | |
| | | | | | | | |
| |
Master Note – 0.9% | |
Toyota Motor Credit Corp.(1-Month U.S. LIBOR plus 15 bps), | | | | | | | | |
2.720%,1-7-19 (B) | | | 4,069 | | | | 4,069 | |
| | | | | | | | |
| |
United States Government Agency Obligations – 0.4% | |
Overseas Private Investment Corp. (GTD by U.S. Government)(3-Month U.S. TB Rate), | | | | | | | | |
2.430%,1-7-19 (B) | | | 1,765 | | | | 1,765 | |
| | | | | | | | |
| |
TOTAL SHORT-TERM SECURITIES – 4.4% | | | $ | 19,824 | |
(Cost: $19,825) | |
| |
TOTAL INVESTMENT
SECURITIES – 99.9% | | | $ | 445,593 | |
(Cost: $460,660) | |
| |
CASH AND OTHER ASSETS, NET OF LIABILITIES – 0.1% | | | | 262 | |
| |
NET ASSETS – 100.0% | | | $ | 445,855 | |
| | |
| SCHEDULE OF INVESTMENTS | | VALUE |
DECEMBER 31, 2018
Notes to Schedule of Investments
| (A) | Rate shown is the yield to maturity at December 31, 2018. |
| (B) | Variable rate security. Interest rate disclosed is that which is in effect at December 31, 2018. Date shown represents the date that the variable rate resets. Description of the reference rate and spread, if applicable, are included in the security description. |
The following written options were outstanding at December 31, 2018 (contracts and exercise prices unrounded):
| | | | | | | | | | | | | | | | | | | | | | | | | | | | | | | | |
| Underlying Security | | Counterparty, if
OTC | | | Type | | Number of
Contracts | | | Notional
Amount | | | Expiration Month | | Exercise Price | | | Premium
Received | | | Value | | | | |
Broadcom, Inc. | | | N/A | | | Call | | | 72 | | | | 7 | | | February 2019 | | $ | 280.00 | | | $ | 27 | | | $ | (19) | | | | | |
Duke Energy Corp. | | | N/A | | | Call | | | 256 | | | | 26 | | | January 2019 | | | 90.00 | | | | 27 | | | | (11) | | | | | |
Energy Transfer Equity L.P. | | | N/A | | | Call | | | 1,613 | | | | 161 | | | January 2019 | | | 17.00 | | | | 22 | | | | (4) | | | | | |
Wal-Mart Stores, Inc. | | | N/A | | | Call | | | 191 | | | | 19 | | | January 2019 | | | 110.00 | | | | 28 | | | | —* | | | | | |
Welltower, Inc. | | | N/A | | | Call | | | 148 | | | | 15 | | | January 2019 | | | 72.50 | | | | 11 | | | | (7) | | | | | |
| | | | | | | | | | | | | | | | | | | | | | | | |
| | | | | | | | | | | | | | | | | | | | | | $ | 115 | | | $ | (41) | | | | | |
| | | | | | | | | | | | | | | | | | | | | | | | |
| | | | | | | | | | | | | | | | |
The following table is a summary of the valuation of the Portfolio’s investments by the fair value hierarchy levels as of December 31, 2018. See Note 3 to the Financial Statements for further information regarding fair value measurement. | | | | | |
| | | Level 1 | | | Level 2 | | | Level 3 | | | | |
Assets | | | | | | | | | | | | | | | | |
Investments in Securities | | | | | | | | | | | | | | | | |
Common Stocks | | $ | 425,769 | | | $ | — | | | $ | — | | | | | |
Short-Term Securities | | | — | | | | 19,824 | | | | — | | | | | |
Total | | $ | 425,769 | | | $ | 19,824 | | | $ | — | | | | | |
Liabilities | | | | | | | | | | | | | | | | |
Written Options | | $ | 22 | | | $ | 19 | | | $ | — | | | | | |
The following acronyms are used throughout this schedule:
ADR = American Depositary Receipts
GTD = Guaranteed
LIBOR = London Interbank Offered Rate
OTC = Over the Counter
REIT = Real Estate Investment Trust
TB = Treasury Bill
See Accompanying Notes to Financial Statements.
| | |
| STATEMENTS OF ASSETS AND LIABILITIES | | IVY VIP |
AS OF DECEMBER 31, 2018
| | | | | | | | | | | | | | | | | | | | | | | | | | | | | | | | | | | | | | | | |
| (In thousands, except per share amounts) | | Core
Equity | | Corporate
Bond(1) | | Global
Bond | | Global
Equity
Income(2) | | Global
Growth | | Limited-
Term Bond | | Securian
Real Estate
Securities(3) | | Value |
ASSETS | | | | | | | | | | | | | | | | | | | | | | | | | | | | | | | | | | | | | | | | |
Investments in unaffiliated securities at value+^ | | | $ | 633,092 | | | | $ | 539,589 | | | | $ | 21,770 | | | | $ | 283,241 | | | | $ | 134,160 | | | | $ | 538,517 | | | | $ | 34,151 | | | | $ | 445,593 | |
Investments at Value | | | | 633,092 | | | | | 539,589 | | | | | 21,770 | | | | | 283,241 | | | | | 134,160 | | | | | 538,517 | | | | | 34,151 | | | | | 445,593 | |
Cash | | | | 1 | | | | | 2 | | | | | 1 | | | | | 1 | | | | | 1 | | | | | 1 | | | | | 1 | | | | | 1 | |
Investment securities sold receivable | | | | 4,631 | | | | | 26 | | | | | — | | | | | 1,618 | | | | | — | | | | | — | | | | | — | | | | | — | |
Dividends and interest receivable | | | | 616 | | | | | 4,754 | | | | | 250 | | | | | 618 | | | | | 425 | | | | | 3,003 | | | | | 178 | | | | | 567 | |
Capital shares sold receivable | | | | 7 | | | | | — | * | | | | — | * | | | | 3 | | | | | 3 | | | | | 599 | | | | | — | * | | | | 4 | |
Receivable from affiliates | | | | 142 | | | | | — | | | | | — | | | | | — | | | | | 47 | | | | | — | | | | | — | | | | | — | |
Unrealized appreciation on forward foreign currency contracts | | | | 127 | | | | | — | | | | | — | | | | | — | | | | | — | | | | | — | | | | | — | | | | | — | |
Receivable from securities lending income – net | | | | 3 | | | | | 1 | | | | | — | * | | | | 7 | | | | | 1 | | | | | — | * | | | | — | | | | | — | |
Prepaid and other assets | | | | 5 | | | | | 3 | | | | | — | * | | | | 1 | | | | | 2 | | | | | 1 | | | | | — | * | | | | 2 | |
Total Assets | | | | 638,624 | | | | | 544,375 | | | | | 22,021 | | | | | 285,489 | | | | | 134,639 | | | | | 542,121 | | | | | 34,330 | | | | | 446,167 | |
LIABILITIES | | | | | | | | | | | | | | | | | | | | | | | | | | | | | | | | | | | | | | | | |
Cash collateral on securities loaned at value | | | | 4,003 | | | | | 112 | | | | | 144 | | | | | — | | | | | 206 | | | | | 243 | | | | | — | | | | | — | |
Investment securities purchased payable | | | | 7,651 | | | | | — | | | | | — | | | | | 1,702 | | | | | — | | | | | — | | | | | — | | | | | — | |
Capital shares redeemed payable | | | | 299 | | | | | 235 | | | | | 32 | | | | | 89 | | | | | 76 | | | | | 164 | | | | | 57 | | | | | 185 | |
Independent Trustees and Chief Compliance Officer fees payable | | | | 202 | | | | | 91 | | | | | 1 | | | | | 39 | | | | | 70 | | | | | 25 | | | | | 6 | | | | | 59 | |
Distribution and service fees payable | | | | 4 | | | | | 4 | | | | | — | * | | | | 2 | | | | | 1 | | | | | 4 | | | | | — | * | | | | 3 | |
Shareholder servicing payable | | | | 1 | | | | | 1 | | | | | — | * | | | | — | * | | | | — | * | | | | 1 | | | | | — | * | | | | 1 | |
Investment management fee payable | | | | 12 | | | | | 7 | | | | | — | | | | | 5 | | | | | 3 | | | | | 7 | | | | | 1 | | | | | 9 | |
Accounting services fee payable | | | | 13 | | | | | 12 | | | | | 1 | | | | | 8 | | | | | 5 | | | | | 12 | | | | | 2 | | | | | 10 | |
Written options at value+ | | | | — | | | | | — | | | | | — | | | | | — | | | | | — | | | | | — | | | | | — | | | | | 41 | |
Other liabilities | | | | 6 | | | | | 5 | | | | | 1 | | | | | 8 | | | | | 4 | | | | | 3 | | | | | 1 | | | | | 4 | |
Total Liabilities | | | | 12,191 | | | | | 467 | | | | | 179 | | | | | 1,853 | | | | | 365 | | | | | 459 | | | | | 67 | | | | | 312 | |
Commitments and Contingencies
(See Note 2 and Note 10) | | | | | | | | | | | | | | | | | | | | | | | | | | | | | | | | | | | | | | | | |
Total Net Assets | | | $ | 626,433 | | | | $ | 543,908 | | | | $ | 21,842 | | | | $ | 283,636 | | | | $ | 134,274 | | | | $ | 541,662 | | | | $ | 34,263 | | | | $ | 445,855 | |
NET ASSETS | | | | | | | | | | | | | | | | | | | | | | | | | | | | | | | | | | | | | | | | |
Capital paid in (shares authorized – unlimited) | | | $ | 593,946 | | | | $ | 549,669 | | | | $ | 23,002 | | | | $ | 228,968 | | | | $ | 35,561 | | | | $ | 542,138 | | | | $ | 36,034 | | | | $ | 428,309 | |
Accumulated distributable earnings gain (loss) | | | | 32,487 | | | | | (5,761 | ) | | | | (1,160 | ) | | | | 54,668 | | | | | 98,713 | | | | | (476 | ) | | | | (1,771 | ) | | | | 17,546 | |
Total Net Assets | | | $ | 626,433 | | | | $ | 543,908 | | | | $ | 21,842 | | | | $ | 283,636 | | | | $ | 134,274 | | | | $ | 541,662 | | | | $ | 34,263 | | | | $ | 445,855 | |
| | | | | | | | |
CAPITAL SHARES OUTSTANDING: | | | | | | | | | | | | | | | | | | | | | | | | | | | | | | | | | | | | | | | | |
Class II | | | | 57,992 | | | | | 105,973 | | | | | 4,543 | | | | | 41,158 | | | | | 15,496 | | | | | 112,015 | | | | | 5,190 | | | | | 78,399 | |
NET ASSET VALUE PER SHARE: | | | | | | | | | | | | | | | | | | | | | | | | | | | | | | | | | | | | | | | | |
Class II | | | $ | 10.80 | | | | $ | 5.13 | | | | $ | 4.81 | | | | $ | 6.89 | | | | $ | 8.67 | | | | $ | 4.84 | | | | $ | 6.60 | | | | $ | 5.69 | |
| | | | | | | | |
+COST | | | | | | | | | | | | | | | | | | | | | | | | | | | | | | | | | | | | | | | | |
Investments in unaffiliated securities at cost | | | $ | 672,291 | | | | $ | 550,308 | | | | $ | 22,501 | | | | $ | 313,543 | | | | $ | 131,753 | | | | $ | 541,572 | | | | $ | 36,579 | | | | $ | 460,660 | |
Written options premiums received at cost | | | | — | | | | | — | | | | | — | | | | | — | | | | | — | | | | | — | | | | | — | | | | | 115 | |
^Securities loaned at value | | | | 7,003 | | | | | 434 | | | | | 141 | | | | | 294 | | | | | 201 | | | | | 237 | | | | | — | | | | | — | |
| * | Not shown due to rounding. |
| (1) | Effective April 30, 2018, the Portfolio’s name changed from Bond to Corporate Bond. |
| (2) | Effective April 30, 2018, the Portfolio’s name changed from Dividend Opportunities to Global Equity Income. |
| (3) | Effective April 30, 2018, the Portfolio’s name changed from Advantus Real Estate Securities to Securian Real Estate Securities. |
See Accompanying Notes to Financial Statements.
| | |
| STATEMENTS OF OPERATIONS | | IVY VIP |
FOR THE YEAR ENDED DECEMBER 31, 2018
| | | | | | | | | | | | | | | | | | | | | | | | | | | | | | | | | | | | | | | | |
| (In thousands) | | Core
Equity | | Corporate
Bond(1) | | Global
Bond | | Global
Equity
Income(2) | | Global
Growth | | Limited-
Term Bond | | Securian
Real Estate
Securities(3) | | Value |
INVESTMENT INCOME | | | | | | | | | | | | | | | | | | | | | | | | | | | | | | | | | | | | | | | | |
Dividends from unaffiliated securities | | | $ | 8,939 | | | | $ | 146 | | | | $ | 16 | | | | $ | 12,212 | | | | $ | 4,465 | | | | $ | 139 | | | | $ | 1,042 | | | | $ | 9,660 | |
Foreign dividend withholding tax | | | | (89 | ) | | | | — | | | | | — | * | | | | (538 | ) | | | | (294 | ) | | | | — | | | | | — | | | | | (42 | ) |
Interest and amortization from unaffiliated securities | | | | 495 | | | | | 19,088 | | | | | 874 | | | | | 295 | | | | | 113 | | | | | 13,837 | | | | | 12 | | | | | 332 | |
Securities lending income—net | | | | 23 | | | | | 5 | | | | | — | * | | | | 48 | | | | | 5 | | | | | 1 | | | | | — | | | | | — | |
Total Investment Income | | | | 9,368 | | | | | 19,239 | | | | | 890 | | | | | 12,017 | | | | | 4,289 | | | | | 13,977 | | | | | 1,054 | | | | | 9,950 | |
| | | | | | | | |
EXPENSES | | | | | | | | | | | | | | | | | | | | | | | | | | | | | | | | | | | | | | | | |
Investment management fee | | | | 4,257 | | | | | 2,578 | | | | | 139 | | | | | 2,785 | | | | | 2,297 | | | | | 2,567 | | | | | 352 | | | | | 3,330 | |
Distribution and service fees: | | | | | | | | | | | | | | | | | | | | | | | | | | | | | | | | | | | | | | | | |
Class II | | | | 1,520 | | | | | 1,357 | | | | | 55 | | | | | 994 | | | | | 675 | | | | | 1,295 | | | | | 98 | | | | | 1,189 | |
Shareholder servicing: | | | | | | | | | | | | | | | | | | | | | | | | | | | | | | | | | | | | | | | | |
Class II | | | | 5 | | | | | 4 | | | | | — | * | | | | 3 | | | | | 2 | | | | | 4 | | | | | — | * | | | | 4 | |
Custodian fees | | | | 23 | | | | | 11 | | | | | 2 | | | | | 28 | | | | | 31 | | | | | 8 | | | | | 7 | | | | | 10 | |
Independent Trustees and Chief Compliance Officer fees | | | | 68 | | | | | 43 | | | | | 7 | | | | | 29 | | | | | 30 | | | | | 29 | | | | | 3 | | | | | 34 | |
Accounting services fee | | | | 157 | | | | | 141 | | | | | 14 | | | | | 113 | | | | | 91 | | | | | 142 | | | | | 22 | | | | | 130 | |
Professional fees | | | | 21 | | | | | 29 | | | | | 20 | | | | | 26 | | | | | 27 | | | | | 27 | | | | | 22 | | | | | 25 | |
Other | | | | 39 | | | | | 34 | | | | | 11 | | | | | 53 | | | | | 39 | | | | | 21 | | | | | 16 | | | | | 39 | |
Total Expenses | | | | 6,090 | | | | | 4,197 | | | | | 248 | | | | | 4,031 | | | | | 3,192 | | | | | 4,093 | | | | | 520 | | | | | 4,761 | |
Less: | | | | | | | | | | | | | | | | | | | | | | | | | | | | | | | | | | | | | | | | |
Expenses in excess of limit | | | | (289 | ) | | | | — | | | | | (138 | ) | | | | — | | | | | (135 | ) | | | | — | | | | | (35 | ) | | | | — | |
Total Net Expenses | | | | 5,801 | | | | | 4,197 | | | | | 110 | | | | | 4,031 | | | | | 3,057 | | | | | 4,093 | | | | | 485 | | | | | 4,761 | |
Net Investment Income | | | | 3,567 | | | | | 15,042 | | | | | 780 | | | | | 7,986 | | | | | 1,232 | | | | | 9,884 | | | | | 569 | | | | | 5,189 | |
| | | | | | | | |
REALIZED AND UNREALIZED GAIN (LOSS) | | | | | | | | | | | | | | | | | | | | | | | | | | | | | | | | | | | | | | | | |
Net realized gain (loss) on: | | | | | | | | | | | | | | | | | | | | | | | | | | | | | | | | | | | | | | | | |
Investments in unaffiliated securities | | | | 66,304 | | | | | (9,986 | ) | | | | (137 | ) | | | | 76,735 | | | | | 95,267 | | | | | (3,611 | ) | | | | 67 | | | | | 26,526 | |
Futures contracts | | | | 1,362 | | | | | — | | | | | — | | | | | — | | | | | 204 | | | | | — | | | | | — | | | | | — | |
Written options | | | | — | | | | | — | | | | | — | | | | | — | | | | | — | | | | | — | | | | | — | | | | | 691 | |
Swap agreements | | | | — | | | | | — | | | | | — | | | | | (223 | ) | | | | (346 | ) | | | | — | | | | | — | | | | | (450 | ) |
Forward foreign currency contracts | | | | 786 | | | | | — | | | | | — | | | | | — | | | | | — | | | | | — | | | | | — | | | | | — | |
Foreign currency exchange transactions | | | | 20 | | | | | — | | | | | 1 | | | | | 93 | | | | | 49 | | | | | — | | | | | — | | | | | — | |
Net change in unrealized appreciation
(depreciation) on: | | | | | | | | | | | | | | | | | | | | | | | | | | | | | | | | | | | | | | | | |
Investments in unaffiliated securities | | | | (117,128 | ) | | | | (15,819 | ) | | | | (699 | ) | | | | (123,778 | ) | | | | (83,797 | ) | | | | (1,036 | ) | | | | (2,818 | ) | | | | (66,878 | ) |
Written options | | | | — | | | | | — | | | | | — | | | | | — | | | | | — | | | | | — | | | | | — | | | | | 74 | |
Swap agreements | | | | — | | | | | — | | | | | — | | | | | — | | | | | — | | | | | — | | | | | — | | | | | 17 | |
Forward foreign currency contracts | | | | 433 | | | | | — | | | | | — | | | | | — | | | | | — | | | | | — | | | | | — | | | | | — | |
Foreign currency exchange transactions | | | | (1 | ) | | | | — | | | | | (1 | ) | | | | (1 | ) | | | | (42 | ) | | | | — | | | | | — | | | | | — | |
Net Realized and Unrealized Gain (Loss) | | | | (48,224 | ) | | | | (25,805 | ) | | | | (836 | ) | | | | (47,174 | ) | | | | 11,335 | | | | | (4,647 | ) | | | | (2,751 | ) | | | | (40,020 | ) |
Net Increase (Decrease) in Net Assets Resulting from Operations | | | $ | (44,657 | ) | | | $ | (10,763 | ) | | | $ | (56 | ) | | | $ | (39,188 | ) | | | $ | 12,567 | | | | $ | 5,237 | | | | $ | (2,182 | ) | | | $ | (34,831 | ) |
| * | Not shown due to rounding. |
| (1) | Effective April 30, 2018, the Portfolio’s name changed from Bond to Corporate Bond. |
| (2) | Effective April 30, 2018, the Portfolio’s name changed from Dividend Opportunities to Global Equity Income. |
| (3) | Effective April 30, 2018, the Portfolio’s name changed from Advantus Real Estate Securities to Securian Real Estate Securities. |
See Accompanying Notes to Financial Statements.
| | |
| STATEMENTS OF CHANGES IN NET ASSETS | | IVY VIP |
| | | | | | | | | | | | | | | | | | | | | | | | | | | | | | |
| | | Core Equity | | Corporate Bond(1) | | Global Bond |
| (In thousands) | | Year ended
12-31-18 | | Year ended
12-31-17 | | Year ended
12-31-18 | | Year ended
12-31-17 | | Year ended
12-31-18 | | Year ended
12-31-17 |
INCREASE (DECREASE) IN NET ASSETS | | | | | | | | | | | | | | | | | | | | | | | | | | | | | | |
Operations: | | | | | | | | | | | | | | | | | | | | | | | | | | | | | | |
Net investment income | | | $ | 3,567 | | | | $ | 1,800 | | | | $ | 15,042 | | | | $ | 10,259 | | | | $ | 780 | | | | $ | 706 | |
Net realized gain (loss) on investments | | | | 68,472 | | | | | 33,743 | | | | | (9,986 | ) | | | | 1,319 | | | | | (136 | ) | | | | (147 | ) |
Net change in unrealized appreciation (depreciation) | | | | (116,696 | ) | | | | 46,168 | | | | | (15,819 | ) | | | | 5,516 | | | | | (700 | ) | | | | 389 | |
Net Increase (Decrease) in Net Assets Resulting from Operations | | | | (44,657 | ) | | | | 81,711 | | | | | (10,763 | ) | | | | 17,094 | | | | | (56 | ) | | | | 948 | |
| | | | | | |
Distributions to Shareholders From: | | | | | | | | | | | | | | | | | | | | | | | | | | | | | | |
Net investment income: | | | | | | | | | | | | | | | | | | | | | | | | | | | | | | |
Class II | | | | | | | | | (1,910 | ) | | | | | | | | | (6,801 | ) | | | | | | | | | (630 | ) |
Net realized gains: | | | | | | | | | | | | | | | | | | | | | | | | | | | | | | |
Class II | | | | | | | | | (17,268 | ) | | | | | | | | | (2,999 | ) | | | | | | | | | — | |
Accumulated earnings: | | | | | | | | | | | | | | | | | | | | | | | | | | | | | | |
(combined net investment income and net realized gains) | | | | | | | | | | | | | | | | | | | | | | | | | | | | | | |
Class II | | | | (35,537 | ) | | | | | | | | | (11,579 | ) | | | | | | | | | (626 | ) | | | | | |
Total Distributions to Shareholders | | | | (35,537 | ) | | | | (19,178 | ) | | | | (11,579 | ) | | | | (9,800 | ) | | | | (626 | ) | | | | (630 | ) |
Capital Share Transactions | | | | 261,848 | | | | | (37,436 | ) | | | | 18,662 | | | | | 124,484 | | | | | (642 | ) | | | | 892 | |
Net Increase (Decrease) in Net Assets | | | | 181,654 | | | | | 25,097 | | | | | (3,680 | ) | | | | 131,778 | | | | | (1,324 | ) | | | | 1,210 | |
Net Assets, Beginning of Period | | | | 444,779 | | | | | 419,682 | | | | | 547,588 | | | | | 415,810 | | | | | 23,166 | | | | | 21,956 | |
Net Assets, End of Period | | | $ | 626,433 | | | | $ | 444,779 | | | | $ | 543,908 | | | | $ | 547,588 | | | | $ | 21,842 | | | | $ | 23,166 | |
Undistributed net investment income | | | | | | | | $ | 1,639 | | | | | | | | | $ | 10,765 | | | | | | | | | $ | 620 | |
| | | |
| | | Global Equity Income(2) | | Global Growth | | Limited-Term Bond |
| (In thousands) | | Year ended
12-31-18 | | Year ended
12-31-17 | | Year ended
12-31-18 | | Year ended
12-31-17 | | Year ended
12-31-18 | | Year ended
12-31-17 |
INCREASE (DECREASE) IN NET ASSETS | | | | | | | | | | | | | | | | | | | | | | | | | | | | | | |
Operations: | | | | | | | | | | | | | | | | | | | | | | | | | | | | | | |
Net investment income | | | $ | 7,986 | | | | $ | 8,269 | | | | $ | 1,232 | | | | $ | 2,004 | | | | $ | 9,884 | | | | $ | 6,837 | |
Net realized gain on investments | | | | 76,605 | | | | | 37,550 | | | | | 95,174 | | | | | 25,607 | | | | | (3,611 | ) | | | | (219 | ) |
Net change in unrealized appreciation (depreciation) | | | | (123,779 | ) | | | | 29,124 | | | | | (83,839 | ) | | | | 66,321 | | | | | (1,036 | ) | | | | (1,166 | ) |
Net Increase (Decrease) in Net Assets Resulting from Operations | | | | (39,188 | ) | | | | 74,943 | | | | | 12,567 | | | | | 93,932 | | | | | 5,237 | | | | | 5,452 | |
| | | | | | |
Distributions to Shareholders From: | | | | | | | | | | | | | | | | | | | | | | | | | | | | | | |
Net investment income: | | | | | | | | | | | | | | | | | | | | | | | | | | | | | | |
Class II | | | | | | | | | (6,575 | ) | | | | | | | | | (213 | ) | | | | | | | | | (6,274 | ) |
Net realized gains: | | | | | | | | | | | | | | | | | | | | | | | | | | | | | | |
Class II | | | | | | | | | (16,978 | ) | | | | | | | | | (11,360 | ) | | | | | | | | | — | |
Accumulated earnings: | | | | | | | | | | | | | | | | | | | | | | | | | | | | | | |
(combined net investment income and net realized gains) | | | | | | | | | | | | | | | | | | | | | | | | | | | | | | |
Class II | | | | (45,707 | ) | | | | | | | | | (27,187 | ) | | | | | | | | | (7,043 | ) | | | | | |
Total Distributions to Shareholders | | | | (45,707 | ) | | | | (23,553 | ) | | | | (27,187 | ) | | | | (11,573 | ) | | | | (7,043 | ) | | | | (6,274 | ) |
Capital Share Transactions | | | | (158,714 | ) | | | | (33,469 | ) | | | | (274,703 | ) | | | | (67,033 | ) | | | | 100,680 | | | | | 48,843 | |
Net Increase (Decrease) in Net Assets | | | | (243,609 | ) | | | | 17,921 | | | | | (289,323 | ) | | | | 15,326 | | | | | 98,874 | | | | | 48,021 | |
Net Assets, Beginning of Period | | | | 527,245 | | | | | 509,324 | | | | | 423,597 | | | | | 408,271 | | | | | 442,788 | | | | | 394,767 | |
Net Assets, End of Period | | | $ | 283,636 | | | | $ | 527,245 | | | | $ | 134,274 | | | | $ | 423,597 | | | | $ | 541,662 | | | | $ | 442,788 | |
Undistributed net investment income | | | | | | | | $ | 8,375 | | | | | | | | | $ | 1,900 | | | | | | | | | $ | 7,149 | |
| (1) | Effective April 30, 2018, the Portfolio’s name changed from Bond to Corporate Bond. |
| (2) | Effective April 30, 2018, the Portfolio’s name changed from Dividend Opportunities to Global Equity Income. |
See Accompanying Notes to Financial Statements.
| | |
| STATEMENTS OF CHANGES IN NET ASSETS | | IVY VIP |
| | | | | | | | | | | | | | | | | | | | |
| | | Securian Real Estate
Securities(1) | | Value |
| (In thousands) | | Year
ended
12-31-18 | | Year ended
12-31-17 | | Year ended
12-31-18 | | Year ended
12-31-17 |
INCREASE (DECREASE) IN NET ASSETS | | | | | | | | | | | | | | | | | | | | |
Operations: | | | | | | | | | | | | | | | | | | | | |
Net investment income | | | $ | 569 | | | | $ | 630 | | | | $ | 5,189 | | | | $ | 6,592 | |
Net realized gain (loss) on investments | | | | 67 | | | | | 2,745 | | | | | 26,767 | | | | | 13,832 | |
Net change in unrealized appreciation (depreciation) | | | | (2,818 | ) | | | | (952 | ) | | | | (66,787 | ) | | | | 25,755 | |
Net Increase (Decrease) in Net Assets Resulting from Operations | | | | (2,182 | ) | | | | 2,423 | | | | | (34,831 | ) | | | | 46,179 | |
| | | | |
Distributions to Shareholders From: | | | | | | | | | | | | | | | | | | | | |
Net investment income: | | | | | | | | | | | | | | | | | | | | |
Class II | | | | | | | | | (601 | ) | | | | | | | | | (4,974 | ) |
Net realized gains: | | | | | | | | | | | | | | | | | | | | |
Class II | | | | | | | | | (5,614 | ) | | | | | | | | | (6,746 | ) |
Accumulated earnings: | | | | | | | | | | | | | | | | | | | | |
(combined net investment income and net realized gains) | | | | | | | | | | | | | | | | | | | | |
Class II | | | | (3,316 | ) | | | | | | | | | (20,089 | ) | | | | | |
Total Distributions to Shareholders | | | | (3,316 | ) | | | | (6,215 | ) | | | | (20,089 | ) | | | | (11,720 | ) |
Capital Share Transactions | | | | (3,612 | ) | | | | (1,653 | ) | | | | 69,186 | | | | | 17,898 | |
Net Increase (Decrease) in Net Assets | | | | (9,110 | ) | | | | (5,445 | ) | | | | 14,266 | | | | | 52,357 | |
Net Assets, Beginning of Period | | | | 43,373 | | | | | 48,818 | | | | | 431,589 | | | | | 379,232 | |
Net Assets, End of Period | | | $ | 34,263 | | | | $ | 43,373 | | | | $ | 445,855 | | | | $ | 431,589 | |
Undistributed net investment income | | | | | | | | $ | 746 | | | | | | | | | $ | 7,913 | |
| (1) | Effective April 30, 2018, the Portfolio’s name changed from Advantus Real Estate Securities to Securian Real Estate Securities. |
See Accompanying Notes to Financial Statements.
| | |
| FINANCIAL HIGHLIGHTS | | IVY VIP |
FOR A SHARE OF CAPITAL STOCK OUTSTANDING THROUGHOUT EACH PERIOD
| | | | | | | | | | | | | | | | | | | | | | | | | | | | | | | | | | | |
| | | | | | | |
| | | Net Asset
Value,
Beginning of
Period | | Net
Investment
Income(1) | | Net Realized
and Unrealized
Gain (Loss) on
Investments | | Total from
Investment
Operations | | Distributions From Net
Investment
Income | | Distributions
From Net
Realized
Gains | | Total
Distributions |
Core Equity | | | | | | | | | | | | | | | | | | | | | | | | | | | | | | | | | | | |
Class II Shares | | | | | | | | | | | | | | | | | | | | | | | | | | | | | | | | | | | |
Year ended12-31-2018 | | | $ | 12.30 | | | | $ | 0.07 | | | | $ | (0.53 | ) | | | $ | (0.46 | ) | | | $ | (0.06 | ) | | | $ | (0.98 | ) | | | $ | (1.04 | ) |
Year ended12-31-2017 | | | | 10.67 | | | | | 0.05 | | | | | 2.09 | | | | | 2.14 | | | | | (0.05 | ) | | | | (0.46 | ) | | | | (0.51 | ) |
Year ended12-31-2016 | | | | 11.75 | | | | | 0.05 | | | | | 0.32 | | | | | 0.37 | | | | | (0.05 | ) | | | | (1.40 | ) | | | | (1.45 | ) |
Year ended12-31-2015 | | | | 14.18 | | | | | 0.05 | | | | | (0.06 | ) | | | | (0.01 | ) | | | | (0.05 | ) | | | | (2.37 | ) | | | | (2.42 | ) |
Year ended12-31-2014 | | | | 15.13 | | | | | 0.05 | | | | | 1.24 | | | | | 1.29 | | | | | (0.08 | ) | | | | (2.16 | ) | | | | (2.24 | ) |
| | | | | | | |
Corporate Bond | | | | | | | | | | | | | | | | | | | | | | | | | | | | | | | | | | | |
Class II Shares | | | | | | | | | | | | | | | | | | | | | | | | | | | | | | | | | | | |
Year ended12-31-2018 | | | | 5.35 | | | | | 0.14 | | | | | (0.24 | ) | | | | (0.10 | ) | | | | (0.11 | ) | | | | (0.01 | ) | | | | (0.12 | ) |
Year ended12-31-2017 | | | | 5.27 | | | | | 0.12 | | | | | 0.08 | | | | | 0.20 | | | | | (0.08 | ) | | | | (0.04 | ) | | | | (0.12 | ) |
Year ended12-31-2016 | | | | 5.20 | | | | | 0.12 | | | | | 0.09 | | | | | 0.21 | | | | | (0.13 | ) | | | | (0.01 | ) | | | | (0.14 | ) |
Year ended12-31-2015 | | | | 5.34 | | | | | 0.10 | | | | | (0.09 | ) | | | | 0.01 | | | | | (0.15 | ) | | | | — | | | | | (0.15 | ) |
Year ended12-31-2014 | | | | 5.49 | | | | | 0.13 | | | | | 0.10 | | | | | 0.23 | | | | | (0.21 | ) | | | | (0.17 | ) | | | | (0.38 | ) |
| | | | | | | |
Global Bond | | | | | | | | | | | | | | | | | | | | | | | | | | | | | | | | | | | |
Class II Shares | | | | | | | | | | | | | | | | | | | | | | | | | | | | | | | | | | | |
Year ended12-31-2018 | | | | 4.96 | | | | | 0.17 | | | | | (0.18 | ) | | | | (0.01 | ) | | | | (0.14 | ) | | | | — | | | | | (0.14 | ) |
Year ended12-31-2017 | | | | 4.89 | | | | | 0.15 | | | | | 0.06 | | | | | 0.21 | | | | | (0.14 | ) | | | | — | | | | | (0.14 | ) |
Year ended12-31-2016 | | | | 4.74 | | | | | 0.16 | | | | | 0.17 | | | | | 0.33 | | | | | (0.18 | ) | | | | — | | | | | (0.18 | ) |
Year ended12-31-2015 | | | | 5.05 | | | | | 0.19 | | | | | (0.31 | ) | | | | (0.12 | ) | | | | (0.19 | ) | | | | — | | | | | (0.19 | ) |
Year ended12-31-2014 | | | | 5.16 | | | | | 0.19 | | | | | (0.18 | ) | | | | 0.01 | | | | | (0.12 | ) | | | | — | | | | | (0.12 | ) |
| | | | | | | |
Global Equity Income | | | | | | | | | | | | | | | | | | | | | | | | | | | | | | | | | | | |
Class II Shares | | | | | | | | | | | | | | | | | | | | | | | | | | | | | | | | | | | |
Year ended12-31-2018 | | | | 8.58 | | | | | 0.16 | | | | | (1.07 | ) | | | | (0.91 | ) | | | | (0.14 | ) | | | | (0.64 | ) | | | | (0.78 | ) |
Year ended12-31-2017 | | | | 7.79 | | | | | 0.13 | | | | | 1.03 | | | | | 1.16 | | | | | (0.10 | ) | | | | (0.27 | ) | | | | (0.37 | ) |
Year ended12-31-2016 | | | | 7.82 | | | | | 0.11 | | | | | 0.40 | | | | | 0.51 | | | | | (0.10 | ) | | | | (0.44 | ) | | | | (0.54 | ) |
Year ended12-31-2015 | | | | 9.05 | | | | | 0.09 | | | | | (0.23 | ) | | | | (0.14 | ) | | | | (0.11 | ) | | | | (0.98 | ) | | | | (1.09 | ) |
Year ended12-31-2014 | | | | 9.04 | | | | | 0.12 | | | | | 0.71 | | | | | 0.83 | | | | | (0.10 | ) | | | | (0.72 | ) | | | | (0.82 | ) |
| | | | | | | |
Global Growth | | | | | | | | | | | | | | | | | | | | | | | | | | | | | | | | | | | |
Class II Shares | | | | | | | | | | | | | | | | | | | | | | | | | | | | | | | | | | | |
Year ended12-31-2018 | | | | 9.87 | | | | | 0.05 | | | | | (0.58 | ) | | | | (0.53 | ) | | | | (0.05 | ) | | | | (0.62 | ) | | | | (0.67 | ) |
Year ended12-31-2017 | | | | 8.14 | | | | | 0.04 | | | | | 1.93 | | | | | 1.97 | | | | | — | * | | | | (0.24 | ) | | | | (0.24 | ) |
Year ended12-31-2016 | | | | 8.68 | | | | | 0.01 | | | | | (0.28 | ) | | | | (0.27 | ) | | | | (0.02 | ) | | | | (0.25 | ) | | | | (0.27 | ) |
Year ended12-31-2015 | | | | 8.84 | | | | | 0.02 | | | | | 0.31 | | | | | 0.33 | | | | | (0.04 | ) | | | | (0.45 | ) | | | | (0.49 | ) |
Year ended12-31-2014 | | | | 9.81 | | | | | 0.09 | | | | | 0.01 | | | | | 0.10 | | | | | (0.21 | ) | | | | (0.86 | ) | | | | (1.07 | ) |
| | | | | | | |
Limited-Term Bond | | | | | | | | | | | | | | | | | | | | | | | | | | | | | | | | | | | |
Class II Shares | | | | | | | | | | | | | | | | | | | | | | | | | | | | | | | | | | | |
Year ended12-31-2018 | | | | 4.88 | | | | | 0.09 | | | | | (0.05 | ) | | | | 0.04 | | | | | (0.08 | ) | | | | — | | | | | (0.08 | ) |
Year ended12-31-2017 | | | | 4.89 | | | | | 0.08 | | | | | (0.01 | ) | | | | 0.07 | | | | | (0.08 | ) | | | | — | | | | | (0.08 | ) |
Year ended12-31-2016 | | | | 4.87 | | | | | 0.08 | | | | | 0.01 | | | | | 0.09 | | | | | (0.07 | ) | | | | — | | | | | (0.07 | ) |
Year ended12-31-2015 | | | | 4.90 | | | | | 0.06 | | | | | (0.02 | ) | | | | 0.04 | | | | | (0.07 | ) | | | | — | | | | | (0.07 | ) |
Year ended12-31-2014 | | | | 4.89 | | | | | 0.07 | | | | | (0.02 | ) | | | | 0.05 | | | | | (0.03 | ) | | | | (0.01 | ) | | | | (0.04 | ) |
| | | | | | | |
Securian Real Estate Securities | | | | | | | | | | | | | | | | | | | | | | | | | | | | | | | | | | | |
Class II Shares | | | | | | | | | | | | | | | | | | | | | | | | | | | | | | | | | | | |
Year ended12-31-2018 | | | | 7.64 | | | | | 0.10 | | | | | (0.54 | ) | | | | (0.44 | ) | | | | (0.11 | ) | | | | (0.49 | ) | | | | (0.60 | ) |
Year ended12-31-2017 | | | | 8.40 | | | | | 0.11 | | | | | 0.27 | | | | | 0.38 | | | | | (0.11 | ) | | | | (1.03 | ) | | | | (1.14 | ) |
Year ended12-31-2016 | | | | 8.98 | | | | | 0.10 | | | | | 0.25 | | | | | 0.35 | | | | | (0.10 | ) | | | | (0.84 | ) | | | | (0.94 | ) |
Year ended12-31-2015 | | | | 9.59 | | | | | 0.10 | | | | | 0.31 | | | | | 0.41 | | | | | (0.10 | ) | | | | (0.92 | ) | | | | (1.02 | ) |
Year ended12-31-2014 | | | | 7.90 | | | | | 0.10 | | | | | 2.20 | | | | | 2.30 | | | | | (0.09 | ) | | | | (0.52 | ) | | | | (0.61 | ) |
| | | | | | | |
Value | | | | | | | | | | | | | | | | | | | | | | | | | | | | | | | | | | | |
Class II Shares | | | | | | | | | | | | | | | | | | | | | | | | | | | | | | | | | | | |
Year ended12-31-2018 | | | | 6.44 | | | | | 0.07 | | | | | (0.51 | ) | | | | (0.44 | ) | | | | (0.12 | ) | | | | (0.19 | ) | | | | (0.31 | ) |
Year ended12-31-2017 | | | | 5.93 | | | | | 0.11 | | | | | 0.61 | | | | | 0.72 | | | | | (0.09 | ) | | | | (0.12 | ) | | | | (0.21 | ) |
Year ended12-31-2016 | | | | 6.15 | | | | | 0.08 | | | | | 0.49 | | | | | 0.57 | | | | | (0.07 | ) | | | | (0.72 | ) | | | | (0.79 | ) |
Year ended12-31-2015 | | | | 7.39 | | | | | 0.06 | | | | | (0.30 | ) | | | | (0.24 | ) | | | | (0.06 | ) | | | | (0.94 | ) | | | | (1.00 | ) |
Year ended12-31-2014 | | | | 7.82 | | | | | 0.05 | | | | | 0.71 | | | | | 0.76 | | | | | (0.09 | ) | | | | (1.10 | ) | | | | (1.19 | ) |
| * | Not shown due to rounding. |
| (1) | Based on average weekly shares outstanding. |
| (2) | Based on net asset value. Total returns do not reflect a sales charge or contingent deferred sales charge, if applicable. Total returns for periods less than one year are not annualized. |
| (3) | Ratios excluding expense waivers are included only for periods in which the class had waived or reimbursed expenses. |
| | | | | | | | | | | | | | | | | | | | | | | | | | | | | | | | |
| | | Net Asset
Value, End of Period | | | Total
Return(2) | | | Net Assets,
End of Period
(in millions) | | | Ratio of Expenses
to Average Net
Assets Including
Expense Waiver | | | Ratio of Net
Investment
Income to
Average Net Assets
Including
Expense
Waiver | | | Ratio of
Expenses to
Average Net Assets
Excluding
Expense
Waiver(3) | | | Ratio of Net
Investment
Income to
Average
Net Assets
Excluding
Expense
Waiver(3) | | | Portfolio
Turnover
Rate | |
Core Equity | | | | | | | | | | | | | | | | | | | | | | | | | | | | | | | | |
Class II Shares | | | | | | | | | | | | | | | | | | | | | | | | | | | | | | | | |
Year ended12-31-2018 | | $ | 10.80 | | | | -4.51 | % | | $ | 626 | | | | 0.95 | % | | | 0.59 | % | | | 1.00 | % | | | 0.54 | % | | | 99 | % |
Year ended12-31-2017 | | | 12.30 | | | | 20.75 | | | | 445 | | | | 0.95 | | | | 0.42 | | | | 1.00 | | | | 0.37 | | | | 78 | |
Year ended12-31-2016 | | | 10.67 | | | | 3.74 | | | | 420 | | | | 0.95 | | | | 0.45 | | | | 1.01 | | | | 0.39 | | | | 75 | |
Year ended12-31-2015 | | | 11.75 | | | | -0.69 | | | | 454 | | | | 0.95 | | | | 0.38 | | | | 1.00 | | | | 0.33 | | | | 60 | |
Year ended12-31-2014 | | | 14.18 | | | | 9.68 | | | | 505 | | | | 0.95 | | | | 0.34 | | | | 1.00 | | | | 0.29 | | | | 57 | |
| | | | | | | | |
Corporate Bond | | | | | | | | | | | | | | | | | | | | | | | | | | | | | | | | |
Class II Shares | | | | | | | | | | | | | | | | | | | | | | | | | | | | | | | | |
Year ended12-31-2018 | | | 5.13 | | | | -1.90 | | | | 544 | | | | 0.77 | | | | 2.77 | | | | — | | | | — | | | | 63 | |
Year ended12-31-2017 | | | 5.35 | | | | 4.01 | | | | 548 | | | | 0.78 | | | | 2.32 | | | | — | | | | — | | | | 66 | |
Year ended12-31-2016 | | | 5.27 | | | | 4.03 | | | | 416 | | | | 0.79 | | | | 2.17 | | | | — | | | | — | | | | 84 | |
Year ended12-31-2015 | | | 5.20 | | | | 0.20 | | | | 280 | | | | 0.78 | | | | 1.87 | | | | — | | | | — | | | | 59 | |
Year ended12-31-2014 | | | 5.34 | | | | 4.34 | | | | 310 | | | | 0.78 | | | | 2.43 | | | | — | | | | — | | | | 28 | |
| | | | | | | | |
Global Bond | | | | | | | | | | | | | | | | | | | | | | | | | | | | | | | | |
Class II Shares | | | | | | | | | | | | | | | | | | | | | | | | | | | | | | | | |
Year ended12-31-2018 | | | 4.81 | | | | -0.18 | | | | 22 | | | | 0.50 | | | | 3.52 | | | | 1.12 | | | | 2.90 | | | | 37 | |
Year ended12-31-2017 | | | 4.96 | | | | 4.27 | | | | 23 | | | | 0.50 | | | | 3.08 | | | | 1.12 | | | | 2.46 | | | | 49 | |
Year ended12-31-2016 | | | 4.89 | | | | 7.04 | | | | 22 | | | | 0.50 | | | | 3.28 | | | | 1.13 | | | | 2.65 | | | | 18 | |
Year ended12-31-2015 | | | 4.74 | | | | -2.65 | | | | 20 | | | | 0.51 | | | | 3.80 | | | | 1.14 | | | | 3.17 | | | | 26 | |
Year ended12-31-2014 | | | 5.05 | | | | 0.18 | | | | 19 | | | | 0.48 | | | | 3.69 | | | | 1.11 | | | | 3.06 | | | | 37 | |
| | | | | | | | |
Global Equity Income | | | | | | | | | | | | | | | | | | | | | | | | | | | | | | | | |
Class II Shares | | | | | | | | | | | | | | | | | | | | | | | | | | | | | | | | |
Year ended12-31-2018 | | | 6.89 | | | | -11.68 | | | | 284 | | | | 1.01 | | | | 2.01 | | | | — | | | | — | | | | 93 | |
Year ended12-31-2017 | | | 8.58 | | | | 15.56 | | | | 527 | | | | 1.00 | | | | 1.60 | | | | — | | | | — | | | | 35 | |
Year ended12-31-2016 | | | 7.79 | | | | 6.95 | | | | 509 | | | | 1.01 | | | | 1.43 | | | | — | | | | — | | | | 59 | |
Year ended12-31-2015 | | | 7.82 | | | | -2.06 | | | | 515 | | | | 1.00 | | | | 1.14 | | | | — | | | | — | | | | 50 | |
Year ended12-31-2014 | | | 9.05 | | | | 9.84 | | | | 511 | | | | 1.00 | | | | 1.33 | | | | — | | | | — | | | | 42 | |
| | | | | | | | |
Global Growth | | | | | | | | | | | | | | | | | | | | | | | | | | | | | | | | |
Class II Shares | | | | | | | | | | | | | | | | | | | | | | | | | | | | | | | | |
Year ended12-31-2018 | | | 8.67 | | | | -6.27 | | | | 134 | | | | 1.13 | | | | 0.46 | | | | 1.18 | | | | 0.41 | | | | 40 | |
Year ended12-31-2017 | | | 9.87 | | | | 24.52 | | | | 424 | | | | 1.14 | | | | 0.47 | | | | 1.17 | | | | 0.44 | | | | 54 | |
Year ended12-31-2016 | | | 8.14 | | | | -3.04 | | | | 408 | | | | 1.13 | | | | 0.09 | | | | 1.16 | | | | 0.06 | | | | 71 | |
Year ended12-31-2015 | | | 8.68 | | | | 3.39 | | | | 507 | | | | 1.14 | | | | 0.23 | | | | 1.17 | | | | 0.20 | | | | 54 | |
Year ended12-31-2014 | | | 8.84 | | | | 0.96 | | | | 431 | | | | 1.13 | | | | 0.93 | | | | 1.16 | | | | 0.90 | | | | 65 | |
| | | | | | | | |
Limited-Term Bond | | | | | | | | | | | | | | | | | | | | | | | | | | | | | | | | |
Class II Shares | | | | | | | | | | | | | | | | | | | | | | | | | | | | | | | | |
Year ended12-31-2018 | | | 4.84 | | | | 0.78 | | | | 542 | | | | 0.79 | | | | 1.91 | | | | — | | | | — | | | | 53 | |
Year ended12-31-2017 | | | 4.88 | | | | 1.40 | | | | 443 | | | | 0.80 | | | | 1.62 | | | | — | | | | — | | | | 55 | |
Year ended12-31-2016 | | | 4.89 | | | | 1.94 | | | | 395 | | | | 0.81 | | | | 1.53 | | | | — | | | | — | | | | 60 | |
Year ended12-31-2015 | | | 4.87 | | | | 0.87 | | | | 385 | | | | 0.80 | | | | 1.31 | | | | — | | | | — | | | | 44 | |
Year ended12-31-2014 | | | 4.90 | | | | 0.97 | | | | 474 | | | | 0.80 | | | | 1.38 | | | | — | | | | — | | | | 34 | |
| | | | | | | | |
Securian Real Estate Securities | | | | | | | | | | | | | | | | | | | | | | | | | | | | | | | | |
Class II Shares | | | | | | | | | | | | | | | | | | | | | | | | | | | | | | | | |
Year ended12-31-2018 | | | 6.60 | | | | -5.57 | | | | 34 | | | | 1.24 | | | | 1.45 | | | | 1.33 | | | | 1.36 | | | | 71 | |
Year ended12-31-2017 | | | 7.64 | | | | 5.39 | | | | 43 | | | | 1.22 | | | | 1.38 | | | | 1.31 | | | | 1.29 | | | | 73 | |
Year ended12-31-2016 | | | 8.39 | | | | 4.26 | | | | 49 | | | | 1.20 | | | | 1.26 | | | | 1.29 | | | | 1.17 | | | | 79 | |
Year ended12-31-2015 | | | 8.98 | | | | 4.78 | | | | 47 | | | | 1.19 | | | | 1.10 | | | | 1.28 | | | | 1.01 | | | | 57 | |
Year ended12-31-2014 | | | 9.59 | | | | 30.17 | | | | 52 | | | | 1.21 | | | | 1.16 | | | | 1.30 | | | | 1.07 | | | | 81 | |
| | | | | | | | |
Value | | | | | | | | | | | | | | | | | | | | | | | | | | | | | | | | |
Class II Shares | | | | | | | | | | | | | | | | | | | | | | | | | | | | | | | | |
Year ended12-31-2018 | | | 5.69 | | | | -7.24 | | | | 446 | | | | 1.00 | | | | 1.09 | | | | — | | | | — | | | | 56 | |
Year ended12-31-2017 | | | 6.44 | | | | 12.49 | | | | 432 | | | | 1.00 | | | | 1.74 | | | | — | | | | — | | | | 67 | |
Year ended12-31-2016 | | | 5.93 | | | | 11.14 | | | | 379 | | | | 1.02 | | | | 1.38 | | | | 1.03 | | | | 1.37 | | | | 54 | |
Year ended12-31-2015 | | | 6.15 | | | | -3.91 | | | | 384 | | | | 0.99 | | | | 0.91 | | | | 1.00 | | | | 0.90 | | | | 74 | |
Year ended12-31-2014 | | | 7.39 | | | | 10.94 | | | | 416 | | | | 1.00 | | | | 0.72 | | | | 1.01 | | | | 0.71 | | | | 76 | |
See Accompanying Notes to Financial Statements.
| | |
| NOTES TO FINANCIAL STATEMENTS | | IVY VIP |
DECEMBER 31, 2018
Ivy Variable Insurance Portfolios, a Delaware statutory trust (the “Trust”), is registered under the Investment Company Act of 1940, as amended (the “1940 Act”), as anopen-end management investment company. Core Equity, Corporate Bond (formerly known as Bond), Global Bond, Global Equity Income (formerly known as Dividend Opportunities), Global Growth, Limited-Term Bond, Securian Real Estate Securities (formerly known as Advantus Real Estate Securities) and Value (each, a “Portfolio”) are eight series of the Trust and are the only series of the Trust included in these financial statements. The assets belonging to each Portfolio are held separately by the custodian. The investment objective, policies and risk factors of each Portfolio are described more fully in the Prospectus and Statement of Additional Information (“SAI”). Each Portfolio’s investment adviser is Ivy Investment Management Company (“IICO”).
| 2. | | SIGNIFICANT ACCOUNTING POLICIES |
The following is a summary of significant accounting policies consistently followed by each Portfolio.
Security Transactions and Related Investment Income. Security transactions are accounted for on the trade date (date the order to buy or sell is executed). Realized gains and losses are calculated on the identified cost basis. Interest income is recorded on the accrual basis and includes paydown gain (loss) and accretion of discounts and amortization of premiums. Dividend income is recorded on theex-dividend date, except certain dividends from foreign securities where theex-dividend date may have passed, which are recorded as soon as the Portfolio is informed of theex-dividend date. All or a portion of the distributions received from a real estate investment trust or publicly traded partnership may be designated as a reduction of cost of the related investment or realized gain.
Foreign Currency Translation. Each Portfolio’s accounting records are maintained in U.S. dollars. All assets and liabilities denominated in foreign currencies are translated into U.S. dollars daily, using foreign exchange rates obtained from an independent pricing service approved by the Board of Trustees of the Trust (the “Board”). Purchases and sales of investment securities and accruals of income and expenses are translated at the rate of exchange prevailing on the date of the transaction. For assets and liabilities other than investments in securities, net realized and unrealized gains and losses from foreign currency translation arise from changes in currency exchange rates. Each Portfolio combines fluctuations from currency exchange rates and fluctuations in value when computing net realized gain (loss) and net change in unrealized appreciation (depreciation) on investments. Foreign exchange rates are typically valued as of the close of the New York Stock Exchange (“NYSE”), normally 4:00 P.M. Eastern time, on each day the NYSE is open for trading.
Dividends and Distributions to Shareholders.Dividends and distributions to shareholders are recorded by each Portfolio on the business day following record date. Net investment income dividends and capital gains distributions are determined in accordance with income tax regulations which may differ from accounting principles generally accepted in the United States of America (“U.S. GAAP”). If the total dividends and distributions made in any tax year exceeds net investment income and accumulated realized capital gains, a portion of the total distribution may be treated as a tax return of capital.
Income Taxes.It is the policy of each Portfolio to distribute all of its taxable income and capital gains to its shareholders and to otherwise qualify as a regulated investment company under Subchapter M of the Internal Revenue Code. In addition, each Portfolio intends to pay distributions as required to avoid imposition of excise tax. Accordingly, no provision has been made for Federal income taxes. The Portfolios file income tax returns in U.S. federal and applicable state jurisdictions. The Portfolios’ tax returns are subject to examination by the relevant taxing authority until expiration of the applicable statute of limitations, which is generally three years after the filing of the tax returns. Management of the Trust periodically reviews all tax positions to assess whether it is more likely than not that the position would be sustained upon examination by the relevant tax authority based on the technical merits of each position. As of the date of these financial statements, management believes that no liability for unrecognized tax positions is required.
Segregation and Collateralization.In cases in which the 1940 Act and the interpretive positions of the Securities and Exchange Commission (“SEC”), the Dodd Frank Wall Street Reform and Consumer Protection Act, or the interpretive rules and regulations of the U.S. Commodities Futures Trading Commission require that a Portfolio either deliver collateral or segregate assets in connection with certain investments (e.g., dollar rolls, financial futures contracts, foreign currency exchange contracts, options written, securities with extended settlement periods, and swaps), the Portfolio will segregate collateral or designate on its books and records, cash or other liquid securities having a value at least equal to the amount that is required to be physically segregated for the benefit of the counterparty. Furthermore, based on requirements and agreements with certain exchanges and third party broker-dealers, each party has requirements to deliver/deposit cash or securities as collateral for certain investments. Certain countries require that cash reserves be held while investing in companies incorporated in that country. These cash reserves and cash collateral that has been pledged to cover obligations of the Portfolios under derivative contracts, if any, will be reported separately on the Statement of Assets and Liabilities as “Restricted cash”. Securities collateral pledged for the same purpose, if any, is noted on the Schedule of Investments.
Concentration of Market and Credit Risk.In the normal course of business, the Portfolios invest in securities and enter into transactions where risks exist due to fluctuations in the market (market risk) or failure of the issuer of a security to meet all its obligations (issuer credit risk). The value of securities held by the Portfolios may decline in response to certain events, including those directly involving the issuers whose securities are owned by the Portfolios; conditions affecting the general economy; overall market changes; local, regional or global political, social or economic instability; and currency and interest rate and price fluctuations. Similar to issuer credit risk, the Portfolios may be exposed to counterparty credit risk, or the risk that an entity with which the Portfolios have unsettled or open transactions may fail to or be unable to perform on its commitments. The Portfolios manage counterparty credit risk by entering into transactions only with counterparties that they believe have the financial resources to honor their obligations and by monitoring the financial stability of those counterparties. Financial assets, which potentially expose the Portfolios to market, issuer and counterparty credit risks, consist principally of financial instruments and receivables due from counterparties. The extent of the Portfolios’ exposure to market, issuer and counterparty credit risks with respect to these financial assets is generally approximated by their value recorded on the Portfolios’ Statement of Assets and Liabilities, less any collateral held by the Portfolios.
Certain Portfolios may hold high-yield ornon-investment-grade bonds, that may be subject to a greater degree of credit risk. Credit risk relates to the ability of the issuer to meet interest or principal payments or both as they become due. The Portfolios may acquire securities in default and are not obligated to dispose of securities whose issuers subsequently default.
Certain Portfolios may enter into financial instrument transactions (such as swaps, futures, options and other derivatives) that may haveoff-balance sheet market risk.Off-balance sheet market risk exists when the maximum potential loss on a particular financial instrument is greater than the value of such financial instrument, as reflected on the Statement of Assets and Liabilities.
If a Portfolio invests directly in foreign currencies or in securities that trade in, and receive revenues in, foreign currencies, or in financial derivatives that provide exposure to foreign currencies, it will be subject to the risk that those currencies will decline in value relative to the base currency of the Portfolio, or, in the case of hedging positions, that the Portfolio’s base currency will decline in value relative to the currency being hedged. Currency rates in foreign countries may fluctuate significantly over short periods of time for a number of reasons, including changes in interest rates, intervention (or the failure to intervene) by U.S. or foreign governments, central banks or supranational entities such as the International Monetary Fund, or by the imposition of currency controls or other political developments in the United States or abroad.
Inflation-Indexed Bonds.Certain Portfolios may invest in inflation-indexed bonds. Inflation-indexed bonds are fixed-income securities whose principal value is periodically adjusted to the rate of inflation. The interest rate on these bonds is generally fixed at issuance at a rate lower than typical bonds. Over the life of an inflation-indexed bond, however, interest will be paid based on a principal value, which is adjusted for inflation. Any increase or decrease in the principal amount of an inflation-indexed bond will be included as interest income on the Statement of Operations, even though investors do not receive their principal until maturity.
Interest Only Obligations.These securities entitle the owner to receive only the interest portion from a bond, Treasury note or pool of mortgages. These securities are generally created by a third party separating a bond or pool of mortgages into distinct interest-only and principal-only securities. As the principal (par) amount of a bond or pool of mortgages is paid down, the amount of interest income earned by the owner will decline as well.
Loans. Certain Portfolios may invest in loans, the interest rates of which float or adjust periodically based upon a specified adjustment schedule, benchmark indicator, or prevailing interest rates, the debtor of which may be a domestic or foreign corporation, partnership or other entity (“Borrower”). Loans generally pay interest at rates which are periodically redetermined by reference to a base lending rate plus a premium. These base lending rates generally include prime rates of one or more major U.S. banks, the London Interbank Offered Rate (“LIBOR”) or certificates of deposit rates. Loans often require prepayments from excess cash flow or permit the Borrower to repay at its election. The degree to which Borrowers repay cannot be predicted with accuracy. As a result, the actual maturity may be substantially less than the stated maturities. Loans are exempt from registration under the Securities Act of 1933, as amended, may contain certain restrictions on resale, and cannot be sold publicly. A Portfolio’s investments in loans may be in the form of participations in loans or assignments of all or a portion of loans from third parties.
When a Portfolio purchases assignments, it acquires all the rights and obligations under the loan agreement of the assigning lender. Assignments may, however, be arranged through private negotiations between potential assignees and potential assignors, and the rights and obligations acquired by the purchaser of an assignment may differ from, and be more limited than those held by the assigning lender. When a Portfolio purchases a participation of a loan interest, the Portfolio typically enters into a contractual agreement with the lender or other third party selling the participation. A participation interest in loans includes the right to receive payments of principal, interest and any fees to which it is entitled from the lender and only upon receipt by the lender of payments from the Borrower, but not from the Borrower directly. When investing in a participation interest, if a Borrower is unable to meet its obligations under a loan agreement, a Portfolio generally has no direct right to enforce compliance with the terms of the loan agreement. As a result, the Portfolio assumes the credit risk of
the Borrower, the selling participant, and any other persons that are interpositioned between the Portfolio and the Borrower. If the lead lender in a typical lending syndicate becomes insolvent, enters Federal Deposit Insurance Corporation (“FDIC”) receivership or, if not FDIC insured, enters into bankruptcy, the Portfolio may incur certain costs and delays in receiving payment or may suffer a loss of principal and interest.
PaymentIn-Kind Securities.Certain Portfolios may invest in paymentin-kind securities (“PIKs”). PIKs give the issuer the option at each interest payment date of making interest payments in cash or in additional debt securities. Those additional debt securities usually have the same terms, including maturity dates and interest rates, and associated risks as the original bonds. The daily market quotations of the original bonds may include the accrued interest (referred to as a dirty price) and require apro-rata adjustment from the unrealized appreciation or depreciation on investments to interest receivable on the Statement of Assets and Liabilities.
Securities on a When-Issued or Delayed Delivery Basis. Certain Portfolios may purchase securities on a “when-issued” basis, and may purchase or sell securities on a “delayed delivery” basis. “When-issued” or “delayed delivery” refers to securities whose terms and indenture are available and for which a market exists, but which are not available for immediate delivery. Delivery and payment for securities that have been purchased by a Portfolio on a when-issued basis normally take place within six months and possibly as long as two years or more after the trade date. During this period, such securities do not earn interest, are subject to market fluctuation and may increase or decrease in value prior to their delivery. The purchase of securities on a when-issued basis may increase the volatility of a Portfolio’s NAV to the extent the Portfolio executes such transactions while remaining substantially fully invested. When a Portfolio engages in when-issued or delayed delivery transactions, it relies on the buyer or seller, as the case may be, to complete the transaction. Their failure to do so may cause the Portfolio to lose the opportunity to obtain or dispose of the security at a price and yield IICO, or the Portfolio’s investment subadviser, as applicable, consider advantageous. The Portfolio maintains internally designated assets with a value equal to or greater than the amount of its purchase commitments. The Portfolio may also sell securities that it purchased on a when-issued or delayed delivery basis prior to settlement of the original purchase.
Custodian Fees. “Custodian fees” on the Statement of Operations may include interest expense incurred by a Portfolio on any cash overdrafts of its custodian account during the period. Such cash overdrafts may result from the effects of failed trades in portfolio securities and from cash outflows resulting from unanticipated shareholder redemption activity. A Portfolio pays interest to its custodian on such cash overdrafts, to the extent they are not offset by positive cash balances maintained by that Portfolio. The “Earnings credit” line item, if shown, represents earnings on cash balances maintained by that Portfolio during the period. Such interest expense and other custodian fees may be paid with these earnings.
Indemnification.The Trust’s organizational documents provide current and former Trustees and Officers with a limited indemnification against liabilities arising in connection with the performance of their duties to the Trust. In the normal course of business, the Trust may also enter into contracts that provide general indemnification. The Trust’s maximum exposure under these arrangements is unknown and is dependent on future claims that may be made against the Trust. The risk of material loss from such claims is considered remote.
Basis of Preparation.Each Portfolio is an investment company and follows accounting and reporting guidance in the Financial Accounting Standards Board (“FASB”) Accounting Standards Codification Topic 946 (“ASC 946”). The accompanying financial statements were prepared in accordance with U.S. GAAP, including but not limited to ASC 946. U.S. GAAP requires the use of estimates made by management. Management believes that estimates and valuations are appropriate; however, actual results may differ from those estimates, and the valuations reflected in the accompanying financial statements may differ from the value ultimately realized upon sale or maturity.
New Rule Issuance.In March 2017, the Financial Accounting Standards Board (“FASB”) issued Accounting Standards Update (“ASU”)No. 2017-08 (“ASU2017-08”), “Receivables — Nonrefundable Fees and Other Costs (Subtopic310-20): Premium Amortization on Purchased Callable Debt Securities.” ASU2017-08 changed the amortization period for certain callable debt securities held at a premium. Specifically, it required the premium to be amortized to the earliest call date. The adoption of ASU2017-08 had no impact on beginning net assets, the current period results from operations, or any prior period information presented in the financial statements.
In August 2018, the FASB issued ASU2018-13, Fair Value Measurement (Topic 820). The amendments in the ASU impact disclosure requirements for fair value measurement. It is anticipated that this change will enhance the effectiveness of disclosures in the notes to the financial statements. This ASU is effective for fiscal years beginning after December 15, 2019. Early adoption is permitted and can include the entire standard or certain provisions that exclude or amend disclosures. For the year ended December 31, 2018, the Portfolios have chosen to adopt the standard. The adoption of this ASU is reflected in the disclosures of the financial statements.
In August 2018, U.S. Securities and Exchange Commission (“SEC”) adopted amendments to certain financial statement disclosure requirements to conform them to GAAP for investment companies. These amendments made certain removals from, changes to and additions to existing disclosure requirements under RegulationS-X. These amendments became effective for filings made with the SEC after November 5, 2018. The Portfolios’ adoption of these amendments, effective with
the financial statements prepared as of December 31, 2018, required modified disclosures reflected herein, but had no effect on the Portfolios’ net assets or results of operations.
Subsequent Events. Management has performed a review for subsequent events through the date this report was issued.
| 3. | | INVESTMENT VALUATION AND FAIR VALUE MEASUREMENTS |
Each Portfolio’s investments are reported at fair value. Fair value is defined as the price that each Portfolio would receive upon selling an asset or would pay upon satisfying a liability in an orderly transaction between market participants at the measurement date. Each Portfolio calculates the NAV of its shares as of the close of the NYSE, normally 4:00 P.M. Eastern time, on each day the NYSE is open for trading.
For purposes of calculating the NAV, the portfolio securities and financial instruments are valued on each business day using pricing and valuation methods as adopted by the Board. Where market quotes are readily available, fair value is generally determined on the basis of the last reported sales price, or if no sales are reported, based on quotes obtained from a quotation reporting system, established market makers, or pricing services.
Prices for fixed-income securities are typically based on quotes that are obtained from an independent pricing service approved by the Board. To determine values of fixed-income securities, the independent pricing service utilizes such factors as current quotations by broker/dealers, coupon, maturity, quality, type of issue, trading characteristics, and other yield and risk factors it deems relevant in determining valuations. Securities that cannot be valued by the independent pricing service may be valued using quotes obtained from dealers that make markets in the securities.
Short-term securities with maturities of 60 days or less are valued based on quotes that are obtained from an independent pricing service approved by the Board as described in the preceding paragraph above.
Because many foreign markets close before the NYSE, events may occur between the close of the foreign market and the close of the NYSE that could have a material impact on the valuation of foreign securities. Waddell & Reed Services Company (“WRSCO”), pursuant to procedures adopted by the Board, evaluates the impact of these events and may adjust the valuation of foreign securities to reflect the fair value as of the close of the NYSE. In addition, all securities for which values are not readily available or are deemed unreliable are appraised at fair value as determined in good faith under the supervision of the Board.
Where market quotes are not readily available, portfolio securities or financial instruments are valued at fair value, as determined in good faith by the Board or Valuation Committee pursuant to procedures approved by the Board.
Market quotes are considered not readily available in circumstances where there is an absence of current or reliable market-based data (e.g., trade information or broker quotes), including where events occur after the close of the relevant market, but prior to the NYSE close, that materially affect the values of a Portfolio’s securities or financial instruments. In addition, market quotes are considered not readily available when, due to extraordinary circumstances, the exchanges or markets on which the securities trade do not open for trading for the entire day and no other market prices are available.
The Board has delegated to WRSCO the responsibility for monitoring significant events that may materially affect the values of a Portfolio’s securities or financial instruments and for determining whether the value of the applicable securities or financial instruments should bere-evaluated in light of such significant events. The Board has established a Valuation Committee to administer and oversee the valuation process, including the use of third party pricing vendors.
The Board has adopted methods for valuing securities and financial instruments in circumstances where market quotes are not readily available. For instances in which daily market quotes are not readily available, investments may be valued, pursuant to procedures established by the Board, with reference to other securities or indices. In the event that the security or financial instrument cannot be valued pursuant to one of the valuation methods established by the Board, the value of the security or financial instrument will be determined in good faith by the Valuation Committee in accordance with the procedures adopted by the Board.
When a Portfolio uses these fair valuation methods applied by WRSCO that use significant unobservable inputs to determine its NAV, securities will be priced by a method that the Board or persons acting at its direction believe accurately reflects fair value and are categorized as Level 3 of the fair value hierarchy. These methods may require subjective determinations about the value of a security. The prices used by a Portfolio may differ from the value that will ultimately be realized at the time the securities are sold.
WRSCO is responsible for monitoring the implementation of the pricing and valuation policies through a series of activities to provide reasonable comfort of the accuracy of prices including: 1) periodic vendor due diligence meetings to review methodologies, new developments, and process at vendors, 2) daily and monthly multi-source pricing comparisons reviewed and submitted to the Valuation Committee, and 3) daily review of unpriced, stale, and variance reports with exceptions reviewed by management and the Valuation Committee.
Accounting standards establish a framework for measuring fair value and a three-level hierarchy for fair value measurements based upon the transparency of inputs to the valuation of an asset or liability. Inputs may be observable or
unobservable and refer broadly to the assumptions that market participants would use in pricing the asset or liability. Observable inputs reflect the assumptions market participants would use in pricing the asset or liability based on market data obtained from sources independent of the reporting entity. Unobservable inputs reflect the reporting entity’s own assumptions about the factors that market participants would use in pricing the asset or liability developed based on the best information available in the circumstances.
An individual investment’s fair value measurement is assigned a level based upon the observability of the inputs which are significant to the overall valuation.
The three-tier hierarchy of inputs is summarized as follows:
Level 1 — Observable input such as quoted prices, available in active markets, for identical assets or liabilities.
Level 2 — Significant other observable inputs, which may include, but are not limited to, quoted prices for similar assets or liabilities in markets that are active, quoted prices for identical or similar assets or liabilities in markets that are not active, inputs other than quoted prices that are observable for the assets or liabilities (such as interest rates, yield curves, volatilities, prepayment speeds, loss severities, credit risks and default rates) or other market corroborated inputs.
Level 3 — Significant unobservable inputs based on the best information available in the circumstances, to the extent observable inputs are not available, which may include assumptions made by the Board or persons acting at its direction that are used in determining the fair value of investments.
A description of the valuation techniques applied to the Portfolios’ major classes of assets and liabilities measured at fair value on a recurring basis follows:
Asset-Backed Securities and Mortgage-Backed Securities. The fair value of asset-backed securities and mortgage-backed securities are estimated using recently executed transactions and based on models that consider the estimated cash flows of each debt tranche of the issuer, establish a benchmark yield, and develop an estimated tranche specific spread to the benchmark yield based on the unique attributes of the tranche including, but not limited to, the prepayment speed assumptions and attributes of the collateral. To the extent the inputs are observable and timely, the values would be categorized in Level 2 of the fair value hierarchy, and otherwise they would be categorized as Level 3.
Corporate Bonds. The fair value of corporate bonds, as obtained from an independent pricing service, is estimated using various techniques, which consider recently executed transactions in securities of the issuer or comparable issuers, market price quotations (where observable), bond spreads, fundamental data relating to the issuer, and credit default swap spreads adjusted for any basis difference between cash and derivative instruments. While most corporate bonds are categorized in Level 2 of the fair value hierarchy, in instances where lower relative weight is placed on transaction prices, quotations, or similar observable inputs, they are categorized in Level 3 of the fair value hierarchy.
Derivative Instruments. Forward foreign currency contracts are valued based upon the closing prices of the forward currency rates determined at the close of the NYSE, which are provided by an independent pricing service. Swaps derive their value from underlying asset prices, indices, reference rates and other inputs or a combination of these factors. Swaps are valued by an independent pricing service unless the price is unavailable, in which case they are valued at the price provided by a dealer in that security. Exchange-traded futures contracts are generally valued at the settlement price. Listed options are ordinarily valued at the mean of the last bid and ask price provided by an independent pricing service unless the price is unavailable, in which case they are valued at a quotation obtained from a broker-dealer. Over the counter (“OTC”) options are ordinarily valued at the mean of the last bid and ask price for a comparable listed option provided by an independent pricing service unless such a price is unavailable, in which case they are valued at a quotation obtained from a broker-dealer.
Listed derivatives that are actively traded are valued based on quoted prices from the exchange and are categorized in Level 1 of the fair value hierarchy. OTC derivative contracts include forward foreign currency contracts, swap agreements, and option contracts related to interest rates, foreign currencies, credit standing of reference entities, equity prices, or commodity prices. Depending on the product and the terms of the transaction, the fair value of the OTC derivative products are modeled taking into account the counterparties’ creditworthiness and using a series of techniques, including simulation models. Many pricing models do not entail material subjectivity because the methodologies employed do not necessitate significant judgments and the pricing inputs are observed from actively quoted markets, as is the case with interest rate swap and option contracts. OTC derivative products valued using pricing models with significant observable inputs are categorized within Level 2 of the fair value hierarchy.
Equity Securities.Equity securities traded on U.S. or foreign securities exchanges or included in a national market system are valued at the official closing price at the close of each business day unless otherwise stated below. OTC equity securities and listed securities for which no price is readily available are valued at the average of the last bid and ask prices.
Mutual funds, including investment funds, typically are valued at the NAV reported as of the valuation date.
Securities that are stated at the last reported sales price or closing price on the day of valuation taken from the primary exchange where the security is principally traded and to the extent these securities are actively traded and valuation adjustments are not applied, they are categorized in Level 1 of the fair value hierarchy.
Foreign securities, for which the primary trading market closes at the same time or after the NYSE, are valued based on quotations from the primary market in which they are traded and categorized in Level 1. Because many foreign securities markets and exchanges close prior to the close of the NYSE, closing prices for foreign securities in those markets or on those exchanges do not reflect the events that occur after that close. Certain foreign securities may be fair valued using a pricing service that considers the correlation of the trading patterns of the foreign security to theintra-day trading in the U.S. markets for investments such as American Depositary Receipts, financial futures, exchange-traded funds, and the movement of certain indices of securities based on a statistical analysis of their historical relationship; such valuations generally are categorized in Level 2.
Preferred stock, repurchase agreements, and other equities traded on inactive markets or valued by reference to similar instruments are also generally categorized in Level 2.
Loans. Loans are valued using a price or composite price from one or more brokers or dealers as obtained from an independent pricing service. The fair value of loans is estimated using recently executed transactions, market price quotations, credit/market events, and cross-asset pricing. Inputs are generally observable market inputs obtained from independent sources. Loans are generally categorized in Level 2 of the fair value hierarchy, unless key inputs are unobservable in which case they would be categorized as Level 3.
Municipal Bonds. Municipal bonds are fair valued based on pricing models used by and obtained from an independent pricing service that take into account, among other factors, information received from market makers and broker-dealers, current trades,bid-wants lists, offerings, market movements, the callability of the bond, state of issuance, benchmark yield curves, and bond insurance. To the extent that these inputs are observable and timely, the fair values of municipal bonds would be categorized as Level 2; otherwise the fair values would be categorized as Level 3.
Restricted Securities. Restricted securities that are deemed to be Rule 144A securities and illiquid, as well as restricted securities held innon-public entities, are included in Level 3 of the fair value hierarchy to the extent that significant inputs to valuation are unobservable, because they trade infrequently, if at all and, therefore, the inputs are unobservable. Restricted securities that are valued at a discount to similar publicly traded securities may be categorized as Level 2 of the fair value hierarchy to the extent that the discount is considered to be insignificant to the fair value measurement in its entirety; otherwise they may be categorized as Level 3.
U.S. Government and Agency Securities. U.S. government and agency securities are normally valued using a model that incorporates market observable data such as reported sales of similar securities, broker quotes, yields, bids, offers, quoted market prices, and reference data. Accordingly, U.S. government and agency securities are normally categorized in Level 2 of the fair value hierarchy depending on the liquidity and transparency of the market.
Transfers from Level 2 to Level 3 occurred primarily due to the lack of observable market data due to decreased market activity or information for these securities. Transfers from Level 3 to Level 2 occurred primarily due to the increased availability of observable market data due to increased market activity or information. Transfers between levels represent the values as of the beginning of the reporting period.
For fair valuations using unobservable inputs, U.S. GAAP requires a reconciliation of the beginning to ending balances for reported fair values that presents changes attributable to total realized and unrealized gains or losses, purchases and sales, and transfers in or out of the Level 3 category during the period. In accordance with the requirements of U.S. GAAP, a fair value hierarchy and Level 3 reconciliation, if any, have been included in the Notes to the Schedule of Investments for each respective Portfolio.
Net realized gain (loss) and net unrealized appreciation (depreciation), shown on the reconciliation of Level 3 investments, if applicable, are included on the Statement of Operations in net realized gain (loss) on investments in unaffiliated and/or affiliated securities and in net change in unrealized appreciation (depreciation) on investments in unaffiliated and/or affiliated securities, respectively. Additionally, the net change in unrealized appreciation (depreciation) for all Level 3 investments still held as of December 31, 2018, if applicable, is included on the Statement of Operations in net change in unrealized appreciation (depreciation) on investments in unaffiliated and/or affiliated securities.
| 4. | | DERIVATIVE INSTRUMENTS($ amounts in thousands unless indicated otherwise) |
The following disclosures contain information on why and how the Portfolios use derivative instruments, the associated risks of investing in derivative instruments, and how derivative instruments affect the Portfolios’ financial positions and results of operations.
Forward Foreign Currency Contracts. All Portfolios are authorized to enter into forward foreign currency contracts (“forward contracts”) for the purchase or sale of a foreign currency at a negotiated rate at a future date. Forward contracts
are reported on a schedule following the Schedule of Investments. Forward contracts are valued daily based upon the closing prices of the forward currency rates provided by an independent pricing service determined at the close of the NYSE. The resulting unrealized appreciation and depreciation is reported on the Statement of Assets and Liabilities as a receivable or payable and on the Statement of Operations within the change in unrealized appreciation (depreciation). At contract close, the difference between the original cost of the contract and the value at the close date is recorded as a realized gain (loss) on the Statement of Operations.
Risks to a Portfolio related to the use of such contracts include both market and credit risk. Market risk is the risk that the value of the forward contract will depreciate due to unfavorable changes in the exchange rates. Credit risk arises from the possibility that the counterparty will default. If the counterparty defaults, a Portfolio’s maximum loss will consist of the aggregate unrealized gain on appreciated contracts that is not collateralized.
Core Equity enters into forward foreign currency exchange contracts as an economic hedge against either specific transactions or portfolio instruments or to obtain exposure to, or hedge exposure away from foreign currencies (foreign currency exchange rate risk).
Futures Contracts. All Portfolios are authorized to engage in buying and selling futures contracts. Upon entering into a futures contract, a Portfolio is required to deposit, in a segregated account, an amount equal to a varying specified percentage of the contract amount. This amount is known as the initial margin. Subsequent amounts, known as variation margin, are paid or received by the Portfolio each day, dependent on the daily fluctuations in the value of the underlying debt security or index. Options on futures contracts may also be purchased or sold by a Portfolio.
Futures contracts are reported on a schedule following the Schedule of Investments. Securities held in collateralized accounts to cover initial margin requirements on open futures contracts are identified on the Schedule of Investments. Cash held by the broker to cover initial margin requirements on open futures contracts and the receivable and/or payable for the daily mark to market for the variation margin are noted on the Statement of Assets and Liabilities. The net change in unrealized appreciation (depreciation) is reported on the Statement of Operations. Realized gains (losses) are reported on the Statement of Operations at the closing or expiration of futures contracts.
Risks of entering into futures contracts include the possibility of loss of securities or cash held as collateral, that there may be an illiquid market where the Portfolio is unable to close the contract or enter into an offsetting position and, if used for hedging purposes, the risk that the price of the contract will correlate imperfectly with the prices of the Portfolio’s securities.
Core Equity invests in long and/or short positions in futures contracts to gain exposure to, or economically hedge against, changes in interest rates (interest rate risk), changes in the value of equity securities (equity risk) or foreign currencies (foreign currency exchange rate risk).
Option Contracts.Options purchased by a Portfolio are accounted for in the same manner as portfolio securities. The cost of the underlying instruments acquired through the exercise of call options is increased by the premium paid to purchase the call. The proceeds from instruments sold through the exercise of put options are decreased by the premium paid to purchase the put.
When a Portfolio writes (sells) an option, an amount equal to the premium received by the Portfolio is recorded as a liability. The amount of the liability is subsequently adjusted to reflect the current value of the option written. When an option expires on its stipulated expiration date or a Portfolio enters into a closing purchase transaction, the Portfolio realizes a gain (or loss if the cost of a closing purchase transaction exceeds the premium received when the call option was sold), and the liability related to such option is extinguished. When a written call option is exercised, the premium is added to the proceeds from the sale of the underlying instrument in determining whether a Portfolio has realized a gain or loss. When a written put is exercised, the cost basis of the instruments purchased by a Portfolio is reduced by the amount of the premium received.
Investments in options, whether purchased or written, involve certain risks. Writing put options and purchasing call options may increase a Portfolio’s exposure to the underlying instrument. With written options, there may be times when a Portfolio will be required to purchase or sell instruments to meet its obligation under the option contract where the required action is not beneficial to the Portfolio, due to unfavorable movement of the market price of the underlying instrument.
Option contracts can be traded on a regulated exchange or traded OTC. Unlike the trades on a regulated exchange where the clearinghouse guarantees the performances of both the buyer and the seller, to the extent a Portfolio enters into OTC option transactions with counterparties, the Portfolio will be exposed to the risk that counterparties to these OTC transactions will be unable to meet their obligations under the terms of the transaction.
Value purchases and writes call and put options to increase or decrease hedging exposure to underlying instruments (which include credit risk, equity risk, foreign currency exchange rate risk, event risk and/or interest rate risk), increase exposure to various equity markets or certain sectors, gain exposure to or facilitate trading in certain securities and/or, in the case of options written, to generate returns from options premiums.
Swap Agreements. All Portfolios are authorized to invest in swap agreements. Swap agreements are bilateraly negotiated agreements between a Portfolio and counterparty to exchange or swap investment cash flows, assets, foreign currencies or market-linked returns at specified, future intervals. Swap agreements are privately negotiated in the over-the-counter market ("OTC swaps"). If the OTC swap entered is one of the swaps identified by a relevant regulator as a swap that is required to be cleared, then it will be cleared through a third party, known as a central counterparty or derivatives clearing organization ("centrally cleared swaps").
Swaps are marked to market daily and changes in value are recorded as unrealized appreciation (depreciation) on the Statement of Operations. Payments received or made by the Portfolio are recorded as realized gain or loss on the Statement of Operations. Any upfront premiums paid are recorded as assets and any upfront fees received are recorded as liabilities and are shown as swap premiums paid and swap premiums received, respectively, if any, on the Statement of Assets and Liabilities and amortized over the term of the swap. An early termination payment received or made at an early termination or a final payment made at the maturity of the swap is recorded as realized gain or loss on the Statement of Operations.
After a centrally cleared swap is accepted for clearing, a Portfolio may be required to deposit initial margin with a Clearing Member in the form of cash or securities. Securities deposited as initial margin, if any, are designated on the Schedule of Investments. Cash deposited as initial margin is identified on the Schedule of Investments and is recorded as restricted cash on the Statement of Assets and Liabilities.
Total return swaps involve a commitment of one party to pay periodic interest payments in exchange for a market-linked return based on a security or a basket of securities including a variety of securities or representing a particular index. To the extent the total return of the security, a basket of securities, or an index exceeds or falls short of the offsetting interest rate obligation, the Portfolio will receive a payment from or make a payment to the counterparty.
Global Equity Income, Global Growth and Value enter into total return swaps to hedge exposure to a security or market.
The creditworthiness of the counterparty with which a Portfolio enters into a swap agreement is monitored by IICO. If a counterparty creditworthiness declines, the value of the agreement would likely decline, potentially resulting in losses. If a default occurs by the counterparty to such a transaction, the Portfolio will have contractual remedies pursuant to the agreement related to the transaction. The maximum loss a Portfolio may incur consists of the aggregate unrealized gain on appreciated contracts that is not collateralized due to facts specific to certain situations (i.e., collateral may not have been posted by the counterparty due to the required collateral amount being less than thepre-agreed thresholds. Additionally, regulatory developments called stay resolutions and the ensuing required contractual amendments to the transactional documentation, including derivatives, permit the relevant regulators to preclude parties to a transaction from terminating trades, among other rights it may have in the trade agreements should a counterparty that it regulates experience financial distress. A relevant regulator also has the authority to reduce the value of certain liabilities owed by the counterparty to a Fund and/or convert cash liabilities of a regulated entity into equity holdings. The power given to the relevant regulators includes the ability to amend transactional agreements unilaterally, modify the maturity of eligible liabilities, reduce the amount of interest payable or change the date on which interest becomes payable, among other powers.
To prevent incurring losses due to the counterparty credit risk, IICO actively monitors the creditworthiness of the counterparties with which it has entered financial transactions. IICO consistently and frequently risk manages the credit risk of the counterparties it faces in transactions.
Collateral and rights of offset. A Portfolio mitigates credit risk with respect to OTC derivative counterparties through credit support annexes (“CSA”) included with an International Swaps and Derivatives Association, Inc. (“ISDA”) Master Agreement which is the standard contract governing all OTC derivative transactions between the Portfolio and each of its counterparties. Although it is not possible to eliminate credit risk entirely, the CSA allows the Portfolio and its counterparty to reduce their exposure to the risk of payment default by the other party by holding an amount in collateral equivalent to the realized and unrealized amount of exposure to the counterparty, which is generally held by the Portfolio’s custodian. An amount of collateral is moved to/from applicable counterparties only if the amount of collateral required to be posted surpasses both the threshold and the minimum transfer amountpre-agreed in the CSA between the Portfolio and the counterparty. See Note 2 “Segregation and Collateralization” for additional information with respect to collateral practices.
Offsetting of Assets and Liabilities. The following tables present financial instruments that are either (1) offset or (2) subject to an enforceable master netting arrangement or similar agreement as of December 31, 2018:
Assets
| | | | | | | | | | | | | | | | | | | | | | | | | | | | |
| | | | | | Gross Amounts Not Offset on the
Statement of Assets and Liabilities | |
| Portfolio | | Gross
Amounts of
Recognized
Assets | | | Gross
Amounts
Offset on the
Statement of
Assets and
Liabilities | | | Net Amounts of Assets
Presented on
the Statement of Assets and
Liabilities | | | Financial
Instruments
and
Derivatives
Available for
Offset | | | Non-Cash
Collateral
Received | | | Cash
Collateral
Received | | | Net Amount
Receivable | |
Core Equity | | | | | | | | | | | | | | | | | | | | | | | | | | | | |
Unrealized appreciation on forward foreign currency contracts(1) | | $ | 404 | | | $ | — | | | $ | 404 | | | $ | — | | | $ | — | | | $ | — | | | $ | 404 | |
| (1) | Amounts include forward contracts that have an offset to an open and close contract, but have not settled. These amounts are included on the Statement of Assets and Liabilities line item for Investment securities sold receivable. |
Additional Disclosure Related to Derivative Instruments
Fair values of derivative instruments as of December 31, 2018:
| | | | | | | | | | | | | | | | | | |
| | | | | Assets | | | | | | Liabilities | |
| Portfolio | | Type of Risk
Exposure | | Statement of Assets & Liabilities
Location | | Value | | | | | | Statement of Assets & Liabilities
Location | | Value | |
| Core Equity | | Foreign currency | | Unrealized appreciation on forward foreign currency contracts | | $ | 127 | | | | | | | | | $ | — | |
| Value | | Equity | | | | | — | | | | | | | Written options at value | | | 41 | |
Amount of realized gain (loss) on derivatives recognized on the Statement of Operations for the year ended December 31, 2018:
| | | | | | | | | | | | | | | | | | | | | | | | | | |
| | | | | Net realized gain (loss) on: | | | | |
| Portfolio | | Type of Risk
Exposure | | Investments in
unaffiliated
securities* | | | Swap
agreements | | | Futures
contracts | | | Written
options | | | Forward
foreign
currency
contracts | | | Total | |
| Core Equity | | Equity | | $ | — | | | $ | — | | | $ | 1,362 | | | $ | — | | | $ | — | | | $ | 1,362 | |
| | | Foreign currency | | | — | | | | — | | | | — | | | | — | | | | 786 | | | | 786 | |
| Global Equity Income | | Equity | | | — | | | | (223 | ) | | | — | | | | — | | | | — | | | | (223 | ) |
| Global Growth | | Equity | | | — | | | | (346 | ) | | | 204 | | | | — | | | | — | | | | (142 | ) |
| Value | | Equity | | | — | | | | (450 | ) | | | — | | | | 691 | | | | — | | | | 241 | |
* Purchased options are reported as investments in unaffiliated securities and are reflected on the accompanying Schedule of Investments.
Change in unrealized appreciation (depreciation) on derivatives recognized on the Statement of Operations for the year ended December 31, 2018:
| | | | | | | | | | | | | | | | | | | | | | | | | | |
| | | | | Net change in unrealized appreciation (depreciation) on: | | | | |
| Portfolio | | Type of Risk
Exposure | | Investments in
unaffiliated
securities* | | | Swap
agreements | | | Futures
contracts | | | Written
options | | | Forward
foreign
currency
contracts | | | Total | |
| Core Equity | | Foreign currency | | $ | — | | | $ | — | | | $ | — | | | $ | — | | | $ | 433 | | | $ | 433 | |
| Value | | Equity | | | — | | | | 17 | | | | — | | | | 74 | | | | — | | | | 91 | |
* Purchased options are reported as investments in unaffiliated securities and are reflected on the accompanying Schedule of Investments.
During the year ended December 31, 2018, the average derivative volume was as follows:
| | | | | | | | | | | | | | | | | | | | | | | | |
| Portfolio | | Forward foreign
currency contracts(1) | | | Long futures
contracts(2) | | | Short futures
contracts(2) | | | Swap
agreements(3) | | | Purchased
options(2) | | | Written
options(2) | |
Core Equity | | $ | 160 | | | $ | — | | | $ | — | | | $ | — | | | $ | — | | | $ | — | |
Value | | | — | | | | — | | | | — | | | | 2,516 | | | | — | | | | 98 | |
| (1) | Average absolute value of unrealized appreciation/depreciation during the period. |
| (2) | Average value outstanding during the period. |
| (3) | Average notional amount outstanding during the period. |
| 5. | | INVESTMENT MANAGEMENT AND PAYMENTS TO AFFILIATED PERSONS($ amounts in thousands unless indicated otherwise) |
Management Fees. IICO, a wholly owned subsidiary of Waddell & Reed, Inc. (“W&R”), serves as each Portfolio’s investment adviser. The management fee is accrued daily by each Portfolio at the following annual rates as a percentage of average daily net assets:
| | | | | | | | | | | | | | | | | | | | | | | | |
| Portfolio (M – Millions) | | $0 to
$500M | | | $500 to
$1,000M | | | $1,000 to
$1,500M | | | $1,500 to
$2,000M | | | $2,000 to
$3,000M | | | Over
$3,000M | |
Core Equity | | | 0.700 | % | | | 0.700 | % | | | 0.650 | % | | | 0.650 | % | | | 0.600 | % | | | 0.550 | % |
Corporate Bond | | | 0.475 | | | | 0.475 | | | | 0.450 | | | | 0.400 | | | | 0.400 | | | | 0.400 | |
Global Bond | | | 0.625 | | | | 0.600 | | | | 0.550 | | | | 0.500 | | | | 0.500 | | | | 0.500 | |
Global Equity Income | | | 0.700 | | | | 0.700 | | | | 0.650 | | | | 0.650 | | | | 0.600 | | | | 0.550 | |
Global Growth | | | 0.850 | | | | 0.850 | | | | 0.830 | | | | 0.830 | | | | 0.800 | | | | 0.760 | |
Limited-Term Bond | | | 0.500 | | | | 0.450 | | | | 0.400 | | | | 0.350 | | | | 0.350 | | | | 0.350 | |
Securian Real Estate Securities | | | 0.900 | | | | 0.900 | | | | 0.870 | | | | 0.870 | | | | 0.840 | | | | 0.800 | |
Value | | | 0.700 | | | | 0.700 | | | | 0.650 | | | | 0.650 | | | | 0.600 | | | | 0.550 | |
IICO has voluntarily agreed to waive a Portfolio’s investment management fee on any Portfolio that is not subadvised on any day that the Portfolio’s net assets are less than $25 million, subject to IICO’s right to change or modify this waiver. See Expense Reimbursements and/or Waivers for more information.
IICO has entered into a Subadvisory Agreement with the following entity on behalf of Securian Real Estate Securities:
Securian Asset Management, Inc. (“Securian”) serves as subadvisor to Securian Real Estate Securities. The subadvisor makes investment decisions in accordance with the Portfolio’s investment objectives, policies and restrictions under the supervision of IICO and the Board of Trustees. IICO pays all applicable costs of the subadvisor.
Independent Trustees and Chief Compliance Officer Fees. Fees paid to the Independent Trustees can be paid in cash or deferred to a later date, at the election of the Trustees according to the Deferred Fee Agreement entered into between the Trust and the Trustee(s). Each Portfolio records its portion of the deferred fees as a liability on the Statement of Assets and Liabilities. All fees paid in cash plus any appreciation (depreciation) in the underlying deferred plan are shown on the Statement of Operations. Additionally, fees paid to the Chief Compliance Officer of the Portfolios are shown on the Statement of Operations.
Accounting Services Fees. The Trust has an Accounting and Administrative Services Agreement with Waddell & Reed Services Company (“WRSCO”), doing business as WI Services Company (“WISC”), an affiliate of W&R. Under the agreement, WISC acts as the agent in providing bookkeeping and accounting services and assistance to the Trust, including maintenance of Portfolio records, pricing of Portfolio shares and preparation of certain shareholder reports. For these services, each Portfolio pays WISC a monthly fee ofone-twelfth of the annual fee based on the average net asset levels shown in the following table:
| | | | | | | | | | | | | | | | | | | | | | | | | | | | | | | | | | | | | | | | |
| (M – Millions) | | $0 to
$10M | | | $10 to
$25M | | | $25 to
$50M | | | $50 to
$100M | | | $100 to
$200M | | | $200 to
$350M | | | $350 to
$550M | | | $550 to
$750M | | | $750 to
$1,000M | | | Over
$1,000M | |
Annual Fee Rate | | $ | 0.00 | | | $ | 11.50 | | | $ | 23.10 | | | $ | 35.50 | | | $ | 48.40 | | | $ | 63.20 | | | $ | 82.50 | | | $ | 96.30 | | | $ | 121.60 | | | $ | 148.50 | |
Each Portfolio also pays WISC a monthly administrative fee at the annual rate of 0.01%, or one basis point, for the first $1 billion of net assets with no fee charged for net assets in excess of $1 billion. This fee is voluntarily waived by WISC until a Portfolio’s net assets are at least $10 million and is included in “Accounting services fee” on the Statement of Operations.
Shareholder Servicing. Under the Transfer Agency Agreement between the Trust and WISC, each Portfolio reimburses WISC for certainout-of-pocket costs.
Service Plan. Class II. Under a Service Plan adopted by the Trust pursuant to Rule 12b–1 under the 1940 Act, each Portfolio may pay a service fee to W&R for Class II shares in an amount not to exceed 0.25% of the Portfolio’s average annual net assets. The fee is to be paid to compensate W&R for amounts it expends in connection with the provision of personal services to Policyowners and/or maintenance of Policyowner accounts.
Expense Reimbursements and/or Waivers.IICO, the Portfolios’ investment manager, IDI, the Portfolios’ distributor, and/or Waddell & Reed Services Company, doing business as WISC, the Portfolios’ transfer agent, have contractually agreed to reimburse sufficient management fees,12b-1 fees and/or shareholder servicing fees to cap the total annual ordinary fund operating expenses (which would exclude interest, taxes, brokerage commissions, acquired fund fees and expenses, and extraordinary expenses, if any). Portfolio and class expense limitations and related waivers/reimbursements for the year ended December 31, 2018 were as follows:
| | | | | | | | | | | | | | | | | | |
| Fund Name | | Share
Class Name | | Type of
Expense
Limit | | Commencement
Date | | End Date | | Expense
Limit | | | Amount of
Expense
Waiver/
Reimbursement | | | Expense
Reduced |
Core Equity | | Class II | | Contractual | | 10-1-2016 | | 4-30-2019 | | | 0.95 | % | | $ | 289 | | | 12b-1 Fees
and/or
Shareholder
Servicing |
Global Bond | | Class II | | Voluntary | | N/A | | N/A | | | N/A | | | $ | 138 | (1) | | Investment
Management
Fee |
Global Growth | | Class II | | Contractual | | 10-1-2016 | | 4-30-2019 | | | 1.13 | % | | $ | 135 | | | 12b-1 Fees
and/or
Shareholder
Servicing |
Securian Real Estate Securities | | Class II | | Contractual | | 12-3-2012 | | 4-30-2019 | | | N/A | | | $ | 35 | (2) | | Investment
Management
Fee |
| (1) | For Portfolios managed solely by IICO, IICO has voluntarily agreed to waive its management fee for any day that a portfolio’s net assets are less than $25 million, subject to IICO’s right to change or modify this waiver. |
| (2) | The Portfolio’s investment management fee is being reduced by 0.09% of average daily net assets until April 30, 2019. |
Any amounts due to the Portfolios as a reimbursement but not paid as of December 31, 2018 are shown as a receivable from affiliates on the Statement of Assets and Liabilities.
| 6. | | INTERFUND LENDING PROGRAM |
Pursuant to an exemptive order issued by the SEC (“Order”), the Ivy Funds, Ivy Variable Insurance Portfolios and InvestEd Portfolios (collectively, the “Funds” only for purposes of this footnote 6) have the ability to lend money to, and borrow money from, each other pursuant to a master interfund lending agreement (“Interfund Lending Program”). Under the Interfund Lending Program, the Funds may lend or borrow money for temporary purposes directly to or from one another (each an “Interfund Loan”), subject to meeting the conditions of the Order. The interest rate to be charged on an Interfund Loan is the average of the overnight repurchase agreement rate and the short-term bank loan rate. The Funds made no Interfund Loans under the Interfund Lending Program during the year ended December 31, 2018.
| 7. | | INVESTMENT SECURITIES TRANSACTIONS($ amounts in thousands) |
The cost of purchases and the proceeds from maturities and sales of investment securities (excluding short-term securities) for the year ended December 31, 2018, were as follows:
| | | | | | | | | | | | | | | | |
| | | Purchases | | | Sales | |
| | | U.S. Government | | | Other Issuers | | | U.S. Government | | | Other Issuers | |
Core Equity | | $ | — | | | $ | 768,752 | | | $ | — | | | $ | 577,623 | |
Corporate Bond | | | 70,513 | | | | 297,956 | | | | 100,096 | | | | 235,790 | |
Global Bond | | | 693 | | | | 7,171 | | | | 3,939 | | | | 6,050 | |
Global Equity Income | | | — | | | | 356,234 | | | | — | | | | 536,693 | |
Global Growth | | | — | | | | 106,260 | | | | — | | | | 398,545 | |
Limited-Term Bond | | | 247,016 | | | | 98,324 | | | | 25,384 | | | | 221,513 | |
Securian Real Estate Securities | | | — | | | | 27,169 | | | | — | | | | 33,953 | |
Value | | | — | | | | 306,186 | | | | — | | | | 252,890 | |
| 8. | | LOANS OF PORTFOLIO SECURITIES($ amounts in thousands) |
The Portfolios may lend their portfolio securities only to borrowers that are approved by the Portfolio’s securities lending agent, The Bank of New York Mellon (“BNYM”). The borrower pledges and maintains with the Portfolio collateral consisting of cash or securities issued or guaranteed by the U.S. government. The initial collateral received by the Portfolio is required to have a value of at least 102% of the market value of the loaned securities for securities traded on U.S. exchanges and a value of at least 105% of the market value for all other securities. The collateral is maintained thereafter, at a market value equal to no less than 100% of the current value of the securities on loan. The market value of the loaned securities is determined at the close of each business day and any additional required collateral is delivered to the Portfolio and any excess collateral is returned by the Portfolio on the next business day. During the term of the loan, the Portfolio is entitled to all distributions made on or in respect of the loaned securities but does not receive interest income on securities received as collateral. Loans of securities are terminable at any time and the borrower, after notice, is required to return borrowed securities within the standard time period for settlement of securities transactions.
Cash received as collateral for securities on loan may be reinvested in the Dreyfus Institutional Preferred Government Money Market Fund — Institutional Shares or certain other registered money market funds and are disclosed in the Portfolio’s Schedule of Investments and are reflected in the Statement of Assets and Liabilities as cash collateral on securities loaned at value.Non-cash collateral, in the form of securities issued or guaranteed by the U.S. government or its agencies or instrumentalities, is not disclosed in the Portfolio’s Statement of Assets and Liabilities as it is held by the lending agent on behalf of the Portfolio and the Portfolio does not have the ability tore-hypothecate these securities. The securities on loan for each Portfolio are also disclosed in its Schedule of Investments. The total value of any securities on loan as of December 31, 2018 and the total value of the related cash collateral are disclosed in the Statement of Assets and Liabilities. Income earned by the Portfolios from securities lending activity is disclosed in the Statements of Operations.
The following is a summary of each Portfolio’s securities lending positions and related cash andnon-cash collateral received as of December 31, 2018:
| | | | | | | | | | | | | | | | |
| Portfolio | | Market
Value of
Securities
on Loan | | | Cash
Collateral
Received | | | Non-Cash
Collateral
Received | | | Total
Collateral
Received | |
Core Equity | | $ | 7,003 | | | $ | 4,003 | | | $ | 3,160 | | | $ | 7,163 | |
Corporate Bond | | | 434 | | | | 112 | | | | 332 | | | | 444 | |
Global Bond | | | 141 | | | | 144 | | | | — | | | | 144 | |
Global Equity Income | | | 294 | | | | — | | | | 314 | | | | 314 | |
Global Growth | | | 201 | | | | 206 | | | | — | | | | 206 | |
Limited-Term Bond | | | 237 | | | | 243 | | | | — | | | | 243 | |
The cash collateral received amounts presented in the table above are transactions accounted for as secured borrowings and have an overnight and continuous maturity. The proceeds from the cash collateral received is invested in registered money market funds.
The risks of securities lending include the risk that the borrower may not provide additional collateral when required or may not return the securities when due. To mitigate these risks, the Portfolios benefit from a borrower indemnity provided by BNYM. BNYM’s indemnity allows for full replacement of securities lent wherein BNYM will purchase the unreturned loaned securities on the open market by applying the proceeds of the collateral or to the extent such proceeds are insufficient or the collateral is unavailable, BNYM will purchase the unreturned loan securities at BNYM’s expense. However, the Portfolio could suffer a loss if the value of the investments purchased with cash collateral falls below the value of the cash collateral received.
| 9. | | CAPITAL SHARE TRANSACTIONS(All amounts in thousands) |
The Trust has authorized an unlimited number of no par value shares of beneficial interest. Transactions in shares of beneficial interest were as follows:
| | | | | | | | | | | | | | | | | | | | | | | | | | | | | | | | | | |
| | | Core Equity | | | | | Corporate Bond | |
| | | Year ended
12-31-18 | | | Year ended
12-31-17 | | | | | Year ended
12-31-18 | | | Year ended
12-31-17 | |
| | | Shares | | | Value | | | Shares | | | Value | | | | | Shares | | | Value | | | Shares | | | Value | |
Shares issued from sale of shares: | |
Class II | | | 27,121 | | | $ | 327,646 | | | | 594 | | | $ | 6,694 | | | | | | 20,518 | | | $ | 105,157 | | | | 30,632 | | | $ | 163,526 | |
Shares issued in reinvestment of distributions to
shareholders: | |
Class II | | | 2,972 | | | | 35,537 | | | | 1,802 | | | | 19,178 | | | | | | 2,297 | | | | 11,579 | | | | 1,856 | | | | 9,800 | |
Shares redeemed: | |
Class II | | | (8,275 | ) | | | (101,335 | ) | | | (5,559 | ) | | | (63,308 | ) | | | | | (19,109 | ) | | | (98,074 | ) | | | (9,177 | ) | | | (48,842 | ) |
| | | | | | | | | | |
Net increase (decrease) | | | 21,818 | | | $ | 261,848 | | | | (3,163 | ) | | $ | (37,436 | ) | | | | | 3,706 | | | $ | 18,662 | | | | 23,311 | | | $ | 124,484 | |
| | | | | | | | | | |
| | | |
| | | Global Bond | | | | | Global Equity Income | |
| | | Year ended
12-31-18 | | | Year ended
12-31-17 | | | | | Year ended
12-31-18 | | | Year ended
12-31-17 | |
| | | Shares | | | Value | | | Shares | | | Value | | | | | Shares | | | Value | | | Shares | | | Value | |
Shares issued from sale of shares: | |
Class II | | | 665 | | | $ | 3,209 | | | | 929 | | | $ | 4,578 | | | | | | 2,705 | | | $ | 20,924 | | | | 2,410 | | | $ | 19,445 | |
Shares issued in reinvestment of distributions to
shareholders: | |
Class II | | | 133 | | | | 626 | | | | 129 | | | | 630 | | | | | | 5,843 | | | | 45,707 | | | | 3,075 | | | | 23,553 | |
Shares redeemed: | |
Class II | | | (928 | ) | | | (4,477 | ) | | | (876 | ) | | | (4,316 | ) | | | | | (28,835 | ) | | | (225,345 | ) | | | (9,452 | ) | | | (76,467 | ) |
| | | | | | | | | | |
Net increase (decrease) | | | (130 | ) | | $ | (642 | ) | | | 182 | | | $ | 892 | | | | | | (20,287 | ) | | $ | (158,714 | ) | | | (3,967 | ) | | $ | (33,469 | ) |
| | | | | | | | | | |
| | | |
| | | Global Growth | | | | | Limited-Term Bond | |
| | | Year ended
12-31-18 | | | Year ended
12-31-17 | | | | | Year ended
12-31-18 | | | Year ended
12-31-17 | |
| | | Shares | | | Value | | | Shares | | | Value | | | | | Shares | | | Value | | | Shares | | | Value | |
Shares issued from sale of shares: | |
Class II | | | 1,061 | | | $ | 10,764 | | | | 811 | | | $ | 7,333 | | | | | | 40,811 | | | $ | 194,572 | | | | 23,779 | | | $ | 116,247 | |
Shares issued in reinvestment of distributions to
shareholders: | |
Class II | | | 2,748 | | | | 27,187 | | | | 1,319 | | | | 11,573 | | | | | | 1,482 | | | | 7,043 | | | | 1,288 | | | | 6,273 | |
Shares redeemed: | |
Class II | | | (31,245 | ) | | | (312,654 | ) | | | (9,326 | ) | | | (85,939 | ) | | | | | (21,008 | ) | | | (100,935 | ) | | | (15,069 | ) | | | (73,677 | ) |
| | | | | | | | | | |
Net increase (decrease) | | | (27,436 | ) | | $ | (274,703 | ) | | | (7,196 | ) | | $ | (67,033 | ) | | | | | 21,285 | | | $ | 100,680 | | | | 9,998 | | | $ | 48,843 | |
| | | | | | | | | | |
| | | |
| | | Securian Real Estate Securities | | | | | Value | |
| | | Year ended
12-31-18 | | | Year ended
12-31-17 | | | | | Year ended
12-31-18 | | | Year ended
12-31-17 | |
| | | Shares | | | Value | | | Shares | | | Value | | | | | Shares | | | Value | | | Shares | | | Value | |
Shares issued from sale of shares: | |
Class II | | | 569 | | | $ | 3,987 | | | | 664 | | | $ | 5,272 | | | | | | 21,135 | | | $ | 132,306 | | | | 13,536 | | | $ | 82,603 | |
Shares issued in reinvestment of distributions to
shareholders: | |
Class II | | | 509 | | | | 3,316 | | | | 857 | | | | 6,215 | | | | | | 3,219 | | | | 20,089 | | | | 2,016 | | | | 11,720 | |
Shares redeemed: | |
Class II | | | (1,564 | ) | | | (10,915 | ) | | | (1,660 | ) | | | (13,140 | ) | | | | | (12,988 | ) | | | (83,209 | ) | | | (12,513 | ) | | | (76,425 | ) |
| | | | | | | | | | |
Net increase (decrease) | | | (486 | ) | | $ | (3,612 | ) | | | (139 | ) | | $ | (1,653 | ) | | | | | 11,366 | | | $ | 69,186 | | | | 3,039 | | | $ | 17,898 | |
| | | | | | | | | | |
Bridge loan commitments may obligate a Portfolio to furnish temporary financing to a borrower until permanent financing can be arranged. In connection with these commitments, the Portfolio earns a commitment fee, typically set as a percentage of the commitment amount. Such fee income is included in interest income on the Statements of Operations. At December 31, 2018, there were no outstanding bridge loan commitments.
| 11. | | FEDERAL INCOME TAX MATTERS($ amounts in thousands) |
For Federal income tax purposes, cost of investments owned at December 31, 2018 and the related unrealized appreciation (depreciation) were as follows:
| | | | | | | | | | | | | | | | |
| Portfolio | | Cost of
Investments | | | Gross
Appreciation | | | Gross
Depreciation | | | Net Unrealized
Appreciation
(Depreciation) | |
Core Equity | | $ | 673,345 | | | $ | 20,398 | | | $ | 60,651 | | | $ | (40,253 | ) |
Corporate Bond | | | 550,310 | | | | 3,289 | | | | 14,010 | | | | (10,721 | ) |
Global Bond | | | 22,501 | | | | 77 | | | | 808 | | | | (731 | ) |
Global Equity Income | | | 313,697 | | | | 8,950 | | | | 39,406 | | | | (30,456 | ) |
Global Growth | | | 131,863 | | | | 16,605 | | | | 14,308 | | | | 2,297 | |
Limited-Term Bond | | | 541,589 | | | | 1,632 | | | | 4,704 | | | | (3,072 | ) |
Securian Real Estate Securities | | | 36,770 | | | | 686 | | | | 3,305 | | | | (2,619 | ) |
Value | | | 459,295 | | | | 23,646 | | | | 37,389 | | | | (13,743 | ) |
For Federal income tax purposes, the Portfolios’ distributed and undistributed earnings and profit for the year ended December 31, 2018 and the post-October and late-year ordinary activity updated with information available through the date of this report were as follows:
| | | | | | | | | | | | | | | | | | | | |
| Portfolio | | Undistributed
Ordinary
Income | | | Undistributed
Long-Term
Capital Gains | | | Tax Return of
Capital | | | Post-
October
Capital
Losses
Deferred | | | Late-Year
Ordinary
Losses
Deferred | |
Core Equity | | $ | 4,131 | | | $ | 68,811 | | | $ | — | | | $ | — | | | $ | — | |
Corporate Bond | | | 15,225 | | | | — | | | | — | | | | — | | | | — | |
Global Bond | | | 780 | | | | — | | | | — | | | | — | | | | — | |
Global Equity Income | | | 7,487 | | | | 77,676 | | | | — | | | | — | | | | — | |
Global Growth | | | 11,992 | | | | 84,490 | | | | — | | | | — | | | | — | |
Limited-Term Bond | | | 9,893 | | | | — | | | | — | | | | — | | | | — | |
Securian Real Estate Securities | | | 580 | | | | 162 | | | | — | | | | — | | | | — | |
Value | | | 4,439 | | | | 26,756 | | | | — | | | | — | | | | — | |
Internal Revenue Code regulations permit each Portfolio to elect to defer into its next fiscal year capital losses and certain specified ordinary items incurred between each November 1 and the end of its fiscal year. Each Portfolio is also permitted to defer into its next fiscal certain ordinary losses that generated between each January 1 and the end of its fiscal year.
The tax character of dividends and distributions paid during the two fiscal years ended December 31, 2018 and 2017 were as follows:
| | | | | | | | | | | | | | | | | | | | |
| | | December 31, 2018 | | | | | | December 31, 2017 | |
| Portfolio | | Distributed
Ordinary
Income(1) | | | Distributed
Long-Term
Capital Gains | | | | | | Distributed
Ordinary
Income(1) | | | Distributed
Long-Term
Capital Gains | |
Core Equity | | $ | 6,304 | | | $ | 29,233 | | | | | | | $ | 1,910 | | | $ | 17,268 | |
Corporate Bond | | | 11,579 | | | | — | | | | | | | | 8,771 | | | | 1,029 | |
Global Bond | | | 626 | | | | — | | | | | | | | 630 | | | | — | |
Global Equity Income | | | 10,709 | | | | 34,998 | | | | | | | | 6,575 | | | | 16,978 | |
Global Growth | | | 6,600 | | | | 20,587 | | | | | | | | 213 | | | | 11,360 | |
Limited-Term Bond | | | 7,043 | | | | — | | | | | | | | 6,274 | | | | — | |
Securian Real Estate Securities | | | 1,197 | | | | 2,119 | | | | | | | | 687 | | | | 5,528 | |
Value | | | 7,704 | | | | 12,385 | | | | | | | | 5,834 | | | | 5,886 | |
| (1) | Includes short-term capital gains distributed, if any. |
Dividends from net investment income and short-term capital gains are treated as ordinary income dividends for federal income tax purposes.
Accumulated capital losses represent net capital loss carryovers as of December 31, 2018 that may be available to offset future realized capital gains and thereby reduce future capital gains distributions. As of December 31, 2018, the capital loss carryforwards were as follows:
| | | | | | | | |
| Portfolio | | Short-Term
Capital Loss
Carryover | | | Long-Term
Capital Loss
Carryover | |
Core Equity | | $ | — | | | $ | — | |
Corporate Bond | | | 5,184 | | | | 4,991 | |
Global Bond | | | 415 | | | | 789 | |
Global Equity Income | | | — | | | | — | |
Global Growth | | | — | | | | — | |
Limited-Term Bond | | | 2,150 | | | | 5,119 | |
Securian Real Estate Securities | | | — | | | | — | |
Value | | | — | | | | — | |
Net investment income dividends and capital gains distributions are determined in accordance with income tax regulations which may differ from U.S. GAAP. These differences are due to differing treatments for items such as deferral of wash sales, post-October losses, late-year ordinary losses, foreign currency transactions, net operating losses, income from passive foreign investment companies (PFICS) and partnership transactions. At December 31, 2018, the following reclassifications were made:
| | | | | | | | |
| Portfolio | | Accumulated
Distributable
Earnings Gain
(Loss) | | | Paid-In Capital | |
Core Equity | | $ | — | * | | $ | — | * |
Corporate Bond | | | — | | | | — | |
Global Bond | | | — | | | | — | |
Global Equity Income | | | 1 | | | | (1 | ) |
Global Growth | | | — | | | | — | |
Limited-Term Bond | | | — | | | | — | |
Securian Real Estate Securities | | | — | | | | — | |
Value | | | 5 | | | | (5 | ) |
* Not shown due to rounding.
| | |
| REPORT OF INDEPENDENT REGISTERED PUBLIC ACCOUNTING FIRM | | IVY VIP |
To the Shareholders and Board of Trustees of Ivy Variable Insurance Portfolios:
Opinion on the Financial Statements and Financial Highlights
We have audited the accompanying statements of assets and liabilities of Ivy VIP Core Equity, Ivy VIP Corporate Bond (formerly, Ivy VIP Bond), Ivy VIP Global Bond, Ivy VIP Global Equity Income (formerly, Ivy VIP Dividend Opportunities), Ivy VIP Global Growth, Ivy VIP Limited-Term Bond, Ivy VIP Securian Real Estate Securities (formerly, Ivy VIP Advantus Real Estate Securities), and Ivy VIP Value (the “Funds”), eight of the series constituting the Ivy Variable Insurance Portfolios, including the schedules of investments, as of December 31, 2018; the related statements of operations for the year then ended, the statements of changes in net assets for each of the two years in the period then ended, the financial highlights for each of the five years in the period then ended, and the related notes. In our opinion, the financial statements and financial highlights present fairly, in all material respects, the financial position of the Funds, as of December 31, 2018, and the results of their operations for the year then ended, the changes in their net assets for each of the two years in the period then ended, and the financial highlights for each of the five years in the period then ended in conformity with accounting principles generally accepted in the United States of America.
Basis for Opinion
These financial statements and financial highlights are the responsibility of the Funds’ management. Our responsibility is to express an opinion on the Funds’ financial statements and financial highlights based on our audits. We are a public accounting firm registered with the Public Company Accounting Oversight Board (United States) (PCAOB) and are required to be independent with respect to the Funds in accordance with the U.S. federal securities laws and the applicable rules and regulations of the Securities and Exchange Commission and the PCAOB.
We conducted our audits in accordance with the standards of the PCAOB. Those standards require that we plan and perform the audit to obtain reasonable assurance about whether the financial statements and financial highlights are free of material misstatement, whether due to error or fraud. The Funds are not required to have, nor were we engaged to perform, an audit of their internal control over financial reporting. As part of our audits we are required to obtain an understanding of internal control over financial reporting but not for the purpose of expressing an opinion on the effectiveness of the Funds’ internal control over financial reporting. Accordingly, we express no such opinion.
Our audits included performing procedures to assess the risks of material misstatement of the financial statements and financial highlights, whether due to error or fraud, and performing procedures that respond to those risks. Such procedures included examining, on a test basis, evidence regarding the amounts and disclosures in the financial statements and financial highlights. Our audits also included evaluating the accounting principles used and significant estimates made by management, as well as evaluating the overall presentation of the financial statements and financial highlights. Our procedures included confirmation of securities owned as of December 31, 2018, by correspondence with the custodian and brokers. We believe that our audits provide a reasonable basis for our opinion.

Kansas City, Missouri
February 15, 2019
We have served as the auditor of one or more Waddell & Reed investment companies since 1997.
| | |
| INCOME TAX INFORMATION | | IVY VIP |
AMOUNTS NOT ROUNDED (UNAUDITED)
The Portfolios hereby designate the following amounts of dividends paid from net ordinary income as dividends qualifying for the 70% dividends received deduction for corporations for the tax period ended December 31, 2018:
| | | | |
| | | Dividends
Received
Deduction for
Corporations | |
Core Equity | | $ | 5,235,005 | |
Corporate Bond | | | — | |
Global Bond | | | — | |
Global Equity Income | | | 10,475,949 | |
Global Growth | | | 2,334,557 | |
Limited-Term Bond | | | — | |
Securian Real Estate Securities | | | — | |
Value | | | 7,703,943 | |
The Portfolios hereby designate the following amounts as distributions of long-term capital gains:
| | | | |
Core Equity | | $ | 29,232,805 | |
Corporate Bond | | | — | |
Global Bond | | | — | |
Global Equity Income | | | 34,997,793 | |
Global Growth | | | 20,587,726 | |
Limited-Term Bond | | | — | |
Securian Real Estate Securities | | | 2,119,503 | (1) |
Value | | | 12,385,225 | |
| (1) | Of this amount $69,408 is Unrecaptured 1250 Gain. |
Internal Revenue Code regulations permit each qualifying Portfolio to elect to pass through a foreign tax credit to shareholders with respect to foreign taxes paid by the Portfolio. Each Portfolio elected to pass the following amounts of creditable foreign taxes through to their shareholders:
| | | | | | | | |
| | | Foreign Tax
Credit | | | Foreign
Derived
Income | |
Global Equity Income | | $ | 362,773 | | | $ | 4,932,209 | |
| | |
| BOARD OF TRUSTEES AND OFFICERS | | IVY VIP |
(UNAUDITED)
Each of the individuals listed below serves as a trustee for the Trust (28 portfolios), and for the rest of the funds within the Fund Complex, which also includes, in addition to the Trust, the Ivy Funds (45 portfolios), the Ivy High Income Opportunities Fund (aclosed-end fund) (“IVH”), Ivy NextShares (“NextShares”) (3 portfolios) and InvestEd Portfolios (“InvestEd”) (6 portfolios).
Board members who are not “interested persons” of the Funds as defined in Section 2(a)(19) of the 1940 Act (Disinterested Trustees) constitute at least 75% of the Board.
Joseph Harroz, Jr. serves as the Independent Chairman of the Trust’s Board and of the Board of Trustees of the other funds in the Fund Complex. Subject to the Trustee Emeritus and Retirement Policy, a Trustee serves until his or her successor is elected and qualified or until his or her earlier death, resignation or removal.
The Statement of Additional Information (the “SAI”) for the Trust includes additional information about the Trust’s trustees. The SAI is available without charge, upon request, by calling 1.888.923.3355. It is also available on the Ivy Investments website,www.ivyinvestments.com.
Disinterested Trustees
| | | | | | | | |
Name, Address and
Year of Birth | | Position(s) Held
with the Trust | | Trustee Since* | | Principal Occupation(s)
During Past 5 Years | | Other Directorships Held |
James M. Concannon 6300 Lamar Avenue Overland Park, KS 66202 1947 | | Trustee | | 1997 | | Professor of Law, Washburn University School of Law (1973 to present). | | Director, Kansas Legal Services for Prisoners, Inc.(non-profit community service); Director, U.S. Alliance Corporation and wholly-owned subsidiaries: U.S. Alliance Life and Security Company and Dakota Capital Life Insurance Company (Insurance) (2009 to present); Director, Kansas Appleseed, Inc.(non-profit community service) (2007 to present); Trustee, Waddell & Reed Advisors Funds (WRA Funds) (1997-2018); Trustee, Ivy Funds; Trustee, IVH; Trustee, NextShares; Trustee, InvestEd. |
James D. Gressett 6300 Lamar Avenue Overland Park, KS 66202 1950 | | Trustee | | Trust: 2017 Fund Complex: 2002 | | Chief Executive Officer (CEO) of CalPac Pizza LLC (2011 to present); CEO of CalPac Pizza II LLC (2012 to present); CEO of PacPizza LLC (Pizza Hut franchise) (2000 to present); Member/CEO, Southern Pac Pizza LLC (2013 to present); Partner, Century Bridge Partners (real estate investments) (2007 to present); Manager, Hartley Ranch Angus Beef, LLC (2013 to present); President, Penn Capital Corp. (1995 to present); Partner, Penn Capital Partners (1999 to present). | | Member/Secretary, The Metochoi Group LLC (1999 to present); Member/Chairman, Idea Homes LLC (homebuilding and development) (2013 to present); Trustee, WRA Funds (2017-2018); Trustee, Ivy Funds; Trustee; IVH; Trustee, NextShares; Trustee, InvestEd. |
Joseph Harroz, Jr. 6300 Lamar Avenue Overland Park, KS 66202 1967 | | Trustee Independent Chairman | | 1998 2015 | | Dean, College of Law, Vice President, University of Oklahoma (2010 to present); Managing Member, Harroz Investments, LLC, (commercial enterprises) (1998 to present). | | Director and Shareholder, Valliance Bank (2007 to present); Director, Foundation Healthcare (formerly Graymark HealthCare) (2008-2017); Trustee, The Mewbourne Family Support Organization (2006 to present)(non-profit); Independent Director, LSQ Manager, Inc. (real estate) (2007-2016); Director, Oklahoma Foundation for Excellence(non-profit) (2008 to present); Trustee/Independent Chairman, WRA Funds (Independent Chairman: 2015-2018; Trustee: 1998-2018); Trustee/ Independent Chairman, Ivy Funds; Trustee/ Independent Chairman, IVH; Trustee/ Independent Chairman, NextShares; Trustee/ Independent Chairman, InvestEd. |
Glendon E. Johnson, Jr. 6300 Lamar Avenue Overland Park, KS 66202 1951 | | Trustee | | Trust: 2017 Fund Complex: 2002 | | Of Counsel, Lee & Smith, PC (law firm, emphasis on finance, securities, mergers and acquisitions law) (1996 to present); Owner and Manager, Castle Valley Ranches, LLC (ranching) and Castle Valley Outdoors, LLC (outdoor recreation) (1995 to present); Formerly, Partner, Kelly, Drye & Warren LLP (law firm) (1989-1996); Partner, Lane & Edson PC (law firm) (1987-1989). | | Director, Thomas Foundation for Cancer Research(non-profit) (2005 to present); Director, Warriors Afield Legacy Foundation(non-profit) (2014 to present); Trustee, WRA Funds (2017-2018); Trustee, Ivy Funds; Trustee, IVH; Trustee, NextShares; Trustee, InvestEd. |
Frank J. Ross, Jr. Polsinelli PC 900 West 48th Place, Suite 900 Kansas City, MO 64112 1953 | | Trustee | | 1996 | | Shareholder/Director, Polsinelli PC (law firm) (1980 to present). | | Trustee, WRA Funds (1996-2018); Trustee, Ivy Funds; Trustee, IVH; Trustee, NextShares; Trustee, InvestEd. |
| | | | | | | | |
Name, Address and
Year of Birth | | Position(s) Held
with the Trust | | Trustee Since* | | Principal Occupation(s)
During Past 5 Years | | Other Directorships Held |
Michael G. Smith 6300 Lamar Avenue Overland Park, KS 66202 1944 | | Trustee | | Trust: 2017 Fund Complex: 2002 | | Retired; formerly, with Merrill Lynch as Managing Director of Global Investor Client Strategy (1996-1998), Head of Regional Institutional Sales (1995-1996) and of U.S. Central Region (1986-1995, 1999). | | Director, Executive Board, Cox Business School, Southern Methodist University (1998 to present); Lead Director, Northwestern Mutual Funds (2003-2017); Director, CTMG, Inc. (clinical testing) (2008-2015); Trustee, WRA Funds (2017-2018); Trustee, Ivy Funds; Trustee, IVH; Trustee, NextShares; Trustee, InvestEd. |
Edward M. Tighe 6300 Lamar Avenue Overland Park, KS 66202 1942 | | Trustee | | Trust: 2017 Fund Complex: 1999 | | Retired; formerly, CEO and Director of Asgard Holdings, LLC (computer network and security services) (2002-2004); President, Citco Technology Management (1995-2000); CEO, Global Mutual Fund Services (1993-2000); Sr. Vice President, Templeton Global Investors (1988-1992). | | Director, The Research Coast Principium Foundation, Inc.(non-profit) (2012-2015); Trustee, WRA Funds (2017-2018); Trustee, Ivy Funds; Trustee, IVH; Trustee, NextShares; Trustee, InvestEd. |
* Each noted Trustee became a Trustee (and, as applicable, an officer) in the year reflected by the first date shown. The second date shows when the Trustee first became a director (and, as applicable, an officer) of one or more of the funds that are the predecessors to current funds within the Fund Complex (if applicable).
Interested Trustee
Mr. Herrmann is “interested” by virtue of his former engagement as an officer of Waddell & Reed Financial, Inc. (“WDR”) or its wholly owned subsidiaries, including each Fund’s investment manager, Ivy Investment Management Company (“IICO”), each Fund’s principal underwriter, Ivy Distributors, Inc. (“IDI”), and each Fund’s shareholder servicing and accounting services agent, Waddell & Reed Services Company, doing business as WI Services Company (“WISC”), a subsidiary of Waddell & Reed, Inc. (Waddell & Reed), as well as by virtue of his personal ownership of shares of WDR. The address for each Interested Trustee and each of the officers in the following tables is 6300 Lamar Avenue, Overland Park, KS 66202.
| | | | | | | | |
| Name and Year of Birth | | Position(s) Held
with the Trust | | Trustee/Officer Since | | Principal Occupation(s)
During Past 5 Years | | Other Directorships Held |
Henry J. Herrmann 1942 | | Trustee | | 1998 | | Retired,Non-Executive Chairman of the Board, WDR (2016-2018); Formerly Chairman, WDR (2010-2018); CEO, WDR (2005-2016); President, CEO and Chairman, IICO (2002-2016); President, CEO and Chairman, Waddell & Reed Investment Management Company (WRIMCO) (1993-2016); President of each of the funds in the Fund Complex (2001-2016). | | Director, WDR, (1998 to present), IICO (2002-2016), WRIMCO (1991-2016), WISC (2001-2016), W&R Capital Management Group, Inc. (2008-2016) and WRI (1993-2016); Director, Blue Cross Blue Shield of Kansas City (2007-2017); Trustee, WRA Funds (1998-2018); Trustee, Ivy Funds; Trustee, IVH; Trustee, NextShares; Trustee, InvestEd. |
Officers
The Board has appointed officers who are responsible for theday-to-day business decisions based on policies it has established. The officers serve at the pleasure of the Board. The Trust’s principal officers are:
| | | | | | | | |
| Name and Year of Birth | | Position(s) Held with the
Trust and Fund Complex | | Officer of
Trust Since | | Officer of Fund
Complex Since* | | Principal Occupation(s) During Past 5 Years |
Jennifer K. Dulski 1980 | | Secretary | | 2017 | | 2017 | | Secretary for each of the funds in the Fund Complex (2017 to present); Senior Vice President and Associate General Counsel of Waddell & Reed and IDI (2018 to present). |
Joseph W. Kauten 1969 | | Vice President Treasurer Principal Financial Officer | | 2009 2009 2009 | | 2006 2006 2007 | | Principal Financial Officer of each of the funds in the Fund Complex (2007 to present); Vice President and Treasurer of each of the funds in the Fund Complex (2006 to present); Principal Accounting Officer of each of the funds in the Fund Complex (2006-2017); Assistant Treasurer of each of the funds in the Fund Complex (2003-2006); Vice President of Waddell & Reed Services Company (WRSCO) (2007 to present). |
Philip J. Sanders 1959 | | President | | 2016 | | 2006 | | CEO of WDR (2016 to present); President, CEO and Chairman of IICO and WRIMCO (2016 to present); President of each of the funds in the Fund Complex (2016 to present); CIO of WDR (2011 to present); CIO of IICO and WRIMCO (2010 to present). |
Scott J. Schneider 1968 | | Vice President Chief Compliance Officer | | 2009 2009 | | 2006 2004 | | Chief Compliance Officer (2004 to present) and Vice President (2006 to present) of each of the funds in the Fund Complex; Vice President of IICO and WRIMCO (2006 to present). |
Philip A. Shipp 1969 | | Assistant Secretary | | 2012 | | 2012 | | Assistant Secretary of each of the funds in the Fund Complex (2012 to present); Vice President of Waddell & Reed and IDI (2010-present). |
John E. Sundeen, Jr. 1960 | | Vice President | | 2009 | | 2006 | | Senior Vice President (1999 to present) and Chief Administrative Officer (2006 to present) of WDR; Executive Vice President and Chief Administrative Officer of IICO and WRIMCO (2004 to present); Executive Vice President of WRSCO (2016 to present). |
*This is the date when the Officer first became an officer of one or more of the funds that are the predecessors to current funds within the Fund Complex (if applicable).
| | |
| RENEWAL OF INVESTMENT MANAGEMENT AGREEMENT | | IVY VIP |
At a meeting of the Board of Trustees (the “Board”) for the Ivy Variable Insurance Portfolios (the “Trust”) held on August 14th and 15th, 2018, the Board, including all of the trustees who are not “interested persons” (the “Independent Trustees”), as defined in Section 2(a)(19) of the Investment Company Act of 1940, as amended (the “1940 Act”), unanimously approved the continuance of the Investment Management Agreement (the “Management Agreement”) between Ivy Investment Management Company (“IICO”) and the Trust and the continuance of the Investment Subadvisory Agreement between IICO and Securian Asset Management, Inc. (the “Subadviser”) with respect to Ivy VIP Securian Real Estate Securities, Ivy VIP Pathfinder Moderate — Managed Volatility, Ivy VIP Pathfinder Moderately Aggressive — Managed Volatility, Ivy VIP Pathfinder Moderately Conservative — Managed Volatility. The Management Agreement and the Investment Subadvisory Agreement are referred to collectively herein as the “Agreements.”
The Board’s Independent Trustees were assisted in their review by independent legal counsel, and met with such counsel separately from representatives of IICO. Independent legal counsel explained the factors that the Board should consider as part of its review of the Agreements, all as outlined in a memorandum it had provided to the Board prior to the meeting, including, among other things, the nature and the quality of the services provided by IICO and the Subadviser, profitability (including anyfall-out benefits) from IICO’s and the Subadviser’s relationships with each series of the Trust (each, a “Fund” and together, the “Funds”), economies of scale, the role played by the Independent Trustees, and information on comparative fees and expenses. The Independent Trustees also considered the written responses and materials produced by IICO and the Subadviser in response to 15(c) due diligence request lists submitted by the Independent Trustees’ legal counsel prior to the meeting, as well as materials produced in response to afollow-up request list sent to IICO by independent legal counsel on behalf of the Independent Trustees. Included in those responses, which had been provided to the Board prior to the meeting, was aFund-by-Fund profitability analysis prepared by IICO, as well as an explanation of the methodology by which the profitability analysis was calculated. The Board also received extensive materials on performance, expenses and comparable fund information from Broadridge, Inc. (“Broadridge”), an independent mutual fund rating service. Finally, the Independent Trustees received and reviewed a considerable amount of information that their independent fee consultant had provided to them. The Independent Trustees previously had reviewed and discussed these materials during a telephonic meeting in July 2018. They further reviewed these materials extensively among themselves, with their independent legal counsel and the independent fee consultant, and with the other Board members at executive sessions of the Independent Trustees at the August14-15, 2018 Board meeting, during which the Board considered various factors described below, none of which by itself was considered dispositive. However, the material factors and conclusions that formed the basis for the Board’s determination to approve the Agreements are discussed separately below.
Nature, Extent and Quality of Services
The Board considered the nature, extent and quality of services provided to the Funds by IICO and the Subadviser, taking into account the large amount of materials produced by IICO and the Subadviser in response to the 15(c) due diligence requests submitted on its behalf by independent legal counsel to the Independent Trustees.
The Board also took into account the report from its Investment Oversight Committee (the “IOC”), in light of that committee’s duties to assist the Board in the 15(c) process. The IOC had reported to the Board on its review of the performance of the Funds, IICO’s investment risk management function, and theon-going changes IICO has been undertaking for itself, the Trust and the overall fund complex. As such, the Board examined all of IICO’s activities in light of performance and expense structure, as well as the proposed overall rationalization of the fund complex, which is designed to provide economies of scale to the shareholders, reduce the Funds’ expenses and enhance the performance of the Funds, particularly in the context of substantial industry change and regulatory developments.
The Board likewise considered the knowledge it had received from its regular meetings, including from the materials provided in connection with those meetings, such as the resources and key personnel of IICO and the Subadviser, as well as the other services provided to the Funds by IICO and the Subadviser (such as managing the quality of execution of portfolio transactions and the selection of broker-dealers for those transactions, monitoring adherence to each Fund’s investment restrictions, producing reports, providing support services for the Board and Board committees, communicating with shareholders and overseeing the activities of other service providers, including monitoring compliance with various Fund policies and procedures and with applicable laws and regulations). The Board also took into account the compliance environment at IICO and the Subadviser, noting the resources that each has dedicated towards compliance. The Board concluded that the nature and extent of the services provided by IICO and the Subadviser were appropriate, that the quality of those services had been consistent with quality norms in the industry and that the Funds were likely to benefit from the continued provision of those services.
Benefits from the Relationship with the Funds
The Board next discussed whether IICO or the Subadviser derives any other direct or indirect benefit from serving the Funds. In that regard, the Board discussed the transfer agency/shareholder servicing fees that Waddell & Reed Services Company, an affiliate of IICO, provides the Funds. The Board took note of the caps that management previously had agreed to on shareholder servicing costs. The Board also considered the benefits that accrue to each service provider organization
from its respective relationship with the Funds, including the fact that a variety of services are provided by affiliates of IICO, including distribution, administrative and Fund accounting services, and, as discussed above, shareholder servicing. After full consideration of these and other factors, the Board concluded that none of IICO, the Subadviser or any of their affiliates receives any additional direct or indirect benefits that would preclude the Board from approving the continuation of the Management Agreement with IICO or the Investment Subadvisory Agreement with the Subadviser.
Economies of Scale
The Board discussed whether economies of scale are being realized by the Funds and whether fee levels reflect those economies of scale for the benefit of the Funds’ shareholders. The Board considered the fact that as a Fund’s assets have grown, the expenses of that Fund generally have fallen, although the Board took into account that the overall assets of the Funds have fallen during the prior year. Additionally, in that regard, the Board considered the significant number of initiatives that IICO is undertaking to seek to rationalize the fund complex, reduce expenses and enhance performance.
Performance of the Funds and Costs of Services Provided
The Board considered the performance of each Fund and the costs of the services provided, focusing in particular on a number of Funds that the independent fee consultant had identified. Specifically, the Board examined the investment performance of each Fund, including the percentile ranking of each Fund over various periods of time. The Board also examined the performance of each Fund against its respective Lipper index for the same periods. After extensively reviewing all of the performance information provided, the Board concluded that the Funds’ performance in each asset class was acceptable. Although the performance of some of the focus Funds identified by the independent fee consultant lagged that of their peers or respective Lipper index, the Board recognized that IICO, or the Subadviser, had taken, or was taking, steps to address that underperformance, and determined to continue to monitor closely the performance of those Funds.
The Board also considered the expenses and expense ratio of each Fund, and the expense limitation and fee reduction arrangements entered into by IICO in light of the services provided by IICO and the Subadviser. The Board also compared each Fund’s expenses, including advisory, distribution and shareholder servicing fees, with the expenses and advisory fees of other investment advisers managing similarly situated funds, as well as the advisory fees that IICO (or an affiliate) charges for providing advisory services to other accounts in the same asset class for certain Funds. In that regard, the Board noted that IICO performs significant additional services for the Funds as compared to those other accounts. The Board also took into account the information on IICO’s profitability in managing the Funds, including the methodology used to calculate profitability. The Board finally considered the amount of assets in each Fund, each Fund’s average account size and how those factors affect the Funds’ expense ratios, noting that, as the Funds’ assets have increased or decreased over time, the expense ratios of the Funds generally have fallen or risen, respectively. After completing this examination, the Board concluded that each Fund’s expenses are appropriate at the current time.
Independent Fee Consultant Review
Independent legal counsel, on behalf of the Independent Trustees, engaged an independent fee consultant to assist them in evaluating the reasonableness of the management fees charged by IICO to the Funds. The independent fee consultant’s review addressed the followingfee-related factors:
| 1. | The nature, extent and quality of IICO’s services to the Funds; |
| 2. | Management fees and expenses in the context of performance; |
| 3. | Product category expenses, including peers; |
| 4. | Profit margins of IICO’s parent from supplying such services; |
| 5. | Subadviser and institutional fee analyses; and |
| 6. | Possible economies of scale as a Fund grows larger. |
The following summarizes the findings of the independent fee consultant retained by the Independent Trustees.
Summary Findings
The report stated that IICO delivered reasonable levels of performance in the longer-term periods and reasonable levels of service to the Funds in relation to its management fees as compared to the investment advisers of comparable funds. For the 36 months ended March 31, 2018, approximately 15% of the funds in the Fund Complex (including the Funds) were in the top quartile of performance and 33% of such funds were in the top two quartiles of performance and that short-term performance of such funds were showing signs of improvement. Specifically, the report noted that 49% of such funds were in the top two quartiles in theone-year period, and that 31% of all such funds had improving performance in theirone-year period. The independent fee consultant noted that the funds’ performance appeared to be grounded in a number of
institutional competitive advantages at IICO including economic analysis, investment management depth, ability to attract top talent, strategic vision, performance-focused culture, and an effective trading infrastructure.
The report further indicated that total expenses of the funds, on average, were 4% below the average total expenses of their respective Broadridge Expense Group peers and flat compared to the average total expenses for their Broadridge Expense Universes. The management fees for the funds were 4% over the average management fees of their respective Broadridge Expense Group peers and 6% over the average management fees for their Broadridge Expense Universes.
The report also stated that the management fees IICO charges to the funds are reasonable in relation to the management fees it charges to its institutional account clients. The report noted that these institutional account clients have different service and infrastructure needs and in addition, the average spread between management fees IICO charged to the funds and those it charges to institutional account clients is reasonable relative to the average fee spreads computed from industry surveys.
The report stated that while it was difficult to confirm overall economies of scale, it was clear that the funds’ shareholders generally are benefitting from lower expenses as the funds’ assets grow through management fee breakpoints, decline in transfer agency expenses, decline in custody contract rates and declines in othernon-management expenses.
The report also noted that the overall profitability of IICO’s parent relative to other complexes is reasonable. Finally, the report noted that IICO has continued to invest in AUM growth, which is designed to help drive down fund expenses and attract top investment management talent, as well as in fund mergers, which could help drive down expenses, both of which can benefit the funds’ investors.
Finally, the report also examined the fees that IICO retains on funds that are subadvised by unaffiliated subadvisers, and indicated that those fees are reasonable relative to the industry. The report also stated that the subadvisory fees that IICO earns for serving as a subadviser to an unaffiliated fund when compared to fees of similar funds likewise are reasonable relative to the industry.
Conclusions
The independent fee consultant’s report concluded that it believes that the services provided by IICO and its affiliates and expenses incurred by the Funds in the previous 12 months are reasonable and provide adequate justification for renewal of the Funds’ existing Agreements.
| | |
| ANNUAL PRIVACY NOTICE | | IVY VIP |
UNAUDITED
Ivy Distributors, Inc., the Ivy Variable Insurance Portfolios and the InvestEd Portfolios ("Ivy") are committed to ensuring their clients have access to a broad range of products and services to help them achieve their personal financial goals. Accurate information lies at the heart of our pledge to provide these products and services, and we strive to protect your personal nonpublic information. In the course of doing business with Ivy, clients are requested to share financial information and they may be asked to provide other personal details. Clients can be assured that Ivy is diligent in its efforts to keep such information confidential.
Recognition of a Client’s Expectation of Privacy
At Ivy, we believe the confidentiality and protection of client information is one of our fundamental responsibilities. And while information is critical to providing quality service, we recognize that one of our most important assets is our clients’ trust. Thus, the safekeeping of client information is a priority for Ivy.
Information Collected
In order to tailor available financial products to your specific needs, Ivy may request that you complete a variety of forms that require nonpublic personal information about your financial history and other personal details, including but not limited to, your name, address, social security number, assets, income and investments. Ivy may also gather information about your transactions with us, our affiliates and others.
Categories of Information that may be Disclosed
While Ivy may disclose information it collects from applications and other forms, as described above, we at Ivy also want to assure all of our clients that whenever information is used, it is done with discretion. The safeguarding of client information is an issue we take seriously.
Categories of Parties to whom we disclose nonpublic personal information
Ivy may disclose nonpublic personal information about you to selectively chosen financial service providers, whom we believe have valuable products or services that could benefit you. Whenever we do this, we carefully review the company and the product or service to make sure that it provides value to our clients. We share the minimum amount of information necessary for that company to offer its product or service. We may also share information with unaffiliated companies that assist us in providing our products and services to our clients; in the normal course of our business (for example, with consumer reporting agencies and government agencies); when legally required or permitted in connection with fraud investigations and litigation; and at the request or with the permission of a client.
In addition, Ivy has entered into a Protocol with a number of other brokerage firms intended to further our clients’ freedom of choice in connection with the movement of their financial advisors to new firms. In the event your account is maintained through Ivy and your financial advisor leaves Ivy to join a firm that has likewise entered the Protocol, Ivy may disclose your name, address and telephone number to the departed advisor’s new firm.
Opt Out Right
If you prefer that we not disclose nonpublic personal information about you to nonaffiliated third parties, you may opt out of those disclosures; that is, you may direct us not to make those disclosures (other than disclosures permitted by law). If you wish to opt out of disclosures to nonaffiliated third parties, you may make this request in writing to: Ivy, Attn: Opt Out Notices, P.O. Box 29220, Shawnee Mission, KS 66201, or you may call 1-888-923-3355 and a Client Services Representative will assist you.
Confidentiality and Security
We restrict access to nonpublic personal information about you to those employees who need to know that information to provide products and services to you. We maintain physical, electronic, and procedural safeguards that comply with federal standards to guard your nonpublic personal information. If you decide to close your account(s) or become an inactive client, we will adhere to the privacy policies and practices as described in this notice.
| | |
| PROXY VOTING INFORMATION | | IVY VIP |
UNAUDITED
Proxy Voting Guidelines
A description of the policies and procedures Ivy Variable Insurance Portfolios uses to determine how to vote proxies relating to portfolio securities is available (i) without charge, upon request, by calling 1.888.923.3355 and (ii) on the Securities and Exchange Commission’s (“SEC”) website at www.sec.gov.
Proxy Voting Records
Information regarding how the Portfolio voted proxies relating to portfolio securities during the most recent12-month period ended June 30 is available on FormN-PX at www.ivyinvestments.com and on the SEC’s website at www.sec.gov.
| | |
| QUARTERLY PORTFOLIO SCHEDULE INFORMATION | | IVY VIP |
Portfolio holdings can be found on the Trust’s website at www.ivyinvestments.com. Alternatively, a complete schedule of portfolio holdings of each Portfolio for the first and third quarters of each fiscal year is filed with the SEC and can be found on the Trust’s FormN-Q. These holdings may be viewed in the following ways:
| • | | On the SEC’s website at www.sec.gov. |
| • | | For review and copy at the SEC’s Public Reference Room in Washington, DC. Information on the operations of the Public Reference Room may be obtained by calling 1.800.SEC.0330. |
This page has been intentionally left blank
| | |
| THE IVY VARIABLE INSURANCE PORTFOLIOS FAMILY | | |
Global/International Portfolios
Global Equity Income
Global Growth
International Core Equity
Domestic Equity Portfolios
Core Equity
Growth
Mid Cap Growth
Small Cap Core
Small Cap Growth
Value
Fixed Income Portfolios
Corporate Bond
Global Bond
High Income
Limited-Term Bond
Money Market Portfolio
Government Money Market
Specialty Portfolios
Asset Strategy
Balanced
Energy
Natural Resources
Pathfinder Aggressive
Pathfinder Conservative
Pathfinder Moderate
Pathfinder Moderately Aggressive
Pathfinder Moderately Conservative
Pathfinder Moderate — Managed Volatility
Pathfinder Moderately Aggressive — Managed Volatility
Pathfinder Moderately Conservative — Managed Volatility
Science and Technology
Securian Real Estate Securities
The underlying portfolios discussed in this report are only available as investment options in variable annuity and variable life insurance contracts issued by life insurance companies. They are not offered or made available directly to the general public.
This report is submitted for the general information of the shareholders of Ivy Variable Insurance Portfolios. It is not authorized for distribution to prospective investors in a Portfolio unless accompanied with or preceded by the current Portfolio prospectus as well as the variable product prospectus.
ANN-VIP2 (12/18)
| | |

VARIABLE INSURANCE PORTFOLIOS | | Annual Report DECEMBER 31, 2018 |
| | | | |
| Ivy Variable Insurance Portfolios | | | | |
| |
| Pathfinder Aggressive | | | Class II | |
| |
| Pathfinder Conservative | | | Class II | |
| |
| Pathfinder Moderate | | | Class II | |
| |
| Pathfinder Moderately Aggressive | | | Class II | |
| |
| Pathfinder Moderately Conservative | | | Class II | |
| |
| Pathfinder Moderate — Managed Volatility | | | Class II | |
| |
| Pathfinder Moderately Aggressive — Managed Volatility | | | Class II | |
| |
| Pathfinder Moderately Conservative — Managed Volatility | | | Class II | |
| |
| Government Money Market | | | Class II | |
Beginning on January 1, 2021, as permitted by regulations adopted by the U.S. Securities and Exchange Commission (SEC), you may not be receiving paper copies of the Fund’s annual or semi-annual shareholder reports by mail, unless you specifically request paper copies of the reports from the insurance company that offers your variable annuity or variable life insurance contract or from your financial intermediary. Instead of delivering paper copies of the report, the insurance company may choose to make the reports available on a website, and will notify you by mail each time a shareholder report is posted and provide you with a website link to access the report. Instructions for requesting paper copies will be provided by your insurance company.
If you already elected to receive shareholder reports electronically, you will not be affected by this change and you need not take any action. You may elect to receive shareholder reports and other communications from the insurance company or your financial intermediary electronically by following the instructions provided by the insurance company or by contacting your financial intermediary.
You may elect to receive all future Fund shareholder reports in paper free of charge from the insurance company. You can inform the insurance company or your financial intermediary that you wish to continue receiving paper copies of your shareholder reports by following the instructions provided by the insurance company or by contacting your financial intermediary. Your election to receive reports in paper will apply to all portfolio companies available under your contract with the insurance company.
| | |
| PRESIDENT’S LETTER | | IVY VIP |
| | |

| | DECEMBER 31, 2018 (UNAUDITED) |
Philip J. Sanders, CFA | | |
Dear Shareholder,
While most of the fiscal year remained relatively calm, dramatic market volatility returned in the final quarter of 2018. The U.S. stock market, which had hit record highs during 2018, concluded the year with the worst quarter for U.S. equities since 2011 and the S&P 500 Index was down 6.24% over the 12-month period. As the year progressed, trade disputes, geopolitical tensions and uncertain global growth rates provided a choppy ride for investors.
The U.S. economy is likely to finish 2018 with the strongest growth rate since the Great Recession that began 10 years ago. Our optimism is tempered somewhat for 2019 as we forecast U.S. gross domestic product (GDP) growth stabilizing around 2.5% with the possibility of further deceleration during the year.
The U.S. Federal Reserve (Fed) has indicated that short-term interest rates are close to what it believes to be neutral, meaning that policy is neither loose nor restrictive. We believe slower economic growth and lower oil prices will keep inflation well contained in early 2019, which is why the Fed decided to take a more dovish tone and ease its pace of quarterly rate hikes. Our base case belief is the Fed will raise rates once, possibly twice, in 2019.
The deterioration in eurozone economic data seems to be waning following an agreement between the U.S. and European Union (EU) to discuss a reduction in tariffs on industrial goods. Brexit negotiations between the U.K. and EU continue to be choppy, which has caused some delays in anticipated capital spending for the eurozone. While we believe the two parties will come to a resolution for the U.K.’s exit from the EU, the ongoing negotiations may cause lingering economic tumult until a deal can be reached.
Emerging markets faced multiple headwinds over the year, namely a strong dollar, China’s focus on deleveraging and regulations, trade wars, volatile energy prices and increased geopolitical risks. By comparison, U.S. equities benefitted from a more attractive growth rate, which was the result of tax reform, lower regulatory pressures and repatriation of overseas earnings.
The U.S.-China trade negotiations remain front and center for many emerging market economies. Any resolution to trade disputes would be critical not just for China, but also its Asian trading counterparts like South Korea and Taiwan. As such, we are cautiously optimistic for a status quo on the trade war without further escalations. We believe China has started loosening policy on the domestic front and we anticipate an easing of regulatory, monetary and fiscal policy as well, which should be supportive of the domestic economy. We believe emerging markets continue to offer a sound longer term fundamental outlook; however, market volatility is likely to persist until there is more clarity surrounding potential risks.
Overall, volatility was the name of the game across the fiscal year. Several forces conspired to create this environment, including macro events like the global trade slowdown and tightening monetary policy, as well as the staggering of the FAANG (Facebook, Apple, Amazon, Netflix and Google-parent Alphabet) stocks, which have been a major equities catalyst over the past couple of years.
Looking ahead, we believe the markets are likely to remain choppy for some time, although the landscape should present more selective opportunities, with greater emphasis on the fundamentals and quality of asset classes and sectors.
We believe it is important to stay focused on the fundamentals and merits of individual market sectors, industries and companies when making investment decisions. Those fundamentals historically have tended to outweigh external factors such as government policies and regulations. While those can affect every business and investor, we think the innovation and management skill within individual companies ultimately drive long-term stock prices.
Economic Snapshot
| | | | | | | | |
| | |
| | | 12/31/18 | | | 12/31/17 | |
S&P 500 Index | | | 2,506.85 | | | | 2,673.61 | |
MSCI EAFE Index | | | 1,719.88 | | | | 2,050.79 | |
10-Year Treasury Yield | | | 2.69 | % | | | 2.40 | % |
U.S. unemployment rate | | | 3.9 | % | | | 4.1 | % |
30-year fixed mortgage rate | | | 4.55 | % | | | 3.99 | % |
Oil price per barrel | | | $45.41 | | | | $60.42 | |
Sources: Bloomberg, U.S. Department of Labor, MBA, CME
All government statistics shown are subject to periodic revision. The S&P 500 Index is an unmanaged index that tracks the stocks of 500 primarily large-cap U.S. companies. MSCI EAFE Index is an unmanaged index comprised of securities that represent the securities markets in Europe, Australasia and the Far East. It is not possible to invest directly in any of these indexes. Mortgage rates are from BankRate and reflect the overnight national average rate on a conventional 30-year fixed loan. Oil prices reflect the market price of West Texas intermediate grade crude.
Respectfully,

Philip J. Sanders, CFA
President
The opinions expressed in this letter are those of the President of the Ivy Variable Insurance Portfolios and are current only through the end of the period of the report, as stated on the cover. The President’s views are subject to change at any time, based on market and other conditions, and no forecasts can be guaranteed.
| | |
| ILLUSTRATION OF PORTFOLIO EXPENSES | | IVY VIP |
(UNAUDITED)
Expense Example
As a shareholder of a Portfolio, you incur ongoing costs, including management fees, distribution and service fees, and other Portfolio expenses. The following table is intended to help you understand your ongoing costs (in dollars) of investing in a Portfolio and to compare these costs with the ongoing costs of investing in other mutual funds. As a shareholder in the underlying Ivy VIP Portfolios, the Pathfinder Aggressive, Pathfinder Conservative, Pathfinder Moderate, Pathfinder Moderately Aggressive and Pathfinder Moderately Conservative Portfolios (collectively, the “Pathfinder Portfolios”) and the Pathfinder Moderate — Managed Volatility, Pathfinder Moderately Aggressive — Managed Volatility and Pathfinder Moderately Conservative — Managed Volatility Portfolios (collectively, the “Managed Volatility Portfolios”) will indirectly bear their pro rata share of the expenses incurred by the underlying funds. These expenses are not included in the Pathfinder Portfolios’ or Managed Volatility Portfolios’ annualized expense ratios or the expenses paid during the period. These expenses are, however, included in the effective expenses paid during the period. The example is based on an investment of $1,000 invested at the beginning of the period and held for thesix-month period ended December 31, 2018.
Actual Expenses
The first section in the following table provides information about actual investment values and actual expenses for each share class. You may use the information in this section, together with your initial investment in Portfolio shares, to estimate the expenses that you paid over the period. Simply divide the value of that investment by $1,000 (for example, a $7,500 initial investment divided by $1,000 = 7.5), then multiply the result by the number in the first section under the heading entitled “Expenses Paid During Period” to estimate the expenses you paid on your investment during this period. In addition, there are fees and expenses imposed under the variable annuity or variable life insurance contract through which shares of the Portfolio are held. Additional fees have the effect of reducing investment returns.
Hypothetical Example for Comparison Purposes
The second section in the following table provides information about hypothetical investment values and hypothetical expenses for each share class based on the Portfolio’s actual expense ratio and an assumed rate of return of five percent per year before expenses, which is not the Portfolio’s actual return. The hypothetical investment values and expenses may not be used to estimate the actual investment value at the end of the period or expenses you paid for the period. You may use this information to compare the ongoing costs of investing in the Portfolio and other funds. To do so, compare this five percent hypothetical example with the five percent hypothetical examples that appear in the shareholder reports of the other funds.
Please note that the expenses shown in the table are meant to highlight your ongoing costs as a shareholder of the Portfolio and do not reflect any fees and expenses imposed under the variable annuity or variable life insurance contract through which shares of the Portfolio are held.
Expenses paid may be impacted by expense reduction arrangements. If those arrangements had not been in place, expenses paid would have been higher. See Note 5 to the Financial Statements for further information.
| | |
| ILLUSTRATION OF PORTFOLIO EXPENSES | | IVY VIP |
(UNAUDITED)
| | | | | | | | | | | | | | | | | | | | | | | | | | | | |
| | | |
| | | Actual(1) | | | Hypothetical(2) | | | | |
| | | | | | | |
| Portfolio | | Beginning Account Value 6-30-18 | | | Ending Account Value 12-31-18 | | | Expenses Paid During Period* | | | Beginning Account Value 6-30-18 | | | Ending Account Value 12-31-18 | | | Expenses Paid During Period* | | | Annualized Expense Ratio Based on the Six-Month Period | |
Pathfinder Aggressive | | | | | | | | | | | | | | | | | | | | | | | | | | | | |
Class II | | $ | 1,000 | | | $ | 920.60 | | | $ | 0.38 | | | $ | 1,000 | | | $ | 1,024.84 | | | $ | 0.40 | | | | 0.07% | |
Pathfinder Conservative | | | | | | | | | | | | | | | | | | | | | | | | | | | | |
Class II | | $ | 1,000 | | | $ | 966.00 | | | $ | 0.29 | | | $ | 1,000 | | | $ | 1,024.91 | | | $ | 0.30 | | | | 0.06% | |
Pathfinder Moderate | | | | | | | | | | | | | | | | | | | | | | | | | | | | |
Class II | | $ | 1,000 | | | $ | 942.80 | | | $ | 0.19 | | | $ | 1,000 | | | $ | 1,025.05 | | | $ | 0.20 | | | | 0.03% | |
Pathfinder Moderately Aggressive | | | | | | | | | | | | | | | | | | | | | | | | | | | | |
Class II | | $ | 1,000 | | | $ | 931.20 | | | $ | 0.19 | | | $ | 1,000 | | | $ | 1,025.05 | | | $ | 0.20 | | | | 0.03% | |
Pathfinder Moderately Conservative | | | | | | | | | | | | | | | | | | | | | | | | | | | | |
Class II | | $ | 1,000 | | | $ | 954.30 | | | $ | 0.20 | | | $ | 1,000 | | | $ | 1,024.98 | | | $ | 0.20 | | | | 0.04% | |
Pathfinder Moderate — Managed Volatility | | | | | | | | | | | | | | | | | | | | | | | | | | | | |
Class II | | $ | 1,000 | | | $ | 946.50 | | | $ | 1.07 | | | $ | 1,000 | | | $ | 1,024.07 | | | $ | 1.11 | | | | 0.22% | |
Pathfinder Moderately Aggressive — Managed Volatility | | | | | | | | | | | | | | | | | | | | | | | | | | | | |
Class II | | $ | 1,000 | | | $ | 936.10 | | | $ | 1.26 | | | $ | 1,000 | | | $ | 1,023.90 | | | $ | 1.32 | | | | 0.26% | |
Pathfinder Moderately Conservative — Managed Volatility | | | | | | | | | | | | | | | | | | | | | | | | | | | | |
Class II | | $ | 1,000 | | | $ | 958.00 | | | $ | 1.47 | | | $ | 1,000 | | | $ | 1,023.74 | | | $ | 1.52 | | | | 0.29% | |
Government Money Market | |
Class II | | $ | 1,000 | | | $ | 1,008.80 | | | $ | 2.01 | | | $ | 1,000 | | | $ | 1,023.19 | | | $ | 2.02 | | | | 0.40% | |
| * | Portfolio expenses are equal to the Portfolio’s annualized expense ratio (provided in the table), multiplied by the average account value over the period, multiplied by 184 days in thesix-month period ended December 31, 2018, and divided by 365. |
| (1) | This section uses the Portfolio’s actual total return and actual Portfolio expenses. It is a guide to the actual expenses paid by the Portfolio in the period. The “Ending Account Value” shown is computed using the Portfolio’s actual return and the “Expenses Paid During Period” column shows the dollar amount that would have been paid by an investor who started with $1,000 in the Portfolio. A shareholder may use the information here, together with the dollar amount invested, to estimate the expenses that were paid over the period. For every thousand dollars a shareholder has invested, the expenses are listed in the last column of this section. |
| (2) | This section uses a hypothetical five percent annual return and actual Portfolio expenses. It helps to compare the Portfolio’s ongoing costs with other mutual funds. A shareholder can compare the Portfolio’s ongoing costs by comparing this hypothetical example with the hypothetical examples that appear in shareholder reports of other Portfolios. |
The above illustrations are based on ongoing costs only.
| | |
| MANAGEMENT DISCUSSION | | PATHFINDER PORTFOLIOS |
(UNAUDITED)

F. Chace Brundige

Aaron D. Young

W. Jeffery Surles
Below, F. Chace Brundige, CFA, Aaron D. Young and W. Jeffery Surles, CFA, portfolio managers of each of the five Ivy VIP Pathfinder Portfolios and the three Ivy VIP Pathfinder Managed Volatility Portfolios, discuss positioning, performance and results for the fiscal year ended December 31, 2018. Mr. Brundige has 25 years of industry experience and has managed each VIP Pathfinder Portfolio and VIP Pathfinder Managed Volatility Portfolio since June 2016. Mr. Young has 13 years of industry experience and has managed the Portfolios since October 2016. Mr. Surles has 17 years of industry experience and has managed the Portfolios since February 2018.Co-Portfolio Manager CynthiaPrince-Fox retired from the company in April 2018. Since the Ivy VIP Pathfinder Managed Volatility Portfolios’ inception, Securian Asset Management, Inc., has served as the subadvisor for the volatility management strategy. Craig Stapleton, CFA, has 16 years of industry experience and has managed the volatility management strategy since inception. Merlin Erickson, with 26 years of industry experience, and Jeremy Gogos, Ph.D., CFA, with 6 years of industry experience, have managed the strategy since December 2017. Advantus Capital Management changed its name to Securian Asset Management, Inc., effective April 30, 2018.
Fiscal Year Performance
| | | | |
For the 12 Months Ended December 31, 2018 | | | | |
Ivy VIP Pathfinder Aggressive | | | -4.27% | |
55% Russell 3000 Index + 30% MSCI EAFE Index + 15% Bloomberg Barclays U.S. Universal Bond Index | | | -6.97% | |
Ivy VIP Pathfinder Conservative | | | -1.93% | |
35% Russell 3000 Index + 35% Bloomberg Barclays U.S. Universal Bond Index + 20% Bloomberg Barclays1-5 Year U.S. Government/Credit Index + 10% MSCI EAFE Index | | | -2.83% | |
Ivy VIP Pathfinder Moderate | | | -3.90% | |
45% Russell 3000 Index + 25% Bloomberg Barclays U.S. Universal Bond Index + 20% MSCI EAFE Index + 10% Bloomberg Barclays1-5 Year U.S. Government/Credit Index | | | -4.89% | |
Ivy VIP Pathfinder Moderately Aggressive | | | -4.71% | |
50% Russell 3000 Index + 25% MSCI EAFE Index + 20% Bloomberg Barclays U.S. Universal Bond Index + 5% Bloomberg Barclays1-5 Year U.S. Government/Credit Index | | | -5.93% | |
Ivy VIP Pathfinder Moderately Conservative | | | -2.67% | |
40% Russell 3000 Index + 30% Bloomberg Barclays U.S. Universal Bond Index + 15% Bloomberg Barclays1-5 Year U.S. Government/Credit Index + 15% MSCI EAFE Index | | | -3.86% | |
Ivy VIP Pathfinder Moderately Conservative — Managed Volatility | | | -2.90% | |
40% Russell 3000 Index + 30% Bloomberg Barclays U.S. Universal Bond Index + 15% Bloomberg Barclays1-5 Year U.S. Government/Credit Index + 15% MSCI EAFE Index | | | -3.86% | |
Ivy VIP Pathfinder Moderate — Managed Volatility | | | -4.00% | |
45% Russell 3000 Index + 25% Bloomberg Barclays U.S. Universal Bond Index + 20% MSCI EAFE Index + 10% Bloomberg Barclays1-5 Year U.S. Government/Credit Index | | | -4.89% | |
Ivy VIP Pathfinder Moderately Aggressive — Managed Volatility | | | -4.75% | |
50% Russell 3000 Index + 25% MSCI EAFE Index + 20% Bloomberg Barclays U.S. Universal Bond Index + 5% Bloomberg Barclays1-5 Year U.S. Government/Credit Index | | | -5.93% | |
Index Performance
| | | | |
Russell 3000 Index | | | -5.24% | |
(generally reflects the performance of the largest 3,000 U.S. companies representing approximately 98% of the investable U.S. equity market) | | | | |
Bloomberg Barclays U.S. Universal Bond Index | | | -0.26% | |
(generally reflects the performance ofUSD-denominated, taxable bonds that are rated either investment grade or high yield) | | | | |
MSCI EAFE Index | | | -13.79% | |
(generally reflects the performance of equity securities across 21 developed market countries in Europe, Australasia and the Far East) | | | | |
Bloomberg Barclays1-5 Year U.S. Government/Credit Index | | | 1.38% | |
(generally reflects the performance of Treasuries, agencies, publicly issued U.S. corporate and foreign debentures and secured notes with at least one but less than five years to maturity) | | | | |
| | | | |
S&P 500 Index* | | | -4.38% | |
(generally reflects the performance of large-capitalization U.S. stocks) | | | | |
Bloomberg Barclays U.S. Aggregate Bond Index* | | | 0.01% | |
(generally reflects the performance of most U.S.-traded investment grade bonds) | | | | |
Bloomberg Barclays U.S. Treasury Bills:1-3 Month Index* | | | 1.83% | |
(generally reflects the performance of investment-grade Treasury bills, representing cash) | | | | |
Multiple indexes are shown because the Portfolios invest in multiple asset classes.
* Prior to April 30, 2018, one or more Portfolios compared its performance to these indexes. Effective April 30, 2018, the Portfolio changed the funds it held (Underlying Funds) and, as a result, no longer compares performance to these benchmark indexes.
Past performance is not a guarantee of future results. For additional performance information for each Portfolio, please see the Comparison of Change in Value of a $10,000 Investment and the Average Annual Total Return information for each Portfolio found in this report.
Please note that the Portfolio returns include applicable investment fees and expenses, whereas the index returns do not include any such fees. Also, each Portfolio’s performance data does not take into account any product expenses or charges associated with owning a variable life or annuity policy, which is invested in Ivy Variable Insurance Portfolios.
Economic growth concerns
Following very robust returns in 2017, the Pathfinder Portfolios generally assumed a more neutral allocation – reducing the anticipated total risk and tracking error of each Portfolio relative to its benchmarks in anticipation of a shift to a higher volatility market regime where stock selection might play a more important role than broad market valuation expansion. We believe this positioned the Portfolios well going into 2018 for what turned out to be a rather volatile year of equity returns.
A mixture of factors drove market volatility in 2018: tightening by the U.S. Federal Reserve (Fed), disturbing trade rhetoric, U.S. government shutdown, Brexit concerns, continued fiscal challenges in the European Union, and slower growth in China and emerging markets generally, to name a few.
Dealing with volatile year
Following a particularly difficult fourth quarter for markets, each Pathfinder Portfolio completed the fiscal year with a single-digit negative return. However, given the allocation changes made in late 2017 and during 2018, each Portfolio outperformed its respective blended benchmark during the period.
We made three significant thematic allocation shifts in the Pathfinder Portfolios inmid-2018 which benefited their performance relative to the performance of their respective blended benchmarks:
| • | | We shortened the duration of the fixed income exposure and moved into higher quality credit exposure, seeking to benefit from the increase in interest rates in thefront-end of the yield curve while mitigating interest rate risk and credit risk should inflation accelerate or should credit conditions deteriorate. |
| • | | In equities, we shifted away from an emphasis on growth equity styles and assumed a more neutral stance with respect to growth versus value, which proved helpful as growth underperformed in the second half of 2018. |
| • | | Wede-emphasized international equity exposure in the middle of 2018, which helped the Portfolios’ relative performance versus the blended benchmark as international equities generally underperformed domestic equities during the period. |
Balanced but cautious outlook
We believe the state of the U.S. economy, while slowing, remains in good condition. Unemployment is quite low, wages are rising, inflation remains at moderate levels and oil prices have fallen, which can benefit consumer spending. The Fed has been tightening monetary policy, but real rates remain rather low, potentially diminishing the risk that the Fed has significantly overtightened as in previous cycles.
Myriad other risk factors remain. The combined effects of Fed rates hikes with balance sheetrun-off will have to be monitored closely given a difficult global environment where no other major central banks are tightening and U.S. dollar strength is a mitigating factor on corporate earnings growth. We think the global trade issue is also a major threat to earnings, which could negatively impact equity markets. In addition, we think the outlook for global growth has worsened, given recent weakness in leading economic indicators, although China is attempting to stimulate its economy, which may reinvigorate demand.
However, the market has begun discounting many of these risk factors and stocks are significantly cheaper than they were in the third quarter of the fiscal year. If markets experience relief in the trade war, looser monetary policy, a softer dollar or a reacceleration of growth, we think valuations would again improve as sentiment has worsened to a point that sometimes signifies capitulation.
Given this balanced but cautious outlook, the Portfolios remain positioned with slightly lower anticipated total risk relative to their respective blended benchmarks. Equity allocations are rather neutral with respect to geography, industry and style, such that we believe the most significant driver of our relative returns will be our underlying active managers’ ability to add alpha through security selection in more volatile markets. The fixed income portion is allocated to slightly shorter duration and higher-quality securities that may offer a diversification benefit to the equity allocation if markets experience a continuedrisk-off scenario.
Past performance is not a guarantee of future results. As with any mutual fund, the value of each Portfolio’s shares will change, and you could lose money on your investment.
The ability of each Portfolio to meet its investment objective depends both on the allocation of its assets among the Underlying Funds and the ability of those funds to meet their respective investment objectives. Each Portfolio’s share price will likely change daily based on the performance of the Underlying Funds in which it invests. In general, each Portfolio is subject to the same risks as those of the Underlying Funds it holds. Because the Portfolios are weighted toward Underlying Funds that invest in stocks, both U.S. and foreign, including mid cap and small cap stocks, as well as bonds and short-term instruments, the Portfolios are more subject to the risks associated with those investments.
Securian Asset Management, Inc., may be unsuccessful in managing volatility, and there is a risk that the Ivy VIP Managed Volatility Portfolios may experience a high level of volatility in their returns. The Portfolios’ holdings are subject to price volatility, and the Portfolios may not be any less volatile than the market as a whole and could be more volatile. In addition, there can be no guarantee that the Portfolios will achieve their goal of managing the volatility of their equity returns. Furthermore, while the management of volatility seeks competitive returns with more consistent volatility, the management of volatility does not ensure that the Portfolios will deliver competitive returns. Additionally, even if successful, the Portfolios’ management of volatility may also generally result in the Portfolios’ NAV increasing to a lesser degree than the markets (for example, in a rising market with relatively high volatility) or decreasing to a greater degree than the market (for example, in a declining market with relatively low volatility). The Portfolios’ managed volatility strategy may expose the Portfolios to losses (some of which may be sudden) to which it would not have otherwise been exposed if invested only in Underlying Funds. Additionally, the derivatives used by Securian Asset Management to hedge the value of the Portfolios are not identical to the Underlying Funds, and as a result, the Portfolios’ investment in derivatives may decline in value at the same time as the Portfolios’ investment in Underlying Funds. Securian Asset Management does not intend to attempt to manage the volatility of the Portfolios’ fixed-income returns. It is possible that the fixed-income portion of the Portfolios, whose volatility would not be managed by the volatility management strategy, could become more volatile than the equity portion of the Portfolios.
The opinions expressed in this report are those of the portfolio managers and are current only through the end of the period of the report as stated on the cover. The managers’ views are subject to change at any time based on market and other conditions, and no forecasts can be guaranteed.
The indexes noted are unmanaged and include reinvested dividends. One cannot invest directly in an index, nor is an index representative of any Ivy VIP Pathfinder Portfolio or Ivy VIP Pathfinder Portfolio — Managed Volatility.
| | |
| PORTFOLIO HIGHLIGHTS | | PATHFINDER PORTFOLIOS |
ALL DATA IS AS OF DECEMBER 31, 2018 (UNAUDITED)
Pathfinder Aggressive – Asset Allocation
| | |
Ivy VIP International Core Equity, Class II | | 17.6% |
Ivy VIP Growth, Class II | | 12.3% |
Ivy VIP Core Equity, Class II | | 12.0% |
Ivy VIP Value, Class II | | 11.9% |
Ivy VIP Global Equity Income, Class II | | 11.8% |
Ivy VIP Limited-Term Bond, Class II | | 10.4% |
Ivy VIP Corporate Bond, Class II | | 9.4% |
Ivy VIP Mid Cap Growth, Class I | | 8.4% |
Ivy VIP Small Cap Growth, Class I | | 2.4% |
Ivy VIP Small Cap Core, Class II | | 1.2% |
Ivy VIP High Income, Class I | | 1.0% |
Cash and Other Assets (Net of Liabilities), and Cash Equivalents+ | | 1.6% |
Pathfinder Conservative – Asset Allocation
| | |
Ivy VIP Limited-Term Bond, Class II | | 24.4% |
Ivy VIP Government Money Market, Class II | | 18.3% |
Ivy VIP Corporate Bond, Class II | | 15.9% |
Ivy VIP Growth, Class II | | 7.2% |
Ivy VIP Core Equity, Class II | | 7.1% |
Ivy VIP Value, Class II | | 7.0% |
Ivy VIP International Core Equity, Class II | | 5.8% |
Ivy VIP Mid Cap Growth, Class I | | 4.9% |
Ivy VIP Global Equity Income, Class II | | 3.8% |
Ivy VIP High Income, Class I | | 2.5% |
Ivy VIP Small Cap Growth, Class I | | 1.4% |
Ivy VIP Small Cap Core, Class II | | 0.7% |
Cash and Other Assets (Net of Liabilities), and Cash Equivalents+ | | 1.0% |
Pathfinder Moderate – Asset Allocation
| | |
Ivy VIP Limited-Term Bond, Class II | | 19.8% |
Ivy VIP Corporate Bond, Class II | | 11.8% |
Ivy VIP International Core Equity, Class II | | 11.7% |
Ivy VIP Growth, Class II | | 9.9% |
Ivy VIP Core Equity, Class II | | 9.6% |
Ivy VIP Value, Class II | | 9.6% |
Ivy VIP Government Money Market, Class II | | 8.3% |
Ivy VIP Global Equity Income, Class II | | 7.9% |
Ivy VIP Mid Cap Growth, Class I | | 6.7% |
Ivy VIP Small Cap Growth, Class I | | 1.9% |
Ivy VIP High Income, Class I | | 1.8% |
Ivy VIP Small Cap Core, Class II | | 0.9% |
Cash and Other Assets (Net of Liabilities), and Cash Equivalents+ | | 0.1% |
Pathfinder Moderately Aggressive – Asset Allocation
| | |
Ivy VIP Limited-Term Bond, Class II | | 15.4% |
Ivy VIP International Core Equity, Class II | | 14.8% |
Ivy VIP Corporate Bond, Class II | | 11.6% |
Ivy VIP Growth, Class II | | 11.2% |
Ivy VIP Core Equity, Class II | | 10.9% |
Ivy VIP Value, Class II | | 10.8% |
Ivy VIP Global Equity Income, Class II | | 9.9% |
Ivy VIP Mid Cap Growth, Class I | | 7.6% |
Ivy VIP Government Money Market, Class II | | 3.1% |
Ivy VIP Small Cap Growth, Class I | | 2.2% |
Ivy VIP High Income, Class I | | 1.3% |
Ivy VIP Small Cap Core, Class II | | 1.1% |
Cash and Other Assets (Net of Liabilities), and Cash Equivalents+ | | 0.1% |
Pathfinder Moderately Conservative – Asset Allocation
| | |
Ivy VIP Limited-Term Bond, Class II | | 22.2% |
Ivy VIP Corporate Bond, Class II | | 13.7% |
Ivy VIP Government Money Market, Class II | | 13.3% |
Ivy VIP International Core Equity, Class II | | 8.7% |
Ivy VIP Growth, Class II | | 8.6% |
Ivy VIP Core Equity, Class II | | 8.4% |
Ivy VIP Value, Class II | | 8.3% |
Ivy VIP Global Equity Income, Class II | | 5.9% |
Ivy VIP Mid Cap Growth, Class I | | 5.8% |
Ivy VIP High Income, Class I | | 2.3% |
Ivy VIP Small Cap Growth, Class I | | 1.6% |
Ivy VIP Small Cap Core, Class II | | 0.8% |
Cash and Other Assets (Net of Liabilities), and Cash Equivalents+ | | 0.4% |
Pathfinder Moderate – Managed Volatility – Asset Allocation
| | |
Ivy VIP Limited-Term Bond, Class II | | 19.2% |
Ivy VIP Corporate Bond, Class II | | 11.5% |
Ivy VIP International Core Equity, Class II | | 11.4% |
Ivy VIP Growth, Class II | | 9.6% |
Ivy VIP Core Equity, Class II | | 9.4% |
Ivy VIP Value, Class II | | 9.3% |
Ivy VIP Government Money Market, Class II | | 8.1% |
Ivy VIP Global Equity Income, Class II | | 7.7% |
Ivy VIP Mid Cap Growth, Class I | | 6.5% |
Ivy VIP Small Cap Growth, Class I | | 1.9% |
Ivy VIP High Income, Class I | | 1.7% |
Ivy VIP Small Cap Core, Class II | | 0.9% |
Cash and Other Assets (Net of Liabilities), and Cash Equivalents+ | | 2.8% |
| | |
| PORTFOLIO HIGHLIGHTS | | PATHFINDER PORTFOLIOS |
ALL DATA IS AS OF DECEMBER 31, 2018 (UNAUDITED)
Pathfinder Moderately Aggressive – Managed Volatility – Asset Allocation
| | |
Ivy VIP Limited-Term Bond, Class II | | 15.1% |
Ivy VIP International Core Equity, Class II | | 14.5% |
Ivy VIP Corporate Bond, Class II | | 11.3% |
Ivy VIP Growth, Class II | | 10.9% |
Ivy VIP Core Equity, Class II | | 10.7% |
Ivy VIP Value, Class II | | 10.6% |
Ivy VIP Global Equity Income, Class II | | 9.7% |
Ivy VIP Mid Cap Growth, Class I | | 7.4% |
Ivy VIP Government Money Market, Class II | | 3.1% |
Ivy VIP Small Cap Growth, Class I | | 2.1% |
Ivy VIP High Income, Class I | | 1.3% |
Ivy VIP Small Cap Core, Class II | | 1.0% |
Cash and Other Assets (Net of Liabilities), and Cash Equivalents+ | | 2.3% |
Pathfinder Moderately Conservative – Managed Volatility – Asset Allocation
| | |
Ivy VIP Limited-Term Bond, Class II | | 21.6% |
Ivy VIP Corporate Bond, Class II | | 13.4% |
Ivy VIP Government Money Market, Class II | | 13.0% |
Ivy VIP International Core Equity, Class II | | 8.5% |
Ivy VIP Growth, Class II | | 8.3% |
Ivy VIP Core Equity, Class II | | 8.2% |
Ivy VIP Value, Class II | | 8.1% |
Ivy VIP Global Equity Income, Class II | | 5.7% |
Ivy VIP Mid Cap Growth, Class I | | 5.7% |
Ivy VIP High Income, Class I | | 2.2% |
Ivy VIP Small Cap Growth, Class I | | 1.6% |
Ivy VIP Small Cap Core, Class II | | 0.8% |
Cash and Other Assets (Net of Liabilities), and Cash Equivalents+ | | 2.9% |
The percentages of investments in the underlying funds may not currently be within the target allocation ranges disclosed in the Portfolios’ prospectus due to market movements; these percentages are expected to change over time, and deviation from the target allocation ranges due to market movements is permitted by the prospectus.
+ Cash equivalents are defined as highly liquid securities with maturities of less than three months. Cash equivalents may include U.S. Government Treasury bills, bank certificates of deposit, bankers’ acceptances, corporate commercial paper and other money market instruments.
| | |
COMPARISON OF CHANGE IN VALUE OF $10,000 INVESTMENT | | PATHFINDER PORTFOLIOS |
(UNAUDITED)
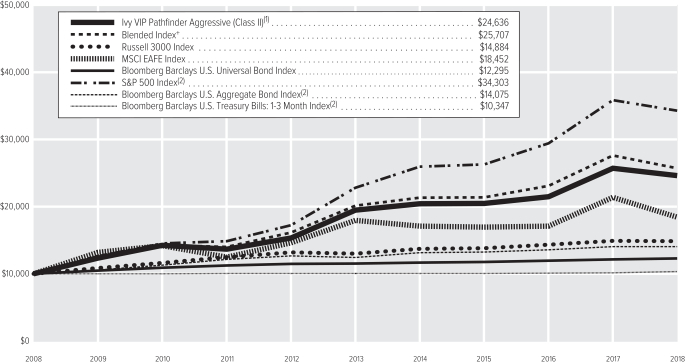
Growth of 10K
+The Blended Benchmark is computed using a combination of 55% Russell 3000 Index + 30% MSCI EAFE Index + 15% Bloomberg Barclays U.S. Universal Bond Index.
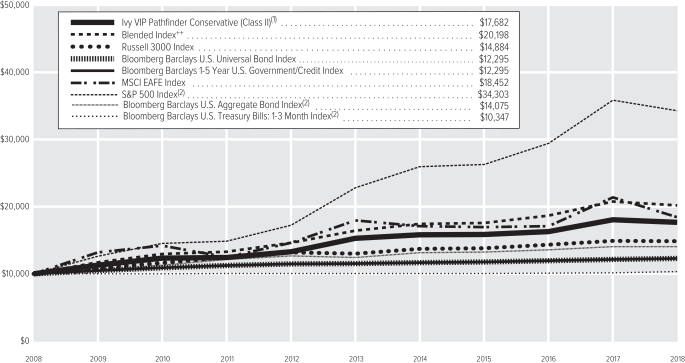
Growth of 10K
++The Blended Benchmark is computed using a combination of 35% Russell 3000 Index + 35% Bloomberg Barclays U.S. Universal Bond Index + 20% Bloomberg Barclays 1-5 Year U.S. Government/Credit Index + 10% MSCI EAFE Index.
See footnotes on page 13.
| | |
COMPARISON OF CHANGE IN VALUE OF $10,000 INVESTMENT | | PATHFINDER PORTFOLIOS |
(UNAUDITED)
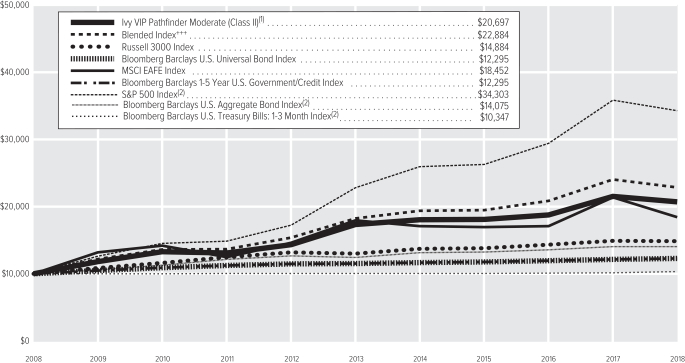
Growth of 10K
+++The Blended Benchmark is computed using a combination of 45% Russell 3000 Index + 25% Bloomberg Barclays U.S. Universal Bond Index + 20% MSCI EAFE Index+ 10%Bloomberg Barclays 1-5 Year U.S. Government/Credit Index.
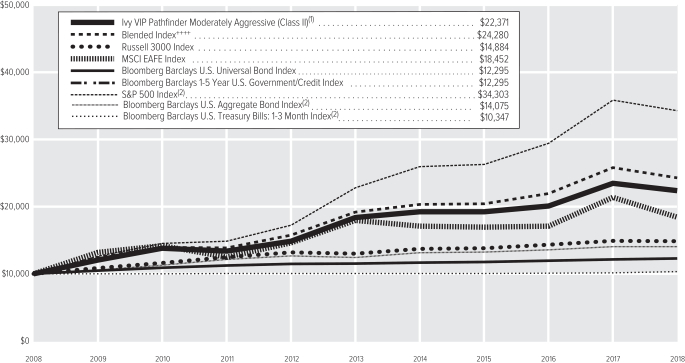
Growth of 10K
++++The Blended Benchmark is computed using a combination of 50% Russell 3000 Index + 25% MSCI EAFE Index + 20% Bloomberg Barclays U.S. Universal Bond Index+5% Bloomberg Barclays 1-5 Year U.S. Government/Credit Index.
See footnotes on page 13.
| | |
COMPARISON OF CHANGE IN VALUE OF $10,000 INVESTMENT | | PATHFINDER PORTFOLIOS |
(UNAUDITED)
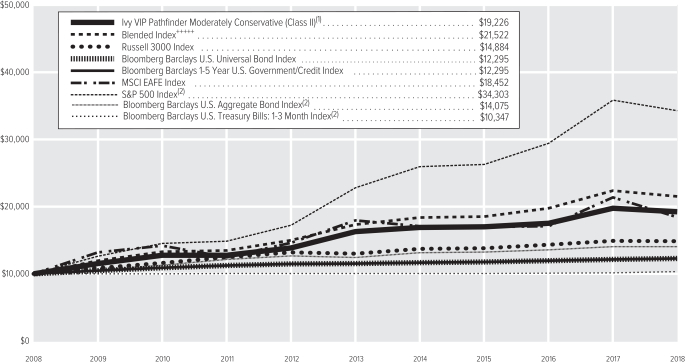
Growth of 10K
+++++The Blended Benchmark is computed using a combination of 40% Russell 3000 Index + 30% Bloomberg Barclays U.S. Universal Bond Index + 15% Bloomberg Barclays1-5 Year U.S. Government/Credit Index + 15% MSCI EAFE Index.
| (1) | The value of the investment in the Portfolio is impacted by the ongoing expenses of the Portfolio and assumes reinvestment of dividends and distributions. |
| (2) | Prior to April 30, 2018, the Portfolio compared its performance to these indexes. Effective April 30, 2018, the Portfolio changed the underlying funds held by the Portfolio. Going forward, the Portfolio will show its performance compared to other, more applicable benchmark indexes and will no longer compare its performance to these indexes. |
| | | | | | | | | | | | | | | | | | | | |
| | | | | |
| Average Annual Total Return(3) | | Pathfinder
Aggressive Class II | | | Pathfinder
Conservative Class II | | | Pathfinder
Moderate Class II | | | Pathfinder
Moderately
Aggressive Class II | | | Pathfinder
Moderately
Conservative Class II | |
1-year period ended12-31-18 | | | -4.27 | % | | | -1.93 | % | | | -3.90 | % | | | -4.71 | % | | | -2.67 | % |
5-year period ended12-31-18 | | | 4.81 | % | | | 2.97 | % | | | 3.62 | % | | | 4.00 | % | | | 3.35 | % |
10-year period ended12-31-18 | | | 9.44 | % | | | 5.87 | % | | | 7.55 | % | | | 8.39 | % | | | 6.75 | % |
| (3) | Data quoted is past performance and current performance may be lower or higher. Past performance is no guarantee of future results. Investment return and principal value of an investment will fluctuate and shares, when redeemed, may be worth more or less than their original cost. Please visit www.ivyinvestments.com for the Portfolio’s most recentmonth-end performance. Performance data quoted does not reflect any expenses or charges associated with owning a variable life insurance policy or variable annuity contract that invests in the Portfolio’s shares. When such charges are deducted, actual investment performance in a variable policy or contract will be lower. |
Past performance is not necessarily indicative of future performance. Indexes are unmanaged. The performance graph and table do not reflect the deduction of taxes that a shareholder would pay on Portfolio distributions or on the redemption of Portfolio shares. Performance results may include the effect of expense reduction arrangements for some or all of the periods shown. If those arrangements had not been in place, the performance results for those periods would have been lower.
| | |
COMPARISON OF CHANGE IN VALUE OF $10,000 INVESTMENT | | PATHFINDER PORTFOLIOS |
(UNAUDITED)
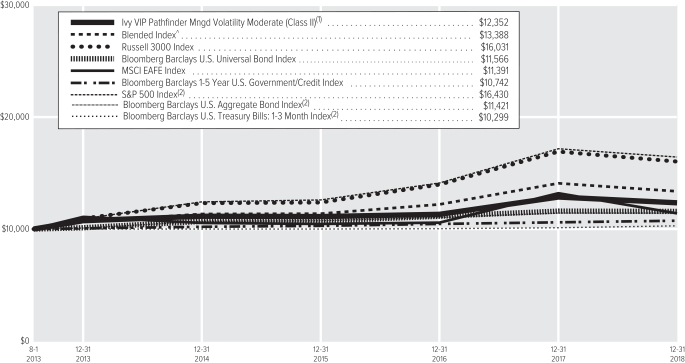
Growth of 10K
^ The Blended Benchmark is computed using a combination of 45% Russell 3000 Index + 25% Bloomberg Barclays U.S. Universal Bond Index + 20% MSCI EAFE Index + 10% Bloomberg Barclays1-5 Year U.S. Government/Credit Index.
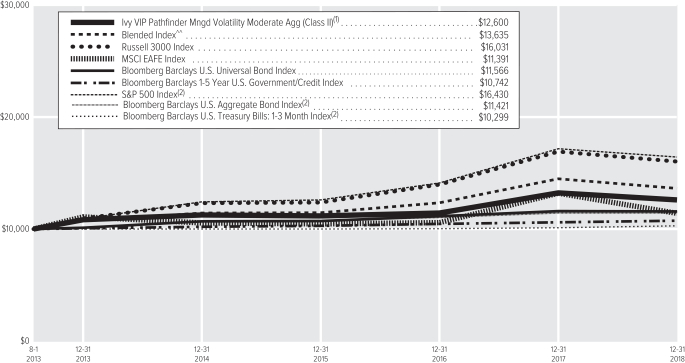
Growth of 10K
^^ The Blended Benchmark is computed using a combination of 50% Russell 3000 Index + 25% MSCI EAFE Index + 20% Bloomberg Barclays U.S. Universal Bond Index + 5% Bloomberg Barclays1-5 Year U.S. Government/Credit Index.
See footnotes on page 15.
| | |
COMPARISON OF CHANGE IN VALUE OF $10,000 INVESTMENT | | PATHFINDER PORTFOLIOS |
(UNAUDITED)
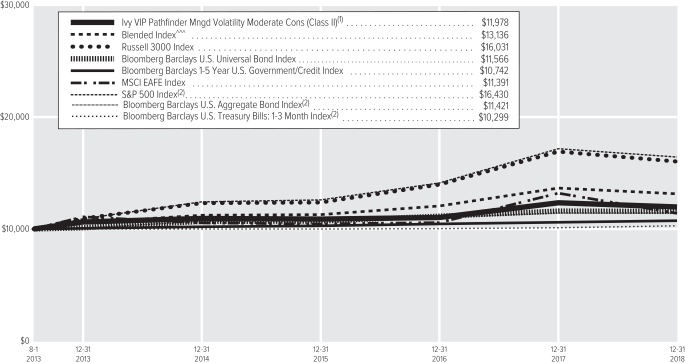
Growth of 10K
^^^The Blended Benchmark is computed using a combination of 40% Russell 3000 Index + 30% Bloomberg Barclays U.S. Universal Bond Index + 15% Bloomberg Barclays1-5 Year U.S. Government/Credit Index + 15% MSCI EAFE Index.
| (1) | The value of the investment in the Portfolio is impacted by the ongoing expenses of the Portfolio and assumes reinvestment of dividends and distributions. |
| (2) | Prior to April 30, 2018, the Portfolio compared its performance to these indexes. Effective April 30, 2018, the Portfolio changed the underlying funds held by the Portfolio. Going forward, the Portfolio will show its performance compared to other, more applicable benchmark indexes and will no longer compare its performance to these indexes. |
| | | | | | | | | | | | |
| | | |
| Average Annual Total Return(3) | | Pathfinder Moderate – Managed Volatility Class II | | | Pathfinder Moderately
Aggressive – Managed
Volatility Class II | | | Pathfinder Moderately
Conservative – Managed
Volatility Class II | |
1-year period ended12-31-18 | | | -4.00 | % | | | -4.75 | % | | | -2.90 | % |
5-year period ended12-31-18 | | | 2.82 | % | | | 3.08 | % | | | 2.42 | % |
10-year period ended12-31-18 | | | — | | | | — | | | | — | |
Since inception of Portfolio(4) through12-31-18 | | | 3.98 | % | | | 4.36 | % | | | 3.39 | % |
| (3) | Data quoted is past performance and current performance may be lower or higher. Past performance is no guarantee of future results. Investment return and principal value of an investment will fluctuate and shares, when redeemed, may be worth more or less than their original cost. Please visit www.ivyinvestments.com for the Portfolio’s most recentmonth-end performance. Performance data quoted does not reflect any expenses or charges associated with owning a variable life insurance policy or variable annuity contract that invests in the Portfolio’s shares. When such charges are deducted, actual investment performance in a variable policy or contract will be lower. |
| (4) | 8-1-13 Pathfinder Moderate—Managed Volatility,8-1-13 Pathfinder Moderately Aggressive—Managed Volatility and8-1-13 Pathfinder Moderately Conservative—Managed Volatility (the date on which shares were first acquired by shareholders). |
Past performance is not necessarily indicative of future performance. Indexes are unmanaged. The performance graph and table do not reflect the deduction of taxes that a shareholder would pay on Portfolio distributions or on the redemption of Portfolio shares. Performance results may include the effect of expense reduction arrangements for some or all of the periods shown. If those arrangements had not been in place, the performance results for those periods would have been lower.
| | |
| SCHEDULE OF INVESTMENTS | | PATHFINDER PORTFOLIOS (in thousands) |
DECEMBER 31, 2018
Pathfinder Aggressive
| | | | | | | | |
| AFFILIATED MUTUAL FUNDS | | Shares | | | Value | |
Ivy VIP Core Equity, Class II | | | 655 | | | $ | 7,076 | |
Ivy VIP Corporate Bond, Class II | | | 1,078 | | | | 5,534 | |
Ivy VIP Global Equity Income, Class II | | | 1,006 | | | | 6,934 | |
Ivy VIP Growth, Class II | | | 658 | | | | 7,248 | |
Ivy VIP High Income, Class I | | | 177 | | | | 593 | |
Ivy VIP International Core Equity, Class II | | | 706 | | | | 10,354 | |
Ivy VIP Limited-Term Bond, Class II | | | 1,263 | | | | 6,107 | |
Ivy VIP Mid Cap Growth, Class I | | | 444 | | | | 4,929 | |
Ivy VIP Small Cap Core, Class II | | | 51 | | | | 687 | |
Ivy VIP Small Cap Growth, Class I | | | 182 | | | | 1,397 | |
Ivy VIP Value, Class II | | | 1,236 | | | | 7,031 | |
| | | | | | | | |
| |
TOTAL AFFILIATED MUTUAL
FUNDS – 98.4% | | | $ | 57,890 | |
(Cost: $65,689) | |
| | |
| SHORT-TERM SECURITIES | | Principal | | | | |
| |
Master Note—1.7% | |
Toyota Motor Credit Corp.(1-Month U.S. LIBOR plus 15 bps), | | | | | | | | |
2.720%,1-7-19(A) | | $ | 986 | | | | 986 | |
| | | | | | | | |
| |
TOTAL SHORT-TERM SECURITIES – 1.7% | | | $ | 986 | |
(Cost: $986) | |
| |
TOTAL INVESTMENT SECURITIES – 100.1% | | | $ | 58,876 | |
(Cost: $66,675) | |
| |
LIABILITIES, NET OF CASH AND OTHER ASSETS – (0.1)% | | | | (86 | ) |
| |
NET ASSETS – 100.0% | | | $ | 58,790 | |
Notes to Schedule of Investments
| (A) | Variable rate security. Interest rate disclosed is that which is in effect at December 31, 2018. Date shown represents the date that the variable rate resets. Description of the reference rate and spread, if applicable, are included in the security description. |
The following table is a summary of the valuation of the Portfolio’s investments by the fair value hierarchy levels as of December 31, 2018. See Note 3 to the Financial Statements for further information regarding fair value measurement.
| | | | | | | | | | | | |
| | | Level 1 | | | Level 2 | | | Level 3 | |
Assets | | | | | | | | | | | | |
Investments in Securities | | | | | | | | | | | | |
Affiliated Mutual Funds | | $ | 57,890 | | | $ | — | | | $ | — | |
Short-Term Securities | | | — | | | | 986 | | | | — | |
| | | | |
Total | | $ | 57,890 | | | $ | 986 | | | $ | — | |
| | | | |
The following acronym is used throughout this schedule:
LIBOR = London Interbank Offered Rate
Pathfinder Conservative
| | | | | | | | |
| AFFILIATED MUTUAL FUNDS | | Shares | | | Value | |
Ivy VIP Core Equity, Class II | | | 613 | | | $ | 6,619 | |
Ivy VIP Corporate Bond, Class II | | | 2,898 | | | | 14,876 | |
Ivy VIP Global Equity Income, Class II | | | 523 | | | | 3,607 | |
Ivy VIP Government Money Market, Class II | | | 17,079 | | | | 17,079 | |
Ivy VIP Growth, Class II | | | 615 | | | | 6,774 | |
Ivy VIP High Income, Class I | | | 692 | | | | 2,315 | |
Ivy VIP International Core Equity, Class II | | | 367 | | | | 5,387 | |
Ivy VIP Limited-Term Bond, Class II | | | 4,731 | | | | 22,879 | |
Ivy VIP Mid Cap Growth, Class I | | | 415 | | | | 4,609 | |
Ivy VIP Small Cap Core, Class II | | | 48 | | | | 643 | |
Ivy VIP Small Cap Growth, Class I | | | 170 | | | | 1,305 | |
Ivy VIP Value, Class II | | | 1,157 | | | | 6,580 | |
| | | | | | | | |
| |
TOTAL AFFILIATED MUTUAL FUNDS – 99.0% | | | $ | 92,673 | |
(Cost: $99,488) | |
| | |
| SHORT-TERM SECURITIES | | Principal | | | | |
| |
Master Note—1.0% | |
Toyota Motor Credit Corp.(1-Month U.S. LIBOR plus 15 bps), | | | | | | | | |
2.720%,1-7-19(A) | | $ | 906 | | | | 906 | |
| | | | | | | | |
| |
TOTAL SHORT-TERM SECURITIES – 1.0% | | | $ | 906 | |
(Cost: $906) | |
| |
TOTAL INVESTMENT SECURITIES – 100.0% | | | $ | 93,579 | |
(Cost: $100,394) | |
| |
LIABILITIES, NET OF CASH AND OTHER ASSETS – 0.0% | | | | — | * |
| |
NET ASSETS – 100.0% | | | $ | 93,579 | |
Notes to Schedule of Investments
| * | Not shown due to rounding. |
| (A) | Variable rate security. Interest rate disclosed is that which is in effect at December 31, 2018. Date shown represents the date that the variable rate resets. Description of the reference rate and spread, if applicable, are included in the security description. |
| | |
| SCHEDULE OF INVESTMENTS | | PATHFINDER PORTFOLIOS (in thousands) |
DECEMBER 31, 2018
The following table is a summary of the valuation of the Portfolio’s investments by the fair value hierarchy levels as of December 31, 2018. See Note 3 to the Financial Statements for further information regarding fair value measurement.
| | | | | | | | | | | | |
| | | Level 1 | | | Level 2 | | | Level 3 | |
Assets | | | | | | | | | | | | |
Investments in Securities | | | | | | | | | | | | |
Affiliated Mutual Funds | | $ | 92,673 | | | $ | — | | | $ | — | |
Short-Term Securities | | | — | | | | 906 | | | | — | |
| | | | |
Total | | $ | 92,673 | | | $ | 906 | | | $ | — | |
| | | | |
The following acronym is used throughout this schedule:
LIBOR = London Interbank Offered Rate
Pathfinder Moderate
| | | | | | | | |
| AFFILIATED MUTUAL FUNDS | | Shares | | | Value | |
Ivy VIP Core Equity, Class II | | | 6,268 | | | $ | 67,706 | |
Ivy VIP Corporate Bond, Class II | | | 16,128 | | | | 82,778 | |
Ivy VIP Global Equity Income, Class II | | | 8,026 | | | | 55,312 | |
Ivy VIP Government Money Market, Class II | | | 58,192 | | | | 58,192 | |
Ivy VIP Growth, Class II | | | 6,290 | | | | 69,319 | |
Ivy VIP High Income, Class I | | | 3,714 | | | | 12,425 | |
Ivy VIP International Core Equity, Class II | | | 5,635 | | | | 82,603 | |
Ivy VIP Limited-Term Bond, Class II | | | 28,715 | | | | 138,854 | |
Ivy VIP Mid Cap Growth, Class I | | | 4,246 | | | | 47,154 | |
Ivy VIP Small Cap Core, Class II | | | 487 | | | | 6,576 | |
Ivy VIP Small Cap Growth, Class I | | | 1,738 | | | | 13,358 | |
Ivy VIP Value, Class II | | | 11,831 | | | | 67,285 | |
| | | | | | | | |
| |
TOTAL AFFILIATED MUTUAL FUNDS – 99.9% | | | $ | 701,562 | |
(Cost: $763,645) | | | | | | | | |
| | |
| SHORT-TERM SECURITIES | | Principal | | | | |
| | |
Master Note—0.1% | | | | | | | | |
Toyota Motor Credit Corp.(1-Month U.S. LIBOR plus 15 bps), | | | | | | | | |
2.720%,1-7-19(A) | | $ | 1,006 | | | | 1,006 | |
| | | | | | | | |
| |
TOTAL SHORT-TERM SECURITIES – 0.1% | | | $ | 1,006 | |
(Cost: $1,006) | | | | | | | | |
| |
TOTAL INVESTMENT SECURITIES – 100.0% | | | $ | 702,568 | |
(Cost: $764,651) | | | | | | | | |
| |
CASH AND OTHER ASSETS, NET OF LIABILITIES – 0.0% | | | | 18 | |
| |
NET ASSETS – 100.0% | | | $ | 702,586 | |
Notes to Schedule of Investments
| (A) | Variable rate security. Interest rate disclosed is that which is in effect at December 31, 2018. Date shown represents the date that the variable rate resets. Description of the reference rate and spread, if applicable, are included in the security description. |
The following table is a summary of the valuation of the Portfolio’s investments by the fair value hierarchy levels as of December 31, 2018. See Note 3 to the Financial Statements for further information regarding fair value measurement.
| | | | | | | | | | | | |
| | | Level 1 | | | Level 2 | | | Level 3 | |
Assets | | | | | | | | | | | | |
Investments in Securities | | | | | | | | | | | | |
Affiliated Mutual Funds | | $ | 701,562 | | | $ | — | | | $ | — | |
Short-Term Securities | | | — | | | | 1,006 | | | | — | |
| | | | |
Total | | $ | 701,562 | | | $ | 1,006 | | | $ | — | |
| | | | |
The following acronym is used throughout this schedule:
LIBOR = London Interbank Offered Rate
| | |
| SCHEDULE OF INVESTMENTS | | PATHFINDER PORTFOLIOS (in thousands) |
DECEMBER 31, 2018
Pathfinder Moderately Aggressive
| | | | | | | | |
| AFFILIATED MUTUAL FUNDS | | Shares | | | Value | |
Ivy VIP Core Equity, Class II | | | 8,468 | | | $ | 91,470 | |
Ivy VIP Corporate Bond, Class II | | | 18,935 | | | | 97,186 | |
Ivy VIP Global Equity Income, Class II | | | 12,046 | | | | 83,015 | |
Ivy VIP Government Money Market, Class II | | | 26,203 | | | | 26,203 | |
Ivy VIP Growth, Class II | | | 8,499 | | | | 93,670 | |
Ivy VIP High Income, Class I | | | 3,186 | | | | 10,657 | |
Ivy VIP International Core Equity, Class II | | | 8,457 | | | | 123,967 | |
Ivy VIP Limited-Term Bond, Class II | | | 26,766 | | | | 129,432 | |
Ivy VIP Mid Cap Growth, Class I | | | 5,737 | | | | 63,711 | |
Ivy VIP Small Cap Core, Class II | | | 658 | | | | 8,884 | |
Ivy VIP Small Cap Growth, Class I | | | 2,348 | | | | 18,049 | |
Ivy VIP Value, Class II | | | 15,983 | | | | 90,893 | |
| | | | | | | | |
| |
TOTAL AFFILIATED MUTUAL
FUNDS – 99.9% | | | $ | 837,137 | |
(Cost: $921,213) | | | | | | | | |
| | |
| SHORT-TERM SECURITIES | | Principal | | | | |
| |
Master Note—0.2% | |
Toyota Motor Credit Corp.(1-Month U.S. LIBOR plus 15 bps), | | | | | | | | |
2.720%,1-7-19(A) | | $ | 1,484 | | | | 1,484 | |
| | | | | | | | |
| |
TOTAL SHORT-TERM SECURITIES – 0.2% | | | $ | 1,484 | |
(Cost: $1,484) | |
| |
TOTAL INVESTMENT SECURITIES – 100.1% | | | $ | 838,621 | |
(Cost: $922,697) | |
| |
LIABILITIES, NET OF CASH AND OTHER ASSETS – (0.1)% | | | | (704 | ) |
| |
NET ASSETS – 100.0% | | | $ | 837,917 | |
Notes to Schedule of Investments
| (A) | Variable rate security. Interest rate disclosed is that which is in effect at December 31, 2018. Date shown represents the date that the variable rate resets. Description of the reference rate and spread, if applicable, are included in the security description. |
The following table is a summary of the valuation of the Portfolio’s investments by the fair value hierarchy levels as of December 31, 2018. See Note 3 to the Financial Statements for further information regarding fair value measurement.
| | | | | | | | | | | | |
| | | Level 1 | | | Level 2 | | | Level 3 | |
Assets | | | | | | | | | | | | |
Investments in Securities | | | | | | | | | | | | |
Affiliated Mutual Funds | | $ | 837,137 | | | $ | — | | | $ | — | |
Short-Term Securities | | | — | | | | 1,484 | | | | — | |
| | | | |
Total | | $ | 837,137 | | | $ | 1,484 | | | $ | — | |
| | | | |
The following acronym is used throughout this schedule:
LIBOR = London Interbank Offered Rate
Pathfinder Moderately Conservative
| | | | | | | | |
| AFFILIATED MUTUAL FUNDS | | Shares | | | Value | |
Ivy VIP Core Equity, Class II | | | 1,587 | | | $ | 17,141 | |
Ivy VIP Corporate Bond, Class II | | | 5,496 | | | | 28,210 | |
Ivy VIP Global Equity Income, Class II | | | 1,742 | | | | 12,005 | |
Ivy VIP Government Money Market, Class II | | | 27,363 | | | | 27,363 | |
Ivy VIP Growth, Class II | | | 1,592 | | | | 17,548 | |
Ivy VIP High Income, Class I | | | 1,382 | | | | 4,622 | |
Ivy VIP International Core Equity, Class II | | | 1,223 | | | | 17,928 | |
Ivy VIP Limited-Term Bond, Class II | | | 9,402 | | | | 45,466 | |
Ivy VIP Mid Cap Growth, Class I | | | 1,075 | | | | 11,937 | |
Ivy VIP Small Cap Core, Class II | | | 123 | | | | 1,665 | |
Ivy VIP Small Cap Growth, Class I | | | 440 | | | | 3,382 | |
Ivy VIP Value, Class II | | | 2,996 | | | | 17,036 | |
| | | | | | | | |
| |
TOTAL AFFILIATED MUTUAL
FUNDS – 99.6% | | | $ | 204,303 | |
(Cost: $220,975) | | | | | | | | |
| | |
| SHORT-TERM SECURITIES | | Principal | | | | |
| |
Master Note—0.4% | |
Toyota Motor Credit Corp.(1-Month U.S. LIBOR plus 15 bps), | | | | | | | | |
2.720%,1-7-19(A) | | $ | 843 | | | | 843 | |
| | | | | | | | |
| |
TOTAL SHORT-TERM SECURITIES – 0.4% | | | $ | 843 | |
(Cost: $843) | | | | | | | | |
| |
TOTAL INVESTMENT SECURITIES – 100.0% | | | $ | 205,146 | |
(Cost: $221,818) | | | | | | | | |
| |
CASH AND OTHER ASSETS, NET OF LIABILITIES – 0.0% | | | | 102 | |
| |
NET ASSETS – 100.0% | | | $ | 205,248 | |
Notes to Schedule of Investments
| (A) | Variable rate security. Interest rate disclosed is that which is in effect at December 31, 2018. Date shown represents the date that the variable rate resets. Description of the reference rate and spread, if applicable, are included in the security description. |
| | |
| SCHEDULE OF INVESTMENTS | | PATHFINDER PORTFOLIOS (in thousands) |
DECEMBER 31, 2018
The following table is a summary of the valuation of the Portfolio’s investments by the fair value hierarchy levels as of December 31, 2018. See Note 3 to the Financial Statements for further information regarding fair value measurement.
| | | | | | | | | | | | |
| | | Level 1 | | | Level 2 | | | Level 3 | |
Assets | | | | | | | | | | | | |
Investments in Securities | | | | | | | | | | | | |
Affiliated Mutual Funds | | $ | 204,303 | | | $ | — | | | $ | — | |
Short-Term Securities | | | — | | | | 843 | | | | — | |
| | | | |
Total | | $ | 204,303 | | | $ | 843 | | | $ | — | |
| | | | |
The following acronym is used throughout this schedule:
LIBOR = London Interbank Offered Rate
Pathfinder Moderate – Managed Volatility
| | | | | | | | |
| AFFILIATED MUTUAL FUNDS | | Shares | | | Value | |
Ivy VIP Core Equity, Class II | | | 5,262 | | | $ | 56,845 | |
Ivy VIP Corporate Bond, Class II | | | 13,521 | | | | 69,399 | |
Ivy VIP Global Equity Income, Class II | | | 6,737 | | | | 46,423 | |
Ivy VIP Government Money Market, Class II | | | 48,794 | | | | 48,794 | |
Ivy VIP Growth, Class II | | | 5,279 | | | | 58,177 | |
Ivy VIP High Income, Class I | | | 3,115 | | | | 10,420 | |
Ivy VIP International Core Equity, Class II | | | 4,730 | | | | 69,330 | |
Ivy VIP Limited-Term Bond, Class II | | | 24,077 | | | | 116,427 | |
Ivy VIP Mid Cap Growth, Class I | | | 3,566 | | | | 39,599 | |
Ivy VIP Small Cap Core, Class II | | | 409 | | | | 5,525 | |
Ivy VIP Small Cap Growth, Class I | | | 1,460 | | | | 11,220 | |
Ivy VIP Value, Class II | | | 9,935 | | | | 56,503 | |
| | | | | | | | |
| |
TOTAL AFFILIATED MUTUAL
FUNDS – 97.2% | | | $ | 588,662 | |
(Cost: $639,900) | |
| | |
| SHORT-TERM SECURITIES | | Principal | | | | |
| |
Commercial Paper(A)—0.3% | |
CVS Health Corp., | | | | | | | | |
2.700%,1-2-19 | | $ | 2,114 | | | | 2,114 | |
| | | | | | | | |
| |
Master Note—1.1% | |
Toyota Motor Credit Corp.(1-Month U.S. LIBOR plus 15 bps), | | | | | | | | |
2.720%,1-7-19(B) | | | 6,789 | | | | 6,789 | |
| | | | | | | | |
| |
United States Government Agency Obligations—1.1% | |
Overseas Private Investment Corp. (GTD by U.S. Government)(3-Month U.S. TB Rate): | | | | | | | | |
2.430%,1-7-19(B) | | | 6,651 | | | | 6,651 | |
| | | | | | | | |
| | | | | | | 6,651 | |
| | | | | | | | |
| |
TOTAL SHORT-TERM SECURITIES – 2.5% | | | $ | 15,554 | |
(Cost: $15,554) | |
| |
TOTAL INVESTMENT SECURITIES – 99.7% | | | $ | 604,216 | |
(Cost: $655,454) | |
| |
CASH AND OTHER ASSETS, NET OF LIABILITIES(C) – 0.3% | | | | 1,613 | |
| |
NET ASSETS – 100.0% | | | $ | 605,829 | |
Notes to Schedule of Investments
| (A) | Rate shown is the yield to maturity at December 31, 2018. |
| (B) | Variable rate security. Interest rate disclosed is that which is in effect at December 31, 2018. Date shown represents the date that the variable rate resets. Description of the reference rate and spread, if applicable, are included in the security description. |
| (C) | Cash of $1,525 has been pledged as collateral on open futures contracts. |
The following futures contracts were outstanding at December 31, 2018 (contracts unrounded):
| | | | | | | | | | | | | | | | | | | | | | |
| Description | | Type | | Number
of
Contracts | | | Expiration
Date | | | Notional
Amount | | | Value | | | Unrealized Appreciation | |
E-mini Russell 2000 Index | | Short | | | 24 | | | | 3-15-19 | | | | 1 | | | $ | (1,619 | ) | | $ | 107 | |
S&P 500 Index | | Short | | | 48 | | | | 3-15-19 | | | | 12 | | | | (30,062 | ) | | | 655 | |
| | | | | | | | | | | | | | | | | | |
| | | | | | | | | | | | | | | | $ | (31,681 | ) | | $ | 762 | |
| | | | | | | | | | | | | | | | | | |
The following table is a summary of the valuation of the Portfolio’s investments by the fair value hierarchy levels as of December 31, 2018. See Note 3 to the Financial Statements for further information regarding fair value measurement.
| | | | | | | | | | | | |
| | | Level 1 | | | Level 2 | | | Level 3 | |
Assets | | | | | | | | | | | | |
Investments in Securities | | | | | | | | | | | | |
Affiliated Mutual Funds | | $ | 588,662 | | | $ | — | | | $ | — | |
Short-Term Securities | | | — | | | | 15,554 | | | | — | |
| | | | |
Total | | $ | 588,662 | | | $ | 15,554 | | | $ | — | |
| | | | |
Futures Contracts | | $ | 762 | | | $ | — | | | $ | — | |
| | | | |
The following acronyms are used throughout this schedule:
GTD = Guaranteed
LIBOR = London Interbank Offered Rate
TB = Treasury Bill
| | |
| SCHEDULE OF INVESTMENTS | | PATHFINDER PORTFOLIOS (in thousands) |
DECEMBER 31, 2018
Pathfinder Moderately Aggressive – Managed Volatility
| | | | | | | | |
| AFFILIATED MUTUAL FUNDS | | Shares | | | Value | |
Ivy VIP Core Equity, Class II | | | 829 | | | $ | 8,959 | |
Ivy VIP Corporate Bond, Class II | | | 1,853 | | | | 9,511 | |
Ivy VIP Global Equity Income, Class II | | | 1,180 | | | | 8,129 | |
Ivy VIP Government Money Market, Class II | | | 2,565 | | | | 2,565 | |
Ivy VIP Growth, Class II | | | 832 | | | | 9,171 | |
Ivy VIP High Income, Class I | | | 312 | | | | 1,043 | |
Ivy VIP International Core Equity, Class II | | | 828 | | | | 12,140 | |
Ivy VIP Limited-Term Bond, Class II | | | 2,620 | | | | 12,668 | |
Ivy VIP Mid Cap Growth, Class I | | | 562 | | | | 6,241 | |
Ivy VIP Small Cap Core, Class II | | | 64 | | | | 870 | |
Ivy VIP Small Cap Growth, Class I | | | 230 | | | | 1,768 | |
Ivy VIP Value, Class II | | | 1,566 | | | | 8,903 | |
| | | | | | | | |
| |
TOTAL AFFILIATED MUTUAL
FUNDS – 97.7% | | | $ | 81,968 | |
(Cost: $91,651) | | | | | | | | |
| | |
| SHORT-TERM SECURITIES | | Principal | | | | |
| |
Master Note—2.1% | |
Toyota Motor Credit Corp.(1-Month U.S. LIBOR plus 15 bps),
2.720%,1-7-19(A) | | $ | 1,803 | | | | 1,803 | |
| | | | | | | | |
| |
TOTAL SHORT-TERM SECURITIES – 2.1% | | | $ | 1,803 | |
(Cost: $1,803) | | | | | | | | |
| |
TOTAL INVESTMENT SECURITIES – 99.8% | | | $ | 83,771 | |
(Cost: $93,454) | | | | | | | | |
| |
CASH AND OTHER ASSETS, NET OF LIABILITIES(B) – 0.2% | | | | 196 | |
| |
NET ASSETS – 100.0% | | | $ | 83,967 | |
Notes to Schedule of Investments
| * | Not shown due to rounding. |
| (A) | Variable rate security. Interest rate disclosed is that which is in effect at December 31, 2018. Date shown represents the date that the variable rate resets. Description of the reference rate and spread, if applicable, are included in the security description. |
| (B) | Cash of $284 has been pledged as collateral on open futures contracts. |
The following futures contracts were outstanding at December 31, 2018 (contracts unrounded):
| | | | | | | | | | | | | | | | | | | | | | |
| Description | | Type | | Number of Contracts | | | Expiration
Date | | | Notional
Amount | | | Value | | | Unrealized
Appreciation | |
E-mini Russell 2000 Index | | Short | | | 4 | | | | 3-15-19 | | | | — | * | | $ | (270 | ) | | $ | 16 | |
S&P 500 Index | | Short | | | 9 | | | | 3-15-19 | | | | 2 | | | | (5,637 | ) | | | 195 | |
| | | | | | | | | | | | | | | | | | |
| | | | | | | | | | | | | | | | $ | (5,907 | ) | | $ | 211 | |
| | | | | | | | | | | | | | | | | | |
The following table is a summary of the valuation of the Portfolio’s investments by the fair value hierarchy levels as of December 31, 2018. See Note 3 to the Financial Statements for further information regarding fair value measurement.
| | | | | | | | | | | | |
| | | Level 1 | | | Level 2 | | | Level 3 | |
Assets | | | | | | | | | | | | |
Investments in Securities | | | | | | | | | | | | |
Affiliated Mutual Funds | | $ | 81,968 | | | $ | — | | | $ | — | |
Short-Term Securities | | | — | | | | 1,803 | | | | — | |
| | | | |
Total | | $ | 81,968 | | | $ | 1,803 | | | $ | — | |
| | | | |
Futures Contracts | | $ | 211 | | | $ | — | | | $ | — | |
| | | | |
The following acronym is used throughout this schedule:
LIBOR = London Interbank Offered Rate
Pathfinder Moderately Conservative – Managed Volatility
| | | | | | | | |
| AFFILIATED MUTUAL FUNDS | | Shares | | | Value | |
Ivy VIP Core Equity, Class II | | | 550 | | | $ | 5,938 | |
Ivy VIP Corporate Bond, Class II | | | 1,901 | | | | 9,756 | |
Ivy VIP Global Equity Income, Class II | | | 603 | | | | 4,157 | |
Ivy VIP Government Money Market, Class II | | | 9,464 | | | | 9,464 | |
Ivy VIP Growth, Class II | | | 551 | | | | 6,076 | |
Ivy VIP High Income, Class I | | | 478 | | | | 1,599 | |
Ivy VIP International Core Equity, Class II | | | 424 | | | | 6,208 | |
Ivy VIP Limited-Term Bond, Class II | | | 3,252 | | | | 15,726 | |
Ivy VIP Mid Cap Growth, Class I | | | 373 | | | | 4,137 | |
Ivy VIP Small Cap Core, Class II | | | 43 | | | | 577 | |
Ivy VIP Small Cap Growth, Class I | | | 153 | | | | 1,172 | |
Ivy VIP Value, Class II | | | 1,038 | | | | 5,903 | |
| | | | | | | | |
| |
TOTAL AFFILIATED MUTUAL
FUNDS – 97.1% | | | $ | 70,713 | |
(Cost: $76,359) | | | | | | | | |
| | |
| SHORT-TERM SECURITIES | | Principal | | | | |
| |
Master Note—2.7% | |
Toyota Motor Credit Corp.(1-Month U.S. LIBOR plus 15 bps),
2.720%,1-7-19(A) | | $ | 1,946 | | | | 1,946 | |
| | | | | | | | |
| |
TOTAL SHORT-TERM SECURITIES – 2.7% | | | $ | 1,946 | |
(Cost: $1,946) | | | | | | | | |
| |
TOTAL INVESTMENT SECURITIES – 99.8% | | | $ | 72,659 | |
(Cost: $78,305) | | | | | | | | |
| |
CASH AND OTHER ASSETS, NET OF LIABILITIES(B) – 0.2% | | | | 177 | |
| |
NET ASSETS – 100.0% | | | $ | 72,836 | |
Notes to Schedule of Investments
| * | Not shown due to rounding. |
| (A) | Variable rate security. Interest rate disclosed is that which is in effect at December 31, 2018. Date shown represents the date that the variable rate resets. Description of the reference rate and spread, if applicable, are included in the security description. |
| (B) | Cash of $254 has been pledged as collateral on open futures contracts. |
| | |
| SCHEDULE OF INVESTMENTS | | PATHFINDER PORTFOLIOS (in thousands) |
DECEMBER 31, 2018
The following futures contracts were outstanding at December 31, 2018 (contracts unrounded):
| | | | | | | | | | | | | | | | | | | | | | |
| Description | | Type | | Number
of
Contracts | | | Expiration
Date | | | Notional
Amounts | | | Value | | | Unrealized Appreciation | |
E-mini Russell 2000 Index | | Short | | | 4 | | | | 3-15-19 | | | | — | * | | $ | (270 | ) | | $ | 9 | |
S&P 500 Index | | Short | | | 8 | | | | 3-15-19 | | | | 2 | | | | (5,010 | ) | | | 109 | |
| | | | | | | | | | | | | | | | | | | | | | |
| | | | | | | | | | | | | | | | $ | (5,280 | ) | | $ | 118 | |
| | | | | | | | | | | | | | | | | | | | | | |
The following table is a summary of the valuation of the Portfolio’s investments by the fair value hierarchy levels as of December 31, 2018. See Note 3 to the Financial Statements for further information regarding fair value measurement.
| | | | | | | | | | | | |
| | | Level 1 | | | Level 2 | | | Level 3 | |
Assets | | | | | | | | | | | | |
Investments in Securities | | | | | | | | | | | | |
Affiliated Mutual Funds | | $ | 70,713 | | | $ | — | | | $ | — | |
Short-Term Securities | | | — | | | | 1,946 | | | | — | |
| | | | |
Total | | $ | 70,713 | | | $ | 1,946 | | | $ | — | |
| | | | |
Futures Contracts | | $ | 118 | | | $ | — | | | $ | — | |
| | | | |
The following acronym is used throughout this schedule:
LIBOR = London Interbank Offered Rate
See Accompanying Notes to Financial Statements.
| | |
| MANAGEMENT DISCUSSION | | GOVERNMENT MONEY MARKET |
(UNAUDITED)

Mira Stevovich
Below, Mira Stevovich, CFA, portfolio manager of Ivy VIP Government Money Market, discusses positioning, performance and results for the fiscal year ended December 31, 2018. She has managed the Portfolio for 20 years and has 32 years of industry experience.
The Portfolio’s fiscal year ended on December 31, 2018 with short-term rates higher than the prior fiscal year end due to four0.25-percentage point rate increases by the Federal Reserve (Fed) in March, June, September and December. The Fed continued to drain liquidity from the economy, a process that began in December 2015, albeit at a gradual pace. The economy showed continued signs of improvement, causing the upward move in rates. During the fiscal year, money markets were positively affected by the increase in short-term rates.
The Fed continued its higher rate path
The Portfolio’s fiscal year started with the federal funds rate between1.25-1.50% and ended with the rate between2.25-2.50% following the four rate increases during the year. The rate increases have provided the money markets with a positive investment environment. It is anticipated that the Fed will pause the
tightening process in 2019, due to the anticipation of a stabilization of the economy and a reduced prospect of the economy overheating. The market implication is for short rates to remain stable for a good part of 2019. We have monitored the Treasury bill market and will continue to monitor this market, as it has been affected by flows and decisions by the U.S. government regarding the debt ceiling. As a result, we will manage the Portfolio based on the interest rate environment, closely monitoring any potential rate changes or external effects on the money markets and adjusting investments accordingly.
The transformation of the money market fund industry by the final amendments to Rule2a-7 under the Investment Company Act of 1940, which became effective October 14, 2016, affected the Portfolio in several ways. The Portfolio, as a government money market fund, is restricted by the Securities and Exchange Commission (SEC) to invest in only U.S. government or U.S. government-backed securities. These securities tend to yield a lower rate of interest compared to corporate money market securities. The restriction to government investments can affect the overall performance of the Portfolio. The SEC liquidity requirement that 30% of the Portfolio mature in seven days or less can affect the overall yield as well, because the shortest maturities tend to carry the lowest rates of interest. Lastly, the Portfolio’s move to a “government money market fund” has changed the way it is managed with credit quality generally not factoring into the equation.
Staying the course
This past fiscal year, we invested a minimum of 99.5% of the Portfolio’s total assets in government securities, cash, and/or repurchase agreements that are collateralized fully, per SEC regulations for government money market funds. The Portfolio has been structured to comply with the “know your investor” mandate, such that a short average maturity is maintained to provide ample liquidity for our investors. We anticipate continuing to use short floating-rate securities in the coming fiscal year as part of our liquidity management of the Portfolio.
We have managed the Portfolio to comply with all SEC regulations that apply to “government money market funds” since the conversion of the Portfolio in 2016. The SEC reformed money fund regulations in 2010 and further modified those regulations in July 2014 in an effort to provide money market investors with greater protection and more timely information about the fund in which they invest. To this end, we seek to maintain daily and weekly liquidity levels according to those regulations, to provide for the liquidity needs of our shareholders. We intend to continue to manage the Portfolio in a prudent manner and in accordance with SEC regulations for “government money market funds.”
You could lose money by investing in Ivy VIP Government Money Market. Although the Portfolio seeks to preserve the value of your investment at $1.00 per share, it cannot guarantee it will do so. An investment in the Portfolio is not insured or guaranteed by the Federal Deposit Insurance Corporation or any other government agency. The Portfolio’s sponsor has no legal obligation to provide financial support to the Portfolio, and you should not expect that the sponsor will provide financial support to the Portfolio at any time.
Interest rate increases can cause the price of a money market security to decrease. A decline in the credit quality of an issuer or a provider of credit support or a maturity-shortening structure for a security can cause the price of a money market security to decrease. Portfolio shares are not guaranteed by the U.S. Government. These and other risks are more fully described in the Portfolio’s prospectus.
The opinions expressed in this report are those of the portfolio manager and are current only through the end of the period of the report as stated on the cover. The manager’s views are subject to change at any time based on market and other conditions, and no forecasts can be guaranteed.
| | |
| PORTFOLIO HIGHLIGHTS | | GOVERNMENT MONEY MARKET |
ALL DATA IS AS OF DECEMBER 31, 2018 (UNAUDITED)
Asset Allocation
| | | | |
Corporate Obligations | | | 0.5% | |
Master Note | | | 0.5% | |
United States Government Agency Obligations | | | 99.3% | |
Cash and Other Assets (Net of Liabilities) | | | 0.2% | |
| | |
| SCHEDULE OF INVESTMENTS | | GOVERNMENT MONEY MARKET (in thousands) |
DECEMBER 31, 2018
| | | | | | | | |
| CORPORATE OBLIGATIONS | | Principal | | | Value | |
Master Note | |
Toyota Motor Credit Corp.(1-Month U.S. LIBOR plus 15 bps),
2.720%,1-7-19 (A) | | $ | 1,177 | | | $ | 1,177 | |
| | | | | | | | |
| |
Total Master Note—0.5% | | | | 1,177 | |
| |
TOTAL CORPORATE OBLIGATIONS – 0.5% | | | $ | 1,177 | |
(Cost: $1,177) | | | | | | | | |
| | |
UNITED STATES GOVERNMENT
AGENCY OBLIGATIONS | | | | | | |
United States Government Agency
Obligations—99.3% | |
Federal Home Loan Bank, | | | | | | | | |
2.100%,1-2-19 | | | 95,409 | | | | 95,404 | |
Overseas Private Investment Corp. (GTD by U.S. Government)(3-Month U.S. TB Rate): | | | | | | | | |
2.470%,1-2-19 (A) | | | 1,310 | | | | 1,310 | |
2.430%,1-7-19 (A) | | | 48,767 | | | | 48,767 | |
2.440%,1-7-19 (A) | | | 13,779 | | | | 13,779 | |
2.450%,1-7-19 (A) | | | 66,435 | | | | 66,435 | |
2.470%,1-7-19 (A) | | | 11,646 | | | | 11,645 | |
| | | | | | | | |
| | | | | | | 237,340 | |
| | | | | | | | |
| |
TOTAL UNITED STATES GOVERNMENT AGENCY OBLIGATIONS – 99.3% | | | $ | 237,340 | |
(Cost: $237,340) | | | | | | | | |
| |
TOTAL INVESTMENT SECURITIES – 99.8% | | | $ | 238,517 | |
(Cost: $238,517) | | | | | | | | |
| |
CASH AND OTHER ASSETS, NET OF LIABILITIES – 0.2% | | | | 419 | |
| |
NET ASSETS – 100.0% | | | $ | 238,936 | |
Notes to Schedule of Investments
| (A) | Variable rate security. Interest rate disclosed is that which is in effect at December 31, 2018. Date shown represents the date that the variable rate resets. Description of the reference rate and spread, if applicable, are included in the security description. |
The following table is a summary of the valuation of the Portfolio’s investments by the fair value hierarchy levels as of December 31, 2018. See Note 3 to the Financial Statements for further information regarding fair value measurement.
| | | | | | | | | | | | |
| | | Level 1 | | | Level 2 | | | Level 3 | |
Assets | | | | | | | | | | | | |
Investments in Securities | | | | | | | | | | | | |
Corporate Obligations | | $ | — | | | $ | 1,177 | | | $ | — | |
United States Government Agency Obligations | | | — | | | | 237,340 | | | | — | |
| | | | |
Total | | $ | — | | | $ | 238,517 | | | $ | — | |
| | | | |
The following acronyms are used throughout this schedule:
GTD = Guaranteed
LIBOR = London Interbank Offered Rate
TB = Treasury Bill
See Accompanying Notes to Financial Statements.
| | |
| STATEMENTS OF ASSETS AND LIABILITIES | | IVY VIP |
AS OF DECEMBER 31, 2018
| | | | | | | | | | | | | | | | | | | | | | | | | | | | | | | | | | | | | | | | |
(In thousands, except per share
amounts) | | Pathfinder
Aggressive | | Pathfinder
Conservative | | Pathfinder
Moderate | | Pathfinder
Moderately
Aggressive | | Pathfinder
Moderately
Conservative | | Pathfinder
Moderate –
Managed
Volatility | | Pathfinder
Moderately
Aggressive –
Managed
Volatility | | Pathfinder
Moderately
Conservative –
Managed
Volatility |
ASSETS | | | | | | | | | | | | | | | | | | | | | | | | | | | | | | | | | | | | | | | | |
Investments in unaffiliated securities at value+ | | | $ | 986 | | | | $ | 906 | | | | $ | 1,006 | | | | $ | 1,484 | | | | $ | 843 | | | | $ | 15,554 | | | | $ | 1,803 | | | | $ | 1,946 | |
Investments in affiliated securities at value+ | | | | 57,890 | | | | | 92,673 | | | | | 701,562 | | | | | 837,137 | | | | | 204,303 | | | | | 588,662 | | | | | 81,968 | | | | | 70,713 | |
Investments at Value | | | | 58,876 | | | | | 93,579 | | | | | 702,568 | | | | | 838,621 | | | | | 205,146 | | | | | 604,216 | | | | | 83,771 | | | | | 72,659 | |
Cash | | | | 1 | | | | | 1 | | | | | 1 | | | | | 1 | | | | | 1 | | | | | 1 | | | | | 1 | | | | | 1 | |
Restricted cash | | | | — | | | | | — | | | | | — | | | | | — | | | | | — | | | | | 1,525 | | | | | 284 | | | | | 254 | |
Investment securities sold receivable | | | | 14 | | | | | 93 | | | | | 493 | | | | | 15 | | | | | 156 | | | | | — | | | | | — | | | | | — | |
Dividends and interest receivable | | | | 2 | | | | | 2 | | | | | 2 | | | | | 2 | | | | | 1 | | | | | 32 | | | | | 4 | | | | | 5 | |
Capital shares sold receivable | | | | 24 | | | | | — | * | | | | 4 | | | | | 1 | | | | | — | * | | | | 386 | | | | | — | | | | | — | |
Prepaid and other assets | | | | 1 | | | | | 1 | | | | | 9 | | | | | 12 | | | | | 3 | | | | | 7 | | | | | 1 | | | | | 1 | |
Total Assets | | | | 58,918 | | | | | 93,676 | | | | | 703,077 | | | | | 838,652 | | | | | 205,307 | | | | | 606,167 | | | | | 84,061 | | | | | 72,920 | |
| | | | | | | | |
LIABILITIES | | | | | | | | | | | | | | | | | | | | | | | | | | | | | | | | | | | | | | | | |
Capital shares redeemed payable | | | | 118 | | | | | 86 | | | | | 418 | | | | | 647 | | | | | 34 | | | | | 67 | | | | | 42 | | | | | 29 | |
Independent Trustees and Chief Compliance Officer fees payable | | | | 7 | | | | | 8 | | | | | 61 | | | | | 73 | | | | | 19 | | | | | 16 | | | | | 3 | | | | | 2 | |
Shareholder servicing payable | | | | — | * | | | | — | * | | | | 1 | | | | | 1 | | | | | 1 | | | | | 1 | | | | | — | * | | | | — | * |
Investment management fee payable | | | | — | | | | | — | | | | | — | | | | | — | | | | | — | | | | | 3 | | | | | — | * | | | | — | * |
Accounting services fee payable | | | | 2 | | | | | 2 | | | | | 10 | | | | | 12 | | | | | 4 | | | | | 9 | | | | | 2 | | | | | 2 | |
Variation margin payable | | | | — | | | | | — | | | | | — | | | | | — | | | | | — | | | | | 240 | | | | | 45 | | | | | 40 | |
Other liabilities | | | | 1 | | | | | 1 | | | | | 1 | | | | | 2 | | | | | 1 | | | | | 2 | | | | | 2 | | | | | 11 | |
Total Liabilities | | | | 128 | | | | | 97 | | | | | 491 | | | | | 735 | | | | | 59 | | | | | 338 | | | | | 94 | | | | | 84 | |
Total Net Assets | | | $ | 58,790 | | | | $ | 93,579 | | | | $ | 702,586 | | | | $ | 837,917 | | | | $ | 205,248 | | | | $ | 605,829 | | | | $ | 83,967 | | | | $ | 72,836 | |
| | | | | | | | |
NET ASSETS | | | | | | | | | | | | | | | | | | | | | | | | | | | | | | | | | | | | | | | | |
Capital paid in (shares authorized – unlimited) | | | $ | 59,264 | | | | $ | 93,577 | | | | $ | 689,207 | | | | $ | 819,562 | | | | $ | 203,581 | | | | $ | 613,293 | | | | $ | 86,123 | | | | $ | 73,596 | |
Accumulated distributable earnings gain (loss) | | | | (474 | ) | | | | 2 | | | | | 13,379 | | | | | 18,355 | | | | | 1,667 | | | | | (7,464 | ) | | | | (2,156 | ) | | | | (760 | ) |
Total Net Assets | | | $ | 58,790 | | | | $ | 93,579 | | | | $ | 702,586 | | | | $ | 837,917 | | | | $ | 205,248 | | | | $ | 605,829 | | | | $ | 83,967 | | | | $ | 72,836 | |
| | | | | | | | |
CAPITAL SHARES OUTSTANDING: | | | | | | | | | | | | | | | | | | | | | | | | | | | | | | | | | | | | | | | | |
Class II | | | | 12,773 | | | | | 19,355 | | | | | 143,819 | | | | | 168,159 | | | | | 41,908 | | | | | 113,589 | | | | | 16,300 | | | | | 14,042 | |
NET ASSET VALUE PER SHARE: | | | | | | | | | | | | | | | | | | | | | | | | | | | | | | | | | | | | | | | | |
Class II | | | $ | 4.60 | | | | $ | 4.83 | | | | $ | 4.89 | | | | $ | 4.98 | | | | $ | 4.90 | | | | $ | 5.33 | | | | $ | 5.15 | | | | $ | 5.19 | |
+COST | | | | | | | | | | | | | | | | | | | | | | | | | | | | | | | | | | | | | | | | |
Investments in unaffiliated securities at cost | | | $ | 986 | | | | $ | 906 | | | | $ | 1,006 | | | | $ | 1,484 | | | | $ | 843 | | | | $ | 15,554 | | | | $ | 1,803 | | | | $ | 1,946 | |
Investments in affiliated securities at cost | | | | 65,689 | | | | | 99,488 | | | | | 763,645 | | | | | 921,213 | | | | | 220,975 | | | | | 639,900 | | | | | 91,651 | | | | | 76,359 | |
*Not shown due to rounding.
See Accompanying Notes to Financial Statements.
| | |
| STATEMENTS OF ASSETS AND LIABILITIES | | IVY VIP |
AS OF DECEMBER 31, 2018
| | | | | |
| (In thousands, except per share amounts) | | Government
Money
Market |
ASSETS | | | | | |
Investments in unaffiliated securities at value+ | | | $ | 238,517 | |
Investments at Value | | | | 238,517 | |
Cash | | | | 1 | |
Investment securities sold receivable | | | | 23 | |
Dividends and interest receivable | | | | 478 | |
Capital shares sold receivable | | | | 528 | |
Prepaid and other assets | | | | 1 | |
Total Assets | | | | 239,548 | |
| |
LIABILITIES | | | | | |
Capital shares redeemed payable | | | | 90 | |
Distributions payable | | | | 459 | |
Independent Trustees and Chief Compliance Officer fees payable | | | | 49 | |
Shareholder servicing payable | | | | 1 | |
Investment management fee payable | | | | 2 | |
Accounting services fee payable | | | | 7 | |
Other liabilities | | | | 4 | |
Total Liabilities | | | | 612 | |
Total Net Assets | | | $ | 238,936 | |
| |
NET ASSETS | | | | | |
Capital paid in (shares authorized – unlimited) | | | $ | 238,909 | |
Accumulated distributable earnings gain | | | | 27 | |
Total Net Assets | | | $ | 238,936 | |
| |
CAPITAL SHARES OUTSTANDING: | | | | | |
Class II | | | | 238,913 | |
| |
NET ASSET VALUE PER SHARE: | | | | | |
Class II | | | $ | 1.00 | |
| |
+COST | | | | | |
Investments in unaffiliated securities at cost | | | $ | 238,517 | |
See Accompanying Notes to Financial Statements.
| | |
| STATEMENTS OF OPERATIONS | | IVY VIP |
FOR THE YEAR ENDED DECEMBER 31, 2018
| | | | | | | | | | | | | | | | | | | | | | | | | | | | | | | | | | | | | | | | |
| (In thousands) | | Pathfinder
Aggressive | | Pathfinder
Conservative | | Pathfinder
Moderate | | Pathfinder
Moderately
Aggressive | | Pathfinder
Moderately
Conservative | | Pathfinder
Moderate –
Managed
Volatility | | Pathfinder
Moderately
Aggressive –
Managed
Volatility | | Pathfinder
Moderately
Conservative –
Managed
Volatility |
INVESTMENT INCOME | | | | | | | | | | | | | | | | | | | | | | | | | | | | | | | | | | | | | | | | |
Dividends from affiliated securities | | | $ | 1,801 | | | | $ | 2,039 | | | | $ | 18,748 | | | | $ | 23,606 | | | | $ | 4,988 | | | | $ | 13,504 | | | | $ | 2,084 | | | | $ | 1,519 | |
Interest and amortization from unaffiliated securities | | | | 20 | | | | | 21 | | | | | 19 | | | | | 18 | | | | | 18 | | | | | 399 | | | | | 47 | | | | | 43 | |
Total Investment Income | | | | 1,821 | | | | | 2,060 | | | | | 18,767 | | | | | 23,624 | | | | | 5,006 | | | | | 13,903 | | | | | 2,131 | | | | | 1,562 | |
| | | | | | | | |
EXPENSES | | | | | | | | | | | | | | | | | | | | | | | | | | | | | | | | | | | | | | | | |
Investment management fee | | | | — | | | | | — | | | | | — | | | | | — | | | | | — | | | | | 1,208 | | | | | 184 | | | | | 150 | |
Shareholder servicing: | | | | | | | | | | | | | | | | | | | | | | | | | | | | | | | | | | | | | | | | |
Class II | | | | — | * | | | | 1 | | | | | 6 | | | | | 7 | | | | | 2 | | | | | 5 | | | | | 1 | | | | | 1 | |
Custodian fees | | | | 2 | | | | | 2 | | | | | 2 | | | | | 3 | | | | | 2 | | | | | 4 | | | | | 2 | | | | | 2 | |
Independent Trustees and Chief Compliance Officer fees | | | | 12 | | | | | 14 | | | | | 63 | | | | | 74 | | | | | 23 | | | | | 32 | | | | | 12 | | | | | 11 | |
Insurance fees | | | | 2 | | | | | 3 | | | | | 23 | | | | | 28 | | | | | 7 | | | | | 16 | | | | | 2 | | | | | 2 | |
Printing fees | | | | 3 | | | | | 4 | | | | | 14 | | | | | 18 | | | | | 10 | | | | | 14 | | | | | 3 | | | | | 3 | |
Accounting services fee | | | | 25 | | | | | 33 | | | | | 140 | | | | | 165 | | | | | 55 | | | | | 110 | | | | | 27 | | | | | 25 | |
Professional fees | | | | 16 | | | | | 16 | | | | | 23 | | | | | 23 | | | | | 17 | | | | | 23 | | | | | 18 | | | | | 17 | |
Other | | | | 1 | | | | | 1 | | | | | 4 | | | | | 3 | | | | | 2 | | | | | 12 | | | | | 2 | | | | | 11 | |
Total Expenses | | | | 61 | | | | | 74 | | | | | 275 | | | | | 321 | | | | | 118 | | | | | 1,424 | | | | | 251 | | | | | 222 | |
Net Investment Income | | | | 1,760 | | | | | 1,986 | | | | | 18,492 | | | | | 23,303 | | | | | 4,888 | | | | | 12,479 | | | | | 1,880 | | | | | 1,340 | |
| | | | | | | | |
REALIZED AND UNREALIZED GAIN (LOSS) | | | | | | | | | | | | | | | | | | | | | | | | | | | | | | | | | | | | | | | | |
Net realized gain (loss) on: | | | | | | | | | | | | | | | | | | | | | | | | | | | | | | | | | | | | | | | | |
Investments in affiliated securities | | | | 1,532 | | | | | 1,243 | | | | | 20,471 | | | | | 28,797 | | | | | 3,949 | | | | | 5,557 | | | | | 1,231 | | | | | 769 | |
Distributions of realized capital gains from affiliated securities | | | | 4,047 | | | | | 3,605 | | | | | 36,585 | | | | | 50,430 | | | | | 9,531 | | | | | 26,436 | | | | | 4,466 | | | | | 2,905 | |
Futures contracts | | | | — | | | | | — | | | | | — | | | | | — | | | | | — | | | | | (1,403 | ) | | | | (241 | ) | | | | (228 | ) |
Net change in unrealized appreciation (depreciation) on: | | | | | | | | | | | | | | | | | | | | | | | | | | | | | | | | | | | | | | | | |
Investments in unaffiliated securities | | | | — | | | | | — | | | | | — | * | | | | — | * | | | | — | * | | | | 2 | | | | | — | * | | | | — | * |
Investments in affiliated securities | | | | (9,373 | ) | | | | (8,469 | ) | | | | (101,333 | ) | | | | (139,803 | ) | | | | (23,345 | ) | | | | (69,655 | ) | | | | (11,650 | ) | | | | (7,088 | ) |
Futures contracts | | | | — | | | | | — | | | | | — | | | | | — | | | | | — | | | | | 762 | | | | | 216 | | | | | 123 | |
Net Realized and Unrealized Loss | | | | (3,794 | ) | | | | (3,621 | ) | | | | (44,277 | ) | | | | (60,576 | ) | | | | (9,865 | ) | | | | (38,301 | ) | | | | (5,978 | ) | | | | (3,519 | ) |
Net Decrease in Net Assets Resulting from Operations | | | $ | (2,034 | ) | | | $ | (1,635 | ) | | | $ | (25,785 | ) | | | $ | (37,273 | ) | | | $ | (4,977 | ) | | | $ | (25,822 | ) | | | $ | (4,098 | ) | | | $ | (2,179 | ) |
*Not shown due to rounding.
See Accompanying Notes to Financial Statements.
| | |
| STATEMENTS OF OPERATIONS | | IVY VIP |
FOR THE YEAR ENDED DECEMBER 31, 2018
| | | | | |
| (In thousands) | | Government
Money
Market |
INVESTMENT INCOME | | | | | |
Interest and amortization from unaffiliated securities | | | $ | 5,509 | |
Total Investment Income | | | | 5,509 | |
| |
EXPENSES | | | | | |
Investment management fee | | | | 1,022 | |
Shareholder servicing: | | | | | |
Class II | | | | 2 | |
Custodian fees | | | | 7 | |
Independent Trustees and Chief Compliance Officer fees | | | | 25 | |
Accounting services fee | | | | 92 | |
Professional fees | | | | 15 | |
Other | | | | 4 | |
Total Expenses | | | | 1,167 | |
Net Investment Income | | | | 4,342 | |
| |
REALIZED AND UNREALIZED GAIN (LOSS) | | | | | |
Net realized gain (loss) on: | | | | | |
Investments in unaffiliated securities | | | | 38 | |
Net change in unrealized appreciation (depreciation) on: | | | | | |
Investments in unaffiliated securities | | | | — | |
Net Realized and Unrealized Gain | | | | 38 | |
Net Increase in Net Assets Resulting from Operations | | | $ | 4,380 | |
See Accompanying Notes to Financial Statements.
| | |
| STATEMENTS OF CHANGES IN NET ASSETS | | IVY VIP |
| | | | | | | | | | | | | | | | | | | | | | | | | | | | | | |
| | | Pathfinder Aggressive | | Pathfinder Conservative | | Pathfinder Moderate |
| (In thousands) | | Year
ended
12-31-18 | | Year
ended
12-31-17 | | Year
ended
12-31-18 | | Year
ended
12-31-17 | | Year
ended
12-31-18 | | Year
ended
12-31-17 |
INCREASE (DECREASE) IN NET ASSETS | | | | | | | | | | | | | | | | | | | | | | | | | | | | | | |
Operations: | | | | | | | | | | | | | | | | | | | | | | | | | | | | | | |
Net investment income | | | $ | 1,760 | | | | $ | 1,278 | | | | $ | 1,986 | | | | $ | 1,195 | | | | $ | 18,492 | | | | $ | 11,459 | |
Net realized gain on investments | | | | 5,579 | | | | | 3,790 | | | | | 4,848 | | | | | 3,528 | | | | | 57,056 | | | | | 37,067 | |
Net change in unrealized appreciation (depreciation) | | | | (9,373 | ) | | | | 8,690 | | | | | (8,469 | ) | | | | 6,533 | | | | | (101,333 | ) | | | | 71,897 | |
Net Increase (Decrease) in Net Assets Resulting from Operations | | | | (2,034 | ) | | | | 13,758 | | | | | (1,635 | ) | | | | 11,256 | | | | | (25,785 | ) | | | | 120,423 | |
| | | | | | |
Distributions to Shareholders From: | | | | | | | | | | | | | | | | | | | | | | | | | | | | | | |
Net investment income: | | | | | | | | | | | | | | | | | | | | | | | | | | | | | | |
Class II | | | | | | | | | (686 | ) | | | | | | | | | (813 | ) | | | | | | | | | (6,745 | ) |
Net realized gains: | | | | | | | | | | | | | | | | | | | | | | | | | | | | | | |
Class II | | | | | | | | | (5,308 | ) | | | | | | | | | (4,589 | ) | | | | | | | | | (47,759 | ) |
Accumulated earnings: | | | | | | | | | | | | | | | | | | | | | | | | | | | | | | |
(combined net investment income and net realized gains) | | | | | | | | | | | | | | | | | | | | | | | | | | | | | | |
Class II | | | | (5,067 | ) | | | | | | | | | (4,722 | ) | | | | | | | | | (48,519 | ) | | | | | |
Total Distributions to Shareholders | | | | (5,067 | ) | | | | (5,994 | ) | | | | (4,722 | ) | | | | (5,402 | ) | | | | (48,519 | ) | | | | (54,504 | ) |
Capital Share Transactions | | | | (9,874 | ) | | | | (6,655 | ) | | | | (8,982 | ) | | | | (11,195 | ) | | | | (100,492 | ) | | | | (49,008 | ) |
Net Increase (Decrease) in Net Assets | | | | (16,975 | ) | | | | 1,109 | | | | | (15,339 | ) | | | | (5,341 | ) | | | | (174,796 | ) | | | | 16,911 | |
Net Assets, Beginning of Period | | | | 75,765 | | | | | 74,656 | | | | | 108,918 | | | | | 114,259 | | | | | 877,382 | | | | | 860,471 | |
Net Assets, End of Period | | | $ | 58,790 | | | | $ | 75,765 | | | | $ | 93,579 | | | | $ | 108,918 | | | | $ | 702,586 | | | | $ | 877,382 | |
Undistributed net investment income | | | | | | | | $ | 1,272 | | | | | | | | | $ | 1,188 | | | | | | | | | $ | 11,413 | |
| | | |
| | | Pathfinder Moderately
Aggressive | | Pathfinder Moderately
Conservative | | Pathfinder Moderate –
Managed Volatility |
| (In thousands) | | Year
ended
12-31-18 | | Year
ended
12-31-17 | | Year
ended
12-31-18 | | Year
ended
12-31-17 | | Year
ended
12-31-18 | | Year
ended
12-31-17 |
| | | | | | |
INCREASE (DECREASE) IN NET ASSETS | | | | | | | | | | | | | | | | | | | | | | | | | | | | | | |
| | | | | | |
Operations: | | | | | | | | | | | | | | | | | | | | | | | | | | | | | | |
Net investment income | | | $ | 23,303 | | | | $ | 17,454 | | | | $ | 4,888 | | | | $ | 3,136 | | | | $ | 12,479 | | | | $ | 5,963 | |
Net realized gain on investments | | | | 79,227 | | | | | 48,284 | | | | | 13,480 | | | | | 9,830 | | | | | 30,590 | | | | | 18,136 | |
Net change in unrealized appreciation (depreciation) | | | | (139,803 | ) | | | | 96,068 | | | | | (23,345 | ) | | | | 18,077 | | | | | (68,891 | ) | | | | 47,266 | |
Net Increase (Decrease) in Net Assets Resulting from Operations | | | | (37,273 | ) | | | | 161,806 | | | | | (4,977 | ) | | | | 31,043 | | | | | (25,822 | ) | | | | 71,365 | |
| | | | | | |
Distributions to Shareholders From: | | | | | | | | | | | | | | | | | | | | | | | | | | | | | | |
Net investment income: | | | | | | | | | | | | | | | | | | | | | | | | | | | | | | |
Class II | | | | | | | | | (8,700 | ) | | | | | | | | | (2,102 | ) | | | | | | | | | (2,508 | ) |
Net realized gains: | | | | | | | | | | | | | | | | | | | | | | | | | | | | | | |
Class II | | | | | | | | | (62,750 | ) | | | | | | | | | (12,185 | ) | | | | | | | | | (14,751 | ) |
Accumulated earnings: | | | | | | | | | | | | | | | | | | | | | | | | | | | | | | |
(combined net investment income and net realized gains) | | | | | | | | | | | | | | | | | | | | | | | | | | | | | | |
Class II | | | | (65,728 | ) | | | | | | | | | (12,955 | ) | | | | | | | | | (24,303 | ) | | | | | |
Total Distributions to Shareholders | | | | (65,728 | ) | | | | (71,450 | ) | | | | (12,955 | ) | | | | (14,287 | ) | | | | (24,303 | ) | | | | (17,259 | ) |
Capital Share Transactions | | | | (111,539 | ) | | | | (57,768 | ) | | | | (28,163 | ) | | | | (26,463 | ) | | | | 56,327 | | | | | 34,164 | |
Net Increase (Decrease) in Net Assets | | | | (214,540 | ) | | | | 32,588 | | | | | (46,095 | ) | | | | (9,707 | ) | | | | 6,202 | | | | | 88,270 | |
Net Assets, Beginning of Period | | | | 1,052,457 | | | | | 1,019,869 | | | | | 251,343 | | | | | 261,050 | | | | | 599,627 | | | | | 511,357 | |
Net Assets, End of Period | | | $ | 837,917 | | | | $ | 1,052,457 | | | | $ | 205,248 | | | | $ | 251,343 | | | | $ | 605,829 | | | | $ | 599,627 | |
Undistributed net investment income | | | | | | | | $ | 17,387 | | | | | | | | | $ | 3,118 | | | | | | | | | $ | 5,928 | |
See Accompanying Notes to Financial Statements.
| | |
| STATEMENTS OF CHANGES IN NET ASSETS | | IVY VIP |
| | | | | | | | | | | | | | | | | | | | | | | | | | | | | | |
| | | Pathfinder Moderately
Aggressive – Managed
Volatility | | Pathfinder Moderately
Conservative – Managed
Volatility | | Government Money Market |
| (In thousands) | | Year
ended
12-31-18 | | Year
ended
12-31-17 | | Year
ended
12-31-18 | | Year
ended
12-31-17 | | Year
ended
12-31-18 | | Year
ended
12-31-17 |
INCREASE (DECREASE) IN NET ASSETS | | | | | | | | | | | | | | | | | | | | | | | | | | | | | | |
Operations: | | | | | | | | | | | | | | | | | | | | | | | | | | | | | | |
Net investment income | | | $ | 1,880 | | | | $ | 1,195 | | | | $ | 1,340 | | | | $ | 676 | | | | $ | 4,342 | | | | $ | 2,127 | |
Net realized gain (loss) on investments | | | | 5,456 | | | | | 2,850 | | | | | 3,446 | | | | | 2,172 | | | | | 38 | | | | | (9 | ) |
Net change in unrealized appreciation (depreciation) | | | | (11,434 | ) | | | | 8,450 | | | | | (6,965 | ) | | | | 5,026 | | | | | — | | | | | — | |
Net Increase (Decrease) in Net Assets Resulting from Operations | | | | (4,098 | ) | | | | 12,495 | | | | | (2,179 | ) | | | | 7,874 | | | | | 4,380 | | | | | 2,118 | |
| | | | | | |
Distributions to Shareholders From: | | | | | | | | | | | | | | | | | | | | | | | | | | | | | | |
Net investment income: | | | | | | | | | | | | | | | | | | | | | | | | | | | | | | |
Class II | | | | | | | | | (388 | ) | | | | | | | | | (298 | ) | | | | | | | | | (2,127 | ) |
Net realized gains: | | | | | | | | | | | | | | | | | | | | | | | | | | | | | | |
Class II | | | | | | | | | (2,463 | ) | | | | | | | | | (1,471 | ) | | | | | | | | | (24 | ) |
Accumulated earnings: | | | | | | | | | | | | | | | | | | | | | | | | | | | | | | |
(combined net investment income and net realized gains) | | | | | | | | | | | | | | | | | | | | | | | | | | | | | | |
Class II | | | | (4,062 | ) | | | | | | | | | (2,876 | ) | | | | | | | | | (4,344 | ) | | | | | |
Total Distributions to Shareholders | | | | (4,062 | ) | | | | (2,851 | ) | | | | (2,876 | ) | | | | (1,769 | ) | | | | (4,344 | ) | | | | (2,151 | ) |
Capital Share Transactions | | | | (176 | ) | | | | 5,109 | | | | | 3,753 | | | | | 915 | | | | | (78,127 | ) | | | | (96,810 | ) |
Net Increase (Decrease) in Net Assets | | | | (8,336 | ) | | | | 14,753 | | | | | (1,302 | ) | | | | 7,020 | | | | | (78,091 | ) | | | | (96,843 | ) |
Net Assets, Beginning of Period | | | | 92,303 | | | | | 77,550 | | | | | 74,138 | | | | | 67,118 | | | | | 317,027 | | | | | 413,870 | |
Net Assets, End of Period | | | $ | 83,967 | | | | $ | 92,303 | | | | $ | 72,836 | | | | $ | 74,138 | | | | $ | 238,936 | | | | $ | 317,027 | |
Undistributed net investment income | | | | | | | | $ | 1,172 | | | | | | | | | $ | 654 | | | | | | | | | $ | — | |
See Accompanying Notes to Financial Statements.
This page intentionally left blank.
| | |
| FINANCIAL HIGHLIGHTS | | IVY VIP |
FOR A SHARE OF CAPITAL STOCK OUTSTANDING THROUGHOUT EACH PERIOD
| | | | | | | | | | | | | | | | | | | | | | | | | | | | | | | | | | | |
| | | | | | | |
| | | Net Asset
Value,
Beginning of
Period | | Net
Investment
Income(1) | | Net Realized
and Unrealized
Gain (Loss) on
Investments | | Total from
Investment
Operations | | Distributions
From Net
Investment
Income | | Distributions
From Net
Realized
Gains | | Total
Distributions |
Pathfinder Aggressive | | | | | | | | | | | | | | | | | | | | | | | | | | | | | | | | | | | |
Class II Shares | | | | | | | | | | | | | | | | | | | | | | | | | | | | | | | | | | | |
Year ended12-31-2018 | | | $ | 5.16 | | | | $ | 0.13 | | | | $ | (0.32 | ) | | | $ | (0.19 | ) | | | $ | (0.09 | ) | | | $ | (0.28 | ) | | | $ | (0.37 | ) |
Year ended12-31-2017 | | | | 4.68 | | | | | 0.08 | | | | | 0.80 | | | | | 0.88 | | | | | (0.05 | ) | | | | (0.35 | ) | | | | (0.40 | ) |
Year ended12-31-2016 | | | | 5.05 | | | | | 0.04 | | | | | 0.15 | | | | | 0.19 | | | | | (0.07 | ) | | | | (0.49 | ) | | | | (0.56 | ) |
Year ended12-31-2015 | | | | 5.73 | | | | | 0.07 | | | | | (0.01 | ) | | | | 0.06 | | | | | (0.16 | ) | | | | (0.58 | ) | | | | (0.74 | ) |
Year ended12-31-2014 | | | | 5.95 | | | | | 0.16 | | | | | 0.10 | | | | | 0.26 | | | | | (0.05 | ) | | | | (0.43 | ) | | | | (0.48 | ) |
| | | | | | | |
Pathfinder Conservative | | | | | | | | | | | | | | | | | | | | | | | | | | | | | | | | | | | |
Class II Shares | | | | | | | | | | | | | | | | | | | | | | | | | | | | | | | | | | | |
Year ended12-31-2018 | | | | 5.16 | | | | | 0.10 | | | | | (0.20 | ) | | | | (0.10 | ) | | | | (0.06 | ) | | | | (0.17 | ) | | | | (0.23 | ) |
Year ended12-31-2017 | | | | 4.90 | | | | | 0.05 | | | | | 0.46 | | | | | 0.51 | | | | | (0.04 | ) | | | | (0.21 | ) | | | | (0.25 | ) |
Year ended12-31-2016 | | | | 5.15 | | | | | 0.04 | | | | | 0.09 | | | | | 0.13 | | | | | (0.06 | ) | | | | (0.32 | ) | | | | (0.38 | ) |
Year ended12-31-2015 | | | | 5.54 | | | | | 0.06 | | | | | (0.03 | ) | | | | 0.03 | | | | | (0.06 | ) | | | | (0.36 | ) | | | | (0.42 | ) |
Year ended12-31-2014 | | | | 5.77 | | | | | 0.06 | | | | | 0.12 | | | | | 0.18 | | | | | (0.06 | ) | | | | (0.35 | ) | | | | (0.41 | ) |
| | | | | | | |
Pathfinder Moderate | | | | | | | | | | | | | | | | | | | | | | | | | | | | | | | | | | | |
Class II Shares | | | | | | | | | | | | | | | | | | | | | | | | | | | | | | | | | | | |
Year ended12-31-2018 | | | | 5.40 | | | | | 0.12 | | | | | (0.31 | ) | | | | (0.19 | ) | | | | (0.08 | ) | | | | (0.24 | ) | | | | (0.32 | ) |
Year ended12-31-2017 | | | | 5.02 | | | | | 0.07 | | | | | 0.64 | | | | | 0.71 | | | | | (0.04 | ) | | | | (0.29 | ) | | | | (0.33 | ) |
Year ended12-31-2016 | | | | 5.34 | | | | | 0.04 | | | | | 0.13 | | | | | 0.17 | | | | | (0.07 | ) | | | | (0.42 | ) | | | | (0.49 | ) |
Year ended12-31-2015 | | | | 5.87 | | | | | 0.07 | | | | | (0.02 | ) | | | | 0.05 | | | | | (0.10 | ) | | | | (0.48 | ) | | | | (0.58 | ) |
Year ended12-31-2014 | | | | 6.14 | | | | | 0.10 | | | | | 0.14 | | | | | 0.24 | | | | | (0.07 | ) | | | | (0.44 | ) | | | | (0.51 | ) |
| | | | | | | |
Pathfinder Moderately Aggressive | | | | | | | | | | | | | | | | | | | | | | | | | | | | | | | | | | | |
Class II Shares | | | | | | | | | | | | | | | | | | | | | | | | | | | | | | | | | | | |
Year ended12-31-2018 | | | | 5.59 | | | | | 0.13 | | | | | (0.37 | ) | | | | (0.24 | ) | | | | (0.10 | ) | | | | (0.27 | ) | | | | (0.37 | ) |
Year ended12-31-2017 | | | | 5.14 | | | | | 0.09 | | | | | 0.74 | | | | | 0.83 | | | | | (0.05 | ) | | | | (0.33 | ) | | | | (0.38 | ) |
Year ended12-31-2016 | | | | 5.50 | | | | | 0.04 | | | | | 0.17 | | | | | 0.21 | | | | | (0.09 | ) | | | | (0.48 | ) | | | | (0.57 | ) |
Year ended12-31-2015 | | | | 6.14 | | | | | 0.09 | | | | | (0.06 | ) | | | | 0.03 | | | | | (0.14 | ) | | | | (0.53 | ) | | | | (0.67 | ) |
Year ended12-31-2014 | | | | 6.38 | | | | | 0.14 | | | | | 0.14 | | | | | 0.28 | | | | | (0.07 | ) | | | | (0.45 | ) | | | | (0.52 | ) |
| | | | | | | |
Pathfinder Moderately Conservative | | | | | | | | | | | | | | | | | | | | | | | | | | | | | | | | | | | |
Class II Shares | | | | | | | | | | | | | | | | | | | | | | | | | | | | | | | | | | | |
Year ended12-31-2018 | | | | 5.32 | | | | | 0.11 | | | | | (0.24 | ) | | | | (0.13 | ) | | | | (0.07 | ) | | | | (0.22 | ) | | | | (0.29 | ) |
Year ended12-31-2017 | | | | 4.99 | | | | | 0.06 | | | | | 0.56 | | | | | 0.62 | | | | | (0.04 | ) | | | | (0.25 | ) | | | | (0.29 | ) |
Year ended12-31-2016 | | | | 5.30 | | | | | 0.04 | | | | | 0.10 | | | | | 0.14 | | | | | (0.07 | ) | | | | (0.38 | ) | | | | (0.45 | ) |
Year ended12-31-2015 | | | | 5.80 | | | | | 0.07 | | | | | (0.03 | ) | | | | 0.04 | | | | | (0.09 | ) | | | | (0.45 | ) | | | | (0.54 | ) |
Year ended12-31-2014 | | | | 6.03 | | | | | 0.08 | | | | | 0.14 | | | | | 0.22 | | | | | (0.06 | ) | | | | (0.39 | ) | | | | (0.45 | ) |
| * | Not shown due to rounding. |
| (1) | Based on average weekly shares outstanding. |
| (2) | Based on net asset value. Total returns do not reflect a sales charge or contingent deferred sales charge, if applicable. Total returns for periods less than one year are not annualized. |
| (3) | Ratios excluding expense waivers are included only for periods in which the class had waived or reimbursed expenses. |
| (4) | Ratios of expenses to average net assets excluding offering cost was 0.26%. |
| (5) | Ratios of expenses to average net assets excluding offering cost was 0.33%. |
| (6) | Ratios of expenses to average net assets excluding offering cost was 0.36%. |
| (7) | Does not include expenses of underlying Ivy VIP Portfolios in which the Portfolio invest. |
| | | | | | | | | | | | | | | | | | | | | | | | | | | | | | |
| | | | | | |
| | | Net Asset
Value,
End of Period | | Total
Return(2) | | Net Assets,
End of Period
(in millions) | | Ratio of Expenses
to Average Net
Assets(7) | | Ratio of Net
Investment
Income to
Average
Net Assets(7) | | Portfolio
Turnover
Rate |
Pathfinder Aggressive | | | | | | | | | | | | | | | | | | | | | | | | | | | | | | |
Class II Shares | | | | | | | | | | | | | | | | | | | | | | | | | | | | | | |
Year ended12-31-2018 | | | $ | 4.60 | | | | | -4.27 | % | | | $ | 59 | | | | | 0.09 | % | | | | 2.49 | % | | | | 51 | % |
Year ended12-31-2017 | | | | 5.16 | | | | | 19.83 | | | | | 76 | | | | | 0.07 | | | | | 1.68 | | | | | 20 | |
Year ended12-31-2016 | | | | 4.68 | | | | | 4.80 | | | | | 75 | | | | | 0.08 | | | | | 0.88 | | | | | 23 | |
Year ended12-31-2015 | | | | 5.05 | | | | | 0.34 | | | | | 85 | | | | | 0.07 | | | | | 1.36 | | | | | 13 | |
Year ended12-31-2014 | | | | 5.73 | | | | | 4.86 | | | | | 85 | | | | | 0.07 | | | | | 2.73 | | | | | 28 | |
| | | | | | |
Pathfinder Conservative | | | | | | | | | | | | | | | | | | | | | | | | | | | | | | |
Class II Shares | | | | | | | | | | | | | | | | | | | | | | | | | | | | | | |
Year ended12-31-2018 | | | | 4.83 | | | | | -1.93 | | | | | 94 | | | | | 0.07 | | | | | 1.89 | | | | | 39 | |
Year ended12-31-2017 | | | | 5.16 | | | | | 10.51 | | | | | 109 | | | | | 0.06 | | | | | 1.06 | | | | | 30 | |
Year ended12-31-2016 | | | | 4.90 | | | | | 2.84 | | | | | 114 | | | | | 0.07 | | | | | 0.71 | | | | | 26 | |
Year ended12-31-2015 | | | | 5.15 | | | | | 0.45 | | | | | 117 | | | | | 0.06 | | | | | 1.09 | | | | | 17 | |
Year ended12-31-2014 | | | | 5.54 | | | | | 3.39 | | | | | 122 | | | | | 0.06 | | | | | 1.13 | | | | | 30 | |
| | | | | | |
Pathfinder Moderate | | | | | | | | | | | | | | | | | | | | | | | | | | | | | | |
Class II Shares | | | | | | | | | | | | | | | | | | | | | | | | | | | | | | |
Year ended12-31-2018 | | | | 4.89 | | | | | -3.90 | | | | | 703 | | | | | 0.03 | | | | | 2.26 | | | | | 36 | |
Year ended12-31-2017 | | | | 5.40 | | | | | 14.70 | | | | | 877 | | | | | 0.03 | | | | | 1.30 | | | | | 22 | |
Year ended12-31-2016 | | | | 5.02 | | | | | 3.65 | | | | | 860 | | | | | 0.03 | | | | | 0.78 | | | | | 19 | |
Year ended12-31-2015 | | | | 5.34 | | | | | 0.32 | | | | | 893 | | | | | 0.03 | | | | | 1.22 | | | | | 13 | |
Year ended12-31-2014 | | | | 5.87 | | | | | 4.24 | | | | | 928 | | | | | 0.03 | | | | | 1.69 | | | | | 24 | |
| | | | |
Pathfinder Moderately Aggressive | | | | | | | | | | | | | | | | | | | | | |
Class II Shares | | | | | | | | | | | | | | | | | | | | | | | | | | | | | | |
Year ended12-31-2018 | | | | 4.98 | | | | | -4.71 | | | | | 838 | | | | | 0.03 | | | | | 2.35 | | | | | 39 | |
Year ended12-31-2017 | | | | 5.59 | | | | | 16.72 | | | | | 1,052 | | | | | 0.03 | | | | | 1.66 | | | | | 20 | |
Year ended12-31-2016 | | | | 5.14 | | | | | 4.52 | | | | | 1,020 | | | | | 0.04 | | | | | 0.85 | | | | | 17 | |
Year ended12-31-2015 | | | | 5.50 | | | | | 0.06 | | | | | 1,054 | | | | | 0.03 | | | | | 1.50 | | | | | 12 | |
Year ended12-31-2014 | | | | 6.14 | | | | | 4.61 | | | | | 1,098 | | | | | 0.03 | | | | | 2.30 | | | | | 23 | |
| | | |
Pathfinder Moderately Conservative | | | | | | | | | | | | | | | | |
Class II Shares | | | | | | | | | | | | | | | | | | | | | | | | | | | | | | |
Year ended12-31-2018 | | | | 4.90 | | | | | -2.67 | | | | | 205 | | | | | 0.05 | | | | | 2.07 | | | | | 34 | |
Year ended12-31-2017 | | | | 5.32 | | | | | 12.77 | | | | | 251 | | | | | 0.05 | | | | | 1.22 | | | | | 24 | |
Year ended12-31-2016 | | | | 4.99 | | | | | 3.10 | | | | | 261 | | | | | 0.05 | | | | | 0.80 | | | | | 16 | |
Year ended12-31-2015 | | | | 5.30 | | | | | 0.33 | | | | | 272 | | | | | 0.04 | | | | | 1.20 | | | | | 16 | |
Year ended12-31-2014 | | | | 5.80 | | | | | 3.88 | | | | | 291 | | | | | 0.04 | | | | | 1.43 | | | | | 27 | |
See Accompanying Notes to Financial Statements.
| | |
| FINANCIAL HIGHLIGHTS | | IVY VIP |
FOR A SHARE OF CAPITAL STOCK OUTSTANDING THROUGHOUT EACH PERIOD
| | | | | | | | | | | | | | | | | | | | | | | | | | | | | | | | | | | |
| | | | | | | |
| | | Net Asset
Value,
Beginning of
Period | | Net
Investment
Income(1) | | Net Realized
and Unrealized
Gain (Loss) on
Investments | | Total from
Investment
Operations | | Distributions
From Net
Investment
Income | | Distributions
From Net
Realized
Gains | | Total
Distributions |
Pathfinder Moderate – Managed Volatility | | | | | | | | | | | | | | | | | | | | | | | | | | |
Class II Shares | | | | | | | | | | | | | | | | | | | | | | | | | | | | | | | | | | | |
Year ended12-31-2018 | | | $ | 5.78 | | | | $ | 0.11 | | | | $ | (0.33 | ) | | | $ | (0.22 | ) | | | $ | (0.06 | ) | | | $ | (0.17 | ) | | | $ | (0.23 | ) |
Year ended12-31-2017 | | | | 5.25 | | | | | 0.06 | | | | | 0.65 | | | | | 0.71 | | | | | (0.03 | ) | | | | (0.15 | ) | | | | (0.18 | ) |
Year ended12-31-2016 | | | | 5.37 | | | | | 0.03 | | | | | 0.06 | | | | | 0.09 | | | | | (0.03 | ) | | | | (0.18 | ) | | | | (0.21 | ) |
Year ended12-31-2015 | | | | 5.39 | | | | | 0.05 | | | | | (0.07 | ) | | | | (0.02 | ) | | | | — | | | | | — | | | | | — | |
Year ended12-31-2014 | | | | 5.37 | | | | | 0.06 | | | | | 0.14 | | | | | 0.20 | | | | | (0.03 | ) | | | | (0.15 | ) | | | | (0.18 | ) |
| | | | | |
Pathfinder Moderately Aggressive – Managed Volatility | | | | | | | | | | | | | | | | | | | | | | | | | | |
Class II Shares | | | | | | | | | | | | | | | | | | | | | | | | | | | | | | | | | | | |
Year ended12-31-2018 | | | | 5.66 | | | | | 0.11 | | | | | (0.37 | ) | | | | (0.26 | ) | | | | (0.07 | ) | | | | (0.18 | ) | | | | (0.25 | ) |
Year ended12-31-2017 | | | | 5.06 | | | | | 0.07 | | | | | 0.71 | | | | | 0.78 | | | | | (0.02 | ) | | | | (0.16 | ) | | | | (0.18 | ) |
Year ended12-31-2016 | | | | 5.25 | | | | | 0.03 | | | | | 0.09 | | | | | 0.12 | | | | | (0.05 | ) | | | | (0.26 | ) | | | | (0.31 | ) |
Year ended12-31-2015 | | | | 5.29 | | | | | 0.06 | | | | | (0.10 | ) | | | | (0.04 | ) | | | | — | | | | | — | | | | | — | |
Year ended12-31-2014 | | | | 5.41 | | | | | 0.09 | | | | | 0.11 | | | | | 0.20 | | | | | (0.07 | ) | | | | (0.25 | ) | | | | (0.32 | ) |
| | | | | |
Pathfinder Moderately Conservative – Managed Volatility | | | | | | | | | | | | | | | | | | | | | | | | | | |
Class II Shares | | | | | | | | | | | | | | | | | | | | | | | | | | | | | | | | | | | |
Year ended12-31-2018 | | | | 5.55 | | | | | 0.10 | | | | | (0.24 | ) | | | | (0.14 | ) | | | | (0.05 | ) | | | | (0.17 | ) | | | | (0.22 | ) |
Year ended12-31-2017 | | | | 5.10 | | | | | 0.05 | | | | | 0.53 | | | | | 0.58 | | | | | (0.02 | ) | | | | (0.11 | ) | | | | (0.13 | ) |
Year ended12-31-2016 | | | | 5.23 | | | | | 0.02 | | | | | 0.04 | | | | | 0.06 | | | | | (0.03 | ) | | | | (0.16 | ) | | | | (0.19 | ) |
Year ended12-31-2015 | | | | 5.27 | | | | | 0.04 | | | | | (0.07 | ) | | | | (0.03 | ) | | | | — | | | | | (0.01 | ) | | | | (0.01 | ) |
Year ended12-31-2014 | | | | 5.31 | | | | | 0.04 | | | | | 0.11 | | | | | 0.15 | | | | | (0.03 | ) | | | | (0.16 | ) | | | | (0.19 | ) |
| | | | | | | |
Government Money Market | | | | | | | | | | | | | | | | | | | | | | | | | | | | | | | | | | | |
Class II Shares | | | | | | | | | | | | | | | | | | | | | | | | | | | | | | | | | | | |
Year ended12-31-2018 | | | | 1.00 | | | | | 0.02 | | | | | 0.00 | * | | | | 0.02 | | | | | (0.02 | ) | | | | — | * | | | | (0.02 | ) |
Year ended12-31-2017 | | | | 1.00 | | | | | 0.01 | | | | | 0.00 | * | | | | 0.01 | | | | | (0.01 | ) | | | | — | * | | | | (0.01 | ) |
Year ended12-31-2016 | | | | 1.00 | | | | | 0.00 | * | | | | 0.00 | * | | | | 0.00 | * | | | | — | * | | | | — | * | | | | — | * |
Year ended12-31-2015 | | | | 1.00 | | | | | 0.00 | * | | | | 0.00 | * | | | | 0.00 | * | | | | — | * | | | | — | | | | | — | * |
Year ended12-31-2014 | | | | 1.00 | | | | | 0.00 | * | | | | 0.00 | * | | | | 0.00 | * | | | | — | * | | | | — | | | | | — | * |
| | | | | | | | | | | | | | | | | | | | | | | | | | | | | | | | | | | | | | | | |
| | | Net Asset
Value,
End of Period | | Total
Return(2) | | Net Assets,
End of Period
(in millions) | | Ratio of Expenses
to Average Net
Assets Including
Expense Waiver | | Ratio of Net
Investment
Income to
Average
Net Assets
Including
Expense
Waiver | | Ratio of
Expenses to
Average
Net Assets
Excluding
Expense
Waiver(3) | | Ratio of Net
Investment
Income
(Loss) to
Average
Net Assets
Excluding
Expense
Waiver(3) | | Portfolio
Turnover
Rate |
Pathfinder Moderate – Managed Volatility | | | | | | | | | | | | | | | | | | | | | | | | | | |
Class II Shares | | | | | | | | | | | | | | | | | | | | | | | | | | | | | | | | | | | | | | | | |
Year ended12-31-2018 | | | $ | 5.33 | | | | | -4.00 | % | | | $ | 606 | | | | | 0.23 | %(7) | | | | 2.00 | %(7) | | | | — | % | | | | — | % | | | | 28 | % |
Year ended12-31-2017 | | | | 5.78 | | | | | 13.80 | | | | | 600 | | | | | 0.23 | (7) | | | | 1.07 | (7) | | | | — | | | | | — | | | | | 21 | |
Year ended12-31-2016 | | | | 5.25 | | | | | 1.81 | | | | | 511 | | | | | 0.24 | (7) | | | | 0.55 | (7) | | | | — | | | | | — | | | | | 14 | |
Year ended12-31-2015 | | | | 5.37 | | | | | -0.43 | | | | | 396 | | | | | 0.24 | (7) | | | | 0.88 | (7) | | | | — | | | | | — | | | | | 7 | |
Year ended12-31-2014 | | | | 5.39 | | | | | 3.75 | | | | | 203 | | | | | 0.28 | (4)(7) | | | | 1.06 | (7) | | | | — | | | | | — | | | | | 23 | |
| | | | |
Pathfinder Moderately Aggressive – Managed Volatility | | | | | | | | | | | | | | | | | | | | | |
Class II Shares | | | | | | | | | | | | | | | | | | | | | | | | | | | | | | | | | | | | | | | | |
Year ended12-31-2018 | | | | 5.15 | | | | | -4.75 | | | | | 84 | | | | | 0.27 | (7) | | | | 2.04 | (7) | | | | — | | | | | — | | | | | 37 | |
Year ended12-31-2017 | | | | 5.66 | | | | | 15.70 | | | | | 92 | | | | | 0.27 | (7) | | | | 1.38 | (7) | | | | — | | | | | — | | | | | 19 | |
Year ended12-31-2016 | | | | 5.06 | | | | | 2.36 | | | | | 78 | | | | | 0.31 | (7) | | | | 0.56 | (7) | | | | — | | | | | — | | | | | 12 | |
Year ended12-31-2015 | | | | 5.25 | | | | | -0.71 | | | | | 67 | | | | | 0.30 | (7) | | | | 1.13 | (7) | | | | — | | | | | — | | | | | 7 | |
Year ended12-31-2014 | | | | 5.29 | | | | | 3.91 | | | | | 43 | | | | | 0.41 | (5)(7) | | | | 1.74 | (7) | | | | — | | | | | — | | | | | 32 | |
| | | | |
Pathfinder Moderately Conservative – Managed Volatility | | | | | | | | | | | | | | | | | | | | | |
Class II Shares | | | | | | | | | | | | | | | | | | | | | | | | | | | | | | | | | | | | | | | | |
Year ended12-31-2018 | | | | 5.19 | | | | | -2.90 | | | | | 73 | | | | | 0.29 | (7) | | | | 1.79 | (7) | | | | — | | | | | — | | | | | 28 | |
Year ended12-31-2017 | | | | 5.55 | | | | | 11.84 | | | | | 74 | | | | | 0.27 | (7) | | | | 0.96 | (7) | | | | — | | | | | — | | | | | 26 | |
Year ended12-31-2016 | | | | 5.10 | | | | | 1.21 | | | | | 67 | | | | | 0.30 | (7) | | | | 0.49 | (7) | | | | — | | | | | — | | | | | 11 | |
Year ended12-31-2015 | | | | 5.23 | | | | | -0.52 | | | | | 54 | | | | | 0.30 | (7) | | | | 0.78 | (7) | | | | — | | | | | — | | | | | 9 | |
Year ended12-31-2014 | | | | 5.27 | | | | | 3.06 | | | | | 31 | | | | | 0.47 | (6)(7) | | | | 0.76 | (7) | | | | — | | | | | — | | | | | 36 | |
| | | | | | | | |
Government Money Market | | | | | | | | | | | | | | | | | | | | | | | | | | | | | | | | | | | | | | | | |
Class II Shares | | | | | | | | | | | | | | | | | | | | | | | | | | | | | | | | | | | | | | | | |
Year ended12-31-2018 | | | | 1.00 | | | | | 1.53 | | | | | 239 | | | | | 0.40 | | | | | 1.49 | | | | | — | | | | | — | | | | | — | |
Year ended12-31-2017 | | | | 1.00 | | | | | 0.59 | | | | | 317 | | | | | 0.41 | | | | | 0.56 | | | | | 0.42 | | | | | 0.55 | | | | | — | |
Year ended12-31-2016 | | | | 1.00 | | | | | 0.13 | | | | | 414 | | | | | 0.45 | | | | | 0.13 | | | | | 0.46 | | | | | 0.12 | | | | | — | |
Year ended12-31-2015 | | | | 1.00 | | | | | 0.02 | | | | | 539 | | | | | 0.20 | | | | | 0.02 | | | | | 0.45 | | | | | -0.23 | | | | | — | |
Year ended12-31-2014 | | | | 1.00 | | | | | 0.02 | | | | | 512 | | | | | 0.15 | | | | | 0.02 | | | | | 0.45 | | | | | -0.28 | | | | | — | |
See Accompanying Notes to Financial Statements.
| | |
| NOTES TO FINANCIAL STATEMENTS | | IVY VIP |
DECEMBER 31, 2018
Ivy Variable Insurance Portfolios, a Delaware statutory trust (the “Trust”), is registered under the Investment Company Act of 1940, as amended (the “1940 Act”), as anopen-end management investment company. Pathfinder Aggressive, Pathfinder Conservative, Pathfinder Moderate, Pathfinder Moderately Aggressive and Pathfinder Moderately Conservative (collectively, the “Pathfinder Portfolios”), Pathfinder Moderate — Managed Volatility, Pathfinder Moderately Aggressive — Managed Volatility and Pathfinder Moderately Conservative — Managed Volatility (collectively, the “Managed Volatility Portfolios”) and Government Money Market (each, a “Portfolio”) are nine series of the Trust and are the only series of the Trust included in the financial statements. The assets belonging to Government Money Market are held separately by the custodian. The assets belonging to each Pathfinder Portfolio and Managed Volatility Portfolio are held separately by the transfer agent for the underlying funds and the custodian. The investment objective, policies and risk factors of each Portfolio are described more fully in the Prospectus and Statement of Additional Information (“SAI”). Each Portfolio’s investment adviser is Ivy Investment Management Company (“IICO”).
| 2. | | SIGNIFICANT ACCOUNTING POLICIES |
The following is a summary of significant accounting policies consistently followed by each Portfolio.
Security Transactions and Related Investment Income. Security transactions are accounted for on the trade date (date the order to buy or sell is executed). Realized gains and losses are calculated on the identified cost basis. Interest income is recorded on the accrual basis and includes paydown gain (loss) and accretion of discounts and amortization of premiums. Dividend income is recorded on theex-dividend date, except certain dividends from foreign securities where theex-dividend date may have passed, which are recorded as soon as the Portfolio is informed of theex-dividend date. All or a portion of the distributions received from a real estate investment trust or publicly traded partnership may be designated as a reduction of cost of the related investment or realized gain. Income or short-term capital gain distributions received from registered investment companies, if any, are recorded as dividend income. Long-term capital gain distributions received from registered investment companies, if any, are recorded as realized gains.
Foreign Currency Translation. Each Portfolio’s accounting records are maintained in U.S. dollars. All assets and liabilities denominated in foreign currencies are translated into U.S. dollars daily, using foreign exchange rates obtained from an independent pricing service approved by the Board of Trustees of the Trust (the “Board”). Purchases and sales of investment securities and accruals of income and expenses are translated at the rate of exchange prevailing on the date of the transaction. For assets and liabilities other than investments in securities, net realized and unrealized gains and losses from foreign currency translation arise from changes in currency exchange rates. Each Portfolio combines fluctuations from currency exchange rates and fluctuations in value when computing net realized gain (loss) and net change in unrealized appreciation (depreciation) on investments. Foreign exchange rates are typically valued as of the close of the New York Stock Exchange (“NYSE”), normally 4:00 P.M. Eastern time, on each day the NYSE is open for trading.
Dividends and Distributions to Shareholders.Dividends and distributions to shareholders are recorded by each Portfolio on the business day following record date. Net investment income dividends and capital gains distributions are determined in accordance with income tax regulations which may differ from accounting principles generally accepted in the United States of America (“U.S. GAAP”). If the total dividends and distributions made in any tax year exceeds net investment income and accumulated realized capital gains, a portion of the total distribution may be treated as a tax return of capital.
Income Taxes.It is the policy of each Portfolio to distribute all of its taxable income and capital gains to its shareholders and to otherwise qualify as a regulated investment company under Subchapter M of the Internal Revenue Code. In addition, each Portfolio intends to pay distributions as required to avoid imposition of excise tax. Accordingly, no provision has been made for Federal income taxes. The Portfolios file income tax returns in U.S. federal and applicable state jurisdictions. The Portfolios’ tax returns are subject to examination by the relevant taxing authority until expiration of the applicable statute of limitations, which is generally three years after the filing of the tax returns. Management of the Trust periodically reviews all tax positions to assess whether it is more likely than not that the position would be sustained upon examination by the relevant tax authority based on the technical merits of each position. As of the date of these financial statements, management believes that no liability for unrecognized tax positions is required.
Segregation and Collateralization.In cases in which the 1940 Act and the interpretive positions of the Securities and Exchange Commission (“SEC”), the Dodd Frank Wall Street Reform and Consumer Protection Act, or the interpretive rules and regulations of the U.S. Commodities Futures Trading Commission require that a Portfolio either deliver collateral or segregate assets in connection with certain investments (e.g., dollar rolls, financial futures contracts, foreign currency exchange contracts, options written, securities with extended settlement periods, and swaps), the Portfolio will segregate collateral or designate on its books and records, cash or other liquid securities having a value at least equal to the amount that is required to be physically segregated for the benefit of the counterparty. Furthermore, based on requirements and
agreements with certain exchanges and third party broker-dealers, each party has requirements to deliver/deposit cash or securities as collateral for certain investments. Certain countries require that cash reserves be held while investing in companies incorporated in that country. These cash reserves and cash collateral that has been pledged to cover obligations of the Portfolios under derivative contracts, if any, will be reported separately on the Statement of Assets and Liabilities as “Restricted cash”. Securities collateral pledged for the same purpose, if any, is noted on the Schedule of Investments.
Concentration of Market and Credit Risk. Because each Pathfinder Portfolio and Managed Volatility Portfolio invests substantially all of its assets in Ivy Variable Insurance Portfolios mutual funds (“Underlying Funds”), the risks associated with investing in the Portfolios are closely related to the risks associated with the securities and other investments held by the Underlying Funds.
In the normal course of business, Government Money Market and the Underlying Funds may invest in securities and enter into transactions where risks exist due to fluctuations in the market (market risk) or failure of the issuer of a security to meet all its obligations (issuer credit risk). The value of securities held by Government Money Market and the Underlying Funds may decline in response to certain events, including those directly involving the issuers whose securities are owned by the Underlying Funds; conditions affecting the general economy; overall market changes; local, regional or global political, social or economic instability; and currency and interest rate and price fluctuations. Similar to issuer credit risk, Government Money Market and the Underlying Funds may be exposed to counterparty credit risk, or the risk that an entity with which Government Money Market or the Underlying Funds have unsettled or open transactions may fail to or be unable to perform on its commitments. Government Money Market and the Underlying Funds manage counterparty credit risk by entering into transactions only with counterparties that they believe have the financial resources to honor their obligations and by monitoring the financial stability of those counterparties. Financial assets, which potentially expose the Underlying Funds to market, issuer and counterparty credit risks, consist principally of financial instruments and receivables due from counterparties.
Certain Underlying Funds may hold high-yield ornon-investment-grade bonds, that may be subject to a greater degree of credit risk. Credit risk relates to the ability of the issuer to meet interest or principal payments or both as they become due. The Underlying Funds may acquire securities in default and are not obligated to dispose of securities whose issuers subsequently default.
Certain Underlying Funds may enter into financial instrument transactions (such as swaps, futures, options and other derivatives) that may haveoff-balance sheet market risk.Off-balance sheet market risk exists when the maximum potential loss on a particular financial instrument is greater than the value of such financial instrument.
If an Underlying Fund invests directly in foreign currencies or in securities that trade in, and receive revenues in, foreign currencies, or in financial derivatives that provide exposure to foreign currencies, it will be subject to the risk that those currencies will decline in value relative to the base currency of the Underlying Funds, or, in the case of hedging positions, that the Underlying Fund’s base currency will decline in value relative to the currency being hedged. Currency rates in foreign countries may fluctuate significantly over short periods of time for a number of reasons, including changes in interest rates, intervention (or the failure to intervene) by U.S. or foreign governments, central banks or supranational entities such as the International Monetary Fund, or by the imposition of currency controls or other political developments in the United States or abroad.
Custodian Fees. “Custodian fees” on the Statement of Operations may include interest expense incurred by a Portfolio on any cash overdrafts of its custodian account during the period. Such cash overdrafts may result from the effects of failed trades in portfolio securities and from cash outflows resulting from unanticipated shareholder redemption activity. A Portfolio pays interest to its custodian on such cash overdrafts, to the extent they are not offset by positive cash balances maintained by that Portfolio. The “Earnings credit” line item, if shown, represents earnings on cash balances maintained by that Portfolio during the period. Such interest expense and other custodian fees may be paid with these earnings.
Indemnification.The Trust’s organizational documents provide current and former Trustees and Officers with a limited indemnification against liabilities arising in connection with the performance of their duties to the Trust. In the normal course of business, the Trust may also enter into contracts that provide general indemnification. The Trust’s maximum exposure under these arrangements is unknown and is dependent on future claims that may be made against the Trust. The risk of material loss from such claims is considered remote.
Basis of Preparation.Each Portfolio is an investment company and follows accounting and reporting guidance in the Financial Accounting Standards Board (“FASB”) Accounting Standards Codification Topic 946 (“ASC 946”). The accompanying financial statements were prepared in accordance with U.S. GAAP, including but not limited to ASC 946. U.S. GAAP requires the use of estimates made by management. Management believes that estimates and valuations are appropriate; however, actual results may differ from those estimates, and the valuations reflected in the accompanying financial statements may differ from the value ultimately realized upon sale or maturity.
New Rule Issuance.In March 2017, the Financial Accounting Standards Board (“FASB”) issued Accounting Standards Update (“ASU”)No. 2017-08 (“ASU2017-08”), “Receivables — Nonrefundable Fees and Other Costs (Subtopic310-20): Premium Amortization on Purchased Callable Debt Securities.” ASU2017-08 changed the amortization period for certain callable debt securities held at a premium. Specifically, it required the premium to be amortized to the earliest call date. The adoption of ASU2017-08 had no impact on beginning net assets, the current period results from operations, or any prior period information presented in the financial statements.
In August 2018, the FASB issued ASU2018-13, Fair Value Measurement (Topic 820). The amendments in the ASU impact disclosure requirements for fair value measurement. It is anticipated that this change will enhance the effectiveness of disclosures in the notes to the financial statements. This ASU is effective for fiscal years beginning after December 15, 2019. Early adoption is permitted and can include the entire standard or certain provisions that exclude or amend disclosures. For the year ended December 31, 2018, the Portfolios have chosen to adopt the standard. The adoption of this ASU is reflected in the disclosures of the financial statements.
In August 2018, U.S. Securities and Exchange Commission (“SEC”) adopted amendments to certain financial statement disclosure requirements to conform them to GAAP for investment companies. These amendments made certain removals from, changes to and additions to existing disclosure requirements under RegulationS-X. These amendments became effective for filings made with the SEC after November 5, 2018. The Portfolios’ adoption of these amendments, effective with the financial statements prepared as of December 31, 2018, required modified disclosures reflected herein, but had no effect on the Portfolios’ net assets or results of operations.
Subsequent Events. Management has performed a review for subsequent events through the date this report was issued.
| 3. | | INVESTMENT VALUATION AND FAIR VALUE MEASUREMENTS |
Investments in affiliated mutual funds within the Ivy Variable Insurance Portfolios family are valued at their Net Asset Value (“NAV”) as reported by the Underlying Funds. Investments in Government Money Market are valued on the basis of amortized cost (which approximates value), whereby a portfolio security is valued at its cost initially, and thereafter valued to reflect a constant amortization to maturity of any discount or premium. Short-term securities with maturities of 60 days or less held in all Portfolios (with the exception of Government Money Market) are valued based on quotes that are obtained from an independent pricing service approved by the Board.
Fair value is defined as the price that each Portfolio would receive upon selling an asset or would pay upon satisfying a liability in an orderly transaction between market participants at the measurement date. For purposes of calculating the NAV, the portfolio securities are valued on each business day using pricing and valuation methods as adopted by the Board. Where market quotes are readily available, fair value is generally determined on the basis of the last reported sales price, or if no sales are reported, based on quotes obtained from a quotation reporting system, established market makers, or pricing services.
Accounting standards establish a framework for measuring fair value and a three-level hierarchy for fair value measurements based upon the transparency of inputs to the valuation of an asset or liability. Inputs may be observable or unobservable and refer broadly to the assumptions that market participants would use in pricing the asset or liability. Observable inputs reflect the assumptions market participants would use in pricing the asset or liability based on market data obtained from sources independent of the reporting entity. Unobservable inputs reflect the reporting entity’s own assumptions about the factors that market participants would use in pricing the asset or liability developed based on the best information available in the circumstances.
An individual investment’s fair value measurement is assigned a level based upon the observability of the inputs which are significant to the overall valuation.
The three-tier hierarchy of inputs is summarized as follows:
• Level 1 – Observable input such as quoted prices, available in active markets, for identical assets or liabilities.
• Level 2 – Significant other observable inputs, which may include, but are not limited to, quoted prices for similar assets or liabilities in markets that are active, quoted prices for identical or similar assets or liabilities in markets that are not active, inputs other than quoted prices that are observable for the assets or liabilities (such as interest rates, yield curves, volatilities, prepayment speeds, loss severities, credit risks and default rates) or other market corroborated inputs.
• Level 3 – Significant unobservable inputs based on the best information available in the circumstances, to the extent observable inputs are not available, which may include assumptions made by the Board or persons acting at its direction that are used in determining the fair value of investments.
A description of the valuation techniques applied to the Portfolios’ major classes of assets and liabilities measured at fair value on a recurring basis follows:
Derivative Instruments. Exchange-traded futures contracts are generally valued at the settlement price.
Listed derivatives that are actively traded are valued based on quoted prices from the exchange and are categorized in Level 1 of the fair value hierarchy. OTC derivative contracts include forward foreign currency contracts, swap agreements, and option contracts related to interest rates, foreign currencies, credit standing of reference entities, equity prices, or commodity prices. Depending on the product and the terms of the transaction, the fair value of the OTC derivative products are modeled taking into account the counterparties’ creditworthiness and using a series of techniques, including simulation models. Many pricing models do not entail material subjectivity because the methodologies employed do not necessitate significant judgments and the pricing inputs are observed from actively quoted markets, as is the case with interest rate swap and option contracts. OTC derivative products valued using pricing models with significant observable inputs are categorized within Level 2 of the fair value hierarchy.
Equity Securities. Investments in registeredopen-end investment management companies will be valued based upon the NAV of such investments and are categorized as Level 1 of the fair value hierarchy.
Short-term Investments. Short-term investments having a maturity of 60 days or less are valued based on quotes that are obtained from an independent pricing service authorized by the Board. These investments are categorized as Level 2 of the fair value hierarchy.
| 4. | | DERIVATIVE INSTRUMENTS($ amounts in thousands unless indicated otherwise) |
The following disclosures contain information on why and how the Portfolios use derivative instruments, the associated risks of investing in derivative instruments, and how derivative instruments affect the Portfolios’ financial positions and results of operations.
Futures Contracts. Each Managed Volatility Portfolio is authorized to engage in buying and selling futures contracts. Upon entering into a futures contract, the Portfolio is required to deposit, in a segregated account, an amount equal to a varying specified percentage of the contract amount. This amount is known as the initial margin. Subsequent amounts, known as variation margin, are paid or received by the Portfolio each day, dependent on the daily fluctuations in the value of the underlying debt security or index. Options on futures contracts may also be purchased or sold by a Portfolio.
Futures contracts are reported on a schedule following the Schedule of Investments. Securities held in collateralized accounts to cover initial margin requirements on open futures contracts are identified on the Schedule of Investments. Cash held by the broker to cover initial margin requirements on open futures contracts and the receivable and/or payable for the daily mark to market for the variation margin are noted on the Statement of Assets and Liabilities. The net change in unrealized appreciation (depreciation) is reported on the Statement of Operations. Realized gains (losses) are reported on the Statement of Operations at the closing or expiration of futures contracts.
Risks of entering into futures contracts include the possibility of loss of securities or cash held as collateral, that there may be an illiquid market where the Portfolio is unable to close the contract or enter into an offsetting position and, if used for hedging purposes, the risk that the price of the contract will correlate imperfectly with the prices of the Portfolio’s securities.
Pathfinder Moderate — Managed Volatility, Pathfinder Moderately Aggressive — Managed Volatility and Pathfinder Moderately Conservative — Managed Volatility invest in long and/or short positions in futures contracts to gain exposure to, or economically hedge against, changes in interest rates (interest rate risk), changes in the value of equity securities (equity risk) or foreign currencies (foreign currency exchange rate risk).
Additional Disclosure Related to Derivative Instruments
Fair values of derivative instruments as of December 31, 2018:
| | | | | | | | | | | | | | | | | | |
| | | | | Assets | | | | | | Liabilities | |
| Portfolio | | Type of Risk
Exposure | | Statement of Assets & Liabilities Location | | Value | | | | | | Statement of Assets & Liabilities Location | | Value | |
| Pathfinder Moderate – Managed Volatility | | Equity | | Unrealized appreciation on futures contracts* | | $ | 762 | | | | | | | | | $ | — | |
| Pathfinder Moderately Aggressive – Managed Volatility | | Equity | | Unrealized appreciation on futures contracts* | | | 211 | | | | | | | | | | — | |
| Pathfinder Moderately Conservative – Managed Volatility | | Equity | | Unrealized appreciation on futures contracts* | | | 118 | | | | | | | | | | — | |
*The value presented includes cumulative gain (loss) on open futures contracts; however, the value reflected on the accompanying Statement of Assets and Liabilities is only the unsettled variation margin receivable (payable) as of December 31, 2018.
Amount of realized gain (loss) on derivatives recognized on the Statement of Operations for the year ended December 31, 2018:
| | | | | | | | | | | | | | | | | | | | | | | | | | |
| | | | | Net realized gain (loss) on: | | | | |
| Portfolio | | Type of Risk
Exposure | | Investments in
unaffiliated
securities* | | | Swap
agreements | | | Futures
contracts | | | Written
options | | | Forward
foreign
currency
contracts | | | Total | |
| Pathfinder Moderate – Managed Volatility | | Equity | | $ | — | | | $ | — | | | $ | (1,403 | ) | | $ | — | | | $ | — | | | $ | (1,403 | ) |
| Pathfinder Moderately Aggressive – Managed Volatility | | Equity | | | — | | | | — | | | | (241 | ) | | | — | | | | — | | | | (241 | ) |
| Pathfinder Moderately Conservative – Managed Volatility | | Equity | | | — | | | | — | | | | (228 | ) | | | — | | | | — | | | | (228 | ) |
*Purchased options are reported as investments in unaffiliated securities and are reflected on the accompanying Schedule of Investments.
Change in unrealized appreciation (depreciation) on derivatives recognized on the Statement of Operations for the year ended December 31, 2018:
| | | | | | | | | | | | | | | | | | | | | | | | | | |
| | | | | Net change in unrealized appreciation (depreciation) on: | | | | |
| Portfolio | | Type of Risk
Exposure | | Investments in
unaffiliated
securities* | | | Swap
agreements | | | Futures
contracts | | | Written
options | | | Forward
foreign
currency
contracts | | | Total | |
Pathfinder Moderate – Managed Volatility | | Equity | | | $— | | | | $— | | | | $762 | | | | $— | | | | $— | | | | $762 | |
Pathfinder Moderately Aggressive – Managed Volatility | | Equity | | | — | | | | — | | | | 216 | | | | — | | | | — | | | | 216 | |
Pathfinder Moderately Conservative – Managed Volatility | | Equity | | | — | | | | — | | | | 123 | | | | — | | | | — | | | | 123 | |
*Purchased options are reported as investments in unaffiliated securities and are reflected on the accompanying Schedule of Investments.
During the year ended December 31, 2018, the average derivative volume was as follows:
| | | | | | | | | | | | | | | | | | | | | | | | |
| Portfolio | | Forward foreign
currency contracts(1) | | | Long futures
contracts(2) | | | Short futures
contracts(2) | | | Swap
agreements(3) | | | Purchased
options(2) | | | Written
options(2) | |
Pathfinder Moderate – Managed Volatility | | $ | | | | $ | — | | | $ | 18,419 | | | $ | — | | | $ | — | | | $ | — | |
Pathfinder Moderately Aggressive – Managed Volatility | | | — | | | | — | | | | 3,574 | | | | — | | | | — | | | | — | |
Pathfinder Moderately Conservative – Managed Volatility | | | — | | | | — | | | | 3,042 | | | | — | | | | — | | | | — | |
| (1) | Average absolute value of unrealized appreciation/depreciation during the period. |
| (2) | Average value outstanding during the period. |
| (3) | Average notional amount outstanding during the period. |
| 5. | | INVESTMENT MANAGEMENT AND PAYMENTS TO AFFILIATED PERSONS($ amounts in thousands unless indicated otherwise) |
Management Fees. IICO, a wholly owned subsidiary of Waddell & Reed, Inc. (“W&R”), serves as each Portfolio’s investment adviser. The management fee is accrued daily by Government Money Market at the following annual rates as a percentage of average daily net assets:
| | | | | | | | |
| Portfolio (M – Millions) | | $0 to
$1,000M | | | Over
$1,000M | |
Government Money Market | | | 0.350 | | | | 0.300 | |
Each Managed Volatility Portfolio pays a management fee to IICO for providing investment advice and supervising its investments at the following annual rates as a percentage of average daily net assets:
| | | | | | | | | | | | |
| Portfolio (M – Millions) | | $0 to
$500M | | | $500 to
$1,000M | | | Over
$1,000M | |
Pathfinder Moderate – Managed Volatility | | | 0.200 | % | | | 0.170 | % | | | 0.150 | % |
Pathfinder Moderately Aggressive – Managed Volatility | | | 0.200 | | | | 0.170 | | | | 0.150 | |
Pathfinder Moderately Conservative – Managed Volatility | | | 0.200 | | | | 0.170 | | | | 0.150 | |
IICO uses all of the management fee it receives from the Managed Volatility Portfolios to pay Securian Asset Management Inc. (“Securian”). Accordingly, Securian receives a fee based on the average daily net assets of the Managed Volatility Portfolios.
The Pathfinder Portfolios pay no management fees; however, IICO receives management fees from the underlying funds.
IICO has entered into Subadvisory Agreements with the following entity on behalf of certain Portfolios:
Securian serves as subadvisor to the Managed Volatility Portfolios. The subadvisor makes investment decisions in accordance with the Portfolio’s investment objectives, policies and restrictions under the supervision of IICO and the Board of Trustees. IICO pays all applicable costs of the subadvisor.
Independent Trustees and Chief Compliance Officer Fees. Fees paid to the Independent Trustees can be paid in cash or deferred to a later date, at the election of the Trustees according to the Deferred Fee Agreement entered into between the Trust and the Trustee(s). Each Portfolio records its portion of the deferred fees as a liability on the Statement of Assets and Liabilities. All fees paid in cash plus any appreciation (depreciation) in the underlying deferred plan are shown on the Statement of Operations. Additionally, fees paid to the Chief Compliance Officer of the Portfolios are shown on the Statement of Operations.
Accounting Services Fees. The Trust has an Accounting and Administrative Services Agreement with Waddell & Reed Services Company (“WRSCO”), doing business as WI Services Company (“WISC”), an affiliate of W&R. Under the agreement, WISC acts as the agent in providing bookkeeping and accounting services and assistance to the Trust, including maintenance of Portfolio records, pricing of Portfolio shares and preparation of certain shareholder reports. For these services Government Money Market pays WISC a monthly fee ofone-twelfth of the annual fee based on the average net asset levels shown in the following table:
| | | | | | | | | | | | | | | | | | | | | | | | | | | | | | | | | | | | | | | | |
| (M – Millions) | | $0 to
$10M | | | $10 to
$25M | | | $25 to
$50M | | | $50 to
$100M | | | $100 to
$200M | | | $200 to
$350M | | | $350 to
$550M | | | $550 to
$750M | | | $750 to
$1,000M | | | Over
$1,000M | |
Annual Fee Rate | | $ | 0.00 | | | $ | 11.50 | | | $ | 23.10 | | | $ | 35.50 | | | $ | 48.40 | | | $ | 63.20 | | | $ | 82.50 | | | $ | 96.30 | | | $ | 121.60 | | | $ | 148.50 | |
Under the Accounting Services Agreement, each Pathfinder Portfolio and Managed Volatility Portfolio pays WISC a monthly fee ofone-twelfth of the annual fee shown in the following table:
| | | | | | | | | | | | | | | | | | | | | | | | | | | | | | | | | | | | | | | | |
| (M – Millions) | | $0 to
$10M | | | $10 to
$25M | | | $25 to
$50M | | | $50 to
$100M | | | $100 to
$200M | | | $200 to
$350M | | | $350 to
$550M | | | $550 to
$750M | | | $750 to
$1,000M | | | Over
$1,000M | |
Annual Fee Rate | | $ | 0.00 | | | $ | 5.75 | | | $ | 11.55 | | | $ | 17.75 | | | $ | 24.20 | | | $ | 31.60 | | | $ | 41.25 | | | $ | 48.15 | | | $ | 60.80 | | | $ | 74.25 | |
Each Portfolio also pays WISC a monthly administrative fee at the annual rate of 0.01%, or one basis point, for the first $1 billion of net assets with no fee charged for net assets in excess of $1 billion. This fee is voluntarily waived by WISC until a Portfolio’s net assets are at least $10 million and is included in “Accounting services fee” on the Statement of Operations.
Shareholder Servicing.Under the Transfer Agency Agreement between the Trust and WISC, each Portfolio reimburses WISC for certainout-of-pocket costs.
| 6. | | INTERFUND LENDING PROGRAM |
Pursuant to an exemptive order issued by the SEC (“Order”), the Ivy Funds, Ivy Variable Insurance Portfolios and InvestEd Portfolios (collectively, the “Funds” only for purposes of this footnote 6) have the ability to lend money to, and borrow money from, each other pursuant to a master interfund lending agreement (“Interfund Lending Program”). Under the Interfund Lending Program, the Funds may lend or borrow money for temporary purposes directly to or from one another (each an “Interfund Loan”), subject to meeting the conditions of the Order. The interest rate to be charged on an Interfund Loan is the average of the overnight repurchase agreement rate and the short-term bank loan rate. The Funds made no Interfund Loans under the Interfund Lending Program during the year ended December 31, 2018.
| 7. | | AFFILIATED COMPANY TRANSACTIONS(All amounts in thousands) |
A summary of the transactions in affiliated companies during the year ended December 31, 2018 follows:
| | | | | | | | | | | | | | | | | | | | | | | | | | | | | | | | | | | | | | | | |
| | | 12-31-17
Share Balance | | Gross
Additions | | Gross
Reductions | | Realized
Gain/(Loss)(1) | | Distributions
Received | | 12-31-18
Share Balance | | 12-31-18
Value | | Net Change
in Unrealized
Appreciation/
(Depreciation) |
Pathfinder Aggressive | | | | | | | | | | | | | | | | | | | | | | | | | | | | | | | | | | | | | | | | |
Ivy VIP Corporate Bond, Class II | | | | 1,103 | | | | $ | 1,601 | | | | $ | 1,734 | | | | $ | 4 | | | | $ | 119 | | | | | 1,078 | | | | $ | 5,534 | | | | $ | (237 | ) |
Ivy VIP Core Equity, Class II | | | | N/A | | | | | 9,211 | | | | | 1,273 | | | | | 27 | | | | | — | | | | | 655 | | | | | 7,076 | | | | | (862 | ) |
Ivy VIP Global Equity Income, Class II | | | | 133 | | | | | 8,184 | | | | | 1,397 | | | | | 38 | | | | | 23 | | | | | 1,006 | | | | | 6,934 | | | | | (991 | ) |
Ivy VIP Global Growth, Class II(2) | | | | 899 | | | | | 735 | | | | | 9,348 | | | | | 815 | | | | | 135 | | | | | N/A | | | | | N/A | | | | | (257 | ) |
Ivy VIP Growth, Class II | | | | 1,223 | | | | | 2,104 | | | | | 8,266 | | | | | 2,359 | | | | | 13 | | | | | 658 | | | | | 7,248 | | | | | (1,380 | ) |
Ivy VIP High Income, Class I | | | | 459 | | | | | 144 | | | | | 1,180 | | | | | (52 | ) | | | | 101 | | | | | 177 | | | | | 593 | | | | | (43 | ) |
Ivy VIP International Core Equity, Class II | | | | 725 | | | | | 2,744 | | | | | 2,952 | | | | | 226 | | | | | 443 | | | | | 706 | | | | | 10,354 | | | | | (2,916 | ) |
Ivy VIP Limited-Term Bond, Class II | | | | 717 | | | | | 5,089 | | | | | 2,495 | | | | | 11 | | | | | 54 | | | | | 1,263 | | | | | 6,107 | | | | | 13 | |
Ivy VIP Mid Cap Growth, Class I | | | | 550 | | | | | 643 | | | | | 1,496 | | | | | 761 | | | | | 36 | | | | | 444 | | | | | 4,929 | | | | | (617 | ) |
Ivy VIP Small Cap Core, Class II | | | | 309 | | | | | 1,154 | | | | | 5,635 | | | | | 270 | | | | | 477 | | | | | 51 | | | | | 687 | | | | | (487 | ) |
Ivy VIP Small Cap Growth, Class I | | | | N/A | | | | | 2,165 | | | | | 32 | | | | | (1 | ) | | | | — | | | | | 182 | | | | | 1,397 | | | | | (737 | ) |
Ivy VIP Small Cap Growth, Class II(2) | | | | 486 | | | | | 1,279 | | | | | 7,020 | | | | | 813 | | | | | 266 | | | | | N/A | | | | | N/A | | | | | 92 | |
Ivy VIP Value, Class II | | | | 1,197 | | | | | 2,477 | | | | | 2,204 | | | | | 308 | | | | | 134 | | | | | 1,236 | | | | | 7,031 | | | | | (951 | ) |
| | | | | | | | | | | | | | | | | | | | | | | | | | | | | | | | | | | | | | | | |
| | | | | | | | | | | | | | | | | | $ | 5,579 | | | | $ | 1,801 | | | | | | | | | $ | 57,890 | | | | $ | (9,373 | ) |
| | | | | | | | | | | | | | | | | | | | | | | | | | | | | | | | | | | | | | | | |
| | | | | | | | | | | | | | | | | | | | | | | | | | | | | | | | | | | | | | | | |
| | | 12-31-17
Share Balance | | Gross
Additions | | Gross
Reductions | | Realized
Gain/(Loss)(1) | | Distributions
Received | | 12-31-18
Share Balance | | 12-31-18
Value | | Net Change
in Unrealized
Appreciation/
(Depreciation) |
Pathfinder Conservative | | | | | | | | | | | | | | | | | | | | | | | | | | | | | | | | | | | | | | | | |
Ivy VIP Corporate Bond, Class II | | | | 2,953 | | | | $ | 3,923 | | | | $ | 4,221 | | | | $ | (12 | ) | | | $ | 329 | | | | | 2,898 | | | | $ | 14,876 | | | | $ | (637 | ) |
Ivy VIP Core Equity, Class II | | | | N/A | | | | | 8,425 | | | | | 1,009 | | | | | 11 | | | | | — | | | | | 613 | | | | | 6,619 | | | | | (796 | ) |
Ivy VIP Global Equity Income, Class II | | | | 1,285 | | | | | 1,782 | | | | | 7,849 | | | | | 614 | | | | | 224 | | | | | 523 | | | | | 3,607 | | | | | (1,350 | ) |
Ivy VIP Global Growth, Class II(2) | | | | 435 | | | | | 477 | | | | | 4,439 | | | | | 601 | | | | | 67 | | | | | N/A | | | | | N/A | | | | | (332 | ) |
Ivy VIP Government Money Market, Class II | | | | 21,446 | | | | | 2,589 | | | | | 6,956 | | | | | — | | | | | 301 | | | | | 17,079 | | | | | 17,079 | | | | | — | |
Ivy VIP Growth, Class II | | | | 1,155 | | | | | 2,800 | | | | | 8,602 | | | | | 2,320 | | | | | 13 | | | | | 615 | | | | | 6,774 | | | | | (1,385 | ) |
Ivy VIP High Income, Class I | | | | 371 | | | | | 1,573 | | | | | 463 | | | | | 2 | | | | | 84 | | | | | 692 | | | | | 2,315 | | | | | (146 | ) |
Ivy VIP International Core Equity, Class II | | | | 351 | | | | | 1,658 | | | | | 1,304 | | | | | 131 | | | | | 220 | | | | | 367 | | | | | 5,387 | | | | | (1,491 | ) |
Ivy VIP Limited-Term Bond, Class II | | | | 4,167 | | | | | 8,398 | | | | | 5,725 | | | | | 23 | | | | | 320 | | | | | 4,731 | | | | | 22,879 | | | | | (128 | ) |
Ivy VIP Mid Cap Growth, Class I | | | | 235 | | | | | 3,275 | | | | | 873 | | | | | 303 | | | | | 15 | | | | | 415 | | | | | 4,609 | | | | | (526 | ) |
Ivy VIP Small Cap Core, Class II | | | | 149 | | | | | 715 | | | | | 2,485 | | | | | 157 | | | | | 237 | | | | | 48 | | | | | 643 | | | | | (324 | ) |
Ivy VIP Small Cap Growth, Class I | | | | N/A | | | | | 2,039 | | | | | 59 | | | | | (4 | ) | | | | — | | | | | 170 | | | | | 1,305 | | | | | (675 | ) |
Ivy VIP Small Cap Growth, Class II(2) | | | | 235 | | | | | 855 | | | | | 3,740 | | | | | 498 | | | | | 140 | | | | | N/A | | | | | N/A | | | | | 151 | |
Ivy VIP Value, Class II | | | | 782 | | | | | 3,979 | | | | | 1,605 | | | | | 204 | | | | | 89 | | | | | 1,157 | | | | | 6,580 | | | | | (830 | ) |
| | | | | | | | | | | | | | | | | | | | | | | | | | | | | | | | | | | | | | | | |
| | | | | | | | | | | | | | | | | | $ | 4,848 | | | | $ | 2,039 | | | | | | | | | $ | 92,673 | | | | $ | (8,469 | ) |
| | | | | | | | | | | | | | | | | | | | | | | | | | | | | | | | | | | | | | | | |
See footnotes page 45.
| | | | | | | | | | | | | | | | | | | | | | | | | | | | | | | | | | | | | | | | |
| | | 12-31-17
Share Balance | | Gross
Additions | | Gross
Reductions | | Realized
Gain/(Loss)(1) | | Distributions
Received | | 12-31-18
Share Balance | | 12-31-18
Value | | Net Change
in Unrealized
Appreciation/
(Depreciation) |
Pathfinder Moderate | | | | | | | | | | | | | | | | | | | | | | | | | | | | | | | | | | | | | | | | |
Ivy VIP Corporate Bond, Class II | | | | 14,973 | | | | $ | 23,738 | | | | $ | 17,903 | | | | $ | 16 | | | | $ | 1,633 | | | | | 16,128 | | | | $ | 82,778 | | | | $ | (3,219 | ) |
Ivy VIP Core Equity, Class II | | | | N/A | | | | | 84,942 | | | | | 9,084 | | | | | 134 | | | | | — | | | | | 6,268 | | | | | 67,706 | | | | | (8,152 | ) |
Ivy VIP Global Equity Income, Class II | | | | 15,576 | | | | | 13,298 | | | | | 66,816 | | | | | 14,351 | | | | | 2,659 | | | | | 8,026 | | | | | 55,312 | | | | | (24,833 | ) |
Ivy VIP Global Growth, Class II(2) | | | | 7,036 | | | | | 4,428 | | | | | 68,716 | | | | | 9,483 | | | | | 1,063 | | | | | N/A | | | | | N/A | | | | | (5,139 | ) |
Ivy VIP Government Money Market, Class II | | | | 86,686 | | | | | 4,905 | | | | | 33,399 | | | | | — | | | | | 1,128 | | | | | 58,192 | | | | | 58,192 | | | | | — | |
Ivy VIP Growth, Class II | | | | 8,616 | | | | | 13,608 | | | | | 37,675 | | | | | 16,082 | | | | | 94 | | | | | 6,290 | | | | | 69,319 | | | | | (10,802 | ) |
Ivy VIP High Income, Class I | | | | 4,193 | | | | | 1,283 | | | | | 3,047 | | | | | (35 | ) | | | | 933 | | | | | 3,714 | | | | | 12,425 | | | | | (1,095 | ) |
Ivy VIP International Core Equity, Class II | | | | 5,676 | | | | | 16,938 | | | | | 15,884 | | | | | 2,812 | | | | | 3,487 | | | | | 5,635 | | | | | 82,603 | | | | | (23,924 | ) |
Ivy VIP Limited-Term Bond, Class II | | | | 24,824 | | | | | 51,279 | | | | | 32,925 | | | | | 108 | | | | | 1,866 | | | | | 28,715 | | | | | 138,854 | | | | | (632 | ) |
Ivy VIP Mid Cap Growth, Class I | | | | 3,039 | | | | | 24,968 | | | | | 7,962 | | | | | 3,723 | | | | | 199 | | | | | 4,246 | | | | | 47,154 | | | | | (5,193 | ) |
Ivy VIP Small Cap Core, Class II | | | | 1,933 | | | | | 6,845 | | | | | 31,675 | | | | | 2,172 | | | | | 3,001 | | | | | 487 | | | | | 6,576 | | | | | (3,992 | ) |
Ivy VIP Small Cap Growth, Class I | | | | N/A | | | | | 20,150 | | | | | 332 | | | | | (20 | ) | | | | — | | | | | 1,738 | | | | | 13,358 | | | | | (6,459 | ) |
Ivy VIP Small Cap Growth, Class II(2) | | | | 3,041 | | | | | 8,205 | | | | | 44,215 | | | | | 6,051 | | | | | 1,737 | | | | | N/A | | | | | N/A | | | | | 647 | |
Ivy VIP Value, Class II | | | | 8,428 | | | | | 36,315 | | | | | 14,756 | | | | | 2,179 | | | | | 948 | | | | | 11,831 | | | | | 67,285 | | | | | (8,540 | ) |
| | | | | | | | | | | | | | | | | | | | | | | | | | | | | | | | | | | | | | | | |
| | | | | | | | | | | | | | | | | | $ | 57,056 | | | | $ | 18,748 | | | | | | | | | $ | 701,562 | | | | $ | (101,333 | ) |
| | | | | | | | | | | | | | | | | | | | | | | | | | | | | | | | | | | | | | | | |
| | | | | | | | | | | | | | | | | | | | | | | | | | | | | | | | | | | | | | | | |
| | | 12-31-17
Share Balance | | Gross
Additions | | Gross
Reductions | | Realized
Gain/(Loss)(1) | | Distributions
Received | | 12-31-18
Share Balance | | 12-31-18
Value | | Net Change
in Unrealized
Appreciation/
(Depreciation) |
Pathfinder Moderately Aggressive | | | | | | | | | | | | | | | | | | | | | | | | | | | | | | | | | | | | | | | | |
Ivy VIP Corporate Bond, Class II | | | | 16,003 | | | | $ | 35,995 | | | | $ | 21,019 | | | | $ | 106 | | | | $ | 1,767 | | | | | 18,935 | | | | $ | 97,186 | | | | $ | (3,470 | ) |
Ivy VIP Core Equity, Class II | | | | N/A | | | | | 116,053 | | | | | 13,516 | | | | | 225 | | | | | — | | | | | 8,468 | | | | | 91,470 | | | | | (11,067 | ) |
Ivy VIP Global Equity Income, Class II | | | | 18,667 | | | | | 15,816 | | | | | 61,500 | | | | | 16,573 | | | | | 3,226 | | | | | 12,046 | | | | | 83,015 | | | | | (31,483 | ) |
Ivy VIP Global Growth, Class II(2) | | | | 10,540 | | | | | 6,640 | | | | | 102,420 | | | | | 14,733 | | | | | 1,612 | | | | | N/A | | | | | N/A | | | | | (8,220 | ) |
Ivy VIP Government Money Market, Class II | | | | 51,942 | | | | | 3,226 | | | | | 28,965 | | | | | — | | | | | 623 | | | | | 26,203 | | | | | 26,203 | | | | | — | |
Ivy VIP Growth, Class II | | | | 12,477 | | | | | 18,586 | | | | | 59,912 | | | | | 24,200 | | | | | 138 | | | | | 8,499 | | | | | 93,670 | | | | | (15,873 | ) |
Ivy VIP High Income, Class I | | | | 5,743 | | | | | 1,294 | | | | | 10,702 | | | | | (472 | ) | | | | 1,294 | | | | | 3,186 | | | | | 10,657 | | | | | (866 | ) |
Ivy VIP International Core Equity, Class II | | | | 8,502 | | | | | 25,487 | | | | | 23,811 | | | | | 3,658 | | | | | 5,289 | | | | | 8,457 | | | | | 123,967 | | | | | (35,699 | ) |
Ivy VIP Limited-Term Bond, Class II | | | | 20,718 | | | | | 59,844 | | | | | 31,144 | | | | | 134 | | | | | 1,578 | | | | | 26,766 | | | | | 129,432 | | | | | (362 | ) |
Ivy VIP Mid Cap Growth, Class I | | | | 4,097 | | | | | 34,078 | | | | | 10,701 | | | | | 5,372 | | | | | 271 | | | | | 5,737 | | | | | 63,711 | | | | | (7,314 | ) |
Ivy VIP Small Cap Core, Class II | | | | 2,605 | | | | | 9,209 | | | | | 42,700 | | | | | 2,886 | | | | | 4,097 | | | | | 658 | | | | | 8,884 | | | | | (5,348 | ) |
Ivy VIP Small Cap Growth, Class I | | | | N/A | | | | | 27,152 | | | | | 491 | | | | | (25 | ) | | | | — | | | | | 2,348 | | | | | 18,049 | | | | | (8,612 | ) |
Ivy VIP Small Cap Growth, Class II(2) | | | | 4,100 | | | | | 11,143 | | | | | 59,226 | | | | | 8,528 | | | | | 2,370 | | | | | N/A | | | | | N/A | | | | | 409 | |
Ivy VIP Value, Class II | | | | 11,783 | | | | | 47,077 | | | | | 20,157 | | | | | 3,309 | | | | | 1,341 | | | | | 15,983 | | | | | 90,893 | | | | | (11,898 | ) |
| | | | | | | | | | | | | | | | | | | | | | | | | | | | | | | | | | | | | | | | |
| | | | | | | | | | | | | | | | | | $ | 79,227 | | | | $ | 23,606 | | | | | | | | | $ | 837,137 | | | | $ | (139,803 | ) |
| | | | | | | | | | | | | | | | | | | | | | | | | | | | | | | | | | | | | | | | |
See footnotes page 45.
| | | | | | | | | | | | | | | | | | | | | | | | | | | | | | | | | | | | | | | | |
| | | 12-31-17
Share Balance | | Gross
Additions | | Gross
Reductions | | Realized
Gain/(Loss)(1) | | Distributions
Received | | 12-31-18
Share Balance | | 12-31-18
Value | | Net Change
in Unrealized
Appreciation/
(Depreciation) |
Pathfinder Moderately Conservative | | | | | | | | | | | | | | | | | | | | | | | | | | | | | | | |
Ivy VIP Corporate Bond, Class II | | | | 5,563 | | | | $ | 6,409 | | | | $ | 6,793 | | | | $ | (25 | ) | | | $ | 609 | | | | | 5,496 | | | | $ | 28,210 | | | | $ | (1,189 | ) |
Ivy VIP Core Equity, Class II | | | | N/A | | | | | 21,500 | | | | | 2,298 | | | | | 20 | | | | | — | | | | | 1,587 | | | | | 17,141 | | | | | (2,062 | ) |
Ivy VIP Global Equity Income, Class II | | | | 2,974 | | | | | 2,771 | | | | | 12,064 | | | | | 2,025 | | | | | 510 | | | | | 1,742 | | | | | 12,005 | | | | | (4,225 | ) |
Ivy VIP Global Growth, Class II(2) | | | | 1,511 | | | | | 968 | | | | | 14,913 | | | | | 1,896 | | | | | 229 | | | | | N/A | | | | | N/A | | | | | (968 | ) |
Ivy VIP Government Money Market, Class II | | | | 37,241 | | | | | 2,065 | | | | | 11,943 | | | | | — | | | | | 502 | | | | | 27,363 | | | | | 27,363 | | | | | — | |
Ivy VIP Growth, Class II | | | | 2,879 | | | | | 4,650 | | | | | 18,355 | | | | | 5,780 | | | | | 31 | | | | | 1,592 | | | | | 17,548 | | | | | (3,561 | ) |
Ivy VIP High Income, Class I | | | | 1,029 | | | | | 2,122 | | | | | 916 | | | | | 2 | | | | | 230 | | | | | 1,382 | | | | | 4,622 | | | | | (336 | ) |
Ivy VIP International Core Equity, Class II | | | | 1,219 | | | | | 3,827 | | | | | 3,563 | | | | | 415 | | | | | 752 | | | | | 1,223 | | | | | 17,928 | | | | | (4,991 | ) |
Ivy VIP Limited-Term Bond, Class II | | | | 8,379 | | | | | 15,162 | | | | | 10,346 | | | | | 33 | | | | | 633 | | | | | 9,402 | | | | | 45,466 | | | | | (238 | ) |
Ivy VIP Mid Cap Growth, Class I | | | | 762 | | | | | 6,379 | | | | | 2,046 | | | | | 859 | | | | | 50 | | | | | 1,075 | | | | | 11,937 | | | | | (1,253 | ) |
Ivy VIP Small Cap Core, Class II | | | | 484 | | | | | 1,752 | | | | | 7,985 | | | | | 508 | | | | | 755 | | | | | 123 | | | | | 1,665 | | | | | (973 | ) |
Ivy VIP Small Cap Growth, Class I | | | | N/A | | | | | 5,201 | | | | | 122 | | | | | (6 | ) | | | | — | | | | | 440 | | | | | 3,382 | | | | | (1,697 | ) |
Ivy VIP Small Cap Growth, Class II(2) | | | | 762 | | | | | 2,086 | | | | | 11,257 | | | | | 1,441 | | | | | 437 | | | | | N/A | | | | | N/A | | | | | 309 | |
Ivy VIP Value, Class II | | | | 2,213 | | | | | 8,684 | | | | | 3,736 | | | | | 532 | | | | | 250 | | | | | 2,996 | | | | | 17,036 | | | | | (2,161 | ) |
| | | | | | | | | | | | | | | | | | | | | | | | | | | | | | | | | | | | | | | | |
| | | | | | | | | | | | | | | | | | $ | 13,480 | | | | $ | 4,988 | | | | | | | | | $ | 204,303 | | | | $ | (23,345 | ) |
| | | | | | | | | | | | | | | | | | | | | | | | | | | | | | | | | | | | | | | | |
| | | | | | | | | | | | | | | | | | | | | | | | | | | | | | | | | | | | | | | | |
| | | 12-31-17
Share Balance | | Gross
Additions | | Gross
Reductions | | Realized
Gain/(Loss)(1) | | Distributions
Received | | 12-31-18
Share Balance | | 12-31-18
Value | | Net Change
in Unrealized
Appreciation/
(Depreciation) |
Pathfinder Moderate – Managed Volatility | | | | | | | | | | | | | | | | | | | | | | | | | | |
Ivy VIP Corporate Bond, Class II | | | | 9,942 | | | | $ | 20,648 | | | | $ | 2,315 | | | | $ | 15 | | | | $ | 1,176 | | | | | 13,521 | | | | $ | 69,399 | | | | $ | (2,161 | ) |
Ivy VIP Core Equity, Class II | | | | N/A | | | | | 63,990 | | | | | 464 | | | | | 29 | | | | | — | | | | | 5,262 | | | | | 56,845 | | | | | (6,681 | ) |
Ivy VIP Global Equity Income, Class II | | | | 10,339 | | | | | 12,394 | | | | | 39,805 | | | | | 6,833 | | | | | 1,908 | | | | | 6,737 | | | | | 46,423 | | | | | (14,884 | ) |
Ivy VIP Global Growth, Class II(2) | | | | 4,672 | | | | | 3,667 | | | | | 46,710 | | | | | 5,991 | | | | | 762 | | | | | N/A | | | | | N/A | | | | | (3,061 | ) |
Ivy VIP Government Money Market, Class II | | | | 57,557 | | | | | 6,029 | | | | | 14,792 | | | | | — | | | | | 842 | | | | | 48,794 | | | | | 48,794 | | | | | — | |
Ivy VIP Growth, Class II | | | | 5,721 | | | | | 13,033 | | | | | 16,739 | | | | | 9,985 | | | | | 68 | | | | | 5,279 | | | | | 58,177 | | | | | (7,300 | ) |
Ivy VIP High Income, Class I | | | | 2,784 | | | | | 1,433 | | | | | 282 | | | | | (1 | ) | | | | 670 | | | | | 3,115 | | | | | 10,420 | | | | | (878 | ) |
Ivy VIP International Core Equity, Class II | | | | 3,769 | | | | | 16,191 | | | | | — | | | | | 396 | | | | | 2,503 | | | | | 4,730 | | | | | 69,330 | | | | | (16,894 | ) |
Ivy VIP Limited-Term Bond, Class II | | | | 16,483 | | | | | 42,221 | | | | | 6,002 | | | | | 59 | | | | | 1,343 | | | | | 24,077 | | | | | 116,427 | | | | | (224 | ) |
Ivy VIP Mid Cap Growth, Class I | | | | 2,017 | | | | | 20,218 | | | | | 821 | | | | | 1,424 | | | | | 142 | | | | | 3,566 | | | | | 39,599 | | | | | (3,259 | ) |
Ivy VIP Small Cap Core, Class I | | | | 1,283 | | | | | 5,448 | | | | | 20,383 | | | | | 1,595 | | | | | 2,154 | | | | | 409 | | | | | 5,525 | | | | | (3,034 | ) |
Ivy VIP Small Cap Growth, Class I | | | | N/A | | | | | 17,044 | | | | | 1 | | | | | (1 | ) | | | | — | | | | | 1,460 | | | | | 11,220 | | | | | (5,823 | ) |
Ivy VIP Small Cap Growth, Class II(2) | | | | 2,019 | | | | | 6,723 | | | | | 31,519 | | | | | 4,317 | | | | | 1,258 | | | | | N/A | | | | | N/A | | | | | 1,319 | |
Ivy VIP Value, Class II | | | | 5,593 | | | | | 29,208 | | | | | 1,940 | | | | | 1,351 | | | | | 678 | | | | | 9,935 | | | | | 56,503 | | | | | (6,775 | ) |
| | | | | | | | | | | | | | | | | | | | | | | | | | | | | | | | | | | | | | | | |
| | | | | | | | | | | | | | | | | | $ | 31,993 | | | | $ | 13,504 | | | | | | | | | $ | 588,662 | | | | $ | (69,655 | ) |
| | | | | | | | | | | | | | | | | | | | | | | | | | | | | | | | | | | | | | | | |
See footnotes page 45.
| | | | | | | | | | | | | | | | | | | | | | | | | | | | | | | | | | | | | | | | |
| | | 12-31-17
Share Balance | | Gross
Additions | | Gross
Reductions | | Realized
Gain/(Loss)(1) | | Distributions
Received | | 12-31-18
Share Balance | | 12-31-18
Value | | Net Change
in Unrealized
Appreciation/
(Depreciation) |
Pathfinder Moderately Aggressive – Managed Volatility | | | | | | | | | | | | | | | | | | | | | | | | | | |
Ivy VIP Corporate Bond, Class II | | | | 1,379 | | | | $ | 3,349 | | | | $ | 929 | | | | $ | 4 | | | | $ | 156 | | | | | 1,853 | | | | $ | 9,511 | | | | $ | (291 | ) |
Ivy VIP Core Equity, Class II | | | | N/A | | | | | 10,315 | | | | | 290 | | | | | 9 | | | | | — | | | | | 829 | | | | | 8,959 | | | | | (1,066 | ) |
Ivy VIP Global Equity Income, Class II | | | | 1,608 | | | | | 1,528 | | | | | 4,804 | | | | | 1,018 | | | | | 284 | | | | | 1,180 | | | | | 8,129 | | | | | (2,394 | ) |
Ivy VIP Global Growth, Class II(2) | | | | 908 | | | | | 655 | | | | | 9,041 | | | | | 1,146 | | | | | 142 | | | | | N/A | | | | | N/A | | | | | (576 | ) |
Ivy VIP Government Money Market, Class II | | | | 4,476 | | | | | 328 | | | | | 2,239 | | | | | — | | | | | 57 | | | | | 2,565 | | | | | 2,565 | | | | | — | |
Ivy VIP Growth, Class II | | | | 1,075 | | | | | 1,782 | | | | | 4,310 | | | | | 1,939 | | | | | 12 | | | | | 832 | | | | | 9,171 | | | | | (1,300 | ) |
Ivy VIP High Income, Class I | | | | 495 | | | | | 131 | | | | | 804 | | | | | (35 | ) | | | | 114 | | | | | 312 | | | | | 1,043 | | | | | (87 | ) |
Ivy VIP International Core Equity, Class II | | | | 733 | | | | | 2,440 | | | | | 692 | | | | | 241 | | | | | 467 | | | | | 828 | | | | | 12,140 | | | | | (3,224 | ) |
Ivy VIP Limited-Term Bond, Class II | | | | 1,785 | | | | | 5,403 | | | | | 1,434 | | | | | 7 | | | | | 139 | | | | | 2,620 | | | | | 12,668 | | | | | (12 | ) |
Ivy VIP Mid Cap Growth, Class I | | | | 353 | | | | | 3,089 | | | | | 398 | | | | | 304 | | | | | 24 | | | | | 562 | | | | | 6,241 | | | | | (556 | ) |
Ivy VIP Small Cap Core, Class II | | | | 224 | | | | | 852 | | | | | 3,736 | | | | | 126 | | | | | 361 | | | | | 64 | | | | | 870 | | | | | (356 | ) |
Ivy VIP Small Cap Growth, Class I | | | | N/A | | | | | 2,791 | | | | | 1 | | | | | — | * | | | | — | | | | | 230 | | | | | 1,768 | | | | | (1,023 | ) |
Ivy VIP Small Cap Growth, Class II(2) | | | | 353 | | | | | 1,041 | | | | | 5,490 | | | | | 677 | | | | | 210 | | | | | N/A | | | | | N/A | | | | | 342 | |
Ivy VIP Value, Class II | | | | 1,015 | | | | | 4,259 | | | | | 783 | | | | | 261 | | | | | 118 | | | | | 1,566 | | | | | 8,903 | | | | | (1,107 | ) |
| | | | | | | | | | | | | | | | | | | | | | | | | | | | | | | | | | | | | | | | |
| | | | | | | | | | | | | | | | | | $ | 5,697 | | | | $ | 2,084 | | | | | | | | | $ | 81,968 | | | | $ | (11,650 | ) |
| | | | | | | | | | | | | | | | | | | | | | | | | | | | | | | | | | | | | | | | |
| | | | | | | | | | | | | | | | | | | | | | | | | | | | | | | | | | | | | | | | |
| | | 12-31-17
Share Balance | | Gross
Additions | | Gross
Reductions | | Realized
Gain/(Loss)(1) | | Distributions
Received | | 12-31-18
Share Balance | | 12-31-18
Value | | Net Change
in Unrealized
Appreciation/
(Depreciation) |
Pathfinder Moderately Conservative – Managed Volatility | | | | | | | | | | | | | | | | | | | | | | | | | | | | | | | |
Ivy VIP Corporate Bond, Class II | | | | 1,606 | | | | $ | 2,158 | | | | $ | 646 | | | | $ | 2 | | | | $ | 185 | | | | | 1,901 | | | | $ | 9,756 | | | | $ | (353 | ) |
Ivy VIP Core Equity, Class II | | | | N/A | | | | | 6,676 | | | | | 44 | | | | | 3 | | | | | — | | | | | 550 | | | | | 5,938 | | | | | (693 | ) |
Ivy VIP Global Equity Income, Class II | | | | 858 | | | | | 926 | | | | | 2,962 | | | | | 471 | | | | | 154 | | | | | 603 | | | | | 4,157 | | | | | (1,171 | ) |
Ivy VIP Global Growth, Class II(2) | | | | 436 | | | | | 298 | | | | | 4,286 | | | | | 589 | | | | | 69 | | | | | N/A | | | | | N/A | | | | | (317 | ) |
Ivy VIP Government Money Market, Class II | | | | 10,749 | | | | | 787 | | | | | 2,072 | | | | | — | | | | | 157 | | | | | 9,464 | | | | | 9,464 | | | | | — | |
Ivy VIP Growth, Class II | | | | 831 | | | | | 1,543 | | | | | 4,489 | | | | | 1,611 | | | | | 10 | | | | | 551 | | | | | 6,076 | | | | | (1,026 | ) |
Ivy VIP High Income, Class I | | | | 297 | | | | | 675 | | | | | 49 | | | | | — | * | | | | 70 | | | | | 478 | | | | | 1,599 | | | | | (109 | ) |
Ivy VIP International Core Equity, Class II | | | | 352 | | | | | 1,312 | | | | | 103 | | | | | 65 | | | | | 228 | | | | | 424 | | | | | 6,208 | | | | | (1,540 | ) |
Ivy VIP Limited-Term Bond, Class II | | | | 2,419 | | | | | 4,879 | | | | | 911 | | | | | 5 | | | | | 192 | | | | | 3,252 | | | | | 15,726 | | | | | (45 | ) |
Ivy VIP Mid Cap Growth, Class I | | | | 220 | | | | | 2,042 | | | | | 123 | | | | | 159 | | | | | 15 | | | | | 373 | | | | | 4,137 | | | | | (339 | ) |
Ivy VIP Small Cap Core, Class II | | | | 140 | | | | | 549 | | | | | 2,201 | | | | | 179 | | | | | 229 | | | | | 43 | | | | | 577 | | | | | (331 | ) |
Ivy VIP Small Cap Growth, Class I | | | | N/A | | | | | 1,798 | | | | | — | * | | | | — | * | | | | — | | | | | 153 | | | | | 1,172 | | | | | (625 | ) |
Ivy VIP Small Cap Growth, Class II(2) | | | | 220 | | | | | 666 | | | | | 3,398 | | | | | 438 | | | | | 134 | | | | | N/A | | | | | N/A | | | | | 174 | |
Ivy VIP Value, Class II | | | | 638 | | | | | 2,776 | | | | | 271 | | | | | 152 | | | | | 76 | | | | | 1,038 | | | | | 5,903 | | | | | (713 | ) |
| | | | | | | | | | | | | | | | | | | | | | | | | | | | | | | | | | | | | | | | |
| | | | | | | | | | | | | | | | | | $ | 3,674 | | | | $ | 1,519 | | | | | | | | | $ | 70,713 | | | | $ | (7,088 | ) |
| | | | | | | | | | | | | | | | | | | | | | | | | | | | | | | | | | | | | | | | |
| * | Not shown due to rounding. |
| (1) | Included in Realized Gain/Loss, if applicable, are distributions from capital gains from the underlying securities. |
| (2) | No longer affiliated as of December 31, 2018. |
| 8. | | INVESTMENT SECURITIES TRANSACTIONS($ amounts in thousands) |
The cost of purchases and the proceeds from maturities and sales of investment securities (excluding short-term securities) for the year ended December 31, 2018, were as follows:
| | | | | | | | | | | | | | | | |
| | | Purchases | | | Sales | |
| | | U.S. Government | | | Other Issuers | | | U.S. Government | | | Other Issuers | |
Pathfinder Aggressive | | $ | — | | | $ | 35,449 | | | $ | — | | | $ | 44,483 | |
Pathfinder Conservative | | | — | | | | 40,588 | | | | — | | | | 48,672 | |
Pathfinder Moderate | | | — | | | | 291,749 | | | | — | | | | 385,707 | |
Pathfinder Moderately Aggressive | | | — | | | | 385,636 | | | | — | | | | 489,097 | |
Pathfinder Moderately Conservative | | | — | | | | 78,660 | | | | — | | | | 105,370 | |
Pathfinder Moderate – Managed Volatility | | | — | | | | 242,111 | | | | — | | | | 171,195 | |
Pathfinder Moderately Aggressive – Managed Volatility | | | — | | | | 35,286 | | | | — | | | | 33,504 | |
Pathfinder Moderately Conservative – Managed Volatility | | | — | | | | 25,388 | | | | — | | | | 20,629 | |
Government Money Market | | | — | | | | — | | | | — | | | | — | |
| 9. | | CAPITAL SHARE TRANSACTIONS(All amounts in thousands) |
The Trust has authorized an unlimited number of no par value shares of beneficial interest. Transactions in shares of beneficial interest were as follows:
| | | | | | | | | | | | | | | | | | | | | | | | | | | | | | | | | | | | |
| | | Pathfinder Aggressive | | | | | | Pathfinder Conservative | |
| | | Year ended
12-31-18 | | | Year ended
12-31-17 | | | | | | Year ended
12-31-18 | | | Year ended
12-31-17 | |
| | | Shares | | | Value | | | Shares | | | Value | | | | | | Shares | | | Value | | | Shares | | | Value | |
Shares issued from sale of shares: | | | | | | | | | | | | | | | | | | | | | | | | | | | | | | | | | | | | |
Class II | | | 671 | | | $ | 3,490 | | | | 635 | | | $ | 3,112 | | | | | | | | 1,999 | | | $ | 10,202 | | | | 1,056 | | | $ | 5,265 | |
Shares issued in reinvestment of distributions to shareholders: | | | | | | | | | | | | | | | | | | | | | | | | | | | | | | | | | | | | |
Class II | | | 1,005 | | | | 5,067 | | | | 1,290 | | | | 5,994 | | | | | | | | 942 | | | | 4,722 | | | | 1,111 | | | | 5,402 | |
Shares redeemed: | | | | | | | | | | | | | | | | | | | | | | | | | | | | | | | | | | | | |
Class II | | | (3,579 | ) | | | (18,431 | ) | | | (3,206 | ) | | | (15,761 | ) | | | | | | | (4,701 | ) | | | (23,906 | ) | | | (4,355 | ) | | | (21,862 | ) |
| | | | | | | | | | | | |
Net decrease | | | (1,903 | ) | | $ | (9,874 | ) | | | (1,281 | ) | | $ | (6,655 | ) | | | | | | | (1,760 | ) | | $ | (8,982 | ) | | | (2,188 | ) | | $ | (11,195 | ) |
| | | | | | | | | | | | |
| | | |
| | | Pathfinder Moderate | | | | | | Pathfinder Moderately Aggressive | |
| | | Year ended
12-31-18 | | | Year ended
12-31-17 | | | | | | Year ended
12-31-18 | | | Year ended
12-31-17 | |
| | | Shares | | | Value | | | Shares | | | Value | | | | | | Shares | | | Value | | | Shares | | | Value | |
Shares issued from sale of shares: | | | | | | | | | | | | | | | | | | | | | | | | | | | | | | | | | | | | |
Class II | | | 702 | | | $ | 3,722 | | | | 898 | | | $ | 4,660 | | | | | | | | 1,237 | | | $ | 6,817 | | | | 1,200 | | | $ | 6,378 | |
Shares issued in reinvestment of distributions to shareholders: | | | | | | | | | | | | | | | | | | | | | | | | | | | | | | | | | | | | |
Class II | | | 9,296 | | | | 48,519 | | | | 10,958 | | | | 54,504 | | | | | | | | 12,169 | | | | 65,728 | | | | 14,017 | | | | 71,450 | |
Shares redeemed: | | | | | | | | | | | | | | | | | | | | | | | | | | | | | | | | | | | | |
Class II | | | (28,797 | ) | | | (152,733 | ) | | | (20,810 | ) | | | (108,172 | ) | | | | | | | (33,636 | ) | | | (184,084 | ) | | | (25,350 | ) | | | (135,596 | ) |
| | | | | | | | | | | | |
Net decrease | | | (18,799 | ) | | $ | (100,492 | ) | | | (8,954 | ) | | $ | (49,008 | ) | | | | | | | (20,230 | ) | | $ | (111,539 | ) | | | (10,133 | ) | | $ | (57,768 | ) |
| | | | | | | | | | | | |
| | | | | | | | | | | | | | | | | | | | | | | | | | | | | | | | | | | | |
| | | Pathfinder Moderately Conservative | | | | | | Pathfinder Moderate – Managed
Volatility | |
| | | Year ended
12-31-18 | | | Year ended
12-31-17 | | | | | | Year ended
12-31-18 | | | Year ended
12-31-17 | |
| | | Shares | | | Value | | | Shares | | | Value | | | | | | Shares | | | Value | | | Shares | | | Value | |
Shares issued from sale of shares: | | | | | | | | | | | | | | | | | | | | | | | | | | | | | | | | | | | | |
Class II | | | 448 | | | $ | 2,338 | | | | 356 | | | $ | 1,832 | | | | | | | | 10,060 | | | $ | 57,624 | | | | 7,845 | | | $ | 43,358 | |
Shares issued in reinvestment of distributions to shareholders: | | | | | | | | | | | | | | | | | | | | | | | | | | | | | | | | | | | | |
Class II | | | 2,514 | | | | 12,955 | | | | 2,884 | | | | 14,287 | | | | | | | | 4,281 | | | | 24,303 | | | | 3,224 | | | | 17,259 | |
Shares redeemed: | | | | | | | | | | | | | | | | | | | | | | | | | | | | | | | | | | | | |
Class II | | | (8,312 | ) | | | (43,456 | ) | | | (8,287 | ) | | | (42,582 | ) | | | | | | | (4,470 | ) | | | (25,600 | ) | | | (4,810 | ) | | | (26,453 | ) |
| | | | | | | | | | | | |
Net increase (decrease) | | | (5,350 | ) | | $ | (28,163 | ) | | | (5,047 | ) | | $ | (26,463 | ) | | | | | | | 9,871 | | | $ | 56,327 | | | | 6,259 | | | $ | 34,164 | |
| | | | | | | | | | | | |
| | | |
| | | Pathfinder Moderately Aggressive –
Managed Volatility | | | | | | Pathfinder Moderately Conservative –
Managed Volatility | |
| | | Year ended
12-31-18 | | | Year ended
12-31-17 | | | | | | Year ended
12-31-18 | | | Year ended
12-31-17 | |
| | | Shares | | | Value | | | Shares | | | Value | | | | | | Shares | | | Value | | | Shares | | | Value | |
Shares issued from sale of shares: | | | | | | | | | | | | | | | | | | | | | | | | | | | | | | | | | | | | |
Class II | | | 1,170 | | | $ | 6,562 | | | | 2,023 | | | $ | 10,772 | | | | | | | | 1,486 | | | $ | 8,146 | | | | 981 | | | $ | 5,224 | |
Shares issued in reinvestment of distributions to shareholders: | | | | | | | | | | | | | | | | | | | | | | | | | | | | | | | | | | | | |
Class II | | | 731 | | | | 4,062 | | | | 550 | | | | 2,851 | | | | | | | | 529 | | | | 2,876 | | | | 340 | | | | 1,769 | |
Shares redeemed: | | | | | | | | | | | | | | | | | | | | | | | | | | | | | | | | | | | | |
Class II | | | (1,923 | ) | | | (10,800 | ) | | | (1,586 | ) | | | (8,514 | ) | | | | | | | (1,321 | ) | | | (7,269 | ) | | | (1,145 | ) | | | (6,078 | ) |
| | | | | | | | | | | | |
Net increase (decrease) | | | (22 | ) | | $ | (176 | ) | | | 987 | | | $ | 5,109 | | | | | | | | 694 | | | $ | 3,753 | | | | 176 | | | $ | 915 | |
| | | | | | | | | | | | |
| | | |
| | | Government Money Market | | | | | | | |
| | | Year ended
12-31-18 | | | Year ended
12-31-17 | | | | | | | | | | |
| | | Shares | | | Value | | | Shares | | | Value | | | | | | | | | | | | | | | | |
Shares issued from sale of shares: | | | | | | | | | | | | | | | | | | | | | | | | | | | | | | | | | | | | |
Class II | | | 56,637 | | | $ | 56,637 | | | | 54,205 | | | $ | 54,205 | | | | | | | | | | | | | | | | | | | | | |
Shares issued in reinvestment of distributions to shareholders: | | | | | | | | | | | | | | | | | | | | | | | | | | | | | | | | | | | | |
Class II | | | 4,349 | | | | 4,349 | | | | 1,954 | | | | 1,954 | | | | | | | | | | | | | | | | | | | | | |
Shares redeemed: | | | | | | | | | | | | | | | | | | | | | | | | | | | | | | | | | | | | |
Class II | | | (139,112 | ) | | | (139,112 | ) | | | (152,969 | ) | | | (152,969 | ) | | | | | | | | | | | | | | | | | | | | |
| | | | | | | | | | | | |
Net decrease | | | (78,126 | ) | | $ | (78,126 | ) | | | (96,810 | ) | | $ | (96,810 | ) | | | | | | | | | | | | | | | | | | | | |
| | | | | | | | | | | | |
| 10. | | FEDERAL INCOME TAX MATTERS($ amounts in thousands) |
For Federal income tax purposes, cost of investments owned at December 31, 2018 and the related unrealized appreciation (depreciation) were as follows:
| | | | | | | | | | | | | | | | |
| Portfolio | | Cost of Investments | | | Gross Appreciation | | | Gross Depreciation | | | Net Unrealized
Depreciation | |
Pathfinder Aggressive | | $ | 66,713 | | | $ | 220 | | | $ | 8,057 | | | $ | (7,837 | ) |
Pathfinder Conservative | | | 100,469 | | | | — | | | | 6,890 | | | | (6,890 | ) |
Pathfinder Moderate | | | 764,715 | | | | — | | | | 62,147 | | | | (62,147 | ) |
Pathfinder Moderately Aggressive | | | 922,760 | | | | — | | | | 84,139 | | | | (84,139 | ) |
Pathfinder Moderately Conservative | | | 221,892 | | | | — | | | | 16,746 | | | | (16,746 | ) |
Pathfinder Moderate – Managed Volatility | | | 655,462 | | | | — | | | | 51,246 | | | | (51,246 | ) |
Pathfinder Moderately Aggressive – Managed Volatility | | | 93,459 | | | | — | | | | 9,688 | | | | (9,688 | ) |
Pathfinder Moderately Conservative – Managed Volatility | | | 78,305 | | | | — | | | | 5,646 | | | | (5,646 | ) |
Government Money Market | | | 238,517 | | | | — | | | | — | | | | — | |
For Federal income tax purposes, the Portfolios’ distributed and undistributed earnings and profit for the year ended December 31, 2018 and the post-October and late-year ordinary activity updated with information available through the date of this report were as follows:
| | | | | | | | | | | | | | | | | | | | |
| Portfolio | | Undistributed
Ordinary
Income | | | Undistributed
Long-Term
Capital Gains | | | Tax Return
of Capital | | | Post-
October
Capital
Losses
Deferred | | | Late-Year
Ordinary
Losses
Deferred | |
Pathfinder Aggressive | | $ | 1,919 | | | $ | 5,451 | | | $ | — | | | $ | — | | | $ | — | |
Pathfinder Conservative | | | 2,138 | | | | 4,761 | | | | — | | | | — | | | | — | |
Pathfinder Moderate | | | 19,527 | | | | 56,059 | | | | — | | | | — | | | | — | |
Pathfinder Moderately Aggressive | | | 24,426 | | | | 78,139 | | | | — | | | | — | | | | — | |
Pathfinder Moderately Conservative | | | 5,000 | | | | 13,431 | | | | — | | | | — | | | | — | |
Pathfinder Moderate – Managed Volatility | | | 12,471 | | | | 31,342 | | | | — | | | | — | | | | — | |
Pathfinder Moderately Aggressive – Managed Volatility | | | 2,043 | | | | 5,510 | | | | — | | | | — | | | | — | |
Pathfinder Moderately Conservative – Managed Volatility | | | 1,338 | | | | 3,568 | | | | — | | | | — | | | | — | |
Government Money Market | | | 59 | | | | 16 | | | | — | | | | — | | | | — | |
Internal Revenue Code regulations permit each Portfolio to elect to defer into its next fiscal year capital losses and certain specified ordinary items incurred between each November 1 and the end of its fiscal year. Each Portfolio is also permitted to defer into its next fiscal certain ordinary losses that generated between each January 1 and the end of its fiscal year.
The tax character of dividends and distributions paid during the two fiscal years ended December 31, 2018 and 2017 were as follows:
| | | | | | | | | | | | | | | | | | | | |
| | | December 31, 2018 | | | | | | December 31, 2017 | |
| Portfolio | | Distributed
Ordinary
Income(1) | | | Distributed
Long-Term
Capital
Gains | | | | | | Distributed
Ordinary
Income(1) | | | Distributed
Long-Term
Capital
Gains | |
Pathfinder Aggressive | | $ | 1,675 | | | $ | 3,392 | | | | | | | $ | 1,058 | | | $ | 4,936 | |
Pathfinder Conservative | | | 1,750 | | | | 2,972 | | | | | | | | 1,230 | | | | 4,172 | |
Pathfinder Moderate | | | 15,410 | | | | 33,109 | | | | | | | | 9,628 | | | | 44,876 | |
Pathfinder Moderately Aggressive | | | 24,003 | | | | 41,725 | | | | | | | | 13,001 | | | | 58,449 | |
Pathfinder Moderately Conservative | | | 4,186 | | | | 8,769 | | | | | | | | 2,870 | | | | 11,417 | |
Pathfinder Moderate – Managed Volatility | | | 8,544 | | | | 15,759 | | | | | | | | 2,508 | | | | 14,751 | |
Pathfinder Moderately Aggressive – Managed Volatility | | | 1,570 | | | | 2,492 | | | | | | | | 388 | | | | 2,463 | |
Pathfinder Moderately Conservative – Managed Volatility | | | 1,057 | | | | 1,819 | | | | | | | | 298 | | | | 1,471 | |
Government Money Market | | | 4,344 | | | | — | | | | | | | | 2,151 | | | | — | |
| (1) | Includes short-term capital gains distributed, if any. |
Dividends from net investment income and short-term capital gains are treated as ordinary income dividends for federal income tax purposes.
Accumulated capital losses represent net capital loss carryovers as of December 31, 2018 that may be available to offset future realized capital gains and thereby reduce future capital gains distributions. As of December 31, 2018, the capital loss carryforwards were as follows:
| | | | | | | | |
| Portfolio | | Short-Term
Capital Loss
Carryover | | | Long-Term
Capital Loss
Carryover | |
Pathfinder Aggressive | | $ | — | | | $ | — | |
Pathfinder Conservative | | | — | | | | — | |
Pathfinder Moderate | | | — | | | | — | |
Pathfinder Moderately Aggressive | | | — | | | | — | |
Pathfinder Moderately Conservative | | | — | | | | — | |
Pathfinder Moderate – Managed Volatility | | | — | | | | — | |
Pathfinder Moderately Aggressive – Managed Volatility | | | — | | | | — | |
Pathfinder Moderately Conservative – Managed Volatility | | | — | | | | — | |
Government Money Market | | | — | | | | — | |
Net investment income dividends and capital gains distributions are determined in accordance with income tax regulations which may differ from U.S. GAAP. These differences are due to differing treatments for items such as deferral of wash sales, post-October losses, late-year ordinary losses, foreign currency transactions and net operating losses. At December 31, 2018, the following reclassifications were made:
| | | | | | | | |
| Portfolio | | Accumulated
Distributable
Earnings
Gain (Loss) | | | Paid-In
Capital | |
Pathfinder Aggressive | | $ | — | | | $ | — | |
Pathfinder Conservative | | | — | | | | — | |
Pathfinder Moderate | | | — | | | | — | |
Pathfinder Moderately Aggressive | | | — | | | | — | |
Pathfinder Moderately Conservative | | | — | | | | — | |
Pathfinder Moderate – Managed Volatility | | | — | | | | — | |
Pathfinder Moderately Aggressive – Managed Volatility | | | — | | | | — | |
Pathfinder Moderately Conservative – Managed Volatility | | | — | | | | — | |
Government Money Market | | | — | | | | — | |
| | |
| REPORT OF INDEPENDENT REGISTERED PUBLIC ACCOUNTING FIRM | | IVY VIP |
To the Shareholders and Board of Trustees of Ivy Variable Insurance Portfolios:
Opinion on the Financial Statements and Financial Highlights
We have audited the accompanying statements of assets and liabilities of Ivy VIP Pathfinder Aggressive, Ivy VIP Pathfinder Conservative, Ivy VIP Pathfinder Moderate, Ivy VIP Pathfinder Moderately Aggressive, Ivy VIP Pathfinder Moderately Conservative, Ivy VIP Pathfinder Moderate – Managed Volatility, Ivy VIP Pathfinder Moderately Aggressive – Managed Volatility, Ivy VIP Pathfinder Moderately Conservative – Managed Volatility, and Ivy VIP Government Money Market (the “Funds”), nine of the series constituting the Ivy Variable Insurance Portfolios, including the schedules of investments, as of December 31, 2018; the related statements of operations for the year then ended, the statements of changes in net assets for each of the two years in the period then ended, the financial highlights for each of the five years in the period then ended, and the related notes. In our opinion, the financial statements and financial highlights present fairly, in all material respects, the financial position of the Funds, as of December 31, 2018, and the results of their operations for the year then ended, the changes in their net assets for each of the two years in the period then ended, and the financial highlights for each of the five years in the period then ended in conformity with accounting principles generally accepted in the United States of America.
Basis for Opinion
These financial statements and financial highlights are the responsibility of the Funds’ management. Our responsibility is to express an opinion on the Funds’ financial statements and financial highlights based on our audits. We are a public accounting firm registered with the Public Company Accounting Oversight Board (United States) (PCAOB) and are required to be independent with respect to the Funds in accordance with the U.S. federal securities laws and the applicable rules and regulations of the Securities and Exchange Commission and the PCAOB.
We conducted our audits in accordance with the standards of the PCAOB. Those standards require that we plan and perform the audit to obtain reasonable assurance about whether the financial statements and financial highlights are free of material misstatement, whether due to error or fraud. The Funds are not required to have, nor were we engaged to perform, an audit of their internal control over financial reporting. As part of our audits we are required to obtain an understanding of internal control over financial reporting but not for the purpose of expressing an opinion on the effectiveness of the Funds’ internal control over financial reporting. Accordingly, we express no such opinion.
Our audits included performing procedures to assess the risks of material misstatement of the financial statements and financial highlights, whether due to error or fraud, and performing procedures that respond to those risks. Such procedures included examining, on a test basis, evidence regarding the amounts and disclosures in the financial statements and financial highlights. Our audits also included evaluating the accounting principles used and significant estimates made by management, as well as evaluating the overall presentation of the financial statements and financial highlights. Our procedures included confirmation of securities owned as of December 31, 2018, by correspondence with the custodian, transfer agent, and brokers; when replies were not received from brokers, we performed other auditing procedures. We believe that our audits provide a reasonable basis for our opinion.

Kansas City, Missouri
February 15, 2019
We have served as the auditor of one or more Waddell & Reed investment companies since 1997.
| | |
| INCOME TAX INFORMATION | | IVY VIP |
AMOUNTS NOT ROUNDED (UNAUDITED)
The Portfolios hereby designate the following amounts of dividends paid from net ordinary income as dividends qualifying for the 70% dividends received deduction for corporations for the tax period ended December 31, 2018:
| | | | |
| | | Dividends
Received
Deduction for
Corporations | |
Pathfinder Aggressive | | $ | 217,146 | |
Pathfinder Conservative | | | 285,003 | |
Pathfinder Moderate | | | 2,905,958 | |
Pathfinder Moderately Aggressive | | | 3,771,573 | |
Pathfinder Moderately Conservative | | | 732,892 | |
Pathfinder Moderate – Managed Volatility | | | 1,741,502 | |
Pathfinder Moderately Aggressive – Managed Volatility | | | 298,444 | |
Pathfinder Moderately Conservative – Managed Volatility | | | 191,689 | |
Government Money Market | | | — | |
The Portfolios hereby designate the following amounts as distributions of long-term capital gains:
| | | | |
Pathfinder Aggressive | | $ | 3,391,846 | |
Pathfinder Conservative | | | 2,971,558 | |
Pathfinder Moderate | | | 33,108,595 | |
Pathfinder Moderately Aggressive | | | 41,725,372 | |
Pathfinder Moderately Conservative | | | 8,769,549 | |
Pathfinder Moderate – Managed Volatility | | | 15,758,927 | |
Pathfinder Moderately Aggressive – Managed Volatility | | | 2,491,413 | |
Pathfinder Moderately Conservative – Managed Volatility | | | 1,818,950 | |
Government Money Market | | | — | |
Internal Revenue Code regulations permit each qualifying Portfolio to elect to pass through a foreign tax credit to shareholders with respect to foreign taxes paid by the Portfolio. Each Portfolio elected to pass the following amounts of creditable foreign taxes through to their shareholders:
| | | | | | | | |
| | | Foreign
Tax Credit | | | Foreign
Derived
Income | |
Pathfinder Aggressive | | $ | 29,529 | | | $ | 263,369 | |
Pathfinder Conservative | | | 14,663 | | | | 130,777 | |
Pathfinder Moderate | | | 232,478 | | | | 2,073,481 | |
Pathfinder Moderately Aggressive | | | 352,575 | | | | 3,144,626 | |
Pathfinder Moderately Conservative | | | 50,131 | | | | 447,121 | |
Pathfinder Moderate – Managed Volatility | | | 166,847 | | | | 1,488,110 | |
Pathfinder Moderately Aggressive – Managed Volatility | | | 3,109 | | | | 261,730 | |
Pathfinder Moderately Conservative – Managed Volatility | | | 15,204 | | | | 135,605 | |
| | |
| BOARD OF TRUSTEES AND OFFICERS | | IVY VIP |
(UNAUDITED)
Each of the individuals listed below serves as a trustee for the Trust (28 portfolios), and for the rest of the funds within the Fund Complex, which also includes, in addition to the Trust, the Ivy Funds (45 portfolios), the Ivy High Income Opportunities Fund (aclosed-end fund) (“IVH”), Ivy NextShares (“NextShares”) (3 portfolios) and InvestEd Portfolios (“InvestEd”) (6 portfolios).
Board members who are not “interested persons” of the Funds as defined in Section 2(a)(19) of the 1940 Act (Disinterested Trustees) constitute at least 75% of the Board.
Joseph Harroz, Jr. serves as the Independent Chairman of the Trust’s Board and of the Board of Trustees of the other funds in the Fund Complex. Subject to the Trustee Emeritus and Retirement Policy, a Trustee serves until his or her successor is elected and qualified or until his or her earlier death, resignation or removal.
The Statement of Additional Information (the “SAI”) for the Trust includes additional information about the Trust’s trustees. The SAI is available without charge, upon request, by calling 1.888.923.3355. It is also available on the Ivy Investments website, www.ivyinvestments.com.
Disinterested Trustees
| | | | | | | | |
Name, Address and
Year of Birth | | Position(s) Held with
the Trust | | Trustee Since* | | Principal Occupation(s)
During Past 5 Years | | Other Directorships Held |
James M. Concannon 6300 Lamar Avenue Overland Park, KS 66202 1947 | | Trustee | | 1997 | | Professor of Law, Washburn University School of Law (1973 to present). | | Director, Kansas Legal Services for Prisoners, Inc.(non-profit community service); Director, U.S. Alliance Corporation and wholly-owned subsidiaries: U.S. Alliance Life and Security Company and Dakota Capital Life Insurance Company (Insurance) (2009 to present); Director, Kansas Appleseed, Inc.(non-profit community service) (2007 to present); Trustee, Waddell & Reed Advisors Funds (WRA Funds) (1997-2018); Trustee, Ivy Funds; Trustee, IVH; Trustee, NextShares; Trustee, InvestEd. |
James D. Gressett 6300 Lamar Avenue Overland Park, KS 66202 1950 | | Trustee | | Trust: 2017 Fund Complex: 2002 | | Chief Executive Officer (CEO) of CalPac Pizza LLC (2011 to present); CEO of CalPac Pizza II LLC (2012 to present); CEO of PacPizza LLC (Pizza Hut franchise) (2000 to present); Member/CEO, Southern Pac Pizza LLC (2013 to present); Partner, Century Bridge Partners (real estate investments) (2007 to present); Manager, Hartley Ranch Angus Beef, LLC (2013 to present); President, Penn Capital Corp. (1995 to present); Partner, Penn Capital Partners (1999 to present). | | Member/Secretary, The Metochoi Group LLC (1999 to present); Member/Chairman, Idea Homes LLC (homebuilding and development) (2013 to present); Trustee, WRA Funds (2017-2018); Trustee, Ivy Funds; Trustee; IVH; Trustee, NextShares; Trustee, InvestEd. |
Joseph Harroz, Jr. 6300 Lamar Avenue Overland Park, KS 66202 1967 | | Trustee Independent Chairman | | 1998 2015 | | Dean, College of Law, Vice President, University of Oklahoma (2010 to present); Managing Member, Harroz Investments, LLC, (commercial enterprises) (1998 to present). | | Director and Shareholder, Valliance Bank (2007 to present); Director, Foundation Healthcare (formerly Graymark HealthCare) (2008-2017); Trustee, The Mewbourne Family Support Organization (2006 to present)(non-profit); Independent Director, LSQ Manager, Inc. (real estate) (2007-2016); Director, Oklahoma Foundation for Excellence(non-profit) (2008 to present); Trustee/Independent Chairman, WRA Funds (Independent Chairman: 2015-2018; Trustee: 1998-2018); Trustee/ Independent Chairman, Ivy Funds; Trustee/ Independent Chairman, IVH; Trustee/ Independent Chairman, NextShares; Trustee/ Independent Chairman, InvestEd. |
Glendon E. Johnson, Jr. 6300 Lamar Avenue Overland Park, KS 66202 1951 | | Trustee | | Trust: 2017 Fund Complex: 2002 | | Of Counsel, Lee & Smith, PC (law firm, emphasis on finance, securities, mergers and acquisitions law) (1996 to present); Owner and Manager, Castle Valley Ranches, LLC (ranching) and Castle Valley Outdoors, LLC (outdoor recreation) (1995 to present); Formerly, Partner, Kelly, Drye & Warren LLP (law firm) (1989-1996); Partner, Lane & Edson PC (law firm) (1987-1989). | | Director, Thomas Foundation for Cancer Research(non-profit) (2005 to present); Director, Warriors Afield Legacy Foundation(non-profit) (2014 to present); Trustee, WRA Funds (2017-2018); Trustee, Ivy Funds; Trustee, IVH; Trustee, NextShares; Trustee, InvestEd. |
| | | | | | | | |
Name, Address and
Year of Birth | | Position(s) Held with
the Trust | | Trustee Since* | | Principal Occupation(s)
During Past 5 Years | | Other Directorships Held |
Frank J. Ross, Jr. Polsinelli PC 900 West 48th Place, Suite 900 Kansas City, MO 64112 1953 | | Trustee | | 1996 | | Shareholder/Director, Polsinelli PC (law firm) (1980 to present). | | Trustee, WRA Funds (1996-2018); Trustee, Ivy Funds; Trustee, IVH; Trustee, NextShares; Trustee, InvestEd. |
Michael G. Smith 6300 Lamar Avenue Overland Park, KS 66202 1944 | | Trustee | | Trust: 2017 Fund Complex: 2002 | | Retired; formerly, with Merrill Lynch as Managing Director of Global Investor Client Strategy (1996-1998), Head of Regional Institutional Sales (1995-1996) and of U.S. Central Region (1986-1995, 1999). | | Director, Executive Board, Cox Business School, Southern Methodist University (1998 to present); Lead Director, Northwestern Mutual Funds (2003-2017); Director, CTMG, Inc. (clinical testing) (2008-2015); Trustee, WRA Funds (2017-2018); Trustee, Ivy Funds; Trustee, IVH; Trustee, NextShares; Trustee, InvestEd. |
Edward M. Tighe 6300 Lamar Avenue Overland Park, KS 66202 1942 | | Trustee | | Trust: 2017 Fund Complex: 1999 | | Retired; formerly, CEO and Director of Asgard Holdings, LLC (computer network and security services) (2002-2004); President, Citco Technology Management (1995-2000); CEO, Global Mutual Fund Services (1993-2000); Sr. Vice President, Templeton Global Investors (1988-1992). | | Director, The Research Coast Principium Foundation, Inc.(non-profit) (2012-2015); Trustee, WRA Funds (2017-2018); Trustee, Ivy Funds; Trustee, IVH; Trustee, NextShares; Trustee, InvestEd. |
*Each noted Trustee became a Trustee (and, as applicable, an officer) in the year reflected by the first date shown. The second date shows when the Trustee first became a director (and, as applicable, an officer) of one or more of the funds that are the predecessors to current funds within the Fund Complex (if applicable).
Interested Trustee
Mr. Herrmann is “interested” by virtue of his former engagement as an officer of Waddell & Reed Financial, Inc. (“WDR”) or its wholly owned subsidiaries, including each Fund’s investment manager, Ivy Investment Management Company (“IICO”), each Fund’s principal underwriter, Ivy Distributors, Inc. (“IDI”), and each Fund’s shareholder servicing and accounting services agent, Waddell & Reed Services Company, doing business as WI Services Company (“WISC”), a subsidiary of Waddell & Reed, Inc. (Waddell & Reed), as well as by virtue of his personal ownership of shares of WDR. The address for each Interested Trustee and each of the officers in the following tables is 6300 Lamar Avenue, Overland Park, KS 66202.
| | | | | | | | |
| Name and Year of Birth | | Position(s) Held with
the Trust | | Trustee/Officer Since | | Principal Occupation(s)
During Past 5 Years | | Other Directorships Held |
Henry J. Herrmann 1942 | | Trustee | | 1998 | | Retired,Non-Executive Chairman of the Board, WDR (2016-2018); Formerly Chairman, WDR (2010-2018); CEO, WDR (2005-2016); President, CEO and Chairman, IICO (2002-2016); President, CEO and Chairman, Waddell & Reed Investment Management Company (WRIMCO) (1993-2016); President of each of the funds in the Fund Complex (2001-2016). | | Director, WDR, (1998 to present), IICO (2002-2016), WRIMCO (1991-2016), WISC (2001-2016), W&R Capital Management Group, Inc. (2008-2016) and WRI (1993-2016); Director, Blue Cross Blue Shield of Kansas City (2007-2017); Trustee, WRA Funds (1998-2018); Trustee, Ivy Funds; Trustee, IVH; Trustee, NextShares; Trustee, InvestEd. |
Officers
The Board has appointed officers who are responsible for theday-to-day business decisions based on policies it has established. The officers serve at the pleasure of the Board. The Trust’s principal officers are:
| | | | | | | | |
| Name and Year of Birth | | Position(s) Held with the
Trust and Fund Complex | | Officer of
Trust Since | | Officer of Fund
Complex Since* | | Principal Occupation(s) During Past 5 Years |
Jennifer K. Dulski 1980 | | Secretary | | 2017 | | 2017 | | Secretary for each of the funds in the Fund Complex (2017 to present); Senior Vice President and Associate General Counsel of Waddell & Reed and IDI (2018 to present). |
Joseph W. Kauten 1969 | | Vice President Treasurer Principal Financial Officer | | 2009 2009 2009 | | 2006 2006 2007 | | Principal Financial Officer of each of the funds in the Fund Complex (2007 to present); Vice President and Treasurer of each of the funds in the Fund Complex (2006 to present); Principal Accounting Officer of each of the funds in the Fund Complex (2006-2017); Assistant Treasurer of each of the funds in the Fund Complex (2003-2006); Vice President of Waddell & Reed Services Company (WRSCO) (2007 to present). |
| | | | | | | | |
| Name and Year of Birth | | Position(s) Held with the
Trust and Fund Complex | | Officer of
Trust Since | | Officer of Fund
Complex Since* | | Principal Occupation(s) During Past 5 Years |
Philip J. Sanders 1959 | | President | | 2016 | | 2006 | | CEO of WDR (2016 to present); President, CEO and Chairman of IICO and WRIMCO (2016 to present); President of each of the funds in the Fund Complex (2016 to present); CIO of WDR (2011 to present); CIO of IICO and WRIMCO (2010 to present). |
Scott J. Schneider 1968 | | Vice President Chief Compliance Officer | | 2009 2009 | | 2006 2004 | | Chief Compliance Officer (2004 to present) and Vice President (2006 to present) of each of the funds in the Fund Complex; Vice President of IICO and WRIMCO (2006 to present). |
Philip A. Shipp 1969 | | Assistant Secretary | | 2012 | | 2012 | | Assistant Secretary of each of the funds in the Fund Complex (2012 to present); Vice President of Waddell & Reed and IDI (2010-present). |
John E. Sundeen, Jr. 1960 | | Vice President | | 2009 | | 2006 | | Senior Vice President (1999 to present) and Chief Administrative Officer (2006 to present) of WDR; Executive Vice President and Chief Administrative Officer of IICO and WRIMCO (2004 to present); Executive Vice President of WRSCO (2016 to present). |
*This is the date when the Officer first became an officer of one or more of the funds that are the predecessors to current funds within the Fund Complex (if applicable).
| | |
| RENEWAL OF INVESTMENT MANAGEMENT AGREEMENT | | IVY VIP |
At a meeting of the Board of Trustees (the “Board”) for the Ivy Variable Insurance Portfolios (the “Trust”) held on August 14th and 15th, 2018, the Board, including all of the trustees who are not “interested persons” (the “Independent Trustees”), as defined in Section 2(a)(19) of the Investment Company Act of 1940, as amended (the “1940 Act”), unanimously approved the continuance of the Investment Management Agreement (the “Management Agreement”) between Ivy Investment Management Company (“IICO”) and the Trust and the continuance of the Investment Subadvisory Agreement between IICO and Securian Asset Management, Inc. (the “Subadviser”) with respect to Ivy VIP Securian Real Estate Securities, Ivy VIP Pathfinder Moderate – Managed Volatility, Ivy VIP Pathfinder Moderately Aggressive – Managed Volatility, Ivy VIP Pathfinder Moderately Conservative – Managed Volatility. The Management Agreement and the Investment Subadvisory Agreement are referred to collectively herein as the “Agreements.”
The Board’s Independent Trustees were assisted in their review by independent legal counsel, and met with such counsel separately from representatives of IICO. Independent legal counsel explained the factors that the Board should consider as part of its review of the Agreements, all as outlined in a memorandum it had provided to the Board prior to the meeting, including, among other things, the nature and the quality of the services provided by IICO and the Subadviser, profitability (including anyfall-out benefits) from IICO’s and the Subadviser’s relationships with each series of the Trust (each, a “Fund” and together, the “Funds”), economies of scale, the role played by the Independent Trustees, and information on comparative fees and expenses. The Independent Trustees also considered the written responses and materials produced by IICO and the Subadviser in response to 15(c) due diligence request lists submitted by the Independent Trustees’ legal counsel prior to the meeting, as well as materials produced in response to afollow-up request list sent to IICO by independent legal counsel on behalf of the Independent Trustees. Included in those responses, which had been provided to the Board prior to the meeting, was aFund-by-Fund profitability analysis prepared by IICO, as well as an explanation of the methodology by which the profitability analysis was calculated. The Board also received extensive materials on performance, expenses and comparable fund information from Broadridge, Inc. (“Broadridge”), an independent mutual fund rating service. Finally, the Independent Trustees received and reviewed a considerable amount of information that their independent fee consultant had provided to them. The Independent Trustees previously had reviewed and discussed these materials during a telephonic meeting in July 2018. They further reviewed these materials extensively among themselves, with their independent legal counsel and the independent fee consultant, and with the other Board members at executive sessions of the Independent Trustees at the August14-15, 2018 Board meeting, during which the Board considered various factors described below, none of which by itself was considered dispositive. However, the material factors and conclusions that formed the basis for the Board’s determination to approve the Agreements are discussed separately below.
Nature, Extent and Quality of Services
The Board considered the nature, extent and quality of services provided to the Funds by IICO and the Subadviser, taking into account the large amount of materials produced by IICO and the Subadviser in response to the 15(c) due diligence requests submitted on its behalf by independent legal counsel to the Independent Trustees.
The Board also took into account the report from its Investment Oversight Committee (the “IOC”), in light of that committee’s duties to assist the Board in the 15(c) process. The IOC had reported to the Board on its review of the performance of the Funds, IICO’s investment risk management function, and theon-going changes IICO has been undertaking for itself, the Trust and the overall fund complex. As such, the Board examined all of IICO’s activities in light of performance and expense structure, as well as the proposed overall rationalization of the fund complex, which is designed to provide economies of scale to the shareholders, reduce the Funds’ expenses and enhance the performance of the Funds, particularly in the context of substantial industry change and regulatory developments.
The Board likewise considered the knowledge it had received from its regular meetings, including from the materials provided in connection with those meetings, such as the resources and key personnel of IICO and the Subadviser, as well as the other services provided to the Funds by IICO and the Subadviser (such as managing the quality of execution of portfolio transactions and the selection of broker-dealers for those transactions, monitoring adherence to each Fund’s investment restrictions, producing reports, providing support services for the Board and Board committees, communicating with shareholders and overseeing the activities of other service providers, including monitoring compliance with various Fund policies and procedures and with applicable laws and regulations). The Board also took into account the compliance environment at IICO and the Subadviser, noting the resources that each has dedicated towards compliance. The Board concluded that the nature and extent of the services provided by IICO and the Subadviser were appropriate, that the quality of those services had been consistent with quality norms in the industry and that the Funds were likely to benefit from the continued provision of those services.
Benefits from the Relationship with the Funds
The Board next discussed whether IICO or the Subadviser derives any other direct or indirect benefit from serving the Funds. In that regard, the Board discussed the transfer agency/shareholder servicing fees that Waddell & Reed Services Company, an affiliate of IICO, provides the Funds. The Board took note of the caps that management previously had agreed to on shareholder servicing costs. The Board also considered the benefits that accrue to each service provider organization
from its respective relationship with the Funds, including the fact that a variety of services are provided by affiliates of IICO, including distribution, administrative and Fund accounting services, and, as discussed above, shareholder servicing. After full consideration of these and other factors, the Board concluded that none of IICO, the Subadviser or any of their affiliates receives any additional direct or indirect benefits that would preclude the Board from approving the continuation of the Management Agreement with IICO or the Investment Subadvisory Agreement with the Subadviser.
Economies of Scale
The Board discussed whether economies of scale are being realized by the Funds and whether fee levels reflect those economies of scale for the benefit of the Funds’ shareholders. The Board considered the fact that as a Fund’s assets have grown, the expenses of that Fund generally have fallen, although the Board took into account that the overall assets of the Funds have fallen during the prior year. Additionally, in that regard, the Board considered the significant number of initiatives that IICO is undertaking to seek to rationalize the fund complex, reduce expenses and enhance performance.
Performance of the Funds and Costs of Services Provided
The Board considered the performance of each Fund and the costs of the services provided, focusing in particular on a number of Funds that the independent fee consultant had identified. Specifically, the Board examined the investment performance of each Fund, including the percentile ranking of each Fund over various periods of time. The Board also examined the performance of each Fund against its respective Lipper index for the same periods. After extensively reviewing all of the performance information provided, the Board concluded that the Funds’ performance in each asset class was acceptable. Although the performance of some of the focus Funds identified by the independent fee consultant lagged that of their peers or respective Lipper index, the Board recognized that IICO, or the Subadviser, had taken, or was taking, steps to address that underperformance, and determined to continue to monitor closely the performance of those Funds.
The Board also considered the expenses and expense ratio of each Fund, and the expense limitation and fee reduction arrangements entered into by IICO in light of the services provided by IICO and the Subadviser. The Board also compared each Fund’s expenses, including advisory, distribution and shareholder servicing fees, with the expenses and advisory fees of other investment advisers managing similarly situated funds, as well as the advisory fees that IICO (or an affiliate) charges for providing advisory services to other accounts in the same asset class for certain Funds. In that regard, the Board noted that IICO performs significant additional services for the Funds as compared to those other accounts. The Board also took into account the information on IICO’s profitability in managing the Funds, including the methodology used to calculate profitability. The Board finally considered the amount of assets in each Fund, each Fund’s average account size and how those factors affect the Funds’ expense ratios, noting that, as the Funds’ assets have increased or decreased over time, the expense ratios of the Funds generally have fallen or risen, respectively. After completing this examination, the Board concluded that each Fund’s expenses are appropriate at the current time.
Independent Fee Consultant Review
Independent legal counsel, on behalf of the Independent Trustees, engaged an independent fee consultant to assist them in evaluating the reasonableness of the management fees charged by IICO to the Funds. The independent fee consultant’s review addressed the followingfee-related factors:
1. The nature, extent and quality of IICO’s services to the Funds;
2. Management fees and expenses in the context of performance;
3. Product category expenses, including peers;
4. Profit margins of IICO’s parent from supplying such services;
5. Subadviser and institutional fee analyses; and
6. Possible economies of scale as a Fund grows larger.
The following summarizes the findings of the independent fee consultant retained by the Independent Trustees.
Summary Findings
The report stated that IICO delivered reasonable levels of performance in the longer-term periods and reasonable levels of service to the Funds in relation to its management fees as compared to the investment advisers of comparable funds. For the 36 months ended March 31, 2018, approximately 15% of the funds in the Fund Complex (including the Funds) were in the top quartile of performance and 33% of such funds were in the top two quartiles of performance and that short-term performance of such funds were showing signs of improvement. Specifically, the report noted that 49% of such funds were in the top two quartiles in theone-year period, and that 31% of all such funds had improving performance in theirone-year period. The independent fee consultant noted that the funds’ performance appeared to be grounded in a number of
institutional competitive advantages at IICO including economic analysis, investment management depth, ability to attract top talent, strategic vision, performance-focused culture, and an effective trading infrastructure.
The report further indicated that total expenses of the funds, on average, were 4% below the average total expenses of their respective Broadridge Expense Group peers and flat compared to the average total expenses for their Broadridge Expense Universes. The management fees for the funds were 4% over the average management fees of their respective Broadridge Expense Group peers and 6% over the average management fees for their Broadridge Expense Universes.
The report also stated that the management fees IICO charges to the funds are reasonable in relation to the management fees it charges to its institutional account clients. The report noted that these institutional account clients have different service and infrastructure needs and in addition, the average spread between management fees IICO charged to the funds and those it charges to institutional account clients is reasonable relative to the average fee spreads computed from industry surveys.
The report stated that while it was difficult to confirm overall economies of scale, it was clear that the funds’ shareholders generally are benefitting from lower expenses as the funds’ assets grow through management fee breakpoints, decline in transfer agency expenses, decline in custody contract rates and declines in othernon-management expenses.
The report also noted that the overall profitability of IICO’s parent relative to other complexes is reasonable. Finally, the report noted that IICO has continued to invest in AUM growth, which is designed to help drive down fund expenses and attract top investment management talent, as well as in fund mergers, which could help drive down expenses, both of which can benefit the funds’ investors.
Finally, the report also examined the fees that IICO retains on funds that are subadvised by unaffiliated subadvisers, and indicated that those fees are reasonable relative to the industry. The report also stated that the subadvisory fees that IICO earns for serving as a subadviser to an unaffiliated fund when compared to fees of similar funds likewise are reasonable relative to the industry.
Conclusions
The independent fee consultant’s report concluded that it believes that the services provided by IICO and its affiliates and expenses incurred by the Funds in the previous 12 months are reasonable and provide adequate justification for renewal of the Funds’ existing Agreements.
| | |
| ANNUAL PRIVACY NOTICE | | IVY VIP |
(UNAUDITED)
Ivy Distributors, Inc., the Ivy Variable Insurance Portfolios and the InvestEd Portfolios (“Ivy”) are committed to ensuring their clients have access to a broad range of products and services to help them achieve their personal financial goals. Accurate information lies at the heart of our pledge to provide these products and services, and we strive to protect your personal nonpublic information. In the course of doing business with Ivy clients are requested to share financial information and they may be asked to provide other personal details. Clients can be assured that Ivy is diligent in its efforts to keep such information confidential.
Recognition of a Client’s Expectation of Privacy
At Ivy, we believe the confidentiality and protection of client information is one of our fundamental responsibilities. And while information is critical to providing quality service, we recognize that one of our most important assets is our clients’ trust. Thus, the safekeeping of client information is a priority for Ivy.
Information Collected
In order to tailor available financial products to your specific needs, Ivy may request that you complete a variety of forms that require nonpublic personal information about your financial history and other personal details, including but not limited to, your name, address, social security number, assets, income and investments. Ivy may also gather information about your transactions with us, our affiliates and others.
Categories of Information that may be Disclosed
While Ivy may disclose information it collects from applications and other forms, as described above, we at Ivy also want to assure all of our clients that whenever information is used, it is done with discretion. The safeguarding of client information is an issue we take seriously.
Categories of Parties to whom we disclose nonpublic personal information
Ivy may disclose nonpublic personal information about you to selectively chosen financial service providers, whom we believe have valuable products or services that could benefit you. Whenever we do this, we carefully review the company and the product or service to make sure that it provides value to our clients. We share the minimum amount of information necessary for that company to offer its product or service. We may also share information with unaffiliated companies that assist us in providing our products and services to our clients; in the normal course of our business (for example, with consumer reporting agencies and government agencies); when legally required or permitted in connection with fraud investigations and litigation; and at the request or with the permission of a client.
In addition, Ivy has entered into a Protocol with a number of other brokerage firms intended to further our clients’ freedom of choice in connection with the movement of their financial advisors to new firms. In the event your account is maintained through Ivy and your financial advisor leaves Ivy to join a firm that has likewise entered the Protocol, Ivy may disclose your name, address and telephone number to the departed advisor’s new firm.
Opt Out Right
If you prefer that we not disclose nonpublic personal information about you to nonaffiliated third parties, you may opt out of those disclosures; that is, you may direct us not to make those disclosures (other than disclosures permitted by law). If you wish to opt out of disclosures to nonaffiliated third parties, you may make this request in writing to: Ivy, Attn: Opt Out Notices, P.O. Box 29220, Shawnee Mission, KS 66201, or you may call 1-888-923-3355 and a Client Services Representative will assist you.
Confidentiality and Security
We restrict access to nonpublic personal information about you to those employees who need to know that information to provide products and services to you. We maintain physical, electronic, and procedural safeguards that comply with federal standards to guard your nonpublic personal information. If you decide to close your account(s) or become an inactive client, we will adhere to the privacy policies and practices as described in this notice.
| | |
| PROXY VOTING INFORMATION | | IVY VIP |
(UNAUDITED)
Proxy Voting Guidelines
A description of the policies and procedures Ivy Variable Insurance Portfolios uses to determine how to vote proxies relating to portfolio securities is available (i) without charge, upon request, by calling 1.888.923.3355 and (ii) on the Securities and Exchange Commission’s (“SEC”) website at www.sec.gov.
Proxy Voting Records
Information regarding how the Portfolio voted proxies relating to portfolio securities during the most recent12-month period ended June 30 is available on FormN-PX at www.ivyinvestments.com and on the SEC’s website at www.sec.gov.
| | |
| QUARTERLY PORTFOLIO SCHEDULE INFORMATION | | IVY VIP |
(UNAUDITED)
Portfolio holdings can be found on the Trust’s website at www.ivyinvestments.com. Alternatively, a complete schedule of portfolio holdings of each Portfolio for the first and third quarters of each fiscal year is filed with the SEC and can be found on the Trust’s FormN-Q. These holdings may be viewed in the following ways:
| • | | On the SEC’s website at www.sec.gov. |
| • | | For review and copy at the SEC’s Public Reference Room in Washington, DC. Information on the operations of the Public Reference Room may be obtained by calling 1.800.SEC.0330. |
This page has been intentionally left blank
This page has been intentionally left blank
| | |
| THE IVY VARIABLE INSURANCE PORTFOLIOS FAMILY | | |
Global/International Portfolios
Global Equity Income
Global Growth
International Core Equity
Domestic Equity Portfolios
Core Equity
Growth
Mid Cap Growth
Small Cap Core
Small Cap Growth
Value
Fixed Income Portfolios
Corporate Bond
Global Bond
High Income
Limited-Term Bond
Money Market Portfolio
Government Money Market
Specialty Portfolios
Asset Strategy
Balanced
Energy
Natural Resources
Pathfinder Aggressive
Pathfinder Conservative
Pathfinder Moderate
Pathfinder Moderately Aggressive
Pathfinder Moderately Conservative
Pathfinder Moderate – Managed Volatility
Pathfinder Moderately Aggressive – Managed Volatility
Pathfinder Moderately Conservative – Managed Volatility
Science and Technology
Securian Real Estate Securities
The underlying portfolios discussed in this report are only available as investment options in variable annuity and variable life insurance contracts issued by life insurance companies. They are not offered or made available directly to the general public.
This report is submitted for the general information of the shareholders of Ivy Variable Insurance Portfolios. It is not authorized for distribution to prospective investors in a Portfolio unless accompanied with or preceded by the current Portfolio prospectus as well as the variable product prospectus.
ANN-VIP-PF (12/18)
ITEM 2. CODE OF ETHICS
| (a) | As of December 31, 2018, the Registrant has adopted a code of ethics (the Code), as defined in Item 2 of FormN-CSR, that applies to the Principal Executive Officer and Principal Financial Officer or persons performing similar functions, regardless of whether these individuals are employed by the registrant or a third party. A copy of this code of ethics is filed as an exhibit to this FormN-CSR. |
| (b) | There have been no amendments, during the period covered by this report, to a provision of the Code that applies to the registrant’s Principal Executive Officer, Principal Financial Officer, Principal Accounting Officer or Controller, or persons performing similar functions, regardless of whether these individuals are employed by the registrant or a third party, and that relates to any element of the Code. |
| (c) | During the period covered by this report, the registrant did not grant any waivers, including an implicit waiver, from a provision of the Code that applies to the registrant’s Principal Executive Officer, Principal Financial Officer, Principal Accounting Officer or Controller, or persons performing similar functions, regardless of whether those individuals were employed by the registrant or a third party, that related to one or more of the items set forth in paragraph (b) of this item’s instructions. |
ITEM 3. AUDIT COMMITTEE FINANCIAL EXPERT
The Board of Trustees of the Registrant has determined that Edward M. Tighe and James D. Gressett are audit committee financial experts, as defined in Item 3 of FormN-CSR, serving on its audit committee. Messrs. Tighe and Gressett are independent for purposes of Item 3 of FormN-CSR.
ITEM 4. PRINCIPAL ACCOUNTANT FEES AND SERVICES.
The aggregate fees billed for professional services rendered by the principal accountant for the audit of the registrant’s annual financial statements or services that are normally provided by the accountant in connection with statutory and regulatory filings or engagements for each of the last two fiscal years are as follows:
| | | | |
2017 | | $ | 381,000 | |
2018 | | | 403,250 | |
The aggregate fees billed for assurance and related services by the principal accountant that are reasonably related to the performance of the audit of the registrant’s annual financial statements and are not reported under paragraph (a) of this Item are as follows:
These fees are related to the review of FormN-1A.
The aggregate fees billed for professional services rendered by the principal accountant for tax compliance, tax advice and tax planning are as follows:
| | | | |
2017 | | $ | 144,820 | |
2018 | | | 171,479 | |
These fees are related to the review of the registrant’s tax returns.
The aggregate fees billed for products and services provided by the principal accountant, other than the services reported in paragraphs (a) through (c) of this item are as follows:
These fees are related to the review of internal control.
| | | | |
| (e) | | (1) | | Registrant’s audit committee considers with the principal accountants all audit services to be provided by the principal accountants andpre-approves all such audit services. |
The audit committee shallpre-approve allnon-audit services to be provided by the principal accountants to the registrant; provided that thepre-approval requirement does not apply tonon-audit services that (i) were not identified as such at the time of thepre-approval and (ii) do not aggregate more than 5% of total fees paid to the principal accountants by the registrant during the fiscal year in which the services are provided, if the audit committee approves the provision of suchnon-audit services prior to the completion of the audit.
The audit committee shallpre-approve allnon-audit services to be provided by the principal accountants to the investment adviser (not including any subadvisor whose role is primarily portfolio management and is subcontracted and overseen by the investment advisor) or any entity controlling, controlled by, or under common control with the investment adviser that provides ongoing services to the registrant if the engagement relates directly to the operations or financial reporting of the registrant; provided that thepre-approval requirement does not apply tonon-audit services that (i) were not identified as such at the time of thepre-approval and (ii) do not aggregate more than 5% of total fees paid to the principal accountants by the registrant for all services and by the registrant’s investment adviser fornon-audit services if the engagement relates directly to the operations or financial reporting of the registrant during the fiscal year in which those services are provided, if the audit committee approves the provision of suchnon-audit services prior to the completion of the audit.
| | | | |
| (e) | | (2) | | None of the services described in each of paragraphs (b) through (d) of this Item were approved by the audit committee pursuant to the waiver provisions of paragraph (c)(7)(i)(C) of Rule2-01 of RegulationS-X. |
| (g) | $164,206 and $218,090 are the aggregatenon-audit fees billed in each of the last two fiscal years for services rendered by the principal accountant to the registrant. $122,000 and $91,000 are the aggregatenon-audit fees billed in each of the last two fiscal years for services rendered by the principal accountant to the investment adviser (not including anysub-adviser whose role is primarily portfolio management and is subcontracted with or overseen by another investment adviser) and any entity controlling, controlled by, or under common control with the adviser that provides ongoing services to the registrant. |
ITEM 5. AUDIT COMMITTEE OF LISTED REGISTRANTS
Not applicable.
ITEM 6. SCHEDULE OF INVESTMENTS.
| (a) | See Item 1 Shareholder Report. |
ITEM 7. DISCLOSURE OF PROXY VOTING POLICIES AND PROCEDURES FORCLOSED-END MANAGEMENT INVESTMENT COMPANIES
Not applicable.
ITEM 8. PORTFOLIO MANAGERS OFCLOSED-END MANAGEMENT INVESTMENT COMPANIES.
Not applicable.
ITEM 9. PURCHASES OF EQUITY SECURITIES BYCLOSED-END MANAGEMENT INVESTMENT COMPANIES AND AFFILIATED PURCHASERS
Not applicable.
ITEM 10. SUBMISSION OF MATTERS TO A VOTE OF SECURITY HOLDERS
There have been no material changes to the procedures by which shareholders may recommend nominees to the Registrant’s board of trustees.
ITEM 11. CONTROLS AND PROCEDURES.
| (a) | The Registrant’s Principal Executive Officer and Principal Financial Officer, or persons performing similar functions, based on their evaluation of the Registrant’s disclosure controls and procedures as of a date within 90 days of the filing date of this report, have concluded that such controls and procedures (as defined in Rule30a-3(c) under the Investment Company Act of 1940, as amended) are effective and adequately designed to ensure that information required to be disclosed by the Registrant in its reports that it files or submits is accumulated and communicated to the Registrant’s management, including the Principal Executive Officer and Principal Financial Officer, or persons performing similar functions, as appropriate, to allow timely decisions regarding required disclosure. |
| (b) | There were no significant changes in the registrant’s internal controls over financial reporting (as defined in Rule30a-3(d) under the Investment Company Act of 1940, as amended) that occurred during the registrant’s second fiscal quarter of the period covered by this report that has materially affected, or is reasonably likely to materially affect, the registrant’s internal control over financial reporting. |
ITEM 12. EXHIBITS.
(a)(1) The Code described in Item 2 of this FormN-CSR.
Attached hereto as Exhibit 99.CODE.
(a)(2) A separate certification for each principal executive officer and principal financial officer of the registrant as required by Rule30a-2(a) under the Investment Company Act of 1940 (17 CFR270.30a-2(a)).
Attached hereto as Exhibit 99.CERT.
(b) A separate certification for each principal executive officer and principal financial officer of the registrant as required by Rule30a-2(b) under the Investment Company Act of 1940 (17 CFR270.30a-2(b)).
Attached hereto as Exhibit 99.906CERT.
SIGNATURES
Pursuant to the requirements of the Securities Exchange Act of 1934 and the Investment Company Act of 1940, the registrant has duly caused this report to be signed on its behalf by the undersigned, thereunto duly authorized.
IVY VARIABLE INSURANCE PORTFOLIOS
(Registrant)
| | |
| By | | /s/ Jennifer K. Dulski |
| | Jennifer K. Dulski, Secretary |
| |
| Date: | | March 8, 2019 |
Pursuant to the requirements of the Securities Exchange Act of 1934 and the Investment Company Act of 1940, this report has been signed below by the following persons on behalf of the registrant and in the capacities and on the dates indicated.
| | |
| By | | /s/ Philip J. Sanders |
| | Philip J. Sanders, Principal Executive Officer |
| |
| Date: | | March 8, 2019 |
| |
| By | | /s/ Joseph W. Kauten |
| | Joseph W. Kauten, Principal Financial Officer |
| |
| Date: | | March 8, 2019 |