Table of Contents
UNITED STATES
SECURITIES AND EXCHANGE COMMISSION
Washington, D.C. 20549
FORM N-CSR
CERTIFIED SHAREHOLDER REPORT OF REGISTERED
MANAGEMENT INVESTMENT COMPANIES
Investment Company Act file number 811-5018
Smith Barney Investment Series
(Exact name of registrant as specified in charter)
| 125 Broad Street, New York, NY | 10004 | |
| (Address of principal executive offices) | (Zip code) | |
Robert I. Frenkel, Esq.
Smith Barney Fund Management LLC
300 First Stamford Place
Stamford, CT 06902
(Name and address of agent for service)
Registrant’s telephone number, including area code: (800) 451-2010
Date of fiscal year end: October 31
Date of reporting period: April 30, 2005
Table of Contents
ITEM 1. | REPORT TO STOCKHOLDERS. | |
| The Semi-Annual Report to Stockholders is filed herewith. | ||
Table of Contents
SMITH BARNEY
INTERNATIONAL FUND
CLASSIC SERIES | SEMI-ANNUAL REPORT | APRIL 30, 2005

NOT FDIC INSURED • NOT BANK GUARANTEED • MAY LOSE VALUE
Table of Contents
Classic Series

Semi-Annual Report • April 30, 2005
SMITH BARNEY
INTERNATIONAL FUND
TEAM MANAGED
A team of individuals employed by the Fund’s subadviser manages the day-to-day operations of the Fund.
FUND OBJECTIVE
The Fund seeks long-term capital growth. Dividend income, if any, is incidental to this goal. It seeks to achieve this objective by investing primarily in the common stocks of foreign companies that the Fund’s manager believes have above-average prospects for growth, including companies in emerging markets.
| 1 | ||
| 3 | ||
| 4 | ||
| 6 | ||
| 10 | ||
| 11 | ||
| 12 | ||
| 13 | ||
| 15 |
Table of Contents

R. JAY GERKEN, CFA
Chairman, President and Chief Executive Officer
Dear Shareholder,
Despite generally lackluster economic news, the international equity markets generated solid results for the six-month reporting period covered by this report. International equities, as measured by the MSCI EAFE Index,i returned 8.71% over the reporting period. In contrast, U.S. stocks, as measured by the S&P 500 Index,ii rose only 3.28% over the same period.
The reporting period began on a bright note, as the international equity markets rallied sharply in November and December 2004. Investors were drawn to stocks as oil prices retreated from their record highs and the uncertainty of the U.S. Presidential election lifted. Thus far in 2005, the equity markets have been volatile. International equities were weak in January and then rallied strongly in February. However, they again fell in March and April. The market’s recent troubles have been attributed to mixed economic data and continued high oil prices.
Performance Review
For the six months ended April 30, 2005, Class A shares of the Smith Barney International Fund, excluding sales charges, returned 6.84%. These shares underperformed the Lipper International Multi Cap Growth Funds Category Average,1 which was 7.32%. The Fund’s unmanaged benchmark, the MSCI EAFE Index, returned 8.71% for the same period.
PERFORMANCE SNAPSHOT
AS OF APRIL 30, 2005
(excluding sales charges)
(unaudited)
| 6 Months | |||
Smith Barney International Fund - Class A Shares | 6.84 | % | |
MSCI EAFE Index | 8.71 | % | |
Lipper International Multi Cap Growth Funds Category Average | 7.32 | % |
The performance shown represents past performance. Past performance is no guarantee of future results and current performance may be higher or lower than the performance shown above. Principal value and investment returns will fluctuate and investors’ shares, when redeemed, may be worth more or less than their original cost. To obtain performance data current to the most recent month-end, please visit our website at www.citigroupam.com.
Current reimbursements and/or fee waivers are voluntary, and may be reduced or terminated at any time. Absent these reimbursements or waivers, performance would have been lower.
Class A share returns assume the reinvestment of all distributions at net asset value and the deduction of all fund expenses. Returns have not been adjusted to include sales charges that may apply when shares are purchased or the deduction of taxes that a shareholder would pay on fund distributions. Excluding sales charges, Class 1 shares returned 6.99%, Class B shares returned 6.42% and Class C shares returned 6.66% over the six months ended April 30, 2005.
| 1 | Lipper, Inc. is a major independent mutual-fund tracking organization. Returns are based on the 6-month period ended April 30, 2005, including the reinvestment of dividends and capital gains distributions, if any, calculated among the 181 funds in the Fund’s Lipper category, and excluding sales charges. |
1 Smith Barney International Fund | 2005 Semi-Annual Report
Table of Contents
Information About Your Fund
As you may be aware, several issues in the mutual fund industry have recently come under the scrutiny of federal and state regulators. The Fund’s Adviser and some of its affiliates have received requests for information from various government regulators regarding market timing, late trading, fees, and other mutual fund issues in connection with various investigations. The regulators appear to be examining, among other things, the Fund’s response to market timing and shareholder exchange activity, including compliance with prospectus disclosure related to these subjects. The Fund has been informed that the Adviser and its affiliates are responding to those information requests, but are not in a position to predict the outcome of these requests and investigations.
Important information concerning the Fund and its Adviser with regard to recent regulatory developments is contained in the “Additional Information” note in the Notes to the Financial Statements included in this report.
As always, thank you for your confidence in our stewardship of your assets. We look forward to helping you continue to meet your financial goals.
Sincerely,

R. Jay Gerken, CFA
Chairman, President and Chief Executive Officer
May 23, 2005
The information provided is not intended to be a forecast of future events, a guarantee of future results or investment advice. Views expressed may differ from those of the firm as a whole.
RISKS: Keep in mind that the Fund is subject to risks associated with overseas investing, which could result in significant market fluctuations. These risks include currency fluctuations, changes in political and economic conditions, differing securities regulations and periods of illiquidity, and are heightened for investments in the securities of issuers located in emerging markets. The Fund may engage in active and frequent trading, resulting in increased transaction costs, which could detract from the Fund’s performance. The Fund may use derivatives, such as options and futures, which can be illiquid, may disproportionately increase losses, and have a potentially large impact on Fund performance. Please see the Fund’s prospectus for more information on these and other risks.
All index performance reflects no deduction for fees, expenses or taxes. Please note an investor cannot invest directly in an index.
| i | The MSCI EAFE Index is an unmanaged index of common stocks of companies located in Europe, Australasia and the Far East. |
| ii | The S&P 500 Index is a market capitalization-weighted index of 500 widely held common stocks. |
2 Smith Barney International Fund | 2005 Semi-Annual Report
Table of Contents
3 Smith Barney International Fund | 2005 Semi-Annual Report
Table of Contents
Example
As a shareholder of the Fund, you may incur two types of costs: (1) transaction costs, including front-end and back-end sales charges (loads) on purchase payments, reinvested dividends, or other distributions; and (2) ongoing costs, including management fees; distribution and/or service (12b-1) fees; and other Fund expenses. This example is intended to help you understand your ongoing costs (in dollars) of investing in the Fund and to compare these costs with the ongoing costs of investing in other mutual funds.
This example is based on an investment of $1,000 invested on November 1, 2004 and held for the six months ended April 30, 2005.
Actual Expenses
The table below titled “Based on Actual Total Return” provides information about actual account values and actual expenses. You may use the information provided in this table, together with the amount you invested, to estimate the expenses that you paid over the period. To estimate the expenses you paid on your account, divide your ending account value by $1,000 (for example, an $8,600 ending account value divided by $1,000 = 8.6), then multiply the result by the number under the heading entitled “Expenses Paid During the Period”.
Based on Actual Total Return(1)
Actual Total Return Without Sales Charges(2) | Beginning Account Value | Ending Account Value | Annualized Expense Ratio | Expenses Paid During the Period(3) | |||||||||||
Class 1 | 6.99 | % | $ | 1,000.00 | $ | 1,069.90 | 1.68 | % | $ | 8.62 | |||||
Class A | 6.84 | 1,000.00 | 1,068.40 | 2.00 | 10.26 | ||||||||||
Class B | 6.42 | 1,000.00 | 1,064.20 | 2.75 | 14.07 | ||||||||||
Class C | 6.66 | 1,000.00 | 1,066.60 | 2.27 | 11.63 | ||||||||||
| (1) | For the six months ended April 30, 2005. |
| (2) | Assumes reinvestment of all dividends and capital gain distributions, if any, at net asset value and does not reflect the deduction of the applicable sales charges with respect to Class 1 and A shares or the applicable contingent deferred sales charges (“CDSC”) with respect to Class B and C shares. Total return is not annualized, as it may not be representative of the total return for the year. Performance figures may reflect voluntary fee waivers and/or expense reimbursements. Past performance is no guarantee of future results. In the absence of voluntary fee waivers and/or expense reimbursements, the total return would have been lower. |
| (3) | Expenses (net of voluntary expense reimbursements) are equal to each class’ respective annualized expense ratio, multiplied by the average account value over the period, multiplied by the number of days in the most recent fiscal half-year, then divided by 365. |
4 Smith Barney International Fund | 2005 Semi-Annual Report
Table of Contents
Fund Expenses (unaudited) (continued)
Hypothetical Example for Comparison Purposes
The table below titled “Based on Hypothetical Total Return” provides information about hypothetical account values and hypothetical expenses based on the actual expense ratio and an assumed rate of return of 5.00% per year before expenses, which is not the Fund’s actual return. The hypothetical account values and expenses may not be used to estimate the actual ending account balance or expenses you paid for the period. You may use the information provided in this table to compare the ongoing costs of investing in the Fund and other funds. To do so, compare the 5.00% hypothetical example relating to the Fund with the 5.00% hypothetical examples that appear in the shareholder reports of the other funds.
Please note that the expenses shown in the table below are meant to highlight your ongoing costs only and do not reflect any transactional costs, such as front-end or back-end sales charges (loads). Therefore, the table is useful in comparing ongoing costs only, and will not help you determine the relative total costs of owning different funds. In addition, if these transaction costs were included, your costs would have been higher.
Based on Hypothetical Total Return(1)
| Hypothetical Annualized Total Return | Beginning Account Value | Ending Account Value | Annualized Expense Ratio | Expenses Paid During the Period(2) | |||||||||||
Class 1 | 5.00 | % | $ | 1,000.00 | $ | 1,016.46 | 1.68 | % | $ | 8.40 | |||||
Class A | 5.00 | 1,000.00 | 1,014.88 | 2.00 | 9.99 | ||||||||||
Class B | 5.00 | 1,000.00 | 1,011.16 | 2.75 | 13.71 | ||||||||||
Class C | 5.00 | 1,000.00 | 1,013.54 | 2.27 | 11.33 | ||||||||||
| (1) | For the six months ended April 30, 2005. |
| (2) | Expenses (net of voluntary expense reimbursements) are equal to each class’ respective annualized expense ratio, multiplied by the average account value over the period, multiplied by the number of days in the most recent fiscal half-year, then divided by 365. |
5 Smith Barney International Fund | 2005 Semi-Annual Report
Table of Contents
| Schedule of Investments (unaudited) | April 30, 2005 |
| SHARES | SECURITY† | VALUE | |||
| COMMON STOCK — 98.9% | |||||
| Australia — 3.6% | |||||
| 196,233 | Australia & New Zealand Banking Group Ltd. | $ | 3,329,530 | ||
| 35,414 | National Australia Bank Ltd. (a) | 811,314 | |||
| 4,140,844 | |||||
| Belgium — 1.2% | |||||
| 48,795 | Fortis | 1,359,350 | |||
| Denmark — 0.3% | |||||
| 8,500 | TDC A/S | 364,515 | |||
| Finland — 3.5% | |||||
| 73,720 | Nokia Oyj (a) | 1,182,673 | |||
| 106,058 | Stora Enso Oyj, Class R Shares | 1,412,458 | |||
| 70,317 | UPM-Kymmene Oyj | 1,411,498 | |||
| 4,006,629 | |||||
| France — 10.7% | |||||
| 16,993 | Accor S.A. (a) | 779,699 | |||
| 49,698 | BNP Paribas S.A. (a) | 3,287,490 | |||
| 67,437 | Credit Agricole S.A. (a) | 1,752,835 | |||
| 11,690 | European Aeronautic Defence and Space Co. (a) | 334,048 | |||
| 26,176 | France Telecom S.A. (a) | 769,231 | |||
| 9,186 | Pinault-Printemps-Redoute S.A. (a) | 907,065 | |||
| 10,005 | Renault S.A. (a) | 841,265 | |||
| 5,325 | Sanofi-Aventis S.A. (a) | 473,363 | |||
| 4,913 | Schneider Electric S.A. (a) | 355,101 | |||
| 13,013 | Total S.A. (a) | 2,899,084 | |||
| 12,399,181 | |||||
| Germany — 9.4% | |||||
| 4,908 | Adidas-Salomon AG (a) | 763,667 | |||
| 16,260 | Altana AG (a) | 1,021,415 | |||
| 34,931 | Bayer AG (a) | 1,150,645 | |||
| 38,367 | DaimlerChrysler AG (a) | 1,511,931 | |||
| 10,272 | Deutsche Bank AG (a) | 842,560 | |||
| 13,905 | E.ON AG (a) | 1,176,581 | |||
| 7,053 | Henkel KGaA-Vorzug (a) | 611,197 | |||
| 35,448 | Metro AG | 1,879,605 | |||
| 4,614 | RWE AG (a) | 276,907 | |||
| 25,276 | Schering AG | 1,674,931 | |||
| 10,909,439 | |||||
| Hong Kong — 1.1% | |||||
| 193,000 | Henderson Land Development Co., Ltd. | 899,864 | |||
| 44,000 | Swire Pacific Ltd. | 369,752 | |||
| 1,269,616 | |||||
| Ireland — 2.2% | |||||
| 109,416 | Allied Irish Banks PLC | 2,234,813 | |||
| 23,929 | Bank of Ireland | 361,899 | |||
| 2,596,712 | |||||
See Notes to Financial Statements.
6 Smith Barney International Fund | 2005 Semi-Annual Report
Table of Contents
Schedule of Investments (unaudited) (continued) | April 30, 2005 |
| SHARES | SECURITY† | VALUE | |||
| Italy — 6.5% | |||||
| 161,144 | Eni S.p.A. (a) | $ | 4,062,847 | ||
| 122,077 | SanPaolo IMI S.p.A (a) | 1,816,204 | |||
| 294,103 | UniCredito Italiano S.p.A. (a) | 1,656,613 | |||
| 7,535,664 | |||||
| Japan — 22.0% | |||||
| 43,000 | Bridgestone Corp. | 827,925 | |||
| 13,800 | Canon Inc. | 721,164 | |||
| 97 | East Japan Railway Co. | 506,316 | |||
| 32,700 | Fuji Photo Film Co., Ltd. | 1,085,465 | |||
| 108,000 | Fujitsu, Ltd. | 597,376 | |||
| 20,700 | Honda Motor Co., Ltd. | 999,417 | |||
| 63,000 | Kao Corp. | 1,452,044 | |||
| 55,000 | Komatsu, Ltd. | 389,264 | |||
| 53,000 | Konica Minolta Holdings, Inc. | 512,951 | |||
| 20,000 | Matsushita Electric Industrial Co., Ltd. | 293,730 | |||
| 175,000 | Mitsubishi Electric Corp. (a) | 929,735 | |||
| 270,000 | Mitsui Sumitomo Insurance Co., Ltd. | 2,463,678 | |||
| 9,700 | Nintendo Co., Ltd. (a) | 1,109,463 | |||
| 124,000 | Nippon Steel Corp. (a) | 315,163 | |||
| 321 | NTT DoCoMo, Inc. | 497,399 | |||
| 89,000 | Ricoh Co., Ltd. (a) | 1,424,925 | |||
| 29,000 | Sankyo Co., Ltd. (a) | 605,785 | |||
| 9,000 | Secom Co., Ltd. | 361,742 | |||
| 19,300 | Seven-Eleven Japan Co., Ltd. | 544,792 | |||
| 162,000 | Sumitomo Chemical Co., Ltd | 831,287 | |||
| 155,000 | Sumitomo Corp. | 1,315,202 | |||
| 89,000 | Sumitomo Electric Industries, Ltd. | 932,979 | |||
| 49,200 | Takeda Pharmaceutical Co., Ltd. | 2,402,443 | |||
| 16,850 | Takefuji Corp. | 1,069,086 | |||
| 24,000 | THK Co., Ltd. (a) | 451,055 | |||
| 48,000 | Toppan Printing Co., Ltd. (a) | 526,223 | |||
| 41,100 | Toyota Motor Corp. | 1,499,578 | |||
| 199 | West Japan Railway Co. | 739,936 | |||
| 25,406,123 | |||||
| Luxembourg — 1.4% | |||||
| 77,303 | Arcelor (a) | 1,570,809 | |||
| The Netherlands — 5.6% | |||||
| 16,592 | DSM N.V. | 1,118,800 | |||
| 13,386 | ING Groep N.V. (a) | 368,450 | |||
| 148,166 | Koninklijke (Royal) KPN N.V. (a) | 1,241,472 | |||
| 82,271 | TNT N.V. | 2,246,340 | |||
| 13,143 | Unilever N.V. | 850,272 | |||
| 22,287 | VNU N.V. (a) | 629,728 | |||
| 6,455,062 | |||||
| Norway — 0.5% | |||||
| 68,600 | Telenor ASA | 575,998 | |||
| Singapore — 0.4% | |||||
| 49,000 | United Overseas Bank Ltd. | 429,711 | |||
See Notes to Financial Statements.
7 Smith Barney International Fund | 2005 Semi-Annual Report
Table of Contents
| Schedule of Investments (unaudited) (continued) | April 30, 2005 |
| SHARES | SECURITY† | VALUE | |||
| Spain — 1.4% | |||||
| 74,959 | Endesa, S.A. (a) | $ | 1,644,182 | ||
| Sweden — 1.3% | |||||
| 15,931 | Atlas Copco AB, Class A Shares (a) | 726,964 | |||
| 18,543 | Electrolux AB, Series B Shares (a) | 376,221 | |||
| 21,630 | Securitas AB, Class B Shares (a) | 348,739 | |||
| 1,451,924 | |||||
| Switzerland — 4.7% | |||||
| 41,628 | Clariant AG | 654,742 | |||
| 57,271 | Credit Suisse Group (a) | 2,421,463 | |||
| 1,731 | Nestle SA (a) | 456,568 | |||
| 11,076 | Zurich Financial Services AG | 1,879,088 | |||
| 5,411,861 | |||||
| United Kingdom — 23.1% | |||||
| 45,830 | AstraZeneca PLC | 2,014,653 | |||
| 304,713 | BP PLC | 3,111,760 | |||
| 76,022 | British American Tobacco PLC | 1,426,506 | |||
| 44,266 | British Sky Broadcasting Group PLC | 459,313 | |||
| 138,807 | Diageo PLC | 2,060,180 | |||
| 76,031 | GlaxoSmithKline PLC | 1,918,599 | |||
| 24,721 | GUS PLC | 394,991 | |||
| 84,981 | HBOS PLC | 1,259,119 | |||
| 64,833 | InterContinental Hotels Group PLC | 772,322 | |||
| 303,425 | International Power PLC | 1,059,734 | |||
| 47,955 | National Grid Transco PLC | 473,078 | |||
| 21,249 | Next PLC | 603,600 | |||
| 89,285 | Royal Bank of Scotland Group PLC | 2,700,685 | |||
| 222,501 | The Sage Group PLC | 835,132 | |||
| 62,400 | Scottish & Southern Energy PLC | 1,122,666 | |||
| 109,233 | Smiths Group PLC | 1,795,590 | |||
| 47,617 | Tomkins PLC | 224,468 | |||
| 1,712,743 | Vodafone Group PLC | 4,481,910 | |||
| 26,714,306 | |||||
| TOTAL COMMON STOCK (Cost — $94,481,710) | 114,241,926 | ||||
FACE AMOUNT | |||||
| SHORT-TERM INVESTMENTS — 25.7% | |||||
| Repurchase Agreements — 0.7% | |||||
| $ 245,000 | Interest in $398,063,000 joint tri-party repurchase agreement dated 4/29/05 with Goldman Sachs & Co., 2.940% due 5/2/05; Proceeds at maturity — $245,060; (Fully collateralized by various U.S. Treasury obligations, 1.250% to 12.750% due 5/31/05 to 11/15/24; Market value — $249,900) (Cost — $245,000) | 245,000 | |||
| 500,000 | Interest in $850,128,000 joint tri-party repurchase agreement dated 4/29/05 with UBS Securities LLC, 2.950% due 5/2/05; Proceeds at maturity — $500,123; (Fully collateralized by various U.S. government agency obligations, 0.000% to 8.875% due 5/26/05 to 8/6/38; Market value — $510,002) | 500,000 | |||
| TOTAL REPURCHASE AGREEMENTS (Cost — $745,000) | 745,000 | ||||
See Notes to Financial Statements.
8 Smith Barney International Fund | 2005 Semi-Annual Report
Table of Contents
Schedule of Investments (unaudited) (continued) | April 30, 2005 |
| SHARES | SECURITY | VALUE | ||||
| Securities Purchased From Securities Lending Collateral — 25.0% | ||||||
| 28,916,031 | State Street Navigator Securities Lending Trust Prime Portfolio (Cost — $28,916,031) | $ | 28,916,031 | |||
| TOTAL SHORT-TERM INVESTMENTS (Cost — $29,661,031) | 29,661,031 | |||||
| TOTAL INVESTMENTS — 124.6% (Cost — $124,142,741*) | 143,902,957 | |||||
Liabilities in Excess of Other Assets — (24.6)% | (28,370,841 | ) | ||||
| TOTAL NET ASSETS — 100.0% | $ | 115,532,116 | ||||
| (a) | All or a portion of this security is on loan. |
| * | Aggregate cost for federal income tax purposes is substantially the same. |
| † | All securities (excluding short-term investments) are fair valued at April 30, 2005 in accordance with the policies adopted by the Board of Trustees. (Note 1A). |
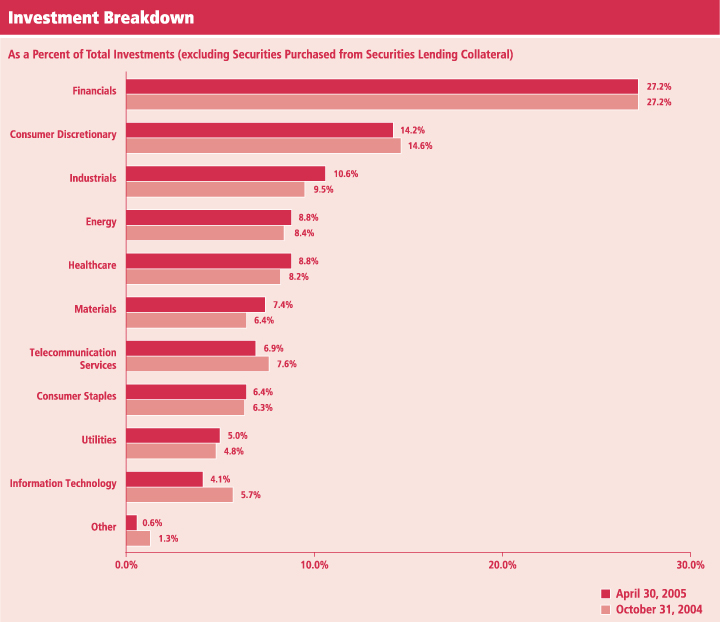
| Summary of Investments by Sector** (unaudited) | |||
Financials | 27.2 | % | |
Consumer Discretionary | 14.2 | ||
Industrials | 10.6 | ||
Energy | 8.8 | ||
Healthcare | 8.8 | ||
Materials | 7.4 | ||
Telecommunication Services | 6.9 | ||
Consumer Staples | 6.4 | ||
Utilities | 5.0 | ||
Information Technology | 4.1 | ||
Other | 0.6 | ||
| 100.0 | % | ||
| ** | As a percentage of total investments (excluding Securities Purchased from Securities Lending Collateral). Please note the Fund holdings are as of April 30, 2005 and are subject to change. |
See Notes to Financial Statements.
9 Smith Barney International Fund | 2005 Semi-Annual Report
Table of Contents
| Statement of Assets and Liabilities (unaudited) | April 30, 2005 |
| ASSETS: | ||||
Investments, at value (Cost — $124,142,741) | $ | 143,902,957 | ||
Foreign currency, at value (Cost — $516,422) | 515,702 | |||
Cash | 271 | |||
Dividends and interest receivable | 507,116 | |||
Receivable for shares of beneficial interest sold | 81,740 | |||
Total Assets | 145,007,786 | |||
| LIABILITIES: | ||||
Payable for loaned securities collateral (Notes 1 and 3) | 28,916,031 | |||
Transfer agency services payable | 283,489 | |||
Payable for shares of beneficial interest reacquired | 100,452 | |||
Management fee payable | 42,530 | |||
Trustees’ retirement plan | 33,315 | |||
Service plan fees payable | 9,213 | |||
Trustees’ fees payable | 1,036 | |||
Accrued expenses | 89,604 | |||
Total Liabilities | 29,475,670 | |||
Total Net Assets | $ | 115,532,116 | ||
| NET ASSETS: | ||||
Par value of shares of beneficial interest (Note 5) | $ | 56 | ||
Capital paid in excess of par value | 191,477,823 | |||
Undistributed net investment income | 240,268 | |||
Accumulated net realized loss from investment transactions and foreign currency transactions | (95,960,007 | ) | ||
Net unrealized appreciation of investments and foreign currencies | 19,773,976 | |||
Total Net Assets | $ | 115,532,116 | ||
Shares Outstanding: | ||||
Class 1 | 149,499 | |||
Class A | 2,793,183 | |||
Class B | 2,560,350 | |||
Class C | 87,882 | |||
Net Asset Value: | ||||
Class 1 (and redemption value) | $22.34 | |||
Class A (and redemption value) | $21.40 | |||
Class B * | $19.73 | |||
Class C * | $21.61 | |||
Maximum Public Offering Price Per Share: | ||||
Class 1 (based on a maximum sales charge of 8.50%) | $24.42 | |||
Class A (based on a maximum sales charge of 5.00%) | $22.53 | |||
| * | Redemption price is NAV of Class B and C shares reduced by a 5.00% and 1.00% contingent deferred sales charge, respectively, if shares are redeemed within one year from purchase payment (See Note 2). |
See Notes to Financial Statements.
10 Smith Barney International Fund | 2005 Semi-Annual Report
Table of Contents
| Statement of Operations (unaudited) | For the Six Months Ended April 30, 2005 |
| INVESTMENT INCOME: | ||||
Dividends | $ | 1,731,793 | ||
Securities lending income | 39,388 | |||
Interest | 8,320 | |||
Less: Foreign withholding tax | (176,920 | ) | ||
Total Investment Income | 1,602,581 | |||
| EXPENSES: | ||||
Transfer agency services (Notes 2 and 4) | 618,128 | |||
Management fee (Note 2) | 497,446 | |||
Service plan fees (Note 4) | 344,150 | |||
Custody | 42,260 | |||
Shareholder communications (Note 4) | 31,230 | |||
Legal | 23,140 | |||
Registration fees | 18,844 | |||
Audit and tax fees | 12,893 | |||
Trustees’ fees | 1,815 | |||
Other | 8,472 | |||
Total Expenses | 1,598,378 | |||
Less: Expense reimbursement (Note 2) | (236,296 | ) | ||
Net Expenses | 1,362,082 | |||
Net Investment Income | 240,499 | |||
| REALIZED AND UNREALIZED GAIN (LOSS) ON INVESTMENTS AND FOREIGN CURRENCIES (NOTES 1 AND 3): | ||||
Realized Gain From: | ||||
Investment transactions | 3,527,214 | |||
Foreign currency transactions | 649 | |||
Net Realized Gain | 3,527,863 | |||
Net Change in Unrealized Appreciation/Depreciation From: | ||||
Investments | 3,641,912 | |||
Foreign currencies | (3,975 | ) | ||
Net Change in Unrealized Appreciation/Depreciation of Investments and Foreign Currencies | 3,637,937 | |||
Net Gain on Investments and Foreign Currencies | 7,165,800 | |||
Increase in Net Assets From Operations | $ | 7,406,299 | ||
See Notes to Financial Statements.
11 Smith Barney International Fund | 2005 Semi-Annual Report
Table of Contents
| Statements of Changes in Net Assets |
For the Six Months Ended April 30, 2005 (unaudited)
and the Year Ended October 31, 2004
| 2005 | 2004 | |||||||
| OPERATIONS: | ||||||||
Net investment income (loss) | $ | 240,499 | $ | (580,136 | ) | |||
Net realized gain | 3,527,863 | 12,995,932 | ||||||
Net Change in unrealized appreciation/depreciation | 3,637,937 | 5,412,418 | ||||||
Increase in Net Assets From Operations | 7,406,299 | 17,828,214 | ||||||
| TRANSACTIONS IN SHARES OF BENEFICIAL INTEREST (NOTE 5): | ||||||||
Net proceeds from sale of shares | 8,473,702 | 14,283,959 | ||||||
Cost of shares reacquired | (11,677,771 | ) | (20,669,359 | ) | ||||
Decrease in Net Assets From Transactions in Shares of Beneficial Interest | (3,204,069 | ) | (6,385,400 | ) | ||||
Increase In Net Assets | 4,202,230 | 11,442,814 | ||||||
| NET ASSETS: | ||||||||
Beginning of period | 111,329,886 | 99,887,072 | ||||||
End of period* | $ | 115,532,116 | $ | 111,329,886 | ||||
* Includes undistributed net investment income and accumulated net investment loss of: | $240,268 | $(231 | ) | |||||
See Notes to Financial Statements.
12 Smith Barney International Fund | 2005 Semi-Annual Report
Table of Contents
For a share of each class of beneficial interest outstanding throughout each year or period ended October 31, unless otherwise noted:
| Class 1 Shares(1) | 2005(2) | 2004 | 2003 | 2002 | 2001 | 2000 | ||||||||||||||||||
Net Asset Value, Beginning of Period | $ | 20.88 | $ | 17.50 | $ | 14.83 | $ | 20.58 | $ | 42.17 | $ | 32.57 | ||||||||||||
Income (Loss) From Operations: | ||||||||||||||||||||||||
Net investment income (loss) | 0.12 | 0.09 | (0.00 | )* | (0.19 | ) | (0.24 | ) | (0.45 | ) | ||||||||||||||
Net realized and unrealized gain (loss) | 1.34 | 3.29 | 2.67 | (5.56 | ) | (21.35 | ) | 10.79 | ||||||||||||||||
Total Income (Loss) From Operations | 1.46 | 3.38 | 2.67 | (5.75 | ) | (21.59 | ) | 10.34 | ||||||||||||||||
Less Distributions From: | ||||||||||||||||||||||||
Net realized gains | — | — | — | — | — | (0.74 | ) | |||||||||||||||||
Return of Capital | — | — | — | — | — | (0.00 | )* | |||||||||||||||||
Total Distributions | — | — | — | — | — | (0.74 | ) | |||||||||||||||||
Net Asset Value, End of Period | $ | 22.34 | $ | 20.88 | $ | 17.50 | $ | 14.83 | $ | 20.58 | $ | 42.17 | ||||||||||||
Total Return(3) | 6.99 | %‡ | 19.31 | % | 18.00 | % | (27.94 | )% | (51.20 | )% | 31.53 | % | ||||||||||||
Net Assets, End of Period (millions) | $3 | $3 | $3 | $3 | $4 | $9 | ||||||||||||||||||
Ratios to Average Net Assets: | ||||||||||||||||||||||||
Expenses | 1.68 | %(4)† | 1.89 | %(5) | 2.45 | % | 2.02 | % | 1.54 | % | 1.42 | % | ||||||||||||
Net investment income (loss) | 1.05 | † | 0.47 | (0.03 | ) | (1.00 | ) | (0.82 | ) | (0.94 | ) | |||||||||||||
Portfolio Turnover Rate | 12 | % | 56 | % | 153 | % | 24 | % | 24 | % | 27 | % | ||||||||||||
| Class A Shares(1) | 2005(2) | 2004 | 2003 | 2002 | 2001 | 2000 | ||||||||||||||||||
Net Asset Value, Beginning of Period | $ | 20.03 | $ | 16.89 | $ | 14.42 | $ | 20.15 | $ | 41.57 | $ | 32.24 | ||||||||||||
Income (Loss) From Operations: | ||||||||||||||||||||||||
Net investment income (loss) | 0.08 | (0.02 | ) | (0.12 | ) | (0.30 | ) | (0.40 | ) | (0.64 | ) | |||||||||||||
Net realized and unrealized gain (loss) | 1.29 | 3.16 | 2.59 | (5.43 | ) | (21.02 | ) | 10.71 | ||||||||||||||||
Total Income (Loss) From Operations | 1.37 | 3.14 | 2.47 | (5.73 | ) | (21.42 | ) | 10.07 | ||||||||||||||||
Less Distributions From: | ||||||||||||||||||||||||
Net realized gains | — | — | — | — | — | (0.74 | ) | |||||||||||||||||
Return of Capital | — | — | — | — | — | (0.00 | )* | |||||||||||||||||
Total Distributions | — | — | — | — | — | (0.74 | ) | |||||||||||||||||
Net Asset Value, End of Period | $ | 21.40 | $ | 20.03 | $ | 16.89 | $ | 14.42 | $ | 20.15 | $ | 41.57 | ||||||||||||
Total Return(3) | 6.84 | %‡ | 18.59 | % | 17.13 | % | (28.44 | )% | (51.53 | )% | 31.00 | % | ||||||||||||
Net Assets, End of Period (millions) | $60 | $56 | $49 | $40 | $53 | $87 | ||||||||||||||||||
Ratios to Average Net Assets: | ||||||||||||||||||||||||
Expenses | 2.00 | %(4)(5)† | 2.49 | %(5) | 3.21 | % | 2.72 | % | 2.17 | % | 1.82 | % | ||||||||||||
Net investment income (loss) | 0.74 | † | (0.13 | ) | (0.77 | ) | (1.67 | ) | (1.44 | ) | (1.36 | ) | ||||||||||||
Portfolio Turnover Rate | 12 | % | 56 | % | 153 | % | 24 | % | 24 | % | 27 | % | ||||||||||||
| (1) | Per share amounts have been calculated using the monthly average shares method. |
| (2) | For the six months ended April 30, 2005 (unaudited). |
| (3) | Performance figures may reflect voluntary fee waivers and/or expense reimbursements. Past performance is no guarantee of future results. In the absence of voluntary fee waivers and/or expense reimbursements, the total return would have been lower. |
| (4) | Effective December 1, 2004, as a result of voluntary expense limitations, the ratio of expenses to average net assets will not exceed 1.75% and 2.00% for Class 1 and Class A shares, respectively. |
| (5) | The investment manager voluntarily waived a portion of its management fee for the year ended October 31, 2004. If such fees were not voluntarily waived, the expense ratios for Class 1 and Class A shares would have been 1.99% and 2.59%, respectively. The investment manager reimbursed certain expenses for the six months ended April 30, 2005 for Class A shares. If such expenses were not reimbursed, the annualized expense ratio would have been 2.33%. |
| * | Amount represents less than $0.01 per share. |
| ‡ | Total return is not annualized, as it may not be representative of the total return for the year. |
| † | Annualized. |
See Notes to Financial Statements.
13 Smith Barney International Fund | 2005 Semi-Annual Report
Table of Contents
| Financial Highlights (continued) |
For a share of each class of beneficial interest outstanding throughout each year or period ended October 31, unless otherwise noted:
| Class B Shares(1) | 2005(2) | 2004 | 2003 | 2002 | 2001 | 2000 | ||||||||||||
Net Asset Value, Beginning of Period | $18.54 | $15.78 | $13.60 | $19.18 | $ 39.86 | $31.16 | ||||||||||||
Income (Loss) From Operations: | ||||||||||||||||||
Net investment loss | (0.00 | )* | (0.19 | ) | (0.24 | ) | (0.44 | ) | (0.59 | ) | (0.94 | ) | ||||||
Net realized and unrealized gain (loss) | 1.19 | 2.95 | 2.42 | (5.14 | ) | (20.09 | ) | 10.38 | ||||||||||
Total Income (Loss) From Operations | 1.19 | 2.76 | 2.18 | (5.58 | ) | (20.68 | ) | 9.44 | ||||||||||
Less Distributions From: | ||||||||||||||||||
Net realized gains | — | — | — | — | — | (0.74 | ) | |||||||||||
Return of Capital | — | — | — | — | — | (0.00 | )* | |||||||||||
Total Distributions | — | — | — | — | — | (0.74 | ) | |||||||||||
Net Asset Value, End of Period | $19.73 | $18.54 | $15.78 | $13.60 | $ 19.18 | $39.86 | ||||||||||||
Total Return(3) | 6.42 | %‡ | 17.49 | % | 16.03 | % | (29.09 | )% | (51.88 | )% | 30.04 | % | ||||||
Net Assets, End of Period (millions) | $51 | $50 | $46 | $43 | $65 | $123 | ||||||||||||
Ratios to Average Net Assets: | ||||||||||||||||||
Expenses | 2.75 | %(4)(5)† | 3.43 | %(5) | 4.15 | % | 3.60 | % | 2.90 | % | 2.53 | % | ||||||
Net investment loss | (0.02 | )† | (1.07 | ) | (1.73 | ) | (2.57 | ) | (2.18 | ) | (2.07 | ) | ||||||
Portfolio Turnover Rate | 12 | % | 56 | % | 153 | % | 24 | % | 24 | % | 27 | % | ||||||
| Class C Shares(1)(6) | 2005(2) | 2004 | 2003 | 2002 | 2001 | 2000(7) | ||||||||||||
Net Asset Value, Beginning of Period | $20.26 | $17.03 | $14.42 | $20.13 | $ 41.61 | $46.13 | ||||||||||||
Income (Loss) From Operations: | ||||||||||||||||||
Net investment income (loss) | 0.05 | 0.02 | (0.01 | ) | (0.30 | ) | (0.43 | ) | (0.11 | ) | ||||||||
Net realized and unrealized gain (loss) | 1.30 | 3.21 | 2.62 | (5.41 | ) | (21.05 | ) | (4.41 | ) | |||||||||
Total Income (Loss) From Operations | 1.35 | 3.23 | 2.61 | (5.71 | ) | (21.48 | ) | (4.52 | ) | |||||||||
Less Distributions From: | ||||||||||||||||||
Return of Capital | — | — | — | — | — | (0.00 | )* | |||||||||||
Total Distributions | — | — | — | — | — | (0.00 | )* | |||||||||||
Net Asset Value, End of Period | $21.61 | $20.26 | $17.03 | $14.42 | $ 20.13 | $41.61 | ||||||||||||
Total Return(3) | 6.66 | %‡ | 18.97 | % | 18.10 | % | (28.37 | )% | (51.62 | )% | (9.80 | )%‡ | ||||||
Net Assets, End of Period (millions) | $2 | $2,128 | $2,153 | $2,358 | $4,123 | $287 | ||||||||||||
Ratios to Average Net Assets: | ||||||||||||||||||
Expenses | 2.27 | %(4)† | 2.24 | %(5) | 2.41 | % | 2.63 | % | 2.49 | % | 2.25 | %† | ||||||
Net investment income (loss) | 0.43 | † | 0.11 | (0.06 | ) | (1.65 | ) | (1.60 | ) | (2.06 | )† | |||||||
Portfolio Turnover Rate | 12 | % | 56 | % | 153 | % | 24 | % | 24 | % | 27 | % | ||||||
| (1) | Per share amounts have been calculated using the monthly average shares method. |
| (2) | For the six months ended April 30, 2005 (unaudited). |
| (3) | Performance figures may reflect voluntary fee waivers and/or expense reimbursements. Past performance is no guarantee of future results. In the absence of voluntary fee waivers and/or expense reimbursements, the total return would have been lower. |
| (4) | Effective December 1, 2004, as a result of voluntary expense limitations, the ratio of expenses to average net assets will not exceed 2.75% and 2.75% for Class B and Class C shares, respectively. |
| (5) | The investment manager voluntarily waived a portion of its management fee for the year ended October 31, 2004. If such fees were not voluntarily waived, the expense ratios for Class B and Class C shares would have been 3.53% and 2.34%, respectively. The investment manager reimbursed certain expenses for the six months ended April 30, 2005 for Class B shares. If such expenses were not reimbursed, the annualized expense ratio would have been 3.28%. |
| (6) | On April 29, 2004, Class L shares were renamed as Class C shares. |
| (7) | For the period September 13, 2000 (inception date) to October 31, 2000. |
| * | Amount represents less than $0.01 per share. |
| ‡ | Total return is not annualized, as it may not be representative of the total return for the year. |
| † | Annualized. |
See Notes to Financial Statements.
14 Smith Barney International Fund | 2005 Semi-Annual Report
Table of Contents
Notes to Financial Statements (unaudited)
| 1. | Organization and Significant Accounting Policies |
The Smith Barney International Fund (“Fund”) is a separate diversified investment fund of the Smith Barney Investment Series (“Trust”), a Massachusetts business trust, which is registered under the Investment Company Act of 1940, as amended (“1940 Act”), as an open-end management investment company.
The following are significant accounting policies consistently followed by the Fund and are in conformity with U.S. generally accepted accounting principles (“GAAP”). Estimates and assumptions are required to be made regarding assets, liabilities and changes in net assets resulting from operations when financial statements are prepared. Changes in the economic environment, financial markets and any other parameters used in determining these estimates could cause actual results to differ.
(a) Investment Valuation. Equity securities for which market quotations are available are valued at the last sale price or official closing price on the primary market or exchange on which they trade. Debt securities are valued at the mean between the bid and asked price provided by an independent pricing service that are based on transactions in debt obligations, quotations from bond dealers, market transactions in comparable securities and various relationships between securities. When prices are not readily available, or are determined not to reflect fair value, such as when the value of a security has been significantly affected by events after the close of the exchange or market on which the security is principally traded, but before the Fund calculates its net asset value, the Fund may value these investments at fair value as determined in accordance with the procedures approved by the Fund’s Board of Trustees. Fair valuing of securities may be determined with the assistance of a pricing service using calculations based on indices of domestic securities and other appropriate indicators, such as prices of relevant ADRs and futures contracts. Short-term obligations with maturities of 60 days or less are valued at amortized cost, which approximates market value.
(b) Repurchase Agreements. When entering into repurchase agreements, it is the Fund’s policy that its custodian or a third party custodian take possession of the underlying collateral securities, the market value of which at least equals the principal amount of the repurchase transaction, including accrued interest. To the extent that any repurchase transaction exceeds one business day, the value of the collateral is marked-to-market to ensure the adequacy of the collateral. If the seller defaults, and the market value of the collateral declines or if bankruptcy proceedings are commenced with respect to the seller of the security, realization of the collateral by the Fund may be delayed or limited.
(c) Forward Foreign Currency Contracts. The Fund may enter into forward foreign currency contracts to hedge against foreign currency exchange rate risk on its non-U.S. dollar denominated securities or to facilitate settlement of foreign currency denominated portfolio transactions. A forward foreign currency contract is an agreement between two parties to buy and sell a currency at a set price on a future date. The contract is marked-to-market daily and the change in value is recorded by the Fund as an unrealized gain or loss. When a forward foreign currency contract is extinguished, through either delivery or offset by entering into another forward foreign currency contract, the Fund records a realized gain or loss equal to the difference between the value of the contract at the time it was opened and the value of the contract at the time it was extinguished.
Forward foreign currency contracts involve elements of market risk in excess of the amounts reflected in the Statement of Assets and Liabilities. The Fund bears the risk of an unfavorable change in the foreign exchange rate underlying the forward foreign currency contract. Risks may also arise upon entering into these contracts from the potential inability of the counterparties to meet the terms of their contracts.
(d) Lending of Portfolio Securities. The Fund has an agreement with its custodian whereby the custodian may lend securities owned by the Fund to brokers, dealers and other financial organizations. In exchange for lending securities under the terms of the agreement with its custodian, the Fund receives a lender’s fee. Fees earned by the Fund on securities lend - -
15 Smith Barney International Fund | 2005 Semi-Annual Report
Table of Contents
Notes to Financial Statements (unaudited) (continued)
ing are recorded as securities lending income. Loans of securities by the Fund are collateralized by cash, U.S. government securities or high quality money market instruments that are maintained at all times in an amount at least equal to the current market value of the loaned securities, plus a margin which varies depending on the type of securities loaned. The custodian establishes and maintains the collateral in a segregated account. The Fund has the right under the lending agreement to recover the securities from the borrower on demand.
The Fund maintains the risk of any loss on the securities on loan as well as the potential loss on investments purchased with cash collateral received from securities lending.
(e) Security Transactions and Investment Income. Security transactions are accounted for on a trade date basis. Interest income, adjusted for amortization of premium and accretion of discount, is recorded on the accrual basis. Dividend income is recorded on the ex-dividend date. Foreign dividend income is recorded on the ex-dividend date or as soon as practical after the Fund determines the existence of a dividend declaration after exercising reasonable due diligence. The cost of investments sold is determined by use of the specific identification method.
(f) Foreign Currency Translation. Investment securities and other assets and liabilities denominated in foreign currencies are translated into U.S. dollar amounts based upon prevailing exchange rates on the date of valuation. Purchases and sales of investment securities and income and expense items denominated in foreign currencies are translated into U.S. dollar amounts based upon prevailing exchange rates on the respective dates of such transactions.
The Fund does not isolate that portion of the results of operations resulting from changes in foreign exchange rates on investments from the fluctuations arising from changes in market prices of securities held. Such fluctuations are included with the net realized and unrealized gain or loss on investments.
Net realized foreign exchange gains or losses arise from sales of foreign currencies, including gains and losses on forward foreign currency contracts, currency gains or losses realized between the trade and settlement dates on securities transactions and the difference between the amounts of dividends, interest and foreign withholding taxes recorded on the Fund’s books and the U.S. dollar equivalent of the amounts actually received or paid. Net unrealized foreign exchange gains and losses arise from changes in the fair values of assets and liabilities, other than investments in securities, at the date of valuation, resulting from changes in exchange rates.
Foreign security and currency transactions may involve certain considerations and risks not typically associated with those of U.S. dollar denominated transactions as a result of, among other factors, the possibility of lower levels of governmental supervision and regulation of foreign securities markets and the possibility of political or economic instability.
(g) Distributions to Shareholders. Distributions from net investment income and distributions of net realized gains, if any, are declared at least annually. Distributions to shareholders of the Fund are recorded on the ex-dividend date and are determined in accordance with income tax regulations, which may differ from GAAP.
(h) Class Accounting. Investment income, common expenses and realized/unrealized gain (loss) on investments are allocated to the various classes of the Fund on the basis of daily net assets of each class. Fees relating to a specific class are charged directly to that class.
(i) Federal and Other taxes. It is the Fund’s policy to comply with the federal income and excise tax requirements of the Internal Revenue Code of 1986, as amended, applicable to regulated investment companies. Accordingly, the Fund intends to distribute substantially all of its taxable income and net realized gains on investments, if any, to shareholders each year. Therefore, no federal income tax provision is required in the Fund’s financial statements. Under the applicable foreign tax laws, a withholding tax may be imposed on interest, dividends and capital gains at various rates.
16 Smith Barney International Fund | 2005 Semi-Annual Report
Table of Contents
Notes to Financial Statements (unaudited) (continued)
(j) Reclassifications. GAAP requires that certain components of net assets be adjusted to reflect permanent differences between financial and tax reporting. These reclassifications have no effect on net assets or net asset values per share.
| 2. | Management Agreement and Other Transactions with Affiliates |
Smith Barney Fund Management LLC (“SBFM”), an indirect wholly-owned subsidiary of Citigroup Inc. (“Citigroup”), acts as the investment manager to the Fund. The Fund pays SBFM a management fee calculated at an annual rate of 0.85% of the Fund’s average daily net assets. This fee is calculated daily and paid monthly.
Effective November 1, 2004, SBFM imposed a voluntary expense limitation of 1.75%, 2.00%, 2.75% and 2.75% for Class 1, Class A, Class B and Class C, respectively. During the six months ended April 30, 2005, SBFM reimbursed certain expenses in the amount of $236,296.
SBFM entered into a sub-advisory agreement with Citigroup Asset Management Ltd. (“CAM Ltd.”). Pursuant to the sub-advisory agreement, the sub-adviser is responsible for the day-to-day operations and investment decisions of the Fund. SBFM pays CAM Ltd. a sub-advisory fee calculated at an annual rate of 0.70% of the aggregate assets of the Fund allocated to the sub-adviser.
Citicorp Trust Bank, fsb. (“CTB”), another subsidiary of Citigroup, acts as the Fund’s transfer agent. PFPC Inc. (“PFPC”) and Primerica Shareholder Services (“PSS”), another subsidiary of Citigroup, act as the Fund’s sub-transfer agents. CTB receives account fees and asset-based fees that vary according to the size and type of account. PFPC and PSS are responsible for shareholder recordkeeping and financial processing for all shareholder accounts and are paid by CTB. For the six months ended April 30, 2005, the Fund paid transfer agent fees of $397,285 to CTB.
In addition, for the six months ended April 30, 2005, the Fund also paid $132 to other Citigroup affiliates for shareholder recordkeeping services.
Citigroup Global Markets Inc. (“CGM”) and PFS Distributors, Inc., both of which are subsidiaries of Citigroup, act as the Fund’s distributors.
There are maximum sales charges of 8.50% and 5.00% for Class 1 and A shares, respectively. There is a contingent deferred sales charge (“CDSC”) of 5.00% on Class B shares, which applies if redemption occurs within one year from purchase payment and declines by 1.00% per year until no CDSC is incurred. Class C shares have a 1.00% CDSC which applies if redemption occurs within one year from purchase payment. In certain cases, Class A shares have a 1.00% CDSC, which applies if redemption occurs within one year from purchase payment. This CDSC only applies to those purchases of Class A shares, which, when combined with current holdings of Class A shares, equal or exceed $1,000,000 in the aggregate. These purchases do not incur a sales charge.
For the six months ended April 30, 2005, CGM and its affiliates received sales charges of approximately $3,000 and $150,000 on the sale of the Fund’s Class 1 shares and Class A shares, respectively. In addition, for the six months ended April 30, 2005, CDSCs paid to CGM and its affiliates were approximately $45,000 for Class B shares.
All officers and one Trustee of the Trust are employees of Citigroup or its affiliates and do not receive compensation from the Trust.
The Trustees of the Fund have adopted a Retirement Plan (“Plan”) for all Trustees who are not “interested persons” of the Fund, within the meaning of the 1940 Act. Under the Plan, all Trustees are required to retire from the Board as of the last day of the calendar year in which the applicable Trustee attains age 75. Trustees may retire under the Plan before attaining
17 Smith Barney International Fund | 2005 Semi-Annual Report
Table of Contents
Notes to Financial Statements (unaudited) (continued)
the mandatory retirement age. Trustees who have served as Trustee of the Trust or any of the investment companies associated with Citigroup for at least ten years when they retire are eligible to receive the maximum retirement benefit under the Plan. The maximum retirement benefit is an amount equal to five times the amount of retainer and regular meeting fees payable to a Trustee during the entirety of the calendar year of the Trustee’s retirement (assuming no change in relevant facts for the balance of the year following the Trustee’s retirement). Amounts under the Plan may be paid in installments or in a lump sum (discounted to present value). Benefits under the Plan are unfunded. Three former Trustees are currently receiving payments under the Plan. In addition two other Trustees elected to receive a lump sum payment from this Plan during this period.
Certain of the Trustees are also covered by a prior retirement plan. Under the prior plan, retirement benefits are payable for a ten-year period following retirement, with the annual payment to be based upon the Trustee’s compensation from the Trust during calendar year 2000. Trustees with more than five but less than ten years of service at retirement will receive a prorated benefit. In order to receive benefits under the current Plan, a Trustee must waive all rights under the prior plan prior to receiving payment under either plan. At April 30, 2005, $33,315 is accrued in connection with these plans.
| 3. | Investments |
During the six months ended April 30, 2005, the aggregate cost of purchases and proceeds from sales of investments (excluding short-term investments) were as follows:
Purchases | $ | 13,694,169 | |
Sales | 18,307,796 | ||
At April 30, 2005 the aggregate gross unrealized appreciation and depreciation of investments for federal income tax purposes were substantially as follows:
Gross unrealized appreciation | $ | 20,806,854 | ||
Gross unrealized depreciation | (1,046,638 | ) | ||
Net unrealized appreciation | $ | 19,760,216 | ||
At April 30, 2005, the Fund loaned securities having a market value of $27,453,883. The Fund received cash collateral amounting to $28,916,031, which was invested in the State Street Navigator Securities Lending Trust Prime Portfolio, a Rule 2a-7 money market fund, under the 1940 Act.
| 4. | Class Specific Expenses |
Pursuant to Rule 12b-1 Service Plans, the Fund pays a distribution/service fee with respect to its Class A, B and C shares calculated at an annual rate not to exceed 0.25% of the average daily net assets with respect to Class A shares and at the annual rate of 1.00% of the respective average daily net assets of Class B and C shares. For the six months ended April 30, 2005, total Rule 12b-1 Service Plan fees, which are accrued daily and paid monthly, were as follows:
| Class A | Class B | Class C | |||||||
Rule 12b-1 Service Plan Fees | $ | 74,574 | $ | 259,253 | $ | 10,323 | |||
For the six months ended April 30, 2005, total Transfer Agency Services expenses were as follows:
| Class 1 | Class A | Class B | Class C | ||||||||
Transfer Agency Services Expenses | $ | 10,413 | $ | 297,535 | $ | 308,444 | $1,736 | ||||
18 Smith Barney International Fund | 2005 Semi-Annual Report
Table of Contents
Notes to Financial Statements (unaudited) (continued)
For the six months ended April 30, 2005, total Shareholder Communication expenses were as follows:
| Class 1 | Class A | Class B | Class C | ||||||
Shareholder Communication Expenses | $ | 793 | $14,876 | $14,876 | $685 | ||||
| 5. | Shares of Beneficial Interest |
The Fund has five classes of beneficial interest, Classes 1, A, B, C and Y, of which four are outstanding, each with a par value of $0.00001 per share. There are an unlimited number of shares authorized. Each share of a class represents an identical interest and has the same rights, except that each class bears certain direct expenses, including those specifically related to the distribution of its shares.
Transactions in shares of each class were as follows:
Six Months Ended April 30, 2005 | Year Ended October 31, 2004 | |||||||||||||
| Shares | Amount | Shares | Amount | |||||||||||
Class 1 | ||||||||||||||
Shares sold | 7,992 | $ | 182,998 | 10,157 | $ | 200,620 | ||||||||
Shares reacquired | (20,417 | ) | (459,008 | ) | (28,012 | ) | (552,228 | ) | ||||||
Net Decrease | (12,425 | ) | $ | (276,010 | ) | (17,855 | ) | $ | (351,608 | ) | ||||
Class A | ||||||||||||||
Shares sold | 261,203 | $ | 5,652,379 | 471,297 | $ | 8,838,905 | ||||||||
Shares reacquired | (275,793 | ) | (5,960,480 | ) | (557,128 | ) | (10,520,113 | ) | ||||||
Net Decrease | (14,590 | ) | $ | (308,101 | ) | (85,831 | ) | $ | (1,681,208 | ) | ||||
Class B | ||||||||||||||
Shares sold | 130,842 | $ | 2,611,348 | 294,081 | $ | 5,144,737 | ||||||||
Shares reacquired | (243,757 | ) | (4,857,915 | ) | (518,234 | ) | (9,086,233 | ) | ||||||
Net Decrease | (112,915 | ) | $ | (2,246,567 | ) | (224,153 | ) | $ | (3,941,496 | ) | ||||
Class C† | ||||||||||||||
Shares sold | 1,217 | $ | 26,977 | 5,272 | $ | 99,697 | ||||||||
Shares reacquired | (18,382 | ) | (400,368 | ) | (26,613 | ) | (510,785 | ) | ||||||
Net Decrease | (17,165 | ) | $ | (373,391 | ) | (21,341 | ) | $ | (411,088 | ) | ||||
| † | On April 29, 2004, Class L shares were renamed as Class C shares. |
| 6. | Capital Loss Carryforward |
On October 31, 2004, the Fund had a net capital loss carryforward of approximately $99,430,716, of which $569,980 expires in 2005, $569,980 expires in 2006, $157,778 expires in 2008, $24,562,212 expires in 2009, $43,173,297 expires in 2010 and $30,397,469 expires in 2011. These amounts will be available to offset any future taxable capital gains.
| 7. | Additional Information |
On May 31, 2005, the U.S. Securities and Exchange Commission (“SEC”) issued an order in connection with the settlement of an administrative proceeding against Smith Barney Fund Management LLC (“SBFM”) and Citigroup Global Markets Inc. (“CGMI”) relating to the appointment of an affiliated transfer agent for the Smith Barney family of mutual funds (the “Funds”).
The SEC order finds that SBFM and CGMI willfully violated Section 206(1) of the Investment Advisers Act of 1940 (“Advisers Act”). Specifically, the order finds that SBFM and CGMI knowingly or recklessly failed to disclose to the boards
19 Smith Barney International Fund | 2005 Semi-Annual Report
Table of Contents
Notes to Financial Statements (unaudited) (continued)
of the Funds in 1999 when proposing a new transfer agent arrangement with an affiliated transfer agent that: First Data Investors Services Group (“First Data”), the Funds’ then-existing transfer agent, had offered to continue as transfer agent and do the same work for substantially less money than before; and that Citigroup Asset Management (“CAM”), the Citigroup business unit that includes the fund’s investment manager and other investment advisory companies, had entered into a side letter with First Data under which CAM agreed to recommend the appointment of First Data as sub-transfer agent to the affiliated transfer agent in exchange, among other things, for a guarantee by First Data of specified amounts of asset management and investment banking fees to CAM and CGMI. The order also finds that SBFM and CGMI willfully violated Section 206(2) of the Advisers Act by virtue of the omissions discussed above and other misrepresentations and omissions in the materials provided to the Funds’ boards, including the failure to make clear that the affiliated transfer agent would earn a high profit for performing limited functions while First Data continued to perform almost all of the transfer agent functions, and the suggestion that the proposed arrangement was in the Funds’ best interests and that no viable alternatives existed. SBFM and CGMI do not admit or deny any wrongdoing or liability. The settlement does not establish wrongdoing or liability for purposes of any other proceeding.
The SEC censured SBFM and CGMI and ordered them to cease and desist from violations of Sections 206(1) and 206(2) of the Advisers Act. The order requires Citigroup to pay $208.1 million, including $109 million in disgorgement of profits, $19.1 million in interest, and a civil money penalty of $80 million. Approximately $24.4 million has already been paid to the Funds, primarily through fee waivers. The remaining $183.7 million, including the penalty, has been paid to the U.S. Treasury and will be distributed pursuant to a plan to be prepared by Citigroup and submitted within 90 days of the entry of the order for approval by the SEC. The order also requires that transfer agency fees received from the Funds since December 1, 2004 less certain expenses be placed in escrow and provides that a portion of such fees may be subsequently distributed in accordance with the terms of the order.
The order requires SBFM to recommend a new transfer agent contract to the Fund boards within 180 days of the entry of the order; if a Citigroup affiliate submits a proposal to serve as transfer agent or sub-transfer agent, an independent monitor must be engaged at the expense of SBFM and CGMI to oversee a competitive bidding process. Under the order, Citigroup also must comply with an amended version of a vendor policy that Citigroup instituted in August 2004. That policy, as amended, among other things, requires that when requested by a Fund board, CAM will retain at its own expense an independent consulting expert to advise and assist the board on the selection of certain service providers affiliated with Citigroup.
At this time, there is no certainty as to how the proceeds of the settlement will be distributed, to whom such distributions will be made, the methodology by which such distributions will be allocated, and when such distributions will be made. Although there can be no assurance, Citigroup does not believe that this matter will have a material adverse effect on the Funds.
| 8. | Legal Matters |
Beginning in June, 2004, class action lawsuits alleging violations of the federal securities laws were filed against Citigroup Global Markets Inc. (the “Distributor”) and a number of its affiliates, including Smith Barney Fund Management LLC and Salomon Brothers Asset Management Inc (the “Advisers”), substantially all of the mutual funds managed by the Advisers, including the Fund (the “Funds”), and directors or trustees of the Funds (collectively, the “Defendants”). The complaints alleged, among other things, that the Distributor created various undisclosed incentives for its brokers to sell Smith Barney and Salomon Brothers funds. In addition, according to the complaints, the Advisers caused the Funds to pay excessive brokerage commissions to the Distributor for steering clients towards proprietary funds. The complaints also alleged that the defendants breached their fiduciary duty to the Funds by improperly charging Rule 12b-1 fees and by drawing on fund assets to make undisclosed payments of soft dollars and excessive brokerage commissions. The complaints also alleged that the Funds failed to adequately disclose certain of the allegedly wrongful conduct. The complaints sought injunctive relief
20 Smith Barney International Fund | 2005 Semi-Annual Report
Table of Contents
Notes to Financial Statements (unaudited) (continued)
and compensatory and punitive damages, rescission of the Funds’ contracts with the Advisers, recovery of all fees paid to the Advisers pursuant to such contracts and an award of attorneys’ fees and litigation expenses.
On December 15, 2004, a consolidated amended complaint (the “Complaint”) was filed alleging substantially similar causes of action. While the lawsuit is in its earliest stages, to the extent that the Complaint purports to state causes of action against the Funds, Citigroup Asset Management believes the Funds have significant defenses to such allegations, which the Funds intend to vigorously assert in responding to the Complaint.
Additional lawsuits arising out of these circumstances and presenting similar allegations and requests for relief may be filed against the Defendants in the future.
As of the date of this report, Citigroup Asset Management and the Funds believe that the resolution of the pending lawsuit will not have a material effect on the financial position or results of operations of the Funds or the ability of the Advisers and their affiliates to continue to render services to the Funds under their respective contracts.
| 9. | Subsequent Event |
On June 24, 2005, Citigroup announced that it has signed a definitive agreement under which Citigroup will sell substantially all of its worldwide asset management business to Legg Mason, Inc. (“Legg Mason”).
As part of this transaction, SBFM (the “Manager”), currently an indirect wholly owned subsidiary of Citigroup, would become an indirect wholly owned subsidiary of Legg Mason. The Manager is the investment adviser to the Fund.
The transaction is subject to certain regulatory approvals, as well as other customary conditions to closing. Subject to such approvals and the satisfaction of the other conditions, Citigroup expects the transaction to be completed later this year.
Under the Investment Company Act of 1940, consummation of the transaction will result in the automatic termination of the investment management contract between the Fund and the Manager. Therefore, the Trust’s Board of Trustees will be asked to approve a new investment management contract between the Fund and the Manager. If approved by the Board, the new investment management contract will be presented to the shareholders of the Fund for their approval.
21 Smith Barney International Fund | 2005 Semi-Annual Report
Table of Contents
SMITH BARNEY
INTERNATIONAL FUND
TRUSTEES Elliott J. Berv Donald M. Carlton A. Benton Cocanougher Mark T. Finn R. Jay Gerken, CFA Stephen R. Gross Diana R. Harrington Susan B. Kerley Alan G. Merten R. Richardson Pettit
OFFICERS R. Jay Gerken, CFA President and Chief Executive Officer
Andrew B. Shoup Senior Vice President and Chief Administrative Officer
Frances M. Guggino Chief Financial Officer and Treasurer
Michael P. McElroy, CFA Vice President and Investment Officer
Andrew Beagley Chief Anti-Money Laundering Compliance Officer and
Wendy S. Setnicka Controller
Robert I. Frenkel Secretary and | INVESTMENT MANAGER Smith Barney Fund
SUB-ADVISER Citigroup Asset Management Ltd.
DISTRIBUTORS Citigroup Global Markets Inc. PFS Distributors, Inc.
CUSTODIAN State Street Bank and
TRANSFER AGENT Citicorp Trust Bank, fsb. 125 Broad Street, 11th Floor New York, New York 10004
SUB-TRANSFER AGENTS PFPC Inc. P.O. Box 9699 Providence, Rhode Island 02940-9699
Primerica Shareholder Services P.O. Box 9662 Providence, Rhode Island 02940-9662 |
Table of Contents
Smith Barney Investment Series
Smith Barney International Fund
The Fund is a separate investment fund of the Smith Barney Investment Series, a Massachusetts business trust.
The Fund files its complete schedule of portfolio holdings with Securities and Exchange Commission for the first and third quarters of each fiscal year on Form N-Q. The Fund’s Forms N-Q are available on the Commission’s website at www.sec.gov. The Fund’s Forms N-Q may be reviewed and copied at the Commission’s Public Reference Room in Washington D.C., and information on the operation of the Public Reference Room may be obtained by calling 1-800-SEC-0330. To obtain information on Form N-Q from the Fund, shareholders can call 1-800-451-2010.
Information on how the Fund voted proxies relating to portfolio securities during the 12-month period ended June 30, 2004 and a description of the policies and procedures that the Fund uses to determine how to vote proxies relating to portfolio securities is available (1) without charge, upon request, by calling 1-800-451-2010, (2) on the Fund’s website at www.citigroupam.com and (3) on the SEC’s website at www.sec.gov.
This report is submitted for the general information of shareholders of Smith Barney Investment Series — Smith Barney International Fund, but it may also be used as sales literature when preceded or accompanied by the current Prospectus.
SMITH BARNEY INTERNATIONAL FUND
Smith Barney Mutual Funds
3120 Breckinridge Boulevard
Duluth, Georgia 30099-0001
This report must be preceded or accompanied by a free prospectus. Investors should consider the fund’s investment objectives, risks, charges and expenses carefully before investing. The prospectus contains this and other important information about the fund. Please read the prospectus carefully before investing.
www.citigroupam.com
©2005 Citigroup Global Markets Inc. Member NASD, SIPC
FD02331 6/0505-8684
Table of Contents
ITEM 2. | CODE OF ETHICS. | |||
| Not Applicable. | ||||
ITEM 3. | AUDIT COMMITTEE FINANCIAL EXPERT. | |||
| Not Applicable. | ||||
ITEM 4. | PRINCIPAL ACCOUNTANT FEES AND SERVICES. | |||
| Not applicable. | ||||
ITEM 5. | AUDIT COMMITTEE OF LISTED REGISTRANTS. | |||
| Not applicable. | ||||
ITEM 6. | SCHEDULE OF INVESTMENTS. | |||
| Not applicable. | ||||
ITEM 7. | DISCLOSURE OF PROXY VOTING POLICIES AND PROCEDURES FOR CLOSED-END MANAGEMENT INVESTMENT COMPANIES. | |||
| Not applicable. | ||||
ITEM 8. | [RESERVED] | |||
ITEM 9. | PURCHASES OF EQUITY SECURITIES BY CLOSED-END MANAGEMENT INVESTMENT COMPANY AND AFFILIATED PURCHASERS. | |||
| Not applicable. | ||||
ITEM 10. | SUBMISSION OF MATTERS TO A VOTE OF SECURITY HOLDERS. | |||
| Not applicable. | ||||
ITEM 11. | CONTROLS AND PROCEDURES. | |||
| (a) | The registrant’s principal executive officer and principal financial officer have concluded that the registrant’s disclosure controls and procedures (as defined in Rule 30a - 3(c) under the Investment Company Act of 1940, as amended (the “1940 Act”)) are effective as of a date within 90 days of the filing date of this report that includes the disclosure required by this paragraph, based on their evaluation of the disclosure controls and procedures required by Rule 30a-3(b) under the 1940 Act and 15d-15(b) under the Securities Exchange Act of 1934. | |||
| (b) | There were no changes in the registrant’s internal control over financial reporting (as defined in Rule 30a-3(d) under the 1940 Act) that occurred during the registrant’s last fiscal half-year (the registrant’s second fiscal half-year in the case of an annual report) that have materially affected, or are likely to materially affect the registrant’s internal control over financial reporting. | |||
Table of Contents
ITEM 12. | EXHIBITS. | |||
(a) Not applicable. | ||||
(b) Attached hereto. | ||||
| Exhibit 99.CERT | Certifications pursuant to section 302 of the Sarbanes-Oxley Act of 2002 | |||
Exhibit 99.906CERT | Certifications pursuant to Section 906 of the Sarbanes-Oxley Act of 2002 | |||
Table of Contents
SIGNATURES
Pursuant to the requirements of the Securities Exchange Act of 1934 and the Investment Company Act of 1940, the registrant has duly caused this Report to be signed on its behalf by the undersigned, there unto duly authorized.
Smith Barney Investment Series
By: | /s/ R. Jay Gerken | |
| R. Jay Gerken | ||
| Chief Executive Officer of | ||
| Smith Barney Investment Series | ||
Date: | July 8, 2005 | |
Pursuant to the requirements of the Securities Exchange Act of 1934 and the Investment Company Act of 1940, this report has been signed below by the following persons on behalf of the registrant and in the capacities and on the dates indicated.
By: | /s/ R. Jay Gerken | |
| R. Jay Gerken | ||
| Chief Executive Officer of | ||
| Smith Barney Investment Series | ||
Date: | July 8, 2005 | |
By: | /s/ Frances M. Guggino | |
| Frances M. Guggino | ||
| Chief Financial Officer of | ||
| Smith Barney Investment Series | ||
Date: | July 8, 2005 | |