UNITED STATES
SECURITIES AND EXCHANGE COMMISSION
Washington, D.C. 20549 |
CERTIFIED SHAREHOLDER REPORT OF REGISTERED MANAGEMENT
INVESTMENT COMPANIES |
Investment Company Act file number 811-5021
Dreyfus Premier Short-Intermediate Municipal Bond Fund
(Exact name of Registrant as specified in charter) |
c/o The Dreyfus Corporation
200 Park Avenue
New York, New York 10166
(Address of principal executive offices) (Zip code) |
Michael A. Rosenberg, Esq.
200 Park Avenue
New York, New York 10166
(Name and address of agent for service) |
Registrant's telephone number, including area code: (212) 922-6000
| Date of fiscal year end: | | 3/31 |
| Date of reporting period: | | 3/31/2009 |
| Item 1. | | Reports to Stockholders. |
Save time. Save paper. View your next shareholder report online as soon as it’s available. Log into www.dreyfus.com and sign up for Dreyfus eCommunications. It’s simple and only takes a few minutes.
The views expressed in this report reflect those of the portfolio manager only through the end of the period covered and do not necessarily represent the views of Dreyfus or any other person in the Dreyfus organization. Any such views are subject to change at any time based upon market or other conditions and Dreyfus disclaims any responsibility to update such views.These views may not be relied on as investment advice and, because investment decisions for a Dreyfus fund are based on numerous factors, may not be relied on as an indication of trading intent on behalf of any Dreyfus fund.

| | Contents |
| |
| | THE FUND |
| |
| 2 | A Letter from the CEO |
| |
| 3 | Discussion of Fund Performance |
| |
| 6 | Fund Performance |
| |
| 8 | Understanding Your Fund’s Expenses |
| |
| 8 | Comparing Your Fund’s Expenses With Those of Other Funds |
| |
| 9 | Statement of Investments |
| |
| 22 | Statement of Assets and Liabilities |
| |
| 23 | Statement of Operations |
| |
| 24 | Statement of Changes in Net Assets |
| |
| 26 | Financial Highlights |
| |
| 29 | Notes to Financial Statements |
| |
| 37 | Report of Independent Registered Public Accounting Firm |
| |
| 38 | Important Tax Information |
| |
| 39 | Board Members Information |
| |
| 41 | Officers of the Fund |
| |
| | FOR MORE INFORMATION |
| |
| | Back Cover |
| |
Dreyfus
Short-Intermediate
Municipal Bond Fund |
The Fund

A LETTER FROM THE CEO
Dear Shareholder:
We present this annual report for Dreyfus Short-Intermediate Municipal Bond Fund, covering the 12-month period from April 1, 2008, through March 31, 2009.
The reporting period has been one of the most challenging for the U.S. economy and financial markets, including many areas of the municipal bond markets. A relatively mild economic downturn was severely exacerbated in mid-September 2008, when the bankruptcy of Lehman Brothers triggered a cascading global economic decline. As the credit crisis dried up the availability of funding for businesses and consumers, international trade activity slumped, commodity prices plummeted, the U.S. and global economies entered a period of intense inventory liquidation, and unemployment surged.
On the heels of a –6.3% annualized U.S. economic growth rate in the fourth quarter of 2008, we expect another sharp decline for the first quarter of 2009. However, our Chief Economist anticipates that the U.S. recession may reach a trough around the third quarter of this year, followed by a slow recovery. Indeed, the U.S. government and monetary authorities have signaled their intent to do whatever it takes to forestall a depression or a deflationary spiral, including historically low interest rates, mortgage modification programs and massive monetary and fiscal stimulus and support for state and local municipalities. Although times seem dire now, we believe it is always appropriate to maintain a long-term investment focus and to discuss any investment modifications with your financial adviser.Together, you can prepare for the risks that lie ahead and position your assets to perform in this current market downturn, and in the future.
For information about how the fund performed during the reporting period, as well as market perspectives, we have provided a Discussion of Fund Performance given by the fund’s Portfolio Manager.
As always, we thank you for your continued confidence and support.

Jonathan R. Baum
Chairman and Chief Executive Officer
The Dreyfus Corporation |

DISCUSSION OF FUND PERFORMANCE
For the period of April 1, 2008, through March 31, 2009, as provided by Douglas Gaylor, Portfolio Manager
Fund and Market Performance Overview
For the 12-month period ended March 31, 2009, Dreyfus Short-Intermediate Municipal Bond Fund’s Class B shares produced a total return of 2.85%, Class D shares returned 3.85%, and Class I shares returned 3.98%.1, 2 In comparison, the fund’s benchmark, the Barclays Capital 3-Year Municipal Bond Index (the “Index”), produced a total return of 5.62% for the reporting period.3 In addition, the average total return for all funds reported in the Lipper Short Municipal Debt Funds category was 1.40%.4
A financial crisis and economic slowdown produced heightened market volatility, particularly over the second half of the reporting period.The fund produced lower returns than its benchmark, which does not reflect fees and expenses like a mutual fund, and higher returns than its Lipper category average, primarily due to a bias toward higher-quality securities and a relatively short average maturity during the worst of the financial crisis.
The Fund’s Investment Approach
The fund seeks to maximize current income exempt from federal income tax to the extent consistent with the preservation of capital.To pursue this goal, the fund normally invests substantially all of its assets in municipal bonds that provide income exempt from federal personal income tax.The fund will invest only in municipal bonds rated investment grade or the unrated equivalent as determined by Dreyfus, but may continue to hold bonds which are subsequently downgraded to below investment grade.5 The fund invests primarily in municipal bonds with remaining maturities of five years or less and generally maintains a dollar-weighted average portfolio maturity of two to three years.
The Fund 3
| DISCUSSION OF FUND PERFORMANCE (continued) |
We may buy and sell bonds based on credit quality, market outlook and yield potential. In selecting municipal bonds for investment, we may assess the current interest-rate environment and the municipal bond’s potential volatility in different rate environments. We focus on bonds with the potential to offer attractive current income, typically looking for bonds that can provide consistently attractive current yields or that are trading at competitive market prices. A portion of the fund’s assets may be allocated to “discount” bonds, which are bonds that sell at a price below their face value, or to “premium” bonds, which are bonds that sell at a price above their face value.The fund’s allocation to either discount bonds or to premium bonds will change along with our changing views of the current interest-rate and market environment.We also may look to select bonds that are most likely to obtain attractive prices when sold.
Municipal Bonds: Caught in the Credit Crisis
An intensifying credit crisis and a severe recession roiled most financial markets, including municipal bonds, during the reporting period. Slumping home values, rising unemployment and plunging consumer confidence contributed to one of the worst recessions since the Great Depression, putting pressure on the fiscal conditions of most states and municipalities. Meanwhile, an ongoing credit crunch escalated into a global financial crisis that punished a number of large financial institutions, including major municipal bond insurers and dealers.
Municipal bonds were adversely affected by widespread selling pressure, causing yield differences between municipal bonds and comparable U.S. Treasury securities to move toward historically wide levels.Volatility was particularly severe over the fourth quarter of 2008, when the bankruptcy of investment bank Lehman Brothers sent shockwaves through the global banking system. Municipal bonds regained a portion of their previous losses during the first quarter of 2009, when monetary and government authorities staged massive interventions to shore up the credit markets, a federal economic stimulus program sent billions in aid to the states, and investors took advantage of attractive values among bonds from fundamentally sound issuers.The short-intermediate segment of the municipal bond market rebounded more strongly than other maturity ranges as investors shifted assets from low yielding money market funds to municipal bonds with two- to five-year maturities.
4
Focus on Quality Supported Fund Returns
The fund’s focus on municipal bonds in the A to AA range helped it avoid the brunt of market volatility during the financial crisis, which was particularly severe for lower-rated securities. When making new purchases, we emphasized high-quality bonds selling at a discount to their face values.
The fund also benefited from its relatively short average duration when interest rates spiked during the worst of the credit crisis in the wake of the Lehman Brothers bankruptcy. As the Federal Reserve Board reduced interest rates and credit markets subsequently stabilized, we gradually increased the fund’s average maturity to maintain higher yields for as long as we deemed practical.
Staying Cautious in a Volatile Market
As of the reporting period’s end, the U.S. economy has remained weak, and the financial crisis has persisted. Consequently, we intend to maintain a defensive posture over the near term, including a focus on higher-quality securities. Over the longer term, however, we believe that attractive valuations, competitive income streams and the likelihood of rising taxes make high yield municipal bonds an attractive asset class.
April 15, 2009
| 1 | Effective December 15, 2008, the fund began to offer Class I shares.The total return for Class I shares of the fund for periods prior to December 15, 2009, reflects the performance of the fund’s Class D shares, adjusted to reflect the applicable fees and expenses for that class. |
| |
| 2 | Total return includes reinvestment of dividends and any capital gains paid, and does not take into consideration the applicable contingent deferred sales charge imposed on redemptions in the case of Class B shares. Had these charges been reflected, returns would have been lower. Past performance is no guarantee of future results. Share price, yield and investment return fluctuate such that upon redemption, fund shares may be worth more or less than their original cost. Income may be subject to state and local taxes, and some income may be subject to the federal alternative minimum tax (AMT) for certain investors. Capital gains, if any, are taxable. Return figure provided for the fund’s Class I shares reflects the absorption of certain fund expenses by The Dreyfus Corporation pursuant to an undertaking in effect that may be extended, terminated or modified at any time. |
| |
| | Had these expenses not been absorbed, the fund’s Class I shares’ return would have been lower. |
| |
| 3 | SOURCE: LIPPER INC. — Reflects reinvestment of dividends and, where applicable, capital gain distributions.The Barclays Capital 3-Year Municipal Bond Index is an unmanaged total return performance benchmark for the investment-grade, geographically unrestricted 3-year tax- exempt bond market, consisting of municipal bonds with maturities of 2-4 years. Index returns do not reflect the fees and expenses associated with operating a mutual fund. |
| |
| 4 | Source: Lipper Inc. |
| |
| 5 | The fund may continue to own investment-grade bonds (at the time of purchase), which are subsequently downgraded to below investment grade. |
| |
The Fund 5
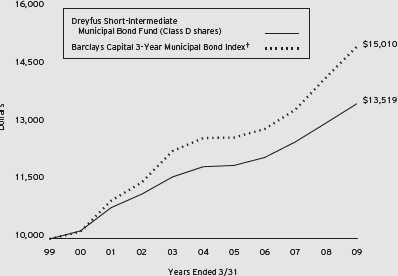
Comparison of change in value of $10,000 investment in Dreyfus Short-Intermediate Municipal Bond Fund Class D shares and the Barclays Capital 3-Year Municipal Bond Index
† Source: Lipper Inc.
Past performance is not predictive of future performance.
The above graph compares a $10,000 investment made in Class D shares of Dreyfus Short-Intermediate Municipal Bond Fund on 3/31/99 to a $10,000 investment made in the Barclays Capital 3-Year Municipal Bond Index (the “Index”) on that date.All dividends and capital gain distributions are reinvested. Performance for Class B and Class I shares will vary from the performance of Class D shares shown above due to differences in charges and expenses.
The fund invests primarily in short-intermediate term municipal securities and maintains a portfolio with a weighted average maturity ranging between 2 and 3 years.The fund’s performance shown in the line graph takes into account fees and expenses.The Index is an unmanaged total return performance benchmark for the investment-grade, geographically unrestricted 3-year tax-exempt bond market, consisting of municipal bonds with maturities of 2-4 years. Unlike a mutual fund, the Index is not subject to charges, fees and other expenses. Investors cannot invest directly in any index. Further information relating to fund performance, including expense reimbursements, if applicable, is contained in the Financial Highlights section of the prospectus and elsewhere in this report.
6
| Average Annual Total Returns as of 3/31/09 | | | | | | |
| | | Inception | | | | | | |
| | | Date | | 1 Year | | 5 Years | | 10 Years |
| |
| |
| |
| |
|
| Class B shares | | | | | | | | |
| with applicable redemption charge† | | 3/12/03 | | (1.15)% | | 1.27% | | 2.86%††,††† |
| without redemption | | 3/12/03 | | 2.85% | | 1.64% | | 2.86%††,††† |
| Class D shares | | 4/30/87 | | 3.85% | | 2.61% | | 3.06% |
| Class I shares | | 12/15/08 | | 3.98%††† | | 2.64%††† | | 3.07%††† |
Past performance is not predictive of future performance.The fund’s performance shown in the graph and table does not reflect the deduction of taxes that a shareholder would pay on fund distributions or the redemption of fund shares.
| † | | The maximum contingent deferred sales charge for Class B shares is 4%.After six years Class B shares convert to |
| | | Class D shares. |
| †† | | Assumes the conversion of Class B shares to Class D shares at the end of the sixth year following the date |
| | | of purchase. |
| ††† | | Total return performance figures presented for Class B and Class I shares of the fund represent the performance of |
| | | the fund’s Class D shares for periods prior to 3/12/03 and 12/15/08 (the inception dates for Class B and Class |
| | | I shares respectively), adjusted to reflect the applicable sales load for that class. |
The Fund 7
UNDERSTANDING YOUR FUND’S EXPENSES (Unaudited)
As a mutual fund investor, you pay ongoing expenses, such as management fees and other expenses. Using the information below, you can estimate how these expenses affect your investment and compare them with the expenses of other funds.You also may pay one-time transaction expenses, including sales charges (loads) and redemption fees, which are not shown in this section and would have resulted in higher total expenses. For more information, see your fund’s prospectus or talk to your financial adviser.
Review your fund’s expenses
The table below shows the expenses you would have paid on a $1,000 investment in Dreyfus Short-Intermediate Municipal Bond Fund from October 1, 2008 to March 31, 2009. It also shows how much a $1,000 investment would be worth at the close of the period, assuming actual returns and expenses.
Expenses and Value of a $1,000 Investment
assuming actual returns for the six months ended March 31, 2009† |
| | | Class B | | Class D | | Class I |
| |
| |
| |
|
| Expenses paid per $1,000†† | | $ 8.98 | | $ 3.94 | | $ 1.93 |
| Ending value (after expenses) | | $1,022.90 | | $1,027.70 | | $1,028.30 |
COMPARING YOUR FUND’S EXPENSES
WITH THOSE OF OTHER FUNDS (Unaudited) |
Using the SEC’s method to compare expenses
The Securities and Exchange Commission (SEC) has established guidelines to help investors assess fund expenses. Per these guidelines, the table below shows your fund’s expenses based on a $1,000 investment, assuming a hypothetical 5% annualized return. You can use this information to compare the ongoing expenses (but not transaction expenses or total cost) of investing in the fund with those of other funds.All mutual fund shareholder reports will provide this information to help you make this comparison. Please note that you cannot use this information to estimate your actual ending account balance and expenses paid during the period.
| | Expenses and Value of a $1,000 Investment
assuming a hypothetical 5% annualized return for the six months ended March 31, 2009 |
| | | Class B | | Class D | | Class I |
| |
| |
| |
|
| Expenses paid per $1,000†††† | | $ 8.95 | | $ 3.94 | | $ 3.28 |
| Ending value (after expenses) | | $1,016.06 | | $1,021.04 | | $1,021.69 |
| † | | From December 15, 2008 (commencement of initial offering) to March 31, 2009 for Class I shares. |
| †† | | Expenses are equal to the fund’s annualized expense ratio of .65% for Class I, multiplied by the average account |
| | | value over the period, multiplied by 107/365 (to reflect the actual days in the period).Expenses are equal to the |
| | | fund’s annualized expense ratio of 1.78% for Class B and .78% for Class D, multiplied by the average account |
| | | value over the period, multiplied by 182/365 (to reflect the one-half year period). |
| ††† | | Please note that while Class I shares commenced operations on December 15, 2008, the hypothetical expenses paid |
| | | during the period reflect projected activity for the full six month period for purposes of comparability.This projection |
| | | assumes that annualized expense ratios were in effect during the period October 1, 2008 to March 31, 2009. |
| †††† | | Expenses are equal to the fund’s annualized expense ratio of 1.78% for Class B, .78% for Class D and |
| | | .65% for Class I, multiplied by the average account value over the period, multiplied by 182/365 (to reflect |
| | | the one-half year period). |
8
STATEMENT OF INVESTMENTS
March 31, 2009 |
| Long-Term Municipal | | Coupon | | Maturity | | Principal | | |
| Investments—93.9% | | Rate (%) | | Date | | Amount ($) | | Value ($) |
| |
| |
| |
| |
|
| Alabama—.9% | | | | | | | | |
| Mobile Industrial Development | | | | | | | | |
| Board, PCR (Alabama Power | | | | | | | | |
| Company Barry Plant Project) | | 4.75 | | 3/19/12 | | 2,000,000 | | 2,053,540 |
| Arizona—1.8% | | | | | | | | |
| Rio Nuevo Multipurpose Facilities | | | | | | | | |
| District, Subordinate Lien | | | | | | | | |
| Excise Tax Revenue (Insured; | | | | | | | | |
| Assured Guaranty) | | 5.50 | | 7/15/14 | | 3,770,000 | | 4,016,747 |
| California—2.7% | | | | | | | | |
| California Municipal Finance | | | | | | | | |
| Authority, COP (Community | | | | | | | | |
| Hospitals of Central | | | | | | | | |
| California Obligated Group) | | 5.00 | | 2/1/11 | | 1,500,000 | | 1,478,910 |
| California Municipal Finance | | | | | | | | |
| Authority, SWDR (Waste | | | | | | | | |
| Management, Inc. Project) | | 4.10 | | 9/1/09 | | 1,000,000 | | 995,780 |
| Port of Oakland, | | | | | | | | |
| Intermediate Lien Revenue | | | | | | | | |
| (Insured; MBIA, Inc.) | | 5.00 | | 11/1/12 | | 3,300,000 | | 3,340,095 |
| Colorado—3.7% | | | | | | | | |
| Black Hawk, | | | | | | | | |
| Device Tax Revenue | | 5.00 | | 12/1/12 | | 760,000 | | 743,660 |
| Denver City and County, | | | | | | | | |
| Airport System Revenue | | 5.00 | | 11/15/11 | | 3,000,000 | | 3,081,210 |
| Denver City and County, | | | | | | | | |
| Airport System Revenue | | | | | | | | |
| (Insured; MBIA, Inc.) | | 5.00 | | 11/15/11 | | 2,000,000 | | 2,053,640 |
| E-470 Public Highway Authority, | | | | | | | | |
| Senior Revenue | | | | | | | | |
| (Insured; MBIA, Inc.) | | 4.00 | | 9/1/10 | | 1,000,000 | | 991,830 |
| Northwest Parkway Public Highway | | | | | | | | |
| Authority, Revenue | | 7.13 | | 6/15/11 | | 1,120,000 a | | 1,196,922 |
| Connecticut—.6% | | | | | | | | |
| Connecticut, | | | | | | | | |
| General Airport Revenue | | | | | | | | |
| (Bradley International | | | | | | | | |
| Airport) (Insured; FGIC) | | 5.25 | | 10/1/10 | | 1,390,000 | | 1,419,941 |
The Fund 9
| STATEMENT OF INVESTMENTS (continued) |
| Long-Term Municipal | | Coupon | | Maturity | | Principal | | | | |
| Investments (continued) | | Rate (%) | | Date | | Amount ($) | | | | Value ($) |
| |
| |
| |
| |
| |
|
| Delaware—.5% | | | | | | | | | | |
| Delaware Economic Development | | | | | | | | | | |
| Authority, PCR (Delmarva Power | | | | | | | | | | |
| and Light Company Project) | | | | | | | | | | |
| (Insured; AMBAC) | | 4.90 | | 5/1/11 | | 1,000,000 | | | | 999,980 |
| District of Columbia—.8% | | | | | | | | | | |
| District of Columbia, | | | | | | | | | | |
| Enterprise Zone Revenue (819 | | | | | | | | | | |
| 7th Street, LLC Issue) (LOC; Branch | | | | | | | | | | |
| Banking and Trust Company) | | 3.60 | | 10/1/09 | | 1,695,000 | | | | 1,707,746 |
| Florida—11.9% | | | | | | | | | | |
| Citizens Property Insurance | | | | | | | | | | |
| Corporation, High-Risk Account | | | | | | | | | | |
| Senior Secured Revenue | | 5.00 | | 6/1/11 | | 2,000,000 | | | | 2,032,660 |
| Citizens Property Insurance | | | | | | | | | | |
| Corporation, High-Risk Account | | | | | | | | | | |
| Senior Secured Revenue | | | | | | | | | | |
| (Insured; MBIA, Inc.) | | 5.00 | | 3/1/12 | | 750,000 | | | | 765,188 |
| Florida Hurricane Catastrophe Fund | | | | | | | | | | |
| Finance Corporation, Revenue | | 5.00 | | 7/1/10 | | 2,000,000 | | | | 2,042,220 |
| Florida Hurricane Catastrophe Fund | | | | | | | | | | |
| Finance Corporation, Revenue | | 5.25 | | 7/1/12 | | 3,430,000 | | | | 3,570,904 |
| Florida State Board of Education, | | | | | | | | | | |
| Lottery Revenue | | 5.00 | | 7/1/13 | | 2,555,000 | | b | | 2,737,836 |
| Florida State Board of Education, | | | | | | | | | | |
| Lottery Revenue | | 5.00 | | 7/1/14 | | 2,500,000 | | b | | 2,669,025 |
| Miami-Dade County, | | | | | | | | | | |
| Aviation Revenue (Miami | | | | | | | | | | |
| International Airport) | | | | | | | | | | |
| (Insured; MBIA, Inc.) | | 5.25 | | 10/1/14 | | 1,000,000 | | | | 994,680 |
| Miami-Dade County School Board, | | | | | | | | | | |
| COP (Master Lease Purchase | | | | | | | | | | |
| Agreement) (Insured; AMBAC) | | 5.00 | | 8/1/14 | | 2,010,000 | | | | 2,123,264 |
| Miami-Dade County School Board, | | | | | | | | | | |
| COP (Master Lease Purchase | | | | | | | | | | |
| Agreement) (Insured; MBIA, Inc.) | | 5.00 | | 5/1/11 | | 2,000,000 | | | | 2,112,580 |
| Orlando-Orange County Expressway | | | | | | | | | | |
| Authority, Revenue | | | | | | | | | | |
| (Insured; AMBAC) | | 5.00 | | 7/1/12 | | 3,870,000 | | | | 4,107,812 |
10
| Long-Term Municipal | | Coupon | | Maturity | | Principal | | |
| Investments (continued) | | Rate (%) | | Date | | Amount ($) | | Value ($) |
| |
| |
| |
| |
|
| Florida (continued) | | | | | | | | |
| Sarasota County School Board, | | | | | | | | |
| COP (Master Lease Program) | | 5.00 | | 7/1/14 | | 1,365,000 | | 1,448,552 |
| South Miami Health Facilities | | | | | | | | |
| Authority, HR (Baptist Health | | | | | | | | |
| South Florida Obligated Group) | | 5.00 | | 8/15/14 | | 1,500,000 | | 1,542,930 |
| Georgia—1.8% | | | | | | | | |
| Development Authority of the City | | | | | | | | |
| of Milledgeville and Baldwin | | | | | | | | |
| County, Revenue (Georgia | | | | | | | | |
| College and State University | | | | | | | | |
| Foundation Property III, LLC | | | | | | | | |
| Student Housing System Project) | | 5.00 | | 9/1/09 | | 1,045,000 | | 1,065,200 |
| Georgia Municipal Association Inc., | | | | | | | | |
| COP (Riverdale Public | | | | | | | | |
| Purpose Project) (Insured; | | | | | | | | |
| Assured Guaranty) | | 4.00 | | 5/1/12 | | 1,930,000 | | 2,028,102 |
| Private Colleges and Universities | | | | | | | | |
| Authority, Student Housing | | | | | | | | |
| Revenue (Mercer Housing | | | | | | | | |
| Corporation Project) | | 6.00 | | 6/1/11 | | 790,000 | | 793,500 |
| Idaho—.8% | | | | | | | | |
| University of Idaho Regents, | | | | | | | | |
| General Revenue (Insured; FSA) | | 4.38 | | 4/1/11 | | 1,600,000 | | 1,658,800 |
| Illinois—1.5% | | | | | | | | |
| Illinois Housing Development | | | | | | | | |
| Authority, Housing Revenue | | 3.85 | | 7/1/09 | | 870,000 | | 875,542 |
| Upper Illinois River Valley | | | | | | | | |
| Development Authority, | | | | | | | | |
| MFHR (Morris Supportive | | | | | | | | |
| Living Project) (LOC; | | | | | | | | |
| Wells Fargo Bank) | | 3.90 | | 1/1/10 | | 2,500,000 | | 2,506,275 |
| Indiana—7.3% | | | | | | | | |
| Indiana Health Facility Financing | | | | | | | | |
| Authority, Revenue (Ascension | | | | | | | | |
| Health Credit Group) | | 3.63 | | 8/1/11 | | 4,000,000 | | 4,029,280 |
| Indiana Health Facility Financing | | | | | | | | |
| Authority, Revenue (Ascension | | | | | | | | |
| Health Subordinate Credit Group) | | 5.00 | | 11/1/10 | | 2,200,000 | | 2,278,694 |
The Fund 11
| STATEMENT OF INVESTMENTS (continued) |
| Long-Term Municipal | | Coupon | | Maturity | | Principal | | |
| Investments (continued) | | Rate (%) | | Date | | Amount ($) | | Value ($) |
| |
| |
| |
| |
|
| Indiana (continued) | | | | | | | | |
| Indiana Health Facility Financing | | | | | | | | |
| Authority, Revenue (Ascension | | | | | | | | |
| Health Subordinate Credit Group) | | 5.00 | | 7/1/11 | | 1,850,000 | | 1,930,253 |
| Indianapolis Local Public | | | | | | | | |
| Improvement Bond Bank, Revenue | | | | | | | | |
| (Indianapolis Airport Authority | | | | | | | | |
| Project) (Insured; FSA) | | 5.63 | | 1/1/14 | | 2,230,000 | | 2,291,503 |
| Rockport, | | | | | | | | |
| PCR (Indiana Michigan Power | | | | | | | | |
| Company Project) | | 6.25 | | 6/2/14 | | 3,000,000 | | 3,020,040 |
| Seymour, | | | | | | | | |
| EDR (Union Camp | | | | | | | | |
| Corporation Project) | | 6.25 | | 7/1/12 | | 2,420,000 | | 2,324,095 |
| Iowa—.5% | | | | | | | | |
| Coralville, | | | | | | | | |
| Annual Appropriation GO Urban | | | | | | | | |
| Renewal Bond Anticipation | | | | | | | | |
| Project Notes | | 4.25 | | 6/1/09 | | 1,000,000 | | 1,005,230 |
| Louisiana—1.1% | | | | | | | | |
| Plaquemines Parish Law Enforcement | | | | | | | | |
| District, Certificates of | | | | | | | | |
| Indebtedness (Insured; FGIC) | | 4.00 | | 3/1/10 | | 1,095,000 | | 1,113,199 |
| Plaquemines Parish Law Enforcement | | | | | | | | |
| District, Certificates of | | | | | | | | |
| Indebtedness (Insured; FGIC) | | 4.50 | | 3/1/11 | | 1,145,000 | | 1,189,151 |
| Maine—1.0% | | | | | | | | |
| Maine Educational Loan Marketing | | | | | | | | |
| Corporation, Subordinate | | | | | | | | |
| Student Loan Revenue | | 6.50 | | 11/1/09 | | 2,195,000 | | 2,229,176 |
| Maryland—1.4% | | | | | | | | |
| Northeast Maryland Waste Disposal | | | | | | | | |
| Authority, Solid Waste Revenue | | | | | | | | |
| (Montgomery County Solid Waste | | | | | | | | |
| Disposal System) (Insured; AMBAC) | | 5.50 | | 4/1/12 | | 3,000,000 | | 3,114,870 |
| Michigan—3.2% | | | | | | | | |
| Michigan Hospital Finance Authority, | | | | | | | | |
| HR (Oakwood Obligated Group) | | 5.00 | | 11/1/10 | | 1,500,000 | | 1,508,730 |
| Royal Oak Hospital Finance | | | | | | | | |
| Authority, HR (William Beaumont | | | | | | | | |
| Hospital Obligated Group) | | 6.25 | | 9/1/14 | | 2,500,000 | | 2,603,025 |
12
| Long-Term Municipal | | Coupon | | Maturity | | Principal | | |
| Investments (continued) | | Rate (%) | | Date | | Amount ($) | | Value ($) |
| |
| |
| |
| |
|
| Michigan (continued) | | | | | | | | |
| Wayne County Airport Authority, | | | | | | | | |
| Airport Revenue (Detroit | | | | | | | | |
| Metropolitan Wayne County | | | | | | | | |
| Airport) (Insured; MBIA, Inc.) | | 5.00 | | 12/1/12 | | 3,000,000 | | 2,982,150 |
| Missouri—.5% | | | | | | | | |
| Saint Louis, | | | | | | | | |
| Airport Revenue (Lambert-Saint | | | | | | | | |
| Louis International Airport) | | | | | | | | |
| (Insured; FSA) | | 5.00 | | 7/1/13 | | 1,000,000 | | 1,071,560 |
| Nevada—2.4% | | | | | | | | |
| Clark County School District, | | | | | | | | |
| Limited Tax GO (Insured; FGIC) | | 5.25 | | 6/15/14 | | 1,005,000 | | 1,089,872 |
| Clark County School District, | | | | | | | | |
| Limited Tax GO (Insured; FSA) | | 5.00 | | 6/15/14 | | 1,000,000 | | 1,074,710 |
| Clark County School District, | | | | | | | | |
| Limited Tax GO (Insured; FSA) | | 5.50 | | 6/15/14 | | 2,650,000 | | 2,990,658 |
| New Jersey—.4% | | | | | | | | |
| Tobacco Settlement Financing | | | | | | | | |
| Corporation of New Jersey, | | | | | | | | |
| Tobacco Settlement | | | | | | | | |
| Asset-Backed Bonds | | 4.25 | | 6/1/11 | | 1,000,000 | | 965,920 |
| New Mexico—3.7% | | | | | | | | |
| Albuquerque, | | | | | | | | |
| Subordinate Lien Airport Revenue | | 5.00 | | 7/1/12 | | 3,000,000 | | 3,153,450 |
| Farmington, | | | | | | | | |
| PCR (Southern California | | | | | | | | |
| Edison Company Four Corners | | | | | | | | |
| Project) (Insured; FGIC) | | 3.55 | | 4/1/10 | | 1,800,000 | | 1,771,848 |
| New Mexico Hospital Equipment Loan | | | | | | | | |
| Council, Hospital System | | | | | | | | |
| Revenue (Presbyterian | | | | | | | | |
| Healthcare Services) | | 5.25 | | 8/1/14 | | 3,000,000 | | 3,243,390 |
| New York—10.9% | | | | | | | | |
| Hempstead Town Industrial | | | | | | | | |
| Development Agency, RRR | | | | | | | | |
| (American Ref-Fuel Company of | | | | | | | | |
| Hempstead Project) | | 5.00 | | 6/1/10 | | 1,000,000 | | 973,590 |
| New York City Housing Development | | | | | | | | |
| Corporation, MFHR | | 4.25 | | 5/1/10 | | 1,545,000 | | 1,567,881 |
The Fund 13
| STATEMENT OF INVESTMENTS (continued) |
| Long-Term Municipal | | Coupon | | Maturity | | Principal | | |
| Investments (continued) | | Rate (%) | | Date | | Amount ($) | | Value ($) |
| |
| |
| |
| |
|
| New York (continued) | | | | | | | | |
| New York City Housing Development | | | | | | | | |
| Corporation, MFHR | | 3.95 | | 11/1/10 | | 4,500,000 | | 4,503,690 |
| New York City Industrial | | | | | | | | |
| Development Agency, Special | | | | | | | | |
| Facility Revenue (Terminal One | | | | | | | | |
| Group Association, L.P. Project) | | 5.00 | | 1/1/10 | | 3,000,000 | | 3,006,900 |
| New York State Dormitory | | | | | | | | |
| Authority, Revenue (State | | | | | | | | |
| University Educational Facilities) | | 5.50 | | 5/15/10 | | 1,800,000 | | 1,894,608 |
| New York State Dormitory | | | | | | | | |
| Authority, Third General | | | | | | | | |
| Resolution Revenue (State | | | | | | | | |
| University Educational | | | | | | | | |
| Facilities Issue) (Insured; FGIC) | | 5.25 | | 5/15/12 | | 2,000,000 | | 2,112,180 |
| New York State Housing Finance | | | | | | | | |
| Agency, Affordable | | | | | | | | |
| Housing Revenue | | 4.05 | | 11/1/10 | | 2,000,000 | | 2,027,240 |
| New York State Housing Finance | | | | | | | | |
| Agency, Affordable Housing | | | | | | | | |
| Revenue (Insured; SONYMA) | | 4.25 | | 5/1/11 | | 2,720,000 | | 2,756,638 |
| New York State Housing Finance | | | | | | | | |
| Agency, MFHR (Crotona | | | | | | | | |
| Estates Apartments) | | 3.95 | | 8/15/10 | | 1,085,000 | | 1,089,394 |
| New York State Housing Finance | | | | | | | | |
| Agency, MFHR (Highland | | | | | | | | |
| Avenue Senior Apartments) | | | | | | | | |
| (Insured; SONYMA) | | 4.40 | | 2/15/11 | | 2,000,000 | | 2,007,560 |
| Troy Industrial Development | | | | | | | | |
| Authority, Civic Facility | | | | | | | | |
| Revenue (Rensselaer | | | | | | | | |
| Polytechnic Institute Project) | | 5.00 | | 9/1/10 | | 2,000,000 | | 2,059,440 |
| North Carolina—1.2% | | | | | | | | |
| North Carolina Infrastructure Finance | | | | | | | | |
| Corporation, COP (State of North | | | | | | | | |
| Carolina Capital Improvements) | | 5.00 | | 2/1/11 | | 2,530,000 | | 2,683,900 |
| Ohio—3.8% | | | | | | | | |
| Buckeye Tobacco Settlement | | | | | | | | |
| Financing Authority, Tobacco | | | | | | | | |
| Settlement Asset-Backed Bonds | | 5.00 | | 6/1/11 | | 4,000,000 | | 3,911,920 |
14
| Long-Term Municipal | | Coupon | | Maturity | | Principal | | |
| Investments (continued) | | Rate (%) | | Date | | Amount ($) | | Value ($) |
| |
| |
| |
| |
|
| Ohio (continued) | | | | | | | | |
| Cuyahoga County, | | | | | | | | |
| Housing Revenue (Riverside | | | | | | | | |
| Park Homes Project) | | 3.90 | | 11/1/09 | | 2,300,000 | | 2,323,391 |
| Hamilton County, | | | | | | | | |
| Local District Cooling Facilities | | | | | | | | |
| Revenue (Trigen-Cinergy Solutions | | | | | | | | |
| of Cincinnati LLC Project) | | 4.60 | | 6/1/09 | | 2,000,000 | | 2,004,440 |
| Pennsylvania—9.9% | | | | | | | | |
| Allegheny County Industrial | | | | | | | | |
| Development Authority, EIR | | | | | | | | |
| (USX Corporation Project) | | 4.75 | | 11/1/11 | | 2,000,000 | | 1,926,040 |
| Allegheny County Sanitary | | | | | | | | |
| Authority, Sewer Revenue | | | | | | | | |
| (Insured; MBIA, Inc.) | | 5.25 | | 12/1/11 | | 1,000,000 | | 1,040,870 |
| Harrisburg Authority, | | | | | | | | |
| Resource Recovery | | | | | | | | |
| Facility Revenue | | 0.00 | | 12/15/10 | | 3,000,000 c,d | | 2,757,900 |
| Indiana County Industrial | | | | | | | | |
| Development Authority, PCR | | | | | | | | |
| (Pennsylvania Electric Company | | | | | | | | |
| Project) (Insured; MBIA, Inc.) | | 5.35 | | 11/1/10 | | 5,350,000 | | 5,641,950 |
| Pennsylvania Higher Educational | | | | | | | | |
| Facilities Authority, Health | | | | | | | | |
| System Revenue (The University | | | | | | | | |
| of Pennsylvania) | | 5.00 | | 8/15/13 | | 3,000,000 | | 3,153,510 |
| Pennsylvania Turnpike Commission, | | | | | | | | |
| Turnpike Revenue (Insured; FGIC) | | 5.50 | | 12/1/13 | | 2,620,000 | | 2,932,094 |
| Philadelphia, | | | | | | | | |
| Airport Revenue (Insured; FSA) | | 5.00 | | 6/15/11 | | 2,860,000 | | 2,931,185 |
| Philadelphia Hospitals and Higher | | | | | | | | |
| Education Facilities | | | | | | | | |
| Authority, HR (Presbyterian | | | | | | | | |
| Medical Center of Philadelphia) | | 6.50 | | 12/1/11 | | 1,060,000 | | 1,148,648 |
| Rhode Island—.9% | | | | | | | | |
| Rhode Island Health and | | | | | | | | |
| Educational Building | | | | | | | | |
| Corporation, Hospital | | | | | | | | |
| Financing Revenue (Lifespan | | | | | | | | |
| Obligated Group Issue) | | 5.00 | | 5/15/11 | | 2,000,000 | | 2,022,380 |
The Fund 15
| STATEMENT OF INVESTMENTS (continued) |
| Long-Term Municipal | | Coupon | | Maturity | | Principal | | |
| Investments (continued) | | Rate (%) | | Date | | Amount ($) | | Value ($) |
| |
| |
| |
| |
|
| South Carolina—2.9% | | | | | | | | |
| Orangeburg Joint Governmental | | | | | | | | |
| Action Authority, Capital | | | | | | | | |
| Projects Sales and Use Tax | | | | | | | | |
| Revenue (Orangeburg County, | | | | | | | | |
| South Carolina Project) | | | | | | | | |
| (Insured; MBIA, Inc.) | | 5.00 | | 4/1/12 | | 2,000,000 | | 1,974,320 |
| South Carolina State Ports | | | | | | | | |
| Authority, Revenue (Insured; FSA) | | 5.25 | | 7/1/13 | | 3,700,000 | | 3,733,781 |
| Spartanburg, | | | | | | | | |
| Water System Revenue | | | | | | | | |
| (Insured; FSA) | | 4.00 | | 6/1/11 | | 500,000 | | 528,745 |
| Tennessee—.5% | | | | | | | | |
| Shelby County Health Educational | | | | | | | | |
| and Housing Facility Board, | | | | | | | | |
| Revenue (Methodist Le Bonheur | | | | | | | | |
| Healthcare) | | 5.00 | | 6/1/12 | | 1,000,000 | | 1,014,340 |
| Texas—2.3% | | | | | | | | |
| Bexar County Health Facilities | | | | | | | | |
| Development Corporation, | | | | | | | | |
| Revenue (Army Retirement | | | | | | | | |
| Residence Foundation Project) | | 5.00 | | 7/1/11 | | 465,000 | | 447,339 |
| Lower Colorado River Authority, | | | | | | | | |
| Revenue | | 5.00 | | 5/15/12 | | 1,000,000 | | 1,073,550 |
| Matagorda County Navigation | | | | | | | | |
| District Number One, PCR | | | | | | | | |
| (AEP Texas Central | | | | | | | | |
| Company Project) | | 5.13 | | 6/1/11 | | 2,000,000 | | 2,007,980 |
| Titus County Fresh Water Supply | | | | | | | | |
| District Number One, PCR | | | | | | | | |
| (Southwestern Electric Power | | | | | | | | |
| Company Project) | | 4.50 | | 7/1/11 | | 1,500,000 | | 1,487,415 |
| Utah—1.6% | | | | | | | | |
| Utah Board of Regents, | | | | | | | | |
| University of Utah HR | | | | | | | | |
| (Insured; MBIA, Inc.) | | 5.00 | | 8/1/14 | | 1,500,000 | | 1,569,495 |
| Utah County, | | | | | | | | |
| EIR (USX Corporation Project) | | 5.05 | | 11/1/11 | | 2,000,000 | | 1,944,620 |
16
| Long-Term Municipal | | Coupon | | Maturity | | Principal | | |
| Investments (continued) | | Rate (%) | | Date | | Amount ($) | | Value ($) |
| |
| |
| |
| |
|
| Virginia—5.5% | | | | | | | | |
| Arlington County Industrial | | | | | | | | |
| Development Authority, RRR | | | | | | | | |
| (Alexandria/Arlington | | | | | | | | |
| Waste-to-Energy Facility) | | | | | | | | |
| (Ogden Martin System of | | | | | | | | |
| Alexandria/Arlington, Inc. | | | | | | | | |
| Project) (Insured; FSA) | | 5.38 | | 1/1/12 | | 2,280,000 | | 2,357,725 |
| Chesterfield County Industrial | | | | | | | | |
| Development Authority, PCR | | | | | | | | |
| (Virginia Electric and Power | | | | | | | | |
| Company Project) | | 5.50 | | 10/1/09 | | 3,250,000 | | 3,256,337 |
| Louisa Industrial Development | | | | | | | | |
| Authority, Solid Waste and | | | | | | | | |
| Sewage Disposal Revenue | | | | | | | | |
| (Virginia Electric and Power | | | | | | | | |
| Company Project) | | 4.25 | | 4/1/10 | | 3,000,000 | | 3,018,990 |
| Riverside Regional Jail Authority, | | | | | | | | |
| Jail Facility Senior RAN | | 4.25 | | 7/1/10 | | 2,500,000 | | 2,521,025 |
| Tobacco Settlement Financing | | | | | | | | |
| Corporation of Virginia, | | | | | | | | |
| Tobacco Settlement | | | | | | | | |
| Asset-Backed Bonds | | 4.00 | | 6/1/09 | | 960,000 a | | 964,646 |
| Washington—2.3% | | | | | | | | |
| Greater Wenatchee Regional Events | | | | | | | | |
| Center Public Facilities District, | | | | | | | | |
| Revenue and Special Tax BAN | | 5.25 | | 12/1/11 | | 3,000,000 | | 3,045,900 |
| Ocean Shores Local Improvement | | | | | | | | |
| District Number 2007-01, BAN | | 5.00 | | 8/1/11 | | 2,000,000 | | 1,933,540 |
| Wisconsin—.5% | | | | | | | | |
| Wisconsin Health and Educational | | | | | | | | |
| Facilities Authority, Revenue | | | | | | | | |
| (Froedtert and Community | | | | | | | | |
| Health, Inc. Obligated Group) | | 5.00 | | 4/1/10 | | 1,000,000 | | 1,022,190 |
| U.S. Related—3.1% | | | | | | | | |
| Puerto Rico Electric Power | | | | | | | | |
| Authority, Power Revenue | | | | | | | | |
| (Insured; XLCA) | | 5.00 | | 7/1/11 | | 1,275,000 | | 1,288,719 |
The Fund 17
| | STATEMENT OF INVESTMENTS (continued) |
| Long-Term Municipal | | Coupon | | Maturity | | Principal | | | | |
| Investments (continued) | | Rate (%) | | Date | | Amount ($) | | | | Value ($) |
| |
| |
| |
| |
| |
|
| U.S. Related (continued) | | | | | | | | | | |
| Puerto Rico Highways and | | | | | | | | | | |
| Transportation Authority, | | | | | | | | | | |
| Transportation Revenue | | 5.00 | | 7/1/12 | | 1,000,000 | | | | 974,070 |
| Puerto Rico Housing Finance | | | | | | | | | | |
| Authority, Housing Revenue | | | | | | | | | | |
| (Vivienda Modernization 1, LLC | | | | | | | | | | |
| Projects) | | 4.75 | | 10/1/11 | | 2,885,000 | | | | 2,815,760 |
| Puerto Rico Municipal Finance | | | | | | | | | | |
| Agency, Revenue (Insured; FSA) | | 6.00 | | 7/1/12 | | 1,500,000 | | | | 1,593,285 |
| Total Long-Term Municipal Investments | | | | | | | | |
| (cost $203,505,115) | | | | | | | | | | 205,186,996 |
| |
| Short-Term Municipal | | | | | | | | | | |
| Investments—6.4% | | | | | | | | | | |
| |
| |
| |
| |
| |
|
| California—.5% | | | | | | | | | | |
| Irvine Reassessment District, | | | | | | | | | | |
| Limited Obligation Improvement | | | | | | | | | | |
| Bonds (Insured; FSA and Liquidity | | | | | | | | | | |
| Facility; Dexia Credit Locale) | | 1.00 | | 4/1/09 | | 1,000,000 | | e | | 1,000,000 |
| Massachusetts—.9% | | | | | | | | | | |
| Massachusetts Health and | | | | | | | | | | |
| Educational Facilities | | | | | | | | | | |
| Authority, Revenue, CP | | | | | | | | | | |
| (Harvard University) | | 3.35 | | 6/11/09 | | 2,000,000 | | | | 2,011,240 |
| New York—3.6% | | | | | | | | | | |
| Monroe County, | | | | | | | | | | |
| GO Notes, RAN | | 6.50 | | 4/15/09 | | 3,000,000 | | | | 3,003,060 |
| New York City, | | | | | | | | | | |
| GO Notes (Liquidity Facility; | | | | | | | | | | |
| Dexia Credit Locale and LOC; | | | | | | | | | | |
| Dexia Credit Locale) | | 1.00 | | 4/1/09 | | 1,000,000 | | e | | 1,000,000 |
| New York City Municipal Water | | | | | | | | | | |
| Finance Authority, Water and | | | | | | | | | | |
| Sewer System Second General | | | | | | | | | | |
| Resolution Revenue (Liquidity | | | | | | | | | | |
| Facility; Dexia Credit Locale) | | 1.00 | | 4/1/09 | | 4,000,000 | | e | | 4,000,000 |
18
| Short-Term Municipal | | Coupon | | Maturity | | Principal | | | | |
| Investments (continued) | | Rate (%) | | Date | | Amount ($) | | | | Value ($) |
| |
| |
| |
| |
| |
|
| Tennessee—.5% | | | | | | | | | | |
| Knox County Health, Educational | | | | | | | | | | |
| and Housing Facility Board, | | | | | | | | | | |
| Hospital Improvement Revenue | | | | | | | | | | |
| (Covenant Health) (Insured; | | | | | | | | | | |
| Assured Guaranty and Liquidity | | | | | | | | | | |
| Facility; SunTrust Bank) | | 0.50 | | 4/1/09 | | 1,000,000 | | e | | 1,000,000 |
| Washington—.9% | | | | | | | | | | |
| Washington Housing Finance | | | | | | | | | | |
| Commission, Nonprofit Housing | | | | | | | | | | |
| Revenue (Mirabella Project) | | | | | | | | | | |
| (LOC; HSH Nordbank) | | 0.85 | | 4/1/09 | | 2,000,000 | | e | | 2,000,000 |
| Total Short-Term Municipal Investments | | | | | | | | |
| (cost $14,000,000) | | | | | | | | | | 14,014,300 |
| |
| Total Investments (cost $217,505,115) | | | | | | 100.3% | | | | 219,201,296 |
| Liabilities, Less Cash and Receivables | | | | | | (.3%) | | | | (714,015) |
| Net Assets | | | | | | 100.0% | | | | 218,487,281 |
| a These securities are prerefunded; the date shown represents the prerefunded date. Bonds which are prerefunded are |
| collateralized by U.S. Government securities which are held in escrow and are used to pay principal and interest on |
| the municipal issue and to retire the bonds in full at the earliest refunding date. |
| b Purchased on a delayed delivery basis. |
| c Security exempt from registration under Rule 144A of the Securities Act of 1933.This security may be resold in |
| transactions exempt from registration, normally to qualified institutional buyers.At March 31, 2009, this security |
| amounted to $2,757,900 or 1.3% of net assets. |
| d Security issued with a zero coupon. Income is recognized through the accretion of discount. |
| e Variable rate demand note—rate shown is the interest rate in effect at March 31, 2009. Maturity date represents the |
| next demand date, or the ultimate maturity date if earlier. |
The Fund 19
| STATEMENT OF INVESTMENTS (continued) |
| Summary of Abbreviations | | | | |
| |
| ABAG | | Association of Bay Area Governments | | ACA | | American Capital Access |
| AGC | | ACE Guaranty Corporation | | AGIC | | Asset Guaranty Insurance Company |
| AMBAC | | American Municipal Bond | | | | |
| | | Assurance Corporation | | ARRN | | Adjustable Rate Receipt Notes |
| BAN | | Bond Anticipation Notes | | BIGI | | Bond Investors Guaranty Insurance |
| BPA | | Bond Purchase Agreement | | CGIC | | Capital Guaranty Insurance Company |
| CIC | | Continental Insurance Company | | CIFG | | CDC Ixis Financial Guaranty |
| CMAC | | Capital Markets Assurance Corporation | | COP | | Certificate of Participation |
| CP | | Commercial Paper | | EDR | | Economic Development Revenue |
| EIR | | Environmental Improvement Revenue | | FGIC | | Financial Guaranty Insurance |
| | | | | | | Company |
| FHA | | Federal Housing Administration | | FHLB | | Federal Home Loan Bank |
| FHLMC | | Federal Home Loan Mortgage | | FNMA | | Federal National |
| | | Corporation | | | | Mortgage Association |
| FSA | | Financial Security Assurance | | GAN | | Grant Anticipation Notes |
| GIC | | Guaranteed Investment Contract | | GNMA | | Government National |
| | | | | | | Mortgage Association |
| GO | | General Obligation | | HR | | Hospital Revenue |
| IDB | | Industrial Development Board | | IDC | | Industrial Development Corporation |
| IDR | | Industrial Development Revenue | | LOC | | Letter of Credit |
| LOR | | Limited Obligation Revenue | | LR | | Lease Revenue |
| MFHR | | Multi-Family Housing Revenue | | MFMR | | Multi-Family Mortgage Revenue |
| PCR | | Pollution Control Revenue | | PILOT | | Payment in Lieu of Taxes |
| RAC | | Revenue Anticipation Certificates | | RAN | | Revenue Anticipation Notes |
| RAW | | Revenue Anticipation Warrants | | RRR | | Resources Recovery Revenue |
| SAAN | | State Aid Anticipation Notes | | SBPA | | Standby Bond Purchase Agreement |
| SFHR | | Single Family Housing Revenue | | SFMR | | Single Family Mortgage Revenue |
| SONYMA | | State of New York Mortgage Agency | | SWDR | | Solid Waste Disposal Revenue |
| TAN | | Tax Anticipation Notes | | TAW | | Tax Anticipation Warrants |
| TRAN | | Tax and Revenue Anticipation Notes | | XLCA | | XL Capital Assurance |
20
| Summary of Combined Ratings (Unaudited) | | |
| |
| Fitch | | or | | Moody’s | | or | | Standard & Poor’s | | Value (%)† |
| |
| |
| |
| |
| |
|
| AAA | | | | Aaa | | | | AAA | | 25.1 |
| AA | | | | Aa | | | | AA | | 30.1 |
| A | | | | A | | | | A | | 19.6 |
| BBB | | | | Baa | | | | BBB | | 12.4 |
| B | | | | B | | | | B | | .6 |
| F1 | | | | MIG1/P1 | | | | SP1/A1 | | 8.2 |
| Not Ratedf | | | | Not Ratedf | | | | Not Ratedf | | 4.0 |
| | | | | | | | | | | 100.0 |
| † | | Based on total investments. |
| f | | Securities which, while not rated by Fitch, Moody’s and Standard & Poor’s, have been determined by the Manager to |
| | | be of comparable quality to those rated securities in which the fund may invest. |
| See notes to financial statements. |
The Fund 21
| | STATEMENT OF ASSETS AND LIABILITIES
March 31, 2009 |
| | | Cost | | Value |
| |
| |
|
| Assets ($): | | | | |
| Investments in securities—See Statement of Investments | | 217,505,115 | | 219,201,296 |
| Cash | | | | 3,977,665 |
| Interest receivable | | | | 2,869,107 |
| Receivable for shares of Beneficial Interest subscribed | | | | 2,528,619 |
| Prepaid expenses | | | | 51,535 |
| | | | | 228,628,222 |
| Liabilities ($): | | | | |
| Due to The Dreyfus Corporation and affiliates—Note 3(c) | | | | 125,012 |
| Payable for investment securities purchased | | | | 9,728,130 |
| Payable for shares of Beneficial Interest redeemed | | | | 243,709 |
| Interest payable—Note 2 | | | | 18 |
| Accrued expenses | | | | 44,072 |
| | | | | 10,140,941 |
| Net Assets ($) | | | | 218,487,281 |
| Composition of Net Assets ($): | | | | |
| Paid-in capital | | | | 223,855,785 |
| Accumulated net realized gain (loss) on investments | | | | (7,064,685) |
| Accumulated net unrealized appreciation | | | | |
| (depreciation) on investments | | | | 1,696,181 |
| Net Assets ($) | | | | 218,487,281 |
| Net Asset Value Per Share | | | | | | |
| | | Class B | | Class D | | Class I |
| |
| |
| |
|
| Net Assets ($) | | 661,651 | | 217,715,298 | | 110,332 |
| Shares Outstanding | | 51,875 | | 17,069,888 | | 8,647 |
| Net Asset Value Per Share ($) | | 12.75 | | 12.75 | | 12.76 |
| |
| See notes to financial statements. | | | | | | |
22
STATEMENT OF OPERATIONS
Year Ended March 31, 2009 |
| Investment Income ($): | | |
| Interest Income | | 6,459,532 |
| Expenses: | | |
| Management fee—Note 3(a) | | 765,791 |
| Distribution fees—Note 3(b) | | 156,385 |
| Shareholder servicing costs—Note 3(c) | | 84,861 |
| Professional fees | | 65,525 |
| Registration fees | | 46,077 |
| Custodian fees—Note 3(c) | | 21,697 |
| Prospectus and shareholders’ reports | | 12,060 |
| Trustees’ fees and expenses—Note 3(d) | | 3,503 |
| Loan commitment fees—Note 2 | | 2,247 |
| Interest expense—Note 2 | | 774 |
| Miscellaneous | | 27,594 |
| Total Expenses | | 1,186,514 |
| Less—reduction in expenses | | |
| due to undertaking—Note 3(a) | | (9) |
| Less—reduction in fees due to | | |
| earnings credits—Note 1(b) | | (5,245) |
| Net Expenses | | 1,181,260 |
| Investment Income—Net | | 5,278,272 |
| Realized and Unrealized Gain (Loss) on Investments—Note 4 ($): | | |
| Net realized gain (loss) on investments | | 12,967 |
| Net unrealized appreciation (depreciation) on investments | | 789,671 |
| Net Realized and Unrealized Gain (Loss) on Investments | | 802,638 |
| Net Increase in Net Assets Resulting from Operations | | 6,080,910 |
| |
| See notes to financial statements. | | |
The Fund 23
STATEMENT OF CHANGES IN NET ASSETS
| | | | | Year Ended March 31, |
| | |
| |
|
| | | 2009 | | 2008 |
| |
| |
|
| Operations ($): | | | | |
| Investment income—net | | 5,278,272 | | 4,522,529 |
| Net realized gain (loss) on investments | | 12,967 | | (120,646) |
| Net unrealized appreciation | | | | |
| (depreciation) on investments | | 789,671 | | 986,329 |
| Net Increase (Decrease) in Net Assets | | | | |
| Resulting from Operations | | 6,080,910 | | 5,388,212 |
| Dividends to Shareholders from ($): | | | | |
| Investment income—net: | | | | |
| Class B Shares | | (12,225) | | (11,557) |
| Class D Shares | | (5,212,329) | | (4,461,921) |
| Class I Shares | | (222) | | — |
| Net realized gain on investments: | | | | |
| Class B Shares | | (208) | | — |
| Class D Shares | | (67,483) | | — |
| Total Dividends | | (5,292,467) | | (4,473,478) |
| Beneficial Interest Transactions ($): | | | | |
| Net proceeds from shares sold: | | | | |
| Class B Shares | | 299,655 | | 3 |
| Class D Shares | | 114,885,047 | | 11,544,017 |
| Class I Shares | | 110,000 | | — |
| Dividends reinvested: | | | | |
| Class B Shares | | 7,959 | | 6,655 |
| Class D Shares | | 4,484,239 | | 3,864,872 |
| Cost of shares redeemed: | | | | |
| Class B Shares | | (78,672) | | (419,179) |
| Class D Shares | | (39,437,100) | | (25,830,737) |
| Increase (Decrease) in Net Assets from | | | | |
| Beneficial Interest Transactions | | 80,271,128 | | (10,834,369) |
| Total Increase (Decrease) in Net Assets | | 81,059,571 | | (9,919,635) |
| Net Assets ($): | | | | |
| Beginning of Period | | 137,427,710 | | 147,347,345 |
| End of Period | | 218,487,281 | | 137,427,710 |
24
| | | | | Year Ended March 31, |
| | |
| |
|
| | | 2009 | | 2008 |
| |
| |
|
| Capital Share Transactions: | | | | |
| Class Bb | | | | |
| Shares sold | | 23,715 | | — |
| Shares issued for dividends reinvested | | 627 | | 527 |
| Shares redeemed | | (6,217) | | (33,213) |
| Net Increase (Decrease) in Shares Outstanding | | 18,125 | | (32,686) |
| Class Db | | | | |
| Shares sold | | 9,050,849 | | 911,429 |
| Shares issued for dividends reinvested | | 353,467 | | 305,490 |
| Shares redeemed | | (3,111,614) | | (2,042,957) |
| Net Increase (Decrease) in Shares Outstanding | | 6,292,702 | | (826,038) |
| Class Ia | | | | |
| Shares sold | | 8,647 | | — |
| a | | From December 15, 2008 (commencement of initial offering) to March 31, 2009 for Class I shares. |
| b | | During the period ended March 31, 2009, 3,271 Class B shares representing $41,472 were automatically |
| | | converted to 3,273 Class D shares and during the period ended March 31, 2008, 44,731 Class B shares |
| | | representing $782,299 were automatically converted to 47,021 Class D shares. |
| See notes to financial statements. |
The Fund 25
FINANCIAL HIGHLIGHTS
The following tables describe the performance for each share class for the fiscal periods indicated. All information (except portfolio turnover rate) reflects financial results for a single fund share.Total return shows how much your investment in the fund would have increased (or decreased) during each period, assuming you had reinvested all dividends and distributions.These figures have been derived from the fund’s financial statements.
| | | | | Year Ended March 31, | | |
| | |
| |
| |
|
| Class B Shares | | 2009 | | 2008 | | 2007 | | 2006 | | 2005 |
| |
| |
| |
| |
| |
|
| Per Share Data ($): | | | | | | | | | | |
| Net asset value, beginning of period | | 12.71 | | 12.63 | | 12.57 | | 12.65 | | 12.93 |
| Investment Operations: | | | | | | | | | | |
| Investment income—neta | | .31 | | .27 | | .25 | | .19 | | .18 |
| Net realized and unrealized | | | | | | | | | | |
| gain (loss) on investments | | .05 | | .09 | | .05 | | (.08) | | (.28) |
| Total from Investment Operations | | .36 | | .36 | | .30 | | .11 | | (.10) |
| Distributions: | | | | | | | | | | |
| Dividends from investment income—net | | (.31) | | (.28) | | (.24) | | (.19) | | (.18) |
| Dividends from net realized | | | | | | | | | | |
| gain on investments | | (.01) | | — | | — | | — | | (.00)b |
| Total Distributions | | (.32) | | (.28) | | (.24) | | (.19) | | (.18) |
| Net asset value, end of period | | 12.75 | | 12.71 | | 12.63 | | 12.57 | | 12.65 |
| Total Return (%)c | | 2.85 | | 2.87 | | 2.39 | | .88 | | (.74) |
| Ratios/Supplemental Data (%): | | | | | | | | | | |
| Ratio of total expenses | | | | | | | | | | |
| to average net assets | | 1.76 | | 1.79 | | 1.72 | | 1.70 | | 1.65 |
| Ratio of net expenses | | | | | | | | | | |
| to average net assets | | 1.76d | | 1.78 | | 1.72 | | 1.70 | | 1.65d |
| Ratio of net investment income | | | | | | | | | | |
| to average net assets | | 2.49 | | 2.23 | | 1.94 | | 1.50 | | 1.42 |
| Portfolio Turnover Rate | | 36.97 | | 62.90 | | 48.46 | | 45.00 | | 33.55 |
| Net Assets, end of period ($ x 1,000) | | 662 | | 429 | | 839 | | 1,021 | | 1,795 |
| a | | Based on average shares outstanding at each month end. |
| b | | Amount represents less than $.01 per share. |
| c | | Exclusive of sales charge. |
| d | | Expense waivers and/or reimbursements amounted to less than .01%. |
| See notes to financial statements. |
26
| | | | | Year Ended March 31, | | |
| | |
| |
| |
|
| Class D Shares | | 2009 | | 2008 | | 2007 | | 2006a | | 2005 |
| |
| |
| |
| |
| |
|
| Per Share Data ($): | | | | | | | | | | |
| Net asset value, beginning of period | | 12.71 | | 12.63 | | 12.57 | | 12.66 | | 12.93 |
| Investment Operations: | | | | | | | | | | |
| Investment income—netb | | .43 | | .41 | | .36 | | .31 | | .30 |
| Net realized and unrealized | | | | | | | | | | |
| gain (loss) on investments | | .05 | | .08 | | .06 | | (.09) | | (.27) |
| Total from Investment Operations | | .48 | | .49 | | .42 | | .22 | | .03 |
| Distributions: | | | | | | | | | | |
| Dividends from investment income—net | | (.43) | | (.41) | | (.36) | | (.31) | | (.30) |
| Dividends from net realized | | | | | | | | | | |
| gain on investments | | (.01) | | — | | — | | — | | (.00)c |
| Total Distributions | | (.44) | | (.41) | | (.36) | | (.31) | | (.30) |
| Net asset value, end of period | | 12.75 | | 12.71 | | 12.63 | | 12.57 | | 12.66 |
| Total Return (%) | | 3.85 | | 3.90 | | 3.37 | | 1.75 | | .26 |
| Ratios/Supplemental Data (%): | | | | | | | | | | |
| Ratio of total expenses | | | | | | | | | | |
| to average net assets | | .77 | | .77 | | .76 | | .76 | | .74 |
| Ratio of net expenses | | | | | | | | | | |
| to average net assets | | .77d | | .77d | | .76 | | .76 | | .74d |
| Ratio of net investment income | | | | | | | | | | |
| to average net assets | | 3.45 | | 3.23 | | 2.89 | | 2.44 | | 2.34 |
| Portfolio Turnover Rate | | 36.97 | | 62.90 | | 48.86 | | 45.00 | | 33.55 |
| Net Assets, end of period ($ x 1,000) | | 217,715 | | 136,999 | | 146,509 | | 192,828 | | 223,267 |
| a | | On January 26, 2006, the fund’s Board of Trustees approved, effective as of the close of business on March 24, 2006 |
| | | reclassifying all of the fund’s Class A and Class P shares as Class D shares of the fund. |
| b | | Based on average shares outstanding at each month end. |
| c | | Amount represents less than $.01 per share. |
| d | | Expense waivers and/or reimbursements amounted to less than .01%. |
| See notes to financial statements. |
The Fund 27
| | FINANCIAL HIGHLIGHTS (continued) |
| | | Year Ended |
| Class I Shares | | March 31, 2009a |
| |
|
| Per Share Data ($): | | |
| Net asset value, beginning of period | | 12.54 |
| Investment Operations: | | |
| Investment income—netb | | .08 |
| Net realized and unrealized | | |
| gain (loss) on investments | | .27 |
| Total from Investment Operations | | .35 |
| Distributions: | | |
| Dividends from investment income—net | | (.13) |
| Net asset value, end of period | | 12.76 |
| Total Return (%)c | | 2.83 |
| Ratios/Supplemental Data (%): | | |
| Ratio of total expenses to average net assetsd | | .82 |
| Ratio of net expenses to average net assetsd | | .65 |
| Ratio of net investment income to average net assetsd | | 3.51 |
| Portfolio Turnover Rate | | 36.97 |
| Net Assets, end of period ($ x 1,000) | | 110 |
| a | | From December 15, 2008 (commencement of initial offering) to March 31, 2009. |
| b | | Based on average shares outstanding at each month end. |
| c | | Not annualized. |
| d | | Annualized. |
| See notes to financial statements. |
28
NOTES TO FINANCIAL STATEMENTS
NOTE 1—Significant Accounting Policies:
Dreyfus Short-Intermediate Municipal Bond Fund (the “fund”) is a series of Dreyfus Premier Short-Intermediate Municipal Bond Fund (the “Company”), which is registered under the Investment Company Act of 1940, as amended (the “Act”), as a non-diversified open-end management investment company.The fund’s investment objective is to provide investors with as high a level of current income exempt from federal income tax as is consistent with the preservation of capital.The Dreyfus Corporation (the “Manager” or “Dreyfus”), a wholly-owned subsidiary of The Bank of New York Mellon Corporation (“BNY Mellon”), serves as the fund’s investment adviser.
At a meeting of the fund’s Board of Trustees held on July 16, 2008, the Board approved, effective December 1, 2008, a proposal to create a new series, named Dreyfus Short-Intermediate Municipal Bond Fund, under the Company. Shares of the Company’s Beneficial Interest were designated as shares of Beneficial Interest of the fund.This change had no impact on shareholders. Effective December 15, 2008, the fund began offering Class I shares.
Effective July 1, 2008, BNY Mellon has reorganized and consolidated a number of its banking and trust company subsidiaries. As a result of the reorganization, any services previously provided to the fund by Mellon Bank, N.A. or Mellon Trust of New England, N.A. are now provided by The Bank of New York Mellon (formerly,The Bank of New York).
MBSC Securities Corporation (the “Distributor”), a wholly-owned subsidiary of the Manager, is the distributor of the fund’s shares. The fund is authorized to issue an unlimited number of $.001 par value shares of Beneficial Interest in each of the following classes of shares: Class B, Class D and Class I. Class B shares are subject to a contingent deferred sales charge (“CDSC”) imposed on Class B share redemptions made within six years of purchase and automatically convert to Class D shares after six years.The fund does not offer Class B shares, except in connection with dividend reinvestment and permitted
The Fund 29
| NOTES TO FINANCIAL STATEMENTS (continued) |
exchanges of Class B shares. Class D shares are sold at net asset value per share directly by Dreyfus and through certain banks and fund supermarkets, and as a part of certain wrap-fee programs. Class I shares are sold at net asset value per share only to institutional investors. Other differences between the classes include the services offered to and the expenses borne by each class, the allocation of certain transfer agency costs and certain voting rights. Income, expenses (other than expenses attributable to a specific class), and realized and unrealized gains or losses on investments are allocated to each class of shares based on its relative net assets.
The fund’s financial statements are prepared in accordance with U.S. generally accepted accounting principles, which may require the use of management estimates and assumptions. Actual results could differ from those estimates.
The fund enters into contracts that contain a variety of indemnifications. The fund’s maximum exposure under these arrangements is unknown.The fund does not anticipate recognizing any loss related to these arrangements.
(a) Portfolio valuation: Investments in securities are valued each business day by an independent pricing service (the “Service”) approved by the Board of Trustees. Investments for which quoted bid prices are readily available and are representative of the bid side of the market in the judgment of the Service are valued at the mean between the quoted bid prices (as obtained by the Service from dealers in such securities) and asked prices (as calculated by the Service based upon its evaluation of the market for such securities). Other investments (which constitute a majority of the portfolio securities) are carried at fair value as determined by the Service, based on methods which include consideration of: yields or prices of municipal securities of comparable quality, coupon, maturity and type; indications as to values from dealers; and general market conditions.
30
The fund adopted Statement of Financial Accounting Standards No. 157 “FairValue Measurements” (“FAS 157”). FAS 157 establishes an authoritative definition of fair value, sets out a framework for measuring fair value, and requires additional disclosures about fair value measurements.
Various inputs are used in determining the value of the fund’s investments relating to FAS 157.These inputs are summarized in the three broad levels listed below.
| | Level 1—quoted prices in active markets for identical investments.
Level 2—other significant observable inputs (including quoted
prices for similar securities, interest rates, prepayment speeds,
credit risk, etc.).
Level 3—significant unobservable inputs (including the fund’s own
assumptions in determining the fair value of investments). |
The inputs or methodology used for valuing securities are not necessarily an indication of the risk associated with investing in those securities.
The following is a summary of the inputs used as of March 31, 2009 in valuing the fund’s investments:
| | | | | Level 2—Other | | Level 3— | | |
| | | Level 1— | | Significant | | Significant | | |
| | | Quoted | | Observable | | Unobservable | | |
| | | Prices | | Inputs | | Inputs | | Total |
| |
| |
| |
| |
|
| Assets ($) | | | | | | | | |
| Investments in | | | | | | | | |
| Securities | | — | | 219,201,296 | | — | | 219,201,296 |
| Other Financial | | | | | | | | |
| Instruments† | | — | | — | | — | | — |
| Liabilities ($) | | | | | | | | |
| Other Financial | | | | | | | | |
| Instruments† | | — | | — | | — | | — |
| † | | Other financial instruments include derivative instruments, such as futures, forward currency |
| | | exchange contracts, swap contracts and options contracts. Amounts shown represent unrealized |
| | | appreciation (depreciation) at period end. |
The Fund 31
| NOTES TO FINANCIAL STATEMENTS (continued) |
(b) Securities transactions and investment income: Securities transactions are recorded on a trade date basis. Realized gains and losses from securities transactions are recorded on the identified cost basis. Interest income, adjusted for accretion of discount and amortization of premium on investments, is earned from settlement date and recognized on the accrual basis. Securities purchased or sold on a when-issued or delayed delivery basis may be settled a month or more after the trade date.
The fund has arrangements with the custodian and cash management bank whereby the fund may receive earnings credits when positive cash balances are maintained, which are used to offset custody and cash management fees. For financial reporting purposes, the fund includes net earnings credits as an expense offset in the Statement of Operations.
(c) Dividends to shareholders: It is the policy of the fund to declare dividends daily from investment income-net. Such dividends are paid monthly. Dividends from net realized capital gains, if any, are normally declared and paid annually, but the fund may make distributions on a more frequent basis to comply with the distribution requirements of the Internal Revenue Code of 1986, as amended (the “Code”).To the extent that net realized capital gains can be offset by capital losses carryovers, it is the policy of the fund not to distribute such gains. Income and capital gain distributions are determined in accordance with income tax regulations, which may differ from U.S. generally accepted accounting principles.
(d) Federal income taxes: It is the policy of the fund to continue to qualify as a regulated investment company, which can distribute tax exempt dividends, by complying with the applicable provisions of the Code, and to make distributions of income and net realized capital gains sufficient to relieve it from substantially all federal income and excise taxes.
As of and during the period ended March 31, 2009, the fund did not have any liabilities for any uncertain tax positions.The fund recognizes interest and penalties, if any, related to uncertain tax positions as income tax expense in the Statement of Operations. During the period, the fund did not incur any interest or penalties.
32
Each of the tax years in the four-year period ended March 31, 2009 remains subject to examination by the Internal Revenue Service and state taxing authorities.
At March 31, 2009, the components of accumulated earnings on a tax basis were as follows: undistributed tax exempt income $125,018, accumulated capital losses $7,118,037 and unrealized appreciation $1,753,754. In addition, the fund had $4,221 of capital losses realized after October 31, 2008, which were deferred for tax purposes to the first day of the following fiscal year.
The accumulated capital loss carryover is available for federal income tax purposes to be applied against future net securities profits, if any, realized subsequent to March 31, 2009. If not applied, $5,378,901 of the carryover expires in fiscal 2011, $44,004 expires in fiscal 2012, $278,375 expires in fiscal 2014, $958,575 expires in fiscal 2015 and $458,182 expires in fiscal 2016.
The tax character of distributions paid to shareholders during the fiscal periods ended March 31, 2009 and March 31, 2008 were as follows: tax exempt income $5,206,309 and $4,473,478 and ordinary income $86,158 and $0, respectively.
During the period ended March 31, 2009, as a result of permanent book to tax differences, primarily due to the tax treatment for amortization adjustments, the fund decreased accumulated undistributed investment income-net by $53,496, increased accumulated net realized gain (loss) on investments by $31,202 and increased paid-in capital by $22,294. Net assets and net asset value per share were not affected by this reclassification.
NOTE 2—Bank Lines of Credit:
Prior to October 15, 2008, the fund participated with other Dreyfus-managed funds in a $350 million unsecured credit facility led by Citibank, N.A. (the “Citibank Facility”). Effective October 15, 2008, the fund participates with other Dreyfus-managed funds in a $145 million unsecured credit facility with Citibank, N.A. and a $300
The Fund 33
| NOTES TO FINANCIAL STATEMENTS (continued) |
unsecured million credit facility provided by The Bank of New York Mellon (the “BNYM Facility”), each to be utilized primarily for temporary or emergency purposes, including the financing of redemptions. In connection therewith, the fund has agreed to pay its pro rata portion of Facility fees for each Facility. Interest is charged to the fund based on rates determined pursuant to the terms of the respective Facility at the time of the borrowing.
The average daily amount of borrowings outstanding under the Facilities during the period ended March 31, 2009 was approximately $36,500, with a related weighted average annualized interest rate of 2.12%.
NOTE 3—Management Fee and Other Transactions With Affiliates:
(a) Pursuant to a management agreement (“Agreement”) with the Manager, the management fee is computed at the annual rate of .50% of the value of the fund’s average daily net assets and is payable monthly. The Agreement provides that if in any full fiscal year the aggregate expenses allocated to Class D, exclusive of taxes, brokerage fees, interest on borrowings, commitment fees and extraordinary expenses, exceed 1 1 / 2% of the value of the average daily net assets of Class D, the fund may deduct from payments to be made to the Manager, or the Manager will bear such excess expense.The Manager had undertaken from December 15, 2008 through March 31, 2009 to reduce the expenses paid by Class I shares, to the extent that Class I shares aggregate annual expenses, exclusive of certain expenses as described above, exceed an annual rate of .65% of the value of the average daily net assets of Class I shares.The reduction in expenses for Class I shares, pursuant to the undertaking amounted to $9 during the period ended March 31, 2009.
During the period ended March 31, 2009, the Distributor retained $587 from CDSCs on redemptions of the fund’s Class B shares.
(b) Under the Distribution Plan (the “Plan”) adopted pursuant to Rule 12b-1 under the Act, Class B and Class D shares pay the Distributor for distributing their shares at an annual rate of .75% of the value of the
34
average daily net assets of Class B shares and .10% of the value of the average daily net assets of Class D shares. During the period ended March 31, 2009, Class B and Class D shares were charged $3,731 and $152,654, respectively, pursuant to the Plan.
(c) Under the Shareholder Services Plan, Class B shares pay the distributor at an annual rate of .25% of the value of the average daily net assets of Class B shares, for the provision of certain services.The services provided may include personal services relating to shareholder accounts, such as answering shareholder inquiries regarding Class B shares and providing reports and other information, and services related to the maintenance of shareholder accounts. The Distributor may make payments to Service Agents (a securities dealer, financial institution or other industry professional) in respect of these services. The Distributor determines the amounts to be paid to Service Agents. During the period ended March 31, 2009, Class B shares were charged $1,244 pursuant to the Shareholder Services Plan.
The fund compensates Dreyfus Transfer, Inc., a wholly-owned subsidiary of the Manager, under a transfer agency agreement for providing personnel and facilities to perform transfer agency services for the fund. During the period ended March 31, 2009, the fund was charged $42,764 pursuant to the transfer agency agreement.
The fund compensates The Bank of NewYork Mellon, a subsidiary of BNY Mellon and an affiliate of Dreyfus, under a cash management agreement for performing cash management services related to fund subscriptions and redemptions. During the period ended March 31, 2009, the fund was charged $3,773 pursuant to the cash management agreement.These fees were offset by earnings credits pursuant to the cash management agreement.
The fund also compensates The Bank of New York Mellon under a custody agreement for providing custodial services for the fund. During the period ended March 31, 2009, the fund was charged $21,697 pursuant to the custody agreement.
The Fund 35
| NOTES TO FINANCIAL STATEMENTS (continued) |
During the period ended March 31, 2009, the fund was charged $5,070 for services performed by the Chief Compliance Officer.
The components of “Due to The Dreyfus Corporation and affiliates” in the Statement of Assets and Liabilities consist of: management fees $87,323, Rule 12b-1 distribution plan fees $17,825, shareholder services plan fees $140, custodian fees $9,982, chief compliance officer fees $2,394 and transfer agency per account fees $7,357, which are offset against an expense reimbursement currently in effect in the amount of $9.
(d) Each Board member also serves as a Board member of other funds within the Dreyfus complex. Annual retainer fees and attendance fees are allocated to each fund based on net assets.
NOTE 4—Securities Transactions:
The aggregate amount of purchases and sales of investment securities, excluding short-term securities, during the period ended March 31, 2009, amounted to $128,947,253 and $53,398,237, respectively.
At March 31, 2009, the cost of investments for federal income tax purposes was $217,447,542; accordingly, accumulated net unrealized appreciation on investments was $1,753,754, consisting of $2,884,734 gross unrealized appreciation and $1,130,980 gross unrealized depreciation.
The Financial Accounting Standards Board released Statement of Financial Accounting Standards No. 161 “Disclosures about Derivative Instruments and Hedging Activities” (“FAS 161”). FAS 161 requires qualitative disclosures about objectives and strategies for using derivatives, quantitative disclosures about fair value amounts of gains and losses on derivative instruments and disclosures about credit-risk-related contingent features in derivative agreements. The application of FAS 161 is required for fiscal years and interim periods beginning after November 15, 2008. At this time, management is evaluating the implications of FAS 161 and its impact on the financial statements and the accompanying notes has not yet been determined.
36
REPORT OF INDEPENDENT REGISTERED
PUBLIC ACCOUNTING FIRM |
Shareholders and Board of Trustees
Dreyfus Short-Intermediate Municipal Bond Fund
We have audited the accompanying statement of assets and liabilities, including the statement of investments, of Dreyfus Short-Intermediate Municipal Bond Fund (formerly, Dreyfus Premier Short-Intermediate Municipal Bond Fund) (the sole series comprising Dreyfus Premier Short-Intermediate Municipal Bond Fund), as of March 31, 2009, and the related statement of operations for the year then ended, the statement of changes in net assets for each of the two years in the period then ended, and financial highlights for each of the periods indicated therein. These financial statements and financial highlights are the responsibility of the Fund’s management. Our responsibility is to express an opinion on these financial statements and financial highlights based on our audits. We conducted our audits in accordance with the standards of the Public Company Accounting Oversight Board (United States).Those standards require that we plan and perform the audit to obtain reasonable assurance about whether the financial statements and financial highlights are free of material misstatement.We were not engaged to perform an audit of the Fund’s internal control over financial reporting. Our audits included consideration of internal control over financial reporting as a basis for designing audit procedures that are appropriate in the circumstances,but not for the purpose of expressing an opinion on the effectiveness of the Fund’s internal control over financial reporting.Accordingly, we express no such opinion. An audit also includes examining, on a test basis, evidence supporting the amounts and disclosures in the financial statements and financial highlights, assessing the accounting principles used and significant estimates made by management, and evaluating the overall financial statement presentation. Our procedures included confirmation of securities owned as of March 31, 2009 by correspondence with the custodian. We believe that our audits provide a reasonable basis for our opinion. In our opinion, the financial statements and financial highlights referred to above present fairly, in all material respects, the financial position of Dreyfus Short-Intermediate Municipal Bond Fund at March 31, 2009, the results of its operations for the year then ended, the changes in its net assets for each of the two years in the period then ended, and the financial highlights for each of the indicated periods, in conformity with U.S. generally accepted accounting principles.

New York, New York
May 14, 2009 |
The Fund 37
IMPORTANT TAX INFORMATION (Unaudited)
In accordance with federal tax law, the fund hereby makes the following designations regarding its fiscal year ended March 31, 2009:
—all the dividends paid from investment income-net are “exempt-interest dividends” (not generally subject to regular federal income tax).
—the fund hereby designates $.0063 per share as a short-term capital gain distribution paid on July 9, 2008.
As required by federal tax law rules, shareholders will receive notification of their portion of the fund’s taxable ordinary dividends (if any) and capital gains distributions (if any) paid for the 2009 calendar year on Form 1099-DIV and their portion of the fund’s exempt-interest dividends paid for the 2009 calendar year on Form 1099-INT, both of which will be mailed by early 2010.
38
BOARD MEMBERS INFORMATION (Unaudited)

The Fund 39
BOARD MEMBERS INFORMATION (Unaudited) (continued)
40
OFFICERS OF THE FUND (Unaudited)
The Fund 41
OFFICERS OF THE FUND (Unaudited) (continued)

42
NOTES
The Registrant has adopted a code of ethics that applies to the Registrant's principal executive officer, principal financial officer, principal accounting officer or controller, or persons performing similar functions. There have been no amendments to, or waivers in connection with, the Code of Ethics during the period covered by this Report.
| Item 3. | | Audit Committee Financial Expert. |
The Registrant's Board has determined that Joseph S. DiMartino, a member of the Audit Committee of the Board, is an audit committee financial expert as defined by the Securities and Exchange Commission (the "SEC"). Mr. DiMartino is "independent" as defined by the SEC for purposes of audit committee financial expert determinations.
| Item 4. | | Principal Accountant Fees and Services |
(a) Audit Fees. The aggregate fees billed for each of the last two fiscal years (the "Reporting Periods") for professional services rendered by the Registrant's principal accountant (the "Auditor") for the audit of the Registrant's annual financial statements, or services that are normally provided by the Auditor in connection with the statutory and regulatory filings or engagements for the Reporting Periods, were $31,807 in 2008 and $32,444 in 2009.
(b) Audit-Related Fees. The aggregate fees billed in the Reporting Periods for assurance and related services by the Auditor that are reasonably related to the performance of the audit of the Registrant's financial statements and are not reported under paragraph (a) of this Item 4 were $0 in 2008 and $5,276 in 2009.
The aggregate fees billed in the Reporting Periods for non-audit assurance and related services by the Auditor to the Registrant's investment adviser (not including any sub-investment adviser whose role is primarily portfolio management and is subcontracted with or overseen by another investment adviser), and any entity controlling, controlled by or under common control with the investment adviser that provides ongoing services to the Registrant ("Service Affiliates"), that were reasonably related to the performance of the annual audit of the Service Affiliate, which required pre-approval by the Audit Committee were $0 in 2008 and $0 in 2009.
Note: For the second paragraph in each of (b) through (d) of this Item 4, certain of such services were not pre-approved prior to May 6, 2003, when such services were required to be pre-approved. On and after May 6, 2003, 100% of all services provided by the Auditor were pre-approved as required. For comparative purposes, the fees shown assume that all such services were pre-approved, including services that were not pre-approved prior to the compliance date of the pre-approval requirement.
(c) Tax Fees. The aggregate fees billed in the Reporting Periods for professional services rendered by the Auditor for tax compliance, tax advice and tax planning ("Tax Services") were $2,462 in 2008 and $3,373 in 2009. These services consisted of (i) review or preparation of U.S. federal, state, local and excise tax returns; (ii) U.S. federal, state and local tax planning, advice and assistance regarding statutory, regulatory or administrative developments, (iii) tax advice regarding tax qualification matters and/or treatment of various financial instruments held or proposed to be acquired or held.
The aggregate fees billed in the Reporting Periods for Tax Services by the Auditor to Service Affiliates which required pre-approval by the Audit Committee were $0 in 2008 and $0 in 2009.
(d) All Other Fees. The aggregate fees billed in the Reporting Periods for products and services provided by the Auditor, other than the services reported in paragraphs (a) through (c) of this Item, were $52 in 2008 and $50 in 2009. These services consisted of a review of the Registrant's anti-money laundering program.
The aggregate fees billed in the Reporting Periods for Non-Audit Services by the Auditor to Service Affiliates, other than the services reported in paragraphs (b) through (c) of this Item, which required pre-approval by the Audit Committee were $0 in 2008 and $0 in 2009.
Audit Committee Pre-Approval Policies and Procedures. The Registrant's Audit Committee has established policies and procedures (the "Policy") for pre-approval (within specified fee limits) of the Auditor's engagements for non-audit services to the Registrant and Service Affiliates without specific case-by-case consideration. Pre-approval considerations include whether the proposed services are compatible with maintaining the Auditor's independence. Pre-approvals pursuant to the Policy are considered annually.
Non-Audit Fees. The aggregate non-audit fees billed by the Auditor for services rendered to the Registrant, and rendered to Service Affiliates, for the Reporting Periods were $2,263,238 in 2008 and $17,417,147 in 2009.
Auditor Independence. The Registrant's Audit Committee has considered whether the provision of non-audit services that were rendered to Service Affiliates which were not pre-approved (not requiring pre-approval) is compatible with maintaining the Auditor's independence.
| Item 5. | | Audit Committee of Listed Registrants. |
| | | Not applicable. [CLOSED-END FUNDS ONLY] |
| Item 6. | | Investments. |
| | | Not applicable. |
| Item 7. | | Disclosure of Proxy Voting Policies and Procedures for Closed-End Management |
| | | Investment Companies. |
| | | Not applicable. [CLOSED-END FUNDS ONLY] |
| Item 8. | | Portfolio Managers of Closed-End Management Investment Companies. |
| | | Not applicable. [CLOSED-END FUNDS ONLY, beginning with reports for periods ended |
| | | on and after December 31, 2005] |
| Item 9. | | Purchases of Equity Securities by Closed-End Management Investment Companies and |
| | | Affiliated Purchasers. |
| | | Not applicable. [CLOSED-END FUNDS ONLY] |
| Item 10. | | Submission of Matters to a Vote of Security Holders. |
| There have been no material changes to the procedures applicable to Item 10. |
| Item 11. | | Controls and Procedures. |
(a) The Registrant's principal executive and principal financial officers have concluded, based on their evaluation of the Registrant's disclosure controls and procedures as of a date within 90 days of the filing date
of this report, that the Registrant's disclosure controls and procedures are reasonably designed to ensure that information required to be disclosed by the Registrant on Form N-CSR is recorded, processed, summarized and reported within the required time periods and that information required to be disclosed by the Registrant in the reports that it files or submits on Form N-CSR is accumulated and communicated to the Registrant's management, including its principal executive and principal financial officers, as appropriate to allow timely decisions regarding required disclosure.
(b) There were no changes to the Registrant's internal control over financial reporting that occurred during the second fiscal quarter of the period covered by this report that have materially affected, or are reasonably likely to materially affect, the Registrant's internal control over financial reporting.
Item 12. Exhibits.
(a)(1) Code of ethics referred to in Item 2.
(a)(2) Certifications of principal executive and principal financial officers as required by Rule 30a-2(a) under the Investment Company Act of 1940.
(a)(3) Not applicable.
(b) Certification of principal executive and principal financial officers as required by Rule 30a-2(b) under the Investment Company Act of 1940.
Pursuant to the requirements of the Securities Exchange Act of 1934 and the Investment Company Act of 1940, the Registrant has duly caused this Report to be signed on its behalf by the undersigned, thereunto duly authorized.
Dreyfus Premier Short-Intermediate Municipal Bond Fund
| By: | | /s/ J. David Officer |
| | |
|
| | | J. David Officer |
| | President |
|
| |
| Date: | | May 28, 2009 |
Pursuant to the requirements of the Securities Exchange Act of 1934 and the Investment Company Act of 1940, this Report has been signed below by the following persons on behalf of the Registrant and in the capacities and on the dates indicated.
| By: | | /s/ J. David Officer |
| | |
|
| | | J. David Officer |
| | President |
|
| |
| Date: | | May 28, 2009 |
| |
| By: | | /s/ James Windels |
| | |
|
| | | James Windels |
| | Treasurer |
|
| |
| Date: | | May 28, 2009 |
EXHIBIT INDEX
(a)(1) Code of ethics referred to in Item 2.
(a)(2) Certifications of principal executive and principal financial officers as required by Rule 30a 2(a) under the Investment Company Act of 1940. (EX-99.CERT)
(b) Certification of principal executive and principal financial officers as required by Rule 30a-2(b) under the Investment Company Act of 1940. (EX-99.906CERT)