UNITED STATES
SECURITIES AND EXCHANGE COMMISSION
Washington, D.C. 20549
FORM N-CSR
CERTIFIED SHAREHOLDER REPORT OF REGISTERED MANAGEMENT
INVESTMENT COMPANIES
Investment Company Act file number | 811-5021 |
| |
| Dreyfus Premier Short-Intermediate Municipal Bond Fund | |
| (Exact name of Registrant as specified in charter) | |
| | |
| c/o The Dreyfus Corporation 200 Park Avenue New York, New York 10166 | |
| (Address of principal executive offices) (Zip code) | |
| | |
| Janette Farragher, Esq. 200 Park Avenue New York, New York 10166 | |
| (Name and address of agent for service) | |
|
Registrant's telephone number, including area code: | (212) 922-6000 |
| |
Date of fiscal year end: | 3/31 | |
Date of reporting period: | 3/31/12 | |
| | | | | | | |
FORM N-CSR
Item 1. Reports to Stockholders.
|
| Dreyfus |
| Short-Intermediate |
| Municipal Bond Fund |
ANNUAL REPORT March 31, 2012

Save time. Save paper. View your next shareholder report online as soon as it’s available. Log into www.dreyfus.com and sign up for Dreyfus eCommunications. It’s simple and only takes a few minutes.
The views expressed in this report reflect those of the portfolio manager only through the end of the period covered and do not necessarily represent the views of Dreyfus or any other person in the Dreyfus organization. Any such views are subject to change at any time based upon market or other conditions and Dreyfus disclaims any responsibility to update such views.These views may not be relied on as investment advice and, because investment decisions for a Dreyfus fund are based on numerous factors, may not be relied on as an indication of trading intent on behalf of any Dreyfus fund.
|
| Not FDIC-Insured • Not Bank-Guaranteed • May Lose Value |
| | Contents |
| | THE FUND |
| 2 | A Letter from the Chairman and CEO |
| 3 | Discussion of Fund Performance |
| 6 | Fund Performance |
| 8 | Understanding Your Fund’s Expenses |
| 8 | Comparing Your Fund’s Expenses With Those of Other Funds |
| 9 | Statement of Investments |
| 28 | Statement of Assets and Liabilities |
| 29 | Statement of Operations |
| 30 | Statement of Changes in Net Assets |
| 32 | Financial Highlights |
| 35 | Notes to Financial Statements |
| 44 | Report of Independent Registered Public Accounting Firm |
| 45 | Important Tax Information |
| 46 | Board Members Information |
| 48 | Officers of the Fund |
| | FOR MORE INFORMATION |
| | Back Cover |
Dreyfus
Short-Intermediate
Municipal Bond Fund
The Fund

A LETTER FROM THE CHAIRMAN AND CEO
Dear Shareholder:
This annual report for Dreyfus Short-Intermediate Municipal Bond Fund covers the 12-month period from April 1, 2011, through March 31, 2012. For information about how the fund performed during the reporting period, as well as general market perspectives, we provide a Discussion of Fund Performance on the pages that follow.
Municipal bonds continued to benefit from positive supply-and-demand factors during the last six-month period, which enabled them to avoid some of the volatility affecting their taxable fixed-income counterparts as economic sentiment changed. The supply of newly issued tax-exempt bonds remained muted when issuers responded to political pressure by reducing spending and borrowing, while demand remained robust from individual and institutional investors seeking high current after-tax yields in a low interest-rate environment. Consequently, municipal bonds produced higher total returns, on average, than most other fixed-income market sectors for the reporting period.
Our economic forecast calls for near-trend growth in 2012, and we expect the United States to continue to post better economic data than most of the rest of the developed world.An aggressively accommodative monetary policy, pent-up demand in several industry groups and gradual improvement in housing prices appear likely to offset risks stemming from the ongoing European debt crisis and volatile energy prices. As always, we encourage you to talk with your financial adviser about how these developments may affect your investments.
Thank you for your continued confidence and support.

Jonathan R. Baum
Chairman and Chief Executive Officer
The Dreyfus Corporation
April 16, 2012
2

DISCUSSION OF FUND PERFORMANCE
For the period of April 1, 2011, through March 31, 2012, as provided by Thomas Casey and Jeffrey Burger, Primary Portfolio Managers
Fund and Market Performance Overview
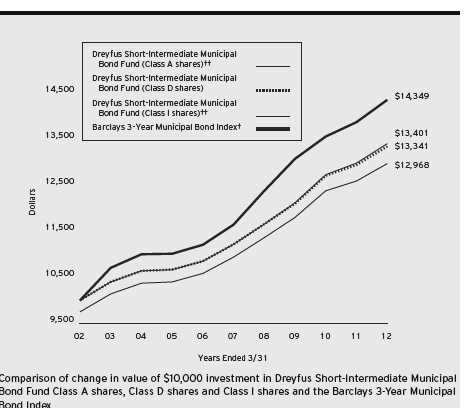
For the 12-month period ended March 31, 2012, Dreyfus Short-Intermediate Municipal Bond Fund’s Class A shares produced a total return of 3.02%, Class D shares returned 3.10% and Class I shares returned 3.26%.1 In comparison, the fund’s benchmark, the Barclays 3-Year Municipal Bond Index (the “Index”), produced a total return of 3.44% for the reporting period.2
Falling long-term interest rates and favorable supply-and-demand factors helped fuel strong performance among municipal bonds in a volatile market environment over the reporting period. The fund produced lower returns than its benchmark, mainly due to underweighted exposure to callable and general obligation bonds over the reporting period’s second half.
The Fund’s Investment Approach
The fund seeks to maximize current income exempt from federal income tax to the extent consistent with the preservation of capital.To pursue this goal, the fund normally invests substantially all of its assets in municipal bonds that provide income exempt from federal personal income tax.The fund will invest only in municipal bonds rated investment grade or the unrated equivalent as determined by Dreyfus, but may continue to hold bonds which are subsequently downgraded to below investment grade.The fund invests primarily in municipal bonds with remaining maturities of five years or less and generally maintains a dollar-weighted average portfolio maturity of two to three years.
The portfolio managers focus on identifying undervalued sectors and securities, and minimizing the use of interest rate forecasting. The portfolio managers select municipal bonds by using fundamental credit analysis to estimate the relative value and attractiveness of various sectors and securities and to exploit pricing inefficiencies in the municipal bond market. They also actively trade among various sectors, such as pre-
DISCUSSION OF FUND PERFORMANCE (continued)
refunded, general obligation and revenue, based on their apparent relative values.The fund seeks to invest in several of these sectors.
Municipal Bonds Rallied as Economic Concerns Eased
The reporting period began in the midst of heightened turmoil in the financial markets sparked by a sovereign debt crisis in Europe and a contentious debate in the United States regarding government spending and borrowing. Market turbulence intensified over the summer of 2011, when a major credit-rating agency downgraded its assessment of long-term U.S. government debt and worries mounted regarding the sustainability of the U.S. economic recovery.
The Federal Reserve Board (the “Fed”) responded to these concerns in the fall with OperationTwist, in which the central bank sold short-term U.S.Treasury securities and purchased long-term bonds, driving longer-term interest rates lower. Longer-term municipal bonds benefited from this development more than shorter-term securities. In addition, better economic data soon encouraged investors to become more tolerant of risks.As a result, municipal bonds that had been punished during the downturn rallied through the reporting period’s end, while higher-quality bonds generally lagged market averages.
Positive supply-and-demand forces also buoyed municipal bond prices. New issuance volumes fell sharply in 2011 after a flood of new supply in late 2010, and political pressure also led to reduced borrowing. Meanwhile, demand remained robust from individuals seeking higher levels of current income in a low interest rate environment. From a credit-quality perspective, many states and municipalities cut spending, helping to ease fiscal concerns.
Defensive Posture Dampened Relative Performance
Early in the reporting period, we positioned the fund more defensively in seeking to mute the potentially damaging effects of heightened market volatility. While this posture helped bolster relative performance during the downturn, it limited the fund’s participation in the subsequent rally. Underweighted exposure to general obligation bonds and bonds with early redemption provisions proved to be a drag on relative results. In addition, the fund held greater exposure than the
4
benchmark to municipal bonds with maturities of two years and less, a segment that lagged market averages.
The fund achieved better relative performance among revenue bonds, particularly those backed by waterworks, sewer facilities, utilities and transportation projects. Overweighted exposure to municipal bonds with A ratings also contributed positively to the fund’s results compared to the benchmark.
Adjusting to a Changing Market Environment
We are encouraged by recently improved U.S. economic data, but we believe the recovery remains vulnerable to unexpected shocks and uncertainty regarding future Fed policy. Consequently, we expect market volatility to remain elevated.
Therefore, we have maintained the fund’s higher-quality bias and emphasis on revenue bonds from essential services facilities. We also have made an effort to prepare the fund for seasonal changes in issuance and maturity patterns that historically have tended to cause municipal bonds to exhibit weakness in the spring and greater strength in the summer. In our judgment, these are prudent strategies after a prolonged market rally lifted valuations to richer levels.
April 16, 2012
Bond funds are subject generally to interest rate, credit, liquidity, and market risks, to varying degrees, all of which are more fully described in the fund’s prospectus. Generally, all other factors being equal, bond prices are inversely related to interest rate changes, and rate increases can cause price declines.
| |
| 1 | Total return includes reinvestment of dividends and any capital gains paid, and does not take into |
| | consideration the maximum initial sales charge in the case of Class A shares. Had this charge been |
| | reflected, returns would have been lower. Class D and I shares are not subject to any initial or |
| | deferred sales charge. Past performance is no guarantee of future results. Share price, yield and |
| | investment return fluctuate such that upon redemption, fund shares may be worth more or less |
| | than their original cost. |
| | Income may be subject to state and local taxes, and some income may be subject to the federal |
| | alternative minimum tax (AMT) for certain investors. Capital gains, if any, are taxable. |
| 2 | SOURCE: LIPPER INC. — Reflects reinvestment of dividends and, where applicable, capital |
| | gain distributions.The Barclays 3-Year Municipal Bond Index is an unmanaged total return |
| | performance benchmark for the investment-grade, geographically unrestricted 3-year tax-exempt |
| | bond market, consisting of municipal bonds with maturities of 2-4 years. Index returns do not |
| | reflect the fees and expenses associated with operating a mutual fund. |
| | Investors cannot invest directly in any index. |
FUND PERFORMANCE
| |
| † | Source: Lipper Inc. |
| †† | The total return figures presented for Class A shares of the fund reflect the performance of the fund’s Class D shares |
| | for the period prior to 8/3/09 (the inception date for Class A shares), adjusted to reflect the applicable sales load for |
| | this share class. |
| | The total return figures presented for Class I shares of the fund reflect the performance of the fund’s Class D shares |
| | for the period prior to 12/15/08 (the inception date for Class I shares). |
Past performance is not predictive of future performance.
The above graph compares a $10,000 investment made in each of the Class A, Class D and Class I shares of Dreyfus Short-Intermediate Municipal Bond Fund on 3/31/02 to a $10,000 investment made in the Barclays 3-Year Municipal Bond Index (the “Index”) on that date.All dividends and capital gain distributions are reinvested.
The fund invests primarily in short-intermediate term municipal securities and maintains a portfolio with a weighted average maturity ranging between 2 and 3 years.The fund’s performance shown in the line graph above takes into account the maximum initial sales charge on Class A shares and all other applicable fees and expenses on all classes.The Index is an unmanaged total return performance benchmark for the investment-grade, geographically unrestricted 3-year tax-exempt bond market, consisting of municipal bonds with maturities of 2-4 years. Unlike a mutual fund, the Index is not subject to charges, fees and other expenses. Investors cannot invest directly in any index. Further information relating to fund performance, including expense reimbursements, if applicable, is contained in the Financial Highlights section of the prospectus and elsewhere in this report.
6
| | | | | | | |
| Average Annual Total Returns as of 3/31/12 | | | |
| Inception |
| | Date | 1Year | 5 Years | 10 Years |
| Class A shares | | | | |
| with maximum sales charge (2.5%) | 8/3/09 | 0.41% | 2.95%† | 2.63%† |
| without sales charge | 8/3/09 | 3.02% | 3.46%† | 2.89%† |
| Class D shares | 4/30/87 | 3.10% | 3.53% | 2.92% |
| Class I shares | 12/15/08 | 3.26% | 3.62%† | 2.97%† |
| Barclays 3-Year | | | | |
| Municipal Bond Index | | 3.44% | 4.26% | 3.68% |
Past performance is not predictive of future performance.The fund’s performance shown in the graph and table does not reflect the deduction of taxes that a shareholder would pay on fund distributions or the redemption of fund shares.
|
| † The total return performance figures presented for Class A shares of the fund reflect the performance of the fund’s |
| Class D shares for the period prior to 8/3/09 (the inception date for Class A shares), adjusted to reflect the |
| applicable sales load for this share class. |
| The total return performance figures presented for Class I shares of the fund reflect the performance of the fund’s |
| Class D shares for the period prior to 12/15/08 (the inception date for Class I shares). |
UNDERSTANDING YOUR FUND’S EXPENSES (Unaudited)
As a mutual fund investor, you pay ongoing expenses, such as management fees and other expenses. Using the information below, you can estimate how these expenses affect your investment and compare them with the expenses of other funds.You also may pay one-time transaction expenses, including sales charges (loads) and redemption fees, which are not shown in this section and would have resulted in higher total expenses. For more information, see your fund’s prospectus or talk to your financial adviser.
Review your fund’s expenses
The table below shows the expenses you would have paid on a $1,000 investment in Dreyfus Short-Intermediate Municipal Bond Fund from October 1, 2011 to March 31, 2012. It also shows how much a $1,000 investment would be worth at the close of the period, assuming actual returns and expenses.
Expenses and Value of a $1,000 Investment
assuming actual returns for the six months ended March 31, 2012
| | | | | | |
| | | Class A | | Class D | | Class I |
| Expenses paid per $1,000† | $ | 4.22 | $ | 3.46 | $ | 2.96 |
| Ending value (after expenses) | $ | 1,008.00 | $ | 1,008.00 | $ | 1,009.30 |
COMPARING YOUR FUND’S EXPENSES
WITH THOSE OF OTHER FUNDS (Unaudited)
Using the SEC’s method to compare expenses
The Securities and Exchange Commission (SEC) has established guidelines to help investors assess fund expenses. Per these guidelines, the table below shows your fund’s expenses based on a $1,000 investment, assuming a hypothetical 5% annualized return. You can use this information to compare the ongoing expenses (but not transaction expenses or total cost) of investing in the fund with those of other funds.All mutual fund shareholder reports will provide this information to help you make this comparison. Please note that you cannot use this information to estimate your actual ending account balance and expenses paid during the period.
Expenses and Value of a $1,000 Investment
assuming a hypothetical 5% annualized return for the six months ended March 31, 2012
| | | | | | |
| | | Class A | | Class D | | Class I |
| Expenses paid per $1,000† | $ | 4.24 | $ | 3.49 | $ | 2.98 |
| Ending value (after expenses) | $ | 1,020.80 | $ | 1,021.55 | $ | 1,022.05 |
|
| † Expenses are equal to the fund’s annualized expense ratio of .84% for Class A, .69% for Class D and .59% |
| for Class I, multiplied by the average account value over the period, multiplied by 183/366 (to reflect the one-half |
| year period). |
8
| | | | |
| STATEMENT OF INVESTMENTS | | | |
| March 31, 2012 | | | | |
| |
| |
| |
| |
| Long-Term Municipal | Coupon | Maturity | Principal | |
| Investments—98.5% | Rate (%) | Date | Amount ($) | Value ($) |
| Alabama—1.1% | | | | |
| Alabama Public School and | | | | |
| College Authority, Capital | | | | |
| Improvement Revenue | 5.00 | 5/1/16 | 2,500,000 | 2,909,750 |
| Alabama Public School and | | | | |
| College Authority, Capital | | | | |
| Improvement Revenue | 5.00 | 12/1/16 | 1,000,000 | 1,183,330 |
| Auburn University, | | | | |
| General Fee Revenue | 4.00 | 6/1/15 | 1,690,000 | 1,864,898 |
| Alaska—.6% | | | | |
| Alaska Industrial Development and | | | | |
| Export Authority, Revolving | | | | |
| Fund Revenue | 5.00 | 4/1/14 | 3,000,000 | 3,240,030 |
| Arizona—2.0% | | | | |
| Pima County, | | | | |
| Sewer System | | | | |
| Revenue Obligations | 5.00 | 7/1/16 | 2,000,000 | 2,297,560 |
| Regional Public Transportation | | | | |
| Authority, Transportation | | | | |
| Excise Tax Revenue | | | | |
| (Maricopa County Public | | | | |
| Transportation Fund) | 5.00 | 7/1/13 | 4,590,000 | 4,846,719 |
| Rio Nuevo Multipurpose Facilities | | | | |
| District, Subordinate Lien Excise | | | | |
| Tax Revenue (Insured; Assured | | | | |
| Guaranty Municipal Corp.) | 5.50 | 7/15/14 | 3,770,000 | 4,131,694 |
| California—8.8% | | | | |
| California, | | | | |
| GO | 5.00 | 9/1/16 | 2,500,000 | 2,886,450 |
| California Department of Water | | | | |
| Resources, Power Supply Revenue | 5.00 | 5/1/15 | 2,550,000 | 2,892,720 |
| California Department of Water | | | | |
| Resources, Water System | | | | |
| Revenue (Central Valley Project) | 5.00 | 12/1/15 | 2,695,000 | 3,120,972 |
| California Housing Finance Agency, | | | | |
| Home Mortgage Revenue | | | | |
| (Insured; FGIC) | 4.15 | 8/1/14 | 3,625,000 | 3,710,006 |
| California State Public Works | | | | |
| Board, LR (Judicial Council of | | | | |
| California) (Various Judicial | | | | |
| Council Projects) | 5.00 | 12/1/15 | 7,335,000 | 8,262,364 |
STATEMENT OF INVESTMENTS (continued)
| | | | |
| Long-Term Municipal | Coupon | Maturity | Principal | |
| Investments (continued) | Rate (%) | Date | Amount ($) | Value ($) |
| California (continued) | | | | |
| California State Public Works | | | | |
| Board, LR (The Regents of the | | | | |
| Univeristy of California) | | | | |
| (Various Univeristy of | | | | |
| California Projects) | 5.00 | 12/1/15 | 5,000,000 | 5,725,550 |
| California State Public Works | | | | |
| Board, LR (Various | | | | |
| Capital Projects) | 4.00 | 10/1/16 | 2,000,000 | 2,191,760 |
| California Statewide Communities | | | | |
| Development Authority, Revenue | | | | |
| (Kaiser Permanente) | 5.00 | 4/1/14 | 4,000,000 | 4,328,120 |
| Los Angeles County Metropolitan | | | | |
| Transportation Authority, | | | | |
| General Revenue (Union Station | | | | |
| Gateway Project) | 5.00 | 7/1/13 | 1,150,000 | 1,216,711 |
| Los Angeles County Metropolitan | | | | |
| Transportation Authority, | | | | |
| Proposition A First Tier | | | | |
| Senior Sales Tax Revenue | 5.00 | 7/1/14 | 5,000,000 | 5,526,600 |
| Los Angeles County Metropolitan | | | | |
| Transportation Authority, | | | | |
| Proposition C Sales Tax Revenue | 5.00 | 7/1/14 | 2,000,000 | 2,206,340 |
| Modesto Irrigation District, | | | | |
| Electric System Revenue | 5.00 | 7/1/16 | 2,250,000 | 2,580,728 |
| Southern California Public Power | | | | |
| Authority, Transmission | | | | |
| Project Subordinate Revenue | | | | |
| (Southern Transmission Project) | 5.00 | 7/1/14 | 3,000,000 | 3,303,450 |
| Southern California Public Power | | | | |
| Authority, Transmission | | | | |
| Project Subordinate Revenue | | | | |
| (Southern Transmission Project) | 4.00 | 7/1/16 | 2,000,000 | 2,246,960 |
| Colorado—.1% | | | | |
| Black Hawk, | | | | |
| Device Tax Revenue | 5.00 | 12/1/12 | 760,000 | 775,170 |
| Connecticut—1.5% | | | | |
| Connecticut, | | | | |
| Special Tax Obligation | | | | |
| Revenue (Transportation | | | | |
| Infrastructure Purposes) | 5.00 | 12/1/15 | 7,500,000 | 8,682,525 |
10
| | | | |
| Long-Term Municipal | Coupon | Maturity | Principal | |
| Investments (continued) | Rate (%) | Date | Amount ($) | Value ($) |
| District of Columbia—1.6% | | | | |
| District of Columbia, | | | | |
| Income Tax Secured Revenue | 5.00 | 12/1/13 | 5,000,000 | 5,391,050 |
| Metropolitan Washington | | | | |
| Airports Authority, | | | | |
| Airport System Revenue | 5.00 | 10/1/13 | 3,300,000 | 3,520,770 |
| Florida—9.0% | | | | |
| Citizens Property Insurance | | | | |
| Corporation, Coastal Account | | | | |
| Senior Secured Revenue | 5.00 | 6/1/15 | 2,000,000 | 2,215,640 |
| Citizens Property Insurance | | | | |
| Corporation, High-Risk Account | | | | |
| Senior Secured Revenue | 5.00 | 6/1/14 | 5,500,000 | 5,948,250 |
| Florida State Board of Education, | | | | |
| Lottery Revenue | 5.00 | 7/1/14 | 2,500,000 | 2,754,050 |
| Florida State Board of Education, | | | | |
| Lottery Revenue | 5.00 | 7/1/14 | 5,375,000 | 5,921,208 |
| Florida State Board of Education, | | | | |
| Lottery Revenue (Insured; | | | | |
| National Public Finance | | | | |
| Guarantee Corp.) | 5.00 | 7/1/14 | 2,265,000 | 2,495,169 |
| Florida Water Pollution Control | | | | |
| Financing Corporation, Water | | | | |
| Pollution Control Revenue | 5.00 | 7/15/15 | 4,315,000 | 4,925,270 |
| Highlands County Health Facilities | | | | |
| Authority, HR (Adventist | | | | |
| Health System/Sunbelt | | | | |
| Obligated Group) | 5.00 | 11/15/13 | 1,000,000 | 1,069,990 |
| Hillsborough County Industrial | | | | |
| Development Authority, PCR | | | | |
| (Tampa Electric Company Project) | 5.10 | 10/1/13 | 1,855,000 | 1,887,741 |
| Kissimmee Utility Authority, | | | | |
| Electric System Revenue | 4.00 | 10/1/15 | 1,850,000 | 2,027,489 |
| Lakeland, | | | | |
| Energy System Revenue | | | | |
| (Insured; Assured Guaranty | | | | |
| Municipal Corp.) | 5.00 | 10/1/15 | 3,150,000 | 3,563,437 |
| Lee County, | | | | |
| Airport Revenue (Insured; Assured | | | | |
| Guaranty Municipal Corp.) | 5.00 | 10/1/14 | 3,000,000 | 3,239,640 |
STATEMENT OF INVESTMENTS (continued)
| | | | | |
| Long-Term Municipal | Coupon | Maturity | Principal | | |
| Investments (continued) | Rate (%) | Date | Amount ($) | | Value ($) |
| Florida (continued) | | | | | |
| Miami-Dade County, | | | | | |
| Aviation Revenue (Miami | | | | | |
| International Airport) | | | | | |
| (Insured; National Public | | | | | |
| Finance Guarantee Corp.) | 5.25 | 10/1/14 | 1,000,000 | | 1,085,980 |
| Miami-Dade County School Board, | | | | | |
| COP (Master Lease Purchase | | | | | |
| Agreement) (Insured; AMBAC) | 5.00 | 8/1/14 | 2,010,000 | | 2,159,283 |
| Orlando-Orange County Expressway | | | | | |
| Authority, Revenue (Insured; | | | | | |
| Assured Guaranty Municipal Corp.) | 5.00 | 7/1/14 | 2,000,000 | | 2,181,960 |
| Saint Petersburg, | | | | | |
| Public Utility Revenue | 5.00 | 10/1/13 | 2,435,000 | | 2,596,367 |
| Sarasota County School Board, | | | | | |
| COP (Master Lease | | | | | |
| Purchase Agreement) | 5.00 | 7/1/14 | 1,365,000 | | 1,474,364 |
| South Miami Health Facilities | | | | | |
| Authority, HR (Baptist Health | | | | | |
| South Florida Obligated Group) | 5.00 | 8/15/14 | 1,500,000 | | 1,643,250 |
| Tampa, | | | | | |
| Solid Waste System Revenue | | | | | |
| (Insured; Assured Guaranty | | | | | |
| Municipal Corp.) | 4.00 | 10/1/14 | 1,715,000 | | 1,800,167 |
| Tampa Bay Water, A Regional | | | | | |
| Water Supply Authority, | | | | | |
| Utility System Revenue | 5.00 | 10/1/15 | 2,080,000 | | 2,390,898 |
| Georgia—2.5% | | | | | |
| Gwinnett County Development | | | | | |
| Authority, COP (Gwinnett | | | | | |
| County Public Schools Project) | | | | | |
| (Insured; National Public | | | | | |
| Finance Guarantee Corp.) | | | | | |
| (Prerefunded) | 5.25 | 1/1/14 | 2,100,000 | a | 2,279,844 |
| Gwinnett County School District, | | | | | |
| GO Sales Tax Bonds | 4.00 | 10/1/16 | 5,000,000 | | 5,689,600 |
| Municipal Electric Authority of | | | | | |
| Georgia, Revenue (Combined | | | | | |
| Cycle Project) | 5.00 | 11/1/16 | 2,500,000 | | 2,902,625 |
| Private Colleges and Universities | | | | | |
| Authority, Revenue | | | | | |
| (Emory University) | 5.00 | 9/1/16 | 1,000,000 | | 1,178,910 |
12
| | | | | |
| Long-Term Municipal | Coupon | Maturity | Principal | | |
| Investments (continued) | Rate (%) | Date | Amount ($) | | Value ($) |
| Georgia (continued) | | | | | |
| Public Gas Partners, Inc., | | | | | |
| Gas Project Revenue (Gas | | | | | |
| Supply Pool Number 1) | 5.00 | 10/1/16 | 1,800,000 | | 2,040,552 |
| Hawaii—1.1% | | | | | |
| Hawaii, | | | | | |
| Airports System Revenue | 5.00 | 7/1/14 | 5,575,000 | | 6,073,851 |
| Illinois—5.6% | | | | | |
| Chicago, | | | | | |
| General Airport Third Lien | | | | | |
| Revenue (Chicago O’Hare | | | | | |
| International Airport) | | | | | |
| (Insured; National Public | | | | | |
| Finance Guarantee Corp.) | 5.25 | 1/1/16 | 3,575,000 | | 4,028,167 |
| Chicago, | | | | | |
| GO (Insured; Assured Guaranty | | | | | |
| Municipal Corp.) (Prerefunded) | 5.00 | 1/1/14 | 2,700,000 | a | 2,917,944 |
| Chicago, | | | | | |
| Passenger Facility Charge | | | | | |
| Revenue (Chicago O’Hare | | | | | |
| International Airport) | 5.00 | 1/1/15 | 1,000,000 | | 1,097,290 |
| Cook County, | | | | | |
| GO Capital Equipment Bonds | 5.00 | 11/15/13 | 2,000,000 | | 2,151,740 |
| Illinois, | | | | | |
| GO | 5.00 | 1/1/14 | 7,300,000 | | 7,793,407 |
| Illinois, | | | | | |
| GO | 5.00 | 1/1/15 | 2,665,000 | | 2,919,721 |
| Illinois, | | | | | |
| Sales Tax Revenue | 5.00 | 6/15/14 | 2,340,000 | | 2,565,833 |
| Illinois, | | | | | |
| Sales Tax Revenue | 4.00 | 6/15/16 | 2,750,000 | | 3,077,057 |
| Railsplitter Tobacco Settlement | | | | | |
| Authority, Tobacco | | | | | |
| Settlement Revenue | 4.00 | 6/1/13 | 1,200,000 | | 1,241,520 |
| Railsplitter Tobacco Settlement | | | | | |
| Authority, Tobacco | | | | | |
| Settlement Revenue | 5.00 | 6/1/14 | 3,800,000 | | 4,095,906 |
| Indiana—1.8% | | | | | |
| Indiana Finance Authority, | | | | | |
| Revenue (Trinity Health | | | | | |
| Credit Group) | 5.00 | 12/1/13 | 2,045,000 | | 2,191,749 |
STATEMENT OF INVESTMENTS (continued)
| | | | |
| Long-Term Municipal | Coupon | Maturity | Principal | |
| Investments (continued) | Rate (%) | Date | Amount ($) | Value ($) |
| Indiana (continued) | | | | |
| Indianapolis, | | | | |
| Thermal Energy System First | | | | |
| Lien Revenue (Insured; Assured | | | | |
| Guaranty Municipal Corp.) | 5.00 | 10/1/15 | 2,000,000 | 2,258,100 |
| Indianapolis Local Public | | | | |
| Improvement Bond Bank, Revenue | | | | |
| (Indianapolis Airport Authority | | | | |
| Project) (Insured; Assured | | | | |
| Guaranty Municipal Corp.) | 5.63 | 1/1/14 | 2,230,000 | 2,302,051 |
| Rockport, | | | | |
| PCR (Indiana Michigan Power | | | | |
| Company Project) | 6.25 | 6/2/14 | 3,000,000 | 3,287,640 |
| Kansas—.4% | | | | |
| Wyandotte County/Kansas City | | | | |
| Unified Government Board of | | | | |
| Public Utilities, Utility | | | | |
| System Revenue | 5.00 | 9/1/14 | 2,060,000 | 2,258,440 |
| Louisiana—1.1% | | | | |
| Parish of Orleans Parishwide | | | | |
| School District, GO | | | | |
| (Insured; Assured | | | | |
| Guaranty Municipal Corp.) | 4.00 | 9/1/14 | 5,885,000 | 6,276,470 |
| Maryland—3.1% | | | | |
| Baltimore County, | | | | |
| GO (Consolidated | | | | |
| Public Improvement) | 5.00 | 8/1/13 | 1,000,000 | 1,063,870 |
| Baltimore County, | | | | |
| GO (Consolidated | | | | |
| Public Improvement) | 5.00 | 11/1/15 | 5,600,000 | 6,478,248 |
| Maryland, | | | | |
| GO (State and Local | | | | |
| Facilities Loan) | 5.00 | 8/1/15 | 3,435,000 | 3,940,185 |
| Montgomery County, | | | | |
| GO (Consolidated | | | | |
| Public Improvement) | 5.00 | 7/1/16 | 5,105,000 | 6,007,870 |
| Massachusetts—2.6% | | | | |
| Massachusetts, | | | | |
| GO (Consolidated Loan) | 5.00 | 12/1/16 | 5,000,000 | 5,944,100 |
14
| | | | |
| Long-Term Municipal | Coupon | Maturity | Principal | |
| Investments (continued) | Rate (%) | Date | Amount ($) | Value ($) |
| Massachusetts (continued) | | | | |
| Massachusetts Development | | | | |
| Finance Agency, Revenue | | | | |
| (Boston College Issue) | 5.00 | 7/1/15 | 2,000,000 | 2,282,680 |
| Massachusetts Development | | | | |
| Finance Agency, Revenue | | | | |
| (Tufts Medical Center Issue) | 5.00 | 1/1/16 | 650,000 | 703,352 |
| Massachusetts Health and | | | | |
| Educational Facilities Authority, | | | | |
| Revenue (Northeastern | | | | |
| University Issue) | 5.00 | 10/1/14 | 1,300,000 | 1,431,508 |
| Massachusetts Municipal Wholesale | | | | |
| Electric Company, Power Supply | | | | |
| Project Revenue (Project | | | | |
| Number 6 Issue) | 5.00 | 7/1/16 | 3,700,000 | 4,265,360 |
| Michigan—3.8% | | | | |
| Detroit, | | | | |
| Sewage Disposal System Senior | | | | |
| Lien Revenue (Insured; National | | | | |
| Public Finance Guarantee Corp.) | 5.50 | 7/1/14 | 3,125,000 | 3,357,125 |
| Detroit, | | | | |
| Water Supply System Senior | | | | |
| Lien Revenue | 5.00 | 7/1/15 | 1,000,000 | 1,093,160 |
| Detroit, | | | | |
| Water Supply System Senior | | | | |
| Lien Revenue | 5.00 | 7/1/16 | 1,000,000 | 1,108,540 |
| Kent Hospital Finance Authority, | | | | |
| Revenue (Spectrum | | | | |
| Health System) | 5.50 | 1/15/15 | 4,300,000 | 4,817,419 |
| Michigan Finance Authority, | | | | |
| Clean Water Revolving | | | | |
| Fund Revenue | 5.00 | 10/1/15 | 5,000,000 | 5,769,900 |
| Royal Oak Hospital Finance | | | | |
| Authority, HR (William Beaumont | | | | |
| Hospital Obligated Group) | 6.25 | 9/1/14 | 2,500,000 | 2,746,625 |
| Wayne County Airport Authority, | | | | |
| Airport Revenue (Detroit | | | | |
| Metropolitan Wayne | | | | |
| County Airport) | 5.00 | 12/1/14 | 2,500,000 | 2,691,500 |
STATEMENT OF INVESTMENTS (continued)
| | | | |
| Long-Term Municipal | Coupon | Maturity | Principal | |
| Investments (continued) | Rate (%) | Date | Amount ($) | Value ($) |
| Minnesota—.6% | | | | |
| Saint Paul Independent School | | | | |
| District Number 625, GO School | | | | |
| Building Bonds (Minnesota | | | | |
| School District Credit | | | | |
| Enhancement Program) | 5.00 | 2/1/14 | 1,415,000 | 1,531,200 |
| University of Minnesota Regents, | | | | |
| GO | 5.00 | 12/1/16 | 1,520,000 | 1,805,319 |
| Missouri—.6% | | | | |
| Missouri Board of Public | | | | |
| Buildings, Special | | | | |
| Obligation Revenue | 4.00 | 10/1/15 | 3,000,000 | 3,350,250 |
| Nebraska—.8% | | | | |
| Omaha Public Power District, | | | | |
| Electric System Revenue | 5.00 | 2/1/16 | 3,770,000 | 4,373,162 |
| Nevada—.9% | | | | |
| Clark County School District, | | | | |
| Limited Tax GO (Insured; Assured | | | | |
| Guaranty Municipal Corp.) | 5.00 | 6/15/14 | 1,000,000 | 1,097,910 |
| Clark County School District, | | | | |
| Limited Tax GO (Insured; Assured | | | | |
| Guaranty Municipal Corp.) | 5.50 | 6/15/14 | 2,650,000 | 2,921,810 |
| Clark County School District, | | | | |
| Limited Tax GO (Insured; | | | | |
| National Public Finance | | | | |
| Guarantee Corp.) | 5.25 | 6/15/14 | 1,005,000 | 1,059,089 |
| New Jersey—2.6% | | | | |
| New Jersey Economic Development | | | | |
| Authority, School Facilities | | | | |
| Construction Revenue | 5.00 | 9/1/15 | 5,000,000 | 5,662,500 |
| New Jersey Health Care Facilities | | | | |
| Financing Authority, Revenue | | | | |
| (Holy Name Medical Center Issue) | 5.00 | 7/1/14 | 1,795,000 | 1,882,758 |
| New Jersey Higher Education | | | | |
| Student Assistance Authority, | | | | |
| Student Loan Revenue | 5.00 | 12/1/14 | 1,660,000 | 1,807,159 |
| New Jersey Transportation | | | | |
| Trust Fund Authority | | | | |
| (Transportation System) | | | | |
| (Insured; National Public | | | | |
| Finance Guarantee Corp.) | 5.25 | 12/15/13 | 215,000 | 233,116 |
16
| | | | |
| Long-Term Municipal | Coupon | Maturity | Principal | |
| Investments (continued) | Rate (%) | Date | Amount ($) | Value ($) |
| New Jersey (continued) | | | | |
| New Jersey Transportation Trust | | | | |
| Fund Authority (Transportation | | | | |
| System) (Insured; National | | | | |
| Public Finance Guarantee Corp.) | 5.25 | 12/15/13 | 4,785,000 | 5,171,102 |
| New Mexico—1.3% | | | | |
| Gallup, | | | | |
| PCR (Tri-State Generation and | | | | |
| Transmission Association, Inc. | | | | |
| Project) (Insured; AMBAC) | 5.00 | 8/15/14 | 3,785,000 | 4,099,193 |
| New Mexico Hospital Equipment | | | | |
| Loan Council, Hospital System | | | | |
| Revenue (Presbyterian | | | | |
| Healthcare Services) | 5.25 | 8/1/14 | 3,000,000 | 3,247,740 |
| New York—7.6% | | | | |
| Erie County Industrial Development | | | | |
| Agency, School Facility | | | | |
| Revenue (City School District | | | | |
| of the City of Buffalo Project) | 5.00 | 5/1/14 | 1,750,000 | 1,904,875 |
| Metropolitan Transportation | | | | |
| Authority, Dedicated Tax | | | | |
| Fund Revenue | 5.00 | 11/15/14 | 2,120,000 | 2,360,260 |
| Metropolitan Transportation | | | | |
| Authority, Dedicated Tax | | | | |
| Fund Revenue | 5.00 | 11/1/15 | 2,750,000 | 3,166,460 |
| Metropolitan Transportation | | | | |
| Authority, Transportation Revenue | 5.00 | 11/15/13 | 2,880,000 | 3,090,931 |
| Metropolitan Transportation | | | | |
| Authority, Transportation | | | | |
| Revenue (Insured; National | | | | |
| Public Finance Guarantee Corp.) | 5.00 | 11/15/15 | 2,645,000 | 3,015,617 |
| New York City, | | | | |
| GO | 5.00 | 8/1/15 | 2,000,000 | 2,277,240 |
| New York City, | | | | |
| GO | 5.00 | 8/1/16 | 5,725,000 | 6,675,980 |
| New York City Health and | | | | |
| Hospitals Corporation, | | | | |
| Health System Revenue | 5.00 | 2/15/15 | 2,000,000 | 2,216,700 |
| New York City Transitional Finance | | | | |
| Authority, Future Tax Secured | | | | |
| Subordinate Revenue | 5.00 | 11/1/13 | 4,105,000 | 4,409,427 |
STATEMENT OF INVESTMENTS (continued)
| | | | |
| Long-Term Municipal | Coupon | Maturity | Principal | |
| Investments (continued) | Rate (%) | Date | Amount ($) | Value ($) |
| New York (continued) | | | | |
| New York City Transitional Finance | | | | |
| Authority, Revenue (New York | | | | |
| City Recovery Bonds) | 5.00 | 11/1/14 | 3,000,000 | 3,348,150 |
| New York State Dormitory | | | | |
| Authority, Revenue (Mount | | | | |
| Sinai School of Medicine of | | | | |
| New York University) | 5.00 | 7/1/15 | 1,000,000 | 1,115,250 |
| New York State Thruway Authority, | | | | |
| Second General Highway and | | | | |
| Bridge Trust Fund Bonds | 5.00 | 4/1/14 | 3,535,000 | 3,853,079 |
| New York State Thruway Authority, | | | | |
| Second General Highway and | | | | |
| Bridge Trust Fund Bonds | 5.00 | 4/1/16 | 5,000,000 | 5,801,000 |
| North Carolina—.6% | | | | |
| Mecklenburg County Public | | | | |
| Facilities Corporation, | | | | |
| Limited Obligation Bonds | 5.00 | 3/1/14 | 3,000,000 | 3,267,180 |
| Ohio—.2% | | | | |
| Ohio State University, | | | | |
| General Receipts Bonds | 5.00 | 12/1/14 | 1,265,000 | 1,415,611 |
| Oklahoma—1.6% | | | | |
| Tulsa County Industrial Authority, | | | | |
| Capital Improvements Revenue | 5.00 | 5/15/14 | 6,000,000 | 6,546,960 |
| Tulsa County Industrial Authority, | | | | |
| Educational Facilities Lease | | | | |
| Revenue (Broken Arrow Public | | | | |
| Schools Project) | 4.00 | 9/1/15 | 2,100,000 | 2,305,674 |
| Oregon—1.4% | | | | |
| Oregon, | | | | |
| GO (State Property— | | | | |
| Various Projects) | 5.00 | 5/1/16 | 1,750,000 | 2,033,535 |
| Oregon Department of | | | | |
| Administrative Services, COP | 5.00 | 11/1/13 | 5,565,000 | 5,970,355 |
| Pennsylvania—5.9% | | | | |
| Adams County Industrial | | | | |
| Development Authority, Revenue | | | | |
| (Gettysburg College) | 5.00 | 8/15/14 | 1,000,000 | 1,089,040 |
18
| | | | |
| Long-Term Municipal | Coupon | Maturity | Principal | |
| Investments (continued) | Rate (%) | Date | Amount ($) | Value ($) |
| Pennsylvania (continued) | | | | |
| Allegheny County Airport | | | | |
| Authority, Airport Revenue | | | | |
| (Pittsburgh International | | | | |
| Airport) (Insured; Assured | | | | |
| Guaranty Municipal Corp.) | 5.00 | 1/1/15 | 1,000,000 | 1,089,060 |
| Allegheny County Higher Education | | | | |
| Building Authority, Revenue | | | | |
| (Carnegie Mellon University) | 5.00 | 3/1/15 | 3,400,000 | 3,827,210 |
| Beaver County Hospital Authority, | | | | |
| Revenue (Heritage Valley | | | | |
| Health System, Inc.) | 5.00 | 5/15/15 | 1,000,000 | 1,111,240 |
| Pennsylvania, | | | | |
| GO | 5.00 | 7/15/14 | 3,000,000 | 3,318,120 |
| Pennsylvania, | | | | |
| GO (Insured; Assured Guaranty | | | | |
| Municipal Corp.) | 5.00 | 9/1/14 | 1,200,000 | 1,333,728 |
| Pennsylvania Economic Development | | | | |
| Financing Authority, SWDR | | | | |
| (Waste Management, Inc. Project) | 4.70 | 11/1/14 | 3,500,000 | 3,758,055 |
| Pennsylvania Higher Educational | | | | |
| Facilities Authority, Health | | | | |
| System Revenue (The University | | | | |
| of Pennsylvania) | 5.00 | 8/15/13 | 3,000,000 | 3,177,600 |
| Pennsylvania Turnpike Commission, | | | | |
| Turnpike Revenue (Insured; | | | | |
| National Public Finance | | | | |
| Guarantee Corp.) | 5.50 | 12/1/13 | 2,620,000 | 2,836,805 |
| Pennsylvania Turnpike Commission, | | | | |
| Turnpike Subordinate Revenue | 5.00 | 6/1/14 | 5,600,000 | 6,050,632 |
| Philadelphia School District, | | | | |
| GO | 5.00 | 9/1/14 | 4,230,000 | 4,634,726 |
| Philadelphia School District, | | | | |
| GO | 5.00 | 9/1/15 | 1,200,000 | 1,352,220 |
| South Carolina—3.5% | | | | |
| Charleston, | | | | |
| Waterworks and Sewer System | | | | |
| Capital Improvement Revenue | 5.13 | 1/1/15 | 1,680,000 | 1,888,942 |
STATEMENT OF INVESTMENTS (continued)
| | | | |
| Long-Term Municipal | Coupon | Maturity | Principal | |
| Investments (continued) | Rate (%) | Date | Amount ($) | Value ($) |
| South Carolina (continued) | | | | |
| Columbia, | | | | |
| Waterworks and Sewer | | | | |
| System Revenue | 4.00 | 2/1/15 | 1,000,000 | 1,097,330 |
| Renewable Water Resources, | | | | |
| Sewer System Revenue | 5.00 | 1/1/14 | 1,000,000 | 1,076,690 |
| South Carolina Public Service | | | | |
| Authority, Revenue Obligations | | | | |
| (Santee Cooper) | 5.00 | 1/1/14 | 1,000,000 | 1,080,350 |
| South Carolina Public Service | | | | |
| Authority, Revenue Obligations | | | | |
| (Santee Cooper) | 5.00 | 1/1/14 | 3,595,000 | 3,883,858 |
| South Carolina Transportation | | | | |
| Infrastructure Bank, Revenue | 5.00 | 10/1/13 | 10,000,000 | 10,654,900 |
| Tennessee—1.0% | | | | |
| Memphis, | | | | |
| Electric System | | | | |
| Subordinate Revenue | 5.00 | 12/1/14 | 5,000,000 | 5,595,300 |
| Texas—9.5% | | | | |
| Clear Creek Independent School | | | | |
| District, Unlimited Tax | | | | |
| Schoolhouse Bonds (Permanent | | | | |
| School Fund Guarantee Program) | 5.00 | 2/15/15 | 1,500,000 | 1,690,950 |
| Copperas Cove Independent School | | | | |
| District, Unlimited Tax School | | | | |
| Building Bonds (Permanent | | | | |
| School Fund Guarantee Program) | 5.00 | 8/15/16 | 1,250,000 | 1,420,200 |
| Cypress-Fairbanks Independent | | | | |
| School District, Unlimited Tax | | | | |
| Schoolhouse Bonds (Permanent | | | | |
| School Fund Guarantee Program) | 5.25 | 2/15/15 | 1,500,000 | 1,701,645 |
| Fort Worth, | | | | |
| Water and Sewer System | | | | |
| Improvement Revenue | 5.00 | 2/15/16 | 2,115,000 | 2,450,439 |
| Garland Independent School | | | | |
| District, Unlimited Tax School | | | | |
| Building Bonds (Permanent | | | | |
| School Fund Guarantee Program) | 5.00 | 2/15/15 | 1,815,000 | 2,046,049 |
| Houston, | | | | |
| Combined Utility System | | | | |
| First Lien Revenue | 5.00 | 11/15/14 | 2,785,000 | 3,115,524 |
20
| | | | |
| Long-Term Municipal | Coupon | Maturity | Principal | |
| Investments (continued) | Rate (%) | Date | Amount ($) | Value ($) |
| Texas (continued) | | | | |
| Houston Convention and | | | | |
| Entertainment Facilities | | | | |
| Department, Hotel Occupancy | | | | |
| Tax and Special Revenue | 5.00 | 9/1/15 | 2,800,000 | 3,131,212 |
| Katy Independent School District, | | | | |
| Unlimited Tax Bonds (Permanent | | | | |
| School Fund Guarantee Program) | 5.00 | 2/15/15 | 1,625,000 | 1,831,862 |
| Lower Colorado River Authority, | | | | |
| Revenue | 5.00 | 5/15/14 | 5,000 | 5,478 |
| Lower Colorado River Authority, | | | | |
| Revenue | 5.00 | 5/15/14 | 5,000 | 5,487 |
| Lower Colorado River Authority, | | | | |
| Revenue | 5.00 | 5/15/14 | 990,000 | 1,080,446 |
| Lubbock, | | | | |
| Tax and Waterworks System | | | | |
| Surplus Revenue (Certificates | | | | |
| of Obligation) | 5.00 | 2/15/14 | 3,630,000 | 3,941,091 |
| Mission Economic Development | | | | |
| Corporation, SWDR (Waste | | | | |
| Management, Inc. Project) | 6.00 | 8/1/13 | 2,500,000 | 2,657,600 |
| North East Independent School | | | | |
| District, Unlimited Tax Bonds | | | | |
| (Permanent School Fund | | | | |
| Guarantee Program) | 5.25 | 8/1/14 | 2,315,000 | 2,575,970 |
| Pflugerville Independent School | | | | |
| District, Unlimited Tax | | | | |
| Refunding Bonds (Permanent | | | | |
| School Fund Guarantee Program) | 5.25 | 8/15/13 | 1,465,000 | 1,565,851 |
| San Antonio, | | | | |
| Airport System Revenue | | | | |
| (Insured; Assured Guaranty | | | | |
| Municipal Corp.) | 6.00 | 7/1/13 | 705,000 | 752,207 |
| San Antonio, | | | | |
| Airport System Revenue | | | | |
| (Insured; Assured Guaranty | | | | |
| Municipal Corp.) | 6.00 | 7/1/13 | 2,295,000 | 2,448,260 |
| San Antonio, | | | | |
| Electric and Gas Systems | | | | |
| Revenue (Insured; Assured | | | | |
| Guaranty Municipal Corp.) | 5.38 | 2/1/14 | 3,000,000 | 3,275,430 |
STATEMENT OF INVESTMENTS (continued)
| | | | | |
| Long-Term Municipal | Coupon | Maturity | Principal | | |
| Investments (continued) | Rate (%) | Date | Amount ($) | | Value ($) |
| Texas (continued) | | | | | |
| Texas A&M University System | | | | | |
| Board of Regents, Financing | | | | | |
| System Revenue | 5.00 | 5/15/14 | 4,835,000 | | 5,307,089 |
| Texas Public Finance Authority, | | | | | |
| Revenue (Building and | | | | | |
| Procurement Commission | | | | | |
| Projects) (Insured; AMBAC) | 5.00 | 2/1/14 | 2,500,000 | | 2,706,125 |
| Texas State University System | | | | | |
| Board of Regents, Financing | | | | | |
| System Revenue | 5.00 | 3/15/14 | 1,000,000 | | 1,090,360 |
| University of Houston System | | | | | |
| Board of Regents, | | | | | |
| Consolidated Revenue | 5.00 | 2/15/16 | 4,415,000 | | 5,117,073 |
| University of Texas System | | | | | |
| Board of Regents, Financing | | | | | |
| System Revenue | 5.00 | 8/15/15 | 1,900,000 | | 2,170,655 |
| University of Texas System | | | | | |
| Board of Regents, Financing | | | | | |
| System Revenue | 5.00 | 8/15/16 | 1,120,000 | | 1,312,606 |
| Waco, | | | | | |
| GO | 4.00 | 2/1/16 | 1,000,000 | | 1,114,620 |
| Utah—.3% | | | | | |
| Utah Board of Regents, | | | | | |
| University of Utah HR | | | | | |
| (Insured; National Public | | | | | |
| Finance Guarantee Corp.) | 5.00 | 8/1/14 | 1,500,000 | | 1,637,745 |
| Virginia—4.3% | | | | | |
| Virginia College Building | | | | | |
| Authority, Educational | | | | | |
| Facilities Revenue (21st | | | | | |
| Century College and | | | | | |
| Equipment Programs) | | | | | |
| (Prerefunded) | 5.00 | 2/1/14 | 1,975,000 | a | 2,143,231 |
| Virginia Commonwealth | | | | | |
| Transportation Board, Federal | | | | | |
| Transportation Grant | | | | | |
| Anticipation Revenue Notes | 5.00 | 9/15/16 | 3,195,000 | | 3,764,030 |
| Virginia Housing Development | | | | | |
| Authority, Commonwealth | | | | | |
| Mortgage Revenue | 4.20 | 1/1/14 | 4,500,000 | | 4,647,870 |
22
| | | | | |
| Long-Term Municipal | Coupon | Maturity | Principal | | |
| Investments (continued) | Rate (%) | Date | Amount ($) | | Value ($) |
| Virginia (continued) | | | | | |
| Virginia Housing Development | | | | | |
| Authority, Commonwealth | | | | | |
| Mortgage Revenue | 4.20 | 7/1/14 | 1,500,000 | | 1,558,020 |
| Virginia Public Building | | | | | |
| Authority, Public | | | | | |
| Facilities Revenue | 5.00 | 8/1/13 | 3,250,000 | | 3,452,085 |
| Virginia Public Building | | | | | |
| Authority, Public | | | | | |
| Facilities Revenue | 5.00 | 8/1/14 | 2,000,000 | | 2,209,400 |
| Virginia Public Building | | | | | |
| Authority, Public | | | | | |
| Facilities Revenue | 5.00 | 8/1/14 | 2,000,000 | | 2,209,400 |
| Virginia Public School Authority, | | | | | |
| School Financing Bonds | 5.00 | 8/1/14 | 3,865,000 | | 4,284,005 |
| Washington—4.9% | | | | | |
| Chelan County Public Utility | | | | | |
| District Number 1, Consolidated | | | | | |
| System Revenue | 5.00 | 7/1/15 | 1,500,000 | | 1,679,490 |
| FYI Properties, | | | | | |
| LR (State of Washington | | | | | |
| Department of Information | | | | | |
| Services Project) | 5.00 | 6/1/14 | 1,700,000 | | 1,847,883 |
| Greater Wenatchee Regional Events | | | | | |
| Center Public Facilities District, | | | | | |
| Revenue and Special Tax BAN | 5.25 | 12/1/11 | 3,000,000 | b | 2,235,000 |
| King County, | | | | | |
| Sewer Revenue | 5.00 | 1/1/16 | 5,000,000 | | 5,763,750 |
| Port of Seattle, | | | | | |
| Intermediate Lien Revenue | 3.00 | 8/1/15 | 2,400,000 | | 2,521,584 |
| Port of Seattle, | | | | | |
| Limited Tax GO | 5.00 | 12/1/15 | 1,050,000 | | 1,183,518 |
| Seattle, | | | | | |
| Municipal Light and Power | | | | | |
| Improvement Revenue | 5.00 | 2/1/14 | 4,500,000 | | 4,883,130 |
| Seattle, | | | | | |
| Municipal Light and Power | | | | | |
| Improvement Revenue | 5.00 | 2/1/15 | 1,500,000 | | 1,687,710 |
| Washington, | | | | | |
| GO (Various Purpose) | 5.00 | 7/1/16 | 5,000,000 | | 5,863,700 |
STATEMENT OF INVESTMENTS (continued)
| | | | |
| Long-Term Municipal | Coupon | Maturity | Principal | |
| Investments (continued) | Rate (%) | Date | Amount ($) | Value ($) |
| Wisconsin—1.2% | | | | |
| Wisconsin, | | | | |
| GO | 5.00 | 5/1/16 | 1,500,000 | 1,750,455 |
| Wisconsin, | | | | |
| Petroleum Inspection | | | | |
| Fee Revenue | 5.00 | 7/1/14 | 3,250,000 | 3,570,645 |
| Wisconsin Health and Educational | | | | |
| Facilities Authority, Revenue | | | | |
| (Aurora Health Care, Inc.) | 5.00 | 4/15/14 | 1,390,000 | 1,494,278 |
| U.S. Related—3.0% | | | | |
| Puerto Rico Commonwealth, | | | | |
| Public Improvement GO | 5.25 | 7/1/14 | 2,300,000 | 2,463,783 |
| Puerto Rico Electric Power | | | | |
| Authority, Power Revenue | | | | |
| (Insured; National Public | | | | |
| Finance Guarantee Corp.) | 5.00 | 7/1/15 | 1,000,000 | 1,098,670 |
| Puerto Rico Government | | | | |
| Development Bank, Senior Notes | 5.25 | 1/1/15 | 5,000,000 | 5,333,800 |
| Puerto Rico Infrastructure | | | | |
| Financing Authority, Special | | | | |
| Tax Revenue (Insured; AMBAC) | 5.50 | 7/1/13 | 1,760,000 | 1,842,157 |
| Puerto Rico Infrastructure | | | | |
| Financing Authority, Special | | | | |
| Tax Revenue (Insured; AMBAC) | 5.50 | 7/1/14 | 5,000,000 | 5,384,700 |
| Virgin Islands Public Finance | | | | |
| Authority, Revenue (Virgin | | | | |
| Islands Matching Fund Loan | | | | |
| Notes) (Senior Lien) | 5.00 | 10/1/13 | 1,000,000 | 1,042,830 |
| Total Long-Term Municipal Investments | | | |
| (cost $546,014,536) | | | | 558,691,735 |
24
| | | | | | |
| Short-Term Municipal | Coupon | Maturity | Principal | | | |
| Investments—.7% | Rate (%) | Date | Amount ($) | | | Value ($) |
| California—.3% | | | | | | |
| California, | | | | | | |
| GO Notes | | | | | | |
| (Kindergarten-University) | | | | | | |
| (LOC: California State | | | | | | |
| Teachers Retirement | | | | | | |
| System and Citibank NA) | 0.16 | 4/1/12 | 1,700,000 c | | | 1,700,000 |
| New York—.4% | | | | | | |
| New York City, | | | | | | |
| GO Notes (LOC; JPMorgan | | | | | | |
| Chase Bank) | 0.17 | 4/1/12 | 2,200,000 c | | | 2,200,000 |
| Total Short-Term Municipal Investments | | | | | |
| (cost $3,900,000) | | | | | | 3,900,000 |
| |
| Total Investments (cost $549,914,536) | | | 99.2 | % | | 562,591,735 |
| Cash and Receivables (Net) | | | .8 | % | | 4,715,665 |
| Net Assets | | | 100.0 | % | | 567,307,400 |
|
| a These securities are prerefunded; the date shown represents the prerefunded date. Bonds which are prerefunded are |
| collateralized by U.S. Government securities which are held in escrow and are used to pay principal and interest on |
| the municipal issue and to retire the bonds in full at the earliest refunding date. |
| b Non-income producing—security in default. |
| c Variable rate demand note—rate shown is the interest rate in effect at March 31, 2012. Maturity date represents the |
| next demand date, or the ultimate maturity date if earlier. |
STATEMENT OF INVESTMENTS (continued)
| | | |
| Summary of Abbreviations | | |
| |
| ABAG | Association of Bay Area Governments | ACA | American Capital Access |
| AGC | ACE Guaranty Corporation | AGIC | Asset Guaranty Insurance Company |
| AMBAC | American Municipal Bond | ARRN | Adjustable Rate |
| | Assurance Corporation | | Receipt Notes |
| BAN | Bond Anticipation Notes | BPA | Bond Purchase Agreement |
| CIFG | CDC Ixis Financial Guaranty | COP | Certificate of Participation |
| CP | Commercial Paper | DRIVERS | Derivative Inverse |
| | | | Tax-Exempt Receipts |
| EDR | Economic Development | EIR | Environmental Improvement |
| | Revenue | | Revenue |
| FGIC | Financial Guaranty | FHA | Federal Housing |
| | Insurance Company | | Administration |
| FHLB | Federal Home | FHLMC | Federal Home Loan Mortgage |
| | Loan Bank | | Corporation |
| FNMA | Federal National | GAN | Grant Anticipation Notes |
| | Mortgage Association | | |
| GIC | Guaranteed Investment | GNMA | Government National Mortgage |
| | Contract | | Association |
| GO | General Obligation | HR | Hospital Revenue |
| IDB | Industrial Development Board | IDC | Industrial Development Corporation |
| IDR | Industrial Development Revenue | LOC | Letter of Credit |
| LOR | Limited Obligation Revenue | LR | Lease Revenue |
| MERLOTS | Municipal Exempt Receipt | MFHR | Multi-Family Housing |
| | Liquidity Option Tender | | Revenue |
| MFMR | Multi-Family Mortgage Revenue | PCR | Pollution Control Revenue |
| PILOT | Payment in Lieu of Taxes | P-FLOATS Puttable Floating Option |
| | | | Tax-Exempt Receipts |
| PUTTERS | Puttable Tax-Exempt Receipts | RAC | Revenue Anticipation Certificates |
| RAN | Revenue Anticipation Notes | RAW | Revenue Anticipation Warrants |
| ROCS | Reset Options Certificates | RRR | Resources Recovery Revenue |
| SAAN | State Aid Anticipation Notes | SBPA | Standby Bond Purchase Agreement |
| SFHR | Single Family Housing Revenue | SFMR | Single Family Mortgage Revenue |
| SONYMA | State of New York Mortgage Agency | SWDR | Solid Waste Disposal Revenue |
| TAN | Tax Anticipation Notes | TAW | Tax Anticipation Warrants |
| TRAN | Tax and Revenue Anticipation Notes | XLCA | XL Capital Assurance |
26
| | | | | |
| Summary of Combined Ratings (Unaudited) | |
| |
| Fitch | or | Moody’s | or | Standard & Poor’s | Value (%)† |
| AAA | | Aaa | | AAA | 18.0 |
| AA | | Aa | | AA | 52.9 |
| A | | A | | A | 22.9 |
| BBB | | Baa | | BBB | 5.4 |
| F1 | | MIG1/P1 | | SP1/A1 | .7 |
| Not Ratedd | | Not Ratedd | | Not Ratedd | .1 |
| | | | | | 100.0 |
|
| † Based on total investments. |
| d Securities which, while not rated by Fitch, Moody’s and Standard & Poor’s, have been determined by the Manager to |
| be of comparable quality to those rated securities in which the fund may invest. |
See notes to financial statements.
|
| STATEMENT OF ASSETS AND LIABILITIES |
| March 31, 2012 |
| | | |
| | | Cost | Value |
| Assets ($): | | | |
| Investments in securities—See Statement of Investments | 549,914,536 | 562,591,735 |
| Cash | | | 551,088 |
| Interest receivable | | | 6,821,021 |
| Receivable for shares of Beneficial Interest subscribed | | 1,206,065 |
| Prepaid expenses | | | 36,018 |
| | | | 571,205,927 |
| Liabilities ($): | | | |
| Due to The Dreyfus Corporation and affiliates—Note 3(c) | | 324,684 |
| Payable for investment securities purchased | | | 2,262,960 |
| Payable for shares of Beneficial Interest redeemed | | | 1,229,474 |
| Accrued expenses | | | 81,409 |
| | | | 3,898,527 |
| Net Assets ($) | | | 567,307,400 |
| Composition of Net Assets ($): | | | |
| Paid-in capital | | | 552,923,010 |
| Accumulated undistributed investment income—net | | | 20,917 |
| Accumulated net realized gain (loss) on investments | | | 1,686,274 |
| Accumulated net unrealized appreciation | | | |
| (depreciation) on investments | | | 12,677,199 |
| Net Assets ($) | | | 567,307,400 |
| |
| |
| Net Asset Value Per Share | | | |
| | Class A | Class D | Class I |
| Net Assets ($) | 47,010,568 | 488,869,446 | 31,427,386 |
| Shares Outstanding | 3,540,877 | 36,827,243 | 2,366,778 |
| Net Asset Value Per Share ($) | 13.28 | 13.27 | 13.28 |
| |
| See notes to financial statements. | | | |
28
| | |
| STATEMENT OF OPERATIONS | |
| Year Ended March 31, 2012 | |
| |
| |
| |
| |
| Investment Income ($): | |
| Interest Income | 12,634,453 |
| Expenses: | |
| Management fee—Note 3(a) | 2,739,028 |
| Distribution fees—Note 3(b) | 472,299 |
| Shareholder servicing costs—Note 3(c) | 310,197 |
| Registration fees | 80,858 |
| Professional fees | 78,650 |
| Custodian fees—Note 3(c) | 47,505 |
| Prospectus and shareholders’ reports | 27,674 |
| Trustees’ fees and expenses—Note 3(d) | 8,163 |
| Loan commitment fees—Note 2 | 8,150 |
| Interest expense—Note 2 | 141 |
| Miscellaneous | 55,700 |
| Total Expenses | 3,828,365 |
| Less—reduction in expenses due to undertaking—Note 3(a) | (88) |
| Less—reduction in fees due to earnings credits—Note 3(c) | (152) |
| Net Expenses | 3,828,125 |
| Investment Income—Net | 8,806,328 |
| Realized and Unrealized Gain (Loss) on Investments—Note 4 ($): | |
| Net realized gain (loss) on investments | 3,272,971 |
| Net unrealized appreciation (depreciation) on investments | 4,665,401 |
| Net Realized and Unrealized Gain (Loss) on Investments | 7,938,372 |
| Net Increase in Net Assets Resulting from Operations | 16,744,700 |
| |
| See notes to financial statements. | |
STATEMENT OF CHANGES IN NET ASSETS
| | | | |
| | | Year Ended March 31, |
| | 2012a | 2011 |
| Operations ($): | | |
| Investment income—net | 8,806,328 | 11,239,779 |
| Net realized gain (loss) on investments | 3,272,971 | 1,064,567 |
| Net unrealized appreciation | | |
| (depreciation) on investments | 4,665,401 | (2,019,366) |
| Net Increase (Decrease) in Net Assets | | |
| Resulting from Operations | 16,744,700 | 10,284,980 |
| Dividends to Shareholders from ($): | | |
| Investment income—net: | | |
| Class A Shares | (637,290) | (768,058) |
| Class B Shares | (82) | (2,050) |
| Class D Shares | (7,573,029) | (9,859,387) |
| Class I Shares | (541,088) | (521,417) |
| Total Dividends | (8,751,489) | (11,150,912) |
| Beneficial Interest Transactions ($): | | |
| Net proceeds from shares sold: | | |
| Class A Shares | 22,841,290 | 39,813,394 |
| Class B Shares | 12,609 | 32,186 |
| Class D Shares | 128,415,342 | 195,678,503 |
| Class I Shares | 26,414,127 | 18,350,408 |
| Dividends reinvested: | | |
| Class A Shares | 499,131 | 562,370 |
| Class B Shares | 78 | 2,036 |
| Class D Shares | 6,846,475 | 8,936,840 |
| Class I Shares | 201,156 | 24,540 |
| Cost of shares redeemed: | | |
| Class A Shares | (23,988,244) | (26,331,763) |
| Class B Shares | (87,730) | (381,820) |
| Class D Shares | (130,073,732) | (253,648,064) |
| Class I Shares | (16,858,738) | (24,036,260) |
| Increase (Decrease) in Net Assets from | | |
| Beneficial Interest Transactions | 14,221,764 | (40,997,630) |
| Total Increase (Decrease) in Net Assets | 22,214,975 | (41,863,562) |
| Net Assets ($): | | |
| Beginning of Period | 545,092,425 | 586,955,987 |
| End of Period | 567,307,400 | 545,092,425 |
| Undistributed investment income—net | 20,917 | — |
30
| | | | |
| | | Year Ended March 31, |
| | 2012a | 2011 |
| Capital Share Transactions: | | |
| Class A | | |
| Shares sold | 1,723,495 | 3,017,415 |
| Shares issued for dividends reinvested | 37,711 | 42,755 |
| Shares redeemed | (1,813,882) | (2,006,522) |
| Net Increase (Decrease) in Shares Outstanding | (52,676) | 1,053,648 |
| Class Bb | | |
| Shares sold | 948 | 2,374 |
| Shares issued for dividends reinvested | 6 | 155 |
| Shares redeemed | (6,610) | (29,009) |
| Net Increase (Decrease) in Shares Outstanding | (5,656) | (26,480) |
| Class Db | | |
| Shares sold | 9,697,569 | 14,874,283 |
| Shares issued for dividends reinvested | 517,313 | 678,961 |
| Shares redeemed | (9,841,518) | (19,318,772) |
| Net Increase (Decrease) in Shares Outstanding | 373,364 | (3,765,528) |
| Class I | | |
| Shares sold | 2,004,688 | 1,392,450 |
| Shares issued for dividends reinvested | 15,189 | 1,867 |
| Shares redeemed | (1,273,554) | (1,830,056) |
| Net Increase (Decrease) in Shares Outstanding | 746,323 | (435,739) |
|
| a Effective as of the close of business on March 13, 2012, the fund no longer offers Class B shares. |
| b During the period ended March 31, 2012, 2,730 Class B shares representing $36,287 were automatically converted |
| to 2,728 Class D shares and during the period ended March 31, 2011, 3,818 Class B shares representing |
| $50,547 were automatically converted to 3,818 Class D shares. |
See notes to financial statements.
FINANCIAL HIGHLIGHTS
The following tables describe the performance for each share class for the fiscal periods indicated.All information (except portfolio turnover rate) reflects financial results for a single fund share.Total return shows how much your investment in the fund would have increased (or decreased) during each period, assuming you had reinvested all dividends and distributions.These figures have been derived from the fund’s financial statements.
| | | | | | |
| | | Year Ended March 31, |
| Class A Shares | 2012 | 2011 | 2010a |
| Per Share Data ($): | | | |
| Net asset value, beginning of period | 13.08 | 13.09 | 12.94 |
| Investment Operations: | | | |
| Investment income—netb | .19 | .23 | .14 |
| Net realized and unrealized | | | |
| gain (loss) on investments | .20 | (.01) | .17 |
| Total from Investment Operations | .39 | .22 | .31 |
| Distributions: | | | |
| Dividends from investment income—net | (.19) | (.23) | (.16) |
| Net asset value, end of period | 13.28 | 13.08 | 13.09 |
| Total Return (%)c | 3.02 | 1.68 | 2.43d |
| Ratios/Supplemental Data (%): | | | |
| Ratio of total expenses to average net assets | .84 | .84 | .86e |
| Ratio of net expenses to average net assets | .84 | .84 | .85e |
| Ratio of net investment income | | | |
| to average net assets | 1.47 | 1.75 | 1.81e |
| Portfolio Turnover Rate | 30.99 | 20.09 | 10.06 |
| Net Assets, end of period ($ x 1,000) | 47,011 | 47,008 | 33,246 |
| |
| a | From August 3, 2009 (commencement of initial offering) to March 31, 2010. |
| b | Based on average shares outstanding at each month end. |
| c | Exclusive of sales charge. |
| d | Not annualized. |
| e | Annualized. |
See notes to financial statements.
32
| | | | | | | | | | |
| | | Year Ended March 31, | |
| Class D Shares | 2012 | 2011 | 2010 | 2009 | 2008 |
| Per Share Data ($): | | | | | |
| Net asset value, beginning of period | 13.08 | 13.09 | 12.75 | 12.71 | 12.63 |
| Investment Operations: | | | | | |
| Investment income—neta | .21 | .25 | .28 | .43 | .41 |
| Net realized and unrealized | | | | | |
| gain (loss) on investments | .19 | (.01) | .35 | .05 | .08 |
| Total from Investment Operations | .40 | .24 | .63 | .48 | .49 |
| Distributions: | | | | | |
| Dividends from investment income—net | (.21) | (.25) | (.29) | (.43) | (.41) |
| Dividends from net realized | | | | | |
| gain on investments | — | — | — | (.01) | — |
| Total Distributions | (.21) | (.25) | (.29) | (.44) | (.41) |
| Net asset value, end of period | 13.27 | 13.08 | 13.09 | 12.75 | 12.71 |
| Total Return (%) | 3.10 | 1.84 | 4.98 | 3.85 | 3.90 |
| Ratios/Supplemental Data (%): | | | | | |
| Ratio of total expenses | | | | | |
| to average net assets | .69 | .70 | .72 | .77 | .77 |
| Ratio of net expenses | | | | | |
| to average net assets | .69 | .70 | .72 | .77 | .77 |
| Ratio of net investment income | | | | | |
| to average net assets | 1.61 | 1.92 | 2.17 | 3.45 | 3.23 |
| Portfolio Turnover Rate | 30.99 | 20.09 | 10.06 | 36.97 | 62.90 |
| Net Assets, end of period ($ x 1,000) | 488,869 | 476,809 | 526,370 | 217,715 | 136,999 |
| |
| a Based on average shares outstanding at each month end. | | | | |
| See notes to financial statements. | | | | | |
FINANCIAL HIGHLIGHTS (continued)
| | | | | | | | |
| | | Year Ended March 31, | |
| Class I Shares | 2012 | 2011 | 2010 | 2009a |
| Per Share Data ($): | | | | |
| Net asset value, beginning of period | 13.08 | 13.09 | 12.76 | 12.54 |
| Investment Operations: | | | | |
| Investment income—netb | .23 | .27 | .28 | .08 |
| Net realized and unrealized | | | | |
| gain (loss) on investments | .19 | (.01) | .36 | .27 |
| Total from Investment Operations | .42 | .26 | .64 | .35 |
| Distributions: | | | | |
| Dividends from investment income—net | (.22) | (.27) | (.31) | (.13) |
| Net asset value, end of period | 13.28 | 13.08 | 13.09 | 12.76 |
| Total Return (%) | 3.26 | 1.96 | 5.03 | 2.83c |
| Ratios/Supplemental Data (%): | | | | |
| Ratio of total expenses to average net assets | .60 | .57 | .59 | .82d |
| Ratio of net expenses to average net assets | .60 | .57 | .59 | .65d |
| Ratio of net investment income | | | | |
| to average net assets | 1.70 | 2.04 | 2.07 | 3.51d |
| Portfolio Turnover Rate | 30.99 | 20.09 | 10.06 | 36.97 |
| Net Assets, end of period ($ x 1,000) | 31,427 | 21,201 | 26,920 | 110 |
| |
| a | From December 15, 2008 (commencement of initial offering) to March 31, 2009. |
| b | Based on average shares outstanding at each month end. |
| c | Not annualized. |
| d | Annualized. |
See notes to financial statements.
34
NOTES TO FINANCIAL STATEMENTS
NOTE 1—Significant Accounting Policies:
Dreyfus Short-Intermediate Municipal Bond Fund (the “fund”) is the sole series of Dreyfus Premier Short-Intermediate Municipal Bond Fund (the “Company”), which is registered under the Investment Company Act of 1940, as amended (the “Act”), as a non-diversified open-end management investment company. The fund’s investment objective is to maximize current income exempt from federal income tax to the extent consistent with the preservation of capital. The Dreyfus Corporation (the “Manager” or “Dreyfus”), a wholly-owned subsidiary of The Bank of New York Mellon Corporation (“BNY Mellon”), serves as the fund’s investment adviser.
Class B shares were subject to a contingent deferred sales charge (“CDSC”) imposed on Class B share redemptions made within six years of purchase and automatically converted to Class D shares after six years. The fund no longer offers B shares. Effective March 13, 2012, all outstanding Class B shares were automatically converted to Class D shares.
MBSC Securities Corporation (the “Distributor”), a wholly-owned subsidiary of the Manager, is the distributor of the fund’s shares.The fund is authorized to issue an unlimited number of $.001 par value shares of Beneficial Interest in each of the following classes of shares: Class A, Class D and Class I. Class A shares are subject to a sales charge imposed at the time of purchase. Class D shares are sold at net asset value per share directly by Dreyfus and through certain banks and fund supermarkets, and as a part of certain wrap-fee programs. Class I shares are sold at net asset value per share only to institutional investors. Other differences between the classes include the services
NOTES TO FINANCIAL STATEMENTS (continued)
offered to and the expenses borne by each class, the allocation of certain transfer agency costs and certain voting rights. Income, expenses (other than expenses attributable to a specific class), and realized and unrealized gains or losses on investments are allocated to each class of shares based on its relative net assets.
The Financial Accounting Standards Board (“FASB”) Accounting Standards Codification is the exclusive reference of authoritative U.S. generally accepted accounting principles (“GAAP”) recognized by the FASB to be applied by nongovernmental entities. Rules and interpretive releases of the Securities and Exchange Commission (“SEC”) under authority of federal laws are also sources of authoritative GAAP for SEC registrants. The fund’s financial statements are prepared in accordance with GAAP, which may require the use of management estimates and assumptions.Actual results could differ from those estimates.
The Company enters into contracts that contain a variety of indemnifications.The fund’s maximum exposure under these arrangements is unknown.The fund does not anticipate recognizing any loss related to these arrangements.
(a) Portfolio valuation: The fair value of a financial instrument is the amount that would be received to sell an asset or paid to transfer a liability in an orderly transaction between market participants at the measurement date (i.e. the exit price). GAAP establishes a fair value hierarchy that prioritizes the inputs of valuation techniques used to measure fair value.This hierarchy gives the highest priority to unadjusted quoted prices in active markets for identical assets or liabilities (Level 1 measurements) and the lowest priority to unobservable inputs (Level 3 measurements).
Additionally, GAAP provides guidance on determining whether the volume and activity in a market has decreased significantly and whether such a decrease in activity results in transactions that are not orderly. GAAP requires enhanced disclosures around valuation inputs and techniques used during annual and interim periods.
36
Various inputs are used in determining the value of the fund’s investments relating to fair value measurements.These inputs are summarized in the three broad levels listed below:
Level 1—unadjusted quoted prices in active markets for identical investments.
Level 2—other significant observable inputs (including quoted prices for similar investments, interest rates, prepayment speeds, credit risk, etc.).
Level 3—significant unobservable inputs (including the fund’s own assumptions in determining the fair value of investments).
The inputs or methodology used for valuing securities are not necessarily an indication of the risk associated with investing in those securities.
Changes in valuation techniques may result in transfers in or out of an assigned level within the disclosure hierarchy. Valuation techniques used to value the fund’s investments are as follows:
Investments in securities are valued each business day by an independent pricing service (the “Service”) approved by the Board of Trustees. Investments for which quoted bid prices are readily available and are representative of the bid side of the market in the judgment of the Service are valued at the mean between the quoted bid prices (as obtained by the Service from dealers in such securities) and asked prices (as calculated by the Service based upon its evaluation of the market for such securities). Other investments (which constitute a majority of the portfolio securities) are carried at fair value as determined by the Service, based on methods which include consideration of: yields or prices of municipal securities of comparable quality, coupon, maturity and type; indications as to values from dealers; and general market con-ditions.All of the preceding securities are categorized within Level 2 of the fair value hierarchy.
The Service’s procedures are reviewed by Dreyfus under the general supervision of the Board of Trustees.
NOTES TO FINANCIAL STATEMENTS (continued)
When market quotations or official closing prices are not readily available, or are determined not to reflect accurately fair value, such as when the value of a security has been significantly affected by events after the close of the exchange or market on which the security is principally traded (for example, a foreign exchange or market), but before the fund calculates its net asset value, the fund may value these investments at fair value as determined in accordance with the procedures approved by the Board of Trustees. Certain factors may be considered when fair valuing investments such as: fundamental analytical data, the nature and duration of restrictions on disposition, an evaluation of the forces that influence the market in which the securities are purchased and sold, and public trading in similar securities of the issuer or comparable issuers. These securities are either categorized as Level 2 or 3 depending on the relevant inputs used.
For restricted securities where observable inputs are limited, assumptions about market activity and risk are used and are categorized within Level 3 of the fair value hierarchy.
The following is a summary of the inputs used as of March 31, 2012 in valuing the fund’s investments:
| | | | |
| | | Level 2—Other | Level 3— | |
| | Level 1— | Significant | Significant | |
| | Unadjusted | Observable | Unobservable | |
| | Quoted Prices | Inputs | Inputs | Total |
| Assets ($) | | | | |
| Investments in Securities: | | | |
| Municipal Bonds | — | 562,591,735 | — | 562,591,735 |
In May 2011, FASB issued Accounting Standards Update (“ASU”) No. 2011-04 “Amendments to Achieve Common FairValue Measurement and Disclosure Requirements in GAAP and International Financial Reporting Standards (“IFRS”)” (“ASU 2011-04”). ASU 2011-04 includes common requirements for measurement of and disclosure about fair value between GAAP and IFRS. ASU 2011-04 will require reporting entities to disclose the following information for fair value measurements categorized within Level 3 of the fair value hierarchy: quantitative information about the unobservable inputs used in the fair
38
value measurement, the valuation processes used by the reporting entity and a narrative description of the sensitivity of the fair value measurement to changes in unobservable inputs and the interrelationships between those unobservable inputs. In addition, ASU 2011-04 will require reporting entities to make disclosures about amounts and reasons for all transfers in and out of Level 1 and Level 2 fair value mea-surements.The new and revised disclosures are effective for interim and annual reporting periods beginning after December 15, 2011. At this time, management is evaluating the implications of ASU 2011-04 and its impact on the financial statements.
(b) Securities transactions and investment income: Securities transactions are recorded on a trade date basis. Realized gains and losses from securities transactions are recorded on the identified cost basis. Interest income, adjusted for accretion of discount and amortization of premium on investments, is earned from settlement date and recognized on the accrual basis. Securities purchased or sold on a when issued or delayed delivery basis may be settled a month or more after the trade date.
(c) Dividends to shareholders: It is the policy of the fund to declare dividends daily from investment income-net. Such dividends are paid monthly. Dividends from net realized capital gains, if any, are normally declared and paid annually, but the fund may make distributions on a more frequent basis to comply with the distribution requirements of the Internal Revenue Code of 1986, as amended (the “Code”).To the extent that net realized capital gains can be offset by capital loss carryovers, it is the policy of the fund not to distribute such gains. Income and capital gain distributions are determined in accordance with income tax regulations, which may differ from GAAP.
(d) Federal income taxes: It is the policy of the fund to continue to qualify as a regulated investment company, which can distribute tax exempt dividends, by complying with the applicable provisions of the Code, and to make distributions of income and net realized capital gain sufficient to relieve it from substantially all federal income and excise taxes.
NOTES TO FINANCIAL STATEMENTS (continued)
As of and during the period ended March 31, 2012, the fund did not have any liabilities for any uncertain tax positions.The fund recognizes interest and penalties, if any, related to uncertain tax positions as income tax expense in the Statement of Operations. During the period, the fund did not incur any interest or penalties.
Each of the tax years in the four-year period ended March 31, 2012 remains subject to examination by the Internal Revenue Service and state taxing authorities.
At March 31, 2012, the components of accumulated earnings on a tax basis were as follows: undistributed tax exempt income $272,886, undistributed ordinary income $93,161, undistributed capital gains $1,533,835 and unrealized appreciation $12,736,477.
The tax character of distributions paid to shareholders during the fiscal periods ended March 31, 2012 and March 31, 2011 were as follows: tax exempt income $8,751,489 and $11,084,892 and ordinary income $0 and $66,020, respectively.
During the period ended March 31, 2012, as a result of permanent book to tax differences, primarily due to the tax treatment for amortization adjustments, the fund decreased accumulated undistributed investment income-net by $33,922, increased accumulated net realized gain (loss) on investments by $16,848 and increased paid-in capital by $17,074. Net assets and net asset value per share were not affected by this reclassification.
NOTE 2—Bank Lines of Credit:
The fund participates with other Dreyfus-managed funds in a $225 million unsecured credit facility led by Citibank, N.A. and a $300 million unsecured credit facility provided by The Bank of New York Mellon, a subsidiary of BNY Mellon and an affiliate of Dreyfus (each, a “Facility”), each to be utilized primarily for temporary or emergency purposes, including the financing of redemptions. In connection therewith, the
40
fund has agreed to pay its pro rata portion of commitment fees for each Facility. Interest is charged to the fund based on rates determined pursuant to the terms of the respective Facility at the time of borrowing.
The average amount of borrowings outstanding under the Facilities during the period ended March 31, 2012, was approximately $10,400 with a related weighted average annualized interest rate of 1.36%.
NOTE 3—Management Fee and Other Transactions with Affiliates:
(a) Pursuant to a management agreement (“Agreement”) with the Manager, the management fee is computed at the annual rate of .50% of the value of the fund’s average daily net assets and is payable monthly.The Agreement provided, until March 13, 2012, if in any full fiscal year the aggregate expenses allocated to Class B (exclusive of taxes, brokerage fees, 12b-1 distribution plan fees, shareholder services fees, interest expense, commitment fees on borrowings and extraordinary expenses) exceed .75% of the value of the average daily net assets of Class B, the fund may deduct from payments to be made to the Manager, or the Manager will bear such excess expense.The reduction in expenses, pursuant to the undertaking, for Class B shares, amounted to $88 during the period ending March 31, 2012.
During the period ended March 31, 2012, the Distributor retained $2,951 from commissions earned on sales of the fund’s Class A shares and $15 from CDSCs on redemptions of the fund’s Class D shares.
(b) Under the Distribution Plan (the “Plan”) adopted pursuant to Rule 12b-1 under the Act, Class B shares paid and Class D shares pay the Distributor for distributing their shares at an annual rate of .75% of the value of the average daily net assets of Class B shares and .10% of the value of the average daily net assets of Class D shares. During the period ended March 31, 2012, Class B and Class D shares were charged $381 and $471,918, respectively, pursuant to the Plan.
NOTES TO FINANCIAL STATEMENTS (continued)
(c) Under the Shareholder Services Plan, Class A shares pay and Class B shares paid the Distributor at an annual rate of .25% of the value of their average daily net assets for the provision of certain services.The services provided may include personal services relating to shareholder accounts, such as answering shareholder inquiries regarding the fund and providing reports and other information, and services related to the maintenance of shareholder accounts.The Distributor may make payments to Service Agents (a securities dealer, financial institution or other industry professional) in respect of these services.The Distributor determines the amounts to be paid to Service Agents. During the period ended March 31, 2012, Class A and Class B shares were charged $109,375 and $127, respectively, pursuant to the Shareholder Services Plan.
The fund compensates DreyfusTransfer, Inc., a wholly-owned subsidiary of the Manager, under a transfer agency agreement for providing personnel and facilities to perform transfer agency services for the fund. During the period ended March 31, 2012, the fund was charged $86,988 pursuant to the transfer agency agreement, which is included in Shareholder servicing costs in the Statement of Operations.
The fund has arrangements with the custodian and cash management bank whereby the fund may receive earnings credits when positive cash balances are maintained, which are used to offset custody and cash management fees. For financial reporting purposes, the fund includes net earnings credits as an expense offset in the Statement of Operations.
The fund compensates The Bank of New York Mellon under a cash management agreement for performing cash management services related to fund subscriptions and redemptions. During the period ended March 31, 2012, the fund was charged $7,363 pursuant to the cash management agreement, which is included in Shareholder servicing costs in the Statement of Operations.These fees were partially offset by earnings credits of $152.
42
The fund also compensates The Bank of New York Mellon under a custody agreement for providing custodial services for the fund. During the period ended March 31, 2012, the fund was charged $47,505 pursuant to the custody agreement.
During the period ended March 31, 2012, the fund was charged $6,808 for services performed by the Chief Compliance Officer and his staff.
The components of “Due to The Dreyfus Corporation and affiliates” in the Statement of Assets and Liabilities consist of: management fees $241,089, Rule 12b-1 distribution plan fees $41,571, shareholder services plan fees $9,923, custodian fees $13,504, chief compliance officer fees $1,591 and transfer agency per account fees $17,006.
(d) Each Board member also serves as a Board member of other funds within the Dreyfus complex. Annual retainer fees and attendance fees are allocated to each fund based on net assets.
NOTE 4—Securities Transactions:
The aggregate amount of purchases and sales of investment securities, excluding short-term securities, during the period ended March 31, 2012, amounted to $195,550,651 and $167,662,346, respectively.
At March 31, 2011, the cost of investments for federal income tax purposes was $549,855,258; accordingly, accumulated net unrealized appreciation on investments was $12,736,477, consisting of $13,863,856 gross unrealized appreciation and $1,127,379 gross unrealized depreciation.
|
| REPORT OF INDEPENDENT REGISTERED |
| PUBLIC ACCOUNTING FIRM |
Shareholders and Board of Trustees
Dreyfus Short-Intermediate Municipal Bond Fund
We have audited the accompanying statement of assets and liabilities, including the statement of investments, of Dreyfus Short-Intermediate Municipal Bond Fund (the sole series comprising Dreyfus Premier Short-Intermediate Municipal Bond Fund) as of March 31, 2012, and the related statement of operations for the year then ended, the statement of changes in net assets for each of the two years in the period then ended, and financial highlights for each of the periods indicated therein.These financial statements and financial highlights are the responsibility of the Fund’s management. Our responsibility is to express an opinion on these financial statements and financial highlights based on our audits.
We conducted our audits in accordance with the standards of the Public Company Accounting Oversight Board (United States).Those standards require that we plan and perform the audit to obtain reasonable assurance about whether the financial statements and financial highlights are free of material misstatement.We were not engaged to perform an audit of the Fund’s internal control over financial reporting. Our audits included consideration of internal control over financial reporting as a basis for designing audit procedures that are appropriate in the circumstances, but not for the purpose of expressing an opinion on the effectiveness of the Fund’s internal control over financial reporting. Accordingly, we express no such opinion.An audit also includes examining, on a test basis, evidence supporting the amounts and disclosures in the financial statements and financial highlights, assessing the accounting principles used and significant estimates made by management, and evaluating the overall financial statement presentation. Our procedures included confirmation of securities owned as of March 31, 2012 by correspondence with the custodian and others. We believe that our audits provide a reasonable basis for our opinion.
In our opinion, the financial statements and financial highlights referred to above present fairly, in all material respects, the financial position of Dreyfus Short-Intermediate Municipal Bond Fund at March 31, 2012, the results of its operations for the year then ended, the changes in its net assets for each of the two years in the period then ended, and the financial highlights for each of the indicated periods, in conformity with U.S. generally accepted accounting principles.

New York, New York
May 29, 2012
44
IMPORTANT TAX INFORMATION (Unaudited)
In accordance with federal tax law, the fund hereby reports all the dividends paid from investment income-net during the fiscal year ended March 31, 2012 as “exempt-interest dividends” (not generally subject to regular federal income tax).Where required by federal tax law rules, shareholders will receive notification of their portion of the fund’s taxable ordinary dividends (if any) and capital gains distributions (if any) paid for the 2012 calendar year on Form 1099-DIV and their portion of the fund’s exempt-interest dividends paid for the 2012 calendar year on Form 1099-INT, both which will be mailed in early 2013.
BOARD MEMBERS INFORMATION (Unaudited)
|
| Joseph S. DiMartino (68) |
| Chairman of the Board (1995) |
| Principal Occupation During Past 5Years: |
| • Corporate Director and Trustee |
| Other Public Company Board Memberships During Past 5Years: |
| • CBIZ (formerly, Century Business Services, Inc.), a provider of outsourcing functions for small |
| and medium size companies, Director (1997-present) |
| • Sunair Services Corporation, a provider of certain outdoor-related services to homes and |
| businesses, Director (2005-2009) |
| • The Newark Group, a provider of a national market of paper recovery facilities, paperboard |
| mills and paperboard converting plants, Director (2000-2010) |
| No. of Portfolios for which Board Member Serves: 161 |
| ——————— |
| Clifford L. Alexander, Jr. (78) |
| Board Member (2003) |
| Principal Occupation During Past 5Years: |
| • President of Alexander & Associates, Inc., a management consulting firm ( January 1981-present) |
| No. of Portfolios for which Board Member Serves: 45 |
| ——————— |
| David W. Burke (75) |
| Board Member (1994) |
| Principal Occupation During Past 5Years: |
| • Corporate Director and Trustee |
| No. of Portfolios for which Board Member Serves: 77 |
| ——————— |
| Whitney I. Gerard (77) |
| Board Member (1989) |
| Principal Occupation During Past 5Years: |
| • Partner of Chadbourne & Parke LLP |
| No. of Portfolios for which Board Member Serves: 25 |
46
|
| Nathan Leventhal (69) |
| Board Member (2009) |
| Principal Occupation During Past 5Years: |
| • Commissioner, NYC Planning Commission (March 2007-present) |
| • Chairman of the Avery-Fisher Artist Program (November 1997-present) |
| Other Public Company Board Memberships During Past 5Years: |
| • Movado Group, Inc., Director |
| No. of Portfolios for which Board Member Serves: 43 |
| ——————— |
| George L. Perry (78) |
| Board Member (1990) |
| Principal Occupation During Past 5Years: |
| • Economist and Senior Fellow at Brookings Institution |
| No. of Portfolios for which Board Member Serves: 25 |
| ——————— |
| Benaree Pratt Wiley (65) |
| Board Member (2009) |
| Principal Occupation During Past 5Years: |
| • Principal,TheWiley Group, a firm specializing in strategy and business development (2005-present) |
| Other Public Company Board Memberships During Past 5Years: |
| • CBIZ (formerly, Century Business Services, Inc.), a provider of outsourcing functions for small |
| and medium size companies, Director (2008-present) |
| No. of Portfolios for which Board Member Serves: 66 |
| ——————— |
Once elected all Board Members serve for an indefinite term, but achieve Emeritus status upon reaching age 80.The address of the Board Members and Officers is in c/o The Dreyfus Corporation, 200 Park Avenue, NewYork, NewYork 10166.Additional information about the Board Members is available in the fund’s Statement of Additional Information which can be obtained from Dreyfus free of charge by calling this toll free number: 1-800-DREYFUS.
Lucy Wilson Benson, Emeritus Board Member
Arthur A. Hartman, Emeritus Board Member
OFFICERS OF THE FUND (Unaudited)
BRADLEY J. SKAPYAK, President since January 2010.
Chief Operating Officer and a director of the Manager since June 2009. From April 2003 to June 2009, Mr. Skapyak was the head of the Investment Accounting and Support Department of the Manager. He is an officer of 74 investment companies (comprised of 160 portfolios) managed by the Manager. He is 53 years old and has been an employee of the Manager since February 1988.
JANETTE E. FARRAGHER, Vice President and Secretary since December 2011.
Assistant General Counsel of BNY Mellon, and an officer of 75 investment companies (comprised of 187 portfolios) managed by the Manager. She is 49 years old and has been an employee of the Manager since February 1984.
KIESHA ASTWOOD, Vice President and Assistant Secretary since January 2010.
Counsel of BNY Mellon, and an officer of 75 investment companies (comprised of 187 portfolios) managed by the Manager. She is 39 years old and has been an employee of the Manager since July 1995.
JAMES BITETTO, Vice President and Assistant Secretary since August 2005.
Senior Counsel of BNY Mellon and Secretary of the Manager, and an officer of 75 investment companies (comprised of 187 portfolios) managed by the Manager. He is 45 years old and has been an employee of the Manager since December 1996.
JONI LACKS CHARATAN, Vice President and Assistant Secretary since August 2005.
Senior Counsel of BNY Mellon, and an officer of 75 investment companies (comprised of 187 portfolios) managed by the Manager. She is 56 years old and has been an employee of the Manager since October 1988.
JOSEPH M. CHIOFFI, Vice President and Assistant Secretary since August 2005.
Senior Counsel of BNY Mellon, and an officer of 75 investment companies (comprised of 187 portfolios) managed by the Manager. He is 50 years old and has been an employee of the Manager since June 2000.
KATHLEEN DENICHOLAS, Vice President and Assistant Secretary since January 2010.
Managing Counsel of BNY Mellon, and an officer of 75 investment companies (comprised of 187 portfolios) managed by the Manager. She is 37 years old and has been an employee of the Manager since February 2001.
JOHN B. HAMMALIAN, Vice President and Assistant Secretary since August 2005.
Senior Managing Counsel of BNY Mellon, and an officer of 75 investment companies (comprised of 187 portfolios) managed by the Manager. He is 48 years old and has been an employee of the Manager since February 1991.
M. CRISTINA MEISER, Vice President and Assistant Secretary since January 2010.
Senior Counsel of BNY Mellon, and an officer of 75 investment companies (comprised of 187 portfolios) managed by the Manager. She is 42 years old and has been an employee of the Manager since August 2001.
ROBERT R. MULLERY, Vice President and Assistant Secretary since August 2005.
Managing Counsel of BNY Mellon, and an officer of 75 investment companies (comprised of 187 portfolios) managed by the Manager. He is 60 years old and has been an employee of the Manager since May 1986.
JEFF PRUSNOFSKY, Vice President and Assistant Secretary since August 2005.
Senior Managing Counsel of BNY Mellon, and an officer of 75 investment companies (comprised of 187 portfolios) managed by the Manager. He is 46 years old and has been an employee of the Manager since October 1990.
48
JAMES WINDELS, Treasurer since November 2001.
Director – Mutual Fund Accounting of the Manager, and an officer of 75 investment companies (comprised of 187 portfolios) managed by the Manager. He is 53 years old and has been an employee of the Manager since April 1985.
RICHARD CASSARO, Assistant Treasurer since January 2008.
Senior Accounting Manager – Money Market and Municipal Bond Funds of the Manager, and an officer of 75 investment companies (comprised of 187 portfolios) managed by the Manager. He is 53 years old and has been an employee of the Manager since September 1982.
GAVIN C. REILLY, Assistant Treasurer since December 2005.
Tax Manager of the Investment Accounting and Support Department of the Manager, and an officer of 75 investment companies (comprised of 187 portfolios) managed by the Manager. He is 43 years old and has been an employee of the Manager since April 1991.
ROBERT S. ROBOL, Assistant Treasurer since August 2005.
Senior Accounting Manager – Fixed Income Funds of the Manager, and an officer of 75 investment companies (comprised of 187 portfolios) managed by the Manager. He is 48 years old and has been an employee of the Manager since October 1988.
ROBERT SALVIOLO, Assistant Treasurer since July 2007.
Senior Accounting Manager – Equity Funds of the Manager, and an officer of 75 investment companies (comprised of 187 portfolios) managed by the Manager. He is 44 years old and has been an employee of the Manager since June 1989.
ROBERT SVAGNA, Assistant Treasurer since August 2005.
Senior Accounting Manager – Equity Funds of the Manager, and an officer of 75 investment companies (comprised of 187 portfolios) managed by the Manager. He is 45 years old and has been an employee of the Manager since November 1990.
JOSEPH W. CONNOLLY, Chief Compliance Officer since October 2004.
Chief Compliance Officer of the Manager and The Dreyfus Family of Funds (75 investment companies, comprised of 187 portfolios). From November 2001 through March 2004, Mr. Connolly was first Vice-President, Mutual Fund Servicing for Mellon Global Securities Services. In that capacity, Mr. Connolly was responsible for managing Mellon’s Custody, Fund Accounting and Fund Administration services to third-party mutual fund clients. He is 54 years old and has served in various capacities with the Manager since 1980, including manager of the firm’s Fund Accounting Department from 1997 through October 2001.
MATTHEW D. CONNOLLY, Anti-Money Laundering Compliance Officer since April 2012.
Anti-Money Laundering Compliance Officer of the Distributor. From March 2010 to September 2011, Global Head, KYC Reviews and Director, UBS Investment Bank; until March 2010,AML Compliance Officer and Senior Vice President, Citi Global Wealth Management. He is an officer of 71 investment companies (comprised of 183 portfolios) managed by the Manager. He is 39 years old and has been an employee of the Distributor since October 2011.
For More Information
Telephone Call your financial representative or 1-800-DREYFUS
Mail The Dreyfus Family of Funds, 144 Glenn Curtiss Boulevard, Uniondale, NY 11556-0144
The fund files its complete schedule of portfolio holdings with the Securities and Exchange Commission (“SEC”) for the first and third quarters of each fiscal year on Form N-Q. The fund’s Forms N-Q are available on the SEC’s website at http://www.sec.gov and may be reviewed and copied at the SEC’s Public Reference Room in Washington, DC. Information on the operation of the Public Reference Room may be obtained by calling 1-800-SEC-0330.
Information regarding how the fund voted proxies relating to portfolio securities for the most recent 12-month period ended June 30 is available on the SEC’s website at http://www.sec.gov and without charge, upon request, by calling 1-800-DREYFUS.

Item 2. Code of Ethics.
The Registrant has adopted a code of ethics that applies to the Registrant's principal executive officer, principal financial officer, principal accounting officer or controller, or persons performing similar functions. There have been no amendments to, or waivers in connection with, the Code of Ethics during the period covered by this Report.
Item 3. Audit Committee Financial Expert.
The Registrant's Board has determined that Joseph S. DiMartino, a member of the Audit Committee of the Board, is an audit committee financial expert as defined by the Securities and Exchange Commission (the "SEC"). Mr. DiMartino is "independent" as defined by the SEC for purposes of audit committee financial expert determinations.
Item 4. Principal Accountant Fees and Services.
(a) Audit Fees. The aggregate fees billed for each of the last two fiscal years (the "Reporting Periods") for professional services rendered by the Registrant's principal accountant (the "Auditor") for the audit of the Registrant's annual financial statements or services that are normally provided by the Auditor in connection with the statutory and regulatory filings or engagements for the Reporting Periods, were $30,312 in 2011 and $31,401 in 2012.
(b) Audit-Related Fees. The aggregate fees billed in the Reporting Periods for assurance and related services by the Auditor that are reasonably related to the performance of the audit of the Registrant's financial statements and are not reported under paragraph (a) of this Item 4 were $6,000 in 2011 and $6,000 in 2012. These services consisted of one or more of the following: (i) agreed upon procedures related to compliance with Internal Revenue Code section 817(h), (ii) security counts required by Rule 17f-2 under the Investment Company Act of 1940, as amended, (iii) advisory services as to the accounting or disclosure treatment of Registrant transactions or events and (iv) advisory services to the accounting or disclosure treatment of the actual or potential impact to the Registrant of final or proposed rules, standards or interpretations by the Securities and Exchange Commission, the Financial Accounting Standards Boards or other regulatory or standard-setting bodies.
The aggregate fees billed in the Reporting Periods for non-audit assurance and related services by the Auditor to the Registrant's investment adviser (not including any sub-investment adviser whose role is primarily portfolio management and is subcontracted with or overseen by another investment adviser), and any entity controlling, controlled by or under common control with the investment adviser that provides ongoing services to the Registrant ("Service Affiliates"), that were reasonably related to the performance of the annual audit of the Service Affiliate, which required pre-approval by the Audit Committee were $0 in 2011 and $0 in 2012.
(c) Tax Fees. The aggregate fees billed in the Reporting Periods for professional services rendered by the Auditor for tax compliance, tax advice, and tax planning ("Tax Services") were $3,559 in 2011 and $2,403 in 2012. These services consisted of: (i) review or preparation of U.S. federal, state, local and excise tax returns; (ii) U.S. federal, state and local tax planning, advice and assistance regarding statutory, regulatory or administrative developments; (iii) tax advice regarding tax qualification matters and/or treatment of various financial instruments held or proposed to be acquired or held. The aggregate fees billed in the Reporting Periods for Tax Services by the Auditor to Service Affiliates, which required pre-approval by the Audit Committee were $0 in 2011 and $0 in 2012.
(d) All Other Fees. The aggregate fees billed in the Reporting Periods for products and services provided by the Auditor, other than the services reported in paragraphs (a) through (c) of this Item, were $189 in 2011 and $15 in 2012. These services consisted of a review of the Registrant's anti-money laundering program.
The aggregate fees billed in the Reporting Periods for Non-Audit Services by the Auditor to Service Affiliates, other than the services reported in paragraphs (b) through (c) of this Item, which required pre-approval by the Audit Committee, were $0 in 2011 and $0 in 2012.
(e)(1) Audit Committee Pre-Approval Policies and Procedures. The Registrant's Audit Committee has established policies and procedures (the "Policy") for pre-approval (within specified fee limits) of the Auditor's engagements for non-audit services to the Registrant and Service Affiliates without specific case-by-case consideration. The pre-approved services in the Policy can include pre-approved audit services, pre-approved audit-related services, pre-approved tax services and pre-approved all other services. Pre-approval considerations include whether the proposed services are compatible with maintaining the Auditor's independence. Pre-approvals pursuant to the Policy are considered annually.
(e)(2) Note: None of the services described in paragraphs (b) through (d) of this Item 4 were approved by the Audit Committee pursuant to paragraph (c)(7)(i)(C) of Rule 2-01 of Regulation S-X.
(f) None of the hours expended on the principal accountant's engagement to audit the registrant's financial statements for the most recent fiscal year were attributed to work performed by persons other than the principal account's full-time, permanent employees.
Non-Audit Fees. The aggregate non-audit fees billed by the Auditor for services rendered to the Registrant, and rendered to Service Affiliates, for the Reporting Periods were $60,419,333 in 2011 and $29,086,580 in 2012.
Auditor Independence. The Registrant's Audit Committee has considered whether the provision of non-audit services that were rendered to Service Affiliates, which were not pre-approved (not requiring pre-approval), is compatible with maintaining the Auditor's independence.
Item 5. Audit Committee of Listed Registrants.
Not applicable. [CLOSED-END FUNDS ONLY]
Item 6. Investments.
(a) Not applicable.
Item 7. Disclosure of Proxy Voting Policies and Procedures for Closed-End Management Investment Companies.
Not applicable. [CLOSED-END FUNDS ONLY]
Item 8. Portfolio Managers of Closed-End Management Investment Companies.
Not applicable. [CLOSED-END FUNDS ONLY, beginning with reports for periods ended on and after December 31, 2005]
Item 9. Purchases of Equity Securities by Closed-End Management Investment Companies and Affiliated Purchasers.
Not applicable. [CLOSED-END FUNDS ONLY]
Item 10. Submission of Matters to a Vote of Security Holders.
There have been no material changes to the procedures applicable to Item 10.
Item 11. Controls and Procedures.
(a) The Registrant's principal executive and principal financial officers have concluded, based on their evaluation of the Registrant's disclosure controls and procedures as of a date within 90 days of the filing date of this report, that the Registrant's disclosure controls and procedures are reasonably designed to ensure that information required to be disclosed by the Registrant on Form N-CSR is recorded, processed, summarized and reported within the required time periods and that information required to be disclosed by the Registrant in the reports that it files or submits on Form N-CSR is accumulated and communicated to the Registrant's management, including its principal executive and principal financial officers, as appropriate to allow timely decisions regarding required disclosure.
(b) There were no changes to the Registrant's internal control over financial reporting that occurred during the second fiscal quarter of the period covered by this report that have materially affected, or are reasonably likely to materially affect, the Registrant's internal control over financial reporting.
Item 12. Exhibits.
(a)(1) Code of ethics referred to in Item 2.
(a)(2) Certifications of principal executive and principal financial officers as required by Rule 30a-2(a) under the Investment Company Act of 1940.
(a)(3) Not applicable.
(b) Certification of principal executive and principal financial officers as required by Rule 30a-2(b) under the Investment Company Act of 1940.
SIGNATURES
Pursuant to the requirements of the Securities Exchange Act of 1934 and the Investment Company Act of 1940, the Registrant has duly caused this Report to be signed on its behalf by the undersigned, thereunto duly authorized.
Dreyfus Premier Short-Intermediate Municipal Bond Fund
By: /s/ Bradley J. Skapyak |
Bradley J. Skapyak, President |
Date: | May 23, 2012 |
|
Pursuant to the requirements of the Securities Exchange Act of 1934 and the Investment Company Act of 1940, this Report has been signed below by the following persons on behalf of the Registrant and in the capacities and on the dates indicated. |
|
By: /s/ Bradley J. Skapyak |
Bradley J. Skapyak, President |
Date: | May 23, 2012 |
|
By: /s/ James Windels |
James Windels, Treasurer |
Date: | May 23, 2012 |
|
EXHIBIT INDEX
(a)(1) Code of ethics referred to in Item 2.
(a)(2) Certifications of principal executive and principal financial officers as required by Rule 30a-2(a) under the Investment Company Act of 1940. (EX-99.CERT)
(b) Certification of principal executive and principal financial officers as required by Rule 30a-2(b) under the Investment Company Act of 1940. (EX-99.906CERT)