UNITED STATES
SECURITIES AND EXCHANGE COMMISSION
Washington, D.C. 20549
FORM N-CSR
CERTIFIED SHAREHOLDER REPORT OF REGISTERED MANAGEMENT
INVESTMENT COMPANIES
Investment Company Act file number | 811-5021 |
| |
| Dreyfus Premier Short-Intermediate Municipal Bond Fund | |
| (Exact name of Registrant as specified in charter) | |
| | |
| c/o The Dreyfus Corporation 200 Park Avenue New York, New York 10166 | |
| (Address of principal executive offices) (Zip code) | |
| | |
| John Pak, Esq. 200 Park Avenue New York, New York 10166 | |
| (Name and address of agent for service) | |
|
Registrant's telephone number, including area code: | (212) 922-6000 |
| |
Date of fiscal year end: | 3/31 | |
Date of reporting period: | 3/31/15 | |
| | | | | | | |
FORM N-CSR
Item 1. Reports to Stockholders.
Dreyfus
Short-Intermediate
Municipal Bond Fund

Save time. Save paper. View your next shareholder report online as soon as it’s available. Log into www.dreyfus.com and sign up for Dreyfus eCommunications. It’s simple and only takes a few minutes.
The views expressed in this report reflect those of the portfolio manager only through the end of the period covered and do not necessarily represent the views of Dreyfus or any other person in the Dreyfus organization. Any such views are subject to change at any time based upon market or other conditions and Dreyfus disclaims any responsibility to update such views.These views may not be relied on as investment advice and, because investment decisions for a Dreyfus fund are based on numerous factors, may not be relied on as an indication of trading intent on behalf of any Dreyfus fund.
Not FDIC-Insured • Not Bank-Guaranteed • May Lose Value
| | Contents |
| | THE FUND |
| 2 | A Letter from the President |
| 3 | Discussion of Fund Performance |
| 6 | Fund Performance |
| 8 | Understanding Your Fund’s Expenses |
| 8 | Comparing Your Fund’s Expenses With Those of Other Funds |
| 9 | Statement of Investments |
| 22 | Statement of Assets and Liabilities |
| 23 | Statement of Operations |
| 24 | Statement of Changes in Net Assets |
| 26 | Financial Highlights |
| 30 | Notes to Financial Statements |
| 38 | Report of Independent Registered Public Accounting Firm |
| 39 | Important Tax Information |
| 40 | Board Members Information |
| 43 | Officers of the Fund |
| | FOR MORE INFORMATION |
| | Back Cover |
Dreyfus
Short-Intermediate
Municipal Bond Fund
The Fund
A LETTER FROM THE PRESIDENT
Dear Shareholder:
This annual report for Dreyfus Short-Intermediate Municipal Bond Fund covers the 12-month period from April 1, 2014, through March 31, 2015. For information about how the fund performed during the reporting period, as well as general market perspectives, we provide a Discussion of Fund Performance on the pages that follow.
Municipal bonds gained value over the reporting period in an environment of falling long-term interest rates and favorable supply-and-demand dynamics. Bond yields continued to move lower despite a sustained U.S. economic recovery, in part due to robust demand from investors seeking relatively safe havens in the midst of disappointing global growth and intensifying geopolitical conflicts.A generally stable supply of newly issued securities and improving credit conditions for many municipal issuers also supported the market’s performance.
We remain optimistic regarding the long-term outlook for the U.S. economy generally and the municipal bond asset class in particular.We believe the domestic economic recovery has continued at a sustainable pace, energy prices appear to have stabilized, and aggressively accommodative monetary policies from the world’s major central banks seem likely to address global economic weakness. While monetary policymakers currently appear prepared to begin raising short-term interest rates later this year, any potential rate hikes are expected to be gradual and modest. As always, we urge you to discuss these observations with your financial adviser, who can help you assess their implications for your investment portfolio.
Thank you for your continued confidence and support.

J. Charles Cardona
President
The Dreyfus Corporation
April 15, 2015
2
DISCUSSION OF FUND PERFORMANCE
For the period of April 1, 2014, through March 31, 2015, as provided by Thomas Casey and Jeffrey Burger, Primary Portfolio Managers
Fund and Market Performance Overview
For the 12-month period ended March 31, 2015, Dreyfus Short-Intermediate Municipal Bond Fund’s Class A shares produced a total return of 0.87%, Class D shares returned 1.02%, Class I shares returned 1.12%, and Class Y shares returned 1.13%.1 In comparison, the fund’s benchmark, the Barclays 3-Year Municipal Bond Index (the “Index”), which is not subject to fees and expenses like a mutual fund, produced a total return of 1.30% for the same period.2
Longer term municipal bonds generally rallied over the reporting period when long-term interest rates fell, but yields of short-term bonds remained anchored by an unchanged federal funds rate. The fund lagged its benchmark, in part due to its focus on higher quality securities.
The Fund’s Investment Approach
The fund seeks to maximize current income exempt from federal income tax to the extent consistent with the preservation of capital.To pursue this goal, the fund normally invests substantially all of its assets in municipal bonds that provide income exempt from federal personal income tax.The fund invests only in municipal bonds rated investment grade or the unrated equivalent as determined by Dreyfus at the time of investment. The fund invests primarily in municipal bonds with remaining maturities of five years or less and generally maintains a dollar-weighted average portfolio maturity of two to three years.
The portfolio managers focus on identifying undervalued sectors and securities, and minimizing the use of interest rate forecasting.The portfolio managers select municipal bonds by using fundamental credit analysis to estimate the relative value and attractiveness of various sectors and securities and to exploit pricing inefficiencies in the municipal bond market.They also actively trade among various sectors, such as pre-refunded, general obligation, and revenue, based on their apparent relative val-ues.The fund seeks to invest in several of these sectors.
The Fund 3
DISCUSSION OF FUND PERFORMANCE (continued)
Falling Long-Term Rates Supported Bond Prices
A sustained U.S. economic recovery persisted throughout the reporting period, including especially robust GDP growth rates during the second and third quarters of 2014. Yet, long-term interest rates fell steadily, defying expectations that an expanding domestic economy would drive bond yields higher. Global investors seeking more competitive yields from sovereign bonds than were available in Europe and Japan flocked to U.S. Treasury securities, and the resulting supply-and-demand imbalance put downward pressure on yields of U.S. fixed-income securities.
Municipal bonds also benefited from favorable supply-and-demand dynamics during most of the reporting period amid robust demand from individual investors seeking competitive levels of tax-exempt income in a low interest-rate environment. Despite greater-than-expected issuance volumes over the first quarter of 2015, the supply of newly issued municipal securities generally remained stable for the reporting period overall.
The economic rebound resulted in better underlying credit conditions for most municipal bond issuers. Tax revenues have climbed beyond pre-recession levels for most state and local governments, enabling them to achieve balanced budgets and replenish reserves.
Fund Strategies Produced Mixed Results
The fund participated substantially in the market’s modest gains during the reporting period, but its relative performance was undermined to a degree by its bias toward high-quality securities, including underweighted exposure to BBB-rated bonds and a modestly overweighted position in AAA-rated bonds. In particular, the fund’s holdings of high-quality municipal bonds backed by revenues from special tax districts and power utilities lagged market averages.
Our security selection strategy proved more effective in other areas, and a general emphasis on revenue bonds over general obligation bonds buoyed relative results.The fund received especially strong contributions from bonds backed by prepaid gas contracts, airports, and the states’ settlement of litigation with U.S. tobacco companies.The fund’s interest rate strategy had relatively little impact on relative performance, as
4
strength stemming from overweighted exposure to municipal bonds with four- to five-year maturities was balanced by weaker results from bonds with maturities in the zero- to two-year range.
A Constructive Investment Posture
We are cautiously constructive regarding the municipal bond market’s prospects.The U.S. economic recovery has gained traction, and credit conditions generally have continued to improve. Although the supply of newly issued municipal securities recently began to increase significantly, we expect investor demand to absorb the additional issuance. Finally, we anticipate that the Federal Reserve Board will begin to raise short-term interest rates over the intermediate term.While we expect market volatility to increase as the inflection point approaches, we note that inflation has remained subdued and tax-exempt bonds historically have tended to be less sensitive than U.S. Treasury securities to rising interest rates. Therefore, as of the reporting period’s end, we have set the fund’s average duration in a modestly long position, and we have retained our focus on revenue bonds with strong income characteristics.
April 15, 2015
|
| Bond funds are subject generally to interest rate, credit, liquidity, and market risks, to varying degrees, all of which are |
| more fully described in the fund’s prospectus. Generally, all other factors being equal, bond prices are inversely related |
| to interest rate changes, and rate increases can cause price declines. |
| 1 Total return includes reinvestment of dividends and any capital gains paid, and does not take into consideration the |
| maximum initial sales charge in the case of Class A shares. Had this charge been reflected, returns would have been |
| lower. Class D, I, andY shares are not subject to any initial or deferred sales charge. Past performance is no guarantee |
| of future results. Share price, yield, and investment return fluctuate such that upon redemption, fund shares may be |
| worth more or less than their original cost. Income may be subject to state and local taxes, and some income may be |
| subject to the federal alternative minimum tax (AMT) for certain investors. Capital gains, if any, are taxable. Return |
| figures provided reflect the absorption of certain fund expenses by The Dreyfus Corporation pursuant to an agreement |
| in effect until August 1, 2015, at which time it may be extended, modified, or terminated. Had these expenses not |
| been absorbed, the fund’s returns would have been lower. |
| 2 SOURCE: LIPPER INC. — Reflects reinvestment of dividends and, where applicable, capital gain distributions. |
| The Barclays 3-Year Municipal Bond Index is an unmanaged total return performance benchmark for the |
| investment-grade, geographically unrestricted 3-year tax-exempt bond market, consisting of municipal bonds with |
| maturities of 2-4 years. Index returns do not reflect the fees and expenses associated with operating a mutual fund. |
| Investors cannot invest directly in any index. |
The Fund 5
FUND PERFORMANCE
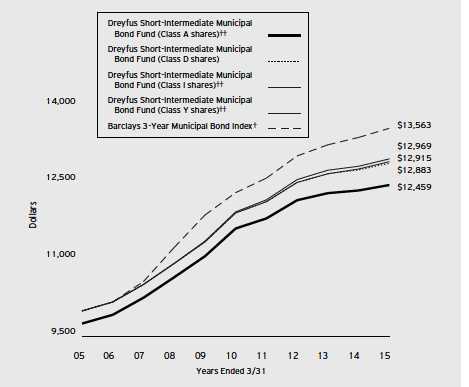
Comparison of change in value of $10,000 investment in Dreyfus Short-Intermediate Municipal Bond Fund Class A shares, Class D shares, Class I shares and Class Y shares and the Barclays 3-Year Municipal Bond Index
| |
| † | Source: Lipper Inc. |
| †† | The total return figures presented for Class A shares of the fund reflect the performance of the fund’s Class D shares |
| | for the period prior to 8/3/09 (the inception date for Class A shares), adjusted to reflect the applicable sales load for |
| | this share class.The total return figures presented for Class I shares of the fund reflect the performance of the fund’s |
| | Class D shares for the period prior to 12/15/08 (the inception date for Class I shares).The total return figures |
| | presented for ClassY shares of the fund reflect the performance of the fund’s Class D shares for the period prior to |
| | 7/1/13 (the inception date for ClassY shares). |
Past performance is not predictive of future performance.
The above graph compares a $10,000 investment made in each of the Class A, Class D, Class I and Class Y shares of Dreyfus Short-Intermediate Municipal Bond Fund on 3/31/05 to a $10,000 investment made in the Barclays 3-Year Municipal Bond Index (the “Index”) on that date. All dividends and capital gain distributions are reinvested.
The fund invests primarily in short-intermediate term municipal securities and maintains a portfolio with a weighted average maturity ranging between 2 and 3 years.The fund’s performance shown in the line graph above takes into account the maximum initial sales charge on Class A shares and all other applicable fees and expenses on all classes.The Index is an unmanaged total return performance benchmark for the investment-grade, geographically unrestricted 3-year tax-exempt bond market, consisting of municipal bonds with maturities of 2-4 years. Unlike a mutual fund, the Index is not subject to charges, fees and other expenses. Investors cannot invest directly in any index. Further information relating to fund performance, including expense reimbursements, if applicable, is contained in the Financial Highlights section of the prospectus and elsewhere in this report.
6
| | | | | | | |
| Average Annual Total Returns as of 3/31/15 | | | | | | |
| Inception |
| | Date | 1 Year | | 5 Years | | 10 Years | |
| Class A shares | | | | | | | |
| with maximum sales charge (2.5%) | 8/3/09 | –1.62 | % | 0.90 | % | 2.22 | %† |
| without sales charge | 8/3/09 | 0.87 | % | 1.42 | % | 2.48 | %† |
| Class D shares | 4/30/87 | 1.02 | % | 1.58 | % | 2.57 | % |
| Class I shares | 12/15/08 | 1.12 | % | 1.68 | % | 2.63 | %† |
| Class Y shares | 7/1/13 | 1.13 | % | 1.63 | %† | 2.59 | %† |
| Barclays 3-Year | | | | | | | |
| Municipal Bond Index | | 1.30 | % | 1.96 | % | 3.09 | % |
Past performance is not predictive of future performance.The fund’s performance shown in the graph and table does not reflect the deduction of taxes that a shareholder would pay on fund distributions or the redemption of fund shares. In addition to the performance of Class A shares shown with and without a maximum sales charge, the fund’s performance shown in the table takes into account all other applicable fees and expenses on all classes.
|
| † The total return performance figures presented for Class A shares of the fund reflect the performance of the fund’s |
| Class D shares for the period prior to 8/3/09 (the inception date for Class A shares), adjusted to reflect the |
| applicable sales load for this share class. |
| The total return performance figures presented for Class I shares of the fund reflect the performance of the fund’s |
| Class D shares for the period prior to 12/15/08 (the inception date for Class I shares). |
| The total return performance figures presented for ClassY shares of the fund reflect the performance of the fund’s |
| Class D shares for the period prior to 7/1/13 (the inception date for ClassY shares). |
The Fund 7
UNDERSTANDING YOUR FUND’S EXPENSES (Unaudited)
As a mutual fund investor, you pay ongoing expenses, such as management fees and other expenses. Using the information below, you can estimate how these expenses affect your investment and compare them with the expenses of other funds.You also may pay one-time transaction expenses, including sales charges (loads) and redemption fees, which are not shown in this section and would have resulted in higher total expenses. For more information, see your fund’s prospectus or talk to your financial adviser.
Review your fund’s expenses
The table below shows the expenses you would have paid on a $1,000 investment in Dreyfus Short-Intermediate Municipal Bond Fund from October 1, 2014 to March 31, 2015. It also shows how much a $1,000 investment would be worth at the close of the period, assuming actual returns and expenses.
| | | | | | | | |
| Expenses and Value of a $1,000 Investment | | | | | | |
| assuming actual returns for the six months ended March 31, 2015 | | | | |
| | | Class A | | Class D | | Class I | | Class Y |
| Expenses paid per $1,000† | | $3.69 | | $2.94 | | $2.45 | | $2.45 |
| Ending value (after expenses) | | $1,001.00 | | $1,001.70 | | $1,002.20 | | $1,002.20 |
COMPARING YOUR FUND’S EXPENSES
WITH THOSE OF OTHER FUNDS (Unaudited)
Using the SEC’s method to compare expenses
The Securities and Exchange Commission (SEC) has established guidelines to help investors assess fund expenses. Per these guidelines, the table below shows your fund’s expenses based on a $1,000 investment, assuming a hypothetical 5% annualized return. You can use this information to compare the ongoing expenses (but not transaction expenses or total cost) of investing in the fund with those of other funds. All mutual fund shareholder reports will provide this information to help you make this comparison. Please note that you cannot use this information to estimate your actual ending account balance and expenses paid during the period.
| | | | | | | | | | | |
| Expenses and Value of a $1,000 Investment | | | | | | | | | |
| assuming a hypothetical 5% annualized return for the six months ended March 31, 2015 |
| | | Class A | | | Class D | | | Class I | | | Class Y |
| Expenses paid per $1,000† | | $3.73 | | | $ 2.97 | | | $ 2.47 | | | $ 2.47 |
| Ending value (after expenses) | | $1,021.24 | | $1,021.99 | | $1,022.49 | | $1,022.49 |
| |
| † Expenses are equal to the fund’s annualized expense ratio of .74% for Class A, .59% for Class D, .49% for Class I |
and .49% for ClassY, multiplied by the average account value over the period, multiplied by 182/365 (to reflect the one- |
| half year period). | | | | | | | | | | | |
8
| | | | |
| STATEMENT OF INVESTMENTS | | | |
| March 31, 2015 | | | | |
| |
| |
| |
| |
| Long-Term Municipal | Coupon | Maturity | Principal | |
| Investments—98.3% | Rate (%) | Date | Amount ($) | Value ($) |
| Alabama—1.6% | | | | |
| Alabama Public School and | | | | |
| College Authority, Capital | | | | |
| Improvement Revenue | 5.00 | 12/1/16 | 1,000,000 | 1,075,800 |
| Alabama Public School and | | | | |
| College Authority, Capital | | | | |
| Improvement Revenue | 5.00 | 1/1/19 | 5,000,000 | 5,706,450 |
| Arizona—1.6% | | | | |
| Phoenix Civic Improvement | | | | |
| Corporation, Junior Lien | | | | |
| Wastewater System Revenue | 5.00 | 7/1/18 | 3,150,000 | 3,557,295 |
| Phoenix Civic Improvement | | | | |
| Corporation, Transit Excise | | | | |
| Tax Revenue (Light | | | | |
| Rail Project) | 5.00 | 7/1/17 | 3,000,000 | 3,292,410 |
| Arkansas—.3% | | | | |
| Arkansas Development Finance | | | | |
| Authority, HR (Washington | | | | |
| Regional Medical Center) | 5.00 | 2/1/20 | 1,070,000 | 1,210,769 |
| California—3.2% | | | | |
| California, | | | | |
| GO (Various Purpose) | 5.00 | 12/1/19 | 3,105,000 | 3,630,614 |
| California State Public Works | | | | |
| Board, LR (Judicial Council of | | | | |
| California) (New Stockton | | | | |
| Courthouse) | 5.00 | 10/1/19 | 1,500,000 | 1,741,095 |
| California State Public Works | | | | |
| Board, LR (Various | | | | |
| Capital Projects) | 4.00 | 10/1/16 | 2,000,000 | 2,109,100 |
| Modesto Irrigation District, | | | | |
| Electric System Revenue | 5.00 | 7/1/16 | 2,250,000 | 2,386,215 |
| North Natomas Community | | | | |
| Facilities District Number 4, | | | | |
| Special Tax Bonds | 5.00 | 9/1/17 | 1,430,000 | 1,562,704 |
| University of California Regents, | | | | |
| General Revenue | 5.00 | 5/15/20 | 1,500,000 | 1,775,445 |
| Colorado—1.1% | | | | |
| City and County of Denver, | | | | |
| Airport System | | | | |
| Subordinate Revenue | 5.00 | 11/15/18 | 1,180,000 | 1,337,565 |
The Fund 9
STATEMENT OF INVESTMENTS (continued)
| | | | |
| Long-Term Municipal | Coupon | Maturity | Principal | |
| Investments (continued) | Rate (%) | Date | Amount ($) | Value ($) |
| Colorado (continued) | | | | |
| Colorado Educational and Cultural | | | | |
| Facilities Authority, Revenue | | | | |
| (Johnson and Wales | | | | |
| University Project) | 5.00 | 4/1/18 | 2,000,000 | 2,207,720 |
| Jefferson County School District | | | | |
| Number R-1, GO | 3.00 | 12/15/16 | 1,000,000 | 1,042,150 |
| Connecticut—.7% | | | | |
| Connecticut, | | | | |
| Special Tax Obligation | | | | |
| Revenue (Transportation | | | | |
| Infrastructure Purposes) | 4.00 | 9/1/18 | 2,750,000 | 3,022,773 |
| District of Columbia—.3% | | | | |
| District of Columbia, | | | | |
| Income Tax Secured Revenue | 5.00 | 12/1/16 | 1,200,000 | 1,291,584 |
| Florida—7.1% | | | | |
| Broward County School Board, | | | | |
| COP (Master Purchase Agreement) | 5.00 | 7/1/16 | 1,500,000 | 1,587,105 |
| Citizens Property Insurance | | | | |
| Corporation, Personal Lines | | | | |
| Account/Commercial Lines | | | | |
| Account Senior Secured Revenue | 5.00 | 6/1/17 | 5,000,000 | 5,449,000 |
| Citizens Property Insurance | | | | |
| Corporation, Personal Lines | | | | |
| Account/Commercial Lines | | | | |
| Account Senior Secured Revenue | 5.00 | 6/1/19 | 5,000,000 | 5,709,250 |
| Florida Board of Education, | | | | |
| Public Education Capital | | | | |
| Outlay Bonds | 5.00 | 6/1/18 | 3,425,000 | 3,861,037 |
| Florida Department of | | | | |
| Transportation, | | | | |
| Turnpike Revenue | 5.00 | 7/1/17 | 4,365,000 | 4,787,357 |
| Higher Educational Facilities | | | | |
| Financing Authority, | | | | |
| Revenue (The University of | | | | |
| Tampa Project) | 4.00 | 4/1/16 | 1,250,000 | 1,286,013 |
| Lee County, | | | | |
| Transportation Facilities | | | | |
| Revenue (Insured; Assured | | | | |
| Guaranty Municipal Corp.) | 5.00 | 10/1/19 | 1,200,000 | 1,386,336 |
10
| | | | |
| Long-Term Municipal | Coupon | Maturity | Principal | |
| Investments (continued) | Rate (%) | Date | Amount ($) | Value ($) |
| Florida (continued) | | | | |
| Miami-Dade County, | | | | |
| Aviation Revenue | 4.00 | 10/1/17 | 3,725,000 | 4,015,550 |
| Tampa, | | | | |
| Capital Improvement Cigarette | | | | |
| Tax Allocation Revenue (H. Lee | | | | |
| Moffitt Cancer Center Project) | 4.00 | 9/1/17 | 1,055,000 | 1,130,791 |
| Georgia—3.9% | | | | |
| Atlanta, | | | | |
| Water and Wastewater Revenue | 5.00 | 11/1/16 | 4,950,000 | 5,307,588 |
| Gwinnett County School District, | | | | |
| GO Sales Tax Bonds | 4.00 | 10/1/16 | 5,000,000 | 5,273,150 |
| Municipal Electric Authority of | | | | |
| Georgia, Revenue (Combined | | | | |
| Cycle Project) | 5.00 | 11/1/16 | 2,500,000 | 2,681,550 |
| Public Gas Partners, Inc., | | | | |
| Gas Project Revenue (Gas | | | | |
| Supply Pool Number 1) | 5.00 | 10/1/16 | 2,800,000 | 2,990,652 |
| Illinois—8.0% | | | | |
| Chicago, | | | | |
| Customer Facility Charge | | | | |
| Senior Lien Revenue (Chicago | | | | |
| O’Hare International Airport) | 5.00 | 1/1/18 | 1,105,000 | 1,211,920 |
| Chicago, | | | | |
| General Airport Senior Lien | | | | |
| Revenue (Chicago O’Hare | | | | |
| International Airport) | 5.00 | 1/1/17 | 4,350,000 | 4,669,986 |
| Illinois, | | | | |
| Sales Tax Revenue (Build | | | | |
| Illinois Bonds) | 5.00 | 6/15/17 | 5,570,000 | 6,093,302 |
| Illinois, | | | | |
| Sales Tax Revenue (Build | | | | |
| Illinois Bonds) (Insured; | | | | |
| National Public Finance | | | | |
| Guarantee Corp.) | 5.75 | 6/15/18 | 2,930,000 | 3,351,979 |
| Illinois Department of | | | | |
| Employment Security, | | | | |
| Unemployment Insurance | | | | |
| Fund Building | | | | |
| Receipts Revenue | 5.00 | 6/15/16 | 1,550,000 | 1,637,746 |
The Fund 11
STATEMENT OF INVESTMENTS (continued)
| | | | |
| Long-Term Municipal | Coupon | Maturity | Principal | |
| Investments (continued) | Rate (%) | Date | Amount ($) | Value ($) |
| Illinois (continued) | | | | |
| Illinois Finance Authority, | | | | |
| Revenue (The University of | | | | |
| Chicago) | 5.00 | 10/1/20 | 1,200,000 | 1,420,224 |
| Illinois Finance Authority, | | | | |
| Revenue (The University of | | | | |
| Chicago Medical Center) | 5.00 | 8/15/16 | 2,105,000 | 2,234,226 |
| Kane County Forest Preserve | | | | |
| District, GO | 4.00 | 12/15/16 | 6,000,000 | 6,338,340 |
| Railsplitter Tobacco Settlement | | | | |
| Authority, Tobacco | | | | |
| Settlement Revenue | 5.00 | 6/1/18 | 5,500,000 | 6,114,130 |
| Indiana—.8% | | | | |
| Richmond Hospital Authority, | | | | |
| Revenue (Reid Hospital Project) | 5.00 | 1/1/20 | 1,000,000 | 1,153,160 |
| Rockport, | | | | |
| PCR (Indiana Michigan Power | | | | |
| Company Project) | 1.75 | 6/1/18 | 2,000,000 | 2,012,200 |
| Kansas—.3% | | | | |
| Kansas Turnpike Authority, | | | | |
| Turnpike Revenue | 5.00 | 9/1/17 | 1,255,000 | 1,384,278 |
| Louisiana—1.4% | | | | |
| East Baton Rouge Sewerage | | | | |
| Commission, Revenue | 5.00 | 2/1/20 | 1,000,000 | 1,167,010 |
| Tobacco Settlement Financing | | | | |
| Corporation of Louisiana, | | | | |
| Tobacco Settlement | | | | |
| Asset-Backed Bonds | 5.00 | 5/15/18 | 4,250,000 | 4,739,940 |
| Maryland—1.5% | | | | |
| Maryland, | | | | |
| GO (State and Local | | | | |
| Facilities Loan) | 5.25 | 8/1/20 | 5,000,000 | 6,009,350 |
| Massachusetts—1.1% | | | | |
| Massachusetts Development Finance | | | | |
| Agency, Revenue (Tufts Medical | | | | |
| Center Issue) | 5.00 | 1/1/16 | 650,000 | 669,890 |
| Massachusetts Municipal Wholesale | | | | |
| Electric Company, Power Supply | | | | |
| Project Revenue (Project | | | | |
| Number 6 Issue) | 5.00 | 7/1/16 | 3,700,000 | 3,914,378 |
12
| | | | |
| Long-Term Municipal | Coupon | Maturity | Principal | |
| Investments (continued) | Rate (%) | Date | Amount ($) | Value ($) |
| Michigan—6.0% | | | | |
| Michigan, | | | | |
| State Trunk Line Revenue | 5.00 | 11/15/17 | 3,830,000 | 4,250,802 |
| Michigan Finance Authority, | | | | |
| Local Government Loan Program | | | | |
| Revenue (Detroit Water and | | | | |
| Sewerage Department, Water | | | | |
| Supply System Revenue Senior | | | | |
| Lien Local Project Bonds) | | | | |
| (Insured; Assured Guaranty | | | | |
| Municipal Corp.) | 5.00 | 7/1/20 | 1,000,000 | 1,145,020 |
| Michigan Finance Authority, | | | | |
| Local Government Loan Program | | | | |
| Revenue (School District of | | | | |
| the City of Detroit State | | | | |
| Qualified Unlimited Tax GO | | | | |
| Local Project Bonds) | 5.00 | 5/1/19 | 4,250,000 | 4,801,565 |
| Michigan Finance Authority, | | | | |
| Revenue (School District of | | | | |
| the City of Detroit) | 5.00 | 6/1/17 | 3,000,000 | 3,192,570 |
| Michigan Finance Authority, | | | | |
| State Aid Revenue | | | | |
| (School District of the | | | | |
| City of Detroit) | 2.85 | 8/20/15 | 4,100,000 | 4,116,933 |
| Michigan Finance Authority, | | | | |
| Student Loan Revenue | 5.00 | 11/1/19 | 1,600,000 | 1,787,824 |
| Wayne County Airport Authority, | | | | |
| Airport Revenue (Detroit | | | | |
| Metropolitan Wayne | | | | |
| County Airport) | 5.00 | 12/1/19 | 5,000,000 | 5,737,100 |
| Minnesota—1.8% | | | | |
| Minnesota, | | | | |
| State General Fund | | | | |
| Appropriation Bonds | 5.00 | 3/1/17 | 5,470,000 | 5,931,340 |
| University of Minnesota Regents, | | | | |
| GO | 5.00 | 12/1/16 | 1,520,000 | 1,635,961 |
| Missouri—2.9% | | | | |
| Missouri Development Finance | | | | |
| Board, Infrastructure | | | | |
| Facilities Revenue (Branson | | | | |
| Landing Project) | 5.00 | 6/1/20 | 3,630,000 | 4,221,508 |
The Fund 13
STATEMENT OF INVESTMENTS (continued)
| | | | | |
| Long-Term Municipal | Coupon | Maturity | Principal | | |
| Investments (continued) | Rate (%) | Date | Amount ($) | | Value ($) |
| Missouri (continued) | | | | | |
| Missouri Joint Municipal Electric | | | | | |
| Utility Commission, Power | | | | | |
| Project Revenue | | | | | |
| (Iatan 2 Project) | 4.00 | 1/1/19 | 1,500,000 | | 1,647,735 |
| Missouri Joint Municipal Electric | | | | | |
| Utility Commission, Power | | | | | |
| Project Revenue (Prairie | | | | | |
| State Project) | 5.00 | 12/1/19 | 2,335,000 | | 2,705,168 |
| Springfield Public Utilities | | | | | |
| Board, COP (Lease/Purchase | | | | | |
| Agreement) | 5.00 | 12/1/16 | 3,000,000 | | 3,226,800 |
| Nebraska—.9% | | | | | |
| Omaha Public Power District, | | | | | |
| Electric System Revenue | 5.00 | 2/1/19 | 3,150,000 | | 3,602,151 |
| Nevada—2.0% | | | | | |
| Nevada, | | | | | |
| Highway Revenue (Motor Vehicle | | | | | |
| Fuel Tax) | 4.00 | 12/1/17 | 5,000,000 | | 5,433,200 |
| Nevada, | | | | | |
| Unemployment Compensation | | | | | |
| Fund Special Revenue | 5.00 | 6/1/18 | 2,500,000 | | 2,790,550 |
| New Jersey—1.1% | | | | | |
| New Jersey Economic Development | | | | | |
| Authority, Cigarette | | | | | |
| Tax Revenue | 5.00 | 6/15/17 | 2,000,000 | | 2,164,020 |
| New Jersey Turnpike Authority, | | | | | |
| Turnpike Revenue | 0.57 | 1/1/18 | 2,500,000 | a | 2,503,975 |
| New Mexico—1.8% | | | | | |
| Albuquerque Bernalillo County | | | | | |
| Water Utility Authority, | | | | | |
| Senior Lien Joint Water and | | | | | |
| Sewer System Revenue | 5.00 | 7/1/20 | 1,675,000 | | 1,986,182 |
| New Mexico Municipal Energy | | | | | |
| Acquisition Authority, Gas | | | | | |
| Supply Revenue | 0.64 | 8/1/17 | 5,395,000 | a | 5,417,875 |
| New York—20.4% | | | | | |
| Metropolitan Transportation | | | | | |
| Authority, Transportation | | | | | |
| Revenue | 5.00 | 11/15/16 | 5,000,000 | | 5,367,500 |
14
| | | | |
| Long-Term Municipal | Coupon | Maturity | Principal | |
| Investments (continued) | Rate (%) | Date | Amount ($) | Value ($) |
| New York (continued) | | | | |
| Metropolitan Transportation | | | | |
| Authority, Transportation | | | | |
| Revenue | 5.00 | 11/15/16 | 1,000,000 | 1,073,500 |
| Metropolitan Transportation | | | | |
| Authority, Transportation | | | | |
| Revenue | 5.00 | 11/15/17 | 1,500,000 | 1,663,560 |
| Metropolitan Transportation | | | | |
| Authority, Transportation | | | | |
| Revenue | 5.00 | 11/15/18 | 1,000,000 | 1,136,960 |
| Metropolitan Transportation | | | | |
| Authority, Transportation | | | | |
| Revenue | 5.00 | 11/15/19 | 4,330,000 | 5,028,472 |
| Metropolitan Transportation | | | | |
| Authority, Transportation | | | | |
| Revenue | 5.00 | 11/15/20 | 1,500,000 | 1,772,610 |
| New York City, | | | | |
| GO | 5.00 | 8/1/18 | 6,500,000 | 7,328,035 |
| New York City, | | | | |
| GO | 5.00 | 8/1/19 | 5,750,000 | 6,622,447 |
| New York City Industrial | | | | |
| Development Agency, | | | | |
| Senior Airport Facilities | | | | |
| Revenue (Transportation | | | | |
| Infrastructure Properties, LLC | | | | |
| Obligated Group) | 5.00 | 7/1/17 | 2,000,000 | 2,152,400 |
| New York City Transitional Finance | | | | |
| Authority, Future Tax Secured | | | | |
| Subordinate Revenue | 5.00 | 11/1/16 | 4,045,000 | 4,344,937 |
| New York City Transitional Finance | | | | |
| Authority, Future Tax Secured | | | | |
| Subordinate Revenue (Escrowed | | | | |
| to Maturity) | 5.00 | 11/1/16 | 955,000 | 1,024,486 |
| New York City Transitional Finance | | | | |
| Authority, Future Tax Secured | | | | |
| Subordinate Revenue (Escrowed | | | | |
| to Maturity) | 5.00 | 5/1/17 | 5,000,000 | 5,456,800 |
| New York City Transitional Finance | | | | |
| Authority, Revenue (New York | | | | |
| City Recovery) | 5.00 | 11/1/17 | 6,050,000 | 6,710,599 |
The Fund 15
STATEMENT OF INVESTMENTS (continued)
| | | | | |
| Long-Term Municipal | Coupon | Maturity | Principal | | |
| Investments (continued) | Rate (%) | Date | Amount ($) | | Value ($) |
| New York (continued) | | | | | |
| New York State Dormitory | | | | | |
| Authority, Revenue (State | | | | | |
| University of New York | | | | | |
| Dormitory Facilities) | 5.00 | 7/1/18 | 1,750,000 | | 1,974,472 |
| New York State Dormitory | | | | | |
| Authority, School Districts | | | | | |
| Revenue (Bond Financing Program) | 5.00 | 10/1/16 | 2,825,000 | | 3,019,360 |
| New York State Dormitory | | | | | |
| Authority, State Personal | | | | | |
| Income Tax Revenue | | | | | |
| (General Purpose) | 5.00 | 3/15/17 | 5,000,000 | | 5,432,850 |
| New York State Dormitory | | | | | |
| Authority, State Personal | | | | | |
| Income Tax Revenue | | | | | |
| (General Purpose) | 5.00 | 2/15/19 | 2,500,000 | | 2,855,300 |
| New York State Dormitory | | | | | |
| Authority, State Personal | | | | | |
| Income Tax Revenue | | | | | |
| (General Purpose) | 5.00 | 2/15/19 | 3,535,000 | | 4,037,394 |
| New York State Thruway Authority, | | | | | |
| General Revenue Junior | | | | | |
| Indebtedness Obligations | 5.00 | 5/1/19 | 3,000,000 | | 3,434,250 |
| Port Authority of New York and New | | | | | |
| Jersey (Consolidated Bonds, | | | | | |
| 175th Series) | 5.00 | 12/1/17 | 3,000,000 | | 3,340,170 |
| Port Authority of New York and New | | | | | |
| Jersey (Consolidated Bonds, | | | | | |
| 185th Series) | 5.00 | 9/1/20 | 3,400,000 | | 3,958,382 |
| Triborough Bridge and Tunnel | | | | | |
| Authority, General Revenue | | | | | |
| (MTA Bridges and Tunnels) | 4.00 | 11/15/17 | 1,500,000 | | 1,626,960 |
| Triborough Bridge and Tunnel | | | | | |
| Authority, General Revenue | | | | | |
| (MTA Bridges and Tunnels) | 0.47 | 12/3/19 | 5,000,000 | a | 5,002,700 |
| North Carolina—1.2% | | | | | |
| North Carolina Municipal Power | | | | | |
| Agency, Catawba Electric Revenue | 4.00 | 1/1/18 | 4,480,000 | | 4,849,958 |
| Ohio—1.0% | | | | | |
| Ohio, | | | | | |
| Common Schools GO Bonds | 5.00 | 3/15/17 | 4,000,000 | | 4,346,040 |
16
| | | | |
| Long-Term Municipal | Coupon | Maturity | Principal | |
| Investments (continued) | Rate (%) | Date | Amount ($) | Value ($) |
| Pennsylvania—3.6% | | | | |
| Allegheny County Airport | | | | |
| Authority, Airport Revenue | | | | |
| (Pittsburgh International | | | | |
| Airport) (Insured; Assured | | | | |
| Guaranty Municipal Corp.) | 5.00 | 1/1/16 | 1,750,000 | 1,810,760 |
| Beaver County Hospital Authority, | | | | |
| Revenue (Heritage Valley | | | | |
| Health System, Inc.) | 5.00 | 5/15/15 | 1,000,000 | 1,005,870 |
| Pennsylvania Economic | | | | |
| Development Financing | | | | |
| Authority, Unemployment | | | | |
| Compensation Revenue | 5.00 | 7/1/17 | 10,835,000 | 11,906,473 |
| Rhode Island—.6% | | | | |
| Tobacco Settlement Financing | | | | |
| Corporation of Rhode Island, | | | | |
| Tobacco Settlement | | | | |
| Asset-Backed Bonds | 5.00 | 6/1/20 | 2,020,000 | 2,358,956 |
| Tennessee—.4% | | | | |
| Tennessee State School Bond | | | | |
| Authority, Higher Educational | | | | |
| Facilities Second Program Bonds | 5.00 | 11/1/19 | 1,350,000 | 1,577,839 |
| Texas—12.0% | | | | |
| Arlington Independent School | | | | |
| District, Unlimited Tax School | | | | |
| Building Bonds (Permanent | | | | |
| School Fund Guarantee Program) | 5.00 | 2/15/19 | 1,295,000 | 1,481,687 |
| Dallas and Fort Worth, | | | | |
| Joint Revenue (Dallas/Fort | | | | |
| Worth International Airport) | 5.00 | 11/1/17 | 7,400,000 | 8,181,440 |
| Dallas and Fort Worth, | | | | |
| Joint Revenue (Dallas/Fort | | | | |
| Worth International Airport) | 5.00 | 11/1/18 | 1,000,000 | 1,133,990 |
| Dallas Independent School | | | | |
| District, Unlimited Tax Bonds | | | | |
| (Permanent School Fund | | | | |
| Guarantee Program) | 5.00 | 8/15/17 | 1,995,000 | 2,197,732 |
| Dickinson Independent School | | | | |
| District, Unlimited Tax Bonds | | | | |
| (Permanent School Fund | | | | |
| Guarantee Program) | 5.00 | 2/15/20 | 3,260,000 | 3,813,385 |
The Fund 17
STATEMENT OF INVESTMENTS (continued)
| | | | |
| Long-Term Municipal | Coupon | Maturity | Principal | |
| Investments (continued) | Rate (%) | Date | Amount ($) | Value ($) |
| Texas (continued) | | | | |
| Harris County-Houston Sports | | | | |
| Authority, Senior Lien Revenue | 5.00 | 11/15/19 | 1,500,000 | 1,733,040 |
| Houston, | | | | |
| Combined Utility System First | | | | |
| Lien Revenue | 5.00 | 11/15/19 | 1,380,000 | 1,607,493 |
| Houston, | | | | |
| Public Improvement GO | 5.00 | 3/1/18 | 5,000,000 | 5,592,500 |
| Houston, | | | | |
| Public Improvement GO | 5.00 | 3/1/20 | 2,800,000 | 3,284,148 |
| Lake Travis Independent School | | | | |
| District, Unlimited Tax School | | | | |
| Building Bonds (Permanent | | | | |
| School Fund Guarantee Program) | 4.00 | 2/15/18 | 4,640,000 | 5,047,949 |
| Love Field Airport Modernization | | | | |
| Corporation, Special | | | | |
| Facilities Revenue (Southwest | | | | |
| Airlines Company—Love Field | | | | |
| Modernization Program Project) | 5.00 | 11/1/16 | 2,340,000 | 2,483,606 |
| North Texas Tollway Authority, | | | | |
| First Tier System Revenue | 5.00 | 1/1/20 | 2,000,000 | 2,325,720 |
| Sam Rayburn Municipal Power | | | | |
| Agency, Power Supply | | | | |
| System Revenue | 5.00 | 10/1/16 | 1,000,000 | 1,064,820 |
| San Antonio, | | | | |
| Electric and Gas Systems | | | | |
| Junior Lien Revenue | 5.00 | 2/1/20 | 6,000,000 | 7,025,280 |
| San Antonio, | | | | |
| Water System Junior | | | | |
| Lien Revenue | 5.00 | 5/15/19 | 1,000,000 | 1,150,870 |
18
| | | | |
| Long-Term Municipal | Coupon | Maturity | Principal | |
| Investments (continued) | Rate (%) | Date | Amount ($) | Value ($) |
| Texas (continued) | | | | |
| Tarrant Regional Water District, A | | | | |
| Water Control and Improvement | | | | |
| District, Water Revenue | 5.00 | 3/1/17 | 1,360,000 | 1,474,702 |
| Utah—2.4% | | | | |
| Intermountain Power Agency, | | | | |
| Subordinated Power | | | | |
| Supply Revenue | 4.00 | 7/1/17 | 7,000,000 | 7,519,610 |
| Intermountain Power Agency, | | | | |
| Subordinated Power | | | | |
| Supply Revenue | 5.00 | 7/1/19 | 2,000,000 | 2,306,760 |
| Virginia—2.2% | | | | |
| Virginia Commonwealth | | | | |
| Transportation Board, Federal | | | | |
| Transportation Grant | | | | |
| Anticipation Revenue Notes | 5.00 | 9/15/16 | 3,195,000 | 3,409,800 |
| Virginia Public School Authority, | | | | |
| School Technology and | | | | |
| Security Notes | 5.00 | 4/15/18 | 5,000,000 | 5,614,250 |
| Washington—4.3% | | | | |
| Energy Northwest, | | | | |
| Electric Revenue (Columbia | | | | |
| Generating Station) | 5.00 | 7/1/18 | 5,000,000 | 5,641,350 |
| Seattle, | | | | |
| Municipal Light and Power | | | | |
| Improvement Revenue | 5.00 | 6/1/17 | 1,950,000 | 2,133,729 |
| Tobacco Settlement Authority of | | | | |
| Washington, Tobbaco | | | | |
| Settlement Revenue | 5.00 | 6/1/18 | 3,650,000 | 4,073,181 |
The Fund 19
STATEMENT OF INVESTMENTS (continued)
| | | | | |
| Long-Term Municipal | Coupon | Maturity | Principal | | |
| Investments (continued) | Rate (%) | Date | Amount ($) | | Value ($) |
| Washington (continued) | | | | | |
| Washington, | | | | | |
| GO (Various Purpose) | 5.00 | 2/1/18 | 5,245,000 | | 5,854,784 |
| Wisconsin—.8% | | | | | |
| Wisconsin, | | | | | |
| GO | 5.00 | 5/1/19 | 3,000,000 | | 3,455,550 |
| Total Investments (cost $403,242,255) | | 98.3 | % | 406,662,822 |
| Cash and Receivables (Net) | | | 1.7 | % | 6,887,340 |
| Net Assets | | | 100.0 | % | 413,550,162 |
| a Variable rate security—interest rate subject to periodic change. | | | | |
| | | |
| Portfolio Summary (Unaudited)† | | |
| |
| | Value (%) | | Value (%) |
| Transportation Services | 21.1 | Utility-Water and Sewer | 5.3 |
| Utility-Electric | 13.4 | County | 4.0 |
| Special Tax | 11.9 | Health Care | 1.8 |
| Education | 11.0 | Lease | .9 |
| State/Territory | 7.0 | Other | 16.5 |
| City | 5.4 | | 98.3 |
| |
| † Based on net assets. | | | |
20
| | | |
| Summary of Abbreviations | | |
| |
| ABAG | Association of Bay Area | ACA | American Capital Access |
| | Governments | | |
| AGC | ACE Guaranty Corporation | AGIC | Asset Guaranty Insurance Company |
| AMBAC | American Municipal Bond | ARRN | Adjustable Rate |
| | Assurance Corporation | | Receipt Notes |
| BAN | Bond Anticipation Notes | BPA | Bond Purchase Agreement |
| CIFG | CDC Ixis Financial Guaranty | COP | Certificate of Participation |
| CP | Commercial Paper | DRIVERS | Derivative Inverse |
| | | | Tax-Exempt Receipts |
| EDR | Economic Development | EIR | Environmental Improvement |
| | Revenue | | Revenue |
| FGIC | Financial Guaranty | FHA | Federal Housing |
| | Insurance Company | | Administration |
| FHLB | Federal Home | FHLMC | Federal Home Loan Mortgage |
| | Loan Bank | | Corporation |
| FNMA | Federal National | GAN | Grant Anticipation Notes |
| | Mortgage Association | | |
| GIC | Guaranteed Investment | GNMA | Government National Mortgage |
| | Contract | | Association |
| GO | General Obligation | HR | Hospital Revenue |
| IDB | Industrial Development Board | IDC | Industrial Development Corporation |
| IDR | Industrial Development | LIFERS | Long Inverse Floating |
| | Revenue | | Exempt Receipts |
| LOC | Letter of Credit | LOR | Limited Obligation Revenue |
| LR | Lease Revenue | MERLOTS | Municipal Exempt Receipts |
| | | | Liquidity Option Tender |
| MFHR | Multi-Family Housing Revenue | MFMR | Multi-Family Mortgage Revenue |
| PCR | Pollution Control Revenue | P-FLOATS Puttable Floating Option |
| | | | Tax-Exempt Receipts |
| PILOT | Payment in Lieu of Taxes | PUTTERS | Puttable Tax-Exempt Receipts |
| RAC | Revenue Anticipation Certificates | RAN | Revenue Anticipation Notes |
| RAW | Revenue Anticipation Warrants | RIB | Residual Interest Bonds |
| ROCS | Reset Option Certificates | RRR | Resources Recovery Revenue |
| SAAN | State Aid Anticipation Notes | SBPA | Standby Bond Purchase Agreement |
| SFHR | Single Family Housing Revenue | SFMR | Single Family Mortgage Revenue |
| SONYMA | State of New York | SPEARS | Short Puttable Exempt |
| | Mortgage Agency | | Adjustable Receipts |
| SWDR | Solid Waste Disposal Revenue | TAN | Tax Anticipation Notes |
| TAW | Tax Anticipation Warrants | TRAN | Tax and Revenue Anticipation Notes |
| XLCA | XL Capital Assurance | | |
| |
| See notes to financial statements. | | |
The Fund 21
STATEMENT OF ASSETS AND LIABILITIES
March 31, 2015
| | |
| | Cost | Value |
| Assets ($): | | |
| Investments in securities—See Statement of Investments | 403,242,255 | 406,662,822 |
| Cash | | 3,083,515 |
| Interest receivable | | 4,766,512 |
| Receivable for investment securities sold | | 2,183,953 |
| Receivable for shares of Beneficial Interest subscribed | | 33,340 |
| Prepaid expenses | | 33,420 |
| | | 416,763,562 |
| Liabilities ($): | | |
| Due to The Dreyfus Corporation and affiliates—Note 3(c) | | 192,627 |
| Payable for investment securities purchased | | 2,682,285 |
| Payable for shares of Beneficial Interest redeemed | | 254,367 |
| Accrued expenses | | 84,121 |
| | | 3,213,400 |
| Net Assets ($) | | 413,550,162 |
| Composition of Net Assets ($): | | |
| Paid-in capital | | 409,361,016 |
| Accumulated net realized gain (loss) on investments | | 768,579 |
| Accumulated net unrealized appreciation | | |
| (depreciation) on investments | | 3,420,567 |
| Net Assets ($) | | 413,550,162 |
| | | | |
| Net Asset Value Per Share | | | | |
| | Class A | Class D | Class I | Class Y |
| Net Assets ($) | 40,721,360 | 334,580,389 | 38,153,508 | 94,905 |
| Shares Outstanding | 3,127,572 | 25,702,390 | 2,929,986 | 7,288 |
| Net Asset Value Per Share ($) | 13.02 | 13.02 | 13.02 | 13.02 |
| See notes to financial statements. | | | | |
22
STATEMENT OF OPERATIONS
Year Ended March 31, 2015
| | |
| Investment Income ($): | | |
| Interest Income | 5,890,127 | |
| Expenses: | | |
| Management fee—Note 3(a) | 2,208,218 | |
| Distribution fees—Note 3(b) | 357,527 | |
| Shareholder servicing costs—Note 3(c) | 247,300 | |
| Trustees’ fees and expenses—Note 3(d) | 117,705 | |
| Professional fees | 87,864 | |
| Registration fees | 76,639 | |
| Custodian fees—Note 3(c) | 38,653 | |
| Prospectus and shareholders’ reports | 21,766 | |
| Loan commitment fees—Note 2 | 4,229 | |
| Miscellaneous | 45,238 | |
| Total Expenses | 3,205,139 | |
| Less—reduction in expenses due to undertaking—Note 3(a) | (568,812 | ) |
| Less—reduction in fees due to earnings credits—Note 3(c) | (132 | ) |
| Net Expenses | 2,636,195 | |
| Investment Income—Net | 3,253,932 | |
| Realized and Unrealized Gain (Loss) on Investments—Note 4 ($): | | |
| Net realized gain (loss) on investments | 2,058,269 | |
| Net unrealized appreciation (depreciation) on investments | (779,943 | ) |
| Net Realized and Unrealized Gain (Loss) on Investments | 1,278,326 | |
| Net Increase in Net Assets Resulting from Operations | 4,532,258 | |
| |
| See notes to financial statements. | | |
The Fund 23
STATEMENT OF CHANGES IN NET ASSETS
| | | | |
| | | | Year Ended March 31, | |
| | 2015 | | 2014 | a |
| Operations ($): | | | | |
| Investment income—net | 3,253,932 | | 4,869,610 | |
| Net realized gain (loss) on investments | 2,058,269 | | 3,594,107 | |
| Net unrealized appreciation | | | | |
| (depreciation) on investments | (779,943 | ) | (6,317,655 | ) |
| Net Increase (Decrease) in Net Assets | | | | |
| Resulting from Operations | 4,532,258 | | 2,146,062 | |
| Dividends to Shareholders from ($): | | | | |
| Investment income—net: | | | | |
| Class A | (257,320 | ) | (493,768 | ) |
| Class D | (2,625,595 | ) | (4,103,590 | ) |
| Class I | (330,488 | ) | (309,979 | ) |
| Class Y | (795 | ) | (9 | ) |
| Net realized gain on investments: | | | | |
| Class A | (220,747 | ) | (507,717 | ) |
| Class D | (1,715,873 | ) | (3,580,425 | ) |
| Class I | (208,564 | ) | (235,946 | ) |
| Class Y | (483 | ) | (9 | ) |
| Total Dividends | (5,359,865 | ) | (9,231,443 | ) |
| Beneficial Interest Transactions ($): | | | | |
| Net proceeds from shares sold: | | | | |
| Class A | 14,198,442 | | 34,196,464 | |
| Class D | 60,289,058 | | 111,679,891 | |
| Class I | 17,002,105 | | 24,088,649 | |
| Class Y | 184,059 | | 1,000 | |
| Dividends reinvested: | | | | |
| Class A | 382,133 | | 693,286 | |
| Class D | 3,997,128 | | 7,091,946 | |
| Class I | 353,312 | | 343,872 | |
| Class Y | 425 | | — | |
| Cost of shares redeemed: | | | | |
| Class A | (23,677,822 | ) | (46,004,442 | ) |
| Class D | (115,031,435 | ) | (203,790,036 | ) |
| Class I | (15,242,660 | ) | (18,153,720 | ) |
| Class Y | (90,184 | ) | — | |
| Increase (Decrease) in Net Assets from | | | | |
| Beneficial Interest Transactions | (57,635,439 | ) | (89,853,090 | ) |
| Total Increase (Decrease) in Net Assets | (58,463,046 | ) | (96,938,471 | ) |
| Net Assets ($): | | | | |
| Beginning of Period | 472,013,208 | | 568,951,679 | |
| End of Period | 413,550,162 | | 472,013,208 | |
24
| | | | |
| | | | Year Ended March 31, | |
| | 2015 | | 2014 | a |
| Capital Share Transactions: | | | | |
| Class A | | | | |
| Shares sold | 1,085,363 | | 2,602,514 | |
| Shares issued for dividends reinvested | 29,289 | | 52,975 | |
| Shares redeemed | (1,811,300 | ) | (3,508,013 | ) |
| Net Increase (Decrease) in Shares Outstanding | (696,648 | ) | (852,524 | ) |
| Class D | | | | |
| Shares sold | 4,607,926 | | 8,509,132 | |
| Shares issued for dividends reinvested | 306,288 | | 541,819 | |
| Shares redeemed | (8,789,709 | ) | (15,523,913 | ) |
| Net Increase (Decrease) in Shares Outstanding | (3,875,495 | ) | (6,472,962 | ) |
| Class Ib | | | | |
| Shares sold | 1,298,406 | | 1,835,787 | |
| Shares issued for dividends reinvested | 27,067 | | 26,261 | |
| Shares redeemed | (1,165,903 | ) | (1,382,275 | ) |
| Net Increase (Decrease) in Shares Outstanding | 159,570 | | 479,773 | |
| Class Yb | | | | |
| Shares sold | 14,053 | | 76.45 | |
| Shares issued for dividends reinvested | 33 | | — | |
| Shares redeemed | (6,874 | ) | — | |
| Net Increase (Decrease) in Shares Outstanding | 7,212 | | 76.45 | |
| |
| a | Effective July 1, 2013, the fund commenced offering ClassY shares. |
| b | During the period ended March 31, 2015, 3,865 Class I shares representing $50,638 were exchanged for 3,865 |
| | ClassY shares. |
| See notes to financial statements. |
The Fund 25
FINANCIAL HIGHLIGHTS
The following tables describe the performance for each share class for the fiscal periods indicated. All information (except portfolio turnover rate) reflects financial results for a single fund share.Total return shows how much your investment in the fund would have increased (or decreased) during each period, assuming you had reinvested all dividends and distributions.These figures have been derived from the fund’s financial statements.
| | | | | | | | | | |
| | | | Year Ended March 31, | | | |
| Class A Shares | 2015 | | 2014 | | 2013 | | 2012 | | 2011 | |
| Per Share Data ($): | | | | | | | | | | |
| Net asset value, beginning of period | 13.05 | | 13.23 | | 13.28 | | 13.08 | | 13.09 | |
| Investment Operations: | | | | | | | | | | |
| Investment income—neta | .08 | | .11 | | .14 | | .19 | | .23 | |
| Net realized and unrealized | | | | | | | | | | |
| gain (loss) on investments | .04 | | (.06 | ) | .02 | | .20 | | (.01 | ) |
| Total from Investment Operations | .12 | | .05 | | .16 | | .39 | | .22 | |
| Distributions: | | | | | | | | | | |
| Dividends from investment income—net | (.08 | ) | (.11 | ) | (.14 | ) | (.19 | ) | (.23 | ) |
| Dividends from net realized | | | | | | | | | | |
| gain on investments | (.07 | ) | (.12 | ) | (.07 | ) | — | | — | |
| Total Distributions | (.15 | ) | (.23 | ) | (.21 | ) | (.19 | ) | (.23 | ) |
| Net asset value, end of period | 13.02 | | 13.05 | | 13.23 | | 13.28 | | 13.08 | |
| Total Return (%)b | .87 | | .43 | | 1.13 | | 3.02 | | 1.68 | |
| Ratios/Supplemental Data (%): | | | | | | | | | | |
| Ratio of total expenses | | | | | | | | | | |
| to average net assets | .87 | | .84 | | .84 | | .84 | | .84 | |
| Ratio of net expenses | | | | | | | | | | |
| to average net assets | .74 | | .74 | | .79 | | .84 | | .84 | |
| Ratio of net investment income | | | | | | | | | | |
| to average net assets | .59 | | .82 | | 1.06 | | 1.47 | | 1.75 | |
| Portfolio Turnover Rate | 32.84 | | 34.38 | | 27.16 | | 30.99 | | 20.09 | |
| Net Assets, end of period ($ x 1,000) | 40,721 | | 49,911 | | 61,862 | | 47,011 | | 47,008 | |
| |
| a | Based on average shares outstanding. |
| b | Exclusive of sales charge. |
| See notes to financial statements. |
26
| | | | | | | | | | |
| | | | Year Ended March 31, | | | |
| Class D Shares | 2015 | | 2014 | | 2013 | | 2012 | | 2011 | |
| Per Share Data ($): | | | | | | | | | | |
| Net asset value, beginning of period | 13.05 | | 13.23 | | 13.27 | | 13.08 | | 13.09 | |
| Investment Operations: | | | | | | | | | | |
| Investment income—neta | .10 | | .13 | | .16 | | .21 | | .25 | |
| Net realized and unrealized | | | | | | | | | | |
| gain (loss) on investments | .04 | | (.06 | ) | .03 | | .19 | | (.01 | ) |
| Total from Investment Operations | .14 | | .07 | | .19 | | .40 | | .24 | |
| Distributions: | | | | | | | | | | |
| Dividends from investment income—net | (.10 | ) | (.13 | ) | (.16 | ) | (.21 | ) | (.25 | ) |
| Dividends from net realized | | | | | | | | | | |
| gain on investments | (.07 | ) | (.12 | ) | (.07 | ) | — | | — | |
| Total Distributions | (.17 | ) | (.25 | ) | (.23 | ) | (.21 | ) | (.25 | ) |
| Net asset value, end of period | 13.02 | | 13.05 | | 13.23 | | 13.27 | | 13.08 | |
| Total Return (%) | 1.02 | | .58 | | 1.36 | | 3.10 | | 1.84 | |
| Ratios/Supplemental Data (%): | | | | | | | | | | |
| Ratio of total expenses | | | | | | | | | | |
| to average net assets | .72 | | .70 | | .69 | | .69 | | .70 | |
| Ratio of net expenses | | | | | | | | | | |
| to average net assets | .59 | | .59 | | .64 | | .69 | | .70 | |
| Ratio of net investment income | | | | | | | | | | |
| to average net assets | .74 | | .97 | | 1.22 | | 1.61 | | 1.92 | |
| Portfolio Turnover Rate | 32.84 | | 34.38 | | 27.16 | | 30.99 | | 20.09 | |
| Net Assets, end of period ($ x 1,000) | 334,580 | | 385,943 | | 476,785 | | 488,869 | | 476,809 | |
| |
| a Based on average shares outstanding. | | | | | | | | | | |
| See notes to financial statements. | | | | | | | | | | |
The Fund 27
FINANCIAL HIGHLIGHTS (continued)
| | | | | | | | | | |
| | | | Year Ended March 31, | | | |
| Class I Shares | 2015 | | 2014 | | 2013 | | 2012 | | 2011 | |
| Per Share Data ($): | | | | | | | | | | |
| Net asset value, beginning of period | 13.05 | | 13.23 | | 13.28 | | 13.08 | | 13.09 | |
| Investment Operations: | | | | | | | | | | |
| Investment income—neta | .11 | | .14 | | .18 | | .23 | | .27 | |
| Net realized and unrealized | | | | | | | | | | |
| gain (loss) on investments | .04 | | (.06 | ) | .01 | | .19 | | (.01 | ) |
| Total from Investment Operations | .15 | | .08 | | .19 | | .42 | | .26 | |
| Distributions: | | | | | | | | | | |
| Dividends from investment income—net | (.11 | ) | (.14 | ) | (.17 | ) | (.22 | ) | (.27 | ) |
| Dividends from net realized | | | | | | | | | | |
| gain on investments | (.07 | ) | (.12 | ) | (.07 | ) | — | | — | |
| Total Distributions | (.18 | ) | (.26 | ) | (.24 | ) | (.22 | ) | (.27 | ) |
| Net asset value, end of period | 13.02 | | 13.05 | | 13.23 | | 13.28 | | 13.08 | |
| Total Return (%) | 1.12 | | .60 | | 1.46 | | 3.26 | | 1.96 | |
| Ratios/Supplemental Data (%): | | | | | | | | | | |
| Ratio of total expenses | | | | | | | | | | |
| to average net assets | .65 | | .63 | | .61 | | .60 | | .57 | |
| Ratio of net expenses | | | | | | | | | | |
| to average net assets | .49 | | .49 | | .55 | | .60 | | .57 | |
| Ratio of net investment income | | | | | | | | | | |
| to average net assets | .84 | | 1.06 | | 1.31 | | 1.70 | | 2.04 | |
| Portfolio Turnover Rate | 32.84 | | 34.38 | | 27.16 | | 30.99 | | 20.09 | |
| Net Assets, end of period ($ x 1,000) | 38,154 | | 36,159 | | 30,305 | | 31,427 | | 21,201 | |
| a Based on average shares outstanding. | | | | | | | | | | |
| See notes to financial statements. | | | | | | | | | | |
28
| | | | |
| | Year Ended March 31, | |
| Class Y Shares | 2015 | | 2014 | a |
| Per Share Data ($): | | | | |
| Net asset value, beginning of period | 13.05 | | 13.08 | |
| Investment Operations: | | | | |
| Investment income—netb | .11 | | .11 | |
| Net realized and unrealized gain (loss) on investments | .04 | | .09 | |
| Total from Investment Operations | .15 | | .20 | |
| Distributions: | | | | |
| Dividends from investment income—net | (.11 | ) | (.11 | ) |
| Dividends from net realized gain on investments | (.07 | ) | (.12 | ) |
| Total Distributions | (.18 | ) | (.23 | ) |
| Net asset value, end of period | 13.02 | | 13.05 | |
| Total Return (%) | 1.13 | | 1.53 | c |
| Ratios/Supplemental Data (%): | | | | |
| Ratio of total expenses | | | | |
| to average net assets | .70 | | .55 | d |
| Ratio of net expenses | | | | |
| to average net assets | .49 | | .49 | d |
| Ratio of net investment income | | | | |
| to average net assets | .83 | | 1.14 | d |
| Portfolio Turnover Rate | 32.84 | | 34.38 | |
| Net Assets, end of period ($ x 1,000) | 95 | | 1 | |
| |
| a | From July 1, 2013 (commencement of initial offering) to March 31, 2014. |
| b | Based on average shares outstanding. |
| c | Not annualized. |
| d | Annualized. |
| See notes to financial statements. |
The Fund 29
NOTES TO FINANCIAL STATEMENTS
NOTE 1—Significant Accounting Policies:
Dreyfus Short-Intermediate Municipal Bond Fund (the “fund”) is the sole series of Dreyfus Premier Short-Intermediate Municipal Bond Fund (the “Company”), which is registered under the Investment Company Act of 1940, as amended (the “Act”), as a non-diversified open-end management investment company. The fund’s investment objective is to maximize current income exempt from federal income tax to the extent consistent with the preservation of capital. The Dreyfus Corporation (the “Manager” or “Dreyfus”), a wholly-owned subsidiary of The Bank of New York Mellon Corporation (“BNY Mellon”), serves as the fund’s investment adviser.
MBSC Securities Corporation (the “Distributor”), a wholly-owned subsidiary of Dreyfus, is the distributor of the fund’s shares. The fund is authorized to issue an unlimited number of $.001 par value shares of Beneficial Interest in each of the following classes of shares: Class A, Class D, Class I and Class Y. Class A shares generally are subject to a sales charge imposed at the time of purchase. Class D shares are sold at net asset value per share directly by Dreyfus and through certain banks and fund supermarkets, and as a part of certain wrap-fee programs. Class I and Class Y shares are sold at net asset value per share generally to institutional investors. Other differences between the classes include the services offered to and the expenses borne by each class, the allocation of certain transfer agency costs, and certain voting rights. Income, expenses (other than expenses attributable to a specific class), and realized and unrealized gains or losses on investments are allocated to each class of shares based on its relative net assets.
The Financial Accounting Standards Board (“FASB”) Accounting Standards Codification (“ASC”) is the exclusive reference of authoritative U.S. generally accepted accounting principles (“GAAP”) recognized by the FASB to be applied by nongovernmental entities. Rules and interpretive releases of the Securities and Exchange Commission (“SEC”) under authority of federal laws are also sources of authoritative GAAP for SEC registrants. The fund’s financial statements are prepared in accor-
30
dance with GAAP, which may require the use of management estimates and assumptions. Actual results could differ from those estimates.
The Company enters into contracts that contain a variety of indemnifications. The fund’s maximum exposure under these arrangements is unknown.The fund does not anticipate recognizing any loss related to these arrangements.
(a) Portfolio valuation: The fair value of a financial instrument is the amount that would be received to sell an asset or paid to transfer a liability in an orderly transaction between market participants at the measurement date (i.e., the exit price). GAAP establishes a fair value hierarchy that prioritizes the inputs of valuation techniques used to measure fair value. This hierarchy gives the highest priority to unadjusted quoted prices in active markets for identical assets or liabilities (Level 1 measurements) and the lowest priority to unobservable inputs (Level 3 measurements).
Additionally, GAAP provides guidance on determining whether the volume and activity in a market has decreased significantly and whether such a decrease in activity results in transactions that are not orderly. GAAP requires enhanced disclosures around valuation inputs and techniques used during annual and interim periods.
Various inputs are used in determining the value of the fund’s investments relating to fair value measurements. These inputs are summarized in the three broad levels listed below:
Level 1—unadjusted quoted prices in active markets for identical investments.
Level 2—other significant observable inputs (including quoted prices for similar investments, interest rates, prepayment speeds, credit risk, etc.).
Level 3—significant unobservable inputs (including the fund’s own assumptions in determining the fair value of investments).
The Fund 31
NOTES TO FINANCIAL STATEMENTS (continued)
The inputs or methodology used for valuing securities are not necessarily an indication of the risk associated with investing in those securities.
Changes in valuation techniques may result in transfers in or out of an assigned level within the disclosure hierarchy. Valuation techniques used to value the fund’s investments are as follows:
Investments in securities are valued each business day by an independent pricing service (the “Service”) approved by the Company’s Board of Trustees (the “Board”). Investments for which quoted bid prices are readily available and are representative of the bid side of the market in the judgment of the Service are valued at the mean between the quoted bid prices (as obtained by the Service from dealers in such securities) and asked prices (as calculated by the Service based upon its evaluation of the market for such securities). Other investments (which constitute a majority of the portfolio securities) are carried at fair value as determined by the Service, based on methods which include consideration of the following: yields or prices of municipal securities of comparable quality, coupon, maturity and type; indications as to values from dealers; and general market conditions. All of the preceding securities are generally categorized within Level 2 of the fair value hierarchy.
The Service’s procedures are generally reviewed by Dreyfus under the general supervision of the Board.
When market quotations or official closing prices are not readily available, or are determined not to reflect accurately fair value, such as when the value of a security has been significantly affected by events after the close of the exchange or market on which the security is principally traded, but before the fund calculates its net asset value, the fund may value these investments at fair value as determined in accordance with the procedures approved by the Board. Certain factors may be considered when fair valuing investments such as: fundamental analytical data, the nature and duration of restrictions on disposition, an evaluation of the forces that influence the market in which the securities are purchased and sold, and public trading in similar securities of
32
the issuer or comparable issuers.These securities are either categorized within Level 2 or 3 of the fair value hierarchy depending on the relevant inputs used.
For restricted securities where observable inputs are limited, assumptions about market activity and risk are used and are generally categorized within Level 3 of the fair value hierarchy.
The following is a summary of the inputs used as of March 31, 2015 in valuing the fund’s investments:
| | | | |
| | | Level 2—Other | Level 3— | |
| | Level 1— | Significant | Significant | |
| | Unadjusted | Observable | Unobservable | |
| | Quoted Prices | Inputs | Inputs | Total |
| Assets ($) | | | | |
| Investments in Securities: | | | |
| Municipal Bonds† | — | 406,662,822 | — | 406,662,822 |
| † See Statement of Investments for additional detailed categorizations. | |
At March 31, 2015, there were no transfers between Level 1 and Level 2 of the fair value hierarchy.
(b) Securities transactions and investment income: Securities transactions are recorded on a trade date basis. Realized gains and losses from securities transactions are recorded on the identified cost basis. Interest income, adjusted for accretion of discount and amortization of premium on investments, is earned from settlement date and recognized on the accrual basis. Securities purchased or sold on a when issued or delayed delivery basis may be settled a month or more after the trade date.
(c) Dividends to shareholders: It is the policy of the fund to declare dividends daily from investment income-net. Such dividends are paid monthly. Dividends from net realized capital gains, if any, are normally declared and paid annually, but the fund may make distributions on a more frequent basis to comply with the distribution requirements of the Internal Revenue Code of 1986, as amended (the “Code”).To the extent that net realized capital gains can be offset by capital loss carry-
The Fund 33
NOTES TO FINANCIAL STATEMENTS (continued)
overs, it is the policy of the fund not to distribute such gains. Income and capital gain distributions are determined in accordance with income tax regulations, which may differ from GAAP.
(d) Federal income taxes: It is the policy of the fund to continue to qualify as a regulated investment company, which can distribute tax-exempt dividends, by complying with the applicable provisions of the Code, and to make distributions of income and net realized capital gain sufficient to relieve it from substantially all federal income and excise taxes.
As of and during the period ended March 31, 2015, the fund did not have any liabilities for any uncertain tax positions.The fund recognizes interest and penalties, if any, related to uncertain tax positions as income tax expense in the Statement of Operations. During the period ended March 31, 2015, the fund did not incur any interest or penalties.
Each tax year in the four-year period ended March 31, 2015 remains subject to examination by the Internal Revenue Service and state taxing authorities.
At March 31, 2015, the components of accumulated earnings on a tax basis were as follows: undistributed tax-exempt income $270,432, undistributed ordinary income $183,919, undistributed capital gains $584,660 and unrealized appreciation $3,420,567.
The tax character of distributions paid to shareholders during the fiscal periods ended March 31, 2015 and March 31, 2014 were as follows: tax-exempt income $3,214,198 and $4,907,346, ordinary income $48,323 and $25,563, and long-term capital gains $2,097,344 and $4,298,534, respectively.
During the period ended March 31, 2015, as a result of permanent book to tax differences, primarily due to the tax treatment for amortization adjustments, the fund decreased accumulated undistributed investment income-net by $39,734, increased accumulated net realized gain (loss) on investments by $33,274 and increased paid-in capital by $6,460. Net assets and net asset value per share were not affected by this reclassification.
34
NOTE 2—Bank Lines of Credit:
The fund participates with other Dreyfus-managed funds in a $430 million unsecured credit facility led by Citibank, N.A. and a $300 million unsecured credit facility provided by The Bank of New York Mellon, a subsidiary of BNY Mellon and an affiliate of Dreyfus (each, a “Facility”), each to be utilized primarily for temporary or emergency purposes, including the financing of redemptions. Prior to October 8, 2014, the unsecured credit facility with Citibank, N.A. was $265 million. In connection therewith, the fund has agreed to pay its pro rata portion of commitment fees for each Facility. Interest is charged to the fund based on rates determined pursuant to the terms of the respective Facility at the time of borrowing. During the period ended March 31, 2015, the fund did not borrow under the Facilities.
NOTE 3—Management Fee and Other Transactions with Affiliates:
(a) Pursuant to a management agreement with Dreyfus, the management fee is computed at the annual rate of .50% of the value of the fund’s average daily net assets and is payable monthly. Dreyfus has contractually agreed, from April 1, 2014 through August 1, 2015, to waive receipt of its fees and/or assume the expenses of the fund so that the expenses of none of the classes (excluding Rule 12b-1 Distribution Plan fees, Shareholder Services Plan fees, taxes, interest expense, brokerage commissions, commitment fees on borrowings and extraordinary expenses) exceed .49% of the value of the fund’s average daily net assets. The reduction in expenses, pursuant to the undertaking, amounted to $568,812 during the period ended March 31, 2015.
During the period ended March 31, 2015, the Distributor retained $1,088 from commissions earned on sales of the fund’s Class A shares.
(b) Under the Distribution Plan adopted pursuant to Rule 12b-1 under the Act, Class D shares pay the Distributor for distributing its shares at an annual rate of .10% of the value of its average daily net
The Fund 35
NOTES TO FINANCIAL STATEMENTS (continued)
assets. During the period ended March 31, 2015, Class D shares were charged $357,527, pursuant to the Distribution Plan.
(c) Under the Shareholder Services Plan, Class A shares pay the Distributor at an annual rate of .25% of the value of its average daily net assets for the provision of certain services. The services provided may include personal services relating to shareholder accounts, such as answering shareholder inquiries regarding the fund and providing reports and other information, and services related to the maintenance of shareholder accounts. The Distributor may make payments to Service Agents (securities dealers, financial institutions or other industry professionals) with respect to these services.The Distributor determines the amounts to be paid to Service Agents. During the period ended March 31, 2015, Class A shares were charged $110,386, pursuant to the Shareholder Services Plan.
The fund has arrangements with the transfer agent and the custodian whereby the fund may receive earnings credits when positive cash balances are maintained, which are used to offset transfer agency and custody fees. For financial reporting purposes, the fund includes net earnings credits as an expense offset in the Statement of Operations.
The fund compensates Dreyfus Transfer, Inc., a wholly-owned subsidiary of Dreyfus, under a transfer agency agreement for providing transfer agency and cash management services for the fund. The majority of transfer agency fees are comprised of amounts paid on a per account basis, while cash management fees are related to fund subscriptions and redemptions. During the period ended March 31, 2015, the fund was charged $61,365 for transfer agency services and $2,629 for cash management services. These fees are included in Shareholder servicing costs in the Statement of Operations. Cash management fees were partially offset by earnings credits of $132.
The fund compensates The Bank of New York Mellon under a custody agreement for providing custodial services for the fund. These fees are determined based on net assets, geographic region and transaction activity. During the period ended March 31, 2015, the fund was charged $38,653 pursuant to the custody agreement.
36
The fund compensates The Bank of New York Mellon for performing certain cash management services related to fund subscriptions and redemptions, including shareholder redemption draft processing, under a cash management agreement. During the period ended March 31, 2015, the fund was charged $1,949 pursuant to the agreement, which is included in Shareholder servicing costs in the Statement of Operations.
During the period ended March 31, 2015, the fund was charged $10,003 for services performed by the Chief Compliance Officer and his staff.
The components of “Due to The Dreyfus Corporation and affiliates” in the Statement of Assets and Liabilities consist of: management fees $176,709, Distribution Plan fees $28,538, Shareholder Services Plan fees $8,705, custodian fees $9,261, Chief Compliance Officer fees $2,867 and transfer agency fees $11,375, which are offset against an expense reimbursement currently in effect in the amount of $44,828.
(d) Each Board member also serves as a Board member of other funds within the Dreyfus complex. Annual retainer fees and attendance fees are allocated to each fund based on net assets.
NOTE 4—Securities Transactions:
The aggregate amount of purchases and sales of investment securities, excluding short-term securities, during the period ended March 31, 2015, amounted to $142,673,092 and $188,378,441, respectively.
At March 31, 2015, the cost of investments for federal income tax purposes was $403,242,255; accordingly, accumulated net unrealized appreciation on investments was $3,420,567, consisting of $3,509,813 gross unrealized appreciation and $89,246 gross unrealized depreciation.
The Fund 37
REPORT OF INDEPENDENT REGISTERED
PUBLIC ACCOUNTING FIRM
Shareholders and Board of Trustees
Dreyfus Short-Intermediate Municipal Bond Fund
We have audited the accompanying statement of assets and liabilities, including the statement of investments, of Dreyfus Short-Intermediate Municipal Bond Fund (the sole series comprising Dreyfus Premier Short-Intermediate Municipal Bond Fund) as of March 31, 2015, and the related statement of operations for the year then ended, the statement of changes in net assets for each of the two years in the period then ended, and the financial highlights for each of the periods indicated therein. These financial statements and financial highlights are the responsibility of the Fund’s management. Our responsibility is to express an opinion on these financial statements and financial highlights based on our audits.
We conducted our audits in accordance with the standards of the Public Company Accounting Oversight Board (United States).Those standards require that we plan and perform the audit to obtain reasonable assurance about whether the financial statements and financial highlights are free of material misstatement. We were not engaged to perform an audit of the Fund’s internal control over financial reporting. Our audits included consideration of internal control over financial reporting as a basis for designing audit procedures that are appropriate in the circumstances, but not for the purpose of expressing an opinion on the effectiveness of the Fund’s internal control over financial reporting. Accordingly, we express no such opinion. An audit also includes examining, on a test basis, evidence supporting the amounts and disclosures in the financial statements and financial highlights, assessing the accounting principles used and significant estimates made by management, and evaluating the overall financial statement presentation. Our procedures included confirmation of securities owned as of March 31, 2015 by correspondence with the custodian and others. We believe that our audits provide a reasonable basis for our opinion.
In our opinion, the financial statements and financial highlights referred to above present fairly, in all material respects, the financial position of Dreyfus Short-Intermediate Municipal Bond Fund at March 31, 2015, the results of its operations for the year then ended, the changes in its net assets for each of the two years in the period then ended, and the financial highlights for each of the indicated periods, in conformity with U.S. generally accepted accounting principles.

New York, New York
May 26, 2015
38
IMPORTANT TAX INFORMATION (Unaudited)
In accordance with federal tax law, the fund hereby reports all the dividends paid from investment income-net during the fiscal year ended March 31, 2015 as “exempt-interest dividends” (not generally subject to regular federal income tax). Where required by federal tax law rules, shareholders will receive notification of their portion of the fund’s taxable ordinary dividends (if any), capital gains distributions (if any) and tax-exempt dividends paid for the 2015 calendar year on Form 1099-DIV which will be mailed in early 2016. Also, the fund hereby reports $.0015 per share as a short-term capital gain distribution and $.0651 per share as a long-term capital gain distribution paid on December 18, 2014.
The Fund 39
BOARD MEMBERS INFORMATION (Unaudited)
INDEPENDENT BOARD MEMBERS
|
| Joseph S. DiMartino (71) |
| Chairman of the Board (1995) |
| Principal Occupation During Past 5Years: |
| • Corporate Director and Trustee (1995-present) |
| Other Public Company Board Memberships During Past 5Years: |
| • CBIZ (formerly, Century Business Services, Inc.), a provider of outsourcing functions for small |
| and medium size companies, Director (1997-present) |
| • The Newark Group, a provider of a national market of paper recovery facilities, paperboard mills |
| and paperboard converting plants, Director (2000-2010) |
| No. of Portfolios for which Board Member Serves: 147 |
| ——————— |
| Francine J. Bovich (63) |
| Board Member (2015)† |
| Principal Occupation During Past 5Years: |
| • Trustee,The Bradley Trusts, private trust funds (2011-present) |
| • Managing Director, Morgan Stanley Investment Management (1993-2010) |
| Other Public Company Board Membership During Past 5Years: |
| • Annaly Capital Management, Inc., Board Member (May 2014-present) |
| No. of Portfolios for which Board Member Serves: 84 |
| ——————— |
| Gordon J. Davis (73) |
| Board Member (2012) |
| Principal Occupation During Past 5Years: |
| • Partner in the law firm of Venable LLP (2012-present) |
| • Partner in the law firm of Dewey & LeBoeuf LLP (1994-2012) |
| Other Public Company Board Memberships During Past 5Years: |
| • Consolidated Edison, Inc., a utility company, Director (1997-2014) |
| • The Phoenix Companies, Inc., a life insurance company, Director (2000-2014) |
| No. of Portfolios for which Board Member Serves: 63 |
| |
| |
| † Francine J. Bovich was elected as a Board Member on April 30, 2015. |
40
|
| Nathan Leventhal (72) |
| Board Member (2009) |
| Principal Occupation During Past 5Years: |
| • President Emeritus of Lincoln Center for the Performing Arts (2001-present) |
| • Chairman of the Avery-Fisher Artist Program (1997-2014) |
| • Commissioner, NYC Planning Commission (2007-2011) |
| Other Public Company Board Membership During Past 5Years: |
| • Movado Group, Inc., Director (2003-present) |
| No. of Portfolios for which Board Member Serves: 52 |
| ——————— |
| Robin A. Melvin (51) |
| Board Member (2014) |
| Principal Occupation During Past 5Years: |
| • Co-chairman, Illinois Mentoring Partnership, non-profit organization dedicated to increasing the |
| quantity and quality of mentoring services in Illinois; (2014-present; board member since 2013) |
| • Director, Boisi Family Foundation, a private family foundation that supports youth-serving orga- |
| nizations that promote the self sufficiency of youth from disadvantaged circumstances (1995-2012) |
| No. of Portfolios for which Board Member Serves: 115 |
| ——————— |
| Roslyn M. Watson (65) |
| Board Member (2014) |
| Principal Occupation During Past 5Years: |
| • Principal,Watson Ventures, Inc., a real estate investment company (1993-present) |
| No. of Portfolios for which Board Member Serves: 70 |
| ——————— |
| Benaree Pratt Wiley (68) |
| Board Member (2009) |
| Principal Occupation During Past 5Years: |
| • Principal,The Wiley Group, a firm specializing in strategy and business |
| development (2005-present) |
| Other Public Company Board Membership During Past 5Years: |
| • CBIZ (formerly, Century Business Services, Inc.), a provider of outsourcing functions for small |
| and medium size companies, Director (2008-present) |
| No. of Portfolios for which Board Member Serves: 70 |
The Fund 41
BOARD MEMBERS INFORMATION (Unaudited) (continued)
INTERESTED BOARD MEMBERS
|
| J. Charles Cardona (59) |
| Board Member (2014) |
| Principal Occupation During Past 5Years: |
| • President and a Director of the Manager (2008-present), Chairman of the Distributor (2013- |
| present; previously, Executive Vice President, 1997-2013), President of Dreyfus Institutional |
| Services Division |
| No. of Portfolios for which Board Member Serves: 38 |
| J. Charles Cardona is deemed to be an “interested person” (as defined in the Act) of the fund as a result of his affiliation |
| with The Dreyfus Corporation. |
| ——————— |
| Isabel P. Dunst (68) |
| Board Member (2014) |
| Principal Occupation During Past 5Years: |
| • Of Counsel to the law firm of Hogan Lovells LLP (2015-present; previously, Partner, 1990-2014) |
| No. of Portfolios for which Board Member Serves: 38 |
| Isabel P. Dunst is deemed to be an “interested person” (as defined in the Act) of the fund as a result of her affiliation |
| with Hogan Lovells LLP, which provides legal services to BNY Mellon and certain of its affiliates. |
| ——————— |
| Once elected all Board Members serve for an indefinite term, but achieve Emeritus status upon reaching age 80.The |
| address of the Board Members and Officers is c/o The Dreyfus Corporation, 200 Park Avenue, NewYork, NewYork |
| 10166.Additional information about the Board Members is available in the fund’s Statement of Additional Information |
| which can be obtained from Dreyfus free of charge by calling this toll free number: 1-800-DREYFUS. |
| Whitney I. Gerard, Emeritus Board Member |
42
OFFICERS OF THE FUND (Unaudited)
The Fund 43
OFFICERS OF THE FUND (Unaudited) (continued)
44
For More Information

Telephone Call your financial representative or 1-800-DREYFUS
Mail The Dreyfus Family of Funds, 144 Glenn Curtiss Boulevard, Uniondale, NY 11556-0144
The fund files its complete schedule of portfolio holdings with the Securities and Exchange Commission (“SEC”) for the first and third quarters of each fiscal year on Form N-Q. The fund’s Forms N-Q are available on the SEC’s website at http://www.sec.gov and may be reviewed and copied at the SEC’s Public Reference Room in Washington, DC. Information on the operation of the Public Reference Room may be obtained by calling 1-800-SEC-0330.
Information regarding how the fund voted proxies relating to portfolio securities for the most recent 12-month period ended June 30 is available on the SEC’s website at http://www.sec.gov. The description of the policies and procedures is also available without charge, upon request, by calling 1-800-DREYFUS.

Item 2. Code of Ethics.
The Registrant has adopted a code of ethics that applies to the Registrant's principal executive officer, principal financial officer, principal accounting officer or controller, or persons performing similar functions. There have been no amendments to, or waivers in connection with, the Code of Ethics during the period covered by this Report.
Item 3. Audit Committee Financial Expert.
The Registrant's Board has determined that Joseph S. DiMartino, a member of the Audit Committee of the Board, is an audit committee financial expert as defined by the Securities and Exchange Commission (the "SEC"). Joseph S. DiMartino is "independent" as defined by the SEC for purposes of audit committee financial expert determinations.
Item 4. Principal Accountant Fees and Services.
(a) Audit Fees. The aggregate fees billed for each of the last two fiscal years (the "Reporting Periods") for professional services rendered by the Registrant's principal accountant (the "Auditor") for the audit of the Registrant's annual financial statements or services that are normally provided by the Auditor in connection with the statutory and regulatory filings or engagements for the Reporting Periods, were $32,792 in 2014 and $33,612 in 2015.
(b) Audit-Related Fees. The aggregate fees billed in the Reporting Periods for assurance and related services by the Auditor that are reasonably related to the performance of the audit of the Registrant's financial statements and are not reported under paragraph (a) of this Item 4 were $14,321 in 2014 and $588 in 2015. These services consisted of one or more of the following: (i) agreed upon procedures related to compliance with Internal Revenue Code section 817(h), (ii) security counts required by Rule 17f-2 under the Investment Company Act of 1940, as amended, (iii) advisory services as to the accounting or disclosure treatment of Registrant transactions or events and (iv) advisory services to the accounting or disclosure treatment of the actual or potential impact to the Registrant of final or proposed rules, standards or interpretations by the Securities and Exchange Commission, the Financial Accounting Standards Boards or other regulatory or standard-setting bodies.
The aggregate fees billed in the Reporting Periods for non-audit assurance and related services by the Auditor to the Registrant's investment adviser (not including any sub-investment adviser whose role is primarily portfolio management and is subcontracted with or overseen by another investment adviser), and any entity controlling, controlled by or under common control with the investment adviser that provides ongoing services to the Registrant ("Service Affiliates"), that were reasonably related to the performance of the annual audit of the Service Affiliate, which required pre-approval by the Audit Committee were $0 in 2014 and $0 in 2015.
(c) Tax Fees. The aggregate fees billed in the Reporting Periods for professional services rendered by the Auditor for tax compliance, tax advice, and tax planning ("Tax Services") were $3,093 in 2014 and $3,503 in 2015. These services consisted of: (i) review or preparation of U.S. federal, state, local and excise tax returns; (ii) U.S. federal, state and local tax planning, advice and assistance regarding statutory, regulatory or administrative developments and (iii) tax advice regarding tax qualification matters and/or treatment of various financial instruments held or proposed to be acquired or held. The aggregate fees billed in the Reporting Periods for Tax Services by the Auditor to Service Affiliates, which required pre-approval by the Audit Committee were $0 in 2014 and $0 in 2015.
(d) All Other Fees. The aggregate fees billed in the Reporting Periods for products and services provided by the Auditor, other than the services reported in paragraphs (a) through (c) of this Item, were $419 in 2014 and $487 in 2015. These services consisted of a review of the Registrant's anti-money laundering program.
The aggregate fees billed in the Reporting Periods for Non-Audit Services by the Auditor to Service Affiliates, other than the services reported in paragraphs (b) through (c) of this Item, which required pre-approval by the Audit Committee, were $0 in 2014 and $0 in 2015.
(e)(1) Audit Committee Pre-Approval Policies and Procedures. The Registrant's Audit Committee has established policies and procedures (the "Policy") for pre-approval (within specified fee limits) of the Auditor's engagements for non-audit services to the Registrant and Service Affiliates without specific case-by-case consideration. The pre-approved services in the Policy can include pre-approved audit services, pre-approved audit-related services, pre-approved tax services and pre-approved all other services. Pre-approval considerations include whether the proposed services are compatible with maintaining the Auditor's independence. Pre-approvals pursuant to the Policy are considered annually.
(e)(2) None of the services described in paragraphs (b) through (d) of this Item 4 were approved by the Audit Committee pursuant to paragraph (c)(7)(i)(C) of Rule 2-01 of Regulation S-X.
(f) None of the hours expended on the principal accountant's engagement to audit the registrant's financial statements for the most recent fiscal year were attributed to work performed by persons other than the principal account's full-time, permanent employees.
(g) Non-Audit Fees. The aggregate non-audit fees billed by the Auditor for services rendered to the Registrant, and rendered to Service Affiliates, for the Reporting Periods were $49,172,911 in 2014 and $22,796,522 in 2015.
(h) Auditor Independence. The Registrant's Audit Committee has considered whether the provision of non-audit services that were rendered to Service Affiliates, which were not pre-approved (not requiring pre-approval), is compatible with maintaining the Auditor's independence.
Item 5. Audit Committee of Listed Registrants.
Not applicable. [CLOSED-END FUNDS ONLY]
Item 6. Investments.
(a) Not applicable.
Item 7. Disclosure of Proxy Voting Policies and Procedures for Closed-End Management Investment Companies.
Not applicable. [CLOSED-END FUNDS ONLY]
Item 8. Portfolio Managers of Closed-End Management Investment Companies.
Not applicable. [CLOSED-END FUNDS ONLY, beginning with reports for periods ended on and after December 31, 2005]
Item 9. Purchases of Equity Securities by Closed-End Management Investment Companies and Affiliated Purchasers.
Not applicable. [CLOSED-END FUNDS ONLY]
Item 10. Submission of Matters to a Vote of Security Holders.
There have been no material changes to the procedures applicable to Item 10.
Item 11. Controls and Procedures.
(a) The Registrant's principal executive and principal financial officers have concluded, based on their evaluation of the Registrant's disclosure controls and procedures as of a date within 90 days of the filing date of this report, that the Registrant's disclosure controls and procedures are reasonably designed to ensure that information required to be disclosed by the Registrant on Form N-CSR is recorded, processed, summarized and reported within the required time periods and that information required to be disclosed by the Registrant in the reports that it files or submits on Form N-CSR is accumulated and communicated to the Registrant's management, including its principal executive and principal financial officers, as appropriate to allow timely decisions regarding required disclosure.
(b) There were no changes to the Registrant's internal control over financial reporting that occurred during the second fiscal quarter of the period covered by this report that have materially affected, or are reasonably likely to materially affect, the Registrant's internal control over financial reporting.
Item 12. Exhibits.
(a)(1) Code of ethics referred to in Item 2.
(a)(2) Certifications of principal executive and principal financial officers as required by Rule 30a-2(a) under the Investment Company Act of 1940.
(a)(3) Not applicable.
(b) Certification of principal executive and principal financial officers as required by Rule 30a-2(b) under the Investment Company Act of 1940.
SIGNATURES
Pursuant to the requirements of the Securities Exchange Act of 1934 and the Investment Company Act of 1940, the Registrant has duly caused this Report to be signed on its behalf by the undersigned, thereunto duly authorized.
Dreyfus Premier Short-Intermediate Municipal Bond Fund
By: /s/ Bradley J. Skapyak
Bradley J. Skapyak,
President
Date: May 19, 2015
Pursuant to the requirements of the Securities Exchange Act of 1934 and the Investment Company Act of 1940, this Report has been signed below by the following persons on behalf of the Registrant and in the capacities and on the dates indicated.
By: /s/ Bradley J. Skapyak
Bradley J. Skapyak,
President
Date: May 19, 2015
By: /s/ James Windels
James Windels,
Treasurer
Date: May 19, 2015
EXHIBIT INDEX
(a)(1) Code of ethics referred to in Item 2.
(a)(2) Certifications of principal executive and principal financial officers as required by Rule 30a-2(a) under the Investment Company Act of 1940. (EX-99.CERT)
(b) Certification of principal executive and principal financial officers as required by Rule 30a-2(b) under the Investment Company Act of 1940. (EX-99.906CERT)