UNITED STATES
SECURITIES AND EXCHANGE COMMISSION
Washington, D.C. 20549
FORM N-CSR
CERTIFIED SHAREHOLDER REPORT OF REGISTERED
MANAGEMENT INVESTMENT COMPANIES
Investment Company Act file number | 811-5022 | ||||||||
| |||||||||
Skyline Funds | |||||||||
(Exact name of registrant as specified in charter) | |||||||||
| |||||||||
311 South Wacker Drive, Suite 4500 |
| 60606 | |||||||
(Address of principal executive offices) |
| (Zip code) | |||||||
| |||||||||
William M. Dutton | Alan Goldberg | ||||||||
(Name and address of agent for service) | |||||||||
| |||||||||
Registrant’s telephone number, including area code: | (312) 913-0900 |
| |||||||
| |||||||||
Date of fiscal year end: | 12/31/05 |
| |||||||
| |||||||||
Date of reporting period: | 12/31/05 |
| |||||||
Item 1. Report to Shareholders
ANNUAL REPORT — December 31, 2005
Skyline Special
Equities Portfolio
![]()

Commentary
December 31, 2005
Overview
The Skyline Special Equities Portfolio generated a gain of 2.51% for the fourth quarter, which compares favorably to the 1.12% gain for the Russell 2000 Index and the 0.67% gain for the Russell 2000 Value Index. For all of 2005, the Fund gained 10.89%, outperforming both the Russell 2000 Index, which rose 4.55%, and the Russell 2000 Value Index, which was up 4.70%. The modest gains posted by the broader stock market indexes for both the fourth quarter and all of 2005 reflect some conflicting signals with regards to the environment for equities. Reasons for optimism include the healthy state of U.S. corporations' fundamentals along with long term interest rates and inflation that remain at relatively low levels. Issues of concern include rising short term interest rates and an inverting yield curve, a moderating housing cycle and higher energy prices. The Fund's solid gain for the fourth quarter relative to its benchmarks was due primarily to favorable sector allocation. For all of 2005, the outperformance of the Fund relative to the benchmarks was due primarily to strong stock selection. In addition, the average size of the companies that make up the Fund are typically slightly larger than the average size of the companies that make up the benchmarks, and thus the Fund benefited as the largest small cap stocks outperformed the smallest stocks during 2005.
Market Review
Stocks posted modest gains in the fourth quarter, as indicated by the 1.12% increase for the Russell 2000 Index, the 0.67% increase for the Russell 2000 Value Index, and the 2.08% rise for the S&P 500 Index. For all of 2005, the Russell 2000 Index generated a total return of 4.55%, the Russell 2000 Value Index returned 4.70%, and the S&P 500 Index returned 4.89%. Although small cap and large cap stocks' returns in 2005 were roughly equivalent, 2005 marked the first year since 1998 that the large cap S&P 500 Index returned more than the small cap Russell 2000 Index. Of note is that the S&P 500 Index's higher return in 2005 relative to the Russell 2000 Index is due to the higher dividend yield of the large cap index. On a price-only basis, the S&P 500 Index was up 3.00% while the Russell 2000 Index was up 3.32%. Within the small cap segment of the market, value stocks outperformed growth stocks for the fifth year in six, as indicated by the Russell 2000 Value Index's 4.70% return compared to the Russell 2000 Growth Index's 4.14% return. However, the fourth quarter marked the second straight quarter that the Russell 2000 Growth Index outperformed the Russell 2000 Value Index.
Stocks were weak at the start of the fourth quarter, due to concerns that the Gulf Coast hurricanes and higher energy prices would lead to an economic slowdown. As the quarter progressed, government statistics pointed to a resilient economy and stocks responded positively. Stocks weakened again late in the quarter in part due to an
Annual Report – December 31, 2005
1
apparent softening in the housing market and an inversion of the U.S. treasury yield curve. New home sales fell the most in 11 years on a month over month basis in November, while the inventory of homes available for sale rose to a 21/2 year high. The strong housing market has supported consumer spending and any weakness could have broader implications for the overall economy. Late in the quarter, when the U.S. Two Year Treasury Note yield rose above that of the U.S. Ten Year Treasury Bond, the yield curve inverted for the first time in five years. An inverted yield curve has often presaged an economic recession.
For the year as a whole, stocks continued to react positively to strong corporate earnings which are estimated to have been up over 13% in 2005. If fourth quarter profits come in as expected, it will be the tenth consecutive quarter of greater than 10% growth, the second longest streak since 1950. For the second year in a row, earnings increased at a faster pace than stock prices, causing a compression in price earnings multiples, leading to more attractive valuations. Long term interest rates, as measured by the yield on the U.S. Ten Year Treasury Bond, rose to 4.40% at the end of 2005 from 4.22% a year ago. Despite this increase, long-term rates remain at relatively low levels. The combination of strong corporate profits and reasonable interest rate levels has led to an increase in merger and acquisition activity. Announced U.S. deals in 2005 were over $1.1 trillion, up 28% from 2004.
Stocks managed only modest gains in 2005 despite the favorable environment for profits, mergers and acquisitions, and long term interest rates. Factors that prevented even stronger equity price appreciation included an inverting yield curve, a softening housing cycle and high energy prices. Short term interest rates as measured by the yield on the U.S. Two Year Treasury Note rose sharply during the year to 4.40% from 3.07% a year ago. The Two Year Note is closely tied to the federal funds rate and responded to the Federal Reserve Board's increase in its target for the federal funds rate to 41/4% from 21/4% during the year. When short-term rates exceed long-term rates, as they did briefly late in the year, it signals that bond investors expect interest rates to head lower, most likely because they believe the economy is expected to decelerate. Many investors believe that the previously mentioned slow down in the housing market, in addition to sharply higher energy prices, will impact consumer spending in a way that will have negative consequences for the broader economy.
Using the Russell 2000 Value Index as the benchmark, the best performing sectors in the fourth quarter were technology, materials and processing, and producer durables, which are all capital spending related. The strong performance of these sectors reflected investors' expectations for continued strength in corporate capital expenditures. Energy and utilities stocks were the poorest performers, in response to a decline in energy prices from their highs earlier in the quarter.
The weak performance by energy and utilities stocks in the fourth quarter wasn't enough to prevent them from being the best performers for all of 2005, due to the increase in energy prices from the beginning of the year. The technology and auto and transportation sectors were the only sectors posting negative returns for the full year. Technology stocks rallied sharply in late 2004, and when the sector was unable to meet expectations early in 2005, the stocks declined. Fundamentals for technology
Annual Report – December 31, 2005
2
companies improved throughout the year, and prices responded positively, although not enough to allow the sector to finish in positive territory for the year. Weak performance by automotive and airline related companies, due to poor industry fundamentals, negatively impacted the autos and transportation sector.
Portfolio Review
The key factor contributing to the Fund's strong performance relative to its benchmarks throughout 2005 was strong stock selection. For the first three quarters of the year, sector allocation detracted from the Fund's performance, but that reversed itself in the fourth quarter when sector allocation had a favorable impact.
The technology sector contributed most to the Fund's performance during the fourth quarter, from both an absolute standpoint and relative to the benchmark. The Fund was overweighted in technology stocks, which was the best performing sector of the market during the quarter. Five of the top ten performing stocks in the Fund during the quarter came from the technology sector, including Syniverse Holdings, a provider of services for wireless phone companies, which benefited from strong fundamentals and a more favorable environment for technology stocks. The consumer discretionary sector detracted most from the Fund's performance on both an absolute basis and relative to the benchmark. Disappointing results from a few holdings, particularly within the commercial services sub-sector, negatively impacted results.
For the full year, the technology sector contributed most to the Fund's absolute and relative performance. The Fund's technology stocks generated a weighted average return of over 14% in an environment where technology stocks in general posted modest declines, a tribute to strong stock selection. In addition to Syniverse Holdings, MEMC Electronic Materials, a provider of silicon for use in semiconductors, performed well due to strong fundamentals. The largest detractors from the Fund's performance during 2005 were its low weightings in the strong performing other energy and utilities sectors. The low weighting in these sectors was due to our difficulty in finding stocks that meet our investment criteria, in particular stocks that meet our valuation criteria in the other energy sector and our growth criteria in the utilities sector.
One of the areas we have highlighted as positive for equity markets is the potential for increased merger and acquisition activity due to strong corporate balance sheets, a favorable financing environment, and the need for companies to find new sources of earnings growth as economic growth slows. Several of the top performing stocks in 2005 benefited from this environment. York International, a supplier of commercial HVAC systems, and Westcorp, a provider of auto loans, both were acquired during the year. Investment Technology Group, a provider of equity transaction services, and Electronics For Imaging, a provider of software for color printers, benefited from utilizing their strong balance sheets to make accretive acquisitions. Other top performers for the year include companies that took advantage of internal growth opportunities even though their end markets are not particularly robust. Examples include Gildan Activewear, an apparel manu facturer that is taking market share from higher cost competitors, and Drew Industries, a supplier of parts for the Recreational
Annual Report – December 31, 2005
3
Vehicle and Manufactured Housing industries, that is benefiting from increasing the breadth of products it sells through its well established distribution system.
Outlook
As we assess the outlook for 2006 and beyond, several issues need to be considered. In our opinion, equity valuations are such that the opportunity for significant P/E multiple expansion is limited. In addition, valuations have converged over the last several years, that is, there are fewer extremely cheap stocks and fewer extremely expensive stocks now than there were five years ago. The strong tailwind to earnings provided by strong GDP growth is likely to slow as the economic cycle matures. We are concerned about the ability of the U.S. consumer to continue to be the driver of the global economy in the face of a softening housing market, higher energy prices, and a low savings rate. Also, as investors in small cap value stocks, we recognize that the strong relative performance of small cap value stocks since March of 2000 cannot go on forever, particularly since the extreme disparities in valuation that existed at that time between value and growth stocks and small and large stocks have largely been eliminated.
What are the implications for the Fund of each of these issues? Although valuations are not particularly inexpensive right now, they are not extremely overvalued either, especially in light of the potential returns available from other asset classes such as bonds. And although valuations have converged, the opportunity to find inexpensive stocks with good growth prospects remains. The economy is likely to slow, but we do not see signs that a recession is imminent. Strong corporate balance sheets, record levels of private equity and leveraged buy-out fund liquidity, and a favorable financing environment are expected to lead to increased merger and acquisition activity, which in turn will support equity valuations and provide an alternate source of earnings growth for companies. We do expect consumer spending to slow but are optimistic that the slack will be picked up by increased capital expenditures, driven by strong balance sheets, increasi ng capacity utilization, and the need to replace aging equipment after years of under spending.
The strong performance of small cap value stocks relative to other equity categories since March of 2000 is unlikely to repeat itself over the next several years. Small cap value stocks are typically among the most sensitive to changes in the domestic economy. As the economic expansion matures and GDP growth slows, small cap value stocks' sensitivity to the economy becomes less of an advantage. In addition, small cap value stocks' relative valuations are usually most attractive at the bottom of the economic cycle. Because they generate strong price performance early on in the economic recovery, they lose some of that relative valuation edge. Despite this, we believe that gains can still be made within the category. Our focus on identifying companies with strong internal growth opportunities and our preference for higher quality, slightly larger small cap stocks make us less reliant on stocks that are closely tied to the vagaries of the econo mic cycle. Also, our strategy of selling stocks when they reach a market multiple helps us avoid holding onto stocks that have appreciated beyond fair value. We believe these disciplines give us the confidence that the Fund
Annual Report – December 31, 2005
4
is well situated to outperform the typical small cap value stock in the current environment.
Past performance does not guarantee future results. The performance data quoted represents past performance and current returns may be lower or higher. The investment return and principal value will fluctuate so that an investor's shares, when redeemed may be worth more or less than the original cost. To obtain performance information current to the most recent month end, please visit www.skylinefunds.com. The performance for the one, three, five and ten years ended December 31, 2005, and for the period April 23, 1987 (inception) through December 31, 2005, is an average annual return calculation.
The Russell 2000 Value Index is an unmanaged, value-oriented index comprised of small stocks that have relatively low price-to-book ratios. The Russell 2000 Index is an unmanaged, market value weighted index comprised of small-sized companies. The S&P 500 Index, a widely quoted stock market index, includes 500 of the largest companies publicly traded in the United States. The Russell 2000 Growth Index is an unmanaged index measuring the performance of those Russell 2000 companies with higher price-to-book ratios and higher forecasted growth rates. The Dow Jones Industrial Average is an average of the stock prices of 30 major corporations in the United States. All figures take into account reinvested dividends. You cannot invest directly in an index.
There are risks of investing in a fund that invests in stocks of small sized companies, which tend to be more volatile and less liquid than stocks of large cap companies. There are also risks in investing in value-oriented stocks, including the risk that value-oriented stocks will underperform growth-oriented stocks during some periods.
The discussion of the Fund's investments and investment strategy represent the views of Skyline Asset Management, L.P., the Fund's investment adviser, at the time of this report. The Fund's investments are subject to change and should not be considered a recommendation to buy individual securities.
This report is not authorized for distribution unless accompanied or preceded by a current prospectus.
Sources: Skyline Asset Management, L.P., Frank Russell Company, and FactSet.
Annual Report – December 31, 2005
5
Performance (%)
| 4Q 2005* | 2005 | 3 yrs | 5 yrs | 10 yrs | Since Inception** | ||||||||||||||||||||||
| Special Equities | 2.51 | 10.89 | 22.08 | 13.96 | 12.99 | 14.19 | |||||||||||||||||||||
| Russell 2000 Value | 0.67 | 4.70 | 23.18 | 13.55 | 13.08 | 12.20 | |||||||||||||||||||||
| Russell 2000 | 1.12 | 4.55 | 22.13 | 8.22 | 9.26 | 9.61 | |||||||||||||||||||||
| S&P 500 | 2.08 | 4.89 | 14.39 | 0.54 | 9.07 | 10.73 | |||||||||||||||||||||
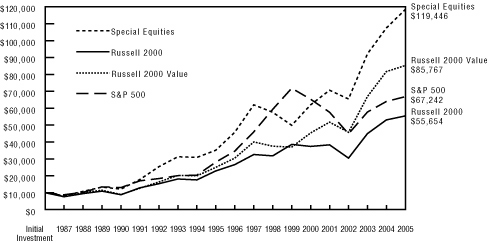
Change in Value of a $10,000 Investment
Comparison of Change in Value of a $10,000 Investment Since Inception
Past performance does not guarantee future results. The performance data quoted represents past performance and current returns may be lower or higher. The investment return and principal value will fluctuate so that an investor's shares, when redeemed may be worth more or less than the original cost. To obtain performance information current to the most recent month end, please visit www.skylinefunds.com. The performance for the one, three, five and ten years ended December 31, 2005, and for the period April 23, 1987 (inception) through December 31, 2005, is an average annual return calculation.
The table does not reflect the deduction of taxes that a shareholder would pay on fund distributions or the redemption of fund shares.
* Not annualized.
** Performance for the Fund, the Russell 2000 Index, and the S&P 500 Index reflects the Fund's inception date of April 23, 1987. The Russell 2000 Value performance reflects an inception date of May 1, 1987.
Annual Report – December 31, 2005
6
| Historical Performance | Special Equities | Russell 2000 Value | Russell 2000 | S&P 500 | |||||||||||||||
| 2005 | 10.9 | 4.7 | 4.6 | 4.9 | |||||||||||||||
| 2004 | 16.6 | 22.3 | 18.3 | 10.9 | |||||||||||||||
| 2003 | 40.7 | 46.0 | 47.3 | 28.7 | |||||||||||||||
| 2002 | -7.3 | -11.4 | -20.5 | -22.1 | |||||||||||||||
| 2001 | 13.9 | 14.0 | 2.5 | -11.9 | |||||||||||||||
| 2000 | 24.2 | 22.8 | -3.0 | -9.2 | |||||||||||||||
| 1999 | -13.3 | -1.5 | 21.3 | 21.1 | |||||||||||||||
| 1998 | -7.2 | -6.5 | -2.6 | 28.8 | |||||||||||||||
| 1997 | 35.4 | 31.8 | 22.4 | 33.4 | |||||||||||||||
| 1996 | 30.4 | 21.4 | 16.5 | 23.3 | |||||||||||||||
| 1995 | 13.8 | 25.8 | 28.4 | 37.5 | |||||||||||||||
| 1994 | -1.2 | -1.6 | -1.8 | 1.3 | |||||||||||||||
| 1993 | 22.9 | 23.8 | 18.9 | 10.0 | |||||||||||||||
| 1992 | 42.5 | 29.1 | 18.4 | 7.7 | |||||||||||||||
| 1991 | 47.4 | 41.7 | 46.1 | 30.6 | |||||||||||||||
| 1990 | -9.3 | -21.8 | -19.5 | -3.2 | |||||||||||||||
| 1989 | 24.0 | 12.4 | 16.2 | 31.4 | |||||||||||||||
| 1988 | 29.7 | 29.5 | 24.9 | 16.5 | |||||||||||||||
| 1987 | * | -16.9 | -21.5 | -24.3 | -12.0 | ||||||||||||||
Past performance does not guarantee future results. The performance data quoted represents past performance and current returns may be lower or higher. The investment return and principal value will fluctuate so that an investor's shares, when redeemed, may be worth more or less than the original cost. To obtain performance information current to the most recent month end, please visit www.skylinefunds.com.
The table does not reflect the deduction of taxes that a shareholder would pay on fund distributions or the redemption of fund shares.
* Performance for the Fund, the Russell 2000 Index, and the S&P 500 Index reflects the Fund's inception date of April 23, 1987. The Russell 2000 Value performance reflects an inception date of May 1, 1987.
Annual Report – December 31, 2005
7
Portfolio Characteristics
| Special Equities | Russell 2000 Value | Russell 2000 | S&P 500 | ||||||||||||||||
| P/E (excluding negative earnings) | 17.3 | 16.6 | 19.2 | 16.8 | |||||||||||||||
| Price/book | 1.90 | 1.67 | 2.21 | 2.81 | |||||||||||||||
| Price/sales | 0.84 | 0.87 | 1.10 | 1.48 | |||||||||||||||
| EPS growth—3yrs. (historical) | 18.0 | % | 8.8 | % | 14.5 | % | 20.2 | % | |||||||||||
| EPS growth—1 yr. (forecasted) | 13.6 | % | 10.1 | % | 15.4 | % | 12.9 | % | |||||||||||
| Market cap $ weighted median | $ | 1,408 | $ | 1,003 | $ | 1,036 | $ | 54,127 | |||||||||||
| Assets | $519 million | ||||||||||||||||||
| Number of Holdings | 77 | ||||||||||||||||||
| Ticker Symbol: | SKSEX | ||||||||||||||||||
| Cusip: | 830833208 | ||||||||||||||||||
| Net Asset Value (per share): | $ | 25.43 | |||||||||||||||||
| Initial investment: | $ | 1,000 | |||||||||||||||||
| Subsequent investment: | $ | 100 | |||||||||||||||||
Top Ten Holdings
| % of net assets | |||||||
| Crane Co. | |||||||
| Industrial conglomerate | 2.4 | % | |||||
| Cytec Industries Inc. | |||||||
| Specialty chemicals | 2.4 | % | |||||
| Reinsurance Group of America, Incorporated | |||||||
| Life reinsurer | 2.2 | % | |||||
| Conseco, Inc. | |||||||
| Life & health insurer | 2.2 | % | |||||
| Benchmark Electronics, Inc. | |||||||
| Contract manufacturer | 2.1 | % | |||||
| NCI Building Systems, Inc. | |||||||
| Metal buildings | 2.0 | % | |||||
| Acuity Brands, Inc. | |||||||
| Manufacturer of lighting fixtures | 2.0 | % | |||||
| Delphi Financial Group, Inc. | |||||||
| Accident & health insurance | 1.9 | % | |||||
| Commscope, Inc. | |||||||
| Networking cable manufacturer | 1.9 | % | |||||
| The Sports Authority, Inc. | |||||||
| Sporting goods retailer | 1.9 | % | |||||
| Top Ten Holdings | 21.0 | % | |||||
Fund holdings are subject to change and should not be considered a recommendation to buy individual securities.
Annual Report – December 31, 2005
8
Sector Performance (%) (as of December 31, 2005)
4Q05**
| Special Equities | Russell 2000 Value | Russell 2000 | |||||||||||||
| Technology | 9.9 | 4.6 | 3.7 | ||||||||||||
| Producer Durables | 7.5 | 2.0 | 0.9 | ||||||||||||
| Autos And Transportation | 7.2 | -0.3 | 5.7 | ||||||||||||
| Materials And Processing | 4.8 | 3.7 | 2.9 | ||||||||||||
| Financial Services | 0.6 | 1.6 | 2.3 | ||||||||||||
| Health Care | 0.2 | 0.6 | 0.1 | ||||||||||||
| Consumer Discretionary | -2.3 | 1.6 | 2.4 | ||||||||||||
| Other Energy | -9.6 | -13.2 | -9.7 | ||||||||||||
| Consumer Staples | NA* | -6.0 | -4.8 | ||||||||||||
| Integrated Oils | NA* | -11.2 | -6.7 | ||||||||||||
| Other | NA* | -1.2 | -2.7 | ||||||||||||
| Utilities | NA* | -4.6 | -4.4 | ||||||||||||
YTD 2005
| Special Equities | Russell 2000 Value | Russell 2000 | |||||||||||||
| Other Energy | 36.1 | 24.4 | 39.5 | ||||||||||||
| Health Care | 22.3 | 3.5 | 5.3 | ||||||||||||
| Materials And Processing | 20.1 | 8.7 | 7.3 | ||||||||||||
| Producer Durables | 16.2 | 7.3 | 3.9 | ||||||||||||
| Technology | 14.1 | -1.2 | -2.5 | ||||||||||||
| Autos And Transportation | 11.6 | -3.3 | 1.3 | ||||||||||||
| Consumer Discretionary | 7.7 | 0.1 | 0.7 | ||||||||||||
| Financial Services | 6.0 | 2.8 | 2.6 | ||||||||||||
| Consumer Staples | NA* | 0.5 | 3.5 | ||||||||||||
| Integrated Oils | NA* | 96.0 | 68.8 | ||||||||||||
| Other | NA* | 0.3 | 3.5 | ||||||||||||
| Utilities | NA* | 10.3 | 11.0 | ||||||||||||
Past performance does not guarantee future results. The performance data quoted represents past performance and current returns may be lower or higher. The investment return and principal value will fluctuate so that an investor's shares, when redeemed may be worth more or less than the original cost. To obtain performance information current to the most recent month end, please visit www.skylinefunds.com.
* Not applicable
** Not annualized
Sector Weightings (as of December 31, 2005)
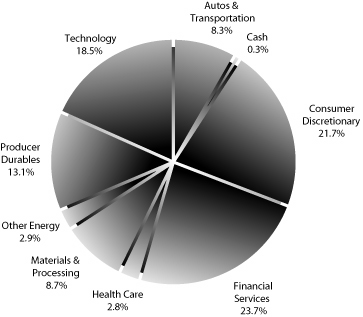
Fund holdings are subject to change and should not be considered a recommendation to buy individual securities.
Annual Report – December 31, 2005
9
Stock Highlights
Adesa, Inc. (KAR)
KAR is the second largest provider of wholesale vehicle auctions. Earnings growth is expected to accelerate beginning in 2006, driven primarily by an increase in the number of vehicles sold through the auction, reversing a trend of declining vehicle sales over the past several years. An increase in the number of vehicles coming off lease and an increase in repossessions are expected to drive higher sales by the second half of 2006. In addition, before becoming a public company in 2004, KAR's parent company was not focused on the growth opportunities available in the vehicle auction business. As an independent company, management is more committed to growth strategies, including accretive acquisitions and increased penetration of an underserved automobile dealer market. We believe earnings growth will accelerate to a minimum of 12% over the next several years. KAR has a strong balance sheet and good cash flow while offering an attractive valu ation.
Synnex Corporation (SNX)
SNX is a leading wholesale distributor of information technology products, which includes personal computers, servers, software, networking equipment, and peripherals. SNX sells 20,000 different products from over 100 original equipment manufacturers (OEMs) to 20,000 customers. The information technology market should grow faster than the overall economy, and SNX should be able to grow faster than the industry as it can sign up additional OEMs and currently only serves a fraction of the potential customer base. Additionally, SNX has the lowest expense structure in the industry due to the use of low cost offshore labor to provide numerous back office functions. We expect SNX to post improved results in 2006 after the company stumbled in 2005 due to some customer specific issues, which should not repeat. SNX's valuation is compelling, trading at a low double-digit P/E and has a solid balance sheet.
Fund holdings are subject to change and should not be considered a recommendation to buy individual securities.
Annual Report – December 31, 2005
10
Glossary of Investment Terms
Earnings Per Share (EPS) A company's net income divided by its outstanding shares.
Earnings Per Share growth — 3 yrs (historical) The compounded annual growth rate of a company's EPS over the last 3 years.
Earnings Per Share growth — 1 yr (forecasted) Analysts' consensus forecast for a company's growth in operating EPS over the immediate future 12 months.
Market Cap Dollar Weighted Median An indicator of the size of companies in which a fund invests; the mid-point of market capitalization (market price times shares outstanding) of a fund's stocks, weighted by the proportion of the fund's assets invested in each stock. Stocks representing half of the fund's assets have market capitalizations above the median, and the rest below it.
Price/Book Ratio The share price of a stock divided by its net worth, or book value, per share.
Price/Earnings (P/E) Ratio An indicator of the relative valuation of the stocks in which a fund invests. For stocks the ratio is calculated by taking the stock's current price to its per-share earnings over the past 12 months. For a fund, the P/E ratio is the average of the P/E ratios of the fund's stocks, weighted by the proportion of the fund's assets invested in each stock.
Price/Sales Ratio The ratio of a stock's current price to its per-share revenue over the past 12 months.
Annual Report – December 31, 2005
11
Portfolio Holdings as of December 31, 2005
| Company Description | Number Shares | Market Value | |||||||||||||
| COMMON STOCKS | |||||||||||||||
| Autos & Transportation — 8.3% | |||||||||||||||
| Autos — 1.3% | |||||||||||||||
| Aftermarket Technology Corp.a | Provider of remanufactured transmissions | 339,700 | $ | 6,603,768 | |||||||||||
| Other Transportation — 5.0% | |||||||||||||||
| Drew Industries Incorporateda | Supplier to RVs and manufactured housing | 186,400 | 5,254,616 | ||||||||||||
| Interpool, Inc. | Container leasing firm | 295,800 | 5,584,704 | ||||||||||||
| Laidlaw International, Inc.a | Provider of transportation services | 390,900 | 9,080,607 | ||||||||||||
| Ryder System, Inc. | Truck leasing company | 141,900 | 5,820,738 | ||||||||||||
| 25,740,665 | |||||||||||||||
| Railroad — 0.8% | |||||||||||||||
| Pacer International, Inc. | Rail logistics firm | 166,500 | 4,338,990 | ||||||||||||
| Trucking — 1.2% | |||||||||||||||
| Swift Transportation Co., Inc.a | Truckload carrier | 309,600 | 6,284,880 | ||||||||||||
| Total Autos & Transportation | 42,968,303 | ||||||||||||||
| Consumer Discretionary — 21.7% | |||||||||||||||
| Commercial Services — 9.0% | |||||||||||||||
| Adesa, Inc. | Wholesale vehicle auctioneer | 385,400 | 9,411,468 | ||||||||||||
| Heidrick & Struggles Intla | Executive search and leadership consulting services | 183,800 | 5,890,790 | ||||||||||||
| Hudson Highland Group, Inc.a | Professional staffing | 338,400 | 5,874,624 | ||||||||||||
| ProQuest Companya | Information content provider | 301,000 | 8,400,910 | ||||||||||||
| Source Interlink Companies, Inc.a | Distributor of magazines | 165,600 | 1,841,472 | ||||||||||||
| United Stationers Inc.a | Office products distributor | 174,100 | 8,443,850 | ||||||||||||
| Watson Wyatt & Company Holdings | Benefit consulting company | 255,900 | 7,139,610 | ||||||||||||
| 47,002,724 | |||||||||||||||
| Consumer Products/Services — 2.7% | |||||||||||||||
| The Scotts Miracle-Gro Companya | Turf & horticultural products | 113,300 | 5,125,692 | ||||||||||||
| The Toro Company | Turf maintenance products | 206,700 | 9,047,259 | ||||||||||||
| 14,172,951 | |||||||||||||||
| Printing/Publishing — 1.6% | |||||||||||||||
| ADVO, Inc. | Direct mail marketing company | 249,901 | 7,042,210 | ||||||||||||
| Schawk , Inc. | Provider of brand imaging solutions | 59,000 | 1,224,250 | ||||||||||||
| 8,266,460 | |||||||||||||||
| Restaurants — 4.2% | |||||||||||||||
| CBRL Group, Inc. | Family dining | 254,400 | 8,942,160 | ||||||||||||
| Rare Hospitalitya | Steakhouse operator | 186,900 | 5,679,891 | ||||||||||||
| The Steak n Shake Companya | Casual dining | 420,800 | 7,132,560 | ||||||||||||
| 21,754,611 | |||||||||||||||
Annual Report – December 31, 2005
12
| Company Description | Number Shares | Market Value | |||||||||||||
| Retail — 4.2% | |||||||||||||||
| Big 5 Sporting Goods Corporation | Regional sporting goods retailer | 277,400 | $ | 6,072,286 | |||||||||||
| Borders Group, Inc. | Book retailer | 261,700 | 5,671,039 | ||||||||||||
| The Sports Authority, Inc.a | Sporting goods retailer | 314,900 | 9,802,837 | ||||||||||||
| 21,546,162 | |||||||||||||||
| Total Consumer Discretionary | 112,742,908 | ||||||||||||||
| Financial Services — 23.7% | |||||||||||||||
| Banks/Thrifts — 4.9% | |||||||||||||||
| Commercial Capital Bancorp, Inc. | Savings Bank | 359,800 | 6,159,776 | ||||||||||||
| Prosperity Bancshares, Inc. | Regional bank | 232,800 | 6,690,672 | ||||||||||||
| Provident Bankshares Corporation | Commercial bank | 172,000 | 5,808,440 | ||||||||||||
| Sterling Financial Corporation | Commercial bank | 280,695 | 7,011,761 | ||||||||||||
| 25,670,649 | |||||||||||||||
| Insurance — 14.1% | |||||||||||||||
| Amerus Group Inc. | Life insurer | 145,200 | 8,228,484 | ||||||||||||
| Aspen Insurance Holdings Limited | Property & casualty insurance | 301,000 | 7,124,670 | ||||||||||||
| Clark, Inc. | Insurance brokerage and consulting | 301,000 | 3,988,250 | ||||||||||||
| Conseco, Inc.a | Life & health insurer | 499,100 | 11,564,147 | ||||||||||||
| Delphi Financial Group, Inc. | Accident & health insurance | 218,868 | 10,070,116 | ||||||||||||
| Reinsurance Group of America | Life reinsurer | 243,000 | 11,605,680 | ||||||||||||
| Scottish Re Group Limited | Life reinsurer | 381,800 | 9,373,190 | ||||||||||||
| Triad Guaranty Inc.a | Mortgage insurance | 74,930 | 3,296,171 | ||||||||||||
| U.S.I. Holdings Corporationa | Insurance brokerage | 589,553 | 8,118,145 | ||||||||||||
| 73,368,853 | |||||||||||||||
| Other Financial Services — 2.8% | |||||||||||||||
| MCG Capital Corporation | Business development company | 522,500 | 7,623,275 | ||||||||||||
| S1 Corporationa | Financial information software | 631,500 | 2,747,025 | ||||||||||||
| United Panam Financial Corpa | Sub-prime auto lender | 163,100 | 4,219,397 | ||||||||||||
| 14,589,697 | |||||||||||||||
| Real Estate Investment Trusts — 1.9% | |||||||||||||||
| iStar Financial Inc. | Commercial real estate lender | 268,800 | 9,582,720 | ||||||||||||
| Total Financial Services | 123,211,919 | ||||||||||||||
| Health Care — 2.8% | |||||||||||||||
| Health Care Services — 2.8% | |||||||||||||||
| Centene Corporationa | Medicaid managed care | 128,000 | 3,365,120 | ||||||||||||
| Davita Inc.a | Provider of dialysis services | 100,150 | 5,071,596 | ||||||||||||
| Triad Hospitals, Inc.a | Hospital Operator | 153,600 | 6,025,728 | ||||||||||||
| Total Health Care | 14,462,444 | ||||||||||||||
Annual Report – December 31, 2005
13
Portfolio Holdings as of December 31, 2005 (continued)
| Company Description | Number Shares | Market Value | |||||||||||||
| Materials & Processing — 8.7% | |||||||||||||||
| Building/Construction Products — 3.1% | |||||||||||||||
| NCI Building Systems, Inc.a | Metal buildings | 249,400 | $ | 10,594,512 | |||||||||||
| Walter Industries, Inc | Natural resources & water products | 105,000 | 5,220,600 | ||||||||||||
| 15,815,112 | |||||||||||||||
| Packaging & Paper — 1.5% | |||||||||||||||
| Albany International Corp. | Paper machine clothing | 220,300 | 7,966,048 | ||||||||||||
| Specialty Chemicals — 4.1% | |||||||||||||||
| Albemarle Corporation | Specialty chemicals | 227,300 | 8,716,955 | ||||||||||||
| Cytec Industries Inc. | Specialty chemicals | 259,000 | 12,336,170 | ||||||||||||
| 21,053,125 | |||||||||||||||
| Total Materials & Processing | 44,834,285 | ||||||||||||||
| Other Energy — 2.9% | |||||||||||||||
| Equipment & Services — 1.2% | |||||||||||||||
| Key Energy Services, Inc.a | Workover services provider | 456,900 | 6,154,443 | ||||||||||||
| Exploration & Production — 1.7% | |||||||||||||||
| Newfield Exploration Companya | Oil & gas producer | 97,000 | 4,856,790 | ||||||||||||
| The Houston Exploration Co.a | Oil exploration and production | 79,100 | 4,176,480 | ||||||||||||
| 9,033,270 | |||||||||||||||
| Total Other Energy | 15,187,713 | ||||||||||||||
| Producer Durables — 13.1% | |||||||||||||||
| Aerospace — 1.0% | |||||||||||||||
| Curtiss-Wright Corporation | Aerospace & defense components mfg. | 98,900 | 5,399,940 | ||||||||||||
| Diversified Manufacturing — 3.9% | |||||||||||||||
| Carlisle Companies Incorporated | Industrial conglomerate | 107,500 | 7,433,625 | ||||||||||||
| Crane Co. | Industrial conglomerate | 354,800 | 12,513,796 | ||||||||||||
| 19,947,421 | |||||||||||||||
| Electrical Equipment — 5.6% | |||||||||||||||
| Acuity Brands, Inc. | Manufacturer of lighting fixtures | 332,602 | 10,576,744 | ||||||||||||
| Belden CDT Inc. | Networking cable manufacturer | 264,400 | 6,459,292 | ||||||||||||
| Commscope, Inc.a | Networking cable manufacturer | 498,800 | 10,040,844 | ||||||||||||
| EnerSysa | Manufacturer of industrial batteries | 130,300 | 1,699,112 | ||||||||||||
| 28,775,992 | |||||||||||||||
| Machinery — 2.6% | |||||||||||||||
| Flowserve Corporationa | Pump and valve manufacturer | 184,900 | 7,314,644 | ||||||||||||
| Global Power Equipment Groupa | Gas turbine equipment | 532,900 | 2,408,708 | ||||||||||||
Annual Report – December 31, 2005
14
| Company Description | Number Shares | Market Value | |||||||||||||
| United Rentals, Inc.a | Equipment rental | 167,200 | $ | 3,910,808 | |||||||||||
| 13,634,160 | |||||||||||||||
| Total Producer Durables | 67,757,513 | ||||||||||||||
| Technology — 18.5% | |||||||||||||||
| Distribution — 1.6% | |||||||||||||||
| Scansource, Inca | Distributor of barcode and telephony products | 66,500 | 3,636,220 | ||||||||||||
| Synnex Corporationa | Distributor of PCs and peripherals | 323,500 | 4,888,085 | ||||||||||||
| 8,524,305 | |||||||||||||||
| Electronic Components — 2.6% | |||||||||||||||
| Artesyn Technologies, Inc.a | Power supply manufacturing | 381,000 | 3,924,300 | ||||||||||||
| Fairchild Semiconductor Int'l., Inc.a | Semiconductors | 561,200 | 9,489,892 | ||||||||||||
| 13,414,192 | |||||||||||||||
| Other Technology — 7.3% | |||||||||||||||
| Applied Films Corporationa | Manufacturer of equipment to coat glass | 212,800 | 4,419,856 | ||||||||||||
| Benchmark Electronics, Inc.a | Contract manufacturer | 319,000 | 10,727,970 | ||||||||||||
| Electronics for Imaging, Inc.a | Products that support color printing | 337,100 | 8,970,231 | ||||||||||||
| MEMC Electronic Materials, Inc.a | Manufacturer of silicon wafers | 240,800 | 5,338,536 | ||||||||||||
| NETGEAR, Inc.a | Manufacturer of networking equipment | 192,800 | 3,711,400 | ||||||||||||
| Park Electrochemical Corporation | Advanced electronic materials | 186,300 | 4,840,074 | ||||||||||||
| 38,008,067 | |||||||||||||||
| Telecommunications — 1.0% | |||||||||||||||
| Andrew Corpa | Manufacturer of equipment for cell sites | 465,000 | 4,989,450 | ||||||||||||
| Services — 1.6% | |||||||||||||||
| Syniverse Holdingsa | Services for wireless carriers | 404,400 | 8,451,960 | ||||||||||||
| Software — 4.4% | |||||||||||||||
| Mentor Graphics Corporationa | Provider of EDA software | 824,500 | 8,525,330 | ||||||||||||
| Parametric Technology Corpa | Design & collaboration software | 884,400 | 5,394,840 | ||||||||||||
| eFunds Corporationa | Provider of EFT software | 369,508 | 8,661,268 | ||||||||||||
| 22,581,438 | |||||||||||||||
| Total Technology | 95,969,412 | ||||||||||||||
Annual Report – December 31, 2005
15
Portfolio Holdings as of December 31, 2005 (continued)
| Company Description | Number Shares | Market Value | |||||||||||||
| TOTAL COMMON STOCKS — 99.7% (Cost $430,343,318) | $ | 517,134,497 | |||||||||||||
| MONEY MARKET INSTRUMENTS — 0.3% US Bank Demand Note, 4.13%b | |||||||||||||||
| (Cost $1,813,233) | 1,813,233 | ||||||||||||||
| TOTAL INVESTMENTS — 100.0% (Cost $432,156,551) | 518,947,730 | ||||||||||||||
| OTHER ASSETS LESS LIABILITIES — 0.0% | 27,347 | ||||||||||||||
| NET ASSETS — 100% | $ | 518,975,077 | |||||||||||||
(a) Non-income producing security.
(b) Variable rate demand note. Interest rate is reset every seven days. Rate disclosed represents rate in effect on December 31, 2005.
See accompanying notes to financial statements.
Annual Report – December 31, 2005
16
Statement of Assets and Liabilities As of December 31, 2005
| ASSETS | |||||||||||
| Investments, at value (Cost: $432,156,551) | $ | 518,947,730 | |||||||||
| Receivable for: | |||||||||||
| Securities sold | $ | 632,870 | |||||||||
| Fund shares sold | 846,831 | ||||||||||
| Dividends and interest | 544,951 | 2,024,652 | |||||||||
| Other assets | 225,082 | ||||||||||
| Total assets | 521,197,464 | ||||||||||
| LIABILITIES & NET ASSETS | |||||||||||
| Payable for: | |||||||||||
| Securities purchased | $ | 467,195 | |||||||||
| Fund shares redeemed | 857,655 | ||||||||||
| Comprehensive management fee | 659,050 | ||||||||||
| Trustee compensation | 13,405 | ||||||||||
| Trustees deferred compensation | 225,082 | 2,222,387 | |||||||||
| Net assets applicable to shares outstanding | $ | 518,975,077 | |||||||||
| Shares outstanding—no par value (unlimited number of shares authorized) | 20,411,210 | ||||||||||
| PRICING OF SHARES | |||||||||||
| Net asset value, offering price and redemption price per share | $ | 25.43 | |||||||||
| ANALYSIS OF NET ASSETS | |||||||||||
| Paid-in capital | $ | 418,059,593 | |||||||||
| Undistributed net investment income | 324,583 | ||||||||||
| Accumulated net realized gain on sales of investments | 13,799,722 | ||||||||||
| Unrealized appreciation of investments | 86,791,179 | ||||||||||
| Net assets applicable to shares outstanding | $ | 518,975,077 | |||||||||
See accompanying notes to financial statements.
Annual Report – December 31, 2005
17
Statement of Operations For the Year Ended December 31, 2005
| Investment income | |||||||
| Dividends | $ | 4,954,793 | |||||
| Interest | 754,613 | ||||||
| Total investment income | 5,709,406 | ||||||
| Expenses: | |||||||
| Comprehensive management fee | 7,699,389 | ||||||
| Fees to unaffilliated trustees | 68,462 | ||||||
| Total expenses | 7,767,851 | ||||||
| Net investment loss | (2,058,445 | ) | |||||
| Net realized and unrealized gain/loss on investments: | |||||||
| Net realized gain on sales of investments | 112,906,191 | ||||||
| Change in unrealized appreciation/depreciation | (57,301,136 | ) | |||||
| Net realized and unrealized gain on investments | 55,605,055 | ||||||
| Net increase in net assets resulting from operations | $ | 53,546,610 | |||||
See accompanying notes to financial statements.
Annual Report – December 31, 2005
18
Statement of Changes in Net Assets
| Year Ended 12/31/2005 | Year ended 12/31/04 | ||||||||||
| From operations: | |||||||||||
| Net investment loss | $ | (2,058,445 | ) | $ | (2,514,039 | ) | |||||
| Net realized gain on sales of investments | 112,906,191 | 65,677,157 | |||||||||
| Change in unrealized appreciation | (57,301,136 | ) | 18,687,895 | ||||||||
| Net increase in net assets resulting from operations | 53,546,610 | 81,851,013 | |||||||||
| Distributions to shareholders from net realized gains | (107,459,203 | ) | (65,096,674 | ) | |||||||
| From fund share transactions: | |||||||||||
| Proceeds from fund shares sold | 56,241,236 | 82,639,085 | |||||||||
| Reinvestment of dividends | 105,393,453 | 63,850,736 | |||||||||
| Payments for fund shares redeemed | (155,103,188 | ) | (121,462,995 | ) | |||||||
| Net increase in net assets resulting from share transactions | 6,531,501 | 25,026,826 | |||||||||
| Total decrease/increase in net assets | (47,381,092 | ) | 41,781,165 | ||||||||
| Net assets at beginning of year | 566,356,169 | 524,575,004 | |||||||||
| Net assets at end of year (includes undistributed net investment income of $324,583 and $383,173 at December 31, 2005 and 2004, respectively) | $ | 518,975,077 | $ | 566,356,169 | |||||||
See accompanying notes to financial statements.
Annual Report – December 31, 2005
19
Financial Highlights
| Year Ended 12/31/05 | Year Ended 12/31/04 | Year Ended 12/31/03 | Year Ended 12/31/02 | Year Ended 12/31/01 | |||||||||||||||||||
| Net asset value at beginning of year | $ | 28.64 | $ | 27.78 | $ | 20.86 | $ | 22.50 | $ | 19.75 | |||||||||||||
| Income from investment operations | |||||||||||||||||||||||
| Net Investment loss | (0.11 | )* | (0.13 | )* | (0.06 | )* | (0.06 | )* | (0.04 | )* | |||||||||||||
| Net realized and unrealized gain/(loss) on investments | 3.32 | 4.68 | 8.54 | (1.58 | ) | 2.79 | |||||||||||||||||
| Total from investment operations | 3.21 | 4.55 | 8.48 | (1.64 | ) | 2.75 | |||||||||||||||||
| Less distributions from net realized gains on investments | (6.42 | ) | (3.69 | ) | (1.56 | ) | — | — | |||||||||||||||
| Net asset value at end of year | $ | 25.43 | $ | 28.64 | $ | 27.78 | $ | 20.86 | $ | 22.50 | |||||||||||||
| Total Return | 10.89 | % | 16.61 | % | 40.71 | % | (7.29 | %) | 13.92 | % | |||||||||||||
| Ratios/Supplemental Data | |||||||||||||||||||||||
| Ratio of expenses to average net assets | 1.47 | % | 1.47 | % | 1.48 | % | 1.48 | % | 1.49 | % | |||||||||||||
| Ratio of net investment loss to average net assets | (0.39 | %) | (0.47 | %) | (0.26 | %) | (0.26 | %) | (0.16 | %) | |||||||||||||
| Portfolio turnover rate | 51 | % | 47 | % | 52 | % | 81 | % | 93 | % | |||||||||||||
| Net assets, end of year (in thousands) | $ | 518,975 | $ | 566,356 | $ | 524,575 | $ | 378,839 | $ | 374,945 | |||||||||||||
* Based on monthly average shares outstanding
Annual Report – December 31, 2005
20
Notes to Financial Statements
Skyline Funds is an open-end, diversified investment management company the sole portfolio of which is Special Equities Portfolio (the "Fund"). The Fund commenced public offering of its shares on April 23, 1987. The Fund's investment adviser is Skyline Asset Management, L.P. (the "Adviser"). The Fund seeks maximum capital appreciation, primarily through investment in common stocks that the Adviser considers to be undervalued.
1
Significant accounting policies
n Security valuation – Investments are stated at value. Each equity security traded on a securities exchange shall be valued at the last current sale price as of the time of valuation on the exchange on which the security is principally traded (the "principal exchange"), or lacking any current reported sale on the principal exchange at the time of valuation, at the most recent bid quotation on the principal exchange. Each over-the-counter security traded in the Nasdaq Stock Market ("Nasdaq") shall be valued at the Nasdaq Official Closing Price ("NOCP"), as determined by Nasdaq, or lacking an NOCP, the last current reported sale price as of the time of valuation on Nasdaq, or lacking any current reported sale on Nasdaq at the time of valuat ion, at the most recent bid quotation on Nasdaq. For certain fixed-income securities, Skyline Funds' Board of Trustees has authorized the use of market valuations provided by an independent pricing service. Short-term instruments with sixty days or less to maturity are valued at amortized cost, which approximates market value. Securities or other assets for which market quotations are not readily available or deemed unreliable, which may include certain restricted securities, are valued at a fair value as determined in good faith by the Skyline Funds' Board of Trustees or a committee thereof.
n Security transactions and investment income – Security transactions are accounted for on the trade date (date the order to buy or sell is executed) and dividend income is recorded on the ex-dividend date. Interest income is recorded on an accrual basis and includes amortization of premiums and discounts. Realized gains and losses from security transactions are reported on an identified cost basis.
n Fund share valuation – Fund shares are sold and redeemed on a continuous basis at net asset value. Net asset value per share is determined as of the close of regular session trading on the New York Stock Exchange (normally 3:00 p.m. Central Time), each day that the Exchange is open for trading. The net asset value per share is determined by dividing the value of all securities and other assets, less liabilities, by the number of shares of the Fund outstanding.
n Federal income taxes and dividends to shareholders – It is the Fund's policy to comply with the special provisions of the Internal Revenue Code applicable to regulated investment companies and, in the manner provided therein, to distribute substantially all of its taxable income to shareholders. Such provisions were complied
Annual Report – December 31, 2005
21
Notes to Financial Statements (continued)
with and, therefore, no federal income taxes have been accrued in the accompanying financial statements.
Dividends payable to its shareholders are recorded by the Fund on the ex-dividend date. The timing and characterization of certain income and capital gain distributions are determined annually in accordance with Federal income tax regulations that may differ from accounting principles generally accepted in the United States. As a result, net investment income or loss and net realized gain or loss for a reporting period may differ from the amount distributed during such period. In addition, the Fund may periodically record reclassifications among certain capital accounts to reflect differences between financial reporting and income tax purposes. These reclassifications have no impact on the net asset value of the Fund.
Accordingly, at December 31, 2005, the following reclassifications were recorded:
| Undistributed Net Investment Income | Accumulated Net Realized Loss | ||||||
| $ | 1,999,855 | ($ | 1,999,855 | ) | |||
On December 16, 2005, a distribution of $6.4224 per share was paid to shareholders of record on December 15, 2005.
The tax character of distributions paid during 2005 and 2004 was as follows:
| 2005 | 2004 | ||||||||||
| Distributions paid from: | |||||||||||
| Ordinary income | $ | 15,250,804 | $ | 20,956,859 | |||||||
| Long-term capital gain | 92,208,399 | 44,139,815 | |||||||||
| $ | 107,459,203 | $ | 65,096,674 | ||||||||
As of December 31, 2005, the cost of investments on a tax basis was $432,791,231. The components of accumulated earnings on a tax basis were as follows:
| Gross unrealized appreciation | $ | 98,079,553 | |||||
| Gross unrealized depreciation | (11,923,054 | ) | |||||
| Net unrealized appreciation | $ | 86,156,499 | |||||
| Undistributed ordinary income | $ | 3,060,696 | |||||
| Undistributed long-term capital gains | 11,862,789 | ||||||
| Total distributable earnings | $ | 14,923,485 | |||||
| Other accumulated losses | $ | (164,500 | ) | ||||
| Total accumulated earnings | $ | 100,915,484 | |||||
The differences between book-basis and tax-basis unrealized appreciation/(depreciation) is attributable primarily to the estimated tax deferral on wash sales and return of capital distributions received from investments in real estate investment trusts.
Annual Report – December 31, 2005
22
n Line of Credit – The Fund has a $3 million committed revolving credit facility for temporary or emergency purposes, including the meeting of redemption requests that otherwise might require the untimely disposition of securities. The Adviser pays a commitment fee of 10 basis points per annum of the average daily unutilized portion of the committed line of credit not utilized. Under the terms of the credit agreement, interest on each loan would be fixed at the prime rate less 150 basis points. For the year ended December 31, 2005, a loan was outstanding for one day during the period and generated interest of $194 which was paid by the Adviser.
n Use of Estimates – The preparation of financial statements in conformity with accounting principles generally accepted in the United States requires management to make estimates and assumptions that affect the amounts reported in the financial statements and accompanying notes. Actual results may differ from those estimates.
n Redemption Fee – The Fund will deduct a redemption fee (the "Redemption Fee") of 2% from the proceeds of any redemption (including a redemption by exchange) of shares if the redemption occurs within 30 days of the purchase of those shares. For the purpose of determining whether a redemption is subject to the Redemption Fee, redemptions of Fund shares are conducted on a first in/first out (FIFO) basis such that shares with the longest holding period will be redeemed first and shares with the shortest holding period will be redeemed last. The Redemption Fee is paid to the Fund and is intended to offset transaction and other expenses caused by short-term trading. The Redemption Fee does not apply to redemptions (including redemptions by exc hange) of shares of the Fund purchased by automatic reinvestment of dividends or capital gains distributions. The Redemption Fee will also not apply to redemptions under hardship circumstances (as determined by the Adviser and the Fund in their discretion, based on a case-by-case analysis). The Redemption Fee will apply only to the redemption of shares purchased through an authorized agent if the authorized agent has indicated that it will administer the Redemption Fee. For the year ended December 31, 2005, the Fund had $1,910 included in capital due to the collection of redemption fees.
n Indemnifications – Under the Trust's organizational documents, its officers and trustees are indemnified against certain liabilities arising out of the performance of their duties to the Trust. In addition, the Trust may enter into contracts that provide for general indemnification. The Trust's maximum liability under those arrangements is unknown, as this would involve future claims that may be made against the Trust. However, based on experience, the Trust expects that risk of loss to be remote.
2
Transactions with affiliates
For the Adviser's management and advisory services and the assumption of most of the Fund's ordinary operating expenses, the Fund incurs a monthly comprehensive fee based on its average daily net assets at the annual rate of 1.50% of the first $200 million, 1.45% of the next $200 million, 1.40% of the next $200 million, and
Annual Report – December 31, 2005
23
Notes to Financial Statements (continued)
1.35% of any excess over $600 million. The total comprehensive management fee incurred for the year ended December 31, 2005 was $7,699,389.
Certain officers and trustees of the Skyline Funds are also officers, limited partners or shareholders of limited partners of the Adviser. The Fund makes no direct payments to the officers or trustees who are affiliated with the Adviser. For the year ended December 31, 2005, the Fund incurred fees of $68,462 to its independent trustees.
The Fund provides a deferred compensation plan for its trustees who are not officers, limited partners or shareholders of limited partners of the Adviser. Under the deferred compensation plan, trustees may elect to defer all or a portion of their compensation. Amounts deferred are retained by the Fund, represent an unfunded obligation of the Fund, and to the extent permitted by the Investment Company Act of 1940, as amended, may be invested in the common shares of the Fund, as selected by the trustees. These shares are held by the Adviser on behalf of Skyline Funds, the value of which is reflected in "Other Assets" on the Statement of Assets and Liabilities at December 31, 2005. Appreciation/depreciation and distributions received from these investments are recorded with an offsetting increase/decrease in the deferred compensation obligation and do not affect the Fund's net asset value.
3
Fund share transactions
As of December 31, 2005, there were an unlimited number of shares of beneficial interest, no par value, authorized. Transactions in the Fund's shares of beneficial interest were as follows:
| Shares | Dollar Amount | ||||||||||||||||||
| Year Ended 12/31/05 | Year Ended 12/31/04 | Year Ended 12/31/05 | Year Ended 12/31/04 | ||||||||||||||||
| Shares sold | 1,939,073 | 2,867,618 | $ | 56,241,236 | $ | 82,639,085 | |||||||||||||
| Shares issued for reinvestment of dividends | 4,083,435 | 2,268,238 | 105,393,453 | 63,850,736 | |||||||||||||||
| Total shares issued | 6,022,508 | 5,135,856 | 161,634,689 | 146,489,821 | |||||||||||||||
| Less shares redeemed | (5,384,405 | ) | (4,243,588 | ) | (155,103,188 | ) | (121,462,995 | ) | |||||||||||
| Net increase | 638,103 | 892,268 | $ | 6,531,501 | $ | 25,026,826 | |||||||||||||
4
Investment transactions
Investment transactions (exclusive of money market instruments) for the year ended December 31, 2005, were as follows:
| Cost of purchases | $ | 262,940,661 | |||||
| Proceeds from sales | $ | 345,703,839 | |||||
Annual Report – December 31, 2005
24
Report of Independent Registered Public Accounting Firm
To the Trustees and Shareholders of Skyline Special Equities Portfolio
and the Board of Trustees of Skyline Funds
In our opinion, the accompanying statement of assets and liabilities, including the portfolio holdings, and the related statements of operations and of changes in net assets and financial highlights present fairly, in all material respects, the financial position of Skyline Special Equities Portfolio (hereafter referred to as the "Fund") at December 31, 2005, the results of its operations for the year then ended and the changes in its net assets and the financial highlights for each of the two years then ended, in conformity with accounting principles generally accepted in the United States of America. These financial statements and financial highlights (hereafter referred to as "financial statements") are the responsibility of the Fund's management; our responsibility is to express an opinion on these financial statements based on our audits. We conducted our audit of these financial statements in accordance with the standards of the Public Company Accounting Oversight Board (United States). Those standards require that we plan and perform the audit to obtain reasonable assurance about whether the financial statements are free of material misstatement. An audit includes examining, on a test basis, evidence supporting the amounts and disclosures in the financial statements, assessing the accounting principles used and significant estimates made by management, and evaluating the overall financial statement presentation. We believe that our audits, which included confirmation of securities at December 31, 2005 by correspondence with the custodian and brokers, provide a reasonable basis for our opinion. The financial highlights of the Fund for the periods ended on or before December 31, 2003 were audited by other independent accountants whose report dated February 20, 2004 expressed an unqualified opinion on those financial highlights.
PricewaterhouseCoopers LLP
February 23, 2006
Annual Report – December 31, 2005
25
Federal Tax Status of 2005 Dividends
Capital gain dividends paid to you, whether received in cash or reinvested in shares, must be included in your federal income tax return and must be reported by the Fund to the Internal Revenue Service in accordance with U.S. Treasury Department regulations. Short-term capital gain dividends paid to you are taxable as ordinary income. Long-term capital gain dividends paid to you are taxable as long-term capital gain income regardless of how long you have held Fund shares. Distributions as a return of capital are not taxable, but reduce the cost basis of shares held.
Expense Example
As a shareholder of the Fund, you incur ongoing costs, including a comprehensive management fee and trustee fees. You may incur a 2% redemption fee in the event shares are redeemed within 30 days. This example is intended to help you understand your ongoing costs (in dollars) of investing in the Fund and to compare these costs with the ongoing costs of investing in other mutual funds.
The example is based on an investment of $1,000 invested at the beginning of the period and held for the entire period (07/01/05 - 12/31/05).
Actual Expenses
The first line of the table that follows provides information about actual account values (which includes the actual return of the Fund) and actual expenses. You may use the information in this line, together with the amount you invested, to estimate the expenses that you paid over the period. Simply divide your account value by $1,000 (for example, an $8,600 account value divided by $1,000 = 8.6), then multiply the result by the number in the first line under the heading entitled "Expenses Paid During Period'' to estimate the expenses you paid on your account during this period. In addition to the expenses paid during the period that are noted in the table, you may be assessed fees for outgoing wire transfers, returned checks and stop payment orders at prevailing rates charged by U.S. Bancorp Fund Services, LLC, the Fund's transfer agent. If you request that a redemption be made by wire transfer, currently a $15.00 fee is charged by the Fun d's transfer agent. IRA accounts will be charged a $15.00 annual maintenance fee. These additional fees have the effect of reducing investment returns.
Hypothetical Example for Comparison Purposes
The second line of the table that follows provides information about hypothetical account values and hypothetical expenses based on the Fund's actual expense ratio and an assumed rate of return of 5% per year before expenses, which is not the Fund's actual return. The hypothetical account values and expenses may not be used to estimate the actual ending account balance or expenses you paid for the period. You
Annual Report – December 31, 2005
26
may use this information to compare the ongoing costs of investing in the Fund and other mutual funds. To do so, compare this 5% hypothetical example with the 5% hypothetical examples that appear in the shareholder reports of the other funds. Please note that the expenses shown in the table are meant to highlight your ongoing costs only and do not reflect any transactional costs, such as, redemption fees, or exchange fees. Therefore, the second line of the table is useful in comparing ongoing costs only, and will not help you determine the relative total costs of owning different mutual funds. In addition, if these transactional costs were included, your costs would have been higher.
Table: Expense Example
| Beginning Account Value 07/01/05 | Ending Account Value 12/31/2005 | Expenses Paid During Period 07/01/05 - 12/31/2005* | |||||||||||||
| Actual | $ | 1,000.00 | $ | 1,082.40 | $ | 7.72 | |||||||||
| Hypothetical (5% return before expenses) | $ | 1,000.00 | $ | 1,017.80 | $ | 7.48 | |||||||||
* Expenses are equal to the Fund's annualized expense ratio of 1.47% multiplied by the average account value over the period multiplied by 184/365 (to reflect the one-half year period).
Annual Report – December 31, 2005
27
Management of Skyline
The Board of Trustees serve indefinite terms of unlimited duration so long as a majority of trustees have been elected by the Fund's shareholders. The trustees appoint their own successors, provided that at least two-thirds of the trustees, after such appointment, have been elected by the Fund's shareholders. The Fund's shareholders may remove a trustee, with or without cause, upon the declaration in writing or a vote of two-thirds of the Fund's outstanding shares. A trustee may be removed with or without cause upon the written declaration of a majority of the trustees.
The names of the trustees and officers of Skyline Funds, the year each was first elected or appointed to office, their principal business occupations and other directorships they have held during at least the last five years, are shown below.
| Name, Position(s) with Skyline and Age at February 1, 2006 | Year First Elected or Appointed to Office | Principal Occupation(s) during Past Five Years | Other Directorships | ||||||||||||
| Trustees who are not interested persons of Skyline: | |||||||||||||||
| William L. Achenbach, 63, Trustee | 1995 | President, W.L. Achenbach & Associates, Inc., a financial counseling firm. | None. | ||||||||||||
| Paul J. Finnegan, 52, Trustee | 1995 | Co-President & Managing Director, Madison Dearborn Partners, Inc., a private equity firm. | Rural Cellular Corporation, Paetec Communications | ||||||||||||
| David A. Martin, 54, Trustee | 1995 | Attorney and Principal, Righeimer, Martin & Cinquino, P.C., a law firm. | None. | ||||||||||||
| Richard K. Pearson, 66, Trustee | 1998 | Director and President, First DuPage Bank (Westmont, IL) and Director and President, First DuPage Bancorp, Inc., (Westmont, Illinois). | Director, First Community Bank (Milton, WI). Director, First Community Bancshares Corp. | ||||||||||||
| Trustee who is an interested person of Skyline: | |||||||||||||||
| William M. Dutton,* 52, President and Trustee | 1995 | Partner and Senior Advisor, Skyline Asset Management, L.P. Previously, Managing Partner, Research and Portfolio Management until January 1, 2005. Prior, Portfolio Manager (Special Equities Portfolio) until 2001. | None. | ||||||||||||
Annual Report – December 31, 2005
28
| Name, Position(s) with Skyline and Age at February 1, 2006 | Year First Elected or Appointed to Office | Principal Occupation(s) during Past Five Years | Other Directorships | ||||||||||||
| Officers of Skyline: | |||||||||||||||
| Stephen F. Kendall, 51, Executive Vice President | 1998 | Partner, Chief Administrative Officer and Director of Marketing, Skyline Asset Management, L.P. since 2005. Previously, Partner and Chief Operating Officer, Skyline Asset Management, L.P. | None. | ||||||||||||
| Benjamin J. Kim, 36 Treasurer and Vice President | 2004 | Chief Financial Officer of Skyline Asset Management, L.P. since 2004 and Securities Analyst of Skyline Asset Management, L.P. | None. | ||||||||||||
| Deanna B. Marotz, 40 Chief Compliance Officer | 2004 | Chief Compliance Officer of the Funds since 2004, Chief Compliance Officer of Skyline Asset Management, L.P. since 2003. Previously, Manager of Marketing Communications of Skyline Asset Management, L.P. | None. | ||||||||||||
| Christine Carsman, 53 Secretary | 2004 | Vice President and Chief Regulatory Counsel, AMG since 2004. Previously, Vice President Senior Counsel and Director of Operational Risk Management and Compliance, Wellington Management Company, LLP. | None. | ||||||||||||
| Geoffrey P. Lutz, 55, Executive Vice President | 1995 | Partner, Institutional Marketing, Skyline Asset Management, L.P. | None. | ||||||||||||
| Michael Maloney, 44, Executive Vice President | 1995 | Partner and Portfolio Manager, Skyline Asset Management, L.P. since 2005. Previously, Partner, Research and Portfolio Management, Skyline Asset Management, L.P. | None. | ||||||||||||
| Michele M. Brennan, 34, Vice President | 1998 | Fund Marketing and Client Service, Skyline Asset Management, L.P. since 2005. Previously, Director of Fund Marketing, Skyline Asset Management, L.P. | None. | ||||||||||||
* Mr. Dutton is an "interested person" of Skyline, as defined in the Investment Company Act of 1940, as amended, because he is an officer of the Adviser.
Annual Report – December 31, 2005
29
Management of Skyline (continued)
The address of Messrs. Dutton, Kim, Kendall, Lutz, and Maloney and Ms. Marotz and Ms. Brennan is c/o Skyline Asset Management, L.P., 311 South Wacker Drive, Suite 4500, Chicago, Illinois 60606. The address of Ms. Carsman is c/o Affiliated Managers Group, Inc., 600 Hale Street, Prides Crossing, MA 09165. The addresses of the other trustees are: William L. Achenbach, 510 East Main Street, Charlottesville, Virginia 22902; Paul J. Finnegan, Three First National Plaza, Suite 3800, Chicago, Illinois 60602; David A. Martin, 20 North Clark Street, Suite 1900, Chicago, Illinois 60602; and Richard K. Pearson, 520 North Cass Avenue, Westmont, Illinois 60559.
Skyline's Statement of Additional Information includes additional information about Skyline's trustees and officers. You may obtain a free copy of the Statement of Additional Information, or request any other information and discuss your questions about us, by writing or calling toll-free:
Skyline Funds
c/o U.S. Bancorp Fund Services, LLC
P.O. Box 701
Milwaukee, WI 53201-0701
800.828.2759
Qualified Dividend Income Percentage
The Fund designated 25% of dividends declared and paid during the year ending December 31, 2005 from net investment income as qualified dividend income under the Jobs Growth and Tax Relief Reconciliation Act of 2003.
Corporate Dividends Received Deduction Percentage
Corporate shareholders may be eligible for a dividends received deduction for certain ordinary income distributions paid by the Fund. The Fund designated 24% of dividends declared and paid during the year ending December 31, 2005 from net investment income as qualifiying for the dividends received deduction. The deduction is a pass through of dividends paid by domestic corporations (i.e. only equities) subject to taxation.
Annual Report – December 31, 2005
30
Proxy Policy & Procedures
A description of the policies and procedures that the Fund uses to determine how to vote proxies relating to portfolio securities is available without charge, upon request, by calling 800.828.2759, and on the Securities and Exchange Commission's website at www.sec.gov. The Fund's proxy voting record for the twelve month period ended June 30, 2005, is also available without charge, upon request, by calling 800.828.2759, by visiting the Fund's website at www.skylinefunds.com and by visiting the SEC website at www.sec.gov.
Form N-Q
The Fund files a complete list of its portfolio holdings with the SEC for the first and third quarters each fiscal year on Form N-Q. The Form N-Q is available without charge, upon request, by calling 800.828.2759 or by visiting the SEC website. You may also review, for a fee, a copy of the form at the SEC's Public Reference Room in Washington, D.C. (800) SEC-0330.
Report for the Year Ended December 31, 2005
This report, including the audited financial statements contained herein, is submitted for the general information of the Fund's shareholders.
Distributor: Managers Distributors, Inc., member NASD.
Annual Report – December 31, 2005
31
This page left blank intentionally.
Annual Report – December 31, 2005
32
For 24-hour account information call: 1.800.828.2SKY
(1.800.828.2759)
To speak with a Skyline Funds Representative during
normal business hours call: 1.800.828.2SKY and press 0 when prompted.
To learn more about our expertise in small cap value, please visit our website at www.skylinefunds.com

Item 2. Code of Ethics.
(a) Registrant has adopted a code of ethics that applies to its principal executive and senior financial officers (the “Code”).
(b) No disclosures are required by this Item 2(b).
(c) During the period covered by the report, registrant did not make any amendments to the provisions of the Code.
(d) During the period covered by the report, registrant did not grant any waivers, including implicit waivers, from the provisions of the Code.
(e) Not applicable.
(f) A copy of the Code is filed as Exhibit (a)(1) to this Form N-CSR.
Item 3. Audit Committee Financial Expert.
Registrant’s board of trustees has determined that Richard K. Pearson, a member of the registrant’s Committee of the Independent Trustees, qualifies as an “audit committee financial expert,” as such term is defined in Instruction 2(b) to Item 3 of Form N-CSR. Mr. Pearson is “independent” as such term is defined in paragraph (a)(2) of Item 3 of Form N-CSR.
Under applicable securities laws, a person who is determined to be an audit committee financial expert will not be deemed an “expert” for any purpose, including without limitation for the purposes of Section 11 of the Securities Act of 1933, as a result of being designated or identified as an audit committee financial expert. The designation or identification of a person as an audit committee financial expert does not impose on such person any duties, obligations, or liabilities that are greater than the duties, obligations, and liabilities imposed on such person as a member of the audit committee and board of trustees in the absence of such designation or identification. The designation or identification of a person as an audit committee financial expert does not affect the duties, obligations, or liability of any other member of the audit committee or board of trustees.
Item 4. Principal Accountant Fees and Services.
(a) Audit Fees
$30,000 (2005) and $30,000 (2004) are the aggregate fees billed in each of the last two fiscal years for professional services rendered by the principal accountant to the registrant for the audit of the registrant’s annual financial statements or services that are normally provided by the accountant in connection with statutory and regulatory filings or engagements for those fiscal years. Please note that under the registrant’s comprehensive management fee agreement, the registrant’s investment adviser pays these fees.
(b) Audit-Related Fees
There were no fees billed in each of the last two fiscal years for assurance and related services rendered by the principal accountant to the registrant that are reasonably related to the performance of the audit of the registrant’s financial statements and are not reported under paragraph (a) of this Item 4.
There were no fees billed in each of the last two fiscal years for assurance and related services rendered by the principal accountant to the registrant’s investment adviser and any entity controlling, controlled by or under common control with the investment adviser that provides ongoing services to the registrant (collectively, the “investment adviser”) that are reasonably related to the performance of the audit of the registrant’s financial statements, are not reported under paragraph (a) of this Item 4 and were required to be pre-approved by the audit committee as described in paragraph (e) (1) of this Item 4.
(c) Tax Fees
$5,500 (2005) and $5,000 (2004) are the aggregate fees billed in each of the last two fiscal years for professional services rendered by the principal accountant to the registrant for tax compliance, tax advice and tax planning. Please note that under the registrant’s comprehensive management fee agreement, the registrant’s investment adviser pays these fees. The nature of these services was for qualified dividend income preparation and various tax consultations.
There were no fees billed in each of the last two fiscal years for professional services rendered by the principal accountant to the investment adviser for tax compliance, tax advice and tax planning and were required to be pre-approved by the audit committee as described in paragraph (e)(1) of this Item 4.
(d) All Other Fees
There were no fees billed in each of the last two fiscal years for products and services provided by the principal accountant to the registrant, other than the services reported in paragraphs (a)-(c) of this Item 4.
There were no fees billed in each of the last two fiscal years for products and services provided by the principal accountant to the investment adviser, other than the services reported in paragraphs (a)-(c) of this Item 4, that were required to be pre-approved by the audit committee as described in paragraph (e)(1) of this Item 4.
(e) (1) Registrant’s Committee of Independent Trustees meets with the principal accountants and management to review and pre-approve all audit services to be provided by the principal accountants.
The Committee of Independent Trustees shall pre-approve all non-audit services to be provided by the principal accountants to the registrant; provided that the pre-approval requirement does not apply to non-audit services that (i) were not identified as such at the time of the pre-approval and (ii) do not aggregate more than 5% of total revenues paid to the principal accountants by the registrant during the fiscal year in which the services are
provided, if the Committee of Independent Trustees approves the provision of such non-audit services prior to the completion of the audit.
The Committee of Independent Trustees shall pre-approve all non-audit services to be provided by the principal accountants to the investment adviser where the nature of the services provided have a direct impact on the operations or financial reporting of the registrant; provided that the pre-approval requirement does not apply to non-audit services that (i) were not identified as such at the time of the pre-approval and (ii) do not aggregate more than 5% of total revenue paid to the principal accountants by the registrant for all services and by the registrant’s investment adviser for services where the nature of the services provided have a direct impact on the operations or financial reporting of the registrant during the fiscal year in which those services are provided, if the Committee of Independent Trustees approves the provision of such non-audit services prior to the completion of the audit.
(2) 100% of the services provided to the registrant described in paragraphs (b)-(d) of this Item 4 were pre-approved by the Committee of Independent Trustees pursuant to paragraph (e)(1) of this Item 4. There were no services provided to the investment adviser described in paragraphs (b)-(d) of this Item 4.
(f) No disclosures are required by this Item 4(f).
(g) $0 (2005) and $0 (2004) are the aggregate non-audit fees billed in each of the last two fiscal years for services rendered by the principal accountant to the registrant. Please note that the registrant does not actually pay those fees. Due to the registrant’s comprehensive management fee, the registrant’s investment adviser pays those fees. There were no non-audit fees billed in each of the last two fiscal years for services rendered by the principal accountant to the investment adviser.
(h) The Committee of Independent Trustees of the Registrant’s board of trustees has considered whether the provision of non-audit services that were rendered by Registrant’s principal accountant to Registrant’s investment adviser, and any entity controlling, controlled by or under common control with the investment adviser that provides ongoing services to the Registrant that were not pre-approved pursuant to paragraph (c) (7)(ii) of Rule 2-01 of Regulation S-X is compatible with maintaining the principal account’s independence. No such services were rendered.
Item 5. Audit Committee of Listed Registrants
Not applicable to open-end investment companies.
Item 6. Schedule of Investments
The Schedule of Investments is included as part of the report to shareholders filed under Item 1 of this Form.
Item 7. Disclosure of Proxy Voting Policies and Procedures for Closed-End Management Investment Companies.
Not applicable to open-end investment companies.
Item 8. Portfolio Managers of Closed-End Management Investment Companies.
Not applicable to open-end investment companies.
Item 9. Purchases of Equity Securities by Closed-End Management Investment Company and Affiliated Purchasers.
Not applicable to open-end investment companies.
Item 10. Submission of Matters to a Vote of Security Holders.
Not applicable.
Item 11. Controls and Procedures.
(a) Based on an evaluation of the disclosure controls and procedures (as defined in Rule 30a-3(c) under the Investment Company Act of 1940, the “Disclosure Controls”) as of a date within 90 days prior to the filing date (the “Filing Date”) of this Form N-CSR (the “Report”), the Disclosure Controls are effectively designed to ensure that information required to be disclosed by the registrant in the Report is recorded, processed, summarized and reported by the Filing Date, including ensuring that information required to be disclosed in the Report is accumulated and communicated to the registrant’s management, including the registrant’s principal executive officer and principal financial officer, as appropriate to allow timely decisions regarding required disclosure.
(b) There were no changes in the registrant’s internal controls over financial reporting (as defined in Rule 30a-3(d) under the Investment Company Act of 1940) that occurred during the registrant’s most recent fiscal year that has materially affected, or is reasonably likely to materially affect, the registrant’s internal control over financial reporting.
Item 12. Exhibits.
(a) | (1) | Code of Ethics for Principal Executive and Senior Financial Officers (as referenced in Item 2 above), attached hereto as Exhibit (a)(1) |
| ||
| (2) | Certifications of William M. Dutton, President and Trustee of Skyline Funds and Benjamin J. Kim, Vice President and Treasurer of Skyline Funds pursuant to Rule 30a-2(a) under the Investment Company Act of 1940 (17 CFR 270.30a-2(a)), attached hereto as Exhibits (a)(2)(i) and (a)(2)(ii) |
| (3) | Not applicable to open end investment companies. |
| ||
(b) |
| Certification of William M. Dutton, President and Trustee of Skyline Funds and Benjamin J. Kim, Vice President and Treasurer of Skyline Funds pursuant to Section 906 of the Sarbanes-Oxley Act of 2002, attached hereto as Exhibit (b). |
SIGNATURES
Pursuant to the requirements of the Securities Exchange Act of 1934 and the Investment Company Act of 1940, the registrant has duly caused this report to be signed on its behalf by the undersigned, thereunto duly authorized.
Skyline Funds
By: | /s/William M. Dutton |
|
| William M. Dutton |
|
| President and Trustee |
|
Date: | February 24, 2006 |
|
Pursuant to the requirements of the Securities Exchange Act of 1934 and the Investment Company Act of 1940, this report has been signed below by the following persons on behalf of the registrant and in the capacities and on the dates indicated.
By: | /s/William M. Dutton |
|
| William M. Dutton |
|
| President and Trustee |
|
Date: | February 24, 2006 |
|
|
|
|
|
|
|
By: | /s/Benjamin J. Kim |
|
| Benjamin J. Kim |
|
| Vice President and Treasurer |
|
Date: | February 24, 2006 |
|