UNITED STATES
SECURITIES AND EXCHANGE COMMISSION
Washington, D.C. 20549
FORM N-CSR
N-CSR
CERTIFIED SHAREHOLDER REPORT OF REGISTERED
MANAGEMENT INVESTMENT COMPANIES
Investment Company Act file number | 811-5022 | |||||||||
| ||||||||||
Skyline Funds | ||||||||||
(Exact name of registrant as specified in charter) | ||||||||||
| ||||||||||
311 South Wacker Drive, Suite 4500 |
| 60606 | ||||||||
(Address of principal executive offices) |
| (Zip code) | ||||||||
| ||||||||||
William M. Dutton |
| Alan Goldberg | ||||||||
Skyline Funds |
| Bell, Boyd & Lloyd LLC | ||||||||
311 South Wacker Drive, Suite 4500 |
| Three First National Plaza, #3300 | ||||||||
Chicago, IL 60606 |
| Chicago, IL 60602 | ||||||||
(Name and address of agents for service) | ||||||||||
| ||||||||||
Registrant’s telephone number, including area code: | (312) 913-0900 |
| ||||||||
| ||||||||||
Date of fiscal year end: | 12/31/06 |
| ||||||||
| ||||||||||
Date of reporting period: | 12/31/06 |
| ||||||||
Item 1. Report to Shareholders.
ANNUAL REPORT — December 31, 2006
Skyline Special
Equities Portfolio
![]()

Commentary
December 31, 2006
Overview
Skyline Special Equities Portfolio generated a return of 8.67% for the fourth quarter, compared to an 8.90% return for the Russell 2000 Index and a 9.03% return for the Russell 2000 Value Index. For all of 2006, the Fund generated a return of 18.71%, compared to an 18.37% return for the Russell 2000 Index and a 23.48% return for the Russell 2000 Value Index. Contributing to the large gain in small cap stock prices for both the fourth quarter and all of 2006 were strong corporate earnings and a high level of mergers and acquisition (M&A) activity. The major macroeconomic issues facing investors in 2006 were a housing-related slow down in the domestic economy, low long term interest rates and a decline in energy prices from their peaks early in the year. As was the case with small cap stocks in general, the excellent absolute returns generated by the Fund during the fourth quarter and full year 2006 were a result of strong underlying funda mentals and heightened M&A activity. On a relative basis, particularly when comparing its results to the Russell 2000 Value Index, the Fund suffered from a comparatively low weighting in the strong performing REIT group and utilities sector.
Market Review
Stocks rose sharply in the fourth quarter, as indicated by the 8.90% and 9.03% gains posted by the Russell 2000 and Russell 2000 Value Indexes respectively, and by the 6.70% gain recorded by the S&P 500 Index. Several factors contributed to the strong gains. Early in the fourth quarter, small companies reported that their third quarter earnings had risen at a double-digit rate on a year-over-year basis. Announced global M&A volume was up 51% over the prior year's fourth quarter. Crude Oil, which had peaked at $77 a barrel in the third quarter, hit an annual low of $56 a barrel late in the quarter before ending the year at $61. Additionally, long term interest rates remain at relatively low levels. The 10 Year US Treasury Bond ended the year yielding 4.71%, up from 4.39% a year ago but down from its recent peak of 5.25% in June of 2006. Although U.S. real GDP growth is estimated to have decelerated to 1.9% in the fourth quarter from 5 .6% as recently as the first quarter of 2006, the strength in stock prices during the quarter appears to indicate that investors believe we are in a "goldilocks" economy – slow enough to ease inflationary pressures, but not so slow as to prevent continued corporate earnings growth. Supporting that viewpoint is the fact that the Federal Reserve has not felt the need to raise or lower rates, having held its target for the federal funds rate at 5.25% since June of 2006.
Using the Russell 2000 Value Index as the benchmark, and focusing on only those sectors that make up a meaningful percentage of the index, every sector posted gains for the quarter. Economically sensitive sectors such as materials and processing and autos and transportation were among the best performers during the quarter. Defensive sectors, such as health care and utilities, were among the quarter's laggards, although consumer staples was an exception. The strength in economically
Commentary is a representation of Skyline Asset Management, L.P. and is unaudited.
Annual Report – December 31, 2006
1
sensitive stocks and the weakness in defensive stocks during the fourth quarter appear at odds with the deceleration in United States GDP. A possible explanation for this apparent contradiction is the fact that economies outside the U.S. remain quite healthy, and domestic companies are generating a greater percentage of their revenues overseas. Additionally, materials and processing, producer durables, and autos and transportation companies are relatively heavy users of fuel and/or raw materials derived from petrochemicals and are likely to be the biggest beneficiaries of the decline in energy prices during the quarter.
For all of 2006, stocks generated exceptional returns, as evidenced by the 18.37% return for the Russell 2000 Index, 23.48% return for the Russell 2000 Value Index and 15.79% return for the S&P 500 Index. The same trends that drove strong fourth quarter results contributed to the full year's gains. Double digit earnings growth, an active M&A environment, relatively low long term interest rates, and a peaking and subsequent decline in energy prices all helped propel stock prices higher.
Every sector of the benchmark generated positive returns for 2006. Five sectors generated returns of over 25% for the year, including the economically sensitive materials and processing and producer durables sectors and the higher than average dividend yielding utilities sector and the REIT group, which is included in the financial services sector. Although most commodity prices have retreated recently, they are still near multi-year highs due to strong demand from economies outside the United States. Higher material prices are helping drive strong earnings for materials and processing companies and the producer durables companies that provide equipment to them. Despite a strong global economy, interest rates in the United States remain at relatively low levels due to concerns about the potential for a recession in this country. In a low interest rate environment, investors place a higher premium on dividend paying companies. REITs are benef iting further from the higher valuations being placed on office buildings and other non-residential real estate. Among the lagging sectors was the autos and transportation sector, whose auto suppliers were hurt by weak big three auto sales, and whose trucking stocks were hurt by the slowing economy. Stocks in the other energy sector also underperformed, in conjunction with the decline in oil and gas prices from their peaks earlier in the year.
Continuing a trend in place for most of this decade, small cap stocks outperformed large cap stocks. The S&P 500 Index's gain of 15.79% for all of 2006 fell short of the 18.37% return posted by the Russell 2000 Index. The outperformance of small cap stocks, which began in April 1999 and ended in May of 2006 was the second longest small cap cycle ever recorded, driven by the extreme relative undervaluation of small cap stocks at the start of the cycle and the strong relative earnings growth posted by small caps over most of the cycle. Although the recent small cap cycle was impressive given its length, it was less impressive in terms of magnitude. During the recent small cap cycle, small cap stocks generated a cumulative return of 109.1% (11.2% annualized) and an annualized excess return over large caps of 10.0% per year. These are the lowest absolute and relative returns of the six small cap cycles since 1932 and well below the average c umulative return of 512.1% (33.0% annualized) and annualized excess return of 12.8%. The well below average cumulative return generated by small cap stocks during this cycle was due in large part to its inception near the peak of the technology and large cap growth stock bubble, when the economy was quite healthy. Stocks had
Commentary is a representation of Skyline Asset Management, L.P. and is unaudited.
Annual Report – December 31, 2006
2
to endure a couple of very difficult economic years before turning up in early 2003. Unlike the current cycle, most small cap cycles start towards the end of a recession, so the economy acts as a wind at the back of small cap stocks throughout the entire period of relative outperformance.
Most of the outperformance of small caps versus large caps in 2006 was achieved in the first quarter of 2006. Despite small caps' fourth quarter outperformance, large caps led small caps for the final nine months of 2006, when the S&P 500 Index returned 11.12% compared to a 3.89% return for the Russell 2000 Index. More recently, small cap and large cap valuations are similar, and earnings growth rates are comparable as well. This makes it less likely that small caps will be able to retain their leadership over large caps on a consistent basis.
In 2006, small cap value stocks outperformed small cap growth stocks for the sixth time in seven years as indicated by the 23.48% return generated by the Russell 2000 Value Index and the 13.35% return generated by the Russell 2000 Growth Index. The Russell 2000 Value Index benefited from comparatively heavy weightings in the strong performing REIT group and utilities sector, while the Russell 2000 Growth Index suffered from relatively heavy weightings in the underperforming technology, health care, and consumer sectors.
Portfolio Review
Solid fundamentals for the companies in the Fund helped drive stock price gains. The median year-over-year increase in quarterly earnings reported by companies in the Fund during the fourth quarter was 14.3%, and we are estimating their median earnings growth over the next twelve months will be 12.6%. In addition, four Fund companies received takeover offers during the quarter.
The financial services and technology sectors contributed most to the Fund's absolute and relative performance during the fourth quarter. The financial services sector's large absolute contribution benefited from strong stock selection and its large weighting in the Fund. Four of the top ten performing stocks during the quarter were from this sector, including Clark, Inc., a benefits broker, which received a takeover offer that represented a 32% premium to Clark's stock price at the time. On a relative basis, strong stock selection within the financial services sector more than offset its lower weighting compared to the benchmark. The technology sector benefited from strong stock selection and a heavy weighting on both an absolute basis and relative to the benchmark. Kanbay International, Inc., an information technology services provider, had already seen significant appreciation in its stock price due to strong fundamentals when it received a buyout offer that provided an additional 16% boost to its price.
The materials and processing sector detracted most from the Fund's relative performance during the quarter. NCI Building Systems, Inc., a large holding in the sector, saw its price decline due to some investors' disappointment that strong top line results did not lead to improved margins. In addition, the Fund is typically underweighted in more commodity oriented industries like steel and agricultural chemicals, which performed well during the quarter.
Commentary is a representation of Skyline Asset Management, L.P. and is unaudited.
Annual Report – December 31, 2006
3
For all of 2006, the Fund's strong absolute gain reflects solid underlying fundamentals, and solid stock selection in several sectors. Additionally, nine Fund holdings received takeover offers during the year.
The technology sector contributed most to the Fund's performance in 2006 on both an absolute basis and relative to the benchmark, due to strong stock selection and its heavy weighting in the Fund. Along with Kanbay, SMART Modular Technologies (WWH), Inc., a provider of memory subsystems to technology OEMs, was a significant contributor to the Fund's return as its stock price responded positively to better than expected fundamentals. The producer durables sector was also a major contributor to the Fund's absolute and relative returns, led by stocks that benefited from strong earnings such as CommScope, Inc., a provider of wire and cable, and Acuity Brands, Inc., a manufacturer of lighting products for commercial buildings.
The financial services and utilities sectors detracted most from the Fund's performance relative to the benchmark. The Fund's financial services stocks underperformed those of the benchmark due primarily to an underweighted position in the strong performing REIT group. REITs have outperformed the S&P 500 Index for seven years in a row, and on some measures their relative valuations are currently 2 times their long-term averages, making it difficult for us to find attractive opportunities in the sector. In addition, a large decline in Scottish Re Group Limited, a life reinsurer, negatively impacted the Fund in 2006. Although we liked Scottish Re's valuation and believed it would benefit from improving industry trends, a large equity write down caused investors to reassess its growth prospects. The Fund was also underweighted in utilities stocks, particularly electric and gas utilities. The general slow growth nature of those industries ma kes it difficult for us to find stocks that meet our growth criteria. Utilities performed strongly during 2006 due to investors' desire for higher dividend yields.
Outlook
The current economic expansion is now over five years old, which is three months longer than the typical post-World War II expansion. In terms of magnitude, the current expansion has not exhibited particularly robust GDP growth. However, corporate earnings growth has been exceptional. S&P 500 Index earnings have cumulatively grown 224% in this expansion (albeit from very depressed levels at the start of the cycle) compared to 85% for the typical post-World War II expansion. An increase in operating margins, as companies outsource and produce more in low-cost offshore locales, has been a major contributor to the earnings gains. Profit margins for S&P Industrials companies now stands at 7.9%, compared to 4.3% at the beginning of this cycle and a 5.5% historical median. S&P 500 Index companies had posted double digit earnings growth every quarter since the first quarter of 2002.
This long stretch of prosperity has helped strengthen corporate balance sheets and has left managements feeling confident about their companies' prospects. Underleveraged balance sheets and optimistic managements, when combined with favorable borrowing conditions and record amounts of private equity capital that needs to be put to use, create a very attractive environment for M&A activity. The year 2006 set a record for global M&A activity, and with over $700 billion in unused private equity capital, the outlook for 2007 is positive as well.
Commentary is a representation of Skyline Asset Management, L.P. and is unaudited.
Annual Report – December 31, 2006
4
Strong earnings trends, record operating margins, solid balance sheets, optimistic managements, favorable borrowing conditions, and large pools of untapped liquidity all make for a positive case for stocks. However, it is important to remember that stocks perform best when the environment is improving, and it is hard to see things getting much better from the current conditions. When the current bull market, which has seen the Russell 2000 Index increase 142.16%, started back in October of 2002, we were just coming off one of the worst earnings recessions on record, margins were depressed, several areas of the economy were suffering from too much debt, managements were fearful, and investors were demanding significant premiums to lend to below investment grade companies.
Our current viewpoint on the market is mixed. It is quite possible that the elements in place today are creating a positive environment for stocks that will continue for the foreseeable future. If that occurs, earnings growth can continue and M&A activity may provide support for equity valuations. However, history tells us that the best time to buy stocks is when things look bleakest and to be cautious when things appear to be as good as they can get.
Commentary is a representation of Skyline Asset Management, L.P. and is unaudited.
Past performance does not guarantee future results. The performance data quoted represents past performance and current returns may be lower or higher. The investment return and principal value will fluctuate so that an investor's shares, when redeemed may be worth more or less than the original cost. To obtain performance information current to the most recent month end, please visit www.skylinefunds.com.
The Russell 2000 Value Index is an unmanaged, value-oriented index comprised of small stocks that have relatively low price-to-book ratios. The Russell 2000 Index is an unmanaged, market value weighted index comprised of small-sized companies. The S&P 500 Index, a widely quoted stock market index, includes 500 of the largest companies publicly traded in the United States. All figures take into account reinvested dividends. You cannot invest directly in an index.
There are risks of investing in a fund that invests in stocks of small sized companies, which tend to be more volatile and less liquid than stocks of large cap companies. There are also risks in investing in value-oriented stocks, including the risk that value-oriented stocks will underperform growth-oriented stocks during some periods.
The discussion of the Fund's investments and investment strategy represent the views of Skyline Asset Management, L.P., the Fund's investment adviser, at the time of this report. The Fund's investments are subject to change and should not be considered a recommendation to buy individual securities.
This report is not authorized for distribution unless accompanied or preceded by a current prospectus.
Distributor: Managers Distributors, Inc., member NASD.
Sources: Skyline Asset Management, L.P., Frank Russell Company, and FactSet.
Annual Report – December 31, 2006
5
Performance (%)
| 4Q 2006* | 2006 | 3 yrs | 5 yrs | 10 yrs | Since Inception** | ||||||||||||||||||||||
| Special Equities | 8.67 | 18.71 | 15.35 | 14.90 | 11.94 | 14.41 | |||||||||||||||||||||
| Russell 2000 Value | 9.03 | 23.48 | 16.48 | 15.37 | 13.27 | 12.75 | |||||||||||||||||||||
| Russell 2000 | 8.90 | 18.37 | 13.56 | 11.39 | 9.44 | 10.04 | |||||||||||||||||||||
| S&P 500 | 6.70 | 15.79 | 10.44 | 6.19 | 8.42 | 10.98 | |||||||||||||||||||||
Change in Value of a $10,000 Investment
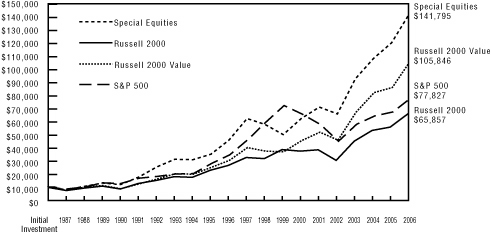
Past performance does not guarantee future results. The performance data quoted represents past performance and current returns may be lower or higher. The investment return and principal value will fluctuate so that an investor's shares, when redeemed may be worth more or less than the original cost. To obtain performance information current to the most recent month end, please visit www.skylinefunds.com. The performance for the one, three, five and ten years ended December 31, 2006, and for the period April 23, 1987 (inception) through December 31, 2006, is an average annual return calculation.
The table does not reflect the deduction of taxes that a shareholder would pay on fund distributions or the redemption of fund shares.
* Not annualized.
** Performance for the Fund, the Russell 2000 Index, and the S&P 500 Index reflects the Fund's inception date of April 23, 1987. The Russell 2000 Value performance reflects an inception date of May 1, 1987.
Annual Report – December 31, 2006
6
| Historical Performance | Special Equities | Russell 2000 Value | Russell 2000 | S&P 500 | |||||||||||||||
| 2006 | 18.7 | 23.5 | 18.4 | 15.8 | |||||||||||||||
| 2005 | 10.9 | 4.7 | 4.6 | 4.9 | |||||||||||||||
| 2004 | 16.6 | 22.3 | 18.3 | 10.9 | |||||||||||||||
| 2003 | 40.7 | 46.0 | 47.3 | 28.7 | |||||||||||||||
| 2002 | -7.3 | -11.4 | -20.5 | -22.1 | |||||||||||||||
| 2001 | 13.9 | 14.0 | 2.5 | -11.9 | |||||||||||||||
| 2000 | 24.2 | 22.8 | -3.0 | -9.1 | |||||||||||||||
| 1999 | -13.3 | -1.5 | 21.3 | 21.0 | |||||||||||||||
| 1998 | -7.2 | -6.5 | -2.6 | 28.6 | |||||||||||||||
| 1997 | 35.4 | 31.8 | 22.4 | 33.4 | |||||||||||||||
| 1996 | 30.4 | 21.4 | 16.5 | 23.0 | |||||||||||||||
| 1995 | 13.8 | 25.8 | 28.5 | 37.6 | |||||||||||||||
| 1994 | -1.2 | -1.5 | -1.8 | 1.3 | |||||||||||||||
| 1993 | 22.8 | 23.8 | 18.9 | 10.1 | |||||||||||||||
| 1992 | 42.4 | 29.1 | 18.4 | 7.6 | |||||||||||||||
| 1991 | 47.4 | 41.7 | 46.0 | 30.5 | |||||||||||||||
| 1990 | -9.3 | -21.8 | -19.5 | -3.1 | |||||||||||||||
| 1989 | 24.0 | 12.4 | 16.3 | 31.7 | |||||||||||||||
| 1988 | 29.7 | 29.5 | 25.0 | 16.6 | |||||||||||||||
| 1987 | * | -16.9 | -21.5 | -24.4 | -12.0 | ||||||||||||||
Past performance does not guarantee future results. The performance data quoted represents past performance and current returns may be lower or higher. The investment return and principal value will fluctuate so that an investor's shares, when redeemed, may be worth more or less than the original cost. To obtain performance information current to the most recent month end, please visit www.skylinefunds.com.
The table does not reflect the deduction of taxes that a shareholder would pay on fund distributions or the redemption of fund shares.
* Performance for the Fund, the Russell 2000 Index, and the S&P 500 Index reflects the Fund's inception date of April 23, 1987. The Russell 2000 Value performance reflects an inception date of May 1, 1987.
Annual Report – December 31, 2006
7
Portfolio Characteristics
| Special Equities | Russell 2000 Value | Russell 2000 | S&P 500 | ||||||||||||||||
| P/E (excluding negative earnings) | 15.5 | 17.3 | 19.3 | 16.5 | |||||||||||||||
| Price/Book | 1.86 | 1.81 | 2.33 | 2.85 | |||||||||||||||
| Price/Sales | 0.88 | 0.94 | 1.17 | 1.51 | |||||||||||||||
| EPS Growth—3yrs. (historical) | 17.1 | % | 9.7 | % | 14.6 | % | 16.2 | % | |||||||||||
| EPS Growth—1 yr. (forecasted) | 12.7 | % | 7.4 | % | 12.7 | % | 14.4 | % | |||||||||||
| Market Capitalization (weighted median) ($ millions) | $ | 1,181 | $ | 1,144 | $ | 1,143 | $ | 57,908 | |||||||||||
| Net Assets | $566 million | ||||||||||||||||||
| Number of holdings | 64 | ||||||||||||||||||
| Ticker symbol: | SKSEX | ||||||||||||||||||
| Cusip: | 830833208 | ||||||||||||||||||
| Net Asset Value (per share): | $ | 25.99 | |||||||||||||||||
| Initial investment: | $ | 1,000 | |||||||||||||||||
| Subsequent investment: | $ | 100 | |||||||||||||||||
Top Ten Holdings
| % of net assets | |||||||
| iStar Financial Inc. | |||||||
| Commercial real estate lender | 3.2 | % | |||||
| Cytec Industries Inc. | |||||||
| Specialty chemicals | 3.2 | % | |||||
| Centene Corporation | |||||||
| Medicaid managed care | 2.8 | % | |||||
| Reinsurance Group of America, Incorporated | |||||||
| Life reinsurer | 2.8 | % | |||||
| Crane Co. | |||||||
| Industrial conglomerate | 2.6 | % | |||||
| NCI Building Systems, Inc. | |||||||
| Metal buildings | 2.5 | % | |||||
| Heidrick & Struggles Int'l., Inc. | |||||||
| Executive search and leadership consulting services | 2.4 | % | |||||
| MCG Capital Corporation | |||||||
| Business development company | 2.2 | % | |||||
| The Toro Company | |||||||
| Turf maintenance products | 2.1 | % | |||||
| The Hanover Insurance Group, Inc. | |||||||
| Property and casualty insurance | 2.1 | % | |||||
| Top Ten Holdings | 25.9 | % | |||||
Fund holdings are subject to change and should not be considered a recommendation to buy individual securities.
Annual Report – December 31, 2006
8
Sector Performance (%) (as of December 31, 2006)
4Q06**
| Special Equities | Russell 2000 Value | Russell 2000 | |||||||||||||
| Health Care | 20.1 | 8.3 | 8.0 | ||||||||||||
| Other Energy | 17.1 | 8.9 | 9.8 | ||||||||||||
| Financial Services | 12.5 | 6.6 | 6.7 | ||||||||||||
| Technology | 11.4 | 7.1 | 7.6 | ||||||||||||
| Autos And Transportation | 9.2 | 11.5 | 10.6 | ||||||||||||
| Consumer Discretionary | 9.1 | 11.2 | 10.5 | ||||||||||||
| Materials And Processing | 3.7 | 14.3 | 12.9 | ||||||||||||
| Producer Durables | 1.2 | 9.7 | 9.4 | ||||||||||||
| Utilities | -5.2 | 8.6 | 8.2 | ||||||||||||
| Consumer Staples | NA* | 15.1 | 13.1 | ||||||||||||
| Integrated Oils | NA* | -5.5 | -1.1 | ||||||||||||
| Other | NA* | 16.5 | 9.2 | ||||||||||||
YTD 2006
| Special Equities | Russell 2000 Value | Russell 2000 | |||||||||||||
| Technology | 31.2 | 20.9 | 13.8 | ||||||||||||
| Autos And Transportation | 30.7 | 9.7 | 12.4 | ||||||||||||
| Producer Durables | 30.0 | 31.5 | 25.3 | ||||||||||||
| Materials And Processing | 27.6 | 37.9 | 31.0 | ||||||||||||
| Consumer Discretionary | 13.4 | 20.1 | 15.8 | ||||||||||||
| Financial Services | 13.2 | 19.7 | 19.2 | ||||||||||||
| Other Energy | 10.3 | 11.6 | 12.5 | ||||||||||||
| Utilities | 4.8 | 31.1 | 29.1 | ||||||||||||
| Consumer Staples | NA* | 23.8 | 31.4 | ||||||||||||
| Health Care | NA* | 19.3 | 8.9 | ||||||||||||
| Integrated Oils | NA* | 47.2 | 24.6 | ||||||||||||
| Other | NA* | 33.7 | 12.1 | ||||||||||||
Past performance does not guarantee future results. The performance data quoted represents past performance and current returns may be lower or higher. The investment return and principal value will fluctuate so that an investor's shares, when redeemed may be worth more or less than the original cost. To obtain performance information current to the most recent month end, please visit www.skylinefunds.com.
* Not applicable
** Not annualized
Sector Weightings (as of December 31, 2006)
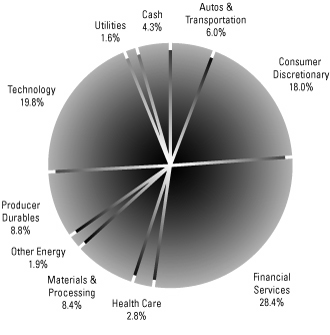
Fund holdings are subject to change and should not be considered a recommendation to buy individual securities. Sector weightings are shown as a percentage of total net assets.
Annual Report – December 31, 2006
9
Stock Highlights
The Hanover Insurance Group, Inc. (THG)
THG is a leading regional provider of property and casualty insurance. We believe THG will deliver above average earnings growth over the next several years due to accelerating revenue growth and improving margins. Revenue growth will be driven by market share gains. THG is taking share from smaller competitors without the resources to develop the systems that THG has implemented, which allow independent agents to quickly and accurately quote a wide spectrum of automobile owners. In addition, THG's commitment to independent agents allows it to take share from many larger competitors that are bypassing agents and marketing directly to consumers. THG has made significant investments in systems and upgrading its management team, and now has an infrastructure capable of handling a much higher level of revenues. As revenue grows, expenses will grow more slowly, leading to margin expansion. Despite these positive attributes, THG sells at a modest premium to its book value and at a low multiple of current earnings.
Perot Systems Corporation (PER)
PER is a global provider of information technology services. PER offers the following services: consulting, infrastructure outsourcing, business process outsourcing, systems development, and application maintenance. The majority of PER's revenues are derived from long-term contracts. PER's main focus is the healthcare sector, which generates 47% of PER's revenues. The healthcare market is an attractive market, currently growing at a double-digit rate. PER is able to offer its customers substantial savings on its services as 29% of its work force is in India. PER's revenue and earnings growth have been masked by the ending of a large contract. This appears to be an isolated occurrence, and we expect growth to return as we move through 2007. PER stock is very reasonably valued with a P/E in the mid-teens, a very strong balance sheet, and a $1.85 in net cash per share.
Fund holdings are subject to change and should not be considered a recommendation to buy individual securities.
Annual Report – December 31, 2006
10
Glossary of Investment Terms
Earnings Per Share (EPS) A company's net income divided by its outstanding shares.
Earnings Per Share growth — 3 yrs (historical) The compounded annual growth rate of a company's EPS over the last 3 years.
Earnings Per Share growth — 1 yr (forecasted) Analysts' consensus forecast for a company's growth in operating EPS over the immediate future 12 months.
Market Cap Dollar Weighted Median An indicator of the size of companies in which a fund invests; the mid-point of market capitalization (market price times shares outstanding) of a fund's stocks, weighted by the proportion of the fund's assets invested in each stock. Stocks representing half of the fund's assets have market capitalizations above the median, and the rest below it.
Price/Book Ratio The share price of a stock divided by its net worth, or book value, per share.
Price/Earnings (P/E) Ratio An indicator of the relative valuation of the stocks in which a fund invests. For stocks the ratio is calculated by taking the stock's current price to its per-share earnings over the past 12 months. For a fund, the P/E ratio is the average of the P/E ratios of the fund's stocks, weighted by the proportion of the fund's assets invested in each stock.
Price/Sales Ratio The ratio of a stock's current price to its per-share revenue over the past 12 months.
Annual Report – December 31, 2006
11
Portfolio Holdings as of December 31, 2006
| Company Description | Number Shares | Market Value | |||||||||||||
| COMMON STOCKS | |||||||||||||||
| Autos & Transportation – 6.0% | |||||||||||||||
| Autos – 2.2% | |||||||||||||||
| Aftermarket Technology Corp.a | Provider of remanufactured transmissions | 328,513 | $ | 6,990,757 | |||||||||||
| American Axle & Mfg. Holdings, Inc. | Auto parts manufacturer | 296,347 | 5,627,630 | ||||||||||||
| 12,618,387 | |||||||||||||||
| Other Transportation – 3.8% | |||||||||||||||
| Interpool, Inc. | Container leasing firm | 397,621 | 9,288,427 | ||||||||||||
| Ryder System, Inc. | Truck leasing company | 82,600 | 4,217,556 | ||||||||||||
| SkyWest, Inc. | Regional Airline | 307,362 | 7,840,805 | ||||||||||||
| 21,346,788 | |||||||||||||||
| Total Autos & Transportation | 33,965,175 | ||||||||||||||
| Consumer Discretionary – 18.0% | |||||||||||||||
| Commercial Services – 5.8% | |||||||||||||||
| Adesa, Inc. | Wholesale vehicle auctioneer | 261,114 | 7,245,914 | ||||||||||||
| Heidrick & Struggles Intl., Inc.a | Executive search and leadership consulting services | 314,265 | 13,312,265 | ||||||||||||
| Navigant Consulting, Inc.a | Provider of financial and legal consulting to business | 607,271 | 11,999,675 | ||||||||||||
| 32,557,854 | |||||||||||||||
| Consumer Products/Services – 2.2% | |||||||||||||||
| The Toro Company | Turf maintenance products | 260,338 | 12,139,561 | ||||||||||||
| Printing/Publishing – 1.7% | |||||||||||||||
| Consolidated Graphics, Inc.a | Printing Services | 164,000 | 9,687,480 | ||||||||||||
| Restaurants – 2.3% | |||||||||||||||
| Rare Hospitalitya | Steakhouse operator | 192,849 | 6,350,518 | ||||||||||||
| The Steak n Shake Companya | Casual dining | 392,445 | 6,907,032 | ||||||||||||
| 13,257,550 | |||||||||||||||
| Retail – 6.0% | |||||||||||||||
| Big 5 Sporting Goods Corporation | Regional sporting goods retailer | 397,422 | 9,705,045 | ||||||||||||
| Jos. A. Bank Clothiers, Inc.a | Men's clothing retailer | 359,053 | 10,538,206 | ||||||||||||
| MarineMax, Inc.a | Recreational boat retailer | 216,900 | 5,624,217 | ||||||||||||
| Talbots, Inc. | Women's clothing retailer | 344,300 | 8,297,630 | ||||||||||||
| 34,165,098 | |||||||||||||||
| Total Consumer Discretionary | 101,807,543 | ||||||||||||||
| Financial Services – 28.4% | |||||||||||||||
| Banks/Thrifts – 4.1% | |||||||||||||||
| Placer Sierra Bancshares | Regional bank | 276,133 | 6,563,681 | ||||||||||||
| Prosperity Bancshares, Inc. | Regional bank | 280,550 | 9,681,781 | ||||||||||||
| Provident Bankshares Corporation | Commercial bank | 205,600 | 7,319,360 | ||||||||||||
| 23,564,822 | |||||||||||||||
Annual Report – December 31, 2006
12
| Company Description | Number Shares | Market Value | |||||||||||||
| Insurance – 14.9% | |||||||||||||||
| Aspen Insurance Holdings Limited | Property & casualty reinsurance | 412,573 | $ | 10,875,424 | |||||||||||
| Clark, Inc. | Insurance brokerage and consulting | 381,749 | 6,348,486 | ||||||||||||
| Delphi Financial Group, Inc. | Accident & health insurance | 229,929 | 9,302,927 | ||||||||||||
| RAM Holdings, Inc.a | Financial guaranty reinsurance | 504,414 | 7,208,076 | ||||||||||||
| Reinsurance Group of America, Inc. | Life reinsurer | 283,547 | 15,793,568 | ||||||||||||
| Seabright Insurance Holdingsa | Property & casualty insurance | 424,516 | 7,645,533 | ||||||||||||
| The Hanover Insurance Group, Inc. | Property & casualty insurance | 246,400 | 12,024,320 | ||||||||||||
| Triad Guaranty Inc.a | Mortgage insurance | 101,105 | 5,547,631 | ||||||||||||
| U.S.I. Holdings Corporationa | Insurance brokerage | 617,666 | 9,487,350 | ||||||||||||
| 84,233,315 | |||||||||||||||
| Other Financial Services – 6.2% | |||||||||||||||
| CompuCredit Corporationa | Sub-prime credit cards | 270,131 | 10,753,915 | ||||||||||||
| Cowen Group, Inc.a | Investment bank | 394,733 | 8,348,603 | ||||||||||||
| MCG Capital Corporation | Business development company | 609,794 | 12,391,014 | ||||||||||||
| United Panam Financial Corp.a | Sub-prime auto lender | 248,819 | 3,423,749 | ||||||||||||
| 34,917,281 | |||||||||||||||
| Real Estate Investment Trusts – 3.2% | |||||||||||||||
| iStar Financial Inc. | Commercial real estate lender | 377,473 | 18,050,759 | ||||||||||||
| Total Financial Services | 160,766,177 | ||||||||||||||
| Health Care – 2.8% | |||||||||||||||
| Health Care Services – 2.8% | |||||||||||||||
| Centene Corporationa | Medicaid managed care | 649,112 | 15,948,682 | ||||||||||||
| Total Health Care | 15,948,682 | ||||||||||||||
| Materials & Processing – 8.4% | |||||||||||||||
| Building/Construction Products – 2.5% | |||||||||||||||
| NCI Building Systems, Inc.a | Metal buildings | 270,131 | 13,979,279 | ||||||||||||
| Engineering & Construction – 1.2% | |||||||||||||||
| Dycom Industries, Inc.a | Specialty contracting services | 322,200 | 6,804,864 | ||||||||||||
| Other Materials/Metals – 1.4% | |||||||||||||||
| Walter Industries, Inc. | Natural resources & water products | 303,906 | 8,220,657 | ||||||||||||
| Specialty Chemicals – 3.3% | |||||||||||||||
| Cabot Microelectronics Corporationa | CMP slurries | 17,800 | 604,132 | ||||||||||||
| Cytec Industries Inc. | Specialty chemicals | 318,565 | 18,002,108 | ||||||||||||
| 18,606,240 | |||||||||||||||
| Total Materials & Processing | 47,611,040 | ||||||||||||||
Annual Report – December 31, 2006
13
Portfolio Holdings as of December 31, 2006 (continued)
| Company Description | Number Shares | Market Value | |||||||||||||
| Other Energy – 1.9% | |||||||||||||||
| Equipment & Services – 1.2% | |||||||||||||||
| Key Energy Services, Inc.a | Workover services provider | 455,934 | $ | 7,135,367 | |||||||||||
| Exploration & Production – 0.7% | |||||||||||||||
| Newfield Exploration Companya | Oil & gas producer | 81,811 | 3,759,215 | ||||||||||||
| Total Other Energy | 10,894,582 | ||||||||||||||
| Producer Durables – 8.8% | |||||||||||||||
| Aerospace – 1.1% | |||||||||||||||
| Curtiss-Wright Corporation | Aerospace & defense components mfg. | 170,352 | 6,316,652 | ||||||||||||
| Diversified Manufacturing – 4.2% | |||||||||||||||
| Carlisle Companies Incorporated | Industrial conglomerate | 116,226 | 9,123,741 | ||||||||||||
| Crane Co. | Industrial conglomerate | 393,933 | 14,433,705 | ||||||||||||
| 23,557,446 | |||||||||||||||
| Electrical Equipment – 1.6% | |||||||||||||||
| Belden CDT Inc. | Networking cable manufacturer | 104,399 | 4,080,957 | ||||||||||||
| Diebold, Incorporated | Manufacturer of ATMs | 103,932 | 4,843,231 | ||||||||||||
| 8,924,188 | |||||||||||||||
| Machinery – 1.9% | |||||||||||||||
| Tennant Company | Manufacturer of floor care products | 68,100 | 1,974,900 | ||||||||||||
| United Rentals, Inc.a | Equipment rental | 357,350 | 9,087,410 | ||||||||||||
| 11,062,310 | |||||||||||||||
| Total Producer Durables | 49,860,596 | ||||||||||||||
| Technology – 19.8% | |||||||||||||||
| Distribution – 1.6% | |||||||||||||||
| Synnex Corporationa | Distributor of PCs and peripherals | 401,104 | 8,800,222 | ||||||||||||
| Electronic Components – 5.6% | |||||||||||||||
| AMIS Holding, Inc.a | Manufacturer of analog semiconductors | 668,470 | 7,065,728 | ||||||||||||
| Fairchild Semiconductor Int'l., Inc.a | Semiconductors | 487,631 | 8,197,077 | ||||||||||||
| Hutchinson Technologya | Manufacturer of disk drive components | 225,176 | 5,307,398 | ||||||||||||
| SMART Modular Technologies (WWH), Inc.a | Manufacturer of memory modules | 818,259 | 11,013,766 | ||||||||||||
| 31,583,969 | |||||||||||||||
| Other Technology – 4.4% | |||||||||||||||
| Benchmark Electronics, Inc.a | Contract manufacturer | 376,189 | 9,163,964 | ||||||||||||
| Electronics for Imaging, Inc.a | Products that support color printing | 399,732 | 10,624,877 | ||||||||||||
| Park Electrochemical Corporation | Advanced electronic materials | 185,912 | 4,768,643 | ||||||||||||
| Plexus Corp.a | Contract manufacturer | 15,418 | 368,182 | ||||||||||||
| 24,925,666 | |||||||||||||||
Annual Report – December 31, 2006
14
| Company Description | Number Shares | Market Value | |||||||||||||
| Services – 2.0% | |||||||||||||||
| Perot Systems Corp.a | IT consulting | 682,123 | $ | 11,179,996 | |||||||||||
| Software – 1.7% | |||||||||||||||
| Parametric Technology Corpa | Design & collaboration software | 542,575 | 9,777,202 | ||||||||||||
| Telecommunications – 4.5% | |||||||||||||||
| ADC Telecommunications, Inc.a | Manufacturer of connectivity products | 308,200 | 4,478,146 | ||||||||||||
| Andrew Corpa | Manufacturer of equipment for cell sites | 1,046,643 | 10,707,158 | ||||||||||||
| Arris Group, Inc.a | Manufacturer of equipment for broadband networks | 427,624 | 5,349,576 | ||||||||||||
| Stratex Networks, Inc.a | Manufacturer of microwave radios | 1,004,958 | 4,853,947 | ||||||||||||
| 25,388,827 | |||||||||||||||
| Total Technology | 111,655,882 | ||||||||||||||
| Utilities – 1.6% | |||||||||||||||
| Telecommunication Services – 1.6% | |||||||||||||||
| Cincinnati Bell, Inc.a | Local wireline and wireless services | 1,993,334 | 9,109,536 | ||||||||||||
| Total Utilities | 9,109,536 | ||||||||||||||
| TOTAL COMMON STOCKS – 95.7% (Cost $457,879,114) | 541,619,213 | ||||||||||||||
| MONEY MARKET INSTRUMENTS Prudential Commercial Paper, 5.11%, due 01/02/07 | 17,977,448 | ||||||||||||||
| US Bank Commercial Paper, 5.12%, due 01/02/07 | 28,408,954 | ||||||||||||||
| TOTAL MONEY MARKET INSTRUMENTS – 8.2% (Cost $46,386,402) | 46,386,402 | ||||||||||||||
| TOTAL INVESTMENTS – 103.9% (Cost $504,265,516) | 588,005,615 | ||||||||||||||
| OTHER ASSETS LESS LIABILITIES – (3.9)% | (21,982,909 | ) | |||||||||||||
| NET ASSETS – 100% | $ | 566,022,706 | |||||||||||||
(a) Non-income producing security.
Annual Report – December 31, 2006
15
Statement of Assets and Liabilities As of December 31, 2006
| ASSETS | |||||||||||
| Investments, at value (Cost: $504,265,516) | $ | 588,005,615 | |||||||||
| Cash | 61,886 | ||||||||||
| Receivable for: | |||||||||||
| Securities sold | $ | 925,708 | |||||||||
| Fund shares sold | 673,463 | ||||||||||
| Dividends and interest | 483,166 | 2,082,337 | |||||||||
| Other assets | 251,043 | ||||||||||
| Total assets | 590,400,881 | ||||||||||
| LIABILITIES & NET ASSETS | |||||||||||
| Payable for: | |||||||||||
| Fund shares redeemed | $ | 23,441,788 | |||||||||
| Comprehensive management fee | 672,344 | ||||||||||
| Trustee compensation | 13,000 | ||||||||||
| Trustees deferred compensation | 251,043 | 24,378,175 | |||||||||
| Net assets applicable to shares outstanding | $ | 566,022,706 | |||||||||
| Shares outstanding—no par value (unlimited number of shares authorized) | 21,780,460 | ||||||||||
| PRICING OF SHARES | |||||||||||
| Net asset value, offering price and redemption price per share | $ | 25.99 | |||||||||
| ANALYSIS OF NET ASSETS | |||||||||||
| Paid-in capital | $ | 453,691,146 | |||||||||
| Undistributed net investment loss | (173,946 | ) | |||||||||
| Accumulated net realized gain on sales of investments | 28,765,407 | ||||||||||
| Unrealized appreciation of investments | 83,740,099 | ||||||||||
| Net assets applicable to shares outstanding | $ | 566,022,706 | |||||||||
See accompanying notes to financial statements.
Annual Report – December 31, 2006
16
Statement of Operations For the Year Ended December 31, 2006
| Investment income | |||||||
| Dividends | $ | 4,898,155 | |||||
| Interest | 1,449,893 | ||||||
| Total investment income | 6,348,048 | ||||||
| Expenses: | |||||||
| Comprehensive management fee | 8,259,002 | ||||||
| Comprehensive management fee waived | (146,599 | ) | |||||
| Fees to unaffilliated trustees | 98,553 | ||||||
| Total expenses | 8,210,956 | ||||||
| Net investment loss | (1,862,908 | ) | |||||
| Net realized and unrealized gain/loss on investments: | |||||||
| Net realized gain on sales of investments | 99,781,378 | ||||||
| Change in unrealized appreciation/depreciation | (3,051,080 | ) | |||||
| Net realized and unrealized gain on investments | 96,730,298 | ||||||
| Net increase in net assets resulting from operations | $ | 94,867,390 | |||||
Annual Report – December 31, 2006
17
Statement of Changes in Net Assets
| Year Ended 12/31/06 | Year ended 12/31/2005 | ||||||||||
| From operations: | |||||||||||
| Net investment loss | $ | (1,862,908 | ) | $ | (2,058,445 | ) | |||||
| Net realized gain on sales of investments | 99,781,378 | 112,906,191 | |||||||||
| Change in unrealized appreciation/depreciation | (3,051,080 | ) | (57,301,136 | ) | |||||||
| Net increase in net assets resulting from operations | 94,867,390 | 53,546,610 | |||||||||
| Distributions to shareholders from net realized gains | (83,452,670 | ) | (107,459,203 | ) | |||||||
| From fund share transactions: | |||||||||||
| Proceeds from fund shares sold | 105,981,583 | 56,241,236 | |||||||||
| Reinvestment of dividends | 81,297,078 | 105,393,453 | |||||||||
| Payments for fund shares redeemed | (151,742,110 | ) | (155,105,098 | ) | |||||||
| Redemption fees | 96,358 | 1,910 | |||||||||
| Net increase in net assets resulting from share transactions | 35,632,909 | 6,531,501 | |||||||||
| Total increase/decrease in net assets | 47,047,629 | (47,381,092 | ) | ||||||||
| Net assets at beginning of year | 518,975,077 | 566,356,169 | |||||||||
| Net assets at end of year (includes undistributed net investment loss of $173,946 and undistributed net investment income of $324,583, respectively) | $ | 566,022,706 | $ | 518,975,077 | |||||||
Annual Report – December 31, 2006
18
Financial Highlights
| Year Ended 12/31/06 | Year Ended 12/31/05 | Year Ended 12/31/04 | Year Ended 12/31/03 | Year Ended 12/31/02 | |||||||||||||||||||
| Net asset value at beginning of year | $ | 25.43 | $ | 28.64 | $ | 27.78 | $ | 20.86 | $ | 22.50 | |||||||||||||
| Income from investment operations | |||||||||||||||||||||||
| Net Investment loss | (0.09 | )* | (0.11 | )* | (0.13 | )* | (0.06 | )* | (0.06 | )* | |||||||||||||
| Net realized and unrealized gain/(loss) on investments | 4.86 | 3.32 | 4.68 | 8.54 | (1.58 | ) | |||||||||||||||||
| Total from investment operations | 4.77 | 3.21 | 4.55 | 8.48 | (1.64 | ) | |||||||||||||||||
| Less distributions from net realized gains on investments | (4.21 | ) | (6.42 | ) | (3.69 | ) | (1.56 | ) | — | ||||||||||||||
| Net asset value at end of year | $ | 25.99 | $ | 25.43 | $ | 28.64 | $ | 27.78 | $ | 20.86 | |||||||||||||
| Total Return | 18.71 | % | 10.89 | % | 16.61 | % | 40.71 | % | (7.29 | %) | |||||||||||||
| Ratios/Supplemental Data | |||||||||||||||||||||||
| Ratio of expenses to average net assets | 1.44 | % | 1.47 | % | 1.47 | % | 1.48 | % | 1.48 | % | |||||||||||||
| Ratio of net investment loss to average net assets | (0.33 | %) | (0.39 | %) | (0.47 | %) | (0.26 | %) | (0.26 | %) | |||||||||||||
| Portfolio turnover rate | 68 | % | 51 | % | 47 | % | 52 | % | 81 | % | |||||||||||||
| Net assets, end of year (in thousands) | $ | 566,023 | $ | 518,975 | $ | 566,356 | $ | 524,575 | $ | 378,839 | |||||||||||||
* Based on monthly average shares outstanding
See accompanying notes to financial statements.
This financial highlights table is intended to help you understand the Fund's financial performance for the past 5 years. Certain information reflects financial results for a single fund share. The total returns in the table represent the rate that an investor would have earned or lost on an investment in the Fund (assuming reinvestment of all dividends and distributions).
Annual Report – December 31, 2006
19
Notes to Financial Statements
Skyline Funds (the "Trust") is an open-end, diversified investment management company the sole portfolio of which is Special Equities Portfolio. The Fund commenced public offering of its shares on April 23, 1987. The Fund's investment adviser is Skyline Asset Management, L.P. (the "Adviser"). The Fund seeks maximum capital appreciation, primarily through investment in common stocks that the Adviser considers to be undervalued.
1
Significant accounting policies
n Security valuation – Investments are stated at value. Each equity security traded on a securities exchange shall be valued at the last current sale price as of the time of valuation on the exchange on which the security is principally traded (the "principal exchange"), or lacking any current reported sale on the principal exchange at the time of valuation, at the most recent bid quotation on the principal exchange. Each over-the-counter security traded in the Nasdaq Stock Market ("Nasdaq") shall be valued at the Nasdaq Official Closing Price ("NOCP"), as determined by Nasdaq, or lacking an NOCP, the last current reported sale price as of the time of valuation on Nasdaq, or lacking any current reported sale on Nasdaq at the time of valuat ion, at the most recent bid quotation on Nasdaq. For certain fixed-income securities, Skyline Funds' Board of Trustees has authorized the use of market valuations provided by an independent pricing service. Short-term instruments with sixty days or less to maturity are valued at amortized cost, which approximates market value. Securities or other assets for which market quotations are not readily available or deemed unreliable, which may include certain restricted securities, are valued at a fair value as determined in good faith by the Skyline Funds' Board of Trustees or a committee thereof.
n Security transactions and investment income – Security transactions are accounted for on the trade date (date the order to buy or sell is executed) and dividend income is recorded on the ex-dividend date. Interest income is recorded on an accrual basis and includes amortization of premiums and discounts. Realized gains and losses from security transactions are reported on an identified cost basis.
n Fund share valuation – Fund shares are sold and redeemed on a continuous basis at net asset value. Net asset value per share is determined as of the close of regular session trading on the New York Stock Exchange (normally 3:00 p.m. Central Time), each day that the Exchange is open for trading. The net asset value per share is determined by dividing the value of all securities and other assets, less liabilities, by the number of shares of the Fund outstanding.
n Federal income taxes and dividends to shareholders – It is the Fund's policy to comply with the special provisions of the Internal Revenue Code applicable to regulated investment companies and, in the manner provided therein, to distribute substantially all of its taxable income to shareholders. Such provisions were complied
Annual Report – December 31, 2006
20
with and, therefore, no federal income taxes have been accrued in the accompanying financial statements.
Dividends payable to its shareholders are recorded by the Fund on the ex-dividend date. The timing and characterization of certain income and capital gain distributions are determined annually in accordance with Federal income tax regulations that may differ from accounting principles generally accepted in the United States. As a result, net investment income or loss and net realized gain or loss for a reporting period may differ from the amount distributed during such period. In addition, the Fund may periodically record reclassifications among certain capital accounts to reflect differences between financial reporting and income tax purposes. These reclassifications have no impact on the net asset value of the Fund.
Accordingly, at December 31, 2006, the following reclassifications were recorded:
| Undistributed Net Investment Income | Accumulated Net Realized Loss | Paid in Capital | |||||||||
| $ | 1,364,379 | ( | $1,363,023 | ) | ($ | 1,356 | ) | ||||
On December 14, 2006, a distribution of $4.2124 per share was paid to shareholders of record on December 13, 2006.
The tax character of distributions paid during 2006 and 2005 was as follows:
| 2006 | 2005 | ||||||||||
| Distributions paid from: | |||||||||||
| Ordinary income | $ | 15,077,938 | $ | 15,250,804 | |||||||
| Long-term capital gain | 68,374,732 | 92,208,399 | |||||||||
| $ | 83,452,670 | $ | 107,459,203 | ||||||||
As of December 31, 2006, the cost of investments on a tax basis was $505,300,966. The components of accumulated earnings on a tax basis were as follows:
| Gross unrealized appreciation | $ | 91,977,488 | |||||
| Gross unrealized depreciation | (9,272,839 | ) | |||||
| Net unrealized appreciation | $ | 82,704,649 | |||||
| Undistributed ordinary income | $ | 8,214,023 | |||||
| Undistributed long-term capital gains | 21,586,834 | ||||||
| Total distributable earnings | $ | 29,800,857 | |||||
| Other accumulated losses | $ | (173,946 | ) | ||||
| Total accumulated earnings | $ | 112,331,560 | |||||
The differences between book-basis and tax-basis unrealized appreciation/(depreciation) is attributable to the estimated tax deferral on wash sales.
Annual Report – December 31, 2006
21
Notes to Financial Statements (continued)
n Line of Credit – The Fund has a $3 million committed revolving credit facility for temporary or emergency purposes, including the meeting of redemption requests that otherwise might require the untimely disposition of securities. The Adviser pays a commitment fee of 10 basis points per annum of the average daily unutilized portion of the committed line of credit. Under the terms of the credit agreement, interest on each loan would be fixed at the prime rate less 150 basis points. For the year ended December 31, 2006 there were no loans outstanding under the credit facility.
n Use of Estimates – The preparation of financial statements in conformity with accounting principles generally accepted in the United States requires management to make estimates and assumptions that affect the amounts reported in the financial statements and accompanying notes. Actual results may differ from those estimates.
n Redemption Fee – The Fund will deduct a redemption fee (the "Redemption Fee") of 2% from the proceeds of any redemption (including a redemption by exchange) of shares if the redemption occurs within 30 days of the purchase of those shares. For the purpose of determining whether a redemption is subject to the Redemption Fee, redemptions of Fund shares are conducted on a first in/first out (FIFO) basis such that shares with the longest holding period will be redeemed first and shares with the shortest holding period will be redeemed last. The Redemption Fee is paid to the Fund and is intended to offset transaction and other expenses caused by short-term trading. The Redemption Fee does not apply to redemptions (including redemptions by exc hange) of shares of the Fund purchased by automatic reinvestment of dividends or capital gains distributions. The Redemption Fee will also not apply to redemptions under hardship circumstances (as determined by the Adviser and the Fund in their discretion, based on a case-by-case analysis). The Redemption Fee will apply only to the redemption of shares purchased through an authorized agent if the authorized agent has indicated that it will administer the Redemption Fee. For the year ended December 31, 2006, the Fund had $96,358 included in capital due to the collection of redemption fees. This amount includes $86,327 reimbursed to the Fund by the Adviser for non-assessed redemption fees.
n Indemnifications – Under the Trust's organizational documents, its officers and trustees are indemnified against certain liabilities arising out of the performance of their duties to the Trust. In addition, the Trust may enter into contracts that provide for general indemnification. The Trust's maximum liability under those arrangements is unknown, as this would involve future claims that may be made against the Trust. However, based on experience, the Trust expects that risk of loss to be remote.
n New Accounting Pronouncements
In June 2006, the Financial Accounting Standards Board ("FASB") released FASB Interpretation No. 48 "Accounting for Uncertainty in Income Taxes" ("FIN 48"). FIN 48 provides guidance for how uncertain tax positions should be recognized, measured, presented and disclosed in the financial statements. FIN 48 requires the evaluation of tax positions taken or expected to be taken in the course of preparing the Fund's tax returns to determine whether the tax positions are "more-likely-than-not" of being sustained by the applicable tax authority. To the extent that a tax benefit of a position
Annual Report – December 31, 2006
22
is not deemed to meet the more-likely-than-not threshold, the Funds would report an income tax expense in the statement of operations. Adoption of FIN 48 is required for fiscal years beginning after December 15, 2006 and is to be applied to all open tax years as of the effective date. Recent SEC guidance allows funds to delay implementing FIN 48 into NAV calculations until the fund's last NAV calculation in the first required financial statement reporting period. As a result, the Fund must begin to incorporate FIN 48 into its NAV calculations on June 29, 2007. At this time, management is evaluating the implications of FIN 48, and the impact, if any, of this standard on the Fund's financial statements has not yet been determined.
In September 2006, the Financial Accounting Standards Board issued Statement of Financial Accounting Standards No. 157, "Fair Value Measurements." The Statement defines fair value, establishes a framework for measuring fair value in generally accepted accounting principles (GAAP), and expands disclosures about fair value measurements. The Statement establishes a fair value hierarchy that distinguishes between (1) market participant assumptions developed based on market data obtained from sources independent of the reporting entity (observable inputs) and (2) the reporting entity's own assumptions about market participant assumptions developed based on the best information available in the circumstances (unobservable inputs). The Statement is effective for financial statements issued for fiscal years beginning after November 15, 2007, and is to be applied prospectively as of the beginning of the fiscal year in which this Statement is initiall y applied. At this time, management is evaluating the implications of FAS 157, and the impact, if any, of this standard on the Fund's financial statements has not yet been determined.
2
Transactions with affiliates
For the Adviser's management and advisory services and the assumption of most of the Fund's ordinary operating expenses, the Fund incurs a monthly comprehensive fee based on its average daily net assets. Effective October 1, 2006, the Adviser has agreed voluntarily to waive a portion of its comprehensive management fee equal to 0.10% of the Fund's average daily net assets. This voluntary fee waiver may be terminated at any time, although the Adviser intends for the waiver to remain in place for an indefinite period. The waiver's effect will be to decrease the annual fee paid by the Fund on its average daily net assets to 1.40% of the first $200 million, 1.35% of the next $200 million (over $200 million to $400 million), 1.30% of the next $200 million (over $400 million to $600 million) and 1.25% of the next $200 million (over $600 million to $800 million). In addition, the Adviser has agreed voluntarily to add two additional breakpoints to i ts fees for assets in excess of $800 million in light of the voluntary waiver, as follows: 1.20% of the next $200 million (over $800 million to $1 billion) and 1.15% of average daily net assets in excess of $1 billion. The total comprehensive management fee incurred, after the fee waiver, for the year ended December 31, 2006 was $8,112,403.
Annual Report – December 31, 2006
23
Notes to Financial Statements (continued)
Certain officers and trustees of the Skyline Funds are also officers, limited partners or shareholders of limited partners of the Adviser. The Fund makes no direct payments to the officers or trustees who are affiliated with the Adviser. For the year ended December 31, 2006, the Fund incurred fees of $98,553 to its independent trustees.
The Fund provides a deferred compensation plan for its trustees who are not officers, limited partners or shareholders of limited partners of the Adviser. Under the deferred compensation plan, trustees may elect to defer all or a portion of their compensation. Amounts deferred are retained by the Fund, represent an unfunded obligation of the Fund, and to the extent permitted by the Investment Company Act of 1940, as amended, may be invested in the common shares of the Fund, as selected by the trustees. These shares are held by the Adviser on behalf of Skyline Funds, the value of which is reflected in "Other Assets" on the Statement of Assets and Liabilities at December 31, 2006. Appreciation/depreciation and distributions received from these investments are recorded with an offsetting increase/decrease in the deferred compensation obligation and do not affect the Fund's net asset value.
3
Fund share transactions
As of December 31, 2006, there were an unlimited number of shares of beneficial interest, no par value, authorized. Transactions in the Fund's shares of beneficial interest were as follows:
| Shares | Dollar Amount | ||||||||||||||||||
| Year Ended 12/31/06 | Year Ended 12/31/05 | Year Ended 12/31/06 | Year Ended 12/31/05 | ||||||||||||||||
| Shares sold | 3,831,466 | 1,939,073 | $ | 105,981,583 | $ | 56,241,236 | |||||||||||||
| Shares issued for reinvestment of dividends | 3,117,219 | 4,083,435 | 81,297,078 | 105,393,453 | |||||||||||||||
| Total shares issued | 6,948,685 | 6,022,508 | 187,278,661 | 161,634,689 | |||||||||||||||
| Less shares redeemed | (5,579,435 | ) | (5,384,405 | ) | (151,742,110 | ) | (155,105,098 | ) | |||||||||||
| Redemption fees | — | — | 96,358 | 1,910 | |||||||||||||||
| Net increase | 1,369,250 | 638,103 | $ | 35,632,909 | $ | 6,531,501 | |||||||||||||
4
Investment transactions
Investment transactions (exclusive of money market instruments) for the year ended December 31, 2006, were as follows:
| Cost of purchases | $ | 365,321,382 | |||||
| Proceeds from sales | $ | 436,818,065 | |||||
Annual Report – December 31, 2006
24
Report of Independent Registered Public Accounting Firm
To the Trustees and Shareholders of Skyline Special Equities Portfolio
and the Board of Trustees of Skyline Funds
In our opinion, the accompanying statement of assets and liabilities, including the portfolio holdings, and the related statements of operations and of changes in net assets and financial highlights present fairly, in all material respects, the financial position of Skyline Special Equities Portfolio (the "Fund") at December 31, 2006, the results of its operations for the year then ended, the changes in its net assets for each of the two years in the period then ended and the financial highlights for each of the three years in the period then ended, in conformity with accounting principles generally accepted in the United States of America. These financial statements and financial highlights (hereafter referred to as "financial statements") are the responsibility of the Fund's management; our responsibility is to express an opinion on these financial statements based on our audits. We conducted our audits of these financial statements in acc ordance with the standards of the Public Company Accounting Oversight Board (United States). Those standards require that we plan and perform the audit to obtain reasonable assurance about whether the financial statements are free of material misstatement. An audit includes examining, on a test basis, evidence supporting the amounts and disclosures in the financial statements, assessing the accounting principles used and significant estimates made by management, and evaluating the overall financial statement presentation. We believe that our audits, which included confirmation of securities at December 31, 2006 by correspondence with the custodian and brokers, provide a reasonable basis for our opinion. The financial highlights of the Fund for the periods ended on or before December 31, 2003 were audited by other independent accountants whose report dated February 20, 2004 expressed an unqualified opinion on those financial highlights.

PricewaterhouseCoopers LLP
February 16, 2007
Annual Report – December 31, 2006
25
Federal Tax Status of 2006 Dividends
Capital gain dividends paid to you, whether received in cash or reinvested in shares, must be included in your federal income tax return and must be reported by the Fund to the Internal Revenue Service in accordance with U.S. Treasury Department regulations. Short-term capital gain dividends paid to you are taxable as ordinary income. Long-term capital gain dividends paid to you are taxable as long-term capital gain income regardless of how long you have held Fund shares. Distributions as a return of capital are not taxable, but reduce the cost basis of shares held.
Expense Example
As a shareholder of the Fund, you incur ongoing costs, including a comprehensive management fee and trustee fees. You may incur a 2% redemption fee in the event shares are redeemed within 30 days. This example is intended to help you understand your ongoing costs (in dollars) of investing in the Fund and to compare these costs with the ongoing costs of investing in other mutual funds.
The example is based on an investment of $1,000 invested at the beginning of the period and held for the entire period (07/01/06 - 12/31/06).
Actual Expenses
The first line of the table that follows provides information about actual account values (which includes the actual return of the Fund) and actual expenses. You may use the information in this line, together with the amount you invested, to estimate the expenses that you paid over the period. Simply divide your account value by $1,000 (for example, an $8,600 account value divided by $1,000 = 8.6), then multiply the result by the number in the first line under the heading entitled "Expenses Paid During Period'' to estimate the expenses you paid on your account during this period. In addition to the expenses paid during the period that are noted in the table, you may be assessed fees for outgoing wire transfers, returned checks and stop payment orders at prevailing rates charged by U.S. Bancorp Fund Services, LLC, the Fund's transfer agent. If you request that a redemption be made by wire transfer, currently a $15.00 fee is charged by the Fun d's transfer agent. IRA accounts will be charged a $15.00 annual maintenance fee. These additional fees have the effect of reducing investment returns.
Annual Report – December 31, 2006
26
Hypothetical Example for Comparison Purposes
The second line of the table that follows provides information about hypothetical account values and hypothetical expenses based on the Fund's actual expense ratio and an assumed rate of return of 5% per year before expenses, which is not the Fund's actual return. The hypothetical account values and expenses may not be used to estimate the actual ending account balance or expenses you paid for the period. You may use this information to compare the ongoing costs of investing in the Fund and other mutual funds. To do so, compare this 5% hypothetical example with the 5% hypothetical examples that appear in the shareholder reports of the other funds. Please note that the expenses shown in the table are meant to highlight your ongoing costs only and do not reflect any transactional costs, such as, redemption fees, or exchange fees. Therefore, the second line of the table is useful in comparing ongoing costs only, and will not help you determine the relative total costs of owning different mutual funds. In addition, if these transactional costs were included, your costs would have been higher.
Table: Expense Example
| Beginning Account Value 07/01/06 | Ending Account Value 12/31/2006 | Expenses Paid During Period 07/01/06 - 12/31/2006* | |||||||||||||
| Actual | $ | 1,000.00 | $ | 1,095.70 | $ | 7.50 | |||||||||
| Hypothetical (5% return before expenses) | $ | 1,000.00 | $ | 1,018.05 | $ | 7.22 | |||||||||
* Expenses are equal to the Fund's annualized expense ratio of 1.42% multiplied by the average account value over the period multiplied by 184/365 (to reflect the one-half year period).
Annual Report – December 31, 2006
27
Management of Skyline
The Board of Trustees serve indefinite terms of unlimited duration so long as a majority of trustees have been elected by the Fund's shareholders. The trustees appoint their own successors, provided that at least two-thirds of the trustees, after such appointment, have been elected by the Fund's shareholders. The Fund's shareholders may remove a trustee, with or without cause, upon the declaration in writing or a vote of two-thirds of the Fund's outstanding shares. A trustee may be removed with or without cause upon the written declaration of a majority of the trustees.
The names of the trustees and officers of Skyline Funds, the year each was first elected or appointed to office, their principal business occupations and other directorships they have held during at least the last five years, are shown below.
| Name, Position(s) with Skyline and Age at February 1, 2007 | Year First Elected or Appointed to Office | Principal Occupation(s) during Past Five Years | Other Directorships | ||||||||||||
| Trustees who are not interested persons of Skyline: | |||||||||||||||
| William L. Achenbach, 64, Trustee | 1995 | President, W.L. Achenbach & Associates, Inc., a financial counseling firm. | None. | ||||||||||||
| Lawrence J. Lawson III, 51 Trustee | 2006 | Co-Chairman, Lincoln International LLC (and its predecessor) and Lincoln International Group, providers of investment banking services. | Bell Industries, Inc. and JEB, Inc. | ||||||||||||
| David A. Martin, 54, Trustee | 1995 | Attorney and Principal, Righeimer, Martin & Cinquino, P.C., a law firm. | None. | ||||||||||||
| Richard K. Pearson, 67, Trustee | 1998 | Director and President, First DuPage Bank (Westmont, IL) and Director and President, First DuPage Bancorp, Inc., (Westmont, Illinois). | Director, First Community Bank (Milton, WI). Director, First Community Bancshares Corp. | ||||||||||||
| Trustee who is an interested person of Skyline: | |||||||||||||||
| William M. Dutton,* 53, President and Trustee | 1995 | Partner and Senior Advisor, Skyline Asset Management, L.P. Previously, Managing Partner, Research and Portfolio Management until January 1, 2005. | None. | ||||||||||||
Annual Report – December 31, 2006
28
Management of Skyline (continued)
| Name, Position(s) with Skyline and Age at February 1, 2007 | Year First Elected or Appointed to Office | Principal Occupation(s) during Past Five Years | Other Directorships | ||||||||||||
| Officers of Skyline: | |||||||||||||||
| Stephen F. Kendall, 52, Executive Vice President | 1998 | Partner, Chief Administrative Officer and Director of Marketing, Skyline Asset Management, L.P. since 2005. Previously, Partner and Chief Operating Officer, Skyline Asset Management, L.P. | None. | ||||||||||||
| Benjamin J. Kim, 37 Treasurer and Vice President | 2004 | Chief Financial Officer of Skyline Asset Management, L.P. since 2004 and Securities Analyst of Skyline Asset Management, L.P. | None. | ||||||||||||
| Deanna B. Marotz, 41 Chief Compliance Officer | 2004 | Chief Compliance Officer of the Funds since 2004, Chief Compliance Officer of Skyline Asset Management, L.P. since 2003. Previously, Manager of Marketing Communications of Skyline Asset Management, L.P. | None. | ||||||||||||
| Christine Carsman, 54 Secretary | 2004 | Vice President and Chief Regulatory Counsel, AMG since 2004. Previously, Vice President Senior Counsel and Director of Operational Risk Management and Compliance, Wellington Management Company, LLP. | None. | ||||||||||||
| Geoffrey P. Lutz, 56, Executive Vice President | 1995 | Partner, Institutional Marketing, Skyline Asset Management, L.P. | None. | ||||||||||||
| Michael Maloney, 44, Executive Vice President | 1995 | Partner and Portfolio Manager, Skyline Asset Management, L.P. since 2005. Previously, Partner, Research and Portfolio Management, Skyline Asset Management, L.P. | None. | ||||||||||||
| Michele M. Brennan, 35, Vice President | 1998 | Fund Marketing and Client Service, Skyline Asset Management, L.P. since 2005. Previously, Director of Fund Marketing, Skyline Asset Management, L.P. | None. | ||||||||||||
| Colin Dean, 29 Assistant Secretary | 2006 | Associate Counsel, AMG since 2005. Previously, Associate, Dechert LLP. | None. | ||||||||||||
* Mr. Dutton is an "interested person" of Skyline, as defined in the Investment Company Act of 1940, as amended, because he is an officer of the Adviser.
Annual Report – December 31, 2006
29
Management of Skyline (continued)
The address of the independent trustees, Messrs. Dutton, Kim, Kendall, Lutz, and Maloney and Ms. Marotz and Ms. Brennan is c/o Skyline Asset Management, L.P., 311 South Wacker Drive, Suite 4500, Chicago, IL 60606. The address of Ms. Carsman and Mr. Dean is c/o Affiliated Managers Group, Inc., 600 Hale Street, Prides Crossing, MA 09165.
Skyline's Statement of Additional Information includes additional information about Skyline's trustees and officers. You may obtain a free copy of the Statement of Additional Information, or request any other information and discuss your questions about us, by writing or calling toll-free:
Skyline Funds
c/o U.S. Bancorp Fund Services, LLC
P.O. Box 701
Milwaukee, WI 53201-0701
800.828.2759
Qualified Dividend Income Percentage (unaudited)
The Fund designated 23% of dividends declared and paid during the year ending December 31, 2006 from net investment income as qualified dividend income under the Jobs Growth and Tax Relief Reconciliation Act of 2003.
Corporate Dividends Received
Deduction Percentage (unaudited)
Corporate shareholders may be eligible for a dividends received deduction for certain ordinary income distributions paid by the Fund. The Fund designated 21% of dividends declared and paid during the year ending December 31, 2006 from net investment income as qualifiying for the dividends received deduction. The deduction is a pass through of dividends paid by domestic corporations (i.e. only equities) subject to taxation.
Annual Report – December 31, 2006
30
Proxy Policy & Procedures
A description of the policies and procedures that the Fund uses to determine how to vote proxies relating to portfolio securities is available without charge, upon request, by calling 800.828.2759, and on the Securities and Exchange Commission's website at www.sec.gov. The Fund's proxy voting record for the twelve-month period ended June 30, 2006, is also available without charge, upon request, by calling 800.828.2759, by visiting the Fund's website at www.skylinefunds.com and by visiting the SEC's website at www.sec.gov.
Form N-Q
The Fund files a complete list of its portfolio holdings with the SEC for the first and third quarters each fiscal year on Form N-Q. The Form N-Q is available without charge, upon request, by calling 800.828.2759 or by visiting the SEC's website at www.sec.gov. You may also review, for a fee, a copy of the form at the SEC's Public Reference Room in Washington, D.C. (800) SEC-0330.
Report for the Year Ended December 31, 2006
This report, including the audited financial statements contained herein, is submitted for the general information of the Fund's shareholders.
Distributor: Managers Distributors, Inc., member NASD.
Annual Report – December 31, 2006
31
This page left blank intentionally.
Annual Report – December 31, 2006
32
For 24-hour account information call: 1.800.828.2SKY
(1.800.828.2759)
To speak with a Skyline Funds Representative during
normal business hours call: 1.800.828.2SKY and press 0 when prompted.
To learn more about our expertise in small cap value, please visit our website at www.skylinefunds.com
Item 2. Code of Ethics.
(a) Registrant has adopted a code of ethics that applies to its principal executive and senior financial officers (the “Code”).
(b) No disclosures are required by this Item 2(b).
(c) During the period covered by the report, registrant did not make any amendments to the provisions of the Code.
(d) During the period covered by the report, registrant did not grant any waivers, including implicit waivers, from the provisions of the Code.
(e) Not applicable.
(f) A copy of the Code is filed as Exhibit (a)(1) to this Form N-CSR.
Item 3. Audit Committee Financial Expert.
Registrant’s board of trustees has determined that Richard K. Pearson and Lawrence J. Lawson III, members of the registrant’s Committee of the Independent Trustees, qualify as “audit committee financial experts,” as such term is defined in Instruction 2(b) to Item 3 of Form N-CSR. Mr. Pearson and Mr. Lawson are “independent” as such term is defined in paragraph (a)(2) of Item 3 of Form N-CSR.
Under applicable securities laws, a person who is determined to be an audit committee financial expert will not be deemed an “expert” for any purpose, including without limitation for the purposes of Section 11 of the Securities Act of 1933, as a result of being designated or identified as an audit committee financial expert. The designation or identification of a person as an audit committee financial expert does not impose on such person any duties, obligations, or liabilities that are greater than the duties, obligations, and liabilities imposed on such person as a member of the audit committee and board of trustees in the absence of such designation or identification.
Item 4. Principal Accountant Fees and Services.
(a) Audit Fees
$32,000 (2006) and $30,000 (2005) are the aggregate fees billed in each of the last two fiscal years for professional services rendered by the principal accountant to the registrant for the audit of the registrant’s annual financial statements or services that are normally provided by the accountant in connection with statutory and regulatory filings or engagements for those fiscal years. Please note the registrant does not actually pay those fees. Under the registrant’s comprehensive management fees agreement, the registrant’s investment adviser pays those fees.
(b) Audit-Related Fees
There were no fees billed in each of the last two fiscal years for assurance and related services rendered by the principal accountant to the registrant that are reasonably related to the performance of the audit of the registrant’s financial statements and are not reported under paragraph (a) of this Item 4.
There were no fees billed in each of the last two fiscal years for assurance and related services rendered by the principal accountant to the registrant’s investment adviser and any entity controlling, controlled by or under common control with the investment adviser that provides ongoing services to the registrant (collectively, the “investment adviser”) that are reasonably related to the performance of the audit of the registrant’s financial statements, are not reported under paragraph (a) of this Item 4 and were required to be pre-approved by the audit committee as described in paragraph (e) (1) of this Item 4.
(c) Tax Fees
$5,950 (2006) and $5,500 (2005) are the aggregate fees billed in each of the last two fiscal years for professional services rendered by the principal accountant to the registrant for tax compliance, tax advice and tax planning. Please note that the registrant does not actually pay for those fees. Under the registrant’s comprehensive management fee agreement, the registrant’s investment adviser pays those fees. The nature of those services was for qualified dividend income preparation and various tax consultations.
There were no fees billed in each of the last two fiscal years for professional services rendered by the principal accountant to the investment adviser for tax compliance, tax advice and tax planning and were required to be pre-approved by the audit committee as described in paragraph (e)(1) of this Item 4.
(d) All Other Fees
There were no fees billed in each of the last two fiscal years for products and services provided by the principal accountant to the registrant, other than the services reported in paragraphs (a)-(c) of this Item 4.
There were no fees billed in each of the last two fiscal years for products and services provided by the principal accountant to the investment adviser, other than the services reported in paragraphs (a)-(c) of this Item 4, that were required to be pre-approved by the audit committee as described in paragraph (e)(1) of this Item 4.
(e) (1) Registrant’s Committee of Independent Trustees meets with the principal accountants and management to review and pre-approve all audit services to be provided by the principal accountants.
The Committee of Independent Trustees shall pre-approve all non-audit services to be provided by the principal accountants to the registrant; provided that the pre-approval requirement does not apply to non-audit services that (i) were not identified as such at the time of the pre-approval and (ii) do not aggregate more than 5% of total revenues paid to the principal accountants by the registrant during the fiscal year in which the services are
provided, if the Committee of Independent Trustees approves the provision of such non-audit services prior to the completion of the audit.
The Committee of Independent Trustees shall pre-approve all non-audit services to be provided by the principal accountants to the investment adviser where the nature of the services provided have a direct impact on the operations or financial reporting of the registrant; provided that the pre-approval requirement does not apply to non-audit services that (i) were not identified as such at the time of the pre-approval and (ii) do not aggregate more than 5% of total revenue paid to the principal accountants by the registrant for all services and by the registrant’s investment adviser for services where the nature of the services provided have a direct impact on the operations or financial reporting of the registrant during the fiscal year in which those services are provided, if the Committee of Independent Trustees approves the provision of such non-audit services prior to the completion of the audit.
(2) 100% of the services provided to the registrant described in paragraphs (b)-(d) of this Item 4 were pre-approved by the Committee of Independent Trustees pursuant to paragraph (e)(1) of this Item 4. There were no services provided to the investment adviser described in paragraphs (b)-(d) of this Item 4.
(f) No disclosures are required by this Item 4(f).
(g) $0 (2006) and $0 (2005) are the aggregate non-audit fees billed in each of the last two fiscal years for services rendered by the principal accountant to the registrant. Please note that the registrant does not actually pay those fees. Due to the registrant’s comprehensive management fee, the registrant’s investment adviser pays those fees. There were no non-audit fees billed in each of the last two fiscal years for services rendered by the principal accountant to the investment adviser.
(h) The Committee of Independent Trustees of the Registrant’s board of trustees has considered whether the provision of non-audit services that were rendered by Registrant’s principal accountant to Registrant’s investment adviser, and any entity controlling, controlled by or under common control with the investment adviser that provides ongoing services to the Registrant that were not pre-approved pursuant to paragraph (c) (7)(ii) of Rule 2-01 of Regulation S-X is compatible with maintaining the principal account’s independence. No such services were rendered.
Item 5. Audit Committee of Listed Registrants
Not applicable to open-end investment companies.
Item 6. Schedule of Investments
Schedule of Investments is included as part of the report to shareholders filed under Item 1 of this Form.
Item 7. Disclosure of Proxy Voting Policies and Procedures for Closed-End Management Investment Companies.
Not applicable to open-end investment companies.
Item 8. Portfolio Managers of Closed-End Management Investment Companies.
Not applicable to open-end investment companies.
Item 9. Purchases of Equity Securities by Closed-End Management Investment Company and Affiliated Purchasers.
Not applicable to open-end investment companies.
Item 10. Submission of Matters to a Vote of Security Holders.
Not applicable.
Item 11. Controls and Procedures.
(a) Based on an evaluation of the disclosure controls and procedures (as defined in Rule 30a-3(c) under the Investment Company Act of 1940, the “Disclosure Controls”) as of a date within 90 days prior to the filing date (the “Filing Date”) of this Form N-CSR (the “Report”), the Disclosure Controls are effectively designed to ensure that information required to be disclosed by the registrant in the Report is recorded, processed, summarized and reported by the Filing Date, including ensuring that information required to be disclosed in the Report is accumulated and communicated to the registrant’s management, including the registrant’s principal executive officer and principal financial officer, as appropriate to allow timely decisions regarding required disclosure.
(b) There were no changes in the registrant’s internal controls over financial reporting (as defined in Rule 30a-3(d) under the Investment Company Act of 1940) that occurred during the registrant’s most recent fiscal year that has materially affected, or is reasonably likely to materially affect, the registrant’s internal control over financial reporting.
Item 12. | Exhibits. | |
|
|
|
(1) | Code of Ethics for Principal Executive and Senior Financial Officers (as referenced in Item 2 above), attached hereto as Exhibit (a)(1) | |
|
|
|
| (2) | Certifications of William M. Dutton, President and Trustee of Skyline Funds and Anthony I. Nanni, Vice President and Treasurer of Skyline Funds pursuant to Rule 30a-2(a) under the Investment Company Act of 1940 (17 CFR 270.30a-2(a)), attached hereto as Exhibits (a)(2)(i) and (a)(2)(ii) |
| (3) | Not applicable to open end investment companies. |
|
|
|
(b) |
| Certification of William M. Dutton, President and Trustee of Skyline Funds and Anthony I. Nanni, Vice President and Treasurer of Skyline Funds pursuant to Section 906 of the Sarbanes-Oxley Act of 2002, attached hereto as Exhibit (b). |
SIGNATURES
Pursuant to the requirements of the Securities Exchange Act of 1934 and the Investment Company Act of 1940, the registrant has duly caused this report to be signed on its behalf by the undersigned, thereunto duly authorized.
Skyline Funds
By: | /s/William M. Dutton |
|
| William M. Dutton | |
| President and Trustee | |
| (Principal Executive Officer) | |
Date: | February 23, 2007 |
|
Pursuant to the requirements of the Securities Exchange Act of 1934 and the Investment Company Act of 1940, this report has been signed below by the following persons on behalf of the registrant and in the capacities and on the dates indicated.
By: | /s/William M. Dutton |
|
|
| William M. Dutton |
| |
| President and Trustee |
| |
| (Principal Executive Officer) |
| |
Date: | February 23, 2007 |
|
|
|
|
| |
|
|
| |
By: | /s/Anthony I. Nanni |
|
|
| Anthony I. Nanni |
| |
| Vice President and Treasurer |
| |
| (Principal Financial Officer) |
| |
Date: | February 23, 2007 |
|
|