UNITED STATES
SECURITIES AND EXCHANGE COMMISSION
Washington, D.C. 20549
FORM N-CSR
CERTIFIED SHAREHOLDER REPORT OF REGISTERED
MANAGEMENT INVESTMENT COMPANIES
Investment Company Act file number | 811-5022 | ||||||||
| |||||||||
Skyline Funds | |||||||||
(Exact name of registrant as specified in charter) | |||||||||
| |||||||||
311 South Wacker Drive, Suite 4500 |
| 60606 | |||||||
(Address of principal executive offices) |
| (Zip code) | |||||||
| |||||||||
William M. Dutton | Alan Goldberg | ||||||||
(Name and address of agent for service) | |||||||||
| |||||||||
Registrant’s telephone number, including area code: | (312) 913-0900 |
| |||||||
| |||||||||
Date of fiscal year end: | 12/31/05 |
| |||||||
| |||||||||
Date of reporting period: | 06/30/06 |
| |||||||
Item 1. Report to Shareholders.
SEMI-ANNUAL REPORT — June 30, 2006
Skyline Special
Equities Portfolio
![]()

Commentary
June 30, 2006
Overview
Skyline Special Equities Portfolio (the "Fund") generated a return of -3.87% for the second quarter, compared to a -5.02% return for the Russell 2000 Index and a -2.70% return for the Russell 2000 Value Index. Stocks were weak throughout most of the period before rallying sharply in the final days of the quarter. The second quarter declines were not enough to offset the strong returns generated in the first quarter of 2006. For the first six months of 2006, the Fund generated a return of 8.34%, compared to a 8.21% return for the Russell 2000 Index and a 10.44% return for the Russell 2000 Value Index. Stock prices were volatile in the first six months of this year. At various times in the first half of 2006, investors were more focused on strong current fundamentals and at other times reacted negatively to rising interest rates and a more restrictive Federal Reserve.
Market Review
Stock prices were weak in the second quarter, as indicated by the -5.02%, -2.70% and -1.44% returns generated by the Russell 2000 Index, the Russell 2000 Value Index and the S&P 500 Index, respectively. The weak second quarter performance followed strong gains in the first quarter, resulting in year-to-date returns of 8.21%, 10.44%, and 2.71% for the Russell 2000 Index, the Russell 2000 Value Index, and the S&P 500 Index respectively. Stocks peaked in early May, following a strong first quarter earnings reporting season in which earnings per share for companies in the Russell 2000 Index rose an estimated 23% on average. Also contributing to stock gains early in 2006 were investors' expectations that the Fed was nearing the end of its cycle of raising interest rates. Beginning in June 2004, the Fed raised rates 16 consecutive times, taking its target for the federal funds rate from 1% to 5%. Earlier this year, consensus forecasts call ed for an imminent end to the rate hikes, a sentiment that appeared to be reinforced by comments from Fed officials. An end to the rate hikes would be favorably looked upon by investors as an indication that the Fed had succeeded in keeping inflation in check without choking off the economic expansion.
However, beginning in early May, Fed officials became more vocal in their concerns about inflationary pressures within the economy. These statements were interpreted by investors to mean that the end to the rate hikes might not be near. Investors began to fear that, in order to prevent an acceleration in inflation, the Fed might have to continue to raise rates to a level that would push the economy into a recession. From its peak on May 5th, the Russell 2000 Index declined 13.96% before bottoming on June 13th. During that same time period, the S&P 500 Index fell 7.70%. The outperformance by large cap stocks relative to small cap stocks during the downdraft signaled that investors were becoming more risk averse, preferring more stable large companies to more volatile small ones.
Semi-Annual Report – June 30, 2006
1
Late in the quarter, stocks rebounded sharply, once again responding to Fed commentary. The Fed's statement announcing its decision to raise its target for the federal funds rate 1/4 point to 51/4% on June 29th included language suggesting it was less inclined towards further rate increases than had been indicated by previous pronoun cements. In response, the Russell 2000 Index rose 3.8% on the day of the release, the largest one day jump since October 2002.
From a sector standpoint, using the Russell 2000 Value Index as the benchmark, technology stocks detracted most from the index's performance during the second quarter. Technology stocks typically have more volatile earnings results and stock prices, and in periods of increasing investor caution like the second quarter, they tend to underperform the average stock. Energy stocks were the best performers during the second quarter, due to the belief that their earnings results would benefit from the continued high level of oil prices.
For the first six months of the year, industrial and commodity oriented stocks performed best, reflecting strength in capital spending and positive supply and demand fundamentals for most commodities, including copper (up 64.86% year to date), oil (up 17.09%) and gold (up 19.15%). Among the poorest performers for the first six months of the year were consumer oriented stocks, due to concerns about consumers' ability to continue to spend at high levels in the face of rising interest rates and leveling home price gains.
Portfolio Review
During the second quarter, the Fund outperformed the benchmarks during the severe sell-off between May 5th and June 13th, but lagged as stocks rebounded sharply late in the quarter. This relative performance is consistent with the Fund's higher quality orientation vs. the benchmarks.
The autos and transportation sector contributed most to the Fund's performance during the second quarter on both an absolute basis and relative to the Russell 2000 Value Index. The Fund had relatively heavy weights in the strong performing trucking and transportation leasing industries, while avoiding exposure to the poorer performing industries within the sector. Swift Transportation Co., Inc., a trucking company, and Ryder System, Inc., a transportation leasing company, were the largest contributors to the Fund's performance during the quarter. Both companies reported stronger than expected earnings growth during the quarter.
The consumer discretionary sector detracted most from the Fund during the second quarter. Although the Fund had a relatively low weighting in stocks directly related to consumer spending, earnings disappointments at a few of the Fund's business services stocks (which are included in the consumer discretionary sector) negatively impacted results during the quarter.
For the first six months of the year, an overweighting in the strong performing producer durables sector was offset by lower relative weightings in the strong performing materials and processing and energy sectors. Stock selection for the first six months of the year was not as strong as it has been in the past, particularly in the
Semi-Annual Report – June 30, 2006
2
consumer discretionary and financial services sectors, where earnings disappointments at several of the Fund's holdings negatively impacted performance.
The producer durables sector contributed most to the Fund's performance for the first six months of the year, reflecting the current strong capital spending environment. Five of the top ten performing stocks for the first six months of the year were from the producer durables sector. Included in these were CommScope, Inc. and Belden CDT Inc., two companies that provide copper cable for various industrial, technology, and telecommunications applications. The consumer discretionary sector detracted most from the Fund's performance for the first half of 2006 due to the reasons previously mentioned.
Outlook
The current economic expansion has reached 57 months, while the average economic expansion since World War II has lasted 55 months. Consumer spending, the driving force behind the current expansion, may not be able to sustain a recovery that is already longer than average. Higher mortgage rates and leveling housing prices will likely reduce home equity refinancing, a major source of cash flow for consumers over the last several years. A slowing economy will likely create a headwind for corporate earnings, whose recent strength has been a major factor behind the stock price gains recorded over the last several years. In our opinion, P/E multiple expansion, the other main driver of stock prices, is unlikely to be a significant contributor to gains given current valuations. Possible offsets to slowing earnings growth and full valuations include increased mergers and acquisition activity and a rebound in capital expenditures, both driven by stro ng corporate balance sheets, a favorable credit environment and a need for companies to find new sources of earnings growth.
We believe the Fund is well positioned in the current environment. While we don't invest in companies with the expectation that they will become takeover targets, many of the qualities that we look for in companies are the same things that are desirable to private equity buyers or strategic acquirers. These include attractive valuations, good earnings growth prospects, strong managements, and solid cash flow generating capabilities. In addition, the Fund is currently positioned to benefit from increased capital expenditures and is less exposed to discretionary consumer spending than it has ever been. If we are correct in our views that mergers and acquisition activity and capital spending will remain elevated, the prospects remain for further gains in the Fund.
Past performance does not guarantee future results. The performance data quoted represents past performance and current returns may be lower or higher. The investment return and principal value will fluctuate so that an investor's shares, when redeemed may be worth more or less than the original cost. To obtain performance information current to the most recent month end, please visit www.skylinefunds.com.
Semi-Annual Report – June 30, 2006
3
The Russell 2000 Value Index is an unmanaged, value-oriented index comprised of small stocks that have relatively low price-to-book ratios. The Russell 2000 Index is an unmanaged, market value weighted index comprised of small-sized companies. The S&P 500 Index, a widely quoted stock market index, includes 500 of the largest companies publicly traded in the United States. All figures take into account reinvested dividends. You cannot invest directly in an index.
There are risks of investing in a fund that invests in stocks of small sized companies, which tend to be more volatile and less liquid than stocks of large cap companies. There are also risks in investing in value-oriented stocks, including the risk that value-oriented stocks will underperform growth-oriented stocks during some periods.
The discussion of the Fund's investments and investment strategy represent the views of Skyline Asset Management, L.P., the Fund's investment adviser, at the time of this report. The Fund's investments are subject to change and should not be considered a recommendation to buy individual securities.
This report is not authorized for distribution unless accompanied or preceded by a current prospectus.
Distributor: Managers Distributors, Inc., member NASD.
Sources: Skyline Asset Management, L.P., Frank Russell Company, and FactSet.
Semi-Annual Report – June 30, 2006
4
Performance (%)
| 2Q 2006* | YTD 2006* | 1 yr | 3 yrs | 5 yrs | 10 yrs | Since Inception** | |||||||||||||||||||||||||
| Special Equities | -3.87 | 8.34 | 17.26 | 19.91 | 13.12 | 12.29 | 14.27 | ||||||||||||||||||||||||
| Russell 2000 Value | -2.70 | 10.44 | 14.61 | 21.01 | 13.09 | 13.26 | 12.45 | ||||||||||||||||||||||||
| Russell 2000 | -5.02 | 8.21 | 14.58 | 18.70 | 8.50 | 9.05 | 9.80 | ||||||||||||||||||||||||
| S&P 500 | -1.44 | 2.71 | 8.63 | 11.22 | 2.49 | 8.32 | 10.59 | ||||||||||||||||||||||||
| Historical Performance | Special Equities | Russell 2000 Value | Russell 2000 | S&P 500 | |||||||||||||||
| 2005 | 10.9 | 4.7 | 4.6 | 4.9 | |||||||||||||||
| 2004 | 16.6 | 22.3 | 18.3 | 10.9 | |||||||||||||||
| 2003 | 40.7 | 46.0 | 47.3 | 28.7 | |||||||||||||||
| 2002 | -7.3 | -11.4 | -20.5 | -22.1 | |||||||||||||||
| 2001 | 13.9 | 14.0 | 2.5 | -11.9 | |||||||||||||||
| 2000 | 24.2 | 22.8 | -3.0 | -9.1 | |||||||||||||||
| 1999 | -13.3 | -1.5 | 21.3 | 21.0 | |||||||||||||||
| 1998 | -7.2 | -6.5 | -2.6 | 28.6 | |||||||||||||||
| 1997 | 35.4 | 31.8 | 22.4 | 33.4 | |||||||||||||||
| 1996 | 30.4 | 21.4 | 16.5 | 23.0 | |||||||||||||||
| 1995 | 13.8 | 25.8 | 28.5 | 37.6 | |||||||||||||||
| 1994 | -1.2 | -1.5 | -1.8 | 1.3 | |||||||||||||||
| 1993 | 22.8 | 23.8 | 18.9 | 10.1 | |||||||||||||||
| 1992 | 42.4 | 29.1 | 18.4 | 7.6 | |||||||||||||||
| 1991 | 47.4 | 41.7 | 46.0 | 30.5 | |||||||||||||||
| 1990 | -9.3 | -21.8 | -19.5 | -3.1 | |||||||||||||||
| 1989 | 24.0 | 12.4 | 16.3 | 31.7 | |||||||||||||||
| 1988 | 29.7 | 29.5 | 25.0 | 16.6 | |||||||||||||||
| 1987 | ** | -16.9 | -21.5 | -24.4 | -12.0 | ||||||||||||||
* Not annualized.
** Performance for the Fund, the Russell 2000 Index, and the S&P 500 Index reflects the Fund's inception date of April 23, 1987. The Russell 2000 Value performance reflects an inception date of May 1, 1987.
Semi-Annual Report – June 30, 2006
5
Past performance does not guarantee future results. The performance data quoted represents past performance and current returns may be lower or higher. The investment return and principal value will fluctuate so that an investor's shares, when redeemed, may be worth more or less than the original cost. To obtain performance information current to the most recent month end, please visit www.skylinefunds.com.
The performance for the one, three, five and ten years ended June 30, 2006, and for the period April 23, 1987 (inception) through June 30, 2006, is an average annual return calculation.
Semi-Annual Report – June 30, 2006
6
Portfolio Characteristics
| Special Equities | Russell 2000 Value | Russell 2000 | S&P 500 | ||||||||||||||||
| P/E (excluding negative earnings) | 16.1 | 15.9 | 18.7 | 15.9 | |||||||||||||||
| Price/book | 1.90 | 1.68 | 2.25 | 2.70 | |||||||||||||||
| Price/sales | 0.90 | 0.83 | 1.04 | 1.43 | |||||||||||||||
| EPS growth—3 yrs. (historical) | 14.9 | % | 10.4 | % | 15.0 | % | 16.8 | % | |||||||||||
| EPS growth—1 yr. (forecasted) | 16.9 | % | 8.2 | % | 13.5 | % | 11.7 | % | |||||||||||
| Market cap $ weighted median | $ | 1,485 | $ | 1,008 | $ | 1,050 | $ | 49,874 | |||||||||||
| Assets | $572 million | ||||||||||||||||||
| Number of Holdings | 68 | ||||||||||||||||||
| Ticker Symbol: | SKSEX | ||||||||||||||||||
| Cusip: | 830833208 | ||||||||||||||||||
| Net Asset Value (per share): | $ | 27.55 | |||||||||||||||||
| Initial investment: | $ | 1,000 | |||||||||||||||||
| Subsequent investment: | $ | 100 | |||||||||||||||||
Top Ten Holdings
| % of net assets | |||||||
| Cytec Industries Inc. | |||||||
| Specialty chemicals | 2.8 | % | |||||
| Crane Co. | |||||||
| Industrial conglomerate | 2.5 | % | |||||
| Conseco, Inc. | |||||||
| Life and health insurer | 2.4 | % | |||||
| iStar Financial Inc. | |||||||
| Commercial real estate lender | 2.3 | % | |||||
| Albemarle Corporation | |||||||
| Specialty chemicals | 2.3 | % | |||||
| Centene Corporation | |||||||
| Medicaid managed care | 2.3 | % | |||||
| Reinsurance Group of America, Incorporated | |||||||
| Life reinsurer | 2.2 | % | |||||
| NCI Building Systems, Inc. | |||||||
| Metal buildings | 2.2 | % | |||||
| Benchmark Electronics, Inc. | |||||||
| Contract manufacturer | 2.1 | % | |||||
| Swift Transportation Co., Inc. | |||||||
| Truckload carrier | 2.0 | % | |||||
| Top Ten Holdings | 23.1 | % | |||||
Fund holdings are subject to change and should not be considered a recommendation to buy individual securities.
Semi-Annual Report – June 30, 2006
7
Sector Performance (%) (as of June 30, 2006)
2Q06**
| Special Equities | Russell 2000 Value | Russell 2000 | |||||||||||||
| Autos and Transportation | 15.7 | 2.3 | 3.3 | ||||||||||||
| Other Energy | 9.1 | 3.2 | 3.4 | ||||||||||||
| Producer Durables | -0.1 | -1.2 | -4.9 | ||||||||||||
| Financial Services | -1.9 | -0.8 | -1.5 | ||||||||||||
| Technology | -4.4 | -11.1 | -12.1 | ||||||||||||
| Materials and Processing | -6.4 | -2.2 | -4.9 | ||||||||||||
| Utilities | -9.3 | -0.9 | -0.9 | ||||||||||||
| Health Care | -14.3 | -4.7 | -9.3 | ||||||||||||
| Consumer Discretionary | -15.3 | -5.2 | -6.5 | ||||||||||||
| Consumer Staples | NA* | -0.7 | 2.9 | ||||||||||||
| Integrated Oils | NA* | -4.3 | -0.5 | ||||||||||||
| Other | NA* | -13.3 | -15.7 | ||||||||||||
YTD 2006**
| Special Equities | Russell 2000 Value | Russell 2000 | |||||||||||||
| Autos and Transportation | 33.3 | 3.4 | 12.7 | ||||||||||||
| Producer Durables | 26.2 | 21.0 | 16.9 | ||||||||||||
| Materials and Processing | 19.1 | 20.8 | 17.7 | ||||||||||||
| Other Energy | 10.1 | 12.6 | 16.4 | ||||||||||||
| Technology | 6.3 | 8.4 | 4.4 | ||||||||||||
| Financial Services | 4.2 | 8.6 | 8.5 | ||||||||||||
| Health Care | -1.4 | 5.9 | 0.2 | ||||||||||||
| Consumer Discretionary | -5.3 | 5.2 | 3.0 | ||||||||||||
| Utilities | -6.0 | 10.9 | 10.2 | ||||||||||||
| Consumer Staples | NA* | 3.6 | 14.5 | ||||||||||||
| Integrated Oils | NA* | 28.1 | 11.1 | ||||||||||||
| Other | NA* | 6.5 | 2.4 | ||||||||||||
Past performance does not guarantee future results. The performance data quoted represents past performance and current returns may be lower or higher. The investment return and principal value will fluctuate so that an investor's shares, when redeemed may be worth more or less than the original cost. To obtain performance information current to the most recent month end, please visit www.skylinefunds.com.
* Not applicable
** Not annualized
Sector Weightings (as of June 30, 2006)
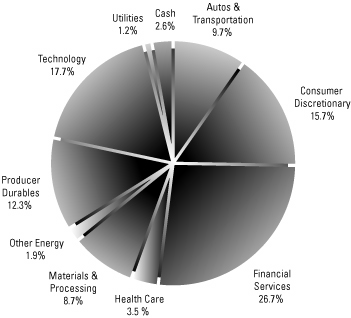
Fund holdings are subject to change and should not be considered a recommendation to buy individual securities. Sector weightings are shown as a percentage of total net assets.
Semi-Annual Report – June 30, 2006
8
Stock Highlights
Albermarle Corporation (ALB)
ALB is a specialty chemical company. The company's catalysts segment, a producer of chemicals that are used to convert crude oil into products such as gasoline, is expected to drive earnings growth over the next several years. Tighter clean fuel standards, the use of heavier and dirtier crude oil, and high capacity utilization at oil refineries are driving catalyst demand to new levels. The strong demand has allowed ALB to increase prices and we expect higher prices to continue throughout 2007. ALB's Fine Chemicals segment has implemented an efficiency program which is expected to lead to higher margins and earnings. On a consolidated basis, higher prices, greater demand for products, and cost efficiencies are expected to drive earnings growth in excess of 40% in 2006 and 15% in 2007, with good visibility into long-term earnings due to additional clean fuel standards that take affect in 2009. ALB generates strong free cash flow and offers an attractive valuation.
The Scotts Miracle-Gro Company (SMG)
SMG is the world's leading supplier and marketer of consumer products for do-it-yourself lawn and garden care, with products for professional horticulture as well. Over the years, the company has built an impressive record of growth through product innovation and the ability to couple their industry-leading brands with an extensive advertising budget to produce ongoing market share gains. More recently, management has focused on improving the company's returns, and is in the process of eliminating unneeded overhead through a multi-year cost reduction program. This program, coupled with solid growth from the core business and rapidly improving profitability from their Scotts Lawn Service business, should produce strong earnings increases ahead. Despite the encouraging prospects, SMG's stock price trades at a significant discount to the market and most other branded consumer products companies.
Fund holdings are subject to change and should not be considered a recommendation to buy individual securities.
Semi-Annual Report – June 30, 2006
9
Glossary of Investment Terms
Earnings Per Share (EPS) A company's net income divided by its outstanding shares.
Earnings Per Share growth — 3 yrs (historical) The compounded annual growth rate of a company's EPS over the last 3 years.
Earnings Per Share growth — 1 yr (forecasted) Analysts' consensus forecast for a company's growth in operating EPS over the immediate future 12 months.
Market Cap Dollar Weighted Median An indicator of the size of companies in which a fund invests; the mid-point of market capitalization (market price times shares outstanding) of a fund's stocks, weighted by the proportion of the fund's assets invested in each stock. Stocks representing half of the fund's assets have market capitalizations above the median, and the rest below it.
Price/Book Ratio The share price of a stock divided by its net worth, or book value, per share.
Price/Earnings (P/E) Ratio An indicator of the relative valuation of the stocks in which a fund invests. For stocks the ratio is calculated by taking the stock's current price to its per-share earnings over the past 12 months. For a fund, the P/E ratio is the average of the P/E ratios of the fund's stocks, weighted by the proportion of the fund's assets invested in each stock.
Price/Sales Ratio The ratio of a stock's current price to its per-share revenue over the past 12 months.
Semi-Annual Report – June 30, 2006
10
Portfolio Holdings as of June 30, 2006
| Company Description | Number Shares | Market Value | |||||||||||||
| COMMON STOCKS | |||||||||||||||
| Autos & Transportation — 9.7% | |||||||||||||||
| Autos — 2.6% | |||||||||||||||
| Aftermarket Technology Corp.a | Provider of remanufactured transmissions | 408,000 | $ | 10,138,800 | |||||||||||
| American Axle & Mfg. Holdings, Inc. | Auto parts manufacturer | 256,500 | 4,388,715 | ||||||||||||
| 14,527,515 | |||||||||||||||
| Other Transportation — 5.1% | |||||||||||||||
| Interpool, Inc. | Container leasing firm | 343,900 | 7,641,458 | ||||||||||||
| Laidlaw International, Inc. | Provider of transportation services | 427,900 | 10,783,080 | ||||||||||||
| Ryder System, Inc. | Truck leasing company | 186,500 | 10,897,195 | ||||||||||||
| 29,321,733 | |||||||||||||||
| Trucking — 2.0% | |||||||||||||||
| Swift Transportation Co., Inc.a | Truckload carrier | 361,400 | 11,478,064 | ||||||||||||
| Total Autos & Transportation | 55,327,312 | ||||||||||||||
| Consumer Discretionary — 15.7% | |||||||||||||||
| Commercial Services — 6.4% | |||||||||||||||
| Adesa, Inc. | Wholesale vehicle auctioneer | 478,000 | 10,630,720 | ||||||||||||
| Heidrick & Struggles Intla | Executive search and leadership consulting services | 303,100 | 10,256,904 | ||||||||||||
| Navigant Consulting, Inc.a | Provider of financial and legal consulting to business | 214,100 | 4,849,365 | ||||||||||||
| Watson Wyatt & Company Holdings | Benefit consulting company | 309,000 | 10,858,260 | ||||||||||||
| 36,595,249 | |||||||||||||||
| Consumer Products/Services — 4.3% | |||||||||||||||
| Polaris Industries, Inc. | Snowmobiles, ATVs, motorcycles | 134,100 | 5,806,530 | ||||||||||||
| The Scotts Miracle-Gro Company | Turf & horticultural products | 209,870 | 8,881,698 | ||||||||||||
| The Toro Company | Turf maintenance products | 215,700 | 10,073,190 | ||||||||||||
| 24,761,418 | |||||||||||||||
| Printing/Publishing — 1.3% | |||||||||||||||
| ADVO, Inc. | Direct mail marketing company | 296,401 | 7,294,429 | ||||||||||||
| Restaurants — 2.6% | |||||||||||||||
| Rare Hospitalitya | Steakhouse operator | 243,200 | 6,994,432 | ||||||||||||
| The Steak n Shake Companya | Casual dining | 524,600 | 7,942,444 | ||||||||||||
| 14,936,876 | |||||||||||||||
| Retail — 1.1% | |||||||||||||||
| Big 5 Sporting Goods Corporation | Regional sporting goods retailer | 332,300 | 6,479,850 | ||||||||||||
| Total Consumer Discretionary | 90,067,822 | ||||||||||||||
Semi-Annual Report – June 30, 2006
11
Portfolio Holdings as of June 30, 2006 (continued)
| Company Description | Number Shares | Market Value | |||||||||||||
| Financial Services — 26.7% | |||||||||||||||
| Banks/Thrifts — 5.5% | |||||||||||||||
| Placer Sierra Bancshares | Regional bank | 262,300 | $ | 6,082,737 | |||||||||||
| Prosperity Bancshares, Inc. | Regional bank | 279,800 | 9,202,622 | ||||||||||||
| Provident Bankshares Corporation | Commercial bank | 186,500 | 6,786,735 | ||||||||||||
| Sterling Financial Corporation | Commercial bank | 311,595 | 9,506,763 | ||||||||||||
| 31,578,857 | |||||||||||||||
| Insurance — 14.2% | |||||||||||||||
| Aspen Insurance Holdings Limited | Property & casualty reinsurance | 355,600 | 8,281,924 | ||||||||||||
| Clark, Inc. | Insurance brokerage and consulting | 361,400 | 4,770,480 | ||||||||||||
| Conseco, Inc.a | Life & health insurer | 600,400 | 13,869,240 | ||||||||||||
| Delphi Financial Group, Inc. | Accident & health insurance | 314,802 | 11,446,201 | ||||||||||||
| RAM Holdings, Inc.a | Financial guaranty reinsurance | 478,000 | 6,008,460 | ||||||||||||
| Reinsurance Group of America | Life reinsurer | 256,500 | 12,606,975 | ||||||||||||
| Scottish Re Group Limited | Life reinsurer | 353,100 | 5,889,708 | ||||||||||||
| Seabright Insurance Holdingsa | Insurance property casualty | 366,681 | 5,907,231 | ||||||||||||
| Triad Guaranty Inc.a | Mortgage insurance | 88,230 | 4,312,682 | ||||||||||||
| U.S.I. Holdings Corporationa | Insurance brokerage | 585,153 | 7,846,902 | ||||||||||||
| 80,939,803 | |||||||||||||||
| Other Financial Services — 4.7% | |||||||||||||||
| CompuCredit Corporationa | Sub-prime credit cards | 233,200 | 8,964,208 | ||||||||||||
| MCG Capital Corporation | Business development company | 625,400 | 9,943,860 | ||||||||||||
| S1 Corporationa | Financial information software | 167,150 | 802,320 | ||||||||||||
| United Panam Financial Corpa | Sub-prime auto lender | 236,600 | 7,192,640 | ||||||||||||
| 26,903,028 | |||||||||||||||
| Real Estate Investment Trusts — 2.3% | |||||||||||||||
| iStar Financial Inc. | Commercial real estate lender | 355,600 | 13,423,900 | ||||||||||||
| Total Financial Services | 152,845,588 | ||||||||||||||
| Health Care — 3.5% | |||||||||||||||
| Health Care Services — 3.5% | |||||||||||||||
| Centene Corporation a | Medicaid managed care | 559,600 | 13,167,388 | ||||||||||||
| Triad Hospitals, Inc.a | Hospital Operator | 180,700 | 7,152,106 | ||||||||||||
| Total Health Care | 20,319,494 | ||||||||||||||
| Materials & Processing — 8.7% | |||||||||||||||
| Building/Construction Products — 3.5% | |||||||||||||||
| NCI Building Systems, Inc. a | Metal buildings | 233,200 | 12,399,244 | ||||||||||||
| Walter Industries, Inc | Natural resources & water products | 134,100 | 7,730,865 | ||||||||||||
| 20,130,109 | |||||||||||||||
Semi-Annual Report – June 30, 2006
12
| Company Description | Number Shares | Market Value | |||||||||||||
| Specialty Chemicals — 5.2% | |||||||||||||||
| Albemarle Corporation | Specialty chemicals | 279,800 | $ | 13,396,824 | |||||||||||
| Cytec Industries Inc. | Specialty chemicals | 303,100 | 16,264,346 | ||||||||||||
| 29,661,170 | |||||||||||||||
| Total Materials & Processing | 49,791,279 | ||||||||||||||
| Other Energy — 1.9% | |||||||||||||||
| Equipment & Services — 1.2% | |||||||||||||||
| Key Energy Services, Inc.a | Workover services provider | 456,900 | 6,967,725 | ||||||||||||
| Exploration & Production — 0.7% | |||||||||||||||
| Newfield Exploration Companya | Oil & gas producer | 75,700 | 3,704,758 | ||||||||||||
| Total Other Energy | 10,672,483 | ||||||||||||||
| Producer Durables — 12.3% | |||||||||||||||
| Aerospace — 0.8% | |||||||||||||||
| Curtiss-Wright Corporation | Aerospace & defense components mfg. | 149,200 | 4,607,296 | ||||||||||||
| Diversified Manufacturing — 4.3% | |||||||||||||||
| Carlisle Companies Incorporated | Industrial conglomerate | 128,200 | 10,166,260 | ||||||||||||
| Crane Co. | Industrial conglomerate | 339,200 | 14,110,720 | ||||||||||||
| 24,276,980 | |||||||||||||||
| Electrical Equipment — 5.1% | |||||||||||||||
| Acuity Brands, Inc. | Manufacturer of lighting fixtures | 199,902 | 7,778,187 | ||||||||||||
| Belden CDT Inc. | Networking cable manufacturer | 314,800 | 10,404,140 | ||||||||||||
| Commscope, Inc. a | Networking cable manufacturer | 355,610 | 11,173,266 | ||||||||||||
| 29,355,593 | |||||||||||||||
| Machinery — 2.1% | |||||||||||||||
| Blount International, Inc.a | Manufacturer of timber related equipment | 349,800 | 4,204,596 | ||||||||||||
| United Rentals, Inc.a | Equipment rental | 244,800 | 7,828,704 | ||||||||||||
| 12,033,300 | |||||||||||||||
| Total Producer Durables | 70,273,169 | ||||||||||||||
| Technology — 17.7% | |||||||||||||||
| Distribution — 1.3% | |||||||||||||||
| Synnex Corporationa | Distributor of PCs and peripherals | 402,200 | 7,625,712 | ||||||||||||
| Electronic Components — 4.1% | |||||||||||||||
| AMIS Holding, Inc.a | Manufacturer of analog semiconductors | 409,800 | 4,098,000 | ||||||||||||
| Fairchild Semiconductor Int'l., Inc.a | Semiconductors | 419,700 | 7,625,949 | ||||||||||||
| Hutchinson Technologya | Manufacturer of disk drive components | 192,400 | 4,161,612 | ||||||||||||
Semi-Annual Report – June 30, 2006
13
Portfolio Holdings as of June 30, 2006 (continued)
| Company Description | Number Shares | Market Value | |||||||||||||
| Smart Modular Technologiesa | Manufacturer of memory | ||||||||||||||
| modules | 858,562 | $ | 7,538,174 | ||||||||||||
| 23,423,735 | |||||||||||||||
| Other Technology — 5.3% | |||||||||||||||
| Benchmark Electronics, Inc.a | Contract manufacturer | 489,700 | 11,811,564 | ||||||||||||
| Electronics for Imaging, Inc.a | Products that support color printing | 354,500 | 7,401,960 | ||||||||||||
| NETGEAR, Inc.a | Manufacturer of networking equipment | 303,100 | 6,562,115 | ||||||||||||
| Park Electrochemical Corporation | Advanced electronic materials | 185,200 | 4,768,900 | ||||||||||||
| 30,544,539 | |||||||||||||||
| Services — 2.1% | |||||||||||||||
| Kanbay International, Inc.a | Provider of offshore IT services | 408,660 | 5,941,916 | ||||||||||||
| Perot Systems Corpa | IT consulting | 413,270 | 5,984,150 | ||||||||||||
| 11,926,066 | |||||||||||||||
| Software — 2.8% | |||||||||||||||
| Mentor Graphics Corporationa | Provider of EDA software | 761,007 | 9,877,871 | ||||||||||||
| Parametric Technology Corpa | Design & collaboration software | 468,720 | 5,957,431 | ||||||||||||
| 15,835,302 | |||||||||||||||
| Telecommunications — 2.1% | |||||||||||||||
| Andrew Corpa | Manufacturer of equipment for cell sites | 791,400 | 7,011,804 | ||||||||||||
| Arris Groupa | Manufacturer of equipment for broadband networks | 367,200 | 4,817,664 | ||||||||||||
| 11,829,468 | |||||||||||||||
| Total Technology | 101,184,822 | ||||||||||||||
| Utilities — 1.2% | |||||||||||||||
| Telecommunication Services — 1.2% | |||||||||||||||
| Cincinnati Bella | Local wireline and wireless services | 1,717,346 | 7,041,119 | ||||||||||||
| Total Utilities | 7,041,119 | ||||||||||||||
| TOTAL COMMON STOCKS — 97.4% (Cost $475,377,545) | 557,523,088 | ||||||||||||||
Semi-Annual Report – June 30, 2006
14
| Market Value | |||||||
| MONEY MARKET INSTRUMENTS US Bank Demand Note, 5.10%b | $ | 2,929,638 | |||||
| US Bank Commercial Paper, 5.07%, due 7/03/06 | 15,100,000 | ||||||
| TOTAL MONEY MARKET INSTRUMENTS — 3.1% (Cost $18,029,638) | 18,029,638 | ||||||
| TOTAL INVESTMENTS — 100.5% (Cost $493,407,183) | 575,552,726 | ||||||
| OTHER ASSETS LESS LIABILITIES — (0.5)% | (3,074,551 | ) | |||||
| NET ASSETS — 100% | $ | 572,478,175 | |||||
(a) Non-income producing security.
(b) Variable rate demand note. Interest rate is reset every seven days. Rate disclosed represents rate in effect on June 30, 2006.
See accompanying notes to financial statements.
Semi-Annual Report – June 30, 2006
15
Statement of Assets and Liabilities As of June 30, 2006 (unaudited)
| ASSETS | |||||||||||
| Investments, at value (Cost: $493,407,183) | $ | 575,552,726 | |||||||||
| Receivable for: | |||||||||||
| Securities sold | $ | 1,750,808 | |||||||||
| Fund shares sold | 505,690 | ||||||||||
| Dividends and interest | 461,140 | 2,717,638 | |||||||||
| Other assets | 277,965 | ||||||||||
| Total assets | 578,548,329 | ||||||||||
| LIABILITIES & NET ASSETS | |||||||||||
| Payable for: | |||||||||||
| Securities purchased | $ | 4,919,506 | |||||||||
| Fund shares redeemed | 179,110 | ||||||||||
| Comprehensive management fee | 675,470 | ||||||||||
| Trustee compensation | 18,103 | ||||||||||
| Trustees deferred compensation | 277,965 | 6,070,154 | |||||||||
| Net assets applicable to shares outstanding | $ | 572,478,175 | |||||||||
| Shares outstanding—no par value (unlimited number of shares authorized) | 20,780,227 | ||||||||||
| PRICING OF SHARES | |||||||||||
| Net asset value, offering price and redemption price per share | $ | 27.55 | |||||||||
| ANALYSIS OF NET ASSETS | |||||||||||
| Paid-in capital | $ | 428,670,725 | |||||||||
| Undistributed net investment loss | (923,275 | ) | |||||||||
| Accumulated net realized gain on sales of investments | 62,585,182 | ||||||||||
| Unrealized appreciation of investments | 82,145,543 | ||||||||||
| Net assets applicable to shares outstanding | $ | 572,478,175 | |||||||||
See accompanying notes to financial statements.
Semi-Annual Report – June 30, 2006
16
Statement of Operations For the Period Ended June 30, 2006 (unaudited)
| Investment income | |||||||
| Dividends | $ | 2,324,937 | |||||
| Interest | 602,221 | ||||||
| Total investment income | 2,927,158 | ||||||
| Expenses: | |||||||
| Comprehensive management fee | 4,122,775 | ||||||
| Fees to unaffilliated trustees | 52,241 | ||||||
| Total expenses | 4,175,016 | ||||||
| Net investment loss | (1,247,858 | ) | |||||
| Net realized and unrealized gain/loss on investments: | |||||||
| Net realized gain on sales of investments | 48,785,460 | ||||||
| Change in unrealized appreciation/depreciation | (4,645,636 | ) | |||||
| Net realized and unrealized gain on investments | 44,139,824 | ||||||
| Net increase in net assets resulting from operations | $ | 42,891,966 | |||||
See accompanying notes to financial statements.
Semi-Annual Report – June 30, 2006
17
Statement of Changes in Net Assets
| Period Ended 6/30/06 (unaudited) | Year ended 12/31/2005 | ||||||||||
| From operations: | |||||||||||
| Net investment loss | $ | (1,247,858 | ) | $ | (2,058,445 | ) | |||||
| Net realized gain on sales of investments | 48,785,460 | 112,906,191 | |||||||||
| Change in unrealized appreciation/depreciation | (4,645,636 | ) | (57,301,136 | ) | |||||||
| Net increase in net assets resulting from operations | 42,891,966 | 53,546,610 | |||||||||
| Distributions to shareholders from net realized gains | — | (107,459,203 | ) | ||||||||
| From fund share transactions: | |||||||||||
| Proceeds from fund shares sold | 64,128,796 | 56,241,236 | |||||||||
| Reinvestment of dividends | — | 105,393,453 | |||||||||
| Payments for fund shares redeemed | (53,517,664 | ) | (155,103,188 | ) | |||||||
| Net increase in net assets resulting from share transactions | 10,611,132 | 6,531,501 | |||||||||
| Total increase/decrease in net assets | 53,503,098 | (47,381,092 | ) | ||||||||
| Net assets at beginning of year | 518,975,077 | 566,356,169 | |||||||||
| Net assets at end of year (includes undistributed net investment loss of $923,275 and undistributed net investment income of $324,583, respectively) | $ | 572,478,175 | $ | 518,975,077 | |||||||
See accompanying notes to financial statements.
Semi-Annual Report – June 30, 2006
18
Financial Highlights
| Period Ended 6/30/06 (unaudited) | Year Ended 12/31/05 | Year Ended 12/31/04 | Year Ended 12/31/03 | Year Ended 12/31/02 | Year Ended 12/31/01 | ||||||||||||||||||||||
| Net asset value at beginning of year | $ | 25.43 | $ | 28.64 | $ | 27.78 | $ | 20.86 | $ | 22.50 | $ | 19.75 | |||||||||||||||
| Income from investment operations | |||||||||||||||||||||||||||
| Net Investment loss | (0.06 | )* | (0.11 | )* | (0.13 | )* | (0.06 | )* | (0.06 | )* | (0.04 | )* | |||||||||||||||
| Net realized and unrealized gain/(loss) on investments | 2.18 | 3.32 | 4.68 | 8.54 | (1.58 | ) | 2.79 | ||||||||||||||||||||
| Total from investment operations | 2.12 | 3.21 | 4.55 | 8.48 | (1.64 | ) | 2.75 | ||||||||||||||||||||
| Less distributions from net realized gains on investments | — | (6.42 | ) | (3.69 | ) | (1.56 | ) | — | — | ||||||||||||||||||
| Net asset value at end of period | $ | 27.55 | $ | 25.43 | $ | 28.64 | $ | 27.78 | $ | 20.86 | $ | 22.50 | |||||||||||||||
| Total Return | 8.34 | %a | 10.89 | % | 16.61 | % | 40.71 | % | (7.29 | %) | 13.92 | % | |||||||||||||||
| Ratios/Supplemental Data | |||||||||||||||||||||||||||
| Ratio of expenses to average net assets | 1.47 | %b | 1.47 | % | 1.47 | % | 1.48 | % | 1.48 | % | 1.49 | % | |||||||||||||||
| Ratio of net investment loss to average net assets | (0.44 | )b | (0.39 | %) | (0.47 | %) | (0.26 | %) | (0.26 | %) | (0.16 | %) | |||||||||||||||
| Portfolio turnover rate | 37 | %a | 51 | % | 47 | % | 52 | % | 81 | % | 93 | % | |||||||||||||||
| Net assets, end of period (in thousands) | $ | 572,478 | $ | 518,975 | $ | 566,356 | $ | 524,575 | $ | 378,839 | $ | 374,945 | |||||||||||||||
* Based on monthly average shares outstanding
a Not Annualized
b Ratios have been determined on an annualized basis
Semi-Annual Report – June 30, 2006
19
Notes to Financial Statements (unaudited)
Skyline Funds (the "Trust") is an open-end, diversified investment management company the sole portfolio of which is Special Equities Portfolio. The Fund commenced public offering of its shares on April 23, 1987. The Fund's investment adviser is Skyline Asset Management, L.P. (the "Adviser"). The Fund seeks maximum capital appreciation, primarily through investment in common stocks that the Adviser considers to be undervalued.
1
Significant accounting policies
n Security valuation – Investments are stated at value. Each equity security traded on a securities exchange shall be valued at the last current sale price as of the time of valuation on the exchange on which the security is principally traded (the "principal exchange"), or lacking any current reported sale on the principal exchange at the time of valuation, at the most recent bid quotation on the principal exchange. Each over-the-counter security traded in the Nasdaq Stock Market ("Nasdaq") shall be valued at the Nasdaq Official Closing Price ("NOCP"), as determined by Nasdaq, or lacking an NOCP, the last current reported sale price as of the time of valuation on Nasdaq, or lacking any current reported sale on Nasdaq at the time of valuat ion, at the most recent bid quotation on Nasdaq. For certain fixed-income securities, Skyline Funds' Board of Trustees has authorized the use of market valuations provided by an independent pricing service. Short-term instruments with sixty days or less to maturity are valued at amortized cost, which approximates market value. Securities or other assets for which market quotations are not readily available or deemed unreliable, which may include certain restricted securities, are valued at a fair value as determined in good faith by the Skyline Funds' Board of Trustees or a committee thereof.
n Security transactions and investment income – Security transactions are accounted for on the trade date (date the order to buy or sell is executed) and dividend income is recorded on the ex-dividend date. Interest income is recorded on an accrual basis and includes amortization of premiums and discounts. Realized gains and losses from security transactions are reported on an identified cost basis.
n Fund share valuation – Fund shares are sold and redeemed on a continuous basis at net asset value. Net asset value per share is determined as of the close of regular session trading on the New York Stock Exchange (normally 3:00 p.m. Central Time), each day that the Exchange is open for trading. The net asset value per share is determined by dividing the value of all securities and other assets, less liabilities, by the number of shares of the Fund outstanding.
n Federal income taxes and dividends to shareholders – It is the Fund's policy to comply with the special provisions of the Internal Revenue Code applicable to regulated investment companies and, in the manner provided therein, to distribute substantially all of its taxable income to shareholders. Such provisions were complied
Semi-Annual Report – June 30, 2006
20
with and, therefore, no federal income taxes have been accrued in the accompanying financial statements.
Dividends payable to its shareholders are recorded by the Fund on the ex-dividend date. The timing and characterization of certain income and capital gain distributions are determined annually in accordance with Federal income tax regulations that may differ from accounting principles generally accepted in the United States. As a result, net investment income or loss and net realized gain or loss for a reporting period may differ from the amount distributed during such period. In addition, the Fund may periodically record reclassifications among certain capital accounts to reflect differences between financial reporting and income tax purposes. These reclassifications have no impact on the net asset value of the Fund, and will be updated at the Fund's fiscal year end.
On December 16, 2005, a distribution of $6.4224 per share was paid to shareholders of record on December 15, 2005.
The tax character of distributions paid during 2005 was as follows:
| 2005 | |||||||
| Distributions paid from: | |||||||
| Ordinary income | $ | 15,250,804 | |||||
| Long-term capital gain | 92,208,399 | ||||||
| $ | 107,459,203 | ||||||
Cost of investments for federal income tax purposes was substantially the same as book cost of $493,407,183 on June 30, 2006, net unrealized appreciation was $82,145,543, consisting of gross unrealized appreciation of $99,413,391 and gross unrealized depreciation of $17,267,848.
n Line of Credit – The Fund has a $3 million committed revolving credit facility for temporary or emergency purposes, including the meeting of redemption requests that otherwise might require the untimely disposition of securities. The Adviser pays a commitment fee of 10 basis points per annum of the average daily unutilized portion of the committed line of credit not utilized. Under the terms of the credit agreement, interest on each loan would be fixed at the prime rate less 150 basis points. For the period ended June 30, 2006 there were no loans outstanding under the credit facility.
n Use of Estimates – The preparation of financial statements in conformity with accounting principles generally accepted in the United States requires management to make estimates and assumptions that affect the amounts reported in the financial statements and accompanying notes. Actual results may differ from those estimates.
n Redemption Fee – The Fund will deduct a redemption fee (the "Redemption Fee") of 2% from the proceeds of any redemption (including a redemption by exchange) of shares if the redemption occurs within 30 days of the purchase of those shares. For the purpose of determining whether a redemption is subject to the Redemption Fee, redemptions of Fund shares are conducted on a first in/first out (FIFO) basis such that shares with the longest holding period will be redeemed first and shares with the
Semi-Annual Report – June 30, 2006
21
Notes to Financial Statements (unaudited) (continued)
shortest holding period will be redeemed last. The Redemption Fee is paid to the Fund and is intended to offset transaction and other expenses caused by short-term trading. The Redemption Fee does not apply to redemptions (including redemptions by exchange) of shares of the Fund purchased by automatic reinvestment of dividends or capital gains distributions. The Redemption Fee will also not apply to redemptions under hardship circumstances (as determined by the Adviser and the Fund in their discretion, based on a case-by-case analysis). The Redemption Fee will apply only to the redemption of shares purchased through an authorized agent if the authorized agent has indicated that it will administer the Redemption Fee. For the period ended June 30, 2006, the Fund had $91,211 included in capital due to the collection of redemption fees.
n Indemnifications – Under the Trust's organizational documents, its officers and trustees are indemnified against certain liabilities arising out of the performance of their duties to the Trust. In addition, the Trust may enter into contracts that provide for general indemnification. The Trust's maximum liability under those arrangements is unknown, as this would involve future claims that may be made against the Trust. However, based on experience, the Trust expects that risk of loss to be remote.
2
Transactions with affiliates
For the Adviser's management and advisory services and the assumption of most of the Fund's ordinary operating expenses, the Fund incurs a monthly comprehensive fee based on its average daily net assets at the annual rate of 1.50% of the first $200 million, 1.45% of the next $200 million, 1.40% of the next $200 million, and 1.35% of any excess over $600 million. The total comprehensive management fee incurred for the period ended June 30, 2006 was $4,122,775.
Certain officers and trustees of the Skyline Funds are also officers, limited partners or shareholders of limited partners of the Adviser. The Fund makes no direct payments to the officers or trustees who are affiliated with the Adviser. For the period ended June 30, 2006, the Fund incurred fees of $52,241 to its independent trustees.
The Fund provides a deferred compensation plan for its trustees who are not officers, limited partners or shareholders of limited partners of the Adviser. Under the deferred compensation plan, trustees may elect to defer all or a portion of their compensation. Amounts deferred are retained by the Fund, represent an unfunded obligation of the Fund, and to the extent permitted by the Investment Company Act of 1940, as amended, may be invested in the common shares of the Fund, as selected by the trustees. These shares are held by the Adviser on behalf of Skyline Funds, the value of which is reflected in "Other Assets" on the Statement of Assets and Liabilities at June 30, 2006. Appreciation/depreciation and distributions received from these investments are recorded with an offsetting increase/decrease in the deferred compensation obligation and do not affect the Fund's net asset value.
Semi-Annual Report – June 30, 2006
22
3
Fund share transactions
As of June 30, 2006, there were an unlimited number of shares of beneficial interest, no par value, authorized. Transactions in the Fund's shares of beneficial interest were as follows:
| Shares | Dollar Amount | ||||||||||||||||||
| Period Ended 06/30/06 | Year Ended 12/31/05 | Period Ended 06/30/06 | Year Ended 12/31/05 | ||||||||||||||||
| Shares sold | 2,305,481 | 1,939,073 | $ | 64,128,796 | $ | 56,241,236 | |||||||||||||
| Shares issued for reinvestment of dividends | — | 4,083,435 | — | 105,393,453 | |||||||||||||||
| Total shares issued | 2,305,481 | 6,022,508 | 64,128,796 | 161,634,689 | |||||||||||||||
| Less shares redeemed | (1,936,464 | ) | (5,384,405 | ) | (53,517,664 | ) | (155,103,188 | ) | |||||||||||
| Net increase | 369,017 | 638,103 | $ | 10,611,132 | $ | 6,531,501 | |||||||||||||
4
Investment transactions
Investment transactions (exclusive of money market instruments) for the six months ended June 30, 2006, were as follows:
| Cost of purchases | $ | 200,494,451 | |||||
| Proceeds from sales | $ | 204,165,522 | |||||
Semi-Annual Report – June 30, 2006
23
Expense Example
As a shareholder of the Fund, you incur ongoing costs, including a comprehensive management fee and trustee fees. You may incur a 2% redemption fee in the event shares are redeemed within 30 days. This example is intended to help you understand your ongoing costs (in dollars) of investing in the Fund and to compare these costs with the ongoing costs of investing in other mutual funds.
The example is based on an investment of $1,000 invested at the beginning of the period and held for the entire period (01/01/06 - 6/30/06).
Actual Expenses
The first line of the table that follows provides information about actual account values (which includes the actual return of the Fund) and actual expenses. You may use the information in this line, together with the amount you invested, to estimate the expenses that you paid over the period. Simply divide your account value by $1,000 (for example, an $8,600 account value divided by $1,000 = 8.6), then multiply the result by the number in the first line under the heading entitled "Expenses Paid During Period'' to estimate the expenses you paid on your account during this period. In addition to the expenses paid during the period that are noted in the table, you may be assessed fees for outgoing wire transfers, returned checks and stop payment orders at prevailing rates charged by U.S. Bancorp Fund Services, LLC, the Fund's transfer agent. If you request that a redemption be made by wire transfer, currently a $15.00 fee is charged by the Fun d's transfer agent. IRA accounts will be charged a $15.00 annual maintenance fee. These additional fees have the effect of reducing investment returns.
Hypothetical Example for Comparison Purposes
The second line of the table that follows provides information about hypothetical account values and hypothetical expenses based on the Fund's actual expense ratio and an assumed rate of return of 5% per year before expenses, which is not the Fund's actual return. The hypothetical account values and expenses may not be used to estimate the actual ending account balance or expenses you paid for the period. You may use this information to compare the ongoing costs of investing in the Fund and other mutual funds. To do so, compare this 5% hypothetical example with the 5% hypothetical examples that appear in the shareholder reports of the other funds. Please note that the expenses shown in the table are meant to highlight your ongoing costs only and do not reflect any transactional costs, such as, redemption fees, or exchange fees. Therefore, the second line of the table is useful in comparing ongoing costs only, and will not help you determine the relative total costs of owning different
Semi-Annual Report – June 30, 2006
24
mutual funds. In addition, if these transactional costs were included, your costs would have been higher.
Table: Expense Example
| Beginning Account Value 01/01/06 | Ending Account Value 06/30/2006 | Expenses Paid During Period 01/01/06 - 6/30/2006 | |||||||||||||
| Actual | $ | 1,000.00 | $ | 1,083.40 | $ | 7.59 | |||||||||
| Hypothetical (5% return before expenses) | $ | 1,000.00 | $ | 1,017.50 | $ | 7.35 | |||||||||
* Expenses are equal to the Fund's annualized expense ratio of 1.47% multiplied by the average account value over the period multiplied by 181/365 (to reflect the one-half year period).
Approval of the Investment Advisory Agreement
by the Independent Trustees
At a meeting (the "Meeting") of the Board of Trustees (the "Board") held on May 16, 2006, the Board, including all the trustees who are not "interested persons" of the Trust, as that term is defined in Section 2(a)(19) of the Investment Company Act of 1940, as amended (hereafter, the "Independent Trustees"), met to consider the continuation of the investment advisory agreement (the "Agreement") between Skyline Asset Management, L.P. ("Adviser") and Skyline Funds (the "Fund").
Prior to the Meeting, the Board had received and reviewed a variety of written materials, including information from the Adviser in response to a written request from counsel to the Independent Trustees. The materials included: a) data comparing the Fund's investment performance, expenses, and fees to comparable, as well as a broad universe of, investment companies, as independently chosen by Lipper, Inc.; b) the background and experience of the Adviser's management and investment personnel; c) the financial condition and stability of the Adviser, including an analysis of the Adviser's profitability for managing the Fund; d) the terms of the Agreement and fee arrangement with the Fund; and e) administrative, compliance and other services provided by the Adviser. The Trustees also received and reviewe d a memorandum from counsel to the Independent Trustees regarding their responsibilities in evaluating the Agreement. During the Meeting, the Independent Trustees engaged in in-person discussions with the Adviser's executive committee along with other employees of the Adviser. The Independent Trustees also met outside the presence of the Adviser and were advised by their legal counsel.
At the meeting, the Trustees determined that the Agreement was fair and reasonable in light of the nature and quality of the services provided by the Adviser, the fees
Semi-Annual Report – June 30, 2006
25
Approval of the Investment Advisory Agreement
by the Independent Trustees (continued)
charged for those services and other matters that the Trustees considered relevant in the exercise of their business judgment. As a result, the Trustees, including all of the Independent Trustees, unanimously approved the continuation of the Agreement, subject to earlier termination as provided in the Agreement.
In considering the continuation of the Agreement, the Trustees reviewed and analyzed various factors that they determined were relevant, including the factors described below, none of which by itself was considered determinative. However, the specific factors and conclusions that formed the basis for the Trustees' determination to approve the continuation of the Agreement are discussed separately below.
Nature, quality and extent of services. The Trustees reviewed the nature, extent and quality of the services provided by the Adviser under the Agreement, taking into account the investment objective and strategy of the Fund and the knowledge the Trustees gained from their quarterly meetings with the Adviser, and the materials provided in connection with those meetings. In addition, the Trustees considered the Adviser's resources and key personnel, especially those who provide investment management services to the Fund. The Trustees particularly noted the highly experienced professional staff of the Adviser involved in providing investment management services to the Fund. The Trustees also considered other services provided to the Fund by the Adviser.
The Trustees concluded that the nature and extent of the services provided by the Adviser were acceptable and consistent with the terms of the Agreement. They also concluded that the Adviser was qualified to continue to manage the Fund's assets in accordance with its investment objective, and that it maintains appropriate compliance procedures.
Performance of the Fund. The Trustees considered information on the short-term and long-term performance of the Fund, including information on comparable funds and as against the Lipper's Small Cap Value Funds universe. The Trustees concluded that, although past performance is not necessarily indicative of future results, they were pleased with the Fund's long-term performance record.
Costs of Services and Profits Realized by the Adviser. The Trustees examined information on fees and expenses of the Fund in comparison to information for other comparable funds. The Trustees considered the all-inclusive fee that the Fund pays to the Adviser under which the Adviser is responsible for payment of all of the Fund's expenses, excluding Independent Trustee fees. The Trustees also considered that the Adviser was undertaking a comprehensive study of the fee structure of the Fund. The Trustees concluded that the fees payable by the Fund were reasonable in relation to the nature and quality of the services provided by the Adviser taking into account the specific fees charged by other advisers for managing comparable mutual funds with
Semi-Annual Report – June 30, 2006
26
similar strategies. The Trustees also concluded that the Fund's overall expense ratio, taking into account quality of services provided by the Adviser and the investment performance of the Fund, was reasonable.
The Trustees reviewed information on the profitability of the Adviser under the Agreement, noting specifically that the Adviser had provided an extensive profitability analysis to the Trustees prior to the meeting. Based on the information available and taking into account the difficulty of making comparisons in this area due to the lack of publicly available information, the Trustees concluded that the profitability of the Adviser in relation to the services rendered under the Agreement was reasonable.
Economies of Scale. The Trustees received and discussed information concerning whether economies of scale are being realized by the Fund and whether fee levels reflect those economies of scale for the benefit of the Fund's shareholders. The Board considered the current and anticipated asset levels of the Fund and the potential for growth in the Fund's assets, and noted that as the Fund's assets increase shareholders will achieve economies of scale.
Other Benefits to the Adviser. The Trustees also considered benefits that accrue to the Adviser from its relationship with the Fund. The Board noted that certain services are provided by an affiliate of the Adviser, including administrative, distribution and compliance services. After full consideration of these and other factors, the Board concluded that neither the Adviser nor its affiliate received any additional direct benefits that would warrant additional consideration or preclude the Board from approving the continuation of the Agreement.
Proxy Policy & Procedures
A description of the policies and procedures that the Fund uses to determine how to vote proxies relating to portfolio securities is available without charge, upon request, by calling 800.828.2759, and on the Securities and Exchange Commission's website at www.sec.gov. The Fund's proxy voting record for the twelve-month period ended June 30, 2006, is also available without charge, upon request, by calling 800.828.2759, by visiting the Fund's website at www.skylinefunds.com and by visiting the SEC's website at www.sec.gov.
Semi-Annual Report – June 30, 2006
27
Form N-Q
The Fund files a complete list of its portfolio holdings with the SEC for the first and third quarters each fiscal year on Form N-Q. The Form N-Q is available without charge, upon request, by calling 800.828.2759 or by visiting the SEC's website at www.sec.gov. You may also review, for a fee, a copy of the form at the SEC's Public Reference Room in Washington, D.C. (800) SEC-0330.
Semi-Annual Report – June 30, 2006
28
For 24-hour account information call: 1.800.828.2SKY
(1.800.828.2759)
To speak with a Skyline Funds Representative during
normal business hours call: 1.800.828.2SKY and press 0 when prompted.
To learn more about our expertise in small cap value, please visit our website at www.skylinefunds.com
Item 2. Code of Ethics.
Not applicable for semi-annual reports.
Item 3. Audit Committee Financial Expert.
Not applicable for semi-annual reports.
Item 4. Principal Accountant Fees and Services.
Not applicable for semi-annual reports.
Item 5. Audit Committee of Listed Registrants
Not applicable to open-end investment companies.
Item 6. Schedule of Investments
Schedule of Investments is included as part of the report to shareholders filed under Item 1 of this Form.
Item 7. Disclosure of Proxy Voting Policies and Procedures for Closed-End Management Investment Companies.
Not applicable to open-end investment companies.
Item 8. Portfolio Managers of Closed-End Management Investment Companies.
Not applicable to open-end investment companies.
Item 9. Purchases of Equity Securities by Closed-End Management Investment Company and Affiliated Purchasers.
Not applicable to open-end investment companies.
Item 10. Submission of Matters to a Vote of Security Holders.
Not applicable.
Item 11. Controls and Procedures.
(a) Based on an evaluation of the disclosure controls and procedures (as defined in Rule 30a-3(c) under the Investment Company Act of 1940, the “Disclosure Controls”) as of a date within 90 days prior to the filing date (the “Filing Date”) of this Form N-CSR (the “Report”), the Disclosure Controls are effectively designed to ensure that information required to be disclosed by the Registrant in the Report is recorded, processed, summarized and reported by the Filing Date, including ensuring that information required to be disclosed in the Report is accumulated and communicated to the Registrant’s management, including the Registrant’s principal executive officer and principal financial officer, as appropriate to allow timely decisions regarding required disclosure.
(b) There were no changes in the Registrant’s internal controls over financial reporting (as defined in Rule 30a-3(d) under the Investment Company Act of 1940) that occurred during the Registrant’s second fiscal quarter of the period covered by the report that has materially affected, or is reasonably likely to materially affect, the Registrant’s internal control over financial reporting.
Item 12. Exhibits.
(A) | Certifications of William M. Dutton, President and Trustee of Skyline Funds and Benjamin J. Kim, Vice President and Treasurer of Skyline Funds pursuant to Rule 30a-2(a) under the Investment Company Act of 1940 (17 CFR 270.30a-2(a)), attached hereto as Exhibits (a)(1) and (a)(2)(ii) |
|
|
(B) | Certifications of William M. Dutton, President and Trustee of Skyline Funds and Benjamin J. Kim, Vice President and Treasurer of Skyline Funds pursuant to Section 906 of the Sarbanes-Oxley Act of 2002, attached hereto as Exhibit (b) |
SIGNATURES
Pursuant to the requirements of the Securities Exchange Act of 1934 and the Investment Company Act of 1940, the registrant has duly caused this report to be signed on its behalf by the undersigned, thereunto duly authorized.
Skyline Funds
By: | /s/William M. Dutton |
|
| William M. Dutton | |
Date: | August 21, 2006 |
|
Pursuant to the requirements of the Securities Exchange Act of 1934 and the Investment Company Act of 1940, this report has been signed below by the following persons on behalf of the registrant and in the capacities and on the dates indicated.
By: | /s/William M. Dutton |
|
| William M. Dutton | |
Date: | August 21, 2006 |
|
|
| |
|
| |
By: | /s/Benjamin J. Kim |
|
| Benjamin J. Kim | |
Date: | August 21, 2006 |
|