UNITED STATES
SECURITIES AND EXCHANGE COMMISSION
Washington, D.C. 20549
FORM N-CSR
CERTIFIED SHAREHOLDER REPORT OF REGISTERED
MANAGEMENT INVESTMENT COMPANIES
Investment Company Act file number | 811-5022 | ||||||||
| |||||||||
Skyline Funds | |||||||||
(Exact name of registrant as specified in charter) | |||||||||
| |||||||||
311 South Wacker Drive, Suite 4500 Chicago, IL |
| 60606 | |||||||
(Address of principal executive offices) |
| (Zip code) | |||||||
| |||||||||
William M. Dutton | Alan Goldberg | ||||||||
Skyline Funds | Bell, Boyd & Lloyd LLC | ||||||||
311 South Wacker Drive, Suite 4500 | Three First National Plaza, #3100 | ||||||||
Chicago, IL 60606 | Chicago, IL 60602 | ||||||||
(Name and address of agent for service) | |||||||||
| |||||||||
Registrant’s telephone number, including area code: | (312) 913-0900 |
| |||||||
| |||||||||
Date of fiscal year end: | 12/31/06 |
| |||||||
| |||||||||
Date of reporting period: | 06/30/07 |
| |||||||
Item 1. Report to Shareholders.
SEMI-ANNUAL REPORT — June 30, 2007
Skyline Special
Equities Portfolio
![]()

Commentary
June 30, 2007
Overview
Skyline Special Equities Portfolio (the "Fund") generated a return of 5.84% for the second quarter, compared to a 4.42% return for the Russell 2000 Index and a 2.30% return for the Russell 2000 Value Index. For the first six months of 2007, the Fund generated a 7.31% return, compared to a 6.45% return for the Russell 2000 Index and a 3.80% return for the Russell 2000 Value Index. The strong gains registered by stocks so far in 2007 are a result of continued high levels of mergers and acquisition (M&A) activity and evidence the economy is rebounding from the weakness it exhibited earlier in the year. The healthy gains posted by stocks came despite a slowdown in earnings growth, rising interest rates, and a widening in credit quality spreads late in the quarter.
The Fund outperformed its benchmarks during the quarter, benefiting from a low weighting in the poor performing financial services and utilities sectors, compared to the Russell 2000 Value Index, and strong stock selection across most sectors, the technology and utilities sectors in particular. The same factors that helped the Fund outperform its benchmarks in the second quarter helped drive outperformance for all of 2007, along with strong stock selection in the producer durables, consumer discretionary, and autos and transportation sectors.
Market Review
Stocks followed up modest first quarter returns by posting strong gains in the second quarter, as indicated by the 4.42% and 2.30% gains posted by the Russell 2000 and Russell 2000 Value Indexes respectively, and by the 6.28% gain recorded by the S&P 500 Index. For the first six months of 2007, the Russell 2000 Index rose 6.45%, the Russell 2000 Value Index rose 3.80%, and the S&P 500 Index rose 6.96%. An apparent reacceleration in the domestic economy provided a positive backdrop for stock prices during the quarter. Economic forecasters now expect second quarter U.S. GDP to increase 2.2%, up from the first quarter's 0.6% rate, as companies replenish depleted inventories and strong overseas growth benefits U.S. exporters. Another positive influence on equities during the quarter was U.S. M&A activity, which reached record levels in the first half of 2007. The dollar value of announced deals equaled $1.0 trillion, rising 36% from a year ago. In addition to the price gains registered by those companies subject to takeover offers, M&A activity supports valuations of the remaining publicly traded companies that could become takeover candidates.
The widespread availability of low cost debt in recent years has helped facilitate the boom in M&A activity, but this could be changing. Late in the quarter, signs of stress in debt markets began to emerge, threatening to undermine M&A activity. Over a period of roughly one month, beginning in early May, the yield on the 10 Year United States Treasury Bond rose over 60 basis points to 5.25% from 4.63%, before settling in at 5.03% at quarter's end. Quality credit spreads, or the premium over treasury bond yields that
Semi-Annual Report – June 30, 2007
1
bond buyers demand to invest in more risky securities, also rose towards the end of the quarter. Private equity firms typically finance a significant portion of their transactions with debt, so the interest rate they pay on that debt is a key variable in determining the price they can pay for the companies they are purchasing. Fixed income investors also began to move away from buying bonds with covenants that favor issuers and increase risks for the buyers. For example, fixed income investors have become less willing to accept bonds with no restrictions on the maximum amount of debt the issuing company can have relative to its cash flow, or bonds that have PIK toggles, provisions that allow the issuing company to pay the bond holders accrued interest completely "in kind" by adding it to the principal, rather than paying it in cash. Higher interest rates and more restrictive covenants have the potential to lower the price private equity firm s are willing to pay to take companies private. Several offerings of bonds intended to finance leveraged buyouts were pulled from the market late in the quarter as investors were dissatisfied with the terms and interest rates the underwriters were proposing.
Small cap growth stocks continued their recent outperformance relative to small cap value stocks during the second quarter, as indicated by the 6.69% gain for the Russell 2000 Growth Index and the 2.30% increase for the Russell 2000 Value Index. Year to date, the Russell 2000 Growth Index is up 9.33% compared to a 3.80% gain for the Russell 2000 Value Index. Value's recent underperformance has been primarily a result of the relatively heavy weighting in the value benchmark of financial services and utilities stocks, which have been among the worst performing sectors so far this year.
The financial services and utilities sectors of the Russell 2000 Value Index were the only sectors that posted declines for the second quarter and the first six months of the year. The increase in interest rates during the quarter negatively impacted both sectors during the quarter. Financial services stocks were also negatively impacted by further evidence of deterioration in the sub-prime mortgage market and fears that problems there would spread to other areas of the economy. Commodity oriented stocks were among the best performers during the second quarter and the first six months of the year. The materials and processing and other energy sectors benefited from increased demand for their products from rapidly industrializing emerging markets.
Portfolio Review
Solid fundamentals for the companies in the Fund helped drive stock price gains. The median year-over-year increase in quarterly earnings reported by companies in the Fund during the second quarter was 12%. In addition, two Fund companies received takeover offers during the quarter and another announced that it was exploring alternatives to maximize shareholder value.
Stock selection benefited returns during the quarter, as every sector of the Fund posted positive returns during the second quarter and all but one sector outperformed its corresponding sector of the benchmark. The technology sector contributed most to the Fund's return relative to its benchmark, due to its heavy weighting and strong stock selection relative to the benchmark. Additionally, the producer durables and materials and processing sectors were significant contributors to the Fund's absolute returns in the quarter. The price gains registered by these three sectors reflect strength in the industrial economy and high commodity prices.
Semi-Annual Report – June 30, 2007
2
Andrew Corporation, a telecommunications equipment manufacturer, was the single largest contributor to the Fund's return during the second quarter. Andrew's stock had performed quite well during the quarter due to improving fundamentals, and received an additional 11% boost late in the quarter when it announced that it was selling itself to a strategic buyer. United Rentals, Inc., an equipment rental company, advanced after it announced that it was exploring alternatives to maximize shareholder value.
For the first six months of 2007, the Fund generated a 7.31% return, ahead of the returns generated by its benchmarks. The technology and producer durables sectors contributed most to the Fund's return on an absolute basis, for the same reasons cited when discussing the second quarter. Although the financial services sector was one of only two sectors to post negative returns for the Fund for the first six months of the year, it was a major contributor to the Fund's relative return, due to its lower weighting (in banks and REITs in particular) and milder price decline relative to the benchmark. The materials and processing sector, despite its strong absolute gain, detracted most from the Fund's relative performance due in part to its lower weighting in more commodity oriented stocks, which were among the best performers for the index for the first six months of the year.
Jos. A. Bank Clothiers, Inc., a retailer of men's clothing, contributed most to the Fund's return during the first six months of 2007 after generating better than expected results in a difficult retailing environment. Dycom Industries, Inc., an engineering and construction firm, benefited from a rebound in capital spending by telephone and cable companies. Dycom was one of three telecom related companies (Andrew Corporation and Cincinnati Bell Inc. were the others) that were among the top contributors to the Fund's year-to-date return.
Outlook
Small cap stocks have more than doubled since the beginning of 2003, as indicated by the 129.54% return generated by the Russell 2000 Index over that time frame. The Fund has generated a 131.78% return over the same period. During the recent bull market, stock price increases were consistent with earnings gains. On most measures, valuations today are not meaningfully different from where they where in early 2003. We believe that bull markets like the most recent one that are earnings growth driven are healthier than bull markets that are primarily a function of earnings multiple expansion, as was the case in the late 1990s.
More recently, earnings gains have become more muted, which is to be expected given the length of the current economic expansion. M&A activity has supplanted earnings growth as the main driver of stock prices. Readily available low cost debt, significant amounts of private equity capital, and confident corporate managements, the conditions necessary for high levels of M&A activity, all remain in place. However, as discussed in the market review section of this letter, warning signs are emerging. Treasury yields have risen, as have credit quality spreads. Fixed income investors are beginning to balk at bond offerings that contain covenants that are highly favorable to the issuers at the expense of the buyer. The environment has not changed enough to derail M&A activity, but these trends bear close monitoring for signs of further deterioration, because a reduction in M&A activity would remove one of the key supports for the cur rent bull market.
Semi-Annual Report – June 30, 2007
3
Slowing earnings growth and the potential for reduced M&A activity cause us to be cautious about the outlook for small cap value stocks. Our response to the current environment is to maintain our investment discipline, focusing on those companies with below average valuations and above average earnings growth. We believe our preference for higher quality small cap value stocks is particularly important in more uncertain market environments.
Total Annual Fund Operating Expenses 1.47%
Effective May 1, 2007, the Advisor has contractually agreed to waive a portion of its Comprehensive Management Fee equal to 0.10% of the Fund's average daily net assets through April 30, 2008, thereby decreasing the Fund's Total Annual Operating Expenses, at asset levels experienced in 2006, to 1.37%. For more information, please reference the Fund's Prospectus.
Past performance does not guarantee future results. The performance data quoted represents past performance and current returns may be lower or higher. The investment return and principal value of an investment will fluctuate so that an investor's shares, when redeemed, may be worth more or less than the original cost. To obtain performance information current to the most recent month end, please visit www.skylinefunds.com.
Portfolio holdings are subject to change and are not a recommendation to buy or sell securities. The views expressed are those of Skyline Asset Management, L.P. and are subject to change. An investment in Skyline Special Equities Portfolio is subject to market risk. The Fund invests in the stocks of small-cap companies. There are risks associated with investing in small-cap companies, which tend to be more volatile and less liquid than stocks of large companies, including the increased risk of price fluctuations. There are also risks of investing in value-oriented stocks; including the risk that value-oriented stocks will underperform growth-oriented stocks during some periods. A 2% redemption fee applies to withdrawals within 30 days of purchase.
The Russell 2000 Value Index is an unmanaged, value-oriented index comprised of small stocks that have relatively low price-to-book ratios. The Russell 2000 Index is an unmanaged, market-value weighted index comprised of small-sized companies. The Russell 2000 Growth Index is an unmanaged, growth-oriented index comprised of small stocks that have relatively high price-to-book ratios. The S&P 500 Index measures the performance of large capitalization U.S. stocks. The S&P 500 Index is a market-value weighted index of 500 stocks that are traded on the NYSE, AMEX, and NASDAQ. The weightings make each company's influence on the index performance directly proportional to that company's value. It is not possible to invest directly in an index.
Investors should carefully consider the Fund's investment objectives, risks, and charges and expenses carefully before investing or sending money. This and other important information is in the Fund's prospectus. To obtain a prospectus, please call 800.828.2759 or visit our website at www.skylinefunds.com. Please read the prospectus carefully before investing.
Sources: Frank Russell Company, FactSet, and Skyline Asset Management, L.P.
Distributed by Managers Distributors, Inc., member FINRA 07/07.
Semi-Annual Report – June 30, 2007
4
Performance (%)
| 2Q 2007* | YTD 2007* | 1 yr | 3 yrs | 5 yrs | 10 yrs | Since Inception** | |||||||||||||||||||||||||
| Special Equities | 5.84 | 7.31 | 17.59 | 16.18 | 14.27 | 10.50 | 14.44 | ||||||||||||||||||||||||
| Russell 2000 Value | 2.30 | 3.80 | 16.05 | 15.02 | 14.62 | 12.14 | 12.62 | ||||||||||||||||||||||||
| Russell 2000 | 4.42 | 6.45 | 16.43 | 13.45 | 13.88 | 9.06 | 10.13 | ||||||||||||||||||||||||
| S&P 500 | 6.28 | 6.96 | 20.59 | 11.68 | 10.71 | 7.13 | 11.07 | ||||||||||||||||||||||||
| Historical Performance | Special Equities | Russell 2000 Value | Russell 2000 | S&P 500 | |||||||||||||||
| 2006 | 18.7 | 23.5 | 18.4 | 15.8 | |||||||||||||||
| 2005 | 10.9 | 4.7 | 4.6 | 4.9 | |||||||||||||||
| 2004 | 16.6 | 22.3 | 18.3 | 10.9 | |||||||||||||||
| 2003 | 40.7 | 46.0 | 47.3 | 28.7 | |||||||||||||||
| 2002 | -7.3 | -11.4 | -20.5 | -22.1 | |||||||||||||||
| 2001 | 13.9 | 14.0 | 2.5 | -11.9 | |||||||||||||||
| 2000 | 24.2 | 22.8 | -3.0 | -9.1 | |||||||||||||||
| 1999 | -13.3 | -1.5 | 21.3 | 21.0 | |||||||||||||||
| 1998 | -7.2 | -6.5 | -2.6 | 28.6 | |||||||||||||||
| 1997 | 35.4 | 31.8 | 22.4 | 33.4 | |||||||||||||||
| 1996 | 30.4 | 21.4 | 16.5 | 23.0 | |||||||||||||||
| 1995 | 13.8 | 25.8 | 28.5 | 37.6 | |||||||||||||||
| 1994 | -1.2 | -1.5 | -1.8 | 1.3 | |||||||||||||||
| 1993 | 22.8 | 23.8 | 18.9 | 10.1 | |||||||||||||||
| 1992 | 42.4 | 29.1 | 18.4 | 7.6 | |||||||||||||||
| 1991 | 47.4 | 41.7 | 46.0 | 30.5 | |||||||||||||||
| 1990 | -9.3 | -21.8 | -19.5 | -3.1 | |||||||||||||||
| 1989 | 24.0 | 12.4 | 16.3 | 31.7 | |||||||||||||||
| 1988 | 29.7 | 29.5 | 25.0 | 16.6 | |||||||||||||||
| 1987 | ** | -16.9 | -21.5 | -24.4 | -12.0 | ||||||||||||||
* Not annualized.
** Performance for the Fund, the Russell 2000 Index, and the S&P 500 Index reflects the Fund's inception date of April 23, 1987. The Russell 2000 Value performance reflects an inception date of May 1, 1987.
Semi-Annual Report – June 30, 2007
5
Past performance does not guarantee future results. The performance data quoted represents past performance and current returns may be lower or higher. The investment return and principal value will fluctuate so that an investor's shares, when redeemed, may be worth more or less than the original cost. To obtain performance information current to the most recent month end, please visit www.skylinefunds.com.
The performance for the one, three, five and ten years ended June 30, 2007 and for the period April 23, 1987 (inception) through June 30, 2007, is an average annual return calculation.
Semi-Annual Report – June 30, 2007
6
Portfolio Characteristics
| SKSEX | Russell 2000 Value | Russell 2000 | S&P 500 | ||||||||||||||||
| P/E (excluding negative earnings) | 15.6 | x | 16.3 | x | 19.3 | x | 16.5 | x | |||||||||||
| Price/book | 1.86 | 1.68 | 2.32 | 2.94 | |||||||||||||||
| Price/sales | 0.83 | 0.93 | 1.22 | 1.57 | |||||||||||||||
| EPS growth—3 yrs. (historical) | 13.2 | % | 10.7 | % | 14.9 | % | 16.4 | % | |||||||||||
| EPS growth—1 yr. (forecasted) | 10.6 | % | 6.1 | % | 11.6 | % | 11.0 | % | |||||||||||
| Market cap $ weighted median | $1.4 billion | $1.1 billion | $1.2 billion | $62.0 billion | |||||||||||||||
| Assets | $606 million | - | - | - | |||||||||||||||
| Number of Holdings | 64 | - | - | - | |||||||||||||||
| Ticker Symbol: | SKSEX | ||||||||||||||||||
| Cusip: | 830833208 | ||||||||||||||||||
| Net Asset Value (per share): | $ | 27.89 | |||||||||||||||||
| Initial minimum investment: | $ | 1,000 | |||||||||||||||||
| Subsequent minimum investment: | $ | 100 | |||||||||||||||||
Top Ten Holdings
| % of net assets | |||||||
| iStar Financial Inc. | |||||||
| Commercial real estate lender | 3.0 | % | |||||
| Reinsurance Group of America, Incorporated | |||||||
| Life reinsurer | 3.0 | % | |||||
| Cytec Industries Inc. | |||||||
| Specialty chemicals | 2.9 | % | |||||
| NCI Building Systems, Inc. | |||||||
| Metal buildings | 2.6 | % | |||||
| Centene Corporation | |||||||
| Medicaid managed care | 2.6 | % | |||||
| Jos. A. Bank Clothiers, Inc. | |||||||
| Men's clothing retailer | 2.4 | % | |||||
| Perot Systems Corp. | |||||||
| IT consulting | 2.4 | % | |||||
| The Hanover Insurance Group, Inc. | |||||||
| Property and casualty insurance | 2.3 | % | |||||
| Andrew Corporation | |||||||
| Manufacturer of equipment for cell sites | 2.3 | % | |||||
| Aspen Insurance Holdings Limited | |||||||
| Property & casualty reinsurance | 2.2 | % | |||||
| Top Ten Holdings | 25.7 | % | |||||
Fund holdings are subject to change and should not be considered a recommendation to buy individual securities.
Semi-Annual Report – June 30, 2007
7
Sector Performance (%) (as of June 30, 2007)
2Q07**
| Special Equities | Russell 2000 Value | Russell 2000 | |||||||||||||
| Utilities | 23.0 | -2.1 | -0.9 | ||||||||||||
| Producer Durables | 12.8 | 7.0 | 10.7 | ||||||||||||
| Other Energy | 12.8 | 12.1 | 12.6 | ||||||||||||
| Materials and Processing | 11.4 | 11.1 | 11.6 | ||||||||||||
| Technology | 9.8 | 4.5 | 6.2 | ||||||||||||
| Autos and Transportation | 5.6 | 7.7 | 6.6 | ||||||||||||
| Consumer Discretionary | 2.3 | 1.8 | 4.8 | ||||||||||||
| Health Care | 2.0 | 1.8 | 2.5 | ||||||||||||
| Financial Services | 1.6 | -2.3 | -1.5 | ||||||||||||
| Consumer Staples | 1.1 | 1.8 | 0.7 | ||||||||||||
| Integrated Oils | NA* | 7.1 | -3.9 | ||||||||||||
| Other | NA* | 9.3 | 6.3 | ||||||||||||
YTD 2007**
| Special Equities | Russell 2000 Value | Russell 2000 | |||||||||||||
| Utilities | 26.5 | -1.1 | -0.1 | ||||||||||||
| Producer Durables | 25.3 | 9.5 | 15.1 | ||||||||||||
| Autos and Transportation | 17.1 | 15.4 | 11.6 | ||||||||||||
| Other Energy | 12.4 | 13.5 | 14.1 | ||||||||||||
| Materials and Processing | 11.3 | 21.6 | 19.1 | ||||||||||||
| Technology | 10.4 | 7.5 | 10.4 | ||||||||||||
| Consumer Discretionary | 9.3 | 5.8 | 8.2 | ||||||||||||
| Consumer Staples | 1.1 | 17.6 | 13.3 | ||||||||||||
| Financial Services | -1.3 | -6.3 | -4.6 | ||||||||||||
| Health Care | -12.8 | 6.3 | 3.7 | ||||||||||||
| Integrated Oils | NA* | 6.9 | -8.3 | ||||||||||||
| Other | NA* | 12.6 | 7.0 | ||||||||||||
Past performance does not guarantee future results. The performance data quoted represents past performance and current returns may be lower or higher. The investment return and principal value will fluctuate so that an investor's shares, when redeemed may be worth more or less than the original cost. To obtain performance information current to the most recent month end, please visit www.skylinefunds.com.
* Not applicable
** Not annualized
Sector Weightings (as of June 30, 2007)
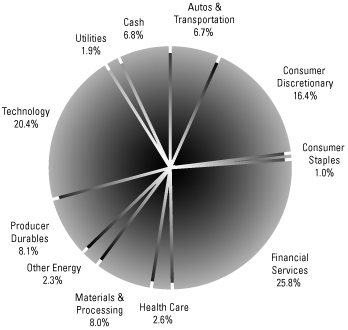
Fund holdings are subject to change and should not be considered a recommendation to buy individual securities. Sector weightings are shown as a percentage of total net assets.
Semi-Annual Report – June 30, 2007
8
Stock Highlights
Consolidated Graphics Inc. (CGX)
CGX is the leading commercial printing company specializing in short-run jobs (typically less than 5,000 pieces). Its competition is largely privately owned, local mom and pop organizations, rather than the large publicly traded printers who focus on longer run jobs. CGX has made significant investments in printing technology, enabling the company to grow at more than twice the industry average and take market share from less efficient, financially constrained competitors. Organic growth has been augmented by acquisitions of smaller competitors, who were unable to make the investments necessary to upgrade their equipment. The dearth of strong competitors makes CGX the acquirer of choice, leading to attractively priced acquisitions that add to earnings. Profitability continues to improve as the addition of state of the art printing equipment has enabled CGX to build a fast growing national accounts business that carries higher margins. In add ition, as the overall size of the business has grown, CGX has begun to more fully leverage their purchasing power, which should result in substantially improved margins. All these factors should result in strong earnings growth and solid cash flow generation over the next several years. Despite encouraging prospects, CGX continues to trade at a modest valuation.
Financial Federal Corporation (FIF)
FIF is a leading financing and leasing company specializing in revenue-producing, essential-use equipment for small to middle-market construction, transportation, and waste disposal companies in the US. FIF has grown receivables and net income at a double-digit rate since 1995. Despite this growth, credit quality has been excellent, driven by FIF's strong, conservative management team and high underwriting standards. FIF has consistently taken market share by providing higher service levels to its customers than its larger competitors. Even with FIF's strong record of growth, the company still commands less than 2% of its $100+ billion end market, providing ample opportunity for continued growth. FIF's balance sheet carries lower financial leverage than its peers, and the company is a strong generator of free cash flow. Despite these positive attributes, FIF is attractively valued on both a price to earnings basis and price to book value bas is.
Fund holdings are subject to change and should not be considered a recommendation to buy individual securities.
Semi-Annual Report – June 30, 2007
9
Glossary of Investment Terms
Earnings Per Share (EPS) A company's net income divided by its outstanding shares.
Earnings Per Share growth — 3 yrs (historical) The compounded annual growth rate of a company's EPS over the last 3 years.
Earnings Per Share growth — 1 yr (forecasted) Analysts' consensus forecast for a company's growth in operating EPS over the immediate future 12 months.
Market Cap Dollar Weighted Median An indicator of the size of companies in which a fund invests; the mid-point of market capitalization (market price times shares outstanding) of a fund's stocks, weighted by the proportion of the fund's assets invested in each stock. Stocks representing half of the fund's assets have market capitalizations above the median, and the rest below it.
Price/Book Ratio The share price of a stock divided by its net worth, or book value, per share.
Price/Earnings (P/E) Ratio An indicator of the relative valuation of the stocks in which a fund invests. For stocks the ratio is calculated by taking the stock's current price to its per-share earnings over the past 12 months. For a fund, the P/E ratio is the average of the P/E ratios of the fund's stocks, weighted by the proportion of the fund's assets invested in each stock.
Price/Sales Ratio The ratio of a stock's current price to its per-share revenue over the past 12 months.
Semi-Annual Report – June 30, 2007
10
Portfolio Holdings as of June 30, 2007 (unaudited)
| Company Description | Number Shares | Market Value | |||||||||||||
| COMMON STOCKS | |||||||||||||||
| Autos & Transportation — 6.7% | |||||||||||||||
| Autos — 3.0% | |||||||||||||||
| Aftermarket Technology Corp.a | Provider of remanufactured | | |||||||||||||
| transmissions | 284,313 | $ | 8,438,410 | ||||||||||||
| American Axle & Mfg. Holdings, Inc. | Auto parts manufacturer | 331,847 | 9,829,308 | ||||||||||||
| 18,267,718 | |||||||||||||||
| Other Transportation — 3.7% | |||||||||||||||
| AirTran Holdings, Inc.a | Regional airline | 409,462 | 4,471,325 | ||||||||||||
| CAI International, Inc.a | Container leasing firm | 325,400 | 4,288,772 | ||||||||||||
| Ryder System, Inc. | Truck leasing company | 97,600 | 5,250,880 | ||||||||||||
| SkyWest, Inc. | Regional Airline | 360,162 | 8,582,660 | ||||||||||||
| 22,593,637 | |||||||||||||||
| Total Autos & Transportation | 40,861,355 | ||||||||||||||
| Consumer Discretionary — 16.4% | |||||||||||||||
| Commercial Services — 3.1% | |||||||||||||||
| Heidrick & Struggles Intl., Inc.a | Executive search and leadership consulting services | 245,465 | 12,577,627 | ||||||||||||
| Spherion Corporationa | Staffing services | 692,100 | 6,498,819 | ||||||||||||
| 19,076,446 | |||||||||||||||
| Consumer Products/Services — 3.8% | |||||||||||||||
| Acco Brands Corpa | Office products manufacturer | 203,000 | 4,679,150 | ||||||||||||
| Nautilus, Inc. | Fitness equipment | 637,800 | 7,679,112 | ||||||||||||
| The Toro Company | Turf maintenance products | 181,938 | 10,714,329 | ||||||||||||
| 23,072,591 | |||||||||||||||
| Printing/Publishing — 1.6% | |||||||||||||||
| Consolidated Graphics, Inc.a | Printing Services | 138,370 | 9,586,274 | ||||||||||||
| Restaurants — 1.0% | |||||||||||||||
| Rare Hospitalitya | Steakhouse operator | 214,649 | 5,746,154 | ||||||||||||
| Retail — 6.9% | |||||||||||||||
| Big 5 Sporting Goods Corporation | Regional sporting goods retailer | 465,122 | 11,860,611 | ||||||||||||
| Jos. A. Bank Clothiers, Inc.a | Men's clothing retailer | 356,753 | 14,794,546 | ||||||||||||
| MarineMax, Inc.a | Recreational boat retailer | 253,700 | 5,079,074 | ||||||||||||
| Talbots, Inc. | Women's clothing retailer | 403,400 | 10,097,102 | ||||||||||||
| 41,831,333 | |||||||||||||||
| Total Consumer Discretionary | 99,312,798 | ||||||||||||||
| Consumer Staples — 1.0% | |||||||||||||||
| Consumer Staples — 1.0% | |||||||||||||||
| B&G Foods, Inc. | Food company | 453,400 | 5,984,880 | ||||||||||||
| Total Consumer Staples | 5,984,880 | ||||||||||||||
Semi-Annual Report – June 30, 2007
11
Portfolio Holdings as of June 30, 2007 (unaudited) (continued)
| Company Description | Number Shares | Market Value | |||||||||||||
| Financial Services — 25.8% | |||||||||||||||
| Banks/Thrifts — 3.8% | |||||||||||||||
| Prosperity Bancshares, Inc. | Regional bank | 328,550 | $ | 10,763,298 | |||||||||||
| Provident Bankshares Corporation | Commercial bank | 366,100 | 12,000,758 | ||||||||||||
| 22,764,056 | |||||||||||||||
| Insurance — 12.4% | |||||||||||||||
| Aspen Insurance Holdings Limited | Property & casualty insurance | 481,373 | 13,512,140 | ||||||||||||
| Delphi Financial Group, Inc. | Accident & health insurance | 267,529 | 11,188,063 | ||||||||||||
| RAM Holdings, Inc.a | Financial guaranty reinsurance | 590,014 | 9,292,720 | ||||||||||||
| Reinsurance Group of America, Inc. | Life reinsurer | 302,547 | 18,225,431 | ||||||||||||
| Seabright Insurance Holdingsa | Property & casualty insurance | 494,916 | 8,651,132 | ||||||||||||
| The Hanover Insurance Group, Inc. | Property & casualty insurance | 289,500 | 14,124,705 | ||||||||||||
| 74,994,191 | |||||||||||||||
| Other Financial Services — 6.6% | |||||||||||||||
| CompuCredit Corporationa | Sub-prime credit cards | 254,731 | 8,920,680 | ||||||||||||
| Cowen Group, Inc.a | Investment bank | 374,133 | 6,700,722 | ||||||||||||
| Financial Federal Corporation | Equipment financing | 43,900 | 1,309,098 | ||||||||||||
| Hercules Technology Growth Capital, Inc. | Business development company | 345,700 | 4,670,407 | ||||||||||||
| MCG Capital Corporation | Business development company | 529,194 | 8,477,688 | ||||||||||||
| TradeStation Group, Inc.a | Online broker/dealer | 502,400 | 5,852,960 | ||||||||||||
| United Pan Am Financial Corp.a | Sub-prime auto lender | 283,019 | 4,035,851 | ||||||||||||
| 39,967,406 | |||||||||||||||
| Real Estate Investment Trusts — 3.0% | |||||||||||||||
| iStar Financial Inc. | Commercial real estate lender | 416,373 | 18,457,815 | ||||||||||||
| Total Financial Services | 156,183,468 | ||||||||||||||
| Health Care — 2.6% | |||||||||||||||
| Health Care Services — 2.6% | |||||||||||||||
| Centene Corporationa | Medicaid managed care | 725,312 | 15,536,183 | ||||||||||||
| Total Health Care | 15,536,183 | ||||||||||||||
| Materials & Processing — 8.0% | |||||||||||||||
| Building/Construction Products — 2.6% | |||||||||||||||
| NCI Building Systems, Inc.a | Metal buildings | 315,531 | 15,565,144 | ||||||||||||
| Engineering & Construction — 0.8% | |||||||||||||||
| Comfort Systems USA, Inc. | HVAC installation | 331,700 | 4,703,506 | ||||||||||||
| Other Materials/Metals — 1.7% | |||||||||||||||
| Walter Industries, Inc. | Metallurgical coal | 351,306 | 10,173,822 | ||||||||||||
| Specialty Chemicals — 2.9% | |||||||||||||||
| Cytec Industries Inc. | Specialty chemicals | 279,265 | 17,808,729 | ||||||||||||
| Total Materials & Processing | 48,251,201 | ||||||||||||||
Semi-Annual Report – June 30, 2007
12
| Company Description | Number Shares | Market Value | |||||||||||||
| Other Energy — 2.3% | |||||||||||||||
| Equipment & Services — 1.4% | |||||||||||||||
| Key Energy Services, Inc.a | Workover services provider | 455,934 | $ | 8,448,457 | |||||||||||
| Exploration & Production — 0.9% | |||||||||||||||
| Edge Petroleum Corporationa | Oil & gas producer | 397,900 | 5,574,579 | ||||||||||||
| Total Other Energy | 14,023,036 | ||||||||||||||
| Producer Durables — 8.1% | |||||||||||||||
| Diversified Manufacturing — 4.2% | |||||||||||||||
| Carlisle Companies Incorporated | Industrial conglomerate | 260,152 | 12,099,670 | ||||||||||||
| Crane Co. | Industrial conglomerate | 288,333 | 13,104,735 | ||||||||||||
| 25,204,405 | |||||||||||||||
| Machinery — 2.5% | |||||||||||||||
| Tennant Company | Manufacturer of floor care products | 146,600 | 5,350,900 | ||||||||||||
| United Rentals, Inc.a | Equipment rental | 310,750 | 10,111,805 | ||||||||||||
| 15,462,705 | |||||||||||||||
| Production Technology Equipment — 1.4% | |||||||||||||||
| Mattson Technologya | Manufacturer of equipment to produce semiconductors | 424,300 | 4,115,710 | ||||||||||||
| Rudolph Technologies, Inc.a | Manufacturer of equipment to produce semiconductors | 259,500 | 4,310,295 | ||||||||||||
| 8,426,005 | |||||||||||||||
| Total Producer Durables | 49,093,115 | ||||||||||||||
| Technology — 20.4% | |||||||||||||||
| Distribution — 1.4% | |||||||||||||||
| Synnex Corporationa | Distributor of PCs and peripherals | 413,104 | 8,514,073 | ||||||||||||
| Electronic Components — 5.2% | |||||||||||||||
| AMIS Holding, Inc.a | Manufacturer of analog semiconductors | 778,670 | 9,748,948 | ||||||||||||
| Fairchild Semiconductor Int'l., Inc.a | Semiconductors | 477,031 | 9,216,239 | ||||||||||||
| IXYS Corporationa | Power semiconductor manufacturer | 477,000 | 3,982,950 | ||||||||||||
| SMART Modular Manufacturer of Technologies (WWH), Inc.a | memory modules | 642,759 | 8,844,364 | ||||||||||||
| 31,792,501 | |||||||||||||||
| Other Technology — 4.4% | |||||||||||||||
| Benchmark Electronics, Inc.a | Contract manufacturer | 281,289 | 6,362,757 | ||||||||||||
| Electronics for Imaging, Inc.a | Products that support color printing | 448,332 | 12,651,929 | ||||||||||||
| Plexus Corp.a | Contract manufacturer | 182,118 | 4,186,893 | ||||||||||||
| Super Micro Computer, Inc.a | Manufacturer of specialized servers | 332,700 | 3,330,327 | ||||||||||||
| 26,531,906 | |||||||||||||||
Semi-Annual Report – June 30, 2007
13
Portfolio Holdings as of June 30, 2007 (unaudited) (continued)
| Company Description | Number Shares | Market Value | |||||||||||||
| Services — 3.4% | |||||||||||||||
| Perot Systems Corp.a | IT consulting | 856,223 | $ | 14,590,040 | |||||||||||
| Syniverse Holdings, Inc.a | Services for wireless carriers | 467,700 | 6,014,622 | ||||||||||||
| 20,604,662 | |||||||||||||||
| Software — 0.3% | |||||||||||||||
| Borland Software Corporationa | Software development tools | 256,600 | 1,524,204 | ||||||||||||
| Telecommunications — 5.7% | |||||||||||||||
| ADC Telecommunications, Inc.a | Manufacturer of connectivity products | 361,100 | 6,618,963 | ||||||||||||
| Andrew Corpa | Manufacturer of equipment for cell sites | 976,643 | 14,102,725 | ||||||||||||
| Arris Group, Inc.a | Manufacturer of equipment for broadband networks | 497,624 | 8,753,206 | ||||||||||||
| Harris Stratex Networks, Inc.a | Manufacturer of microwave radios | 296,039 | 5,322,781 | ||||||||||||
| 34,797,675 | |||||||||||||||
| Total Technology | 123,765,021 | ||||||||||||||
| Utilities — 1.9% | |||||||||||||||
| Telecommunication Services — 1.9% | |||||||||||||||
| Cincinnati Bell, Inc.a | Local wireline and wireless services | 2,009,434 | 11,614,529 | ||||||||||||
| Total Utilities | 11,614,529 | ||||||||||||||
| TOTAL COMMON STOCKS — 93.2% (Cost $473,269,475) | 564,625,586 | ||||||||||||||
| MONEY MARKET INSTRUMENTS Chesham Finance Commercial Paper, due 07/02/07 | 27,495,990 | ||||||||||||||
| US Bank Commercial Paper, 5.20%, due 07/02/07 | 9,026,984 | ||||||||||||||
| TOTAL MONEY MARKET INSTRUMENTS — 6.0% (Cost $36,522,974) | 36,522,974 | ||||||||||||||
| TOTAL INVESTMENTS — 99.2% (Cost $509,792,449) | 601,148,560 | ||||||||||||||
| OTHER ASSETS LESS LIABILITIES — 0.8% | 5,040,581 | ||||||||||||||
| NET ASSETS — 100% | $ | 606,189,141 | |||||||||||||
(a) Non-income producing security.
See accompanying notes to financial statements.
Semi-Annual Report – June 30, 2007
14
Statement of Assets and Liabilities As of June 30, 2007 (unaudited)
| ASSETS | |||||||||||
| Investments, at value (Cost: $509,792,449) | $ | 601,148,560 | |||||||||
| Receivable for: | |||||||||||
| Securities sold | $ | 8,148,064 | |||||||||
| Fund shares sold | 620,958 | ||||||||||
| Dividends and interest | 402,273 | 9,171,295 | |||||||||
| Other assets | 308,419 | ||||||||||
| Total assets | 610,628,274 | ||||||||||
| LIABILITIES & NET ASSETS | |||||||||||
| Payable for: | |||||||||||
| Securities purchased | $ | 3,308,636 | |||||||||
| Fund shares redeemed | 129,533 | ||||||||||
| Comprehensive management fee | 677,993 | ||||||||||
| Trustee compensation | 14,552 | ||||||||||
| Trustees deferred compensation | 308,419 | 4,439,133 | |||||||||
| Net assets applicable to shares outstanding | $ | 606,189,141 | |||||||||
| Shares outstanding—no par value (unlimited number of shares authorized) | 21,735,292 | ||||||||||
| PRICING OF SHARES | |||||||||||
| Net asset value, offering price and redemption price per share | $ | 27.89 | |||||||||
| ANALYSIS OF NET ASSETS | |||||||||||
| Paid-in capital | 452,026,186 | ||||||||||
| Undistributed net investment loss | (887,266 | ) | |||||||||
| Accumulated net realized gain on sales of investments | 63,673,734 | ||||||||||
| Unrealized appreciation of investments | 91,376,487 | ||||||||||
| Net assets applicable to shares outstanding | $ | 606,189,141 | |||||||||
See accompanying notes to financial statements.
Semi-Annual Report – June 30, 2007
15
Statement of Operations For the Period Ended June 30, 2007 (unaudited)
| Investment income | |||||||
| Dividends | $ | 2,263,653 | |||||
| Interest | 1,058,691 | ||||||
| Total investment income | 3,322,344 | ||||||
| Expenses: | |||||||
| Comprehensive management fee | 4,256,693 | ||||||
| Fees to unaffilliated trustees | 72,444 | ||||||
| Total expenses | 4,329,137 | ||||||
| Comprehensive management fee waived | (293,473 | ) | |||||
| Net expenses | 4,035,664 | ||||||
| Net investment loss | (713,320 | ) | |||||
| Net realized and unrealized gain/loss on investments: | |||||||
| Net realized gain on sales of investments | 34,908,327 | ||||||
| Change in unrealized appreciation/depreciation | 7,636,388 | ||||||
| Net realized and unrealized gain on investments | 42,544,715 | ||||||
| Net increase in net assets resulting from operations | $ | 41,831,395 | |||||
Semi-Annual Report – June 30, 2007
16
Statement of Changes in Net Assets (unaudited)
| Period Ended 6/30/07 (unaudited) | Year Ended 12/31/06 | ||||||||||
| From operations: | |||||||||||
| Net investment loss | $ | (713,320 | ) | $ | (1,862,908 | ) | |||||
| Net realized gain on sales of investments | 34,908,327 | 99,781,378 | |||||||||
| Change in unrealized appreciation/depreciation | 7,636,388 | (3,051,080 | ) | ||||||||
| Net increase in net assets resulting from operations | 41,831,395 | 94,867,390 | |||||||||
| Distributions to shareholders from net realized gains | — | (83,452,670 | ) | ||||||||
| From fund share transactions: | |||||||||||
| Proceeds from fund shares sold | 46,669,805 | 105,981,583 | |||||||||
| Reinvestment of dividends | — | 81,297,078 | |||||||||
| Payments for fund shares redeemed | (48,339,639 | ) | (151,742,110 | ) | |||||||
| Redemption fees | 4,874 | 96,358 | |||||||||
| Net increase (decrease) in net assets resulting from share transactions | (1,664,960 | ) | 35,632,909 | ||||||||
| Total increase/decrease in net assets | 40,166,435 | 47,047,629 | |||||||||
| Net assets at beginning of period | 566,022,706 | 518,975,077 | |||||||||
| Net assets at end of period (includes undistributed net investment loss of $887,266 and $173,946, respectively) | $ | 606,189,141 | $ | 566,022,706 | |||||||
Semi-Annual Report – June 30, 2007
17
Financial Highlights (unaudited)
| Period Ended 6/30/07 (unaudited) | Year Ended 12/31/06 | Year Ended 12/31/05 | Year Ended 12/31/04 | Year Ended 12/31/03 | Year Ended 12/31/02 | ||||||||||||||||||||||
| Net asset value at beginning of period | $ | 25.99 | $ | 25.43 | $ | 28.64 | $ | 27.78 | $ | 20.86 | $ | 22.50 | |||||||||||||||
| Income from investment operations | |||||||||||||||||||||||||||
| Net Investment loss | (0.03 | )* | (0.09 | )* | (0.11 | )* | (0.13 | )* | (0.06 | )* | (0.06 | )* | |||||||||||||||
| Net realized and unrealized gain/(loss) on investments | 1.93 | 4.86 | 3.32 | 4.68 | 8.54 | (1.58 | ) | ||||||||||||||||||||
| Total from investment operations | 1.90 | 4.77 | 3.21 | 4.55 | 8.48 | (1.64 | ) | ||||||||||||||||||||
| Less distributions from net realized gains on investments | — | (4.21 | ) | (6.42 | ) | (3.69 | ) | (1.56 | ) | — | |||||||||||||||||
| Net asset value at end of period | $ | 27.89 | $ | 25.99 | $ | 25.43 | $ | 28.64 | $ | 27.78 | $ | 20.86 | |||||||||||||||
| Total Return | 7.31 | %a | 18.71 | % | 10.89 | % | 16.61 | % | 40.71 | % | (7.29 | %) | |||||||||||||||
| Ratios/Supplemental Data | |||||||||||||||||||||||||||
| Ratio of expenses to average net assets | 1.37 | %b,c | 1.44 | %c | 1.47 | % | 1.47 | % | 1.48 | % | 1.48 | % | |||||||||||||||
| Ratio of net investment loss to average net assets | (0.24 | %)b | (0.33 | %) | (0.39 | %) | (0.47 | %) | (0.26 | %) | (0.26 | %) | |||||||||||||||
| Portfolio turnover rate | 29 | %a | 68 | % | 51 | % | 47 | % | 52 | % | 81 | % | |||||||||||||||
| Net assets, end of period (in thousands) | $ | 606,189 | $ | 566,023 | $ | 518,975 | $ | 566,356 | $ | 524,575 | $ | 378,839 | |||||||||||||||
* Based on monthly average shares outstanding
a Not annualized
b Ratios have been determined on an annualized basis
c Expense ratios are net of waivers. The ratio of expenses to average net assets was 1.47% before voluntary waivers for the period ended June 30, 2007, and was 1.47% before voluntary waivers for the period ended December 31, 2006.
See accompanying notes to financial statements.
This financial highlights table is intended to help you understand the Fund's financial performance for the past 51/2 years. Certain information reflects financial results for a single fund share. The total returns in the table represent the rate that an investor would have earned or lost on an investment in the Fund (assuming reinvestment of all dividends and distributions).
Semi-Annual Report – June 30, 2007
18
Notes to Financial Statements (unaudited)
Skyline Funds (the "Trust") is an open-end, diversified investment management company the sole portfolio of which is Special Equities Portfolio. The Fund commenced public offering of its shares on April 23, 1987. The Fund's investment adviser is Skyline Asset Management, L.P. (the "Adviser"). The Fund seeks maximum capital appreciation, primarily through investment in common stocks that the Adviser considers to be undervalued.
1
Significant accounting policies
n Security valuation – Investments are stated at value. Each equity security traded on a securities exchange shall be valued at the last current sale price as of the time of valuation on the exchange on which the security is principally traded (the "principal exchange"), or lacking any current reported sale on the principal exchange at the time of valuation, at the most recent bid quotation on the principal exchange. Each over-the-counter security traded in the Nasdaq Stock Market ("Nasdaq") shall be valued at the Nasdaq Official Closing Price ("NOCP"), as determined by Nasdaq, or lacking an NOCP, the last current reported sale price as of the time of valuation on Nasdaq, or lacking any current reported sale on Nasdaq at the time of valuat ion, at the most recent bid quotation on Nasdaq. For certain fixed-income securities, Skyline Funds' Board of Trustees has authorized the use of market valuations provided by an independent pricing service. Short-term instruments with sixty days or less to maturity are valued at amortized cost, which approximates market value. Securities or other assets for which market quotations are not readily available or deemed unreliable, which may include certain restricted securities, are valued at a fair value as determined in good faith by the Skyline Funds' Board of Trustees or a committee thereof.
n Security transactions and investment income – Security transactions are accounted for on the trade date (date the order to buy or sell is executed) and dividend income is recorded on the ex-dividend date. Interest income is recorded on an accrual basis and includes amortization of premiums and discounts. Realized gains and losses from security transactions are reported on an identified cost basis.
n Fund share valuation – Fund shares are sold and redeemed on a continuous basis at net asset value. Net asset value per share is determined as of the close of regular session trading on the New York Stock Exchange (normally 3:00 p.m. Central Time), each day that the Exchange is open for trading. The net asset value per share is determined by dividing the value of all securities and other assets, less liabilities, by the number of shares of the Fund outstanding.
n Federal income taxes and dividends to shareholders – It is the Fund's policy to comply with the special provisions of the Internal Revenue Code applicable to regulated investment companies and, in the manner provided therein, to distribute substantially all of its taxable income to shareholders. Such provisions were complied
Semi-Annual Report – June 30, 2007
19
Notes to Financial Statements (unaudited) (continued)
with and, therefore, no federal income taxes have been accrued in the accompanying financial statements.
Dividends payable to its shareholders are recorded by the Fund on the ex-dividend date. The timing and characterization of certain income and capital gain distributions are determined annually in accordance with Federal income tax regulations that may differ from accounting principles generally accepted in the United States. As a result, net investment income or loss and net realized gain or loss for a reporting period may differ from the amount distributed during such period. In addition, the Fund may periodically record reclassifications among certain capital accounts to reflect differences between financial reporting and income tax purposes. These reclassifications have no impact on the net asset value of the Fund, and will be updated at the Fund's fiscal year end.
On December 14, 2006, a distribution of $4.2124 per share was paid to shareholders of record on December 13, 2006.
The tax character of distributions paid during 2006 was as follows:
| 2006 | |||||||
| Distributions paid from: | |||||||
| Ordinary income | $ | 15,077,938 | |||||
| Long-term capital gain | 68,374,732 | ||||||
| $ | 83,452,670 | ||||||
Cost of investments for federal income tax purposes was substantially the same as book cost of $509,792,449 on June 30, 2007. Net unrealized appreciation was $91,376,487, consisting of gross unrealized appreciation of $103,771,065 and gross unrealized depreciation of $12,394,578.
n Line of Credit – The Fund has a $3 million committed revolving credit facility for temporary or emergency purposes, including the meeting of redemption requests that otherwise might require the untimely disposition of securities. The Adviser pays a commitment fee of 0.10% per annum of the average daily unutilized portion of the committed line of credit. Under the terms of the credit agreement, interest on each loan would be fixed at the prime rate less 1.50%. For the period ended June 30, 2007 there were no loans outstanding under the credit facility.
n Use of Estimates – The preparation of financial statements in conformity with accounting principles generally accepted in the United States requires management to make estimates and assumptions that affect the amounts reported in the financial statements and accompanying notes. Actual results may differ from those estimates.
n Redemption Fee – The Fund will deduct a redemption fee (the "Redemption Fee") of 2% from the proceeds of any redemption (including a redemption by exchange) of shares if the redemption occurs within 30 days of the purchase of those shares. For the purpose of determining whether a redemption is subject to the Redemption Fee,
Semi-Annual Report – June 30, 2007
20
redemptions of Fund shares are conducted on a first in/first out (FIFO) basis such that shares with the longest holding period will be redeemed first and shares with the shortest holding period will be redeemed last. The Redemption Fee is paid to the Fund and is intended to offset transaction and other expenses caused by short-term trading. The Redemption Fee does not apply to redemptions (including redemptions by exchange) of shares of the Fund purchased by automatic reinvestment of dividends or capital gains distributions. The Redemption Fee will also not apply to redemptions under hardship circumstances (as determined by the Adviser and the Fund in their discretion, based on a case-by-case analysis). The Redemption Fee will apply only to the redemption of shares purchased through an authorized agent if the authorized agent has indicated that it will administer the Redemption Fee. For the period ended June 30, 2007, the Fund had $4,874 inc luded in capital due to the collection of redemption fees.
n Indemnifications – Under the Trust's organizational documents, its officers and trustees are indemnified against certain liabilities arising out of the performance of their duties to the Trust. In addition, the Trust may enter into contracts that provide for general indemnification. The Trust's maximum liability under those arrangements is unknown, as this would involve future claims that may be made against the Trust. However, based on experience, the Trust expects that risk of loss to be remote.
n New Accounting Pronouncements
In June 2006, the Financial Accounting Standards Board (FASB) issued FASB Interpretation No. 48 – Accounting for Uncertainty in Income Taxes (FIN 48), an interpretation of FASB Statement 109, that requires additional tax disclosures and the tax effects of certain income tax positions whether on previously filed tax returns or those expected to be taken on future returns. These positions must meet a "more likely than not" standard that based on the technical merits have a more than 50 percent likelihood of being sustained upon examination. In evaluating whether a tax position has met the more-likely-than-not recognition threshold, Management of the Fund must presume that the position will be examined by the appropriate taxing authority that has full knowledge of all relevant information. The Fund adopted the provisions of FIN 48 on June 29, 2007, the extended required implementation date set by the U.S. Securities and Exchange Commission for mutual funds.
FIN 48 requires Management of the Fund to analyze all open tax years, as defined by Statute of Limitations, for all major jurisdictions. Open tax years are those that are open for exam by taxing authorities. Major jurisdictions for the Fund include Federal and the State of Illinois. As of June 29, 2007, open Federal and Illinois tax years include the tax years ended December 31, 2004 through 2006. The Fund has no examinations in progress and none are expected at this time.
As of June 29, 2007, Management of the Fund has reviewed all open tax years and major jurisdictions and concluded the adoption of FIN 48 resulted in no effect to the Fund's financial position or results of operations. There is no tax liability resulting
Semi-Annual Report – June 30, 2007
21
Notes to Financial Statements (unaudited) (continued)
from unrecognized tax benefits relating to uncertain income tax positions taken or expected to be taken in future tax returns. The Fund is also not aware of any tax positions for which it is reasonably possible that the total amounts of unrecognized tax benefits will significantly change in the next 12 months.
In September 2006, the Financial Accounting Standards Board issued Statement of Financial Accounting Standards No. 157, "Fair Value Measurements." The Statement defines fair value, establishes a framework for measuring fair value in generally accepted accounting principles (GAAP), and expands disclosures about fair value measurements. The Statement establishes a fair value hierarchy that distinguishes between (1) market participant assumptions developed based on market data obtained from sources independent of the reporting entity (observable inputs) and (2) the reporting entity's own assumptions about market participant assumptions developed based on the best information available in the circumstances (unobservable inputs). The Statement is effective for financial statements issued for fiscal years beginning after November 15, 2007, and is to be applied prospectively as of the beginning of the fiscal year in which this Statement is initiall y applied. At this time, management is evaluating the implications of FAS 157, and the impact, if any, of this standard on the Fund's financial statements has not yet been determined.
2
Transactions with affiliates
For the Adviser's management and advisory services and the assumption of most of the Fund's ordinary operating expenses, the Fund incurs a monthly comprehensive fee based on its average daily net assets. For the period October 1, 2006 through April 30, 2007, the Adviser agreed to voluntarily waive a portion of its comprehensive management fee equal to 0.10% of the Fund's average daily net assets. Effective May 1, 2007, the Adviser has contractually agreed to waive a portion of its comprehensive management fee equal to 0.10% of the Fund's average daily net assets through April 30, 2008. The waiver's effect will be to decrease the annual fee paid by the Fund on its average daily net assets to 1.40% of the first $200 million, 1.35% of the next $200 million (over $200 million to $400 million), 1.30% of the next $200 million (over $400 million to $600 million) and 1.25% of the next $200 million (over $600 million to $800 million). In addition, th e Adviser has agreed to add two additional breakpoints to its fees for assets in excess of $800 million in light of the waiver, as follows: 1.20% of the next $200 million (over $800 million to $1 billion) and 1.15% of average daily net assets in excess of $1 billion. The total comprehensive management fee incurred, after the fee waiver, for the 6-month period ended June 30, 2007 was $3,963,220.
Certain officers and trustees of the Skyline Funds are also officers, limited partners or shareholders of limited partners of the Adviser. The Fund makes no direct payments to the officers or trustees who are affiliated with the Adviser. For the period ended
Semi-Annual Report – June 30, 2007
22
June 30, 2007, total trustee compensation amounted to $72,444 which includes fees incurred by the fund of $52,068 and the change in unrealized appreciation of the assets held in the deferred compensation plan of $20,376.
The Fund provides a deferred compensation plan for its trustees who are not officers, limited partners or shareholders of limited partners of the Adviser. Under the deferred compensation plan, trustees may elect to defer all or a portion of their compensation. Amounts deferred are retained by the Fund, represent an unfunded obligation of the Fund, and to the extent permitted by the Investment Company Act of 1940, as amended, may be invested in the common shares of the Fund, as selected by the trustees. These shares are held by the Adviser on behalf of Skyline Funds, the value of which is reflected in "Other Assets" on the Statement of Assets and Liabilities at December 31, 2006. Appreciation/depreciation and distributions received from these investments are recorded with an offsetting increase/decrease in the deferred compensation obligation and do not affect the Fund's net asset value.
3
Fund share transactions
As of June 30, 2007, there were an unlimited number of shares of beneficial interest, no par value, authorized. Transactions in the Fund's shares of beneficial interest were as follows:
| Shares | Dollar Amount | ||||||||||||||||||
| Period Ended 6/30/07 | Year Ended 12/31/06 | Period Ended 6/30/07 | Year Ended 12/31/06 | ||||||||||||||||
| Shares sold | 1,743,367 | 3,831,466 | $ | 46,669,805 | $ | 105,981,583 | |||||||||||||
| Shares issued for reinvestment of dividends | — | 3,117,219 | — | 81,297,078 | |||||||||||||||
| Total shares issued | 1,743,367 | 6,948,685 | 46,669,805 | 187,278,661 | |||||||||||||||
| Less shares redeemed | (1,788,535 | ) | (5,579,435 | ) | (48,339,639 | ) | (151,742,110 | ) | |||||||||||
| Redemption fees | — | — | 4,874 | 96,358 | |||||||||||||||
| Net increase (decrease) | (45,168 | ) | 1,369,250 | $ | (1,664,960 | ) | $ | 35,632,909 | |||||||||||
4
Investment transactions
Investment transactions (exclusive of money market instruments) for the period ended June 30, 2007, were as follows:
| Cost of purchases | $ | 161,106,144 | |||||
| Proceeds from sales | $ | 180,619,387 | |||||
Semi-Annual Report – June 30, 2007
23
Expense Example
As a shareholder of the Fund, you incur ongoing costs, including a comprehensive management fee and trustee fees. You may incur a 2% redemption fee in the event shares are redeemed within 30 days. This example is intended to help you understand your ongoing costs (in dollars) of investing in the Fund and to compare these costs with the ongoing costs of investing in other mutual funds.
The example is based on an investment of $1,000 invested at the beginning of the period and held for the entire period (01/01/07 - 06/30/07).
Actual Expenses
The first line of the table that follows provides information about actual account values (which includes the actual return of the Fund) and actual expenses. You may use the information in this line, together with the amount you invested, to estimate the expenses that you paid over the period. Simply divide your account value by $1,000 (for example, an $8,600 account value divided by $1,000 = 8.6), then multiply the result by the number in the first line under the heading entitled "Expenses Paid During Period'' to estimate the expenses you paid on your account during this period. In addition to the expenses paid during the period that are noted in the table, you may be assessed fees for outgoing wire transfers, returned checks and stop payment orders at prevailing rates charged by U.S. Bancorp Fund Services, LLC, the Fund's transfer agent. If you request that a redemption be made by wire transfer, currently a $15.00 fee is charged by the Fun d's transfer agent. IRA accounts will be charged a $15.00 annual maintenance fee. These additional fees have the effect of reducing investment returns.
Hypothetical Example for Comparison Purposes
The second line of the table that follows provides information about hypothetical account values and hypothetical expenses based on the Fund's actual expense ratio and an assumed rate of return of 5% per year before expenses, which is not the Fund's actual return. The hypothetical account values and expenses may not be used to estimate the actual ending account balance or expenses you paid for the period. You may use this information to compare the ongoing costs of investing in the Fund and other mutual funds. To do so, compare this 5% hypothetical example with the 5% hypothetical examples that appear in the shareholder reports of the other funds. Please note that the expenses shown in the table are meant to highlight your ongoing costs only and do not reflect any transactional costs, such as, redemption fees, or exchange fees. Therefore, the second line of the table is useful in comparing ongoing costs only, and will not help you determine the relative total costs of owning different
Semi-Annual Report – June 30, 2007
24
mutual funds. In addition, if these transactional costs were included, your costs would have been higher.
Table: Expense Example
| Beginning Account Value 01/01/07 | Ending Account Value 06/30/07 | Expenses Paid During Period 01/01/07 - 6/30/07* | |||||||||||||
| Actual | $ | 1,000.00 | $ | 1,073.10 | $ | 7.04 | |||||||||
| Hypothetical (5% return before expenses) | $ | 1,000.00 | $ | 1,018.00 | $ | 6.85 | |||||||||
* Expenses are equal to the Fund's annualized expense ratio of 1.37% multiplied by the average account value over the period multiplied by 181/365 (to reflect the one-half year period).
Approval of the Investment Advisory Agreement
by the Independent Trustees
At a meeting (the "Meeting") of the Board of Trustees (the "Board") held on March 13, 2007, the Board, including all the trustees who are not "interested persons" of the Trust, as that term is defined in Section 2(a)(19) of the Investment Company Act of 1940, as amended (hereafter, the "Independent Trustees"), met to consider the continuation of the investment advisory agreement (the "Agreement") between Skyline Asset Management, L.P. ("Adviser") and Skyline Funds (the "Fund").
Prior to the Meeting, the Board had received and reviewed a variety of written materials, including information from the Adviser in response to a written request from counsel to the Independent Trustees. That information included a) data comparing the Fund's investment performance, expenses, and fees to comparable, as well as a broad universe of, investment companies, as independently chosen by Lipper, Inc. ("Lipper"); b) the background and experience of the Adviser's management and investment personnel; c) the Adviser's financial condition and stability, including an analysis of the Adviser's profitability for managing the Fund; d) the terms of the Agreement and fee arrangement with the Fund; and e) administrative, compliance and other services provided by the Adviser. The Board also received and reviewed a memorandum from counsel to the Independent Trustees regarding their responsibilities in evaluating the Agreement. During the Meeting, t he Independent Trustees engaged in in-person discussions with the Adviser's executive committee along with other of the Adviser's employees. The Independent Trustees also met outside the presence of the Adviser and were advised by their independent legal counsel.
At the Meeting, the Board determined that the Agreement was fair and reasonable in light of the nature and quality of the services provided by the Adviser, the fees charged
Semi-Annual Report – June 30, 2007
25
Approval of the Investment Advisory Agreement
by the Independent Trustees (continued)
for those services and other matters that the Board considered relevant in the exercise of its business judgment. As a result, the Board, including all of the Independent Trustees, unanimously approved the continuation of the Agreement, subject to earlier termination as provided in the Agreement.
In considering the continuation of the Agreement, the Board reviewed and analyzed various factors that it determined were relevant, including the factors described below, none of which by itself was considered determinative. However, the specific factors and conclusions that formed the basis for the Board's determination to approve the continuation of the Agreement are discussed separately below.
Nature, quality and extent of services. The Board reviewed the nature, extent and quality of the services provided by the Adviser under the Agreement, taking into account the Fund's investment objective and strategy and the Trustees' knowledge gained from their quarterly meetings with the Adviser, and the materials provided in connection with those meetings. In addition, the Board reviewed information on the Adviser's operations and personnel, including the qualifications of the portfolio management, compliance and executive personnel; the Adviser's compliance programs, and the Adviser's adherence to the Fund's compliance requirements; the Adviser's investment process and the performance achieved through the investment strategy for the Fund; and the Adviser's financial condition. The Board particularly noted the Adviser's large and highly experienced profes sional staff involved in providing investment management services to the Fund. The Board also considered other services provided to the Fund by the Adviser. The Board concluded that the nature and extent of the services provided by the Adviser were acceptable.
The Fund's Performance. The Board considered information on the Fund's short-term and long-term performance, including information on comparable funds and as against the Lipper Small Cap Value Index, as well as Lipper's methodology for undertaking the comparison. The Board noted that the Fund's total return outperformed the median in the comparative universes for nearly all of the annualized periods presented by the Lipper report. The Board also noted that for the three-year, five-year and since inception periods, the Fund's total return was higher than the small cap value investment objective average, while its volatility was lower than average. The Board concluded that, although past performance is not necessarily indicative of future results, the Fund's performance record had been acceptable.
Costs of Services and Profits Realized by the Adviser. The Trustees examined information on the Fund's fees and expenses in comparison to information for other comparable funds and for separately managed institutional accounts. The Board also considered the all-inclusive fee that the Fund pays to the Adviser under which the Adviser is responsible for payment of all of the Fund's expenses, excluding Independent Trustee fees.
Semi-Annual Report – June 30, 2007
26
The Board also considered the Adviser's willingness to enter into a contractual waiver of a portion of its all-inclusive fee equal to 0.10% of average daily net assets under management at each breakpoint level and to effectively add two additional breakpoints at net assets over $800 million and $1 billion by waiving a portion of its fees equal to 0.15% and 0.20% (including the 0.10% contractual waiver) of average daily net assets under management, respectively. The Board concluded that the fees payable by the Fund were acceptable in relation to the nature and quality of the services provided by the Adviser taking into account the specific fees charged by other advisers for managing comparable mutual funds with similar strategies.
The Board reviewed information on the Adviser's profitability under the Agreement, noting specifically that the Adviser had provided an extensive profitability analysis to the Board prior to the meeting. The Board reviewed the various platform arrangements for the Fund, their fee structures and the Adviser's payment for such arrangements out of its all-inclusive fee. The Board also discussed the Adviser's methodology for calculating its profitability. Based on the information available and taking into account the difficulty of making comparisons in this area due to the lack of publicly available information, the Board concluded that the Adviser's profitability in relation to the services rendered under the Agreement was acceptable.
Economies of Scale. The Board received and discussed information concerning whether economies of scale are being realized by the Fund and whether fee levels reflect those economies of scale for the benefit of the Fund's shareholders. The Board considered the Fund's current and anticipated asset levels, and whether shareholders will achieve economies of scale through the Fund's breakpoints as assets grow. The Board also considered efforts underway to increase the Fund's assets and the potential impact of those efforts, if successful, on the Fund's expense ratio. The Board concluded that Fund fees were structured in such a way that shareholders had the potential to enjoy economies of scale.
Other Benefits to the Adviser. The Board also considered benefits that accrue to the Adviser from its relationship with the Fund. The Board considered that an affiliate of the Adviser provides certain services to the Adviser on the Fund's behalf, including administrative, distribution and compliance services. The Board considered whether the Adviser's trading practices provided any fall-out benefits to the Adviser. After full consideration of these and other factors, the Board concluded that neither the Adviser nor its affiliate received any fall-out benefits that would preclude the Board from approving the continuation of the Agreement.
Semi-Annual Report – June 30, 2007
27
Proxy Policy & Procedures
A description of the policies and procedures that the Fund uses to determine how to vote proxies relating to portfolio securities is available without charge, upon request, by calling 800.828.2759, and on the Securities and Exchange Commission's website at www.sec.gov. The Fund's proxy voting record for the twelve-month period ended June 30, 2007, is also available without charge, upon request, by calling 800.828.2759, by visiting the Fund's website at www.skylinefunds.com and by visiting the SEC's website at www.sec.gov.
Form N-Q
The Fund files a complete list of its portfolio holdings with the SEC for the first and third quarters each fiscal year on Form N-Q. The Form N-Q is available without charge, upon request, by calling 800.828.2759 or by visiting the SEC's website at www.sec.gov. You may also review, for a fee, a copy of the form from the SEC's Public Reference Room in Washington, D.C. Information on the operation of the Public Reference Room may be obtained by calling 800.SEC.0330.
Semi-Annual Report – June 30, 2007
28
For 24-hour account information call: 1.800.828.2SKY
(1.800.828.2759)
To speak with a Skyline Funds Representative during
normal business hours call: 1.800.828.2SKY and press 0 when prompted.
To learn more about our expertise in small cap value, please visit our website at www.skylinefunds.com
Item 2. Code of Ethics.
Not applicable for semi-annual reports.
Item 3. Audit Committee Financial Expert.
Not applicable for semi-annual reports.
Item 4. Principal Accountant Fees and Services.
Not applicable for semi-annual reports.
Item 5. Audit Committee of Listed Registrants
Not applicable to open-end investment companies.
Item 6. Schedule of Investments
Schedule of Investments is included as part of the report to shareholders filed under Item 1 of this Form.
Item 7. Disclosure of Proxy Voting Policies and Procedures for Closed-End Management Investment Companies.
Not applicable to open-end investment companies.
Item 8. Portfolio Managers of Closed-End Management Investment Companies.
Not applicable to open-end investment companies.
Item 9. Purchases of Equity Securities by Closed-End Management Investment Company and Affiliated Purchasers.
Not applicable to open-end investment companies.
Item 10. Submission of Matters to a Vote of Security Holders.
Not applicable.
Item 11. Controls and Procedures.
(a) Based on an evaluation of the disclosure controls and procedures (as defined in Rule 30a-3(c) under the Investment Company Act of 1940, the “Disclosure Controls”) as of a date within 90 days prior to the filing date (the “Filing Date”) of this Form N-CSR (the “Report”), the Disclosure Controls are effectively designed to ensure that information required to be disclosed by the Registrant in the Report is recorded, processed, summarized and reported by the Filing Date, including ensuring that information required to be disclosed in the Report is accumulated and communicated to the Registrant’s management, including the Registrant’s principal executive officer and principal financial officer, as appropriate to allow timely decisions regarding required disclosure.
(b) There were no changes in the Registrant’s internal controls over financial reporting (as defined in Rule 30a-3(d) under the Investment Company Act of 1940) that occurred during the Registrant’s second fiscal quarter of the period covered by the report that has materially affected, or is reasonably likely to materially affect, the Registrant’s internal control over financial reporting.
Item 12. Exhibits.
(A) |
| Certifications of William M. Dutton, President and Trustee of Skyline Funds and Anthony I. Nanni, Vice President and Treasurer of Skyline Funds pursuant to Rule 30a-2(a) under the Investment Company Act of 1940 (17 CFR 270.30a-2(a)), attached hereto as Exhibits (a)(1) and (a)(2)(ii) |
|
|
|
(B) |
| Certifications of William M. Dutton, President and Trustee of Skyline Funds and Anthony I. Nanni, Vice President and Treasurer of Skyline Funds pursuant to Section 906 of the Sarbanes-Oxley Act of 2002, attached hereto as Exhibit (b) |
SIGNATURES
Pursuant to the requirements of the Securities Exchange Act of 1934 and the Investment Company Act of 1940, the registrant has duly caused this report to be signed on its behalf by the undersigned, thereunto duly authorized.
Skyline Funds
By: | /s/William M. Dutton |
|
|
| William M. Dutton |
| |
Date: | August 20, 2007 |
|
|
Pursuant to the requirements of the Securities Exchange Act of 1934 and the Investment Company Act of 1940, this report has been signed below by the following persons on behalf of the registrant and in the capacities and on the dates indicated.
By: | /s/William M. Dutton |
|
|
| William M. Dutton |
| |
Date: | August 20, 2007 |
|
|
|
|
| |
|
|
| |
By: | /s/Anthony I. Nanni |
|
|
| Anthony I. Nanni |
| |
Date: | August 17, 2007 |
|
|