Exhibit 99
| Investor News | NYSE:PEG |

For further information, contact:
• Kathleen A. Lally, Vice President – Investor Relations | Phone: 973-430-6565 | |
• Carlotta Chan Lane, Manager – Investor Relations | Phone: 973-430-6596 |
PSEG ANNOUNCES 2012 THIRD QUARTER RESULTS
$0.68 PER SHARE FROM CONTINUING OPERATIONS
$0.75 PER SHARE OF OPERATING EARNINGS
PSE&G Positioned as Second Largest Owner of Transmission in PJM
Public Service Enterprise Group (PSEG) today reported third quarter 2012 Income from Continuing Operations and Net Income of $347 million or $0.68 per share as compared to $265 million or $0.52 per share for the third quarter of 2011. Including Income from Discontinued Operations, PSEG reported Net Income for the third quarter of 2011 of $294 million or $0.58 per share. Operating earnings for the third quarter of 2012 were $382 million or $0.75 per share compared to the third quarter of 2011 operating earnings of $420 million or $0.83 per share.
Ralph Izzo, chairman, president and chief executive officer, commented that “our third quarter financial results were strong, and, supports our full year operating earnings guidance of $2.25 - $2.50 per share.”
PSEG believes that the non-GAAP financial measure of “Operating Earnings” provides a consistent and comparable measure of performance of its businesses to help shareholders understand performance trends. Operating Earnings exclude the impact of returns/(losses) associated with Nuclear Decommissioning Trust (NDT), certain Mark-to-Market (MTM) accounting and other material one time items. The table below provides a reconciliation of PSEG’s Net Income to Operating Earnings (a non-GAAP measure) for the third quarter. See Attachment 12 for a complete list of items excluded from Income from Continuing Operations in the determination of Operating Earnings.
PSEG CONSOLIDATED EARNINGS (unaudited)
Third Quarter Comparative Results
2012 and 2011
| Income ($millions) | Diluted Earnings Per Share | |||||||||||||||
| 2012 | 2011 | 2012 | 2011 | |||||||||||||
Operating Earnings | $ | 382 | $ | 420 | $ | 0.75 | $ | 0.83 | ||||||||
|
|
|
|
|
|
|
| |||||||||
Less: Reconciling Items | (35 | ) | (155 | ) | (0.07 | ) | (0.31 | ) | ||||||||
Add: Other Excluded Items | ||||||||||||||||
|
|
|
|
|
|
|
| |||||||||
Income from Continuing Operations | $ | 347 | $ | 265 | $ | 0.68 | $ | 0.52 | ||||||||
|
|
|
|
|
|
|
| |||||||||
Income from Discontinued Operations | 29 | 0.06 | ||||||||||||||
|
|
|
|
|
|
|
| |||||||||
Net Income | $ | 347 | $ | 294 | $ | 0.68 | $ | 0.58 | ||||||||
|
|
|
|
|
|
|
| |||||||||
| Average Shares | 507 | M | 507 | M | ||||||||||||
Mr. Izzo went on to say, “our results demonstrate the success of a strategy that serves our customers and shareholders well. The flexibility of our generating fleet has allowed us to take advantage of market opportunities as we remain diligent in managing costs. Our investment program remains on track. Our success in obtaining key regulatory approvals necessary for the construction of the Susquehanna – Roseland transmission line enables us to proceed with this critical investment that will provide long lasting benefits to New Jersey’s economy and support double-digit compound annual growth in our regulated operations through 2014.”
Operating Earnings guidance by company for the full year is as follows:
Operating Earnings
($ millions, except EPS)
2012E | 2011A | |||||
PSEG Power | $575 - $665 | $ | 845 | |||
PSE&G | $530 - $560 | $ | 521 | |||
PSEG Energy Holdings/Parent | $35 - $45 | $ | 23 | |||
|
|
| ||||
Total | $1,140 - $1,270 | $ | 1,389 | |||
|
|
| ||||
Earnings Per Share | $2.25 - $2.50 | $ | 2.74 | |||
He continued by saying “the efforts of our employees to manage costs and execute on a large capital program, unprecedented in our transmission and distribution business, in a disciplined fashion position PSEG for success over the long-term.”
Operating Earnings Review and Outlook by Operating Subsidiary
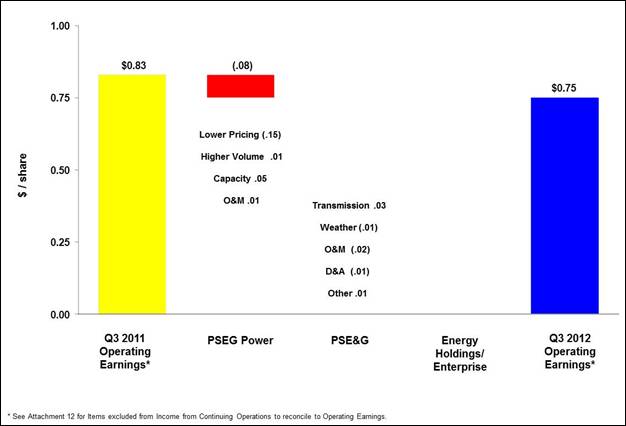
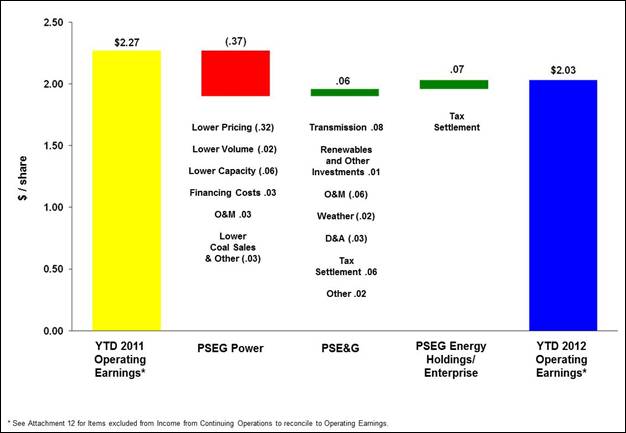
See Attachment 6 for detail regarding the quarter-over-quarter reconciliations for each of PSEG’s businesses.
PSEG Power
PSEG Power reported operating earnings of $217 million ($0.43 per share) for the third quarter of 2012 compared with operating earnings of $258 million ($0.51 per share) for the third quarter of 2011.
PSEG Power’s earnings were aided by increased dispatch of the combined cycle and peaking fleets in response to demand and a continued strong contribution from the nuclear fleet.
Lower realized prices for energy reduced Power’s earnings by $0.15 per share quarter-over-quarter. The decline in prices reflects lower prices under the Basic Generation Services (BGS) contract as well as lower wholesale prices for power. The contract price for one-third of the BGS related load declined to $84 per MWh on June 1, 2012 from $104 per MWh. The impact on earnings from lower prices incorporates the effect of customer migration away from the BGS contract. An increase in capacity prices increased earnings in the quarter by $0.05 per share. The average price for capacity increased on June 1, 2012 to $153 per MW-day from $110 per MW-day. Power’s quarter-over-quarter earnings continue to benefit from tight controls on expenses at the Fossil stations. A reduction in operating and maintenance expense improved earnings by $0.01 per share.
Output from Power’s generating fleet for the quarter increased 3% from year-ago levels. The increase in output added $0.01 to earnings per share. Production from Power’s combined cycle natural gas fleet increased 17% in the quarter to represent 32% of generation. This level of production represented the highest summer output ever achieved in the history of our combined cycle fleet. The combined cycle fleet’s capacity factor for the quarter improved to approximately 67% from 57% in the year-ago quarter. The PJM fossil fleet also benefited from the increased dispatch of 267 MW of new, more efficient peaking capacity which entered service at Kearny in June. The improved dispatch from the combined cycle and peaking fleet offset a decline in dispatch from Power’s coal-fired fleet which continues to be affected by low gas prices, relative to coal.
Production from the nuclear fleet, which represents over 50% of Power’s generation, increased 2% from the year-ago quarter. The fleet benefited from strong operations at the Salem station which recorded its second highest level of output during its operating life for a summer period. The strong result from Salem and continued strong performance at Hope Creek lifted the nuclear fleet’s average capacity factor in the third quarter to 92% from 90.6% in the year ago quarter. The performance in the quarter has resulted in a year-to-date capacity factor for the fleet of 92.5%. The fleet is expected to operate at a capacity factor of 91% for the year. The full year estimate reflects a scheduled refueling at Salem 2 which began in mid-October 2012, and was interrupted by storm-related safety precautions, as well as the removal of Salem 1 from service to reduce the impact of storm surge on its operations.
Power continues to forecast output for 2012 of 53-54 TWh. Approximately 80% - 85% of output for the remainder of the year is hedged at an average price of $54 per MWh resulting in an average hedge price for the year of $60 per MWh. For 2013, Power has hedged approximately 60% - 65% of its forecast output of 52-54 TWh at an average price of $51 per MWh; for 2014, Power has hedged approximately 30% - 35% of its forecast output of 53-55 TWh at an average price of $49 per MWh. (Average hedge prices exclude the price for capacity embedded in full requirement contracts.)
PSE&G
PSE&G reported operating earnings of $155 million ($0.30 per share) for the third quarter of 2012 compared with operating earnings of $154 million ($0.30 per share) for the third quarter of 2011.
PSE&G’s results were affected by an increase in transmission revenue. An annualized increase in transmission revenue of $94 million effective on January 1, 2012 added $0.03 per share to quarter-over-quarter earnings.
Weather conditions in the third quarter almost exclusively impacted summer related cooling loads. The weather experienced in the summer of 2012 was hotter than normal; but, cooler on average than conditions experienced in the year-ago quarter. As a result of the less favorable weather conditions, electric sales declined 0.6% in the quarter. The decline in sales reduced earnings by $0.01 per share.
PSE&G experienced an increase in O&M which reduced earnings during the quarter by $0.02 per share. The increase reflects higher pension expense and the cost associated with an expansion of its investment in transmission, which more than offset the absence of storm related expenses in the year-ago quarter. Depreciation expense, also associated with the expansion of the company’s investment program, reduced earnings in the quarter by $0.01 per share, but, was offset by other miscellaneous items.
PSE&G received key regulatory approvals required for construction of the Susquehanna – Roseland 500 Kv transmission line from the National Park Service and the NJ Department of Environmental
Protection. This line is scheduled to enter service in mid-2015. PSE&G’s share of the capital cost is forecast to be $790 million. PSE&G’s existing commitment to expand its investment in transmission will position it as the second largest owner of transmission within PJM.
PSE&G filed its 2013 Annual Formula Rate Update with the Federal Energy Regulatory Commission (FERC) in October 2012. The request would provide for an increase in annual transmission revenues of $174 million to be effective on January 1, 2013. The request reflects the costs associated with an expansion in PSE&G’s transmission related investment over the next year.
PSE&G’s capital program and commitment to cost control are expected to support double-digit compound annual growth in earnings over the 2011- 2014 period.
PSEG Energy Holdings/Enterprise
PSEG Energy Holdings/Enterprise reported operating earnings of $10 million ($0.02 per share) for the third quarter of 2012 versus operating earnings of $8 million ($0.02 per share) during the third quarter of 2011. The results for the quarter reflect the continued benefits of a reduction in financing costs which more than offset a decline in income on the lease portfolio from the divestment of leases in late 2011.
Subsequent Events
In late October 2012, high winds, heavy rainfall and the related flooding associated with Hurricane Sandy caused severe damage to our transmission and distribution system throughout our service territory as well as to some of our generation infrastructure in the northern part of New Jersey. The walls of water created by the storm surge flooded a large number of substations along the Passaic, Raritan and Hudson rivers. The magnitude of the flooding in contiguous areas is unprecedented. At the peak of the outages, approximately 1.5 million of our customers were without power due to the storm. In terms of customer outages, this was the most in PSE&G’s history, surpassing both Tropical Storm Irene and the October snowstorm in 2011. With the assistance of mutual aid crews from other utilities, our associates are working to minimize the length of time our customers are without electric or gas service. PSE&G and Power are unable to estimate the possible loss or range of loss related to Hurricane Sandy, however, such costs could be material.
On October 26, 2012, PSE&G filed a petition with the BPU seeking authorization to defer on our books actually incurred, uninsured, incremental storm restoration costs associated with our gas and electric distribution systems. We requested similar relief in August 2011 as Tropical Storm Irene approached. Both requests are currently pending before the BPU. We maintain property insurance for both nuclear and non-nuclear property. We intend to seek recovery from our insurers for any property damage above our self-insured retentions, however, no assurances can be given relative to the timing or amount of such recovery.
Forward-Looking Statement
Readers are cautioned that statements contained in this presentation about our future performance, including future revenues, earnings, strategies, prospects, consequences and all other statements that are not purely historical, are forward-looking statements for purposes of the safe harbor provisions under The Private Securities Litigation Reform Act of 1995. When used herein, the words “anticipate”, “intend”, “estimate”, “believe”, “expect”, “plan”, “should”, “hypothetical”, “potential”, “forecast”, “project”, variations of such words and similar expressions are intended to identify forward-looking statements. Although we believe that our expectations are based on reasonable assumptions, they are subject to risks and uncertainties and we can give no assurance they will be achieved. The results or developments projected or predicted in these statements
may differ materially from what may actually occur. Factors which could cause results or events to differ from current expectations include, but are not limited to:
| • | adverse changes in the demand for or price of the capacity and energy that we sell into wholesale electricity markets, |
| • | adverse changes in energy industry law, policies and regulation, including market structures and a potential shift away from competitive markets toward subsidized market mechanisms, transmission planning and cost allocation rules, including rules regarding how transmission is planned and who is permitted to build transmission in the future, and reliability standards, |
| • | any inability of our transmission and distribution businesses to obtain adequate and timely rate relief and regulatory approvals from federal and state regulators, |
| • | changes in federal and state environmental regulations that could increase our costs or limit our operations, |
| • | changes in nuclear regulation and/or general developments in the nuclear power industry, including various impacts from any accidents or incidents experienced at our facilities or by others in the industry, that could limit operations of our nuclear generating units, |
| • | actions or activities at one of our nuclear units located on a multi-unit site that might adversely affect our ability to continue to operate that unit or other units located at the same site, |
| • | any inability to balance our energy obligations, available supply and trading risks, |
| • | any deterioration in our credit quality, or the credit quality of our counterparties, including in our leveraged leases, |
| • | availability of capital and credit at commercially reasonable terms and conditions and our ability to meet cash needs, |
| • | any inability to realize anticipated tax benefits or retain tax credits, |
| • | changes in the cost of, or interruption in the supply of, fuel and other commodities necessary to the operation of our generating units, |
| • | delays in receipt of necessary permits and approvals for our construction and development activities, |
| • | delays or unforeseen cost escalations in our construction and development activities, |
| • | any inability to achieve or continue to sustain, our expected levels of operating performance, |
| • | increase in competition in energy supply markets as well as competition for certain rate-based transmission projects, |
| • | any inability to realize anticipated tax benefits or retain tax credits, |
| • | challenges associated with recruitment and/or retention of a qualified workforce, |
| • | adverse performance of our decommissioning and defined benefit plan trust fund investments and changes in discount rates and funding requirements, and |
| • | changes in technology and customer usage patterns. |
For further information, please refer to our Annual Report on Form 10-K, including Item 1A. Risk Factors, and subsequent reports on Form 10-Q and Form 8-K filed with the Securities and Exchange Commission. These documents address in further detail our business, industry issues and other factors that could cause actual results to differ materially from those indicated in this presentation. In addition, any forward-looking statements included herein represent our estimates only as of today and should not be relied upon as representing our estimates as of any subsequent date. While we may elect to update forward-looking statements from time to time, we specifically disclaim any obligation to do so, even if our internal estimates change, unless otherwise required by applicable securities laws.
Attachment 1
PUBLIC SERVICE ENTERPRISE GROUP INCORPORATED
Operating Earnings and Per Share Results by Subsidiary
(Unaudited)
| Three Months Ended September 30, | Nine Months Ended September 30, | |||||||||||||||
| 2012 | 2011 | 2012 | 2011 | |||||||||||||
Earnings Results ($ Millions) | ||||||||||||||||
PSEG Power | $ | 217 | $ | 258 | $ | 523 | $ | 710 | ||||||||
PSE&G | 155 | 154 | 453 | 422 | ||||||||||||
PSEG Energy Holdings/Enterprise | 10 | 8 | 53 | 20 | ||||||||||||
|
|
|
|
|
|
|
| |||||||||
Operating Earnings | $ | 382 | $ | 420 | $ | 1,029 | $ | 1,152 | ||||||||
|
|
|
|
|
|
|
| |||||||||
Reconciling Items (a) | (35 | ) | (155 | ) | 22 | (105 | ) | |||||||||
|
|
|
|
|
|
|
| |||||||||
Income from Continuing Operations | $ | 347 | $ | 265 | $ | 1,051 | $ | 1,047 | ||||||||
|
|
|
|
|
|
|
| |||||||||
Discontinued Operations | — | 29 | — | 96 | ||||||||||||
|
|
|
|
|
|
|
| |||||||||
Net Income | $ | 347 | $ | 294 | $ | 1,051 | $ | 1,143 | ||||||||
|
|
|
|
|
|
|
| |||||||||
Fully Diluted Average Shares Outstanding (in Millions) | 507 | 507 | 507 | 507 | ||||||||||||
|
|
|
|
|
|
|
| |||||||||
Per Share Results (Diluted) | ||||||||||||||||
PSEG Power | $ | 0.43 | $ | 0.51 | $ | 1.03 | $ | 1.40 | ||||||||
PSE&G | 0.30 | 0.30 | 0.89 | 0.83 | ||||||||||||
PSEG Energy Holdings/Enterprise | 0.02 | 0.02 | 0.11 | 0.04 | ||||||||||||
|
|
|
|
|
|
|
| |||||||||
Operating Earnings | $ | 0.75 | $ | 0.83 | $ | 2.03 | $ | 2.27 | ||||||||
|
|
|
|
|
|
|
| |||||||||
Reconciling Items (a) | (0.07 | ) | (0.31 | ) | 0.04 | (0.21 | ) | |||||||||
|
|
|
|
|
|
|
| |||||||||
Income from Continuing Operations | $ | 0.68 | $ | 0.52 | $ | 2.07 | $ | 2.06 | ||||||||
|
|
|
|
|
|
|
| |||||||||
Discontinued Operations | — | 0.06 | — | 0.19 | ||||||||||||
|
|
|
|
|
|
|
| |||||||||
Net Income | $ | 0.68 | $ | 0.58 | $ | 2.07 | $ | 2.25 | ||||||||
|
|
|
|
|
|
|
| |||||||||
| (a) | See attachment 12 for details of items excluded from Income from Continuing Operations to compute Operating Earnings. |
Attachment 2
PUBLIC SERVICE ENTERPRISE GROUP INCORPORATED
Consolidating Statements of Operations
(Unaudited, $ Millions)
| Three Months Ended September 30, 2012 | ||||||||||||||||
| PSEG | PSEG Energy Holdings/ Enterprise (a) | PSEG POWER | PSE&G | |||||||||||||
OPERATING REVENUES | $ | 2,402 | $ | (319 | ) | $ | 1,038 | $ | 1,683 | |||||||
OPERATING EXPENSES | ||||||||||||||||
Energy Costs | 879 | (333 | ) | 456 | 756 | |||||||||||
Operation and Maintenance | 619 | (2 | ) | 255 | 366 | |||||||||||
Depreciation and Amortization | 286 | 10 | 60 | 216 | ||||||||||||
Taxes Other Than Income Taxes | 24 | — | — | 24 | ||||||||||||
|
|
|
|
|
|
|
| |||||||||
Total Operating Expenses | 1,808 | (325 | ) | 771 | 1,362 | |||||||||||
|
|
|
|
|
|
|
| |||||||||
OPERATING INCOME | 594 | 6 | 267 | 321 | ||||||||||||
Income from Equity Method Investments | 7 | 7 | — | — | ||||||||||||
Other Income and (Deductions) | 95 | 1 | 84 | 10 | ||||||||||||
Other Than Temporary Impairments | (2 | ) | — | (2 | ) | — | ||||||||||
Interest Expense | (106 | ) | 2 | (35 | ) | (73 | ) | |||||||||
|
|
|
|
|
|
|
| |||||||||
INCOME FROM CONTINUING OPERATIONS BEFORE INCOME TAXES | 588 | 16 | 314 | 258 | ||||||||||||
Income Tax Benefit (Expense) | (241 | ) | (5 | ) | (133 | ) | (103 | ) | ||||||||
|
|
|
|
|
|
|
| |||||||||
NET INCOME | $ | 347 | $ | 11 | $ | 181 | $ | 155 | ||||||||
|
|
|
|
|
|
|
| |||||||||
OPERATING EARNINGS | $ | 382 | $ | 10 | $ | 217 | $ | 155 | ||||||||
Reconciling Items Excluded from Continuing Operations (b) | (35 | ) | 1 | (36 | ) | — | ||||||||||
|
|
|
|
|
|
|
| |||||||||
INCOME FROM CONTINUING OPERATIONS | $ | 347 | $ | 11 | $ | 181 | $ | 155 | ||||||||
|
|
|
|
|
|
|
| |||||||||
| Three Months Ended September 30, 2011 | ||||||||||||||||
| PSEG | PSEG Energy Holdings/ Enterprise (a) | PSEG POWER | PSE&G | |||||||||||||
OPERATING REVENUES | $ | 2,620 | $ | (619 | ) | $ | 1,398 | $ | 1,841 | |||||||
OPERATING EXPENSES | ||||||||||||||||
Energy Costs | 1,167 | (373 | ) | 597 | 943 | |||||||||||
Operation and Maintenance | 603 | (1 | ) | 262 | 342 | |||||||||||
Depreciation and Amortization | 263 | 10 | 56 | 197 | ||||||||||||
Taxes Other Than Income Taxes | 31 | — | — | 31 | ||||||||||||
|
|
|
|
|
|
|
| |||||||||
Total Operating Expenses | 2,064 | (364 | ) | 915 | 1,513 | |||||||||||
|
|
|
|
|
|
|
| |||||||||
OPERATING INCOME | 556 | (255 | ) | 483 | 328 | |||||||||||
Income from Equity Method Investments | 1 | 1 | — | — | ||||||||||||
Other Income and (Deductions) | 34 | 1 | 27 | 6 | ||||||||||||
Other Than Temporary Impairments | (8 | ) | — | (8 | ) | — | ||||||||||
Interest Expense | (117 | ) | 2 | (42 | ) | (77 | ) | |||||||||
|
|
|
|
|
|
|
| |||||||||
INCOME FROM CONTINUING OPERATIONS BEFORE INCOME TAXES | 466 | (251 | ) | 460 | 257 | |||||||||||
Income Tax Benefit (Expense) | (201 | ) | 89 | (187 | ) | (103 | ) | |||||||||
|
|
|
|
|
|
|
| |||||||||
INCOME FROM CONTINUING OPERATIONS | 265 | (162 | ) | 273 | 154 | |||||||||||
Discontinued Operations, net of tax | 29 | — | 29 | — | ||||||||||||
|
|
|
|
|
|
|
| |||||||||
NET INCOME | $ | 294 | $ | (162 | ) | $ | 302 | $ | 154 | |||||||
|
|
|
|
|
|
|
| |||||||||
OPERATING EARNINGS | $ | 420 | $ | 8 | $ | 258 | $ | 154 | ||||||||
Reconciling Items Excluded from Continuing Operations(b) | (155 | ) | (170 | ) | 15 | — | ||||||||||
|
|
|
|
|
|
|
| |||||||||
INCOME FROM CONTINUING OPERATIONS | $ | 265 | $ | (162 | ) | $ | 273 | $ | 154 | |||||||
|
|
|
|
|
|
|
| |||||||||
| (a) | Includes activities at Energy Holdings and the Parent as well as intercompany eliminations. |
| (b) | See attachment 12 for details of items excluded from Income from Continuing Operations to compute Operating Earnings. |
Attachment 3
PUBLIC SERVICE ENTERPRISE GROUP INCORPORATED
Consolidating Statements of Operations
(Unaudited, $ Millions)
| Nine Months Ended September 30, 2012 | ||||||||||||||||
| PSEG | PSEG Energy Holdings/ Enterprise (a) | PSEG POWER | PSE&G | |||||||||||||
OPERATING REVENUES | $ | 7,375 | $ | (1,238 | ) | $ | 3,584 | $ | 5,029 | |||||||
OPERATING EXPENSES | ||||||||||||||||
Energy Costs | 2,819 | (1,286 | ) | 1,725 | 2,380 | |||||||||||
Operation and Maintenance | 1,876 | 4 | 780 | 1,092 | ||||||||||||
Depreciation and Amortization | 797 | 28 | 175 | 594 | ||||||||||||
Taxes Other Than Income Taxes | 73 | — | — | 73 | ||||||||||||
|
|
|
|
|
|
|
| |||||||||
Total Operating Expenses | 5,565 | (1,254 | ) | 2,680 | 4,139 | |||||||||||
|
|
|
|
|
|
|
| |||||||||
OPERATING INCOME | 1,810 | 16 | 904 | 890 | ||||||||||||
Income from Equity Method Investments | 9 | 9 | — | — | ||||||||||||
Other Income and (Deductions) | 155 | 5 | 119 | 31 | ||||||||||||
Other Than Temporary Impairments | (14 | ) | — | (14 | ) | — | ||||||||||
Interest Expense | (310 | ) | 7 | (97 | ) | (220 | ) | |||||||||
|
|
|
|
|
|
|
| |||||||||
INCOME FROM CONTINUING OPERATIONSBEFORE INCOME TAXES | 1,650 | 37 | 912 | 701 | ||||||||||||
Income Tax Benefit (Expense) | (599 | ) | 23 | (374 | ) | (248 | ) | |||||||||
|
|
|
|
|
|
|
| |||||||||
NET INCOME | $ | 1,051 | $ | 60 | $ | 538 | $ | 453 | ||||||||
|
|
|
|
|
|
|
| |||||||||
OPERATING EARNINGS | $ | 1,029 | $ | 53 | $ | 523 | $ | 453 | ||||||||
Reconciling Items Excluded from Continuing Operations (b) | 22 | 7 | 15 | — | ||||||||||||
|
|
|
|
|
|
|
| |||||||||
INCOME FROM CONTINUING OPERATIONS | $ | 1,051 | $ | 60 | $ | 538 | $ | 453 | ||||||||
|
|
|
|
|
|
|
| |||||||||
| Nine Months Ended September 30, 2011 | ||||||||||||||||
| PSEG | PSEG Energy Holdings/ Enterprise (a) | PSEG POWER | PSE&G | |||||||||||||
OPERATING REVENUES | $ | 8,443 | $ | (1,925 | ) | $ | 4,650 | $ | 5,718 | |||||||
OPERATING EXPENSES | ||||||||||||||||
Energy Costs | 3,740 | (1,719 | ) | 2,335 | 3,124 | |||||||||||
Operation and Maintenance | 1,829 | 5 | 810 | 1,014 | ||||||||||||
Depreciation and Amortization | 739 | 25 | 166 | 548 | ||||||||||||
Taxes Other Than Income Taxes | 102 | — | — | 102 | ||||||||||||
|
|
|
|
|
|
|
| |||||||||
Total Operating Expenses | 6,410 | (1,689 | ) | 3,311 | 4,788 | |||||||||||
|
|
|
|
|
|
|
| |||||||||
OPERATING INCOME | 2,033 | (236 | ) | 1,339 | 930 | |||||||||||
Income from Equity Method Investments | 8 | 8 | — | — | ||||||||||||
Other Income and (Deductions) | 137 | 4 | 119 | 14 | ||||||||||||
Other Than Temporary Impairments | (13 | ) | (2 | ) | (10 | ) | (1 | ) | ||||||||
Interest Expense | (361 | ) | 7 | (134 | ) | (234 | ) | |||||||||
|
|
|
|
|
|
|
| |||||||||
INCOME FROM CONTINUING OPERATIONSBEFORE INCOME TAXES | 1,804 | (219 | ) | 1,314 | 709 | |||||||||||
Income Tax Benefit (Expense) | (757 | ) | 69 | (539 | ) | (287 | ) | |||||||||
|
|
|
|
|
|
|
| |||||||||
INCOME FROM CONTINUING OPERATIONS | 1,047 | (150 | ) | 775 | 422 | |||||||||||
Discontinued Operations, net of tax | 96 | — | 96 | — | ||||||||||||
|
|
|
|
|
|
|
| |||||||||
NET INCOME | $ | 1,143 | $ | (150 | ) | $ | 871 | $ | 422 | |||||||
|
|
|
|
|
|
|
| |||||||||
OPERATING EARNINGS | $ | 1,152 | $ | 20 | $ | 710 | $ | 422 | ||||||||
Reconciling Items Excluded from Continuing Operations (b) | (105 | ) | (170 | ) | 65 | — | ||||||||||
|
|
|
|
|
|
|
| |||||||||
INCOME FROM CONTINUING OPERATIONS | $ | 1,047 | $ | (150 | ) | $ | 775 | $ | 422 | |||||||
|
|
|
|
|
|
|
| |||||||||
| (a) | Includes activities at Energy Holdings and the Parent as well as intercompany eliminations. |
| (b) | See attachment 12 for details of items excluded from Income from Continuing Operations to compute Operating Earnings. |
Attachment 4
PUBLIC SERVICE ENTERPRISE GROUP INCORPORATED
Capitalization Schedule
(Unaudited, $ Millions)
| September 30, 2012 | December 31, 2011 | |||||||
DEBT | ||||||||
Long-Term Debt | $ | 7,479 | $ | 7,060 | ||||
Securitization Debt | 785 | 939 | ||||||
Project Level, Non-Recourse Debt | 45 | 95 | ||||||
|
|
|
| |||||
Total Debt | 8,309 | 8,094 | ||||||
STOCKHOLDERS' EQUITY | ||||||||
Common Stock | 4,836 | 4,823 | ||||||
Treasury Stock | (606 | ) | (601 | ) | ||||
Retained Earnings | 6,898 | 6,385 | ||||||
Accumulated Other Comprehensive Loss | (322 | ) | (337 | ) | ||||
|
|
|
| |||||
Total Common Stockholders' Equity | 10,806 | 10,270 | ||||||
Noncontrolling Interests - Equity Investments | 2 | 2 | ||||||
|
|
|
| |||||
Total Equity | 10,808 | 10,272 | ||||||
|
|
|
| |||||
Total Capitalization | $ | 19,117 | $ | 18,366 | ||||
|
|
|
| |||||
Attachment 5
PUBLIC SERVICE ENTERPRISE GROUP INCORPORATED
CONDENSED CONSOLIDATED STATEMENTS OF CASH FLOWS
(Unaudited, $ Millions)
| Nine Months Ended September 30, | ||||||||
| 2012 | 2011 | |||||||
CASH FLOWS FROM OPERATING ACTIVITIES | ||||||||
Net Income | $ | 1,051 | $ | 1,143 | ||||
Adjustments to Reconcile Net Income to Net Cash Flows From Operating Activities | 1,260 | 1,266 | ||||||
|
|
|
| |||||
NET CASH PROVIDED BY OPERATING ACTIVITIES | 2,311 | 2,409 | ||||||
|
|
|
| |||||
NET CASH USED IN INVESTING ACTIVITIES | (2,051 | ) | (827 | ) | ||||
|
|
|
| |||||
NET CASH USED IN FINANCING ACTIVITIES | (314 | ) | (620 | ) | ||||
|
|
|
| |||||
Net Decrease in Cash and Cash Equivalents | (54 | ) | 962 | |||||
Cash and Cash Equivalents at Beginning of Period | 834 | 280 | ||||||
|
|
|
| |||||
Cash and Cash Equivalents at End of Period | $ | 780 | $ | 1,242 | ||||
|
|
|
| |||||
Attachment 6
PUBLIC SERVICE ENTERPRISE GROUP INCORPORATED
Quarter-over-Quarter EPS Reconciliation
September 30, 2012 vs. September 30, 2011
(Unaudited)
Attachment 7
PUBLIC SERVICE ENTERPRISE GROUP INCORPORATED
Year-over-Year EPS Reconciliation
September 30, 2012 vs. September 30, 2011
(Unaudited)
Attachment 8
PSEG POWER LLC
Generation Measures
(Unaudited)
| GWhr Breakdown | GWhr Breakdown | |||||||||||||||
| Three Months Ended September 30, | Nine Months Ended September 30, | |||||||||||||||
| 2012 | 2011 | 2012 | 2011 | |||||||||||||
Nuclear - NJ | 5,490 | 5,276 | 15,525 | 15,583 | ||||||||||||
Nuclear - PA | 2,069 | 2,141 | 7,079 | 7,069 | ||||||||||||
|
|
|
|
|
|
|
| |||||||||
Total Nuclear | 7,559 | 7,417 | 22,604 | 22,652 | ||||||||||||
Fossil - Coal/Natural Gas - NJ* | 694 | 897 | 1,101 | 2,469 | ||||||||||||
Fossil - Coal - PA | 1,344 | 1,414 | 3,477 | 4,080 | ||||||||||||
Fossil - Coal - CT | 33 | 225 | 78 | 490 | ||||||||||||
|
|
|
|
|
|
|
| |||||||||
Total Coal | 2,071 | 2,536 | 4,656 | 7,039 | ||||||||||||
Fossil - Oil & Natural Gas - NJ | 3,874 | 3,211 | 9,711 | 8,843 | ||||||||||||
Fossil - Oil & Natural Gas - NY | 1,344 | 1,218 | 3,719 | 3,188 | ||||||||||||
Fossil - Oil & Natural Gas - CT | 71 | 44 | 79 | 57 | ||||||||||||
|
|
|
|
|
|
|
| |||||||||
Total Oil & Natural Gas | 5,289 | 4,473 | 13,509 | 12,088 | ||||||||||||
|
|
|
|
|
|
|
| |||||||||
| 14,919 | 14,426 | 40,769 | 41,779 | |||||||||||||
|
|
|
|
|
|
|
| |||||||||
| % Generation by Fuel Type | % Generation by Fuel Type | |||||||||||||||
| Three Months Ended September 30, | Nine Months Ended September 30, | |||||||||||||||
| 2012 | 2011 | 2012 | 2011 | |||||||||||||
Nuclear - NJ | 37 | % | 36 | % | 38 | % | 37 | % | ||||||||
Nuclear - PA | 14 | % | 15 | % | 17 | % | 17 | % | ||||||||
|
|
|
|
|
|
|
| |||||||||
Total Nuclear | 51 | % | 51 | % | 55 | % | 54 | % | ||||||||
Fossil - Coal/Natural Gas - NJ* | 5 | % | 6 | % | 3 | % | 6 | % | ||||||||
Fossil - Coal - PA | 9 | % | 10 | % | 9 | % | 10 | % | ||||||||
Fossil - Coal - CT | 0 | % | 2 | % | 0 | % | 1 | % | ||||||||
|
|
|
|
|
|
|
| |||||||||
Total Coal | 14 | % | 18 | % | 12 | % | 17 | % | ||||||||
Fossil - Oil & Natural Gas - NJ | 26 | % | 22 | % | 24 | % | 21 | % | ||||||||
Fossil - Oil & Natural Gas - NY | 9 | % | 9 | % | 9 | % | 8 | % | ||||||||
Fossil - Oil & Natural Gas - CT | 0 | % | 0 | % | 0 | % | 0 | % | ||||||||
|
|
|
|
|
|
|
| |||||||||
Total Oil & Natural Gas | 35 | % | 31 | % | 33 | % | 29 | % | ||||||||
|
|
|
|
|
|
|
| |||||||||
| 100 | % | 100 | % | 100 | % | 100 | % | |||||||||
|
|
|
|
|
|
|
| |||||||||
| * | Includes Pumped Storage. Pumped Storage accounted for <1% of total generation for the three and nine months ended September 30, 2012 and 2011. Also, 2012 generation includes natural gas fuel switching intervals. |
Attachment 9
PUBLIC SERVICE ELECTRIC & GAS COMPANY
Retail Sales and Revenues
(Unaudited)
September 30, 2012
Electric Sales and Revenues
| Three Months Ended | Change vs. 2011 | Nine Months Ended | Change vs. 2011 | |||||||||||||
Sales (millions kwh) | ||||||||||||||||
Residential | 4,640 | -0.9 | % | 10,682 | -3.9 | % | ||||||||||
Commercial & Industrial | 7,833 | -0.5 | % | 21,441 | -2.0 | % | ||||||||||
Street Lighting | 73 | 19.9 | % | 230 | -3.9 | % | ||||||||||
Interdepartmental | 3 | 1.4 | % | 7 | -3.3 | % | ||||||||||
|
|
|
| |||||||||||||
Total | 12,549 | -0.6 | % | 32,360 | -2.6 | % | ||||||||||
|
|
|
| |||||||||||||
Revenue (in millions) | ||||||||||||||||
Residential | $ | 710 | -7.9 | % | $ | 1,681 | -8.9 | % | ||||||||
Commercial & Industrial | 645 | -8.6 | % | 1,665 | -8.2 | % | ||||||||||
Street Lighting | 17 | -0.4 | % | 55 | 0.0 | % | ||||||||||
Other Operating Revenues* | 101 | -6.0 | % | 275 | -6.6 | % | ||||||||||
|
|
|
| |||||||||||||
Total | $ | 1,473 | -8.0 | % | $ | 3,676 | -8.3 | % | ||||||||
|
|
|
| |||||||||||||
| Three Months Ended | Change vs. 2011 | Nine Months Ended | Change vs. 2011 | |||||||||||||
Weather Data | ||||||||||||||||
THI Hours - Actual | 13,546 | -7.8 | % | 17,954 | -9.8 | % | ||||||||||
THI Hours - Normal | 11,291 | 15,267 | ||||||||||||||
| * | Primarily sales of Non-Utility Generator energy to PJM and Transmission related revenues. |
Attachment 10
PUBLIC SERVICE ELECTRIC & GAS COMPANY
Retail Sales and Revenues
(Unaudited)
September 30, 2012
Gas Sold and Transported
| Three Months Ended | Change vs. 2011 | Nine Months Ended | Change vs. 2011 | |||||||||||||
Sales (millions therms) | ||||||||||||||||
Residential Sales | 82 | -11.0 | % | 761 | -19.0 | % | ||||||||||
Commercial & Industrial - Firm Sales | 32 | -5.7 | % | 276 | -20.2 | % | ||||||||||
Commercial & Industrial - Interr. & Cogen | 22 | -55.3 | % | 65 | -49.8 | % | ||||||||||
|
|
|
| |||||||||||||
Total | 136 | -22.6 | % | 1,102 | -22.1 | % | ||||||||||
|
|
|
| |||||||||||||
Gas Transported - Firm Sales | 64 | -2.0 | % | 357 | -9.0 | % | ||||||||||
Gas Transported - Non-Firm | 445 | 56.8 | % | 989 | 38.7 | % | ||||||||||
Revenue (in millions) | ||||||||||||||||
Residential Sales | $ | 46 | -19.8 | % | $ | 401 | -31.3 | % | ||||||||
Commercial & Industrial - Firm Sales | 16 | -22.7 | % | 135 | -38.3 | % | ||||||||||
Commercial & Industrial - Interr. & Cogen | 9 | -63.6 | % | 27 | -61.3 | % | ||||||||||
Other Operating Revenues* | 40 | -2.6 | % | 119 | 1.4 | % | ||||||||||
|
|
|
| |||||||||||||
Total | $ | 111 | -23.1 | % | $ | 682 | -31.2 | % | ||||||||
|
|
|
| |||||||||||||
Gas Transported | $ | 99 | 2.9 | % | $ | 671 | -7.0 | % | ||||||||
| Three Months Ended | Change vs. 2011 | Nine Months Ended | Change vs. 2011 | |||||||||||||
Weather Data | ||||||||||||||||
Degree Days - Actual | 18 | -5.6 | % | 2,426 | -19.0 | % | ||||||||||
Degree Days - Normal | 32 | 3,100 | ||||||||||||||
| * | Primarily Appliance Service. |
Attachment 11
PUBLIC SERVICE ENTERPRISE GROUP INCORPORATED
Statistical Measures
(Unaudited)
| Three Months Ended September 30 | Nine Months Ended September 30 | |||||||||||||||
| 2012 | 2011 | 2012 | 2011 | |||||||||||||
Weighted Average Common Shares Outstanding (000’s) | ||||||||||||||||
Basic | 505,914 | 505,909 | 505,942 | 505,959 | ||||||||||||
Diluted | 507,111 | 506,999 | 507,037 | 506,963 | ||||||||||||
Stock Price at End of Period | $ | 32.18 | $ | 33.37 | ||||||||||||
Dividends Paid per Share of Common Stock | $ | 0.3550 | $ | 0.3425 | $ | 1.0650 | $ | 1.0275 | ||||||||
Dividend Payout Ratio* | 56.8 | % | 47.7 | % | ||||||||||||
Dividend Yield | 4.4 | % | 4.1 | % | ||||||||||||
Price/Earnings Ratio* | 12.9 | 11.6 | ||||||||||||||
Rate of Return on Average Common Equity* | 12.1 | % | 14.7 | % | ||||||||||||
Book Value per Common Share | $ | 21.36 | $ | 20.08 | ||||||||||||
Market Price as a Percent of Book Value | 151 | % | 166 | % | ||||||||||||
Total Shareholder Return | 0.1 | % | 3.3 | % | 0.9 | % | 8.3 | % | ||||||||
| * | Calculation based on Operating Earnings for the 12 month period ended. |
Attachment 12
PUBLIC SERVICE ENTERPRISE GROUP INCORPORATED
Reconciling Items Excluded from Continuing Operations to Compute Operating Earnings
(Unaudited)
| Pro-forma Adjustments, net of tax | Three Months Ended September 30, | Nine Months Ended September 30, | ||||||||||||||
| 2012 | 2011 | 2012 | 2011 | |||||||||||||
Earnings Impact ($ Millions) | ||||||||||||||||
Gain (Loss) on Nuclear Decommissioning Trust (NDT)Fund Related Activity (PSEG Power) | $ | 40 | $ | 7 | $ | 49 | $ | 49 | ||||||||
Gain (Loss) on Mark-to-Market (MTM) (a) (PSEG Power) | (76 | ) | 8 | (34 | ) | 16 | ||||||||||
Lease Related Activity (PSEG Energy Holdings) | 1 | (170 | ) | 7 | (170 | ) | ||||||||||
|
|
|
|
|
|
|
| |||||||||
Total Pro-forma adjustments | $ | (35 | ) | $ | (155 | ) | $ | 22 | $ | (105 | ) | |||||
|
|
|
|
|
|
|
| |||||||||
Fully Diluted Average Shares Outstanding (in Millions) | 507 | 507 | 507 | 507 | ||||||||||||
|
|
|
|
|
|
|
| |||||||||
Per Share Impact (Diluted) | ||||||||||||||||
Gain (Loss) on NDT Fund Related Activity (PSEG Power) | $ | 0.08 | $ | 0.01 | $ | 0.10 | $ | 0.10 | ||||||||
Gain (Loss) on MTM (a) (PSEG Power) | (0.15 | ) | 0.02 | (0.07 | ) | 0.03 | ||||||||||
Lease Related Activity (PSEG Energy Holdings) | — | (0.34 | ) | 0.01 | (0.34 | ) | ||||||||||
|
|
|
|
|
|
|
| |||||||||
Total Pro-forma adjustments | $ | (0.07 | ) | $ | (0.31 | ) | $ | 0.04 | $ | (0.21 | ) | |||||
|
|
|
|
|
|
|
| |||||||||
| (a) | Includes the financial impact from positions with forward delivery months. |