 Public Service Enterprise Group PSEG Earnings Conference Call 3rd Quarter 2012 November 1, 2012 Exhibit 99.1 |
1 Forward-Looking Statement Readers are cautioned that statements contained in this presentation about our future performance, including future revenues, earnings, strategies, prospects, consequences and all other statements that are not purely historical, are forward-looking statements for purposes of the safe harbor provisions under The Private Securities Litigation Reform Act of 1995. When used herein, the words “anticipate”, “intend”, “estimate”, “believe”, “expect”, “plan”, “should”, “hypothetical”, “potential”, “forecast”, “project”, variations of such words and similar expressions are intended to identify forward-looking statements. Although we believe that our expectations are based on reasonable assumptions, they are subject to risks and uncertainties and we can give no assurance they will be achieved. The results or developments projected or predicted in these statements may differ materially from what may actually occur. Factors which could cause results or events to differ from current expectations include, but are not limited to: • adverse changes in the demand for or price of the capacity and energy that we sell into wholesale electricity markets, • adverse changes in energy industry law, policies and regulation, including market structures and a potential shift away from competitive markets toward subsidized market mechanisms, transmission planning and cost allocation rules, including rules regarding how transmission is planned and who is permitted to build transmission in the future, and reliability standards, • any inability of our transmission and distribution businesses to obtain adequate and timely rate relief and regulatory approvals from federal and state regulators, • changes in federal and state environmental regulations that could increase our costs or limit our operations, • changes in nuclear regulation and/or general developments in the nuclear power industry, including various impacts from any accidents or incidents experienced at our facilities or by others in the industry, that could limit operations of our nuclear generating units, • actions or activities at one of our nuclear units located on a multi-unit site that might adversely affect our ability to continue to operate that unit or other units located at the same site, • any inability to balance our energy obligations, available supply and trading risks, • any deterioration in our credit quality, or the credit quality of our counterparties, including in our leveraged leases, • availability of capital and credit at commercially reasonable terms and conditions and our ability to meet cash needs, • any inability to realize anticipated tax benefits or retain tax credits, • changes in the cost of, or interruption in the supply of, fuel and other commodities necessary to the operation of our generating units, • delays in receipt of necessary permits and approvals for our construction and development activities, • delays or unforeseen cost escalations in our construction and development activities, • any inability to achieve or continue to sustain, our expected levels of operating performance, • increase in competition in energy supply markets as well as competition for certain rate-based transmission projects, • any inability to realize anticipated tax benefits or retain tax credits, • challenges associated with recruitment and/or retention of a qualified workforce, • adverse performance of our decommissioning and defined benefit plan trust fund investments and changes in discount rates and funding requirements, and • changes in technology and customer usage patterns. For further information, please refer to our Annual Report on Form 10-K, including Item 1A. Risk Factors, and subsequent reports on Form 10-Q and Form 8-K filed with the Securities and Exchange Commission. These documents address in further detail our business, industry issues and other factors that could cause actual results to differ materially from those indicated in this presentation. In addition, any forward-looking statements included herein represent our estimates only as of today and should not be relied upon as representing our estimates as of any subsequent date. While we may elect to update forward-looking statements from time to time, we specifically disclaim any obligation to do so, even if our internal estimates change, unless otherwise required by applicable securities laws. |
2 GAAP Disclaimer PSEG presents Operating Earnings in addition to its Net Income reported in accordance with accounting principles generally accepted in the United States (GAAP). Operating Earnings is a non-GAAP financial measure that differs from Net Income because it excludes gains or losses associated with Nuclear Decommissioning Trust (NDT), Mark-to-Market (MTM) accounting, and other material one-time items. PSEG presents Operating Earnings because management believes that it is appropriate for investors to consider results excluding these items in addition to the results reported in accordance with GAAP. PSEG believes that the non-GAAP financial measure of Operating Earnings provides a consistent and comparable measure of performance of its businesses to help shareholders understand performance trends. This information is not intended to be viewed as an alternative to GAAP information. The last slide in this presentation includes a list of items excluded from Income from Continuing Operations to reconcile to Operating Earnings, with a reference to that slide included on each of the slides where the non-GAAP information appears. |
 PSEG 2012 Q3 Review Caroline Dorsa EVP and Chief Financial Officer |
 4 Q3 Earnings Summary $ millions (except EPS) 2012 2011 Operating Earnings $ 382 $ 420 Reconciling Items, Net of Tax (35) (155) Income from Continuing Operations $ 347 $ 265 Discontinued Operations, Net of Tax - 29 Net Income $ 347 $ 294 EPS from Operating Earnings* $ 0.75 $ 0.83 Quarter ended September 30 * See Page A for Items excluded from Income from Continuing Operations to reconcile to Operating Earnings. |
 5 Year to Date 2012 Earnings Summary $ millions (except EPS) 2012 2011 Operating Earnings $ 1,029 $ 1,152 Reconciling Items, Net of Tax 22 (105) Income from Continuing Operations $ 1,051 $ 1,047 Discontinued Operations - 96 Net Income $ 1,051 $ 1,143 EPS from Operating Earnings* $ 2.03 $ 2.27 Nine months ended September 30 * See Page A for Items excluded from Income from Continuing Operations to reconcile to Operating Earnings. |
 6 PSEG – Q3 2012 Highlights Solid financial results -- Operating Earnings of $0.75 vs. $0.83 per share in Q3 2011 Executing on operational goals Record output from CCGTs, strong production from Nuclear, and Power’s control of O&M supported results Transmission becoming a significant contributor to earnings Executing on capital program Key regulatory approvals received for Susquehanna-Roseland transmission line Decisions expected in Q1 2013 on extensions to Solar 4 All and Solar Loan investment programs Power added 400 MW of new peakers on time to respond to summer demand Holdings’ Queen Creek solar farm in AZ achieved commercial operation in October; announced a new $47 million, Delaware solar investment with completion target by January 2013 Competitive market issues under review US District Court will proceed to hearings on LCAPP litigation PJM MOPR settlement to be filed with FERC that establishes revised price bidding rules for new generation supply beginning with the May 2013 auction |
 PSEG – Subsequent Events 7 In late October 2012, Hurricane Sandy’s high winds, heavy rainfall and related flooding caused severe damage to our transmission and distribution system throughout our service territory as well as to some of our generation infrastructure in the northern part of New Jersey. Walls of water created by the storm surge flooded a large number of substations along the Passaic, Raritan and Hudson rivers. The magnitude of the flooding in contiguous areas is unprecedented. At the peak of the outages, approximately 1.5 million of our customers were without power due to the storm; the most in PSE&G’s history -- surpassing both Tropical Storm Irene and the October 2011 snowstorm. With the assistance of mutual aid crews from other utilities, our associates are working to minimize the length of time our customers are without electric or gas service. PSE&G and Power are unable to estimate the possible loss or range of loss related to Hurricane Sandy, however, such costs could be material. On October 26, 2012, PSE&G filed a petition with the BPU seeking authorization to defer on our books actually incurred, uninsured, incremental storm restoration costs associated with our gas and electric distribution systems. PSE&G requested similar relief in August 2011 as Tropical Storm Irene approached. Both requests are currently pending before the BPU. We maintain property insurance for both nuclear and non-nuclear property. We intend to seek recovery from our insurers for any property damage above our self-insured retentions, however, no assurances can be given relative to the timing or amount of such recovery. |
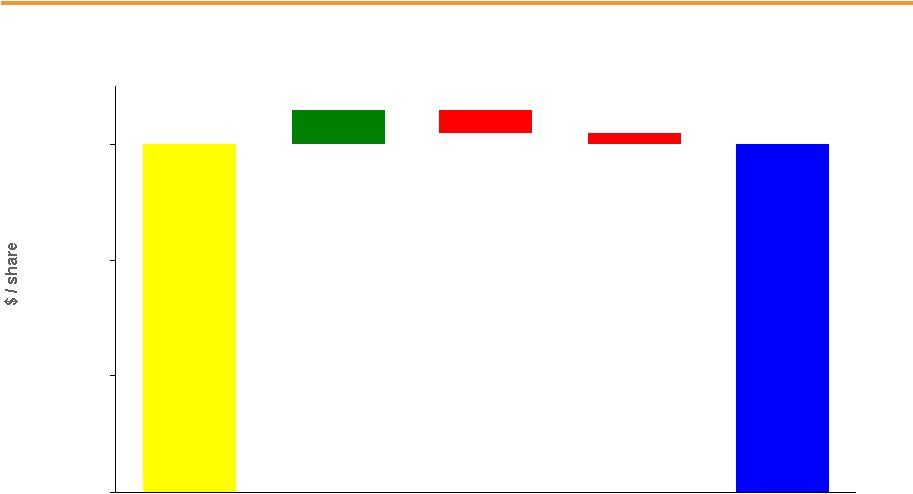
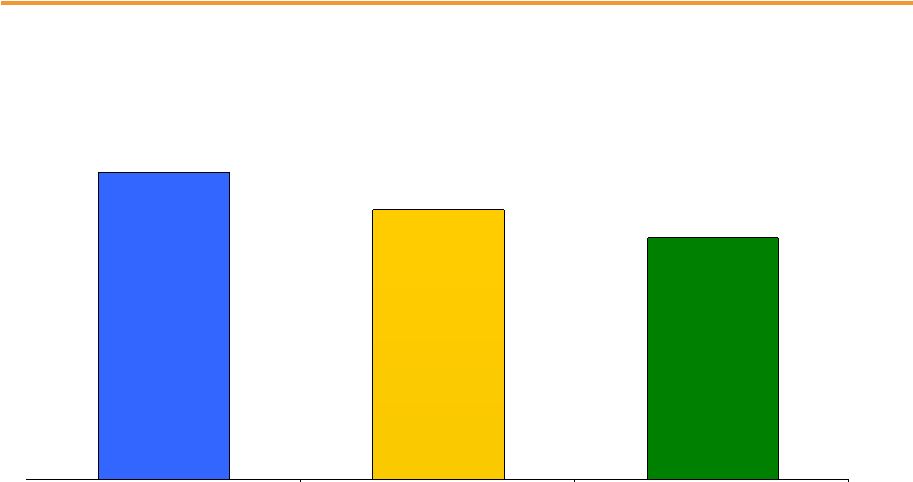 2010 Operating Earnings* 2011 Operating Earnings* 2012 Guidance 8 $2.25 - $2.50E PSEG – Maintaining 2012 Guidance $3.12 * See Page A for Items excluded from Income from Continuing Operations to reconcile to Operating Earnings. $2.74 YTD 9/30/12 EPS $2.03 |
 PSEG 2012 Q3 Operating Company Review |
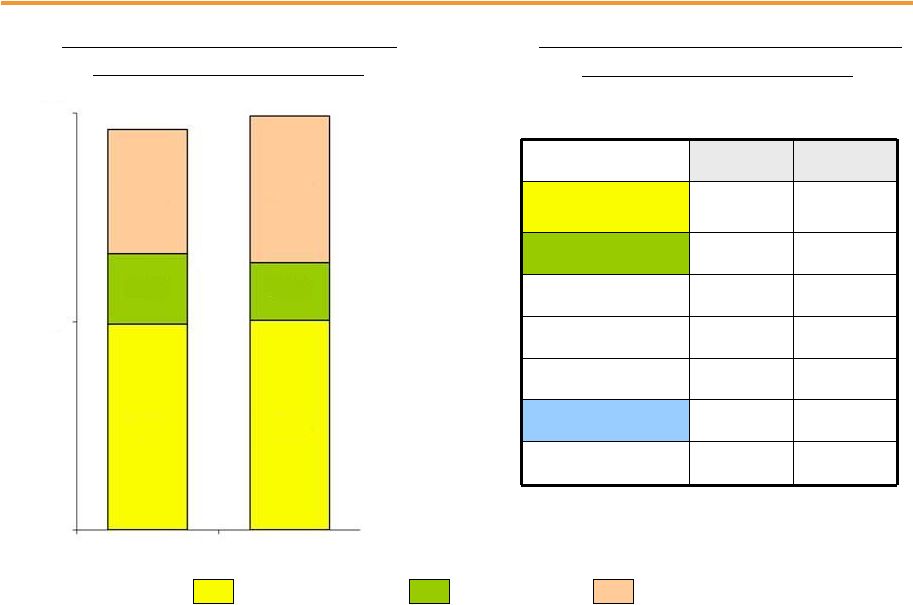
 10 Q3 Operating Earnings by Subsidiary Operating Earnings Earnings per Share $ millions (except EPS) 2012 2011 2012 2011 PSEG Power $ 217 $ 258 $ 0.43 $ 0.51 PSE&G 155 154 0.30 0.30 PSEG Energy Holdings/ Enterprise 10 8 0.02 0.02 Operating Earnings* $ 382 $ 420 $ 0.75 $ 0.83 Quarter ended September 30 * See Page A for Items excluded from Income from Continuing Operations to reconcile to Operating Earnings. |
 11 $0.83 $0.75 (.08) 0.00 0.25 0.50 0.75 1.00 PSEG EPS Reconciliation – Q3 2012 versus Q3 2011 Lower Pricing (.15) Higher Volume .01 Capacity .05 O&M .01 Transmission .03 Weather (.01) O&M (.02) D&A (.01) Other .01 Q3 2012 Operating Earnings* Q3 2011 Operating Earnings* PSEG Power PSE&G Energy Holdings/ Enterprise * See Page A for Items excluded from Income from Continuing Operations to reconcile to Operating Earnings. |
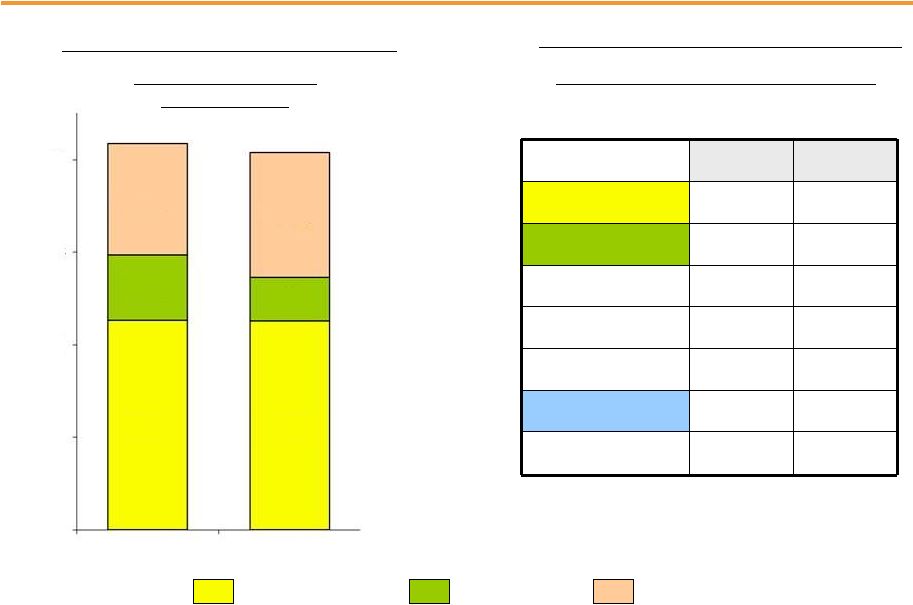
 12 Year to Date Operating Earnings by Subsidiary Operating Earnings Earnings per Share $ millions (except EPS) 2012 2011 2012 2011 PSEG Power $ 523 $ 710 $ 1.03 $ 1.40 PSE&G 453 422 0.89 0.83 PSEG Energy Holdings/ Enterprise 53 20 0.11 0.04 Operating Earnings* $ 1,029 $ 1,152 $ 2.03 $ 2.27 Nine months ended September 30 •See Page A for Items excluded from Income from Continuing Operations to reconcile to Operating Earnings. |
 13 PSEG EPS Reconciliation – YTD 2012 versus YTD 2011 YTD 2012 Operating Earnings* YTD 2011 Operating Earnings* Lower Pricing (.32) Lower Volume (.02) Lower Capacity (.06) Financing Costs .03 O&M .03 Lower Coal Sales & Other (.03) PSEG Power Transmission .08 Renewables and Other Investments .01 O&M (.06) Weather (.02) D&A (.03) Tax Settlement .06 Other .02 PSE&G PSEG Energy Holdings/ Enterprise Tax Settlement * See Page A for Items excluded from Income from Continuing Operations to reconcile to Operating Earnings. $2.27 .06 .07 $2.03 (.37) 0.00 0.50 1.00 1.50 2.00 2.50 |
 PSEG Power 2012 Q3 Review |
 15 PSEG Power – Q3 2012 EPS Summary $ millions (except EPS) Q3 2012 Q3 2011 Variance Operating Revenues $ 1,038 $ 1,398 $ (360) Operating Earnings $ 217 $ 258 $ (41) NDT Funds Related Activity, Net of Tax 40 7 33 Mark-to-Market, Net of Tax** (76) 8 (84) Income from Continuing Operations 181 273 (92) Discontinued Operations, Net of Tax - 29 (29) Net Income $ 181 $ 302 (121) EPS from Operating Earnings* $ 0.43 $ 0.51 $ (0.08) * See Page A for Items excluded from Income from Continuing Operations to reconcile to Operating Earnings. **Includes the financial impact from positions with forward delivery months. |
 16 Lower Pricing (.15) Volume .01 Capacity .05 PSEG Power EPS Reconciliation – Q3 2012 versus Q3 2011 Q3 2012 Operating Earnings* Q3 2011 Operating Earnings* O&M .01 * See Page A for Items excluded from Income from Continuing Operations to reconcile to Operating Earnings. $0.51 .01 $0.43 (0.09) 0.00 0.10 0.20 0.30 0.40 0.50 |
 17 PSEG Power – Generation Measures Quarter ended September 30 Total Nuclear Total Coal* Oil & Natural Gas * Includes figures for Pumped Storage. Includes Hudson and Mercer with Gas. PSEG Power – Generation (GWh) 14,426 14,919 Quarter ended September 30 PSEG Power – Capacity Factors (%) 2011 2012 Nuclear 90.6 92.0 Coal* NJ (Coal/Gas) 33.9 26.6 PA 83.2 79.0 CT 25.5 3.8 Combined Cycle PJM and NY 57.5 67.1 15,000 7,500 0 2011 2012 4,473 5,289 2,536 2,071 7,417 7,559 |
 18 PSEG Power – Generation Measures Nine Months ended September 30 Total Nuclear Total Coal* Oil & Natural Gas * Includes figures for Pumped Storage. Includes Hudson and Mercer with Gas. PSEG Power – Generation (GWh) 41,779 40,769 Nine Months ended September 30 PSEG Power – Capacity Factors (%) 2011 2012 Nuclear 93.3 92.5 Coal* NJ (Coal/Gas) 32.7 14.2 PA 80.9 68.7 CT 18.7 2.9 Combined Cycle PJM and NY 54.2 60.3 40,000 30,000 20,000 10,000 0 12,088 13,509 7,039 4,656 22,652 22,604 2011 2012 |
 19 PSEG Power – Fuel Costs Quarter ended September 30 ($ millions) 2011 2012 Coal 98.4 64.9 Oil & Gas 184.8 166.7 Total Fossil 283.2 231.6 Nuclear 45.3 52.7 Total Fuel Cost 328.5 284.3 Total Generation (GWh) 14,426 14,919 $ / MWh 22.77 19.05 PSEG Power – Fuel Costs* * Based on Operating Earnings. YTD ended September 30 ($ millions) 2011 2012 Coal 271.2 142.4 Oil & Gas 530.3 407.8 Total Fossil 801.5 550.2 Nuclear 135.4 150.7 Total Fuel Cost 936.9 700.9 Total Generation (GWh) 41,779 40,769 $ / MWh 22.43 17.19 |
 20 $57 $54 $47 PSEG Power – Gross Margin Performance Highest ever combined cycle output Margins aided by increased reliance on low-cost, efficient CCGT fleet Migration volumes slightly lower than Q2, in line with full-year estimate of 36%-40% Regional Performance Region Q3 2012 Gross Margin* ($M) 2012 Performance PJM $652 Decline in energy prices partially offset by strong performance of nuclear fleet and CCGT production New England $19 Hurt by lower dark spreads and lower coal sales New York $26 Margin improved over the year earlier on strong CCGT production PSEG Power Gross Margin* ($/MWh) Quarter ended September 30 * Based on Operating Earnings. $0 $25 $50 $75 2010 2011 2012 |
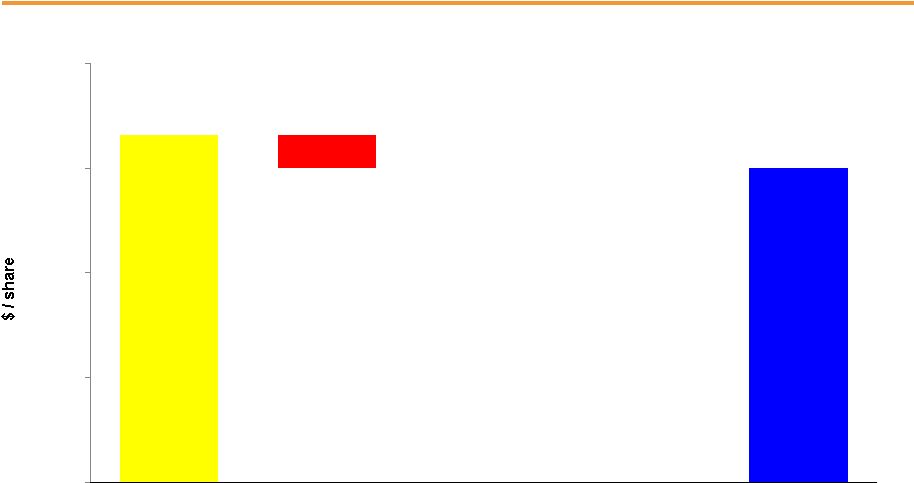
 21 Hedging Update… Contracted Energy* * Hedge percentages and prices as of September 28, 2012. Revenues of full requirement load deals based on contract price, including renewable energy credits, ancillary, and transmission components but excluding capacity. Hedges include positions with MTM accounting treatment and options. Volume TWh 12 35 35 Base Load % Hedged 100% 90-95% 50-55% (Nuclear and Base Load Coal) Price $/MWh $54 $51 $49 Volume TWh 4 18 18 Intermediate Coal, Combined % Hedged 35-40% 0% 0% Cycle, Peaking Price $/MWh $54 $51 $49 Volume TWh 13 52-54 53-55 Total % Hedged 80-85% 60-65% 30-35% Price $/MWh $54 $51 $49 Oct -Dec 2012 2013 2014 |
 22 PSEG Power – Q3 2012 Operating Highlights Q3 output increased 3% from the Q3 2011 level Combined-cycle production represented 32% of generation for Q3 and was the highest ever Summer output achieved by the CCGT fleet Strong nuclear performance has resulted in a YTD nuclear capacity factor of 92.5% Planned Salem 2 refueling outage began in mid-October Operations Regulatory and Market Environment Financial MOPR reform discussions ongoing at PJM Federal Court update on November 13 Average energy only hedge price for 2012 is $60/MWh Customer migration held at approximately 37% for the quarter Power’s total debt as a percentage of capital at September 30 was 33% Power’s next maturity is a $300 million, 2.50% Senior Note due April 2013 |
 MOPR Reform – Comparison of Features 23 Design Feature Existing MOPR Proposed MOPR Resource Type All new generating resources (except nuclear, coal, IGCC, hydro, wind, solar, have zero minimum price threshold). All new gas-fired resources (CC, CT, IGCC) over 20 MW (except for landfill gas and eligible cogeneration) Locations Any LDA for which separate VRR curve is established Entire PJM market region Default MOPR Lower of 90% NET CONE for the asset type (70% where there is no applicable asset type CONE ) or unit specific minimum offer floor determined by the IMM and PJM 100% of NET CONE for asset type Exemption Unit specific alternative minimum offer established through detailed review of project cost/revenue Specific exemptions for the following categories subject to specific criteria: • Self supply (traditional business models building or contracting for the capacity needs of their customers and consistent with specific criteria) • Competitive entry Duration of Mitigation Until new resource clears in one RPM auction Non-exempt units must clear in RPM auctions for 3 separate delivery years, or must clear in 1 RPM auction in certain situations where reliability could be detrimentally affected Source: www.pjm.com ; Minimum Offer Price Rule Education Session Materials – October 4, 2102 |
 PSE&G 2012 Q3 Review |
 25 PSE&G – Q3 Earnings Summary $ millions (except EPS) Q3 2012 Q3 2011 Variance Operating Revenues $ 1,683 $ 1,841 (158) Operating Expenses 756 943 (187) 366 342 24 216 197 19 24 31 (7) Total Operating Expenses 1,362 1,513 (151) Operating Earnings / Net Income $ 155 $154 $ 1 EPS from Operating Earnings $ 0.30 $ 0.30 - Energy Costs Operation & Maintenance Depreciation & Amortization Taxes Other than Income Taxes |
 26 $0.30 .03 $0.30 (.02) (.01) 0.00 0.10 0.20 0.30 PSE&G EPS Reconciliation – Q3 2012 versus Q3 2011 Q3 2012 Operating Earnings Q3 2011 Operating Earnings Transmission O&M (.02) D&A (.01) Other .01 Weather |
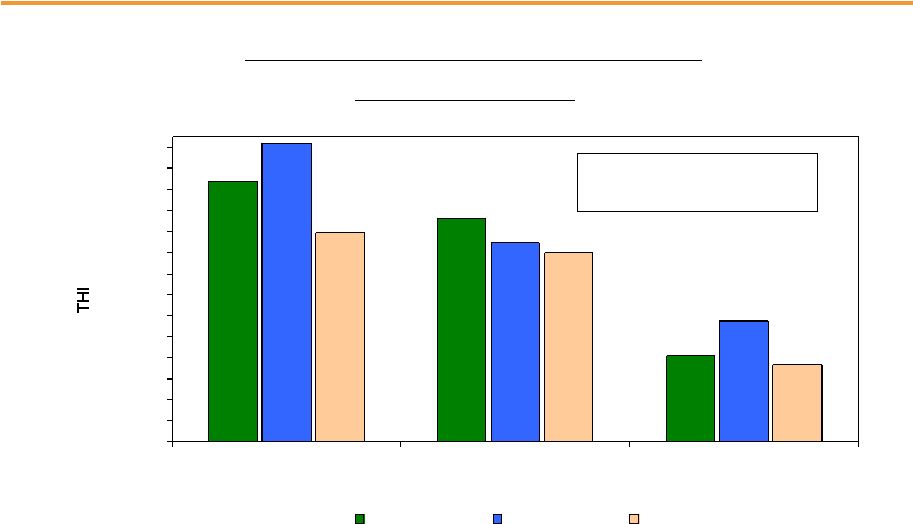 27 PSE&G – Monthly Summer Weather Data 6,184 5,308 2,054 7,092 4,730 2,868 4,967 4,489 1,835 0 500 1,000 1,500 2,000 2,500 3,000 3,500 4,000 4,500 5,000 5,500 6,000 6,500 7,000 July August September 2012 2011 Normal 2012 vs. 2011 vs. Normal PSE&G Monthly Temperature Humidity Index (THI) -7.8% Q3 2012 vs. Q3 2011 +20% Q3 2012 vs. Normal |
 28 PSE&G – Q3 Operating Highlights Received key regulatory approvals for the Susquehanna-Roseland transmission line; construction is underway PSE&G expects the BPU to decide on two requests to spend up to $883 million to expand the Solar 4 All and Solar Loan programs in early 2013 PSE&G lowered its residential gas prices by an additional 3.6%, the 9 th price reduction in a row and a 39% savings in gas supply costs since January 2009 PSE&G earned its authorized return Issued $350 million of secured medium-term notes at 3.65% due September 2042 Retired $300 million of 5.13% secured medium-term notes at maturity Operations Regulatory and Market Environment Financial Weather in Q3 2012 warmer than normal but cooler than Q3 2011 Transmission revenues were $0.03 per share higher over Q3 2011 O&M remains under control |
 PSEG Energy Holdings/Enterprise 2012 Q3 Review |
 30 PSEG Energy Holdings/Enterprise – Q3 2012 Earnings Summary $ millions (except EPS) Q3 2012 Q3 2011 Variance Operating Earnings $ 10 $ 8 $ 2 Lease Related Activity 1 (170) 171 Net Income $ 11 $ (162) $ 173 EPS from Operating Earnings* $ 0.02 $ 0.02 - * See Page A for Items excluded from Income from Continuing Operations to reconcile to Operating Earnings. |
 31 PSEG Energy Holdings/Enterprise – Q3 Operating Highlights Financial Payments on Holdings’ remaining lease portfolio are current A new $47 million investment in the Milford Solar Farm in Delaware with a completion target of January 2013 $75 million investment in Queen Creek Arizona solar farm; achieved commercial operation in early October |
 PSEG |
 33 PSEG Financial Highlights Maintaining full-year operating earnings guidance of $2.25 - $2.50 per share Focused on maintaining operating efficiency and customer reliability Executing on capital program Financial position remains strong Debt as a percentage of capital at 41% at September 30 Proactively and aggressively investing in infrastructure at attractive utility returns as a means of enhancing reliability, improving the environment and supporting the NJ economy In October 2012, S&P published updated credit opinions for Power and PSE&G that kept their ratings and outlooks unchanged |
 34 PSEG 2012 Operating Earnings Guidance - By Subsidiary $ millions (except EPS) 2012E 2011A PSEG Power $575 – $665 $ 845 PSE&G $530 – $560 $ 521 PSEG Energy Holdings/Enterprise $35 – $45 $ 23 Operating Earnings* $1,140 – $1,270 $ 1,389 Earnings per Share $ 2.25 – $ 2.50 $2.74 * See Page A for Items excluded from Income from Continuing Operations to reconcile to Operating Earnings. |
 35 PSEG Liquidity as of September 30, 2012 Company Facility Date Facility Usage Liquidity ($Millions) PSE&G 5-year Credit Facility Apr-16 $600 $1 $599 5-Year Credit Facility (Power) Mar-17 $1,600 $119 $1,481 5-Year Credit Facility (Power) Apr-16 $1,000 $0 $1,000 5-Year Bilateral (Power) Sep-15 $100 $100 $0 5-year Credit Facility (PSEG) Mar-17 $500 $4 $496 5-year Credit Facility (PSEG) Apr-16 $500 $0 $500 Total $4,300 $224 $4,076 $662 PSE&G ST Investment $48 Total Liquidity Available $4,786 Total Parent / Power Liquidity $4,139 PSEG / Power PSEG Money Pool ST Investment |
 Items Excluded from Income from Continuing Operations to Reconcile to Operating Earnings Please see Page 2 for an explanation of PSEG’s use of Operating Earnings as a non-GAAP financial measure and how it differs from Net Income. A (Unaudited) 2012 2011 2012 2011 Earnings Impact ($ Millions) Gain (Loss) on Nuclear Decommissioning Trust (NDT) Fund Related Activity (PSEG Power) 40 $ 7 $ 49 $ 49 $ 50 $ 46 $ Gain (Loss) on Mark-to-Market (MTM) (a) (PSEG Power) (76) 8 (34) 16 107 (1) Dynegy Related Activity (PSEG Energy Holdings) 1 (170) 7 (170) - - Market Transition Charge Refund (PSE&G) - - - - - (72) Gain on Sale of Qwest Building (Energy Holdings) - - - - 34 - Lease Transaction Loss (Energy Holdings) - - - - (173) - Total Pro-forma adjustments (35) $ (155) $ 22 $ (105) $ 18 $ (27) $ Fully Diluted Average Shares Outstanding (in Millions) 507 507 507 507 507 507 Per Share Impact (Diluted) Gain (Loss) on NDT Fund Related Activity (PSEG Power) 0.08 $ 0.01 $ 0.10 $ 0.10 $ 0.10 $ 0.09 $ Gain (Loss) on MTM (a) (PSEG Power) (0.15) 0.02 (0.07) 0.03 0.21 - Dynegy Related Activity (PSEG Energy Holdings) - (0.34) 0.01 (0.34) - - Market Transition Charge Refund (PSE&G) - - - - - (0.14) Gain on Sale of Qwest Building (Energy Holdings) - - - - 0.06 - Lease Transaction Loss (Energy Holdings) - - - - (0.34) - Total Pro-forma adjustments (0.07) $ (0.31) $ 0.04 $ (0.21) $ 0.03 $ (0.05) $ (a) Includes the financial impact from positions with forward delivery months. September 30, For the Twelve Months Ended September 30, Reconciling Items Excluded from Continuing Operations to Compute Operating Earnings PUBLIC SERVICE ENTERPRISE GROUP INCORPORATED For the Three Months Ended For the Nine Months Ended December 31, Pro-forma Adjustments, net of tax 2011 2010 |