UNITED STATES
SECURITIES AND EXCHANGE COMMISSION
Washington, D.C. 20549
FORM N-CSR
CERTIFIED SHAREHOLDER REPORT OF REGISTERED
MANAGEMENT INVESTMENT COMPANIES
Investment Company Act file number 811-05010
(Exact name of registrant as specified in charter)
|
2960 North Meridian Street, Suite 300 Attn: Huntington Funds Officer Indianapolis, IN 46208 |
(Address of principal executive offices) (Zip code)
|
Ronald J. Corn, Esq. The Huntington National Bank 41 South High Street Columbus, OH 43287 |
(Name and address of agent for service)
Copies to:
David C. Mahaffey, Esq.
Sullivan & Worcester
1666 K Street, N.W.
Washington, DC 20006
Registrant’s telephone number, including area code: 1-800-253-0412
Date of fiscal year end: December 31
Date of reporting period: December 31, 2010
Item 1. Reports to Stockholders.

Money Market Funds
Huntington Tax-Free Money Market Fund
Huntington Money Market Fund
Huntington Ohio Municipal Money Market Fund
Huntington U.S. Treasury Money Market Fund
Equity Funds
Huntington Dividend Capture Fund
Huntington Global Select Markets Fund
Huntington Growth Fund
Huntington Income Equity Fund
Huntington International Equity Fund
Huntington Macro 100 Fund
Huntington Mid Corp America Fund
Huntington New Economy Fund
Huntington Real Strategies Fund
Huntington Rotating Markets Fund
Huntington Situs Fund
Huntington Technical Opportunities Fund
Income Funds
Huntington Fixed Income Securities Fund
Huntington Intermediate Government Income Fund
Huntington Mortgage Securities Fund
Huntington Ohio Tax-Free Fund
Huntington Short/Intermediate Fixed Income Securities Fund
Asset Allocation Funds
Huntington Balanced Allocation Fund
Huntington Conservative Allocation Fund
Huntington Growth Allocation Fund
DECEMBER 31, 2010
CLASS A SHARES
TRUST SHARES
| | |
Dividend Capture Fund | | As of 12/31/10 |
Management’s Discussion of Fund Performance
Portfolio Manager:
Kirk Mentzer, MBA, Director of Research
Huntington Asset Advisors, Inc.
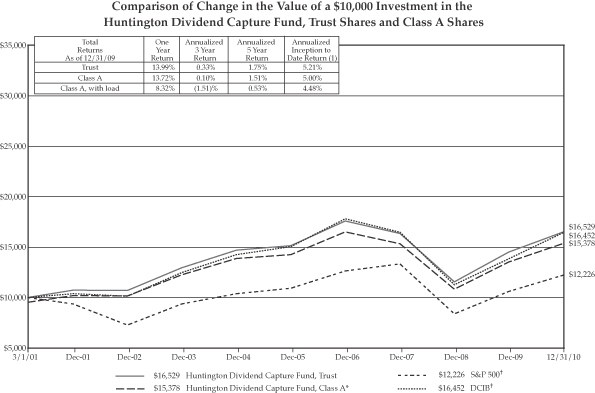
For the fiscal year ended December 31, 2010, the Huntington Dividend Capture Fund’s Trust Shares and Class A Shares produced total returns (not including the deduction of applicable sales charges) of 13.99% and 13.72%, respectively, based on net asset value. This performance was less than the total return of 15.06% for the Fund’s benchmark, the Standard & Poor’s 500 Index (S&P 500),1 and less than the 17.12% total return for the Dividend Capture Indices Blend (DCIB).2 The Huntington Dividend Capture A class shares underperformed the benchmark by -1.34%.
The Fund is managed using our top-down style and portfolio construction techniques, which are aimed at producing a high level of stable income and low volatility. In general terms, income-producing stocks and value-oriented investments lagged overall market performance during the fiscal year. Improving market sentiment, policy clarity and increased merger activity all converged late in the year to provide a strong finish for equity markets in 2010. However, the market had to wade through considerable uncertainty to get to its final destination. Sovereign debt issues in Europe at the beginning of summer threatened the durability of the financial system recovery. As a result, the Federal Reserve initiated further bond purchases in late summer to enhance market liquidity. Despite the US mid-term elections and China raising interest rates in the fall, the US equity market was able to power through all these barriers thanks to plentiful liquidity. For all of 2010, the S&P 500 posted a total return of 15.06%. Fourth quarter results were likewise strong at 10.76%. The Fund’s asset allocation efforts were successful in capturing much of the fourth quarter equity market move by selling REITs ( Real Estate Investment Trusts) and Preferred shares in favor of common stocks which were the best performing of the three classes.
Trading activity was responsible for -1.74% of the performance relative to the benchmark while portfolio structure had a positive impact of 0.62%. Portfolio structure can be explained by adding Security Characteristics: -0.01%, Sector Allocation: -1.09% and Security Selection: 1.72%. The three holdings that had the largest positive contribution to the Fund’s performance were Polaris Industries Inc. , Chevron Corp. and A.O. Smith Corp. These three holdings added 1.62% to the fund’s return. The three holdings that had the largest negative contribution to the Funds performance were Avon Products Inc., Pfizer Inc., and Archer Daniels Midland Co. These three holdings subtracted -0.86% from the Fund’s return.
| ¿ | | The composition of the Fund’s holdings is subject to change. |
| (1) | The S&P 500 is a capitalization-weighted index comprised of 500 stocks and is designed to measure performance of the broad domestic economy through changes in the aggregate market value of 500 stocks representing all major industries. The index is unmanaged and, unlike the Fund, is not affected by cashflows. It is not possible to invest directly in an Index. |
| (2) | The DCIB is a custom, blended index comprised of the following three indices with their noted respective weightings: S&P 500 Value Index (40%), Merrill Lynch Fixed Rate Preferred Index (40%) and NAREIT Index (20%). This custom, blended index and its respective weightings are reflective of the Fund’s sector diversification. Indices are unmanaged and, unlike the Fund, are not affected by cashflows. It is not possible to invest directly in an Index. |
Annual Shareholder Report
1
Dividend Capture Fund (Continued)
Performance data quoted represents past performance which is no guarantee of future results. Investment return and principal value will fluctuate so that an investor’s shares, when redeemed, may be worth more or less than their original cost. Mutual fund performance changes over time and current performance may be lower or higher than what is stated. For current to the most recent month end performance, visit www.huntingtonfunds.com or call 1-800-253-0412. For after-tax returns call 1-800-253-0412. Returns shown do not reflect the deduction of taxes that a shareholder would pay on Fund distributions or the redemption of Fund Shares. Mutual funds are not obligations of or guaranteed by any bank and are not federally insured. Total returns, at load, include the maximum 4.75% sales charge for the Class A Shares.
| | | | |
| Class | | Expense Ratios | |
A | | | 1.66% | |
Trust | | | 1.41% | |
The above expense ratios are from the Funds’ prospectus dated May 1, 2010. Additional information pertaining to the Fund’s expense ratio as of December 31, 2010 can be found in the financial highlights.
The Fund’s performance assumes the reinvestment of all dividends and distributions on securities. The S&P 500 and DCIB have been adjusted to reflect reinvestment of dividends on securities in the indices.
| * | Represents a hypothetical investment of $10,000 in the Fund after deducting the maximum sales load of 4.75% ($10,000 investment minus $475 sales load = $9,525). |
| (1) | The Fund commenced operations for all Share classes on March 1, 2001. |
| † | The S&P 500 and DCIB are not adjusted to reflect sales charges, expenses, or other fees that the Securities and Exchange Commission requires to be reflected in the Fund’s performance. The indices are unmanaged and, unlike the Fund, are not affected by cashflows. It is not possible to invest directly in an index. |
Annual Shareholder Report
2
| | |
Global Select Markets Fund | | As of 12/31/10 |
Management’s Discussion of Fund Performance
Portfolio Manager: Paul W. Attwood, CFA
Vice President
Huntington Asset Advisors, Inc.
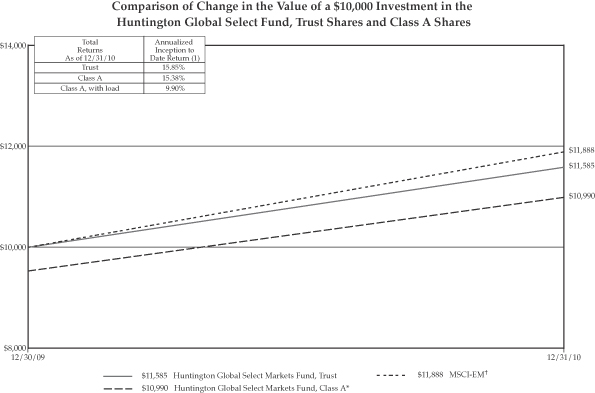
For the fiscal year ended December 31, 2010, the Huntington Global Select Markets Fund produced total returns (not including the deduction of applicable sales charges) of 15.85% and 15.38% for its Trust and Class A Shares respectively, based on net asset value. This underperformed the total return of 18.88% for the Morgan Stanley Capital International (MSCI) Emerging Market Index (MSCI-EM),1 the Fund’s benchmark index.
From a country perspective, Brazil and China were laggards which negatively affected the performance of the Fund. Some of the smaller emerging markets, such as the Indonesian Jakarta Composite, which appreciated 48.94%, bolstered overall total return. This turned out to be the major theme within the emerging markets for most of the year. A significant outperformance in 2009 along with concerns over overheating economies and inflation kept most of the larger markets in a trading range. The fund has a significant overweight in India which had a weak fourth quarter and played a major role in affecting relative performance.
The developing market currencies once again had positive performances versus the U.S dollar. Concerns over European sovereign debt negatively affected most Eastern European nations even though they are not European Community members. Another theme which is permeated these markets was concern over increasing capital flows and hence rising currencies. After Japan relented to global pressure in the 1990’s allowing the Yen to appreciate too rapidly, their competitiveness suffered dramatically and led to increases in unemployment and what is commonly referred to as the lost decade. Leaders within emerging market countries are committed to avoiding the same mistake. Brazil, for example, has imposed a “tariff” on international investors wanting to purchase Brazilian Real in order to gain exposure to equities or bonds. Other countries are expected to follow suit.
Consumer Discretionary and Staples were the top performing sectors for the year which was beneficial to the Fund’s performance. A major theme of the Fund is focused on the emergence of a middle-class consumer in select Asia and Latin America regions. Energy and Utilities were the weakest areas. Sector performance was highly differentiated on a regional basis. As an example, Brazil’s energy stocks were down over 16% as a group while China’s were up over 19%. Consumer names owned by the Fund produced some significant gains throughout the year, such as Taiwan-based President Chain Store which was up almost 100% and Brazil’s Ambev which was up over 50%. One of the weaker names was Petrobras which was down over 18% due to a large secondary offering during the year.
| ¿ | | The composition of the Fund’s holdings is subject to change. |
| ¿ | | International investing involves special risks including currency risk, political risk, increased volatility of foreign securities, and differences in auditing and other financial statements. |
| (1) | The MSCI-EM is a market-capitalization weighted equity index comprising 21 of the 48 countries in the MSCI universe. Each MSCI country index is created separately, then aggregated, without change, into MSCI indices. The index is unmanaged and, unlike the Fund, is not affected by cashflows. It is not possible to invest directly in an Index. |
Annual Shareholder Report
3
Global Select Markets Fund (Continued)
Performance data quoted represents past performance which is no guarantee of future results. Investment return and principal value will fluctuate so that an investor’s shares, when redeemed, may be worth more or less than their original cost. Mutual fund performance changes over time and current performance may be lower or higher than what is stated. For current to the most recent month end performance, visit www.huntingtonfunds.com or call 1-800-253-0412. For after-tax returns call 1-800-253-0412. Returns shown do not reflect the deduction of taxes that a shareholder would pay on Fund distributions or the redemption of Fund Shares. Mutual funds are not obligations of or guaranteed by any bank and are not federally insured. Total returns, at load, include the maximum 4.75% sales charge for the Class A Shares.
| | | | |
| Class | | Expense Ratios | |
A | | | 2.16% | |
Trust | | | 1.91% | |
The above expense ratios are from the Funds’ prospectus dated May 1, 2010. Additional information pertaining to the Fund’s expense ratio as of December 31, 2010 can be found in the financial highlights.
The Fund’s performance assumes the reinvestment of all dividends and distributions on securities. The MSCI-EM has been adjusted to reflect reinvestment of dividends on securities in the index.
| * | Represents a hypothetical investment of $10,000 in the Fund after deducting the maximum sales load of 4.75% ($10,000 investment minus $475 sales load = $9,525). |
| (1) | The Fund commenced operations for all Share classes on December 30, 2009. |
| † | The MSCI-EM is not adjusted to reflect sales charges, expenses, or other fees that the Securities and Exchange Commission requires to be reflected in the Fund’s performance. The index is unmanaged and, unlike the Fund, is not affected by cashflows. It is not possible to invest directly in an index. |
Annual Shareholder Report
4
| | |
Growth Fund | | As of 12/31/10 |
Management’s Discussion of Fund Performance
Portfolio Manager:
Herb Chen, MBA
Senior Vice President
Huntington Asset Advisors, Inc.
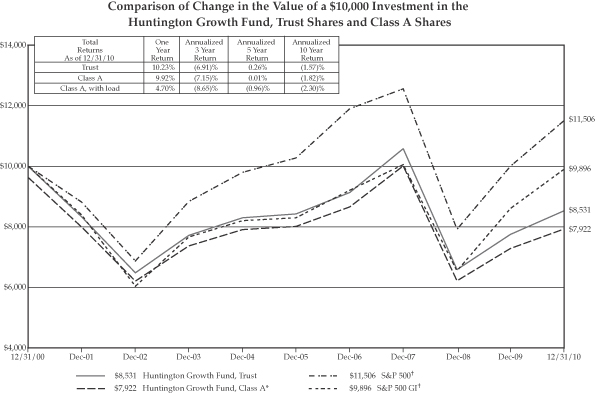
For the fiscal year ended December 31, 2010, the Huntington Growth Fund produced total returns (not including the deduction of applicable sales charges) of 10.23% and 9.92% for Trust Shares and Class A Shares, respectively, based on net asset value. This underperformed the total return of 15.05% for the Standard & Poor’s 500 Growth Index (S&P 500 GI), 1 the Fund’s benchmark and a total return of 15.06% for the Standard & Poor’s 500 Index (S&P 500)2 for the reporting period.
Under the management of the previous fund managers, the Growth Fund began the year with a relatively defensively structured portfolio. With the S& P 500 GI being up 3.71%, the Fund lagged by 1.74% at the end of the first quarter.
In April 2010, Herb Chen assumed management responsibility and three major changes were implemented to turn around Fund performance: the Fund was aligned with our forecast of an economic recovery, the number of positions was reduced from greater than 100 to 40, and the Beta of the Fund was increased above 1 to reflect a more aggressive growth portfolio.
In May 2010, the first month after the full rebalancing of the Fund, we began seeing positive relative returns. The Fund’s Trust Shares beat the benchmark by 1.83% in May 2010, and another 0.3% in June 2010. During these months, we were overweight in Consumer Discretionary, Energy, Industrials, and Materials, which typically outperform in an economic recovery.
In third quarter, profits were realized from Consumer Discretionary and re-invested into an overweight in Technology. The Fund delivered a 16.06% return, exceeding the benchmark by 3.43%. Security selection was the largest contributor at 4.57%, followed by security characteristics (-1.10%) and sector allocation (-1.07%). Baidu (2.40%),VMware (1.73%) and Salesforce.com (1.6%) were top stock contributors, representing 5.4%, 5.4% and 5.74% of the portfolio, respectively, at the end of the third quarter.
In the final quarter, Technology was returned to an underweight, with Consumer Discretionary moving back to an overweight. Security characteristics and sector allocation contributed 1.71%, to the Fund’s return, while stock selection reversed course with a -5.17% return. We believe this was more of an anomaly and will be carefully watched going forward. Companies that had appreciated significantly during the year disappointed during earnings release and sold off sharply. Several of these positions were sold to establish a fresh start in 2011.
| ¿ | | The composition of the Fund’s holdings is subject to change. |
| (1) | The S&P 500 GI is a capitalization-weighted index comprised of stocks in the S&P 500 having the highest price to book ratios. The index consists of approximately half of the S&P 500 on a market capitalization basis. The index is unmanaged and, unlike the Fund, is not affected by cashflows. It is not possible to invest directly in an Index. |
| (2) | The S&P 500 is a capitalization-weighted index comprised of 500 stocks and designed to measure performance of the broad domestic economy through changes in the aggregate market value of 500 stocks representing all major industries. The index is unmanaged and, unlike the Fund, is not affected by cashflows. It is not possible to invest directly in an Index. |
Annual Shareholder Report
5
Growth Fund (Continued)
Performance data quoted represents past performance which is no guarantee of future results. Investment return and principal value will fluctuate so that an investor’s shares, when redeemed, may be worth more or less than their original cost. Mutual fund performance changes over time and current performance may be lower or higher than what is stated. For current to the most recent month end performance, visit www.huntingtonfunds.com or call 1-800-253-0412. For after-tax returns call 1-800-253-0412. Returns shown do not reflect the deduction of taxes that a shareholder would pay on Fund distributions or the redemption of Fund Shares. Mutual funds are not obligations of or guaranteed by any bank and are not federally insured. Total returns, at load, include the maximum 4.75% sales charge for the Class A Shares.
| | | | |
| Class | | Expense Ratios | |
A | | | 1.47% | |
Trust | | | 1.22% | |
The above expense ratios are from the Funds’ prospectus dated May 1, 2010. Additional information pertaining to the Fund’s expense ratio as of December 31, 2010 can be found in the financial highlights.
The Fund’s performance assumes the reinvestment of all dividends and distributions on securities. The S&P 500 and S&P 500 GI have been adjusted to reflect reinvestment of dividends on securities in the indices.
| * | Represents a hypothetical investment of $10,000 in the Fund after deducting the maximum sales load of 4.75% ($10,000 investment minus $475 sales load = $9,525). |
| † | The S&P 500 and S&P 500 GI are not adjusted to reflect sales charges, expenses, or other fees that the Securities and Exchange Commission requires to be reflected in the Fund’s performance. The indices are unmanaged and, unlike the Fund, are not affected by cashflows. It is not possible to invest directly in an index. |
Annual Shareholder Report
6
| | |
Income Equity Fund | | As of 12/31/10 |
Management’s Discussion of Fund Performance
Portfolio Manager: Craig J. Hardy, CFA, MBA
Vice President
Huntington Asset Advisors, Inc.
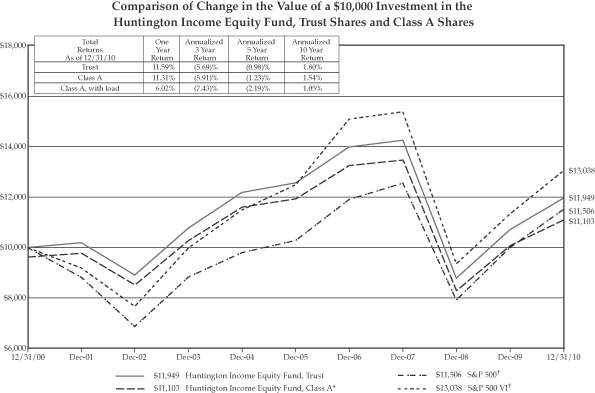
For the fiscal year ended December 31, 2010, the total returns (not including the deduction of applicable sales charges) for the Huntington Income Equity Fund were 11.59% and 11.31% for Trust Shares and Class A Shares, respectively, based on net asset value. These returns compare with a total return of 15.10% for the Standard & Poor’s 500 Value Index (S&P 500 VI),1 the Fund’s benchmark. The Standard & Poor’s 500 Index (S&P 500)2 returned 15.06% for the same period.
During the fiscal year, the Fund was positioned relatively conservatively, with an emphasis on stocks with above average dividend yields, reasonable dividend growth prospects and value orientation. Constructing the Fund with those characteristics meant that the Fund’s largest sector exposure during the fiscal year was in the Financial sector. This combination of characteristics produced returns for the Fund that were somewhat lower than the return of the S&P 500 VI and the S&P 500 for the reporting period.
The sectors that contributed most positively to the performance of the Fund during the year were Materials, Consumer Discretionary and Telecommunications. These sectors were positively affected by a growing economic environment and economic cyclicality. The sectors that most negatively impacted the Fund’s performance during the reporting period were Information Technology, Health Care and Energy. During a year of general stock market strength, these three sectors provided a degree of earnings stability and lesser economic sensitivity, but showed generally lower returns than some of the more cyclical sectors. The stocks that contributed most positively to the performance of the Fund during the year were Caterpillar Inc., Sara Lee Corp. and Limited Inc. The stocks that most negatively impacted Fund performance during the year were Banco Santander, BP and Sanofi-Aventis. In general, the sale of covered calls as a hedging technique added to the performance of the Fund.
| ¿ | | The composition of the Fund’s holdings is subject to change. |
| (1) | The S&P 500 VI is a capitalization-weighted index comprised of the stocks in the S&P 500 having the lowest price to book ratios and consists of approximately half of the S&P 500 on a market capitalization basis. The S&P multifactor methodology is used to score constituents, which are weighted according to market cap and classified as value. The index has a relatively low turnover. The index is unmanaged and, unlike the Fund, is not affected by cashflows. It is not possible to invest directly in an Index. |
| (2) | The S&P 500 is a capitalization-weighted index comprised of 500 stocks and designed to measure performance of the broad domestic economy through changes in the aggregate market value of 500 stocks representing all major industries. The index is unmanaged and, unlike the Fund, is not affected by cashflows. It is not possible to invest directly in an Index. |
Annual Shareholder Report
7
Income Equity Fund (Continued)
Performance data quoted represents past performance which is no guarantee of future results. Investment return and principal value will fluctuate so that an investor’s shares, when redeemed, may be worth more or less than their original cost. Mutual fund performance changes over time and current performance may be lower or higher than what is stated. For current to the most recent month end performance, visit www.huntingtonfunds.com or call 1-800-253-0412. For after-tax returns call 1-800-253-0412. Returns shown do not reflect the deduction of taxes that a shareholder would pay on Fund distributions or the redemption of Fund Shares. Mutual funds are not obligations of or guaranteed by any bank and are not federally insured. Total returns, at load, include the maximum 4.75% sales charge for the Class A Shares.
| | | | |
| Class | | Expense Ratios | |
A | | | 1.47% | |
Trust | | | 1.22% | |
The above expense ratios are from the Funds’ prospectus dated May 1, 2010. Additional information pertaining to the Fund’s expense ratio as of December 31, 2010 can be found in the financial highlights.
The Fund’s performance assumes the reinvestment of all dividends and distributions on securities. The S&P 500 and the S&P 500 CVI have been adjusted to reflect reinvestment of dividends on securities in the indices.
| * | Represents a hypothetical investment of $10,000 in the Fund after deducting the maximum sales load of 4.75% ($10,000 investment minus $475 sales load = $9,525). |
| † | The S&P 500 and the S&P 500 VI are not adjusted to reflect sales charges, expenses, or other fees that the Securities and Exchange Commission requires to be reflected in the Fund’s performance. The indices are unmanaged and, unlike the Fund, are not affected by cashflows. It is not possible to invest directly in an index. |
Annual Shareholder Report
8
| | |
International Equity Fund | | As of 12/31/10 |
Management’s Discussion of Fund Performance
Portfolio Manager: Madelynn M. Matlock, CFA, MBA
Director of International Investments
Senior Vice President
Huntington Asset Advisors, Inc.
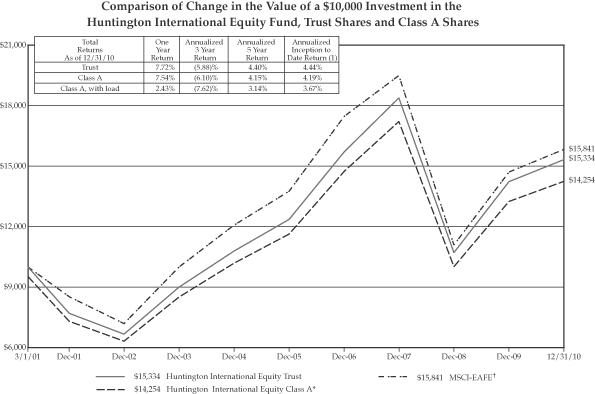
For the fiscal year ended December 31, 2010, the Huntington International Equity Fund produced total returns (not including the deduction of applicable sales charges) of 7.72%, and 7.54% for its Trust Shares and Class A Shares, respectively, based on net asset value. This slightly underperformed the total return of 7.75% for the Morgan Stanley Capital International (MSCI) Europe, Australasia and Far East Index (MSCI-EAFE),1 the Fund’s benchmark index.
The Fund’s small shortfall to the MSCI-EAFE was influenced by three main factors: its allocation to sectors, currency and regions, along with trading activity, which offset the beneficial impact from the selection of particular securities. Overall, sector weightings did not contribute to positive relative performance for the year. The portfolio had a less-than-benchmark weighting in materials and consumer discretionary stocks, which were strong contributors to index performance. This was partially offset by an above-index weighting in industrial and technology stocks, which did add value.
The best contributors to overall return were stocks in the industrial sector, including Fanuc and Komatsu in Japan, GEA Group in Germany, and Rolls Royce in the UK. Energy stocks also contributed to relative performance, including the Italian oil service stock Saipem and Canadian-based Cenovus. The currency exposure of the portfolio was slightly negative for performance, with a positive contribution due to an underweight in the euro offset by a lower than index exposure to the Australian dollar and the Swedish krona, which added to the MSCI-EAFE return. The Fund benefitted from a lighter weighting in financial stocks than the index, but one the weakest stocks in the portfolio was Banco Bilbao Vizcaya, which offset some of that positive effect.
The generally negative impact of trading in the portfolio was related to the positive impact of security selection. To control the risk of large position sizes, stock positions are trimmed when they become larger proportions of the portfolio, but in a year when good relative performance for particular stocks tended to persist, this meant reducing exposure to positions that were doing relatively well.
| ¿ | | The composition of the Fund’s holdings is subject to change. |
| ¿ | | International investing involves special risks including currency risk, political risk, increased volatility of foreign securities, and differences in auditing and other financial statements. |
| (1) | The MSCI-EAFE is a market-capitalization weighted equity index comprising 20 of the 48 countries in the MSCI universe and representing the developed world outside of North America. Each MSCI country index is created separately, then aggregated, without change, into MSCI indices. The index is unmanaged and, unlike the Fund, is not affected by cashflows. It is not possible to invest directly in an Index. |
Annual Shareholder Report
9
International Equity Fund (Continued)
Performance data quoted represents past performance which is no guarantee of future results. Investment return and principal value will fluctuate so that an investor’s shares, when redeemed, may be worth more or less than their original cost. Mutual fund performance changes over time and current performance may be lower or higher than what is stated. For current to the most recent month end performance, visit www.huntingtonfunds.com or call 1-800-253-0412. For after-tax returns call 1-800-253-0412. Returns shown do not reflect the deduction of taxes that a shareholder would pay on Fund distributions or the redemption of Fund Shares. Mutual funds are not obligations of or guaranteed by any bank and are not federally insured. Total returns, at load, include the maximum 4.75% sales charge for the Class A Shares.
| | | | |
| Class | | Expense Ratios | |
A | | | 1.89% | |
Trust | | | 1.64% | |
The above expense ratios are from the Funds’ prospectus dated May 1, 2010. Additional information pertaining to the Fund’s expense ratio as of December 31, 2010 can be found in the financial highlights.
The Fund’s performance assumes the reinvestment of all dividends and distributions. The MSCI-EAFE has been adjusted to reflect reinvestment of dividends on securities in the index.
| * | Represents a hypothetical investment of $10,000 in the Fund after deducting the maximum sales load of 4.75% ($10,000 investment minus $475 sales load = $9,525). |
| (1) | The Fund commenced operations for all share classes on March 1, 2001. |
| † | The MSCI-EAFE is not adjusted to reflect sales charges, expenses, or other fees that the Securities and Exchange Commission requires to be reflected in the Fund’s performance. The index is unmanaged and, unlike the Fund, is not affected by cashflows. It is not possible to invest directly in an index. |
Annual Shareholder Report
10
| | |
Macro 100 Fund | | As of 12/31/10 |
Management’s Discussion of Fund Performance
Portfolio Manager: Chadd Oviatt, Vice President and Senior Portfolio Manager
Huntington Asset Advisors, Inc.
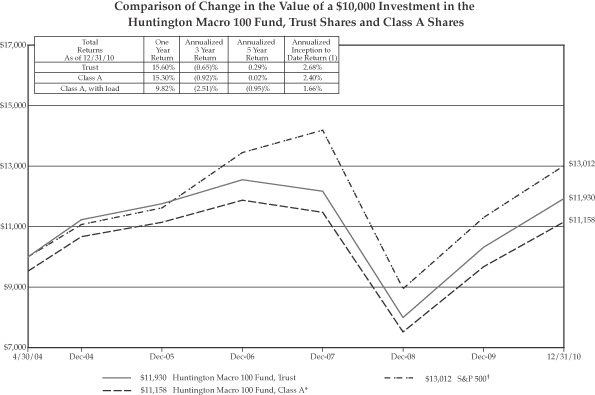
For the fiscal year ended December 31, 2010, the Huntington Macro 100 Fund produced total returns (not including the deduction of applicable sales charges) for the Fund’s Trust Shares and Class A Shares of 15.60% and 15.30%, respectively, based on net asset value. The Fund outperformed the total return of 15.06% for the Standard & Poor’s 500 Index (S&P 500),1 the Fund’s benchmark index.
The Fund’s outperformance relative to the S&P 500 was, in large part, due to the types of securities owned rather than the overall industry allocations. The Fund benefited from a slightly lower average market capitalization relative to its benchmark and was also positively impacted by other fundamental factors such as average earnings per share, average revenue per share and favorable debt to equity ratios. The major detractor from performance for the year was the Fund’s limited participation in the performance of the Consumer Discretionary sector. The combination of an underweight position in the Consumer Discretionary sector and individual security selection in this sector resulted in the underperformance relative the benchmark’s sector performance. The Financial Sector was also a detractor from performance due to its underweight position.
Despite a change in portfolio managers, which occurred in April of 2010, the Fund continued the process of integrating the quantitative macro-economic research provided by the consulting firm, Laffer Associates, Inc. (where the S & P 500 stocks are ranked according to the output of Laffer’s statistical models) with Huntington Asset Advisors’ recommended sector bias’. It was the combination of these two disciplines that resulted in added value within the investment selection process.
The Macro-economic environment, both domestically and globally, had a significant impact on the portfolio once again this year. The beginning of 2010 seemed to indicate that economic stability was taking hold, and a positive macroeconomic outlook helped to fuel the S&P 500 return of 5.39% in the first quarter. Unfortunately, the second quarter saw a global economy that was shaken by developments in Europe. The S&P 500 was not immune to the global disruption and posted a -11.43% return for the quarter. Of course, the third quarter was a much different story for the S&P 500 as global sentiment improved due in large part to the actions of various governments from around the world, as well as generally better than expected economic numbers. The S&P 500 returned 11.29% for the quarter. This positive momentum continued into the fourth quarter and paved the way for the S&P 500’s 15.06% total return for 2010. The Macro 100 Fund had a similar pattern throughout 2010, but was able to finish the year with a total return of 15.60% for the Trust Shares and 15.30% for the Class A Shares.
| ¿ | | The composition of the Fund’s holdings is subject to change. |
| (1) | The S&P 500 is a capitalization-weighted index comprised of 500 stocks and is designed to measure performance of the broad domestic economy through changes in the aggregate market value of 500 stocks representing all major industries. The index is unmanaged and, unlike the Fund, is not affected by cashflows. It is not possible to invest directly in an Index. |
Annual Shareholder Report
11
Macro 100 Fund (Continued)
Performance data quoted represents past performance which is no guarantee of future results. Investment return and principal value will fluctuate so that an investor’s shares, when redeemed, may be worth more or less than their original cost. Mutual fund performance changes over time and current performance may be lower or higher than what is stated. For current to the most recent month end performance, visit www.huntingtonfunds.com or call 1-800-253-0412. For after-tax returns call 1-800-253-0412. Returns shown do not reflect the deduction of taxes that a shareholder would pay on Fund distributions or the redemption of Fund Shares. Mutual funds are not obligations of or guaranteed by any bank and are not federally insured. Total returns, at load, include the maximum 4.75% sales charge for the Class A Shares.
| | | | |
| Class | | Expense Ratios | |
A | | | 1.82% | |
Trust | | | 1.57% | |
The above expense ratios are from the Funds’ prospectus dated May 1, 2010. Additional information pertaining to the Fund’s expense ratio as of December 31, 2010 can be found in the financial highlights.
The Fund’s performance assumes the reinvestment of all dividends and distributions. The S&P 500 has been adjusted to reflect reinvestment of dividends on securities in the index.
| * | Represents a hypothetical investment of $10,000 in the Fund after deducting the maximum sales load of 4.75% ($10,000 investment minus $475 sales load = $9,525). |
| (1) | The Fund commenced operations for all share classes on April 30, 2004. |
| † | The S&P 500 is not adjusted to reflect sales charges, expenses, or other fees that the Securities and Exchange Commission requires to be reflected in the Fund’s performance. The index is unmanaged and, unlike the Fund, is not affected by cashflows. It is not possible to invest directly in an index. |
Annual Shareholder Report
12
| | |
Mid Corp America Fund | | As of 12/31/10 |
Management’s Discussion of Fund Performance
Portfolio Manager: Christopher M. Rowane, CFA, MBA
Senior Vice President
Huntington Asset Advisors, Inc.
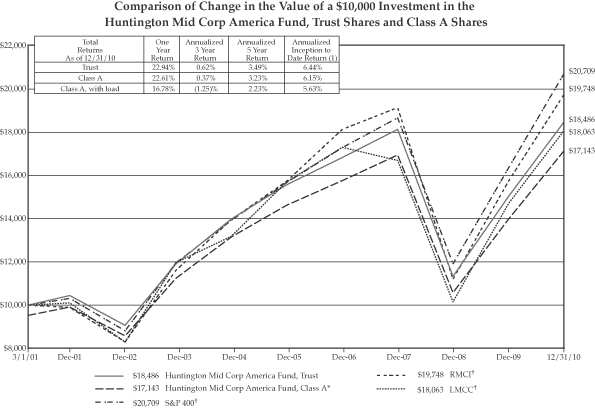
For the fiscal year ended December 31, 2010, the Huntington Mid Corp America Fund produced total returns (not including the deduction of applicable sales charges) of 22.94% and 22.61% for the Fund’s Trust Shares and Class A Shares, respectively, based on net asset value. In the same period the Fund’s benchmark, the Standard & Poor’s MidCap 400 Index (S&P 400),1 produced a total return of 26.64% and the Russell Midcap Index (RMCI) 2 produced a total return of 25.48%, while the Lipper Mid Cap Core Average (LMCC)3 returned 22.87%.
The Fund experienced volatility during 2010, subjected to the market lows in the summer months with a strong rebound toward year’s end. The highlight of the mid cap market was that it presented one of the greatest upsides in 2010 compared to other indices, outpacing large caps and slightly ahead of small caps, as represented by the Standard & Poor’s 500 Index (S&P 500)4 and the Standard & Poor’s Small Cap 600 Index (S&P 600)5 respectively.
The Fund underperformed the S&P 400 for 2010, mainly due to being defensive and maintaining higher quality securities. According to a Morningstar research report, only 22% of active mid cap managers have outpaced the S&P 400 index in the past decade, leading us to a strategy where managing risk might be as important as performance in these volatile markets.
The Fund was underweighted in the Consumer Discretionary and Financials sectors, while overweighted in the Energy and Technology sectors. The performance impact of being underweight in Consumer Discretionary lead to underperformance in the Fund, even with holdings like Royal Caribbean Cruises, which gained 85% for the year. The underweight in Financials proved to be a great benefit to performance, avoiding some of the weakest performers in the mid cap universe. Industrials proved to be another bright spot in sector weighting as well as security selection, but not without some volatile holdings, like Cummins Inc., which gained 142% and L-3 Communications Holdings, which fell 17% over the year. The greatest impact came with the under-exposure to Technology, with the index sector holdings registering a 32% return versus the portfolio’s return of 21% for this sector. The challenge was finding companies that met the quality earnings profile without the added incremental risk. The Fund focused on the long-term sector and stock selection attributes that have added to its performance over volatile cycles. The Fund maintained a higher number of holdings than some of its peers to provide greater diversification.6
| ¿ | | The composition of the Fund’s holdings is subject to change. |
| (1) | The S&P 400 is a capitalization weighted index comprised of common stocks representing all major industries in the mid-cap range of the U.S. stock market. The index is unmanaged and, unlike the Fund, is not affected by cashflows. It is not possible to invest directly in an Index. |
| (2) | The RMCI measures the performance of the 800 smallest companies in the Russell 1000 Index, which represent approximately 26% of the total market capitalization of the Russell 1000 Index. The index is unmanaged and, unlike the Fund, is not affected by cashflows. It is not possible to invest directly in an Index. |
| (3) | LMCC figures represent the average of the total returns reported by all of the mutual funds designated by the Lipper Inc. as falling in the category indicated. They do not reflect sales charges. |
| (4) | The S&P 500 is a capitalization-weighted index comprised of 500 stocks and designed to measure performance of the broad domestic economy through changes in the aggregate market value of 500 stocks representing all major industries. The index is unmanaged and, unlike the Fund, is not affected by cashflows. It is not possible to invest directly in an Index. |
| (5) | The S&P 600 is a capitalization-weighted index representing all major industries in the small-cap range of the U.S. stock market. The index is unmanaged and, unlike the Fund, is not affected by cashflows. It is not possible to invest directly in an Index. |
| (6) | Diversification does not assure a profit nor protect against loss. |
Annual Shareholder Report
13
Mid Corp America Fund (Continued)
Performance data quoted represents past performance which is no guarantee of future results. Investment return and principal value will fluctuate so that an investor’s shares, when redeemed, may be worth more or less than their original cost. Mutual fund performance changes over time and current performance may be lower or higher than what is stated. For current to the most recent month end performance, visit www.huntingtonfunds.com or call 1-800-253-0412. For after-tax returns call 1-800-253-0412. Returns shown do not reflect the deduction of taxes that a shareholder would pay on Fund distributions or the redemption of Fund Shares. Mutual funds are not obligations of or guaranteed by any bank and are not federally insured. Total returns, at load, include the maximum 4.75% sales charge for the Class A Shares.
| | | | |
| Class | | Expense Ratios | |
A | | | 1.64% | |
Trust | | | 1.39% | |
The above expense ratios are from the Funds’ prospectus dated May 1, 2010. Additional information pertaining to the Fund’s expense ratio as of December 31, 2010 can be found in the financial highlights.
The Fund’s performance assumes the reinvestment of all dividends and distributions. The S&P 400, RMCI and LMCC have been adjusted to reflect reinvestment of dividends on securities in the indices and average.
| * | Represents a hypothetical investment of $10,000 in the Fund after deducting the maximum sales load of 4.75% ($10,000 investment minus $475 sales load = $9,525). |
| (1) | The Fund commenced operations for all Share classes on March 1, 2001. |
| † | The S&P 400 and RMCI are not adjusted to reflect sales charges, expenses, or other fees that the Securities and Exchange Commission (SEC) requires to be reflected in the Fund’s performance. The indices are unmanaged and, unlike the Fund, are not affected by cashflows. It is not possible to invest directly in an index. The LMCC represents the average of the total returns reported by all of the mutual funds designated by Lipper, Inc. as falling in the category indicated, and is not adjusted to reflect any sales charges. However, these total returns are reported net of expenses or other fees that the SEC requires to be reflected in a Fund’s performance. |
Annual Shareholder Report
14
| | |
New Economy Fund | | As of 12/31/10 |
Management’s Discussion of Fund Performance
Portfolio Manager: Randy Hare
Vice President
Huntington Asset Advisors, Inc.
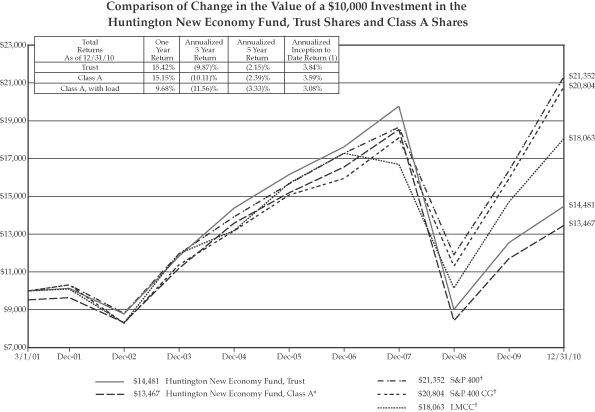
For the fiscal year ended December 31, 2010, the Huntington New Economy Fund produced total returns (not including the deduction of applicable sales charges) for the Fund’s Trust Shares and Class A Shares of 15.42% and 15.15% respectively, based on net asset value. The Fund’s benchmark, the Standard & Poor’s MidCap 400 Growth Index (S&P 400 GI)1 had a total return of 30.57%, and the Standard & Poor’s Mid Cap 400 Index (S&P 400)2 had a total return of 26.64%, while the Lipper Mid Cap Core Average (LMCC)3 returned 22.78%.
During the year, the Fund’s holdings remained invested in companies producing or benefiting from increased productivity trends. Trading activity was responsible for -6.69% of the performance relative to the benchmark, while portfolio structure had a negative impact of -8.46%. Portfolio structure can be explained by adding Security Characteristics: -0.34%, Sector Allocation: -0.16% and Security Selection: -7.95%.
The Fund’s performance relative to the benchmark was affected by both sector selection and individual stock selection. The Consumer Discretionary and Information Technology sectors provided the largest sources of returns above the benchmark. Consumer Discretionary was a focus in the beginning of the year and the Fund reduced exposure throughout the year. Information Technology remained an overweight sector for the year ending December 31, 2010. The source for the largest underperformance relative to the benchmark was the stock selection in the Financial sector. The Fund’s overweight position in the Energy sector also provided negative relative performance for the Fund during the year. The remaining relative sector weights provided minimal contribution versus the Fund’s benchmark. The Fund’s sector selection process during 2010 continued to be driven by the sector strategy of Huntington Asset Advisors, Inc.
The three holdings that had the largest positive contribution to the Fund’s performance were F5 Networks Inc., CF Industries Holdings Inc. and lululemon athletica inc. These three holdings added 4.95% to the Fund’s return. The three holdings that had the largest negative contribution to the Fund’s performance were iPath S&P 500 Vix Call JAN11 48, Intuitive Surgical Inc. and iPath S&P 500 VIX SH TM FT CALL (0.02%). These three holdings subtracted -1.74% from the Fund’s return.
| ¿ | | The composition of the Fund’s holdings is subject to change. |
| (1) | The S&P 400 GI is designed to provide a comprehensive measure of mid-cap U.S. equity “growth” performance. It is a float adjusted market capitalization weighted index comprised of stocks representing approximately half the market capitalization of the S&P MidCap 400 that have been identified as being on the growth end of the growth-value spectrum. Indices are unmanaged and, unlike the Fund, are not affected by cashflows. It is not possible to invest directly in an Index. |
| (2) | The S&P 400 is a capitalization-weighted index comprised of common stocks representing all major industries in the mid-range of the U.S. stock market. The index is unmanaged and, unlike the Fund, is not affected by cashflows. It is not possible to invest directly in an Index. |
| (3) | LMCC figures represent the average of the total returns reported by all of the mutual funds designated by the Lipper Inc. as falling in the category indicated. They do not reflect sales charges. |
Annual Shareholder Report
15
| | |
New Economy Fund (Continued) | | |
Performance data quoted represents past performance which is no guarantee of future results. Investment return and principal value will fluctuate so that an investor’s shares, when redeemed, may be worth more or less than their original cost. Mutual fund performance changes over time and current performance may be lower or higher than what is stated. For current to the most recent month end performance, visit www.huntingtonfunds.com or call 1-800-253-0412. For after-tax returns call 1-800-253-0412. Returns shown do not reflect the deduction of taxes that a shareholder would pay on Fund distributions or the redemption of Fund Shares. Mutual funds are not obligations of or guaranteed by any bank and are not federally insured. Total returns, at load, include the maximum 4.75% sales charge for the Class A Shares.
| | | | |
| Class | | Expense Ratios | |
A | | | 1.84% | |
Trust | | | 1.59% | |
The above expense ratios are from the Funds’ prospectus dated May 1, 2010. Additional information pertaining to the Fund’s expense ratio as of December 31, 2010 can be found in the financial highlights.
The Fund’s performance assumes the reinvestment of all dividends and distributions. The S&P 400, S&P 400 CG and LMCC have been adjusted to reflect reinvestment of dividends on securities in the indices.
| * | Represents a hypothetical investment of $10,000 in the Fund after deducting the maximum sales load of 4.75% a ($10,000 investment minus $475 sales load = $9,525). |
| (1) | The Fund commenced operations for all classes on March 1, 2001. |
| † | The S&P 400 and S&P 400 CG are not adjusted to reflect sales charges, expenses, or other fees that the Securities and Exchange Commission requires to be reflected in the Fund’s performance. The indices are unmanaged and, unlike the Fund, are not affected by cashflows. It is not possible to invest directly in an index. The LMCC represents the average of the total returns reported by all of the mutual funds designated by Lipper, Inc. as falling in the category indicated, and is not adjusted to reflect any sales charges. However, these total returns are reported net of expenses or other fees that the SEC requires to be reflected in a Fund’s performance. |
Annual Shareholder Report
16
| | |
Real Strategies Fund | | As of 12/31/10 |
Management’s Discussion of Fund Performance
Portfolio Manager: Peter Sorrentino, CFA
Vice President
Huntington Asset Advisors, Inc.
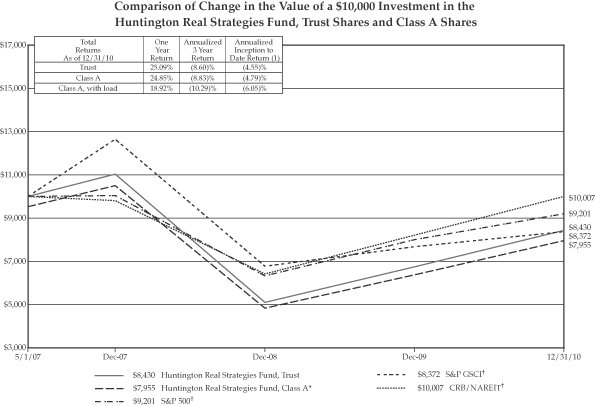
For the fiscal year ended December 31, 2010, the Huntington Real Strategies Fund produced total returns (not including the deduction of applicable sales charges) of 25.09% and 24.85% for Trust Shares and Class A Shares, respectively, based upon net asset value. The Fund outperformed its benchmark, the S&P GSCI® Index1, which had a total return of 9.03%. The Fund also outperformed the Standard & Poor’s 500 Index (S&P 500)2, which returned 15.06% and the Real Strategies Indices Blend3, which returned 21.90% for the same period.
The Fund’s performance during the year was bifurcated with performance during the opening months of the year driven by agriculture related themes and the closing months of the year driven by energy related themes. Overall, prices for precious metals increased throughout the year, but performance was also bifurcated with gold moving rapidly higher in the opening months only to be supplanted by silver during the second half of the year.
In the realm of agriculture, the Fund’s most successful investments were those in a number of fertilizer producers and machinery manufacturers. This area experienced considerable merger and acquisition activity throughout the year that propelled prices higher for companies around the globe. The Fund’s shares of Sociedad Quimeca y Minera de Chile advanced over 60%, followed by the 58% contribution from Bucyrus International and 56% for AGCO Corp. Not all agriculture related holdings worked however, as witnessed by the 34% decline in Monsanto.
Returns for the Fund’s energy holdings were strongest for coal and uranium, and the unifying theme for both was demand from China. China lacks the infrastructure to fully utilize its domestic coal supply and is increasingly relying upon seaborne supplies to meet its needs. The Chinese began an aggressive reactor construction program some years ago and now many of those stations are reaching the fueling stage. This demand, combined with refueling needs for existing stations around the world, sent the prices for uranium mining companies higher. The Fund’s shares of Uranium Energy Corp. advanced Fund’s coal holdings, Arch Coal enjoyed the largest advance, picking up 63%, while shares of Peabody Energy added 41%. Again, as with agriculture, not all coal stocks were positive for the year, as shares of James River Coal slipped 8%.
The Fund did benefit from the resurgence of merger and acquisition activity during the year where. While the attempt by BHP to acquire Potash failed, it served to sustain the run-up in price that swept the group during the Agrium CF Industries transaction. This was also evident in the equipment sector, as Caterpillar’s bid for the shares of Bucyrus International served to boost the price for shares of Deer & Co. and AGCO Corp.
| ¿ | | The composition of the Fund’s holdings is subject to change. |
| (1) | The S&P GSCI® Index measures general price movements and inflation in the world economy. The Index is calculated primarily on a world production-weighted basis and is comprised of the principal physical commodities that are the subject of active, liquid futures markets. The Fund’s investment adviser elected to change the benchmark index from the S&P 500 to the S&P GSCI® Index because the S&P GSCI® Index is more reflective of the securities in which the Fund invests. The indices are unmanaged and, unlike the Fund, are not affected by cashflows. It is not possible to invest directly in an index. |
| (2) | The S&P 500 is a capitalization-weighted Index comprised of 500 stocks and is designed to measure performance of the broad domestic economy through changes in the aggregate market value of 500 stocks representing all major industries. The index is unmanaged and, unlike the Fund, is not affected by cashflows. It is not possible to invest directly in an Index. |
| (3) | The Real Strategies Indices Blend is a custom blended index comprised of the following two indices with their noted respective weightings; Reuters/Jefferies CRB Total Return Index (50%) and NAREIT Index (50%). The Reuters/Jefferies CRB Total Return Index is a commodity index, a basket of exchange-traded futures contracts representing long-only positions in underlying commodities. Indices typically include a variety of commodity sectors to provide investors broader exposure to commodities as an asset class and free the investor from the mechanics of future trading (e.g., contract rolling and physical delivery). The index return does not reflect the deduction of expenses, which have been deducted from the Fund’s returns. The Index return assumes reinvestment of all distributions and does not reflect the deduction of taxes and fees. Individuals cannot invest directly in the Index, however, an individual can invest in exchange traded funds or other investment vehicles that attempt to track the performance of benchmark Index. The NAREIT represents returns for the National Association of Real Estate Investment Trust Equity Index. The indices are unmanaged and, unlike the Fund, are not affected by cashflows. |
Annual Shareholder Report
17
Real Strategies Fund (Continued)
Performance data quoted represents past performance which is no guarantee of future results. Investment return and principal value will fluctuate so that an investor’s shares, when redeemed, may be worth more or less than their original cost. Mutual fund performance changes over time and current performance may be lower or higher than what is stated. For current to the most recent month end performance, visit www.huntingtonfunds.com or call 1-800-253-0412. For after-tax returns call 1-800-253-0412. Returns shown do not reflect the deduction of taxes that a shareholder would pay on Fund distributions or the redemption of Fund Shares. Mutual funds are not obligations of or guaranteed by any bank and are not federally insured. Total returns, at load, include the maximum 4.75% sales charge for the Class A Shares.
| | | | |
| Class | | Expense Ratios | |
A | | | 1.77% | |
Trust | | | 1.52% | |
The above expense ratios are from the Funds’ prospectus dated May 1, 2010. Additional information pertaining to the Fund’s expense ratio as of December 31, 2010 can be found in the financial highlights.
The Fund’s performance assumes the reinvestment of all dividends and distributions. The S&P 500, S&P GSCI and CRB/NAREIT have been adjusted to reflect reinvestment of dividends on securities in the indices.
| * | Represents a hypothetical investment of $10,000 in the Fund after deducting the maximum sales load of 4.75% ($10,000 investment minus $475 sales load = $9,525). |
| (1) | The Fund commenced operations for all Share classes on May 1, 2007. |
| † | The S&P 500, S&P GSCI and CRB/NAREIT are not adjusted to reflect sales charges, expenses, or other fees that the Securities and Exchange Commission requires to be reflected in the Fund’s performance. The indices are unmanaged and, unlike the Fund, are not affected by cashflows. It is not possible to invest directly in an index. |
Annual Shareholder Report
18
| | |
Rotating Markets Fund | | As of 12/31/10 |
Management’s Discussion of Fund Performance
Portfolio Manager: Paul Koscik, JD
Vice President
Huntington Asset Advisors, Inc.
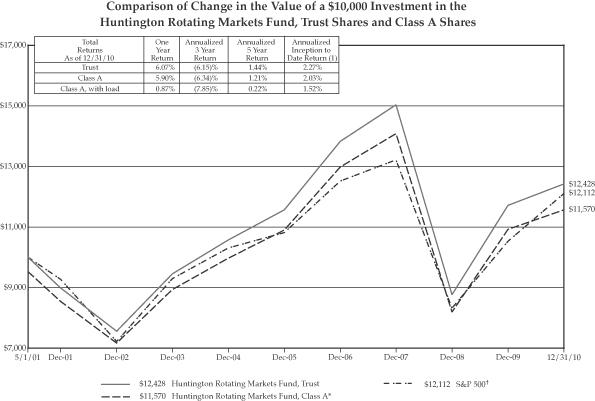
For the fiscal year ended December 31, 2010, the Huntington Rotating Markets Fund produced total returns (not including the deduction of applicable sales charges 6.07% and 5.90% for Trust Shares and Class A Shares, respectively, based on net asset value. This underperformed the total return of 15.06% for the Fund’s benchmark, the Standard & Poor’s 500 Index (S&P 500).1
The Rotating Markets Fund finished 2009 invested in the Global segment of the stock market having significantly outperformed its benchmark, the S&P 500, by more than 650 basis points. 2010 began with the Fund still invested in the global segment. As the year progressed, it became apparent that international stocks were becoming a drag on performance. Concerns about the fiscal stability of the European Union in general, and such countries as Greece and Ireland in particular, were causing investors to shift funds toward the US. In response to the shifting investment environment, the Fund elected to rotate to the Large Cap segment of the stock market. Because the equity markets had staged a massive rally from the March, 2009 bottom (the S&P 500 for example was up 60%) without any significant correction, it was decided to emulate the Dow Jones Industrial Average, which is a conservative equity index. This index is viewed as one of the best indices to own in the event of a sharp correction. Unfortunately, no correction occurred after the rotation on September 1, 2010. In fact, the rally continued the rest of the year with the more aggressive S&P 500 handily outperforming the more conservative Dow Jones Industrial Average. Although the Fund underperformed the S&P 500 Index because of its conservative stance regarding the equity market, it is well positioned in the event that a correction does occur.
| ¿ | | The composition of the Fund’s holdings is subject to change. |
| (1) | The S&P 500 is a capitalization-weighted index comprised of 500 stocks and is designed to measure performance of the broad domestic economy through changes in the aggregate market value of 500 stocks representing all major industries. The index is unmanaged and, unlike the Fund, is not affected by cashflows. It is not possible to invest directly in an Index. |
Annual Shareholder Report
19
Rotating Markets Fund (Continued)
Performance data quoted represents past performance which is no guarantee of future results. Investment return and principal value will fluctuate so that an investor’s shares, when redeemed, may be worth more or less than their original cost. Mutual fund performance changes over time and current performance may be lower or higher than what is stated. For current to the most recent month end performance, visit www.huntingtonfunds.com or call 1-800-253-0412. For after-tax returns call 1-800-253-0412. Returns shown do not reflect the deduction of taxes that a shareholder would pay on Fund distributions or the redemption of Fund Shares. Mutual funds are not obligations of or guaranteed by any bank and are not federally insured. Total returns, at load, include the maximum 4.75% sales charge for the Class A Shares.
| | | | |
| Class | | Expense Ratios | |
A | | | 2.31% | |
Trust | | | 2.06% | |
The above expense ratios are from the Funds’ prospectus dated May 1, 2010. Additional information pertaining to the Fund’s expense ratio as of December 31, 2010 can be found in the financial highlights.
The Fund’s performance assumes the reinvestment of all dividends and distributions. The S&P 500 has been adjusted to reflect reinvestment of dividends on securities in the index.
| * | Represents a hypothetical investment of $10,000 in the Fund after deducting the maximum sales load of 4.75% ($10,000 investment minus $475 sales load = $9,525). |
| (1) | Trust Shares and Class A Shares commenced operations on May 1, 2001. |
| † | The S&P 500 is not adjusted to reflect sales charges, expenses, or other fees that the Securities and Exchange Commission requires to be reflected in the Fund’s performance. The index is unmanaged and, unlike the Fund, is not affected by cashflows. It is not possible to invest directly in an index. |
Annual Shareholder Report
20
| | |
Situs Fund | | As of 12/31/10 |
Management’s Discussion of Fund Performance
Portfolio Manager: B. Randolph Bateman, CFA
Chief Investment Officer
Huntington Asset Advisors, Inc.
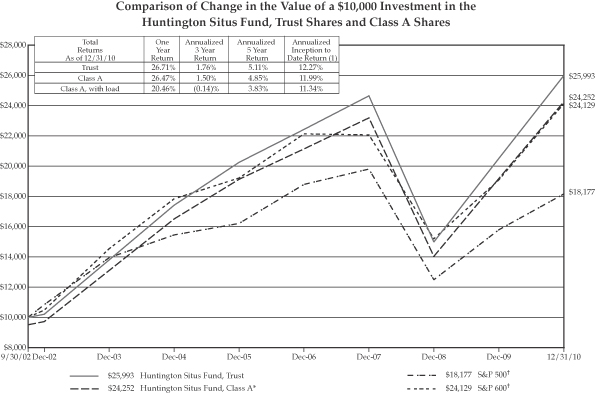
For the fiscal year ended December 31, 2010, the Huntington Situs Fund produced total returns (not including the deduction of applicable sales charges) of 26.71% and 26.47% for Trust Shares and Class A shares, respectively, based on net asset value. The Fund experienced a strongly positive relative performance versus its benchmark, the Standard & Poor’s Small Cap 600 Index (S&P 600),1 which had a total return of 26.31% for the same period. This represented a return for the Fund’s Trust Shares that was 40 basis points above the benchmark index. This was the second consecutive year that the fund exceeded the unmanaged benchmark.
The Fund also outperformed the Standard & Poor’s 500 Index (S&P 500),2 the broader stock market index, which had a return of 15.06% for the reporting period. The Fund continued to focus on its approach of utilizing, among other things, strict quantitative analysis, industry sector emphasis or de-emphasis according to the policy guidelines established by Huntington Asset Advisors, Inc.’s Investment Policy Committee and selecting stocks of companies with geographical location advantages. These factors contributed to the Fund outperforming its benchmark and market peers over the longer term and were significant in the over performance achieved in 2010.
During the reporting period, the economy moved from a rebound phase to an expansion and most markets reflected this positive movement in the economy. The small and mid cap stocks, however, seemed to fair the best in this environment and their performance significantly outperformed their larger counterparts. The sectors that outperformed in the Situs Fund were Energy and Materials, of which the Fund held an overweight position during much of the year. It was difficult to develop investment strategies in the market environment of 2010. There was a lack of sector leadership on any consistent basis and there were considerable swings in daily performance in individual names as well as industries. The Situs Fund wrote few options during the year as market conditions were not favorable, but with two years of strong back to back performance (+25% each), it is likely that the manager will employ more coverage strategies in 2011. In addition, we anticipate that the Energy and Material sectors will be lightened during the year as capital gains situations are considered. The Fund had taken a large amount of gains during the 2010 tax period and the manager was hesitant to incur greater taxes in order to balance the sector weights.
| ¿ | | The composition of the Fund’s holdings is subject to change. |
| (1) | The S&P 600 is a capitalization-weighted index representing all major industries in the small-cap range of the U.S. stock market. The index is unmanaged and, unlike the Fund, is not affected by cashflows. It is not possible to invest directly in an Index. |
| (2) | The S&P 500 is a capitalization-weighted index comprised of 500 stocks and designed to measure performance of the broad domestic economy through changes in the aggregate market value of 500 stocks representing all major industries. The index is unmanaged and, unlike the Fund, is not affected by cashflows. It is not possible to invest directly in an Index. |
Annual Shareholder Report
21
Situs Fund (Continued)
Performance data quoted represents past performance which is no guarantee of future results. Investment return and principal value will fluctuate so that an investor’s shares, when redeemed, may be worth more or less than their original cost. Mutual fund performance changes over time and current performance may be lower or higher than what is stated. For current to the most recent month end performance, visit www.huntingtonfunds.com or call 1-800-253-0412. For after-tax returns call 1-800-253-0412. Returns shown do not reflect the deduction of taxes that a shareholder would pay on Fund distributions or the redemption of Fund Shares. Mutual funds are not obligations of or guaranteed by any bank and are not federally insured. Total returns, at load, include the maximum 4.75% sales charge for the Class A Shares.
| | | | |
| Class | | Expense Ratios | |
A | | | 1.66% | |
Trust | | | 1.41% | |
The above expense ratios are from the Funds’ prospectus dated May 1, 2010. Additional information pertaining to the Fund’s expense ratio as of December 31, 2010 can be found in the financial highlights.
The Fund’s performance assumes the reinvestment of all dividends and distributions. The S&P 600 and S&P 500 have been adjusted to reflect reinvestment of dividends on securities in the indices.
| * | Represents a hypothetical investment of $10,000 in the Fund after deducting the maximum sales load of 4.75% ($10,000 investment minus $475 sales load = $9,525). |
| (1) | The Fund commenced operations for all classes on September 30, 2002. |
| † | The S&P 600 and S&P 500 are not adjusted to reflect sales charges, expenses, or other fees that the Securities and Exchange Commission requires to be reflected in the Fund’s performance. The indices are unmanaged and, unlike the Fund, are not affected by cashflows. It is not possible to invest directly in an index. |
Annual Shareholder Report
22
| | |
Technical Opportunities Fund | | As of 12/31/10 |
Management’s Discussion of Fund Performance
Co-Portfolio Managers:
Martina Cheung, CFA, CMT, MBA
Vice President
Portfolio Manager: Paul Koscik, JD
Vice President
Huntington Asset Advisors, Inc.
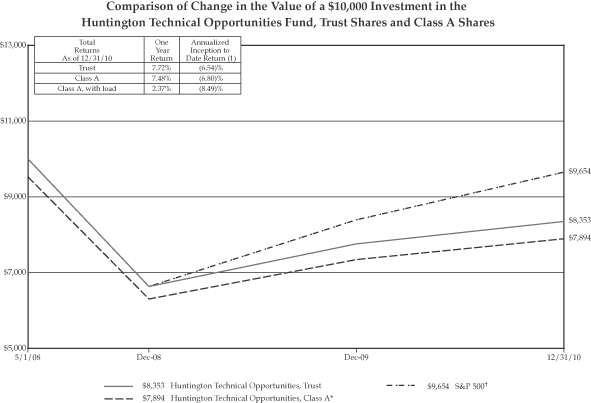
For the fiscal year ended December 31, 2010, the Huntington Technical Opportunities Fund produced total returns (not including the deduction of applicable sales charges) of 7.72% and 7.48% for Trust Shares and Class A Shares, respectively, based on net asset value. The Fund underperformed the total return of 15.06% for the Fund’s benchmark, the Standard & Poor’s 500 Index (S&P 500)1, for the same time period.
The Fund commenced operations in 2010 with 36% of its portfolio invested in international equities. Although this exposure was very helpful to performance in 2009, the holdings in the Exchange Traded Funds with exposure to certain Emerging Markets (South Korea, Brazil and Singapore) had a very negative impact on performance in the first quarter of the year. In fact, the Fund’s underperformance for all of 2010 was largely due its first quarter results.
The rest of the year was characterized by restructuring the portfolio to add more international exposure, with an emphasis on emerging markets, and gaining exposure to various commodities. This strategy was pursued because these areas would most likely be beneficiaries of any global recovery. The added exposure was accomplished by purchasing individual equities that looked promising using technical analysis. Purchases were made all over the world including companies located in Mexico, Australia, Israel, Russia, South Africa, and China. These purchases were complemented by adding exposure to various commodities through the purchase of companies with exposure to oil, platinum, copper, and gold. As a result of the portfolio changes, the Fund had comparable performance to the S&P 500 Index for the remainder of the year. As we look forward to the year 2011, the Fund is well positioned to benefit from a global recovery.
| ¿ | | The composition of the Fund’s holdings is subject to change. |
| (1) | The S&P 500 is a capitalization-weighted index comprised of 500 stocks and is designed to measure performance of the broad domestic economy through changes in the aggregate market value of 500 stocks representing all major industries. The index is unmanaged and, unlike the Fund, is not affected by cashflows. It is not possible to invest directly in an Index. |
Annual Shareholder Report
23
Technical Opportunities Fund (Continued)
Performance data quoted represents past performance which is no guarantee of future results. Investment return and principal value will fluctuate so that an investor’s shares, when redeemed, may be worth more or less than their original cost. Mutual fund performance changes over time and current performance may be lower or higher than what is stated. For current to the most recent month end performance, visit www.huntingtonfunds.com or call 1-800-253-0412. For after-tax returns call 1-800-253-0412. Returns shown do not reflect the deduction of taxes that a shareholder would pay on Fund distributions or the redemption of Fund Shares. Mutual funds are not obligations of or guaranteed by any bank and are not federally insured. Total returns, at load, include the maximum 4.75% sales charge for the Class A Shares.
| | | | |
| Class | | Expense Ratios | |
A | | | 3.18% | |
Trust | | | 2.93% | |
The above expense ratios are from the Funds’ prospectus dated May 1, 2010. Additional information pertaining to the Fund’s expense ratio as of December 31, 2010 can be found in the financial highlights.
The Fund’s performance assumes the reinvestment of all dividends and distributions. The S&P 500 has been adjusted to reflect reinvestment of dividends on securities in the index.
| * | Represents a hypothetical investment of $10,000 in the Fund after deducting the maximum sales load of 4.75% ($10,000 investment minus $475 sales load = $9,525). |
| (1) | The Fund commenced operations for all Share classes on May 1, 2008. |
| † | The S&P 500 is not adjusted to reflect sales charges, expenses, or other fees that the Securities and Exchange Commission requires to be reflected in the Fund’s performance. The index is unmanaged and, unlike the Fund, is not affected by cashflows. It is not possible to invest directly in an index. |
Annual Shareholder Report
24
| | |
Fixed Income Securities Fund | | As of 12/31/10 |
Management’s Discussion of Fund Performance
Portfolio Manager: Kirk Mentzer, MBA
Senior Vice President and Director of Research
Huntington Asset Advisors, Inc.
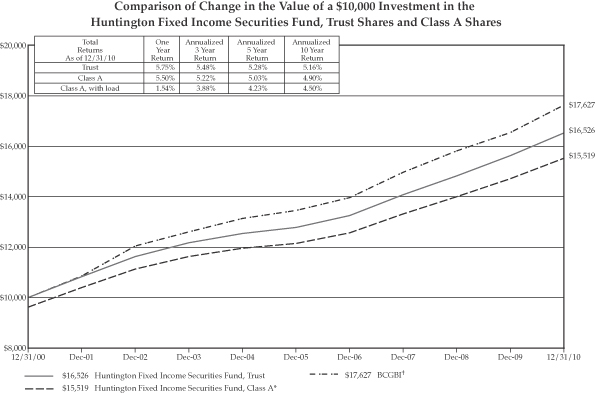
For the fiscal year ended December 31, 2010, the Huntington Fixed Income Securities Fund’s Trust Shares and Class A Shares produced total returns (not including the deduction of applicable sales charges) of 5.75% and 5.50%, respectively, based on net asset value. These returns compared to the Fund’s benchmark, the Barclays Government/Credit Bond Index (BGCBI),1 which had a total return of 6.59% for the same period. The Fund’s returns were below the 7.73% total return of the Lipper Intermediate Investment Grade Debt Funds Average,2 the Fund’s peer group.
In 2010, corporate bonds posted another positive year with excess returns beating Treasury securities by 2.8%. Agency and mortgage securities experienced a similar effect during the year as well, with gains exceeding +0.8% and 2.7% respectively above Treasury markets. Treasury yields rose substantially in the fourth quarter on improving economic growth, erasing most of the decline that occurred earlier in 2010, leaving Treasuries as one of the worst performing segments for both the year and final quarter of 2010. For the year, broad fixed income market indices produced a total return of 6.59%, as measured by the BGCBI.
The Fund’s Trust Share’s gross returns for the fiscal year exceeded the benchmark index by 0.24% when measured on a gross of fee basis. Net of fees, the Fund trailed both the index and peer groups. Positive contributors to Fund performance included tactical purchases of corporate bonds when yield premiums were attractive. Overall for the year, the Fund’s exposure to corporate bonds had a positive impact on performance. Detractors from Fund relative performance were predominantly related to the Fund upgrading its holdings to higher quality issuers. Purchases of Treasury and agency securities did not produce the total returns expected and relative performance was negatively impacted
| ¿ | | The composition of the Fund’s holdings is subject to change. |
| (1) | The BGCBI comprises bonds that are investment grade rated Baa or higher by Moody’s or BBB or higher by Standard & Poor’s, if unrated by Moody’s. Issues must have at least one year to maturity. The index is unmanaged and, unlike the Fund, is not affected by cashflows. It is not possible to invest directly in an Index. |
| (2) | Lipper figures represent the average of the total returns reported by all of the mutual funds designated by Lipper Inc. as falling into the category indicated. They do not reflect sales charges. |
Annual Shareholder Report
25
Fixed Income Securities Fund (Continued)
Performance data quoted represents past performance which is no guarantee of future results. Investment return and principal value will fluctuate so that an investor’s shares, when redeemed, may be worth more or less than their original cost. Mutual fund performance changes over time and current performance may be lower or higher than what is stated. For current to the most recent month end performance, visit www.huntingtonfunds.com or call 1-800-253-0412. For after-tax returns call 1-800-253-0412. Returns shown do not reflect the deduction of taxes that a shareholder would pay on Fund distributions or the redemption of Fund Shares. Mutual funds are not obligations of or guaranteed by any bank and are not federally insured. Total returns, at load, include the maximum 3.75% sales charge for the Class A Shares.
| | | | |
| Class | | Expense Ratios | |
A | | | 1.34% | |
Trust | | | 1.09% | |
The above expense ratios are from the Funds’ prospectus dated May 1, 2010. Additional information pertaining to the Fund’s expense ratio as of December 31, 2010 can be found in the financial highlights.
The Fund’s performance assumes the reinvestment of all dividends and distributions. The BGCBI has been adjusted to reflect reinvestment of dividends on securities in the index.
| * | Represents a hypothetical investment of $10,000 in the Fund after deducting the maximum sales load of 3.75% ($10,000 investment minus $375 sales load = $9,625). |
| † | The BGCBI is not adjusted to reflect sales charges, expenses, or other fees that the Securities and Exchange Commission requires to be reflected in the Fund’s performance. The index is unmanaged and, unlike the Fund, is not affected by cashflows. It is not possible to invest directly in an index. |
Annual Shareholder Report
26
| | |
Intermediate Government Income Fund | | As of 12/31/10 |
Management’s Discussion of Fund Performance
Portfolio Manager: William G. Doughty; MBA
Vice President
Huntington Asset Advisors, Inc.
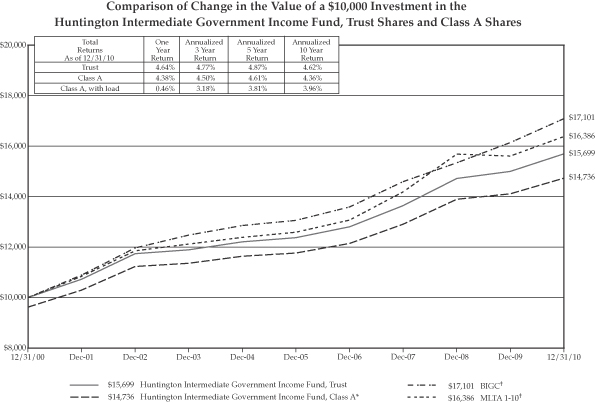
For the fiscal year ended December 31, 2010, the Huntington Intermediate Government Income Fund produced total returns (not including the deduction of applicable sales charges) of 4.64%, and 4.38% for Trust and Class A Shares, respectively, based on net asset value. This compared with the return of the Barclays Intermediate Government/Credit Index (BIGC),1 the Fund’s benchmark, return of 5.89%, the Merrill Lynch U.S. Treasuries/Agencies 1-10 Years Index’s (G5A0 1-10)2 return of 4.93% and the Lipper Short-Intermediate Government Funds Average3 of 3.54% for the same period.
During 2010, the Barclays U.S. Aggregate Bond Index 4, which represents a broad bond market index, showed a return of 6.15%. Sector performance favored the corporate bond market by a wide margin. This was the second year in a row where corporate bonds outperformed other asset classes. The Fund’s underperformance against its benchmark index, the BIGC, was due to the asset mix of the portfolio. The Fund had a heavy weighting in Treasuries and Agencies, which were the fixed income asset classes with the two worst returns in 2010. The mortgage portion of portfolio did benefit the Fund, as mortgage securities had good relative performance in 2010, despite the Treasury purchase program of mortgage securities ending in the first quarter of 2010.
| ¿ | | The composition of the Fund’s holdings is subject to change. |
| | Bond prices are sensitive to changes in interest rates and a rise in interest rates can cause a decline in their prices. |
| (1) | The BIGC is a market value weighted performance benchmark for government and corporate fixed-rate debt issues with maturities between one and ten years. The index is unmanaged and, unlike the Fund, is not affected by cashflows. It is not possible to invest directly in an Index. |
| (2) | The MLTA 1-10 tracks the current 10-year Treasury securities. This index is produced by Merrill Lynch, Pierce, Fenner & Smith, Inc. The index is unmanaged and, unlike the Fund, is not affected by cashflows. It is not possible to invest directly in an Index. |
| (3) | Lipper figures represent the average of the total returns reported by all of the mutual funds designated by Lipper Inc. as falling into the category indicated. They do not reflect sales charges. |
| (4) | The Barclay’s U.S. Aggregate Bond Index is composed of securities from the Barclay’s Government/Corporate Bond Index, Mortgage Securities Index and the Asset Based Securities Index. Total return comprises price appreciation/depreciation and income as a percentage of the original investment. Indices are rebalanced monthly by market capitalization. The index is unmanaged and, unlike the Fund, is not affected by cashflows. It is not possible to invest directly in an Index. |
Annual Shareholder Report
27
Intermediate Government Income Fund (Continued)
Performance data quoted represents past performance which is no guarantee of future results. Investment return and principal value will fluctuate so that an investor’s shares, when redeemed, may be worth more or less than their original cost. Mutual fund performance changes over time and current performance may be lower or higher than what is stated. For current to the most recent month end performance, visit www.huntingtonfunds.com or call 1-800-253-0412. For after-tax returns call 1-800-253-0412. Returns shown do not reflect the deduction of taxes that a shareholder would pay on Fund distributions or the redemption of Fund Shares. Mutual funds are not obligations of or guaranteed by any bank and are not federally insured. Total returns, at load, include the maximum 3.75% sales charge for the Class A Shares.
| | | | |
| Class | | Expense Ratios | |
A | | | 1.36% | |
Trust | | | 1.11% | |
The above expense ratios are from the Funds’ prospectus dated May 1, 2010. Additional information pertaining to the Fund’s expense ratio as of December 31, 2010 can be found in the financial highlights.
The Fund’s performance assumes the reinvestment of all dividends and distributions. The BIGC and MLTA 1-10 have been adjusted to reflect reinvestment of dividends on securities in the indices.
| * | Represents a hypothetical investment of $10,000 in the Fund after deducting the maximum sales load of 3.75% ($10,000 investment minus $375 sales load = $9,625). |
| † | The BIGC and MLTA 1-10 are not adjusted to reflect sales charges, expenses, or other fees that the Securities and Exchange Commission requires to be reflected in the Fund’s performance. The indices are unmanaged and, unlike the Fund, are not affected by cashflows. It is not possible to invest directly in an index. |
Annual Shareholder Report
28
| | |
Mortgage Securities Fund | | As of 12/31/10 |
Management’s Discussion of Fund Performance
Co-Portfolio Managers:
William G. Doughty, MBA
Vice President
Gustave J. Seasongood
Vice President
Huntington Asset Advisors, Inc.
For the fiscal year ended December 31, 2010, the Huntington Mortgage Securities Fund produced returns (not including the deduction of applicable sales charges) of 5.21% and 5.03% for the Fund’s Trust and Class A Shares, respectively, based on net asset value. This compared to the total return of 5.37% for the Fund’s benchmark, the Barclays Mortgage Backed Securities Index (BMBSI),1 and the Lipper U.S. Mortgage Funds Average2 return of 6.74% for the same reporting period.
During 2010, the mortgage market was generally even with Treasuries securities. Mortgages had a return of 5.37%, as measured by the BMBSI for the year, compared to a return of 5.88% for Treasuries. The Agency position also had a negative effect on the portfolio. The small underperformance of the Fund was due to its more defensive nature as it owned both 15 and 20 year mortgages. The 10% exposure to the REIT (Real Estate Investment Trust) market, which was up from 5% last year, helped the Fund’s return. As measured by the NAREIT Index (NAREIT),3 REITs produced a return of 27.95%.
| ¿ | | The composition of the Fund’s holdings is subject to change. |
| | Bond prices are sensitive to changes in interest rates, and a rise in interest rates can cause a decline in their prices. |
| (1) | The BMBSI is composed of all fixed securities mortgage pools by the Government National Mortgage Association (GNMA), Federal National Mortgage Association and the Federal Home Loan Mortgage Corporation, including GNMA Graduated Payment Mortgages. The index is unmanaged and, unlike the Fund, is not affected by cashflows. It is not possible to invest directly in an Index. |
| (2) | Lipper figures represent the average of the total returns reported by all of the mutual funds designated by Lipper Inc. as falling into the category indicated. They do not reflect sales charges |
| (3) | The NAREIT Index represents returns for the National Association of Real Estate Investment Trust Equity Index. The index is unmanaged and, unlike the Fund, is not affected by cashflows. It is not possible to invest directly in an Index. |
Annual Shareholder Report
29
Mortgage Securities Fund (Continued)
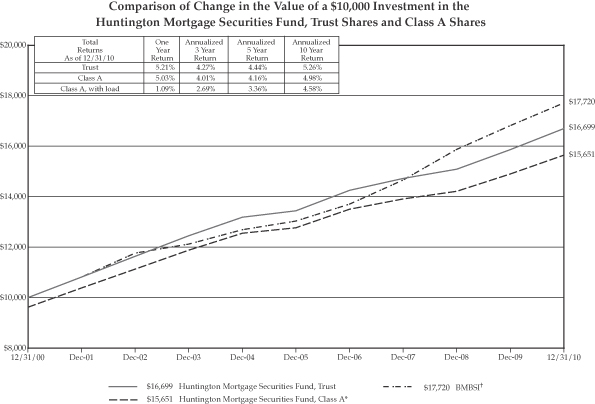
Performance data quoted represents past performance which is no guarantee of future results. Investment return and principal value will fluctuate so that an investor’s shares, when redeemed, may be worth more or less than their original cost. Mutual fund performance changes over time and current performance may be lower or higher than what is stated. For current to the most recent month end performance, visit www.huntingtonfunds.com or call 1-800-253-0412. For after-tax returns call 1-800-253-0412. Returns shown do not reflect the deduction of taxes that a shareholder would pay on Fund distributions or the redemption of Fund Shares. Mutual funds are not obligations of or guaranteed by any bank and are not federally insured. Total returns, at load, include the maximum 3.75% sales charge for the Class A Shares.
| | | | |
Class | | Expense Ratios | |
A | | | 1.38% | |
Trust | | | 1.13% | |
The above expense ratios are from the Funds’ prospectus dated May 1, 2010. Additional information pertaining to the Fund’s expense ratio as of December 31, 2010 can be found in the financial highlights.
The Fund’s performance assumes the reinvestment of all dividends and distributions. The BMBSI has been adjusted to reflect reinvestment of dividends on securities in the index.
| * | Represents a hypothetical investment of $10,000 in the Fund after deducting the maximum sales load of 3.75% ($10,000 investment minus $375 sales load = $9,625). |
| † | The BMBSI is not adjusted to reflect sales charges, expenses, or other fees that the Securities and Exchange Commission requires to be reflected in the Fund’s performance. The index is unmanaged and, unlike the Fund, is not affected by cashflows. It is not possible to invest directly in an index. |
Annual Shareholder Report
30
| | |
Ohio Tax-Free Fund | | As of 12/31/10 |
Management’s Discussion of Fund Performance
Portfolio Manager: Kathy Stylarek
Vice President
Huntington Asset Advisors, Inc.
For the fiscal year ended December 31, 2010, the Huntington Ohio Tax-Free Fund’s Trust Share and Class A Shares produced total returns (not including the deduction of applicable sales charges) of 1.85% and 1.60%, respectively, based on net asset value. The Fund’s benchmark, the Barclays 7-YearMunicipal Bond Index (B7MB),1 returned 4.25% for the same period. The Lipper Other States Intermediate Municipal Debt Funds Average,2 the Fund’s peer group, had a total return of 0.95% for the reporting period.
The Fund was positioned more defensively than its benchmark with a shorter duration, which resulted in a lower but consistent relative performance for the year. The Fund outperformed its Lipper peer group and was positively impacted by the strong performance of municipals in the intermediate range of the curve. The higher quality, intermediate curve performed well the second half of the year. Municipal bonds began the year with the ratio of municipals to Treasuries paying 53-96% of what Treasury yields were paying.3 By the end of the year the yield ratio of municipals to Treasuries was back to the 86-170% levels. The number of new deals continued to increase but at a decreasing rate throughout the year. Also, it should be mentioned that approximately 40% of the new deals that came to market were of the Build America Bond (taxable) type that did not help us with the inventory shortage.
In general, the low quality bond sector began the year strong but then dipped in value by year end. The second half of 2010 recaptured the gains it had picked up in the high yield, long bond market in the first half of the year. Additionally, the bond sector exhibited a great deal of volatility with buy and sell spreads widening. However, the Fund’s steady performance in the municipal market came from its holdings in higher quality general obligation and essential service bonds. The yield spread between low quality and high quality bonds began to widen especially during the second half of the fiscal year. The best predictable value was from the highest quality municipals, which positively affected the Fund’s performance.
We were also able to capitalize on some sectors that we usually do not participate in because bonds are priced with not enough yield. We took positions in some Housing bonds and some Zero Coupon bonds that offered good value against the current yield curve. The Housing bonds gave us the ability to shorten the duration while maintaining the same yield. The Zero Coupon bonds also offered good yield and offset some of the NAV reduction from the Premium Bond amortization within the fund. Both sectors offered stability and yield. Our focus remained on the non-AMT bonds, which pay income that is tax-free.
| ¿ | | The composition of the Fund’s holdings is subject to change. |
| (1) | The B7MB is comprised of intermediate term, investment grade, tax-exempt bonds with maturities between 6 and 8 years. The index is unmanaged and, unlike the Fund, is not affected by cashflows. It is not possible to invest directly in an Index. |
| (2) | Lipper figures represent the average of the total returns reported by all of the mutual funds designated by Lipper Inc. as falling into the respective category indicated. They do not reflect sales charges. |
| (3) | Bond prices are sensitive to changes in interest rates, and a rise in interest rates can cause a decline in their prices. |
Income generated by this Fund may be subject to the federal alternative minimum tax.
Annual Shareholder Report
31
Ohio Tax-Free Fund (Continued)
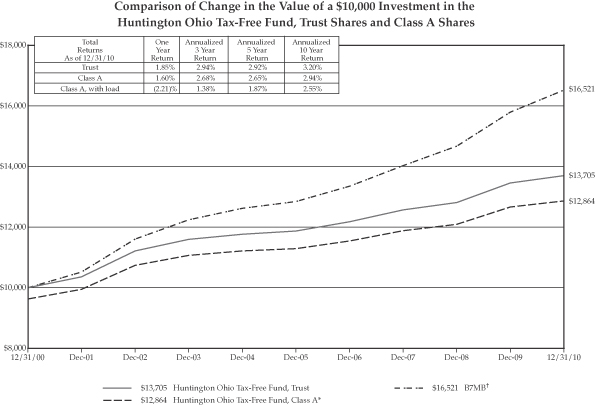
Performance data quoted represents past performance which is no guarantee of future results. Investment return and principal value will fluctuate so that an investor’s shares, when redeemed, may be worth more or less than their original cost. Mutual fund performance changes over time and current performance may be lower or higher than what is stated. For current to the most recent month end performance, visit www.huntingtonfunds.com or call 1-800-253-0412. For after-tax returns call 1-800-253-0412. Returns shown do not reflect the deduction of taxes that a shareholder would pay on Fund distributions or the redemption of Fund Shares. Mutual funds are not obligations of or guaranteed by any bank and are not federally insured. Total returns, at load, include the maximum 3.75% sales charge for the Class A Shares.
| | | | |
| Class | | Expense Ratios | |
A | | | 1.45% | |
Trust | | | 1.20% | |
The above expense ratios are from the Funds’ prospectus dated May 1, 2010. Additional information pertaining to the Fund’s expense ratio as of December 31, 2010 can be found in the financial highlights.
The Fund’s performance assumes the reinvestment of all dividends and distributions. The B7MB has been adjusted to reflect reinvestment of dividends on securities in the index.
| * | Represents a hypothetical investment of $10,000 in the Fund after deducting the maximum sales load of 3.75% ($10,000 investment minus $375 sales load = $9,625). |
| † | The B7MB is not adjusted to reflect sales charges, expenses, or other fees that the Securities and Exchange Commission requires to be reflected in the Fund’s performance. The index is unmanaged and, unlike the Fund, is not affected by cashflows. It is not possible to invest directly in an index. |
Annual Shareholder Report
32
| | |
Short/Intermediate Fixed Income Securities Fund | | As of 12/31/10 |
Management’s Discussion of Fund Performance
Portfolio Manager: William G. Doughty, MBA
Vice President
Huntington Asset Advisors, Inc.
For the fiscal year ended December 31, 2010, the Huntington Short/Intermediate Fixed Income Securities Fund produced total returns (not including the deduction of applicable sales charges) of 2.99% and 2.78% for the Fund’s Trust and Class A Shares, respectively, based on net asset value. This compared with a return for the Merrill Lynch 1-5 Year Corporate/Government Credit Index (ML 1-5YGC),1 the Fund’s benchmark index, of 4.17%, and the Lipper Short-Intermediate Investment Grade Debt Fund Average2 of 5.49% for the same period.
Overall, performance of the Fund for 2010 was lower than similar funds and the benchmark index due to the Fund’s underweight in the Treasury market. During 2010, Treasuries had a return of 5.88% for the year.3 Agencies had a return of 4.61%, while corporate bonds had a return of 9.52%. At fiscal year end, the Fund held 60% of its portfolio in corporate debt, 36% in federal agencies, 3.0% in Treasuries and 2% in cash. Corporate bonds experienced another good year as spreads tightened to Treasuries, liquidity returned to the markets and accounts were willing to take on more risk. Also affecting the performance was the shorter nature of the Fund and its more defensive posture with the expectation of higher rates. The two-year Treasury had a return of 2.28%, while the 5-year Treasury had a return of 6.76%. The duration of the Fund was 2.4 years.
| ¿ | | The composition of the Fund’s holdings is subject to change. |
| (1) | The ML 1-5YGC trades short-term U.S. government securities and short-term domestic investment-grade corporate bonds with maturities between 1 and 4.99 years. The index is unmanaged and, unlike the Fund, is not affected by cashflows. It is not possible to invest directly in an Index. |
| (2) | Lipper figures represent the average of the total returns reported by all of the mutual funds designated by Lipper Inc. as falling into the category indicated. They do not reflect sales charges. |
| (3) | Bond prices are sensitive to changes in interest rates, and a rise in interest rates can cause a decline in their prices. |
Annual Shareholder Report
33
Short/Intermediate Fixed Income Securities Fund (Continued)
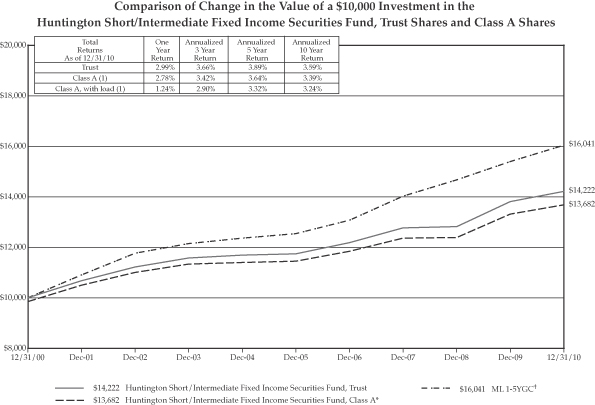
Performance data quoted represents past performance which is no guarantee of future results. Investment return and principal value will fluctuate so that an investor’s shares, when redeemed, may be worth more or less than their original cost. Mutual fund performance changes over time and current performance may be lower or higher than what is stated. For current to the most recent month end performance, visit www.huntingtonfunds.com or call 1-800-253-0412. For after-tax returns call 1-800-253-0412. Returns shown do not reflect the deduction of taxes that a shareholder would pay on Fund distributions or the redemption of Fund Shares. Mutual funds are not obligations of or guaranteed by any bank and are not federally insured. Total returns, at load, include the maximum 1.50% sales charge for the Class A Shares.
| | | | |
| Class | | Expense Ratios | |
A | | | 1.36% | |
Trust | | | 1.11% | |
The above expense ratios are from the Funds’ prospectus dated May 1, 2010. Additional information pertaining to the Fund’s expense ratio as of December 31, 2010 can be found in the financial highlights.
The Fund’s performance assumes the reinvestment of all dividends and distributions. The ML1-5YGC has been adjusted to reflect reinvestment of dividends on securities in the index.
| * | Represents a hypothetical investment of $10,000 in the Fund after deducting the maximum sales load of 1.50% ($10,000 investment minus $150 sales load = $9,850). |
| (1) | Class A Shares commenced operations on May 9, 2003. Prior to May 9, 2003, performance is based on the performance of Trust Shares adjusted for the Class A Shares 12b-1 fees and sales charge. |
| † | The ML 1-5YGC is not adjusted to reflect sales charges, expenses, or other fees that the Securities and Exchange Commission requires to be reflected in the Fund’s performance. The index is unmanaged and, unlike the Fund, is not affected by cashflows. It is not possible to invest directly in an index. |
Annual Shareholder Report
34
| | |
Balanced Allocation Fund | | As of 12/31/10 |
Management’s Discussion of Fund Performance
Manager: Paula Jurcenko
Senior Vice President
Huntington Asset Advisors, Inc.
For the fiscal year ended December 31, 2010, the Huntington Balanced Allocation Fund Class A Shares produced a total return (not including the deduction of applicable sales charges) of 9.14% based on net asset value. This performance compares to the 15.06% total return of its benchmark, the Standard and Poor’s 500 Index (S&P 500)1 and the 11.87% total return for the Balanced Allocation Indices Blend (BAIB)2 for the same period.
Huntington Asset Advisor’s Inc. utilizes optimization software and both internal and external research to analyze the economy and the capital markets to determine the optimal allocation of asset classes to capitalize on current market conditions. Based on these models, the manager constructs the portfolio of the underlying Huntington Funds that comprise the Balanced Allocation Fund. During 2010, this resulted in four tactical allocation changes that were implemented in the Fund.
The first tactical allocation change occurred in April when the Fund increased holdings in the International Equity class, bringing the Fund to an equal weight in this category. The fiscal train wreck in Greece led to a wave of concern about sovereign debt levels and their sustainability, even in the “core” of Europe (France and Germany). The poor sentiment spread to both the U.S. and Japanese markets as well. Due to these concerns, International Equity exposure was further reduced to an underweight position with another tactical change in May. This increased the Fund���s exposure to the Domestic Equity class. The Fund continued to maintain an underweight in Fixed Income, as compared to the Fund’s target allocations. In early July of the third quarter, the Fund reduced its Equity exposure to neutral and increased exposure to cash. Again in September, there was an opportunity to take advantage of a market rally and further reduce the Fund’s equity exposure and increase exposure to Fixed Income.
At the end of 2010, the Balanced Allocation Fund had a 60% allocation to equity funds. Of particular importance to the Fund’s performance were the two largest equity fund holdings in the portfolio, the Huntington International Equity Fund (12.8% of the portfolio) and the Huntington Macro 100 Fund (8.9% of the portfolio). For the year ended December 31, 2010, the Huntington International Equity Fund Trust shares returned 7.72%, which slightly underperformed the 7.75% return of its benchmark, the MSCI Europe, Australasia and Far East Index (EAFE) for the same period. The Huntington Macro 100 Fund Trust shares returned 15.60%, which outperformed the 15.06% return of its benchmark, the S&P 500 Index.
At the end of 2010, the Balanced Allocation Fund had an allocation of 37% to fixed-income funds. The two largest holdings in this category were represented by the Huntington Fixed Income Securities Fund (16.9% of the portfolio) and the Huntington Intermediate Government Income Fund (7.9% of the portfolio). The Fixed Income Securities Fund Trust Shares attained a total return of 5.75% compared to the 6.59% return of its benchmark, the Barclays Government/Credit Index, for the year ended December 31, 2010. The Intermediate Government Income Fund Trust Shares had a return of 4.64% for the same time period, which compared to the total return for the Barclays Capital Intermediate Govt./Credit Index return of 5.89%.
| ¿ | | The composition of the Fund’s holdings is subject to change. |
| (1) | The S&P 500 is a capitalization-weighted index comprised of 500 stocks and designed to measure performance of the broad domestic economy through changes in the aggregate market value of 500 stocks representing all major industries. The index is unmanaged and, unlike the Fund, is not affected by cashflows. It is not possible to invest directly in an Index. |
| (2) | The Balanced Allocation Blended Benchmark is a custom blended index comprised of the following two indices with their noted respective weightings: Standard & Poor’s 500 Index (60%) and the Barclays U.S. Aggregate Bond Index (40%). The Barclays U.S. Aggregate Index is comprised of securities from the Barclays Government/Corporate Bond Index, Mortgage Securities Index and the Asset Based Index. Total return comprises price appreciation/depreciation and income as a percentage of the original investment. Indices are rebalanced monthly by market capitalization. The index is unmanaged and, unlike the Fund, is not affected by cashflows. It is not possible to invest directly in an Index. The S&P 500 Index is an unmanaged index generally representing the performance of the broad domestic economy through changes in the aggregate market value of 500 stocks representing all major industries. Investments cannot be made in an index. |
Annual Shareholder Report
35
Balanced Allocation Fund (Continued)
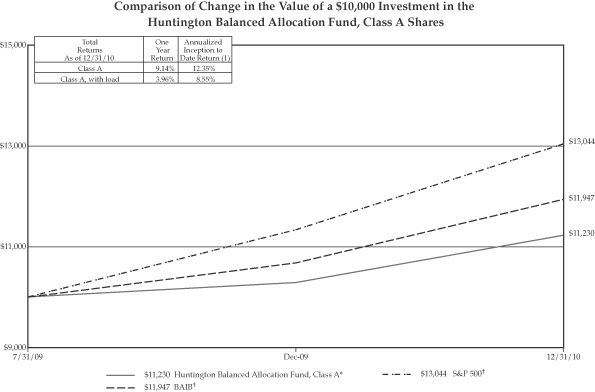
Performance data quoted represents past performance which is no guarantee of future results. Investment return and principal value will fluctuate so that an investor’s shares, when redeemed, may be worth more or less than their original cost. Mutual fund performance changes over time and current performance may be lower or higher than what is stated. For current to the most recent month end performance, visit www.huntingtonfunds.com or call 1-800-253-0412. For after-tax returns call 1-800-253-0412. Returns shown do not reflect the deduction of taxes that a shareholder would pay on Fund distributions or the redemption of Fund Shares. Mutual funds are not obligations of or guaranteed by any bank and are not federally insured. Total returns, at load, include the maximum 4.75% sales charge for the Class A Shares.
| | | | |
| Class | | Expense Ratio | |
A | | | 1.90% | |
The above expense ratios are from the Funds’ prospectus dated May 1, 2010. Additional information pertaining to the Fund’s expense ratio as of December 31, 2010 can be found in the financial highlights.
The Fund’s performance assumes the reinvestment of all dividends and distributions on securities. The S&P 500 and BAIB have been adjusted to reflect reinvestment of dividends on securities in the indices.
| * | Represents a hypothetical investment of $10,000 in the Fund after deducting the maximum sales load of 4.75% ($10,000 investment minus $475 sales load = $9,525). |
| (1) | The Fund commenced operations on July 31, 2009. |
| † | The S&P 500 and BAIB are not adjusted to reflect sales charges, expenses, or other fees that the Securities and Exchange Commission requires to be reflected in the Fund’s performance. The indices are unmanaged and, unlike the Fund, are not affected by cashflows. It is not possible to invest directly in an index. |
Annual Shareholder Report
36
| | |
Conservative Allocation Fund | | As of 12/31/10 |
Management’s Discussion of Fund Performance
Manager: Paula Jurcenko
Senior Vice President
Huntington Asset Advisors, Inc.
For the fiscal year ended December 31, 2010, the Huntington Conservative Allocation Fund Class A Shares produced a total return (not including the deduction of applicable sales charges) of 5.70% based on net asset value. This performance compares to the 6.54% total return of its benchmark, the Barclay’s U.S. Aggregate Bond Index (BUSAI)1 and 8.40% total return for the Conservative Allocation Indices Blend (CAIB)2 for the same period.
Huntington Asset Advisors, Inc. utilizes optimization software and both internal and external research to analyze the economy and the capital markets to determine the optimal allocation of asset classes to capitalize on current market conditions. Based on these models, the manager constructs the portfolio of the underlying Huntington Funds that comprise the Conservative Allocation Fund. During 2010, this resulted in four tactical allocation changes that were implemented in the Fund.
The first tactical allocation change occurred In April when the Fund increased holdings in the International Equity class, bringing the Fund to an equalweight in this category. The fiscal train wreck in Greece led to a wave of concern about sovereign debt levels and their sustainability, even in the “core” of Europe (France and Germany). The poor sentiment spread to both the U.S. and Japanese markets as well. Due to these concerns, International Equity exposure was further reduced to an underweight position with another tactical change in May. This increased the Fund’s exposure to the Domestic Equity class. The Fund continued to maintain an underweight in Fixed Income, as compared to the Fund’s target allocations. In early July of the third quarter, the Fund reduced its Equity exposure to neutral and increased exposure to Cash. Again in September, there was an opportunity to take advantage of a market rally and further reduce the Fund’s equity exposure and increase exposure to Fixed Income.
At the end of 2010, the Conservative Allocation Fund had an allocation of 76% to fixed income funds. The two largest holding in this category were represented by the Huntington Fixed Income Securities Fund (34.6% of the portfolio) and the Huntington Intermediate Government Income Fund (16.1% of the portfolio). The Fixed Income Securities Fund Trust Shares attained a total return of 5.75%, compared to the 6.59% return of its benchmark, the Barclays Government/Credit Index, for the year ended December 31, 2010. The Intermediate Government Income Fund’s Trust Shares had a return of 4.64% for the same time period, which compared to the total return for the Barclays Capital Intermediate Govt./Credit Index return of 5.89%.
At the end of 2010, the Conservative Allocation Fund had a 20% allocation to equity funds. Of particular importance to the Fund’s performance were the two largest equity fund holdings in the portfolio, the Huntington International Equity Fund (4.2% of the portfolio) and the Huntington Macro 100 Fund (2.9% of the portfolio). For the year ended December 31, 2010, the Huntington International Equity Fund Trust shares returned 7.72%, which slightly underperformed the 7.75% return of its benchmark, the MSCI Europe, Australasia and Far East Index (EAFE) for the same period, while the Huntington Macro 100 Fund Trust shares returned 15.60%, which outperformed the 15.06% return of its benchmark, the S&P 500 Index.
| ¿ | | The composition of the Fund’s holdings is subject to change. |
| (1) | The Barclay’s U.S. Aggregate Bond Index is composed of securities from the Barclay’s Government/Corporate Bond Index, Mortgage Securities Index and the Asset Based Securities Index. Total return comprises price appreciation/depreciation and income as a percentage of the original investment. Indices are rebalanced monthly by market capitalization. The index is unmanaged and, unlike the Fund, is not affected by cashflows. It is not possible to invest directly in an Index. |
| (2) | The Conservative Allocation Blended Benchmark is a custom blended index comprised of the following two indices with their Index (80%). The Barclays U.S. Aggregate Index is comprised of securities from the Barclays Government/Corporate Bond Index, Mortgage Securities Index and the Asset Based Index. Total return comprises price appreciation/depreciation and income as a percentage of the original investment. Indices are rebalanced monthly by market capitalization. The index is unmanaged and, unlike the Fund, is not affected by cashflows. It is not possible to invest directly in an Index. The S&P 500 Index is an unmanaged index generally representing the performance of the broad domestic economy through changes in the aggregate market value of 500 stocks representing all major industries. Investments cannot be made in an index. |
Annual Shareholder Report
37
Conservative Allocation Fund (Continued)
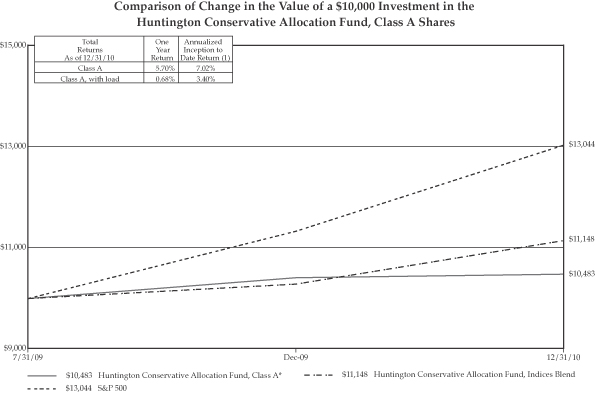
Performance data quoted represents past performance which is no guarantee of future results. Investment return and principal value will fluctuate so that an investor’s shares, when redeemed, may be worth more or less than their original cost. Mutual fund performance changes over time and current performance may be lower or higher than what is stated. For current to the most recent month end performance, visit www.huntingtonfunds.com or call 1-800-253-0412. For after-tax returns call 1-800-253-0412. Returns shown do not reflect the deduction of taxes that a shareholder would pay on Fund distributions or the redemption of Fund Shares. Mutual funds are not obligations of or guaranteed by any bank and are not federally insured. Total returns, at load, include the maximum 4.75% sales charge for the Class A Shares.
| | | | |
Class | | Expense Ratio | |
A | | | 1.90% | |
The above expense ratios are from the Funds’ prospectus dated May 1, 2010. Additional information pertaining to the Fund’s expense ratio as of December 31, 2010 can be found in the financial highlights.
The Fund’s performance assumes the reinvestment of all dividends and distributions on securities. The BUSAI and CAIB have been adjusted to reflect reinvestment of dividends on securities in the indices.
| * | Represents a hypothetical investment of $10,000 in the Fund after deducting the maximum sales load of 4.75% ($10,000 investment minus $475 sales load = $9,525). |
| (1) | The Fund commenced operations on July 31, 2009. |
| † | The BUSAI and CAIB are not adjusted to reflect sales charges, expenses, or other fees that the Securities and Exchange Commission requires to be reflected in the Fund’s performance. The indices are unmanaged and, unlike the Fund, are not affected by cashflows. It is not possible to invest directly in an index. |
Annual Shareholder Report
38
| | |
Growth Allocation Fund | | As of 12/31/10 |
Management’s Discussion of Fund Performance
Manager: Paula Jurcenko
Senior Vice President
Huntington Asset Advisors, Inc.
For the fiscal year ended December 31, 2010, the Huntington Balanced Allocation Fund Class A Shares produced a total return (not including the deduction of applicable sales charges) of 10.69% based on net asset value. This performance compares to the 15.06% total return of its benchmark, the Standard and Poor’s 500 Index (S&P 500)1 and the 13.50% total return for the Growth Allocation Indices Blend (GAIB)2 for the same period.
Huntington Asset Advisor’s Inc. utilizes optimization software and both internal and external research to analyze the economy and the capital markets to determine the optimal allocation of asset classes to capitalize on current market conditions. Based on these models, the manager constructs the portfolio of the underlying Huntington Funds that comprise the Conservative Allocation Fund. During 2010, this resulted in four tactical allocation changes that were implemented in the Fund.
The first tactical allocation change occurred In April when the Fund increased holdings in the International Equity class, bringing the Fund to an equal weight in this category. The fiscal train wreck in Greece led to a wave of concern about sovereign debt levels and their sustainability, even in the “core” of Europe (France and Germany). The poor sentiment spread to both the U.S. and Japanese markets as well. Due to these concerns, International Equity exposure was further reduced to an underweight position with another tactical change in May. This increased the Fund’s exposure to the Domestic Equity class. The Fund continued to maintain an underweight in Fixed Income, as compared to the Fund’s target allocations. In early July of the third quarter, the Fund reduced its Equity exposure to neutral and increased exposure to Cash. Again in September, there was an opportunity to take advantage of a market rally and further reduce the Fund’s equity exposure and increase exposure to Fixed Income.
At the end of 2010, the Growth Allocation Fund had an 80% allocation to equity funds. Of particular importance to the Fund’s performance were the three largest equity fund holdings in the portfolio, the Huntington International Equity Fund (17.0% of the portfolio), the Huntington Macro 100 Fund (11.9% of the portfolio) and Huntington Income Equity Fund (11.7% of the portfolio). For the year ended December 31, 2010, the Huntington International Equity Fund Trust Shares returned 7.72%, which slightly underperformed the 7.75% return of its benchmark, the MSCI Europe, Australasia and Far East Index (EAFE) for the same period, while the Huntington Macro 100 Fund Trust Shares returned 15.60%, which outperformed the 15.06% return of its benchmark, the S&P 500 Index. The Income Equity Fund Trust Shares returned 11.59%, which underperformed the 15.06% return of its benchmark, the S&P 500 Index.
At the end of 2010, the Growth Allocation Fund had an allocation of 17% to fixed income funds. The largest holding in this category was represented by the Huntington Fixed Income Securities Fund (7.8% of the portfolio). The Fixed Income Securities Fund Trust Shares attained a total return of 5.75%, compared to the 6.591% return of its benchmark, the Barclays Government/Credit Index, for the year ended December 31, 2010.
| ¿ | | The composition of the Fund’s holdings is subject to change. |
| (1) | The S&P 500 is a capitalization-weighted index comprised of 500 stocks and designed to measure performance of the broad domestic economy through changes in the aggregate market value of 500 stocks representing all major industries. The index is unmanaged and, unlike the Fund, is not affected by cashflows. It is not possible to invest directly in an Index. |
| (2) | The Growth Allocation Blended Benchmark is a custom blended index comprised of the following two indices with their noted respective weightings: Standard & Poor’s 500 Index (80%) and the Barclays U.S. Aggregate Bond Index (20%). The Barclays U.S. Aggregate Index is comprised of securities from the Barclays Government/Corporate Bond Index, Mortgage Securities Index and the Asset Based Index. Total return comprises price appreciation/depreciation and income as a percentage of the original investment. Indices are rebalanced monthly by market capitalization. The index is unmanaged and, unlike the Fund, is not affected by cashflows. It is not possible to invest directly in an Index. The S&P 500 Index is an unmanaged index generally representing the performance of the broad domestic economy through changes in the aggregate market value of 500 stocks representing all major industries. Investments cannot be made in an index. |
Annual Shareholder Report
39
Growth Allocation Fund (Continued)
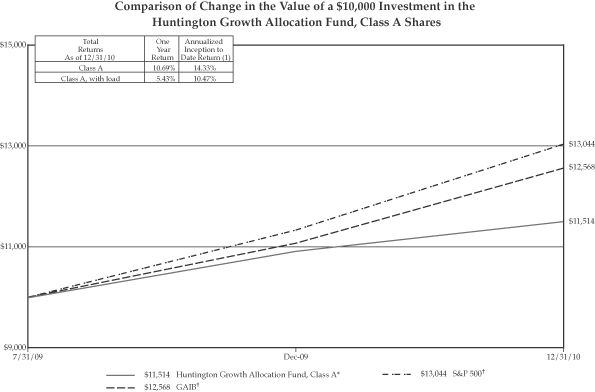
Performance data quoted represents past performance which is no guarantee of future results. Investment return and principal value will fluctuate so that an investor’s shares, when redeemed, may be worth more or less than their original cost. Mutual fund performance changes over time and current performance may be lower or higher than what is stated. For current to the most recent month end performance, visit www.huntingtonfunds.com or call 1-800-253-0412. For after-tax returns call 1-800-253-0412. Returns shown do not reflect the deduction of taxes that a shareholder would pay on Fund distributions or the redemption of Fund Shares. Mutual funds are not obligations of or guaranteed by any bank and are not federally insured. Total returns, at load, include the maximum 4.75% sales charge for the Class A Shares.
| | | | |
| Class | | Expense Ratio | |
A | | | 1.90% | |
The above expense ratios are from the Funds’ prospectus dated May 1, 2010. Additional information pertaining to the Fund’s expense ratio as of December 31, 2010 can be found in the financial highlights.
The Fund’s performance assumes the reinvestment of all dividends and distributions on securities. The S&P 500 and GAIB have been adjusted to reflect reinvestment of dividends on securities in the indices.
| * | Represents a hypothetical investment of $10,000 in the Fund after deducting the maximum sales load of 4.75% ($10,000 investment minus $475 sales load = $9,525). |
| (1) | The Fund commenced operations on July 31, 2009. |
| † | The S&P 500 and GAIB are not adjusted to reflect sales charges, expenses, or other fees that the Securities and Exchange Commission requires to be reflected in the Fund’s performance. The indices are unmanaged and, unlike the Fund, are not affected by cashflows. It is not possible to invest directly in an index. |
Annual Shareholder Report
40
| | |
| | |
| Huntington Tax Free Money Market Fund | | December 31, 2010 |
| | |
| Portfolio of Investments Summary Table | | (unaudited) |
| | | | |
| Asset Allocation | | Percentage of
Market Value | |
Demand Notes | | | 73.6% | |
General Market Notes | | | 26.4% | |
Total | | | 100.0% | |
Portfolio holdings and allocations are subject to change. As of December 31, 2010, percentages in the table above are based on total investments. Such total investments may differ from the percentages set forth below in the Portfolio of Investments which are computed using the Fund’s total net assets.
The Portfolio of Investments Summary Table and the Portfolio of Investments are broken down by sectors, and these sectors do not represent industry categories for purposes of identifying “industry concentration” as described in the Investment Company Act of 1940, as amended.
Portfolio of Investments
| | | | | | | | | | |
Principal
Amount | | | | | Value | | | |
| | | | | | | | | | |
| Municipal Bonds — 92.3% | | | | | | |
| Colorado — 5.3% | | | | | | |
| $ | 1,000,000 | | | Colorado Educational & Cultural Facilities Authority Revenue, National Jewish Federation , Series A-8, (LOC - Bank of America N.A.),
0.290%, 9/1/35 (a) | | $ | 1,000,000 | | | |
| | 1,500,000 | | | Colorado Educational & Cultural Facilities Authority Revenue, National Jewish Federation, Series D-3, (AGM Ins. LOC - JPMorgan Chase Bank),
0.290%, 12/1/37 (a) | | | 1,500,000 | | | |
| | 350,000 | | | Colorado Housing & Finance Authority, (Fannie Mae Ins.),
0.300%, 10/15/16 (a) | | | 350,000 | | | |
| | 350,000 | | | Colorado Housing & Finance Authority, (Fannie Mae Ins.),
0.300%, 10/15/16 (a) | | | 350,000 | | | |
| | 500,000 | | | Colorado Housing & Finance Authority, (Fannie Mae Ins.),
0.330%, 10/15/16 (a) | | | 500,000 | | | |
| | 700,000 | | | Colorado Holland Creek Metropolitan District Revenue, (LOC - Bank of America N.A.), 0.330%, 6/1/41 (a) | | | 700,000 | | | |
| | | | | | | | 4,400,000 | | | |
| Connecticut — 0.1% | | | | | | |
| | 100,000 | | | Farmington, CT, G.O., 3.250%, 2/15/11 | | | 100,295 | | | |
| Florida — 35.1% | | | | | | |
| | 800,000 | | | Broward County, FL, Education Facilities Authority Revenue, (LOC - Bank of America N.A.),
0.330%, 4/1/20 (a) | | | 800,000 | | | |
| | 2,990,000 | | | Broward County, FL, School Board, Certificate Participation, (AGM Ins.), 0.420%, 7/1/21 (a) | | | 2,990,000 | | | |
| | 1,365,000 | | | Broward County, FL, Housing Finance Authority Revenue, (Freddie Mac Ins.), 0.320%, 12/1/29 (a) | | | 1,365,000 | | | |
| | | | | | | | | | |
Principal
Amount | | | | | Value | | | |
| | | | | | | | | | |
| Municipal Bonds — (Continued) | | | | | | |
| Florida — (Continued) | | | | | | |
| $ | 5,000,000 | | | Broward County, FL, School Board, Certificate Participation, Series B, (AGM Ins. SPA - Dexia Credit Local),
0.330%, 7/1/31 (a) | | $ | 5,000,000 | | | |
| | 100,000 | | | Broward County, FL, Education Facilities Authority Revenue, (LOC - Citibank N.A.), 0.310%, 11/1/31 (a) | | | 100,000 | | | |
| | 85,000 | | | Charlotte County, FL, Utility Revenue, Series B, (AGM Ins.),
0.369%, 10/1/21 (a) | | | 85,000 | | | |
| | 550,000 | | | Duval County, FL, Housing Finance Authority Revenue, (LOC - U.S. Bank N.A.), 0.340%, 7/1/25 (a) | | | 550,000 | | | |
| | 1,580,000 | | | Florida Housing Finance Agency Revenue, Series B, (Fannie Mae Ins. LOC - FNMA), 0.340%, 8/1/11 (a) | | | 1,580,000 | | | |
| | 1,800,000 | | | Florida State Department Environmental Protection Preservation Revenue,
Series A, (Assured Guaranty),
0.290%, 7/1/27 (a) | | | 1,800,000 | | | |
| | 425,000 | | | Fort Pierce, FL, Capital Improvement Revenue, (FGIC), 4.750%, 9/1/21 | | | 434,796 | | | |
| | 330,000 | | | Hernando County, FL, Revenue, (Assured Guaranty), 2.000%, 2/1/11 | | | 330,276 | | | |
| | 900,000 | | | North Broward, FL, , Hospital District Revenue, (MBIA Ins. LOC - Wachovia Bank N.A.), 0.300%, 1/15/27 (a) | | | 900,000 | | | |
| | 2,790,000 | | | Orlando & Orange County Authority, FL, Expressway Revenue, (FSA Ins.),
0.330%, 7/1/25 (a) | | | 2,790,000 | | | |
| | 2,000,000 | | | Orlando & Orange County Authority, FL, Expressway Revenue, Series D, (AGM Ins. SPA - Dexia Credit Local),
0.490%, 7/1/32 (a) | | | 2,000,000 | | | |
(See notes which are an integral part of the Financial Statements)
Annual Shareholder Report
41
| | |
| Huntington Tax Free Money Market Fund | | (Continued) |
| | | | | | | | | | |
Principal
Amount | | | | | Value | | | |
| | | | | | | | | | |
| Municipal Bonds — (Continued) | | | | | | |
| Florida — (Continued) | | | | | | |
| $ | 200,000 | | | Palm Beach County, FL, Revenue, (INS LOC - Northern Trust Co.),
0.350%, 5/1/25 (a) | | $ | 200,000 | | | |
| | 1,050,000 | | | Palm Beach County, FL, Revenue, (LOC - Northern Trust Co.),
0.350%, 3/1/30 (a) | | | 1,050,000 | | | |
| | 700,000 | | | Palm Beach County, FL, Revenue, (LOC - Northern Trust Co.),
0.390%, 11/1/36 (a) | | | 700,000 | | | |
| | 500,000 | | | Pinellas County, FL, , Health Facilities Authority Revenue, Series B-2, (AGM Ins.), 0.390%, 11/15/33 (a) | | | 500,000 | | | |
| | 140,000 | | | Reedy Creek, FL, Improvement Disctrict Florida Utility Revenue, (SPA - Ambac), 5.000%, 10/1/11 | | | 144,063 | | | |
| | 3,500,000 | | | Sarasota County, Fl, Public Hospital District Hospital Revenue, Sarasota Memorial Hospital, Series A, (LOC - Northern Trust Co.),
0.260%, 7/1/37 (a) | | | 3,500,000 | | | |
| | 1,000,000 | | | University of South Florida Research Foundation, Inc., Revenue, (LOC - Bank of America N.A.),
0.380%, 8/1/34 (a) | | | 1,000,000 | | | |
| | 1,100,000 | | | Volusia County, FL, Housing Finance Authority Refunding Revenue, (Fannie Mae Ins.),
0.320%, 1/15/32 (a) | | | 1,100,000 | | | |
| | | | | | | | 28,919,135 | | | |
| Illinois — 3.7% | | | | | | |
| | 665,000 | | | Chicago, IL, Board of Education,
Series D, (AMG Ins. SPA - Dexia Credit Local), 0.350%, 3/1/32 (a) | | | 665,000 | | | |
| | 1,990,000 | | | Chicago, IL, Board of Education, G.O., Series B, (FSA Ins.),
0.450%, 3/1/32 (a) | | | 1,990,000 | | | |
| | 400,000 | | | Kane Cook & DuPage Counties, IL, School District, G.O., 2.000%, 1/1/11 | | | 400,000 | | | |
| | | | | | | | 3,055,000 | | | |
| Indiana — 0.9% | | | | | | |
| | 700,000 | | | Indiana State Educational Facilities Authority Revenue, Series E, (LOC - U.S. Bank N.A.), 0.350%, 10/1/24 (a) | | | 700,000 | | | |
| Kentucky — 0.6% | | | | | | |
| | 475,000 | | | Russell, KY, Revenue, Series B, (FSA Ins.), 0.340%, 11/1/26 (a) | | | 475,000 | | | |
| Massachusetts — 1.5% | | | | | | |
| | 1,250,000 | | | Fitchburg Massachusettes Bond Anticipatory Notes, G.O.,
1.500%, 6/30/11 | | | 1,254,278 | | | |
| | | | | | | | | | | | |
Principal
Amount | | | | | Value | | | | |
| | | | | | | | | | | | |
| Municipal Bonds — (Continued) | | | | | | | | |
| Michigan — 0.5% | | | | | | | | |
| $ | 450,000 | | | Milan, MI, Area Schools, G.O., (Q-SBLF Ins. LOC - Landesbank Hessen-Thuringen), 0.350%, 5/1/30 (a) | | $ | 450,000 | | | | | |
| Minnesota — 2.4% | | | | | | | | |
| | 1,995,000 | | | Minneapolis, MN, Housing and Redevelopment Health Care, Allina Health Systems, Series B-1,
0.290%, 11/15/35 (a) | | | 1,995,000 | | | | | |
| Missouri — 2.5% | | | | | | | | |
| | 1,000,000 | | | Missouri State Health & Educational Facilities Authority Facilities Revenue, Saint Louis Univerisity, Series B, (SPA - Bank of America N.A.), 0.290%, 10/1/24 (a) | | | 1,000,000 | | | | | |
| | 1,100,000 | | | Missouri State Health & Educational Facilities Authority Facilities Revenue, Washington University, Series B, (SPA - U.S. Bank N.A.),
0.260%, 2/15/33 (a) | | | 1,100,000 | | | | | |
| | | | | | | | 2,100,000 | | | | | |
| New Jersey — 3.7% | | | | | | | | |
| | 3,000,000 | | | Patterson, NJ, G.O., 1.500%, 6/16/11 | | | 3,009,465 | | | | | |
| New Mexico — 0.1% | | | | | | | | |
| | 100,000 | | | New Mexico Finance Authority Revenue, Senior Lien Public Project Revolving, Series C, 3.250%, 6/1/11 | | | 101,028 | | | | | |
| New York — 4.1% | | | | | | | | |
| | 207,922 | | | Alfred Almond Central School District, 3.000%, 6/15/11 | | | 209,927 | | | | | |
| | 1,000,000 | | | Sag Harbor, NY, Union Free School District, G.O., 1.500%, 6/23/11 | | | 1,002,815 | | | | | |
| | 300,000 | | | South County Central School District, NY, 2.125%, 6/30/11 | | | 302,023 | | | | | |
| | 900,000 | | | Triborough Bridge & Tunnel Authority, NY, Revenue, Series AB, (AGM Ins. SPA - JPMorgan Chase Bank),
0.320%, 1/1/19 (a) | | | 900,000 | | | | | |
| | 1,000,000 | | | Wyandanch, NY, Union Free School District, 2.250%, 6/30/11 | | | 1,002,908 | | | | | |
| | | | | | | | 3,417,673 | | | | | |
| North Carolina — 1.7% | | | | | | | | |
| | 500,000 | | | New Hanover County, NC, Hosipital Revenue, Series A-1, (AGM Ins. SPA - Wachovia Bank N.A.),
0.370%, 10/1/23 (a) | | | 500,000 | | | | | |
| | 400,000 | | | New Hanover County, NC, Hosipital Revenue, Series B-1, (AGM Ins.),
0.370%, 10/1/26 (a) | | | 400,000 | | | | | |
(See notes which are an integral part of the Financial Statements)
Annual Shareholder Report
42
| | |
| Huntington Tax Free Money Market Fund | | (Continued) |
| | | | | | | | | | | | |
Principal
Amount | | | | | Value | | | | |
| | | | | | | | | | | | |
| Municipal Bonds — (Continued) | | | | | | | | |
| North Carolina — (Continued) | | | | | | | | |
| $ | 500,000 | | | North Carolina Capital Facilities Finance Agency Revenue, (LOC - Wachovia Bank N.A.), 0.400%, 5/1/27 (a) | | $ | 500,000 | | | | | |
| | | | | | | | 1,400,000 | | | | | |
| Ohio — 17.6% | | | | | | | | |
| | 2,000,000 | | | Akron, OH, Health Benefit Claims, Revenue, (BAN), 1.750%, 3/17/11 | | | 2,001,011 | | | | | |
| | 610,000 | | | Butler County, OH, Capital Funding Revenue Bond, Series A, (LOC - U.S. Bank N.A.), 0.360%, 6/1/35 (a) | | | 610,000 | | | | | |
| | 2,385,000 | | | Butler County, OH, Port Authority Economic Development Facilities Revenue, Refunding & Improvement, Great Miami Valley, (LOC - JPMorgan Chase Bank), 0.330%, 9/1/37 (a) | | | 2,385,000 | | | | | |
| | 400,000 | | | Clevaland, Ohio, Cleveland-Cuyahoga Ohio Port Authority Revenue, Carnegie/96th Research Building Project, (LOC - PNC Bank N.A.), 0.320%, 1/1/33 (a) | | | 400,000 | | | | | |
| | 200,000 | | | Columbus, OH, Regional Airport Authority Capital Funding Revenue,, Series A, (LOC - U.S. Bank N.A.),
0.340%, 3/1/34 (a) | | | 200,000 | | | | | |
| | 1,000,000 | | | Cuyahoga County, OH, Revenue Subseries B3, (Cleveland Clinic), (SPA - Bank of America N.A.),
0.280%, 1/1/39 (a) | | | 1,000,000 | | | | | |
| | 200,000 | | | Franklin County, OH, Hospital Revenue, U.S. Health Corp., Series A, (LOC - Citibank N.A.), 0.310%, 12/1/21 (a) | | | 200,000 | | | | | |
| | 335,000 | | | Geauga County, OH, Health Care Facilities Revenue, Heather Hill, Inc. Project, Series B, (LOC - Bank One Columbus N.A.), 0.330%, 7/1/23 (a) | | | 335,000 | | | | | |
| | 520,000 | | | Geauga County, OH, Health Care Facilities Revenue, Heather Hill, Inc. Project, Series A, (LOC - Bank One Columbus N.A.), 0.330%, 7/1/23 (a) | | | 520,000 | | | | | |
| | 115,000 | | | Hamilton County, OH, Hospital Facilities Revenue, Drake Center, Inc.,
Series A, (LOC - U.S. Bank N.A.),
0.360%, 6/1/19 (a) | | | 115,000 | | | | | |
| | 3,500,000 | | | Orange County, Fl, Health Facilities Authority Revenue, Orlando Regional Healthcare, Series A-1, (SPA - Dexia Credit Local), 0.380%, 10/1/41 (a) | | | 3,500,000 | | | | | |
| | 1,200,000 | | | Teays Valley, OH, Local School District, G.O., 1.625%, 2/25/11 | | | 1,201,479 | | | | | |
| | | | | | | | | | | | |
Principal
Amount | | | | | Value | | | | |
| | | | | | | | | | | | |
| Municipal Bonds — (Continued) | | | | | | | | |
| Ohio — (Continued) | | | | | | | | |
| $ | 1,000,000 | | | Union Township, OH, G.O., (BAN),
1.250%, 9/13/11 | | $ | 1,003,470 | | | | | |
| | 1,000,000 | | | University of Toledo, OH, General Receipts Bonds, 1.500%, 6/1/11 | | | 1,003,199 | | | | | |
| | | | | | | | 14,474,159 | | | | | |
| Oregon — 0.6% | | | | | | | | |
| | 500,000 | | | Clackamas County, OR, Hospital Facilities Revenue, Legacy Health System,
0.310%, 6/1/37 (a) | | | 500,000 | | | | | |
| Pennsylvania — 4.7% | | | | | | | | |
| | 400,000 | | | Allegheny County, PA, Hosipital Revenue, UPMC Senior Living Corp., (Fannie Mae Ins.),
0.320%, 7/15/28 (a) | | | 400,000 | | | | | |
| | 500,000 | | | Butler County, PA, Industrial Development Revenue,
0.330%, 12/1/14 (a) | | | 500,000 | | | | | |
| | 1,000,000 | | | Philadelphia, PA, 2.000%, 6/30/11 | | | 1,006,367 | | | | | |
| | 2,000,000 | | | Pittsburgh, PA, Water & Sewer Authority Revenue, Series B-1, (AGM Ins. SPA - JPMorgan Chase Bank),
0.340%, 9/1/33 (a) | | | 2,000,000 | | | | | |
| | | | | | | | 3,906,367 | | | | | |
| Rhode Island — 1.2% | | | | | | | | |
| | 1,000,000 | | | Chariho, RI, Regional High School District, 1.500%, 6/23/11 | | | 1,004,002 | | | | | |
| Tennessee — 2.0% | | | | | | | | |
| | 1,625,000 | | | Jackson, TN, Health Educational & Housing Facility Board Multifamily Revenue, (Fannie Mae Ins.),
0.340%, 5/15/31 (a) | | | 1,625,000 | | | | | |
| Texas — 2.7% | | | | | | | | |
| | 200,000 | | | Austin, Texas, Housing Finance Corporation Multi Family Housing Revenue, Stassney Woods Apartments, Series A, (Fannie Mae Ins. LOC - JPMorgan Chase Bank),
0.320%, 10/15/32 (a) | | | 200,000 | | | | | |
| | 900,000 | | | Katy, TX, Independent School District, G.O., 0.370%, 8/15/33 (a) | | | 900,000 | | | | | |
| | 1,110,000 | | | Travis County, TX, Housing Finance Corp, Multifamily Housing Revenue, Series A, (Fannie Mae Ins.),
0.340%, 2/15/34 (a) | | | 1,110,000 | | | | | |
| | | | | | | | 2,210,000 | | | | | |
(See notes which are an integral part of the Financial Statements)
Annual Shareholder Report
43
| | |
| Huntington Tax Free Money Market Fund | | (Continued) |
| | | | | | | | | | |
Principal
Amount or Shares | | | | | Value | | | |
| | | | | | | | | | |
| Municipal Bonds — (Continued) | | | | | | |
| Virginia — 0.9% | | | | | | |
| $ | 725,000 | | | Hampton, VA, Redevelopment & Housing Authority Multifamily Housing Revenue, Township Apartments Project, (Fannie Mae Ins.),
0.320%, 10/15/32 (a) | | $ | 725,000 | | | |
| West Virginia — 0.4% | | | | | | |
| | 300,000 | | | West Virginia Economic Development Authority Revenue, Series A, (SPA - PNC Bank N.A.), 0.400%, 7/1/17 (a) | | | 300,000 | | | |
| Total Municipal Bonds (Cost $76,121,402) | | | 76,121,402 | | | |
| Cash Equivalents — 7.5% | | | | | | |
| | 3,455,220 | | | Fidelity Institutional Tax-Exempt Portfolio, 0.180%, 01/03/11 (b) | | | 3,455,220 | | | |
| | | | | | | | | | |
Principal
Amount
or Shares | | | | | Value | | | |
| | | | | | | | | | |
| Cash Equivalents — (Continued) | | | | | | |
| | 2,756,593 | | | Fidelity Tax-Exempt Portfolio,
0.140%, 01/03/11 (b) | | $ | 2,756,593 | | | |
| Total Cash Equivalents (Cost $6,211,813) | | | 6,211,813 | | | |
| Total Investments
(Cost $82,333,215) — 99.8% | | | 82,333,215 | | | |
| Other Assets in Excess of Liabilities — 0.2% | | | 124,369 | | | |
| Net Assets — 100.0% | | $ | 82,457,584 | | | |
| (a) | Variable or Floating Rate Security. Rate disclosed is as of December 31, 2010. |
| (b) | Rate disclosed is the seven day yield as of December 31, 2010. |
| AGM | — Assured Guaranty Municipal Corp. |
| BAN | — Bond Anticipation Note |
| MBIA | — Municipal Bond Insurance Association |
| Q-SBLF | — Qualified School Bond Loan Fund |
| SPA | — Standby Purchase Agreementt |
(See notes which are an integral part of the Financial Statements)
Annual Shareholder Report
44
| | |
| | |
| Huntington Money Market Fund | | December 31, 2010 |
| | |
| Portfolio of Investments Summary Table | | (unaudited) |
| | | | |
| Asset Allocation | | Percentage of
Market Value | |
U.S. Government Agencies | | | 23.4% | |
Corporate Bonds | | | 21.3% | |
Municipal Bonds | | | 19.9% | |
Commercial Paper | | | 15.2% | |
Cash | | | 8.8% | |
Certificates of Deposit | | | 7.6% | |
U.S. Treasury Obligations | | | 2.5% | |
Repurchase Agreements | | | 1.3% | |
Total | | | 100.0% | |
Portfolio holdings and allocations are subject to change. As of December 31, 2010, percentages in the table above are based on total investments. Such total investments may differ from the percentages set forth below in the Portfolio of Investments which are computed using the Fund’s total net assets.
The Portfolio of Investments Summary Table and the Portfolio of Investments are broken down by sectors, and these sectors do not represent industry categories for purposes of identifying “industry concentration” as described in the Investment Company Act of 1940, as amended.
Portfolio of Investments
| | | | | | | | | | | | |
Principal
Amount | | | | | Value | | | | |
| | | | | | | | | | | | |
| U.S. Government Agencies — 23.4% | | | | | | | | |
| Federal Farm Credit Bank — 5.1% | | | | | | | | |
| $ | 5,000,000 | | | 0.210%, 1/4/11 (a) | | $ | 5,000,005 | | | | | |
| | 10,000,000 | | | 0.400%, 6/1/11 (a) | | | 10,000,000 | | | | | |
| | 5,000,000 | | | 0.322%, 7/1/11 (a) | | | 5,000,997 | | | | | |
| | | | | | | | 20,001,002 | | | | | |
| Federal Home Loan Bank — 14.5% | | | | | | | | |
| | 10,000,000 | | | 0.700%, 4/18/11 | | | 10,005,053 | | | | | |
| | 10,000,000 | | | 0.290%, 5/27/11 (a) | | | 10,000,000 | | | | | |
| | 10,000,000 | | | 0.310%, 7/22/11 (a) | | | 10,000,000 | | | | | |
| | 12,495,000 | | | 0.287%, 7/29/11 (a) | | | 12,495,000 | | | | | |
| | 5,000,000 | | | 0.266%, 10/21/11 (a) | | | 5,002,055 | | | | | |
| | 10,000,000 | | | 0.500%, 12/30/11 (a) | | | 10,000,000 | | | | | |
| | | | | | | | 57,502,108 | | | | | |
| Federal Home Loan Mortgage
Corporation — 3.8% | | | | | | | | |
| | 15,000,000 | | | 0.311%, 2/14/11 | | | 15,002,640 | | | | | |
| Total U.S. Government Agencies
(Cost $92,505,750) | | | 92,505,750 | | | | | |
| Corporate Bonds — 21.3% | | | | | | | | |
| Financials — 21.3% | | | | | | | | |
| | 15,000,000 | | | Bank of Nova Scotia,
0.450%, 12/9/11 (a) | | | 15,000,000 | | | | | |
| | 5,450,000 | | | BB&T Corp., 3.100%, 7/28/11 | | | 5,524,056 | | | | | |
| | 8,555,000 | | | Citigroup Funding, Inc.,
0.206%, 5/5/11 | | | 8,554,558 | | | | | |
| | 5,000,000 | | | Citigroup, Inc., 5.125%, 2/14/11 | | | 5,026,227 | | | | | |
| | | | | | | | | | | | |
Principal
Amount | | | | | Value | | | | |
| | | | | | | | | | | | |
| Corporate Bonds — (Continued) | | | | | | | | |
| Financials — (Continued) | | | | | | | | |
| $ | 5,000,000 | | | Countrywide Home, 4.000%, 3/22/11 | | $ | 5,038,189 | | | | | |
| | 15,000,000 | | | Credit Suisse USA, Inc.,
0.490%, 3/2/11 (a) | | | 15,004,935 | | | | | |
| | 5,000,000 | | | General Electric Capital Corp.,
0.372%, 3/11/11 | | | 5,001,444 | | | | | |
| | 5,000,000 | | | Goldman Sachs Group, Inc.,
Series B, MTN,
0.506%, 8/5/11 (a) | | | 4,997,952 | | | | | |
| | 5,000,000 | | | HSBC Finance Corp., 5.700%, 6/1/11 | | | 5,101,795 | | | | | |
| | 5,000,000 | | | JPMorgan Chase & Co.,
0.459%, 1/17/11 (a) | | | 5,000,131 | | | | | |
| | 5,000,000 | | | Morgan Stanley, 0.539%, 1/18/11 (a) | | | 4,998,285 | | | | | |
| | 5,000,000 | | | Wells Fargo & Co., MTN,
0.738%, 1/24/11 (a) | | | 5,001,301 | | | | | |
| Total Corporate Bonds (Cost $84,248,873) | | | 84,248,873 | | | | | |
| Municipal Bonds — 19.9% | | | | | | | | |
| Kentucky — 2.4% | | | | | | | | |
| | 9,600,000 | | | Carroll County, KY, Solid Waste Disposal Revenue, BPB Acquisition Project, (LOC - Bank of America N.A.), AMT,
0.350%, 5/1/31 (a) | | | 9,600,000 | | | | | |
| Massachusetts — 1.3% | | | | | | | | |
| | 5,000,000 | | | University of Massachusetts Building Authority Revenue, Series 4, (SPA - Bank of America N.A.),
0.320%, 11/1/34 (a) | | | 5,000,000 | | | | | |
(See notes which are an integral part of the Financial Statements)
Annual Shareholder Report
45
| | |
| Huntington Money Market Fund | | (Continued) |
| | | | | | | | | | | | |
Principal
Amount | | | | | Value | | | | |
| | | | | | | | | | | | |
| Municipal Bonds — (Continued) | | | | | | | | |
| New York — 2.8% | | | | | | | | |
| $ | 5,000,000 | | | New York Long Island Power Authority Electric Systems Revenue, Series D, (AGM Ins. SPA - Dexia Credit Local),
0.400%, 12/1/29 (a) | | $ | 5,000,000 | | | | | |
| | 6,000,000 | | | New York State Local Government Assistance Corporation, GO of Corp., Series B, (SPA - JPMorgan Chase Bank), 0.330%, 4/1/21 (a) | | | 6,000,000 | | | | | |
| | | | | | | | 11,000,000 | | | | | |
| North Carolina — 3.7% | | | | | | | | |
| | 5,000,000 | | | Charlotte, NC, Special Obligation Revenue, Uptown Project, (SPA - Wachovia Bank N.A.),
0.350%, 6/1/21 (a) | | | 5,000,000 | | | | | |
| | 4,800,000 | | | North Carolina Capital Facilities Finance Agency Education Facilities Revenue, (LOC - Branch Banking & Trust),
0.350%, 10/1/34 (a) | | | 4,800,000 | | | | | |
| | 5,000,000 | | | Winston-Salem, NC, Water & Sewer Systems Revenue, Series B, (SPA - Branch Banking & Trust),
0.320%, 6/1/30 (a) | | | 5,000,000 | | | | | |
| | | | | | | | 14,800,000 | | | | | |
| Ohio — 6.3% | | | | | | | | |
| | 10,000,000 | | | Franklin County, OH, Hospital Revenue, Series A, (SPA - JPMorgan Chase Bank),
0.330%, 11/15/33 (a) | | | 10,000,000 | | | | | |
| | 15,000,000 | | | Ohio State Housing Finance Agency Residential Mortgage Revenue, Series I, (SPA - Citibank N.A.), AMT, 0.320%, 9/1/36 (a) | | | 15,000,000 | | | | | |
| | | | | | | | 25,000,000 | | | | | |
| Texas — 3.4% | | | | | | | | |
| | 5,360,000 | | | Houston, TX, Independent School District, G.O., (SPA - Bank of America N.A.),
0.360%, 6/15/31 (a) | | | 5,360,000 | | | | | |
| | 8,000,000 | | | Texas State Department of Housing & Community Affairs Multifamily Housing Revenue, (LOC - Citibank N.A.), AMT, 0.360%, 5/1/40 (a) | | | 8,000,000 | | | | | |
| | | | | | | | 13,360,000 | | | | | |
| Total Municipal Bonds (Cost $78,760,000) | | | 78,760,000 | | | | | |
| Commercial Papers — 15.1% | | | | | | | | |
| | 15,000,000 | | | ANZ National Int’l Ltd/London,
0.388%, 7/25/11 (a) (b) (c) | | | 15,000,000 | | | | | |
| | 5,000,000 | | | Caterpillar Finance, 0.190%, 2/23/11 | | | 4,998,601 | | | | | |
| | | | | | | | | | | | |
Principal
Amount or Shares | | | | | Value | | | | |
| | | | | | | | | | | | |
| Commercial Papers — (Continued) | | | | | | | | |
| $ | 5,000,000 | | | John Deere, 0.210%, 1/13/11 | | $ | 4,999,617 | | | | | |
| | 5,000,000 | | | Nestle Capital Corp., 0.170%, 2/9/11 | | | 4,999,079 | | | | | |
| | 5,000,000 | | | Pepsico, Inc., 0.170%, 2/22/11 | | | 4,998,772 | | | | | |
| | 5,000,000 | | | Shell International, 0.490%, 3/2/11 (b) (c) | | | 4,995,833 | | | | | |
| | 15,000,000 | | | UBS Financial, 0.520%, 7/22/11 | | | 14,956,233 | | | | | |
| | 5,000,000 | | | Walt Disney, 0.160%, 2/7/11 | | | 4,999,178 | | | | | |
| Total Commercial Papers (Cost $59,947,313) | | | 59,947,313 | | | | | |
| Certificates of Deposit — 7.6% | | | | | | | | |
| | 15,000,000 | | | Standard Chartered Bank New York,
0.730%, 1/18/11 | | | 15,000,000 | | | | | |
| | 15,000,000 | | | Toronto Dominion Bank,
0.300%, 2/28/11 | | | 14,994,442 | | | | | |
| Total Certificates of Deposit (Cost $29,994,442) | | | 29,994,442 | | | | | |
| U.S. Treasury Obligations — 2.5% | | | | | | | | |
| U.S. Treasury Bills — 2.5% | | | | | | | | |
| | 10,000,000 | | | 0.190%, 6/23/11 (d) | | | 9,991,062 | | | | | |
| Total U.S. Treasury Obligations
(Cost $9,991,062) | | | 9,991,062 | | | | | |
| Repurchase Agreements — 1.3% | | | | | | | | |
| | 4,984,900 | | | Morgan Stanley, 0.010%, dated 12/31/10, due 01/03/11, repurchase price $4,984,901 (Fully collateralized by Federal Home Loan Mortgage Corporation,
0.00%, 03/25/11) | | | 4,984,900 | | | | | |
| Total Repurchase Agreements (Cost $4,984,900) | | | 4,984,900 | | | | | |
| Cash Equivalents — 8.8% | | | | | | | | |
| | 10,000,000 | | | FFI Institutional Fund,
0.250%, 01/03/11 (e) | | | 10,000,000 | | | | | |
| | 25,000,000 | | | Fidelity Money Market,
0.280%, 01/03/11 (e) | | | 25,000,000 | | | | | |
| Total Cash Equivalents (Cost $35,000,000) | | | 35,000,000 | | | | | |
| Total Investments
(Cost $395,432,340) — 99.9% | | | 395,432,340 | | | | | |
| Other Assets in Excess of Liabilities — 0.1% | | | 246,563 | | | | | |
| Net Assets — 100.0% | | $ | 395,678,903 | | | | | |
| (a) | Variable or Floating Rate Security. Rate disclosed is as of December 31, 2010. |
| (b) | Security exempt from registration under Rule 144A or Section 4(2) of the Securities Act of 1933. The security may be resold in transactions exempt from registration, normally to qualified institutional buyers. |
| (d) | Rate represents the effective yield at purchase. |
| (e) | Rate disclosed is the seven day yield as of December 31, 2010. |
AMT — Subject to alternative minimum tax
G.O. — General Obligation
LOC — Letter of Credit
MTN — Medium Term Note
SPA — Standby Purchase Agreement
(See notes which are an integral part of the Financial Statements)
Annual Shareholder Report
46
| | |
| | |
| Huntington Ohio Municipal Money Market Fund | | December 31, 2010 |
| | |
| Portfolio of Investments Summary Table | | (unaudited) |
| | | | |
| Asset Allocation | | Percentage of
Market Value | |
Demand Notes | | | 73.5% | |
General Market Notes | | | 26.5% | |
Total | | | 100.0% | |
Portfolio holdings and allocations are subject to change. As of December 31, 2010, percentages in the table above are based on total investments. Such total investments may differ from the percentages set forth below in the Portfolio of Investments which are computed using the Fund’s total net assets.
The Portfolio of Investments Summary Table and the Portfolio of Investments are broken down by sectors, and these sectors do not represent industry categories for purposes of identifying “industry concentration” as described in the Investment Company Act of 1940, as amended.
Portfolio of Investments
| | | | | | | | | | |
Principal
Amount | | | | | Value | | | |
| | | | | | | | | | |
| Municipal Bonds — 90.6% | | | | | | |
| Ohio — 90.6% | | | | | | |
| $ | 1,000,000 | | | Akron, OH, Health Benefit Claims, Revenue, BAN, 1.750%, 3/17/11 | | $ | 1,000,505 | | | |
| | 600,000 | | | Allen County, OH, Catholic Healthcare, Series C, (LOC - Bank of Nova Scotia), 0.270%, 6/1/34 (a) | | | 600,000 | | | |
| | 2,400,000 | | | Allen County, OH, Hospital Facilities Revenue, Series B, (LOC - JPMorgan Chase Bank),
0.280%, 10/1/31 (a) | | | 2,400,000 | | | |
| | 1,100,000 | | | Butler County, OH, Capital Funding Revenue Bond, Series A, (LOC - U.S. Bank N.A.), 0.360%, 6/1/35 (a) | | | 1,100,000 | | | |
| | 1,335,000 | | | Canal Wincherster, OH, Local School District, BAN, 1.600%, 11/17/11 | | | 1,344,870 | | | |
| | 1,850,000 | | | Cleveland Heights, OH,
1.250%, 8/4/11 | | | 1,854,860 | | | |
| | 150,000 | | | Cleveland, OH, Waterworks Revenue, Series P, 4.000%, 1/1/11 | | | 150,000 | | | |
| | 2,400,000 | | | Cleveland, OH, Cuyahoga County Port Authority Revenue, (LOC - JPMorgan Chase Bank),
0.300%, 1/1/37 (a) | | | 2,400,000 | | | |
| | 1,220,000 | | | Cleveland, OH, Cuyahoga County Port Authority Revenue, (LOC - JPMorgan Chase Bank),
0.320%, 1/1/37 (a) | | | 1,220,000 | | | |
| | 590,000 | | | Columbus, OH, Regional Airport Authority Capital Funding Revenue,, (LOC - U.S. Bank N.A.),
0.360%, 12/1/36 (a) | | | 590,000 | | | |
| | 225,000 | | | Columbus, OH, Regional Airport Authority Capital Funding Revenue,, Series A, (LOC - U.S. Bank N.A.),
0.340%, 1/1/30 (a) | | | 225,000 | | | |
| | | | | | | | | | |
Principal
Amount | | | | | Value | | | |
| | | | | | | | | | |
| Municipal Bonds — (Continued) | | | | | | |
| Ohio — (Continued) | | | | | | |
| $ | 6,450,000 | | | Columbus, OH, Regional Airport Authority Capital Funding Revenue,, Series A, (LOC - U.S. Bank N.A.), 0.340%, 3/1/34 (a) | | $ | 6,450,000 | | | |
| | 2,100,000 | | | Columbus, OH, G.O., Series 1, (SPA - JPMorgan Chase Bank),
0.300%, 6/1/16 (a) | | | 2,100,000 | | | |
| | 2,795,000 | | | Columbus, OH, G.O.,
Series 1, 0.290%, 12/1/26 (a) | | | 2,795,000 | | | |
| | 3,605,000 | | | Columbus, OH, Airport Authority Revenue,, (LOC - U.S. Bank N.A.),
0.340%, 7/1/35 (a) | | | 3,605,000 | | | |
| | 840,000 | | | Coshocton County, OH, Hospital Facilities Revenue, (LOC - Bank One Chicago N.A.), 0.330%, 3/1/19 (a) | | | 840,000 | | | |
| | 6,520,000 | | | Cuyahoga County, OH, Revenue Subseries B1, (SPA - JPMorgan Chase Bank), 0.280%, 1/1/39 (a) | | | 6,520,000 | | | |
| | 7,610,000 | | | Cuyahoga County, OH, Revenue Subseries B3, (Cleveland Clinic), (SPA - Bank of America N.A.),
0.280%, 1/1/39 (a) | | | 7,610,000 | | | |
| | 400,000 | | | Cuyahoga County, OH, Revenue Refunding, Series A,
5.500%, 1/1/11 | | | 400,000 | | | |
| | 1,800,000 | | | Cuyahoga County, OH, Health Care Facilities Revenue, (Visiting Nurse Association), (LOC - Bank One Chicago N.A.), 0.320%, 11/1/25 (a) | | | 1,800,000 | | | |
| | 2,100,000 | | | Cuyahoga County, OH, Hospital Revenue, (LOC - Key Bank N.A.), 0.320%, 3/1/33 (a) | | | 2,100,000 | | | |
| | 500,000 | | | Cuyahoga Falls, OH, Various Purposes, G.O., BAN,
1.250%, 12/8/11 | | | 502,177 | | | |
(See notes which are an integral part of the Financial Statements)
Annual Shareholder Report
47
| | |
| Huntington Ohio Municipal Money Market Fund | | (Continued) |
| | | | | | | | | | |
Principal
Amount | | | | | Value | | | |
| | | | | | | | | | |
| Municipal Bonds — (Continued) | | | | | | |
| Ohio — (Continued) | | | | | | |
| $ | 600,000 | | | Deerfield Township, OH, Various Purposes, G.O., Series B, BAN, 1.500%, 11/8/11 | | $ | 604,316 | | | |
| | 530,000 | | | Delaware County, OH, Port Authority, Economic Development Revenue, (The Columbus Zoological Park Association, Inc.), (LOC - JPMorgan Chase Bank),
0.360%, 8/1/18 (a) | | | 530,000 | | | |
| | 2,000,000 | | | East Knox, OH, Local School Facilities Construction, G.O.,
1.625%, 2/24/11 | | | 2,002,420 | | | |
| | 1,200,000 | | | Elyria, OH, G.O., BAN, 1.250%, 6/9/11 | | | 1,202,073 | | | |
| | 2,000,000 | | | Elyria, OH, G.O., BAN, 1.125%, 6/9/11 | | | 2,002,370 | | | |
| | 2,000,000 | | | Euclid, OH, G.O., BAN,
1.875%, 5/18/11 | | | 2,006,583 | | | |
| | 1,395,000 | | | Forest Park, OH, Various Purposes, G.O., Series B, BAN,
1.350%, 10/27/11 | | | 1,401,795 | | | |
| | 2,000,000 | | | Franklin County, OH, Hospital Revenue, 0.300%, 6/1/16 (a) | | | 2,000,000 | | | |
| | 410,000 | | | Franklin County, OH, Hospital Revenue, (LOC - Citibank N.A.), 0.310%, 12/1/11 (a) | | | 410,000 | | | |
| | 1,480,000 | | | Franklin County, OH, Industrial Development Revenue, (LOC - Bank One Columbus N.A.),
0.290%, 11/1/14 (a) | | | 1,480,000 | | | |
| | 3,515,000 | | | Franklin County, OH, Health Care Facilities Revenue, Ohio Presbyterian, Series C, (LOC - National City Bank),
0.330%, 7/1/20 (a) | | | 3,515,000 | | | |
| | 7,000,000 | | | Franklin County, OH, Health Care Facilities Revenue, Ohio Presbyterian, Series A, (LOC - PNC Bank N.A.), 0.320%, 7/1/36 (a) | | | 7,000,000 | | | |
| | 1,000,000 | | | Franklin County, OH, Hospital Revenue, 0.370%, 11/15/41 (a) | | | 1,000,000 | | | |
| | 590,000 | | | Fulton Couny, OH, Health Care Revenue, (LOC - JPMorgan Chase Bank), 0.330%, 11/1/35 (a) | | | 590,000 | | | |
| | 1,935,000 | | | Geauga County, OH, Health Care Facilities Revenue, Heather Hill, Inc. Project, Series A, (LOC - Bank One Columbus N.A.),
0.330%, 7/1/23 (a) | | | 1,935,000 | | | |
| | 2,500,000 | | | Geauga County, OH, G.O., BAN, 1.500%, 8/18/11 | | | 2,513,238 | | | |
| | | | | | | | | | |
Principal
Amount | | | | | Value | | | |
| | | | | | | | | | |
| Municipal Bonds — (Continued) | | | | | | |
| Ohio — (Continued) | | | | | | |
| $ | 270,000 | | | Greene County, OH, Revenue, (LOC - Bank of America N.A.),
0.530%, 1/1/11 (a) | | $ | 270,000 | | | |
| | 1,100,000 | | | Greene County, OH, Various Purposes, Series D, BAN,
1.500%, 11/2/11 | | | 1,108,217 | | | |
| | 3,335,000 | | | Hamilton County, OH, Hospital Facilities Revenue, (LOC - JPMorgan Chase Bank),
0.360%, 5/15/28 (a) | | | 3,335,000 | | | |
| | 2,000,000 | | | Hamilton County, OH, Hospital Facilities Revenue, Series B, (LOC - PNC Bank N.A.), 0.320%, 6/1/27 (a) | | | 2,000,000 | | | |
| | 795,000 | | | Hamilton County, OH, 2.000%, 6/1/11 | | | 799,089 | | | |
| | 2,340,000 | | | Hamilton County, OH, Economic Development Revenue, Samuel
W. Bell Home for Sightless, Inc. Project, (LOC - U.S. Bank N.A.),
0.340%, 4/1/22 (a) | | | 2,340,000 | | | |
| | 555,000 | | | Hamilton County, OH, Hospital Facilities Revenue, Drake Center, Inc., Series A, (LOC - U.S. Bank N.A.), 0.360%, 6/1/19 (a) | | | 555,000 | | | |
| | 2,420,000 | | | Hamilton County, OH, Hospital Facilities Revenue, (LOC - U.S. Bank N.A.), 0.360%, 5/15/28 (a) | | | 2,420,000 | | | |
| | 500,000 | | | Huron County, OH, Hospital Facilities Revenue, (Fisher Titus Medical Center), Series A, (LOC - National City Bank), 0.330%, 12/1/27 (a) | | | 500,000 | | | |
| | 200,000 | | | Kent State University, OH, General Receipts Revenue, (Various),
Series B, 2.000%, 5/1/11 | | | 200,729 | | | |
| | 4,000,000 | | | Kent State University, OH, General Receipts Revenue, (Various),
Series B, (LOC - Bank of America N.A.), 0.330%, 5/1/32 (a) | | | 4,000,000 | | | |
| | 640,000 | | | Lima, OH, Hospital Revenue, Lima Memorial Hospital Project, (LOC - JPMorgan Chase Bank),
0.330%, 6/1/33 (a) | | | 640,000 | | | |
| | 600,000 | | | Lima, OH, G.O., 2.350%, 4/28/11 | | | 601,610 | | | |
| | 455,000 | | | Lockland, OH, G.O., BAN,
2.100%, 3/16/11 | | | 456,005 | | | |
| | 2,250,000 | | | Lorain County, OH, Highway Improvement, G.O., BAN,
1.500%, 3/21/11 | | | 2,254,454 | | | |
| | 2,290,000 | | | Loveland, OH, G.O., BAN,
1.750%, 2/23/11 | | | 2,293,798 | | | |
(See notes which are an integral part of the Financial Statements)
Annual Shareholder Report
48
| | |
| Huntington Ohio Municipal Money Market Fund | | (Continued) |
| | | | | | | | | | |
Principal
Amount | | | | | Value | | | |
| | | | | | | | | | |
| Municipal Bonds — (Continued) | | | | | | |
| Ohio — (Continued) | | | | | | |
| $ | 4,800,000 | | | Lucas County, OH,
0.300%, 11/15/34 (a) | | $ | 4,800,000 | | | |
| | 1,000,000 | | | Lucas County, OH, Hospital Rev, ProMedica Healthcare, Series A, (LOC - UBS AG), 1.125%, 9/15/11 | | | 1,002,971 | | | |
| | 715,000 | | | Mahoning County, OH, G,O., BAN, 2.000%, 11/23/11 | | | 719,726 | | | |
| | 811,000 | | | Maple Heights, OH, City School District, G.O., BAN,
1.125%, 4/13/11 | | | 811,616 | | | |
| | 1,200,000 | | | Mayfield, OH, City School District, G.O., 1.875%, 6/29/11 | | | 1,206,283 | | | |
| | 500,000 | | | Medina, OH, City School District, G.O., BAN, 1.750%, 5/19/11 | | | 501,403 | | | |
| | 775,000 | | | Middletown, OH, Develepment Revenue, Bishop Fenwick High School Project, (LOC - JPMorgan Chase Bank), 0.380%, 8/1/33 (a) | | | 775,000 | | | |
| | 4,000,000 | | | Montgomery County, OH, Hospital Revenue, Series B, (AMG Ins.), 0.455%, 8/1/47 (a) | | | 4,000,000 | | | |
| | 1,300,000 | | | Montgomery, OH, Hospital Revenue,
Series B-2, 0.370%, 3/1/27 (a) | | | 1,300,000 | | | |
| | 712,000 | | | Norton, OH, Various Purposes, G.O., BAN, 2.250%, 8/25/11 | | | 717,708 | | | |
| | 755,000 | | | Norton, OH, City School District, Refunding School Improvement, G.O., 1.875%, 8/25/11 | | | 758,740 | | | |
| | 500,000 | | | Ohio Air Quality Development Authority Refunding Revenue, Series B, (LOC - Wells Fargo Bank N.A.), 0.330%, 12/1/33 (a) | | | 500,000 | | | |
| | 400,000 | | | Ohio Housing Finance Agency Multifamily Revenue, (Housing Chambrel at Montrose),
Series F, (Fannie Mae Ins.),
0.279%, 11/15/32 (a) | | | 400,000 | | | |
| | 500,000 | | | Ohio State, G.O., Series C,
0.310%, 6/15/26 (a) | | | 500,000 | | | |
| | 50,000 | | | Ohio State Highway Capital Improvement, G.O., Series L, 3.000%, 5/1/11 | | | 50,376 | | | |
| | 3,540,000 | | | Ohio State, Economic Development Revenue, YMCA Greater Cincinnati Project, (LOC - Bank One N.A.), 0.330%, 11/1/21 (a) | | | 3,540,000 | | | |
| | 800,000 | | | Ohio State Higher Educational , (LOC - Bank of America N.A.),
0.290%, 12/1/44 (a) | | | 800,000 | | | |
| | | | | | | | | | |
Principal
Amount | | | | | Value | | | |
| | | | | | | | | | |
| Municipal Bonds — (Continued) | | | | | | |
| Ohio — (Continued) | | | | | | |
| $ | 500,000 | | | Ohio State Higher Educational Facilities, 0.330%, 12/1/37 (a) | | $ | 500,000 | | | |
| | 2,690,000 | | | Ohio State Higher Educational Facilities Revenue, Xavier University, (LOC - U.S. Bank N.A.),
0.320%, 11/1/30 (a) | | | 2,690,000 | | | |
| | 1,045,000 | | | Ohio State Higher Educational Facilities Revenue, Marietta College Project, (LOC - JPMorgan Chase Bank), 0.370%, 12/1/24 (a) | | | 1,045,000 | | | |
| | 345,000 | | | Ohio State Higher Educational Facilities Revenue,
(LOC - JPMorgan Chase Bank),
0.330%, 12/1/32 (a) | | | 345,000 | | | |
| | 5,000,000 | | | Ohio State Higher Educational Facilities Revenue, (Case Western Reserve), Series B, (LOC - Bank of America N.A.), 0.288%, 12/1/44 (a) | | | 5,000,000 | | | |
| | 1,180,000 | | | Ohio State Higher Educational Facilities Revenue, Xavier University Project, (Various), (LOC - U.S. Bank N.A.), 0.320%, 5/1/15 (a) | | | 1,180,000 | | | |
| | 500,000 | | | Ohio State Hospital Facilities Revenue, Cleveland Clinic, Series B,
4.000%, 1/1/11 | | | 500,000 | | | |
| | 5,350,000 | | | Ohio State Parks & Recreation Revenue, G.O., Series D,
0.300%, 2/1/19 (a) | | | 5,350,000 | | | |
| | 425,000 | | | Ohio State Parks & Recreation Revenue, School Improvements, G.O., Series A, 0.300%, 3/15/25 (a) | | | 425,000 | | | |
| | 7,045,000 | | | Ohio State Parks & Recreation Revenue, Infrastructure Improvements Revenue, G.O.,
Series B, 0.300%, 8/1/17 (a) | | | 7,045,000 | | | |
| | 65,000 | | | Ohio State University, Infrastructure Improvements Revenue, Series B,
0.300%, 8/1/21 (a) | | | 65,000 | | | |
| | 200,000 | | | Ohio State University General Receipts Revenue, G.O., Series B,
0.300%, 6/1/35 (a) | | | 200,000 | | | |
| | 3,265,000 | | | Ohio State University General Receipts Revenue, (Various), (AMG Ins.),
0.580%, 12/1/26 (a) | | | 3,265,000 | | | |
| | 1,160,000 | | | Ohio State University General Receipts Revenue, (Various),
0.330%, 12/1/27 (a) | | | 1,160,000 | | | |
(See notes which are an integral part of the Financial Statements)
Annual Shareholder Report
49
| | |
| Huntington Ohio Municipal Money Market Fund | | (Continued) |
| | | | | | | | | | |
Principal
Amount | | | | | Value | | | |
| | | | | | | | | | |
| Municipal Bonds — (Continued) | | | | | | |
| Ohio — (Continued) | | | | | | |
| $ | 6,850,000 | | | Ohio State Water Development Authority Revenue, Series B, (LOC - Wachovia Bank N.A.),
0.280%, 12/1/33 (a) | | $ | 6,850,000 | | | |
| | 4,000,000 | | | Orange County, Fl, Health Facilities Authority Revenue, Orlando Regional Healthcare, Series A-1, (SPA - Dexia Credit Local),
0.380%, 10/1/41 (a) | | | 4,000,000 | | | |
| | 700,000 | | | Parma, OH, Hospital Improvements Revenue, Series C, (LOC - JPMorgan Chase Bank),
0.320%, 11/1/30 (a) | | | 700,000 | | | |
| | 625,000 | | | Princeton, OH, County School District, G.O., 1.300%, 11/29/11 | | | 628,671 | | | |
| | 1,145,000 | | | Salem, OH, Hospital Revenue, (LOC - JPMorgan Chase Bank),
0.300%, 9/1/35 (a) | | | 1,145,000 | | | |
| | 4,000,000 | | | Summit County, OH, Healthcare Facilities Revenue, (LOC - PNC Bank. N.A.), 0.360%, 12/1/25 (a) | | | 4,000,000 | | | |
| | 2,000,000 | | | Union Township, OH, G.O., BAN, 1.250%, 9/13/11 | | | 2,006,941 | | | |
| | 190,000 | | | University of Akron, OH, General Receipts Revenue, Series C-2, (Assured Guaranty SPA - Dexia Credit Local), 0.410%, 1/1/29 (a) | | | 190,000 | | | |
| | 190,000 | | | University of Akron, OH, General Receipts Revenue, Series C-1, (Assured Guaranty SPA - Dexia Credit Local), 0.410%, 1/1/29 (a) | | | 190,000 | | | |
| | | | | | | | | | | | |
Principal
Amount or Shares | | | | | Value | | | | |
| | | | | | | | | | | | |
| Municipal Bonds — (Continued) | | | | | | | | |
| Ohio — (Continued) | | | | | | | | |
| $ | 2,000,000 | | | University of Cincinnati, OH, General Receipts Revenue, Series A 1.500%, 5/12/11 | | $ | 2,002,731 | | | | | |
| | 3,100,000 | | | University of Toledo, OH, General Receipts Revenue, (Various),
Series B, (LOC - JPMorgan Chase Bank), 0.350%, 6/1/32 (a) | | | 3,100,000 | | | | | |
| | 1,850,000 | | | Wauseon, OH, Industrial Development Revenue, 1.500%, 8/26/11 | | | 1,858,337 | | | | | |
| | 165,000 | | | Xenia, OH, Community School District, 1.000%, 6/1/11 | | | 165,135 | | | | | |
| Total Municipal Bonds (Cost $179,564,747) | | | 179,564,747 | | | | | |
| Cash Equivalents — 9.3% | | | | | | | | |
| | 9,400,000 | | | Fidelity Institutional Tax-Exempt Portfolio, 0.140% (b) | | | 9,400,000 | | | | | |
| | 8,958,714 | | | Fidelity Tax-Exempt Portfolio,
0.180% (b) | | | 8,958,714 | | | | | |
| Total Cash Equivalents (Cost $18,358,714) | | | 18,358,714 | | | | | |
| Total Investments
(Cost $197,923,461) — 99.9% | | | 197,923,461 | | | | | |
| Other Assets in Excess of Liabilities — 0.1% | | | 208,530 | | | | | |
| Net Assets — 100.0% | | $ | 198,131,991 | | | | | |
| (a) | Variable or Floating Rate Security. Rate disclosed is as of December 31, 2010. |
| (b) | Rate disclosed is the seven day yield as of December 31, 2010. |
BAN — Bond Anticipation Note
G.O. — General Obligation
LOC — Letter of Credit
SPA — Standby Purchase Agreement
(See notes which are an integral part of the Financial Statements)
Annual Shareholder Report
50
| | |
| | |
| Huntington U.S. Treasury Money Market Fund | | December 31, 2010 |
| | |
| Portfolio of Investments Summary Table | | (unaudited) |
| | | | |
| Asset Allocation | | Percentage of
Market Value | |
U.S. Treasury Obligations | | | 73.2% | |
Repurchase Agreements | | | 26.8% | |
Total | | | 100.0% | |
Portfolio holdings and allocations are subject to change. As of December 31, 2010, percentages in the table above are based on total investments. Such total investments may differ from the percentages set forth below in the Portfolio of Investments which are computed using the Fund’s total net assets.
The Portfolio of Investments Summary Table and the Portfolio of Investments are broken down by sectors, and these sectors do not represent industry categories for purposes of identifying “industry concentration” as described in the Investment Company Act of 1940, as amended.
Portfolio of Investments
| | | | | | | | | | | | |
Principal
Amount | | | | | Value | | | | |
| | | | | | | | | | | | |
| U.S. Treasury Obligations — 73.2% | | | | | | | | |
| U.S. Treasury Bills — 73.2% | | | | | | | | |
| $ | 75,000,000 | | | 0.015%, 1/6/11 | | $ | 74,999,541 | | | | | |
| | 5,000,000 | | | 0.110%, 1/20/11 | | | 4,999,498 | | | | | |
| | 5,000,000 | | | 0.120%, 1/27/11 | | | 4,999,529 | | | | | |
| | 10,000,000 | | | 0.140%, 2/3/11 | | | 9,998,478 | | | | | |
| | 30,000,000 | | | 0.150%, 2/10/11 | | | 29,994,911 | | | | | |
| | 23,916,000 | | | 0.160%, 2/17/11 | | | 23,911,111 | | | | | |
| | 10,000,000 | | | 0.150%, 2/24/11 | | | 9,998,328 | | | | | |
| | 10,000,000 | | | 0.160%, 3/10/11 | | | 9,996,728 | | | | | |
| | 5,000,000 | | | 0.170%, 3/17/11 | | | 4,998,021 | | | | | |
| | 5,000,000 | | | 0.150%, 3/24/11 | | | 4,997,893 | | | | | |
| | 10,000,000 | | | 0.150%, 3/31/11 | | | 9,995,896 | | | | | |
| | 5,000,000 | | | 0.160%, 4/14/11 | | | 4,997,604 | | | | | |
| | 10,000,000 | | | 0.170%, 4/21/11 | | | 9,994,729 | | | | | |
| | 5,000,000 | | | 0.160%, 4/28/11 | | | 4,997,229 | | | | | |
| | 10,000,000 | | | 0.160%, 5/5/11 | | | 9,994,145 | | | | | |
| | 5,000,000 | | | 0.160%, 5/12/11 | | | 4,997,043 | | | | | |
| | 10,000,000 | | | 0.160%, 5/19/11 | | | 9,994,154 | | | | | |
| | 10,000,000 | | | 0.160%, 5/26/11 | | | 9,992,549 | | | | | |
| | 5,000,000 | | | 0.160%, 6/2/11 | | | 4,995,883 | | | | | |
| | 15,000,000 | | | 0.160%, 6/9/11 | | | 14,988,793 | | | | | |
| | 5,000,000 | | | 0.180%, 6/23/11 | | | 4,995,615 | | | | | |
| | 15,000,000 | | | 0.180%, 6/30/11 | | | 14,985,775 | | | | | |
| Total U.S. Treasury Obligations
(Cost $283,823,453) | | | 283,823,453 | | | | | |
| | | | | | | | | | | | |
Principal
Amount | | | | | Value | | | | |
| | | | | | | | | | | | |
| Repurchase Agreements — 26.8% | | | | | | | | |
| $ | 30,000,000 | | | Barclays Capital Group, 0.060%, dated 12/29/10, due 1/5/11, repurchase price $30,300,350 (Fully collateralized by U.S. Treasury Bond,
1.000%, 10/31/11) | | $ | 30,000,000 | | | | | |
| | 30,000,000 | | | Credit Suisse, 0.080%, dated 12/31/10, due 1/4/11, repurchase price $30,000,267 (Fully collateralized by U.S. Treasury Bond, 2.375%, 1/15/17) | | | 30,000,000 | | | | | |
| | 30,000,000 | | | Goldman Sachs, 0.100%, dated 12/28/10, due 1/4/11, repurchase price $30,000,583 (Fully collaterized by U.S. Treasury Bond, 5.500%, 8/15/28) | | | 30,000,000 | | | | | |
| | 13,898,000 | | | Morgan Stanley, 0.010%, dated 12/31/10, due 1/3/11, repurchase price $13,898,000 (Fully collateralized by U.S. Treasury Bond, 3.125%, 8/31/13) | | | 13,898,000 | | | | | |
| Total Repurchase Agreements
(Cost $103,898,000) | | | 103,898,000 | | | | | |
| Total Investments
(Cost $387,721,453) — 100.0% | | | 387,721,453 | | | | | |
| Liabilities in Excess of Other Assets — (0.0)% | | | (6,358) | | | | | |
| Net Assets — 100.0% | | $ | 387,715,095 | | | | | |
(See notes which are an integral part of the Financial Statements)
Annual Shareholder Report
51
| | |
| | |
| Huntington Dividend Capture Fund | | December 31, 2010 |
| | |
| Portfolio of Investments Summary Table | | (unaudited) |
| | | | |
| Asset Allocation | | Percentage of
Market Value | |
Common Stocks (includes 4.8% Real Estate Investment Trusts) | | | 76.3% | |
Preferred Stocks (includes 2.9% Real Estate Investment Trusts) | | | 21.6% | |
Exchange Traded Funds | | | 1.2% | |
Cash1 | | | 0.9% | |
Total | | | 100.0% | |
| 1 | Investments in an affiliated money market fund. |
Portfolio holdings and allocations are subject to change. As of December 31, 2010, percentages in the table above are based on total investments. Such total investments may differ from the percentages set forth below in the Portfolio of Investments which are computed using the Fund’s total net assets.
The Portfolio of Investments Summary Table and the Portfolio of Investments are broken down by sectors, and these sectors do not represent industry categories for purposes of identifying “industry concentration” as described in the Investment Company Act of 1940, as amended.
Portfolio of Investments
| | | | | | | | | | |
| Shares | | | | | Value | | | |
| | | | | | | | | | |
| Common Stocks — 76.8% | | | | | | |
| Consumer Discretionary — 4.5% | | | | | | |
| | 35,500 | | | Genuine Parts Co. | | $ | 1,822,570 | | | |
| | 22,000 | | | The TJX Cos., Inc. | | | 976,580 | | | |
| | 14,000 | | | V.F. Corp. | | | 1,206,520 | | | |
| | 28,000 | | | Yum! Brands, Inc. | | | 1,373,400 | | | |
| | | | | | | | 5,379,070 | | | |
| Consumer Staples — 6.9% | | | | | | |
| | 35,500 | | | Archer-Daniels-Midland Co. | | | 1,067,840 | | | |
| | 50,000 | | | Ruddick Corp. | | | 1,842,000 | | | |
| | 16,000 | | | Sanderson Farms, Inc. | | | 626,400 | | | |
| | 25,500 | | | The Clorox Co. | | | 1,613,640 | | | |
| | 28,500 | | | The Hershey Co. | | | 1,343,775 | | | |
| | 35,000 | | | Universal Corp. | | | 1,424,500 | | | |
| | 4,500 | | | Wal-Mart Stores, Inc. | | | 242,685 | | | |
| | | | | | | | 8,160,840 | | | |
| Energy — 14.9% | | | | | | |
| | 31,000 | | | Cenovus Energy, Inc. | | | 1,030,440 | | | |
| | 33,500 | | | Chevron Texaco Corp. | | | 3,056,875 | | | |
| | 25,000 | | | ConocoPhillips | | | 1,702,500 | | | |
| | 17,500 | | | Eni SpA ADR | | | 765,450 | | | |
| | 54,000 | | | Exxon Mobil Corp. | | | 3,948,480 | | | |
| | 30,000 | | | Marathon Oil Corp. | | | 1,110,900 | | | |
| | 58,500 | | | Royal Dutch Shell PLC ADR | | | 3,906,630 | | | |
| | 39,000 | | | Total SA ADR | | | 2,085,720 | | | |
| | | | | | | | 17,606,995 | | | |
| Financials — 15.8% | | | | | | |
| | 59,500 | | | American Financial Group, Inc. | | | 1,921,255 | | | |
| | 31,500 | | | Assurant, Inc. | | | 1,213,380 | | | |
| | 49,500 | | | BB&T Corp. | | | 1,301,355 | | | |
| | 61,500 | | | Federated Investors, Inc., Class B | | | 1,609,455 | | | |
| | 124,000 | | | Fidelity National Title Group, Inc. | | | 1,696,320 | | | |
| | 38,500 | | | JPMorgan Chase & Co. | | | 1,633,170 | | | |
| | 21,500 | | | Prudential Financial, Inc. | | | 1,262,265 | | | |
| | 24,000 | | | Royal Bank of Canada | | | 1,256,640 | | | |
| | 38,000 | | | The Toronto-Dominion Bank | | | 2,823,780 | | | |
| | 26,500 | | | The Travelers Cos., Inc. | | | 1,476,315 | | | |
| | | | | | | | | | |
| Shares | | | | | Value | | | |
| | | | | | | | | | |
| | | | | | | | | | |
| Common Stocks — (Continued) | | | | | | |
| Financials — (Continued) | | | | | | |
| | 28,000 | | | U.S. Bancorp | | $ | 755,160 | | | |
| | 61,000 | | | Unitrin, Inc. | | | 1,496,940 | | | |
| | 10,000 | | | Wells Fargo & Co. | | | 309,900 | | | |
| | | | | | | | 18,755,935 | | | |
| Health Care — 6.7% | | | | | | |
| | 42,500 | | | Abbott Laboratories | | | 2,036,175 | | | |
| | 44,500 | | | AstraZeneca PLC ADR | | | 2,055,455 | | | |
| | 8,000 | | | Baxter International, Inc. | | | 404,960 | | | |
| | 48,000 | | | Eli Lilly & Co. | | | 1,681,920 | | | |
| | 45,500 | | | GlaxoSmithKline PLC ADR | | | 1,784,510 | | | |
| | | | | | | | 7,963,020 | | | |
| Industrials — 8.5% | | | | | | |
| | 14,500 | | | 3M Co. | | | 1,251,350 | | | |
| | 25,000 | | | Applied Industrial Technologies, Inc. | | | 812,000 | | | |
| | 99,000 | | | General Electric Co. | | | 1,810,710 | | | |
| | 18,500 | | | Lockheed Martin Corp. | | | 1,293,335 | | | |
| | 28,500 | | | Norfolk Southern Corp. | | | 1,790,370 | | | |
| | 51,000 | | | Waste Management, Inc. | | | 1,880,370 | | | |
| | 19,000 | | | Watsco, Inc. | | | 1,198,520 | | | |
| | | | | | | | 10,036,655 | | | |
| Information Technology — 3.7% | | | | | | |
| | 52,000 | | | Corning, Inc. | | | 1,004,640 | | | |
| | 73,000 | | | Intel Corp. | | | 1,535,190 | | | |
| | 49,500 | | | Microsoft Corp. | | | 1,382,040 | | | |
| | 12,299 | | | Taiwan Semiconductor Manufacturing Co. Ltd. ADR | | | 154,229 | | | |
| | 8,000 | | | Texas Instruments, Inc. | | | 260,000 | | | |
| | | | | | | | 4,336,099 | | | |
| Materials — 2.3% | | | | | | |
| | 34,500 | | | AMCOL International Corp. | | | 1,069,500 | | | |
| | 42,500 | | | MeadWestvaco Corp. | | | 1,111,800 | | | |
| | 10,500 | | | Southern Copper Corp. | | | 511,770 | | | |
| | | | | | | | 2,693,070 | | | |
(See notes which are an integral part of the Financial Statements)
Annual Shareholder Report
52
| | |
| Huntington Dividend Capture Fund | | (Continued) |
| | | | | | | | | | |
| Shares | | | | | Value | | | |
| | | | | | | | | | |
| Common Stocks — (Continued) | | | | | | |
| Real Estate Investment Trusts — 4.8% | | | | | | |
| | 23,000 | | | Acadia Realty Trust | | $ | 419,520 | | | |
| | 60,000 | | | Duke Realty Corp. | | | 747,600 | | | |
| | 3,000 | | | EastGroup Properties, Inc. | | | 126,960 | | | |
| | 5,000 | | | Equity Residential | | | 259,750 | | | |
| | 10,000 | | | HCP, Inc. | | | 367,900 | | | |
| | 9,500 | | | Home Properties, Inc. | | | 527,155 | | | |
| | 20,500 | | | National Health Investors, Inc. | | | 922,910 | | | |
| | 7,000 | | | National Retail Properties, Inc. | | | 185,500 | | | |
| | 8,500 | | | PS Business Parks, Inc. | | | 473,620 | | | |
| | 10,500 | | | Rayonier, Inc. | | | 551,460 | | | |
| | 5,000 | | | Simon Property Group, Inc. | | | 497,450 | | | |
| | 17,000 | | | Sovran Self Storage, Inc. | | | 625,770 | | | |
| | | | | | | | 5,705,595 | | | |
| Telecommunication Services — 2.0% | | | | | | |
| | 21,500 | | | Verizon Communications, Inc. | | | 769,270 | | | |
| | 59,500 | | | Vodafone Group PLC ADR | | | 1,572,585 | | | |
| | | | | | | | 2,341,855 | | | |
| Utilities — 6.7% | | | | | | |
| | 73,250 | | | Entergy Corp. | | | 5,188,298 | | | |
| | 44,500 | | | Nicor, Inc. | | | 2,221,440 | | | |
| | 32,000 | | | TECO Energy, Inc. | | | 569,600 | | | |
| | | | | | | | 7,979,338 | | | |
| Total Common Stocks (Cost $84,326,890) | | | 90,958,472 | | | |
| Preferred Stocks — 21.7% | | | | | | |
| Consumer Discretionary — 0.8% | | | | | | |
| | 15,000 | | | Comcast Corp., 7.000% | | | 380,250 | | | |
| | 25,000 | | | Viacom, Inc., 6.850% | | | 634,500 | | | |
| | | | | | | | 1,014,750 | | | |
| Financials — 15.2% | | | | | | |
| | 45,000 | | | Allianz SE, 8.375% | | | 1,182,659 | | | |
| | 10,000 | | | Ameriprise Financial, Inc., 7.750% | | | 266,500 | | | |
| | 40,000 | | | Barclays Bank PLC, 6.625% | | | 933,200 | | | |
| | 44,998 | | | BB&T Capital Trust V, 8.950% (a) | | | 1,235,195 | | | |
| | 35,000 | | | Credit Suisse Guernsey, 7.900% | | | 937,300 | | | |
| | 8,568 | | | Everest Re Cap Trust II, 6.200% | | | 190,724 | | | |
| | 24,179 | | | Goldman Sachs Group, Inc., 6.200% | | | 583,923 | | | |
| | 15,000 | | | HSBC Holdings PLC, 6.200% | | | 343,500 | | | |
| | 40,000 | | | JPMorgan Chase
Capital XXVI, 8.000% (a) | | | 1,076,400 | | | |
| | 12,000 | | | KeyCorp Capital VIII, 7.000% | | | 293,280 | | | |
| | 20,000 | | | M&T Capital Trust IV, 8.500% | | | 532,400 | | | |
| | 40,000 | | | Merrill Lynch & Co. Capital
Trust V, 7.280% | | | 980,000 | | | |
| | 18,000 | | | MetLife, Inc., 6.500% | | | 446,400 | | | |
| | 60,000 | | | Morgan Stanley Capital Trust, 6.600% | | | 1,425,000 | | | |
| | 55,000 | | | National City Capital Trust II, 6.625% | | | 1,373,900 | | | |
| | 34,000 | | | Partnerre Ltd., 6.500% | | | 818,720 | | | |
| | 42,386 | | | PLC Capital Trust IV, 7.250% | | | 1,055,411 | | | |
| | | | | | | | | | |
| Shares | | | | | Value | | | |
| | | | | | | | | | |
| Preferred Stocks — (Continued) | | | | | | |
| Financials — (Continued) | | | | | | |
| | 40,000 | | | Prudential Financial, Inc., 9.000% | | $ | 1,099,600 | | | |
| | 30,000 | | | Prudential PLC, 6.500% | | | 739,800 | | | |
| | 10,000 | | | RenaissanceRe Holdings Ltd., 6.500% | | | 227,400 | | | |
| | 23,000 | | | SunTrust Capital IX, 7.875% | | | 593,630 | | | |
| | 10,000 | | | USB Capital XI, 6.600% | | | 251,000 | | | |
| | 40,000 | | | Wachovia Capital Trust X, 7.850% | | | 1,054,000 | | | |
| | 15,000 | | | Wells Fargo Capital IV, 7.000% | | | 379,950 | | | |
| | | | | | | | 18,019,892 | | | |
| Real Estate Investment Trusts — 2.9% | | | | | | |
| | 55,000 | | | Kimco Realty Corp., 7.750% | | | 1,452,000 | | | |
| | 30,000 | | | Public Storage, Inc., 6.450% | | | 727,500 | | | |
| | 46,424 | | | Vornado Realty LP, 7.875% | | | 1,238,128 | | | |
| | | | | | | | 3,417,628 | | | |
| Telecommunication Services — 1.2% | | | | | | |
| | 25,422 | | | AT&T, Inc., 6.375% | | | 676,479 | | | |
| | 28,255 | | | Telephone & Data
Systems, Inc., 7.600% | | | 712,309 | | | |
| | | | | | | | 1,388,788 | | | |
| Utilities — 1.6% | | | | | | |
| | 38,000 | | | Dominion Resources, Inc.,
Class A, 8.375% | | | 1,076,920 | | | |
| | 30,000 | | | Xcel Energy, Inc., 7.600% | | | 822,900 | | | |
| | | | | | | | 1,899,820 | | | |
| Total Preferred Stocks (Cost $23,789,629) | | | 25,740,878 | | | |
| Mutual Funds — 1.2% | | | | | | |
| Exchange Traded Funds — 1.2% | | | | | | |
| | 55,000 | | | The Technology Select
Sector SPDR Fund | | | 1,384,900 | | | |
| Total Mutual Funds (Cost $914,244) | | | 1,384,900 | | | |
| Cash Equivalents — 1.0% | | | | | | |
| | 1,122,914 | | | Huntington Money Market Fund, Interfund Shares,
0.010% (b) (c) | | | 1,122,914 | | | |
| Total Cash Equivalents (Cost $1,122,914) | | | 1,122,914 | | | |
| Total Investments
(Cost $110,134,031) — 100.7% | | | 119,207,164 | | | |
| Liabilities in Excess of Other Assets — (0.7)% | | | (801,500) | | | |
| Net Assets — 100.0% | | $ | 118,405,664 | | | |
| (a) | Variable or Floating Rate Security. Rate disclosed is as of December 31, 2010. |
| (b) | Investment in affiliate. |
| (c) | Rate disclosed is the seven day yield as of December 31, 2010. |
ADR — American Depositary Receipt.
LP — Limited Partnership
PLC — Public Liability Co.
(See notes which are an integral part of the Financial Statements)
Annual Shareholder Report
53
| | |
| | |
| Huntington Global Select Markets Fund | | December 31, 2010 |
| | |
| Portfolio of Investments Summary Table | | (unaudited) |
| | | | |
| Asset Allocation | | Percentage of
Market Value | |
Common Stocks | | | 92.1% | |
Foreign Bonds | | | 2.9% | |
Mutual Funds | | | 3.3% | |
Cash1 | | | 1.7% | |
Total | | | 100.0% | |
| 1 | Investments in an affiliated money market fund. |
Portfolio holdings and allocations are subject to change. As of December 31, 2010, percentages in the table above are based on total investments. Such total investments may differ from the percentages set forth below in the Portfolio of Investments which are computed using the Fund’s total net assets.
The Portfolio of Investments Summary Table and the Portfolio of Investments are broken down by sectors, and these sectors do not represent industry categories for purposes of identifying “industry concentration” as described in the Investment Company Act of 1940, as amended.
Portfolio of Investments
| | | | | | | | | | | | |
| Shares | | Value | | | | |
| | | | | | | | | | | | |
| | | | | | | | | | | | |
| Common Stocks — 92.2% | | | | | | | | |
| Brazil — 16.6% | | | | | | | | |
| Consumer Discretionary — 5.8% | | | | | | | | |
| | 23,600 | | | Cia Brasileira de Distribuicao Grupo Pao de Acucar ADR | | $ | 990,728 | | | | | |
| | 22,500 | | | Companhia Brasileira de Distribuicao Grupo Pao de Acucar ADR | | | 698,175 | | | | | |
| | 20,000 | | | Lojas Americanas SA | | | 184,458 | | | | | |
| | 90,000 | | | PDG Realty SA Empreendimentos e Participacoes | | | 550,843 | | | | | |
| | | | | | | | 2,424,204 | | | | | |
| Consumer Staples — 0.9% | | | | | | | | |
| | 13,000 | | | Natura Cosmeticos SA | | | 373,476 | | | | | |
| Energy — 2.5% | | | | | | | | |
| | 28,000 | | | Petroleo Brasileiro SA ADR | | | 1,059,520 | | | | | |
| Financials — 2.2% | | | | | | | | |
| | 25,000 | | | Banco Bradesco SA ADR | | | 507,250 | | | | | |
| | 18,000 | | | Itau Unibanco Holding SA | | | 431,458 | | | | | |
| | | | | | | | 938,708 | | | | | |
| Information Technology — 1.2% | | | | | | | | |
| | 5,000 | | | Totvs SA | | | 509,036 | | | | | |
| Materials — 2.9% | | | | | | | | |
| | 35,000 | | | Vale SA ADR | | | 1,209,950 | | | | | |
| Utilities — 1.1% | | | | | | | | |
| | 26,500 | | | Companhia Energetica de Minas Gerais - CEMIG ADR | | | 439,635 | | | | | |
| | | | | | | | 6,954,529 | | | | | |
| Canada — 4.2% | | | | | | | | |
| Energy — 0.9% | | | | | | | | |
| | 7,500 | | | EnCana Corp. | | | 218,400 | | | | | |
| | 4,200 | | | TransCanada Corp. | | | 159,768 | | | | | |
| | | | | | | | 378,168 | | | | | |
| | | | | | | | | | | | |
| Shares | | Value | | | | |
| | | | | | | | | | | | |
| | | | | | | | | | | | |
| | | | | | | | | | | | |
| Common Stocks — (Continued) | | | | | | | | |
| Canada — (Continued) | | | | | | | | |
| Financials — 1.4% | | | | | | | | |
| | 10,000 | | | Bank of Montreal | | $ | 575,700 | | | | | |
| Materials — 1.9% | | | | | | | | |
| | 35,000 | | | NovaGold Resources, Inc.* | | | 499,450 | | | | | |
| | 1,900 | | | Potash Corp. of Saskatchewan, Inc. | | | 294,177 | | | | | |
| | | | | | | | 793,627 | | | | | |
| | | | | | | | 1,747,495 | | | | | |
| China — 11.2% | | | | | | | | |
| Consumer Discretionary — 1.4% | | | | | | | | |
| | 230,000 | | | Anta Sports Products Ltd. | | | 365,150 | | | | | |
| | 135,000 | | | Parkson Retail Group Ltd. | | | 208,074 | | | | | |
| | | | | | | | 573,224 | | | | | |
| Consumer Staples — 2.1% | | | | | | | | |
| | 120,000 | | | China Yurun Food Group Ltd. | | | 394,458 | | | | | |
| | 95,000 | | | Tsingtao Brewery Co. Ltd. | | | 497,446 | | | | | |
| | | | | | | | 891,904 | | | | | |
| Energy — 2.0% | | | | | | | | |
| | 500,000 | | | China Petroleum and Chemical Corp. (Sinopec) | | | 478,598 | | | | | |
| | 2,700 | | | PetroChina Co. Ltd. ADR | | | 355,023 | | | | | |
| | | | | | | | 833,621 | | | | | |
| Financials — 2.3% | | | | | | | | |
| | 1,800,000 | | | Bank of China Ltd. | | | 949,477 | | | | | |
| Health Care — 1.2% | | | | | | | | |
| | 180,000 | | | Shandong Weigao Group Medical Polymer Co. Ltd. | | | 510,633 | | | | | |
(See notes which are an integral part of the Financial Statements)
Annual Shareholder Report
54
| | |
| Huntington Global Select Markets Fund | | (Continued) |
| | | | | | | | | | | | |
| Shares | | Value | | | | |
| | | | | | | | | | | | |
| Common Stocks — (Continued) | | | | | | | | |
| China — (Continued) | | | | | | | | |
| Industrials — 1.1% | | | | | | | | |
| | 97,000 | | | Dongfang Electric Corp. Ltd. | | $ | 480,464 | | | | | |
| Information Technology — 1.1% | | | | | | | | |
| | 21,000 | | | Tencent Holdings Ltd. | | | 456,328 | | | | | |
| | | | | | | | 4,695,651 | | | | | |
| Hong Kong — 8.1% | | | | | | | | |
| Consumer Discretionary — 2.4% | | | | | | | | |
| | 440,000 | | | Wynn Macau, Ltd. | | | 984,986 | | | | | |
| Energy — 1.1% | | | | | | | | |
| | 2,000 | | | CNOOC Ltd. ADR | | | 476,740 | | | | | |
| Financials — 1.7% | | | | | | | | |
| | 152,000 | | | China Resources Land Ltd. | | | 277,690 | | | | | |
| | 27,000 | | | Swire Pacific Ltd. | | | 443,938 | | | | | |
| | | | | | | | 721,628 | | | | | |
| Information Technology — 1.7% | | | | | | | | |
| | 390,000 | | | Digital China Holdings Ltd. | | | 729,553 | | | | | |
| Telecommunication Services — 1.2% | | | | | | | | |
| | 10,000 | | | China Mobile Ltd. ADR | | | 496,200 | | | | | |
| | | | | | | | 3,409,107 | | | | | |
| India — 13.1% | | | | | | | | |
| Financials — 3.3% | | | | | | | | |
| | 13,000 | | | Axis Bank Ltd. | | | 392,515 | | | | | |
| | 10,000 | | | ICICI Bank Ltd. ADR | | | 506,400 | | | | | |
| | 70,000 | | | Rural Electrification Corp. Ltd. | | | 468,232 | | | | | |
| | | | | | | | 1,367,147 | | | | | |
| Health Care — 3.4% | | | | | | | | |
| | 13,000 | | | Dr. Reddy’s Laboratories Ltd. ADR | | | 480,480 | | | | | |
| | 70,000 | | | Opto Circuits India Ltd. | | | 420,172 | | | | | |
| | 50,000 | | | Sun Pharmaceutical Industries Ltd. | | | 542,268 | | | | | |
| | | | | | | | 1,442,920 | | | | | |
| Industrials — 2.3% | | | | | | | | |
| | 22,000 | | | Larsen & Touboro Ltd. | | | 973,801 | | | | | |
| Information Technology — 2.7% | | | | | | | | |
| | 15,000 | | | Infosys Technologies Ltd. ADR | | | 1,141,200 | | | | | |
| Materials — 1.4% | | | | | | | | |
| | 105,000 | | | Hindalco Industries Ltd. | | | 580,007 | | | | | |
| | | | | | | | 5,505,075 | | | | | |
| Indonesia — 6.4% | | | | | | | | |
| Consumer Discretionary — 0.7% | | | | | | | | |
| | 50,000 | | | Astra International Tbk PT | | | 303,089 | | | | | |
| Consumer Staples — 1.0% | | | | | | | | |
| | 800,000 | | | Indofood Sukses Makmur Tbk PT | | | 433,381 | | | | | |
| | | | | | | | | | |
| Shares | | Value | | | |
| | | | | | | | | | |
| Common Stocks — (Continued) | | | | | | |
| Indonesia — (Continued) | | | | | | |
| Energy — 1.4% | | | | | | |
| | 1,200,000 | | | Perusahaan Gas Negara Tbk PT | | $ | 590,066 | | | |
| Financials — 0.5% | | | | | | |
| | 280,000 | | | Bank Mandiri Tbk PT | | | 202,245 | | | |
| Industrials — 0.8% | | | | | | |
| | 125,000 | | | United Tractors Tbk PT | | | 330,592 | | | |
| Materials — 2.0% | | | | | | |
| | 1,540,000 | | | Holcim Indonesia Tbk PT* | | | 385,043 | | | |
| | 430,000 | | | Semen Gresik Persero Tbk PT | | | 451,550 | | | |
| | | | | | | | 836,593 | | | |
| | | | | | | | 2,695,966 | | | |
| Mexico — 1.4% | | | | | | |
| Telecommunication Services — 1.4% | | | | | | |
| | 10,000 | | | America Movil SA de CV,, Series 1 ADR | | | 573,400 | | | |
| Poland — 4.1% | | | | | | |
| Consumer Discretionary — 1.1% | | | | | | |
| | 75,000 | | | TVN SA | | | 432,503 | | | |
| Financials — 1.9% | | | | | | |
| | 3,200 | | | Bank Pekoe SA | | | 193,168 | | | |
| | 6,000 | | | Bre Bank* | | | 615,115 | | | |
| | | | | | | | 808,283 | | | |
| Utilities — 1.1% | | | | | | |
| | 60,000 | | | Polska Grupa Energetyczna SA | | | 469,227 | | | |
| | | | | | | | 1,710,013 | | | |
| Republic Of South Korea — 11.4% | | | | | | |
| Consumer Staples — 1.2% | | | | | | |
| | 1,450 | | | LG Household & Health Care Ltd. | | | 504,550 | | | |
| Financials — 1.3% | | | | | | |
| | 21,420 | | | Korean Reinsurance Co. | | | 225,514 | | | |
| | 7,000 | | | Shinhan Financial Group Co. Ltd.* | | | 330,389 | | | |
| | | | | | | | 555,903 | | | |
| Industrials — 3.9% | | | | | | |
| | 63,000 | | | Dong Ah Tire & Rubber Co. Ltd. | | | 528,373 | | | |
| | 2,750 | | | Hyundai Heavy Industries Co. Ltd.* | | | 1,086,947 | | | |
| | | | | | | | 1,615,320 | | | |
| Information Technology — 2.8% | | | | | | |
| | 1,410 | | | Samsung Electronics Co. Ltd.* | | | 1,193,870 | | | |
| Materials — 2.2% | | | | | | |
| | 1,400 | | | Korea Zinc Co. Ltd. | | | 345,378 | | | |
| | 5,500 | | | POSCO ADR | | | 592,295 | | | |
| | | | | | | | 937,673 | | | |
| | | | | | | | 4,807,316 | | | |
(See notes which are an integral part of the Financial Statements)
Annual Shareholder Report
55
| | |
| Huntington Global Select Markets Fund | | (Continued) |
| | | | | | | | | | | | |
Shares | | Value | | | | |
| | | | | | | | | | | | |
| Common Stocks — (Continued) | | | | | | | | |
| Russian Federation — 1.7% | | | | | | | | |
| Materials — 1.7% | | | | | | | | |
| | 30,000 | | | Mining and Metallurgical Co. Norilsk Nickel ADR | | $ | 721,200 | | | | | |
| South Africa — 1.5% | | | | | | | | |
| Energy — 1.5% | | | | | | | | |
| | 12,000 | | | Sasol Ltd. ADR | | | 624,600 | | | | | |
| Taiwan — 11.5% | | | | | | | | |
| Consumer Staples — 0.8% | | | | | | | | |
| | 70,000 | | | President Chain Store Corp. | | | 322,962 | | | | | |
| Financials — 2.3% | | | | | | | | |
| | 710,000 | | | Fubon Financial Holding Co. Ltd. | | | 974,204 | | | | | |
| Industrials — 1.5% | | | | | | | | |
| | 190,000 | | | Formosa Plastics Corp. | | | 635,462 | | | | | |
| Information Technology — 2.4% | | | | | | | | |
| | 510,000 | | | Unimicron Technology Corp. | | | 993,688 | | | | | |
| Materials — 3.3% | | | | | | | | |
| | 435,160 | | | Asia Cement Corp. | | | 481,405 | | | | | |
| | 243,000 | | | Taiwan Fertilizer Co. Ltd. | | | 908,583 | | | | | |
| | | | | | | | 1,389,988 | | | | | |
| Telecommunication Services — 1.2% | | | | | | | | |
| | 19,636 | | | Chunghwa Telecom Co., Ltd. ADR | | | 496,202 | | | | | |
| | | | | | | | 4,812,506 | | | | | |
| United Kingdom — 1.0% | | | | | | | | |
| Materials — 1.0% | | | | | | | | |
| | 5,800 | | | Rio Tinto PLC ADR | | | 415,628 | | | | | |
| Total Common Stocks (Cost $34,026,338) | | | 38,672,486 | | | | | |
| Mutual Funds — 3.3% | | | | | | | | |
| Exchange Traded Funds — 2.9% | | | | | | | | |
| | 10,000 | | | Guggenheim China Small Cap Index ETF | | | 300,600 | | | | | |
| | 6,200 | | | iPath MCSI India Index ETN | | | 481,492 | | | | | |
| | 10,200 | | | iShares FTSE China 25 Index Fund | | | 439,518 | | | | | |
| | | | | | | | 1,221,610 | | | | | |
| | | | | | | | | | | | |
Principal
Amount
or Shares | | Value | | | | |
| | | | | | | | | | | | |
| Mutual Funds — (Continued) | | | | | | | | |
| Closed-End Funds — 0.4% | | | | | | | | |
| | 10,000 | | | Morgan Stanley Emerging Markets Domestic Debt Fund, Inc. | | $ | 161,500 | | | | | |
| Total Mutual Funds (Cost $1,210,515) | | | 1,383,110 | | | | | |
| Foreign Bonds — 2.9% | | | | | | | | |
| | 200,000 | | | Australian Government,
6.000%, 2/15/17 (a) | | | 210,370 | | | | | |
| | 200,000 | | | Australian Government,
6.250%, 4/15/15 (a) | | | 211,450 | | | | | |
| | 250,000 | | | Brazilian Government International Bond, 12.500%, 1/5/16 (b) | | | 174,398 | | | | | |
| | 200,000 | | | Canadian Government,
4.000%, 6/1/17 (c) | | | 215,660 | | | | | |
| | 350,000 | | | European Bank for Reconstruction & Development, Series E, MTN,
9.500%, 11/6/13 (b) | | | 218,065 | | | | | |
| | 1,700,000,000 | | | KFW, Series E,
7.500%, 7/17/12 (d) | | | 195,163 | | | | | |
| Total Foreign Bonds (Cost $1,104,682) | | | 1,225,106 | | | | | |
| Cash Equivalents — 1.7% | | | | | | | | |
| | 250 | | | Fidelity Institutional Money Market Portfolio, 0.250% (e) | | | 250 | | | | | |
| | 716,504 | | | Huntington Money Market Fund, Interfund Shares, 0.010% (e) (f) | | | 716,504 | | | | | |
| Total Cash Equivalents (Cost $716,754) | | | 716,754 | | | | | |
| Total Investments
(Cost $37,058,289) — 100.1% | | | 41,997,456 | | | | | |
| Liabilities in Excess of Other Assets — (0.1)% | | | (21,887) | | | | | |
| Net Assets — 100.0% | | $ | 41,975,569 | | | | | |
| (a) | Foreign-denominated security. Principal amount is reported in Australian Dollars. |
| (b) | Foreign-denominated security. Principal amount is reported in Brazilian Real. |
| (c) | Foreign-denominated security. Principal amount is reported in Canadian Dollars. |
| (d) | Foreign-denominated security. Principal amount is reported in Indonesian Rupiah. |
| (e) | Rate disclosed is the seven day yield as of December 31, 2010. |
| (f) | Investment in affiliate. |
| * | Non-income producing security. |
| ADR | — American Depositary Receipt |
(See notes which are an integral part of the Financial Statements)
Annual Shareholder Report
56
| | |
| | |
| Huntington Growth Fund | | December 31, 2010 |
| | |
| Portfolio of Investments Summary Table | | (unaudited) |
| | | | |
| Asset Allocation | | Percentage of
Market Value | |
Information Technology | | | 34.1% | |
Industrials | | | 13.0% | |
Energy | | | 12.3% | |
Health Care | | | 8.5% | |
Consumer Staples | | | 7.5% | |
Consumer Discretionary | | | 6.8% | |
Materials | | | 6.7% | |
Cash1 | | | 5.0% | |
Real Estate Investment Trusts | | | 2.8% | |
Financials | | | 2.0% | |
Telecommunication Services | | | 1.3% | |
Total | | | 100.0% | |
| 1 | Investments in an affiliated money market fund. |
Portfolio holdings and allocations are subject to change. As of December 31, 2010, percentages in the table above are based on total investments. Such total investments may differ from the percentages set forth below in the Portfolio of Investments which are computed using the Fund’s total net assets.
The Portfolio of Investments Summary Table and the Portfolio of Investments are broken down by sectors, and these sectors do not represent industry categories for purposes of identifying “industry concentration” as described in the Investment Company Act of 1940, as amended.
Portfolio of Investments
| | | | | | | | | | |
| Shares | | | | | Value | | | |
| | | | | | | | | | |
| Common Stocks — 95.9% | | | | | | |
| Consumer Discretionary — 6.8% | | | | | | |
| | 46,550 | | | Coach, Inc. | | $ | 2,574,681 | | | |
| | 51,430 | | | Family Dollar Stores, Inc. | | | 2,556,585 | | | |
| | 18,930 | | | Lululemon Athletica, Inc.* | | | 1,295,191 | | | |
| | 7,330 | | | Netflix, Inc.* | | | 1,287,881 | | | |
| | 15,270 | | | Nike, Inc., Class B | | | 1,304,363 | | | |
| | | | | | | | 9,018,701 | | | |
| Consumer Staples — 7.6% | | | | | | |
| | 51,760 | | | Altria Group, Inc. | | | 1,274,331 | | | |
| | 86,350 | | | Companhia Brasileira de Distribuicao Grupo Pao de Acucar ADR | | | 2,679,441 | | | |
| | 52,380 | | | McCormick & Co., Inc. | | | 2,437,241 | | | |
| | 21,610 | | | Philip Morris International, Inc. | | | 1,264,833 | | | |
| | 36,720 | | | The Coca-Cola Co. | | | 2,415,074 | | | |
| | | | | | | | 10,070,920 | | | |
| Energy — 12.5% | | | | | | |
| | 41,290 | | | Anadarko Petroleum Corp. | | | 3,144,647 | | | |
| | 16,750 | | | CNOOC Ltd. ADR | | | 3,992,698 | | | |
| | 30,280 | | | Core Laboratories NV | | | 2,696,434 | | | |
| | 58,870 | | | Peabody Energy Corp. | | | 3,766,503 | | | |
| | 41,670 | | | Transocean Ltd.* | | | 2,896,482 | | | |
| | | | | | | | 16,496,764 | | | |
| Financials — 2.0% | | | | | | |
| | 15,520 | | | Goldman Sachs Group, Inc. | | | 2,609,843 | | | |
| Health Care — 8.6% | | | | | | |
| | 36,510 | | | Merck & Co., Inc. | | | 1,315,820 | | | |
| | | | | | | | | | |
| Shares | | | | | Value | | | |
| | | | | | | | | | |
| Common Stocks — (Continued) | | | | | | |
| Health Care — (Continued) | | | | | | |
| | 30,610 | | | Novo-Nordisk A/S ADR | | $ | 3,445,768 | | | |
| | 77,200 | | | Pfizer, Inc. | | | 1,351,772 | | | |
| | 36,560 | | | Stryker Corp. | | | 1,963,272 | | | |
| | 48,140 | | | Varian Medical Systems, Inc.* | | | 3,335,139 | | | |
| | | | | | | | 11,411,771 | | | |
| Industrials — 13.2% | | | | | | |
| | 53,800 | | | Caterpillar, Inc. | | | 5,038,908 | | | |
| | 42,200 | | | CSX Corp. | | | 2,726,542 | | | |
| | 31,630 | | | Deere & Co. | | | 2,626,872 | | | |
| | 50,620 | | | Joy Global, Inc. | | | 4,391,285 | | | |
| | 28,540 | | | Union Pacific Corp. | | | 2,644,516 | | | |
| | | | | | | | 17,428,123 | | | |
| Information Technology — 34.4% | | | | | | |
| | 25,020 | | | Apple, Inc.* | | | 8,070,451 | | | |
| | 46,300 | | | Baidu, Inc. SP ADR* | | | 4,469,339 | | | |
| | 221,310 | | | Cisco Systems, Inc.* | | | 4,477,101 | | | |
| | 37,640 | | | Cognizant Technology Solutions Corp., Class A* | | | 2,758,636 | | | |
| | 170,380 | | | EMC Corp.* | | | 3,901,702 | | | |
| | 22,620 | | | F5 Networks, Inc.* | | | 2,944,219 | | | |
| | 5,660 | | | Google, Inc., Class A* | | | 3,361,870 | | | |
| | 141,140 | | | Microsoft Corp. | | | 3,940,629 | | | |
| | 49,320 | | | NetApp, Inc.* | | | 2,710,627 | | | |
| | 91,430 | | | Oracle Corp. | | | 2,861,759 | | | |
| | 84,750 | | | Rackspace Hosting, Inc.* | | | 2,661,998 | | | |
(See notes which are an integral part of the Financial Statements)
Annual Shareholder Report
57
| | |
| Huntington Growth Fund | | (Continued) |
| | | | | | | | | | |
| Shares | | | | | Value | | | |
| | | | | | | | | | |
| Common Stocks — (Continued) | | | | | | |
| Information Technology — (Continued) | | | | | | |
| | 68,000 | | | SanDisk Corp.* | | $ | 3,390,480 | | | |
| | | | | | | | 45,548,811 | | | |
| Materials — 6.7% | | | | | | |
| | 23,500 | | | Agrium, Inc. | | | 2,156,125 | | | |
| | 38,300 | | | Du Pont (E.I.) de Nemours & Co. | | | 1,910,404 | | | |
| | 21,510 | | | Freeport-McMoran Copper & Gold, Inc., Series B, Class B | | | 2,583,136 | | | |
| | 32,050 | | | Rio Tinto PLC ADR | | | 2,296,703 | | | |
| | | | | | | | 8,946,368 | | | |
| Real Estate Investment Trusts — 2.8% | | | | | | |
| | 24,380 | | | Health Care, Inc. | | | 1,161,463 | | | |
| | 19,670 | | | Mid-America Apartment Communities, Inc. | | | 1,248,848 | | | |
| | 48,310 | | | National Retail Properties, Inc. | | | 1,280,215 | | | |
| | | | | | | | 3,690,526 | | | |
| Telecommunication Services — 1.3% | | | | | | |
| | 90,580 | | | Frontier Communications Corp. | | | 881,343 | | | |
| | 63,240 | | | Windstream Corp. | | | 881,566 | | | |
| | | | | | | | 1,762,909 | | | |
| Total Common Stocks (Cost $109,490,542) | | | 126,984,736 | | | |
| | | | | | | | | | |
| Shares | | | | | Value | | | |
| | | | | | | | | | |
| Cash Equivalents — 5.1% | | | | | | |
| | 6,700,122 | | | Huntington Money Market Fund, Interfund Shares,
0.010% (a) (b) | | $ | 6,700,122 | | | |
| Total Cash Equivalents (Cost $6,700,122) | | | 6,700,122 | | | |
| Total Investments (Cost $116,190,664) — 101.0% | | | 133,684,858 | | | |
| Liabilities in Excess of Other Assets — (1.0)% | | | (1,344,535) | | | |
| Net Assets — 100.0% | | $ | 132,340,323 | | | |
| (a) | Investment in affiliate. |
| (b) | Rate disclosed is the seven day yield as of December 31, 2010. |
| * | Non-income producing security. |
ADR —American Depositary Receipt.
PLC — Public Liability Co.
(See notes which are an integral part of the Financial Statements)
Annual Shareholder Report
58
| | |
| | |
| Huntington Income Equity Fund | | December 31, 2010 |
| | |
| Portfolio of Investments Summary Table | | (unaudited) |
| | | | |
| Asset Allocation | | Percentage of
Market Value | |
Energy | | | 19.1% | |
Financials | | | 11.7% | |
Industrials | | | 11.7% | |
Real Estate Investment Trusts | | | 10.5% | |
Consumer Staples | | | 9.6% | |
Health Care | | | 9.3% | |
Information Technology | | | 6.6% | |
Utilities | | | 6.4% | |
Consumer Discretionary | | | 6.2% | |
Materials | | | 3.2% | |
Cash1 | | | 3.0% | |
Telecommunication Services | | | 2.7% | |
Total | | | 100.0% | |
| 1 | Investments in an affiliated money market fund. |
Portfolio holdings and allocations are subject to change. As of December 31, 2010, percentages in the table above are based on total investments. Such total investments may differ from the percentages set forth below in the Portfolio of Investments which are computed using the Fund’s total net assets.
The Portfolio of Investments Summary Table and the Portfolio of Investments are broken down by sectors, and these sectors do not represent industry categories for purposes of identifying “industry concentration” as described in the Investment Company Act of 1940, as amended.
Portfolio of Investments
| | | | | | | | | | |
| Shares | | | | | Value | | | |
| | | | | | | | | | |
| Common Stocks — 97.0% | | | | | | |
| Consumer Discretionary — 6.2% | | | | | | |
| | 157,000 | | | H & R Block, Inc. | | $ | 1,869,870 | | | |
| | 31,100 | | | McDonald’s Corp. | | | 2,387,236 | | | |
| | 35,900 | | | Time Warner, Inc. | | | 2,370,477 | | | |
| | | | | | | | 6,627,583 | | | |
| Consumer Staples — 9.6% | | | | | | |
| | 72,000 | | | Altria Group, Inc. | | | 1,772,640 | | | |
| | 38,400 | | | HJ Heinz Co. | | | 1,899,264 | | | |
| | 22,300 | | | Kimberly-Clark Corp. | | | 1,405,792 | | | |
| | 27,200 | | | PepsiCo, Inc. | | | 1,776,976 | | | |
| | 34,100 | | | Philip Morris International, Inc. | | | 1,995,873 | | | |
| | 21,300 | | | The Coca-Cola Co. | | | 1,400,901 | | | |
| | | | | | | | 10,251,446 | | | |
| Energy — 19.2% | | | | | | |
| | 22,600 | | | Chevron Texaco Corp. | | | 2,062,250 | | | |
| | 22,600 | | | ConocoPhillips | | | 1,539,060 | | | |
| | 71,700 | | | Enerplus Resources Fund | | | 2,211,228 | | | |
| | 33,900 | | | Eni SpA ADR | | | 1,482,786 | | | |
| | 27,500 | | | Exxon Mobil Corp. | | | 2,010,800 | | | |
| | 36,100 | | | Marathon Oil Corp. | | | 1,336,783 | | | |
| | 76,000 | | | Penn West Energy Trust | | | 1,817,920 | | | |
| | 12,000 | | | PetroChina Co. Ltd. ADR | | | 1,577,880 | | | |
| | 47,900 | | | Repsol YPF SA ADR | | | 1,338,326 | | | |
| | 23,300 | | | Royal Dutch Shell PLC ADR | | | 1,555,974 | | | |
| | 80,000 | | | Spectra Energy Corp. | | | 1,999,200 | | | |
| | | | | | | | | | |
| Shares | | | | | Value | | | |
| | | | | | | | | | |
| Common Stocks — (Continued) | | | | | | |
| Energy — (Continued) | | | | | | |
| | 29,400 | | | Total SA ADR | | $ | 1,572,312 | | | |
| | | | | | | | 20,504,519 | | | |
| Financials — 11.7% | | | | | | |
| | 36,700 | | | Bank of Montreal | | | 2,112,819 | | | |
| | 30,200 | | | Canadian Imperial Bank of Commerce | | | 2,367,680 | | | |
| | 32,600 | | | Chubb Corp. | | | 1,944,264 | | | |
| | 22,900 | | | M & T Bank Corp. | | | 1,993,445 | | | |
| | 71,000 | | | Sun Life Financial, Inc. | | | 2,137,100 | | | |
| | 35,200 | | | The Travelers Cos., Inc. | | | 1,960,992 | | | |
| | | | | | | | 12,516,300 | | | |
| Health Care — 9.3% | | | | | | |
| | 44,100 | | | Abbott Laboratories | | | 2,112,831 | | | |
| | 40,700 | | | AstraZeneca PLC ADR | | | 1,879,933 | | | |
| | 46,800 | | | Eli Lilly & Co. | | | 1,639,872 | | | |
| | 114,000 | | | Pfizer, Inc. | | | 1,996,140 | | | |
| | 73,000 | | | Sanofi-Aventis ADR | | | 2,352,790 | | | |
| | | | | | | | 9,981,566 | | | |
| Industrials — 11.7% | | | | | | |
| | 19,000 | | | Caterpillar, Inc. | | | 1,779,540 | | | |
| | 16,500 | | | Eaton Corp. | | | 1,674,915 | | | |
| | 25,700 | | | Lockheed Martin Corp. | | | 1,796,687 | | | |
| | 134,000 | | | R.R. Donnelley & Sons Co. | | | 2,340,980 | | | |
| | 25,400 | | | The Boeing Co. | | | 1,657,604 | | | |
(See notes which are an integral part of the Financial Statements)
Annual Shareholder Report
59
| | |
| Huntington Income Equity Fund | | (Continued) |
| | | | | | | | | | |
| Shares | | | | | Value | | | |
| | | | | | | | | | |
| Common Stocks — (Continued) | | | | | | |
| Industrials — (Continued) | | | | | | |
| | 22,900 | | | United Parcel Service, Inc., Class B | | $ | 1,662,082 | | | |
| | 43,300 | | | Waste Management, Inc. | | | 1,596,471 | | | |
| | | | | | | | 12,508,279 | | | |
| Information Technology — 6.6% | | | | | | |
| | 110,000 | | | Intel Corp. | | | 2,313,300 | | | |
| | 16,200 | | | International Business Machines Corp. | | | 2,377,512 | | | |
| | 87,000 | | | Microsoft Corp. | | | 2,429,040 | | | |
| | | | | | | | 7,119,852 | | | |
| Materials — 3.2% | | | | | | |
| | 32,700 | | | Du Pont (E.I.) de Nemours & Co. | | | 1,631,076 | | | |
| | 20,900 | | | PPG Industries, Inc. | | | 1,757,063 | | | |
| | | | | | | | 3,388,139 | | | |
| Real Estate Investment Trusts — 10.5% | | | | | | |
| | 30,100 | | | Equity Residential | | | 1,563,695 | | | |
| | 69,700 | | | HCP, Inc. | | | 2,564,263 | | | |
| | 50,900 | | | Health Care, Inc. | | | 2,424,876 | | | |
| | 74,200 | | | Mack-Cali Realty Corp. | | | 2,453,052 | | | |
| | 22,100 | | | Simon Property Group, Inc. | | | 2,198,729 | | | |
| | | | | | | | 11,204,615 | | | |
| Telecommunication Services — 2.7% | | | | | | |
| | 49,600 | | | AT&T, Inc. | | | 1,457,248 | | | |
| | 41,100 | | | Verizon Communications, Inc. | | | 1,470,558 | | | |
| | | | | | | | 2,927,806 | | | |
| | | | | | | | | | |
| Shares | | | | | Value | | | |
| | | | | | | | | | |
| Common Stocks — (Continued) | | | | | | |
| Utilities — 6.3% | | | | | | |
| | 44,800 | | | Ameren Corp. | | $ | 1,262,912 | | | |
| | 27,600 | | | DTE Energy Co. | | | 1,250,832 | | | |
| | 68,000 | | | Duke Energy Corp. | | | 1,211,080 | | | |
| | 28,600 | | | Exelon Corp. | | | 1,190,904 | | | |
| | 107,000 | | | NiSource, Inc. | | | 1,885,340 | | | |
| | | | | | | | 6,801,068 | | | |
| Total Common Stocks (Cost $95,243,066) | | | 103,831,173 | | | |
| Cash Equivalents — 3.0% | | | | | | |
| | 3,214,284 | | | Huntington Money Market Fund, Interfund Shares, 0.010% (a) (b) | | | 3,214,284 | | | |
| Total Cash Equivalents (Cost $3,214,284) | | | 3,214,284 | | | |
| Total Investments (Cost $98,435,640) — 100.0% | | | 107,045,457 | | | |
| Liabilities in Excess of Other Assets — (0.0)% | | | (33,757) | | | |
| Net Assets — 100.0% | | $ | 107,011,700 | | | |
(a) Investment in affiliate.
(b) Rate disclosed is the seven day yield as of December 31, 2010.
ADR — American Depositary Receipt.
PLC — Public Liability Co.
(See notes which are an integral part of the Financial Statements)
Annual Shareholder Report
60
| | |
| | |
| Huntington International Equity Fund | | December 31, 2010 |
| | |
| Portfolio of Investments Summary Table | | (unaudited) |
| | | | |
| Asset Allocation | | Percentage of
Market Value | |
Japan | | | 19.5% | |
United Kingdom | | | 17.3% | |
France | | | 8.7% | |
Germany | | | 6.9% | |
Switzerland | | | 6.8% | |
Singapore | | | 5.6% | |
Mutual Funds | | | 5.4% | |
Australia | | | 4.5% | |
Sweden | | | 4.5% | |
Canada | | | 3.9% | |
Netherlands | | | 3.7% | |
Cash1 | | | 2.9% | |
Taiwan | | | 2.2% | |
Italy | | | 1.7% | |
Spain | | | 1.7% | |
United States | | | 1.4% | |
Mexico | | | 1.2% | |
Hong Kong | | | 1.1% | |
Israel | | | 1.0% | |
Total | | | 100.0% | |
| 1 | Investments in an affiliated money market fund. |
Portfolio holdings and allocations are subject to change. As of December 31, 2010, percentages in the table above are based on total investments. Such total investments may differ from the percentages set forth below in the Portfolio of Investments which are computed using the Fund’s total net assets.
The Portfolio of Investments Summary Table and the Portfolio of Investments are broken down by sectors, and these sectors do not represent industry categories for purposes of identifying “industry concentration” as described in the Investment Company Act of 1940, as amended.
Portfolio of Investments
| | | | | | | | | | |
| Shares | | | | | Value | | | |
| | | | | | | | | | |
| Common Stocks — 90.5% | | | | | | |
| Australia — 4.5% | | | | | | |
| Consumer Staples — 1.8% | | | | | | |
| | 934,000 | | | Foster’s Group Ltd. | | $ | 5,421,409 | | | |
| Materials — 2.7% | | | | | | |
| | 180,000 | | | BHP Billiton Ltd. | | | 8,323,540 | | | |
| | | | | | | | 13,744,949 | | | |
| Canada — 3.9% | | | | | | |
| Energy — 2.2% | | | | | | |
| | 108,000 | | | Cenovus Energy, Inc. | | | 3,589,920 | | | |
| | 108,000 | | | EnCana Corp. | | | 3,144,960 | | | |
| | | | | | | | 6,734,880 | | | |
| Telecommunication Services — 1.7% | | | | | | |
| | 146,000 | | | BCE, Inc. | | | 5,177,160 | | | |
| | | | | | | | 11,912,040 | | | |
| France — 8.6% | | | | | | |
| Energy — 2.2% | | | | | | |
| | 126,840 | | | Total SA | | | 6,723,987 | | | |
| | | | | | | | | | |
| Shares | | | | | Value | | | |
| | | | | | | | | | |
| Common Stocks — (Continued) | | | | | | |
| France — (Continued) | | | |
| Financials — 3.1% | | | | | | |
| | 243,900 | | | AXA SA ADR | | $ | 4,060,935 | | | |
| | 84,011 | | | BNP Paribas | | | 5,347,635 | | | |
| | | | | | | | 9,408,570 | | | |
| Health Care — 1.8% | | | | | | |
| | 88,000 | | | Sanofi-Aventis | | | 5,629,788 | | | |
| Utilities — 1.5% | | | | | | |
| | 46,172 | | | GDF Suez ADR | | | 1,664,039 | | | |
| | 81,000 | | | GDF Suez | | | 2,907,748 | | | |
| | | | | | | | 4,571,787 | | | |
| | | | | | | | 26,334,132 | | | |
| Germany — 6.8% | | | |
| Consumer Staples — 1.8% | | | | | | |
| | 86,000 | | | Henkel AG & Co. KGaA | | | 5,378,809 | | | |
(See notes which are an integral part of the Financial Statements)
Annual Shareholder Report
61
| | |
| Huntington International Equity Fund | | (Continued) |
| | | | | | | | | | |
| Shares | | | | | Value | | | |
| | | | | | | | | | |
| Common Stocks — (Continued) | | | | | | |
| Germany — (Continued) | | | | | | |
| Industrials — 3.4% | | | | | | |
| | 222,000 | | | GEA Group AG | | $ | 6,412,608 | | | |
| | 32,500 | | | Siemens AG | | | 4,048,432 | | | |
| | | | | | | | 10,461,040 | | | |
| Materials — 1.6% | | | | | | |
| | 67,000 | | | K+S AG | | | 5,071,021 | | | |
| | | | | | | | 20,910,870 | | | |
| Hong Kong — 1.1% | | | | | | |
| Financials — 1.1% | | | | | | |
| | 434,000 | | | The Wharf (Holdings) Ltd. | | | 3,339,020 | | | |
| Israel — 1.0% | | | | | | |
| Health Care — 1.0% | | | | | | |
| | 60,000 | | | Teva Pharmaceutical Industries Ltd., ADR | | | 3,127,800 | | | |
| Italy — 1.6% | | | | | | |
| Energy — 1.6% | | | | | | |
| | 102,000 | | | Saipem SpA | | | 5,023,972 | | | |
| Japan — 19.2% | | | |
| Consumer Discretionary — 3.9% | | | | | | |
| | 149,000 | | | Honda Motor Co. Ltd | | | 5,897,630 | | | |
| | 438,000 | | | Panasonic Corp. | | | 6,217,470 | | | |
| | | | | | | | 12,115,100 | | | |
| Consumer Staples — 3.5% | | | | | | |
| | 230,000 | | | Shiseido Co. Ltd. | | | 5,023,330 | | | |
| | 145,800 | | | Unicharm Corp. | | | 5,797,895 | | | |
| | | | | | | | 10,821,225 | | | |
| Financials — 2.5% | | | | | | |
| | 1,500 | | | Japan Prime Realty Investment Corp. | | | 4,616,805 | | | |
| | 300 | | | Japan Real Estate Investment Corp. | | | 3,109,880 | | | |
| | | | | | | | 7,726,685 | | | |
| Industrials — 4.3% | | | | | | |
| | 36,900 | | | FANUC Ltd. | | | 5,665,042 | | | |
| | 244,000 | | | KOMATSU Ltd. | | | 7,380,831 | | | |
| | | | | | | | 13,045,873 | | | |
| Information Technology — 5.0% | | | | | | |
| | 168,500 | | | Canon, Inc. | | | 8,733,580 | | | |
| | 22,900 | | | KEYENCE Corp. | | | 6,631,062 | | | |
| | | | | | | | 15,364,642 | | | |
| | | | | | | | 59,073,525 | | | |
| Mexico — 1.1% | | | |
| Telecommunication Services — 1.1% | | | | | | |
| | 62,500 | | | America Movil SA de CV., Series L ADR | | | 3,583,750 | | | |
| | | | | | | | | | | | |
| Shares | | | | | Value | | | | |
| | | | | | | | | | | | |
| Common Stocks — (Continued) | | | | | | | | |
| Netherlands — 3.7% | | | | | |
| Consumer Discretionary — 1.3% | | | | | | | | |
| | 133,000 | | | Koninklijke (Royal) Philips
Electronics NV NYS | | $ | 4,083,100 | | | | | |
| Energy — 2.4% | | | | | | | | |
| | 217,000 | | | Royal Dutch Shell PLC, Class A | | | 7,236,717 | | | | | |
| | | | | | | | 11,319,817 | | | | | |
| Singapore — 5.6% | | | | | |
| Financials — 1.5% | | | | | | | | |
| | 390,000 | | | DBS Group Holdings Ltd. | | | 4,353,601 | | | | | |
| | 118,400 | | | K-Green Trust* | | | 98,759 | | | | | |
| | | | | | | | 4,452,360 | | | | | |
| Industrials — 2.1% | | | | | | | | |
| | 742,000 | | | Keppel Corp Ltd. | | | 6,547,739 | | | | | |
| Telecommunication Services — 2.0% | | | | | | | | |
| | 2,575,930 | | | Singapore Telecommunications Ltd | | | 6,124,561 | | | | | |
| | | | | | | | 17,124,660 | | | | | |
| Spain — 1.7% | | | | | | | | |
| Financials — 1.7% | | | | | | | | |
| | 519,066 | | | Banco Bilbao Vizcaya
Argentaria SA ADR | | | 5,278,901 | | | | | |
| Sweden — 4.4% | | | | | | | | |
| Consumer Discretionary — 1.5% | | | | | | | | |
| | 142,000 | | | Hennes & Mauritz AB | | | 4,735,447 | | | | | |
| Consumer Staples — 1.3% | | | | | | | | |
| | 245,000 | | | Svenska Cellulosa AB (SCA) | | | 3,873,604 | | | | | |
| Industrials — 1.6% | | | | | | | | |
| | 282,000 | | | Volvo AB* | | | 4,974,989 | | | | | |
| | | | | | | | 13,584,040 | | | | | |
| Switzerland — 6.7% | | | | | | | | |
| Financials — 2.1% | | | | | | | | |
| | 104,300 | | | ACE Ltd. | | | 6,492,675 | | | | | |
| Health Care — 2.1% | | | | | | | | |
| | 111,400 | | | Novartis AG | | | 6,552,590 | | | | | |
| Materials — 2.5% | | | | | | | | |
| | 128,100 | | | Syngenta AG ADR | | | 7,529,718 | | | | | |
| | | | | | | | 20,574,983 | | | | | |
| Taiwan — 2.1% | | | | | | | | |
| Information Technology — 2.1% | | | | | | | | |
| | 522,854 | | | Taiwan Semiconductor Manufacturing Co. Ltd. ADR | | | 6,556,589 | | | | | |
| United Kingdom — 17.1% | | | | | | | | |
| Consumer Discretionary — 1.9% | | | | | | | | |
| | 364,000 | | | Pearson, Inc. | | | 5,721,825 | | | | | |
(See notes which are an integral part of the Financial Statements)
Annual Shareholder Report
62
| | |
| Huntington International Equity Fund | | (Continued) |
| | | | | | | | | | |
| Shares | | | | | Value | | | |
| | | | | | | | | | |
| Common Stocks — (Continued) | | | | | | |
| United Kingdom — (Continued) | | | | | | |
| Consumer Staples — 3.6% | | | | | | |
| | 109,000 | | | Reckitt Benckiser Group PLC | | $ | 5,991,813 | | | |
| | 778,284 | | | TESCO PLC | | | 5,158,217 | | | |
| | | | | | | | 11,150,030 | | | |
| Energy — 2.0% | | | | | | |
| | 302,000 | | | BG Group PLC | | | 6,103,579 | | | |
| Financials — 3.2% | | | | | | |
| | 950,000 | | | Barclays PLC | | | 3,876,296 | | | |
| | 216,337 | | | Standard Chartered PLC | | | 5,821,279 | | | |
| | | | | | | | 9,697,575 | | | |
| Health Care — 1.3% | | | | | | |
| | 103,850 | | | GlaxoSmithKline PLC ADR | | | 4,072,997 | | | |
| Industrials — 1.7% | | | | | | |
| | 528,000 | | | Rolls-Royce Group PLC | | | 5,129,731 | | | |
| Telecommunication Services — 2.0% | | | | | | |
| | 2,430,000 | | | Vodafone Group PLC | | | 6,282,947 | | | |
| Utilities — 1.4% | | | | | | |
| | 231,100 | | | Scottish & Southern Energy PLC | | | 4,414,776 | | | |
| | | | | | | | 52,573,460 | | | |
| United States — 1.4% | | | | | | |
| Energy — 1.4% | | | | | | |
| | 51,352 | | | Schlumberger Ltd. | | | 4,287,892 | | | |
| Total Common Stocks (Cost $221,898,811) | | | 278,350,400 | | | |
| | | | | | | | | | |
| Shares | | | | | Value | | | |
| | | | | | | | | | |
| Mutual Funds — 5.3% | | | | | | |
| Exchange Traded Funds — 1.2% | | | | | | |
| | 212,000 | | | iShares MSCI Hong Kong Index Fund | | $ | 4,008,920 | | | |
| | 69,500 | | | iShares MSCI South Korea Index Fund | | | 4,252,705 | | | |
| | 222,000 | | | iShares MSCI Taiwan Index Fund | | | 3,467,640 | | | |
| | 60,000 | | | ProShares UltraShort Yen* | | | 943,200 | | | |
| | | | | | | | 12,672,465 | | | |
| Closed-End Funds — 1.2% | | | | | | |
| | 139,000 | | | Morgan Stanley India Investment Fund, Inc.* | | | 3,570,910 | | | |
| Total Mutual Funds (Cost $11,531,172) | | | 16,243,375 | | | |
| Cash Equivalents — 2.9% | | | | | | |
| | 8,803,071 | | | Huntington Money Market Fund,
Interfund Shares,
0.010% (a) (b) | | | 8,803,071 | | | |
| Total Cash Equivalents (Cost $8,803,071) | | | 8,803,071 | | | |
| Total Investments
(Cost $242,233,054) — 98.7% | | | 303,396,846 | | | |
| Other Assets in Excess of Liabilities — 1.3% | | | 4,031,841 | | | |
| Net Assets — 100.0% | | $ | 307,428,687 | | | |
| (a) | Investment in affiliate. |
| (b) | Rate disclosed is the seven day yield as of December 31, 2010. |
| * | Non-income producing security. |
ADR — American Depositary Receipt.
NYS — New York Shares.
PLC — Public Liability Co.
(See notes which are an integral part of the Financial Statements)
Annual Shareholder Report
63
| | |
| | |
| Huntington Macro 100 Fund | | December 31, 2010 |
| | |
| Portfolio of Investments Summary Table | | (unaudited) |
| | | | |
| Asset Allocation | | Percentage of
Market Value | |
Information Technology | | | 18.1% | |
Energy | | | 12.3% | |
Industrials | | | 12.0% | |
Financials | | | 11.4% | |
Health Care | | | 10.6% | |
Consumer Staples | | | 9.4% | |
Consumer Discretionary | | | 9.0% | |
Materials | | | 5.3% | |
Cash1 | | | 4.6% | |
Telecommunication Services | | | 3.2% | |
Utilities | | | 2.4% | |
Real Estate Investment Trusts | | | 1.7% | |
Total | | | 100.0% | |
| 1 | Investments in an affiliated money market fund. |
Portfolio holdings and allocations are subject to change. As of December 31, 2010, percentages in the table above are based on total investments. Such total investments may differ from the percentages set forth below in the Portfolio of Investments which are computed using the Fund’s total net assets.
The Portfolio of Investments Summary Table and the Portfolio of Investments are broken down by sectors, and these sectors do not represent industry categories for purposes of identifying “industry concentration” as described in the Investment Company Act of 1940, as amended.
Portfolio of Investments
| | | | | | | | | | |
| Shares | | | | | Value | | | |
| | | | | | | | | | |
| Common Stocks — 95.2% | | | | | | |
| Consumer Discretionary — 9.0% | | | | | | |
| | 1,150 | | | AutoZone, Inc.* | | $ | 313,478 | | | |
| | 12,800 | | | GameStop Corp., Class A* | | | 292,864 | | | |
| | 6,400 | | | Hasbro, Inc. | | | 301,952 | | | |
| | 8,600 | | | Johnson Controls, Inc. | | | 328,520 | | | |
| | 4,075 | | | McDonald’s Corp. | | | 312,797 | | | |
| | 23,900 | | | Newell Rubbermaid, Inc. | | | 434,502 | | | |
| | 4,585 | | | Omnicom Group, Inc. | | | 209,993 | | | |
| | 3,000 | | | Polo Ralph Lauren Corp. | | | 332,760 | | | |
| | 6,000 | | | Scripps Networks Interactive, Class A | | | 310,500 | | | |
| | 6,100 | | | Starwood Hotels & Resorts Worldwide, Inc. | | | 370,758 | | | |
| | 5,600 | | | The TJX Cos., Inc. | | | 248,584 | | | |
| | 7,400 | | | The Walt Disney Co. | | | 277,574 | | | |
| | 4,000 | | | V.F. Corp. | | | 344,720 | | | |
| | | | | | | | 4,079,002 | | | |
| Consumer Staples — 9.4% | | | | | | |
| | 11,100 | | | Avon Products, Inc. | | | 322,566 | | | |
| | 4,500 | | | Colgate-Palmolive Co. | | | 361,665 | | | |
| | 20,600 | | | Constellation Brands, Inc.* | | | 456,290 | | | |
| | 9,800 | | | Dr. Pepper Snapple Group, Inc. | | | 344,568 | | | |
| | 13,700 | | | Kellogg Co. | | | 699,796 | | | |
| | 9,700 | | | Kraft Foods, Inc. | | | 305,647 | | | |
| | 9,000 | | | McCormick & Co., Inc. | | | 418,770 | | | |
| | 7,600 | | | Procter & Gamble Co. | | | 488,908 | | | |
| | 17,200 | | | Sysco Corp. | | | 505,680 | | | |
| | 5,900 | | | The Clorox Co. | | | 373,352 | | | |
| | | | | | | | 4,277,242 | | | |
| | | | | | | | | | |
| Shares | | | | | Value | | | |
| | | | | | | | | | |
| Common Stocks — (Continued) | | | | | | |
| Energy — 12.2% | | | | | | |
| | 6,800 | | | Apache Corp. | | $ | 810,764 | | | |
| | 6,269 | | | Baker Hughes, Inc. | | | 358,399 | | | |
| | 10,600 | | | ConocoPhillips | | | 721,860 | | | |
| | 15,300 | | | Denbury Resources, Inc.* | | | 292,077 | | | |
| | 5,600 | | | Devon Energy Corp. | | | 439,656 | | | |
| | 1,500 | | | EOG Resources, Inc. | | | 137,115 | | | |
| | 8,157 | | | Exxon Mobil Corp. | | | 596,440 | | | |
| | 12,000 | | | Marathon Oil Corp. | | | 444,360 | | | |
| | 4,550 | | | Occidental Petroleum Corp. | | | 446,355 | | | |
| | 7,600 | | | Peabody Energy Corp. | | | 486,248 | | | |
| | 23,700 | | | Rowan Cos., Inc.* | | | 827,367 | | | |
| | | | | | | | 5,560,641 | | | |
| Financials — 11.4% | | | | | | |
| | 10,000 | | | Aflac, Inc. | | | 564,300 | | | |
| | 27,000 | | | Discover Financial Services | | | 500,310 | | | |
| | 19,200 | | | JPMorgan Chase & Co. | | | 814,464 | | | |
| | 12,900 | | | Lincoln National Corp. | | | 358,749 | | | |
| | 70,000 | | | Regions Financial Corp. | | | 490,000 | | | |
| | 10,000 | | | State Street Corp. | | | 463,400 | | | |
| | 8,400 | | | The Allstate Corp. | | | 267,792 | | | |
| | 6,000 | | | Torchmark Corp. | | | 358,440 | | | |
| | 22,500 | | | U.S. Bancorp | | | 606,825 | | | |
| | 23,864 | | | Wells Fargo & Co. | | | 739,545 | | | |
| | | | | | | | 5,163,825 | | | |
(See notes which are an integral part of the Financial Statements)
Annual Shareholder Report
64
| | |
| Huntington Macro 100 Fund | | (Continued) |
| | | | | | | | | | |
| Shares | | | | | Value | | | |
| | | | | | | | | | |
| Common Stocks — (Continued) | | | | | | |
| Health Care — 10.6% | | | | | | |
| | 8,400 | | | Becton, Dickinson & Co. | | $ | 709,968 | | | |
| | 3,900 | | | C.R. Bard, Inc. | | | 357,903 | | | |
| | 3,300 | | | Genzyme Corp.* | | | 234,960 | | | |
| | 6,800 | | | Johnson & Johnson | | | 420,580 | | | |
| | 8,600 | | | McKesson Corp. | | | 605,268 | | | |
| | 7,900 | | | Medtronic, Inc. | | | 293,011 | | | |
| | 22,500 | | | Mylan Laboratories, Inc.* | | | 475,425 | | | |
| | 10,700 | | | Patterson Cos., Inc. | | | 327,741 | | | |
| | 21,450 | | | Pfizer, Inc. | | | 375,589 | | | |
| | 5,500 | | | Stryker Corp. | | | 295,350 | | | |
| | 6,700 | | | Thermo Fisher Scientific, Inc.* | | | 370,912 | | | |
| | 6,300 | | | Zimmer Holdings, Inc.* | | | 338,184 | | | |
| | | | | | | | 4,804,891 | | | |
| Industrials — 11.9% | | | | | | |
| | 4,500 | | | Cummins, Inc. | | | 495,045 | | | |
| | 3,300 | | | Flowserve Corp. | | | 393,426 | | | |
| | 6,300 | | | General Dynamics Corp. | | | 447,048 | | | |
| | 7,800 | | | Illinois Tool Works, Inc. | | | 416,520 | | | |
| | 7,500 | | | Jacobs Engineering Group, Inc.* | | | 343,875 | | | |
| | 3,800 | | | Pall Corp. | | | 188,404 | | | |
| | 3,000 | | | Parker Hannifin Corp. | | | 258,900 | | | |
| | 10,125 | | | Republic Services, Inc., Class A | | | 302,333 | | | |
| | 5,000 | | | Stericycle, Inc.* | | | 404,600 | | | |
| | 10,400 | | | Union Pacific Corp. | | | 963,664 | | | |
| | 4,300 | | | United Parcel Service, Inc., Class B | | | 312,094 | | | |
| | 6,900 | | | United Technologies Corp. | | | 543,168 | | | |
| | 2,600 | | | W.W. Grainger, Inc. | | | 359,086 | | | |
| | | | | | | | 5,428,163 | | | |
| Information Technology — 18.1% | | | | | | |
| | 6,700 | | | Akamai Technologies, Inc.* | | | 315,235 | | | |
| | 2,700 | | | Apple, Inc.* | | | 870,912 | | | |
| | 9,900 | | | BMC Software, Inc.* | | | 466,686 | | | |
| | 50,800 | | | Cisco Systems, Inc.* | | | 1,027,684 | | | |
| | 6,500 | | | Cognizant Technology Solutions Corp., Class A* | | | 476,385 | | | |
| | 21,700 | | | EMC Corp.* | | | 496,930 | | | |
| | 6,175 | | | Fiserv, Inc.* | | | 361,608 | | | |
| | 1,075 | | | Google, Inc., Class A* | | | 638,518 | | | |
| | 4,200 | | | International Business Machines Corp. | | | 616,392 | | | |
| | 8,800 | | | Intuit, Inc.* | | | 433,840 | | | |
| | 54,200 | | | Jabil Circuit, Inc. | | | 1,088,878 | | | |
| | 22,250 | | | Microsoft Corp. | | | 621,220 | | | |
| | 11,000 | | | VeriSign, Inc.* | | | 359,370 | | | |
| | 39,092 | | | Xerox Corp. | | | 450,340 | | | |
| | | | | | | | 8,223,998 | | | |
| | | | | | | | | | |
| Shares | | | | | Value | | | |
| | | | | | | | | | |
| Common Stocks — (Continued) | | | | | | |
| Materials — 5.3% | | | | | | |
| | 14,400 | | | Ball Corp. | | $ | 979,920 | | | |
| | 4,500 | | | Cliffs Natural Resources, Inc. | | | 351,045 | | | |
| | 5,000 | | | Ecolab, Inc. | | | 252,100 | | | |
| | 16,000 | | | The Dow Chemical Co. | | | 546,240 | | | |
| | 16,000 | | | Titanium Metals Corp.* | | | 274,880 | | | |
| | | | | | | | 2,404,185 | | | |
| | | | | | | | | | |
| Real Estate Investment Trusts — 1.7% | | | | | | |
| | 9,800 | | | HCP, Inc. | | | 360,542 | | | |
| | 22,500 | | | Host Hotels & Resorts, Inc. | | | 402,075 | | | |
| | | | | | | | 762,617 | | | |
| Telecommunication Services — 3.2% | | | | | | |
| | 11,000 | | | AT&T, Inc. | | | 323,180 | | | |
| | 11,900 | | | CenturyLink, Inc. | | | 549,423 | | | |
| | 16,050 | | | Verizon Communications, Inc. | | | 574,269 | | | |
| | | | | | | | 1,446,872 | | | |
| Utilities — 2.4% | | | | | | |
| | 3,800 | | | Consolidated Edison, Inc. | | | 188,366 | | | |
| | 4,900 | | | Dominion Resources, Inc., Class A | | | 209,328 | | | |
| | 1,800 | | | Entergy Corp. | | | 127,494 | | | |
| | 2,100 | | | Integrys Energy Group, Inc. | | | 101,871 | | | |
| | 3,300 | | | Pinnacle West Capital Corp. | | | 136,785 | | | |
| | 3,600 | | | Progress Energy, Inc. | | | 156,528 | | | |
| | 2,900 | | | Wisconsin Energy Corp. | | | 170,694 | | | |
| | | | | | | | 1,091,066 | | | |
| Total Common Stocks (Cost $35,012,675) | | | 43,242,502 | | | |
| Cash Equivalents — 4.6% | | | | | | |
| | 2,108,417 | | | Huntington Money Market Fund, Interfund Shares, 0.010% (a) (b) | | | 2,108,417 | | | |
| Total Cash Equivalents (Cost $2,108,417) | | | 2,108,417 | | | |
| Total Investments (Cost $37,121,092) — 99.8% | | | 45,350,919 | | | |
| Other Assets in Excess of Liabilities — 0.2% | | | 95,320 | | | |
| Net Assets — 100.0% | | $ | 45,446,239 | | | |
| (a) | Investment in affiliate. |
| (b) | Rate disclosed is the seven day yield as of December 31, 2010. |
| * | Non-income producing security. |
(See notes which are an integral part of the Financial Statements)
Annual Shareholder Report
65
| | |
| | |
| Huntington Mid Corp America | | December 31, 2010 |
| | |
| Portfolio of Investments Summary Table | | (unaudited) |
| | | | |
| Asset Allocation | | Percentage of
Market Value | |
Industrials | | | 19.1% | |
Information Technology | | | 17.9% | |
Consumer Discretionary | | | 12.5% | |
Health Care | | | 12.5% | |
Financials | | | 9.6% | |
Materials | | | 7.1% | |
Energy | | | 6.5% | |
Real Estate Investment Trusts | | | 4.9% | |
Utilities | | | 4.0% | |
Consumer Staples | | | 3.5% | |
Cash1 | | | 1.3% | |
Telecommunication Services | | | 1.1% | |
Total | | | 100.0% | |
| 1 | Investments in an affiliated money market fund. |
Portfolio holdings and allocations are subject to change. As of December 31, 2010, percentages in the table above are based on total investments. Such total investments may differ from the percentages set forth below in the Portfolio of Investments which are computed using the Fund’s total net assets.
The Portfolio of Investments Summary Table and the Portfolio of Investments are broken down by sectors, and these sectors do not represent industry categories for purposes of identifying “industry concentration” as described in the Investment Company Act of 1940, as amended.
Portfolio of Investments
| | | | | | | | | | |
| Shares | | | | | Value | | | |
| | | | | | | | | | |
| | | | | | | | | | |
| Common Stocks — 98.7% | | | | | | |
| Consumer Discretionary — 12.5% | | | | | | |
| | 7,120 | | | Advance Auto Parts, Inc. | | $ | 470,988 | | | |
| | 15,900 | | | Best Buy Co., Inc. | | | 545,211 | | | |
| | 25,340 | | | Bob Evans Farms, Inc. | | | 835,206 | | | |
| | 22,400 | | | BorgWarner, Inc.* | | | 1,620,864 | | | |
| | 12,100 | | | Coinstar, Inc.* | | | 682,924 | | | |
| | 20,670 | | | Guess?, Inc. | | | 978,104 | | | |
| | 12,365 | | | ITT Educational Services, Inc.* | | | 787,527 | | | |
| | 30,300 | | | J Crew Group, Inc.* | | | 1,307,142 | | | |
| | 20,800 | | | Kohl’s Corp.* | | | 1,130,272 | | | |
| | 19,500 | | | Mohawk Industries, Inc.* | | | 1,106,820 | | | |
| | 40,000 | | | Nordstrom, Inc. | | | 1,695,200 | | | |
| | 24,650 | | | PetSmart, Inc. | | | 981,563 | | | |
| | 6,710 | | | Polo Ralph Lauren Corp. | | | 744,273 | | | |
| | 15,540 | | | Ross Stores, Inc. | | | 982,905 | | | |
| | 37,200 | | | Royal Caribbean Cruises Ltd.* | | | 1,748,400 | | | |
| | 16,070 | | | Stanley Black & Decker, Inc. | | | 1,074,601 | | | |
| | 15,760 | | | V.F. Corp. | | | 1,358,197 | | | |
| | 4,100 | | | Whirlpool Corp. | | | 364,203 | | | |
| | 8,000 | | | Wolverine World Wide, Inc. | | | 255,040 | | | |
| | | | | | | | 18,669,440 | | | |
| Consumer Staples — 3.5% | | | | | | |
| | 32,000 | | | Church & Dwight Co., Inc. | | | 2,208,640 | | | |
| | 25,950 | | | Constellation Brands, Inc.* | | | 574,793 | | | |
| | 28,900 | | | Dr. Pepper Snapple Group, Inc. | | | 1,016,124 | | | |
| | 20,700 | | | Ralcorp Holding, Inc.* | | | 1,345,707 | | | |
| | | | | | | | 5,145,264 | | | |
| | | | | | | | | | |
| Shares | | | | | Value | | | |
| | | | | | | | | | |
| Common Stocks — (Continued) | | | | | | |
| Energy — 6.5% | | | | | | |
| | 46,700 | | | Chesapeake Energy Corp. | | $ | 1,209,997 | | | |
| | 11,300 | | | Forest Oil Corp.* | | | 429,061 | | | |
| | 29,200 | | | Helmerich & Payne, Inc. | | | 1,415,616 | | | |
| | 28,160 | | | Murphy Oil Corp. | | | 2,099,328 | | | |
| | 35,500 | | | Noble Energy, Inc. | | | 3,055,840 | | | |
| | 13,170 | | | Oceaneering International, Inc.* | | | 969,707 | | | |
| | 11,250 | | | Unit Corp.* | | | 522,900 | | | |
| | | | | | | | 9,702,449 | | | |
| Financials — 9.6% | | | | | | |
| | 10,000 | | | Allied World Assurance Co.
Holdings, Ltd. | | | 594,400 | | | |
| | 28,100 | | | Cincinnati Financial Corp. | | | 890,489 | | | |
| | 26,900 | | | City National Corp. | | | 1,650,584 | | | |
| | 4,310 | | | Everest Re Group Ltd. | | | 365,574 | | | |
| | 34,430 | | | First American Financial Corp. | | | 514,384 | | | |
| | 59,900 | | | First Niagara Financial Group, Inc. | | | 837,402 | | | |
| | 10,000 | | | Hanover Insurance Group, Inc. | | | 467,200 | | | |
| | 9,730 | | | HCC Insurance Holdings, Inc. | | | 281,586 | | | |
| | 21,800 | | | Invesco Ltd. | | | 524,508 | | | |
| | 9,800 | | | Jones Lang LaSalle, Inc. | | | 822,416 | | | |
| | 20,000 | | | Legg Mason, Inc. | | | 725,400 | | | |
| | 45,400 | | | Principal Financial Group | | | 1,478,224 | | | |
| | 21,800 | | | Prosperity Bancshares, Inc. | | | 856,304 | | | |
| | 22,240 | | | T. Rowe Price Group, Inc. | | | 1,435,370 | | | |
| | 30,590 | | | Torchmark Corp. | | | 1,827,447 | | | |
| | 27,390 | | | Trustmark Corp. | | | 680,368 | | | |
| | 16,070 | | | Unum Group | | | 389,215 | | | |
| | | | | | | | 14,340,871 | | | |
(See notes which are an integral part of the Financial Statements)
Annual Shareholder Report
66
| | |
| Huntington Mid Corp America | | (Continued) |
| | | | | | | | | | |
| Shares | | | | | Value | | | |
| | | | | | | | | | |
| Common Stocks — (Continued) | | | | | | |
| Health Care — 12.5% | | | | | | |
| | 60,000 | | | AmerisourceBergen Corp. | | $ | 2,047,200 | | | |
| | 12,430 | | | Biogen Idec, Inc.* | | | 833,431 | | | |
| | 13,840 | | | Cephalon, Inc.* | | | 854,205 | | | |
| | 18,775 | | | Coventry Health Care, Inc.* | | | 495,660 | | | |
| | 49,600 | | | Life Technologies Corp.* | | | 2,752,800 | | | |
| | 44,700 | | | Lincare Holdings, Inc. | | | 1,199,301 | | | |
| | 33,300 | | | Owens & Minor, Inc. | | | 980,019 | | | |
| | 38,300 | | | PDL BioPharma, Inc. | | | 238,609 | | | |
| | 16,000 | | | Quest Diagnostics, Inc. | | | 863,520 | | | |
| | 32,490 | | | St Jude Medical, Inc.* | | | 1,388,947 | | | |
| | 21,500 | | | Teleflex, Inc. | | | 1,156,915 | | | |
| | 68,156 | | | Thermo Fisher Scientific, Inc.* | | | 3,773,116 | | | |
| | 38,830 | | | Watson Pharmaceutical, Inc.* | | | 2,005,569 | | | |
| | | | | | | | 18,589,292 | | | |
| Industrials — 19.1% | | | | | | |
| | 10,200 | | | Alliant Techsystems, Inc.* | | | 759,186 | | | |
| | 30,200 | | | CNH Global NV NYS* | | | 1,441,748 | | | |
| | 47,200 | | | Cooper Industries PLC | | | 2,751,288 | | | |
| | 14,400 | | | Cummins, Inc. | | | 1,584,144 | | | |
| | 16,000 | | | Elbit Systems Ltd. | | | 846,720 | | | |
| | 22,900 | | | EMCOR Group, Inc.* | | | 663,642 | | | |
| | 3,320 | | | Flowserve Corp. | | | 395,810 | | | |
| | 28,700 | | | General Cable Corp.* | | | 1,007,083 | | | |
| | 53,400 | | | John Bean Technologies Corp. | | | 1,074,942 | | | |
| | 54,000 | | | Kennametal, Inc. | | | 2,130,840 | | | |
| | 39,000 | | | L-3 Communications Holdings, Inc. | | | 2,749,110 | | | |
| | 15,700 | | | Ladish Co., Inc.* | | | 763,177 | | | |
| | 25,800 | | | Pall Corp. | | | 1,279,164 | | | |
| | 23,400 | | | Parker Hannifin Corp. | | | 2,019,420 | | | |
| | 10,100 | | | Precision Castparts Corp. | | | 1,406,021 | | | |
| | 20,000 | | | Quanex Building Products Corp. | | | 379,400 | | | |
| | 7,000 | | | R.R. Donnelley & Sons Co. | | | 122,290 | | | |
| | 3,000 | | | Rockwell International Corp. | | | 215,130 | | | |
| | 21,000 | | | Ryder System, Inc. | | | 1,105,440 | | | |
| | 20,000 | | | Sonoco Products Co. | | | 673,400 | | | |
| | 30,500 | | | Thomas & Betts Corp.* | | | 1,473,150 | | | |
| | 10,000 | | | UniFirst Corp. | | | 550,500 | | | |
| | 59,270 | | | Vishay Intertechnology, Inc.* | | | 870,084 | | | |
| | 25,150 | | | Watsco, Inc. | | | 1,586,462 | | | |
| | 25,200 | | | Weatherford International Ltd.* | | | 574,560 | | | |
| | | | | | | | 28,422,711 | | | |
| Information Technology — 17.9% | | | | | | |
| | 225,066 | | | Activision Blizzard, Inc. | | | 2,799,821 | | | |
| | 11,000 | | | Amdocs Ltd.* | | | 302,170 | | | |
| | 111,660 | | | Amkor Technology, Inc.* | | | 825,167 | | | |
| | 53,697 | | | Aviat Networks, Inc.* | | | 272,244 | | | |
| | 22,135 | | | Benchmark Electronics, Inc.* | | | 401,972 | | | |
| | 19,170 | | | BMC Software, Inc.* | | | 903,674 | | | |
| | 24,200 | | | Broadcom Corp., Class A | | | 1,053,910 | | | |
| | 33,730 | | | Broadridge Financial Solutions, Inc. | | | 739,699 | | | |
| | 34,900 | | | Citrix Systems, Inc.* | | | 2,387,509 | | | |
| | 34,430 | | | CoreLogic, Inc. | | | 637,644 | | | |
| | 53,400 | | | CTS Corp. | | | 590,604 | | | |
| | 8,000 | | | Cymer, Inc.* | | | 360,560 | | | |
| | | | | | | | | | |
| Shares | | | | | Value | | | |
| | | | | | | | | | |
| Common Stocks — (Continued) | | | | | | |
| Information Technology — (Continued) | | | | | | |
| | 32,866 | | | Fidelity National Information Services, Inc. | | $ | 900,200 | | | |
| | 14,100 | | | Fiserv, Inc.* | | | 825,696 | | | |
| | 28,430 | | | FLIR Systems, Inc.* | | | 845,792 | | | |
| | 40,000 | | | Forrester Research, Inc. | | | 1,411,600 | | | |
| | 33,000 | | | Harris Corp. | | | 1,494,900 | | | |
| | 29,000 | | | JDA Software Group, Inc.* | | | 812,000 | | | |
| | 25,700 | | | Molex, Inc. | | | 583,904 | | | |
| | 15,300 | | | Multi-Fineline Electronix, Inc.* | | | 405,297 | | | |
| | 30,800 | | | NCR Corp.* | | | 473,396 | | | |
| | 49,600 | | | NVIDIA Corp.* | | | 763,840 | | | |
| | 112,100 | | | ON Semiconductor Corp.* | | | 1,107,548 | | | |
| | 17,200 | | | Progress Software Corp.* | | | 727,904 | | | |
| | 31,600 | | | Synopsys, Inc.* | | | 850,356 | | | |
| | 20,600 | | | Syntel, Inc. | | | 984,474 | | | |
| | 50,280 | | | Teradata Corp.* | | | 2,069,525 | | | |
| | 29,250 | | | Varian Semiconductor Equipment Associates, Inc.* | | | 1,081,372 | | | |
| | | | | | | | 26,612,778 | | | |
| Materials — 7.1% | | | | | | |
| | 16,800 | | | Albemarle Corp. | | | 937,104 | | | |
| | 18,100 | | | AptarGroup, Inc. | | | 861,017 | | | |
| | 6,000 | | | Ball Corp. | | | 408,300 | | | |
| | 29,300 | | | Cytec Industries, Inc. | | | 1,554,658 | | | |
| | 27,000 | | | FMC Corp. | | | 2,157,030 | | | |
| | 14,000 | | | Innophos Holdings, Inc. | | | 505,120 | | | |
| | 18,800 | | | Lubrizol Corp. | | | 2,009,344 | | | |
| | 3,000 | | | Minerals Technologies, Inc. | | | 196,230 | | | |
| | 12,280 | | | PPG Industries, Inc. | | | 1,032,380 | | | |
| | 20,900 | | | RPM International, Inc. | | | 461,890 | | | |
| | 6,000 | | | Schnitzer Steel Industries, Inc. | | | 398,340 | | | |
| | | | | | | | 10,521,413 | | | |
| Real Estate Investment Trusts — 4.9% | | | | | | |
| | 14,450 | | | Alexandria Real Estate Equities, Inc. | | | 1,058,607 | | | |
| | 9,300 | | | Federal Realty Investment Trust | | | 724,749 | | | |
| | 12,200 | | | Home Properties, Inc. | | | 676,978 | | | |
| | 28,334 | | | Host Hotels & Resorts, Inc. | | | 506,329 | | | |
| | 12,210 | | | Liberty Property Trust | | | 389,743 | | | |
| | 21,510 | | | Mack-Cali Realty Corp. | | | 711,121 | | | |
| | 13,360 | | | Mid-America Apartment Communities, Inc. | | | 848,226 | | | |
| | 16,690 | | | PS Business Parks, Inc. | | | 929,967 | | | |
| | 15,200 | | | Rayonier, Inc. | | | 798,304 | | | |
| | 18,260 | | | Sovran Self Storage, Inc. | | | 672,151 | | | |
| | | | | | | | 7,316,175 | | | |
| Telecommunication Services — 1.1% | | | | | | |
| | 26,570 | | | CenturyLink, Inc. | | | 1,226,737 | | | |
| | 9,000 | | | TELUS Corp. | | | 392,040 | | | |
| | | | | | | | 1,618,777 | | | |
| Utilities — 4.0% | | | | | | |
| | 12,000 | | | AGL Resources, Inc. | | | 430,200 | | | |
| | 18,620 | | | CMS Energy Corp. | | | 346,332 | | | |
(See notes which are an integral part of the Financial Statements)
Annual Shareholder Report
67
| | |
| Huntington Mid Corp America | | (Continued) |
| | | | | | | | | | |
| Shares | | | | | Value | | | |
| | | | | | | | | | |
| Common Stocks — (Continued) | | | | | | |
| Utilities — (Continued) | | | | | | |
| | 6,980 | | | DTE Energy Co. | | $ | 316,334 | | | |
| | 60,750 | | | MDU Resources Group, Inc. | | | 1,231,402 | | | |
| | 13,950 | | | National Fuel Gas Co. | | | 915,399 | | | |
| | 14,250 | | | New Jersey Resources Corp. | | | 614,317 | | | |
| | 33,700 | | | Portland General Electric Co. | | | 731,290 | | | |
| | 63,000 | | | Questar Corp. | | | 1,096,830 | | | |
| | 12,640 | | | Xcel Energy, Inc. | | | 297,672 | | | |
| | | | | | | | 5,979,776 | | | |
| Total Common Stocks (Cost $81,560,871) | | | 146,918,946 | | | |
| | | | | | | | | | |
| Shares | | | | | Value | | | |
| | | | | | | | | | |
| Cash Equivalents — 1.3% | | | | | | |
| | 1,913,483 | | | Huntington Money Market Fund, Interfund Shares, 0.010% (a) (b) | | $ | 1,913,483 | | | |
| Total Cash Equivalents (Cost $1,913,483) | | | 1,913,483 | | | |
| Total Investments (Cost $83,429,803) — 100.0% | | | 148,832,429 | | | |
| Liabilities in Excess of Other Assets — (0.0)% | | | (36,808) | | | |
| Net Assets — 100.0% | | $ | 148,795,621 | | | |
| (a) | Rate disclosed is the seven day yield as of December 31, 2010. |
| (b) | Investment in affiliate. |
| * | Non-income producing security. |
NYS — New York Shares
PLC — Public Liability Co.
(See notes which are an integral part of the Financial Statements)
Annual Shareholder Report
68
| | |
| | |
| Huntington New Economy Fund | | December 31, 2010 |
| | |
| Portfolio of Investments Summary Table | | (unaudited) |
| | | | |
| Asset Allocation | | Percentage of
Market Value | |
Information Technology | | | 22.0% | |
Energy | | | 14.6% | |
Industrials | | | 14.1% | |
Consumer Discretionary | | | 12.3% | |
Financials | | | 10.5% | |
Materials | | | 9.7% | |
Health Care | | | 7.1% | |
Consumer Staples | | | 3.2% | |
Cash1 | | | 2.8% | |
Utilities | | | 1.7% | |
Real Estate Investment Trusts | | | 1.1% | |
Options Purchased | | | 0.9% | |
Total | | | 100.0% | |
| 1 | Investments in an affiliated money market fund. |
Portfolio holdings and allocations are subject to change. As of December 31, 2010, percentages in the table above are based on total investments. Such total investments may differ from the percentages set forth below in the Portfolio of Investments which are computed using the Fund’s total net assets.
The Portfolio of Investments Summary Table and the Portfolio of Investments are broken down by sectors, and these sectors do not represent industry categories for purposes of identifying “industry concentration” as described in the Investment Company Act of 1940, as amended.
Portfolio of Investments
| | | | | | | | | | |
| Shares | | | | | Value | | | |
| | | | | | | | | | |
| Common Stocks — 97.8% | | | | | | |
| Consumer Discretionary — 12.5% | | | | | | |
| | 6,900 | | | Advance Auto Parts, Inc. | | $ | 456,435 | | | |
| | 16,300 | | | Columbia Sportswear Co. | | | 982,890 | | | |
| | 20,800 | | | Crocs, Inc.* | | | 356,096 | | | |
| | 14,900 | | | Iconix Brand Group, Inc.* | | | 287,719 | | | |
| | 27,300 | | | Limited Brands, Inc. | | | 838,929 | | | |
| | 18,820 | | | Lululemon Athletica, Inc.* | | | 1,287,664 | | | |
| | 1,200 | | | Priceline.com, Inc.* | | | 479,460 | | | |
| | 16,300 | | | Tractor Supply Co. | | | 790,387 | | | |
| | 44,580 | | | True Religion Apparel, Inc.* | | | 992,351 | | | |
| | 9,300 | | | Under Armour, Inc., Series A, Class A* | | | 510,012 | | | |
| | | | | | | | 6,981,943 | | | |
| Consumer Staples — 3.3% | | | | | | |
| | 25,800 | | | Green Mountain Coffee Roasters, Inc.* | | | 847,788 | | | |
| | 15,700 | | | Mead Johnson Nutrition Co. | | | 977,325 | | | |
| | | | | | | | 1,825,113 | | | |
| Energy — 14.8% | | | | | | |
| | 28,000 | | | Alpha Natural Resources, Inc.* | | | 1,680,840 | | | |
| | 17,200 | | | AMCOL International Corp. | | | 533,200 | | | |
| | 15,700 | | | Atwood Oceanics, Inc.* | | | 586,709 | | | |
| | 18,600 | | | Holly Corp. | | | 758,322 | | | |
| | 25,900 | | | Nabors Industries Ltd.* | | | 607,614 | | | |
| | 12,000 | | | National Oilwell Varco, Inc. | | | 807,000 | | | |
| | 54,900 | | | Patriot Coal Corp.* | | | 1,063,413 | | | |
| | 68,500 | | | Quicksilver Resources, Inc.* | | | 1,009,690 | | | |
| | | | | | | | | | |
| Shares | | | | | Value | | | |
| | | | | | | | | | |
| Common Stocks — (Continued) | | | | | | |
| Energy — (Continued) | | | | | | |
| | 10,300 | | | Tenaris SA ADR | | $ | 504,494 | | | |
| | 39,600 | | | Tesoro Corp.* | | | 734,184 | | | |
| | | | | | | | 8,285,466 | | | |
| Financials — 10.7% | | | | | | |
| | 6,000 | | | Ameriprise Financial, Inc. | | | 345,300 | | | |
| | 11,000 | | | Bank of Hawaii Corp. | | | 519,310 | | | |
| | 22,700 | | | BB&T Corp. | | | 596,783 | | | |
| | 21,600 | | | Jefferies Group, Inc. | | | 575,208 | | | |
| | 110,300 | | | Marshall & Ilsley Corp. | | | 763,276 | | | |
| | 26,000 | | | MSCI, Inc., Class A* | | | 1,012,960 | | | |
| | 28,400 | | | SVB Financial Group* | | | 1,506,620 | | | |
| | 24,400 | | | U.S. Bancorp | | | 658,068 | | | |
| | | | | | | | 5,977,525 | | | |
| Health Care — 7.3% | | | | | | |
| | 11,450 | | | Abbott Laboratories | | | 548,570 | | | |
| | 16,800 | | | CareFusion Corp.* | | | 431,760 | | | |
| | 16,500 | | | Integra LifeSciences Holdings Corp.* | | | 780,450 | | | |
| | 9,800 | | | Life Technologies Corp. (a)* | | | 543,900 | | | |
| | 10,100 | | | Perrigo Co. | | | 639,633 | | | |
| | 39,700 | | | Thoratec Corp.* | | | 1,124,304 | | | |
| | | | | | | | 4,068,617 | | | |
| Industrials — 14.3% | | | | | | |
| | 10,000 | | | AGCO Corp.* | | | 506,600 | | | |
| | 18,700 | | | CNH Global NV NYS* | | | 892,738 | | | |
(See notes which are an integral part of the Financial Statements)
Annual Shareholder Report
69
| | |
| Huntington New Economy Fund | | (Continued) |
| | | | | | | | | | |
| Shares | | | | | Value | | | |
| | | | | | | | | | |
| Common Stocks — (Continued) | | | | | | |
| Industrials — (Continued) | | | | | | |
| | 9,000 | | | FMC Technologies, Inc.* | | $ | 800,190 | | | |
| | 6,900 | | | Haynes International, Inc. | | | 288,627 | | | |
| | 34,300 | | | Hexcel Corp.* | | | 620,487 | | | |
| | 12,600 | | | Joy Global, Inc. | | | 1,093,050 | | | |
| | 15,700 | | | Lindsay Corp. | | | 933,051 | | | |
| | 5,600 | | | Precision Castparts Corp. | | | 779,576 | | | |
| | 3,800 | | | SPX Corp. | | | 271,662 | | | |
| | 14,100 | | | The Boeing Co. | | | 920,166 | | | |
| | 10,000 | | | Valmont Industries, Inc. | | | 887,300 | | | |
| | | | | | | | 7,993,447 | | | |
| Information Technology — 22.3% | | | | | | |
| | 12,200 | | | 3D Systems Corp.* | | | 384,178 | | | |
| | 14,300 | | | Acme Packet, Inc.* | | | 760,188 | | | |
| | 3,180 | | | Apple, Inc.* | | | 1,025,741 | | | |
| | 79,200 | | | Compellent Technologies, Inc.* | | | 2,185,128 | | | |
| | 16,060 | | | Cree, Inc. (a)* | | | 1,058,193 | | | |
| | 22,000 | | | Mellanox Technologies Ltd.* | | | 575,740 | | | |
| | 6,600 | | | NetApp, Inc. (a)* | | | 362,736 | | | |
| | 29,500 | | | Netlogic Microsystems, Inc.* | | | 926,595 | | | |
| | 30,500 | | | NVIDIA Corp.* | | | 469,700 | | | |
| | 17,200 | | | Riverbed Technology, Inc. (a)* | | | 604,924 | | | |
| | 22,100 | | | Rovi Corp.* | | | 1,370,421 | | | |
| | 15,100 | | | Solera Holdings, Inc. | | | 774,932 | | | |
| | 16,300 | | | STEC, Inc.* | | | 287,695 | | | |
| | 80,300 | | | Take-Two Interactive Software, Inc.* | | | 982,872 | | | |
| | 8,000 | | | VMware, Inc., Class A* | | | 711,280 | | | |
| | | | | | | | 12,480,323 | | | |
| Materials — 9.8% | | | | | | |
| | 11,900 | | | Agrium, Inc. (a) | | | 1,091,825 | | | |
| | 7,000 | | | Barrick Gold Corp. | | | 372,260 | | | |
| | 12,400 | | | CF Industries Holdings, Inc. (a) | | | 1,675,860 | | | |
| | 10,700 | | | FMC Corp. | | | 854,823 | | | |
| | 35,800 | | | Stillwater Mining Co.* | | | 764,330 | | | |
| | 43,600 | | | Titanium Metals Corp.* | | | 749,048 | | | |
| | | | | | | | 5,508,146 | | | |
| | | | | | | | | | |
| Shares | | | | | Value | | | |
| | | | | | | | | | |
| Common Stocks — (Continued) | | | | | | |
| Real Estate Investment Trusts — 1.1% | | | | | | |
| | 16,400 | | | HCP, Inc. | | $ | 603,356 | | | |
| Utilities — 1.7% | | | | | | |
| | 25,700 | | | FirstEnergy Corp. | | | 951,414 | | | |
| Total Common Stocks (Cost $47,070,547) | | | 54,675,350 | | | |
| Options Purchased — 0.9% | | | | | | |
| | 1,000 | | | iPath S&P 500 VIX Mid-Term Futures ETN, Call @ $75, Expiring
January 2011 | | | 20,000 | | | |
| | 2,000 | | | iPath S&P 500 VIX Short-Term Futures ETN, Call @ $40, Expiring
February 2011 | | | 490,000 | | | |
| Total Options Purchased (Cost $833,363) | | | 510,000 | | | |
| Cash Equivalents — 2.9% | | | | | | |
| | 1,609,241 | | | Huntington Money Market Fund, Interfund Shares, 0.010% (b) (c) | | | 1,609,241 | | | |
| Total Cash Equivalents (Cost $1,609,241) | | | 1,609,241 | | | |
| Total Investments (Cost $49,513,151) — 101.6% | | | 56,794,591 | | | |
| Liabilities in Excess of Other Assets — (1.6)% | | | (912,733) | | | |
| Net Assets — 100.0% | | $ | 55,881,858 | | | |
| (a) | All or a portion of the security is held as collateral for options. |
| (b) | Investment in affiliate. |
| (c) | Rate disclosed is the seven day yield as of December 31, 2010. |
| * | Non-income producing security. |
ADR — American Depositary Receipt.
NYS — New York Shares.
(See notes which are an integral part of the Financial Statements)
Annual Shareholder Report
70
| | |
| | |
| Huntington Real Strategies Fund | | December 31, 2010 |
| | |
| Portfolio of Investments Summary Table | | (unaudited) |
| | | | |
| Asset Allocation | | Percentage of
Market Value | |
Energy | | | 44.3% | |
Materials | | | 23.3% | |
Industrials | | | 13.4% | |
Real Estate Investment Trusts | | | 8.7% | |
Mutual Funds | | | 7.8% | |
Utilities | | | 1.5% | |
Financials | | | 0.9% | |
Cash1 | | | 0.1% | |
Total | | | 100.0% | |
| 1 | Investments in an affiliated money market fund. |
Portfolio holdings and allocations are subject to change. As of December 31, 2010, percentages in the table above are based on total investments. Such total investments may differ from the percentages set forth below in the Portfolio of Investments which are computed using the Fund’s total net assets.
The Portfolio of Investments Summary Table and the Portfolio of Investments are broken down by sectors, and these sectors do not represent industry categories for purposes of identifying “industry concentration” as described in the Investment Company Act of 1940, as amended.
Portfolio of Investments
| | | | | | | | | | |
| Shares | | | | | Value | | | |
| | | | | | | | | | |
| Common Stocks — 92.6% | | | | | | |
| Energy — 45.0% | | | | | | |
| | 44,300 | | | Arch Coal, Inc. (a) | | $ | 1,553,158 | | | |
| | 48,100 | | | Cameco Corp. | | | 1,942,278 | | | |
| | 32,000 | | | Canadian Natural Resources Ltd. | | | 1,421,440 | | | |
| | 49,800 | | | Chesapeake Energy Corp. | | | 1,290,318 | | | |
| | 20,000 | | | Consol Energy, Inc. | | | 974,800 | | | |
| | 78,200 | | | El Paso Corp. | | | 1,076,032 | | | |
| | 33,400 | | | EnCana Corp. | | | 972,608 | | | |
| | 28,700 | | | Enterprise Products Partners LP | | | 1,194,207 | | | |
| | 52,800 | | | Hugoton Royalty Trust | | | 1,083,456 | | | |
| | 43,500 | | | Linn Energy LLC | | | 1,630,815 | | | |
| | 36,600 | | | Marathon Oil Corp. (a) | | | 1,355,298 | | | |
| | 25,800 | | | National Oilwell Varco, Inc. | | | 1,735,050 | | | |
| | 61,000 | | | Natural Resource Partners LP | | | 2,025,200 | | | |
| | 27,600 | | | Newfield Exploration Co.* | | | 1,990,236 | | | |
| | 28,000 | | | Noble Corp. | | | 1,001,560 | | | |
| | 22,700 | | | Peabody Energy Corp. (a) | | | 1,452,346 | | | |
| | 58,600 | | | Penn Virginia Resource Partners, LP | | | 1,659,552 | | | |
| | 47,300 | | | Petroleo Brasileiro SA ADR | | | 1,789,832 | | | |
| | 41,100 | | | Sasol Ltd. ADR | | | 2,139,255 | | | |
| | 13,932 | | | Schlumberger Ltd. | | | 1,163,322 | | | |
| | 64,900 | | | Spectra Energy Corp. | | | 1,621,851 | | | |
| | 40,646 | | | StatoilHydro ASA ADR | | | 966,155 | | | |
| | 20,200 | | | Tenaris SA ADR | | | 989,396 | | | |
| | 60,000 | | | Tesoro Corp. (a)* | | | 1,112,400 | | | |
| | 19,198 | | | Transocean Ltd.* | | | 1,334,453 | | | |
| | 350,000 | | | Uranium Energy Corp.* | | | 2,114,000 | | | |
| | 255,400 | | | USEC, Inc.* | | | 1,537,508 | | | |
| | 41,000 | | | Valero Energy Corp. (a) | | | 947,920 | | | |
| | 13,700 | | | Walter Energy, Inc. | | | 1,751,408 | | | |
| | | | | | | | 41,825,854 | | | |
| | | | | | | | | | |
| Shares | | | | | Value | | | |
| | | | | | | | | | |
| Common Stocks — (Continued) | | | | | | |
| Industrials — 13.6% | | | | | | |
| | 45,100 | | | AGCO Corp.* | | $ | 2,284,766 | | | |
| | 10,000 | | | Bucyrus International, Inc. | | | 894,000 | | | |
| | 27,000 | | | Deere & Co. | | | 2,242,350 | | | |
| | 12,000 | | | Fluor Corp. | | | 795,120 | | | |
| | 44,500 | | | Foster Wheeler AG* | | | 1,536,140 | | | |
| | 39,000 | | | Harsco Corp. | | | 1,104,480 | | | |
| | 40,000 | | | KOMATSU Ltd. ADR | | | 1,218,800 | | | |
| | 97,900 | | | Manitowoc Co., Inc. | | | 1,283,469 | | | |
| | 35,000 | | | Robbins & Myers, Inc. | | | 1,252,300 | | | |
| | | | | | | | 12,611,425 | | | |
| Materials — 23.7% | | | | | | |
| | 12,770 | | | Agrium, Inc. (a) | | | 1,171,648 | | | |
| | 20,000 | | | Allegheny Technologies, Inc. (a) | | | 1,103,600 | | | |
| | 14,800 | | | BHP Billiton Ltd. ADR | | | 1,375,216 | | | |
| | 13,000 | | | FMC Corp. | | | 1,038,570 | | | |
| | 98,000 | | | Olin Corp. | | | 2,010,960 | | | |
| | 7,500 | | | POSCO ADR | | | 807,675 | | | |
| | 12,320 | | | Potash Corp. of Saskatchewan, Inc. | | | 1,907,506 | | | |
| | 13,800 | | | Praxair, Inc. | | | 1,317,486 | | | |
| | 47,000 | | | Rio Tinto PLC ADR | | | 3,368,020 | | | |
| | 33,400 | | | Sociedad Quimica y Minera de Chile SA ADR | | | 1,951,228 | | | |
| | 10,700 | | | Terra Nitrogen Co., LP | | | 1,156,777 | | | |
| | 19,500 | | | The Mosaic Co. | | | 1,489,020 | | | |
| | 41,300 | | | Vale SA ADR | | | 1,427,741 | | | |
| | 32,000 | | | Yara International ASA ADR | | | 1,856,000 | | | |
| | | | | | | | 21,981,447 | | | |
| Real Estate Investment Trusts — 8.8% | | | | | | |
| | 9,081 | | | Avalonbay Communities, Inc. | | | 1,022,067 | | | |
| | 17,900 | | | Boston Properties, Inc. (a) | | | 1,541,190 | | | |
(See notes which are an integral part of the Financial Statements)
Annual Shareholder Report
71
| | |
| Huntington Real Strategies Fund | | (Continued) |
| | | | | | | | | | | | |
| Shares | | | | | Value | | | | |
| | | | | | | | | | | | |
| Common Stocks — (Continued) | | | | | | | | |
| Real Estate Investment Trusts — (Continued) | | | | | | | | |
| | 80,000 | | | Duke Realty Corp. | | $ | 996,800 | | | | | |
| | 39,300 | | | Plum Creek Timber Co., Inc. | | | 1,471,785 | | | | | |
| | 32,800 | | | Rayonier, Inc. | | | 1,722,656 | | | | | |
| | 16,806 | | | Vornado Realty Trust | | | 1,400,444 | | | | | |
| | | | | | | | 8,154,942 | | | | | |
| Utilities — 1.5% | | | | | | | | |
| | 78,600 | | | Questar Corp. | | | 1,368,426 | | | | | |
| Total Common Stocks (Cost $76,563,887) | | | 85,942,094 | | | | | |
| Corporate Bonds — 0.9% | | | | | | | | |
| Financials — 0.9% | | | | | | | | |
| | 750,000 | | | Credit Suisse Securities USA LLC,
0.000%, 3/26/13 | | | 859,425 | | | | | |
| Total Corporate Bonds (Cost $750,000) | | | 859,425 | | | | | |
| Mutual Funds — 7.9% | | | | | | | | |
| Exchange Traded Funds — 5.2% | | | | | | | | |
| | 12,000 | | | Oil Services HOLDRs Trust | | | 1,686,360 | | | | | |
| | 50,000 | | | PowerShares DB Agriculture Fund* | | | 1,617,500 | | | | | |
| | 36,000 | | | ProShares Short S&P 500 Treasury* | | | 1,333,800 | | | | | |
| | 32,200 | | | US Natural Gas Fund LP* (a) | | | 192,556 | | | | | |
| | | | | | | | 4,830,216 | | | | | |
| | | | | | | | | | | | |
| Shares | | | | | Value | | | | |
| | | | | | | | | | | | |
| Mutual Funds — (Continued) | | | | | | | | |
| Investment Companies — 2.7% | | | | | | | | |
| | 119,800 | | | Central Fund of Canada Ltd., Class A | | $ | 2,483,454 | | | | | |
| Total Mutual Funds (Cost $7,161,894) | | | 7,313,670 | | | | | |
| Cash Equivalents — 0.1% | | | | | | | | |
| | 101,452 | | | Huntington Money Market Fund, Interfund Shares, 0.010% (b) (c) | | | 101,452 | | | | | |
| Total Cash Equivalents (Cost $101,452) | | | 101,452 | | | | | |
| Total Investments (Cost $84,529,118) — 101.5% | | | 94,216,641 | | | | | |
| Liabilities in Excess of Other Assets — (1.5)% | | | (1,351,263) | | | | | |
| Net Assets — 100.0% | | $ | 92,865,378 | | | | | |
| (a) | All or a portion of the security is held as collateral for options. |
| (b) | Investment in affiliate. |
| (c) | Rate disclosed is the seven day yield as of December 31, 2010. |
| * | Non-income producing security. |
ADR — American Depositary Receipt.
LP — Limited Partnership.
PLC — Public Liability Co.
(See notes which are an integral part of the Financial Statements)
Annual Shareholder Report
72
| | |
| | |
| Huntington Rotating Markets Fund | | December 31, 2010 |
| | |
| Portfolio of Investments Summary Table | | (unaudited) |
| | | | |
| Asset Allocation | | Percentage of
Market Value | |
Industrials | | | 21.0% | |
Information Technology | | | 15.9% | |
Consumer Staples | | | 13.1% | |
Energy | | | 10.1% | |
Financials | | | 9.4% | |
Consumer Discretionary | | | 9.0% | |
Health Care | | | 7.0% | |
Mutual Funds | | | 6.0% | |
Materials | | | 4.0% | |
Telecommunication Services | | | 4.0% | |
Cash1 | | | 0.5% | |
Total | | | 100.0% | |
| 1 | Investments in an affiliated money market fund. |
Portfolio holdings and allocations are subject to change. As of December 31, 2010, percentages in the table above are based on total investments. Such total investments may differ from the percentages set forth below in the Portfolio of Investments which are computed using the Fund’s total net assets.
The Portfolio of Investments Summary Table and the Portfolio of Investments are broken down by sectors, and these sectors do not represent industry categories for purposes of identifying “industry concentration” as described in the Investment Company Act of 1940, as amended.
Portfolio of Investments
| | | | | | | | | | |
| Shares | | | | | Value | | | |
| | | | | | | | | | |
| Common Stocks — 93.5% | | | | | | |
| Consumer Discretionary — 9.0% | | | | | | |
| | 23,061 | | | Home Depot, Inc. | | $ | 808,519 | | | |
| | 23,875 | | | McDonald’s Corp. | | | 1,832,645 | | | |
| | 24,250 | | | The Walt Disney Co. | | | 909,618 | | | |
| | | | | | | | 3,550,782 | | | |
| Consumer Staples — 13.1% | | | | | | |
| | 23,926 | | | Kraft Foods, Inc. | | | 753,908 | | | |
| | 23,843 | | | Procter & Gamble Co. | | | 1,533,820 | | | |
| | 24,076 | | | The Coca-Cola Co. | | | 1,583,479 | | | |
| | 23,953 | | | Wal-Mart Stores, Inc. | | | 1,291,785 | | | |
| | | | | | | | 5,162,992 | | | |
| Energy — 10.1% | | | | | | |
| | 24,024 | | | Chevron Texaco Corp. | | | 2,192,190 | | | |
| | 24,140 | | | Exxon Mobil Corp. | | | 1,765,117 | | | |
| | | | | | | | 3,957,307 | | | |
| Financials — 9.5% | | | | | | |
| | 24,145 | | | American Express Co. | | | 1,036,303 | | | |
| | 23,947 | | | Bank of America Corp. | | | 319,453 | | | |
| | 24,022 | | | JPMorgan Chase & Co. | | | 1,019,013 | | | |
| | 24,017 | | | The Travelers Cos., Inc. | | | 1,337,987 | | | |
| | | | | | | | 3,712,756 | | | |
| Health Care — 7.0% | | | | | | |
| | 23,844 | | | Johnson & Johnson | | | 1,474,751 | | | |
| | 23,883 | | | Merck & Co., Inc. | | | 860,743 | | | |
| | 24,096 | | | Pfizer, Inc. | | | 421,921 | | | |
| | | | | | | | 2,757,415 | | | |
| | | | | | | | | | |
| Shares | | | | | Value | | | |
| | | | | | | | | | |
| Common Stocks — (Continued) | | | | | | |
| Industrials — 21.0% | | | | | | |
| | 23,997 | | | 3M Co. | | $ | 2,070,941 | | | |
| | 24,250 | | | Caterpillar, Inc. | | | 2,271,255 | | | |
| | 24,149 | | | General Electric Co. | | | 441,685 | | | |
| | 24,118 | | | The Boeing Co. | | | 1,573,941 | | | |
| | 24,188 | | | United Technologies Corp. | | | 1,904,079 | | | |
| | | | | | | | 8,261,901 | | | |
| Information Technology — 15.8% | | | | | | |
| | 24,414 | | | Cisco Systems, Inc.* | | | 493,895 | | | |
| | 24,357 | | | Hewlett-Packard Co. | | | 1,025,430 | | | |
| | 23,881 | | | Intel Corp. | | | 502,217 | | | |
| | 24,148 | | | International Business Machines Corp. | | | 3,543,961 | | | |
| | 23,792 | | | Microsoft Corp. | | | 664,273 | | | |
| | | | | | | | 6,229,776 | | | |
| Materials — 4.0% | | | | | | |
| | 24,235 | | | Alcoa, Inc. | | | 372,977 | | | |
| | 24,100 | | | Du Pont (E.I.) de Nemours & Co. | | | 1,202,108 | | | |
| | | | | | | | 1,575,085 | | | |
| Telecommunication Services — 4.0% | | | | | | |
| | 23,800 | | | AT&T, Inc. | | | 699,244 | | | |
| | 23,897 | | | Verizon Communications, Inc. | | | 855,035 | | | |
| | | | | | | | 1,554,279 | | | |
| Total Common Stocks (Cost $31,929,213) | | | 36,762,293 | | | |
(See notes which are an integral part of the Financial Statements)
Annual Shareholder Report
73
| | |
| Huntington Rotating Markets Fund | | (Continued) |
| | | | | | | | | | |
| Shares | | | | | Value | | | |
| | | | | | | | | | |
| Mutual Funds — 5.9% | | | | | | |
| Exchange Traded Funds — 5.9% | | | | | | |
| | 20,286 | | | SPDR Dow Jones Industrial Average ETF Trust | | $ | 2,345,062 | | | |
| Total Mutual Funds (Cost $2,043,954) | | | 2,345,062 | | | |
| Cash Equivalents — 0.5% | | | | | | |
| | 183,730 | | | Huntington Money Market Fund, Interfund Shares, 0.010% (a) (b) | | | 183,730 | | | |
| Total Cash Equivalents (Cost $183,730) | | | 183,730 | | | |
| Total Investments (Cost $34,156,897) — 99.9% | | | 39,291,085 | | | |
| Other Assets in Excess of Liabilities — 0.1% | | | 38,139 | | | |
| Net Assets — 100.0% | | $ | 39,329,224 | | | |
| (a) | Investment in affiliate. |
| (b) | Rate disclosed is the seven day yield as of December 31, 2010. |
| * | Non-income producing security. |
(See notes which are an integral part of the Financial Statements)
Annual Shareholder Report
74
| | |
| | |
| Huntington Situs Fund | | December 31, 2010 |
| | |
| Portfolio of Investments Summary Table | | (unaudited) |
| | | | |
| Asset Allocation | | Percentage of
Market Value | |
Industrials | | | 16.9% | |
Information Technology | | | 16.0% | |
Energy | | | 15.2% | |
Health Care | | | 14.0% | |
Consumer Discretionary | | | 11.4% | |
Materials | | | 10.3% | |
Financials | | | 8.3% | |
Consumer Staples | | | 2.7% | |
Mutual Funds | | | 2.4% | |
Utilities | | | 1.7% | |
Real Estate Investment Trusts | | | 0.9% | |
Telecommunication Services | | | 0.2% | |
Cash1 | | | 0.0% | |
Total | | | 100.0% | |
| 1 | Investments in an affiliated money market fund. |
Portfolio holdings and allocations are subject to change. As of December 31, 2010, percentages in the table above are based on total investments. Such total investments may differ from the percentages set forth below in the Portfolio of Investments which are computed using the Fund’s total net assets.
The Portfolio of Investments Summary Table and the Portfolio of Investments are broken down by sectors, and these sectors do not represent industry categories for purposes of identifying “industry concentration” as described in the Investment Company Act of 1940, as amended.
Portfolio of Investments
| | | | | | | | | | |
| Shares | | | | | Value | | | |
| | | | | | | | | | |
| Common Stocks — 96.4% | | | | | | |
| Bermuda — 1.3% | | | |
| Financials — 1.3% | | | | | | |
| | 30,000 | | | Arch Capital Group Ltd.* | | $ | 2,641,500 | | | |
| Brazil — 0.8% | | | |
| Consumer Discretionary — 0.8% | | | | | | |
| | 38,200 | | | Cia Brasileira de Distribuicao Grupo Pao de Acucar ADR | | | 1,603,636 | | | |
| Canada — 0.1% | | | |
| Energy — 0.1% | | | | | | |
| | 35,000 | | | Denison Mines Corp.* | | | 119,700 | | | |
| Cayman Islands — 0.4% | | | |
| Consumer Discretionary — 0.4% | | | | | | |
| | 30,000 | | | Garmin Ltd. | | | 929,700 | | | |
| Chile — 0.7% | | | |
| Materials — 0.7% | | | | | | |
| | 24,000 | | | Sociedad Quimica y Minera de Chile SA ADR | | | 1,402,080 | | | |
| China — 0.3% | | | |
| Consumer Discretionary — 0.3% | | | | | | |
| | 17,500 | | | Shanda Interactive Entertainment Ltd ADR* | | | 693,700 | | | |
| | | | | | | | | | |
| Shares | | | | | Value | | | |
| | | | | | | | | | |
| Common Stocks — (Continued) | | | | | | |
| Denmark — 1.0% | | | |
| Energy — 0.3% | | | | | | |
| | 18,900 | | | Vestas Wind Systems A/S* | | $ | 596,949 | | | |
| Health Care — 0.7% | | | | | | |
| | 10,500 | | | Novozymes A/S , Class B | | | 1,463,277 | | | |
| | | | | | | | 2,060,226 | | | |
| Germany — 0.6% | | | |
| Health Care — 0.6% | | | | | | |
| | 35,500 | | | Stada Arzneimittel AG | | | 1,204,613 | | | |
| Hong Kong — 0.4% | | | |
| Consumer Discretionary — 0.4% | | | | | | |
| | 162,500 | | | Television Broadcasts Ltd. | | | 878,073 | | | |
| Japan — 1.8% | | | |
| Consumer Discretionary — 0.6% | | | | | | |
| | 31,400 | | | Honda Motor Co., Ltd. ADR | | | 1,240,300 | | | |
| Consumer Staples — 0.4% | | | | | | |
| | 38,300 | | | Shiseido Co. Ltd. | | | 836,494 | | | |
| Financials — 0.2% | | | | | | |
| | 70 | | | Japan Prime Realty Investment Corp. | | | 215,451 | | | |
| | 20 | | | Japan Real Estate Investment Corp. | | | 207,325 | | | |
| | | | | | | | 422,776 | | | |
(See notes which are an integral part of the Financial Statements)
Annual Shareholder Report
75
| | |
| Huntington Situs Fund | | (Continued) |
| | | | | | | | | | |
| Shares | | | | | Value | | | |
| | | | | | | | | | |
| Common Stocks — (Continued) | | | | | | |
| Japan — (Continued) | | | |
| Health Care — 0.6% | | | | | | |
| | 20,600 | | | Terumo Corp. | | $ | 1,159,028 | | | |
| | | | | | | | 3,658,598 | | | |
| Mexico — 0.4% | | | |
| Consumer Discretionary — 0.4% | | | | | | |
| | 27,400 | | | Desarrolladora Homex S.A.B. de C.V. ADR* | | | 926,394 | | | |
| Singapore — 0.5% | | | |
| Consumer Staples — 0.5% | | | | | | |
| | 74,000 | | | Asia Pacific Breweries Ltd. | | | 1,127,191 | | | |
| South Africa — 0.6% | | | |
| Materials — 0.6% | | | | | | |
| | 100,032 | | | Harmony Gold Mining Co. Ltd. ADR | | | 1,254,401 | | | |
| Sweden — 0.9% | | | |
| Consumer Discretionary — 0.9% | | | | | | |
| | 116,800 | | | Haldex AB* | | | 1,830,162 | | | |
| United Kingdom — 0.4% | | | |
| Consumer Staples — 0.4% | | | | | | |
| | 16,000 | | | Reckitt Benckiser Group PLC | | | 879,532 | | | |
| United States — 86.2% | | | |
| Consumer Discretionary — 7.3% | | | | | | |
| | 180,000 | | | Cabela’s Inc., Class A* | | | 3,915,000 | | | |
| | 13,500 | | | Columbia Sportswear Co. | | | 814,050 | | | |
| | 2,050 | | | Fossil, Inc.* | | | 144,484 | | | |
| | 50,000 | | | Jakks Pacific, Inc.* | | | 911,000 | | | |
| | 30,000 | | | Papa John’s International, Inc.* | | | 831,000 | | | |
| | 8,000 | | | Polo Ralph Lauren Corp. | | | 887,360 | | | |
| | 23,850 | | | Rent-A-Center, Inc. | | | 769,878 | | | |
| | 310,000 | | | Sonic Corp.* | | | 3,137,200 | | | |
| | 20,000 | | | Sturm Ruger & Co., Inc. | | | 305,800 | | | |
| | 97,000 | | | Urban Outfitters, Inc.* | | | 3,473,570 | | | |
| | | | | | | | 15,189,342 | | | |
| Consumer Staples — 1.3% | | | | | | |
| | 80,000 | | | Fresh Del Monte Produce, Inc. | | | 1,996,000 | | | |
| | 15,000 | | | Sanderson Farms, Inc. | | | 587,250 | | | |
| | | | | | | | 2,583,250 | | | |
| Energy — 14.6% | | | | | | |
| | 65,000 | | | Alliance Resource Partners LP | | | 4,274,400 | | | |
| | 20,000 | | | Amyris, Inc.* | | | 533,600 | | | |
| | 20,000 | | | Atwood Oceanics, Inc.* | | | 747,400 | | | |
| | 40,000 | | | Carbo Ceramics, Inc. | | | 4,141,600 | | | |
| | 140,400 | | | Denbury Resources, Inc.* | | | 2,680,236 | | | |
| | 15,000 | | | Dril-Quip, Inc.* | | | 1,165,800 | | | |
| | 70,000 | | | Lufkin Industries, Inc. | | | 4,367,300 | | | |
| | 40,000 | | | Newfield Exploration Co.* | | | 2,884,400 | | | |
| | 17,300 | | | Oceaneering International, Inc.* | | | 1,273,799 | | | |
| | 15,000 | | | Overseas Shipholding Group, Inc. | | | 531,300 | | | |
| | 52,000 | | | OYO Geospace Corp.* | | | 5,153,720 | | | |
| | | | | | | | | | |
| Shares | | | | | Value | | | |
| | | | | | | | | | |
| Common Stocks — (Continued) | | | | | | |
| United States — (Continued) | | | |
| Energy — (Continued) | | | | | | |
| | 25,000 | | | SM Energy Co. | | $ | 1,473,250 | | | |
| | 28,000 | | | Swift Energy Co.* | | | 1,096,200 | | | |
| | | | | | | | 30,323,005 | | | |
| Financials — 6.7% | | | | | | |
| | 52,300 | | | Cullen/Frost Bankers, Inc. | | | 3,196,576 | | | |
| | 90,000 | | | Equity One, Inc. | | | 1,636,200 | | | |
| | 110,000 | | | International Bancshares Corp. | | | 2,203,300 | | | |
| | 130,000 | | | Raymond James Financial, Inc. | | | 4,251,000 | | | |
| | 61,383 | | | SCBT Financial Corp. | | | 2,010,293 | | | |
| | 13,800 | | | WSFS Financial Corp. | | | 654,672 | | | |
| | | | | | | | 13,952,041 | | | |
| Health Care — 12.0% | | | | | | |
| | 150,000 | | | Albany Molecular Research* | | | 843,000 | | | |
| | 15,000 | | | Bio-Rad Laboratories, Inc., Class A* | | | 1,557,750 | | | |
| | 50,000 | | | Cerner Corp.* | | | 4,737,000 | | | |
| | 75,000 | | | Edwards LifeSciences Corp.* | | | 6,063,000 | | | |
| | 40,000 | | | Kindred Healthcare, Inc.* | | | 734,800 | | | |
| | 86,000 | | | Kinetic Concepts, Inc.* | | | 3,601,680 | | | |
| | 100,000 | | | Lincare Holdings, Inc. | | | 2,683,000 | | | |
| | 10,000 | | | Myriad Genetics, Inc.* | | | 228,400 | | | |
| | 75,000 | | | Osiris Therapeutics, Inc.* | | | 584,250 | | | |
| | 75,000 | | | Watson Pharmaceutical, Inc.* | | | 3,873,750 | | | |
| | | | | | | | 24,906,630 | | | |
| Industrials — 16.7% | | | | | | |
| | 30,000 | | | American Superconductor Corp.* | | | 857,700 | | | |
| | 20,000 | | | American Woodmark Corp. | | | 490,800 | | | |
| | 50,000 | | | BE Aerospace, Inc.* | | | 1,851,500 | | | |
| | 20,000 | | | Codexis, Inc.* | | | 212,000 | | | |
| | 120,000 | | | EnPro Industries, Inc.* | | | 4,987,200 | | | |
| | 30,000 | | | Flowserve Corp. | | | 3,576,600 | | | |
| | 140,000 | | | Harsco Corp. | | | 3,964,800 | | | |
| | 52,000 | | | Jacobs Engineering Group, Inc.* | | | 2,384,200 | | | |
| | 120,000 | | | Quanta Services, Inc.* | | | 2,390,400 | | | |
| | 40,000 | | | Ryder System, Inc. | | | 2,105,600 | | | |
| | 140,000 | | | Southwest Airlines Co. | | | 1,817,200 | | | |
| | 50,000 | | | Taser International, Inc.* | | | 235,000 | | | |
| | 180,000 | | | Trinity Industries, Inc. | | | 4,789,800 | | | |
| | 50,000 | | | Universal Forest Products, Inc. | | | 1,945,000 | | | |
| | 80,000 | | | Watts Water Technologies, Inc., Class A | | | 2,927,200 | | | |
| | 3,750 | | | Werner Enterprises, Inc. | | | 84,750 | | | |
| | | | | | | | 34,619,750 | | | |
| Information Technology — 15.8% | | | | | | |
| | 52,900 | | | ACI Worldwide, Inc.* | | | 1,421,423 | | | |
| | 75,000 | | | Anixter International, Inc. | | | 4,479,750 | | | |
| | 75,900 | | | CommScope, Inc.* | | | 2,369,598 | | | |
| | 40,000 | | | Diodes, Inc.* | | | 1,079,600 | | | |
| | 50,000 | | | Exlservice Holdings, Inc.* | | | 1,074,000 | | | |
| | 250,000 | | | Jabil Circuit, Inc. | | | 5,022,500 | | | |
| | 80,600 | | | Methode Electronics, Inc. | | | 1,045,382 | | | |
| | 110,000 | | | Red Hat, Inc.* | | | 5,021,500 | | | |
| | 35,000 | | | Scansource, Inc.* | | | 1,116,500 | | | |
(See notes which are an integral part of the Financial Statements)
Annual Shareholder Report
76
| | |
| Huntington Situs Fund | | (Continued) |
| | | | | | | | | | |
| Shares | | | | | Value | | | |
| | | | | | | | | | |
| Common Stocks — (Continued) | | | | | | |
| United States — (Continued) | | | |
| Information Technology —(Continued) | | | | | | |
| | 200,000 | | | Sigma Designs, Inc.* | | $ | 2,834,000 | | | |
| | 70,900 | | | Standard Microsystems Corp.* | | | 2,044,047 | | | |
| | 130,000 | | | Trimble Navigation Ltd.* | | | 5,190,900 | | | |
| | | | | | | | 32,699,200 | | | |
| Materials — 8.9% | | | | | | |
| | 50,400 | | | Eagle Materials, Inc. | | | 1,423,800 | | | |
| | 35,000 | | | Eastman Chemical Co. | | | 2,942,800 | | | |
| | 100,000 | | | Owens-Illinois, Inc.* | | | 3,070,000 | | | |
| | 90,000 | | | Quaker Chemical Corp. | | | 3,750,300 | | | |
| | 40,000 | | | RTI International Metals, Inc.* | | | 1,079,200 | | | |
| | 65,000 | | | Texas Industries, Inc. | | | 2,975,700 | | | |
| | 20,000 | | | The Scotts Co. | | | 1,015,400 | | | |
| | 50,000 | | | United States Lime & Minerals, Inc.* | | | 2,106,500 | | | |
| | | | | | | | 18,363,700 | | | |
| Real Estate Investment Trusts — 0.9% | | | | | | |
| | 31,500 | | | Camden Property Trust | | | 1,700,370 | | | |
| | 10,000 | | | Weingarten Realty Investors | | | 237,600 | | | |
| | | | | | | | 1,937,970 | | | |
| Telecommunication Services — 0.3% | | | | | | |
| | 39,000 | | | General Communication, Inc., Class A* | | | 493,740 | | | |
| Utilities — 1.7% | | | | | | |
| | 15,000 | | | AGL Resources, Inc. | | | 537,750 | | | |
| | 39,900 | | | Hawaiian Electric Industries, Inc. | | | 909,321 | | | |
| | 13,100 | | | Northwest Natural Gas Co. | | | 608,757 | | | |
| | 60,000 | | | Portland General Electric Co. | | | 1,302,000 | | | |
| | 5,500 | | | UGI Corp. | | | 173,690 | | | |
| | | | | | | | 3,531,518 | | | |
| | | | | | | | 178,600,146 | | | |
| Total Common Stocks (Cost $138,063,230) | | | 199,809,652 | | | |
| | | | | | | | | | |
| Shares | | | | | Value | | | |
| | | | | | | | | | |
| Mutual Funds — 2.3% | | | | | | |
| Closed-End Funds — 0.3% | | | | | | |
| | 30,000 | | | Central Fund of Canada Ltd., Class A | | $ | 621,900 | | | |
| Exchange Traded Funds — 2.0% | | | | | | |
| | 25,000 | | | iShares FTSE/Xinhua China 25 Index Fund | | | 1,077,250 | | | |
| | 54,555 | | | SPDR S&P Emerging Markets SmallCap ETF | | | 3,110,181 | | | |
| | | | | | | | 4,187,431 | | | |
| Total Mutual Funds (Cost $4,118,796) | | | 4,809,331 | | | |
| Cash Equivalents — 0.0% | | | | | | |
| | 28 | | | Huntington Money Market Fund,
Interfund Shares, 0.010% (a) (b) | | | 28 | | | |
| Total Cash Equivalents (Cost $28) | | | 28 | | | |
| Total Investments (Cost $142,146,714) — 98.7% | | | 204,619,011 | | | |
| Other Assets in Excess of Liabilities — 1.3% | | | 2,682,157 | | | |
| Net Assets — 100.0% | | $ | 207,301,168 | | | |
| (a) | Investment in affiliate. |
| (b) | Rate disclosed is the seven day yield as of December 31, 2010. |
| * | Non-income producing security. |
| ADR | — American Depositary Receipt |
LP — Limited Partnership
| PLC | — Public Liability Co. |
(See notes which are an integral part of the Financial Statements)
Annual Shareholder Report
77
| | |
| | |
| Huntington Technical Opportunities Fund | | December 31, 2010 |
| | |
| Portfolio of Investments Summary Table | | (unaudited) |
| | | | |
| Asset Allocation | | Percentage of
Market Value | |
Exchange Traded Funds | | | 28.2% | |
Industrials | | | 16.9% | |
Energy | | | 16.8% | |
Consumer Discretionary | | | 10.6% | |
Consumer Staples | | | 8.2% | |
Cash1 | | | 6.2% | |
Materials | | | 6.1% | |
Information Technology | | | 5.0% | |
Financials | | | 1.0% | |
Telecommunication Services | | | 1.0% | |
Total | | | 100.0% | |
| 1 | Investments in an affiliated money market fund. |
Portfolio holdings and allocations are subject to change. As of December 31, 2010, percentages in the table above are based on total investments. Such total investments may differ from the percentages set forth below in the Portfolio of Investments which are computed using the Fund’s total net assets.
The Portfolio of Investments Summary Table and the Portfolio of Investments are broken down by sectors, and these sectors do not represent industry categories for purposes of identifying “industry concentration” as described in the Investment Company Act of 1940, as amended.
Portfolio of Investments
| | | | | | | | | | |
| Shares | | | | | Value | | | |
| | | | | | | | | | |
| Common Stocks — 66.9% | | | | | | |
| Consumer Discretionary — 10.8% | | | | | | |
| | 5,800 | | | Brunswick Corp. | | $ | 108,692 | | | |
| | 7,415 | | | Ford Motor Co.* | | | 124,498 | | | |
| | 3,900 | | | Grupo Aeroportuario del Sureste S.A.B. de C.V. ADR | | | 220,155 | | | |
| | 1,815 | | | Laboratory Corp. of America Holdings* | | | 159,575 | | | |
| | 3,000 | | | Mitsubishi Corp. ADR | | | 160,650 | | | |
| | 2,580 | | | Ross Stores, Inc. | | | 163,185 | | | |
| | 1,600 | | | Sodexo ADR | | | 111,440 | | | |
| | 1,300 | | | The Sherwin-Williams Co. | | | 108,875 | | | |
| | | | | | | | 1,157,070 | | | |
| Consumer Staples — 8.3% | | | | | | |
| | 13,000 | | | BRF-Brasil Foods SA ADR | | | 219,440 | | | |
| | 2,650 | | | Corn Products International, Inc. | | | 121,900 | | | |
| | 1,845 | | | Nestle SA ADR | | | 108,523 | | | |
| | 6,050 | | | SABMiller PLC ADR | | | 215,743 | | | |
| | 7,900 | | | Wal-Mart de Mexico SAB de CV ADR | | | 225,782 | | | |
| | | | | | | | 891,388 | | | |
| Energy — 17.2% | | | | | | |
| | 1,900 | | | Apache Corp. | | | 226,537 | | | |
| | 3,315 | | | Arch Coal, Inc. | | | 116,224 | | | |
| | 1,200 | | | Cimarex Energy Co. | | | 106,236 | | | |
| | 5,375 | | | Denbury Resources, Inc.* | | | 102,609 | | | |
| | 3,065 | | | Ensco PLC ADR | | | 163,610 | | | |
| | 3,000 | | | Forest Oil Corp.* | | | 113,910 | | | |
| | 2,200 | | | Helmerich & Payne, Inc. | | | 106,656 | | | |
| | 11,500 | | | Impala Platinum Holdings Ltd. ADR | | | 406,985 | | | |
| | 1,700 | | | Kumba Iron Ore Ltd. ADR | | | 110,976 | | | |
| | | | | | | | | | |
| Shares | | | | | Value | | | |
| | | | | | | | | | |
| Common Stocks — (Continued) | | | | | | |
| Energy — (Continued) | | | | | | |
| | 4,150 | | | Sinopec Shanghai Petrochemical Co. Ltd. ADR | | $ | 214,015 | | | |
| | 3,350 | | | Tenaris SA ADR | | | 164,083 | | | |
| | | | | | | | 1,831,841 | | | |
| Financials — 1.0% | | | | | | |
| | 4,300 | | | Australia and New Zealand Banking Group Ltd. ADR | | | 103,372 | | | |
| Industrials — 17.2% | | | | | | |
| | 3,225 | | | Astec Industries, Inc.* | | | 104,522 | | | |
| | 2,375 | | | Badger Meter, Inc. | | | 105,023 | | | |
| | 4,130 | | | Bridgestone Corp. | | | 159,955 | | | |
| | 4,900 | | | CLARCOR, Inc. | | | 210,161 | | | |
| | 1,330 | | | Clean Harbors, Inc.* | | | 111,826 | | | |
| | 9,215 | | | DENSO Corp. ADR | | | 158,037 | | | |
| | 12,320 | | | Israel Chemicals Ltd. | | | 206,976 | | | |
| | 2,255 | | | Kubota Corp. ADR | | | 107,113 | | | |
| | 1,800 | | | National Presto Industries, Inc. | | | 234,018 | | | |
| | 785 | | | Novozymes A/S ADR | | | 109,680 | | | |
| | 19,900 | | | Origin Agritech Ltd.* | | | 211,935 | | | |
| | 2,000 | | | Syngenta AG ADR | | | 117,560 | | | |
| | | | | | | | 1,836,806 | | | |
| Information Technology — 5.1% | | | | | | |
| | 6,000 | | | Aixtron SE ADR | | | 223,200 | | | |
| | 2,650 | | | Cass Information Systems, Inc. | | | 100,541 | | | |
| | 6,500 | | | CGI Group, Inc. - Class A* | | | 112,190 | | | |
| | 3,200 | | | NICE Systems Ltd. ADR* | | | 111,680 | | | |
| | | | | | | | 547,611 | | | |
(See notes which are an integral part of the Financial Statements)
Annual Shareholder Report
78
| | |
| Huntington Technical Opportunities Fund | | (Continued) |
| | | | | | | | | | |
| Shares | | | | | Value | | | |
| | | | | | | | | | |
| Common Stocks — (Continued) | | | | | | |
| Materials — 6.2% | | | | | | |
| | 7,020 | | | Carpenter Technology Corp. | | $ | 282,485 | | | |
| | 3,800 | | | Mechel ADR | | | 111,074 | | | |
| | 7,250 | | | Stillwater Mining Co.* | | | 154,787 | | | |
| | 3,200 | | | Vale SA ADR* | | | 110,624 | | | |
| | | | | | | | 658,970 | | | |
| Telecommunication Services — 1.1% | | | | | | |
| | 7,650 | | | City Telecom (HK) Ltd. ADR | | | 113,296 | | | |
| Total Common Stocks (Cost $6,746,798) | | | 7,140,354 | | | |
| Mutual Funds — 28.7% | | | | | | |
| Exchange Traded Funds — 28.7% | | | | | | |
| | 10,320 | | | iShares MSCI Canada Index Fund | | | 319,920 | | | |
| | 3,500 | | | iShares MSCI Isreal Capped Investable Market Index Fund | | | 211,820 | | | |
| | 3,450 | | | iShares MSCI Mexico Investable Market Index Fund | | | 213,624 | | | |
| | 12,800 | | | iShares MSCI Sweden Index Fund | | | 399,744 | | | |
| | 12,085 | | | iShares S&P MidCap 400 Value Index Fund | | | 960,274 | | | |
| | 15,810 | | | Powershares QQQ | | | 861,171 | | | |
| | 2,250 | | | ProShares Short S&P 500 Treasury* | | | 98,640 | | | |
| Total Mutual Funds (Cost $2,878,647) | | | 3,065,193 | | | |
| | | | | | | | | | |
| Shares | | | | | Value | | | |
| | | | | | | | | | |
| Cash Equivalents — 6.3% | | | | | | |
| | 675,043 | | | Huntington Money Market Fund, Interfund Shares, 0.010% (a) (b) | | $ | 675,043 | | | |
| Total Cash Equivalents (Cost $675,043) | | | 675,043 | | | |
| Total Investments
(Cost $10,300,488) — 101.9% | | | 10,880,590 | | | |
| Liabilities in Excess of Other Assets — (1.9)% | | | (200,892) | | | |
| Net Assets — 100.0% | | $ | 10,679,698 | | | |
| (a) | Investment in affiliate. |
| (b) | Rate disclosed is the seven day yield as of December 31, 2010. |
| * | Non-income producing security. |
ADR — American Depositary Receipt.
PLC — Public Liability Co.
(See notes which are an integral part of the Financial Statements)
Annual Shareholder Report
79
| | |
| | |
| Huntington Fixed Income Securities Fund | | December 31, 2010 |
| | |
| Portfolio of Investments Summary Table | | (unaudited) |
| | | | |
| Asset Allocation | | Percentage of
Market Value | |
Corporate Bonds | | | 54.6% | |
U.S. Government Agencies | | | 27.3% | |
U.S. Treasury Obligations | | | 15.4% | |
U.S. Government Mortgage Backed Securities | | | 1.9% | |
Cash1 | | | 0.5% | |
Preferred Stocks | | | 0.3% | |
Total | | | 100.0% | |
| 1 | Investments in an affiliated money market fund. |
Portfolio holdings and allocations are subject to change. As of December 31, 2010, percentages in the table above are based on total investments. Such total investments may differ from the percentages set forth below in the Portfolio of Investments which are computed using the Fund’s total net assets.
The Portfolio of Investments Summary Table and the Portfolio of Investments are broken down by sectors, and these sectors do not represent industry categories for purposes of identifying “industry concentration” as described in the Investment Company Act of 1940, as amended.
Portfolio of Investments
| | | | | | | | | | |
Principal
Amount | | | | | Value | | | |
| | | | | | | | | | |
| Corporate Bonds — 54.2% | | | | | | |
| Consumer Discretionary — 2.8% | | | | | | |
| $ | 2,000,000 | | | Comcast Corp., Class A,
6.500%, 1/15/17 | | $ | 2,305,544 | | | |
| | 1,500,000 | | | The Walt Disney Co., Series MTNB, 6.200%, 6/20/14 | | | 1,713,467 | | | |
| | 4,000,000 | | | Time Warner, Inc., 3.150%, 7/15/15 | | | 4,064,072 | | | |
| | | | | | | | 8,083,083 | | | |
| Consumer Staples — 3.9% | | | | | | |
| | 1,498,000 | | | ConAgra Foods, Inc., 6.750%, 9/15/11 | | | 1,558,919 | | | |
| | 3,000,000 | | | Kellogg Co., 4.250%, 3/6/13 | | | 3,184,191 | | | |
| | 2,000,000 | | | Kraft Foods, Inc., 6.000%, 2/11/13 | | | 2,190,112 | | | |
| | 2,000,000 | | | The Kroger Co., 7.500%, 1/15/14 | | | 2,305,906 | | | |
| | 2,000,000 | | | Wal-Mart Stores, Inc.,
6.200%, 4/15/38 | | | 2,276,830 | | | |
| | | | | | | | 11,515,958 | | | |
| Energy — 1.7% | | | | | | |
| | 2,005,000 | | | EQT Corp., 8.125%, 6/1/19 | | | 2,332,830 | | | |
| | 2,000,000 | | | Halliburton Co., 6.150%, 9/15/19 | | | 2,297,102 | | | |
| | 500,000 | | | Rowan Cos., Inc., 5.000%, 9/1/17 | | | 504,353 | | | |
| | | | | | | | 5,134,285 | | | |
| Financials — 18.3% | | | | | | |
| | 2,000,000 | | | American Express Credit Co., Series C, 7.300%, 8/20/13 | | | 2,253,716 | | | |
| | 1,000,000 | | | Bank of America Corp.,
6.250%, 4/15/12 | | | 1,053,332 | | | |
| | 2,000,000 | | | Barrick International Bank Corp., Series 144A,
5.750%, 10/15/16 (a) (b) | | | 2,198,122 | | | |
| | | | | | | | | | |
Principal
Amount | | | | | Value | | | |
| | | | | | | | | | |
| Corporate Bonds — (Continued) | | | | | | |
| Financials — (Continued) | | | | | | |
| $ | 3,000,000 | | | BlackRock, Inc., 6.250%, 9/15/17 | | $ | 3,377,079 | | | |
| | 4,000,000 | | | Citigroup, Inc., 5.625%, 8/27/12 | | | 4,197,416 | | | |
| | 3,000,000 | | | FIA Card Services NA, Series BKNT, 7.125%, 11/15/12 (a) (b) | | | 3,244,002 | | | |
| | 2,000,000 | | | General Electric Capital Corp., Series GMTN, 5.720%, 8/22/11 | | | 2,055,614 | | | |
| | 1,000,000 | | | General Electric Capital Corp., Series GMTN, 5.250%, 10/19/12 | | | 1,068,783 | | | |
| | 1,000,000 | | | Goldman Sachs Group, Inc.,
6.600%, 1/15/12 | | | 1,057,463 | | | |
| | 1,000,000 | | | Goldman Sachs Group, Inc.,
5.250%, 10/15/13 | | | 1,082,218 | | | |
| | 2,000,000 | | | Hospitality Properties Trust,
6.750%, 2/15/13 | | | 2,112,604 | | | |
| | 2,000,000 | | | HSBC Finance Corp., Series NOTZ, 5.625%, 6/15/20 | | | 1,984,116 | | | |
| | 1,000,000 | | | JPMorgan Chase & Co.,
6.000%, 1/15/18 | | | 1,116,746 | | | |
| | 1,000,000 | | | Kimco Realty Corp., 4.820%, 6/1/14 | | | 1,054,686 | | | |
| | 1,000,000 | | | Lincoln National Corp.,
4.750%, 2/15/14 | | | 1,048,596 | | | |
| | 4,000,000 | | | Manulife Financial Corp.,
3.400%, 9/17/15 | | | 3,918,120 | | | |
| | 1,000,000 | | | MetLife, Inc., 5.000%, 11/24/13 | | | 1,083,559 | | | |
| | 2,000,000 | | | Morgan Stanley, Series G, MTN,
2.786%, 5/14/13 (c) | | | 2,072,556 | | | |
| | 1,000,000 | | | Morgan Stanley, 6.750%, 10/15/13 | | | 1,090,216 | | | |
(See notes which are an integral part of the Financial Statements)
Annual Shareholder Report
80
| | |
| Huntington Fixed Income Securities Fund | | (Continued) |
| | | | | | | | | | |
Principal
Amount | | | | | Value | | | |
| | | | | | | | | | |
| Corporate Bonds — (Continued) | | | | | | |
| Financials — (Continued) | | | | | | |
| $ | 2,000,000 | | | Nationwide Financial Services, Inc., 6.250%, 11/15/11 | | $ | 2,083,794 | | | |
| | 1,915,000 | | | Northern Trust Co., 6.500%, 8/15/18 | | | 2,239,058 | | | |
| | 2,000,000 | | | PNC Funding Corp., 3.625%, 2/8/15 | | | 2,067,908 | | | |
| | 2,050,000 | | | RenaissanceRe Holdings Ltd.,
5.875%, 2/15/13 | | | 2,169,837 | | | |
| | 2,000,000 | | | Royal Bank of Canada, Series MTN, 2.100%, 7/29/13 | | | 2,039,488 | | | |
| | 2,000,000 | | | Simon Property Group LP,
5.650%, 2/1/20 | | | 2,163,468 | | | |
| | 3,395,000 | | | Wachovia Corp., 5.625%, 10/15/16 | | | 3,693,227 | | | |
| | | | | | | | 53,525,724 | | | |
| Health Care — 1.2% | | | | | | |
| | 2,000,000 | | | AstraZeneca PLC, 5.900%, 9/15/17 | | | 2,316,062 | | | |
| | 1,000,000 | | | Pfizer, Inc., 5.350%, 3/15/15 | | | 1,124,159 | | | |
| | | | | | | | 3,440,221 | | | |
| Industrials — 7.9% | | | | | | |
| | 2,500,000 | | | Covidien International Finance SA,
1.875%, 6/15/13 | | | 2,529,938 | | | |
| | 1,000,000 | | | Covidien International Finance SA,
2.800%, 6/15/15 | | | 1,003,694 | | | |
| | 1,665,000 | | | Emerson Electric Co.,
5.125%, 12/1/16 | | | 1,864,755 | | | |
| | 1,629,000 | | | Enterprise Products Operating LP,
5.600%, 10/15/14 | | | 1,798,914 | | | |
| | 2,000,000 | | | Enterprise Products Operating LP,
3.700%, 6/1/15 | | | 2,063,136 | | | |
| | 1,000,000 | | | Marathon Oil Canada Corp.,
8.375%, 5/1/12 | | | 1,088,023 | | | |
| | 2,000,000 | | | Mattel, Inc., 6.200%, 10/1/40 | | | 1,967,740 | | | |
| | 2,000,000 | | | Plum Creek Timberlands PLC,
4.700%, 3/15/21 | | | 1,903,422 | | | |
| | 1,000,000 | | | Transocean, Inc., 7.375%, 4/15/18 | | | 1,105,855 | | | |
| | 2,000,000 | | | Union Pacific Corp., 5.650%, 5/1/17 | | | 2,208,406 | | | |
| | 2,000,000 | | | United Technologies Corp.,
6.125%, 2/1/19 | | | 2,338,798 | | | |
| | 2,000,000 | | | Williams Partners LP,
5.250%, 3/15/20 | | | 2,073,200 | | | |
| | 1,000,000 | | | Wyeth, 5.500%, 3/15/13 | | | 1,093,377 | | | |
| | | | | | | | 23,039,258 | | | |
| Information Technology — 5.5% | | | | | | |
| | 2,000,000 | | | CA, Inc., 6.125%, 12/1/14 | | | 2,192,678 | | | |
| | 2,000,000 | | | Cisco Systems, Inc., 5.500%, 1/15/40 | | | 2,089,346 | | | |
| | 2,000,000 | | | Hewlett-Packard Co., 5.500%, 3/1/18 | | | 2,253,454 | | | |
| | | | | | | | | | |
Principal
Amount | | | | | Value | | | |
| | | | | | | | | | |
| Corporate Bonds — (Continued) | | | | | | |
| Information Technology — (Continued) | | | | | | |
| $ | 3,000,000 | | | International Business Machines Corp., 7.625%, 10/15/18 | | $ | 3,818,877 | | | |
| | 2,000,000 | | | Oracle Corp., 5.250%, 1/15/16 | | | 2,248,564 | | | |
| | 3,000,000 | | | Oracle Corp., 6.125%, 7/8/39 | | | 3,366,624 | | | |
| | | | | | | | 15,969,543 | | | |
| Materials — 1.5% | | | | | | |
| | 2,000,000 | | | Nucor Corp., 5.000%, 6/1/13 | | | 2,159,372 | | | |
| | 2,000,000 | | | Potash Corp. of Saskatchewan, Inc., 5.250%, 5/15/14 | | | 2,186,942 | | | |
| | | | | | | | 4,346,314 | | | |
| Telecommunication Services — 2.3% | | | | | | |
| | 2,000,000 | | | AT&T, Inc., 5.600%, 5/15/18 | | | 2,231,488 | | | |
| | 2,000,000 | | | Verizon Wireless,
7.375%, 11/15/13 (a) (b) | | | 2,317,118 | | | |
| | 2,000,000 | | | Vodafone Group PLC,
5.000%, 12/16/13 | | | 2,177,168 | | | |
| | | | | | | | 6,725,774 | | | |
| Utilities — 9.1% | | | | | | |
| | 2,500,000 | | | Bay State Gas Co., Series MTN, 9.200%, 6/6/11 | | | 2,583,920 | | | |
| | 1,000,000 | | | Consolidated Edison Co. of New York, Inc., Series 03-B, 3.850%, 6/15/13 | | | 1,057,552 | | | |
| | 2,000,000 | | | Constellation Energy Group, Inc., 4.550%, 6/15/15 | | | 2,074,774 | | | |
| | 2,950,000 | | | Dominion Resources, Inc., Class A, Series D, 5.000%, 3/15/13 | | | 3,169,017 | | | |
| | 1,000,000 | | | Duke Energy Corp., 6.300%, 2/1/14 | | | 1,113,845 | | | |
| | 4,500,000 | | | Duquesne Light Co., Series O, 6.700%, 4/15/12 | | | 4,784,949 | | | |
| | 1,000,000 | | | Georgia Power Co., 5.400%, 6/1/40 | | | 1,010,134 | | | |
| | 1,800,000 | | | Gulf Power Co., Series K,
4.900%, 10/1/14 | | | 1,917,992 | | | |
| | 2,310,000 | | | Metropolitan Edison, 4.875%, 4/1/14 | | | 2,422,157 | | | |
| | 3,000,000 | | | Pacific Gas & Electric Co.,
6.250%, 12/1/13 | | | 3,363,063 | | | |
| | 3,000,000 | | | PSEG Power LLC, 2.500%, 4/15/13 | | | 3,060,459 | | | |
| | | | | | | | 26,557,862 | | | |
| Total Corporate Bonds (Cost $151,525,318) | | | 158,338,022 | | | |
| U.S. Government Agencies — 27.1% | | | | | | |
| Federal Farm Credit Bank — 1.8% | | | | | | |
| | 3,000,000 | | | 2.490%, 3/3/14 | | | 3,011,199 | | | |
| | 2,000,000 | | | 4.710%, 3/6/15 | | | 2,241,404 | | | |
| | | | | | | | 5,252,603 | | | |
| Federal Home Loan Bank — 12.0% | | | | | | |
| | 3,000,000 | | | 5.000%, 9/9/11 | | | 3,091,944 | | | |
(See notes which are an integral part of the Financial Statements)
Annual Shareholder Report
81
| | |
| Huntington Fixed Income Securities Fund | | (Continued) |
| | | | | | | | | | |
Principal
Amount | | | | | Value | | | |
| | | | | | | | | | |
| U.S. Government Agencies — (Continued) | | | | | | |
| Federal Home Loan Bank — (Continued) | | | | | | |
| $ | 3,000,000 | | | 4.375%, 6/8/12 | | $ | 3,147,327 | | | |
| | 3,000,000 | | | 1.750%, 12/14/12 | | | 3,059,283 | | | |
| | 3,000,000 | | | 1.750%, 3/8/13 | | | 3,056,007 | | | |
| | 3,000,000 | | | 5.375%, 6/14/13 | | | 3,322,569 | | | |
| | 1,380,000 | | | 5.000%, 7/16/13 | | | 1,515,960 | | | |
| | 2,000,000 | | | 2.000%, 5/14/15 (d) | | | 2,040,080 | | | |
| | 3,000,000 | | | 2.170%, 8/10/15 | | | 2,986,893 | | | |
| | 5,000,000 | | | 4.750%, 9/11/15 | | | 5,573,895 | | | |
| | 6,500,000 | | | 4.750%, 12/16/16 | | | 7,269,028 | | | |
| | | | | | | | 35,062,986 | | | |
| Federal Home Loan Mortgage
Corporation — 7.9% | | | | | | |
| | 4,000,000 | | | 6.480%, 12/5/11 | | | 4,220,556 | | | |
| | 2,000,000 | | | 1.750%, 1/15/13 | | | 2,007,558 | | | |
| | 3,000,000 | | | 2.000%, 1/25/13 | | | 3,002,667 | | | |
| | 3,000,000 | | | 1.500%, 7/12/13 | | | 3,010,818 | | | |
| | 5,000,000 | | | 5.000%, 1/30/14 | | | 5,562,865 | | | |
| | 3,000,000 | | | 5.500%, 3/28/16 | | | 3,033,960 | | | |
| | 2,000,000 | | | 4.875%, 6/13/18 | | | 2,236,674 | | | |
| | | | | | | | 23,075,098 | | | |
| Federal National Mortgage Association — 5.4% | | | | | | |
| | 2,000,000 | | | 2.020%, 8/20/13 | | | 2,009,446 | | | |
| | 3,000,000 | | | 2.250%, 6/2/14 | | | 3,023,871 | | | |
| | 4,000,000 | | | 1.200%, 7/21/14 | | | 3,946,468 | | | |
| | 3,000,000 | | | 1.000%, 9/2/14 | | | 2,947,956 | | | |
| | 4,000,000 | | | 1.250%, 10/28/14 | | | 3,952,164 | | | |
| | | | | | | | 15,879,905 | | | |
| Total U.S. Government Agencies
(Cost $76,541,967) | | | 79,270,592 | | | |
| U.S. Treasury Obligations — 15.3% | | | | | | |
| U.S. Treasury Bonds — 12.7% | | | | | | |
| | 1,500,000 | | | 9.125%, 5/15/18 | | | 2,149,218 | | | |
| | 2,000,000 | | | 8.750%, 8/15/20 | | | 2,921,562 | | | |
| | 4,000,000 | | | 7.125%, 2/15/23 | | | 5,372,500 | | | |
| | 4,000,000 | | | 7.625%, 2/15/25 | | | 5,672,500 | | | |
| | 4,000,000 | | | 6.750%, 8/15/26 | | | 5,311,248 | | | |
| | 4,000,000 | | | 5.250%, 11/15/28 | | | 4,584,376 | | | |
| | 4,000,000 | | | 6.125%, 8/15/29 | | | 5,059,376 | | | |
| | 4,000,000 | | | 4.250%, 5/15/39 | | | 3,940,624 | | | |
| | 2,000,000 | | | 4.500%, 8/15/39 | | | 2,053,750 | | | |
| | | | | | | | 37,065,154 | | | |
| U.S. Treasury Notes — 2.6% | | | | | | |
| | 8,000,000 | | | U.S. Treasury Note, 2.625%, 11/15/20 | | | 7,546,248 | | | |
| Total U.S. Treasury Obligations
(Cost $40,659,698) | | | 44,611,402 | | | |
| U.S. Government Mortgage Backed
Agencies — 1.9% |
| | |
| Federal Home Loan Mortgage
Corporation — 0.8% | | | | | | |
| | 991,548 | | | Pool # J05518, 5.500%, 9/1/22 | | | 1,063,280 | | | |
| | | | | | | | | | |
Principal
Amount | | | | | Value | | | |
| | | | | | | | | | |
| U.S. Government Mortgage Backed
Agencies — (Continued) |
| | |
| Federal Home Loan Mortgage
Corporation — (Continued) | | | | | | |
| $ | 1,241,198 | | | Pool # J08160, 5.000%, 12/1/22 | | $ | 1,311,209 | | | |
| | | | | | | | 2,374,489 | | | |
| Federal National Mortgage Association — 0.1% | | | | | | |
| | 70,815 | | | Pool # 599630, 6.500%, 8/1/16 | | | 77,266 | | | |
| | 186,458 | | | Pool # 254594, 6.000%, 8/1/17 | | | 203,384 | | | |
| | | | | | | | 280,650 | | | |
| Government National Mortgage
Association — 1.0% | | | | | | |
| | 1,616,654 | | | Pool # 683937, 6.000%, 2/15/23 | | | 1,759,122 | | | |
| | 964,528 | | | Pool # 689593, 6.000%, 7/15/23 | | | 1,052,391 | | | |
| | 100,823 | | | Pool # 345128, 6.500%, 1/15/24 | | | 114,485 | | | |
| | 27,800 | | | Pool # 373015, 7.000%, 3/15/24 | | | 31,753 | | | |
| | 24,386 | | | Pool # 373015, 8.000%, 6/15/24 | | | 28,734 | | | |
| | | | | | | | 2,986,485 | | | |
| Total U.S. Government Mortgage Backed Agencies
(Cost $5,332,847) | | | 5,641,624 | | | |
| Preferred Stocks — 0.3% | | | | | | |
| Financials — 0.1% | | | | | | |
| | 9,530 | | | Prudential PLC, 6.500% | | | 235,010 | | | |
| Real Estate Investment Trusts — 0.2% | | | | | | |
| | 25,000 | | | Public Storage, Inc., Series F, 6.450% | | | 606,250 | | | |
| Total Preferred Stocks (Cost $699,569) | | | 841,260 | | | |
| Cash Equivalents — 0.5% | | | | | | |
| | 1,571,742 | | | Huntington Money Market Fund, Interfund Shares, 0.010% (e) (f) | | | 1,571,742 | | | |
| Total Cash Equivalents (Cost $1,571,742) | | | 1,571,742 | | | |
| Total Investments (Cost $276,331,141) — 99.3% | | | 290,274,642 | | | |
| Other Assets in Excess of Liabilities — 0.7% | | | 2,091,560 | | | |
| Net Assets — 100.0% | | $ | 292,366,202 | | | |
| (a) | Security exempt from registration under Rule 144A or Section 4(2) of the Securities Act of 1933. The security may be resold in transactions exempt from registration, normally to qualified institutional buyers. |
| (c) | Variable or Floating Rate Security. Rate disclosed is as of December 31, 2010. |
| (d) | Step Bond: Coupon rate is set for an initial period and then increased to an higher coupon rate at a specified date. The rate shown is the rate in effect at December 31, 2010. |
| (e) | Investment in affiliate. |
| (f) | Rate disclosed is the seven day yield as of December 31, 2010. |
LP—Limited Partnership
PLC—Public Liability Co.
MTN—Median Term Note
(See notes which are an integral part of the Financial Statements)
Annual Shareholder Report
82
| | |
| | |
| Huntington Intermediate Government Income Fund | | December 31, 2010 |
| | |
| Portfolio of Investments Summary Table | | (unaudited) |
| | | | |
| Asset Allocation | | Percentage of
Market Value | |
U.S. Government Agencies | | | 56.5% | |
U.S. Government Mortgage Backed Securities | | | 20.9% | |
U.S. Treasury Obligations | | | 13.1% | |
Collateralized Mortgage Obligations | | | 6.3% | |
Corporate Bonds | | | 1.7% | |
Cash1 | | | 1.5% | |
Total | | | 100.0% | |
| 1 | Investments in an affiliated money market fund. |
Portfolio holdings and allocations are subject to change. As of December 31, 2010, percentages in the table above are based on total investments. Such total investments may differ from the percentages set forth below in the Portfolio of Investments which are computed using the Fund’s total net assets.
The Portfolio of Investments Summary Table and the Portfolio of Investments are broken down by sectors, and these sectors do not represent industry categories for purposes of identifying “industry concentration” as described in the Investment Company Act of 1940, as amended.
Portfolio of Investments
| | | | | | | | | | |
Principal
Amount | | Value | | | |
| | | | | | | | | | |
| | | | | | | | | | |
| U.S. Government Agencies — 56.2% | | | | | | |
| Federal Farm Credit Bank — 21.3% | | | | | | |
| $ | 3,000,000 | | | 2.125%, 6/18/12 | | $ | 3,068,808 | | | |
| | 3,000,000 | | | 1.375%, 6/25/13 | | | 3,039,087 | | | |
| | 2,000,000 | | | 1.620%, 11/16/15 | | | 1,950,242 | | | |
| | 1,000,000 | | | 4.500%, 12/15/15 | | | 1,108,114 | | | |
| | 2,000,000 | | | 4.875%, 12/16/15 | | | 2,248,184 | | | |
| | 1,000,000 | | | 3.750%, 1/29/16 | | | 1,071,935 | | | |
| | 1,000,000 | | | 4.350%, 6/17/16 | | | 1,018,367 | | | |
| | 1,000,000 | | | 5.270%, 9/1/16 | | | 1,146,905 | | | |
| | 2,000,000 | | | 5.050%, 3/8/17 | | | 2,250,862 | | | |
| | 1,000,000 | | | 5.550%, 8/1/17 | | | 1,168,363 | | | |
| | 1,000,000 | | | 2.500%, 9/21/17 | | | 981,423 | | | |
| | 1,000,000 | | | 4.250%, 4/16/18 | | | 1,067,684 | | | |
| | 2,000,000 | | | 5.050%, 8/1/18 | | | 2,269,982 | | | |
| | 2,000,000 | | | 3.950%, 11/25/19 | | | 2,059,104 | | | |
| | 1,000,000 | | | 5.375%, 11/10/20 | | | 1,151,843 | | | |
| | | | | | | | 25,600,903 | | | |
| Federal Home Loan Bank — 23.4% | | | | | | |
| | 373,142 | | | 5.270%, 12/28/12 | | | 394,821 | | | |
| | 3,000,000 | | | 5.375%, 6/14/13 | | | 3,322,569 | | | |
| | 1,000,000 | | | 3.750%, 6/14/13 | | | 1,066,827 | | | |
| | 1,000,000 | | | 4.375%, 9/13/13 | | | 1,088,477 | | | |
| | 830,000 | | | 4.750%, 12/12/14 | | | 925,680 | | | |
| | 1,000,000 | | | 4.375%, 2/13/15 | | | 1,093,756 | | | |
| | 2,500,000 | | | 2.875%, 6/12/15 | | | 2,592,313 | | | |
| | 2,000,000 | | | 4.750%, 9/11/15 | | | 2,229,558 | | | |
| | 2,000,000 | | | 1.900%, 12/29/15 | | | 1,955,522 | | | |
| | 1,000,000 | | | 4.875%, 3/11/16 | | | 1,118,810 | | | |
| | 1,500,000 | | | 4.250%, 3/9/18 | | | 1,619,463 | | | |
| | 5,000,000 | | | 4.125%, 12/13/19 | | | 5,261,820 | | | |
| | 2,000,000 | | | 3.000%, 3/18/20 | | | 1,933,062 | | | |
| | 3,500,000 | | | 3.375%, 6/12/20 | | | 3,448,036 | | | |
| | | | | | | | 28,050,714 | | | |
| | | | | | | | | | |
Principal
Amount | | Value | | | |
| | | | | | | | | | |
| U.S. Government Agencies — (Continued) | | | | | | |
| Federal Home Loan Mortgage
Corporation — 1.7% | | | | | | |
| $ | 2,000,000 | | | 2.500%, 1/27/14 | | $ | 2,002,794 | | | |
| Federal National Mortgage Association — 7.6% | | | | | | |
| | 2,000,000 | | | 1.500%, 9/25/12 | | | 2,004,848 | | | |
| | 2,000,000 | | | 1.500%, 9/8/14 | | | 1,998,548 | | | |
| | 1,000,000 | | | 3.125%, 5/15/15 | | | 1,030,605 | | | |
| | 1,000,000 | | | 4.125%, 2/24/20 | | | 1,011,477 | | | |
| | 3,000,000 | | | 5.625%, 11/15/21 | | | 3,120,102 | | | |
| | | | | | | | 9,165,580 | | | |
| Government National Mortgage
Association — 2.2% | | | | | | |
| | 1,500,000 | | | 5.500%, 1/20/23 | | | 1,623,876 | | | |
| | 1,000,000 | | | 5.000%, 5/20/32 | | | 1,061,841 | | | |
| | | | | | | | 2,685,717 | | | |
| Total U.S. Government Agencies
(Cost $64,730,082) | | | 67,505,708 | | | |
| U.S. Government Mortgage Backed
Agencies — 20.7% | | | | | | |
| Federal Home Loan Mortgage Corporation —5.4% | | | | | | |
| | 247,520 | | | Pool # M81004, 5.000%, 1/1/13 | | | 255,988 | | | |
| | 181,812 | | | Pool # E01184, 6.000%, 8/1/17 | | | 198,014 | | | |
| | 604,903 | | | Pool # B10827, 4.500%, 11/1/18 | | | 638,551 | | | |
| | 1,116,711 | | | Pool # J03237, 5.500%, 11/1/20 | | | 1,208,665 | | | |
| | 572,160 | | | Pool # C90699, 5.000%, 8/1/23 | | | 608,153 | | | |
| | 680,212 | | | Pool # C91296, 5.000%, 4/1/28 | | | 713,825 | | | |
| | 300,276 | | | Pool # G08168, 5.500%, 8/1/34 | | | 322,152 | | | |
| | 372,771 | | | Pool # 1G0865, 4.837%, 7/1/35 (a) | | | 391,274 | | | |
| | 1,340,303 | | | Pool # 972190, 5.415%, 11/1/35 (a) | | | 1,433,445 | | | |
| | 657,434 | | | Pool # G03609, 5.500%, 10/1/37 | | | 701,427 | | | |
| | | | | | | | 6,471,494 | | | |
(See notes which are an integral part of the Financial Statements)
Annual Shareholder Report
83
| | |
| Huntington Intermediate Government Income Fund | | (Continued) |
| | | | | | | | | | |
Principal
Amount | | Value | | | |
| | | | | | | | | | |
| U.S. Government Mortgage Backed Agencies —
(Continued) |
| | |
| Federal National Mortgage Association — 12.3% | | | |
| $ | 133,317 | | | Pool # 647408, 5.000%, 10/1/17 | | $ | 142,587 | | | |
| | 825,521 | | | Pool # 357805, 5.000%, 6/1/20 | | | 876,213 | | | |
| | 886,008 | | | Pool # 889799, 5.500%, 2/1/23 | | | 953,705 | | | |
| | 304,534 | | | Pool # 255360, 5.000%, 10/1/23 | | | 324,300 | | | |
| | 721,310 | | | Pool # 255360, 5.000%, 8/1/24 | | | 767,406 | | | |
| | 682,817 | | | Pool # 256213, 5.500%, 6/1/25 | | | 737,976 | | | |
| | 946,563 | | | Pool # 256213, 4.500%, 11/1/25 | | | 995,548 | | | |
| | 673,222 | | | Pool # 256213, 6.000%, 2/1/26 | | | 734,969 | | | |
| | 542,118 | | | Pool # 256213, 6.000%, 4/1/26 | | | 591,840 | | | |
| | 913,650 | | | Pool # 257536, 5.000%, 1/1/29 | | | 961,469 | | | |
| | 1,041,064 | | | Pool # MA0171, 4.500%, 7/1/29 | | | 1,080,108 | | | |
| | 992,470 | | | Pool # MA0563, 4.000%, 11/1/30 | | | 1,005,667 | | | |
| | 485,352 | | | Pool # 254594, 5.500%, 1/1/33 | | | 522,553 | | | |
| | 796,925 | | | Pool # 783793, 6.000%, 7/1/34 | | | 877,894 | | | |
| | 424,282 | | | Pool # 806715, 5.500%, 1/1/35 | | | 456,670 | | | |
| | 622,293 | | | Pool # 807963, 5.000%, 1/1/35 | | | 658,557 | | | |
| | 799,402 | | | Pool # 735224, 5.500%, 2/1/35 | | | 861,674 | | | |
| | 757,946 | | | Pool # 868935, 5.500%, 5/1/36 | | | 812,725 | | | |
| | 362,907 | | | Pool # 907484, 6.000%, 1/1/37 | | | 394,903 | | | |
| | 963,290 | | | Pool # AD7906, 5.000%, 7/1/40 | | | 1,013,407 | | | |
| | 14,770,171 | | | |
| Government National Mortgage Association — 3.0% | | | |
| | 635,957 | | | Pool # 683937, 5.500%, 2/15/23 | | | 687,727 | | | |
| | 756,436 | | | Pool # 666057, 5.000%, 3/15/23 | | | 807,377 | | | |
| | 183,333 | | | Pool # 2699, 6.000%, 1/20/29 | | | 202,132 | | | |
| | 234,562 | | | Pool # 576456, 6.000%, 3/15/32 | | | 258,982 | | | |
| | 646,558 | | | Pool # 676974, 5.500%, 5/15/38 | | | 699,391 | | | |
| | 962,331 | | | Pool # 733602, 5.000%, 4/15/40 | | | 1,030,392 | | | |
| | | | | 3,686,001 | | | |
| Total U.S. Government Mortgage Backed Agencies
(Cost $23,688,835) | | | 24,927,666 | | | |
| U.S. Treasury Obligations — 13.0% | | | |
| U.S. Treasury Inflation Protection Notes — 1.8% | | | |
| | 2,000,000 | | | 4.250%, 11/15/14 | | | 2,211,094 | | | |
| U.S. Treasury Notes — 11.2% | | | |
| | 2,000,000 | | | 2.625%, 11/15/20 | | | 1,886,562 | | | |
| | 1,000,000 | | | 5.000%, 8/15/11 | | | 1,029,375 | | | |
| | 1,000,000 | | | 4.125%, 8/31/12 | | | 1,059,922 | | | |
| | 3,000,000 | | | 2.125%, 11/30/14 | | | 3,073,125 | | | |
| | 1,500,000 | | | 2.000%, 1/15/16 | | | 1,799,864 | | | |
| | | | | | | | | | |
Principal
Amount
or Shares | | Value | | | |
| | | | | | | | | | |
| U.S. Treasury Obligations — (Continued) | | | |
| U.S. Treasury Notes — (Continued) | | | |
| $ | 2,000,000 | | | 4.500%, 2/15/16 | | $ | 2,239,532 | | | |
| | 2,000,000 | | | 5.125%, 5/15/16 | | | 2,304,218 | | | |
| | | | | 13,392,598 | | | |
| Total U.S. Treasury Obligations
(Cost $14,496,567) | | | 15,603,692 | | | |
| Collateralized Mortgage Obligations — 6.3% | | | | | | |
| Federal Home Loan Mortgage
Corporation — 5.6% | | | | | | |
| | 355,664 | | | Series 2543, 4.250%, 1/15/18 | | | 375,495 | | | |
| | 2,500,000 | | | Series 2571, 5.500%, 7/15/21 | | | 2,682,151 | | | |
| | 84,964 | | | Series 2676, 5.500%, 1/15/29 | | | 85,065 | | | |
| | 1,784,110 | | | Series 2802, 5.500%, 11/15/31 | | | 1,897,965 | | | |
| | 1,000,000 | | | Series 2974, 5.000%, 9/15/31 | | | 1,035,742 | | | |
| | 542,180 | | | Series 2976, 4.500%, 1/15/33 | | | 575,068 | | | |
| | 65,181 | | | Series R007, 5.875%, 5/15/16 | | | 65,784 | | | |
| | | | | | | | 6,717,270 | | | |
| Federal National Mortgage Association — 0.7% | | | | | | |
| | 469,744 | | | Series 2003-11, 5.500%, 8/25/32 | | | 503,969 | | | |
| | 136,998 | | | Series 2003-16, 4.000%, 2/25/33 | | | 144,162 | | | |
| | 155,673 | | | Series 2003-32, 5.000%, 3/25/17 | | | 158,500 | | | |
| | | | | | | | 806,631 | | | |
| Total Collateralized Mortgage Obligations
(Cost $7,101,810) | | | 7,523,901 | | | |
| Corporate Bonds — 1.7% | | | | | | |
| Financials — 1.7% | | | | | | |
| | 2,000,000 | | | Morgan Stanley, 1.950%, 6/20/12 (b) | | | 2,041,356 | | | |
| Total Corporate Bonds(Cost $1,999,632) | | | 2,041,356 | | | |
| Cash Equivalents — 1.5% | | | | | | |
| | 1,783,867 | | | Huntington Money Market Fund, Interfund Shares,
0.010% (c) (d) | | | 1,783,867 | | | |
| Total Cash Equivalents (Cost $1,783,867) | | | 1,783,867 | | | |
| Total Investments (Cost $113,800,793) — 99.4% | | | 119,386,190 | | | |
| Other Assets in Excess of Liabilities — 0.6% | | | 758,252 | | | |
| Net Assets — 100.0% | | $ | 120,144,442 | | | |
| (a) | Variable or Floating Rate Security. Rate disclosed is as of December 31, 2010. |
| (b) | Security issued under terms of the Temporary Liquidity Guarantee Program and is guaranteed by the Federal Deposit Insurance Corporation. |
| (c) | Investment in affiliate. |
| (d) | Rate disclosed is the seven day yield as of December 31, 2010. |
(See notes which are an integral part of the Financial Statements)
Annual Shareholder Report
84
| | |
| | |
| Huntington Mortgage Securities Fund | | December 31, 2010 |
| | |
| Portfolio of Investments Summary Table | | (unaudited) |
| | | | |
| Asset Allocation | | Percentage of
Market Value | |
U.S. Government Mortgage Backed Securities | | | 66.7% | |
Real Estate Investment Trusts | | | 11.2% | |
Collateralized Mortgage Obligations | | | 10.4% | |
U.S. Government Agencies | | | 9.0% | |
Cash1 | | | 2.7% | |
Total | | | 100.0% | |
| 1 | Investments in an affiliated money market fund. |
Portfolio holdings and allocations are subject to change. As of December 31, 2010, percentages in the table above are based on total investments. Such total investments may differ from the percentages set forth below in the Portfolio of Investments which are computed using the Fund’s total net assets.
The Portfolio of Investments Summary Table and the Portfolio of Investments are broken down by sectors, and these sectors do not represent industry categories for purposes of identifying “industry concentration” as described in the Investment Company Act of 1940, as amended.
Portfolio of Investments
| | | | | | | | | | |
Principal
Amount | | | | | Value | | | |
| | | | | | | | | | |
| U.S. Government Mortgage Backed
Agencies — 66.6% | | | | | | |
| Federal Home Loan Mortgage Corporation — 19.8% | | | | | | |
| $ | 140,302 | | | Pool # M81004, 5.000%, 7/1/11 | | $ | 143,848 | | | |
| | 1,586 | | | Pool # E65142, 6.500%, 7/1/11 | | | 1,729 | | | |
| | 247,520 | | | Pool # M81004, 5.000%, 1/1/13 | | | 256,065 | | | |
| | 270,583 | | | Pool # J03237, 5.500%, 8/1/16 | | | 290,200 | | | |
| | 163,095 | | | Pool # E96459, 5.000%, 5/1/18 | | | 173,951 | | | |
| | 63,814 | | | Pool # C90699, 6.500%, 11/1/18 | | | 70,417 | | | |
| | 604,903 | | | Pool # B10827, 4.500%, 11/1/18 | | | 638,740 | | | |
| | 748,590 | | | Pool # J10396, 4.000%, 7/1/19 | | | 777,364 | | | |
| | 275,532 | | | Pool # G12425, 6.000%, 7/1/21 | | | 300,933 | | | |
| | 979,492 | | | Pool # G12867, 4.500%, 8/1/22 | | | 1,033,058 | | | |
| | 430,477 | | | Pool # C90699, 5.000%, 1/1/24 | | | 456,400 | | | |
| | 450,674 | | | Pool # C90699, 5.500%, 10/1/24 | | | 486,123 | | | |
| | 541,131 | | | Pool # C91296, 5.500%, 11/1/26 | | | 582,476 | | | |
| | 680,212 | | | Pool # C91296, 5.000%, 4/1/28 | | | 714,038 | | | |
| | 939,918 | | | Pool # C91296, 5.000%, 5/1/28 | | | 986,658 | | | |
| | 174,461 | | | Pool # C00730, 6.000%, 3/1/29 | | | 191,759 | | | |
| | 3,913,741 | | | Pool # C91296, 4.500%, 6/1/29 | | | 4,069,305 | | | |
| | 2,539,521 | | | Pool # C91296, 5.000%, 4/1/30 | | | 2,665,806 | | | |
| | 511,383 | | | Pool # A15284, 5.500%, 10/1/33 | | | 549,517 | | | |
| | 600,553 | | | Pool # G08168, 5.500%, 8/1/34 | | | 644,398 | | | |
| | 372,771 | | | Pool # 1G0865, 4.837%, 7/1/35 (a) | | | 391,390 | | | |
| | 354,811 | | | Pool # G08168, 6.000%, 12/1/36 | | | 385,665 | | | |
| | 529,758 | | | Pool # A55565, 6.000%, 12/1/36 | | | 575,826 | | | |
| | 572,345 | | | Pool # G03609, 5.500%, 11/1/37 | | | 610,733 | | | |
| | 1,989,751 | | | Pool # G06023, 4.000%, 9/1/40 | | | 1,977,967 | | | |
| | 995,012 | | | Pool # A94008, 4.000%, 9/1/40 | | | 989,119 | | | |
| | | | | | | | 19,963,485 | | | |
| Federal National Mortgage Association — 40.4% | | | | | | |
| | 217,134 | | | Pool # 254594, 5.000%, 9/1/17 | | | 232,266 | | | |
| | 255,080 | | | Pool # 663808, 5.000%, 11/1/17 | | | 272,856 | | | |
| | 357,385 | | | Pool # 684488, 5.000%, 12/1/17 | | | 382,290 | | | |
| | 483,114 | | | Pool # 693256, 5.000%, 4/1/18 | | | 517,385 | | | |
| | 324,022 | | | Pool # 254594, 4.500%, 5/1/18 | | | 343,362 | | | |
| | 324,414 | | | Pool # 786729, 5.500%, 8/1/19 | | | 352,293 | | | |
| | | | | | | | | | |
Principal
Amount | | | | | Value | | | |
| | | | | | | | | | |
| U.S. Government Mortgage Backed
Agencies — (Continued) | | | | | | |
| Federal National Mortgage
Association — (Continued) | | | | | | |
| $ | 403,550 | | | Pool # 896597, 5.000%, 8/1/21 | | $ | 429,781 | | | |
| | 400,277 | | | Pool # 255360, 5.000%, 8/1/23 | | | 426,383 | | | |
| | 852,505 | | | Pool # 255360, 5.000%, 9/1/23 | | | 908,104 | | | |
| | 802,807 | | | Pool # 255360, 5.000%, 10/1/23 | | | 855,165 | | | |
| | 347,305 | | | Pool # 255360, 5.000%, 7/1/24 | | | 369,956 | | | |
| | 2,582,913 | | | Pool # 932438, 4.000%, 1/1/25 | | | 2,664,840 | | | |
| | 1,074,039 | | | Pool # 256213, 5.500%, 4/1/25 | | | 1,161,137 | | | |
| | 317,469 | | | Pool # 357805, 5.000%, 5/1/25 | | | 337,856 | | | |
| | 648,202 | | | Pool # 256213, 4.500%, 6/1/25 | | | 682,598 | | | |
| | 946,563 | | | Pool # 256213, 4.500%, 11/1/25 | | | 995,844 | | | |
| | 841,528 | | | Pool # 256213, 6.000%, 2/1/26 | | | 918,975 | | | |
| | 1,841,070 | | | Pool # 257281, 5.000%, 4/1/28 | | | 1,938,005 | | | |
| | 1,091,585 | | | Pool # 257281, 5.000%, 6/1/28 | | | 1,149,058 | | | |
| | 1,011,952 | | | Pool # 257281, 5.000%, 7/1/28 | | | 1,065,233 | | | |
| | 913,650 | | | Pool # 257536, 5.000%, 1/1/29 | | | 961,754 | | | |
| | 1,665,702 | | | Pool # MA0171, 4.500%, 7/1/29 | | | 1,728,693 | | | |
| | 3,448,390 | | | Pool # AC1219, 4.500%, 8/1/29 | | | 3,578,452 | | | |
| | 1,740,138 | | | Pool # MA0171, 4.500%, 9/1/29 | | | 1,805,771 | | | |
| | 992,470 | | | Pool # MA0563, 4.000%, 11/1/30 | | | 1,005,977 | | | |
| | 49,808 | | | Pool # 602879, 6.000%, 11/1/31 | | | 54,876 | | | |
| | 918,107 | | | Pool # 729535, 5.500%, 7/1/33 | | | 989,769 | | | |
| | 90,985 | | | Pool # 748422, 6.000%, 8/1/33 | | | 100,244 | | | |
| | 493,418 | | | Pool # 786457, 5.337%, 7/1/34 (a) | | | 525,995 | | | |
| | 796,924 | | | Pool # 783793, 6.000%, 7/1/34 | | | 878,019 | | | |
| | 254,519 | | | Pool # 814261, 6.000%, 1/1/35 | | | 279,226 | | | |
| | 424,282 | | | Pool # 806715, 5.500%, 1/1/35 | | | 456,737 | | | |
| | 799,402 | | | Pool # 735224, 5.500%, 2/1/35 | | | 861,799 | | | |
| | 239,555 | | | Pool # 836450, 6.000%, 10/1/35 | | | 261,462 | | | |
| | 509,015 | | | Pool # 845573, 5.520%, 2/1/36 (a) | | | 542,231 | | | |
| | 484,569 | | | Pool # 745511, 5.000%, 4/1/36 | | | 510,158 | | | |
| | 834,998 | | | Pool # 745511, 5.500%, 4/1/36 | | | 898,086 | | | |
| | 324,100 | | | Pool # 888029, 6.000%, 12/1/36 | | | 353,333 | | | |
| | 362,907 | | | Pool # 907484, 6.000%, 1/1/37 | | | 394,959 | | | |
| | 963,290 | | | Pool # AD7906, 5.000%, 7/1/40 | | | 1,013,557 | | | |
(See notes which are an integral part of the Financial Statements)
Annual Shareholder Report
85
| | |
| Huntington Mortgage Securities Fund | | (Continued) |
| | | | | | | | | | |
Principal
Amount or
Shares | | | | | Value | | | |
| | | | | | | | | | |
| U.S. Government Mortgage Backed
Agencies — (Continued) | | | | | | |
| Federal National Mortgage
Association — (Continued) | | | | | | |
| $ | 3,959,509 | | | Pool # AE4310, 4.000%, 9/1/40 | | $ | 3,944,102 | | | |
| | 1,477,088 | | | Pool # AE4628, 4.500%, 10/1/40 | | | 1,518,028 | | | |
| | 1,953,796 | | | Pool # AE0395, 4.500%, 10/1/40 | | | 2,007,937 | | | |
| | | | | | | | 40,674,552 | | | |
| Government National Mortgage
Association — 6.4% | | | | | | |
| | 615,336 | | | Pool # 683937, 5.000%, 1/15/23 | | | 660,717 | | | |
| | 645,846 | | | Pool # 691761, 5.000%, 7/15/23 | | | 689,340 | | | |
| | 1,890,179 | | | Pool # 605653, 5.500%, 8/15/34 | | | 2,053,197 | | | |
| | 1,190,476 | | | Pool # 3741, 5.500%, 11/20/34 | | | 1,287,893 | | | |
| | 646,558 | | | Pool # 676974, 5.500%, 5/15/38 | | | 699,391 | | | |
| | 962,331 | | | Pool # 733602, 5.000%, 4/15/40 | | | 1,030,543 | | | |
| | | | | | | | 6,421,081 | | | |
| Total U.S. Government Mortgage Backed Agencies
(Cost $65,162,788) | | | 67,059,118 | | | |
| Common Stocks — 11.2% | | | | | | |
| Real Estate Investment Trusts — 11.2% | | | | | | |
| | 10,074 | | | Acadia Realty Trust | | | 183,750 | | | |
| | 7,500 | | | Alexandria Real Estate Equities, Inc. | | | 549,450 | | | |
| | 2,000 | | | AMB Property Corp. | | | 63,420 | | | |
| | 11,000 | | | American Campus Communities, Inc. | | | 349,360 | | | |
| | 1,000 | | | Associated Estates Realty Corp. | | | 15,290 | | | |
| | 3,000 | | | BioMed Realty Trust, Inc. | | | 55,950 | | | |
| | 5,500 | | | Boston Properties, Inc. | | | 473,550 | | | |
| | 6,500 | | | Brandywine Realty Trust | | | 75,725 | | | |
| | 1,000 | | | Camden Property Trust | | | 53,980 | | | |
| | 6,000 | | | Cogdell Spencer, Inc. | | | 34,800 | | | |
| | 1,000 | | | Coresite Realty Corp. | | | 13,640 | | | |
| | 2,000 | | | Corporate Office Properties Trust | | | 69,900 | | | |
| | 1,000 | | | Developers Diversified Realty Corp. | | | 14,090 | | | |
| | 7,500 | | | Digital Realty Trust, Inc. | | | 386,550 | | | |
| | 16,000 | | | Douglas Emmett, Inc. | | | 265,600 | | | |
| | 15,000 | | | Duke Realty Corp. | | | 186,900 | | | |
| | 5,000 | | | DuPont Fabros Technology, Inc. | | | 106,350 | | | |
| | 9,000 | | | EastGroup Properties, Inc. | | | 380,880 | | | |
| | 8,500 | | | Equity Lifestyle Properties, Inc. | | | 475,405 | | | |
| | 8,000 | | | Equity Residential | | | 415,600 | | | |
| | 4,500 | | | Essex Property Trust, Inc. | | | 513,990 | | | |
| | 2,000 | | | Excel Trust, Inc. | | | 24,200 | | | |
| | 1,500 | | | Federal Realty Investment Trust | | | 116,895 | | | |
| | 7,000 | | | HCP, Inc. | | | 257,530 | | | |
| | 3,500 | | | Healthcare Realty Trust, Inc. | | | 74,095 | | | |
| | | | | | | | | | |
Principal
Amount or
Shares | | | | | Value | | | |
| | | | | | | | | | |
| Common Stocks — (Continued) | | | | | | |
| Real Estate Investment Trusts — (Continued) | | | | | | |
| | 8,000 | | | Home Properties, Inc. | | $ | 443,920 | | | |
| | 12,616 | | | Host Hotels & Resorts, Inc. | | | 225,448 | | | |
| | 9,600 | | | Kimco Realty Corp. | | | 173,184 | | | |
| | 10,000 | | | Kite Realty Group Trust | | | 54,100 | | | |
| | 13,000 | | | LaSalle Hotel Properties | | | 343,200 | | | |
| | 12,000 | | | Mack-Cali Realty Corp. | | | 396,720 | | | |
| | 7,500 | | | National Retail Properties, Inc. | | | 198,750 | | | |
| | 3,500 | | | Pennsylvania Real Estate Investment Trust | | | 50,855 | | | |
| | 1,000 | | | Post Properties, Inc. | | | 36,300 | | | |
| | 9,386 | | | ProLogis Trust | | | 135,534 | | | |
| | 5,000 | | | Public Storage, Inc. | | | 507,100 | | | |
| | 2,000 | | | Realty Income Corp. | | | 68,400 | | | |
| | 6,500 | | | Regency Centers Corp. | | | 274,560 | | | |
| | 4,980 | | | Simon Property Group, Inc. | | | 495,460 | | | |
| | 1,903 | | | SL Green Realty Corp. | | | 128,472 | | | |
| | 1,000 | | | Sovran Self Storage, Inc. | | | 36,810 | | | |
| | 9,000 | | | Tanger Factory Outlet Centers, Inc. | | | 460,710 | | | |
| | 1,000 | | | Terreno Realty Corp.* | | | 17,930 | | | |
| | 11,915 | | | The Macerich Co. | | | 564,414 | | | |
| | 6,376 | | | UDR, Inc. | | | 149,963 | | | |
| | 10,000 | | | Ventas, Inc. | | | 524,800 | | | |
| | 5,936 | | | Vornado Realty Trust | | | 494,647 | | | |
| | 5,000 | | | Washington Real Estate Investment Trust | | | 154,950 | | | |
| | 7,500 | | | Weingarten Realty Investors | | | 178,200 | | | |
| | 2,000 | | | Westfield Group | | | 19,580 | | | |
| | 2,000 | | | Westfield Retail Trust* | | | 5,253 | | | |
| Total Common Stocks (Cost $8,900,253) | | | 11,296,160 | | | |
| Collateralized Mortgage Obligations — 10.4% | | | | | | |
| Citigroup Mortgage Securities, Inc. — 0.9% | | | | | | |
| $ | 957,146 | | | 5.500%, 10/25/35 | | | 958,551 | | | |
| Collateralized Mortgage Obligations — 0.4% | | | | | | |
| | 345,377 | | | Series Z2-2013, 4.800%, 2/25/13 | | | 362,130 | | | |
| Federal Home Loan Mortgage Corporation — 8.5% | | | | | | |
| | 1,000,000 | | | Series 2541, 5.500%, 11/15/20 | | | 1,044,863 | | | |
| | 446,427 | | | Series 2543, 5.500%, 4/15/22 | | | 473,703 | | | |
| | 1,000,000 | | | Series 2571, 5.500%, 7/15/21 | | | 1,072,860 | | | |
| | 420,191 | | | Series 2584, 4.000%, 12/15/13 | | | 426,515 | | | |
| | 1,000,000 | | | Series 2672, 5.500%, 8/15/31 | | | 1,065,494 | | | |
| | 84,964 | | | Series 2676, 5.500%, 1/15/29 | | | 85,065 | | | |
(See notes which are an integral part of the Financial Statements)
Annual Shareholder Report
86
| | |
| Huntington Mortgage Securities Fund | | (Continued) |
| | | | | | | | | | |
Principal
Amount | | | | | Value | | | |
| Federal Home Loan Mortgage Corporation —
(Continued) | | | | | | |
| $ | 628,791 | | | Series 2770, 4.000%, 1/15/18 | | $ | 652,047 | | | |
| | 1,000,000 | | | Series 2784, 4.000%, 4/15/19 | | | 1,049,299 | | | |
| | 1,000,000 | | | Series 2802, 5.500%, 11/15/31 | | | 1,063,816 | | | |
| | 1,000,000 | | | Series 2974, 5.000%, 9/15/31 | | | 1,035,742 | | | |
| | 542,180 | | | Series 2976, 4.500%, 1/15/33 | | | 575,068 | | | |
| | | | | | | | 8,544,472 | | | |
| Federal National Mortgage Association — 0.6% | | | | | | |
| | 429,206 | | | Series 1999-13,
6.000%, 4/25/29 | | | 472,809 | | | |
| | 107,591 | | | Series 2002-62,
5.500%, 12/25/16 | | | 108,184 | | | |
| | | | | | | | 580,993 | | | |
| Total Collateralized Mortgage Obligations
(Cost $9,959,722) | | | 10,446,146 | | | |
| U.S. Government Agencies — 8.9% | | | | | | |
| Federal Home Loan Bank — 3.2% | | | | | | |
| | 1,000,000 | | | 4.250%, 3/9/18 | | | 1,081,320 | | | |
| | 2,000,000 | | | 4.125%, 12/13/19 | | | 2,108,668 | | | |
| | | | | | | | 3,189,988 | | | |
| Federal Home Loan Mortgage Corporation — 2.3% | | | | | | |
| | 500,000 | | | 4.500%, 4/2/14 | | | 547,874 | | | |
| | 382,906 | | | 4.500%, 3/15/17 | | | 386,303 | | | |
| | 537,320 | | | 5.250%, 4/15/17 | | | 570,886 | | | |
| | 534,004 | | | 5.000%, 9/15/17 | | | 569,596 | | | |
| | 298,839 | | | 5.000%, 7/15/35 | | | 307,535 | | | |
| | | | | | | | 2,382,194 | | | |
| | | | | | | | | | |
Principal
Amount or
Shares | | | | | Value | | | |
| U.S. Government Agencies — (Continued) | | | | | | |
| Federal National Mortgage Association — 3.4% | | | | | | |
| $ | 1,000,000 | | | 5.000%, 3/2/15 | | $ | 1,125,352 | | | |
| | 98,164 | | | 6.000%, 11/25/22 | | | 99,732 | | | |
| | 332,048 | | | 5.000%, 3/25/23 | | | 353,890 | | | |
| | 43,497 | | | 5.500%, 11/25/28 | | | 43,479 | | | |
| | 714,454 | | | 5.000%, 12/25/31 | | | 740,263 | | | |
| | 1,000,000 | | | 5.000%, 3/25/32 | | | 1,065,206 | | | |
| | | | | | | | 3,427,922 | | | |
| Total U.S. Government Agencies
(Cost $8,429,065) | | | 9,000,104 | | | |
| Cash Equivalents — 2.6% | | | | | | |
| | 2,668,401 | | | Huntington Money Market Fund, Interfund Shares,
0.010% (b) (c) | | | 2,668,401 | | | |
| Total Cash Equivalents (Cost $2,668,401) | | | 2,668,401 | | | |
| Total Investments (Cost $95,070,367) — 99.7% | | | 100,469,929 | | | |
| Other Assets in Excess of Liabilities — 0.3% | | | 272,049 | | | |
| Net Assets — 100.0% | | $ | 100,741,978 | | | |
| (a) | Variable or Floating Rate Security. Rate disclosed is as of December 31, 2010. |
| (b) | Investment in affiliate. |
| (c) | Rate disclosed is the seven day yield as of December 31, 2010. |
| * | Non-income producing security. |
(See notes which are an integral part of the Financial Statements)
Annual Shareholder Report
87
| | |
| | |
| Huntington Ohio Tax Free Fund | | December 31, 2010 |
| | |
| Portfolio of Investments Summary Table | | (unaudited) |
| | | | |
| Asset Allocation | | Percentage of
Market Value | |
General Obligations | | | 37.2% | |
School Districts | | | 30.0% | |
Higher Education | | | 10.6% | |
Water | | | 8.3% | |
General Fund | | | 3.6% | |
Facilities | | | 3.3% | |
Airports | | | 2.5% | |
Medical | | | 1.8% | |
Power | | | 1.4% | |
Other | | | 0.8% | |
Cash | | | 0.5% | |
Transportation | | | 0.0% | |
Total | | | 100.0% | |
Portfolio holdings and allocations are subject to change. As of December 31, 2010, percentages in the table above are based on total investments. Such total investments may differ from the percentages set forth below in the Portfolio of Investments which are computed using the Fund’s total net assets.
The Portfolio of Investments Summary Table and the Portfolio of Investments are broken down by sectors, and these sectors do not represent industry categories for purposes of identifying “industry concentration” as described in the Investment Company Act of 1940, as amended.
Portfolio of Investments
| | | | | | | | | | |
Principal
Amount | | | | | Value | | | |
| | | | | | | | | | |
| Municipal Bonds — 99.3% | | | | | | |
| Ohio — 99.3% | | | | | | |
| $ | 225,000 | | | Akron, OH, G.O., (AMBAC Ins.), 5.000%, 12/1/24 | | $ | 234,821 | | | |
| | 500,000 | | | Akron, OH, Series A, 5.000%, 12/1/16 | | | 560,635 | | | |
| | 70,000 | | | Akron, OH, Refunding & Improvement, G.O., (National Reinsurance), 5.250%, 12/1/18 | | | 70,819 | | | |
| | 50,000 | | | Akron, OH, Bath Copley Joint Township Hospital District, (AGM Ins.), 5.250%, 11/15/15 | | | 51,435 | | | |
| | 100,000 | | | Akron, OH, G.O., (MBIA-RE FGIC Ins.), 5.000%, 12/1/22 | | | 102,014 | | | |
| | 120,000 | | | Akron, OH, Pension Funding Refunding Revenue, (AMBAC Ins.),
5.250%, 12/1/18 | | | 126,976 | | | |
| | 100,000 | | | Ashland, OH, Various Purposes, 4.500%, 12/1/22 | | | 101,438 | | | |
| | 205,000 | | | Avon Lake, OH, G.O., 3.500%, 12/1/17 | | | 212,905 | | | |
| | 150,000 | | | Barberton, OH, City School District, 5.000%, 12/1/22 | | | 161,820 | | | |
| | 115,000 | | | Big Walnut, OH, Local School District, (AGM Ins.), 5.000%, 12/1/22 | | | 122,018 | | | |
| | 205,000 | | | Bowling Green State University, OH, General Receipts Revenue, (AMBAC Ins.), 5.250%, 6/1/19 | | | 212,817 | | | |
| | | | | | | | | | |
Principal
Amount | | | | | Value | | | |
| | | | | | | | | | |
| Municipal Bonds — (Continued) | | | | | | |
| Ohio — (Continued) | | | | | | |
| $ | 320,000 | | | Bowling Green, OH, City School District, (AGM Ins.),
5.000%, 12/1/24 | | $ | 337,542 | | | |
| | 500,000 | | | Brookfield Local School District, OH, School Facilities Improvement, G.O., (AGM Ins. Student Credit Program), 5.000%, 1/15/22 | | | 532,570 | | | |
| | 250,000 | | | Bucyrus, OH, City School District, (AGM Ins.), 5.000%, 12/1/22 | | | 264,237 | | | |
| | 400,000 | | | Butler County, OH, G.O., (AMBAC Ins.), 4.750%, 12/1/24 | | | 417,200 | | | |
| | 300,000 | | | Butler County, OH, Sewer Systems Revenue, (AGM Ins.),
5.000%, 12/1/19 | | | 331,026 | | | |
| | 445,000 | | | Butler County, OH, G.O.,
4.000%, 12/1/21 | | | 451,177 | | | |
| | 170,000 | | | Butler County, OH, G.O., (AMBAC Ins.), 4.750%, 12/1/20 | | | 178,259 | | | |
| | 500,000 | | | Centerville, OH, G.O., (National Reinsurance), 5.000%, 12/1/20 | | | 531,775 | | | |
| | 200,000 | | | Chagrin Falls, OH, Exempt Village School District, G.O., (MBIA Ins.), 5.250%, 12/1/19 | | | 215,316 | | | |
(See notes which are an integral part of the Financial Statements)
Annual Shareholder Report
88
| | |
| Huntington Ohio Tax Free Fund | | (Continued) |
| | | | | | | | | | |
Principal
Amount | | | | | Value | | | |
| | | | | | | | | | |
| Municipal Bonds — (Continued) | | | | | | |
| Ohio — (Continued) | | | | | | |
| $ | 400,000 | | | Cincinnati, OH, Recovery Zone Facility Revenue, Series A, (AMBAC Ins.), 4.000%, 11/1/19 | | $ | 407,136 | | | |
| | 500,000 | | | Cleveland, OH, Public Power System Revenue, Series A, (National Reinsurance, FGIC Ins.),
5.000%, 11/15/16 | | | 557,630 | | | |
| | 600,000 | | | Cleveland, OH, Municipal School District, G.O., (National Reinsurance, FGIC Ins., Student Credit Program), 5.000%, 12/1/21 | | | 622,272 | | | |
| | 65,000 | | | Cleveland, OH, Waterworks Refunding Revenue, Series G, (MBIA Ins.), 5.500%, 1/1/13 | | | 66,466 | | | |
| | 335,000 | | | Cleveland, OH, State University Revenue, (FGIC Ins.),
5.000%, 6/1/17 | | | 370,483 | | | |
| | 400,000 | | | Cleveland, OH, School District Refunding, G.O., (FGIC Ins.), 5.000%, 12/1/18 | | | 419,096 | | | |
| | 365,000 | | | Cleveland, OH, Airport System Revenue, Series C, (Assured Guaranty), 5.000%, 1/1/23 | | | 374,665 | | | |
| | 500,000 | | | Cleveland, OH, Airport System Revenue, Series C, (AGM Ins.), 5.000%, 1/1/18 | | | 540,205 | | | |
| | 80,000 | | | Cleveland, OH, School District Refunding, G.O., (FGIC Ins.), 5.250%, 12/1/14 | | | 85,755 | | | |
| | 150,000 | | | Cleveland, OH, Income Tax Revenue, 5.000%, 5/15/17 | | | 166,242 | | | |
| | 150,000 | | | Clyde-Green Springs Exempted Village School District, School Facilities Construction and Improvement, 5.000%, 12/1/19 | | | 165,591 | | | |
| | 100,000 | | | Columbus, OH, Regional Airport Authority Revenue, (AGM National Reinsurance), 5.000%, 1/1/21 | | | 105,551 | | | |
| | 250,000 | | | Columbus, OH, Regional Airport Authority Revenue, (MBIA Ins.), 5.000%, 1/1/20 | | | 266,347 | | | |
| | 500,000 | | | Columbus, OH, Refunding, G.O., Series C, 5.000%, 7/15/16 | | | 565,545 | | | |
| | 250,000 | | | Cuyahoga County, OH, Refunding Revenue, Series A, 5.750%, 1/1/24 | | | 259,125 | | | |
| | 500,000 | | | Cuyahoga County, OH, Revenue, Series A, 6.000%, 1/1/17 | | | 539,835 | | | |
| | | | | | | | | | |
Principal
Amount | | | | | Value | | | |
| | | | | | | | | | |
| Municipal Bonds — (Continued) | | | | | | |
| Ohio — (Continued) | | | | | | |
| $ | 250,000 | | | Delaware, OH, Parks & Recreational Income Tax Special Obligation Revenue, 4.000%, 12/1/19 | | $ | 256,595 | | | |
| | 250,000 | | | Dublin, OH, City School District, School Facilities Construction & Improvement, G.O., (AGM Ins.), 5.000%, 12/1/20 | | | 267,187 | | | |
| | 360,000 | | | Fairfield Union, OH, Local School District, G.O., (AGM Ins.),
4.250%, 12/1/18 | | | 381,578 | | | |
| | 150,000 | | | Fairless, OH, Local School District, G.O., (AGM Ins.), 5.000%, 12/1/21 | | | 155,754 | | | |
| | 65,000 | | | Field, OH, Local School District, G.O., 5.000%, 12/1/19 | | | 65,534 | | | |
| | 115,000 | | | Field, OH, Local School District, G.O., (AMBAC Ins.), 5.000%, 12/1/18 | | | 117,362 | | | |
| | 220,000 | | | Findlay, OH, City School District, Capital Appreciation School Facilities Construction & Improvement, G.O., Series A, 0.000%, 12/1/17 (a) | | | 172,775 | | | |
| | 155,000 | | | Forest Hills, OH, Local School District, (AGM Ins.), 4.750%, 12/1/16 | | | 164,488 | | | |
| | 190,000 | | | Franklin County, OH, Municipal Facilities Improvements, G.O., (MBIA Ins.), 4.650%, 12/1/15 | | | 198,022 | | | |
| | 350,000 | | | Franklin County, OH, Hospital Revenue, 4.000%, 11/1/16 | | | 368,749 | | | |
| | 35,000 | | | Gallia, OH, County Local School District, Local School District, G.O., (AGM Ins.), 4.500%, 12/1/20 | | | 35,519 | | | |
| | 215,000 | | | Greater Cleveland Regional Transit Authority, OH, G.O., (FGIC Ins.), 5.000%, 12/1/15 | | | 242,099 | | | |
| | 335,000 | | | Greater Cleveland Regional Transit Authority, OH, Capital Improvement, G.O., (MBIA-RE FGIC Ins.),
5.000%, 12/1/21 | | | 354,313 | | | |
| | 450,000 | | | Greene County, OH, Sewer Systems Revenue, (AMBAC Ins.),
5.000%, 12/1/18 | | | 488,619 | | | |
| | 275,000 | | | Greene County, OH, Water & Sewer Revenue, (AGM Ins.),
5.000%, 12/1/21 | | | 288,799 | | | |
| | 540,000 | | | Greene County, OH, Refunding , G.O., Series A, (AMBAC Ins.),
5.000%, 12/1/19 | | | 608,099 | | | |
| | 170,000 | | | Hamilton County, OH, Stratford Heights Project, (AGM Ins.), 5.000%, 6/1/18 | | | 188,727 | | | |
(See notes which are an integral part of the Financial Statements)
Annual Shareholder Report
89
| | |
| Huntington Ohio Tax Free Fund | | (Continued) |
| | | | | | | | | | |
Principal
Amount | | | | | Value | | | |
| | | | | | | | | | |
| Municipal Bonds — (Continued) | | | | | | |
| Ohio — (Continued) | | | | | | |
| $ | 200,000 | | | Hamilton County, OH, Sewer Systems Revenue, Series A, (MBIA Ins.), 5.000%, 12/1/20 | | $ | 216,874 | | | |
| | 135,000 | | | Hamilton, OH, Electric Revenue, Series A, (AGM Ins.), 4.150%, 10/15/15 | | | 145,791 | | | |
| | 280,000 | | | Hamilton, OH, (Various Purposes), (Assured Guaranty),
5.000%, 11/1/21 | | | 302,140 | | | |
| | 400,000 | | | Harrison, OH, G.O., 2.600%, 12/8/11 | | | 405,144 | | | |
| | 260,000 | | | Hilliard, OH, School District, G.O., Series B, 0.000%, 12/1/18 (a) | | | 196,555 | | | |
| | 200,000 | | | Huber Heights Ohio City School District, School Improvement, 4.750%, 12/1/24 | | | 205,698 | | | |
| | 150,000 | | | Hudson, OH, G.O., (AMBAC Ins.), 5.000%, 12/1/19 | | | 160,404 | | | |
| | 75,000 | | | Independence, OH, Rockside Road Improvement, G.O., (AMBAC Ins.), 5.000%, 12/1/20 | | | 80,483 | | | |
| | 335,000 | | | Kent State University, OH, General Receipts Revenue, G.O., Series B, (Assured Guaranty), 5.000%, 5/1/19 | | | 370,229 | | | |
| | 75,000 | | | Kent State University, OH, General Receipts Revenue, Series B,
5.000%, 5/1/15 | | | 83,382 | | | |
| | 400,000 | | | Kettering, OH, City School District, G.O., (AGM Ins.), 4.750%, 12/1/22 | | | 417,252 | | | |
| | 95,000 | | | Keystone, OH, Local School District, G.O., (AGM Ins.), 5.000%, 12/1/19 | | | 99,753 | | | |
| | 285,000 | | | Lakewood City, OH, School District, G.O., (AGM Ins.), 5.000%, 12/1/18 | | | 300,658 | | | |
| | 300,000 | | | Licking Heights, OH, Local School District, G.O., (National Reinsurance, FGIC Ins.), 4.750%, 12/1/20 | | | 310,857 | | | |
| | 235,000 | | | Madison, OH, Local School District, G.O., (AGM Ins.), 4.000%, 12/1/17 | | | 242,099 | | | |
| | 600,000 | | | Medina County, OH, Library District, G.O., (FGIC Ins.), 5.250%, 12/1/20 | | | 626,388 | | | |
| | 500,000 | | | Middletown, OH, G.O., (AGM Ins.), 5.000%, 12/1/21 | | | 540,745 | | | |
| | 250,000 | | | Montgomery County, OH, Water Refunding Revenue, (AMBAC Ins.), 5.375%, 11/15/16 | | | 257,680 | | | |
| | 540,000 | | | Montgomery County, OH, Refunding & Improvement, G.O., (National Reinsurance), 5.000%, 12/1/21 | | | 572,146 | | | |
| | | | | | | | | | |
Principal
Amount | | | | | Value | | | |
| | | | | | | | | | |
| Municipal Bonds — (Continued) | | | | | | |
| Ohio — (Continued) | | | | | | |
| $ | 200,000 | | | Mount Healthy, OH, City School District, G.O., (AGM Ins.),
5.250%, 12/1/19 | | $ | 224,316 | | | |
| | 480,000 | | | Mount Vernon, OH, Waterworks Refunding Revenue, (Assured Guaranty), 5.000%, 12/1/17 | | | 530,318 | | | |
| | 50,000 | | | Mount Vernon, OH, City School District, G.O., (AGM Ins.), 5.000%, 12/1/17 | | | 54,161 | | | |
| | 400,000 | | | North Canton, OH, City School District, G.O., (Assured Guaranty),
4.000%, 12/1/15 | | | 425,816 | | | |
| | 275,000 | | | Northwest, OH, Local School District, 0.000%, 12/1/20 (a) | | | 175,818 | | | |
| | 500,000 | | | Norton, OH, City School District, Refunding School Improvement, G.O., 1.875%, 8/25/11 | | | 502,490 | | | |
| | 175,000 | | | Ohio State, G.O., 5.000%, 9/1/20 | | | 191,597 | | | |
| | 200,000 | | | Ohio Capital Asset Financing Program Fractionalized Interest, G.O., Series B, 5.000%, 12/1/22 | | | 209,018 | | | |
| | 155,000 | | | Ohio Housing Finance Agency, Single-family mortgage revenue, Series 1, 2.650%, 5/1/17 | | | 148,913 | | | |
| | 400,000 | | | Ohio Housing Finance Agency, Single-family mortgage revenue, Series 1, 3.250%, 5/1/20 | | | 374,072 | | | |
| | 750,000 | | | Ohio State, G.O., Series B,
4.500%, 9/15/23 | | | 765,472 | | | |
| | 600,000 | | | Ohio State, G.O., Series B,
4.500%, 9/15/24 | | | 608,208 | | | |
| | 500,000 | | | Ohio State, G.O., Series B,
5.000%, 9/15/19 | | | 541,165 | | | |
| | 655,000 | | | Ohio State, G.O., Series B,
5.375%, 9/1/23 | | | 714,782 | | | |
| | 50,000 | | | Ohio State, G.O., Series A,
4.000%, 9/15/18 | | | 53,875 | | | |
| | 100,000 | | | Ohio State, G.O., Series B,
5.000%, 3/1/20 | | | 107,945 | | | |
| | 130,000 | | | Ohio State, Infrastructure Improvement, G.O., Series A, 5.000%, 9/1/23 | | | 137,388 | | | |
| | 150,000 | | | Ohio State, G.O., Series B,
5.000%, 9/15/21 | | | 160,154 | | | |
| | 250,000 | | | Ohio State, G.O., Series B,
5.000%, 4/1/21 | | | 262,540 | | | |
| | 350,000 | | | Ohio State, G.O., Series B,
5.000%, 9/15/20 | | | 376,789 | | | |
| | 100,000 | | | Ohio State, G.O., Series B,
5.500%, 9/15/19 | | | 117,663 | | | |
(See notes which are an integral part of the Financial Statements)
Annual Shareholder Report
90
| | |
| Huntington Ohio Tax Free Fund | | (Continued) |
| | | | | | | | | | |
Principal
Amount | | | | | Value | | | |
| | | | | | | | | | |
| Municipal Bonds — (Continued) | | | | | | |
| Ohio — (Continued) | | | | | | |
| $ | 75,000 | | | Ohio State, G.O., Series C,
5.000%, 8/1/20 | | $ | 84,537 | | | |
| | 75,000 | | | Ohio State, G.O., Series A,
5.000%, 9/15/17 | | | 82,987 | | | |
| | 685,000 | | | Ohio State, G.O., Series B,
5.000%, 3/1/18 | | | 745,890 | | | |
| | 50,000 | | | Ohio State Air Quality Development Authority Revenue, 3.000%, 12/1/13 | | | 51,091 | | | |
| | 125,000 | | | Ohio State Building Authority, Series A, (AGM Ins.), 5.500%, 10/1/14 | | | 128,695 | | | |
| | 150,000 | | | Ohio State Building Authority, Series A, 5.000%, 4/1/16 | | | 159,767 | | | |
| | 400,000 | | | Ohio State Building Authority, Series A, 5.000%, 10/1/23 | | | 425,792 | | | |
| | 250,000 | | | Ohio State Higher Educational Facilities Commission Revenue, Denison University Project Revenue,
5.000%, 11/1/20 | | | 263,845 | | | |
| | 250,000 | | | Ohio State Higher Educational Facilities Commission Revenue, Case Western Reserve University, Series PJ-A, 4.500%, 12/1/23 | | | 251,887 | | | |
| | 115,000 | | | Ohio State Housing Finance Agency Residential Mortgage Revenue, Series J, (GNMA/FNMA/FHLMC Ins.), 4.875%, 9/1/15 | | | 120,449 | | | |
| | 175,000 | | | Ohio State Housing Finance Agency Residential Mortgage Revenue, Series J, (GNMA/FNMA/FHLMC Ins.), 5.900%, 9/1/23 | | | 184,632 | | | |
| | 180,000 | | | Ohio State Housing Finance Agency Residential Mortgage Revenue, Series J, (GNMA/FNMA/FHLMC Ins.), 5.000%, 9/1/23 | | | 184,941 | | | |
| | 150,000 | | | Ohio State Parks & Recreation Revenue, Series II-A,,
5.000%, 12/1/17 | | | 160,660 | | | |
| | 550,000 | | | Ohio State Parks & Recreation Revenue, G.O., Series A,
5.000%, 6/15/21 | | | 582,406 | | | |
| | 670,000 | | | Ohio State Parks & Recreation Revenue, G.O., Series A,
5.000%, 2/1/24 | | | 697,229 | | | |
| | 225,000 | | | Ohio State Parks & Recreation Revenue, G.O., Series A,
5.000%, 3/1/19 | | | 241,391 | | | |
| | 150,000 | | | Ohio State Parks & Recreation Revenue, G.O., Series A,
5.000%, 6/15/24 | | | 156,150 | | | |
| | | | | | | | | | |
Principal
Amount | | | | | Value | | | |
| | | | | | | | | | |
| Municipal Bonds — (Continued) | | | | | | |
| Ohio — (Continued) | | | | | | |
| $ | 300,000 | | | Ohio State Parks & Recreation Revenue, G.O., Series A,
5.000%, 5/1/22 | | $ | 312,870 | | | |
| | 150,000 | | | Ohio State Parks & Recreation Revenue, G.O., Series A,
5.000%, 6/15/22 | | | 157,686 | | | |
| | 1,000,000 | | | Ohio State Turnpike Commission, (FGIC Ins.), 5.500%, 2/15/20 | | | 1,126,560 | | | |
| | 170,000 | | | Ohio State University, General Receipts Revenue, Series A, 5.000%, 6/1/25 | | | 176,519 | | | |
| | 400,000 | | | Ohio State Water Development Authority, 5.000%, 6/1/17 | | | 437,372 | | | |
| | 395,000 | | | Olentangy, OH, Local School District, G.O., Series A, 0.000%, 12/1/10 (a) | | | 286,723 | | | |
| | 300,000 | | | Olentangy, OH, Local School District, G.O., (AGM Ins.), 5.000%, 12/1/21 | | | 321,519 | | | |
| | 500,000 | | | Olentangy, OH, Local School District, G.O., (AGM Ins.), 5.000%, 12/1/18 | | | 558,270 | | | |
| | 170,000 | | | Ottawa & Glandorf, OH, Local School District, Series A, 0.00%, 12/1/21 (a) | | | 100,973 | | | |
| | 175,000 | | | Ottawa & Glandorf, OH, Local School District, Series A,
0.000%, 12/1/20 (a) | | | 110,502 | | | |
| | 235,000 | | | Pandora Gilboa, OH, Local School District, Putnam County Capital Appreciation Refunding, G.O., (Student Credit Program),
0.000%, 12/1/15 (a) | | | 204,144 | | | |
| | 140,000 | | | Pandora Gilboa, OH, Local School District, Putnam County Capital Appreciation Refunding, G.O., (Student Credit Program),
0.000%, 12/1/16 (a) | | | 116,066 | | | |
| | 200,000 | | | Pickerington, OH, Local School District, School Facilities Construction & Improvement, G.O., 5.000%, 12/1/17 | | | 223,454 | | | |
| | 500,000 | | | Princeton, OH, Local School District, Series B, 0.000%, 12/1/20 (a) | | | 333,120 | | | |
| | 470,000 | | | River Valley, OH, Local School District, G.O., (AGM Ins. Student Credit Program), 5.250%, 11/1/23 | | | 517,042 | | | |
| | 100,000 | | | Sebring, OH, Local School District, Capital Appreciation Refunding Class Room Facilities, G.O., (Student Credit Program), 0.000%, 12/1/17 (a) | | | 76,900 | | | |
| | 100,000 | | | Sebring, OH, Local School District, Capital Appreciation Refunding Class Room Facilities, G.O., (Student Credit Program), 0.000%, 12/1/16 (a) | | | 81,425 | | | |
(See notes which are an integral part of the Financial Statements)
Annual Shareholder Report
91
| | |
| Huntington Ohio Tax Free Fund | | (Continued) |
| | | | | | | | | | |
Principal
Amount | | | | | Value | | | |
| | | | | | | | | | |
| Municipal Bonds — (Continued) | | | | | | |
| Ohio — (Continued) | | | | | | |
| $ | 150,000 | | | Seven Hills, OH, Capital Improvement, G.O., 5.250%, 12/1/18 | | $ | 171,099 | | | |
| | 1,040,000 | | | Shaker Heights, OH, Urban Renewal Refunding, G.O., (AMBAC Ins.), 5.000%, 12/1/17 | | | 1,097,138 | | | |
| | 105,000 | | | Southern Local School Disctict Ohio, Various Purposes Constructiona and Improvement, G.O.,
Series A, 12/1/17 | | | 82,966 | | | |
| | 105,000 | | | Southern Local School Disctict Ohio, Various Purposes Constructiona and Improvement, G.O.,
Series A, 12/1/15 | | | 91,878 | | | |
| | 780,000 | | | Southwest Licking Local School District, G.O., (AMBAC Ins.), 5.000%, 12/1/19 | | | 809,476 | | | |
| | 500,000 | | | South-Western City School District, (AGM Ins.), 4.750%, 12/1/22 | | | 522,745 | | | |
| | 150,000 | | | Springboro, OH, Various Purposes, G.O., 5.000%, 12/1/18 | | | 170,179 | | | |
| | 125,000 | | | Springfield City, OH, School District, (AGM Ins.), 5.000%, 12/1/21 | | | 132,321 | | | |
| | 100,000 | | | State of Ohio, Series A, (AGM Ins.), 5.000%, 4/1/17 | | | 108,773 | | | |
| | 50,000 | | | State of Ohio, Series 2008-1,
5.500%, 6/15/20 | | | 56,294 | | | |
| | 325,000 | | | Strongsville, OH, Library Improvements, G.O., (FGIC Ins.), 5.000%, 12/1/15 | | | 333,642 | | | |
| | 235,000 | | | Swanton, OH, Local School District, School Improvement, G.O.,
(FGIC Ins.), 4.900%, 12/1/15 | | | 242,269 | | | |
| | 700,000 | | | Toledo, OH, Waterworks Revenue, (MBIA Ins.), 5.000%, 11/15/19 | | | 753,669 | | | |
| | 300,000 | | | Toledo, OH, Waterworks Revenue, (MBIA-RE FGIC Ins.),
5.000%, 11/15/22 | | | 315,012 | | | |
| | 225,000 | | | Toledo, OH, Sewer System Revenue, (AMBAC Ins.), 5.000%, 11/15/18 | | | 235,165 | | | |
| | 200,000 | | | Toledo, OH, City School District, (FGIC Ins.), 5.000%, 12/1/21 | | | 210,304 | | | |
| | 615,000 | | | Toledo, OH, City School District, School Facilities Improvements, G.O., (Student Credit Program),
4.125%, 12/1/19 | | | 634,889 | | | |
| | 400,000 | | | Troy, OH, City School District, School Improvement, G.O., (AGM Ins.), 5.000%, 12/1/18 | | | 428,656 | | | |
| | | | | | | | | | |
Principal
Amount | | | | | Value | | | |
| | | | | | | | | | |
| Municipal Bonds — (Continued) | | | | | | |
| Ohio — (Continued) | | | | | | |
| $ | 320,000 | | | Troy, OH, G.O., 4.750%, 12/1/24 | | $ | 327,661 | | | |
| | 1,050,000 | | | Troy, OH, G.O., 4.750%, 12/1/22 | | | 1,083,579 | | | |
| | 75,000 | | | Trumbull County, OH, G.O., (AGM Ins.), 5.000%, 12/1/20 | | | 81,896 | | | |
| | 655,000 | | | Twinsburg, OH, Recreational Facilities Improvements, G.O., (FGIC Ins.), 5.500%, 12/1/17 | | | 671,277 | | | |
| | 235,000 | | | Twinsburg, OH , Local School District Refunding, G.O., (FGIC Ins.), 5.000%, 12/1/18 | | | 255,264 | | | |
| | 500,000 | | | University of Akron, OH, General Receipts Revenue, Series B,
(AGM Ins.), 5.250%, 1/1/24 | | | 527,175 | | | |
| | 350,000 | | | University of Akron, OH, (AGM Ins.), 5.000%, 1/1/21 | | | 372,911 | | | |
| | 300,000 | | | University of Cincinnati, OH, General Receipts Revenue, Series A,
(AMBAC Ins.), 5.000%, 6/1/19 | | | 324,183 | | | |
| | 500,000 | | | University of Cincinnati, OH, General Receipts Revenue, Series A,
(MBIA Ins.), 5.000%, 6/1/22 | | | 525,970 | | | |
| | 500,000 | | | University of Cincinnati, OH, General Receipts Revenue, Series A,
(AGM Ins.), 5.000%, 6/1/20 | | | 533,080 | | | |
| | 500,000 | | | University of Cincinnati, OH, General Receipts Revenue, Series A,
(AMBAC Ins.), 5.000%, 6/1/17 | | | 542,905 | | | |
| | 300,000 | | | University of Cincinnati, OH, General Receipts Revenue, Series A,
(AMBAC Ins.), 5.000%, 6/1/19 | | | 319,728 | | | |
| | 400,000 | | | University of Toledo, OH, General Receipts Revenue, Series A,
(AMBAC Ins.), 5.000%, 6/1/19 | | | 427,784 | | | |
| | 100,000 | | | Van Buren, OH, School District, Capital Appreciation Advance Refunding, G.O., (AGM Ins.),
0.000%, 12/1/16 (a) | | | 83,582 | | | |
| | 150,000 | | | Warren County, OH, Waterworks Refunding Revenue, (AGM Ins.), 5.000%, 12/1/18 | | | 156,759 | | | |
| | 50,000 | | | Warren County, OH, Waterworks Refunding Revenue, (AGM Ins.),
5.000%, 12/1/15 | | | 53,058 | | | |
| | 650,000 | | | Washington County, OH, School Improvements, G.O., (FGIC Ins.),
5.000%, 12/1/19 | | | 673,978 | | | |
(See notes which are an integral part of the Financial Statements)
Annual Shareholder Report
92
| | |
| Huntington Ohio Tax Free Fund | | (Continued) |
| | | | | | | | | | |
Principal
Amount | | | | | Value | | | |
| | | | | | | | | | |
| Municipal Bonds — (Continued) | | | | | | |
| Ohio — (Continued) | | | | | | |
| $ | 325,000 | | | Western Reserve, OH, Local School District, Capital Appreciation Classroom Facilities, G.O., (Student Credit Program),
0.000%, 1/15/19 (a) | | $ | 233,525 | | | |
| | 65,000 | | | Western Reserve, OH, Local School District, Capital Appreciation Classroom Facilities, G.O., (Student Credit Program),
0.000%, 1/15/18 (a) | | | 49,412 | | | |
| | 205,000 | | | Western Reserve, OH, Local School District, Capital Appreciation Classroom Facilities, G.O., (Student Credit Program),
0.000%, 12/1/16 (a) | | | 168,196 | | | |
| | 200,000 | | | Westerville, OH, City School District, G.O., (National Reinsurance),
5.000%, 12/1/17 | | | 215,782 | | | |
| | 120,000 | | | Westerville, OH, G.O., 2.750%, 12/1/17 | | | 122,273 | | | |
| | 125,000 | | | Westerville, OH, G.O., (AMBAC Ins.), 5.000%, 12/1/23 | | | 133,875 | | | |
| | 300,000 | | | Wyoming, OH, School District, Refunding School Improvement, G.O., (AGM Ins.), 5.000%, 12/1/20 | | | 318,723 | | | |
| Total Municipal Bonds (Cost $51,300,823) | | | 51,562,286 | | | |
| | | | | | | | | | |
Principal
Amount
or Shares | | | | | Value | | | |
| | | | | | | | | | |
| Cash Equivalents — 0.5% | | | | | | |
| | 257,778 | | | Fidelity Tax-Exempt Portfolio,
0.140% (b) | | $ | 257,778 | | | |
| Total Cash Equivalents (Cost $257,778) | | | 257,778 | | | |
| Total Investments (Cost $51,558,601) — 99.8% | | | 51,820,064 | | | |
| Other Assets in Excess of Liabilities — 0.2% | | | 113,266 | | | |
| Net Assets — 100.0% | | $ | 51,933,330 | | | |
| (a) | Zero coupon capital appreciation bonds. |
| (b) | Rate disclosed is the seven day yield as of December 31, 2010. |
AGM — Assured Guaranty Municipal Corp.
AMBAC — American Municipal Bond Assurance Corp.
FGIC — Financial Guaranty Insurance Co.
FHLMC — Federal Home Loan Mortgage Corporation
FNMA — Federal National Mortgage Association
GNMA — Government National Mortgage Association
G.O. — General Obligation
MBIA — Municipal Bond Insurance Association
(See notes which are an integral part of the Financial Statements)
Annual Shareholder Report
93
| | |
| | |
| Huntington Short/Intermediate Fixed Income Securities Fund | | December 31, 2010 |
| | |
| Portfolio of Investments Summary Table | | (unaudited) |
| | | | |
| Asset Allocation | | Percentage of
Market Value | |
Corporate Bonds | | | 60.5% | |
U.S. Government Agencies | | | 34.3% | |
U.S. Treasury Obligations | | | 3.2% | |
Cash1 | | | 2.0% | |
Total | | | 100.0% | |
| 1 | Investments in an affiliated money market fund. |
Portfolio holdings and allocations are subject to change. As of December 31, 2010, percentages in the table above are based on total investments. Such total investments may differ from the percentages set forth below in the Portfolio of Investments which are computed using the Fund’s total net assets.
The Portfolio of Investments Summary Table and the Portfolio of Investments are broken down by sectors, and these sectors do not represent industry categories for purposes of identifying “industry concentration” as described in the Investment Company Act of 1940, as amended.
Portfolio of Investments
| | | | | | | | | | |
Principal
Amount | | | | | Value | | | |
| | | | | | | | | | |
| Corporate Bonds — 60.8% | | | | | | |
| Consumer Discretionary — 3.1% | | | | | | |
| $ | 1,000,000 | | | Comcast Corp., Class A, 5.500%, 3/15/11 | | $ | 1,009,760 | | | |
| | 1,000,000 | | | Home Depot, Inc., 5.250%, 12/16/13 | | | 1,097,546 | | | |
| | 1,000,000 | | | Johnson Controls, Inc., 4.875%, 9/15/13 | | | 1,074,522 | | | |
| | 1,000,000 | | | McDonald’s Corp., Series G, MTN, 4.300%, 3/1/13 | | | 1,066,051 | | | |
| | 1,000,000 | | | The Walt Disney Co., Series D, 4.500%, 12/15/13 | | | 1,092,129 | | | |
| | 1,000,000 | | | Time Warner, Inc., 3.150%, 7/15/15 | | | 1,016,018 | | | |
| | | | | | | | 6,356,026 | | | |
| Consumer Staples — 5.1% | | | | | | |
| | 1,000,000 | | | ConAgra Foods, Inc., 5.875%, 4/15/14 | | | 1,107,119 | | | |
| | 1,000,000 | | | CVS Caremark Corp., 4.875%, 9/15/14 | | | 1,085,841 | | | |
| | 1,585,000 | | | General Mills, Inc., 5.250%, 8/15/13 | | | 1,742,173 | | | |
| | 1,000,000 | | | HJ Heinz Co., 5.350%, 7/15/13 | | | 1,096,413 | | | |
| | 2,000,000 | | | Kellogg Co., 5.125%, 12/3/12 | | | 2,143,474 | | | |
| | 2,000,000 | | | Safeway, Inc., 5.800%, 8/15/12 | | | 2,152,442 | | | |
| | 1,000,000 | | | Sysco Corp., 4.200%, 2/12/13 | | | 1,063,996 | | | |
| | | | | | | | 10,391,458 | | | |
| Energy — 3.7% | | | | | | |
| | 1,000,000 | | | Apache Corp., 6.000%, 9/15/13 | | | 1,122,895 | | | |
| | 1,000,000 | | | Chevron Corp., 3.450%, 3/3/12 | | | 1,031,866 | | | |
| | 1,000,000 | | | ConocoPhillips, 4.750%, 2/1/14 | | | 1,086,262 | | | |
| | 1,000,000 | | | Kinder Morgan Energy Partners LP, 5.000%, 12/15/13 | | | 1,086,469 | | | |
| | 1,000,000 | | | Marathon Oil Corp., 6.500%, 2/15/14 | | | 1,125,721 | | | |
| | 1,000,000 | | | Noble Corp., 5.875%, 6/1/13 | | | 1,091,903 | | | |
| | | | | | | | | | |
Principal
Amount | | | | | Value | | | |
| | | | | | | | | | |
| Corporate Bonds — (Continued) | | | | | | |
| Energy — (Continued) | | | | | | |
| $ | 1,000,000 | | | Spectra Energy Capital LLC, 5.900%, 9/15/13 | | $ | 1,100,048 | | | |
| | | | | | | | 7,645,164 | | | |
| Financials — 18.4% | | | | | | |
| | 2,000,000 | | | American Express Credit Co., 2.750%, 9/15/15 | | | 1,967,372 | | | |
| | 2,000,000 | | | Bank of New York Mellon Corp/The, 2.950%, 6/18/15 | | | 2,025,652 | | | |
| | 2,000,000 | | | Bank of Nova Scotia,
2.375%, 12/17/13 | | | 2,060,552 | | | |
| | 1,000,000 | | | BB&T Corp., 3.100%, 7/28/11 | | | 1,011,826 | | | |
| | 1,000,000 | | | Boeing Capital Corp.,
3.250%, 10/27/14 | | | 1,042,061 | | | |
| | 2,000,000 | | | Caterpillar Financial Services Corp., Series F, MTN, 5.125%, 10/12/11 | | | 2,070,806 | | | |
| | 1,000,000 | | | Charles Schwab Corp/The, 4.950%, 6/1/14 | | | 1,087,433 | | | |
| | 1,500,000 | | | Citigroup, Inc., 6.010%, 1/15/15 | | | 1,645,539 | | | |
| | 2,500,000 | | | General Electric Capital Corp., 2.250%, 11/9/15 | | | 2,403,387 | | | |
| | 1,500,000 | | | Goldman Sachs Group, Inc., 5.500%, 11/15/14 | | | 1,622,182 | | | |
| | 2,000,000 | | | HSBC Financial Corp.,
3.500%, 06/28/15 (a) (b) | | | 2,050,210 | | | |
| | 1,000,000 | | | KeyBank NA, BKNT, 5.091%, 3/26/15 | | | 1,043,058 | | | |
| | 433,000 | | | M&I Marshall & Ilsley Bank, BKNT, 5.300%, 9/8/11 | | | 436,170 | | | |
| | 2,000,000 | | | Manulife Financial Corp., 3.400%, 9/17/15 | | | 1,959,060 | | | |
| | 2,000,000 | | | MetLife Global Funding I, 5.125%, 11/9/11 (a) (b) | | | 2,071,436 | | | |
(See notes which are an integral part of the Financial Statements)
Annual Shareholder Report
94
| | |
| Huntington Short/Intermediate Fixed Income Securities Fund | | (Continued) |
| | | | | | | | | | |
Principal
Amount | | | | | Value | | | |
| | | | | | | | | | |
| Corporate Bonds — (Continued) | | | | | | |
| Financials — (Continued) | | | | | | |
| $ | 2,000,000 | | | Morgan Stanley, Series G, MTN, 2.786%, 5/14/13 (c) | | $ | 2,072,556 | | | |
| | 1,500,000 | | | PNC Funding Corp., 3.625%, 2/8/15 | | | 1,550,931 | | | |
| | 1,500,000 | | | Principal Life Income Funding Trusts, MTN, 5.150%, 9/30/11 | | | 1,536,318 | | | |
| | 2,000,000 | | | Prudential Financial, Inc., Series D, 3.875%, 1/14/15 | | | 2,063,356 | | | |
| | 2,060,000 | | | Simon Property Group LP, 4.200%, 2/1/15 | | | 2,153,998 | | | |
| | 2,000,000 | | | US Bank NA, 4.950%, 10/30/14 | | | 2,179,638 | | | |
| | 1,500,000 | | | Wells Fargo & Co., Series I, 3.750%, 10/1/14 | | | 1,565,828 | | | |
| | | | | | | | 37,619,369 | | | |
| Health Care — 4.5% | | | | | | |
| | 1,500,000 | | | McKesson Corp., 5.250%, 3/1/13 | | | 1,611,079 | | | |
| | 1,000,000 | | | Medco Health Solutions, Inc., 6.125%, 3/15/13 | | | 1,089,539 | | | |
| | 2,000,000 | | | Medtronic, Inc., 3.000%, 3/15/15 | | | 2,052,370 | | | |
| | 1,000,000 | | | Pfizer, Inc., 4.450%, 3/15/12 | | | 1,043,455 | | | |
| | 1,200,000 | | | St Jude Medical, Inc., 3.750%, 7/15/14 | | | 1,268,296 | | | |
| | 2,000,000 | | | Thermo Fisher Scientific, Inc., 3.200%, 5/1/15 | | | 2,046,160 | | | |
| | | | | | | | 9,110,899 | | | |
| Industrials — 12.6% | | | | | | |
| | 1,000,000 | | | 3M Co., Series A, MTN,
4.375%, 8/15/13 | | | 1,087,922 | | | |
| | 2,000,000 | | | Anheuser-Busch InBev Worldwide, Inc., 2.500%, 3/26/13 | | | 2,046,612 | | | |
| | 2,000,000 | | | BJ Services Co., 5.750%, 6/1/11 | | | 2,042,764 | | | |
| | 1,000,000 | | | Broadcom Corp., 2.375%, 11/1/15 | | | 973,445 | | | |
| | 2,000,000 | | | Covidien International Finance SA, 2.800%, 6/15/15 | | | 2,007,388 | | | |
| | 1,500,000 | | | CSX Corp., 6.750%, 3/15/11 | | | 1,516,919 | | | |
| | 1,000,000 | | | Dell, Inc., 2.300%, 9/10/15 | | | 974,767 | | | |
| | 2,000,000 | | | Eaton Corp., 4.900%, 5/15/13 | | | 2,157,370 | | | |
| | 1,000,000 | | | Emerson Electric Co.,
4.625%, 10/15/12 | | | 1,066,664 | | | |
| | 2,000,000 | | | Harsco Corp., 2.700%, 10/15/15 | | | 1,949,026 | | | |
| | 1,000,000 | | | ITT Corp., 4.900%, 5/1/14 | | | 1,073,561 | | | |
| | 1,000,000 | | | Nabors Industries, Inc.,
5.375%, 8/15/12 | | | 1,055,756 | | | |
| | 1,500,000 | | | Northrop Grumman Corp., 3.700%, 8/1/14 | | | 1,575,195 | | | |
| | 1,000,000 | | | Premcor Refining Group Inc/The, 6.125%, 5/1/11 | | | 1,015,438 | | | |
| | 1,000,000 | | | Raytheon Co., 1.625%, 10/15/15 | | | 959,456 | | | |
| | | | | | | | | | |
Principal
Amount | | | | | Value | | | |
| | | | | | | | | | |
| Corporate Bonds — (Continued) | | | | | | |
| Industrials — (Continued) | | | | | | |
| $ | 1,000,000 | | | Shell International Finance BV, 4.000%, 3/21/14 | | $ | 1,064,097 | | | |
| | 2,000,000 | | | Symantec Corp., 2.750%, 9/15/15 | | | 1,951,646 | | | |
| | 1,000,000 | | | Wyeth, 5.500%, 3/15/13 | | | 1,093,377 | | | |
| | | | | | | | 25,611,403 | | | |
| Information Technology — 2.9% | | | | | | |
| | 1,000,000 | | | Cisco Systems, Inc., 5.250%, 2/22/11 | | | 1,006,266 | | | |
| | 1,000,000 | | | Dell, Inc., 4.700%, 4/15/13 | | | 1,073,463 | | | |
| | 1,500,000 | | | Hewlett-Packard Co., 4.250%, 2/24/12 | | | 1,558,794 | | | |
| | 2,000,000 | | | Oracle Corp., 4.950%, 4/15/13 | | | 2,178,808 | | | |
| | | | | | | | 5,817,331 | | | |
| Materials — 5.2% | | | | | | |
| | 2,000,000 | | | Air Products & Chemicals, Inc., 4.150%, 2/1/13 | | | 2,101,014 | | | |
| | 1,000,000 | | | Nucor Corp., 4.875%, 10/1/12 | | | 1,065,964 | | | |
| | 1,000,000 | | | Nucor Corp., 5.000%, 12/1/12 | | | 1,071,967 | | | |
| | 2,000,000 | | | Potash Corp. of Saskatchewan, Inc., 4.875%, 3/1/13 | | | 2,129,630 | | | |
| | 2,000,000 | | | PPG Industries, Inc., 5.750%, 3/15/13 | | | 2,170,716 | | | |
| | 2,000,000 | | | Sherwin-Williams Co/The, 3.125%, 12/15/14 | | | 2,057,854 | | | |
| | | | | | | | 10,597,145 | | | |
| Telecommunication Services — 1.5% | | | | | | |
| | 2,000,000 | | | AT&T, Inc., 2.500%, 8/15/15 | | | 1,992,972 | | | |
| | 1,000,000 | | | Verizon Wireless, 7.375%, 11/15/13 | | | 1,158,559 | | | |
| | | | | | | | 3,151,531 | | | |
| Utilities — 3.8% | | | | | | |
| | 1,500,000 | | | FPL Group Capital, Inc.,
5.350%, 6/15/13 | | | 1,625,080 | | | |
| | 1,000,000 | | | Georgia Power Co., Series S, 4.000%, 1/15/11 | | | 1,000,792 | | | |
| | 1,000,000 | | | Indiana Michigan Power Co., 6.375%, 11/1/12 | | | 1,079,405 | | | |
| | 2,000,000 | | | PSEG Power LLC, 2.500%, 4/15/13 | | | 2,040,306 | | | |
| | 1,000,000 | | | Southern Co., 2.375%, 9/15/15 | | | 984,395 | | | |
| | 1,000,000 | | | Wisconsin Public Service Corp., 4.875%, 12/1/12 | | | 1,068,666 | | | |
| | | | | | | | 7,798,644 | | | |
| Total Corporate Bonds (Cost $120,845,641) | | | 124,098,970 | | | |
| U.S. Government Agencies — 34.4% | | | | | | |
| Federal Farm Credit Bank — 5.0% | | | | | | |
| | 3,000,000 | | | 2.125%, 6/18/12 | | | 3,068,808 | | | |
| | 2,000,000 | | | 1.000%, 6/22/12 | | | 2,005,662 | | | |
| | 3,000,000 | | | 1.875%, 12/7/12 | | | 3,069,054 | | | |
| | 2,000,000 | | | 3.400%, 2/7/13 | | | 2,110,182 | | | |
| | | | | | | | 10,253,706 | | | |
(See notes which are an integral part of the Financial Statements)
Annual Shareholder Report
95
| | |
| Huntington Short/Intermediate Fixed Income Securities Fund | | (Continued) |
| | | | | | | | | | |
Principal
Amount | | | | | Value | | | |
| | | | | | | | | | |
| U.S. Government Agencies — (Continued) | | | | | | |
| Federal Home Loan Bank — 18.9% | | | | | | |
| $ | 2,000,000 | | | 3.125%, 6/10/11 | | $ | 2,022,952 | | | |
| | 2,000,000 | | | 1.625%, 7/27/11 | | | 2,014,634 | | | |
| | 2,000,000 | | | 1.000%, 12/28/11 | | | 2,011,806 | | | |
| | 2,000,000 | | | 1.125%, 5/18/12 | | | 2,017,312 | | | |
| | 2,000,000 | | | 1.875%, 6/20/12 | | | 2,039,604 | | | |
| | 3,000,000 | | | 1.750%, 8/22/12 | | | 3,057,537 | | | |
| | 1,000,000 | | | 1.625%, 9/26/12 | | | 1,017,570 | | | |
| | 7,000,000 | | | 0.550%, 10/25/12 | | | 6,977,488 | | | |
| | 3,000,000 | | | 1.625%, 6/14/13 | | | 3,051,252 | | | |
| | 3,000,000 | | | 1.000%, 9/13/13 | | | 2,997,360 | | | |
| | 1,000,000 | | | 4.375%, 9/13/13 | | | 1,088,477 | | | |
| | 2,000,000 | | | 1.375%, 9/12/14 | | | 1,993,086 | | | |
| | 2,000,000 | | | 3.250%, 9/12/14 | | | 2,125,760 | | | |
| | 2,000,000 | | | 4.750%, 11/14/14 | | | 2,235,904 | | | |
| | 2,000,000 | | | 1.750%, 9/11/15 | | | 1,959,160 | | | |
| | 2,000,000 | | | 1.900%, 12/29/15 | | | 1,955,522 | | | |
| | | | | | | | 38,565,424 | | | |
| Federal Home Loan Mortgage Corporation — 2.0% | | | | | | |
| | 2,000,000 | | | 4.750%, 1/18/11 | | | 2,003,552 | | | |
| | 2,000,000 | | | 2.175%, 2/19/14 | | | 2,058,498 | | | |
| | | | | | | | 4,062,050 | | | |
| Federal National Mortgage Association — 8.5% | | | | | | |
| | 1,435,000 | | | 2.000%, 1/30/12 | | | 1,457,633 | | | |
| | 2,000,000 | | | 1.250%, 6/22/12 | | | 2,020,916 | | | |
| | 5,000,000 | | | 0.625%, 9/24/12 | | | 5,005,165 | | | |
| | | | | | | | | | |
Principal
Amount or
Shares | | | | | Value | | | |
| | | | | | | | | | |
| U.S. Government Agencies — (Continued) | | | | | | |
| Federal National Mortgage
Association — (Continued) | | | | | | |
| $ | 2,000,000 | | | 1.750%, 12/28/12 | | $ | 2,011,148 | | | |
| | 4,000,000 | | | 1.500%, 9/8/14 | | | 3,997,096 | | | |
| | 3,000,000 | | | 1.625%, 10/26/15 | | | 2,924,037 | | | |
| | | | | | | | 17,415,995 | | | |
| Total U.S. Government Agencies
(Cost $69,869,405) | | | 70,297,175 | | | |
| U.S. Treasury Obligations — 3.2% | | | | | | |
| U.S. Treasury Notes — 3.2% | | | | | | |
| | 5,000,000 | | | 0.875%, 2/29/12 | | | 5,029,100 | | | |
| | 1,500,000 | | | 0.750%, 12/15/13 | | | 1,489,337 | | | |
| Total U.S. Treasury Obligations (Cost $6,490,023) | | | 6,518,437 | | | |
| Cash Equivalents — 2.1% | | | | | | |
| | 4,188,774 | | | Huntington Money Market Fund, Interfund Shares, 0.010% (d) (e) | | | 4,188,774 | | | |
| Total Cash Equivalents (Cost $4,188,774) | | | 4,188,774 | | | |
| Total Investments
(Cost $201,393,843) — 100.5% | | | 205,103,356 | | | |
| Liabilities in Excess of Other Assets — (0.5)% | | | (985,364) | | | |
| Net Assets — 100.0% | | $ | 204,117,992 | | | |
| (a) | Security exempt from registration under Rule 144A or Section 4(2) of the Securities Act of 1933. The security may be resold in transactions exempt from registration, normally to qualified institutional buyers. |
| (c) | Variable or Floating Rate Security. Rate disclosed is as of December 31, 2010. |
| (d) | Investment in affiliate. |
| (e) | Rate disclosed is the seven day yield as of December 31, 2010. |
| LLC | — Limited Liability Co. |
(See notes which are an integral part of the Financial Statements)
Annual Shareholder Report
96
| | |
| | |
| Huntington Balanced Allocation Fund | | December 31, 2010 |
| | |
| Portfolio of Investments Summary Table | | (unaudited) |
| | | | |
| Asset Allocation | | Percentage of
Market Value | |
Equity Mutual Funds1 | | | 59.9% | |
Fixed Income Mutual Funds1 | | | 37.1% | |
Cash1 | | | 3.0% | |
Total | | | 100.0% | |
| 1 | Investments in affiliated funds. |
Portfolio holdings and allocations are subject to change. As of December 31, 2010, percentages in the table above are based on total investments. Such total investments may differ from the percentages set forth below in the Portfolio of Investments which are computed using the Fund’s total net assets.
The Portfolio of Investments Summary Table and the Portfolio of Investments are broken down by sectors, and these sectors do not represent industry categories for purposes of identifying “industry concentration” as described in the Investment Company Act of 1940, as amended.
Portfolio of Investments
| | | | | | | | | | |
| Shares | | | | | Value | | | |
| | | | | | | | | | |
| Mutual Funds — 96.6% (a) | | | | | | |
| | 134,101 | | | Huntington Dividend Capture Fund, Trust Shares | | $ | 1,165,338 | | | |
| | 187,147 | | | Huntington Fixed Income Securities Fund, Trust Shares | | | 4,147,173 | | | |
| | 81,964 | | | Huntington Growth Fund, Trust Shares | | | 2,093,366 | | | |
| | 106,518 | | | Huntington Income Equity Fund, Trust Shares | | | 2,160,184 | | | |
| | 177,363 | | | Huntington Intermediate Government Income Fund, Trust Shares | | | 1,933,254 | | | |
| | 271,754 | | | Huntington International Equity Fund, Trust Shares | | | 3,133,325 | | | |
| | 225,126 | | | Huntington Macro 100 Fund, Trust Shares | | | 2,181,473 | | | |
| | 72,099 | | | Huntington Mid Corp America Fund, Trust Shares | | | 1,126,908 | | | |
| | 121,060 | | | Huntington Mortgage Securities Fund, Trust Shares | | | 1,101,642 | | | |
| | 78,351 | | | Huntington New Economy Fund, Trust Shares* | | | 844,626 | | | |
| | 96,454 | | | Huntington Short/Intermediate Fixed Income Securities Fund, Trust Shares | | | 1,926,180 | | | |
| | 99,192 | | | Huntington Situs Fund, Trust Shares* | | | 2,004,678 | | | |
| Total Mutual Funds (Cost $21,518,914) | | | 23,818,147 | | | |
| | | | | | | | | | |
| Shares | | | | | Value | | | |
| Cash Equivalents — 3.0% | | | | | | |
| | 749,149 | | | Huntington Money Market Fund, Interfund Shares, 0.010% (a) (b) | | $ | 749,149 | | | |
| Total Cash Equivalents (Cost $749,149) | | | 749,149 | | | |
| Total Investments
(Cost $22,268,063) — 99.6% | | | 24,567,296 | | | |
| Other Assets in Excess of Liabilities — 0.4% | | | 88,689 | | | |
| Net Assets — 100.0% | | $ | 24,655,985 | | | |
| (a) | Investment in affiliate. |
| (b) | Rate disclosed is the seven day yield as of December 31, 2010. |
| * | Non-income producing security. |
(See notes which are an integral part of the Financial Statements)
Annual Shareholder Report
97
| | |
| | |
| Huntington Conservative Allocation Fund | | December 31, 2010 |
| | |
| Portfolio of Investments Summary Table | | (unaudited) |
| | | | |
| Asset Allocation | | Percentage of
Market Value | |
Fixed Income Mutual Funds1 | | | 76.0% | |
Equity Mutual Funds1 | | | 19.7% | |
Cash1 | | | 4.3% | |
Total | | | 100.0% | |
| 1 | Investments in affiliated funds. |
Portfolio holdings and allocations are subject to change. As of December 31, 2010, percentages in the table above are based on total investments. Such total investments may differ from the percentages set forth below in the Portfolio of Investments which are computed using the Fund’s total net assets.
The Portfolio of Investments Summary Table and the Portfolio of Investments are broken down by sectors, and these sectors do not represent industry categories for purposes of identifying “industry concentration” as described in the Investment Company Act of 1940, as amended.
Portfolio of Investments
| | | | | | | | | | |
| Shares | | | | | Value | | | |
| Mutual Funds — 95.5% (a) | | | | | | |
| | 26,600 | | | Huntington Dividend Capture Fund, Trust Shares | | $ | 231,157 | | | |
| | 231,296 | | | Huntington Fixed Income Securities Fund, Trust Shares | | | 5,125,522 | | | |
| | 16,245 | | | Huntington Growth Fund, Trust Shares | | | 414,890 | | | |
| | 21,110 | | | Huntington Income Equity Fund, Trust Shares | | | 428,107 | | | |
| | 219,138 | | | Huntington Intermediate Government Income Fund, Trust Shares | | | 2,388,604 | | | |
| | 53,810 | | | Huntington International Equity Fund, Trust Shares | | | 620,425 | | | |
| | 44,612 | | | Huntington Macro 100 Fund, Trust Shares | | | 432,293 | | | |
| | 14,272 | | | Huntington Mid Corp America Fund, Trust Shares | | | 223,074 | | | |
| | 149,735 | | | Huntington Mortgage Securities Fund, Trust Shares | | | 1,362,587 | | | |
| | 15,511 | | | Huntington New Economy Fund, Trust Shares * | | | 167,208 | | | |
| | 119,160 | | | Huntington Short/Intermediate Fixed Income Securities Fund, Trust Shares | | | 2,379,626 | | | |
| | 19,662 | | | Huntington Situs Fund, Trust Shares* | | | 397,378 | | | |
| Total Mutual Funds
(Cost $13,437,903) | | | 14,170,871 | | | |
| | | | | | | | | | |
| Shares | | | | | Value | | | |
| Cash Equivalents — 4.3% | | | | | | |
| | 637,641 | | | Huntington Money Market Fund, Interfund Shares, 0.010% (a) (b) | | $ | 637,641 | | | |
| Total Cash Equivalents
(Cost $637,641) | | | 637,641 | | | |
| Total Investments
(Cost $14,075,544) — 99.8% | | | 14,808,512 | | | |
| Other Assets in Excess of Liabilities — 0.2% | | | 31,369 | | | |
| Net Assets — 100.0% | | $ | 14,839,881 | | | |
| (a) | Investment in affiliate. |
| (b) | Rate disclosed is the seven day yield as of December 31, 2010. |
| * | Non-income producing security. |
(See notes which are an integral part of the Financial Statements)
Annual Shareholder Report
98
| | |
| | |
| Huntington Growth Allocation Fund | | December 31, 2010 |
| | |
| Portfolio of Investments Summary Table | | (unaudited) |
| | | | |
| Asset Allocation | | Percentage of
Market Value | |
Equity Mutual Funds1 | | | 79.9% | |
Fixed Income Mutual Funds1 | | | 17.1% | |
Cash1 | | | 3.0% | |
Total | | | 100.0% | |
| 1 | Investments in affiliated funds. |
Portfolio holdings and allocations are subject to change. As of December 31, 2010, percentages in the table above are based on total investments. Such total investments may differ from the percentages set forth below in the Portfolio of Investments which are computed using the Fund’s total net assets.
The Portfolio of Investments Summary Table and the Portfolio of Investments are broken down by sectors, and these sectors do not represent industry categories for purposes of identifying “industry concentration” as described in the Investment Company Act of 1940, as amended.
Portfolio of Investments
| | | | | | | | | | |
| Shares | | | | | Value | | | |
| | | | | | | | | | |
| Mutual Funds — 96.7% (a) | | | |
| | 138,905 | | | Huntington Dividend Capture Fund, Trust Shares | | $ | 1,207,081 | | | |
| | 66,879 | | | Huntington Fixed Income Securities Fund, Trust Shares | | | 1,482,045 | | | |
| | 84,936 | | | Huntington Growth Fund, Trust Shares | | | 2,169,260 | | | |
| | 110,383 | | | Huntington Income Equity Fund, Trust Shares | | | 2,238,576 | | | |
| | 63,425 | | | Huntington Intermediate Government Income Fund, Trust Shares | | | 691,331 | | | |
| | 281,901 | | | Huntington International Equity Fund, Trust Shares | | | 3,250,323 | | | |
| | 233,501 | | | Huntington Macro 100 Fund, Trust Shares | | | 2,262,629 | | | |
| | 74,637 | | | Huntington Mid Corp America Fund, Trust Shares | | | 1,166,583 | | | |
| | 43,287 | | | Huntington Mortgage Securities Fund, Trust Shares | | | 393,913 | | | |
| | 81,238 | | | Huntington New Economy Fund, Trust Shares * | | | 875,746 | | | |
| | 34,494 | | | Huntington Short/Intermediate Fixed Income Securities Fund, Trust Shares | | | 688,840 | | | |
| | 102,875 | | | Huntington Situs Fund, Trust Shares* | | | 2,079,110 | | | |
| Total Mutual Funds (Cost $16,091,866) | | | 18,505,437 | | | |
| Cash Equivalents — 3.0% | | | | | | |
| | 576,965 | | | Huntington Money Market Fund, Interfund Shares, 0.010% (a) (b) | | | 576,965 | | | |
| Total Cash Equivalents (Cost $576,965) | | | 576,965 | | | |
| Total Investments
(Cost $16,668,831) — 99.7% | | | 19,082,402 | | | |
| Other Assets in Excess of Liabilities — 0.3% | | | 49,632 | | | |
| Net Assets — 100.0% | | $ | 19,132,034 | | | |
| (a) | Investment in affiliate. |
| (b) | Rate disclosed is the seven day yield as of December 31, 2010. |
| * | Non-income producing security. |
(See notes which are an integral part of the Financial Statements)
Annual Shareholder Report
99
[THIS PAGE INTENTIONALLY LEFT BLANK]
Statements of Assets and Liabilities
December 31, 2010
| | | | | | | | | | | | | | | | |
| | | Huntington
Tax Free
Money Market
Fund | | | Huntington
Money Market
Fund | | | Huntington
Ohio Municipal
Money Market
Fund | | | Huntington
U.S. Treasury
Money Market
Fund | |
| Assets: | | | | | | | | | | | | | | | | |
Investments, at cost | | $ | 82,333,215 | | | $ | 395,432,340 | | | $ | 197,923,461 | | | $ | 387,721,453 | |
Investments, at value | | $ | 82,333,215 | | | $ | 390,447,440 | | | $ | 197,923,461 | | | $ | 283,823,453 | |
Investments in affiliated securities, at value | | | — | | | | — | | | | — | | | | — | |
Investments in repurchase agreements, at cost | | | — | | | | 4,984,900 | | | | — | | | | 103,898,000 | |
Total Investments | | | 82,333,215 | | | | 395,432,340 | | | | 197,923,461 | | | | 387,721,453 | |
Cash | | | — | | | | — | | | | — | | | | 21 | |
Foreign currencies, at value (Cost $-, $-, $-, $-, $-, $490, $-, $-, $345, $-) | | | — | | | | — | | | | — | | | | — | |
Income receivable | | | 162,105 | | | | 444,144 | | | | 318,036 | | | | 550 | |
Receivable for investments sold | | | — | | | | — | | | | — | | | | — | |
Receivable for shares sold | | | — | | | | 7,588 | | | | — | | | | — | |
Tax reclaims receivable | | | — | | | | — | | | | — | | | | — | |
Receivable from Advisor | | | — | | | | — | | | | — | | | | 121,901 | |
Prepaid expenses and other assets | | | 10,208 | | | | 23,209 | | | | 16,415 | | | | 19,155 | |
Total assets | | | 82,505,528 | | | | 395,907,281 | | | | 198,257,912 | | | | 387,863,080 | |
| Liabilities: | | | | | | | | | | | | | | | | |
Payable to custodian | | | — | | | | 6,276 | | | | — | | | | — | |
Payable for investments purchased | | | — | | | | — | | | | — | | | | — | |
Payable for shares redeemed | | | — | | | | — | | | | — | | | | — | |
Income distribution payable | | | 693 | | | | 2,601 | | | | 1,062 | | | | 3,039 | |
Accrued expenses and other payables | | | | | | | | | | | | | | | | |
Investment advisor fees | | | 14,670 | | | | 23,316 | | | | 18,911 | | | | — | |
Administration fees | | | 14,199 | | | | 57,053 | | | | 26,058 | | | | 52,603 | |
Custodian fees | | | 2,081 | | | | 10,084 | | | | 4,987 | | | | 8,132 | |
Financial administration fees | | | 1,634 | | | | 1,321 | | | | 1,838 | | | | 1,174 | |
Distribution service fee | | | — | | | | — | | | | — | | | | — | |
Shareholder services fee | | | — | | | | — | | | | — | | | | — | |
Transfer agent fees | | | 3,044 | | | | 10,669 | | | | 5,065 | | | | 6,341 | |
Compliance service fees | | | 2,101 | | | | 10,527 | | | | 5,373 | | | | 7,973 | |
Other | | | 9,522 | | | | 106,531 | | | | 62,627 | | | | 68,723 | |
Total liabilities | | | 47,944 | | | | 228,378 | | | | 125,921 | | | | 147,985 | |
Net Assets | | $ | 82,457,584 | | | $ | 395,678,903 | | | $ | 198,131,991 | | | $ | 387,715,095 | |
| | | | | | | | | | | | | | | | | |
| Net Assets Consist of: | | | | | | | | | | | | | | | | |
Paid in capital | | $ | 82,588,652 | | | $ | 396,135,532 | | | $ | 198,385,827 | | | $ | 387,711,285 | |
Net unrealized appreciation of investments, options and translations of assets and liabilities in foreign currency | | | — | | | | — | | | | — | | | | — | |
Accumulated net realized gain (loss) on investments, options and foreign currency transactions | | | (131,068 | ) | | | (456,629 | ) | | | (253,836 | ) | | | (350 | ) |
Accumulated net investment income (loss) | | | — | | | | — | | | | — | | | | 4,160 | |
Total Net Assets | | $ | 82,457,584 | | | $ | 395,678,903 | | | $ | 198,131,991 | | | $ | 387,715,095 | |
| | | | | | | | | | | | | | | | | |
| Net Assets: | | | | | | | | | | | | | | | | |
Trust Shares | | $ | 66,918,532 | | | $ | 214,980,880 | | | $ | 81,023,477 | | | $ | 312,870,263 | |
Class A Shares | | $ | 15,539,052 | | | $ | 134,974,155 | | | $ | 117,108,514 | | | $ | 74,844,832 | |
Interfund Shares | | | — | | | $ | 45,723,868 | | | | — | | | | — | |
| Shares Outstanding: (unlimited number of shares authorized, no par value): | | | | | | | | | | | | | | | | |
Trust Shares | | | 67,016,566 | | | | 215,454,252 | | | | 81,174,592 | | | | 312,841,800 | |
Class A Shares | | | 15,571,128 | | | | 134,946,467 | | | | 117,203,749 | | | | 74,871,919 | |
Interfund Shares | | | — | | | | 45,740,284 | | | | — | | | | — | |
| Net Asset Value, Redemption Price and Offering Price Per Share: | | | | | | | | | | | | | | | | |
Trust Shares | | $ | 1.00 | | | $ | 1.00 | | | $ | 1.00 | | | $ | 1.00 | |
Class A Shares | | $ | 1.00 | | | $ | 1.00 | | | $ | 1.00 | | | $ | 1.00 | |
Interfund Shares | | | — | | | $ | 1.00 | | | | — | | | | — | |
| Offering Price Per Share (100%/(100%-maximum sales charge) of net asset value adjusted to the nearest cent) per share: | | | | | | | | | | | | | | | | |
Class A Shares | | | — | | | | — | | | | — | | | | — | |
| Maximum Sales Charge: | | | | | | | | | | | | | | | | |
Class A Shares | | | — | | | | — | | | | — | | | | — | |
| | | | | | | | | | | | | | | | | |
(See notes which are an integral part of the Financial Statements)
Annual Shareholder Report
101
| | | | | | | | | | | | | | | | | | | | | | |
Huntington
Dividend
Capture
Fund | | | Huntington
Global Select
Markets Fund | | | Huntington
Growth
Fund | | | Huntington
Income
Equity
Fund | | | Huntington
International
Equity
Fund | | | Huntington
Macro 100
Fund | |
| | | | | | | | | | | | | | | | | | | | | | |
| $ | 110,134,031 | | | $ | 37,058,289 | | | $ | 116,190,664 | | | $ | 98,435,640 | | | $ | 242,233,054 | | | $ | 37,121,092 | |
| $ | 118,084,250 | | | $ | 41,280,952 | | | | 126,984,736 | | | $ | 103,831,173 | | | $ | 294,593,775 | | | $ | 43,242,502 | |
| | 1,122,914 | | | | 716,504 | | | | 6,700,122 | | | | 3,214,284 | | | | 8,803,071 | | | | 2,108,417 | |
| | — | | | | — | | | | — | | | | — | | | | — | | | | — | |
| | 119,207,164 | | | | 41,997,456 | | | | 133,684,858 | | | | 107,045,457 | | | | 303,396,846 | | | | 45,350,919 | |
| | — | | | | — | | | | 1,598 | | | | — | | | | — | | | | — | |
|
— |
| | | 490 | | | | — | | | | — | | | | 372 | | | | — | |
| | 248,877 | | | | 84,824 | | | | 108,744 | | | | 197,083 | | | | 1,029,733 | | | | 36,345 | |
| | 161,330 | | | | — | | | | 1,262,763 | | | | — | | | | 3,152,524 | | | | — | |
| | 81,681 | | | | 37,837 | | | | 106,866 | | | | 29,365 | | | | 130,238 | | | | 96,243 | |
| | — | | | | 2,702 | | | | — | | | | — | | | | 336,958 | | | | — | |
| | — | | | | — | | | | — | | | | — | | | | — | | | | — | |
| | 8,966 | | | | 361 | | | | 15,970 | | | | 14,596 | | | | 13,907 | | | | 21,092 | |
| | 119,708,018 | | | | 42,123,670 | | | | 135,180,799 | | | | 107,286,501 | | | | 308,060,578 | | | | 45,504,599 | |
| | | | | | | | | | | | | | | | | | | | | | |
| | — | | | | — | | | | — | | | | — | | | | 21,592 | | | | — | |
| | 952,945 | | | | — | | | | 2,622,313 | | | | — | | | | — | | | | — | |
| | 192,558 | | | | 36,772 | | | | 50,164 | | | | 144,303 | | | | 151,275 | | | | 1,750 | |
| | — | | | | — | | | | — | | | | — | | | | — | | | | — | |
| | | | | | | | | | | | | | | | | | | | | | |
| | 73,762 | | | | 77,630 | | | | 66,782 | | | | 53,848 | | | | 256,629 | | | | 28,530 | |
| | 23,368 | | | | 7,886 | | | | 19,152 | | | | 15,767 | | | | 39,225 | | | | 7,666 | |
| | 2,074 | | | | 3,292 | | | | 2,815 | | | | 2,245 | | | | 9,912 | | | | 798 | |
| | 1,801 | | | | 11,084 | | | | 1,613 | | | | 1,466 | | | | 10,647 | | | | 1,749 | |
| | 4,831 | | | | 212 | | | | 2,265 | | | | 1,650 | | | | 2,518 | | | | 485 | |
| | 24,601 | | | | 8,622 | | | | 27,827 | | | | 22,435 | | | | 64,170 | | | | 9,510 | |
| | 10,830 | | | | 2,219 | | | | 10,623 | | | | 8,338 | | | | 12,240 | | | | 5,013 | |
| | 2,000 | | | | 384 | | | | 2,970 | | | | 2,356 | | | | 6,860 | | | | 783 | |
| | 13,584 | | | | — | | | | 33,952 | | | | 22,393 | | | | 56,823 | | | | 2,076 | |
| | 1,302,354 | | | | 148,101 | | | | 2,840,476 | | | | 274,801 | | | | 631,891 | | | | 58,360 | |
| $ | 118,405,664 | | | $ | 41,975,569 | | | $ | 132,340,323 | | | $ | 107,011,700 | | | $ | 307,428,687 | | | $ | 45,446,239 | |
| | | | | | | | | | | | | | | | | | | | | | | |
| | | | | | | | | | | | | | | | | | | | | | |
| $ | 140,603,287 | | | $ | 37,385,247 | | | $ | 115,338,641 | | | $ | 117,512,585 | | | $ | 269,375,543 | | | $ | 45,786,115 | |
|
9,073,133 |
| | | 4,939,943 | | | | 17,494,194 | | | | 8,609,817 | | | | 61,209,874 | | | | 8,229,827 | |
| (31,299,900 | ) | | | (105,318 | ) | | | (500,862 | ) | | | (19,157,178 | ) | | | (23,716,220 | ) | | | (8,575,719 | ) |
| | 29,144 | | | | (244,303 | ) | | | 8,350 | | | | 46,476 | | | | 559,490 | | | | 6,016 | |
| $ | 118,405,664 | | | $ | 41,975,569 | | | $ | 132,340,323 | | | $ | 107,011,700 | | | $ | 307,428,687 | | | $ | 45,446,239 | |
| | | | | | | | | | | | | | | | | | | | | | | |
| | | | | | | | | | | | | | | | | | | | | | |
| $ | 100,622,003 | | | $ | 41,115,964 | | | $ | 123,808,590 | | | $ | 101,076,258 | | | $ | 296,797,323 | | | $ | 43,630,622 | |
| $ | 17,783,661 | | | $ | 859,605 | | | $ | 8,531,733 | | | $ | 5,935,442 | | | $ | 10,631,364 | | | $ | 1,815,617 | |
| | — | | | | — | | | | — | | | | — | | | | — | | | | — | |
| | | | | | | | | | | | | | | | | | | | | | |
| | 11,572,417 | | | | 3,587,816 | | | | 4,848,136 | | | | 4,984,560 | | | | 25,732,222 | | | | 4,503,155 | |
| | 2,046,079 | | | | 75,211 | | | | 343,582 | | | | 292,600 | | | | 928,715 | | | | 189,667 | |
| | — | | | | — | | | | — | | | | — | | | | — | | | | — | |
| | | | | | | | | | | | | | | | | | | | | | |
| $ | 8.69 | | | $ | 11.46 | | | $ | 25.54 | | | $ | 20.28 | | | $ | 11.53 | | | $ | 9.69 | |
| $ | 8.69 | | | $ | 11.43 | | | $ | 24.83 | | | $ | 20.29 | | | $ | 11.45 | | | $ | 9.57 | |
| | — | | | | — | | | | — | | | | — | | | | — | | | | — | |
| | | | | | | | | | | | | | | | | | | | | | |
| $ | 9.12 | | | $ | 12.00 | | | $ | 26.07 | | | $ | 21.30 | | | $ | 12.02 | | | $ | 10.05 | |
| | | | | | | | | | | | | | | | | | | | | | |
| | 4.75 | % | | | 4.75 | % | | | 4.75 | % | | | 4.75 | % | | | 4.75 | % | | | 4.75 | % |
| | | | | | | | | | | | | | | | | | | | | | | |
Annual Shareholder Report
102
Statements of Assets and Liabilities (Continued)
December 31, 2010
| | | | | | | | | | | | | | | | |
| | | Huntington
Mid Corp
America
Fund | | | Huntington
New Economy
Fund | | | Huntington
Real
Strategies
Fund | | | Huntington
Rotating
Markets
Fund | |
| Assets: | | | | | | | | | | | | | | | | |
Investments, at cost | | $ | 83,429,803 | | | $ | 49,513,151 | | | $ | 84,529,118 | | | $ | 34,156,897 | |
Investments, at value | | $ | 146,918,946 | | | $ | 55,185,350 | | | $ | 94,115,189 | | | $ | 39,107,355 | |
Investments in affiliated securities, at value | | | 1,913,483 | | | | 1,609,241 | | | | 101,452 | | | | 183,730 | |
Investments in repurchase agreements, at cost | | | — | | | | — | | | | — | | | | — | |
Total Investments | | | 148,832,429 | | | | 56,794,591 | | | | 94,216,641 | | | | 39,291,085 | |
Cash | | | — | | | | — | | | | — | | | | — | |
Income receivable | | | 122,761 | | | | 13,057 | | | | 69,796 | | | | 46,709 | |
Receivable for investments sold | | | — | | | | — | | | | — | | | | — | |
Receivable for shares sold | | | 56,732 | | | | 29,767 | | | | 81,863 | | | | 40,714 | |
Tax reclaims receivable | | | — | | | | — | | | | — | | | | — | |
Prepaid expenses and other assets | | | 11,175 | | | | 9,166 | | | | 15,065 | | | | 14,045 | |
Total assets | | | 149,023,097 | | | | 56,846,581 | | | | 94,383,365 | | | | 39,392,553 | |
| Liabilities: | | | | | | | | | | | | | | | | |
Cash overdraft | | | — | | | | — | | | | — | | | | — | |
Options written, at value (premium received $-, $521,395, $837,870, $-, $-, $-, $-, $-, $-, $) | | | — | | | | 828,330 | | | | 1,375,219 | | | | — | |
Income distribution payable | | | — | | | | — | | | | — | | | | — | |
Payable for investments purchased | | | — | | | | — | | | | 14,112 | | | | — | |
Payable for shares redeemed | | | 24,918 | | | | 54,082 | | | | 26,549 | | | | 23,315 | |
Accrued expenses and other payables | | | | | | | | | | | | | | | | |
Investment advisor fees | | | 94,813 | | | | 40,313 | | | | 57,372 | | | | 16,579 | |
Administration fees | | | 22,338 | | | | 8,572 | | | | 14,364 | | | | 5,510 | |
Custodian fees | | | 3,030 | | | | 1,161 | | | | 1,756 | | | | 847 | |
Financial administration fees | | | 2,210 | | | | 1,802 | | | | 1,640 | | | | 1,101 | |
Distribution service fee | | | 1,989 | | | | 1,265 | | | | 476 | | | | 661 | |
Shareholder services fee | | | 31,612 | | | | 11,854 | | | | 19,126 | | | | 8,288 | |
Transfer agent fees | | | 9,546 | | | | 7,310 | | | | 4,255 | | | | 4,122 | |
Compliance service fees | | | 3,150 | | | | 1,171 | | | | 1,739 | | | | 905 | |
Other | | | 33,870 | | | | 8,863 | | | | 1,379 | | | | 2,001 | |
Total liabilities | | | 227,476 | | | | 964,723 | | | | 1,517,987 | | | | 63,329 | |
Net Assets | | $ | 148,795,621 | | | $ | 55,881,858 | | | $ | 92,865,378 | | | $ | 39,329,224 | �� |
| | | | | | | | | | | | | | | | | |
| Net Assets Consist of: | | | | | | | | | | | | | | | | |
Paid in capital | | $ | 82,796,785 | | | $ | 73,031,587 | | | $ | 103,459,590 | | | $ | 38,377,988 | |
Net unrealized appreciation of investments, options and translations of assets and liabilities in foreign currency | | | 65,402,626 | | | | 6,974,505 | | | | 9,150,174 | | | | 5,134,188 | |
Accumulated net realized gain (loss) on investments, options and foreign currency transactions | | | 576,042 | | | | (24,133,322 | ) | | | (19,366,986 | ) | | | (4,284,016 | ) |
Accumulated net investment income (loss) | | | 20,168 | | | | 9,088 | | | | (377,400 | ) | | | 101,064 | |
Total Net Assets | | $ | 148,795,621 | | | $ | 55,881,858 | | | $ | 92,865,378 | | | $ | 39,329,224 | |
| | | | | | | | | | | | | | | | | |
| Net Assets: | | | | | | | | | | | | | | | | |
Trust Shares | | $ | 141,282,458 | | | $ | 50,582,774 | | | $ | 90,813,177 | | | $ | 36,728,741 | |
Class A Shares | | $ | 7,513,163 | | | $ | 5,299,084 | | | $ | 2,052,201 | | | $ | 2,600,483 | |
| Shares Outstanding: (unlimited number of shares authorized, no par value): | | | | | | | | | | | | | | | | |
Trust Shares | | | 9,039,527 | | | | 4,692,724 | | | | 11,360,656 | | | | 3,384,217 | |
Class A Shares | | | 492,561 | | | | 505,284 | | | | 256,544 | | | | 241,277 | |
Net Asset Value, Redemption Price and Offering Price
Per Share: | | | | | | | | | | | | | | | | |
Trust Shares | | $ | 15.63 | | | $ | 10.78 | | | $ | 7.99 | | | $ | 10.85 | |
Class A Shares | | $ | 15.25 | | | $ | 10.49 | | | $ | 8.00 | | | $ | 10.78 | |
| Offering Price Per Share (100%/(100%-maximum sales charge) of net asset value adjusted to the nearest cent) per share: | | | | | | | | | | | | | | | | |
Class A Shares | | $ | 16.01 | | | $ | 11.01 | | | $ | 8.40 | | | $ | 11.32 | |
| Maximum Sales Charge: | | | | | | | | | | | | | | | | |
Class A Shares | | | 4.75 | % | | | 4.75 | % | | | 4.75 | % | | | 4.75 | % |
| | | | | | | | | | | | | | | | | |
(See notes which are an integral part of the Financial Statements)
Annual Shareholder Report
103
| | | | | | | | | | | | | | | | | | | | | | |
Huntington
Situs
Fund | | | Huntington
Technical
Opportunities
Fund | | | Huntington
Fixed Income
Securities
Fund | | | Huntington
Intermediate
Government
Income Fund | | | Huntington
Mortgage
Securities
Fund | | | Huntington
Ohio
Tax Free
Fund | |
| | | | | | | | | | | | | | | | | | | | | | |
| $ | 142,146,714 | | | $ | 10,300,488 | | | $ | 276,331,141 | | | $ | 113,800,793 | | | $ | 95,070,367 | | | $ | 51,558,601 | |
| $ | 204,618,983 | | | $ | 10,205,547 | | | $ | 288,702,900 | | | $ | 117,602,323 | | | $ | 97,801,528 | | | $ | 51,820,064 | |
| | 28 | | | | 675,043 | | | | 1,571,742 | | | | 1,783,867 | | | | 2,668,401 | | | | — | |
| | — | | | | — | | | | — | | | | — | | | | — | | | | — | |
| | 204,619,011 | | | | 10,880,590 | | | | 290,274,642 | | | | 119,386,190 | | | | 100,469,929 | | | | 51,820,064 | |
| | 1,115,151 | | | | — | | | | — | | | | — | | | | — | | | | — | |
| | 88,403 | | | | 6,429 | | | | 3,267,255 | | | | 676,083 | | | | 390,551 | | | | 385,405 | |
| | 2,201,679 | | | | 1,229,892 | | | | — | | | | 347,039 | | | | 2 | | | | — | |
| | 163,054 | | | | | | | | 214,225 | | | | 78,874 | | | | 4,661 | | | | — | |
| | 18,427 | | | | — | | | | — | | | | — | | | | — | | | | — | |
| | 23,238 | | | | 32,036 | | | | 19,700 | | | | 14,561 | | | | 14,907 | | | | 13,633 | |
| | 208,228,963 | | | | 12,148,947 | | | | 293,775,822 | | | | 120,502,747 | | | | 100,880,050 | | | | 52,219,102 | |
| | | | | | | | | | | | | | | | | | | | | | |
| | — | | | | 210,549 | | | | — | | | | — | | | | — | | | | — | |
|
— |
| | | — | | | | — | | | | — | | | | — | | | | — | |
| | — | | | | — | | | | 383,786 | | | | 135,706 | | | | | | | | 99,891 | |
| | 505,148 | | | | 1,237,225 | | | | | | | | — | | | | — | | | | — | |
| | 135,057 | | | | — | | | | 719,792 | | | | 93,459 | | | | 27,782 | | | | 125,831 | |
| | | | | | | | | | | | | | | | | | | | | | |
| | 130,700 | | | | 6,702 | | | | 123,552 | | | | 50,810 | | | | 42,686 | | | | 22,246 | |
| | 32,127 | | | | 1,610 | | | | 56,703 | | | | 19,021 | | | | 15,233 | | | | 10,372 | |
| | 4,101 | | | | 208 | | | | 5,748 | | | | 2,507 | | | | 2,284 | | | | 1,066 | |
| | 10,068 | | | | 1,168 | | | | 6,100 | | | | 5,456 | | | | 6,651 | | | | 9,924 | |
| | 7,255 | | | | 26 | | | | 2,376 | | | | 1,250 | | | | 935 | | | | 888 | |
| | 43,547 | | | | 2,234 | | | | 61,788 | | | | 25,407 | | | | 21,347 | | | | 11,126 | |
| | 12,857 | | | | 2,513 | | | | 7,468 | | | | 4,879 | | | | 4,527 | | | | 3,354 | |
| | 3,790 | | | | 214 | | | | 5,686 | | | | 2,540 | | | | 2,383 | | | | 1,074 | |
| | 43,145 | | | | 6,800 | | | | 36,621 | | | | 17,270 | | | | 14,244 | | | | — | |
| | 927,795 | | | | 1,469,249 | | | | 1,409,620 | | | | 358,305 | | | | 138,072 | | | | 285,772 | |
| $ | 207,301,168 | | | $ | 10,679,698 | | | $ | 292,366,202 | | | $ | 120,144,442 | | | $ | 100,741,978 | | | $ | 51,933,330 | |
| | | | | | | | | | | | | | | | | | | | | | | |
| | | | | | | | | | | | | | | | | | | | | | |
| $ | 153,643,981 | | | $ | 11,496,490 | | | $ | 278,182,319 | | | $ | 114,477,922 | | | $ | 96,113,538 | | | $ | 51,589,089 | |
|
62,472,676 |
| | | 580,102 | | | | 13,943,501 | | | | 5,585,397 | | | | 5,399,562 | | | | 261,463 | |
|
(8,838,552 |
) | | | (1,396,894 | ) | | | 220,503 | | | | 33,694 | | | | (977,170 | ) | | | 82,965 | |
| | 23,063 | | | | — | | | | 19,879 | | | | 47,429 | | | | 206,048 | | | | (187 | ) |
| $ | 207,301,168 | | | $ | 10,679,698 | | | $ | 292,366,202 | | | $ | 120,144,442 | | | $ | 100,741,978 | | | $ | 51,933,330 | |
| | | | | | | | | | | | | | | | | | | | | | | |
| | | | | | | | | | | | | | | | | | | | | | |
| $ | 183,310,864 | | | $ | 10,574,043 | | | $ | 283,953,436 | | | $ | 115,469,843 | | | $ | 96,831,923 | | | $ | 48,741,174 | |
| $ | 23,990,304 | | | $ | 105,655 | | | $ | 8,412,766 | | | $ | 4,674,599 | | | $ | 3,910,055 | | | $ | 3,192,156 | |
| | | | | | | | | | | | | | | | | | | | | | |
| | 9,068,423 | | | | 1,279,743 | | | | 12,814,628 | | | | 10,595,212 | | | | 10,635,793 | | | | 2,319,177 | |
| | 1,212,959 | | | | 12,858 | | | | 379,698 | | | | 428,951 | | | | 426,907 | | | | 151,983 | |
| | | | | | | | | | | | | | | | | | | | | | |
| $ | 20.21 | | | $ | 8.26 | | | $ | 22.16 | | | $ | 10.90 | | | $ | 9.10 | | | $ | 21.02 | |
| $ | 19.78 | | | $ | 8.22 | | | $ | 22.16 | | | $ | 10.90 | | | $ | 9.16 | | | $ | 21.00 | |
| | | | | | | | | | | | | | | | | | | | | | |
| $ | 20.77 | | | $ | 8.63 | | | $ | 23.02 | | | $ | 11.32 | | | $ | 9.52 | | | $ | 21.82 | |
| | | | | | | | | | | | | | | | | | | | | | |
| | 4.75 | % | | | 4.75 | % | | | 3.75 | % | | | 3.75 | % | | | 3.75 | % | | | 3.75 | % |
| | | | | | | | | | | | | | | | | | | | | | | |
Annual Shareholder Report
104
Statements of Assets and Liabilities (Continued)
December 31, 2010
| | | | | | | | | | | | | | | | |
| | | Huntington
Short/Intermediate
Fixed Income
Securities Fund | | | Huntington
Balanced
Allocation
Fund | | | Huntington
Conservative
Allocation
Fund | | | Huntington
Growth
Allocation
Fund | |
| Assets: | | | | | | | | | | | | | | | | |
Investments, at cost | | $ | 201,393,843 | | | $ | 22,268,063 | | | $ | 14,075,544 | | | $ | 16,668,831 | |
Investments, at value | | $ | 200,914,582 | | | | — | | | | — | | | | — | |
Investments in affiliated securities, at value | | | 4,188,774 | | | | 24,567,296 | | | | 14,808,512 | | | | 19,082,402 | |
Total Investments | | | 205,103,356 | | | | 24,567,296 | | | | 14,808,512 | | | | 19,082,402 | |
Income receivable | | | 1,511,034 | | | | 14,986 | | | | 19,146 | | | | 5,218 | |
Receivable for shares sold | | | 338,057 | | | | 91,002 | | | | 16,717 | | | | 71,052 | |
Receivable from Advisor | | | — | | | | 852 | | | | — | | | | 7,815 | |
Prepaid expenses and other assets | | | 15,426 | | | | 12,296 | | | | 7,333 | | | | 10,265 | |
Total assets | | | 206,967,873 | | | | 24,686,432 | | | | 14,851,708 | | | | 19,176,752 | |
| Liabilities: | | | | | | | | | | | | | | | | |
Income distribution payable | | | 208,266 | | | | 1,911 | | | | 580 | | | | 1,880 | |
Payable for investments purchased | | | 2,174,360 | | | | — | | | | — | | | | — | |
Payable for shares redeemed | | | 263,186 | | | | 6,317 | | | | 794 | | | | 26,856 | |
Accrued expenses and other payables | | | | | | | | | | | | | | | | |
Investment advisor fees | | | 85,641 | | | | — | | | | 1,493 | | | | — | |
Administration fees | | | 34,024 | | | | 9,506 | | | | 646 | | | | 1,968 | |
Custodian fees | | | 3,736 | | | | 156 | | | | 107 | | | | 130 | |
Financial administration fees | | | 5,744 | | | | 1,004 | | | | 1,004 | | | | 1,004 | |
Distribution service fee | | | 2,368 | | | | 8,091 | | | | 5,455 | | | | 9,959 | |
Shareholder services fee | | | 42,837 | | | | — | | | | — | | | | — | |
Transfer agent fees | | | 4,394 | | | | 3,083 | | | | 1,474 | | | | 2,593 | |
Compliance service fees | | | 3,623 | | | | 379 | | | | 274 | | | | 328 | |
Other | | | 21,702 | | | | — | | | | — | | | | — | |
Total liabilities | | | 2,849,881 | | | | 30,447 | | | | 11,827 | | | | 44,718 | |
Net Assets | | $ | 204,117,992 | | | $ | 24,655,985 | | | $ | 14,839,881 | | | $ | 19,132,034 | |
| | | | | | | | | | | | | | | | | |
| Net Assets Consist of: | | | | | | | | | | | | | | | | |
Paid in capital | | $ | 202,450,014 | | | $ | 22,339,225 | | | $ | 14,088,767 | | | $ | 16,706,668 | |
Net unrealized appreciation of investments, options and translations of assets and liabilities in foreign currency | | | 3,709,513 | | | | 2,299,233 | | | | 732,968 | | | | 2,413,571 | |
Accumulated net realized gain (loss) on investments, options and foreign currency transactions | | | (2,041,535 | ) | | | 16,964 | | | | 17,441 | | | | 11,593 | |
Accumulated net investment income (loss) | | | — | | | | 563 | | | | 705 | | | | 202 | |
Total Net Assets | | $ | 204,117,992 | | | $ | 24,655,985 | | | $ | 14,839,881 | | | $ | 19,132,034 | |
| | | | | | | | | | | | | | | | | |
| Net Assets: | | | | | | | | | | | | | | | | |
Trust Shares | | $ | 196,478,741 | | | | — | | | | — | | | | — | |
Class A Shares | | $ | 7,639,251 | | | $ | 24,655,985 | | | $ | 14,839,881 | | | $ | 19,132,034 | |
| Shares Outstanding: (unlimited number of shares authorized, no par value): | | | | | | | | | | | | | | | | |
Trust Shares | | | 9,836,304 | | | | — | | | | — | | | | — | |
Class A Shares | | | 382,390 | | | | 2,131,420 | | | | 1,388,030 | | | | 1,610,352 | |
| Net Asset Value, Redemption Price and Offering Price Per Share: | | | | | | | | | | | | | | | | |
Trust Shares | | $ | 19.97 | | | | — | | | | — | | | | — | |
Class A Shares | | $ | 19.98 | | | $ | 11.57 | | | $ | 10.69 | | | $ | 11.88 | |
| Offering Price Per Share (100%/(100%-maximum sales charge) of net asset value adjusted to the nearest cent) per share: | | | | | | | | | | | | | | | | |
Class A Shares | | $ | 20.28 | | | $ | 12.15 | | | $ | 11.22 | | | $ | 12.47 | |
| Maximum Sales Charge: | | | | | | | | | | | | | | | | |
Class A Shares | | | 1.50 | % | | | 4.75 | % | | | 4.75 | % | | | 4.75 | % |
| | | | | | | | | | | | | | | | | |
(See notes which are an integral part of the Financial Statements)
Annual Shareholder Report
105
[THIS PAGE INTENTIONALLY LEFT BLANK]
Statements of Operations
Year Ended December 31, 2010
| | | | | | | | | | | | | | | | | | | | |
| | | Huntington
Tax Free
Money Market
Fund | | | Huntington
Money Market
Fund | | | Huntington
Ohio
Municipal
Money Market
Fund | | | Huntington
U.S. Treasury
Money Market
Fund | | | Huntington
Dividend
Capture
Fund | |
| Investment Income: | | | | | | | | | | | | | | | | | | | | |
Dividend income | | $ | 6,881 | | | $ | 155,240 | | | $ | 14,046 | | | $ | 45 | | | $ | 4,401,249 | |
Dividend income from affiliated securities | | | — | | | | — | | | | — | | | | — | | | | 227 | |
Interest income | | | 423,809 | | | | 1,331,056 | | | | 954,599 | | | | 563,630 | | | | — | |
Foreign dividend taxes withheld | | | — | | | | — | | | | — | | | | — | | | | (41,449 | ) |
Total investment income | | | 430,690 | | | | 1,486,296 | | | | 968,645 | | | | 563,675 | | | | 4,360,027 | |
| Expenses: | | | | | | | | | | | | | | | | | | | | |
Investment advisor fees | | | 285,679 | | | | 1,373,133 | | | | 690,534 | | | | 719,777 | | | | 726,020 | |
Administration fees | | | 173,452 | | | | 834,137 | | | | 419,303 | | | | 655,714 | | | | 176,386 | |
Custodian fees | | | 24,974 | | | | 121,006 | | | | 59,846 | | | | 97,578 | | | | 24,887 | |
Transfer and dividend disbursing agent fees and expenses | | | 36,528 | | | | 127,491 | | | | 60,781 | | | | 76,097 | | | | 86,699 | |
Trustees’ fees | | | 9,863 | | | | 47,168 | | | | 24,626 | | | | 35,222 | | | | 9,072 | |
Professional fees | | | 23,949 | | | | 117,377 | | | | 59,255 | | | | 91,378 | | | | 23,977 | |
Financial administration fees | | | 4,903 | | | | 3,962 | | | | 5,515 | | | | 3,523 | | | | 5,404 | |
Distribution services fee—Class A Shares | | | 49,069 | | | | 323,343 | | | | 290,698 | | | �� | 163,042 | | | | 25,657 | |
Distribution services fee—Class B Shares(a) | | | — | | | | 782 | | | | — | | | | — | | | | 26,936 | |
Shareholder services fee—Trust Shares | | | 188,926 | | | | 617,155 | | | | 284,631 | | | | 736,670 | | | | 207,385 | |
Shareholder services fee—Class A Shares | | | 49,069 | | | | 323,343 | | | | 290,698 | | | | 163,042 | | | | 25,657 | |
Shareholder services fee—Class B Shares(a) | | | — | | | | 261 | | | | — | | | | — | | | | 8,979 | |
Share registration costs | | | 30,958 | | | | 41,833 | | | | 29,975 | | | | 30,759 | | | | 36,874 | |
Offering costs | | | — | | | | — | | | | — | | | | — | | | | — | |
Printing and postage | | | 6,701 | | | | 52,120 | | | | 18,614 | | | | 28,535 | | | | 7,707 | |
Insurance premiums | | | 6,390 | | | | 18,983 | | | | 11,197 | | | | 16,341 | | | | 5,319 | |
Compliance service fees | | | 4,201 | | | | 21,054 | | | | 10,746 | | | | 15,947 | | | | 4,001 | |
Other | | | 1,362 | | | | 112,829 | | | | 46,366 | | | | 68,627 | | | | 4,960 | |
Total expenses | | | 896,024 | | | | 4,135,977 | | | | 2,302,785 | | | | 2,902,252 | | | | 1,405,920 | |
Investment advisory fees waived | | | (187,676 | ) | | | (1,373,133 | ) | | | (491,216 | ) | | | (719,777 | ) | | | — | |
Distributions services fees waived | | | (49,069 | ) | | | (324,125 | ) | | | (290,698 | ) | | | (163,042 | ) | | | — | |
Shareholder services fees waived | | | (237,995 | ) | | | (940,759 | ) | | | (575,329 | ) | | | (899,712 | ) | | | — | |
Reimbursements from Advisor | | | — | | | | (58,168 | ) | | | — | | | | (593,004 | ) | | | — | |
Net expenses | | | 421,284 | | | | 1,439,792 | | | | 945,542 | | | | 526,717 | | | | 1,405,920 | |
Net Investment income (loss) | | | 9,406 | | | | 46,504 | | | | 23,103 | | | | 36,958 | | | | 2,954,107 | |
| Net Realized/Unrealized Gain (Loss) on Investments, Options and Foreign Currency Transactions: | | | | | | | | | | | | | | | | | | | | |
Net realized gain (loss) on investment transactions | | | (1,399 | ) | | | (4,591 | ) | | | (14,231 | ) | | | 3,808 | | | | 5,176,097 | |
Net realized gain (loss) on option transactions | | | — | | | | — | | | | — | | | | — | | | | 120,070 | |
Net realized gain (loss) on foreign currency transactions | | | — | | | | — | | | | — | | | | — | | | | — | |
Net realized gain (loss) on investments, options and translation of assets and liabilities in foreign currency transactions | | | (1,399 | ) | | | (4,591 | ) | | | (14,231 | ) | | | 3,808 | | | | 5,296,167 | |
Net change in unrealized appreciation/depreciation of investments, options and translation of assets and liabilities in foreign currency | | | — | | | | — | | | | — | | | | — | | | | 5,598,095 | |
Net realized and unrealized gain (loss) on investments options and foreign currency transactions | | | (1,399 | ) | | | (4,591 | ) | | | (14,231 | ) | | | 3,808 | | | | 10,894,262 | |
Change in net assets resulting from operations | | $ | 8,007 | | | $ | 41,913 | | | $ | 8,872 | | | $ | 40,766 | | | $ | 13,848,369 | |
| | | | | | | | | | | | | | | | | | | | | |
| (a) | Effective June 29, 2010, Class B shares were converted to Class A shares. |
(See notes which are an integral part of the Financial Statements)
Annual Shareholder Report
107
| | | | | | | | | | | | | | | | | | | | | | | | | | |
Huntington
Global Select
Markets Fund | | | Huntington
Growth
Fund | | | Huntington
Income Equity
Fund | | | Huntington
International
Equity
Fund | | | Huntington
Macro 100
Fund | | |
Huntington
Mid Corp
America
Fund | | | Huntington
New
Economy
Fund | |
| | | | | | | | | | | | | | | | | | | | | | | | | | |
| $ | 509,989 | | | $ | 1,693,037 | | | $ | 4,114,169 | | | $ | 8,880,527 | | | $ | 596,352 | | | $ | 2,039,230 | | | $ | 366,451 | |
| | 203 | | | | 575 | | | | 182 | | | | 1,360 | | | | 349 | | | | 640 | | | | 408 | |
| | 66,061 | | | | 97 | | | | — | | | | — | | | | 38 | | | | — | | | | — | |
| | (35,391 | ) | | | (30,015 | ) | | | (109,470 | ) | | | (555,128 | ) | | | — | | | | (6,920 | ) | | | (1,081 | ) |
| | 540,862 | | | | 1,663,694 | | | | 4,004,881 | | | | 8,326,759 | | | | 596,739 | | | | 2,032,950 | | | | 365,778 | |
| | | | | | | | | | | | | | | | | | | | | | | | | | |
| | 235,249 | | | | 790,567 | | | | 630,515 | | | | 3,046,232 | | | | 282,467 | | | | 1,062,100 | | | | 448,995 | |
| | 42,862 | | | | 240,070 | | | | 191,466 | | | | 555,034 | | | | 68,621 | | | | 258,026 | | | | 96,242 | |
| | 39,939 | | | | 33,782 | | | | 26,938 | | | | 118,940 | | | | 8,570 | | | | 36,357 | | | | 13,936 | |
|
25,193 |
| | | 93,175 | | | | 71,566 | | | | 108,834 | | | | 40,792 | | | | 80,328 | | | | 56,932 | |
| | 1,561 | | | | 13,802 | | | | 10,769 | | | | 31,498 | | | | 2,473 | | | | 14,144 | | | | 5,254 | |
| | 5,699 | | | | 33,528 | | | | 26,613 | | | | 77,966 | | | | 8,319 | | | | 35,600 | | | | 13,214 | |
| | 28,099 | | | | 4,839 | | | | 4,399 | | | | 26,787 | | | | 5,246 | | | | 6,630 | | | | 5,405 | |
| | 1,307 | | | | 17,507 | | | | 11,634 | | | | 20,446 | | | | 3,179 | | | | 13,244 | | | | 10,910 | |
| | — | | | | 9,417 | | | | 9,916 | | | | 8,144 | | | | 3,412 | | | | 13,448 | | | | 6,261 | |
| | 57,505 | | | | 308,756 | | | | 247,773 | | | | 738,407 | | | | 89,839 | | | | 336,313 | | | | 119,058 | |
| | 1,307 | | | | 17,507 | | | | 11,634 | | | | 20,446 | | | | 3,179 | | | | 13,244 | | | | 10,910 | |
| | — | | | | 3,139 | | | | 3,305 | | | | 2,715 | | | | 1,137 | | | | 4,483 | | | | 2,087 | |
| | 4,536 | | | | 40,091 | | | | 36,894 | | | | 41,784 | | | | 26,081 | | | | 40,495 | | | | 34,953 | |
| | 49,031 | | | | — | | | | — | | | | — | | | | — | | | | — | | | | — | |
| | 1,187 | | | | 11,360 | | | | 8,966 | | | | 27,347 | | | | 2,895 | | | | 11,641 | | | | 4,829 | |
| | 388 | | | | 7,335 | | | | 5,892 | | | | 11,636 | | | | 3,592 | | | | 6,634 | | | | 4,259 | |
| | 768 | | | | 5,940 | | | | 4,712 | | | | 13,719 | | | | 1,566 | | | | 6,300 | | | | 2,342 | |
| | 22,898 | | | | 10,813 | | | | 1,974 | | | | 26,129 | | | | 2,487 | | | | 11,283 | | | | 2,823 | |
| | 517,529 | | | | 1,641,628 | | | | 1,304,966 | | | | 4,876,064 | | | | 553,855 | | | | 1,950,270 | | | | 838,410 | |
| | — | | | | — | | | | — | | | | — | | | | — | | | | — | | | | — | |
| | — | | | | — | | | | — | | | | — | | | | — | | | | — | | | | — | |
| | — | | | | — | | | | — | | | | — | | | | — | | | | — | | | | — | |
| | (69,223 | ) | | | — | | | | — | | | | — | | | | — | | | | — | | | | — | |
| | 448,306 | | | | 1,641,628 | | | | 1,304,966 | | | | 4,876,064 | | | | 553,855 | | | | 1,950,270 | | | | 838,410 | |
| | 92,556 | | | | 22,066 | | | | 2,699,915 | | | | 3,450,695 | | | | 42,884 | | | | 82,680 | | | | (472,632 | ) |
| | | | | | | | | | | | | | | | | | | | | | | | | | |
| | (200,830 | ) | | | 25,800,758 | | | | 9,935,049 | | | | (2,509,219 | ) | | | (110,491 | ) | | | 5,736,320 | | | | 4,974,953 | |
| | 159,427 | | | | (48,558 | ) | | | 82,415 | | | | — | | | | 3,122 | | | | 97,229 | | | | (3,189,034 | ) |
| | (50,151 | ) | | | (436 | ) | | | (5 | ) | | | (271,669 | ) | | | — | | | | — | | | | — | |
| (91,554 | ) | | | 25,751,764 | | | | 10,017,459 | | | | (2,780,888 | ) | | | (107,369 | ) | | | 5,833,549 | | | | 1,785,919 | |
| 4,939,943 | | | | (13,801,489 | ) | | | (1,260,463 | ) | | | 17,681,037 | | | | 5,782,446 | | | | 23,282,399 | | | | 6,261,203 | |
| 4,848,389 | | | | 11,950,275 | | | | 8,756,996 | | | | 14,900,149 | | | | 5,675,077 | | | | 29,115,948 | | | | 8,047,122 | |
| $ | 4,940,945 | | | $ | 11,972,341 | | | $ | 11,456,911 | | | $ | 18,350,844 | | | $ | 5,717,961 | | | $ | 29,198,628 | | | $ | 7,574,490 | |
| | | | | | | | | | | | | | | | | | | | | | | | | | | |
Annual Shareholder Report
108
Statements of Operations (Continued)
Year Ended December 31, 2010
| | | | | | | | | | | | | | | | | | | | |
| | | Huntington
Real Strategies
Fund | | | Huntington
Rotating
Markets
Fund | | | Huntington
Situs
Fund | | | Huntington
Technical
Opportunities
Fund | | |
Huntington
Fixed Income
Securities
Fund | |
| Investment Income: | | | | | | | | | | | | | | | | | | | | |
Dividend income | | $ | 1,323,951 | | | $ | 580,977 | | | $ | 2,125,349 | | | $ | 123,899 | | | $ | 55,613 | |
Dividend income from affiliated securities | | | 579 | | | | 189 | | | | 540 | | | | 50 | | | | 744 | |
Interest income | | | — | | | | — | | | | — | | | | — | | | | 10,757,339 | |
Foreign dividend taxes withheld | | | (20,988 | ) | | | — | | | | (2,189 | ) | | | (816 | ) | | | — | |
Total investment income | | | 1,303,542 | | | | 581,166 | | | | 2,123,700 | | | | 123,133 | | | | 10,813,696 | |
| Expenses: | | | | | | | | | | | | | | | | | | | | |
Investment advisor fees | | | 603,361 | | | | 198,927 | | | | 1,322,646 | | | | 73,433 | | | | 1,333,226 | |
Administration fees | | | 146,579 | | | | 72,488 | | | | 321,302 | | | | 17,840 | | | | 485,840 | |
Custodian fees | | | 21,068 | | | | 9,665 | | | | 49,216 | | | | 2,499 | | | | 68,977 | |
Transfer and dividend disbursing agent fees and expenses | | | 33,958 | | | | 34,220 | | | | 102,479 | | | | 19,631 | | | | 76,548 | |
Trustees’ fees | | | 7,837 | | | | 3,941 | | | | 17,012 | | | | 970 | | | | 25,636 | |
Professional fees | | | 17,321 | | | | 10,157 | | | | 44,144 | | | | 2,479 | | | | 66,974 | |
Financial administration fees | | | 4,919 | | | | 3,304 | | | | 25,051 | | | | 3,504 | | | | 18,300 | |
Distribution services fee—Class A Shares | | | 3,817 | | | | 5,599 | | | | 48,088 | | | | 211 | | | | 14,856 | |
Distribution services fee—Class B Shares(a) | | | 1,112 | | | | 1,538 | | | | 12,210 | | | | 19 | | | | 7,092 | |
Shareholder services fee—Trust Shares | | | 196,935 | | | | 93,350 | | | | 388,704 | | | | 24,261 | | | | 649,405 | |
Shareholder services fee—Class A Shares | | | 3,818 | | | | 5,599 | | | | 48,088 | | | | 211 | | | | 14,856 | |
Shareholder services fee—Class B Shares(a) | | | 371 | | | | 513 | | | | 4,070 | | | | 7 | | | | 2,364 | |
Share registration costs | | | 31,157 | | | | 30,637 | | | | 39,159 | | | | 19,904 | | | | 40,368 | |
Printing and postage | | | 5,995 | | | | 3,354 | | | | 19,381 | | | | 743 | | | | 19,331 | |
Insurance premiums | | | 4,743 | | | | 3,964 | | | | 7,038 | | | | 2,501 | | | | 9,831 | |
Compliance service fees | | | 3,478 | | | | 1,610 | | | | 7,580 | | | | 427 | | | | 11,372 | |
Other | | | 4,912 | | | | 1,234 | | | | 10,309 | | | | 2,719 | | | | 11,187 | |
Total expenses | | | 1,091,381 | | | | 480,100 | | | | 2,466,477 | | | | 171,359 | | | | 2,856,163 | |
Investment advisory fees waived | | | — | | | | — | | | | — | | | | — | | | | — | |
Distributions services fees waived | | | — | | | | — | | | | — | | | | — | | | | — | |
Shareholder services fees waived | | | — | | | | — | | | | — | | | | — | | | | — | |
Reimbursement from Advisor | | | — | | | | — | | | | — | | | | — | | | | — | |
Net expenses | | | 1,091,381 | | | | 480,100 | | | | 2,466,477 | | | | 171,359 | | | | 2,856,163 | |
Net Investment income (loss) | | | 212,161 | | | | 101,066 | | | | (342,777 | ) | | | (48,226 | ) | | | 7,957,533 | |
| Net Realized/Unrealized Gain (Loss) on Investments, Options and Foreign Currency Transactions: | | | | | | | | | | | | | | | | | | | | |
Net realized gain (loss) on investment transactions | | | (1,823,260 | ) | | | 3,306,337 | | | | 6,466,161 | | | | 1,512,512 | | | | 1,872,593 | |
Net realized gain (loss) on option transactions | | | (289,055 | ) | | | — | | | | 1,344,298 | | | | (44,029 | ) | | | — | |
Net realized gain (loss) on foreign currency transactions | | | — | | | | — | | | | (1,758 | ) | | | — | | | | — | |
Net realized gain (loss) on investments, options and translation of assets and liabilities in foreign currency transactions | | | (2,112,315 | ) | | | 3,306,337 | | | | 7,808,701 | | | | 1,468,483 | | | | 1,872,593 | |
Net change in unrealized appreciation/depreciation of investments, options and translation of assets and liabilities in foreign currency | | | 20,723,483 | | | | (1,033,929 | ) | | | 36,255,243 | | | | (680,918 | ) | | | 4,051,840 | |
Net realized and unrealized gain (loss) on investments options and foreign currency transactions | | | 18,611,168 | | | | 2,272,408 | | | | 44,063,944 | | | | 787,565 | | | | 5,924,433 | |
Change in net assets resulting from operations | | $ | 18,823,329 | | | $ | 2,373,474 | | | $ | 43,721,167 | | | $ | 739,339 | | | $ | 13,881,966 | |
| | | | | | | | | | | | | | | | | | | | | |
| (a) | Effective June 29, 2010, Class B shares were converted to Class A shares. |
(See notes which are an integral part of the Financial Statements)
Annual Shareholder Report
109
| | | | | | | | | | | | | | | | | | | | | | | | | | |
Huntington
Intermediate
Government
Income
Fund | | | Huntington
Mortgage
Securities
Fund | | | Huntington
Ohio
Tax Free
Fund | | | Huntington
Short/Intermediate
Fixed Income
Securities Fund | | | Huntington
Balanced
Allocation
Fund | | | Huntington
Conservative
Allocation
Fund | | | Huntington
Growth
Allocation
Fund | |
| | | | | | | | | | | | | | | | | | | | | | | | | | |
| $ | — | | | $ | 256,347 | | | $ | 979 | | | $ | 14 | | | $ | — | | | $ | — | | | $ | — | |
| | 339 | | | | 301 | | | | — | | | | 495 | | | | 288,928 | | | | 297,798 | | | | 177,268 | |
| | 4,523,573 | | | | 3,949,207 | | | | 1,768,749 | | | | 5,276,275 | | | | — | | | | — | | | | — | |
| | — | | | | (88 | ) | | | — | | | | — | | | | — | | | | — | | | | — | |
| | 4,523,912 | | | | 4,205,767 | | | | 1,769,728 | | | | 5,276,784 | | | | 288,928 | | | | 297,798 | | | | 177,268 | |
| | | | | | | | | | | | | | | | | | | | | | | | | | |
| | 580,316 | | | | 528,278 | | | | 248,657 | | | | 869,335 | | | | 18,946 | | | | 12,934 | | | | 15,775 | |
| | 211,470 | | | | 192,508 | | | | 90,613 | | | | 316,800 | | | | 34,521 | | | | 23,566 | | | | 28,743 | |
| | 30,081 | | | | 27,414 | | | | 12,792 | | | | 44,836 | | | | 1,873 | | | | 1,287 | | | | 1,556 | |
|
51,281 |
| | | 47,887 | | | | 37,614 | | | | 49,683 | | | | 16,899 | | | | 14,598 | | | | 15,815 | |
| | 11,575 | | | | 10,690 | | | | 4,826 | | | | 16,420 | | | | 1,687 | | | | 1,233 | | | | 1,471 | |
| | 29,297 | | | | 26,696 | | | | 12,420 | | | | 43,754 | | | | 4,699 | | | | 3,251 | | | | 3,949 | |
| | 16,369 | | | | 19,954 | | | | 29,773 | | | | 17,231 | | | | 3,012 | | | | 3,012 | | | | 3,012 | |
| | 8,398 | | | | 7,578 | | | | 6,501 | | | | 11,348 | | | | 46,944 | | | | 32,335 | | | | 39,228 | |
| | 3,279 | | | | 2,037 | | | | 3,420 | | | | — | | | | — | | | | — | | | | — | |
| | 280,669 | | | | 255,885 | | | | 116,690 | | | | 423,336 | | | | — | | | | — | | | | — | |
| | 8,398 | | | | 7,578 | | | | 6,501 | | | | 11,348 | | | | — | | | | — | | | | — | |
| | 1,093 | | | | 679 | | | | 1,140 | | | | — | | | | — | | | | — | | | | — | |
| | 36,042 | | | | 31,723 | | | | 25,762 | | | | 30,378 | | | | 5,576 | | | | 5,476 | | | | 5,526 | |
| | 8,578 | | | | 8,083 | | | | 3,568 | | | | 12,012 | | | | 1,426 | | | | 1,005 | | | | 1,401 | |
| | 6,450 | | | | 5,699 | | | | 4,133 | | | | 6,667 | | | | 2,864 | | | | 2,821 | | | | 2,861 | |
| | 5,079 | | | | 3,765 | | | | 2,148 | | | | 7,245 | | | | 757 | | | | 549 | | | | 656 | |
| | 2,939 | | | | 5,416 | | | | 1,654 | | | | 1,834 | | | | 1,035 | | | | 17 | | | | 1,266 | |
| | 1,291,314 | | | | 1,181,870 | | | | 608,212 | | | | 1,862,227 | | | | 140,239 | | | | 102,084 | | | | 121,259 | |
| | — | | | | — | | | | — | | | | — | | | | (28.952 | ) | | | (11,431 | ) | | | (40,912 | ) |
| | — | | | | — | | | | — | | | | — | | | | — | | | | — | | | | — | |
| | — | | | | — | | | | — | | | | — | | | | — | | | | — | | | | — | |
| | — | | | | — | | | | — | | | | — | | | | — | | | | — | | | | — | |
| | 1,291,314 | | | | 1,181,870 | | | | 608,212 | | | | 1,862,227 | | | | 111,287 | | | | 90,653 | | | | 80,347 | |
| | 3,232,598 | | | | 3,023,897 | | | | 1,161,516 | | | | 3,414,557 | | | | 177,641 | | | | 207,145 | | | | 96,921 | |
| | | | | | | | | | | | | | | | | | | | | | | | | | |
|
130,740 |
| | | 185,541 | | | | 346,571 | | | | 1,408,501 | | | | 36,657 | | | | 53,760 | | | | 37,120 | |
| | — | | | | — | | | | — | | | | — | | | | — | | | | — | | | | — | |
|
— |
| | | 52 | | | | — | | | | — | | | | — | | | | — | | | | — | |
|
130,740 |
| | | 185,593 | | | | 346,571 | | | | 1,408,501 | | | | 36,657 | | | | 53,760 | | | | 37,120 | |
|
1,707,229 |
| | | 2,287,489 | | | | (671,744 | ) | | | (231,473 | ) | | | 1,693,127 | | | | 455,584 | | | | 1,653,097 | |
|
1,837,969 |
| | | 2,473,082 | | | | (325,173 | ) | | | 1,177,028 | | | | 1,729,784 | | | | 509,344 | | | | 1,690,217 | |
| $ | 5,070,567 | | | $ | 5,496,979 | | | $ | 836,343 | | | $ | 4,591,585 | | | $ | 1,907,425 | | | $ | 716,489 | | | $ | 1,787,138 | |
| | | | | | | | | | | | | | | | | | | | | | | | | | | |
Annual Shareholder Report
110
Statements of Changes in Net Assets
| | | | | | | | |
| | | Huntington Tax-Free
Money Market Fund | |
| | | Year Ended
December 31,
2010 | | | Year Ended
December 31,
2009 | |
| Increase (Decrease) in Net Assets: | | | | | | | | |
| Operations— | | | | | | | | |
Net investment income | | $ | 9,406 | | | $ | 106,763 | |
Net realized gain (loss) on investments, options and foreign currency transactions | | | (1,399 | ) | | | (55,252 | ) |
Change in net assets resulting from operations | | | 8,007 | | | | 51,511 | |
| Distributions to Shareholders— | | | | | | | | |
From and/or in excess of net investment income: | | | | | | | | |
From net investment income | | | | | | | | |
Trust Shares | | | (7,470 | ) | | | (95,705 | ) |
Class A Shares | | | (1,936 | ) | | | (11,058 | ) |
Class B Shares | | | — | | | | — | |
Interfund Shares | | | — | | | | — | |
Change in net assets resulting from distributions to shareholders | | | (9,406 | ) | | | (106,763 | ) |
| Change in net assets resulting from capital transactions | | | (16,054,701 | ) | | | (84,758,287 | ) |
Change in net assets | | | (16,056,100 | ) | | | (84,813,539 | ) |
| Net Assets: | | | | | | | | |
Beginning of period | | | 98,513,684 | | | | 183,327,223 | |
End of period | | $ | 82,457,584 | | | $ | 98,513,684 | |
| | | | | | | | | |
Accumulated net investment income included in net assets at end of period | | $ | — | | | $ | — | |
| Capital Transactions: | | | | | | | | |
Trust Shares | | | | | | | | |
Shares sold | | $ | 137,458,703 | | | $ | 138,617,223 | |
Dividends reinvested | | | — | | | | — | |
Shares redeemed | | | (147,344,067 | ) | | | (206,636,768 | ) |
Total Trust Shares | | | (9,885,364 | ) | | | (68,019,545 | ) |
Class A Shares | | | | | | | | |
Shares sold | | | 76,461,653 | | | | 142,937,621 | |
Shares sold in class consolidation (a) | | | — | | | | — | |
Dividends reinvested | | | 797 | | | | 6,904 | |
Shares redeemed | | | (82,631,787 | ) | | | (159,683,267 | ) |
Total Class A Shares | | | (6,169,337 | ) | | | (16,738,742 | ) |
Class B Shares (a) | | | | | | | | |
Shares sold | | | — | | | | — | |
Dividends reinvested | | | — | | | | — | |
Shares redeemed in class consolidation (a) | | | — | | | | — | |
Shares redeemed | | | — | | | | — | |
Total Class B Shares | | | — | | | | — | |
Interfund Shares | | | | | | | | |
Shares sold | | | — | | | | — | |
Shares redeemed | | | — | | | | — | |
Total Interfund Shares | | | — | | | | — | |
Net change resulting from capital transactions | | $ | (16,054,701 | ) | | $ | (84,758,287 | ) |
| Share Transactions: | | | | | | | | |
Trust Shares | | | | | | | | |
Shares sold | | | 137,458,703 | | | | 138,617,223 | |
Dividends reinvested | | | — | | | | — | |
Shares redeemed | | | (147,344,067 | ) | | | (206,636,768 | ) |
Total Trust Shares | | | (9,885,364 | ) | | | (68,019,545 | ) |
Class A Shares | | | | | | | | |
Shares sold | | | 76,461,653 | | | | 142,937,621 | |
Shares sold in class consolidation (a) | | | — | | | | — | |
Dividends reinvested | | | 797 | | | | 6,904 | |
Shares redeemed | | | (82,631,787 | ) | | | (159,683,267 | ) |
Total A Shares | | | (6,169,337 | ) | | | (16,738,742 | ) |
Class B Shares (a) | | | | | | | | |
Shares sold | | | — | | | | — | |
Dividends reinvested | | | — | | | | — | |
Shares redeemed in class consolidation (a) | | | — | | | | — | |
Shares redeemed | | | — | | | | — | |
Total B Shares | | | — | | | | — | |
Interfund Shares | | | | | | | | |
Shares sold | | | — | | | | — | |
Shares redeemed | | | — | | | | — | |
Total Interfund Shares | | | — | | | | — | |
Net change resulting from share transactions | | | (16,054,701 | ) | | | (84,758,287 | ) |
| | | | | | | | | |
| (a) | Effective June 29, 2010, Class B shares were converted to Class A shares. |
(See notes which are an integral part of the Financial Statements)
Annual Shareholder Report
111
| | | | | | | | | | | | | | | | | | | | | | |
Huntington Money
Market Fund | | | Huntington Ohio Municipal
Money Market Fund | | | Huntington U.S. Treasury
Money Market Fund | |
Year Ended
December 31,
2010 | | | Year Ended
December 31,
2009 | | | Year Ended
December 31,
2010 | | | Year Ended
December 31,
2009 | | | Year Ended
December 31,
2010 | | | Year Ended
December 31,
2009 | |
| | | | | | | | | | | | | | | | | | | | | | |
| | | | | | | | | | | | | | | | | | | | | | |
| $ | 46,504 | | | $ | 119,933 | | | $ | 23,103 | | | $ | 260,936 | | | $ | 36,958 | | | $ | 33,454 | |
| | (4,591 | ) | | | 41,682 | | | | (14,231 | ) | | | (181,920 | ) | | | 3,808 | | | | 192 | |
| | 41,913 | | | | 161,615 | | | | 8,872 | | | | 79,016 | | | | 40,766 | | | | 33,646 | |
| | | | | | | | | | | | | | | | | | | | | | |
| | | | | | | | | | | | | | | | | | | | | | |
| | | | | | | | | | | | | | | | | | | | | | |
| | (25,098 | ) | | | (71,449 | ) | | | (11,414 | ) | | | (237,814 | ) | | | (30,463 | ) | | | (65,609 | ) |
| | (13,109 | ) | | | (25,441 | ) | | | (11,689 | ) | | | (23,122 | ) | | | (6,686 | ) | | | (9,836 | ) |
| | (10 | ) | | | (49 | ) | | | — | | | | — | | | | — | | | | — | |
| | (8,287 | ) | | | (22,994 | ) | | | — | | | | — | | | | — | | | | — | |
| | (46,504 | ) | | | (119,933 | ) | | | (23,103 | ) | | | (260,936 | ) | | | (37,149 | ) | | | (75,445 | ) |
| | (62,920,898 | ) | | | (656,458,332 | ) | | | (56,857,307 | ) | | | (163,898,652 | ) | | | 71,513,112 | | | | (393,294,585 | ) |
| | (62,925,489 | ) | | | (656,416,650 | ) | | | (56,871,538 | ) | | | (164,080,572 | ) | | | 71,516,729 | | | | (393,336,384 | ) |
| | | | | | | | | | | | | | | | | | | | | | |
| | 458,604,392 | | | | 1,115,021,042 | | | | 255,003,529 | | | | 419,084,101 | | | | 316,198,366 | | | | 709,534,750 | |
| $ | 395,678,903 | | | $ | 458,604,392 | | | $ | 198,131,991 | | | $ | 255,003,529 | | | $ | 387,715,095 | | | $ | 316,198,366 | |
| | | | | | | | | | | | | | | | | | | | | | | |
| $ | — | | | $ | — | | | $ | — | | | $ | — | | | $ | 4,160 | | | $ | 193 | |
| | | | | | | | | | | | | | | | | | | | | | |
| | | | | | | | | | | | | | | | | | | | | | |
| $ | 874,783,454 | | | $ | 970,437,598 | | | $ | 244,447,562 | | | $ | 181,009,493 | | | $ | 863,202,276 | | | $ | 1,218,476,251 | |
| | 380 | | | | 879 | | | | 22 | | | | 586 | | | | — | | | | — | |
| | (920,519,877 | ) | | | (1,488,900,099 | ) | | | (306,372,704 | ) | | | (350,394,268 | ) | | | (811,597,858 | ) | | | (1,540,225,386 | ) |
| | (45,736,043 | ) | | | (518,461,622 | ) | | | (61,925,120 | ) | | | (169,384,189 | ) | | | 51,604,418 | | | | (321,749,135 | ) |
| | | | | | | | | | | | | | | | | | | | | | |
| | 274,406,116 | | | | 411,008,765 | | | | 146,181,653 | | | | 198,486,543 | | | | 189,053,736 | | | | 295,318,833 | |
| | — | | | | — | | | | — | | | | — | | | | — | | | | — | |
| | 10,590 | | | | 17,951 | | | | 6,606 | | | | 7,459 | | | | 868 | | | | 3,282 | |
| | (274,701,138 | ) | | | (575,108,386 | ) | | | (141,120,446 | ) | | | (193,008,465 | ) | | | (169,145,910 | ) | | | (366,867,565 | ) |
| | (284,432 | ) | | | (164,081,670 | ) | | | 5,067,813 | | | | 5,485,537 | | | | 19,908,694 | | | | (71,545,450 | ) |
| | | | | | | | | | | | | | | | | | | | | | |
| | 9,183 | | | | 278,171 | | | | — | | | | — | | | | — | | | | — | |
| | 10 | | | | 47 | | | | — | | | | — | | | | — | | | | — | |
| | — | | | | — | | | | — | | | | — | | | | — | | | | — | |
| | (257,733 | ) | | | (461,107 | ) | | | — | | | | — | | | | — | | | | — | |
| | (248,540 | ) | | | (182,889 | ) | | | — | | | | — | | | | — | | | | — | |
| | | | | | | | | | | | | | | | | | | | | | |
| | 478,749,433 | | | | 365,917,434 | | | | — | | | | — | | | | — | | | | — | |
| | (495,401,316 | ) | | | (339,649,585 | ) | | | — | | | | — | | | | — | | | | — | |
| | (16,651,883 | ) | | | 26,267,849 | | | | — | | | | — | | | | — | | | | — | |
| $ | (62,920,898 | ) | | $ | (656,458,332 | ) | | $ | (56,857,307 | ) | | $ | (163,898,652 | ) | | $ | 71,513,112 | | | $ | (393,294,585 | ) |
| | | | | | | | | | | | | | | | | | | | | | |
| | | | | | | | | | | | | | | | | | | | | | |
| | 874,783,454 | | | | 970,437,548 | | | | 244,447,562 | | | | 181,009,476 | | | | 863,202,276 | | | | 1,218,476,251 | |
| | 380 | | | | 879 | | | | 22 | | | | 586 | | | | — | | | | — | |
| | (920,519,877 | ) | | | (1,488,899,882 | ) | | | (306,372,704 | ) | | | (350,394,268 | ) | | | (811,597,858 | ) | | | (1,540,225,386 | ) |
| | (45,736,043 | ) | | | (518,461,455 | ) | | | (61,925,120 | ) | | | (169,384,206 | ) | | | 51,604,418 | | | | (321,749,135 | ) |
| | | | | | | | | | | | | | | | | | | | | | |
| | 274,406,116 | | | | 411,008,765 | | | | 146,181,653 | | | | 198,486,543 | | | | 189,053,736 | | | | 295,318,833 | |
| | — | | | | — | | | | — | | | | — | | | | — | | | | — | |
| | 10,590 | | | | 17,951 | | | | 6,606 | | | | 7,459 | | | | 868 | | | | 3,282 | |
| | (274,701,138 | ) | | | (575,108,199 | ) | | | (141,120,446 | ) | | | (193,008,465 | ) | | | (169,145,910 | ) | | | (366,867,565 | ) |
| | (284,432 | ) | | | (164,081,483 | ) | | | 5,067,813 | | | | 5,485,537 | | | | 19,908,694 | | | | (71,545,450 | ) |
| | | | | | | | | | | | | | | | | | | | | | |
| | 9,183 | | | | 277,649 | | | | — | | | | — | | | | — | | | | — | |
| | 10 | | | | 47 | | | | — | | | | — | | | | — | | | | — | |
| | — | | | | — | | | | — | | | | — | | | | — | | | | — | |
| | (257,733 | ) | | | (460,939 | ) | | | — | | | | — | | | | — | | | | — | |
| | (248,540 | ) | | | (183,243 | ) | | | — | | | | — | | | | — | | | | — | |
| | | | | | | | | | | | | | | | | | | | | | |
| | 478,749,433 | | | | 365,917,434 | | | | — | | | | — | | | | — | | | | — | |
| | (495,401,316 | ) | | | (339,649,585 | ) | | | — | | | | — | | | | — | | | | — | |
| | (16,651,883 | ) | | | 26,267,849 | | | | — | | | | — | | | | — | | | | — | |
| | (62,920,898 | ) | | | (656,458,332 | ) | | | (56,857,307 | ) | | | (163,898,669 | ) | | | 71,513,112 | | | | (393,294,585 | ) |
| | | | | | | | | | | | | | | | | | | | | | | |
Annual Shareholder Report
112
Statements of Changes in Net Assets (Continued)
| | | | | | | | |
| | | Huntington Dividend
Capture Fund | |
| | | Year Ended
December 31,
2010 | | | Year Ended
December 31,
2009 | |
| Increase (Decrease) in Net Assets: | | | | | | | | |
| Operations— | | | | | | | | |
Net investment income (loss) | | $ | 2,954,107 | | | $ | 3,281,761 | |
Net realized gain (loss) on investments, options and foreign currency transactions | | | 5,296,167 | | | | (14,163,051 | ) |
Net change in unrealized appreciation/depreciation of investments and foreign currency transactions | | | 5,598,095 | | | | 28,867,966 | |
Change in net assets resulting from operations | | | 13,848,369 | | | | 17,986,676 | |
| Distributions to Shareholders— | | | | | | | | |
From and/or in excess of net investment income: | | | | | | | | |
Trust Shares | | | (2,548,196 | ) | | | (2,822,474 | ) |
Class A Shares | | | (281,521 | ) | | | (192,423 | ) |
Class B Shares | | | (95,246 | ) | | | (258,584 | ) |
From net realized gain on investments: | | | | | | | | |
Trust Shares | | | — | | | | — | |
Class A Shares | | | — | | | | — | |
Class B Shares | | | — | | | | — | |
From return of capital: | | | | | | | | |
Trust Shares | | | — | | | | (153,159 | ) |
Class A Shares | | | — | | | | (11,221 | ) |
Class B Shares | | | — | | | | (17,306 | ) |
Change in net assets resulting from distributions to shareholders | | | (2,924,963 | ) | | | (3,455,167 | ) |
| Change in net assets resulting from capital transactions | | | 19,924,950 | | | | (251,986 | ) |
Change in net assets | | | 30,848,356 | | | | 14,279,523 | |
| Net Assets: | | | | | | | | |
Beginning of period | | | 87,557,308 | | | | 73,277,785 | |
End of period | | $ | 118,405,664 | | | $ | 87,557,308 | |
| | | | | | | | | |
Accumulated net investment income (loss) included in net assets at end of period | | $ | 29,144 | | | $ | — | |
| Capital Transactions: | | | | | | | | |
Trust Shares | | | | | | | | |
Shares sold | | $ | 28,363,588 | | | $ | 14,073,470 | |
Dividends reinvested | | | 1,386,702 | | | | 1,618,153 | |
Shares redeemed | | | (13,154,436 | ) | | | (13,743,009 | ) |
Total Trust Shares | | | 16,595,854 | | | | 1,948,614 | |
Class A Shares | | | | | | | | |
Shares sold | | | 6,559,018 | | | | 631,611 | |
Shares sold in class consolidation (a) | | | 6,422,265 | | | | — | |
Dividends reinvested | | | 240,983 | | | | 168,200 | |
Shares redeemed | | | (2,564,382 | ) | | | (1,251,995 | ) |
Total Class A Shares | | | 10,657,884 | | | | (452,184 | ) |
Class B Shares (a) | | | | | | | | |
Shares sold | | | 119,022 | | | | 138,442 | |
Dividends reinvested | | | 86,563 | | | | 252,553 | |
Shares redeemed in class consolidation (a) | | | (6,422,265 | ) | | | — | |
Shares redeemed | | | (1,112,108 | ) | | | (2,139,411 | ) |
Total Class B Shares | | | (7,328,788 | ) | | | (1,748,416 | ) |
Net change resulting from capital transactions | | $ | 19,924,950 | | | $ | (251,986 | ) |
| Share Transactions: | | | | | | | | |
Trust Shares | | | | | | | | |
Shares sold | | | 3,514,014 | | | | 2,136,480 | |
Dividends reinvested | | | 171,223 | | | | 241,552 | |
Shares redeemed | | | (1,608,121 | ) | | | (2,045,926 | ) |
Total Trust Shares | | | 2,077,116 | | | | 332,106 | |
Class A Shares | | | | | | | | |
Shares sold | | | 791,992 | | | | 88,888 | |
Shares sold in class consolidation (a) | | | 840,611 | | | | — | |
Dividends reinvested | | | 29,479 | | | | 25,245 | |
Shares redeemed | | | (312,633 | ) | | | (193,247 | ) |
Total Investment/Class A Shares | | | 1,349,449 | | | | (79,114 | ) |
Class B Shares (a) | | | | | | | | |
Shares sold | | | 14,768 | | | | 22,302 | |
Dividends reinvested | | | 10,965 | | | | 38,105 | |
Shares redeemed in class consolidation (a) | | | (843,924 | ) | | | — | |
Shares redeemed | | | (139,301 | ) | | | (329,522 | ) |
Total Investment/Class B Shares | | | (957,492 | ) | | | (269,115 | ) |
Net change resulting from share transactions | | | 2,469,073 | | | | (16,123 | ) |
| | | | | | | | | |
| (1) | Reflects operations for the period from December 30, 2009 (date of commencement of operations) to December 31, 2009. |
| (2) | Rounds to less than $1. |
| (a) | Effective June 29, 2010, Class B shares were converted to Class A shares. |
(See notes which are an integral part of the Financial Statements)
Annual Shareholder Report
113
| | | | | | | | | | | | | | | | | | | | | | | | | | | | | | |
Huntington Global
Select Markets Fund | | | Huntington
Growth Fund | | | Huntington Income
Equity Fund | | | Huntington International
Equity Fund | |
Year Ended
December 31,
2010 | | | Period Ended
December 31,
2009(1) | | | Year Ended
December 31,
2010 | | | Year Ended
December 31,
2009 | | | Year Ended
December 31,
2010 | | | Year Ended
December 31,
2009 | | | Year Ended
December 31,
2010 | | | Year Ended
December 31,
2009 | |
| | | | | | | | | | | | | | | | | | | | | | | | | | | | | | |
| | | | | | | | | | | | | | | | | | | | | | | | | | | | | | |
| $ | 92,556 | | | $ | — | (2) | | $ | 22,066 | | | $ | 9,983 | | | $ | 2,699,915 | | | $ | 2,938,005 | | | $ | 3,450,695 | | | $ | 4,569,072 | |
| | (91,554 | ) | | | — | | | | 25,751,764 | | | | (6,872,503 | ) | | | 10,017,459 | | | | (17,918,728 | ) | | | (2,780,888 | ) | | | (21,833,004 | ) |
| | 4,939,943 | | | | — | (2) | | | (13,801,489 | ) | | | 31,169,501 | | | | (1,260,463 | ) | | | 35,063,649 | | | | 17,681,037 | | | | 103,830,604 | |
| | 4,940,945 | | | | — | | | | 11,972,341 | | | | 24,306,981 | | | | 11,456,911 | | | | 20,082,926 | | | | 18,350,844 | | | | 86,566,672 | |
| | | | | | | | | | | | | | | | | | | | | | | | | | | | | | |
| | | | | | | | | | | | | | | | | | | | | | | | | | | | | | |
| | (392,639 | ) | | | — | | | | (378 | ) | | | (33,067 | ) | | | (2,521,176 | ) | | | (2,755,535 | ) | | | (2,391,416 | ) | | | (2,949,875 | ) |
| | (7,192 | ) | | | — | | | | (19 | ) | | | — | | | | (104,186 | ) | | | (81,421 | ) | | | (72,760 | ) | | | (46,814 | ) |
| | — | | | | — | | | | — | | | | — | | | | (27,815 | ) | | | (63,309 | ) | | | — | | | | (2,670 | ) |
| | | | | | | | | | | | | | | | | | | | | | | | | | | | | | |
| | — | | | | — | | | | — | | | | — | | | | — | | | | — | | | | — | | | | (577,926 | ) |
| | — | | | | — | | | | — | | | | — | | | | — | | | | — | | | | — | | | | (17,339 | ) |
| | — | | | | — | | | | — | | | | — | | | | — | | | | — | | | | — | | | | (4,488 | ) |
| | | | | | | | | | | | | | | | | | | | | | | | | | | | | | |
| | (50,356 | ) | | | — | | | | — | | | | — | | | | — | | | | (73,924 | ) | | | — | | | | — | |
| | (1,144 | ) | | | — | | | | — | | | | — | | | | — | | | | (2,393 | ) | | | — | | | | — | |
| | — | | | | — | | | | — | | | | — | | | | — | | | | (2,242 | ) | | | — | | | | — | |
| | (451,331 | ) | | | — | | | | (397 | ) | | | (33,067 | ) | | | (2,653,177 | ) | | | (2,978,824 | ) | | | (2,464,176 | ) | | | (3,599,112 | ) |
| | 37,484,955 | | | | 1,000 | | | | (28,770,178 | ) | | | (13,294,868 | ) | | | (12,420,285 | ) | | | (2,644,200 | ) | | | (40,749,610 | ) | | | 49,389,685 | |
| | 41,974,569 | | | | 1,000 | | | | (16,798,234 | ) | | | 10,979,046 | | | | (3,616,551 | ) | | | 14,459,902 | | | | (24,862,942 | ) | | | 132,357,245 | |
| | | | | | | | | | | | | | | | | | | | | | | | | | | | | | |
| | 1,000 | | | | — | | | | 149,138,557 | | | | 138,159,511 | | | | 110,628,251 | | | | 96,168,349 | | | | 332,291,629 | | | | 199,934,384 | |
| $ | 41,975,569 | | | $ | 1,000 | | | $ | 132,340,323 | | | $ | 149,138,557 | | | $ | 107,011,700 | | | $ | 110,628,251 | | | $ | 307,428,687 | | | $ | 332,291,629 | |
| | | | | | | | | | | | | | | | | | | | | | | | | | | | | | | |
| $ | (244,303 | ) | | $ | — | | | $ | 8,350 | | | $ | 404 | | | $ | 46,476 | | | $ | — | | | $ | 559,490 | | | $ | (386,291 | ) |
| | | | | | | | | | | | | | | | | | | | | | | | | | | | | | |
| | | | | | | | | | | | | | | | | | | | | | | | | | | | | | |
| $ | 37,539,607 | | | $ | 500 | | | $ | 12,842,248 | | | $ | 33,779,715 | | | $ | 12,158,596 | | | $ | 21,427,415 | | | $ | 53,700,060 | | | $ | 108,643,636 | |
| | 237,959 | | | | — | | | | 226 | | | | 18,815 | | | | 1,307,009 | | | | 1,477,314 | | | | 793,877 | | | | 1,232,979 | |
| | (1,064,024 | ) | | | — | | | | (40,453,766 | ) | | | (46,304,608 | ) | | | (25,147,192 | ) | | | (24,473,024 | ) | | | (95,416,225 | ) | | | (58,900,808 | ) |
| | 36,713,542 | | | | 500 | | | | (27,611,292 | ) | | | (12,506,078 | ) | | | (11,681,587 | ) | | | (1,568,295 | ) | | | (40,922,288 | ) | | | 50,975,807 | |
| | | | | | | | | | | | | | | | | | | | | | | | | | | | | | |
| | 1,018,671 | | | | 500 | | | | 982,549 | | | | 765,892 | | | | 785,109 | | | | 386,292 | | | | 2,536,935 | | | | 3,327,103 | |
| | — | | | | — | | | | 2,079,387 | | | | — | | | | 2,244,174 | | | | — | | | | 1,954,659 | | | | — | |
| | 6,400 | | | | — | | | | 17 | | | | 28 | | | | 98,867 | | | | 79,886 | | | | 63,912 | | | | 62,719 | |
| | (253,658 | ) | | | — | | | | (1,598,082 | ) | | | (983,839 | ) | | | (1,111,811 | ) | | | (904,536 | ) | | | (2,320,079 | ) | | | (4,883,507 | ) |
| | 771,413 | | | | 500 | | | | 1,463,871 | | | | (217,919 | ) | | | 2,016,339 | | | | (438,358 | ) | | | 2,235,427 | | | | (1,493,685 | ) |
| | | | | | | | | | | | | | | | | | | | | | | | | | | | | | |
| | — | | | | — | | | | 47,039 | | | | 159,840 | | | | 71,030 | | | | 61,009 | | | | 159,052 | | | | 281,397 | |
| | — | | | | — | | | | — | | | | — | | | | 26,668 | | | | 63,188 | | | | — | | | | 6,972 | |
| | — | | | | — | | | | (2,079,387 | ) | | | — | | | | (2,244,174 | ) | | | — | | | | (1,954,659 | ) | | | — | |
| | — | | | | — | | | | (590,409 | ) | | | (730,711 | ) | | | (608,561 | ) | | | (761,744 | ) | | | (267,142 | ) | | | (380,806 | ) |
| | — | | | | — | | | | (2,622,757 | ) | | | (570,871 | ) | | | (2,755,037 | ) | | | (637,547 | ) | | | (2,062,749 | ) | | | (92,437 | ) |
| $ | 37,484,955 | | | $ | 1,000 | | | $ | (28,770,178 | ) | | $ | (13,294,868 | ) | | $ | (12,420,285 | ) | | $ | (2,644,200 | ) | | $ | (40,749,610 | ) | | $ | 49,389,685 | |
| | | | | | | | | | | | | | | | | | | | | | | | | | | | | | |
| | | | | | | | | | | | | | | | | | | | | | | | | | | | | | |
| | 3,668,554 | | | | 50 | | | | 549,642 | | | | 1,702,652 | | | | 647,759 | | | | 1,340,332 | | | | 5,059,393 | | | | 13,029,865 | |
| | 20,873 | | | | — | | | | 11 | | | | 908 | | | | 70,566 | | | | 97,308 | | | | 68,977 | | | | 124,036 | |
| | (101,661 | ) | | | — | | | | (1,751,756 | ) | | | (2,236,390 | ) | | | (1,334,020 | ) | | | (1,525,705 | ) | | | (9,278,730 | ) | | | (6,525,303 | ) |
| | 3,587,766 | | | | 50 | | | | (1,202,103 | ) | | | (532,830 | ) | | | (615,695 | ) | | | (88,065 | ) | | | (4,150,360 | ) | | | 6,628,598 | |
| | | | | | | | | | | | | | | | | | | | | | | | | | | | | | |
| | 99,395 | | | | 50 | | | | 43,320 | | | | 37,956 | | | | 42,174 | | | | 24,508 | | | | 238,025 | | | | 371,017 | |
| | — | | | | — | | | | 101,088 | | | | — | | | | 129,347 | | | | — | | | | 205,106 | | | | — | |
| | 563 | | | | — | | | | 1 | | | | 2 | | | | 5,334 | | | | 5,315 | | | | 5,592 | | | | 6,563 | |
| | (24,797 | ) | | | — | | | | (70,602 | ) | | | (50,421 | ) | | | (59,557 | ) | | | (58,007 | ) | | | (223,912 | ) | | | (522,841 | ) |
| | 75,161 | | | | 50 | | | | 73,807 | | | | (12,463 | ) | | | 117,298 | | | | (28,184 | ) | | | 224,811 | | | | (145,261 | ) |
| | | | | | | | | | | | | | | | | | | | | | | | | | | | | | |
| | — | | | | — | | | | 2,254 | | | | 9,060 | | | | 3,844 | | | | 3,958 | | | | 15,412 | | | | 32,181 | |
| | — | | | | — | | | | — | | | | — | | | | 1,462 | | | | 4,259 | | | | — | | | | 787 | |
| | — | | | | — | | | | (109,212 | ) | | | — | | | | (130,248 | ) | | | — | | | | (209,727 | ) | | | — | |
| | — | | | | — | | | | (28,409 | ) | | | (39,497 | ) | | | (32,970 | ) | | | (50,380 | ) | | | (26,207 | ) | | | (42,847 | ) |
| | — | | | | — | | | | (135,367 | ) | | | (30,437 | ) | | | (157,912 | ) | | | (42,163 | ) | | | (220,522 | ) | | | (9,879 | ) |
| | 3,662,927 | | | | 100 | | | | (1,263,663 | ) | | | (575,730 | ) | | | (656,309 | ) | | | (158,412 | ) | | | (4,146,071 | ) | | | 6,473,458 | |
| | | | | | | | | | | | | | | | | | | | | | | | | | | | | | | |
Annual Shareholder Report
114
Statements of Changes in Net Assets (Continued)
| | | | | | | | |
| | | Huntington
Macro 100 Fund | |
| | | Year Ended
December 31,
2010 | | | Year Ended
December 31,
2009 | |
| Increase (Decrease) in Net Assets: | | | | | | | | |
| Operations— | | | | | | | | |
Net investment income (loss) | | $ | 42,884 | | | $ | 60,214 | |
Net realized gain (loss) on investments, options and foreign currency transactions | | | (107,369 | ) | | | (1,322,727 | ) |
Net change in unrealized appreciation/depreciation of investments and foreign currency transactions | | | 5,782,446 | | | | 7,839,434 | |
Change in net assets resulting from operations | | | 5,717,961 | | | | 6,576,921 | |
| Distributions to Shareholders— | | | | | | | | |
From and/or in excess of net investment income: | | | | | | | | |
Trust Shares | | | (39,179 | ) | | | (60,212 | ) |
Class A Shares | | | — | | | | — | |
Class B Shares | | | — | | | | — | |
From net realized gain on investments: | | | | | | | | |
Trust Shares | | | — | | | | — | |
Class A Shares | | | — | | | | — | |
Change in net assets resulting from distributions to shareholders | | | (39,179 | ) | | | (60,212 | ) |
| Change in net assets resulting from capital transactions | | | 9,641,517 | | | | 8,119,574 | |
Change in net assets | | | 15,320,299 | | | | 14,636,283 | |
| Net Assets: | | | | | | | | |
Beginning of period | | | 30,125,940 | | | | 15,489,657 | |
End of period | | $ | 45,446,239 | | | $ | 30,125,940 | |
| | | | | | | | | |
Accumulated net investment income (loss) included in net assets at end of period | | $ | 6,016 | | | $ | 2,311 | |
| Capital Transactions: | | | | | | | | |
Trust Shares | | | | | | | | |
Shares sold | | $ | 17,038,052 | | | $ | 14,285,900 | |
Dividends reinvested | | | 17,810 | | | | 30,946 | |
Shares redeemed | | | (7,140,435 | ) | | | (5,639,083 | ) |
Total Trust Shares | | | 9,915,427 | | | | 8,677,763 | |
Class A Shares | | | | | | | | |
Shares sold | | | 173,176 | | | | 103,111 | |
Shares sold in class consolidation (a) | | | 807,433 | | | | — | |
Dividends reinvested | | | — | | | | — | |
Shares redeemed | | | (288,184 | ) | | | (463,125 | ) |
Total Class A Shares | | | 692,425 | | | | (360,014 | ) |
Class B Shares(a) | | | | | | | | |
Shares sold | | | 19,109 | | | | 22,388 | |
Dividends reinvested | | | — | | | | — | |
Shares redeemed in class consolidation (a) | | | (807,433 | ) | | | — | |
Shares redeemed | | | (178,011 | ) | | | (220,563 | ) |
Total Class B Shares | | | (966,335 | ) | | | (198,175 | ) |
Net change resulting from capital transactions | | $ | 9,641,517 | | | $ | 8,119,574 | |
| Share Transactions: | | | | | | | | |
Trust Shares | | | | | | | | |
Shares sold | | | 1,939,161 | | | | 2,086,351 | |
Dividends reinvested | | | 1,836 | | | | 3,654 | |
Shares redeemed | | | (809,687 | ) | | | (795,462 | ) |
Total Trust Shares | | | 1,131,310 | | | | 1,294,543 | |
Class A Shares | | | | | | | | |
Shares sold | | | 20,307 | | | | 15,090 | |
Shares sold in class consolidation (a) | | | 100,677 | | | | — | |
Dividends reinvested | | | — | | | | — | |
Shares redeemed | | | (34,038 | ) | | | (67,739 | ) |
Total Investment/Class A Shares | | | 86,946 | | | | (52,649 | ) |
Class B Shares(a) | | | | | | | | |
Shares sold | | | 2,222 | | | | 3,460 | |
Dividends reinvested | | | — | | | | — | |
Shares redeemed in class consolidation (a) | | | (103,120 | ) | | | — | |
Shares redeemed | | | (21,618 | ) | | | (33,447 | ) |
Total Investment/Class B Shares | | | (122,516 | ) | | | (29,987 | ) |
Net change resulting from share transactions | | | 1,095,740 | | | | 1,211,907 | |
| | | | | | | | | |
| (a) | Effective June 29, 2010, Class B shares were converted to Class A shares. |
(See notes which are an integral part of the Financial Statements)
Annual Shareholder Report
115
| | | | | | | | | | | | | | | | | | | | | | | | | | | | | | |
Huntington Mid Corp
America Fund | | | Huntington New
Economy Fund | | | Huntington Real
Strategies Fund | | | Huntington Rotating
Markets Fund | |
Year Ended
December 31,
2010 | | | Year Ended
December 31,
2009 | | | Year Ended
December 31,
2010 | | | Year Ended
December 31,
2009 | | | Year Ended
December 31,
2010 | | | Year Ended
December 31,
2009 | | | Year Ended
December 31,
2010 | | | Year Ended
December 31,
2009 | |
| | | | | | | | | | | | | | | | | | | | | | | | | | | | | | |
| | | | | | | | | | | | | | | | | | | | | | | | | | | | | | |
| $ | 82,680 | | | $ | 326,636 | | | $ | (472,632 | ) | | $ | (183,071 | ) | | $ | 212,161 | | | $ | 475,407 | | | $ | 101,066 | | | $ | 425,295 | |
| | 5,833,549 | | | | (121,299 | ) | | | 1,785,919 | | | | (10,319,530 | ) | | | (2,112,315 | ) | | | (7,991,270 | ) | | | 3,306,337 | | | | (1,739,757 | ) |
| | 23,282,399 | | | | 35,714,049 | | | | 6,261,203 | | | | 25,626,779 | | | | 20,723,483 | | | | 24,556,080 | | | | (1,033,929 | ) | | | 12,210,346 | |
| | 29,198,628 | | | | 35,919,386 | | | | 7,574,490 | | | | 15,124,178 | | | | 18,823,329 | | | | 17,040,217 | | | | 2,373,474 | | | | 10,895,884 | |
| | | | | | | | | | | | | | | | | | | | | | | | | | | | | | |
| | | | | | | | | | | | | | | | | | | | | | | | | | | | | | |
| | (62,512 | ) | | | (365,323 | ) | | | — | | | | — | | | | (457,786 | ) | | | (726,816 | ) | | | (2,522 | ) | | | (408,767 | ) |
| | — | | | | (3,401 | ) | | | — | | | | — | | | | (7,157 | ) | | | (9,733 | ) | | | (177 | ) | | | (13,933 | ) |
| | — | | | | — | | | | — | | | | — | | | | — | | | | (1,232 | ) | | | — | | | | (2,509 | ) |
| | | | | | | | | | | | | | | | | | | | | | | | | | | | | | |
| | (4,468,719 | ) | | | — | | | | — | | | | — | | | | — | | | | — | | | | — | | | | — | |
| | (236,519 | ) | | | — | | | | — | | | | — | | | | — | | | | — | | | | — | | | | — | |
| | (4,767,750 | ) | | | (368,724 | ) | | | — | | | | — | | | | (464,943 | ) | | | (737,781 | ) | | | (2,699 | ) | | | (425,209 | ) |
| | (14,727,099 | ) | | | 8,847,158 | | | | (2,751,500 | ) | | | (4,125,836 | ) | | | 488,388 | | | | 21,956,780 | | | | (7,034,927 | ) | | | 3,084,280 | |
| | 9,703,779 | | | | 44,397,820 | | | | 4,822,990 | | | | 10,998,342 | | | | 18,846,774 | | | | 38,259,216 | | | | (4,664,152 | ) | | | 13,554,955 | |
| | | | | | | | | | | | | | | | | | | | | | | | | | | | | | |
| | 139,091,842 | | | | 94,694,022 | | | | 51,058,868 | | | | 40,060,526 | | | | 74,018,604 | | | | 35,759,388 | | | | 43,993,376 | | | | 30,438,421 | |
| $ | 148,795,621 | | | $ | 139,091,842 | | | $ | 55,881,858 | | | $ | 51,058,868 | | | $ | 92,865,378 | | | $ | 74,018,604 | | | $ | 39,329,224 | | | $ | 43,993,376 | |
| | | | | | | | | | | | | | | | | | | | | | | | | | | | | | | |
| $ | 20,168 | | | $ | — | | | $ | 9,088 | | | $ | 2,171 | | | $ | (377,400 | ) | | $ | (187,155 | ) | | $ | 101,064 | | | $ | 2,697 | |
| | | | | | | | | | | | | | | | | | | | | | | | | | | | | | |
| | | | | | | | | | | | | | | | | | | | | | | | | | | | | | |
| $ | 16,843,639 | | | $ | 33,756,756 | | | $ | 9,198,803 | | | $ | 9,940,386 | | | $ | 26,207,190 | | | $ | 34,982,399 | | | $ | 3,675,994 | | | $ | 8,106,299 | |
| | 1,560,512 | | | | 132,250 | | | | — | | | | — | | | | 153,667 | | | | 231,640 | | | | 1,479 | | | | 216,853 | |
| | (32,000,397 | ) | | | (23,761,222 | ) | | | (11,131,548 | ) | | | (12,800,558 | ) | | | (26,161,352 | ) | | | (13,724,010 | ) | | | (10,955,692 | ) | | | (4,854,147 | ) |
| | (13,596,246 | ) | | | 10,127,784 | | | | (1,932,745 | ) | | | (2,860,172 | ) | | | 199,505 | | | | 21,490,029 | | | | (7,278,219 | ) | | | 3,469,005 | |
| | | | | | | | | | | | | | | | | | | | | | | | | | | | | | |
| | 871,497 | | | | 653,555 | | | | 530,957 | | | | 655,131 | | | | 525,252 | | | | 510,322 | | | | 748,046 | | | | 268,850 | |
| | 3,055,265 | | | | — | | | | 1,448,141 | | | | — | | | | 262,045 | | | | — | | | | 420,143 | | | | — | |
| | 229,929 | | | | 3,199 | | | | — | | | | — | | | | 6,718 | | | | 8,676 | | | | 167 | | | | 13,467 | |
| | (1,452,171 | ) | | | (758,769 | ) | | | (1,063,887 | ) | | | (1,435,394 | ) | | | (270,600 | ) | | | (124,504 | ) | | | (699,394 | ) | | | (869,240 | ) |
| | 2,704,520 | | | | (102,015 | ) | | | 915,211 | | | | (780,263 | ) | | | 523,415 | | | | 394,494 | | | | 468,962 | | | | (586,923 | ) |
| | | | | | | | | | | | | | | | | | | | | | | | | | | | | | |
| | 48,822 | | | | 127,210 | | | | 12,188 | | | | 48,923 | | | | 74,092 | | | | 104,113 | | | | 232,135 | | | | 209,093 | |
| | — | | | | — | | | | — | | | | — | | | | — | | | | 1,232 | | | | — | | | | 2,110 | |
| | (3,055,265 | ) | | | — | | | | (1,448,141 | ) | | | — | | | | (262,045 | ) | | | — | | | | (420,143 | ) | | | — | |
| | (828,930 | ) | | | (1,305,821 | ) | | | (298,013 | ) | | | (534,324 | ) | | | (46,579 | ) | | | (33,088 | ) | | | (37,662 | ) | | | (9,005 | ) |
| | (3,835,373 | ) | | | (1,178,611 | ) | | | (1,733,966 | ) | | | (485,401 | ) | | | (234,532 | ) | | | 72,257 | | | | (225,670 | ) | | | 202,198 | |
| $ | (14,727,099 | ) | | $ | 8,847,158 | | | $ | (2,751,500 | ) | | $ | (4,125,836 | ) | | $ | 488,388 | | | $ | 21,956,780 | | | $ | (7,034,927 | ) | | $ | 3,084,280 | |
| | | | | | | | | | | | | | | | | | | | | | | | | | | | | | |
| | | | | | | | | | | | | | | | | | | | | | | | | | | | | | |
| | 1,213,070 | | | | 3,290,842 | | | | 952,401 | | | | 1,273,360 | | | | 3,923,406 | | | | 6,558,762 | | | | 371,830 | | | | 953,348 | |
| | 101,242 | | | | 9,951 | | | | — | | | | — | | | | 19,281 | | | | 35,802 | | | | 157 | | | | 21,095 | |
| | (2,300,605 | ) | | | (2,120,486 | ) | | | (1,147,077 | ) | | | (1,607,511 | ) | | | (3,891,127 | ) | | | (2,447,717 | ) | | | (1,072,809 | ) | �� | | (559,778 | ) |
| | (986,293 | ) | | | 1,180,307 | | | | (194,676 | ) | | | (334,151 | ) | | | 51,560 | | | | 4,146,847 | | | | (700,822 | ) | | | 414,665 | |
| | | | | | | | | | | | | | | | | | | | | | | | | | | | | | |
| | 63,383 | | | | 57,500 | | | | 55,651 | | | | 85,056 | | | | 77,710 | | | | 90,233 | | | | 74,095 | | | | 30,075 | |
| | 240,951 | | | | — | | | | 166,453 | | | | — | | | | 44,566 | | | | — | | | | 45,717 | | | | — | |
| | 15,287 | | | | 246 | | | | — | | | | — | | | | 842 | | | | 1,339 | | | | 18 | | | | 1,316 | |
| | (107,799 | ) | | | (72,560 | ) | | | (112,849 | ) | | | (190,948 | ) | | | (39,790 | ) | | | (22,980 | ) | | | (68,791 | ) | | | (101,325 | ) |
| | 211,822 | | | | (14,814 | ) | | | 109,255 | | | | (105,892 | ) | | | 83,328 | | | | 68,592 | | | | 51,039 | | | | (69,934 | ) |
| | | | | | | | | | | | | | | | | | | | | | | | | | | | | | |
| | 3,733 | | | | 13,191 | | | | 1,350 | | | | 6,923 | | | | 11,113 | | | | 18,976 | | | | 23,347 | | | | 21,299 | |
| | — | | | | — | | | | — | | | | — | | | | — | | | | 191 | | | | — | | | | 209 | |
| | (253,129 | ) | | | — | | | | (176,603 | ) | | | — | | | | (44,871 | ) | | | — | | | | (46,476 | ) | | | — | |
| | (64,238 | ) | | | (125,998 | ) | | | (33,135 | ) | | | (75,489 | ) | | | (7,285 | ) | | | (5,662 | ) | | | (3,822 | ) | | | (970 | ) |
| | (313,634 | ) | | | (112,807 | ) | | | (208,388 | ) | | | (68,566 | ) | | | (41,043 | ) | | | 13,505 | | | | (26,951 | ) | | | 20,538 | |
| | (1,088,105 | ) | | | 1,052,686 | | | | (293,809 | ) | | | (508,609 | ) | | | 93,845 | | | | 4,228,944 | | | | (676,734 | ) | | | 365,269 | |
| | | | | | | | | | | | | | | | | | | | | | | | | | | | | | | |
Annual Shareholder Report
116
Statements of Changes in Net Assets (Continued)
| | | | | | | | |
| | | Huntington Situs
Fund | |
| | | Year Ended
December 31,
2010 | | | Year Ended
December 31,
2009 | |
| Increase (Decrease) in Net Assets: | | | | | | | | |
| Operations— | | | | | | | | |
Net investment income (loss) | | $ | (342,777 | ) | | $ | 267,309 | |
Net realized gain (loss) on investments, options and foreign currency transactions | | | 7,808,701 | | | | (16,170,019 | ) |
Net change in unrealized appreciation/depreciation of investments and foreign currency transactions | | | 36,255,243 | | | | 60,633,114 | |
Change in net assets resulting from operations | | | 43,721,167 | | | | 44,730,404 | |
| Distributions to Shareholders— | | | | | | | | |
From and/or in excess of net investment income: | | | | | | | | |
Trust Shares | | | — | | | | (137,349 | ) |
Class A Shares | | | — | | | | (1,062 | ) |
Class B Shares | | | — | | | | — | |
From net realized gain on investments: | | | | | | | | |
Trust Shares | | | — | | | | (303,439 | ) |
Class A Shares | | | — | | | | (37,293 | ) |
Class B Shares | | | — | | | | (7,568 | ) |
From return of capital: | | | | | | | | |
Trust Shares | | | — | | | | (157,791 | ) |
Class A Shares | | | — | | | | (1,219 | ) |
Class B Shares | | | — | | | | — | |
Change in net assets resulting from distributions to shareholders | | | — | | | | (645,721 | ) |
| Change in net assets resulting from capital transactions | | | 2,298,252 | | | | 24,638,941 | |
Change in net assets | | | 46,019,419 | | | | 68,723,624 | |
| Net Assets: | | | | | | | | |
Beginning of period | | | 161,281,749 | | | | 92,558,125 | |
End of period | | $ | 207,301,168 | | | $ | 161,281,749 | |
| | | | | | | | | |
Accumulated net investment income (loss) included in net assets at end of period | | $ | 23,063 | | | $ | 67,375 | |
| Capital Transactions: | | | | | | | | |
Trust Shares | | | | | | | | |
Shares sold | | $ | 39,896,511 | | | $ | 57,231,341 | |
Dividends reinvested | | | — | | | | 249,366 | |
Shares redeemed | | | (36,552,768 | ) | | | (32,901,269 | ) |
Total Trust Shares | | | 3,343,743 | | | | 24,579,438 | |
Class A Shares | | | | | | | | |
Shares sold | | | 4,703,589 | | | | 4,332,365 | |
Shares sold in class consolidation (a) | | | 3,002,021 | | | | — | |
Dividends reinvested | | | — | | | | 39,050 | |
Shares redeemed | | | (5,625,833 | ) | | | (4,187,864 | ) |
Total Class A Shares | | | 2,079,777 | | | | 183,551 | |
Class B Shares(a) | | | | | | | | |
Shares sold | | | 208,548 | | | | 352,520 | |
Dividends reinvested | | | — | | | | 7,286 | |
Shares redeemed in class consolidation (a) | | | (3,002,021 | ) | | | — | |
Shares redeemed | | | (331,795 | ) | | | (483,854 | ) |
Total Class B Shares | | | (3,125,268 | ) | | | (124,048 | ) |
Net change resulting from capital transactions | | $ | 2,298,252 | | | $ | 24,638,941 | |
| Share Transactions: | | | | | | | | |
Trust Shares | | | | | | | | |
Shares sold | | | 2,346,760 | | | | 4,604,054 | |
Dividends reinvested | | | — | | | | 17,659 | |
Shares redeemed | | | (2,141,099 | ) | | | (2,417,894 | ) |
Total Trust Shares | | | 205,661 | | | | 2,203,819 | |
Class A Shares | | | | | | | | |
Shares sold | | | 281,058 | | | | 337,114 | |
Shares sold in class consolidation (a) | | | 196,082 | | | | — | |
Dividends reinvested | | | — | | | | 3,091 | |
Shares redeemed | | | (334,692 | ) | | | (324,573 | ) |
Total Investment/Class A Shares | | | 142,448 | | | | 15,632 | |
Class B Shares(a) | | | | | | | | |
Shares sold | | | 13,217 | | | | 28,635 | |
Dividends reinvested | | | — | | | | 608 | |
Shares redeemed in class consolidation (a) | | | (205,056 | ) | | | — | |
Shares redeemed | | | (21,145 | ) | | | (41,324 | ) |
Total Investment/Class B Shares | | | (212,984 | ) | | | (12,081 | ) |
Net change resulting from share transactions | | | 135,125 | | | | 2,207,370 | |
| | | | | | | | | |
| (a) | Effective June 29, 2010, Class B shares were converted to Class A shares. |
(See notes which are an integral part of the Financial Statements)
Annual Shareholder Report
117
| | | | | | | | | | | | | | | | | | | | | | | | | | | | | | |
Huntington Technical
Opportunities Fund | | | Huntington Fixed Income
Securities Fund | | | Huntington Intermediate
Government Income Fund | | | Huntington Mortgage
Securities Fund | |
Year Ended
December 31,
2010 | | | Year Ended
December 31,
2009 | | | Year Ended
December 31,
2010 | | | Year Ended
December 31,
2009 | | | Year Ended
December 31,
2010 | | | Year Ended
December 31,
2009 | | | Year ended
December 31,
2010 | | | Year Ended
December 31,
2009 | |
| | | | | | | | | | | | | | | | | | | | | | | | | | | | | | |
| | | | | | | | | | | | | | | | | | | | | | | | | | | | | | |
| $ | (48,226 | ) | | $ | 59,685 | | | $ | 7,957,533 | | | $ | 7,864,639 | | | $ | 3,232,598 | | | $ | 3,707,576 | | | $ | 3,023,897 | | | $ | 3,271,577 | |
| | 1,468,483 | | | | (664,660 | ) | | | 1,872,593 | | | | (1,168,072 | ) | | | 130,740 | | | | 389,587 | | | | 185,593 | | | | (409,852 | ) |
| | (680,918 | ) | | | 2,020,496 | | | | 4,051,840 | | | | 4,881,922 | | | | 1,707,229 | | | | (1,883,421 | ) | | | 2,287,489 | | | | 2,248,532 | |
| | 739,339 | | | | 1,415,521 | | | | 13,881,966 | | | | 11,578,489 | | | | 5,070,567 | | | | 2,213,742 | | | | 5,496,979 | | | | 5,110,257 | |
| | | | | | | | | | | | | | | | | | | | | | | | | | | | | | |
| | | | | | | | | | | | | | | | | | | | | | | | | | | | | | |
| | (2,333 | ) | | | (58,053 | ) | | | (7,801,926 | ) | | | (7,755,385 | ) | | | (3,187,112 | ) | | | (3,670,980 | ) | | | (3,105,050 | ) | | | (3,397,493 | ) |
| | (24 | ) | | | (229 | ) | | | (159,981 | ) | | | (92,552 | ) | | | (85,429 | ) | | | (50,025 | ) | | | (93,677 | ) | | | (92,194 | ) |
| | — | | | | — | | | | (23,043 | ) | | | (60,457 | ) | | | (9,667 | ) | | | (19,137 | ) | | | (3,441 | ) | | | (14,901 | ) |
| | | | | | | | | | | | | | | | | | | | | | | | | | | | | | |
| | — | | | | — | | | | (350,955 | ) | | | (580,161 | ) | | | (259,371 | ) | | | — | | | | — | | | | — | |
| | — | | | | — | | | | (10,945 | ) | | | (6,950 | ) | | | (9,101 | ) | | | — | | | | — | | | | — | |
| | — | | | | — | | | | — | | | | (5,692 | ) | | | — | | | | — | | | | — | | | | — | |
| | | | | | | | | | | | | | | | | | | | | | | | | | | | | | |
| | — | | | | — | | | | — | | | | — | | | | — | | | | — | | | | — | | | | — | |
| | — | | | | — | | | | — | | | | — | | | | — | | | | — | | | | — | | | | — | |
| | — | | | | — | | | | — | | | | — | | | | — | | | | — | | | | — | | | | — | |
| | (2,357 | ) | | | (58,282 | ) | | | (8,346,850 | ) | | | (8,501,197 | ) | | | (3,550,680 | ) | | | (3,740,142 | ) | | | (3,202,168 | ) | | | (3,504,588 | ) |
| | 232,132 | | | | 2,116,204 | | | | 51,868,990 | | | | 44,148,673 | | | | 4,776,641 | | | | (1,839,872 | ) | | | (4,836,073 | ) | | | 15,361,832 | |
| | 969,114 | | | | 3,473,443 | | | | 57,404,106 | | | | 47,225,965 | | | | 6,296,528 | | | | (3,366,272 | ) | | | (2,541,262 | ) | | | 16,967,501 | |
| | | | | | | | | | | | | | | | | | | | | | | | | | | | | | |
| | 9,710,584 | | | | 6,237,141 | | | | 234,962,096 | | | | 187,736,131 | | | | 113,847,914 | | | | 117,214,186 | | | | 103,283,240 | | | | 86,315,739 | |
| $ | 10,679,698 | | | $ | 9,710,584 | | | $ | 292,366,202 | | | $ | 234,962,096 | | | $ | 120,144,442 | | | $ | 113,847,914 | | | $ | 100,741,978 | | | $ | 103,283,240 | |
| | | | | | | | | | | | | | | | | | | | | | | | | | | | | | | |
| $ | — | | | $ | 2,739 | | | $ | 19,879 | | | $ | 9 | | | $ | 47,429 | | | $ | — | | | $ | 206,048 | | | $ | — | |
| | | | | | | | | | | | | | | | | | | | | | | | | | | | | | |
| | | | | | | | | | | | | | | | | | | | | | | | | | | | | | |
| $ | 1,282,064 | | | $ | 3,336,611 | | | $ | 89,304,830 | | | $ | 89,412,734 | | | $ | 21,411,140 | | | $ | 40,875,081 | | | $ | 14,825,753 | | | $ | 31,185,601 | |
| | 1,998 | | | | 43,003 | | | | 3,524,347 | | | | 3,504,724 | | | | 1,759,548 | | | | 1,969,792 | | | | 1,398,109 | | | | 1,549,345 | |
| | (1,084,074 | ) | | | (1,233,922 | ) | | | (43,892,319 | ) | | | (49,379,619 | ) | | | (19,954,994 | ) | | | (45,743,761 | ) | | | (21,748,608 | ) | | | (16,910,041 | ) |
| | 199,988 | | | | 2,145,692 | | | | 48,936,858 | | | | 43,537,839 | | | | 3,215,694 | | | | (2,898,888 | ) | | | (5,524,746 | ) | | | 15,824,905 | |
| | | | | | | | | | | | | | | | | | | | | | | | | | | | | | |
| | 47,253 | | | | 15,534 | | | | 5,043,132 | | | | 1,478,309 | | | | 2,386,504 | | | | 1,098,395 | | | | 1,156,292 | | | | 46,545 | |
| | 4,906 | | | | — | | | | 1,838,391 | | | | — | | | | 902,507 | | | | — | | | | 560,977 | | | | — | |
| | 23 | | | | 222 | | | | 135,103 | | | | 72,402 | | | | 69,109 | | | | 38,813 | | | | 75,400 | | | | 71,958 | |
| | (15,132 | ) | | | (28,949 | ) | | | (2,044,653 | ) | | | (684,629 | ) | | | (903,594 | ) | | | (340,073 | ) | | | (551,603 | ) | | | (547,762 | ) |
| | 37,050 | | | | (13,193 | ) | | | 4,971,973 | | | | 866,082 | | | | 2,454,526 | | | | 797,135 | | | | 1,241,066 | | | | (429,259 | ) |
| | | | | | | | | | | | | | | | | | | | | | | | | | | | | | |
| | — | | | | 4,000 | | | | 74,087 | | | | 226,008 | | | | 40,750 | | | | 397,766 | | | | 42,377 | | | | 30,813 | |
| | — | | | | — | | | | 19,645 | | | | 56,450 | | | | 8,138 | | | | 17,795 | | | | 3,369 | | | | 14,819 | |
| | (4,906 | ) | | | — | | | | (1,838,391 | ) | | | — | | | | (902,507 | ) | | | — | | | | (560,977 | ) | | | — | |
| | — | | | | (20,295 | ) | | | (295,182 | ) | | | (537,706 | ) | | | (39,960 | ) | | | (153,680 | ) | | | (37,162 | ) | | | (79,446 | ) |
| | (4,906 | ) | | | (16,295 | ) | | | (2,039,841 | ) | | | (255,248 | ) | | | (893,579 | ) | | | 261,881 | | | | (552,393 | ) | | | (33,814 | ) |
| $ | 232,132 | | | $ | 2,116,204 | | | $ | 51,868,990 | | | $ | 44,148,673 | | | $ | 4,776,641 | | | $ | (1,839,872 | ) | | $ | (4,836,073 | ) | | $ | 15,361,832 | |
| | | | | | | | | | | | | | | | | | | | | | | | | | | | | | |
| | | | | | | | | | | | | | | | | | | | | | | | | | | | | | |
| | 167,891 | | | | 504,999 | | | | 4,014,079 | | | | 4,181,224 | | | | 1,953,280 | | | | 3,786,327 | | | | 1,624,092 | | | | 3,555,321 | |
| | 293 | | | | 5,570 | | | | 158,026 | | | | 163,626 | | | | 160,279 | | | | 182,544 | | | | 152,933 | | | | 176,713 | |
| | (145,505 | ) | | | (185,169 | ) | | | (1,976,293 | ) | | | (2,301,987 | ) | | | (1,827,782 | ) | | | (4,233,209 | ) | | | (2,367,709 | ) | | | (1,912,972 | ) |
| | 22,679 | | | | 325,400 | | | | 2,195,812 | | | | 2,042,863 | | | | 285,777 | | | | (264,338 | ) | | | (590,684 | ) | | | 1,819,062 | |
| | | | | | | | | | | | | | | | | | | | | | | | | | | | | | |
| | 6,236 | | | | 2,435 | | | | 225,399 | | | | 68,538 | | | | 216,616 | | | | 102,041 | | | | 124,588 | | | | 5,229 | |
| | 710 | | | | — | | | | 82,108 | | | | — | | | | 81,972 | | | | — | | | | 61,042 | | | | — | |
| | 3 | | | | 29 | | | | 6,041 | | | | 3,380 | | | | 6,279 | | | | 3,596 | | | | 8,196 | | | | 8,168 | |
| | (2,051 | ) | | | (4,616 | ) | | | (92,044 | ) | | | (32,084 | ) | | | (82,097 | ) | | | (31,522 | ) | | | (60,101 | ) | | | (61,957 | ) |
| | 4,898 | | | | (2,152 | ) | | | 221,504 | | | | 39,834 | | | | 222,770 | | | | 74,115 | | | | 133,725 | | | | (48,560 | ) |
| | | | | | | | | | | | | | | | | | | | | | | | | | | | | | |
| | — | | | | 613 | | | | 3,388 | | | | 10,605 | | | | 3,759 | | | | 37,049 | | | | 4,655 | | | | 3,495 | |
| | — | | | | — | | | | 894 | | | | 2,642 | | | | 748 | | | | 1,648 | | | | 370 | | | | 1,687 | |
| | (714 | ) | | | — | | | | (82,219 | ) | | | — | | | | (81,897 | ) | | | — | | | | (61,242 | ) | | | — | |
| | — | | | | (3,371 | ) | | | (13,440 | ) | | | (25,092 | ) | | | (3,687 | ) | | | (14,215 | ) | | | (4,068 | ) | | | (9,048 | ) |
| | (714 | ) | | | (2,758 | ) | | | (91,377 | ) | | | (11,845 | ) | | | (81,077 | ) | | | 24,482 | | | | (60,285 | ) | | | (3,866 | ) |
| | 26,863 | | | | 320,490 | | | | 2,325,939 | | | | 2,070,852 | | | | 427,470 | | | | (165,741 | ) | | | (517,244 | ) | | | 1,766,636 | |
| | | | | | | | | | | | | | | | | | | | | | | | | | | | | | | |
Annual Shareholder Report
118
Statements of Changes in Net Assets (Continued)
| | | | | | | | |
| | | Huntington Ohio
Tax-Free Fund | |
| | | Year Ended
December 31,
2010 | | | Year Ended
December 31,
2009 | |
| Increase (Decrease) in Net Assets: | | | | | | | | |
| Operations— | | | | | | | | |
Net investment income (loss) | | $ | 1,161,516 | | | $ | 1,165,906 | |
Net realized gain (loss) on investments, options and foreign currency transactions | | | 346,571 | | | | (53,124 | ) |
Net change in unrealized appreciation/depreciation of investments and foreign currency transactions | | | (671,744 | ) | | | 772,362 | |
Change in net assets resulting from operations | | | 836,343 | | | | 1,885,144 | |
| Distributions to Shareholders— | | | | | | | | |
From and/or in excess of net investment income: | | | | | | | | |
Trust Shares | | | (1,099,620 | ) | | | (1,106,033 | ) |
Class A Shares | | | (54,422 | ) | | | (38,681 | ) |
Class B Shares | | | (7,662 | ) | | | (21,221 | ) |
From net realized gain on investments: | | | | | | | | |
Trust Shares | | | (159,909 | ) | | | — | |
Class A Shares | | | (10,438 | ) | | | — | |
Class B Shares | | | — | | | | — | |
From return of capital: | | | | | | | | |
Trust Shares | | | — | | | | — | |
Class A Shares | | | — | | | | — | |
Class B Shares | | | — | | | | — | |
Change in net assets resulting from distributions to shareholders | | | (1,332,051 | ) | | | (1,165,935 | ) |
Change in net assets resulting from capital transactions | | | 7,086,223 | | | | 9,251,645 | |
Change in net assets | | | 6,590,515 | | | | 9,970,854 | |
| Net Assets: | | | | | | | | |
Beginning of period | | | 45,342,815 | | | | 35,371,961 | |
End of period | | $ | 51,933,330 | | | $ | 45,342,815 | |
| | | | | | | | | |
Accumulated net investment income (loss) included in net assets at end of period | | $ | (187 | ) | | $ | 1 | |
| Capital Transactions: | | | | | | | | |
Trust Shares | | | | | | | | |
Shares sold | | $ | 14,445,882 | | | $ | 15,262,985 | |
Dividends reinvested | | | 151,156 | | | | 152,160 | |
Shares redeemed | | | (7,958,085 | ) | | | (6,464,541 | ) |
Total Trust Shares | | | 6,638,953 | | | | 8,950,604 | |
Class A Shares | | | | | | | | |
Shares sold | | | 918,341 | | | | 521,043 | |
Shares sold in class consolidation (a) | | | 897,826 | | | | — | |
Dividends reinvested | | | 53,999 | | | | 34,700 | |
Shares redeemed | | | (386,771 | ) | | | (258,433 | ) |
Total Class A Shares | | | 1,483,395 | | | | 297,310 | |
Class B Shares(a) | | | | | | | | |
Shares sold | | | 6,300 | | | | 57,800 | |
Dividends reinvested | | | 5,652 | | | | 16,324 | |
Shares redeemed in class consolidation (a) | | | (897,826 | ) | | | — | |
Shares redeemed | | | (150,251 | ) | | | (70,393 | ) |
Total Class B Shares | | | (1,036,125 | ) | | | 3,731 | |
Net change resulting from capital transactions | | $ | 7,086,223 | | | $ | 9,251,645 | |
| Share Transactions: | | | | | | | | |
Trust Shares | | | | | | | | |
Shares sold | | | 675,066 | | | | 718,635 | |
Dividends reinvested | | | 7,081 | | | | 7,165 | |
Shares redeemed | | | (371,028 | ) | | | (305,521 | ) |
Total Trust Shares | | | 311,119 | | | | 420,279 | |
Class A Shares | | | | | | | | |
Shares sold | | | 42,824 | | | | 24,501 | |
Shares sold in class consolidation (a) | | | 42,092 | | | | — | |
Dividends reinvested | | | 2,529 | | | | 1,635 | |
Shares redeemed | | | (17,844 | ) | | | (12,340 | ) |
Total Investment/Class A Shares | | | 69,601 | | | | 13,796 | |
Class B Shares(a) | | | | | | | | |
Shares sold | | | 297 | | | | 2,750 | |
Dividends reinvested | | | 265 | | | | 769 | |
Shares redeemed in class consolidation (a) | | | (42,092 | ) | | | — | |
Shares redeemed | | | (7,059 | ) | | | (3,335 | ) |
Total Investment/Class B Shares | | | (48,589 | ) | | | 184 | |
Net change resulting from share transactions | | | 332,131 | | | | 434,259 | |
| | | | | | | | | |
| (1) | Reflects operations for the period from July 31, 2009 (date of commencement of operations) to December 31, 2009. |
| (a) | Effective June 29, 2010, Class B shares were converted to Class A shares. |
(See notes which are an integral part of the Financial Statements)
Annual Shareholder Report
119
| | | | | | | | | | | | | | | | | | | | | | | | | | | | | | |
Huntington Short/Intermediate
Fixed Income Fund | | | Huntington Balanced
Allocation Fund | | | Huntington Conservative
Allocation Fund | | | Huntington Growth
Allocation Fund | |
Year Ended
December 31,
2010 | | | Year Ended
December 31,
2009 | | | Year Ended
December 31,
2010 | | | Period Ended
December 31,
2009(1) | | | Year Ended
December 31,
2010 | | | Period Ended
December 31,
2009(1) | | | Year Ended
December 31,
2010 | | | Period Ended
December 31,
2009(1) | |
| | | | | | | | | | | | | | | | | | | | | | | | | | | | | | |
| | | | | | | | | | | | | | | | | | | | | | | | | | | | | | |
| $ | 3,414,557 | | | $ | 3,172,259 | | | $ | 177,641 | | | $ | 61,310 | | | $ | 207,145 | | | $ | 83,157 | | | $ | 96,921 | | | $ | 48,181 | |
| | 1,408,501 | | | | (270,239 | ) | | | 36,657 | | | | 77,393 | | | | 53,760 | | | | 32,732 | | | | 37,120 | | | | 98,894 | |
| | (231,473 | ) | | | 5,592,730 | | | | 1,693,127 | | | | 606,106 | | | | 455,584 | | | | 277,384 | | | | 1,653,097 | | | | 760,474 | |
| | 4,591,585 | | | | 8,494,750 | | | | 1,907,425 | | | | 744,809 | | | | 716,489 | | | | 393,273 | | | | 1,787,138 | | | | 907,549 | |
| | | | | | | | | | | | | | | | | | | | | | | | | | | | | | |
| | | | | | | | | | | | | | | | | | | | | | | | | | | | | | |
| | — | | | | — | | | | (177,167 | ) | | | (69,748 | ) | | | (206,601 | ) | | | (91,089 | ) | | | (96,753 | ) | | | (56,570 | ) |
| | (3,341,841 | ) | | | (3,155,522 | ) | | | — | | | | — | | | | — | | | | — | | | | — | | | | — | |
| | (72,716 | ) | | | (15,818 | ) | | | — | | | | — | | | | — | | | | — | | | | — | | | | — | |
| | | | | | | | | | | | | | | | | | | | | | | | | | | | | | |
| | — | | | | — | | | | (92,266 | ) | | | (4,820 | ) | | | (63,238 | ) | | | (5,813 | ) | | | (120,311 | ) | | | (4,110 | ) |
| | — | | | | — | | | | — | | | | — | | | | — | | | | — | | | | — | | | | — | |
| | — | | | | — | | | | — | | | | — | | | | — | | | | — | | | | — | | | | — | |
| | | | | | | | | | | | | | | | | | | | | | | | | | | | | | |
| | — | | | | — | | | | — | | | | — | | | | — | | | | — | | | | — | | | | — | |
| | — | | | | — | | | | — | | | | — | | | | — | | | | — | | | | — | | | | — | |
| | — | | | | — | | | | — | | | | — | | | | — | | | | — | | | | — | | | | — | |
| | (3,414,557 | ) | | | (3,171,340 | ) | | | (269,433 | ) | | | (74,568 | ) | | | (269,839 | ) | | | (96,902 | ) | | | (217,064 | ) | | | (60,680 | ) |
| | 52,480,998 | | | | 65,451,462 | | | | 9,681,633 | | | | 12,666,119 | | | | 3,144,837 | | | | 10,952,023 | | | | 4,639,422 | | | | 12,075,669 | |
| | 53,658,026 | | | | 70,774,872 | | | | 11,319,625 | | | | 13,336,360 | | | | 3,591,487 | | | | 11,248,394 | | | | 6,209,496 | | | | 12,922,538 | |
| | | | | | | | | | | | | | | | | | | | | | | | | | | | | | |
| | 150,459,966 | | | | 79,685,094 | | | | 13,336,360 | | | | — | | | | 11,248,394 | | | | — | | | | 12,922,538 | | | | — | |
| $ | 204,117,992 | | | $ | 150,459,966 | | | $ | 24,655,985 | | | $ | 13,336,360 | | | $ | 14,839,881 | | | $ | 11,248,394 | | | $ | 19,132,034 | | | $ | 12,922,538 | |
| | | | | | | | | | | | | | | | | | | | | | | | | | | | | | | |
| $ | — | | | $ | — | | | $ | 563 | | | $ | 89 | | | $ | 705 | | | $ | 161 | | | $ | 202 | | | $ | 34 | |
| | | | | | | | | | | | | | | | | | | | | | | | | | | | | | |
| | | | | | | | | | | | | | | | | | | | | | | | | | | | | | |
| $ | 74,732,503 | | | $ | 91,686,492 | | | $ | 11,109,153 | | | $ | 12,728,615 | | | $ | 3,498,712 | | | $ | 11,051,834 | | | $ | 5,456,006 | | | $ | 12,018,440 | |
| | 943,045 | | | | 1,139,715 | | | | 263,147 | | | | 73,732 | | | | 267,039 | | | | 96,761 | | | | 212,739 | | | | 59,697 | |
| | (29,773,510 | ) | | | (27,869,753 | ) | | | (1,690,667 | ) | | | (136,228 | ) | | | (620,914 | ) | | | (196,572 | ) | | | (1,029,323 | ) | | | (2,468 | ) |
| | 45,902,038 | | | | 64,956,454 | | | | 9,681,633 | | | | 12,666,119 | | | | 3,144,837 | | | | 10,952,023 | | | | 4,639,422 | | | | 12,075,669 | |
| | | | | | | | | | | | | | | | | | | | | | | | | | | | | | |
| | 8,001,574 | | | | 586,130 | | | | — | | | | — | | | | — | | | | — | | | | — | | | | — | |
| | — | | | | — | | | | — | | | | — | | | | — | | | | — | | | | — | | | | — | |
| | 69,097 | | | | 12,897 | | | | — | | | | — | | | | — | | | | — | | | | — | | | | — | |
| | (1,491,711 | ) | | | (104,019 | ) | | | — | | | | — | | | | — | | | | — | | | | — | | | | — | |
| | 6,578,960 | | | | 495,008 | | | | — | | | | — | | | | — | | | | — | | | | — | | | | — | |
| | | | | | | | | | | | | | | | | | | | | | | | | | | | | | |
| | — | | | | — | | | | — | | | | — | | | | — | | | | — | | | | — | | | | — | |
| | — | | | | — | | | | — | | | | — | | | | — | | | | — | | | | — | | | | — | |
| | — | | | | — | | | | — | | | | — | | | | — | | | | — | | | | — | | | | — | |
| | — | | | | — | | | | — | | | | — | | | | — | | | | — | | | | — | | | | — | |
| | — | | | | — | | | | — | | | | — | | | | — | | | | — | | | | — | | | | — | |
| $ | 52,480,998 | | | $ | 65,451,462 | | | $ | 9,681,633 | | | $ | 12,666,119 | | | $ | 3,144,837 | | | $ | 10,952,023 | | | $ | 4,639,422 | | | $ | 12,075,669 | |
| | | | | | | | | | | | | | | | | | | | | | | | | | | | | | |
| | — | | | | — | | | | 1,018,862 | | | | 1,247,514 | | | | 331,611 | | | | 1,099,719 | | | | 494,932 | | | | 1,183,911 | |
| | 3,725,784 | | | | 4,733,505 | | | | 24,176 | | | | 6,888 | | | | 25,340 | | | | 9,406 | | | | 19,343 | | | | 5,494 | |
| | 47,048 | | | | 58,664 | | | | (153,268 | ) | | | (12,752 | ) | | | (59,082 | ) | | | (18,964 | ) | | | (93,091 | ) | | | (237 | ) |
| | (1,487,987 | ) | | | (1,434,251 | ) | | | — | | | | — | | | | — | | | | — | | | | — | | | | — | |
| | 2,284,845 | | | | 3,357,918 | | | | 889,770 | | | | 1,241,650 | | | | 297,869 | | | | 1,090,161 | | | | 421,184 | | | | 1,189,168 | |
| | | | | | | | | | | | | | | | | | | | | | | | | | | | | | |
| | 399,203 | | | | 29,726 | | | | — | | | | — | | | | — | | | | — | | | | — | | | | — | |
| | — | | | | — | | | | — | | | | — | | | | — | | | | — | | | | — | | | | — | |
| | 3,436 | | | | 663 | | | | — | | | | — | | | | — | | | | — | | | | — | | | | — | |
| | (74,625 | ) | | | (5,401 | ) | | | — | | | | — | | | | — | | | | — | | | | — | | | | — | |
| | 328,014 | | | | 24,988 | | | | — | | | | — | | | | — | | | | — | | | | — | | | | — | |
| | | | | | | �� | | | | | | | | | | | | | | | | | | | | | | | |
| | — | | | | — | | | | — | | | | — | | | | — | | | | — | | | | — | | | | — | |
| | — | | | | — | | | | — | | | | — | | | | — | | | | — | | | | — | | | | — | |
| | — | | | | — | | | | — | | | | — | | | | — | | | | — | | | | — | | | | — | |
| | — | | | | — | | | | — | | | | — | | | | — | | | | — | | | | — | | | | — | |
| | — | | | | — | | | | — | | | | — | | | | — | | | | — | | | | — | | | | — | |
| | 2,612,859 | | | | 3,382,906 | | | | 889,770 | | | | 1,241,650 | | | | 297,869 | | | | 1,090,161 | | | | 421,184 | | | | 1,189,168 | |
| | | | | | | | | | | | | | | | | | | | | | | | | | | | | | | |
Annual Shareholder Report
120
Financial Highlights
Money Market Funds
(For a share outstanding throughout each period)
| | | | | | | | | | | | | | | | | | | | | | | | | | | | |
| | | Net Asset
Value,
beginning
of period | | | Net
investment
income | | | Net realized
and unrealized
gain (loss) on
investments | | | Total from
investment
operations | | | Distributions
from net investment
income | | | Distributions
from net
realized gain
on investment
transactions | | | Total
distributions | |
| HUNTINGTON TAX-FREE MONEY MARKET FUND | | | | | | | | | | | | | | | | | |
| Trust Shares | | | | | | | | | | | | | | | | | | | | | | | | | |
| 2006 | | $ | 1.00 | | | | 0.02 | | | | — | (1) | | | 0.02 | | | | (0.02 | ) | | | — | | | | (0.02 | ) |
| 2007 | | $ | 1.00 | | | | 0.03 | | | | — | (1) | | | 0.03 | | | | (0.03 | ) | | | — | | | | (0.03 | ) |
| 2008 | | $ | 1.00 | | | | 0.02 | | | | — | (1) | | | 0.02 | | | | (0.02 | ) | | | — | | | | (0.02 | ) |
| 2009 | | $ | 1.00 | | | | — | (1) | | | — | (1) | | | — | (1) | | | — | (1) | | | — | | | | — | (1) |
| 2010 | | $ | 1.00 | | | | — | (1) | | | — | (1) | | | — | (1) | | | — | (1) | | | — | | | | — | (1) |
| Class A Shares | | | | | | | | | | | | | | | | | |
| 2006 | | $ | 1.00 | | | | 0.02 | | | | — | (1) | | | 0.02 | | | | (0.02 | ) | | | — | | | | (0.02 | ) |
| 2007 | | $ | 1.00 | | | | 0.02 | | | | — | (1) | | | 0.02 | | | | (0.02 | ) | | | — | | | | (0.02 | ) |
| 2008 | | $ | 1.00 | | | | 0.02 | | | | — | (1) | | | 0.02 | | | | (0.02 | ) | | | — | | | | (0.02 | ) |
| 2009 | | $ | 1.00 | | | | — | (1) | | | — | (1) | | | — | (1) | | | — | (1) | | | — | (1) | | | — | (1) |
| 2010 | | $ | 1.00 | | | | — | (1) | | | — | (1) | | | — | (1) | | | — | (1) | | | — | | | | — | (1) |
| HUNTINGTON MONEY MARKET FUND | | | | | | | | | | | | | | | | | |
| Trust Shares | | | | | | | | | | | | | | | | | |
| 2006 | | $ | 1.00 | | | | 0.04 | | | | — | (1) | | | 0.04 | | | | (0.04 | ) | | | — | | | | (0.04 | ) |
| 2007 | | $ | 1.00 | | | | 0.04 | | | | — | (1) | | | 0.04 | | | | (0.04 | ) | | | — | | | | (0.04 | ) |
| 2008 | | $ | 1.00 | | | | 0.02 | | | | — | (1) | | | 0.02 | | | | (0.02 | ) | | | — | | | | (0.02 | ) |
| 2009 | | $ | 1.00 | | | | — | (1) | | | — | (1) | | | — | (1) | | | — | (1) | | | — | | | | — | (1) |
| 2010 | | $ | 1.00 | | | | — | (1) | | | — | (1) | | | — | (1) | | | — | (1) | | | — | | | | — | (1) |
| Class A Shares | | | | | | | | | | | | | | | | | |
| 2006 | | $ | 1.00 | | | | 0.04 | | | | — | (1) | | | 0.04 | | | | (0.04 | ) | | | — | | | | (0.04 | ) |
| 2007 | | $ | 1.00 | | | | 0.05 | | | | — | (1) | | | 0.04 | | | | (0.04 | ) | | | — | | | | (0.04 | ) |
| 2008 | | $ | 1.00 | | | | 0.01 | | | | — | (1) | | | 0.01 | | | | (0.01 | ) | | | — | | | | (0.01 | ) |
| 2009 | | $ | 1.00 | | | | — | (1) | | | — | (1) | | | — | (1) | | | — | (1) | | | — | | | | — | (1) |
| 2010 | | $ | 1.00 | | | | — | (1) | | | — | (1) | | | — | (1) | | | — | (1) | | | — | | | | — | (1) |
| InterFund Shares | | | | | | | | | | | | | | | | | |
| 2006 | | $ | 1.00 | | | | 0.04 | | | | — | (1) | | | 0.04 | | | | (0.04 | ) | | | — | | | | (0.04 | ) |
| 2007 | | $ | 1.00 | | | | 0.05 | | | | — | (1) | | | 0.05 | | | | (0.05 | ) | | | — | | | | (0.05 | ) |
| 2008 | | $ | 1.00 | | | | 0.02 | | | | — | (1) | | | 0.02 | | | | (0.02 | ) | | | — | | | | (0.02 | ) |
| 2009 | | $ | 1.00 | | | | — | (1) | | | — | (1) | | | — | (1) | | | — | (1) | | | — | | | | — | (1) |
| 2010 | | $ | 1.00 | | | | — | (1) | | | — | (1) | | | — | (1) | | | — | (1) | | | — | | | | — | (1) |
| (1) | Amount is less than $0.005. |
| (2) | During the period certain fees were waived and/or reimbursed. If such waivers/reimbursements had not occurred, the ratios would have been as indicated. |
(See notes which are an integral part of the Financial Statements)
Annual Shareholder Report
121
| | | | | | | | | | | | | | | | | | | | |
Net Asset
Value, end
of period | | Total
return | | | Ratio of Net
Expenses to
Average Net
Assets | | | Ratio of Net
Investment
Income to
Average Net
Assets | | | Ratio of Expenses
(Prior to
Reimbursements)
to Average
Net Assets(2) | | | Net Assets,
at end of
period
(000 omitted) | |
| | | | | | | | | | | | | | | | | | | | |
| | | | | | | | | | | | | | | | | | | | |
| $1.00 | | | 2.48 | % | | | 0.93 | % | | | 2.46 | % | | | 0.93 | % | | $ | 25,361 | |
| $1.00 | | | 2.76 | % | | | 0.88 | % | | | 2.69 | % | | | 0.88 | % | | $ | 48,585 | |
| $1.00 | | | 1.86 | % | | | 0.88 | % | | | 1.75 | % | | | 0.88 | % | | $ | 144,861 | |
| $1.00 | | | 0.10 | % | | | 0.78 | % | | | 0.12 | % | | | 0.89 | % | | $ | 76,805 | |
| $1.00 | | | 0.01 | % | | | 0.44 | % | | | 0.01 | % | | | 0.89 | % | | $ | 66,919 | |
| | | | | | | | | | | | | | | | | | | | |
| $1.00 | | | 2.23 | % | | | 1.18 | % | | | 2.22 | % | | | 1.18 | % | | $ | 14,205 | |
| $1.00 | | | 2.51 | % | | | 1.15 | % | | | 2.48 | % | | | 1.15 | % | | $ | 6,086 | |
| $1.00 | | | 1.61 | % | | | 1.13 | % | | | 1.48 | % | | | 1.13 | % | | $ | 38,466 | |
| $1.00 | | | 0.03 | % | | | 0.87 | % | | | 0.03 | % | | | 1.15 | % | | $ | 21,709 | |
| $1.00 | | | 0.01 | % | | | 0.45 | % | | | 0.01 | % | | | 1.16 | % | | $ | 15,539 | |
| | | | | | | | | | | | | | | | | | | | |
| | | | | | | | | | | | | | | | | | | | |
| $1.00 | | | 4.20 | % | | | 0.82 | % | | | 4.12 | % | | | 0.82 | % | | $ | 500,167 | |
| $1.00 | | | 4.37 | % | | | 0.79 | % | | | 4.27 | % | | | 0.79 | % | | $ | 632,776 | |
| $1.00 | | | 1.59 | % | | | 0.80 | % | | | 1.53 | % | | | 0.80 | % | | $ | 779,158 | |
| $1.00 | | | 0.01 | % | | | 0.45 | % | | | 0.02 | % | | | 0.87 | % | | $ | 260,720 | |
| $1.00 | | | 0.01 | % | | | 0.31 | % | | | 0.01 | % | | | 0.88 | % | | $ | 214,981 | |
| | | | | | | | | | | | | | | | | | | | |
| $1.00 | | | 3.94 | % | | | 1.07 | % | | | 3.92 | % | | | 1.07 | % | | $ | 406,510 | |
| $1.00 | | | 4.11 | % | | | 1.04 | % | | | 4.02 | % | | | 1.04 | % | | $ | 528,326 | |
| $1.00 | | | 1.34 | % | | | 1.04 | % | | | 1.48 | % | | | 1.04 | % | | $ | 299,329 | |
| $1.00 | | | 0.01 | % | | | 0.42 | % | | | 0.01 | % | | | 1.12 | % | | $ | 135,260 | |
| $1.00 | | | 0.01 | % | | | 0.32 | % | | | 0.01 | % | | | 1.13 | % | | $ | 134,974 | |
| | | | | | | | | | | | | | | | | | | | |
| $1.00 | | | 4.46 | % | | | 0.57 | % | | | 4.36 | % | | | 0.57 | % | | $ | 40,803 | |
| $1.00 | | | 4.63 | % | | | 0.54 | % | | | 4.51 | % | | | 0.54 | % | | $ | 60,548 | |
| $1.00 | | | 1.85 | % | | | 0.55 | % | | | 1.91 | % | | | 0.55 | % | | $ | 36,102 | |
| $1.00 | | | 0.03 | % | | | 0.37 | % | | | 0.03 | % | | | 0.63 | % | | $ | 62,376 | |
| $1.00 | | | 0.01 | % | | | 0.31 | % | | | 0.01 | % | | | 0.63 | % | | $ | 45,724 | |
Annual Shareholder Report
122
Financial Highlights (Continued)
Money Market Funds (Continued)
(For a share outstanding throughout each period)
| | | | | | | | | | | | | | | | | | | | | | | | | | | | |
| | | Net Asset
Value,
beginning
of period | | | Net
investment
income | | | Net realized
and unrealized
gain on
investments | | | Total from
investment
operations | | | Distributions
from net
investment
income | | | Distributions
from net
realized gain
on investment
transactions | | | Total
distributions | |
| HUNTINGTON OHIO MUNICIPAL MONEY MARKET FUND | | | | | | | | | | | | | |
| Trust Shares | | | | | | | | | | | | | | | | | |
| 2006 | | $ | 1.00 | | | | 0.03 | | | | — | (1) | | | 0.03 | | | | (0.03 | ) | | | — | | | | (0.03 | ) |
| 2007 | | $ | 1.00 | | | | 0.03 | | | | — | (1) | | | 0.03 | | | | (0.03 | ) | | | — | | | | (0.03 | ) |
| 2008 | | $ | 1.00 | | | | 0.02 | | | | — | (1) | | | 0.02 | | | | (0.02 | ) | | | — | | | | (0.02 | ) |
| 2009 | | $ | 1.00 | | | | — | (1) | | | — | (1) | | | — | (1) | | | — | (1) | | | — | | | | — | (1) |
| 2010 | | $ | 1.00 | | | | — | (1) | | | — | (1) | | | — | (1) | | | — | (1) | | | — | | | | — | (1) |
| Class A Shares | | | | | | | | | | | | | | | | | |
| 2006 | | $ | 1.00 | | | | 0.02 | | | | — | (1) | | | 0.02 | | | | (0.02 | ) | | | — | | | | (0.02 | ) |
| 2007 | | $ | 1.00 | | | | 0.03 | | | | — | (1) | | | 0.03 | | | | (0.03 | ) | | | — | | | | (0.03 | ) |
| 2008 | | $ | 1.00 | | | | 0.02 | | | | — | (1) | | | 0.02 | | | | (0.02 | ) | | | — | | | | (0.02 | ) |
| 2009 | | $ | 1.00 | | | | — | (1) | | | — | (1) | | | — | (1) | | | — | (1) | | | — | | | | — | (1) |
| 2010 | | $ | 1.00 | | | | — | (1) | | | — | (1) | | | — | (1) | | | — | (1) | | | — | | | | — | (1) |
| HUNTINGTON U.S. TREASURY MONEY MARKET FUND | | | | | | | | | | | | | |
| Trust Shares | | | | | | | | | | | | | | | | | |
| 2006 | | $ | 1.00 | | | | 0.04 | | | | — | (1) | | | 0.04 | | | | (0.04 | ) | | | — | | | | (0.04 | ) |
| 2007 | | $ | 1.00 | | | | 0.04 | | | | — | (1) | | | 0.04 | | | | (0.04 | ) | | | — | (1) | | | (0.04 | ) |
| 2008 | | $ | 1.00 | | | | 0.01 | | | | — | (1) | | | 0.01 | | | | (0.01 | ) | | | — | | | | (0.01 | ) |
| 2009 | | $ | 1.00 | | | | — | (1) | | | — | (1) | | | — | (1) | | | — | (1) | | | — | | | | — | (1) |
| 2010 | | $ | 1.00 | | | | — | (1) | | | — | (1) | | | — | (1) | | | — | (1) | | | — | | | | — | (1) |
| Class A Shares | | | | | | | | | | | | | | | | | |
| 2006 | | $ | 1.00 | | | | 0.04 | | | | — | (1) | | | 0.04 | | | | (0.04 | ) | | | — | | | | (0.04 | ) |
| 2007 | | $ | 1.00 | | | | 0.04 | | | | — | (1) | | | 0.04 | | | | (0.04 | ) | | | — | (1) | | | (0.04 | ) |
| 2008 | | $ | 1.00 | | | | 0.01 | | | | — | (1) | | | 0.01 | | | | (0.01 | ) | | | — | | | | (0.01 | ) |
| 2009 | | $ | 1.00 | | | | — | (1) | | | — | (1) | | | — | (1) | | | — | (1) | | | — | | | | — | (1) |
| 2010 | | $ | 1.00 | | | | — | (1) | | | — | (1) | | | — | (1) | | | — | (1) | | | — | | | | — | (1) |
| (1) | Amount is less than $0.005. |
| (2) | During the period certain fees were waived and/or reimbursed. If such waivers/reimbursements had not occurred, the ratios would have been as indicated. |
(See notes which are an integral part of the Financial Statements)
Annual Shareholder Report
123
| | | | | | | | | | | | | | | | | | | | |
Net Asset
Value, end
of period | | Total
return | | | Ratio of Net
Expenses to
Average Net
Assets | | | Ratio of Net
Investment
Income to
Average Net
Assets | | | Ratio of Expenses
(Prior to
Reimbursements)
to Average
Net Assets(2) | | | Net Assets,
at end of
period
(000 omitted) | |
| | | | | | | | | | | | | | | | | | | | |
| | | | | | | | | | | | | | | | | | | | |
| $1.00 | | | 2.60 | % | | | 0.85 | % | | | 2.58 | % | | | 0.85 | % | | $ | 95,205 | |
| $1.00 | | | 2.83 | % | | | 0.82 | % | | | 2.78 | % | | | 0.82 | % | | $ | 199,613 | |
| $1.00 | | | 1.81 | % | | | 0.83 | % | | | 1.73 | % | | | 0.83 | % | | $ | 312,467 | |
| $1.00 | | | 0.12 | % | | | 0.78 | % | | | 0.14 | % | | | 0.89 | % | | $ | 142,956 | |
| $1.00 | | | 0.01 | % | | | 0.42 | % | | | 0.01 | % | | | 0.88 | % | | $ | 81,023 | |
| | | | | | | | | | | | | | | | | | | | |
| $1.00 | | | 2.35 | % | | | 1.10 | % | | | 2.33 | % | | | 1.10 | % | | $ | 108,666 | |
| $1.00 | | | 2.57 | % | | | 1.07 | % | | | 2.54 | % | | | 1.07 | % | | $ | 122,147 | |
| $1.00 | | | 1.56 | % | | | 1.08 | % | | | 1.54 | % | | | 1.08 | % | | $ | 106,617 | |
| $1.00 | | | 0.02 | % | | | 0.82 | % | | | 0.02 | % | | | 1.14 | % | | $ | 112,048 | |
| $1.00 | | | 0.01 | % | | | 0.41 | % | | | 0.01 | % | | | 1.12 | % | | $ | 117,109 | |
| | | | | | | | | | | | | | | | | | | | |
| | | | | | | | | | | | | | | | | | | | |
| $1.00 | | | 4.12 | % | | | 0.74 | % | | | 4.06 | % | | | 0.74 | % | | $ | 536,387 | |
| $1.00 | | | 4.01 | % | | | 0.72 | % | | | 3.89 | % | | | 0.72 | % | | $ | 757,331 | |
| $1.00 | | | 0.93 | % | | | 0.69 | % | | | 0.93 | % | | | 0.76 | % | | $ | 583,050 | |
| $1.00 | | | 0.01 | % | | | 0.20 | % | | | 0.01 | % | | | 0.79 | % | | $ | 261,263 | |
| $1.00 | | | 0.01 | % | | | 0.15 | % | | | 0.01 | % | | | 0.76 | % | | $ | 312,870 | |
| | | | | | | | | | | | | | | | | | | | |
| $1.00 | | | 3.86 | % | | | 0.99 | % | | | 3.80 | % | | | 0.99 | % | | $ | 68,073 | |
| $1.00 | | | 3.75 | % | | | 0.97 | % | | | 3.61 | % | | | 0.97 | % | | $ | 103,041 | |
| $1.00 | | | 0.74 | % | | | 0.83 | % | | | 0.67 | % | | | 0.98 | % | | $ | 126,485 | |
| $1.00 | | | 0.01 | % | | | 0.20 | % | | | 0.01 | % | | | 1.03 | % | | $ | 54,935 | |
| $1.00 | | | 0.01 | % | | | 0.15 | % | | | 0.01 | % | | | 1.01 | % | | $ | 74,845 | |
Annual Shareholder Report
124
Financial Highlights (Continued)
Equity Funds
(For a share outstanding throughout each period)
| | | | | | | | | | | | | | | | | | | | | | | | | | | | | | | | |
| | | Net Asset
Value,
beginning
of period | | | Net
investment
income | | | Net realized
and unrealized
gain (loss) on
investments | | | Total from
investment
operations | | | Distributions
from net
investment
income | | |
Distributions
from net
realized gain
on investment
transactions | | | Distributions
from return
of capital | | | Total
distributions | |
| HUNTINGTON DIVIDEND CAPTURE FUND | | | | | | | | | | | | | | | | | | | | | |
| Trust Shares | | | | | | | | | | | | | | | | | | | | | | | | | | | | | |
2006 | | $ | 10.86 | | | | 0.39 | | | | 1.32 | | | | 1.71 | | | | (0.39 | ) | | | (0.54 | ) | | | — | | | | (0.93 | ) |
2007 | | $ | 11.64 | | | | 0.38 | | | | (1.15 | ) | | | (0.77 | ) | | | (0.39 | ) | | | (0.59 | ) | | | — | | | | (0.98 | ) |
2008 | | $ | 9.89 | | | | 0.40 | | | | (3.18 | ) | | | (2.78 | ) | | | (0.39 | ) | | | (0.12 | ) | | | (0.03 | ) | | | (0.54 | ) |
2009 | | $ | 6.57 | | | | 0.29 | | | | 1.31 | | | | 1.60 | | | | (0.29 | ) | | | — | | | | (0.02 | ) | | | (0.31 | ) |
2010 | | $ | 7.86 | | | | 0.25 | | | | 0.83 | | | | 1.08 | | | | (0.25 | ) | | | — | | | | — | | | | (0.25 | ) |
| Class A Shares | | | | | | | | | | | | | | | | | | | | | | | | | | | | | |
2006 | | $ | 10.86 | | | | 0.36 | | | | 1.32 | | | | 1.68 | | | | (0.36 | ) | | | (0.54 | ) | | | — | | | | (0.90 | ) |
2007 | | $ | 11.63 | | | | 0.35 | | | | (1.14 | ) | | | (0.79 | ) | | | (0.36 | ) | | | (0.59 | ) | | | — | | | | (0.95 | ) |
2008 | | $ | 9.89 | | | | 0.38 | | | | (3.18 | ) | | | (2.80 | ) | | | (0.37 | ) | | | (0.12 | ) | | | (0.03 | ) | | | (0.52 | ) |
2009 | | $ | 6.57 | | | | 0.27 | | | | 1.31 | | | | 1.58 | | | | (0.27 | ) | | | — | | | | (0.02 | ) | | | (0.29 | ) |
2010 | | $ | 7.86 | | | | 0.23 | | | | 0.83 | | | | 1.06 | | | | (0.23 | ) | | | — | | | | — | | | | (0.23 | ) |
| HUNTINGTON GLOBAL SELECT MARKETS FUND | | | | | |
| Trust Shares | | | | | | | | | | | | | | | | | | | | | | | | | | | | | |
2009(4) | | $ | 10.00 | | | | — | (5) | | | — | (5) | | | — | (5) | | | — | | | | — | | | | — | | | | — | |
2010 | | $ | 10.00 | | | | 0.03 | | | | 1.55 | | | | 1.58 | | | | (0.11 | ) | | | — | | | | (0.01 | ) | | | (0.12 | ) |
| Class A Shares | | | | | | | | | | | | | | | | | | | | | | | | | | | | | |
2009(4) | | $ | 10.00 | | | | — | (5) | | | — | (5) | | | — | (5) | | | — | | | | — | | | | — | | | | — | |
2010 | | $ | 10.00 | | | | 0.01 | | | | 1.53 | | | | 1.54 | | | | (0.09 | ) | | | — | | | | (0.02 | ) | | | (0.11 | ) |
| (1) | Based on net asset value, which does not reflect a sales charge or contingent deferred sales charge, if applicable. |
| (2) | If applicable, certain fees were waived and/or reimbursed. If such waivers/reimbursements had not occurred, the ratios would have been as indicated. |
| (3) | Portfolio Turnover is calculated on the basis of the Fund as a whole without distinguishing among the classes of shares. |
| (4) | Reflects operations for the period from December 30, 2009 (commencement of operations) to December 31, 2009. |
| (5) | Amount is less than $0.005 |
| (7) | Computed on an annualized basis. |
(See notes which are an integral part of the Financial Statements)
Annual Shareholder Report
125
| | | | | | | | | | | | | | | | | | | | | | | | | | |
Net Asset
Value, end
of period | | | Total
return(1) | | | Ratio of Net
Expenses to
Average Net
Assets | | | Ratio of Net
Investment
Income
(Loss) to
Average
Net Assets | | | Ratio of Expenses
(Prior to
Reimbursements)
to Average
Net Assets(2) | | | Net Assets,
at end of
period
(000 omitted) | | | Portfolio
turnover
rate(3) | |
| | | | | | | | | | | | | | | | | | | | | | | | | | |
| | | | | | | | | | | | | | | | | | | | | | | | | | |
| | $11.64 | | | | 16.03 | % | | | 1.31 | % | | | 3.44 | % | | | 1.31 | % | | $ | 112,404 | | | | 98 | % |
| | $9.89 | | | | (6.91 | )% | | | 1.30 | % | | | 3.35 | % | | | 1.30 | % | | $ | 93,862 | | | | 87 | % |
| | $6.57 | | | | (29.26 | )% | | | 1.31 | % | | | 4.56 | % | | | 1.31 | % | | $ | 60,162 | | | | 66 | % |
| | $7.86 | | | | 25.24 | % | | | 1.41 | % | | | 4.37 | % | | | 1.41 | % | | $ | 74,593 | | | | 99 | % |
| | $8.69 | | | | 13.99 | % | | | 1.40 | % | | | 3.05 | % | | | 1.40 | % | | $ | 100,622 | | | | 115 | % |
| | | | | | | | | | | | | | | | | | | | | | | | | | |
| | $11.63 | | | | 15.74 | % | | | 1.56 | % | | | 3.18 | % | | | 1.56 | % | | $ | 11,502 | | | | 98 | % |
| | $9.89 | | | | (7.14 | )% | | | 1.55 | % | | | 3.11 | % | | | 1.55 | % | | $ | 10,366 | | | | 87 | % |
| | $6.57 | | | | (29.41 | )% | | | 1.56 | % | | | 4.18 | % | | | 1.56 | % | | $ | 5,094 | | | | 66 | % |
| | $7.86 | | | | 24.93 | % | | | 1.66 | % | | | 4.10 | % | | | 1.66 | % | | $ | 5,473 | | | | 99 | % |
| | $8.69 | | | | 13.72 | % | | | 1.64 | % | | | 2.82 | % | | | 1.64 | % | | $ | 17,784 | | | | 115 | % |
| | | | | | | | | | | | | | | | | | | | | | | | | | |
| | | | | | | | | | | | | | | | | | | | | | | | | | |
| | $10.00 | | | | 0.00 | %(6) | | | 1.83 | %(7) | | | (1.46 | )%(7) | | | 1.83 | %(7) | | $ | 1 | | | | — | %(6) |
| | $11.46 | | | | 15.85 | % | | | 1.90 | % | | | 0.40 | % | | | 2.19 | % | | $ | 41,116 | | | | 45 | % |
| | | | | | | | | | | | | | | | | | | | | | | | | | |
| | $10.00 | | | | 0.00 | %(6) | | | 2.19 | %(7) | | | (2.92 | )%(7) | | | 2.19 | %(7) | | $ | 1 | | | | — | %(6) |
| $ | 11.43 | | | | 15.38 | % | | | 2.16 | % | | | 0.20 | % | | | 2.44 | % | | $ | 860 | | | | 45 | % |
Annual Shareholder Report
126
Financial Highlights (Continued)
Equity Funds (Continued)
(For a share outstanding throughout each period)
| | | | | | | | | | | | | | | | | | | | | | | | | | | | | | | | |
| | | Net Asset
Value,
beginning
of period | | | Net
investment
income (loss) | | | Net realized
and unrealized
gain (loss) on
investments | | | Total from
investment
operations | | | Distributions
from net
investment
income | | |
Distributions
from net
realized gain
on investment
transactions | | | Distributions
from return
of capital | | | Total
distributions | |
| HUNTINGTON GROWTH FUND | | | | | | | | | | | | | | | | | | | | | |
| Trust Shares | | | | | | | | | | | | | | | | | | | | | | | | | | | | | |
2006 | | $ | 39.52 | | | | 0.09 | | | | 3.10 | | | | 3.19 | | | | (0.08 | ) | | | (5.39 | ) | | | — | | | | (5.47 | ) |
2007 | | $ | 37.24 | | | | 0.12 | | | | 5.57 | | | | 5.69 | | | | (0.11 | ) | | | (7.81 | ) | | | — | | | | (7.92 | ) |
2008 | | $ | 35.01 | | | | 0.05 | | | | (12.12 | ) | | | (12.07 | ) | | | (0.04 | ) | | | (3.19 | ) | | | — | | | | (3.23 | ) |
2009 | | $ | 19.71 | | | | 0.01 | | | | 3.45 | | | | 3.46 | | | | — | (4) | | | — | | | | — | | | | — | (4) |
2010 | | $ | 23.17 | | | | 0.01 | | | | 2.36 | | | | 2.37 | | | | — | (4) | | | — | | | | — | | | | — | (4) |
| Class A Shares | | | | | | | | | | | | | | | | | | | | | | | | | | | | | |
2006 | | $ | 39.01 | | | | (0.01 | ) | | | 3.05 | | | | 3.04 | | | | — | | | | (5.39 | ) | | | — | | | | (5.39 | ) |
2007 | | $ | 36.66 | | | | 0.03 | | | | 5.47 | | | | 5.50 | | | | (0.04 | ) | | | (7.81 | ) | | | — | | | | (7.85 | ) |
2008 | | $ | 34.31 | | | | (0.03 | ) | | | (11.83 | ) | | | (11.86 | ) | | | — | (4) | | | (3.19 | ) | | | — | | | | (3.19 | ) |
2009 | | $ | 19.26 | | | | (0.04 | ) | | | 3.37 | | | | 3.33 | | | | — | | | | — | | | | — | | | | — | |
2010 | | $ | 22.59 | | | | (0.03 | ) | | | 2.27 | | | | 2.24 | | | | — | (4) | | | — | | | | — | | | | — | (4) |
| HUNTINGTON INCOME EQUITY FUND | | | | | | | | | | | | | | | | | | | | | |
| Trust Shares | | | | | | | | | | | | | | | | | | | | | | | | | | | | | |
2006 | | $ | 31.26 | | | | 0.57 | | | | 2.94 | | | | 3.51 | | | | (0.57 | ) | | | (3.09 | ) | | | — | | | | (3.66 | ) |
2007 | | $ | 31.11 | | | | 0.55 | | | | — | (4) | | | 0.55 | | | | (0.54 | ) | | | (4.66 | ) | | | — | | | | (5.20 | ) |
2008 | | $ | 26.46 | | | | 0.57 | | | | (10.54 | ) | | | (9.99 | ) | | | (0.54 | ) | | | (0.11 | ) | | | (0.03 | ) | | | (0.68 | ) |
2009 | | $ | 15.79 | | | | 0.47 | | | | 2.87 | | | | 3.34 | | | | (0.47 | ) | | | — | | | | (0.01 | ) | | | (0.48 | ) |
2010 | | $ | 18.65 | | | | 0.49 | | | | 1.62 | | | | 2.11 | | | | (0.48 | ) | | | — | | | | — | | | | (0.48 | ) |
| Class A Shares | | | | | | | | | | | | | | | | | | | | | | | | | | | | | |
2006 | | $ | 31.27 | | | | 0.49 | | | | 2.93 | | | | 3.42 | | | | (0.49 | ) | | | (3.09 | ) | | | — | | | | (3.58 | ) |
2007 | | $ | 31.11 | | | | 0.46 | | | | 0.01 | | | | 0.47 | | | | (0.46 | ) | | | (4.66 | ) | | | — | | | | (5.12 | ) |
2008 | | $ | 26.46 | | | | 0.51 | | | | (10.54 | ) | | | (10.03 | ) | | | (0.49 | ) | | | (0.11 | ) | | | (0.03 | ) | | | (0.63 | ) |
2009 | | $ | 15.80 | | | | 0.44 | | | | 2.86 | | | | 3.30 | | | | (0.43 | ) | | | — | | | | (0.01 | ) | | | (0.44 | ) |
2010 | | $ | 18.66 | | | | 0.44 | | | | 1.62 | | | | 2.06 | | | | (0.43 | ) | | | — | | | | — | | | | (0.43 | ) |
| (1) | Based on net asset value, which does not reflect a sales charge or contingent deferred sales charge, if applicable. |
| (2) | Portfolio Turnover is calculated on the basis of the Fund as a whole without distinguishing among the classes of shares. |
| (3) | Portfolio turnover rate increased significantly during the period. This increase was attributable to changes in equity management staff, cash flows into and out of the Fund, as well as tactical portfolio adjustments made. The basic characteristics of the Fund’s investment strategy in terms of market capitalization, style and diversification have not changed (Unaudited). |
| (4) | Amount is less than $0.005. |
(See notes which are an integral part of the Financial Statements)
Annual Shareholder Report
127
| | | | | | | | | | | | | | | | | | | | | | | | | | |
Net Asset
Value, end
of period | | | Total
return(1) | | | Ratio of Net
Expenses to
Average Net
Assets | | | Ratio of Net
Investment
Income
(Loss) to
Average
Net Assets | | | Ratio of Expenses
(Prior to
Reimbursements)
to Average
Net Assets | | | Net Assets,
at end of
period
(000 omitted) | | | Portfolio
turnover
rate(2) | |
| | | | | | | | | | | | | | | | | | | | | | | | | | |
| | | | | | | | | | | | | | | | | | | | | | | | | | |
| | $37.24 | | | | 8.36 | % | | | 1.15 | % | | | 0.22 | % | | | 1.15 | % | | $ | 223,155 | | | | 31 | % |
| | $35.01 | | | | 15.93 | % | | | 1.13 | % | | | 0.32 | % | | | 1.13 | % | | $ | 227,972 | | | | 86 | %(3) |
| | $19.71 | | | | (37.76 | )% | | | 1.15 | % | | | 0.15 | % | | | 1.15 | % | | $ | 129,745 | | | | 83 | % |
| | $23.17 | | | | 17.58 | % | | | 1.20 | % | | | 0.03 | % | | | 1.20 | % | | $ | 140,206 | | | | 120 | % |
| | $25.54 | | | | 10.23 | % | | | 1.23 | % | | | 0.04 | % | | | 1.23 | % | | $ | 123,809 | | | | 292 | % |
| | | | | | | | | | | | | | | | | | | | | | | | | | |
| | $36.66 | | | | 8.11 | % | | | 1.40 | % | | | (0.03 | )% | | | 1.40 | % | | $ | 9,209 | | | | 31 | % |
| | $34.31 | | | | 15.62 | % | | | 1.38 | % | | | 0.07 | % | | | 1.38 | % | | $ | 9,680 | | | | 86 | %(3) |
| | $19.26 | | | | (37.92 | )% | | | 1.40 | % | | | (0.11 | )% | | | 1.40 | % | | $ | 5,436 | | | | 83 | % |
| | $22.59 | | | | 17.29 | % | | | 1.45 | % | | | (0.22 | )% | | | 1.45 | % | | $ | 6,096 | | | | 120 | % |
| | $24.83 | | | | 9.92 | % | | | 1.47 | % | | | (0.15 | )% | | | 1.47 | % | | $ | 8,532 | | | | 292 | % |
| | | | | | | | | | | | | | | | | | | | | | | | | | |
| | | | | | | | | | | | | | | | | | | | | | | | | | |
| | $31.11 | | | | 11.36 | % | | | 1.15 | % | | | 1.79 | % | | | 1.15 | % | | $ | 185,816 | | | | 43 | % |
| | $26.46 | | | | 1.90 | % | | | 1.14 | % | | | 1.72 | % | | | 1.14 | % | | $ | 158,501 | | | | 90 | % |
| | $15.79 | | | | (38.35 | )% | | | 1.16 | % | | | 2.60 | % | | | 1.16 | % | | $ | 89,815 | | | | 88 | % |
| | $18.65 | | | | 21.92 | % | | | 1.22 | % | | | 3.05 | % | | | 1.22 | % | | $ | 104,433 | | | | 90 | % |
| | $20.28 | | | | 11.59 | % | | | 1.22 | % | | | 2.59 | % | | | 1.22 | % | | $ | 101,076 | | | | 89 | % |
| | | | | | | | | | | | | | | | | | | | | | | | | | |
| | $31.11 | | | | 11.05 | % | | | 1.40 | % | | | 1.53 | % | | | 1.40 | % | | $ | 6,139 | | | | 43 | % |
| | $26.46 | | | | 1.65 | % | | | 1.39 | % | | | 1.48 | % | | | 1.39 | % | | $ | 6,330 | | | | 90 | % |
| | $15.80 | | | | (38.47 | )% | | | 1.41 | % | | | 2.34 | % | | | 1.41 | % | | $ | 3,214 | | | | 88 | % |
| | $18.66 | | | | 21.60 | % | | | 1.47 | % | | | 2.83 | % | | | 1.47 | % | | $ | 3,271 | | | | 90 | % |
| $ | 20.29 | | | | 11.31 | % | | | 1.47 | % | | | 2.39 | % | | | 1.47 | % | | $ | 5,935 | | | | 89 | % |
Annual Shareholder Report
128
Financial Highlights (Continued)
Equity Funds (Continued)
(For a share outstanding throughout each period)
| | | | | | | | | | | | | | | | | | | | | | | | | | | | |
| | | Net Asset
Value,
beginning
of period | | | Net
investment
income (loss) | | | Net realized
and unrealized
gain (loss) on
investments | | | Total from
investment
operations | | | Distributions
from net
investment
income | | |
Distributions
from net
realized gain
on investment
transactions | | | Total
distributions | |
| HUNTINGTON INTERNATIONAL EQUITY FUND | | | | | | | | | | | | | | | | | |
| Trust Shares | | | | | | | | | | | | | | | | | | | | | | | | | |
2006 | | $ | 11.79 | | | | 0.09 | | | | 3.10 | | | | 3.19 | | | | (0.08 | ) | | | (0.97 | ) | | | (1.05 | ) |
2007 | | $ | 13.93 | | | | 0.13 | | | | 2.20 | | | | 2.33 | | | | (0.15 | ) | | | (1.10 | ) | | | (1.25 | ) |
2008 | | $ | 15.01 | | | | 0.17 | | | | (6.36 | ) | | | (6.19 | ) | | | (0.13 | ) | | | (0.47 | ) | | | (0.60 | ) |
2009 | | $ | 8.22 | | | | 0.17 | | | | 2.52 | | | | 2.69 | | | | (0.10 | ) | | | (0.02 | ) | | | (0.12 | ) |
2010 | | $ | 10.79 | | | | 0.13 | | | | 0.70 | | | | 0.83 | | | | (0.09 | ) | | | — | | | | (0.09 | ) |
| Class A Shares | | | | | | | | | | | | | | | | | | | | | | | | | |
2006 | | $ | 11.74 | | | | 0.03 | | | | 3.10 | | | | 3.13 | | | | (0.06 | ) | | | (0.97 | ) | | | (1.03 | ) |
2007 | | $ | 13.84 | | | | 0.08 | | | | 2.19 | | | | 2.27 | | | | (0.11 | ) | | | (1.10 | ) | | | (1.21 | ) |
2008 | | $ | 14.90 | | | | 0.13 | | | | (6.29 | ) | | | (6.16 | ) | | | (0.11 | ) | | | (0.47 | ) | | | (0.58 | ) |
2009 | | $ | 8.16 | | | | 0.13 | | | | 2.51 | | | | 2.64 | | | | (0.06 | ) | | | (0.02 | ) | | | (0.08 | ) |
2010 | | $ | 10.72 | | | | 0.08 | | | | 0.73 | | | | 0.81 | | | | (0.08 | ) | | | — | | | | (0.08 | ) |
| HUNTINGTON MACRO 100 FUND | | | | | | | | | | | | | | | | | |
| Trust Shares | | | | | | | | | | | | | | | | | | | | | | | | | |
2006 | | $ | 11.31 | | | | — | (3) | | | 0.77 | | | | 0.77 | | | | — | | | | (0.24 | ) | | | (0.24 | ) |
2007 | | $ | 11.84 | | | | — | (3) | | | (0.33 | ) | | | (0.33 | ) | | | — | | | | (1.46 | ) | | | (1.46 | ) |
2008 | | $ | 10.05 | | | | 0.09 | | | | (3.54 | ) | | | (3.45 | ) | | | (0.09 | ) | | | — | | | | (0.09 | ) |
2009 | | $ | 6.51 | | | | 0.02 | | | | 1.88 | | | | 1.90 | | | | (0.02 | ) | | | — | | | | (0.02 | ) |
2010 | | $ | 8.39 | | | | 0.01 | | | | 1.30 | | | | 1.31 | | | | (0.01 | ) | | | — | | | | (0.01 | ) |
| Class A Shares | | | | | | | | | | | | | | | | | | | | | | | | | |
2006 | | $ | 11.26 | | | | (0.02 | ) | | | 0.76 | | | | 0.74 | | | | — | | | | (0.24 | ) | | | (0.24 | ) |
2007 | | $ | 11.76 | | | | (0.03 | ) | | | (0.33 | ) | | | (0.36 | ) | | | — | | | | (1.46 | ) | | | (1.46 | ) |
2008 | | $ | 9.94 | | | | 0.07 | | | | (3.49 | ) | | | (3.42 | ) | | | (0.07 | ) | | | — | | | | (0.07 | ) |
2009 | | $ | 6.45 | | | | — | (3) | | | 1.85 | | | | 1.85 | | | | — | | | | — | | | | — | |
2010 | | $ | 8.30 | | | | (0.01 | ) | | | 1.28 | | | | 1.27 | | | | — | | | | — | | | | — | |
| (1) | Based on net asset value, which does not reflect a sales charge or contingent deferred sales charge, if applicable. |
| (2) | Portfolio Turnover is calculated on the basis of the Fund as a whole without distinguishing among the classes of shares. |
| (3) | Amount is less than $0.005. |
| (4) | The major cause of increase to portfolio turnover was changes made to the portfolio by the management team based upon changing macroeconomic fundamentals. |
(See notes which are an integral part of the Financial Statements)
Annual Shareholder Report
129
| | | | | | | | | | | | | | | | | | | | | | | | |
Net Asset
Value, end
of period | | Total
return(1) | | | Ratio of Net
Expenses to Average Net
Assets | | | Ratio of Net
Investment
Income
(Loss) to
Average
Net Assets | | | Ratio of Expenses
(Prior to
Reimbursements)
to Average
Net Assets | | | Net Assets,
at end of
period
(000 omitted) | | | Portfolio
turnover
rate(2) | |
| | | | | | | | | | | | | | | | | | | | | | | | |
| | | | | | | | | | | | | | | | | | | | | | | | |
| $13.93 | | | 27.04 | % | | | 1.57 | % | | | 0.73 | % | | | 1.57 | % | | $ | 266,509 | | | | 26 | % |
| $15.01 | | | 17.06 | % | | | 1.54 | % | | | 0.92 | % | | | 1.54 | % | | $ | 324,158 | | | | 25 | % |
| $8.22 | | | (41.73 | )% | | | 1.57 | % | | | 1.37 | % | | | 1.57 | % | | $ | 191,163 | | | | 21 | % |
| $10.79 | | | 32.84 | % | | | 1.59 | % | | | 1.68 | % | | | 1.59 | % | | $ | 322,427 | | | | 26 | % |
| $11.53 | | | 7.72 | % | | | 1.59 | % | | | 1.14 | % | | | 1.59 | % | | $ | 296,797 | | | | 41 | % |
| | | | | | | | | | | | | | | | | | | | | | | | |
| $13.84 | | | 26.79 | % | | | 1.83 | % | | | 0.40 | % | | | 1.83 | % | | $ | 6,509 | | | | 26 | % |
| $14.90 | | | 16.76 | % | | | 1.79 | % | | | 0.71 | % | | | 1.79 | % | | $ | 11,151 | | | | 25 | % |
| $8.16 | | | (41.88 | )% | | | 1.82 | % | | | 1.13 | % | | | 1.82 | % | | $ | 6,929 | | | | 21 | % |
| $10.72 | | | 32.45 | % | | | 1.84 | % | | | 1.28 | % | | | 1.84 | % | | $ | 7,547 | | | | 26 | % |
| $11.45 | | | 7.54 | % | | | 1.84 | % | | | 0.86 | % | | | 1.84 | % | | $ | 10,631 | | | | 41 | % |
| | | | | | | | | | | | | | | | | | | | | | | | |
| | | | | | | | | | | | | | | | | | | | | | | | |
| $11.84 | | | 6.79 | % | | | 1.43 | % | | | 0.04 | % | | | 1.43 | % | | $ | 42,758 | | | | 222 | %(4) |
| $10.05 | | | (3.12 | )% | | | 1.36 | % | | | 0.02 | % | | | 1.36 | % | | $ | 32,284 | | | | 153 | % |
| $6.51 | | | (34.32 | )% | | | 1.56 | % | | | 0.88 | % | | | 1.56 | % | | $ | 13,521 | | | | 318 | %(4) |
| $8.39 | | | 29.15 | % | | | 1.55 | % | | | 0.28 | % | | | 1.55 | % | | $ | 28,278 | | | | 10 | % |
| $9.69 | | | 15.60 | % | | | 1.45 | % | | | 0.13 | % | | | 1.45 | % | | $ | 43,631 | | | | 27 | % |
| | | | | | | | | | | | | | | | | | | | | | | | |
| $11.76 | | | 6.55 | % | | | 1.68 | % | | | (0.23 | )% | | | 1.68 | % | | $ | 3,189 | | | | 222 | %(4) |
| $9.94 | | | (3.40 | )% | | | 1.61 | % | | | (0.23 | )% | | | 1.61 | % | | $ | 2,621 | | | | 153 | % |
| $6.45 | | | (34.45 | )% | | | 1.82 | % | | | 0.66 | % | | | 1.82 | % | | $ | 1,001 | | | | 318 | %(4) |
| $8.30 | | | 28.68 | % | | | 1.80 | % | | | 0.06 | % | | | 1.80 | % | | $ | 853 | | | | 10 | % |
| $9.57 | | | 15.30 | % | | | 1.69 | % | | | (0.09 | )% | | | 1.69 | % | | $ | 1,816 | | | | 27 | % |
Annual Shareholder Report
130
Financial Highlights (Continued)
Equity Fund (Continued)
(For a share outstanding throughout each period)
| | | | | | | | | | | | | | | | | | | | | | | | | | | | | | | | |
| | | Net Asset
Value,
beginning
of period | | | Net
investment
income (loss) | | | Net realized
and unrealized
gain (loss) on
investments | | | Total from
investment
operations | | | Distributions
from net
investment
income | | |
Distributions
from net
realized gain
on investment
transactions | | | Distributions
from return
of capital | | | Total
distributions | |
| HUNTINGTON MID CORP AMERICA FUND | | | | | | | | | | | | | | | | | | | | | |
| Trust Shares | | | | | | | | | | | | | | | | | | | | | | | | | | | | | |
2006 | | $ | 15.47 | | | | 0.02 | | | | 1.24 | | | | 1.26 | | | | (0.01 | ) | | | (0.29 | ) | | | — | | | | (0.30 | ) |
2007 | | $ | 16.43 | | | | (0.01 | ) | | | 1.26 | | | | 1.25 | | | | — | (3) | | | (1.37 | ) | | | — | | | | (1.37 | ) |
2008 | | $ | 16.31 | | | | 0.02 | | | | (5.98 | ) | | | (5.96 | ) | | | (0.01 | ) | | | (0.41 | ) | | | — | | | | (0.42 | ) |
2009 | | $ | 9.93 | | | | 0.04 | | | | 3.20 | | | | 3.24 | | | | (0.04 | ) | | | — | | | | — | | | | (0.04 | ) |
2010 | | $ | 13.13 | | | | 0.01 | | | | 3.00 | | | | 3.01 | | | | (0.01 | ) | | | (0.50 | ) | | | — | | | | (0.51 | ) |
| Class A Shares | | | | | | | | | | | | | | | | | | | | | | | | | | | | | |
2006 | | $ | 15.27 | | | | (0.03 | ) | | | 1.23 | | | | 1.20 | | | | — | | | | (0.29 | ) | | | — | | | | (0.29 | ) |
2007 | | $ | 16.18 | | | | (0.05 | ) | | | 1.24 | | | | 1.19 | | | | — | | | | (1.37 | ) | | | — | | | | (1.37 | ) |
2008 | | $ | 16.00 | | | | (0.02 | ) | | | (5.84 | ) | | | (5.86 | ) | | | — | | | | (0.41 | ) | | | — | | | | (0.41 | ) |
2009 | | $ | 9.73 | | | | 0.01 | | | | 3.12 | | | | 3.13 | | | | (0.01 | ) | | | — | | | | — | | | | (0.01 | ) |
2010 | | $ | 12.85 | | | | (0.01 | ) | | | 2.91 | | | | 2.90 | | | | — | | | | (0.50 | ) | | | — | | | | (0.50 | ) |
| HUNTINGTON NEW ECONOMY FUND | | | | | | | | | | | | | | | | | | | | | |
| Trust Shares | | | | | | | | | | | | | | | | | | | | | | | | | | | | | |
2006 | | $ | 15.92 | | | | (0.06 | ) | | | 1.50 | | | | 1.44 | | | | — | | | | (1.32 | ) | | | — | | | | (1.32 | ) |
2007 | | $ | 16.04 | | | | 0.02 | | | | 1.84 | | | | 1.86 | | | | (0.01 | ) | | | (3.16 | ) | | | — | | | | (3.17 | ) |
2008 | | $ | 14.73 | | | | (0.04 | )(5) | | | (7.97 | ) | | | (8.01 | ) | | | — | | | | — | | | | (0.01 | ) | | | (0.01 | ) |
2009 | | $ | 6.71 | | | | (0.03 | ) | | | 2.66 | | | | 2.63 | | | | — | | | | — | | | | — | | | | — | |
2010 | | $ | 9.34 | | | | (0.09 | ) | | | 1.53 | | | | 1.44 | | | | — | | | | — | | | | — | | | | — | |
| Class A Shares | | | | | | | | | | | | | | | | | | | | | | | | | | | | | |
2006 | | $ | 15.74 | | | | (0.09 | ) | | | 1.49 | | | | 1.40 | | | | — | | | | (1.32 | ) | | | — | | | | (1.32 | ) |
2007 | | $ | 15.81 | | | | (0.01 | ) | | | 1.81 | | | | 1.80 | | | | — | | | | (3.16 | ) | | | — | | | | (3.16 | ) |
2008 | | $ | 14.45 | | | | (0.07 | )(5) | | | (7.81 | ) | | | (7.88 | ) | | | — | | | | — | | | | (0.01 | ) | | | (0.01 | ) |
2009 | | $ | 6.56 | | | | (0.05 | ) | | | 2.60 | | | | 2.55 | | | | — | | | | — | | | | — | | | | — | |
2010 | | $ | 9.11 | | | | (0.10 | ) | | | 1.48 | | | | 1.38 | | | | — | | | | — | | | | — | | | | — | |
| (1) | Based on net asset value, which does not reflect a sales charge or contingent deferred sales charge, if applicable. |
| (2) | Portfolio Turnover is calculated on the basis of the Fund as a whole without distinguishing among the classes of shares. |
| (3) | Amount is less than $0.005. |
| (4) | Portfolio turnover rate increased significantly during the period. This increase was attributable to changes in equity management staff, cash flows into and out of the Fund, as well as tactical portfolio adjustments made. The basic characteristics of the Fund’s investment strategy in terms of market capitalization, style and diversification have not changed (Unaudited). |
| (5) | Per share net investment income (loss) has been calculated using the average daily shares method. |
(See notes which are an integral part of the Financial Statements)
Annual Shareholder Report
131
| | | | | | | | | | | | | | | | | | | | | | | | |
Net Asset
Value, end
of period | | Total
return(1) | | | Ratio of Net
Expenses to
Average Net
Assets | | | Ratio of Net
Investment
Income
(Loss) to
Average
Net Assets | | | Ratio of Expenses
(Prior to
Reimbursements)
to Average
Net Assets | | | Net Assets,
at end of
period
(000 omitted) | | | Portfolio
turnover
rate(2) | |
| | | | | | | | | | | | | | | | | | | | | | | | |
| | | | | | | | | | | | | | | | | | | | | | | | |
| $16.43 | | | 8.09 | % | | | 1.31 | % | | | 0.07 | % | | | 1.31 | % | | $ | 150,902 | | | | 6 | % |
| $16.31 | | | 7.79 | % | | | 1.30 | % | | | (0.04 | )% | | | 1.30 | % | | $ | 149,245 | | | | 11 | % |
| $9.93 | | | (37.51 | )% | | | 1.31 | % | | | 0.10 | % | | | 1.31 | % | | $ | 87,843 | | | | 18 | % |
| $13.13 | | | 32.59 | % | | | 1.36 | % | | | 0.30 | % | | | 1.36 | % | | $ | 131,638 | | | | 12 | % |
| $15.63 | | | 22.94 | % | | | 1.36 | % | | | 0.08 | % | | | 1.36 | % | | $ | 141,282 | | | | 19 | % |
| | | | | | | | | | | | | | | | | | | | | | | | |
| $16.18 | | | 7.84 | % | | | 1.56 | % | | | (0.17 | )% | | | 1.56 | % | | $ | 4,986 | | | | 6 | % |
| $16.00 | | | 7.53 | % | | | 1.55 | % | | | (0.29 | )% | | | 1.55 | % | | $ | 5,240 | | | | 11 | % |
| $9.73 | | | (37.62 | )% | | | 1.56 | % | | | (0.16 | )% | | | 1.56 | % | | $ | 2,875 | | | | 18 | % |
| $12.85 | | | 32.19 | % | | | 1.61 | % | | | 0.04 | % | | | 1.61 | % | | $ | 3,608 | | | | 12 | % |
| $15.25 | | | 22.61 | % | | | 1.61 | % | | | (0.13 | )% | | | 1.61 | % | | $ | 7,513 | | | | 19 | % |
| | | | | | | | | | | | | | | | | | | | | | | | |
| | | | | | | | | | | | | | | | | | | | | | | | |
| $16.04 | | | 9.18 | % | | | 1.43 | % | | | (0.39 | )% | | | 1.43 | % | | $ | 97,791 | | | | 50 | % |
| $14.73 | | | 12.19 | % | | | 1.41 | % | | | 0.14 | % | | | 1.41 | % | | $ | 106,812 | | | | 119 | %(4) |
| $6.71 | | | (54.43 | )% | | | 1.44 | % | | | (0.38 | )% | | | 1.44 | % | | $ | 35,041 | | | | 127 | % |
| $9.34 | | | 39.20 | % | | | 1.55 | % | | | (0.34 | )% | | | 1.55 | % | | $ | 45,656 | | | | 114 | % |
| $10.78 | | | 15.42 | % | | | 1.55 | % | | | (0.86 | )% | | | 1.55 | % | | $ | 50,583 | | | | 256 | % |
| | | | | | | | | | | | | | | | | | | | | | | | |
| $15.81 | | | 8.96 | % | | | 1.68 | % | | | (0.64 | )% | | | 1.68 | % | | $ | 8,607 | | | | 50 | % |
| $14.45 | | | 11.99 | % | | | 1.66 | % | | | (0.11 | )% | | | 1.66 | % | | $ | 8,943 | | | | 119 | %(4) |
| $6.56 | | | (54.58 | )% | | | 1.69 | % | | | (0.63 | )% | | | 1.69 | % | | $ | 3,294 | | | | 127 | % |
| $9.11 | | | 38.87 | % | | | 1.80 | % | | | (0.62 | )% | | | 1.80 | % | | $ | 3,609 | | | | 114 | % |
| $10.49 | | | 15.15 | % | | | 1.80 | % | | | (1.11 | )% | | | 1.80 | % | | $ | 5,299 | | | | 256 | % |
Annual Shareholder Report
132
Financial Highlights (Continued)
Equity Funds (Continued)
(For a share outstanding throughout each period)
| | | | | | | | | | | | | | | | | | | | | | | | | | | | | | | | |
| | | Net Asset
Value,
beginning
of period | | | Net
investment
income (loss) | | | Net realized
and unrealized
gain (loss) on
investments | | | Total from
investment
operations | | | Distributions
from net
investment
income | | | Distributions
from net
realized gain
on investment
transactions | | | Distributions
from return
of capital | | | Total
distributions | |
| HUNTINGTON REAL STRATEGIES FUND | | | | | | | | | | | | | | | | | | | | | |
| Trust Shares | | | | | | | | | | | | | | | | | | | | | | | | | | | | | |
2007(3) | | $ | 10.00 | | | | 0.11 | | | | 0.92 | | | | 1.03 | | | | (0.11 | ) | | | (0.13 | ) | | | — | | | | (0.24 | ) |
2008 | | $ | 10.79 | | | | 0.05 | (5) | | | (5.86 | ) | | | (5.81 | ) | | | (0.05 | ) | | | — | | | | (0.03 | ) | | | (0.08 | ) |
2009 | | $ | 4.90 | | | | 0.04 | | | | 1.54 | | | | 1.58 | | | | (0.06 | ) | | | — | | | | — | | | | (0.06 | ) |
2010 | | $ | 6.42 | | | | 0.02 | | | | 1.59 | | | | 1.61 | | | | (0.04 | ) | | | — | | | | — | | | | (0.04 | ) |
| Class A Shares | | | | | | | | | | | | | | | | | | | | | | | | | | | | | |
2007(3) | | $ | 10.00 | | | | 0.09 | | | | 0.92 | | | | 1.01 | | | | (0.10 | ) | | | (0.13 | ) | | | — | | | | (0.23 | ) |
2008 | | $ | 10.78 | | | | 0.03 | (5) | | | (5.85 | ) | | | (5.82 | ) | | | (0.02 | ) | | | — | | | | (0.02 | ) | | | (0.04 | ) |
2009 | | $ | 4.92 | | | | 0.03 | | | | 1.54 | | | | 1.57 | | | | (0.06 | ) | | | — | | | | — | | | | (0.06 | ) |
2010 | | $ | 6.43 | | | | 0.01 | | | | 1.59 | | | | 1.60 | | | | (0.03 | ) | | | — | | | | — | | | | (0.03 | ) |
| HUNTINGTON ROTATING MARKETS FUND | | | | | | | | | | | | | | | | | | | | | |
| Trust Shares | | | | | | | | | | | | | | | | | | | | | | | | | | | | | |
2006 | | $ | 11.41 | | | | 0.12 | | | | 2.10 | | | | 2.22 | | | | (0.12 | ) | | | (0.20 | ) | | | — | | | | (0.32 | ) |
2007 | | $ | 13.31 | | | | 0.14 | | | | 1.00 | | | | 1.14 | | | | (0.14 | ) | | | (0.68 | ) | | | — | | | | (0.82 | ) |
2008 | | $ | 13.63 | | | | 0.10 | | | | (5.71 | ) | | | (5.61 | ) | | | (0.10 | ) | | | (0.19 | ) | | | — | | | | (0.29 | ) |
2009 | | $ | 7.73 | | | | 0.10 | | | | 2.50 | | | | 2.60 | | | | (0.10 | ) | | | — | | | | — | | | | (0.10 | ) |
2010 | | $ | 10.23 | | | | 0.03 | | | | 0.59 | | | | 0.62 | | | | — | (7) | | | — | | | | — | | | | — | (7) |
| Class A Shares | | | | | | | | | | | | | | | | | | | | | | | | | | | | | |
2006 | | $ | 11.35 | | | | 0.10 | | | | 2.08 | | | | 2.18 | | | | (0.10 | ) | | | (0.20 | ) | | | — | | | | (0.30 | ) |
2007 | | $ | 13.23 | | | | 0.10 | | | | 0.99 | | | | 1.09 | | | | (0.10 | ) | | | (0.68 | ) | | | — | | | | (0.78 | ) |
2008 | | $ | 13.54 | | | | 0.07 | | | | (5.66 | ) | | | (5.59 | ) | | | (0.07 | ) | | | (0.19 | ) | | | — | | | | (0.26 | ) |
2009 | | $ | 7.69 | | | | 0.08 | | | | 2.48 | | | | 2.56 | | | | (0.07 | ) | | | — | | | | — | | | | (0.07 | ) |
2010 | | $ | 10.18 | | | | 0.01 | | | | 0.59 | | | | 0.60 | | | | — | (7) | | | — | | | | — | | | | — | (7) |
| (1) | Based on net asset value, which does not reflect a sales charge or contingent deferred sales charge, if applicable. |
| (2) | Portfolio turnover is calculated on the basis of the Fund as a whole without distinguishing among the classes of shares. |
| (3) | Reflects operations for the period from May 1, 2007 (date of commencement of operations) to December 31, 2007. |
| (4) | Does not include the effect of expenses of underlying funds. |
| (5) | Per share net investment income (loss) has been calculated using the average daily shares method. |
| (6) | The portfolio turnover rate increased significantly during the period. This increase was attributable to cash flows into and out of the Fund, as well as tactical portfolio adjustments made. The basic characteristics of the Fund’s investment strategy have not changed (Unaudited). |
| (7) | Amount less than $0.005. |
(See notes which are an integral part of the Financial Statements)
Annual Shareholder Report
133
| | | | | | | | | | | | | | | | | | | | | | | | |
Net Asset
Value, end
of period | | Total
return(1) | | | Ratio of Net
Expenses to
Average Net
Assets | | | Ratio of Net
Investment
Income
(Loss) to
Average
Net Assets | | | Ratio of Expenses
(Prior to
Reimbursements)
to Average
Net Assets | | | Net Assets,
at end of
period
(000 omitted) | | | Portfolio
turnover
rate(2) | |
| | | | | | | | | | | | | | | | | | | | | | | | |
| | | | | | | | | | | | | | | | | | | | | | | | |
| $10.79 | | | 10.41 | % | | | 1.49 | %(4) | | | 2.54 | % | | | 1.61 | %(4) | | $ | 44,523 | | | | 39 | % |
| $4.90 | | | (53.87 | )% | | | 1.38 | %(4) | | | 0.65 | % | | | 1.38 | %(4) | | $ | 35,110 | | | | 72 | % |
| $6.42 | | | 32.33 | % | | | 1.38 | %(4) | | | 0.82 | % | | | 1.38 | %(4) | | $ | 72,641 | | | | 36 | % |
| $7.99 | | | 25.09 | % | | | 1.35 | %(4) | | | 0.27 | % | | | 1.35 | %(4) | | $ | 90,813 | | | | 22 | % |
| | | | | | | | | | | | | | | | | | | | | | | | |
| $10.78 | | | 10.22 | % | | | 1.70 | %(4) | | | 2.30 | % | | | 1.83 | %(4) | | $ | 706 | | | | 39 | % |
| $4.92 | | | (53.95 | )% | | | 1.63 | %(4) | | | 0.39 | % | | | 1.63 | %(4) | | $ | 514 | | | | 72 | % |
| $6.43 | | | 31.82 | % | | | 1.63 | %(4) | | | 0.64 | % | | | 1.63 | %(4) | | $ | 1,114 | | | | 36 | % |
| $8.00 | | | 24.85 | % | | | 1.60 | %(4) | | | 0.03 | % | | | 1.60 | %(4) | | $ | 2,052 | | | | 22 | % |
| | | | | | | | | | | | | | | | | | | | | | | | |
| | | | | | | | | | | | | | | | | | | | | | | | |
| $13.31 | | | 19.56 | % | | | 1.15 | %(4) | | | 1.13 | % | | | 1.15 | %(4) | | $ | 45,161 | | | | 35 | % |
| $13.63 | | | 8.67 | % | | | 1.08 | %(4) | | | 1.08 | % | | | 1.08 | %(4) | | $ | 53,375 | | | | 54 | % |
| $7.73 | | | (41.68 | )% | | | 1.18 | %(4) | | | 0.85 | % | | | 1.18 | %(4) | | $ | 28,390 | | | | 218 | %(6) |
| $10.23 | | | 33.64 | % | | | 1.19 | %(4) | | | 1.16 | % | | | 1.19 | %(4) | | $ | 41,786 | | | | 230 | % |
| $10.85 | | | 6.07 | % | | | 1.19 | %(4) | | | 0.27 | % | | | 1.19 | %(4) | | $ | 36,729 | | | | 250 | % |
| | | | | | | | | | | | | | | | | | | | | | | | |
| $13.23 | | | 19.19 | % | | | 1.40 | %(4) | | | 0.95 | % | | | 1.40 | %(4) | | $ | 3,438 | | | | 35 | % |
| $13.54 | | | 8.43 | % | | | 1.33 | %(4) | | | 0.69 | % | | | 1.33 | %(4) | | $ | 3,982 | | | | 54 | % |
| $7.69 | | | (41.81 | )% | | | 1.43 | %(4) | | | 0.59 | % | | | 1.43 | %(4) | | $ | 2,000 | | | | 218 | %(6) |
| $10.18 | | | 33.32 | % | | | 1.44 | %(4) | | | 0.85 | % | | | 1.44 | %(4) | | $ | 1,937 | | | | 230 | % |
| $10.78 | | | 5.90 | % | | | 1.43 | %(4) | | | 0.09 | % | | | 1.43 | %(4) | | $ | 2,600 | | | | 250 | % |
Annual Shareholder Report
134
Financial Highlights (Continued)
Equity Funds (Continued)
(For a share outstanding throughout each period)
| | | | | | | | | | | | | | | | | | | | | | | | | | | | | | | | |
| | | Net Asset
Value,
beginning
of period | | | Net
investment
income (loss) | | | Net realized
and unrealized
gain (loss) on
investments | | | Total from
investment
operations | | | Distributions
from net
investment
income | | | Distributions
from net
realized gain
on investment
transactions | | | Distributions
from return
of capital | | | Total
distributions | |
| HUNTINGTON SITUS FUND | | | | | | | | | | | | | | | | | | | | | |
| Trust Shares | | | | | | | | | | | | | | | | | | | | | | | | | | | | | |
2006 | | $ | 19.24 | | | | (0.07 | ) | | | 2.12 | | | | 2.05 | | | | — | | | | (1.15 | ) | | | — | | | | (1.15 | ) |
2007 | | $ | 20.14 | | | | 0.02 | | | | 1.94 | | | | 1.96 | | | | — | | | | (2.10 | ) | | | — | | | | (2.10 | ) |
2008 | | $ | 20.00 | | | | 0.01 | | | | (7.83 | ) | | | (7.82 | ) | | | — | | | | (0.47 | ) | | | — | | | | (0.47 | ) |
2009 | | $ | 11.71 | | | | 0.03 | | | | 4.27 | | | | 4.30 | | | | (0.01 | ) | | | (0.03 | ) | | | (0.02 | ) | | | (0.06 | ) |
2010 | | $ | 15.95 | | | | (0.03 | ) | | | 4.29 | | | | 4.26 | | | | — | | | | — | | | | — | | | | — | |
| Class A Shares | | | | | | | | | | | | | | | | | | | | | | | | | | | | | |
2006 | | $ | 19.08 | | | | (0.09 | ) | | | 2.08 | | | | 1.99 | | | | — | | | | (1.15 | ) | | | — | | | | (1.15 | ) |
2007 | | $ | 19.92 | | | | (0.03 | ) | | | 1.91 | | | | 1.88 | | | | — | | | | (2.10 | ) | | | — | | | | (2.10 | ) |
2008 | | $ | 19.70 | | | | (0.03 | ) | | | (7.71 | ) | | | (7.74 | ) | | | — | | | | (0.47 | ) | | | — | | | | (0.47 | ) |
2009 | | $ | 11.49 | | | | (0.01 | ) | | | 4.19 | | | | 4.18 | | | | — | (5) | | | (0.03 | ) | | | — | (5) | | | (0.03 | ) |
2010 | | $ | 15.64 | | | | (0.06 | ) | | | 4.20 | | | | 4.14 | | | | — | | | | — | | | | — | | | | — | |
| HUNTINGTON TECHNICAL OPPORTUNITIES FUND | | | | | | | | | | | | | | | | | | | | | |
| Trust Shares | | | | | | | | | | | | | | | | | | | | | | | | | | | | | |
2008(6) | | $ | 10.00 | | | | (0.06 | )(7) | | | (3.31 | ) | | | (3.37 | ) | | | — | | | | — | | | | (0.03 | ) | | | (0.03 | ) |
2009 | | $ | 6.60 | | | | 0.05 | | | | 1.07 | | | | 1.12 | | | | (0.05 | ) | | | — | | | | — | | | | (0.05 | ) |
2010 | | $ | 7.67 | | | | (0.04 | ) | | | 0.63 | | | | 0.59 | | | | — | (5) | | | — | | | | — | | | | — | (5) |
| Class A Shares | | | | | | | | | | | | | | | | | | | | | | | | | | | | | |
2008(6) | | $ | 10.00 | | | | (0.08 | )(7) | | | (3.30 | ) | | | (3.38 | ) | | | — | | | | — | | | | (0.03 | ) | | | (0.03 | ) |
2009 | | $ | 6.59 | | | | 0.03 | | | | 1.06 | | | | 1.09 | | | | (0.03 | ) | | | — | | | | — | | | | (0.03 | ) |
2010 | | $ | 7.65 | | | | (0.05 | ) | | | 0.62 | | | | 0.57 | | | | — | (5) | | | — | | | | — | | | | — | (5) |
| (1) | Based on net asset value, which does not reflect a sales charge or contingent deferred sales charge, if applicable. |
| (2) | Portfolio Turnover is calculated on the basis of the Fund as a whole without distinguishing among the classes of shares. |
| (4) | Computed on an annualized basis. |
| (5) | Amount less than $0.005. |
| (6) | Reflects operations for the period from May 1, 2008 (date of commencement of operations) to December 31, 2008. |
| (7) | Per share net investment income (loss) has been calculated using the average daily shares method. |
(See notes which are an integral part of the Financial Statements)
Annual Shareholder Report
135
| | | | | | | | | | | | | | | | | | | | | | | | |
Net Asset
Value, end
of period | | Total
return(1) | | | Ratio of Net
Expenses to
Average Net
Assets | | | Ratio of Net
Investment
Income
(Loss) to
Average
Net Assets | | | Ratio of Expenses
(Prior to
Reimbursements)
to Average
Net Assets | | | Net Assets,
at end of
period
(000 omitted) | | | Portfolio
turnover
rate(2) | |
| | | | | | | | | | | | | | | | | | | | | | | | |
| | | | | | | | | | | | | | | | | | | | | | | | |
| $20.14 | | | 10.73 | % | | | 1.38 | % | | | (0.34 | )% | | | 1.38 | % | | $ | 89,230 | | | | 19 | % |
| $20.00 | | | 9.95 | % | | | 1.32 | % | | | 0.09 | % | | | 1.32 | % | | $ | 108,350 | | | | 22 | % |
| $11.71 | | | (39.25 | )% | | | 1.34 | % | | | 0.06 | % | | | 1.34 | % | | $ | 77,947 | | | | 19 | % |
| $15.95 | | | 36.86 | % | | | 1.38 | % | | | 0.25 | % | | | 1.38 | % | | $ | 141,342 | | | | 25 | % |
| $20.21 | | | 26.71 | % | | | 1.36 | % | | | (0.16 | )% | | | 1.36 | % | | $ | 183,311 | | | | 32 | % |
| | | | | | | | | | | | | | | | | | | | | | | | |
| $19.92 | | | 10.50 | % | | | 1.64 | % | | | (0.59 | )% | | | 1.64 | % | | $ | 11,685 | | | | 19 | % |
| $19.70 | | | 9.66 | % | | | 1.57 | % | | | (0.15 | )% | | | 1.57 | % | | $ | 15,658 | | | | 22 | % |
| $11.49 | | | (39.44 | )% | | | 1.59 | % | | | (0.21 | )% | | | 1.59 | % | | $ | 12,121 | | | | 19 | % |
| $15.64 | | | 36.52 | % | | | 1.63 | % | | | (0.01 | )% | | | 1.63 | % | | $ | 16,747 | | | | 25 | % |
| $19.78 | | | 26.47 | % | | | 1.61 | % | | | (0.38 | )% | | | 1.61 | % | | $ | 23,990 | | | | 32 | % |
| | | | | | | | | | | | | | | | | | | | | | | | |
| | | | | | | | | | | | | | | | | | | | | | | | |
| $6.60 | | | (33.68 | )%(3) | | | 2.58 | %(4) | | | (1.04 | )%(4) | | | 2.58 | %(4) | | $ | 6,148 | | | | 152 | % |
| $7.67 | | | 16.91 | % | | | 1.94 | % | | | 0.68 | % | | | 1.94 | % | | $ | 9,644 | | | | 374 | % |
| $8.26 | | | 7.72 | % | | | 1.75 | % | | | (0.49 | )% | | | 1.75 | % | | $ | 10,574 | | | | 436 | % |
| | | | | | | | | | | | | | | | | | | | | | | | |
| $6.59 | | | (33.81 | )%(3) | | | 3.13 | %(4) | | | (1.49 | )%(4) | | | 3.13 | %(4) | | $ | 67 | | | | 152 | % |
| $7.65 | | | 16.52 | % | | | 2.20 | % | | | 0.41 | % | | | 2.20 | % | | $ | 61 | | | | 374 | % |
| $8.22 | | | 7.48 | % | | | 1.98 | % | | | (0.69 | )% | | | 1.98 | % | | $ | 106 | | | | 436 | % |
Annual Shareholder Report
136
Financial Highlights (Continued)
Income Funds
(For a share outstanding throughout each period)
| | | | | | | | | | | | | | | | | | | | | | | | | | | | |
| | | Net Asset
Value,
beginning
of period | | | Net
investment
income | | | Net realized
and unrealized
gain (loss) on
investments | | | Total from
investment
operations | | | Distributions
from net
investment
income | | | Distributions
from net
realized gain
on investment
transactions | | | Total
distributions | |
| HUNTINGTON FIXED INCOME SECURITIES FUND | | | | | | | | | | | | | | | | | |
| Trust Shares | | | | | | | | | | | | | | | | | | | | | | | | | |
2006 | | $ | 20.79 | | | | 0.79 | | | | (0.04 | ) | | | 0.75 | | | | (0.78 | ) | | | — | | | | (0.78 | ) |
2007 | | $ | 20.76 | | | | 0.87 | | | | 0.39 | | | | 1.26 | | | | (0.87 | ) | | | — | (3) | | | (0.87 | ) |
2008 | | $ | 21.15 | | | | 0.85 | | | | 0.24 | | | | 1.09 | | | | (0.85 | ) | | | (0.05 | ) | | | (0.90 | ) |
2009 | | $ | 21.34 | | | | 0.78 | | | | 0.34 | | | | 1.12 | | | | (0.78 | ) | | | (0.06 | ) | | | (0.84 | ) |
2010 | | $ | 21.62 | | | | 0.67 | | | | 0.57 | | | | 1.24 | | | | (0.67 | ) | | | (0.03 | ) | | | (0.70 | ) |
| Class A Shares | | | | | | | | | | | | | | | | | | | | | | | | | |
2006 | | $ | 20.78 | | | | 0.74 | | | | (0.03 | ) | | | 0.71 | | | | (0.73 | ) | | | — | | | | (0.73 | ) |
2007 | | $ | 20.76 | | | | 0.82 | | | | 0.39 | | | | 1.21 | | | | (0.82 | ) | | | — | (3) | | | (0.82 | ) |
2008 | | $ | 21.15 | | | | 0.80 | | | | 0.24 | | | | 1.04 | | | | (0.80 | ) | | | (0.05 | ) | | | (0.85 | ) |
2009 | | $ | 21.34 | | | | 0.73 | | | | 0.34 | | | | 1.07 | | | | (0.73 | ) | | | (0.06 | ) | | | (0.79 | ) |
2010 | | $ | 21.62 | | | | 0.61 | | | | 0.57 | | | | 1.18 | | | | (0.61 | ) | | | (0.03 | ) | | | (0.64 | ) |
| HUNTINGTON INTERMEDIATE GOVERNMENT INCOME FUND | | | | | | | | | | | | | | | | | |
| Trust Shares | | | | | | | | | | | | | | | | | | | | | | | | | |
2006 | | $ | 10.28 | | | | 0.39 | | | | (0.04 | ) | | | 0.35 | | | | (0.39 | ) | | | — | (3) | | | (0.39 | ) |
2007 | | $ | 10.24 | | | | 0.41 | | | | 0.25 | | | | 0.66 | | | | (0.41 | ) | | | — | | | | (0.41 | ) |
2008 | | $ | 10.49 | | | | 0.41 | | | | 0.40 | | | | 0.81 | | | | (0.41 | ) | | | — | | | | (0.41 | ) |
2009 | | $ | 10.89 | | | | 0.35 | | | | (0.15 | ) | | | 0.20 | | | | (0.35 | ) | | | — | | | | (0.35 | ) |
2010 | | $ | 10.74 | | | | 0.31 | | | | 0.19 | | | | 0.50 | | | | (0.31 | ) | | | (0.03 | ) | | | (0.34 | ) |
| Class A Shares | | | | | | | | | | | | | | | | | | | | | | | | | |
2006 | | $ | 10.28 | | | | 0.35 | | | | (0.03 | ) | | | 0.32 | | | | (0.36 | ) | | | — | (3) | | | (0.36 | ) |
2007 | | $ | 10.24 | | | | 0.38 | | | | 0.25 | | | | 0.63 | | | | (0.38 | ) | | | — | | | | (0.38 | ) |
2008 | | $ | 10.49 | | | | 0.38 | | | | 0.40 | | | | 0.78 | | | | (0.38 | ) | | | — | | | | (0.38 | ) |
2009 | | $ | 10.89 | | | | 0.32 | | | | (0.15 | ) | | | 0.17 | | | | (0.32 | ) | | | — | | | | (0.32 | ) |
2010 | | $ | 10.74 | | | | 0.28 | | | | 0.19 | | | | 0.47 | | | | (0.28 | ) | | | (0.03 | ) | | | (0.31 | ) |
| (1) | Based on net asset value, which does not reflect a sales charge or contingent deferred sales charge, if applicable. |
| (2) | Portfolio Turnover is calculated on the basis of the Fund as a whole without distinguishing among the classes of shares. |
| (3) | Amount is less than $0.005. |
(See notes which are an integral part of the Financial Statements)
Annual Shareholder Report
137
| | | | | | | | | | | | | | | | | | | | | | | | |
Net Asset
Value, end
of period | | Total
return(1) | | | Ratio of Net
Expenses to
Average Net
Assets | | | Ratio of Net
Investment
Income to
Average Net
Assets | | | Ratio of Expenses
(Prior to
Reimbursements)
to Average
Net Assets | | | Net Assets,
at end of
period
(000 omitted) | | | Portfolio
turnover
rate(2) | |
| | | | | | | | | | | | | | | | | | | | | | | | |
| | | | | | | | | | | | | | | | | | | | | | | | |
| $20.76 | | | 3.74 | % | | | 1.06 | % | | | 3.87 | % | | | 1.06 | % | | $ | 173,305 | | | | 55 | % |
| $21.15 | | | 6.23 | % | | | 1.04 | % | | | 4.18 | % | | | 1.04 | % | | $ | 183,283 | | | | 42 | % |
| $21.34 | | | 5.32 | % | | | 1.06 | % | | | 4.05 | % | | | 1.06 | % | | $ | 183,011 | | | | 31 | % |
| $21.62 | | | 5.36 | % | | | 1.08 | % | | | 3.62 | % | | | 1.08 | % | | $ | 229,570 | | | | 30 | % |
| $22.16 | | | 5.75 | % | | | 1.06 | % | | | 2.99 | % | | | 1.06 | % | | $ | 283,953 | | | | 19 | % |
| | | | | | | | | | | | | | | | | | | | | | | | |
| $20.76 | | | 3.53 | % | | | 1.31 | % | | | 3.62 | % | | | 1.31 | % | | $ | 1,702 | | | | 55 | % |
| $21.15 | | | 5.96 | % | | | 1.29 | % | | | 3.92 | % | | | 1.29 | % | | $ | 2,589 | | | | 42 | % |
| $21.34 | | | 5.06 | % | | | 1.31 | % | | | 3.80 | % | | | 1.31 | % | | $ | 2,525 | | | | 31 | % |
| $21.62 | | | 5.10 | % | | | 1.33 | % | | | 3.36 | % | | | 1.33 | % | | $ | 3,420 | | | | 30 | % |
| $22.16 | | | 5.50 | % | | | 1.30 | % | | | 2.68 | % | | | 1.30 | % | | $ | 8,413 | | | | 19 | % |
| | | | | | | | | | | | | | | | | | | | | | | | |
| | | | | | | | | | | | | | | | | | | | | | | | |
| $10.24 | | | 3.51 | % | | | 1.08 | % | | | 3.80 | % | | | 1.08 | % | | $ | 108,312 | | | | 32 | % |
| $10.49 | | | 6.58 | % | | | 1.08 | % | | | 3.96 | % | | | 1.08 | % | | $ | 115,155 | | | | 30 | % |
| $10.89 | | | 7.88 | % | | | 1.07 | % | | | 3.84 | % | | | 1.07 | % | | $ | 115,159 | | | | 27 | % |
| $10.74 | | | 1.86 | % | | | 1.10 | % | | | 3.21 | % | | | 1.10 | % | | $ | 110,761 | | | | 26 | % |
| $10.90 | | | 4.64 | % | | | 1.10 | % | | | 2.80 | % | | | 1.10 | % | | $ | 115,470 | | | | 6 | % |
| | | | | | | | | | | | | | | | | | | | | | | | |
| $10.24 | | | 3.25 | % | | | 1.34 | % | | | 3.55 | % | | | 1.34 | % | | $ | 1,599 | | | | 32 | % |
| $10.49 | | | 6.32 | % | | | 1.33 | % | | | 3.71 | % | | | 1.33 | % | | $ | 1,588 | | | | 30 | % |
| $10.89 | | | 7.62 | % | | | 1.32 | % | | | 3.60 | % | | | 1.32 | % | | $ | 1,438 | | | | 27 | % |
| $10.74 | | | 1.60 | % | | | 1.35 | % | | | 2.93 | % | | | 1.35 | % | | $ | 2,215 | | | | 26 | % |
| $10.90 | | | 4.38 | % | | | 1.34 | % | | | 2.50 | % | | | 1.34 | % | | $ | 4,675 | | | | 6 | % |
Annual Shareholder Report
138
Financial Highlights (Continued)
Income Funds (Continued)
(For a share outstanding throughout each period)
| | | | | | | | | | | | | | | | | | | | | | | | | | | | |
| | | Net Asset
Value,
beginning
of period | | | Net
investment
income | | | Net realized
and unrealized
gain (loss) on
investments | | | Total from
investment
operations | | | Distributions
from net
investment
income | | | Distributions
from net
realized gain
on investment
transactions | | | Total
distributions | |
| HUNTINGTON MORTGAGE SECURITIES FUND | | | | | | | | | | | | | | | | | |
| Trust Shares | | | | | | | | | | | | | | | | | | | | | | | | | |
2006 | | $ | 8.87 | | | | 0.33 | | | | 0.20 | | | | 0.53 | | | | (0.33 | ) | | | (0.06 | ) | | | (0.39 | ) |
2007 | | $ | 9.01 | | | | 0.34 | | | | (0.04 | ) | | | 0.30 | | | | (0.36 | ) | | | (0.03 | ) | | | (0.39 | ) |
2008 | | $ | 8.92 | | | | 0.34 | | | | (0.12 | ) | | | 0.22 | | | | (0.34 | ) | | | (0.01 | ) | | | (0.35 | ) |
2009 | | $ | 8.79 | | | | 0.29 | | | | 0.15 | | | | 0.44 | | | | (0.31 | ) | | | — | | | | (0.31 | ) |
2010 | | $ | 8.92 | | | | 0.27 | | | | 0.19 | | | | 0.46 | | | | (0.28 | ) | | | — | | | | (0.28 | ) |
| Class A Shares | | | | | | | | | | | | | | | | | | | | | | | | | |
2006 | | $ | 8.92 | | | | 0.30 | | | | 0.20 | | | | 0.50 | | | | (0.30 | ) | | | (0.06 | ) | | | (0.36 | ) |
2007 | | $ | 9.06 | | | | 0.29 | | | | (0.02 | ) | | | 0.27 | | | | (0.33 | ) | | | (0.03 | ) | | | (0.36 | ) |
2008 | | $ | 8.97 | | | | 0.32 | | | | (0.13 | ) | | | 0.19 | | | | (0.31 | ) | | | (0.01 | ) | | | (0.32 | ) |
2009 | | $ | 8.84 | | | | 0.27 | | | | 0.15 | | | | 0.42 | | | | (0.29 | ) | | | — | | | | (0.29 | ) |
2010 | | $ | 8.97 | | | | 0.23 | | | | 0.22 | | | | 0.45 | | | | (0.26 | ) | | | — | | | | (0.26 | ) |
| HUNTINGTON OHIO TAX-FREE FUND | | | | | | | | | | | | | | | | | |
| Trust Shares | | | | | | | | | | | | | | | | | | | | | | | | | |
2006 | | $ | 20.91 | | | | 0.58 | | | | (0.05 | ) | | | 0.53 | | | | (0.58 | ) | | | — | | | | (0.58 | ) |
2007 | | $ | 20.86 | | | | 0.55 | | | | 0.10 | | | | 0.65 | | | | (0.55 | ) | | | (0.01 | ) | | | (0.56 | ) |
2008 | | $ | 20.95 | | | | 0.57 | | | | (0.17 | ) | | | 0.40 | | | | (0.57 | ) | | | (0.03 | ) | | | (0.60 | ) |
2009 | | $ | 20.75 | | | | 0.59 | | | | 0.45 | | | | 1.04 | | | | (0.59 | ) | | | — | | | | (0.59 | ) |
2010 | | $ | 21.20 | | | | 0.50 | | | | (0.11 | ) | | | 0.39 | | | | (0.50 | ) | | | (0.07 | ) | | | (0.57 | ) |
| Class A Shares | | | | | | | | | | | | | | | | | | | | | | | | | |
2006 | | $ | 20.90 | | | | 0.53 | | | | (0.06 | ) | | | 0.47 | | | | (0.53 | ) | | | — | | | | (0.53 | ) |
2007 | | $ | 20.84 | | | | 0.50 | | | | 0.10 | | | | 0.60 | | | | (0.50 | ) | | | (0.01 | ) | | | (0.51 | ) |
2008 | | $ | 20.93 | | | | 0.51 | | | | (0.16 | ) | | | 0.35 | | | | (0.51 | ) | | | (0.03 | ) | | | (0.54 | ) |
2009 | | $ | 20.74 | | | | 0.54 | | | | 0.44 | | | | 0.98 | | | | (0.54 | ) | | | — | | | | (0.54 | ) |
2010 | | $ | 21.18 | | | | 0.45 | | | | (0.11 | ) | | | 0.34 | | | | (0.45 | ) | | | (0.07 | ) | | | (0.52 | ) |
| (1) | Based on net asset value, which does not reflect a sales charge or contingent deferred sales charge, if applicable. |
| (2) | Portfolio Turnover is calculated on the basis of the Fund as a whole without distinguishing among the classes of shares. |
(See notes which are an integral part of the Financial Statements)
Annual Shareholder Report
139
| | | | | | | | | | | | | | | | | | | | | | | | |
Net Asset
Value, end
of period | | Total return(1) | | | Ratio of Net
Expenses to
Average Net
Assets | | | Ratio of Net
Investment
Income to
Average Net
Assets | | | Ratio of Expenses
(Prior to
Reimbursements)
to Average
Net Assets | | | Net Assets,
at end of
period
(000 omitted) | | | Portfolio
turnover
rate(2) | |
| | | | | | | | | | | | | | | | | | | | | | | | |
| | | | | | | | | | | | | | | | | | | | | | | | |
| $9.01 | | | 6.06 | % | | | 1.10 | % | | | 3.68 | % | | | 1.10 | % | | $ | 85,995 | | | | 29 | % |
| $8.92 | | | 3.33 | % | | | 1.09 | % | | | 3.72 | % | | | 1.09 | % | | $ | 83,728 | | | | 17 | % |
| $8.79 | | | 2.45 | % | | | 1.10 | % | | | 3.82 | % | | | 1.10 | % | | $ | 82,729 | | | | 13 | % |
| $8.92 | | | 5.17 | % | | | 1.11 | % | | | 3.32 | % | | | 1.11 | % | | $ | 100,114 | | | | 24 | % |
| $9.10 | | | 5.21 | % | | | 1.11 | % | | | 2.87 | % | | | 1.11 | % | | $ | 96,832 | | | | 6 | % |
| | | | | | | | | | | | | | | | | | | | | | | | |
| $9.06 | | | 5.74 | % | | | 1.35 | % | | | 3.41 | % | | | 1.35 | % | | $ | 1,683 | | | | 29 | % |
| $8.97 | | | 3.03 | % | | | 1.32 | % | | | 3.45 | % | | | 1.32 | % | | $ | 3,190 | | | | 17 | % |
| $8.84 | | | 2.16 | % | | | 1.35 | % | | | 3.55 | % | | | 1.35 | % | | $ | 3,022 | | | | 13 | % |
| $8.97 | | | 4.85 | % | | | 1.36 | % | | | 3.07 | % | | | 1.36 | % | | $ | 2,629 | | | | 24 | % |
| $9.16 | | | 5.03 | % | | | 1.35 | % | | | 2.62 | % | | | 1.35 | % | | $ | 3,910 | | | | 6 | % |
| | | | | | | | | | | | | | | | | | | | | | | | |
| | | | | | | | | | | | | | | | | | | | | | | | |
| $20.86 | | | 2.59 | % | | | 1.17 | % | | | 2.80 | % | | | 1.17 | % | | $ | 40,319 | | | | 17 | % |
| $20.95 | | | 3.18 | % | | | 1.18 | % | | | 2.67 | % | | | 1.18 | % | | $ | 34,098 | | | | 15 | % |
| $20.75 | | | 1.95 | % | | | 1.22 | % | | | 2.73 | % | | | 1.22 | % | | $ | 32,946 | | | | 19 | % |
| $21.20 | | | 5.05 | % | | | 1.20 | % | | | 2.80 | % | | | 1.20 | % | | $ | 42,568 | | | | 21 | % |
| $21.02 | | | 1.85 | % | | | 1.20 | % | | | 2.36 | % | | | 1.20 | % | | $ | 48,741 | | | | 18 | % |
| | | | | | | | | | | | | | | | | | | | | | | | |
| $20.84 | | | 2.29 | % | | | 1.43 | % | | | 2.58 | % | | | 1.43 | % | | $ | 1,686 | | | | 17 | % |
| $20.93 | | | 2.93 | % | | | 1.43 | % | | | 2.42 | % | | | 1.43 | % | | $ | 1,706 | | | | 15 | % |
| $20.74 | | | 1.74 | % | | | 1.47 | % | | | 2.49 | % | | | 1.47 | % | | $ | 1,422 | | | | 19 | % |
| $21.18 | | | 4.74 | % | | | 1.45 | % | | | 2.54 | % | | | 1.45 | % | | $ | 1,745 | | | | 21 | % |
| $21.00 | | | 1.60 | % | | | 1.45 | % | | | 2.09 | % | | | 1.45 | % | | $ | 3,192 | | | | 18 | % |
Annual Shareholder Report
140
Financial Highlights (Continued)
Income Funds (Continued)
(For a share outstanding throughout each period)
| | | | | | | | | | | | | | | | | | | | | | | | |
| | | Net Asset
Value,
beginning
of period | | | Net
investment
income | | |
Net realized
and unrealized
gain (loss) on
investments | | | Total from
investment
operations | | | Distributions
from net
investment
income | | | Total
distributions | |
| HUNTINGTON SHORT/INTERMEDIATE FIXED INCOME FUND | | | | | | | | | | | | | |
| Trust Shares | | | | | | | | | | | | | | | | | | | | | |
2006 | | $ | 19.15 | | | | 0.60 | | | | 0.10 | | | | 0.70 | | | | (0.60 | ) | | | (0.60 | ) |
2007 | | $ | 19.25 | | | | 0.70 | | | | 0.21 | | | | 0.91 | | | | (0.70 | ) | | | (0.70 | ) |
2008 | | $ | 19.46 | | | | 0.67 | | | | (0.59 | ) | | | 0.08 | | | | (0.67 | ) | | | (0.67 | ) |
2009 | | $ | 18.87 | | | | 0.53 | | | | 0.91 | | | | 1.44 | | | | (0.53 | ) | | | (0.53 | ) |
2010 | | $ | 19.78 | | | | 0.40 | | | | 0.19 | | | | 0.59 | | | | (0.40 | ) | | | (0.40 | ) |
| Class A Shares | | | | | | | | | | | | | | | | | | | | | |
2006 | | $ | 19.16 | | | | 0.55 | | | | 0.10 | | | | 0.65 | | | | (0.55 | ) | | | (0.55 | ) |
2007 | | $ | 19.26 | | | | 0.65 | | | | 0.20 | | | | 0.85 | | | | (0.65 | ) | | | (0.65 | ) |
2008 | | $ | 19.46 | | | | 0.63 | | | | (0.59 | ) | | | 0.04 | | | | (0.63 | ) | | | (0.63 | ) |
2009 | | $ | 18.87 | | | | 0.48 | | | | 0.91 | | | | 1.39 | | | | (0.48 | ) | | | (0.48 | ) |
2010 | | $ | 19.78 | | | | 0.35 | | | | 0.20 | | | | 0.55 | | | | (0.35 | ) | | | (0.35 | ) |
| (1) | Based on net asset value, which does not reflect a sales charge or contingent deferred sales charge, if applicable. |
| (2) | Portfolio Turnover is calculated on the basis of the Fund as a whole without distinguishing among the classes of shares. |
(See notes which are an integral part of the Financial Statements)
Annual Shareholder Report
141
| | | | | | | | | | | | | | | | | | | | | | | | |
Net Asset
Value, end
of period | | Total
return(1) | | | Ratio of Net
Expenses to
Average Net
Assets | | | Ratio of Net
Investment
Income to
Average Net
Assets | | | Ratio of Expenses
(Prior to
Reimbursements)
to Average
Net Assets | | | Net Assets,
at end of
period
(000 omitted) | | | Portfolio
turnover
rate(2) | |
| | | | | | | | | | | | | | | | | | | | | | | | |
| | | | | | | | | | | | | | | | | | | | | | | | |
| $19.25 | | | 3.70 | % | | | 1.07 | % | | | 3.11 | % | | | 1.07 | % | | $ | 95,512 | | | | 36 | % |
| $19.46 | | | 4.79 | % | | | 1.06 | % | | | 3.60 | % | | | 1.06 | % | | $ | 82,730 | | | | 29 | % |
| $18.87 | | | 0.43 | % | | | 1.08 | % | | | 3.51 | % | | | 1.08 | % | | $ | 79,130 | | | | 51 | % |
| $19.78 | | | 7.70 | % | | | 1.09 | % | | | 2.67 | % | | | 1.09 | % | | $ | 149,384 | | | | 50 | % |
| $19.97 | | | 2.99 | % | | | 1.06 | % | | | 1.97 | % | | | 1.06 | % | | $ | 196,479 | | | | 24 | % |
| | | | | | | | | | | | | | | | | | | | | | | | |
| $19.26 | | | 3.44 | % | | | 1.33 | % | | | 2.80 | % | | | 1.33 | % | | $ | 668 | | | | 36 | % |
| $19.46 | | | 4.48 | % | | | 1.31 | % | | | 3.35 | % | | | 1.31 | % | | $ | 485 | | | | 29 | % |
| $18.87 | | | 0.18 | % | | | 1.33 | % | | | 3.26 | % | | | 1.33 | % | | $ | 555 | | | | 51 | % |
| $19.78 | | | 7.43 | % | | | 1.33 | % | | | 2.38 | % | | | 1.33 | % | | $ | 1,076 | | | | 50 | % |
| $19.98 | | | 2.78 | % | | | 1.30 | % | | | 1.60 | % | | | 1.30 | % | | $ | 7,639 | | | | 24 | % |
Annual Shareholder Report
142
Financial Highlights (Continued)
Asset Allocation Funds
(For a share outstanding throughout each period)
| | | | | | | | | | | | | | | | | | | | | | | | | | | | |
| | | Net Asset
Value,
beginning
of period | | | Net
investment
income | | | Net realized
and unrealized
gain (loss) on
investments | | | Total from
investment
operations | | | Distributions
from net
investment
income | | | Distributions
from net
realized gain
on investment
transactions | | | Total
distributions | |
| HUNTINGTON BALANCED ALLOCATION FUND | | | | | | | | | | | | | | | | | |
2009(2) | | $ | 10.00 | | | | 0.05 | | | | 0.75 | | | | 0.80 | | | | (0.06 | ) | | | — | (3) | | | (0.06 | ) |
2010 | | $ | 10.74 | | | | 0.09 | | | | 0.88 | | | | 0.97 | | | | (0.09 | ) | | | (0.05 | ) | | | (0.14 | ) |
| HUNTINGTON CONSERVATIVE ALLOCATION FUND | | | | | | | | | | | | | | | | | |
2009(2) | | $ | 10.00 | | | | 0.08 | | | | 0.34 | | | | 0.42 | | | | (0.09 | ) | | | (0.01 | ) | | | (0.10 | ) |
2010 | | $ | 10.32 | | | | 0.17 | | | | 0.41 | | | | 0.58 | | | | (0.16 | ) | | | (0.05 | ) | | | (0.21 | ) |
| HUNTINGTON GROWTH ALLOCATION FUND | | | | | | | | | | | | | | | | | |
2009(2) | | $ | 10.00 | | | | 0.04 | | | | 0.88 | | | | 0.92 | | | | (0.05 | ) | | | — | (3) | | | (0.05 | ) |
2010 | | $ | 10.87 | | | | 0.06 | | | | 1.09 | | | | 1.15 | | | | (0.06 | ) | | | (0.08 | ) | | | (0.14 | ) |
| (1) | Based on net asset value, which does not reflect a sales charge or contingent deferred sales charge, if applicable. |
| (2) | Reflects operations for the period from July 31, 2009 (date of commencement of operations) to December 31, 2009. |
| (3) | Amount less than $0.005 |
| (5) | Computed on an annualized basis. |
| (6) | Does not include the effect of expenses on underlying funds. |
(See notes which are an integral part of the Financial Statements)
Annual Shareholder Report
143
| | | | | | | | | | | | | | | | | | | | | | | | |
Net Asset
Value, end
of period | | Total
return(1) | | | Ratio of Net
Expenses to
Average Net
Assets | | | Ratio of Net
Investment
Income to
Average Net
Assets | | | Ratio of Expenses
(Prior to
Reimbursements)
to Average
Net Assets | | | Net Assets,
at end of
period
(000 omitted) | | | Portfolio
turnover
rate | |
| | | | | | | | | | | | | | | | | | | | | | | | |
| $10.74 | | | 8.03 | %(4) | | | 0.62 | %(5)(6) | | | 1.30 | %(5) | | | 0.85 | %(5)(6) | | $ | 13,336 | | | | 42 | % |
| $11.57 | | | 9.14 | % | | | 0.59 | %(6) | | | 0.94 | % | | | 0.74 | %(6) | | $ | 24,656 | | | | 26 | % |
| | | | | | | | | | | | | | | | | | | | | | | | |
| $10.32 | | | 4.13 | %(4) | | | 0.72 | %(5)(6) | | | 1.91 | %(5) | | | 0.86 | %(5)(6) | | $ | 11,248 | | | | 32 | % |
| $10.69 | | | 5.70 | % | | | 0.70 | %(6) | | | 1.60 | % | | | 0.79 | %(6) | | $ | 14,840 | | | | 22 | % |
| | | | | | | | | | | | | | | | | | | | | | | | |
| $10.87 | | | 9.21 | %(4) | | | 0.52 | %(5)(6) | | | 1.03 | %(5) | | | 0.85 | %(5)(6) | | $ | 12,923 | | | | 52 | % |
| $11.88 | | | 10.69 | % | | | 0.51 | %(6) | | | 0.61 | % | | | 0.77 | %(6) | | $ | 19,132 | | | | 29 | % |
Annual Shareholder Report
144
Notes to Financial Statements
December 31, 2010
The Huntington Funds (the “Trust”) was originally two separate Massachusetts business trusts: The Huntington Funds, established on February 10, 1987, and Huntington VA Funds, established on June 30, 1999 (together, the “Original Trusts”). On June 23, 2006, the Original Trusts were reorganized into a single Delaware statutory trust retaining the name of The Huntington Funds. The Trust is registered under the Investment Company Act of 1940, as amended (the “1940 Act”), as an open-end management investment company. At December 31, 2010, the Trust operated 36 separate series, or mutual funds, each with its own investment objective and strategy. The Funds’ prospectus provides a description of each Fund’s investment objectives, policies and strategies along with information on the classes of shares currently being offered. This report contains financial statements and financial highlights of the retail funds listed below (individually referred to as a “Fund,” or collectively as the “Funds”):
| | |
| Funds | | Investment Share
Classes Offered* |
Huntington Tax-Free Money Market Fund
(“Tax-Free Money Market Fund”) | | Trust & A |
Huntington Money Market Fund
(“Money Market Fund”) | | Trust, A, & Interfund |
Huntington Ohio Municipal Money Market Fund (“Ohio Municipal Money Market Fund”) | | Trust & A |
Huntington U.S. Treasury Money Market Fund (“U.S. Treasury Money Market Fund”) | | Trust & A |
Huntington Dividend Capture Fund
(“Dividend Capture Fund”) | | Trust & A |
Huntington Global Select Markets Fund
(“Global Select Markets Fund”) | | Trust & A |
Huntington Growth Fund (“Growth Fund”) | | Trust & A |
Huntington Income Equity Fund
(“Income Equity Fund”) | | Trust & A |
Huntington International Equity Fund (“International Equity Fund”) | | Trust & A |
Huntington Macro 100 Fund (“Macro 100 Fund”) | | Trust & A |
Huntington Mid Corp America Fund
(“Mid Corp America Fund”) | | Trust & A |
Huntington New Economy Fund
(“New Economy Fund”) | | Trust & A |
Huntington Real Strategies Fund
(“Real Strategies Fund”) | | Trust & A |
Huntington Rotating Markets Fund
(“Rotating Markets Fund”) | | Trust & A |
Huntington Situs Fund (“Situs Fund”) | | Trust & A |
Huntington Technical Opportunities Fund (“Technical Opportunities Fund”) | | Trust & A |
Huntington Fixed Income Securities Fund
(“Fixed Income Securities Fund”) | | Trust & A |
Huntington Intermediate Government Income Fund
(“Intermediate Government Income Fund”) | | Trust & A |
Huntington Mortgage Securities Fund
(“Mortgage Securities Fund”) | | Trust & A |
Huntington Ohio Tax-Free Fund
(“Ohio Tax-Free Fund”) | | Trust & A |
| | |
| Funds | | Investment Share
Classes Offered* |
Huntington Short/Intermediate Fixed Income Securities Fund
(“Short/Intermediate Fixed Income Securities Fund”) | | Trust & A |
Huntington Balanced Allocation Fund
(“Balanced Allocation Fund”) | | A |
Huntington Conservative Allocation Fund (“Conservative Allocation Fund”) | | A |
Huntington Growth Allocation Fund
(“Growth Allocation Fund”) | | A |
| * | Each class of shares for each Fund has identical rights and privileges except with respect to distribution (12b-1) and service fees, voting rights on matters affecting a single class of shares, exchange privileges of each class of shares and sales charges. Class A has a maximum sales charge on purchases of 4.75% as a percentage of the original purchase price except for the Fixed Income Securities Fund, Intermediate Government Income Fund, Mortgage Securities Fund and Ohio Tax Free Fund which are 3.75%, and the Short/Intermediate Fixed Income Securities Fund which is 1.50%. The Tax Free Money Market Fund, Money Market Fund, Ohio Municipal Money Market Fund and the U.S. Treasury Money Market Fund do not have sales charges on original purchases. Effective May 1, 2010, the Institutional Shares were renamed Trust Shares. Effective June 29, 2010, Class B shares were converted to Class A shares. |
Under the Trust’s organizational documents, its officers and Board of Trustees (“Trustees”) are indemnified against certain liabilities arising out of the performance of their duties to the Funds. In addition, in the normal course of business, the Trust may enter into contracts with vendors and others that provide for general indemnifications. The Trust’s maximum exposure under these arrangements is unknown, as this would involve future claims that may be made against the Trust. However, based on experience, the Trust expects that risk of loss to be remote.
| (2) | Significant Accounting Policies |
The following is a summary of significant accounting policies consistently followed by each Fund in the preparation of its financial statements. These policies are in conformity with generally accepted accounting principles in the United States of America (“GAAP”). The preparation of financial statements in conformity with GAAP requires management to make estimates and assumptions that affect the amounts of assets, liabilities, and disclosure of contingent assets and liabilities at the date of the financial statements and the reported amounts of income and expenses for the period. Actual results could differ from those estimates.
The price at which the Funds will offer or redeem shares is the net asset value (“NAV”) per share next determined after the order is considered received, subject to any applicable front end or contingent deferred sales charges.
Annual Shareholder Report
145
The Trust calculates the NAV for each of the Funds (other than the Money Market Funds) by valuing securities held based on fair value. Fair value is defined as the price that would be received to sell an asset or paid to transfer a liability in an orderly transaction between market participants at the measurement date.
For the Money Market Funds, the Trust attempts to stabilize the NAV per share at $1.00 per share by valuing portfolio securities using the amortized cost method, which approximates market value. Under the amortized cost method, premium or discount, if any, is amortized or accreted, respectively, on a constant (straight-line) basis to the maturity of the security.
In computing the NAV of the Funds, other than the Money Market Funds, fair value is based on market valuations with respect to portfolio securities for which market quotations are readily available. Pursuant to Trustee-approved policies, the Trust relies on certain security pricing services to provide the current market value of securities. Those security pricing services value equity securities (including foreign equity securities) traded on a securities exchange at the last reported sales price on the principal exchange. Equity securities quoted by NASDAQ are valued at the NASDAQ official closing price. If there is no reported sale on the principal exchange, and in the case of over-the-counter securities, equity securities are valued at a bid price estimated by the security pricing service. Option contracts are generally valued using the closing price based on quote data from the six major U.S. options exchanges on which such options are traded.
Debt securities traded on a national securities exchange or in the over-the-counter market are valued at the last reported sales price on the principal exchange, except that U.S. government obligations held by Mortgage Securities Fund are valued at the mean between the over-the-counter bid and asked prices furnished by the security pricing service. If there is no reported sale on the principal exchange, and for all other debt securities, debt securities are valued at a bid price estimated by the security pricing service. Foreign securities quoted in foreign currencies are translated in U.S. dollars at the foreign exchange rate in effect as of the close of the New York Stock Exchange (NYSE) (generally 4:00 p.m. Eastern Time), on the day the value of the foreign security is determined. Short-term investments with remaining maturities of 60 days or less at the time of purchase are valued at amortized cost. Investments in other open-end investment companies are valued at NAV.
Under certain circumstances, a good faith determination of the fair value of a security may be used instead of its current market value, even if the security’s market price is readily available. In such circumstances, the Trust’s Sub-Financial Administrator may request that the Trust’s Pricing Committee make its own fair value determination.
Securities for which market quotations are not readily available are valued at fair value under Trust procedures approved by the Trustees. In these cases, a Pricing Committee established and appointed by the Trustees determines in good
faith, subject to Trust procedures, the fair value of portfolio securities held by a Fund (“good faith fair valuation”). When a good faith fair valuation of a security is required, consideration is generally given to a number of factors including, but not limited to the following: dealer quotes, published analyses by dealers or analysts regarding the security, transactions which provide implicit valuation of the security (such as a merger or tender offer transaction), the value of other securities or contracts which derive their value from the security at issue, and the implications of any other circumstances which have caused trading in the security to halt. With respect to certain narrow categories of securities, the procedures utilized by the Pricing Committee detail specific valuation methodologies to be applied in lieu of considering the aforementioned list of factors.
Fair valuation procedures are also used when a significant event affecting the value of a portfolio security is determined to have occurred between the time when the price of the portfolio security is determined and the close of trading on the NYSE, which is when each Fund’s NAV is computed. An event is considered significant if there is both an affirmative expectation that the security’s value will change in response to the event and a reasonable basis for quantifying the resulting change in value. Significant events include significant securities market movements occurring between the time the price of the portfolio security is determined and the close of trading on the NYSE. For domestic fixed income securities, such events may occur where the cut-off time for the market information used by the independent pricing service is earlier than the end of regular trading on the NYSE. For securities normally priced at their last sale price in a foreign market, such events can occur between the close of trading in the foreign market and the close of trading on the NYSE.
In some cases, events affecting the issuer of a portfolio security may be considered significant events. Examples of potentially significant events include announcements concerning earnings, acquisitions, new products, management changes, litigation developments, a strike or natural disaster affecting the company’s operations or regulatory changes or market developments affecting the issuer’s industry occurring between the time when the price of the portfolio security is determined and the close of trading on the NYSE. For securities of foreign issuers, such events could also include political or other developments affecting the economy or markets in which the issuer conducts its operations or its securities are traded.
The Funds’ Trustees have authorized the use of an independent fair valuation service to monitor changes in a designated U.S. market index after foreign markets close, and to implement a fair valuation methodology to adjust the closing prices of foreign securities if the movement in the index is significant.
There can be no assurance that a Fund could purchase or sell a portfolio security at the price used to calculate the Fund’s NAV. In the case of good faith fair valued portfolio securities, lack of information and uncertainty as to the significance of information may lead to a conclusion that a prior valuation is
Annual Shareholder Report
146
Notes to Financial Statements (Continued)
the best indication of a portfolio security’s present value. Good faith fair valuations generally remain unchanged until new information becomes available. Consequently, changes in good faith fair valuation of portfolio securities may be less frequent and of greater magnitude than changes in the price of portfolio securities valued at their last sale price, by an independent pricing service, or based on market quotations.
The valuation techniques described above maximize the use of observable inputs and minimize the use of unobservable inputs in determining fair value. The inputs used for valuing the Funds’ investments are summarized in the three broad levels listed below:
| • | | Level 1—quoted prices in active markets for identical assets. |
| • | | Level 2—other significant observable inputs (including quoted prices for similar securities, interest rates, prepayment speeds, credit risk, etc.). |
| • | | Level 3—significant unobservable inputs (including the Funds’ own assumptions in determining the fair value of investments). |
The inputs or methodology used for valuing investments are not necessarily an indication of the risk associated with investing in those investments.
Pursuant to the valuation procedures noted previously, equity securities (including foreign equity securities) are generally recognized as Level 1 securities in the fair value hierarchy (unless there is a fair valuation event, in which case affected securities are generally categorized as Level 2 securities). Option securities are generally recognized as Level 1 securities in the fair value hierarchy. Debt securities are generally recognized as Level 2 securities in the fair value hierarchy. Mutual funds, exchange traded funds and cash equivalents are generally recognized as Level 1 securities in the fair value hierarchy (unless there is a fair valuation event, in which case affected securities are generally categorized as Level 2 securities).
For the fiscal year ended December 31, 2010, there were no Level 3 investments for which significant unobservable inputs were used to determine fair value.
The following is a summary of the inputs used to value the Funds’ investments as of December 31, 2010, while the breakdown, by category, of common stocks is disclosed in the Portfolio of Investments for each Fund:
| | | | | | | | | | | | | | | | | | | | | | | | |
| | | LEVEL 1—Quoted Prices | | | LEVEL 2—Other Significant
Observable Inputs | | | Total | |
| Fund Name | | Securities | | | Other
Financial
Investments* | | | Securities | | | Other
Financial
Investments* | | | Securities | | | Other
Financial
Investments* | |
Tax-Free Money Market Fund | | | | | | | | | | | | | | | | | | | | | | | | |
Municipal Bonds | | $ | — | | | $ | — | | | $ | 76,121,402 | | | $ | — | | | $ | 76,121,402 | | | $ | — | |
Cash Equivalents | | | 6,211,813 | | | | — | | | | | | | | — | | | | 6,211,813 | | | | — | |
| | | | | | | | | | | | | | | | | | | | | | | | |
Total | | | 6,211,813 | | | | — | | | | 76,121,402 | | | | — | | | | 82,333,215 | | | | — | |
Money Market Fund | | | | | | | | | | | | | | | | | | | | | | | | |
U.S. Government Agencies | | | — | | | | — | | | | 92,505,750 | | | | — | | | | 92,505,750 | | | | — | |
Corporate Bonds | | | — | | | | — | | | | 84,248,873 | | | | — | | | | 84,248,873 | | | | — | |
Municipal Bonds | | | — | | | | — | | | | 78,760,000 | | | | — | | | | 78,760,000 | | | | — | |
Commercial Papers | | | — | | | | — | | | | 59,947,313 | | | | — | | | | 59,947,313 | | | | — | |
Certificates of Deposit | | | — | | | | — | | | | 29,994,442 | | | | — | | | | 29,994,442 | | | | — | |
U.S. Treasury Obligations | | | — | | | | — | | | | 9,991,062 | | | | — | | | | 9,991,062 | | | | — | |
Repurchase Agreements | | | — | | | | — | | | | 4,984,900 | | | | — | | | | 4,984,900 | | | | | |
Cash Equivalents | | | 35,000,000 | | | | — | | | | — | | | | — | | | | 35,000,000 | | | | — | |
| | | | | | | | | | | | | | | | | | | | | | | | |
Total | | | 35,000,000 | | | | — | | | | 360,432,340 | | | | — | | | | 395,432,340 | | | | — | |
Ohio Municipal Money Market Fund | | | | | | | | | | | | | | | | | | | | | | | | |
Municipal Bonds | | | — | | | | — | | | | 179,564,747 | | | | — | | | | 179,564,747 | | | | — | |
Cash Equivalents | | | 18,358,714 | | | | — | | | | — | | | | — | | | | 18,358,714 | | | | — | |
| | | | | | | | | | | | | | | | | | | | | | | | |
Total | | | 18,358,714 | | | | — | | | | 179,564,747 | | | | — | | | | 197,923,461 | | | | — | |
U.S. Treasury Money Market Fund | | | | | | | | | | | | | | | | | | | | | | | | |
U.S. Treasury Obligations | | | — | | | | — | | | | 283,823,453 | | | | — | | | | 283,823,453 | | | | — | |
Repurchase Agreements | | | — | | | | — | | | | 103,898,000 | | | | — | | | | 103,898,000 | | | | — | |
| | | | | | | | | | | | | | | | | | | | | | | | |
Total | | | — | | | | — | | | | 387,721,453 | | | | — | | | | 387,721,453 | | | | — | |
Dividend Capture Fund | | | | | | | | | | | | | | | | | | | | | | | | |
Common Stocks | | | 90,958,472 | | | | — | | | | — | | | | — | | | | 90,958,472 | | | | — | |
Preferred Stocks | | | 24,558,219 | | | | — | | | | 1,182,659 | (1) | | | — | | | | 25,740,878 | | | | — | |
Mutual Funds | | | 1,384,900 | | | | — | | | | — | | | | — | | | | 1,384,900 | | | | — | |
Cash Equivalents | | | 1,122,914 | | | | — | | | | — | | | | — | | | | 1,122,914 | | | | — | |
| | | | | | | | | | | | | | | | | | | | | | | | |
Total | | | 118,024,505 | | | | — | | | | 1,182,659 | | | | — | | | | 119,207,164 | | | | — | |
Global Select Markets Fund | | | | | | | | | | | | | | | | | | | | | | | | |
Common Stocks | | | 38,672,486 | | | | — | | | | — | | | | — | | | | 38,672,486 | | | | — | |
Mutual Funds | | | 1,383,110 | | | | — | | | | — | | | | — | | | | 1,383,110 | | | | — | |
Foreign Bonds | | | — | | | | — | | | | 1,225,106 | | | | — | | | | 1,225,106 | | | | — | |
Cash Equivalents | | | 716,754 | | | | — | | | | — | | | | — | | | | 716,754 | | | | — | |
| | | | | | | | | | | | | | | | | | | | | | | | |
Total | | | 40,772,350 | | | | — | | | | 1,225,106 | | | | — | | | | 41,997,456 | | | | — | |
Annual Shareholder Report
147
| | | | | | | | | | | | | | | | | | | | | | | | |
| | | LEVEL 1—Quoted Prices | | | LEVEL 2—Other Significant
Observable Inputs | | | Total | |
| Fund Name | | Securities | | | Other
Financial
Investments* | | | Securities | | | Other
Financial
Investments* | | | Securities | | | Other
Financial
Investments* | |
Growth Fund | | | | | | | | | | | | | | | | | | | | | | | | |
Common Stocks | | $ | 126,984,736 | | | $ | — | | | $ | — | | | $ | — | | | $ | 126,984,736 | | | $ | — | |
Cash Equivalents | | | 6,700,122 | | | | — | | | | — | | | | — | | | | 6,700,122 | | | | — | |
| | | | | | | | | | | | | | | | | | | | | | | | |
Total | | | 133,684,858 | | | | — | | | | — | | | | — | | | | 133,684,858 | | | | — | |
Income Equity Fund | | | | | | | | | | | | | | | | | | | | | | | | |
Common Stocks | | | 103,831,173 | | | | — | | | | — | | | | — | | | | 103,831,173 | | | | — | |
Cash Equivalents | | | 3,214,284 | | | | — | | | | — | | | | — | | | | 3,214,284 | | | | — | |
| | | | | | | | | | | | | | | | | | | | | | | | |
Total | | | 107,045,457 | | | | — | | | | — | | | | — | | | | 107,045,457 | | | | — | |
International Equity Fund | | | | | | | | | | | | | | | | | | | | | | | | |
Common Stocks | | | 278,350,400 | | | | — | | | | — | | | | — | | | | 278,350,400 | | | | — | |
Mutual Funds | | | 16,243,375 | | | | — | | | | — | | | | — | | | | 16,243,375 | | | | — | |
Cash Equivalents | | | 8,803,071 | | | | — | | | | — | | | | — | | | | 8,803,071 | | | | — | |
| | | | | | | | | | | | | | | | | | | | | | | | |
Total | | | 303,396,846 | | | | — | | | | — | | | | — | | | | 303,396,846 | | | | — | |
Macro 100 Fund | | | | | | | | | | | | | | | | | | | | | | | | |
Common Stocks | | | 43,242,502 | | | | — | | | | — | | | | — | | | | 43,242,502 | | | | — | |
Cash Equivalents | | | 2,108,417 | | | | — | | | | — | | | | — | | | | 2,108,417 | | | | — | |
| | | | | | | | | | | | | | | | | | | | | | | | |
Total | | | 45,350,919 | | | | — | | | | — | | | | — | | | | 45,350,919 | | | | — | |
Mid Corp America Fund | | | | | | | | | | | | | | | | | | | | | | | | |
Common Stocks | | | 146,918,946 | | | | — | | | | — | | | | — | | | | 146,918,946 | | | | — | |
Cash Equivalents | | | 1,913,483 | | | | — | | | | — | | | | — | | | | 1,913,483 | | | | — | |
| | | | | | | | | | | | | | | | | | | | | | | | |
Total | | | 148,832,429 | | | | — | | | | — | | | | — | | | | 148,832,429 | | | | — | |
New Economy Fund | | | | | | | | | | | | | | | | | | | | | | | | |
Common Stocks | | | 54,675,350 | | | | — | | | | — | | | | — | | | | 54,675,350 | | | | — | |
Options Purchased | | | 510,000 | | | | — | | | | — | | | | — | | | | 510,000 | | | | — | |
Cash Equivalents | | | 1,609,241 | | | | — | | | | — | | | | — | | | | 1,609,241 | | | | — | |
Written Options | | | — | | | | (828,330 | ) | | | — | | | | — | | | | — | | | | (828,330 | ) |
| | | | | | | | | | | | | | | | | | | | | | | | |
Total | | | 56,794,591 | | | | (828,330 | ) | | | — | | | | — | | | | 56,794,591 | | | | (828,330 | ) |
Real Strategies Fund | | | | | | | | | | | | | | | | | | | | | | | | |
Common Stocks | | | 85,942,094 | | | | — | | | | — | | | | — | | | | 85,942,094 | | | | — | |
Corporate Bonds | | | — | | | | — | | | | 859,425 | | | | — | | | | 859,425 | | | | — | |
Mutual Funds | | | 7,313,670 | | | | — | | | | — | | | | — | | | | 7,313,670 | | | | — | |
Cash Equivalents | | | 101,452 | | | | — | | | | — | | | | — | | | | 101,452 | | | | — | |
Written Options | | | — | | | | (1,375,219 | ) | | | — | | | | — | | | | — | | | | (1,375,219 | ) |
| | | | | | | | | | | | | | | | | | | | | | | | |
Total | | | 93,357,216 | | | | (1,375,219 | ) | | | 859,425 | | | | — | | | | 94,216,641 | | | | (1,375,219 | ) |
Rotating Markets Fund | | | | | | | | | | | | | | | | | | | | | | | | |
Common Stocks | | | 36,762,293 | | | | — | | | | — | | | | — | | | | 36,762,293 | | | | — | |
Mutual Funds | | | 2,345,062 | | | | — | | | | — | | | | — | | | | 2,345,062 | | | | — | |
Cash Equivalents | | | 183,730 | | | | — | | | | — | | | | — | | | | 183,730 | | | | — | |
| | | | | | | | | | | | | | | | | | | | | | | | |
Total | | | 39,291,085 | | | | — | | | | — | | | | — | | | | 39,291,085 | | | | — | |
Situs Fund | | | | | | | | | | | | | | | | | | | | | | | | |
Common Stocks | | | 199,809,652 | | | | — | | | | — | | | | — | | | | 199,809,652 | | | | — | |
Mutual Funds | | | 4,809,331 | | | | — | | | | — | | | | — | | | | 4,809,331 | | | | — | |
Cash Equivalents | | | 28 | | | | — | | | | — | | | | — | | | | 28 | | | | — | |
| | | | | | | | | | | | | | | | | | | | | | | | |
Total | | | 204,619,011 | | | | — | | | | — | | | | — | | | | 204,619,011 | | | | — | |
Technical Opportunities Fund | | | | | | | | | | | | | | | | | | | | | | | | |
Common Stocks | | | 7,140,354 | | | | — | | | | — | | | | — | | | | 7,140,354 | | | | — | |
Mutual Funds | | | 3,065,193 | | | | — | | | | — | | | | — | | | | 3,065,193 | | | | — | |
Cash Equivalents | | | 675,043 | | | | — | | | | — | | | | — | | | | 675,043 | | | | — | |
| | | | | | | | | | | | | | | | | | | | | | | | |
Total | | | 10,880,590 | | | | — | | | | — | | | | — | | | | 10,880,590 | | | | — | |
Fixed Income Securities Fund | | | | | | | | | | | | | | | | | | | | | | | | |
Corporate Bonds | | | — | | | | — | | | | 158,338,022 | | | | — | | | | 158,338,022 | | | | — | |
U.S. Government Agencies | | | — | | | | — | | | | 79,270,592 | | | | — | | | | 79,270,592 | | | | — | |
U.S. Treasury Obligations | | | — | | | | — | | | | 44,611,402 | | | | — | | | | 44,611,402 | | | | — | |
U.S. Government Mortgage Backed Agencies | | | — | | | | — | | | | 5,641,624 | | | | — | | | | 5,641,624 | | | | — | |
Preferred Stocks | | | 841,260 | | | | — | | | | — | | | | — | | | | 841,260 | | | | — | |
Cash Equivalents | | | 1,571,742 | | | | — | | | | — | | | | — | | | | 1,571,742 | | | | — | |
| | | | | | | | | | | | | | | | | | | | | | | | |
Total | | | 2,413,002 | | | | — | | | | 287,861,640 | | | | — | | | | 290,274,642 | | | | — | |
Annual Shareholder Report
148
Notes to Financial Statements (Continued)
| | | | | | | | | | | | | | | | | | | | | | | | |
| | | LEVEL 1—Quoted Prices | | | LEVEL 2—Other Significant
Observable Inputs | | | Total | |
| Fund Name | | Securities | | | Other
Financial
Investments* | | | Securities | | | Other
Financial
Investments* | | | Securities | | | Other
Financial
Investments* | |
Intermediate Government Income Fund | | | | | | | | | | | | | | | | | | | | | | | | |
U.S. Government Agencies | | $ | — | | | $ | — | | | $ | 67,505,708 | | | $ | — | | | $ | 67,505,708 | | | $ | — | |
U.S. Government Mortgage Backed Agencies | | | — | | | | — | | | | 24,927,666 | | | | — | | | | 24,927,666 | | | | — | |
U.S. Treasury Obligations | | | — | | | | — | | | | 15,603,692 | | | | — | | | | 15,603,692 | | | | — | |
Collateralized Mortgage Obligations | | | — | | | | — | | | | 7,523,901 | | | | — | | | | 7,523,901 | | | | — | |
Corporate Bonds | | | — | | | | — | | | | 2,041,356 | | | | — | | | | 2,041,356 | | | | — | |
Cash Equivalents | | | 1,783,867 | | | | — | | | | — | | | | — | | | | 1,783,867 | | | | — | |
| | | | | | | | | | | | | | | | | | | | | | | | |
Total | | | 1,783,867 | | | | — | | | | 117,602,323 | | | | — | | | | 119,386,190 | | | | — | |
Mortgage Securities Fund | | | | | | | | | | | | | | | | | | | | | | | | |
U.S. Government Mortgage Backed Agencies | | | — | | | | — | | | | 67,059,118 | | | | — | | | | 67,059,118 | | | | — | |
Common Stocks | | | 11,296,160 | | | | — | | | | — | | | | — | | | | 11,296,160 | | | | — | |
Collateralized Mortgage Obligations | | | — | | | | — | | | | 10,446,146 | | | | — | | | | 10,446,146 | | | | — | |
U.S. Government Agencies | | | — | | | | — | | | | 9,000,104 | | | | — | | | | 9,000,104 | | | | — | |
Cash Equivalents | | | 2,668,401 | | | | — | | | | — | | | | — | | | | 2,668,401 | | | | — | |
| | | | | | | | | | | | | | | | | | | | | | | | |
Total | | | 13,964,561 | | | | — | | | | 86,505,368 | | | | — | | | | 100,469,929 | | | | — | |
Ohio Tax-Free Fund | | | | | | | | | | | | | | | | | | | | | | | | |
Municipal Bonds | | | — | | | | — | | | | 51,562,286 | | | | — | | | | 51,562,286 | | | | — | |
Cash Equivalents | | | 257,778 | | | | — | | | | — | | | | — | | | | 257,778 | | | | — | |
| | | | | | | | | | | | | | | | | | | | | | | | |
Total | | | 257,778 | | | | — | | | | 51,562,286 | | | | — | | | | 51,820,064 | | | | — | |
Short/Intermediate Fixed Income Securities Fund | | | | | | | | | | | | | | | | | | | | | | | | |
Corporate Bonds | | | — | | | | — | | | | 124,098,970 | | | | — | | | | 124,098,970 | | | | — | |
U.S. Government Agencies | | | — | | | | — | | | | 70,297,175 | | | | — | | | | 70,297,175 | | | | — | |
U.S. Treasury Obligations | | | — | | | | — | | | | 6,518,437 | | | | — | | | | 6,518,437 | | | | — | |
Cash Equivalents | | | 4,188,774 | | | | — | | | | — | | | | — | | | | 4,188,774 | | | | — | |
| | | | | | | | | | | | | | | | | | | | | | | | |
Total | | | 4,188,774 | | | | — | | | | 200,914,582 | | | | — | | | | 205,103,356 | | | | — | |
Balanced Allocation Fund | | | | | | | | | | | | | | | | | | | | | | | | |
Mutual Funds | | | 23,818,147 | | | | — | | | | — | | | | — | | | | 23,818,147 | | | | — | |
Cash Equivalents | | | 749,149 | | | | — | | | | — | | | | — | | | | 749,149 | | | | — | |
| | | | | | | | | | | | | | | | | | | | | | | | |
Total | | | 24,567,296 | | | | — | | | | — | | | | — | | | | 24,567,296 | | | | — | |
Conservative Allocation Fund | | | | | | | | | | | | | | | | | | | | | | | | |
Mutual Funds | | | 14,170,871 | | | | — | | | | — | | | | — | | | | 14,170,871 | | | | — | |
Cash Equivalents | | | 637,641 | | | | — | | | | — | | | | — | | | | 637,641 | | | | — | |
| | | | | | | | | | | | | | | | | | | | | | | | |
Total | | | 14,808,512 | | | | — | | | | — | | | | — | | | | 14,808,512 | | | | — | |
Growth Allocation Fund | | | | | | | | | | | | | | | | | | | | | | | | |
Mutual Funds | | | 18,505,437 | | | | — | | | | — | | | | — | | | | 18,505,437 | | | | — | |
Cash Equivalents | | | 576,965 | | | | — | | | | — | | | | — | | | | 576,965 | | | | — | |
| | | | | | | | | | | | | | | | | | | | | | | | |
Total | | | 19,082,402 | | | | — | | | | — | | | | — | | | | 19,082,402 | | | | — | |
| * | Other financial investments are derivative instruments not reflected on the Portfolio of Investments, such as written options contracts. |
| (1) | Consists of Allianz SE, 8.375%, listed under Financials. |
The Trust recognizes significant transfers between fair value hierarchy levels at the reporting period end. There were no significant transfers between all levels as of December 31, 2010.
The Funds may enter into repurchase agreements with banks and other recognized financial institutions, such as broker/dealers, which are deemed by Huntington Asset Advisors, Inc., a subsidiary of The Huntington National Bank, to be creditworthy pursuant to the guidelines and/or standards reviewed or established by the Trustees. It is the policy of the Funds to require the custodian bank to take possession of, to have legally segregated in the Federal Reserve Book Entry System, or to have segregated within the custodian bank’s vault, all securities held as collateral under repurchase agreement transactions. Additionally, procedures have been established by the Funds to monitor, on a daily basis, the
market value of each repurchase agreement’s collateral to ensure that the value of collateral at least equals the repurchase price to be paid under the repurchase agreement transaction. If the counterparty defaults and the fair value of the collateral declines, realization of the collateral by the Funds may be delayed or limited.
| C. | When-Issued and Delayed Transactions |
The Funds may engage in when-issued or delayed delivery transactions. The Funds record when-issued securities on the trade date and maintain security positions such that sufficient liquid assets will be available to make payment for the securities purchased. Securities purchased on a when-issued or delayed delivery basis are marked to market daily and begin earning interest on the settlement date. Losses may occur on these transactions due to changes in market conditions or the failure of counterparties to perform under the contract.
Annual Shareholder Report
149
| D. | Foreign Currency Translation |
The accounting records of the Funds are maintained in U.S. dollars. Foreign currency amounts are translated into U.S. dollars at the current rate of exchange each business day to determine the value of investments, and other assets and liabilities. Purchases and sales of foreign securities, and income and expenses, are translated at the prevailing rate of exchange on the respective date of these transactions. The Funds do not isolate that portion of the results of operations resulting from changes in foreign exchange rates on investments from fluctuation arising from changes in market prices of securities held. These fluctuations are included with the net realized and unrealized gain or loss from investments and foreign currency transactions.
Certain of the Funds may be subject to equity price risk and foreign currency exchange risk in the normal course of pursuing their investment objectives. Certain of the Funds may invest in various financial instruments including positions in foreign currency contracts and written option contracts to gain exposure to or hedge against changes in the value of equities or foreign currencies. The following is a description of the derivative instruments utilized by the Funds, including the primary underlying risk exposure related to each instrument type.
Foreign Exchange Contracts—Global Select Markets Fund, International Equity Fund, Real Strategies Fund, Situs Fund and Technical Opportunities Fund may enter into forward foreign
exchange contracts. A forward foreign exchange contract involves an obligation to purchase or sell a specific currency at a future date at a price set at the time of the contract. Such contracts are used to sell unwanted currency exposure that comes with holding securities in a market, or to buy currency exposure where the exposure from holding securities is insufficient to provide the desired currency exposure. The contracts are marked-to-market daily and the change in market value is recorded as unrealized appreciation or depreciation. When a forward foreign currency contract is closed, a Fund records a realized gain or loss equal to the difference between the value at the time it was opened and the value at the time it was closed. The Funds could be exposed to risks if the counterparties to the contracts are unable to meet the terms of their contracts and from unanticipated movements in exchange rates. At December 31, 2010, Global Select Markets Fund, International Equity Fund, Real Strategies Fund, Situs Fund and Technical Opportunities Fund did not have any forward foreign exchange contracts outstanding.
Written Options Contracts—Certain of the Funds may write options contracts for which premiums received are recorded as liabilities and are subsequently adjusted to the current value of the options written. Premiums received from writing options which expire are treated as realized gains. Premiums received from writing options which are either exercised or closed are offset against the proceeds received or the amount paid on the transaction to determine realized gains or losses. Investing in written options contracts exposes a Fund to equity price risk.
The following is a summary of Dividend Capture Fund's written option activity for the year ended December 31, 2010:
| | | | | | | | |
| Contracts | | Number of
Contracts | | | Premium | |
Outstanding at 12/31/2009 | | | 400 | | | $ | 94,118 | |
Options written | | | 1,520 | | | | 315,809 | |
Options expired | | | (250 | ) | | | (45,247 | ) |
Options closed | | | (1,320 | ) | | | (294,663 | ) |
Options exercised | | | (350 | ) | | | (70,017 | ) |
Outstanding at 12/31/2010 | | | — | | | $ | — | |
The following is a summary of Global Select Markets Fund written option activity for the year ended December 31, 2010:
| | | | | | | | |
| Contracts | | Number of
Contracts | | | Premium | |
Outstanding at 12/31/2009 | | | — | | | $ | — | |
Options written | | | 2,599 | | | | 295,795 | |
Options expired | | | (1,728 | ) | | | (168,563 | ) |
Options closed | | | (50 | ) | | | (7,100 | ) |
Options exercised | | | (821 | ) | | | (120,132 | ) |
Outstanding at 12/31/2010 | | | — | | | $ | — | |
Annual Shareholder Report
150
Notes to Financial Statements (Continued)
The following is a summary of Growth Fund's written option activity for the year ended December 31, 2010:
| | | | | | | | |
| Contracts | | Number of
Contracts | | | Premium | |
Outstanding at 12/31/2009 | | | 4,207 | | | $ | 529,707 | |
Options written | | | 6,167 | | | | 870,779 | |
Options expired | | | (1,654 | ) | | | (193,081 | ) |
Options closed | | | (5,140 | ) | | | (686,982 | ) |
Options exercised | | | (3,580 | ) | | | (520,423 | ) |
Outstanding at 12/31/2010 | | | — | | | $ | — | |
The following is a summary of Income Equity Fund's written option activity for the year ended December 31, 2010:
| | | | | | | | |
| Contracts | | Number of
Contracts | | | Premium | |
Outstanding at 12/31/2009 | | | 700 | | | $ | 86,191 | |
Options written | | | 5,690 | | | | 237,110 | |
Options expired | | | (5,225 | ) | | | (204,117 | ) |
Options closed | | | (465 | ) | | | (32,993 | ) |
Options exercised | | | (700 | ) | | | (86,191 | ) |
Outstanding at 12/31/2010 | | | — | | | $ | — | |
The following is a summary of Macro 100 Fund written option activity for the year ended December 31, 2010:
| | | | | | | | |
| Contracts | | Number of
Contracts | | | Premium | |
Outstanding at 12/31/2009 | | | 89 | | | $ | 8,174 | |
Options written | | | 70 | | | | 9,321 | |
Options expired | | | (89 | ) | | | (8,174 | ) |
Options closed | | | (35 | ) | | | (2,240 | ) |
Options exercised | | | (35 | ) | | | (7,081 | ) |
Outstanding at 12/31/2010 | | | — | | | $ | — | |
The following is a summary of Mid Corp America Fund’s written option activity for the year ended December 31, 2010:
| | | | | | | | |
| Contracts | | Number of
Contracts | | | Premium | |
Outstanding at 12/31/2009 | | | — | | | $ | — | |
Options written | | | 1,535 | | | | 214,777 | |
Options expired | | | (810 | ) | | | (104,428 | ) |
Options closed | | | (130 | ) | | | (27,710 | ) |
Options exercised | | | (595 | ) | | | (82,639 | ) |
Outstanding at 12/31/2010 | | | — | | | $ | — | |
Annual Shareholder Report
151
The following is a summary of New Economy Fund's written option activity for the year ended December 31, 2010:
| | | | | | | | |
| Contracts | | Number of
Contracts | | | Premium | |
Outstanding at 12/31/2009 | | | 354 | | | $ | 92,691 | |
Options written | | | 20,247 | | | | 9,950,824 | |
Options expired | | | (406 | ) | | | (90,728 | ) |
Options closed | | | (19,044 | ) | | | (9,261,273 | ) |
Options exercised | | | (302 | ) | | | (170,119 | ) |
Outstanding at 12/31/2010 | | | 849 | | | $ | 521,395 | |
At December 31, 2010, New Economy Fund had the following outstanding options:
WRITTEN OPTION CONTRACTS
| | | | | | | | | | | | | | | | | | | | | | | | |
| Contract | | Type | | | Expiration
Date | | | Exercise
Price | | | Number of
Contracts | | | Fair
Value | | | Unrealized
Appreciation
(Depreciation) | |
Agrium, Inc. | | | Call | | | | January 2011 | | | $ | 75 | | | | 119 | | | $ | 199,920 | | | $ | (109,830 | ) |
CF Industries Holdings | | | Call | | | | January 2011 | | | | 110 | | | | 124 | | | | 318,060 | | | | (182,034 | ) |
Cree, Inc. | | | Call | | | | January 2011 | | | | 65 | | | | 160 | | | | 60,000 | | | | 29,131 | |
Life Technologies | | | Call | | | | January 2011 | | | | 45 | | | | 98 | | | | 103,390 | | | | (45,865 | ) |
Molycorp | | | Put | | | | January 2011 | | | | 44 | | | | 110 | | | | 17,050 | | | | 4,900 | |
Netapp, Inc. | | | Call | | | | January 2011 | | | | 50 | | | | 66 | | | | 35,310 | | | | 2,441 | |
Riverbed Technology, Inc. | | | Call | | | | January 2011 | | | | 30 | | | | 172 | | | | 94,600 | | | | (5,678 | ) |
NET UNREALIZED DEPRECIATION ON WRITTEN OPTION CONTRACTS | | | | | | | | | | | | | | | | | | | | | | $ | (306,935 | ) |
The following is a summary of Real Strategies Fund’s written option activity for the year ended December 31, 2010:
| | | | | | | | |
| Contracts | | Number of
Contracts | | | Premium | |
Outstanding at 12/31/2009 | | | 3,327 | | | $ | 449,858 | |
Options written | | | 32,147 | | | | 6,776,252 | |
Options expired | | | (7,985 | ) | | | (985,613 | ) |
Options closed | | | (20,772 | ) | | | (4,672,263 | ) |
Options exercised | | | (2,717 | ) | | | (730,364 | ) |
Outstanding at 12/31/2010 | | | 4,000 | | | $ | 837,870 | |
At December 31, 2010, Real Strategies Fund had the following outstanding options:
WRITTEN OPTION CONTRACTS
| | | | | | | | | | | | | | | | | | | | | | | | |
| Contract | | Type | | | Expiration
Date | | | Exercise
Price | | | Number of
Contracts | | | Fair
Value | | | Unrealized
Appreciation
(Depreciation) | |
United States Natural Gas Fund | | | Put | | | | January 2011 | | | $ | 10 | | | | 678 | | | $ | 271,200 | | | $ | (152,303 | ) |
Arch Coal | | | Call | | | | January 2011 | | | | 29 | | | | 443 | | | | 272,445 | | | | (216,767 | ) |
Agrium, Inc. | | | Call | | | | January 2011 | | | | 70 | | | | 127 | | | | 280,035 | | | | (172,595 | ) |
Allegheny Technologies | | | Call | | | | January 2011 | | | | 52.50 | | | | 200 | | | | 72,000 | | | | (1,491 | ) |
Peabody Energy Corp. | | | Call | | | | January 2011 | | | | 60 | | | | 227 | | | | 102,150 | | | | (39,843 | ) |
Boston Properties, Inc. | | | Call | | | | January 2011 | | | | 90 | | | | 179 | | | | 7,607 | | | | 69,887 | |
Devon Energy Corp. | | | Put | | | | January 2011 | | | | 65 | | | | 125 | | | | 438 | | | | 73,849 | |
Molycorp | | | Put | | | | January 2011 | | | | 44 | | | | 450 | | | | 69,750 | | | | 20,046 | |
Marathon Oil Corp. | | | Call | | | | January 2011 | | | | 35 | | | | 366 | | | | 80,154 | | | | (41,725 | ) |
Annual Shareholder Report
152
Notes to Financial Statements (Continued)
| | | | | | | | | | | | | | | | | | | | | | | | |
| Contract | | Type | | | Expiration
Date | | | Exercise
Price | | | Number of
Contracts | | | Fair
Value | | | Unrealized
Appreciation
(Depreciation) | |
Petroleo Brasileiro SA | | | Put | | | | January 2011 | | | $ | 37 | | | | 195 | | | $ | 13,065 | | | $ | 65,689 | |
Tesoro Corp. | | | Call | | | | January 2011 | | | | 17.50 | | | | 600 | | | | 76,200 | | | | (48,000 | ) |
Valero Energy | | | Call | | | | January 2011 | | | | 20 | | | | 410 | | | | 130,175 | | | | (94,096 | ) |
NET UNREALIZED DEPRECIATION ON WRITTEN OPTION CONTRACTS | | | | | | | | | | | | | | | | | | | | | | $ | (537,349 | ) |
The following is a summary of Situs Fund’s written option activity for the year ended December 31, 2010:
| | | | | | | | |
| Contracts | | Number of
Contracts | | | Premium | |
Outstanding at 12/31/2009 | | | 16,927 | | | $ | 2,771,876 | |
Options written | | | 2,000 | | | | 322,394 | |
Options expired | | | (6,498 | ) | | | (1,051,744 | ) |
Options closed | | | (2,772 | ) | | | (435,569 | ) |
Options exercised | | | (9,657 | ) | | | (1,606,957 | ) |
Outstanding at 12/31/2010 | | | — | | | $ | — | |
The following tables provide a summary of the fair value of derivative instruments, not accounted for as hedging instruments as of December 31, 2010, and the effect of derivative instruments on the Statements of Operations for the year ended December 31, 2010.
The Fair Value of Derivative Instruments as of December 31, 2010:
| | | | | | | | | | | | | | | | |
| | | Asset Derivatives | | | Liability Derivatives | | | | | | | |
| Primary Risk Exposure | | Statements of Assets and
Liabilities Location | | | Statements of Assets and
Liabilities Location | | | Fund | | | Fair Value | |
Option Contracts | | | | | | | Options Written, at value | | | | New Economy Fund | | | $ | 828,330 | |
| | | | | | | | | | | Real Strategies Fund | | | | 1,375,219 | |
| | | | Investments, at value | | | | | | | | New Economy Fund | | | | 510,000 | |
The effect of Derivative Instruments on the Statements of Operations for the year ended December 31, 2010:
| | | | | | | | | | | | | | | | |
Derivatives not accounted
for as hedging instruments
under Statement 133 | | Location of Gain
(Loss) on
Derivatives
Recognized
in Income | | Fund | | Realized Gain
(Loss) on
Derivatives
Recognized
in Income | | | Change in
Unrealized
Appreciation/
Depreciation
on Derivatives
Recognized
in Income | | | Gross Notional
Amount
Outstanding
as of
December 31,
2010 | |
Option Contracts | | Net Realized gain (loss) on option transactions/net change in unrealized appreciation/depreciation of investments and options | | Dividend Capture Fund | | $ | 120,070 | | | $ | (27,118 | ) | | $ | — | |
| | | Global Select Markets Fund | | | 159,427 | | | | — | | | | — | |
| | | Growth Fund | | | (48,558 | ) | | | 738,703 | | | | — | |
| | | Income Equity Fund | | | 82,415 | | | | (14,816 | ) | | | — | |
| | | Macro 100 Fund | | | 3,122 | | | | (5,539 | ) | | | — | |
| | | Mid Corp America Fund | | | 97,229 | | | | — | | | | — | |
| | | New Economy Fund | | | (3,189,034 | ) | | | (632,829 | ) | | | 20,567,500 | |
| | | Real Strategies Fund | | | (289,055 | ) | | | (608,300 | ) | | | 13,539,700 | |
| | | Situs Fund | | | 1,344,298 | | | | 244,339 | | | | — | |
| | | | | Technical Opportunities Fund | | | (44,029 | ) | | | — | | | | — | |
The gross notional amount of options outstanding (both purchased and written) is indicative of the volume of each Fund’s derivative activity for the year ended December 31, 2010.
Derivative positions open during the period and at period end are reflected for each Fund in the tables above. The volume of these positions relative to each Fund’s net assets at the close of the reporting period is generally higher than the volume of such positions at the beginning of the reporting period. The
Funds value derivative instruments at fair value and recognize changes in fair value currently in the results on operations.
F. Securities Lending
To generate additional income, the Funds may lend a certain percentage of their total assets, to the extent permitted by the 1940 Act or the rules or regulations thereunder, on a short-term basis to certain brokers, dealers or other financial
Annual Shareholder Report
153
institutions. In determining whether to lend to a particular broker, dealer or financial institution, the Advisor will consider all relevant facts and circumstances, including the size, creditworthiness and reputation of the borrower. Any loans made will be continuously secured by collateral in cash at least equal to 100% of the value of the securities on loan for the Funds, based on the prior day’s closing price. The Funds receive payments from borrowers equivalent to the dividends and interest that would have been earned on securities on loan. In addition, the Funds retain all or a portion of the interest received on investment of collateral or receive a fee from the borrower. Collateral is marked-to-market daily. One of the risks in lending portfolio securities, as with other extensions of credit, is the possible delay in recovery of the securities or possible loss of rights in the collateral should the borrower fail financially. Although the loan is fully
collateralized, if a borrower defaults, a Fund could lose money. There is also the risk that, when lending portfolio securities, the securities may not be available to a Fund on a timely basis and a Fund may, therefore, lose the opportunity to sell the securities at a desirable price. In addition, in the event that a borrower of securities would file for bankruptcy or become insolvent, disposition of the securities may be delayed pending court action. Loans are subject to termination by the Funds or the borrower at any time and, therefore, are not considered to be illiquid investments. Brown Brothers Harriman (“BBH”) serves as the sub-custodian for the securities lending. BBH retains a portion of the earnings from the investment and reinvestment of cash collateral and a portion of any loan fees paid by borrowers with respect to securities loans. As of December 31, 2010, the Funds did not have securities on loan.
G. Restricted Securities
Restricted securities are securities that may only be resold upon registration under federal securities laws or in transactions exempt from such registration. In some cases, the issuer of restricted securities has agreed to register such securities for resale, at the issuer’s expense, either upon demand by the Funds or in connection with another registered offering of the securities. Many restricted securities may be resold in the secondary market in transactions exempt from registration. Such restricted securities may be determined to be liquid. The Funds will not incur any registration costs upon such resale. The Funds’ restricted securities are valued at the price provided by dealers in the secondary market or, if no market prices are available, at the fair value price as determined by the Trust’s Pricing Committee. At December 31, 2010, the Money Market Fund, Fixed Income Securities Fund and Short/Intermediate Fixed Income Securities Fund held illiquid restricted securities representing 5.05%, 2.65% and 2.02%, respectively, of net assets as listed below:
| | | | | | | | | | | | | | | | |
| Issuer Description | | Acquisition Date | | | Principal Amount | | | Cost | | | Value | |
Money Market Fund: | | | | | | | | | | | | | | | | |
ANZ National Int'l Ltd/London, 0.388%, 07/25/11 | | | 7/26/10 | | | $ | 15,000,000 | | | $ | 15,000,000 | | | $ | 15,000,000 | |
Shell International, 0.490%, 03/02/11 | | | 7/29/10 | | | | 5,000,000 | | | | 4,985,000 | | | | 4,995,833 | |
Fixed Income Securities Fund: | | | | | | | | | | | | | | | | |
Barrick International Bank Corp., 5.750%, 10/15/16 | | | 12/17/09 | | | | 2,000,000 | | | | 1,919,640 | | | | 2,198,122 | |
FIA Card Services NA, Series BKNT, 7.125%, 11/15/12 | | | 6/20/06 | | | | 3,000,000 | | | | 3,205,500 | | | | 3,244,002 | |
Verizon Wireless, 7.375%, 11/15/13 | | | (a) | | | | 2,000,000 | | | | 2,084,550 | | | | 2,317,118 | |
Short/Intermediate Fixed Income Securities Fund: | | | | | | | | | | | | | | | | |
HSBC Financial Corp., 3.500%, 06/28/15 | | | 9/24/10 | | | | 2,000,000 | | | | 2,105,880 | | | | 2,050,210 | |
MetLife Global Funding I, 5.125%, 11/9/11 | | | 3/5/08 | | | | 2,000,000 | | | | 2,060,600 | | | | 2,071,436 | |
| (a) | Purchased on various dates beginning 11/20/08. |
| H. | Security Transactions and Related Income |
During the period, investment transactions are accounted for no later than the first calculation of the NAV on the business day following the trade date. For financial reporting purposes, however, security transactions are accounted for on the trade date on the last business day of the reporting period. Discounts and premiums on securities purchased are amortized over the lives of the respective securities. Securities gains and losses are calculated on the identified cost basis. Interest income and expenses are accrued daily. Dividends, less foreign tax withholding (if any), are recorded on the ex-dividend date.
| I. | Dividends and Distributions to Shareholders |
Dividends from net investment income are declared daily and paid monthly for the Funds except as follows: Dividend Capture Fund, Income Equity Fund, Mortgage Securities Fund and Conservative Allocation Fund declare and pay dividends, if any, monthly; International Equity Fund, Macro 100 Fund, Mid
Corp America Fund, New Economy Fund, Rotating Markets Fund, Situs Fund, Technical Opportunities Fund and Growth Allocation Fund declare and pay dividends, if any, annually; and Growth Fund, Real Strategies Fund and Balanced Allocation Fund declare and pay dividends, if any, quarterly. Dividends are declared separately for each class. No class has preferential rights; differences in per share dividend rates are generally due to differences in separate class expenses. Net realized capital gains, if any, are distributed at least annually. The amount of dividends from net investment income and net realized gains are determined in accordance with the federal income tax regulations, which may differ from GAAP. These “book/tax” differences are either considered temporary or permanent in nature. To the extent these differences are permanent in nature (e.g. foreign currency gain/loss, paydowns, distributions and income received from pass through investments, and net investment loss adjustments), such amounts are reclassified within the capital accounts based on their nature for federal income tax purposes;
Annual Shareholder Report
154
Notes to Financial Statements (Continued)
temporary differences do not require reclassification. Temporary differences are primarily due to market discounts, capital loss carryforwards and losses deferred due to wash sales, straddles, and return of capital from investments.
Certain of the Funds may own shares of real estate investments trusts (“REITs”) which report information on the source of their distributions annually. Distributions received from investments in REITs in excess of income from underlying investments are recorded as realized gain and/or as a reduction to the cost of the individual REIT.
| J. | Allocation of Expenses, Income, and Gains and Losses |
Expenses directly attributable to a Fund are charged to that Fund. Expenses specific to a class are charged to that class.
Except for the daily dividend Funds, expenses not directly attributable to a Fund are allocated proportionally among various Funds or all Funds within the Trust in relation to the net assets of each Fund or on another reasonable basis. For the daily dividend Funds, expenses not directly attributable to
a Fund are allocated pursuant to the “settled shares method.” Income and realized and unrealized gains or losses on investments are allocated to each class of shares based on its relative net assets.
It is the policy of each Fund to qualify or continue to qualify as a regulated investment company by complying with the provisions available to certain investment companies, as defined in applicable sections of the Internal Revenue Code, and to make distributions of net investment income and net realized capital gains sufficient to relieve it from all, or substantially all, federal income taxes.
Withholding taxes on foreign interest, dividends and capital gains with respect to International Equity Fund, Real Strategies Fund, Situs Fund and Technical Opportunities Fund have been provided for in accordance with each applicable country’s tax rules and rates.
As of December 31, 2010, the tax cost of securities and the breakdown of unrealized appreciation (depreciation) for each Fund was as follows:
| | | | | | | | | | | | | | | | |
| Fund | | Tax Cost of
Securities | | | Unrealized
Appreciation | | | Unrealized
Depreciation | | | Net Unrealized
Appreciation/
(Depreciation)* | |
Tax-Free Money Market Fund | | $ | 82,333,215 | | | $ | — | | | $ | — | | | $ | — | |
Money Market Fund | | | 395,432,340 | | | | — | | | | — | | | | — | |
Ohio Municipal Money Market Fund | | | 197,923,461 | | | | — | | | | — | | | | — | |
U.S. Treasury Money Market Fund | | | 387,721,803 | | | | — | | | | (350 | ) | | | (350 | ) |
Dividend Capture Fund | | | 110,340,426 | | | | 9,911,539 | | | | (1,044,802 | ) | | | 8,866,737 | |
Global Select Markets Fund | | | 37,269,969 | | | | 4,995,732 | | | | (268,245 | ) | | | 4,727,487 | |
Growth Fund | | | 117,170,410 | | | | 18,475,596 | | | | (1,961,148 | ) | | | 16,514,448 | |
Income Equity Fund | | | 99,210,417 | | | | 9,989,736 | | | | (2,154,696 | ) | | | 7,835,040 | |
International Equity Fund | | | 244,928,041 | | | | 66,258,604 | | | | (7,789,798 | ) | | | 58,468,806 | |
Macro 100 Fund | | | 37,212,611 | | | | 9,229,202 | | | | (1,090,895 | ) | | | 8,138,307 | |
Mid Corp America Fund | | | 83,429,808 | | | | 65,715,060 | | | | (312,438 | ) | | | 65,402,622 | |
New Economy Fund | | | 48,994,651 | | | | 8,021,846 | | | | (1,050,237 | ) | | | 6,971,609 | |
Real Strategies Fund | | | 84,342,131 | | | | 15,071,736 | | | | (6,578,045 | ) | | | 8,493,691 | |
Rotating Markets Fund | | | 34,156,896 | | | | 5,135,399 | | | | (1,211 | ) | | | 5,134,188 | |
Situs Fund | | | 142,322,566 | | | | 66,602,127 | | | | (4,305,682 | ) | | | 62,296,445 | |
Technical Opportunities Fund | | | 10,300,488 | | | | 618,381 | | | | (37,879 | ) | | | 580,102 | |
Fixed Income Securities Fund | | | 276,424,941 | | | | 14,830,771 | | | | (981,071 | ) | | | 13,849,700 | |
Intermediate Government Income Fund | | | 113,800,793 | | | | 5,979,232 | | | | (393,835 | ) | | | 5,585,397 | |
Mortgage Securities Fund | | | 95,085,207 | | | | 5,862,094 | | | | (477,373 | ) | | | 5,384,721 | |
Ohio Tax-Free Fund | | | 51,558,601 | | | | 753,953 | | | | (492,490 | ) | | | 261,463 | |
Short/Intermediate Fixed Income Securities Fund | | | 201,393,843 | | | | 4,591,905 | | | | (882,392 | ) | | | 3,709,513 | |
Balanced Allocation Fund | | | 22,321,171 | | | | 2,566,443 | | | | (320,317 | ) | | | 2,246,126 | |
Conservative Allocation Fund | | | 14,090,738 | | | | 732,968 | | | | (15,193 | ) | | | 717,775 | |
Growth Allocation Fund | | | 16,716,381 | | | | 2,413,571 | | | | (47,550 | ) | | | 2,366,021 | |
| * | The differences between the book-basis unrealized appreciation/(depreciation) are attributable primarily to: tax deferral of losses on wash sales, the differences between book and tax amortization methods for premium and market discount, differences related to partnership investments, the realization for tax purposes of unrealized gains/losses on investments in passive foreign investment companies and the return of capital adjustments from real estate investment trusts. |
Annual Shareholder Report
155
As of December 31, 2010, for federal income tax purposes, the following Funds had capital loss carryforwards available to offset future gains, if any, to the extent provided by the Treasury regulations:
| | | | | | | | | | | | | | | | | | | | | | | | | | | | | | | | |
| | | Expiration Year | |
| | | 2011 | | | 2012 | | | 2013 | | | 2014 | | | 2015 | | | 2016 | | | 2017 | | | 2018 | |
Tax-Free Money Market Fund | | $ | 231 | | | $ | 1,529 | | | $ | 5,818 | | | $ | 4,861 | | | $ | 1,434 | | | $ | 60,543 | | | $ | 55,252 | | | $ | — | |
Money Market Fund | | | 438,540 | | | | 3,032 | | | | 7,224 | | | | 921 | | | | 106 | | | | — | | | | — | | | | — | |
Ohio Municipal Money Market Fund | | | — | | | | 463 | | | | 25,291 | | | | 7,739 | | | | 12,350 | | | | — | | | | 193,762 | | | | 14,321 | |
Dividend Capture Fund | | | — | | | | — | | | | — | | | | — | | | | — | | | | 7,483,221 | | | | 23,601,723 | | | | — | |
Global Select Markets Fund | | | — | | | | — | | | | — | | | | — | | | | — | | | | — | | | | — | | | | 86,796 | |
Income Equity Fund | | | — | | | | — | | | | — | | | | — | | | | — | | | | — | | | | 18,290,031 | | | | — | |
International Equity Fund | | | — | | | | — | | | | — | | | | — | | | | — | | | | — | | | | 19,366,897 | | | | 3,782,569 | |
Macro 100 Fund | | | — | | | | — | | | | — | | | | — | | | | — | | | | 6,793,287 | | | | 826,640 | | | | 855,981 | |
New Economy Fund | | | — | | | | — | | | | — | | | | — | | | | — | | | | 1,910,726 | | | | 21,858,508 | | | | — | |
Real Strategies Fund | | | — | | | | — | | | | — | | | | — | | | | — | | | | 1,193,027 | | | | 15,813,875 | | | | 1,826,337 | |
Rotating Markets Fund | | | — | | | | — | | | | — | | | | — | | | | — | | | | — | | | | 4,284,016 | | | | — | |
Situs Fund | | | — | | | | — | | | | — | | | | — | | | | — | | | | — | | | | 8,623,731 | | | | — | |
Technical Opportunities Fund | | | — | | | | — | | | | — | | | | — | | | | — | | | | 86,652 | | | | 1,310,241 | | | | — | |
Mortgage Securities Fund | | | — | | | | — | | | | — | | | | — | | | | — | | | | 6,916 | | | | 753,414 | | | | 140,239 | |
Short/Intermediate Fixed Income Securities Fund | | | — | | | | — | | | | — | | | | 613,260 | | | | 299,850 | | | | 850,465 | | | | 277,960 | | | | — | |
During the year ended December 31, 2010, the Money Market Fund, Dividend Capture Fund, Growth Fund, Income Equity Fund, Mid Corp America Fund, New Economy Fund, Rotating Markets Fund, Situs Fund, Fixed Income Securities Fund, Ohio Tax-Free Fund, Technical Opportunities Fund and Short/Intermediate Fixed Income Securities Fund, utilized $2,215, $3,327,592, $26,278,447, $8,622,018, $545,578, $269,571, $3,306,337, $5,612,843, $1,035,827, $89,568, $1,468,100 and $1,408,501, respectively, in capital loss carryforwards.
The tax character of distributions paid during the fiscal year ended December 31, 2010, was as follows:
| | | | | | | | | | | | | | | | | | | | | | | | |
| | | Distributions Paid From* | | | | | | | | | | | | | |
| Fund | | Ordinary
Income | | | Net Long
Term
Capital
Gains | | | Total
Taxable
Distributions | | | Tax Exempt
Distributions | | | Tax
Return
of
Capital | | | Total
Distributions
Paid | |
Tax-Free Money Market Fund | | $ | — | | | $ | — | | | $ | — | | | $ | 9,406 | | | $ | — | | | $ | 9,406 | |
Money Market Fund | | | 46,504 | | | | — | | | | 46,504 | | | | — | | | | — | | | | 46,504 | |
Ohio Municipal Money Market Fund | | | — | | | | — | | | | — | | | | 23,103 | | | | — | | | | 23,103 | |
U.S. Treasury Money Market Fund | | | 37,149 | | | | — | | | | 37,149 | | | | — | | | | — | | | | 37,149 | |
Dividend Capture Fund | | | 2,924,965 | | | | — | | | | 2,924,965 | | | | — | | | | — | | | | 2,924,965 | |
Global Select Markets Fund | | | 399,831 | | | | — | | | | 399,831 | | | | — | | | | 51,500 | | | | 451,331 | |
Growth Fund | | | 397 | | | | — | | | | 397 | | | | — | | | | — | | | | 397 | |
Income Equity Fund | | | 2,653,177 | | | | — | | | | 2,653,177 | | | | — | | | | — | | | | 2,653,177 | |
International Equity Fund | | | 2,464,176 | | | | — | | | | 2,464,176 | | | | — | | | | — | | | | 2,464,176 | |
Macro 100 Fund | | | 39,179 | | | | — | | | | 39,179 | | | | — | | | | — | | | | 39,179 | |
Mid Corp America Fund | | | 62,512 | | | | 4,705,238 | | | | 4,767,750 | | | | — | | | | — | | | | 4,767,750 | |
Real Strategies Fund | | | 464,942 | | | | — | | | | 464,942 | | | | — | | | | — | | | | 464,942 | |
Rotating Markets Fund | | | 2,699 | | | | — | | | | 2,699 | | | | — | | | | — | | | | 2,699 | |
Technical Opportunities Fund | | | 2,356 | | | | — | | | | 2,356 | | | | — | | | | — | | | | 2,356 | |
Fixed Income Securities Fund | | | 8,093,924 | | | | 253,105 | | | | 8,347,029 | | | | — | | | | — | | | | 8,347,029 | |
Intermediate Government Income Fund | | | 3,282,208 | | | | 268,472 | | | | 3,550,680 | | | | — | | | | — | | | | 3,550,680 | |
Mortgage Securities Fund | | | 3,202,168 | | | | — | | | | 3,202,168 | | | | — | | | | — | | | | 3,202,168 | |
Ohio Tax-Free Fund | | | 1,862 | | | | 170,347 | | | | 172,209 | | | | 1,159,655 | | | | — | | | | 1,331,864 | |
Short/Intermediate Fixed Income Securities Fund | | | 3,414,557 | | | | — | | | | 3,414,557 | | | | — | | | | — | | | | 3,414,557 | |
Balanced Allocation Fund | | | 265,841 | | | | 3,592 | | | | 269,433 | | | | — | | | | — | | | | 269,433 | |
Conservative Allocation Fund | | | 259,033 | | | | 10,807 | | | | 269,840 | | | | — | | | | — | | | | 269,840 | |
Growth Allocation Fund | | | 213,302 | | | | 3,762 | | | | 217,064 | | | | — | | | | — | | | | 217,064 | |
| * | The tax character of distributions paid may differ from the character of distributions shown on the statements of changes in net assets due to short-term capital gains being treated as ordinary income for tax purposes. |
Annual Shareholder Report
156
Notes to Financial Statements (Continued)
The tax character of distributions paid during the fiscal year ended December 31, 2009, was as follows:
| | | | | | | | | | | | | | | | | | | | | | | | |
| | | Distributions Paid From* | | | | | | | | | | | | | |
| Fund | | Ordinary
Income | | | Net
Long Term
Capital Gains | | | Total
Taxable
Distributions | | | Tax Exempt
Distributions | | | Tax Return
of Capital | | | Total
Distributions
Paid | |
Tax-Free Money Market Fund | | $ | — | | | $ | — | | | $ | — | | | $ | 106,763 | | | $ | — | | | $ | 106,763 | |
Money Market Fund | | | 119,933 | | | | — | | | | 119,933 | | | | — | | | | — | | | | 119,933 | |
Ohio Municipal Money Market Fund | | | — | | | | — | | | | — | | | | 260,936 | | | | — | | | | 260,936 | |
U.S. Treasury Money Market Fund | | | 75,445 | | | | — | | | | 75,445 | | | | — | | | | — | | | | 75,445 | |
Dividend Capture Fund | | | 3,273,481 | | | | — | | | | 3,273,481 | | | | — | | | | 181,686 | | | | 3,455,167 | |
Growth Fund | | | 33,067 | | | | — | | | | 33,067 | | | | — | | | | — | | | | 33,067 | |
Income Equity Fund | | | 2,900,265 | | | | — | | | | 2,900,265 | | | | — | | | | 78,559 | | | | 2,978,824 | |
International Equity Fund | | | 2,999,359 | | | | 599,753 | | | | 3,599,112 | | | | — | | | | — | | | | 3,599,112 | |
Macro 100 Fund | | | 59,957 | | | | — | | | | 59,957 | | | | — | | | | 255 | | | | 60,212 | |
Mid Corp America Fund | | | 326,636 | | | | — | | | | 326,636 | | | | — | | | | 42,088 | | | | 368,724 | |
Real Strategies Fund | | | 702,404 | | | | — | | | | 702,404 | | | | — | | | | 35,377 | | | | 737,781 | |
Rotating Markets Fund | | | 425,209 | | | | — | | | | 425,209 | | | | — | | | | — | | | | 425,209 | |
Situs Fund | | | 234,007 | | | | 252,704 | | | | 486,711 | | | | — | | | | 159,010 | | | | 645,721 | |
Technical Opportunities Fund | | | 58,282 | | | | — | | | | 58,282 | | | | — | | | | — | | | | 58,282 | |
Fixed Income Securities Fund | | | 7,908,394 | | | | 592,803 | | | | 8,501,197 | | | | — | | | | — | | | | 8,501,197 | |
Intermediate Government Income Fund | | | 3,739,795 | | | | 347 | | | | 3,740,142 | | | | — | | | | — | | | | 3,740,142 | |
Mortgage Securities Fund | | | 3,437,734 | | | | — | | | | 3,437,734 | | | | — | | | | 66,854 | | | | 3,504,588 | |
Ohio Tax-Free Fund | | | 8 | | | | — | | | | 8 | | | | 1,165,927 | | | | — | | | | 1,165,935 | |
Short/Intermediate Fixed Income Securities Fund | | | 3,171,340 | | | | — | | | | 3,171,340 | | | | — | | | | — | | | | 3,171,340 | |
Balanced Allocation Fund | | | 74,568 | | | | — | | | | 74,568 | | | | — | | | | — | | | | 74,568 | |
Conservative Allocation Fund | | | 96,902 | | | | — | | | | 96,902 | | | | — | | | | — | | | | 96,902 | |
Growth Allocation Fund | | | 60,680 | | | | — | | | | 60,680 | | | | — | | | | — | | | | 60,680 | |
| * | The tax character of distributions paid may differ from the character of distributions shown on the statements of changes in net assets due to short-term capital gains being treated as ordinary income for tax purposes. |
As of December 31, 2010, the components of accumulated earnings (deficit) were as follows:
| | | | | | | | | | | | | | | | | | | | | | | | | | | | | | | | |
| Fund | | Undistributed
Tax Exempt
Income | | | Undistributed
Ordinary
Income | | | Undistributed
Long-Term
Capital Gains | | | Accumulated
Earnings | | | Distributions
Payable | | | Accumulated
Capital and
Other
Losses | | | Unrealized
Appreciation
(Depreciation)* | | | Total
Accumulated
Earnings
(Deficit) | |
Tax-Free Money Market Fund | | $ | — | | | $ | — | | | $ | — | | | $ | — | | | $ | — | | | $ | (131,067 | ) | | $ | — | | | $ | (131,067 | ) |
Money Market Fund | | | — | | | | — | | | | — | | | | — | | | | — | | | | (456,629 | ) | | | — | | | | (456,629 | ) |
Ohio Municipal Money Market Fund | | | — | | | | — | | | | — | | | | — | | | | — | | | | (253,836 | ) | | | — | | | | (253,836 | ) |
U.S. Treasury Money Market Fund | | | — | | | | 4,160 | | | | — | | | | 4,160 | | | | — | | | | — | | | | (350 | ) | | | 3,810 | |
Dividend Capture Fund | | | — | | | | 20,581 | | | | — | | | | 20,581 | | | | — | | | | (31,084,944 | ) | | | 8,866,737 | | | | (22,197,626 | ) |
Global Select Markets Fund | | | — | | | | — | | | | — | | | | — | | | | — | | | | (137,941 | ) | | | 4,728,263 | | | | 4,590,322 | |
Growth Fund | | | — | | | | — | | | | 487,671 | | | | 487,671 | | | | — | | | | (435 | ) | | | 16,514,448 | | | | 17,001,684 | |
Income Equity Fund | | | — | | | | 30,105 | | | | — | | | | 30,105 | | | | — | | | | (18,366,030 | ) | | | 7,835,040 | | | | (10,500,885 | ) |
International Equity Fund | | | — | | | | 2,718,214 | | | | — | | | | 2,718,214 | | | | | | | | (23,179,957 | ) | | | 58,514,888 | | | | 38,053,145 | |
Macro 100 Fund | | | — | | | | 2,055 | | | | — | | | | 2,055 | | | | — | | | | (8,480,238 | ) | | | 8,138,307 | | | | (339,876 | ) |
Mid Corp America Fund | | | — | | | | 117,757 | | | | 478,457 | | | | 596,214 | | | | — | | | | — | | | | 65,402,622 | | | | 65,998,836 | |
New Economy Fund | | | — | | | | — | | | | — | | | | — | | | | — | | | | (24,121,337 | ) | | | 6,971,609 | | | | (17,149,728 | ) |
Real Strategies Fund | | | — | | | | 65,886 | | | | — | | | | 65,886 | | | | — | | | | (19,159,389 | ) | | | 8,493,691 | | | | (10,599,812 | ) |
Rotating Markets Fund | | | — | | | | 101,064 | | | | — | | | | 101,064 | | | | — | | | | (4,284,016 | ) | | | 5,134,188 | | | | 951,236 | |
Situs Fund | | | — | | | | — | | | | — | | | | — | | | | — | | | | (8,639,637 | ) | | | 62,296,824 | | | | 53,657,187 | |
Technical Opportunities Fund | | | — | | | | — | | | | — | | | | — | | | | — | | | | (1,396,894 | ) | | | 580,102 | | | | (816,792 | ) |
Fixed Income Securities Fund | | | — | | | | 19,735 | | | | 314,445 | | | | 334,180 | | | | — | | | | — | | | | 13,849,700 | | | | 14,183,880 | |
Intermediate Government Income Fund | | | — | | | | 92,673 | | | | 8,440 | | | | 101,113 | | | | — | | | | (19,990 | ) | | | 5,585,396 | | | | 5,666,519 | |
Mortgage Securities Fund | | | — | | | | 220,843 | | | | — | | | | 220,843 | | | | — | | | | (977,124 | ) | | | 5,384,721 | | | | 4,628,440 | |
Ohio Tax-Free Fund | | | — | | | | — | | | | 82,966 | | | | 82,966 | | | | (187 | ) | | | — | | | | 261,463 | | | | 344,242 | |
Short/Intermediate Fixed Income Securities Fund | | | — | | | | — | | | | — | | | | — | | | | — | | | | (2,041,535 | ) | | | 3,709,513 | | | | 1,667,978 | |
Balanced Allocation Fund | | | — | | | | 31,381 | | | | 39,254 | | | | 70,635 | | | | — | | | | — | | | | 2,246,126 | | | | 2,316,761 | |
Conservative Allocation Fund | | | — | | | | 17,433 | | | | 15,907 | | | | 33,340 | | | | — | | | | — | | | | 717,775 | | | | 751,115 | |
Growth Allocation Fund | | | — | | | | 20,117 | | | | 39,228 | | | | 59,345 | | | | — | | | | — | | | | 2,366,021 | | | | 2,425,366 | |
| * | The differences between the book-basis unrealized appreciation (depreciation) are attributable primarily to: tax deferral of losses on wash sales, the differences between book and tax amortization methods for premium and market discount, and the return of capital adjustments from real estate investment trusts. |
Annual Shareholder Report
157
Net capital losses incurred after October 31 and within the taxable year are deemed to arise on the first business day of the Funds’ next taxable year. For the year ended December 31, 2010, the Funds deferred post-October capital losses and post-October currency losses as follows:
| | | | | | | | |
| Fund | | Capital
Losses | | | Currency
Losses | |
Tax-Free Money Market Fund | | $ | 1,399 | | | $ | — | |
Money Market Fund | | | 6,806 | | | | — | |
Global Select Markets Fund | | | — | | | | 51,145 | |
Growth Fund | | | — | | | | 435 | |
Income Equity Fund | | | — | | | | 5 | |
International Equity Fund | | | — | | | | 30,491 | |
Situs Fund | | | 15,906 | | | | — | |
Intermediate Government Income Fund | | | 19,990 | | | | — | |
Mortgage Securities Fund | | | 76,555 | | | | — | |
Management of the Funds has reviewed tax positions taken in tax years that remain subject to examination by all major tax jurisdictions, including federal (i.e., the last four tax year ends
and the interim tax period since then). Management believes there is no tax liability resulting from unrecognized tax benefits related to uncertain tax positions taken.
The Regulated Investment Company Modernization Act of 2010 (the “Act”) was enacted on December 22, 2010. The Act makes changes to several tax rules impacting the Funds. In general, the provisions of the Act will be effective for the Funds’ fiscal year ending December 31, 2011. Although the Act provides several benefits, including the unlimited carryover of future capital losses, there may be a greater likelihood that all or a portion of each fund’s pre-enactment capital loss carryovers may expire without being utilized due to the fact that post-enactment capital losses get utilized before pre-enactment capital loss carryovers. Relevant information regarding the impact of the Act on the Fund, if any, will be contained within the “Federal Taxes” section of the financial statement notes for the fiscal year ending December 31, 2011.
| (3) | Investment Advisory Fee and Other Transactions with Affiliates |
| | | | | | | | | | | | |
| | | Tiered Annual Rate: | |
| Fund | | Up to $500 million | | | On the next $500 million | | | In Excess of $1 billion | |
Tax-Free Money Market Fund | | | 0.30 | % | | | 0.25 | % | | | 0.20 | % |
Money Market | | | 0.30 | % | | | 0.25 | % | | | 0.20 | % |
Ohio Municipal Money Market Fund | | | 0.30 | % | | | 0.25 | % | | | 0.20 | % |
Dividend Capture Fund | | | 0.75 | % | | | 0.70 | % | | | 0.65 | % |
Growth Fund | | | 0.60 | % | | | 0.55 | % | | | 0.50 | % |
Income Equity Fund | | | 0.60 | % | | | 0.55 | % | | | 0.50 | % |
International Equity Fund | | | 1.00 | % | | | 0.95 | % | | | 0.90 | % |
Macro 100 Fund | | | 0.75 | % | | | 0.70 | % | | | 0.65 | % |
Mid Corp America Fund | | | 0.75 | % | | | 0.70 | % | | | 0.65 | % |
New Economy Fund | | | 0.85 | % | | | 0.80 | % | | | 0.75 | % |
Real Strategies Fund | | | 0.75 | % | | | 0.70 | % | | | 0.65 | % |
Rotating Markets Fund | | | 0.50 | % | | | 0.45 | % | | | 0.40 | % |
Situs Fund | | | 0.75 | % | | | 0.70 | % | | | 0.65 | % |
Technical Opportunities Fund | | | 0.75 | % | | | 0.70 | % | | | 0.65 | % |
Fixed Income Securities Fund | | | 0.50 | % | | | 0.45 | % | | | 0.40 | % |
Intermediate Government Income Fund | | | 0.50 | % | | | 0.45 | % | | | 0.40 | % |
Mortgage Securities Fund | | | 0.50 | % | | | 0.45 | % | | | 0.40 | % |
Ohio Tax-Free Fund | | | 0.50 | % | | | 0.45 | % | | | 0.40 | % |
Short/Intermediate Fixed Income Securities Fund | | | 0.50 | % | | | 0.45 | % | | | 0.40 | % |
Investment Advisory Fee—Huntington Asset Advisors, Inc. (the “Advisor”), a subsidiary of The Huntington National Bank (“Huntington”), serves as the Funds’ investment advisor. The Advisor receives a fee for its services, computed daily and paid monthly, based on a percentage of each Fund’s average daily net assets on a tiered basis, according to the table below:
The U.S. Treasury Money Market Fund pays the Advisor a fee of 0.20% of its average daily net assets, computed daily and paid monthly. Global Select Markets Fund pays the Advisor a fee of 1.00% of the Fund’s average daily net assets, computed daily and paid monthly, up to $500 million, 0.95% of the Fund’s average daily net assets between $500 million and $1 billion and 0.90% of the Fund’s average daily net assets over $1 billion. They Advisor has agreed to contractually waive all or a portion of its investment advisory fee for Global Select
Markets Fund (based on average daily net assets to which it is otherwise entitled to receive and/or to reimburse certain operating expenses and acquired (underlying) fund operating expenses to not more than 1.90% and 2.15% of Trust Shares and Class A Shares, respectively, through April 30, 2011. Additionally, each of Balanced Allocation Fund, Conservative Allocation Fund and Growth Allocation Fund pays the Advisor a fee of 0.10% of its average daily net assets, computed daily and paid monthly. The Advisor has agreed to contractually waive all or a portion of its investment advisory fee for Balanced Allocation Fund, Conservative Allocation Fund and Growth Allocation Fund (based on average daily net assets) to which it is otherwise entitled to receive and/or to reimburse certain operating expenses of Balanced Allocation Fund, Conservative Allocation Fund and Growth Allocation Fund in
Annual Shareholder Report
158
Notes to Financial Statements (Continued)
order to limit the total direct net annual operating expenses and acquired (underlying) fund operating expenses to not more than 1.90% of the average daily net assets of each of Balanced Allocation Fund, Conservative Allocation Fund and Growth Allocation Fund through April 30, 2011.
Huntington and the Advisor may also pay out of their reasonable profits and other resources (including those of their affiliates) advertising, marketing, and other expenses for the benefit of the Funds.
Consulting Fee—Laffer Investments, Inc. acts as a consultant (“the Consultant”) to the Advisor for Macro 100 Fund. The Advisor pays the Consultant a fee for its services. Neither the Trust nor the Macro 100 Fund is liable for payment of this fee.
Administrative and Financial Administration Fees—Huntington is the Administrator to the Trust, and Huntington Asset Services, Inc. (“HASI”), an affiliate of Huntington, is the Sub-Administrator. Prior to September 1, 2010, Citi Fund Services Ohio, Inc. was the Sub-Administrator. As Administrator, Huntington provides the Funds with certain administrative services. As Sub-Administrator, HASI provides the Funds with certain administrative personnel, and generally assists with the provision of administrative services necessary to operate the Funds. The Administrator pays the Sub-Administrator a fee for the services it provides to the Trust. Huntington also provides portfolio accounting services to the Funds. Huntington has sub-contracted certain fund accounting services to HASI. HASI is paid directly by Huntington, not the Funds, for these services. The fees paid for administrative, sub-administrative, financial administrative and sub-financial administrative services are based on the level of average net assets of each Fund for the period, subject to minimum fees in certain circumstances.
| | |
Maximum
Administrative Fee | | Average Daily Net Assets
of the Trust |
0.1822% | | On the first $4 billion |
0.1650% | | On the next $2 billion |
0.1575% | | On the next $2 billion |
0.1450% | | On assets in excess of $8 billion |
There is no minimum annual fee per fund or class of shares.
Distribution and Shareholder Services Fees—The Funds have adopted a Distribution Plan (the “Plan”) pursuant to Rule 12b-1 under the 1940 Act. Under the terms of the Plan, the Funds will compensate qualified intermediaries for distribution services in connection with Class A Shares not to exceed 0.25% of the daily net assets of each Fund’s Class A Shares. Trust Shares are not subject to Rule 12b-1 fees. Class A Shares and Trust Shares are also subject to a shareholder services fee not to exceed 0.25% of the daily net assets of such shares. For the year ended December 31, 2010, Huntington and its affiliates received $4,759,286 in shareholder service fees. For the fiscal year ended December 31, 2010, Unified Financial Securities, Inc., the Funds’ distributor, received underwriter commissions of $157,922 earned on sales of Class A Shares. For the year ended December 31, 2010, the Funds paid $1,620,650 to affiliated broker-dealers of the Funds.
Transfer and Dividend Disbursing Agent Fees and Expense—HASI is the transfer and dividend disbursing agent for the Funds. For its services, HASI receives a yearly fixed amount per shareholder account, subject to a yearly minimum fee of $12,000 for each of the Funds. Unified is also entitled to receive additional amounts that may be activity or time-based charges, plus reimbursement for out-of-pocket expenses.
Custodian Fees—Huntington serves as custodian for each of the Funds. Brown Brothers Harriman serves as sub-custodian for Global Select Market Fund’s, International Equity Fund’s, Real Strategies Fund’s, Situs Fund’s and Technical Opportunities Fund’s foreign assets. Huntington and Brown Brothers Harriman receive fees based on the level of each Fund’s average daily net assets for the period, plus out-of-pocket expenses.
Compliance Services—The Trust has contracted with Huntington to provide a Chief Compliance Officer to the Trust, for which it pays Huntington $125,000 annually.
General—Certain officers of the Trust are Officers, Directors and/or Trustees of the above companies.
Annual Shareholder Report
159
Pursuant to an exemptive order issued by the Securities and Exchange Commission, the Funds may invest in a certain affiliated money market fund which is managed by the Advisor. Income distributions earned from investments in this fund are recorded as income from affiliates in the accompanying financial statements. A summary of each Fund’s investment in such affiliated money market fund (Huntington Money Market Fund) is set forth below:
| | | | | | | | | | | | | | | | | | | | |
| Fund | | 12/31/09
Market Value | | | Purchases | | | Sales | | | 12/31/10
Market Value | | | Income | |
Dividend Capture Fund | | $ | 1,008,304 | | | $ | 42,805,286 | | | $ | (42,690,676 | ) | | $ | 1,122,914 | | | $ | 227 | |
Global Select Markets Fund | | | 151 | | | | 26,810,329 | | | | (26,093,976 | ) | | | 716,504 | | | | 203 | |
Growth Fund | | | 515,548 | | | | 176,836,709 | | | | (170,652,135 | ) | | | 6,700,122 | | | | 575 | |
Income Equity Fund | | | 843,426 | | | | 24,019,132 | | | | (21,648,274 | ) | | | 3,214,284 | | | | 182 | |
International Equity | | | 8,877,051 | | | | 125,635,398 | | | | (125,709,378 | ) | | | 8,803,071 | �� | | | 1,360 | |
Macro 100 Fund | | | 2,087,400 | | | | 15,543,036 | | | | (15,522,019 | ) | | | 2,108,417 | | | | 349 | |
Mid Corp America Fund | | | 6,946,743 | | | | 38,700,190 | | | | (43,733,450 | ) | | | 1,913,483 | | | | 640 | |
New Economy Fund | | | 4,594,933 | | | | 70,134,424 | | | | (73,120,116 | ) | | | 1,609,241 | | | | 408 | |
Real Strategies Fund | | | 8,766,417 | | | | 26,457,021 | | | | (35,121,986 | ) | | | 101,452 | | | | 579 | |
Rotating Markets Fund | | | 2,012,698 | | | | 14,185,007 | | | | (16,013,975 | ) | | | 183,730 | | | | 189 | |
Situs Fund | | | 1,505,460 | | | | 60,405,117 | | | | (61,910,549 | ) | | | 28 | | | | 540 | |
Technical Opportunities Fund | | | 214,085 | | | | 7,004,240 | | | | (6,543,282 | ) | | | 675,043 | | | | 50 | |
Fixed Income Securities Fund | | | 5,082,016 | | | | 104,082,073 | | | | (107,592,347 | ) | | | 1,571,742 | | | | 744 | |
Intermediate Government Income Fund | | | 2,143,403 | | | | 38,079,197 | | | | (38,438,733 | ) | | | 1,783,867 | | | | 339 | |
Mortgage Securities Fund | | | 2,781,569 | | | | 37,285,156 | | | | (37,398,324 | ) | | | 2,668,401 | | | | 301 | |
Short/Intermediate Fixed Income Securities Fund | | | 5,261,922 | | | | 90,988,637 | | | | (92,061,785 | ) | | | 4,188,774 | | | | 495 | |
Additionally, Balanced Allocation Fund, Conservative Allocation Fund and Growth Allocation Fund invest in other Funds within the Trust. A summary of these investments in affiliated funds is set forth below:
| | | | | | | | | | | | | | | | | | | | |
| Balanced Allocation Fund | | 12/31/09
Market Value | | | Purchases | | | Sales | | | 12/31/10
Market Value | | | Income | |
Money Market Fund | | $ | 168,439 | | | $ | 7,258,950 | | | $ | (6,678,240 | ) | | $ | 749,149 | | | $ | 54 | |
Dividend Capture Fund | | | 658,235 | | | | 636,154 | | | | (228,958 | ) | | | 1,165,338 | | | | 28,789 | |
Growth Fund | | | 1,360,546 | | | | 1,036,685 | | | | (511,636 | ) | | | 2,093,366 | | | | 6 | |
Income Equity Fund | | | 1,392,759 | | | | 1,060,678 | | | | (474,130 | ) | | | 2,160,184 | | | | 45,965 | |
International Equity Fund | | | 2,727,944 | | | | 1,628,631 | | | | (1,386,739 | ) | | | 3,133,325 | | | | 25,211 | |
Macro 100 Fund | | | 485,037 | | | | 1,743,807 | | | | (271,551 | ) | | | 2,181,473 | | | | 1,968 | |
Mid Corp America Fund | | | 636,592 | | | | 613,732 | | | | (330,448 | ) | | | 1,126,908 | | | | 507 | |
New Economy Fund | | | 366,926 | | | | 502,915 | | | | (125,297 | ) | | | 844,626 | | | | — | |
Situs Fund | | | 1,081,195 | | | | 979,796 | | | | (495,262 | ) | | | 2,004,678 | | | | 11 | |
Fixed Income Securities Fund | | | 2,212,275 | | | | 2,348,644 | | | | (470,064 | ) | | | 4,147,173 | | | | 96,424 | |
Intermediate Government Income Fund | | | 1,031,894 | | | | 1,093,215 | | | | (208,238 | ) | | | 1,933,254 | | | | 41,381 | |
Mortgage Securities Fund | | | 594,823 | | | | 607,977 | | | | (110,296 | ) | | | 1,101,642 | | | | 28,678 | |
Short/Intermediate Fixed Income Securities Fund | | | 593,721 | | | | 1,440,893 | | | | (106,719 | ) | | | 1,926,180 | | | | 19,934 | |
| | | | | | | | | | | | | | | | | | | | |
| Conservative Allocation Fund | | 12/31/09
Market Value | | | Purchases | | | Sales | | | 12/31/10
Market Value | | | Income | |
Money Market Fund | | $ | 123,821 | | | $ | 3,579,823 | | | $ | (3,066,002 | ) | | $ | 637,641 | | | $ | 36 | |
Dividend Capture Fund | | | 216,561 | | | | 111,712 | | | | (120,124 | ) | | | 231,157 | | | | 7,130 | |
Growth Fund | | | 447,260 | | | | 160,619 | | | | (235,785 | ) | | | 414,890 | | | | 1 | |
Income Equity Fund | | | 457,610 | | | | 166,412 | | | | (233,978 | ) | | | 428,107 | | | | 11,643 | |
International Equity Fund | | | 896,554 | | | | 204,152 | | | | (501,513 | ) | | | 620,425 | | | | 4,975 | |
Macro 100 Fund | | | 159,612 | | | | 404,726 | | | | (176,630 | ) | | | 432,293 | | | | 389 | |
Mid Corp America Fund | | | 209,368 | | | | 108,267 | | | | (133,681 | ) | | | 223,074 | | | | 99 | |
New Economy Fund | | | 121,007 | | | | 101,433 | | | | (76,821 | ) | | | 167,208 | | | | — | |
Situs Fund | | | 355,064 | | | | 172,122 | | | | (225,423 | ) | | | 397,378 | | | | — | |
Fixed Income Securities Fund | | | 4,113,792 | | | | 1,506,946 | | | | (601,991 | ) | | | 5,125,522 | | | | 143,056 | |
Intermediate Government Income Fund | | | 1,919,886 | | | | 695,897 | | | | (260,940 | ) | | | 2,388,604 | | | | 61,587 | |
Mortgage Securities Fund | | | 1,104,907 | | | | 386,668 | | | | (148,695 | ) | | | 1,362,587 | | | | 39,673 | |
Short/Intermediate Fixed Income Securities Fund | | | 1,104,188 | | | | 1,346,190 | | | | (73,057 | ) | | | 2,379,626 | | | | 29,209 | |
Annual Shareholder Report
160
Notes to Financial Statements (Continued)
| | | | | | | | | | | | | | | | | | | | |
| Growth Allocation Fund | | 12/31/09
Market Value | | | Purchases | | | Sales | | | 12/31/10
Market Value | | | Income | |
Money Market Fund | | $ | 222,574 | | | $ | 4,508,044 | | | $ | (4,153,652 | ) | | $ | 576,965 | | | $ | 37 | |
Dividend Capture Fund | | | 831,893 | | | | 504,387 | | | | (233,415 | ) | | | 1,207,081 | | | | 31,387 | |
Growth Fund | | | 1,717,941 | | | | 798,111 | | | | (554,009 | ) | | | 2,169,260 | | | | 7 | |
Income Equity Fund | | | 1,757,710 | | | | 740,350 | | | | (441,464 | ) | | | 2,238,576 | | | | 50,557 | |
International Equity Fund | | | 3,440,856 | | | | 1,220,726 | | | | (1,539,411 | ) | | | 3,250,323 | | | | 26,097 | |
Macro 100 Fund | | | 612,087 | | | | 1,622,523 | | | | (196,421 | ) | | | 2,262,629 | | | | 2,037 | |
Mid Corp America Fund | | | 802,306 | | | | 448,136 | | | | (264,709 | ) | | | 1,166,583 | | | | 520 | |
New Economy Fund | | | 464,258 | | | | 408,224 | | | | (99,448 | ) | | | 875,746 | | | | — | |
Situs Fund | | | 1,364,686 | | | | 694,360 | | | | (438,507 | ) | | | 2,079,110 | | | | 4 | |
Fixed Income Securities Fund | | | 878,910 | | | | 877,687 | | | | (295,102 | ) | | | 1,482,045 | | | | 34,450 | |
Intermediate Government Income Fund | | | 410,555 | | | | 408,991 | | | | (134,748 | ) | | | 691,331 | | | | 14,820 | |
Mortgage Securities Fund | | | 236,406 | | | | 225,445 | | | | (71,602 | ) | | | 393,913 | | | | 10,219 | |
Short/Intermediate Fixed Income Securities Fund | | | 235,224 | | | | 527,642 | | | | (73,748 | ) | | | 688,840 | | | | 7,133 | |
Tax-Free Money Market Fund, Money Market Fund, Ohio Municipal Money Market Fund and U.S. Treasury Money Market Fund (collectively the “Money Market Funds”) were subject to a fee waiver and expense reimbursement agreement with the Advisor whereby the Advisor has agreed to waive fees or reimburse expenses in amounts necessary to maintain a minimum yield of 0.01% and in which the Money Market Funds have agreed to repay amounts that were waived or reimbursed by the Adviser for a period up to three years after such waiver or reimbursement was made to the extent that such repayments would not cause the yield of a class to decrease below 0.01%. As of December 31, 2010, the following amounts have been waived or reimbursed by the Adviser and are subject to repayment by the respective Fund:
| | | | | | | | |
| Fund | | Amount
Waived or
Reimbursed | | | Expiring
Beginning
December 31, | |
Tax-Free Money Market Fund | | $ | 158,548 | | | | 2012 | |
| | | 474,740 | | | | 2013 | |
Money Market Fund | | | 1,526,152 | | | | 2012 | |
| | | 2,696,185 | | | | 2013 | |
Ohio Municipal Money Market | | | 506,451 | | | | 2012 | |
| | | 1,357,243 | | | | 2013 | |
U.S. Treasury Money Market Fund | | | 1,437,890 | | | | 2012 | |
| | | | 2,375,535 | | | | 2013 | |
| (4) | Rotating Markets Fund, Real Strategies Fund, Technical Opportunities Fund, Balanced Allocation Fund, Conservative Allocation Fund and Growth Allocation Fund Structure |
Rotating Markets Fund, Real Strategies Fund, Technical Opportunities Fund, Balanced Allocation Fund, Conservative Allocation Fund and Growth Allocation Fund (“Investing Funds”), in accordance with their prospectus, seek to achieve their investment objectives by investing in other investment companies (“Underlying Funds”) with similar investment objectives. As a result, investors in the Investing Funds incur expenses of both the Investing Funds and Underlying Funds, including transaction costs related to the purchases and sales of Underlying Fund shares.
| (5) | Investment Transactions |
Purchases and sales of investments, excluding short-term securities, for the year ended December 31, 2010, were as follows:
| | | | | | | | |
| Fund | | Purchases | | | Sales | |
Dividend Capture Fund | | $ | 132,215,730 | | | $ | 108,879,017 | |
Global Select Markets Fund | | | 46,355,811 | | | | 9,277,062 | |
Growth Fund | | | 366,313,944 | | | | 397,715,954 | |
Income Equity Fund | | | 91,505,975 | | | | 105,881,085 | |
International Equity Fund | | | 116,755,689 | | | | 159,538,286 | |
Macro 100 Fund | | | 18,927,092 | | | | 9,023,230 | |
Mid Corp America Fund | | | 25,269,759 | | | | 39,012,236 | |
New Economy Fund | | | 124,113,701 | | | | 127,719,540 | |
Real Strategies Fund | | | 27,528,202 | | | | 16,503,196 | |
Rotating Markets Fund | | | 94,593,708 | | | | 99,717,457 | |
Situs Fund | | | 55,428,862 | | | | 55,307,184 | |
Technical Opportunities Fund | | | 40,712,044 | | | | 40,829,421 | |
Fixed Income Securities Fund | | | 142,810,100 | | | | 47,180,145 | |
Intermediate Government Income Fund | | | 34,311,324 | | | | 6,242,973 | |
Mortgage Securities Fund | | | 28,380,229 | | | | 5,838,160 | |
Ohio Tax-Free Fund | | | 17,319,915 | | | | 8,833,664 | |
Short/Intermediate Fixed Income Securities Fund | | | 118,651,590 | | | | 35,222,984 | |
Balanced Allocation Fund | | | 13,693,127 | | | | 4,676,550 | |
Conservative Allocation Fund | | | 5,365,144 | | | | 2,783,373 | |
Growth Allocation Fund | | | 8,476,581 | | | | 4,379,632 | |
Purchases and sales of long-term U.S. government securities, for the year ended December 31, 2010, were as follows:
| | | | | | | | |
| Fund | | Purchases | | | Sales | |
Fixed Income Securities Fund | | $ | 60,741,218 | | | $ | 28,410,853 | |
Intermediate Government Income Fund | | | 34,311,324 | | | | 6,242,973 | |
Mortgage Securities Fund | | | 24,404,902 | | | | 5,362,451 | |
Short/Intermediate Fixed Income Securities Fund | | | 55,845,580 | | | | 11,132,383 | |
| (6) | Concentration of Credit Risk |
Since each of Ohio Municipal Money Market Fund and Ohio Tax-Free Fund invest a substantial portion of their assets in issuers located in the state of Ohio, they will be more susceptible to factors adversely affecting issuers of Ohio than would be a comparable tax-exempt mutual fund that invests nationally. In order to reduce the credit risk associated with such factors, at December 31, 2010, the securities in the portfolio of investments are backed by letters of credit or bond insurance from various financial institutions and financial guaranty assurance agencies, as indicated on each Fund’s Portfolio of Investments.
Annual Shareholder Report
161
| (7) | Foreign Investment Risk |
Compared with investing in the United States, investing in foreign markets involves a greater degree and variety of risk. Investors in international or foreign markets may face delayed settlements, currency controls and adverse economic developments as well as higher overall transaction costs. In addition, fluctuations in the U.S. dollar’s value versus other currencies may erode or reverse gains from investments denominated in foreign currencies or widen losses. Foreign governments may expropriate assets, imposed capital or currency controls, impose punitive taxes, impose limits on ownership or nationalize a company or industry. Any of these actions could have severe effect on security prices and impair the Fund’s ability to bring its capital or income back to the U.S. Exchange rate fluctuations also may impair an issuer’s ability to repay U.S. dollar denominated debt, thereby increasing credit risk of such debt. Finally, the value of foreign securities may be affected by incomplete, less frequent or inaccurate financial information about their issuers, social upheavals or political actions ranging from tax code changes to government collapse. Foreign companies may also receive less coverage than U.S. companies by market analysts, and financial reporting standards or regulatory requirements may not be comparable to those applicable to U.S. companies.
| (8) | Other Tax Information (unaudited) |
For the year ended December 31, 2010, certain dividends paid by the Funds may be subject to a maximum tax rate of 15% as provided for by the Jobs and Growth Tax Relief Reconciliation Act of 2003. The Funds intend to designate the maximum amount allowable as taxed at a maximum rate of 15%. Complete information will be reported in conjunction with your 2010 Form 1099-DIV.
For the year ended December 31, 2010, the following Funds paid qualified dividend income:
| | | | |
| Fund | | Qualified
Dividend
Income | |
Dividend Capture Fund | | | 100 | % |
Global Select Markets Fund | | | 100 | % |
Growth Fund | | | 100 | % |
Income Equity Fund | | | 100 | % |
Macro 100 Fund | | | 100 | % |
International Equity Fund | | | 100 | % |
Mid Corp America Fund | | | 100 | % |
Real Strategies Fund | | | 100 | % |
Rotating Markets Fund | | | 100 | % |
Technical Opportunities Fund | | | 100 | % |
Balanced Allocation Fund | | | 29 | % |
Conservative Allocation Fund | | | 13 | % |
Growth Allocation Fund | | | 39 | % |
For the taxable year ended December 31, 2010, the following percentage of ordinary income dividends paid by the Funds qualify for the dividends received deduction available to corportions:
| | | | |
| Fund | | Dividends
Received
Deduction | |
Dividend Capture Fund | | | 100 | % |
Global Select Markets Fund | | | 100 | % |
Growth Fund | | | 100 | % |
Income Equity Fund | | | 100 | % |
Macro 100 Fund | | | 100 | % |
International Equity Fund | | | 100 | % |
Mid Corp America Fund | | | 100 | % |
Real Strategies Fund | | | 100 | % |
Rotating Markets Fund | | | 52 | % |
Technical Opportunities Fund | | | 100 | % |
Balanced Allocation Fund | | | 25 | % |
Conservative Allocation Fund | | | 12 | % |
Growth Allocation Fund | | | 33 | % |
The Funds designate the following amounts as long-term capital gains distributions. The amounts designated may not agree with long term capital gains in the tax character of distribution table due to utilization of earnings and profits distributed to shareholders on redemption of shares.
| | | | |
| Fund | | Long Term
Capital
Gains Paid
Amount | |
Mid Corp America Fund | | | 4,705,238 | |
Fixed Income Securities Fund | | | 253,105 | |
Intermediate Government Income Fund | | | 268,472 | |
Ohio Tax Free Fund | | | 170,347 | |
Balanced Allocation Fund | | | 3,592 | |
Conservative Allocation Fund | | | 10,807 | |
Growth Allocation Fund | | | 3,762 | |
For the year ended December 31, 2010, certain dividends paid by the Funds may be subject to a maximum tax rate of 15%, as provided for by the Jobs and Growth Tax Relief Reconciliation Act of 2003. The following Funds designated the following percentage of ordinary dividends paid as qualified interest income distribution:
| | | | |
| Fund | | Qualified
Interest
Income | |
Money Market Fund | | | 100 | % |
U.S. Treasury Money Market Fund | | | 99 | % |
Intermediate Government Income Fund | | | 98 | % |
Mortgage Securities Fund | | | 96 | % |
Short/Intermediate Fixed Income Securities Fund | | | 100 | % |
Balanced Allocation Fund | | | 43 | % |
Conservative Allocation Fund | | | 73 | % |
Growth Allocation Fund | | | 8 | % |
Annual Shareholder Report
162
Notes to Financial Statements (Continued)
The Funds designated the following amounts as short term capital gain distributions:
| | | | |
| Fund | | Short Term
Capital
Gains Paid
Amount | |
U.S. Treasury Money Market Fund | | $ | 4,158 | |
Fixed Income Securities | | | 108,796 | |
Balanced Allocation Fund | | | 88,674 | |
Conservative Allocation Fund | | | 52,432 | |
Growth Allocation Fund | | | 116,550 | |
The International Equity Fund intends to elect to pass through to shareholders the income tax credit for taxes paid to foreign coutries. Foreign source income and foreign tax expense per outstanding shares on December 31, 2010 are as follows:
| | | | | | | | |
| Fund | | Foreign
Source
Income | | | Foreign
Tax
Expense | |
International Equity Fund | | | 0.30 | | | | 0.02 | |
The pass-through of the foreign tax credit will only affect those persons who are shareholders on the dividend record date in December 2010. These shareholders will receive more detailed information along with the 2010, Form 1099 DIV.
For the year ended December 31, 2010, certain Funds designated the maximum allowable, but not less than the following amounts, as tax-exempt dividends:
| | | | |
| Fund | | Amount | |
Tax Free Money Market | | $ | 9,406 | |
Ohio Municipal Money Market Fund | | | 23,103 | |
Ohio Tax Free Fund | | | 1,159,654 | |
Annual Shareholder Report
163
Report of Independent Registered Public Accounting Firm
The Board of Trustees and Shareholders of The Huntington Funds:
We have audited the accompanying statements of assets and liabilities of the Huntington Tax-Free Money Fund, Huntington Money Market Fund, Huntington Ohio Municipal Money Market Fund, Huntington U.S. Treasury Money Market Fund, Huntington Dividend Capture Fund, Huntington Global Select Markets Fund, Huntington Growth Fund, Huntington Income Equity Fund, Huntington International Equity Fund, Huntington Macro 100 Fund, Huntington Mid Corp America Fund, Huntington New Economy Fund, Huntington Real Strategies Fund, Huntington Rotating Market Fund, Huntington Situs Fund, Huntington Technical Opportunities Fund, Huntington Fixed Income Securities Fund, Huntington Intermediate Government Income Fund, Huntington Mortgage Securities Fund, Huntington Ohio Tax-Free Fund, Huntington Short/Intermediate Fixed Income Securities Fund, Huntington Balanced Allocation Fund, Huntington Conservative Allocation Fund, and Huntington Growth Allocation Fund (twenty-four of the portfolios constituting The Huntington Funds, collectively referred to as the “Funds”), including the portfolios of investments, as of December 31, 2010, and the related statements of operations for the year then ended, and the statements of changes in net assets and the financial highlights for each of the periods indicated therein. These financial statements and financial highlights are the responsibility of the Funds’ management. Our responsibility is to express an opinion on these financial statements and financial highlights based on our audits.
We conducted our audits in accordance with the standards of the Public Company Accounting Oversight Board (United States). Those standards require that we plan and perform the audit to obtain reasonable assurance about whether the financial statements and financial highlights are free of material misstatement. We were not engaged to perform an audit of the Funds’ internal control over financial reporting. Our audits included consideration of internal control over financial reporting as a basis for designing audit procedures that are appropriate in the circumstances, but not for the purpose of expressing an opinion on the effectiveness of the Funds’ internal control over financial reporting. Accordingly, we express no such opinion. An audit also includes examining, on a test basis, evidence supporting the amounts and disclosures in the financial statements and financial highlights, assessing the accounting principles used and significant estimates made by management, and evaluating the overall financial statement presentation. Our procedures included confirmation of securities owned as of December 31, 2010, by correspondence with the custodian and brokers. We believe that our audits provide a reasonable basis for our opinion.
In our opinion, the financial statements and financial highlights referred to above present fairly, in all material respects, the financial position of each of The Huntington Funds identified above at December 31, 2010, the results of their operations for the year then ended, and the changes in their net assets and the financial highlights for each of the periods indicated therein, in conformity with U.S. generally accepted accounting principles.

Columbus, Ohio
March 1, 2011
Annual Shareholder Report
164
Board of Trustees and Trust Officers (Unaudited)
The following tables give information about the Independent Trustees (Trustees who are not “interested persons” of the Trust, as defined in the 1940 Act), Interested Trustees (Trustees who are “interested persons” of the Trust, as defined in the 1940 Act) and the senior officers of the Trust. Each Trustee oversees all portfolios of the Trust and serves for an indefinite term (subject to mandatory retirement provisions). Unless otherwise noted, the business address of each person listed below is c/o The Huntington Funds, 2960 North Meridian Street, Suite 300, Attention: Huntington Trust Officer, Indianapolis, IN. Unless otherwise noted, each officer is elected annually. The Huntington Funds consists of 36 portfolios. Each Trustee serves as Trustee for all portfolios of The Huntington Funds. The Funds’ Statement of Additional Information includes additional information about The Huntington Funds’ Trustees and is available, without charge and upon request, by calling 1-800-253-0412.
Interested Trustees’ Background
| | |
Name Age Positions Held with Trust Date Service Began | | Principal Occupation(s) for Past Five Years, Other Directorships Held and Previous Position(s) |
B. Randolph Bateman* Age: 61 PRESIDENT AND TRUSTEE Began Serving: February 2008 | | Principal Occupations: President and Chief Investment Officer, Huntington Asset Advisors, Inc. (February 2001 to present); Chief Investment Officer, The Huntington National Bank (October 2000 to present). Previous Positions: Senior Vice President, Star Bank (June 1988 to October 2000). Other Directorships Held: None. |
Thomas J. Westerfield** Age: 55 TRUSTEE Began serving: January 2001 | | Principal Occupation: Since August 2005, of Counsel, Dinsmore & Shohl LLP (law firm). Previous Position: From 1993 to 2005, of Counsel, Cors & Bassett LLC (law firm). Other Directorships Held: None. |
| * | B. Randolph Bateman has been deemed an Interested Trustee due to the positions he holds with The Huntington National Bank and its subsidiaries. |
| ** | Thomas J. Westerfield has been deemed an Interested Trustee due to the position he holds with Dinsmore & Shohl LLP, which may be retained to provide legal services to Huntington. |
Independent Trustees’ Background
| | |
Name Age Positions Held with Trust Date Service Began | | Principal Occupation(s) for Past Five Years, Other Directorships Held and Previous Position(s) |
David S. Schoedinger* Age: 68 CHAIRMAN OF THE BOARD and TRUSTEE Began serving: June 1990 | | Principal Occupation: Since 1965, Chairman of the Board and Funeral Director, Schoedinger Funeral Service. Since 1987, CEO, Schoedinger Financial Services, Inc. Previous Position: From 1992 to 1993, President, Board of Directors of National Selected Morticians (national trade association for morticians). Other Directorships Held: None. |
Alistair Jessiman Age: 53 TRUSTEE Began serving: January 2010 | | Principal Occupation: Managing Director, Novantas LLC (September 2005 to present) (Specialist research and advisory firm); President/Founder, Wallace & Mackenzie, Inc. (January 2001 to September 2005) (management consulting firm); Previous Positions: Managing Director or Vice President of various departments, J.P. Morgan (1979 to 2001). Other Directorships Held: Board Member, The Alger Funds; Board Member, National Foundation for Teaching Entrepreneurship. |
Tadd C. Seitz Age: 69 TRUSTEE Began serving: July 2006 | | Principal Occupation: Retired Previous Positions: Chairman and Chief Executive Officer, the Scotts Company (June 1983 - March 1995); Interim Chief Executive Officer (February 1996 - July 1996). Other Directorships Held: None. |
Mark D. Shary Age: 50 TRUSTEE Began serving: July 2006 | | Principal Occupations: Private investor (2007 to present). Previous Position: President, Bostech Corporation (2000 - 2002); Chief Executive Officer and President, Best-Transport.com, Inc. (2003 to 2007). Other Directorships Held: None. |
Annual Shareholder Report
165
| | |
Name Age Positions Held with Trust Date Service Began | | Principal Occupation(s) for Past Five Years, Other Directorships Held and Previous Position(s) |
William H. Zimmer, III Age: 57 TRUSTEE Began Serving: December 2006 | | Principal Occupation: Independent Consultant (February 2009 to present). Previous Positions: Assistant Treasurer, Dana Corporation (September 2006 to February 2009) (manufacturing); Vice President and Manager, Global Treasury Management, National City Bank (January 2004 to January 2006); Vice President, Treasury Management Operations, Provident Bank (June 2003 to January 2004); Financial Consultant (April 2001 to June 2003). Other Directorships Held: None. |
| * | David S. Schoedinger became Chairman of the Funds on April 30, 2003. |
Officers
| | |
Name Age Address Positions Held with Trust Date Service Began | | Principal Occupation(s) and Previous Positions |
R. Jeffrey Young Age: 46 CHIEF EXECUTIVE OFFICER Began Serving: February 2010 | | Principal Occupations: Senior Vice President, HASI (formerly, Unified Fund Services, Inc.) (January 2010 to present); Chairman of the Board, Valued Advisers Trust (June 2010 to present); Chief Executive Officer and President, Valued Advisers Trust (January 2010 to present). Previous Positions: Independent Chair, Valued Advisers Trust (August 2008-Janaury 2010); Managing Director, Chief Operating Officer, WealthStone (2007 to 2009); Senior Vice President, Operations, BISYS Fund Services (2006 to 2007); Senior Vice President/Vice President, Client Services, BISYS Fund Services (1994 to 2006). |
Matthew J. Miller Age: 34 VICE PRESIDENT Began Serving: February 2010 | | Principal Occupations: Vice President, Relationship Management, Huntington Asset Services, Inc. (formerly known as Unified) (2008 to present). Previous Position: Vice President, Transfer Agency Operations, Huntington Asset Services, Inc. (formerly known as Unified) (2002 to 2008). |
David R. Carson Age: 52 3805 Edwards Road, Suite 3805 Cincinnati, OH CHIEF COMPLIANCE OFFICER and ANTI-MONEY LAUNDERING OFFICER Began Serving: September 2005 | | Principal Occupations: Chief Compliance Officer and Anti-Money Laundering Officer of the Trust (September 2005 to present). Previous Positions: Treasurer and Assistant Treasurer of the Huntington Funds, Huntington Asset Advisors, Inc. (February 2002 to February 2005); Vice President and Private Financial Group Marketing Manager, Huntington National Bank (June 2001 to September 2005); Trust Officer, Firstar Bank (October 1982 to February 2001). |
Robert W. Silva Age: 44 TREASURER Began Serving: November 2010 | | Principal Occupation: Vice President, Fund Administration, Huntington Asset Services, Inc. (September 2010 to present). Previous Positions: Senior Vice President, Citi Fund Services Ohio, Inc., (September 2007 to September 2010); Assistant Vice President, Citizens Advisers, Inc., (May 2002 to August 2007). |
John C. Swhear Age: 50 SECRETARY Began Serving: April 2010 | | Principal Occupations: Chief Compliance Officer of Valued Advisers Trust (August 2008 to present); Acting Chief Executive Officer, Dreman Contrarian Funds (February 2008 to present); Chief Compliance Officer of Unified Financial Securities, Inc., the Trust’s distributor (May 2007 to present); Vice President of Legal Administration and Compliance for HASI (formerly, Unified Fund Services, Inc.) (April 2007 to present); Vice President, Dreman Contrarian Funds (September 2007 to present); Senior Vice President, Unified Series Trust (May 2007 to present). Previous Positions: Employed in various positions with American United Life Insurance Company from June 1983 to April 2007, including: Chief Counsel, OneAmerica Securities Inc. (February 2007 to April 2007); Associate General Counsel (April 2003 to April 2007); Investment Adviser Chief Compliance Officer (June 2004 to April 2007); Chief Compliance Officer of OneAmerica Funds, Inc. (June 2004 to April 2007). |
Annual Shareholder Report
166
Investment Contract Review Disclosure (Unaudited)
BOARD OF TRUSTEES’ CONSIDERATION OF INVESTMENT ADVISORY AGREEMENTS FOR THE HUNTINGTON FUNDS (the “Funds”)
The Board of Trustees is responsible for determining whether to approve the Funds’ investment advisory agreements. At a meeting held on August 12, 2010, the Board, including a majority of the independent Trustees, approved the investment advisory agreements between Huntington Asset Advisors, Inc. (the “Advisor”) and the Funds (the “Advisory Agreements”). Pursuant to the Advisory Agreements between the Advisor and the Funds, the Advisor provides advisory services to the Funds.
During the review process, the Board received assistance and advice from, and met separately with, independent legal counsel. In approving each of the Advisory Agreements, the Board, including a majority of the independent Trustees, considered many factors, the most significant of which were: (1) the nature of the services provided to the Funds by the Advisor in relation to the advisory fees; (2) the individual performance of the Funds; (3) the Advisor’s costs and the profits realized through providing the Funds with advisory services; (4) whether the Advisor has realized or may realize economies of scale in providing services to the Funds and if these economies are shared with the Funds; and (5) a comparison of the fees and performance of comparable funds.
Nature, Extent and Quality of Services in Relation to the Advisory Fees. In considering the nature, extent and quality of the services provided by the Advisor, the Board reviewed information relating to the Advisor’s operations and personnel. Among other things, the Advisor provided descriptions of its organizational and management structure, biographical information on its supervisory and portfolio management staff on a fund-by-fund basis, and financial information. The Trustees also took into account the financial condition of the Advisor with respect to its ability to provide the services required under the Advisory Agreements. The Board determined that the nature, extent and quality of the services provided by the Advisor, in relation to the advisory fees, were acceptable.
Individual Performance of the Funds. The Board reviewed the Funds’ short-term and long-term performance records and the Advisor’s management styles in relation to comparable funds and appropriate benchmarks. The Board noted that the Board reviews on a quarterly basis detailed information about the Funds’ performance. The Board also reviewed various comparative data for each of the Funds provided to them in connection with their consideration of the renewal of the Advisory Agreements, including, among other information, each Fund’s performance compared to similar funds based on information provided by Lipper Inc. (“Lipper”) for the one-, three-, five- and ten-year periods, as applicable, ending June 30, 2010.
Advisor’s Costs and the Profits Realized Through Providing the Funds With Advisory Services. In considering the reasonableness of the advisory fees, the Board reviewed information provided by the Advisor setting forth all revenues and other benefits, both direct and indirect, received by the Advisor and its affiliates attributable to managing each of the Funds individually, the cost of providing such services and the resulting profitability to the Advisor and its affiliates from these relationships. The Trustees determined that the profitability of the Advisor was acceptable in relation to the nature and quality of services provided to the Funds. The Board also took into consideration the Advisor’s agreement with the Trust with respect to the Huntington Growth Allocation Fund, the Huntington Balanced Allocation Fund and the Huntington Conservative Allocation Fund (the “Allocation Funds”), whereby the Advisor agreed to waive all or a portion of its advisory fee in order to limit each Allocation Fund’s total annual fund operating expenses for the period of May 1, 2010 until April 30, 2011. In addition, the Board considered the Advisor’s agreement with the four money market funds, whereby the Advisor agreed to waive all or a portion of its investment advisory fee and/or reimburse certain operating expenses of each money market fund to the extent necessary to ensure that each money market fund maintains a positive yield of at least 0.01%.
Economies of Scale in Providing Services to the Funds and Whether These Economies Are Shared With the Funds. The Board also considered the effect of the Funds’ growth and size on their performance and fees. The Board noted that, with the exception of the Allocation Funds and the Huntington U.S. Treasury Money Market Fund, all of the Funds’ Advisory Agreements reflect the implementation of investment advisory fee breakpoints for the Funds. The Board further noted that the administration fee charged to all of the Funds included fee breakpoints, which allowed the Funds to realize economies of scale as the assets of the Funds increased over time.
Annual Shareholder Report
167
Investment Contract Review Disclosure (Continued)
Comparison of the Fees and Performance of Comparable Funds. With respect to the Funds’ performance and fees, the Board considered comparisons to other mutual funds with comparable investment programs to be particularly useful, given the high degree of competition in the mutual fund business. The Board used peer group information provided by Morningstar, Inc. with respect to its comparable fee analysis for the Funds’ Trust Shares. The Board considered performance information based on the performance of the Funds’ Trust Shares, and considered the performance of Class A Shares for those Funds that did not offer Trust Shares. The Board also received information concerning fees charged by the Advisor to other accounts, but did not consider that information to be as relevant in light of the differences in services provided.
Other Considerations. The Board also requests and receives substantial and detailed information about the Funds and the Advisor on a regular basis. The Advisor provides much of this information at each regular meeting of the Board and furnishes additional reports in connection with the Board’s formal review of the Advisory Agreements. The Board may also receive information between regular meetings relating to particular matters as the need arises. The Board’s evaluation of the Advisory Agreements is informed by reports covering such matters as: the Advisor’s investment philosophy, personnel, and processes; operating strategies; the Funds’ short- and long term performance (in absolute terms, both on a gross basis and net of expenses, as well as in relationship to its particular investment program and certain competitive funds and/or other benchmarks, as appropriate) and comments on reasons for performance. The Board also considered reports concerning the Funds’ expenses (including the advisory fee itself and the overall expense structure of the Funds, both in absolute terms and relative to similar and/or competing funds, with due regard for contractual or voluntary expense limitations); the use and allocation of brokerage commissions derived from trading the Funds’ portfolio securities; the nature and extent of the advisory and other services provided to the Funds by the Advisor and its affiliates; compliance and audit reports concerning the Funds (including communications from regulatory agencies), as well as the Advisor’s responses to any issues raised therein; and relevant developments in the mutual fund industry and how the Funds and the Advisor are responding to them. In the course of their deliberations regarding the Advisory Agreements, the Board also evaluated, among other things, the Advisor’s ability to supervise each of the Fund’s other service providers and its compliance program.
The Board based its decision to approve the Advisory Agreements on the totality of the circumstances and relevant factors and with a view to past and future long-term considerations. Not all of the factors and considerations identified above are relevant to each of the Funds, nor does the Board consider any one of them to be determinative. With respect to the factors that are relevant, the Board’s decision to approve the Advisory Agreements reflects its determination that the Advisor’s performance and actions provide an acceptable basis to support the decision to continue the existing arrangements.
While attention was given to all information furnished, the following discusses the primary factors relevant to the Board’s decisions. In each case, the Board concluded that the Funds’ performance was acceptable and that the Funds’ advisory and total fees were reasonable in light of the quality and nature of services provided by the Advisor and its affiliates.
Huntington Dividend Capture Fund
Among other data considered, the Board noted that the Fund outperformed its benchmark for the one- and three-year periods ended June 30, 2010, but underperformed its benchmark for the five-year period ended the same date. The Fund outperformed its Lipper peer group for the one-, three- and five-year periods ended June 30, 2010. The Board also noted that the Fund’s combined net advisory fee and administrative fee and total expenses were above the medians of its peer group.
Huntington Fixed Income Securities Fund
Among other data considered, the Board noted that the Fund underperformed its benchmark for the one-, three-, five- and ten-year periods ended June 30, 2010. The Fund underperformed its Lipper peer group for the one-year period ended June 30, 2010, outperformed its Lipper peer group for the three- and five-year periods ended
Annual Shareholder Report
168
Investment Contract Review Disclosure (Continued) (Unaudited)
June 30, 2010, and performed at the average of its Lipper peer group for the ten-year period ended the same date. The Board also noted that the Fund’s combined net advisory fee and administrative fee and total expenses were above the medians of its peer group. The Board took into account management’s discussion of the Fund’s performance, including the impact of market conditions on the Fund’s performance, and management’s plans with respect to the Fund.
Huntington Growth Fund
Among other data considered, the Board noted that the Fund underperformed its benchmark for the one-, three-, five- and ten-year periods ended June 30, 2010. The Fund underperformed its Lipper peer group for the one-, three- and five-year periods ended June 30, 2010, and outperformed its Lipper peer group for the ten-year period ended the same date. The Board also noted that the Fund’s combined net advisory fee and administrative fee and total expenses are above the medians of its peer group. The Board took into account management’s discussion of the Fund’s performance, including the impact of market conditions on the Fund’s performance, and management’s plans with respect to the Fund.
Huntington Income Equity Fund
Among other data considered, the Board noted that the Fund outperformed its benchmark for the ten-year period ended June 30, 2010, but underperformed its benchmark for the one-, three- and five-year periods ended the same date. The Fund outperformed its Lipper peer group for the one-year period ended June 30, 2010, and underperformed its Lipper peer group for the three-, five- and ten-year periods ended the same date. The Board also noted that the Fund’s combined net advisory fee and administrative fee and total expenses were above the medians of its peer group. The Board took into account management’s discussion of the Fund’s performance, including the impact of market conditions on the Fund’s performance, and management’s plans with respect to the Fund.
Huntington Intermediate Government Income Fund
Among other data considered, the Board noted that the Fund underperformed its benchmark for the one-, three-, five- and ten-year periods ended June 30, 2010. The Fund outperformed its Lipper peer group for the one-, three-, five- and ten-year periods ended June 30, 2010. The Board also noted that the Fund’s combined net advisory fee and administrative fee and total expenses were above the medians of its peer group.
Huntington International Equity Fund
Among other data considered, the Board noted that the Fund outperformed its benchmark for the one-, three- and five-year periods ended June 30, 2010. The Fund underperformed its Lipper peer group for the one-year period ended June 30, 2010, and outperformed its Lipper peer group for the three- and five-year periods ended the same date. The Board also noted that the Fund’s combined net advisory fee and administrative fee and total expenses were above the medians of its peer group.
Huntington Macro 100 Fund
Among other data considered, the Board noted that the Fund outperformed its benchmark and its Lipper peer group for the one- and three-year periods ended June 30, 2010. The Fund underperformed its benchmark and its Lipper peer group for the five-year period ended June 30, 2010. The Board also noted that the Fund’s combined net advisory fee and administrative fee and total expenses were above the medians of its peer group.
Huntington Mid Corp America Fund
Among other data considered, the Board noted that the Fund underperformed its benchmark for the one-, three- and five-year periods ended June 30, 2010. The Fund underperformed its Lipper peer group for the one- and five-year periods ended June 30, 2010, and outperformed its Lipper peer group for the three-year period ended the same date. The Board also noted that the Fund’s combined net advisory fee and administrative fee and total
Annual Shareholder Report
169
Investment Contract Review Disclosure (Continued)
expenses were above the medians of its peer group. The Board took into account management’s discussion of the Fund’s performance, including the impact of market conditions on the Fund’s performance, and management’s plans with respect to the Fund.
Huntington Money Market Fund
Among other data considered, the Board noted that the Fund underperformed its benchmark for the one-year period ended June 30, 2010. The Board also noted that the Fund underperformed its Lipper peer group for the one-, three- and five-year periods ended June 30, 2010. The Board took into consideration the Advisor’s agreement to waive all or a portion of its advisory fee and/or reimburse operating expenses of the Fund and noted that the Fund’s combined net advisory fee and administrative fee and total expenses were below the medians of its peer group. The Board took into account management’s discussion of the Fund’s performance, including the impact of market conditions on the Fund’s performance, and management’s plans with respect to the Fund.
Huntington Mortgage Securities Fund
Among other data considered, the Board noted that the Fund underperformed its benchmark for the one-, three-, five- and ten-year periods ended June 30, 2010. The Fund underperformed its Lipper peer group for the one-, three- and five-year periods ended June 30, 2010, and outperformed its Lipper peer group for the ten-year period ended the same date. The Board also noted that the Fund’s combined net advisory fee and administrative fee and total expenses were above the medians of its peer group. The Board took into account management’s discussion of the Fund’s performance, including the impact of market conditions on the Fund’s performance, and management’s plans with respect to the Fund.
Huntington New Economy Fund
Among other data considered, the Board noted that the Fund underperformed its benchmark and its Lipper peer group for the one-, three- and five-year periods ended June 30, 2010. The Board also noted that the Fund’s combined net advisory fee and administrative fee and total expenses were above the medians of its peer group. The Board took into account management’s discussion of the Fund’s performance, including the impact of market conditions on the Fund’s performance, and management’s plans with respect to the Fund.
Huntington Ohio Municipal Money Market Fund
Among other data considered, the Board noted that the Fund underperformed its benchmark for the one-year period ended June 30, 2010. The Board also noted that the Fund underperformed its Lipper peer group for the one-, three- and five-year periods ended June 30, 2010. The Board took into consideration the Advisor’s agreement to waive all or a portion of its advisory fee and/or reimburse operating expenses of the Fund and noted that the Fund’s combined net advisory fee and administrative fee and the Fund’s total expenses were above the medians of its peer group. The Board took into account management’s discussion of the Fund’s performance, including the impact of market conditions on the Fund’s performance, and management’s plans with respect to the Fund.
Huntington Ohio Tax-Free Fund
Among other data considered, the Board noted that the Fund underperformed its benchmark for the one-, three-, five- and ten-year periods ended June 30, 2010. The Fund underperformed its Lipper peer group for the one-, five- and ten-year periods ended June 30, 2010, and outperformed its Lipper peer group for the three-year period ended the same date. The Board also noted that the Fund’s combined net advisory fee and administrative fee and total expenses were above the medians of its peer group. The Board took into account management’s discussion of the Fund’s performance, including the impact of market conditions on the Fund’s performance, and management’s plans with respect to the Fund.
Annual Shareholder Report
170
Investment Contract Review Disclosure (Continued) (Unaudited)
Huntington Real Strategies Fund
Among other data considered, the Board noted that the Fund outperformed its benchmark for the one-year period ended June 30, 2010, but underperformed its benchmark for the three-year period ended the same date. The Fund underperformed its Lipper peer group for the one- and three-year periods ended June 30, 2010. The Board also noted that the Fund’s combined net advisory fee and administrative fee and total expenses were above the medians of its peer group. The Board took into account management’s discussion of the Fund’s performance, including the impact of market conditions on the Fund’s performance, and management’s plans with respect to the Fund.
Huntington Rotating Markets Fund
Among other data considered, the Board noted that the Fund underperformed its benchmark and its Lipper peer group for the one- and three-year periods ended June 30, 2010, and outperformed its benchmark and its Lipper peer group for the five-year period ended the same date. The Board also noted that the Fund’s combined net advisory fee and administrative fee and total expenses were above the median of its peer group. The Board took into account management’s discussion of the Fund’s performance, including the impact of market conditions on the Fund’s performance, and management’s plans with respect to the Fund.
Huntington Short/Intermediate Fixed Income Securities Fund
Among other data considered, the Board noted that the Fund underperformed its benchmark and its Lipper peer group for the one-, three-, five- and ten-year periods ended June 30, 2010. The Board also noted that the Fund’s combined net advisory fee and administrative fee and total expenses were above the medians of its peer group. The Board took into account management’s discussion of the Fund’s performance, including the impact of market conditions on the Fund’s performance, and management’s plans with respect to the Fund.
Huntington Situs Fund
Among other data considered, the Board noted that the Fund outperformed its benchmark for the five-year period ended June 30, 2010 but underperformed its benchmark for the one- and three-year periods ended the same date. The Fund underperformed its Lipper peer group for the one-year period ended June 30, 2010, and outperformed its Lipper peer group for the three- and five-year periods ended the same date. The Board also noted that the Fund’s combined net advisory fee and administrative fee and total expenses were above the medians of its peer group.
Huntington Technical Opportunities Fund
Among other data considered, the Board noted that the Fund underperformed its benchmark and its Lipper peer group for the one-year period ended June 30, 2010. The Board also noted that the Fund’s combined net advisory fee and administrative fee and total expenses were above the medians of its peer group. The Board took into account management’s discussion of the Fund’s performance, including the impact of market conditions on the Fund’s performance, and management’s plans with respect to the Fund.
Huntington U.S. Treasury Money Market Fund
Among other data considered, the Board noted that the Fund performed at its benchmark for the one-year period ended June 30, 2010. The Fund outperformed its Lipper peer group for the one-year period ended June 30, 2010, but underperformed its Lipper peer group for the three, five- and ten-year periods ended the same date. The Board took into consideration the Advisor’s agreement to waive all or a portion of its advisory fee and/or reimburse operating expenses of the Fund and noted that the Fund’s combined net advisory fee and administrative fee and total expenses were below the medians of its peer group. The Board took into account management’s discussion of the Fund’s performance, including the impact of market conditions on the Fund’s performance, and management’s plans with respect to the Fund.
Annual Shareholder Report
171
Investment Contract Review Disclosure (Continued)
Huntington Tax-Free Money Market Fund
Among other data considered, the Board noted that the Fund underperformed its benchmark for the one-year period ended June 30, 2010. The Board also noted that the Fund underperformed its Lipper peer group for the one-, three- and five-year periods ended June 30, 2010. The Board took into consideration the Advisor’s agreement to waive all or a portion of its advisory fee and/or reimburse operating expenses of the Fund and noted that the Fund’s combined net advisory fee and administrative fee and the Fund’s total expenses were above the medians of its peer group. The Board took into account management’s discussion of the Fund’s performance, including the impact of market conditions on the Fund’s performance, and management’s plans with respect to the Fund.
Huntington Balanced Allocation Fund
Among other data considered, the Board noted that the Fund underperformed its benchmark and its Lipper peer group for the year-to-date period ended June 30, 2010. The Board noted that the Fund commenced operations on August 1, 2009, and therefore did not have a significant operating history. The Board took into consideration the Advisor’s agreement to waive all or a portion of its advisory fee for the Fund and noted that the Fund’s combined net advisory fee and administrative fee was below the median of its peer group and the Fund’s total expenses were above the median of its peer group.
Huntington Growth Allocation Fund
Among other data considered, the Board noted that the Fund underperformed its benchmark and its Lipper peer group for the year-to-date period ended June 30, 2010. The Board noted that the Fund commenced operations on August 1, 2009, and therefore did not have a significant operating history. The Board took into consideration the Advisor’s agreement to waive all or a portion of its advisory fee for the Fund and noted that the Fund’s combined net advisory fee and administrative fee was below the median of its peer group and the Fund’s total expenses were above the median of its peer group.
Huntington Conservative Allocation Fund
Among other data considered, the Board noted that the Fund underperformed its benchmark and outperformed its Lipper peer group for the year-to-date period ended June 30, 2010. The Board noted that the Fund commenced operations on August 1, 2009, and therefore did not have a significant operating history. The Board took into consideration the Advisor’s agreement to waive all or a portion of its advisory fee for the Fund and noted that the Fund’s combined net advisory fee and administrative fee was below the median of its peer group and the Fund’s total expenses were above the median of its peer group.
Annual Shareholder Report
172
Supplemental Information (Unaudited)
Shareholder Expense Examples
Fund Expenses—As a shareholder of a Fund, you incur two types of costs: (1) transaction costs, which may include sales charges (loads) on purchase payments, contingent deferred sales charges on redemptions; and (2) ongoing costs, including management fees, distribution and service fees; and other Fund expenses. These examples are intended to help you understand your ongoing costs (in dollars) of investing in the Funds and to compare these costs with the ongoing costs of investing in other mutual funds.
The examples are based on an investment of $1,000.00 invested at the beginning of the period and held for the entire six-month period from July 1, 2010 to December 31, 2010.
Actual Expenses—The “Actual” lines of the table provide information about actual account values and actual expenses. You may use the information on this line for the class of shares you hold, together with the amount you invested, to estimate the expenses that you paid over the period. Simply divide your account value by $1,000.00 (for example, an $8,600.00 account value divided by $1,000.00 = 8.60), then multiply the result by the number in the “Actual” line under
the heading entitled “Expenses Paid During Period” to estimate the expenses you paid on your account during this period.
Hypothetical Example for Comparison Purposes—The “Hypothetical” lines of the table provide information about hypothetical account values and hypothetical expenses based on the Funds’ actual expense ratios for each class of shares and an assumed rate of return of 5% per year before expenses, which are not the Funds’ actual returns. The hypothetical account values and expenses may not be used to estimate the actual ending account balance or expenses you paid for the period. You may use this information to compare the ongoing costs of investing in the Funds and other funds. To do so, compare the 5% hypothetical examples with the 5% hypothetical examples that appear in the shareholder reports of other funds.
Please note that the expenses shown in the table are meant to highlight your ongoing costs only and do not reflect any transactional costs. Therefore, the “Hypothetical” lines of the table are useful in comparing ongoing costs only, and will not help you determine the relative total costs of owning different funds. In addition, if these transactional costs were included, your costs would have been higher.
| | | | | | | | | | | | | | | | | | |
| | | | | Beginning
Account
Value,
July 1, 2010 | | | Ending
Account Value,
December 31, 2010 | | | Expenses
Paid
During
Period(1) | | | Annualized
Expense
Ratio | |
| | | | | |
Tax-Free Money Market Fund | | | | | | | | | | | | | | | | | | |
Trust Shares | | Actual | | $ | 1,000.00 | | | $ | 1,000.00 | | | $ | 1.90 | | | | 0.38 | % |
| | | Hypothetical (2) | | $ | 1,000.00 | | | $ | 1,023.30 | | | $ | 1.92 | | | | 0.38 | % |
Class A Shares | | Actual | | $ | 1,000.00 | | | $ | 1,000.00 | | | $ | 1.90 | | | | 0.38 | % |
| | | Hypothetical (2) | | $ | 1,000.00 | | | $ | 1,023.30 | | | $ | 1.92 | | | | 0.38 | % |
Money Market Fund | | | | | | | | | | | | | | | | | | |
Trust Shares | | Actual | | $ | 1,000.00 | | | $ | 1,000.10 | | | $ | 1.77 | | | | 0.35 | % |
| | | Hypothetical (2) | | $ | 1,000.00 | | | $ | 1,023.44 | | | $ | 1.79 | | | | 0.35 | % |
Class A Shares | | Actual | | $ | 1,000.00 | | | $ | 1,000.00 | | | $ | 1.77 | | | | 0.35 | % |
| | | Hypothetical (2) | | $ | 1,000.00 | | | $ | 1,023.43 | | | $ | 1.79 | | | | 0.35 | % |
Interfund | | Actual | | $ | 1,000.00 | | | $ | 1,000.10 | | | $ | 1.77 | | | | 0.35 | % |
| | | Hypothetical (2) | | $ | 1,000.00 | | | $ | 1,023.44 | | | $ | 1.79 | | | | 0.35 | % |
Ohio Municipal Money Market Fund | | | | | | | | | | | | | | | | | | |
Trust Shares | | Actual | | $ | 1,000.00 | | | $ | 1,000.10 | | | $ | 1.84 | | | | 0.36 | % |
| | | Hypothetical (2) | | $ | 1,000.00 | | | $ | 1,023.37 | | | $ | 1.86 | | | | 0.36 | % |
Class A Shares | | Actual | | $ | 1,000.00 | | | $ | 1,000.10 | | | $ | 1.84 | | | | 0.36 | % |
| | | Hypothetical (2) | | $ | 1,000.00 | | | $ | 1,023.37 | | | $ | 1.86 | | | | 0.36 | % |
U.S. Treasury Money Market Fund | | | | | | | | | | | | | | | | | | |
Trust Shares | | Actual | | $ | 1,000.00 | | | $ | 1,000.10 | | | $ | 0.77 | | | | 0.15 | % |
| | | Hypothetical (2) | | $ | 1,000.00 | | | $ | 1,024.44 | | | $ | 0.78 | | | | 0.15 | % |
Class A Shares | | Actual | | $ | 1,000.00 | | | $ | 1,000.10 | | | $ | 0.77 | | | | 0.15 | % |
| | | Hypothetical (2) | | $ | 1,000.00 | | | $ | 1,024.44 | | | $ | 0.78 | | | | 0.15 | % |
Annual Shareholder Report
173
| | | | | | | | | | | | | | | | | | |
| | | | | Beginning
Account
Value,
July 1, 2010 | | | Ending
Account Value,
December 31, 2010 | | | Expenses
Paid
During
Period(1) | | | Annualized
Expense
Ratio | |
| | | | | |
Dividend Capture Fund | | | | | | | | | | | | | | | | | | |
Trust Shares | | Actual | | $ | 1,000.00 | | | $ | 1,162.60 | | | $ | 7.47 | | | | 1.37 | % |
| | | Hypothetical (2) | | $ | 1,000.00 | | | $ | 1,018.29 | | | $ | 6.97 | | | | 1.37 | % |
Class A Shares | | Actual | | $ | 1,000.00 | | | $ | 1,161.20 | | | $ | 8.81 | | | | 1.62 | % |
| | | Hypothetical (2) | | $ | 1,000.00 | | | $ | 1,017.05 | | | $ | 8.22 | | | | 1.62 | % |
Global Select Markets Fund | | | | | | | | | | | | | | | | | | |
Trust Shares | | Actual | | $ | 1,000.00 | | | $ | 1,228.50 | | | $ | 10.67 | | | | 1.90 | % |
| | | Hypothetical (2) | | $ | 1,000.00 | | | $ | 1,015.63 | | | $ | 9.65 | | | | 1.90 | % |
Class A Shares | | Actual | | $ | 1,000.00 | | | $ | 1,224.80 | | | $ | 12.13 | | | | 2.16 | % |
| | | Hypothetical (2) | | $ | 1,000.00 | | | $ | 1,014.30 | | | $ | 10.98 | | | | 2.16 | % |
Growth Fund | | | | | | | | | | | | | | | | | | |
Trust Shares | | Actual | | $ | 1,000.00 | | | $ | 1,220.80 | | | $ | 6.80 | | | | 1.22 | % |
| | | Hypothetical (2) | | $ | 1,000.00 | | | $ | 1,019.08 | | | $ | 6.19 | | | | 1.22 | % |
Class A Shares | | Actual | | $ | 1,000.00 | | | $ | 1,219.60 | | | $ | 8.19 | | | | 1.46 | % |
| | | Hypothetical (2) | | $ | 1,000.00 | | | $ | 1,017.82 | | | $ | 7.45 | | | | 1.46 | % |
Income Equity Fund | | | | | | | | | | | | | | | | | | |
Trust Shares | | Actual | | $ | 1,000.00 | | | $ | 1,195.70 | | | $ | 6.71 | | | | 1.21 | % |
| | | Hypothetical (2) | | $ | 1,000.00 | | | $ | 1,019.09 | | | $ | 6.17 | | | | 1.21 | % |
Class A Shares | | Actual | | $ | 1,000.00 | | | $ | 1,194.00 | | | $ | 8.09 | | | | 1.46 | % |
| | | Hypothetical (2) | | $ | 1,000.00 | | | $ | 1,017.83 | | | $ | 7.44 | | | | 1.46 | % |
International Equity Fund | | | | | | | | | | | | | | | | | | |
Trust Shares | | Actual | | $ | 1,000.00 | | | $ | 1,228.70 | | | $ | 8.92 | | | | 1.59 | % |
| | | Hypothetical (2) | | $ | 1,000.00 | | | $ | 1,017.20 | | | $ | 8.07 | | | | 1.59 | % |
Class A Shares | | Actual | | $ | 1,000.00 | | | $ | 1,227.70 | | | $ | 10.31 | | | | 1.84 | % |
| | | Hypothetical (2) | | $ | 1,000.00 | | | $ | 1,015.95 | | | $ | 9.33 | | | | 1.84 | % |
Macro 100 Fund | | | | | | | | | | | | | | | | | | |
Trust Shares | | Actual | | $ | 1,000.00 | | | $ | 1,206.30 | | | $ | 7.82 | | | | 1.41 | % |
| | | Hypothetical (2) | | $ | 1,000.00 | | | $ | 1,018.12 | | | $ | 7.15 | | | | 1.41 | % |
Class A Shares | | Actual | | $ | 1,000.00 | | | $ | 1,203.80 | | | $ | 9.22 | | | | 1.66 | % |
| | | Hypothetical (2) | | $ | 1,000.00 | | | $ | 1,016.84 | | | $ | 8.43 | | | | 1.66 | % |
Mid Corp America Fund | | | | | | | | | | | | | | | | | | |
Trust Shares | | Actual | | $ | 1,000.00 | | | $ | 1,256.20 | | | $ | 7.67 | | | | 1.35 | % |
| | | Hypothetical (2) | | $ | 1,000.00 | | | $ | 1,018.41 | | | $ | 6.86 | | | | 1.35 | % |
Class A Shares | | Actual | | $ | 1,000.00 | | | $ | 1,254.40 | | | $ | 9.08 | | | | 1.60 | % |
| | | Hypothetical (2) | | $ | 1,000.00 | | | $ | 1,017.15 | | | $ | 8.13 | | | | 1.60 | % |
New Economy Fund | | | | | | | | | | | | | | | | | | |
Trust Shares | | Actual | | $ | 1,000.00 | | | $ | 1,215.30 | | | $ | 8.55 | | | | 1.53 | % |
| | | Hypothetical (2) | | $ | 1,000.00 | | | $ | 1,017.49 | | | $ | 7.79 | | | | 1.53 | % |
Class A Shares | | Actual | | $ | 1,000.00 | | | $ | 1,214.10 | | | $ | 9.94 | | | | 1.78 | % |
| | | Hypothetical (2) | | $ | 1,000.00 | | | $ | 1,016.23 | | | $ | 9.05 | | | | 1.78 | % |
Real Strategies Fund | | | | | | | | | | | | | | | | | | |
Trust Shares | | Actual | | $ | 1,000.00 | | | $ | 1,377.40 | | | $ | 7.95 | | | | 1.33 | % |
| | | Hypothetical (2) | | $ | 1,000.00 | | | $ | 1,018.52 | | | $ | 6.75 | | | | 1.33 | % |
Class A Shares | | Actual | | $ | 1,000.00 | | | $ | 1,374.70 | | | $ | 9.42 | | | | 1.57 | % |
| | | Hypothetical (2) | | $ | 1,000.00 | | | $ | 1,017.27 | | | $ | 8.00 | | | | 1.57 | % |
Annual Shareholder Report
174
Supplemental Information (Unaudited) (Continued)
| | | | | | | | | | | | | | | | | | |
| | | | | Beginning
Account
Value,
July 1, 2010 | | | Ending
Account Value,
December 31, 2010 | | | Expenses
Paid
During
Period(1) | | | Annualized
Expense
Ratio | |
| | | | | |
Rotating Markets Fund | | | | | | | | | | | | | | | | | | |
Trust Shares | | Actual | | $ | 1,000.00 | | | $ | 1,184.60 | | | $ | 6.37 | | | | 1.16 | % |
| | | Hypothetical (2) | | $ | 1,000.00 | | | $ | 1,019.38 | | | $ | 5.88 | | | | 1.16 | % |
Class A Shares | | Actual | | $ | 1,000.00 | | | $ | 1,184.70 | | | $ | 7.72 | | | | 1.40 | % |
| | | Hypothetical (2) | | $ | 1,000.00 | | | $ | 1,018.14 | | | $ | 7.13 | | | | 1.40 | % |
Situs Fund | | | | | | | | | | | | | | | | | | |
Trust Shares | | Actual | | $ | 1,000.00 | | | $ | 1,303.00 | | | $ | 7.92 | | | | 1.36 | % |
| | | Hypothetical (2) | | $ | 1,000.00 | | | $ | 1,018.33 | | | $ | 6.94 | | | | 1.36 | % |
Class A Shares | | Actual | | $ | 1,000.00 | | | $ | 1,302.20 | | | $ | 9.36 | | | | 1.61 | % |
| | | Hypothetical (2) | | $ | 1,000.00 | | | $ | 1,017.07 | | | $ | 8.20 | | | | 1.61 | % |
Technical Opportunities Fund | | | | | | | | | | | | | | | | | | |
Trust Shares | | Actual | | $ | 1,000.00 | | | $ | 1,200.90 | | | $ | 8.79 | | | | 1.58 | % |
| | | Hypothetical (2) | | $ | 1,000.00 | | | $ | 1,017.22 | | | $ | 8.06 | | | | 1.58 | % |
Class A Shares | | Actual | | $ | 1,000.00 | | | $ | 1,198.60 | | | $ | 10.16 | | | | 1.83 | % |
| | | Hypothetical (2) | | $ | 1,000.00 | | | $ | 1,015.96 | | | $ | 9.32 | | | | 1.83 | % |
Fixed Income Securities Fund | | | | | | | | | | | | | | | | | | |
Trust Shares | | Actual | | $ | 1,000.00 | | | $ | 1,004.80 | | | $ | 5.32 | | | | 1.05 | % |
| | | Hypothetical (2) | | $ | 1,000.00 | | | $ | 1,019.90 | | | $ | 5.36 | | | | 1.05 | % |
Class A Shares | | Actual | | $ | 1,000.00 | | | $ | 1,003.60 | | | $ | 6.55 | | | | 1.30 | % |
| | | Hypothetical (2) | | $ | 1,000.00 | | | $ | 1,018.67 | | | $ | 6.60 | | | | 1.30 | % |
Intermediate Government Income Fund | | | | | | | | | | | | | | | | | | |
Trust Shares | | Actual | | $ | 1,000.00 | | | $ | 1,005.90 | | | $ | 5.46 | | | | 1.08 | % |
| | | Hypothetical (2) | | $ | 1,000.00 | | | $ | 1,019.76 | | | $ | 5.50 | | | | 1.08 | % |
Class A Shares | | Actual | | $ | 1,000.00 | | | $ | 1,004.60 | | | $ | 6.70 | | | | 1.33 | % |
| | | Hypothetical (2) | | $ | 1,000.00 | | | $ | 1,018.52 | | | $ | 6.75 | | | | 1.33 | % |
Mortgage Securities Fund | | | | | | | | | | | | | | | | | | |
Trust Shares | | Actual | | $ | 1,000.00 | | | $ | 1,018.80 | | | $ | 5.57 | | | | 1.10 | % |
| | | Hypothetical (2) | | $ | 1,000.00 | | | $ | 1,019.68 | | | $ | 5.58 | | | | 1.10 | % |
Class A Shares | | Actual | | $ | 1,000.00 | | | $ | 1,018.50 | | | $ | 6.81 | | | | 1.34 | % |
| | | Hypothetical (2) | | $ | 1,000.00 | | | $ | 1,018.46 | | | $ | 6.81 | | | | 1.34 | % |
Ohio Tax-Free Fund | | | | | | | | | | | | | | | | | | |
Trust Shares | | Actual | | $ | 1,000.00 | | | $ | 998.90 | | | $ | 5.89 | | | | 1.17 | % |
| | | Hypothetical (2) | | $ | 1,000.00 | | | $ | 1,019.32 | | | $ | 5.95 | | | | 1.17 | % |
Class A Shares | | Actual | | $ | 1,000.00 | | | $ | 997.10 | | | $ | 7.15 | | | | 1.42 | % |
| | | Hypothetical (2) | | $ | 1,000.00 | | | $ | 1,018.05 | | | $ | 7.22 | | | | 1.42 | % |
Short/Intermediate Fixed Income Securities Fund | | | | | | | | | | | | | | | | |
Trust Shares | | Actual | | $ | 1,000.00 | | | $ | 1,005.60 | | | $ | 5.32 | | | | 1.05 | % |
| | | Hypothetical (2) | | $ | 1,000.00 | | | $ | 1,019.90 | | | $ | 5.36 | | | | 1.05 | % |
Class A Shares | | Actual | | $ | 1,000.00 | | | $ | 1,004.40 | | | $ | 6.56 | | | | 1.30 | % |
| | | Hypothetical (2) | | $ | 1,000.00 | | | $ | 1,018.66 | | | $ | 6.61 | | | | 1.30 | % |
Balanced Allocation Fund | | | | | | | | | | | | | | | | | | |
Class A Shares | | Actual | | $ | 1,000.00 | | | $ | 1,135.00 | | | $ | 2.99 | | | | 0.56 | % |
| | | Hypothetical (2) | | $ | 1,000.00 | | | $ | 1,022.41 | | | $ | 2.83 | | | | 0.56 | % |
Conservative Allocation Fund | | | | | | | | | | | | | | | | | | |
Class A Shares | | Actual | | $ | 1,000.00 | | | $ | 1,048.20 | | | $ | 3.36 | | | | 0.65 | % |
| | | Hypothetical (2) | | $ | 1,000.00 | | | $ | 1,021.92 | | | $ | 3.32 | | | | 0.65 | % |
Annual Shareholder Report
175
| | | | | | | | | | | | | | | | | | |
| | | | | Beginning
Account
Value,
July 1, 2010 | | | Ending
Account Value,
December 31, 2010 | | | Expenses
Paid
During
Period(1) | | | Annualized
Expense
Ratio | |
| | | | | |
Growth Allocation Fund | | | | | | | | | | | | | | | | | | |
Class A Shares | | Actual | | $ | 1,000.00 | | | $ | 1,179.60 | | | $ | 2.57 | | | | 0.47 | % |
| | | Hypothetical (2) | | $ | 1,000.00 | | | $ | 1,022.84 | | | $ | 2.39 | | | | 0.47 | % |
| (1) | Expenses are equal to the Fund’s annualized expense ratios, multiplied by the average account value over the period, multiplied by 184/365 (to reflect the one-half year period). The annualized expense ratios reflect reimbursement of expenses by the Funds’ Adviser for the period beginning July 1, 2010 through December 31, 2010. The “Financial Highlights” tables in the Funds’ financial statements, included in the report, also show the gross expense ratios, without such reimbursements. |
| (2) | Hypothetical assumes 5% annual return before expenses. |
Annual Shareholder Report
176
VOTING PROXIES ON FUND PORTFOLIO SECURITIES
A copy of the policies and procedures that the Funds use to determine how to vote proxies relating to securities held in the Funds’ portfolios, as well as a record of how the Funds voted any such proxies during the most recent 12-month period ended June 30, is available without charge and upon request by calling 1-800-253-0412 or at www.huntingtonfunds.com. This information is also available from the EDGAR database on the SEC’s website at www.sec.gov.
QUARTERLY PORTFOLIO SCHEDULE
The Funds file with the SEC a complete schedule of their portfolio holdings, as of the close of the first and third quarters of their fiscal year, on “Form N-Q.” These filings are available on the SEC’s website at www.sec.gov and may be reviewed and copied at the SEC’s Public Reference Room in Washington, DC. (call 1-202-551-8090 for information on the operation of the Public Reference Room.) You may also access this information at www.huntingtonfunds.com by selecting “Form N-Q”.
The Huntington National Bank, a subsidiary of Huntington Bancshares, Inc., is the Administrator, Financial Administrator and Custodian of The Huntington Funds. Huntington Asset Services, Inc. serves as the Sub-Administrator and Sub-Fund Accountant and is affiliated with the Huntington National Bank. Additionally, Brown Brothers Harriman & Co. is the Sub-Custodian of certain of the Funds. Huntington Asset Advisors, Inc., a subsidiary of the Huntington National Bank, serves as Investment Advisor to the Funds. Unified Financial Securities, Inc. serves as the Distributor of The Huntington Funds and is affiliated with the Huntington National Bank.
Mutual funds, including money market funds, are not bank deposits or obligations, are not guaranteed by any bank, and are not insured or guaranteed by the U.S. government, the Federal Deposit Insurance Corporation, the Federal Reserve Board, or any other government agency. Investment in mutual funds involves investment risk, including the possible loss of principal. Although money market funds seek to preserve the value of your investment at $1.00 per share, it is possible to lose money by investing in the Funds.
This report is authorized for distribution to prospective investors only when preceded or accompanied by a prospectus which contains facts concerning the Funds’ objectives and policies, management fees, expenses and other information.
| | |
| Cusip 446327504 | | Cusip 446327538 |
| Cusip 446327603 | | Cusip 446327462 |
| Cusip 446327108 | | Cusip 446327488 |
| Cusip 446327207 | | Cusip 446327777 |
| Cusip 446327496 | | Cusip 446327769 |
| Cusip 446327306 | | Cusip 446327173 |
| Cusip 446327405 | | Cusip 446327199 |
| Cusip 446327702 | | Cusip 446327736 |
| Cusip 446327801 | | Cusip 446327728 |
| Cusip 446327660 | | Cusip 446327793 |
| Cusip 446327645 | | Cusip 446327785 |
| Cusip 446327884 | | Cusip 446327447 |
| Cusip 446327876 | | Cusip 446327843 |
| Cusip 446327868 | | Cusip 446327835 |
| Cusip 446327850 | | Cusip 446327827 |
| Cusip 446327637 | | Cusip 446327819 |
| Cusip 446327611 | | Cusip 446327744 |
| Cusip 446327330 | | Cusip 446327413 |
| Cusip 446327314 | | Cusip 446327298 |
| Cusip 446327561 | | Cusip 446327272 |
| Cusip 446327546 | | Cusip 446327157 |
| Cusip 446327595 | | Cusip 446327140 |
| Cusip 446327579 | | Cusip 446327132 |
| Cusip 446327520 | | |
Huntington Funds Shareholder Services: 1-800-253-0412

27057 (02/11)

Annual Shareholder Report
Balanced Fund
Huntington VA Balanced Fund
Equity Funds
Huntington VA Dividend Capture Fund
Huntington VA Growth Fund
Huntington VA Income Equity Fund
Huntington VA International Equity Fund
Huntington VA Macro 100 Fund
Huntington VA Mid Corp America Fund
Huntington VA New Economy Fund
Huntington VA Real Strategies Fund
Huntington VA Rotating Markets Fund
Huntington VA Situs Fund
Income Funds
Huntington VA Mortgage Securities Fund
DECEMBER 31, 2010
Huntington
VA Balanced Fund
Management’s Discussion of Fund Performance
Investment Advisor: Kristi Abbey
Huntington Asset Advisors, Inc.
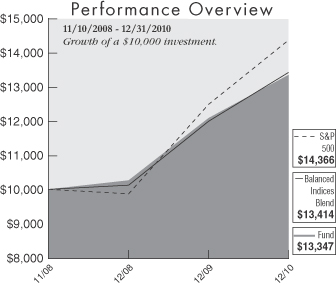
| | | | |
| | | Average Annual
Total Return for
the Period Ended
12/31/10 | |
1 Year | | | 10.43 | % |
Start of Performance (11/10/08) | | | 14.45 | % |
| | | | |
| | | Expense Ratios | |
Gross | | | 1.56 | % |
With Contractual Waivers | | | 0.10 | % |
The graph above illustrates the hypothetical investment of $10,000* in the Huntington VA Balanced Fund from November 10, 2008 (inception) to December 31, 2010, compared to the S&P 500 and Balanced Indices Blend.
The performance information does not include the charges and expenses imposed by the insurance company separate accounts or charges and expenses under the variable insurance product contracts. The inclusion of such charges would lower performance. Please refer to the variable insurance product prospectus for a complete listing of these expenses. The above expense ratios are from the Funds’ prospectus dated May 1, 2010. Additional information pertaining to the Fund’s expense ratio as of December 31, 2010 can be found in the financial highlights. For the fiscal year ended 12/31/10, Fund shares were available exclusively as a funding vehicle for Hartford Life Insurance Company’s separate accounts in connection with the Huntington Director, Huntington Director Outlook and Huntington Hartford Leaders Outlook variable annuity contracts, Transamerica Life Insurance Company’s separate accounts in connection with the Huntington Allstar Select variable annuity contract, and to the separate accounts of Nationwide Life and Annuity Insurance Company, Nationwide Life Insurance Company and Sun Life Assurance Company of Canada (U.S.). Variable investment options are not obligations of or guaranteed by any bank and are not federally insured.
| * | The Fund’s performance assumes the reinvestment of all dividends and distributions. The S&P 500 and Balanced Indices Blend have been adjusted to reflect reinvestment of dividends on securities in the indices. |
For the fiscal year ended December 31, 2010, the Huntington VA Balanced Fund produced a total return of 10.43%. This underperformed the total return of 15.06% for the Fund’s benchmark, the Standard & Poor’s 500 Index (S&P 500)1. Because of the Fund’s 40% exposure to fixed income, the Fund underperformed its benchmark index, which is comprised entirely of equity securities. The Fund’s total return also underperformed the Balanced Indices Blend2 total return of 11.65%.
The VA Balanced Fund is a fund of funds, which invests solely in the shares of other underlying funds (Huntington VA Funds and Huntington Funds). The Fund’s assets were allocated approximately 60% equities and 40% fixed income.
Relative to the Fund’s benchmark total return of 15.06%, underlying funds contributing positive performance for the year ended December 31, 2010, included the VA Dividend Capture Fund with a return of 15.12%, VA Mid Corp America Fund with a return of 22.80%, VA New Economy Fund 15.97% and the VA Situs Fund with a return of 29.61%.
Underlying funds detracting from performance included the VA Growth Fund with a return of 9.72%, VA Income Equity Fund with a return of 11.79%, VA International Equity Fund With a return of 9.18%, VA Macro 100 Fund with a return of 14.12%, VA Mortgage Securities Fund with a return of 4.89% and the Huntington Fixed Income Securities Fund’s Trust Shares with a return of 5.75%.
Performance data quoted represents past performance which is no guarantee of future results. Investment return and principal value will fluctuate so that an investor’s shares, when redeemed, may be worth more or less than their original cost. Performance for a variable investment option changes over time and current performance may be lower or higher than what is stated. For current to the most recent month end performance, contact your insurance company.
| p | The composition of the Fund’s holdings is subject to change. |
| 1 | The S&P 500 is a capitalization-weighted index comprised of 500 stocks and designed to measure performance of the broad domestic economy through changes in the aggregate market value of 500 stocks representing all major industries. The index is unmanaged and, unlike the Fund, is not affected by cashflows. It is not possible to invest directly in an index. |
| 2 | The Balanced Indices Blend is a custom, blended index comprised of 60% S&P 500 and 40% Barclays Capital U.S. Aggregate Bond Index. This custom, blended index and its weightings are reflective of the Fund’s equity/fixed income allocation. The S&P 500 Index is composed of 500 widely held common stocks. The Barclays Capital U.S. Aggregate Bond Index includes U.S. government, corporate and mortgage-backed securities with maturities up to 30 years. It is not possible to invest directly in an index. |
H U N T I N G T O N F U N D S
Huntington
VA Dividend Capture Fund
Management’s Discussion of Fund Performance
Portfolio Manager:
Kirk Mentzer, MBA, Director of Research
Huntington Asset Advisors, Inc.
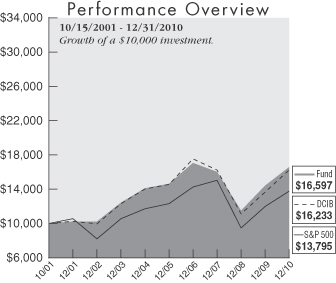
| | | | |
| | | Average Annual
Total Return for
the Period Ended
12/31/10 | |
1 Year | | | 15.12 | % |
3 Year | | | 1.18 | % |
5 Year | | | 2.54 | % |
Start of Performance (10/15/01) | | | 5.66 | % |
The graph above illustrates the hypothetical investment of $10,000* in the Huntington VA Dividend Capture Fund from October 15, 2001 (inception) to December 31, 2010, compared to the S&P 500 and DCIB.
The performance information does not include the charges and expenses imposed by the insurance company separate accounts or charges and expenses under the variable insurance product contracts. The inclusion of such charges would lower performance. Please refer to the variable insurance product prospectus for a complete listing of these expenses. The above expense ratio is from the Funds’ prospectus dated May 1, 2010. Additional information pertaining to the Fund’s expense ratio as of December 31, 2010 can be found in the financial highlights. For the fiscal year ended 12/31/10, Fund shares were available exclusively as a funding vehicle for Hartford Life Insurance Company’s separate accounts in connection with the Huntington Director, Huntington Director Outlook and Huntington Hartford Leaders Outlook variable annuity contracts, Transamerica Life Insurance Company’s separate accounts in connection with the Huntington Allstar Select variable annuity contract, and to the separate accounts of Nationwide Life and Annuity Insurance Company, Nationwide Life Insurance Company and Sun Life Assurance Company of Canada (U.S.). Variable investment options are not obligations of or guaranteed by any bank and are not federally insured.
| * | The Fund’s performance assumes the reinvestment of all dividends and distributions. The S&P 500 and DCIB have been adjusted to reflect reinvestment of dividends on securities in the indices. |
For the fiscal year ended December 31, 2010, the Huntington VA Dividend Capture Fund produced a total return of 15.12% based on net asset value. This performance exceeded the total return of 15.06% for the Fund’s benchmark, the Standard & Poor’s 500 Index (S&P 500),1 and was less than the 17.12% total return for the Dividend Capture Indices Blend (DCIB).2
The Fund is managed using our top-down style and portfolio construction techniques, which are aimed at producing a high level of stable income and low volatility. In general terms, income-producing stocks and value-oriented investments lagged overall market performance during the fiscal year. Improving market sentiment, policy clarity and increased merger activity all converged late in the year to provide a strong finish for equity markets in 2010. However, the market had to wade through considerable uncertainty to get to its final destination. Sovereign debt issues in Europe at the beginning of summer threatened the durability of the financial system recovery. As a result, the Federal Reserve initiated further bond purchases in late summer to enhance market liquidity. Despite the US mid-term elections and China raising interest rates in the fall, the US equity market was able to power through all these barriers thanks to plentiful liquidity. For all of 2010, the S&P 500 posted a total return of 15.06%. Fourth quarter results were likewise strong at 10.76%. The Fund’s asset allocation efforts were successful in capturing much of the fourth quarter equity market move by selling REITs (Real Estate Investment Trusts) and Preferred shares in favor of common stocks which were the best performing of the three classes. As a result, the Fund was able to exceed the return of its benchmark.
The three holdings that had the largest positive contribution to the Fund’s performance were Polaris Industries Inc., Chevron Corp. and A.O. Smith Corp. The three holdings that had the largest negative contribution to the Fund’s performance and their percentage of total net assets were Avon Products Inc., Pfizer Inc. and Archer Daniels Midland Co.
Performance data quoted represents past performance which is no guarantee of future results. Investment return and principal value will fluctuate so that an investor’s shares, when redeemed, may be worth more or less than their original cost. Performance for a variable investment option changes over time and current performance may be lower or higher than what is stated. For current to the most recent month end performance, contact your insurance company.
| p | The composition of the Fund’s holdings is subject to change. |
| 1 | The S&P 500 is a capitalization-weighted index comprised of 500 stocks and is designed to measure performance of the broad domestic economy through changes in the aggregate market value of 500 stocks representing all major industries. The index is unmanaged and, unlike the Fund, is not affected by cashflows. It is not possible to invest directly in an Index. |
| 2 | The DCIB is a custom, blended index comprised of the following three indices with their noted respective weightings: S&P 500 Value Index (40%), Merrill Lynch Fixed Rate Preferred Index (40%) and NAREIT Index (20%). This custom, blended index and its respective weightings are reflective of the Fund’s sector diversification. Indices are unmanaged and, unlike the Fund, are not affected by cashflows. It is not possible to invest directly in an Index. |
Huntington
VA Growth Fund
Management’s Discussion of Fund Performance
Portfolio Manager:
Herb Chen, MBA
Senior Vice President
Huntington Asset Advisors, Inc.
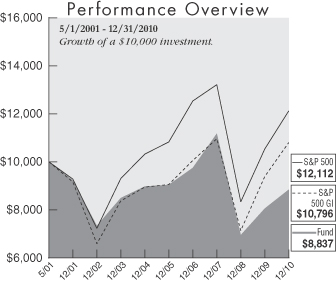
| | | | |
| | | Average Annual
Total Return for
the Period Ended
12/31/10 | |
1 Year | | | 9.72 | % |
3 Year | | | (7.51 | )% |
5 Year | | | (0.45 | )% |
Start of Performance (05/01/01) | | | (1.27 | )% |
The graph above illustrates the hypothetical investment of $10,000* in the Huntington VA Growth Fund from May 1, 2001 (inception) to December 31, 2010, compared to the S&P 500 GI.
The performance information does not include the charges and expenses imposed by the insurance company separate accounts or charges and expenses under the variable insurance product contracts. The inclusion of such charges would lower performance. Please refer to the variable insurance product prospectus for a complete listing of these expenses. The above expense ratio is from the Funds’ prospectus dated May 1, 2010 (Amended November 3, 2010). Additional information pertaining to the Fund’s expense ratio as of December 31, 2010 can be found in the financial highlights. For the fiscal year ended 12/31/10, Fund shares were available exclusively as a funding vehicle for Hartford Life Insurance Company’s separate accounts in connection with the Huntington Director, Huntington Director Outlook and Huntington Hartford Leaders Outlook variable annuity contracts, Transamerica Life Insurance Company’s separate accounts in connection with the Huntington Allstar Select variable annuity contract, and to the separate accounts of Nationwide Life and Annuity Insurance Company, Nationwide Life Insurance Company and Sun Life Assurance Company of Canada (U.S.). Variable investment options are not obligations of or guaranteed by any bank and are not federally insured.
| * | The Fund’s performance assumes the reinvestment of all dividends and distributions. The S&P 500 GI has been adjusted to reflect reinvestment of dividends on securities in the indices. |
For the fiscal year ended December 31, 2010, the Huntington VA Growth Fund produced a total return of 9.72% based on net asset value. This underperformed the total return of 15.06% for the Standard & Poor’s 500 Growth Index (S&P 500 GI),1 the Fund’s benchmark, and a total return of 15.06% for the Standard & Poor’s 500 Index (S&P 500)2 for the reporting period.
Under the management of the previous fund managers, the VA Growth Fund began the year with a relatively defensively structured portfolio. With the S&P 500 GI being up 3.71%, the Fund lagged by 1.74% at the end of the first quarter.
In April 2010, Herb Chen assumed management responsibility and three major changes were implemented to turn around Fund performance: the Fund was aligned with our forecast of an economic recovery, the number of positions was reduced from greater than 100 to 40 and the Beta of the Fund was increased above 1 to reflect a more aggressive growth portfolio.
In May 2010, the first month after the full rebalancing of the Fund, we began seeing positive relative returns. The Fund beat its benchmark in May and June. During these months, we were overweight in Consumer Discretionary, Energy, Industrial, and Materials, which typically outperform in an economic recovery. In third quarter, profits were realized from Consumer Discretionary and re-invested into an overweight in Technology. The Fund exceeded the benchmark for the quarter ended September 30, 2010. Security selection was the largest contributor, followed by security characteristics and sector allocation. Baidu, VMware and Salesforce.com were top stock contributors.
In the final quarter, Technology was returned to an underweight, with Consumer Discretionary moving back to an overweight. Security characteristics and sector allocation positively contributed, to the Fund’s return, while stock selection reversed course with a negative return. We believe this was more of an anomaly and will be carefully watched going forward. Companies that had appreciated significantly during the year disappointed during earnings release and sold off sharply. Several of these positions were sold to establish a fresh start in 2011.
Performance data quoted represents past performance which is no guarantee of future results. Investment return and principal value will fluctuate so that an investor’s shares, when redeemed, may be worth more or less than their original cost. Performance for a variable investment option changes over time and current performance maybe lower or higher than what is stated. For current to the most recent month end performance, contact your insurance company.
| p | The composition of the Fund’s holdings is subject to change. |
| 1 | The S&P 500 GI is a capitalization-weighted index comprised of stocks in the S&P 500 having the highest price to book ratios. The index consists of approximately half of the S&P 500 on a market capitalization basis. The index is unmanaged and, unlike the Fund, is not affected by cashflows. It is not possible to invest directly in an index. |
| 2 | The S&P 500 is a capitalization-weighted index comprised of 500 stocks and designed to measure performance of the broad domestic economy through changes in the aggregate market value of 500 stocks representing all major industries. The index is unmanaged and, unlike the Fund, is not affected by cashflows. It is not possible to invest directly in an Index. |
H U N T I N G T O N F U N D S
Huntington
VA Income Equity Fund
Management’s Discussion of Fund Performance
Portfolio Manager: Craig J. Hardy, CFA, MBA
Vice President
Huntington Asset Advisors, Inc.
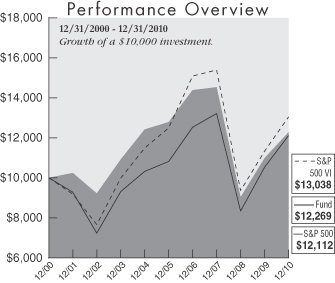
| | | | |
| | | Average Annual
Total Return for
the Period Ended
12/31/10 | |
1 Year | | | 11.79 | % |
3 Year | | | (5.45 | )% |
5 Year | | | (0.80 | )% |
10 Year | | | 2.07 | % |
The graph above illustrates the hypothetical investment of $10,000* in the Huntington VA Income Equity Fund from December 31, 1999 to December 31, 2010, compared to the S&P 500 VI and the S&P 500.
The performance information does not include the charges and expenses imposed by the insurance company separate accounts or charges and expenses under the variable insurance product contracts. The inclusion of such charges would lower performance. Please refer to the variable insurance product prospectus for a complete listing of these expenses. The above expense ratio is from the Funds’ prospectus dated May 1, 2010. Additional information pertaining to the Fund’s expense ratio as of December 31, 2010 can be found in the financial highlights. For the fiscal year ended 12/31/10, Fund shares were available exclusively as a funding vehicle for Hartford Life Insurance Company’s separate accounts in connection with the Huntington Director, Huntington Director Outlook and Huntington Hartford Leaders Outlook variable annuity contracts, Transamerica Life Insurance Company’s separate accounts in connection with the Huntington Allstar Select variable annuity contract, and to the separate accounts of Nationwide Life and Annuity Insurance Company, Nationwide Life Insurance Company and Sun Life Assurance Company of Canada (U.S.). Variable investment options are not obligations of or guaranteed by any bank and are not federally insured.
| * | The Fund’s performance assumes the reinvestment of all dividends and distributions. The S&P 500 and S&P 500 VI have been adjusted to reflect reinvestment of all dividends on securities in the indices. |
For the fiscal year ended December 31, 2010, the total return for the Huntington VA Income Equity Fund was 11.79% based on net asset value. These returns compare with a total return of 15.10% for the Standard & Poor’s 500 Value Index (S&P 500 VI),1 the Fund’s benchmark. The Standard & Poor’s 500 Index (S&P 500)2 returned 15.06% for the same period.
During the fiscal year, the Fund was positioned relatively conservatively, with an emphasis on stocks with above average dividend yields, reasonable dividend growth prospects and value orientation. Constructing the Fund with those characteristics meant that the Fund’s largest sector exposure during the fiscal year was in the Financial sector. This combination of characteristics produced returns for the Fund that were somewhat lower than the return of the S&P 500 VI and the S&P 500 for the reporting period.
The sectors that contributed most positively to the performance of the Fund during the year were Materials, Consumer Discretionary and Telecommunications. These sectors were positively affected by a growing economic environment and economic cyclicality. The sectors that most negatively impacted the Fund’s performance during the reporting period were Information Technology, Health Care and Energy. During a year of general stock market strength, these three sectors provided a degree of earnings stability and lesser economic sensitivity, but showed generally lower returns than some of the more cyclical sectors. The stocks that contributed most positively to the performance of the Fund during the year were Caterpillar Inc., Sara Lee Corp. and Limited Inc. The stocks that most negatively impacted Fund performance during the year were Banco Santander, BP and Sanofi-Aventis. In general, the sale of covered calls as a hedging technique added to the performance of the Fund.
Performance data quoted represents past performance which is no guarantee of future results. Investment return and principal value will fluctuate so that an investor’s shares, when redeemed, may be worth more or less than their original cost. Performance for a variable investment option changes over time and current performance maybe lower or higher than what is stated. For current to the most recent month end performance, contact your insurance company.
| p | The composition of the Fund’s holdings is subject to change. |
| 1 | The S&P 500 VI is a capitalization-weighted index comprised of the stocks in the S&P 500 having the lowest price to book ratios and consists of approximately half of the S&P 500 on a market capitalization basis. The S&P multifactor methodology is used to score constituents, which are weighted according to market cap and classified as value. The index has a relatively low turnover. The index is unmanaged and, unlike the Fund, is not affected by cashflows. It is not possible to invest directly in an index. |
| 2 | The S&P 500 is a capitalization-weighted index comprised of 500 stocks and designed to measure performance of the broad domestic economy through changes in the aggregate market value of 500 stocks representing all major industries. The index is unmanaged and, unlike the Fund, is not affected by cashflows. It is not possible to invest directly in an index. |
Huntington
VA International Equity Fund
Management’s Discussion of Fund Performance
Portfolio Manager: Madelynn M. Matlock, CFA, MBA
Director of International Investments
Senior Vice President
Huntington Asset Advisors, Inc.
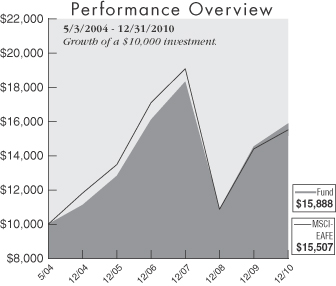
| | | | |
| | | Average Annual
Total Return for
the Period Ended
12/31/10 | |
1 Year | | | 9.18 | % |
3 Year | | | (4.67 | )% |
5 Year | | | 4.39 | % |
Start of Performance (05/03/04) | | | 7.20 | % |
The graph above illustrates the hypothetical investment of $10,000* in the Huntington VA International Equity Fund from May 3, 2004 (inception) to December 31, 2010, compared to the MSCI-EAFE.
The performance information does not include the charges and expenses imposed by the insurance company separate accounts or charges and expenses under the variable insurance product contracts. The inclusion of such charges would lower performance. Please refer to the variable insurance product prospectus for a complete listing of these expenses. The above expense ratio is from the Funds’ prospectus dated May 1, 2010. Additional information pertaining to the Fund’s expense ratio as of December 31, 2010 can be found in the financial highlights. For the fiscal year ended 12/31/10, Fund shares were available exclusively as a funding vehicle for Hartford Life Insurance Company’s separate accounts in connection with the Huntington Director, Huntington Director Outlook and Huntington Hartford Leaders Outlook variable annuity contracts, Transamerica Life Insurance Company’s separate accounts in connection with the Huntington Allstar Select variable annuity contract, and to the separate accounts of Nationwide Life and Annuity Insurance Company, Nationwide Life Insurance Company and Sun Life Assurance Company of Canada (U.S.). Variable investment options are not obligations of or guaranteed by any bank and are not federally insured.
| * | The Fund’s performance assumes the reinvestment of all dividends and distributions. The MSCI-EAFE has been adjusted to reflect reinvestment of all dividends on securities in the index. |
For the fiscal year ended December 31, 2010, the Huntington VA International Equity Fund produced a total return of 9.18% based on net asset value. This outperformed the total return of 7.75% for the Morgan Stanley Capital International (MSCI) Europe, Australasia and Far East Index (MSCI-EAFE),1 the Fund’s benchmark index.
The Fund’s outperformance relative to the MSCI-EAFE was influenced by three main factors: its allocation to sectors, currency and regions, along with trading activity, which added to the beneficial impact from the selection of particular securities. Overall, sector weightings did not contribute to positive relative performance for the year. The portfolio had a less-than-benchmark weighting in materials and consumer discretionary stocks, which were strong contributors to index performance. This was partially offset by an above-index weighting in industrial and technology stocks, which did add value.
The best contributors to overall return were stocks in the industrial sector, including Fanuc and Komatsu in Japan, GEA Group in Germany, and Rolls Royce in the UK. Energy stocks also contributed to relative performance, including the Italian oil service stock Saipem and Canadian-based Cenovus. The currency exposure of the portfolio was slightly negative for performance, with a positive contribution due to an underweight in the euro offset by a lower than index exposure to the Australian dollar and the Swedish krona, which added to the MSCI-EAFE return. The Fund benefited from a lighter weighting in financial stocks than the index, but one the weakest stocks in the portfolio was Banco Bilbao Vizcaya, which offset some of that positive effect.
Overall, there was a positive impact of security selection. To control the risk of large position sizes, stock positions are trimmed when they become larger proportions of the portfolio, but in a year when good relative performance for particular stocks tended to persist, this meant reducing exposure to positions that were doing relatively well.
Performance data quoted represents past performance which is no guarantee of future results. Investment return and principal value will fluctuate so that an investor’s shares, when redeemed, may be worth more or less than their original cost. Performance for a variable investment option changes over time and current performance maybe lower or higher than what is stated. For current to the most recent month end performance, contact your insurance company.
| p | The composition of the Fund’s holdings is subject to change. |
| 1 | The MSCI-EAFE is a market capitalization-weighted equity index comprising 20 of the 48 countries in the MSCI universe and representing the developed world outside of North America. Each MSCI country index is created separately, then aggregated, without change, into regional MSCI indices. The index is unmanaged and, unlike the Fund, is not affected by cash flows. It is not possible to invest directly in an index. |
International investing involves special risks including currency risk, political risk, increased volatility of foreign securities, and differences in auditing and other financial standards.
H U N T I N G T O N F U N D S
Huntington
VA Macro 100 Fund
Management’s Discussion of Fund Performance
Investment Advisor: Chad J. Oviatt
Huntington Asset Advisors, Inc.
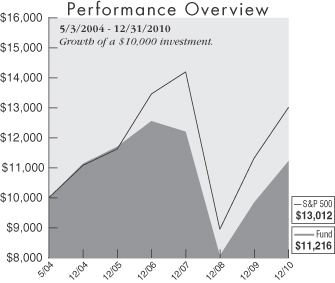
| | | | |
| | | Average Annual
Total Return for
the Period Ended
12/31/10 | |
1 Year | | | 14.12 | % |
3 Year | | | (2.77 | )% |
5 Year | | | (0.85 | )% |
Start of Performance (05/03/04) | | | 1.74 | % |
The graph above illustrates the hypothetical investment of $10,000* in the Huntington VA Macro 100 Fund from May 3, 2004 (inception) to December 31, 2010, compared to the S&P 500.
The performance information does not include the charges and expenses imposed by the insurance company separate accounts or charges and expenses under the variable insurance product contracts. The inclusion of such charges would lower performance. Please refer to the variable insurance product prospectus for a complete listing of these expenses. The above expense ratio is from the Funds’ prospectus dated May 1, 2010. Additional information pertaining to the Fund’s expense ratio as of December 31, 2010 can be found in the financial highlights. For the fiscal year ended 12/31/10, Fund shares were available exclusively as a funding vehicle for Hartford Life Insurance Company’s separate accounts in connection with the Huntington Director, Huntington Director Outlook and Huntington Hartford Leaders Outlook variable annuity contracts, Transamerica Life Insurance Company’s separate accounts in connection with the Huntington Allstar Select variable annuity contract, and to the separate accounts of Nationwide Life and Annuity Insurance Company, Nationwide Life Insurance Company and Sun Life Assurance Company of Canada (U.S.). Variable investment options are not obligations of or guaranteed by any bank and are not federally insured.
| * | The Fund’s performance assumes the reinvestment of all dividends and distributions. The S&P 500 has been adjusted to reflect reinvestment of all dividends on securities in the index. |
For the fiscal year ended December 31, 2010, the Huntington VA Macro 100 Fund produced a total return of 14.12% based on net asset value. This undeperformed the total return of 15.06% for the Standard & Poor’s 500 Index (S&P 500),1 the Fund’s benchmark index.
The Fund’s performance relative to the S&P 500 was, in large part, due to the types of securities owned rather than the overall industry allocations. The Fund benefited from a slightly lower average market capitalization relative to its benchmark and was also positively impacted by other fundamental factors such as average earnings per share, average revenue per share and favorable debt to equity ratios. The major detractor from performance for the year was the Fund’s limited participation in the performance of the Consumer Discretionary sector. The combination of an underweight position in the Consumer Discretionary sector and individual security selection in this sector resulted in the underperformance relative the benchmark’s sector performance. The Financial Sector was also a detractor from performance due to its underweight position.
Despite a change in portfolio managers, which occurred in April of 2010, the Fund continued the process of integrating the quantitative macro-economic research provided by the consulting firm, Laffer Associates, Inc. (where the S&P 500 stocks are ranked according to the output of Laffer’s statistical models) with Huntington Asset Advisors’ recommended sector bias’. It was the combination of these two disciplines that resulted in added value within the investment selection process.
The Macro-economic environment, both domestically and globally, had a significant impact on the portfolio once again this year. The beginning of 2010 seemed to indicate that economic stability was taking hold, and a positive macroeconomic outlook helped to fuel the S&P 500 return of 5.39% in the first quarter. Unfortunately, the second quarter saw a global economy that was shaken by developments in Europe. The S&P 500 was not immune to the global disruption and posted a -11.43% return for the quarter. Of course, the third quarter was a much different story for the S&P 500 as global sentiment improved due in large part to the actions of various governments from around the world, as well as generally better than expected economic numbers. The S&P 500 returned 11.29% for the quarter. This positive momentum continued into the fourth quarter and paved the way for the S&P 500’s 15.06% total return for 2010.
Performance data quoted represents past performance which is no guarantee of future results. Investment return and principal value will fluctuate so that an investor’s shares, when redeemed, may be worth more or less than their original cost. Performance for a variable investment option changes over time and current performance may be lower or higher than what is stated. For current to the most recent month end performance, contact your insurance company.
| p | The composition of the Fund’s holdings is subject to change. |
| 1 | The S&P 500 is a capitalization-weighted index comprised of 500 stocks and designed to measure performance of the broad domestic economy through changes in the aggregate market value of 500 stocks representing all major industries. The index is unmanaged and, unlike the Fund, is not affected by cashflows. It is not possible to invest directly in an index. |
Huntington
VA Mid Corp America Fund
Management’s Discussion of Fund Performance
Portfolio Manager: Christopher M. Rowane, CFA, MBA
Senior Vice President
Huntington Asset Advisors, Inc.
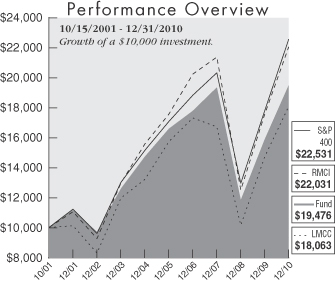
| | | | |
| | | Average Annual
Total Return for
the Period Ended
12/31/10 | |
1 Year | | | 22.80 | % |
3 Year | | | 0.27 | % |
5 Year | | | 3.29 | % |
Start of Performance (10/15/01) | | | 7.51 | % |
The graph above illustrates the hypothetical investment of $10,000* in the Huntington VA Mid Corp America Fund from October 15, 2001 (inception) to December 31, 2010, compared to the S&P 400, the RMCI, and the LMCC.
The performance information does not include the charges and expenses imposed by the insurance company separate accounts or charges and expenses under the variable insurance product contracts. The inclusion of such charges would lower performance. Please refer to the variable insurance product prospectus for a complete listing of these expenses. The above expense ratio is from the Funds’ prospectus dated May 1, 2010. Additional information pertaining to the Fund’s expense ratio as of December 31, 2010 can be found in the financial highlights. For the fiscal year ended 12/31/10, Fund shares were available exclusively as a funding vehicle for Hartford Life Insurance Company’s separate accounts in connection with the Huntington Director, Huntington Director Outlook and Huntington Hartford Leaders Outlook variable annuity contracts, Transamerica Life Insurance Company’s separate accounts in connection with the Huntington Allstar Select variable annuity contract, and to the separate accounts of Nationwide Life and Annuity Insurance Company, Nationwide Life Insurance Company and Sun Life Assurance Company of Canada (U.S.). Variable investment options are not obligations of or guaranteed by any bank and are not federally insured.
| * | The Fund’s performance assumes the reinvestment of all dividends and distributions. The S&P 400, RMCI and LMCC have been adjusted to reflect reinvestment of dividends on securities in the indices and average. |
For the fiscal year ended December 31, 2010, the Huntington VA Mid Corp America Fund produced a total return of 22.80% based on net asset value. In the same period, the Fund’s benchmark, the Standard & Poor’s MidCap 400 Index (S&P 400)1 produced a total return of 26.64%, and the Russell Midcap Index (RMCI)2 produced a total return of 25.48%, while the Lipper Mid Cap Core Average (LMCC)3 returned 22.87%.
The Fund experienced volatility during 2010, subjected to the market lows in the summer months with a strong rebound toward year’s end. The highlight of the mid cap market was that it presented one of the greatest upsides in 2010 compared to other indices, outpacing large caps and slightly ahead of small caps, as represented by the Standard & Poor’s 500 Index (S&P 500)4 and the Standard & Poor’s Small Cap 600 Index (S&P 600),5 respectively.
The Fund underperformed the S&P 400 for 2010, mainly due to being defensive and maintaining higher quality securities. According to a Morningstar research report, only 22% of active mid cap managers have outpaced the S&P 400 index in the past decade, leading us to a strategy where managing risk might be as important as performance in these volatile markets.
The Fund was underweighted in the Consumer Discretionary and Financials sectors, while over weighted in the Energy and Technology sectors. The performance impact of being underweight in Consumer Discretionary lead to underperformance in the Fund, even with holdings like Royal Caribbean Cruises, which gained 85% for the year. The underweight in Financials proved to be a great benefit to performance, avoiding some of the weakest performers in the mid cap universe. Industrials proved to be another bright spot in sector weighting as well as security selection, but not without some volatile holdings, like Cummins Inc. gaining 142%, and L-3 Communications Holdings, which fell 17% over the year. The greatest impact came with the under-exposure to Technology, with the index sector holdings registering a 32% return versus the portfolio’s return of 21% for this sector. The challenge was finding companies that met the quality earnings profile without the added incremental risk. The Fund focused on the long-term sector and stock selection attributes that have added to its performance over volatile cycles. The Fund maintained a higher number of holdings than some of its peers to provide greater diversification.6
Performance data quoted represents past performance which is no guarantee of future results. Investment return and principal value will fluctuate so that an investor’s shares, when redeemed, may be worth more or less than their original cost. Performance for a variable investment option changes over time and current performance may be lower or higher than what is stated. For current to the most recent month end performance, contact your insurance company.
| p | The composition of the Fund’s holdings is subject to change. |
| 1 | The S&P 400 is a capitalization weighted index comprised of common stocks representing all major industries in the mid-cap range of the U.S. stock market. The index is unmanaged and, unlike the Fund, is not affected by cashflows. It is not possible to invest directly in an index. |
| 2 | The RMCI measures the performance of the 800 smallest companies in the Russell 1000 Index, which represent approximately 26% of the total market capitalization of the Russell 1000 Index. The index is unmanaged and, unlike the Fund, is not affected by cashflows. It is not possible to invest directly in an index. |
| 3 | LMCC figures represent the average of the total returns reported by all of the mutual funds designated by Lipper Inc. as falling in the category indicated. They do not reflect sales charges. |
| 4 | The S&P 500 is a capitalization-weighted index comprised of 500 stocks and designed to measure performance of the broad domestic economy through changes in the aggregate market value of 500 stocks representing all major industries. The index is unmanaged and, unlike the Fund, is not affected by cashflows. It is not possible to invest directly in an index. |
| 5 | The S&P 600 is a capitalization-weighted index representing all major industries in the small-cap range of the U.S. stock market. The index is unmanaged and, unlike the Fund, is not affected by cashflows. It is not possible to invest directly in an index. |
| 6 | Diversification does not assure a profit nor protect against loss. |
H U N T I N G T O N F U N D S
Huntington
VA New Economy Fund
Management’s Discussion of Fund Performance
Portfolio Manager: Randy Hare
Vice President
Huntington Asset Advisors, Inc.
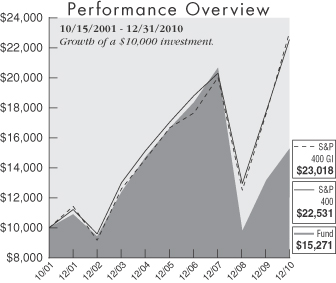
| | | | |
| | | Average Annual
Total Return for
the Period Ended
12/31/10 | |
1 Year | | | 15.97 | % |
3 Year | | | (9.58 | )% |
5 Year | | | (1.71 | )% |
Start of Performance (10/15/01) | | | 4.70 | % |
The graph above illustrates the hypothetical investment of $10,000* in the Huntington VA New Economy Fund from October 15, 2001 (inception) to December 31, 2010, compared to the S&P 400 and the S&P 400 GI.
The performance information does not include the charges and expenses imposed by the insurance company separate accounts or charges and expenses under the variable insurance product contracts. The inclusion of such charges would lower performance. Please refer to the variable insurance product prospectus for a complete listing of these expenses. The above expense ratio is from the Funds’ prospectus dated May 1, 2010. Additional information pertaining to the Fund’s expense ratio as of December 31, 2010 can be found in the financial highlights. For the fiscal year ended 12/31/10, Fund shares were available exclusively as a funding vehicle for Hartford Life Insurance Company’s separate accounts in connection with the Huntington Director, Huntington Director Outlook and Huntington Hartford Leaders Outlook variable annuity contracts, Transamerica Life Insurance Company’s separate accounts in connection with the Huntington Allstar Select variable annuity contract, and to the separate accounts of Nationwide Life and Annuity Insurance Company, Nationwide Life Insurance Company and Sun Life Assurance Company of Canada (U.S.). Variable investment options are not obligations of or guaranteed by any bank and are not federally insured.
| * | The Fund’s performance assumes the reinvestment of all dividends and distributions. The S&P 400 and the S&P 400 GI indices have been adjusted to reflect reinvestment of dividends on securities in the indices. |
For the fiscal year ended December 31, 2010, the Huntington VA New Economy Fund produced a total return of 15.97% based on net asset value. The Fund’s benchmark, the Standard & Poor’s MidCap 400 Growth Index (S&P 400 GI)1 had a total return of 30.57%, while the Standard & Poor’s Mid Cap 400 Index (S&P 400)2, had a total return of 26.64%.
During the year, the Fund’s holdings remained invested in companies producing or benefiting from increased productivity trends. Trading activity was responsible for -6.69% of the performance relative to the benchmark, while portfolio structure had a negative impact of -8.46%. Portfolio structure can be explained by adding Security Characteristics: -0.34%, Sector Allocation: -0.16% and Security Selection: -7.95%.
The Fund’s performance relative to the benchmark was affected by both sector selection and individual stock selection. The Consumer Discretionary and Information Technology sectors provided the largest sources of returns above the benchmark. Consumer Discretionary was a focus in the beginning of the year and the Fund reduced exposure throughout the year. Information Technology remained an overweight sector for the year ending December 31, 2010. The source for the largest underperformance relative to the benchmark was the stock selection in the Financial sector. The Fund’s overweight position in the Energy sector also provided negative relative performance for the Fund during the year. The remaining relative sector weights provided minimal contribution versus the Fund’s benchmark. The Fund’s sector selection process during 2010 continued to be driven by the sector strategy of Huntington Asset Advisors, Inc.
The three holdings that had the largest positive contribution to the Fund’s performance were F5 Networks Inc., CF Industries Holdings Inc. and lululemon athletica inc. These three holdings added 4.95% to the Fund’s return. The three holdings that had the largest negative contribution to the Fund’s performance were iPath S&P 500 Vix Call JAN11 48, Intuitive Surgical Inc. and iPath S&P 500 VIX SH TM FT CALL (0.02%). These three holdings subtracted -1.74% from the Fund’s return.
Performance data quoted represents past performance which is no guarantee of future results. Investment return and principal value will fluctuate so that an investor’s shares, when redeemed, may be worth more or less than their original cost. Performance for a variable investment option changes over time and current performance may be lower or higher than what is stated. For current to the most recent month end performance, contact your insurance company.
| p | The composition of the Fund’s holdings is subject to change. |
| 1 | The S&P 400 GI is designed to provide a comprehensive measure of mid-cap U.S. equity “growth” performance. It is a float adjusted market capitalization-weighted index comprised of stocks representing approximately half the market capitalization of the S&P 400 that have been indentified as being on the growth end of the growth-value spectrum. Indices are unmanaged and, unlike the Fund, are not affected by cashflows. It is not possible to invest directly in an index. |
| 2 | The S&P 400 is a capitalization-weighted index comprised of common stocks representing all major industries in the mid-range of the U.S. stock market. The index is unmanaged and, unlike the Fund, is not affected by cashflows. It is not possible to invest directly in an index. |
Huntington
VA Real Strategies Fund
Management’s Discussion of Fund Performance
Portfolio Manager: Peter Sorrentino, CFA
Vice President
Huntington Asset Advisors, Inc.
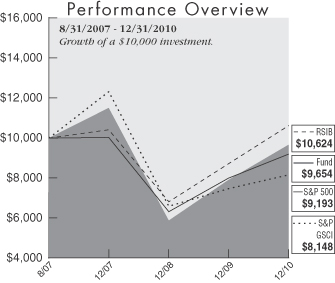
| | | | |
| | | Average Annual
Total Return for
the Period Ended
12/31/10 | |
1 Year | | | 22.15 | % |
3 Year | | | (5.67 | )% |
Start of Performance (08/31/07) | | | (1.05 | )% |
The graph above illustrates the hypothetical investment of $10,000* in the Huntington VA Real Strategies Fund from August 31, 2007 (inception) to December 31, 2010, compared to the S&P GSCI, S&P 500 and RSIB.
The performance information does not include the charges and expenses imposed by the insurance company separate accounts or charges and expenses under the variable insurance product contracts. The inclusion of such charges would lower performance. Please refer to the variable insurance product prospectus for a complete listing of these expenses. The above expense ratios are from the Funds’ prospectus dated May 1, 2010. Additional information pertaining to the Fund’s expense ratio as of December 31, 2010 can be found in the financial highlights. For the fiscal year ended 12/31/10, Fund shares were available exclusively as a funding vehicle for Hartford Life Insurance Company’s separate accounts in connection with the Huntington Director, Huntington Director Outlook and Huntington Hartford Leaders Outlook variable annuity contracts, Transamerica Life Insurance Company’s separate accounts in connection with the Huntington Allstar Select variable annuity contract, and to the separate accounts of Nationwide Life and Annuity Insurance Company, Nationwide Life Insurance Company and Sun Life Assurance Company of Canada (U.S.). Variable investment options are not obligations of or guaranteed by any bank and are not federally insured.
| * | The Fund’s performance assumes the reinvestment of all dividends and distributions. The S&P GSCI, the S&P 500 and the RSIB have been adjusted to reflect reinvestment of dividends on securities in the indices. |
For the fiscal year ended December 31, 2010, the Huntington VA Real Strategies Fund produced a total return of 22.15% based upon net asset value. The Fund outperformed its benchmark, the S&P GSCI® Index1, which had a total return of 9.03%. The Fund also outperformed the Standard & Poor’s 500 Index2 (S&P 500), which returned 15.06% and the Real Strategies Indices Blend3, which returned 21.90% for the same period.
The Fund’s performance during the year was bifurcated with performance during the opening months of the year driven by agriculture related themes and the closing months of the year driven by energy related themes. Overall, prices for precious metals increased throughout the year, but performance was also bifurcated with gold moving rapidly higher in the opening months only to be supplanted by silver during the second half of the year.
In the realm of agriculture, the Fund’s most successful investments were those in a number of fertilizer producers and machinery manufacturers. This area experienced considerable merger and acquisition activity throughout the year that propelled prices higher for companies around the globe. The Fund’s shares of Sociedad Quimeca y Minera de Chile advanced over 60%, followed by the 58% contribution from Bucyrus International and 56% for AGCO Corp. Not all agriculture related holdings worked however, as witnessed by the 34% decline in Monsanto.
Returns for the Fund’s energy holdings were strongest for coal and uranium, and the unifying theme for both was demand from China. China lacks the infrastructure to fully utilize its domestic coal supply and is increasingly relying upon seaborne supplies to meet its needs. The Chinese began an aggressive reactor construction program some years ago and now many of those stations are reaching the fueling stage. This demand, combined with refueling needs for existing stations around the world, sent the prices for uranium mining companies higher. The Fund’s shares of Uranium Energy Corp. advanced Fund’s coal holdings, Arch Coal enjoyed the largest advance, picking up 63%, while shares of Peabody Energy added 41%. Again, as with agriculture, not all coal stocks were positive for the year, as shares of James River Coal slipped 8%.
The Fund did benefit from the resurgence of merger and acquisition activity during the year where. While the attempt by BHP to acquire Potash failed, it served to sustain the run-up in price that swept the group during the Agrium CF Industries transaction. This was also evident in the equipment sector, as Caterpillar’s bid for the shares of Bucyrus International served to boost the price for shares of Deer & Co. and AGCO Corp.
Performance data quoted represents past performance which is no guarantee of future results. Investment return and principal value will fluctuate so that an investor’s shares, when redeemed, may be worth more or less than their original cost. Performance for a variable option changes over time and current performance may be lower or higher than what is stated. For current to the most recent month end performance, contact your insurance company.
| p | The composition of the Fund’s holdings is subject to change. |
| 1 | The S&P GSCI® Index measures general price movements and inflation in the world economy. The index is calculated primarily on a world production-weighted basis and is comprised of the principal physical commodities that are the subject of active, liquid futures markets. The Fund’s investment adviser elected to change the benchmark index from the S&P 500 to the S&P GSCI® Index because the S&P GSCI® Index is more reflective of the securities in which the Fund invests. The index is unmanaged and, unlike the Fund, is not affected by cashflows. It is not possible to invest directly in an index. |
| 2 | The S&P 500 is a capitalization-weighted Index comprised of 500 stocks and designed to measure performance of the broad domestic economy through changes in the aggregate market value of 500 stocks representing all major industries. The index is unmanaged and, unlike the Fund, is not affected by cashflows. It is not possible to invest directly in an index. |
| 3 | The Real Strategies Indices Blend is a custom blended index comprised of the following two indices with their noted respective weightings: Reuters/Jefferies CRB Total Return Index (50%) and NAREIT Index (50%). The Reuters/Jefferies CRB Total Return Index is a commodity index, a basket of exchange-traded futures contract representing long-only positions in underlying commodities. Indices typically include a variety of commodity sectors to provide investors broader exposure to commodities as an asset class and free the investor from the mechanics of future trading (e.g., contract rolling and physical delivery). The index return does not reflect the deduction of expenses, which have been deducted from the Fund’s returns. The index return assumes reinvestment of all distributions and does not reflect the deduction of taxes and fees. Individuals cannot invest directly in the index, however, an individual can invest in exchange traded funds or other investment vehicles that attempt to track the performance of a benchmark index. The NAREIT represents returns for the National Association of Real Estate Investment Trust Equity Index. The indices are unmanaged and, unlike the Fund, are not affected by cashflows. |
H U N T I N G T O N F U N D S
Huntington
VA Rotating Markets Fund
Management’s Discussion of Fund Performance
Portfolio Manager: Paul Koscik, JD
Vice President
Huntington Asset Advisors, Inc.
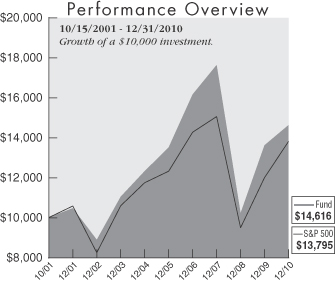
| | | | |
| | | Average Annual
Total Return for
the Period Ended
12/31/10 | |
1 Year | | | 7.34 | % |
3 year | | | (6.04 | )% |
5 Year | | | 1.60 | % |
Start of Performance (10/15/01) | | | 4.21 | % |
The graph above illustrates the hypothetical investment of $10,000* in the Huntington VA Rotating Markets Fund from October 15, 2001 (inception) to December 31, 2010, compared to the S&P 500.
The performance information does not include the charges and expenses imposed by the insurance company separate accounts or changes and expenses under the variable insurance product contracts. The inclusion of such charges would lower performance. Please refer to the variable insurance product prospectus for a complete listing of these expenses. The above expense ratio is from the Funds’ prospectus dated May 1, 2010. Additional information pertaining to the Fund’s expense ratio as of December 31, 2010 can be found in the financial highlights. For the fiscal year ended 12/31/10, Fund shares were available exclusively as a funding vehicle for Hartford Life Insurance Company’s separate accounts in connection with the Huntington Director, Huntington Director Outlook and Huntington Hartford Leaders Outlook variable annuity contracts, Transamerica Life Insurance Company’s separate accounts in connection with the Huntington Allstar Select variable annuity contract, and to the separate accounts of Nationwide Life and Annuity Insurance Company, Nationwide Life Insurance Company and Sun Life Assurance Company of Canada (U.S.). Variable investment options are not obligations of or guaranteed by any bank and are not federally insured.
| * | The Fund’s performance assumes the reinvestment of all dividends and distributions. The S&P 500 has been adjusted to reflect reinvestment of all dividends on securities in the index. |
For the fiscal year ended December 31, 2010, the Huntington VA Rotating Markets Fund produced a total return of 7.34% based on net asset value. This underperformed the total return of 15.06% for the Fund’s benchmark, the Standard & Poor’s 500 Index (S&P 500).1
The Rotating Markets Fund finished 2009 invested in the Global segment of the stock market having significantly outperformed its benchmark, the S&P 500, by more than 650 basis points. 2010 began with the Fund still invested in the global segment. As the year progressed, it became apparent that international stocks were becoming a drag on performance. Concerns about the fiscal stability of the European Union in general, and such countries as Greece and Ireland in particular, were causing investors to shift funds toward the US. In response to the shifting investment environment, the Fund elected to rotate to the Large Cap segment of the stock market. Because the equity markets had staged a massive rally from the March, 2009 bottom (the S&P 500 for example was up 60%) without any significant correction, it was decided to emulate the Dow Jones Industrial Average, which is a conservative equity index. This index is viewed as one of the best indices to own in the event of a sharp correction. Unfortunately, no correction occurred after the rotation on September 1, 2010. In fact, the rally continued the rest of the year with the more aggressive S&P 500 handily outperforming the more conservative Dow Jones Industrial Average. Although the Fund underperformed the S&P 500 Index because of its conservative stance regarding the equity market, it is well positioned in the event that a correction does occur.
Performance data quoted represents past performance which is no guarantee of future results. Investment return and principal value will fluctuate so that an investor’s shares, when redeemed, may be worth more or less than their original cost. Performance for a variable investment option changes over time and current performance may be lower or higher than what is stated. For current to the most recent month end performance, contact your insurance company.
| p | The composition of the Fund’s holdings is subject to change. |
| 1 | The S&P 500 is a capitalization-weighted index comprised of 500 stocks and designed to measure performance of the broad domestic economy through changes in the aggregate market value of 500 stocks representing all major industries. The index is unmanaged and, unlike the Fund, is not affected by cashflows. It is not possible to invest directly in an Index. |
Huntington
VA Situs Fund
Management’s Discussion of Fund Performance
Portfolio Manager: B. Randolph Bateman, CFA
Chief Investment Officer
Huntington Asset Advisors, Inc.
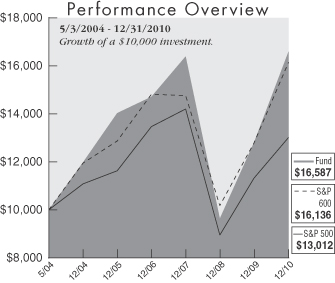
| | | | |
| | | Average Annual
Total Return for
the Period Ended
12/31/10 | |
1 Year | | | 29.61 | % |
3 Year | | | 0.42 | % |
5 Year | | | 3.41 | % |
Start of Performance (05/03/04) | | | 7.90 | % |
The graph above illustrates the hypothetical investment of $10,000* in the Huntington VA Situs Fund from May 3, 2004 (inception) to December 31, 2010, compared to the S&P 600 and the S&P 500.
The performance information does not include the charges and expenses imposed by the insurance company separate accounts or changes and expenses under the variable insurance product contracts. The inclusion of such charges would lower performance. Please refer to the variable insurance product prospectus for a complete listing of these expenses. The above expense ratio is from the Funds’ prospectus dated May 1, 2010. Additional information pertaining to the Fund’s expense ratio as of December 31, 2010 can be found in the financial highlights. For the fiscal year ended 12/31/10, Fund shares were available exclusively as a funding vehicle for Hartford Life Insurance Company’s separate accounts in connection with the Huntington Director, Huntington Director Outlook and Huntington Hartford Leaders Outlook variable annuity contracts, Transamerica Life Insurance Company’s separate accounts in connection with the Huntington Allstar Select variable annuity contract, and to the separate accounts of Nationwide Life and Annuity Insurance Company, Nationwide Life Insurance Company and Sun Life Assurance Company of Canada (U.S.). Variable investment options are not obligations of or guaranteed by any bank and are not federally insured.
| * | The Fund’s performance assumes the reinvestment of all dividends and distributions. The S&P 600 and the S&P 500 indices have been adjusted to reflect reinvestment of dividends on securities in the indices. |
For the fiscal year ended December 31, 2010, the Huntington VA Situs Fund produced a total return 29.61% based on net asset value. The Fund experienced a strongly positive relative performance versus its benchmark, the Standard & Poor’s Small Cap 600 Index (S&P 600),1 which had a total return of 26.31% for the same period. This represented a return that was 330 basis points above the benchmark index. This was the second consecutive year that the fund exceeded the unmanaged benchmark.
The Fund also outperformed the Standard & Poor’s 500 Index (S&P 500),2 the broader stock market index, which had a return of 15.06% for the reporting period. The Fund continued to focus on its approach of utilizing, among other things, strict quantitative analysis, industry sector emphasis or de-emphasis according to the policy guidelines established by Huntington Asset Advisors, Inc.’s Investment Policy Committee and selecting stocks of companies with geographical location advantages. These factors contributed to the Fund outperforming its benchmark and market peers over the longer term and were significant in the overperformance achieved in 2010.
During the reporting period, the economy moved from a rebound phase to an expansion and most markets reflected this positive movement in the economy. The small and mid cap stocks, however, seemed to fair the best in this environment and their performance significantly outperformed their larger counterparts. The sectors that outperformed in the Situs Fund were Energy and Materials, of which the Fund held an overweight position during much of the year. It was difficult to develop investment strategies in the market environment of 2010. There was a lack of sector leadership on any consistent basis and there were considerable swings in daily performance in individual names as well as industries. The Situs Fund wrote few options during the year as market conditions were not favorable, but with two years of strong back to back performance (+25% each), it is likely that the manager will employ more coverage strategies in 2011. In addition, we anticipate that the Energy and Material sectors will be lightened during the year as capital gains situations are considered. The Fund had taken a large amount of gains during the 2010 tax period and the manager was hesitant to incur greater taxes in order to balance the sector weights.
Performance data quoted represents past performance which is no guarantee of future results. Investment return and principal value will fluctuate so that an investor’s shares, when redeemed, may be worth more or less than their original cost. Performance for a variable investment option changes over time and current performance may be lower or higher than what is stated. For current to the most recent month end performance, contact your insurance company.
| p | The composition of the Fund’s holdings is subject to change. |
| 1 | The S&P 600 is a capitalization-weighted index representing all major industries in the small-cap range of the U.S. stock market. The index is unmanaged and, unlike the Fund, is not affected by cashflows. It is not possible to invest directly in an index. |
| 2 | The S&P 500 is a capitalization-weighted index comprised of 500 stocks and designed to measure performance of the broad domestic economy through changes in the aggregate market value of 500 stocks representing all major industries. The index is unmanaged and, unlike the Fund, is not affected by cashflows. It is not possible to invest directly in an index. |
H U N T I N G T O N F U N D S
Huntington
VA Mortgage Securities Fund
Management’s Discussion of Fund Performance
Co-Portfolio Managers:
William G. Doughty, MBA
Vice President
Gustave J. Seasongood
Vice President
Huntington Asset Advisors, Inc.
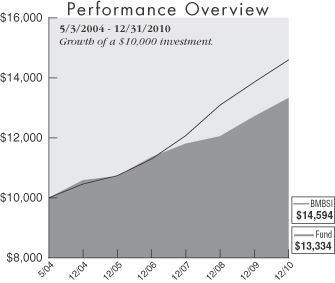
| | | | |
| | | Average Annual
Total Return for
the Period Ended
12/31/10 | |
1 Year | | | 4.89 | % |
3 Year | | | 4.16 | % |
5 Year | | | 4.45 | % |
Start of Performance (05/03/04) | | | 4.41 | % |
The graph above illustrates the hypothetical investment of $10,000* in the Huntington VA Mortgage Securities Fund from May 3, 2004 (inception) to December 31, 2010, compared to the BMBSI.
The performance information does not include the charges and expenses imposed by the insurance company separate accounts or changes and expenses under the variable insurance product contracts. The inclusion of such charges would lower performance. Please refer to the variable insurance product prospectus for a complete listing of these expenses. The above expense ratios are from the Funds’ prospectus dated May 1, 2010. Additional information pertaining to the Fund’s expense ratio as of December 31, 2010 can be found in the financial highlights. For the fiscal year ended 12/31/10, Fund shares were available exclusively as a funding vehicle for Hartford Life Insurance Company’s separate accounts in connection with the Huntington Director, Huntington Director Outlook and Huntington Hartford Leaders Outlook variable annuity contracts, Transamerica Life Insurance Company’s separate accounts in connection with the Huntington Allstar Select variable annuity contract, and to the separate accounts of Nationwide Life and Annuity Insurance Company, Nationwide Life Insurance Company and Sun Life Assurance Company of Canada (U.S.). Variable investment options are not obligations of or guaranteed by any bank and are not federally insured.
| * | The Fund’s performance assumes the reinvestment of all dividends and distributions. The BMBSI has been adjusted to reflect reinvestment of dividends on securities in the index. |
For the fiscal year ended December 31, 2010, the Huntington VA Mortgage Securities Fund produced a return of 4.89% based on net asset value. This compared to the total return of 5.37% for the Fund’s benchmark, the Barclays Mortgage Backed Securities Index (BMBSI),1 and the Lipper U.S. Mortgage Funds Average2 return of 6.74% for the same reporting period.
During 2010, the mortgage market was generally even with Treasury securities. Mortgages had a return of 5.37%, as measured by the BMBSI for the year, compared to a return of 5.88% for Treasuries. The Agency position also had a negative effect on the portfolio. The small underperformance of the Fund was due to its more defensive nature as it owned both 15 and 20 year mortgages. The 10% exposure to the REIT (Real Estate Investment Trust) market, which was up from 5% last year, helped the Fund’s return. As measured by the NAREIT Index (NAREIT),3 REITs produced a return of 27.95%.
Performance data quoted represents past performance which is no guarantee of future results. Investment return and principal value will fluctuate so that an investor’s shares, when redeemed, may be worth more or less than their original cost. Performance for a variable investment option changes over time and current performance maybe lower or higher than what is stated. For current to the most recent month end performance, contact your insurance company.
| p | The composition of the Fund’s holdings is subject to change. |
Bond prices are sensitive to changes in interest rates, and a rise in interest rates can cause a decline in their prices.
| 1 | The BMBSI is composed of all fixed securities mortgage pools by the Government National Mortgage Association (GNMA), Federal National Mortgage Association and the Federal Home Loan Mortgage Corporation, including GNMA Graduated Payment Mortgages. The index is unmanaged and, unlike the Fund, is not affected by cashflows. It is not possible to invest directly in an index. |
| 2 | Lipper figures represent the average of the total returns reported by all of the mutual funds designated by Lipper Inc. as falling into the category indicated. They do not reflect sales charges. |
| 3 | The NAREIT Index represents returns for the National Association of Real Estate Investment Trust Equity Index. The index is unmanaged and, unlike the Fund, is not affected by cashflows. It is not possible to invest directly in an Index. |
Huntington VA Balanced Fund
Portfolio of Investments Summary Table (Unaudited)
December 31, 2010
| | | | |
| Asset Allocation | | Percentage of
Market Value | |
Equity Mutual Funds1 | | | 59.9 | % |
Fixed Income Mutual Funds1 | | | 38.1 | % |
Cash1 | | | 2.0 | % |
| | | | |
Total | | | 100.0 | % |
| 1 | Investments in affiliated funds. |
Portfolio holdings and allocations are subject to change. Percentages in the table above, as of December 31, 2010, are based on total investments, which may differ from the percentages set forth below in the Portfolio of Investments which are computed using the Fund’s net assets.
The Portfolio of Investments Summary Table and the Portfolio of Investments are broken down by sectors, and these sectors do not represent industry categories for purposes of identifying “industry concentration” as described in the Investment Company Act of 1940, as amended.
Portfolio of Investments
December 31, 2010
| | | | | | | | |
| Shares | | | | | Value | |
| | | | Mutual Funds — 97.7% (a) | | | | |
| | 382,079 | | | Huntington Fixed Income Securities Fund, Trust Shares | | $ | 8,466,869 | |
| | 109,556 | | | Huntington VA Dividend Capture Fund | | | 1,068,169 | |
| | 615,775 | | | Huntington VA Growth Fund | | | 4,809,200 | |
| | 369,703 | | | Huntington VA Income Equity Fund | | | 3,205,326 | |
| | 185,840 | | | Huntington VA International Equity Fund | | | 2,687,250 | |
| | 147,724 | | | Huntington VA Macro 100 Fund | | | 1,330,993 | |
| | 60,259 | | | Huntington VA Mid Corp Fund | | | 1,062,960 | |
| | 151,812 | | | Huntington VA Mortgage Securities Fund | | | 1,744,317 | |
| | 94,876 | | | Huntington VA New Economy Fund | | | 1,200,180 | |
| | 44,445 | | | Huntington VA Situs Fund | | | 666,228 | |
| | | | | | | | |
| | | | Total Mutual Funds
(Cost $24,190,668) | | | 26,241,492 | |
| | | | | | | | |
| | | | | | | | |
| Shares | | | | | Value | |
| | | | Cash Equivalents — 2.0% | | | | |
| | 545,928 | | | Huntington Money Market Fund, Interfund Shares, 0.010% (a) (b) | | $ | 545,928 | |
| | | | | | | | |
| | | | Total Cash Equivalents
(Cost $545,928) | | | 545,928 | |
| | | | | | | | |
| | | | Total Investments (Cost $24,736,596) — 99.7% | | | 26,787,420 | |
| | | | | | | | |
| | | | Other Assets in Excess of
Liabilities — 0.3% | | | 81,302 | |
| | | | | | | | |
| | | | Net Assets — 100.0% | | $ | 26,868,722 | |
| | | | | | | | |
| (a) | Investment in affiliate. |
| (b) | Rate disclosed is the seven day yield as of December 31, 2010. |
H U N T I N G T O N F U N D S
See Notes which are an integral part of the Financial Statements.
Huntington VA Dividend Capture Fund
Portfolio of Investments Summary Table (Unaudited)
December 31, 2010
| | | | |
| Asset Allocation | | Percentage of
Market Value | |
Common Stocks (Includes 5.0% Real Estate Investment Trusts) | | | 76.8 | % |
Preferred Stocks (Includes 2.0% Real Estate Investment Trusts) | | | 21.1 | % |
Exchange Traded Funds | | | 1.6 | % |
Cash1 | | | 0.5 | % |
| | | | |
Total | | | 100.0 | % |
| 1 | Investments in an affiliated money market fund. |
Portfolio holdings and allocations are subject to change. Percentages in the table above, as of December 31, 2010, are based on total investments, which may differ from the percentages set forth below in the Portfolio of Investments which are computed using the Fund’s net assets.
The Portfolio of Investments Summary Table and the Portfolio of Investments are broken down by sectors, and these sectors do not represent industry categories for purposes of identifying “industry concentration” as described in the Investment Company Act of 1940, as amended.
Portfolio of Investments
December 31, 2010
| | | | | | | | |
| Shares | | | | | Value | |
| | | | Common Stocks — 76.9% | | | | |
| | | | Consumer Discretionary — 4.6% | |
| | 9,500 | | | Genuine Parts Co. | | $ | 487,730 | |
| | 6,000 | | | The TJX Cos., Inc. | | | 266,340 | |
| | 3,500 | | | V.F. Corp. | | | 301,630 | |
| | 10,000 | | | Yum! Brands, Inc. | | | 490,500 | |
| | | | | | | | |
| | | | | | | 1,546,200 | |
| | | | | | | | |
| | | | Consumer Staples — 7.0% | |
| | 10,000 | | | Archer-Daniels-Midland Co. | | | 300,800 | |
| | 12,500 | | | Ruddick Corp. | | | 460,500 | |
| | 2,000 | | | Sanderson Farms, Inc. | | | 78,300 | |
| | 7,500 | | | The Clorox Co. | | | 474,600 | |
| | 10,000 | | | The Hershey Co. | | | 471,500 | |
| | 11,000 | | | Universal Corp. | | | 447,700 | |
| | 2,000 | | | Wal-Mart Stores, Inc. | | | 107,860 | |
| | | | | | | | |
| | | | | | | 2,341,260 | |
| | | | | | | | |
| | | | Energy — 14.9% | |
| | 7,000 | | | Cenovus Energy, Inc. | | | 232,680 | |
| | 10,500 | | | Chevron Texaco Corp. | | | 958,125 | |
| | 8,500 | | | ConocoPhillips | | | 578,850 | |
| | 5,500 | | | Eni SpA ADR | | | 240,570 | |
| | 15,500 | | | Exxon Mobil Corp. | | | 1,133,360 | |
| | 6,500 | | | Marathon Oil Corp. | | | 240,695 | |
| | 17,000 | | | Royal Dutch Shell PLC ADR | | | 1,135,260 | |
| | 9,500 | | | Total SA ADR | | | 508,060 | |
| | | | | | | | |
| | | | | | | 5,027,600 | |
| | | | | | | | |
| | | | Financials — 15.6% | |
| | 19,500 | | | American Financial Group, Inc. | | | 629,655 | |
| | 10,500 | | | Assurant, Inc. | | | 404,460 | |
| | 13,500 | | | BB&T Corp. | | | 354,915 | |
| | 19,500 | | | Federated Investors, Inc., Class B | | | 510,315 | |
| | 34,500 | | | Fidelity National Title Group, Inc. | | | 471,960 | |
| | 15,500 | | | JPMorgan Chase & Co. | | | 657,510 | |
| | 5,500 | | | Prudential Financial, Inc. | | | 322,905 | |
| | 6,750 | | | Royal Bank of Canada | | | 353,430 | |
| | 8,500 | | | The Toronto-Dominion Bank | | | 631,635 | |
| | 3,500 | | | The Travelers Cos., Inc. | | | 194,985 | |
| | | | | | | | |
| Shares | | | | | Value | |
| | | | Financials — (continued) | |
| | 8,000 | | | U.S. Bancorp | | $ | 215,760 | |
| | 17,500 | | | Unitrin, Inc. | | | 429,450 | |
| | 2,000 | | | Wells Fargo & Co. | | | 61,980 | |
| | | | | | | | |
| | | | | | | 5,238,960 | |
| | | | | | | | |
| | | | Health Care — 6.8% | | | | |
| | 13,500 | | | Abbott Laboratories | | | 646,785 | |
| | 12,000 | | | AstraZeneca PLC ADR | | | 554,280 | |
| | 4,000 | | | Baxter International, Inc. | | | 202,480 | |
| | 13,000 | | | Eli Lilly & Co. | | | 455,520 | |
| | 11,000 | | | GlaxoSmithKline PLC ADR | | | 431,420 | |
| | | | | | | | |
| | | | | | | 2,290,485 | |
| | | | | | | | |
| | | | Industrials — 8.6% | |
| | 5,250 | | | 3M Co. | | | 453,075 | |
| | 7,500 | | | Applied Industrial Technologies, Inc. | | | 243,600 | |
| | 31,500 | | | General Electric Co. | | | 576,135 | |
| | 5,500 | | | Lockheed Martin Corp. | | | 384,505 | |
| | 8,500 | | | Norfolk Southern Corp. | | | 533,970 | |
| | 13,500 | | | Waste Management, Inc. | | | 497,745 | |
| | 3,000 | | | Watsco, Inc. | | | 189,240 | |
| | | | | | | | |
| | | | | | | 2,878,270 | |
| | | | | | | | |
| | | | Information Technology — 3.3% | |
| | 10,500 | | | Corning, Inc. | | | 202,860 | |
| | 24,000 | | | Intel Corp. | | | 504,720 | |
| | 10,500 | | | Microsoft Corp. | | | 293,160 | |
| | 1,624 | | | Taiwan Semiconductor Manufacturing Co. Ltd. ADR | | | 20,365 | |
| | 3,000 | | | Texas Instruments, Inc. | | | 97,500 | |
| | | | | | | | |
| | | | | | | 1,118,605 | |
| | | | | | | | |
| | | | Materials — 2.3% | |
| | 5,500 | | | AMCOL International Corp. | | | 170,500 | |
| | 14,000 | | | MeadWestvaco Corp. | | | 366,240 | |
| | 5,000 | | | Southern Copper Corp. | | | 243,700 | |
| | | | | | | | |
| | | | | | | 780,440 | |
| | | | | | | | |
See Notes which are an integral part of the Financial Statements.
Huntington VA Dividend Capture Fund
Portfolio of Investments (continued)
December 31, 2010
| | | | | | | | |
| Shares | | | | | Value | |
| | | | Common Stocks — (continued) | |
| | | | Real Estate Investment Trusts — 5.0% | |
| | 9,000 | | | Acadia Realty Trust | | $ | 164,160 | |
| | 17,500 | | | Duke Realty Corp. | | | 218,050 | |
| | 1,500 | | | EastGroup Properties, Inc. | | | 63,480 | |
| | 1,500 | | | Equity Residential | | | 77,925 | |
| | 3,000 | | | HCP, Inc. | | | 110,370 | |
| | 3,000 | | | Home Properties, Inc. | | | 166,470 | |
| | 5,500 | | | National Health Investors, Inc. | | | 247,610 | |
| | 2,500 | | | National Retail Properties, Inc. | | | 66,250 | |
| | 2,500 | | | PS Business Parks, Inc. | | | 139,300 | |
| | 3,500 | | | Rayonier, Inc. | | | 183,820 | |
| | 1,374 | | | Simon Property Group, Inc. | | | 136,699 | |
| | 3,000 | | | Sovran Self Storage, Inc. | | | 110,430 | |
| | | | | | | | |
| | | | | | | 1,684,564 | |
| | | | | | | | |
| | | | Telecommunication Services — 2.0% | |
| | 6,500 | | | Verizon Communications, Inc. | | | 232,570 | |
| | 16,500 | | | Vodafone Group PLC ADR | | | 436,095 | |
| | | | | | | | |
| | | | | | | 668,665 | |
| | | | | | | | |
| | | | Utilities — 6.8% | |
| | 20,250 | | | Entergy Corp. | | | 1,434,307 | |
| | 11,500 | | | Nicor, Inc. | | | 574,080 | |
| | 16,000 | | | TECO Energy, Inc. | | | 284,800 | |
| | | | | | | | |
| | | | | | | 2,293,187 | |
| | | | | | | | |
| | | | Total Common Stocks
(Cost $23,896,887) | | | 25,868,236 | |
| | | | | | | | |
| | | | Preferred Stocks — 21.1% | |
| | | | Consumer Discretionary — 0.6% | |
| | 1,000 | | | Comcast Corp., 7.000% | | | 25,350 | |
| | 7,000 | | | Viacom, Inc., 6.850% | | | 177,660 | |
| | | | | | | | |
| | | | | | | 203,010 | |
| | | | | | | | |
| | | | Financials — 16.0% | |
| | 15,000 | | | Allianz SE, 8.375% | | | 394,219 | |
| | 12,000 | | | Barclays Bank PLC, 6.625% | | | 279,960 | |
| | 16,000 | | | BB&T Capital Trust V, 8.950% | | | 439,200 | |
| | 14,000 | | | Credit Suisse Guernsey, 7.900% | | | 374,920 | |
| | 2,426 | | | Everest Re Cap Trust II, 6.200% | | | 54,003 | |
| | 806 | | | Goldman Sachs Group, Inc., 6.200% | | | 19,465 | |
| | 3,500 | | | HSBC Holdings PLC, 6.200% | | | 80,150 | |
| | 15,000 | | | JPMorgan Chase
Capital XXVI, 8.000% | | | 403,650 | |
| | 5,000 | | | KeyCorp Capital VIII, 7.000% | | | 122,200 | |
| | 1,000 | | | M&T Capital Trust IV, 8.500% | | | 26,620 | |
| | 13,000 | | | Merrill Lynch & Co. Capital
Trust V, 7.280% | | | 318,500 | |
| | 1,000 | | | MetLife, Inc., 6.500% | | | 24,800 | |
| | 16,000 | | | Morgan Stanley Capital Trust, 6.600% | | | 380,000 | |
| | 21,000 | | | National City Capital Trust II, 6.625% | | | 524,580 | |
| | 8,000 | | | Partnerre Ltd., 6.500% | | | 192,640 | |
| | 11,914 | | | PLC Capital Trust IV, 7.250% | | | 296,659 | |
| | 20,000 | | | Prudential Financial, Inc., 9.000% | | | 549,800 | |
| | 5,000 | | | Prudential PLC, 6.500% | | | 123,300 | |
| | 3,000 | | | RenaissanceRe Holdings Ltd., 6.500% | | | 68,220 | |
| | 8,000 | | | SunTrust Capital IX, 7.875% | | | 206,480 | |
| | | | | | | | |
| Shares | | | | | Value | |
| | | | Financials — (continued) | |
| | 1,000 | | | USB Capital XI, 6.600% | | $ | 25,100 | |
| | 16,000 | | | Wachovia Capital Trust X, 7.850% | | | 421,600 | |
| | 2,000 | | | Wells Fargo Capital IV, 7.000% | | | 50,660 | |
| | | | | | | | |
| | | | | | | 5,376,726 | |
| | | | | | | | |
| | | | Real Estate Investment Trusts — 2.0% | |
| | 8,000 | | | Kimco Realty Corp., 7.750% | | | 211,200 | |
| | 2,000 | | | Public Storage, Inc., 6.450% | | | 48,500 | |
| | 16,000 | | | Vornado Realty LP, 7.875% | | | 426,720 | |
| | | | | | | | |
| | | | | | | 686,420 | |
| | | | | | | | |
| | | | Telecommunication Services — 1.2% | |
| | 5,117 | | | AT&T, Inc., 6.375% | | | 136,163 | |
| | 10,731 | | | Telephone & Data Systems, Inc.,
7.600% | | | 270,529 | |
| | | | | | | | |
| | | | | | | 406,692 | |
| | | | | | | | |
| | | | Utilities — 1.3% | |
| | 11,000 | | | Dominion Resources, Inc.,
Class A, 8.375% | | | 311,740 | |
| | 4,000 | | | Xcel Energy, Inc., 7.600% | | | 109,720 | |
| | | | | | | | |
| | | | | | | 421,460 | |
| | | | | | | | |
| | | | Total Preferred Stocks
(Cost $6,274,336) | | | 7,094,308 | |
| | | | | | | | |
| | | | Mutual Funds — 1.6% | | | | |
| | | | Exchange Traded Funds — 1.6% | | | | |
| | 21,000 | | | The Technology Select
Sector SPDR Fund | | | 528,780 | |
| | | | | | | | |
| | | | Total Mutual Funds
(Cost $383,684) | | | 528,780 | |
| | | | | | | | |
| | | | Cash Equivalents — 0.5% | | | | |
| | 160,142 | | | Huntington Money Market Fund, Interfund Shares, 0.010% (a) (b) | | | 160,142 | |
| | | | | | | | |
| | | | Total Cash Equivalents
(Cost $160,142) | | | 160,142 | |
| | | | | | | | |
| | | | Total Investments
(Cost $30,715,049) — 100.1% | | | 33,651,466 | |
| | | | | | | | |
| | | | Liabilities in Excess of Other Assets — (0.1)% | | | (26,528 | ) |
| | | | | | | | |
| | | | Net Assets — 100.0% | | $ | 33,624,938 | |
| | | | | | | | |
| (a) | Investment in affiliate. |
| (b) | Rate disclosed is the seven day yield as of December 31, 2010. |
| | |
| ADR | | —American Depositary Receipt |
| LP | | —Limited Partnership |
| PLC | | —Public Liability Co. |
H U N T I N G T O N F U N D S
See Notes which are an integral part of the Financial Statements.
Huntington VA Growth Fund
Portfolio of Investments Summary Table (Unaudited)
December 31, 2010
| | | | |
| Asset Allocation | | Percentage of
Market Value | |
Information Technology | | | 34.1 | % |
Industrials | | | 13.0 | % |
Energy | | | 12.3 | % |
Health Care | | | 8.6 | % |
Consumer Staples | | | 7.6 | % |
Consumer Discretionary | | | 6.8 | % |
Materials | | | 6.7 | % |
Cash1 | | | 4.9 | % |
Real Estate Investment Trusts | | | 2.8 | % |
Financials | | | 1.9 | % |
Telecommunication Services | | | 1.3 | % |
| | | | |
Total | | | 100.0 | % |
| 1 | Investments in an affiliated money market fund. |
Portfolio holdings and allocations are subject to change. Percentages in the table above, as of December 31, 2010, are based on total investments, which may differ from the percentages set forth below in the Portfolio of Investments which are computed using the Fund’s net assets.
The Portfolio of Investments Summary Table and the Portfolio of Investments are broken down by sectors, and these sectors do not represent industry categories for purposes of identifying “industry concentration” as described in the Investment Company Act of 1940, as amended.
Portfolio of Investments
December 31, 2010
| | | | | | | | |
| Shares | | | | | Value | |
| | | | Common Stocks — 96.0% | | | | |
| | | | Consumer Discretionary — 6.8% | |
| | 6,520 | | | Coach, Inc. | | $ | 360,621 | |
| | 7,200 | | | Family Dollar Stores, Inc. | | | 357,912 | |
| | 2,650 | | | Lululemon Athletica, Inc. * | | | 181,313 | |
| | 1,030 | | | Netflix, Inc. * | | | 180,971 | |
| | 2,140 | | | Nike, Inc., Class B | | | 182,799 | |
| | | | | | | | |
| | | | | | | 1,263,616 | |
| | | | | | | | |
| | | | Consumer Staples — 7.6% | | | | |
| | 7,240 | | | Altria Group, Inc. | | | 178,249 | |
| | 12,100 | | | Companhia Brasileira de Distribuicao Grupo Pao de Acucar ADR | | | 375,463 | |
| | 7,390 | | | McCormick & Co., Inc. | | | 343,857 | |
| | 3,020 | | | Philip Morris International, Inc. | | | 176,761 | |
| | 5,150 | | | The Coca-Cola Co. | | | 338,715 | |
| | | | | | | | |
| | | | | | | 1,413,045 | |
| | | | | | | | |
| | | | Energy — 12.4% | | | | |
| | 5,740 | | | Anadarko Petroleum Corp. | | | 437,158 | |
| | 2,350 | | | CNOOC Ltd. ADR | | | 560,169 | |
| | 4,240 | | | Core Laboratories NV | | | 377,572 | |
| | 8,250 | | | Peabody Energy Corp. | | | 527,835 | |
| | 5,840 | | | Transocean Ltd. | | | 405,938 | |
| | | | | | | | |
| | | | | | | 2,308,672 | |
| | | | | | | | |
| | | | Financials — 2.0% | | | | |
| | 2,160 | | | Goldman Sachs Group, Inc. | | | 363,226 | |
| | | | | | | | |
| | | | Health Care — 8.6% | | | | |
| | 5,130 | | | Merck & Co., Inc. | | | 184,885 | |
| | 4,302 | | | Novo-Nordisk A/S ADR | | | 484,276 | |
| | 10,850 | | | Pfizer, Inc. | | | 189,984 | |
| | | | | | | | |
| Shares | | | | | Value | |
| | | | Health Care — (continued) | | | | |
| | 5,120 | | | Stryker Corp. | | $ | 274,944 | |
| | 6,720 | | | Varian Medical Systems, Inc. * | | | 465,562 | |
| | | | | | | | |
| | | | | | | 1,599,651 | |
| | | | | | | | |
| | | | Industrials — 13.2% | | | | |
| | 7,530 | | | Caterpillar, Inc. | | | 705,260 | |
| | 5,910 | | | CSX Corp. | | | 381,845 | |
| | 4,420 | | | Deere & Co. | | | 367,081 | |
| | 7,090 | | | Joy Global, Inc. | | | 615,057 | |
| | 3,990 | | | Union Pacific Corp. | | | 369,713 | |
| | | | | | | | |
| | | | | | | 2,438,956 | |
| | | | | | | | |
| | | | Information Technology — 34.5% | |
| | 3,510 | | | Apple, Inc. * | | | 1,132,186 | |
| | 6,500 | | | Baidu, Inc. SP ADR * | | | 627,445 | |
| | 31,020 | | | Cisco Systems, Inc. * | | | 627,535 | |
| | 5,280 | | | Cognizant Technology Solutions Corp., Class A * | | | 386,971 | |
| | 23,930 | | | EMC Corp. * | | | 547,997 | |
| | 3,170 | | | F5 Networks, Inc. * | | | 412,607 | |
| | 790 | | | Google, Inc., Class A * | | | 469,236 | |
| | 19,770 | | | Microsoft Corp. | | | 551,978 | |
| | 6,920 | | | NetApp, Inc. * | | | 380,323 | |
| | 12,820 | | | Oracle Corp. | | | 401,266 | |
| | 11,910 | | | Rackspace Hosting, Inc. * | | | 374,093 | |
| | 9,520 | | | SanDisk Corp. * | | | 474,667 | |
| | | | | | | | |
| | | | | | | 6,386,304 | |
| | | | | | | | |
| | | | Materials — 6.8% | | | | |
| | 3,290 | | | Agrium, Inc. | | | 301,858 | |
| | 5,350 | | | Du Pont (E.I.) de Nemours & Co. | | | 266,858 | |
See Notes which are an integral part of the Financial Statements.
Huntington VA Growth Fund
Portfolio of Investments (continued)
December 31, 2010
| | | | | | | | |
| Shares | | | | | Value | |
| | | | Common Stocks — (continued) | | | | |
| | | | Materials — (continued) | | | | |
| | 3,040 | | | Freeport-McMoran Copper & Gold, Inc., Series B, Class B | | $ | 365,074 | |
| | 4,480 | | | Rio Tinto PLC ADR | | | 321,037 | |
| | | | | | | | |
| | | | | | | 1,254,827 | |
| | | | | | | | |
| | | | Real Estate Investment Trusts — 2.8% | |
| | 3,380 | | | Health Care, Inc. | | | 161,023 | |
| | 2,720 | | | Mid-America Apartment
Communities, Inc. | | | 172,693 | |
| | 6,760 | | | National Retail Properties, Inc. | | | 179,140 | |
| | | | | | | | |
| | | | | | | 512,856 | |
| | | | | | | | |
| | | | Telecommunication Services — 1.3% | |
| | 12,710 | | | Frontier Communications Corp. | | | 123,668 | |
| | 8,870 | | | Windstream Corp. | | | 123,648 | |
| | | | | | | | |
| | | | | | | 247,316 | |
| | | | | | | | |
| | | | Total Common Stocks
(Cost $15,881,848) | | | 17,788,469 | |
| | | | | | | | |
| | | | | | | | |
| Shares | | | | | Value | |
| | | | Cash Equivalents — 5.0% | | | | |
| | 922,241 | | | Huntington Money Market Fund, Interfund Shares,
0.010% (a) (b) | | $ | 922,241 | |
| | | | | | | | |
| | | | Total Cash Equivalents
(Cost $922,241) | | | 922,241 | |
| | | | | | | | |
| | | | Total Investments
(Cost $16,804,089) — 101.0% | | | 18,710,710 | |
| | | | | | | | |
| | | | Liabilities in Excess of Other
Assets — (1.0)% | | | (199,260 | ) |
| | | | | | | | |
| | | | Net Assets — 100.0% | | $ | 18,511,450 | |
| | | | | | | | |
| (a) | Investment in affiliate. |
| (b) | Rate disclosed is the seven day yield as of December 31, 2010. |
| * | Non-income producing security. |
| | |
| ADR | | —American Depositary Receipt |
| PLC | | —Public Liability Co. |
H U N T I N G T O N F U N D S
See Notes which are an integral part of the Financial Statements.
Huntington VA Income Equity Fund
Portfolio of Investments Summary Table (Unaudited)
December 31, 2010
| | | | |
| Asset Allocation | | Percentage of
Market Value | |
Energy | | | 19.1 | % |
Financials | | | 11.7 | % |
Industrials | | | 11.7 | % |
Real Estate Investment Trusts | | | 10.4 | % |
Consumer Staples | | | 9.6 | % |
Health Care | | | 9.3 | % |
Information Technology | | | 6.7 | % |
Utilities | | | 6.3 | % |
Consumer Discretionary | | | 6.1 | % |
Cash1 | | | 3.2 | % |
Materials | | | 3.2 | % |
Telecommunication Services | | | 2.7 | % |
| | | | |
Total | | | 100.0 | % |
| 1 | Investments in an affiliated money market fund. |
Portfolio holdings and allocations are subject to change. Percentages in the table above, as of December 31, 2010, are based on total investments, which may differ from the percentages set forth below in the Portfolio of Investments which are computed using the Fund’s net assets.
The Portfolio of Investments Summary Table and the Portfolio of Investments are broken down by sectors, and these sectors do not represent industry categories for purposes of identifying “industry concentration” as described in the Investment Company Act of 1940, as amended.
Portfolio of Investments
December 31, 2010
| | | | | | | | |
| Shares | | | | | Value | |
| | | | Common Stocks — 96.7% | | | | |
| | | | Consumer Discretionary — 6.1% | |
| | 31,800 | | | H & R Block, Inc. | | | 378,738 | |
| | 6,300 | | | McDonald’s Corp. | | $ | 483,588 | |
| | 7,200 | | | Time Warner, Inc. | | | 475,416 | |
| | | | | | | | |
| | | | | | | 1,337,742 | |
| | | | | | | | |
| | | | Consumer Staples — 9.5% | | | | |
| | 14,600 | | | Altria Group, Inc. | | | 359,452 | |
| | 7,800 | | | HJ Heinz Co. | | | 385,788 | |
| | 4,500 | | | Kimberly-Clark Corp. | | | 283,680 | |
| | 5,500 | | | PepsiCo, Inc. | | | 359,315 | |
| | 7,000 | | | Philip Morris International, Inc. | | | 409,710 | |
| | 4,300 | | | The Coca-Cola Co. | | | 282,811 | |
| | | | | | | | |
| | | | | | | 2,080,756 | |
| | | | | | | | |
| | | | Energy — 19.1% | | | | |
| | 4,600 | | | Chevron Texaco Corp. | | | 419,750 | |
| | 4,600 | | | ConocoPhillips | | | 313,260 | |
| | 14,600 | | | Enerplus Resources Fund | | | 450,264 | |
| | 6,900 | | | Eni SpA ADR | | | 301,806 | |
| | 5,600 | | | Exxon Mobil Corp. | | | 409,472 | |
| | 7,300 | | | Marathon Oil Corp. | | | 270,319 | |
| | 15,600 | | | Penn West Energy Trust | | | 373,152 | |
| | 2,400 | | | PetroChina Co. Ltd. ADR | | | 315,576 | |
| | 9,800 | | | Repsol YPF SA ADR | | | 273,812 | |
| | 4,700 | | | Royal Dutch Shell PLC ADR | | | 313,866 | |
| | 16,100 | | | Spectra Energy Corp. | | | 402,339 | |
| | 6,000 | | | Total SA ADR | | | 320,880 | |
| | | | | | | | |
| | | | | | | 4,164,496 | |
| | | | | | | | |
| | | | | | | | |
| Shares | | | | | Value | |
| | | | Financials — 11.7% | | | | |
| | 7,500 | | | Bank of Montreal | | $ | 431,775 | |
| | 6,100 | | | Canadian Imperial Bank of Commerce | | | 478,240 | |
| | 6,600 | | | Chubb Corp. | | | 393,624 | |
| | 4,700 | | | M & T Bank Corp. | | | 409,135 | |
| | 14,600 | | | Sun Life Financial, Inc. | | | 439,460 | |
| | 7,200 | | | The Travelers Cos., Inc. | | | 401,112 | |
| | | | | | | | |
| | | | | | | 2,553,346 | |
| | | | | | | | |
| | | | Health Care — 9.3% | | | | |
| | 9,000 | | | Abbott Laboratories | | | 431,190 | |
| | 8,300 | | | AstraZeneca PLC ADR | | | 383,377 | |
| | 9,500 | | | Eli Lilly & Co. | | | 332,880 | |
| | 23,100 | | | Pfizer, Inc. | | | 404,481 | |
| | 14,800 | | | Sanofi-Aventis ADR | | | 477,004 | |
| | | | | | | | |
| | | | | | | 2,028,932 | |
| | | | | | | | |
| | | | Industrials — 11.6% | | | | |
| | 3,900 | | | Caterpillar, Inc. | | | 365,274 | |
| | 3,400 | | | Eaton Corp. | | | 345,134 | |
| | 5,200 | | | Lockheed Martin Corp. | | | 363,532 | |
| | 27,200 | | | R.R. Donnelley & Sons Co. | | | 475,184 | |
| | 5,200 | | | The Boeing Co. | | | 339,352 | |
| | 4,600 | | | United Parcel Service, Inc., Class B | | | 333,868 | |
| | 8,600 | | | Waste Management, Inc. | | | 317,082 | |
| | | | | | | | |
| | | | | | | 2,539,426 | |
| | | | | | | | |
| | | | Information Technology — 6.7% | | | | |
| | 22,400 | | | Intel Corp. | | | 471,072 | |
| | 3,300 | | | International Business Machines Corp. | | | 484,308 | |
| | 17,700 | | | Microsoft Corp. | | | 494,184 | |
| | | | | | | | |
| | | | | | | 1,449,564 | |
| | | | | | | | |
See Notes which are an integral part of the Financial Statements.
Huntington VA Income Equity Fund
Portfolio of Investments (continued)
December 31, 2010
| | | | | | | | |
| Shares | | | | | Value | |
| | | | Common Stocks — (continued) | | | | |
| | | | Materials — 3.2% | | | | |
| | 6,600 | | | Du Pont (E.I.) de Nemours & Co. | | $ | 329,208 | |
| | 4,300 | | | PPG Industries, Inc. | | | 361,501 | |
| | | | | | | | |
| | | | | | | 690,709 | |
| | | | | | | | |
| | | | Real Estate Investment Trusts — 10.4% | |
| | 5,800 | | | Equity Residential | | | 301,310 | |
| | 14,200 | | | HCP, Inc. | | | 522,418 | |
| | 10,300 | | | Health Care, Inc. | | | 490,692 | |
| | 15,200 | | | Mack-Cali Realty Corp. | | | 502,512 | |
| | 4,500 | | | Simon Property Group, Inc. | | | 447,705 | |
| | | | | | | | |
| | | | | | | 2,264,637 | |
| | | | | | | | |
| | | | Telecommunication Services — 2.7% | |
| | 10,100 | | | AT&T, Inc. | | | 296,738 | |
| | 8,300 | | | Verizon Communications, Inc. | | | 296,974 | |
| | | | | | | | |
| | | | | | | 593,712 | |
| | | | | | | | |
| | | | Utilities — 6.3% | | | | |
| | 9,200 | | | Ameren Corp. | | | 259,348 | |
| | 5,600 | | | DTE Energy Co. | | | 253,792 | |
| | 13,900 | | | Duke Energy Corp. | | | 247,559 | |
| | 5,800 | | | Exelon Corp. | | | 241,512 | |
| | 21,400 | | | NiSource, Inc. | | | 377,068 | |
| | | | | | | | |
| | | | | | | 1,379,279 | |
| | | | | | | | |
| | | | Total Common Stocks
(Cost $19,314,782) | | | 21,082,599 | |
| | | | | | | | |
| | | | | | | | |
| Shares | | | | | Value | |
| | | | Cash Equivalents — 3.2% | | | | |
| | 687,915 | | | Huntington Money Market Fund, Interfund Shares,
0.010% (a) (b) | | $ | 687,915 | |
| | | | | | | | |
| | | | Total Cash Equivalents
(Cost $687,915) | | | 687,915 | |
| | | | | | | | |
| | | | Total Investments (Cost $20,002,697) — 99.9% | | | 21,770,514 | |
| | | | | | | | |
| | | | Other Assets in Excess of
Liabilities — 0.1% | | | 27,801 | |
| | | | | | | | |
| | | | Net Assets — 100.0% | | $ | 21,798,315 | |
| | | | | | | | |
| (a) | Investment in affiliate. |
| (b) | Rate disclosed is the seven day yield as of December 31, 2010. |
| | |
| ADR | | —American Depositary Receipt |
| PLC | | —Public Liability Co. |
H U N T I N G T O N F U N D S
See Notes which are an integral part of the Financial Statements.
Huntington VA International Equity Fund
Portfolio of Investments Summary Table (Unaudited)
December 31, 2010
| | | | |
| Asset Allocation | | Percentage of
Market Value | |
United Kingdom | | | 16.0 | % |
Japan | | | 15.5 | % |
Germany | | | 8.5 | % |
France | | | 7.6 | % |
Switzerland | | | 7.4 | % |
Sweden | | | 6.4 | % |
Mutual Funds | | | 5.1 | % |
Singapore | | | 4.9 | % |
Australia | | | 4.7 | % |
Netherlands | | | 3.8 | % |
Canada | | | 3.7 | % |
Cash1 | | | 3.7 | % |
Hong Kong | | | 2.8 | % |
Italy | | | 2.7 | % |
Taiwan | | | 2.1 | % |
Mexico | | | 1.6 | % |
United States | | | 1.5 | % |
Spain | | | 1.0 | % |
Israel | | | 1.0 | % |
| | | | |
Total | | | 100.0 | % |
| 1 | Investments in an affiliated money market fund. |
Portfolio holdings and allocations are subject to change. Percentages in the table above, as of December 31, 2010, are based on total investments, which may differ from the percentages set forth below in the Portfolio of Investments which are computed using the Fund’s net assets.
The Portfolio of Investments Summary Table and the Portfolio of Investments are broken down by sectors, and these sectors do not represent industry categories for purposes of identifying “industry concentration” as described in the Investment Company Act of 1940, as amended.
Portfolio of Investments
December 31, 2010
| | | | | | | | |
| Shares | | | | | Value | |
| | | | Common Stocks — 90.3% | | | | |
| | | | Australia — 4.6% | | | | |
| | | | Consumer Staples — 1.8% | | | | |
| | 70,000 | | | Foster’s Group Ltd. | | $ | 406,315 | |
| | | | | | | | |
| | | | Materials — 2.8% | | | | |
| | 14,000 | | | BHP Billiton Ltd. | | | 647,386 | |
| | | | | | | | |
| | | | | | | 1,053,701 | |
| | | | | | | | |
| | | | Canada — 3.6% | | | | |
| | | | Energy — 1.7% | | | | |
| | 6,870 | | | Cenovus Energy, Inc. | | | 228,359 | |
| | 5,870 | | | EnCana Corp. | | | 170,934 | |
| | | | | | | | |
| | | | | | | 399,293 | |
| | | | | | | | |
| | | | Telecommunication Services — 1.9% | | | | |
| | 12,000 | | | BCE, Inc. | | | 425,520 | |
| | | | | | | | |
| | | | | | | 824,813 | |
| | | | | | | | |
| | | | France — 7.5% | | | | |
| | | | Energy — 2.0% | | | | |
| | 8,400 | | | Total SA ADR | | | 449,232 | |
| | | | | | | | |
| | | | Financials — 3.1% | | | | |
| | 18,809 | | | AXA SA ADR | | | 313,170 | |
| | 6,147 | | | BNP Paribas | | | 391,281 | |
| | | | | | | | |
| | | | | | | 704,451 | |
| | | | | | | | |
| | | | | | | | |
| Shares | | | | | Value | |
| | | | Health Care — 1.4% | | | | |
| | 5,000 | | | Sanofi-Aventis | | $ | 319,874 | |
| | | | | | | | |
| | | | Utilities — 1.0% | | | | |
| | 4,823 | | | GDF Suez ADR | | | 173,821 | |
| | 1,600 | | | GDF Suez | | | 57,437 | |
| | | | | | | | |
| | | | | | | 231,258 | |
| | | | | | | | |
| | | | | | | 1,704,815 | |
| | | | | | | | |
| | | | Germany — 8.4% | | | | |
| | | | Consumer Staples — 1.3% | | | | |
| | 4,800 | | | Henkel AG & Co. KGaA | | | 300,213 | |
| | | | | | | | |
| | | | Industrials — 3.5% | | | | |
| | 14,600 | | | GEA Group AG | | | 421,730 | |
| | 3,036 | | | Siemens AG ADR | | | 377,223 | |
| | | | | | | | |
| | | | | | | 798,953 | |
| | | | | | | | |
| | | | Materials — 2.5% | | | | |
| | 7,500 | | | K+S AG | | | 567,652 | |
| | | | | | | | |
| | | | Utilities — 1.1% | | | | |
| | 8,000 | | | E.ON AG ADR | | | 243,280 | |
| | | | | | | | |
| | | | | | | 1,910,098 | |
| | | | | | | | |
| | | | Hong Kong — 2.8% | | | | |
| | | | Consumer Discretionary — 1.1% | | | | |
| | 65,000 | | | MTR Corp. Ltd. | | | 236,662 | |
| | | | | | | | |
See Notes which are an integral part of the Financial Statements.
Huntington VA International Equity Fund
Portfolio of Investments (continued)
December 31, 2010
| | | | | | | | |
| Shares | | | | | Value | |
| | | | Common Stocks — (continued) | | | | |
| | | | Financials — 1.7% | | | | |
| | 50,800 | | | The Wharf (Holdings) Ltd. | | $ | 390,835 | |
| | | | | | | | |
| | | | | | | 627,497 | |
| | | | | | | | |
| | | | Israel — 1.0% | | | | |
| | | | Health Care — 1.0% | | | | |
| | 4,400 | | | Teva Pharmaceutical Industries Ltd., ADR | | | 229,372 | |
| | | | | | | | |
| | | | Italy — 2.6% | | | | |
| | | | Energy — 2.6% | | | | |
| | 12,200 | | | Saipem SpA | | | 600,906 | |
| | | | | | | | |
| | | | Japan — 15.4% | | | | |
| | | | Consumer Discretionary — 2.8% | | | | |
| | 7,010 | | | Honda Motor Co. Ltd. ADR | | | 276,895 | |
| | 25,390 | | | Panasonic Corp. ADR | | | 357,999 | |
| | | | | | | | |
| | | | | | | 634,894 | |
| | | | | | | | |
| | | | Consumer Staples — 3.2% | | | | |
| | 14,000 | | | Shiseido Co. Ltd. | | | 305,768 | |
| | 10,200 | | | Unicharm Corp. | | | 405,614 | |
| | | | | | | | |
| | | | | | | 711,382 | |
| | | | | | | | |
| | | | Financials — 0.9% | | | | |
| | 49 | | | Japan Prime Realty Investment Corp. | | | 150,816 | |
| | 6 | | | Japan Real Estate Investment Corp. | | | 62,198 | |
| | | | | | | | |
| | | | | | | 213,014 | |
| | | | | | | | |
| | | | Industrials — 4.0% | | | | |
| | 2,700 | | | FANUC Ltd. | | | 414,515 | |
| | 16,000 | | | KOMATSU Ltd. | | | 483,989 | |
| | | | | | | | |
| | | | | | | 898,504 | |
| | | | | | | | |
| | | | Information Technology — 4.5% | | | | |
| | 12,051 | | | Canon, Inc. ADR | | | 618,698 | |
| | 1,400 | | | KEYENCE Corp. | | | 405,392 | |
| | | | | | | | |
| | | | | | | 1,024,090 | |
| | | | | | | | |
| | | | | | | 3,481,884 | |
| | | | | | | | |
| | | | Mexico — 1.6% | | | | |
| | | | Telecommunication Services — 1.6% | | | | |
| | 6,200 | | | America Movil SA de CV., Series L ADR | | | 355,508 | |
| | | | | | | | |
| | | | Netherlands — 3.8% | | | | |
| | | | Energy — 2.1% | | | | |
| | 14,300 | | | Royal Dutch Shell PLC, Class A | | | 476,890 | |
| | | | | | | | |
| | | | Industrials — 1.7% | | | | |
| | 12,225 | | | Koninklijke (Royal) Philips Electronics NV NYS | | | 375,308 | |
| | | | | | | | |
| | | | | | | 852,198 | |
| | | | | | | | |
| | | | Singapore — 4.8% | | | | |
| | | | Financials — 1.6% | | | | |
| | 31,000 | | | DBS Group Holdings Ltd. | | | 346,056 | |
| | 10,200 | | | K-Green Trust * | | | 8,508 | |
| | | | | | | | |
| | | | | | | 354,564 | |
| | | | | | | | |
| | | | | | | | |
| Shares | | | | | Value | |
| | | | Industrials — 2.0% | | | | |
| | 51,000 | | | Keppel Corp Ltd. | | $ | 450,047 | |
| | | | | | | | |
| | | | Telecommunication Services — 1.2% | | | | |
| | 12,005 | | | Singapore Telecommunications ADR | | | 285,119 | |
| | | | | | | | |
| | | | | | | 1,089,730 | |
| | | | | | | | |
| | | | Spain — 1.0% | | | | |
| | | | Financials — 1.0% | | | | |
| | 21,708 | | | Banco Bilbao Vizcaya Argentaria SA ADR | | | 220,770 | |
| | | | | | | | |
| | | | Sweden — 6.4% | | | | |
| | | | Consumer Discretionary — 1.9% | | | | |
| | 12,800 | | | Hennes & Mauritz AB * | | | 426,857 | |
| | | | | | | | |
| | | | Consumer Staples — 1.8% | | | | |
| | 25,000 | | | Svenska Cellulosa AB (SCA) | | | 395,266 | |
| | | | | | | | |
| | | | Industrials — 2.7% | | | | |
| | 35,000 | | | Volvo AB * | | | 617,463 | |
| | | | | | | | |
| | | | | | | 1,439,586 | |
| | | | | | | | |
| | | | Switzerland — 7.3% | | | | |
| | | | Financials — 2.7% | | | | |
| | 10,000 | | | ACE Ltd. | | | 622,500 | |
| | | | | | | | |
| | | | Health Care — 2.5% | | | | |
| | 9,690 | | | Novartis AG ADR | | | 571,226 | |
| | | | | | | | |
| | | | Materials — 2.1% | | | | |
| | 8,030 | | | Syngenta AG ADR | | | 472,003 | |
| | | | | | | | |
| | | | | | | 1,665,729 | |
| | | | | | | | |
| | | | Taiwan — 2.1% | | | | |
| | | | Information Technology — 2.1% | | | | |
| | 37,677 | | | Taiwan Semiconductor Manufacturing Co. Ltd. ADR | | | 472,470 | |
| | | | | | | | |
| | | | United Kingdom — 15.9% | | | | |
| | | | Consumer Discretionary — 1.7% | | | | |
| | 24,750 | | | Pearson PLC ADR | | | 393,278 | |
| | | | | | | | |
| | | | Consumer Staples — 3.1% | | | | |
| | 6,600 | | | Reckitt Benckiser Group PLC | | | 362,807 | |
| | 13,874 | | | Tesco PLC ADR | | | 279,977 | |
| | 10,000 | | | TESCO PLC | | | 66,277 | |
| | | | | | | | |
| | | | | | | 709,061 | |
| | | | | | | | |
| | | | Energy — 3.1% | | | | |
| | 3,750 | | | BG Group PLC ADR | | | 382,500 | |
| | 16,100 | | | Scottish & Southern Energy PLC | | | 307,563 | |
| | | | | | | | |
| | | | | | | 690,063 | |
| | | | | | | | |
| | | | Financials — 2.8% | | | | |
| | 63,000 | | | Barclays PLC | | | 257,060 | |
| | 14,175 | | | Standard Chartered PLC | | | 381,426 | |
| | | | | | | | |
| | | | | | | 638,486 | |
| | | | | | | | |
| | | | Health Care — 1.7% | | | | |
| | 9,645 | | | GlaxoSmithKline PLC ADR | | | 378,277 | |
| | | | | | | | |
H U N T I N G T O N F U N D S
See Notes which are an integral part of the Financial Statements.
Huntington VA International Equity Fund
Portfolio of Investments (continued)
December 31, 2010
| | | | | | | | |
| Shares | | | | | Value | |
| | | | Common Stocks — (continued) | | | | |
| | | | Industrials — 1.6% | | | | |
| | 36,200 | | | Rolls-Royce Group PLC * | | $ | 351,697 | |
| | | | | | | | |
| | | | Telecommunication Services — 1.5% | | | | |
| | 133,000 | | | Vodafone Group PLC | | | 343,881 | |
| | | | | | | | |
| | | | Utilities — 0.4% | | | | |
| | 4,525 | | | Scottish & Southern Energy PLC ADR | | | 88,192 | |
| | | | | | | | |
| | | | | | | 3,592,935 | |
| | | | | | | | |
| | | | United States — 1.5% | | | | |
| | | | Energy — 1.5% | | | | |
| | 4,080 | | | Schlumberger Ltd. | | | 340,680 | |
| | | | | | | | |
| | | | Total Common Stocks
(Cost $17,588,805) | | | 20,462,692 | |
| | | | | | | | |
| | | | Mutual Funds — 5.1% | | | | |
| | | | Exchange Traded Funds — 4.0% | | | | |
| | 15,200 | | | iShares MSCI Hong Kong Index Fund | | | 287,432 | |
| | 4,800 | | | iShares MSCI South Korea Index Fund | | | 293,712 | |
| | 16,300 | | | iShares MSCI Taiwan Index Fund | | | 254,606 | |
| | 5,000 | | | ProShares UltraShort Yen Fund * | | | 78,600 | |
| | | | | | | | |
| | | | | | | 914,350 | |
| | | | | | | | |
| | | | | | | | |
| Shares | | | | | Value | |
| | | | Closed-End Funds — 1.1% | | | | |
| | 8,966 | | | Morgan Stanley India
Investment Fund, Inc. * | | $ | 230,337 | |
| | | | | | | | |
| | | | Total Mutual Funds
(Cost $787,218) | | | 1,144,687 | |
| | | | | | | | |
| | | | Cash Equivalents — 3.7% | | | | |
| | 840,153 | | | Huntington Money Market Fund, Interfund Shares, 0.010% (a) (b) | | | 840,153 | |
| | | | | | | | |
| | | | Total Cash Equivalents
(Cost $840,153) | | | 840,153 | |
| | | | | | | | |
| | | | Total Investments
(Cost $19,216,176) — 99.1% | | | 22,447,532 | |
| | | | | | | | |
| | | | Other Assets in Excess of
Liabilities — 0.9% | | | 200,399 | |
| | | | | | | | |
| | | | Net Assets — 100.0% | | $ | 22,647,931 | |
| | | | | | | | |
| (a) | Investment in affiliate. |
| (b) | Rate disclosed is the seven day yield as of December 31, 2010. |
| * | Non-income producing security. |
| | |
| ADR | | —American Depositary Receipt |
| NYS | | —New York Shares |
| PLC | | —Public Liability Co. |
See Notes which are an integral part of the Financial Statements.
Huntington VA Macro 100 Fund
Portfolio of Investments Summary Table (Unaudited)
December 31, 2010
| | | | |
| Asset Allocation | | Percentage of
Market Value | |
Information Technology | | | 17.5 | % |
Industrials | | | 11.9 | % |
Consumer Discretionary | | | 10.6 | % |
Health Care | | | 10.5 | % |
Energy | | | 9.3 | % |
Financials | | | 9.3 | % |
Consumer Staples | | | 9.1 | % |
Cash1 | | | 8.2 | % |
Utilities | | | 4.5 | % |
Materials | | | 3.8 | % |
Telecommunication Services | | | 3.7 | % |
Real Estate Investment Trusts | | | 1.6 | % |
| | | | |
Total | | | 100.0 | % |
| 1 | Investments in an affiliated money market fund. |
Portfolio holdings and allocations are subject to change. Percentages in the table above, as of December 31, 2010, are based on total investments, which may differ from the percentages set forth below in the Portfolio of Investments which are computed using the Fund’s net assets.
The Portfolio of Investments Summary Table and the Portfolio of Investments are broken down by sectors, and these sectors do not represent industry categories for purposes of identifying “industry concentration” as described in the Investment Company Act of 1940, as amended.
Portfolio of Investments
December 31, 2010
| | | | | | | | |
| Shares | | | | | Value | |
| | | | Common Stocks — 91.7% | | | | |
| | | | Consumer Discretionary — 10.6% | | | | |
| | 300 | | | AutoZone, Inc. * | | $ | 81,777 | |
| | 2,500 | | | GameStop Corp., Class A * | | | 57,200 | |
| | 1,100 | | | Hasbro, Inc. | | | 51,898 | |
| | 2,100 | | | Johnson Controls, Inc. | | | 80,220 | |
| | 625 | | | McDonald’s Corp. | | | 47,975 | |
| | 3,700 | | | Newell Rubbermaid, Inc. | | | 67,266 | |
| | 1,300 | | | Omnicom Group, Inc. | | | 59,540 | |
| | 450 | | | Polo Ralph Lauren Corp. | | | 49,914 | |
| | 900 | | | Scripps Networks Interactive, Class A | | | 46,575 | |
| | 500 | | | Starwood Hotels & Resorts Worldwide, Inc. | | | 30,390 | |
| | 1,000 | | | The TJX Cos., Inc. | | | 44,390 | |
| | 750 | | | The Walt Disney Co. | | | 28,133 | |
| | 650 | | | V.F. Corp. | | | 56,017 | |
| | | | | | | | |
| | | | | | | 701,295 | |
| | | | | | | | |
| | | | Consumer Staples — 9.1% | | | | |
| | 2,100 | | | Avon Products, Inc. | | | 61,026 | |
| | 1,000 | | | Colgate-Palmolive Co. | | | 80,370 | |
| | 1,700 | | | Constellation Brands, Inc. * | | | 37,655 | |
| | 1,500 | | | Dr. Pepper Snapple Group, Inc. | | | 52,740 | |
| | 1,500 | | | Kellogg Co. | | | 76,620 | |
| | 1,350 | | | Kraft Foods, Inc. | | | 42,539 | |
| | 1,100 | | | McCormick & Co., Inc. | | | 51,183 | |
| | 1,400 | | | Procter & Gamble Co. | | | 90,062 | |
| | 2,100 | | | Sysco Corp. | | | 61,740 | |
| | 800 | | | The Clorox Co. | | | 50,624 | |
| | | | | | | | |
| | | | | | | 604,559 | |
| | | | | | | | |
| | | | | | | | |
| Shares | | | | | Value | |
| | | | Energy — 9.3% | | | | |
| | 900 | | | Apache Corp. | | $ | 107,307 | |
| | 600 | | | Baker Hughes, Inc. | | | 34,302 | |
| | 500 | | | ConocoPhillips | | | 34,050 | |
| | 800 | | | Denbury Resources, Inc. * | | | 15,272 | |
| | 1,100 | | | Devon Energy Corp. | | | 86,361 | |
| | 350 | | | EOG Resources, Inc. | | | 31,994 | |
| | 1,343 | | | Exxon Mobil Corp. | | | 98,200 | |
| | 1,200 | | | Marathon Oil Corp. | | | 44,436 | |
| | 750 | | | Occidental Petroleum Corp. | | | 73,575 | |
| | 900 | | | Peabody Energy Corp. | | | 57,582 | |
| | 900 | | | Rowan Cos., Inc. * | | | 31,419 | |
| | | | | | | | |
| | | | | | | 614,498 | |
| | | | | | | | |
| | | | Financials — 9.3% | | | | |
| | 3,700 | | | Discover Financial Services | | | 68,561 | |
| | 2,900 | | | JPMorgan Chase & Co. | | | 123,018 | |
| | 1,300 | | | Lincoln National Corp. | | | 36,153 | |
| | 10,000 | | | Regions Financial Corp. | | | 70,000 | |
| | 2,100 | | | The Allstate Corp. | | | 66,948 | |
| | 700 | | | Torchmark Corp. | | | 41,818 | |
| | 3,000 | | | U.S. Bancorp | | | 80,910 | |
| | 4,054 | | | Wells Fargo & Co. | | | 125,633 | |
| | | | | | | | |
| | | | | | | 613,041 | |
| | | | | | | | |
| | | | Health Care — 10.5% | | | | |
| | 1,000 | | | Becton, Dickinson & Co. | | | 84,520 | |
| | 500 | | | C.R. Bard, Inc. | | | 45,885 | |
| | 700 | | | Genzyme Corp. * | | | 49,840 | |
| | 1,400 | | | Johnson & Johnson | | | 86,590 | |
H U N T I N G T O N F U N D S
See Notes which are an integral part of the Financial Statements.
Huntington VA Macro 100 Fund
Portfolio of Investments (continued)
December 31, 2010
| | | | | | | | |
| Shares | | | | | Value | |
| | | | Common Stocks — (continued) | | | | |
| | | | Health Care — (continued) | | | | |
| | 1,100 | | | McKesson Corp. | | $ | 77,418 | |
| | 1,850 | | | Medtronic, Inc. | | | 68,616 | |
| | 4,200 | | | Mylan Laboratories, Inc. * | | | 88,746 | |
| | 1,300 | | | Patterson Cos., Inc. | | | 39,819 | |
| | 900 | | | Stryker Corp. | | | 48,330 | |
| | 1,000 | | | Thermo Fisher Scientific, Inc. * | | | 55,360 | |
| | 900 | | | Zimmer Holdings, Inc. * | | | 48,312 | |
| | | | | | | | |
| | | | | | | 693,436 | |
| | | | | | | | |
| | | | Industrials — 11.9% | | | | |
| | 600 | | | Cummins, Inc. | | | 66,006 | |
| | 500 | | | Flowserve Corp. | | | 59,610 | |
| | 1,100 | | | General Dynamics Corp. | | | 78,056 | |
| | 1,400 | | | Illinois Tool Works, Inc. | | | 74,760 | |
| | 600 | | | Jacobs Engineering Group, Inc. * | | | 27,510 | |
| | 1,000 | | | Pall Corp. | | | 49,580 | |
| | 1,925 | | | Republic Services, Inc., Class A | | | 57,481 | |
| | 1,400 | | | Union Pacific Corp. | | | 129,724 | |
| | 1,250 | | | United Parcel Service, Inc., Class B | | | 90,725 | |
| | 1,300 | | | United Technologies Corp. | | | 102,336 | |
| | 375 | | | W.W. Grainger, Inc. | | | 51,791 | |
| | | | | | | | |
| | | | | | | 787,579 | |
| | | | | | | | |
| | | | Information Technology — 17.5% | | | | |
| | 900 | | | Akamai Technologies, Inc. * | | | 42,345 | |
| | 300 | | | Apple, Inc. * | | | 96,768 | |
| | 1,200 | | | BMC Software, Inc. * | | | 56,568 | |
| | 4,200 | | | Cisco Systems, Inc. * | | | 84,966 | |
| | 1,500 | | | Cognizant Technology Solutions Corp., Class A * | | | 109,935 | |
| | 2,400 | | | EMC Corp. * | | | 54,960 | |
| | 1,500 | | | Fiserv, Inc. * | | | 87,840 | |
| | 150 | | | Google, Inc., Class A * | | | 89,095 | |
| | 1,700 | | | Intuit, Inc. * | | | 83,810 | |
| | 13,000 | | | Jabil Circuit, Inc. | | | 261,170 | |
| | 2,025 | | | Microsoft Corp. | | | 56,538 | |
| | 1,300 | | | VeriSign, Inc. * | | | 42,471 | |
| | 7,848 | | | Xerox Corp. | | | 90,409 | |
| | | | | | | | |
| | | | | | | 1,156,875 | |
| | | | | | | | |
| | | | Materials — 3.7% | | | | |
| | 1,800 | | | Ball Corp. | | | 122,490 | |
| | 200 | | | Cliffs Natural Resources, Inc. | | | 15,602 | |
| | 1,000 | | | Ecolab, Inc. | | | 50,420 | |
| | 500 | | | The Dow Chemical Co. | | | 17,070 | |
| | 2,500 | | | Titanium Metals Corp. * | | | 42,950 | |
| | | | | | | | |
| | | | | | | 248,532 | |
| | | | | | | | |
| | | | | | | | |
| Shares | | | | | Value | |
| | | | Real Estate Investment Trusts — 1.6% | |
| | 1,400 | | | HCP, Inc. | | $ | 51,506 | |
| | 3,000 | | | Host Hotels & Resorts, Inc. | | | 53,610 | |
| | | | | | | | |
| | | | | | | 105,116 | |
| | | | | | | | |
| | | | Telecommunication Services — 3.7% | |
| | 1,450 | | | AT&T, Inc. | | | 42,601 | |
| | 1,700 | | | CenturyLink, Inc. | | | 78,489 | |
| | 3,450 | | | Verizon Communications, Inc. | | | 123,441 | |
| | | | | | | | |
| | | | | | | 244,531 | |
| | | | | | | | |
| | | | Utilities — 4.5% | | | | |
| | 1,300 | | | Consolidated Edison, Inc. | | | 64,441 | |
| | 1,000 | | | Dominion Resources, Inc., Class A | | | 42,720 | |
| | 600 | | | Entergy Corp. | | | 42,498 | |
| | 700 | | | Integrys Energy Group, Inc. | | | 33,957 | |
| | 1,100 | | | Pinnacle West Capital Corp. | | | 45,595 | |
| | 1,200 | | | Progress Energy, Inc. | | | 52,176 | |
| | 300 | | | Wisconsin Energy Corp. | | | 17,658 | |
| | | | | | | | |
| | | | | | | 299,045 | |
| | | | | | | | |
| | | | Total Common Stocks
(Cost $5,303,335) | | | 6,068,507 | |
| | | | | | | | |
| | | | Cash Equivalents — 8.2% | | | | |
| | 539,053 | | | Huntington Money Market Fund, Interfund Shares, 0.010% (a) (b) | | | 539,053 | |
| | | | | | | | |
| | | | Total Cash Equivalents
(Cost $539,053) | | | 539,053 | |
| | | | | | | | |
| | | | Total Investments
(Cost $5,842,388) — 99.9% | | | 6,607,560 | |
| | | | | | | | |
| | | | Other Assets in Excess of
Liabilities — 0.1% | | | 7,359 | |
| | | | | | | | |
| | | | Net Assets — 100.0% | | $ | 6,614,919 | |
| | | | | | | | |
| (a) | Investment in affiliate. |
| (b) | Rate disclosed is the seven day yield as of December 31, 2010. |
| * | Non-income producing security. |
See Notes which are an integral part of the Financial Statements.
Huntington VA Mid Corp America Fund
Portfolio of Investments Summary Table (Unaudited)
December 31, 2010
| | | | |
| Asset Allocation | | Percentage of
Market Value | |
Information Technology | | | 17.8 | % |
Industrials | | | 16.9 | % |
Consumer Discretionary | | | 12.4 | % |
Health Care | | | 12.0 | % |
Financials | | | 9.7 | % |
Materials | | | 7.2 | % |
Energy | | | 6.7 | % |
Real Estate Investment Trusts | | | 4.7 | % |
Cash1 | | | 4.5 | % |
Utilities | | | 3.8 | % |
Consumer Staples | | | 3.3 | % |
Telecommunication Services | | | 1.0 | % |
| | | | |
Total | | | 100.0 | % |
| 1 | Investments in an affiliated money market fund. |
Portfolio holdings and allocations are subject to change. Percentages in the table above, as of December 31, 2010, are based on total investments, which may differ from the percentages set forth below in the Portfolio of Investments which are computed using the Fund’s net assets.
The Portfolio of Investments Summary Table and the Portfolio of Investments are broken down by sectors, and these sectors do not represent industry categories for purposes of identifying “industry concentration” as described in the Investment Company Act of 1940, as amended.
Portfolio of Investments
December 31, 2010
| | | | | | | | |
| Shares | | | | | Value | |
| | | | Common Stocks — 95.5% | | | | |
| | | | Consumer Discretionary — 12.4% | | | | |
| | 910 | | | Advance Auto Parts, Inc. | | $ | 60,197 | |
| | 2,100 | | | Best Buy Co., Inc. | | | 72,009 | |
| | 3,320 | | | Bob Evans Farms, Inc. | | | 109,427 | |
| | 4,200 | | | BorgWarner, Inc. * | | | 303,912 | |
| | 1,600 | | | Coinstar, Inc. * | | | 90,304 | |
| | 2,700 | | | Guess?, Inc. | | | 127,764 | |
| | 1,632 | | | ITT Educational Services, Inc. * | | | 103,942 | |
| | 3,900 | | | J Crew Group, Inc. * | | | 168,246 | |
| | 2,700 | | | Kohl’s Corp. * | | | 146,718 | |
| | 2,500 | | | Mohawk Industries, Inc. * | | | 141,900 | |
| | 5,158 | | | Nordstrom, Inc. | | | 218,596 | |
| | 3,220 | | | PetSmart, Inc. | | | 128,220 | |
| | 850 | | | Polo Ralph Lauren Corp. | | | 94,282 | |
| | 2,040 | | | Ross Stores, Inc. | | | 129,030 | |
| | 4,782 | | | Royal Caribbean Cruises Ltd. * | | | 224,754 | |
| | 2,093 | | | Stanley Black & Decker, Inc. | | | 139,959 | |
| | 2,020 | | | V.F. Corp. | | | 174,084 | |
| | 530 | | | Whirlpool Corp. | | | 47,080 | |
| | 1,000 | | | Wolverine World Wide, Inc. | | | 31,880 | |
| | | | | | | | |
| | | | | | | 2,512,304 | |
| | | | | | | | |
| | | | Consumer Staples — 3.3% | | | | |
| | 4,330 | | | Church & Dwight Co., Inc. | | | 298,857 | |
| | 3,370 | | | Constellation Brands, Inc. * | | | 74,646 | |
| | 3,700 | | | Dr. Pepper Snapple Group, Inc. | | | 130,092 | |
| | 2,711 | | | Ralcorp Holding, Inc. * | | | 176,242 | |
| | | | | | | | |
| | | | | | | 679,837 | |
| | | | | | | | |
| | | | | | | | |
| Shares | | | | | Value | |
| | | | Energy — 6.7% | | | | |
| | 6,058 | | | Chesapeake Energy Corp. | | $ | 156,963 | |
| | 1,500 | | | Forest Oil Corp. * | | | 56,955 | |
| | 3,800 | | | Helmerich & Payne, Inc. | | | 184,224 | |
| | 3,670 | | | Murphy Oil Corp. | | | 273,598 | |
| | 4,784 | | | Noble Energy, Inc. | | | 411,807 | |
| | 1,790 | | | Oceaneering International, Inc. * | | | 131,798 | |
| | 1,493 | | | Unit Corp. * | | | 69,395 | |
| | 3,228 | | | Weatherford International Ltd. * | | | 73,598 | |
| | | | | | | | |
| | | | | | | 1,358,338 | |
| | | | | | | | |
| | | | Financials — 9.7% | | | | |
| | 1,300 | | | Allied World Assurance Co. Holdings, Ltd. | | | 77,272 | |
| | 5,000 | | | Cincinnati Financial Corp. | | | 158,450 | |
| | 3,459 | | | City National Corp. | | | 212,244 | |
| | 580 | | | Everest Re Group Ltd. | | | 49,196 | |
| | 4,610 | | | First American Financial Corp. | | | 68,873 | |
| | 8,100 | | | First Niagara Financial Group, Inc. | | | 113,238 | |
| | 2,500 | | | Hanover Insurance Group, Inc. | | | 116,800 | |
| | 1,210 | | | HCC Insurance Holdings, Inc. | | | 35,017 | |
| | 2,800 | | | Invesco Ltd. | | | 67,368 | |
| | 1,300 | | | Jones Lang LaSalle, Inc. | | | 109,096 | |
| | 2,567 | | | Legg Mason, Inc. | | | 93,105 | |
| | 5,840 | | | Principal Financial Group | | | 190,150 | |
| | 2,830 | | | Prosperity Bancshares, Inc. | | | 111,162 | |
| | 2,900 | | | T. Rowe Price Group, Inc. | | | 187,166 | |
| | 3,907 | | | Torchmark Corp. | | | 233,404 | |
| | 3,510 | | | Trustmark Corp. | | | 87,188 | |
| | 2,100 | | | Unum Group | | | 50,862 | |
| | | | | | | | |
| | | | | | | 1,960,591 | |
| | | | | | | | |
H U N T I N G T O N F U N D S
See Notes which are an integral part of the Financial Statements.
Huntington VA Mid Corp America Fund
Portfolio of Investments (continued)
December 31, 2010
| | | | | | | | |
| Shares | | | | | Value | |
| | | | Common Stocks — (continued) | | | | |
| | | | Health Care — 12.0% | | | | |
| | 7,700 | | | AmerisourceBergen Corp. | | $ | 262,724 | |
| | 1,580 | | | Biogen Idec, Inc. * | | | 105,939 | |
| | 1,776 | | | Cephalon, Inc. * | | | 109,615 | |
| | 2,400 | | | Coventry Health Care, Inc. * | | | 63,360 | |
| | 6,656 | | | Life Technologies Corp. * | | | 369,408 | |
| | 5,749 | | | Lincare Holdings, Inc. | | | 154,246 | |
| | 4,280 | | | Owens & Minor, Inc. | | | 125,960 | |
| | 4,900 | | | PDL BioPharma, Inc. * | | | 30,527 | |
| | 2,100 | | | Quest Diagnostics, Inc. | | | 113,337 | |
| | 4,240 | | | St Jude Medical, Inc. * | | | 181,260 | |
| | 2,821 | | | Teleflex, Inc. | | | 151,798 | |
| | 9,113 | | | Thermo Fisher Scientific, Inc. * | | | 504,496 | |
| | 5,020 | | | Watson Pharmaceutical, Inc. * | | | 259,283 | |
| | | | | | | | |
| | | | | | | 2,431,953 | |
| | | | | | | | |
| | | | Industrials — 16.9% | | | | |
| | 1,275 | | | Alliant Techsystems, Inc. | | | 94,898 | |
| | 3,900 | | | CNH Global NV NYS * | | | 186,186 | |
| | 6,112 | | | Cooper Industries PLC | | | 356,268 | |
| | 1,900 | | | Cummins, Inc. | | | 209,019 | |
| | 2,100 | | | Elbit Systems Ltd. | | | 111,132 | |
| | 3,000 | | | EMCOR Group, Inc. * | | | 86,940 | |
| | 450 | | | Flowserve Corp. | | | 53,649 | |
| | 3,700 | | | General Cable Corp. * | | | 129,833 | |
| | 6,900 | | | John Bean Technologies Corp. | | | 138,897 | |
| | 6,938 | | | Kennametal, Inc. | | | 273,773 | |
| | 5,259 | | | L-3 Communications Holdings, Inc. | | | 370,707 | |
| | 2,000 | | | Ladish Co., Inc. * | | | 97,220 | |
| | 3,379 | | | Pall Corp. | | | 167,531 | |
| | 3,034 | | | Parker Hannifin Corp. | | | 261,834 | |
| | 1,400 | | | Precision Castparts Corp. | | | 194,894 | |
| | 2,600 | | | Quanex Building Products Corp. | | | 49,322 | |
| | 900 | | | R.R. Donnelley & Sons Co. | | | 15,723 | |
| | 400 | | | Rockwell International Corp. | | | 28,684 | |
| | 2,700 | | | Ryder System, Inc. | | | 142,128 | |
| | 3,900 | | | Thomas & Betts Corp. * | | | 188,370 | |
| | 1,300 | | | UniFirst Corp. | | | 71,565 | |
| | 3,390 | | | Watsco, Inc. | | | 213,841 | |
| | | | | | | | |
| | | | | | | 3,442,414 | |
| | | | | | | | |
| | | | Information Technology — 17.8% | | | | |
| | 30,108 | | | Activision Blizzard, Inc. | | | 374,544 | |
| | 1,400 | | | Amdocs Ltd. * | | | 38,458 | |
| | 15,260 | | | Amkor Technology, Inc. * | | | 112,771 | |
| | 6,942 | | | Aviat Networks, Inc. * | | | 35,196 | |
| | 2,895 | | | Benchmark Electronics, Inc. * | | | 52,573 | |
| | 2,430 | | | BMC Software, Inc. * | | | 114,550 | |
| | 3,100 | | | Broadcom Corp., Class A | | | 135,005 | |
| | 4,370 | | | Broadridge Financial Solutions, Inc. | | | 95,834 | |
| | 4,700 | | | Citrix Systems, Inc. * | | | 321,527 | |
| | 4,610 | | | CoreLogic, Inc. | | | 85,377 | |
| | 6,900 | | | CTS Corp. | | | 76,314 | |
| | 1,000 | | | Cymer, Inc. * | | | 45,070 | |
| | 4,205 | | | Fidelity National Information Services, Inc. | | | 115,175 | |
| | | | | | | | |
| Shares | | | | | Value | |
| | | | Information Technology — (continued) | | | | |
| | 1,800 | | | Fiserv, Inc. * | | $ | 105,408 | |
| | 3,632 | | | FLIR Systems, Inc. * | | | 108,052 | |
| | 5,210 | | | Forrester Research, Inc. * | | | 183,861 | |
| | 4,300 | | | Harris Corp. | | | 194,790 | |
| | 3,700 | | | JDA Software Group, Inc. * | | | 103,600 | |
| | 4,750 | | | Molex, Inc. | | | 107,920 | |
| | 2,000 | | | Multi-Fineline Electronix, Inc. * | | | 52,980 | |
| | 3,948 | | | NCR Corp. * | | | 60,681 | |
| | 6,400 | | | NVIDIA Corp. * | | | 98,560 | |
| | 14,520 | | | ON Semiconductor Corp. * | | | 143,458 | |
| | 2,240 | | | Progress Software Corp. * | | | 94,797 | |
| | 4,100 | | | Synopsys, Inc. * | | | 110,331 | |
| | 2,700 | | | Syntel, Inc. | | | 129,033 | |
| | 6,468 | | | Teradata Corp. * | | | 266,223 | |
| | 3,762 | | | Varian Semiconductor Equipment
Associates, Inc. * | | | 139,081 | |
| | 7,650 | | | Vishay Intertechnology, Inc. * | | | 112,302 | |
| | | | | | | | |
| | | | | | | 3,613,471 | |
| | | | | | | | |
| | | | Materials — 7.2% | | | | |
| | 2,200 | | | Albemarle Corp. | | | 122,716 | |
| | 2,300 | | | AptarGroup, Inc. | | | 109,411 | |
| | 800 | | | Ball Corp. | | | 54,440 | |
| | 3,800 | | | Cytec Industries, Inc. | | | 201,628 | |
| | 3,500 | | | FMC Corp. | | | 279,615 | |
| | 1,800 | | | Innophos Holdings, Inc. | | | 64,944 | |
| | 2,460 | | | Lubrizol Corp. | | | 262,925 | |
| | 400 | | | Minerals Technologies, Inc. | | | 26,164 | |
| | 1,550 | | | PPG Industries, Inc. | | | 130,309 | |
| | 2,700 | | | RPM International, Inc. | | | 59,670 | |
| | 800 | | | Schnitzer Steel Industries, Inc. | | | 53,112 | |
| | 2,700 | | | Sonoco Products Co. | | | 90,909 | |
| | | | | | | | |
| | | | | | | 1,455,843 | |
| | | | | | | | |
| | | | Real Estate Investment Trusts — 4.7% | | | | |
| | 1,960 | | | Alexandria Real Estate Equities, Inc. | | | 143,590 | |
| | 1,200 | | | Federal Realty Investment Trust | | | 93,516 | |
| | 1,600 | | | Home Properties, Inc. | | | 88,784 | |
| | 3,631 | | | Host Hotels & Resorts, Inc. | | | 64,886 | |
| | 1,600 | | | Liberty Property Trust | | | 51,072 | |
| | 2,920 | | | Mack-Cali Realty Corp. | | | 96,535 | |
| | 1,700 | | | Mid-America Apartment
Communities, Inc. | | | 107,933 | |
| | 2,140 | | | PS Business Parks, Inc. | | | 119,241 | |
| | 2,000 | | | Rayonier, Inc. | | | 105,040 | |
| | 2,340 | | | Sovran Self Storage, Inc. | | | 86,135 | |
| | | | | | | | |
| | | | | | | 956,732 | |
| | | | | | | | |
| | | | Telecommunication Services — 1.0% | | | | |
| | 3,417 | | | CenturyLink, Inc. | | | 157,763 | |
| | 1,200 | | | TELUS Corp. | | | 52,272 | |
| | | | | | | | |
| | | | | | | 210,035 | |
| | | | | | | | |
See Notes which are an integral part of the Financial Statements.
Huntington VA Mid Corp America Fund
Portfolio of Investments (continued)
December 31, 2010
| | | | | | | | |
| Shares | | | | | Value | |
| | | | Common Stocks — (continued) | | | | |
| | | | Utilities — 3.8% | | | | |
| | 1,500 | | | AGL Resources, Inc. | | $ | 53,775 | |
| | 2,510 | | | CMS Energy Corp. | | | 46,686 | |
| | 940 | | | DTE Energy Co. | | | 42,601 | |
| | 7,881 | | | MDU Resources Group, Inc. | | | 159,748 | |
| | 1,800 | | | National Fuel Gas Co. | | | 118,116 | |
| | 1,800 | | | New Jersey Resources Corp. | | | 77,598 | |
| | 4,600 | | | Portland General Electric Co. | | | 99,820 | |
| | 8,128 | | | Questar Corp. | | | 141,508 | |
| | 1,670 | | | Xcel Energy, Inc. | | | 39,329 | |
| | | | | | | 779,181 | |
| | | | | | | | |
| | | | Total Common Stocks
(Cost $11,566,851) | | | 19,400,699 | |
| | | | | | | | |
| | | | | | | | |
| Shares | | | | | Value | |
| | | | Cash Equivalents — 4.5% | | | | |
| | 910,222 | | | Huntington Money Market Fund, Interfund Shares, 0.010% (a) (b) | | $ | 910,222 | |
| | | | | | | | |
| | | | Total Cash Equivalents
(Cost $910,222) | | | 910,222 | |
| | | | | | | | |
| | | | Total Investments
(Cost $12,477,073) — 100.0% | | | 20,310,921 | |
| | | | | | | | |
| | | | Other Assets in Excess of
Liabilities — 0.0% | | | 5,159 | |
| | | | | | | | |
| | | | Net Assets — 100.0% | | $ | 20,316,080 | |
| | | | | | | | |
| (a) | Investment in affiliate. |
| (b) | Rate disclosed is the seven day yield as of December 31, 2010. |
| * | Non-income producing security. |
| | |
| PLC | | —Public Liability Co. |
| NYS | | —New York Shares |
H U N T I N G T O N F U N D S
See Notes which are an integral part of the Financial Statements.
Huntington VA New Economy Fund
Portfolio of Investments Summary Table (Unaudited)
December 31, 2010
| | | | |
| Asset Allocation | | Percentage of
Market Value | |
Information Technology | | | 21.6 | % |
Energy | | | 14.5 | % |
Industrials | | | 14.0 | % |
Consumer Discretionary | | | 12.2 | % |
Financials | | | 10.5 | % |
Materials | | | 9.6 | % |
Health Care | | | 7.1 | % |
Cash1 | | | 3.6 | % |
Consumer Staples | | | 3.2 | % |
Utilities | | | 1.7 | % |
Real Estate Investment Trusts | | | 1.1 | % |
Options Purchased | | | 0.9 | % |
| | | | |
Total | | | 100.0 | % |
| 1 | Investments in an affiliated money market fund. |
Portfolio holdings and allocations are subject to change. Percentages in the table above, as of December 31, 2010, are based on total investments, which may differ from the percentages set forth below in the Portfolio of Investments which are computed using the Fund’s net assets.
The Portfolio of Investments Summary Table and the Portfolio of Investments are broken down by sectors, and these sectors do not represent industry categories for purposes of identifying “industry concentration” as described in the Investment Company Act of 1940, as amended.
Portfolio of Investments
December 31, 2010
| | | | | | | | |
| Shares | | | | | Value | |
| | | | Common Stocks — 96.8% | | | | |
| | | | Consumer Discretionary — 12.3% | | | | |
| | 1,400 | | | Advance Auto Parts, Inc. | | $ | 92,610 | |
| | 3,700 | | | Columbia Sportswear Co. | | | 223,110 | |
| | 4,700 | | | Crocs, Inc. * | | | 80,464 | |
| | 3,200 | | | Iconix Brand Group, Inc. * | | | 61,792 | |
| | 6,200 | | | Limited Brands, Inc. | | | 190,526 | |
| | 4,160 | | | Lululemon Athletica, Inc. * | | | 284,627 | |
| | 300 | | | Priceline.com, Inc. * | | | 119,865 | |
| | 3,600 | | | Tractor Supply Co. | | | 174,564 | |
| | 10,000 | | | True Religion Apparel, Inc. * | | | 222,600 | |
| | 2,100 | | | Under Armour, Inc., Series A, Class A * | | | 115,164 | |
| | | | | | | | |
| | | | | | | 1,565,322 | |
| | | | | | | | |
| | | | Consumer Staples — 3.2% | | | | |
| | 5,800 | | | Green Mountain Coffee Roasters, Inc. * | | | 190,588 | |
| | 3,500 | | | Mead Johnson Nutrition Co. | | | 217,875 | |
| | | | | | | | |
| | | | | | | 408,463 | |
| | | | | | | | |
| | | | Energy — 14.7% | | | | |
| | 6,300 | | | Alpha Natural Resources, Inc. * | | | 378,189 | |
| | 3,800 | | | AMCOL International Corp. | | | 117,800 | |
| | 3,500 | | | Atwood Oceanics, Inc. * | | | 130,795 | |
| | 4,200 | | | Holly Corp. | | | 171,234 | |
| | 5,800 | | | Nabors Industries Ltd. * | | | 136,068 | |
| | 2,700 | | | National Oilwell Varco, Inc. | | | 181,575 | |
| | 12,400 | | | Patriot Coal Corp. * | | | 240,188 | |
| | 15,400 | | | Quicksilver Resources, Inc. * | | | 226,996 | |
| | 2,300 | | | Tenaris SA ADR | | | 112,654 | |
| | 8,900 | | | Tesoro Corp. * | | | 165,006 | |
| | | | | | | | |
| | | | | | | 1,860,505 | |
| | | | | | | | |
| | | | | | | | |
| Shares | | | | | Value | |
| | | | Financials — 10.7% | | | | |
| | 1,300 | | | Ameriprise Financial, Inc. | | $ | 74,815 | |
| | 2,500 | | | Bank of Hawaii Corp. | | | 118,025 | |
| | 5,100 | | | BB&T Corp. | | | 134,079 | |
| | 4,900 | | | Jefferies Group, Inc. | | | 130,487 | |
| | 24,900 | | | Marshall & Ilsley Corp. | | | 172,308 | |
| | 6,000 | | | MSCI, Inc., Series A, Class A * | | | 233,760 | |
| | 6,400 | | | SVB Financial Group * | | | 339,520 | |
| | 5,500 | | | U.S. Bancorp | | | 148,335 | |
| | | | | | | | |
| | | | | | | 1,351,329 | |
| | | | | | | | |
| | | | Health Care — 7.2% | | | | |
| | 2,580 | | | Abbott Laboratories | | | 123,608 | |
| | 3,800 | | | CareFusion Corp. * | | | 97,660 | |
| | 3,700 | | | Integra LifeSciences Holdings Corp. * | | | 175,010 | |
| | 2,200 | | | Life Technologies Corp. (a) * | | | 122,100 | |
| | 2,300 | | | Perrigo Co. | | | 145,659 | |
| | 8,900 | | | Thoratec Corp. * | | | 252,048 | |
| | | | | | | | |
| | | | | | | 916,085 | |
| | | | | | | | |
| | | | Industrials — 14.2% | | | | |
| | 2,300 | | | AGCO Corp. * | | | 116,518 | |
| | 4,200 | | | CNH Global NV NYS * | | | 200,508 | |
| | 2,000 | | | FMC Technologies, Inc. * | | | 177,820 | |
| | 1,600 | | | Haynes International, Inc. | | | 66,928 | |
| | 7,700 | | | Hexcel Corp. * | | | 139,293 | |
| | 2,800 | | | Joy Global, Inc. | | | 242,900 | |
| | 3,500 | | | Lindsay Corp. | | | 208,005 | |
| | 1,300 | | | Precision Castparts Corp. | | | 180,973 | |
| | 800 | | | SPX Corp. | | | 57,192 | |
See Notes which are an integral part of the Financial Statements.
Huntington VA New Economy Fund
Portfolio of Investments (continued)
December 31, 2010
| | | | | | | | |
| Shares | | | | | Value | |
| | | | Common Stocks — (continued) | | | | |
| | | | Industrials — (continued) | | | | |
| | 3,200 | | | The Boeing Co. | | $ | 208,832 | |
| | 2,300 | | | Valmont Industries, Inc. | | | 204,079 | |
| | | | | | | | |
| | | | | | | 1,803,048 | |
| | | | | | | | |
| | | | Information Technology — 22.0% | | | | |
| | 2,700 | | | 3D Systems Corp. * | | | 85,023 | |
| | 3,200 | | | Acme Packet, Inc. * | | | 170,112 | |
| | 730 | | | Apple, Inc. * | | | 235,469 | |
| | 17,800 | | | Compellent Technologies, Inc. * | | | 491,102 | |
| | 3,620 | | | Cree, Inc. (a) * | | | 238,522 | |
| | 5,000 | | | Mellanox Technologies Ltd. * | | | 130,850 | |
| | 1,500 | | | NetApp, Inc. (a)* | | | 82,440 | |
| | 6,600 | | | Netlogic Microsystems, Inc. * | | | 207,306 | |
| | 6,800 | | | NVIDIA Corp. * | | | 104,720 | |
| | 3,800 | | | Riverbed Technology, Inc. (a) * | | | 133,646 | |
| | 4,600 | | | Rovi Corp. * | | | 285,246 | |
| | 3,400 | | | Solera Holdings, Inc. | | | 174,488 | |
| | 3,700 | | | STEC, Inc. * | | | 65,305 | |
| | 17,900 | | | Take-Two Interactive Software, Inc. * | | | 219,096 | |
| | 1,800 | | | VMware, Inc., Class A * | | | 160,038 | |
| | | | | | | | |
| | | | | | | 2,783,363 | |
| | | | | | | | |
| | | | Materials — 9.7% | | | | |
| | 2,700 | | | Agrium, Inc. (a) | | | 247,725 | |
| | 1,600 | | | Barrick Gold Corp. | | | 85,088 | |
| | 2,700 | | | CF Industries Holdings, Inc. (a) | | | 364,905 | |
| | 2,400 | | | FMC Corp. | | | 191,736 | |
| | 8,100 | | | Stillwater Mining Co. * | | | 172,935 | |
| | 9,700 | | | Titanium Metals Corp. * | | | 166,646 | |
| | | | | | | | |
| | | | | | | 1,229,035 | |
| | | | | | | | |
| | | | Real Estate Investment Trusts — 1.1% | |
| | 3,700 | | | HCP, Inc. | | | 136,123 | |
| | | | | | | | |
| | | | Utilities — 1.7% | | | | |
| | 5,785 | | | FirstEnergy Corp. | | | 214,161 | |
| | | | | | | | |
| | | | Total Common Stocks
(Cost $10,630,312) | | | 12,267,434 | |
| | | | | | | | |
| | | | | | | | |
| Shares | | | | | Value | |
| | | | Options Purchased — 0.9% | | | | |
| | 250 | | | iPath S&P 500 VIX Mid-Term
Futures ETN, Call @ $75,
Expiring January 2011 | | $ | 5,000 | |
| | | | | | | | |
| | 475 | | | iPath S&P 500 VIX Short-Term
Futures ETN, Call @ $40,
Expiring February 2011 | | | 116,375 | |
| | | | | | | | |
| | | | Total Options Purchased
(Cost $199,657) | | | 121,375 | |
| | | | | | | | |
| | | | Cash Equivalents — 3.7% | | | | |
| | 465,599 | | | Huntington Money Market Fund, Interfund Shares, 0.010% (b) (c) | | | 465,599 | |
| | | | | | | | |
| | | | Total Cash Equivalents
(Cost $465,599) | | | 465,599 | |
| | | | | | | | |
| | | | Total Investments
(Cost $11,295,568) — 101.4% | | | 12,854,408 | |
| | | | | | | | |
| | | | Liabilities in Excess of Other
Assets — (1.4)% | | | (183,536 | ) |
| | | | | | | | |
| | | | Net Assets — 100.0% | | $ | 12,670,872 | |
| | | | | | | | |
| (a) | All or a portion of the security is held as collateral for options. |
| (b) | Rate disclosed is the seven day yield as of December 31, 2010. |
| (c) | Investment in affiliate. |
| * | Non-income producing security. |
| | |
| ADR | | —American Depositary Receipt |
H U N T I N G T O N F U N D S
See Notes which are an integral part of the Financial Statements.
Huntington VA Real Strategies Fund
Portfolio of Investments Summary Table (Unaudited)
December 31, 2010
| | | | |
| Asset Allocation | | Percentage of
Market Value | |
Energy | | | 43.3 | % |
Materials | | | 20.0 | % |
Industrials | | | 10.7 | % |
Real Estate Investment Trusts | | | 8.7 | % |
Cash1 | | | 7.7 | % |
Mutual Funds | | | 6.3 | % |
Financials | | | 1.9 | % |
Utilities | | | 1.4 | % |
| | | | |
Total | | | 100.0 | % |
| 1 | Investments in an affiliated money market fund. |
Portfolio holdings and allocations are subject to change. Percentages in the table above, as of December 31, 2010, are based on total investments, which may differ from the percentages set forth below in the Portfolio of Investments which are computed using the Fund’s total net assets.
The Portfolio of Investments Summary Table and the Portfolio of Investments are broken down by sectors, and these sectors do not represent industry categories for purposes of identifying “industry concentration” as described in the Investment Company Act of 1940, as amended.
Portfolio of Investments
December 31, 2010
| | | | | | | | |
| Shares | | | | | Value | |
| | | | Common Stocks — 84.4% | | | | |
| | | | Energy — 43.4% | | | | |
| | 2,400 | | | Arch Coal, Inc. (a) | | $ | 84,144 | |
| | 1,200 | | | Cameco Corp. | | | 48,456 | |
| | 800 | | | Canadian Natural Resources Ltd. | | | 35,536 | |
| | 1,200 | | | Chesapeake Energy Corp. | | | 31,092 | |
| | 900 | | | Consol Energy, Inc. | | | 43,866 | |
| | 1,940 | | | El Paso Corp. | | | 26,694 | |
| | 800 | | | EnCana Corp. | | | 23,296 | |
| | 670 | | | Enterprise Products Partners LP | | | 27,879 | |
| | 600 | | | Frontier Oil Corp. * | | | 10,806 | |
| | 1,300 | | | Hugoton Royalty Trust | | | 26,676 | |
| | 1,100 | | | Linn Energy LLC | | | 41,239 | |
| | 900 | | | Marathon Oil Corp. (a) | | | 33,327 | |
| | 600 | | | National Oilwell Varco, Inc. | | | 40,350 | |
| | 1,975 | | | Natural Resource Partners LP | | | 65,570 | |
| | 690 | | | Newfield Exploration Co. * | | | 49,756 | |
| | 700 | | | Noble Corp. | | | 25,039 | |
| | 1,200 | | | Peabody Energy Corp. (a) | | | 76,776 | |
| | 1,900 | | | Penn Virginia Resource Partners, L.P. | | | 53,808 | |
| | 1,600 | | | Petroleo Brasileiro SA ADR | | | 60,544 | |
| | 500 | | | QEP Resources, Inc. | | | 18,155 | |
| | 900 | | | Rowan Cos., Inc. * | | | 31,419 | |
| | 1,400 | | | Sasol Ltd. ADR | | | 72,870 | |
| | 348 | | | Schlumberger Ltd. | | | 29,058 | |
| | 1,600 | | | Spectra Energy Corp. | | | 39,984 | |
| | 986 | | | StatoilHydro ASA ADR | | | 23,437 | |
| | 500 | | | Tenaris SA ADR | | | 24,490 | |
| | 1,500 | | | Tesoro Corp. (a) * | | | 27,810 | |
| | 500 | | | Transocean Ltd. * | | | 34,755 | |
| | 8,700 | | | Uranium Energy Corp. * | | | 52,548 | |
| | 6,300 | | | USEC, Inc. * | | | 37,926 | |
| | 2,200 | | | Valero Energy Corp. (a) | | | 50,864 | |
| | 500 | | | Walter Energy, Inc. | | | 63,920 | |
| | | | | | | | |
| | | | | | | 1,312,090 | |
| | | | | | | | |
| | | | | | | | |
| Shares | | | | | Value | |
| | | | Industrials — 10.8% | | | | |
| | 1,100 | | | AGCO Corp. * | | $ | 55,726 | |
| | 200 | | | Bucyrus International, Inc. | | | 17,880 | |
| | 200 | | | Canadian National Railway Co. | | | 13,294 | |
| | 700 | | | Deere & Co. | | | 58,135 | |
| | 300 | | | Fluor Corp. | | | 19,878 | |
| | 1,100 | | | Foster Wheeler AG * | | | 37,972 | |
| | 1,000 | | | Harsco Corp. | | | 28,320 | |
| | 1,000 | | | KOMATSU Ltd. ADR | | | 30,470 | |
| | 2,400 | | | Manitowoc Co., Inc. | | | 31,464 | |
| | 900 | | | Robbins & Myers, Inc. | | | 32,202 | |
| | | | | | | | |
| | | | | | | 325,341 | |
| | | | | | | | |
| | | | Materials — 20.1% | | | | |
| | 650 | | | Agrium, Inc. (a) | | | 59,638 | |
| | 800 | | | Allegheny Technologies, Inc. (a) | | | 44,144 | |
| | 400 | | | BHP Billiton Ltd. ADR | | | 37,168 | |
| | 300 | | | FMC Corp. | | | 23,967 | |
| | 2,400 | | | Olin Corp. | | | 49,248 | |
| | 200 | | | POSCO ADR | | | 21,538 | |
| | 370 | | | Potash Corp. of Saskatchewan, Inc. | | | 57,287 | |
| | 300 | | | Praxair, Inc. | | | 28,641 | |
| | 1,200 | | | Rio Tinto PLC ADR | | | 85,992 | |
| | 800 | | | Sociedad Quimica y Minera
de Chile SA ADR | | | 46,736 | |
| | 300 | | | Terra Nitrogen Co., LP | | | 32,433 | |
| | 500 | | | The Mosaic Co. | | | 38,180 | |
| | 1,000 | | | Vale SA ADR | | | 34,570 | |
| | 800 | | | Yara International ASA ADR | | | 46,400 | |
| | | | | | | | |
| | | | | | | 605,942 | |
| | | | | | | | |
| | | | Real Estate Investment Trusts — 8.7% | | | | |
| | 300 | | | Avalonbay Communities, Inc. | | | 33,765 | |
| | 800 | | | Boston Properties, Inc. (a) | | | 68,880 | |
| | 2,800 | | | Duke Realty Corp. | | | 34,888 | |
| | 1,200 | | | Plum Creek Timber Co., Inc. | | | 44,940 | |
See Notes which are an integral part of the Financial Statements.
Huntington VA Real Strategies Fund
Portfolio of Investments (continued)
December 31, 2010
| | | | | | | | |
Shares or
Principal
Amount | | | | | Value | |
| | | | Common Stocks — (continued) | | | | |
| | | | Real Estate Investment
Trusts — (continued) | | | | |
| | 900 | | | Rayonier, Inc. | | $ | 47,268 | |
| | 403 | | | Vornado Realty Trust | | | 33,582 | |
| | | | | | | | |
| | | | | | | 263,323 | |
| | | | | | | | |
| | | | Utilities — 1.4% | | | | |
| | 2,500 | | | Questar Corp. | | | 43,525 | |
| | | | | | | | |
| | | | Total Common Stocks
(Cost $2,025,759) | | | 2,550,221 | |
| | | | | | | | |
| | | | Corporate Bonds — 1.9% | | | | |
| | | | Financials — 1.9% | | | | |
| | $50,000 | | | Credit Suisse Securities USA LLC, 0.000%, 3/26/13 (b) | | | 57,295 | |
| | | | | | | | |
| | | | Total Corporate Bonds
(Cost $50,000) | | | 57,295 | |
| | | | | | | | |
| | | | Mutual Funds — 6.4% | | | | |
| | | | Exchange Traded Funds — 4.3% | |
| | 300 | | | Oil Services HOLDRs Trust | | | 42,159 | |
| | 1,200 | | | PowerShares DB Agriculture Fund * | | | 38,820 | |
| | 500 | | | ProShares Short S&P 500 Treasury Fund * | | | 18,525 | |
| | 5,000 | | | US Natural Gas Fund LP * | | | 29,900 | |
| | | | | | | | |
| | | | | | | 129,404 | |
| | | | | | | | |
| | | | Investment Companies — 2.1% | |
| | 3,000 | | | Central Fund of Canada Ltd., Series A, Class A | | | 62,190 | |
| | | | | | | | |
| | | | Total Mutual Funds
(Cost $169,873) | | | 191,594 | |
| | | | | | | | |
| | | | | | | | |
| Shares | | | | | Value | |
| | | | Cash Equivalents — 7.7% | | | | |
| | 231,852 | | | Huntington Money Market Fund, Interfund Shares, 0.010% (c) (d) | | $ | 231,852 | |
| | | | | | | | |
| | | | Total Cash Equivalents
(Cost $231,852) | | | 231,852 | |
| | | | | | | | |
| | | | Total Investments (Cost $2,477,484) — 100.4% | | | 3,030,962 | |
| | | | | | | | |
| | | | Liabilities in Excess of Other
Assets — (0.4)% | | | (10,632 | ) |
| | | | | | | | |
| | | | Net Assets — 100.0% | | $ | 3,020,330 | |
| | | | | | | | |
| (a) | All or a portion of the security is held as collateral for options. |
| (c) | Rate disclosed is the seven day yield as of December 31, 2010. |
| (d) | Investment in affiliate. |
| * | Non-income producing security. |
| | |
| ADR | | —American Depositary Receipt |
| LLC | | —Limited Liability Co. |
| LP | | —Limited Partnership |
| PLC | | —Public Liability Co. |
H U N T I N G T O N F U N D S
See Notes which are an integral part of the Financial Statements.
Huntington VA Rotating Markets Fund
Portfolio of Investments Summary Table (Unaudited)
December 31, 2010
| | | | |
| Asset Allocation | | Percentage of
Market Value | |
Industrials | | | 20.2 | % |
Information Technology | | | 15.2 | % |
Consumer Staples | | | 12.6 | % |
Energy | | | 9.7 | % |
Financials | | | 9.1 | % |
Consumer Discretionary | | | 8.6 | % |
Mutual Funds | | | 7.3 | % |
Health Care | | | 6.7 | % |
Materials | | | 3.9 | % |
Telecommunication Services | | | 3.8 | % |
Cash1 | | | 2.9 | % |
| | | | |
Total | | | 100.0 | % |
| 1 | Investments in an affiliated money market fund. |
Portfolio holdings and allocations are subject to change. Percentages in the table above, as of December 31, 2010, are based on total investments, which may differ from the percentages set forth below in the Portfolio of Investments which are computed using the Fund’s net assets.
The Portfolio of Investments Summary Table and the Portfolio of Investments are broken down by sectors, and these sectors do not represent industry categories for purposes of identifying “industry concentration” as described in the Investment Company Act of 1940, as amended.
Portfolio of Investments
December 31, 2010
| | | | | | | | |
| Shares | | | | | Value | |
| | | | Common Stocks — 89.7% | | | | |
| | | | Consumer Discretionary — 8.6% | | | | |
| | 3,900 | | | Home Depot, Inc. | | $ | 136,734 | |
| | 4,000 | | | McDonald’s Corp. | | | 307,040 | |
| | 4,100 | | | The Walt Disney Co. | | | 153,791 | |
| | | | | | | | |
| | | | | | | 597,565 | |
| | | | | | | | |
| | | | Consumer Staples — 12.6% | | | | |
| | 4,100 | | | Kraft Foods, Inc. | | | 129,191 | |
| | 4,000 | | | Procter & Gamble Co. | | | 257,320 | |
| | 4,100 | | | The Coca-Cola Co. | | | 269,657 | |
| | 4,100 | | | Wal-Mart Stores, Inc. | | | 221,113 | |
| | | | | | | | |
| | | | | | | 877,281 | |
| | | | | | | | |
| | | | Energy — 9.7% | | | | |
| | 4,100 | | | Chevron Texaco Corp. | | | 374,125 | |
| | 4,100 | | | Exxon Mobil Corp. | | | 299,792 | |
| | | | | | | | |
| | | | | | | 673,917 | |
| | | | | | | | |
| | | | Financials — 9.1% | | | | |
| | 4,100 | | | American Express Co. | | | 175,972 | |
| | 4,100 | | | Bank of America Corp. | | | 54,694 | |
| | 4,100 | | | JPMorgan Chase & Co. | | | 173,922 | |
| | 4,100 | | | The Travelers Cos., Inc. | | | 228,411 | |
| | | | | | | | |
| | | | | | | 632,999 | |
| | | | | | | | |
| | | | Health Care — 6.7% | | | | |
| | 4,000 | | | Johnson & Johnson | | | 247,400 | |
| | 4,100 | | | Merck & Co., Inc. | | | 147,764 | |
| | 4,100 | | | Pfizer, Inc. | | | 71,791 | |
| | | | | | | | |
| | | | | | | 466,955 | |
| | | | | | | | |
| | | | Industrials — 20.2% | | | | |
| | 4,100 | | | 3M Co. | | | 353,830 | |
| | 4,100 | | | Caterpillar, Inc. | | | 384,006 | |
| | | | | | | | |
| Shares | | | | | Value | |
| | | | Industrials — (continued) | | | | |
| | 4,100 | | | General Electric Co. | | $ | 74,989 | |
| | 4,100 | | | The Boeing Co. | | | 267,566 | |
| | 4,100 | | | United Technologies Corp. | | | 322,752 | |
| | | | | | | | |
| | | | | | | 1,403,143 | |
| | | | | | | | |
| | | | Information Technology — 15.2% | | | | |
| | 4,100 | | | Cisco Systems, Inc. * | | | 82,943 | |
| | 4,100 | | | Hewlett-Packard Co. | | | 172,610 | |
| | 4,100 | | | Intel Corp. | | | 86,223 | |
| | 4,100 | | | International Business Machines Corp. | | | 601,716 | |
| | 4,000 | | | Microsoft Corp. | | | 111,680 | |
| | | | | | | | |
| | | | | | | 1,055,172 | |
| | | | | | | | |
| | | | Materials — 3.8% | | | | |
| | 4,100 | | | Alcoa, Inc. | | | 63,099 | |
| | 4,100 | | | Du Pont (E.I.) de Nemours & Co. | | | 204,508 | |
| | | | | | | | |
| | | | | | | 267,607 | |
| | | | | | | | |
| | | | Telecommunication Services — 3.8% | | | | |
| | 4,000 | | | AT&T, Inc. | | | 117,520 | |
| | 4,100 | | | Verizon Communications, Inc. | | | 146,698 | |
| | | | | | | | |
| | | | | | | 264,218 | |
| | | | | | | | |
| | | | Total Common Stocks
(Cost $5,533,767) | | | 6,238,857 | |
| | | | | | | | |
| | | | Mutual Funds — 7.3% | | | | |
| | | | Exchange Traded Funds — 7.3% | | | | |
| | 4,420 | | | SPDR Dow Jones Industrial
Average ETF Trust | | | 510,952 | |
| | | | | | | | |
| | | | Total Mutual Funds
(Cost $454,374) | | | 510,952 | |
| | | | | | | | |
See Notes which are an integral part of the Financial Statements.
Huntington VA Rotating Markets Fund
Portfolio of Investments (continued)
December 31, 2010
| | | | | | | | |
| Shares | | | | | Value | |
| | | | Cash Equivalents — 2.9% | | | | |
| | 198,325 | | | Huntington Money Market Fund, Interfund Shares, 0.010% (a) (b) | | $ | 198,325 | |
| | | | | | | | |
| | | | Total Cash Equivalents
(Cost $198,324) | | | 198,325 | |
| | | | | | | | |
| | | | Total Investments (Cost $6,186,465) — 99.9% | | | 6,948,134 | |
| | | | | | | | |
| | | | Other Assets in Excess of
Liabilities — 0.1% | | | 9,216 | |
| | | | | | | | |
| | | | Net Assets — 100.0% | | $ | 6,957,350 | |
| | | | | | | | |
| (a) | Investment in affiliate. |
| (b) | Rate disclosed is the seven day yield as of December 31, 2010. |
| * | Non-income producing security. |
H U N T I N G T O N F U N D S
See Notes which are an integral part of the Financial Statements.
Huntington VA Situs Fund
Portfolio of Investments Summary Table (Unaudited)
December 31, 2010
| | | | |
| Asset Allocation | | Percentage of
Market Value | |
Information Technology | | | 19.4 | % |
Industrials | | | 15.5 | % |
Health Care | | | 14.9 | % |
Energy | | | 14.6 | % |
Financials | | | 12.5 | % |
Consumer Discretionary | | | 8.2 | % |
Materials | | | 8.0 | % |
Utilities | | | 2.2 | % |
Consumer Staples | | | 1.4 | % |
Real Estate Investment Trusts | | | 1.0 | % |
Cash1 | | | 1.0 | % |
Telecommunication Services | | | 0.7 | % |
Mutual Funds | | | 0.6 | % |
| | | | |
Total | | | 100.0 | % |
| 1 | Investments in an affiliated money market fund. |
Portfolio holdings and allocations are subject to change. Percentages in the table above, as of December 31, 2010, are based on total investments, which may differ from the percentages set forth below in the Portfolio of Investments which are computed using the Fund’s net assets.
The Portfolio of Investments Summary Table and the Portfolio of Investments are broken down by sectors, and these sectors do not represent industry categories for purposes of identifying “industry concentration” as described in the Investment Company Act of 1940, as amended.
Portfolio of Investments
December 31, 2010
| | | | | | | | |
| Shares | | | | | Value | |
| | | | Common Stocks — 98.6% | | | | |
| | | | Bermuda — 2.0% | | | | |
| | | | Financials — 2.0% | | | | |
| | 5,250 | | | Arch Capital Group Ltd. * | | $ | 462,263 | |
| | | | | | | | |
| | | | Brazil — 0.2% | | | | |
| | | | Consumer Discretionary — 0.2% | | | | |
| | 1,000 | | | Cia Brasileira de Distribuicao Grupo Pao de Acucar ADR | | | 41,980 | |
| | | | | | | | |
| | | | Chile — 0.2% | | | | |
| | | | Materials — 0.2% | | | | |
| | 800 | | | Sociedad Quimica y Minera
de Chile SA ADR | | | 46,736 | |
| | | | | | | | |
| | | | Finland — 1.4% | | | | |
| | | | Industrials — 1.4% | | | | |
| | 2,000 | | | Cargotec Oyj | | | 104,365 | |
| | 4,200 | | | Kone Oyj | | | 233,599 | |
| | | | | | | | |
| | | | | | | 337,964 | |
| | | | | | | | |
| | | | Germany — 0.6% | | | | |
| | | | Consumer Discretionary — 0.3% | | | | |
| | 1,500 | | | Douglas Holding AG | | | 84,230 | |
| | | | | | | | |
| | | | Health Care — 0.3% | | | | |
| | 1,900 | | | Stada Arzneimittel AG | | | 64,472 | |
| | | | | | | | |
| | | | | | | 148,702 | |
| | | | | | | | |
| | | | Hong Kong — 0.3% | | | | |
| | | | Consumer Discretionary — 0.3% | | | | |
| | 13,000 | | | Television Broadcasts Ltd. | | | 70,246 | |
| | | | | | | | |
| | | | | | | | |
| Shares | | | | | Value | |
| | | | Ireland — 0.5% | | | | |
| | | | Consumer Staples — 0.5% | | | | |
| | 3,500 | | | Kerry Group PLC | | $ | 116,846 | |
| | | | | | | | |
| | | | Japan — 0.9% | | | | |
| | | | Consumer Discretionary — 0.4% | | | | |
| | 2,000 | | | Honda Motor Co., Ltd. ADR | | | 79,000 | |
| | | | | | | | |
| | | | Industrials — 0.2% | | | | |
| | 3,500 | | | Sato Corp. | | | 46,365 | |
| | | | | | | | |
| | | | Information Technology — 0.3% | | | | |
| | 14,800 | | | Furuno Electric Co. Ltd. | | | 72,702 | |
| | | | | | | | |
| | | | | | | 198,067 | |
| | | | | | | | |
| | | | Sweden — 0.3% | | | | |
| | | | Consumer Discretionary — 0.3% | | | | |
| | 4,800 | | | Haldex AB * | | | 75,212 | |
| | | | | | | | |
| | | | United Kingdom — 0.6% | | | | |
| | | | Industrials — 0.6% | | | | |
| | 26,003 | | | HALMA PLC | | | 145,576 | |
| | | | | | | | |
| | | | United States — 91.6% | | | | |
| | | | Consumer Discretionary — 6.7% | | | | |
| | 20,000 | | | Cabela’s Inc., Class A * | | | 435,000 | |
| | 3,000 | | | Deckers Outdoor Corp. * | | | 239,220 | |
| | 3,000 | | | Jakks Pacific, Inc. * | | | 54,660 | |
| | 500 | | | Polo Ralph Lauren Corp. | | | 55,460 | |
| | 2,000 | | | Rent-A-Center, Inc. | | | 64,560 | |
| | 20,000 | | | Sonic Corp. * | | | 202,400 | |
| | 15,000 | | | Urban Outfitters, Inc. * | | | 537,150 | |
| | | | | | | | |
| | | | | | | 1,588,450 | |
| | | | | | | | |
See Notes which are an integral part of the Financial Statements.
Huntington VA Situs Fund
Portfolio of Investments (continued)
December 31, 2010
| | | | | | | | |
| Shares | | | | | Value | |
| | | | Common Stocks — (continued) | | | | |
| | | | Consumer Staples — 0.9% | | | | |
| | 7,100 | | | Fresh Del Monte Produce, Inc. | | $ | 177,145 | |
| | 1,000 | | | Sanderson Farms, Inc. | | | 39,150 | |
| | | | | | | | |
| | | | | | | 216,295 | |
| | | | | | | | |
| | | | Energy — 14.6% | | | | |
| | 10,000 | | | Alliance Resource Partners LP | | | 657,600 | |
| | 4,000 | | | Atwood Oceanics, Inc. * | | | 149,480 | |
| | 7,000 | | | Carbo Ceramics, Inc. | | | 724,780 | |
| | 7,800 | | | Denbury Resources, Inc. * | | | 148,902 | |
| | 500 | | | Dril-Quip, Inc. * | | | 38,860 | |
| | 1,744 | | | Helix Energy Solutions Group, Inc.* | | | 21,172 | |
| | 10,000 | | | Lufkin Industries, Inc. | | | 623,900 | |
| | 1,000 | | | Newfield Exploration Co. * | | | 72,110 | |
| | 3,000 | | | Oceaneering International, Inc. * | | | 220,890 | |
| | 6,000 | | | OYO Geospace Corp. * | | | 594,660 | |
| | 2,000 | | | Rowan Cos., Inc. * | | | 69,820 | |
| | 2,500 | | | SM Energy Co. | | | 147,325 | |
| | | | | | | | |
| | | | | | | 3,469,499 | |
| | | | | | | | |
| | | | Financials — 10.6% | | | | |
| | 8,000 | | | BB&T Corp. | | | 210,320 | |
| | 1,064 | | | CBL & Associates Properties, Inc. | | | 18,620 | |
| | 12,000 | | | Cullen/Frost Bankers, Inc. | | | 733,440 | |
| | 8,500 | | | Equity One, Inc. | | | 154,530 | |
| | 15,000 | | | Protective Life Corp. | | | 399,600 | |
| | 25,000 | | | Raymond James Financial, Inc. | | | 817,500 | |
| | 3,000 | | | SCBT Financial Corp. | | | 98,250 | |
| | 1,500 | | | WSFS Financial Corp. | | | 71,160 | |
| | | | | | | | |
| | | | | | | 2,503,420 | |
| | | | | | | | |
| | | | Health Care — 14.7% | | | | |
| | 20,000 | | | Albany Molecular Research * | | | 112,400 | |
| | 650 | | | Bio-Rad Laboratories, Inc., Class A * | | | 67,503 | |
| | 8,500 | | | Cerner Corp. * | | | 805,290 | |
| | 12,000 | | | Edwards LifeSciences Corp. * | | | 970,080 | |
| | 3,000 | | | Kindred Healthcare, Inc. * | | | 55,110 | |
| | 13,000 | | | Kinetic Concepts, Inc. * | | | 544,440 | |
| | 18,000 | | | Lincare Holdings, Inc. | | | 482,940 | |
| | 3,000 | | | Myriad Genetics, Inc. * | | | 68,520 | |
| | 7,000 | | | Osiris Therapeutics, Inc. * | | | 54,530 | |
| | 1 | | | PharMerica Corp. * | | | 11 | |
| | 6,000 | | | Watson Pharmaceutical, Inc. * | | | 309,900 | |
| | | | | | | | |
| | | | | | | 3,470,724 | |
| | | | | | | | |
| | | | Industrials — 13.3% | | | | |
| | 1,000 | | | American Superconductor Corp. * | | | 28,590 | |
| | 5,000 | | | BE Aerospace, Inc. * | | | 185,150 | |
| | 12,000 | | | EnPro Industries, Inc. * | | | 498,720 | |
| | 5,500 | | | Flowserve Corp. | | | 655,710 | |
| | 10,000 | | | Harsco Corp. | | | 283,200 | |
| | 5,000 | | | Jacobs Engineering Group, Inc. * | | | 229,250 | |
| | 10,000 | | | Quanta Services, Inc. * | | | 199,200 | |
| | 1,000 | | | Ryder System, Inc. | | | 52,640 | |
| | 22,000 | | | Southwest Airlines Co. | | | 285,560 | |
| | 25,000 | | | Trinity Industries, Inc. | | | 665,250 | |
| | | | | | | | |
| Shares | | | | | Value | |
| | | | Industrials — (continued) | | | | |
| | 2,000 | | | Watts Water Technologies, Inc., Class A | | $ | 73,180 | |
| | | | | | | | |
| | | | | | | 3,156,450 | |
| | | | | | | | |
| | | | Information Technology — 19.1% | | | | |
| | 8,000 | | | ACI Worldwide, Inc. * | | | 214,960 | |
| | 12,000 | | | Anixter International, Inc. * | | | 716,760 | |
| | 4,000 | | | Black Box Corp. | | | 153,160 | |
| | 20,000 | | | CommScope, Inc. * | | | 624,400 | |
| | 3,000 | | | Exlservice Holdings, Inc. * | | | 64,440 | |
| | 3,000 | | | Hutchinson Technology, Inc. * | | | 11,130 | |
| | 6,000 | | | Imation Corp. * | | | 61,860 | |
| | 35,000 | | | Jabil Circuit, Inc. | | | 703,150 | |
| | 16,600 | | | Red Hat, Inc. * | | | 757,790 | |
| | 3,000 | | | Scansource, Inc. * | | | 95,700 | |
| | 6,000 | | | Sigma Designs, Inc. * | | | 85,020 | |
| | 10,000 | | | Standard Microsystems Corp. * | | | 288,300 | |
| | 19,000 | | | Trimble Navigation Ltd. * | | | 758,670 | |
| | | | | | | | |
| | | | | | | 4,535,340 | |
| | | | | | | | |
| | | | Materials — 7.8% | | | | |
| | 8,000 | | | Albemarle Corp. | | | 446,240 | |
| | 1,048 | | | CF Industries Holdings, Inc. | | | 141,637 | |
| | 3,000 | | | Commercial Metals Co. | | | 49,770 | |
| | 1,500 | | | Eagle Materials, Inc. | | | 42,375 | |
| | 3,000 | | | Eastman Chemical Co. | | | 252,240 | |
| | 10,000 | | | Owens-Illinois, Inc. * | | | 307,000 | |
| | 3,000 | | | Quaker Chemical Corp. | | | 125,010 | |
| | 4,000 | | | RTI International Metals, Inc. * | | | 107,920 | |
| | 5,000 | | | Texas Industries, Inc. | | | 228,900 | |
| | 2,400 | | | The Scotts Co. | | | 121,848 | |
| | 500 | | | United States Lime & Minerals, Inc. * | | | 21,065 | |
| | | | | | | | |
| | | | | | | 1,844,005 | |
| | | | | | | | |
| | | | Real Estate Investment Trusts — 1.0% | |
| | 3,500 | | | Camden Property Trust | | | 188,930 | |
| | 2,000 | | | Weingarten Realty Investors | | | 47,520 | |
| | | | | | | | |
| | | | | | | 236,450 | |
| | | | | | | | |
| | | | Telecommunication Services — 0.7% | | | | |
| | 12,300 | | | General Communication, Inc., Class A * | | | 155,718 | |
| | | | | | | | |
| | | | Utilities — 2.2% | | | | |
| | 1,000 | | | AGL Resources, Inc. | | | 35,850 | |
| | 5,000 | | | Hawaiian Electric Industries, Inc. | | | 113,950 | |
| | 6,000 | | | Portland General Electric Co. | | | 130,200 | |
| | 7,500 | | | UGI Corp. | | | 236,850 | |
| | | | | | | | |
| | | | | | | 516,850 | |
| | | | | | | | |
| | | | | | | 21,693,201 | |
| | | | | | | | |
| | | | Total Common Stocks
(Cost $18,579,418) | | | 23,336,793 | |
| | | | | | | | |
| | | | Mutual Funds — 0.6% | | | | |
| | 3,500 | | | iShares FTSE/Xinhua China 25
Index Fund | | | 150,815 | |
| | | | | | | | |
| | | | Total Mutual Funds
(Cost $89,145) | | | 150,815 | |
| | | | | | | | |
H U N T I N G T O N F U N D S
See Notes which are an integral part of the Financial Statements.
Huntington VA Situs Fund
Portfolio of Investments (continued)
December 31, 2010
| | | | | | | | |
| Shares | | | | | Value | |
| | | | Cash Equivalents — 1.0% | | | | |
| | 243,370 | | | Huntington Money Market Fund, Interfund Shares, 0.010% (a) (b) | | $ | 243,370 | |
| | | | | | | | |
| | | | Total Cash Equivalents
(Cost $243,370) | | | 243,370 | |
| | | | | | | | |
| | | | Total Investments
(Cost $18,911,933) — 100.2% | | | 23,730,978 | |
| | | | | | | | |
| | | | Liabilities in Excess of Other
Assets — (0.2)% | | | (48,189 | ) |
| | | | | | | | |
| | | | Net Assets — 100.0% | | $ | 23,682,789 | |
| | | | | | | | |
| (a) | Investment in affiliate. |
| (b) | Rate disclosed is the seven day yield as of December 31, 2010. |
| * | Non-income producing security. |
| | |
| ADR | | —American Depositary Receipt |
| LP | | —Limited Partnership |
| PLC | | —Public Liability Co. |
See Notes which are an integral part of the Financial Statements.
Huntington VA Mortgage Securities Fund
Portfolio of Investments Summary Table (Unaudited)
December 31, 2010
| | | | |
| Asset Allocation | | Percentage of
Market Value | |
U.S. Government Mortgage Backed Securities | | | 62.0 | % |
U.S. Government Agencies | | | 16.7 | % |
Real Estate Investment Trusts | | | 10.0 | % |
Collateralized Mortgage Obligations | | | 7.4 | % |
Cash1 | | | 3.9 | % |
| | | | |
Total | | | 100.0 | % |
| 1 | Investments in an affiliated money market fund. |
Portfolio holdings and allocations are subject to change. Percentages in the table above, as of December 31, 2010, are based on total investments, which may differ from the percentages set forth below in the Portfolio of Investments which are computed using the Fund’s net assets.
The Portfolio of Investments Summary Table and the Portfolio of Investments are broken down by sectors, and these sectors do not represent industry categories for purposes of identifying “industry concentration” as described in the Investment Company Act of 1940, as amended.
Portfolio of Investments
December 31, 2010
| | | | | | | | |
Principal
Amount | | | | | Value | |
| | | | U.S. Government Mortgage Backed Agencies — 61.6% | | | | |
| | | | Federal Home Loan Mortgage Corporation — 23.1% | | | | |
| | $ 27,391 | | | Pool # M81004, 5.000%, 7/1/12 | | $ | 28,336 | |
| | 24,752 | | | Pool # M81004, 5.000%, 1/1/13 | | | 25,607 | |
| | 13,442 | | | Pool # B18052, 4.500%, 3/1/15 | | | 13,996 | |
| | 27,058 | | | Pool # J03237, 5.500%, 8/1/16 | | | 29,020 | |
| | 16,309 | | | Pool # E96459, 5.000%, 5/1/18 | | | 17,395 | |
| | 149,081 | | | Pool # J10396, 4.000%, 7/1/19 | | | 154,811 | |
| | 15,191 | | | Pool # G18015, 4.500%, 9/1/19 | | | 16,041 | |
| | 8,129 | | | Pool # G18015, 4.500%, 10/1/19 | | | 8,584 | |
| | 71,922 | | | Pool # G12425, 5.000%, 7/1/21 | | | 76,350 | |
| | 55,106 | | | Pool # G12425, 6.000%, 7/1/21 | | | 60,187 | |
| | 64,401 | | | Pool # G12425, 5.500%, 10/1/21 | | | 69,110 | |
| | 88,303 | | | Pool # E02402, 6.000%, 10/1/22 | | | 96,852 | |
| | 43,048 | | | Pool # C90699, 5.000%, 1/1/24 | | | 45,640 | |
| | 14,727 | | | Pool # C90699, 5.500%, 6/1/24 | | | 15,886 | |
| | 181,339 | | | Pool # G13629, 4.500%, 8/1/24 | | | 189,556 | |
| | 189,320 | | | Pool # J11053, 4.500%, 10/1/24 | | | 197,898 | |
| | 276,301 | | | Pool # J11829, 4.000%, 3/1/25 | | | 285,626 | |
| | 239,962 | | | Pool # E02696, 4.000%, 5/1/25 | | | 247,274 | |
| | 34,983 | | | Pool # C91296, 6.000%, 11/1/26 | | | 38,322 | |
| | 289,195 | | | Pool # D97248, 5.500%, 4/1/27 | | | 308,998 | |
| | 130,307 | | | Pool # C91296, 5.000%, 5/1/28 | | | 136,787 | |
| | 205,986 | | | Pool # C91296, 4.500%, 6/1/29 | | | 214,174 | |
| | 268,625 | | | Pool # C91284, 4.500%, 1/1/30 | | | 279,303 | |
| | 282,169 | | | Pool # C91296, 5.000%, 4/1/30 | | | 296,201 | |
| | 37,277 | | | Pool # 1G0865, 4.837%, 7/1/35 (a) | | | 39,139 | |
| | 105,952 | | | Pool # A55565, 6.000%, 12/1/36 | | | 115,165 | |
| | 114,469 | | | Pool # G03609, 5.500%, 11/1/37 | | | 122,147 | |
| | 377,781 | | | Pool # A93316, 4.500%, 8/1/40 | | | 387,603 | |
| | 497,506 | | | Pool # A94008, 4.000%, 9/1/40 | | | 494,560 | |
| | | | | | | | |
| | | | | | | 4,010,568 | |
| | | | | | | | |
| | | | | | | | |
Principal
Amount | | | | | Value | |
| | | | Federal National Mortgage
Association — 32.8% | | | | |
| | $ 8,633 | | | Pool # 255360, 4.000%, 5/1/11 | | $ | 8,779 | |
| | 29,596 | | | Pool # 254594, 4.500%, 4/1/13 | | | 31,247 | |
| | 22,038 | | | Pool # 255360, 4.500%, 9/1/13 | | | 22,684 | |
| | 145,590 | | | Pool # 786729, 5.500%, 8/1/19 | | | 158,101 | |
| | 87,874 | | | Pool # 254594, 5.500%, 9/1/22 | | | 95,176 | |
| | 160,779 | | | Pool # 889255, 5.000%, 3/1/23 | | | 170,693 | |
| | 14,425 | | | Pool # 255360, 5.000%, 9/1/23 | | | 15,366 | |
| | 9,016 | | | Pool # 255360, 5.000%, 8/1/24 | | | 9,595 | |
| | 184,547 | | | Pool # 935763, 4.000%, 11/1/24 | | | 191,439 | |
| | 516,583 | | | Pool # 932438, 4.000%, 1/1/25 | | | 532,968 | |
| | 35,801 | | | Pool # 256213, 5.500%, 4/1/25 | | | 38,705 | |
| | 31,747 | | | Pool # 357805, 5.000%, 5/1/25 | | | 33,786 | |
| | 33,657 | | | Pool # 256213, 5.500%, 5/1/25 | | | 36,386 | |
| | 34,141 | | | Pool # 256213, 5.500%, 6/1/25 | | | 36,909 | |
| | 137,497 | | | Pool # 256213, 4.500%, 6/1/25 | | | 144,793 | |
| | 27,660 | | | Pool # 256213, 5.000%, 7/1/25 | | | 29,425 | |
| | 94,656 | | | Pool # 256213, 4.500%, 11/1/25 | | | 99,584 | |
| | 33,661 | | | Pool # 256213, 6.000%, 2/1/26 | | | 36,759 | |
| | 149,276 | | | Pool # 257281, 5.000%, 4/1/28 | | | 157,136 | |
| | 107,690 | | | Pool # 257281, 5.000%, 6/1/28 | | | 113,360 | |
| | 269,963 | | | Pool # 257237, 4.500%, 6/1/28 | | | 280,145 | |
| | 208,213 | | | Pool # MA0171, 4.500%, 7/1/29 | | | 216,087 | |
| | 229,893 | | | Pool # AC1219, 4.500%, 8/1/29 | | | 238,563 | |
| | 174,014 | | | Pool # MA0171, 4.500%, 9/1/29 | | | 180,577 | |
| | 248,118 | | | Pool # MA0563, 4.000%, 11/1/30 | | | 251,494 | |
| | 16,729 | | | Pool # 721540, 5.000%, 7/1/33 | | | 17,697 | |
| | 97,922 | | | Pool # 746683, 5.500%, 10/1/33 | | | 105,565 | |
| | 22,575 | | | Pool # 786457, 5.337%, 7/1/34 (a) | | | 24,065 | |
| | 20,361 | | | Pool # 845573, 5.520%, 2/1/36 (a) | | | 21,689 | |
| | 121,189 | | | Pool # 831487, 5.500%, 4/1/36 | | | 129,967 | |
| | 122,787 | | | Pool # 745511, 5.000%, 4/1/36 | | | 129,271 | |
| | 113,692 | | | Pool # 868935, 5.500%, 5/1/36 | | | 121,927 | |
| | 80,750 | | | Pool # 903812, 5.500%, 12/1/36 | | | 86,598 | |
| | 36,291 | | | Pool # 907484, 6.000%, 1/1/37 | | | 39,496 | |
| | 240,823 | | | Pool # AD7906, 5.000%, 7/1/40 | | | 253,389 | |
| | 494,939 | | | Pool # AE4310, 4.000%, 9/1/40 | | | 493,013 | |
H U N T I N G T O N F U N D S
See Notes which are an integral part of the Financial Statements.
Huntington VA Mortgage Securities Fund
Portfolio of Investments (continued)
December 31, 2010
| | | | | | | | |
Shares or
Principal
Amount | | | | | Value | |
| | | | U.S. Government Mortgage Backed Agencies — (continued) | | | | |
| | | | Federal National Mortgage Association — (continued) | | | | |
| | $296,674 | | | Pool # AE7535, 4.000%, 10/1/40 | | $ | 295,519 | |
| | 246,181 | | | Pool # AE4628, 4.500%, 10/1/40 | | | 253,005 | |
| | 293,069 | | | Pool # AE0395, 4.500%, 10/1/40 | | | 301,191 | |
| | 297,974 | | | Pool # AE8395, 4.000%, 11/1/40 | | | 296,814 | |
| | | | | | | | |
| | | | | | | 5,698,963 | |
| | | | | | | | |
| | | | Government National Mortgage Association — 5.7% | | | | |
| | 13,127 | | | Pool # 3590, 5.500%, 8/20/19 | | | 14,187 | |
| | 36,930 | | | Pool # 3741, 5.500%, 5/20/20 | | | 39,893 | |
| | 45,056 | | | Pool # 3741, 4.500%, 8/20/20 | | | 47,675 | |
| | 37,825 | | | Pool # 683937, 6.000%, 2/15/23 | | | 41,164 | |
| | 148,507 | | | Pool # 666057, 5.000%, 3/15/23 | | | 158,508 | |
| | 10,079 | | | Pool # 3590, 6.500%, 6/20/34 | | | 11,387 | |
| | 141,555 | | | Pool # 605653, 5.500%, 8/15/34 | | | 153,764 | |
| | 8,503 | | | Pool # 3741, 5.500%, 11/20/34 | | | 9,199 | |
| | 32,495 | | | Pool # 3741, 5.000%, 5/20/35 | | | 34,700 | |
| | 34,954 | | | Pool # 650348, 5.500%, 11/15/35 | | | 37,924 | |
| | 161,640 | | | Pool # 676974, 5.500%, 5/15/38 | | | 174,848 | |
| | 240,583 | | | Pool # 733602, 5.000%, 4/15/40 | | | 257,636 | |
| | | | | | | | |
| | | | | | | 980,885 | |
| | | | | | | | |
| | | | Total U.S. Government Mortgage Backed Agencies
(Cost $10,536,647) | | | 10,690,416 | |
| | | | | | | | |
| | | | U.S. Government Agencies — 16.6% | | | | |
| | | | Federal Farm Credit Bank — 7.2% | | | | |
| | 250,000 | | | 2.125%, 6/18/12 | | | 255,826 | |
| | 500,000 | | | 1.500%, 11/16/15 | | | 486,001 | |
| | 500,000 | | | 3.650%, 12/28/18 | | | 498,958 | |
| | | | | | | | |
| | | | | | | 1,240,785 | |
| | | | | | | | |
| | | | Federal Home Loan Bank — 1.5% | | | | |
| | 250,000 | | | 4.125%, 12/13/19 | | | 263,584 | |
| | | | | | | | |
| | | | Federal Home Loan Mortgage Corporation — 2.9% | | | | |
| | 500,000 | | | 2.400%, 3/25/14 | | | 502,501 | |
| | | | | | | | |
| | | | Federal National Mortgage Association — 2.9% | | | | |
| | 500,000 | | | 1.500%, 9/25/12 | | | 501,240 | |
| | | | | | | | |
| | | | Government National Mortgage Association — 2.1% | | | | |
| | 200,000 | | | 5.000%, 5/20/32 | | | 212,368 | |
| | 151,481 | | | 5.500%, 4/20/36 | | | 154,647 | |
| | | | | | | | |
| | | | | | | 367,015 | |
| | | | | | | | |
| | | | Total U.S. Government Agencies
(Cost $2,853,521) | | | 2,875,125 | |
| | | | | | | | |
| | | | Common Stocks — 9.9% | | | | |
| | | | Real Estate Investment Trusts — 9.9% | |
| | 1,553 | | | Acadia Realty Trust | | | 28,327 | |
| | 1,200 | | | Alexandria Real Estate Equities, Inc. | | | 87,912 | |
| | | | | | | | |
| Shares | | | | | Value | |
| | | | Real Estate Investment
Trusts — (continued) | | | | |
| | 500 | | | AMB Property Corp. | | $ | 15,855 | |
| | 2,300 | | | American Campus Communities, Inc. | | | 73,048 | |
| | 500 | | | Associated Estates Realty Corp. | | | 7,645 | |
| | 700 | | | BioMed Realty Trust, Inc. | | | 13,055 | |
| | 700 | | | Boston Properties, Inc. | | | 60,270 | |
| | 1,000 | | | Cogdell Spencer, Inc. | | | 5,800 | |
| | 1,700 | | | Coresite Realty Corp. | | | 23,188 | |
| | 400 | | | Corporate Office Properties Trust | | | 13,980 | |
| | 100 | | | Developers Diversified Realty Corp. | | | 1,409 | |
| | 1,200 | | | Digital Realty Trust, Inc. | | | 61,848 | |
| | 2,000 | | | Douglas Emmett, Inc. | | | 33,200 | |
| | 4,000 | | | Duke Realty Corp. | | | 49,840 | |
| | 700 | | | DuPont Fabros Technology, Inc. | | | 14,889 | |
| | 1,300 | | | EastGroup Properties, Inc. | | | 55,016 | |
| | 1,300 | | | Equity Lifestyle Properties, Inc. | | | 72,709 | |
| | 1,100 | | | Equity Residential | | | 57,145 | |
| | 700 | | | Essex Property Trust, Inc. | | | 79,954 | |
| | 1,000 | | | Excel Trust, Inc. | | | 12,100 | |
| | 300 | | | Extra Space Storage, Inc. | | | 5,220 | |
| | 300 | | | Federal Realty Investment Trust | | | 23,379 | |
| | 700 | | | HCP, Inc. | | | 25,753 | |
| | 1,100 | | | Home Properties, Inc. | | | 61,039 | |
| | 3,114 | | | Host Hotels & Resorts, Inc. | | | 55,647 | |
| | 1,100 | | | Kimco Realty Corp. | | | 19,844 | |
| | 1,500 | | | Kite Realty Group Trust | | | 8,115 | |
| | 2,800 | | | LaSalle Hotel Properties | | | 73,920 | |
| | 2,100 | | | Mack-Cali Realty Corp. | | | 69,426 | |
| | 400 | | | National Retail Properties, Inc. | | | 10,600 | |
| | 500 | | | Nationwide Health Properties, Inc. | | | 18,190 | |
| | 600 | | | Pennsylvania Real Estate Investment Trust | | | 8,718 | |
| | 100 | | | Post Properties, Inc. | | | 3,630 | |
| | 1,200 | | | ProLogis Trust | | | 17,328 | |
| | 700 | | | Public Storage, Inc. | | | 70,994 | |
| | 700 | | | Regency Centers Corp. | | | 29,568 | |
| | 674 | | | Simon Property Group, Inc. | | | 67,056 | |
| | 400 | | | SL Green Realty Corp. | | | 27,004 | |
| | 200 | | | Sovran Self Storage, Inc. | | | 7,362 | |
| | 900 | | | Tanger Factory Outlet Centers, Inc. | | | 46,071 | |
| | 300 | | | Terreno Realty Corp.* | | | 5,379 | |
| | 1,713 | | | The Macerich Co. | | | 81,145 | |
| | 816 | | | UDR, Inc. | | | 19,192 | |
| | 1,500 | | | Ventas, Inc. | | | 78,720 | |
| | 716 | | | Vornado Realty Trust | | | 59,664 | |
| | 2,500 | | | Weingarten Realty Investors | | | 59,400 | |
| | 200 | | | Westfield Group | | | 1,958 | |
| | 200 | | | Westfield Retail Trust* | | | 525 | |
| | | | | | | | |
| | | | Total Common Stocks
(Cost $1,526,870) | | | 1,722,037 | |
| | | | | | | | |
See Notes which are an integral part of the Financial Statements.
Huntington VA Mortgage Securities Fund
Portfolio of Investments (continued)
December 31, 2010
| | | | | | | | |
Principal
Amount | | | | | Value | |
| | | | Collateralized Mortgage Obligations — 7.4% | | | | |
| | | | Citigroup Mortgage Securities,
Inc. — 0.4% | | | | |
| | $ 63,810 | | | 5.500%, 10/25/35 | | $ | 63,903 | |
| | | | | | | | |
| | | | Federal Home Loan Bank — 1.8% | | | | |
| | 111,942 | | | Series 00-0606,
5.270%, 12/28/12 | | | 118,446 | |
| | 35,211 | | | Series 6B-2012,
5.125%, 4/25/12 | | | 36,728 | |
| | 85,344 | | | Series SK-2015,
5.000%, 6/15/12 | | | 88,971 | |
| | 37,635 | | | Series SK-2015,
5.140%, 8/18/15 | | | 40,372 | |
| | 24,670 | | | Series Z2-2013,
4.800%, 2/25/13 | | | 25,866 | |
| | | | | | | | |
| | | | | | | 310,383 | |
| | | | | | | | |
| | | | Federal Home Loan Mortgage Corporation — 4.8% | | | | |
| | 243,076 | | | Series 2541,
5.500%, 11/15/20 | | | 253,981 | |
| | 87,696 | | | Series 2542,
5.500%, 2/15/22 | | | 91,802 | |
| | 50,000 | | | Series 2672,
5.500%, 8/15/31 | | | 53,275 | |
| | 50,303 | | | Series 2770,
4.000%, 1/15/18 | | | 52,164 | |
| | 200,000 | | | Series 2784,
4.000%, 4/15/19 | | | 209,860 | |
| | 52,664 | | | Series R005,
5.500%, 12/15/18 | | | 54,802 | |
| | 13,036 | | | Series R007,
5.875%, 5/15/16 | | | 13,157 | |
| | 101,588 | | | Series R010,
5.500%, 12/15/19 | | | 107,098 | |
| | | | | | | | |
| | | | | | | 836,139 | |
| | | | | | | | |
| | | | | | | | |
Principal
Amount | | | | | Value | |
| | | | Federal National Mortgage Association — 0.4% | | | | |
| | $ 42,921 | | | Series 1999-13,
6.000%, 4/25/29 | | $ | 47,281 | |
| | 26,898 | | | Series 2002-62,
5.500%, 12/25/16 | | | 27,046 | |
| | | | | | | | |
| | | | | | | 74,327 | |
| | | | | | | | |
| | | | Total Collateralized Mortgage Obligations
(Cost $1,228,824) | | | 1,284,752 | |
| | | | | | | | |
| | | | Cash Equivalents — 3.9% | | | | |
| | 670,903 | | | Huntington Money Market Fund, Interfund Shares, 0.010%, 01/03/11 (b) (c) | | | 670,903 | |
| | | | | | | | |
| | | | Total Cash Equivalents
(Cost $670,903) | | | 670,903 | |
| | | | | | | | |
| | | | Total Investments
(Cost $16,816,765) — 99.4% | | | 17,243,233 | |
| | | | Other Assets in Excess of
Liabilities — 0.6% | | | 104,509 | |
| | | | | | | | |
| | | | Net Assets — 100.0% | | $ | 17,347,742 | |
| | | | | | | | |
| (a) | Variable or Floating Rate Security. Rate disclosed is as of December 31, 2010. |
| (b) | Investment in affiliate. |
| (c) | Rate disclosed is the seven day yield as of December 31, 2010. |
| * | Non-income producing security. |
H U N T I N G T O N F U N D S
See Notes which are an integral part of the Financial Statements.
Huntington Funds
Statements of Assets and Liabilities
December 31, 2010
| | | | | | | | | | | | | | | | |
| | | Huntington VA
Balanced
Fund | | | Huntington VA
Dividend
Capture Fund | | | Huntington VA
Growth Fund | | | Huntington VA
Income Equity
Fund | |
Assets: | | | | | | | | | | | | | | | | |
Investments, at cost | | $ | 24,736,596 | | | $ | 30,715,049 | | | $ | 16,804,089 | | | $ | 20,002,697 | |
| | | | | | | | | | | | | | | | |
Investments, at value | | | — | | | | 33,491,324 | | | | 17,788,469 | | | | 21,082,599 | |
Investments in affiliated securities, at value | | | 26,787,420 | | | | 160,142 | | | | 922,241 | | | | 687,915 | |
| | | | | | | | | | | | | | | | |
Total investments | | | 26,787,420 | | | | 33,651,466 | | | | 18,710,710 | | | | 21,770,514 | |
Income receivable | | | 18,316 | | | | 67,886 | | | | 15,235 | | | | 40,272 | |
Receivable for investments sold | | | — | | | | 48,365 | | | | 177,382 | | | | — | |
Receivable for shares sold | | | 54,166 | | | | 4,364 | | | | 5,864 | | | | 3,160 | |
Receivable from Advisor | | | 11,585 | | | | — | | | | — | | | | — | |
Prepaid expenses and other assets | | | 6,646 | | | | 2,236 | | | | 3,527 | | | | 2,383 | |
| | | | | | | | | | | | | | | | |
Total assets | | | 26,878,133 | | | | 33,774,317 | | | | 18,912,718 | | | | 21,816,329 | |
Liabilities: | | | | | | | | | | | | | | | | |
Payable to custodian | | | — | | | | — | | | | 17,434 | | | | — | |
Payable for investments purchased | | | — | | | | 117,687 | | | | 367,299 | | | | — | |
Payable for shares redeemed | | | — | | | | 1,051 | | | | 1,140 | | | | 592 | |
Accrued expenses and other payables | | | | | | | | | | | | | | | | |
Investment Advisor fees | | | 2,220 | | | | 16,909 | | | | 9,365 | | | | 10,974 | |
Administration fees | | | 5,060 | | | | 5,873 | | | | 2,981 | | | | 3,282 | |
Custodian fees | | | 141 | | | | 702 | | | | 348 | | | | 444 | |
Financial administration fees | | | 1,004 | | | | 1,786 | | | | 1,623 | | | | 1,467 | |
Transfer agent fees | | | 682 | | | | 960 | | | | 732 | | | | 797 | |
Compliance service fees | | | 304 | | | | 732 | | | | 346 | | | | 458 | |
Other | | | — | | | | 3,679 | | | | — | | | | — | |
| | | | | | | | | | | | | | | | |
Total liabilities | | | 9,411 | | | | 149,379 | | | | 401,268 | | | | 18,014 | |
| | | | | | | | | | | | | | | | |
Net Assets | | $ | 26,868,722 | | | $ | 33,624,938 | | | $ | 18,511,450 | | | $ | 21,798,315 | |
| | | | | | | | | | | | | | | | |
Net Assets Consist of: | | | | | | | | | | | | | | | | |
Paid in capital | | $ | 24,542,566 | | | $ | 43,199,707 | | | $ | 19,079,409 | | | $ | 25,853,869 | |
Net unrealized appreciation of investments, options and translations of assets and liabilities in foreign currency | | | 2,050,824 | | | | 2,936,417 | | | | 1,906,621 | | | | 1,767,817 | |
Accumulated net realized loss on investments, options and foreign currency transactions | | | (80,362 | ) | | | (13,673,733 | ) | | | (2,501,994 | ) | | | (6,407,008 | ) |
Accumulated net investment income | | | 355,694 | | | | 1,162,547 | | | | 27,414 | | | | 583,637 | |
| | | | | | | | | | | | | | | | |
Total Net Assets | | $ | 26,868,722 | | | $ | 33,624,938 | | | $ | 18,511,450 | | | $ | 21,798,315 | |
| | | | | | | | | | | | | | | | |
Shares Outstanding | | | 2,025,816 | | | | 3,449,635 | | | | 2,373,923 | | | | 2,513,054 | |
| | | | | | | | | | | | | | | | |
Net Asset Value, Redemption Price and Offering Price Per Share: | | | | | | | | | | | | | | | | |
(Net asset value, offering and redemption price per share) | | $ | 13.26 | | | $ | 9.75 | | | $ | 7.80 | | | $ | 8.67 | |
| | | | | | | | | | | | | | | | |
See Notes which are an integral part of the Financial Statements.
Huntington Funds
Statements of Assets and Liabilities
December 31, 2010
| | | | | | | | | | | | | | | | |
| | | Huntington VA
International
Equity Fund | | | Huntington VA
Macro 100
Fund | | | Huntington VA
Mid Corp
America Fund | | | Huntington VA
New Economy
Fund | |
Assets: | | | | | | | | | | | | | | | | |
Investments, at cost | | $ | 19,216,176 | | | $ | 5,842,388 | | | $ | 12,477,073 | | | $ | 11,295,568 | |
| | | | | | | | | | | | | | | | |
Investments, at value | | | 21,607,379 | | | | 6,068,507 | | | | 19,400,699 | | | | 12,388,809 | |
Investments in affiliated securities, at value | | | 840,153 | | | | 539,053 | | | | 910,222 | | | | 465,599 | |
| | | | | | | | | | | | | | | | |
Total investments | | | 22,447,532 | | | | 6,607,560 | | | | 20,310,921 | | | | 12,854,408 | |
Cash | | | — | | | | — | | | | 2,406 | | | | — | |
Income receivable | | | 60,726 | | | | 5,536 | | | | 16,837 | | | | 2,906 | |
Receivable for investments sold | | | 136,809 | | | | — | | | | — | | | | — | |
Receivable for shares sold | | | 17,778 | | | | 1,512 | | | | 307 | | | | 4,172 | |
Tax reclaims receivable | | | 10,420 | | | | — | | | | — | | | | — | |
Prepaid expenses and other assets | | | 1,953 | | | | 7,175 | | | | 3,045 | | | | 4,823 | |
| | | | | | | | | | | | | | | | |
Total assets | | | 22,675,218 | | | | 6,621,783 | | | | 20,333,516 | | | | 12,866,309 | |
Liabilities: | | | | | | | | | | | | | | | | |
Payable to custodian | | | 1,727 | | | | — | | | | — | | | | — | |
Foreign currency payable | | | 10 | | | | — | | | | — | | | | — | |
Options written, at value (premium received $-, $-, $- and $115,244) | | | — | | | | — | | | | — | | | | 183,350 | |
Payable for shares redeemed | | | 355 | | | | 153 | | | | 346 | | | | 771 | |
Accrued expenses and other payables | | | | | | | | | | | | | | | | |
Investment advisor fees | | | 11,216 | | | | 3,322 | | | | 10,308 | | | | 6,411 | |
Administration fees | | | 3,445 | | | | 997 | | | | 3,017 | | | | 1,906 | |
Custodian fees | | | 949 | | | | 125 | | | | 402 | | | | 257 | |
Financial administration fees | | | 2,568 | | | | 1,536 | | | | 2,175 | | | | 1,803 | |
Transfer agent fees | | | 754 | | | | 604 | | | | 773 | | | | 681 | |
Compliance service fees | | | 396 | | | | 127 | | | | 415 | | | | 258 | |
Other | | | 5,867 | | | | — | | | | — | | | | — | |
| | | | | | | | | | | | | | | | |
Total liabilities | | | 27,287 | | | | 6,864 | | | | 17,436 | | | | 195,437 | |
| | | | | | | | | | | | | | | | |
Net Assets | | $ | 22,647,931 | | | $ | 6,614,919 | | | $ | 20,316,080 | | | $ | 12,670,872 | |
| | | | | | | | | | | | | | | | |
Net Assets Consist of: | | | | | | | | | | | | | | | | |
Paid in capital | | $ | 22,024,372 | | | $ | 8,521,786 | | | $ | 13,483,214 | | | $ | 14,750,092 | |
Net unrealized appreciation of investments, options and translations of assets and liabilities in foreign currency | | | 3,232,817 | | | | 765,172 | | | | 7,833,848 | | | | 1,490,734 | |
Accumulated net realized loss on investments, options and foreign currency transactions | | | (2,870,037 | ) | | | (2,707,168 | ) | | | (1,078,346 | ) | | | (3,571,984 | ) |
Accumulated net investment income (loss) | | | 260,779 | | | | 35,129 | | | | 77,364 | | | | 2,030 | |
| | | | | | | | | | | | | | | | |
Total Net Assets | | $ | 22,647,931 | | | $ | 6,614,919 | | | $ | 20,316,080 | | | $ | 12,670,872 | |
| | | | | | | | | | | | | | | | |
Shares Outstanding | | | 1,566,687 | | | | 734,182 | | | | 1,151,840 | | | | 1,001,701 | |
| | | | | | | | | | | | | | | | |
Net Asset Value, Redemption Price and Offering Price Per Share: | | | | | | | | | | | | | | | | |
(Net asset value, offering and redemption price per share) | | $ | 14.46 | | | $ | 9.01 | | | $ | 17.64 | | | $ | 12.65 | |
| | | | | | | | | | | | | | | | |
H U N T I N G T O N F U N D S
See Notes which are an integral part of the Financial Statements.
Huntington Funds
Statements of Assets and Liabilities
December 31, 2010
| | | | | | | | | | | | | | | | |
| | | Huntington VA
Real Strategies
Fund | | | Huntington VA
Rotating
Markets Fund | | | Huntington VA
Situs Fund | | | Huntington VA
Mortgage
Securities Fund | |
Assets: | | | | | | | | | | | | | | | | |
Investments, at cost | | $ | 2,477,484 | | | $ | 6,186,465 | | | $ | 18,911,933 | | | $ | 16,816,765 | |
| | | | | | | | | | | | | | | | |
Investments, at value | | | 2,799,110 | | | | 6,749,809 | | | | 23,487,608 | | | | 16,572,330 | |
Investments in affiliated securities, at value | | | 231,852 | | | | 198,325 | | | | 243,370 | | | | 670,903 | |
| | | | | | | | | | | | | | | | |
Total investments | | | 3,030,962 | | | | 6,948,134 | | | | 23,730,978 | | | | 17,243,233 | |
Cash | | | — | | | | — | | | | 2,083 | | | | 7,960 | |
Income receivable | | | 2,130 | | | | 8,462 | | | | 13,789 | | | | 58,863 | |
Receivable for investments sold | | | — | | | | — | | | | 255,801 | | | | — | |
Receivable for shares sold | | | 11,657 | | | | 2,422 | | | | 12,040 | | | | 51,557 | |
Tax reclaims receivable | | | — | | | | — | | | | 1,206 | | | | — | |
Prepaid expenses and other assets | | | 8,267 | | | | 5,167 | | | | 2,493 | | | | 4,143 | |
| | | | | | | | | | | | | | | | |
Total assets | | | 3,053,016 | | | | 6,964,185 | | | | 24,018,390 | | | | 17,365,756 | |
Liabilities: | | | | | | | | | | | | | | | | |
Options written, at value (premium received $22,750, $-, $- and $-) | | | 28,936 | | | | — | | | | — | | | | — | |
Payable for shares redeemed | | | 26 | | | | 278 | | | | 1,024 | | | | 416 | |
Payable for investments purchased | | | — | | | | — | | | | 314,376 | | | | — | |
Accrued expenses and other payables | | | | | | | | | | | | | | | | |
Investment advisor fees | | | 1,467 | | | | 3,515 | | | | 11,899 | | | | 8,578 | |
Administration fees | | | — | | | | 1,046 | | | | 4,448 | | | | 2,823 | |
Custodian fees | | | 45 | | | | 138 | | | | 512 | | | | 301 | |
Financial administration fees | | | 1,622 | | | | 1,100 | | | | 2,167 | | | | 4,915 | |
Transfer agent fees | | | 551 | | | | 615 | | | | 764 | | | | 692 | |
Compliance service fees | | | 39 | | | | 143 | | | | 411 | | | | 289 | |
| | | | | | | | | | | | | | | | |
Total liabilities | | | 32,686 | | | | 6,835 | | | | 335,601 | | | | 18,014 | |
| | | | | | | | | | | | | | | | |
Net Assets | | $ | 3,020,330 | | | $ | 6,957,350 | | | $ | 23,682,789 | | | $ | 17,347,742 | |
| | | | | | | | | | | | | | | | |
Net Assets Consist of: | | | | | | | | | | | | | | | | |
Paid in capital | | $ | 2,548,151 | | | $ | 7,158,723 | | | $ | 21,068,979 | | | $ | 16,760,456 | |
Net unrealized appreciation of investments, options and translations of assets and liabilities in foreign currency | | | 547,292 | | | | 761,669 | | | | 4,819,064 | | | | 426,468 | |
Accumulated net realized loss on investments, options and foreign currency transactions | | | (67,472 | ) | | | (984,512 | ) | | | (2,250,833 | ) | | | (225,843 | ) |
Accumulated net investment income (loss) | | | (7,641 | ) | | | 21,470 | | | | 45,579 | | | | 386,661 | |
| | | | | | | | | | | | | | | | |
Total Net Assets | | $ | 3,020,330 | | | $ | 6,957,350 | | | $ | 23,682,789 | | | $ | 17,347,742 | |
| | | | | | | | | | | | | | | | |
Shares Outstanding | | | 324,255 | | | | 626,551 | | | | 1,580,082 | | | | 1,509,876 | |
| | | | | | | | | | | | | | | | |
Net Asset Value, Redemption Price and Offering Price Per Share: | | | | | | | | | | | | | | | | |
(Net asset value, offering and redemption price per share) | | $ | 9.31 | | | $ | 11.10 | | | $ | 14.99 | | | $ | 11.49 | |
| | | | | | | | | | | | | | | | |
See Notes which are an integral part of the Financial Statements.
Huntington Funds
Statements of Operations
Year Ended December 31, 2010
| | | | | | | | | | | | | | | | |
| | | Huntington VA
Balanced
Fund | | | Huntington VA
Dividend
Capture Fund | | | Huntington VA
Growth Fund | | | Huntington VA
Income Equity
Fund | |
Investment Income: | | | | | | | | | | | | | | | | |
Dividend income | | $ | — | | | | $1,496,002 | | | $ | 200,181 | | | $ | 812,963 | |
Dividend income from affiliated securities | | | 372,216 | | | | 50 | | | | 161 | | | | 33 | |
Interest income | | | 9 | | | | — | | | | 12 | | | | — | |
Foriegn dividend taxes withheld | | | — | | | | (13,214 | ) | | | (3,645 | ) | | | (22,091 | ) |
| | | | | | | | | | | | | | | | |
Total investment income | | | 372,225 | | | | 1,482,838 | | | | 196,709 | | | | 790,905 | |
| | | | | | | | | | | | | | | | |
Expenses: | | | | | | | | | | | | | | | | |
Investment advisor fees | | | 17,110 | | | | 196,809 | | | | 97,779 | | | | 124,534 | |
Administration fees | | | 31,176 | | | | 59,764 | | | | 29,692 | | | | 37,817 | |
Custodian fees | | | 1,693 | | | | 8,702 | | | | 4,179 | | | | 5,326 | |
Transfer and dividend disbursing agent fees and expenses | | | 8,184 | | | | 11,515 | | | | 8,779 | | | | 9,561 | |
Trustees’ fees | | | 1,313 | | | | 3,324 | | | | 1,575 | | | | 2,082 | |
Professional fees | | | 4,152 | | | | 8,361 | | | | 4,125 | | | | 5,279 | |
Financial administration fees | | | 3,012 | | | | 5,359 | | | | 4,870 | | | | 4,401 | |
Printing and postage | | | 5,332 | | | | 15,062 | | | | 7,797 | | | | 9,888 | |
Insurance premiums | | | 2,430 | | | | 3,661 | | | | 3,206 | | | | 3,330 | |
Compliance service fees | | | 610 | | | | 1,465 | | | | 693 | | | | 916 | |
Other | | | 2,389 | | | | 6,267 | | | | 3,146 | | | | 4,132 | |
| | | | | | | | | | | | | | | | |
Total expenses | | | 77,401 | | | | 320,289 | | | | 165,841 | | | | 207,266 | |
| | | | | | | | | | | | | | | | |
Investment advisory fees waived | | | (17,110 | ) | | | — | | | | — | | | | — | |
Reimbursements from Advisor | | | (43,761 | ) | | | — | | | | — | | | | — | |
| | | | | | | | | | | | | | | | |
Net expenses | | | 16,530 | | | | 320,289 | | | | 165,841 | | | | 207,266 | |
| | | | | | | | | | | | | | | | |
Net investment income | | | 355,695 | | | | 1,162,549 | | | | 30,868 | | | | 583,639 | |
| | | | | | | | | | | | | | | | |
Net Realized/Unrealized Gain (Loss) on Investments and Options Transactions: | | | | | | | | | | | | | | | | |
Net Realized/Unrealized Gain (Loss) on Investments Options and Foriegn Currency Transactions: | | | | | | | | | | | | | | | | |
Net realized gain on investment transactions | | | — | | | | 1,715,342 | | | | 1,732,350 | | | | 1,822,026 | |
Net realized loss on investment transactions of affiliates | | | (69,309 | ) | | | — | | | | — | | | | — | |
Net realized gain (loss) on option transactions | | | — | | | | — | | | | (9,582 | ) | | | 15,397 | |
Net realized loss on foriegn currency transactions | | | — | | | | — | | | | (60 | ) | | | (1 | ) |
| | | | | | | | | | | | | | | | |
Net realized gain (loss) on investments, options and translation of assets and liabilities in foreign currency transactions | | | (69,309 | ) | | | 1,715,342 | | | | 1,722,708 | | | | 1,837,422 | |
| | | | | | | | | | | | | | | | |
Net change in unrealized appreciation/depreciation of investments, options and translation of assets and liabilities in foreign currency | | | 1,728,944 | | | | 1,632,830 | | | | (107,683 | ) | | | (102,496 | ) |
| | | | | | | | | | | | | | | | |
Net realized and unrealized gain on investments, options and foreign currency transactions | | | 1,659,635 | | | | 3,348,172 | | | | 1,615,025 | | | | 1,734,926 | |
| | | | | | | | | | | | | | | | |
Change in net assets resulting from operations | | $ | 2,015,330 | | | $ | 4,510,721 | | | $ | 1,645,893 | | | $ | 2,318,565 | |
| | | | | | | | | | | | | | | | |
H U N T I N G T O N F U N D S
See Notes which are an integral part of the Financial Statements.
Huntington Funds
Statements of Operations
Year Ended December 31, 2010
| | | | | | | | | | | | | | | | |
| | | Huntington VA
International
Equity Fund | | | Huntington VA
Macro 100
Fund | | | Huntington VA
Mid Corp
America Fund | | | Huntington VA
New Economy
Fund | |
Investment Income: | | | | | | | | | | | | | | | | |
Dividend income | | $ | 507,045 | | | $ | 103,359 | | | $ | 269,877 | | | $ | 85,505 | |
Dividend income from affiliated securities | | | 136 | | | | 42 | | | | 91 | | | | 90 | |
Foreign dividend taxes withheld | | | (31,052 | ) | | | — | | | | (921 | ) | | | (232 | ) |
| | | | | | | | | | | | | | | | |
Total investment income | | | 476,129 | | | | 103,401 | | | | 269,047 | | | | 85,363 | |
| | | | | | | | | | | | | | | | |
Expenses: | | | | | | | | | | | | | | | | |
Investment advisor fees | | | 113,542 | | | | 35,166 | | | | 113,000 | | | | 70,261 | |
Administration fees | | | 34,479 | | | | 10,679 | | | | 34,314 | | | | 21,336 | |
Custodian fees | | | 11,391 | | | | 1,496 | | | | 4,826 | | | | 3,086 | |
Transfer and dividend disbursing agent fees and expenses | | | 9,045 | | | | 7,250 | | | | 9,282 | | | | 8,173 | |
Trustees’ fees | | | 1,791 | | | | 574 | | | | 1,876 | | | | 1,163 | |
Professional fees | | | 4,755 | | | | 1,484 | | | | 4,775 | | | | 2,964 | |
Financial administration fees | | | 7,703 | | | | 5,208 | | | | 6,526 | | | | 5,409 | |
Printing and postage | | | 8,493 | | | | 3,730 | | | | 9,237 | | | | 6,183 | |
Insurance premiums | | | 3,186 | | | | 2,937 | | | | 3,293 | | | | 3,098 | |
Compliance service fees | | | 793 | | | | 255 | | | | 830 | | | | 516 | |
Other | | | 12,253 | | | | 1,492 | | | | 3,723 | | | | 2,063 | |
| | | | | | | | | | | | | | | | |
Total expenses | | | 207,431 | | | | 70,271 | | | | 191,682 | | | | 124,252 | |
| | | | | | | | | | | | | | | | |
Investment advisory fees waived | | | — | | | | (2,000 | ) | | | — | | | | — | |
| | | | | | | | | | | | | | | | |
Net expenses | | | 207,431 | | | | 68,271 | | | | 191,682 | | | | 124,252 | |
| | | | | | | | | | | | | | | | |
Net investment income (loss) | | | 268,698 | | | | 35,130 | | | | 77,365 | | | | (38,889 | ) |
| | | | | | | | | | | | | | | | |
Net Realized/Unrealized Gain (Loss) on Investments, Options and Foreign Currency Transactions: | | | | | | | | | | | | | | | | |
Net realized gain (loss) on investment transactions | | | (501,391 | ) | | | (350,721 | ) | | | 745,882 | | | | 1,122,647 | |
Net realized loss on option transactions | | | — | | | | — | | | | — | | | | (708,712 | ) |
Net realized loss on foreign currency transactions | | | (9,614 | ) | | | — | | | | — | | | | — | |
| | | | | | | | | | | | | | | | |
Net realized gain (loss) on investments, options and translation of assets and liabilities in foreign currency transactions | | | (511,005 | ) | | | (350,721 | ) | | | 745,882 | | | | 413,935 | |
| | | | | | | | | | | | | | | | |
Net change in unrealized appreciation of investments, options and translation of assets and liabilities in foreign currency | | | 2,170,204 | | | | 1,107,007 | | | | 3,100,180 | | | | 1,364,782 | |
| | | | | | | | | | | | | | | | |
Net realized and unrealized gain on investments, options and foreign currency transactions | | | 1,659,199 | | | | 756,286 | | | | 3,846,062 | | | | 1,778,717 | |
| | | | | | | | | | | | | | | | |
Change in net assets resulting from operations | | $ | 1,927,897 | | | $ | 791,416 | | | $ | 3,923,427 | | | $ | 1,739,828 | |
| | | | | | | | | | | | | | | | |
See Notes which are an integral part of the Financial Statements.
Huntington Funds
Statements of Operations
Year Ended December 31, 2010
| | | | | | | | | | | | | | | | |
| | | Huntington VA
Real Strategies
Fund | | | Huntington VA
Rotating
Markets Fund | | | Huntington VA
Situs Fund | | | Huntington VA
Mortgage
Securities Fund | |
Investment Income: | | | | | | | | | | | | | | | | |
Dividend income | | $ | 29,166 | | | $ | 95,665 | | | $ | 223,962 | | | $ | 32,816 | |
Dividend income from affiliated securities | | | 35 | | | | 40 | | | | 80 | | | | 81 | |
Interest income | | | 11 | | | | — | | | | — | | | | 463,688 | |
Foreign dividend taxes withheld | | | (592 | ) | | | — | | | | (1,355 | ) | | | (9 | ) |
| | | | | | | | | | | | | | | | |
Total investment income | | | 28,620 | | | | 95,705 | | | | 222,687 | | | | 496,576 | |
| | | | | | | | | | | | | | | | |
Expenses: | | | | | | | | | | | | | | | | |
Investment advisor fees | | | 12,248 | | | | 38,922 | | | | 116,379 | | | | 83,875 | |
Administration fees | | | 3,719 | | | | 11,820 | | | | 35,341 | | | | 25,470 | |
Custodian fees | | | 540 | | | | 1,661 | | | | 6,147 | | | | 3,612 | |
Transfer and dividend disbursing agent fees and expenses | | | 6,611 | | | | 7,377 | | | | 9,167 | | | | 8,303 | |
Trustees’ fees | | | 169 | | | | 645 | | | | 1,844 | | | | 1,287 | |
Professional fees | | | 499 | | | | 1,644 | | | | 4,877 | | | | 3,487 | |
Financial administration fees | | | 4,866 | | | | 3,299 | | | | 6,500 | | | | 17,746 | |
Printing and postage | | | 1,967 | | | | 4,045 | | | | 8,957 | | | | 6,689 | |
Insurance premiums | | | 2,934 | | | | 2,947 | | | | 3,249 | | | | 3,065 | |
Compliance service fees | | | 78 | | | | 285 | | | | 822 | | | | 579 | |
Other | | | 687 | | | | 1,590 | | | | 3,793 | | | | 1,756 | |
| | | | | | | | | | | | | | | | |
Total expenses | | | 34,318 | | | | 74,235 | | | | 197,076 | | | | 155,869 | |
| | | | | | | | | | | | | | | | |
Net investment income (loss) | | | (5,698 | ) | | | 21,470 | | | | 25,611 | | | | 340,707 | |
| | | | | | | | | | | | | | | | |
Net Realized/Unrealized Gain (Loss) on Investments, Options and Foreign Currency Transactions: | | | | | | | | | | | | | | | | |
Net realized gain (loss) on investment transactions | | | 17,307 | | | | 389,123 | | | | (259,892 | ) | | | 13,511 | |
Net realized gain (loss) on option transactions | | | (15,671 | ) | | | — | | | | 90,683 | | | | — | |
Net realized gain (loss) on foreign currency transactions | | | — | | | | — | | | | (4 | ) | | | 5 | |
| | | | | | | | | | | | | | | | |
Net realized gain (loss) on investments, options and translation of assets and liabilities in foreign currency transactions | | | 1,636 | | | | 389,123 | | | | (169,213 | ) | | | 13,516 | |
| | | | | | | | | | | | | | | | |
Net change in unrealized appreciation of investments, options and translation of assets and liabilities in foreign currency | | | 500,970 | | | | 44,781 | | | | 5,483,759 | | | | 240,809 | |
| | | | | | | | | | | | | | | | |
Net realized and unrealized gain on investments, options and foreign currency transactions | | | 502,606 | | | | 433,904 | | | | 5,314,546 | | | | 254,325 | |
| | | | | | | | | | | | | | | | |
Change in net assets resulting from operations | | $ | 496,908 | | | $ | 455,374 | | | $ | 5,340,157 | | | $ | 595,032 | |
| | | | | | | | | | | | | | | | |
H U N T I N G T O N F U N D S
See Notes which are an integral part of the Financial Statements.
Huntington Funds
Statements of Changes in Net Assets
| | | | | | | | | | | | | | | | |
| | | Huntington VA
Balanced Fund | | | Huntington VA
Dividend Capture Fund | |
| | | Year Ended
December 31,
2010 | | | Year Ended
December 31,
2009 | | | Year Ended
December 31,
2010 | | | Year Ended
December 31,
2009 | |
Increase (Decrease) in Net Assets: | | | | | | | | | | | | | | | | |
Operations— | | | | | | | | | | | | | | | | |
Net investment income | | $ | 355,695 | | | $ | 21,195 | | | $ | 1,162,549 | | | $ | 1,392,842 | |
Net realized gain (loss) on investments | | | (69,309 | ) | | | (10,253 | ) | | | 1,715,342 | | | | (5,970,182 | ) |
Net change in unrealized appreciation of investments | | | 1,728,944 | | | | 318,978 | | | | 1,632,830 | | | | 11,316,225 | |
| | | | | | | | | | | | | | | | |
Change in net assets resulting from operations | | | 2,015,330 | | | | 329,920 | | | | 4,510,721 | | | | 6,738,885 | |
| | | | | | | | | | | | | | | | |
Distributions to Shareholders— | | | | | | | | | | | | | | | | |
From net investment income | | | (21,245 | ) | | | (3,995 | ) | | | (1,386,649 | ) | | | — | |
| | | | | | | | | | | | | | | | |
Change in net assets resulting from distributions to shareholders | | | (21,245 | ) | | | (3,995 | ) | | | (1,386,649 | ) | | | — | |
| | | | | | | | | | | | | | | | |
Change in net assets resulting from capital transactions | | | 18,064,670 | | | | 6,249,589 | | | | (3,056,040 | ) | | | (2,514,401 | ) |
| | | | | | | | | | | | | | | | |
Change in net assets | | | 20,058,755 | | | | 6,575,514 | | | | 68,032 | | | | 4,224,484 | |
Net Assets: | | | | | | | | | | | | | | | | |
Beginning of year | | | 6,809,967 | | | | 234,453 | | | | 33,556,906 | | | | 29,332,422 | |
| | | | | | | | | | | | | | | | |
End of year | | $ | 26,868,722 | | | $ | 6,809,967 | | | $ | 33,624,938 | | | $ | 33,556,906 | |
| | | | | | | | | | | | | | | | |
Accumulated net investment income included in net assets at end of year | | $ | 355,694 | | | $ | 21,244 | | | $ | 1,162,547 | | | $ | 1,391,042 | |
| | | | | | | | | | | | | | | | |
Capital Transactions: | | | | | | | | | | | | | | | | |
Shares sold | | $ | 18,536,992 | | | $ | 6,317,200 | | | $ | 4,703,605 | | | $ | 3,249,303 | |
Dividends reinvested | | | 21,245 | | | | 3,995 | | | | 1,386,649 | | | | — | |
Shares redeemed | | | (493,567 | ) | | | (71,606 | ) | | | (9,146,294 | ) | | | (5,763,704 | ) |
| | | | | | | | | | | | | | | | |
Net change resulting from capital transactions | | $ | 18,064,670 | | | $ | 6,249,589 | | | $ | (3,056,040 | ) | | $ | (2,514,401 | ) |
| | | | | | | | | | | | | | | | |
Share Transactions: | | | | | | | | | | | | | | | | |
Issued | | | 1,498,102 | | | | 549,741 | | | | 506,151 | | | | 435,553 | |
Reinvested | | | 1,762 | | | | 382 | | | | 159,202 | | | | — | |
Redeemed | | | (40,514 | ) | | | (6,505 | ) | | | (997,616 | ) | | | (790,255 | ) |
| | | | | | | | | | | | | | | | |
Net change resulting from share transactions | | | 1,459,350 | | | | 543,618 | | | | (332,263 | ) | | | (354,702 | ) |
| | | | | | | | | | | | | | | | |
See Notes which are an integral part of the Financial Statements.
Huntington Funds
Statements of Changes in Net Assets
| | | | | | | | | | | | | | | | |
| | | Huntington VA
Growth Fund | | | Huntington VA
Income Equity Fund | |
| | | Year Ended
December 31,
2010 | | | Year Ended
December 31,
2009 | | | Year Ended
December 31,
2010 | | | Year Ended
December 31,
2009 | |
Increase (Decrease) in Net Assets: | | | | | | | | | | | | | | | | |
Operations— | | | | | | | | | | | | | | | | |
Net investment income | | $ | 30,868 | | | $ | 24,485 | | | $ | 583,639 | | | $ | 580,270 | |
Net realized gain (loss) on investments and options | | | 1,722,708 | | | | (1,286,523 | ) | | | 1,837,422 | | | | (3,594,616 | ) |
Net change in unrealized appreciation/depreciation of investments | | | (107,683 | ) | | | 3,284,431 | | | | (102,496 | ) | | | 6,686,497 | |
| | | | | | | | | | | | | | | | |
Change in net assets resulting from operations | | | 1,645,893 | | | | 2,022,393 | | | | 2,318,565 | | | | 3,672,151 | |
| | | | | | | | | | | | | | | | |
Distributions to Shareholders— | | | | | | | | | | | | | | | | |
From net investment income | | | (24,485 | ) | | | — | | | | (573,537 | ) | | | — | |
| | | | | | | | | | | | | | | | |
Change in net assets resulting from distributions to shareholders | | | (24,485 | ) | | | — | | | | (573,537 | ) | | | — | |
| | | | | | | | | | | | | | | | |
Change in net assets resulting from capital transactions | | | 1,617,597 | | | | 589,176 | | | | (650,515 | ) | | | (1,154,899 | ) |
| | | | | | | | | | | | | | | | |
Change in net assets | | | 3,239,005 | | | | 2,611,569 | | | | 1,094,513 | | | | 2,517,252 | |
Net Assets: | | | | | | | | | | | | | | | | |
Beginning of year | | | 15,272,445 | | | | 12,660,876 | | | | 20,703,802 | | | | 18,186,550 | |
| | | | | | | | | | | | | | | | |
End of year | | $ | 18,511,450 | | | $ | 15,272,445 | | | $ | 21,798,315 | | | $ | 20,703,802 | |
| | | | | | | | | | | | | | | | |
Accumulated net investment income included in net assets at end of year | | $ | 27,414 | | | $ | 24,485 | | | $ | 583,637 | | | $ | 573,536 | |
| | | | | | | | | | | | | | | | |
Capital Transactions: | | | | | | | | | | | | | | | | |
Shares sold | | $ | 5,361,327 | | | $ | 2,339,196 | | | $ | 3,737,093 | | | $ | 2,014,927 | |
Dividends reinvested | | | 24,485 | | | | — | | | | 573,537 | | | | — | |
Shares redeemed | | | (3,768,215 | ) | | | (1,750,020 | ) | | | (4,961,145 | ) | | | (3,169,826 | ) |
| | | | | | | | | | | | | | | | |
Net change resulting from capital transactions | | $ | 1,617,597 | | | $ | 589,176 | | | $ | (650,515 | ) | | $ | (1,154,899 | ) |
| | | | | | | | | | | | | | | | |
Share Transactions: | | | | | | | | | | | | | | | | |
Issued | | | 757,448 | | | | 361,601 | | | | 461,041 | | | | 301,495 | |
Reinvested | | | 3,671 | | | | — | | | | 75,865 | | | | — | |
Redeemed | | | (531,551 | ) | | | (279,685 | ) | | | (613,994 | ) | | | (477,683 | ) |
| | | | | | | | | | | | | | | | |
Net change resulting from share transactions | | | 229,568 | | | | 81,916 | | | | (77,088 | ) | | | (176,188 | ) |
| | | | | | | | | | | | | | | | |
H U N T I N G T O N F U N D S
See Notes which are an integral part of the Financial Statements.
Huntington Funds
Statements of Changes in Net Assets
| | | | | | | | | | | | | | | | |
| | | Huntington VA
International Equity Fund | | | Huntington VA
Macro 100 Fund | |
| | | Year Ended
December 31,
2010 | | | Year Ended
December 31,
2009 | | | Year Ended
December 31,
2010 | | | Year Ended
December 31,
2009 | |
Increase (Decrease) in Net Assets: | | | | | | | | | | | | | | | | |
Operations— | | | | | | | | | | | | | | | | |
Net investment income | | $ | 268,698 | | | $ | 267,976 | | | $ | 35,130 | | | $ | 50,144 | |
Net realized loss on investments and foreign currency transactions | | | (511,005 | ) | | | (1,903,030 | ) | | | (350,721 | ) | | | (423,626 | ) |
Net change in unrealized appreciation of investments and foreign currency transactions | | | 2,170,204 | | | | 5,359,892 | | | | 1,107,007 | | | | 1,334,086 | |
| | | | | | | | | | | | | | | | |
Change in net assets resulting from operations | | | 1,927,897 | | | | 3,724,838 | | | | 791,416 | | | | 960,604 | |
| | | | | | | | | | | | | | | | |
Distributions to Shareholders— | | | | | | | | | | | | | | | | |
From net investment income | | | (244,844 | ) | | | (6,126 | ) | | | (50,145 | ) | | | — | |
| | | | | | | | | | | | | | | | |
Change in net assets resulting from distributions to shareholders | | | (244,844 | ) | | | (6,126 | ) | | | (50,145 | ) | | | — | |
| | | | | | | | | | | | | | | | |
Change in net assets resulting from capital transactions | | | 4,602,948 | | | | 2,659,779 | | | | 283,938 | | | | 164,896 | |
| | | | | | | | | | | | | | | | |
Change in net assets | | | 6,286,001 | | | | 6,378,491 | | | | 1,025,209 | | | | 1,125,500 | |
Net Assets: | | | | | | | | | | | | | | | | |
Beginning of year | | | 16,361,930 | | | | 9,983,439 | | | | 5,589,710 | | | | 4,464,210 | |
| | | | | | | | | | | | | | | | |
End of year | | $ | 22,647,931 | | | $ | 16,361,930 | | | $ | 6,614,919 | | | $ | 5,589,710 | |
| | | | | | | | | | | | | | | | |
Accumulated net investment income included in net assets at end of year | | $ | 260,779 | | | $ | 233,308 | | | $ | 35,129 | | | $ | 50,144 | |
| | | | | | | | | | | | | | | | |
Capital Transactions: | | | | | | | | | | | | | | | | |
Shares sold | | $ | 7,266,270 | | | $ | 4,473,348 | | | $ | 1,850,890 | | | $ | 883,733 | |
Dividends reinvested | | | 244,844 | | | | 6,126 | | | | 50,145 | | | | — | |
Shares redeemed | | | (2,908,166 | ) | | | (1,819,695 | ) | | | (1,617,097 | ) | | | (718,837 | ) |
| | | | | | | | | | | | | | | | |
Net change resulting from capital transactions | | $ | 4,602,948 | | | $ | 2,659,779 | | | $ | 283,938 | | | $ | 164,896 | |
| | | | | | | | | | | | | | | | |
Share Transactions: | | | | | | | | | | | | | | | | |
Issued | | | 551,823 | | | | 389,528 | | | | 224,779 | | | | 127,474 | |
Reinvested | | | 19,955 | | | | 545 | | | | 6,615 | | | | — | |
Redeemed | | | (223,923 | ) | | | (163,345 | ) | | | (198,356 | ) | | | (109,268 | ) |
| | | | | | | | | | | | | | | | |
Net change resulting from share transactions | | | 347,855 | | | | 226,728 | | | | 33,038 | | | | 18,206 | |
| | | | | | | | | | | | | | | | |
See Notes which are an integral part of the Financial Statements.
Huntington Funds
Statements of Changes in Net Assets
| | | | | | | | | | | | | | | | |
| | | Huntington VA
Mid Corp America Fund | | | Huntington VA
New Economy Fund | |
| | | Year Ended
December 31,
2010 | | | Year Ended
December 31,
2009 | | | Year Ended
December 31,
2010 | | | Year Ended
December 31,
2009 | |
Increase (Decrease) in Net Assets: | | | | | | | | | | | | | | | | |
Operations— | | | | | | | | | | | | | | | | |
Net investment income (loss) | | $ | 77,365 | | | $ | 123,643 | | | $ | (38,889 | ) | | $ | 11,957 | |
Net realized gain (loss) on investments and options | | | 745,882 | | | | (1,336,524 | ) | | | 413,935 | | | | (1,596,019 | ) |
Net change in unrealized appreciation of investments | | | 3,100,180 | | | | 6,099,546 | | | | 1,364,782 | | | | 4,500,924 | |
| | | | | | | | | | | | | | | | |
Change in net assets resulting from operations | | | 3,923,427 | | | | 4,886,665 | | | | 1,739,828 | | | | 2,916,862 | |
| | | | | | | | | | | | | | | | |
Distributions to Shareholders— | | | | | | | | | | | | | | | | |
From net investment income | | | (123,644 | ) | | | — | | | | (11,498 | ) | | | — | |
| | | | | | | | | | | | | | | | |
Change in net assets resulting from distributions to shareholders | | | (123,644 | ) | | | — | | | | (11,498 | ) | | | — | |
| | | | | | | | | | | | | | | | |
Change in net assets resulting from capital transactions | | | (2,157,198 | ) | | | (1,626,072 | ) | | | (501,627 | ) | | | 13,056 | |
| | | | | | | | | | | | | | | | |
Change in net assets | | | 1,642,585 | | | | 3,260,593 | | | | 1,226,703 | | | | 2,929,918 | |
Net Assets: | | | | | | | | | | | | | | | | |
Beginning of year | | | 18,673,495 | | | | 15,412,902 | | | | 11,444,169 | | | | 8,514,251 | |
| | | | | | | | | | | | | | | | |
End of year | | $ | 20,316,080 | | | $ | 18,673,495 | | | $ | 12,670,872 | | | $ | 11,444,169 | |
| | | | | | | | | | | | | | | | |
Accumulated net investment income (loss) included in net assets at end of year | | $ | 77,364 | | | $ | 123,643 | | | $ | 2,030 | | | $ | 11,957 | |
| | | | | | | | | | | | | | | | |
Capital Transactions: | | | | | | | | | | | | | | | | |
Shares sold | | $ | 2,489,155 | | | $ | 1,652,655 | | | $ | 2,019,346 | | | $ | 1,241,549 | |
Dividends reinvested | | | 123,644 | | | | — | | | | 11,498 | | | | — | |
Shares redeemed | | | (4,769,997 | ) | | | (3,278,727 | ) | | | (2,532,471 | ) | | | (1,228,493 | ) |
| | | | | | | | | | | | | | | | |
Net change resulting from capital transactions | | $ | (2,157,198 | ) | | $ | (1,626,072 | ) | | $ | (501,627 | ) | | $ | 13,056 | |
| | | | | | | | | | | | | | | | |
Share Transactions: | | | | | | | | | | | | | | | | |
Issued | | | 160,510 | | | | 131,264 | | | | 176,292 | | | | 130,831 | |
Reinvested | | | 8,677 | | | | — | | | | 1,071 | | | | — | |
Redeemed | | | (308,173 | ) | | | (269,661 | ) | | | (223,297 | ) | | | (132,620 | ) |
| | | | | | | | | | | | | | | | |
Net change resulting from share transactions | | | (138,986 | ) | | | (138,397 | ) | | | (45,934 | ) | | | (1,789 | ) |
| | | | | | | | | | | | | | | | |
H U N T I N G T O N F U N D S
See Notes which are an integral part of the Financial Statements.
Huntington Funds
Statements of Changes in Net Assets
| | | | | | | | | | | | | | | | |
| | | Huntington VA
Real Strategies Fund | | | Huntington VA
Rotating Markets Fund | |
| | | Year Ended
December 31,
2010 | | | Year Ended
December 31,
2009 | | | Year Ended
December 31,
2010 | | | Year Ended
December 31,
2009 | |
Increase (Decrease) in Net Assets: | | | | | | | | | | | | | | | | |
Operations— | | | | | | | | | | | | | | | | |
Net investment income (loss) | | $ | (5,698 | ) | | $ | 4,383 | | | $ | 21,470 | | | $ | 73,676 | |
Net realized gain (loss) on investments and options | | | 1,636 | | | | (26,776 | ) | | | 389,123 | | | | (296,580 | ) |
Net change in unrealized appreciation of investments | | | 500,970 | | | | 193,088 | | | | 44,781 | | | | 1,810,237 | |
| | | | | | | | | | | | | | | | |
Change in net assets resulting from operations | | | 496,908 | | | | 170,695 | | | | 455,374 | | | | 1,587,333 | |
| | | | | | | | | | | | | | | | |
Distributions to Shareholders— | | | | | | | | | | | | | | | | |
From net investment income | | | (5,230 | ) | | | — | | | | (73,676 | ) | | | — | |
| | | | | | | | | | | | | | | | |
Change in net assets resulting from distributions to shareholders | | | (5,230 | ) | | | — | | | | (73,676 | ) | | | — | |
| | | | | | | | | | | | | | | | |
Change in net assets resulting from capital transactions | | | 1,362,555 | | | | 725,079 | | | | 102,979 | | | | (155,964 | ) |
| | | | | | | | | | | | | | | | |
Change in net assets | | | 1,854,233 | | | | 895,774 | | | | 484,677 | | | | 1,431,369 | |
Net Assets: | | | | | | | | | | | | | | | | |
Beginning of year | | | 1,166,097 | | | | 270,323 | | | | 6,472,673 | | | | 5,041,304 | |
| | | | | | | | | | | | | | | | |
End of year | | $ | 3,020,330 | | | $ | 1,166,097 | | | $ | 6,957,350 | | | $ | 6,472,673 | |
| | | | | | | | | | | | | | | | |
Accumulated net investment income included in net assets at end of year | | $ | (7,641 | ) | | $ | 4,563 | | | $ | 21,470 | | | $ | 73,676 | |
| | | | | | | | | | | | | | | | |
Capital Transactions: | | | | | | | | | | | | | | | | |
Shares sold | | $ | 1,650,462 | | | $ | 754,235 | | | $ | 1,562,561 | | | $ | 774,313 | |
Dividends reinvested | | | 5,230 | | | | — | | | | 73,676 | | | | — | |
Shares redeemed | | | (293,137 | ) | | | (29,156 | ) | | | (1,533,258 | ) | | | (930,277 | ) |
| | | | | | | | | | | | | | | | |
Net change resulting from capital transactions | | $ | 1,362,555 | | | $ | 725,079 | | | $ | 102,979 | | | $ | (155,964 | ) |
| | | | | | | | | | | | | | | | |
Share Transactions: | | | | | | | | | | | | | | | | |
Issued | | | 207,292 | | | | 109,967 | | | | 148,441 | | | | 84,636 | |
Reinvested | | | 700 | | | | — | | | | 7,691 | | | | — | |
Redeemed | | | (36,433 | ) | | | (4,971 | ) | | | (147,556 | ) | | | (108,489 | ) |
| | | | | | | | | | | | | | | | |
Net change resulting from share transactions | | | 171,559 | | | | 104,996 | | | | 8,576 | | | | (23,853 | ) |
| | | | | | | | | | | | | | | | |
See Notes which are an integral part of the Financial Statements.
Huntington Funds
Statements of Changes in Net Assets
| | | | | | | | | | | | | | | | |
| | | Huntington VA
Situs Fund | | | Huntington VA
Mortgage Securities Fund | |
| | | Year Ended
December 31,
2010 | | | Year Ended
December 31,
2009 | | | Year Ended
December 31,
2010 | | | Year Ended
December 31,
2009 | |
Increase (Decrease) in Net Assets: | | | | | | | | | | | | | | | | |
Operations— | | | | | | | | | | | | | | | | |
Net investment income | | $ | 25,611 | | | $ | 98,919 | | | $ | 340,707 | | | $ | 313,795 | |
Net realized gain (loss) on investments, options and foreign currency transactions | | | (169,213 | ) | | | (1,869,149 | ) | | | 13,516 | | | | (76,424 | ) |
Net change in unrealized appreciation of investments and foreign currency transactions | | | 5,483,759 | | | | 5,767,998 | | | | 240,809 | | | | 235,154 | |
| | | | | | | | | | | | | | | | |
Change in net assets resulting from operations | | | 5,340,157 | | | | 3,997,768 | | | | 595,032 | | | | 472,525 | |
| | | | | | | | | | | | | | | | |
Distributions to Shareholders— | | | | | | | | | | | | | | | | |
From net investment income | | | (83,106 | ) | | | — | | | | (316,096 | ) | | | — | |
| | | | | | | | | | | | | | | | |
Change in net assets resulting from distributions to shareholders | | | (83,106 | ) | | | — | | | | (316,096 | ) | | | — | |
| | | | | | | | | | | | | | | | |
Change in net assets resulting from capital transactions | | | 1,390,750 | | | | 1,527,697 | | | | 6,111,058 | | | | 1,495,434 | |
| | | | | | | | | | | | | | | | |
Change in net assets | | | 6,647,801 | | | | 5,525,465 | | | | 6,389,994 | | | | 1,967,959 | |
Net Assets: | | | | | | | | | | | | | | | | |
Beginning of year | | | 17,034,988 | | | | 11,509,523 | | | | 10,957,748 | | | | 8,989,789 | |
| | | | | | | | | | | | | | | | |
End of year | | $ | 23,682,789 | | | $ | 17,034,988 | | | $ | 17,347,742 | | | $ | 10,957,748 | |
| | | | | | | | | | | | | | | | |
Accumulated net investment income included in net assets at end of year | | $ | 45,579 | | | $ | 103,078 | | | $ | 386,661 | | | $ | 316,096 | |
| | | | | | | | | | | | | | | | |
Capital Transactions: | | | | | | | | | | | | | | | | |
Shares sold | | $ | 5,288,342 | | | $ | 2,997,588 | | | $ | 8,644,318 | | | $ | 3,455,833 | |
Dividends reinvested | | | 83,106 | | | | — | | | | 316,096 | | | | — | |
Shares redeemed | | | (3,980,698 | ) | | | (1,469,891 | ) | | | (2,849,356 | ) | | | (1,960,399 | ) |
| | | | | | | | | | | | | | | | |
Net change resulting from capital transactions | | $ | 1,390,750 | | | $ | 1,527,697 | | | $ | 6,111,058 | | | $ | 1,495,434 | |
| | | | | | | | | | | | | | | | |
Share Transactions: | | | | | | | | | | | | | | | | |
Issued | | | 415,761 | | | | 297,997 | | | | 751,755 | | | | 314,006 | |
Reinvested | | | 7,329 | | | | — | | | | 27,606 | | | | — | |
Redeemed | | | (308,866 | ) | | | (148,330 | ) | | | (247,608 | ) | | | (182,135 | ) |
| | | | | | | | | | | | | | | | |
Net change resulting from share transactions | | | 114,224 | | | | 149,667 | | | | 531,753 | | | | 131,871 | |
| | | | | | | | | | | | | | | | |
H U N T I N G T O N F U N D S
See Notes which are an integral part of the Financial Statements.
Huntington Funds
Financial Highlights
(For a share outstanding throughout each period)
| | | | | | | | | | | | | | | | | | | | | | | | | | | | | | | | |
| | | Net Asset
Value,
Beginning
of Period | | | Net
Investment
Income | | | Net Realized
and Unrealized
Gain (Loss) on
Investments | | | Total from
Investment
Operations | | | Distributions
from Net
Investment
Income | | |
Distributions
from Net
Realized Gain
on Investment
Transactions | | | Return of
Capital | | | Total
Distributions | |
Huntington VA Balanced Fund | | | | | | | | | | | | | | | | | | | | | |
2008(2) | | $ | 10.00 | | | | 0.18 | | | | 0.09 | | | | 0.27 | | | | (0.01 | ) | | | — | | | | — | | | | (0.01 | ) |
2009 | | $ | 10.26 | | | | 0.13 | (6) | | | 1.68 | | | | 1.81 | | | | (0.05 | ) | | | — | | | | — | | | | (0.05 | ) |
2010 | | $ | 12.02 | | | | 0.16 | | | | 1.09 | | | | 1.25 | | | | (0.01 | ) | | | — | | | | — | | | | (0.01 | ) |
Huntington VA Dividend Capture Fund | | | | | | | | | | | | | | | | | | | | | |
2006 | | $ | 12.41 | | | | 0.47 | | | | 1.49 | | | | 1.96 | | | | (0.46 | ) | | | (0.30 | ) | | | — | | | | (0.76 | ) |
2007 | | $ | 13.61 | | | | 0.47 | | | | (1.20 | ) | | | (0.73 | ) | | | (0.46 | ) | | | (0.65 | ) | | | — | | | | (1.11 | ) |
2008 | | $ | 11.77 | | | | 0.58 | | | | (3.57 | ) | | | (2.99 | ) | | | (1.05 | ) | | | (0.58 | ) | | | (0.06 | ) | | | (1.69 | ) |
2009 | | $ | 7.09 | | | | 0.37 | | | | 1.41 | | | | 1.78 | | | | — | | | | — | | | | — | | | | — | |
2010 | | $ | 8.87 | | | | 0.38 | | | | 0.91 | | | | 1.29 | | | | (0.41 | ) | | | — | | | | — | | | | (0.41 | ) |
| | | | | | | | | | | | | | | | | | | | | | | | | | | | | | | | | |
| (1) | If applicable, certain fees were waived and/or reimbursed. If such waivers/reimbursements had not occurred, the ratios would have been as indicated. |
| (2) | Reflects operations for the period from November 10, 2008 (commencement of operations) to December 31, 2008. |
| (4) | Computed on an annualized basis. |
| (5) | Does not include the effect of expenses of underlying funds. |
| (6) | Per share net investment income has been calculated using the average daily shares method. |
See Notes which are an integral part of the Financial Statements.
| | | | | | | | | | | | | | | | | | | | | | | | | | |
Net
Asset
Value,
End of
Period | | | Total
Return | | | Ratio of Net
Expenses to
Average Net
Assets | | | Ratio of Net
Investment
Income to
Average Net
Assets | | | Ratio of
Expenses
(Prior to
Reimbursements)
to Average Net
Assets(1) | | | Net Assets, at
End of Period
(000 Omitted) | | | Portfolio
Turnover
Rate | |
| | | | | | | | | | | | | | | | | | | | | | | | | | |
| $ | 10.26 | | | | 2.68 | %(3) | | | 0.10 | %(4)(5) | | | 14.05 | %(4) | | | 31.88 | %(4)(5) | | $ | 234 | | | | 19 | %(3) |
| $ | 12.02 | | | | 17.70 | % | | | 0.10 | %(5) | | | 1.11 | % | | | 0.61 | %(5) | | $ | 6,810 | | | | 20 | % |
| $ | 13.26 | | | | 10.43 | % | | | 0.10 | %(5) | | | 2.08 | % | | | 0.45 | %(5) | | $ | 26,869 | | | | 17 | % |
| | | | | | | | | | | | | | | | | | | | | | | | | | |
| $ | 13.61 | | | | 16.59 | % | | | 0.92 | % | | | 3.90 | % | | | 0.92 | % | | $ | 53,671 | | | | 94 | % |
| $ | 11.77 | | | | (6.13 | )% | | | 0.92 | % | | | 3.82 | % | | | 0.92 | % | | $ | 51,243 | | | | 85 | % |
| $ | 7.09 | | | | (28.08 | )% | | | 0.91 | % | | | 4.88 | % | | | 0.91 | % | | $ | 29,332 | | | | 65 | % |
| $ | 8.87 | | | | 25.11 | % | | | 1.00 | % | | | 4.81 | % | | | 1.00 | % | | $ | 33,557 | | | | 94 | % |
| $ | 9.75 | | | | 15.12 | % | | | 0.98 | % | | | 3.54 | % | | | 0.98 | % | | $ | 33,625 | | | | 120 | % |
| | | | | | | | | | | | | | | | | | | | | | | | | | | |
H U N T I N G T O N F U N D S
Huntington Funds
Financial Highlights
(For a share outstanding throughout each period)
| | | | | | | | | | | | | | | | | | | | | | | | | | | | | | | | |
| | | Net Asset
Value,
Beginning
of Period | | | Net
Investment
Income | | | Net Realized
and Unrealized
Gain (Loss) on
Investments | | | Total from
Investment
Operations | | | Distributions
from Net
Investment
Income | | |
Distributions
from Net
Realized Gain
on Investment
Transactions | | | Return of
Capital | | | Total
Distributions | |
Huntington VA Growth Fund | | | | | | | | | | | | | |
2006 | | $ | 8.97 | | | | 0.04 | | | | 0.65 | | | | 0.69 | | | | (0.04 | ) | | | (0.11 | ) | | | — | | | | (0.15 | ) |
2007 | | $ | 9.51 | | | | 0.05 | | | | 1.34 | | | | 1.39 | | | | (0.04 | ) | | | — | (2) | | | — | | | | (0.04 | ) |
2008 | | $ | 10.86 | | | | 0.05 | | | | (3.84 | ) | | | (3.79 | ) | | | (0.10 | ) | | | (0.83 | ) | | | — | | | | (0.93 | ) |
2009 | | $ | 6.14 | | | | 0.01 | | | | 0.97 | | | | 0.98 | | | | — | | | | — | | | | — | | | | — | |
2010 | | $ | 7.12 | | | | 0.01 | | | | 0.68 | | | | 0.69 | | | | (0.01 | ) | | | — | | | | — | | | | (0.01 | ) |
Huntington VA Income Equity Fund | | | | | | | | | | | | | |
2006 | | $ | 11.78 | | | | 0.24 | | | | 1.20 | | | | 1.44 | | | | (0.24 | ) | | | (0.36 | ) | | | — | | | | (0.60 | ) |
2007 | | $ | 12.62 | | | | 0.27 | | | | (0.10 | ) | | | 0.17 | | | | (0.24 | ) | | | (0.44 | ) | | | — | | | | (0.68 | ) |
2008 | | $ | 12.11 | | | | 0.31 | | | | (4.58 | ) | | | (4.27 | ) | | | (0.56 | ) | | | (0.70 | ) | | | 0.01 | | | | (1.27 | ) |
2009 | | $ | 6.57 | | | | 0.22 | | | | 1.20 | | | | 1.42 | | | | — | | | | — | | | | — | | | | — | |
2010 | | $ | 7.99 | | | | 0.24 | | | | 0.67 | | | | 0.91 | | | | (0.23 | ) | | | — | | | | — | | | | (0.23 | ) |
| | | | | | | | | | | | | | | | | | | | | | | | | | | | | | | | | |
| (1) | If applicable, certain fees were waived and/or reimbursed. If such waivers/reimbursements had not occurred, the ratios would have been as indicated. |
| (2) | Amount is less than $0.005. |
| (3) | The portfolio turnover rate increased significantly during the period. This increase was attributable to changes in equity management staff, cash flows in and out of the Fund, as well as tactical portfolio adjustments made. The basic characteristics of the Fund’s investment strategy in terms of market capitalization, style and diversification did not change (unaudited). |
See Notes which are an integral part of the Financial Statements.
| | | | | | | | | | | | | | | | | | | | | | | | | | |
Net
Asset
Value,
End of
Period | | | Total
Return | | | Ratio of Net
Expenses to
Average Net
Assets | | | Ratio of Net
Investment
Income (Loss)
to Average Net
Assets | | | Ratio of
Expenses
(Prior to
Reimbursements)
to Average Net
Assets(1) | | | Net Assets, at
End of Period
(000 Omitted) | | | Portfolio
Turnover
Rate | |
| | | | | | | | | | | | | | | | | | | | | | | | | | |
| $ | 9.51 | | | | 7.76 | % | | | 0.93 | % | | | 0.48 | % | | | 0.93 | % | | $ | 21,191 | | | | 19 | % |
| $ | 10.86 | | | | 14.70 | % | | | 0.94 | % | | | 0.52 | % | | | 0.96 | % | | $ | 23,172 | | | | 111 | %(3) |
| $ | 6.14 | | | | (37.91 | )% | | | 0.87 | % | | | 0.46 | % | | | 0.87 | % | | $ | 12,661 | | | | 84 | % |
| $ | 7.12 | | | | 15.96 | % | | | 0.99 | % | | | 0.19 | % | | | 0.99 | % | | $ | 15,272 | | | | 118 | % |
| $ | 7.80 | | | | 9.72 | % | | | 1.02 | % | | | 0.19 | % | | | 1.02 | % | | $ | 18,511 | | | | 331 | % |
| | | | | | | | | | | | | | | | | | | | | | | | | | |
| $ | 12.62 | | | | 12.59 | % | | | 0.92 | % | | | 2.03 | % | | | 0.92 | % | | $ | 38,614 | | | | 73 | % |
| $ | 12.11 | | | | 0.94 | % | | | 0.91 | % | | | 1.97 | % | | | 0.91 | % | | $ | 36,332 | | | | 116 | % |
| $ | 6.57 | | | | (37.83 | )% | | | 0.92 | % | | | 2.85 | % | | | 0.92 | % | | $ | 18,187 | | | | 96 | % |
| $ | 7.99 | | | | 21.61 | % | | | 0.97 | % | | | 3.28 | % | | | 0.97 | % | | $ | 20,704 | | | | 96 | % |
| $ | 8.67 | | | | 11.79 | % | | | 1.00 | % | | | 2.81 | % | | | 1.00 | % | | $ | 21,798 | | | | 107 | % |
| | | | | | | | | | | | | | | | | | | | | | | | | | | |
H U N T I N G T O N F U N D S
Huntington Funds
Financial Highlights
(For a share outstanding throughout each period)
| | | | | | | | | | | | | | | | | | | | | | | | | | | | | | | | |
| | | Net Asset
Value,
Beginning
of Period | | | Net
Investment
Income
(Loss) | | | Net Realized
and Unrealized
Gain (Loss) on
Investments | | | Total from
Investment
Operations | | | Distributions
from Net
Investment
Income | | |
Distributions
from Net
Realized Gain
on Investment
Transactions | | | Return of
Capital | | | Total
Distributions | |
Huntington VA International Equity Fund | |
2006 | | $ | 12.67 | | | | 0.13 | | | | 3.14 | | | | 3.27 | | | | (0.11 | ) | | | (0.08 | ) | | | — | | | | (0.19 | ) |
2007 | | $ | 15.75 | | | | 0.16 | | | | 1.99 | | | | 2.15 | | | | — | (2) | | | (0.03 | ) | | | — | | | | (0.03 | ) |
2008 | | $ | 17.87 | | | | 0.26 | | | | (7.31 | ) | | | (7.05 | ) | | | (0.40 | ) | | | (0.36 | ) | | | — | | | | (0.76 | ) |
2009 | | $ | 10.06 | | | | 0.23 | | | | 3.14 | | | | 3.37 | | | | (0.01 | ) | | | — | | | | — | | | | (0.01 | ) |
2010 | | $ | 13.42 | | | | 0.14 | | | | 1.06 | | | | 1.20 | | | | (0.16 | ) | | | — | | | | — | | | | (0.16 | ) |
Huntington VA Macro 100 Fund | |
2006 | | $ | 11.68 | | | | 0.05 | | | | 0.79 | | | | 0.84 | | | | (0.02 | ) | | | (0.14 | ) | | | — | | | | (0.16 | ) |
2007 | | $ | 12.36 | | | | 0.05 | | | | (0.34 | ) | | | (0.29 | ) | | | (0.05 | ) | | | (1.70 | ) | | | (0.18 | ) | | | (1.93 | ) |
2008 | | $ | 10.14 | | | | 0.16 | | | | (3.60 | ) | | | (3.44 | ) | | | (0.16 | ) | | | — | | | | — | | | | (0.16 | ) |
2009 | | $ | 6.54 | | | | 0.07 | | | | 1.36 | | | | 1.43 | | | | — | | | | — | | | | — | | | | — | |
2010 | | $ | 7.97 | | | | 0.05 | | | | 1.06 | | | | 1.11 | | | | (0.07 | ) | | | — | | | | — | | | | (0.07 | ) |
| | | | | | | | | | | | | | | | | | | | | | | | | | | | | | | | | |
| (1) | If applicable, certain fees were waived and/or reimbursed. If such waivers/reimbursements had not occurred, the ratios would have been as indicated. |
| (2) | Amount is less than $0.005. |
| (3) | The major cause of increase to portfolio turnover was changes made to the portfolio by the management team based upon changing macroeconomic fundamentals (unaudited). |
See Notes which are an integral part of the Financial Statements.
| | | | | | | | | | | | | | | | | | | | | | | | | | |
Net
Asset
Value,
End of
Period | | | Total
Return | | | Ratio of Net
Expenses to
Average Net
Assets | | | Ratio of Net
Investment
Income to
Average Net
Assets | | | Ratio of
Expenses
(Prior to
Reimbursements)
to Average Net
Assets(1) | | | Net Assets, at
End of Period
(000 Omitted) | | | Portfolio
Turnover
Rate | |
| | | | | | | | | | | | | | | | | | | | | | | | | | |
| $ | 15.75 | | | | 25.84 | % | | | 0.97 | % | | | 1.31 | % | | | 1.06 | % | | $ | 7,666 | | | | 10 | % |
| $ | 17.87 | | | | 13.70 | % | | | 0.98 | % | | | 1.12 | % | | | 1.13 | % | | $ | 14,377 | | | | 21 | % |
| $ | 10.06 | | | | (40.56 | )% | | | 0.99 | % | | | 2.02 | % | | | 1.03 | % | | $ | 9,983 | | | | 16 | % |
| $ | 13.42 | | | | 33.47 | % | | | 1.01 | % | | | 2.17 | % | | | 1.05 | % | | $ | 16,362 | | | | 29 | % |
| $ | 14.46 | | | | 9.18 | % | | | 1.10 | % | | | 1.42 | % | | | 1.10 | % | | $ | 22,648 | | | | 35 | % |
| | | | | | | | | | | | | | | | | | | | | | | | | | |
| $ | 12.36 | | | | 7.26 | % | | | 0.97 | % | | | 0.49 | % | | | 0.97 | % | | $ | 10,138 | | | | 213 | %(3) |
| $ | 10.14 | | | | (2.79 | )% | | | 0.95 | % | | | 0.45 | % | | | 0.95 | % | | $ | 9,773 | | | | 148 | % |
| $ | 6.54 | | | | (33.91 | )% | | | 0.98 | % | | | 1.46 | % | | | 0.98 | % | | $ | 4,464 | | | | 287 | % |
| $ | 7.97 | | | | 21.87 | % | | | 1.04 | % | | | 1.09 | % | | | 1.06 | % | | $ | 5,590 | | | | 10 | % |
| $ | 9.01 | | | | 14.12 | % | | | 1.16 | % | | | 0.60 | % | | | 1.20 | % | | $ | 6,615 | | | | 29 | % |
| | | | | | | | | | | | | | | | | | | | | | | | | | | |
H U N T I N G T O N F U N D S
Huntington Funds
Financial Highlights
(For a share outstanding throughout each period)
| | | | | | | | | | | | | | | | | | | | | | | | | | | | | | | | |
| | | Net Asset
Value,
Beginning
of Period | | | Net
Investment
Income
(Loss) | | | Net Realized
and Unrealized
Gain (Loss) on
Investments | | | Total from
Investment
Operations | | | Distributions
from Net
Investment
Income | | | Distributions
from Net
Realized Gain
on Investment
Transactions | | | Return of
Capital | | | Total
Distributions | |
Huntington VA Mid Corp America Fund | |
2006 | | $ | 16.49 | | | | 0.11 | | | | 1.07 | | | | 1.18 | | | | (0.07 | ) | | | (0.20 | ) | | | — | | | | (0.27 | ) |
2007 | | $ | 17.40 | | | | 0.11 | | | | 1.42 | | | | 1.53 | | | | (0.11 | ) | | | (0.21 | ) | | | — | | | | (0.32 | ) |
2008 | | $ | 18.61 | | | | 0.08 | | | | (6.95 | ) | | | (6.87 | ) | | | (0.19 | ) | | | (0.77 | ) | | | — | | | | (0.96 | ) |
2009 | | $ | 10.78 | | | | 0.10 | | | | 3.59 | | | | 3.69 | | | | — | | | | — | | | | — | | | | — | |
2010 | | $ | 14.47 | | | | 0.08 | | | | 3.19 | | | | 3.27 | | | | (0.10 | ) | | | — | | | | — | | | | (0.10 | ) |
Huntington VA New Economy Fund | |
2006 | | $ | 16.27 | | | | 0.04 | | | | 1.62 | | | | 1.66 | | | | (0.02 | ) | | | (0.25 | ) | | | — | | | | (0.27 | ) |
2007 | | $ | 17.66 | | | | 0.10 | | | | 2.10 | | | | 2.20 | | | | (0.03 | ) | | | (0.38 | ) | | | — | | | | (0.41 | ) |
2008 | | $ | 19.45 | | | | 0.03 | | | | (9.21 | ) | | | (9.18 | ) | | | (0.11 | ) | | | (2.04 | ) | | | (0.01 | ) | | | (2.16 | ) |
2009 | | $ | 8.11 | | | | 0.01 | | | | 2.80 | | | | 2.81 | | | | — | | | | — | | | | — | | | | — | |
2010 | | $ | 10.92 | | | | (0.04 | ) | | | 1.78 | | | | 1.74 | | | | (0.01 | ) | | | — | | | | — | | | | (0.01 | ) |
| | | | | | | | | | | | | | | | | | | | | | | | | | | | | | | | | |
| (1) | If applicable, certain fees were waived and/or reimbursed. If such waivers/reimbursements had not occurred, the ratios would have been as indicated. |
| (2) | The portfolio turnover rate increased significantly during the period. This increase was attributable to changes in equity management staff, cash flows into and out of the Fund, as well as tactical portfolio adjustments made. The basic characteristics of the Fund’s investment strategy in terms of market capitalization, style and diversification did not change (unaudited). |
See Notes which are an integral part of the Financial Statements.
| | | | | | | | | | | | | | | | | | | | | | | | | | |
Net
Asset
Value,
End of
Period | | | Total
Return | | | Ratio of Net
Expenses to
Average Net
Assets | | | Ratio of Net
Investment
Income (Loss) to
Average Net
Assets | | | Ratio of
Expenses
(Prior to
Reimbursements)
to Average Net
Assets(1) | | | Net Assets, at
End of Period
(000 Omitted) | | | Portfolio
Turnover
Rate | |
| | |
| $ | 17.40 | | | | 7.24 | % | | | 0.93 | % | | | 0.65 | % | | | 0.93 | % | | $ | 28,814 | | | | 8 | % |
| $ | 18.61 | | | | 8.75 | % | | | 0.92 | % | | | 0.56 | % | | | 0.92 | % | | $ | 30,392 | | | | 16 | % |
| $ | 10.78 | | | | (38.83 | )% | | | 0.93 | % | | | 0.43 | % | | | 0.93 | % | | $ | 15,413 | | | | 19 | % |
| $ | 14.47 | | | | 34.23 | % | | | 0.97 | % | | | 0.76 | % | | | 0.97 | % | | $ | 18,673 | | | | 23 | % |
| $ | 17.64 | | | | 22.80 | % | | | 1.02 | % | | | 0.41 | % | | | 1.02 | % | | $ | 20,316 | | | | 21 | % |
| | | | | | | | | | | | | | | | | | | | | | | | | | |
| $ | 17.66 | | | | 10.28 | % | | | 0.96 | % | | | 0.24 | % | | | 0.96 | % | | $ | 15,127 | | | | 51 | % |
| $ | 19.45 | | | | 12.50 | % | | | 0.94 | % | | | 0.59 | % | | | 0.94 | % | | $ | 18,972 | | | | 102 | %(2) |
| $ | 8.11 | | | | (52.65 | )% | | | 0.93 | % | | | 0.18 | % | | | 0.93 | % | | $ | 8,514 | | | | 150 | % |
| $ | 10.92 | | | | 34.65 | % | | | 0.99 | % | | | 0.12 | % | | | 1.00 | % | | $ | 11,444 | | | | 122 | % |
| $ | 12.65 | | | | 15.97 | % | | | 1.06 | % | | | (0.33 | )% | | | 1.06 | % | | $ | 12,671 | | | | 256 | % |
| | | | | | | | | | | | | | | | | | | | | | | | | | | |
H U N T I N G T O N F U N D S
Huntington Funds
Financial Highlights
(For a share outstanding throughout each period)
| | | | | | | | | | | | | | | | | | | | | | | | | | | | | | | | |
| | | Net Asset
Value,
Beginning
of Period | | | Net
Investment
Income
(Loss) | | | Net Realized
and Unrealized
Gain (Loss) on
Investments | | | Total from
Investment
Operations | | | Distributions
from Net
Investment
Income | | | Distributions
from Net
Realized Gain
on Investment
Transactions | | | Return of
Capital | | | Total
Distributions | |
Huntington VA Real Strategies Fund | |
2007(2) | | $ | 10.00 | | | | 0.16 | | | | 1.34 | | | | 1.50 | | | | — | | | | — | | | | — | | | | — | |
2008 | | $ | 11.50 | | | | 0.04 | (5) | | | (5.50 | ) | | | (5.46 | ) | | | (0.13 | ) | | | (0.21 | ) | | | (0.03 | ) | | | (0.37 | ) |
2009 | | $ | 5.67 | | | | 0.03 | | | | 1.94 | | | | 1.97 | | | | — | | | | — | | | | — | | | | — | |
2010 | | $ | 7.64 | | | | (0.03 | ) | | | 1.72 | | | | 1.69 | | | | (0.02 | ) | | | — | | | | — | | | | (0.02 | ) |
Huntington VA Rotating Markets Fund | |
2006 | | $ | 12.70 | | | | 0.14 | | | | 2.29 | | | | 2.43 | | | | (0.09 | ) | | | (0.47 | ) | | | — | | | | (0.56 | ) |
2007 | | $ | 14.57 | | | | 0.15 | | | | 1.16 | | | | 1.31 | | | | (0.13 | ) | | | (0.71 | ) | | | — | | | | (0.84 | ) |
2008 | | $ | 15.04 | | | | 0.15 | | | | (6.02 | ) | | | (5.87 | ) | | | (0.31 | ) | | | (1.01 | ) | | | — | | | | (1.32 | ) |
2009 | | $ | 7.85 | | | | 0.12 | | | | 2.50 | | | | 2.62 | | | | — | | | | — | | | | — | | | | — | |
2010 | | $ | 10.47 | | | | 0.03 | | | | 0.72 | | | | 0.75 | | | | (0.12 | ) | | | — | | | | — | | | | (0.12 | ) |
| | | | | | | | | | | | | | | | | | | | | | | | | | | | | | | | | |
| (1) | If applicable, certain fees were waived and/or reimbursed. If such waivers/reimbursements had not occurred, the ratios would have been as indicated. |
| (2) | Reflects operations for the period from August 31, 2007 (commencement of operations) to December 31, 2007. |
| (4) | Computed on an annualized basis. |
| (5) | Per share net investment income (loss) has been calculated using the average daily shares method. |
| (6) | Does not include the effect of expenses of underlying funds. |
| (7) | The portfolio turnover rate increased significantly during the period. This increase was attributable to cash flows into and out of the Fund, as well as tactical portfolio adjustments made. The basic characteristics of the Fund’s investment strategy did not change (unaudited). |
See Notes which are an integral part of the Financial Statements.
| | | | | | | | | | | | | | | | | | | | | | | | | | |
Net
Asset
Value,
End of
Period | | | Total
Return | | | Ratio of Net
Expenses to
Average Net
Assets | | | Ratio of Net
Investment
Income (Loss) to
Average Net
Assets | | | Ratio of
Expenses
(Prior to
Reimbursements)
to Average Net
Assets(1) | | | Net Assets, at
End of Period
(000 Omitted) | | | Portfolio
Turnover
Rate | |
| | | | | | | | | | | | | | | | | | | | | | | | | | |
| $ | 11.50 | | | | 15.00 | %(3) | | | 1.00 | %(4) | | | 4.35 | %(4) | | | 7.01 | %(4) | | $ | 241 | | | | 34 | %(3) |
| $ | 5.67 | | | | (49.00 | )% | | | 1.00 | % | | | 0.41 | % | | | 3.59 | % | | $ | 270 | | | | 44 | % |
| $ | 7.64 | | | | 34.74 | % | | | 1.42 | % | | | 0.75 | % | | | 1.79 | % | | $ | 1,166 | | | | 33 | % |
| $ | 9.31 | | | | 22.15 | % | | | 1.68 | % | | | (0.28 | )% | | | 1.68 | % | | $ | 3,020 | | | | 23 | % |
| | | | | | | | | | | | | | | | | | | | | | | | | | |
| $ | 14.57 | | | | 19.61 | % | | | 0.97 | %(6) | | | 1.08 | % | | | 0.97 | %(6) | | $ | 8,558 | | | | 31 | % |
| $ | 15.04 | | | | 9.03 | % | | | 0.98 | %(6) | | | 1.17 | % | | | 0.98 | %(6) | | $ | 10,538 | | | | 49 | % |
| $ | 7.85 | | | | (42.03 | )% | | | 0.93 | %(6) | | | 1.09 | % | | | 0.93 | %(6) | | $ | 5,041 | | | | 221 | %(7) |
| $ | 10.47 | | | | 33.38 | % | | | 1.01 | %(6) | | | 1.34 | % | | | 1.02 | %(6) | | $ | 6,473 | | | | 229 | % |
| $ | 11.10 | | | | 7.34 | % | | | 1.14 | %(6) | | | 0.33 | % | | | 1.14 | %(6) | | $ | 6,957 | | | | 254 | % |
| | | | | | | | | | | | | | | | | | | | | | | | | | | |
H U N T I N G T O N F U N D S
Huntington Funds
Financial Highlights
(For a share outstanding throughout each period)
| | | | | | | | | | | | | | | | | | | | | | | | | | | | |
| | | Net Asset
Value,
Beginning
of Period | | | Net
Investment
Income
(Loss) | | | Net Realized
and Unrealized
Gain (Loss) on
Investments | | | Total from
Investment
Operations | | | Distributions
from Net
Investment
Income | | | Distributions
from Net
Realized Gain
on Investment
Transactions | | | Total
Distributions | |
Huntington VA Situs Fund | |
2006 | | $ | 13.95 | | | | — | (2) | | | 0.68 | | | | 0.68 | | | | (0.01 | ) | | | (0.18 | ) | | | (0.19 | ) |
2007 | | $ | 14.44 | | | | 0.02 | | | | 1.60 | | | | 1.62 | | | | (0.05 | ) | | | (0.86 | ) | | | (0.91 | ) |
2008 | | $ | 15.15 | | | | 0.02 | | | | (6.18 | ) | | | (6.16 | ) | | | (0.03 | ) | | | (0.22 | ) | | | (0.25 | ) |
2009 | | $ | 8.74 | | | | 0.07 | | | | 2.81 | | | | 2.88 | | | | — | | | | — | | | | — | |
2010 | | $ | 11.62 | | | | 0.01 | | | | 3.41 | | | | 3.42 | | | | (0.05 | ) | | | — | | | | (0.05 | ) |
Huntington VA Mortgage Securities Fund | |
2006 | | $ | 10.65 | | | | 0.43 | (3) | | | 0.20 | | | | 0.63 | | | | (0.14 | ) | | | — | | | | (0.14 | ) |
2007 | | $ | 11.14 | | | | 0.46 | (3) | | | (0.04 | ) | | | 0.42 | | | | (0.24 | ) | | | — | (2) | | | (0.24 | ) |
2008 | | $ | 11.32 | | | | 0.51 | | | | (0.27 | ) | | | 0.24 | | | | (0.92 | ) | | | (0.02 | ) | | | (0.94 | ) |
2009 | | $ | 10.62 | | | | 0.32 | | | | 0.26 | | | | 0.58 | | | | — | | | | — | | | �� | — | |
2010 | | $ | 11.20 | | | | 0.16 | | | | 0.39 | | | | 0.55 | | | | (0.26 | ) | | | — | | | | (0.26 | ) |
| | | | | | | | | | | | | | | | | | | | | | | | | | | | | |
| (1) | If applicable, certain fees were waived and/or reimbursed. If such waivers/reimbursements had not occurred, the ratios would have been as indicated. |
| (2) | Amount is less than $0.005. |
| (3) | Per share net investment income (loss) has been calculated using the average daily shares method. |
See Notes which are an integral part of the Financial Statements.
| | | | | | | | | | | | | | | | | | | | | | | | | | |
Net
Asset
Value,
End of
Period | | | Total
Return | | | Ratio of Net
Expenses to
Average Net
Assets | | | Ratio of Net
Investment
Income (Loss) to
Average Net
Assets | | | Ratio of
Expenses
(Prior to
Reimbursements)
to Average Net
Assets(1) | | | Net Assets, at
End of Period
(000 Omitted) | | | Portfolio
Turnover
Rate | |
| | | | | | | | | | | | | | | | | | | | | | | | | | |
| $ | 14.44 | | | | 4.84 | % | | | 0.95 | % | | | 0.01 | % | | | 0.95 | % | | $ | 14,402 | | | | 17 | % |
| $ | 15.15 | | | | 11.37 | % | | | 0.94 | % | | | 0.19 | % | | | 0.94 | % | | $ | 19,246 | | | | 29 | % |
| $ | 8.74 | | | | (41.23 | )% | | | 0.95 | % | | | 0.18 | % | | | 0.95 | % | | $ | 11,510 | | | | 21 | % |
| $ | 11.62 | | | | 32.95 | % | | | 1.01 | % | | | 0.73 | % | | | 1.01 | % | | $ | 17,035 | | | | 10 | % |
| $ | 14.99 | | | | 29.61 | % | | | 1.02 | % | | | 0.13 | % | | | 1.02 | % | | $ | 23,683 | | | | 19 | % |
| | | | | | | | | | | | | | | | | | | | | | | | | | |
| $ | 11.14 | | | | 5.89 | % | | | 0.99 | % | | | 3.99 | % | | | 1.15 | % | | $ | 7,132 | | | | 36 | % |
| $ | 11.32 | | | | 3.93 | % | | | 1.00 | % | | | 4.09 | % | | | 1.07 | % | | $ | 10,249 | | | | 17 | % |
| $ | 10.62 | | | | 2.15 | % | | | 1.00 | % | | | 3.98 | % | | | 1.04 | % | | $ | 8,990 | | | | 23 | % |
| $ | 11.20 | | | | 5.46 | % | | | 1.05 | % | | | 3.40 | % | | | 1.07 | % | | $ | 10,958 | | | | 29 | % |
| $ | 11.49 | | | | 4.89 | % | | | 1.11 | % | | | 2.44 | % | | | 1.11 | % | | $ | 17,348 | | | | 3 | % |
| | | | | | | | | | | | | | | | | | | | | | | | | | | |
H U N T I N G T O N F U N D S
Huntington Funds
Notes to Financial Statements
December 31, 2010
The Huntington Funds (the “Trust”) was originally two separate Massachusetts business trusts: The Huntington Funds, established on February 10, 1987, and Huntington VA Funds, established on June 30, 1999 (together, the “Original Trusts”). On June 23, 2006, the Original Trusts were reorganized into a single Delaware statutory trust that retained the name of The Huntington Funds. The Trust is registered under the Investment Company Act of 1940, as amended (the “1940 Act”), as an open-end management investment company. At December 31, 2010, the Trust operated 36 separate series, or mutual funds, each with its own investment objective and strategy. The Funds’ prospectus provides a description of each Fund’s investment objectives, policies and strategies along with information on the classes of shares currently being offered. This report contains financial statements and financial highlights of the funds listed below (individually referred to as a “Fund,” or collectively as the “Funds”):
Huntington VA Balanced Fund (“VA Balanced Fund”)
Huntington VA Dividend Capture Fund (“VA Dividend Capture Fund”)
Huntington VA Growth Fund (“VA Growth Fund”)
Huntington VA Income Equity Fund (“VA Income Equity Fund”)
Huntington VA International Equity Fund (“VA International Equity Fund”)
Huntington VA Macro 100 Fund (“VA Macro 100 Fund”)
Huntington VA Mid Corp America Fund (“VA Mid Corp America Fund”)
Huntington VA New Economy Fund (“VA New Economy Fund”)
Huntington VA Real Strategies Fund (“VA Real Strategies Fund”)
Huntington VA Rotating Markets Fund (“VA Rotating Markets Fund”)
Huntington VA Situs Fund (“VA Situs Fund”)
Huntington VA Mortgage Securities Fund (“VA Mortgage Securities Fund”)
The assets of each Fund are segregated and a shareholder’s interest is limited to the Fund in which shares are held.
The Trust accounts for the assets, liabilities and operations of each Fund separately. Shares of the Funds are not offered directly to the public but, pursuant to an exemptive order granted by the Securities and Exchange Commission and procedures adopted by the Trust’s Board of Trustees (the “Trustees”), the Funds were sold during the year only to separate accounts of Hartford Life Insurance Company, Hartford Life and Annuity Insurance Company, Sun Life Assurance Company of Canada (U.S.) and Transamerica Life Insurance Company for use with their respective variable insurance contracts and policies.
Under the Trust’s organizational documents, its officers and Trustees are indemnified against certain liabilities arising out of the performance of their duties to the Funds. In addition, in the normal course of business, the Trust may enter into contracts with vendors and others that provide for general indemnifications. The Trust’s maximum exposure under these arrangements is unknown, as this would involve future claims that may be made against the Trust. However, based on experience, the Trust expects that risk of loss to be remote.
| (2) | Significant Accounting Policies |
The following is a summary of significant accounting policies consistently followed by each Fund in the preparation of its financial statements. These policies are in conformity with generally accepted accounting principles in the United States of America (“GAAP”). The preparation of financial statements in conformity with GAAP requires management to make estimates and assumptions that affect the amounts of assets, liabilities, and disclosure of contingent assets and liabilities at the date of the financial statements and the reported amounts of income and expenses for the period. Actual results could differ from those estimates.
The price at which the Funds will offer or redeem shares is the net asset value (“NAV”) per share next determined after the order is considered received. The Trust calculates the NAV for each of the Funds by valuing securities held based on fair value. Fair value is defined as the price that would be received to sell an asset or paid to transfer a liability in an orderly transaction between market participants at the measurement date.
In computing the NAV of the Funds, fair value is based on market valuations with respect to portfolio securities for which market quotations are readily available. Pursuant to Trustee-approved policies, the Trust relies on certain security pricing services to provide current market value of securities. Those security pricing services value equity securities (including foreign equity securities) traded on a securities exchange at the last reported sales price on the principal exchange. Equity securities quoted by NASDAQ are valued at the NASDAQ official closing price. If there is no reported sale on the principal exchange, and in the case of over-the-counter securities, equity securities are valued at a bid price estimated by the security pricing service. Option
Huntington Funds
Notes to Financial Statements (continued)
December 31, 2010
contracts are generally valued using the closing price based on quote data from the six major U.S. options exchanges on which such options are traded.
Debt securities traded on a national securities exchange or in the over-the-counter market are valued at the last reported sales price on the principal exchange, except the U.S. government obligations held by the VA Mortgage Securities Fund are valued at the mean between the over-the-counter bid and asked prices furnished by the security pricing service. If there is no reported sale on the principal exchange, and for all other debt securities, debt securities are valued at a bid price estimated by the security pricing service. Foreign securities quoted in foreign currencies are translated in U.S. dollars at the foreign exchange rate in effect as of the close of the New York Stock Exchange (NYSE) (generally 4:00 p.m. Eastern Time), on the day the value of the foreign security is determined. Short-term investments with remaining maturities of 60 days or less at the time of purchase are valued at amortized cost. Investments in other open-end investment companies are valued at the NAV.
Under certain circumstances, a good faith determination of the fair value of a security may be used instead of its current market value, even if the security’s market price is readily available. In such circumstances, the Trust’s Sub-Financial Administrator may request that the Trust’s Pricing Committee make its own fair value determination.
Securities for which market quotations are not readily available are valued at fair value under Trust procedures approved by the Trustees. In these cases, a Pricing Committee established and appointed by the Trustees determines in good faith, subject to Trust procedures, the fair value of portfolio securities held by a Fund (“good faith fair valuation”). When a good faith fair valuation of a security is required, consideration is generally given to a number of factors including, but not limited to the following: dealer quotes, published analyses by dealers or analysts regarding the security, transactions which provide implicit valuation of the security (such as a merger or tender offer transaction), the value of other securities or contracts which derive their value from the security at issue, and the implications of any other circumstances which have caused trading in the security to halt. With respect to certain narrow categories of securities, the procedures utilized by the Pricing Committee detail specific valuation methodologies to be applied in lieu of considering the aforementioned list of factors.
Fair valuation procedures are also used when a significant event affecting the value of a portfolio security is determined to have occurred between the time when the price of the portfolio security is determined and the close of trading on the NYSE, which is when each Fund’s NAV is computed. An event is considered significant if there is both an affirmative expectation that the security’s value will change in response to the event and a reasonable basis for quantifying the resulting change in value. Significant events include significant securities market movements occurring between the time the price of the portfolio security is determined and the close of trading on the NYSE. For domestic fixed income securities, such events may occur where the cut-off time for the market information used by the independent pricing service is earlier than the end of regular trading on the NYSE. For securities normally priced at their last sale price in a foreign market, such events can occur between the close of trading in the foreign market and the close of trading on the NYSE.
In some cases, events affecting the issuer of a portfolio security may be considered significant events. Examples of potentially significant events include announcements concerning earnings, acquisitions, new products, management changes, litigation developments, a strike or natural disaster affecting the company’s operations or regulatory changes or market developments affecting the issuer’s industry occurring between the time when the price of the portfolio security is determined and the close of trading on the NYSE. For securities of foreign issuers, such events could also include political or other developments affecting the economy or markets in which the issuer conducts its operations or its securities are traded.
The Funds’ Trustees have authorized the use of an independent fair valuation service to monitor changes in a designated U.S. market index after foreign markets close, and to implement a fair valuation methodology to adjust the closing prices of foreign securities if the movement in the index is significant.
There can be no assurance that a Fund could purchase or sell a portfolio security at the price used to calculate the Fund’s NAV. In the case of good faith fair valued portfolio securities, lack of information and uncertainty as to the significance of information may lead to a conclusion that a prior valuation is the best indication of a portfolio security’s present value. Good faith fair valuations generally remain unchanged until new information becomes available. Consequently, changes in good faith fair valuation of portfolio securities may be less frequent and of greater magnitude than changes in the price of portfolio securities valued at their last sale price, by an independent pricing service, or based on market quotations.
H U N T I N G T O N F U N D S
Huntington Funds
Notes to Financial Statements (continued)
December 31, 2010
The valuation techniques described above maximize the use of observable inputs and minimize the use of unobservable inputs in determining fair value. The inputs used for valuing the Funds’ investments are summarized in the three broad levels listed below:
| | |
| |
• Level 1 | | - quoted prices in active markets for identical assets. |
| |
• Level 2 | | - other significant observable inputs (including quoted prices for similar securities, interest rates, prepayment speeds, credit risk, etc.). |
| |
• Level 3 | | - significant unobservable inputs (including the Funds’ own assumptions in determining the fair value of investments). |
The inputs or methodology used for valuing investments are not necessarily an indication of the risk associated with investing in those investments.
Pursuant to the valuation procedures noted previously, equity securities (including foreign equity securities) are generally recognized as Level 1 securities in the fair value hierarchy (unless there is a fair valuation event, in which case affected securities are generally categorized as Level 2 securities). Option securities are generally recognized as Level 1 securities in the fair value hierarchy. Debt securities are generally recognized as Level 2 securities in the fair value hierarchy. Mutual funds, exchange traded funds and cash equivalents are generally recognized as Level 1 securities in the fair value hierarchy (unless there is a fair valuation event, in which case affected securities are generally categorized as Level 2 securities).
For the fiscal year ended December 31, 2010, there were no Level 3 investments for which significant unobservable inputs were used to determine fair value.
The following is a summary of the inputs used to value the Funds’ investments as of December 31, 2010, while the breakdown, by category, of common stocks is disclosed in the Portfolio of Investments for each Fund: .
| | | | | | | | | | | | | | | | | | | | | | | | |
| | | LEVEL 1 - Quoted Prices | | | LEVEL 2 - Other Significant
Observable Inputs | | | Total | |
Fund Name | | Securities | | | Other Financial
Investments* | | | Securities | | | Other Financial
Investments* | | | Securities | | | Other Financial
Investments* | |
VA Balanced Fund | | | | | | | | | | | | | | | | | | | | | | | | |
Mutual Funds | | $ | 26,241,492 | | | $ | — | | | $ | — | | | $ | — | | | $ | 26,241,492 | | | $ | — | |
Cash Equivalents | | | 545,928 | | | | — | | | | — | | | | — | | | | 545,928 | | | | — | |
| | | | | | | | | | | | | | | | | | | | | | | | |
Total | | | 26,787,420 | | | | — | | | | — | | | | — | | | | 26,787,420 | | | | — | |
VA Dividend Capture Fund | | | | | | | | | | | | | | | | | | | | | | | | |
Common Stocks | | | 25,868,236 | | | | — | | | | — | | | | — | | | | 25,868,236 | | | | — | |
Preferred Stocks | | | 6,700,089 | | | | — | | | | 394,219 | (1) | | | — | | | | 7,094,308 | | | | — | |
Mutual Funds | | | 528,780 | | | | — | | | | — | | | | — | | | | 528,780 | | | | — | |
Cash Equivalents | | | 160,142 | | | | — | | | | — | | | | — | | | | 160,142 | | | | — | |
| | | | | | | | | | | | | | | | | | | | | | | | |
Total | | | 33,257,247 | | | | — | | | | 394,219 | | | | — | | | | 33,651,466 | | | | — | |
VA Growth Fund | | | | | | | | | | | | | | | | | | | | | | | | |
Common Stocks | | | 17,788,469 | | | | — | | | | — | | | | — | | | | 17,788,469 | | | | — | |
Cash Equivalents | | | 922,241 | | | | — | | | | — | | | | — | | | | 922,241 | | | | — | |
| | | | | | | | | | | | | | | | | | | | | | | | |
Total | | | 18,710,710 | | | | — | | | | — | | | | — | | | | 18,710,710 | | | | — | |
VA Income Equity Fund | | | | | | | | | | | | | | | | | | | | | | | | |
Common Stocks | | | 21,082,599 | | | | — | | | | — | | | | — | | | | 21,082,599 | | | | — | |
Cash Equivalents | | | 687,915 | | | | — | | | | — | | | | — | | | | 687,915 | | | | — | |
| | | | | | | | | | | | | | | | | | | | | | | | |
Total | | | 21,770,514 | | | | — | | | | — | | | | — | | | | 21,770,514 | | | | — | |
VA International Equity Fund | | | | | | | | | | | | | | | | | | | | | | | | |
Common Stocks | | | 20,462,692 | | | | — | | | | — | | | | — | | | | 20,462,692 | | | | — | |
Mutual Funds | | | 1,144,687 | | | | — | | | | — | | | | — | | | | 1,144,687 | | | | — | |
Cash Equivalents | | | 840,153 | | | | — | | | | — | | | | — | | | | 840,153 | | | | — | |
| | | | | | | | | | | | | | | | | | | | | | | | |
Total | | | 22,447,532 | | | | — | | | | — | | | | — | | | | 22,447,532 | | | | — | |
VA Macro 100 Fund | | | | | | | | | | | | | | | | | | | | | | | | |
Common Stocks | | | 6,068,507 | | | | — | | | | — | | | | — | | | | 6,068,507 | | | | — | |
Cash Equivalents | | | 539,053 | | | | — | | | | — | | | | — | | | | 539,053 | | | | — | |
| | | | | | | | | | | | | | | | | | | | | | | | |
Total | | | 6,607,560 | | | | — | | | | — | | | | — | | | | 6,607,560 | | | | — | |
Huntington Funds
Notes to Financial Statements (continued)
December 31, 2010
| | | | | | | | | | | | | | | | | | | | | | | | |
| | | LEVEL 1 - Quoted Prices | | | LEVEL 2 - Other Significant
Observable Inputs | | | Total | |
Fund Name | | Securities | | | Other Financial
Investments* | | | Securities | | | Other Financial
Investments* | | | Securities | | | Other Financial
Investments* | |
VA Mid Corp America Fund | | | | | | | | | | | | | | | | | | | | | | | | |
Common Stocks | | $ | 19,400,699 | | | $ | — | | | $ | — | | | $ | — | | | $ | 19,400,699 | | | $ | — | |
Cash Equivalents | | | 910,222 | | | | — | | | | — | | | | — | | | | 910,222 | | | | — | |
| | | | | | | | | | | | | | | | | | | | | | | | |
Total | | | 20,310,921 | | | | — | | | | — | | | | — | | | | 20,310,921 | | | | — | |
VA New Economy Fund | | | | | | | | | | | | | | | | | | | | | | | | |
Common Stocks | | | 12,267,434 | | | | — | | | | — | | | | — | | | | 12,267,434 | | | | — | |
Options Purchased | | | 121,375 | | | | — | | | | — | | | | — | | | | 121,375 | | | | — | |
Cash Equivalents | | | 465,599 | | | | — | | | | — | | | | — | | | | 465,599 | | | | — | |
Written Options | | | — | | | | (183,350 | ) | | | — | | | | — | | | | — | | | | (183,350 | ) |
| | | | | | | | | | | | | | | | | | | | | | | | |
Total | | | 12,854,408 | | | | (183,350 | ) | | | — | | | | — | | | | 12,854,408 | | | | (183,350 | ) |
VA Real Strategies Fund | | | | | | | | | | | | | | | | | | | | | | | | |
Common Stocks | | | 2,550,221 | | | | — | | | | — | | | | — | | | | 2,550,221 | | | | — | |
Corporate Bonds | | | — | | | | — | | | | 57,295 | | | | — | | | | 57,295 | �� | | | — | |
Mutual Funds | | | 191,594 | | | | — | | | | — | | | | — | | | | 191,594 | | | | — | |
Cash Equivalents | | | 231,852 | | | | — | | | | — | | | | — | | | | 231,852 | | | | — | |
Written Options | | | — | | | | (28,936 | ) | | | — | | | | — | | | | — | | | | (28,936 | ) |
| | | | | | | | | | | | | | | | | | | | | | | | |
Total | | | 2,973,667 | | | | (28,936 | ) | | | 57,295 | | | | — | | | | 3,030,962 | | | | (28,936 | ) |
VA Rotating Markets Fund | | | | | | | | | | | | | | | | | | | | | | | | |
Common Stocks | | | 6,238,857 | | | | — | | | | — | | | | — | | | | 6,238,857 | | | | — | |
Mutual Funds | | | 510,952 | | | | — | | | | — | | | | — | | | | 510,952 | | | | — | |
Cash Equivalents | | | 198,325 | | | | — | | | | — | | | | — | | | | 198,325 | | | | — | |
| | | | | | | | | | | | | | | | | | | | | | | | |
Total | | | 6,948,134 | | | | — | | | | — | | | | — | | | | 6,948,134 | | | | — | |
VA Situs Fund | | | | | | | | | | | | | | | | | | | | | | | | |
Common Stocks | | | 23,336,793 | | | | — | | | | — | | | | — | | | | 23,336,793 | | | | — | |
Mutual Funds | | | 150,815 | | | | — | | | | — | | | | — | | | | 150,815 | | | | — | |
Cash Equivalents | | | 243,370 | | | | — | | | | — | | | | — | | | | 243,370 | | | | — | |
| | | | | | | | | | | | | | | | | | | | | | | | |
Total | | | 23,730,978 | | | | — | | | | — | | | | — | | | | 23,730,978 | | | | — | |
VA Mortgage Securities Fund | | | | | | | | | | | | | | | | | | | | | | | | |
U.S. Government Mortgage Backed Agencies | | | — | | | | — | | | | 10,690,416 | | | | — | | | | 10,690,416 | | | | — | |
U.S. Government Agencies | | | — | | | | — | | | | 2,875,125 | | | | — | | | | 2,875,125 | | | | — | |
Common Stocks | | | 1,722,037 | | | | — | | | | — | | | | — | | | | 1,722,037 | | | | — | |
Collateralized Mortgage Obligations | | | — | | | | — | | | | 1,284,752 | | | | — | | | | 1,284,752 | | | | — | |
Cash Equivalents | | | 670,903 | | | | — | | | | — | | | | — | | | | 670,903 | | | | — | |
| | | | | | | | | | | | | | | | | | | | | | | | |
Total | | | 2,392,940 | | | | — | | | | 14,850,293 | | | | — | | | | 17,243,233 | | | | — | |
| | * | Other financial investments are derivative instruments not reflected on the Portfolio of Investments, such as written options contracts. |
| | (1) | Consists of Allianz SE, 8.375%, listed under Financials. |
The Trust recognizes significant transfers between fair value hierarchy levels at the reporting period end. There were no significant transfers between all Levels as of December 31, 2010.
The Funds may enter into repurchase agreements with banks and other recognized financial institutions, such as broker/dealers, which are deemed by Huntington Asset Advisors, Inc., a subsidiary of The Huntington National Bank, to be creditworthy pursuant to the guidelines and/or standards reviewed or established by the Trustees. It is the policy of the Funds to require the custodian bank to take possession of, to have legally segregated in the Federal Reserve Book Entry System, or to have segregated within the custodian bank’s vault, all securities held as collateral under repurchase agreement transactions. Additionally, procedures have been established by the Funds to monitor, on a daily basis, the market value of each repurchase agreement’s collateral to ensure that the value of collateral at least equals the repurchase price to be paid under the repurchase agreement transaction. If the counterparty defaults and the fair value of the collateral declines, realization of the collateral by the Funds may be delayed or limited.
| C. | When-Issued and Delayed Delivery Transactions |
The Funds may engage in when-issued or delayed delivery transactions. The Funds record when-issued securities on the trade date and maintain security positions such that sufficient liquid assets will be available to make payment for the securities purchased. Securities purchased on a when-issued or delayed delivery basis are marked to market daily and begin earning interest on the settlement date. Losses may occur on these transactions due to changes in market conditions or the failure of counterparties to perform under the contract.
H U N T I N G T O N F U N D S
Huntington Funds
Notes to Financial Statements (continued)
December 31, 2010
| D. | Foreign Currency Translation |
The accounting records of the Funds are maintained in U.S. dollars. Foreign currency amounts are translated into U.S. dollars at the current rate of exchange each business day to determine the value of investments, and other assets and liabilities. Purchases and sales of foreign securities, and income and expenses, are translated at the prevailing rate of exchange on the respective date of these transactions. The Funds do not isolate that portion of the results of operations resulting from changes in foreign exchange rates on investments from fluctuation arising from changes in market prices of securities held. These fluctuations are included with the net realized and unrealized gain or loss from investments and foreign currency transactions.
Certain of the Funds may be subject to equity price risk and foreign currency exchange risk in the normal course of pursuing their investment objectives. Certain of the Funds may invest in various financial instruments including positions in foreign currency contracts and written option contracts to gain exposure to or hedge against changes in the value of equities or foreign currencies. The following is a description of the derivative instruments utilized by the Funds, including the primary underlying risk exposure related to each instrument type.
Foreign Exchange Contracts—VA International Equity Fund, VA Real Strategies Fund and VA Situs Fund may enter into forward foreign exchange contracts. A forward foreign exchange contract involves an obligation to purchase or sell a specific currency at a future date at a price set at the time of the contract. Such contracts are used to sell unwanted currency exposure that comes with holding securities in a market, or to buy currency exposure where the exposure from holding securities is insufficient to provide the desired currency exposure. The contracts are marked-to-market daily and the change in market value is recorded as unrealized appreciation or depreciation. When a forward foreign currency contract is closed, a Fund records a realized gain or loss equal to the difference between the value at the time it was opened and the value at the time it was closed. These unrealized and realized gains and losses are reported on the Statement of Operations. The Funds could be exposed to risks if the counterparties to the contracts are unable to meet the terms of their contracts and from unanticipated movements in exchange rates. At December 31, 2010, International Equity Fund, VA Real Strategies Fund and VA Situs Fund did not have any forward foreign exchange contracts outstanding.
Written Options Contracts—Certain of the Funds may write options contracts for which premiums received are recorded as liabilities and are subsequently adjusted to the current value of the options written. Premiums received from writing options which expire are treated as realized gains. Premiums received from writing options which are either exercised or closed are offset against the proceeds received or amount paid on the transaction to determine realized gains or losses. Investing in written options contracts exposes a Fund to equity price risk.
The following is a summary of VA Growth Fund’s written option activity for the year ended December 31, 2010:
| | | | | | | | |
Contracts | | Number of Contracts | | | Premium | |
Outstanding at 12/31/2009 | | | 366 | | | $ | 45,847 | |
Options written | | | 708 | | | | 92,855 | |
Options expired | | | (174 | ) | | | (19,242 | ) |
Options closed | | | (541 | ) | | | (69,350 | ) |
Options exercised | | | (359 | ) | | | (50,110 | ) |
| | | | | | | | |
Outstanding at 12/31/2010 | | | — | | | $ | — | |
| | | | | | | | |
At December 31, 2010, VA Growth Fund had no outstanding options.
The following is a summary of VA Income Equity Fund’s written option activity for the year ended December 31, 2010:
| | | | | | | | |
Contracts | | Number of Contracts | | | Premium | |
Outstanding at 12/31/2009 | | | 130 | | | $ | 16,031 | |
Options written | | | 1,080 | | | | 44,756 | |
Options expired | | | (985 | ) | | | (38,340 | ) |
Options closed | | | (95 | ) | | | (6,416 | ) |
Options exercised | | | (130 | ) | | | (16,031 | ) |
| | | | | | | | |
Outstanding at 12/31/2010 | | | — | | | $ | — | |
| | | | | | | | |
Huntington Funds
Notes to Financial Statements (continued)
December 31, 2010
At December 31, 2010, VA Income Equity Fund had no outstanding options.
The following is a summary of VA New Economy Fund’s written option activity for the year ended December 31, 2010:
| | | | | | | | |
Contracts | | Number of Contracts | | | Premium | |
Outstanding at 12/31/2009 | | | 74 | | | $ | 19,347 | |
Options written | | | 4,492 | | | | 2,191,905 | |
Options expired | | | (91 | ) | | | (20,385 | ) |
Options closed | | | (4,238 | ) | | | (2,051,679 | ) |
Options exercised | | | (52 | ) | | | (23,944 | ) |
| | | | | | | | |
Outstanding at 12/31/2010 | | | 185 | | | $ | 115,244 | |
| | | | | | | | |
At December 31, 2010, VA New Economy Fund had the following outstanding options:
WRITTEN OPTION CONTRACTS
| | | | | | | | | | | | | | | | | | | | | | | | |
Contract | | Type | | | Expiration
Date | | | Exercise
Price | | | Number of
Contracts | | | Fair
Value | | | Unrealized
Appreciation
(Depreciation) | |
Agrium, Inc. | | | Call | | | | January 2011 | | | $ | 75 | | | | 27 | | | $ | 45,360 | | | $ | (24,920 | ) |
CF Industries Holdings | | | Call | | | | January 2011 | | | | 110 | | | | 27 | | | | 69,255 | | | | (39,637 | ) |
Cree, Inc. | | | Call | | | | January 2011 | | | | 65 | | | | 36 | | | | 13,500 | | | | 6,554 | |
Life Technologies | | | Call | | | | January 2011 | | | | 45 | | | | 22 | | | | 23,210 | | | | (10,296 | ) |
Molycorp | | | Put | | | | January 2011 | | | | 44 | | | | 20 | | | | 3,100 | | | | 891 | |
Netapp, Inc. | | | Call | | | | January 2011 | | | | 50 | | | | 15 | | | | 8,025 | | | | 555 | |
Riverbed Technology, Inc. | | | Call | | | | January 2011 | | | | 30 | | | | 38 | | | | 20,900 | | | | (1,253 | ) |
| | |
NET UNREALIZED DEPRECIATION ON WRITTEN OPTION CONTRACTS | | | $ | (68,106 | ) |
| | | | | | | | | | | | | | | | | | | | | | | | |
The following is a summary of VA Real Strategies Fund’s written option activity for the year ended December 31, 2010:
| | | | | | | | |
Contracts | | Number of Contracts | | | Premium | |
Outstanding at 12/31/2009 | | | 50 | | | $ | 6,416 | |
Options written | | | 959 | | | | 208,659 | |
Options expired | | | (211 | ) | | | (23,352 | ) |
Options closed | | | (606 | ) | | | (146,078 | ) |
Options exercised | | | (97 | ) | | | (22,895 | ) |
| | | | | | | | |
Outstanding at 12/31/2010 | | | 95 | | | $ | 22,750 | |
| | | | | | | | |
At December 31, 2010, VA Real Strategies Fund had the following outstanding options:
WRITTEN OPTION CONTRACTS
| | | | | | | | | | | | | | | | | | | | | | | | |
Contract | | Type | | | Expiration
Date | | | Exercise
Price | | | Number of
Contracts | | | Fair
Value | | | Unrealized
Appreciation
(Depreciation) | |
Arch Coal | | | Call | | | | January 2011 | | | $ | 29 | | | | 11 | | | $ | 6,765 | | | $ | (5,383 | ) |
Agrium, Inc. | | | Call | | | | January 2011 | | | | 70 | | | | 3 | | | | 6,615 | | | | (4,093 | ) |
Allegheny Technologies | | | Call | | | | January 2011 | | | | 53 | | | | 8 | | | | 2,880 | | | | (60 | ) |
Peabody Energy Corp. | | | Call | | | | January 2011 | | | | 60 | | | | 6 | | | | 2,700 | | | | (1,060 | ) |
Boston Properties, Inc. | | | Call | | | | January 2011 | | | | 90 | | | | 4 | | | | 170 | | | | 1,549 | |
Devon Energy Corp. | | | Put | | | | January 2011 | | | | 65 | | | | 8 | | | | 28 | | | | 4,725 | |
Molycorp | | | Put | | | | January 2011 | | | | 44 | | | | 15 | | | | 2,325 | | | | 668 | |
Marathon Oil Corp. | | | Call | | | | January 2011 | | | | 35 | | | | 9 | | | | 1,971 | | | | (1,026 | ) |
Petroleo Brasileiro SA | | | Put | | | | January 2011 | | | | 37 | | | | 6 | | | | 402 | | | | 2,014 | |
Tesoro Corp. | | | Call | | | | January 2011 | | | | 18 | | | | 15 | | | | 1,905 | | | | (1,210 | ) |
Valero Energy | | | Call | | | | January 2011 | | | | 20 | | | | 10 | | | | 3,175 | | | | (2,310 | ) |
| | |
NET UNREALIZED DEPRECIATION ON WRITTEN OPTION CONTRACTS | | | $ | (6,186 | ) |
| | | | | | | | | | | | | | | | | | | | | | | | |
H U N T I N G T O N F U N D S
Huntington Funds
Notes to Financial Statements (continued)
December 31, 2010
The following is a summary of VA Situs Fund’s written option activity for the year ended December 31, 2010:
| | | | | | | | |
Contracts | | Number of Contracts | | | Premium | |
Outstanding at 12/31/2009 | | | — | | | $ | — | |
Options written | | | 744 | | | | 226,379 | |
Options expired | | | (254 | ) | | | (72,603 | ) |
Options closed | | | (80 | ) | | | (22,959 | ) |
Options exercised | | | (410 | ) | | | (130,817 | ) |
| | | | | | | | |
Outstanding at 12/31/2010 | | | — | | | $ | — | |
| | | | | | | | |
At December 31, 2010, VA Situs Fund had no outstanding options.
The following tables provide a summary of the fair value of derivative instruments, not accounted for as hedging instruments as of December 31, 2010, and the effect of derivative instruments on the Statement of Operations for the year ended December 31, 2010.
The fair value of Derivative Instruments as of December 31, 2010 is as follows:
| | | | | | | | | | | | | | | | |
| | | Asset Derivatives | | | Liability Derivatives | | | | | | | |
Primary Risk Exposure | | Statements of Assets and
Liabilities Location | | | Statements of Assets and
Liabilities Location | | | Fund | | | Fair Value | |
Equity Contracts | | | | | | | Options Written, at value | | | | VA New Economy Fund | | | $ | 183,350 | |
| | | | | | | | | | | VA Real Strategies Fund | | | | 28,936 | |
| | | Investments, at value | | | | | | | | VA New Economy Fund | | | | 121,375 | |
The effect of Derivative Instruments on the Statements of Operations for the year ended December 31, 2010 is as follows:
| | | | | | | | | | | | | | | | |
Primary Risk Exposure | | Location of Gain (Loss) on Derivatives Recognized in Income | | Fund | | Realized Gain (Loss)
on Derivatives
Recognized in Income | | | Change in Unrealized
Appreciation/Depreciation
on Derivatives Recognized
in Income | | | Gross Notional
Amount
Outstanding
as of
December 31,
2010 | |
Equity Contracts | | Net Realized gain (loss) on option transactions/net change in unrealized appreciation/depreciation of investments and options | | VA Growth Fund
VA Income Equity Fund
VA New Economy Fund
VA Real Strategies Fund
VA Situs Fund | | $
| (9,582
15,397 (708,712 (15,671 90,683 | )
) ) | | $
| 37,243
(2,031 (68,670 (5,696 — |
) ) ) | | $
| —
— 4,884,500 386,000 — |
|
The gross notional amount of options outstanding (both purchased and written) is indicative of the volume of each Fund’s derivative activity for the year ended December 31, 2010.
Derivative positions during the period and at period end are reflected for each Fund in the tables presented above. The volume of these positions relative to each Fund’s net assets at the close of the reporting period is generally higher than the volume of such positions at the beginning of the reporting period. The Funds value derivative instruments at fair value and recognize changes in fair value currently in the results on operations.
To generate additional income, the Funds may lend a certain percentage of their total assets, to the extent permitted by the 1940 Act or the rules or regulations thereunder, on a short-term basis to certain brokers, dealers or other financial institutions. In determining whether to lend to a particular broker, dealer or financial institution, the Advisor will consider all relevant facts and circumstances, including the size, creditworthiness and reputation of the borrower. Any loans made will be continuously secured by collateral in cash at least equal to 100% of the value of the securities on loan for the Funds based on the prior day’s closing price. The Funds receive payments from borrowers equivalent to the dividends and interest that would have been earned on securities on loan. In addition, the Funds retain all or a portion of the interest received on investment of collateral or receive a fee from the borrower. Collateral is marked-to-market daily. One of the risks in lending portfolio securities, as with other extensions of credit, is the possible delay in recovery of the securities or possible loss of rights in the collateral should the borrower fail financially. Although the loan is fully collateralized, if a borrower defaults, a Fund could lose money. There is also the risk that, when lending portfolio securities, the securities may not be available to a Fund on a timely basis and a Fund may, therefore, lose the opportunity to sell the securities at a desirable price. In addition, in the event that a borrower of securities would file for bankruptcy or become insolvent, disposition of the securities may be delayed pending court action. Loans are subject to termination by
Huntington Funds
Notes to Financial Statements (continued)
December 31, 2010
the Funds or the borrower at any time and, therefore, are not considered to be illiquid investments. Brown Brothers Harriman (“BBH”) serves as the sub-custodian for the securities lending program. BBH retains a portion of the earnings from the investment and reinvestment of cash collateral and a portion of any loan fees paid by borrowing with respect to securities loans.
As of December 31, 2010, the Funds did not have securities on loan.
| G. | Security Transactions and Related Income |
During the period, investment transactions are accounted for no later than the first calculation of the NAV on the business day following the trade date. For financial reporting purposes, however, security transactions are accounted for on trade date on the last business day of the reporting period. Discounts and premiums on securities purchased are amortized over the lives of the respective securities. Securities gains and losses are calculated on the identified cost basis. Interest income and expenses are accrued daily. Dividends, less foreign tax withholding (if any), are recorded on the ex-dividend date.
| H. | Dividends and Distributions to Shareholders |
Dividends from net investment income, if any, are declared and paid annually for the Funds. Net realized capital gains, if any, are distributed at least annually. The amount of dividends from net investment income and net realized gains are determined in accordance with the federal income tax regulations, which may differ from GAAP. These “book/tax” differences are either considered temporary or permanent in nature. To the extent these differences are permanent in nature (e.g. foreign currency gain/loss, paydowns, distributions and income received from pass through investments), such amounts are reclassified within the capital accounts based on their nature for federal income tax purposes; temporary differences do not require reclassification. Temporary differences are primarily due to market discounts, capital loss carryforwards and losses deferred due to wash sales.
Certain of the Funds may own shares of real estate investment trusts (“REITs”) which report information on the source of their distributions annually. Distributions received from investments in REITs in excess of income from underlying investments are recorded as realized gain and/or as a reduction to the cost of the individual REIT.
Expenses directly attributable to a Fund are charged to that Fund. Expenses not directly attributable to a Fund are allocated proportionally among various Funds or all Funds within the Trust in relation to the net assets of each Fund or on another reasonable basis.
It is the policy of each Fund to qualify or continue to qualify as a regulated investment company by complying with the provisions available to certain investment companies, as defined in applicable sections of the Internal Revenue Code, and to make distributions of net investment income and net realized capital gains sufficient to relieve it from all, or substantially all, federal income taxes. In addition to complying with the federal tax requirements applicable to regulated investment companies, the Funds also plan to comply with certain diversification standards applicable to underlying assets of variable annuity contracts in order to avoid taxation on the variable contract owners with respect to earnings allocable to the contract from investments in the Funds.
Withholding taxes on foreign interest, dividends and capital gains with respect to VA Dividend Capture Fund, VA Growth Fund, VA Income Equity Fund, VA International Equity Fund, VA Mid Corp America Fund, VA New Economy Fund, VA Real Strategies Fund, VA Situs Fund and VA Mortgage Securities Fund have been provided for in accordance with each applicable country’s tax rules and rates.
As of December 31, 2010, the tax cost of securities and the breakdown of unrealized appreciation (depreciation) for each Fund was as follows:
| | | | | | | | | | | | | | | | |
Fund | | Tax Cost of
Securities | | | Unrealized
Appreciation | | | Unrealized
Depreciation | | | Net Unrealized
Appreciation/
(Depreciation)* | |
VA Balanced Fund | | $ | 24,818,589 | | | $ | 2,050,824 | | | $ | (81,993 | ) | | $ | 1,968,831 | |
VA Dividend Capture Fund | | | 30,783,378 | | | | 3,147,055 | | | | (278,966 | ) | | | 2,868,089 | |
VA Growth Fund | | | 17,028,857 | | | | 2,023,929 | | | | (342,076 | ) | | | 1,681,853 | |
VA Income Equity Fund | | | 20,270,314 | | | | 1,981,780 | | | | (481,580 | ) | | | 1,500,200 | |
VA International Equity Fund | | | 19,372,280 | | | | 3,928,296 | | | | (853,044 | ) | | | 3,075,252 | |
VA Macro 100 Fund | | | 5,853,035 | | | | 1,034,127 | | | | (279,602 | ) | | | 754,525 | |
VA Mid Corp America Fund | | | 12,480,514 | | | | 7,899,999 | | | | (69,592 | ) | | | 7,830,407 | |
H U N T I N G T O N F U N D S
Huntington Funds
Notes to Financial Statements (continued)
December 31, 2010
| | | | | | | | | | | | | | | | |
Fund | | Tax Cost of
Securities | | | Unrealized
Appreciation | | | Unrealized
Depreciation | | | Net Unrealized
Appreciation/
(Depreciation)* | |
VA New Economy Fund | | $ | 11,181,110 | | | $ | 1,790,327 | | | $ | (300,379 | ) | | $ | 1,489,948 | |
VA Real Strategies Fund | | | 2,469,830 | | | | 588,735 | | | | (56,539 | ) | | | 532,196 | |
VA Rotating Markets Fund | | | 6,186,465 | | | | 763,595 | | | | (1,926 | ) | | | 761,669 | |
VA Situs Fund | | | 18,973,700 | | | | 6,493,170 | | | | (1,735,892 | ) | | | 4,757,278 | |
VA Mortgage Securities Fund | | | 16,819,631 | | | | 565,153 | | | | (141,551 | ) | | | 423,602 | |
| | * | The differences between the book-basis unrealized appreciation/(depreciation) are attributable primarily to: tax deferral of losses on wash sales, the differences between book and tax amortization methods for premium and market discount, differences related to partnership investments, the realization for tax purposes of unrealized gains/losses on investments in passive foreign investment companies and the return of capital adjustments from real estate investment trusts. |
As of December 31, 2010, for federal income tax purposes, the following Funds had capital loss carryforwards available to offset future gains if any, to the extent provided by the Treasury regulations:
| | | | | | | | |
Fund | | Amount | | | Expires | |
VA Dividend Capture Fund | | $ | 3,223,609 | | | | 2016 | |
VA Dividend Capture Fund | | $ | 10,379,593 | | | | 2017 | |
VA Growth Fund | | $ | 268,401 | | | | 2016 | |
VA Growth Fund | | $ | 2,008,824 | | | | 2017 | |
VA Income Equity Fund | | $ | 1,255,286 | | | | 2016 | |
VA Income Equity Fund | | $ | 4,884,104 | | | | 2017 | |
VA International Equity Fund | | $ | 226,000 | | | | 2016 | |
VA International Equity Fund | | $ | 1,984,700 | | | | 2017 | |
VA International Equity Fund | | $ | 563,899 | | | | 2018 | |
VA Macro 100 Fund | | $ | 1,759,976 | | | | 2016 | |
VA Macro 100 Fund | | $ | 436,650 | | | | 2017 | |
VA Macro 100 Fund | | $ | 494,288 | | | | 2018 | |
VA Mid Corp America Fund | | $ | 1,074,905 | | | | 2017 | |
VA New Economy Fund | | $ | 3,531,313 | | | | 2017 | |
VA Real Strategies Fund | | $ | 15,905 | | | | 2016 | |
VA Real Strategies Fund | | $ | 46,457 | | | | 2017 | |
VA Rotating Markets Fund | | $ | 984,512 | | | | 2017 | |
VA Situs Fund | | $ | 157,155 | | | | 2016 | |
VA Situs Fund | | $ | 1,862,604 | | | | 2017 | |
VA Situs Fund | | $ | 92,594 | | | | 2018 | |
VA Mortgage Securities Fund | | $ | 100,360 | | | | 2016 | |
VA Mortgage Securities Fund | | $ | 90,146 | | | | 2017 | |
VA Mortgage Securities Fund | | $ | 19,982 | | | | 2018 | |
During the year ended December 31, 2010, VA Balanced Fund, VA Dividend Capture Fund, VA Growth Fund, VA Income Equity Fund, VA Mid Corp America Fund, VA New Economy Fund, VA Real Strategies Fund and VA Rotating Markets Fund utilized $9,565, $877,704, $1,890,401, $1,518,929, $711,912, $270,399, $8,022 and $389,123 respectively, in capital loss carryforwards.
The tax character of distributions paid during the fiscal year ended December 31, 2010, was as follows:
| | | | | | | | | | | | | | | | | | | | |
| | | Distributions Paid From* | | | | | | | | | | |
Fund | | Ordinary
Income | | | Net Long Term
Capital Gains | | | Total Taxable
Distributions | | | Tax Return
of Capital | | | Total
Distributions
Paid | |
VA Balanced Fund | | $ | 21,245 | | | $ | — | | | $ | 21,245 | | | $ | — | | | $ | 21,245 | |
VA Dividend Capture Fund | | | 1,386,649 | | | | — | | | | 1,386,649 | | | | — | | | | 1,386,649 | |
VA Growth Fund | | | 24,485 | | | | — | | | | 24,485 | | | | — | | | | 24,485 | |
VA Income Equity Fund | | | 573,537 | | | | — | | | | 573,537 | | | | — | | | | 573,537 | |
VA International Equity Fund | | | 244,844 | | | | — | | | | 244,844 | | | | — | | | | 244,844 | |
VA Macro 100 Fund | | | 50,145 | | | | — | | | | 50,145 | | | | — | | | | 50,145 | |
VA Mid Corp America Fund | | | 123,644 | | | | — | | | | 123,644 | | | | — | | | | 123,644 | |
VA New Economy Fund | | | 11,498 | | | | — | | | | 11,498 | | | | — | | | | 11,498 | |
VA Real Strategies Fund | | | 5,230 | | | | — | | | | 5,230 | | | | — | | | | 5,230 | |
VA Rotating Markets Fund | | | 73,676 | | | | — | | | | 73,676 | | | | — | | | | 73,676 | |
Huntington Funds
Notes to Financial Statements (continued)
December 31, 2010
| | | | | | | | | | | | | | | | | | | | |
| | | Distributions Paid From* | | | | | | | | | | |
Fund | | Ordinary
Income | | | Net Long Term
Capital Gains | | | Total Taxable
Distributions | | | Tax Return
of Capital | | | Total
Distributions
Paid | |
VA Situs Fund | | $ | 83,106 | | | $ | — | | | $ | 83,106 | | | $ | — | | | $ | 83,106 | |
VA Mortgage Securities Fund | | | 316,096 | | | | — | | | | 316,096 | | | | — | | | | 316,096 | |
| | * | The tax character of distributions paid may differ from the character of distributions shown on the statements of changes in net assets due to short-term capital gains being treated as ordinary income for tax purposes. |
The tax character of distributions paid during the fiscal year ended December 31, 2009, was as follows:
| | | | | | | | | | | | |
| | | Distributions Paid From* | | | | |
Fund | | Ordinary
Income | | | Net Long Term
Capital Gains | | | Total Taxable
Distributions | |
VA Balanced Fund | | $ | 3,995 | | | $ | — | | | $ | 3,995 | |
VA International Equity Fund | | | 6,126 | | | | — | | | | 6,126 | |
| | * | The tax character of distributions paid may differ from the character of distributions shown on the statements of changes in net assets due to short-term capital gains being treated as ordinary income for tax purposes. |
As of December 31, 2010, the components of accumulated earnings (deficit) on a tax basis were as follows:
| | | | | | | | | | | | | | | | | | | | | | | | |
Fund | | Undistributed
Ordinary Income | | | Undistributed
Long-Term
Capital Gains | | | Accumulated
Earnings | | | Accumulated
Capital and
Other Losses | | | Unrealized
Appreciation
(Depreciation)* | | | Total
Accumulated
Earnings
(Deficit) | |
VA Balanced Fund | | $ | 355,694 | | | $ | 1,631 | | | $ | 357,325 | | | $ | — | | | $ | 1,968,831 | | | $ | 2,326,156 | |
VA Dividend Capture Fund | | | 1,160,345 | | | | — | | | | 1,160,345 | | | | (13,603,202 | ) | | | 2,868,089 | | | | (9,574,768 | ) |
VA Growth Fund | | | 27,473 | | | | — | | | | 27,473 | | | | (2,277,286 | ) | | | 1,681,853 | | | | (567,960 | ) |
VA Income Equity Fund | | | 583,638 | | | | — | | | | 583,638 | | | | (6,139,391 | ) | | | 1,500,200 | | | | (4,055,553 | ) |
VA International Equity Fund | | | 323,696 | | | | — | | | | 323,696 | | | | (2,776,853 | ) | | | 3,076,714 | | | | 623,557 | |
VA Macro 100 Fund | | | 35,121 | | | | — | | | | 35,121 | | | | (2,696,514 | ) | | | 754,525 | | | | (1,906,868 | ) |
VA Mid Corp America Fund | | | 77,366 | | | | — | | | | 77,366 | | | | (1,074,907 | ) | | | 7,830,407 | | | | 6,832,866 | |
VA New Economy Fund | | | — | | | | — | | | | — | | | | (3,569,167 | ) | | | 1,489,948 | | | | (2,079,219 | ) |
VA Real Strategies Fund | | | 7,538 | | | | — | | | | 7,538 | | | | (67,554 | ) | | | 532,196 | | | | 472,180 | |
VA Rotating Markets Fund | | | 21,470 | | | | — | | | | 21,470 | | | | (984,512 | ) | | | 761,669 | | | | (201,373 | ) |
VA Situs Fund | | | 10,156 | | | | — | | | | 10,156 | | | | (2,153,643 | ) | | | 4,757,297 | | | | 2,613,810 | |
VA Mortgage Securities Fund | | | 388,141 | | | | — | | | | 388,141 | | | | (224,457 | ) | | | 423,602 | | | | 587,286 | |
| | * | The differences between the book-basis unrealized appreciation (depreciation) are attributable primarily to: tax deferral of losses on wash sales, the differences between book and tax amortization methods for premium and market discount, and the return between book and tax amortization methods for premium and market discount, and the return of capital adjustments from real estate investment trusts. |
Net capital losses incurred after October 31 and within the taxable year are deemed to arise of the first business day of the Funds' next taxable year. For the year ended December 31, 2010, the Fund deferred post-October capital losses and post-October currency losses as follows:
| | | | | | | | |
Fund | | Capital
Losses | | | Currency
Losses | |
VA Growth Fund | | $ | — | | | $ | 60 | |
VA Income Equity Fund | | | — | | | | 1 | |
VA International Equity Fund | | | — | | | | 2,253 | |
VA Macro 100 Fund | | | 5,601 | | | | — | |
VA Real Strategies Fund | | | 1,694 | | | | — | |
VA Situs Fund | | | 41,289 | | | | — | |
VA Mortgage Securities Fund | | | 13,969 | | | | — | |
Management of the Funds has reviewed tax positions taken in tax years that remain subject to examination by all major tax jurisdictions, including federal (i.e., the last four tax year ends and the interim tax period since then). Management believes there is no tax liability resulting from unrecognized tax benefits related to uncertain tax positions taken.
The Regulated Investment Company Modernization Act of 2010 (the ‘‘Act’’) was enacted on December 22, 2010. The Act makes changes to several tax rules impacting the Funds. In general, the provisions of the Act will be effective for the Funds’ fiscal year
H U N T I N G T O N F U N D S
Huntington Funds
Notes to Financial Statements (continued)
December 31, 2010
ending December 31, 2011. Although the Act provides several benefits, including the unlimited carryover of future capital losses, there may be a greater likelihood that all or a portion of each fund’s pre-enactment capital loss carryovers may expire without being utilized due to the fact that post-enactment capital losses get utilized before pre-enactment capital loss carryovers. Relevant information regarding the impact of the Act on the Fund, if any, will be contained within the ‘‘Federal Taxes’’ section of the financial statement notes for the fiscal year ending December 31, 2011.
| (3) | Investment Advisory Fee and Other Transactions with Affiliates |
Investment Advisory Fee—Huntington Asset Advisors, Inc. (the “Advisor”), a subsidiary of The Huntington National Bank (“Huntington”), serves as the Funds’ investment advisor. The Advisor receives a fee for its services, computed daily and paid monthly, at an annual rate of 0.60% of the average daily net assets of each Fund, except for VA Balanced Fund, for which the Advisor receives a fee, computed daily and paid monthly, at an annual rate of 0.10% of the average daily net assets of the VA Balanced Fund.
The Advisor has agreed to contractually waive all or a portion of its investment advisory fee for VA Balanced Fund (based on average daily net assets) to which it is otherwise entitled and/or to reimburse certain operating expenses of VA Balanced Fund in order to limit the total direct net annual operating expenses to not more than 0.10% of the average daily net assets of VA Balanced Fund through April 30, 2011. Huntington and the Advisor may also pay out of their reasonable profits and other resources (including those of their affiliates) advertising, marketing, and other expenses for the benefit of the Funds.
Consulting Fee—Laffer Investments, Inc. acts as a consultant (the “Consultant”) to the Advisor for VA Macro 100 Fund. The Advisor pays the Consultant a fee for its services. Neither the Trust nor VA Macro 100 Fund is liable for payment of this fee.
Administrative and Financial Administration Fees—Huntington is the Administrator to the Trust, and Huntington Asset Services, Inc. (“HASI”), an affiliate of Huntington, is the Sub-Administrator. Prior to September 1, 2010, Citi Fund Services Ohio, Inc. was the Sub-Administrator. As Administrator, Huntington provides the Funds with certain administrative services. As Sub-Administrator, HASI provides the Funds with certain administrative personnel, and generally assists with the provision of administrative services necessary to operate the Funds. The Administrator pays the Sub-Administrator a fee for the services it provides to the Trust. Huntington also provides portfolio accounting services to the Funds. Huntington has sub-contracted certain fund accounting services to HASI. HASI is paid directly by Huntington, not the Funds, for these services. The fees paid for administrative, sub-administrative, financial administrative and sub-financial administrative services are based on the level of average net assets of each Fund for the period, subject to minimum fees in certain circumstances.
Huntington provides administrative and financial administration and accounting services at the following annual rate on a tiered basis:
| | |
Maximum Administrative Fee | | Average Daily Net Assets of the Trust |
0.1822% | | On the first $4 billion |
0.1650% | | On the next $2 billion |
0.1575% | | On the next $2 billion |
0.1450% | | On assets in excess of $8 billion |
There is no minimum annual fee per fund or class of shares.
Transfer and Dividend Disbursing Agent Fees and Expenses—HASI is the transfer and dividend disbursing agent for the Funds. For its services, HASI receives a yearly fixed amount per shareholder account, subject to a yearly minimum of $6,000 for each of the Funds. HASI is also entitled to receive additional amounts that may be activity or time-based charges, plus reimbursement for out-of-pocket expenses.
Custodian Fees—Huntington serves as custodian for each of the Funds. Brown Brothers Harriman serves as sub-custodian for VA International Equity Fund’s, VA Real Strategies Fund’s and VA Situs Fund’s foreign assets. Huntington and Brown Brothers Harriman receive fees based on the level of a Fund’s average daily net assets for the period, plus out-of-pocket expenses.
Compliance Services—The Trust has contracted with Huntington to provide a Chief Compliance Officer to the Trust, for which it pays Huntington $125,000 annually.
General—Certain officers of the Trust are Officers and/or Directors or Trustees of the above companies.
Pursuant to an exemptive order issued by the Securities and Exchange Commission, the Funds may invest in a certain affiliated money market fund which is managed by the Advisor. Income distributions earned from investments in this fund are recorded as
Huntington Funds
Notes to Financial Statements (continued)
December 31, 2010
income from affiliates in the accompanying financial statements. A summary of each Fund’s investment in such affiliated money market fund (Huntington Money Market Fund) is set forth below:
| | | | | | | | | | | | | | | | | | | | |
Fund | | 12/31/09
Market Value | | | Purchases | | | Sales | | | 12/31/10
Market Value | | | Income | |
VA Dividend Capture Fund | | $ | 850,721 | | | $ | 9,246,566 | | | $ | (9,937,145 | ) | | $ | 160,142 | | | $ | 50 | |
VA Growth Fund | | | 1,818,207 | | | | 22,959,570 | | | | (23,855,536 | ) | | | 922,241 | | | | 161 | |
VA Income Equity Fund | | | 354,364 | | | | 5,066,033 | | | | (4,732,482 | ) | | | 687,915 | | | | 33 | |
VA International Equity Fund | | | 896,597 | | | | 9,109,371 | | | | (9,165,815 | ) | | | 840,153 | | | | 136 | |
VA Macro 100 Fund | | | 261,103 | | | | 2,046,614 | | | | (1,768,664 | ) | | | 539,053 | | | | 42 | |
VA Mid Corp America Fund | | | 866,180 | | | | 5,684,698 | | | | (5,640,656 | ) | | | 910,222 | | | | 91 | |
VA New Economy Fund | | | 1,261,950 | | | | 15,050,686 | | | | (15,847,037 | ) | | | 465,599 | | | | 90 | |
VA Real Strategies Fund | | | 229,580 | | | | 1,258,108 | | | | (1,255,836 | ) | | | 231,852 | | | | 35 | |
VA Rotating Markets Fund | | | 389,619 | | | | 2,167,791 | | | | (2,359,085 | ) | | | 198,325 | | | | 40 | |
VA Situs Fund | | | 1,709,035 | | | | 5,986,483 | | | | (7,452,148 | ) | | | 243,370 | | | | 80 | |
VA Mortgage Securities Fund | | | 551,476 | | | | 10,476,314 | | | | (10,356,887 | ) | | | 670,903 | | | | 81 | |
Additionally, VA Balanced Fund invests in other funds within the Trust. A summary of the VA Balanced Fund’s investments in these affiliated funds is set forth below:
| | | | | | | | | | | | | | | | | | | | |
VA Balanced Fund | | 12/31/09
Market Value | | | Purchases | | | Sales | | | 12/31/10
Market Value | | | Income | |
Huntington Money Market Fund | | $ | 47,374 | | | $ | 10,721,644 | | | $ | (10,223,090 | ) | | $ | 545,928 | | | $ | 44 | |
Huntington Fixed Income Securities Fund | | | 2,115,777 | | | | 7,476,686 | | | | (1,165,297 | ) | | | 8,466,869 | | | | 190,155 | |
VA Dividend Capture Fund | | | 267,237 | | | | 789,017 | | | | (61,375 | ) | | | 1,068,169 | | | | 35,693 | |
VA Growth Fund | | | 1,200,674 | | | | 3,633,923 | | | | (478,931 | ) | | | 4,809,200 | | | | 5,455 | |
VA Income Equity Fund | | | 798,198 | | | | 2,377,575 | | | | (211,593 | ) | | | 3,205,326 | | | | 69,042 | |
VA International Equity Fund | | | 668,221 | | | | 2,011,868 | | | | (247,164 | ) | | | 2,687,250 | | | | 25,573 | |
VA Macro 100 Fund | | | 332,562 | | | | 952,023 | | | | (93,143 | ) | | | 1,330,993 | | | | 9,095 | |
VA Mid Corp America Fund | | | 265,754 | | | | 768,412 | | | | (135,094 | ) | | | 1,062,960 | | | | 5,678 | |
VA New Economy Fund | | | 299,676 | | | | 935,157 | | | | (177,232 | ) | | | 1,200,180 | | | | 927 | |
VA Situs Fund | | | 165,752 | | | | 477,059 | | | | (114,043 | ) | | | 666,228 | | | | 2,284 | |
VA Mortgage Securities Fund | | | 436,045 | | | | 1,415,911 | | | | (117,986 | ) | | | 1,744,317 | | | | 28,270 | |
| (4) | VA Balanced Fund, VA Real Strategies Fund and VA Rotating Markets Fund Structure |
The VA Balanced Fund, VA Real Strategies Fund and VA Rotating Markets Fund (“Investing Funds”), in accordance with their prospectuses, seek to achieve their investment objectives by investing in other investment companies (“Underlying Funds”) with similar investment objectives. As a result, investors in the Investing Funds incur expenses of both the Investing Funds and Underlying Funds, including transaction costs related to the purchases and sales of Underlying Fund shares.
| (5) | Investment Transactions |
Purchases and sales of investments, excluding short-term securities, for the fiscal year ended December 31, 2010, were as follows:
| | | | | | | | |
Fund | | Purchases | | | Sales | |
VA Balanced Fund | | $ | 20,837,630 | | | $ | 2,801,858 | |
VA Dividend Capture Fund | | | 38,706,610 | | | | 40,306,497 | |
VA Growth Fund | | | 51,661,305 | | | | 48,938,567 | |
VA Income Equity Fund | | | 21,590,321 | | | | 22,511,192 | |
VA International Equity Fund | | | 10,608,014 | | | | 6,066,388 | |
VA Macro 100 Fund | | | 1,653,816 | | | | 1,591,413 | |
VA Mid Corp America Fund | | | 3,758,293 | | | | 5,944,961 | |
VA New Economy Fund | | | 27,494,712 | | | | 28,062,225 | |
VA Real Strategies Fund | | | 1,850,431 | | | | 381,902 | |
VA Rotating Markets Fund | | | 15,626,211 | | | | 15,391,786 | |
VA Situs Fund | | | 6,656,921 | | | | 3,565,837 | |
VA Mortgage Securities Fund | | | 10,059,763 | | | | 381,054 | |
Purchases and sales of long-term U.S. government securities for the fiscal year ended December 31, 2010 were as follows:
| | | | | | | | |
Fund | | Purchases | | | Sales | |
VA Mortgage Securities Fund | | $ | 9,060,023 | | | $ | 292,934 | |
H U N T I N G T O N F U N D S
Huntington Funds
Notes to Financial Statements (continued)
December 31, 2010
| (6) | Foreign Investment Risk |
Compared with investing in the United States, investing in foreign markets involves a greater degree and variety of risk. Investors in international or foreign markets may face delayed settlements, currency controls and adverse economic developments as well as higher overall transaction costs. In addition, fluctuations in the U.S. dollar’s value versus other currencies may erode or reverse gains from investments denominated in foreign currencies or widen losses. Foreign governments may expropriate assets, impose capital or currency controls, impose punitive taxes, impose limits on ownership or nationalize a company or industry. Any of these actions could have a sever effect on security prices and impair the Fund’s ability to bring its capital or income back to the U.S. Exchange rate. Fluctuations also may impair an issuer’s ability to repay U.S. dollar denominated debt, thereby increasing credit risk of such debt. Finally, the value of foreign securities may be affected by incomplete, less frequent or inaccurate financial information about their issuers, social upheavals or political actions ranging from tax code changes to government collapse. Foreign companies may also receive less coverage than U.S. companies by market analysts and financial reporting standards or regulatory requirements comparable to those applicable to U.S. companies.
| (7) | Other Tax Information (unaudited) |
For the year ended December 31, 2010, certain dividends paid by the Funds may be subject to a maximum tax rate of 15% as provided for by the Jobs and Growth Tax Relief Reconciliation Act of 2003. The Funds intend to designate the maximum amount allowable as taxed at a maximum rate of 15%. Complete information will be reported in conjunction with your 2010 Form 1099-DIV.
For the year ended December 31, 2010, the following Funds paid qualified dividend income:
| | | | |
Fund | | Qualified
Dividend
Income | |
VA Growth Fund | | | 86 | % |
VA Mid Corp America Fund | | | 97 | % |
VA New Economy Fund | | | 88 | % |
VA Situs Fund | | | 65 | % |
For the taxable year ended December 31, 2010, the following percentage of ordinary income dividends paid by the Funds qualify for the dividends received deduction available to corporations:
| | | | |
Fund | | Dividends
Deduction
Received | |
VA Growth Fund | | | 100 | % |
VA International Equity Fund | | | 10 | % |
VA Macro 100 Fund | | | 100 | % |
VA Mid Corp America Fund | | | 100 | % |
VA New Economy Fund | | | 100 | % |
VA Situs Fund | | | 100 | % |
The VA International Equity Fund intends to elect to pass through to shareholders the income tax credit for taxes paid to foreign countries. Foreign source income and foreign tax expense per outstanding shares on December 31, 2010 are as follows:
| | | | | | | | |
| | | Foreign
Source
Income | | | Foreign
Tax
Expense | |
VA International Equity Fund | | $ | 0.30 | | | $ | 0.02 | |
The pass-through of the foreign tax credit will only affect those persons who are shareholders on the dividend record date in December 2010. These shareholders will receive more detailed information along with their 2010, Form 1099-DIV.
Huntington Funds
Report of Independent Registered Public Accounting Firm
The Board of Trustees and Shareholders of The Huntington Funds:
We have audited the accompanying statements of assets and liabilities of the Huntington VA Balanced Fund, Huntington VA Dividend Capture Fund, Huntington VA Growth Fund, Huntington VA Income Equity Fund, Huntington VA International Equity Fund, Huntington VA Macro 100 Fund, Huntington VA Mid Corp America Fund, Huntington VA New Economy Fund, Huntington VA Real Strategies Fund, Huntington VA Rotating Markets Fund, Huntington VA Situs Fund, and Huntington VA Mortgage Securities Fund (twelve of the portfolios constituting The Huntington Funds, collectively referred to as the “Funds”), including the portfolios of investments, as of December 31, 2010, and the related statements of operations for the year then ended, and the statements of changes in net assets and the financial highlights for each of the periods indicated therein. These financial statements and financial highlights are the responsibility of the Funds’ management. Our responsibility is to express an opinion on these financial statements and financial highlights based on our audits.
We conducted our audits in accordance with the standards of the Public Company Accounting Oversight Board (United States). Those standards require that we plan and perform the audit to obtain reasonable assurance about whether the financial statements and financial highlights are free of material misstatement. We were not engaged to perform an audit of the Funds’ internal control over financial reporting. Our audits included consideration of internal control over financial reporting as a basis for designing audit procedures that are appropriate in the circumstances, but not for the purpose of expressing an opinion on the effectiveness of the Funds’ internal control over financial reporting. Accordingly, we express no such opinion. An audit also includes examining, on a test basis, evidence supporting the amounts and disclosures in the financial statements and financial highlights, assessing the accounting principles used and significant estimates made by management, and evaluating the overall financial statement presentation. Our procedures included confirmation of securities owned as of December 31, 2010, by correspondence with the custodian and brokers or by other appropriate auditing procedures where replies from brokers were not received. We believe that our audits provide a reasonable basis for our opinion.
In our opinion, the financial statements and financial highlights referred to above present fairly, in all material respects, the financial position of each of The Huntington Funds identified above at December 31, 2010, the results of their operations for the year then ended, and the changes in their net assets and the financial highlights for each of the periods indicated therein, in conformity with U.S. generally accepted accounting principles.

Columbus, Ohio
February 15, 2011
H U N T I N G T O N F U N D S
Huntington Funds
Board of Trustees and Trust Officers (Unaudited)
The following tables give information about Independent Trustees (Trustees who are not “interested persons” of the Trust, as defined in the 1940 Act), Interested Trustees (Trustees who are “interested persons” of the Trust, as defined in the 1940 Act) and the senior officers of the Trust. Each Trustee oversees all portfolios of the Trust and serves for an indefinite term (subject to mandatory retirement provisions). Unless otherwise noted, the business address of each person listed below is 2960 North Meridian Street, Suite 300, Indianapolis, IN 46208. Attention: Huntington Trust Officer. Unless otherwise noted, each officer is elected annually. The Huntington Funds consists of 36 portfolios. Each Trustee serves as Trustee for all portfolios of The Huntington Funds. The Funds’ Statement of Additional Information includes additional information about The Huntington Funds’ Trustees and is available, without charge and upon request, by calling 1-800-253-0412.
INTERESTED TRUSTEES’ BACKGROUND
| | |
Name
Age
Positions Held with Trust
Date Service Began | | Principal Occupation(s) for Past Five Years, Other Directorships Held and Previous Position(s) |
B. Randolph Bateman* Age: 61 PRESIDENT AND TRUSTEE Began Serving: February 2008 | | Principal Occupations: President and Chief Investment Officer, Huntington Asset Advisors, Inc. (February 2001 to present); Chief Investment Officer, The Huntington National Bank (October 2000 to present). Previous Positions: Senior Vice President, Star Bank (June 1988 to October 2000). Other Directorships Held: Board Member, The Huntington Strategy Shares |
Thomas J. Westerfield** Age: 55 TRUSTEE Began serving: January 2001 | | Principal Occupation: Since August 2005, of Counsel, Dinsmore & Shohl LLP (law firm). Previous Position: From 1993 to 2005, of Counsel, Cors & Bassett LLC (law firm). Other Directorships Held: Board Member, The Huntington Strategy Shares |
| * | B. Randolph Bateman has been deemed an Interested Trustee due to the positions he holds with The Huntington National Bank and its subsidiaries. |
| ** | Thomas J. Westerfield has been deemed an Interested Trustee due to the position he holds with Dinsmore & Shohl LLP, which may be retained to provide legal services to Huntington. |
INDEPENDENT TRUSTEES’ BACKGROUND
| | |
Name
Age
Positions Held with Trust
Date Service Began | | Principal Occupation(s) for Past Five Years, Other Directorships Held and Previous Position(s) |
David S. Schoedinger* Age: 68 CHAIRMAN OF THE BOARD AND TRUSTEE Began serving: June 1990 | | Principal Occupation: Since 1965, Chairman of the Board and Funeral Director, Schoedinger Funeral Service. Since 1987, CEO, Schoedinger Financial Services, Inc. Previous Position: From 1992 to 1993, President, Board of Directors of National Selected Morticians (national trade association for morticians). Other Directorships Held: Board Member, The Huntington Strategy Shares |
Alistair Jessiman Age: 53 TRUSTEE Began serving: January 2010 | | Principal Occupations: Managing Director, Novantas LLC (September 2005 to present) (specialist research and advisory firm); President/Founder, Wallace & Mackenzie, Inc. (January 2001 to September 2005) (management consulting firm). Previous Positions: Managing Director or Vice President of various departments, J. P. Morgan (1979 to 2001). Other Directorships Held: Board Member, The Alger Funds; Board Member, National Foundation for Teaching Entrepreneurship; Board Member, The Huntington Strategy Shares |
Huntington Funds
Board of Trustees and Trust Officers (continued)
| | |
Name
Age
Positions Held with Trust
Date Service Began
| | Principal Occupation(s) for Past Five Years, Other Directorships Held and Previous Position(s) |
Tadd C. Seitz Age: 69 TRUSTEE Began serving: July 2006 | | Principal Occupation: Retired Previous Positions: Chairman and Chief Executive Officer, the Scotts Company (June 1983 - March 1995); Interim Chief Executive Officer (February 1996 - July 1996). Other Directorships Held: Board Member, The Huntington Strategy Shares |
Mark D. Shary Age: 50 TRUSTEE Began serving: July 2006 | | Principal Occupations: Private investor (2007 - present). Previous Position: President, Bostech Corporation (2000 - 2002); Chief Executive Officer and President, BestTransport.com, Inc. (2003 to 2007). Other Directorships Held: Board Member, The Huntington Strategy Shares |
William H. Zimmer, III Age: 57 TRUSTEE Began Serving: December 2006 | | Principal Occupation: Independent Consultant (February 2009 to present). Previous Positions: Assistant Treasurer, Dana Corp. (September 2006 to February 2009) (manufacturing); Vice President and Manager, Global Treasury Management, National City Bank (January 2004 to January 2006); Vice President, Treasury Management Operations, Provident Bank (June 2003 to January 2004); Financial Consultant (April 2001 to June 2003). Other Directorships Held: Board Member, The Huntington Strategy Shares |
| * | David S. Schoedinger became Chairman of the Funds on April 30, 2003. |
Officers
| | |
Name
Age
Positions Held with Trust
Address
Date Service Began | | Principal Occupation(s) and Previous Positions |
R. Jeffrey Young Age: 46 CHIEF EXECUTIVE OFFICER 2960 N. Meridian St., Ste. 300 Indianapolis, IN Began Serving: February 2010 | | Principal Occupations: Senior Vice President, HASI (formerly, Unified Fund Services, Inc.) (January 2010 to present); Chairman of the Board, Valued Advisers Trust (June 2010 to present); Chief Executive Officer and President, Valued Advisers Trust (January 2010 to present). Previous Positions: Independent Chair, Valued Advisers Trust (August 2008-Janaury 2010); Managing Director, Chief Operating Officer, WealthStone (2007 to 2009); Senior Vice President, Operations, BISYS Fund Services (2006 to 2007); Senior Vice President/Vice President, Client Services, BISYS Fund Services (1994 to 2006). |
Matthew J. Miller Age: 34 VICE PRESIDENT Began Serving: February 2010 | | Principal Occupation: Vice President, Relationship Management, Huntington Asset Services, Inc. (formerly known as Unified) (2008 to present). Previous Position: Vice President, Transfer Agency Operations, Huntington Asset Services, Inc. (formerly known as Unified) (2002 to 2008). |
David R. Carson Age: 52 CHIEF COMPLIANCE OFFICER AND ANTI-MONEY LAUNDERING OFFICER 3805 Edwards Road, Suite 3805 Cincinnati, OH Began Serving: September 2005 | | Principal Occupations: Chief Compliance Officer and Anti-Money Laundering Officer of the Trust (September 2005 to present). Previous Positions: Treasurer and Assistant Treasurer of the Huntington Funds, Huntington Asset Advisors, Inc. (February 2002 to February 2005); Vice President and Private Financial Group Marketing Manager, Huntington National Bank (June 2001 to September 2005); Trust Officer, Firstar Bank (October 1982 to February 2001). |
H U N T I N G T O N F U N D S
Huntington Funds
Board of Trustees and Trust Officers (continued)
| | |
Name
Age
Positions Held with Trust
Address
Date Service Began | | Principal Occupation(s) and Previous Positions |
Robert W. Silva Age: 44 TREASURER Began Serving: November 2010 | | Principal Occupation: Vice President Fund Administration, Huntington Asset Services, Inc. (November 2010 to present). Previous Positions: Senior Vice President, Citi Fund Services Ohio, Inc., (September 2007 to September 2010); Assistant Vice President, Citizens Advisers, Inc., (May 2002 to August 2007). |
John C. Swhear Age: 50 SECRETARY 2960 N. Meridian St., Ste. 300 Indianapolis, IN Began Serving: April 2010 | | Principal Occupations: Chief Compliance Officer of Valued Advisers Trust (August 2008 to present); Acting Chief Executive Officer, Dreman Contrarian Funds (February 2008 to March 2010); President, Dreman Contrarian Funds (March 2010 to present); Chief Compliance Officer of Unified Financial Securities, Inc., the Trust’s distributor (May 2007 to present); Vice President of Legal, Compliance and Risk for HASI (formerly, Unified Fund Services, Inc.) (April 2007 to present); Vice President, Dreman Contrarian Funds (September 2007 to March 2010); Senior Vice President, Unified Series Trust (May 2007 to present). Previous Positions: Employed in various positions with American United Life Insurance Company from June 1983 to April 2007, including: Chief Counsel, OneAmerica Securities Inc. (February 2007 to April 2007); Associate General Counsel (April 2003 to April 2007); Investment Adviser Chief Compliance Officer (June 2004 to April 2007); Chief Compliance Officer of OneAmerica Funds, Inc. (June 2004 to April 2007). |
Huntington Funds
Board of Trustees’ Consideration of Investment Advisory Agreement for
The Huntington VA Funds (the “Funds”)
The Board of Trustees is responsible for determining whether to approve the Funds’ investment advisory agreements. At a meeting held on August 12, 2010, the Board, including a majority of the independent Trustees, approved the investment advisory agreements (the “Advisory Agreements”) between Huntington Asset Advisors, Inc. (the “Advisor”) and the Funds. Pursuant to the Advisory Agreements between the Advisor and the Funds, the Advisor provides advisory services to the Funds.
During the review process, the Board received assistance and advice from, and met separately with, independent legal counsel. In approving each of the Advisory Agreements, the Board, including a majority of the independent Trustees, considered many factors, among the most significant of which are: (1) the nature of the services provided to the Funds by the Advisor in relation to the advisory fees; (2) the individual performance of the Funds; (3) the Advisor’s costs and the profits realized through providing the Funds with advisory services; (4) whether the Advisor has realized or may realize economies of scale in providing services to the Funds and if these economies are shared with the Funds; and (5) a comparison of the fees and performance of comparable funds.
Nature, Extent and Quality of Services in Relation to the Advisory Fee. In considering the nature, extent and quality of the services provided by the Advisor, the Board reviewed information relating to the Advisor’s operations and personnel. Among other things, the Advisor provided descriptions of its organizational and management structure, biographical information on its supervisory and portfolio management staff on a fund-by-fund basis, and financial information. The Trustees also took into account the financial condition of the Advisor with respect to its ability to provide the services required under the Advisory Agreements. The Board determined that the nature, extent and quality of the services provided by the Advisor in relation to the advisory fees were acceptable.
Individual Performance of the Funds. The Board reviewed the Funds’ performance record and the Advisor’s management styles in relation to comparable funds and appropriate benchmarks. The Board noted that the Board reviews on a quarterly basis detailed information about the Funds’ performance. The Board also reviewed various comparative data for each of the Funds provided to them in connection with their consideration of the renewal of the Advisory Agreements, including, among other information, each Fund’s performance compared to similar funds based on information provided by Lipper Inc. (“Lipper”) for the one-, three-, five- and ten-year periods, as applicable, ending June 30, 2010.
Advisor’s Costs and the Profits Realized Through Providing the Funds With Advisory Services. In considering the reasonableness of the advisory fees, the Board reviewed information provided by the Advisor setting forth all revenues and other benefits, both direct and indirect, received by the Advisor and its affiliates attributable to managing each of the Funds individually, the cost of providing such services and the resulting profitability to the Advisor and its affiliates from these relationships. The Board also took into account the Advisor’s agreement to limit the total direct net annual operating expenses of the VA Balanced Fund to not more than 0.10% of its average daily net assets for the period of May 1, 2010 to April 30, 2011. The Trustees determined that the profitability of the Advisor was acceptable in relation to the nature and quality of services provided to the Funds.
Economies of Scale in Providing Services to the Funds and Whether These Economies are Shared With the Funds. The Board also considered the effect of the Funds’ growth and size on their performance and fees. The Board considered the fees under the Advisory Agreements for each Fund and possible economies of scale that may be realized as the assets of the Funds grow. The Board noted that none of the Funds was currently large enough to have realized economies of scale. However, the Board noted that the administrative fee charged to all of the Funds included fee breakpoints, which allowed the Funds to realize economies of scale as the assets of the Funds increased over time.
Comparison of the Fees and Performance of Comparable Funds. With respect to the Funds’ performance and fees, the Board considered comparisons to other mutual funds with comparable investment programs to be particularly useful, given the high degree of competition in the mutual fund business. The Board also received information concerning fees charged by the Advisor to other accounts but did not consider that information to be as relevant in light of the differences in services provided.
Other Considerations. The Board also requests and receives substantial and detailed information about the Funds and the Advisor on a regular basis. The Advisor provides much of this information at each regular meeting of the Board and furnishes additional reports in connection with the Board’s formal review of the Advisory Agreements. The Board may also receive information between regular meetings relating to particular matters as the need arises. The Board’s evaluation of the Advisory Agreements is informed by reports covering such matters as the Advisor’s investment philosophy, personnel, and processes; operating strategies; each Fund’s short- and long-term performance (in absolute terms, both on a gross basis and net of expenses, as well as in relationship to its particular investment program and certain competitive funds and/or other benchmarks, as appropriate) and comments on reasons for performance; the Funds’ expenses (including the advisory fee itself and the overall expense structure of the Funds, both in absolute terms and relative to similar and/or competing funds, with due regard for contractual or voluntary expense limitations); the use and allocation of brokerage commissions derived from trading the Funds’ portfolio securities; the nature and extent of the advisory and other services provided to the Funds by the Advisor and its affiliates; compliance and audit reports concerning the Funds (including communications from regulatory agencies), as well as the Advisor’s responses to any issues raised therein; and relevant developments in the mutual fund
H U N T I N G T O N F U N D S
Huntington Funds
Board of Trustees’ Consideration of Investment Advisory Agreement for
The Huntington VA Funds (the “Funds”) (continued)
industry and how the Funds and the Advisor are responding to them. In the course of their deliberations regarding the Advisory Agreements, the Board also evaluated, among other things, the Advisor’s ability to supervise each of the Fund’s other service providers and their compliance programs.
The Board based its decision to approve the Advisory Agreements on the totality of the circumstances and relevant factors and with a view to past and future long-term considerations. Not all of the factors and considerations identified above are relevant to each of the Funds, nor does the Board consider any one of them to be determinative. With respect to the factors that are relevant, the Board’s decision to approve the Advisory Agreements reflects its determination that the Advisor’s performance and actions provide an acceptable basis to support the decision to continue the existing arrangements.
While attention was given to all information furnished, the following discusses the primary factors relevant to the Board’s decisions. In each case, the Board concluded that the Funds’ performance was acceptable and that the Funds’ advisory and total fees were reasonable in light of the quality and nature of services provided by the Advisor and its affiliates.
Huntington VA Mortgage Securities Fund
Among other data considered, the Trustees noted that the Fund underperformed its Lipper peer group and its benchmark for the one-, three- and five-year periods ended June 30, 2010. The Trustees also noted that the Fund’s combined net advisory and administrative fee was below the median of its peer group and its total expenses were above the median of its peer group.
Huntington VA Growth Fund
Among other data considered, the Trustees noted that the Fund underperformed its Lipper peer group and its benchmark for the one-, three- and five-year periods ended June 30, 2010. The Trustees also noted that the Fund’s combined net advisory and administrative fee and its total expenses were above the medians of its peer group.
Huntington VA Income Equity Fund
Among other data considered, the Trustees noted that the Fund outperformed its Lipper peer group for the one-year period ended June 30, 2010, but underperformed its Lipper peer group for the three-, five- and ten-year periods ended the same date. The Fund outperformed its benchmark for the one-, three- and ten-year periods ended June 30, 2010, but underperformed its benchmark for the five-year period ended the same date. The Trustees noted that the Fund’s combined net advisory and administrative fee and its total expenses were above the medians of its peer group.
Huntington VA Rotating Markets Fund
Among other data considered, the Trustees noted that the Fund underperformed its Lipper peer group and benchmark for the one- and three-year periods ended June 30, 2010, and outperformed its Lipper peer group and benchmark for the five-year period ended the same date. The Trustees noted that the Fund’s combined net advisory and administrative fee and its total expenses were above the medians of its peer group.
Huntington VA Dividend Capture Fund
Among other data considered, the Trustees noted that the Fund outperformed its Lipper peer group and benchmark for the one-, three- and five-year periods ended June 30, 2010. The Trustees noted that the Fund’s combined net advisory and administrative fee and its total expenses were below the medians of its peer group.
Huntington VA International Equity Fund
Among other data considered, the Trustees noted that the Fund underperformed its Lipper peer group for the one-year period ended June 30, 2010, but outperformed its Lipper peer group for the three- and five-year periods ended the same date. The Fund outperformed its benchmark for the one-, three- and five-year periods ended June 30, 2010. The Trustees also noted that the Fund’s combined net advisory and administrative fee and its total expenses were below the medians of its peer group.
Huntington VA Macro 100 Fund
Among other data considered, the Trustees noted that the Fund outperformed its Lipper peer group and benchmark for the one-year period ended June 30, 2010, and underperformed its Lipper peer group and benchmark for the three- and five-year periods ended the same date. The Trustees noted that the Fund’s combined net advisory and administrative fee and its total expenses were above the medians of its peer group.
Huntington Funds
Board of Trustees’ Consideration of Investment Advisory Agreement for
The Huntington VA Funds (the “Funds”) (continued)
Huntington VA Mid Corp America Fund
Among other data considered, the Trustees noted that the Fund underperformed its Lipper peer group for the one- and five-year periods ended June 30, 2010, and outperformed its Lipper peer group for the three-year period ended the same date. The Fund underperformed its benchmark for the one-, three- and five-year periods ended June 30, 2010. The Trustees also noted that the Fund’s combined advisory and administrative fee and its total expenses were above the medians of its peer group.
Huntington VA New Economy Fund
Among other data considered, the Trustees noted that the Fund underperformed its Lipper peer group and its benchmark for the one-, three- and five-year periods ended June 30, 2010. The Trustees also noted that the Fund’s combined advisory and administrative fee and its total expenses were below the medians of its peer group.
Huntington VA Real Strategies Fund
Among other data considered, the Trustees noted that the Fund underperformed its Lipper peer group but outperformed its benchmark for the one-year period ended June 30, 2010. The Trustees noted that the Fund’s combined net advisory and administrative fee was below the median of its peer group and its total expenses were above the median of its peer group.
Huntington VA Situs Fund
Among other data considered, the Trustees noted that the Fund underperformed its Lipper peer group for the one- and five-year periods ended June 30, 2010, and outperformed its Lipper peer group for the three-year period ended the same date. The Fund underperformed its benchmark for the one-, three- and five-year periods ended June 30, 2010. The Trustees also noted that the Fund’s combined net advisory and administrative fee and its total expenses were above the medians of its peer group.
Huntington VA Balanced Fund
Among other data considered, the Trustees noted that the Fund underperformed its Lipper peer group and its benchmark for the one-year period ended June 30, 2010. The Trustees also noted that the Fund’s combined net advisory and administrative fee and its total expenses were below the medians of its peer group.
H U N T I N G T O N F U N D S
Huntington Funds
Supplemental Information (Unaudited)
Shareholder Expense Examples
Fund Expenses. As a shareholder of a Fund, you incur ongoing costs, including management fees and other Fund expenses. These examples are intended to help you understand your ongoing costs (in dollars) of investing in the Funds and to compare these costs with the ongoing costs of investing in other mutual funds.
These examples are based on an investment of $1,000.00 invested at the beginning of the period and held for the entire six-month period from July 1, 2010 to December 31, 2010.
Actual Expenses. The “Actual” lines of the table provide information about actual account values and actual expenses. You may use the information on this line together with the amount you invested to estimate the expense that you paid over the period. Simply divide your account value by $1,000.00 (for example, an $8,600.00 account value divided by $1,000.00 = 8.60), then multiply the result by the number in the “Actual” line under the heading entitled “Expenses Paid During Period” to estimate the expenses you paid on your account during this period.
Hypothetical Example for Comparison Purposes. The “Hypothetical” lines of the table provide information about hypothetical account values and hypothetical expenses based on the Funds’ actual expense ratios and an assumed rate of return of 5% per year before expenses, which are not the Funds’ actual returns. The hypothetical account values and expenses may not be used to estimate the actual ending account balance or expenses you paid for the period. You may use this information to compare the ongoing costs of investing in the Funds and other funds. To do so, compare the 5% hypothetical examples with the 5% hypothetical examples that appear in the shareholder reports of other funds.
Please note that the expenses shown in the table are meant to highlight your ongoing costs only and do not reflect any transactional costs, such as withdrawal charges, mortality and expense risk fees and other charges that may be assessed by participating insurance companies under the separate accounts, variable annuity contracts or variable life insurance policies. Therefore, the “Hypothetical” lines of the table are useful in comparing ongoing costs only, and will not help you determine the relative total costs of owning different funds. In addition, if these transactional costs were included, your costs would have been higher.
| | | | | | | | | | | | | | | | |
| | | Beginning
Account
Value,
July 1, 2010 | | | Ending
Account
Value,
December 31, 2010 | | | Expenses
Paid
During
Period(1) | | | Annualized
Expense
Ratio | |
VA Balanced Fund | | | | | | | | | | | | | | | | |
Actual | | $ | 1,000.00 | | | $ | 1,128.80 | | | $ | 0.52 | | | | 0.10 | % |
Hypothetical(2) | | $ | 1,000.00 | | | $ | 1,024.72 | | | $ | 0.49 | | | | 0.10 | % |
VA Dividend Capture Fund | | | | | | | | | | | | | | | | |
Actual | | $ | 1,000.00 | | | $ | 1,168.30 | | | $ | 5.45 | | | | 1.00 | % |
Hypothetical(2) | | $ | 1,000.00 | | | $ | 1,020.18 | | | $ | 5.08 | | | | 1.00 | % |
VA Growth Fund | | | | | | | | | | | | | | | | |
Actual | | $ | 1,000.00 | | | $ | 1,211.20 | | | $ | 5.76 | | | | 1.03 | % |
Hypothetical(2) | | $ | 1,000.00 | | | $ | 1,020.00 | | | $ | 5.26 | | | | 1.03 | % |
VA Income Equity Fund | | | | | | | | | | | | | | | | |
Actual | | $ | 1,000.00 | | | $ | 1,194.10 | | | $ | 5.63 | | | | 1.02 | % |
Hypothetical(2) | | $ | 1,000.00 | | | $ | 1,020.07 | | | $ | 5.18 | | | | 1.02 | % |
VA International Equity Fund | | | | | | | | | | | | | | | | |
Actual | | $ | 1,000.00 | | | $ | 1,239.60 | | | $ | 6.60 | | | | 1.17 | % |
Hypothetical(2) | | $ | 1,000.00 | | | $ | 1,019.31 | | | $ | 5.95 | | | | 1.17 | % |
VA Macro 100 Fund | | | | | | | | | | | | | | | | |
Actual | | $ | 1,000.00 | | | $ | 1,199.90 | | | $ | 6.58 | | | | 1.19 | % |
Hypothetical(2) | | $ | 1,000.00 | | | $ | 1,019.22 | | | $ | 6.04 | | | | 1.19 | % |
VA Mid Corp America Fund | | | | | | | | | | | | | | | | |
Actual | | $ | 1,000.00 | | | $ | 1,253.10 | | | $ | 5.91 | | | | 1.04 | % |
Hypothetical(2) | | $ | 1,000.00 | | | $ | 1,019.96 | | | $ | 5.30 | | | | 1.04 | % |
VA New Economy Fund | | | | | | | | | | | | | | | | |
Actual | | $ | 1,000.00 | | | $ | 1,215.30 | | | $ | 6.09 | | | | 1.09 | % |
Hypothetical(2) | | $ | 1,000.00 | | | $ | 1,019.71 | | | $ | 5.55 | | | | 1.09 | % |
Huntington Funds
| | | | | | | | | | | | | | | | |
| | | Beginning
Account
Value,
July 1, 2010 | | | Ending
Account
Value,
December 31, 2010 | | | Expenses
Paid
During
Period(1) | | | Annualized
Expense
Ratio | |
VA Real Strategies Fund | | | | | | | | | | | | | | | | |
Actual | | $ | 1,000.00 | | | $ | 1,321.80 | | | $ | 9.94 | | | | 1.70 | % |
Hypothetical(2) | | $ | 1,000.00 | | | $ | 1,016.64 | | | $ | 8.64 | | | | 1.70 | % |
VA Rotating Markets Fund | | | | | | | | | | | | | | | | |
Actual | | $ | 1,000.00 | | | $ | 1,189.30 | | | $ | 6.57 | | | | 1.19 | % |
Hypothetical(2) | | $ | 1,000.00 | | | $ | 1,019.20 | | | $ | 6.06 | | | | 1.19 | % |
VA Situs Fund | | | | | | | | | | | | | | | | |
Actual | | $ | 1,000.00 | | | $ | 1,311.90 | | | $ | 6.05 | | | | 1.04 | % |
Hypothetical(2) | | $ | 1,000.00 | | | $ | 1,019.97 | | | $ | 5.29 | | | | 1.04 | % |
VA Mortgage Securities Fund | | | | | | | | | | | | | | | | |
Actual | | $ | 1,000.00 | | | $ | 1,015.30 | | | $ | 5.78 | | | | 1.14 | % |
Hypothetical(2) | | $ | 1,000.00 | | | $ | 1,019.46 | | | $ | 5.80 | | | | 1.14 | % |
| (1) | Expenses are equal to the Fund’s annualized expense ratios, multiplied by the average account value over the period, multiplied by 184/365 (to reflect the one-half year period). The annualized expense ratios reflect reimbursement of expenses by the Funds’ Adviser for the period beginning July 1, 2010 through December 31, 2010. The “Financial Highlights” tables in the Funds’ financial statements, included in the report, also show the gross expense ratios, without such reimbursements. |
| (2) | Hypothetical assumes 5% annual return before expenses. |
H U N T I N G T O N F U N D S
Variable investment options are not bank deposits or obligations, are not guaranteed by any bank, and are not insured or guaranteed by the U.S. government, the Federal Deposit Insurance Corporation, the Federal Reserve Board or any other government agency. Investment in variable investment options involves investment risk, including the possible loss of principal.
This report is authorized for distribution to prospective investors only when preceded or accompanied by the Funds’ prospectus, which contains facts concerning each Fund’s objective and policies, management fees, expenses and other information.
VOTING PROXIES ON FUND PORTFOLIO SECURITIES
A copy of the policies and procedures that the Funds use to determine how to vote proxies relating to securities held in the Funds’ portfolios, as well as a record of how the Funds voted any such proxies during the most recent 12-month period ended June 30, is available without charge and upon request by calling 1-800-253-0412 or at www.huntingtonvafunds.com. This information is also available from the EDGAR database on the SEC’s website at www.sec.gov.
QUARTERLY PORTFOLIO SCHEDULE
The Funds file with the SEC a complete schedule of their portfolio holdings, as of the first and third quarters of their fiscal year, on “Form N-Q”. These filings are available on the SEC’s website at www.sec.gov and may be reviewed and copied at the SEC’s Public Reference Room in Washington, D.C. (call 1-202-551-8090 for information on the operation of the Public Reference Room.) You may also access this information at www.huntingtonvafunds.com by selecting “Form N-Q.”

The Huntington National Bank, a subsidiary of Huntington Bancshares, Inc., is the Administrator, Financial Administrator and Custodian of The Huntington Funds. Huntington Asset Services, Inc. serves as the Sub-Administrator and Sub-Fund Accountant and is affiliated with the Huntington National Bank. Additionally, Brown Brothers Harriman & Co. is the Sub-Custodian of certain of the Funds. Huntington Asset Advisors, Inc., a subsidiary of the Huntington National Bank, serves as Investment Adviser to the Funds. Unified Financial Securities, Inc. serves as the Distributor of The Huntington Funds and is affiliated with the Huntington National Bank.
Cusip 446327165
Cusip 446771206
Cusip 446771107
Cusip 446771701
Cusip 446771305
Cusip 446771503
Cusip 446771602
Cusip 446771800
Cusip 446771875
Cusip 446771867
Cusip 446771883
Cusip 446327215
Item 2. Code of Ethics.
(a) As of the end of the period covered by the report, the registrant has adopted a code of ethics that applies to the registrant’s Principal Executive Officer and Principal Financial Officer.
(b) Not applicable.
(c) During the period covered by the report, with respect to the registrant’s code of ethics that applies to its Principal Executive Officer and Principal Financial Officer: there have been no amendments to a provision that relates to any element of the code of ethics definition enumerated in paragraph (b) of this Item 2.
(d) During the period covered by the report, with respect to the registrant’s code of ethics that applies to its Principal Executive Officer and Principal Financial Officer: there have been no waivers granted from a provision that relates to any element of the code of ethics definition enumerated in paragraph (b) of this Item 2.
(e) Not applicable.
(f) The registrant has included a copy of the code of ethics that applies to the registrant’s Principal Executive Officer and Principal Financial Officer. This code of ethics is included as an Exhibit on this Form N-CSR.
Item 3. Audit Committee Financial Expert.
3(a)(1) The registrant’s Board of Trustees has determined that the registrant has at least one audit committee financial expert serving on its audit committee.
3(a)(2) The audit committee financial expert is William H. Zimmer III, who is “independent” for purposes of this Item 3 of Form N-CSR.
Item 4. Principal Accountant Fees and Services.
(a) Audit Fees billed to the registrant by its principal accountants for the two most recent fiscal years:
Fiscal year ended 2010: $458,370
Fiscal year ended 2009: $449,700
(b) Audit-Related Fees billed to the registrant by its principal accountants for the two most recent fiscal years:
Fiscal year ended 2010: $ 6,500
Fiscal year ended 2009: $11,500
Fees for 2010 and 2009 related to the agreed-upon review of items within the Management’s Discussion of Fund Performance sections of the Funds’ Form N-CSR filing. 2010 fees also include the review of Form N-1A for 2010. Amount requiring approval of the registrant’s audit committee pursuant to paragraph (c)(7)(ii) of Rule 2-01 of Regulation S-X, $ 6,500 and $11,500 respectively.
(c) Tax Fees billed to the registrant by its principal accountants for the two most recent fiscal years:
Fiscal year ended 2010: $162,695
Fiscal year ended 2009: $159,195
Fees for 2010 and 2009 related to the review of the registrant’s tax returns. Amount requiring approval of the registrant’s audit committee pursuant to paragraph (c)(7)(ii) of Rule 2-01 of Regulation S-X, $0 and $0 respectively.
(d) All other fees billed to the registrant by its principal accountants for the two most recent fiscal years:
Fiscal year ended 2010: $0
Fiscal year ended 2009: $0
Amount requiring approval of the registrant’s audit committee pursuant to paragraph (c)(7)(ii) of Rule 2-01 of Regulation S-X, $0 and $0 respectively.
(e)(1) Audit and Non-Audit Services Pre-Approval Policies and Procedures
I. Purpose
Under the Sarbanes-Oxley Act of 2002 (the “Act”), the Audit Committee of the Board of Trustees of The Huntington Funds (the “Fund”) is responsible for the appointment, compensation and oversight of the work of the Fund’s independent auditor. As part of this responsibility, the Audit Committee is required to grant approval for audit and non-audit services performed by the independent auditor for the Fund in order assure that they do not impair the auditor’s independence from the Fund. In addition, the Audit Committee also must pre-approve its independent auditor’s engagement for non-audit services with the Fund’s investment adviser (not including a sub-adviser whose role is primarily portfolio management and is sub-contracted or overseen by another investment adviser) and any entity controlling, controlled by, or under common control with the investment adviser that provides ongoing services to the Fund, if the engagement relates directly to the operations and/or financial reporting of the Fund.
To implement these provisions of the Act, the Securities and Exchange Commission (the “SEC”) has issued rules specifying the types of services that the Fund’s independent auditor may not provide to the Fund, as well as the Audit Committee’s administration of the engagement of the independent auditor. Under these rules, the SEC has provided that a permissible approval of audit and non-audit services can take the form of either (i) a general pre-approval, or (ii) a specific pre-approval (where a specific type of service is authorized, generally subject to a fee maximum). General pre-approvals are authorized by SEC rules only subject to detailed policies and procedures. Unless a type of service has received general pre-approval, it will require specific pre-approval by the Audit Committee if it is to be provided by the independent auditor. Accordingly, the Audit Committee has adopted these Audit and Non-Audit Services Pre-Approval Policies and Procedures, which set forth the procedures and the conditions pursuant to which services for the Fund may be performed by the independent auditor under pre-approvals.
II. General Pre-Approval Policies
It is the policy of the Audit Committee that audit and non-audit services to be performed by the Fund’s independent auditor be pre-approved only when in the best interests of the Fund’s shareholders and fully consistent with applicable law and, particularly, the maintenance of the auditor’s independence. In granting any pre-approval, consideration shall be given to:
1. the qualifications of the auditor to perform the services involved;
2. the proposed costs (which may be presented as an estimate or based on professional time charges subject to a ceiling) of the services and the reasonableness thereof;
3. the permissibility of the services under applicable rules and guidance of the SEC;
4. the effect, if any, of the performance of the proposed services on the auditor’s independence;
5. the effect of the compensation for the proposed services on the auditor’s independence; and
6. the effect, if any, of the proposed services on the Fund’s ability to manage or control risk or to improve audit quality.
In accordance with SEC rules, non-audit services performed by the Fund’s independent auditor may not include the following:
1. Bookkeeping or other services related to the accounting records or financial statements of the audit client;
2. Financial information systems design and implementation;
3. Appraisal or valuation services, fairness opinions or contribution-in-kind reports;
4. Actuarial services;
5. Internal audit outsourcing services;
6. Management functions or human resources;
7. Broker-dealer, investment adviser or investment banking services; and
8. Legal services and expert services unrelated to the audit.
III. Procedures for Pre-Approval by the Audit Committee
1. Requests for pre-approval shall be in writing and may be made by either the independent auditors or by management of the Fund.
2. All requests for pre-approval shall be made to the full Audit Committee at regularly scheduled meetings thereof (or at a special meeting of the Audit Committee set to coincide with regular meetings of the Fund’s Board of Trustees) whenever practicable.
3. Under normal circumstances, requests for pre-approval should be presented at least 7 days prior (and in no event later than 48 hours prior) to the proposed commencement of the engagement.
4. If consideration of a request for pre-approval on the dates identified in Section III (2) would not be timely, the requesting party shall notify the Chairman of the Audit Committee. The Chairman of the Audit Committee shall then determine whether to schedule a special meeting of the Audit Committee (which may be conducted telephonically) on an alternative date or whether the request may appropriately be presented to a delegate of the Audit Committee under procedures set forth in Section IV below.
5. Requests for pre-approval may include, but are not limited to, the following services:
a. audit engagement, particularly for interim periods;
b. tax compliance, tax planning, and tax advice;
c. review and consents with respect to use of reports in post-effective amendments to the registration statements of the Fund;
d. review of IRS shareholder materials;
e. review and validation of fund procedures (e.g., valuation, interfund lending, etc.), and
f. market research and strategic insights.
6. Requests for pre-approval should identify the nature of the services to be provided in a manner sufficiently specific to allow evaluation of the considerations identified above in Section II.
In accordance with PCAOB Rule 3524, requests for pre-approval of permissible tax services by the independent auditor must have the following items described in writing for the audit committee:
a. the scope of the proposed tax service,
b. the fee structure for the engagement,
c. any side letters, amendments to the engagement letter or any other agreements, whether oral, written, or otherwise, relating to the service between the audit firm and the Funds, and
d. any compensation arrangements or other agreements between the audit firm and any third party with respect to promoting, marketing, or recommending a transaction covered by the proposed tax service.
The audit firm should discuss with the Audit Committee, the potential effect of the proposed tax service(s) on the audit firm’s independence.
7. Requests for pre-approval must include an assessment by the independent auditor of its independence should the request be granted and the proposed services rendered.
8. The Audit Committee’s action on a request for pre-approval shall be recorded in the Audit Committee’s minutes.
9. The Audit Committee’s action on a request for pre-approval shall be communicated in writing to the independent auditor and, under normal circumstances, a copy of this communication shall be provided to the Fund’s management.
10. The Audit Committee’s action on a request for pre-approval shall be reported to the full Board of Trustees.
11. Pre-approvals will be granted for a period of no more than one year.
IV. Procedures for Pre-Approval by a Delegate of the Audit Committee
1. Where it has been determined by the Chairman of the Audit Committee that consideration of a request for pre-approval by the full Audit Committee would not be timely, the Chairman may determine that the request be presented to a member(s) of the Audit Committee appointed by the Audit Committee as its delegate (the “Delegate”) for this purpose. (As of the date of the adoption of these guidelines and procedures, the Chairman of the Audit Committee has been so appointed, and such appointment may be revoked or modified by the Audit Committee at any time.)
2. Requests for pre-approval shall be in writing and may be made by either the independent auditors or by management of the Fund.
3. Under normal circumstances, requests for pre-approval should be presented at least 7 days prior (and in no event later than 48 hours prior) to the proposed commencement of the engagement.
4. Requests for pre-approval may include, but are not limited to, the following services:
a. audit engagement, particularly for interim periods;
b. tax compliance, tax planning, and tax advice;
c. review and consents with respect to use of reports in post-effective amendments to the registration statements of the Fund;
d. review of IRS shareholder materials;
e. review and validation of fund procedures (e.g., valuation, interfund lending, etc.); and
f. market research and strategic insights.
5. Requests for pre-approval should identify the nature of the services to be provided in a manner sufficiently specific to allow evaluation of the considerations identified above in Section II.
6. Requests for pre-approval must include an assessment by the independent auditor of its independence should the request be granted and the proposed services rendered.
7. The Delegate’s action on a request for pre-approval shall be communicated in writing to the independent auditor, with a copy to each other member of the Audit Committee and, under normal circumstances, to the Fund’s management.
8. Pre-approvals by the Delegate shall be reviewed by the Audit Committee at a meeting held no later than the next scheduled meeting of the Board of Trustees or the Audit Committee, whichever occurs sooner. An earlier review shall be conducted upon the written request of one or more Audit Committee members addressed to the Chairman of the Audit Committee.
9. Pre-approvals by the Delegate may be modified or revoked by the Audit Committee, but will not absolve the Fund of its responsibility to compensate the independent auditor for services rendered prior to such modification or revocation.
10. The results of the Audit Committee’s review of the Delegate’s action on a request for pre-approval shall be recorded in the Audit Committee’s minutes and reported to the full Board of Trustees.
11. Pre-approvals will be granted by the Delegate for a period of no more than one year.
V. Procedures for Monitoring Engagements Authorized Under Pre-Approval Procedures
The independent auditor shall inform the Audit Committee in writing upon the commencement of services rendered under a pre-approval. The independent auditor shall thereafter provide the Audit Committee with written quarterly progress reports within one month of the close of each calendar quarter detailing the work done and fees and other charges incurred during said calendar quarter. Should fees and expenses exceed those specified in a pre-approval (or appear likely to do so prior to completion of the work), the independent auditor or management shall so apprise the Audit Committee and an additional express approval or pre-approval must be obtained.
VI. Amendment
These Policies and Procedures may be amended or revoked at any time by the Audit Committee and shall be reviewed at least annually in conjunction with review of the Audit Committee Charter.
Adopted May 4, 2006 and revised February 14, 2007 and October 23, 2007
(e)(2) Percentage of services described in each of paragraphs (b) through (d) of this Item that were approved by the audit committee pursuant to paragraph (C)(7)(i)(C) of Rule 2-01 of Regulation S-X.
| | |
4(b) | | Fiscal year ended 2010- 0% |
| | Fiscal year ended 2009- 0% |
Percentage of services provided to the registrant’s investment adviser and any entity controlling, controlled by, or under common control with the investment adviser that provides ongoing services to the registrant that were approved by the registrant’s audit committee pursuant to paragraph (C)(7)(i)(C) of Rule 2-01 of Regulation S-X, 0% and 0% respectively.
(f) Not applicable.
(g) The aggregate non-audit fees billed by Ernst and Young for the Funds and certain entities (including the adviser (excluding sub-adviser) and any entity controlling, controlled by or under common control with the advisor that provides ongoing services to the registrant (Funds)), totaled $ 162,695 and $159,195 in 2010 and 2009, respectively, which includes the Funds’ tax fees above in Section I and tax fees for Huntington’s Trust Department related to settlement funds where Huntington National Bank is the executor.
(h) The registrant’s Audit Committee has considered whether the provision of nonaudit services that were rendered to registrant’s investment adviser (not including any sub adviser whose role is primarily portfolio management and is subcontracted with or overseen by another investment adviser), and any entity controlling, controlled by, or under common control with the investment adviser that provide ongoing services to the registrant that were not pre-approved pursuant to paragraph (c)(7)(ii) of Rule 2-01 of Regulation S-X is compatible with maintaining the principal account’s independence.
Item 5. Audit Committee of Listed Registrants.
Not applicable.
Item 6. Schedule of Investments.
(a) Not applicable.
(b) Not applicable.
Item 7. Disclosure of Proxy Voting Policies and Procedures for Closed-End Management Investment Companies.
Not applicable.
Item 8. Portfolio Managers of Closed-End Management Investment Companies.
Not applicable.
Item 9. Purchases of Equity Securities by Closed-End Management Investment Company and Affiliated Purchasers.
Not applicable.
Item 10. Submission of Matters to a Vote of Security Holders.
Not applicable.
Item 11. Controls and Procedures.
(a) The registrant’s Principal Executive Officer and Principal Financial Officer have concluded that the registrant’s disclosure controls and procedures (as defined in Rule 30a-3(c) under the Act) are effective in design and operation and are sufficient to form the basis of the certifications required by Rule 30a-2 under the Act, based on their evaluation of these disclosure controls and procedures within 90 days of the filing of this report on Form N-CSR.
(b) There were no changes in the registrant’s internal control over financial reporting (as defined in Rule 30a-3(d) under the Act (17 CFR 270.30a-3(d)) that occurred during the second fiscal quarter of the period covered by this report that have materially affected or are reasonably likely to materially affect, the registrant’s internal control over financial reporting.
Item 12. Exhibits.
| | |
| |
| (a)(1) | | The code of ethics that is the subject of the disclosure required by Item 2 is attached hereto. |
| |
| (a)(2) | | Certifications pursuant to Rule 30a-2(a) are attached hereto. |
| |
| (a)(3) | | Not applicable. |
| |
| (b) | | Certifications pursuant to Rule 30a-2(b) are furnished herewith. |
SIGNATURES
Pursuant to the requirements of the Securities Exchange Act of 1934 and the Investment Company Act of 1940, the registrant has duly caused this report to be signed on its behalf by the undersigned, thereunto duly authorized.
(Registrant) The Huntington Funds
| | |
| By (Signature and Title)* | | /s/ R. Jeffrey Young |
| | R. Jeffrey Young, Chief Executive Officer and Principal Executive Officer |
Date 03/09/2011
Pursuant to the requirements of the Securities Exchange Act of 1934 and the Investment Company Act of 1940, this report has been signed below by the following persons on behalf of the registrant and in the capacities and on the dates indicated.
| | |
| By (Signature and Title)* | | /s/ R. Jeffrey Young |
| | R. Jeffrey Young, Chief Executive Officer and Principal Executive Officer |
Date 03/09/2011
| | |
| By (Signature and Title)* | | /s/ Robert Silva |
| | Robert Silva, Treasurer and Principal Financial Officer |
Date 03/09/2011