As filed with the Securities and Exchange Commission on October 7, 2014
1933 Act File No.
UNITED STATES
SECURITIES AND EXCHANGE COMMISSION
Washington, D.C. 20549
FORM N-14
| | | | | | |
| | REGISTRATION STATEMENT | | | | |
| | UNDER | | | | |
| | THE SECURITIES ACT OF 1933 | | | | |
| | Pre-Effective Amendment No. | | ¨ | | |
| | Post-Effective Amendment No. | | x | | |
The Huntington Funds
(Exact Name of Registrant as Specified in Charter)
2960 N. Meridian Street, Suite 300
Indianapolis, IN 46208
(Address of Principal Executive Offices:)
(800) 544-8347
(Area Code and Telephone Number)
Jay S. Fitton, Esq.
The Huntington National Bank
3805 Edwards Road
Cincinnati, OH 45209
(Name and Address of Agent for Service)
Copies to:
David C. Mahaffey, Esq.
Sullivan & Worcester, LLP
1666 K Street, NW
Washington, DC 20006
202-775-1207
No filing fee is due because the Registrant is relying on Section 24(f) of the Investment Company Act of 1940, as amended.
This post-effective amendment no. is being filed solely for the purpose of filing exhibits to the registration statement on Form N-14 (File No. ), filed with the Commission on October 7, 2014 (the “Registration Statement”). Parts A and B are incorporated herein by reference to the definitive proxy statement/prospectus filed pursuant to Rule 497 under the Securities Act of 1933, as amended, filed on November , 2014.
As filed with the Securities and Exchange Commission on October 7, 2014
1933 Act File No.
UNITED STATES
SECURITIES AND EXCHANGE COMMISSION
Washington, D.C. 20549
FORM N-14
REGISTRATION STATEMENT UNDER THE
SECURITIES ACT OF 1933
¨ Pre-Effective Amendment No. x Post-Effective Amendment No.
The Huntington Funds
(Exact Name of Registrant as Specified in Charter)
2960 N. Meridian Street, Suite 300
Indianapolis, IN 46208
(Address of Principal Executive Offices)
(800) 544-8347
(Area Code and Telephone Number)
Jay S. Fitton, Esq.
The Huntington National Bank
3805 Edwards Road
Cincinnati, OH 45209
(Name and address of Agent for service)
Copies to:
David C. Mahaffey, Esq.
Sullivan & Worcester, LLP
1666 K Street, NW
Washington, DC 20006
202-775-1207
Approximate Date of Proposed Public Offering: As soon as practicable after this Registration Statement becomes effective under the Securities Act of 1933.
Title of Securities Being Registered: Class A and Institutional Shares of beneficial interest, without par value, of the Huntington Global Select Markets Fund, a series of the Huntington Funds.
No filing fee is due because Registrant is relying on Section 24(f) of the Investment Company Act of 1940, as amended. It is proposed that this filing will become effective on November 6, 2014, pursuant to Rule 488 under the Securities Act of 1933.
TABLE OF CONTENTS
1
Acquisition of Assets and Liabilities of
HUNTINGTON INTERNATIONAL EQUITY FUND
a series of
The Huntington Funds
2960 N. Meridian Street, Suite 300
Indianapolis, IN 46208
(800) 253-0412
By and in Exchange for Shares of
HUNTINGTON GLOBAL SELECT MARKETS FUND
also a series of
The Huntington Funds
PROSPECTUS/INFORMATION STATEMENT
This Prospectus/Information Statement is available online at:
http://huntingtonfunds.com/newsite/taxes/taxinformation.php.
Dated November 6, 2014
This document is a prospectus/information statement (“Prospectus/Information Statement”). This Prospectus/Information Statement is being furnished to shareholders of the Huntington International Equity Fund (“Huntington International Equity” or “Acquired Fund”), a series of the Huntington Funds (the “Trust”), in connection with the approval by the Board of Trustees of the Trust (collectively, the “Board” or the “Trustees”) of an Agreement and Plan of Reorganization relating to Huntington International Equity.
The Trust is organized as a Delaware statutory trust, and is not required to hold an annual meeting of its shareholders.
THIS PROSPECTUS/INFORMATION STATEMENT IS FOR INFORMATIONAL PURPOSES ONLY. YOU DO NOT NEED TO DO ANYTHING IN RESPONSE TO THIS PROSPECTUS/INFORMATION STATEMENT. WE ARE NOT ASKING YOU FOR A PROXY OR WRITTEN CONSENT, AND YOU ARE REQUESTED NOT TO SEND US A PROXY OR WRITTEN CONSENT.
The Board has fixed the close of business on December 19, 2014 as the record date for determination of shareholders entitled to receive this Prospectus/Information Statement (“Record Date”). As of November 1, 2014, the number of shares outstanding for Huntington International Equity was [ ] total shares, which represents [ ] Institutional Shares and [ ] Class A Shares.
1
GENERAL
The Board has approved an Agreement and Plan of Reorganization (the “Reorganization Plan” or the “Plan”), a copy of which is attached as Exhibit A to this Prospectus/Information Statement, providing for the transfer of all of the assets of Huntington International Equity to the Huntington Global Select Markets Fund (“Huntington Global Select Markets” or “Acquiring Fund”), a series of the Trust (such actions taken in accordance with the Reorganization Plan being the “Reorganization”). The transfer will involve (a) an exchange of your shares of Huntington International Equity for shares of Huntington Global Select Markets, which would be distributed pro rata by Huntington International Equity to its shareholders in complete liquidation of Huntington International Equity, and (b) the assumption by Huntington Global Select Markets of all of the liabilities of Huntington International Equity. The total value of your investment will not change as a result of the Reorganization. Immediately after the Reorganization, you will hold the number of full or fractional shares of Huntington Global Select Markets which have an aggregate net asset value equal to the aggregate net asset value of the shares of Huntington International Equity you held immediately before the Reorganization.
Huntington International Equity and Huntington Global Select Markets (each, a “Fund,” and together, the “Funds”) are each a separate, diversified series of the Trust. The primary investment objectives of the Huntington International Equity and Huntington Global Select Markets are identical, as follows:
| | |
Portfolio | | Investment Objective |
| Huntington International Equity | | To seek total return. |
| Huntington Global Select Markets | | To seek total return. |
This Prospectus/Information Statement explains concisely the information about Huntington Global Select Markets that you should know. Please read it carefully and keep it for future reference. Additional information concerning each Fund and the Reorganization is contained in the documents described below, all of which have been filed with the Securities and Exchange Commission (“SEC”):
| | |
Information about Huntington International Equity: | | How to Obtain this Information: |
Prospectus of the Trust relating to Huntington International Equity, dated April 30, 2014, as Amended September 2, 2014 Statement of Additional Information of the Trust relating to Huntington International Equity, dated April 30, 2014, as Amended September 2, 2014 Annual Report of the Trust relating to Huntington International Equity for the year ended December 31, 2013 Semi-Annual Report of the Trust relating to Huntington International Equity, for the period ended June 30, 2014 | | Copies are available upon request and without charge if you: • Visit www.huntingtonfunds.com on the internet; or • Write to The Huntington Funds P.O. Box 6110 Indianapolis, IN 46206-6110; or • Call (800) 253-0412 toll-free. |
2
| | |
Information about Huntington Global Select Markets: | | How to Obtain this Information: |
Prospectus of the Trust relating to Huntington Global Select Markets, dated April 30, 2014, as Amended September 2, 2014 Statement of Additional Information of the Trust relating to Huntington Global Select Markets, dated April 30, 2014, as Amended September 2, 2014 Annual Report of the Trust relating to Huntington Global Select Markets for the year ended December 31, 2013 Semi-Annual Report of the Trust relating to Huntington Global Select Markets, for the period ended June 30, 2014 | | Copies are available upon request and without charge if you: • Visit www.huntingtonfunds.com on the internet; or • Write to The Huntington Funds P.O. Box 6110 Indianapolis, IN 46206-6110; or • Call (800) 253-0412 toll-free. |
| | |
Information about the Reorganization: | | How to Obtain this Information: |
| Statement of Additional Information dated November 6, 2014, which relates to this Prospectus/Information Statement and the Reorganization | | Copies are available upon request and without charge if you: • Write to The Huntington Funds P.O. Box 6110 Indianapolis, IN 46206-6110; or • Call (800) 253-0412 toll-free. |
You can also obtain copies of any of these documents without charge on the EDGAR database on the SEC’s Internet site at http://www.sec.gov. Copies are available for a fee by electronic request at the following e-mail address: publicinfo@sec.gov, or from the Public Reference Branch, Office of Consumer Affairs and Information Services, Securities and Exchange Commission, 100 F Street, N.E., Washington, D.C. 20549.
Information contained in the Prospectuses of Huntington International Equity and Huntington Global Select Markets, each dated April 30, 2014, as Amended September 2, 2014, (SEC File No. 811-05010) are incorporated by reference in this document. (This means that such information is legally considered to be part of this Prospectus/Information Statement.) The Statement of Additional Information dated November 6, 2014, relating to this Prospectus/Information Statement and the Reorganization, which includes the Annual Reports of the Trust relating to Huntington International Equity and Huntington Global Select Markets for the year ended December 31, 2013 (SEC File No. 811-05010), the Semi-annual Reports of the Trust relating to Huntington Global Select Markets and Huntington International Equity for the six month period ended June 30, 2014 (SEC File No. 811-05010), and pro forma financial information of the Trust relating to Huntington Global Select Markets for the twelve month period ended June 30, 2014, are each incorporated by reference into this document.
THE SECURITIES AND EXCHANGE COMMISSION HAS NOT DETERMINED THAT THE INFORMATION IN THIS PROSPECTUS/INFORMATION STATEMENT IS ACCURATE OR ADEQUATE, NOR HAS IT APPROVED OR DISAPPROVED THESE SECURITIES. ANYONE WHO TELLS YOU OTHERWISE IS COMMITTING A CRIMINAL OFFENSE.
An investment in Huntington Global Select Markets:
| | • | | is not a deposit of, or guaranteed by, any bank |
| | • | | is not insured by the FDIC, the Federal Reserve Board or any other government agency |
| | • | | is not endorsed by any bank or government agency |
| | • | | involves investment risk, including possible loss of the purchase payment of your original investment |
3
SUMMARY
THIS SECTION SUMMARIZES THE PRIMARY FEATURES AND CONSEQUENCES OF THE REORGANIZATION. IT MAY NOT CONTAIN ALL OF THE INFORMATION THAT IS IMPORTANT TO YOU. TO UNDERSTAND THE REORGANIZATION, YOU SHOULD READ THIS ENTIRE PROSPECTUS/INFORMATION STATEMENT AND THE EXHIBIT.
This summary is qualified in its entirety by reference to the additional information contained elsewhere in this Prospectus/Information Statement, the Prospectuses and Statements of Information relating to the Funds and the Form of Agreement and Plan of Reorganization which is attached to this Prospectus/Information Statement.
Overview: Reasons for The Reorganization
The Reorganization will combine two series of the Trust with similar investment objectives, Huntington International Equity and Huntington Global Select Markets into one fund and is designed to achieve operating efficiencies due to the spreading of fixed costs over a larger pool of assets in the surviving Fund. The Board, consisting entirely of Independent Trustees, unanimously approved the Reorganization Plan based on information requested by the Board and provided by Huntington Asset Advisors, Inc. (the “Advisor”). Before approving the Plan, the Trustees evaluated extensive information provided by management of the Trust and reviewed various factors about the Funds and the proposed Reorganization. The Trustees considered the similarity of investment objectives and the relative performance of the Funds. Huntington Global Select Markets outperformed its benchmark for the one-year and since-inception periods ended December 31, 2013; whereas, Huntington International Equity underperformed its benchmark for the one- and five-year periods ended December 31, 2013. The Huntington International Equity outperformed its benchmark for the ten-year period ended December 31, 2013. Huntington Global Select Markets outperformed Huntington International Equity for the one-year period ended June 30, 2014; and Huntington International Equity outperformed Huntington Global Select Markets for the three-year period ended June 30, 2014. The Trustees also considered the relative asset size of Huntington International Equity, including the benefits of Huntington International Equity joining Huntington Global Select Markets. Upon completion of the Reorganization, Huntington Global Select Markets may achieve operating efficiencies because it will have a greater level of assets. As of June 30, 2014, Huntington International Equity and Huntington Global Select Markets’ total assets were approximately $189,552,152 and $17,006,696, respectively. If the Reorganization is completed, Huntington Global Select Markets is expected to have total assets of approximately $206,558,848. The Trustees also reasoned that the Reorganization would likely result in expenses at least as low as that of the Huntington International Equity shareholders due to the Advisor contractually capping expenses of the Huntington Global Select Markets’ Total Annual Fund Operating Expenses through at least April 30, 2017, prior to the Closing Date of the Reorganization.
Accordingly, in approving the Reorganization, the Board determined that the Reorganization would be in the best interests of Huntington International Equity and its shareholders, and that the interests of the shareholders of Huntington International Equity would not be diluted as a result of effecting the Reorganization.
Impact of the Reorganization on Huntington International Equity Shareholders
It is anticipated that the Reorganization will benefit you as follows, although no assurance can be given that the Reorganization will result in any such benefits:
| | • | | OPERATING EFFICIENCIES: Upon the reorganization of Huntington International Equity into Huntington Global Select Markets, operating efficiencies may be achieved by Huntington Global Select Markets because it is expected to have a greater level of assets than is currently in either of the Funds. As of June 30, 2014, Huntington International Equity had total net assets of approximately $189,552,152, while Huntington Global Select Markets had total net assets of approximately $17,006,696 as of that date. |
4
| | • | | COST CONSIDERATIONS: Following the Reorganization, total annual operating expenses of Huntington Global Select Markets are anticipated to be at least as low as that of the Huntington International Equity shareholders due to the Advisor contractually capping expenses of the Huntington Global Select Markets’ Total Annual Fund Operating Expenses through at least April 30, 2017, prior to the Closing Date of the Reorganization. A decrease in the total annual operating expenses of Huntington Global Select Markets compared to its pre-reorganization total annual operating expenses is due to the approval of an Expense Limitation Agreement between the Funds and the Advisor wherein the Huntington Global Select Markets total annual operating expenses are expected to be 0.94% lower following the Reorganization. While no assurance can be provided, following the Reorganization, the total annual operating expenses of Huntington Global Select Markets may decrease over the long-term due to the spreading of fixed costs over a larger pool of assets so that shareholders of Huntington Global Select Markets may in the future benefit from lower expenses achieved through economies of scale. |
Although Huntington International Equity and Huntington Global Select Markets have identical investment objectives and similar principal investment strategies, it is likely that some of the securities held by Huntington International Equity may need to be sold in connection with the Reorganization for the purpose of complying with the investment policies or limitations of Huntington Global Select Markets. If such sales occur, the transaction costs will be borne by the Advisor.
Summary of the Agreement and Plan of Reorganization
The Plan sets forth the key features of the Reorganization. For a complete description of the Reorganization, see Exhibit A. The Plan generally provides for the following:
| | • | | the in-kind transfer of all of the assets of Huntington International Equity to Huntington Global Select Markets in exchange for shares of Huntington Global Select Markets; |
| | • | | the assumption by Huntington Global Select Markets of all of the liabilities of Huntington International Equity; |
| | • | | the liquidation of Huntington International Equity by distribution of shares of Huntington Global Select Markets; and |
| | • | | the structuring of the Reorganization as a tax-free reorganization for federal income tax purposes. |
The Reorganization is expected to be completed on or about December 19, 2014.
COMPARISON OF THE HUNTINGTON INTERNATIONAL EQUITY AND
HUNTINGTON GLOBAL SELECT MARKETS FUNDS
Investment Objectives; Principal Investment Strategies and Risks
The investment objectives of Huntington Global Select Markets and Huntington International Equity are identical, as each Fund seeks total return. Although the principal investment strategies of the Funds are similar, there are differences between the Funds.
Specifically, Huntington Global Select Markets normally pursues its investment objective by investing primarily in equity and fixed income securities, including real estate investment trusts (“REITS”), in the United States and in developed and emerging markets throughout the world. Huntington Global Select Markets invests across different countries and regions, and under normal market conditions, will invest at least 40% of its assets in securities of issuers outside of the United States. Huntington Global Select Markets has no maturity restrictions on the fixed income securities in which it invests. Huntington Global Select Markets may invest in securities of issuers of any market capitalization and seeks to moderate volatility by employing a strategy of investing in equity and fixed income securities in developed and emerging markets.
5
In contrast, Huntington International Equity normally pursues its investment objective by investing at least 80% of its assets in equity securities, and at least 65% of its assets in companies based outside of the United States. Like Huntington Global Select Markets, Huntington International Equity invests in emerging markets; however Huntington International Equity may not invest more than 20% of its assets in companies located in emerging markets. In determining which markets are emerging markets, Huntington International Equity assesses whether the market is large and liquid enough that trading is readily available, and whether the management of the market itself has a history of meeting what the Advisor believes to be global norms of transparency.
In managing Huntington Global Select Markets Fund’s portfolio, the Advisor utilizes a “top-down” macroeconomic analysis to identify those countries believed to have the best prospects for sustainable growth and a “bottom-up” process is utilized to identify securities expected to provide what the Advisor believes will be superior risk-adjusted returns in those countries. Huntington Global Select Markets may also use various techniques, such as buying and selling futures contracts and exchange traded funds (“ETFs”), to increase or decrease the Huntington Global Select Markets’ exposure to changing security prices, interest rates or other factors that affect security values. In addition, in limited circumstances Huntington Global Select Markets may enter into derivatives contracts in which a foreign currency is an underlying asset in order to help manage the Fund’s exposure to changes in the value of the U.S. dollar relative to other currencies. In addition, the Fund may invest up to 20% of its assets in lower quality fixed income securities (also known as “junk bonds”). Similar to the Huntington Global Select Markets, the Advisor utilizes a “bottom-up” approach to stock selection and a “top-down” evaluation of industry and country exposure in managing the Huntington International Equity.
For detailed information about the principal investment strategies and risks of Huntington Global Select Markets, as well as each of its investment limitations and restrictions, see the current Prospectus and Statement of Additional Information for Huntington Global Select Markets, which is incorporated herein by reference.
The following summarizes a comparison of the Funds with respect to their principal investment strategies, as set forth in the Prospectus and Statement of Additional Information relating to each respective Fund.
| | | | |
| | | Huntington International Equity | | Huntington Global Select Markets |
Investment
Objective | | Seeks total return. | | Seeks total return. |
| | |
Principal
Investment
Strategy | | The Fund normally pursues its investment objective by investing at least 80% of its assets in equity securities, and at least 65% of its assets in companies based outside the United States. The Advisor manages the Fund based on the view that international equity markets are inefficient at pricing securities and that careful security selection generally offers the best potential for superior long-term investment returns. The Advisor uses a “bottom-up” approach to stock selection (searching for outstanding performance of individual stocks before considering the impact of economic trends) and evaluates industry and country exposure to be consistent with a “top-down” approach. The Advisor attempts to purchase | | The Fund normally pursues its investment objective by investing in equity and fixed income securities [including real estate investment trusts (“REITs”)] in the United States and in developed and emerging markets throughout the world. The proportions of the Fund’s assets invested in equity and fixed income securities vary based on the Advisor’s interpretation of economic conditions and underlying securities values. The Advisor generally allocates the Fund’s investments across different countries and regions, and under normal market conditions, the Fund invests significantly (at least 40% — unless market conditions are not deemed favorable by the Advisor, in which case the Fund invests at least 30%) in securities of issuers based outside the United States. The Fund |
6
| | | | |
| | | Huntington International Equity | | Huntington Global Select Markets |
| | |
| | securities with value characteristics consistent with an overall assessment of the economic environment in which the underlying company operates and the overall growth in the company’s economic value. The Fund will not invest more than 20% of its assets in companies located in emerging markets. In determining which markets are emerging markets, the Advisor will look at whether the market is large and liquid enough that trading is readily available, and that the management of the market itself has a history of meeting what the Advisor believes to be global norms of transparency. Because the Fund contains “equity” in its name, the Fund will normally invest at least 80% of its assets in equity securities and will notify shareholders at least 60 days in advance of any changes in this investment policy. | | may invest in equity and fixed income securities of issuers of any market capitalization. The Advisor will employ continuous “top-down” macroeconomic analysis to identify those countries believed to have the best prospects for sustainable growth. A “bottom up” process will then identify securities expected to provide what the Advisor believes will be superior risk-adjusted returns in those countries. By investing in equities and fixed income securities in developed and emerging markets, the Fund seeks to moderate volatility compared to investing solely in emerging market equities. The Fund has no maturity restrictions on the fixed income securities in which it invests. The Advisor may also use various techniques, such as buying and selling futures contracts and exchange traded funds (“ETFs”), to increase or decrease the Fund’s exposure to changing security prices, interest rates or other factors that affect security values. In addition, in limited circumstances the Advisor may, in order to help the Fund manage its exposure to changes in the value of the U.S. dollar relative to other currencies, enter into derivatives contracts in which a foreign currency is an underlying asset. In addition, the Fund may invest up to 20% of its assets in lower quality fixed income securities (also known as “junk bonds”) — for example, securities which at time of purchase are not rated in one of the four highest categories by a U.S. nationally rated statistical rating organization (or, if unrated, are not determined by the Advisor to be of a quality comparable to a security rated within the four highest rating categories). |
7
Principal Risks
An investment in each Fund is subject to certain risks. There is no assurance that the investment performance of either Fund will be positive or that either Fund will meet its investment objective. The following discussion highlights the principal risks associated with investment in each of the Funds. The risks of the Funds are similar because the Funds have identical investment objectives and similar principal investment strategies.
Huntington Global Select Markets and Huntington International Equity
Each of the Funds has the following risks:
Emerging Markets Risk. In addition to all of the risks of investing in foreign developed markets, emerging market securities involve risks attendant to less mature and stable governments and economies, such as lower trading volume, trading suspension, security price volatility, repatriation restrictions, government confiscation, inflation, deflation, currency devaluation and adverse government regulations of industries or markets. As a result of these risks, the prices of emerging market securities tend to be more volatile than the securities of issuers located in developed markets.
Equity Securities Risk. The price of equity securities in the Fund’s portfolio will fluctuate based on actual or perceived changes in a company’s financial condition and on market and economic conditions.
Foreign Custodial Services and Related Investment Costs Risk. Foreign custodial services are generally more expensive in foreign jurisdictions than in the United States. In addition, because the procedures for settling securities transactions in foreign markets differ from those in the United States, it may be more difficult for the Fund to make intended purchases and sales of securities in foreign countries.
Foreign Investment/Currency Risk. Investments in foreign securities tend to be more volatile and less liquid than investments in U.S. securities because, among other things, they involve risks relating to political, social and economic developments abroad, as well as risks resulting from differences between the regulations and reporting standards and practices to which U.S. and foreign issuers are subject. All of the risks of investing in foreign securities are typically increased by investing in emerging market countries. Securities denominated in foreign currencies may be adversely affected by changes in currency rates and by substantial currency conversion costs.
Liquidity Risk. Liquidity risk refers to the possibility that the Fund may not be able to sell a security when it wants to, which could cause the Fund to continue to hold the security and thereby incur a loss.
Market Risk. The value of securities in the Fund’s portfolio will fluctuate and, as a result, the Fund’s share price may decline suddenly or over a sustained period of time.
Huntington International Equity
Huntington International Equity has the following additional risks:
Investment Style Risk. The type of securities in which a Fund invests may underperform other assets or the overall market.
Huntington Global Select Markets
Huntington Global Select Markets has the following additional risks:
Counterparty Risk. The value of the Fund’s investments may be adversely affected if an issuer’s securities experience a credit downgrade; an issuer or guarantor of an investment held by the Fund fails to pay an
8
obligation on a timely basis, otherwise defaults or is perceived by other investors to be less creditworthy; or a counterparty to a derivatives or other transaction with the Fund files for bankruptcy, becomes insolvent, or otherwise becomes unable or unwilling to honor its obligation to the Fund.
Credit Risk. Issuers of securities in which the Fund invests may have their credit ratings downgraded or may default in the payment of principal or interest on the securities, which would cause the Fund to lose money.
Derivative Contracts and Hybrid Instruments Risk. Derivatives contracts and hybrid instruments involve risks different from, and possibly greater than, traditional investments, including valuation and tax issues, increased potential for losses and/or costs to the Fund, and interest rate, credit, currency, liquidity and leverage risks. For additional information regarding these risks, see the “Investment Risks” section in the Fund’s Statement of Additional Information.
Exchange-Traded Funds Risk. Like an open-end investment company (mutual fund), the value of an ETF can fluctuate based on the prices of the securities owned by the ETF, and ETFs are also subject to the following additional risks: (i) the ETF’s market price may be less than its net asset value; (ii) an active market for the ETF may not develop; and (iii) market trading in the ETF may be halted under certain circumstances.
Government Intervention and Extreme Volatility Risk. Governments and their agencies may take legislative or regulatory actions that affect the securities in which the Fund invests, the issuers of such securities or the Fund itself, in a manner which could limit or preclude the Fund’s ability to achieve its investment objective.
Hedging Risk. When a derivative contract is used as a hedge against an opposite position that the Fund holds, any loss on an underlying security (or position) should be substantially offset by gains on the hedged investment, and vice versa. Because it may not always be possible to perfectly offset one position with another, there is no assurance that the Fund’s hedging transactions will be effective.
Interest Rate Risk. The value of the Fund’s investments in fixed income securities may decline when prevailing interest rates rise or increase when interest rates go down. The longer a security’s maturity or duration, the greater its value will change in response to changes in interest rates. The interest earned on the Fund’s investments in fixed income securities may decline when prevailing interest rates decline.
Leverage Risk. Derivatives and other transactions that give rise to leverage may cause the Fund’s performance to be more volatile than if the Fund had not been leveraged. Leveraging also may require that the Fund liquidate securities when it may not be advantageous to do so to satisfy its obligations or to meet segregation requirements.
Manager Risk. The Advisor’s selection of securities for the Fund may cause the Fund to underperform similar funds or relevant benchmarks.
Market Capitalization Risk. Investing primarily in issuers in one market capitalization category (large, medium or small) carries the risk that due to current market conditions that category may be out of favor with investors. Larger, more established companies may be unable to respond quickly to new competitive challenges or attain the high growth rate of successful smaller companies. Stocks of smaller companies may be more volatile than those of larger companies due to, among other things, narrower product lines, more limited financial resources and fewer experienced managers. In addition, there is typically less publicly available information about small capitalization companies, and their stocks may have a more limited trading market than stocks of larger companies.
Non-Investment Grade Securities Risk. Fixed income securities rated below investment grade generally entail greater interest rate, liquidity and credit risks than investment grade securities.
9
Real Estate/REIT Risk. The Fund’s investments in REITs are subject to the same risks as direct investments in real estate, including sensitivity to general economic downturns and the volatility of local real estate markets. REITs may have limited financial resources and their securities may trade infrequently and in limited volume, and thus they may be more volatile than other securities.
Fees and Expenses
The Reorganization is expected to result in annual fund operating expenses that are at least as low as those of Huntington International Equity prior to the Reorganization due to the Advisor contractually capping expenses of Huntington Global Select Markets through April 30, 2017. The investment management fee charged by the Advisor for Huntington Global Select Markets is the same as the investment management fee charged for Huntington International Equity and the fee rates to be charged by the various service providers to Huntington Global Select Markets are the same or lower than the fee rates charged to Huntington International Equity. More detailed information about the annual fund operating expenses for the each Fund is set forth in the respective Prospectus.
The following tables show the various sales charges, fees and expenses that you may pay for buying, holding and redeeming shares of each Fund.
Huntington International Equity
| | | | | | | | |
Shareholder Fees (fees paid directly from your investment) | | Institutional
Shares | | | Class A
Shares | |
Maximum Sales Charge (Load) Imposed on Purchase (as a percentage of offering price) | | | None | | | | 4.75 | % |
Maximum Deferred Sales Charge (Load) (as a percentage of net asset value) | | | None | | | | None | |
Redemption Fee (as a percentage of amount redeemed, if applicable) | | | None | | | | None | |
| | | | | | | | |
Annual Fund Operating Expenses (expenses that you pay each year as a percentage of the value of your
investment) | | Institutional
Shares | | | Class A
Shares | |
Management Fees | | | 1.00 | % | | | 1.00 | % |
Distribution (12b-1) Fees | | | None | | | | 0.25 | % |
Other Expenses (including shareholder services fee) | | | 0.55 | % | | | 0.55 | % |
Acquired Fund Fees and Expenses | | | 0.03 | % | | | 0.03 | % |
Total Annual Fund Operating Expenses | | | 1.58 | % | | | 1.83 | % |
Fee Waivers and/or Expense Reimbursements(1) | | | (0.68 | )% | | | (0.68 | )% |
| | | | | | | | |
Total Annual Fund Operating Expenses After Fee Waivers and/or Expense Reimbursements | | | 0.90 | % | | | 1.15 | % |
| | | | | | | | |
| (1) | Huntington Asset Advisors, Inc. (the “Advisor”) has contractually agreed to waive all or a portion of its management fee and/or reimburse certain operating expenses of the Fund to the extent necessary in order to limit the Fund’s total annual fund operating expenses (after the fee waivers and/or expense reimbursements, and exclusive of acquired fund fees and expenses, brokerage costs, interest, taxes and dividends, and extraordinary expenses) to not more than 0.87% and 1.12% of the Institutional Shares and Class A Shares daily net assets, respectively, through April 30, 2015. This arrangement may only be terminated prior to this date with the agreement of the Fund’s Board of Trustees. Under certain conditions, the Advisor may recapture operating expenses reimbursed under these arrangements for a period of three years following the |
10
| | fiscal year in which such reimbursement occurred. Any amounts recaptured by the Advisor may not cause the Fund’s total annual fund operating expenses to exceed the stated expense caps. |
Huntington Global Select Markets
| | | | | | | | |
Shareholder Fees (fees paid directly from your investment) | | Institutional
Shares | | | Class A
Shares | |
Maximum Sales Charge (Load) Imposed on Purchase (as a percentage of offering price) | | | None | | | | 4.75 | % |
Maximum Deferred Sales Charge (Load) (as a percentage of net asset value) | | | None | | | | None | |
Redemption Fee (as a percentage of amount redeemed, if applicable) | | | None | | | | None | |
| | | | | | | | |
Annual Fund Operating Expenses (expenses that you pay each year as a percentage of the value of your
investment) | | Institutional
Shares | | | Class A
Shares | |
Management Fees | | | 1.00 | % | | | 1.00 | % |
Distribution (12b-1) Fees | | | None | | | | 0.25 | % |
Other Expenses (including shareholder services fee) | | | 1.01 | % | | | 1.01 | % |
Acquired Fund Fees and Expenses | | | 0.09 | % | | | 0.09 | % |
Total Annual Fund Operating Expenses | | | 2.10 | % | | | 2.35 | % |
Fee Waivers and/or Expense Reimbursements(1) | | | (1.14 | )% | | | (1.14 | )% |
| | | | | | | | |
Total Annual Fund Operating Expenses After Fee Waivers and/or Expense Reimbursements | | | 0.96 | % | | | 1.21 | % |
| | | | | | | | |
| (1) | Huntington Asset Advisors, Inc. (the “Advisor”) has contractually agreed to waive all or a portion of its management fee and/or reimburse certain operating expenses of the Fund to the extent necessary in order to limit the Fund’s total annual fund operating expenses (after the fee waivers and/or expense reimbursements, and exclusive of acquired fund fees and expenses, brokerage costs, interest, taxes and dividends, and extraordinary expenses) to not more than 0.87% and 1.12% of the Institutional Shares and Class A Shares daily net assets, respectively, through April 30, 2017. This arrangement may only be terminated prior to this date with the agreement of the Fund’s Board of Trustees. Under certain conditions, the Advisor may recapture operating expenses reimbursed under these arrangements for a period of three years following the fiscal year in which such reimbursement occurred. Any amounts recaptured by the Advisor may not cause the Fund’s total annual fund operating expenses to exceed the stated expense caps. |
11
Huntington Global Select Markets (Pro Forma)
| | | | | | | | |
Shareholder Fees (fees paid directly from your investment) | | Institutional
Shares | | | Class A
Shares | |
Maximum Sales Charge (Load) Imposed on Purchase (as a percentage of offering price) | | | None | | | | 4.75 | % |
Maximum Deferred Sales Charge (Load) (as a percentage of net asset value) | | | None | | | | None | |
Redemption Fee (as a percentage of amount redeemed, if applicable) | | | None | | | | None | |
| | | | | | | | |
Annual Fund Operating Expenses (expenses that you pay each year as a percentage of the value of your
investment) | | Institutional
Shares | | | Class A
Shares | |
Management Fees | | | 1.00 | % | | | 1.00 | % |
Distribution (12b-1) Fees | | | None | | | | 0.25 | % |
Other Expenses (including shareholder services fee) | | | 0.61 | % | | | 0.61 | % |
Acquired Fund Fees and Expenses | | | 0.03 | % | | | 0.03 | % |
Total Annual Fund Operating Expenses | | | 1.64 | % | | | 1.89 | % |
Fee Waivers and/or Expense Reimbursements(1) | | | (0.74 | )% | | | (0.74 | )% |
| | | | | | | | |
Total Annual Fund Operating Expenses After Fee Waivers and/or Expense Reimbursements | | | 0.90 | % | | | 1.15 | % |
| | | | | | | | |
| (1) | Huntington Asset Advisors, Inc. (the “Advisor”) has contractually agreed to waive all or a portion of its management fee and/or reimburse certain operating expenses of the Fund to the extent necessary in order to limit the Fund’s total annual fund operating expenses (after the fee waivers and/or expense reimbursements, and exclusive of acquired fund fees and expenses, brokerage costs, interest, taxes and dividends, and extraordinary expenses) to not more than 0.87% and 1.12% of the Institutional Shares and Class A Shares daily net assets, respectively, through April 30, 2017. This arrangement may only be terminated prior to this date with the agreement of the Fund’s Board of Trustees. Under certain conditions, the Advisor may recapture operating expenses reimbursed under these arrangements for a period of three years following the fiscal year in which such reimbursement occurred. |
12
The tables below show examples that are intended to help you compare the cost of investing in the Funds and Huntington Global Select Markets Pro Forma, assuming the Reorganization takes place. The examples assume that you invest $10,000 in the Funds for the one-, three-, five- and ten-year periods as indicated. They show your costs if you sold your shares at the end of the period or continued to hold them. The examples also assume that your investment has a 5% return each year and that each Fund’s operating expenses remain the same, and the expenses were capped for two years in each period for the Huntington Global Select Markets Pro Forma. Although your actual costs may be higher or lower, based on these assumptions your costs would be:
Examples of Fund Expenses
| | | | | | | | |
| | | One Year | | Three
Years | | Five
Years | | Ten
Years |
Huntington International Equity | | | | | | | | |
Institutional Shares | | $92 | | $432 | | $796 | | $1,821 |
Class A Shares | | $587 | | $960 | | $1,358 | | $2,468 |
Huntington Global Select Markets | | | | | | | | |
Institutional Shares | | $98 | | $358 | | $843 | | $2,182 |
Class A Shares | | $592 | | $890 | | $1,402 | | $2,804 |
Huntington Global Select Markets (Pro Forma) | | | | | | | | |
Institutional Shares | | $92 | | $339 | | $719 | | $1,789 |
Class A Shares | | $587 | | $872 | | $1,286 | | $2,439 |
Portfolio Turnover
Each Fund pays transaction costs, such as commissions, when it buys and sells securities (or “turns over” its portfolio). A higher portfolio turnover rate may indicate higher transaction costs and may result in higher taxes when Fund shares are held in a taxable account. These costs, which are not reflected in annual fund operating expenses or in the Example, affect the Fund’s performance. During the most recent fiscal year, the Funds’ portfolio turnover rates were 62% and 156% of the average value of the portfolios of Huntington International Equity and Huntington Global Select Markets, respectively.
13
Performance Records
The following charts show the past performance record of each Fund. Past performance is not an indication of future results. The Funds may also experience short-term performance swings as indicated in the high and low quarter information at the bottom of each chart.
Huntington International Equity
The performance information shown below will help you analyze the Fund’s investment risks in light of its historical returns. The bar chart shows the variability of the Fund’s Institutional Shares total returns on a calendar year-by-year basis. The Average Annual Total Return Table shows returns averaged over the stated periods, and includes comparative performance information. The Fund’s performance will fluctuate, and past performance (before and after taxes) is not necessarily an indication of future results.
The annual returns in the bar chart which follows are for the Institutional Shares without reflecting payment of any sales charge; if they did reflect such payment of sales charges, annual returns would be lower.
Updated performance information will be available at www.huntingtonfunds.com, or by calling 800-253-0412.
Performance Bar Chart and Table
| | | | | | | | | | |
Risk/Return Bar Chart 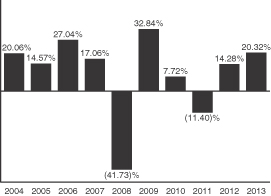
| | Best Quarter Worst Quarter | |
| Q2 2009
Q4 2008 |
| |
| 22.90
(23.11 | %
)% |
| | | | | | | | | | |
| | | | | | | | | | |
| | | | | | | | | | |
| | | | | | | | | | |
| | | | | | | | | | |
| | | | | | | | | | |
| | | | | | | | | | |
| | | | | | | | | | |
| | | | | | | | | | |
| | | | | | | | | | |
| | | | | | | | | | |
| | | | | | | | | | |
14
| | |
| | Average Annual Total Return Table (for the periods ended December 31, 2013) |
| | | | | | | | | | | | |
| | | 1 Year | | | 5 Years | | | 10 Years | |
| International Equity Fund — Institutional Shares | | | | | | | | | | | | |
| Returns before taxes | | | 20.32% | | | | 11.76% | | | | 7.59% | |
| Returns after taxes on distributions(1) | | | 19.72% | | | | 11.61% | | | | 7.16% | |
Returns after taxes on distributions and sales of
Institutional Shares(1) | | | 12.26% | | | | 9.60% | | | | 6.47% | |
International Equity Fund — Class A Shares
(with 4.75% sales charge) | | | | | | | | | | | | |
| Returns before taxes | | | 14.32% | | | | 10.39% | | | | 6.80% | |
Morgan Stanley Capital International Europe, Australasia and Far East Index (MSCI-EAFE) (reflects no deduction for fees, expenses or taxes)(2) | | | 22.78% | | | | 12.44% | | | | 6.91% | |
| (1) | After tax returns are calculated using a standard set of assumptions. The stated returns assume the highest historical federal income and capital gains tax rates. Returns after taxes on distributions assumes a continued investment in the Fund and show the effect of taxes on Fund distributions. Returns after taxes on distributions and sales of Fund Shares assumes all Shares were redeemed at the end of each measurement period, and shows the effect of any taxable gain (or offsetting loss) on redemption, as well as the effects of taxes on Fund distributions. These after tax returns do not reflect the effect of any applicable state and local taxes. After tax returns are not relevant to investors holding Shares through tax-deferred programs, such as IRA or 401(k) plans. |
| (2) | The MSCI-EAFE Index is a free float-adjusted market capitalization index that is designed to measure the equity market performance of developed markets, excluding the US & Canada. The MSCI-EAFE Index consists of the following 22 developed market country indices: Australia, Austria, Belgium, Denmark, Finland, France, Germany, Greece, Hong Kong, Ireland, Israel, Italy, Japan, the Netherlands, New Zealand, Norway, Portugal, Singapore, Spain, Sweden, Switzerland, and the United Kingdom. The index is unmanaged and, unlike the Fund, is not affected by cash flows. It is not possible to invest directly in an Index. |
15
Huntington Global Select Markets
The performance information shown below will help you analyze the Fund’s investment risks in light of its historical returns. The bar chart shows the variability of the Fund’s Institutional Shares total returns on a calendar year-by-year basis. The Average Annual Total Return Table shows returns averaged over the stated periods, and includes comparative performance information. The Fund’s performance will fluctuate, and past performance (before and after taxes) is not necessarily an indication of future results.
The annual returns in the bar chart which follows are for the Institutional Shares without reflecting payment of any sales charge; if they did reflect such payment of sales charges, annual returns would be lower.
Updated performance information will be available at www.huntingtonfunds.com, or by calling 800-253-0412.
Performance Bar Chart and Table
| | | | | | | | | | |
Risk/Return Bar Chart 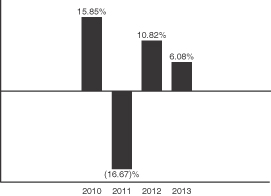
| | Best Quarter Worst Quarter | |
| Q3 2010
Q3 2011 |
| |
| 16.86
(21.81 | %
)% |
| | | | | | | | | | |
| | | | | | | | | | |
| | | | | | | | | | |
| | | | | | | | | | |
| | | | | | | | | | |
| | | | | | | | | | |
| | | | | | | | | | |
| | | | | | | | | | |
| | | | | | | | | | |
| | | | | | | | | | |
| | | | | | | | | | |
| | | | | | | | | | |
| | |
| | Average Annual Total Return Table (for the periods ended December 31, 2013) |
| | | | | | | | | | |
| | | 1 Year | | | Since Class
Inception* | | | |
| Global Select Markets Fund — Institutional Shares | | | | | | | | | | |
| Returns before taxes | | | 6.08% | | | | 3.21% | | | |
| Returns after taxes on distributions(1) | | | 5.54% | | | | 2.97% | | | |
Returns after taxes on distributions and sales of
Institutional Shares(1) | | | 3.80% | | | | 2.55% | | | |
Global Select Markets Fund — Class A Shares (with 4.75% sales charge) | | | | | | | | | | |
| Returns before taxes | | | 0.88% | | | | 1.67% | | | |
Morgan Stanley Capital International Emerging Markets Index (MSCI-EM) (reflects no deduction for fees, expenses or taxes)(2) | | | (2.60)% | | | | 3.03% | | | |
16
| (1) | After tax returns are calculated using a standard set of assumptions. The stated returns assume the highest historical federal income and capital gains tax rates. Returns after taxes on distributions assumes a continued investment in the Fund and show the effect of taxes on Fund distributions. Returns after taxes on distributions and sales of Fund Shares assumes all Shares were redeemed at the end of each measurement period, and shows the effect of any taxable gain (or offsetting loss) on redemption, as well as the effects of taxes on Fund distributions. These after tax returns do not reflect the effect of any applicable state and local taxes. After tax returns are not relevant to investors holding Shares through tax-deferred programs, such as IRA or 401(k) plans. |
| (2) | The MSCI-EM is a market capitalization-weighted equity index comprising 21 of the 48 countries in the MSCI universe. Each MSCI country index is created separately, then aggregated, without change, into MSCI indices. The index is unmanaged and, unlike the Fund, is not affected by cash flows. It is not possible to invest directly in an Index. |
| * | Since December 30, 2009. |
For a detailed discussion of the manner of calculating total return, please see the Statement of Additional Information for Huntington Global Select Markets. Generally, the calculations of total return assume the reinvestment of all dividends and capital gain distributions on the reinvestment date and the deduction of all recurring expenses that were charged to shareholders’ accounts.
Important information about Huntington Global Select Markets is also contained in management’s discussion of Huntington Global Select Markets’ performance which appears in the most recent Annual Report of the Trust relating to Huntington Global Select Markets.
Management of the Funds
Investment Advisor
The Trustees of the Trust are responsible for generally overseeing the conduct of each Fund’s business. The Advisor, whose address is Huntington Center, 41 South High Street, Columbus, Ohio 43215, serves as investment advisor to the Funds pursuant to investment advisory agreements with the Trust.
Subject to the supervision of the Trustees, the Advisor provides a continuous investment program for the Funds, including investment research and management with respect to all securities, instruments, cash and cash equivalents in the Funds.
The Advisor, a separate, wholly owned subsidiary of Huntington National Bank (“Huntington Bank”), is the investment advisor to the Huntington Funds. As of December 31, 2013, the Advisor had assets under management of $3.8 billion. The Advisor (and its predecessor) has served as investment advisor to the Funds since 1987.
Huntington Bank, 41 South High Street, Columbus, Ohio 43215, is a direct, wholly-owned subsidiary of Huntington Bancshares Incorporated, a Maryland corporation with executive offices located at Huntington Center, 41 South High Street, Columbus, Ohio 43215. As of June 30, 2014, Huntington Bank had assets of over $64 billion.
As compensation for its investment advisory services, each Fund pays the Advisor management fees as a percentage of average daily net assets on the following tiered schedule:
| | | | | | |
Global Select Markets Fund | | Up to $500 million | | | 1.00 | % |
| | On the next $500 million to $1 billion | | | 0.95 | % |
| | On excess of $1 billion | | | 0.90 | % |
| | |
International Equity Fund | | Up to $500 million | | | 1.00 | % |
| | On the next $500 million to $1 billion | | | 0.95 | % |
| | On excess of $1 billion | | | 0.90 | % |
17
Portfolio Managers
Paul Attwood, CFA, and Martina Cheung, CFA, CMT, are responsible for the day-to-day management of the Global Select Markets Fund and International Equity Fund.
Paul W. Attwood is responsible for the day-to-day management of the Global Select Markets Fund and International Equity Fund. Mr. Attwood has served as the Portfolio Manager of the Global Select Markets Fund since the Fund’s inception and has served as the Portfolio Manager of the International Equity Fund since 2012. He joined Huntington in 2002 and is a Senior Vice President of the Advisor. Prior to joining the Advisor, Mr. Attwood was a Senior Research Analyst and Portfolio Manager with Haberer Investment Advisor, a division of Huntington Private Financial Group. He has over 15 years of experience in the financial services industry. Mr. Attwood holds a Chartered Financial Analyst designation. He received his Bachelor’s degree from the University of Cincinnati.
Martina Cheung is responsible for the day-to-day management of the Global Select Markets Fund and International Equity Fund. Ms. Cheung has served as the Portfolio Manager of the Global Select Markets Fund and International Equity Fund since 2014. Ms. Cheung joined The Huntington National Bank in 1995 as a securities analyst and is currently a Senior Vice President and portfolio manager. Ms. Cheung holds a Chartered Financial Analyst designation and a Chartered Market Technician designation. She received her Bachelor’s degree in Finance and Management Information Systems from The Ohio State University and received her M.B.A. from Capital University.
For more detailed information about the portfolio managers, including each portfolio manager’s principal occupation for the past five years, compensation information and other accounts managed, see the Prospectus and Statement of Additional Information for each Fund.
INFORMATION ABOUT THE REORGANIZATION
Reasons for the Reorganization
At an in-person meeting held on September 22, 2014, the Board, consisting entirely of Independent Trustees, unanimously approved the Reorganization Plan based on information requested by the Board and provided by the Advisor. In approving the Reorganization, the Board determined that the Reorganization would be in the best interests of Huntington International Equity and its shareholders, and that the interests of the shareholders of Huntington International Equity would not be diluted as a result of effecting the Reorganization.
Before approving the Plan, the Trustees evaluated extensive information provided by management of the Trust and reviewed various factors about the Funds and the proposed Reorganization. The Trustees considered the relative asset sizes of Huntington International Equity and Huntington Global Select Markets, including the benefits of Huntington International Equity joining Huntington Global Select Markets.
The Trustees reviewed the historical performance record of each Fund and also noted that the Huntington Global Select Markets outperformed the Huntington International Equity for the one-year period ended June 30, 2014; and Huntington International Equity outperformed Huntington Global Select Markets for the three-year period ended June 30, 2014. Huntington Global Select Markets outperformed its benchmark for the one-year and since-inception periods ended December 31, 2013; whereas, Huntington International Equity underperformed its benchmark for the one- and five-year periods ended December 31, 2013. Huntington International Equity outperformed its benchmark for the ten-year period ended December 31, 2013. Upon completion of the Reorganization, Huntington Global Select Markets may achieve operating efficiencies because it will have a greater level of assets. As of June 30, 2014, Huntington International Equity had total net assets of approximately $189,552,152, while Huntington Global Select Markets had total net assets of approximately $17,006,696 as of that date. If the Reorganization is completed, Huntington Global Select Markets is expected to have total assets
18
of approximately $206,558,848. The Trustees considered the identical investment objectives, similar investment strategies and relative performance of the Funds. The Trustees also reasoned that the Reorganization would likely result in expenses at least as low as that of the Huntington International Equity shareholders due to the Advisor contractually capping expenses of the Huntington Global Select Markets’ Total Annual Fund Operating Expenses through at least April 30, 2017, prior to the Closing Date of the Reorganization.
In addition, the Trustees considered, among other things:
| | • | | the fact that the Funds have identical investment objectives and similar principal investment strategies and restrictions, and Huntington Global Select Markets will be managed by the same Advisor managing Huntington International Equity immediately prior to the Reorganization; |
| | • | | the terms and conditions of the Reorganization; |
| | • | | the fact that the Reorganization would not result in the dilution of shareholders’ interests; |
| | • | | the expense ratios, fees and expenses of Huntington International Equity and the fact that the anticipated expense ratios, fees and expenses of Huntington Global Select Markets will be at least as low as that of Huntington International Equity; |
| | • | | the investment objective and policies of each Fund; |
| | • | | the composition of each Fund’s portfolio; |
| | • | | the differences in the risks of each Fund; |
| | • | | the fact that Huntington Global Select Markets has better performance than Huntington International Equity over the one-year period ended June 30, 2014; |
| | • | | the potential benefits to shareholders, including operating efficiencies that may be achieved from the Reorganization; |
| | • | | the fact that Huntington Global Select Markets will assume all of the liabilities of Huntington International Equity; |
| | • | | the fact that the Advisor is paying the costs of the Reorganization; |
| | • | | the fact that the Reorganization is expected to be a tax-free transaction for federal income tax purposes; and |
| | • | | alternatives available to shareholders of Huntington International Equity, including the ability to redeem their shares. |
During their consideration of the Reorganization, the Independent Trustees of the Trust discussed with counsel to the Independent Trustees the legal issues involved.
After consideration of the factors noted above, together with other factors and information considered to be relevant, and recognizing that there can be no assurance that any operating efficiencies or other benefits will in fact be realized, the Trustees of the Trust concluded that the proposed Reorganization would be in the best interests of Huntington International Equity and its shareholders. Consequently, they approved the Plan on behalf of the shareholders of Huntington International Equity.
The Trustees of the Trust have also approved the Plan on behalf of Huntington Global Select Markets.
Agreement and Plan of Reorganization
Below is a summary of the important terms of the Reorganization Plan. This summary is qualified in its entirety by reference to the Reorganization Plan itself, a form of which is set forth in Exhibit A to this Prospectus/Information Statement, and which we encourage you to read in its entirety.
19
The Reorganization is expected to take effect on or before December 19, 2014 (the “Closing Date”), although that date may be adjusted in accordance with the Reorganization Plan.
General Information
The Reorganization Plan provides that all of the assets of Huntington International Equity will be acquired by Huntington Global Select Markets in exchange for shares of Huntington Global Select Markets and the assumption by Huntington Global Select Markets of all of the liabilities of Huntington International Equity on or about December 19, 2014 or such other date as may be agreed upon by the parties (the “Closing Date”).
On or prior to the Closing Date, Huntington International Equity will declare a dividend or dividends and distribution or distributions which, together with all previous dividends and distributions, shall have the effect of distributing to the Fund’s shareholders all of the Fund’s investment company taxable income for the taxable period ending on the Closing Date (computed without regard to any deduction for dividends paid) and all of the Fund’s net capital gains realized in all taxable periods ending on the Closing Date (after reductions for any capital loss carryforward).
The number of full and fractional shares of each class of Huntington Global Select Markets to be received by shareholders of Huntington International Equity will be determined by multiplying the number of outstanding full and fractional shares of each class of Huntington International Equity by a factor which shall be computed by dividing the net asset value (“NAV”) per share of Huntington International Equity by the NAV per share of the corresponding class of shares of Huntington Global Select Markets. These computations will take place as of the Valuation Time. The NAV per share of Huntington Global Select Markets and Huntington International Equity will be determined by dividing assets, less liabilities, by the total number of outstanding shares.
Immediately thereafter, Huntington International Equity will liquidate and distribute the shares received from Huntington Global Select Markets to its shareholders. This will be accomplished by opening an account on the books of Huntington Global Select Markets in the name of each shareholder of record of Huntington International Equity and transferring Huntington Global Select Markets shares to each such account in complete liquidation of Huntington International Equity. Each account will represent the pro rata number of full and fractional shares of Huntington Global Select Markets due to the respective Huntington International Equity shareholders. All issued and outstanding shares of Huntington International Equity will be canceled. The shares of Huntington Global Select Markets to be issued will have no preemptive or conversion rights and no share certificates will be issued. After these distributions and the winding up of its affairs, Huntington International Equity will be terminated.
Until the Closing Date, shareholders of Huntington International Equity will continue to be able to redeem their shares at the NAV per share next determined after receipt by Huntington International Equity’s transfer agent of a redemption request in proper form. After the Reorganization, all of the issued and outstanding shares of Huntington International Equity will be canceled on the books of Huntington International Equity, and the share transfer books of Huntington International Equity will be permanently closed. If the Reorganization is consummated, shareholders will be free to redeem the shares of Huntington Global Select Markets that they receive in the transaction at their then-current NAV. Shareholders of Huntington International Equity may wish to consult their tax advisors as to any different consequences of redeeming their shares prior to the Reorganization or exchanging such shares for shares of Huntington Global Select Markets following the Reorganization.
Other Provisions
The Reorganization is subject to a number of conditions set forth in the Reorganization Plan. Certain of these conditions may be waived by the Board of Trustees. The significant conditions include receipt by the Board and the Trust of an opinion of counsel as to certain federal income tax aspects of the Reorganization. The
20
Reorganization Plan may be terminated and the Reorganization abandoned at any time prior to the Closing Date by the Board of Trustees.
In the proposed Reorganization, shareholders of Huntington International Equity will receive shares of Huntington Global Select Markets and will be able to purchase, redeem and exchange shares and receive distributions the same way as they currently do with respect to their shares of Huntington International Equity.
Prior to or at the completion of the Reorganization, Huntington International Equity and Huntington Global Select Markets will have each received an opinion from the law firm of Sullivan & Worcester LLP that, while not entirely free from doubt, the reorganization will qualify as a tax-free reorganization within the meaning of section 368(a) of the United States Internal Revenue Code of 1986, as amended (the “Code”). Accordingly, it is believed that no gain or loss generally will be recognized by Huntington International Equity or Huntington Global Select Markets or their respective shareholders. See “Federal Income Tax Consequences” for more information on the federal tax consequences of the Reorganization.
At a meeting held on September 22, 2014, the Board approved the Reorganization Plan, finding that the Reorganization is in the best interests of Huntington International Equity and its shareholders.
Comparison of Share Classes, Sales Charges and Rule 12b-1 Fees
Share Classes
Each Fund offers two share classes, Institutional Shares and Class A Shares. The different classes of shares represent investments in the same portfolio of securities, but the classes are subject to different sales charges and expenses that are likely to result in different share prices. Class A shares of the Acquiring Fund will be issued for Class A shares of the Acquired Fund. Institutional shares of the Acquiring Fund will be issued for Institutional shares of the Acquired Fund.
Sales Charges
Class A shares of each of the Funds are offered at their public offering price, which is its NAV plus the applicable sales charge. The sales charge varies, depending on how much you invest. There are some instances where investors can purchase Class A shares without a sales charge. More detailed information about sales charges can be found in the respective Fund prospectuses.
Institutional shares of each of the Funds are offered at their public offering price, which is its NAV. There are no sales charges on Institutional shares. Institutional shares are available for purchase only to fiduciary, advisory and agency accounts of Huntington Bank correspondent banks and the Huntington Asset Allocation Funds, as well as participants in special programs that may be offered from time to time through financial intermediaries.
No sales charges will be imposed on existing shareholders in connection with the Reorganization.
Distribution and Service (Rule 12b-1) Fee Comparison
The Trust has adopted a Distribution and Shareholder Servicing Plan pursuant to Rule 12b-1 under the 1940 Act for Huntington Global Select Markets and Huntington International Equity which allows the Funds to pay fees to financial intermediaries for the sale and distribution of shares. There will be no change in the fee rates paid by shareholders pursuant to the Plan following the Reorganization.
21
Purchases and Redemptions
Each Fund has the same purchase and redemption procedures. You may purchase shares on any business day when the New York Stock Exchange (“NYSE”) is open. You may redeem shares on any business day when both the NYSE and Federal Reserve Bank are open.
Exchanges
Each Fund has the same exchange privileges. On any business day when the NYSE is open, you may exchange shares of each Fund for the same class of shares of any other Huntington Fund offering such shares.
For more information, see the sections “Purchasing Shares” and “Redeeming Shares” in the respective Fund prospectus.
Dividends and Distributions
The Funds have the same dividend distribution policy. Each Fund declares and pays dividends on investment income, if any, annually. Each Fund distributes its capital gains at least annually. All dividends and distributions payable to a holder of Shares will be automatically reinvested in additional Shares of the same class of the Fund, unless the shareholder makes an alternative election. Shareholders may choose to receive all distributions in cash or may choose to reinvest capital gains distributions, but receive all other distributions in cash. See the respective Funds’ prospectuses for further information concerning dividends and distributions.
Fiscal Year
Huntington International Equity and Huntington Global Select Markets currently operate on a fiscal year ending December 31. Following the Reorganization Huntington Global Select Markets will continue to operate on a fiscal year ending December 31 of each year.
Expenses of the Reorganization
The expenses associated with the transactions contemplated by the Reorganization Plan shall be borne by the Advisor.
Federal Income Tax Consequences
The Reorganization is intended to qualify for federal income tax purposes as a tax-free reorganization within the meaning of Section 368(a) of the Code. No gain or loss will be recognized as a consequence of the Reorganization by Huntington International Equity (except to the extent that such assets consist of contracts described in Section 1256 of the Code), nor will a gain or loss be recognized by the shareholders of Huntington International Equity as a result of Huntington Global Select Markets’ distribution of its corresponding Fund shares to such shareholders in exchange for such shareholder’s Huntington International Equity Fund shares. In addition, a shareholder’s tax basis for shares held in Huntington International Equity will carry over to the shares of Huntington Global Select Markets acquired in the Reorganization, and the holding period for shares held as a capital asset also will carry over to Huntington Global Select Markets shares received in the Reorganization. As a condition to the closing of the proposed Reorganization, each of the Trust and the Acquiring Fund shall have received a legal opinion from Sullivan & Worcester LLP to the effect that, while the matter is not entirely free from doubt, the Reorganization will qualify as a tax-free reorganization with the foregoing tax consequences. That opinion will be based upon certain assumptions and conditions and on the representations set forth in the Reorganization Plan (and, if such counsel requests, in separate letters from the Trust and the Acquiring Fund) being true and complete at the time of the Closing Date and the Reorganization’s being consummated in
22
accordance with the Reorganization Plan (without the waiver or modification of any terms or conditions thereof and without taking into account any amendment thereof that counsel has not approved).
Opinions of counsel are not binding upon the Internal Revenue Service (“IRS”) or the courts. If a Reorganization is consummated but does not qualify as a tax-free reorganization under the Code, Huntington International Equity would recognize gain or loss on the transfer of its assets to Huntington Global Select Markets and each shareholder of Huntington International Equity would recognize a taxable gain or loss equal to the difference between its tax basis in the shares of Huntington International Equity and the fair market value of the shares of Huntington Global Select Markets it receives.
Immediately prior to the Closing Date, Huntington International Equity shall have declared and paid a distribution or distributions that, together with all previous distributions, shall have the effect of distributing to its shareholders: (i) all of its investment company taxable income and all of its net realized capital gains, if any, for the period from the close of its last fiscal year to 4:00 p.m. Eastern Time on the Closing Date, and (ii) any undistributed investment company taxable income and net realized capital gains from any period to the extent not otherwise already distributed.
You should consult your tax adviser regarding the effect, if any, of the proposed Reorganization in light of your individual circumstances. Since the foregoing discussion relates only to the federal income tax consequences of the Reorganization, you should also consult your tax adviser as to state and local tax consequences, if any, of the Reorganization.
Pro Forma Capitalization
The following table sets forth the capitalization of the Funds as of June 30, 2014, and the capitalization of Huntington Global Select Markets on a pro forma basis as of that date, giving effect to the proposed acquisition of assets at net asset value. The pro forma data reflects an exchange ratio of approximately 1.14 and 1.15 shares of Class A Shares and Institutional Shares, respectively, of Huntington Global Select Markets for each share of Class A Shares and Institutional Shares of Huntington International Equity, respectively.
Capitalization of Huntington International Equity, Huntington Global Select Markets and
Huntington Global Select Markets (Pro Forma)
| | | | | | | | | | | | | | | | |
| | | Huntington
International
Equity | | | Huntington
Global Select
Markets | | | Adjustments | | | Huntington
Global Select
Markets Pro
Forma (After
Reorganization) | |
Net Assets | | | | | | | | | | | | | | | | |
Institutional Class | | $ | 180,395,387 | | | $ | 16,018,622 | | | | | | | $ | 196,414,009 | |
Class A | | $ | 9,156,765 | | | $ | 988,074 | | | | | | | $ | 10,144,839 | |
Total Net Assets | | $ | 189,552,152 | | | $ | 17,006,696 | | | | | | | $ | 206,558,848 | |
Net Asset Value Per Share | | | | | | | | | | | | | | | | |
Institutional Class | | $ | 13.07 | | | $ | 11.35 | | | | | | | $ | 11.35 | |
Class A | | $ | 12.95 | | | $ | 11.33 | | | | | | | $ | 11.33 | |
Shares Outstanding | | | | | | | | | | | | | | | | |
Institutional Class | | | 13,805,774 | | | | 1,411,662 | | | | 2,087,763 | | | | 17,305,199 | |
Class A | | | 706,895 | | | | 87,227 | | | | 101,274 | | | | 895,396 | |
Total Shares Outstanding | | | 14,512,669 | | | | 1,498,889 | | | | 2,189,037 | | | | 18,200,595 | |
The table set forth above should not be relied upon to calculate the number of shares to be received in the Reorganization; the actual number of shares to be received will depend upon the net asset value and number of shares outstanding of each Fund at the time of the Reorganization.
23
COMPARATIVE INFORMATION ON SHAREHOLDERS’ RIGHTS
Form of Organization
Huntington International Equity and Huntington Global Select Markets are series of the Trust, an open-end management investment company registered with the SEC under the 1940 Act. The Trust was reorganized as a Delaware statutory trust in June 2006, and is governed by its Declaration of Trust and By-Laws, as amended, its Board of Trustees, and applicable Delaware and federal law. The Trust is organized as a “series company” as that term is used in Rule 18f-2 under the 1940 Act. The series of the Trust currently consist of Huntington International Equity and Huntington Global Select Markets and 16 other mutual funds of various asset classes.
Capitalization
The beneficial interests in the Trust are represented by an unlimited number of transferable shares of beneficial interest, no par value, of one or more series. The Declaration of Trust of the Trust permits the Trustees to allocate shares into one or more series, and classes thereof, with rights determined by the Trustees, all without shareholder approval. Fractional shares may be issued by each Fund.
Shareholders of each Fund are entitled to receive dividends and other amounts as determined by the Trustees. Shareholders of each Fund vote separately, by Fund, as to matters, such as changes in fundamental investment restrictions, that affect only their particular Fund.
Shareholder Liability
Under Delaware law, shareholders of a Delaware statutory trust are entitled to the same limitation of personal liability extended to stockholders of Delaware corporations. To the extent that the Trust or a shareholder of the Trust is subject to the jurisdiction of courts in other states, it is possible that a court may not apply Delaware law and may thereby subject shareholders of the Trust to liability. To guard against this risk, the Trust’s Declaration of Trust (a) provides that any written obligation of the Trust may contain a statement that such obligation may only be enforced against the assets of the Trust or the particular series in question and the obligation is not binding upon the shareholders of the Trust; however, the omission of such a disclaimer will not operate to create personal liability for any shareholder; and (b) provides for indemnification out of Trust property of any shareholder held personally liable for the obligations of the Trust. Accordingly, the risk of a shareholder of the Trust incurring financial loss beyond that shareholder’s investment because of shareholder liability is limited to circumstances in which: (1) a court refuses to apply Delaware law; (2) no contractual limitation of liability was in effect; and (3) the Trust itself is unable to meet its obligations. In light of Delaware law, the nature of the Trust’s business, and the nature of its assets, the risk of personal liability to a shareholder of the Trust is remote.
Shareholder Meetings and Voting Rights
The Trust, on behalf of Huntington International Equity and Huntington Global Select Markets, is not required to hold annual meetings of shareholders. However, a meeting of shareholders for the purpose of voting upon the question of removal of a Trustee must be called when requested in writing by the holders of at least 10% of the outstanding shares of the Trust. In addition, the Trust is required to call a meeting of shareholders for the purpose of electing Trustees if, at any time, less than a majority of the Trustees then holding office were elected by shareholders. The Trust currently does not intend to hold regular shareholder meetings. Cumulative voting is not permitted in the election of Trustees of the Trust.
Except when a larger quorum is required by applicable law or the applicable governing documents, 33 1/3% of the shares entitled to vote constitutes a quorum for consideration of a matter at a shareholders’ meeting. When
24
a quorum is present at a meeting, a majority (greater than 50%) of the shares voted is sufficient to act on a matter and a plurality of the shares voted is required to elect a Trustee (unless otherwise specifically required by the applicable governing documents or other law, including the 1940 Act).
A Trustee of the Trust may be removed with or without cause at a meeting of shareholders by a vote of two-thirds of the outstanding shares of the Trust, or with or without cause by the vote of two-thirds of the number of Trustees prior to removal.
Under the Trust’s Declaration of Trust, each shareholder is entitled to one vote for each dollar of net asset value of each share owned by such shareholder and each fractional dollar amount is entitled to a proportionate fractional vote.
The Trust’s Declaration of Trust provides that unless otherwise required by applicable law (including the 1940 Act), the Board of Trustees may, without obtaining a shareholder vote: (1) reorganize the Trust as a corporation or other entity, (2) merge the Trust into another entity, or merge, consolidate or transfer the assets and liabilities or class of shares to another entity, and (3) combine the assets and liabilities held with respect to two or more series or classes into assets and liabilities held with respect to a single series or class.
Under certain circumstances, the Trustees of the Trust may also terminate the Trust, a series, or a class of shares, upon written notice to the shareholders.
Liquidation
In the event of the liquidation of the Trust, either Fund, or a class of shares, the shareholders are entitled to receive, when and as declared by the Trustees, the excess of the assets belonging to the Trust, the Fund, or attributable to the class over the liabilities belonging to the Trust, the Fund, or attributable to the class. The assets so distributable to shareholders of the Fund will be distributed among the shareholders in proportion to the dollar value of shares of such Fund or class of the Fund held by them on the date of distribution.
Liability and Indemnification of Trustees
The Declaration of Trust of the Trust provides that no Trustee or officer shall be liable to the Trust or to any shareholder, Trustee, officer, employee or agent of the Trust for any action or failure to act except for his or her own willful misfeasance, bad faith, gross negligence or reckless disregard of his or her duties involved in the conduct of his or her office. The Declaration of Trust provides that present and former Trustees or officers are generally entitled to indemnification against liabilities and expenses with respect to claims related to their position with the Funds unless, in the case of any liability to the Funds or their shareholders, such Trustee or officer is liable by reason of his or her willful misfeasance, bad faith, gross negligence or reckless disregard of his or her duties involved in the conduct of his or her office.
The foregoing is only a summary of certain characteristics of the operations of the Declaration of Trust of the Trust, its Bylaws and Delaware and federal law and is not a complete description of those documents or law. Shareholders should refer to the provisions of such Declaration of Trust, Bylaws and Delaware and federal law directly for more complete information.
25
Shareholder Information
As of June 30, 2014 the total number of shares of Huntington International Equity outstanding was as follows:
| | | | |
| | | Number of Shares | |
Institutional Shares | | | 13,805,774 | |
Class A Shares | | | 706,895 | |
| | | | |
Total | | | 14,512,669 | |
As of [ ], 2014, the officers and Trustees of the Trust, as a group, owned beneficially or of record less than 1% of the outstanding shares of Huntington International Equity.
As of [ ], 2014, the officers and Trustees of the Trust, as a group, owned beneficially or of record less than 1% of the outstanding shares of Huntington Global Select Markets.
Control Persons and Principal Holders of Securities
The beneficial owners or record owners of more than 5% of the shares of Huntington International Equity and Huntington Global Select Markets as of [ ], 2014, were as follows:
Huntington International Equity
| | | | | | |
Name and Address | | Total Shares | | % of Shares of
Portfolio Before
Reorganization | | % of Shares of
Portfolio After
Reorganization |
Huntington Global Select Markets
| | | | | | |
Name and Address | | Total Shares | | % of Shares of
Portfolio Before
Reorganization | | % of Shares of
Portfolio After
Reorganization |
Financial Statements and Experts
The Annual Report of the Trust relating to Huntington International Equity, for the year ended as of December 31, 2013, including the financial statements and financial highlights for the periods indicated therein, has been incorporated by reference herein and in the Registration Statement. The financial statements audited by Ernst & Young LLP, independent registered public accounting firm, have been included in reliance on their report given on their authority as experts in accounting and auditing.
The Annual Report of the Trust relating to Huntington Global Select Markets, for the year ended as of December 31, 2013, including the financial statements and financial highlights for the periods indicated therein, has been incorporated by reference herein and in the Registration Statement. The financial statements audited by Ernst & Young LLP, independent registered public accounting firm, have been included in reliance on their report given on their authority as experts in accounting and auditing.
26
Legal Matters
Certain legal matters concerning the issuance of shares of Huntington Global Select Markets will be passed upon by Sullivan & Worcester LLP, counsel to the Trust.
Additional Information
The Trust is subject to the informational requirements of the Securities Exchange Act of 1934 and the 1940 Act, and in accordance therewith files reports and other information including proxy material and charter documents with the SEC. These items can be inspected and copied at the Public Reference Facilities maintained by the SEC at 100 F Street, N.E., Washington, D.C. 20549, and at the SEC’s Chicago Regional Office located at 175 W. Jackson Boulevard, Suite 900, Chicago, Illinois 60604 and the SEC’s New York Regional office located at 3 World Financial Center, Suite 400, New York, New York 10281. Copies of such materials can also be obtained at prescribed rates from the Public Reference Branch, Office of Consumer Affairs and Information Services, Securities and Exchange Commission, 100 F Street, N.E., Washington, D.C. 20549.
October 7, 2014
27
Exhibit “A”
FORM OF AGREEMENT AND PLAN OF REORGANIZATION
THIS AGREEMENT AND PLAN OF REORGANIZATION (the “Agreement”) is made as of this 22nd day of September, 2014, by and between The Huntington Funds, a Delaware statutory trust, with its principal place of business at 2960 N. Meridian Street, Suite 300, Indianapolis, IN 46208 (the “Trust”), with respect to its Huntington Global Select Markets Fund (the “Acquiring Fund”), and the Trust, with respect to its Huntington International Equity Fund (the “Selling Fund”).
The reorganization (the “Reorganization”) will consist of (i) the transfer of all of the assets of the Selling Fund in exchange solely for shares of beneficial interest, without par value per share, of the Acquiring Fund (the “Acquiring Fund Shares”); (ii) the assumption by the Acquiring Fund of all of the liabilities of the Selling Fund; and (iii) the distribution, after the Closing Date hereinafter referred to, of the Acquiring Fund Shares to the shareholders of the Selling Fund in liquidation of the Selling Fund as provided herein, all upon the terms and conditions hereinafter set forth in this Agreement.
WHEREAS, the Selling Fund and the Acquiring Fund are each a separate investment series of an open-end, registered investment company of the management type and the Selling Fund owns securities that generally are assets of the character in which the Acquiring Fund is permitted to invest;
WHEREAS, the Selling Fund and the Acquiring Fund are authorized to issue their shares of beneficial interest;
WHEREAS, the Trustees of the Trust have determined that the transactions contemplated herein will be in the best interests of the Acquiring Fund and its shareholders;
WHEREAS, the Trustees of the Trust have determined that the Selling Fund should exchange all of its assets and liabilities for Acquiring Fund Shares and that the interests of the existing shareholders of the Selling Fund will not be diluted as a result of the transactions contemplated herein;
NOW, THEREFORE, in consideration of the premises and of the covenants and agreements hereinafter set forth, the parties hereto covenant and agree as follows:
ARTICLE I
TRANSFER OF ASSETS OF THE SELLING FUND IN EXCHANGE FOR THE
ACQUIRING FUND SHARES AND ASSUMPTION OF SELLING FUND
LIABILITIES AND LIQUIDATION OF THE SELLING FUND
1.1 THE EXCHANGE. Subject to the terms and conditions herein set forth and on the basis of the representations and warranties contained herein, the Selling Fund agrees to transfer all of the Selling Fund’s assets as set forth in paragraph 1.2 to the Acquiring Fund. The Acquiring Fund agrees in exchange for the Selling Fund’s assets (i) to deliver to the Selling Fund the number of Acquiring Fund Shares, including fractional Acquiring Fund Shares, computed in the manner and as of the time and date set forth in paragraphs 2.2 and 2.3; and (ii) to assume all of the liabilities of the Selling Fund, as set forth in paragraph 1.3. Such transactions shall take place on the Closing Date provided for in paragraph 3.1.
1.2 ASSETS TO BE ACQUIRED. The assets of the Selling Fund to be acquired by the Acquiring Fund shall consist of all property, including, without limitation, all cash, securities, commodities, interests in futures and dividends or interest receivables, that is owned by the Selling Fund and any deferred or prepaid expenses shown as an asset on the books of the Selling Fund on the Closing Date.
1
Exhibit “A”
The Selling Fund has provided the Acquiring Fund with its most recent unaudited financial statements, which contain a list of all of the Selling Fund’s assets as of the date thereof. The Selling Fund hereby represents that as of the date of the execution of this Agreement there have been no changes in its financial position as reflected in said financial statements other than those occurring in the ordinary course of its business in connection with the purchase and sale of securities and the payment of its normal operating expenses. The Selling Fund reserves the right to sell any of such securities, but will not, without the prior written approval of the Acquiring Fund, acquire any additional securities other than securities of the type in which the Acquiring Fund is permitted to invest.
The Acquiring Fund will, within a reasonable time prior to the Closing Date, furnish the Selling Fund with a list of the securities, if any, on the Selling Fund’s list referred to in the second sentence of this paragraph that do not conform to the Acquiring Fund’s investment objectives, policies, and restrictions. The Selling Fund will, within a reasonable period of time (not less than 30 days) prior to the Closing Date, furnish the Acquiring Fund with a list of its portfolio securities and other investments. In the event that the Selling Fund holds any investments that the Acquiring Fund may not hold, the Selling Fund, if requested by the Acquiring Fund, will dispose of such securities prior to the Closing Date. In addition, if it is determined that the Selling Fund and the Acquiring Fund portfolios, when aggregated, would contain investments exceeding certain percentage limitations imposed upon the Acquiring Fund with respect to such investments, the Selling Fund if requested by the Acquiring Fund will dispose of a sufficient amount of such investments as may be necessary to avoid violating such limitations as of the Closing Date. Notwithstanding the foregoing, nothing herein will require the Selling Fund to dispose of any investments or securities if, in the reasonable judgment of the Selling Fund, such disposition would violate the Selling Fund’s fiduciary duty to its shareholders.
1.3 LIABILITIES TO BE ASSUMED. The Selling Fund will endeavor to discharge all of its known liabilities and obligations prior to the Closing Date. The Acquiring Fund shall assume all of the Selling Fund’s liabilities and obligations of any kind whatsoever, whether absolute, accrued, contingent or otherwise in existence on the Closing Date.
1.4 LIQUIDATION AND DISTRIBUTION. On or as soon after the Closing Date as is conveniently practicable (the “Liquidation Date”), (a) the Selling Fund will liquidate and distribute pro rata to the Selling Fund’s shareholders of record, determined as of the close of business on the Valuation Date (the “Selling Fund Shareholders”), the Acquiring Fund Shares received by the Selling Fund pursuant to paragraph 1.1; and (b) the Selling Fund will thereupon proceed to terminate as set forth in paragraph 1.8 below. Such liquidation and distribution will be accomplished by the transfer of the Acquiring Fund Shares then credited to the account of the Selling Fund on the books of the Acquiring Fund to open accounts on the share records of the Acquiring Fund in the names of the Selling Fund Shareholders and representing the respective pro rata number of the Acquiring Fund Shares due such shareholders. All issued and outstanding shares of the Selling Fund will simultaneously be canceled on the books of the Selling Fund. The Acquiring Fund shall not issue certificates representing the Acquiring Fund Shares in connection with such exchange.
1.5 OWNERSHIP OF SHARES. Ownership of Acquiring Fund Shares will be shown on the books of the Acquiring Fund’s transfer agent. Shares of the Acquiring Fund will be issued in the manner described in the Prospectus/Information Statement which has been distributed to shareholders of the Selling Fund as described in paragraph 4.1(o).
1.6 TRANSFER TAXES. Any transfer taxes payable upon issuance of the Acquiring Fund Shares in a name other than the registered holder of the Selling Fund shares on the books of the Selling Fund as of that time shall, as a condition of such issuance and transfer, be paid by the person to whom such Acquiring Fund Shares are to be issued and transferred.
2
Exhibit “A”
1.7 REPORTING RESPONSIBILITY. Any reporting responsibility of the Selling Fund is and shall remain the responsibility of the Selling Fund up to and including the Closing Date and such later date on which the Selling Fund is terminated.
1.8 TERMINATION. The Trust shall take all necessary and appropriate steps under applicable law to terminate the Selling Fund promptly following the Closing Date and the making of all distributions pursuant to paragraph 1.4.
ARTICLE II
VALUATION
2.1 VALUATION OF ASSETS. The value of the Selling Fund’s assets to be acquired by the Acquiring Fund hereunder shall be the value of such assets computed as of the close of business on the New York Stock Exchange on the business day next preceding the Closing Date (such time and date being hereinafter called the “Valuation Date”), using the valuation procedures set forth in the Trust’s Declaration of Trust and the Selling Fund’s then current prospectus and statement of additional information or such other valuation procedures as shall be mutually agreed upon by the parties.
2.2 VALUATION OF SHARES. The net asset value per share of the Acquiring Fund Shares shall be the net asset value per share computed as of the close of business on the New York Stock Exchange on the Valuation Date, using the valuation procedures set forth in the Trust’s Declaration of Trust and the Acquiring Fund’s then current prospectus and statement of additional information.
2.3 SHARES TO BE ISSUED. The number of full and fractional Acquiring Fund Shares to be issued in exchange for the Selling Fund’s assets shall be determined by multiplying the outstanding shares of the Selling Fund by the ratio computed by dividing the net asset value per share of the Selling Fund by the net asset value per share of the Acquiring Fund on the Valuation Date, determined in accordance with paragraph 2.2.
2.4 DETERMINATION OF VALUE. All computations of value shall be made by Huntington Asset Services, Inc., the Acquiring Fund’s and the Selling Fund’s transfer agent, in accordance with its regular practice in pricing the shares and assets of the Acquiring Fund and the Selling Fund.
ARTICLE III
CLOSING AND CLOSING DATE
3.1 CLOSING DATE. The closing of the Reorganization (the “Closing”) shall take place on or about December 19, 2014 or such other date as the parties may agree to in writing (the “Closing Date”). All acts taking place at the Closing shall be deemed to take place simultaneously immediately prior to the opening of business on the Closing Date unless otherwise provided. The Closing shall be held as of 8:00 a.m. EST at the offices of the Trust, or at such other time and/or place as the parties may agree.
3.2 EFFECT OF SUSPENSION IN TRADING. In the event that on the Valuation Date (a) the New York Stock Exchange or another primary trading market for portfolio securities of the Acquiring Fund or the Selling Fund shall be closed to trading or trading thereon shall be restricted; or (b) trading or the reporting of trading on said Exchange or elsewhere shall be disrupted so that accurate appraisal of the value of the net assets of the Acquiring Fund or the Selling Fund is impracticable, the Valuation Date (and the Closing Date) shall be postponed until the first business day after the day when trading shall have been fully resumed and reporting shall have been restored.
3
Exhibit “A”
3.3 TRANSFER AGENT’S CERTIFICATE. The Selling Fund shall cause its transfer agent to deliver at the Closing a certificate of an authorized officer stating that its records contain the names and addresses of the Selling Fund Shareholders and the number and percentage ownership of outstanding shares owned by each such shareholder immediately prior to the Closing. The Acquiring Fund shall issue and deliver, or cause its transfer agent, to issue and deliver, to the Secretary of the Trust a confirmation evidencing the Acquiring Fund Shares to be credited on the Closing Date or provide evidence satisfactory to the Selling Fund that such Acquiring Fund Shares have been credited to the Selling Fund’s account on the books of the Acquiring Fund. At the Closing, each party shall deliver to the other such bills of sale, checks, assignments, share certificates, if any, receipts and other documents as such other party or its counsel may reasonably request.
ARTICLE IV
REPRESENTATIONS AND WARRANTIES
4.1 REPRESENTATIONS OF THE SELLING FUND. The Selling Fund represents and warrants to the Acquiring Fund as follows:
| | (a) | The Selling Fund is a separate investment series of the Trust, a statutory trust duly organized, validly existing, and in good standing under the laws of Delaware. |
| | (b) | The Selling Fund is a separate investment series of the Trust, which is registered as an investment company classified as a management company of the open-end type, and its registration with the Securities and Exchange Commission (the “Commission”) as an investment company under the Investment Company Act of 1940, as amended (the “1940 Act”), is in full force and effect. |
| | (c) | The current prospectus and statement of additional information of the Selling Fund conform in all material respects to the applicable requirements of the Securities Act of 1933, as amended (the “1933 Act”), and the 1940 Act and the rules and regulations of the Commission thereunder and do not include any untrue statement of a material fact or omit to state any material fact required to be stated therein or necessary to make the statements therein, in light of the circumstances under which they were made, not misleading. |
| | (d) | The Selling Fund is not, and the execution, delivery, and performance of this Agreement will not result, in violation of any provision of the Trust’s Declaration of Trust or By-Laws or of any material agreement, indenture, instrument, contract, lease, or other undertaking to which the Selling Fund is a party or by which it is bound. |
| | (e) | The Selling Fund has no material contracts or other commitments (other than this Agreement) that will be terminated with liability to it prior to the Closing Date, except for liabilities, if any, to be discharged as provided in paragraph 1.3 hereof. |
| | (f) | Except as otherwise disclosed in writing to and accepted by the Acquiring Fund, no litigation, administrative proceeding, or investigation of or before any court or governmental body is presently pending or to its knowledge threatened against the Selling Fund or any of its properties or assets, which, if adversely determined, would materially and adversely affect its financial condition, the conduct of its business, or the ability of the Selling Fund to carry out the transactions contemplated by this Agreement. The Selling Fund knows of no facts that might form the basis for the institution of such proceedings and is not a party to or subject to the provisions of any order, decree, or judgment of any court or governmental body that materially and adversely affects its business or its ability to consummate the transactions herein contemplated. |
| | (g) | The audited financial statements of the Selling Fund at June 30, 2014 are in accordance with generally accepted accounting principles consistently applied, and such statements (copies of |
4
Exhibit “A”
| | which have been furnished to the Acquiring Fund) fairly reflect the financial condition of the Selling Fund as of such date, and there are no known contingent liabilities of the Selling Fund as of such date not disclosed therein. |
| | (h) | Since June 30, 2014, there has not been any material adverse change in the Selling Fund’s financial condition, assets, liabilities, or business other than changes occurring in the ordinary course of business, or any incurrence by the Selling Fund of indebtedness maturing more than one year from the date such indebtedness was incurred, except as otherwise disclosed to and accepted by the Acquiring Fund. For the purposes of this subparagraph (h), a decline in the net asset value of the Selling Fund shall not constitute a material adverse change. |
| | (i) | At the Closing Date, all federal and other tax returns and reports of the Selling Fund required by law to have been filed by such date shall have been filed, and all federal and other taxes shown due on said returns and reports shall have been paid, or provision shall have been made for the payment thereof. To the best of the Selling Fund’s knowledge, no such return is currently under audit, and no assessment has been asserted with respect to such returns. |
| | (j) | For each fiscal year of its operation, the Selling Fund has met the requirements of Subchapter M of the Code for qualification and treatment as a regulated investment company and has distributed in each such year all net investment income and realized capital gains. |
| | (k) | All issued and outstanding shares of the Selling Fund are, and at the Closing Date will be, duly and validly issued and outstanding, fully paid and non-assessable by the Selling Fund. All of the issued and outstanding shares of the Selling Fund will, at the time of the Closing Date, be held by the persons and in the amounts set forth in the records of the transfer agent as provided in paragraph 3.3. The Selling Fund does not have outstanding any options, warrants, or other rights to subscribe for or purchase any of the Selling Fund shares, nor is there outstanding any security convertible into any of the Selling Fund shares. |
| | (l) | At the Closing Date, the Selling Fund will have good and marketable title to the Selling Fund’s assets to be transferred to the Acquiring Fund pursuant to paragraph 1.2 and full right, power, and authority to sell, assign, transfer, and deliver such assets hereunder, and, upon delivery and payment for such assets, the Acquiring Fund will acquire good and marketable title thereto, subject to no restrictions on the full transfer thereof, including such restrictions as might arise under the 1933 Act, other than as disclosed to the Acquiring Fund and accepted by the Acquiring Fund. |
| | (m) | The execution, delivery, and performance of this Agreement have been duly authorized by all necessary action on the part of the Selling Fund and, subject to approval by the Selling Fund’s shareholders, this Agreement constitutes a valid and binding obligation of the Selling Fund, enforceable in accordance with its terms, subject as to enforcement, to bankruptcy, insolvency, reorganization, moratorium, and other laws relating to or affecting creditors’ rights and to general equity principles. |
| | (n) | The information furnished by the Selling Fund for use in no-action letters, applications for orders, registration statements, proxy materials, and other documents that may be necessary in connection with the transactions contemplated hereby is accurate and complete in all material respects and complies in all material respects with federal securities and other laws and regulations thereunder applicable thereto. |
| | (o) | The Selling Fund has provided the Acquiring Fund with information reasonably necessary for the preparation of a Prospectus/Information Statement, in compliance with the 1933 Act, the Securities Exchange Act of 1934, as amended (the “1934 Act”) and the 1940 Act. The Prospectus/Information Statement (other than information therein that relates to the Acquiring Fund and any |
5
Exhibit “A”
| | other fund described therein other than the Selling Fund) does not contain any untrue statement of a material fact or omit to state a material fact required to be stated therein or necessary to make the statements therein, in light of the circumstances under which such statements were made, not misleading. |
4.2 REPRESENTATIONS OF THE ACQUIRING FUND. The Acquiring Fund represents and warrants to the Selling Fund as follows:
| | (a) | The Acquiring Fund is a separate investment series of the Trust. |
| | (b) | The Acquiring Fund is a separate investment series of the Trust, which is registered as an investment company classified as a management company of the open-end type, and its registration with the Commission as an investment company under the 1940 Act is in full force and effect. |
| | (c) | The prospectus and statement of additional information, as of the date of the Prospectus/Information Statement, of the Acquiring Fund will conform in all material respects to the applicable requirements of the 1933 Act and the 1940 Act and the rules and regulations of the Commission thereunder and will not include any untrue statement of a material fact or omit to state any material fact required to be stated therein or necessary to make the statements therein, in light of the circumstances under which they were made, not misleading. |
| | (d) | The Acquiring Fund is not, and the execution, delivery and performance of this Agreement will not result, in violation of the Trust’s Declaration of Trust or By-Laws or of any material agreement, indenture, instrument, contract, lease, or other undertaking to which the Acquiring Fund is a party or by which it is bound. |
| | (e) | Except as otherwise disclosed in writing to the Selling Fund and accepted by the Selling Fund, no litigation, administrative proceeding or investigation of or before any court or governmental body is presently pending or to its knowledge threatened against the Acquiring Fund or any of its properties or assets, which, if adversely determined, would materially and adversely affect its financial condition and the conduct of its business or the ability of the Acquiring Fund to carry out the transactions contemplated by this Agreement. The Acquiring Fund knows of no facts that might form the basis for the institution of such proceedings and is not a party to or subject to the provisions of any order, decree, or judgment of any court or governmental body that materially and adversely affects its business or its ability to consummate the transactions contemplated herein. |
| | (f) | The audited financial statements of the Acquiring Fund at June 30, 2014, are in accordance with generally accepted accounting principles consistently applied, and such statements (copies of which have been furnished to the Selling Fund) fairly reflect the financial condition of the Acquiring Fund as of such date, and there are no known contingent liabilities of the Acquiring Fund as of such date not disclosed therein. |
| | (g) | Since June 30, 2014, there has not been any material adverse change in the Acquiring Fund’s financial condition, assets, liabilities, or business other than changes occurring in the ordinary course of business, or any incurrence by the Acquiring Fund of indebtedness maturing more than one year from the date such indebtedness was incurred, except as otherwise disclosed to and accepted by the Selling Fund. For the purposes of this subparagraph (g), a decline in the net asset value of the Acquiring Fund shall not constitute a material adverse change. |
| | (h) | At the Closing Date, all federal and other tax returns and reports of the Acquiring Fund required by law then to be filed by such date shall have been filed, and all federal and other taxes shown due on said returns and reports shall have been paid or provision shall have been made for the |
6
Exhibit “A”
| | payment thereof. To the best of the Acquiring Fund’s knowledge, no such return is currently under audit, and no assessment has been asserted with respect to such returns. |
| | (i) | For each fiscal year of its operation, the Selling Fund has met the requirements of Subchapter M of the Code for qualification and treatment as a regulated investment company and has distributed in each such year all net investment income and realized capital gains. |
| | (j) | All issued and outstanding Acquiring Fund Shares are, and at the Closing Date will be, duly and validly issued and outstanding, fully paid and non-assessable. The Acquiring Fund does not have outstanding any options, warrants, or other rights to subscribe for or purchase any Acquiring Fund Shares, nor is there outstanding any security convertible into any Acquiring Fund Shares. |
| | (k) | The execution, delivery, and performance of this Agreement have been duly authorized by all necessary action on the part of the Acquiring Fund, and this Agreement constitutes a valid and binding obligation of the Acquiring Fund enforceable in accordance with its terms, subject as to enforcement, to bankruptcy, insolvency, reorganization, moratorium, and other laws relating to or affecting creditors’ rights and to general equity principles. |
| | (l) | The Acquiring Fund Shares to be issued and delivered to the Selling Fund, for the account of the Selling Fund Shareholders, pursuant to the terms of this Agreement will, at the Closing Date, have been duly authorized and, when so issued and delivered, will be duly and validly issued Acquiring Fund Shares, and will be fully paid and non-assessable. |
| | (m) | The information furnished by the Acquiring Fund for use in no-action letters, applications for orders, registration statements, proxy materials, and other documents that may be necessary in connection with the transactions contemplated hereby is accurate and complete in all material respects and complies in all material respects with federal securities and other laws and regulations applicable thereto. |
| | (n) | The Prospectus/Information Statement (only insofar as it relates to the Acquiring Fund) does not contain any untrue statement of a material fact or omit to state a material fact required to be stated therein or necessary to make the statements therein, in light of the circumstances under which such statements were made, not misleading. |
| | (o) | The Acquiring Fund agrees to use all reasonable efforts to obtain the approvals and authorizations required by the 1933 Act, the 1940 Act, and such of the state Blue Sky or securities laws as it may deem appropriate in order to continue its operations after the Closing Date. |
ARTICLE V
COVENANTS OF THE ACQUIRING FUND AND THE SELLING FUND
5.1 OPERATION IN ORDINARY COURSE. The Acquiring Fund and the Selling Fund each will operate its business in the ordinary course between the date hereof and the Closing Date, it being understood that such ordinary course of business will include customary dividends and distributions.
5.2 INVESTMENT REPRESENTATION. The Selling Fund covenants that the Acquiring Fund Shares to be issued hereunder are not being acquired for the purpose of making any distribution thereof other than in accordance with the terms of this Agreement.
5.3 ADDITIONAL INFORMATION. The Selling Fund will assist the Acquiring Fund in obtaining such information as the Acquiring Fund reasonably requests concerning the beneficial ownership of the Selling Fund shares.
7
Exhibit “A”
5.4 FURTHER ACTION. Subject to the provisions of this Agreement, the Acquiring Fund and the Selling Fund will each take, or cause to be taken, all action, and do or cause to be done, all things reasonably necessary, proper or advisable to consummate and make effective the transactions contemplated by this Agreement, including any actions required to be taken after the Closing Date.
ARTICLE VI
CONDITIONS PRECEDENT TO OBLIGATIONS OF THE SELLING FUND
The obligations of the Selling Fund to consummate the transactions provided for herein shall be subject, at its election, to the performance by the Acquiring Fund of all the obligations to be performed by it hereunder on or before the Closing Date, and, in addition thereto, the following further conditions:
6.1 All representations and warranties of the Acquiring Fund contained in this Agreement shall be true and correct as of the date hereof and as of the Closing Date with the same force and effect as if made on and as of the Closing Date, and the Acquiring Fund shall have delivered to the Selling Fund a certificate executed in its name by the Trust’s President or Vice President, in form and substance reasonably satisfactory to the Selling Fund and dated as of the Closing Date, to such effect and as to such other matters as the Selling Fund shall reasonably request.
6.2 With respect to the Selling Fund, the Trust shall have received on the Closing Date an opinion from Sullivan & Worcester LLP, counsel to the Trust and the Acquiring Fund, dated as of the Closing Date, in a form reasonably satisfactory to the Selling Fund, covering the following points:
| | (a) | The Acquiring Fund is a separate investment series of a business trust duly organized, validly existing and in good standing under the laws of the State of Delaware and has the trust power to own all of its properties and assets and, to the knowledge of such counsel, to carry on its business as presently conducted. |
| | (b) | The Acquiring Fund is a separate series of a Delaware statutory trust registered as an investment company under the 1940 Act, and, to such counsel’s knowledge, such registration with the Commission as an investment company under the 1940 Act is in full force and effect. |
| | (c) | This Agreement has been duly authorized, executed, and delivered by the Acquiring Fund and, assuming due authorization, execution and delivery of this Agreement by the Selling Fund, is a valid and binding obligation of the Acquiring Fund enforceable against the Acquiring Fund in accordance with its terms, subject as to enforcement, to bankruptcy, insolvency, reorganization, moratorium, and other laws relating to or affecting creditors’ rights generally and to general equity principles. |
| | (d) | Assuming that a consideration therefor not less than the net asset value thereof has been paid, the Acquiring Fund Shares to be issued and delivered to the Selling Fund on behalf of the Selling Fund Shareholders as provided by this Agreement are duly authorized and upon such delivery will be legally issued and outstanding and fully paid and non-assessable, and no shareholder of the Acquiring Fund has any statutory preemptive rights in respect thereof. |
| | (e) | The Registration Statement, to the knowledge of such counsel, has been declared effective by the Commission and no stop order under the 1933 Act pertaining thereto has been issued; and to the knowledge of such counsel, no consent, approval, authorization or order of any court or governmental authority of the United States or the State of Delaware is required for consummation by the Acquiring Fund of the transactions contemplated herein, except such as have been obtained under the 1933 Act and the 1940 Act, and as may be required under state securities laws. |
8
Exhibit “A”
| | (f) | The execution and delivery of this Agreement did not, and the consummation of the transactions contemplated hereby will not, result in a violation of the Trust’s Declaration of Trust or By-Laws or a material provision of any material agreement, indenture, instrument, contract, lease or other undertaking (in each case known to such counsel) to which the Acquiring Fund is a party or by which it or any of its properties may be bound or, to the knowledge of such counsel, result in the acceleration of any obligation or the imposition of any penalty under any agreement, judgment, or decree to which the Acquiring Fund is a party or by which it is bound. |
| | (g) | Only insofar as they relate to the Acquiring Fund, the descriptions in the Prospectus/Information Statement of statutes, legal and governmental proceedings and material contracts, if any, are accurate and fairly present the information required to be shown. |
| | (h) | Such counsel does not know of any legal or governmental proceedings, only insofar as they relate to the Acquiring Fund, existing on or before the effective date of the Prospectus/Information Statement or the Closing Date required to be described in the Prospectus/Information Statement or to be filed as exhibits to the Prospectus/Information Statement which are not described or filed as required. |
| | (i) | To the knowledge of such counsel, no litigation or administrative proceeding or investigation of or before any court or governmental body is presently pending or threatened as to the Acquiring Fund or any of its properties or assets and the Acquiring Fund is not a party to or subject to the provisions of any order, decree or judgment of any court or governmental body, which materially and adversely affects its business, other than as previously disclosed in the Prospectus/Information Statement. |
Such opinion shall contain such assumptions and limitations as shall be in the opinion of Sullivan & Worcester LLP appropriate to render the opinions expressed therein.
ARTICLE VII
CONDITIONS PRECEDENT TO OBLIGATIONS OF THE ACQUIRING FUND
The obligations of the Acquiring Fund to complete the transactions provided for herein shall be subject, at its election, to the performance by the Selling Fund of all the obligations to be performed by it hereunder on or before the Closing Date and, in addition thereto, the following conditions:
7.1 All representations and warranties of the Selling Fund contained in this Agreement shall be true and correct as of the date hereof and as of the Closing Date with the same force and effect as if made on and as of the Closing Date, and the Selling Fund shall have delivered to the Acquiring Fund on the Closing Date a certificate executed in its name by the Trust’s President or Vice President, in form and substance satisfactory to the Acquiring Fund and dated as of the Closing Date, to such effect and as to such other matters as the Acquiring Fund shall reasonably request.
7.2 The Selling Fund shall have delivered to the Acquiring Fund a statement of the Selling Fund’s assets and liabilities, together with a list of the Selling Fund’s portfolio securities showing the tax costs of such securities by lot and the holding periods of such securities, as of the Closing Date, certified by the Treasurer or Assistant Treasurer of the Trust.
9
Exhibit “A”
7.3 With respect to the Acquiring Fund, the Trust shall have received on the Closing Date an opinion of Sullivan & Worcester LLP, counsel to the Trust and the Selling Fund, in a form reasonably satisfactory to the Acquiring Fund, covering the following points:
| | (a) | The Selling Fund is a separate investment series of the Trust, a statutory trust duly organized, validly existing and in good standing under the laws of the State of Delaware and has the trust power to own all of its properties and assets and, to the knowledge of such counsel, to carry on its business as presently conducted. |
| | (b) | The Selling Fund is a separate investment series of a Delaware statutory trust registered as an investment company under the 1940 Act, and, to such counsel’s knowledge, such registration with the Commission as an investment company under the 1940 Act is in full force and effect. |
| | (c) | This Agreement has been duly authorized, executed and delivered by the Selling Fund and, assuming due authorization, execution, and delivery of this Agreement by the Acquiring Fund, is a valid and binding obligation of the Selling Fund enforceable against the Selling Fund in accordance with its terms, subject as to enforcement, to bankruptcy, insolvency, reorganization, moratorium and other laws relating to or affecting creditors’ rights generally and to general equity principles. |
| | (d) | To the knowledge of such counsel, no consent, approval, authorization or order of any court or governmental authority of the United States or the State of Delaware is required for consummation by the Selling Fund of the transactions contemplated herein, except such as have been obtained under the 1933 Act and the 1940 Act, and as may be required under state securities laws. |
| | (e) | The execution and delivery of this Agreement did not, and the consummation of the transactions contemplated hereby will not, result in a violation of the Trust’s Declaration of Trust or By-laws, or a material provision of any material agreement, indenture, instrument, contract, lease or other undertaking (in each case known to such counsel) to which the Selling Fund is a party or by which it or any of its properties may be bound or, to the knowledge of such counsel, result in the acceleration of any obligation or the imposition of any penalty, under any agreement, judgment, or decree to which the Selling Fund is a party or by which it is bound. |
| | (f) | Only insofar as they relate to the Selling Fund, the descriptions in the Prospectus/Information Statement of statutes, legal and governmental proceedings and material contracts, if any, are accurate and fairly represent the information required to be shown. |
| | (g) | Such counsel does not know of any legal or governmental proceedings, only insofar as they relate to the Selling Fund existing on or before the effective date of the Prospectus/Information Statement or the Closing Date, required to be described in the Prospectus/Information Statement or to be filed as exhibits to the Prospectus/Information Statement which are not described or filed as required. |
| | (h) | To the knowledge of such counsel, no litigation or administrative proceeding or investigation of or before any court or governmental body is presently pending or threatened as to the Selling Fund or any of its respective properties or assets and the Selling Fund is not a party to nor subject to the provisions of any order, decree or judgment of any court or governmental body, which materially and adversely affects its business other than as previously disclosed in the Prospectus/Information Statement. |
| | (i) | Assuming that a consideration therefor of not less than the net asset value thereof has been paid, and assuming that such shares were issued in accordance with the terms of the Selling Fund’s registration statement, or any amendment thereto, in effect at the time of such issuance, all issued and outstanding shares of the Selling Fund are legally issued and fully paid and non-assessable. |
10
Exhibit “A”
Such opinion shall contain such other assumptions and limitations as shall be in the opinion of Sullivan & Worcester LLP appropriate to render the opinions expressed therein.
ARTICLE VIII
FURTHER CONDITIONS PRECEDENT TO OBLIGATIONS OF THE ACQUIRING FUND AND THE SELLING FUND
If any of the conditions set forth below do not exist on or before the Closing Date with respect to the Selling Fund or the Acquiring Fund, the other party to this Agreement shall, at its option, not be required to consummate the transactions contemplated by this Agreement:
8.1 On the Closing Date, the Commission shall not have issued an unfavorable report under Section 25(b) of the 1940 Act, nor instituted any proceeding seeking to enjoin the consummation of the transactions contemplated by this Agreement under Section 25(c) of the 1940 Act and no action, suit or other proceeding shall be threatened or pending before any court or governmental agency in which it is sought to restrain or prohibit, or obtain damages or other relief in connection with, this Agreement or the transactions contemplated herein.
8.2 All required consents of other parties and all other consents, orders, and permits of federal, state and local regulatory authorities (including those of the Commission and of state Blue Sky securities authorities, including any necessary “no-action” positions of and exemptive orders from such federal and state authorities) to permit consummation of the transactions contemplated hereby shall have been obtained, except where failure to obtain any such consent, order, or permit would not involve a risk of a material adverse effect on the assets or properties of the Acquiring Fund or the Selling Fund, provided that either party hereto may for itself waive any of such conditions.
8.3 The Selling Fund shall have declared a dividend or dividends which, together with all previous such dividends shall have the effect of distributing to the Selling Fund Shareholders all of the Selling Fund’s investment company taxable income for all taxable periods ending on the Closing Date (computed without regard to any deduction for dividends paid) and all of the net capital gains realized in all taxable periods ending on the Closing Date (after reduction for any capital loss carryforward).
8.4 The Trust shall have received a favorable opinion of Sullivan & Worcester LLP addressed to the Acquiring Fund and the Selling Fund substantially to the effect that, for federal income tax purposes, and while the matter is not entirely free from doubt:
| | (a) | The transfer of all of the Selling Fund assets in exchange solely for the Acquiring Fund Shares and the assumption by the Acquiring Fund of the liabilities of the Selling Fund followed by the distribution of the Acquiring Fund Shares to the Selling Fund Shareholders in dissolution and liquidation of the Selling Fund will constitute a “reorganization” within the meaning of Section 368(a)(1)(C) of the Code, and the Acquiring Fund and the Selling Fund will each be a “party to a reorganization” within the meaning of Section 368(b) of the Code. |
| | (b) | No gain or loss will be recognized by the Acquiring Fund upon the receipt of the assets of the Selling Fund solely in exchange for the Acquiring Fund Shares and the assumption by the Acquiring Fund of the liabilities of the Selling Fund. |
| | (c) | No gain or loss will be recognized by the Selling Fund upon the transfer of the Selling Fund assets to the Acquiring Fund in exchange for the Acquiring Fund Shares and the assumption by the Acquiring Fund of the liabilities of the Selling Fund or upon the distribution (whether actual or constructive) of the Acquiring Fund Shares to Selling Fund Shareholders in exchange for their shares of the Selling Fund. |
11
Exhibit “A”
| | (d) | No gain or loss will be recognized by the Selling Fund Shareholders upon the exchange of their Selling Fund shares for the Acquiring Fund Shares in liquidation of the Selling Fund. |
| | (e) | The aggregate tax basis for the Acquiring Fund Shares received by each Selling Fund Shareholder pursuant to the Reorganization will be the same as the aggregate tax basis of the Selling Fund shares held by such Shareholder immediately prior to the Closing, and the holding period of the Acquiring Fund Shares received by each Selling Fund Shareholder will include the period during which the Selling Fund shares exchanged therefor were held by such Shareholder (provided the Selling Fund shares were held as capital assets on the date of the Closing). |
| | (f) | The tax basis of the Selling Fund assets acquired by the Acquiring Fund will be the same as the tax basis of such assets to the Selling Fund immediately prior to the Closing, and the holding period of the assets of the Selling Fund in the hands of the Acquiring Fund will include the period during which those assets were held by the Selling Fund. |
ARTICLE IX
EXPENSES
9.1 Except as otherwise provided for herein, all expenses of the transactions contemplated by this Agreement incurred by the Selling Fund and the Acquiring Fund, whether incurred before or after the date of this Agreement, will be borne by the Advisor. Such expenses include, without limitation, (a) expenses incurred in connection with the entering into and the carrying out of the provisions of this Agreement; (b) expenses associated with the preparation and filing of the Prospectus/Information Statement under the 1933 Act covering the Acquiring Fund Shares to be issued pursuant to the provisions of this Agreement; (c) registration or qualification fees and expenses of preparing and filing such forms as are necessary under applicable state securities laws to qualify the Acquiring Fund Shares to be issued in connection herewith in each state in which the Selling Fund Shareholders are resident as of the date of the mailing of the Prospectus/Information Statement to such shareholders; (d) postage; (e) printing; (f) accounting fees; (g) legal fees; and (h) solicitation costs of the transaction.
ARTICLE X
ENTIRE AGREEMENT; SURVIVAL OF WARRANTIES
10.1 The Acquiring Fund and the Selling Fund agree that neither party has made any representation, warranty or covenant not set forth herein and that this Agreement constitutes the entire agreement between the parties.
10.2 The representations, warranties, and covenants contained in this Agreement or in any document delivered pursuant hereto or in connection herewith shall not survive the consummation of the transactions contemplated hereunder.
ARTICLE XI
TERMINATION
11.1 This Agreement may be terminated by the mutual agreement of the Acquiring Fund and the Selling Fund. In addition, either the Acquiring Fund or the Selling Fund may at its option terminate this Agreement at or prior to the Closing Date because:
| | (a) | of a breach by the other of any representation, warranty, or agreement contained herein to be performed at or prior to the Closing Date, if not cured within 30 days; or |
12
Exhibit “A”
| | (b) | a condition herein expressed to be precedent to the obligations of the terminating party has not been met and it reasonably appears that it will not or cannot be met. |
11.2 In the event of any such termination, in the absence of willful default, there shall be no liability for damages on the part of the Acquiring Fund, the Selling Fund, the Trust, or its Trustees or officers, to the other party, but each shall bear the expenses incurred by it incidental to the preparation and carrying out of this Agreement as provided in paragraph 9.1.
ARTICLE XII
AMENDMENTS
12.1 This Agreement may be amended, modified, or supplemented in such manner as may be mutually agreed upon in writing by the authorized officers of the Trust.
ARTICLE XIII
HEADINGS; COUNTERPARTS; GOVERNING LAW; ASSIGNMENT; LIMITATION OF LIABILITY
13.1 The Article and paragraph headings contained in this Agreement are for reference purposes only and shall not affect in any way the meaning or interpretation of this Agreement.
13.2 This Agreement may be executed in any number of counterparts, each of which shall be deemed an original.
13.3 This Agreement shall be governed by and construed in accordance with the laws of the State of Delaware, without giving effect to the conflicts of laws provisions thereof.
13.4 This Agreement shall bind and inure to the benefit of the parties hereto and their respective successors and assigns, but no assignment or transfer hereof or of any rights or obligations hereunder shall be made by any party without the written consent of the other party. Nothing herein expressed or implied is intended or shall be construed to confer upon or give any person, firm, or corporation, other than the parties hereto and their respective successors and permitted assigns, any rights or remedies under or by reason of this Agreement.
13.5 With respect to the Trust, the name used herein refers respectively to the trust created and, as the case may be, the Trustees, as trustees but not individually or personally, acting from time to time under organizational documents filed in Delaware, which are hereby referred to and are also on file at the principal offices of the Trust. The obligations of the Trust entered into in the name or on behalf thereof by any of the Trustees, representatives or agents of the Trust, are made not individually, but in such capacities, and are not binding upon any of the Trustees, shareholders or representatives of the Trust personally, but bind only the trust property, and all persons dealing with the Selling Fund and the Acquiring Fund must look solely to the trust property belonging to the Selling Fund and the Acquiring Fund for the enforcement of any claims against the Selling Fund and the Acquiring Fund, respectively.
13
Exhibit “A”
IN WITNESS WHEREOF, the parties have duly executed this Agreement, all as of the date first written above.
| | |
THE HUNTINGTON FUNDS ON BEHALF OF
HUNTINGTON INTERNATIONAL EQUITY
FUND |
| |
| By: | | /s/ Joseph L. Rezabek |
| Name: Joseph L. Rezabek |
| Title: President |
|
| THE HUNTINGTON FUNDS ON BEHALF OF HUNTINGTON GLOBAL SELECT MARKETS FUND |
| |
| By: | | /s/ R. Jeffrey Young |
| Name: R. Jeffrey Young |
| Title: Chief Executive Officer |
14
STATEMENT OF ADDITIONAL INFORMATION
Acquisition of Assets of
HUNTINGTON INTERNATIONAL EQUITY FUND
a series of
The Huntington Funds
2960 N. Meridian Street
Indianapolis, IN 46208
(800) 253-0412
BY AND IN EXCHANGE FOR SHARES OF
HUNTINGTON GLOBAL SELECT MARKETS FUND
another series of
The Huntington Funds
This Statement of Additional Information, dated November 6, 2014, relating specifically to the proposed transfer of the assets and liabilities of Huntington International Equity Fund (“Huntington International Equity”), a series of the Huntington Funds (the “Trust”) to Huntington Global Select Markets Fund (“Huntington Global Select Markets”), another series of the Trust, in exchange for Class A Shares and Institutional Shares of beneficial interest, no par value, of Huntington Global Select Markets (to be issued to holders of shares of Huntington International Equity), consists of the information set forth below pertaining to Huntington International Equity and Huntington Global Select Markets and the following described documents, each of which is incorporated by reference herein:
| | (1) | The Statement of Additional Information of the Trust relating to Huntington International Equity and Huntington Global Select Markets, dated April 30, 2014, as Amended September 2, 2014; |
| | (2) | Annual Report of the Trust relating to Huntington International Equity and Huntington Global Select Markets for the year ended December 31, 2013; and |
| | (3) | Semi-Annual Report of the Trust relating to Huntington International Equity and Huntington Global Select Markets for the period ended June 30, 2014. |
This Statement of Additional Information, which is not a prospectus, supplements, and should be read in conjunction with, the Prospectus/Information Statement of Huntington International Equity and Huntington Global Select Markets dated November 6, 2014. A copy of the Prospectus/Information Statement may be obtained without charge by calling or writing to the Trust at the telephone number or address set forth above.
Pro Forma Combined Statements of Operations
For the Year Ended June 30, 2014
| | | | | | | | | | | | | | | | |
| | | Huntington
International
Equity Fund | | | Huntington
Global Select
Markets Fund | | | Pro Forma
Adjustments | | | Pro Forma
Combined | |
Investment Income: | | | | | | | | | | | | | | | | |
Dividend income | | $ | 7,316,911 | | | $ | 349,012 | | | $ | — | | | $ | 7,665,923 | |
Dividend income from affiliated securities | | | 1,918 | | | | 309 | | | | — | | | | 2,227 | |
Interest income | | | — | | | | 15,550 | | | | — | | | | 15,550 | |
Income from securities lending, net | | | 181,069 | | | | 24,241 | | | | — | | | | 205,310 | |
Foreign dividend taxes withheld | | | (737,583 | ) | | | (33,246 | ) | | | — | | | | (770,829 | ) |
| | | | | | | | | | | | | | | | |
Total investment income | | | 6,762,315 | | | | 355,866 | | | | — | | | | 7,118,181 | |
| | | | | | | | | | | | | | | | |
Expenses: | | | | | | | | | | | | | | | | |
Investment advisory fees | | | 2,724,251 | | | | 247,690 | | | | — | | | | 2,971,941 | |
Administration fees | | | 494,786 | | | | 44,984 | | | | — | | | | 539,770 | |
Custodian fees | | | 90,277 | | | | 33,928 | | | | — | | | | 124,205 | |
Transfer and dividend disbursing agent fees and expenses | | | 75,135 | | | | 29,691 | | | | (24,000 | ) (a) | | | 80,826 | |
Trustees’ fees | | | 27,102 | | | | 2,444 | | | | — | | | | 29,546 | |
Professional fees | | | 39,132 | | | | 24,621 | | | | — | | | | 63,753 | |
Distribution services fee-Class A Shares | | | 23,596 | | | | 1,428 | | | | — | | | | 25,024 | |
Shareholder services fee-Trust Shares | | | 657,466 | | | | 60,494 | | | | — | | | | 717,960 | |
Shareholder services fee-Class A Shares | | | 23,596 | | | | 1,428 | | | | — | | | | 25,024 | |
State registration costs | | | 39,232 | | | | 29,116 | | | | (39,232 | ) (a) | | | 29,116 | |
Printing and postage | | | 25,893 | | | | 3,705 | | | | — | | | | 29,598 | |
Insurance premiums | �� | | 9,193 | | | | 3,281 | | | | — | | | | 12,474 | |
Compliance service fees | | | 10,316 | | | | 912 | | | | — | | | | 11,228 | |
Line of credit fees | | | 3,566 | | | | 428 | | | | — | | | | 3,994 | |
Interest expense | | | 311 | | | | 379 | | | | — | | | | 690 | |
Other | | | 36,728 | | | | 53,576 | | | | (1,000 | ) (a) | | | 89,304 | |
| | | | | | | | | | | | | | | | |
Total expenses | | | 4,280,580 | | | | 538,105 | | | | (64,232 | ) | | | 4,754,453 | |
| | | | | | | | | | | | | | | | |
Investment advisory fees waived | | | (643,835 | ) | | | (74,601 | ) | | | (17,559 | ) (b) | | | (735,995 | ) |
| | | | | | | | | | | | | | | | |
Net expenses | | | 3,636,745 | | | | 463,504 | | | | (81,791 | ) | | | 4,018,458 | |
| | | | | | | | | | | | | | | | |
Net investment income | | | 3,125,570 | | | | (107,638 | ) | | | 81,791 | | | | 3,099,723 | |
| | | | | | | | | | | | | | | | |
Net Realized/Unrealized Gain (Loss) on Investments, Options and Foreign Currency Transactions: | | | | | | | | | | | | | | | | |
Net realized gain on investment transactions | | | 39,872,441 | | | | 1,131,079 | | | | — | | | | 41,003,520 | |
Net realized loss on foreign currency transactions | | | (297,944 | ) | | | (26,382 | ) | | | — | | | | (324,326 | ) |
| | | | | | | | | | | | | | | | |
Net realized gain on investments and translation of assets and liabilities in foreign currency transactions | | | 39,574,497 | | | | 1,104,697 | | | | — | | | | 40,679,194 | |
| | | | | | | | | | | | | | | | |
Net change in unrealized appreciation of investments and translation of assets and liabilities in foreign currency | | | (3,618,459 | ) | | | 2,734,326 | | | | — | | | | (884,133 | ) |
| | | | | | | | | | | | | | | | |
Net realized and unrealized gain on investments and foreign currency transactions | | | 35,956,038 | | | | 3,839,023 | | | | — | | | | 39,795,061 | |
| | | | | | | | | | | | | | | | |
Change in net assets resulting from operations | | $ | 39,081,608 | | | $ | 3,731,385 | | | $ | 81,791 | | | $ | 42,894,784 | |
| | | | | | | | | | | | | | | | |
| (a) | Decrease in expenses due to the elimination of duplicative expenses achieved by merging the funds. |
| (b) | Reflects additional waiver of Advisory fees due to reduction of the Acquiring Fund’s contractual expense cap to the same terms as the Target Fund. |
Pro Forma Combined Statements of Assets and Liabilities
As of June 30, 2014
| | | | | | | | | | | | | | | | |
| | | Huntington
International
Equity Fund | | | Huntington
Global Select
Markets Fund | | | Pro Forma
Adjustments | | | Pro Forma
Combined | |
Assets: | | | | | | | | | | | | | | | | |
Investments, at cost | | $ | 156,555,026 | | | $ | 14,462,944 | | | $ | — | | | $ | 171,017,970 | |
| | | | | | | | | | | | | | | | |
Investments, at value | | $ | 191,527,170 | | | $ | 16,880,121 | | | $ | — | | | $ | 208,407,291 | |
Investments in affiliated securities, at value | | | 4,616,051 | | | | 126,746 | | | | — | | | | 4,742,797 | |
| | | | | | | | | | | | | | | | |
Total investments | | | 196,143,221 | | | | 17,006,867 | | | | — | | | | 213,150,088 | |
| | | | | | | | | | | | | | | | |
Cash | | | 14,693 | | | | — | | | | — | | | | 14,693 | |
Foreign Currencies, at value (Cost $101,748 and $3,469) | | | 101,834 | | | | 3,467 | | | | — | | | | 105,301 | |
Income receivable | | | 228,141 | | | | 27,468 | | | | — | | | | 255,609 | |
Receivable for shares sold | | | 55,291 | | | | — | | | | — | | | | 55,291 | |
Tax reclaims receivable | | | 638,135 | | | | 23,477 | | | | — | | | | 661,612 | |
Prepaid expenses and other assets | | | 13,071 | | | | 13,958 | | | | — | | | | 27,029 | |
| | | | | | | | | | | | | | | | |
Total assets | | | 197,194,386 | | | | 17,075,237 | | | | — | | | | 214,269,623 | |
| | | | | | | | | | | | | | | | |
Liabilities: | | | | | | | | | | | | | | | | |
Payable for return of collateral on loaned securities | | | 7,101,852 | | | | — | | | | — | | | | 7,101,852 | |
Payable for shares redeemed | | | 340,879 | | | | 27,725 | | | | — | | | | 368,604 | |
Accrued expenses and other payables: | | | | | | | | | | | — | | | | — | |
Investment advisory | | | 41,686 | | | | 6,990 | | | | — | | | | 48,676 | |
Administration | | | 29,739 | | | | 2,589 | | | | — | | | | 32,328 | |
Custodian | | | 26,083 | | | | 12,790 | | | | — | | | | 38,873 | |
Distribution (12b-1) | | | 1,880 | | | | 197 | | | | — | | | | 2,077 | |
Shareholder services | | | 40,805 | | | | 3,553 | | | | — | | | | 44,358 | |
Transfer and dividend disbursing agent | | | 16,475 | | | | 5,869 | | | | — | | | | 22,344 | |
Trustee | | | 3,714 | | | | 7 | | | | — | | | | 3,721 | |
Professional fees | | | 20,278 | | | | 3,123 | | | | — | | | | 23,401 | |
Printing and postage | | | 8,678 | | | | 184 | | | | — | | | | 8,862 | |
Compliance service fees | | | 3,106 | | | | 285 | | | | — | | | | 3,391 | |
Other | | | 7,059 | | | | 5,229 | | | | — | | | | 12,288 | |
| | | | | | | | | | | | | | | | |
Total Liabilities | | | 7,642,234 | | | | 68,541 | | | | — | | | | 7,710,775 | |
| | | | | | | | | | | | | | | | |
Net Assets | | $ | 189,552,152 | | | $ | 17,006,696 | | | $ | — | | | $ | 206,558,848 | |
| | | | | | | | | | | | | | | | |
Net Assets consist of: | | | | | | | | | | | | | | | | |
Paid in capital | | $ | 117,503,846 | | | $ | 14,946,526 | | | $ | — | | | $ | 132,450,372 | |
Net unrealized appreciation of investments and translations of assets and liabilities in foreign currency | | | 39,607,028 | | | | 2,537,648 | | | | — | | | | 42,144,676 | |
Accumulated net realized gain (loss) on investments and foreign currency transactions | | | 29,884,073 | | | | (325,905 | ) | | | — | | | | 29,558,168 | |
Accumulated net investment income (loss) | | | 2,557,205 | | | | (151,573 | ) | | | — | | | | 2,405,632 | |
| | | | | | | | | | | | | | | | |
Net Assets | | $ | 189,552,152 | | | $ | 17,006,696 | | | $ | — | | | $ | 206,558,848 | |
| | | | | | | | | | | | | | | | |
Net Assets: | | | | | | | | | | | | | | | | |
Institutional Shares | | $ | 180,395,387 | | | $ | 16,018,622 | | | $ | — | | | $ | 196,414,009 | |
| | | | | | | | | | | | | | | | |
Class A Shares | | $ | 9,156,765 | | | $ | 988,074 | | | $ | — | | | $ | 10,144,839 | |
| | | | | | | | | | | | | | | | |
Shares Outstanding: (unlimited number of shares authorized, no par value): | | | | | | | | | | | | | | | | |
Institutional Shares | | | 13,805,774 | | | | 1,411,662 | | | | 2,087,763 | | | | 17,305,199 | |
| | | | | | | | | | | | | | | | |
Class A Shares | | | 706,895 | | | | 87,227 | | | | 101,274 | | | | 895,396 | |
| | | | | | | | | | | | | | | | |
Net Asset Value, Redemption Price and Offering Price Per Share: | | | | | | | | | | | | | | | | |
Institutional Shares | | $ | 13.07 | | | $ | 11.35 | | | | | | | $ | 11.35 | |
| | | | | | | | | | | | | | | | |
Class A Shares | | $ | 12.95 | | | $ | 11.33 | | | | | | | $ | 11.33 | |
| | | | | | | | | | | | | | | | |
Offering Price Per Share (100%/(100%-maximum sales charge) of net asset value adjusted to the nearest cent) per share: | | | | | | | | | | | | | | | | |
Class A Shares | | $ | 13.60 | | | $ | 11.90 | | | | | | | $ | 11.90 | |
| | | | | | | | | | | | | | | | |
Maximum Sales Charge: | | | | | | | | | | | | | | | | |
Class A Shares | | | 4.75 | % | | | 4.75 | % | | | | | | | 4.75 | % |
| | | | | | | | | | | | | | | | |
Pro Forma Combined Portfolios of Investments
As of June 30, 2014
| | | | | | | | | | | | | | | | | | | | | | | | |
| | | Huntington International
Equity Fund | | | Huntington Global Select
Markets Fund | | | Pro Forma
Combined | |
| | | | | | |
| | | Shares | | | Value | | | Shares or
Principal Amount | | | Value | | | Shares or
Principal Amount | | | Value | |
Common Stocks — 95.4% | | | | | | | | | | | | | | | | | | | | | | | | |
| Belgium — 1.8% | | | | | | | | | | | | | | | | | | | | | | | | |
Consumer Staples — 1.8% | | | | | | | | | | | | | | | | | | | — | | | | — | |
Anheuser-Busch InBev NV | | | 32,300 | | | $ | 3,710,509 | | | | — | | | $ | — | | | | 32,300 | | | $ | 3,710,509 | |
| | | | | | |
Brazil — 0.9% | | | | | | | | | | | | | | | | | | | | | | | | |
Consumer Discretionary — 0.3% | | | | | | | | | | | | | | | | | | | — | | | | — | |
Kroton Educacional SA | | | — | | | | — | | | | 11,600 | | | | 325,196 | | | | 11,600 | | | $ | 325,196 | |
Lojas Americanas SA | | | — | | | | — | | | | 62,000 | | | | 394,149 | | | | 62,000 | | | | 394,149 | |
| | | | | | | | | | | | | | | | | | | | | | | | |
| | | | | | | 0 | | | | | | | | 719,345 | | | | | | | | 719,345 | |
| | | | | | | | | | | | | | | | | | | | | | | | |
Financials — 0.2% | | | | | | | | | | | | | | | | | | | | | | | | |
BB Seguridade Participacoes SA | | | — | | | | — | | | | 23,000 | | | | 335,218 | | | | 23,000 | | | $ | 335,218 | |
| | | | | | |
Health Care — 0.2% | | | | | | | | | | | | | | | | | | | | | | | | |
Qualicorp SA * | | | — | | | | — | | | | 30,000 | | | | 353,802 | | | | 30,000 | | | $ | 353,802 | |
| | | | | | |
Information Technology — 0.2% | | | | | | | | | | | | | | | | | | | | | | | | |
Linx SA | | | — | | | | — | | | | 15,000 | | | | 352,244 | | | | 15,000 | | | $ | 352,244 | |
| | | | | | | | | | | | | | | | | | | | | | | | |
| | | | | | | 0 | | | | | | | | 1,760,609 | | | | | | | | 1,760,609 | |
| | | | | | | | | | | | | | | | | | | | | | | | |
Canada — 7.9% | | | | | | | | | | | | | | | | | | | | | | | | |
Energy — 1.0% | | | | | | | | | | | | | | | | | | | | | | | | |
Tourmaline Oil Corp. * | | | 38,000 | | | | 2,003,542 | | | | — | | | | — | | | | 38,000 | | | $ | 2,003,542 | |
| | | | | | |
Industrials — 5.9% | | | | | | | | | | | | | | | | | | | | | | | | |
Canadian National Railway Co. | | | 76,000 | | | | 4,942,974 | | | | — | | | | — | | | | 76,000 | | | $ | 4,942,974 | |
Canadian Pacific Railway Ltd. | | | 40,000 | | | | 7,245,600 | | | | | | | | | | | | 40,000 | | | | 7,245,600 | |
| | | | | | | | | | | | | | | | | | | | | | | | |
| | | | | | | 12,188,574 | | | | | | | | 0 | | | | | | | | 12,188,574 | |
| | | | | | | | | | | | | | | | | | | | | | | | |
Materials — 1.0% | | | | | | | | | | | | | | | | | | | | | | | | |
Methanex Corp. | | | 33,000 | | | | 2,040,214 | | | | — | | | | — | | | | 33,000 | | | $ | 2,040,214 | |
| | | | | | | | | | | | | | | | | | | | | | | | |
| | | | | | | 16,232,330 | | | | | | | | 0 | | | | | | | | 16,232,330 | |
| | | | | | | | | | | | | | | | | | | | | | | | |
China — 0.9% | | | | | | | | | | | | | | | | | | | | | | | | |
Consumer Discretionary — 0.4% | | | | | | | | | | | | | | | | | | | | | | | | |
Byd Co. Ltd. | | | — | | | | — | | | | 83,000 | | | | 477,092 | | | | 83,000 | | | $ | 477,092 | |
Vipshop Holdings Ltd ADR * | | | — | | | | — | | | | 2,050 | | | | 384,867 | | | | 2,050 | | | | 384,867 | |
| | | | | | | | | | | | | | | | | | | | | | | | |
| | | | | | | 0 | | | | | | | | 861,959 | | | | | | | | 861,959 | |
| | | | | | | | | | | | | | | | | | | | | | | | |
Information Technology — 0.5% | | | | | | | | | | | | | | | | | | | | | | | | |
Baidu, Inc. ADR * | | | — | | | | — | | | | 1,700 | | | | 317,577 | | | | 1,700 | | | $ | 317,577 | |
Qihoo 360 Technology Co. Ltd. ADR * | | | — | | | | — | | | | 4,400 | | | | 404,976 | | | | 4,400 | | | | 404,976 | |
Tencent Holdings Ltd. | | | — | | | | — | | | | 22,000 | | | | 335,518 | | | | 22,000 | | | | 335,518 | |
| | | | | | | | | | | | | | | | | | | | | | | | |
| | | | | | | 0 | | | | | | | | 1,058,071 | | | | | | | | 1,058,071 | |
| | | | | | | | | | | | | | | | | | | | | | | | |
| | | | | | | 0 | | | | | | | | 1,920,030 | | | | | | | | 1,920,030 | |
| | | | | | | | | | | | | | | | | | | | | | | | |
Denmark — 1.0% | | | | | | | | | | | | | | | | | | | | | | | | |
Telecommunications Services — 1.0% | | | | | | | | | | | | | | | | | | | | | | | | |
GN Store Nord A/S | | | 75,000 | | | | 2,148,784 | | | | — | | | | — | | | | 75,000 | | | $ | 2,148,784 | |
| | | | | | |
France — 4.4% | | | | | | | | | | | | | | | | | | | | | | | | |
Financials — 1.6% | | | | | | | | | | | | | | | | | | | | | | | | |
Credit Agricole SA | | | 230,000 | | | | 3,243,650 | | | | — | | | | — | | | | 230,000 | | | $ | 3,243,650 | |
| | | | | | |
Industrials — 2.8% | | | | | | | | | | | | | | | | | | | | | | | | |
Safran SA | | | 88,000 | | | | 5,761,238 | | | | — | | | | — | | | | 88,000 | | | $ | 5,761,238 | |
| | | | | | | | | | | | | | | | | | | | | | | | |
| | | | | | | 9,004,888 | | | | | | | | 0 | | | | | | | | 9,004,888 | |
| | | | | | | | | | | | | | | | | | | | | | | | |
Germany — 12.3% | | | | | | | | | | | | | | | | | | | | | | | | |
Financials — 1.8% | | | | | | | | | | | | | | | | | | | | | | | | |
Allianz SE (a) | | | 22,300 | | | | 3,715,903 | | | | — | | | | — | | | | 22,300 | | | $ | 3,715,903 | |
| | | | | | |
Health Care — 4.1% | | | | | | | | | | | | | | | | | | | | | | | | |
Bayer AG | | | 26,000 | | | | 3,672,075 | | | | — | | | | — | | | | 26,000 | | | $ | 3,672,075 | |
Stada Arzneimittel AG (a) | | | 100,000 | | | | 4,762,785 | | | | — | | | | — | | | | 100,000 | | | | 4,762,785 | |
| | | | | | | | | | | | | | | | | | | | | | | | |
| | | | | | | 8,434,860 | | | | | | | | 0 | | | | | | | | 8,434,860 | |
| | | | | | | | | | | | | | | | | | | | | | | | |
Industrials — 5.4% | | | | | | | | | | | | | | | | | | | | | | | | |
GEA Group AG | | | 98,000 | | | | 4,640,022 | | | | — | | | | — | | | | 98,000 | | | $ | 4,640,022 | |
Siemens AG | | | 49,000 | | | | 6,470,938 | | | | — | | | | — | | | | 49,000 | | | | 6,470,938 | |
| | | | | | | | | | | | | | | | | | | | | | | | |
| | | | | | | 11,110,960 | | | | | | | | 0 | | | | | | | | 11,110,960 | |
| | | | | | | | | | | | | | | | | | | | | | | | |
Information Technology — 1.0% | | | | | | | | | | | | | | | | | | | | | | | | |
Infineon Technologies AG | | | 165,000 | | | | 2,062,415 | | | | — | | | | — | | | | 165,000 | | | $ | 2,062,415 | |
| | | | | | | | | | | | | | | | | | | | | | | | |
| | | | | | | 25,324,138 | | | | | | | | 0 | | | | | | | | 25,324,138 | |
| | | | | | | | | | | | | | | | | | | | | | | | |
Hong Kong — 3.2% | | | | | | | | | | | | | | | | | | | | | | | | |
Health Care — 0.2% | | | | | | | | | | | | | | | | | | | | | | | | |
Sino Biopharmaceutical Ltd. | | | — | | | | — | | | | 475,000 | | | | 384,883 | | | | 475,000 | | | $ | 384,883 | |
| | | | | | |
Industrials — 3.0% | | | | | | | | | | | | | | | | | | | | | | | | |
Hutchison Whampoa Ltd. | | | 450,000 | | | | 6,154,521 | | | | — | | | | — | | | | 450,000 | | | $ | 6,154,521 | |
| | | | | | | | | | | | | | | | | | | | | | | | |
| | | | | | | 6,154,521 | | | | | | | | 0 | | | | | | | | 6,154,521 | |
| | | | | | | | | | | | | | | | | | | | | | | | |
| | | | | | | 6,154,521 | | | | | | | | 384,883 | | | | | | | | 6,539,404 | |
| | | | | | | | | | | | | | | | | | | | | | | | |
| | | | | | | | | | | | | | | | | | | | | | | | |
India — 1.2% | | | | | | | | | | | | | | | | | | | | | | | | |
Consumer Discretionary — 0.2% | | | | | | | | | | | | | | | | | | | | | | | | |
Zee Entertainment Enterprises Ltd. | | | — | | | | — | | | | 66,000 | | | | 322,473 | | | | 66,000 | | | $ | 322,473 | |
| | | | | | |
Consumer Staples — 0.1% | | | | | | | | | | | | | | | | | | | | | | | | |
Godrej Consumer Products Ltd. | | | — | | | | — | | | | 20,000 | | | | 274,526 | | | | 20,000 | | | $ | 274,526 | |
| | | | | | |
Financials — 0.2% | | | | | | | | | | | | | | | | | | | | | | | | |
ICICI Bank Ltd. ADR | | | — | | | | — | | | | 7,000 | | | | 349,300 | | | | 7,000 | | | $ | 349,300 | |
| | | | | | |
Health Care — 0.2% | | | | | | | | | | | | | | | | | | | | | | | | |
Sun Pharmaceutical Industries Ltd. | | | — | | | | — | | | | 38,000 | | | | 435,266 | | | | 38,000 | | | $ | 435,266 | |
| | | | | | |
Industrials — 0.2% | | | | | | | | | | | | | | | | | | | | | | | | |
Amara Raja Batteries Ltd. | | | — | | | | — | | | | 50,000 | | | | 391,941 | | | | 50,000 | | | $ | 391,941 | |
| | | | | | |
Information Technology — 0.3% | | | | | | | | | | | | | | | | | | | | | | | | |
Tata Consultancy Services Ltd. | | | — | | | | — | | | | 11,000 | | | | 444,213 | | | | 11,000 | | | $ | 444,213 | |
Tech Mahindra Ltd. | | | — | | | | — | | | | 10,000 | | | | 358,308 | | | | 10,000 | | | | 358,308 | |
| | | | | | | | | | | | | | | | | | | | | | | | |
| | | | | | | 0 | | | | | | | | 802,521 | | | | | | | | 802,521 | |
| | | | | | | | | | | | | | | | | | | | | | | | |
| | | | | | | 0 | | | | | | | | 2,576,027 | | | | | | | | 2,576,027 | |
| | | | | | | | | | | | | | | | | | | | | | | | |
Indonesia — 0.6% | | | | | | | | | | | | | | | | | | | | | | | | |
Consumer Discretionary — 0.2% | | | | | | | | | | | | | | | | | | | | | | | | |
Matahari Department Store Tbk PT | | | — | | | | — | | | | 305,000 | | | | 354,890 | | | | 305,000 | | | $ | 354,890 | |
| | | | | | |
Health Care — 0.2% | | | | | | | | | | | | | | | | | | | | | | | | |
Siloam International Hospitals Tbk PT * | | | — | | | | — | | | | 270,000 | | | | 328,963 | | | | 270,000 | | | $ | 328,963 | |
| | | | | | |
Telecommunication Services — 0.2% | | | | | | | | | | | | | | | | | | | | | | | | |
Tower Bersama Infrastructure Tbk PT | | | — | | | | — | | | | 700,000 | | | | 475,127 | | | | 700,000 | | | $ | 475,127 | |
| | | | | | | | | | | | | | | | | | | | | | | | |
| | | | | | | 0 | | | | | | | | 1,158,980 | | | | | | | | 1,158,980 | |
| | | | | | | | | | | | | | | | | | | | | | | | |
Ireland — 3.2% | | | | | | | | | | | | | | | | | | | | | | | | |
Health Care — 3.2% | | | | | | | | | | | | | | | | | | | | | | | | |
Jazz Pharmaceuticals PLC * | | | 13,500 | | | | 1,984,635 | | | | — | | | | — | | | | 13,500 | | | $ | 1,984,635 | |
Shire PLC ADR | | | 20,000 | | | | 4,709,800 | | | | — | | | | — | | | | 20,000 | | | | 4,709,800 | |
| | | | | | | | | | | | | | | | | | | | | | | | |
| | | | | | | 6,694,435 | | | | | | | | 0 | | | | | | | | 6,694,435 | |
| | | | | | | | | | | | | | | | | | | | | | | | |
Japan — 18.5% | | | | | | | | | | | | | | | | | | | | | | | | |
Consumer Discretionary — 1.8% | | | | | | | | | | | | | | | | | | | | | | | | |
Denso Corp. | | | 79,000 | | | | 3,770,259 | | | | — | | | | — | | | | 79,000 | | | $ | 3,770,259 | |
| | | | | | |
Consumer Staples — 3.0% | | | | | | | | | | | | | | | | | | | | | | | | |
Seven & I Holdings Co. Ltd. | | | 100,000 | | | | 4,212,812 | | | | — | | | | — | | | | 100,000 | | | $ | 4,212,812 | |
Welcia Holdings Co. Ltd. | | | 32,800 | | | | 2,010,542 | | | | — | | | | — | | | | 32,800 | | | | 2,010,542 | |
| | | | | | | | | | | | | | | | | | | | | | | | |
| | | | | | | 6,223,354 | | | | | | | | 0 | | | | | | | | 6,223,354 | |
| | | | | | | | | | | | | | | | | | | | | | | | |
Health Care — 1.0% | | | | | | | | | | | | | | | | | | | | | | | | |
Astellas Pharma, Inc. | | | 155,000 | | | | 2,036,373 | | | | — | | | | — | | | | 155,000 | | | $ | 2,036,373 | |
| | | | | | |
Industrials — 4.5% | | | | | | | | | | | | | | | | | | | | | | | | |
Daifuku Co. Ltd. | | | 150,000 | | | | 2,102,458 | | | | — | | | | — | | | | 150,000 | | | $ | 2,102,458 | |
Makita Corp. | | | 116,000 | | | | 7,167,703 | | | | — | | | | — | | | | 116,000 | | | | 7,167,703 | |
| | | | | | | | | | | | | | | | | | | | | | | | |
| | | | | | | 9,270,161 | | | | | | | | 0 | | | | | | | | 9,270,161 | |
| | | | | | | | | | | | | | | | | | | | | | | | |
Information Technology — 5.3% | | | | | | | | | | | | | | | | | | | | | | | | |
KEYENCE Corp. | | | 11,180 | | | | 4,877,111 | | | | — | | | | — | | | | 11,180 | | | $ | 4,877,111 | |
Murata Manufacturing Co. Ltd. | | | 64,000 | | | | 5,989,379 | | | | — | | | | — | | | | 64,000 | | | | 5,989,379 | |
| | | | | | | | | | | | | | | | | | | | | | | | |
| | | | | | | 10,866,490 | | | | | | | | 0 | | | | | | | | 10,866,490 | |
| | | | | | | | | | | | | | | | | | | | | | | | |
Telecommunication Services — 2.9% | | | | | | | | | | | | | | | | | | | | | | | | |
Softbank Corp. | | | 80,000 | | | | 5,956,371 | | | | — | | | | — | | | | 80,000 | | | $ | 5,956,371 | |
| | | | | | | | | | | | | | | | | | | | | | | | |
| | | | | | | 38,123,008 | | | | | | | | 0 | | | | | | | | 38,123,008 | |
| | | | | | | | | | | | | | | | | | | | | | | | |
Malaysia — 0.2% | | | | | | | | | | | | | | | | | | | | | | | | |
Information Technology — 0.2% | | | | | | | | | | | | | | | | | | | | | | | | |
Globetronics Technology BHD | | | — | | | | — | | | | 240,000 | | | | 316,114 | | | | 240,000 | | | $ | 316,114 | |
| | | | | | |
Mexico — 0.6% | | | | | | | | | | | | | | | | | | | | | | | | |
Consumer Discretionary — 0.2% | | | | | | | | | | | | | | | | | | | | | | | | |
Alsea SAB de CV * | | | — | | | | — | | | | 87,000 | | | | 312,834 | | | | 87,000 | | | $ | 312,834 | |
| | | | | | |
Financials — 0.3% | | | | | | | | | | | | | | | | | | | | | | | | |
Compartamos SAB de CV | | | — | | | | — | | | | 161,000 | | | | 310,992 | | | | 161,000 | | | $ | 310,992 | |
Grupo Financiero Banorte SAB de CV | | | — | | | | — | | | | 42,000 | | | | 300,363 | | | | 42,000 | | | | 300,363 | |
| | | | | | | | | | | | | | | | | | | | | | | | |
| | | | | | | 0 | | | | | | | | 611,355 | | | | | | | | 611,355 | |
| | | | | | | | | | | | | | | | | | | | | | | | |
Health Care — 0.1% | | | | | | | | | | | | | | | | | | | | | | | | |
Genomma Lab Internacional SAB de CV* | | | — | | | | — | | | | 114,000 | | | | 308,868 | | | | 114,000 | | | $ | 308,868 | |
| | | | | | | | | | | | | | | | | | | | | | | | |
| | | | | | | 0 | | | | | | | | 1,233,057 | | | | | | | | 1,233,057 | |
| | | | | | | | | | | | | | | | | | | | | | | | |
Netherlands — 3.1% | | | | | | | | | | | | | | | | | | | | | | | | |
Information Technology — 0.9% | | | | | | | | | | | | | | | | | | | | | | | | |
Gemalto NV | | | 18,000 | | | | 1,865,681 | | | | — | | | | — | | | | 18,000 | | | $ | 1,865,681 | |
| | | | | | |
Materials — 2.2% | | | | | | | | | | | | | | | | | | | | | | | | |
Lyondellbasell Industries NV, Class A | | | 46,000 | | | | 4,491,900 | | | | — | | | | — | | | | 46,000 | | | $ | 4,491,900 | |
| | | | | | | | | | | | | | | | | | | | | | | | |
| | | | | | | 6,357,581 | | | | | | | | 0 | | | | | | | | 6,357,581 | |
| | | | | | | | | | | | | | | | | | | | | | | | |
| | | | | | | | | | | | | | | | | | | | | | | | |
Philippines — 0.2% | | | | | | | | | | | | | | | | | | | | | | | | |
Consumer Staples — 0.2% | | | | | | | | | | | | | | | | | | | | | | | | |
Gemalto NV | | | — | | | | — | | | | 380,000 | | | | 377,737 | | | | 380,000 | | | $ | 377,737 | |
| | | | | | |
Poland — 0.4% | | | | | | | | | | | | | | | | | | | | | | | | |
Consumer Discretionary — 0.1% | | | | | | | | | | | | | | | | | | | | | | | | |
LPP SA | | | — | | | | — | | | | 105 | | | | 290,428 | | | | 105 | | | $ | 290,428 | |
| | | | | | |
Financials — 0.2% | | | | | | | | | | | | | | | | | | | | | | | | |
Bank Millennium SA | | | — | | | | — | | | | 134,000 | | | | 342,843 | | | | 134,000 | | | $ | 342,843 | |
| | | | | | |
Information Technology — 0.1% | | | | | | | | | | | | | | | | | | | | | | | | |
CD Projekt SA * | | | — | | | | — | | | | 56,000 | | | | 281,023 | | | | 56,000 | | | $ | 281,023 | |
| | | | | | | | | | | | | | | | | | | | | | | | |
| | | | | | | 0 | | | | | | | | 914,294 | | | | | | | | 914,294 | |
| | | | | | | | | | | | | | | | | | | | | | | | |
Republic of South Korea — 1.1% | | | | | | | | | | | | | | | | | | | | | | | | |
Consumer Discretionary — 0.2% | | | | | | | | | | | | | | | | | | | | | | | | |
Pyeong Hwa Automotive Co. Ltd. | | | — | | | | — | | | | 17,700 | | | | 385,676 | | | | 17,700 | | | $ | 385,676 | |
| | | | | | |
Consumer Staples — 0.5% | | | | | | | | | | | | | | | | | | | | | | | | |
Cosmax, Inc. | | | — | | | | — | | | | 5,244 | | | | 493,334 | | | | 5,244 | | | $ | 493,334 | |
Cosmax BTI, Inc. | | | — | | | | — | | | | 4,055 | | | | 192,943 | | | | 4,055 | | | | 192,943 | |
i-SENS, Inc. * | | | | | | | | | | | 8,000 | | | | 406,344 | | | | 8,000 | | | | 406,344 | |
| | | | | | | | | | | | | | | | | | | | | | | | |
| | | | | | | 0 | | | | | | | | 1,092,621 | | | | | | | | 1,092,621 | |
| | | | | | | | | | | | | | | | | | | | | | | | |
Financials — 0.2% | | | | | | | | | | | | | | | | | | | | | | | | |
Shinhan Financial Group Co. Ltd. | | | — | | | | — | | | | 7,000 | | | | 324,077 | | | | 7,000 | | | $ | 324,077 | |
| | | | | | |
Information Technology — 0.2% | | | | | | | | | | | | | | | | | | | | | | | | |
NAVER Corp. | | | — | | | | — | | | | 550 | | | | 453,827 | | | | 550 | | | $ | 453,827 | |
| | | | | | | | | | | | | | | | | | | | | | | | |
| | | | | | | 0 | | | | | | | | 2,256,201 | | | | | | | | 2,256,201 | |
| | | | | | | | | | | | | | | | | | | | | | | | |
Singapore — 0.0% | | | | | | | | | | | | | | | | | | | | | | | | |
Real Estate Investment Trust — 0.0% | | | | | | | | | | | | | | | | | | | | | | | | |
Keppel REIT | | | 53,430 | | | | 54,848 | | | | — | | | | — | | | | 53,430 | | | $ | 54,848 | |
| | | | | | |
Spain — 3.3% | | | | | | | | | | | | | | | | | | | | | | | | |
Financials — 2.4% | | | | | | | | | | | | | | | | | | | | | | | | |
Banco Bilbao Vizcaya SA | | | 386,097 | | | | 4,921,171 | | | | — | | | | — | | | | 386,097 | | | $ | 4,921,171 | |
Banco Santander SA ADR | | | 4 | | | | 42 | | | | — | | | | — | | | | 4 | | | | 42 | |
| | | | | | | | | | | | | | | | | | | | | | | | |
| | | | | | | 4,921,213 | | | | | | | | 0 | | | | | | | | 4,921,213 | |
| | | | | | | | | | | | | | | | | | | | | | | | |
Health Care — 0.9% | | | | | | | | | | | | | | | | | | | | | | | | |
Grifols SA | | | 35,000 | | | | 1,912,816 | | | | — | | | | — | | | | 35,000 | | | $ | 1,912,816 | |
| | | | | | | | | | | | | | | | | | | | | | | | |
| | | | | | | 6,834,029 | | | | | | | | 0 | | | | | | | | 6,834,029 | |
| | | | | | | | | | | | | | | | | | | | | | | | |
Sweden — 4.2% | | | | | | | | | | | | | | | | | | | | | | | | |
Consumer Discretionary — 2.3% | | | | | | | | | | | | | | | | | | | | | | | | |
Hennes & Mauritz AB | | | 108,200 | | | | 4,728,384 | | | | — | | | | — | | | | 108,200 | | | $ | 4,728,384 | |
| | | | | | |
Materials — 1.9% | | | | | | | | | | | | | | | | | | | | | | | | |
Svenska Cellulosa AB | | | 158,000 | | | | 4,116,788 | | | | — | | | | — | | | | 158,000 | | | $ | 4,116,788 | |
| | | | | | | | | | | | | | | | | | | | | | | | |
| | | | | | | 8,845,172 | | | | | | | | 0 | | | | | | | | 8,845,172 | |
| | | | | | | | | | | | | | | | | | | | | | | | |
Switzerland — 7.6% | | | | | | | | | | | | | | | | | | | | | | | | |
Financials — 4.0% | | | | | | | | | | | | | | | | | | | | | | | | |
ACE Ltd. | | | 42,000 | | | | 4,355,400 | | | | — | | | | — | | | | 42,000 | | | $ | 4,355,400 | |
Credit Suisse Group AG | | | 136,800 | | | | 3,912,230 | | | | — | | | | — | | | | 136,800 | | | | 3,912,230 | |
| | | | | | | | | | | | | | | | | | | | | | | | |
| | | | | | | 8,267,630 | | | | | | | | 0 | | | | | | | | 8,267,630 | |
| | | | | | | | | | | | | | | | | | | | | | | | |
Health Care — 3.6% | | | | | | | | | | | | | | | | | | | | | | | | |
Novartis AG | | | 41,000 | | | | 3,712,688 | | | | — | | | | — | | | | 41,000 | | | $ | 3,712,688 | |
Roche Holding AG | | | 12,200 | | | | 3,638,937 | | | | — | | | | — | | | | 12,200 | | | | 3,638,937 | |
| | | | | | | | | | | | | | | | | | | | | | | | |
| | | | | | | 7,351,625 | | | | | | | | 0 | | | | | | | | 7,351,625 | |
| | | | | | | | | | | | | | | | | | | | | | | | |
| | | | | | | 15,619,255 | | | | | | | | 0 | | | | | | | | 15,619,255 | |
| | | | | | | | | | | | | | | | | | | | | | | | |
Taiwan — 1.4% | | | | | | | | | | | | | | | | | | | | | | | | |
Consumer Discretionary — 0.2% | | | | | | | | | | | | | | | | | | | | | | | | |
PChome Online, Inc. | | | — | | | | — | | | | 35,000 | | | | 387,951 | | | | 35,000 | | | $ | 387,951 | |
| | | | | | |
Financials — 0.2% | | | | | | | | | | | | | | | | | | | | | | | | |
Fubon Financial Holding Co. Ltd. | | | — | | | | — | | | | 302,687 | | | | 437,377 | | | | 302,687 | | | $ | 437,377 | |
| | | | | | |
Industrials — 0.3% | | | | | | | | | | | | | | | | | | | | | | | | |
Delta Electronics, Inc. | | | — | | | | — | | | | 48,000 | | | | 349,608 | | | | 48,000 | | | $ | 349,608 | |
Teco Electric and Machinery Co. Ltd. | | | — | | | | — | | | | 262,000 | | | | 301,376 | | | | 262,000 | | | | 301,376 | |
| | | | | | | | | | | | | | | | | | | | | | | | |
| | | | | | | 0 | | | | | | | | 650,984 | | | | | | | | 650,984 | |
| | | | | | | | | | | | | | | | | | | | | | | | |
Information Technology — 0.3% | | | | | | | | | | | | | | | | | | | | | | | | |
MediaTek, Inc. | | | — | | | | — | | | | 24,000 | | | | 405,867 | | | | 24,000 | | | $ | 405,867 | |
Taiwan Semiconductor Manufacturing Co. Ltd. ADR | | | — | | | | — | | | | 12,400 | | | | 265,236 | | | | 12,400 | | | | 265,236 | |
| | | | | | | | | | | | | | | | | | | | | | | | |
| | | | | | | 0 | | | | | | | | 671,103 | | | | | | | | 671,103 | |
| | | | | | | | | | | | | | | | | | | | | | | | |
Materials — 0.4% | | | | | | | | | | | | | | | | | | | | | | | | |
Asia Cement Corp. | | | — | | | | — | | | | 300,246 | | | | 411,227 | | | | 300,246 | | | $ | 411,227 | |
Ton Yi Industrial Corp. | | | — | | | | — | | | | 375,000 | | | | 381,128 | | | | 375,000 | | | | 381,128 | |
| | | | | | | | | | | | | | | | | | | | | | | | |
| | | | | | | 0 | | | | | | | | 792,355 | | | | | | | | 792,355 | |
| | | | | | | | | | | | | | | | | | | | | | | | |
| | | | | | | 0 | | | | | | | | 2,939,770 | | | | | | | | 2,939,770 | |
| | | | | | | | | | | | | | | | | | | | | | | | |
| | | | | | | | | | | | | | | | | | | | | | | | |
Thailand — 0.2% | | | | | | | | | | | | | | | | | | | | | | | | |
Telecommunications
Services — 0.2% | | | | | | | | | | | | | | | | | | | | | | | | |
Thaicom PCL | | | — | | | | — | | | | 390,000 | | | | 462,783 | | | | 390,000 | | | $ | 462,783 | |
| | | | | | |
United Kingdom — 11.8% | | | | | | | | | | | | | | | | | | | | | | | | |
Consumer Discretionary — 3.7% | | | | | | | | | | | | | | | | | | | | | | | | |
Greene King PLC | | | 255,000 | | | | 3,681,515 | | | | — | | | | — | | | | 255,000 | | | $ | 3,681,515 | |
Liberty Global PLC, Class A (a) * | | | 45,000 | | | | 1,989,900 | | | | — | | | | — | | | | 45,000 | | | | 1,989,900 | |
Liberty Global PLC, Class C * | | | 45,000 | | | | 1,903,950 | | | | — | | | | — | | | | 45,000 | | | | 1,903,950 | |
| | | | | | | | | | | | | | | | | | | | | | | | |
| | | | | | | 7,575,365 | | | | | | | | 0 | | | | | | | | 7,575,365 | |
| | | | | | | | | | | | | | | | | | | | | | | | |
Consumer Staples — 2.0% | | | | | | | | | | | | | | | | | | | | | | | | |
Reckitt Benckiser Group PLC | | | 46,601 | | | | 4,067,866 | | | | — | | | | — | | | | 46,601 | | | $ | 4,067,866 | |
| | | | | | |
Health Care — 1.3% | | | | | | | | | | | | | | | | | | | | | | | | |
AstraZeneca PLC ADR | | | 35,000 | | | | 2,600,850 | | | | — | | | | — | | | | 35,000 | | | $ | 2,600,850 | |
| | | | | | |
Information Technology — 1.4% | | | | | | | | | | | | | | | | | | | | | | | | |
Monitise PLC * | | | 3,200,000 | | | | 2,834,403 | | | | — | | | | — | | | | 3,200,000 | | | $ | 2,834,403 | |
| | | | | | |
Telecommunication Services — 3.4% | | | | | | | | | | | | | | | | | | | | | | | | |
BT Group PLC | | | 559,000 | | | | 3,682,655 | | | | — | | | | — | | | | 559,000 | | | $ | 3,682,655 | |
Vodafone Group PLC | | | 1,003,636 | | | | 3,349,748 | | | | — | | | | — | | | | 1,003,636 | | | | 3,349,748 | |
| | | | | | | | | | | | | | | | | | | | | | | | |
| | | | | | | 7,032,403 | | | | | | | | 0 | | | | | | | | 7,032,403 | |
| | | | | | | | | | | | | | | | | | | | | | | | |
| | | | | | | 24,110,887 | | | | | | | | 0 | | | | | | | | 24,110,887 | |
| | | | | | | | | | | | | | | | | | | | | | | | |
United States — 5.6% | | | | | | | | | | | | | | | | | | | | | | | | |
Energy — 2.3% | | | | | | | | | | | | | | | | | | | | | | | | |
Schlumberger Ltd. | | | 40,852 | | | | 4,818,493 | | | | — | | | | — | | | | 40,852 | | | $ | 4,818,493 | |
| | | | | | |
Financials — 2.2% | | | | | | | | | | | | | | | | | | | | | | | | |
American International Group, Inc. | | | 80,000 | | | | 4,366,400 | | | | — | | | | — | | | | 80,000 | | | $ | 4,366,400 | |
| | | | | | |
Information Technology — 1.1% | | | | | | | | | | | | | | | | | | | | | | | | |
Google, Inc., Class A * | | | 2,000 | | | | 1,169,340 | | | | — | | | | — | | | | 2,000 | | | $ | 1,169,340 | |
Google, Inc., Class C * | | | 2,000 | | | | 1,150,560 | | | | — | | | | — | | | | 2,000 | | | | 1,150,560 | |
| | | | | | | | | | | | | | | | | | | | | | | | |
| | | | | | | 2,319,900 | | | | | | | | 0 | | | | | | | | 2,319,900 | |
| | | | | | | | | | | | | | | | | | | | | | | | |
| | | | | | | 11,504,793 | | | | | | | | 0 | | | | | | | | 11,504,793 | |
| | | | | | | | | | | | | | | | | | | | | | | | |
Total Common Stocks | | | | | | | 180,719,178 | | | | | | | | 16,300,485 | | | | | | | | 197,019,663 | |
| | | | | | |
Preferred Stocks — 0.0% | | | | | | | | | | | | | | | | | | | | | | | | |
India — 0.0% | | | | | | | | | | | | | | | | | | | | | | | | |
Consumer Discretionary — 0.0% | | | | | | | | | | | | | | | | | | | | | | | | |
Zee Entertainment Enterprises Ltd., 6.000% | | | — | | | | — | | | | 2,730,000 | | | | 34,545 | | | | 2,730,000 | | | $ | 34,545 | |
| | | | | | | | | | | | | | | | | | | | | | | | |
Total Preferred Stocks | | | | | | | 0 | | | | | | | | 34,545 | | | | | | | | 34,545 | |
| | | | | | | | | | | | | | | | | | | | | | | | |
Exchanged Traded Funds — 2.0% | | | | | | | | | | | | | | | | | | | | | | | | |
iShares MSCI Emerging Markets ETF | | | — | | | | — | | | | 9,300 | | | | 402,039 | | | | 9,300 | | | $ | 402,039 | |
iShares MSCI South Korea Capped ETF | | | 57,000 | | | | 3,706,140 | | | | 0 | | | | 0 | | | | 57,000 | | | | 3,706,140 | |
| | | | | | | | | | | | | | | | | | | | | | | | |
Total Exchange Traded Funds | | | | | | | 3,706,140 | | | | | | | | 402,039 | | | | | | | | 4,108,179 | |
| | | | | | | | | | | | | | | | | | | | | | | | |
Foreign Government Bonds — 0.1% | | | | | | | | | | | | | | | | | | | | | | | | |
Indonesia — 0.1% | | | | | | | | | | | | | | | | | | | | | | | | |
Indonesian Government, Series FR55, 7.375%, 9/15/16^ | | | — | | | | — | | | | 1,700,000,000 | | | | 143,052 | | | | 1,700,000,000 | | | $ | 143,052 | |
| | | | | | | | | | | | | | | | | | | | | | | | |
Total Foreign Government Bonds | | | | | | | 0 | | | | | | | | 143,052 | | | | | | | | 143,052 | |
| | | | | | | | | | | | | | | | | | | | | | | | |
Cash Equivalents — 2.3% | | | | | | | | | | | | | | | | | | | | | | | | |
Huntington U.S. Treasury Money Market Fund, Institutional Shares, 0.030% (b) (c) | | | 4,616,051 | | | | 4,616,051 | | | | 126,746 | | | | 126,746 | | | | 4,742,797 | | | $ | 4,742,797 | |
| | | | | | | | | | | | | | | | | | | | | | | | |
Total Cash Equivalents | | | | | | | 4,616,051 | | | | | | | | 126,746 | | | | | | | | 4,742,797 | |
| | | | | | | | | | | | | | | | | | | | | | | | |
Short-Term Securities Held as Collateral for Securities
Lending — 3.4% | | | | | | | | | | | | | | | | | | | | | | | | |
Fidelity Institutional Money Market Portfolio, Institutional Class, 0.090% (c) | | | 7,101,852 | | | | 7,101,852 | | | | — | | | | — | | | | 7,101,852 | | | $ | 7,101,852 | |
| | | | | | | | | | | | | | | | | | | | | | | | |
Total Short-Term Securities Held as Collateral for Securities Lending | | | | | | | 7,101,852 | | | | | | | | 0 | | | | | | | | 7,101,852 | |
| | | | | | | | | | | | | | | | | | | | | | | | |
Total Investments | | | | | | | 196,143,221 | | | | | | | | 17,006,867 | | | | | | | | 213,150,088 | |
| | | | | | | | | | | | | | | | | | | | | | | | |
Liabilities in Excess of Other
Assets — -3.2% | | | | | | | (6,591,069 | ) | | | | | | | (171 | ) | | | | | | | (6,591,240 | ) |
| | | | | | | | | | | | | | | | | | | | | | | | |
Net Assets — 100.0% | | | | | | $ | 189,552,152 | | | | | | | $ | 17,006,696 | | | | | | | $ | 206,558,848 | |
| | | | | | | | | | | | | | | | | | | | | | | | |
Total Investments, at Cost | | | | | | $ | 156,555,026 | | | | | | | $ | 14,462,944 | | | | | | | $ | 171,017,970 | |
| | | | | | | | | | | | | | | | | | | | | | | | |
| (a) | All or a portion of the security was on loan as of June 30, 2014. The total value of securities on loan as of June 30, 2014 was $4,982,210. |
| (b) | Investment in affiliate. |
| (c) | Rate disclosed is the seven day yield as of June 30, 2014. |
| * | Non-income producing security. |
| ^ | Foreign-denominated security. Principal amount is report in applicable country’s currency. |
|
ADR - American Depositary Receipt |
ETF - Exchange-Traded Fund |
Pro Forma Notes to the Financial Statements
At June 30, 2014
Note 1 – Description
The Huntington Global Select Markets Fund (“Acquiring Fund”), a series of the Huntington Funds (the “Trust”), is registered under the Investment Company Act of 1940, as amended, as an open-end, diversified investment company.
The Acquiring Fund consists of two classes of shares: Institutional Shares and Class A Shares. All shareholders bear the common expenses of the Fund based on the daily net assets of each class of shares, without distinction between share classes. Dividends are declared separately for each class. Differences in per share dividend rates are generally due to differences in separate class expenses.
The accompanying pro forma financial statements are presented to show the effect of the proposed acquisition of Huntington International Equity Fund (“Target Fund”), a series of the Trust, by the Acquiring Fund as if such acquisition had taken place as of June 30, 2014.
Note 2 – Basis of Combination
Under the terms of the Plan of Reorganization, the combination of Target Fund and Acquiring Fund will be accounted for by the method of accounting for tax-free mergers of investment companies. The acquisition would be accomplished by an acquisition of the net assets of Target Fund in exchange for shares of Acquiring Fund at net asset value. The statement of assets and liabilities and the related statement of operations of Target Fund and Acquiring Fund have been combined as of and for the year ended June 30, 2014. Following the acquisition, the Acquiring Fund will be the accounting survivor. In accordance with accounting principles generally accepted in the United States of America (“GAAP”), the historical cost of investment securities will be carried forward to the surviving fund and the results of operations for precombination periods of the surviving fund will not be restated.
The unaudited pro forma portfolio of investments, statement of assets and liabilities and statement of operations should be read in conjunction with the historical financial statements of each portfolio that are incorporated by reference in the Statement of Additional Information.
Note 3 – Security Valuation
The preparation of financial statements in conformity with GAAP requires management to make estimates and assumptions that affect the amounts of assets, liabilities, and disclosure of contingent assets and liabilities at the date of the financial statements and the reported amounts of income and expenses for the period. Actual results could differ from those estimates.
The Trust calculates the NAV for each of the funds by valuing securities held based on fair value. Fair value is defined as the price that would be received to sell an asset or paid to transfer a liability in an orderly transaction between market participants at the measurement date.
The valuation techniques described below maximize the use of observable inputs and minimize the use of unobservable inputs in determining fair value. The inputs used for valuing the Funds’ investments are summarized in the three broad levels listed below:
| • | | Level 1—quoted prices in active markets for identical assets. |
| • | | Level 2—other significant observable inputs (including quoted prices for similar securities, interest rates, prepayment speeds, credit risk, etc.). |
| • | | Level 3—significant unobservable inputs (including the Funds’ own assumptions in determining the fair value of investments). |
Changes in valuation techniques may result in transfers in or out of an assigned level within the disclosure hierarchy. The Trust recognizes transfers between fair value hierarchy levels at the reporting period end. The inputs or methodology used for valuing investments is not necessarily an indication of the risk associated with investing in those investments.
In computing the NAV of the Funds, fair value is based on market valuations with respect to portfolio securities for which market quotations are readily available. Pursuant to Trustee-approved policies, the Trust relies on certain security pricing services to provide the current market value of securities. Those security pricing services value equity securities (including foreign equity securities, exchange-traded funds and closed-end funds) traded on a securities exchange at the last reported sales price on the principal exchange. Equity securities quoted by NASDAQ are valued at the NASDAQ official closing price. If there is no reported sale on the principal exchange, and in the case of over-the-counter securities, equity securities are valued at a bid price estimated by the security pricing service. In each of these situations, valuations are typically categorized as Level 1 in the fair value hierarchy. Investments in open-end investment companies are valued at their respective net asset value as reported by such companies and are typically categorized as Level 1 in the fair value hierarchy.
Option contracts are generally valued using the closing price based on quote data from the six major U.S. options exchanges on which such options are traded, and are typically categorized as Level 1 in the fair value hierarchy.
Debt securities traded on a national securities exchange or in the over-the-counter market are valued at the last reported sales price on the principal exchange. If there is no reported sale on the principal exchange, and for all other debt securities, debt securities are valued at a bid price estimated by the security pricing service. Foreign securities quoted in foreign currencies are translated in U.S. dollars at the foreign exchange rate in effect as of the close of the New York Stock Exchange (NYSE) (generally 4:00 p.m. Eastern Time), on the day the value of the foreign security is determined. In each of these situations, valuations are typically categorized as Level 2 in the fair value hierarchy.
Under certain circumstances, a good faith determination of the fair value of a security may be used instead of its current market value, even if the security’s market price is readily available. In such circumstances, the Trust’s Administrator may request that the Trust’s Pricing Committee make its own fair value determination.
Securities for which market quotations are not readily available are valued at fair value under Trust procedures approved by the Trustees. In these cases, a Pricing Committee established and appointed by the Trustees determines in good faith, subject to Trust procedures, the fair value of portfolio securities held by a Fund (“good faith fair valuation”). When a good faith fair valuation of a security is required, consideration is generally given to a number of factors including, but not limited to the following: dealer quotes, published analyses by dealers or analysts regarding the security, transactions which provide implicit valuation of the security (such as a merger or tender offer transaction), the value of other securities or contracts which derive their value from the security at issue, and the implications of any other circumstances which have caused trading in the security to halt. With respect to certain narrow categories of securities, the procedures utilized by the Pricing Committee detail specific valuation methodologies to be applied in lieu of considering the aforementioned list of factors. Depending on the source and relative significance of valuation inputs, these instruments may be classified as Level 2 or Level 3 in the fair value hierarchy.
Fair valuation procedures are also used when a significant event affecting the value of a portfolio security is determined to have occurred between the time when the price of the portfolio security is determined and the close of trading on the NYSE, which is when each Fund’s NAV is computed. An event is considered significant if there is both an affirmative expectation that the security’s value will change in response to the event and a reasonable basis for quantifying the resulting change in value. Significant events include significant securities market movements occurring between the time the price of the portfolio security is determined and the close of trading on the NYSE. For domestic fixed income securities, such events may occur where the cut-off time for the market information used by the independent pricing service is earlier than the end of regular trading on the NYSE. For securities normally priced at their last sale price in a foreign market, such events can occur between the close of trading in the foreign market and the close of trading on the NYSE.
In some cases, events affecting the issuer of a portfolio security may be considered significant events. Examples of potentially significant events include announcements concerning earnings, acquisitions, new products, management changes, litigation developments, a strike or natural disaster affecting the company’s operations or regulatory changes or market developments affecting the issuer’s industry occurring between the time when the price of the portfolio security is determined and the close of trading on the NYSE. For securities of foreign issuers, such events could also include political or other developments affecting the economy or markets in which the issuer conducts its operations or its securities are traded.
There can be no assurance that a Fund could purchase or sell a portfolio security at the price used to calculate the Fund’s NAV. In the case of good faith fair valued portfolio securities, lack of information and uncertainty as to the significance of information may lead to a conclusion that a prior valuation is the best indication of a portfolio security’s present value. Good faith fair valuations generally remain unchanged until new information becomes available. Consequently, changes in good faith fair valuation of portfolio securities may be less frequent and of greater magnitude than changes in the price of portfolio securities valued at their last sale price, by an independent pricing service, or based on market quotations.
The Funds’ Trustees have authorized the use of an independent fair valuation service to monitor changes in a designated U.S. market index after foreign markets close, and to implement a fair valuation methodology to adjust the closing prices of foreign securities if the movement in the index is significant. In the event of an increase or decrease greater than predetermined levels, the Funds may use a systematic valuation model provided by an independent third party to fair value its international equity securities, which are then typically categorized as Level 2 in the fair value hierarchy.
In accordance with the valuation procedures adopted by the Trustees, real estate investments are fair valued using discounted cash flow models, which the Trustees deem indicative of the estimated fair value of the real estate investments.
The following is a summary of the inputs used to value the Funds’ investments as of June 30, 2014 based on the three levels defined above:
| | | | | | | | | | | | |
| | | LEVEL 1 | | | LEVEL 2 | | | Total | |
International Equity Fund | | | | | | | | | | | | |
Investment Securities: | | | | | | | | | | | | |
Common Stocks | | | 180,719,178 | | | | — | | | | 180,719,178 | |
Exchange-Traded Funds | | | 3,706,140 | | | | — | | | | 3,706,140 | |
Cash Equivalents | | | 4,616,051 | | | | — | | | | 4,616,051 | |
Short-Term Securities Held as Collateral for Securities Lending | | | 7,101,852 | | | | — | | | | 7,101,852 | |
| | | | | | | | | | | | |
Total Investment Securities | | | 196,143,221 | | | | — | | | | 196,143,221 | |
| | | | | | | | | | | | |
Global Select Markets Fund | | | | | | | | | | | | |
Investment Securities: | | | | | | | | | | | | |
Common Stocks | | | 16,300,485 | | | | — | | | | 16,300,485 | |
Preferred Stocks | | | 34,545 | | | | — | | | | 34,545 | |
Exchange-Traded Funds | | | 402,039 | | | | — | | | | 402,039 | |
Foreign Government Bonds | | | — | | | | 143,052 | | | | 143,052 | |
Cash Equivalents | | | 126,746 | | | | — | | | | 126,746 | |
| | | | | | | | | | | | |
Total Investment Securities | | | 16,863,815 | | | | 143,052 | | | | 17,006,867 | |
| | | | | | | | | | | | |
Proforma Combined | | | | | | | | | | | | |
Investment Securities: | | | | | | | | | | | | |
Common Stocks | | | 197,019,663 | | | | — | | | | 197,019,663 | |
Preferred Stocks | | | 34,545 | | | | — | | | | 34,545 | |
Exchange-Traded Funds | | | 4,108,179 | | | | — | | | | 4,108,179 | |
Foreign Government Bonds | | | — | | | | 143,052 | | | | 143,052 | |
Cash Equivalents | | | 4,742,797 | | | | — | | | | 4,742,797 | |
Short-Term Securities Held as Collateral for Securities Lending | | | 7,101,852 | | | | | | | | 7,101,852 | |
| | | | | | | | | | | | |
Total Investment Securities | | | 213,007,036 | | | | 143,052 | | | | 213,150,088 | |
| | | | | | | | | | | | |
Note 4 – Derivative Instruments
The Funds may be subject to equity price risk and foreign currency exchange risk in the normal course of pursuing their investment objectives. The Funds may invest in various financial instruments including positions in foreign currency contracts and written option contracts to gain exposure to or hedge against changes in the value of equities or foreign currencies.
Note 5 – Capital Shares
The unaudited pro forma net asset value per share assumes retired shares of common stock in connection with the proposed acquisition of Target Fund by Acquiring Fund as of June 30, 2014. The number of retired shares was calculated by dividing the net asset value of Target Fund by the respective net asset value per share of Acquiring Fund. The pro forma number of shares outstanding, by class of shares, for the combined fund consists of the following at June 30, 2014:
| | | | | | | | | | | | |
Class of Shares | | Shares of
Acquiring Fund
Pre-Combination | | | Additional Shares
Assumed Issued
In Reorganization | | | Total Outstanding
Shares
Post-Combination | |
Institutional Shares | | | 1,411,662 | | | | 15,893,537 | | | | 17,305,199 | |
Class A Shares | | | 87,227 | | | | 808,169 | | | | 895,396 | |
Note 6 – Federal Income Taxes
Each fund has elected to be taxed as a “regulated investment company” under the Internal Revenue Code. After the acquisition, the Acquiring Fund intends to continue to qualify as a regulated investment company, if such qualification is in the best interests of its shareholders, by complying with the provisions available to certain investment companies, as defined in applicable sections of the Internal Revenue Code, and to make distributions of taxable income sufficient to relieve it from all, or substantially all, Federal income taxes.
Federal income tax law permits a regulated investment company to carry forward its net capital losses incurred prior to December 22, 2010, for a period of up to eight taxable years (net capital losses that arise in a tax year beginning after December 22, 2010 will generally be able to be carried forward without limit). The Acquiring Fund is presently entitled to net capital loss carryforwards for federal income tax purposes which have no expiration.
THE HUNTINGTON FUNDS
HUNTINGTON INTERNATIONAL EQUITY FUND
CLASS A SHARES
INSTITUTIONAL SHARES
HUNTINGTON GLOBAL SELECT MARKETS FUND
CLASS A SHARES
INSTITUTIONAL SHARES
SUPPLEMENT DATED SEPTEMBER 29, 2014 TO THE PROSPECTUS DATED
APRIL 30, 2014, AS AMENDED SEPTEMBER 2, 2014
NOTICE OF CHANGE TO INVESTMENT POLICY AND STRATEGY OF THE
HUNTINGTON INTERNATIONAL EQUITY FUND
AND
NOTICE OF REORGANIZATION OF THE HUNTINGTON INTERNATIONAL
EQUITY FUND INTO THE HUNTINGTON GLOBAL SELECT MARKETS FUND
AND
NOTICE OF ADVISOR’S EXPENSE LIMITATION AGREEMENT TO LIMIT THE
TOTAL ANNUAL OPERATING EXPENSES FOR THE
HUNTINGTON GLOBAL SELECT MARKETS FUND
At a meeting of the Board of Trustees of the Huntington International Equity Fund (the “International Equity Fund”) held on September 22, 2014, the Trustees approved a proposal to reorganize the International Equity Fund into the Huntington Global Select Markets Fund (the “Global Select Markets Fund”). The International Equity Fund will transfer substantially all of its assets to the Global Select Markets Fund (the “Reorganization”). Class A shares of the International Equity Fund will be exchanged for Class A shares of the Global Select Markets Fund. Institutional Class shares of the International Equity Fund will be exchanged for Institutional Class shares of the Global Select Markets Fund. Shareholders will not incur any sales charges or other transaction charges as a result of the Reorganization. Both Funds are currently managed by the same portfolio managers and the portfolio managers will not change as a result of the Reorganization. Information regarding the Reorganization can be found below and additional information will be provided in an Information Statement distributed to shareholders prior to the Reorganization.
International Equity Fund’s Change in Investment Strategies
Both the International Equity Fund and the Global Select Markets Fund seek total return as each Fund’s investment objective. After the Reorganization, the Global Select Markets Fund will retain its current investment goals and strategies. As a result of the Reorganization, the current investment goals and strategies of the International Equity Fund will change to mirror those of the Global Select Markets Fund. The principal investment strategy of the Global Select Markets Fund, as stated in the Fund’s prospectus dated April 30, 2014, as Amended on September 2, 2014, can be found below. Additional information regarding each Fund’s investment strategies and risks will be included in the Information Statement distributed to shareholders prior the Reorganization and can be found in each Funds’ prospectus and statement of additional information by accessing the Funds’ website at http://www.huntingtonfunds.com/, by contacting your investment professional directly, or by calling The Huntington Funds at 800-253-0412.
Global Select Market Fund’s Principal Investment Strategy
The Fund normally pursues its investment objective by investing in equity and fixed income securities [including real estate investment trusts (“REITs”)] in the United States and in developed and emerging markets throughout the world. The proportions of the Fund’s assets invested in equity and fixed income securities vary based on the Advisor’s interpretation of economic conditions and underlying securities values. The Advisor generally
1
allocates the Fund’s investments across different countries and regions, and, under normal market conditions, the Fund invests significantly (at least 40% — unless market conditions are not deemed favorable by the Advisor, in which case the Fund invests at least 30%) in securities of issuers based outside the United States. The Fund may invest in equity and fixed income securities of issuers of any market capitalization.
The Advisor will employ continuous “top-down” macroeconomic analysis to identify those countries believed to have the best prospects for sustainable growth. A “bottom up” process will then identify securities expected to provide what the Advisor believes will be superior risk-adjusted returns in those countries. By investing in equities and fixed income securities in developed and emerging markets, the Fund seeks to moderate volatility compared to investing solely in emerging market equities. The Fund has no maturity restrictions on the fixed income securities in which it invests.
The Advisor may also use various techniques, such as buying and selling futures contracts and exchange traded funds (“ETFs”), to increase or decrease the Fund’s exposure to changing security prices, interest rates or other factors that affect security values. In addition, in limited circumstances the Advisor may, in order to help the Fund manage its exposure to changes in the value of the U.S. dollar relative to other currencies, enter into derivatives contracts in which a foreign currency is an underlying asset. In addition, the Fund may invest up to 20% of its assets in lower quality fixed income securities (also known as “junk bonds”) — for example, securities which at time of purchase are not rated in one of the four highest categories by a U.S. nationally rated statistical rating organization (or, if unrated, are not determined by the Advisor to be of a quality comparable to a security rated within the four highest rating categories).
Advisor’s Expense Limitation Agreement to limit the Total Annual Fund Operating Expenses of the Global Select Markets Fund Effective October 1, 2014
Effective October 1, 2014, the Advisor has contractually agreed to waive all or a portion of its management fee and/or reimburse certain operating expenses of the Global Select Markets Fund to the extent necessary in order to limit the Global Select Market Fund’s total annual fund operating expenses (after the fee waivers and/or expense reimbursements, and exclusive of acquired fund fees and expenses, brokerage costs, interest, taxes and dividends, and extraordinary expenses) to not more than 0.87% and 1.12% of the Institutional Shares and Class A Shares daily net assets, respectively, through April 30, 2017. This arrangement may only be terminated prior to this date with the agreement of the Fund’s Board of Trustees. Under certain conditions, the Advisor may recapture operating expenses reimbursed under these arrangements for a period of three years following the fiscal year in which such reimbursement occurred.
Effective October 1, 2014, the updated Fee Table for the Global Select Markets Fund with the fee waiver in place will be:
Fees and Expenses
This table describes the fees and expenses that you may pay if you buy and hold shares of the Fund. You may qualify for sales charge discounts if you and members of your household invest, or agree to invest in the future, at least $50,000 in Huntington Funds. More information about these and other discounts is available from your financial professional and in the “Sales Charges” section at page 134 of this prospectus and in the Fund’s Statement of Additional Information.
| | | | | | | | |
Shareholder Fees (fees paid directly from your investment) | | Institutional
Shares | | | Class A
Shares | |
Maximum Sales Charge (Load) Imposed on Purchase (as a percentage of offering price) | | | None | | | | 4.75 | % |
Maximum Deferred Sales Charge (Load) (as a percentage of net asset value) | | | None | | | | None | |
Redemption Fee (as a percentage of amount redeemed, if applicable) | | | None | | | | None | |
2
| | | | | | | | |
| | |
Annual Fund Operating Expenses (expenses that you pay each year as a percentage of the value of your
investment) | | Institutional
Shares | | | Class A
Shares | |
Management Fees | | | 1.00 | % | | | 1.00 | % |
Distribution (12b-1) Fees | | | None | | | | 0.25 | % |
Other Expenses (including shareholder services fee) | | | 1.01 | % | | | 1.01 | % |
Acquired Fund Fees and Expenses | | | 0.09 | % | | | 0.09 | % |
| | | | | | | | | |
Total Annual Fund Operating Expenses | | | 2.10 | % | | | 2.35 | % |
Fee Waivers and/or Expense Reimbursements(1) | | | (1.14 | )% | | | (1.14 | )% |
Total Annual Fund Operating Expenses After Fee Waivers and/or Expense Reimbursements | | | 0.96 | % | | | 1.21 | % |
| (1) | Huntington Asset Advisors, Inc. (the “Advisor”) has contractually agreed to waive all or a portion of its management fee and/or reimburse certain operating expenses of the Fund to the extent necessary in order to limit the Fund’s total annual fund operating expenses (after the fee waivers and/or expense reimbursements, and exclusive of acquired fund fees and expenses, brokerage costs, interest, taxes and dividends, and extraordinary expenses) to not more than 0.87% and 1.12% of the Institutional Shares and Class A Shares daily net assets, respectively, through April 30, 2017. This arrangement may only be terminated prior to this date with the agreement of the Fund’s Board of Trustees. Under certain conditions, the Advisor may recapture operating expenses reimbursed under these arrangements for a period of three years following the fiscal year in which such reimbursement occurred. Any amounts recaptured by the Advisor may not cause the Fund’s total annual fund operating expenses to exceed the stated expense caps. |
Example
This example is intended to help you compare the cost of investing in the Fund with the cost of investing in other mutual funds. The example shows the operating expenses you would incur as a shareholder if you invested $10,000 in the Fund over the time periods shown and you redeem all your shares at the end of those periods. The example assumes that the average annual return was 5%, operating expenses remained the same, and expenses were capped for two years in each period. Although your actual costs may be higher or lower, based on the above assumptions, your costs would be:
| | | | | | | | | | | | | | | | |
| | | 1 Year | | | 3 Years | | | 5 Years | | | 10 Years | |
Institutional Shares | | $ | 98 | | | $ | 358 | | | $ | 843 | | | $ | 2,182 | |
Class A Shares | | $ | 592 | | | $ | 890 | | | $ | 1,402 | | | $ | 2,804 | |
Additional Information Regarding the Reorganization
Class A Shares and Institutional Shares of the International Equity Fund are closed to all new and subsequent investments effective as of the close of business on December 12, 2014, except that the Fund may continue to accept purchases from certain existing institutional relationships and systematic contributions from an Automatic Investment Plan, until such time as it is administratively feasible to terminate these arrangements. If you participate in an Automatic Investment Plan, automatic deductions will roll over automatically to the Global Select Markets Fund from your bank account on or after December 12, 2014. If your Automatic Investment Plan is held at a financial intermediary, you should consult with the appropriate representative to confirm that your automatic investments will roll over to the Global Select Markets Fund as a result of the Reorganization.
3
The Reorganization is intended to qualify for federal income tax purposes as a tax-free reorganization within the meaning of Section 368(a) of the Internal Revenue Code.
Pending distribution of a Prospectus/Information Statement to shareholders, the Reorganization is scheduled to take place at the close of business on or about December 19, 2014.
You may obtain additional information by calling the Huntington Funds at 1-800-253-0412.
Please retain this Supplement for future reference.
4
THE HUNTINGTON FUNDS
HUNTINGTON TAX-FREE MONEY MARKET FUND
HUNTINGTON MONEY MARKET FUND
HUNTINGTON OHIO MUNICIPAL MONEY MARKET FUND
HUNTINGTON U.S. TREASURY MONEY MARKET FUND
HUNTINGTON DISCIPLINED EQUITY FUND
HUNTINGTON DIVIDEND CAPTURE FUND
HUNTINGTON GLOBAL SELECT MARKETS FUND
HUNTINGTON INTERNATIONAL EQUITY FUND
HUNTINGTON REAL STRATEGIES FUND
HUNTINGTON SITUS FUND
HUNTINGTON BALANCED ALLOCATION FUND
HUNTINGTON CONSERVATIVE ALLOCATION FUND
HUNTINGTON GROWTH ALLOCATION FUND
SUPPLEMENT DATED SEPTEMBER 25, 2014, TO THE HUNTINGTON FUNDS’
PROSPECTUS DATED APRIL 30, 2014, AS AMENDED SEPTEMBER 2, 2014
EFFECTIVE AS OF SEPTEMBER 25, 2014, PLEASE REPLACE THE SECTION TITLED “INVESTMENT ADVISOR AND PORTFOLIO MANAGER” IN THE HUNTINGTON REAL STRATEGIES FUND’S SUMMARY PROSPECTUS ON PAGE 44 WITH THE FOLLOWING:
Investment Advisor and Portfolio Managers
The Fund’s investment advisor is Huntington Asset Advisors, Inc. Peter Sorrentino, CFA, Senior Vice President of the Advisor, and Paul W. Attwood, CFA, Senior Vice President of the Advisor, are primarily responsible for the day-to-day management of the Fund. Mr. Sorrentino has served as the Fund’s Portfolio Manager since its inception in 2007. Mr. Attwood has served as the Fund’s Portfolio Manager since 2014.
1
EFFECTIVE AS OF SEPTEMBER 25, 2014, PLEASE REPLACE THE SECTION TITLED “INVESTMENT ADVISOR” IN THE HUNTINGTON FUNDS’ PROSPECTUS ON PAGES 145 AND 146 WITH THE FOLLOWING:
Investment Advisor
Subject to the supervision of the Trustees, Huntington Asset Advisors, Inc. (“the Advisor”) provides a continuous investment program for the Funds, including investment research and management with respect to all securities, instruments, cash and cash equivalents in the Funds.
The Advisor, a separate, wholly-owned subsidiary of Huntington National Bank, is the investment advisor to the Huntington Funds. As of December 31, 2013, the Advisor had assets under management of $3.8 billion. The Advisor (and its predecessor) has served as investment advisor to the Funds since 1987.
Huntington National Bank is a direct, wholly-owned subsidiary of Huntington Bancshares Incorporated, a Maryland corporation with executive offices located at Huntington Center, 41 South High Street, Columbus, Ohio 43215. As of December 31, 2013, Huntington National Bank had assets of over $59 billion.
The Advisor has designated the following as Portfolio Managers for the Funds. Included is their business experience for the last five years.
Peter Sorrentino, CFA, is responsible for the day-to-day management of the Disciplined Equity Fund.
Kirk Mentzer and Peter Sorrentino, CFA, are responsible for the day-to-day management of the Dividend Capture Fund.
Paul Attwood, CFA, and Martina Cheung, CFA, CMT, are responsible for the day-to-day management of the Global Select Markets Fund and International Equity Fund.
Peter Sorrentino, CFA, and Paul W. Attwood, CFA, are responsible for the day-to-day management of the Real Strategies Fund.
B. Randolph “Randy” Bateman, CFA, and Kirk Mentzer are responsible for the day-to-day management of the Situs Fund.
B. Randolph “Randy” Bateman, CFA, is responsible for the day-to-day management of the Balanced Allocation Fund, Conservative Allocation Fund and Growth Allocation Fund.
Paul W. Attwood is responsible for the day-to-day management of the Global Select Markets Fund, International Equity Fund and Real Strategies Fund. Mr. Attwood has served as the Portfolio Manager of the Global Select Markets Fund since the Fund’s inception and has served as the Portfolio Manager of the International Equity Fund since 2012. He has served as the Portfolio Manager of the Real Strategies Fund since 2014. He joined Huntington in 2002 and is a Senior Vice President of the Advisor. Prior to joining the Advisor, Mr. Attwood was a Senior Research Analyst and Portfolio Manager with Haberer Investment Advisor, a division of Huntington Private Financial Group. He has over 15 years of experience in the financial services industry. Mr. Attwood holds a Chartered Financial Analyst designation. He received his Bachelor’s degree from the University of Cincinnati.
B. Randolph “Randy” Bateman is responsible for the day-to-day management of the Situs Fund, Balanced Allocation Fund, Conservative Allocation Fund and Growth Allocation Fund. Mr. Bateman has served as the Portfolio Manager of the Situs Fund since 2002 and has served as the Portfolio Manager of the Asset Allocation Funds since 2013. He is Chief Investment Officer of the Advisor. Mr. Bateman joined The Huntington National Bank in 2000 as Chief Investment Officer. Mr. Bateman served as Senior Vice President of Star Bank from 1988
2
through 2000. Mr. Bateman holds a Chartered Financial Analyst designation. He received his Bachelor’s Degree from North Carolina State University.
Martina Cheung is responsible for the day-to-day management of the Global Select Markets Fund and International Equity Fund. Ms. Cheung has served as the Portfolio Manager of the Global Select Markets Fund and International Equity Fund since 2014. Ms. Cheung joined The Huntington National Bank in 1995 as a securities analyst and is currently a Senior Vice President and portfolio manager. Ms. Cheung holds a Chartered Financial Analyst designation and a Chartered Market Technician designation. She received her Bachelor’s degree in Finance and Management Information Systems from The Ohio State University and received her M.B.A. from Capital University.
Kirk Mentzer is responsible for the day-to-day management of the Dividend Capture Fund and Situs Fund. Mr. Mentzer has served as Portfolio Manager of the Dividend Capture Fund since 2001 and as Portfolio Manager of the Situs Fund since 2014. He is Senior Vice President and Director of Investment Research of the Advisor. Mr. Mentzer joined The Huntington National Bank in 2000. Mr. Mentzer has been a Portfolio Manager since 2000 and from 2000 to 2001 he was Director of Fixed Income Investments. He became Director of Investment Research in 2001. He served as Vice President of Firstar Investment Research & Management Co. from 1989 through 2000 and managed Firstar’s Strategic Income and U.S. Government funds from 1999 to 2000. Mr. Mentzer received his M.B.A. from Xavier University.
Peter Sorrentino is responsible for the day-to-day management of the Dividend Capture Fund, Disciplined Equity Fund, and Real Strategies Fund. Mr. Sorrentino has served as the Portfolio Manager of the Real Strategies Fund since the Fund’s inception. He has served as Portfolio Manager of the Disciplined Equity Fund since 2012 and as Portfolio Manager of the Dividend Capture Fund since 2014. Mr. Sorrentino joined The Huntington National Bank in October of 2006 as a Senior Portfolio Manager and is Senior Vice President of the Advisor. From 2001 until joining Huntington, he served as the lead portfolio manager for the Legg Mason Balanced Trust. Mr. Sorrentino holds a Chartered Financial Analyst designation. He received his Bachelor’s Degree in Finance and Accounting from the University of Cincinnati.
The Funds’ SAI provides additional information about the Portfolio Managers’ compensation, management of other accounts, and ownership of securities in the Funds.
3


Prospectus
APRIL 30, 2014
As Amended September 2, 2014
CLASS A SHARES
CLASS C SHARES
INSTITUTIONAL SHARES
EQUITY FUNDS
Huntington Disciplined Equity Fund
Symbol: HDEAX (A Shares)
Symbol: HDETX (Institutional Shares)
Huntington Dividend Capture Fund
Symbol: HDCAX (A Shares)
Symbol: HDCEX (C Shares)
Symbol: HDCTX (Institutional Shares)
Huntington Global Select Markets Fund
Symbol: HGSAX (A Shares)
Symbol: HGSIX (Institutional Shares)
Huntington International Equity Fund
Symbol: HIEAX (A Shares)
Symbol: HIETX (Institutional Shares)
Huntington Real Strategies Fund
Symbol: HRSAX (A Shares)
Symbol: HRSTX (Institutional Shares)
Huntington Situs Fund
Symbol: HSUAX (A Shares)
Symbol: HSUCX (C Shares)
Symbol: HSUTX (Institutional Shares)
MONEY MARKET FUNDS
Huntington Tax-Free Money Market Fund
Symbol: HFTXX (A Shares)
Symbol: HFLXX (Institutional Shares)
Huntington Money Market Fund
Symbol: HFIXX (A Shares)
Symbol: HFDXX (Institutional Shares)
Huntington Ohio Municipal Money Market Fund
Symbol: HOBXX (A Shares)
Symbol: HFXXX (Institutional Shares)
Huntington U.S. Treasury Money Market Fund
Symbol: HUIXX (A Shares)
Symbol: HTTXX (Institutional Shares)
ASSET ALLOCATION FUNDS
Huntington Balanced Allocation Fund
Symbol: HBAFX (A Shares)
Huntington Conservative Allocation Fund
Symbol: HCAFX (A Shares)
Huntington Growth Allocation Fund
Symbol: HGRFX (A Shares)
The Securities and Exchange Commission (SEC) has not approved or disapproved of these securities or determined whether this Prospectus is accurate or complete. Any representation to the contrary is a criminal offense.
Not a Deposit • Not FDIC Insured • Not Insured by a Government Agency • No Bank Guarantee • May Lose Value
The Huntington FundsTable of Contents
1
Fund Summaries
Huntington Tax-Free Money Market Fund
Fund Summary
Investment Objective | The Fund’s investment objective is to seek to provide the highest level of interest income exempt from federal income tax, consistent with liquidity and stability of principal. |
Fees and Expenses
This table describes the fees and expenses that you may pay if you buy and hold shares of the Fund.
| | | | | | | | |
Shareholder Fees
(fees paid directly from your investment) | | Institutional
Shares | | | Class A
Shares | |
Maximum Sales Charge (Load) Imposed on Purchases
(as a percentage of offering price) | | | None | | | | None | |
| |
Maximum Deferred Sales Charge (Load)
(as a percentage of net asset value) | | | None | | | | None | |
| |
Redemption Fee
(as a percentage of amount redeemed, if applicable) | | | None | | | | None | |
| | | | | | | | |
Annual Fund Operating Expenses
(expenses that you pay each year as a percentage of the
value of your investment) | | Institutional
Shares | | | Class A
Shares | |
| Management Fees | | | 0.30% | | | | 0.30% | |
| |
| Distribution (12b-1) Fees | | | None | | | | 0.25% | |
| |
Other Expenses
(including shareholder services fee) | | | 0.64% | | | | 0.64% | |
| |
| Acquired Fund Fees and Expenses | | | None | | | | None | |
| |
| Total Annual Fund Operating Expenses | | | 0.94% | | | | 1.19% | |
Example
This Example is intended to help you compare the cost of investing in the Fund with the cost of investing in other mutual funds. The Example assumes that you invest $10,000 in the Fund for the time periods indicated and then redeem all of your shares at the end of those periods. The Example also assumes that your investment has a 5% return each year and that the Fund’s operating expenses remain the same. Although your actual costs may be higher or lower, based on these assumptions your costs would be:
| | | | | | | | | | | | | | | | |
| | | 1 Year | | | 3 Years | | | 5 Years | | | 10 Years | |
Institutional Shares | | $ | 96 | | | $ | 300 | | | $ | 520 | | | $ | 1,155 | |
Class A Shares | | $ | 121 | | | $ | 378 | | | $ | 654 | | | $ | 1,443 | |
Principal Investment Strategy
The Advisor strives to maintain a $1.00 net asset value (“NAV”) per share for the Tax-Free Money Market Fund by investing at least 80% of the Fund’s assets in short-term tax-exempt securities which are either rated in the highest rating category by a Nationally Recognized Statistical Rating Organization (“NRSRO”) or unrated and deemed to be of comparable quality by the Advisor. No more than 20% of the Fund’s annual income will be subject to the alternative minimum tax (“AMT”).
In managing the portfolio, the Advisor determines an appropriate dollar-weighted average maturity range for the Fund and endeavors to diversify the portfolio’s holdings as much as possible. In addition, the Advisor analyzes cash flows, maturities, settlements, tax payments, yields and credit quality and monitors new issue calendars for potential purchases.
Tax-exempt securities are debt securities typically issued by states, counties, cities, and other political subdivisions and authorities and which pay interest that is exempt from Federal income tax.
Because the Fund refers to tax-exempt securities in its name, it will notify shareholders at least 60 days in advance of any changes in its investment policies that would enable the Fund to normally invest less than 80% of its assets in tax-exempt securities.
2
Fund Summaries
Huntington Tax-Free Money Market Fund
continued
Principal Investment Risks
All mutual funds take investment risks. Therefore, it is possible to lose money by investing in the Fund. An investment in the Fund is not a bank deposit and is not insured or guaranteed by the Federal Deposit Insurance Corporation or any other government agency. Although the Fund seeks to preserve the value of your investment at $1.00 per share, it is possible to lose money by investing in the Fund. Additionally, you should be aware that a very small number of money market funds in other fund complexes have, in the past, “broken the buck,” which means that investors did not receive $1.00 per share for their investment in those funds, and any money market fund may do so in the future. You should also be aware that the Advisor and its affiliates are under no obligation to provide financial support to the Fund or take other measures to ensure that you receive $1.00 per share for your investment in the Fund. You should not invest in the Fund with the expectation that any such action will be taken. The primary factors that may reduce the Fund’s NAV and returns include:
Counterparty Risk. The value of the Fund’s investments may be adversely affected if an issuer’s securities experience a credit downgrade; an issuer or guarantor of an investment held by the Fund fails to pay an obligation on a timely basis, otherwise defaults or is perceived by other investors to be less creditworthy; or a counterparty to a transaction with the Fund files for bankruptcy, becomes insolvent, or otherwise becomes unable or unwilling to honor its obligation to the Fund.
Credit Enhancement Risk. A security held by the Fund may be subject to “credit enhancement” (for example, a guarantee) provided by a third-party “credit enhancer.” If the credit rating of the credit enhancer is downgraded, the value of the security held by the Fund may be adversely affected.
Credit Risk. Issuers of securities in which the Fund invests may have their credit ratings downgraded or may default in the payment of principal or interest on the securities, which would cause the Fund to lose money.
Interest Rate Risk. The value of the Fund’s investments in fixed income securities may decline when prevailing interest rates rise or increase when interest rates go down. The longer a security’s maturity or duration, the greater its value will change in response to changes in interest rates. The interest earned on the Fund’s investments in fixed income securities may decline when prevailing interest rates decline.
Recoupment Risk. The Advisor entered into an agreement with the Fund, whereby the Advisor agreed to waive all or a portion of its investment advisory fee and/or to reimburse certain operating expenses of the Fund to the extent necessary to ensure that the Fund maintains a positive yield of at least 0.01%. The Advisor shall be entitled to recoup from the Fund any waived and/or reimbursed amounts pursuant to the agreement for a period of up to three (3) years from the date of the waiver and/or reimbursement. This recoupment could negatively affect the Fund’s future yield. The Advisor may terminate the agreement at any time upon thirty (30) days prior written notice to the Fund.
For more information, please see “Principal Investment Strategies and Risks.”
3
Fund Summaries
Huntington Tax-Free Money Market Fund
continued
Performance: Bar Chart for Institutional Shares and Average Annual Total Return Table
The performance information shown below will help you analyze the Fund’s investment risks in light of its historical returns. The bar chart shows the variability of the Fund’s Institutional Shares total returns on a calendar year-by-year basis. The Average Annual Total Return Table shows returns averaged over the stated periods, and includes comparative performance information. The Fund’s performance will fluctuate, and past performance (before and after taxes) is not necessarily an indication of future results.
Updated performance information will be available at www.huntingtonfunds.com, or by calling 800-253-0412.
| | | | | | | | | | |
Risk/Return Bar Chart 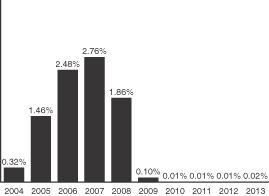
| | Best Quarter Worst Quarter | |
| Q3 2007
Q4 2012 |
| |
| 0.72%
0.00% |
|
| | | | | | | | | | |
| | | | | | | | | | |
| | | | | | | | | | |
| | | | | | | | | | |
| | | | | | | | | | |
| | | | | | | | | | |
| | | | | | | | | | |
| | | | | | | | | | |
| | | | | | | | | | |
| | | | | | | | | | |
| | | | | | | | | | |
| | | | | | | | | | |
| | |
| | Average Annual Total Return Table (for the periods ended December 31, 2013) |
| | | | | | | | | | | | |
| | | 1 Year | | | 5 Years | | | 10 Years | |
| Tax-Free Money Market Fund — Institutional Shares | | | | | | | | | | | | |
| Returns before taxes | | | 0.02% | | | | 0.03% | | | | 0.90% | |
| Tax-Free Money Market Fund — Class A Shares | | | | | | | | | | | | |
| Returns before taxes | | | 0.01% | | | | 0.01% | | | | 0.78% | |
Investment Advisor
The Fund’s investment advisor is Huntington Asset Advisors, Inc.
Purchasing and Redeeming Shares
The minimum initial purchase for the Fund’s Class A and Institutional Shares is $1,000. For Class A Shares, the minimum subsequent investment is $50; for Institutional Shares, the minimum subsequent investment is $500. For Class A Shares and Institutional Shares, the minimum initial and subsequent investment through the Systematic Investment Program (“SIP”) is $50.
Shares may be purchased or redeemed by calling your investment professional or directly from the Trust at 800-253-0412; by check payable to the Huntington Tax-Free Money Market Fund and applicable Share class (for example, Huntington Tax-Free Money Market Fund Class A Shares) (Mail to: The Huntington Funds, P.O. Box 6110, Indianapolis, IN 46206-6110); or by Federal funds wire (please call the Trust at 800-253-0412 for wire instructions). You may redeem your Shares on any business day when both the Federal Reserve Bank and New York Stock Exchange are open by telephone at 800-253-0412, or by calling your Investment Professional; or by mail to the Huntington Funds address above. You may receive redemption proceeds by wire (wire transfer fees may apply), by electronic bank transfer or by check. Sales charges may apply to the purchase or redemption of Shares.
4
Fund Summaries
Huntington Tax-Free Money Market Fund
continued
Tax Information
It is anticipated that Fund distributions will be primarily dividends that are exempt from federal regular income tax, although a portion of the Fund’s dividends may not be tax-exempt. Dividends may be subject to state and local taxes. Although the Fund does not seek to realize capital gains, the Fund may realize and distribute capital gains from time to time as a result of the Fund’s normal investment activities. Any Fund distributions of capital gains are taxable at applicable capital gains rates. The Fund is not a suitable investment for retirement accounts.
Payments to Broker-Dealers and Other Financial Intermediaries
If you purchase the Fund through a broker-dealer or other financial intermediary (such as a bank), the Fund and its related companies may pay the intermediary for the sale of Fund shares and related services. These payments may create a conflict of interest by influencing the broker-dealer or other intermediary and your salesperson to recommend the Fund over another investment. Ask your salesperson or visit your financial intermediary’s Web site for more information.
5
Fund Summaries
Huntington Money Market Fund
Fund Summary
Investment Objective | The Fund’s investment objective is to seek to maximize current income while preserving capital and maintaining liquidity by investing in a portfolio of high-quality money market instruments. |
Fees and Expenses
This table describes the fees and expenses that you may pay if you buy and hold shares of the Fund.
| | | | | | | | |
Shareholder Fees
(fees paid directly from your investment) | | Institutional
Shares | | | Class A
Shares | |
Maximum Sales Charge (Load) Imposed on Purchase
(as a percentage of offering price) | | | None | | | | None | |
| |
Maximum Deferred Sales Charge (Load)
(as a percentage of net asset value) | | | None | | | | None | |
| |
Redemption Fee
(as a percentage of amount redeemed, if applicable) | | | None | | | | None | |
| | | | | | | | |
Annual Fund Operating Expenses
(expenses that you pay each year as a percentage of the
value of your investment) | | Institutional
Shares | | | Class A
Shares | |
| Management Fees | | | 0.30% | | | | 0.30% | |
| |
| Distribution (12b-1) Fees | | | None | | | | 0.25% | |
| |
Other Expenses
(including shareholder services fee) | | | 0.54% | | | | 0.54% | |
| |
| Acquired Fund Fees and Expenses | | | 0.01% | | | | 0.01% | |
| |
| Total Annual Fund Operating Expenses | | | 0.85% | | | | 1.10% | |
Example
This Example is intended to help you compare the cost of investing in the Fund with the cost of investing in other mutual funds. The Example assumes that you invest $10,000 in the Fund for the time periods indicated and then redeem all of your shares at the end of those periods. The Example also assumes that your investment has a 5% return each year and that the Fund’s operating expenses remain the same. Although your actual costs may be higher or lower, based on these assumptions your costs would be:
| | | | | | | | | | | | | | | | |
| | | 1 Year | | | 3 Years | | | 5 Years | | | 10 Years | |
Institutional Shares | | $ | 87 | | | $ | 271 | | | $ | 471 | | | $ | 1,049 | |
Class A Shares | | $ | 112 | | | $ | 350 | | | $ | 606 | | | $ | 1,340 | |
Principal Investment Strategy
The Advisor strives to maintain a $1.00 net asset value (“NAV”) per share for the Fund by investing in commercial paper and U.S. government agency notes, and other short-term money market instruments, which may include municipal securities, that are either rated in the highest rating category by a Nationally Recognized Statistical Rating Organization (“NRSRO”) or unrated and deemed to be of comparable quality by the Advisor. In managing the portfolio, the Advisor maintains a dollar-weighted average portfolio maturity of 60 days or less and a dollar-weighted average life of 120 days or less, and endeavors to diversify the portfolio across market sectors.
The Fund intends to invest in the securities of U.S. government-sponsored entities (“GSEs”), including both GSE securities backed by the full faith and credit of the U.S. government and GSE securities that are not backed by the full faith and credit of the U.S. government.
Principal Investment Risks
All mutual funds take investment risks. Therefore, it is possible to lose money by investing in the Fund. An investment in the Fund is not a bank deposit and is not insured or guaranteed by the Federal Deposit
6
Fund Summaries
Huntington Money Market Fund
continued
Insurance Corporation or any other government agency. Although the Fund seeks to preserve the value of your investment at $1.00 per share, it is possible to lose money by investing in the Fund. Additionally, you should be aware that a very small number of money market funds in other fund complexes have, in the past, “broken the buck,” which means that investors did not receive $1.00 per share for their investment in those funds, and any money market fund may do so in the future. You should also be aware that the Advisor and its affiliates are under no obligation to provide financial support to the Fund or take other measures to ensure that you receive $1.00 per share for your investment in the Fund. You should not invest in the Fund with the expectation that any such action will be taken. The primary factors that may reduce the Fund’s NAV and returns include:
Counterparty Risk. The value of the Fund’s investments may be adversely affected if an issuer’s securities experience a credit downgrade; an issuer or guarantor of an investment held by the Fund fails to pay an obligation on a timely basis, otherwise defaults or is perceived by other investors to be less creditworthy; or a counterparty to a transaction with the Fund files for bankruptcy, becomes insolvent, or otherwise becomes unable or unwilling to honor its obligation to the Fund.
Credit Enhancement Risk. A security held by the Fund may be subject to “credit enhancement” (for example, a guarantee) provided by a third-party “credit enhancer.” If the credit rating of the credit enhancer is downgraded, the value of the security held by the Fund may be adversely affected.
Credit Risk. Issuers of securities in which the Fund invests may have their credit ratings downgraded or may default in the payment of principal or interest on the securities, which would cause the Fund to lose money.
Interest Rate Risk. The value of the Fund’s investments in fixed income securities may decline when prevailing interest rates rise or increase when interest rates go down. The longer a security’s maturity or duration, the greater its value will change in response to changes in interest rates. The interest earned on the Fund’s investments in fixed income securities may decline when prevailing interest rates decline.
Recoupment Risk. The Advisor entered into an agreement with the Fund, whereby the Advisor agreed to waive all or a portion of its investment advisory fee and/or to reimburse certain operating expenses of the Fund to the extent necessary to ensure that the Fund maintains a positive yield of at least 0.01%. The Advisor shall be entitled to recoup from the Fund any waived and/or reimbursed amounts pursuant to the agreement for a period of up to three (3) years from the date of the waiver and/or reimbursement. This recoupment could negatively affect the Fund’s future yield. The Advisor may terminate the agreement at any time upon thirty (30) days prior written notice to the Fund.
For more information, please see “Principal Investment Strategies and Risks.”
7
Fund Summaries
Huntington Money Market Fund
continued
Performance: Bar Chart for Institutional Shares and Average Annual Total Return Table
The performance information shown below will help you analyze the Fund’s investment risks in light of its historical returns. The bar chart shows the variability of the Fund’s Institutional Shares total returns on a calendar year-by-year basis. The Average Annual Total Return Table shows returns averaged over the stated periods, and includes comparative performance information. The Fund’s performance will fluctuate, and past performance (before and after taxes) is not necessarily an indication of future results.
Updated performance information will be available at www.huntingtonfunds.com, or by calling 800-253-0412.
| | | | | | | | | | |
Risk/Return Bar Chart 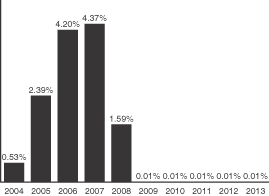
| | Best Quarter Worst Quarter | |
| Q3 2006
Q4 2013 |
| |
| 1.12
0.00 | %
% |
| | | | | | | | | | |
| | | | | | | | | | |
| | | | | | | | | | |
| | | | | | | | | | |
| | | | | | | | | | |
| | | | | | | | | | |
| | | | | | | | | | |
| | | | | | | | | | |
| | | | | | | | | | |
| | | | | | | | | | |
| | | | | | | | | | |
| | | | | | | | | | |
| | |
| | Average Annual Total Return Table (for the periods ended December 31, 2013) |
| | | | | | | | | | | | |
| | | 1 Year | | | 5 Years | | | 10 Years | |
| Money Market Fund — Institutional Shares | | | | | | | | | | | | |
| Returns before taxes | | | 0.01% | | | | 0.01% | | | | 1.30% | |
| Money Market Fund — Class A Shares | | | | | | | | | | | | |
| Returns before taxes | | | 0.01% | | | | 0.01% | | | | 1.19% | |
Investment Advisor
The Fund’s investment advisor is Huntington Asset Advisors, Inc.
Purchasing and Redeeming Shares
The minimum initial purchase for the Fund’s Class A and Institutional Shares is $1,000. For Class A Shares, the minimum subsequent investment is $50; for Institutional Shares, the minimum subsequent investment is $500. For Class A Shares and Institutional Shares, the minimum initial and subsequent investment through the Systematic Investment Program (“SIP”) is $50.
Shares may be purchased or redeemed by calling your investment professional or directly from the Trust at 800-253-0412; by check payable to the Huntington Money Market Fund and applicable Share class (for example, Huntington Money Market Fund Class A Shares) (Mail to: The Huntington Funds, P.O. Box 6110, Indianapolis, IN 46206-6110); or by Federal funds wire (please call the Trust at 800-253-0412 for wire instructions). You may redeem your Shares on any business day when both the Federal Reserve Bank and New York Stock Exchange are open by telephone at 800-253-0412, or by calling your Investment Professional; or by mail to the Huntington Funds address above. You may receive redemption proceeds by wire (wire transfer fees may apply), by electronic bank transfer or by check. Sales charges may apply to the purchase or redemption of Shares.
8
Fund Summaries
Huntington Money Market Fund
continued
Tax Information
The Fund’s distributions are taxable as ordinary income or capital gains, except when your investment is through an Individual Retirement Account (“IRA”).
Payments to Broker-Dealers and Other Financial Intermediaries
If you purchase the Fund through a broker-dealer or other financial intermediary (such as a bank), the Fund and its related companies may pay the intermediary for the sale of Fund shares and related services. These payments may create a conflict of interest by influencing the broker-dealer or other intermediary and your salesperson to recommend the Fund over another investment. Ask your salesperson or visit your financial intermediary’s Web site for more information.
9
Fund Summaries
Huntington Ohio Municipal Money Market Fund
Fund Summary
Investment Objective | The Fund’s investment objective is to seek to provide income exempt from both federal regular income tax and Ohio personal income taxes while preserving capital and maintaining liquidity. |
Fees and Expenses
This table describes the fees and expenses that you may pay if you buy and hold shares of the Fund.
| | | | | | | | |
Shareholder Fees
(fees paid directly from your investment) | | Institutional
Shares | | | Class A
Shares | |
Maximum Sales Charge (Load) Imposed on Purchases
(as a percentage of offering price) | | | None | | | | None | |
| |
Maximum Deferred Sales Charge (Load)
(as a percentage of net asset value) | | | None | | | | None | |
| |
Redemption Fee
(as a percentage of amount redeemed, if applicable) | | | None | | | | None | |
| | | | | | | | |
Annual Fund Operating Expenses
(expenses that you pay each year as a percentage of the
value of your investment) | | Institutional
Shares | | | Class A
Shares | |
| Management Fees | | | 0.30% | | | | 0.30% | |
| |
| Distribution (12b-1) Fees | | | None | | | | 0.25% | |
| |
Other Expenses
(including shareholder services fee) | | | 0.58% | | | | 0.58% | |
| |
| Acquired Fund Fees and Expenses | | | None | | | | None | |
| |
| Total Annual Fund Operating Expenses | | | 0.88% | | | | 1.13% | |
Example
This Example is intended to help you compare the cost of investing in the Fund with the cost of investing in other mutual funds. The Example assumes that you invest $10,000 in the Fund for the time periods indicated and then redeem all of your shares at the end of those periods. The Example also assumes that your investment has a 5% return each year and that the Fund’s operating expenses remain the same. Although your actual costs may be higher or lower, based on these assumptions your costs would be:
| | | | | | | | | | | | | | | | |
| | | 1 Year | | | 3 Years | | | 5 Years | | | 10 Years | |
Institutional Shares | | $ | 90 | | | $ | 281 | | | $ | 488 | | | $ | 1,084 | |
Class A Shares | | $ | 115 | | | $ | 359 | | | $ | 622 | | | $ | 1,375 | |
Principal Investment Strategy
The Advisor strives to maintain a $1.00 net asset value (“NAV”) per share for the Fund by investing at least 80% of the Fund’s assets in short-term Ohio tax-exempt securities which are either rated in the highest rating category by a Nationally Recognized Statistical Rating Organization (“NRSRO”) or unrated and deemed to be of comparable quality by the Advisor. In managing the portfolio, the Advisor determines an appropriate dollar-weighted average maturity range for the Fund and endeavors to diversify the portfolio’s holdings within Ohio as much as possible. In addition, the Advisor analyzes cash flows, maturities, settlements, tax payments, yields and credit quality, and monitors new issue calendars for potential purchases.
Ohio tax-exempt securities are debt obligations which (i) are issued by or on behalf of the state of Ohio or its respective authorities, agencies, instrumentalities and political subdivisions, and (ii) produce interest which, in the opinion of bond counsel at the time of issuance, is exempt from federal income tax and Ohio personal income taxes.
The Fund is non-diversified, which means that it can invest a greater percentage of its assets in any one issuer than a diversified fund.
10
Fund Summaries
Huntington Ohio Municipal Money Market Fund
continued
Because the Fund refers to Ohio tax-exempt securities in its name, it will notify shareholders at least 60 days in advance of any changes in its investment policies that would enable the Fund to normally invest less than 80% of its assets in Ohio tax-exempt securities.
Principal Investment Risks
All mutual funds take investment risks. Therefore, it is possible to lose money by investing in the Fund. An investment in the Fund is not a bank deposit and is not insured or guaranteed by the Federal Deposit Insurance Corporation or any other government agency. Although the Fund seeks to preserve the value of your investment at $1.00 per share, it is possible to lose money by investing in the Fund. Additionally, you should be aware that a very small number of money market funds in other fund complexes have, in the past, “broken the buck,” which means that investors did not receive $1.00 per share for their investment in those funds, and any money market fund may do so in the future. You should also be aware that the Advisor and its affiliates are under no obligation to provide financial support to the Fund or take other measures to ensure that you receive $1.00 per share for your investment in the Fund. You should not invest in the Fund with the expectation that any such action will be taken. The primary factors that may reduce the Fund’s NAV and returns include:
Counterparty Risk. The value of the Fund’s investments may be adversely affected if an issuer’s securities experience a credit downgrade; an issuer or guarantor of an investment held by the Fund fails to pay an obligation on a timely basis, otherwise defaults or is perceived by other investors to be less creditworthy; or a counterparty to a transaction with the Fund files for bankruptcy, becomes insolvent, or otherwise becomes unable or unwilling to honor its obligation to the Fund.
Credit Enhancement Risk. A security held by the Fund may be subject to “credit enhancement” (for example, a guarantee) provided by a third-party “credit enhancer.” If the credit rating of the credit enhancer is downgraded, the value of the security held by the Fund may be adversely affected.
Credit Risk. Issuers of securities in which the Fund invests may have their credit ratings downgraded or may default in the payment of principal or interest on the securities, which would cause the Fund to lose money.
Interest Rate Risk. The value of the Fund’s investments in fixed income securities may decline when prevailing interest rates rise or increase when interest rates go down. The longer a security’s maturity or duration, the greater its value will change in response to changes in interest rates. The interest earned on the Fund’s investments in fixed income securities may decline when prevailing interest rates decline.
Non-Diversification Risk. Because the Fund invests in a small number of issuers, its value will be affected to a greater extent by the performance of any one of those issuers or by any single economic, political, market or regulatory event affecting any one of those issuers than is a fund that invests in a larger number of issuers.
Recoupment Risk. The Advisor entered into an agreement with the Fund, whereby the Advisor agreed to waive all or a portion of its investment advisory fee and/or to reimburse certain operating expenses of the Fund to the extent necessary to ensure that the Fund maintains a positive yield of at least 0.01%. The Advisor shall be entitled to recoup from the Fund any waived and/or reimbursed amounts pursuant to the agreement for a period of up to three (3) years from the date of the waiver and/or reimbursement. This recoupment could negatively affect the Fund’s future yield. The Advisor may terminate the agreement at any time upon thirty (30) days prior written notice to the Fund.
State Concentration Risk. Because the Fund primarily purchases municipal bonds from Ohio, the Fund is more susceptible to adverse economic, political or regulatory changes affecting municipal issues in that state.
For more information, please see “Principal Investment Strategies and Risks.”
11
Fund Summaries
Huntington Ohio Municipal Money Market Fund
continued
Performance: Bar Chart for Institutional Shares and Average Annual Total Return Table
The performance information shown below will help you analyze the Fund’s investment risks in light of its historical returns. The bar chart shows the variability of the Fund’s Institutional Shares total returns on a calendar year-by-year basis. The Average Annual Total Return Table shows returns averaged over the stated periods, and includes comparative performance information. The Fund’s performance will fluctuate, and past performance (before and after taxes) is not necessarily an indication of future results.
Updated performance information will be available at www.huntingtonfunds.com, or by calling 800-253-0412.
| | | | | | | | | | |
Risk/Return Bar Chart 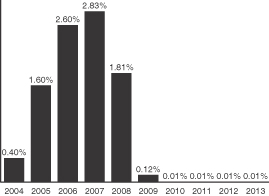
| | Best Quarter Worst Quarter | |
| Q3 2007
Q4 2013 |
| |
| 0.73
0.00 | %
% |
| | | | | | | | | | |
| | | | | | | | | | |
| | | | | | | | | | |
| | | | | | | | | | |
| | | | | | | | | | |
| | | | | | | | | | |
| | | | | | | | | | |
| | | | | | | | | | |
| | | | | | | | | | |
| | | | | | | | | | |
| | | | | | | | | | |
| | | | | | | | | | |
| | | | | | |
| | Average Annual Total Return Table (for the periods ended December 31, 2013) |
| | | | | | | | | | | | |
| | | 1 Year | | | 5 Years | | | 10 Years | |
| Ohio Municipal Money Market Fund — Institutional Shares | | | | | | | | | | | | |
| Returns before taxes | | | 0.01% | | | | 0.03% | | | | 0.93% | |
| Ohio Municipal Money Market Fund — Class A Shares | | | | | | | | | | | | |
| Returns before taxes | | | 0.01% | | | | 0.01% | | | | 0.81% | |
Investment Advisor
The Fund’s investment advisor is Huntington Asset Advisors, Inc.
Purchasing and Redeeming Shares
The minimum initial purchase for the Fund’s Class A and Institutional Shares is $1,000. For Class A Shares, the minimum subsequent investment is $50; for Institutional Shares, the minimum subsequent investment is $500. For Class A Shares and Institutional Shares, the minimum initial and subsequent investment through the Systematic Investment Program (“SIP”) is $50.
Shares may be purchased or redeemed by calling your investment professional or directly from the Trust at 800-253-0412; by check payable to the Huntington Ohio Municipal Money Market Fund and applicable Share class (for example, Huntington Ohio Municipal Money Market Fund Class A Shares) (Mail to: The Huntington Funds, P.O. Box 6110, Indianapolis, IN 46206-6110); or by Federal funds wire (please call the Trust at 800-253-0412 for wire instructions). You may redeem your Shares on any business day when both the Federal Reserve Bank and New York Stock Exchange are open by telephone at 800-253-0412, or by calling your Investment Professional; or by mail to the Huntington Funds address above. You may receive redemption proceeds by wire (wire transfer fees may apply), by electronic bank transfer or by check. Sales charges may apply to the purchase or redemption of Shares.
12
Fund Summaries
Huntington Ohio Municipal Money Market Fund
continued
Tax Information
The Fund intends to distribute dividends exempt from federal regular income tax, although a portion of the Fund’s dividends may not be tax-exempt. Dividends may be subject to state and local taxes except for Ohio taxes to the extent derived from Ohio tax-exempt investments and eligible for tax-exempt treatment under Ohio law. Any Fund distributions of capital gains are taxable at applicable capital gains rates. The Fund is not a suitable investment for retirement accounts.
Payments to Broker-Dealers and Other Financial Intermediaries
If you purchase the Fund through a broker-dealer or other financial intermediary (such as a bank), the Fund and its related companies may pay the intermediary for the sale of Fund shares and related services. These payments may create a conflict of interest by influencing the broker-dealer or other intermediary and your salesperson to recommend the Fund over another investment. Ask your salesperson or visit your financial intermediary’s Web site for more information.
13
Fund Summaries
Huntington U.S. Treasury Money Market Fund
Fund Summary
Investment Objective | The Fund’s investment objective is to seek to maximize current income while preserving capital and maintaining liquidity by investing exclusively in obligations issued by the U.S. government and backed by its full faith and credit and in repurchase agreements with respect to such obligations. |
Fees and Expenses
This table describes the fees and expenses that you may pay if you buy and hold shares of the Fund.
| | | | | | | | |
Shareholder Fees
(fees paid directly from your investment) | | Institutional
Shares | | | Class A
Shares | |
Maximum Sales Charge (Load) Imposed on Purchases
(as a percentage of offering price) | | | None | | | | None | |
| |
Maximum Deferred Sales Charge (Load)
(as a percentage of net asset value) | | | None | | | | None | |
| |
Redemption Fee
(as a percentage of amount redeemed, if applicable) | | | None | | | | None | |
| | | | | | | | |
Annual Fund Operating Expenses
(expenses that you pay each year as a percentage of the
value of your investment) | | Institutional
Shares | | | Class A
Shares | |
| Management Fees | | | 0.20% | | | | 0.20% | |
| |
| Distribution (12b-1) Fees | | | None | | | | 0.25% | |
| |
Other Expenses
(including shareholder services fee) | | | 0.49% | | | | 0.49% | |
| |
| Acquired Fund Fees and Expenses | | | None | | | | None | |
| |
| Total Annual Fund Operating Expenses | | | 0.69% | | | | 0.94% | |
| |
| Fee Waivers and/or Expense Reimbursements(1) | | | (0.44 | )% | | | (0.44 | )% |
| |
| Total Annual Fund Operating Expenses After Fee Waivers and/or Expense Reimbursements | | | 0.25% | | | | 0.50% | |
| (1) | | Huntington Asset Advisors, Inc. (the “Advisor”) has contractually agreed to waive all or a portion of its management fee and/or reimburse certain operating expenses of the Fund to the extent necessary in order to limit the Fund’s total annual fund operating expenses (after the fee waivers and/or expense reimbursements, and exclusive of acquired fund fees and expenses, brokerage costs, interest, taxes and dividends, and extraordinary expenses) to not more than 0.25% and 0.50% of the Institutional Shares and Class A Shares daily net assets, respectively, through April 30, 2015. This arrangement may only be terminated prior to this date with the agreement of the Fund’s Board of Trustees. Under certain conditions, the Advisor may recapture operating expenses reimbursed under these arrangements for a period of three years following the fiscal year in which such reimbursement occurred. Any amounts recaptured by the Advisor may not cause the Fund’s total annual fund operating expenses to exceed the stated expense caps. |
Example
This example is intended to help you compare the cost of investing in the Fund with the cost of investing in other mutual funds. The example shows the operating expenses you would incur as a shareholder if you invested $10,000 in the Fund over the time periods shown and you redeem all your shares at the end of those periods. The example assumes that the average annual return was 5%, operating expenses remained the same, and expenses were capped for one year in each period. Although your actual costs may be higher or lower, based on the above assumptions, your costs would be:
| | | | | | | | | | | | | | | | |
| | | 1 Year | | | 3 Years | | | 5 Years | | | 10 Years | |
Institutional Shares | | $ | 26 | | | $ | 176 | | | $ | 341 | | | $ | 817 | |
Class A Shares | | $ | 51 | | | $ | 256 | | | $ | 477 | | | $ | 1,114 | |
14
Fund Summaries
Huntington U.S. Treasury Money Market Fund
continued
Principal Investment Strategy
The Advisor strives to maintain a $1.00 net asset value (“NAV”) per share for the Fund by investing at least 80% of the Fund’s assets in short-term obligations of the U.S. government. In managing the portfolio, the Advisor maintains a dollar-weighted average portfolio maturity of 60 days or less and a dollar-weighted average life of 120 days or less.
Because the Fund refers to U.S. Treasury obligations in its name, it will notify shareholders at least 60 days in advance of any changes in its investment policies that would enable the Fund to normally invest less than 80% of its assets in U.S. Treasury obligations.
Principal Investment Risks
All mutual funds take investment risks. Therefore, it is possible to lose money by investing in the Fund. An investment in the Fund is not a bank deposit and is not insured or guaranteed by the Federal Deposit Insurance Corporation or any other government agency. Although the Fund seeks to preserve the value of your investment at $1.00 per share, it is possible to lose money by investing in the Fund. Additionally, you should be aware that a very small number of money market funds in other fund complexes have, in the past, “broken the buck,” which means that investors did not receive $1.00 per share for their investment in those funds, and any money market fund may do so in the future. You should also be aware that the Advisor and its affiliates are under no obligation to provide financial support to the Fund or take other measures to ensure that you receive $1.00 per share for your investment in the Fund. You should not invest in the Fund with the expectation that any such action will be taken. The primary factors that may reduce the Fund’s NAV and returns include:
Interest Rate Risk. The value of the Fund’s investments in fixed income securities may decline when prevailing interest rates rise or increase when interest rates go down. The longer a security’s maturity or duration, the greater its value will change in response to changes in interest rates. The interest earned on the Fund’s investments in fixed income securities may decline when prevailing interest rates decline.
Recoupment Risk. The Advisor entered into an agreement with the Fund, whereby the Advisor agreed to waive all or a portion of its investment advisory fee and/or to reimburse certain operating expenses of the Fund to the extent necessary to ensure that the Fund maintains a yield of at least 0.00%. The Advisor shall be entitled to recoup from the Fund any waived and/or reimbursed amounts pursuant to the agreement for a period of up to three (3) years from the date of the waiver and/or reimbursement. This recoupment could negatively affect the Fund’s future yield. The Advisor may terminate the agreement at any time upon thirty (30) days prior written notice to the Fund.
For more information, please see “Principal Investment Strategies and Risks.”
15
Fund Summaries
Huntington U.S. Treasury Money Market Fund
continued
Performance: Bar Chart for Institutional Shares and Average Annual Total Return Table
The performance information shown below will help you analyze the Fund’s investment risks in light of its historical returns. The bar chart shows the variability of the Fund’s Institutional Shares total returns on a calendar year-by-year basis. The Average Annual Total Return Table shows returns averaged over the stated periods, and includes comparative performance information. The Fund’s performance will fluctuate, and past performance (before and after taxes) is not necessarily an indication of future results. Updated performance information will be available at www.huntingtonfunds.com, or by calling 800-253-0412.
| | | | | | | | | | |
Risk/Return Bar Chart 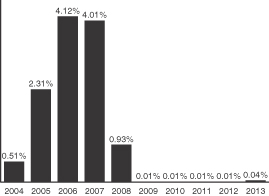
| | Best Quarter Worst Quarter | |
| Q3 2006
Q3 2012 |
| |
| 1.10
0.00 | %
% |
| | | | | | | | | | |
| | | | | | | | | | |
| | | | | | | | | | |
| | | | | | | | | | |
| | | | | | | | | | |
| | | | | | | | | | |
| | | | | | | | | | |
| | | | | | | | | | |
| | | | | | | | | | |
| | | | | | | | | | |
| | | | | | | | | | |
| | | | | | | | | | |
| | |
| | Average Annual Total Return Table (for the periods ended December 31, 2013) |
| | | | | | | | | | | | |
| | | 1 Year | | | 5 Years | | | 10 Years | |
| U.S. Treasury Money Market Fund — Institutional Shares | | | | | | | | | | | | |
| Returns before taxes | | | 0.04% | | | | 0.02% | | | | 1.18% | |
| U.S. Treasury Money Market Fund — Class A Shares | | | | | | | | | | | | |
| Returns before taxes | | | 0.00% | | | | 0.01% | | | | 1.07% | |
Investment Advisor
The Fund’s investment advisor is Huntington Asset Advisors, Inc.
Purchasing and Redeeming Shares
The minimum initial purchase for the Fund’s Class A and Institutional Shares is $1,000. For Class A Shares, the minimum subsequent investment is $50; for Institutional Shares, the minimum subsequent investment is $500. For Class A Shares and Institutional Shares, the minimum initial and subsequent investment through the Systematic Investment Program (“SIP”) is $50.
Shares may be purchased or redeemed by calling your investment professional or directly from the Trust at 800-253-0412; by check payable to the Huntington U.S. Treasury Money Market Fund and applicable Share class (for example, Huntington U.S. Treasury Money Market Fund Class A Shares) (Mail to: The Huntington Funds, P.O. Box 6110, Indianapolis, IN 46206-6110); or by Federal funds wire (please call the Trust at 800-253-0412 for wire instructions). You may redeem your Shares on any business day when both the Federal Reserve Bank and New York Stock Exchange are open by telephone at 800-253-0412, or by calling your Investment Professional; or by mail to the Huntington Funds address above. You may receive redemption proceeds by wire (wire transfer fees may apply), by electronic bank transfer or by check. Sales charges may apply to the purchase or redemption of Shares.
16
Fund Summaries
Huntington U.S. Treasury Money Market Fund
continued
Tax Information
The Fund’s distributions are taxable as ordinary income or capital gains, except when your investment is through an Individual Retirement Account (“IRA”).
Payments to Broker-Dealers and Other Financial Intermediaries
If you purchase the Fund through a broker-dealer or other financial intermediary (such as a bank), the Fund and its related companies may pay the intermediary for the sale of Fund shares and related services. These payments may create a conflict of interest by influencing the broker-dealer or other intermediary and your salesperson to recommend the Fund over another investment. Ask your salesperson or visit your financial intermediary’s Web site for more information.
17
Fund Summaries
Huntington Disciplined Equity Fund
Fund Summary
Investment Objective | The Fund seeks capital appreciation while seeking to reduce volatility. |
Fees and Expenses
This table describes the fees and expenses that you may pay if you buy and hold shares of the Fund. You may qualify for sales charge discounts if you and members of your household invest, or agree to invest in the future, at least $50,000 in Huntington Funds. More information about these and other discounts is available from your financial professional and in the “Sales Charges” section at page 134 of this prospectus and in the Fund’s Statement of Additional Information.
| | | | | | | | |
Shareholder Fees
(fees paid directly from your investment) | | Institutional
Shares | | | Class A
Shares | |
Maximum Sales Charge (Load) Imposed on Purchases
(as a percentage of offering price) | | | None | | | | 4.75% | |
| |
Maximum Deferred Sales Charge (Load)
(as a percentage of net asset value) | | | None | | | | None | |
| |
Redemption Fee
(as a percentage of amount redeemed, if applicable) | | | None | | | | None | |
| | | | | | | | |
Annual Fund Operating Expenses
(expenses that you pay each year as a percentage of the
value of your investment) | | Institutional
Shares | | | Class A
Shares | |
| Management Fees | | | 0.60% | | | | 0.60% | |
| |
| Distribution (12b-1) Fees | | | None | | | | 0.25% | |
| |
Other Expenses
(including shareholder services fee) | | | 0.59% | | | | 0.59% | |
| |
| Acquired Fund Fees and Expenses | | | None | | | | None | |
| |
| Total Annual Fund Operating Expenses | | | 1.19% | | | | 1.44% | |
| |
| Fee Waivers and/or Expense Reimbursements(1) | | | (0.18 | )% | | | (0.18 | )% |
| |
| Total Annual Fund Operating Expenses After Fee Waivers and/or Expense Reimbursements | | | 1.01% | | | | 1.26% | |
| (1) | | Huntington Asset Advisors, Inc. (the “Advisor”) has contractually agreed to waive all or a portion of its management fee and/or reimburse certain operating expenses of the Fund to the extent necessary in order to limit the Fund’s total annual fund operating expenses (after the fee waivers and/or expense reimbursements, and exclusive of acquired fund fees and expenses, brokerage costs, interest, taxes and dividends, and extraordinary expenses) to not more than 1.01% and 1.26% of the Institutional Shares and Class A Shares daily net assets, respectively, through April 30, 2015. This arrangement may only be terminated prior to this date with the agreement of the Fund’s Board of Trustees. Under certain conditions, the Advisor may recapture operating expenses reimbursed under these arrangements for a period of three years following the fiscal year in which such reimbursement occurred. Any amounts recaptured by the Advisor may not cause the Fund’s total annual fund operating expenses to exceed the stated expense caps. |
Example
This example is intended to help you compare the cost of investing in the Fund with the cost of investing in other mutual funds. The example shows the operating expenses you would incur as a shareholder if you invested $10,000 in the Fund over the time periods shown and you redeem all your shares at the end of those periods. The example assumes that the average annual return was 5%, operating expenses remained the same, and expenses were capped for one year in each period.
Although your actual costs may be higher or lower, based on the above assumptions, your costs would be:
| | | | | | | | | | | | | | | | |
| | | 1 Year | | | 3 Years | | | 5 Years | | | 10 Years | |
Institutional Shares | | $ | 103 | | | $ | 360 | | | $ | 637 | | | $ | 1,427 | |
Class A Shares | | $ | 597 | | | $ | 892 | | | $ | 1,208 | | | $ | 2,103 | |
18
Fund Summaries
Huntington Disciplined Equity Fund
continued
Portfolio Turnover
The Fund pays transaction costs, such as commissions, when it buys and sells securities (or “turns over” its portfolio). A higher portfolio turnover rate may indicate higher transaction costs and may result in higher taxes when Fund shares are held in a taxable account. These costs, which are not reflected in annual fund operating expenses or in the Example, affect the Fund’s performance. During the most recent fiscal year, the Fund’s portfolio turnover rate was 45% of the average value of its portfolio.
Principal Investment Strategy
Under normal conditions, the Fund pursues its investment objective by investing at least 80% of its assets in equity securities, which include put and call options on individual securities and stock indices. The Fund normally invests at least 65% of its total assets in companies organized in the U.S. and included in the S&P 500 Index (“S&P 500 Companies”) or the S&P 100 Index (“S&P 100 Companies”). As of May 31, 2013, the market capitalization range for the companies included in the S&P 500 Index was approximately $2.3 billion to $422.1 billion, with a median of $17.1 billion, while the market capitalization range for the companies included in the S&P 100 Index as of March 31, 2014, was approximately $25.3 billion to $478.8 billion, with a median of $45.2 billion.
Generally, the portfolio manager will invest the Fund’s portfolio in the common stocks of the larger companies comprising each sector of the S&P 500 Index or the S&P 100 Index (each, an “Index” and together, the “Indices”), consistent with the sector weightings of the applicable Index. Among the many factors that the portfolio manager considers in determining whether to base portfolio composition upon the S&P 500 or S&P 100 are obtaining desirable diversification while considering the transaction costs inherent in owning more stocks from the broader Index, volatility of options on stocks of the respective Indices, and ease of exercising options. Whether the Fund’s portfolio corresponds to the composition of the S&P 500 Index or the S&P 100 Index will depend upon the availability of put options on those Indices necessary to effectively hedge the Fund’s portfolio against potential market declines. The portfolio manager has discretion to change the composition of the Fund’s portfolio without prior notice to align with one Index in lieu of the other.
The Fund will also purchase put options on the Indices and write call options on individual securities held in its portfolio. All options written or purchased by the Fund shall trade on a U.S. stock exchange. Put options on the applicable Index will be limited to less than 10% (at cost) of the Fund’s total assets. The put options will be used to hedge the Fund’s portfolio to the extent the value of the Fund’s common stock positions decline. The Fund may also write covered call options on common stocks held in the Fund’s portfolio to generate a portion of the income necessary to purchase put options on the applicable Index. During the term of a covered call option, the Fund will own the underlying common stock which may be sold pursuant to the option.
The Fund also expects to hold approximately 4-5% of assets in cash or cash equivalents. At the portfolio manager’s discretion, the Fund’s cash may be held in short term bonds or money market instruments.
The Fund actively trades its portfolio securities in an attempt to achieve its investment objective.
Because the Fund contains “equity” in its name, the Fund will normally invest at least 80% of its assets in equity securities and will notify shareholders at least 60 days in advance of any changes in this investment policy.
Principal Investment Risks
All mutual funds take investment risks. An investment in the Fund is not a bank deposit and is not insured or guaranteed by the Federal Deposit Insurance Corporation or any other government agency. Therefore, it is possible to lose money by investing in the Fund. The primary factors that may reduce the Fund’s net asset value (“NAV”) and returns include:
Class/Sector/Region Focus Risk. If the Fund invests more than 25% of its net assets in a particular asset class, or securities of issuers within a particular market sector or geographic region, it is subject to increased risk. Performance will generally depend on the performance of the class, sector or region, which may differ
19
Fund Summaries
Huntington Disciplined Equity Fund
continued
in direction and degree from that of the overall U.S. stock or bond markets. In addition, financial, economic, business and political developments affecting the class, sector or region may have a greater effect on the Fund.
Counterparty Risk. The value of the Fund’s investments may be adversely affected if an issuer’s securities experience a credit downgrade; an issuer or guarantor of an investment held by the Fund fails to pay an obligation on a timely basis, otherwise defaults or is perceived by other investors to be less creditworthy; or a counterparty to a derivatives or other transaction with the Fund files for bankruptcy, becomes insolvent, or otherwise becomes unable or unwilling to honor its obligation to the Fund.
Derivative Contracts Risk. A derivative is an instrument whose value is derived from an underlying contract, index or security, or any combination thereof, including options (e.g. puts and calls). The Fund’s investment in derivatives will come primarily through writing put and call options and purchasing put option on the Indices. Derivatives contracts involve risks different from, and possibly greater than, traditional investments, including valuation and tax issues, increased potential for losses and/or costs to the Fund, and interest rate, credit, currency, liquidity and leverage risks. For additional information regarding these risks, see the “Investment Risks” section in the Fund’s Statement of Additional Information.
Equity Securities Risk. The price of equity securities in the Fund’s portfolio will fluctuate based on actual or perceived changes in a company’s financial condition and on market and economic conditions.
Exchange-Traded Funds Risk. Like an open-end investment company (mutual fund), the value of an ETF can fluctuate based on the prices of the securities owned by the ETF, and ETFs are also subject to the following additional risks: (i) the ETF’s market price may be less than its net asset value; (ii) an active market for the ETF may not develop; and (iii) market trading in the ETF may be halted under certain circumstances.
Hedging Risk. When a derivative contract is used as a hedge against an opposite position that the Fund holds, any loss on an underlying security (or position) should be substantially offset by gains on the hedged investment, and vice versa. Because it may not always be possible to perfectly offset one position with another, there is no assurance that the Fund’s hedging transactions will be effective.
Interest Rate Risk. The value of the Fund’s investments in fixed income securities may decline when prevailing interest rates rise or increase when interest rates go down. The longer a security’s maturity or duration, the greater its value will change in response to changes in interest rates. The interest earned on the Fund’s investments in fixed income securities may decline when prevailing interest rates decline.
Investment Style Risk. The type of securities in which the Fund invests may underperform other assets or the overall market.
Leverage Risk. Derivatives and other transactions that give rise to leverage may cause the Fund’s performance to be more volatile than if the Fund had not been leveraged. Leveraging also may require that the Fund liquidate securities when it may not be advantageous to do so to satisfy its obligations or to meet segregation requirements.
Market Risk. The value of securities in the Fund’s portfolio will fluctuate and, as a result, the Fund’s share price may decline suddenly or over a sustained period of time.
Management Risk. The risk that a strategy used by the Fund’s portfolio manager may fail to produce the intended result. This includes the risk that changes in the value of a hedging instrument will not match those of the asset being hedged.
For more information, please see “Principal Investment Strategies and Risks.”
20
Fund Summaries
Huntington Disciplined Equity Fund
continued
Performance: Bar Chart for Institutional Shares and Average Annual Total Return Table
The performance information shown below will help you analyze the Fund’s investment risks in light of its historical returns. The bar chart shows the variability of the Fund’s Institutional Shares total returns on a calendar year-by-year basis. The Average Annual Total Return Table shows returns averaged over the stated periods, and includes comparative performance information. The Fund’s performance will fluctuate, and past performance (before and after taxes) is not necessarily an indication of future results.
The annual returns in the bar chart which follows are for the Institutional Shares without reflecting payment of any sales charge; if they did reflect such payment of sales charges, annual returns would be lower.
Updated performance information will be available at www.huntingtonfunds.com, or by calling 800-253-0412.
| | | | | | | | | | |
Risk/Return Bar Chart 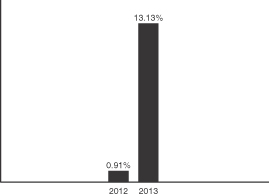
| | Best Quarter Worst Quarter | |
| Q4 2013
Q2 2012 |
| |
| 6.09
(1.87 | %
)% |
| | | | | | | | | | |
| | | | | | | | | | |
| | | | | | | | | | |
| | | | | | | | | | |
| | | | | | | | | | |
| | | | | | | | | | |
| | | | | | | | | | |
| | | | | | | | | | |
| | | | | | | | | | |
| | | | | | | | | | |
| | | | | | | | | | |
| | | | | | | | | | |
| | |
| | Average Annual Total Return Table (for the periods ended December 31, 2013) |
| | | | | | | | | | |
| | | 1 Year | | | Since Class
Inception* | | | |
| Disciplined Equity Fund — Institutional Shares | | | | | | | | | | |
| Returns before taxes | | | 13.13% | | | | 4.97% | | | |
| Returns after taxes on distributions(1) | | | 12.87% | | | | 4.77% | | | |
| Returns after taxes on distributions and sales of Institutional Shares(1) | | | 7.64% | | | | 3.85% | | | |
Disciplined Equity Fund — Class A Shares
(with 4.75% sales charge) | | | | | | | | | | |
| Returns before taxes | | | 7.49% | | | | 2.57% | | | |
Standard & Poor’s 100 Index (S&P 100)
(reflects no deduction for fees, expenses or taxes)(2) | | | 30.39% | | | | 18.44% | | | |
| (1) | | After tax returns are calculated using a standard set of assumptions. The stated returns assume the highest historical federal income and capital gains tax rates. Returns after taxes on distributions assumes a continued investment in the Fund and show the effect of taxes on Fund distributions. Returns after taxes on distributions and sales of Fund Shares assumes all Shares were redeemed at the end of each measurement period, and shows the effect of any taxable gain (or offsetting loss) on redemption, as well as the effects of taxes on Fund distributions. These after tax returns do not reflect the effect of any applicable state and local taxes. After tax returns are not relevant to investors holding shares through tax-deferred programs, such as IRA or 401(k) plans. |
21
Fund Summaries
Huntington Disciplined Equity Fund
continued
| (2) | | The S&P 100 measures the performance of large cap companies in the United States, and is comprised of 100 major, blue chip companies across multiple industry groups. The S&P 100 is not adjusted to reflect sales charges, expenses, or other fees that the Securities and Exchange Commission requires to be reflected in the Fund’s performance. The index is unmanaged and, unlike the Fund, is not affected by cash flows. It is not possible to invest directly in an index. |
Investment Advisor and Portfolio Manager
The Fund’s investment advisor is Huntington Asset Advisors, Inc. Peter Sorrentino, CFA, Senior Vice President of the Advisor, is primarily responsible for the day-to-day management of the Fund. Mr. Sorrentino has served as the Fund’s Portfolio Manager since 2012.
Purchasing and Redeeming Shares
The minimum initial purchase for the Fund’s Class A and Institutional Shares is $1,000. For Class A Shares, the minimum subsequent investment is $50; for Institutional Shares, the minimum subsequent investment is $500. For Class A Shares and Institutional Shares, the minimum initial and subsequent investment through the Systematic Investment Program (“SIP”) is $50.
Shares may be purchased or redeemed by calling your investment professional or directly from the Trust at 800-253-0412; by check payable to the Huntington Disciplined Equity Fund and applicable Share class (for example, Huntington Disciplined Equity Fund Class A Shares) (Mail to: The Huntington Funds, P.O. Box 6110, Indianapolis, IN 46206-6110); or by Federal funds wire (please call the Trust at 800-253-0412 for wire instructions). You may redeem your Shares on any business day when both the Federal Reserve Bank and New York Stock Exchange are open by telephone at 800-253-0412, or by calling your Investment Professional; or by mail to the Huntington Funds address above. You may receive redemption proceeds by wire (wire transfer fees may apply), by electronic bank transfer or by check. Sales charges may apply to the purchase or redemption of Shares.
Tax Information
The Fund’s distributions are taxable as ordinary income or capital gains, except when your investment is through an Individual Retirement Account (“IRA”).
Payments to Broker-Dealers and Other Financial Intermediaries
If you purchase the Fund through a broker-dealer or other financial intermediary (such as a bank), the Fund and its related companies may pay the intermediary for the sale of Fund shares and related services. These payments may create a conflict of interest by influencing the broker-dealer or other intermediary and your salesperson to recommend the Fund over another investment. Ask your salesperson or visit your financial intermediary’s Web site for more information.
22
Fund Summaries
Huntington Dividend Capture Fund
Fund Summary
Investment Objective | The Fund’s investment objective is to seek total return on investment, with dividend income an important component of that return. |
Fees and Expenses
This table describes the fees and expenses that you may pay if you buy and hold shares of the Fund. You may qualify for sales charge discounts if you and members of your household invest, or agree to invest in the future, at least $50,000 in Huntington Funds. More information about these and other discounts is available from your financial professional and in the “Sales Charges” section at page 134 of this prospectus and in the Fund’s Statement of Additional Information.
| | | | | | | | | | | | |
Shareholder Fees
(fees paid directly from your investment) | | Institutional
Shares | | | Class A
Shares | | | Class C
Shares | |
Maximum Sales Charge (Load) Imposed on Purchases
(as a percentage of offering price) | | | None | | | | 4.75% | | | | None | |
| |
Maximum Deferred Sales Charge (Load)(1)
(as a percentage of net asset value) | | | None | | | | None | | | | 1.00% | |
| |
Redemption Fee
(as a percentage of amount redeemed, if applicable) | | | None | | | | None | | | | None | |
| | | | | | | | | | | | |
Annual Fund Operating Expenses
(expenses that you pay each year as a percentage of the
value of your investment) | | Institutional
Shares | | | Class A
Shares | | | Class C
Shares | |
| Management Fees | | | 0.75% | | | | 0.75% | | | | 0.75% | |
| |
| Distribution (12b-1) Fees | | | None | | | | 0.25% | | | | 1.00% | |
| |
Other Expenses
(including shareholder services fee of 0.25% applicable to Institutional Shares and Class A Shares only) | | | 0.58% | | | | 0.58% | | | | 0.33% | |
| |
| Acquired Fund Fees and Expenses | | | 0.02% | | | | 0.02% | | | | 0.02% | |
| |
| Total Annual Fund Operating Expenses | | | 1.35% | | | | 1.60% | | | | 2.10% | |
| |
| Fee Waivers and/or Expense Reimbursements(2) | | | (0.45 | )% | | | (0.45 | )% | | | (0.45 | )% |
| |
| Total Annual Fund Operating Expenses After Fee Waivers and/or Expense Reimbursements | | | 0.90% | | | | 1.15% | | | | 1.65% | |
| (1) | | Maximum Deferred Sales Charge on Class C Shares applies to shares sold within 12 months of purchase. |
| (2) | | Huntington Asset Advisors, Inc. (the “Advisor”) has contractually agreed to waive all or a portion of its management fee and/or reimburse certain operating expenses of the Fund to the extent necessary in order to limit the Fund’s total annual fund operating expenses (after the fee waivers and/or expense reimbursements, and exclusive of acquired fund fees and expenses, brokerage costs, interest, taxes and dividends, and extraordinary expenses) to not more than 0.88%, 1.13% and 1.63% of the Institutional Shares, Class A Shares and Class C Shares daily net assets, respectively, through April 30, 2016. This arrangement may only be terminated prior to this date with the agreement of the Fund’s Board of Trustees. Under certain conditions, the Advisor may recapture operating expenses reimbursed under these arrangements for a period of three years following the fiscal year in which such reimbursement occurred. Any amounts recaptured by the Advisor may not cause the Fund’s total annual fund operating expenses to exceed the stated expense caps. |
Example
This example is intended to help you compare the cost of investing in the Fund with the cost of investing in other mutual funds. The example shows the operating expenses you would incur as a shareholder if you invested $10,000 in the Fund over the time periods shown and you redeem all your shares at the end of those periods. The example assumes that the average annual return was 5%, operating expenses remained the same, and expenses were capped for two years in each period.
23
Fund Summaries
Huntington Dividend Capture Fund
continued
Although your actual costs may be higher or lower, based on the above assumptions, your costs would be:
| | | | | | | | | | | | | | | | |
| | | 1 Year | | | 3 Years | | | 5 Years | | | 10 Years | |
Institutional Shares | | $ | 92 | | | $ | 336 | | | $ | 651 | | | $ | 1,543 | |
Class A Shares | | $ | 587 | | | $ | 870 | | | $ | 1,221 | | | $ | 2,210 | |
Class C Shares — no redemption | | $ | 168 | | | $ | 569 | | | $ | 1,044 | | | $ | 2,358 | |
Class C Shares — with redemption | | $ | 268 | | | $ | 569 | | | $ | 1,044 | | | $ | 2,358 | |
Portfolio Turnover
The Fund pays transaction costs, such as commissions, when it buys and sells securities (or “turns over” its portfolio). A higher portfolio turnover rate may indicate higher transaction costs and may result in higher taxes when Fund shares are held in a taxable account. These costs, which are not reflected in annual fund operating expenses or in the Example, affect the Fund’s performance. During the most recent fiscal year, the Fund’s portfolio turnover rate was 130% of the average value of its portfolio.
Principal Investment Strategy
The Fund normally invests at least 65% of its assets in dividend-paying stocks, and the Advisor focuses on those it believes are undervalued or out-of-favor. The Fund may invest in convertible bonds and other securities [such as preferred stock and real estate investment trusts (“REITs”)] that contain aspects of both stocks and bonds. The Advisor will also frequently purchase stocks in a short period prior to the ex- dividend date (the interval between the announcement and the payments of the next dividend) which increases the amount of trading costs the Fund will incur.
The Fund generally invests in mature, middle and large-capitalization U.S. corporations. Quantitative analysis is used to identify stocks that the Advisor believes are undervalued relative to the market and to the security’s historic valuations. It then uses a qualitative stock selection model based on earnings expectations and supplemental valuation measures to narrow the list of stocks to the most attractive.
Principal Investment Risks
All mutual funds take investment risks. Therefore, it is possible to lose money by investing in the Fund. An investment in the Fund is not a bank deposit and is not insured or guaranteed by the Federal Deposit Insurance Corporation or any other government agency. The primary factors that may reduce the Fund’s net asset value (“NAV”) and returns include:
Call Risk. Issuers of securities may redeem the securities prior to maturity at a price below their current market value.
Class/Sector/Region Focus Risk. If the Fund invests more than 25% of its net assets in a particular asset class, or securities of issuers within a particular market sector or geographic region, it is subject to increased risk. Performance will generally depend on the performance of the class, sector or region, which may differ in direction and degree from that of the overall U.S. stock or bond markets. In addition, financial, economic, business and political developments affecting the class, sector or region may have a greater effect on the Fund.
Credit Risk. Issuers of securities in which the Fund invests may have their credit ratings downgraded or may default in the payment of principal or interest on the securities, which would cause the Fund to lose money.
Equity Securities Risk. The price of equity securities in the Fund’s portfolio will fluctuate based on actual or perceived changes in a company’s financial condition and on market and economic conditions.
Interest Rate Risk. The value of the Fund’s investments in fixed income securities may decline when prevailing interest rates rise or increase when interest rates go down. The longer a security’s maturity or duration, the greater its value will change in response to changes in interest rates. The interest earned on the Fund’s investments in fixed income securities may decline when prevailing interest rates decline.
Investment Style Risk. The type of securities in which a Fund invests may underperform other assets or the overall market.
24
Fund Summaries
Huntington Dividend Capture Fund
continued
Market Risk. The value of securities in the Fund’s portfolio will fluctuate and, as a result, the Fund’s share price may decline suddenly or over a sustained period of time.
Portfolio Turnover Risk. The Fund may trade securities actively, which could increase its transaction costs (thereby lowering its performance) and could increase the amount of taxes you owe by generating short-term gains, which may be taxed at a higher rate.
Real Estate/REIT Risk. The Fund’s investments in REITs are subject to the same risks as direct investments in real estate, including sensitivity to general economic downturns and the volatility of local real estate markets. REITs may have limited financial resources and their securities may trade infrequently and in limited volume, and thus they may be more volatile than other securities.
For more information, please see “Principal Investment Strategies and Risks.”
Performance: Bar Chart for Institutional Shares and Average Annual Total Return Table
The performance information shown below will help you analyze the Fund’s investment risks in light of its historical returns. The bar chart shows the variability of the Fund’s Institutional Shares total returns on a calendar year-by-year basis. The Average Annual Total Return Table shows returns averaged over the stated periods, and includes comparative performance information. The Fund’s performance will fluctuate, and past performance (before and after taxes) is not necessarily an indication of future results.
The annual returns in the bar chart which follows are for the Institutional Shares without reflecting payment of any sales charge; if they did reflect such payment of sales charges, annual returns would be lower.
Class C Shares commenced operations on January 2, 2014, and have not been operational for a full calendar year. Institutional Shares would have had substantially similar annual returns because the shares are invested in the same portfolio. Annual returns would differ only to the extent that the classes have different expenses.
Updated performance information will be available at www.huntingtonfunds.com, or by calling 800-253-0412.
| | | | | | | | | | |
Risk/Return Bar Chart 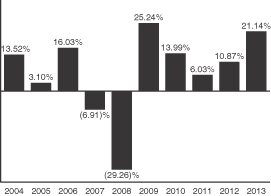
| | Best Quarter Worst Quarter | |
| Q2 2009
Q1 2009 |
| |
| 23.66
(17.31 | %
)% |
| | | | | | | | | | |
| | | | | | | | | | |
| | | | | | | | | | |
| | | | | | | | | | |
| | | | | | | | | | |
| | | | | | | | | | |
| | | | | | | | | | |
| | | | | | | | | | |
| | | | | | | | | | |
| | | | | | | | | | |
| | | | | | | | | | |
| | | | | | | | | | |
25
Fund Summaries
Huntington Dividend Capture Fund
continued
| | |
| | Average Annual Total Return Table (for the periods ended December 31, 2013) |
| | | | | | | | | | | | |
| | | 1 Year | | | 5 Years | | | 10 Years | |
| Dividend Capture Fund — Institutional Shares | | | | | | | | | | | | |
| Returns before taxes | | | 21.14% | | | | 15.25% | | | | 6.16% | |
| Returns after taxes on distributions(1) | | | 19.15% | | | | 13.98% | | | | 4.67% | |
| Returns after taxes on distributions and sales of Institutional Shares(1) | | | 13.35% | | | | 11.96% | | | | 4.65% | |
Dividend Capture Fund — Class A Shares
(with 4.75% sales charge) | | | | | | | | | | | | |
| Returns before taxes | | | 15.04% | | | | 13.82% | | | | 5.38% | |
| Dividend Capture Fund — Class C Shares | | | ** | | | | ** | | | | ** | |
Standard & Poor’s 500 Index (S&P 500)
(reflects no deduction for fees, expenses or taxes)(2) | | | 32.39% | | | | 17.94% | | | | 7.41% | |
| Dividend Capture Indices Blend (DCIB) | | | | | | | | | | | | |
| (reflects no deduction for fees, expenses or taxes)(3) | | | 11.91% | | | | 13.93% | | | | 5.49% | |
| (1) | | After tax returns are calculated using a standard set of assumptions. The stated returns assume the highest historical federal income and capital gains tax rates. Returns after taxes on distributions assumes a continued investment in the Fund and show the effect of taxes on Fund distributions. Returns after taxes on distributions and sales of Fund Shares assumes all Shares were redeemed at the end of each measurement period, and shows the effect of any taxable gain (or offsetting loss) on redemption, as well as the effects of taxes on Fund distributions. These after tax returns do not reflect the effect of any applicable state and local taxes. After tax returns are not relevant to investors holding shares through tax-deferred programs, such as IRA or 401(k) plans. |
| (2) | | The S&P 500 is a capitalization-weighted index comprised of 500 stocks and is designed to measure performance of the broad domestic economy through changes in the aggregate market value of 500 stocks representing all major industries. The index is unmanaged and, unlike the Fund, is not affected by cash flows. It is not possible to invest directly in an Index. |
| (3) | | The unmanaged DCIB is a custom, blended index comprised of the S&P 500 Value Index (40%), BofA/Merrill Lynch Fixed Rate Preferred Index (40%) and NAREIT Index (20%). This custom blended index and its respective weightings are reflective of the Fund’s sector diversification. The S&P 500 Value Index is comprised of approximately half the market capitalization of the S&P 500 that has been identified as being on the value end of the growth-value spectrum. The BofA/Merrill Lynch Fixed Rate Preferred Index is a total return index comprised of fixed-rate preferred stock issues. NAREIT Index represents returns for the National Association of Real Estate Investment Trust Equity Index. |
| ** | | Class C Shares commenced operations on January 2, 2014, and information regarding annual returns will be available when the Fund has been in operation a full calendar year. Institutional Shares would have had substantially similar annual returns because the shares are invested in the same portfolio. Annual returns would differ only to the extent that the classes have different expenses. |
Investment Advisor and Portfolio Managers
The Fund’s investment advisor is Huntington Asset Advisors, Inc. Kirk Mentzer, Senior Vice President and Director of Investment Research of the Advisor, and Peter Sorrentino, CFA, Senior Vice President of the Advisor, are primarily responsible for the day-to-day management of the Fund. Mr. Mentzer has served as Portfolio Manager of the Fund since 2001 and Mr. Sorrentino has served as Portfolio Manager of the Fund since March 2014.
Purchasing and Redeeming Shares
The minimum initial purchase for the Fund’s Class A, Class C and Institutional Shares is $1,000. For Class A and Class C Shares, the minimum subsequent investment is $50; for Institutional Shares, the minimum subsequent investment is $500. For Class A Shares, Class C Shares and Institutional Shares, the minimum initial and subsequent investment through the Systematic Investment Program (“SIP”) is $50.
26
Fund Summaries
Huntington Dividend Capture Fund
continued
Shares may be purchased or redeemed by calling your investment professional or directly from the Trust at 800-253-0412; by check payable to the Huntington Dividend Capture Fund and applicable Share class (for example, Huntington Dividend Capture Fund Class A Shares) (Mail to: The Huntington Funds, P.O. Box 6110, Indianapolis, IN 46206-6110); or by Federal funds wire (please call the Trust at 800-253-0412 for wire instructions). You may redeem your Shares on any business day when both the Federal Reserve Bank and New York Stock Exchange are open by telephone at 800-253-0412, or by calling your Investment Professional; or by mail to the Huntington Funds address above. You may receive redemption proceeds by wire (wire transfer fees may apply), by electronic bank transfer or by check. Sales charges may apply to the purchase or redemption of Shares.
Tax Information
The Fund’s distributions are taxable as ordinary income or capital gains, except when your investment is through an Individual Retirement Account (“IRA”).
Payments to Broker-Dealers and Other Financial Intermediaries
If you purchase the Fund through a broker-dealer or other financial intermediary (such as a bank), the Fund and its related companies may pay the intermediary for the sale of Fund shares and related services. These payments may create a conflict of interest by influencing the broker-dealer or other intermediary and your salesperson to recommend the Fund over another investment. Ask your salesperson or visit your financial intermediary’s Web site for more information.
27
Fund Summaries
Huntington Global Select Markets Fund
Fund Summary
Investment Objective | The Fund’s investment objective is to seek total return. |
Fees and Expenses
This table describes the fees and expenses that you may pay if you buy and hold shares of the Fund. You may qualify for sales charge discounts if you and members of your household invest, or agree to invest in the future, at least $50,000 in Huntington Funds. More information about these and other discounts is available from your financial professional and in the “Sales Charges” section at page 134 of this prospectus and in the Fund’s Statement of Additional Information.
| | | | | | | | |
Shareholder Fees
(fees paid directly from your investment) | | Institutional
Shares | | | Class A
Shares | |
Maximum Sales Charge (Load) Imposed on Purchases
(as a percentage of offering price) | | | None | | | | 4.75% | |
| |
Maximum Deferred Sales Charge (Load)
(as a percentage of net asset value) | | | None | | | | None | |
| |
Redemption Fee
(as a percentage of amount redeemed, if applicable) | | | None | | | | None | |
| | | | | | | | |
Annual Fund Operating Expenses
(expenses that you pay each year as a percentage of the
value of your investment) | | Institutional
Shares | | | Class A
Shares | |
| Management Fees | | | 1.00% | | | | 1.00% | |
| |
| Distribution (12b-1) Fees | | | None | | | | 0.25% | |
| |
| Other Expenses (including shareholder services fee) | | | 1.01% | | | | 1.01% | |
| |
| Acquired Fund Fees and Expenses | | | 0.09% | | | | 0.09% | |
| |
| Total Annual Fund Operating Expenses | | | 2.10% | | | | 2.35% | |
| |
| Fee Waivers and/or Expense Reimbursements(1) | | | (0.20 | )% | | | (0.20 | )% |
| |
| Total Annual Fund Operating Expenses After Fee Waivers and/or Expense Reimbursements | | | 1.90% | | | | 2.15% | |
| (1) | | Huntington Asset Advisors, Inc. (the “Advisor”) has contractually agreed to waive all or a portion of its management fee and/or reimburse certain operating expenses of the Fund to the extent necessary in order to limit the Fund’s total annual fund operating expenses (after the fee waivers and/or expense reimbursements, and exclusive of acquired fund fees and expenses, brokerage costs, interest, taxes and dividends, and extraordinary expenses) to not more than 1.81% and 2.06% of the Institutional Shares and Class A Shares daily net assets, respectively, through April 30, 2015. This arrangement may only be terminated prior to this date with the agreement of the Fund’s Board of Trustees. Under certain conditions, the Advisor may recapture operating expenses reimbursed under these arrangements for a period of three years following the fiscal year in which such reimbursement occurred. Any amounts recaptured by the Advisor may not cause the Fund’s total annual fund operating expenses to exceed the stated expense caps. |
Example
This example is intended to help you compare the cost of investing in the Fund with the cost of investing in other mutual funds. The example shows the operating expenses you would incur as a shareholder if you invested $10,000 in the Fund over the time periods shown and you redeem all your shares at the end of those periods. The example assumes that the average annual return was 5%, operating expenses remained the same, and expenses were capped for one year in each period. Although your actual costs may be higher or lower, based on the above assumptions, your costs would be:
| | | | | | | | | | | | | | | | |
| | | 1 Year | | | 3 Years | | | 5 Years | | | 10 Years | |
Institutional Shares | | $ | 193 | | | $ | 639 | | | $ | 1,111 | | | $ | 2,415 | |
Class A Shares | | $ | 683 | | | $ | 1,155 | | | $ | 1,654 | | | $ | 3,019 | |
28
Fund Summaries
Huntington Global Select Markets Fund
continued
Portfolio Turnover
The Fund pays transaction costs, such as commissions, when it buys and sells securities (or “turns over” its portfolio). A higher portfolio turnover rate may indicate higher transaction costs and may result in higher taxes when Fund shares are held in a taxable account. These costs, which are not reflected in annual fund operating expenses or in the Example, affect the Fund’s performance. During the most recent fiscal year, the Fund’s portfolio turnover rate was 156% of the average value of its portfolio.
Principal Investment Strategy
The Fund normally pursues its investment objective by investing in equity and fixed income securities [including real estate investment trusts (“REITs”)] in the United States and in developed and emerging markets throughout the world. The proportions of the Fund’s assets invested in equity and fixed income securities vary based on the Advisor’s interpretation of economic conditions and underlying securities values. The Advisor generally allocates the Fund’s investments across different countries and regions, and under normal market conditions, the Fund invests significantly (at least 40% — unless market conditions are not deemed favorable by the Advisor, in which case the Fund invests at least 30%) in securities of issuers based outside the United States. The Fund may invest in equity and fixed income securities of issuers of any market capitalization.
The Advisor will employ continuous “top-down” macro economic analysis to identify those countries believed to have the best prospects for sustainable growth. A “bottom up” process will then identify securities expected to provide what the Advisor believes will be superior risk-adjusted returns in those countries. By investing in equities and fixed income securities in developed and emerging markets, the Fund seeks to moderate volatility compared to investing solely in emerging market equities. The Fund has no maturity restrictions on the fixed income securities in which it invests.
The Advisor may also use various techniques, such as buying and selling futures contracts and exchange traded funds (“ETFs”), to increase or decrease the Fund’s exposure to changing security prices, interest rates or other factors that affect security values. In addition, in limited circumstances the Advisor may, in order to help the Fund manage its exposure to changes in the value of the U.S. dollar relative to other currencies, enter into derivatives contracts in which a foreign currency is an underlying asset. In addition, the Fund may invest up to 20% of its assets in lower quality fixed income securities (also known as “junk bonds”) — for example, securities which at time of purchase are not rated in one of the four highest categories by a U.S. nationally rated statistical rating organization (or, if unrated, are not determined by the Advisor to be of a quality comparable to a security rated within the four highest rating categories).
Principal Investment Risks
All mutual funds take investment risks. Therefore, it is possible to lose money by investing in the Fund. An investment in the Fund is not a bank deposit and is not insured or guaranteed by the Federal Deposit Insurance Corporation or any other government agency. The primary factors that may reduce the Fund’s net asset value (“NAV”) and returns include:
Counterparty Risk. The value of the Fund’s investments may be adversely affected if an issuer’s securities experience a credit downgrade; an issuer or guarantor of an investment held by the Fund fails to pay an obligation on a timely basis, otherwise defaults or is perceived by other investors to be less creditworthy; or a counterparty to a derivatives or other transaction with the Fund files for bankruptcy, becomes insolvent, or otherwise becomes unable or unwilling to honor its obligation to the Fund.
Credit Risk. Issuers of securities in which the Fund invests may have their credit ratings downgraded or may default in the payment of principal or interest on the securities, which would cause the Fund to lose money.
Derivative Contracts and Hybrid Instruments Risk. Derivatives contracts and hybrid instruments involve risks different from, and possibly greater than, traditional investments, including valuation and tax issues, increased potential for losses and/or costs to the Fund, and interest rate, credit, currency, liquidity and leverage risks. For additional information regarding these risks, see the “Investment Risks” section in the Fund’s Statement of Additional Information.
29
Fund Summaries
Huntington Global Select Markets Fund
continued
Emerging Markets Risk. In addition to all of the risks of investing in foreign developed markets, emerging market securities involve risks attendant to less mature and stable governments and economies, such as lower trading volume, trading suspension, security price volatility, repatriation restrictions, government confiscation, inflation, deflation, currency devaluation and adverse government regulations of industries or markets. As a result of these risks, the prices of emerging market securities tend to be more volatile than the securities of issuers located in developed markets.
Equity Securities Risk. The price of equity securities in the Fund’s portfolio will fluctuate based on actual or perceived changes in a company’s financial condition and on market and economic conditions.
Exchange-Traded Funds Risk. Like an open-end investment company (mutual fund), the value of an ETF can fluctuate based on the prices of the securities owned by the ETF, and ETFs are also subject to the following additional risks: (i) the ETF’s market price may be less than its net asset value; (ii) an active market for the ETF may not develop; and (iii) market trading in the ETF may be halted under certain circumstances.
Foreign Custodial Services and Related Investment Costs Risk. Foreign custodial services are generally more expensive in foreign jurisdictions than in the United States. In addition, because the procedures for settling securities transactions in foreign markets differ from those in the United States, it may be more difficult for the Fund to make intended purchases and sales of securities in foreign countries.
Foreign Investment/Currency Risk. Investments in foreign securities tend to be more volatile and less liquid than investments in U.S. securities because, among other things, they involve risks relating to political, social and economic developments abroad, as well as risks resulting from differences between the regulations and reporting standards and practices to which U.S. and foreign issuers are subject. All of the risks of investing in foreign securities are typically increased by investing in emerging market countries. Securities denominated in foreign currencies may be adversely affected by changes in currency rates and by substantial currency conversion costs.
Government Intervention and Extreme Volatility Risk. Governments and their agencies may take legislative or regulatory actions that affect the securities in which the Fund invests, the issuers of such securities or the Fund itself, in a manner which could limit or preclude the Fund’s ability to achieve its investment objective.
Hedging Risk. When a derivative contract is used as a hedge against an opposite position that the Fund holds, any loss on an underlying security (or position) should be substantially offset by gains on the hedged investment, and vice versa. Because it may not always be possible to perfectly offset one position with another, there is no assurance that the Fund’s hedging transactions will be effective.
Interest Rate Risk. The value of the Fund’s investments in fixed income securities may decline when prevailing interest rates rise or increase when interest rates go down. The longer a security’s maturity or duration, the greater its value will change in response to changes in interest rates. The interest earned on the Fund’s investments in fixed income securities may decline when prevailing interest rates decline.
Leverage Risk. Derivatives and other transactions that give rise to leverage may cause the Fund’s performance to be more volatile than if the Fund had not been leveraged. Leveraging also may require that the Fund liquidate securities when it may not be advantageous to do so to satisfy its obligations or to meet segregation requirements.
Liquidity Risk. Liquidity risk refers to the possibility that the Fund may not be able to sell a security when it wants to, which could cause the Fund to continue to hold the security and thereby incur a loss.
Manager Risk. The Advisor’s selection of securities for the Fund may cause the Fund to underperform similar funds or relevant benchmarks.
Market Capitalization Risk. Investing primarily in issuers in one market capitalization category (large, medium or small) carries the risk that due to current market conditions that category may be out of favor with investors. Larger, more established companies may be unable to respond quickly to new competitive challenges or attain the high growth rate of successful smaller companies. Stocks of smaller companies may be more volatile than those of larger companies due to, among other things, narrower product lines, more limited financial resources and fewer experienced managers. In addition, there is typically less publicly
30
Fund Summaries
Huntington Global Select Markets Fund
continued
available information about small capitalization companies, and their stocks may have a more limited trading market than stocks of larger companies.
Market Risk. The value of securities in the Fund’s portfolio will fluctuate and, as a result, the Fund’s share price may decline suddenly or over a sustained period of time.
Non-Investment Grade Securities Risk. Fixed income securities rated below investment grade generally entail greater interest rate, liquidity and credit risks than investment grade securities.
Real Estate/REIT Risk. The Fund’s investments in REITs are subject to the same risks as direct investments in real estate, including sensitivity to general economic downturns and the volatility of local real estate markets. REITs may have limited financial resources and their securities may trade infrequently and in limited volume, and thus they may be more volatile than other securities.
For more information, please see “Principal Investment Strategies and Risks.”
Performance: Bar Chart for Institutional Shares and Average Annual Total Return Table
The performance information shown below will help you analyze the Fund’s investment risks in light of its historical returns. The bar chart shows the variability of the Fund’s Institutional Shares total returns on a calendar year-by-year basis. The Average Annual Total Return Table shows returns averaged over the stated periods, and includes comparative performance information. The Fund’s performance will fluctuate, and past performance (before and after taxes) is not necessarily an indication of future results.
The annual returns in the bar chart which follows are for the Institutional Shares without reflecting payment of any sales charge; if they did reflect such payment of sales charges, annual returns would be lower.
Updated performance information will be available at www.huntingtonfunds.com, or by calling 800-253-0412.
| | | | | | | | | | |
Risk/Return Bar Chart
| | Best Quarter Worst Quarter | |
| Q3 2010
Q3 2011 |
| |
| 16.86
(21.81 | %
)% |
| | | | | | | | | | |
| | | | | | | | | | |
| | | | | | | | | | |
| | | | | | | | | | |
| | | | | | | | | | |
| | | | | | | | | | |
| | | | | | | | | | |
| | | | | | | | | | |
| | | | | | | | | | |
| | | | | | | | | | |
| | | | | | | | | | |
| | | | | | | | | | |
31
Fund Summaries
Huntington Global Select Markets Fund
continued
| | |
| | Average Annual Total Return Table (for the periods ended December 31, 2013) |
| | | | | | | | | | |
| | | 1 Year | | | Since Class
Inception* | | | |
| Global Select Markets Fund — Institutional Shares | | | | | | | | | | |
| Returns before taxes | | | 6.08% | | | | 3.21% | | | |
| Returns after taxes on distributions(1) | | | 5.54% | | | | 2.97% | | | |
| Returns after taxes on distributions and sales of Institutional Shares(1) | | | 3.80% | | | | 2.55% | | | |
Global Select Markets Fund — Class A Shares
(with 4.75% sales charge) | | | | | | | | | | |
| Returns before taxes | | | 0.88% | | | | 1.67% | | | |
Morgan Stanley Capital International Emerging Markets Index (MSCI-EM)
(reflects no deduction for fees, expenses or taxes)(2) | | | -2.60% | | | | 3.03% | | | |
| (1) | | After tax returns are calculated using a standard set of assumptions. The stated returns assume the highest historical federal income and capital gains tax rates. Returns after taxes on distributions assumes a continued investment in the Fund and show the effect of taxes on Fund distributions. Returns after taxes on distributions and sales of Fund Shares assumes all Shares were redeemed at the end of each measurement period, and shows the effect of any taxable gain (or offsetting loss) on redemption, as well as the effects of taxes on Fund distributions. These after tax returns do not reflect the effect of any applicable state and local taxes. After tax returns are not relevant to investors holding Shares through tax-deferred programs, such as IRA or 401(k) plans. |
| (2) | | The MSCI-EM is a market capitalization-weighted equity index comprising 21 of the 48 countries in the MSCI universe. Each MSCI country index is created separately, then aggregated, without change, into MSCI indices. The index is unmanaged and, unlike the Fund, is not affected by cash flows. It is not possible to invest directly in an Index. |
| * | | Since December 30, 2009. |
Investment Advisor and Portfolio Managers
The Fund’s investment advisor is Huntington Asset Advisors, Inc. Paul W. Attwood, CFA, Senior Vice President of the Advisor, and Martina Cheung, CFA, CMT, Senior Vice President of the Advisor, are primarily responsible for the day-to-day management of the Fund. Mr. Attwood has served as the Fund’s Portfolio Manager since its inception in 2009 and Ms. Cheung has served as the Fund’s Portfolio Manager since March 2014.
Purchasing and Redeeming Shares
The minimum initial purchase for the Fund’s Class A and Institutional Shares is $1,000. For Class A Shares, the minimum subsequent investment is $50; for Institutional Shares, the minimum subsequent investment is $500. For Class A Shares and Institutional Shares, the minimum initial and subsequent investment through the Systematic Investment Program (“SIP”) is $50.
Shares may be purchased or redeemed by calling your investment professional or directly from the Trust at 800-253-0412; by check payable to the Huntington Global Select Markets Fund and applicable Share class (for example, Huntington Global Select Markets Fund Class A Shares) (Mail to: The Huntington Funds, P.O. Box 6110, Indianapolis, IN 46206-6110); or by Federal funds wire (please call the Trust at 800-253-0412 for wire instructions). You may redeem your Shares on any business day when both the Federal Reserve Bank and New York Stock Exchange are open by telephone at 800-253-0412, or by calling your Investment Professional; or by mail to the Huntington Funds address above. You may receive redemption proceeds by wire (wire transfer fees may apply), by electronic bank transfer or by check. Sales charges may apply to the purchase or redemption of Shares.
32
Fund Summaries
Huntington Global Select Markets Fund
continued
Tax Information
The Fund’s distributions are taxable as ordinary income or capital gains, except when your investment is through an Individual Retirement Account (“IRA”).
Payments to Broker-Dealers and Other Financial Intermediaries
If you purchase the Fund through a broker-dealer or other financial intermediary (such as a bank), the Fund and its related companies may pay the intermediary for the sale of Fund shares and related services. These payments may create a conflict of interest by influencing the broker-dealer or other intermediary and your salesperson to recommend the Fund over another investment. Ask your salesperson or visit your financial intermediary’s Web site for more information.
33
Fund Summaries
Huntington International Equity Fund
Fund Summary
Investment Objective | The Fund’s investment objective is to seek total return. |
Fees and Expenses
This table describes the fees and expenses that you may pay if you buy and hold shares of the Fund. You may qualify for sales charge discounts if you and members of your household invest, or agree to invest in the future, at least $50,000 in Huntington Funds. More information about these and other discounts is available from your financial professional and in the “Sales Charges” section at page 134 of this prospectus and in the Fund’s Statement of Additional Information.
| | | | | | | | |
Shareholder Fees
(fees paid directly from your investment) | | Institutional
Shares | | | Class A
Shares | |
Maximum Sales Charge (Load) Imposed on Purchase
(as a percentage of offering price) | | | None | | | | 4.75% | |
| | | | | | | | |
Maximum Deferred Sales Charge (Load)
(as a percentage of net asset value) | | | None | | | | None | |
| | | | | | | | |
Redemption Fee
(as a percentage of amount redeemed, if applicable) | | | None | | | | None | |
| | | | | | | | |
Annual Fund Operating Expenses
(expenses that you pay each year as a percentage of the
value of your investment) | | Institutional
Shares | | | Class A
Shares | |
| Management Fees | | | 1.00% | | | | 1.00% | |
| | | | | | | | |
| Distribution (12b-1) Fees | | | None | | | | 0.25% | |
| | | | | | | | |
Other Expenses
(including shareholder services fee) | | | 0.55% | | | | 0.55% | |
| | | | | | | | |
| Acquired Fund Fees and Expenses | | | 0.03% | | | | 0.03% | |
| | | | | | | | |
| Total Annual Fund Operating Expenses | | | 1.58% | | | | 1.83% | |
| | | | | | | | |
| Fee Waivers and/or Expense Reimbursements(1) | | | (0.68 | )% | | | (0.68 | )% |
| | | | | | | | |
| Total Annual Fund Operating Expenses After Fee Waivers and/or Expense Reimbursements | | | 0.90% | | | | 1.15% | |
| (1) | | Huntington Asset Advisors, Inc. (the “Advisor”) has contractually agreed to waive all or a portion of its management fee and/or reimburse certain operating expenses of the Fund to the extent necessary in order to limit the Fund’s total annual fund operating expenses (after the fee waivers and/or expense reimbursements, and exclusive of acquired fund fees and expenses, brokerage costs, interest, taxes and dividends, and extraordinary expenses) to not more than 0.87% and 1.12% of the Institutional Shares and Class A Shares daily net assets, respectively, through April 30, 2015. This arrangement may only be terminated prior to this date with the agreement of the Fund’s Board of Trustees. Under certain conditions, the Advisor may recapture operating expenses reimbursed under these arrangements for a period of three years following the fiscal year in which such reimbursement occurred. Any amounts recaptured by the Advisor may not cause the Fund’s total annual fund operating expenses to exceed the stated expense caps. |
Example
This Example is intended to help you compare the cost of investing in the Fund with the cost of investing in other mutual funds. The Example assumes that you invest $10,000 in the Fund for the time periods indicated and then redeem all of your shares at the end of those periods. The Example also assumes that your investment has a 5% return each year and that the Fund’s operating expenses remain the same and expenses were capped in the first year for each period. Although your actual costs may be higher or lower, based on these assumptions your costs would be:
| | | | | | | | | | | | | | | | |
| | | 1 Year | | | 3 Years | | | 5 Years | | | 10 Years | |
Institutional Shares | | $ | 92 | | | $ | 432 | | | $ | 796 | | | $ | 1,821 | |
Class A Shares | | $ | 587 | | | $ | 960 | | | $ | 1,358 | | | $ | 2,468 | |
34
Fund Summaries
Huntington International Equity Fund
continued
Portfolio Turnover
The Fund pays transaction costs, such as commissions, when it buys and sells securities (or “turns over” its portfolio). A higher portfolio turnover rate may indicate higher transaction costs and may result in higher taxes when Fund shares are held in a taxable account. These costs, which are not reflected in annual fund operating expenses or in the Example, affect the Fund’s performance. During the most recent fiscal year, the Fund’s portfolio turnover rate was 62% of the average value of its portfolio.
Principal Investment Strategy
The Fund normally pursues its investment objective by investing at least 80% of its assets in equity securities, and at least 65% of its assets in companies based outside the United States. The Advisor manages the Fund based on the view that international equity markets are inefficient at pricing securities and that careful security selection generally offers the best potential for superior long-term investment returns. The Advisor uses a “bottom-up” approach to stock selection (searching for outstanding performance of individual stocks before considering the impact of economic trends) and evaluates industry and country exposure to be consistent with a “top-down” approach. The Advisor attempts to purchase securities with value characteristics consistent with an overall assessment of the economic environment in which the underlying company operates and the overall growth in the company’s economic value.
The Fund will not invest more than 20% of its assets in companies located in emerging markets. In determining which markets are emerging markets, the Advisor will look at whether the market is large and liquid enough that trading is readily available, and that the management of the market itself has a history of meeting what the Advisor believes to be global norms of transparency.
Because the Fund contains “equity” in its name, the Fund will normally invest at least 80% of its assets in equity securities and will notify shareholders at least 60 days in advance of any changes in this investment policy.
Principal Investment Risks
All mutual funds take investment risks. Therefore, it is possible to lose money by investing in the Fund. An investment in the Fund is not a bank deposit and is not insured or guaranteed by the Federal Deposit Insurance Corporation or any other government agency. The primary factors that may reduce the Fund’s net asset value (“NAV”) and returns include:
Emerging Markets Risk. In addition to all of the risks of investing in foreign developed markets, emerging market securities involve risks attendant to less mature and stable governments and economies, such as lower trading volume, trading suspension, security price volatility, repatriation restrictions, government confiscation, inflation, deflation, currency devaluation and adverse government regulations of industries or markets. As a result of these risks, the prices of emerging market securities tend to be more volatile than the securities of issuers located in developed markets.
Equity Securities Risk. The price of equity securities in the Fund’s portfolio will fluctuate based on actual or perceived changes in a company’s financial condition and on market and economic conditions.
Foreign Custodial Services and Related Investment Costs Risk. Foreign custodial services are generally more expensive in foreign jurisdictions than in the United States. In addition, because the procedures for settling securities transactions in foreign markets differ from those in the United States, it may be more difficult for the Fund to make intended purchases and sales of securities in foreign countries.
Foreign Investment/Currency Risk. Investments in foreign securities tend to be more volatile and less liquid than investments in U.S. securities because, among other things, they involve risks relating to political, social and economic developments abroad, as well as risks resulting from differences between the regulations and reporting standards and practices to which U.S. and foreign issuers are subject. All of the risks of investing in foreign securities are typically increased by investing in emerging market countries. Securities denominated in foreign currencies may be adversely affected by changes in currency rates and by substantial currency conversion costs.
35
Fund Summaries
Huntington International Equity Fund
continued
Investment Style Risk. The type of securities in which a Fund invests may underperform other assets or the overall market.
Liquidity Risk. Liquidity risk refers to the possibility that the Fund may not be able to sell a security when it wants to, which could cause the Fund to continue to hold the security and thereby incur a loss.
Market Risk. The value of securities in the Fund’s portfolio will fluctuate and, as a result, the Fund’s share price may decline suddenly or over a sustained period of time.
For more information, please see “Principal Investment Strategies and Risks.”
Performance: Bar Chart for Institutional Shares and Average Annual Total Return Table
The performance information shown below will help you analyze the Fund’s investment risks in light of its historical returns. The bar chart shows the variability of the Fund’s Institutional Shares total returns on a calendar year-by-year basis. The Average Annual Total Return Table shows returns averaged over the stated periods, and includes comparative performance information. The Fund’s performance will fluctuate, and past performance (before and after taxes) is not necessarily an indication of future results.
The annual returns in the bar chart which follows are for the Institutional Shares without reflecting payment of any sales charge; if they did reflect such payment of sales charges, annual returns would be lower.
Updated performance information will be available at www.huntingtonfunds.com, or by calling 800-253-0412.
| | | | | | | | | | |
Risk/Return Bar Chart
| | Best Quarter Worst Quarter | |
| Q2 2009
Q4 2008 |
| |
| 22.90
(23.11 | %
)% |
| | | | | | | | | | |
| | | | | | | | | | |
| | | | | | | | | | |
| | | | | | | | | | |
| | | | | | | | | | |
| | | | | | | | | | |
| | | | | | | | | | |
| | | | | | | | | | |
| | | | | | | | | | |
| | | | | | | | | | |
| | | | | | | | | | |
| | | | | | | | | | |
36
Fund Summaries
Huntington International Equity Fund
continued
| | |
| | Average Annual Total Return Table (for the periods ended December 31, 2013) |
| | | | | | | | | | | | |
| | | 1 Year | | | 5 Years | | | 10 Years | |
| International Equity Fund — Institutional Shares | | | | | | | | | | | | |
| Returns before taxes | | | 20.32% | | | | 11.76% | | | | 7.59% | |
| Returns after taxes on distributions(1) | | | 19.72% | | | | 11.61% | | | | 7.16% | |
| Returns after taxes on distributions and sales of Institutional Shares(1) | | | 12.26% | | | | 9.60% | | | | 6.47% | |
International Equity Fund — Class A Shares
(with 4.75% sales charge) | | | | | | | | | | | | |
| Returns before taxes | | | 14.32% | | | | 10.39% | | | | 6.80% | |
Morgan Stanley Capital International Europe, Australasia and Far East Index (MSCI-EAFE) (reflects no deduction for fees, expenses or taxes)(2) | | | 22.78% | | | | 12.44% | | | | 6.91% | |
| (1) | | After tax returns are calculated using a standard set of assumptions. The stated returns assume the highest historical federal income and capital gains tax rates. Returns after taxes on distributions assumes a continued investment in the Fund and show the effect of taxes on Fund distributions. Returns after taxes on distributions and sales of Fund Shares assumes all Shares were redeemed at the end of each measurement period, and shows the effect of any taxable gain (or offsetting loss) on redemption, as well as the effects of taxes on Fund distributions. These after tax returns do not reflect the effect of any applicable state and local taxes. After tax returns are not relevant to investors holding Shares through tax-deferred programs, such as IRA or 401(k) plans. |
| (2) | | The MSCI-EAFE Index is a free float-adjusted market capitalization index that is designed to measure the equity market performance of developed markets, excluding the US & Canada. The MSCI-EAFE Index consists of the following 22 developed market country indices: Australia, Austria, Belgium, Denmark, Finland, France, Germany, Greece, Hong Kong, Ireland, Israel, Italy, Japan, the Netherlands, New Zealand, Norway, Portugal, Singapore, Spain, Sweden, Switzerland, and the United Kingdom. The index is unmanaged and, unlike the Fund, is not affected by cash flows. It is not possible to invest directly in an Index. |
Investment Advisor and Portfolio Managers
The Fund’s investment advisor is Huntington Asset Advisors, Inc. Paul W. Attwood, CFA, Senior Vice President of the Advisor, and Martina Cheung, CFA, CMT, Senior Vice President of the Advisor, are primarily responsible for the day-to-day management of the Fund. Mr. Attwood has served as the Fund’s Portfolio Manager since 2012 and Ms. Cheung has served as the Fund’s Portfolio Manager since March 2014.
Purchasing and Redeeming Shares
The minimum initial purchase for the Fund’s Class A and Institutional Shares is $1,000. For Class A Shares, the minimum subsequent investment is $50; for Institutional Shares, the minimum subsequent investment is $500. For Class A Shares and Institutional Shares, the minimum initial and subsequent investment through the Systematic Investment Program (“SIP”) is $50.
Shares may be purchased or redeemed by calling your investment professional or directly from the Trust at 800-253-0412; by check payable to the Huntington International Equity Fund and applicable Share class (for example, Huntington International Equity Fund Class A Shares) (Mail to: The Huntington Funds, P.O. Box 6110, Indianapolis, IN 46206-6110); or by Federal funds wire (please call the Trust at 800-253-0412 for wire instructions). You may redeem your Shares on any business day when both the Federal Reserve Bank and New York Stock Exchange are open by telephone at 800-253-0412, or by calling your Investment Professional; or by mail to the Huntington Funds address above. You may receive redemption proceeds by wire (wire transfer fees may apply), by electronic bank transfer or by check. Sales charges may apply to the purchase or redemption of Shares.
37
Fund Summaries
Huntington International Equity Fund
continued
Tax Information
The Fund’s distributions are taxable as ordinary income or capital gains, except when your investment is through an Individual Retirement Account (“IRA”).
Payments to Broker-Dealers and Other Financial Intermediaries
If you purchase the Fund through a broker-dealer or other financial intermediary (such as a bank), the Fund and its related companies may pay the intermediary for the sale of Fund shares and related services. These payments may create a conflict of interest by influencing the broker-dealer or other intermediary and your salesperson to recommend the Fund over another investment. Ask your salesperson or visit your financial intermediary’s Web site for more information.
38
Fund Summaries
Huntington Real Strategies Fund
Fund Summary
Investment Objective | The Fund’s investment objective is to seek total return consisting of capital appreciation and income. |
Fees and Expenses
This table describes the fees and expenses that you may pay if you buy and hold shares of the Fund. You may qualify for sales charge discounts if you and members of your household invest, or agree to invest in the future, at least $50,000 in Huntington Funds. More information about these and other discounts is available from your financial professional and in the “Sales Charges” section at page 134 of this prospectus and in the Fund’s Statement of Additional Information.
| | | | | | | | |
Shareholder Fees
(fees paid directly from your investment) | | Institutional
Shares | | | Class A
Shares | |
Maximum Sales Charge (Load) Imposed on Purchase
(as a percentage of offering price) | | | None | | | | 4.75% | |
| |
Maximum Deferred Sales Charge (Load)
(as a percentage of net asset value) | | | None | | | | None | |
| |
Redemption Fee
(as a percentage of amount redeemed, if applicable) | | | None | | | | None | |
| | | | | | | | |
Annual Fund Operating Expenses
(expenses that you pay each year as a percentage of the
value of your investment) | | Institutional
Shares | | | Class A
Shares | |
| Management Fees | | | 0.75% | | | | 0.75% | |
| |
| Distribution (12b-1) Fees | | | None | | | | 0.25% | |
| |
Other Expenses
(including shareholder services fee) | | | 0.61% | | | | 0.61% | |
| |
| Acquired Fund Fees and Expenses | | | 0.06% | | | | 0.06% | |
| |
| Total Annual Fund Operating Expenses | | | 1.42% | | | | 1.67% | |
| |
| Fee Waivers and/or Expense Reimbursements(1) | | | (0.32 | )% | | | (0.32 | )% |
| |
| Total Annual Fund Operating Expenses After Fee Waivers and/or Expense Reimbursements | | | 1.10% | | | | 1.35% | |
| (1) | | Huntington Asset Advisors, Inc. (the “Advisor”) has contractually agreed to waive all or a portion of its management fee and/or reimburse certain operating expenses of the Fund to the extent necessary in order to limit the Fund’s total annual fund operating expenses (after the fee waivers and/or expense reimbursements, and exclusive of acquired fund fees and expenses, brokerage costs, interest, taxes and dividends, and extraordinary expenses) to not more than 1.04% and 1.29% of the Institutional Shares and Class A Shares daily net assets, respectively, through April 30, 2015. This arrangement may only be terminated prior to this date with the agreement of the Fund’s Board of Trustees. Under certain conditions, the Advisor may recapture operating expenses reimbursed under these arrangements for a period of three years following the fiscal year in which such reimbursement occurred. Any amounts recaptured by the Advisor may not cause the Fund’s total annual fund operating expenses to exceed the stated expense caps. |
Example
This Example is intended to help you compare the cost of investing in the Fund with the cost of investing in other mutual funds. The Example assumes that you invest $10,000 in the Fund for the time periods indicated and then redeem all of your shares at the end of those periods. The Example also assumes that your investment has a 5% return each year and that the Fund’s operating expenses remain the same and expenses were capped in the first year for each period. Although your actual costs may be higher or lower, based on these assumptions your costs would be:
| | | | | | | | | | | | | | | | |
| | | 1 Year | | | 3 Years | | | 5 Years | | | 10 Years | |
Institutional Shares | | $ | 112 | | | $ | 418 | | | $ | 746 | | | $ | 1,674 | |
Class A Shares | | $ | 606 | | | $ | 947 | | | $ | 1,311 | | | $ | 2,332 | |
39
Fund Summaries
Huntington Real Strategies Fund
continued
Portfolio Turnover
The Fund pays transaction costs, such as commissions, when it buys and sells securities (or “turns over” its portfolio). A higher portfolio turnover rate may indicate higher transaction costs and may result in higher taxes when Fund shares are held in a taxable account. These costs, which are not reflected in annual fund operating expenses or in the Example, affect the Fund’s performance. During the most recent fiscal year, the Fund’s portfolio turnover rate was 43% of the average value of its portfolio.
Principal Investment Strategy
The Fund normally pursues its objective by making investments that have performed well relative to general U.S. stocks and bonds during periods of increased inflation. The Fund implements its strategy by investing in a combination of the following types of securities:
| • | | Real estate investment trusts (“REITs”) that own commercial or residential properties, timberlands and other real estate or that provide real estate financing; |
| • | | Equity securities issued by corporations engaged in real estate-related or commodities-related businesses, index-based securities and investment companies that invest in such equity securities, and other securities representing interests in cash flows or returns from real estate or commodities; |
| • | | Publicly traded partnerships and trusts, including exchange traded commodity funds (“ETCFs”) and master limited partnerships (“MLPs”), that (1) invest in real estate or commodities, or in derivative contracts for real estate, commodities or related indices, or (2) conduct real estate-related or commodities-related businesses; and |
| • | | Inflation-Protected Securities (“IPS”) issued by U.S. and non-U.S. governments, their agencies or instrumentalities and by corporations, that are structured to provide protection against inflation, and other fixed income securities that historically have provided protection against inflation. |
For purposes of this investment strategy, commodities include any physical good used principally in the manufacture or production of products, or the construction of facilities, including without limitation, agricultural products, minerals and energy. The Fund will treat a good as a commodity after it has been harvested or extracted, and after it has been processed or manufactured into another form.
In addition, an issuer is “real estate-related” if it engages primarily in the business of (1) acquiring, developing, managing or financing real estate or (2) providing goods, equipment or services to companies engaged in such businesses. An issuer is “commodities-related” if it engages primarily in the business of (1) growing, harvesting, transporting, processing or selling crops (including timber) or livestock, (2) finding, extracting, transporting, refining, manufacturing or selling minerals, (3) generating, transporting or selling electricity, or (4) providing goods, equipment or services to companies engaged in any of the foregoing businesses.
The Advisor bases the Fund’s investment strategy on its evaluation of the current and expected market conditions for real estate and commodities, and its outlook for inflation in the United States.
Under ordinary market conditions, the Fund will hold IPS to the extent that the Advisor cannot find more favorable real estate-related and commodities-related investment opportunities. IPS will include U.S. Treasury Inflation-Protected Securities (“TIPS”), other U.S. dollar denominated fixed income securities issued by U.S. government agencies and instrumentalities or corporations, and derivatives contracts, with inflation protection provisions (including adjustable interest rates).
The Fund is not limited as to the minimum or maximum amount of its assets it may invest in real estate-related, commodities-related or inflation-protected investments, or in any combination thereof. In addition, the Fund’s investment strategy may result in investment of more than 25% of its portfolio in certain business sectors (such as energy or mining) or in certain geographic regions or countries.
The Fund may invest in securities issued by U.S. and foreign governments and companies, and in securities denominated in foreign currencies. The Fund may invest in companies of any size, including small, high growth companies. The Fund also may invest in companies whose shares are being, or recently have been, offered to the public for the first time.
40
Fund Summaries
Huntington Real Strategies Fund
continued
The Fund actively trades its portfolio securities in an attempt to achieve its investment objective.
Principal Investment Risks
All mutual funds take investment risks. Therefore, it is possible to lose money by investing in the Fund. An investment in the Fund is not a bank deposit and is not insured or guaranteed by the Federal Deposit Insurance Corporation or any other government agency. The primary factors that may reduce the Fund’s net asset value (“NAV”) and returns include:
Active Trading Risk. The Fund may trade securities actively, which could increase its transaction costs (thereby lowering its performance) and could increase the amount of taxes you owe by generating short-term gains, which may be taxed at a higher rate.
Agriculture Risk. Investments in agriculture-related companies are subject to the same risks as investments in agricultural commodities, such as adverse weather conditions, embargoes, tariffs, and adverse international economic, political and regulatory developments.
Class/Sector/Region Focus Risk. If the Fund invests more than 25% of its net assets in a particular asset class, or securities of issuers within a particular market sector or geographic region, it is subject to increased risk. Performance will generally depend on the performance of the class, sector or region, which may differ in direction and degree from that of the overall U.S. stock or bond markets. In addition, financial, economic, business and political developments affecting the class, sector or region may have a greater effect on the Fund.
Commodities-Related Investment Risk. Neither the Advisor nor the Fund anticipate being subject to registration or regulation by the Commodities Futures Trading Commission (“CFTC”) as a commodity pool, commodity pool operator (“CPO”) or a commodity trading adviser (“CTA”) under the Commodity Exchange Act (“CEA”) as a result of the Fund’s commodities-related investments. However, should the Advisor or the Fund be deemed to fall under these categories, then the Advisor would be subject to registration and regulation in its capacity as the Fund’s CPO or CTA, and the Fund would be subject to regulation as a commodity pool under the CEA. A Fund may incur additional expenses as a result of the registration and regulation obligations and certain investments may be limited or restricted.
Counterparty Risk. The value of the Fund’s investments may be adversely affected if an issuer’s securities experience a credit downgrade; an issuer or guarantor of an investment held by the Fund fails to pay an obligation on a timely basis, otherwise defaults or is perceived by other investors to be less creditworthy; or a counterparty to a derivatives or other transaction with the Fund files for bankruptcy, becomes insolvent, or otherwise becomes unable or unwilling to honor its obligation to the Fund.
Credit Risk. Issuers of securities in which the Fund invests may have their credit ratings downgraded or may default in the payment of principal or interest on the securities, which would cause the Fund to lose money.
Energy Risk. Investments in energy-related companies may fluctuate substantially in value over both short and long periods, based on changes in the prices and supplies of oil and other energy fuels.
Equity Securities Risk. The price of equity securities in the Fund’s portfolio will fluctuate based on actual or perceived changes in a company’s financial condition and on market and economic conditions.
Exchange-Traded Funds (“ETFs”) Risk. Like a conventional mutual fund, the value of an ETF can fluctuate based on the prices of the securities owned by the ETF, and ETFs are also subject to the following additional risks: (i) the ETF’s market price may be less than its net asset value; (ii) an active market for the ETF may not develop; and (iii) market trading in the ETF may be halted under certain circumstances.
Fee Layering Risk. Because the Fund may invest its assets in underlying mutual funds or ETFs that have their own fees and expenses in addition to those charged directly by the Fund, the Fund may bear higher expenses than a Fund that invests directly in individual securities.
Foreign Custodial Services and Related Investment Costs Risk. Foreign custodial services are generally more expensive in foreign jurisdictions than in the United States. In addition, because the procedures for settling securities transactions in foreign markets differ from those in the United States, it may be more difficult for the Fund to make intended purchases and sales of securities in foreign countries.
41
Fund Summaries
Huntington Real Strategies Fund
continued
Foreign Investment/Currency Risk. Investments in foreign securities tend to be more volatile and less liquid than investments in U.S. securities because, among other things, they involve risks relating to political, social and economic developments abroad, as well as risks resulting from differences between the regulations and reporting standards and practices to which U.S. and foreign issuers are subject. All of the risks of investing in foreign securities are typically increased by investing in emerging market countries. Securities denominated in foreign currencies may be adversely affected by changes in currency rates and by substantial currency conversion costs.
Inflation-Protected Securities (“IPS”) Risk. While IPS adjust positively in response to inflation, their value may under certain circumstances decline or underperform relative to other fixed-income securities. In addition, the tax and other characteristics of IPS held by the Fund could require the Fund to liquidate other portfolio securities at disadvantageous times in order to pay taxes, and could cause fluctuations in the Fund’s income distributions.
Interest Rate Risk. The value of the Fund’s investments in fixed income securities may decline when prevailing interest rates rise or increase when interest rates go down. The longer a security’s maturity or duration, the greater its value will change in response to changes in interest rates. The interest earned on the Fund’s investments in fixed income securities may decline when prevailing interest rates decline.
Investment Company Risk. Because the Fund may invest in underlying funds that have their own fees and expenses in addition to those charged directly by the Fund, the Fund may pay higher expenses than a Fund that invests directly in equity or fixed income securities.
Investment Style Risk. The type of securities in which a Fund invests may underperform other assets or the overall market.
Market Capitalization Risk. Investing primarily in issuers in one market capitalization category (large, medium or small) carries the risk that due to current market conditions that category may be out of favor with investors. Larger, more established companies may be unable to respond quickly to new competitive challenges or attain the high growth rate of successful smaller companies. Stocks of smaller companies may be more volatile than those of larger companies due to, among other things, narrower product lines, more limited financial resources and fewer experienced managers. In addition, there is typically less publicly available information about small capitalization companies, and their stocks may have a more limited trading market than stocks of larger companies.
Market Risk. The value of securities in the Fund’s portfolio will fluctuate and, as a result, the Fund’s share price may decline suddenly or over a sustained period of time.
Mineral and Mining Risk. The Fund’s investment in minerals and mining related companies are subject to the same risks as direct investments in minerals. Mineral prices rise and fall in response to many factors, which could lead to significant and rapid fluctuations in the value of mining related investments held by the Fund.
Real Estate/REIT Risk. The Fund’s investment in REITs is subject to the same risks as direct investments in real estate, including sensitivity to general economic downturns and the volatility of local real estate markets. REITs may have limited financial resources and their securities may trade infrequently and in limited volume, and thus they may be more volatile than other securities.
For more information, please see “Principal Investment Strategies and Risks.”
42
Fund Summaries
Huntington Real Strategies Fund
continued
Performance: Bar Chart for Institutional Shares and Average Annual Total Return Table
The performance information shown below will help you analyze the Fund’s investment risks in light of its historical returns. The bar chart shows the variability of the Fund’s Institutional Shares total returns on a calendar year-by-year basis. The Average Annual Total Return Table shows returns averaged over the stated periods, and includes comparative performance information. The Fund’s performance will fluctuate, and past performance (before and after taxes) is not necessarily an indication of future results.
The annual returns in the bar chart which follows are for the Institutional Shares without reflecting payment of any sales charge; if they did reflect such payment of sales charges, annual returns would be lower.
Updated performance information will be available at www.huntingtonfunds.com, or by calling 800-253-0412.
| | | | | | | | | | |
Risk/Return Bar Chart 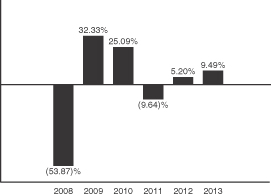
| | Best Quarter Worst Quarter | |
| Q3 2010
Q4 2008 |
| |
| 19.04
(35.61 | %
)% |
| | | | | | | | | | |
| | | | | | | | | | |
| | | | | | | | | | |
| | | | | | | | | | |
| | | | | | | | | | |
| | | | | | | | | | |
| | | | | | | | | | |
| | | | | | | | | | |
| | | | | | | | | | |
| | | | | | | | | | |
| | | | | | | | | | |
| | | | | | | | | | |
| | |
| | Average Annual Total Return Table (for the periods ended December 31, 2013) |
| | | | | | | | | | | | |
| | | 1 Year | | | 5 Years | | | Since Class
inception* | |
| Real Strategies Fund — Institutional Shares | | | | | | | | | | | | |
| Returns before taxes | | | 9.49% | | | | 11.49% | | | | (1.94)% | |
| Returns after taxes on distributions(1) | | | 9.23% | | | | 11.31% | | | | (2.21)% | |
| Returns after taxes on distributions and sales of Institutional Shares(1) | | | 5.54% | | | | 9.21% | | | | (1.45)% | |
Real Strategies Fund — Class A Shares
(with 4.75% sales charge) | | | | | | | | | | | | |
| Returns before taxes | | | 3.91% | | | | 10.08% | | | | (2.92)% | |
Standard & Poor’s Goldman Sachs Commodity Index (S&P GSCI®)
(reflects no deduction for fees, expenses or taxes)(2) | | | (1.24)% | | | | 3.87% | | | | (2.96)% | |
| (1) | | After tax returns are calculated using a standard set of assumptions. The stated returns assume the highest historical federal income and capital gains tax rates. Returns after taxes on distributions assumes a continued investment in the Fund and show the effect of taxes on Fund distributions. Returns after taxes on distributions and sales of Fund Shares assumes all Shares were redeemed at the end of each measurement period, and shows the effect of any taxable gain (or offsetting loss) on redemption, as well as the effects of taxes on Fund distributions. These after tax returns do not reflect the effect of any applicable state and local taxes. After tax returns are not relevant to investors holding Shares through tax-deferred programs, such as IRA or 401(k) plans. |
43
Fund Summaries
Huntington Real Strategies Fund
continued
| (2) | | The S&P Goldman Sachs Commodity Index (“S&P GSCI®”) measures general price movements and inflation in the world economy. The S&P GSCI® is calculated primarily on a world production-weighted basis and is comprised of the principal physical commodities that are the subject of active, liquid futures markets. The index is unmanaged and, unlike the Fund, is not affected by cash flows. It is not possible to invest directly in an Index. |
Investment Advisor and Portfolio Manager
The Fund’s investment advisor is Huntington Asset Advisors, Inc. Peter Sorrentino, CFA, Senior Vice President of the Advisor, is primarily responsible for the day-to-day management of the Fund. Mr. Sorrentino has served as the Fund’s Portfolio Manager since its inception in 2007.
Purchasing and Redeeming Shares
The minimum initial purchase for the Fund’s Class A and Institutional Shares is $1,000. For Class A Shares, the minimum subsequent investment is $50; for Institutional Shares, the minimum subsequent investment is $500. For Class A Shares and Institutional Shares, the minimum initial and subsequent investment through the Systematic Investment Program (“SIP”) is $50.
Shares may be purchased or redeemed by calling your investment professional or directly from the Trust at 800-253-0412; by check payable to the Huntington Real Strategies Fund and applicable Share class (for example, Huntington Real Strategies Fund Class A Shares) (Mail to: The Huntington Funds, P.O. Box 6110, Indianapolis, IN 46206-6110); or by Federal funds wire (please call the Trust at 800-253-0412 for wire instructions). You may redeem your Shares on any business day when both the Federal Reserve Bank and New York Stock Exchange are open by telephone at 800-253-0412, or by calling your Investment Professional; or by mail to the Huntington Funds address above. You may receive redemption proceeds by wire (wire transfer fees may apply), by electronic bank transfer or by check. Sales charges may apply to the purchase or redemption of Shares.
Tax Information
The Fund’s distributions are taxable as ordinary income or capital gains, except when your investment is through an Individual Retirement Account (“IRA”).
Payments to Broker-Dealers and Other Financial Intermediaries
If you purchase the Fund through a broker-dealer or other financial intermediary (such as a bank), the Fund and its related companies may pay the intermediary for the sale of Fund shares and related services. These payments may create a conflict of interest by influencing the broker-dealer or other intermediary and your salesperson to recommend the Fund over another investment. Ask your salesperson or visit your financial intermediary’s Web site for more information.
44
Fund Summaries
Huntington Situs Fund
Fund Summary
Investment Objective | The Fund’s investment objective is to seek long-term capital appreciation. |
Fees and Expenses
This table describes the fees and expenses that you may pay if you buy and hold shares of the Fund. You may qualify for sales charge discounts if you and members of your household invest, or agree to invest in the future, at least $50,000 in Huntington Funds. More information about these and other discounts is available from your financial professional and in the “Sales Charges” section at page 134 of this prospectus and in the Fund’s Statement of Additional Information.
| | | | | | | | | | | | |
Shareholder Fees
(fees paid directly from your investment) | | Institutional
Shares | | | Class A
Shares | | | Class C
Shares | |
Maximum Sales Charge (Load) Imposed on Purchase
(as a percentage of offering price) | | | None | | | | 4.75% | | | | None | |
| |
Maximum Deferred Sales Charge (Load)(1)
(as a percentage of net asset value) | | | None | | | | None | | | | 1.00% | |
| |
Redemption Fee
(as a percentage of amount redeemed, if applicable) | | | None | | | | None | | | | None | |
| | | | | | | | | | | | |
Annual Fund Operating Expenses (expenses that you pay each year as a percentage of the
value of your investment) | | Institutional
Shares | | | Class A
Shares | | | Class C
Shares | |
| Management Fees | | | 0.75% | | | | 0.75% | | | | 0.75% | |
| |
| Distribution (12b-1) Fees | | | None | | | | 0.25% | | | | 1.00% | |
| |
Other Expenses
(including shareholder services fee of 0.25% applicable to Institutional Shares and Class A Shares only) | | | 0.58% | | | | 0.58% | | | | 0.33% | |
| |
| Acquired Fund Fees and Expenses | | | None | | | | None | | | | None | |
| |
| Total Annual Fund Operating Expenses | | | 1.33% | | | | 1.58% | | | | 2.08% | |
| |
| Fee Waivers and/or Expense Reimbursements(2) | | | (0.30 | )% | | | (0.30 | )% | | | (0.30 | )% |
| |
| Total Annual Fund Operating Expenses After Fee Waivers and/or Expense Reimbursements | | | 1.03% | | | | 1.28% | | | | 1.78% | |
| (1) | | Maximum Deferred Sales Charge on Class C Shares applies to shares sold within 12 months of purchase. |
| (2) | | Huntington Asset Advisors, Inc. (the “Advisor”) has contractually agreed to waive all or a portion of its management fee and/or reimburse certain operating expenses of the Fund to the extent necessary in order to limit the Fund’s total annual fund operating expenses (after the fee waivers and/or expense reimbursements, and exclusive of acquired fund fees and expenses, brokerage costs, interest, taxes and dividends, and extraordinary expenses) to not more than 1.03%, 1.28% and 1.78% of the Institutional Shares, Class A Shares and Class C Shares daily net assets, respectively, through April 30, 2015. This arrangement may only be terminated prior to this date with the agreement of the Fund’s Board of Trustees. Under certain conditions, the Advisor may recapture operating expenses reimbursed under these arrangements for a period of three years following the fiscal year in which such reimbursement occurred. Any amounts recaptured by the Advisor may not cause the Fund’s total annual fund operating expenses to exceed the stated expense caps. |
Example
This Example is intended to help you compare the cost of investing in the Fund with the cost of investing in other mutual funds. The Example assumes that you invest $10,000 in the Fund for the time periods indicated and then redeem all of your shares at the end of those periods. The Example also assumes that
45
Fund Summaries
Huntington Situs Fund
continued
your investment has a 5% return each year, operating expenses remain the same and expenses were capped for one year in each period. Although your actual costs may be higher or lower, based on these assumptions your costs would be:
| | | | | | | | | | | | | | | | |
| | | 1 Year | | | 3 Years | | | 5 Years | | | 10 Years | |
Institutional Shares | | $ | 105 | | | $ | 392 | | | $ | 700 | | | $ | 1,575 | |
Class A Shares | | $ | 599 | | | $ | 922 | | | $ | 1,268 | | | $ | 2,240 | |
Class C Shares — no redemption | | $ | 181 | | | $ | 623 | | | $ | 1,091 | | | $ | 2,387 | |
Class C Shares — with redemption | | $ | 281 | | | $ | 623 | | | $ | 1,091 | | | $ | 2,387 | |
Portfolio Turnover
The Fund pays transaction costs, such as commissions, when it buys and sells securities (or “turns over” its portfolio). A higher portfolio turnover rate may indicate higher transaction costs and may result in higher taxes when Fund shares are held in a taxable account. These costs, which are not reflected in annual fund operating expenses or in the Example, affect the Fund’s performance. During the most recent fiscal year, the Fund’s portfolio turnover rate was 22% of the average value of its portfolio.
Principal Investment Strategy
The Fund normally pursues its investment objective by investing primarily in equity securities of companies whose geographical, political and/or demographic situs positions them to outperform other companies. Equity securities include common stocks, preferred stocks and securities convertible into common stocks such as convertible bonds and convertible preferred stocks which, if rated by a Nationally Recognized Statistical Rating Organization (“NRSRO”), will be investment-grade at the time of investment. If a security has not received a rating from an NRSRO, the Fund must rely entirely upon the Advisor’s credit assessment that the security is comparable to investment-grade.
Under normal market conditions, the Advisor invests at least 80% of the Fund’s assets in equity securities. The Fund may also invest up to 20% of its assets in the equity securities of foreign issuers.
In managing the Fund’s portfolio, the Advisor utilizes a screening process that identifies companies based on situs, which is one or more geographical locations that are positioned and likely to allow the companies to outperform those in other locations. Examples of situs advantages include favorable political, social or economic factors or population demographics. While the Fund may invest in companies of any size, smaller companies tend to be best positioned to outperform due to situs factors.
The Advisor also employs fundamental analysis, valuation techniques, and technical analysis. Fundamental analysis focuses on qualitative aspects of the company’s product, management, and competitive strategy. Valuation techniques include quantitative screens to review historical earnings, revenue, and cash flow. Technical analysis will be deployed as it relates to the timing of trading the securities.
Principal Investment Risks
All mutual funds take investment risks. Therefore, it is possible to lose money by investing in the Fund. An investment in the Fund is not a bank deposit and is not insured or guaranteed by the Federal Deposit Insurance Corporation or any other government agency. The primary factors that may reduce the Fund’s net asset value (“NAV”) and returns include:
Call Risk. Issuers of securities may redeem the securities prior to maturity at a price below their current market value.
Credit Risk. Issuers of securities in which the Fund invests may have their credit ratings downgraded or may default in the payment of principal or interest on the securities, which would cause the Fund to lose money.
Emerging Markets Risk. In addition to all of the risks of investing in foreign developed markets, emerging market securities involve risks attendant to less mature and stable governments and economies, such as lower trading volume, trading suspension, security price volatility, repatriation restrictions, government confiscation, inflation, deflation, currency devaluation and adverse government regulations of industries or markets. As a result of these risks, the prices of emerging market securities tend to be more volatile than the securities of issuers located in developed markets.
46
Fund Summaries
Huntington Situs Fund
continued
Equity Securities Risk. The price of equity securities in the Fund’s portfolio will fluctuate based on actual or perceived changes in a company’s financial condition and on market and economic conditions.
Foreign Custodial Services and Related Investment Costs Risk. Foreign custodial services are generally more expensive in foreign jurisdictions than in the United States. In addition, because the procedures for settling securities transactions in foreign markets differ from those in the United States, it may be more difficult for the Fund to make intended purchases and sales of securities in foreign countries.
Foreign Investment/Currency Risk. Investments in foreign securities tend to be more volatile and less liquid than investments in U.S. securities because, among other things, they involve risks relating to political, social and economic developments abroad, as well as risks resulting from differences between the regulations and reporting standards and practices to which U.S. and foreign issuers are subject. All of the risks of investing in foreign securities are typically increased by investing in emerging market countries. Securities denominated in foreign currencies may be adversely affected by changes in currency rates and by substantial currency conversion costs.
Investment Style Risk. The type of securities in which a Fund invests may underperform other assets or the overall market.
Market Capitalization Risk. Investing primarily in issuers in one market capitalization category (large, medium or small) carries the risk that due to current market conditions that category may be out of favor with investors. Larger, more established companies may be unable to respond quickly to new competitive challenges or attain the high growth rate of successful smaller companies. Stocks of smaller companies may be more volatile than those of larger companies due to, among other things, narrower product lines, more limited financial resources and fewer experienced managers. In addition, there is typically less publicly available information about small capitalization companies, and their stocks may have a more limited trading market than stocks of larger companies.
Market Risk. The value of securities in the Fund’s portfolio will fluctuate and, as a result, the Fund’s share price may decline suddenly or over a sustained period of time.
For more information, please see “Principal Investment Strategies and Risks.”
47
Fund Summaries
Huntington Situs Fund
continued
Performance: Bar Chart for Institutional Shares and Average Annual Total Return Table
The performance information shown below will help you analyze the Fund’s investment risks in light of its historical returns. The bar chart shows the variability of the Fund’s Institutional Shares total returns on a calendar year-by-year basis. The Average Annual Total Return Table shows returns averaged over the stated periods, and includes comparative performance information. The Fund’s performance will fluctuate, and past performance (before and after taxes) is not necessarily an indication of future results.
The annual returns in the bar chart which follows are for the Institutional Shares without reflecting payment of any sales charge; if they did reflect such payment of sales charges, annual returns would be lower.
Class C Shares commenced operations on January 2, 2014, and have not been operational for a full calendar year. Institutional Shares would have had substantially similar annual returns because the shares are invested in the same portfolio. Annual returns would differ only to the extent that the classes have different expenses.
Updated performance information will be available at www.huntingtonfunds.com, or by calling 800-253-0412.
| | | | | | | | | | |
Risk/Return Bar Chart 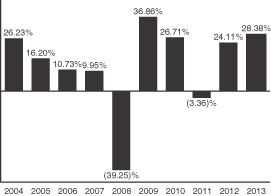
| | Best Quarter Worst Quarter | |
| Q2 2009
Q4 2008 |
| |
| 22.55
(26.23 | %
)% |
| | | | | | | | | | |
| | | | | | | | | | |
| | | | | | | | | | |
| | | | | | | | | | |
| | | | | | | | | | |
| | | | | | | | | | |
| | | | | | | | | | |
| | | | | | | | | | |
| | | | | | | | | | |
| | | | | | | | | | |
| | | | | | | | | | |
| | | | | | | | | | |
| | |
| | Average Annual Total Return Table (for the periods ended December 31, 2013) |
| | | | | | | | | | | | |
| | | 1 Year | | | 5 Years | | | 10 Years | |
| Situs Fund — Institutional Shares | | | | | | | | | | | | |
| Returns before taxes | | | 28.38% | | | | 21.71% | | | | 11.22% | |
| Returns after taxes on distributions(1) | | | 27.02% | | | | 21.31% | | | | 10.63% | |
| Returns after taxes on distributions and sales of Institutional Shares(1) | | | 17.10% | | | | 17.86% | | | | 9.33% | |
Situs Fund — Class A Shares
(with 4.75% sales charge) | | | | | | | | | | | | |
| Returns before taxes | | | 22.00% | | | | 20.24% | | | | 10.40% | |
| Situs Fund — Class C Shares | | | ** | | | | ** | | | | ** | |
| Standard & Poor’s Small-Cap 600 Index (S&P 600) (reflects no deduction for fees, expenses or taxes)(2) | | | 41.31% | | | | 21.37% | | | | 10.65% | |
| Standard & Poor’s MidCap 400 Index (S&P 400) (reflects no deduction for fees, expenses or taxes)(3) | | | 33.50% | | | | 21.89% | | | | 10.36% | |
| (1) | | After tax returns are calculated using a standard set of assumptions. The stated returns assume the highest historical federal income and capital gains tax rates. Returns after taxes on distributions assumes a continued |
48
Fund Summaries
Huntington Situs Fund
continued
| | investment in the Fund and show the effect of taxes on Fund distributions. Returns after taxes on distributions and sales of Fund Shares assumes all Shares were redeemed at the end of each measurement period, and shows the effect of any taxable gain (or offsetting loss) on redemption, as well as the effects of taxes on Fund distributions. These after tax returns do not reflect the effect of any applicable state and local taxes. After tax returns are not relevant to investors holding Shares through tax-deferred programs, such as IRA or 401(k) plans. |
| (2) | | The S&P 600 is a capitalization-weighted index representing all major industries in the small-cap range of the U.S. stock market. The index is unmanaged and, unlike the Fund, is not affected by cash flows. It is not possible to invest directly in an Index. |
| (3) | | The S&P 400 is a capitalization-weighted index comprised of common stocks representing all major industries in the mid-range of the U.S. stock market. The index is unmanaged and, unlike the Fund, is not affected by cash flows. It is not possible to invest directly in an Index. |
| ** | | Class C Shares commenced operations on January 2, 2014, and information regarding annual returns will be available when the Fund has been in operation a full calendar year. Institutional Shares would have had substantially similar annual returns because the shares are invested in the same portfolio. Annual returns would differ only to the extent that the classes have different expenses. |
Investment Advisor and Portfolio Managers
The Fund’s investment advisor is Huntington Asset Advisors, Inc. B. Randolph “Randy” Bateman, CFA, Chief Investment Officer of the Advisor, and Kirk Mentzer, Senior Vice President and Director of Investment Research of the Advisor, are primarily responsible for the day-to-day management of the Fund. Mr. Bateman has served as the Fund’s Portfolio Manager since its inception in 2002 and Mr. Mentzer has served as the Fund’s Portfolio Manager since March 2014.
Purchasing and Redeeming Shares
The minimum initial purchase for the Fund’s Class A, Class C and Institutional Shares is $1,000. For Class A and Class C Shares, the minimum subsequent investment is $50; for Institutional Shares, the minimum subsequent investment is $500. For Class A Shares, Class C Shares and Institutional Shares, the minimum initial and subsequent investment through the Systematic Investment Program (“SIP”) is $50.
Shares may be purchased or redeemed by calling your investment professional or directly from the Trust at 800-253-0412; by check payable to the Huntington Situs Fund and applicable Share class (for example, Huntington Situs Fund Class A Shares) (Mail to: The Huntington Funds, P.O. Box 6110, Indianapolis, IN 46206-6110); or by Federal funds wire (please call the Trust at 800-253-0412 for wire instructions). You may redeem your Shares on any business day when both the Federal Reserve Bank and New York Stock Exchange are open by telephone at 800-253-0412, or by calling your Investment Professional; or by mail to the Huntington Funds address above. You may receive redemption proceeds by wire (wire transfer fees may apply), by electronic bank transfer or by check. Sales charges may apply to the purchase or redemption of Shares.
Tax Information
The Fund’s distributions are taxable as ordinary income or capital gains, except when your investment is through an Individual Retirement Account (“IRA”).
Payments to Broker-Dealers and Other Financial Intermediaries
If you purchase the Fund through a broker-dealer or other financial intermediary (such as a bank), the Fund and its related companies may pay the intermediary for the sale of Fund shares and related services. These payments may create a conflict of interest by influencing the broker-dealer or other intermediary and your salesperson to recommend the Fund over another investment. Ask your salesperson or visit your financial intermediary’s Web site for more information.
49
Fund Summaries
Huntington Balanced Allocation Fund
Fund Summary
Investment Objective | The Fund’s investment objective is to seek current income and moderate appreciation of capital. |
Fees and Expenses
This table describes the fees and expenses that you may pay if you buy and hold shares of the Fund. You may qualify for sales charge discounts if you and members of your household invest, or agree to invest in the future, at least $50,000 in Huntington Funds. More information about these and other discounts is available from your financial professional and in the “Sales Charges” section at page 134 of this prospectus and in the Fund’s Statement of Additional Information.
| | | | |
Shareholder Fees
(fees paid directly from your investment) | | Class A
Shares | |
Maximum Sales Charge (Load) Imposed on Purchases
(as a percentage of offering price) | | | 4.75% | |
| | | | |
Maximum Deferred Sales Charge (Load)
(as a percentage of net asset value) | | | None | |
| | | | |
Redemption Fee (as a percentage of amount redeemed, if applicable) | | | None | |
| | | | |
Annual Fund Operating Expenses
(expenses that you pay each year as a percentage of the
value of your investment) | | Class A
Shares | |
| Management Fees | | | 0.10% | |
| | | | |
| Distribution (12b-1) Fees | | | 0.25% | |
| | | | |
Other Expenses
(including shareholder services fee) | | | 0.58% | |
| | | | |
| Acquired Fund Fees and Expenses | | | 1.20% | |
| | | | |
| Total Annual Fund Operating Expenses | | | 2.13% | |
| Fee Waivers and/or Expense Reimbursements(1) | | | (0.23 | )% |
| | | | |
Total Annual Fund Operating Expenses After Fee Waivers and/or
Expense Reimbursements | | | 1.90% | |
| (1) | | Huntington Asset Advisors, Inc. (the “Advisor”) has contractually agreed to waive all or a portion of its investment advisory fee and/or reimburse certain operating expenses of the Fund to the extent necessary in order to limit the Fund’s Class A Shares total annual fund operating expenses (after the fee waivers and/or expense reimbursements, and exclusive of acquired fund fees and expenses, brokerage costs, interest, taxes and dividends, and extraordinary expenses) to not more than 0.70% of the Fund’s daily net assets through April 30, 2015. This arrangement may only be terminated prior to this date with the agreement of the Fund’s Board of Trustees. Under certain conditions, the Advisor may recapture operating expenses reimbursed under these arrangements for a period of three years following the fiscal year in which such reimbursement occurred. Any amounts recaptured by the Advisor may not cause the Fund’s total annual fund operating expenses to exceed the stated expense caps. |
Example
This example is intended to help you compare the cost of investing in the Fund with the cost of investing in other mutual funds. The example shows the operating expenses you would incur as a shareholder if you invested $10,000 in the Fund over the time periods shown and you redeem all your shares at the end of those periods. The example assumes that the average annual return was 5%, operating expenses remained the same, and expenses were capped for one year in each period. Although your actual costs may be higher or lower, based on the above assumptions, your costs would be:
| | | | | | | | | | | | | | | | |
| | | 1 Year | | | 3 Years | | | 5 Years | | | 10 Years | |
Class A Shares | | $ | 659 | | | $ | 1,089 | | | $ | 1,545 | | | $ | 2,803 | |
50
Fund Summaries
Huntington Balanced Allocation Fund
continued
Portfolio Turnover
The Fund pays transaction costs, such as commissions, when it buys and sells securities (or “turns over” its portfolio). A higher portfolio turnover rate may indicate higher transaction costs and may result in higher taxes when Fund shares are held in a taxable account. These costs, which are not reflected in annual fund operating expenses or in the Example, affect the Fund’s performance. During the most recent fiscal year, the Fund’s portfolio turnover rate was 44% of the average value of its portfolio.
Principal Investment Strategy
The Fund seeks to achieve its objective by investing in a combination of underlying Huntington Funds and Huntington Strategy Shares which are also managed by the Advisor, as well as unaffiliated mutual funds and ETFs (the “Underlying Funds”); with an asset allocation target of 60% Equity and 40% Income, which may include up to 15% in Money Market instruments. Utilizing optimization software and both internal and external research, the Advisor analyzes the economy and the capital markets to determine the optimal allocations to the various Underlying Funds. The Equity portion of the Fund’s portfolio is significantly weighted to large-cap domestic equity funds and international equity funds, but also includes weightings to mid-cap equities and small-cap equities. The Advisor allocates the Income portion of the Fund’s portfolio to the Underlying Funds based on the Advisor’s interest rate and fixed income forecasts and its analysis of credit quality, sector emphasis and the duration of the portfolio. The Advisor reviews the allocations to the Underlying Funds within the stated targets on an ongoing basis and adjusts them based on the analysis of current research and macroeconomic factors. Note that variations in the Equity and Income asset allocation targets are permitted up to 10% in either direction. Although variations beyond the 10% range are generally not permitted, the Advisor may determine in light of market or economic conditions that the normal percentage limitations should be exceeded as a temporary defensive position to protect an Asset Allocation Fund or to help achieve its goal.
The Underlying Funds as a group hold a wide range of equity type securities. These include (but are not limited to) small-, mid- and large-capitalization stocks; domestic and foreign securities (including emerging market securities); and sector holdings, such as utilities and science and technology stocks. Each of the Underlying Funds has its own investment strategy which, for example, may focus on growth stocks or value stocks or may employ a strategy combining growth and income stocks and/or may invest in derivatives such as options on securities and futures contracts. Certain of the Underlying Funds focus their investment strategy on fixed-income securities, which may include investment grade and below investment grade debt securities with maturities that range from short to longer term. The fixed-income Underlying Funds collectively hold various types of debt instruments, such as corporate bonds and mortgage-backed, government-issued, domestic and international securities.
For defensive purposes, in abnormal market conditions, or to meet redemption requests or make anticipated cash payments, the Fund may temporarily invest extensively in cash and cash equivalents. In taking these measures, the Fund might not achieve its investment goal.
Principal Investment Risks
All mutual funds take investment risks. Therefore, it is possible to lose money by investing in the Fund. An investment in the Fund is not a bank deposit and is not insured or guaranteed by the Federal Deposit Insurance Corporation or any other government agency. The risks of the Fund will directly correspond to the risks of the Underlying Funds in which it invests. These risks will vary depending upon how the assets are allocated among the Underlying Funds. Certain risks associated with investing in the Underlying Funds are described in this section. The primary factors that may reduce the Fund’s net asset value (“NAV”) and returns include:
Advisor’s Potential Conflict Risk. Because the Advisor is primarily responsible for managing both the Fund and certain Underlying Funds, the Advisor is subject to conflicts of interest with respect to how it allocates the Fund’s assets among the Underlying Funds.
Allocation Risk. Because the Fund must allocate its assets among each of three asset classes, the Fund has less flexibility in its investment strategy than other funds which may invest all of their assets in a single asset class.
51
Fund Summaries
Huntington Balanced Allocation Fund
continued
Call Risk. Issuers of securities may redeem the securities prior to maturity at a price below their current market value.
Class/Sector/Region Focus Risk. If the Fund invests more than 25% of its net assets in a particular asset class, or securities of issuers within a particular market sector or geographic region, it is subject to increased risk. Performance will generally depend on the performance of the class, sector or region, which may differ in direction and degree from that of the overall U.S. stock or bond markets. In addition, financial, economic, business and political developments affecting the class, sector or region may have a greater effect on the Fund.
Counterparty Risk. The value of the Fund’s investments may be adversely affected if an issuer’s securities experience a credit downgrade; an issuer or guarantor of an investment held by the Fund fails to pay an obligation on a timely basis, otherwise defaults or is perceived by other investors to be less creditworthy; or a counterparty to a derivatives or other transaction with the Fund files for bankruptcy, becomes insolvent, or otherwise becomes unable or unwilling to honor its obligation to the Fund.
Credit Risk. Issuers of securities in which the Fund invests may have their credit ratings downgraded or may default in the payment of principal or interest on the securities, which would cause the Fund to lose money.
Derivative Contracts and Hybrid Instruments Risk. Derivatives contracts and hybrid instruments involve risks different from, and possibly greater than, traditional investments, including valuation and tax issues, increased potential for losses and/or costs to the Fund, and interest rate, credit, currency, liquidity and leverage risks. For additional information regarding these risks, see the “Investment Risks” section in the Fund’s Statement of Additional Information.
Emerging Markets Risk. In addition to all of the risks of investing in foreign developed markets, emerging market securities involve risks attendant to less mature and stable governments and economies, such as lower trading volume, trading suspension, security price volatility, repatriation restrictions, government confiscation, inflation, deflation, currency devaluation and adverse government regulations of industries or markets. As a result of these risks, the prices of emerging market securities tend to be more volatile than the securities of issuers located in developed markets.
Equity Securities Risk. The price of equity securities in the Fund’s portfolio will fluctuate based on actual or perceived changes in a company’s financial condition and on market and economic conditions.
Exchange-Traded Funds Risk. Like an open-end investment company (mutual fund), the value of an ETF can fluctuate based on the prices of the securities owned by the ETF, and ETFs are also subject to the following additional risks: (i) the ETF’s market price may be less than its net asset value; (ii) an active market for the ETF may not develop; and (iii) market trading in the ETF may be halted under certain circumstances.
Extension Risk. When interest rates rise, anticipated prepayments may occur at a slower-than expected rate, thus effectively extending the maturity of mortgage-backed securities. Prices of longer-term securities generally fluctuate more widely in response to changes in interest rates than prices of shorter-term securities.
Fee Layering Risk. Because the Fund may invest its assets in underlying mutual funds or ETFs that have their own fees and expenses in addition to those charged directly by the Fund, the Fund may bear higher expenses than a Fund that invests directly in individual securities.
Foreign Investment/Currency Risk. Investments in foreign securities tend to be more volatile and less liquid than investments in U.S. securities because, among other things, they involve risks relating to political, social and economic developments abroad, as well as risks resulting from differences between the regulations and reporting standards and practices to which U.S. and foreign issuers are subject. All of the risks of investing in foreign securities are typically increased by investing in emerging market countries. Securities denominated in foreign currencies may be adversely affected by changes in currency rates and by substantial currency conversion costs.
Growth Investing Risk. The growth stocks in which the Fund invests are typically more volatile than value stocks and may depend more on price changes than dividends for return.
52
Fund Summaries
Huntington Balanced Allocation Fund
continued
Interest Rate Risk. The value of the Fund’s investments in fixed income securities may decline when prevailing interest rates rise or increase when interest rates go down. The longer a security’s maturity or duration, the greater its value will change in response to changes in interest rates. The interest earned on the Fund’s investments in fixed income securities may decline when prevailing interest rates decline.
Investment Company Risk. Because the Fund may invest in underlying funds that have their own fees and expenses in addition to those charged directly by the Fund, the Fund may pay higher expenses than a Fund that invests directly in equity or fixed income securities.
Liquidity Risk. Liquidity risk refers to the possibility that the Fund may not be able to sell a security when it wants to, which could cause the Fund to continue to hold the security and thereby incur a loss.
Market Capitalization Risk. Investing primarily in issuers in one market capitalization category (large, medium or small) carries the risk that due to current market conditions that category may be out of favor with investors. Larger, more established companies may be unable to respond quickly to new competitive challenges or attain the high growth rate of successful smaller companies. Stocks of smaller companies may be more volatile than those of larger companies due to, among other things, narrower product lines, more limited financial resources and fewer experienced managers. In addition, there is typically less publicly available information about small capitalization companies, and their stocks may have a more limited trading market than stocks of larger companies.
Market Risk. The value of securities in the Fund’s portfolio will fluctuate and, as a result, the Fund’s share price may decline suddenly or over a sustained period of time.
Mortgage-Backed and Asset-Backed Securities Risk. Mortgage-backed and asset-backed securities, particularly those with complex or highly variable terms, such as CMOs, entail greater prepayment and liquidity risks than other fixed-income securities. As a result, their prices may be more volatile and their trading market may be more limited than that of other fixed income securities.
Prepayment Risk. When homeowners prepay their mortgages in response to lower interest rates, the Fund will be required to reinvest the proceeds at the lower interest rates available. Also, when interest rates fall, the price of mortgage-backed securities may not rise as quickly as the prices of other fixed-income securities.
Value Investing Risk. Due to their low valuations, value stocks are typically less volatile than growth stocks. However, value stocks may lag behind growth stocks in an up market.
For more information, please see “Principal Investment Strategies and Risks.”
53
Fund Summaries
Huntington Balanced Allocation Fund
continued
Performance: Bar Chart for Class A Shares and Average Annual Total Return Table
The performance information shown below will help you analyze the Fund’s investment risks in light of its historical returns. The bar chart shows the variability of the Fund’s Class A Shares total returns on a calendar year-by-year basis. The Average Annual Total Return Table shows returns averaged over the stated periods, and includes comparative performance information. The Fund’s performance will fluctuate, and past performance (before and after taxes) is not necessarily an indication of future results.
The annual returns in the bar chart which follows are for Class A Shares without reflecting payment of any sales charge; if they did reflect such payment of sales charges, annual returns would be lower.
Updated performance information will be available at www.huntingtonfunds.com, or by calling 800-253-0412.
| | | | | | | | | | |
Risk/Return Bar Chart 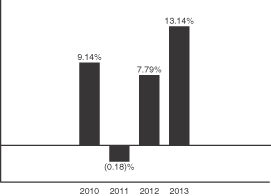
| | Best Quarter Worst Quarter | |
| Q3 2010
Q3 2011 |
| |
| 8.13
(9.68 | %
)% |
| | | | | | | | | | |
| | | | | | | | | | |
| | | | | | | | | | |
| | | | | | | | | | |
| | | | | | | | | | |
| | | | | | | | | | |
| | | | | | | | | | |
| | | | | | | | | | |
| | | | | | | | | | |
| | | | | | | | | | |
| | | | | | | | | | |
| | | | | | | | | | |
| | |
| | Average Annual Total Return Table (for the periods ended December 31, 2013) |
| | | | | | | | | | |
| | | 1 Year | | | Since Class
Inception* | | | |
Balanced Allocation Fund — Class A Shares
(with 4.75% sales charge) | | | | | | | | | | |
| Returns before taxes | | | 7.74% | | | | 7.32% | | | |
| Returns after taxes on distributions(1) | | | 5.97% | | | | 6.22% | | | |
| Returns after taxes on distributions and sales of Shares(1) | | | 5.09% | | | | 5.65% | | | |
Standard and Poor’s 500 Index (S&P 500)
(reflects no deduction for fees, expenses or taxes)(2) | | | 32.39% | | | | 17.73% | | | |
Balanced Allocation Indices Blend (BAIB)
(reflects no deduction for fees, expenses or taxes)(3) | | | 18.62% | | | | 12.46% | | | |
| (1) | | After tax returns are calculated using a standard set of assumptions. The stated returns assume the highest historical federal income and capital gains tax rates. Returns after taxes on distributions assumes a continued investment in the Fund and show the effect of taxes on Fund distributions. Returns after taxes on distributions and sales of Fund Shares assumes all Shares were redeemed at the end of each measurement period, and shows the effect of any taxable gain (or offsetting loss) on redemption, as well as the effects of taxes on Fund distributions. These after tax returns do not reflect the effect of any applicable state and local taxes. After tax returns are not relevant to investors holding Shares through tax-deferred programs, such as IRA or 401(k) plans. |
54
Fund Summaries
Huntington Balanced Allocation Fund
continued
| (2) | | The S&P 500 is a capitalization-weighted index comprised of 500 stocks and designed to measure performance of the broad domestic economy through changes in the aggregate market value of 500 stocks representing all major industries. The index is unmanaged and, unlike the Fund, is not affected by cash flows. It is not possible to invest directly in an Index. |
| (3) | | The BAIB is a custom blended index comprised of the following two indices with their noted respective weightings: Standard & Poor’s 500 Index (60%) and the Barclays U.S. Aggregate Bond Index (40%). The Barclays U.S. Aggregate Index is comprised of securities from the Barclays Government/Corporate Bond Index, Mortgage Securities Index and the Asset Based Index. Total return comprises price appreciation/depreciation and income as a percentage of the original investment. Indices are rebalanced monthly by market capitalization. The index is unmanaged and, unlike the Fund, is not affected by cash flows. It is not possible to invest directly in an Index. The S&P 500 Index is an unmanaged index generally representing the performance of the broad domestic economy through changes in the aggregate market value of 500 stocks representing all major industries. Investments cannot be made in an index. |
Investment Advisor and Portfolio Manager
The Fund’s investment advisor is Huntington Asset Advisors, Inc. B. Randolph “Randy” Bateman, CFA, Chief Investment Officer of the Advisor, is primarily responsible for the day-to-day management of the Fund. Mr. Bateman has served as the Fund’s Portfolio Manager since 2013.
Purchasing and Redeeming Shares
The minimum initial purchase for the Fund’s Class A Shares is $1,000. For Class A Shares, the minimum subsequent investment is $50. For Class A Shares, the minimum initial and subsequent investment through the Systematic Investment Program (“SIP”) is $50.
Shares may be purchased or redeemed by calling your investment professional or directly from the Trust at 800-253-0412; by check payable to the Huntington Balanced Allocation Fund and applicable Share class (for example, Huntington Balanced Allocation Fund Class A Shares) (Mail to: The Huntington Funds, P.O. Box 6110, Indianapolis, IN 46206-6110); or by Federal funds wire (please call the Trust at 800-253-0412 for wire instructions). You may redeem your Shares on any business day when both the Federal Reserve Bank and New York Stock Exchange are open by telephone at 800-253-0412, or by calling your Investment Professional; or by mail to the Huntington Funds address above. You may receive redemption proceeds by wire (wire transfer fees may apply), by electronic bank transfer or by check. Sales charges may apply to the purchase or redemption of Shares.
Tax Information
The Fund’s distributions are taxable as ordinary income or capital gains, except when your investment is through an Individual Retirement Account (“IRA”).
Payments to Broker-Dealers and Other Financial Intermediaries
If you purchase the Fund through a broker-dealer or other financial intermediary (such as a bank), the Fund and its related companies may pay the intermediary for the sale of Fund shares and related services. These payments may create a conflict of interest by influencing the broker-dealer or other intermediary and your salesperson to recommend the Fund over another investment. Ask your salesperson or visit your financial intermediary’s Web site for more information.
55
Fund Summaries
Huntington Conservative Allocation Fund
Fund Summary
Investment Objective | The Fund’s investment objective is to seek high current income. |
Fees and Expenses
This table describes the fees and expenses that you may pay if you buy and hold shares of the Fund. You may qualify for sales charge discounts if you and members of your household invest, or agree to invest in the future, at least $50,000 in Huntington Funds. More information about these and other discounts is available from your financial professional and in the “Sales Charges” section at page 134 of this prospectus and in the Fund’s Statement of Additional Information.
| | | | |
Shareholder Fees
(fees paid directly from your investment) | | Class A
Shares | |
Maximum Sales Charge (Load) Imposed on Purchases
(as a percentage of offering price) | | | 4.75% | |
| |
Maximum Deferred Sales Charge (Load)
(as a percentage of net asset value) | | | None | |
| |
Redemption Fee
(as a percentage of amount redeemed, if applicable) | | | None | |
| | | | |
Annual Fund Operating Expenses
(expenses that you pay each year as a percentage of the
value of your investment) | | Class A
Shares | |
| Management Fees | | | 0.10% | |
| |
| Distribution (12b-1) Fees | | | 0.25% | |
| |
Other Expenses
(including shareholder services fee) | | | 1.03% | |
| |
| Acquired Fund Fees and Expenses | | | 1.20% | |
| |
| Total Annual Fund Operating Expenses | | | 2.58% | |
| |
| Fee Waivers and/or Expense Reimbursements(1) | | | (0.68 | )% |
| |
Total Annual Fund Operating Expenses After Fee Waivers and/or
Expense Reimbursements | | | 1.90% | |
| (1) | | Huntington Asset Advisors, Inc. (the “Advisor”) has contractually agreed to waive all or a portion of its investment advisory fee and/or reimburse certain operating expenses of the Fund to the extent necessary in order to limit the Fund’s Class A Shares total annual fund operating expenses (after the fee waivers and/or expense reimbursements, and exclusive of acquired fund fees and expenses, brokerage costs, interest, taxes and dividends, and extraordinary expenses) to not more than 0.70% of the Fund’s daily net assets through April 30, 2015. This arrangement may only be terminated prior to this date with the agreement of the Fund’s Board of Trustees. Under certain conditions, the Advisor may recapture operating expenses reimbursed under these arrangements for a period of three years following the fiscal year in which such reimbursement occurred. Any amounts recaptured by the Advisor may not cause the Fund’s total annual fund operating expenses to exceed the stated expense caps. |
Example
This example is intended to help you compare the cost of investing in the Fund with the cost of investing in other mutual funds. The example shows the operating expenses you would incur as a shareholder if you invested $10,000 in the Fund over the time periods shown and you redeem all your shares at the end of those periods. The example assumes that the average annual return was 5%, operating expenses remained the same, and expenses were capped for one year in each period. Although your actual costs may be higher or lower, based on the above assumptions, your costs would be:
| | | | | | | | | | | | | | | | |
| | | 1 Year | | | 3 Years | | | 5 Years | | | 10 Years | |
Class A Shares | | $ | 659 | | | $ | 1,178 | | | $ | 1,722 | | | $ | 3,203 | |
56
Fund Summaries
Huntington Conservative Allocation Fund
continued
Portfolio Turnover
The Fund pays transaction costs, such as commissions, when it buys and sells securities (or “turns over” its portfolio). A higher portfolio turnover rate may indicate higher transaction costs and may result in higher taxes when Fund shares are held in a taxable account. These costs, which are not reflected in annual fund operating expenses or in the Example, affect the Fund’s performance. During the most recent fiscal year, the Fund’s portfolio turnover rate was 55% of the average value of its portfolio.
Principal Investment Strategy
The Fund seeks to achieve its objective by investing in a combination of underlying Huntington Funds and Huntington Strategy Shares which are also managed by the Advisor, as well as unaffiliated mutual funds and ETFs (the “Underlying Funds”); with an asset allocation target of 20% Equity and 80% Income, which may include up to 15% in Money Market instruments. Utilizing optimization software and both internal and external research, the Advisor analyzes the economy and the capital markets to determine the optimal allocations to the various Underlying Funds. The Equity portion of the Fund’s portfolio is significantly weighted to large-cap domestic equity funds and international equity funds, but also includes weightings to mid-cap equities and small-cap equities. The Advisor allocates the Income portion of the Fund’s portfolio to the Underlying Funds based on the Advisor’s interest rate and fixed income forecasts and its analysis of credit quality, sector emphasis and the duration of the portfolio. The Advisor reviews the allocations to Underlying Funds within the stated targets on an ongoing basis and adjusts them based on the analysis of current research and macroeconomic factors. Note that variations in the Equity and Income asset allocation targets are permitted up to 10% in either direction. Although variations beyond the 10% range are generally not permitted, the Advisor may determine in light of market or economic conditions that the normal percentage limitations should be exceeded as a temporary defensive position to protect an Asset Allocation Fund or to help achieve its goal.
The Underlying Funds as a group hold a wide range of equity type securities. These include (but are not limited to) small-, mid- and large-capitalization stocks; domestic and foreign securities (including emerging market securities); and sector holdings, such as utilities and science and technology stocks. Each of the Underlying Funds has its own investment strategy which, for example, may focus on growth stocks or value stocks or may employ a strategy combining growth and income stocks and/or may invest in derivatives such as options on securities and futures contracts. Certain of the Underlying Funds focus their investment strategy on fixed-income securities, which may include investment grade and below investment grade debt securities with maturities that range from short to longer term. The fixed-income Underlying Funds collectively hold various types of debt instruments, such as corporate bonds and mortgage-backed, government-issued, domestic and international securities.
For defensive purposes in abnormal market conditions or to meet redemption requests or make anticipated cash payments, the Fund may temporarily invest extensively in cash and cash equivalents. In taking these measures, the Fund might not achieve its investment goal.
Principal Investment Risks
All mutual funds take investment risks. Therefore, it is possible to lose money by investing in the Fund. An investment in the Fund is not a bank deposit and is not insured or guaranteed by the Federal Deposit Insurance Corporation or any other government agency. The risks of the Fund will directly correspond to the risks of the Underlying Funds in which it invests. These risks will vary depending upon how the assets are allocated among the Underlying Funds. Certain risks associated with investing in the Underlying Funds are described in this section. The primary factors that may reduce the Fund’s net asset value (“NAV”) and returns include:
Advisor’s Potential Conflict Risk. Because the Advisor is primarily responsible for managing both the Fund and certain Underlying Funds, the Advisor is subject to conflicts of interest with respect to how it allocates the Fund’s assets among the Underlying Funds.
Allocation Risk. Because the Fund must allocate its assets among each of three asset classes, the Fund has less flexibility in its investment strategy than other funds which may invest all its assets in a single asset class.
57
Fund Summaries
Huntington Conservative Allocation Fund
continued
Call Risk. Issuers of securities may redeem the securities prior to maturity at a price below their current market value.
Class/Sector/Region Focus Risk. If the Fund invests more than 25% of its net assets in a particular asset class, or securities of issuers within a particular market sector or geographic region, it is subject to increased risk. Performance will generally depend on the performance of the class, sector or region, which may differ in direction and degree from that of the overall U.S. stock or bond markets. In addition, financial, economic, business and political developments affecting the class, sector or region may have a greater effect on the Fund.
Counterparty Risk. The value of the Fund’s investments may be adversely affected if an issuer’s securities experience a credit downgrade; an issuer or guarantor of an investment held by the Fund fails to pay an obligation on a timely basis, otherwise defaults or is perceived by other investors to be less creditworthy; or a counterparty to a derivatives or other transaction with the Fund files for bankruptcy, becomes insolvent, or otherwise becomes unable or unwilling to honor its obligation to the Fund.
Credit Risk. Issuers of securities in which the Fund invests may have their credit ratings downgraded or may default in the payment of principal or interest on the securities, which would cause the Fund to lose money.
Derivative Contracts and Hybrid Instruments Risk. Derivatives contracts and hybrid instruments involve risks different from, and possibly greater than, traditional investments, including valuation and tax issues, increased potential for losses and/or costs to the Fund, and interest rate, credit, currency, liquidity and leverage risks. For additional information regarding these risks, see the “Investment Risks” section in the Fund’s Statement of Additional Information.
Emerging Markets Risk. In addition to all of the risks of investing in foreign developed markets, emerging market securities involve risks attendant to less mature and stable governments and economies, such as lower trading volume, trading suspension, security price volatility, repatriation restrictions, government confiscation, inflation, deflation, currency devaluation and adverse government regulations of industries or markets. As a result of these risks, the prices of emerging market securities tend to be more volatile than the securities of issuers located in developed markets.
Exchange-Traded Funds Risk. Like an open-end investment company (mutual fund), the value of an ETF can fluctuate based on the prices of the securities owned by the ETF, and ETFs are also subject to the following additional risks: (i) the ETF’s market price may be less than its net asset value; (ii) an active market for the ETF may not develop; and (iii) market trading in the ETF may be halted under certain circumstances.
Extension Risk. When interest rates rise, anticipated prepayments may occur at a slower than expected rate, thus effectively extending the maturity of mortgage-backed securities. Prices of longer-term securities generally fluctuate more widely in response to changes in interest rates than prices of shorter-term securities.
Fee Layering Risk. Because the Fund may invest its assets in underlying mutual funds or ETFs that have their own fees and expenses in addition to those charged directly by the Fund, the Fund may bear higher expenses than a Fund that invests directly in individual securities.
Foreign Investment/Currency Risk. Investments in foreign securities tend to be more volatile and less liquid than investments in U.S. securities because, among other things, they involve risks relating to political, social and economic developments abroad, as well as risks resulting from differences between the regulations and reporting standards and practices to which U.S. and foreign issuers are subject. All of the risks of investing in foreign securities are typically increased by investing in emerging market countries. Securities denominated in foreign currencies may be adversely affected by changes in currency rates and by substantial currency conversion costs.
Interest Rate Risk. The value of the Fund’s investments in fixed income securities may decline when prevailing interest rates rise or increase when interest rates go down. The longer a security’s maturity or duration, the greater its value will change in response to changes in interest rates. The interest earned on the Fund’s investments in fixed income securities may decline when prevailing interest rates decline.
58
Fund Summaries
Huntington Conservative Allocation Fund
continued
Investment Company Risk. Because the Fund may invest in underlying funds that have their own fees and expenses in addition to those charged directly by the Fund, the Fund may pay higher expenses than a Fund that invests directly in equity or fixed income securities.
Market Capitalization Risk. Investing primarily in issuers in one market capitalization category (large, medium or small) carries the risk that due to current market conditions that category may be out of favor with investors. Larger, more established companies may be unable to respond quickly to new competitive challenges or attain the high growth rate of successful smaller companies. Stocks of smaller companies may be more volatile than those of larger companies due to, among other things, narrower product lines, more limited financial resources and fewer experienced managers. In addition, there is typically less publicly available information about small capitalization companies, and their stocks may have a more limited trading market than stocks of larger companies.
Mortgage-Backed and Asset-Backed Securities Risk. Mortgage-backed and asset-backed securities, particularly those with complex or highly variable terms, such as CMOs, entail greater prepayment and liquidity risks than other fixed-income securities. As a result, their prices may be more volatile and their trading market may be more limited than that of other fixed income securities.
Prepayment Risk. When homeowners prepay their mortgages in response to lower interest rates, the Fund will be required to reinvest the proceeds at the lower interest rates available. Also, when interest rates fall, the price of mortgage -backed securities may not rise as quickly as the prices of other fixed-income securities.
Value Investing Risk. Due to their low valuations, value stocks are typically less volatile than growth stocks. However, value stocks may lag behind growth stocks in an up market.
For more information, please see “Principal Investment Strategies and Risks.”
Performance: Bar Chart for Class A Shares and Average Annual Total Return Table
The performance information shown below will help you analyze the Fund’s investment risks in light of its historical returns. The bar chart shows the variability of the Fund’s Class A Shares total returns on a calendar year-by-year basis. The Average Annual Total Return Table shows returns averaged over the stated periods, and includes comparative performance information. The Fund’s performance will fluctuate, and past performance (before and after taxes) is not necessarily an indication of future results.
The annual returns in the bar chart which follows are for Class A Shares without reflecting payment of any sales charge; if they did reflect such payment of sales charges, annual returns would be lower.
Updated performance information will be available at www.huntingtonfunds.com, or by calling 800-253-0412.
| | | | | | | | | | |
Risk/Return Bar Chart 
| | Best Quarter Worst Quarter | |
| Q3 2010
Q3 2011 |
| |
| 4.08
(2.26 | %
)% |
| | | | | | | | | | |
| | | | | | | | | | |
| | | | | | | | | | |
| | | | | | | | | | |
| | | | | | | | | | |
| | | | | | | | | | |
| | | | | | | | | | |
| | | | | | | | | | |
| | | | | | | | | | |
| | | | | | | | | | |
| | | | | | | | | | |
| | | | | | | | | | |
59
Fund Summaries
Huntington Conservative Allocation Fund
continued
| | |
| | Average Annual Total Return Table (for the periods ended December 31, 2013) |
| | | | | | | | | | |
| | | 1 Year | | | Since Class
Inception* | | | |
Conservative Allocation Fund — Class A Shares
(with 4.75% sales charge) | | | | | | | | | | |
| Returns before taxes | | | (2.14)% | | | | 3.26% | | | |
| Returns after taxes on distributions(1) | | | (3.73)% | | | | 1.74% | | | |
| Returns after taxes on distributions and sales of Shares(1) | | | (0.36)% | | | | 2.61% | | | |
Barclays U.S. Aggregate Bond Index (BUSAI)
(reflects no deduction for fees, expenses or taxes)(2) | | | (2.02)% | | | | 4.36% | | | |
Conservative Allocation Indices Blend (CAIB)
(reflects no deduction for fees, expenses or taxes)(3) | | | 4.86% | | | | 7.09% | | | |
| (1) | | After tax returns are calculated using a standard set of assumptions. The stated returns assume the highest historical federal income and capital gains tax rates. Returns after taxes on distributions assumes a continued investment in the Fund and show the effect of taxes on Fund distributions. Returns after taxes on distributions and sales of Fund Shares assumes all Shares were redeemed at the end of each measurement period, and shows the effect of any taxable gain (or offsetting loss) on redemption, as well as the effects of taxes on Fund distributions. These after tax returns do not reflect the effect of any applicable state and local taxes. After tax returns are not relevant to investors holding Shares through tax-deferred programs, such as IRA or 401(k) plans. |
| (2) | | The BUSAI is composed of securities from the Barclay’s Government/Corporate Bond Index, Mortgage Securities Index and the Asset Based Securities Index. Total return comprises price appreciation/depreciation and income as a percentage of the original investment. Indices are rebalanced monthly by market capitalization. The index is unmanaged and, unlike the Fund, is not affected by cash flows. It is not possible to invest directly in an Index. |
| (3) | | The CAIB is a custom blended index comprised of the following two indices with their noted respective weightings: Barclays U.S. Aggregate Bond Index (80%) and S&P 500 Index (20%). The Barclays U.S. Aggregate Bond Index is comprised of securities from the Barclays Government/Corporate Bond Index, Mortgage Securities Index and the Asset Based Index. Total return comprises price appreciation/depreciation and income as a percentage of the original investment. Indices are rebalanced monthly by market capitalization. The index is unmanaged and, unlike the Fund, is not affected by cash flows. It is not possible to invest directly in an Index. The S&P 500 Index is an unmanaged index generally representing the performance of the broad domestic economy through changes in the aggregate market value of 500 stocks representing all major industries. Investments cannot be made in an index. |
Investment Advisor and Portfolio Manager
The Fund’s investment advisor is Huntington Asset Advisors, Inc. B. Randolph “Randy” Bateman, CFA, Chief Investment Officer of the Advisor is primarily responsible for the day-to-day management of the Fund. Mr. Bateman has served as the Fund’s Portfolio Manager since 2013.
Purchasing and Redeeming Shares
The minimum initial purchase for the Fund’s Class A Shares is $1,000. For Class A Shares, the minimum subsequent investment is $50. For Class A Shares, the minimum initial and subsequent investment through the Systematic Investment Program (“SIP”) is $50.
Shares may be purchased or redeemed by calling your investment professional or directly from the Trust at 800-253-0412; by check payable to the Huntington Conservative Allocation Fund and applicable Share class (for example, Huntington Conservative Allocation Fund Class A Shares) (Mail to: The Huntington Funds, P.O. Box 6110, Indianapolis, IN 46206-6110); or by Federal funds wire (please call the Trust at 800-253-0412 for wire instructions). You may redeem your Shares on any business day when both the Federal Reserve Bank and New York Stock Exchange are open by telephone at 800-253-0412, or by calling your Investment Professional; or by mail to the Huntington Funds address above. You may receive redemption
60
Fund Summaries
Huntington Conservative Allocation Fund
continued
proceeds by wire (wire transfer fees may apply), by electronic bank transfer or by check. Sales charges may apply to the purchase or redemption of Shares.
Tax Information
The Fund’s distributions are taxable as ordinary income or capital gains, except when your investment is through an Individual Retirement Account (“IRA”).
Payments to Broker-Dealers and Other Financial Intermediaries
If you purchase the Fund through a broker-dealer or other financial intermediary (such as a bank), the Fund and its related companies may pay the intermediary for the sale of Fund shares and related services. These payments may create a conflict of interest by influencing the broker-dealer or other intermediary and your salesperson to recommend the Fund over another investment. Ask your salesperson or visit your financial intermediary’s Web site for more information.
61
Fund Summaries
Huntington Growth Allocation Fund
Fund Summary
Investment Objective | The Fund’s investment objective is to seek capital appreciation, with current income as a secondary goal. |
Fees and Expenses
This table describes the fees and expenses that you may pay if you buy and hold shares of the Fund. You may qualify for sales charge discounts if you and members of your household invest, or agree to invest in the future, at least $50,000 in Huntington Funds. More information about these and other discounts is available from your financial professional and in the “Sales Charges” section at page 134 of this prospectus and in the Fund’s Statement of Additional Information.
| | | | |
Shareholder Fees
(fees paid directly from your investment) | | Class A
Shares | |
Maximum Sales Charge (Load) Imposed on Purchases
(as a percentage of offering price) | | | 4.75% | |
| |
Maximum Deferred Sales Charge (Load)
(as a percentage of net asset value) | | | None | |
| |
Redemption Fee
(as a percentage of amount redeemed, if applicable) | | | None | |
| | | | |
Annual Fund Operating Expenses
(expenses that you pay each year as a percentage of the
value of your investment) | | Class A
Shares | |
| Management Fees | | | 0.10% | |
| |
| Distribution (12b-1) Fees | | | 0.25% | |
| |
Other Expenses
(including shareholder services fee) | | | 0.67% | |
| |
| Acquired Fund Fees and Expenses | | | 1.25% | |
| |
| Total Annual Fund Operating Expenses | | | 2.27% | |
| |
| Fee Waivers and/or Expense Reimbursements(1) | | | (0.37 | )% |
| |
| Total Annual Fund Operating Expenses After Fee Waivers and/or Expense Reimbursements | | | 1.90% | |
| (1) | | Huntington Asset Advisors, Inc. (the “Advisor”) has contractually agreed to waive all or a portion of its investment advisory fee and/or reimburse certain operating expenses of the Fund to the extent necessary in order to limit the Fund’s Class A Shares total annual fund operating expenses (after the fee waivers and/or expense reimbursements, and exclusive of acquired fund fees and expenses, brokerage costs, interest, taxes and dividends, and extraordinary expenses) to not more than 0.65% of the Fund’s daily net assets through April 30, 2015. This arrangement may only be terminated prior to this date with the agreement of the Fund’s Board of Trustees. Under certain conditions, the Advisor may recapture operating expenses reimbursed under these arrangements for a period of three years following the fiscal year in which such reimbursement occurred. Any amounts recaptured by the Advisor may not cause the Fund’s total annual fund operating expenses to exceed the stated expense caps. |
Example
This example is intended to help you compare the cost of investing in the Fund with the cost of investing in other mutual funds. The example shows the operating expenses you would incur as a shareholder if you invested $10,000 in the Fund over the time periods shown and you redeem all your shares at the end of those periods. The example assumes that the average annual return was 5%, operating expenses remained the same, and expenses were capped for one year in each period. Although your actual costs may be higher or lower, based on the above assumptions, your costs would be:
| | | | | | | | | | | | | | | | |
| | | 1 Year | | | 3 Years | | | 5 Years | | | 10 Years | |
Class A Shares | | $ | 659 | | | $ | 1,117 | | | $ | 1,600 | | | $ | 2,929 | |
62
Fund Summaries
Huntington Growth Allocation Fund
continued
Portfolio Turnover
The Fund pays transaction costs, such as commissions, when it buys and sells securities (or “turns over” its portfolio). A higher portfolio turnover rate may indicate higher transaction costs and may result in higher taxes when Fund shares are held in a taxable account. These costs, which are not reflected in annual fund operating expenses or in the Example, affect the Fund’s performance. During the most recent fiscal year, the Fund’s portfolio turnover rate was 55% of the average value of its portfolio.
Principal Investment Strategy
The Fund seeks to achieve its objective by investing in a combination of underlying Huntington Funds and Huntington Strategy Shares which are also managed by the Advisor, as well as unaffiliated mutual funds and ETFs (the “Underlying Funds”); with an asset allocation target of 80% Equity and 20% Income, which may include up to 15% in Money Market instruments. Utilizing optimization software and both internal and external research, the Advisor analyzes the economy and the capital markets to determine the optimal allocations to the various Underlying Funds. The Equity portion of the Fund’s portfolio is significantly weighted to large-cap domestic equity funds and international equity funds, but also includes weightings to mid-cap equities and small-cap equities. The Advisor allocates the Income portion of the Fund’s portfolio to the Underlying Funds based on the Advisor’s interest rate and fixed income forecasts and its analysis of credit quality, sector emphasis and the duration of the portfolio. The Advisor reviews the allocations to Underlying Funds within the stated targets on an ongoing basis and adjusts them based on the analysis of current research and macroeconomic factors. Note that variations in the Equity and Income asset allocation targets are permitted up to 10% in either direction. Although variations beyond the 10% range are generally not permitted, the Advisor may determine in light of market or economic conditions that the normal percentage limitations should be exceeded as a temporary defensive position to protect an Asset Allocation Fund or to help achieve its goal.
The Underlying Funds as a group hold a wide range of equity type securities. These include (but are not limited to) small-, mid- and large-capitalization stocks; domestic and foreign securities (including emerging market securities); and sector holdings, such as utilities and science and technology stocks. Each of the Underlying Funds has its own investment strategy which, for example, may focus on growth stocks or value stocks or may employ a strategy combining growth and income stocks and/or may invest in derivatives such as options on securities and futures contracts. Certain of the Underlying Funds focus their investment strategy on fixed-income securities, which may include investment grade and below investment grade debt securities with maturities that range from short to longer term. The fixed-income Underlying Funds collectively hold various types of debt instruments, such as corporate bonds and mortgage-backed, government-issued, domestic and international securities.
For defensive purposes in abnormal market conditions or to meet redemption requests or make anticipated cash payments, the Fund may temporarily invest extensively in cash and cash equivalents. In taking these measures, the Fund might not achieve its investment goal.
Principal Investment Risks
All mutual funds take investment risks. Therefore, it is possible to lose money by investing in the Fund. An investment in the Fund is not a bank deposit and is not insured or guaranteed by the Federal Deposit Insurance Corporation or any other government agency. The risks of the Fund will directly correspond to the risks of the Underlying Funds in which it invests. These risks will vary depending upon how the assets are allocated among the Underlying Funds. Certain risks associated with investing in the Underlying Funds are described in this section. The primary factors that may reduce the Fund’s net asset value (“NAV”) and returns include:
Advisor’s Potential Conflict Risk. Because the Advisor is primarily responsible for managing both the Fund and certain Underlying Funds, the Advisor is subject to conflicts of interest with respect to how it allocates the Fund’s assets among the Underlying Funds.
Allocation Risk. Because the Fund must allocate its assets among each of three asset classes, the Fund has less flexibility in its investment strategy than other funds which may invest all its assets in a single asset class.
63
Fund Summaries
Huntington Growth Allocation Fund
continued
Counterparty Risk. The value of the Fund’s investments may be adversely affected if an issuer’s securities experience a credit downgrade; an issuer or guarantor of an investment held by the Fund fails to pay an obligation on a timely basis, otherwise defaults or is perceived by other investors to be less creditworthy; or a counterparty to a derivatives or other transaction with the Fund files for bankruptcy, becomes insolvent, or otherwise becomes unable or unwilling to honor its obligation to the Fund.
Derivative Contracts and Hybrid Instruments Risk. Derivatives contracts and hybrid instruments involve risks different from, and possibly greater than, traditional investments, including valuation and tax issues, increased potential for losses and/or costs to the Fund, and interest rate, credit, currency, liquidity and leverage risks. For additional information regarding these risks, see the “Investment Risks” section in the Fund’s Statement of Additional Information.
Emerging Markets Risk. In addition to all of the risks of investing in foreign developed markets, emerging market securities involve risks attendant to less mature and stable governments and economies, such as lower trading volume, trading suspension, security price volatility, repatriation restrictions, government confiscation, inflation, deflation, currency devaluation and adverse government regulations of industries or markets. As a result of these risks, the prices of emerging market securities tend to be more volatile than the securities of issuers located in developed markets.
Equity Securities Risk. The price of equity securities in the Fund’s portfolio will fluctuate based on actual or perceived changes in a company’s financial condition and on market and economic conditions.
Exchange-Traded Funds Risk. Like an open-end investment company (mutual fund), the value of an ETF can fluctuate based on the prices of the securities owned by the ETF, and ETFs are also subject to the following additional risks: (i) the ETF’s market price may be less than its net asset value; (ii) an active market for the ETF may not develop; and (iii) market trading in the ETF may be halted under certain circumstances.
Fee Layering Risk. Because the Fund may invest its assets in underlying mutual funds or ETFs that have their own fees and expenses in addition to those charged directly by the Fund, the Fund may bear higher expenses than a Fund that invests directly in individual securities.
Foreign Investment/Currency Risk. Investments in foreign securities tend to be more volatile and less liquid than investments in U.S. securities because, among other things, they involve risks relating to political, social and economic developments abroad, as well as risks resulting from differences between the regulations and reporting standards and practices to which U.S. and foreign issuers are subject. All of the risks of investing in foreign securities are typically increased by investing in emerging market countries. Securities denominated in foreign currencies may be adversely affected by changes in currency rates and by substantial currency conversion costs.
Growth Investing Risk. The growth stocks in which the Fund invests are typically more volatile than value stocks and may depend more on price changes than dividends for return.
Investment Company Risk. Because the Fund may invest in underlying funds that have their own fees and expenses in addition to those charged directly by the Fund, the Fund may pay higher expenses than a Fund that invests directly in equity or fixed income securities.
Liquidity Risk. Liquidity risk refers to the possibility that the Fund may not be able to sell a security when it wants to, which could cause the Fund to continue to hold the security and thereby incur a loss.
Market Capitalization Risk. Investing primarily in issuers in one market capitalization category (large, medium or small) carries the risk that due to current market conditions that category may be out of favor with investors. Larger, more established companies may be unable to respond quickly to new competitive challenges or attain the high growth rate of successful smaller companies. Stocks of smaller companies may be more volatile than those of larger companies due to, among other things, narrower product lines, more limited financial resources and fewer experienced managers. In addition, there is typically less publicly available information about small capitalization companies, and their stocks may have a more limited trading market than stocks of larger companies.
64
Fund Summaries
Huntington Growth Allocation Fund
continued
Market Risk. The value of securities in the Fund’s portfolio will fluctuate and, as a result, the Fund’s share price may decline suddenly or over a sustained period of time.
Value Investing Risk. Due to their low valuations, value stocks are typically less volatile than growth stocks. However, value stocks may lag behind growth stocks in an up market.
For more information, please see “Principal Investment Strategies and Risks.”
Performance: Bar Chart for Class A Shares and Average Annual Total Return Table
The performance information shown below will help you analyze the Fund’s investment risks in light of its historical returns. The bar chart shows the variability of the Fund’s Class A Shares total returns on a calendar year-by-year basis. The Average Annual Total Return Table shows returns averaged over the stated periods, and includes comparative performance information. The Fund’s performance will fluctuate, and past performance (before and after taxes) is not necessarily an indication of future results.
The annual returns in the bar chart which follows are for Class A Shares without reflecting payment of any sales charge; if they did reflect such payment of sales charges, annual returns would be lower.
Updated performance information will be available at www.huntingtonfunds.com, or by calling 800-253-0412.
| | | | | | | | | | |
Risk/Return Bar Chart 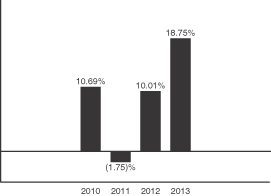
| | Best Quarter Worst Quarter | |
| Q3 2010
Q3 2011 |
| |
| 10.23
(13.04 | %
)% |
| | | | | | | | | | |
| | | | | | | | | | |
| | | | | | | | | | |
| | | | | | | | | | |
| | | | | | | | | | |
| | | | | | | | | | |
| | | | | | | | | | |
| | | | | | | | | | |
| | | | | | | | | | |
| | | | | | | | | | |
| | | | | | | | | | |
| | | | | | | | | | |
| | |
| | Average Annual Total Return Table (for the periods ended December 31, 2013) |
| | | | | | | | | | |
| | | 1 Year | | | Since Class
Inception* | | | |
Growth Allocation Fund — Class A Shares
(with 4.75% sales charge) | | | | | | | | | | |
| Returns before taxes | | | 13.13% | | | | 9.23% | | | |
| Returns after taxes on distributions(1) | | | 10.52% | | | | 7.85% | | | |
| Returns after taxes on distributions and sales of Shares(1) | | | 8.73% | | | | 7.24% | | | |
Standard and Poor’s 500 Index (S&P 500)
(reflects no deduction for fees, expenses or taxes)(2) | | | 32.39% | | | | 17.73% | | | |
Growth Allocation Indices Blend (GAIB)
(reflects no deduction for fees, expenses or taxes)(3) | | | 25.51% | | | | 15.10% | | | |
65
Fund Summaries
Huntington Growth Allocation Fund
continued
| (1) | | After tax returns are calculated using a standard set of assumptions. The stated returns assume the highest historical federal income and capital gains tax rates. Returns after taxes on distributions assumes a continued investment in the Fund and show the effect of taxes on Fund distributions. Returns after taxes on distributions and sales of Fund Shares assumes all Shares were redeemed at the end of each measurement period, and shows the effect of any taxable gain (or offsetting loss) on redemption, as well as the effects of taxes on Fund distributions. These after tax returns do not reflect the effect of any applicable state and local taxes. After tax returns are not relevant to investors holding Shares through tax-deferred programs, such as IRA or 401(k) plans. |
| (2) | | The S&P 500 is a capitalization-weighted index comprised of 500 stocks and designed to measure performance of the broad domestic economy through changes in the aggregate market value of 500 stocks representing all major industries. The index is unmanaged and, unlike the Fund, is not affected by cash flows. It is not possible to invest directly in an Index. |
| (3) | | The GAIB is a custom blended index comprised of the following two indices with their noted respective weightings: Standard & Poor’s 500 Index (80%) and the Barclays U.S. Aggregate Bond Index (20%). The Barclays U.S. Aggregate Bond Index is comprised of securities from the Barclays Government/Corporate Bond Index, Mortgage Securities Index and the Asset Based Index. Total return comprises price appreciation/depreciation and income as a percentage of the original investment. Indices are rebalanced monthly by market capitalization. The index is unmanaged and, unlike the Fund, is not affected by cash flows. It is not possible to invest directly in an Index. The S&P 500 Index is an unmanaged index generally representing the performance of the broad domestic economy through changes in the aggregate market value of 500 stocks representing all major industries. Investments cannot be made in an index. |
Investment Advisor and Portfolio Manager
The Fund’s investment advisor is Huntington Asset Advisors, Inc. B. Randolph “Randy” Bateman, CFA, Chief Investment Officer of the Advisor is primarily responsible for the day-to-day management of the Fund. Mr. Bateman has served as the Fund’s Portfolio Manager since 2013.
Purchasing and Redeeming Shares
The minimum initial purchase for the Fund’s Class A Shares is $1,000. For Class A Shares, the minimum subsequent investment is $50. For Class A Shares, the minimum initial and subsequent investment through the Systematic Investment Program (“SIP”) is $50.
Shares may be purchased or redeemed by calling your investment professional or directly from the Trust at 800-253-0412; by check payable to the Huntington Growth Allocation Fund and applicable Share class (for example, Huntington Growth Allocation Fund Class A Shares) (Mail to: The Huntington Funds, P.O. Box 6110, Indianapolis, IN 46206-6110); or by Federal funds wire (please call the Trust at 800-253-0412 for wire instructions). You may redeem your Shares on any business day when both the Federal Reserve Bank and New York Stock Exchange are open by telephone at 800-253-0412, or by calling your Investment Professional; or by mail to the Huntington Funds address above. You may receive redemption proceeds by wire (wire transfer fees may apply), by electronic bank transfer or by check. Sales charges may apply to the purchase or redemption of Shares.
Tax Information
The Fund’s distributions are taxable as ordinary income or capital gains, except when your investment is through an Individual Retirement Account (“IRA”).
Payments to Broker-Dealers and Other Financial Intermediaries
If you purchase the Fund through a broker-dealer or other financial intermediary (such as a bank), the Fund and its related companies may pay the intermediary for the sale of Fund shares and related services. These payments may create a conflict of interest by influencing the broker-dealer or other intermediary and your salesperson to recommend the Fund over another investment. Ask your salesperson or visit your financial intermediary’s Web site for more information.
66
Principal Investment Strategies and Risks
Each Fund is a mutual fund that issues shares. A mutual fund pools shareholders’ money and, using professional investment managers, invests it in securities such as stocks and bonds. Before you look at specific Funds, you should know a few basics about investing in mutual funds.
The value of your investment in a mutual fund is based on the market prices of the securities the mutual fund holds. These prices change daily due to economic trends and other developments that generally affect securities markets, as well as those that affect particular types of issuers. These price movements, also called volatility, vary depending on the types of securities a mutual fund owns and the markets where these securities trade.
As with other investments, you could lose money on your investment in a mutual fund. Your investment in the Funds is not a deposit or an obligation of Huntington National Bank, its affiliates or any bank. It is not insured by the Federal Deposit Insurance Corporation (“FDIC”) or any other government agency.
Each Fund has its own investment goal and strategies for reaching that goal. There is no guarantee that a Fund will achieve its goal. Before investing, make sure that the Fund’s goal matches your own. Unless otherwise noted, each Fund’s investment objective is fundamental and may be changed only by a vote of a majority of the Fund’s outstanding Shares. Unless otherwise noted, each Fund’s investment strategies are not fundamental and may be changed by the Trust’s Board of Trustees (“Trustees”).
The portfolio manager invests each Fund’s assets in a way that he or she believes will help the Fund achieve its goal. A portfolio manager’s judgments about the securities markets, economy and companies, and his or her investment selection, may cause a Fund to underperform other funds with similar objectives.
67
Principal Investment Strategies and Risks
Huntington Tax-Free Money Market Fund
Investment Strategy | The Fund’s investment objective is to seek to provide the highest level of interest income exempt from federal income tax, consistent with liquidity and stability of principal. |
The Advisor strives to maintain a $1.00 net asset value (“NAV”) per share for the Tax-Free Money Market Fund by investing at least 80% of the Fund’s assets in short-term tax-exempt securities which are either rated in the highest rating category by a Nationally Recognized Statistical Rating Organization (“NRSRO”) or unrated and deemed to be of comparable quality by the Advisor. No more than 20% of the Fund’s annual income will be subject to the alternative minimum tax (“AMT”).
In managing the portfolio, the Advisor maintains a dollar-weighted average portfolio maturity of 60 days or less and a dollar-weighted average life of 120 days or less and endeavors to diversify the portfolio’s holdings as much as possible. In addition, the Advisor analyzes cash flows, maturities, settlements, tax payments, yields and credit quality and monitors new issue calendars for potential purchases.
Tax-exempt securities are debt securities typically issued by states, counties, cities, and other political subdivisions and authorities and which pay interest that is exempt from Federal income tax.
Because the Fund refers to tax-exempt securities in its name, it will notify shareholders at least 60 days in advance of any changes in its investment policies that would enable the Fund to normally invest less than 80% of its assets in tax-exempt securities.
For temporary defensive or liquidity purposes, the Fund may invest in securities the interest on which is subject to federal income tax.
For more information about the Fund’s investment strategies, please see “Additional Investment Strategies.”
For more detail regarding the securities in which the Fund may invest, please see the section entitled, “Securities in Which the Funds Invest” in the Funds’ SAI.
What are the main risks of investing in this Fund? | Loss of money is a risk of investing in the Fund. The Fund may also be significantly affected by “Government Intervention and Extreme Volatility Risk,” as described in the “Investment Risks” section in the Funds’ SAI. Additionally, you should be aware that a very small number of money market funds in other fund complexes have, in the past, “broken the buck,” which means that investors did not receive $1.00 per share for their investment in those funds, and any money market fund may do so in the future. You should also be aware that the Advisor and its affiliates are under no obligation to provide financial support to the Fund or take other measures to ensure that you receive $1.00 per share for your investment in the Fund. You should not invest in the Fund with the expectation that any such action will be taken. In addition, your investment in the Fund may be subject to the following principal risks: |
Interest Rate Risk. Prices of fixed income securities rise and fall in response to changes in the interest rate paid by similar securities. Generally, when interest rates rise, prices of fixed income securities fall. However, market factors, such as the demand for particular fixed income securities, may cause the price of certain fixed income securities to fall while the prices of other securities rise or remain unchanged.
68
Principal Investment Strategies and Risks
Huntington Tax-Free Money Market Fund
continued
Interest rate changes have a greater effect on the price of fixed income securities with longer durations. Duration measures the price sensitivity of a fixed income security to changes in interest rates.
Credit Enhancement Risk. The securities in which the Fund invests may be subject to credit enhancement (for example, guarantees, letters of credit or bond insurance). Credit enhancement is designed to assure timely payment of the security; it does not protect the Fund against losses caused by declines in a security’s value due to changes in market conditions. Securities subject to credit enhancement generally would be assigned a lower credit rating if the rating were based primarily on the credit quality of the issuer without regard to the credit enhancement. If the credit quality of the credit enhancement provider (for example, a bank or bond insurer) is downgraded, the rating on a security credit enhanced by such credit enhancement provider also may be downgraded.
A single bank, bond insurer or other enhancement provider may provide credit enhancement to more than one of the Fund’s investments. Having multiple securities credit enhanced by the same enhancement provider will increase the adverse effects on the Fund that are likely to result from a downgrading of, or a default by, such an enhancement provider. Adverse developments in the banking or bond insurance industries also may negatively affect the Fund, as the Fund may invest its assets in securities credit enhanced by banks or by bond insurers without limit. Bond insurers that provide credit enhancement for large segments of the fixed income markets, particularly the municipal bond market, may be more susceptible to being downgraded or defaulting during recessions or similar periods of economic stress.
Credit Risk. Credit risk is the possibility that an issuer may default on a security by failing to pay interest or principal when due. If an issuer defaults, the Fund will lose money.
Many fixed income securities receive credit ratings from NRSROs, which assign ratings to securities by assessing the likelihood of issuer default. Lower credit ratings correspond to higher credit risk. If a security has not received a rating, the Fund must rely entirely upon the Advisor’s credit assessment.
Fixed income securities generally compensate for greater credit risk by paying interest at a higher rate. The difference between the yield of a security and the yield of a U.S. Treasury security with a comparable maturity (the spread) measures the additional interest paid for risk. Spreads may increase generally in response to adverse economic or market conditions. A security’s spread may also increase if the security’s rating is lowered, or the security is perceived to have an increased credit risk. An increase in the spread will cause the price of the security to decline.
Counterparty Risk. The value of the Fund’s investments may be adversely affected if an issuer’s securities experience a credit downgrade; an issuer or guarantor of an investment held by the Fund fails to pay an obligation on a timely basis, otherwise defaults or is perceived by other investors to be less creditworthy; or a counterparty to
69
Principal Investment Strategies and Risks
Huntington Tax-Free Money Market Fund
continued
a derivatives or other transaction with the Fund files for bankruptcy, becomes insolvent, or otherwise becomes unable or unwilling to honor its obligation to the Fund.
Recoupment Risk. The Advisor has entered into an Agreement with the Fund whereby the Advisor has agreed to waive all or a portion of its investment advisory fee and/or reimburse certain operating expenses of the Fund if necessary, to ensure that the Fund maintains a positive yield of at least 0.01%. Pursuant to this agreement, the Advisor is entitled to recoup from the Fund any waived and/or reimbursed amounts for a period of up to three (3) years from the date of the waiver and/or reimbursement. The recoupment could negatively affect the Fund’s future yield.
For more information about risks, please see “Investments Risks” in the Funds’ SAI.
An investment in the Fund is not a deposit or an obligation of Huntington National Bank, its affiliates or any bank, and it is not insured or guaranteed by the FDIC or any other government agency. Although the Fund seeks to preserve the value of your investment at $1.00 per share, it is possible to lose money by investing in the Fund.
Yield
The income a fund generates is commonly referred to as its “yield.” For money market funds, yield may be a more useful indication than total return of how a portfolio is performing. As a result, advertisements and other communications about the Fund will typically mention the portfolio’s yield. There are various types of yield, including current or 7-day yield and effective yield. All mutual funds must use the same formulas to calculate each of these yields.
The formula for effective yield assumes that investors take advantage of compounding by reinvesting their dividends; current or 7-day yield does not make the same assumption. As a result, a portfolio’s effective yield typically will be slightly higher than its current or 7-day yield. Both types of yield will tend to fluctuate daily due to such factors as a fund’s interest rate exposure as well as the type and credit quality of its portfolio holdings.
To obtain current yield information for the Fund, please call 800-253-0412.
70
Principal Investment Strategies and Risks
Huntington Money Market Fund
Investment Strategy | The Fund’s investment objective is to seek to maximize current income while preserving capital and maintaining liquidity by investing in a portfolio of high-quality money market instruments. |
| | The Advisor strives to maintain a $1.00 NAV per share for the Fund by investing in commercial paper and U.S. government agency notes, and other short-term money market instruments, which may include municipal securities that are either rated in the highest rating category by a Nationally Recognized Statistical Rating Organization (“NRSRO”) or unrated and deemed to be of comparable quality by the Advisor. In managing the portfolio, the Advisor maintains a dollar-weighted average portfolio maturity of 60 days or less and a dollar-weighted average life of 120 days or less, and endeavors to diversify the portfolio across market sectors. The Advisor employs a top-down analysis of economic and market factors to select Fund investments. In addition, the Advisor analyzes cash flows, maturities, settlements, tax payments, yields and credit quality and monitors new issue calendars for potential purchases. |
| | The Fund intends to invest in the securities of U.S. government-sponsored entities (“GSEs”), including GSE securities backed by the full faith and credit of the U.S. government and some GSE securities that are not backed by the full faith and credit of the U.S. government. GSE securities not backed by the full faith and credit of the U.S. government may include, but are not limited to, those issued by the Federal Home Loan Mortgage Corporation, the Federal National Mortgage Association, and the Federal Home Loan Bank System. These entities are, however, supported through federal subsidies, loans or other benefits. GSE securities that are supported by the full faith and credit of the U.S. government include, but are not limited to, those issued by the Government National Mortgage Association. Finally, the Fund may invest in GSE securities that are not backed by the full faith and credit of the U.S. government and have no explicit financial support. Such securities include those issued by the Farm Credit System and the Financing Corporation. |
| | For more detail regarding the securities in which the Fund may invest, please see the section entitled, “Securities in Which the Funds Invest” in the Funds’ SAI. |
What are the main risks of investing in this Fund? | Loss of money is a risk of investing in the Fund. The Fund may also be significantly affected by “Government Intervention and Extreme Volatility Risk,” as described in the “Investment Risks” section of the Funds’ SAI. Additionally, you should be aware that a very small number of money market funds in other fund complexes have, in the past, “broken the buck,” which means that investors did not receive $1.00 per share for their investment in those funds, and any money market fund may do so in the future. You should also be aware that the Advisor and its affiliates are under no obligation to provide financial support to the Fund or take other measures to ensure that you receive $1.00 per share for your investment in the Fund. You should not invest in the Fund with the expectation that any such action will be taken. In addition, your investment in the Fund may be subject to the following principal risks: |
Interest Rate Risk. Prices of fixed income securities rise and fall in response to changes in the interest rate paid by similar securities. Generally, when interest rates rise, prices of fixed income securities fall. However, market factors, such as the demand for particular fixed
71
Principal Investment Strategies and Risks
Huntington Money Market Fund
continued
income securities, may cause the price of certain fixed income securities to fall while the prices of other securities rise or remain unchanged.
Interest rate changes have a greater effect on the price of fixed income securities with longer durations. Duration measures the price sensitivity of a fixed income security to changes in interest rates.
Counterparty Risk. The value of the Fund’s investments may be adversely affected if an issuer’s securities experience a credit downgrade; an issuer or guarantor of an investment held by the Fund fails to pay an obligation on a timely basis, otherwise defaults or is perceived by other investors to be less creditworthy; or a counterparty to a derivatives or other transaction with the Fund files for bankruptcy, becomes insolvent, or otherwise becomes unable or unwilling to honor its obligation to the Fund.
Credit Enhancement Risk. The securities in which the Fund invests may be subject to credit enhancement (for example, guarantees, letters of credit or bond insurance). Credit enhancement is designed to assure timely payment of the security; it does not protect the Fund against losses caused by declines in a security’s value due to changes in market conditions. Securities subject to credit enhancement generally would be assigned a lower credit rating if the rating were based primarily on the credit quality of the issuer without regard to the credit enhancement. If the credit quality of the credit enhancement provider (for example, a bank or bond insurer) is downgraded, the rating on a security credit enhanced by such credit enhancement provider also may be downgraded.
A single bank, bond insurer or other enhancement provider may provide credit enhancement to more than one of the Fund’s investments. Having multiple securities credit enhanced by the same enhancement provider will increase the adverse effects on the Fund that are likely to result from a downgrading of, or a default by, such an enhancement provider. Adverse developments in the banking or bond insurance industries also may negatively affect the Fund, as the Fund may invest its assets in securities credit enhanced by banks or by bond insurers without limit. Bond insurers that provide credit enhancement for large segments of the fixed income markets, particularly the municipal bond market, may be more susceptible to being downgraded or defaulting during recessions or similar periods of economic stress.
Credit Risk. Credit risk is the possibility that an issuer may default on a security by failing to pay interest or principal when due. If an issuer defaults, the Fund will lose money.
Many fixed income securities receive credit ratings from NRSROs, which assign ratings to securities by assessing the likelihood of issuer default. Lower credit ratings correspond to higher credit risk. If a security has not received a rating, the Fund must rely entirely upon the Advisor’s credit assessment.
Fixed income securities generally compensate for greater credit risk by paying interest at a higher rate. The difference between the yield of a security and the yield of a U.S. Treasury security with a comparable maturity (the spread) measures the additional interest paid for risk.
72
Principal Investment Strategies and Risks
Huntington Money Market Fund
continued
Spreads may increase generally in response to adverse economic or market conditions. A security’s spread may also increase if the security’s rating is lowered, or the security is perceived to have an increased credit risk. An increase in the spread will cause the price of the security to decline.
Recoupment Risk. The Advisor has entered into an Agreement with the Fund whereby the Advisor has agreed to waive all or a portion of its investment advisory fee and/or reimburse certain operating expenses of the Fund if necessary, to ensure that the Fund maintains a positive yield of at least 0.01%. Pursuant to this agreement, the Advisor is entitled to recoup from the Fund any waived and/or reimbursed amounts for a period of up to three (3) years from the date of the waiver and/or reimbursement. The recoupment could negatively affect the Fund’s future yield.
For more information about risks, please see “Investment Risks” in the Funds’ SAI.
An investment in the Fund is not a deposit or an obligation of Huntington National Bank, its affiliates or any bank, and it is not insured or guaranteed by the FDIC or any other government agency. Although the Fund seeks to preserve the value of your investment at $1.00 per share, it is possible to lose money by investing in the Fund.
Yield
The income a fund generates is commonly referred to as its “yield.” For money market funds, yield may be a more useful indication than total return of how a portfolio is performing. As a result, advertisements and other communications about the Fund will typically mention the portfolio’s yield. There are various types of yield, including current or 7-day yield and effective yield. All mutual funds must use the same formulas to calculate each of these yields.
The formula for effective yield assumes that investors take advantage of compounding by reinvesting their dividends; current or 7-day yield does not make the same assumption. As a result, a portfolio’s effective yield typically will be slightly higher than its current or 7-day yield. Both types of yield will tend to fluctuate daily due to such factors as a fund’s interest rate exposure as well as the type and credit quality of its portfolio holdings.
To obtain current yield information for the Fund, please call 800-253-0412.
73
Principal Investment Strategies and Risks
Huntington Ohio Municipal Money Market Fund
Investment Strategy | The Fund’s investment objective is to seek to provide income exempt from both federal regular income tax and Ohio personal income taxes while preserving capital and maintaining liquidity. |
The Advisor strives to maintain a $1.00 NAV per share for the Fund by investing substantially all of the Fund’s assets in short-term Ohio tax-exempt securities which are either rated in the highest rating category by a Nationally Recognized Statistical Rating Organization (“NRSRO”) or unrated and deemed to be of comparable quality by the Advisor. In managing the portfolio, the Advisor maintains a dollar-weighted average portfolio maturity of 60 days or less and a dollar-weighted average life of 120 days or less and endeavors to diversify the portfolio’s holdings within Ohio as much as possible. In addition, the Advisor analyzes cash flows, maturities, settlements, tax payments, yields and credit quality, and monitors new issue calendars for potential purchases.
Ohio tax-exempt securities are debt obligations which (i) are issued by or on behalf of the state of Ohio or its respective authorities, agencies, instrumentalities and political subdivisions, and (ii) produce interest which, in the opinion of bond counsel at the time of issuance, is exempt from federal income tax and Ohio personal income taxes.
Because the Fund refers to Ohio tax-exempt securities in its name, it will notify shareholders at least 60 days in advance of any changes in its investment policies that would enable the Fund to normally invest less than 80% of its assets in Ohio tax-exempt securities.
For temporary defensive or liquidity purposes, the Fund may invest in securities the interest on which is subject to federal income tax or Ohio personal income taxes.
For more information about the Fund’s investment strategies, please see “Additional Investment Strategies.”
For more detail regarding the securities in which the Fund may invest, please see the section entitled, “Securities in Which the Funds Invest” in the Funds’ SAI.
What are the main risks of investing in this Fund? | Loss of money is a risk of investing in the Fund. The Fund may also be significantly affected by “Government Intervention and Extreme Volatility Risk,” as described in the “Investment Risks” section in the Funds’ SAI. Additionally, you should be aware that a very small number of money market funds in other fund complexes have, in the past, “broken the buck,” which means that investors did not receive $1.00 per share for their investment in those funds, and any money market fund may do so in the future. You should also be aware that the Advisor and its affiliates are under no obligation to provide financial support to the Fund or take other measures to ensure that you receive $1.00 per share for your investment in the Fund. You should not invest in the Fund with the expectation that any such action will be taken. In addition, your investment in the Fund may be subject to the following principal risks: |
State Concentration Risk. By concentrating its investments in Ohio, the Fund may be more vulnerable to unfavorable developments in that state than funds that are more geographically diversified. The economy of Ohio is largely concentrated in agriculture, motor vehicles and equipment, steel, rubber products and household appliances, and therefore tends to be more cyclical than some other states and the nation as a whole.
74
Principal Investment Strategies and Risks
Huntington Ohio Municipal Money Market Fund
continued
Non-Diversification Risk. As a non-diversified fund, the Fund may invest a greater percentage of its assets in the securities of a single issuer than do other mutual funds, and therefore Fund performance can be significantly affected by the performance of one or a small number of issuers.
Interest Rate Risk. Prices of fixed income securities rise and fall in response to changes in the interest rate paid by similar securities. Generally, when interest rates rise, prices of fixed income securities fall. However, market factors, such as the demand for particular fixed income securities, may cause the price of certain fixed income securities to fall while the prices of other securities rise or remain unchanged.
Interest rate changes have a greater effect on the price of fixed income securities with longer durations. Duration measures the price sensitivity of a fixed income security to changes in interest rates.
Credit Enhancement Risk. The securities in which the Fund invests may be subject to credit enhancement (for example, guarantees, letters of credit or bond insurance). Credit enhancement is designed to assure timely payment of the security; it does not protect the Fund against losses caused by declines in a security’s value due to changes in market conditions. Securities subject to credit enhancement generally would be assigned a lower credit rating if the rating were based primarily on the credit quality of the issuer without regard to the credit enhancement. If the credit quality of the credit enhancement provider (for example, a bank or bond insurer) is downgraded, the rating on a security credit enhanced by such credit enhancement provider also may be downgraded.
A single bank, bond insurer or other enhancement provider may provide credit enhancement to more than one of the Fund’s investments. Having multiple securities credit enhanced by the same enhancement provider will increase the adverse effects on the Fund that are likely to result from a downgrading of, or a default by, such an enhancement provider. Adverse developments in the banking or bond insurance industries also may negatively affect the Fund, as the Fund may invest its assets in securities credit enhanced by banks or by bond insurers without limit. Bond insurers that provide credit enhancement for large segments of the fixed income markets, particularly the municipal bond market, may be more susceptible to being downgraded or defaulting during recessions or similar periods of economic stress.
Credit Risk. Credit risk is the possibility that an issuer may default on a security by failing to pay interest or principal when due. If an issuer defaults, the Fund will lose money.
Many fixed income securities receive credit ratings from NRSROs, which assign ratings to securities by assessing the likelihood of issuer default. Lower credit ratings correspond to higher credit risk. If a security has not received a rating, the Fund must rely entirely upon the Advisor’s credit assessment.
Fixed income securities generally compensate for greater credit risk by paying interest at a higher rate. The difference between the yield of a security and the yield of a U.S. Treasury security with a comparable
75
Principal Investment Strategies and Risks
Huntington Ohio Municipal Money Market Fund
continued
maturity (the spread) measures the additional interest paid for risk. Spreads may increase generally in response to adverse economic or market conditions. A security’s spread may also increase if the security’s rating is lowered, or the security is perceived to have an increased credit risk. An increase in the spread will cause the price of the security to decline.
Counterparty Risk. The value of the Fund’s investments may be adversely affected if an issuer’s securities experience a credit downgrade; an issuer or guarantor of an investment held by the Fund fails to pay an obligation on a timely basis, otherwise defaults or is perceived by other investors to be less creditworthy; or a counterparty to a derivatives or other transaction with the Fund files for bankruptcy, becomes insolvent, or otherwise becomes unable or unwilling to honor its obligation to the Fund.
Recoupment Risk. The Advisor has entered into an Agreement with the Fund whereby the Advisor has agreed to waive all or a portion of its investment advisory fee and/or reimburse certain operating expenses of the Fund if necessary, to ensure that the Fund maintains a positive yield of at least 0.01%. Pursuant to this agreement, the Advisor is entitled to recoup from the Fund any waived and/or reimbursed amounts for a period of up to three (3) years from the date of the waiver and/or reimbursement. The recoupment could negatively affect the Fund’s future yield.
For more information about risks, please see “Investment Risks” in the Funds’ SAI.
An investment in the Fund is not a deposit or an obligation of Huntington National Bank, its affiliates or any bank, and it is not insured or guaranteed by the FDIC or any other government agency. Although the Fund seeks to preserve the value of your investment at $1.00 per share, it is possible to lose money by investing in the Fund.
Yield
The income a fund generates is commonly referred to as its “yield.” For money market funds, yield may be a more useful indication than total return of how a portfolio is performing. As a result, advertisements and other communications about the Fund will typically mention the portfolio’s yield. There are various types of yield, including current or 7-day yield and effective yield. All mutual funds must use the same formulas to calculate each of these yields.
The formula for effective yield assumes that investors take advantage of compounding by reinvesting their dividends; current or 7-day yield does not make the same assumption. As a result, a portfolio’s effective yield typically will be slightly higher than its current or 7-day yield. Both types of yield will tend to fluctuate daily due to such factors as a fund’s interest rate exposure as well as the type and credit quality of its portfolio holdings.
To obtain current yield information for the Fund, please call 800-253-0412.
76
Principal Investment Strategies and Risks
Huntington U.S. Treasury Money Market Fund
Investment Strategy | The Fund’s investment objective is to seek to maximize current income while preserving capital and maintaining liquidity by investing exclusively in obligations issued by the U.S. government and backed by its full faith and credit and in repurchase agreements with respect to such obligations. |
| | The Advisor strives to maintain a $1.00 NAV per share for the Fund by investing substantially all of the Fund’s assets in short-term obligations of the U.S. government. In managing the portfolio, the Advisor maintains a dollar-weighted average portfolio maturity of 60 days or less and a dollar-weighted average life of 120 days or less. In addition, the Advisor analyzes cash flows, maturities, settlements, tax payments and yields and opposite direction; and monitors new issue calendars for potential purchases. |
| | Because the Fund refers to U.S. Treasury obligations in its name, it will notify shareholders at least 60 days in advance of any changes in its investment policies that would enable the Fund to normally invest less than 80% of its assets in U.S. Treasury obligations. |
| | For more detail regarding the securities in which the Fund may invest, please see the section entitled, “Securities in Which the Funds Invest” in the Funds’ SAI. |
What are the main risks of investing in this Fund? | Loss of money is a risk of investing in the Fund. The Fund may also be significantly affected by “Government Intervention and Extreme Volatility Risk,” as described in the “Investment Risks” section in the Funds’ SAI. Additionally, you should be aware that a very small number of money market funds in other fund complexes have, in the past, “broken the buck,” which means that investors did not receive $1.00 per share for their investment in those funds, and any money market fund may do so in the future. You should also be aware that the Advisor and its affiliates are under no obligation to provide financial support to the Fund or take other measures to ensure that you receive $1.00 per share for your investment in the Fund. You should not invest in the Fund with the expectation that any such action will be taken. In addition, your investment in the Fund may be subject to the following principal risk: |
Interest Rate Risk. Prices of fixed income securities rise and fall in response to changes in the interest rate paid by similar securities. Generally, when interest rates rise, prices of fixed income securities fall. However, market factors, such as the demand for particular fixed income securities, may cause the price of certain fixed income securities to fall while the prices of other securities rise or remain unchanged.
Interest rate changes have a greater effect on the price of fixed income securities with longer durations. Duration measures the price sensitivity of a fixed income security to changes in interest rates.
Recoupment Risk. The Advisor has entered into an Agreement with the Fund whereby the Advisor has agreed to waive all or a portion of its investment advisory fee and/or reimburse certain operating expenses of the Fund if necessary, to ensure that the Fund maintains a yield of at least 0.00%. Pursuant to this agreement, the Advisor is entitled to recoup from the Fund any waived and/or reimbursed amounts for a period of up to three (3) years from the date of the waiver and/or reimbursement. The recoupment could negatively affect the Fund’s future yield.
77
Principal Investment Strategies and Risks
Huntington U.S. Treasury Money Market Fund
continued
For more information about risks, please see “Investment Risks” in the Funds’ SAI.
An investment in the Fund is not a deposit or an obligation of Huntington National Bank, its affiliates or any bank, and it is not insured or guaranteed by the FDIC or any other government agency. Although the Fund seeks to preserve the value of your investment at $1.00 per share, it is possible to lose money by investing in the Fund.
Yield
The income a fund generates is commonly referred to as its “yield.” For money market funds, yield may be a more useful indication than total return of how a portfolio is performing. As a result, advertisements and other communications about the Fund will typically mention the portfolio’s yield. There are various types of yield, including current or 7-day yield and effective yield. All mutual funds must use the same formulas to calculate each of these yields.
The formula for effective yield assumes that investors take advantage of compounding by reinvesting their dividends; current or 7-day yield does not make the same assumption. As a result, a portfolio’s effective yield typically will be slightly higher than its current or 7-day yield. Both types of yield will tend to fluctuate daily due to such factors as a fund’s interest rate exposure as well as the type and credit quality of its portfolio holdings.
To obtain current yield information for the Fund, please call 800-253-0412.
78
Principal Investment Strategies and Risks
Huntington Disciplined Equity Fund
Investment Strategy | The Fund’s investment objective is to seek capital appreciation while seeking to reduce volatility. |
| | The portfolio manager will invest in the larger companies of each sector comprising the S&P 500 Index or the S&P 100 Index consistent with the sector weighting of the applicable index. Whether the Fund’s portfolio corresponds to the composition of the S&P 500 Index or the S&P 100 Index will depend upon the availability of put options on those Indices necessary to effectively hedge the Fund’s portfolio against potential market declines. |
| | The Fund will purchase put options to hedge the Fund’s portfolio to the extent the value of the Fund’s common stock positions decline. Factors considered by the portfolio manager when purchasing put options on the applicable Index include cost and volatility. Generally, put options nearing expiration are less expensive than options with a longer duration. |
| | The Fund also writes covered call options on common stocks maintained in its portfolio to generate income from the premiums paid by the purchaser of the option. Generally, the Fund will only write covered calls that are “out of the money” so as to reduce the potential that the purchaser will exercise the option and obligate the Fund to sell the underlying security held in its portfolio at the exercise price designated in the option contract. A call option is “out of the money” if the exercise price of the option is higher than the market price of the security on which the option is written. |
| | Because the Fund contains equity in its name, the Fund will normally invest at least 80% of its assets in equity securities and will notify shareholders at least 60 days in advance of any changes in this investment policy. |
| | Equity securities (stocks) represent a share of an issuer’s earnings and assets, after the issuer pays its liabilities. The Fund cannot predict the income it will receive from equity securities because issuers generally have discretion as to the payment of any dividends or distributions. However, equity securities offer greater potential for appreciation than many other types of securities, because their value increases directly with the value of the issuer’s business. The following describes the principal types of equity securities in which the Fund may invest. |
Common Stocks. Common stocks are the most prevalent type of equity security. Common stocks receive the issuer’s earnings after the issuer pays its creditors and any preferred stockholders. As a result, changes in an issuer’s earnings directly influence the value of its common stock.
Exchange-Traded Funds. The Fund may invest in ETFs as an efficient means of carrying out its investment strategies. As with traditional mutual funds, ETFs charge asset-based fees, although these fees tend to be relatively low. ETFs are traded on stock exchanges or on the over-the-counter market. ETFs do not charge initial sales charges or redemption fees and investors pay only customary brokerage fees to buy and sell ETF shares.
| | Derivative contracts are financial instruments that require payments based upon changes in the values of designated (or underlying) securities, currencies, commodities, financial indices or other assets. Some derivative contracts (such as futures, forwards and options) require payments relating to a future trade involving the underlying asset. Other derivative contracts (such as swaps) require payments relating to the income or returns from the underlying asset. The other party to a derivative contract is referred to as a counterparty. |
79
Principal Investment Strategies and Risks
Huntington Disciplined Equity Fund
continued
| | Depending upon how the Fund uses derivative contracts and the relationships between the market value of a derivative contract and the underlying asset, derivative contracts may increase or decrease the Fund’s exposure to interest rate risk, and may also expose the Fund to liquidity and leverage risks. Over the counter (“OTC”) contracts also expose the Fund to credit risks in the event that a counterparty defaults on the contract. |
| | The Fund may trade in the following types of derivative contracts in addition to the derivative contracts described under “Foreign Securities — Foreign Exchange and Forward Contracts”: |
Futures and Related Options. A contract providing for the future sale and purchase of a specific amount of a specific security, class of securities, or index at a specified time in the future and at a specified price. The Fund will limit the aggregate value of its obligations under futures, options on futures, and options on securities to no more than 10% of the Fund’s total assets.
Call and Put Options. A call option gives the buyer the right to buy, and obligates the seller of the option to sell, a security at a specified price. A put option gives the buyer the right to sell, and obligates the seller of the option to buy, a security at a specified price. Funds that are authorized to write or purchase put and call options must cover such options, and may buy existing option contracts to close their open positions.
| | The Fund may temporarily depart from its principal investment strategy by investing its assets in cash and shorter-term debt securities and similar obligations. It may do this to minimize potential losses and maintain liquidity to meet shareholder redemptions during adverse market conditions. This may cause the Fund to fail to meet its investment objective and to give up greater investment returns to maintain the safety of principal, that is, the original amount invested by shareholders. Interest income from temporary investments may be taxable to shareholders as ordinary income. |
| | For more detail regarding the securities in which the Fund may invest, please see the section entitled, “Securities in Which the Funds Invest” in the Funds’ SAI. |
What are the main risks of investing in this Fund? | Loss of money is a risk of investing in the Fund. The Fund may also be significantly affected by “Government Intervention and Extreme Volatility Risk,” as described in the “Investment Risks” section in the Funds’ SAI. In addition, your investment in the Fund may be subject to the following principal risks: |
Market Risk. The risk that a security’s market value may decline, sometimes rapidly and unpredictably. These fluctuations may cause a security to be worth less than the price the Fund originally paid for it, or less than it was worth at an earlier time. Market risk may affect a single issuer, industrial sector or the market as a whole. For fixed income securities, market risk is largely influenced by changes in interest rates. Rising interest rates typically cause the value of bonds to decrease, while falling rates typically cause the value of bonds to increase.
Equity Securities Risk. Equity securities include common, preferred and convertible preferred stocks and securities the values of which are tied to the price of stocks, such as rights, warrants and convertible debt securities. Common and preferred stocks represent equity ownership in
80
Principal Investment Strategies and Risks
Huntington Disciplined Equity Fund
continued
a company. Stock markets are volatile. The price of equity securities will fluctuate and can decline, reducing the value of the Fund. The price of equity securities fluctuates based on actual or perceived changes in a company’s financial condition and overall market and economic conditions. The value of equity securities purchased by the Fund could decline if the financial condition of the companies in which the Fund is invested in declines or if overall market and economic conditions deteriorate.
Even funds that invest in high quality or “blue chip” equity securities or securities of established companies with large market capitalizations (which generally have strong financial characteristics) can be negatively impacted by poor overall market and economic conditions. Companies with large market capitalizations may also have less growth potential than smaller companies and may be able to react less quickly to changes in the marketplace.
The Fund may maintain substantial exposure to equities and generally will not attempt to time the market. Because of this exposure, the possibility that stock market prices in general will decline over short or extended periods subjects the Fund to unpredictable declines in the value of its investments, as well as periods of poor performance.
Investment Style Risk. The risk that the particular type of investment in which the Fund invests (such as small cap value stocks or large-cap growth stocks) may underperform other asset classes or the overall market. Individual market segments tend to go through cycles of performing better or worse than other market segments. These periods may last as long as several years. Additionally, a particular market segment could fall out of favor with investors, causing a fund that focuses on that market segment to underperform those that favor other kinds of securities.
Management Risk. The risk that a strategy used by a Fund’s portfolio manager may fail to produce the intended result. This includes the risk that changes in the value of a hedging instrument will not match those of the asset being hedged.
Active Trading Risk. Active trading will cause the Fund to have an increased portfolio turnover rate, which is likely to generate shorter-term gains (losses) for its shareholders, which are taxed at a higher rate than longer-term gains (losses). Actively trading portfolio securities increases the Fund’s trading costs and may have an adverse impact on the Fund’s performance.
Class/Sector/Region Focus Risk. When the Fund invests more than 25% of its net assets in a particular asset class (such as real estate-related or commodities-related securities), or securities of issuers within a particular business sector or geographic region, it is subject to increased risk. Performance will generally depend on the performance of the class, sector or region, which may differ in direction and degree from that of the overall U.S. stock or bond markets. In addition, financial, economic, business and political developments affecting the class, sector or region may have a greater effect on the Fund than it would on a fund that did not focus on the sector, asset class or region.
81
Principal Investment Strategies and Risks
Huntington Disciplined Equity Fund
continued
Interest Rate Risk. Prices of fixed income securities rise and fall in response to changes in the interest rate paid by similar securities. Generally, when interest rates rise, prices of fixed income securities fall. However, market factors, such as the demand for particular fixed income securities, may cause the price of certain fixed income securities to fall while the prices of other securities rise or remain unchanged.
Interest rate changes have a greater effect on the price of fixed income securities with longer durations. Duration measures the price sensitivity of a fixed income security to changes in interest rates.
Counterparty Risk. The value of the Fund’s investments may be adversely affected if an issuer’s securities experience a credit downgrade; an issuer or guarantor of an investment held by the Fund fails to pay an obligation on a timely basis, otherwise defaults or is perceived by other investors to be less creditworthy; or a counterparty to a derivatives or other transaction with the Fund files for bankruptcy, becomes insolvent, or otherwise becomes unable or unwilling to honor its obligation to the Fund.
Exchange-Traded Funds Risk. An investment in an exchange-traded fund (ETF) generally presents the same primary risks as an investment in an open-end investment company (mutual fund) that has the same investment objectives, strategies, and policies. The price of an ETF can fluctuate up or down, and the Fund could lose money investing in an ETF if the prices of the securities owned by the ETF go down. In addition, ETFs may be subject to the following risks that do not apply to conventional mutual funds: (i) the market price of an ETF’s shares may trade above or below their net asset value; (ii) an active trading market for an ETF’s shares may not develop or be maintained; or (iii) trading of an ETF’s shares may be halted if the listing exchange’s officials deem such action appropriate, the shares are delisted from the exchange, or the activation of market-wide “circuit breakers” (which are tied to large decreases in stock prices) halts stock trading generally.
Derivative Contracts Risk. Derivative contracts involve risks different from, or possibly greater than, risks associated with investing directly in securities and other traditional investments. The Fund’s investment in derivatives will come primarily through writing put and call options and purchasing put options on the Indices. Specific risk issues related to the use of such contracts and instruments include valuation and tax issues, increased potential for losses and/or costs to the Fund, and a potential reduction in gains to the Fund. Each of these issues is described in greater detail in this prospectus. Derivative contracts may also involve other risks described in this prospectus or the Fund’s SAI, such as interest rate, credit, currency, liquidity and leverage risks.
Leverage Risk. Some transactions, such as derivatives, dollar rolls and reverse repurchase agreements may give rise to a form of leverage which may expose the Fund to greater risk and increase its costs. When transactions create leverage, adverse changes in the value or level of the underlying asset, reference rate or index can result in a loss substantially greater than the amount invested in the derivatives or other instruments themselves. Certain transactions have the potential for unlimited loss, regardless of the size of the initial investments. Increases and decreases
82
Principal Investment Strategies and Risks
Huntington Disciplined Equity Fund
continued
in the value of the securities held by the Fund and therefore in the Fund’s net asset value will be magnified when the Fund uses leverage because leverage tends to increase the Fund’s exposure to market risk, interest rate risk or other risks by, in effect, increasing assets available for investment.
To mitigate leverage risk, the Advisor will segregate liquid assets on the books of the Fund or otherwise cover the transactions. The use of leverage may cause the Fund to liquidate Fund positions when it may not be advantageous to do so to satisfy its obligations or to meet segregation requirements. The Fund will also have to pay interest on its borrowing, reducing the Fund’s return. This interest expense may be greater than the Fund’s return on the underlying investment.
Hedging Risk. When a derivative (a security whose value is based on that of another security or index) is used as a hedge against an opposite position that the Fund holds, any loss on the derivative should be substantially offset by gains on the hedged investment, and vice versa. Although hedging can be an effective way to reduce the Fund’s risk, it may not always be possible to perfectly offset one position with another. As a result, there is no assurance that the Fund’s hedging transactions will be effective.
For more information about risks, please see “Investment Risks” in the Funds’ SAI.
83
Principal Investment Strategies and Risks
Huntington Dividend Capture Fund
Investment Strategy | The Fund’s investment objective is to seek total return on investment, with dividend income as an important component of that return. |
To pursue its investment objective, the Fund normally invests at least 65% of its assets in dividend-paying stocks that the Advisor believes are undervalued or out-of-favor. The Advisor invests in common stock, preferred stock, and real estate investment trusts (“REITs”) which generally pay high dividends. The Fund may invest in convertible bonds and other types of hybrid securities (securities that contain aspects of both stocks and bonds). As an additional income source, the Advisor will frequently purchase stocks in a short period prior to the ex-dividend date (the interval between the announcement and the payments of the next dividend) which increases the amount of trading the Fund will incur. As a result, these dividends, as well as dividends paid by REITs and certain foreign corporations, may not qualify for lower rates that apply to certain other “qualified investment income.”
The companies in which the Fund invests are generally mature, middle and large-capitalization U.S. corporations. In-depth fundamental research (both quantitative and qualitative) confirms the value characteristics of individual stocks and evaluates the issuer’s future prospects.
Quantitative analysis is used to identify stocks that the Advisor believes are undervalued relative to the market and to the security’s historic valuations. The Advisor considers fundamental factors such as earnings growth, cash flow, and credit quality to identify the best companies. It then uses a qualitative stock selection model based on earnings expectations and supplemental valuation measures to narrow the list of stocks to the most attractive.
The Advisor typically begins to pare down a position when the stock has declared an ex- dividend date or is at a valuation level that, in the Advisor’s opinion, leaves little room for investor gain. The Advisor may eliminate a stock from the Fund’s portfolio if its long-term fundamentals become unfavorable.
The Fund actively trades its portfolio securities in an attempt to achieve its investment objective.
The Fund may, from time to time, take temporary defensive positions that are inconsistent with the Fund’s principal investment strategies in attempting to respond to adverse market, economic, political or other conditions. In these and in other cases, the Fund may not achieve its investment objective.
For more detail regarding the securities in which the Fund may invest, please see the section entitled, “Securities in Which the Funds Invest” in the Funds’ SAI.
What are the main risks of investing in this Fund? | Loss of money is a risk of investing in the Fund. The Fund may also be significantly affected by “Government Intervention and Extreme Volatility Risk,” as described in the “Investment Risks” section in the Funds’ SAI. In addition, your investment in the Fund may be subject to the following principal risks: |
Equity Securities Risk. Equity securities include common, preferred and convertible preferred stocks and securities the values of which are tied to the price of stocks, such as rights, warrants and convertible debt securities. Common and preferred stocks represent equity ownership in a company. Stock markets are volatile. The price of equity securities will fluctuate and can decline, reducing the value of the Fund. The price of
84
Principal Investment Strategies and Risks
Huntington Dividend Capture Fund
continued
equity securities fluctuates based on actual or perceived changes in a company’s financial condition and overall market and economic conditions. The value of equity securities purchased by the Fund could decline if the financial condition of the companies in which the Fund is invested in declines or if overall market and economic conditions deteriorate.
Even funds that invest in high quality or “blue chip” equity securities or securities of established companies with large market capitalizations (which generally have strong financial characteristics) can be negatively impacted by poor overall market and economic conditions. Companies with large market capitalizations may also have less growth potential than smaller companies and may be able to react less quickly to changes in the marketplace.
The Fund may maintain substantial exposure to equities and generally will not attempt to time the market. Because of this exposure, the possibility that stock market prices in general will decline over short or extended periods subjects the Fund to unpredictable declines in the value of its investments, as well as periods of poor performance.
Market Risk. The risk that a security’s market value may decline, sometimes rapidly and unpredictably. These fluctuations may cause a security to be worth less than the price the Fund originally paid for it, or less than it was worth at an earlier time. Market risk may affect a single issuer, industrial sector or the market as a whole. For fixed income securities, market risk is largely influenced by changes in interest rates. Rising interest rates typically cause the value of bonds to decrease, while falling rates typically cause the value of bonds to increase.
Investment Style Risk. The risk that a particular type of investment in which the Fund invests (such as small cap value stocks or large-cap growth stocks) may underperform other asset classes or the overall market. Individual market segments tend to go through cycles of performing better or worse than other market segments. These periods may last as long as several years. Additionally, a particular market segment could fall out of favor with investors, causing a fund that focuses on that market segment to underperform those that favor other kinds of securities.
Real Estate/REIT Risk. The Fund’s investments in REITs are subject to the same risks as direct investments in real estate. The real estate industry is particularly sensitive to economic downturns. The value of REITs and other real estate-related investments is sensitive to changes in real estate values and rental income, property taxes, interest rates, tax and regulatory requirements, overbuilding, extended vacancies of properties and the issuer’s management skills. In the event of a default by an underlying tenant or borrower, a REIT could experience delays in enforcing its rights as a lessor or mortgagee and may incur substantial costs associated with protecting its investments. In addition, the value of a REIT can depend on the structure of and cash flow generated by the REIT. Also, REITs may have limited financial resources, may trade less frequently and in limited volume and may be more volatile than other securities.
Portfolio Turnover Risk. Active trading will cause the Fund to have an increased portfolio turnover rate, which is likely to generate shorter-term
85
Principal Investment Strategies and Risks
Huntington Dividend Capture Fund
continued
gains (losses) for its shareholders, which are taxed at a higher rate than longer-term gains (losses). Actively trading portfolio securities increases the Fund’s trading costs and may have an adverse impact on the Fund’s performance.
Interest Rate Risk. Prices of fixed income securities rise and fall in response to changes in the interest rate paid by similar securities. Generally, when interest rates rise, prices of fixed income securities fall. However, market factors, such as the demand for particular fixed income securities, may cause the price of certain fixed income securities to fall while the prices of other securities rise or remain unchanged.
Interest rate changes have a greater effect on the price of fixed income securities with longer durations. Duration measures the price sensitivity of a fixed income security to changes in interest rates.
Call Risk. Call risk is the possibility that an issuer may redeem a fixed income security before maturity (a call) at a price below its current market price. An increase in the likelihood of a call may reduce the security’s price.
If a fixed income security is called, the Fund may have to reinvest the proceeds in other fixed income securities with lower interest rates, higher credit risks, or other less favorable characteristics.
Class/Sector/Region Focus Risk. When the Fund invests more than 25% of its net assets in a particular asset class (such as real estate-related or commodities-related securities), or securities of issuers within a particular business sector or geographic region, it is subject to increased risk. Performance will generally depend on the performance of the class, sector or region, which may differ in direction and degree from that of the overall U.S. stock or bond markets. In addition, financial, economic, business and political developments affecting the class, sector or region may have a greater effect on the Fund than it would on a fund that did not focus on the sector, asset class or region.
Credit Risk. Credit risk is the possibility that an issuer may default on a security by failing to pay interest or principal when due. If an issuer defaults, the Fund will lose money.
Many fixed income securities receive credit ratings from nationally recognized securities ratings organizations, which assign ratings to securities by assessing the likelihood of issuer default. Lower credit ratings correspond to higher credit risk. If a security has not received a rating, the Fund must rely entirely upon the Advisor’s credit assessment.
Fixed income securities generally compensate for greater credit risk by paying interest at a higher rate. The difference between the yield of a security and the yield of a U.S. Treasury security with a comparable maturity (the spread) measures the additional interest paid for risk. Spreads may increase generally in response to adverse economic or market conditions. A security’s spread may also increase if the security’s rating is lowered, or the security is perceived to have an increased credit risk. An increase in the spread will cause the price of the security to decline.
For more information about risks, please see “Investment Risks” in the Funds’ SAI.
86
Principal Investment Strategies and Risks
Huntington Global Select Markets Fund
Investment Strategy | The Fund’s investment objective is to seek total return. This objective may not be changed without shareholder approval. |
The Fund normally pursues its investment objective by investing in equity and fixed income securities (including real estate investment trusts) in the United States and in developed and emerging markets throughout the world. The proportions of the Fund’s assets invested in each type of security vary based on Huntington Asset Advisors, Inc.’s (the “Advisor”) interpretation of economic conditions and underlying securities values. The Advisor generally allocates the Fund’s investments across different countries and regions, and under normal market conditions, the Fund invests significantly (at least 40% — unless market conditions are not deemed favorable by the Advisor, in which case the Fund invests at least 30%) in securities of issuers based outside the United States. The Fund may invest in equity and fixed income securities of issuers of any market capitalization.
The Advisor will employ continuous “top-down” macro economic analysis to identify those countries believed to have the best prospects for sustainable growth. A “bottom up” process will then identify securities expected to provide what the Advisor believes will be superior risk-adjusted returns in those countries. By investing in equities and fixed income securities in developed and emerging markets, the Fund seeks to moderate volatility compared to investing solely in emerging market equities. The Fund has no maturity restrictions on the fixed income securities in which it invests.
The Advisor may also use various techniques, such as buying and selling futures contracts and exchange traded funds (“ETFs”), to increase or decrease the Fund’s exposure to changing security prices, interest rates or other factors that affect security values. In addition, in limited circumstances the Advisor may, in order to help the Fund manage its exposure to changes in the value of the U.S. dollar relative to other currencies, enter into derivatives contracts in which a foreign currency is an underlying asset. In addition, the Fund may invest up to 20% of its assets in lower quality fixed income securities (also known as junk bonds) — for example, securities which at time of purchase are not rated in one of the four highest categories by a U.S. nationally rated statistical rating organization (or, if unrated, are not determined by the Advisor to be of a quality comparable to a security rated within the four highest rating categories).
Additional Investment Strategies | The Fund may invest its assets in securities of other investment companies (“Acquired Funds”), including ETFs and the securities of affiliated money market funds, as an efficient means of carrying out its investment policies and managing its uninvested cash. The Fund’s shareholders indirectly bear the expenses of the Acquired Funds in which the Fund invests, and these expenses are reflected in the caption “Acquired Fund Fees and Expenses” contained in the Fees and Expenses Table in the Fund Summary. The Fund’s indirect expense reflected in the table is based upon the average allocation of the Fund’s investment in the Acquired Funds and upon the actual total operating expenses of the Acquired Funds from their most recent shareholder reports (including any current waiver) for the fiscal year ended December 31, 2013. Actual Acquired Fund expenses incurred by the Fund may vary with changes in the allocation of the Fund’s assets among the Acquired Funds and with other events that directly affect the expenses of the Acquired Funds. |
87
Principal Investment Strategies and Risks
Huntington Global Select Markets Fund
continued
For more detail regarding the securities in which the Fund may invest, please see the section entitled, “Securities in Which the Funds Invest” in the Funds’ SAI.
What are the main risks of investing in this Fund? | Loss of money is a risk of investing in the Fund. The Fund may also be significantly affected by “Government Intervention and Extreme Volatility Risk,” as described below and in the “Investment Risks” section in the Funds’ SAI. In addition, your investment in the Fund may be subject to the following principal risks: |
Government Intervention and Extreme Volatility Risk. Instability in the financial markets has led the United States government and other governments to take a number of unprecedented actions designed to support certain financial institutions and segments of the financial markets that have experienced extreme volatility, and in some cases a lack of liquidity. Federal, state, and other governments, their regulatory agencies, or self-regulatory organizations may take actions that affect the regulation of the instruments in which the Fund invests, or the issuers of such instruments, in ways that are unforeseeable. Legislation or regulation may also change the way in which the Fund itself is regulated. Such legislation or regulation could limit or preclude the Fund’s ability to achieve its investment objective.
Credit Risk. Credit risk is the possibility that an issuer may default on a security by failing to pay interest or principal when due. If an issuer defaults, the Fund will lose money.
Many fixed income securities receive credit ratings from NRSROs, which assign ratings to securities by assessing the likelihood of issuer default. Lower credit ratings correspond to higher credit risk. If a security has not received a rating, the Fund must rely entirely upon the Advisor’s credit assessment.
Fixed income securities generally compensate for greater credit risk by paying interest at a higher rate. The difference between the yield of a security and the yield of a U.S. Treasury security with a comparable maturity (the spread) measures the additional interest paid for risk. Spreads may increase generally in response to adverse economic or market conditions. A security’s spread may also increase if the security’s rating is lowered, or the security is perceived to have an increased credit risk. An increase in the spread will cause the price of the security to decline.
Counterparty Risk. The value of the Fund’s investments may be adversely affected if an issuer’s securities experience a credit downgrade; an issuer or guarantor of an investment held by the Fund fails to pay an obligation on a timely basis, otherwise defaults or is perceived by other investors to be less creditworthy; or a counterparty to a derivatives or other transaction with the Fund files for bankruptcy, becomes insolvent, or otherwise becomes unable or unwilling to honor its obligation to the Fund.
Derivative Contracts and Hybrid Instruments Risk. Derivative contracts and hybrid instruments involve risks different from, or possibly greater than, risks associated with investing directly in securities and other traditional investments. Specific risk issues related to the use of such
88
Principal Investment Strategies and Risks
Huntington Global Select Markets Fund
continued
contracts and instruments include valuation and tax issues, increased potential for losses and/or costs to the Fund, and a potential reduction in gains to the Fund. Each of these issues is described in greater detail in this prospectus. Derivative contracts and hybrid instruments may also involve other risks described in this prospectus or the Fund’s SAI, such as market, interest rate, credit, currency, liquidity and leverage risks.
Emerging Markets Risk. In addition to all of the risks of investing in foreign developed markets, emerging market securities involve risks attendant to less mature and stable governments and economies, such as lower trading volume, trading suspension, security price volatility, repatriation restrictions, government confiscation, inflation, deflation, currency devaluation and adverse government regulations of industries or markets. As a result of these risks, the prices of emerging market securities tend to be more volatile than the securities of issuers located in developed markets. Emerging market economies may also experience more severe downturns (with corresponding currency devaluations) than developed economies.
Equity Securities Risk. Equity securities include common, preferred and convertible preferred stocks and securities the values of which are tied to the price of stocks, such as rights, warrants and convertible debt securities. Common and preferred stocks represent equity ownership in a company. Stock markets are volatile. The price of equity securities will fluctuate and can decline, reducing the value of the Fund. The price of equity securities fluctuates based on actual or perceived changes in a company’s financial condition and overall market and economic conditions. The value of equity securities purchased by the Fund could decline if the financial condition of the companies in which the Fund is invested in declines or if overall market and economic conditions deteriorate.
Even funds that invest in high quality or “blue chip” equity securities or securities of established companies with large market capitalizations (which generally have strong financial characteristics) can be negatively impacted by poor overall market and economic conditions. Companies with large market capitalizations may also have less growth potential than smaller companies and may be able to react less quickly to changes in the marketplace.
The Fund may maintain substantial exposure to equities and generally will not attempt to time the market. Because of this exposure, the possibility that stock market prices in general will decline over short or extended periods subjects the Fund to unpredictable declines in the value of its investments, as well as periods of poor performance.
Foreign Custodial Services and Related Investment Costs Risk. Foreign custodial services and other costs relating to investment in international securities markets are generally more expensive than in the United States. Such markets have settlement and clearance procedures that differ from those in the United States. In certain markets there have been times when settlements have been unable to keep pace with the volume of securities transactions, making it difficult to conduct such transactions. Inability of the Fund to make intended securities purchases due to settlement problems could cause the Fund to miss
89
Principal Investment Strategies and Risks
Huntington Global Select Markets Fund
continued
attractive investment opportunities. Inability to dispose of a portfolio security caused by settlement problems could result in losses to the Fund due to a subsequent decline in value of the portfolio security. In addition, security settlement and clearance procedures in some emerging market countries may not fully protect the Fund against loss or theft of its assets.
Foreign Investment/Currency Risk. Compared with investing in the United States, investing in foreign markets involves a greater degree and variety of risk. Investors in international or foreign markets may face delayed settlements, currency controls and adverse economic developments as well as higher overall transaction costs. In addition, fluctuations in the U.S. dollar’s value versus other currencies may erode or reverse gains from investments denominated in foreign currencies or widen losses. Exchanged rates for currencies fluctuate daily. Foreign governments may expropriate assets, impose capital or currency controls, impose punitive taxes, impose limits on ownership or nationalize a company or industry. Any of these actions could have a severe effect on security prices and impair the Fund’s ability to bring its capital or income back to the U.S. Currency exchange rate fluctuations also may impair an issuer’s ability to repay U.S. dollar denominated debt, thereby increasing credit risk of such debt. Finally, the value of foreign securities may be affected by incomplete, less frequent or inaccurate financial information about their issuers, social upheavals or political actions ranging from tax code changes to governmental collapse. Foreign companies may also receive less coverage than U.S. companies by market analysts and the financial press. In addition, foreign countries may lack uniform accounting, auditing and financial reporting standards or regulatory requirements comparable to those applicable to U.S. companies. These risks are greater in emerging markets. The combination of currency risk and market risk tends to make the value of securities traded in foreign markets more volatile than securities traded exclusively in the United States.
Hedging Risk. When a derivative (a security whose value is based on that of another security or index) is used as a hedge against an opposite position that a fund holds, any loss on the derivative should be substantially offset by gains on the hedged investment, and vice versa. Although hedging can be an effective way to reduce the Fund’s risk, it may not always be possible to perfectly offset one position with another. As a result, there is no assurance that the Fund’s hedging transactions will be effective.
Interest Rate Risk. Prices of fixed income securities rise and fall in response to changes in the interest rate paid by similar securities. Generally, when interest rates rise, prices of fixed income securities fall. However, market factors, such as the demand for particular fixed income securities, may cause the price of certain fixed income securities to fall while the prices of other securities rise or remain unchanged.
Interest rate changes have a greater effect on the price of fixed income securities with longer durations. Duration measures the price sensitivity of a fixed income security to changes in interest rates.
90
Principal Investment Strategies and Risks
Huntington Global Select Markets Fund
continued
Leverage Risk. Some transactions, such as derivatives, dollar rolls and reverse repurchase agreements may give rise to a form of leverage which may expose the Fund to greater risk and increase its costs. When transactions create leverage, adverse changes in the value or level of the underlying asset, reference rate or index can result in a loss substantially greater than the amount invested in the derivatives or other instruments themselves. Certain transactions have the potential for unlimited loss, regardless of the size of the initial investments. Increases and decreases in the value of the securities held by the Fund and therefore in the Fund’s net asset value will be magnified when the Fund uses leverage because leverage tends to increase the Fund’s exposure to market risk, interest rate risk or other risks by, in effect, increasing assets available for investment.
To mitigate leverage risk, the Advisor will segregate liquid assets on the books of the Fund or otherwise cover the transactions. The use of leverage may cause the Fund to liquidate Fund positions when it may not be advantageous to do so to satisfy its obligations or to meet segregation requirements. The Fund will also have to pay interest on its borrowing, reducing the Fund’s return. This interest expense may be greater than the Fund’s return on the underlying investment.
Liquidity Risk. Liquidity risk refers to the possibility that the Fund may not be able to sell a security or close out a derivative contract when it wants to. If this happens, the Fund will be required to continue to hold the security or keep the position open, and the Fund could incur losses. OTC derivative contracts generally carry greater liquidity risk than exchange-traded contracts.
Exchange-Traded Funds Risk. An investment in an exchange-traded fund (ETF) generally presents the same primary risks as an investment in an open-end investment company (mutual fund) that has the same investment objectives, strategies, and policies. The price of an ETF can fluctuate up or down, and the Fund could lose money investing in an ETF if the prices of the securities owned by the ETF go down. In addition, ETFs may be subject to the following risks that do not apply to conventional mutual funds: (i) the market price of an ETF’s shares may trade above or below their net asset value; (ii) an active trading market for an ETF’s shares may not develop or be maintained; or (iii) trading of an ETF’s shares may be halted if the listing exchange’s officials deem such action appropriate, the shares are delisted from the exchange, or the activation of market-wide “circuit breakers” (which are tied to large decreases in stock prices) halts stock trading generally.
Market Risk. The risk that a security’s market value may decline, sometimes rapidly and unpredictably. These fluctuations may cause a security to be worth less than the price the Fund originally paid for it, or less than it was worth at an earlier time. Market risk may affect a single issuer, industrial sector or the market as a whole. For fixed income securities, market risk is largely influenced by changes in interest rates. Rising interest rates typically cause the value of bonds to decrease, while falling rates typically cause the value of bonds to increase.
Manager Risk. The Advisor’s selection of securities for the Fund may cause the Fund to underperform similar funds or relevant benchmarks.
91
Principal Investment Strategies and Risks
Huntington Global Select Markets Fund
continued
Market Capitalization Risk. Stocks fall into three broad market capitalization categories — large, medium and small. A Fund that invests primarily in one of these categories carries the risk that due to current market conditions that category may be out of favor with investors. If valuations of large capitalization companies appear to be greatly out of proportion to the valuations of small or medium capitalization companies, investors may migrate to the stocks of small and medium-sized companies. Larger, more established companies may also be unable to respond quickly to new competitive challenges such as changes in technology and consumer tastes. Many larger companies also may not be able to attain the high growth rate of successful smaller companies, especially during extended periods of economic expansion. Investing in medium and small capitalization companies may be subject to special risks associated with narrower product lines, more limited financial resources, fewer experienced managers, dependence on a few key employees, and a more limited trading market for their stocks, as compared with larger companies. In addition, securities of these companies are subject to the risk that, during certain periods, the liquidity of particular issuers or industries will shrink or disappear with little forewarning as a result of adverse economic or market conditions, or adverse investor perceptions, whether or not accurate. Securities of medium and smaller capitalization issuers may therefore be subject to greater price volatility and may decline more significantly in market downturns than securities of larger companies. Smaller and medium capitalization issuers may also require substantial additional capital to support their operations, to finance expansion or to maintain their competitive position; and may have substantial borrowings or may otherwise have a weak financial condition, and may be susceptible to bankruptcy. Transaction costs for these investments are often higher than those of larger capitalization companies. There is typically less publicly available information about small capitalization companies. Some small and medium capitalization companies also may be relatively new issuers, which carries risks in addition to the risks of other medium and small capitalization companies. New issuers may be more speculative because such companies are relatively unseasoned. These companies will often be involved in the development or marketing of a new product with no established market, which could lead to significant losses.
Non-Investment Grade Securities Risk. The securities in which the Fund may invest may be rated below investment grade. Such securities are known as junk bonds. Junk bonds generally entail greater market, credit and liquidity risks than investment grade securities. For example, their prices are more volatile, economic downturns and financial setbacks may affect their prices more negatively, and their trading market may be more limited.
Real Estate/REIT Risk. The Fund’s investments in REITs are subject to the same risks as direct investments in real estate. The real estate industry is particularly sensitive to economic downturns. The value of REITs and other real estate-related investments is sensitive to changes in real estate values and rental income, property taxes, interest rates, tax and regulatory requirements, overbuilding, extended vacancies of
92
Principal Investment Strategies and Risks
Huntington Global Select Markets Fund
continued
properties and the issuer’s management skills. In the event of a default by an underlying tenant or borrower, a REIT could experience delays in enforcing its rights as a lessor or mortgagee and may incur substantial costs associated with protecting its investments. In addition, the value of a REIT can depend on the structure of and cash flow generated by the REIT. Also, REITs may have limited financial resources, may trade less frequently and in limited volume and may be more volatile than other securities.
For more information about risks, please see “Investment Risks” in the Funds’ SAI.
93
Principal Investment Strategies and Risks
Huntington International Equity Fund
Investment Strategy | The Fund’s investment objective is to seek total return. |
The Fund’s total return will consist of two components: (1) changes in the market value of its portfolio securities (both realized and unrealized appreciation); and (2) income received from its portfolio securities. The Fund expects that changes in market value will comprise the largest component of its total return. This investment objective may be changed by the Fund’s Trustees without shareholder approval.
The Fund normally pursues its investment objective by investing at least 80% of its assets in equity securities, and at least 65% of its assets in companies based outside the United States. The Advisor manages the Fund based on the view that international equity markets are inefficient at pricing securities and that careful security selection offers the best potential for superior long-term investment returns. The Advisor uses a “bottom-up” approach to stock selection (searching for outstanding performance of individual stocks before considering the impact of economic trends) and evaluates industry and country exposure to be consistent with a “top-down” approach. The Advisor attempts to purchase securities with value characteristics consistent with an overall assessment of the economic environment in which the underlying company operates.
The Advisor ranks the relative valuation and recent price performance of a universe of companies. The Advisor then evaluates what it believes to be the most attractively valued portion of this universe using such factors as a company’s price/earnings ratio, enterprise value, organic growth rates versus growth through acquisition, product niche and management quality. The Advisor also reviews the company’s financial statements and forecasts of earnings. Based on this information, the Advisor evaluates the sustainability of the company’s current growth trends and potential catalysts for increased valuation, based on the company’s potential to add economic value to the enterprise.
The Advisor frequently identifies benchmarks for certain securities such as return on invested capital, market implied growth rates, price/earnings ratios, and/or stock prices. When those benchmarks are achieved, the Advisor may consider selling all or a portion of the Fund’s holdings to lock in profit. Holdings may also be sold if they fail to meet performance expectations or better investment opportunities are identified.
With respect to the Fund’s investments in developed markets, companies may be grouped together in broad categories called business sectors. The Advisor may emphasize certain business sectors in the portfolio that exhibit stronger growth potential or higher profit margins. The Fund will not invest more than 20% of its assets in companies located in emerging markets. In determining which markets are emerging markets, the Advisor will look at whether the market is large and liquid enough that trading is readily available, and that the management of the market itself has a history of meeting what the Advisor believes to be global norms of transparency. Additionally, in selecting emerging markets countries in which to invest, the Advisor reviews the country’s economic outlook, its interest and inflation rates, and the political and foreign exchange risk of investing in a particular country. The Advisor then analyzes companies located in particular emerging market countries.
94
Principal Investment Strategies and Risks
Huntington International Equity Fund
continued
The Fund may temporarily depart from its principal investment strategies by investing its assets in cash, cash items, and shorter-term, higher quality debt securities and similar obligations. It may do this to minimize potential losses and maintain liquidity to meet shareholder redemptions during adverse market conditions. This may cause the Fund to give up greater investment returns to maintain the safety of principal, that is, the original amount invested by shareholders.
Because the Fund contains equity in its name, the Fund will normally invest at least 80% of its assets in equity securities and will notify shareholders at least 60 days in advance of any changes in this investment policy.
| | For more detail regarding the securities in which the Fund may invest, please see the section entitled, “Securities in Which the Funds Invest” in the Funds’ SAI. |
What are the main risks of investing in this Fund? | Loss of money is a risk of investing in the Fund. The Fund may also be significantly affected by “Government Intervention and Extreme Volatility Risk,” as described in the “Investment Risks” section in the Funds’ SAI. In addition, your investment in the Fund may be subject to the following principal risks: |
Market Risk. The risk that a security’s market value may decline, sometimes rapidly and unpredictably. These fluctuations may cause a security to be worth less than the price the Fund originally paid for it, or less than it was worth at an earlier time. Market risk may affect a single issuer, industrial sector or the market as a whole. For fixed income securities, market risk is largely influenced by changes in interest rates. Rising interest rates typically cause the value of bonds to decrease, while falling rates typically cause the value of bonds to increase.
Equity Securities Risk. Equity securities include common, preferred and convertible preferred stocks and securities the values of which are tied to the price of stocks, such as rights, warrants and convertible debt securities. Common and preferred stocks represent equity ownership in a company. Stock markets are volatile. The price of equity securities will fluctuate and can decline, reducing the value of a Fund. The price of equity securities fluctuates based on actual or perceived changes in a company’s financial condition and overall market and economic conditions. The value of equity securities purchased by a Fund could decline if the financial condition of the companies in which the Fund is invested in declines or if overall market and economic conditions deteriorate.
Even Funds that invest in high quality or “blue chip” equity securities or securities of established companies with large market capitalizations (which generally have strong financial characteristics) can be negatively impacted by poor overall market and economic conditions. Companies with large market capitalizations may also have less growth potential than smaller companies and may be able to react less quickly to changes in the marketplace.
The Funds may maintain substantial exposure to equities and generally will not attempt to time the market. Because of this exposure, the possibility that stock market prices in general will decline over short or extended periods subjects the Funds to unpredictable declines in the value of its investments, as well as periods of poor performance.
95
Principal Investment Strategies and Risks
Huntington International Equity Fund
continued
Investment Style Risk. The risk that the particular type of investment in which a Fund invests (such as small cap value stocks or large-cap growth stocks) may underperform other asset classes or the overall market. Individual market segments tend to go through cycles of performing better or worse than other market segments. These periods may last as long as several years. Additionally, a particular market segment could fall out of favor with investors, causing a Fund that focuses on that market segment to underperform those that favor other kinds of securities.
Liquidity Risk. Liquidity risk refers to the possibility that a Fund may not be able to sell a security or close out a derivative contract when it wants to. If this happens, a Fund will be required to continue to hold the security or keep the position open, and a Fund could incur losses. OTC derivative contracts generally carry greater liquidity risk than exchange-traded contracts.
Foreign Investment/Currency Risk. Compared with investing in the United States, investing in foreign markets involves a greater degree and variety of risk. Investors in international or foreign markets may face delayed settlements, currency controls and adverse economic developments as well as higher overall transaction costs. In addition, fluctuations in the U.S. dollar’s value versus other currencies may erode or reverse gains from investments denominated in foreign currencies or widen losses. Exchange rates for currencies fluctuate daily. Foreign governments may expropriate assets, impose capital or currency controls, impose punitive taxes, impose limits on ownership or nationalize a company or industry. Any of these actions could have a severe effect on security prices and impair the fund’s ability to bring its capital or income back to the U.S. Currency exchange rate fluctuations also may impair an issuer’s ability to repay U.S. dollar denominated debt, thereby increasing credit risk of such debt. Finally, the value of foreign securities may be affected by incomplete, less frequent or inaccurate financial information about their issuers, social upheavals or political actions ranging from tax code changes to governmental collapse. Foreign companies may also receive less coverage than U.S. companies by market analysts and the financial press. In addition, foreign countries may lack uniform accounting, auditing and financial reporting standards or regulatory requirements comparable to those applicable to U.S. companies. These risks are greater in emerging markets. The combination of currency risk and market risk tends to make the value of securities traded in foreign markets more volatile than securities traded exclusively in the United States.
Foreign Custodial Services and Related Investment Costs Risk. Foreign custodial services and other costs relating to investment in international securities markets are generally more expensive than in the United States. Such markets have settlement and clearance procedures that differ from those in the United States. In certain markets there have been times when settlements have been unable to keep pace with the volume of securities transactions, making it difficult to conduct such transactions. Inability of a Fund to make intended securities purchases due to settlement problems could cause a Fund to miss attractive
96
Principal Investment Strategies and Risks
Huntington International Equity Fund
continued
investment opportunities. Inability to dispose of a portfolio security caused by settlement problems could result in losses to a Fund due to a subsequent decline in value of the portfolio security. In addition, security settlement and clearance procedures in some emerging market countries may not fully protect a Fund against loss or theft of its assets.
Emerging Markets Risk. In addition to all of the risks of investing in foreign developed markets, emerging market securities involve risks attendant to less mature and stable governments and economies, such as lower trading volume, trading suspension, security price volatility, repatriation restrictions, government confiscation, inflation, deflation, currency devaluation and adverse government regulations of industries or markets. As a result of these risks, the prices of emerging market securities tend to be more volatile than the securities of issuers located in developed markets. Emerging market economies may also experience more severe downturns (with corresponding currency devaluations) than developed economies.
For more information about risks, please see “Investment Risks” in the Funds’ SAI.
97
Principal Investment Strategies and Risks
Huntington Real Strategies Fund
Investment Strategy | The Fund’s investment objective is to seek total return consisting of capital appreciation and income. |
| | The Fund normally pursues this objective by making investments in asset classes that have performed well relative to general U.S. stocks and bonds during periods of increased inflation. The Fund implements its strategy by investing in a combination of the following types of securities: |
• Real estate investment trusts (“REITs”) that own commercial or residential properties, timberlands and other real estate or that provide real estate financing;
• Equity securities issued by corporations engaged in real estate-related or commodities-related businesses, index-based securities and investment companies that invest in such equity securities, and other securities representing interests in cash flows or returns from real estate or commodities;
• Publicly traded partnerships and trusts, including exchange traded commodity funds (“ETCFs”) and master limited partnerships (“MLPs”), that (1) invest in real estate or commodities, or in derivative contracts for real estate, commodities or related indices, or (2) conduct real estate-related or commodities-related businesses; and
• Inflation-Protected Securities (“IPS”) issued by U.S. and non-U.S. governments, their agencies or instrumentalities and by corporations that are structured to provide protection against inflation, and other fixed income securities that historically have provided protection against inflation.
For purposes of this investment strategy, commodities include any physical good used principally in the manufacture or production of products, or the construction of facilities, including without limitation, agricultural products, minerals and energy. The Fund will treat a good as a commodity after it has been harvested or extracted, and after it has been processed or manufactured into another form. For example, the Fund will treat iron ore deposits, extracted iron ore, iron, and steel manufactured from iron as commodities, but will not treat cars, airplanes, buildings or other finished goods constructed with steel as commodities.
In addition, an issuer is “real estate-related” if it engages primarily in the business of (1) acquiring, developing, managing or financing real estate or (2) providing goods, equipment or services to companies engaged in such businesses. For example, a company that builds and manages commercial properties would be engaged in a real estate-related business, as would a company that manufactures equipment used primarily in building construction. An issuer is “commodities-related” if it engages primarily in the business of (1) growing, harvesting, transporting, processing or selling crops (including timber) or livestock, (2) finding, extracting, transporting, refining, manufacturing or selling minerals, (3) generating, transporting or selling electricity, or (4) providing goods, equipment or services to companies engaged in any of the foregoing businesses. For example, a company that mines and processes ore would be engaged in a commodities-related business, as would a company that manufactures mining equipment. Companies that engage primarily in a combination of the foregoing businesses will also be treated as real estate-related or commodities-related.
98
Principal Investment Strategies and Risks
Huntington Real Strategies Fund
continued
The Advisor bases the Fund’s investment strategy on its evaluation of the current and expected market conditions for real estate and commodities, and its outlook for inflation in the United States. For example, when the Advisor believes there may be a favorable increase in demand for real estate in a particular market, the Fund may seek to invest in REITs and MLPs that hold real estate related investments in that market, and in other companies engaged in real estate-related businesses in that market. The Fund will generally sell such investments when the Advisor concludes that demand for real estate in the related market will probably decline. However, there is no assurance that a particular market will perform as expected or that the Advisor’s analysis will incorporate all relevant information.
| | The Advisor also will analyze the current and expected global supply and demand for commodities. When the Advisor believes that global market conditions favor higher prices for a commodity, the Fund may seek to hold equity securities issued by ETCFs and MLPs that invest in the commodity, either directly or through derivative contracts for the commodity or an index that includes the commodity. The Fund also may seek to invest in equity securities issued by other companies engaged in businesses related to the commodity. The Fund will generally sell such investments when the Advisor concludes that market conditions no longer favor higher prices for the commodity. |
| | Under ordinary market conditions, the Fund will hold IPS to the extent that the Advisor cannot find more favorable real estate-related and commodities-related investment opportunities. IPS will include U.S. Treasury Inflation-Protected Securities (“TIPS”), as well as other U.S. dollar denominated fixed income securities issued by U.S. government agencies and instrumentalities or corporations, and derivatives contracts, with inflation protection provisions (including adjustable interest rates). |
| | The fixed income securities selected by the Advisor are: (i) rated investment-grade or better by a NRSRO; or (ii) not rated, but deemed by the Advisor to be of comparable quality. Securities will be investment-grade at the time of purchase. However, if a security is downgraded below investment-grade after the time of purchase, the Advisor will reevaluate the security, but will not be required to sell it. In addition, these fixed income securities will have remaining maturities of no more than 10 years. |
| | The Fund is not limited as to the minimum or maximum amount of its assets it may invest in real estate-related, commodities-related or inflation-protected investments, or in any combination thereof. In addition, the Fund’s investment strategy may result in investment of more than 25% of its portfolio in certain business sectors (such as energy or mining) or in certain geographic regions or countries. |
| | The Fund may invest in securities issued by U.S. and foreign governments and companies, and in securities denominated in foreign currencies. The Fund may invest in companies of any size, including small, high growth companies. The Fund also may invest in companies whose shares are being, or recently have been, offered to the public for the first time. |
| | The Fund actively trades its portfolio securities in an attempt to achieve its investment objective. |
99
Principal Investment Strategies and Risks
Huntington Real Strategies Fund
continued
| | The Fund may, from time-to-time, take temporary defensive positions that are inconsistent with the Fund’s principal investment strategies in attempting to respond to adverse market, economic, political or other conditions. In these and in other cases, the Fund may not achieve its investment objective. |
| | For more information about the Fund’s investment strategies, please see “Additional Investment Strategies.” |
| | For more detail regarding the securities in which the Fund may invest, please see the section entitled, “Securities in Which the Funds Invest” in the Funds’ SAI. |
What are the main risks of investing in this Fund? | Loss of money is a risk of investing in the Fund. The Fund may also be significantly affected by “Government Intervention and Extreme Volatility Risk,” as described in the “Investment Risks” section in the Funds’ SAI. In addition, your investment in the Fund may be subject to the following principal risks: |
Market Risk. The risk that a security’s market value may decline, sometimes rapidly and unpredictably. These fluctuations may cause a security to be worth less than the price the Fund originally paid for it, or less than it was worth at an earlier time. Market risk may affect a single issuer, industrial sector or the market as a whole. For fixed income securities, market risk is largely influenced by changes in interest rates. Rising interest rates typically cause the value of bonds to decrease, while falling rates typically cause the value of bonds to increase.
Equity Securities Risk. Equity securities include common, preferred and convertible preferred stocks and securities the values of which are tied to the price of stocks, such as rights, warrants and convertible debt securities. Common and preferred stocks represent equity ownership in a company. Stock markets are volatile. The price of equity securities will fluctuate and can decline, reducing the value of a Fund. The price of equity securities fluctuates based on actual or perceived changes in a company’s financial condition and overall market and economic conditions. The value of equity securities purchased by a Fund could decline if the financial condition of the companies in which the Fund is invested in declines or if overall market and economic conditions deteriorate.
Even funds that invest in high quality or “blue chip” equity securities or securities of established companies with large market capitalizations (which generally have strong financial characteristics) can be negatively impacted by poor overall market and economic conditions. Companies with large market capitalizations may also have less growth potential than smaller companies and may be able to react less quickly to changes in the marketplace.
The Funds may maintain substantial exposure to equities and generally will not attempt to time the market. Because of this exposure, the possibility that stock market prices in general will decline over short or extended periods subjects the Funds to unpredictable declines in the value of its investments, as well as periods of poor performance.
Investment Style Risk. A particular type of investment in which a Fund invests (such as small cap value stocks or large-cap growth stocks) may underperform other asset classes or the overall market. Individual
100
Principal Investment Strategies and Risks
Huntington Real Strategies Fund
continued
market segments tend to go through cycles of performing better or worse than other market segments. These periods may last as long as several years. Additionally, a particular market segment could fall out of favor with investors, causing a Fund that focuses on that market segment to underperform those that favor other kinds of securities.
Agriculture Risk. The Fund’s investments in agriculture-related companies are subject to the same risks as direct investments in agricultural commodities. Agricultural commodity prices rise and fall in response to many factors, including: drought, floods, weather, diseases, embargoes, tariffs and international economic, political and regulatory developments. These factors could lead to significant and rapid fluctuations in the value of ETCFs investing in agricultural commodities or in derivative contracts for agricultural commodities. Fluctuations in prices for agricultural commodities also may affect indirectly the value of companies whose businesses depend upon or otherwise relate to such agricultural commodities.
Counterparty Risk. The value of the Fund’s investments may be adversely affected if an issuer’s securities experience a credit downgrade; an issuer or guarantor of an investment held by the Fund fails to pay an obligation on a timely basis, otherwise defaults or is perceived by other investors to be less creditworthy; or a counterparty to a derivatives or other transaction with the Fund files for bankruptcy, becomes insolvent, or otherwise becomes unable or unwilling to honor its obligation to the Fund.
Class/Sector/Region Focus Risk. When the Fund invests more than 25% of its net assets in a particular asset class (such as real estate-related or commodities-related securities), or securities of issuers within a particular business sector or geographic region, it is subject to increased risk. Performance will generally depend on the performance of the class, sector or region, which may differ in direction and degree from that of the overall U.S. stock or bond markets. In addition, financial, economic, business and political developments affecting the class, sector or region may have a greater effect on the Fund than it would on a fund that did not focus on the sector, asset class or region.
Commodities-Related Investment Risk. Neither the Advisor nor the Fund anticipate being subject to registration or regulation by the Commodities Futures Trading Commission (“CFTC”) as a commodity pool, commodity pool operator (“CPO”) or a commodity trading adviser (“CTA”) under the Commodity Exchange Act (“CEA”) as a result of the Fund’s commodities-related investments. However, should the Advisor or the Fund be deemed to fall under these categories, then the Advisor would be subject to registration and regulation in its capacity as the Fund’s CPO or CTA, and the Fund would be subject to regulation as a commodity pool under the CEA. A Fund may incur additional expenses as a result of the registration and regulation obligations and certain investments may be limited or restricted.
Credit Risk. Credit risk is the possibility that an issuer may default on a security by failing to pay interest or principal when due. If an issuer defaults, a Fund will lose money.
101
Principal Investment Strategies and Risks
Huntington Real Strategies Fund
continued
Many fixed income securities receive credit ratings from NRSROs, which assign ratings to securities by assessing the likelihood of issuer default. Lower credit ratings correspond to higher credit risk. If a security has not received a rating, the Fund must rely entirely upon the Advisor’s credit assessment.
Fixed income securities generally compensate for greater credit risk by paying interest at a higher rate. The difference between the yield of a security and the yield of a U.S. Treasury security with a comparable maturity (the spread) measures the additional interest paid for risk. Spreads may increase generally in response to adverse economic or market conditions. A security’s spread may also increase if the security’s rating is lowered, or the security is perceived to have an increased credit risk. An increase in the spread will cause the price of the security to decline.
Energy Risk. To the extent that a Fund invests in energy-related companies, it takes on additional risks. The Fund faces the risk that the earnings, dividends, and stock prices of energy companies may be greatly affected by changes in the prices and supplies of oil and other energy fuels. Prices and supplies of energy can fluctuate significantly over short and long periods because of a variety of factors, including: changes in international politics; policies of the Organization of Petroleum Exporting Countries (“OPEC”); relationships among OPEC members and between OPEC and oil-importing nations; energy conservation; the regulatory environment; government tax policies; development of alternative sources of energy; and the economic growth and stability of the key energy-consuming countries. These factors could lead to substantial fluctuations in the value of the Fund’s energy-related investments, particularly ETCFs that invest in derivative contracts for fossil fuels and electricity and MLPs engaged in their production or generation, including significant and rapid increases and decreases in value from time to time.
Exchange-Traded Funds Risk. An investment in an exchange-traded fund (ETF) generally presents the same primary risks as an investment in an open-end investment company (mutual fund) that has the same investment objectives, strategies, and policies. The price of an ETF can fluctuate up or down, and the Fund could lose money investing in an ETF if the prices of the securities owned by the ETF go down. In addition, ETFs may be subject to the following risks that do not apply to conventional mutual funds: (i) the market price of an ETF’s shares may trade above or below their net asset value; (ii) an active trading market for an ETF’s shares may not develop or be maintained; or (iii) trading of an ETF’s shares may be halted if the listing exchange’s officials deem such action appropriate, the shares are delisted from the exchange, or the activation of market-wide “circuit breakers” (which are tied to large decreases in stock prices) halts stock trading generally.
Fee Layering Risk. The Fund is an actively managed investment fund that has management and other fees associated with its operations. The Fund may invest some or all of its assets in index-based securities that separately have their own management and other fees (such as ETCFs and investment companies), and would be borne by the Fund as an
102
Principal Investment Strategies and Risks
Huntington Real Strategies Fund
continued
investor. This could cause the Fund’s performance to be lower than if it were to invest directly in the securities underlying such index-based securities.
Investment Company Risk. Mutual fund portfolios bear expenses for advisory fees and operational expenses. The Fund will bear these expenses as an investor in underlying funds and, as a result, investors in the Fund may bear higher expenses than a Fund that invests directly in equity or fixed income securities. These estimated expenses of the Fund are disclosed in a separate line in the fee table (Annual Fund Operating Expenses).
Foreign Custodial Services and Related Investment Costs Risk. Foreign custodial services and other costs relating to investment in international securities markets are generally more expensive than in the United States. Such markets have settlement and clearance procedures that differ from those in the United States. In certain markets there have been times when settlements have been unable to keep pace with the volume of securities transactions, making it difficult to conduct such transactions. Inability of a Fund to make intended securities purchases due to settlement problems could cause a Fund to miss attractive investment opportunities. Inability to dispose of a portfolio security caused by settlement problems could result in losses to a Fund due to a subsequent decline in value of the portfolio security. In addition, security settlement and clearance procedures in some emerging market countries may not fully protect a Fund against loss or theft of its assets.
Foreign Investment/Currency Risk. Compared with investing in the United States, investing in foreign markets involves a greater degree and variety of risk. Investors in international or foreign markets may face delayed settlements, currency controls and adverse economic developments as well as higher overall transaction costs. In addition, fluctuations in the U.S. dollar’s value versus other currencies may erode or reverse gains from investments denominated in foreign currencies or widen losses. Exchange rates for currencies fluctuate daily. Foreign governments may expropriate assets, impose capital or currency controls, impose punitive taxes, impose limits on ownership or nationalize a company or industry. Any of these actions could have a severe effect on security prices and impair the fund’s ability to bring its capital or income back to the U.S. Currency exchange rate fluctuations also may impair an issuer’s ability to repay U.S. dollar denominated debt, thereby increasing credit risk of such debt. Finally, the value of foreign securities may be affected by incomplete, less frequent or inaccurate financial information about their issuers, social upheavals or political actions ranging from tax code changes to governmental collapse. Foreign companies may also receive less coverage than U.S. companies by market analysts and the financial press. In addition, foreign countries may lack uniform accounting, auditing and financial reporting standards or regulatory requirements comparable to those applicable to U.S. companies. These risks are greater in emerging markets. The combination of currency risk and market risk tends to make the value of securities traded in foreign markets more volatile than securities traded exclusively in the United States.
103
Principal Investment Strategies and Risks
Huntington Real Strategies Fund
continued
Inflation-Protected Securities “IPS” Risk. While IPS adjust in response to inflation as measured by a specific price index, the value of these securities generally may still decline in response to an increase in real interest rates. Real interest rates are measured by subtracting the expected rate of inflation from the nominal interest rate of fixed income securities. The value of IPS may also fall if there is a decline in the price index (deflation), which generally will reduce any previous adjustments made to the IPS. IPS may also underperform other fixed income securities if inflationary expectations exceed the rate of inflation measured by the price index.
In addition, any increase in principal value of an IPS caused by an increase in the price index is taxable in the year the increase occurs, even though the Fund generally will not receive cash representing the increase at that time. As a result, the Fund could be required at times to liquidate other investments, including when it is not advantageous to do so, in order to satisfy its distribution requirements as a regulated investment company under the Internal Revenue Code. Also, to the extent that the Fund invests in IPS, income distributions are more likely to fluctuate. There is no assurance that the rate of inflation measured by the relevant price index will correspond to the inflation experienced by an investor.
Interest Rate Risk. Prices of fixed income securities rise and fall in response to changes in the interest rate paid by similar securities. Generally, when interest rates rise, prices of fixed income securities fall. However, market factors, such as the demand for particular fixed income securities, may cause the price of certain fixed income securities to fall while the prices of other securities rise or remain unchanged.
Interest rate changes have a greater effect on the price of fixed income securities with longer durations. Duration measures the price sensitivity of a fixed income security to changes in interest rates.
Market Capitalization Risk. Stocks fall into three broad market capitalization categories — large, medium and small. A Fund that invests primarily in one of these categories carries the risk that due to current market conditions that category may be out of favor with investors. If valuations of large capitalization companies appear to be greatly out of proportion to the valuations of small or medium capitalization companies, investors may migrate to the stocks of small and medium-sized companies. Larger, more established companies may also be unable to respond quickly to new competitive challenges such as changes in technology and consumer tastes. Many larger companies also may not be able to attain the high growth rate of successful smaller companies, especially during extended periods of economic expansion. Investing in medium and small capitalization companies may be subject to special risks associated with narrower product lines, more limited financial resources, fewer experienced managers, dependence on a few key employees, and a more limited trading market for their stocks, as compared with larger companies. In addition, securities of these companies are subject to the risk that, during certain periods, the liquidity of particular issuers or industries will shrink or disappear with little forewarning as a result of adverse
104
Principal Investment Strategies and Risks
Huntington Real Strategies Fund
continued
economic or market conditions, or adverse investor perceptions, whether or not accurate. Securities of medium and smaller capitalization issuers may therefore be subject to greater price volatility and may decline more significantly in market downturns than securities of larger companies. Smaller and medium capitalization issuers may also require substantial additional capital to support their operations, to finance expansion or to maintain their competitive position; and may have substantial borrowings or may otherwise have a weak financial condition, and may be susceptible to bankruptcy. Transaction costs for these investments are often higher than those of larger capitalization companies. There is typically less publicly available information about small capitalization companies. Some small and medium capitalization companies also may be relatively new issuers, which carries risks in addition to the risks of other medium and small capitalization companies. New issuers may be more speculative because such companies are relatively unseasoned. These companies will often be involved in the development or marketing of a new product with no established market, which could lead to significant losses.
Mineral and Mining Risk. The Fund’s investments in mineral or mining-related companies are subject to the same risks as direct investments in minerals. Mineral prices rise and fall in response to many factors, including: economic cycles; changes in inflation or expectations about inflation in various countries; interest rates; currency fluctuations; metal sales by governments, central banks, or international agencies; investment speculation; resource availability; fluctuations in industrial and commercial supply and demand; government regulation of the metals and materials industries; and government prohibitions or restrictions on the private ownership of certain precious and rare metals and minerals. These factors could lead to significant and rapid fluctuations in the value of mining companies and ETCFs investing in mineral commodities or in derivative contracts for mineral commodities. Fluctuations in prices for mineral commodities also may affect indirectly the value of other companies whose businesses depend upon or otherwise relate to such mineral commodities.
Real Estate/REIT Risk. The Fund’s investments in REITs are subject to the same risks as direct investments in real estate. The real estate industry is particularly sensitive to economic downturns. The value of REITs and other real estate-related investments is sensitive to changes in real estate values and rental income, property taxes, interest rates, tax and regulatory requirements, overbuilding, extended vacancies of properties and the issuer’s management skills. In the event of a default by an underlying tenant or borrower, a REIT could experience delays in enforcing its rights as a lessor or mortgagee and may incur substantial costs associated with protecting its investments. In addition, the value of a REIT can depend on the structure of and cash flow generated by the REIT. Also, REITs may have limited financial resources, may trade less frequently and in limited volume and may be more volatile than other securities.
For more information about risks, please see “Investment Risks” in the Funds’ SAI.
105
Principal Investment Strategies and Risks
Huntington Situs Fund
Investment Strategy | The Fund’s investment objective is to seek long-term capital appreciation. |
The Fund normally pursues this objective by investing primarily in equity securities of companies whose geographical, political and/or demographic situs positions them to outperform other companies. Equity securities include common stocks, preferred stocks and securities convertible into common stocks such as convertible bonds and convertible preferred stocks which, if rated by a Nationally Recognized Statistical Ratings Organization (“NRSRO”), will be investment-grade at the time of investment. If a security has not received a rating from an NRSRO, the Fund must rely entirely upon the Advisor’s credit assessment that the security is comparable to investment-grade.
Under normal market conditions, the Advisor invests at least 80% of the Fund’s assets in equity securities. The Fund may also invest up to 20% of its assets in the equity securities of foreign issuers, including American Depositary Receipts (“ADRs”), Global Depositary Receipts (“GDRs”) and European Depositary Receipts (“EDRs”). In managing the Fund’s portfolio, the Advisor utilizes a screening process that identifies companies based on situs, which is one or more geographical locations that are positioned and likely to allow the companies to outperform those in other locations. Examples of situs advantages include favorable political, social or economic factors or population demographics, such as a state or country that is reducing taxes or experiencing beneficial demographic changes. For instance, the Fund may invest in a certain type of company located in a state that is reducing its business tax because the tax reduction may result in lower costs for the company and allow it to sell products more competitively at lower prices or realize a higher profit on sales. Similarly, if a state is experiencing a growing population, then certain types of financial services companies or real estate-related investments may benefit from the service needs and housing demands of this population growth. Additionally, the Advisor emphasizes both growth and value in seeking companies with above-average growth potential or with temporarily depressed prices. As a result, the Fund invests in a blend of both “growth” and “value” stocks. While the Fund may invest in companies of any size, smaller companies tend to be best positioned to outperform due to situs factors.
The Advisor also employs fundamental analysis, valuation techniques, and technical analysis. Fundamental analysis focuses on qualitative aspects of the company’s product, management, and competitive strategy. Valuation techniques include quantitative screens to review historical earnings, revenue, and cash flow. Technical analysis will be deployed as it relates to the timing of trading the securities. This process is utilized to identify the most attractive companies and to evaluate the growth potential of these companies. On an ongoing basis, the Advisor monitors the Fund’s existing positions to determine benefits of retaining a particular security.
The Advisor applies a “top down” strategy in stock selection (analyzing the impact of economic trends before considering the performance of individual stocks) to evaluate broad economic trends, anticipate shifts in the business cycle, and determine which sectors, industries or markets may provide relatively higher performance. The Advisor also uses portfolio optimization programs to enhance risk/return potential. These programs analyze and characterize the industry exposure of multi-industry companies in an attempt to balance the industry diversification of the portfolio to achieve certain risk/return
106
Principal Investment Strategies and Risks
Huntington Situs Fund
continued
models. The Fund’s foreign investments are generally in developed countries. Companies in developed countries may be grouped together in broad categories called business sectors. The Advisor may emphasize certain business sectors in the portfolio that exhibit stronger growth potential or higher profit margins. The Fund may choose to invest up to 20% of its assets in companies located in emerging markets. In selecting emerging market countries, the Advisor reviews the country’s economic outlook, its interest and inflation rates, and the political and foreign exchange risk of investing in a particular country. The Advisor then analyzes companies located in particular emerging market countries.
The Fund may, from time to time, take temporary defensive positions that are inconsistent with the Fund’s principal investment strategies in attempting to respond to adverse market, economic, political or other conditions. In these and in other cases, the Fund may not achieve its investment objective.
The Fund may also invest in certain other equity securities in addition to those described above, although none are anticipated to be principal investments.
For more detail regarding the securities in which the Fund may invest, please see the section entitled, “Securities in Which the Funds Invest” in the Funds’ SAI.
What are the main risks of investing in this Fund? | Loss of money is a risk of investing in the Fund. The Fund may also be significantly affected by “Government Intervention and Extreme Volatility Risk,” as described in the “Investment Risks” section in the Funds’ SAI. In addition, your investment in the Fund may be subject to the following principal risks: |
Market Capitalization Risk. Stocks fall into three broad market capitalization categories — large, medium and small. A Fund that invests primarily in one of these categories carries the risk that due to current market conditions that category may be out of favor with investors. If valuations of large capitalization companies appear to be greatly out of proportion to the valuations of small or medium capitalization companies, investors may migrate to the stocks of small and medium-sized companies. Larger, more established companies may also be unable to respond quickly to new competitive challenges such as changes in technology and consumer tastes. Many larger companies also may not be able to attain the high growth rate of successful smaller companies, especially during extended periods of economic expansion. Investing in medium and small capitalization companies may be subject to special risks associated with narrower product lines, more limited financial resources, fewer experienced managers, dependence on a few key employees, and a more limited trading market for their stocks, as compared with larger companies. In addition, securities of these companies are subject to the risk that, during certain periods, the liquidity of particular issuers or industries will shrink or disappear with little forewarning as a result of adverse economic or market conditions, or adverse investor perceptions, whether or not accurate. Securities of medium and smaller capitalization issuers may therefore be subject to greater price volatility and may decline more significantly in market downturns than securities of larger companies. Smaller and medium capitalization issuers may also require
107
Principal Investment Strategies and Risks
Huntington Situs Fund
continued
substantial additional capital to support their operations, to finance expansion or to maintain their competitive position; and may have substantial borrowings or may otherwise have a weak financial condition, and may be susceptible to bankruptcy. Transaction costs for these investments are often higher than those of larger capitalization companies. There is typically less publicly available information about small capitalization companies. Some small and medium capitalization companies also may be relatively new issuers, which carries risks in addition to the risks of other medium and small capitalization companies. New issuers may be more speculative because such companies are relatively unseasoned. These companies will often be involved in the development or marketing of a new product with no established market, which could lead to significant losses.
Market Risk. The risk that a security’s market value may decline, sometimes rapidly and unpredictably. These fluctuations may cause a security to be worth less than the price the Fund originally paid for it, or less than it was worth at an earlier time. Market risk may affect a single issuer, industrial sector or the market as a whole. For fixed income securities, market risk is largely influenced by changes in interest rates. Rising interest rates typically cause the value of bonds to decrease, while falling rates typically cause the value of bonds to increase.
Equity Securities Risk. Equity securities include common, preferred and convertible preferred stocks and securities the values of which are tied to the price of stocks, such as rights, warrants and convertible debt securities. Common and preferred stocks represent equity ownership in a company. Stock markets are volatile. The price of equity securities will fluctuate and can decline, reducing the value of a Fund. The price of equity securities fluctuates based on actual or perceived changes in a company’s financial condition and overall market and economic conditions. The value of equity securities purchased by a Fund could decline if the financial condition of the companies in which the Fund is invested in declines or if overall market and economic conditions deteriorate.
Even Funds that invest in high quality or “blue chip” equity securities or securities of established companies with large market capitalizations (which generally have strong financial characteristics) can be negatively impacted by poor overall market and economic conditions. Companies with large market capitalizations may also have less growth potential than smaller companies and may be able to react less quickly to changes in the marketplace.
The Funds may maintain substantial exposure to equities and generally will not attempt to time the market. Because of this exposure, the possibility that stock market prices in general will decline over short or extended periods subjects the Funds to unpredictable declines in the value of its investments, as well as periods of poor performance.
Investment Style Risk. The risk that the particular type of investment in which a Fund invests (such as small cap value stocks or large-cap growth stocks) may underperform other asset classes or the overall market. Individual market segments tend to go through cycles of performing better or worse than other market segments. These periods
108
Principal Investment Strategies and Risks
Huntington Situs Fund
continued
may last as long as several years. Additionally, a particular market segment could fall out of favor with investors, causing a Fund that focuses on that market segment to underperform those that favor other kinds of securities.
Foreign Investment/Currency Risk. Compared with investing in the United States, investing in foreign markets involves a greater degree and variety of risk. Investors in international or foreign markets may face delayed settlements, currency controls and adverse economic developments as well as higher overall transaction costs. In addition, fluctuations in the U.S. dollar’s value versus other currencies may erode or reverse gains from investments denominated in foreign currencies or widen losses. Exchange rates for currencies fluctuate daily. Foreign governments may expropriate assets, impose capital or currency controls, impose punitive taxes, impose limits on ownership or nationalize a company or industry. Any of these actions could have a severe effect on security prices and impair the fund’s ability to bring its capital or income back to the U.S. Currency exchange rate fluctuations also may impair an issuer’s ability to repay U.S. dollar denominated debt, thereby increasing credit risk of such debt. Finally, the value of foreign securities may be affected by incomplete, less frequent or inaccurate financial information about their issuers, social upheavals or political actions ranging from tax code changes to governmental collapse. Foreign companies may also receive less coverage than U.S. companies by market analysts and the financial press. In addition, foreign countries may lack uniform accounting, auditing and financial reporting standards or regulatory requirements comparable to those applicable to U.S. companies. These risks are greater in emerging markets. The combination of currency risk and market risk tends to make the value of securities traded in foreign markets more volatile than securities traded exclusively in the United States.
Foreign Custodial Services and Related Investment Costs Risk. Foreign custodial services and other costs relating to investment in international securities markets are generally more expensive than in the United States. Such markets have settlement and clearance procedures that differ from those in the United States. In certain markets there have been times when settlements have been unable to keep pace with the volume of securities transactions, making it difficult to conduct such transactions. Inability of a Fund to make intended securities purchases due to settlement problems could cause a Fund to miss attractive investment opportunities. Inability to dispose of a portfolio security caused by settlement problems could result in losses to a Fund due to a subsequent decline in value of the portfolio security. In addition, security settlement and clearance procedures in some emerging market countries may not fully protect a Fund against loss or theft of its assets.
Emerging Markets Risk. In addition to all of the risks of investing in foreign developed markets, emerging market securities involve risks attendant to less mature and stable governments and economies, such as lower trading volume, trading suspension, security price volatility, repatriation restrictions, government confiscation, inflation, deflation, currency devaluation and adverse government regulations of industries
109
Principal Investment Strategies and Risks
Huntington Situs Fund
continued
or markets. As a result of these risks, the prices of emerging market securities tend to be more volatile than the securities of issuers located in developed markets. Emerging market economies may also experience more severe downturns (with corresponding currency devaluations) than developed economies.
Call Risk. Call risk is the possibility that an issuer may redeem a fixed income security before maturity (a call) at a price below its current market price. An increase in the likelihood of a call may reduce the security’s price.
If a fixed income security is called, a Fund may have to reinvest the proceeds in other fixed income securities with lower interest rates, higher credit risks, or other less favorable characteristics.
Credit Risk. Credit risk is the possibility that an issuer may default on a security by failing to pay interest or principal when due. If an issuer defaults, a Fund will lose money.
Many fixed income securities receive credit ratings from NRSROs, which assign ratings to securities by assessing the likelihood of issuer default. Lower credit ratings correspond to higher credit risk. If a security has not received a rating, the Fund must rely entirely upon the Advisor’s credit assessment.
Fixed income securities generally compensate for greater credit risk by paying interest at a higher rate. The difference between the yield of a security and the yield of a U.S. Treasury security with a comparable maturity (the spread) measures the additional interest paid for risk. Spreads may increase generally in response to adverse economic or market conditions. A security’s spread may also increase if the security’s rating is lowered, or the security is perceived to have an increased credit risk. An increase in the spread will cause the price of the security to decline.
For more information about risks, please see “Investment Risks” in the Funds’ SAI.
110
Principal Investment Strategies and Risks
Huntington Asset Allocation Funds Overview
There are three “Asset Allocation Funds”: Huntington Balanced Allocation Fund, Huntington Conservative Allocation Fund and Huntington Growth Allocation Fund. Each Asset Allocation Fund is a “fund of funds” that invests all of its assets in other Huntington Funds and Huntington Strategy Shares which are also managed by the Advisor (“Underlying Funds”), excluding Huntington Real Strategies Fund, Huntington Tax-Free Money Market Fund, Huntington Ohio Municipal Money Market Fund; and Huntington VA Dividend Capture Fund, Huntington VA International Equity Fund, Huntington VA Situs Fund and (the “Huntington VA Funds”). The Asset Allocation Funds may also invest in unaffiliated mutual funds and ETFs.
Because investors have different investment goals, risk tolerances, investment time horizons and financial circumstances, the Asset Allocation Funds offer three distinct, comprehensive investment programs designed for differing investment orientations. Each Asset Allocation Fund has a target percentage allocation among three kinds of Underlying Funds: those that invest primarily in equity securities (“Underlying Equity Funds”), those that invest primarily in fixed-income securities (“Underlying Income Funds”) and those that invest primarily in money market securities (“Underlying Money Market Funds”). The goals, strategies and risks of each Underlying Fund are set forth elsewhere in this prospectus.
The Asset Allocation Funds offer Class A Shares. Each Asset Allocation Fund invests exclusively in Institutional Shares of Underlying Funds, with the exception of Underlying Huntington Strategy Shares which offer exchange-traded funds and are also managed by the Advisor. Institutional Shares are sold without any sales charge and are not subject to distribution or Rule 12b-1 fees. Huntington Strategy Shares are sold without any sales charge and, pursuant to a Distribution Plan, the Funds may pay a 12b-1 fee not to exceed 0.25% per year of the Fund’s average daily net assets. No 12b-1 fee is currently paid by the Funds of the Huntington Strategy Shares and the Fund’s Board of Trustees (“Board”) has not approved any payments under the plan. Institutional Shares charge a 25 basis point shareholder servicing fee.
Each Asset Allocation Fund is monitored daily, and to maintain target allocations in the Underlying Funds, cash flow for each Asset Allocation Fund will be directed to its Underlying Funds that most deviate from the target. Quarterly, the Advisor may also rebalance each Fund’s investment allocation to maintain its target allocations. The Advisor may from time to time adjust the percentage of assets invested in any specific Underlying Fund held by an Asset Allocation Fund. Such adjustments may be made to increase or decrease an Asset Allocation Fund’s holdings of particular asset classes, such as common stocks of foreign issuers, or to adjust Fund quality or the duration of fixed-income securities. In adjustments, changes may be made to reflect changes in the investment market and economic environment.
The investment performance of each Asset Allocation Fund will reflect both the Advisor’s allocation decisions with respect to the Underlying Funds and its investment decisions made on behalf of the Underlying Funds.
111
Principal Investment Strategies and Risks
Huntington Balanced Allocation Fund
Investment Strategy | The Fund’s investment objective is to seek current income and moderate appreciation of capital. The Fund seeks to achieve its objective by investing in a combination of underlying Huntington Funds and Huntington Strategy Shares which are also managed by the Advisor, as well as unaffiliated mutual funds and ETFs, excluding Huntington Real Strategies Fund, Huntington Tax-Free Money Market Fund, Huntington Ohio Municipal Money Market Fund and the Huntington VA Funds, with an asset allocation target of 60% Equity, 40% Income, including 0-15% in Money Market instruments. Utilizing optimization software and both internal and external research, the Advisor analyzes the economy and the capital markets to determine the optimal allocations to the various Underlying Funds. The Equity portion of the Fund’s portfolio is significantly weighted to large-cap domestic equity funds and international equity funds, but also includes weightings to mid-cap equities and small-cap equities. The Advisor allocates the Income portion of the Fund’s portfolio to the Underlying Funds based on the Advisor’s interest rate and fixed income forecasts and its analysis of credit quality, sector emphasis and the duration of the portfolio. The Advisor reviews the allocations to Underlying Funds within the stated targets on an ongoing basis and adjusts them based on the analysis of current research and macroeconomic factors. |
For more detail regarding the securities in which the Fund may invest, please see the section entitled, “Securities in Which the Funds Invest” in the Funds’ SAI.
What are the main risks of investing in this Fund? | Loss of money is a risk of investing in the Fund. The Fund may also be significantly affected by “Government Intervention and Extreme Volatility Risk,” as described in the “Investment Risks” section in the Funds’ SAI. In addition, your investment in the Fund may be subject to the following principal risks: |
Investment Company Risk. Mutual fund portfolios bear expenses for advisory fees and operational expenses. The Fund and the Underlying Funds in which it will invest will each bear these expenses, so investors in the Fund may bear higher expenses than a fund that invests directly in equity or fixed-income securities. These estimated expenses of the Underlying Funds are disclosed in a separate line in the fee table (Annual Fund Operating Expenses).
Allocation Risk. Because the Asset Allocation Funds have set limitations on the amount of assets that may be allocated to Underlying Equity Funds, Underlying Income Funds and Underlying Money Market Funds, respectively, the Asset Allocation Funds have less flexibility in their investment strategies than funds that are not subject to such limitations. In addition, the asset allocations made by the Asset Allocation Fund may not effectively decrease risk or increase returns for investors.
Advisor’s Potential Conflict Risk. In managing the Asset Allocation Funds, the Advisor has sole discretion in selecting and substituting the Underlying Funds in which the Asset Allocation Funds will invest at any given time. Because the Advisor is primarily responsible for managing the Asset Allocation Funds and certain of the Underlying Funds, the Advisor is subject to conflict of interest with respect to how it allocates the Asset Allocation Funds’ assets among the various Underlying Funds. The conflict primarily arises because the expenses paid by the Advisor in connection with its management of certain of the Underlying Funds
112
Principal Investment Strategies and Risks
Huntington Balanced Allocation Fund
continued
could be higher than expenses paid for other Underlying Funds, likewise, fees payable to the Advisor and/or its affiliates (primarily management fees) by some Underlying Funds are higher than the fees payable by other Underlying Funds. See “Fees Paid to Advisor and Affiliates” in the Fund’s SAI.
Interest Rate Risk. Prices of fixed income securities rise and fall in response to changes in the interest rate paid by similar securities. Generally, when interest rates rise, prices of fixed income securities fall. However, market factors, such as the demand for particular fixed income securities, may cause the price of certain fixed income securities to fall while the prices of other securities rise or remain unchanged.
Interest rate changes have a greater effect on the price of fixed income securities with longer durations. Duration measures the price sensitivity of a fixed income security to changes in interest rates.
Equity Securities Risk. Equity securities include common, preferred and convertible preferred stocks and securities the values of which are tied to the price of stocks, such as rights, warrants and convertible debt securities. Common and preferred stocks represent equity ownership in a company. Stock markets are volatile. The price of equity securities will fluctuate and can decline, reducing the value of a Fund. The price of equity securities fluctuates based on actual or perceived changes in a company’s financial condition and overall market and economic conditions. The value of equity securities purchased by a Fund could decline if the financial condition of the companies in which the Fund is invested in declines or if overall market and economic conditions deteriorate.
Even funds that invest in high quality or “blue chip” equity securities or securities of established companies with large market capitalizations (which generally have strong financial characteristics) can be negatively impacted by poor overall market and economic conditions. Companies with large market capitalizations may also have less growth potential than smaller companies and may be able to react less quickly to changes in the marketplace.
The Fund may maintain substantial exposure to equities and generally will not attempt to time the market. Because of this exposure, the possibility that stock market prices in general will decline over short or extended periods subjects the Funds to unpredictable declines in the value of its investments, as well as periods of poor performance.
Market Capitalization Risk. Stocks fall into three broad market capitalization categories — large, medium and small. A Fund that invests primarily in one of these categories carries the risk that due to current market conditions that category may be out of favor with investors. If valuations of large capitalization companies appear to be greatly out of proportion to the valuations of small or medium capitalization companies, investors may migrate to the stocks of small and medium-sized companies. Larger, more established companies may also be unable to respond quickly to new competitive challenges such as changes in technology and consumer tastes. Many larger companies also may not be able to attain the high growth rate of
113
Principal Investment Strategies and Risks
Huntington Balanced Allocation Fund
continued
successful smaller companies, especially during extended periods of economic expansion. Investing in medium and small capitalization companies may be subject to special risks associated with narrower product lines, more limited financial resources, fewer experienced managers, dependence on a few key employees, and a more limited trading market for their stocks, as compared with larger companies. In addition, securities of these companies are subject to the risk that, during certain periods, the liquidity of particular issuers or industries will shrink or disappear with little forewarning as a result of adverse economic or market conditions, or adverse investor perceptions, whether or not accurate. Securities of medium and smaller capitalization issuers may therefore be subject to greater price volatility and may decline more significantly in market downturns than securities of larger companies. Smaller and medium capitalization issuers may also require substantial additional capital to support their operations, to finance expansion or to maintain their competitive position; and may have substantial borrowings or may otherwise have a weak financial condition, and may be susceptible to bankruptcy. Transaction costs for these investments are often higher than those of larger capitalization companies. There is typically less publicly available information about small capitalization companies. Some small and medium capitalization companies also may be relatively new issuers, which carries risks in addition to the risks of other medium and small capitalization companies. New issuers may be more speculative because such companies are relatively unseasoned. These companies will often be involved in the development or marketing of a new product with no established market, which could lead to significant losses.
Market Risk. The risk that a security’s market value may decline, sometimes rapidly and unpredictably. These fluctuations may cause a security to be worth less than the price the Fund originally paid for it, or less than it was worth at an earlier time. Market risk may affect a single issuer, industrial sector or the market as a whole. For fixed income securities, market risk is largely influenced by changes in interest rates. Rising interest rates typically cause the value of bonds to decrease, while falling rates typically cause the value of bonds to increase.
Growth Investing Risk. Due to their relatively high valuations, growth stocks are typically more volatile than value stocks. For instance, the price of a growth stock may experience a larger decline on a forecast of lower earnings, a negative fundamental development, or an adverse market development. Further, growth stocks may not pay dividends or may pay lower dividends than value stocks. This means they depend more on price changes for returns and may be more adversely affected in a down market compared to value stocks that pay higher dividends.
Counterparty Risk. The value of the Fund’s investments may be adversely affected if an issuer’s securities experience a credit downgrade; an issuer or guarantor of an investment held by the Fund fails to pay an obligation on a timely basis, otherwise defaults or is perceived by other investors to be less creditworthy; or a counterparty to a derivatives or other transaction with the Fund files for bankruptcy, becomes insolvent, or otherwise becomes unable or unwilling to honor its obligation to the Fund.
114
Principal Investment Strategies and Risks
Huntington Balanced Allocation Fund
continued
Credit Risk. Credit risk is the possibility that an issuer may default on a security by failing to pay interest or principal when due. If an issuer defaults, a Fund will lose money.
Many fixed income securities receive credit ratings from NRSROs, which assign ratings to securities by assessing the likelihood of issuer default. Lower credit ratings correspond to higher credit risk. If a security has not received a rating, the Fund must rely entirely upon the Advisor’s credit assessment.
Fixed income securities generally compensate for greater credit risk by paying interest at a higher rate. The difference between the yield of a security and the yield of a U.S. Treasury security with a comparable maturity (the spread) measures the additional interest paid for risk. Spreads may increase generally in response to adverse economic or market conditions. A security’s spread may also increase if the security’s rating is lowered, or the security is perceived to have an increased credit risk. An increase in the spread will cause the price of the security to decline.
Liquidity Risk. Liquidity risk refers to the possibility that a Fund may not be able to sell a security or close out a derivative contract when it wants to. If this happens, a Fund will be required to continue to hold the security or keep the position open, and a Fund could incur losses. OTC derivative contracts generally carry greater liquidity risk than exchange-traded contracts.
Mortgage-Backed and Asset-Backed Securities Risk. Mortgage-backed securities represent participating interests in pools of residential mortgage loans, some of which are guaranteed by the U.S. Government, its agencies or instrumentalities. However, the guarantee of these types of securities relates to the principal and interest payments and not the market value of such securities. In addition, the guarantee only relates to the mortgage-backed securities held by a Fund and not the purchase of shares of the Fund.
Mortgage-backed securities do not have a fixed maturity and their expected maturities may vary when interest rates rise or fall. An increased rate of prepayments on the Fund’s mortgage-backed securities will result in an unforeseen loss of interest income to the Fund as the Fund may be required to reinvest assets at a lower interest rate. A decreased rate of prepayments lengthens the expected maturity of a mortgage-backed security. The prices of mortgage-backed securities may decrease more than prices of other fixed-income securities when interest rates rise.
Collateralized Mortgage Obligations: A Fund may invest in mortgage-backed securities called collateralized mortgage obligations (“CMOs”). CMOs are issued in separate classes with different stated maturities. As the mortgage pool experiences prepayments, the pool pays off investors in classes with shorter maturities first. By investing in CMOs, a Fund may manage the prepayment risk of mortgage-backed securities. However, prepayments may cause the actual maturity of a CMO to be substantially shorter than its stated maturity.
115
Principal Investment Strategies and Risks
Huntington Balanced Allocation Fund
continued
Asset-Backed Securities: Asset-backed securities include interests in pools of debt securities, commercial or consumer loans, or other receivables. The value of these securities depends on many factors, including changes in interest rates, the availability of information concerning the pool and its structure, the credit quality of the underlying assets, the market’s perception of the servicer of the pool, and any credit enhancement provided. In addition, asset-backed securities have prepayment risks similar to mortgage-backed securities.
Prepayment Risk. Many types of fixed income securities are subject to prepayment risk, including mortgage-backed securities. Prepayment risk occurs when the issuer of a security can repay principal prior to the security’s maturity. This is more likely to occur when interest rates fall. The prepayment of principal can adversely affect the return of the Fund since it may have to reinvest the proceeds in securities that pay a lower interest rate. Generally, mortgage-backed securities compensate for the increased risk associated with prepayments by paying a higher yield. The additional interest paid for risk is measured by the difference between the yield of a mortgage-backed security and the yield of a U.S. Treasury security with a comparable maturity (the spread). An increase in the spread may cause the price of the mortgage-backed security to decline. Spreads generally increase in response to adverse economic or market conditions. Spreads may also increase if the security is perceived to have an increased prepayment risk or is perceived to have less market demand.
Extension Risk. Extension risk is the possibility that rising interest rates may cause anticipated prepayments to occur at a slower than expected rate. This particular risk may effectively change a security which was considered short- or intermediate-term at the time of purchase into a long-term security. Long-term securities generally fluctuate more widely in response to changes in interest rates than the prices of short- or intermediate-term securities.
Call Risk. Call risk is the possibility that an issuer may redeem a fixed income security before maturity (a call) at a price below its current market price. An increase in the likelihood of a call may reduce the security’s price.
If a fixed income security is called, a Fund may have to reinvest the proceeds in other fixed income securities with lower interest rates, higher credit risks, or other less favorable characteristics.
Fee Layering Risk. The Fund is an actively managed investment fund that has management and other fees associated with its operations. The Fund may invest some or all of its assets in index-based securities that separately have their own management and other fees (such as ETCFs and investment companies), and would be borne by the Fund as an investor. This could cause the Fund’s performance to be lower than if it were to invest directly in the securities underlying such index-based securities.
Class/Sector/Region Focus Risk. When a Fund invests more than 25% of its net assets in a particular asset class (such as real estate-related or
116
Principal Investment Strategies and Risks
Huntington Balanced Allocation Fund
continued
commodities-related securities), or securities of issuers within a particular business sector or geographic region, it is subject to increased risk. Performance will generally depend on the performance of the class, sector or region, which may differ in direction and degree from that of the overall U.S. stock or bond markets. In addition, financial, economic, business and political developments affecting the class, sector or region may have a greater effect on these Funds than it would on a fund that did not focus on the sector, asset class or region.
Foreign Investment/Currency Risk. Investors in international or foreign markets may face delayed settlements, currency controls and adverse economic developments as well as higher overall transaction costs. In addition, fluctuations in the U.S. dollar’s value versus other currencies may erode or reverse gains from investments denominated in foreign currencies or widen losses. Exchange rates for currencies fluctuate daily. Foreign governments may expropriate assets, impose capital or currency controls, impose punitive taxes, impose limits on ownership or nationalize a company or industry. Any of these actions could have a severe effect on security prices and impair the fund’s ability to bring its capital or income back to the U.S. Currency exchange rate fluctuations also may impair an issuer’s ability to repay U.S. dollar denominated debt, thereby increasing credit risk of such debt. Finally, the value of foreign securities may be affected by incomplete, less frequent or inaccurate financial information about their issuers, social upheavals or political actions ranging from tax code changes to governmental collapse. Foreign companies may also receive less coverage than U.S. companies by market analysts and the financial press. In addition, foreign countries may lack uniform accounting, auditing and financial reporting standards or regulatory requirements comparable to those applicable to U.S. companies. These risks are greater in emerging markets. The combination of currency risk and market risk tends to make the value of securities traded in foreign markets more volatile than securities traded exclusively in the United States.
Emerging Markets Risk. In addition to all of the risks of investing in foreign developed markets, emerging market securities involve risks attendant to less mature and stable governments and economies, such as lower trading volume, trading suspension, security price volatility, repatriation restrictions, government confiscation, inflation, deflation, currency devaluation and adverse government regulations of industries or markets. As a result of these risks, the prices of emerging market securities tend to be more volatile than the securities of issuers located in developed markets. Emerging market economies may also experience more severe downturns (with corresponding currency devaluations) than developed economies.
Exchange-Traded Funds Risk. An investment in an exchange-traded fund (ETF) generally presents the same primary risks as an investment in an open-end investment company (mutual fund) that has the same investment objectives, strategies, and policies. The price of an ETF can fluctuate up or down, and the Fund could lose money investing in an ETF if the prices of the securities owned by the ETF go down. In addition, ETFs may be subject to the following risks that do not apply to
117
Principal Investment Strategies and Risks
Huntington Balanced Allocation Fund
continued
conventional mutual funds: (i) the market price of an ETF’s shares may trade above or below their net asset value; (ii) an active trading market for an ETF’s shares may not develop or be maintained; or (iii) trading of an ETF’s shares may be halted if the listing exchange’s officials deem such action appropriate, the shares are delisted from the exchange, or the activation of market-wide “circuit breakers” (which are tied to large decreases in stock prices) halts stock trading generally.
Value Investing Risk. Due to their relatively low valuations, value stocks are typically less volatile than growth stocks. For instance, the price of a value stock may experience a smaller increase on a forecast of higher earnings, a positive fundamental development, or positive market development. Further, value stocks tend to have higher dividends than growth stocks. This means they depend less on price changes for returns and may lag behind growth stocks in an up market.
For more information about risks, please see “Investment Risks” in the Funds’ SAI.
118
Principal Investment Strategies and Risks
Huntington Conservative Allocation Fund
Principal Investment Strategy | The Fund’s investment objective is to seek current income. |
The Fund seeks to achieve its objective by investing in a combination of underlying Huntington Funds and Huntington Strategy Shares which are also managed by the Advisor, as well as unaffiliated mutual funds and ETFs, excluding Huntington Real Strategies Fund, Huntington Tax-Free Money Market Fund, Huntington Ohio Municipal Money Market Fund and the Huntington VA Funds, with an asset allocation target of 20% Equity, 80% Income, including 0-15% in Money Market instruments. Utilizing optimization software and both internal and external research, the Advisor analyzes the economy and the capital markets to determine the optimal allocations to the various Underlying Funds. The Equity portion of the Fund’s portfolio is significantly weighted to large-cap domestic equity funds and international equity funds, but also includes weightings to mid-cap equities and small-cap equities. The Advisor allocates the Income portion of the Fund’s portfolio to the Underlying Funds based on the Advisor’s interest rate and fixed income forecasts and its analysis of credit quality, sector emphasis and the duration of the portfolio. The Advisor reviews the allocations to Underlying Funds within the stated targets on an ongoing basis and adjusts them based on the analysis of current research and macroeconomic factors.
For more detail regarding the securities in which the Fund may invest, please see the section entitled, “Securities in Which the Funds Invest” in the Funds’ SAI.
What are the main risks of investing in this Fund? | Loss of money is a risk of investing in the Fund. The Fund may also be significantly affected by “Government Intervention and Extreme Volatility Risk,” as described in the “Investment Risks” section in the Funds’ SAI. In addition, your investment in the Fund may be subject to the following principal risks: |
Investment Company Risk. Mutual fund portfolios bear expenses for advisory fees and operational expenses. The Fund and the Underlying Funds in which it will invest will each bear these expenses, so investors in the Fund may bear higher expenses than a fund that invests directly in equity or fixed-income securities. These estimated expenses of the Underlying Funds are disclosed in a separate line in the fee table (Annual Fund Operating Expenses).
Allocation Risk. Because the Asset Allocation Funds have set limitations on the amount of assets that may be allocated to Underlying Equity Funds, Underlying Income Funds and Underlying Money Market Funds, respectively, the Asset Allocation Funds have less flexibility in their investment strategies than funds that are not subject to such limitations. In addition, the asset allocations made by the Asset Allocation Fund may not effectively decrease risk or increase returns for investors.
Advisor’s Potential Conflict Risk. In managing the Asset Allocation Funds, the Advisor has sole discretion in selecting and substituting the Underlying Funds in which the Asset Allocation Funds will invest at any given time. Because the Advisor is primarily responsible for managing the Asset Allocation Funds and certain of the Underlying Funds, the Advisor is subject to conflict of interest with respect to how it allocates the Asset Allocation Funds’ assets among the various Underlying Funds. The conflict primarily arises because the expenses paid by the Advisor in connection with its management of certain of the Underlying Funds
119
Principal Investment Strategies and Risks
Huntington Conservative Allocation Fund
continued
could be higher than expenses paid for other Underlying Funds, likewise, fees payable to the Advisor and/or its affiliates (primarily management fees) by some Underlying Funds are higher than the fees payable by other Underlying Funds. See “Fees Paid to Advisor and Affiliates.”
Interest Rate Risk. Prices of fixed income securities rise and fall in response to changes in the interest rate paid by similar securities. Generally, when interest rates rise, prices of fixed income securities fall. However, market factors, such as the demand for particular fixed income securities, may cause the price of certain fixed income securities to fall while the prices of other securities rise or remain unchanged.
Interest rate changes have a greater effect on the price of fixed income securities with longer durations. Duration measures the price sensitivity of a fixed income security to changes in interest rates.
Counterparty Risk. The value of the Fund’s investments may be adversely affected if an issuer’s securities experience a credit downgrade; an issuer or guarantor of an investment held by the Fund fails to pay an obligation on a timely basis, otherwise defaults or is perceived by other investors to be less creditworthy; or a counterparty to a derivatives or other transaction with the Fund files for bankruptcy, becomes insolvent, or otherwise becomes unable or unwilling to honor its obligation to the Fund.
Credit Risk. Credit risk is the possibility that an issuer may default on a security by failing to pay interest or principal when due. If an issuer defaults, a Fund will lose money.
Many fixed income securities receive credit ratings from NRSROs, which assign ratings to securities by assessing the likelihood of issuer default. Lower credit ratings correspond to higher credit risk. If a security has not received a rating, the Fund must rely entirely upon the Advisor’s credit assessment.
Fixed income securities generally compensate for greater credit risk by paying interest at a higher rate. The difference between the yield of a security and the yield of a U.S. Treasury security with a comparable maturity (the spread) measures the additional interest paid for risk. Spreads may increase generally in response to adverse economic or market conditions. A security’s spread may also increase if the security’s rating is lowered, or the security is perceived to have an increased credit risk. An increase in the spread will cause the price of the security to decline.
Market Capitalization Risk. Stocks fall into three broad market capitalization categories — large, medium and small. A Fund that invests primarily in one of these categories carries the risk that due to current market conditions that category may be out of favor with investors. If valuations of large capitalization companies appear to be greatly out of proportion to the valuations of small or medium capitalization companies, investors may migrate to the stocks of small and medium-sized companies. Larger, more established companies may also be unable to respond quickly to new competitive challenges such as changes in technology and consumer tastes. Many larger
120
Principal Investment Strategies and Risks
Huntington Conservative Allocation Fund
continued
companies also may not be able to attain the high growth rate of successful smaller companies, especially during extended periods of economic expansion. Investing in medium and small capitalization companies may be subject to special risks associated with narrower product lines, more limited financial resources, fewer experienced managers, dependence on a few key employees, and a more limited trading market for their stocks, as compared with larger companies. In addition, securities of these companies are subject to the risk that, during certain periods, the liquidity of particular issuers or industries will shrink or disappear with little forewarning as a result of adverse economic or market conditions, or adverse investor perceptions, whether or not accurate. Securities of medium and smaller capitalization issuers may therefore be subject to greater price volatility and may decline more significantly in market downturns than securities of larger companies. Smaller and medium capitalization issuers may also require substantial additional capital to support their operations, to finance expansion or to maintain their competitive position; and may have substantial borrowings or may otherwise have a weak financial condition, and may be susceptible to bankruptcy. Transaction costs for these investments are often higher than those of larger capitalization companies. There is typically less publicly available information about small capitalization companies. Some small and medium capitalization companies also may be relatively new issuers, which carries risks in addition to the risks of other medium and small capitalization companies. New issuers may be more speculative because such companies are relatively unseasoned. These companies will often be involved in the development or marketing of a new product with no established market, which could lead to significant losses.
Value Investing Risk. Due to their relatively low valuations, value stocks are typically less volatile than growth stocks. For instance, the price of a value stock may experience a smaller increase on a forecast of higher earnings, a positive fundamental development, or positive market development. Further, value stocks tend to have higher dividends than growth stocks. This means they depend less on price changes for returns and may lag behind growth stocks in an up market.
Mortgage-Backed and Asset-Backed Securities Risk. Mortgage-backed securities represent participating interests in pools of residential mortgage loans, some of which are guaranteed by the U.S. Government, its agencies or instrumentalities. However, the guarantee of these types of securities relates to the principal and interest payments and not the market value of such securities. In addition, the guarantee only relates to the mortgage-backed securities held by a Fund and not the purchase of shares of the Fund.
Mortgage-backed securities do not have a fixed maturity and their expected maturities may vary when interest rates rise or fall. An increased rate of prepayments on the Fund’s mortgage-backed securities will result in an unforeseen loss of interest income to the Fund as the Fund may be required to reinvest assets at a lower interest rate. A decreased rate of prepayments lengthens the expected maturity of a mortgage-backed security. The prices of mortgage-backed securities may decrease more than prices of other fixed-income securities when interest rates rise.
121
Principal Investment Strategies and Risks
Huntington Conservative Allocation Fund
continued
Collateralized Mortgage Obligations: A Fund may invest in mortgage-backed securities called collateralized mortgage obligations (“CMOs”). CMOs are issued in separate classes with different stated maturities. As the mortgage pool experiences prepayments, the pool pays off investors in classes with shorter maturities first. By investing in CMOs, a Fund may manage the prepayment risk of mortgage-backed securities. However, prepayments may cause the actual maturity of a CMO to be substantially shorter than its stated maturity.
Asset-Backed Securities: Asset-backed securities include interests in pools of debt securities, commercial or consumer loans, or other receivables. The value of these securities depends on many factors, including changes in interest rates, the availability of information concerning the pool and its structure, the credit quality of the underlying assets, the market’s perception of the servicer of the pool, and any credit enhancement provided. In addition, asset-backed securities have prepayment risks similar to mortgage-backed securities.
Prepayment Risk. Many types of fixed income securities are subject to prepayment risk, including mortgage-backed securities. Prepayment risk occurs when the issuer of a security can repay principal prior to the security’s maturity. This is more likely to occur when interest rates fall. The prepayment of principal can adversely affect the return of the Fund since it may have to reinvest the proceeds in securities that pay a lower interest rate. Generally, mortgage-backed securities compensate for the increased risk associated with prepayments by paying a higher yield. The additional interest paid for risk is measured by the difference between the yield of a mortgage-backed security and the yield of a U.S. Treasury security with a comparable maturity (the spread). An increase in the spread may cause the price of the mortgage-backed security to decline. Spreads generally increase in response to adverse economic or market conditions. Spreads may also increase if the security is perceived to have an increased prepayment risk or is perceived to have less market demand.
Extension Risk. Extension risk is the possibility that rising interest rates may cause anticipated prepayments to occur at a slower than expected rate. This particular risk may effectively change a security which was considered short- or intermediate-term at the time of purchase into a long-term security. Long-term securities generally fluctuate more widely in response to changes in interest rates than the prices of short- or intermediate-term securities.
Call Risk. Call risk is the possibility that an issuer may redeem a fixed income security before maturity (a call) at a price below its current market price. An increase in the likelihood of a call may reduce the security’s price.
If a fixed income security is called, a Fund may have to reinvest the proceeds in other fixed income securities with lower interest rates, higher credit risks, or other less favorable characteristics.
Fee Layering Risk. The Fund is an actively managed investment fund that has management and other fees associated with its operations. The Fund may invest some or all of its assets in index-based securities that
122
Principal Investment Strategies and Risks
Huntington Conservative Allocation Fund
continued
separately have their own management and other fees (such as ETCFs and investment companies), and would be borne by the Fund as an investor. This could cause the Fund’s performance to be lower than if it were to invest directly in the securities underlying such index-based securities.
Class/Sector/Region Focus Risk. When a Fund invests more than 25% of its net assets in a particular asset class, or securities of issuers within a particular business sector or geographic region, it is subject to increased risk. Performance will generally depend on the performance of the class, sector or region, which may differ in direction and degree from that of the overall U.S. stock or bond markets. In addition, financial, economic, business and political developments affecting the class, sector or region may have a greater effect on these Funds than it would on a fund that did not focus on the sector, asset class or region.
Exchange-Traded Funds Risk. An investment in an exchange-traded fund (ETF) generally presents the same primary risks as an investment in an open-end investment company (mutual fund) that has the same investment objectives, strategies, and policies. The price of an ETF can fluctuate up or down, and the Fund could lose money investing in an ETF if the prices of the securities owned by the ETF go down. In addition, ETFs may be subject to the following risks that do not apply to conventional mutual funds: (i) the market price of an ETF’s shares may trade above or below their net asset value; (ii) an active trading market for an ETF’s shares may not develop or be maintained; or (iii) trading of an ETF’s shares may be halted if the listing exchange’s officials deem such action appropriate, the shares are delisted from the exchange, or the activation of market-wide “circuit breakers” (which are tied to large decreases in stock prices) halts stock trading generally.
Emerging Markets Risk. In addition to all of the risks of investing in foreign developed markets, emerging market securities involve risks attendant to less mature and stable governments and economies, such as lower trading volume, trading suspension, security price volatility, repatriation restrictions, government confiscation, inflation, deflation, currency devaluation and adverse government regulations of industries or markets. As a result of these risks, the prices of emerging market securities tend to be more volatile than the securities of issuers located in developed markets. Emerging market economies may also experience more severe downturns (with corresponding currency devaluations) than developed economies.
Foreign Investment/Currency Risk. Compared with investing in the United States, investing in foreign markets involves a greater degree and variety of risk. Investors in international or foreign markets may face delayed settlements, currency controls and adverse economic developments as well as higher overall transaction costs. In addition, fluctuations in the U.S. dollar’s value versus other currencies may erode or reverse gains from investments denominated in foreign currencies or widen losses. Exchange rates for currencies fluctuate daily. Foreign governments may expropriate assets, impose capital or currency controls, impose punitive taxes, impose limits on ownership or nationalize a company or industry. Any of these actions could have a
123
Principal Investment Strategies and Risks
Huntington Conservative Allocation Fund
continued
severe effect on security prices and impair the fund’s ability to bring its capital or income back to the U.S. Currency exchange rate fluctuations also may impair an issuer’s ability to repay U.S. dollar denominated debt, thereby increasing credit risk of such debt. Finally, the value of foreign securities may be affected by incomplete, less frequent or inaccurate financial information about their issuers, social upheavals or political actions ranging from tax code changes to governmental collapse. Foreign companies may also receive less coverage than U.S. companies by market analysts and the financial press. In addition, foreign countries may lack uniform accounting, auditing and financial reporting standards or regulatory requirements comparable to those applicable to U.S. companies. These risks are greater in emerging markets. The combination of currency risk and market risk tends to make the value of securities traded in foreign markets more volatile than securities traded exclusively in the United States.
For more information about risks, please see “Investment Risks” in the Funds’ SAI.
124
Principal Investment Strategies and Risks
Huntington Growth Allocation Fund
Principal Investment Strategy | The Fund’s investment objective is to seek capital appreciation, with current income as a secondary goal. The Fund seeks to achieve its objective by investing in a combination of underlying Huntington Funds and Huntington Strategy Shares which are also managed by the Advisor, as well as unaffiliated mutual funds and ETFs, excluding Huntington Real Strategies Fund, Huntington Tax-Free Money Market Fund, Huntington Ohio Municipal Money Market Fund and the Huntington VA Funds, with an asset allocation target of 80% Equity, 20% Income, including 0-15% in Money Market instruments. Utilizing optimization software and both internal and external research, the Advisor analyzes the economy and the capital markets to determine the optimal allocations to the various Underlying Funds. The Equity portion of the Fund’s portfolio is significantly weighted to large-cap domestic equity funds and international equity funds, but also includes weightings to mid-cap equities and small-cap equities. The Advisor allocates the Income portion of the Fund’s portfolio to the Underlying Funds based on the Advisor’s interest rate and fixed income forecasts and its analysis of credit quality, sector emphasis and the duration of the portfolio. The Advisor reviews the allocations to Underlying Funds within the stated targets on an ongoing basis and adjusts them based on the analysis of current research and macroeconomic factors. |
| | For more detail regarding the securities in which the Fund may invest, please see the section entitled, “Securities in Which the Funds Invest” in the Funds’ SAI. |
What are the main risks of investing in this Fund? | Loss of money is a risk of investing in the Fund. The Fund may also be significantly affected by “Government Intervention and Extreme Volatility Risk,” as described in the “Investment Risks” section in the Funds’ SAI. In addition, your investment in the Fund may be subject to the following principal risks: |
Investment Company Risk. Mutual fund portfolios bear expenses for advisory fees and operational expenses. The Fund and the Underlying Funds in which it will invest will each bear these expenses, so investors in the Fund may bear higher expenses than a fund that invests directly in equity or fixed-income securities. These estimated expenses of the Underlying Funds are disclosed in a separate line in the fee table (Annual Fund Operating Expenses).
Allocation Risk. Because the Asset Allocation Funds have set limitations on the amount of assets that may be allocated to Underlying Equity Funds, Underlying Income Funds and Underlying Money Market Funds, respectively, the Asset Allocation Funds have less flexibility in their investment strategies than funds that are not subject to such limitations. In addition, the asset allocations made by the Asset Allocation Fund may not effectively decrease risk or increase returns for investors.
Advisor’s Potential Conflict Risk. In managing the Asset Allocation Funds, the Advisor has sole discretion in selecting and substituting the Underlying Funds in which the Asset Allocation Funds will invest at any given time. Because the Advisor is primarily responsible for managing the Asset Allocation Funds and certain of the Underlying Funds, the Advisor is subject to conflict of interest with respect to how it allocates the Asset Allocation Funds’ assets among the various Underlying Funds. The conflict primarily arises because the expenses paid by the Advisor in connection with its management of certain of the Underlying Funds
125
Principal Investment Strategies and Risks
Huntington Growth Allocation Fund
continued
could be higher than expenses paid for other Underlying Funds, likewise, fees payable to the Advisor and/or its affiliates (primarily management fees) by some Underlying Funds are higher than the fees payable by other Underlying Funds. See “Fees Paid to Advisor and Affiliates.”
Equity Securities Risk. Equity securities include common, preferred and convertible preferred stocks and securities the values of which are tied to the price of stocks, such as rights, warrants and convertible debt securities. Common and preferred stocks represent equity ownership in a company. Stock markets are volatile. The price of equity securities will fluctuate and can decline, reducing the value of a Fund. The price of equity securities fluctuates based on actual or perceived changes in a company’s financial condition and overall market and economic conditions. The value of equity securities purchased by a Fund could decline if the financial condition of the companies in which the Fund is invested in declines or if overall market and economic conditions deteriorate.
Even funds that invest in high quality or “blue chip” equity securities or securities of established companies with large market capitalizations (which generally have strong financial characteristics) can be negatively impacted by poor overall market and economic conditions. Companies with large market capitalizations may also have less growth potential than smaller companies and may be able to react less quickly to changes in the marketplace.
The Fund may maintain substantial exposure to equities and generally will not attempt to time the market. Because of this exposure, the possibility that stock market prices in general will decline over short or extended periods subjects the Funds to unpredictable declines in the value of its investments, as well as periods of poor performance.
Market Capitalization Risk. Stocks fall into three broad market capitalization categories — large, medium and small. A Fund that invests primarily in one of these categories carries the risk that due to current market conditions that category may be out of favor with investors. If valuations of large capitalization companies appear to be greatly out of proportion to the valuations of small or medium capitalization companies, investors may migrate to the stocks of small and medium-sized companies. Larger, more established companies may also be unable to respond quickly to new competitive challenges such as changes in technology and consumer tastes. Many larger companies also may not be able to attain the high growth rate of successful smaller companies, especially during extended periods of economic expansion. Investing in medium and small capitalization companies may be subject to special risks associated with narrower product lines, more limited financial resources, fewer experienced managers, dependence on a few key employees, and a more limited trading market for their stocks, as compared with larger companies. In addition, securities of these companies are subject to the risk that, during certain periods, the liquidity of particular issuers or industries will shrink or disappear with little forewarning as a result of adverse economic or market conditions, or adverse investor perceptions,
126
Principal Investment Strategies and Risks
Huntington Growth Allocation Fund
continued
whether or not accurate. Securities of medium and smaller capitalization issuers may therefore be subject to greater price volatility and may decline more significantly in market downturns than securities of larger companies. Smaller and medium capitalization issuers may also require substantial additional capital to support their operations, to finance expansion or to maintain their competitive position; and may have substantial borrowings or may otherwise have a weak financial condition, and may be susceptible to bankruptcy. Transaction costs for these investments are often higher than those of larger capitalization companies. There is typically less publicly available information about small capitalization companies. Some small and medium capitalization companies also may be relatively new issuers, which carries risks in addition to the risks of other medium and small capitalization companies. New issuers may be more speculative because such companies are relatively unseasoned. These companies will often be involved in the development or marketing of a new product with no established market, which could lead to significant losses.
Market Risk. The risk that a security’s market value may decline, sometimes rapidly and unpredictably. These fluctuations may cause a security to be worth less than the price the Fund originally paid for it, or less than it was worth at an earlier time. Market risk may affect a single issuer, industrial sector or the market as a whole. For fixed income securities, market risk is largely influenced by changes in interest rates. Rising interest rates typically cause the value of bonds to decrease, while falling rates typically cause the value of bonds to increase.
Growth Investing Risk. Due to their relatively high valuations, growth stocks are typically more volatile than value stocks. For instance, the price of a growth stock may experience a larger decline on a forecast of lower earnings, a negative fundamental development, or an adverse market development. Further, growth stocks may not pay dividends or may pay lower dividends than value stocks. This means they depend more on price changes for returns and may be more adversely affected in a down market compared to value stocks that pay higher dividends.
Liquidity Risk. Liquidity risk refers to the possibility that a Fund may not be able to sell a security or close out a derivative contract when it wants to. If this happens, a Fund will be required to continue to hold the security or keep the position open, and a Fund could incur losses. OTC derivative contracts generally carry greater liquidity risk than exchange-traded contracts.
Foreign Investment/Currency Risk. Compared with investing in the United States, investing in foreign markets involves a greater degree and variety of risk. Investors in international or foreign markets may face delayed settlements, currency controls and adverse economic developments as well as higher overall transaction costs. In addition, fluctuations in the U.S. dollar’s value versus other currencies may erode or reverse gains from investments denominated in foreign currencies or widen losses. Exchange rates for currencies fluctuate daily. Foreign governments may expropriate assets, impose capital or currency controls, impose punitive taxes, impose limits on ownership or nationalize a company or industry. Any of these actions could have a
127
Principal Investment Strategies and Risks
Huntington Growth Allocation Fund
continued
severe effect on security prices and impair the fund’s ability to bring its capital or income back to the U.S. Currency exchange rate fluctuations also may impair an issuer’s ability to repay U.S. dollar denominated debt, thereby increasing credit risk of such debt. Finally, the value of foreign securities may be affected by incomplete, less frequent or inaccurate financial information about their issuers, social upheavals or political actions ranging from tax code changes to governmental collapse. Foreign companies may also receive less coverage than U.S. companies by market analysts and the financial press. In addition, foreign countries may lack uniform accounting, auditing and financial reporting standards or regulatory requirements comparable to those applicable to U.S. companies. These risks are greater in emerging markets. The combination of currency risk and market risk tends to make the value of securities traded in foreign markets more volatile than securities traded exclusively in the United States.
Fee Layering Risk. The Fund is an actively managed investment fund that has management and other fees associated with its operations. The Fund may invest some or all of its assets in index-based securities that separately have their own management and other fees (such as ETCFs and investment companies), and would be borne by the Fund as an investor. This could cause the Fund’s performance to be lower than if it were to invest directly in the securities underlying such index-based securities.
Emerging Markets Risk. In addition to all of the risks of investing in foreign developed markets, emerging market securities involve risks attendant to less mature and stable governments and economies, such as lower trading volume, trading suspension, security price volatility, repatriation restrictions, government confiscation, inflation, deflation, currency devaluation and adverse government regulations of industries or markets. As a result of these risks, the prices of emerging market securities tend to be more volatile than the securities of issuers located in developed markets. Emerging market economies may also experience more severe downturns (with corresponding currency devaluations) than developed economies.
Exchange-Traded Funds Risk. An investment in an exchange-traded fund (ETF) generally presents the same primary risks as an investment in an open-end investment company (mutual fund) that has the same investment objectives, strategies, and policies. The price of an ETF can fluctuate up or down, and the Fund could lose money investing in an ETF if the prices of the securities owned by the ETF go down. In addition, ETFs may be subject to the following risks that do not apply to conventional mutual funds: (i) the market price of an ETF’s shares may trade above or below their net asset value; (ii) an active trading market for an ETF’s shares may not develop or be maintained; or (iii) trading of an ETF’s shares may be halted if the listing exchange’s officials deem such action appropriate, the shares are delisted from the exchange, or the activation of market-wide “circuit breakers” (which are tied to large decreases in stock prices) halts stock trading generally.
Value Investing Risk. Due to their relatively low valuations, value stocks are typically less volatile than growth stocks. For instance, the price of a
128
Principal Investment Strategies and Risks
Huntington Growth Allocation Fund
continued
value stock may experience a smaller increase on a forecast of higher earnings, a positive fundamental development, or positive market development. Further, value stocks tend to have higher dividends than growth stocks. This means they depend less on price changes for returns and may lag behind growth stocks in an up market.
For more information about risks, please see “Investment Risks” in the Funds’ SAI.
129
Principal Investment Strategies and Risks
Additional Investment Strategies
Fundamental Investment Policies
The following are fundamental policies of the indicated Fund:
Tax-Free Money Market Fund
| • | | under normal circumstances, at least 80% of the income distributed will be exempt from federal regular income tax. |
Ohio Municipal Money Market Fund
| • | | under normal circumstances, at least 80% of the income distributed will be exempt from federal regular income tax and the personal income taxes imposed by the State of Ohio and Ohio municipalities. |
Additional Investment Information
Funds (other than the Money Market Funds) may invest in an affiliated money market fund or short-term investments in order to maintain sufficient cash to pay for daily net redemptions and portfolio transactions. In the event that the Fund does not have sufficient cash for these purposes, it could incur overdrafts, enter into reverse repurchase agreements or otherwise borrow money in accordance with its investment limitations.
Real Strategies Fund. Currently, U.S. tax laws prevent the Fund from investing more than 25% of its assets in companies treated as qualified publicly traded partnerships (such as MLPs and certain ETCFs). Such laws also limit the Fund’s ability to invest directly in real estate and commodities, in derivative contracts for real estate or commodities, and in other types of partnerships or trusts (other than REITs) that make such direct or derivative investments. Consequently, the Fund will invest in securities issued by real estate-related and commodity-related businesses and IPS that are affected only indirectly by changing prices for real estate and commodities. IPS may include non-U.S. dollar denominated fixed income securities issued by foreign governments, their agencies and instrumentalities or corporations, and related derivative contracts. The Fund also may invest in fixed income securities denominated in another currency if the Advisor expects favorable global market conditions to increase the exchange rate of such currency against the U.S. dollar. IPS also may include certain CMOs that historically have outperformed other types of fixed income securities during periods of increased inflation or rising interest rates.
The Fund may sell options on securities or financial futures contracts to earn income from the premiums. For example, the Fund may sell a put option for a security with the expectation that the price of the security will probably remain above the strike price of the option, so that the option will not be exercised. If the price of the security or contract does not behave as expected, the Fund may have to purchase the underlying security or contract for more than its market value, in the case of a put option, or sell a security or contract for less than its market value, in the case of a call option.
130
Principal Investment Strategies and Risks
Additional Investment Strategies — All Asset Allocation Funds
To pursue its goal, each Asset Allocation Fund, which is a fund of funds, normally invests in Underlying Equity Funds, Underlying Income Funds and Underlying Money Market Funds as follows:
Target Allocation Among Underlying Funds (%)
| | | | | | | | | | | | | | |
Fund | | Investment Objective | | Equity
Funds | | | Income
Funds | | | Money
Market
Funds | |
Balanced Allocation | | Seeks current income and moderate appreciation of capital | | | 60 | % | | | 40 | % | | | 0-15 | % |
Conservative Allocation | | Seeks high current income | | | 20 | % | | | 80 | % | | | 0-15 | % |
Growth Allocation | | Seeks capital appreciation, with current income as a secondary goal | | | 80 | % | | | 20 | % | | | 0-15 | % |
Variations in the target percentage allocation between Underlying Funds that invest primarily in equity securities and Underlying Funds that invest primarily in fixed-income securities are permitted up to 10% in either direction.
Thus, based on its target percentage allocation, each Asset Allocation Fund may have an allocation range among Underlying Equity Funds and Underlying Income Funds as follows:
| | | | |
Fund | | Equity/Income Underlying Funds Allocation | |
| Balanced Allocation | | | 70 | %/30% to 50%/50% |
| Conservative Allocation | | | 30 | %/70% to 10%/90% |
| Growth Allocation | | | 90 | %/10% to 70%/30% |
Although variations beyond the 10% range are generally not permitted, the Advisor may determine in light of market or economic conditions that the normal percentage limitations should be exceeded as a temporary defensive position to protect an Asset Allocation Fund or to help achieve its goal.
Within the prescribed percentage allocations, the Advisor selects the percentage level to be maintained in specific Underlying Funds. The assets of each Asset Allocation Fund are rebalanced quarterly to maintain the selected percentage level. The Advisor may from time to time adjust the percentage of assets invested in any specific Underlying Funds to increase or decrease an Asset Allocation Fund’s holdings of particular asset classes, such as common stocks of foreign issuers, to adjust the duration of fixed-income securities, or to reflect changes in the investment environment.
Each Asset Allocation Fund may invest in various Underlying Funds that as a group hold a wide range of equity type securities. These include small-, mid- and large-capitalization stocks; domestic and foreign securities (including emerging market securities); and sector holdings, such as utilities and science and technology stocks. Each of the Underlying Funds has its own investment strategy which, for example, may focus on growth stocks or value stocks or may employ a strategy combining growth and income stocks and/or may invest in derivatives such as options on securities and futures contracts. Certain of the Underlying Funds focus their investment strategy on fixed-income securities, which may include investment grade and below investment grade debt securities with maturities that range from short to longer term. The fixed-income Underlying Funds collectively hold various types of debt instruments, such as corporate bonds and mortgage-backed, government-issued, domestic and international securities.
For defensive purposes in abnormal market conditions or to meet redemption requests or make anticipated cash payments, an Asset Allocation Fund may temporarily invest extensively in cash and cash equivalents. In taking these measures, the Asset Allocation Fund might not achieve its investment goal.
131
More About the Huntington Funds
Before you invest, we encourage you to carefully read the Fund profiles included in this Prospectus and consider which Funds are appropriate for your particular financial situation, risk tolerance and goals. As always, your investment professional can provide you with valuable assistance in making this decision. He or she can also help you choose which of the Fund share classes we offer is right for you. It is important to note, however, that your investment professional may receive different compensation depending on which share class you purchase. Each investment professional has different policies and procedures relating to transacting in Fund Shares, so it is best if you contact your investment professional directly.
Choosing a Share Class
The Funds listed in this Prospectus offer two classes of Shares: Class A Shares and Institutional Shares, except for the Dividend Capture Fund and Situs Fund which offer Class A Shares, Class C Shares and Institutional Shares and the Asset Allocation Funds which offer Class A Shares only. Under a separate prospectus, the Trust offers Interfund Shares of the Money Market Fund.
To choose the share class of the applicable Fund that is best suited to your needs and goals, consider the amount of money you want to invest, how long you expect to invest it and whether you plan to make additional investments. As shown below, a sales charge structure applies to Class A and Class C Shares. You should consider, for example, that it may be possible to reduce the front-end sales charges imposed on purchases of Class A Shares. Among other ways, Class A Shares have a series of “breakpoints,” which means that the front-end sales charges decrease (and can be eliminated entirely) as the amount invested increases. (The breakpoint schedule is set out below under “Sales Charges.”)
The following are some of the main differences between Class A Shares, Class C Shares and Institutional Shares of the Funds:
Class A Shares
| • | | Front-end sales charges, as described below under “Sales Charges.” |
| • | | Distribution (Rule 12b-1) fees of 0.25% of the Fund’s average daily net assets. |
| • | | A non-Rule 12b-1 shareholder servicing fee of 0.25% of the Fund’s average daily net assets. |
Class C Shares
| • | | No front-end sales charges, all of your money goes to work for you right away. |
| • | | Back-end deferred sales charges on shares sold within 12 months of purchase and as described below under “Sales Charges.” |
| • | | Distribution (Rule 12b-1) fees of 1.00% of the Fund’s average daily net assets. |
Institutional Shares
| • | | No Distribution (Rule 12b-1) fees. |
| • | | A non-Rule 12b-1 shareholder servicing fee of 0.25% of the Fund’s average daily net assets. |
| • | | Available only to fiduciary, advisory and agency accounts of The Huntington National Bank, correspondent banks and the Huntington Asset Allocation Funds. |
For the actual past expenses of each share class, see the individual Fund profiles earlier in this Prospectus.
The Huntington Money Market Fund offers Interfund Shares, which have their own expense structures. Interfund Shares are available for purchase only by the Funds.
For purchases of $100,000 or more on the Short/Intermediate Fixed Income Securities Fund and $1 million or more on the Equity Funds, Asset Allocation Funds and all the other Income Funds, the sales charge for Class A Shares is waived.
Distribution of the Funds
Unified Financial Securities, Inc. (“Distributor”), whose address is P.O. Box 6110, Indianapolis, IN 46206-6110 is the Distributor of the Funds. The Distributor is a wholly owned subsidiary of Huntington Bancshares, Incorporated (“HBI”).
132
More About the Huntington Funds
In connection with the sale of Class A Shares, the Distributor collects the applicable sales charge and, if the sale is made through a registered broker-dealer, generally pays a portion of this charge (known as the “dealer reallowance”) to selling broker-dealers that are eligible to receive it. The Distributor retains any portion not paid to a broker-dealer.
The Distributor is responsible for collecting applicable contingent deferred sales charges in connection with the redemption of Class C Shares and Class A Shares. The Distributor will cause these charges to be paid to a designated agent, which may include the Advisor and its affiliates, and other investment professionals for advancing any sales commissions on the sale of Class C Shares and Class A Shares. See the “Sales Charges” section for the Dealer Reallowance Schedule.
The Distributor may, from time to time in its sole discretion, institute one or more promotional incentive programs for dealers, which will be paid for by the Distributor from any sales charge it receives or from any other source available to it, including amounts made available by the Distributor, Advisor and their affiliates out of their reasonable resources and profits. Under any such program, the Distributor may provide cash or non-cash compensation as recognition for past sales or encouragement for future sales that may include the following: merchandise, travel expenses, prizes, meals, and lodgings, and gifts that do not exceed $100 per year, per individual.
Shareholder Servicing Fees
The Trust has adopted a Shareholder Servicing Plan with respect to the Funds’ Share Classes. The Funds may pay Shareholder Services Fees up to 0.25% of the average daily NAV of Class A Shares, Class C Shares and Institutional Shares (included in a Fund’s 12b-1 fees above for Class C Shares only) to financial intermediaries for providing shareholder assistance, maintaining shareholder accounts and communicating or facilitating purchases and redemptions of Shares.
Distribution Plan (Rule 12b-1 Fees)
Each of the Funds have adopted a Distribution Plan (the “12b-1 Plan”) on behalf of its Class A Shares and Class C Shares which allows them to pay fees to financial intermediaries (which may be paid through the Distributor) for the sale and distribution of these Shares. Pursuant to each Fund’s 12b-1 Plan, the Fund may finance from the assets of Class A and Class C Shares certain activities or expenses that are intended primarily to result in the sale of the Class A Shares or Class C Shares, as applicable.
For each of the Funds offered by this Prospectus, the maximum Rule 12b-1 fee is 0.25% of the applicable Fund’s Class A Shares average daily net assets.
With respect to Class C Shares, the fee paid to the Distributor by a Fund is computed on an annualized basis reflecting the average daily net assets of the Class C Shares, equal to 1.00% for Class C Share expenses. Of this amount, 0.75% represents distribution fees and 0.25% represents shareholder servicing fees paid to institutions that have agreements with the Distributor to provide such services.
Because these Shares pay marketing fees on an ongoing basis, your investment costs may be higher over time than other shares with different sales charges and marketing fees.
In addition to paying fees under the 12b-1 Plan, the Funds may pay service fees to intermediaries such as banks, broker-dealers, financial advisors or other financial institutions, including affiliates of the Advisor or Distributor, for sub-administration, sub-transfer agency and other shareholder services associated with shareholders whose shares are held of record in omnibus, other group accounts or accounts traded through registered securities clearing agents.
The Funds may waive or reduce the maximum amount of Rule 12b-1 fees they pay from time to time at their sole discretion. In addition, a financial intermediary (including the Distributor, the Advisor or their affiliates) may voluntarily waive or reduce any fees to which they may be entitled. From time to time, the Distributor may pay out of its reasonable profits and other resources (including those of its affiliates) advertising, marketing and other expenses for the benefit of the Funds.
Additional Payments To Financial Intermediaries
The Distributor, the Advisor and/or their affiliates may pay out of their own profits and reasonable resources amounts (including items of material value) to certain financial intermediaries that support the sale of Shares
133
More About the Huntington Funds
or provide services to Fund shareholders. The amounts of these payments could be significant, and may create an incentive for the financial intermediaries or their employees or associated persons to recommend or sell Shares of the Fund to you. These payments are not reflected in the fees and expenses listed in the fee table section of the Funds’ Prospectus because they are not paid by the Funds.
These payments are negotiated and may be based on such factors as the number or value of Shares that the financial intermediary sells or may sell; the value of client assets invested; or the type and nature of services or support furnished by the financial intermediary. These payments may be in addition to payments made by the Fund to the financial intermediary under a Rule 12b-1 Plan and/or shareholder service fees arrangement. You can ask your financial intermediary for information about any payments it receives from the Distributor, the Advisor, their affiliates, or the Funds and any services the financial intermediary provides. The Funds’ SAI contains additional information on the types of additional payments that may be paid.
Sales Charges
Purchases of Class A Shares of any of the Funds except the Money Market Funds are subject to front-end sales charges.
Equity Funds and Asset Allocation Funds
| | | | | | | | | | | | |
Amount of Transaction | | Sales Charge as a
Percentage of
Public Offering Price | | | Sales Charge as a
Percentage of
Net Amount Invested | | | Dealer
Reallowance | |
$0-$49,999 | | | 4.75 | % | | | 4.99 | % | | | 4.28 | % |
$50,000-$99,999 | | | 3.75 | % | | | 3.90 | % | | | 3.38 | % |
$100,000-$249,999 | | | 3.00 | % | | | 3.09 | % | | | 2.70 | % |
$250,000-$499,999 | | | 2.50 | % | | | 2.56 | % | | | 2.25 | % |
$500,000-$749,999 | | | 2.00 | % | | | 2.04 | % | | | 1.80 | % |
$750,000-$999,999 | | | 1.25 | % | | | 1.27 | % | | | 1.13 | % |
$1,000,000 and Over | | | 0.00 | %* | | | 0.00 | %* | | | 0.00 | % |
| * | | A contingent deferred sales charge of 1.00% of the redemption amount applies to Class A Shares redeemed up to 13 months after purchase under certain investment programs where an investment professional received an advance payment on the transaction. |
Sales Charges — Class C Shares
Class C Shares are sold without an initial front-end sales charge so that the full amount of your purchase is invested in a Fund. A deferred sales charge of 1.00% applies, however, if Class C Shares are sold within 12 months of purchase.
Shares acquired through reinvestment of dividends or capital gains distributions are not subject to a deferred sales charge. In addition, the deferred sales charge may be waived in certain circumstances. See “Waiver of Deferred Sales Charge — Class C Shares” below. The deferred sales charge is based upon the lesser of: (1) the NAV of the shares redeemed or (2) the cost of such shares.
To keep your deferred sales charges as low as possible, each time you place a request to sell shares, we will first sell any shares in your account that are not subject to a deferred sales charge. If there are not enough of these shares available, we will sell shares that have the lowest deferred sales charge.
For purposes of the deferred sales charge, we use the effective date for each individual purchase.
Waiver of Deferred Sales Charge — Class C Shares
The deferred sales charge on Class C Shares may be waived for:
| | 1. | Certain post-retirement withdrawals from an IRA or other retirement plan if you are over 70 1/2; |
| | 2. | Redemptions by certain eligible 401(a) and 401(k) plans and certain retirement plan rollovers; |
| | 3. | Redemptions where your dealer of record notifies the Distributor, prior to the time of investment, that the dealer waives the 1.00% advance payment otherwise payable to such dealer; |
134
More About the Huntington Funds
| | 4. | Withdrawals resulting from shareholder death or disability provided that the redemption is requested within one year of death or disability; and |
| | 5. | Withdrawals through the Systematic Withdrawal Plan. |
In order to verify your eligibility for these discounts, reductions and waivers, you may need to provide the Trust or your investment professional with certain information, including account statements and records that reflect any investments in the Funds by you, your spouse, or your children under 21. If you or your investment professional believe that you qualify, please notify the Trust by calling 800-253-0412. If the Distributor is notified of your eligibility, it will reduce or eliminate the sales charge, as applicable, once it confirms your qualification. If the Distributor is not notified, you will receive the discount or waivers only on subsequent purchases for which the Distributor is notified, and not retroactively on past purchases. The deferred sales charges applicable to the Shares offered in this Prospectus, and the break-point discounts offered with respect to such Shares, are described in full in this Prospectus. Because the Prospectus is available on the Huntington Funds’ website free of charge, we do not disclose this information separately on the website.
More information about deferred sales charge reductions is provided in the SAI.
Other Quantity Discounts, Reductions and Waivers
Other quantity discounts, reductions and waivers may also apply to purchases of Class A Shares. In order to verify your eligibility for these discounts, reductions and waivers, you may need to provide the Trust or your investment professional with certain information, including account statements and records that reflect any investments in the Funds by you, your spouse, or your children under 21. If you or your investment professional believe that you qualify, please notify the Trust by calling 800-253-0412. If the Distributor is notified of your eligibility, it will reduce or eliminate the sales charge, as applicable, once it confirms your qualification. If the Distributor is not notified, you will receive the discount or waivers only on subsequent purchases for which the Distributor is notified, and not retroactively on past purchases. The sales charges applicable to the Shares offered in this Prospectus, and the break point discounts offered with respect to such Shares, are described in full in this Prospectus. Because the Prospectus is available on the Huntington Funds’ website free of charge, we do not disclose this information separately on the website.
No sales charges will apply to purchases of Class A Shares made:
| | • | | Through an investment professional that does not accept a sales commission from the Distributor. Financial intermediaries that do not accept sales commissions must enter into specific load waived Class A agreements in order to be eligible for Class A Shares at NAV. |
| | • | | Through the automatic reinvestment of dividends and capital gains distributions |
| | • | | By current and former/retired Trustees and officers of the Trust, their spouses and immediate family members |
| | • | | By current officers, directors and employees of HBI or its subsidiaries, their spouses and immediate family members and by current employees of other financial institutions with which HBI or its subsidiary has entered into definitive merger agreements (“Current Employees”) |
| | • | | By retired officers and employees of HBI or its subsidiaries and their spouses |
| | • | | By participants in certain financial services programs offered by HBI subsidiaries |
| | • | | By members of certain affinity groups which have entered into arrangements with the Advisor or the Distributor |
| | • | | By investors who have sold an equal or greater amount of Shares of an Equity, Income or Asset Allocation Fund within the last 60 days (not available more than once) |
Reduced sales charges on Class A Shares (based on the quantity discounts noted above) will apply to purchases made through Huntington Investment Company, except for investments made through the Systematic Investment Plan:
| | • | | By investors whose multiple investments over time in Class A Shares of any Equity, Income or Asset Allocation Fund have a total current market value subject to a quantity discount |
135
More About the Huntington Funds
| | • | | By investors whose investments over time in Class A Shares of any Equity, Income or Asset Allocation Fund plus investments by their spouse and children under age 21 made over time in Class A Shares of any Equity, Income or Asset Allocation Fund at the same time, have a total current market value subject to a quantity discount |
| | • | | By investors who sign a letter of intent to invest at least $100,000 in the Short/Intermediate Fixed Income Securities Fund, or $50,000 in the Equity Funds, Asset Allocation Funds or other Income Funds within a 13-month period* |
| | • | | By investors whose investments in Class A Shares of multiple Equity, Income and/or Asset Allocation Funds at the same time have a total current market value subject to a quantity discount |
| | • | | By trustees or fiduciaries whose investments in Class A Shares of Equity, Income and/or Asset Allocation Funds on behalf of a single trust estate or fiduciary account have a total current market value subject to a quantity discount |
Reduced sales charges on Class A Shares (based on the quantity discounts noted above) will also apply to purchases made through Huntington Investment Company, except for purchases made through the Systematic Investment Plan:
| | • | | By investors whose multiple investments over time in Class A Shares of any Equity, Income or Asset Allocation Fund, and/or whose multiple investments over time in shares of any other mutual fund(s) (for example, non-Huntington Funds) which were subject to a sales load, have a total value** subject to a quantity discount as set forth in the tables above |
| | • | | By investors whose investments in Class A Shares of multiple Equity, Income, Asset Allocation Funds and/or other mutual fund(s) (for example, non-Huntington Funds) subject to a sales load, at the same time have a total value** subject to a quantity discount as set forth in the tables above |
| | • | | By trustees or fiduciaries whose investments in Class A Shares of Equity, Income, Asset Allocation Funds and/or other mutual fund(s) (for example, non-Huntington Funds) subject to a sales load, on behalf of a single trust estate or fiduciary account have a total value** subject to a quantity discount as set forth in the tables above. |
With respect to reduced sales charges which apply to aggregated purchases as noted above, purchases through multiple intermediaries or Individual Retirement Accounts (which do not include employer sponsored retirement plans) may be aggregated to achieve a sales charge discount or waiver.
*Letter of Intent. An investor may sign a letter of intent to purchase within a 13-month period the minimum amount of Class A Shares in any Equity or Asset Allocation Fund required to be eligible for the applicable sales charge reduction on each purchase over the 13-month period. Until the investor reaches the necessary threshold, the Trust will hold up to 4.75% of the Shares in escrow. Reinvested dividends will not be included in calculating an investor’s fulfillment of his/her letter of intent.
The Shares held in escrow will be released to the investor’s account at the end of the 13-month period unless the amount specified in the Letter of Intent is not purchased.
A Letter of Intent will not obligate the investor to purchase Class A Shares, but if he or she does, each purchase during the period will be at the sales charge applicable to the total amount intended to be purchased. The Letter of Intent may be dated as of a prior date to include any purchases made within the past 90 days.
**For purposes of the above, and where noted with **, holdings in Equity and Asset Allocation Funds and holdings in other mutual fund(s) (for example, non-Huntington Funds) will be valued at current market value.
Pricing Shares
The price at which the Funds will offer or redeem Shares is the NAV per Share next determined after the order is considered received, subject to any applicable front-end sales charge or CDSCs. Consult your investment professional to determine if there are additional fees or charges that are separately assessed when purchasing, exchanging or redeeming Shares.
136
More About the Huntington Funds
The Trust calculates NAV for each of the Funds (other than the Money Market Funds) by valuing securities held based on market value. The Trust attempts to stabilize the NAV per share for each of the Money Market Funds at $1.00 per share by valuing its portfolio securities using the amortized cost method.
In computing NAV for the Funds (except the Asset Allocation Funds), current market value is used to value portfolio securities with respect to which market quotations are readily available. The NAV of the Asset Allocation Funds is computed based upon the share prices of the Underlying Funds in which the Asset Allocation Funds invest; and the prices of those shares are determined by the current market value of the portfolio securities held by the Underlying Funds.
Pursuant to Trustee-approved policies, the Funds rely on certain security pricing services to provide current market value of securities. Those security pricing services value equity securities (including foreign equity securities) traded on a securities exchange at the last reported sales price on the principal exchange. Equity securities quoted by NASDAQ are valued at the NASDAQ Official Closing Price. If there is no reported sale on the principal exchange, and in the case of over-the-counter securities, equity securities are valued at a bid price estimated by the security pricing service. Foreign securities are subject to modification based on significant events, as described below. U.S. government obligations held by a Fund are valued at the mean between the over-the-counter bid and asked prices furnished by the security pricing service. Except as noted above, debt securities traded on a national securities exchange or in the over-the-counter market are valued at the last reported sales price on the principal exchange. If there is no reported sale on the principal exchange, and for all other debt securities, including zero-coupon securities, debt securities are valued at a bid price estimated by the security pricing service. Foreign securities quoted in foreign currencies are translated in U.S. dollars at the foreign exchange rate in effect as of the close of the NYSE (generally 4:00 p.m., Eastern Time) on the day the value of the foreign security is determined. Options contracts are generally valued at the closing price if it is between the bid and asked prices as reported on days when the contracts are traded. If no trades are reported the mean of the bid and the asked prices is used as the value.
Under certain circumstances, a good faith determination of the fair value of a security or option may be used instead of its current market value, even if the security’s market price is readily available. In such situations, the Trust’s administrator may request that the Trust’s Pricing Committee, as described herein, make its own fair value determination.
Securities for which market quotations are not readily available are valued at their “fair value.” In these cases, a Pricing Committee established and appointed by the Trustees determines in good faith, subject to Trust procedures, the fair value of portfolio securities held by a Fund (“good faith fair valuation”). When a good faith fair valuation of a security is required, consideration is generally given to a number of factors, including, but not limited to the following: dealer quotes, published analyses by dealers or analysts of the situation at issue, transactions implicitly valuing the security at issue (such as a merger, tender offer, etc.), the value of other securities or contracts which derive their value from the security at issue, and the implications (whether negative or positive) of the circumstances which have caused trading in the security to halt. The final good faith fair valuation of a security is based on an analysis of those factors deemed relevant to the security valuation at issue. With respect to certain narrow categories of securities, the Pricing Committee’s procedures detail specific valuation methodologies to be used in lieu of considering the aforementioned list of factors.
The Funds may use the fair value of a security to calculate NAV when a market price is not readily available, such as when: (1) a portfolio security is not traded in a public market or the principal market in which the security trades is closed, (2) trading in a portfolio security is suspended and not resumed prior to the normal market close, (3) a portfolio security is not traded in significant volume for a substantial period, or (4) the Funds’ Advisor determines that the quotation or price for a portfolio security provided by a dealer or independent pricing service is inaccurate.
137
More About the Huntington Funds
Fair valuation procedures are also used when a significant event affecting the value of a portfolio security is determined to have occurred between the time when the price of the portfolio security is determined and the close of trading on the New York Stock Exchange (“NYSE”), which is when each Fund’s NAV is computed. An event is considered significant if there is both an affirmative expectation that the security’s value will change in response to the event and a reasonable basis for quantifying the resulting change in value. Significant events include significant general securities market movements occurring between the time when the price of the portfolio security is determined and the close of trading on the NYSE. For domestic fixed income securities, such events may occur where the cut-off time for the market information used by the independent pricing service is earlier than the end of regular trading on the NYSE. For securities normally priced at their last sale price in a foreign market, such events can occur between the close of trading in the foreign market and the close of trading on the NYSE. In such cases, use of fair valuation can reduce an investor’s ability to seek to profit by estimating a Fund’s NAV in advance of the time when the NAV is calculated.
In some cases, events affecting the issuer of a portfolio security may be considered significant events. Examples of potentially significant events include announcements concerning earnings, acquisitions, new products, management changes, litigation developments, a strike or natural disaster affecting the company’s operations or regulatory changes or market developments affecting the issuer’s industry occurring between the time when the price of the portfolio security is determined and the close of trading on the NYSE. For securities of foreign issuers, such events could also include political or other developments affecting the economy or markets in which the issuer conducts its operations or its securities are traded.
The Funds’ Trustees have authorized the use of an independent fair valuation service to monitor changes in a designated U.S. market index after foreign markets close, and the implementation of a fair valuation methodology to adjust the closing prices of foreign securities if the movement in the index is significant. Since the Global Select Markets Fund and International Equity Fund invest primarily in foreign securities, they are most likely to be affected by this fair valuation methodology. Since the Situs Fund, the Real Strategies Fund, and certain of the Asset Allocation Funds’ Underlying Funds may invest some of their assets in foreign securities, these Funds also may be affected, although to a lesser extent.
There can be no assurance that a Fund could purchase or sell a portfolio security at the price used to calculate the Fund’s NAV. In the case of fair valued portfolio securities, lack of information and uncertainty as to the significance of information may lead to a conclusion that a prior valuation is the best indication of a portfolio security’s present value. Fair valuations generally remain unchanged until new information becomes available. Consequently, changes in the fair valuation of portfolio securities may be less frequent and of greater magnitude than changes in the price of portfolio securities valued at their last sale price, by an independent pricing service, or based on market quotations. Fair valuation determinations often involve the consideration of a number of subjective factors, and the fair value price may be higher or lower than the price assigned to a particular security one may obtain in a market transaction.
The Trust calculates the NAV per share for each of the Funds (other than the Money Market Funds) as of the close of regular trading of the NYSE (generally 4:00 p.m. Eastern Time) on each day the NYSE is open. The Trust calculates the NAV per share for each Money Market Fund as follows: at 10:00 a.m. Eastern Time for the Ohio Municipal Money Market Fund and the Tax-Free Money Market Fund; and at 1:00 p.m. Eastern Time for the Money Market Fund and the U.S. Treasury Money Market Fund.
In addition, the Money Market Funds reserve the right to allow the purchase, redemption, and exchange of Shares on any other day on which regular trading in money market instruments is taking place. On any day that the bond markets close early, such as days in advance of holidays or in the event of any emergency, the Money Market Funds reserve the right to advance the time NAV is determined and by which purchase, redemption, and exchange orders must be received on that day, to the time of such closing. Please call the Trust at 800-253-0412, if you have any questions about purchasing Shares.
The Funds are open for business on any day the NYSE is open. The Funds are closed on the following NYSE holidays: New Year’s Day, Martin Luther King, Jr. Day, President’s Day, Good Friday, Memorial Day, Independence Day, Labor Day, Thanksgiving Day and Christmas Day.
138
More About the Huntington Funds
Purchasing Shares
You may purchase Shares of the Money Market Funds on any business day when the Federal Reserve Bank and the NYSE are open, and as discussed under “Pricing Shares” above. You may purchase Shares of all the Income Funds, Equity Funds and Asset Allocation Funds on any day the NYSE is open. In connection with the sale of a Fund’s Shares, the Distributor or its affiliates may from time to time offer certain items of nominal value to any shareholder.
What Shares Cost
Money Market Funds
Your purchase order is priced at the next NAV calculated after your order is received by the Trust or its designated agent. With regard to investments in the Money Market Fund or the U.S. Treasury Money Market Fund, if your order is received by a Fund or its designated agent before 1:00 p.m. (Eastern Time) and the Fund receives payment in federal funds by the close of the Federal Reserve wire system, you will begin earning dividends that day. With regard to investments in the Ohio Municipal Money Market Fund and the Tax-Free Money Market Fund, if your order is received by the Fund or its designated agent before 10:00 a.m. (Eastern Time) and the Fund receives payment in federal funds by the close of the Federal Reserve wire system, you will begin earning dividends that day. Investments in the money market funds made by check, Automated Clearing House (“ACH”) or Systematic Investment Program (“SIP”) will begin earning dividends when the payment is converted to federal funds (normally the next business day).
All Other Funds
Your purchase order for Class A Shares, Class C Shares and Institutional Shares is priced at the next NAV calculated after your order is received by the Fund or its designated agent, plus any applicable sales charge.
In order to purchase Fund Shares (other than the Money Market Funds) on a particular day, the Funds must receive payment in good federal funds within three (3) business days.
Notes About Purchases
The Trust reserves the right to suspend the sale of Fund Shares temporarily and the right to refuse any order to purchase Fund Shares.
If the Trust receives insufficient payment for a purchase, or the Trust does not receive payment within three (3) business days, or your check does not clear, it may cancel the purchase and you may be liable for any losses to the Funds. In addition, you will be liable for any losses or fees incurred by the Funds or their transfer agent in connection with the transaction.
The Funds may limit the amount of purchases and refuse to sell Shares to any person. If your check or wire does not clear, you will be responsible for any loss incurred by the Funds. If you are already a shareholder, the Funds can redeem shares from any identically registered account in the Funds as reimbursement for any loss incurred. You may be prohibited or restricted from making future purchases in the Funds. Checks must be made payable to the Funds in U.S. dollars and drawn on a U.S. bank. The Funds and their servicing agent reserve the right to refuse any specific purchase order for any reason. Cash, third party checks (except for properly endorsed IRA rollover checks), counter checks, starter checks, traveler’s checks, money orders, credit card checks, and checks drawn on non-U.S. financial institutions will not be accepted. Cashier’s checks and bank official checks may be accepted in amounts greater than $10,000. In such cases, a fifteen (15) business day hold will be applied to the funds (which means that you may not redeem your shares until the holding period has expired). Signature guarantee stamps may be required on identification documentation. All documentation requiring a signature guarantee must utilize a New Technology Medallion stamp, generally available from the bank where you maintain a checking or savings account.
State Escheatment Laws
Please note that your property may be transferred to the appropriate state if no activity occurs in the account within the time period specified by state escheatment laws.
139
More About the Huntington Funds
How to Buy Shares
| 1. | | Minimum investment requirements |
Class A Shares:
| | • | | $1,000 for initial investments outside the SIP ($100 for Current Employees) |
| | • | | $50 for initial investments through the SIP ($25 for Current Employees) |
| | • | | $50 for subsequent investments outside or through the SIP |
Class C Shares:
| | • | | $1,000 for initial investments outside the SIP ($100 for Current Employees) |
| | • | | $50 for initial investments through the SIP ($25 for Current Employees) |
| | • | | $50 for subsequent investments outside or through the SIP |
Institutional Shares:
| | • | | $1,000 for initial investments outside the SIP |
| | • | | $500 for subsequent investments outside the SIP |
| | • | | $50 for initial and subsequent investment through the SIP |
| | • | | The Huntington Funds at 800-253-0412 |
| | • | | Your Investment Professional |
| | • | | By check payable to the applicable Fund and Share class (for example, Huntington Dividend Capture Fund — Class A Shares) to: |
The Huntington Funds
P.O. Box 6110
Indianapolis, IN 46206-6110
Note: Checks must be made payable to the Huntington Funds. Third party checks will not be accepted.
(The Trust will treat your order as having been received once the Trust receives your check.) OR
| | • | | By Wire — You may also purchase shares of the Fund by wiring federal funds from your bank, which may charge you a fee for doing so. To wire money, you must call Shareholder Services at 800-253-0412 to obtain instructions on how to set up your account and to obtain an account number. |
OR
| | • | | Through the SIP (Once you become a participant in the SIP, your investments will be made automatically at your requested intervals) |
Other methods of acceptable payment are discussed in the SAI.
The reference to “Current Employees” in the prospectus includes employees of HBI and its affiliates.
Redemption in Kind
Although the Funds intend to pay Share redemptions in cash, they reserve the right to pay the redemption price in whole or in part by a distribution of the Fund’s portfolio securities.
Systematic Investment Program (“SIP”)
You may invest on a regular basis in Shares of the Funds through the SIP. To participate, you must open an account with the Trust by calling 800-253-0412, request and complete an application, and invest at least $50 at periodic intervals ($25 for Current Employees). Minimum initial and subsequent investment requirements may be different for accounts with your investment professional.
Once you have signed up for the SIP, the Trust will automatically withdraw money from your bank account and invest it, subject to any applicable sales charges, in either Class A Shares or Class C Shares of the Fund or Funds, as you specify. Your participation in the SIP may be canceled if you do not maintain sufficient funds in your bank account to pay for your investment.
140
More About the Huntington Funds
Exchanging Shares
Money Market Funds
On any business day when the Federal Reserve Bank and the NYSE are open, you may exchange Shares of any Fund for the same class of Shares of any other Fund offering such Shares and as discussed under “Pricing Shares.”
All Other Funds
On any business day when the NYSE is open, you may exchange Shares of all other Funds for the same class of Shares of any other Huntington Fund offering such Shares. Additionally, The Huntington National Bank will be permitted to exchange Institutional Shares of all other Funds for Class A Shares of the Asset Allocation Funds, without incurring a sales charge.
Additional Information
In order to exchange Shares of a Fund on a particular day, the Fund or its designated agent must receive your request before the close of regular trading on the NYSE (normally 4:00 p.m. Eastern Time) that day.
The Trust may terminate or modify the exchange privilege at any time. In the case of termination or material changes other than the elimination of applicable sales charges, you will be given 60 days prior notice. However, the Fund’s management or Advisor may determine from the amount, frequency and pattern of exchanges that a shareholder is engaged in excessive trading that is detrimental to the Fund and other shareholders. If this occurs, the Fund may terminate the availability of exchanges to that shareholder and may bar that shareholder from purchasing other Funds. (See “Frequent Trading Policies”)
An exchange is treated as a sale for federal income tax purposes and, depending on the circumstances, you may realize a short or long-term capital gain or loss. In addition, if you exchange shares of a Fund that imposes a sales charge into another Fund that imposes such a charge, there may be special tax consequences.
The SAI contains more information about exchanges.
Exchanging Class A Shares
For Class A Shares, the Trust makes exchanges at NAV (determined after the order is considered received), plus any applicable sales charges.
| | | | |
Exchange Out Of | | Exchange Into | | Sales Charge |
Any Money Market Fund | | Any Money Market Fund | | NO |
Any Money Market Fund | | Any Equity Fund | | YES—See “Sales Charges” |
Any Equity or Asset Allocation Fund | | Any Money Market, Equity, or Asset Allocation | | NO |
Exchanging C Shares
Class C Shares for a Fund may be exchanged for Class C Shares of any other Huntington Fund offering such shares. The Trust makes exchanges at NAV (determined after the order is considered received), without a sales charge.
Exchanging Institutional Shares
For Institutional Shares, the Trust makes exchanges at NAV (determined after the order is considered received) without a sales charge.
In addition, The Huntington National Bank will be permitted to exchange Institutional Shares of all funds for Class A Shares of its Asset Allocation Funds (Huntington Balanced Allocation Fund, Huntington Conservative Allocation Fund and Huntington Growth Allocation Fund), without incurring a sales charge.
How to Exchange Shares
| 1. | | Satisfy the minimum account balance requirements |
| | • | | You must maintain the required minimum account balance in the Fund out of which you are exchanging Shares. |
141
More About the Huntington Funds
| 2. | | Call (You must have completed the appropriate section on your account application) |
| | • | | The Huntington Funds at 800-253-0412 |
| | • | | Your Investment Professional |
OR
P.O. Box 6110
Indianapolis, IN 46206-6110
| 3. | | Provide the required information |
| | • | | Name of the Fund from which you wish to make the exchange (exchange OUT OF) |
| | • | | Specify the share class |
| | • | | The name and address on your account (account registrations must be identical) |
| | • | | The dollar amount or number of Shares to be exchanged |
| | • | | Name of the Fund into which you wish to make the exchange (exchange INTO) — (Make sure this Fund offers the applicable class of shares) |
| | • | | Your signature (for written requests) |
(For corporations, executors, administrators, trustees and guardians, and in certain other special circumstances, telephone exchanges will not be available and you will need a New Technology Medallion Signature Guarantee in order to make an exchange.)
Redeeming Shares
Money Market Funds
You may redeem Shares of the Money Market Funds on any business day when the Federal Reserve Bank and the NYSE are open, and as discussed under “Pricing Shares” above.
All Other Funds
You may redeem Shares of all other Funds on any business day when the NYSE is open.
How to Redeem Shares
| 1. | | Call (You must have completed the appropriate section on your account application) |
| | • | | The Huntington Funds at 800-253-0412 |
| | • | | Your Investment Professional |
OR
P.O. Box 6110
Indianapolis, IN 46206-6110
OR
| | | Write a Check (Class A Shares of the Money Market Funds Only) |
| | • | | In an amount of at least $250 from your applicable Money Market Fund’s account (You may not use a check to close an account.) See “Checkwriting” below for more information. |
| 2. | | Provide the required information |
| | • | | The name of the Fund from which you wish to redeem Shares |
| | • | | Specify the share class |
| | • | | The name and address on your account |
| | • | | Your bank’s wire transfer information (for wire transfers) |
| | • | | The dollar amount or number of Shares you wish to redeem |
| | • | | Your signature (for written requests) |
142
More About the Huntington Funds
(If you request a redemption of over $50,000, request any redemption to be sent to an address other than the address on record with the Trust, or request any redemption to be paid to a person or persons other than the shareholder(s) of record, you will need a New Technology Medallion Signature Guarantee in order to redeem.)
Note: Proceeds from the redemption of Shares purchased by check, ACH, or SIP will be delayed until the purchase has cleared, which may take up to ten business days.
Additional Information
In order to redeem Shares of the Equity Funds or Asset Allocation Funds on a particular day, the Fund or its designated agent must receive your request before the close of regular trading on the NYSE (normally 4:00 p.m. Eastern Time).
For shareholders who request redemptions prior to 1:00 p.m. (Eastern Time) for the Money Market Fund and the U.S. Treasury Money Market Fund and prior to 10:00 a.m. (Eastern Time) for the Ohio Municipal Money Market Fund and the Tax-Free Money Market Fund, usually the proceeds will be wired on the same day or a check will be mailed on the following business day. In addition, you will not receive dividends declared on the day of the redemption. For shareholders of Money Market Funds who request redemptions after the cut-off times mentioned above and for shareholders of the Income Funds, Equity Funds or Asset Allocation Funds, usually proceeds will be wired or a check will be mailed the following business day after NAV is next determined, in which case you will be entitled to receive dividends declared on the day of redemption. Proceeds are wired to an account previously designated in writing by the shareholder at any domestic commercial bank which is a member of the Federal Reserve System. Proceeds to be paid by check are sent to the shareholder’s address of record.
Redemption in Kind
Although the Funds intend to pay Share redemptions in cash, they reserve the right to pay the redemption price in whole or in part by a distribution of the Fund’s portfolio securities.
Systematic Withdrawal Program
You may choose to receive periodic payments from redemptions of Shares, subject to any applicable CDSCs, of one or more Funds you hold through the Systematic Withdrawal Program. To participate, you must have an account balance with the Trust of at least $10,000. Once you have signed up for the Systematic Withdrawal Program by calling the Trust or your investment professional, the Trust will automatically redeem Shares from your account and electronically send the proceeds to the bank account you specify.
Generally, it is not advisable to continue to purchase Class A Shares or Class C Shares subject to a sales charge while redeeming Class A Shares or Class C Shares using this program.
Telephone Transactions
If you authorized telephone transactions by completing the appropriate paperwork with the Funds and your investment professional, you are eligible to call to redeem or exchange Shares. Your telephone instructions may be recorded to verify that the Fund, its transfer agent and/or your investment professional follows reasonable procedures. Otherwise, they may be liable for losses due to unauthorized or fraudulent telephone instructions.
Checkwriting (Class A Shares of the Money Market Funds Only)
You may request checks to redeem your Fund Shares. Please request and complete an application for checkwriting. Your account will continue to receive the daily dividend declared on the Shares being redeemed until the check is presented for payment.
Redemption of Accounts with Balances Under $1,000
Due to the high cost of maintaining accounts with low balances, if your account balance in any one Fund falls below $1,000, the Trust may choose to redeem those Shares and close that account without your consent. The Trust will not close any account which is held through a retirement plan or any account whose value falls below $1,000 as a result of changes in a Fund’s NAV. If the Trust plans to close your account, it will notify you and provide you with 30 days to add to your account balance.
143
More About the Huntington Funds
Other Information
To the extent permitted by federal securities laws, the Trust reserves the right to suspend the redemption of Shares of any of the Funds temporarily under extraordinary market conditions such as market closures or suspension of trading by the SEC. The Trust also reserves the right to postpone payment for more than seven days where payment for Shares to be redeemed has not yet cleared.
Frequent Trading Policies
Frequent or short-term trading into and out of a Fund can have adverse consequences for the Fund and shareholders who use the Fund as a long-term investment vehicle. Such trading in significant amounts can disrupt a Fund’s investment strategies (for example, by requiring it to sell investments at inopportune times or maintain excessive short-term or cash positions to support redemptions), increase brokerage and administrative costs, and affect the timing and amount of taxable gains distributed by the Fund. Investors engaged in such trading may also seek to profit by anticipating changes in a Fund’s NAV in advance of the time as of which NAV is calculated or through an overall strategy to buy and sell Shares in response to incremental changes in a Fund’s NAV.
The Trustees have approved policies and procedures intended to discourage excessive, frequent or short-term trading of the Funds’ Shares. The Funds’ fair valuation procedures are intended in part to discourage short-term trading strategies by reducing the potential for these strategies to succeed. (See “Pricing Shares.”) The Funds also monitor trading in Shares in an effort to identify disruptive trading activity. The Funds monitor trades where there is a purchase and redemption or exchange in excess of a certain amount into and out of the Funds within a period of 45 days. The Funds may also monitor trades into and out of the Funds over periods longer than 45 days. Whether or not the specific monitoring limits are exceeded, the Funds’ management or Advisor may determine from the amount, frequency or pattern of purchases and redemptions or exchanges that a shareholder is engaged in excessive trading that is or could be detrimental to the Funds and other shareholders and may preclude the shareholder from making further purchases or exchanges of Shares. The Funds’ management and Advisor may also take action to limit or suspend further trading by a financial intermediary if it is deemed to be engaged in excessive trading and/or does not cooperate satisfactorily with requests for details about trading activity. No matter how the Funds define their limits on frequent trading of Shares, other purchases and sales of Shares may have adverse effects on the management of a Fund’s portfolio and its performance. Also, it is possible that frequent trading may occur in the Funds without being identified because certain investors may seek to hide their identity or trading activity, or there may be operational or technical limitations that limit the Funds’ ability to monitor and restrict frequent trading.
The Funds’ objective is that their restrictions on short-term trading should apply to all shareholders, regardless of the number or type of accounts in which Shares are held. However, the Funds anticipate that limitations on their ability to identify trading activity to specific shareholders, including where shares are held through intermediaries in multiple or omnibus accounts, will mean that these reductions may not be able to be applied uniformly in all cases.
The Advisor will provide to the Trustees, at least quarterly, a report of all potential occurrences which were detected during the preceding quarter, and a description of any action taken with respect thereto.
Because the Asset Allocation Funds invest exclusively in Shares of the Underlying Funds, the policy and procedures set forth herein relating to frequent trading restrictions will not apply to the Asset Allocation Funds’ purchases and sales of the Underlying Funds. The Asset Allocation Funds will impose the same frequent trading restrictions as the Underlying Funds at their shareholder level. In addition, allocation changes of each Asset Allocation Fund are monitored, and the managers of the Underlying Fund are required to determine that there is no material adverse impact on the Underlying Fund or its shareholders.
The intent of this exception is to allow the manager of each Asset Allocation Fund to accommodate cash flows that result from purchases and sales by shareholders of the Asset Allocation Funds, and to reallocate portfolio investments of the Asset Allocation Funds among various Underlying Funds in accordance with the investment objectives of the Asset Allocation Fund where the aggregate of such trades would otherwise exceed the monitoring limits. Nevertheless, as with any trading in Fund Shares, purchases and redemptions of Underlying Fund Shares by an Asset Allocation Fund could adversely affect the management of an Underlying Fund’s portfolio and its performance.
144
More About the Huntington Funds
Money Market Funds
Given the short-term nature of the Money Market Funds’ investments and their use of the amortized cost method for calculating the NAV of Money Market Fund Shares, the Funds do not anticipate that, in the normal case, frequent or short-term trading into and out of the Money Market Funds will have significant adverse consequences for the Money Market Funds and their shareholders. For this reason and because the Money Market Funds are intended to be used as liquid short-term investments, the Funds’ policies or procedures to discourage frequent or short-term trading do not apply to the Money Market Funds’ Shares. However, the Money Market Funds may limit or terminate the availability of purchases or exchanges to a shareholder and may bar the shareholder from purchasing or exchanging Shares of the Money Market Funds and other non-Money Market Funds if the Funds’ management or Advisor determines from the amount, frequency or pattern of purchases and redemptions or exchanges that the shareholder is engaged in excessive trading that is or could be detrimental to the Funds and their shareholders.
Portfolio Holdings Information
You can access summary portfolio composition information concerning the Fund’s portfolio holdings in the “Fund Fact Sheets” option under the “Fund Shareholders” or “Prospective Investors” pages of the Huntington Funds website at www.huntingtonfunds.com/newsite/funds/factsheets.php. This information is prepared as of the end of each quarter for each of the Funds, except for the Money Market Funds. The information is posted on the web site approximately 30 days after the end of the month or quarter, as applicable, and remains there until replaced by the information for the succeeding period. The portfolio composition information may include the following types of information, but is subject to change: identification of the Funds’ top 25 or full holdings, and percentage breakdowns of the portfolio holdings by sector, credit quality, and/or country, as applicable. Portfolio holdings information for the Money Market Funds is filed with the SEC monthly on Form N-MFP, with portfolio holdings information becoming publicly available sixty days after the end of the month to which the specific monthly report relates.
In addition, the Funds’ Annual and Semi-Annual reports contain complete listings of the Funds’ portfolio holdings as of the end of the Funds’ second and fourth fiscal quarters. You may obtain copies at www.huntingtonfunds.com or by calling 800-253-0412. Each Fund also prepares a report on Form N-Q of its portfolio holdings as of the end of the Funds’ first and third fiscal quarters. Each of these fiscal quarter reports contains complete listings of each Fund’s portfolio holdings and is filed with the SEC within 60 days of the end of the reporting period at the SEC’s website at www.sec.gov, or you may request a copy by calling the Huntington Funds at 800-253-0412. These reports on Form N-Q and the Funds’ Annual and Semi-Annual reports are also posted on the Funds’ website at www.huntingtonfunds.com.
Management of the Trust
The Trustees of the Trust are responsible for generally overseeing the conduct of each Fund’s business. The Advisor, whose address is Huntington Center, 41 South High Street, Columbus, Ohio 43215, serves as investment advisor to the Funds pursuant to investment advisory agreements with the Trust.
Investment Advisor
Subject to the supervision of the Trustees, Huntington Asset Advisors, Inc. (“the Advisor”) provides a continuous investment program for the Funds, including investment research and management with respect to all securities, instruments, cash and cash equivalents in the Funds.
The Advisor, a separate, wholly-owned subsidiary of Huntington National Bank, is the investment advisor to the Huntington Funds. As of December 31, 2013, the Advisor had assets under management of $3.8 billion. The Advisor (and its predecessor) has served as investment advisor to the Funds since 1987.
Huntington National Bank is a direct, wholly-owned subsidiary of Huntington Bancshares Incorporated, a Maryland corporation with executive offices located at Huntington Center, 41 South High Street, Columbus, Ohio 43215. As of December 31, 2013, Huntington National Bank had assets of over $59 billion.
The Advisor has designated the following as Portfolio Managers for the Funds. Included is their business experience for the last five years.
Peter Sorrentino, CFA, is responsible for the day-to-day management of the Disciplined Equity Fund and Real Strategies Fund.
145
More About the Huntington Funds
Kirk Mentzer and Peter Sorrentino, CFA, are responsible for the day-to-day management of the Dividend Capture Fund.
Paul Attwood, CFA, and Martina Cheung, CFA, CMT, are responsible for the day-to-day management of the Global Select Markets Fund and International Equity Fund.
B. Randolph “Randy” Bateman, CFA, and Kirk Mentzer are responsible for the day-to-day management of the Situs Fund.
B. Randolph “Randy” Bateman, CFA, is responsible for the day-to-day management of the Balanced Allocation Fund, Conservative Allocation Fund and Growth Allocation Fund.
Paul W. Attwood is responsible for the day-to-day management of the Global Select Markets Fund and International Equity Fund. Mr. Attwood has served as the Portfolio Manager of the Global Select Markets Fund since the Fund’s inception and has served as the Portfolio Manager of the International Equity Fund since 2012. He joined Huntington in 2002 and is a Senior Vice President of the Advisor. Prior to joining the Advisor, Mr. Attwood was a Senior Research Analyst and Portfolio Manager with Haberer Investment Advisor, a division of Huntington Private Financial Group. He has over 15 years of experience in the financial services industry. Mr. Attwood holds a Chartered Financial Analyst designation. He received his bachelor’s degree from the University of Cincinnati.
B. Randolph “Randy” Bateman is responsible for the day-to-day management of the Situs Fund, Balanced Allocation Fund, Conservative Allocation Fund and Growth Allocation Fund. Mr. Bateman has served as the Portfolio Manager of the Situs Fund since 2002 and has served as the Portfolio Manager of the Asset Allocation Funds since 2013. He is Chief Investment Officer of the Advisor. Mr. Bateman joined The Huntington National Bank in 2000 as Chief Investment Officer. Mr. Bateman served as Senior Vice President of Star Bank from 1988 through 2000. Mr. Bateman holds a Chartered Financial Analyst designation. He received his Bachelor’s Degree from North Carolina State University.
Martina Cheung is responsible for the day-to-day management of the Global Select Markets Fund and International Equity Fund. Ms. Cheung has served as the Portfolio Manager of the Global Select Markets Fund and International Equity Fund since 2014. Ms. Cheung joined The Huntington National Bank in 1995 as a securities analyst and is currently a Senior Vice President and portfolio manager. Ms. Cheung holds a Chartered Financial Analyst designation and a Chartered Market Technician designation. She received her Bachelor’s degree in Finance and Management Information Systems from The Ohio State University and received her Master’s of Business Administration from Capital University.
Kirk Mentzer is responsible for the day-to-day management of the Dividend Capture Fund and Situs Fund. Mr. Mentzer has served as Portfolio Manager of the Dividend Capture Fund since 2001 as Portfolio Manager of the Situs Fund since 2014. He is Senior Vice President and Director of Investment Research of the Advisor. Mr. Mentzer joined The Huntington National Bank in 2000. Mr. Mentzer has been a Portfolio Manager since 2000 and from 2000 to 2001 he was Director of Fixed Income Investments. He became Director of Investment Research in 2001. He served as Vice President of Firstar Investment Research & Management Co. from 1989 through 2000 and managed Firstar’s Strategic Income and U.S. Government funds from 1999 to 2000. Mr. Mentzer received his M.B.A. from Xavier University.
Peter Sorrentino is responsible for the day-to-day management of the Dividend Capture Fund, Disciplined Equity Fund, and Real Strategies Fund. Mr. Sorrentino has served as the Portfolio Manager of the Real Strategies Fund since the Fund’s inception. He has served as Portfolio Manager of the Disciplined Equity Fund since 2012 and as Portfolio Manager of the Dividend Capture Fund since 2014. Mr. Sorrentino joined Huntington National Bank in October of 2006 as a Senior Portfolio Manager and is Senior Vice President of the Advisor. From 2001 until joining Huntington, he served as the lead portfolio manager for the Legg Mason Balanced Trust. Mr. Sorrentino holds a Chartered Financial Analyst designation. He received his Bachelor’s Degree in Finance and Accounting from the University of Cincinnati.
The Funds’ SAI provides additional information about the Portfolio Managers’ compensation, management of other accounts, and ownership of securities in the Funds.
Fees Paid To Advisor and Affiliates
The Advisor and its affiliates provide the Funds with advisory, administration, transfer agency, accounting, distribution and custodian services.
146
More About the Huntington Funds
A discussion of the Trustees’ review of the investment advisory agreements with the Trust is available in the Funds’ Annual Report for the period ended December 31, 2013.
Advisory Services
The Funds pay the Advisor management fees as a percentage of each Fund’s average daily net assets (“ADNA”) for its services as investment advisor as set forth in the chart below and the paragraphs that immediately follow:
| | | | | | |
Fund | | Tier | | Annual Rate | |
Tax-Free Money Market Fund | | Up to $500 million | | | 0.30 | % |
| | On the next $500 million to $1 billion | | | 0.25 | % |
| | On excess of $1 billion | | | 0.20 | % |
| | |
Money Market Fund | | Up to $500 million | | | 0.30 | % |
| | On the next $500 million to $1 billion | | | 0.25 | % |
| | On excess of $1 billion | | | 0.20 | % |
| | |
Ohio Municipal Money Market Fund | | Up to $500 million | | | 0.30 | % |
| | On the next $500 million to $1 billion | | | 0.25 | % |
| | On excess of $1 billion | | | 0.20 | % |
| | |
Disciplined Equity Fund | | Up to $500 million | | | 0.60 | % |
| | On the next $500 million to $1 billion | | | 0.55 | % |
| | On excess of $1 billion | | | 0.50 | % |
| | |
Dividend Capture Fund | | Up to $500 million | | | 0.75 | % |
| | On the next $500 million to $1 billion | | | 0.70 | % |
| | On excess of $1 billion | | | 0.65 | % |
| | |
Global Select Markets Fund | | Up to $500 million | | | 1.00 | % |
| | On the next $500 million to $1 billion | | | 0.95 | % |
| | On excess of $1 billion | | | 0.90 | % |
| | |
International Equity Fund | | Up to $500 million | | | 1.00 | % |
| | On the next $500 million to $1 billion | | | 0.95 | % |
| | On excess of $1 billion | | | 0.90 | % |
| | |
Real Strategies Fund | | Up to $500 million | | | 0.75 | % |
| | On the next $500 million to $1 billion | | | 0.70 | % |
| | On excess of $1 billion | | | 0.65 | % |
| | |
Situs Fund | | Up to $500 million | | | 0.75 | % |
| | On the next $500 million to $1 billion | | | 0.70 | % |
| | On excess of $1 billion | | | 0.65 | % |
The U.S. Treasury Money Market Fund pays the Advisor management fees of 0.20% of its ADNA.
Each Asset Allocation Fund pays the Advisor management fees of 0.10% of its ADNA.
For the fiscal year ended December 31, 2013, the following Funds paid the Advisor management fees (after waivers) based on the respective Fund’s average daily net assets of:
| | | | |
Fund | | Management Fees
Paid After Waivers
(based upon average
daily net assets) | |
Disciplined Equity Fund | | | 0.59 | % |
Dividend Capture Fund | | | 0.31 | % |
Global Select Markets Fund | | | 0.86 | % |
147
More About the Huntington Funds
| | | | |
Fund | | Management Fees
Paid After Waivers
(based upon average
daily net assets) | |
International Equity Fund | | | 1.00 | % |
Real Strategies Fund | | | 0.73 | % |
Situs Fund | | | 0.72 | % |
For the fiscal year ended December 31, 2013, the following Funds did not pay the Advisor management fees (after waivers): Tax-Free Money Market Fund, Money Market Fund, Ohio Municipal Money Market Fund, U.S. Treasury Money Market Fund, Balanced Allocation Fund, Conservative Allocation Fund and Growth Allocation Fund.
The Tax-Free Money Market Fund, Money Market Fund, Ohio Municipal Money Market Fund and U.S. Treasury Money Market Fund (“Money Market Funds”) are subject to a fee waiver and expense reimbursement agreement with the Advisor whereby the Advisor has agreed to waive fees or reimburse expenses in amounts necessary to maintain a minimum yield of 0.01% (0.00% for the U.S. Treasury Money Market Fund) and in which the Money Market Funds have agreed to repay amounts that were waived or reimbursed by the Advisor for a period up to three years after such waiver or reimbursement was made to the extent that such repayments would not cause the yield of a class to decrease below 0.01% (0.00% for the U.S. Treasury Money Market Fund).
The Advisor has contractually agreed to waive all or a portion of its management fee and/or reimburse certain operating expenses of certain Funds as listed below to the extent necessary in order to limit each Fund’s total annual fund operating expenses (after the fee waivers and/or expense reimbursements, and exclusive of acquired fund fees and expenses, brokerage costs, interest, taxes and dividends, and extraordinary expenses) to the expense cap noted below through April 30, 2015 (except where noted with (*) below). This arrangement may only be terminated prior to this date with the agreement of the Fund’s Board of Trustees. Under certain conditions, the Advisor may recapture operating expenses reimbursed under these arrangements for a period of three years following the fiscal year in which such reimbursement occurred. Any amounts recaptured by the Advisor may not cause the Fund’s total annual fund operating expenses to exceed the stated expense caps.
| | | | | | |
Fund | | Share Class | | Total Annual Fund Operating
Expenses After Fee Waivers
and/or Expense Reimbursements | |
U.S. Treasury Money Market Fund | | Class A Shares | | | 0.50 | % |
U.S. Treasury Money Market Fund | | Institutional Shares | | | 0.25 | % |
Disciplined Equity Fund | | Class A Shares | | | 1.26 | % |
Disciplined Equity Fund | | Institutional Shares | | | 1.01 | % |
Dividend Capture Fund* | | Class A Shares | | | 1.13 | % |
Dividend Capture Fund* | | Class C Shares | | | 1.63 | % |
Dividend Capture Fund* | | Institutional Shares | | | 0.88 | % |
Global Select Markets Fund | | Class A Shares | | | 2.06 | % |
Global Select Markets Fund | | Institutional Shares | | | 1.81 | % |
International Equity Fund | | Class A Shares | | | 1.12 | % |
International Equity Fund | | Institutional Shares | | | 0.87 | % |
Real Strategies Fund | | Class A Shares | | | 1.29 | % |
Real Strategies Fund | | Institutional Shares | | | 1.04 | % |
Situs Fund | | Class A Shares | | | 1.28 | % |
Situs Fund | | Class C Shares | | | 1.78 | % |
Situs Fund | | Institutional Shares | | | 1.03 | % |
Balanced Allocation Fund | | Class A Shares | | | 0.70 | % |
Conservative Allocation Fund | | Class A Shares | | | 0.70 | % |
Growth Allocation Fund | | Class A Shares | | | 0.65 | % |
| * | | Expense caps stated for the Dividend Capture Fund extend through April 30, 2016. |
148
More About the Huntington Funds
Administration Services
Huntington Asset Services, Inc. (“HASI”), a wholly owned subsidiary of Huntington Bancshares, Incorporated, provides administration and accounting services to the Funds. Additional information regarding fees charged for Administration Services can be found in the Funds’ SAI.
Custody Services
The Huntington National Bank currently serves as custodian for the Funds. For its custody services, the Huntington National Bank receives an annual maximum fee of 0.026% calculated on the domestic assets in each Fund (except the Asset Allocation Funds) as of the last day of each month, plus out of pocket expenses. For the Asset Allocation Funds, The Huntington National Bank receives an annual maximum fee of 0.01% calculated on the assets in the Asset Allocation Funds as of the last day of each month, plus out of pocket expenses. It also receives an annual surcharge of 0.005% of 1.00% calculated on the net non-domestic assets of the Global Select Markets Fund, the Situs Fund, the Real Strategies Fund, and the International Equity Fund as of the last day of each month.
Brown Brothers Harriman & Co. serves as sub-custodian for the non-domestic assets of the Global Select Markets Fund, the Real Strategies Fund, the Situs Fund, and the International Equity Fund.
Transfer Agency Services
HASI is transfer and dividend disbursing agent for the Funds.
For its services, HASI is entitled to receive a yearly fixed amount per shareholder account, subject to yearly minimum fees per portfolio and/or share class. HASI is also entitled to receive additional amounts that may be activity or time-based charges, plus reimbursement for out-of-pocket expenses.
Dividends and Distributions
The following Funds declare dividends and have ex-dates on investment income daily and pay monthly: Tax-Free Money Market Fund, Money Market Fund, Ohio Municipal Money Market Fund, and U.S. Treasury Money Market Fund.
Each of the other Funds offered by this Prospectus declare, have ex-dates and pay dividends on investment income, if any, according to the following schedule:
| | | | | | |
Disciplined Equity Fund | | | | | | Annually |
Dividend Capture Fund | | | | | | Monthly |
Global Select Markets Fund | | | | | | Annually |
International Equity Fund | | | | | | Annually |
Real Strategies Fund | | | | | | Annually |
Situs Fund | | | | | | Annually |
Balanced Allocation Fund | | | | | | Quarterly |
Conservative Allocation Fund | | | | | | Monthly |
Growth Allocation Fund | | | | | | Annually |
The Funds also make distributions of net capital gains, if any, at least annually.
If you purchase Shares by check, ACH or SIP, you will begin earning dividends on the next business day after your order has been received by the Trust.
Distribution Options
All dividends and distributions payable to a holder of Shares will be automatically reinvested in additional Shares of the same class of the Fund, unless the shareholder makes an alternative election. Shareholders may choose to receive all distributions in cash or may choose to reinvest capital gains distributions, but receive all other distributions in cash.
Tax Consequences
There are many important tax consequences associated with investment in the Funds offered by this Prospectus. The following is a brief summary of certain income tax consequences relating to an investment in the Funds, and shareholders are urged to consult their own tax advisors regarding the taxation of their investments under federal, state and local laws.
149
More About the Huntington Funds
Federal Income Taxes
Taxation of Shareholder Transactions
An exchange of a Fund’s Shares for shares of another Fund will be treated as a sale of the Fund’s Shares and, as with all sales, exchanges or redemptions of Fund Shares, any gain on the transaction will be subject to federal income tax.
Taxation of Distributions
Each of the Funds offered by this Prospectus intends to distribute substantially all of its net investment income (including net realized capital gains and tax-exempt interest income, if any) to its shareholders at least annually. Unless otherwise exempt or as discussed below, shareholders are required to pay federal income tax on any dividends and other distributions, including capital gains distributions received. This applies whether dividends and other distributions are received in cash or as additional Shares. Distributions representing long-term capital gains, if any, will be taxable to shareholders as long-term capital gains no matter how long a shareholder has held the Shares. Additionally, distributions of investment income designated by the Funds as derived from “qualified investment income” will be taxed at the rate applicable to long-term capital gains, provided holding period and other requirements are met at both the shareholder and Fund level. Generally, dividends paid by REITs do not qualify for the lower tax rates that apply to certain other “qualified investment income.” Distributions are taxable to shareholders even if they are paid from income or gains earned by a Fund before a shareholder’s investment (and thus were included in the price paid).
Individuals, trusts and estates whose income exceeds certain threshold amounts will be subject to a 3.8% Medicare contribution tax on “net investment income” in tax years beginning on or after January 1, 2013. Net investment income includes any ordinary dividends and capital gain distributions from the Fund as well as any capital gains recognized on the sale or exchange of Fund shares.
Exempt-Interest Dividends
If, at the end of each quarter of its taxable year, at least 50% of the value of a Fund’s assets consists of obligations the interest on which is exempt from federal tax under IRC section 103(a), the Fund may pay dividends that pass through to shareholders the tax-exempt character of exempt interest earned by the Fund. Generally, these dividends are not taxable to fund shareholders for U.S. federal income tax purposes but may be subject to state and local taxes. Exempt-interest dividends attributable to investments in certain “private activity” bonds will be treated as tax preference items in computing the Alternative Minimum Tax (“AMT”). Also, a portion of all other exempt-interest dividends earned by a corporation may be subject to the AMT. In certain limited instances, the portion of Social Security or Railroad Retirement benefits that may be subject to federal income taxation may be affected by the amount of tax-exempt interest income, including exempt-interest dividends, received by a shareholder.
Avoid Withholding Tax
Each Fund is required to withhold a portion of taxable dividends, capital gains distributions and proceeds of sales, exchanges, or redemptions paid to any shareholder who has not provided the Fund with his or her certified Taxpayer Identification Number (your Social Security Number for individual investors) or otherwise fails to meet certain requirements imposed by the Internal Revenue Service. Shareholders are urged to read the additional information concerning withholding provided in the SAI.
Tax-Exempt Funds
It is anticipated that distributions for Tax-Free Money Market Fund and Ohio Municipal Money Market Fund will be comprised primarily of dividends that are exempt from federal income tax, although a portion of each Fund’s dividends may not be exempt. Dividends may be subject to state and local taxes, although the income dividends distributed by the Ohio Municipal Money Market Fund is generally intended to be exempt from Ohio personal income taxes. For any portion of each Fund’s distributions not invested in tax-exempt securities, distributions of income dividends may be subject to state taxation.
150
(This page intentionally left blank.)
More About the Huntington Funds
Financial Information
Financial Highlights
The financial highlights tables that follow are intended to help you understand each Fund’s financial performance for the fiscal years ended December 31. Certain information reflects financial results for a single Fund share. No financial highlights are presented for Class C Shares of the Dividend Capture Fund and Situs Fund because the respective share classes of the Funds commenced operations on January 2, 2014. The total returns in the table represent the rate that an investor would have earned or lost on an investment in the Fund (assuming reinvestment of all dividends and distributions). This information has been derived from the Funds’ financial statements, which, for the past five fiscal years, have been audited by Ernst & Young LLP, independent registered public accounting firm, whose report, along with the Funds’ financial statements, is included in the Funds’ Annual Report, which is available upon request.
Money Market Funds
(For a share outstanding throughout each period)
| | | | | | | | | | | | | | | | | | | | | | | | | | | | |
| | | Net Asset
Value,
beginning
of period | | | Net
investment
income
(loss) | | | Net realized
and unrealized
gain (loss) on investments | | | Total from
investment
operations | | | Distributions
from net
investment
income | | | Distributions
from net
realized gain
on investment
transactions | | | Total
distributions | |
HUNTINGTON TAX FREE MONEY MARKET FUND | | | | | | | | | | | | | | | | | | | | | |
Institutional Shares | | | | | | | | | | | | | | | | | | | | | | | | | | | | |
2009 | | $ | 1.00 | | | | — | (2) | | | — | (2) | | | — | (2) | | | — | (2) | | | — | | | | — | (2) |
2010 | | $ | 1.00 | | | | — | (2) | | | — | (2) | | | — | (2) | | | — | (2) | | | — | | | | — | (2) |
2011 | | $ | 1.00 | | | | — | (2) | | | — | (2) | | | — | (2) | | | — | (2) | | | — | | | | — | (2) |
2012 | | $ | 1.00 | | | | — | (2) | | | — | (2) | | | — | (2) | | | — | (2) | | | — | | | | — | (2) |
2013 | | $ | 1.00 | | | | — | (2) | | | — | (2) | | | — | (2) | | | — | (2) | | | — | | | | — | (2) |
Class A Shares | | | | | | | | | | | | | | | | | | | | | | | | | | | | |
2009 | | $ | 1.00 | | | | — | (2) | | | — | (2) | | | — | (2) | | | — | (2) | | | — | (2) | | | — | (2) |
2010 | | $ | 1.00 | | | | — | (2) | | | — | (2) | | | — | (2) | | | — | (2) | | | — | | | | — | (2) |
2011 | | $ | 1.00 | | | | — | (2) | | | — | (2) | | | — | (2) | | | — | (2) | | | — | | | | — | (2) |
2012 | | $ | 1.00 | | | | — | (2) | | | — | (2) | | | — | (2) | | | — | (2) | | | — | | | | — | (2) |
2013 | | $ | 1.00 | | | | — | (2) | | | — | (2) | | | — | (2) | | | — | (2) | | | — | | | | — | (2) |
HUNTINGTON MONEY MARKET FUND | | | | | | | | | | | | | | | | | | | | | |
Institutional Shares | | | | | | | | | | | | | | | | | | | | | | | | | | | | |
2009 | | $ | 1.00 | | | | — | (2) | | | — | (2) | | | — | (2) | | | — | (2) | | | — | | | | — | (2) |
2010 | | $ | 1.00 | | | | — | (2) | | | — | (2) | | | — | (2) | | | — | (2) | | | — | | | | — | (2) |
2011 | | $ | 1.00 | | | | — | (2) | | | — | (2) | | | — | (2) | | | — | (2) | | | — | | | | — | (2) |
2012 | | $ | 1.00 | | | | — | (2) | | | — | (2) | | | — | (2) | | | — | (2) | | | — | | | | — | (2) |
2013 | | $ | 1.00 | | | | — | (2) | | | — | (2) | | | — | (2) | | | — | (2) | | | — | | | | — | (2) |
Class A Shares | | | | | | | | | | | | | | | | | | | | | | | | | | | | |
2009 | | $ | 1.00 | | | | — | (2) | | | — | (2) | | | — | (2) | | | — | (2) | | | — | | | | — | (2) |
2010 | | $ | 1.00 | | | | — | (2) | | | — | (2) | | | — | (2) | | | — | (2) | | | — | | | | — | (2) |
2011 | | $ | 1.00 | | | | — | (2) | | | — | (2) | | | — | (2) | | | — | (2) | | | — | | | | — | (2) |
2012 | | $ | 1.00 | | | | — | (2) | | | — | (2) | | | — | (2) | | | — | (2) | | | — | | | | — | (2) |
2013 | | $ | 1.00 | | | | — | (2) | | | — | (2) | | | — | (2) | | | — | (2) | | | — | | | | — | (2) |
InterFund Shares | | | | | | | | | | | | | | | | | | | | | | | | | | | | |
2009 | | $ | 1.00 | | | | — | (2) | | | — | (2) | | | — | (2) | | | — | (2) | | | — | | | | — | (2) |
2010 | | $ | 1.00 | | | | — | (2) | | | — | (2) | | | — | (2) | | | — | (2) | | | — | | | | — | (2) |
2011 | | $ | 1.00 | | | | — | (2) | | | — | (2) | | | — | (2) | | | — | (2) | | | — | | | | — | (2) |
2012(3) | | $ | 1.00 | | | | — | (2) | | | — | (2) | | | — | (2) | | | — | (2) | | | — | | | | — | (2) |
2013(6) | | $ | 0.00 | | | | — | | | | — | | | | — | | | | — | | | | — | | | | — | |
| (1) | If applicable, certain fees were waived and/or reimbursed. If such waivers/reimbursements had not occurred, the ratios would have been as indicated. |
| (2) | Amount is less than $0.005. |
| (3) | For the period January 1, 2012 to November 28, 2012. All of the assets of the Interfund Shares were redeemed on November 28, 2012. As of December 31, 2012, the Interfund Shares are available for purchase by the Funds; however the balance remains zero. |
| (5) | Computed on an annualized basis. |
| (6) | For the year ended December 31, 2013, the Interfund Shares are available for purchase by the Funds; however there were no balances or transactions during the year. |
152
More About the Huntington Funds
| | | | | | | | | | | | | | | | | | | | | | |
Net Asset
Value, end
of period | | | Total
return | | | Ratio of Net
Expenses to
Average Net
Assets | | | Ratio of Net
Investment
Income (Loss) to
Average Net
Assets | | | Ratio of Expenses
(Prior to
Reimbursements)
to Average
Net Assets(1) | | | Net Assets,
at end of
period
(000 omitted) | |
| | | | | | | | | | | | | | | | | | | | | | |
| | | | | | | | | | | | | | | | | | | | | | |
| $ | 1.00 | | | | 0.10 | % | | | 0.78 | % | | | 0.12 | % | | | 0.89 | % | | $ | 76,805 | |
| $ | 1.00 | | | | 0.01 | % | | | 0.44 | % | | | 0.01 | % | | | 0.89 | % | | $ | 66,919 | |
| $ | 1.00 | | | | 0.01 | % | | | 0.30 | % | | | 0.01 | % | | | 0.92 | % | | $ | 73,147 | |
| $ | 1.00 | | | | 0.01 | % | | | 0.22 | % | | | 0.01 | % | | | 0.93 | % | | $ | 57,317 | |
| $ | 1.00 | | | | 0.02 | % | | | 0.16 | % | | | 0.02 | % | | | 0.94 | % | | $ | 25,458 | |
| | | | | | | | | | | | | | | | | | | | | | |
| $ | 1.00 | | | | 0.03 | % | | | 0.87 | % | | | 0.03 | % | | | 1.15 | % | | $ | 21,709 | |
| $ | 1.00 | | | | 0.01 | % | | | 0.45 | % | | | 0.01 | % | | | 1.16 | % | | $ | 15,539 | |
| $ | 1.00 | | | | 0.01 | % | | | 0.30 | % | | | 0.01 | % | | | 1.17 | % | | $ | 18,882 | |
| $ | 1.00 | | | | 0.01 | % | | | 0.22 | % | | | 0.01 | % | | | 1.18 | % | | $ | 16,765 | |
| $ | 1.00 | | | | 0.01 | % | | | 0.16 | % | | | 0.01 | % | | | 1.19 | % | | $ | 17,185 | |
| | | | | | | | | | | | | | | | | | | | | | |
| | | | | | | | | | | | | | | | | | | | | | |
| $ | 1.00 | | | | 0.01 | % | | | 0.45 | % | | | 0.02 | % | | | 0.87 | % | | $ | 260,720 | |
| $ | 1.00 | | | | 0.01 | % | | | 0.31 | % | | | 0.01 | % | | | 0.88 | % | | $ | 214,981 | |
| $ | 1.00 | | | | 0.01 | % | | | 0.24 | % | | | 0.01 | % | | | 0.84 | % | | $ | 262,067 | |
| $ | 1.00 | | | | 0.01 | % | | | 0.23 | % | | | 0.01 | % | | | 0.86 | % | | $ | 240,924 | |
| $ | 1.00 | | | | 0.01 | % | | | 0.12 | % | | | 0.01 | % | | | 0.84 | % | | $ | 208,783 | |
| | | | | | | | | | | | | | | | | | | | | | |
| $ | 1.00 | | | | 0.01 | % | | | 0.42 | % | | | 0.01 | % | | | 1.12 | % | | $ | 135,260 | |
| $ | 1.00 | | | | 0.01 | % | | | 0.32 | % | | | 0.01 | % | | | 1.13 | % | | $ | 134,974 | |
| $ | 1.00 | | | | 0.01 | % | | | 0.24 | % | | | 0.01 | % | | | 1.09 | % | | $ | 97,936 | |
| $ | 1.00 | | | | 0.01 | % | | | 0.23 | % | | | 0.01 | % | | | 1.11 | % | | $ | 105,688 | |
| $ | 1.00 | | | | 0.01 | % | | | 0.12 | % | | | 0.01 | % | | | 1.09 | % | | $ | 136,589 | |
| | | | | | | | | | | | | | | | | | | | | | |
| $ | 1.00 | | | | 0.03 | % | | | 0.37 | % | | | 0.03 | % | | | 0.63 | % | | $ | 62,376 | |
| $ | 1.00 | | | | 0.01 | % | | | 0.31 | % | | | 0.01 | % | | | 0.63 | % | | $ | 45,724 | |
| $ | 1.00 | | | | 0.01 | % | | | 0.24 | % | | | 0.01 | % | | | 0.59 | % | | $ | 73,921 | |
| $ | 1.00 | | | | 0.01 | %(4) | | | 0.23 | %(5) | | | 0.01 | %(5) | | | 0.61 | %(5) | | $ | — | |
| $ | — | | | | 0.00 | % | | | — | | | | — | | | | — | | | $ | — | |
153
More About the Huntington Funds
Financial Highlights
Money Market Funds (continued)
(For a share outstanding throughout each period)
| | | | | | | | | | | | | | | | | | | | | | | | | | | | |
| | | Net Asset
Value,
beginning
of period | | | Net
investment
income
(loss) | | | Net realized
and unrealized
gain (loss)
on investments | | | Total from
investment
operations | | | Distributions
from net
investment
income | | | Distributions
from net
realized gain
on investment
transactions | | | Total
distributions | |
HUNTINGTON OHIO MUNICIPAL MONEY MARKET FUND | | | | | | | | | |
Institutional Shares | | | | | | | | | |
2009 | | $ | 1.00 | | | | — | (2) | | | — | (2) | | | — | (2) | | | — | (2) | | | — | | | | — | (2) |
2010 | | $ | 1.00 | | | | — | (2) | | | — | (2) | | | — | (2) | | | — | (2) | | | — | | | | — | (2) |
2011 | | $ | 1.00 | | | | — | (2) | | | — | (2) | | | — | (2) | | | — | (2) | | | — | | | | — | (2) |
2012 | | $ | 1.00 | | | | — | (2) | | | — | (2) | | | — | (2) | | | — | (2) | | | — | | | | — | (2) |
2013 | | $ | 1.00 | | | | — | (2) | | | — | (2) | | | — | (2) | | | — | (2) | | | — | | | | — | (2) |
Class A Shares | | | | | | | | | |
2009 | | $ | 1.00 | | | | — | (2) | | | — | (2) | | | — | (2) | | | — | (2) | | | — | | | | — | (2) |
2010 | | $ | 1.00 | | | | — | (2) | | | — | (2) | | | — | (2) | | | — | (2) | | | — | | | | — | (2) |
2011 | | $ | 1.00 | | | | — | (2) | | | — | (2) | | | — | (2) | | | — | (2) | | | — | | | | — | (2) |
2012 | | $ | 1.00 | | | | — | (2) | | | — | (2) | | | — | (2) | | | — | (2) | | | — | | | | — | (2) |
2013 | | $ | 1.00 | | | | — | (2) | | | — | (2) | | | — | (2) | | | — | (2) | | | — | | | | — | (2) |
HUNTINGTON U.S. TREASURY MONEY MARKET FUND | | | | | | | | | |
Institutional Shares | | | | | | | | | |
2009 | | $ | 1.00 | | | | — | (2) | | | — | (2) | | | — | (2) | | | — | (2) | | | — | | | | — | (2) |
2010 | | $ | 1.00 | | | | — | (2) | | | — | (2) | | | — | (2) | | | — | (2) | | | — | | | | — | (2) |
2011 | | $ | 1.00 | | | | — | (2) | | | — | (2) | | | — | (2) | | | — | (2) | | | — | (2) | | | — | (2) |
2012 | | $ | 1.00 | | | | — | (2) | | | — | (2) | | | — | (2) | | | — | (2) | | | — | | | | — | (2) |
2013 | | $ | 1.00 | | | | — | (2) | | | — | (2) | | | — | (2) | | | — | (2) | | | — | | | | — | (2) |
Class A Shares | | | | | | | | | | | | | | | | | | | | | |
2009 | | $ | 1.00 | | | | — | (2) | | | — | (2) | | | — | (2) | | | — | (2) | | | — | | | | — | (2) |
2010 | | $ | 1.00 | | | | — | (2) | | | — | (2) | | | — | (2) | | | — | (2) | | | — | | | | — | (2) |
2011 | | $ | 1.00 | | | | — | (2) | | | — | (2) | | | — | (2) | | | — | (2) | | | — | (2) | | | — | (2) |
2012 | | $ | 1.00 | | | | — | (2) | | | — | (2) | | | — | (2) | | | — | | | | — | | | | — | |
2013 | | $ | 1.00 | | | | — | | | | — | (2) | | | — | (2) | | | — | | | | — | | | | — | |
| (1) | If applicable, certain fees were waived and/or reimbursed. If such waivers/reimbursements had not occurred, the ratios would have been as indicated. |
| (2) | Amount is less than $0.005. |
| (3) | Rounds to less than 0.005%. |
154
More About the Huntington Funds
| | | | | | | | | | | | | | | | | | | | | | |
Net Asset
Value, end
of period | | | Total
return | | | Ratio of Net
Expenses to
Average Net
Assets | | | Ratio of Net
Investment
Income (Loss) to
Average Net
Assets | | | Ratio of Expenses
(Prior to
Reimbursements)
to Average
Net Assets(1) | | | Net Assets,
at end
of period
(000 omitted) | |
| | |
| | | | | | | | | | | | | | | | | | | | | | |
| $ | 1.00 | | | | 0.12 | % | | | 0.78 | % | | | 0.14 | % | | | 0.89 | % | | $ | 142,956 | |
| $ | 1.00 | | | | 0.01 | % | | | 0.42 | % | | | 0.01 | % | | | 0.88 | % | | $ | 81,023 | |
| $ | 1.00 | | | | 0.01 | % | | | 0.28 | % | | | 0.01 | % | | | 0.84 | % | | $ | 61,212 | |
| $ | 1.00 | | | | 0.01 | % | | | 0.20 | % | | | 0.01 | % | | | 0.88 | % | | $ | 58,279 | |
| $ | 1.00 | | | | 0.01 | % | | | 0.15 | % | | | 0.01 | % | | | 0.88 | % | | $ | 64,439 | |
| | | | | | | | | | | | | | | | | | | | | | |
| $ | 1.00 | | | | 0.02 | % | | | 0.82 | % | | | 0.02 | % | | | 1.14 | % | | $ | 112,048 | |
| $ | 1.00 | | | | 0.01 | % | | | 0.41 | % | | | 0.01 | % | | | 1.12 | % | | $ | 117,109 | |
| $ | 1.00 | | | | 0.01 | % | | | 0.28 | % | | | 0.01 | % | | | 1.09 | % | | $ | 83,858 | |
| $ | 1.00 | | | | 0.01 | % | | | 0.20 | % | | | 0.01 | % | | | 1.13 | % | | $ | 73,528 | |
| $ | 1.00 | | | | 0.01 | % | | | 0.15 | % | | | 0.01 | % | | | 1.13 | % | | $ | 59,179 | |
| | |
| | | | | | | | | | | | | | | | | | | | | | |
| $ | 1.00 | | | | 0.01 | % | | | 0.20 | % | | | 0.01 | % | | | 0.79 | % | | $ | 261,263 | |
| $ | 1.00 | | | | 0.01 | % | | | 0.15 | % | | | 0.01 | % | | | 0.76 | % | | $ | 312,870 | |
| $ | 1.00 | | | | 0.01 | % | | | 0.07 | % | | | 0.01 | % | | | 0.74 | % | | $ | 251,704 | |
| $ | 1.00 | | | | 0.01 | % | | | 0.09 | % | | | 0.01 | % | | | 0.74 | % | | $ | 737,310 | |
| $ | 1.00 | | | | 0.04 | % | | | 0.04 | % | | | 0.04 | % | | | 0.69 | % | | $ | 977,168 | |
| | | | | | | | | | | | | | | | | | | | | | |
| $ | 1.00 | | | | 0.01 | % | | | 0.20 | % | | | 0.01 | % | | | 1.03 | % | | $ | 54,935 | |
| $ | 1.00 | | | | 0.01 | % | | | 0.15 | % | | | 0.01 | % | | | 1.01 | % | | $ | 74,845 | |
| $ | 1.00 | | | | 0.01 | % | | | 0.07 | % | | | 0.01 | % | | | 0.99 | % | | $ | 83,204 | |
| $ | 1.00 | | | | — | % | | | 0.09 | % | | | — | %(3) | | | 0.99 | % | | $ | 108,885 | |
| $ | 1.00 | | | | — | % | | | 0.08 | % | | | — | % | | | 0.94 | % | | $ | 130,827 | |
155
More About the Huntington Funds
Financial Highlights
Equity Funds
(For a share outstanding throughout each period)
| | | | | | | | | | | | | | | | | | | | | | | | | | | | | | | | |
| | | Net Asset
Value,
beginning
of period | | | Net
investment
income
(loss) | | | Net realized
and unrealized
gain (loss)
on investments | | | Total from
investment
operations | | | Distributions
from net
investment
income | | | Distributions
from net
realized gain
on investment
transactions | | | Distributions
from return
of capital | | | Total
distributions | |
HUNTINGTON DISCIPLINED EQUITY FUND | | | | | | | | | | | | | | | | | | | | | | | | | |
Institutional Shares | | | | | | | | | | | | | | | | | | | | | | | | | | | | | | | | |
2011(4) | | $ | 10.00 | | | | 0.04 | | | | (0.19 | ) | | | (0.15 | ) | | | (0.04 | ) | | | — | | | | — | | | | (0.04 | ) |
2012 | | $ | 9.81 | | | | 0.10 | | | | (0.01 | ) | | | 0.09 | | | | (0.10 | ) | | | — | | | | — | | | | (0.10 | ) |
2013 | | $ | 9.80 | | | | 0.11 | | | | 1.18 | | | | 1.29 | | | | (0.11 | ) | | | — | | | | — | | | | (0.11 | ) |
Class A Shares | | | | | | | | | | | | | | | | | | | | | | | | | | | | | | | | |
2011(4) | | $ | 10.00 | | | | 0.02 | | | | (0.19 | ) | | | (0.17 | ) | | | (0.04 | ) | | | — | | | | — | | | | (0.04 | ) |
2012 | | $ | 9.79 | | | | 0.08 | | | | (0.02 | ) | | | 0.06 | | | | (0.07 | ) | | | — | | | | — | | | | (0.07 | ) |
2013 | | $ | 9.78 | | | | 0.09 | | | | 1.17 | | | | 1.26 | | | | (0.07 | ) | | | — | | | | — | | | | (0.07 | ) |
HUNTINGTON DIVIDEND CAPTURE FUND | | | | | | | | | | | | | | | | | | | | | | | | | |
Institutional Shares | | | | | | | | | | | | | | | | | | | | | | | | | | | | | | | | |
2009 | | $ | 6.57 | | | | 0.29 | | | | 1.31 | | | | 1.60 | | | | (0.29 | ) | | | — | | | | (0.02 | ) | | | (0.31 | ) |
2010 | | $ | 7.86 | | | | 0.25 | | | | 0.83 | | | | 1.08 | | | | (0.25 | ) | | | — | | | | — | | | | (0.25 | ) |
2011 | | $ | 8.69 | | | | 0.30 | | | | 0.22 | | | | 0.52 | | | | (0.30 | ) | | | — | | | | — | | | | (0.30 | ) |
2012 | | $ | 8.91 | | | | 0.33 | | | | 0.63 | | | | 0.96 | | | | (0.38 | ) | | | — | | | | — | | | | (0.38 | ) |
2013 | | $ | 9.49 | | | | 0.36 | | | | 1.60 | | | | 1.96 | | | | (0.32 | ) | | | (0.39 | ) | | | — | | | | (0.71 | ) |
Class A Shares | | | | | | | | | | | | | | | | | | | | | | | | | | | | | | | | |
2009 | | $ | 6.57 | | | | 0.27 | | | | 1.31 | | | | 1.58 | | | | (0.27 | ) | | | — | | | | (0.02 | ) | | | (0.29 | ) |
2010 | | $ | 7.86 | | | | 0.23 | | | | 0.83 | | | | 1.06 | | | | (0.23 | ) | | | — | | | | — | | | | (0.23 | ) |
2011 | | $ | 8.69 | | | | 0.28 | | | | 0.21 | | | | 0.49 | | | | (0.28 | ) | | | — | | | | — | | | | (0.28 | ) |
2012 | | $ | 8.90 | | | | 0.30 | | | | 0.65 | | | | 0.95 | | | | (0.36 | ) | | | — | | | | — | | | | (0.36 | ) |
2013 | | $ | 9.49 | | | | 0.34 | | | | 1.59 | | | | 1.93 | | | | (0.30 | ) | | | (0.39 | ) | | | — | | | | (0.69 | ) |
HUNTINGTON GLOBAL SELECT MARKETS FUND | | | | | | | | | | | | | | | | | | | | | | | | | |
Institutional Shares | | | | | | | | | | | | | | | | | | | | | | | | | | | | | | | | |
2009(7) | | $ | 10.00 | | | | — | (8) | | | — | (8) | | | — | (8) | | | — | | | | — | | | | — | | | | — | |
2010 | | $ | 10.00 | | | | 0.03 | | | | 1.55 | | | | 1.58 | | | | (0.11 | ) | | | — | | | | (0.01 | ) | | | (0.12 | ) |
2011 | | $ | 11.46 | | | | 0.08 | | | | (1.99 | ) | | | (1.91 | ) | | | (0.05 | ) | | | (0.14 | ) | | | — | | | | (0.19 | ) |
2012 | | $ | 9.36 | | | | 0.04 | | | | 0.97 | | | | 1.01 | | | | (0.04 | ) | | | — | | | | — | | | | (0.04 | ) |
2013 | | $ | 10.33 | | | | 0.04 | | | | 0.58 | | | | 0.62 | | | | (0.21 | ) | | | — | | | | — | | | | (0.21 | ) |
Class A Shares | | | | | | | | | | | | | | | | | | | | | | | | | | | | | | | | |
2009(7) | | $ | 10.00 | | | | — | (8) | | | — | (8) | | | — | (8) | | | — | | | | — | | | | — | | | | — | |
2010 | | $ | 10.00 | | | | 0.01 | | | | 1.53 | | | | 1.54 | | | | (0.09 | ) | | | — | | | | (0.02 | ) | | | (0.11 | ) |
2011 | | $ | 11.43 | | | | 0.04 | | | | (1.97 | ) | | | (1.93 | ) | | | — | (8) | | | (0.14 | ) | | | — | | | | (0.14 | ) |
2012 | | $ | 9.36 | | | | 0.01 | | | | 0.97 | | | | 0.98 | | | | (0.02 | ) | | | — | | | | — | | | | (0.02 | ) |
2013 | | $ | 10.32 | | | | 0.01 | | | | 0.59 | | | | 0.60 | | | | (0.19 | ) | | | — | | | | — | | | | (0.19 | ) |
| (1) | Based on net asset value, which does not reflect a sales charge or contingent deferred sales charge, if applicable. |
| (2) | If applicable, certain fees were waived and/or reimbursed. If such waivers/reimbursements had not occurred, the ratios would have been as indicated. |
| (3) | Portfolio Turnover is calculated on the basis of the Fund as a whole without distinguishing among classes of shares. |
| (4) | Reflects operations for the period from August 1, 2011 (commencement of operations) to December 31, 2011. |
| (6) | Computed on an annualized basis. |
| (7) | Reflects operations for the period from December 30, 2009 (commencement of operations) to December 31, 2009. |
| (8) | Amount is less than $0.005. |
156
More About the Huntington Funds
| | | | | | | | | | | | | | | | | | | | | | | | | | |
Net Asset
Value, end
of period | | | Total
return(1) | | | Ratio of Net
Expenses to
Average Net
Assets | | | Ratio of Net
Investment
Income (Loss) to
Average Net
Assets | | | Ratio of Expenses
(Prior to
Reimbursements)
to Average
Net Assets(2) | | | Net Assets,
at end
of period
(000 omitted) | | | Portfolio
turnover
rate(3) | |
| | | | | | | | | | | | | | | | | | | | | | | | | | |
| | | | | | | | | | | | | | | | | | | | | | | | | | |
| $ | 9.81 | | | | (1.50 | )%(5) | | | 1.20 | %(6) | | | 0.98 | %(6) | | | 1.33 | %(6) | | $ | 65,294 | | | | 3 | %(5) |
| $ | 9.80 | | | | 0.91 | % | | | 1.20 | % | | | 1.07 | % | | | 1.23 | % | | $ | 86,382 | | | | 9 | % |
| $ | 10.98 | | | | 13.13 | % | | | 1.18 | % | | | 0.96 | % | | | 1.19 | % | | $ | 92,281 | | | | 45 | % |
| | | | | | | | | | | | | | | | | | | | | | | | | | |
| $ | 9.79 | | | | (1.73 | )%(5) | | | 1.45 | %(6) | | | 0.72 | %(6) | | | 1.58 | %(6) | | $ | 5,661 | | | | 3 | %(5) |
| $ | 9.78 | | | | 0.67 | % | | | 1.45 | % | | | 0.82 | % | | | 1.48 | % | | $ | 7,605 | | | | 9 | % |
| $ | 10.97 | | | | 12.87 | % | | | 1.43 | % | | | 0.71 | % | | | 1.44 | % | | $ | 5,558 | | | | 45 | % |
| | | | | | | | | | | | | | | | | | | | | | | | | | |
| | | | | | | | | | | | | | | | | | | | | | | | | | |
| $ | 7.86 | | | | 25.24 | % | | | 1.41 | % | | | 4.37 | % | | | 1.41 | % | | $ | 74,593 | | | | 99 | % |
| $ | 8.69 | | | | 13.99 | % | | | 1.40 | % | | | 3.05 | % | | | 1.40 | % | | $ | 100,622 | | | | 115 | % |
| $ | 8.91 | | | | 6.03 | % | | | 1.36 | % | | | 3.40 | % | | | 1.36 | % | | $ | 117,798 | | | | 143 | % |
| $ | 9.49 | | | | 10.87 | % | | | 1.21 | % | | | 3.55 | % | | | 1.36 | % | | $ | 145,946 | | | | 109 | % |
| $ | 10.74 | | | | 21.14 | % | | | 0.89 | % | | | 3.59 | % | | | 1.33 | % | | $ | 278,917 | | | | 130 | % |
| | | | | | | | | | | | | | | | | | | | | | | | | | |
| $ | 7.86 | | | | 24.93 | % | | | 1.66 | % | | | 4.10 | % | | | 1.66 | % | | $ | 5,473 | | | | 99 | % |
| $ | 8.69 | | | | 13.72 | % | | | 1.64 | % | | | 2.82 | % | | | 1.64 | % | | $ | 17,784 | | | | 115 | % |
| $ | 8.90 | | | | 5.65 | % | | | 1.61 | % | | | 3.19 | % | | | 1.61 | % | | $ | 26,843 | | | | 143 | % |
| $ | 9.49 | | | | 10.72 | % | | | 1.46 | % | | | 3.37 | % | | | 1.61 | % | | $ | 46,343 | | | | 109 | % |
| $ | 10.73 | | | | 20.74 | % | | | 1.14 | % | | | 3.32 | % | | | 1.58 | % | | $ | 71,258 | | | | 130 | % |
| | | | | | | | | | | | | | | | | | | | | | | | | | |
| | | | | | | | | | | | | | | | | | | | | | | | | | |
| $ | 10.00 | | | | — | %(5) | | | 1.83 | %(6) | | | (1.46 | )%(6) | | | 1.83 | %(6) | | $ | 1 | | | | — | %(5) |
| $ | 11.46 | | | | 15.85 | % | | | 1.90 | % | | | 0.40 | % | | | 2.19 | % | | $ | 41,116 | | | | 45 | % |
| $ | 9.36 | | | | (16.67 | )% | | | 1.79 | % | | | 0.71 | % | | | 1.79 | % | | $ | 38,871 | | | | 110 | % |
| $ | 10.33 | | | | 10.82 | % | | | 1.90 | % | | | 0.40 | % | | | 1.90 | % | | $ | 38,696 | | | | 97 | % |
| $ | 10.74 | | | | 6.08 | % | | | 1.87 | % | | | 0.40 | % | | | 2.01 | % | | $ | 27,015 | | | | 156 | % |
| | | | | | | | | | | | | | | | | | | | | | | | | | |
| $ | 10.00 | | | | — | %(5) | | | 2.19 | %(6) | | | (2.92 | )%(6) | | | 2.19 | %(6) | | $ | 1 | | | | — | %(5) |
| $ | 11.43 | | | | 15.38 | % | | | 2.16 | % | | | 0.20 | % | | | 2.44 | % | | $ | 860 | | | | 45 | % |
| $ | 9.36 | | | | (16.80 | )% | | | 2.04 | % | | | 0.48 | % | | | 2.04 | % | | $ | 541 | | | | 110 | % |
| $ | 10.32 | | | | 10.43 | % | | | 2.15 | % | | | 0.09 | % | | | 2.15 | % | | $ | 416 | | | | 97 | % |
| $ | 10.73 | | | | 5.87 | % | | | 2.12 | % | | | 0.06 | % | | | 2.26 | % | | $ | 429 | | | | 156 | % |
157
More About the Huntington Funds
Financial Highlights
Equity Funds (continued)
(For a share outstanding throughout each period)
| | | | | | | | | | | | | | | | | | | | | | | | | | | | | | | | |
| | | Net Asset
Value,
beginning
of period | | | Net
investment
income
(loss) | | | Net realized
and unrealized
gain (loss)
on investments | | | Total from
investment
operations | | | Distributions
from net
investment
income | | | Distributions
from net
realized gain
on investment
transactions | | | Distributions
from return
of capital | | | Total
distributions | |
HUNTINGTON INTERNATIONAL EQUITY FUND | | | | | | | | | | | | | | | | | | | | | |
Institutional Shares | | | | | | | | | | | | | | | | | | | | | | | | | | | | | | | | |
2009 | | $ | 8.22 | | | | 0.17 | | | | 2.52 | | | | 2.69 | | | | (0.10 | ) | | | (0.02 | ) | | | — | | | | (0.12 | ) |
2010 | | $ | 10.79 | | | | 0.13 | | | | 0.70 | | | | 0.83 | | | | (0.09 | ) | | | — | | | | — | | | | (0.09 | ) |
2011 | | $ | 11.53 | | | | 0.15 | | | | (1.47 | ) | | | (1.32 | ) | | | (0.12 | ) | | | — | | | | — | | | | (0.12 | ) |
2012 | | $ | 10.09 | | | | 0.14 | | | | 1.30 | | | | 1.44 | | | | (0.19 | ) | | | — | | | | — | (4) | | | (0.19 | ) |
2013 | | $ | 11.34 | | | | 0.15 | | | | 2.14 | | | | 2.29 | | | | (0.14 | ) | | | (0.21 | ) | | | — | | | | (0.35 | ) |
Class A Shares | | | | | | | | | | | | | | | | | | | | | | | | | | | | | | | | |
2009 | | $ | 8.16 | | | | 0.13 | | | | 2.51 | | | | 2.64 | | | | (0.06 | ) | | | (0.02 | ) | | | — | | | | (0.08 | ) |
2010 | | $ | 10.72 | | | | 0.08 | | | | 0.73 | | | | 0.81 | | | | (0.08 | ) | | | — | | | | — | | | | (0.08 | ) |
2011 | | $ | 11.45 | | | | 0.13 | | | | (1.47 | ) | | | (1.34 | ) | | | (0.09 | ) | | | — | | | | — | | | | (0.09 | ) |
2012 | | $ | 10.02 | | | | 0.12 | | | | 1.28 | | | | 1.40 | | | | (0.16 | ) | | | — | | | | — | (4) | | | (0.16 | ) |
2013 | | $ | 11.26 | | | | 0.11 | | | | 2.13 | | | | 2.24 | | | | (0.11 | ) | | | (0.21 | ) | | | — | | | | (0.32 | ) |
HUNTINGTON REAL STRATEGIES FUND | | | | | | | | | | | | | | | | | | | | | | | | | |
Institutional Shares | | | | | | | | | | | | | | | | | | | | | | | | | | | | | | | | |
2009 | | $ | 4.90 | | | | 0.04 | | | | 1.54 | | | | 1.58 | | | | (0.06 | ) | | | — | | | | — | | | | (0.06 | ) |
2010 | | $ | 6.42 | | | | 0.02 | | | | 1.59 | | | | 1.61 | | | | (0.04 | ) | | | — | | | | — | | | | (0.04 | ) |
2011 | | $ | 7.99 | | | | 0.05 | | | | (0.82 | ) | | | (0.77 | ) | | | (0.07 | ) | | | — | | | | — | | | | (0.07 | ) |
2012 | | $ | 7.15 | | | | 0.11 | | | | 0.26 | | | | 0.37 | | | | (0.10 | ) | | | — | | | | — | | | | (0.10 | ) |
2013 | | $ | 7.42 | | | | 0.15 | | | | 0.55 | | | | 0.70 | | | | (0.07 | ) | | | — | | | | — | | | | (0.07 | ) |
Class A Shares | | | | | | | | | | | | | | | | | | | | | | | | | | | | | | | | |
2009 | | $ | 4.92 | | | | 0.03 | | | | 1.54 | | | | 1.57 | | | | (0.06 | ) | | | — | | | | — | | | | (0.06 | ) |
2010 | | $ | 6.43 | | | | 0.01 | | | | 1.59 | | | | 1.60 | | | | (0.03 | ) | | | — | | | | — | | | | (0.03 | ) |
2011 | | $ | 8.00 | | | | 0.03 | | | | (0.82 | ) | | | (0.79 | ) | | | (0.05 | ) | | | — | | | | — | | | | (0.05 | ) |
2012 | | $ | 7.16 | | | | 0.09 | | | | 0.26 | | | | 0.35 | | | | (0.08 | ) | | | — | | | | — | | | | (0.08 | ) |
2013 | | $ | 7.43 | | | | 0.13 | | | | 0.54 | | | | 0.67 | | | | (0.05 | ) | | | — | | | | — | | | | (0.05 | ) |
| (1) | Based on net asset value, which does not reflect a sales charge or contingent deferred sales charge, if applicable. |
| (2) | If applicable, certain fees were waived and/or reimbursed. If such waivers/reimbursements had not occurred, the ratios would have been as indicated. |
| (3) | Portfolio Turnover is calculated on the basis of the Fund as a whole without distinguishing among the classes of shares. |
| (4) | Amount is less than $0.005. |
158
More About the Huntington Funds
| | | | | | | | | | | | | | | | | | | | | | | | | | |
Net Asset
Value, end
of period | | | Total
return(1) | | | Ratio of Net
Expenses to
Average Net
Assets | | | Ratio of Net
Investment
Income (Loss) to
Average Net
Assets | | | Ratio of Expenses
(Prior to
Reimbursements)
to Average
Net Assets(2) | | | Net Assets,
at end
of period
(000 omitted) | | | Portfolio
turnover
rate(3) | |
| | |
| | | | | | | | | | | | | | | | | | | | | | |
| $ | 10.79 | | | | 32.84 | % | | | 1.59 | % | | | 1.68 | % | | | 1.59 | % | | $ | 322,427 | | | | 26 | % |
| $ | 11.53 | | | | 7.72 | % | | | 1.59 | % | | | 1.14 | % | | | 1.59 | % | | $ | 296,797 | | | | 41 | % |
| $ | 10.09 | | | | (11.40 | )% | | | 1.56 | % | | | 1.28 | % | | | 1.56 | % | | $ | 255,832 | | | | 39 | % |
| $ | 11.34 | | | | 14.28 | % | | | 1.58 | % | | | 1.32 | % | | | 1.58 | % | | $ | 285,361 | | | | 25 | % |
| $ | 13.28 | | | | 20.32 | % | | | 1.55 | % | | | 1.15 | % | | | 1.55 | % | | $ | 289,399 | | | | 62 | % |
| | | | | | | | | | | | | | | | | | | | | | |
| $ | 10.72 | | | | 32.45 | % | | | 1.84 | % | | | 1.28 | % | | | 1.84 | % | | $ | 7,547 | | | | 26 | % |
| $ | 11.45 | | | | 7.54 | % | | | 1.84 | % | | | 0.86 | % | | | 1.84 | % | | $ | 10,631 | | | | 41 | % |
| $ | 10.02 | | | | (11.67 | )% | | | 1.81 | % | | | 1.03 | % | | | 1.81 | % | | $ | 8,192 | | | | 39 | % |
| $ | 11.26 | | | | 14.00 | % | | | 1.83 | % | | | 1.06 | % | | | 1.83 | % | | $ | 9,105 | | | | 25 | % |
| $ | 13.18 | | | | 20.01 | % | | | 1.80 | % | | | 0.90 | % | | | 1.80 | % | | $ | 10,004 | | | | 62 | % |
| | | | | | | | | | | | | | |
| | | | | | | | | | | | | | | | | | | | | | |
| $ | 6.42 | | | | 32.33 | % | | | 1.38 | % | | | 0.82 | % | | | 1.38 | % | | $ | 72,641 | | | | 36 | % |
| $ | 7.99 | | | | 25.09 | % | | | 1.35 | % | | | 0.27 | % | | | 1.35 | % | | $ | 90,813 | | | | 22 | % |
| $ | 7.15 | | | | (9.64 | )% | | | 1.35 | % | | | 0.66 | % | | | 1.35 | % | | $ | 92,475 | | | | 60 | % |
| $ | 7.42 | | | | 5.20 | % | | | 1.35 | % | | | 1.54 | % | | | 1.35 | % | | $ | 96,292 | | | | 30 | % |
| $ | 8.05 | | | | 9.49 | % | | | 1.34 | % | | | 1.93 | % | | | 1.36 | % | | $ | 89,571 | | | | 43 | % |
| | | | | | | | | | | | | | | | | | | | | | |
| $ | 6.43 | | | | 31.82 | % | | | 1.63 | % | | | 0.64 | % | | | 1.63 | % | | $ | 1,114 | | | | 36 | % |
| $ | 8.00 | | | | 24.85 | % | | | 1.60 | % | | | 0.03 | % | | | 1.60 | % | | $ | 2,052 | | | | 22 | % |
| $ | 7.16 | | | | (9.88 | )% | | | 1.60 | % | | | 0.39 | % | | | 1.60 | % | | $ | 2,004 | | | | 60 | % |
| $ | 7.43 | | | | 4.96 | % | | | 1.60 | % | | | 1.30 | % | | | 1.60 | % | | $ | 2,173 | | | | 30 | % |
| $ | 8.05 | | | | 9.09 | % | | | 1.59 | % | | | 1.68 | % | | | 1.61 | % | | $ | 2,366 | | | | 43 | % |
159
More About the Huntington Funds
Financial Highlights
Equity Funds (continued)
(For a share outstanding throughout each period)
| | | | | | | | | | | | | | | | | | | | | | | | | | | | | | | | |
| | | Net Asset
Value,
beginning
of period | | | Net
investment
income
(loss) | | | Net realized
and unrealized
gain (loss)
on investments | | | Total from
investment
operations | | | Distributions
from net
investment
income | | | Distributions
from net
realized gain
on investment
transactions | | | Distributions
from return
of capital | | | Total
distributions | |
HUNTINGTON SITUS FUND | | | | | | | | | | | | | | | | | | | | | | | | | |
Institutional Shares | | | | | | | | | | | | | | | | | | | | | | | | | |
2009 | | $ | 11.71 | | | | 0.03 | | | | 4.27 | | | | 4.30 | | | | (0.01 | ) | | | (0.03 | )�� | | | (0.02 | ) | | | (0.06 | ) |
2010 | | $ | 15.95 | | | | (0.03 | ) | | | 4.29 | | | | 4.26 | | | | — | | | | — | | | | — | | | | — | |
2011 | | $ | 20.21 | | | | (0.05 | ) | | | (0.63 | ) | | | (0.68 | ) | | | — | | | | — | | | | — | | | | — | |
2012 | | $ | 19.53 | | | | 0.09 | | | | 4.60 | | | | 4.69 | | | | (0.04 | ) | | | (0.74 | ) | | | — | | | | (0.78 | ) |
2013 | | $ | 23.44 | | | | (0.01 | ) | | | 6.60 | | | | 6.59 | | | | (0.01 | ) | | | (1.27 | ) | | | — | | | | (1.28 | ) |
Class A Shares | | | | | | | | | | | | | | | | | | | | | | | | | |
2009 | | $ | 11.49 | | | | (0.01 | ) | | | 4.19 | | | | 4.18 | | | | — | (4) | | | (0.03 | ) | | | — | (4) | | | (0.03 | ) |
2010 | | $ | 15.64 | | | | (0.06 | ) | | | 4.20 | | | | 4.14 | | | | — | | | | — | | | | — | | | | — | |
2011 | | $ | 19.78 | | | | (0.10 | ) | | | (0.62 | ) | | | (0.72 | ) | | | — | | | | — | | | | — | | | | — | |
2012 | | $ | 19.06 | | | | 0.04 | | | | 4.48 | | | | 4.52 | | | | — | | | | (0.74 | ) | | | — | | | | (0.74 | ) |
2013 | | $ | 22.84 | | | | (0.07 | ) | | | 6.42 | | | | 6.35 | | | | — | | | | (1.27 | ) | | | — | | | | (1.27 | ) |
| (1) | Based on net asset value, which does not reflect a sales charge or contingent deferred sales charge, if applicable. |
| (2) | If applicable, certain fees were waived and/or reimbursed. If such waivers/reimbursements had not occurred, the ratios would have been as indicated. |
| (3) | Portfolio Turnover is calculated on the basis of the Fund as a whole without distinguishing among the classes of shares. |
| (4) | Amount is less than $0.005. |
160
More About the Huntington Funds
| | | | | | | | | | | | | | | | | | | | | | | | | | |
Net Asset
Value, end
of period | | | Total
return(1) | | | Ratio of Net
Expenses to
Average Net
Assets | | | Ratio of Net
Investment
Income (Loss) to
Average Net
Assets | | | Ratio of Expenses
(Prior to
Reimbursements) to Average
Net Assets(2) | | | Net Assets,
at end
of period
(000 omitted) | | | Portfolio
turnover
rate(3) | |
| | | | | | | | | | | | | | | | | | | | | | | | | | |
| | | | | | | | | | | | | | | | | | | | | | | | | | |
| $ | 15.95 | | | | 36.86 | % | | | 1.38 | % | | | 0.25 | % | | | 1.38 | % | | $ | 141,342 | | | | 25 | % |
| $ | 20.21 | | | | 26.71 | % | | | 1.36 | % | | | (0.16 | )% | | | 1.36 | % | | $ | 183,311 | | | | 32 | % |
| $ | 19.53 | | | | (3.36 | )% | | | 1.32 | % | | | (0.25 | )% | | | 1.32 | % | | $ | 166,134 | | | | 18 | % |
| $ | 23.44 | | | | 24.11 | % | | | 1.35 | % | | | 0.41 | % | | | 1.35 | % | | $ | 192,757 | | | | 11 | % |
| $ | 28.75 | | | | 28.38 | % | | | 1.30 | % | | | (0.05 | )% | | | 1.33 | % | | $ | 339,983 | | | | 22 | % |
| | | | | | | | | | | | | | | | | | | | | | | | | | |
| $ | 15.64 | | | | 36.52 | % | | | 1.63 | % | | | (0.01 | )% | | | 1.63 | % | | $ | 16,747 | | | | 25 | % |
| $ | 19.78 | | | | 26.47 | % | | | 1.61 | % | | | (0.38 | )% | | | 1.61 | % | | $ | 23,990 | | | | 32 | % |
| $ | 19.06 | | | | (3.64 | )% | | | 1.57 | % | | | (0.50 | )% | | | 1.57 | % | | $ | 22,409 | | | | 18 | % |
| $ | 22.84 | | | | 23.82 | % | | | 1.60 | % | | | 0.17 | % | | | 1.60 | % | | $ | 28,485 | | | | 11 | % |
| $ | 27.92 | | | | 28.09 | % | | | 1.55 | % | | | (0.27 | )% | | | 1.58 | % | | $ | 74,132 | | | | 22 | % |
161
More About the Huntington Funds
Financial Highlights
Asset Allocation Funds
(For a share outstanding throughout each period)
| | | | | | | | | | | | | | | | | | | | | | | | | | | | |
| | | Net Asset
Value,
beginning
of period | | | Net
investment
income
(loss) | | | Net realized
and unrealized
gain (loss)
on investments | | | Total from
investment
operations | | | Distributions
from net
investment
income | | | Distributions
from net
realized gain
on investment
transactions | | | Total
distributions | |
HUNTINGTON BALANCED ALLOCATION FUND | | | | | | | | | |
Class A Shares | | | | | | | | | | | | | |
2009(4) | | $ | 10.00 | | | | 0.05 | | | | 0.75 | | | | 0.80 | | | | (0.06 | ) | | | — | (5) | | | (0.06 | ) |
2010 | | $ | 10.74 | | | | 0.09 | | | | 0.88 | | | | 0.97 | | | | (0.09 | ) | | | (0.05 | ) | | | (0.14 | ) |
2011 | | $ | 11.57 | | | | 0.10 | | | | (0.13 | ) | | | (0.03 | ) | | | (0.10 | ) | | | (0.11 | ) | | | (0.21 | ) |
2012 | | $ | 11.33 | | | | 0.12 | | | | 0.75 | | | | 0.87 | | | | (0.12 | ) | | | (1.09 | ) | | | (1.21 | ) |
2013 | | $ | 10.99 | | | | 0.09 | | | | 1.34 | | | | 1.43 | | | | (0.24 | ) | | | (0.41 | ) | | | (0.65 | ) |
HUNTINGTON CONSERVATIVE ALLOCATION FUND | | | | | |
Class A Shares | | | | | | | | | | | | | |
2009(4) | | $ | 10.00 | | | | 0.08 | | | | 0.34 | | | | 0.42 | | | | (0.09 | ) | | | (0.01 | ) | | | (0.10 | ) |
2010 | | $ | 10.32 | | | | 0.17 | | | | 0.41 | | | | 0.58 | | | | (0.16 | ) | | | (0.05 | ) | | | (0.21 | ) |
2011 | | $ | 10.69 | | | | 0.15 | | | | 0.11 | | | | 0.26 | | | | (0.15 | ) | | | (0.08 | ) | | | (0.23 | ) |
2012 | | $ | 10.72 | | | | 0.14 | | | | 0.33 | | | | 0.47 | | | | (0.14 | ) | | | (1.93 | ) | | | (2.07 | ) |
2013 | | $ | 9.12 | | | | 0.07 | | | | 0.17 | | | | 0.24 | | | | (0.13 | ) | | | (0.40 | ) | | | (0.53 | ) |
HUNTINGTON GROWTH ALLOCATION FUND | | | | | | | | | | | | | |
Class A Shares | | | | | | | | | | | | | |
2009(4) | | $ | 10.00 | | | | 0.04 | | | | 0.88 | | | | 0.92 | | | | (0.05 | ) | | | — | (5) | | | (0.05 | ) |
2010 | | $ | 10.87 | | | | 0.06 | | | | 1.09 | | | | 1.15 | | | | (0.06 | ) | | | (0.08 | ) | | | (0.14 | ) |
2011 | | $ | 11.88 | | | | 0.07 | | | | (0.28 | ) | | | (0.21 | ) | | | (0.07 | ) | | | (0.15 | ) | | | (0.22 | ) |
2012 | | $ | 11.45 | | | | 0.11 | | | | 1.03 | | | | 1.14 | | | | (0.11 | ) | | | (1.61 | ) | | | (1.72 | ) |
2013 | | $ | 10.87 | | | | 0.09 | | | | 1.95 | | | | 2.04 | | | | (0.30 | ) | | | (0.73 | ) | | | (1.03 | ) |
| (1) | Based on net asset value, which does not reflect a sales charge or contingent deferred sales charge, if applicable. |
| (2) | Does not include the effect of expenses of underlying funds. |
| (3) | If applicable, certain fees were waived and/or reimbursed. If such waivers/reimbursements had not occurred, the ratios would have been as indicated. |
| (4) | Reflects operations for the period from July 31, 2009 (commencement of operations) to December 31, 2009. |
| (5) | Amount is less than $0.005. |
| (7) | Computed on an annualized basis. |
162
More About the Huntington Funds
| | | | | | | | | | | | | | | | | | | | | | | | | | |
Net Asset
Value, end
of period | | | Total
return(1) | | | Ratio of Net
Expenses to
Average Net
Assets(2) | | | Ratio of Net
Investment
Income (Loss) to
Average Net
Assets | | | Ratio of Expenses
(Prior to
Reimbursements)
to Average
Net Assets(2)(3) | | | Net Assets,
at end
of period
(000 omitted) | | | Portfolio
turnover
rate | |
| | | | | | | | | | | | | | | | | | | | | | | | | | |
| | | | | | | | | | | | | | | | | | | | | | | | | | |
| $ | 10.74 | | | | 8.03 | %(6) | | | 0.62 | %(7) | | | 1.30 | %(7) | | | 0.85 | %(7) | | $ | 13,336 | | | | 42 | %(6) |
| $ | 11.57 | | | | 9.14 | % | | | 0.59 | % | | | 0.94 | % | | | 0.74 | % | | $ | 24,656 | | | | 26 | % |
| $ | 11.33 | | | | (0.18 | )% | | | 0.67 | % | | | 0.90 | % | | | 0.80 | % | | $ | 27,642 | | | | 23 | % |
| $ | 10.99 | | | | 7.79 | % | | | 0.68 | % | | | 0.98 | % | | | 0.89 | % | | $ | 18,192 | | | | 74 | % |
| $ | 11.77 | | | | 13.14 | % | | | 0.74 | % | | | 0.72 | % | | | 0.93 | % | | $ | 21,065 | | | | 44 | % |
| | | | | | | | | | | | | | | | | | | | | | | | | | |
| | | | | | | | | | | | | | | | | | | | | | | | | | |
| $ | 10.32 | | | | 4.13 | %(6) | | | 0.72 | %(7) | | | 1.91 | %(7) | | | 0.86 | %(7) | | $ | 11,248 | | | | 32 | %(6) |
| $ | 10.69 | | | | 5.70 | % | | | 0.70 | % | | | 1.60 | % | | | 0.79 | % | | $ | 14,840 | | | | 22 | % |
| $ | 10.72 | | | | 2.50 | % | | | 0.73 | % | | | 1.43 | % | | | 0.83 | % | | $ | 15,544 | | | | 15 | % |
| $ | 9.12 | | | | 4.43 | % | | | 0.80 | % | | | 1.11 | % | | | 1.00 | % | | $ | 4,767 | | | | 37 | % |
| $ | 8.83 | | | | 2.69 | % | | | 0.83 | % | | | 0.90 | % | | | 1.38 | % | | $ | 3,678 | | | | 55 | % |
| | | | | | | | | | | | | | | | | | | | | | | | | | |
| | | | | | | | | | | | | | | | | | | | | | | | | | |
| $ | 10.87 | | | | 9.21 | %(6) | | | 0.52 | %(7) | | | 1.03 | %(7) | | | 0.85 | %(7) | | $ | 12,923 | | | | 52 | %(6) |
| $ | 11.88 | | | | 10.69 | % | | | 0.51 | % | | | 0.61 | % | | | 0.77 | % | | $ | 19,132 | | | | 29 | % |
| $ | 11.45 | | | | (1.75 | )% | | | 0.64 | % | | | 0.63 | % | | | 0.84 | % | | $ | 21,618 | | | | 23 | % |
| $ | 10.87 | | | | 10.01 | % | | | 0.63 | % | | | 0.85 | % | | | 0.95 | % | | $ | 13,190 | | | | 54 | % |
| $ | 11.88 | | | | 18.75 | % | | | 0.70 | % | | | 0.62 | % | | | 1.02 | % | | $ | 15,109 | | | | 55 | % |
163
More information about the Funds is available free upon request, including the following:
ANNUAL AND SEMI-ANNUAL REPORTS
Additional information about the Funds’ investments is available in the Funds’ annual and semi-annual reports to shareholders. In the Funds’ annual report, you will find a discussion of the market conditions and investment strategies that significantly affected the Funds’ performance during its last fiscal year.
STATEMENT OF ADDITIONAL INFORMATION (SAI)
The SAI provides more detailed information about the Funds and their policies. A current SAI is on file with the SEC and is incorporated by reference into (considered a legal part of) this Prospectus.
The SAI contains a description of the Funds’ policies and procedures with respect to the disclosure of their portfolio securities. These documents, as well as additional information about the Funds are also available on The Huntington Funds’ website at www.huntingtonfunds.com.
HUNTINGTON ASSET ADVISORS, INC., a wholly owned subsidiary of The Huntington National Bank, is the Advisor to the Huntington Funds.
UNIFIED FINANCIAL SECURITIES, INC. is the Distributor. The Distributor is a wholly-owned subsidiary of Huntington Bancshares, Incorporated.
To obtain the SAI, Annual Report, Semi-Annual Report and other information without charge, and to make inquiries:
CALL
800-253-0412
WRITE
The Huntington Funds, P.O. Box 6110, Indianapolis, IN 46206-6110
LOG ON TO THE INTERNET
You may also access Fund information at www.huntingtonfunds.com or from the EDGAR Database on the SEC’s website at www.sec.gov.
CONTACT THE SEC
Call (202) 551-8090 about visiting the SEC’s Public Reference Room in Washington D.C. to review and copy information about the Funds.
Alternatively, you may send your request to the SEC by e-mail at publicinfo@sec.gov or by mail with a duplicating fee to the SEC’s Public Reference Section, Washington, D.C. 20549-1520.
Huntington Funds Shareholder Services: 800-253-0412
The Huntington Funds’ Investment Company Act file number is 811-5010
Not A Deposit • Not FDIC Insured • Not Insured By Any Government Agency • No Bank Guarantee • May Lose Value
PART C. OTHER INFORMATION
Item 15 Indemnification
(1)
Indemnification is provided to Officers and Trustees of the Registrant pursuant to Article VII, Section 4 of Registrant’s Agreement and Declaration of Trust and Section 2 of the Trustees’ Indemnification Agreements. The Investment Advisory Contracts provide that, in the absence of willful misfeasance, bad faith or gross negligence, on the part of the Adviser in the performance of its duties or from reckless disregard by it of its obligations and duties under the Investment Advisory Contracts. Adviser shall not be liable for any error of judgment or mistake of law or for any loss suffered by the Fund in connection with the performance of the Investment Advisory Contracts. Indemnification of Registrant’s distributor, custodian and transfer agent against certain losses is provided for, respectively, in Section 10 of the Distributor’s Contract, incorporated herein by reference as Exhibit (e)(i), Section 8 of the Custodian Contract, incorporated herein by reference as Exhibit (g)(i) and Section 8 of the Transfer Agency Agreement incorporated herein by reference as Exhibit (h)(i). Registrant’s Trustees and Officers are covered by an Investment Trust Errors and Omissions Policy.
Insofar as indemnification for liabilities arising under the Securities Act of 1933 may be permitted to Trustees, Officers, and controlling persons of the Registrant by the Registrant pursuant to the Declaration of Trust or otherwise, the Registrant is aware that in the opinion of the Securities and Exchange Commission, such indemnification is against public policy as expressed in the Act and, therefore, is unenforceable. In the event that a claim for indemnification against such liabilities (other than the payment by the Registrant of expenses incurred or paid by Trustees, Officers, or controlling persons of the Registrant in connection with the successful defense of any act, suit, or proceeding) is asserted by such Trustees, Officers, or controlling persons in connection with the shares being registered, the Registrant will, unless in the opinion of its counsel the matter has been settled by controlling precedent, submit to a court of appropriate jurisdiction the question whether such indemnification by it is against public policy as expressed in the Act and will be governed by the final adjudication of such issues.
Insofar as indemnification for liabilities may be permitted pursuant to Section 17 of the Investment Company Act of 1940 for Trustees, Officers, and controlling persons of the Registrant by the Registrant pursuant to the Declaration of Trust or otherwise, the Registrant is aware of the position of the Securities and Exchange Commission as set forth in Investment Company Act Release No. IC-11330. Therefore, the Registrant undertakes that in addition to complying with the applicable provisions of the Declaration of Trust or otherwise, in the absence of a final decision on the merits by a court or other body before which the proceeding was brought, that an indemnification payment will not be made unless in the absence of such a decision, a reasonable determination based upon factual review has been made (i) by a majority vote of a quorum of non-party Trustees who are not interested persons of the Registrant or (ii) by independent legal counsel in a written opinion that the indemnitee was not liable for an act of willful misfeasance, bad faith, gross negligence, or reckless disregard of duties. The Registrant further undertakes that advancement of expenses incurred in the defense of a proceeding (upon undertaking for repayment unless it is ultimately determined that indemnification is appropriate) against an Officer, Trustee, or controlling person of the Registrant will not be made absent the fulfillment of at least one of the following conditions: (i) the indemnitee provides security for his undertaking; (ii) the Registrant is insured against losses arising by reason of any lawful advances; or (iii) a majority of a quorum of disinterested non-party Trustees or independent legal counsel in a written opinion makes a factual determination that there is reason to believe the indemnitee will be entitled to indemnification.
| | | | | | | | |
| (1) | | | | | | | | |
| | 1 | | Conformed copy of Agreement and Declaration of Trust of the Registrant, dated April 27, 2006; | | | (9 | ) |
| | | |
| | 2 | | Conformed copy of Amendment No. 1 to Agreement and Declaration of trust of the Registrant, dated April 27, 2006; | | | (9 | ) |
| | | | | | |
| (2) | | | | | | |
| | 1 | | Copy of By-Laws of the Registrant, dated April 27, 2006; | | (9) |
| | | |
| (3) | | | | Not applicable | | |
| | | |
| (4) | | | | | | |
| | 1 | | Form of Agreement and Plan of Reorganization is filed herewith | | (+) |
| | | |
| (5) | | | | Instruments Defining Rights of Security Holders are herein incorporated by reference | | |
| | | |
| (6) | | | | | | |
| | 1 | | Conformed copy of Investment Advisory Agreement dated June 23, 2006, between the Registrant and Huntington Asset Advisors, Inc., relating to the Dividend Capture Fund, International Equity Fund, Mid Corp America Fund, New Economy Fund, Rotating Markets Fund, Macro 100 Fund and Situs Small Cap Fund; | | (9) |
| | | |
| | 2 | | Conformed copy of Amendment to Investment Advisory Agreement dated June 23, 2006, between the Registrant and Huntington Asset Advisors, Inc., relating to the Dividend Capture Fund, International Equity Fund, Mid Corp America Fund, New Economy Fund, Rotating Markets Fund, Macro 100 Fund and Situs Small Cap Fund; | | (9) |
| | | |
| | 3 | | Conformed copy of Investment Advisory Agreement dated June 23, 2006, between the Registrant and Huntington Asset Advisors, Inc., relating to the U.S. Treasury Money Market Fund, Growth Fund, Income Equity Fund, Fixed Income Securities Fund, Short/Intermediate Fixed Income Securities Fund, Money Market Fund, Ohio Municipal Money Market Fund, Ohio Tax-Free Fund, Michigan Tax-Free Fund, Mortgage Securities Fund, Florida Tax-Free Fund and Intermediate Government Income Fund; | | (9) |
| | | |
| | 4 | | Conformed Copy of Amendment to Investment Advisory Agreement dated June 23, 2006, between the Registrant and Huntington Asset Advisors, Inc., relating to the U.S. Treasury Money Market Fund, Growth Fund, Income Equity Fund, Fixed Income Securities Fund, Short/Intermediate Fixed Income Securities Fund, Money Market Fund, Ohio Municipal Money Market Fund, Ohio Tax-Free Fund, Michigan Tax-Free Fund, Mortgage Securities Fund, Florida Tax-Free Fund and Intermediate Government Income Fund; | | (9) |
| | | |
| | 5 | | Conformed copy of Investment Advisory Agreement dated June 23, 2006, between the Registrant and Huntington Asset Advisors, Inc., relating to the VA Dividend Capture Fund, VA Growth Fund, VA Income Equity Fund, VA Macro 100 Fund, VA Mid Corp America Fund, VA Mortgage Securities Fund, VA New Economy Fund, VA Rotating Markets Fund and VA Situs Small Cap Fund; | | (9) |
| | | |
| | 6 | | Conformed copy of Amendment to Investment Advisory Agreement dated June 23, 2006, between the Registrant and Huntington Asset Advisors, Inc., relating to the VA Dividend Capture Fund, VA Growth Fund, VA Income Equity Fund, VA International Equity Fund, VA Macro 100 Fund, VA Mid Corp America Fund, VA Mortgage Securities Fund, VA New Economy Fund, VA Rotating Markets Fund and VA Situs Small Cap Fund; | | (9) |
| | | |
| | 7 | | Conformed copy of Letter Agreement dated June 23, 2006, to the Investment Advisory Agreement dated June 23, 2006, between the Registrant and Huntington Asset Advisors, Inc., relating to the VA Dividend Capture Fund, VA Growth Fund, VA Income Equity Fund, VA International Equity Fund, VA Macro 100 Fund, VA Mid Corp America Fund, VA Mortgage Securities Fund, VA New Economy Fund, VA Rotating Markets Fund and VA Situs Small Cap Fund; | | (10) |
| | | | | | |
| | | |
| | 8 | | Conformed copy of Letter Agreement dated February 27, 2007, to the Investment Advisory Agreement dated June 23, 2006, between the Registrant and Huntington Asset Advisors, Inc., relating to the VA Dividend Capture Fund, VA Growth Fund, VA Income Equity Fund, VA International Equity Fund, VA Macro 100 Fund, VA Mid Corp America Fund, VA Mortgage Securities Fund, VA New Economy Fund, VA Rotating Markets Fund and VA Situs Small Cap Fund; | | (13) |
| | | |
| | 9 | | Conformed copy of Letter Agreement dated February 27, 2007, to the Investment Advisory Agreement dated June 23, 2006, between the Registrant and Huntington Asset Advisors, Inc., relating to the VA Dividend Capture Fund, VA Growth Fund, VA Income Equity Fund, VA International Equity Fund, VA Macro 100 Fund, VA Mid Corp America Fund, VA Mortgage Securities Fund, VA New Economy Fund, VA Rotating Markets Fund and VA Situs Small Cap Fund; | | (13) |
| | | |
| | 10 | | Conformed copy of Letter Agreement dated January 24, 2008, to the Investment Advisory Agreement dated June 23, 2006, between the Registrant and Huntington Asset Advisors, Inc., relating to the VA Dividend Capture Fund, VA Growth Fund, VA Income Equity Fund, VA International Equity Fund, VA Macro 100 Fund, VA Mid Corp America Fund, VA Mortgage Securities Fund, VA New Economy Fund, VA Rotating Markets Fund and VA Situs Small Cap Fund; | | (13) |
| | | |
| | 11 | | Conformed copy of Subadvisory Agreement dated June 23, 2006, between the Registrant, Huntington Asset Advisors, Inc. and Laffer Investments, Inc. (terminated); | | (9) |
| | | |
| | 12 | | Conformed copy of Amended and Restated Exhibit 1 to Schedule A to the Investment Advisory Agreement between Registrant and Huntington Asset Advisors, Inc.; | | (11) |
| | | |
| | 13 | | Conformed copy of Letter Agreement dated October 29, 2008 to the Investment Advisory Agreement dated June 23, 2006 between the Registrant and Huntington Asset Advisors, Inc., relating to the VA Balanced Fund; | | (15) |
| | | |
| | 14 | | Conformed copy of Letter Agreement dated January 29, 2009 to the Investment Advisory Agreement dated June 23, 2006 between the Registrant and Huntington Asset Advisors, Inc., relating to the VA Balanced Fund; | | (15) |
| | | |
| | 15 | | Conformed copy of Exhibit A to the Investment Advisory Agreement by and between the Registrant and Huntington Asset Advisors, Inc., amended and restated as of October 21, 2008; | | (15) |
| | | |
| | 16 | | Conformed copy of Schedule A to the Investment Advisory Agreement between the Registrant and Huntington Asset Advisors, Inc.; | | (15) |
| | | |
| | 17 | | Conformed copy of Letter Agreement dated April 27, 2009, to the Investment Advisory Agreement dated June 23, 2006, between the Registrant and Huntington Asset Advisors, Inc., relating to the VA Balanced Fund; | | (17) |
| | | |
| | 18 | | Conformed copy of Letter Agreement dated June 15, 2009, to the Investment Advisory Agreement dated June 23, 2006, between the Registrant and Huntington Asset Advisors, Inc., relating to the Tax-Free Money Market Fund, Money Market Fund, Ohio Municipal Money Market Fund and U.S. Treasury Money Market Fund; | | (17) |
| | | | | | |
| | 19 | | Conformed copy of Letter Agreement dated July 29, 2009, to the Investment Advisory Agreement dated June 23, 2006, between the Registrant and Huntington Asset Advisors, Inc., relating to the Growth Allocation Fund, Balanced Allocation Fund and Conservative Allocation Fund; | | (17) |
| | | |
| | 20 | | Conformed copy of Letter Agreement dated December 28, 2009 to Investment Advisory Agreement dated June 23, 2006 between the Registrant and Huntington Asset Advisors, Inc., relating to the Global Select Markets Fund; | | (19) |
| | | |
| | 21 | | Conformed copy of Schedule A to the Investment Advisory Agreement between the Registrant and Huntington Asset Advisors, Inc., amended and restated as of December 28, 2009; | | (19) |
| | | |
| | 22 | | Amendment to the Investment Advisory Agreement dated June 23, 2006 between the Registrant and Huntington Asset Advisors, Inc., relating to the Huntington World Income Fund; | | (22) |
| | | |
| | 23 | | Amendment to the Investment Advisory Agreement dated June 23, 2006 between the Registrant and Huntington Asset Advisors, Inc., relating to the Huntington Disciplined Equity Fund; | | (23) |
| | | |
| | 24 | | Investment Subadvisory Agreement dated July 21, 2011 between Huntington Asset Advisors, Inc. and Haberer Registered Investment Advisor, Inc., relating to the Huntington Disciplined Equity Fund; | | (23) |
| | | |
| | 25 | | Amendment to the Investment Advisory Agreement dated May 25, 2012, between the Registrant and Huntington Asset Advisors, Inc., relating to the Huntington Income Generation Fund; | | (24) |
| | | |
| | 26 | | Amendment to the Investment Advisory Agreement dated June 22, 2012, between the Registrant and Huntington Asset Advisors, Inc., relating to the Huntington Longer Duration Fixed Income Fund; | | (25) |
| | | |
| | 27 | | Amendment to the Investment Advisory Agreement dated August 9, 2012, between the Registrant and Huntington Asset Advisors, Inc.; | | (26) |
| | | |
| | 28 | | Amendment to the Investment Advisory Agreement dated August 9, 2012, between the Registrant and Huntington Asset Advisors, Inc.; | | (26) |
| | | |
| | 29 | | Amendment to the Investment Advisory Agreement dated August 19, 2013, between the Registrant and Huntington Asset Advisors, Inc. on behalf of the Huntington Retail Funds; | | (30) |
| | | |
| | 30 | | Amendment to the Investment Advisory Agreement dated August 19, 2013, between the Registrant and Huntington Asset Advisors, Inc. on behalf of the Huntington Retail Funds; | | (30) |
| | | |
| | 31 | | Amendment to the Investment Advisory Agreement dated August 19, 2013, between the Registrant and Huntington Asset Advisors, Inc. on behalf of the Huntington VA Funds; | | (30) |
| | | | | | |
| | 32 | | Amendment to the Investment Advisory Agreement dated December 13, 2013, between the Registrant and Huntington Asset Advisors, Inc. on behalf of the Huntington Retail Funds; | | (33) |
| | | |
| | 33 | | Amendment to the Investment Advisory Agreement dated December 13, 2013, between the Registrant and Huntington Asset Advisors, Inc. on behalf of the Huntington Retail Funds; | | (33) |
| | | |
| | 34 | | Amendment to the Investment Advisory Agreement dated August 19, 2014, between the Registrant and Huntington Asset Advisors, Inc. on behalf of the Huntington Money Market Funds; | | (34) |
| | | |
| | 35 | | Amendment to the Investment Advisory Agreement dated August 19, 2014, between the Registrant and Huntington Asset Advisors, Inc. on behalf of the Huntington Retail Funds; | | (34) |
| | | |
| | 36 | | Amendment to the Investment Advisory Agreement dated August 19, 2014, between the Registrant and Huntington Asset Advisors, Inc. on behalf of the Huntington VA Funds; | | (34) |
| | | |
| (7) | | | | | | |
| | 1 | | Conformed copy of Distributor’s Contract dated June 23, 2006, between the Registrant and Edgewood Services Inc.; | | (9) |
| | | |
| | 2 | | Conformed copy of Amendment to the Distributor’s Contract dated June 23, 2006, between the Registrant and Edgewood Services Inc.; | | (9) |
| | | |
| | 3 | | Conformed copy of Exhibit A to the Distributor’s Contract dated June 23, 2006, between the Registrant and Edgewood Services Inc.; | | (9) |
| | | |
| | 4 | | Conformed copy of Amended and Restated Amendment #1 to Exhibit A to the Distributor’s Contract between Registrant and Edgewood Services, Inc.; | | (11) |
| | | |
| | 5 | | Conformed copy of Exhibit B to the Distributor’s Contract dated June 23, 2006, between the Registrant and Edgewood Services Inc.; | | (9) |
| | | |
| | 6 | | Conformed copy of Amendment #1 to Exhibit B dated April 30, 2007 to the Distributor’s Contract dated June 23, 2006, between the Registrant and Edgewood Services Inc.; | | (11) |
| | | |
| | 7 | | Conformed copy of Exhibit C to the Distributor’s Contract dated June 23, 2006, between the Registrant and Edgewood Services Inc.; | | (9) |
| | | |
| | 8 | | Conformed copy of Amendment #1 to Exhibit C dated April 30, 2007 to the Distributor’s Contract dated June 23, 2006, between the Registrant and Edgewood Services Inc.; | | (11) |
| | | |
| | 9 | | Conformed copy of Exhibit D to the Distributor’s Contract dated June 23, 2006, between the Registrant and Edgewood Services Inc.; | | (9) |
| | | |
| | 10 | | Conformed copy of Amended and Restated Exhibit E dated August 31, 2007 to the Distributor’s Contract dated June 23, 2006, between the Registrant and Edgewood Services Inc.; | | (12) |
| | | |
| | 11 | | Form of Distribution Agreement between the Registrant and Unified Financial Securities, Inc., dated April 1, 2009; | | (15) |
| | | | | | |
| | 12 | | Conformed copy of Distribution Agreement between the Registrant and Unified Financial Securities, Inc., dated April 1, 2009, including Exhibits A and B; | | (17) |
| | | |
| | 13 | | Conformed copy of Amended and Restated Exhibit A to the Distribution Agreement, dated December 28, 2009; | | (17) |
| | | |
| | 14 | | Amendment to Distribution Agreement between the Registrant and Unified Financial Securities, Inc., dated April 1, 2009, including Exhibit A, relating to the Huntington World Income Fund; | | (22) |
| | | |
| | 15 | | Amendment to Distribution Agreement between the Registrant and Unified Financial Securities, Inc., dated April 1, 2009, including Exhibit A, relating to the Huntington Disciplined Equity Fund; | | (23) |
| | | |
| | 16 | | Amendment to the Distribution Agreement dated May 25, 2012, including Exhibit A, between the Registrant and Unified Financial Securities, Inc., relating to the Huntington Income Generation Fund; | | (24) |
| | | |
| | 17 | | Amendment to the Distribution Agreement dated June 22, 2012, including Exhibit A, between the Registrant and Unified Financial Securities, Inc., relating to the Huntington Longer Duration Fixed Income Fund; | | (25) |
| | | |
| | 18 | | Amended Distribution Agreement dated August 31, 2012, including Exhibits A and B, between the Registrant and Unified Financial Securities, Inc.; | | (26) |
| | | |
| | 19 | | Letter Agreement dated November 15, 2012, between the Registrant and Unified Financial Securities, Inc., relating to the U.S. Treasury Money Market Fund; | | (29) |
| | | |
| | 20 | | Amended Distribution Agreement dated August 19, 2013, including Exhibits A and B, between the Registrant and Unified Financial Securities, Inc.; | | (30) |
| | | |
| | 21 | | Amended Distribution Agreement dated December 13, 2013, including Exhibits A and B, between the Registrant and Unified Financial Securities, Inc.; | | (33) |
| | | |
| | 22 | | Amended Distribution Agreement dated August 19, 2014, including Exhibits A and B, between the Registrant and Unified Financial Securities, Inc.; | | (34) |
| | | |
| (8) | | | | Not applicable | | |
| | | |
| (9) | | | | | | |
| | 1 | | Conformed copy of Custodian Agreement, dated June 23, 2006, between the Registrant and The Huntington National Bank; | | (9) |
| | | |
| | 2 | | Conformed copy of Schedule A to Custodian Agreement, dated June 23, 2006, between the Registrant and The Huntington National Bank; | | (9) |
| | | |
| | 3 | | Conformed copy of Schedule B dated September 11, 2007 as Amended and Restated on August 31, 2007, to Custodian Agreement, dated June 23, 2006, between the Registrant and The Huntington National Bank; | | (12) |
| | | | | | |
| | 4 | | Conformed copy of Amendment to Custodian Agreement, dated June 23, 2006, between the Registrant and The Huntington National Bank; | | (9) |
| | | |
| | 5 | | Conformed copy of Foreign Custody Manager Agreement between the Registrant and The Bank of New York, dated June 23, 2006; | | (9) |
| | | |
| | 6 | | Form of Exhibit A, Amended and Restated as of August 31, 2007, to Foreign Custody Manager Agreement between the Registrant and The Bank of New York, dated June 23, 2006; | | (12) |
| | | |
| | 7 | | Copy of Schedule I to Foreign Custody Manager Agreement between the Registrant and The Bank of New York, dated June 23, 2006; | | (9) |
| | | |
| | 8 | | Conformed copy of Foreign Custody Agreement between the Registrant and The Bank of New York, dated June 23, 2006; | | (9) |
| | | |
| | 9 | | Conformed copy of Schedule I to Foreign Custody Agreement between the Registrant and The Bank of New York, dated June 23, 2006; | | (12) |
| | | |
| | 10 | | Form of Schedule II, Amended and Restated as of August 31, 2007, to Foreign Custody Agreement between the Registrant and The Bank of New York, dated June 23, 2006; | | (12) |
| | | |
| | 11 | | Copy of Schedule III to Foreign Custody Agreement between the Registrant and The Bank of New York, dated June 23, 2006; | | (9) |
| | | |
| | 12 | | Conformed copy of Appendix I to Foreign Custody Agreement between the Registrant and The Bank of New York, dated June 23, 2006; | | (9) |
| | | |
| | 13 | | Conformed copy of Sub-Custody Agreement between the Registrant, The Huntington National Bank and PFPC Trust Company dated June 23, 2006; | | (10) |
| | | |
| | 14 | | Conformed copy of Custodian Agreement dated June 26, 2006 between Registrant and State Street Bank and Trust Company including Schedules A, B and C and the Remote Access Services Addendum; | | (11) |
| | | |
| | 15 | | Conformed copies of Schedules A and B to the Custodian Agreement between the Registrant and Huntington National Bank, dated October 21, 2008; | | (15) |
| | | |
| | 16 | | Conformed copy of Securities Lending Customer Agreement between the Registrant and PFPC Trust Company, dated September 19, 2007; | | (15) |
| | | |
| | 17 | | Form of Global Sub-Custodian Agreement between The Huntington National Bank and Brown Brothers Harriman & Co.; | | (15) |
| | | |
| | 18 | | Conformed copy of Custodian Agreement, dated May 26, 2009, between the Registrant and The Huntington National Bank; | | (17) |
| | | |
| | 19 | | Conformed copy of Appendix B Amended & Restated as of July 29, 2009, to the Custodian Agreement, dated May 26, 2009, between the Registrant and The Huntington National Bank; | | (17) |
| | | | | | |
| | 20 | | Conformed copy of Appendix B Amended & Restated as of December 28, 2009, to the Custodian Agreement, dated May 26, 2009, between the Registrant and The Huntington National Bank; | | (19) |
| | | |
| | 21 | | Amendment to the Custodian Agreement, dated May 26, 2009, between the Registrant and The Huntington National Bank, relating to the Huntington World Income Fund; | | (22) |
| | | |
| | 22 | | Amendment to the Custodian Agreement, dated May 26, 2009, between the Registrant and The Huntington National Bank, relating to the Huntington Disciplined Equity Fund; | | (23) |
| | | |
| | 23 | | Amended and Restated Custodian Agreement dated May 26, 2009, as amended August 31, 2012, between the Registrant and The Huntington National Bank; | | (24) |
| | | |
| | 24 | | Amendment to Custodian Agreement dated November 8, 2012, between the Registrant and The Huntington National Bank; | | (25) |
| | | |
| | 25 | | Revised Amendment to Custodian Agreement dated November 8, 2012, between the Registrant and The Huntington National Bank; | | (26) |
| | | |
| | 26 | | Revised Amendment to Custodian Agreement effective June 1, 2013, between the Registrant and The Huntington National Bank; | | (30) |
| | | |
| | 27 | | Revised Amendment to Custodian Agreement effective August 19, 2014, between the Registrant and The Huntington National Bank; | | (34) |
| | | |
| (10) | | | | | | |
| | 1 | | Copy of the Distribution Plan of the Registrant, dated June 23, 2006 | | (9) |
| | | |
| | 2 | | Copy of Exhibit A to Distribution Plan of the Registrant, dated June 23, 2006; | | (9) |
| | | |
| | 3 | | Copy of the Amended and Restated Exhibit 1 to Exhibit A to Registrant’s Distribution Plan; | | (11) |
| | | |
| | 4 | | Copy of Amended and Restated Distribution Plan of the Registrant, dated April 1, 2009; | | (15) |
| | | |
| | 5 | | Copy of Exhibit A to Amended and Restated Distribution Plan of the Registrant, dated April 1, 2009; | | (17) |
| | | |
| | 6 | | Copy of Exhibit A to Distribution Plan of the Registrant, amended and restated as of December 28, 2009; | | (19) |
| | | |
| | 7 | | Amendment to the Distribution Plan of the Registrant, regarding the Huntington World Income Fund; | | (22) |
| | | |
| | 8 | | Amendment to the Distribution Plan of the Registrant, regarding the Huntington Disciplined Equity Fund; | | (23) |
| | | |
| | 9 | | Amended and Restated Distribution Plan of the Registrant dated August 31, 2012; | | (24) |
| | | |
| | 10 | | Amended and Restated Distribution Plan of the Registrant dated August 19, 2013; | | (30) |
| | | | | | |
| | 11 | | Amended and Restated Distribution Plan of the Registrant dated December 13, 2013; | | (33) |
| | | |
| | 12 | | Amended and Restated Distribution Plan of the Registrant dated August 19, 2014; | | (34) |
| | | |
| (11) | | | | Not applicable | | |
| | | |
| (12) | | | | | | |
| | 1 | | Opinions of Sullivan & Worcester, LLP, as to certain tax consequences, are filed herewith | | (+) |
| | | |
| (13) | | | | | | |
| | 1 | | Conformed copy of Mutual Fund Services Agreement, Transfer Agency Services, dated June 23, 2006, between the Registrant and Unified Funds Services, Inc.; | | (9) |
| | | |
| | 2 | | Conformed copy of Amended and Restated Exhibit A to the Mutual Fund Services Agreement, Transfer Agency Services, dated April 23, 2008, between the Registrant and Unified Funds Services, Inc.; | | (14) |
| | | |
| | 3 | | Copy of Exhibit B to the Mutual Fund Services Agreement, Transfer Agency Services, dated June 23, 2006, between the Registrant and Unified Funds Services, Inc.; | | (9) |
| | | |
| | 4 | | Copy of Exhibit C to the Mutual Fund Services Agreement, Transfer Agency Services, dated June 23, 2006, between the Registrant and Unified Funds Services, Inc.; | | (9) |
| | | |
| | 5 | | Copy of Exhibit D to the Mutual Fund Services Agreement, Transfer Agency Services, dated June 23, 2006, between the Registrant and Unified Funds Services, Inc.; | | (9) |
| | | |
| | 6 | | Conformed copy of Administrative Services Agreement dated June 23, 2006, between the Registrant and The Huntington National Bank; | | (12) |
| | | |
| | 7 | | Conformed copy of Investment Company Exhibit, Amended and Restated as of August 31, 2007, to Administrative Services Agreement dated June 23, 2006, between the Registrant and The Huntington National Bank; | | (12) |
| | | |
| | 8 | | Conformed copy of Administrative Services Fee Exhibit to Administrative Services Agreement dated June 23, 2006, between the Registrant and The Huntington National Bank; | | (12) |
| | | |
| | 9 | | Conformed copy of First Amendment, dated June 29, 2007, to Administrative Services Agreement dated June 23, 2006, between the Registrant and The Huntington National Bank; | | (12) |
| | | |
| | 10 | | Conformed copy of Administrative Services Agreement (Shareholder Services) between the Registrant and The Huntington National Bank, dated June 23, 2006; | | (9) |
| | | |
| | 11 | | Conformed copy of Exhibit A to Administrative Services Agreement (Shareholder Services) between the Registrant and The Huntington National Bank, dated June 23, 2006; | | (9) |
| | | |
| | 12 | | Conformed copy of Agreement for Sub-Administrative Services, dated June 23, 2006, among Registrant, The Huntington National Bank and Federated Services Company; | | (9) |
| | | | | | |
| | 13 | | Conformed copy of Investment Company Exhibit, Amended and Restated as of August 31, 2007, dated September 11, 2007, to Agreement for Sub-Administrative Services, dated June 23, 2006, among Registrant, The Huntington National Bank and Federated Services Company; | | (12) |
| | | |
| | 14 | | Conformed copy of Sub-Administrative Services Fee Exhibit to Agreement for Sub-Administrative Services, dated June 23, 2006, among Registrant, The Huntington National Bank and Federated Services Company; | | (9) |
| | | |
| | 15 | | Conformed copy of First Amendment, dated June 29, 2007, to Sub-Administrative Services Fee Exhibit to Agreement for Sub-Administrative Services, dated June 23, 2006, among Registrant, The Huntington National Bank and Federated Services Company; | | (12) |
| | | |
| | 16 | | Conformed copy of Financial Administration and Accounting Services Agreement between the Registrant and The Huntington National Bank dated December 1, 2001; | | (9) |
| | | |
| | 17 | | Conformed copy of Exhibit A, Amended and Restated as of August 31, 2007, dated September 11, 2007, to the Financial Administration and Accounting Services Agreement between the Registrant and The Huntington National Bank dated December 1, 2001; | | (12) |
| | | |
| | 18 | | Conformed copy of Fund Accounting Agreement dated May 1, 2002, between the Registrant and BISYS Fund Services Ohio, Inc.; | | (10) |
| | | |
| | 19 | | Conformed copy of Amendment #1 to Fund Accounting Agreement dated May 1, 2002, between the Registrant and BISYS Fund Services Ohio, Inc.; | | (10) |
| | | |
| | 20 | | Conformed copy of Amendment #2 to Fund Accounting Agreement dated May 1, 2002, between the Registrant and BISYS Fund Services Ohio, Inc.; | | (10) |
| | | |
| | 21 | | Conformed copy of Amendment #3 to Fund Accounting Agreement dated May 1, 2002, between the Registrant and BISYS Fund Services Ohio, Inc.; | | (10) |
| | | |
| | 22 | | Conformed copy of Fund Participation Agreement among the Registrant, Huntington Asset Advisors, Inc., Edgewood Services, Inc. and Hartford Life Insurance Company, dated June 23, 2006; | | (10) |
| | | |
| | 23 | | Conformed copy of Schedule A dated June 23, 2006 to the Fund Participation Agreement among the Registrant, Huntington Asset Advisors, Inc., Edgewood Services, Inc. and Hartford Life Insurance Company, dated June 23, 2006; | | (12) |
| | | |
| | 24 | | Form of Amended and Restated Amendment #1 to Schedule B dated June 23, 2006 and revised August 31, 2007, to the Fund Participation Agreement among the Registrant, Huntington Asset Advisors, Inc., Edgewood Services, Inc. and Hartford Life Insurance Company, dated June 23, 2006; | | (12) |
| | | |
| | 25 | | Copy of Schedule C to the Fund Participation Agreement among the Registrant, Huntington Asset Advisors, Inc., Edgewood Services, Inc. and Hartford Life Insurance Company, dated June 23, 2006; | | (12) |
| | | |
| | 26 | | Form of Fund Participation Agreement among Nationwide Life Insurance Company and | | (10) |
| | | | | | |
| | | | Nationwide Life and Annuity Insurance Company; the Registrant; Huntington Asset Advisors, Inc.; and Edgewood Services, Inc., dated June 23, 2006, including Exhibits A through E; | | |
| | | |
| | 27 | | Conformed copy of Fund Participation Agreement among the Registrant, Edgewood Services, Inc., Huntington Asset Advisors, Inc., and Transamerica Life Insurance Company, dated June 23, 2006; | | (10) |
| | | |
| | 28 | | Conformed copy of Fund Participation Agreement among the Registrant, Edgewood Services, Inc., Huntington Asset Advisors, Inc. and Sun Life Assurance Company of Canada (U.S.) dated January 1, 2008; | | (12) |
| | | |
| | 29 | | Conformed copy of Registrant’s Shareholder Services Plan dated February 13, 2007; | | (11) |
| | | |
| | 30 | | Conformed copy of Exhibit A dated September 10, 2008 to Registrant’s Shareholder Services Plan; | | (14) |
| | | |
| | 31 | | Conformed copy of Indemnification Agreement between Registrant and Trustee of Trust dated November 9, 2006; | | (11) |
| | | |
| | 32 | | Conformed copy of Indemnification Agreement between Registrant and Trustee of Trust dated November 9, 2006; | | (11) |
| | | |
| | 33 | | Conformed copy of Indemnification Agreement between Registrant and Trustee of Trust dated November 9, 2006; | | (11) |
| | | |
| | 34 | | Conformed copy of Indemnification Agreement between Registrant and Trustee of Trust dated November 9, 2006; | | (11) |
| | | |
| | 35 | | Conformed copy of Indemnification Agreement between Registrant and Trustee of Trust dated November 9, 2006; | | (11) |
| | | |
| | 36 | | Conformed copy of Indemnification Agreement between Registrant and Trustee of Trust dated December 1, 2006; | | (11) |
| | | |
| | 37 | | Conformed copy of Indemnification Agreement between Registrant and Trustee of Trust dated November 9, 2006; | | (11) |
| | | |
| | 38 | | Conformed copy of Consultant Agreement between Huntington Asset Advisors, Inc. and Laffer Investments, Inc. dated September 1, 2008; | | (14) |
| | | |
| | 39 | | Conformed copy of Schedule A to the Fund Participation Agreement among the Registrant, Edgewood Services, Inc., Huntington Asset Advisors, Inc. and Sun Life Assurance Company of Canada (U.S.), dated October 21, 2008; | | (15) |
| | | |
| | 40 | | Copy of Appendix A to Indemnification Agreement between Registrant and Trustee William H. Zimmer III, dated October 21, 2008; | | (15) |
| | | |
| | 41 | | Copy of Appendix A to Indemnification Agreement between Registrant and Trustee Thomas Westerfield, dated October 21, 2008 | | (15) |
| | | | | | |
| | 42 | | Copy of Appendix A to Indemnification Agreement between Registrant and Trustee Mark Shary, dated October 21, 2008; | | (15) |
| | | |
| | 43 | | Copy of Appendix A to Indemnification Agreement between Registrant and Trustee Tadd Seitz, dated October 21, 2008; | | (15) |
| | | |
| | 44 | | Copy of Appendix A to Indemnification Agreement between Registrant and Trustee B. Randolph Bateman, dated October 21, 2008; | | (15) |
| | | |
| | 45 | | Copy of Appendix A to Indemnification Agreement between Registrant and Trustee David Schoedinger, dated October 21, 2008; | | (15) |
| | | |
| | 46 | | Conformed copy of Amended and Restated Administrative Services Agreement between the Registrant and The Huntington National Bank, dated December 1, 2008; | | (15) |
| | | |
| | 47 | | Form of Mutual Fund Services Agreement, Fund Sub-Administration Services between The Huntington National Bank and Unified Fund Services, Inc., dated April 1, 2009; | | (15) |
| | | |
| | 48 | | Form of Mutual Fund Sales and Services Agreement (Unified Financial Securities, Inc.); | | (15) |
| | | |
| | 49 | | Conformed copy of Amended and Restated Exhibit #2 to Exhibit A to Administrative Services Agreement (Shareholder Services) between the Registrant and Huntington National Bank, dated May 1, 2008; | | (15) |
| | | |
| | 50 | | Conformed copy of Exhibit A to the Mutual Fund Services Agreement for Transfer Agency Services between Unified Fund Services, Inc. and the Registrant (Amended and Restated as of October 21, 2008); | | (15) |
| | | |
| | 51 | | Conformed copy of Amendment No. 2 to Participation Agreement among the Registrant, Edgewood Services, Inc., Huntington Asset Advisors, Inc., and Transamerica Life Insurance Company, dated November 1, 2008; | | (15) |
| | | |
| | 52 | | Form of Shareholder Services Agreement of the Registrant (including Amended and Restated Amendment #1 to Exhibit A); | | (15) |
| | | |
| | 53 | | Conformed copy of Second Amended and Restated Exhibit A to The Huntington Funds Shareholder Services Plan, dated September 17, 2008; | | (15) |
| | | |
| | 54 | | Conformed copy of Mutual Fund Services Agreement for Sub-Administration Services between Huntington National Bank and Unified Fund Services, Inc., dated April 1, 2009, including Exhibit A and Exhibit B; | | (17) |
| | | |
| | 55 | | Conformed copy of Amended and Restated Exhibit A (dated April 1, 2009) to Administrative Services Agreement (Shareholder Services) between the Registrant and Huntington National Bank, dated June 23, 2006; | | (17) |
| | | |
| | 56 | | Conformed copy of Amendment dated May 7, 2009, to Amended and Restated Administrative Services Agreement dated June 23, 2006, between the Registrant and Huntington National Bank; | | (17) |
| | | |
| | 57 | | Conformed copy of Fund Participation Agreement between Nationwide Financial Services, Inc. and Unified Financial Securities, Inc. as distributor of the Funds, dated April 21, 2009, including Exhibits A through D | | (17) |
| | | | | | |
| | 58 | | Form of Fund Participation Agreement among the Registrant, Huntington Asset Advisors, Inc., Unified Financial Securities, Inc. and Hartford Life Insurance Company, dated April 1, 2009, including Schedules A through C; | | (17) |
| | | |
| | 59 | | Conformed copy of Exhibit A, Amended & Restated as of July 29, 2009, to Mutual Fund Services Agreement, Transfer Agency Services dated June 23, 2006, between the Registrant and Unified Funds Services, Inc.; | | (17) |
| | | |
| | 60 | | Conformed copy of Indemnification Agreement between Registrant and Trustee Alistair Jessiman, dated January 29, 2010; | | (19) |
| | | |
| | 61 | | Conformed copy of Exhibit A to the Shareholder Services Plan of The Huntington Funds, amended and restated as of December 28, 2009; | | (19) |
| | | |
| | 62 | | Copy of Exhibit A to the Shareholder Services Agreement of the Registrant, amended and restated as of
December 28, 2009; | | (19) |
| | | |
| | 63 | | Conformed copy of Exhibit A to the Mutual Fund Services Agreement for Fund Sub-Administration Services, dated December 28, 2009; | | (19) |
| | | |
| | 64 | | Conformed copy of Exhibit A to the Mutual Fund Services Agreement for Transfer Agency Services between Unified Fund Services, Inc. and The Huntington Funds, amended and restated as of December 28, 2009; | | (19) |
| | | |
| | 65 | | Conformed copy of Exhibit A to the Administrative Services Agreement, amended and restated as of December 28, 2009; | | (19) |
| | | |
| | 66 | | Amendment to Mutual Fund Services Agreement, Transfer Agency Services, dated June 23, 2006, between the Registrant and Unified Funds Services, Inc., relating to the Huntington World Income Fund; | | (22) |
| | | |
| | 67 | | Amendment to Administrative Services Agreement, Exhibit A, dated June 23, 2006, between the registrant and Huntington National Bank, relating to the Huntington World Income Fund; | | (22) |
| | | |
| | 68 | | Amendment to the Shareholder Services Agreement, regarding the Huntington World Income Fund; | | (22) |
| | | |
| | 69 | | Amendment to Mutual Fund Services Agreement, Transfer Agency Services, dated June 23, 2006, between the Registrant and Unified Funds Services, Inc., relating to the Huntington Disciplined Equity Fund; | | (23) |
| | | |
| | 70 | | Amendment to Administrative Services Agreement, Exhibit A, dated June 23, 2006, between the registrant and Huntington National Bank, relating to the Huntington Disciplined Equity Fund; | | (23) |
| | | |
| | 71 | | Amendment to the Shareholder Services Agreement, regarding the Huntington Disciplined Equity Fund; | | (23) |
| | | | | | |
| | 72 | | Conformed copy of Exhibit A, Amended and Restated as of July 5, 2010, to the Financial Administration and Accounting Services Agreement between the Registrant and The Huntington National Bank dated December 1, 2001; | | (23) |
| | | |
| | 73 | | Expense Limitation Agreement dated May 25, 2012, between the Registrant and Huntington Asset Advisors, Inc., relating to the Huntington Income Generation Fund; | | (24) |
| | | |
| | 74 | | Expense Limitation Agreement dated May 1, 2011, between the Registrant and Huntington Asset Advisors, Inc., relating to the Huntington Balanced Allocation Fund; | | (27) |
| | | |
| | 75 | | Expense Limitation Agreement dated May 1, 2011, between the Registrant and Huntington Asset Advisors, Inc., relating to the Huntington Conservative Allocation Fund; | | (27) |
| | | |
| | 76 | | Expense Limitation Agreement dated May 1, 2011, between the Registrant and Huntington Asset Advisors, Inc., relating to the Huntington Growth Allocation Fund; | | (27) |
| | | |
| | 77 | | Expense Limitation Agreement dated May 1, 2011, between the Registrant and Huntington Asset Advisors, Inc., relating to the Huntington Global Select Markets Fund; | | (27) |
| | | |
| | 78 | | Expense Limitation Agreement dated May 1, 2011, between the Registrant and Huntington Asset Advisors, Inc., relating to the Huntington VA Balanced Fund; | | (27) |
| | | |
| | 79 | | Expense Limitation Agreement dated May 1, 2012, between the Registrant and Huntington Asset Advisors, Inc., relating to the Huntington Balanced Allocation Fund; | | (27) |
| | | |
| | 80 | | Expense Limitation Agreement dated May 1, 2012, between the Registrant and Huntington Asset Advisors, Inc., relating to the Huntington Conservative Allocation Fund; | | (27) |
| | | |
| | 81 | | Expense Limitation Agreement dated May 1, 2012, between the Registrant and Huntington Asset Advisors, Inc., relating to the Huntington Growth Allocation Fund; | | (27) |
| | | |
| | 82 | | Expense Limitation Agreement dated May 1, 2012, between the Registrant and Huntington Asset Advisors, Inc., relating to the Huntington Global Select Markets Fund; | | (27) |
| | | |
| | 83 | | Expense Limitation Agreement dated May 1, 2012, between the Registrant and Huntington Asset Advisors, Inc., relating to the Huntington VA Balanced Fund; | | (27) |
| | | |
| | 84 | | Expense Limitation Agreement dated August 31, 2012, between the Registrant and Huntington Asset Advisors, Inc., relating to the Huntington Income Generation Fund; | | (27) |
| | | |
| | 85 | | Expense Limitation Agreement dated September 28, 2012, between the Registrant and Huntington Asset Advisors, Inc., relating to the Huntington Dividend Capture Fund; | | (27) |
| | | |
| | 86 | | Expense Limitation Agreement dated November 30, 2012, between the Registrant and Huntington Asset Advisors, Inc., relating to the Huntington World Income Fund; | | (27) |
| | | |
| | 87 | | Expense Limitation Agreement dated February 1, 2013, between the Registrant and Huntington Asset Advisors, Inc., relating to the Huntington US Treasury Money Market Fund; | | (27) |
| | | | | | |
| | 88 | | Expense Limitation Agreement dated February 15, 2013, between the Registrant and Huntington Asset Advisors, Inc., relating to the Huntington VA Real Strategies Fund; | | (27) |
| | | |
| | 89 | | Expense Limitation Agreement dated May 1, 2013, between the Registrant and Huntington Asset Advisors, Inc., relating to the Huntington Balanced Allocation Fund; | | (27) |
| | | |
| | 90 | | Expense Limitation Agreement dated May 1, 2013, between the Registrant and Huntington Asset Advisors, Inc., relating to the Huntington Conservative Allocation Fund; | | (27) |
| | | |
| | 91 | | Expense Limitation Agreement dated May 1, 2013, between the Registrant and Huntington Asset Advisors, Inc., relating to the Huntington Growth Allocation Fund; | | (27) |
| | | |
| | 92 | | Expense Limitation Agreement dated May 1, 2013, between the Registrant and Huntington Asset Advisors, Inc., relating to the Huntington Global Select Markets Fund; | | (27) |
| | | |
| | 93 | | Expense Limitation Agreement dated May 1, 2013, between the Registrant and Huntington Asset Advisors, Inc., relating to the Huntington VA Balanced Fund; | | (27) |
| | | |
| | 94 | | Amended and Restated Administrative Services Agreement dated June 23, 2006, as amended August 31, 2012, between the Registrant and The Huntington National Bank; | | (29) |
| | | |
| | 95 | | Amendment to Mutual Fund Services Agreement for Transfer Agency Services dated August 31, 2012, between the Registrant and Huntington Asset Services, Inc.; | | (29) |
| | | |
| | 96 | | Administrative Services Agreement dated December 1, 2012, between the Registrant and Huntington Asset Services, Inc.; | | (29) |
| | | |
| | 97 | | Expense Limitation Agreement dated April 24, 2013, between the Registrant and Huntington Asset Advisors, Inc., relating to the Huntington Growth Fund; | | (29) |
| | | |
| | 98 | | 364-Day Credit Agreement dated January 18, 2013 and Letter Amendment dated December 27, 2012, between Citibank, N.A. and the Registrant; | | (30) |
| | | |
| | 99 | | Amendment No. 4 dated May 1, 2013, to the Participation Agreement between the Registrant, Unified Financial Securities, Inc., Huntington Asset Advisors, Inc., Transamerica Financial Life Insurance Company and Transamerica Life Insurance Company; | | (30) |
| | | |
| | 100 | | Supplement to the Master Securities Loan Agreement dated May 22, 2013 between Morgan Stanley & Co., LLC, MS Securities Services Inc. and the Registrant on behalf of the Funds listed on Schedule 1; | | (30) |
| | | |
| | 101 | | Amendment to Mutual Fund Services Agreement for Transfer Agency Services dated August 19, 2013, between the Registrant and Huntington Asset Services, Inc.; | | (30) |
| | | |
| | 102 | | Amendment to Exhibit A dated August 19, 2013, to the Administrative Services Agreement dated June 23, 2006, between the Registrant and The Huntington National Bank; | | (30) |
| | | | | | |
| | 103 | | Expense Limitation Agreement dated November 22, 2013, between the Registrant and Huntington Asset Advisors, Inc., relating to the Huntington Dividend Capture Fund; | | (31) |
| | | |
| | 104 | | Expense Limitation Agreement dated December 13, 2013, between the Registrant and Huntington Asset Advisors, Inc., relating to the Huntington Disciplined Equity Fund; | | (31) |
| | | |
| | 105 | | Expense Limitation Agreement dated December 13, 2013, between the Registrant and Huntington Asset Advisors, Inc., relating to the Huntington Dividend Capture Fund; | | (31) |
| | | |
| | 106 | | Expense Limitation Agreement dated December 13, 2013, between the Registrant and Huntington Asset Advisors, Inc., relating to the Huntington Income Generation Fund; | | (31) |
| | | |
| | 107 | | Expense Limitation Agreement dated December 13, 2013, between the Registrant and Huntington Asset Advisors, Inc., relating to the Huntington Real Strategies Fund; | | (31) |
| | | |
| | 108 | | Expense Limitation Agreement dated December 13, 2013, between the Registrant and Huntington Asset Advisors, Inc., relating to the Huntington Situs Fund; | | (31) |
| | | |
| | 109 | | Expense Limitation Agreement dated December 13, 2013, between the Registrant and Huntington Asset Advisors, Inc., relating to the Huntington World Income Fund; | | (31) |
| | | |
| | 110 | | Expense Limitation Agreement dated February 28, 2014, between the Registrant and Huntington Asset Advisors, Inc., relating to the Huntington Income Generation Fund; | | (32) |
| | | |
| | 111 | | Expense Limitation Agreement dated February 28, 2014, between the Registrant and Huntington Asset Advisors, Inc., relating to the Huntington World Income Fund; | | (32) |
| | | |
| | 112 | | Amended and Restated Administrative Services Agreement dated June 23, 2006, as amended December 13, 2013, between the Registrant and The Huntington National Bank; | | (33) |
| | | |
| | 113 | | 364-Day Credit Agreement dated December 19, 2013, between Citibank, N.A. and the Registrant; | | (33) |
| | | |
| | 114 | | Expense Limitation Agreement dated February 10, 2014, between the Registrant and Huntington Asset Advisors, Inc., relating to the Huntington Income Generation Fund; | | (33) |
| | | |
| | 115 | | Expense Limitation Agreement dated February 26, 2014, between the Registrant and Huntington Asset Advisors, Inc., relating to the Huntington Rotating Markets Fund; | | (33) |
| | | |
| | 116 | | Expense Limitation Agreement dated March 5, 2014, between the Registrant and Huntington Asset Advisors, Inc., relating to the Huntington VA Growth Fund; | | (33) |
| | | |
| | 117 | | Expense Limitation Agreement dated March 5, 2014, between the Registrant and Huntington Asset Advisors, Inc., relating to the Huntington VA Income Equity Fund; | | (33) |
| | | |
| | 118 | | Expense Limitation Agreement dated March 5, 2014, between the Registrant and Huntington Asset Advisors, Inc., relating to the Huntington VA Mid Corp America Fund; | | (33) |
| | | |
| | 119 | | Expense Limitation Agreement dated May 1, 2014, between the Registrant and Huntington Asset Advisors, Inc., relating to the Huntington Disciplined Equity Fund; | | (33) |
| | | | | | |
| | 120 | | Expense Limitation Agreement dated May 1, 2014, between the Registrant and Huntington Asset Advisors, Inc., relating to the Huntington Dividend Capture Fund; | | (33) |
| | | |
| | 121 | | Expense Limitation Agreement dated May 1, 2014, between the Registrant and Huntington Asset Advisors, Inc., relating to the Huntington Global Select Markets Fund; | | (33) |
| | | |
| | 122 | | Expense Limitation Agreement dated May 1, 2014, between the Registrant and Huntington Asset Advisors, Inc., relating to the Huntington International Equity Fund; | | (33) |
| | | |
| | 123 | | Expense Limitation Agreement dated May 1, 2014, between the Registrant and Huntington Asset Advisors, Inc., relating to the Huntington Real Strategies Fund; | | (33) |
| | | |
| | 124 | | Expense Limitation Agreement dated May 1, 2014, between the Registrant and Huntington Asset Advisors, Inc., relating to the Huntington Situs Fund; | | (33) |
| | | |
| | 125 | | Expense Limitation Agreement dated May 1, 2014, between the Registrant and Huntington Asset Advisors, Inc., relating to the Huntington Balanced Allocation Fund; | | (33) |
| | | |
| | 126 | | Expense Limitation Agreement dated May 1, 2014, between the Registrant and Huntington Asset Advisors, Inc., relating to the Huntington Conservative Allocation Fund; | | (33) |
| | | |
| | 127 | | Expense Limitation Agreement dated May 1, 2014, between the Registrant and Huntington Asset Advisors, Inc., relating to the Huntington Growth Allocation Fund; | | (33) |
| | | |
| | 128 | | Expense Limitation Agreement dated May 1, 2014, between the Registrant and Huntington Asset Advisors, Inc., relating to the Huntington VA Balanced Fund; | | (33) |
| | | |
| | 129 | | Expense Limitation Agreement dated May 1, 2014, between the Registrant and Huntington Asset Advisors, Inc., relating to the Huntington VA Dividend Capture Fund; | | (33) |
| | | |
| | 130 | | Expense Limitation Agreement dated May 1, 2014, between the Registrant and Huntington Asset Advisors, Inc., relating to the Huntington VA International Equity Fund; | | (33) |
| | | |
| | 131 | | Expense Limitation Agreement dated May 1, 2014, between the Registrant and Huntington Asset Advisors, Inc., relating to the Huntington VA Rotating Markets Fund; | | (33) |
| | | |
| | 132 | | Expense Limitation Agreement dated May 1, 2014, between the Registrant and Huntington Asset Advisors, Inc., relating to the Huntington VA Real Strategies Fund; | | (33) |
| | | |
| | 133 | | Expense Limitation Agreement dated May 1, 2014, between the Registrant and Huntington Asset Advisors, Inc., relating to the Huntington VA Situs Fund; | | (33) |
| | | |
| | 134 | | Expense Limitation Agreement dated May 1, 2014, between the Registrant and Huntington Asset Advisors, Inc., relating to the Huntington VA Mortgage Securities Fund; | | (33) |
| | | |
| | 135 | | Amendment to Exhibit A dated August 19, 2014, to the Administrative Services Agreement dated June 23, 2006, between the Registrant and The Huntington National Bank; | | (34) |
| | | | | | |
| | 136 | | Amendment to Mutual Fund Services Agreement for Transfer Agency Services dated August 19, 2014, between the Registrant and Huntington Asset Services, Inc.; | | (34) |
| | | |
| | 137 | | Amendment dated June 1, 2014 to the Master Securities Loan Agreement dated February 21, 2012, and the Exclusive Fee Side Letter dated May 22, 2013, between Morgan Stanley & Co., LLC, and the Registrant on behalf of the Funds listed on Schedule I; | | (34) |
| | | |
| | 138 | | Exclusive Lending Letter dated July 11, 2014, and effective August 19, 2014, to the Master Securities Loan Agreement dated February 21, 2012, between Morgan Stanley & Co., LLC, and the Registrant on behalf of the Funds listed on Schedule I; | | (34) |
| | | |
| | 139 | | Form of Mutual Fund Sales and Services Agreement (Unified Financial Securities, Inc.); | | (34) |
| | | |
| (14) | | | | | | |
| | 1 | | Consent of Ernst & Young, LLP, is filed herewith. | | (+) |
| | | |
| (15) | | | | Not applicable | | |
| | | |
| (16) | | | | | | |
| | 1 | | Powers of Attorney of the Board of Trustees of The Huntington Funds, is filed herewith. | | (+) |
| | | |
| (17) | | | | Not applicable | | |
| | | |
| (+) | | | | Exhibit is being filed electronically with registration statement. | | |
ALL RESPONSES, UNLESS OTHERWISE INDICATED, ARE INCORPORATED BY REFERENCE TO A POST-EFFECTIVE AMENDMENT (PEA) OF THE REGISTRANT FILED ON FORM N-1A (FILE NOS. 33-11905 and 811-5010.)
| 1 | PEA No. 20 filed April 26, 1996. |
| 2 | PEA No. 38 filed February 21, 2002. |
| 3 | PEA No. 26 filed April 30, 1998. |
| 4 | PEA No. 43 filed February 2, 2004. |
| 5 | PEA No. 44 filed February 23, 2004. |
| 6 | PEA No. 45 filed April 29, 2004. |
| 7 | PEA No. 47 filed April 29, 2005. |
| 8 | PEA No. 48 filed April 28, 2006. |
| 9 | PEA No. 50 filed August 24, 2006. |
| 10 | PEA No. 51 filed February 8, 2007. |
| 11 | PEA No. 52 filed April 30, 2007. |
| 12 | PEA No. 56 filed April 14, 2008. |
| 13 | PEA No. 57 filed April 29, 2008. |
| 14 | PEA No. 63 filed October 21, 2008. |
| 15 | PEA No. 64 filed April 29, 2009. |
| 16 | PEA No. 65 filed May 15, 2009. |
| 17 | PEA No. 66 filed October 14, 2009. |
| 18 | PEA No. 67 filed February 24, 2010. |
| 19 | PEA No. 68 filed April 30, 2010. |
| 20 | PEA No. 69 filed February 14, 2011. |
| 21 | PEA No. 71 filed April 15, 2011. |
| 22 | PEA No. 72 filed May 2, 2011. |
| 23 | PEA No. 76 filed July 28, 2011. |
| 24 | PEA No. 84 filed June 1, 2012. |
| 25 | PEA No. 85 filed July 6, 2012. |
| 26 | PEA No. 86 filed August 15, 2012. |
| 27 | PEA No. 88 filed February 28, 2013. |
| 28 | PEA No. 90 filed April 16, 2013. |
| 29 | PEA No. 91 filed April 30, 2013. |
| 30 | Form 497 relating to the Part C filed September 4, 2013. |
| 31 | PEA No. 96 filed December 13, 2013 |
| 32 | PEA No. 100 filed February 27, 2014 |
| 33 | PEA No. 103 filed April 29. 2014. |
| 34 | Form 497 relating to the Part C filed September 3, 2014. |
SIGNATURES
Pursuant to the requirements of the Securities Act of 1933, as amended, the Registrant certifies that it meets all of the requirements for effectiveness of this Post-Effective Amendment No. to the Registrant’s registration statement on Form N-14 under Rule 485(b) under the Securities Act of 1933, as amended, and has duly caused this Post-Effective Amendment No. to the Registrant’s registration statement on Form N-14 to be signed on its behalf by the undersigned, duly authorized, in the City of Indianapolis.
THE HUNTINGTON FUNDS
| | |
| BY: | | /s/ Jay S. Fitton |
| | Jay S. Fitton, Secretary |
Pursuant to the requirements of the Securities Act of 1933, this Registration Statement on Form N-14 has been signed below by the following persons in the capacities and on the date(s) indicated:
| | | | | | |
| *By: | | /s/ Jay S. Fitton | | | | October 7, 2014 |
| Jay S. Fitton, Attorney in Fact for the Persons Listed Below | | | | Date |
| | |
/s/ Joseph L. Rezabek | | | | October 7, 2014 |
| Joseph L. Rezabek, President | | | | Date |
| | |
/s/ R. Jeffrey Young | | | | October 7, 2014 |
| R. Jeffrey Young, Principal Executive Officer | | | | Date |
| | |
/s/ Martin R. Dean | | | | October 7, 2014 |
| Anti-Money Laundering Officer and Chief Compliance Officer | | | | |
| | | | |
/s/ Bryan W. Ashmus | | | | October 7, 2014 |
| Bryan W. Ashmus, Treasurer and Principal Financial Officer | | | | Date |
| | |
* | | | | October 7, 2014 |
| Thomas J. Westerfield, Trustee | | | | Date |
| | |
* | | | | October 7, 2014 |
| Mark D. Shary, Trustee | | | | Date |
| | |
* | | | | October 7, 2014 |
| William H. Zimmer, Trustee | | | | Date |
Exhibit Index
| | |
Exhibit | | Item |
| |
| (4) 1 | | Form of Agreement and Plan of Reorganization |
| |
| (12) 1 | | Opinions of Sullivan & Worcester, LLP, as to certain tax consequences |
| |
| (14) 1 | | Consent of Ernst & Young, LLP |
| |
| (16) 1 | | Powers of Attorney of the Board of Trustees of The Huntington Funds |