| | | | |
OMB APPROVAL |
| OMB Number: | | 3235-0570 |
| Expires: | | August 31, 2020 |
| Estimated average burden |
| Hours per response ......... | | 20.6 |
UNITED STATES
SECURITIES AND EXCHANGE COMMISSION
Washington, DC 20549
FORMN-CSR
CERTIFIED SHAREHOLDER REPORT OF REGISTERED
MANAGEMENT INVESTMENT COMPANIES
Investment Company Act file number:811-5032
BARON INVESTMENT FUNDS TRUST f/k/a BARON ASSET FUND
(Exact Name of Registrant as Specified in Charter)
767 Fifth Avenue, 49th Floor
New York, NY 10153
(Address of Principal Executive Offices) (Zip Code)
Patrick M. Patalino, General Counsel
c/o Baron Investment Funds Trust
767 Fifth Avenue, 49th Floor
New York, NY 10153
(Name and Address of Agent for Service)
(Registrant’s Telephone Number, including Area Code):212-583-2000
Date of fiscal year end: September 30
Date of reporting period: September 30, 2019
FormN-CSR is to be used by management investment companies to file reports with the Commission not later than 10 days after the transmission to stockholders of any report that is required to be transmitted to stockholders under Rule30e-1 under the Investment Company Act of 1940 (17CRF270.30e-1). The Commission may use the information provided on FormN-CSR in its regulatory, disclosure review, inspection, and policymaking roles.
A registrant is required to disclose the information specified by FormN-CSR, and the Commission will make this information public. A registrant is not required to respond to the collection of information contained in FormN-CSR unless the Form displays a currently valid Office of Management and Budget (“OMB”) control number. Please direct comments concerning the accuracy of the information collection burden estimate and suggestions for reducing the burden to Secretary, Securities and Exchange Commission, 450 5th Street, NW, Washington, D.C. 20549-0609. The OMB has reviewed this collection of information under the clearance requirements of 44 U.S.C. Section 3507.
Persons who are to respond to the collection of information contained in this form are not required to respond unless the form displays a currently valid OMB control number.
SEC 2569(5-07)
| Item 1. | Report to Stockholders. |
Baron Asset Fund
Baron Growth Fund
Baron Small Cap Fund
Baron Opportunity Fund
Baron Fifth Avenue Growth Fund
Baron Discovery Fund
Baron Durable Advantage Fund
Baron Funds®
Baron Investment Funds Trust
Annual Financial Report
Beginning on January 1, 2021, as permitted by regulations adopted by the U.S. Securities and Exchange Commission, paper copies of the Funds’ shareholder reports like this one will no longer be sent by mail, unless you specifically request paper copies of the reports from Baron Funds (“Baron”) or from your financial intermediary, such as a broker-dealer or bank. Instead, the reports will be made available on the Baron website, and you will be notified by mail each time a report is posted and provided with a website link to access the report.
If you already elected to receive shareholder reports electronically, you will not be affected by this change and you need not take any action. You may elect to receive shareholder reports and other communications from Baron or your financial intermediary electronically by contacting your financial intermediary or going toicsdelivery.com/baronfunds.
You may elect to receive all future reports in paper free of charge. You can inform Baron or your financial intermediary that you wish to continue receiving paper copies of your shareholder reports by following the instructions included on the envelope or slip inserted with this disclosure. Your election to receive reports in paper will apply to all funds held with Baron or your financial intermediary.
DEAR BARON INVESTMENT FUNDS SHAREHOLDER:
In this report, you will find audited financial statements for Baron Asset Fund, Baron Growth Fund, Baron Small Cap Fund, Baron Opportunity Fund, Baron Fifth Avenue Growth Fund, Baron Discovery Fund and Baron Durable Advantage Fund (the “Funds”) for the year ended September 30, 2019. The U.S. Securities and Exchange Commission (the “SEC”) requires mutual funds to furnish these statements semi-annually to their shareholders. We hope you find these statements informative and useful.
We thank you for choosing to join us as fellow shareholders in Baron Funds. We will continue to work hard to justify your confidence.
Sincerely,
| | | | |
 | |  | |  |
Ronald Baron Chief Executive Officer and Chief Investment Officer November 25, 2019 | | Linda S. Martinson Chairman, President and Chief Operating Officer November 25, 2019 | | Peggy Wong Treasurer and Chief Financial Officer November 25, 2019 |
This Annual Financial Report is for the Baron Investment Funds Trust, which currently has seven series: Baron Asset Fund, Baron Growth Fund, Baron Small Cap Fund, Baron Opportunity Fund, Baron Fifth Avenue Growth Fund, Baron Discovery Fund and Baron Durable Advantage Fund. If you are interested in Baron Select Funds, which contains the Baron Partners Fund, Baron Focused Growth Fund, Baron International Growth Fund, Baron Real Estate Fund, Baron Emerging Markets Fund, Baron Global Advantage Fund, Baron Real Estate Income Fund, Baron WealthBuilder Fund, and Baron Health Care Fund series, please visit the Funds’ website at www.BaronFunds.com or contact us at1-800-99BARON.
The Funds’ Proxy Voting Policy is available without charge and can be found on the Funds’ website at www.BaronFunds.com, by clicking on the “Legal Notices” link at the bottom left corner of the homepage or by calling1-800-99BARON and on the SEC’s website at www.sec.gov. The Funds’ most current proxy voting record, Form N-PX, is also available on the Funds’ website and on the SEC’s website.
The Funds file their complete schedules of portfolio holdings with the SEC for the first and third quarters of each fiscal year as an exhibit to their reports on Form N-PORT. The Funds’ Form N-PORT reports are available on the SEC’s website at www.sec.gov. Schedules of portfolio holdings current to the most recent quarter are also available on the Funds’ website.
Some of the comments contained in this report are based on current management expectations and are considered “forward-looking statements.” Actual future results, however, may prove to be different from our expectations. You can identify forward-looking statements by words such as “estimate,” “may,” “expect,” “should,” “could,” “believe,” “plan” and other similar terms. We cannot promise future returns and our opinions are a reflection of our best judgment at the time this report is compiled.
The views expressed in this report reflect those of BAMCO, Inc. (“BAMCO” or the “Adviser”) only through the end of the period stated in this report. The views are not intended as recommendations or investment advice to any person reading this report and are subject to change at any time without notice based on market and other conditions.
Past performance is no guarantee of future results. The investment return and principal value of an investment will fluctuate; an investor’s shares, when redeemed, may be worth more or less than their original cost. For more complete information about Baron Funds, including charges and expenses, call, write or go to www.BaronFunds.com for a prospectus or summary prospectus. Read them carefully before you invest or send money. This report is not authorized for use as an offer of sale or a solicitation of an offer to buy shares of the Funds, unless accompanied or preceded by the Funds’ current prospectus or summary prospectus.

| | |
| Baron Asset Fund(Unaudited) | | September 30, 2019 |
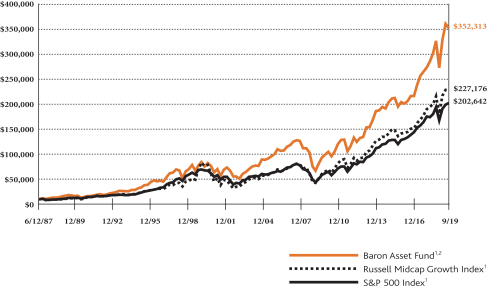
COMPARISONOFTHECHANGEIN VALUEOF $10,000INVESTMENTIN BARON ASSET FUND (RETAIL SHARES)
INRELATIONTOTHE RUSSELL MIDCAP GROWTH INDEXANDTHE S&P 500 INDEX
| | | | | | | | | | | | | | | | | | | | |
| AVERAGE ANNUAL TOTAL RETURNSFORTHEPERIODSENDED SEPTEMBER 30, 2019 | |
| | | One
Year | | | Three
Years | | | Five
Years | | | Ten
Years | | | Since
Inception
(June 12,
1987) | |
Baron Asset Fund — Retail Shares1,2 | | | 7.82% | | | | 17.56% | | | | 12.96% | | | | 14.19% | | | | 11.66% | |
Baron Asset Fund — Institutional Shares1,2,4 | | | 8.11% | | | | 17.88% | | | | 13.26% | | | | 14.50% | | | | 11.75% | |
Baron Asset Fund — R6 Shares1,2,4 | | | 8.09% | | | | 17.87% | | | | 13.26% | | | | 14.50% | | | | 11.75% | |
Russell Midcap Growth Index1 | | | 5.20% | | | | 14.50% | | | | 11.12% | | | | 14.08% | | | | 10.17% | 3 |
S&P 500 Index1 | | | 4.25% | | | | 13.39% | | | | 10.84% | | | | 13.24% | | | | 9.76% | |
| 1 | The indexes are unmanaged. The index performance is not Fund performance; one cannot invest directly into an index. The Russell MidcapTM Growth Index measures the performance of medium-sized U.S. companies that are classified as growth and the S&P 500 Index of 500 widely held large cap U.S. companies. The indexes and the Fund are with dividends reinvested, which positively impact the performance results. |
| 2 | Past performance is not predictive of future performance. The performance data does not reflect the deduction of taxes that a shareholder would pay on Fund distributions or redemption of Fund shares. The Fund’s transfer agency expenses may be reduced by expense offsets from an unaffiliated transfer agent, without which performance would have been lower. |
| 3 | For the period June 30, 1987 to September 30, 2019. |
| 4 | Performance for the Institutional Shares prior to May 29, 2009 is based on the performance of the Retail Shares. Performance for the R6 Shares prior to January 29, 2016 is based on the performance of the Institutional Shares, and prior to May 29, 2009 is based on the Retail Shares. The Retail Shares have a distribution fee, but Institutional Shares and R6 Shares do not. If the annual returns for the Institutional Shares and R6 Shares prior to May 29, 2009 did not reflect this fee, the returns would be higher. |
2
| | |
| September 30, 2019 (Unaudited) | | Baron Asset Fund |
TOP TEN HOLDINGSASOF SEPTEMBER 30, 2019
| | | | |
| | | Percent of
Net Assets | |
IDEXX Laboratories, Inc. | | | 6.1% | |
Gartner, Inc. | | | 5.2% | |
Verisk Analytics, Inc. | | | 4.8% | |
Mettler-Toledo International, Inc. | | | 4.1% | |
Guidewire Software, Inc. | | | 3.4% | |
Vail Resorts, Inc. | | | 3.4% | |
ANSYS, Inc. | | | 3.1% | |
Verisign, Inc. | | | 3.0% | |
CoStar Group, Inc. | | | 3.0% | |
TransUnion | | | 2.8% | |
| |
| | | | 38.9% | |
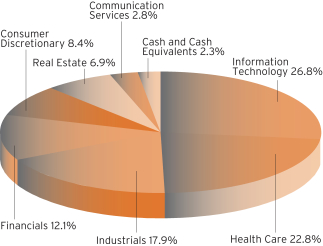
SECTOR BREAKDOWNASOF SEPTEMBER 30, 2019†
(as a percentage of net assets)
MANAGEMENT’S DISCUSSIONOF FUND PERFORMANCE
For the 12-month period ended September 30, 2019, Baron Asset Fund1 increased 7.82%, while the Russell Midcap Growth Index gained 5.20% and the S&P 500 Index gained 4.25%.
Baron Asset Fund invests primarily in medium-sized growth companies for the long term, using a value-oriented purchase discipline. The Fund purchases companies that we believe have sustainable competitive advantages, strong financial characteristics, and exceptional management; and operate in industries with favorable growth characteristics.
U.S. equity indexes started off the 12-month period with a steep decline, fueled by trade tensions with China, the possibility of rising interest rates, and slowing global growth. The market recovered over the next six months, with most major indexes reaching new highs, as investors appeared encouraged by signs of easing trade tensions and focused instead on attractive stock valuations and indications of a more dovish Federal Reserve. Volatility returned late in the period, as trade tensions flared yet again, global growth showed renewed signs of a slowdown and the 10-year and 2-year U.S. yield curves inverted. Nevertheless, domestic economic and employment data remained strong, with wage growth and consumer confidence suggesting that the record-long period of expansion may still have some runway if concerns over geopolitical uncertainties abate.
Information Technology, Industrials, and Financials were the top contributing sectors in the period. Consumer Discretionary, Communication Services, and Energy detracted.
Verisk Analytics, Inc., a leading data and analytics vendor, contributed the most on solid quarterly financial results throughout the period. The Insurance segment maintained strong performance, and both the Energy and Financial Services segments showed signs of improvement. We remain positive about the competitive positioning, defensive business model, long-term growth, margin expansion, and capital deployment prospects for the business.
Vail Resorts, Inc., a global operator of ski resorts, detracted the most, due to destination visitation that missed investor expectations and lowered 2019 guidance early in the period. However, toward the end of the period, Vail regained ground on strong growth in pass sales for the upcoming ski season. We think the recent closing of the Peak Resorts acquisition, which opens up access to 17 additional ski resorts across the U.S., should drive more season pass sales. Growth in season pass sales helps lock up revenue early, giving strong visibility to earnings and cash flow. We retain conviction.
We continue to believe that mid-sized growth stocks represent an attractive investment opportunity. The U.S. economy remains among the world’s healthiest, its equity market multiples remain within the range of their long-term historic averages, and interest rates continue to be quite low by historic standards. We believe our diversified portfolio of fast growing, well managed, competitively advantaged businesses will continue to perform well in this environment. There is, of course, no guarantee that this will be the case.
| † | Sector levels are provided from the Global Industry Classification Standard (“GICS”), developed and exclusively owned by MSCI, Inc. and Standard & Poor’s Financial Services LLC, unless otherwise stated that they have been reclassified or classified by the Adviser. All GICS data is provided “as is” with no warranties. |
| 1 | Performance information reflects results of the Retail Shares. |
3
| | |
| Baron Growth Fund(Unaudited) | | September 30, 2019 |
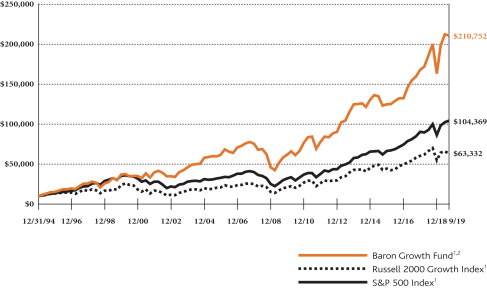
COMPARISONOFTHECHANGEIN VALUEOF $10,000INVESTMENTIN BARON GROWTH FUND (RETAIL SHARES)
INRELATIONTOTHE RUSSELL 2000 GROWTH INDEXANDTHE S&P 500 INDEX
| | | | | | | | | | | | | | | | | | | | |
| AVERAGE ANNUAL TOTAL RETURNSFORTHEPERIODSENDED SEPTEMBER 30, 2019 | |
| | | One
Year | | | Three
Years | | | Five
Years | | | Ten
Years | | | Since
Inception
(December 31,
1994) | |
Baron Growth Fund — Retail Shares1,2 | | | 5.09% | | | | 16.70% | | | | 11.61% | | | | 13.70% | | | | 13.11% | |
Baron Growth Fund — Institutional Shares1,2,3 | | | 5.36% | | | | 17.00% | | | | 11.89% | | | | 14.00% | | | | 13.23% | |
Baron Growth Fund — R6 Shares1,2,3 | | | 5.36% | | | | 17.01% | | | | 11.90% | | | | 14.00% | | | | 13.23% | |
Russell 2000 Growth Index1 | | | (9.63)% | | | | 9.79% | | | | 9.08% | | | | 12.25% | | | | 7.74% | |
S&P 500 Index1 | | | 4.25% | | | | 13.39% | | | | 10.84% | | | | 13.24% | | | | 9.94% | |
| 1 | The indexes are unmanaged. The index performance is not Fund performance; one cannot invest directly into an index. The Russell 2000® Growth Index measures the performance of small-sized U.S. companies that are classified as growth and the S&P 500 Index of 500 widely held large cap U.S. companies. The indexes and the Fund are with dividends reinvested, which positively impact the performance results. |
| 2 | Past performance is not predictive of future performance. The performance data does not reflect the deduction of taxes that a shareholder would pay on Fund distributions or redemption of Fund shares. The Fund’s transfer agency expenses may be reduced by expense offsets from an unaffiliated transfer agent, without which performance would have been lower. |
| 3 | Performance for the Institutional Shares prior to May 29, 2009 is based on the performance of the Retail Shares. Performance for the R6 Shares prior to January 29, 2016 is based on the performance of the Institutional Shares, and prior to May 29, 2009 is based on the Retail Shares. The Retail Shares have a distribution fee, but Institutional Shares and R6 Shares do not. If the annual returns for the Institutional Shares and R6 Shares prior to May 29, 2009 did not reflect this fee, the returns would be higher. |
4
| | |
| September 30, 2019 (Unaudited) | | Baron Growth Fund |
TOP TEN HOLDINGSASOF SEPTEMBER 30, 2019
| | | | |
| | | Percent of
Net Assets | |
CoStar Group, Inc. | | | 7.4% | |
Vail Resorts, Inc. | | | 7.0% | |
Arch Capital Group Ltd. | | | 6.0% | |
MSCI, Inc. | | | 5.8% | |
ANSYS, Inc. | | | 4.9% | |
Gartner, Inc. | | | 4.7% | |
FactSet Research Systems, Inc. | | | 4.5% | |
IDEXX Laboratories, Inc. | | | 4.4% | |
Choice Hotels International, Inc. | | | 3.9% | |
Bright Horizons Family Solutions, Inc. | | | 3.8% | |
| |
| | | | 52.4% | |
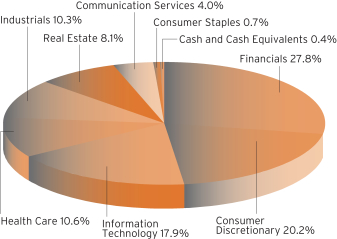
SECTOR BREAKDOWNASOF SEPTEMBER 30, 2019†
(as a percentage of net assets)
MANAGEMENT’S DISCUSSIONOF FUND PERFORMANCE
For the 12-month period ended September 30, 2019, Baron Growth Fund1 gained 5.09%, while the Russell 2000 Growth Index declined 9.63% and the S&P 500 Index gained 4.25%.
Baron Growth Fund invests primarily in small-sized U.S. growth companies for the long term. Through independent research, we utilize an investment approach that we believe allows us to look at a business’s fundamental characteristics and beyond the current market environment. We invest based on the potential profitability of a business at what we believe are attractive valuations.
U.S. equity indexes started off the 12-month period with a steep decline, fueled by trade tensions with China, the possibility of rising interest rates, and slowing global growth. The market recovered over the next six months, with most major indexes reaching new highs, as investors appeared encouraged by signs of easing trade tensions and focused instead on attractive stock valuations and indications of a more dovish Federal Reserve. Volatility returned late in the period, as trade tensions flared yet again, global growth showed renewed signs of a slowdown and the 10-year and 2-year U.S. yield curves inverted. Nevertheless, domestic economic and employment data remained strong, with wage growth and consumer confidence suggesting that the record-long period of expansion may still have some runway if concerns over geopolitical uncertainties abate.
Financials, Industrials, and Real Estate were the top contributing sectors in the period. Consumer Discretionary, Communication Services, and Information Technology detracted.
CoStar Group, Inc. was the top contributor. Business trends for this real estate information and marketing firm were excellent, with the company’s bookings steadily improving to reach new highs. We see a path for quarterly bookings to improve toward $70 million, driving revenue acceleration toward 20%. The company now has over $1.3 billion of cash on its balance sheet, which we expect it to use for opportunistic acquisitions, which should expand CoStar’s addressable market.
Vail Resorts, Inc., a global operator of ski resorts, detracted the most, due to destination visitation that missed investor expectations and lowered 2019 guidance early in the period. However, toward the end of the period, Vail regained ground on strong growth in pass sales for the upcoming ski season. We think the recent closing of the Peak Resorts acquisition, which opens up access to 17 additional ski resorts across the U.S., should drive more season pass sales. Growth in season pass sales helps lock up revenue early, giving strong visibility to earnings and cash flow. We retain conviction.
The Fund continues to invest in a portfolio of businesses that have better financial characteristics than the benchmark index against which it is compared. These businesses generally have higher operating profit margins, net margins, EBITDA margins, return on invested capital, return on equity, return on assets, and lower standard deviations of earnings growth. While we do not try to predict short-term macro developments or current events, we believe conditions remain favorable for the U.S. economy and equity markets.
| † | Sector levels are provided from the Global Industry Classification Standard (“GICS”), developed and exclusively owned by MSCI, Inc. and Standard & Poor’s Financial Services LLC, unless otherwise stated that they have been reclassified or classified by the Adviser. All GICS data is provided “as is” with no warranties. |
| 1 | Performance information reflects results of the Retail Shares. |
5
| | |
| Baron Small Cap Fund(Unaudited) | | September 30, 2019 |
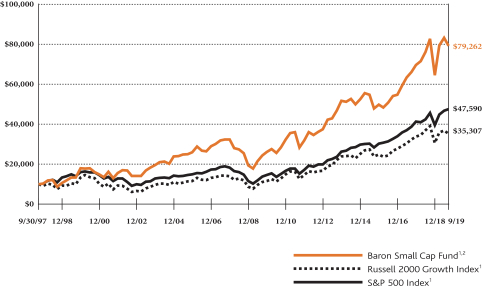
COMPARISONOFTHECHANGEIN VALUEOF $10,000INVESTMENTIN BARON SMALL CAP FUND (RETAIL SHARES)
IN RELATIONTOTHE RUSSELL 2000 GROWTH INDEXANDTHE S&P 500 INDEX
| | | | | | | | | | | | | | | | | | | | |
| AVERAGE ANNUAL TOTAL RETURNSFORTHEPERIODSENDED SEPTEMBER 30, 2019 | |
| | | One
Year | | | Three
Years | | | Five
Years | | | Ten
Years | | | Since Inception
(September 30,
1997) | |
Baron Small Cap Fund — Retail Shares1,2 | | | (4.17)% | | | | 13.62% | | | | 9.64% | | | | 12.51% | | | | 9.87% | |
Baron Small Cap Fund — Institutional Shares1,2,3 | | | (3.91)% | | | | 13.92% | | | | 9.93% | | | | 12.80% | | | | 10.00% | |
Baron Small Cap Fund — R6 Shares1,2,3 | | | (3.91)% | | | | 13.91% | | | | 9.92% | | | | 12.79% | | | | 10.00% | |
Russell 2000 Growth Index1 | | | (9.63)% | | | | 9.79% | | | | 9.08% | | | | 12.25% | | | | 5.90% | |
S&P 500 Index1 | | | 4.25% | | | | 13.39% | | | | 10.84% | | | | 13.24% | | | | 7.35% | |
| 1 | The indexes are unmanaged. The index performance is not Fund performance; one cannot invest directly into an index. The Russell 2000® Growth Index measures the performance of small-sized U.S. companies that are classified as growth and the S&P 500 Index of 500 widely held large cap U.S. companies. The indexes and the Fund are with dividends reinvested, which positively impact the performance results. |
| 2 | Past performance is not predictive of future performance. The performance data does not reflect the deduction of taxes that a shareholder would pay on Fund distributions or redemption of Fund shares. The Fund’s transfer agency expenses may be reduced by expense offsets from an unaffiliated transfer agent, without which performance would have been lower. |
| 3 | Performance for the Institutional Shares prior to May 29, 2009 is based on the performance of the Retail Shares. Performance for the R6 Shares prior to January 29, 2016 is based on the performance of the Institutional Shares, and prior to May 29, 2009 is based on the Retail Shares. The Retail Shares have a distribution fee, but Institutional Shares and R6 Shares do not. If the annual returns for the Institutional Shares and R6 Shares prior to May 29, 2009 did not reflect this fee, the returns would be higher. |
6
| | |
| September 30, 2019 (Unaudited) | | Baron Small Cap Fund |
TOP TEN HOLDINGSASOF SEPTEMBER 30, 2019
| | | | |
| | | Percent of
Net Assets | |
Guidewire Software, Inc. | | | 4.5% | |
Gartner, Inc. | | | 3.7% | |
Bright Horizons Family Solutions, Inc. | | | 3.2% | |
SBA Communications Corp. | | | 3.1% | |
Waste Connections, Inc. | | | 2.9% | |
SiteOne Landscape Supply, Inc. | | | 2.9% | |
ASGN Incorporated | | | 2.8% | |
IDEXX Laboratories, Inc. | | | 2.8% | |
TransDigm Group, Inc. | | | 2.7% | |
ICON plc | | | 2.7% | |
| |
| | | | 31.3% | |
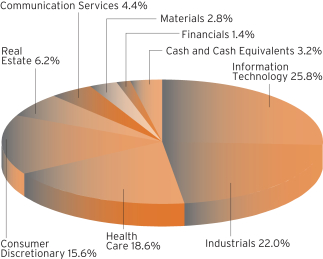
SECTOR BREAKDOWNASOF SEPTEMBER 30, 2019†
(as a percentage of net assets)
MANAGEMENT’S DISCUSSIONOF FUND PERFORMANCE
For the year ended September 30, 2019, Baron Small Cap Fund1 declined 4.17%, while the Russell 2000 Growth Index declined 9.63% and the S&P 500 Index increased 4.25%.
Baron Small Cap Fund invests primarily in small-cap growth companies for the long term. The Fund invests in what we believe are well-run small-cap growth businesses that can be purchased at prices that represent a significant discount to our assessment of future value.
U.S. equity indexes started off the 12-month period with a steep decline, fueled by trade tensions with China, the possibility of rising interest rates, and slowing global growth. The market recovered over the next six months, with most major indexes reaching new highs, as investors appeared encouraged by signs of easing trade tensions and focused instead on attractive stock valuations and indications of a more dovish Federal Reserve. Volatility returned late in the period, as trade tensions flared yet again, global growth showed renewed signs of a slowdown and the 10-year and 2-year U.S. yield curves inverted. Nevertheless, domestic economic and employment data remained strong, with wage growth and consumer confidence suggesting that the record-long period of expansion may still have some runway if concerns over geopolitical uncertainties abate.
Holdings in the Real Estate and Industrials sectors were the top contributors. Information Technology, Health Care, and Materials detracted the most.
TransDigm Group, Inc. was the top contributor. Shares of this producer and supplier of engineered aerospace components for commercial and military aircraft customers increased on strong quarterly results throughout the period, bolstered by steadily growing commercial passenger traffic and growth in defense products. The company also announced the sale of a non-core subsidiary for $920 million. Post-sale, TransDigm will have $2 billion of cash on hand, which can be deployed to other acquisitions. The company continues to surprise to the upside, and we believe it has many years of growth ahead.
GTT Communications, Inc. was the top detractor. Shares of this telecommunications services provider to multi-national enterprise customers declined as the company continued to struggle to integrate the Interoute business acquired last year. We exited our position, as execution has continuously missed investor expectations against high leverage, and we have lost confidence that the company can return to organic growth.
Baron Small Cap Fund invests primarily in classic growth stocks that we believe have significant long-term growth prospects and can be purchased at what we believe are attractive prices because their prospects have not yet been appreciated by investors. We also invest in fallen angels, which are companies that we believe have strong long-term franchises but have disappointed investors with short-term results, creating what we believe is a buying opportunity. A third category of investment is special situations, including special purpose acquisition companies, spin-offs and recapitalizations, where lack of investor awareness creates opportunities to purchase what we believe are strong businesses at attractive prices.
| † | Sector levels are provided from the Global Industry Classification Standard (“GICS”), developed and exclusively owned by MSCI, Inc. and Standard & Poor’s Financial Services LLC, unless otherwise stated that they have been reclassified or classified by the Adviser. All GICS data is provided “as is” with no warranties. |
| 1 | Performance information reflects results of the Retail Shares. |
7
| | |
| Baron Opportunity Fund(Unaudited) | | September 30, 2019 |
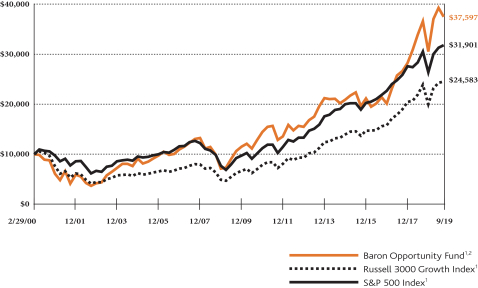
COMPARISONOFTHECHANGEIN VALUEOF $10,000INVESTMENTIN BARON OPPORTUNITY FUND† (RETAIL SHARES)
INRELATIONTOTHE RUSSELL 3000 GROWTH INDEXANDTHE S&P 500 INDEX
| | | | | | | | | | | | | | | | | | | | |
| AVERAGE ANNUAL TOTAL RETURNSFORTHEPERIODSENDED SEPTEMBER 30, 2019 | |
| | | One
Year | | | Three
Years | | | Five
Years | | | Ten
Years | | | Since
Inception
(February 29,
2000) | |
Baron Opportunity Fund — Retail Shares1,2 | | | 2.51% | | | | 20.53% | | | | 13.22% | | | | 13.45% | | | | 7.00% | |
Baron Opportunity Fund — Institutional Shares1,2,3 | | | 2.78% | | | | 20.84% | | | | 13.52% | | | | 13.74% | | | | 7.14% | |
Baron Opportunity Fund — R6 Shares1,2,3 | | | 2.78% | | | | 20.87% | | | | 13.55% | | | | 13.76% | | | | 7.15% | |
Russell 3000 Growth Index1 | | | 2.70% | | | | 16.36% | | | | 13.07% | | | | 14.74% | | | | 4.70% | |
S&P 500 Index1 | | | 4.25% | | | | 13.39% | | | | 10.84% | | | | 13.24% | | | | 6.10% | |
| † | The Fund’s historical performance was impacted by gains from IPOs and/or secondary offerings. There is no guarantee that these results can be repeated or that the Fund’s level of participation in IPOs and secondary offerings will be the same in the future. |
| 1 | The indexes are unmanaged. The index performance is not Fund performance; one cannot invest directly into an index. The Russell 3000® Growth Index measures the performance of those companies classified as growth among the largest 3,000 U.S. companies, and the S&P 500 Index of 500 widely held large cap U.S. companies. The indexes and the Fund are with dividends reinvested, which positively impact the performance results. |
| 2 | Past performance is not predictive of future performance. The performance data does not reflect the deduction of taxes that a shareholder would pay on Fund distributions or redemption of Fund shares. The Adviser reimburses certain Fund expenses pursuant to a contract expiring on August 29, 2030, unless renewed for another 11-year term and the Fund’s transfer agency expenses may be reduced by expense offsets from an unaffiliated transfer agent, without which performance would have been lower. |
| 3 | Performance for the Institutional Shares prior to May 29, 2009 is based on the performance of the Retail Shares. Performance for the R6 Shares prior to August 31, 2016 is based on the performance of the Institutional Shares, and prior to May 29, 2009 is based on the Retail Shares. The Retail Shares have a distribution fee, but Institutional Shares and R6 Shares do not. If the annual returns for the Institutional Shares and R6 Shares prior to May 29, 2009 did not reflect this fee, the returns would be higher. |
8
| | |
| September 30, 2019 (Unaudited) | | Baron Opportunity Fund |
TOP TEN HOLDINGSASOF SEPTEMBER 30, 2019
| | | | |
| | | Percent of
Total Investments | |
Microsoft Corporation | | | 6.8% | |
Amazon.com, Inc. | | | 6.1% | |
Alphabet Inc. | | | 5.4% | |
Guidewire Software, Inc. | | | 5.2% | |
Gartner, Inc. | | | 3.8% | |
Tesla, Inc. | | | 2.8% | |
CoStar Group, Inc. | | | 2.7% | |
Equinix, Inc. | | | 2.6% | |
Trainline Plc | | | 2.4% | |
Mastercard Incorporated | | | 2.3% | |
| |
| | | | 40.1% | |
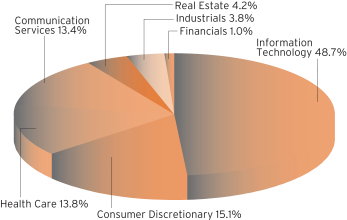
SECTOR BREAKDOWNASOF SEPTEMBER 30, 2019†
(as a percentage of total investments)
MANAGEMENT’S DISCUSSIONOF FUND PERFORMANCE
For the 12-month period ended September 30, 2019, Baron Opportunity Fund1 gained 2.51%, while the Russell 3000 Growth Index gained 2.70% and the S&P 500 Index gained 4.25%.
Baron Opportunity Fund invests primarily in U.S. growth companies that we believe are driving or benefiting from innovation, through development of pioneering, transformative, or technologically advanced products and services. The Fund invests in high growth businesses of any market capitalization, selected for their capital appreciation potential.
U.S. equity indexes started off the 12-month period with a steep decline, fueled by trade tensions with China, the possibility of rising interest rates, and slowing global growth. The market recovered over the next six months, with most major indexes reaching new highs, as investors appeared encouraged by signs of easing trade tensions and focused instead on attractive stock valuations and indications of a more dovish Federal Reserve. Volatility returned late in the period, as trade tensions flared yet again, global growth showed renewed signs of a slowdown and the 10-year and 2-year U.S. yield curves inverted. Nevertheless, domestic economic and employment data remained strong, with wage growth and consumer confidence suggesting that the record-long period of expansion may still have some runway if concerns over geopolitical uncertainties abate.
Investments in Information Technology, Health Care, and Real Estate contributed the most during the period. Communication Services, Consumer Discretionary, and Energy detracted.
The top contributor was argenx SE, a Belgian biotechnology company developing innovative antibody therapies for cancer and auto-immune diseases. Strong performance was driven by a previously undisclosed milestone payment from AbbVie on an underfollowed asset in argenx’s pipeline and an exclusive licensing deal with Halozyme to utilize its subcutaneous technology that we believe practically assures argenx’s lead in the FcRn market. We believe argenx’s FcRn platform is one of the most valuable assets in the biotechnology development space.
e-commerce leader Amazon.com, Inc. was the top detractor. Shares fell on softer revenue growth, but the company remains one of our highest conviction investment ideas. While penetration of e-commerce is rising rapidly, Amazon continues to grow its total addressable market at an unprecedented pace. We believe Amazon’s advertising business has the potential to generate $30 billion in the next four years and the ability to substantially improve Amazon’s core margins. AWS is also the leader in the cloud infrastructure market by a wide margin.
We remain focused on finding unique businesses across different segments of the economy that we believe offer long-term secular growth, sustainable competitive advantages, high-quality management teams, and attractive stock prices. We believe that investment returns for stocks are driven by earnings growth, and therefore direct our research towards understanding the drivers of business profit and projecting future profit growth as accurately as we can.
| † | Sector levels are provided from the Global Industry Classification Standard (“GICS”), developed and exclusively owned by MSCI, Inc. and Standard & Poor’s Financial Services LLC, unless otherwise stated that they have been reclassified or classified by the Adviser. All GICS data is provided “as is” with no warranties. |
| 1 | Performance information reflects results of the Retail Shares. |
9
| | |
| Baron Fifth Avenue Growth Fund(Unaudited) | | September 30, 2019 |
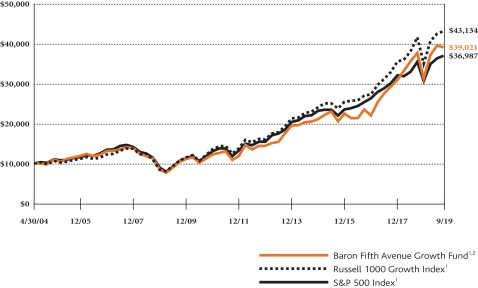
COMPARISONOFTHECHANGEIN VALUEOF $10,000INVESTMENTIN BARON FIFTH AVENUE GROWTH FUND†
(RETAIL SHARES)INRELATIONTOTHE RUSSELL 1000 GROWTH INDEXANDTHE S&P 500 INDEX
| | | | | | | | | | | | | | | | | | | | |
| AVERAGE ANNUAL TOTAL RETURNSFORTHEPERIODSENDED SEPTEMBER 30, 2019 | |
| | | One
Year | | | Three
Years | | | Five
Years | | | Ten
Years | | | Since
Inception
(April 30,
2004) | |
Baron Fifth Avenue Growth Fund — Retail Shares1,2 | | | 3.48% | | | | 18.38% | | | | 13.78% | | | | 14.11% | | | | 9.23% | |
Baron Fifth Avenue Growth Fund — Institutional Shares1,2,3 | | | 3.73% | | | | 18.68% | | | | 14.08% | | | | 14.39% | | | | 9.42% | |
Baron Fifth Avenue Growth Fund — R6 Shares1,2,3 | | | 3.73% | | | | 18.68% | | | | 14.08% | | | | 14.39% | | | | 9.42% | |
Russell 1000 Growth Index1 | | | 3.71% | | | | 16.89% | | | | 13.39% | | | | 14.94% | | | | 9.95% | |
S&P 500 Index1 | | | 4.25% | | | | 13.39% | | | | 10.84% | | | | 13.24% | | | | 8.85% | |
| † | The Fund’s historical performance was impacted by gains from IPOs and/or secondary offerings. There is no guarantee that these results can be repeated or that the Fund’s level of participation in IPOs and secondary offerings will be the same in the future. |
| 1 | The indexes are unmanaged. The index performance is not Fund performance; one cannot invest directly into an index. The Russell 1000® Growth Index measures the performance of large-sized U.S. companies that are classified as growth and the S&P 500 Index of 500 widely held large cap U.S. companies. The indexes and the Fund are with dividends reinvested, which positively impact the performance results. |
| 2 | Past performance is not predictive of future performance. The performance data does not reflect the deduction of taxes that a shareholder would pay on Fund distributions or redemption of Fund shares. The Adviser reimburses certain Fund expenses pursuant to a contract expiring on August 29, 2030, unless renewed for another 11-year term and the Fund’s transfer agency expenses may be reduced by expense offsets from an unaffiliated transfer agent, without which performance would have been lower. |
| 3 | Performance for the Institutional Shares prior to May 29, 2009 is based on the performance of the Retail Shares. Performance for the R6 Shares prior to January 29, 2016 is based on the performance of the Institutional Shares, and prior to May 29, 2009 is based on the Retail Shares. The Retail Shares have a distribution fee, but Institutional Shares and R6 Shares do not. If the annual returns for the Institutional Shares and R6 Shares prior to May 29, 2009 did not reflect this fee, the returns would be higher. |
10
| | |
| September 30, 2019 (Unaudited) | | Baron Fifth Avenue Growth Fund |
TOP TEN HOLDINGSASOF SEPTEMBER 30, 2019
| | | | |
| | | Percent of
Net Assets | |
Amazon.com, Inc. | | | 11.7% | |
Mastercard Incorporated | | | 5.9% | |
Alibaba Group Holding Limited | | | 5.0% | |
Veeva Systems Inc. | | | 5.0% | |
Alphabet Inc. | | | 4.9% | |
Visa, Inc. | | | 4.8% | |
Illumina, Inc. | | | 4.4% | |
Intuitive Surgical, Inc. | | | 4.3% | |
Fidelity National Information Services, Inc. | | | 3.8% | |
Facebook, Inc. | | | 3.7% | |
| |
| | | | 53.5% | |
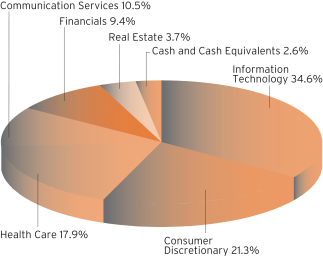
SECTOR BREAKDOWNASOF SEPTEMBER 30, 2019†
(as a percentage of net assets)
MANAGEMENT’S DISCUSSIONOF FUND PERFORMANCE
For the 12-month period ended September 30, 2019, Baron Fifth Avenue Growth Fund1 gained 3.48%, while the Russell 1000 Growth Index gained 3.71% and the S&P 500 Index gained 4.25%.
Baron Fifth Avenue Growth Fund focuses on identifying and investing in what we believe are unique companies with sustainable competitive advantages that have the ability to redeploy capital at high rates of return. The portfolio is constructed on a bottom-up basis, with the quality of ideas and conviction level the most important determinants of the size of each investment. We expect our highest conviction businesses to have meaningful weight in the portfolio. Sector weightings are incidental to portfolio construction, and exposure to any sector is a result of stock selection.
U.S. equity indexes started off the 12-month period with a steep decline, fueled by trade tensions with China, the possibility of rising interest rates, and slowing global growth. The market recovered over the next six months, with most major indexes reaching new highs, as investors appeared encouraged by signs of easing trade tensions and focused instead on attractive stock valuations and indications of a more dovish Federal Reserve. Volatility returned late in the period, as trade tensions flared yet again, global growth showed renewed signs of a slowdown and the 10-year and 2-year U.S. yield curves inverted. Nevertheless, domestic economic and employment data remained strong, with wage growth and consumer confidence suggesting that the record-long period of expansion may still have some runway if concerns over geopolitical uncertainties abate.
Information Technology, Financials, and Real Estate were the top contributing sectors in the period. Consumer Discretionary, Communication Services, and Industrials detracted.
Cloud software provider Veeva Systems Inc. was the top contributor due to sustainable growth in its CRM business and rapid growth in in its newer Vault business. New product development, maturing product offerings, and a loyal customer base are adding confidence in Veeva’s unique position and in its ability to support growth while generating significant free cash flow.
e-commerce leader Amazon.com, Inc. was the top detractor. Shares fell on softer revenue growth, but the company remains one of our highest conviction investment ideas. While penetration of e-commerce is rising rapidly, Amazon continues to grow its total addressable market at an unprecedented pace. We believe Amazon’s advertising business has the potential to generate $30 billion in the next four years and the ability to substantially improve Amazon’s core margins. AWS is also the leader in the cloud infrastructure market by a wide margin.
The Fund seeks to manage risk by focusing on business risk (competition, management, regulations), valuation risk (purchase price providing a large enough margin of safety), financial risk (leverage and capital structure), and analysis risk (our assumptions). Our objective is not to predict how markets may perform in a given year. Instead, we aim to create a portfolio of unique companies with different end markets because, in our experience, this is the best way to manage market risk over time.
| † | Sector levels are provided from the Global Industry Classification Standard (“GICS”), developed and exclusively owned by MSCI, Inc. and Standard & Poor’s Financial Services LLC, unless otherwise stated that they have been reclassified or classified by the Adviser. All GICS data is provided “as is” with no warranties. |
| 1 | Performance information reflects results of the Retail Shares. |
11
| | |
| Baron Discovery Fund(Unaudited) | | September 30, 2019 |
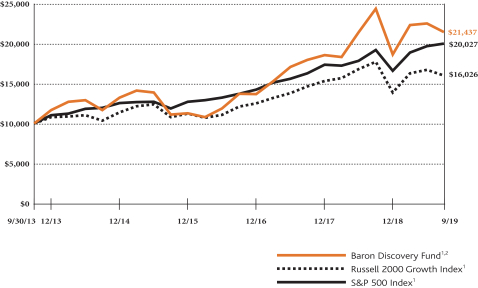
COMPARISONOFTHECHANGEIN VALUEOF $10,000INVESTMENTIN BARON DISCOVERY FUND† (RETAIL SHARES)
INRELATIONTOTHE RUSSELL 2000 GROWTH INDEXANDTHE S&P 500 INDEX
| | | | | | | | | | | | | | | | |
| AVERAGE ANNUAL TOTAL RETURNSFORTHEPERIODSENDED SEPTEMBER 30, 2019 | |
| | | One
Year | | | Three
Years | | | Five
Years | | | Since Inception
(September 30,
2013) | |
Baron Discovery Fund — Retail Shares1,2 | | | (11.93)% | | | | 16.05% | | | | 12.91% | | | | 13.55% | |
Baron Discovery Fund — Institutional Shares1,2 | | | (11.75)% | | | | 16.33% | | | | 13.18% | | | | 13.83% | |
Baron Discovery Fund — R6 Shares1,2,3 | | | (11.75)% | | | | 16.33% | | | | 13.19% | | | | 13.83% | |
Russell 2000 Growth Index1 | | | (9.63)% | | | | 9.79% | | | | 9.08% | | | | 8.18% | |
S&P 500 Index1 | | | 4.25% | | | | 13.39% | | | | 10.84% | | | | 12.27% | |
| † | The Fund’s historical performance was impacted by gains from IPOs and/or secondary offerings. There is no guarantee that these results can be repeated or that the Fund’s level of participation in IPOs and secondary offerings will be the same in the future. |
| 1 | The indexes are unmanaged. The index performance is not Fund performance; one cannot invest directly into an index. The Russell 2000® Growth Index measures the performance of small-sized U.S. companies that are classified as growth and the S&P 500 Index of 500 widely held large cap U.S. companies. The indexes and the Fund are with dividends reinvested, which positively impact the performance results. |
| 2 | Past performance is not predictive of future performance. The performance data does not reflect the deduction of taxes that a shareholder would pay on Fund distributions or redemption of Fund shares. The Adviser reimburses certain Fund expenses pursuant to a contract expiring on August 29, 2030, unless renewed for another 11-year term and the Fund’s transfer agency expenses may be reduced by expense offsets from an unaffiliated transfer agent, without which performance would have been lower. |
| 3 | Performance for the R6 Shares prior to August 31, 2016 is based on the performance of the Institutional Shares. |
12
| | |
| September 30, 2019 (Unaudited) | | Baron Discovery Fund |
TOP TEN HOLDINGSASOF SEPTEMBER 30, 2019
| | | | |
| | | Percent of
Net Assets | |
Kinsale Capital Group, Inc. | | | 3.8% | |
Mercury Systems, Inc. | | | 3.5% | |
RIB Software SE | | | 3.1% | |
Americold Realty Trust | | | 3.1% | |
Floor & Decor Holdings, Inc. | | | 3.1% | |
Emergent BioSolutions Inc. | | | 2.8% | |
SiteOne Landscape Supply, Inc. | | | 2.7% | |
TPI Composites, Inc. | | | 2.5% | |
Rexford Industrial Realty, Inc. | | | 2.5% | |
TherapeuticsMD, Inc. | | | 2.4% | |
| |
| | | | 29.5% | |
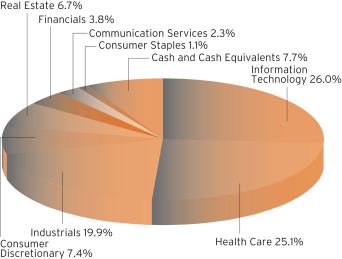
SECTOR BREAKDOWNASOF SEPTEMBER 30, 2019†
(as a percentage of net assets)
MANAGEMENT’S DISCUSSIONOF FUND PERFORMANCE
For the 12-month period ended September 30, 2019, Baron Discovery Fund1 declined 11.93%, while the Russell 2000 Growth Index declined 9.63% and the S&P 500 Index gained 4.25%.
Baron Discovery Fund invests primarily in small-sized U.S. growth companies, at the time of purchase, with market capitalizations up to the largest market cap stock in the Russell 2000 Growth Index at June 30, or companies with market capitalizations up to $2.5 billion, whichever is larger, so long as the purchase of those securities would not cause the Fund’s weighted average market capitalization to exceed that of the Russell 2000 Growth Index. If at any time the Fund’s weighted average market capitalization exceeds that of the Russell 2000 Growth Index, the Fund may only purchase securities with market capitalizations up to the weighted average market capitalization of the Russell 2000 Growth Index. We seek investments for the Fund that are for the long term at attractive valuations in companies with appropriately capitalized, open-ended growth opportunities, exceptional leadership, and sustainable competitive advantages.
U.S. equity indexes started off the 12-month period with a steep decline, fueled by trade tensions with China, the possibility of rising interest rates, and slowing global growth. The market recovered over the next six months, with most major indexes reaching new highs, as investors appeared encouraged by signs of easing trade tensions and focused instead on attractive stock valuations and indications of a more dovish Federal Reserve. Volatility returned late in the period, as trade tensions flared yet again, global growth showed renewed signs of a slowdown and the 10-year and 2-year U.S. yield curves inverted. Nevertheless, domestic economic and employment data remained strong, with wage growth and consumer confidence suggesting that the record-long period of expansion may still have some runway if concerns over geopolitical uncertainties abate.
Real Estate, Financials, and Industrials were the top contributing sectors. Health Care, Consumer Staples, and Consumer Discretionary detracted.
Kinsale Capital Group, Inc. was the top contributor in the period. The company is a property and casualty insurance carrier focused on the specialty excess and surplus (“E&S”) lines market. The E&S segment accounts for $50 billion of annual premiums and has historically grown faster and with higher margins than the overall insurance market. Shares increased on strong financial results driven by the continued improvement of E&S market conditions after retrenchment from several large competitors.
Medical device company Sientra, Inc. was the top detractor. Shares declined as a result of delays in ramping of a breast implant facility and industry concerns over textured implant safety that dampened overall procedure volume. Sientra’s textured implants have far fewer negative incidences per implant versus competitors, and there was no bad news in the wake of an FDA industry oversight meeting. We believe shares will rebound as Sientra increases production of implants.
We think the long-term fundamentals of our companies remain strong. We believe that the companies we own are high quality, innovative and run by excellent management teams. We are optimistic that they will be significantly bigger next year than they are today and that this growth can continue for years after. There is, of course, no guarantee that this will be the case.
| † | Sector levels are provided from the Global Industry Classification Standard (“GICS”), developed and exclusively owned by MSCI, Inc. and Standard & Poor’s Financial Services LLC, unless otherwise stated that they have been reclassified or classified by the Adviser. All GICS data is provided “as is” with no warranties. |
| 1 | Performance information reflects results of the Retail Shares. |
13
| | |
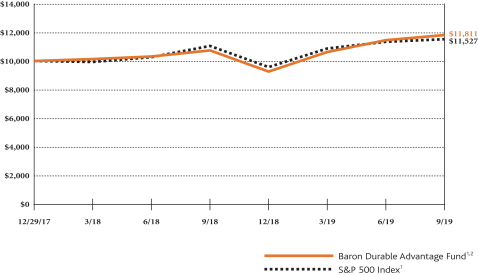
| Baron Durable Advantage Fund | | September 30, 2019 |
COMPARISONOFTHECHANGEIN VALUEOF $10,000INVESTMENTIN BARON DURABLE ADVANTAGE FUND
(RETAIL SHARES)INRELATIONTOTHE S&P 500 INDEX
| | | | | | | | |
| AVERAGE ANNUAL TOTAL RETURNSFORTHEPERIODSENDED SEPTEMBER 30, 2019 | |
| | | One
Year | | | Since
Inception
(December 29,
2017) | |
Baron Durable Advantage Fund — Retail Shares1,2 | | | 9.97% | | | | 9.98% | |
Baron Durable Advantage Fund — Institutional Shares1,2 | | | 10.23% | | | | 10.25% | |
Baron Durable Advantage Fund — R6 Shares1,2 | | | 10.34% | | | | 10.25% | |
S&P 500 Index1 | | | 4.25% | | | | 8.46% | |
| 1 | The index is unmanaged. The index performance is not Fund performance; one cannot invest directly into an index. The S&P 500 Index measures the performance of 500 widely held large cap U.S. companies. The index and the Fund are with dividends reinvested, which positively impact the performance results. |
| 2 | Past performance is not predictive of future performance. The performance data does not reflect the deduction of taxes that a shareholder would pay on Fund distributions or redemption of Fund shares. The Adviser reimburses certain Fund expenses pursuant to a contract expiring on August 29, 2030, unless renewed for another 11-year term and the Fund’s transfer agency expenses may be reduced by expense offsets from an unaffiliated transfer agent, without which performance would have been lower. |
14
| | |
| September 30, 2019 (Unaudited) | | Baron Durable Advantage Fund |
TOP TEN HOLDINGSASOF SEPTEMBER 30, 2019
| | | | |
| | | Percent of
Net Assets | |
Microsoft Corporation | | | 5.2% | |
IHS Markit Ltd. | | | 4.9% | |
Mastercard Incorporated | | | 4.9% | |
S&P Global Inc. | | | 4.7% | |
Moody’s Corporation | | | 4.6% | |
Constellation Brands, Inc. | | | 4.3% | |
Danaher Corporation | | | 4.2% | |
Apple, Inc. | | | 4.0% | |
Accenture plc | | | 3.8% | |
UnitedHealth Group Incorporated | | | 3.3% | |
| |
| | | | 43.9% | |
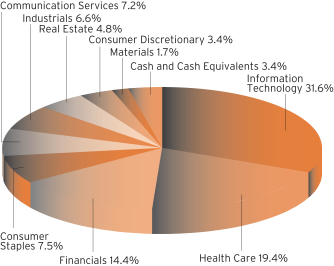
SECTOR BREAKDOWNASOF SEPTEMBER 30, 2019†
(as a percentage of net assets)
MANAGEMENT’S DISCUSSIONOF FUND PERFORMANCE
For the 12-month period ended September 30, 2019, Baron Durable Advantage Fund1 increased 9.97%, while the S&P 500 Index rose 4.25%.
Baron Durable Advantage Fund invests primarily in large-sized U.S. companies with competitive advantages and market capitalizations no smaller than the top 90th percentile by market capitalization of the S&P 500 Index at June 30, or companies with market capitalizations above $10 billion, whichever is smaller. The Fund emphasizes businesses with excess free cash flow that can be returned to shareholders.
U.S. equity indexes started off the 12-month period with a steep decline, fueled by trade tensions with China, the possibility of rising interest rates, and slowing global growth. The market recovered over the next six months, with most major indexes reaching new highs, as investors appeared encouraged by signs of easing trade tensions and focused instead on attractive stock valuations and indications of a more dovish Federal Reserve. Volatility returned late in the period, as trade tensions flared yet again, global growth showed renewed signs of a slowdown and the 10-year and 2-year U.S. yield curves inverted. Nevertheless, domestic economic and employment data remained strong, with wage growth and consumer confidence suggesting that the record-long period of expansion may still have some runway if concerns over geopolitical uncertainties abate.
Holdings in Information Technology, Financials, and Health Care contributed most to performance. Communication Services was the only detracting sector.
Life sciences tools company Danaher Corporation was the top contributor. Shares appreciated after the company announced the acquisition of GE’s bioproduction business for $21 billion. The recently acquired business is a leader in the fast-growing, attractive bioproduction market, and the transaction brings scale to Danaher’s existing bioproduction business. We expect the acquisition to elevate Danaher’s growth rate and to be accretive to earnings, and it increases our conviction in our investment thesis.
Video game publisher Activision Blizzard, Inc. was the top detractor due to questions around the company’s launch slate for 2019 and broad negative sentiment across the video game sector. We exited our position.
Our goal is to invest in large-cap companies that we believe have strong and durable competitive advantages, proven track records of successful capital allocation, high returns on invested capital, and high free cash flow generation, a significant portion of which is regularly returned to the shareholders in the form of either dividends or share repurchases. We hope to maximize long-term returns without taking significant risks of permanent loss of capital. We are optimistic about the prospects of the companies in which we are invested and will always continue to search for new ideas and opportunities.
| † | Sector levels are provided from the Global Industry Classification Standard (“GICS”), developed and exclusively owned by MSCI, Inc. and Standard & Poor’s Financial Services LLC, unless otherwise stated that they have been reclassified or classified by the Adviser. All GICS data is provided “as is” with no warranties. |
| 1 | Performance information reflects results of the Retail Shares. |
15
| | |
| Baron Asset Fund | | September 30, 2019 |
STATEMENT OF NET ASSETS
| | | | | | | | | | | | |
| Shares | | | | | Cost | | | Value | |
| Common Stocks (97.70%) | |
| Communication Services (2.77%) | |
| | | | Cable & Satellite (1.03%) | | | | | | | | |
| | 425,000 | | | Liberty Broadband Corporation, Cl C1 | | $ | 32,000,689 | | | $ | 44,484,750 | |
| | | |
| | | | Interactive Media & Services (1.74%) | | | | | | | | |
| | 220,000 | | | IAC/InterActiveCorp1 | | | 48,083,119 | | | | 47,953,400 | |
| | 918,374 | | | Zillow Group, Inc., Cl C1 | | | 27,002,314 | | | | 27,385,913 | |
| | | | | | | | | | | | |
| | | | 75,085,433 | | | | 75,339,313 | |
| | | | | | | | | |
| | Total Communication Services | | | 107,086,122 | | | | 119,824,063 | |
| | | | | | | | | |
|
| Consumer Discretionary (8.42%) | |
| | | | Hotels, Resorts & Cruise Lines (2.07%) | | | | | | | | |
| | 556,442 | | | Choice Hotels International, Inc. | | | 5,979,508 | | | | 49,501,081 | |
| | 543,233 | | | Hyatt Hotels Corp., Cl A | | | 16,817,762 | | | | 40,019,975 | |
| | | | | | | | | | | | |
| | | | 22,797,270 | | | | 89,521,056 | |
| | | |
| | | | Internet & Direct Marketing Retail (2.02%) | | | | | | | | |
| | 25,759 | | | Booking Holdings, Inc.1 | | | 4,113,567 | | | | 50,554,871 | |
| | 275,627 | | | Expedia Group, Inc. | | | 33,767,566 | | | | 37,047,025 | |
| | | | | | | | | | | | |
| | | | 37,881,133 | | | | 87,601,896 | |
| |
| | | | Leisure Facilities (3.36%) | |
| | 639,538 | | | Vail Resorts, Inc. | | | 12,388,781 | | | | 145,533,267 | |
| |
| | | | Specialty Stores (0.97%) | |
| | 455,117 | | | Tiffany & Co. | | | 28,342,285 | | | | 42,157,488 | |
| | | | | | | | | | | | |
| | Total Consumer Discretionary | | | 101,409,469 | | | | 364,813,707 | |
| | | | | | | | | |
|
| Financials (12.12%) | |
| | | | Asset Management & Custody Banks (0.81%) | | | | | | | | |
| | 307,514 | | | T. Rowe Price Group, Inc. | | | 11,188,453 | | | | 35,133,475 | |
| | | |
| | | | Financial Exchanges & Data (4.42%) | | | | | | | | |
| | 390,725 | | | FactSet Research Systems, Inc. | | | 21,032,965 | | | | 94,934,453 | |
| | 257,267 | | | MarketAxess Holdings, Inc. | | | 31,487,484 | | | | 84,254,943 | |
| | 326,189 | | | Tradeweb Markets Inc., Cl A | | | 11,978,713 | | | | 12,062,469 | |
| | | | | | | | | | | | |
| | | | 64,499,162 | | | | 191,251,865 | |
| | | |
| | | | Insurance Brokers (1.74%) | | | | | | | | |
| | 390,421 | | | Willis Towers Watson plc2 | | | 49,888,995 | | | | 75,339,540 | |
| | | |
| | | | Investment Banking & Brokerage (2.05%) | | | | | | | | |
| | 2,125,936 | | | The Charles Schwab Corp. | | | 1,921,092 | | | | 88,927,903 | |
| | | |
| | | | Property & Casualty Insurance (2.32%) | | | | | | | | |
| | 2,393,444 | | | Arch Capital Group Ltd.1,2 | | | 8,625,560 | | | | 100,476,779 | |
| |
| | | | Regional Banks (0.78%) | |
| | 350,421 | | | First Republic Bank | | | 9,109,161 | | | | 33,885,711 | |
| | | | | | | | | | | | |
| | Total Financials | | | 145,232,423 | | | | 525,015,273 | |
| | | | | | | | | |
| | | | | | | | | | | | |
| Shares | | | | | Cost | | | Value | |
| Common Stocks (continued) | |
| Health Care (22.81%) | |
| | | | Biotechnology (0.99%) | |
| | 75,000 | | | argenx SE, ADR1,2 | | $ | 10,263,438 | | | $ | 8,547,000 | |
| | 244,658 | | | Sage Therapeutics, Inc.1 | | | 38,535,486 | | | | 34,323,071 | |
| | | | | | | | | | | | |
| | | | 48,798,924 | | | | 42,870,071 | |
| | | |
| | | | Health Care Equipment (8.35%) | | | | | | | | |
| | 188,000 | | | DexCom, Inc.1 | | | 28,214,251 | | | | 28,057,120 | |
| | 976,630 | | | IDEXX Laboratories, Inc.1 | | | 18,197,737 | | | | 265,574,996 | |
| | 199,644 | | | Teleflex, Inc. | | | 40,334,965 | | | | 67,829,049 | |
| | | | | | | | | | | | |
| | | | 86,746,953 | | | | 361,461,165 | |
| |
| | | | Health Care Supplies (3.44%) | |
| | 215,418 | | | The Cooper Companies, Inc. | | | 36,713,299 | | | | 63,979,146 | |
| | 598,404 | | | West Pharmaceutical Services, Inc. | | | 26,107,582 | | | | 84,865,655 | |
| | | | | | | | | | | | |
| | | | 62,820,881 | | | | 148,844,801 | |
| | | |
| | | | Health Care Technology (1.71%) | | | | | | | | |
| | 484,386 | | | Veeva Systems Inc., Cl A1 | | | 30,296,950 | | | | 73,960,898 | |
| | | |
| | | | Life Sciences Tools & Services (8.32%) | | | | | | | | |
| | 100,682 | | | 10X Genomics, Inc., Cl A1 | | | 3,926,598 | | | | 5,074,373 | |
| | 441,986 | | | Bio-Techne Corporation | | | 48,051,890 | | | | 86,483,401 | |
| | 302,552 | | | Illumina, Inc.1 | | | 13,002,071 | | | | 92,042,369 | |
| | 251,117 | | | Mettler-Toledo International, Inc.1 | | | 26,581,877 | | | | 176,886,815 | |
| | | | | | | | | | | | |
| | | | 91,562,436 | | | | 360,486,958 | |
| | | | | | | | | |
| | Total Health Care | | | 320,226,144 | | | | 987,623,893 | |
| | | | | | | | | |
|
| Industrials (17.94%) | |
| | | | Aerospace & Defense (0.78%) | | | | | | | | |
| | 588,082 | | | BWX Technologies, Inc. | | | 29,416,776 | | | | 33,644,171 | |
| | | |
| | | | Agricultural & Farm Machinery (1.03%) | | | | | | | | |
| | 607,045 | | | The Toro Co. | | | 37,800,467 | | | | 44,496,398 | |
| | | |
| | | | Environmental & Facilities Services (0.86%) | | | | | | | | |
| | 1,095,612 | | | Rollins, Inc. | | | 24,597,482 | | | | 37,327,501 | |
| | | |
| | | | Industrial Conglomerates (2.16%) | | | | | | | | |
| | 262,192 | | | Roper Technologies, Inc. | | | 27,831,603 | | | | 93,497,667 | |
| | | |
| | | | Industrial Machinery (1.74%) | | | | | | | | |
| | 460,760 | | | IDEX Corporation | | | 36,231,831 | | | | 75,509,349 | |
| | | |
| | | | Research & Consulting Services (11.37%) | | | | | | | | |
| | 2,075,474 | | | Clarivate Analytics Plc1,2 | | | 33,261,499 | | | | 35,013,246 | |
| | 219,493 | | | CoStar Group, Inc.1 | | | 44,044,865 | | | | 130,203,248 | |
| | 1,468,500 | | | TransUnion | | | 79,691,638 | | | | 119,110,035 | |
| | 1,316,206 | | | Verisk Analytics, Inc. | | | 46,585,700 | | | | 208,144,817 | |
| | | | | | | | | | | | |
| | | | 203,583,702 | | | | 492,471,346 | |
| | | | | | | | | |
| | Total Industrials | | | 359,461,861 | | | | 776,946,432 | |
| | | | | | | | | |
| | |
| 16 | | See Notes to Financial Statements. |
| | |
| September 30, 2019 | | Baron Asset Fund |
STATEMENT OF NET ASSETS (Continued)
| | | | | | | | | | | | |
| Shares | | | | | Cost | | | Value | |
| Common Stocks (continued) | |
| Information Technology (26.80%) | |
| | | | Application Software (11.06%) | |
| | 611,856 | | | ANSYS, Inc.1 | | $ | 29,041,017 | | | $ | 135,440,444 | |
| | 380,000 | | | Aspen Technology, Inc.1 | | | 38,965,115 | | | | 46,770,400 | |
| | 1,569,093 | | | Ceridian HCM Holding, Inc.1 | | | 60,253,761 | | | | 77,466,121 | |
| | 1,411,809 | | | Guidewire Software, Inc.1 | | | 76,708,781 | | | | 148,776,433 | |
| | 1,042,076 | | | SS&C Technologies Holdings, Inc. | | | 32,682,577 | | | | 53,739,859 | |
| | 90,000 | | | The Trade Desk, Cl A1 | | | 17,937,948 | | | | 16,879,500 | |
| | | | | | | | | | | | |
| | | | 255,589,199 | | | | 479,072,757 | |
| | | |
| | | | Data Processing & Outsourced Services (4.28%) | | | | | | | | |
| | 770,217 | | | Fidelity National Information Services, Inc. | | | 48,700,871 | | | | 102,254,009 | |
| | 217,448 | | | FleetCor Technologies, Inc.1 | | | 12,816,767 | | | | 62,359,738 | |
| | 268,986 | | | MAXIMUS, Inc. | | | 13,080,694 | | | | 20,781,858 | |
| | | | | | | | | | | | |
| | | | 74,598,332 | | | | 185,395,605 | |
| |
| | | | Electronic Components (0.76%) | |
| | 340,000 | | | Amphenol Corp., Cl A | | | 31,503,447 | | | | 32,810,000 | |
| | | |
| | | | Internet Services & Infrastructure (4.31%) | | | | | | | | |
| | 699,103 | | | Verisign, Inc.1 | | | 42,196,952 | | | | 131,871,799 | |
| | 468,000 | | | Wix.com Ltd.1,2 | | | 41,821,919 | | | | 54,634,320 | |
| | | | | | | | | | | | |
| | | | 84,018,871 | | | | 186,506,119 | |
| | | |
| | | | IT Consulting & Other Services (5.23%) | | | | | | | | |
| | 1,584,323 | | | Gartner, Inc.1 | | | 39,586,888 | | | | 226,542,346 | |
| | | |
| | | | Technology Distributors (1.16%) | | | | | | | | |
| | 407,363 | | | CDW Corp. | | | 27,215,415 | | | | 50,203,416 | |
| | | | | | | | | | | | |
| | Total Information Technology | | | 512,512,152 | | | | 1,160,530,243 | |
| | | | | | | | | |
|
| Real Estate (6.84%) | |
| | | | Office REITs (0.33%) | | | | | | | | |
| | 41,583 | | | Alexander’s, Inc.4 | | | 1,760,107 | | | | 14,487,933 | |
| | | |
| | | | Real Estate Services (1.52%) | | | | | | | | |
| | 1,243,323 | | | CBRE Group, Inc., Cl A1 | | | 19,021,762 | | | | 65,908,552 | |
| | | |
| | | | Specialized REITs (4.99%) | | | | | | | | |
| | 136,000 | | | Alexandria Real Estate Equities, Inc.4 | | | 20,316,293 | | | | 20,949,440 | |
| | 133,416 | | | Equinix, Inc. | | | 12,783,698 | | | | 76,954,349 | |
| | 489,856 | | | SBA Communications Corp. | | | 18,137,560 | | | | 118,128,774 | |
| | | | | | | | | | | | |
| | | | 51,237,551 | | | | 216,032,563 | |
| | | | | | | | | |
| | Total Real Estate | | | 72,019,420 | | | | 296,429,048 | |
| | | | | | | | | |
| | Total Common Stocks | | | 1,617,947,591 | | | | 4,231,182,659 | |
| | | | | | | | | |
| | | | | | | | | | | | |
| Private Partnerships (0.01%) | |
| Financials (0.01%) | |
| | | | Asset Management & Custody Banks (0.01%) | | | | | | | | |
| | 7,056,223 | | | Windy City Investments Holdings, L.L.C.1,3,4,6 | | | 0 | | | | 179,228 | |
| | | | | | | | | | | | |
| | | | | | | | | | | | |
| Principal Amount | | Cost | | | Value | |
| Short Term Investments (1.98%) | |
| | $85,756,291 | | | Repurchase Agreement with Fixed Income Clearing Corp., dated 9/30/2019, 0.35% due 10/1/2019; Proceeds at maturity - $85,757,125; (Fully collateralized by $27,885,000 U.S. Treasury Note, 2.875% due 8/15/2028; Market value - $30,758,633) and $50,000,000 U.S. Treasury Note, 3.125% due 11/15/2028; Market value - $56,717,800)5 | | $ | 85,756,291 | | | $ | 85,756,291 | |
| | | | | | | | | | | | |
| | Total Investments (99.69%) | | $ | 1,703,703,882 | | | | 4,317,118,178 | |
| | | | | | | | | | | | |
| | Cash and Other Assets Less Liabilities (0.31%) | | | | 13,559,523 | |
| | | | | | | | | | | | |
| | Net Assets | | | $ | 4,330,677,701 | |
| | | | | | | | | | | | |
| Retail Shares (Equivalent to $82.28 per share
based on 27,247,953 shares outstanding) |
| | $ | 2,241,980,173 | |
| | | | | | | | | | | | |
| Institutional Shares (Equivalent to $85.67 per share
based on 23,109,986 shares outstanding) |
| | $ | 1,979,735,661 | |
| | | | | | | | | | | | |
| R6 Shares (Equivalent to $85.65 per share
based on 1,272,160 shares outstanding) |
| | $ | 108,961,867 | |
| | | | | | | | | | | | |
| % | Represents percentage of net assets. |
| 1 | Non-income producing securities. |
| 3 | At September 30, 2019, the market value of restricted and fair valued securities amounted to $179,228 or 0.01% of net assets. This security is not deemed liquid. See Note 6 regarding Restricted Securities. |
| 4 | The Adviser has reclassified/classified certain securities in or out of thissub-industry. Such reclassifications/classifications are not supported by S&P or MSCI (unaudited). |
| 5 | Level 2 security. See Note 7 regarding Fair Value Measurements |
| 6 | Level 3 security. See Note 7 regarding Fair Value Measurements. |
| ADR | American Depositary Receipt. |
All securities are Level 1, unless otherwise noted.
| | |
| See Notes to Financial Statements. | | 17 |
| | |
| Baron Growth Fund | | September 30, 2019 |
STATEMENT OF NET ASSETS
| | | | | | | | | | | | |
| Shares | | | | | Cost | | | Value | |
| Common Stocks (99.50%) | |
| Communication Services (3.99%) | |
| | | | Alternative Carriers (2.78%) | | | | | | | | |
| | 8,862,608 | | | Iridium Communications Inc.1,4 | | $ | 55,774,685 | | | $ | 188,596,298 | |
| | | |
| | | | Movies & Entertainment (1.21%) | | | | | | | | |
| | 5,000,000 | | | Manchester United plc, Cl A2 | | | 70,291,779 | | | | 82,150,000 | |
| | | | | | | | | | | | |
| | Total Communication Services | | | 126,066,464 | | | | 270,746,298 | |
| | | | | | | | | |
|
| Consumer Discretionary (20.24%) | |
| | | | Casinos & Gaming (2.75%) | | | | | | | | |
| | 725,000 | | | Boyd Gaming Corporation | | | 18,479,841 | | | | 17,363,750 | |
| | 5,640,000 | | | Penn National Gaming, Inc.1 | | | 76,554,318 | | | | 105,045,000 | |
| | 3,156,887 | | | Red Rock Resorts, Inc., Cl A | | | 66,164,237 | | | | 64,100,591 | |
| | | | | | | | | | | | |
| | | | 161,198,396 | | | | 186,509,341 | |
| | | |
| | | | Education Services (3.76%) | | | | | | | | |
| | 1,675,000 | | | Bright Horizons Family Solutions, Inc.1 | | | 53,610,279 | | | | 255,437,500 | |
| | |
| | | | General Merchandise Stores (0.27%) | | | | | |
| | 310,000 | | | Ollie’s Bargain Outlet Holdings, Inc.1 | | | 14,541,755 | | | | 18,178,400 | |
| | | |
| | | | Hotels, Resorts & Cruise Lines (6.42%) | | | | | | | | |
| | 3,000,000 | | | Choice Hotels International, Inc.4 | | | 72,782,127 | | | | 266,880,000 | |
| | 1,550,000 | | | Marriott Vacations Worldwide Corp. | | | 84,292,546 | | | | 160,595,500 | |
| | 555,000 | | | OneSpaWorld Holdings Ltd.1,2,5 | | | 5,550,000 | | | | 8,619,150 | |
| | | | | | | | | | | | |
| | | | 162,624,673 | | | | 436,094,650 | |
| | | |
| | | | Leisure Facilities (7.04%) | | | | | | | | |
| | 2,100,000 | | | Vail Resorts, Inc.4 | | | 65,291,780 | | | | 477,876,000 | |
| | | | | | | | | | | | |
| | Total Consumer Discretionary | | | 457,266,883 | | | | 1,374,095,891 | |
| | | | | | | | | |
|
| Consumer Staples (0.68%) | |
| | | | Food Distributors (0.68%) | | | | | | | | |
| | 1,000,000 | | | Performance Food Group Co.1 | | | 19,000,000 | | | | 46,010,000 | |
| | | | | | | | | | | | |
|
| Financials (27.76%) | |
| | | | Asset Management & Custody Banks (2.52%) | | | | | | | | |
| | 2,400,000 | | | The Carlyle Group | | | 50,219,527 | | | | 61,344,000 | |
| | 2,000,000 | | | Cohen & Steers, Inc. | | | 48,597,830 | | | | 109,860,000 | |
| | | | | | | | | | | | |
| | | | 98,817,357 | | | | 171,204,000 | |
| | | |
| | | | Financial Exchanges & Data (12.72%) | | | | | | | | |
| | 1,250,000 | | | FactSet Research Systems, Inc. | | | 62,536,096 | | | | 303,712,500 | |
| | 1,150,000 | | | Morningstar, Inc. | | | 27,237,863 | | | | 168,061,000 | |
| | 1,800,000 | | | MSCI, Inc. | | | 34,264,435 | | | | 391,950,000 | |
| | | | | | | | | | | | |
| | | | 124,038,394 | | | | 863,723,500 | |
| | | |
| | | | Investment Banking & Brokerage (0.68%) | | | | | | | | |
| | 450,000 | | | Houlihan Lokey, Inc. | | | 19,625,873 | | | | 20,295,000 | |
| | 775,000 | | | Moelis & Co., Cl A | | | 19,151,132 | | | | 25,458,750 | |
| | | | | | | | | | | | |
| | | | 38,777,005 | | | | 45,753,750 | |
| | | |
| | | | Life & Health Insurance (3.51%) | | | | | | | | |
| | 1,875,000 | | | Primerica, Inc. | | | 40,103,890 | | | | 238,556,250 | |
| | | | | | | | | | | | |
| Shares | | | | | Cost | | | Value | |
| Common Stocks (continued) | |
| Financials (continued) | |
| | | |
| | | | Property & Casualty Insurance (7.50%) | | | | | | | | |
| | 9,725,000 | | | Arch Capital Group Ltd.1,2 | | $ | 30,657,488 | | | $ | 408,255,500 | |
| | 978,449 | | | Kinsale Capital Group, Inc. | | | 32,761,205 | | | | 101,083,566 | |
| | | | | | | | | | | | |
| | | | 63,418,693 | | | | 509,339,066 | |
| | | |
| | | | Thrifts & Mortgage Finance (0.83%) | | | | | | | | |
| | 530,000 | | | Essent Group Ltd.2 | | | 14,737,154 | | | | 25,265,100 | |
| | 100,059 | | | LendingTree, Inc.1 | | | 24,206,736 | | | | 31,061,316 | |
| | | | | | | | | | | | |
| | | | 38,943,890 | | | | 56,326,416 | |
| | | | | | | | | |
| | Total Financials | | | 404,099,229 | | | | 1,884,902,982 | |
| | | | | | | | | |
|
| Health Care (10.49%) | |
| | | | Biotechnology (0.22%) | | | | | | | | |
| | 330,000 | | | Alector, Inc.1 | | | 7,092,149 | | | | 4,758,600 | |
| | 678,051 | | | Denali Therapeutics, Inc.1 | | | 12,825,338 | | | | 10,387,741 | |
| | | | | | | | | | | | |
| | | | 19,917,487 | | | | 15,146,341 | |
| | | |
| | | | Health Care Equipment (4.41%) | | | | | | | | |
| | 1,100,000 | | | IDEXX Laboratories, Inc.1 | | | 16,287,498 | | | | 299,123,000 | |
| | | |
| | | | Health Care Supplies (1.85%) | | | | | | | | |
| | 573,717 | | | Neogen Corp.1 | | | 13,141,411 | | | | 39,075,865 | |
| | 610,000 | | | West Pharmaceutical Services, Inc. | | | 20,909,842 | | | | 86,510,200 | |
| | | | | | | | | | | | |
| | | | 34,051,253 | | | | 125,586,065 | |
| | | |
| | | | Life Sciences Tools & Services (3.86%) | | | | | | | | |
| | 432,655 | | | Adaptive Biotechnologies Corporation1 | | | 14,268,834 | | | | 13,369,040 | |
| | 850,000 | | | Bio-Techne Corporation | | | 44,923,356 | | | | 166,319,500 | |
| | 116,500 | | | Mettler-Toledo International, Inc.1 | | | 5,334,241 | | | | 82,062,600 | |
| | | | | | | | | | | | |
| | | | 64,526,431 | | | | 261,751,140 | |
| | | |
| | | | Pharmaceuticals (0.15%) | | | | | | | | |
| | 300,000 | | | Dechra Pharmaceuticals PLC
(United Kingdom)2,6 | | | 8,518,489 | | | | 10,211,884 | |
| | | | | | | | | | | | |
| | Total Health Care | | | 143,301,158 | | | | 711,818,430 | |
| | | | | | | | | |
|
| Industrials (10.34%) | |
| | | | Building Products (1.99%) | | | | | | | | |
| | 1,490,000 | | | Trex Company, Inc.1 | | | 27,131,528 | | | | 135,485,700 | |
| | | |
| | | | Environmental & Facilities Services (0.10%) | | | | | | | | |
| | 386,108 | | | BrightView Holdings, Inc.1 | | | 4,656,114 | | | | 6,621,752 | |
| | | |
| | | | Industrial Machinery (0.41%) | | | | | | | | |
| | 90,507 | | | Albany International Corp., Cl A | | | 6,117,079 | | | | 8,160,111 | |
| | 4,275,000 | | | Marel hf (Netherlands)2 | | | 18,281,670 | | | | 19,570,058 | |
| | | | | | | | | | | | |
| | | | 24,398,749 | | | | 27,730,169 | |
| | | |
| | | | Research & Consulting Services (7.43%) | | | | | | | | |
| | 850,000 | | | CoStar Group, Inc.1 | | | 36,184,525 | | | | 504,220,000 | |
| | | |
| | | | Trading Companies & Distributors (0.41%) | | | | | | | | |
| | 675,000 | | | Air Lease Corp. | | | 15,498,764 | | | | 28,228,500 | |
| | | | | | | | | | | | |
| | Total Industrials | | | 107,869,680 | | | | 702,286,121 | |
| | | | | | | | | |
| | |
| 18 | | See Notes to Financial Statements. |
| | |
| September 30, 2019 | | Baron Growth Fund |
STATEMENT OF NET ASSETS (Continued)
| | | | | | | | | | | | |
| Shares | | | | | Cost | | | Value | |
| Common Stocks (continued) | |
| Information Technology (17.93%) | |
| | | | Application Software (11.60%) | | | | | | | | |
| | 725,000 | | | Altair Engineering, Inc., Cl A1 | | $ | 11,330,019 | | | $ | 25,099,500 | |
| | 1,500,000 | | | ANSYS, Inc.1 | | | 35,363,291 | | | | 332,040,000 | |
| | 2,200,000 | | | Benefitfocus, Inc.1,4 | | | 83,233,571 | | | | 52,382,000 | |
| | 1,190,000 | | | Guidewire Software, Inc.1 | | | 38,711,926 | | | | 125,402,200 | |
| | 1,000,000 | | | Pegasystems, Inc. | | | 13,997,009 | | | | 68,050,000 | |
| | 3,575,000 | | | SS&C Technologies Holdings, Inc. | | | 28,111,122 | | | | 184,362,750 | |
| | | | | | | | | | | | |
| | | | 210,746,938 | | | | 787,336,450 | |
| | | |
| | | | Data Processing & Outsourced Services (0.23%) | | | | | | | | |
| | 205,000 | | | MAXIMUS, Inc. | | | 3,702,541 | | | | 15,838,300 | |
| | | |
| | | | Electronic Components (0.69%) | | | | | | | | |
| | 265,000 | | | Littelfuse, Inc. | | | 29,679,172 | | | | 46,987,150 | |
| | | |
| | | | Internet Services & Infrastructure (0.75%) | | | | | | | | |
| | 438,207 | | | Wix.com Ltd.1,2 | | | 28,664,771 | | | | 51,156,285 | |
| | | |
| | | | IT Consulting & Other Services (4.66%) | | | | | | | | |
| | 2,210,000 | | | Gartner, Inc.1 | | | 33,498,066 | | | | 316,007,900 | |
| | | | | | | | | | | | |
| | Total Information Technology | | | 306,291,488 | | | | 1,217,326,085 | |
| | | | | | | | | |
|
| Real Estate (8.07%) | |
| | | | Diversified REITs (0.32%) | | | | | | | | |
| | 460,135 | | | American Assets Trust, Inc. | | | 8,484,044 | | | | 21,506,710 | |
| | | |
| | | | Office REITs (2.83%) | | | | | | | | |
| | 91,000 | | | Alexander’s, Inc.5 | | | 11,506,781 | | | | 31,705,310 | |
| | 3,750,000 | | | Douglas Emmett, Inc. | | | 43,603,704 | | | | 160,612,500 | |
| | | | | | | | | | | | |
| | | | 55,110,485 | | | | 192,317,810 | |
| | | |
| | | | Real Estate Development (0.18%) | | | | | | | | |
| | 675,000 | | | Forestar Group, Inc.1 | | | 11,930,668 | | | | 12,339,000 | |
| | | |
| | | | Specialized REITs (4.74%) | | | | | | | | |
| | 750,000 | | | Alexandria Real Estate Equities, Inc.5 | | | 26,438,288 | | | | 115,530,000 | |
| | 5,400,000 | | | Gaming and Leisure Properties, Inc. | | | 117,127,090 | | | | 206,496,000 | |
| | | | | | | | | | | | |
| | | | 143,565,378 | | | | 322,026,000 | |
| | | | | | | | | |
| | Total Real Estate | | | 219,090,575 | | | | 548,189,520 | |
| | | | | | | | | |
| | Total Common Stocks | | | 1,782,985,477 | | | | 6,755,375,327 | |
| | | | | | | | | |
| | |
| Private Preferred Stocks (0.08%) | |
| Health Care (0.08%) | |
| | | | Health Care Technology (0.08%) | | | | | | | | |
| | 3,354,353 | | | Schrödinger, Inc., Series E1,3,5,7 | | | 4,999,999 | | | | 5,870,118 | |
| | | | | | | | | | | | |
| | | | | | | | | | | | |
| Shares | | | | | Cost | | | Value | |
| Private Partnerships (0.00%) | |
| Financials (0.00%) | |
| | | | Asset Management & Custody Banks (0.00%) | | | | | | | | |
| | 2,375,173 | | | Windy City Investments Holdings, L.L.C.1,3,5,7 | | $ | 0 | | | $ | 60,329 | |
| | | | | | | | | | | | |
| | | | | | | | | | | | |
| Warrants (0.01%) | |
| Consumer Discretionary (0.01%) | |
| | | | Hotels, Resorts & Cruise Lines (0.01%) | | | | | | | | |
| | 96,515 | | | OneSpaWorld Holdings Ltd. Warrants, Exp 3/20/20311,2,5,6 | | | 0 | | | | 550,135 | |
| | | | | | | | | | | | |
| | | | | | | | | | | | |
| | | |
| Principal Amount | | | | | | |
| Short Term Investments (0.60%) | |
| | $40,856,879 | | | Repurchase Agreement with Fixed Income Clearing Corp., dated 9/30/2019, 0.35% due 10/1/2019; Proceeds at maturity - $40,857,276; (Fully collateralized by $37,785,000 U.S. Treasury Note, 2.875% due 8/15/2028; Market value - $41,678,858)6 | | | 40,856,879 | | | | 40,856,879 | |
| | | | | | | | | | | | |
| | Total Investments (100.19%) | | $ | 1,828,842,355 | | | | 6,802,712,788 | |
| | | | | | | | | | | | |
| | Liabilities Less Cash and Other Assets(-0.19%) | | | | (13,207,044 | ) |
| | | | | | | | | | | | |
| | Net Assets | | | $ | 6,789,505,744 | |
| | | | | | | | | | | | |
| Retail Shares (Equivalent to $78.95 per share
based on 31,753,587 shares outstanding) |
| | $ | 2,506,967,489 | |
| | | | | | | | | | | | |
| Institutional Shares (Equivalent to $81.69 per share
based on 50,812,644 shares outstanding) |
| | $ | 4,150,891,456 | |
| | | | | | | | | | | | |
| R6 Shares (Equivalent to $81.70 per share
based on 1,611,343 shares outstanding) |
| | $ | 131,646,799 | |
| | | | | | | | | | | | |
| % | Represents percentage of net assets. |
| 1 | Non-income producing securities. |
| 3 | At September 30, 2019, the market value of restricted and fair valued securities amounted to $5,930,447 or 0.08% of net assets. These securities are not deemed liquid. See Note 6 regarding Restricted Securities. |
| 4 | See Note 10 regarding “Affiliated” companies. |
| 5 | The Adviser has reclassified/classified certain securities in or out of thissub-industry. Such reclassifications/classifications are not supported by S&P or MSCI (unaudited). |
| 6 | Level 2 security. See Note 7 regarding Fair Value Measurements. |
| 7 | Level 3 security. See Note 7 regarding Fair Value Measurements. |
All securities are Level 1, unless otherwise noted.
| | |
| See Notes to Financial Statements. | | 19 |
| | |
| Baron Small Cap Fund | | September 30, 2019 |
STATEMENT OF NET ASSETS
| | | | | | | | | | | | |
| Shares | | | | | Cost | | | Value | |
| Common Stocks (96.72%) | |
| Communication Services (4.42%) | |
| | | | Cable & Satellite (2.09%) | | | | | | | | |
| | 100,000 | | | Liberty Broadband Corporation, Cl A1 | | $ | 404,823 | | | $ | 10,452,000 | |
| | 275,000 | | | Liberty Broadband Corporation, Cl C1 | | | 1,079,680 | | | | 28,784,250 | |
| | 1,000,000 | | | Liberty SiriusXM Group, Cl C1 | | | 2,168,308 | | | | 41,960,000 | |
| | | | | | | | | | | | |
| | | | 3,652,811 | | | | 81,196,250 | |
| | |
| | | | Movies & Entertainment (2.33%) | | | | | |
| | 750,000 | | | Liberty Media Corporation-Liberty Formula One, Cl C1 | | | 10,168,679 | | | | 31,192,500 | |
| | 225,000 | | | The Madison Square Garden Company, Cl A1 | | | 11,968,716 | | | | 59,292,000 | |
| | | | | | | | | | | | |
| | | | 22,137,395 | | | | 90,484,500 | |
| | | | | | | | | |
| | Total Communication Services | | | 25,790,206 | | | | 171,680,750 | |
| | | | | | | | | |
|
| Consumer Discretionary (15.61%) | |
| | | | Casinos & Gaming (1.57%) | | | | | | | | |
| | 3,000,000 | | | Red Rock Resorts, Inc., Cl A | | | 65,067,490 | | | | 60,915,000 | |
| | | |
| | | | Education Services (3.24%) | | | | | | | | |
| | 825,000 | | | Bright Horizons Family Solutions, Inc.1 | | | 25,784,147 | | | | 125,812,500 | |
| | | |
| | | | General Merchandise Stores (0.60%) | | | | | | | | |
| | 400,000 | | | Ollie’s Bargain Outlet Holdings, Inc.1 | | | 24,205,463 | | | | 23,456,000 | |
| | | |
| | | | Home Improvement Retail (2.64%) | | | | | | | | |
| | 2,000,000 | | | Floor & Decor Holdings, Inc., Cl A1 | | | 78,500,578 | | | | 102,300,000 | |
| | | |
| | | | Homebuilding (2.22%) | | | | | | | | |
| | 1,500,000 | | | Installed Building Products, Inc.1 | | | 88,307,354 | | | | 86,010,000 | |
| | | |
| | | | Hotels, Resorts & Cruise Lines (1.00%) | | | | | | | | |
| | 2,500,000 | | | OneSpaWorld Holdings Ltd.1,2,5 | | | 27,000,000 | | | | 38,825,000 | |
| | | |
| | | | Internet & Direct Marketing Retail (0.65%) | | | | | | | | |
| | 600,000 | | | The RealReal, Inc.1 | | | 12,949,355 | | | | 13,416,000 | |
| | 500,000 | | | Revolve Group, Inc.1 | | | 9,535,208 | | | | 11,685,000 | |
| | | | | | | | | | | | |
| | | | 22,484,563 | | | | 25,101,000 | |
| | | |
| | | | Leisure Facilities (1.19%) | | | | | | | | |
| | 800,000 | | | Planet Fitness, Inc., Cl A1 | | | 28,416,505 | | | | 46,296,000 | |
| | | |
| | | | Restaurants (1.55%) | | | | | | | | |
| | 600,000 | | | BJ’s Restaurants, Inc. | | | 23,242,737 | | | | 23,304,000 | |
| | 800,000 | | | The Cheesecake Factory, Inc. | | | 21,568,144 | | | | 33,344,000 | |
| | 40,000 | | | Wingstop Inc. | | | 574,326 | | | | 3,491,200 | |
| | | | | | | | | | | | |
| | | | 45,385,207 | | | | 60,139,200 | |
| | | |
| | | | Specialty Stores (0.95%) | | | | | | | | |
| | 3,000,000 | | | Hudson Ltd., Cl A1,2 | | | 54,314,533 | | | | 36,810,000 | |
| | | | | | | | | | | | |
| | Total Consumer Discretionary | | | 459,465,840 | | | | 605,664,700 | |
| | | | | | | | | |
|
| Financials (1.36%) | |
| | | | Investment Banking & Brokerage (1.36%) | | | | | | | | |
| | 625,000 | | | Houlihan Lokey, Inc. | | | 28,909,333 | | | | 28,187,500 | |
| | 750,000 | | | Moelis & Co., Cl A | | | 15,297,250 | | | | 24,637,500 | |
| | | | | | | | | | | | |
| | Total Financials | | | 44,206,583 | | | | 52,825,000 | |
| | | | | | | | | |
| | | | | | | | | | | | |
| Shares | | | | | Cost | | | Value | |
| Common Stocks (continued) | |
| Health Care (18.57%) | |
| | | | Biotechnology (0.45%) | | | | | | | | |
| | 1,250,000 | | | Abcam plc (United Kingdom)2,6 | | $ | 11,616,424 | | | $ | 17,614,891 | |
| | | |
| | | | Health Care Equipment (6.44%) | | | | | | | | |
| | 650,000 | | | Cantel Medical Corp. | | | 33,013,793 | | | | 48,620,000 | |
| | 300,000 | | | DexCom, Inc.1 | | | 3,984,388 | | | | 44,772,000 | |
| | 400,000 | | | IDEXX Laboratories, Inc.1 | | | 6,012,291 | | | | 108,772,000 | |
| | 300,000 | | | Inspire Medical Systems, Inc.1,5 | | | 15,398,159 | | | | 18,306,000 | |
| | 900,000 | | | Silk Road Medical, Inc.1,5 | | | 35,055,499 | | | | 29,277,000 | |
| | | | | | | | | | | | |
| | | | 93,464,130 | | | | 249,747,000 | |
| | | |
| | | | Health Care Supplies (0.31%) | | | | | | | | |
| | 177,483 | | | Neogen Corp.1 | | | 9,609,768 | | | | 12,088,367 | |
| | | |
| | | | Health Care Technology (2.09%) | | | | | | | | |
| | 1,200,000 | | | Teladoc Health, Inc.1 | | | 37,982,777 | | | | 81,264,000 | |
| | | |
| | | | Life Sciences Tools & Services (6.93%) | | | | | | | | |
| | 250,000 | | | Adaptive Biotechnologies Corporation1 | | | 7,637,982 | | | | 7,725,000 | |
| | 250,000 | | | Guardant Health, Inc.1,5 | | | 4,953,266 | | | | 15,957,500 | |
| | 700,000 | | | ICON plc1,2 | | | 19,870,562 | | | | 103,138,000 | |
| | 75,000 | | | Mettler-Toledo International, Inc.1 | | | 3,665,865 | | | | 52,830,000 | |
| | 900,000 | | | PRA Health Sciences, Inc.1 | | | 16,553,917 | | | | 89,307,000 | |
| | | | | | | | | | | | |
| | | | 52,681,592 | | | | 268,957,500 | |
| | | |
| | | | Managed Health Care (1.47%) | | | | | | | | |
| | 1,000,000 | | | HealthEquity, Inc.1 | | | 23,274,521 | | | | 57,145,000 | |
| | | |
| | | | Pharmaceuticals (0.88%) | | | | | | | | |
| | 1,000,000 | | | Dechra Pharmaceuticals PLC
(United Kingdom)2,6 | | | 28,027,985 | | | | 34,039,613 | |
| | | | | | | | | | | | |
| | Total Health Care | | | 256,657,197 | | | | 720,856,371 | |
| | | | | | | | | |
|
| Industrials (22.02%) | |
| | | | Aerospace & Defense (4.78%) | | | | | | | | |
| | 1,000,000 | | | Mercury Systems, Inc.1 | | | 25,872,953 | | | | 81,170,000 | |
| | 200,000 | | | TransDigm Group, Inc.1 | | | 0 | | | | 104,134,000 | |
| | | | | | | | | | | | |
| | | | 25,872,953 | | | | 185,304,000 | |
| | | |
| | | | Building Products (1.57%) | | | | | | | | |
| | 625,000 | | | Advanced Drainage Systems, Inc. | | | 19,142,606 | | | | 20,168,750 | |
| | 450,000 | | | Trex Company, Inc.1 | | | 35,044,299 | | | | 40,918,500 | |
| | | | | | | | | | | | |
| | | | 54,186,905 | | | | 61,087,250 | |
| | | |
| | | | Environmental & Facilities Services (2.90%) | | | | | | | | |
| | 1,225,000 | | | Waste Connections, Inc.2 | | | 53,491,667 | | | | 112,700,000 | |
| | | |
| | | | Human Resource & Employment Services (2.83%) | | | | | | | | |
| | 1,750,000 | | | ASGN, Inc.1 | | | 45,317,074 | | | | 110,005,000 | |
| | | |
| | | | Industrial Conglomerates (0.66%) | | | | | | | | |
| | 760,000 | | | Raven Industries, Inc. | | | 26,972,733 | | | | 25,429,600 | |
| | | |
| | | | Industrial Machinery (4.25%) | | | | | | | | |
| | 725,000 | | | Helios Technologies, Inc. | | | 34,755,037 | | | | 29,413,250 | |
| | 725,000 | | | John Bean Technologies Corp. | | | 62,999,777 | | | | 72,086,750 | |
| | 150,000 | | | Nordson Corp. | | | 4,103,822 | | | | 21,939,000 | |
| | 250,000 | | | RBC Bearings Incorporated1 | | | 15,921,127 | | | | 41,477,500 | |
| | | | | | | | | | | | |
| | | | 117,779,763 | | | | 164,916,500 | |
| | | |
| | | | Research & Consulting Services (1.74%) | | | | | | | | |
| | 4,000,000 | | | Clarivate Analytics Plc1,2 | | | 44,078,833 | | | | 67,480,000 | |
| | |
| 20 | | See Notes to Financial Statements. |
| | |
| September 30, 2019 | | Baron Small Cap Fund |
STATEMENT OF NET ASSETS (Continued)
| | | | | | | | | | | | |
| Shares | | | | | Cost | | | Value | |
| Common Stocks (continued) | |
| Industrials (continued) | |
| | | |
| | | | Trading Companies & Distributors (3.29%) | | | | | | | | |
| | 1,500,000 | | | SiteOne Landscape Supply, Inc.1 | | $ | 50,671,463 | | | $ | 111,030,000 | |
| | 800,000 | | | Univar Solutions, Inc. (formerly, Univar, Inc.)1 | | | 15,184,380 | | | | 16,608,000 | |
| | | | | | | | | | | | |
| | | | 65,855,843 | | | | 127,638,000 | |
| | | | | | | | | |
| | Total Industrials | | | 433,555,771 | | | | 854,560,350 | |
| | | | | | | | | |
| Information Technology (25.75%) | |
| | | | Application Software (13.03%) | | | | | | | | |
| | 1,050,000 | | | Altair Engineering, Inc., Cl A1 | | | 17,162,704 | | | | 36,351,000 | |
| | 800,000 | | | Aspen Technology, Inc.1 | | | 29,983,938 | | | | 98,464,000 | |
| | 850,000 | | | Ceridian HCM Holding, Inc.1 | | | 23,711,721 | | | | 41,964,500 | |
| | 5,997,900 | | | Cision Ltd.1,2 | | | 64,968,513 | | | | 46,123,851 | |
| | 1,650,000 | | | Guidewire Software, Inc.1 | | | 48,997,264 | | | | 173,877,000 | |
| | 300,000 | | | Pagerduty, Inc.1 | | | 9,800,372 | | | | 8,475,000 | |
| | 450,000 | | | The Trade Desk, Cl A1 | | | 16,518,585 | | | | 84,397,500 | |
| | 1,000,000 | | | Yext, Inc.1 | | | 13,112,639 | | | | 15,890,000 | |
| | | | | | | | | | | | |
| | | | 224,255,736 | | | | 505,542,851 | |
| | | |
| | | | Data Processing & Outsourced Services (3.52%) | | | | | | | | |
| | 3,500,000 | | | Repay Holdings Corporation1,3,4,6 | | | 35,000,000 | | | | 45,535,000 | |
| | 450,000 | | | WEX, Inc.1 | | | 18,982,530 | | | | 90,931,500 | |
| | | | | | | | | | | | |
| | | | 53,982,530 | | | | 136,466,500 | |
| | | |
| | | | Electronic Equipment & Instruments (2.02%) | | | | | | | | |
| | 1,600,000 | | | Cognex Corp. | | | 12,733,859 | | | | 78,608,000 | |
| | | |
| | | | Internet Services & Infrastructure (1.80%) | | | | | | | | |
| | 600,000 | | | Wix.com Ltd.1,2 | | | 33,260,000 | | | | 70,044,000 | |
| | | |
| | | | IT Consulting & Other Services (5.38%) | | | | | | | | |
| | 600,000 | | | Endava plc, ADR1,2 | | | 16,610,349 | | | | 22,710,000 | |
| | 1,000,000 | | | Gartner, Inc.1 | | | 14,988,362 | | | | 142,990,000 | |
| | 1,000,000 | | | LiveRamp Holdings, Inc.1 | | | 21,949,295 | | | | 42,960,000 | |
| | | | | | | | | | | | |
| | | | | | | 53,548,006 | | | | 208,660,000 | |
| | | | | | | | | | | | |
| | Total Information Technology | | | 377,780,131 | | | | 999,321,351 | |
| | | | | | | | | |
| Materials (2.79%) | |
| | | | Construction Materials (1.00%) | | | | | | | | |
| | 1,750,000 | | | Summit Materials, Inc., Cl A1 | | | 32,596,422 | | | | 38,850,000 | |
| | |
| | | | Metal & Glass Containers (0.81%) | | | | | |
| | 800,000 | | | Berry Global Group, Inc.1 | | | 12,652,147 | | | | 31,416,000 | |
| | | |
| | | | Specialty Chemicals (0.98%) | | | | | | | | |
| | 450,000 | | | Ingevity Corp.1 | | | 39,582,818 | | | | 38,178,000 | |
| | | | | | | | | | | | |
| | Total Materials | | | 84,831,387 | | | | 108,444,000 | |
| | | | | | | | | |
| Real Estate (6.20%) | |
| | | | Office REITs (0.21%) | | | | | | | | |
| | 100,000 | | | SL Green Realty Corp. | | | 2,127,325 | | | | 8,175,000 | |
| | | |
| | | | Specialized REITs (5.99%) | | | | | | | | |
| | 2,500,000 | | | Americold Realty Trust5 | | | 54,430,446 | | | | 92,675,000 | |
| | 500,000 | | | Gaming and Leisure Properties, Inc. | | | 6,306,755 | | | | 19,120,000 | |
| | 500,000 | | | SBA Communications Corp. | | | 2,014,480 | | | | 120,575,000 | |
| | | | | | | | | | | | |
| | | | | | | 62,751,681 | | | | 232,370,000 | |
| | | | | | | | | | | | |
| | Total Real Estate | | | 64,879,006 | | | | 240,545,000 | |
| | | | | | | | | |
| | Total Common Stocks | | | 1,747,166,121 | | | | 3,753,897,522 | |
| | | | | | | | | | | | |
| | | | | | | | | | | | |
| Shares | | | | | Cost | | | Value | |
| Warrants (0.12%) | |
| Consumer Discretionary (0.04%) | |
| | | | Hotels, Resorts & Cruise Lines (0.04%) | | | | | | | | |
| | 260,850 | | | OneSpaWorld Holdings Ltd. Warrants, Exp 3/19/20241,2,5,6 | | $ | 0 | | | $ | 1,486,845 | |
| | | | | | | | | | | | |
| Information Technology (0.08%) | |
| | | | Data Processing & Outsourced Services (0.08%) | | | | | | | | |
| | 3,500,000 | | | Repay Holdings Corporation Warrants, Exp 7/11/20241,3,4,6 | | | 0 | | | | 3,010,000 | |
| | | | | | | | | | | | |
| | Total Warrants | | | 0 | | | | 4,496,845 | |
| | | | | | | | | |
| | | |
| Principal Amount | | | | | | |
| Short Term Investments (3.29%) | |
| | $127,606,118 | | | Repurchase Agreement with Fixed Income Clearing Corp., dated 9/30/2019, 0.35% due 10/1/2019; Proceeds at maturity - $127,607,359; (Fully collateralized by $109,545,000 U.S. Treasury Bond, 3.00% due 5/15/2045; Market value - $130,162,903)6 | | $ | 127,606,118 | | | $ | 127,606,118 | |
| | | | | | | | | | | | |
| | Total Investments (100.13%) | | $ | 1,874,772,239 | | | | 3,886,000,485 | |
| | | | | | | | | | | | |
| | Liabilities Less Cash and Other Assets(-0.13%) | | | | (4,862,758 | ) |
| | | | | | | | | | | | |
| | Net Assets | | | $ | 3,881,137,727 | |
| | | | | | | | | | | | |
| Retail Shares (Equivalent to $29.44 per share
based on 49,322,422 shares outstanding) |
| | $ | 1,451,874,833 | |
| | | | | | | | | | | | |
| Institutional Shares (Equivalent to $30.74 per share
based on 73,760,889 shares outstanding) |
| | $ | 2,267,322,637 | |
| | | | | | | | | | | | |
| R6 Shares (Equivalent to $30.73 per share
based on 5,269,696 shares outstanding) |
| | $ | 161,940,257 | |
| | | | | | | | | | | | |
| % | Represents percentage of net assets. |
| 1 | Non-income producing securities. |
| 3 | At September 30, 2019, the market value of restricted and fair valued securities amounted to $48,545,000 or 1.25% of net assets. These securities are not deemed liquid. See Note 6 regarding Restricted Securities. |
| 4 | See Note 10 regarding “Affiliated” companies. |
| 5 | The Adviser has reclassified/classified certain securities in or out of thissub-industry. Such reclassifications/classifications are not supported by S&P or MSCI (unaudited). |
| 6 | Level 2 security. See Note 7 regarding Fair Value Measurements |
| ADR | American Depositary Receipt. |
All securities are Level 1, unless otherwise noted.
| | |
| See Notes to Financial Statements. | | 21 |
| | |
| Baron Opportunity Fund | | September 30, 2019 |
STATEMENT OF NET ASSETS
| | | | | | | | | | | | |
| Shares | | | | | Cost | | | Value | |
| Common Stocks (103.78%) | |
| Communication Services (13.89%) | |
| | | | Interactive Home Entertainment (3.92%) | | | | | | | | |
| | 90,400 | | | Electronic Arts, Inc.1 | | $ | 9,460,393 | | | $ | 8,842,928 | |
| | 58,100 | | | Take-Two Interactive Software, Inc.1 | | | 6,420,497 | | | | 7,282,254 | |
| | | | | | | | | | | | |
| | | | 15,880,890 | | | | 16,125,182 | |
| | | |
| | | | Interactive Media & Services (7.15%) | | | | | | | | |
| | 18,850 | | | Alphabet Inc., Cl C1 | | | 15,336,239 | | | | 22,978,150 | |
| | 29,500 | | | IAC/InterActiveCorp1 | | | 5,429,439 | | | | 6,430,115 | |
| | | | | | | | | | | | |
| | | | 20,765,678 | | | | 29,408,265 | |
| | | |
| | | | Movies & Entertainment (2.82%) | | | | | | | | |
| | 175,814 | | | Manchester United plc, Cl A2 | | | 2,756,090 | | | | 2,888,624 | |
| | 20,025 | | | Netflix, Inc.1 | | | 1,644,298 | | | | 5,359,090 | |
| | 29,600 | | | Spotify Technology SA1,2 | | | 4,277,500 | | | | 3,374,400 | |
| | | | | | | | | | | | |
| | | | 8,677,888 | | | | 11,622,114 | |
| | | | | | | | | |
| | Total Communication Services | | | 45,324,456 | | | | 57,155,561 | |
| | | | | | | | | |
|
| Consumer Discretionary (15.66%) | |
| | | | Automobile Manufacturers (2.95%) | | | | | | | | |
| | 50,500 | | | Tesla, Inc.1 | | | 10,865,198 | | | | 12,163,935 | |
| | | |
| | | | Education Services (1.15%) | | | | | | | | |
| | 93,436 | | | Arco Platform Limited, Cl A1,2 | | | 1,635,130 | | | | 4,736,271 | |
| | | |
| | | | Internet & Direct Marketing Retail (11.56%) | | | | | | | | |
| | 36,900 | | | Alibaba Group Holding Limited, ADR1,2 | | | 2,789,515 | | | | 6,170,787 | |
| | 14,975 | | | Amazon.com, Inc.1 | | | 4,786,247 | | | | 25,995,252 | |
| | 9,629 | | | MercadoLibre, Inc.1 | | | 5,582,412 | | | | 5,307,794 | |
| | 1,957,126 | | | Trainline Plc, 144A (United Kingdom)1,2 | | | 8,729,565 | | | | 10,082,746 | |
| | | | | | | | | | | | |
| | | | 21,887,739 | | | | 47,556,579 | |
| | | | | | | | | |
| | Total Consumer Discretionary | | | 34,388,067 | | | | 64,456,785 | |
| | | | | | | | | |
|
| Financials (1.05%) | |
| | | | Financial Exchanges & Data (1.05%) | | | | | | | | |
| | 13,200 | | | MarketAxess Holdings, Inc. | | | 1,489,792 | | | | 4,323,000 | |
| | | | | | | | | | | | |
|
| Health Care (14.29%) | |
| | | | Biotechnology (8.14%) | | | | | | | | |
| | 85,300 | | | Acceleron Pharma, Inc.1 | | | 3,061,691 | | | | 3,370,203 | |
| | 81,102 | | | argenx SE, ADR1,2 | | | 2,814,828 | | | | 9,242,384 | |
| | 162,000 | | | Arrowhead Pharmaceuticals, Inc.1 | | | 2,493,521 | | | | 4,565,160 | |
| | 29,700 | | | Neurocrine Biosciences, Inc.1 | | | 2,480,851 | | | | 2,676,267 | |
| | 57,600 | | | Sage Therapeutics, Inc.1 | | | 4,090,451 | | | | 8,080,704 | |
| | 32,700 | | | Vertex Pharmaceuticals Incorporated1 | | | 5,077,281 | | | | 5,540,034 | |
| | | | | | | | | | | | |
| | | | 20,018,623 | | | | 33,474,752 | |
| | | |
| | | | Health Care Equipment (2.57%) | | | | | | | | |
| | 25,000 | | | Edwards Lifesciences Corp.1 | | | 2,188,379 | | | | 5,497,750 | |
| | 9,435 | | | Intuitive Surgical, Inc.1 | | | 2,084,841 | | | | 5,094,240 | |
| | | | | | | | | | | | |
| | | | 4,273,220 | | | | 10,591,990 | |
| | | |
| | | | Health Care Technology (0.27%) | | | | | | | | |
| | 7,200 | | | Veeva Systems Inc., Cl A1 | | | 1,099,411 | | | | 1,099,368 | |
| | | | | | | | | | | | |
| Shares | | | | | Cost | | | Value | |
| Common Stocks (continued) | |
|
| Health Care (continued) | |
| | | | Life Sciences Tools & Services (3.31%) | | | | | | | | |
| | 10,419 | | | 10X Genomics, Inc., Cl A1 | | $ | 406,341 | | | $ | 525,118 | |
| | 11,545 | | | Adaptive Biotechnologies Corporation1 | | | 230,900 | | | | 356,740 | |
| | 26,837 | | | Guardant Health, Inc.1,3 | | | 1,713,167 | | | | 1,713,006 | |
| | 19,415 | | | Illumina, Inc.1 | | | 1,838,580 | | | | 5,906,431 | |
| | 213,390 | | | Veracyte, Inc.1,3 | | | 5,223,266 | | | | 5,121,360 | |
| | | | | | | | | | | | |
| | | | 9,412,254 | | | | 13,622,655 | |
| | | | | | | | | |
| | Total Health Care | | | 34,803,508 | | | | 58,788,765 | |
| | | | | | | | | |
|
| Industrials (3.93%) | |
| | | | Research & Consulting Services (3.93%) | | | | | | | | |
| | 19,133 | | | CoStar Group, Inc.1 | | | 324,519 | | | | 11,349,695 | |
| | 30,590 | | | Verisk Analytics, Inc. | | | 1,652,699 | | | | 4,837,503 | |
| | | | | | | | | | | | |
| | Total Industrials | | | 1,977,218 | | | | 16,187,198 | |
| | | | | | | | | |
|
| Information Technology (50.61%) | |
| | | | Application Software (19.89%) | | | | | | | | |
| | 29,100 | | | Adobe, Inc.1 | | | 5,600,047 | | | | 8,038,875 | |
| | 22,775 | | | ANSYS, Inc.1 | | | 2,305,432 | | | | 5,041,474 | |
| | 103,170 | | | Ceridian HCM Holding, Inc.1 | | | 3,278,154 | | | | 5,093,503 | |
| | 4,900 | | | Coupa Software, Inc.1 | | | 437,312 | | | | 634,893 | |
| | 210,300 | | | Guidewire Software, Inc.1 | | | 6,684,817 | | | | 22,161,414 | |
| | 165,000 | | | Medallia, Inc.1 | | | 4,499,255 | | | | 4,525,950 | |
| | 42,700 | | | RingCentral, Inc., Cl A1 | | | 3,277,189 | | | | 5,365,682 | |
| | 26,980 | | | salesforce.com, Inc.1 | | | 1,564,651 | | | | 4,004,911 | |
| | 20,900 | | | ServiceNow, Inc.1,3 | | | 1,110,572 | | | | 5,305,465 | |
| | 31,000 | | | Splunk, Inc.1 | | | 1,733,740 | | | | 3,653,660 | |
| | 145,900 | | | SS&C Technologies Holdings, Inc. | | | 5,203,956 | | | | 7,524,063 | |
| | 22,900 | | | The Trade Desk, Cl A1 | | | 412,200 | | | | 4,294,895 | |
| | 331,900 | | | Yext, Inc.1 | | | 4,815,635 | | | | 5,273,891 | |
| | 12,207 | | | Zoom Video Communications, Inc., Cl A1 | | | 930,247 | | | | 930,174 | |
| | | | | | | | | | | | |
| | | | 41,853,207 | | | | 81,848,850 | |
| | | |
| | | | Data Processing & Outsourced Services (6.03%) | | | | | | | | |
| | 35,900 | | | MasterCard Incorporated, Cl A | | | 2,942,992 | | | | 9,749,363 | |
| | 51,500 | | | PagSeguro Digital Ltd., Cl A1,2 | | | 1,562,129 | | | | 2,384,965 | |
| | 32,300 | | | PayPal Holdings, Inc.1 | | | 2,989,160 | | | | 3,345,957 | |
| | 54,200 | | | Visa, Inc., Cl A | | | 4,409,505 | | | | 9,322,942 | |
| | | | | | | | | | | | |
| | | | 11,903,786 | | | | 24,803,227 | |
| | | |
| | | | Internet Services & Infrastructure (3.92%) | | | | | | | | |
| | 121,000 | | | GDS Holdings Limited, ADR1,2 | | | 4,299,832 | | | | 4,849,680 | |
| | 35,241 | | | Twilio, Inc., Cl A1 | | | 4,426,460 | | | | 3,875,100 | |
| | 63,543 | | | Wix.com Ltd.1,2 | | | 3,424,599 | | | | 7,418,010 | |
| | | | | | | | | | | | |
| | | | 12,150,891 | | | | 16,142,790 | |
| | | |
| | | | IT Consulting & Other Services (7.06%) | | | | | | | | |
| | 169,076 | | | Endava plc, ADR1,2 | | | 4,712,959 | | | | 6,399,527 | |
| | 114,687 | | | Gartner, Inc.1 | | | 3,210,687 | | | | 16,399,094 | |
| | 145,500 | | | LiveRamp Holdings, Inc.1 | | | 4,521,278 | | | | 6,250,680 | |
| | | | | | | | | | | | |
| | | | 12,444,924 | | | | 29,049,301 | |
| | | |
| | | | Semiconductors (3.44%) | | | | | | | | |
| | 80,200 | | | Mellanox Technologies Ltd.1,2 | | | 4,716,457 | | | | 8,789,118 | |
| | 30,800 | | | NVIDIA Corp. | | | 6,246,064 | | | | 5,361,356 | |
| | | | | | | | | | | | |
| | | | 10,962,521 | | | | 14,150,474 | |
| | |
| 22 | | See Notes to Financial Statements. |
| | |
| September 30, 2019 | | Baron Opportunity Fund |
STATEMENT OF NET ASSETS (Continued)
| | | | | | | | | | | | |
| Shares | | | | | Cost | | | Value | |
| Common Stocks (continued) | |
| Information Technology (continued) | |
| | | | Systems Software (10.27%) | | | | | | | | |
| | 10,223 | | | Crowdstrike Holdings, Inc., Cl A1 | | $ | 347,582 | | | $ | 596,103 | |
| | 203,920 | | | Datadog, Inc., Cl A1,3 | | | 5,505,840 | | | | 6,914,927 | |
| | 112,437 | | | Dynatrace, Inc.1,3 | | | 2,104,405 | | | | 2,099,199 | |
| | 208,100 | | | Microsoft Corp. | | | 18,829,508 | | | | 28,932,143 | |
| | 28,800 | | | Proofpoint, Inc.1 | | | 2,314,362 | | | | 3,716,640 | |
| | | | | | | | | | | | |
| | | | 29,101,697 | | | | 42,259,012 | |
| | | | | | | | | |
| | Total Information Technology | | | 118,417,026 | | | | 208,253,654 | |
| | | | | | | | | |
| Real Estate (4.35%) | |
| | | | Specialized REITs (4.35%) | | | | | | | | |
| | 28,100 | | | Alexandria Real Estate Equities, Inc.3 | | | 3,889,445 | | | | 4,328,524 | |
| | 19,525 | | | Equinix, Inc. | | | 4,501,566 | | | | 11,262,020 | |
| | 9,600 | | | SBA Communications Corp. | | | 32,108 | | | | 2,315,040 | |
| | | | | | | | | | | | |
| | Total Real Estate | | | 8,423,119 | | | | 17,905,584 | |
| | | | | | | | | |
| | Total Investments (103.78%) | | $ | 244,823,186 | | | | 427,070,547 | |
| | | | | | | | | |
| | Liabilities Less Cash and Other Assets(-3.78%) | | | | (15,556,155 | ) |
| | | | | | | | | |
| | Net Assets | | | $ | 411,514,392 | |
| | | | | | | | | |
| Retail Shares (Equivalent to $21.53 per share
based on 14,057,814 shares outstanding) |
| | $ | 302,601,487 | |
| | | | | | | | | |
| Institutional Shares (Equivalent to $22.42 per share
based on 4,212,619 shares outstanding) |
| | $ | 94,456,247 | |
| | | | | | | | | |
| R6 Shares (Equivalent to $22.45 per share
based on 644,054 shares outstanding) |
| | $ | 14,456,658 | |
| | | | | | | | | |
| % | Represents percentage of net assets. |
| 1 | Non-income producing securities. |
| 3 | The Adviser has reclassified/classified certain securities in or out of thissub-industry. Such reclassifications/classifications are not supported by S&P or MSCI (unaudited). |
| ADR | American Depositary Receipt. |
| 144A | Security is exempt from registration pursuant to Rule 144A under the Securities Act of 1933. This security may be resold in transactions that are exempt from registration, normally to qualified institutional buyers. At September 30, 2019, the market value of Rule 144A securities amounted to $10,082,746 or 2.45% of net assets. |
All securities are Level 1, unless otherwise noted.
| | |
| See Notes to Financial Statements. | | 23 |
| | |
| Baron Fifth Avenue Growth Fund | | September 30, 2019 |
STATEMENT OF NET ASSETS
| | | | | | | | | | | | |
| Shares | | | | | Cost | | | Value | |
| Common Stocks (97.42%) | |
| Communication Services (10.54%) | |
| | | | Interactive Media & Services (10.54%) | | | | | | | | |
| | 1,948 | | | Alphabet Inc., Cl A1 | | $ | 280,365 | | | $ | 2,378,781 | |
| | 10,283 | | | Alphabet Inc., Cl C1 | | | 4,420,382 | | | | 12,534,977 | |
| | 64,665 | | | Facebook, Inc., Cl A1 | | | 2,342,792 | | | | 11,515,543 | |
| | 27,768 | | | IAC/InterActive Corp1 | | | 5,715,645 | | | | 6,052,591 | |
| | | | | | | | | | | | |
| | Total Communication Services | | | 12,759,184 | | | | 32,481,892 | |
| | | | | | | | | |
| Consumer Discretionary (21.33%) | |
| | | | Internet & Direct Marketing Retail (21.33%) | | | | | |
| | 92,830 | | | Alibaba Group Holding Limited, ADR1,2 | | | 7,959,441 | | | | 15,523,961 | |
| | 20,785 | | | Amazon.com, Inc.1 | | | 4,735,475 | | | | 36,080,889 | |
| | 2,416 | | | Booking Holdings, Inc.1 | | | 1,282,530 | | | | 4,741,666 | |
| | 63,223 | | | Ctrip.com International Ltd., ADR1,2 | | | 1,700,557 | | | | 1,851,802 | |
| | 7,040 | | | MercadoLibre, Inc.1 | | | 3,764,019 | | | | 3,880,659 | |
| | 24,450 | | | Naspers Limited, Cl N (South Africa)2,4 | | | 3,492,992 | | | | 3,701,955 | |
| | | | | | | | | | | | |
| | Total Consumer Discretionary | | | 22,935,014 | | | | 65,780,932 | |
| | | | | | | | | |
| Financials (9.40%) | |
| | | | Diversified Banks (1.13%) | | | | | | | | |
| | 150,000 | | | Kotak Mahindra Bank Ltd. (India)2,4 | | | 2,937,439 | | | | 3,483,901 | |
| | | |
| | | | Financial Exchanges & Data (5.98%) | | | | | | | | |
| | 54,208 | | | CME Group, Inc. | | | 5,248,889 | | | | 11,456,319 | |
| | 28,569 | | | S&P Global, Inc. | | | 5,452,631 | | | | 6,998,833 | |
| | | | | | | | | | | | |
| | | | 10,701,520 | | | | 18,455,152 | |
| | |
| | | | Investment Banking & Brokerage (2.29%) | | | | | |
| | 168,693 | | | The Charles Schwab Corp. | | | 6,277,649 | | | | 7,056,428 | |
| | | | | | | | | | | | |
| | Total Financials | | | 19,916,608 | | | | 28,995,481 | |
| | | | | | | | | |
| Health Care (17.94%) | |
| | | | Biotechnology (4.16%) | | | | | | | | |
| | 45,621 | | | Sage Therapeutics, Inc.1 | | | 7,050,220 | | | | 6,400,170 | |
| | 37,971 | | | Vertex Pharmaceuticals Incorporated1 | | | 5,909,494 | | | | 6,433,047 | |
| | | | | | | | | | | | |
| | | | 12,959,714 | | | | 12,833,217 | |
| | | |
| | | | Health Care Equipment (4.27%) | | | | | | | | |
| | 24,371 | | | Intuitive Surgical, Inc.1 | | | 8,390,754 | | | | 13,158,634 | |
| | | |
| | | | Health Care Technology (4.97%) | | | | | | | | |
| | 100,453 | | | Veeva Systems Inc., Cl A1 | | | 7,493,347 | | | | 15,338,168 | |
| | | |
| | | | Life Sciences Tools & Services (4.54%) | | | | | | | | |
| | 7,194 | | | 10X Genomics, Inc., Cl A1 | | | 280,566 | | | | 362,578 | |
| | 44,814 | | | Illumina, Inc.1 | | | 5,436,613 | | | | 13,633,315 | |
| | | | | | | | | | | | |
| | | | 5,717,179 | | | | 13,995,893 | |
| | | | | | | | | |
| | Total Health Care | | | 34,560,994 | | | | 55,325,912 | |
| | | | | | | | | |
| Information Technology (34.55%) | |
| | | | Application Software (3.67%) | | | | | | | | |
| | 34,774 | | | RingCentral, Inc., Cl A1 | | | 2,908,042 | | | | 4,369,701 | |
| | 58,909 | | | Splunk, Inc.1 | | | 6,940,258 | | | | 6,943,015 | |
| | | | | | | | | | | | |
| | | | 9,848,300 | | | | 11,312,716 | |
| | | |
| | | | Data Processing & Outsourced Services (19.74%) | | | | | | | | |
| | 4,627 | | | Adyen B.V, 144A (Netherlands)1,2,4 | | | 3,403,372 | | | | 3,042,828 | |
| | 89,358 | | | Fidelity National Information
Services, Inc. | | | 7,601,621 | | | | 11,863,168 | |
| | 66,851 | | | MasterCard Incorporated, Cl A | | | 3,750,511 | | | | 18,154,726 | |
| | 197,125 | | | PagSeguro Digital Ltd., Cl A1,2 | | | 4,879,574 | | | | 9,128,859 | |
| | 114,585 | | | StoneCo Ltd., Cl A1,2 | | | 4,316,950 | | | | 3,985,266 | |
| | 85,434 | | | Visa, Inc., Cl A | | | 2,870,563 | | | | 14,695,502 | |
| | | | | | | | | | | | |
| | | | 26,822,591 | | | | 60,870,349 | |
| | | | | | | | | | | | |
| Shares | | | | | Cost | | | Value | |
| Common Stocks (continued) | |
| Information Technology (continued) | |
| | | |
| | | | Internet Services & Infrastructure (3.17%) | | | | | | | | |
| | 42,130 | | | Twilio Inc., Cl A1 | | $ | 5,408,656 | | | $ | 4,632,615 | |
| | 44,145 | | | Wix.com Ltd.1,2 | | | 3,671,497 | | | | 5,153,487 | |
| | | | | | | | | | | | |
| | | | 9,080,153 | | | | 9,786,102 | |
| | | |
| | | | IT Consulting & Other Services (3.02%) | | | | | | | | |
| | 51,126 | | | EPAM Systems, Inc.1 | | | 4,736,195 | | | | 9,321,292 | |
| | | |
| | | | Semiconductor Equipment (3.16%) | | | | | | | | |
| | 39,157 | | | ASML Holding N.V.2 | | | 4,042,938 | | | | 9,727,382 | |
| | | |
| | | | Systems Software (1.79%) | | | | | | | | |
| | 13,015 | | | Crowdstrike Holdings, Inc., Cl A1 | | | 442,510 | | | | 758,905 | |
| | 140,287 | | | Datadog, Inc., Cl A1,3 | | | 3,787,749 | | | | 4,757,132 | |
| | | | | | | | | | | | |
| | | | | | | 4,230,259 | | | | 5,516,037 | |
| | | | | | | | | | | | |
| | Total Information Technology | | | 58,760,436 | | | | 106,533,878 | |
| | | | | | | | | |
| Real Estate (3.66%) | |
| | | | Specialized REITs (3.66%) | | | | | | | | |
| | 19,555 | | | Equinix, Inc. | | | 3,178,515 | | | | 11,279,324 | |
| | | | | | | | | | | | |
| | Total Common Stocks | | | 152,110,751 | | | | 300,397,419 | |
| | | | | | | | | |
| | | | | | | | | | | | |
| | | |
| Principal Amount | | | | | | |
| Short Term Investments (3.19%) | |
| | $9,834,253 | | | Repurchase Agreement with Fixed Income Clearing Corp., dated 9/30/2019, 0.35% due 10/1/2019; Proceeds at maturity - $9,834,348; (Fully collateralized by $9,095,000 U.S. Treasury Note, 2.875% due 8/15/2028;Market value - $10,032,267)4 | | | 9,834,253 | | | | 9,834,253 | |
| | | | | | | | | | | | |
| | Total Investments (100.61%) | | $ | 161,945,004 | | | | 310,231,672 | |
| | | | | | | | | |
| | Liabilities Less Cash and Other Assets(-0.61%) | | | | (1,878,077 | ) |
| | | | | | | | | |
| | Net Assets | | | $ | 308,353,595 | |
| | | | | | | | | |
| Retail Shares (Equivalent to $32.10 per share
based on 3,597,827 shares outstanding) |
| | $ | 115,480,135 | |
| | | | | | | | | |
| Institutional Shares (Equivalent to $32.80 per share
based on 5,194,015 shares outstanding) |
| | $ | 170,349,745 | |
| | | | | | | | | |
| R6 Shares (Equivalent to $32.81 per share
based on 686,518 shares outstanding) |
| | $ | 22,523,715 | |
| | | | | | | | | |
| % | Represents percentage of net assets. |
| 1 | Non-income producing securities. |
| 3 | The Adviser has reclassified/classified certain securities in or out of thissub-industry. Such reclassifications/classifications are not supported by S&P or MSCI (unaudited). |
| 4 | Level 2 security. See Note 7 regarding Fair Value Measurements. |
| ADR | American Depositary Receipt. |
| 144A | Security is exempt from registration pursuant to Rule 144A under the Securities Act of 1933. This security may be resold in transactions that are exempt from registration, normally to qualified institutional buyers. At September 30, 2019, the market value of Rule 144A securities amounted to $3,042,828 or 0.99% of net assets. |
All securities are Level 1, unless otherwise noted.
| | |
| 24 | | See Notes to Financial Statements. |
| | |
| September 30, 2019 | | Baron Discovery Fund |
STATEMENT OF NET ASSETS
| | | | | | | | | | | | |
| Shares | | | | | Cost | | | Value | |
| Common Stocks (92.26%) | |
| Communication Services (2.25%) | |
| | | | Movies & Entertainment (1.36%) | | | | | | | | |
| | 185,000 | | | Liberty Media Corporation-Liberty Formula One, Cl A1 | | $ | 5,634,811 | | | $ | 7,324,150 | |
| | | |
| | | | Publishing (0.89%) | | | | | | | | |
| | 320,000 | | | Future PLC (United Kingdom)2 | | | 4,534,134 | | | | 4,823,769 | |
| | | | | | | | | | | | |
| | Total Communication Services | | | 10,168,945 | | | | 12,147,919 | |
| | | | | | | | | |
|
| Consumer Discretionary (7.40%) | |
| | | | Casinos & Gaming (3.03%) | | | | | | | | |
| | 300,000 | | | Boyd Gaming Corporation | | | 6,358,834 | | | | 7,185,000 | |
| | 350,000 | | | Red Rock Resorts, Inc., Cl A | | | 7,202,468 | | | | 7,106,750 | |
| | 100,000 | | | Studio City International Holdings Ltd., ADR1,2 | | | 1,250,000 | | | | 2,010,000 | |
| | | | | | | | | | | | |
| | | | 14,811,302 | | | | 16,301,750 | |
| | | |
| | | | Home Improvement Retail (3.08%) | | | | | | | | |
| | 325,000 | | | Floor & Decor Holdings, Inc., Cl A1 | | | 10,815,199 | | | | 16,623,750 | |
| | | |
| | | | Internet & Direct Marketing Retail (0.97%) | | | | | | | | |
| | 100,000 | | | Fiverr International Ltd.1,2 | | | 2,100,000 | | | | 1,870,000 | |
| | 150,000 | | | The RealReal, Inc.1 | | | 2,988,038 | | | | 3,354,000 | |
| | | | | | | | | | | | |
| | | | 5,088,038 | | | | 5,224,000 | |
| | | |
| | | | Restaurants (0.32%) | | | | | | | | |
| | 20,000 | | | Wingstop, Inc. | | | 1,748,398 | | | | 1,745,600 | |
| | | | | | | | | | | | |
| | Total Consumer Discretionary | | | 32,462,937 | | | | 39,895,100 | |
| | | | | | | | | |
|
| Consumer Staples (1.08%) | |
| | | | Agricultural Products (1.02%) | | | | | | | | |
| | 300,000 | | | Limoneira Co. | | | 7,032,781 | | | | 5,508,000 | |
| | | |
| | | | Packaged Foods & Meats (0.06%) | | | | | | | | |
| | 1,050,000 | | | Barfresh Food Group, Inc.1 | | | 597,200 | | | | 325,500 | |
| | | | | | | | | | | | |
| | Total Consumer Staples | | | 7,629,981 | | | | 5,833,500 | |
| | | | | | | | | |
|
| Financials (3.81%) | |
| | | | Property & Casualty Insurance (3.81%) | | | | | | | | |
| | 198,500 | | | Kinsale Capital Group, Inc. | | | 9,609,422 | | | | 20,507,035 | |
| | | | | | | | | | | | |
|
| Health Care (25.14%) | |
| | | | Biotechnology (4.57%) | | | | | | | | |
| | 290,000 | | | Emergent BioSolutions, Inc.1 | | | 13,932,817 | | | | 15,161,200 | |
| | 188,500 | | | Esperion Therapeutics, Inc.1 | | | 8,975,676 | | | | 6,910,410 | |
| | 18,000 | | | Sage Therapeutics, Inc.1 | | | 1,395,612 | | | | 2,525,220 | |
| | | | | | | | | | | | |
| | | | 24,304,105 | | | | 24,596,830 | |
| | | |
| | | | Health Care Equipment (5.32%) | | | | | | | | |
| | 425,084 | | | AxoGen, Inc.1 | | | 7,186,804 | | | | 5,305,048 | |
| | 100,000 | | | Inogen, Inc.1 | | | 4,705,574 | | | | 4,791,000 | |
| | 50,000 | | | Inspire Medical Systems, Inc.1,3 | | | 2,923,748 | | | | 3,051,000 | |
| | 90,000 | | | Intersect ENT, Inc.1,3 | | | 2,460,952 | | | | 1,530,900 | |
| | 509,431 | | | RA Medical Systems, Inc.1 | | | 7,695,327 | | | | 713,204 | |
| | 325,208 | | | Silk Road Medical, Inc.1,3 | | | 11,147,635 | | | | 10,579,016 | |
| | 935,000 | | | ViewRay, Inc.1 | | | 6,098,828 | | | | 2,711,500 | |
| | | | | | | | | | | | |
| | | | 42,218,868 | | | | 28,681,668 | |
| | | | | | | | | | | | |
| Shares | | | | | Cost | | | Value | |
| Common Stocks (continued) | |
|
| Health Care (continued) | |
| | | |
| | | | Health Care Supplies (3.48%) | | | | | | | | |
| | 1,615,000 | | | Cerus Corp.1 | | $ | 7,646,777 | | | $ | 8,325,325 | |
| | 1,603,963 | | | Sientra, Inc.1 | | | 14,435,503 | | | | 10,393,680 | |
| | | | | | | | | | | | |
| | | | 22,082,280 | | | | 18,719,005 | |
| | | |
| | | | Health Care Technology (1.77%) | | | | | | | | |
| | 141,000 | | | Teladoc Health, Inc.1 | | | 4,635,571 | | | | 9,548,520 | |
| | | |
| | | | Life Sciences Tools & Services (5.56%) | | | | | | | | |
| | 12,312 | | | 10X Genomics, Inc., Cl A1 | | | 480,168 | | | | 620,525 | |
| | 260,000 | | | Accelerate Diagnostics, Inc.1 | | | 4,117,791 | | | | 4,828,200 | |
| | 172,699 | | | CareDx, Inc.1,3 | | | 2,286,737 | | | | 3,904,724 | |
| | 285,000 | | | Myriad Genetics, Inc.1,3 | | | 7,021,019 | | | | 8,159,550 | |
| | 519,190 | | | Veracyte, Inc.1,3 | | | 12,884,315 | | | | 12,460,560 | |
| | | | | | | | | | | | |
| | | | 26,790,030 | | | | 29,973,559 | |
| | | |
| | | | Pharmaceuticals (4.44%) | | | | | | | | |
| | 827,732 | | | Revance Therapeutics, Inc.1 | | | 12,763,107 | | | | 10,760,516 | |
| | 3,631,500 | | | TherapeuticsMD, Inc.1 | | | 15,687,494 | | | | 13,182,345 | |
| | | | | | | | | | | | |
| | | | 28,450,601 | | | | 23,942,861 | |
| | | | | | | | | |
| | Total Health Care | | | 148,481,455 | | | | 135,462,443 | |
| | | | | | | | | |
|
| Industrials (19.93%) | |
| | | | Aerospace & Defense (5.43%) | | | | | | | | |
| | 150,000 | | | Cubic Corp. | | | 8,702,515 | | | | 10,564,500 | |
| | 230,600 | | | Mercury Systems, Inc.1 | | | 7,155,936 | | | | 18,717,802 | |
| | | | | | | | | | | | |
| | | | 15,858,451 | | | | 29,282,302 | |
| | | |
| | | | Building Products (3.56%) | | | | | | | | |
| | 200,000 | | | Advanced Drainage Systems, Inc. | | | 6,127,823 | | | | 6,454,000 | |
| | 140,000 | | | Trex Company, Inc.1 | | | 9,529,319 | | | | 12,730,200 | |
| | | | | | | | | | | | |
| | | | 15,657,142 | | | | 19,184,200 | |
| | | |
| | | | Heavy Electrical Equipment (2.46%) | | | | | | | | |
| | 707,000 | | | TPI Composites, Inc.1 | | | 15,134,506 | | | | 13,256,250 | |
| | | |
| | | | Industrial Conglomerates (0.81%) | | | | | | | | |
| | 130,000 | | | Raven Industries, Inc. | | | 4,395,761 | | | | 4,349,800 | |
| | | |
| | | | Industrial Machinery (4.92%) | | | | | | | | |
| | 86,600 | | | ESCO Technologies, Inc. | | | 4,658,023 | | | | 6,889,896 | |
| | 170,000 | | | Helios Technologies, Inc. | | | 7,616,777 | | | | 6,896,900 | |
| | 293,000 | | | Kornit Digital Ltd.1,2 | | | 4,908,173 | | | | 9,018,540 | |
| | 240,000 | | | Luxfer Holdings plc2 | | | 5,563,295 | | | | 3,739,200 | |
| | | | | | | | | | | | |
| | | | 22,746,268 | | | | 26,544,536 | |
| | | |
| | | | Trading Companies & Distributors (2.75%) | | | | | | | | |
| | 200,000 | | | SiteOne Landscape Supply, Inc.1 | | | 10,275,246 | | | | 14,804,000 | |
| | | | | | | | | | | | |
| | Total Industrials | | | 84,067,374 | | | | 107,421,088 | |
| | | | | | | | | |
|
| Information Technology (26.01%) | |
| | | | Application Software (7.27%) | | | | | | | | |
| | 50,700 | | | Envestnet, Inc.1 | | | 1,772,888 | | | | 2,874,690 | |
| | 370,000 | | | Medallia, Inc.1 | | | 10,923,052 | | | | 10,149,100 | |
| | 723,300 | | | RIB Software SE (Germany)2,4 | | | 11,484,857 | | | | 16,743,258 | |
| | 10,000 | | | The Trade Desk Cl A1 | | | 2,106,329 | | | | 1,875,500 | |
| | 475,000 | | | Yext, Inc.1 | | | 7,143,324 | | | | 7,547,750 | |
| | | | | | | | | | | | |
| | | | 33,430,450 | | | | 39,190,298 | |
| | |
| See Notes to Financial Statements. | | 25 |
| | |
| Baron Discovery Fund | | September 30, 2019 |
STATEMENT OF NET ASSETS (Continued)
| | | | | | | | | | | | |
| Shares | | | | | Cost | | | Value | |
| Common Stocks (continued) | |
|
| Information Technology (continued) | |
| | | |
| | | | Data Processing & Outsourced Services (1.61%) | | | | | | | | |
| | 650,000 | | | Repay Holdings Corporation (formerly, Thunder Bridge Acquisition Ltd., Cl A)1 | | $ | 8,937,500 | | | $ | 8,664,500 | |
| | | |
| | | | Electronic Equipment & Instruments (1.70%) | | | | | | | | |
| | 10,431 | | | Novanta, Inc.1,2 | | | 272,590 | | | | 852,421 | |
| | 350,000 | | | PAR Technology Corp.1 | | | 7,405,074 | | | | 8,319,500 | |
| | | | | | | | | | | | |
| | | | 7,677,664 | | | | 9,171,921 | |
| | | |
| | | | IT Consulting & Other Services (3.24%) | | | | | | | | |
| | 325,000 | | | Endava plc, ADR1,2 | | | 7,762,121 | | | | 12,301,250 | |
| | 120,000 | | | LiveRamp Holdings, Inc.1 | | | 3,526,876 | | | | 5,155,200 | |
| | | | | | | | | | | | |
| | | | 11,288,997 | | | | 17,456,450 | |
| | | |
| | | | Semiconductor Equipment (3.15%) | | | | | | | | |
| | 360,000 | | | Ichor Holdings Ltd.1,2 | | | 7,124,786 | | | | 8,704,800 | |
| | 260,000 | | | Nova Measuring Instruments Ltd.1,2 | | | 6,318,760 | | | | 8,260,200 | |
| | | | | | | | | | | | |
| | | | 13,443,546 | | | | 16,965,000 | |
| | | |
| | | | Semiconductors (0.66%) | | | | | | | | |
| | 580,000 | | | Everspin Technologies, Inc.1 | | | 5,093,299 | | | | 3,555,400 | |
| | | |
| | | | Systems Software (8.38%) | | | | | | | | |
| | 330,000 | | | Blue Prism Group plc
(United Kingdom)1,2,4 | | | 8,142,526 | | | | 3,856,877 | |
| | 226,275 | | | Dynatrace, Inc.1,3 | | | 4,185,529 | | | | 4,224,554 | |
| | 319,000 | | | ForeScout Technologies, Inc.1 | | | 8,902,279 | | | | 12,096,480 | |
| | 55,000 | | | New Relic, Inc.1,3 | | | 3,149,337 | | | | 3,379,750 | |
| | 400,000 | | | Ping Identity Holding Corp.1 | | | 6,378,000 | | | | 6,900,000 | |
| | 90,000 | | | Qualys, Inc.1 | | | 3,114,726 | | | | 6,801,300 | |
| | 132,000 | | | Varonis Systems, Inc.1 | | | 8,436,568 | | | | 7,890,960 | |
| | | | | | | | | | | | |
| | | | 42,308,965 | | | | 45,149,921 | |
| | | | | | | | | |
| | Total Information Technology | | | 122,180,421 | | | | 140,153,490 | |
| | | | | | | | | |
| | | | | | | | | | | | |
| Shares | | | | | Cost | | | Value | |
| Common Stocks (continued) | |
| Real Estate (6.64%) | |
| | | | Diversified REITs (1.09%) | | | | | | | | |
| | 240,000 | | | Alexander & Baldwin, Inc. | | $ | 6,737,712 | | | $ | 5,882,400 | |
| | | |
| | | | Industrial REITs (2.45%) | | | | | | | | |
| | 300,000 | | | Rexford Industrial Realty, Inc. | | | 10,096,521 | | | | 13,206,000 | |
| | | |
| | | | Specialized REITs (3.10%) | | | | | | | | |
| | 450,000 | | | Americold Realty Trust3 | | | 8,996,573 | | | | 16,681,500 | |
| | | | | | | | | | | | |
| | Total Real Estate | | | 25,830,806 | | | | 35,769,900 | |
| | | | | | | | | |
| | Total Common Stocks | | | 440,431,341 | | | | 497,190,475 | |
| | | | | | | | | |
| | | | | | | | | | | | |
| | | |
| Principal Amount | | | | | | |
| Short Term Investments (7.73%) | |
| | $41,673,966 | | | Repurchase Agreement with Fixed Income Clearing Corp., dated 9/30/2019, 0.35% due 10/1/2019; Proceeds atmaturity - $41,674,371; (Fully collateralized by $38,540,000 U.S. Treasury Note, 2.875% due 8/15/2028;Market value - $42,511,663)4 | | | 41,673,966 | | | | 41,673,966 | |
| | | | | | | | | | | | |
| | Total Investments (99.99%) | | $ | 482,105,307 | | | | 538,864,441 | |
| | | | | | | | | |
| | Cash and Other Assets Less Liabilities (0.01%) | | | | 43,476 | |
| | | | | | | | | |
| | Net Assets | | | $ | 538,907,917 | |
| | | | | | | | | |
| Retail Shares (Equivalent to $19.41 per share
based on 6,324,793 shares outstanding) |
| | $ | 122,748,285 | |
| | | | | | | | | |
| Institutional Shares (Equivalent to $19.68 per share
based on 20,799,458 shares outstanding) |
| | $ | 409,395,370 | |
| | | | | | | | | |
| R6 Shares (Equivalent to $19.68 per share
based on 343,637 shares outstanding) |
| | $ | 6,764,262 | |
| | | | | | | | | |
| % | Represents percentage of net assets. |
| 1 | Non-income producing securities. |
| 3 | The Adviser has reclassified/classified certain securities in or out of thissub-industry. Such reclassifications/classifications are not supported by S&P or MSCI (unaudited). |
| 4 | Level 2 security. See Note 7 regarding Fair Value Measurements. |
| ADR | American Depositary Receipt. |
All securities are Level 1, unless otherwise noted.
| | |
| 26 | | See Notes to Financial Statements. |
| | |
| September 30, 2019 | | Baron Durable Advantage Fund |
STATEMENT OF NET ASSETS
| | | | | | | | | | | | |
| Shares | | | | | Cost | | | Value | |
| Common Stocks (96.63%) | |
| Communication Services (7.22%) | |
| | | | Cable & Satellite (2.00%) | | | | | | | | |
| | 343 | | | Charter Communications, Inc., Cl A1 | | $ | 113,835 | | | $ | 141,357 | |
| | | |
| | | | Interactive Home Entertainment (1.64%) | | | | | | | | |
| | 1,182 | | | Electronic Arts, Inc.1 | | | 138,754 | | | | 115,623 | |
| | | |
| | | | Interactive Media & Services (2.54%) | | | | | | | | |
| | 147 | | | Alphabet Inc., Cl C1 | | | 159,798 | | | | 179,193 | |
| | | |
| | | | Movies & Entertainment (1.04%) | | | | | | | | |
| | 565 | | | The Walt Disney Company | | | 78,009 | | | | 73,631 | |
| | | | | | | | | | | | |
| | Total Communication Services | | | 490,396 | | | | 509,804 | |
| | | | | | | | | |
|
| Consumer Discretionary (3.39%) | |
| | | | Apparel, Accessories & Luxury Goods (2.14%) | | | | | | | | |
| | 381 | | | LVMH Moët Hennessy Louis
Vuitton SE (France)2,4 | | | 122,482 | | | | 151,165 | |
| | | |
| | | | Internet & Direct Marketing Retail (1.25%) | | | | | | | | |
| | 45 | | | Booking Holdings, Inc.1 | | | 87,686 | | | | 88,318 | |
| | | | | | | | | | | | |
| | Total Consumer Discretionary | | | 210,168 | | | | 239,483 | |
| | | | | | | | | |
|
| Consumer Staples (7.55%) | |
| | | | Distillers & Vintners (4.25%) | | | | | | | | |
| | 1,448 | | | Constellation Brands, Inc., Cl A | | | 293,040 | | | | 300,142 | |
| | | |
| | | | Hypermarkets & Super Centers (1.80%) | | | | | | | | |
| | 443 | | | Costco Wholesale Corp. | | | 99,940 | | | | 127,633 | |
| | | |
| | | | Personal Products (1.50%) | | | | | | | | |
| | 532 | | | The Estée Lauder Companies, Inc., Cl A | | | 79,372 | | | | 105,841 | |
| | | | | | | | | | | | |
| | Total Consumer Staples | | | 472,352 | | | | 533,616 | |
| | | | | | | | | |
|
| Financials (14.39%) | |
| | | | Asset Management & Custody Banks (2.62%) | | | | | | | | |
| | 415 | | | BlackRock, Inc. | | | 209,547 | | | | 184,941 | |
| | | |
| | | | Financial Exchanges & Data (11.77%) | | | | | | | | |
| | 808 | | | CME Group, Inc. | | | 125,886 | | | | 170,763 | |
| | 1,597 | | | Moody’s Corp. | | | 282,617 | | | | 327,113 | |
| | 1,364 | | | S&P Global, Inc. | | | 277,270 | | | | 334,153 | |
| | | | | | | | | | | | |
| | | | 685,773 | | | | 832,029 | |
| | | | | | | | | |
| | Total Financials | | | 895,320 | | | | 1,016,970 | |
| | | | | | | | | |
|
| Health Care (19.37%) | |
| | | | Health Care Equipment (4.15%) | | | | | | | | |
| | 2,029 | | | Danaher Corp. | | | 227,379 | | | | 293,048 | |
| | | |
| | | | Life Sciences Tools & Services (8.99%) | | | | | | | | |
| | 1,550 | | | Agilent Technologies, Inc. | | | 107,517 | | | | 118,777 | |
| | 1,283 | | | IQVIA Holdings Inc.1 | | | 184,333 | | | | 191,655 | |
| | 176 | | | Mettler-Toledo International, Inc.1 | | | 111,617 | | | | 123,974 | |
| | 690 | | | Thermo Fisher Scientific, Inc. | | | 197,982 | | | | 200,976 | |
| | | | | | | | | | | | |
| | | | 601,449 | | | | 635,382 | |
| | | |
| | | | Managed Health Care (3.25%) | | | | | | | | |
| | 1,055 | | | UnitedHealth Group, Incorporated | | | 242,318 | | | | 229,273 | |
| | | | | | | | | | | | |
| Shares | | | | | Cost | | | Value | |
| Common Stocks (continued) | |
| Health Care (continued) | |
| | | |
| | | | Pharmaceuticals (2.98%) | | | | | | | | |
| | 4,730 | | | AstraZeneca PLC, ADR2 | | $ | 195,999 | | | $ | 210,816 | |
| | | | | | | | | | | | |
| | Total Health Care | | | 1,267,145 | | | | 1,368,519 | |
| | | | | | | | | |
|
| Industrials (6.58%) | |
| | | | Industrial Machinery (0.76%) | | | | | | | | |
| | 344 | | | Illinois Tool Works, Inc. | | | 57,196 | | | | 53,832 | |
| | | |
| | | | Research & Consulting Services (4.93%) | | | | | | | | |
| | 5,202 | | | IHS Markit Ltd.1,2 | | | 304,760 | | | | 347,910 | |
| | | |
| | | | Trading Companies & Distributors (0.89%) | | | | | | | | |
| | 1,924 | | | Fastenal Co. | | | 51,877 | | | | 62,857 | |
| | | | | | | | | | | | |
| | Total Industrials | | | 413,833 | | | | 464,599 | |
| | | | | | | | | |
|
| Information Technology (31.61%) | |
| | | | Application Software (5.52%) | | | | | | | | |
| | 765 | | | Adobe, Inc.1 | | | 213,132 | | | | 211,331 | |
| | 3,468 | | | SS&C Technologies Holdings, Inc. | | | 180,948 | | | | 178,845 | |
| | | | | | | | | | | | |
| | | | 394,080 | | | | 390,176 | |
| | | | Data Processing & Outsourced Services (6.92%) | | | | | | | | |
| | 1,076 | | | Fidelity National Information Services, Inc. | | | 142,428 | | | | 142,850 | |
| | 1,275 | | | MasterCard Incorporated, Cl A | | | 248,971 | | | | 346,251 | |
| | | | | | | | | | | | |
| | | | | | | 391,399 | | | | 489,101 | |
| | | |
| | | | Electronic Manufacturing Services (2.44%) | | | | | | | | |
| | 1,853 | | | TE Connectivity Ltd.2 | | | 175,312 | | | | 172,662 | |
| | | |
| | | | IT Consulting & Other Services (3.82%) | | | | | | | | |
| | 1,402 | | | Accenture plc, Cl A2 | | | 239,768 | | | | 269,675 | |
| | | |
| | | | Semiconductor Equipment (1.65%) | | | | | | | | |
| | 468 | | | ASML Holding N.V.2 | | | 86,675 | | | | 116,261 | |
| | | |
| | | | Semiconductors (2.08%) | | | | | | | | |
| | 1,139 | | | Texas Instruments, Inc. | | | 130,354 | | | | 147,204 | |
| | | |
| | | | Systems Software (5.17%) | | | | | | | | |
| | 2,626 | | | Microsoft Corp. | | | 274,484 | | | | 365,093 | |
| | | |
| | | | Technology Hardware, Storage & Peripherals (4.01%) | | | | | | | | |
| | 1,266 | | | Apple, Inc. | | | 237,463 | | | | 283,546 | |
| | | | | | | | | | | | |
| | Total Information Technology | | | 1,929,535 | | | | 2,233,718 | |
| | | | | | | | | |
|
| Materials (1.72%) | |
| | | | Specialty Chemicals (1.72%) | | | | | | | | |
| | 221 | | | The Sherwin-Williams Co. | | | 97,730 | | | | 121,521 | |
| | | | | | | | | | | | |
|
| Real Estate (4.80%) | |
| | | | Specialized REITs (4.80%) | | | | | | | | |
| | 1,286 | | | Alexandria Real Estate Equities, Inc.3 | | | 191,253 | | | | 198,096 | |
| | 244 | | | Equinix, Inc. | | | 110,961 | | | | 140,739 | |
| | | | | | | | | | | | |
| | Total Real Estate | | | 302,214 | | | | 338,835 | |
| | | | | | | | | |
| | Total Common Stocks | | | 6,078,693 | | | | 6,827,065 | |
| | | | | | | | | |
| | |
| See Notes to Financial Statements. | | 27 |
| | |
| Baron Durable Advantage Fund | | September 30, 2019 |
STATEMENT OF NET ASSETS (Continued)
| | | | | | | | | | | | |
| Principal Amount | | Cost | | | Value | |
| Short Term Investments (6.17%) | |
| | $436,141 | | | Repurchase Agreement with Fixed Income Clearing Corp., dated 9/30/2019, 0.35% due 10/1/2019; Proceeds at maturity - $436,145; (Fully collateralized by $405,000 U.S. Treasury Note, 2.875% due 8/15/2028; Market value - $446,736)4 | | $ | 436,141 | | | $ | 436,141 | |
| | | | | | | | | | | | |
| | Total Investments (102.80%) | | $ | 6,514,834 | | | | 7,263,206 | |
| | | | | | | | | | | | |
| | Liabilities Less Cash and Other Assets(-2.80%) | | | | (197,834 | ) |
| | | | | | | | | | | | |
| | Net Assets | | | $ | 7,065,372 | |
| | | | | | | | | | | | |
| Retail Shares (Equivalent to $11.77 per share
based on 163,325 shares outstanding) |
| | $ | 1,922,635 | |
| | | | | | | | | | | | |
| Institutional Shares (Equivalent to $11.82 per share
based on 392,201 shares outstanding) |
| | $ | 4,635,370 | |
| | | | | | | | | | | | |
| R6 Shares (Equivalent to $11.82 per share
based on 42,938 shares outstanding) |
| | $ | 507,367 | |
| | | | | | | | | | | | |
| % | Represents percentage of net assets. |
| 1 | Non-income producing securities. |
| 3 | The Adviser has reclassified/classified certain securities in or out of thissub-industry. Such reclassifications/classifications are not supported by S&P or MSCI (unaudited). |
| 4 | Level 2 security. See Note 7 regarding Fair Value Measurements. |
| ADR | American Depositary Receipt. |
All securities are Level 1, unless otherwise noted.
| | |
| 28 | | See Notes to Financial Statements. |
| | |
| September 30, 2019 | | Baron Funds |
STATEMENTS OF ASSETS AND LIABILITIES
| | | | | | | | | | | | | | | | |
| | | Baron Asset
Fund | | | Baron
Growth Fund | | | Baron Small
Cap Fund | | | Baron
Opportunity
Fund | |
Assets: | | | | | | | | | | | | | | | | |
Investments in securities, at value* | | | | | | | | | | | | | | | | |
Unaffiliated investments | | $ | 4,317,118,178 | | | $ | 5,816,978,490 | | | $ | 3,837,455,485 | | | $ | 427,070,547 | |
“Affiliated” investments | | | — | | | | 985,734,298 | | | | 48,545,000 | | | | — | |
| | | | | | | | | | | | | | | | |
Total investments, at value | | | 4,317,118,178 | | | | 6,802,712,788 | | | | 3,886,000,485 | | | | 427,070,547 | |
Cash | | | 853,915 | | | | 1,354,303 | | | | — | | | | 50,862 | |
Receivable for securities sold | | | 148,789,140 | | | | — | | | | 40,559,592 | | | | 16,815,372 | |
Receivable for shares sold | | | 4,440,125 | | | | 8,930,878 | | | | 1,813,264 | | | | 193,086 | |
Dividends and interest receivable | | | 865,623 | | | | 2,607,688 | | | | 586,241 | | | | 28,100 | |
Prepaid expenses | | | 14,100 | | | | 25,390 | | | | 16,047 | | | | 1,697 | |
| | | | | | | | | | | | | | | | |
| | | 4,472,081,081 | | | | 6,815,631,047 | | | | 3,928,975,629 | | | | 444,159,664 | |
| | | | | | | | | | | | | | | | |
Liabilities: | | | | | | | | | | | | | | | | |
Payable for securities purchased | | | 136,488,240 | | | | 1,470,778 | | | | 43,511,697 | | | | 10,967,475 | |
Payable for shares redeemed | | | 4,291,499 | | | | 23,864,709 | | | | 3,634,677 | | | | 7,960,064 | |
Trustee fees payable (Note 4) | | | 49,069 | | | | 83,285 | | | | 52,401 | | | | 5,798 | |
Investment advisory fees payable (Note 4) | | | 616 | | | | 984 | | | | 782 | | | | 108 | |
Distribution fees payable (Note 4) | | | 297 | | | | 709 | | | | 231 | | | | 723 | |
Payable for borrowings against line of credit | | | — | | | | — | | | | — | | | | 13,600,000 | |
Accrued expenses and other payables | | | 573,659 | | | | 704,838 | | | | 638,114 | | | | 111,104 | |
| | | | | | | | | | | | | | | | |
| | | 141,403,380 | | | | 26,125,303 | | | | 47,837,902 | | | | 32,645,272 | |
| | | | | | | | | | | | | | | | |
Net Assets | | $ | 4,330,677,701 | | | $ | 6,789,505,744 | | | $ | 3,881,137,727 | | | $ | 411,514,392 | |
| | | | | | | | | | | | | | | | |
Net Assets consist of: | | | | | | | | | | | | | | | | |
Paid-in capital | | $ | 1,666,836,861 | | | $ | 1,592,509,444 | | | $ | 1,535,414,900 | | | $ | 209,190,845 | |
Distributable earnings/(losses) | | | 2,663,840,840 | | | | 5,196,996,300 | | | | 2,345,722,827 | | | | 202,323,547 | |
| | | | | | | | | | | | | | | | |
Net Assets | | $ | 4,330,677,701 | | | $ | 6,789,505,744 | | | $ | 3,881,137,727 | | | $ | 411,514,392 | |
| | | | | | | | | | | | | | | | |
Retail Shares: | | | | | | | | | | | | | | | | |
Net Assets | | $ | 2,241,980,173 | | | $ | 2,506,967,489 | | | $ | 1,451,874,833 | | | $ | 302,601,487 | |
Shares Outstanding ($0.01 par value; indefinite shares authorized) | | | 27,247,953 | | | | 31,753,587 | | | | 49,322,422 | | | | 14,057,814 | |
| | | | | | | | | | | | | | | | |
Net Asset Value and Offering Price Per Share | | $ | 82.28 | | | $ | 78.95 | | | $ | 29.44 | | | $ | 21.53 | |
| | | | | | | | | | | | | | | | |
Institutional Shares: | | | | | | | | | | | | | | | | |
Net Assets | | $ | 1,979,735,661 | | | $ | 4,150,891,456 | | | $ | 2,267,322,637 | | | $ | 94,456,247 | |
Shares Outstanding ($0.01 par value; indefinite shares authorized) | | | 23,109,986 | | | | 50,812,644 | | | | 73,760,889 | | | | 4,212,619 | |
| | | | | | | | | | | | | | | | |
Net Asset Value and Offering Price Per Share | | $ | 85.67 | | | $ | 81.69 | | | $ | 30.74 | | | $ | 22.42 | |
| | | | | | | | | | | | | | | | |
R6 Shares: | | | | | | | | | | | | | | | | |
Net Assets | | $ | 108,961,867 | | | $ | 131,646,799 | | | $ | 161,940,257 | | | $ | 14,456,658 | |
Shares Outstanding ($0.01 par value; indefinite shares authorized) | | | 1,272,160 | | | | 1,611,343 | | | | 5,269,696 | | | | 644,054 | |
| | | | | | | | | | | | | | | | |
Net Asset Value and Offering Price Per Share | | $ | 85.65 | | | $ | 81.70 | | | $ | 30.73 | | | $ | 22.45 | |
| | | | | | | | | | | | | | | | |
| | | | |
*Investments in securities, at cost | | | | | | | | | | | | | | | | |
Unaffiliated investments | | $ | 1,703,703,882 | | | $ | 1,551,760,192 | | | $ | 1,839,772,239 | | | $ | 244,823,186 | |
“Affiliated” investments | | | — | | | | 277,082,163 | | | | 35,000,000 | | | | — | |
| | | | | | | | | | | | | | | | |
Total investments, at cost | | $ | 1,703,703,882 | | | $ | 1,828,842,355 | | | $ | 1,874,772,239 | | | $ | 244,823,186 | |
| | | | | | | | | | | | | | | | |
| | |
| See Notes to Financial Statements. | | 29 |
| | |
| Baron Funds | | September 30, 2019 |
STATEMENTS OF ASSETS AND LIABILITIES (Continued)
| | | | | | | | | | | | |
| | | Baron Fifth
Avenue Growth
Fund | | | Baron
Discovery
Fund | | | Baron Durable
Advantage
Fund | |
Assets: | | | | | | | | | | | | |
Investments in securities, at value* | | | | | | | | | | | | |
Unaffiliated investments | | $ | 310,231,672 | | | $ | 538,864,441 | | | $ | 7,263,206 | |
“Affiliated” investments | | | — | | | | — | | | | — | |
| | | | | | | | | | | | |
Total investments, at value | | | 310,231,672 | | | | 538,864,441 | | | | 7,263,206 | |
Cash | | | — | | | | — | | | | — | |
Receivable for securities sold | | | 168,776 | | | | — | | | | — | |
Receivable for shares sold | | | 221,764 | | | | 1,847,899 | | | | 1,662 | |
Dividends and interest receivable | | | 96 | | | | 185,136 | | | | 2,328 | |
Prepaid expenses | | | 1,096 | | | | 6,800 | | | | 15 | |
| | | | | | | | | | | | |
| | | 310,623,404 | | | | 540,904,276 | | | | 7,267,211 | |
| | | | | | | | | | | | |
Liabilities: | | | | | | | | | | | | |
Payable for securities purchased | | | 1,729,241 | | | | — | | | | 134,912 | |
Payable for shares redeemed | | | 449,311 | | | | 1,851,236 | | | | 2,253 | |
Trustee fees payable (Note 4) | | | 3,700 | | | | 6,030 | | | | 55 | |
Investment advisory fees payable (Note 4) | | | 770 | | | | 117 | | | | — | |
Distribution fees payable (Note 4) | | | 177 | | | | 880 | | | | 640 | |
Payable for borrowings against line of credit | | | — | | | | — | | | | — | |
Accrued expenses and other payables | | | 86,610 | | | | 138,096 | | | | 63,979 | |
| | | | | | | | | | | | |
| | | 2,269,809 | | | | 1,996,359 | | | | 201,839 | |
| | | | | | | | | | | | |
Net Assets | | $ | 308,353,595 | | | $ | 538,907,917 | | | $ | 7,065,372 | |
| | | | | | | | | | | | |
Net Assets consist of: | | | | | | | | | | | | |
Paid-in capital | | $ | 150,626,427 | | | $ | 489,018,631 | | | $ | 6,434,512 | |
Distributable earnings/(losses) | | | 157,727,168 | | | | 49,889,286 | | | | 630,860 | |
| | | | | | | | | | | | |
Net Assets | | $ | 308,353,595 | | | $ | 538,907,917 | | | $ | 7,065,372 | |
| | | | | | | | | | | | |
Retail Shares: | | | | | | | | | | | | |
Net Assets | | $ | 115,480,135 | | | $ | 122,748,285 | | | $ | 1,922,635 | |
Shares Outstanding ($0.01 par value; indefinite shares authorized) | | | 3,597,827 | | | | 6,324,793 | | | | 163,325 | |
| | | | | | | | | | | | |
Net Asset Value and Offering Price Per Share | | $ | 32.10 | | | $ | 19.41 | | | $ | 11.77 | |
| | | | | | | | | | | | |
Institutional Shares: | | | | | | | | | | | | |
Net Assets | | $ | 170,349,745 | | | $ | 409,395,370 | | | $ | 4,635,370 | |
Shares Outstanding ($0.01 par value; indefinite shares authorized) | | | 5,194,015 | | | | 20,799,458 | | | | 392,201 | |
| | | | | | | | | | | | |
Net Asset Value and Offering Price Per Share | | $ | 32.80 | | | $ | 19.68 | | | $ | 11.82 | |
| | | | | | | | | | | | |
R6 Shares: | | | | | | | | | | | | |
Net Assets | | $ | 22,523,715 | | | $ | 6,764,262 | | | $ | 507,367 | |
Shares Outstanding ($0.01 par value; indefinite shares authorized) | | | 686,518 | | | | 343,637 | | | | 42,938 | |
| | | | | | | | | | | | |
Net Asset Value and Offering Price Per Share | | $ | 32.81 | | | $ | 19.68 | | | $ | 11.82 | |
| | | | | | | | | | | | |
| | | |
*Investments in securities, at cost | | | | | | | | | | | | |
Unaffiliated investments | | $ | 161,945,004 | | | $ | 482,105,307 | | | $ | 6,514,834 | |
“Affiliated” investments | | | — | | | | — | | | | — | |
| | | | | | | | | | | | |
Total investments, at cost | | $ | 161,945,004 | | | $ | 482,105,307 | | | $ | 6,514,834 | |
| | | | | | | | | | | | |
| | |
| 30 | | See Notes to Financial Statements. |
| | |
| September 30, 2019 | | Baron Funds |
STATEMENTS OF OPERATIONS
|
FOR THE YEAR ENDED SEPTEMBER 30, 2019 |
| | | | | | | | | | | | | | | | |
| | | Baron Asset
Fund | | | Baron
Growth Fund | | | Baron Small
Cap Fund | | | Baron
Opportunity
Fund | |
Investment income: | | | | | | | | | | | | | | | | |
Income: | | | | | | | | | | | | | | | | |
Dividends — Unaffiliated investments | | $ | 21,635,706 | | | $ | 52,510,511 | | | $ | 13,919,558 | | | $ | 1,129,128 | |
Dividends — “Affiliated” investments | | | — | | | | 16,839,124 | | | | — | | | | — | |
Interest | | | 447,896 | | | | 136,847 | | | | 482,212 | | | | 65,734 | |
Securities lending income, net | | | — | | | | 349,286 | | | | 146,479 | | | | — | |
Foreign taxes withheld on dividends | | | — | | | | — | | | | (225,350 | ) | | | — | |
| | | | | | | | | | | | | | | | |
Total income | | | 22,083,602 | | | | 69,835,768 | | | | 14,322,899 | | | | 1,194,862 | |
| | | | | | | | | | | | | | | | |
Expenses: | | | | | | | | | | | | | | | | |
Investment advisory fees (Note 4) | | | 38,528,799 | | | | 64,917,189 | | | | 40,060,532 | | | | 4,402,860 | |
Distribution fees — Retail Shares (Note 4) | | | 5,384,250 | | | | 6,175,642 | | | | 3,836,032 | | | | 837,767 | |
Shareholder servicing agent fees and expenses — Retail Shares | | | 281,035 | | | | 231,615 | | | | 172,863 | | | | 65,485 | |
Shareholder servicing agent fees and expenses — Institutional Shares | | | 73,030 | | | | 161,935 | | | | 95,245 | | | | 14,675 | |
Shareholder servicing agent fees and expenses — R6 Shares | | | 3,514 | | | | 5,025 | | | | 6,927 | | | | 626 | |
Reports to shareholders | | | 797,100 | | | | 908,280 | | | | 1,002,600 | | | | 83,760 | |
Trustee fees and expenses (Note 4) | | | 195,603 | | | | 346,747 | | | | 217,592 | | | | 24,423 | |
Registration and filing fees | | | 161,600 | | | | 176,440 | | | | 106,400 | | | | 70,070 | |
Custodian and fund accounting fees | | | 141,405 | | | | 233,395 | | | | 163,480 | | | | 44,830 | |
Professional fees | | | 110,280 | | | | 197,238 | | | | 115,000 | | | | 48,938 | |
Administration fees | | | 59,271 | | | | 68,929 | | | | 59,962 | | | | 46,344 | |
Line of credit fees | | | 46,976 | | | | 76,287 | | | | 46,559 | | | | 5,287 | |
Insurance expense | | | 37,156 | | | | 68,820 | | | | 45,170 | | | | 4,040 | |
Miscellaneous expenses | | | 1,949 | | | | 4,505 | | | | 1,957 | | | | 1,957 | |
| | | | | | | | | | | | | | | | |
Total operating expenses | | | 45,821,968 | | | | 73,572,047 | | | | 45,930,319 | | | | 5,651,062 | |
Interest expense on borrowings | | | — | | | | 132,849 | | | | — | | | | 1,139 | |
| | | | | | | | | | | | | | | | |
Total expenses | | | 45,821,968 | | | | 73,704,896 | | | | 45,930,319 | | | | 5,652,201 | |
| | | | | | | | | | | | | | | | |
Net investment income (loss) | | | (23,738,366 | ) | | | (3,869,128 | ) | | | (31,607,420 | ) | | | (4,457,339 | ) |
| | | | | | | | | | | | | | | | |
Realized and unrealized gain (loss) on investments: | | | | | | | | | | | | | | | | |
Net realized gain (loss) on investments sold — Unaffiliated investments | | | 77,477,454 | | | | 286,411,149 | | | | 428,374,839 | | | | 30,916,903 | |
Net realized gain (loss) on investments sold — “Affiliated” investments | | | — | | | | 15 | | | | — | | | | — | |
Net realized gain (loss) on foreign currency transactions | | | — | | | | 28,409 | | | | (17,785 | ) | | | 19,660 | |
Change in net unrealized appreciation (depreciation) of: | | | | | | | | | | | | | | | | |
Investments — Unaffiliated investments | | | 267,286,723 | | | | 151,858,205 | | | | (639,494,915 | ) | | | (19,284,942 | ) |
Investments — “Affiliated” investments | | | — | | | | (129,186,487 | ) | | | 13,545,000 | | | | — | |
Foreign currency translations | | | — | | | | (11 | ) | | | — | | | | — | |
| | | | | | | | | | | | | | | | |
Net gain (loss) on investments | | | 344,764,177 | | | | 309,111,280 | | | | (197,592,861 | ) | | | 11,651,621 | |
| | | | | | | | | | | | | | | | |
Net increase (decrease) in net assets resulting from operations | | $ | 321,025,811 | | | $ | 305,242,152 | | | $ | (229,200,281 | ) | | $ | 7,194,282 | |
| | | | | | | | | | | | | | | | |
| | |
| See Notes to Financial Statements. | | 31 |
| | |
| Baron Funds | | September 30, 2019 |
STATEMENTS OF OPERATIONS (Continued)
|
FOR THE YEAR ENDED SEPTEMBER 30, 2019 |
| | | | | | | | | | | | |
| | | Baron
Fifth Avenue
Growth Fund | | | Baron
Discovery
Fund | | | Baron Durable
Advantage
Fund | |
Investment income: | | | | | | | | | | | | |
Income: | | | | | | | | | | | | |
Dividends — Unaffiliated investments | | $ | 3,669,918 | | | $ | 842,437 | | | $ | 51,533 | |
Dividends — “Affiliated” investments | | | — | | | | �� | | | | — | |
Interest | | | 48,027 | | | | 175,055 | | | | 1,467 | |
Securities lending income, net | | | — | | | | 38,961 | | | | — | |
Foreign taxes withheld on dividends | | | (16,111 | ) | | | (19,824 | ) | | | (693 | ) |
| | | | | | | | | | | | |
Total income | | | 3,701,834 | | | | 1,036,629 | | | | 52,307 | |
| | | | | | | | | | | | |
Expenses: | | | | | | | | | | | | |
Investment advisory fees (Note 4) | | | 2,031,243 | | | | 4,684,551 | | | | 27,909 | |
Distribution fees — Retail Shares (Note 4) | | | 287,143 | | | | 313,858 | | | | 2,007 | |
Shareholder servicing agent fees and expenses — Retail Shares | | | 30,428 | | | | 28,166 | | | | 12,293 | |
Shareholder servicing agent fees and expenses — Institutional Shares | | | 16,596 | | | | 31,090 | | | | 8,980 | |
Shareholder servicing agent fees and expenses — R6 Shares | | | 940 | | | | 246 | | | | 19 | |
Reports to shareholders | | | 33,850 | | | | 115,050 | | | | 1,044 | |
Trustee fees and expenses (Note 4) | | | 15,510 | | | | 23,731 | | | | 192 | |
Registration and filing fees | | | 57,140 | | | | 104,540 | | | | 46,002 | |
Custodian and fund accounting fees | | | 47,164 | | | | 58,663 | | | | 29,681 | |
Professional fees | | | 46,665 | | | | 43,525 | | | | 42,834 | |
Administration fees | | | 45,736 | | | | 46,441 | | | | 47,333 | |
Line of credit fees | | | 3,453 | | | | 5,952 | | | | 59 | |
Insurance expense | | | 2,778 | | | | 4,382 | | | | 37 | |
Miscellaneous expenses | | | 1,946 | | | | 1,957 | | | | 1,909 | |
| | | | | | | | | | | | |
Total operating expenses | | | 2,620,592 | | | | 5,462,152 | | | | 220,299 | |
Interest expense on borrowings | | | — | | | | — | | | | — | |
| | | | | | | | | | | | |
Total expenses | | | 2,620,592 | | | | 5,462,152 | | | | 220,299 | |
Reimbursement of expenses by Adviser — Retail Shares (Note 4) | | | (73,740 | ) | | | (12,080 | ) | | | (42,298 | ) |
Reimbursement of expenses by Adviser — Institutional Shares (Note 4) | | | (74,577 | ) | | | — | | | | (129,100 | ) |
Reimbursement of expenses by Adviser — R6 Shares (Note 4) | | | (8,800 | ) | | | — | | | | (16,838 | ) |
| | | | | | | | | | | | |
Net expenses | | | 2,463,475 | | | | 5,450,072 | | | | 32,063 | |
| | | | | | | | | | | | |
Net investment income (loss) | | | 1,238,359 | | | | (4,413,443 | ) | | | 20,244 | |
| | | | | | | | | | | | |
Realized and unrealized gain (loss) on investments: | | | | | | | | | | | | |
Net realized gain (loss) on investments sold — Unaffiliated investments | | | 10,648,331 | | | | 955,143 | | | | (108,751 | ) |
Net realized gain (loss) on investments sold — “Affiliated” investments | | | — | | | | — | | | | — | |
Net realized gain (loss) on foreign currency transactions | | | (13,772 | ) | | | (9,106 | ) | | | 108 | |
Change in net unrealized appreciation (depreciation) of: | | | | | | | | | | | | |
Investments — Unaffiliated investments | | | (3,703,325 | ) | | | (42,042,495 | ) | | | 521,107 | |
Investments — “Affiliated” investments | | | — | | | | — | | | | — | |
Foreign currency translations | | | — | | | | (610 | ) | | | 3 | |
| | | | | | | | | | | | |
Net gain (loss) on investments | | | 6,931,234 | | | | (41,097,068 | ) | | | 412,467 | |
| | | | | | | | | | | | |
Net increase (decrease) in net assets resulting from operations | | $ | 8,169,593 | | | $ | (45,510,511 | ) | | $ | 432,711 | |
| | | | | | | | | | | | |
| | |
| 32 | | See Notes to Financial Statements. |
| | |
| September 30, 2019 | | Baron Funds |
STATEMENTS OF CHANGES IN NET ASSETS
| | | | | | | | | | | | | | | | | | | | | | | | |
| | | Baron Asset Fund | | | Baron Growth Fund | | | Baron Small Cap Fund | |
| | | For the Year
Ended
September 30,
2019 | | | For the Year
Ended
September 30,
2018 | | | For the Year
Ended
September 30,
2019 | | | For the Year
Ended
September 30,
2018 | | | For the Year
Ended
September 30,
2019 | | | For the Year
Ended
September 30,
2018 | |
Increase (Decrease) in Net Assets: | | | | | | | | | | | | | | | | | | | | | | | | |
Operations: | | | | | | | | | | | | | | | | | | | | | | | | |
Net investment income (loss) | | $ | (23,738,366 | ) | | $ | (22,870,685 | ) | | $ | (3,869,128 | ) | | $ | (6,109,140 | ) | | $ | (31,607,420 | ) | | $ | (39,158,929 | ) |
Net realized gain (loss) | | | 77,477,454 | | | | 246,510,674 | | | | 286,439,573 | | | | 418,906,952 | | | | 428,357,054 | | | | 319,980,930 | |
Change in net unrealized appreciation (depreciation) | | | 267,286,723 | | | | 460,312,015 | | | | 22,671,707 | | | | 1,063,864,961 | | | | (625,949,915 | ) | | | 710,656,024 | |
| | | | | | | | | | | | | | | | | | | | | | | | |
Increase (decrease) in net assets resulting from operations | | | 321,025,811 | | | | 683,952,004 | | | | 305,242,152 | | | | 1,476,662,773 | | | | (229,200,281 | ) | | | 991,478,025 | |
| | | | | | | | | | | | | | | | | | | | | | | | |
Distributions to shareholders from: | | | | | | | | | | | | | | | | | | | | | | | | |
Distributable earnings — Retail Shares | | | (130,380,628 | ) | | | (137,145,474 | ) | | | (169,748,607 | ) | | | (286,221,373 | ) | | | (139,200,153 | ) | | | (212,143,374 | ) |
Distributable earnings — Institutional Shares | | | (76,943,077 | ) | | | (69,986,292 | ) | | | (253,497,504 | ) | | | (368,081,112 | ) | | | (200,198,138 | ) | | | (289,023,146 | ) |
Distributable earnings — R6 Shares | | | (4,155,669 | ) | | | (1,607,248 | ) | | | (6,757,066 | ) | | | (1,451,955 | ) | | | (11,607,108 | ) | | | (12,501,687 | ) |
| | | | | | | | | | | | | | | | | | | | | | | | |
Decrease in net assets from distributions to shareholders | | | (211,479,374 | ) | | | (208,739,014 | ) | | | (430,003,177 | ) | | | (655,754,440 | ) | | | (351,005,399 | ) | | | (513,668,207 | ) |
| | | | | | | | | | | | | | | | | | | | | | | | |
Capital share transactions: | | | | | | | | | | | | | | | | | | | | | | | | |
Proceeds from the sale of shares — Retail Shares | | | 139,761,881 | | | | 145,710,396 | | | | 184,857,908 | | | | 213,929,778 | | | | 117,344,513 | | | | 143,456,114 | |
Proceeds from the sale of shares — Institutional Shares | | | 784,662,813 | | | | 317,182,069 | | | | 684,000,375 | | | | 676,657,030 | | | | 345,558,212 | | | | 376,610,849 | |
Proceeds from the sale of shares — R6 Shares | | | 33,278,592 | | | | 42,718,734 | | | | 31,434,617 | | | | 85,899,908 | | | | 36,598,906 | | | | 50,674,971 | |
Net asset value of shares issued in reinvestment of distributions — Retail Shares | | | 126,966,908 | | | | 133,709,022 | | | | 166,152,109 | | | | 280,013,446 | | | | 136,479,004 | | | | 208,476,203 | |
Net asset value of shares issued in reinvestment of distributions — Institutional Shares | | | 74,160,022 | | | | 67,770,160 | | | | 244,717,993 | | | | 355,815,178 | | | | 189,732,531 | | | | 274,001,939 | |
Net asset value of shares issues in reinvestment of distribution — R6 Shares | | | 4,155,668 | | | | 1,607,248 | | | | 6,757,066 | | | | 1,451,955 | | | | 11,607,108 | | | | 12,501,687 | |
Cost of shares redeemed — Retail Shares | | | (313,093,759 | ) | | | (298,949,695 | ) | | | (525,413,424 | ) | | | (741,149,282 | ) | | | (401,321,540 | ) | | | (429,031,648 | ) |
Cost of shares redeemed — Institutional Shares | | | (273,943,356 | ) | | | (255,979,096 | ) | | | (854,055,168 | ) | | | (810,971,404 | ) | | | (632,543,578 | ) | | | (641,665,078 | ) |
Cost of shares redeemed — R6 Shares | | | (3,720,596 | ) | | | (2,632,984 | ) | | | (13,616,954 | ) | | | (5,762,745 | ) | | | (25,262,003 | ) | | | (26,381,460 | ) |
| | | | | | | | | | | | | | | | | | | | | | | | |
Increase (decrease) in net assets derived from capital share transactions | | | 572,228,173 | | | | 151,135,854 | | | | (75,165,478 | ) | | | 55,883,864 | | | | (221,806,847 | ) | | | (31,356,423 | ) |
| | | | | | | | | | | | | | | | | | | | | | | | |
Net increase (decrease) in net assets | | | 681,774,610 | | | | 626,348,844 | | | | (199,926,503 | ) | | | 876,792,197 | | | | (802,012,527 | ) | | | 446,453,395 | |
| | | | | | | | | | | | | | | | | | | | | | | | |
Net Assets: | | | | | | | | | | | | | | | | | | | | | | | | |
Beginning of year | | | 3,648,903,091 | | | | 3,022,554,247 | | | | 6,989,432,247 | | | | 6,112,640,050 | | | | 4,683,150,254 | | | | 4,236,696,859 | |
| | | | | | | | | | | | | | | | | | | | | | | | |
End of year | | $ | 4,330,677,701 | | | $ | 3,648,903,091 | | | $ | 6,789,505,744 | | | $ | 6,989,432,247 | | | $ | 3,881,137,727 | | | $ | 4,683,150,254 | |
| | | | | | | | | | | | | | | | | | | | | | | | |
Capital share transactions — Retail Shares | | | | | | | | | | | | | | | | | | | | | | | | |
Shares sold | | | 1,814,155 | | | | 1,979,848 | | | | 2,480,330 | | | | 2,928,463 | | | | 4,083,207 | | | | 4,700,114 | |
Shares issued in reinvestment of distributions | | | 1,787,091 | | | | 1,932,766 | | | | 2,395,503 | | | | 4,139,149 | | | | 5,032,412 | | | | 7,437,610 | |
Shares redeemed | | | (4,103,726 | ) | | | (4,087,569 | ) | | | (7,178,486 | ) | | | (10,164,662 | ) | | | (14,172,315 | ) | | | (14,231,999 | ) |
| | | | | | | | | | | | | | | | | | | | | | | | |
Net increase (decrease) | | | (502,480 | ) | | | (174,955 | ) | | | (2,302,653 | ) | | | (3,097,050 | ) | | | (5,056,696 | ) | | | (2,094,275 | ) |
| | | | | | | | | | | | | | | | | | | | | | | | |
Capital share transactions — Institutional Shares | | | | | | | | | | | | | | | | | | | | | | | | |
Shares sold | | | 9,947,466 | | | | 4,114,203 | | | | 9,249,961 | | | | 8,883,101 | | | | 11,564,148 | | | | 11,959,733 | |
Shares issued in reinvestment of distributions | | | 1,004,292 | | | | 947,569 | | | | 3,417,372 | | | | 5,118,906 | | | | 6,713,819 | | | | 9,438,578 | |
Shares redeemed | | | (3,437,876 | ) | | | (3,437,913 | ) | | | (11,611,446 | ) | | | (10,949,366 | ) | | | (21,685,076 | ) | | | (20,373,903 | ) |
| | | | | | | | | | | | | | | | | | | | | | | | |
Net increase (decrease) | | | 7,513,882 | | | | 1,623,859 | | | | 1,055,887 | | | | 3,052,641 | | | | (3,407,109 | ) | | | 1,024,408 | |
| | | | | | | | | | | | | | | | | | | | | | | | |
Capital share transactions — R6 Shares | | | | | | | | | | | | | | | | | | | | | | | | |
Shares sold | | | 391,414 | | | | 574,868 | | | | 398,540 | | | | 1,177,916 | | | | 1,258,690 | | | | 1,621,053 | |
Shares issued in reinvestment of dividends | | | 56,305 | | | | 22,476 | | | | 94,346 | | | | 20,885 | | | | 410,871 | | | | 430,796 | |
Shares redeemed | | | (46,562 | ) | | | (34,172 | ) | | | (174,647 | ) | | | (75,433 | ) | | | (841,402 | ) | | | (833,374 | ) |
| | | | | | | | | | | | | | | | | | | | | | | | |
Net increase (decrease) | | | 401,157 | | | | 563,172 | | | | 318,239 | | | | 1,123,368 | | | | 828,159 | | | | 1,218,475 | |
| | | | | | | | | | | | | | | | | | | | | | | | |
| | |
| See Notes to Financial Statements. | | 33 |
| | |
| Baron Funds | | September 30, 2019 |
STATEMENTS OF CHANGES IN NET ASSETS (Continued)
| | | | | | | | | | | | | | | | |
| | | Baron Opportunity Fund | | | Baron Fifth Avenue Growth Fund | |
| | | For the Year
Ended
September 30,
2019 | | | For the Year
Ended
September 30,
2018 | | | For the Year
Ended
September 30,
2019 | | | For the Year
Ended
September 30,
2018 | |
Increase (Decrease) in Net Assets: | | | | | | | | | | | | | | | | |
Operations: | | | | | | | | | | | | | | | | |
Net investment income (loss) | | $ | (4,457,339 | ) | | $ | (3,679,738 | ) | | $ | 1,238,359 | | | $ | (1,128,622 | ) |
Net realized gain (loss) | | | 30,936,563 | | | | 19,097,360 | | | | 10,634,559 | | | | 3,777,328 | |
Change in net unrealized appreciation (depreciation) | | | (19,284,942 | ) | | | 90,239,084 | | | | (3,703,325 | ) | | | 55,249,261 | |
| | | | | | | | | | | | | | | | |
Increase (decrease) in net assets resulting from operations | | | 7,194,282 | | | | 105,656,706 | | | | 8,169,593 | | | | 57,897,967 | |
| | | | | | | | | | | | | | | | |
Distributions to shareholders from: | | | | | | | | | | | | | | | | |
Distributable earnings — Retail Shares | | | (15,007,464 | ) | | | (27,302,633 | ) | | | — | | | | — | |
Distributable earnings — Institutional Shares | | | (3,825,457 | ) | | | (7,324,844 | ) | | | — | | | | — | |
Distributable earnings — R6 Shares | | | (568,972 | ) | | | (146,779 | ) | | | — | | | | — | |
| | | | | | | | | | | | | | | | |
Decrease in net assets from distributions to shareholders | | | (19,401,893 | ) | | | (34,774,256 | ) | | | — | | | | — | |
| | | | | | | | | | | | | | | | |
Capital share transactions: | | | | | | | | | | | | | | | | |
Proceeds from the sale of shares — Retail Shares | | | 60,083,597 | | | | 148,307,035 | | | | 22,290,459 | | | | 52,971,547 | |
Proceeds from the sale of shares — Institutional Shares | | | 33,710,032 | | | | 43,391,025 | | | | 45,794,664 | | | | 61,793,522 | |
Proceeds from the sale of shares — R6 Shares | | | 168,932 | | | | 10,775,252 | | | | 575,354 | | | | 13,907,376 | |
Net asset value of shares issued in reinvestment of distributions — Retail Shares | | | 14,672,714 | | | | 26,639,115 | | | | — | | | | — | |
Net asset value of shares issued in reinvestment of distributions — Institutional Shares | | | 3,594,064 | | | | 7,193,158 | | | | — | | | | — | |
Net asset value of shares issues in reinvestment of distribution — R6 Shares | | | 568,972 | | | | 146,779 | | | | — | | | | — | |
Cost of shares redeemed — Retail Shares | | | (125,706,274 | ) | | | (68,353,321 | ) | | | (41,302,711 | ) | | | (35,442,845 | ) |
Cost of shares redeemed — Institutional Shares | | | (37,190,698 | ) | | | (19,134,278 | ) | | | (32,721,299 | ) | | | (26,943,779 | ) |
Cost of shares redeemed — R6 Shares | | | (145,524 | ) | | | (4,762 | ) | | | (268,565 | ) | | | (38,609 | ) |
| | | | | | | | | | | | | | | | |
Increase (decrease) in net assets derived from capital share transactions | | | (50,244,185 | ) | | | 148,960,003 | | | | (5,632,098 | ) | | | 66,247,212 | |
| | | | | | | | | | | | | | | | |
Net increase (decrease) in net assets | | | (62,451,796 | ) | | | 219,842,453 | | | | 2,537,495 | | | | 124,145,179 | |
| | | | | | | | | | | | | | | | |
Net Assets: | | | | | | | | | | | | | | | | |
Beginning of year | | | 473,966,188 | | | | 254,123,735 | | | | 305,816,100 | | | | 181,670,921 | |
| | | | | | | | | | | | | | | | |
End of year | | $ | 411,514,392 | | | $ | 473,966,188 | | | $ | 308,353,595 | | | $ | 305,816,100 | |
| | | | | | | | | | | | | | | | |
Capital share transactions — Retail Shares | | | | | | | | | | | | | | | | |
Shares sold | | | 2,921,912 | | | | 7,557,683 | | | | 742,314 | | | | 1,853,727 | |
Shares issued in reinvestment of distributions | | | 768,205 | | | | 1,571,629 | | | | — | | | | — | |
Shares redeemed | | | (6,145,594 | ) | | | (3,486,243 | ) | | | (1,406,171 | ) | | | (1,232,408 | ) |
| | | | | | | | | | | | | | | | |
Net increase (decrease) | | | (2,455,477 | ) | | | 5,643,069 | | | | (663,857 | ) | | | 621,319 | |
| | | | | | | | | | | | | | | | |
Capital share transactions — Institutional Shares | | | | | | | | | | | | | | | | |
Shares sold | | | 1,587,636 | | | | 2,070,452 | | | | 1,498,812 | | | | 2,100,233 | |
Shares issued in reinvestment of distributions | | | 181,061 | | | | 410,100 | | | | — | | | | — | |
Shares redeemed | | | (1,776,413 | ) | | | (969,977 | ) | | | (1,117,427 | ) | | | (947,317 | ) |
| | | | | | | | | | | | | | | | |
Net increase (decrease) | | | (7,716 | ) | | | 1,510,575 | | | | 381,385 | | | | 1,152,916 | |
| | | | | | | | | | | | | | | | |
Capital share transactions — R6 Shares | | | | | | | | | | | | | | | | |
Shares sold | | | 7,484 | | | | 550,824 | | | | 16,693 | | | | 487,758 | |
Shares issued in reinvestment of dividends | | | 28,634 | | | | 8,363 | | | | — | | | | — | |
Shares redeemed | | | (6,414 | ) | | | (240 | ) | | | (8,558 | ) | | | (1,333 | ) |
| | | | | | | | | | | | | | | | |
Net increase (decrease) | | | 29,704 | | | | 558,947 | | | | 8,135 | | | | 486,425 | |
| | | | | | | | | | | | | | | | |
| | |
| 34 | | See Notes to Financial Statements. |
| | |
| September 30, 2019 | | Baron Funds |
STATEMENTS OF CHANGES IN NET ASSETS (Continued)
| | | | | | | | | | | | | | | | |
| | | Baron Discovery Fund | | | Baron Durable Advantage Fund | |
| | | For the Year
Ended
September 30,
2019 | | | For the Year
Ended
September 30,
2018 | | | For the Year
Ended
September 30,
2019 | | | For the Period
Ended
September 30,
2018(1) | |
Increase (Decrease) in Net Assets: | | | | | | | | | | | | | | | | |
Operations: | | | | | | | | | | | | | | | | |
Net investment income (loss) | | $ | (4,413,443 | ) | | $ | 549,549 | | | $ | 20,244 | | | $ | 9,541 | |
Net realized gain (loss) | | | 946,037 | | | | 28,185,906 | | | | (108,643 | ) | | | (26,238 | ) |
Change in net unrealized appreciation (depreciation) | | | (42,043,105 | ) | | | 53,718,312 | | | | 521,110 | | | | 227,257 | |
| | | | | | | | | | | | | | | | |
Increase (decrease) in net assets resulting from operations | | | (45,510,511 | ) | | | 82,453,767 | | | | 432,711 | | | | 210,560 | |
| | | | | | | | | | | | | | | | |
Distributions to shareholders from: | | | | | | | | | | | | | | | | |
Distributable earnings — Retail Shares | | | (7,715,143 | ) | | | (48,993 | ) | | | (1,989 | ) | | | — | |
Distributable earnings — Institutional Shares | | | (18,229,890 | ) | | | (244,807 | ) | | | (9,620 | ) | | | — | |
Distributable earnings — R6 Shares | | | (356,349 | ) | | | (7,283 | ) | | | (1,393 | ) | | | — | |
| | | | | | | | | | | | | | | | |
Decrease in net assets from distributions to shareholders | | | (26,301,382 | ) | | | (301,083 | ) | | | (13,002 | ) | | | — | |
| | | | | | | | | | | | | | | | |
Capital share transactions: | | | | | | | | | | | | | | | | |
Proceeds from the sale of shares — Retail Shares | | | 105,144,464 | | | | 65,318,638 | | | | 1,480,843 | | | | 1,611,165 | |
Proceeds from the sale of shares — Institutional Shares | | | 279,070,683 | | | | 149,777,093 | | | | 1,608,216 | | | | 2,880,771 | |
Proceeds from the sale of shares — R6 Shares | | | 2,815,364 | | | | 2,454,595 | | | | 51,965 | | | | 431,489 | |
Net asset value of shares issued in reinvestment of distributions — Retail Shares | | | 7,658,228 | | | | 48,796 | | | | 1,905 | | | | — | |
Net asset value of shares issued in reinvestment of distributions — Institutional Shares | | | 17,151,065 | | | | 216,670 | | | | 9,620 | | | | — | |
Net asset value of shares issues in reinvestment of distribution — R6 Shares | | | 356,349 | | | | 7,283 | | | | 1,393 | | | | — | |
Cost of shares redeemed — Retail Shares | | | (78,740,567 | ) | | | (113,762,983 | ) | | | (233,841 | ) | | | (1,095,401 | ) |
Cost of shares redeemed — Institutional Shares | | | (115,824,380 | ) | | | (38,843,415 | ) | | | (279,432 | ) | | | (4,738 | ) |
Cost of shares redeemed — R6 Shares | | | (929,826 | ) | | | (1,348,639 | ) | | | (28,842 | ) | | | (10 | ) |
| | | | | | | | | | | | | | | | |
Increase (decrease) in net assets derived from capital share transactions | | | 216,701,380 | | | | 63,868,038 | | | | 2,611,827 | | | | 3,823,276 | |
| | | | | | | | | | | | | | | | |
Net increase (decrease) in net assets | | | 144,889,487 | | | | 146,020,722 | | | | 3,031,536 | | | | 4,033,836 | |
| | | | | | | | | | | | | | | | |
Net Assets: | | | | | | | | | | | | | | | | |
Beginning of year | | | 394,018,430 | | | | 247,997,708 | | | | 4,033,836 | | | | — | |
| | | | | | | | | | | | | | | | |
End of year | | $ | 538,907,917 | | | $ | 394,018,430 | | | $ | 7,065,372 | | | $ | 4,033,836 | |
| | | | | | | | | | | | | | | | |
Capital share transactions — Retail Shares | | | | | | | | | | | | | | | | |
Shares sold | | | 5,416,591 | | | | 3,167,654 | | | | 129,313 | | | | 158,803 | |
Shares issued in reinvestment of distributions | | | 400,954 | | | | 2,690 | | | | 193 | | | | — | |
Shares redeemed | | | (4,044,554 | ) | | | (6,087,493 | ) | | | (20,379 | ) | | | (104,605 | ) |
| | | | | | | | | | | | | | | | |
Net increase (decrease) | | | 1,772,991 | | | | (2,917,149 | ) | | | 109,127 | | | | 54,198 | |
| | | | | | | | | | | | | | | | |
Capital share transactions — Institutional Shares | | | | | | | | | | | | | | | | |
Shares sold | | | 14,122,841 | | | | 7,243,735 | | | | 137,943 | | | | 280,159 | |
Shares issued in reinvestment of distributions | | | 887,277 | | | | 11,840 | | | | 971 | | | | — | |
Shares redeemed | | | (5,869,417 | ) | | | (2,001,903 | ) | | | (26,404 | ) | | | (468 | ) |
| | | | | | | | | | | | | | | | |
Net increase (decrease) | | | 9,140,701 | | | | 5,253,672 | | | | 112,510 | | | | 279,691 | |
| | | | | | | | | | | | | | | | |
Capital share transactions — R6 Shares | | | | | | | | | | | | | | | | |
Shares sold | | | 139,152 | | | | 125,327 | | | | 4,445 | | | | 41,260 | |
Shares issued in reinvestment of dividends | | | 18,435 | | | | 398 | | | | 141 | | | | — | |
Shares redeemed | | | (48,698 | ) | | | (70,934 | ) | | | (2,907 | ) | | | (1 | ) |
| | | | | | | | | | | | | | | | |
Net increase (decrease) | | | 108,889 | | | | 54,791 | | | | 1,679 | | | | 41,259 | |
| | | | | | | | | | | | | | | | |
| 1 | For the period January 2, 2018 (commencement of operations) to September 30, 2018. |
| | |
| See Notes to Financial Statements. | | 35 |
| | |
| Baron Funds | | September 30, 2019 |
NOTES TO FINANCIAL STATEMENTS
1. ORGANIZATION
Baron Investment Funds Trust (the “Trust”) is registered under the Investment Company Act of 1940, as amended (the “1940 Act”), as an open-end management investment company established as a Massachusetts business trust on February 19, 1987, and accordingly follows the investment company accounting and reporting guidance of the Financial Accounting Standards Board (“FASB”) Accounting Standard Codification Topic 946 Financial Services — Investment Companies. The Trust currently offers seven series (individually, a “Fund” and collectively, the “Funds”): Baron Asset Fund, Baron Growth Fund, Baron Small Cap Fund, Baron Opportunity Fund, Baron Fifth Avenue Growth Fund, Baron Discovery Fund, and Baron Durable Advantage Fund.
Each Fund offers Retail Shares, Institutional Shares, and R6 Shares. Each class of shares differs only in its ongoing fees, expenses and eligibility requirements. Retail Shares are offered to all investors. Institutional Shares are for investments in the amount of $1 million or more per Fund. Institutional Shares are intended for certain financial intermediaries that offer shares of Baron Funds through fee-based platforms, retirement platforms, or other platforms. R6 Shares are for investments in the amount of $5 million or more per Fund. R6 Shares are available only to qualified 401(a) plans (including 401(k) plans, Keogh plans, profit sharing plans, money purchase pension plans, target benefit plans, defined benefit pension plans, and Taft-Hartley multi-employer pension plans), endowment funds and foundations, any state, county or city, or its instrumentality, department, authority, or agency, 457 plans, including 457(a) governmental entity plans and tax-exempt plans, accounts registered to insurance companies, trust companies and bank trust departments, investment companies, both affiliated and not affiliated with BAMCO, Inc. (the “Adviser”), and any entity that is considered a corporation for tax purposes, including corporate non-qualified deferred compensation plans of such corporations. Each class of shares has equal rights to earnings and assets, except that each class bears different expenses for distribution and shareholder servicing. Each Fund’s investment income, realized and unrealized gains or losses on investments and foreign currency, and expenses other than those attributable to a specific class are allocated to each class based on its relative net assets. Each class of shares has exclusive voting rights with respect to matters that affect just that class. The investment goals of the Funds are as follows:
Baron Asset Fund seeks capital appreciation through long-term investments primarily in securities of medium-sized companies with undervalued assets or favorable growth prospects.
Baron Growth Fund seeks capital appreciation through long-term investments primarily in securities of small-sized growth companies.
Baron Small Cap Fund seeks capital appreciation through investments primarily in securities of small-sized growth companies.
Baron Opportunity Fund seeks capital appreciation through investments primarily in growth companies that benefit from technology advances.
Baron Fifth Avenue Growth Fund seeks capital appreciation through investments primarily in securities of large-sized growth companies.
Baron Discovery Fund seeks capital appreciation through investments primarily in securities of small-sized growth companies.
Baron Durable Advantage Fund seeks capital appreciation through long-term investments primarily in securities of large-sized companies.
2. SIGNIFICANT ACCOUNTING POLICIES
The following is a summary of significant accounting policies followed by the Funds. The policies are in conformity with accounting principles generally accepted in the United States of America (“GAAP”). The preparation of financial statements in accordance with GAAP requires management to make estimates and assumptions that affect the reported amounts of assets and liabilities at the date of the financial statements and the amounts of income and expenses during the period. Actual results could differ from those estimates. Events occurring subsequent to the date of the Statements of Assets and Liabilities and through the date of issuance of the financial statements have been evaluated for adjustment to or disclosure in the financial statements.
a) Security Valuation. The Funds’ share prices or net asset values (“NAV”) are calculated as of the scheduled close of the regular trading session (usually 4 p.m. E.T. or such other time as of which the Funds’ NAVs are calculated (the “NAV Calculation Time”)) on the New York Stock Exchange (the “Exchange”) on any day the Exchange is scheduled to be open. Portfolio securities traded on any national stock exchange are valued based on the last sale price on the exchange where such shares are principally traded. For securities traded on NASDAQ, the Funds use the NASDAQ Official Closing Price. If there are no sales on a given day, the value of the security may be the average of the most recent bid and asked quotations on such exchange or the last sale price from a prior day. Where market quotations are not readily available, or, if in the Adviser’s judgment, they do not accurately reflect the fair value of a security, or an event occurs after the market close but before the Funds are priced that materially affects the value of a security, the security will be valued by the Adviser using policies and procedures approved by the Board of Trustees (the “Board”). Some of the more common reasons that may necessitate that a security be valued using “fair value” pricing may include, but are not limited to: trading of the security has been halted or suspended; or the security has not been traded for an extended period of time. The Adviser has a Fair Valuation Committee (the “Committee”) comprised of senior management representatives and the Committee reports to the Board every quarter. Factors the Committee may consider when valuing a security include whether a current price is stale, there is recent news, the security is thinly traded, transactions are infrequent or quotations are genuine. There can be no guarantee, however, that a fair valuation used by the Funds on any given day will more accurately reflect the market value of an investment than the closing price of such investment in its market. U.S. Government obligations, money market instruments, and other debt instruments held by the Funds with a remaining maturity of 60 days or less are generally valued at amortized cost, which approximates fair value. Debt instruments having a greater remaining maturity will be valued on the basis of prices obtained from a pricing service approved by the Board or at the mean of the bid and ask prices from the dealer maintaining an active market in that security. The value of the Funds’ investments in convertible bonds/convertible preferred stocks is determined primarily by obtaining valuations from independent pricing services based on readily available bid quotations or, if quotations are not available, by methods which include various considerations such as yields or prices of securities of comparable quality, coupon, maturity and type; indications as to values from dealers; and general market conditions. Other inputs used by an independent pricing service to value convertible bonds/convertible preferred stocks generally include underlying stock data, conversion premiums, listed bond and preferred stock prices and other market information which may include benchmark curves, trade execution data, sensitivity analysis, when available, or intrinsic value, which is calculated as the price of the common share on the valuation date adjusted for accrued and unpaid dividends. Open-end investment companies, including securities lending collateral invested in registered investment company money market funds, are valued at their NAV each day.
36
| | |
| September 30, 2019 | | Baron Funds |
NOTES TO FINANCIAL STATEMENTS (Continued)
2. SIGNIFICANT ACCOUNTING POLICIES (Continued)
Non-U.S. equity securities traded on foreign securities exchanges are generally valued using an independent pricing vendor that provides daily fair value adjustment factors based on information such as local closing price, relevant general and sector indexes, currency fluctuations, and depositary receipts, as applicable. Securities valued using such adjustment factors are classified as Level 2 in the fair value hierarchy. The models of the independent pricing vendor generate an adjustment factor for each security, which is applied to the local closing price to adjust it for post-closing market movements up to the time the Funds are valued and translated into U.S. dollars. If the vendor does not provide an adjustment factor for a security, the security is valued based on its most recent local closing price and translated into U. S. dollars. The Adviser may also fair value securities in other situations, for example, when a particular foreign market is closed but the Funds are open. Other mutual funds may adjust the prices of their securities by different amounts.
b) Securities Transactions, Investment Income and Expense Allocation. Securities transactions are recorded on a trade date basis. Realized gain and loss from securities transactions are recorded on an identified cost basis for financial reporting and federal income tax purposes. Dividend income is recognized on the ex-dividend date and interest income is recognized on an accrual basis, which includes the accretion of discounts and amortization of premiums. Non-cash dividends received in the form of stock, if any, are recognized on the ex-dividend date and recorded as non-cash dividend income at fair value. Certain dividends from foreign securities will be recorded as soon as the Funds are informed of the dividend if such information is obtained subsequent to the ex-dividend date. Distributions received from certain investments held by the Funds may be comprised of dividends, realized gains and returns of capital. The Funds originally estimate the expected classification of such payments. The amounts may subsequently be reclassified upon receipt of information from the issuer. The Funds are charged for those expenses of the Trust that are directly attributable to each Fund, such as advisory and custodian fees. Expenses that are not directly attributable to a Fund are typically allocated among the Funds in proportion to their respective net assets.
c) Foreign Currency Translations. Values of assets and liabilities denominated in foreign currencies are translated into U.S. dollars using the price of such currencies at the time the NAV is determined. Purchases and sales of investments and dividend income are converted at the prevailing rate of exchange on the respective dates of such transactions. Net realized gain (loss) on foreign currency transactions includes gain (loss) arising from the fluctuation in the exchange rates between trade and settlement dates on security transactions and currency gain (loss) between the accrual and payment dates on dividends and foreign withholding taxes. The Funds do not isolate that portion of the results of operations resulting from changes in foreign exchange rates on investments from the fluctuations arising from changes in market prices of securities held. Such fluctuations are included with the net realized and unrealized gain or loss from investments and foreign currency transactions on the Statements of Operations. The Funds may invest in foreign securities and foreign currency transactions that may involve risks not associated with domestic investments as a result of the level of governmental supervision and regulation of foreign securities markets and the possibility of political or economic instability, among others.
Pursuant to U.S. federal income tax regulations, gains and losses from certain foreign currency transactions and the foreign currency portion of gains and losses realized on sales and maturities of foreign denominated debt securities are generally treated as ordinary income for U.S. federal income tax purposes.
d) Securities Lending. The Funds may lend securities to certain brokers under the terms of a master netting agreement. Upon such loans, the Funds receive collateral which is maintained by the custodian. The Funds may pay fees to the custodian for administering the securities lending program. The Funds earn interest on such collateral and earn income in the form of negotiated lenders’ fees, both of which are included in securities lending income in the Statements of Operations. Securities loaned are required to be secured at all times by collateral equal to at least 102% of the market value of the securities loaned. Risks may arise upon entering into securities lending to the extent that the value of the collateral is less than the value of the securities loaned due to the changes in the value of collateral or the loaned securities. The collateral is marked-to-market daily and settled on the next business day. The Funds may receive collateral in the form of cash or other eligible securities, such as a letter of credit issued by a U.S. bank or securities issued or guaranteed by the U.S. government. Securities purchased with cash collateral are subject to the risks inherent in investing in these securities.
Baron Growth Fund, Baron Small Cap Fund, and Baron Discovery Fund participated in securities lending activities during the year ended September 30, 2019. There were no securities on loan at September 30, 2019.
e) Repurchase Agreements. The Funds may invest in repurchase agreements, which are short term investments whereby the Funds acquire ownership of a debt security and the seller agrees to repurchase the security at a future date at a specified price. When entering into repurchase agreements, it is the Funds’ policy that their custodian take possession of the underlying collateral securities, the market value of which, at all times, equals at least 102% of the principal amount of the repurchase transaction. To the extent that any repurchase transaction exceeds one business day, the value of the collateral is marked-to-market to ensure the adequacy of the collateral. If the seller defaults and the market value of the collateral declines or if bankruptcy proceedings are commenced with respect to the seller of the security, realization of the collateral by the Funds may be delayed or limited. The information required to be disclosed by FASB Accounting Standards Update No. 2011-11 for the Funds’ investments in repurchase agreements at September 30, 2019, including the fair value of the repurchase agreement and the amount of collateral, can be found in each respective Fund’s Statement of Net Assets.
f) Master Limited Partnerships. The Funds may invest in master limited partnerships (“MLPs”). MLPs are limited partnerships or limited liability companies, whose partnership units or limited liability interests are listed and traded on a U.S. securities exchange, and are treated as publicly traded partnerships for federal income tax purposes. To qualify to be treated as a partnership for tax purposes, an MLP must receive at least 90% of its income from qualifying sources as set forth in Section 7704(d) of the Internal Revenue Code of 1986, as amended. These qualifying sources include interest, dividend, real property rent, gain from sale or other disposition of real property and income from activities such as the exploration, development, mining, production, processing, refining, transportation, storage and marketing of mineral or natural resources.
g) Federal and Foreign Income Taxes. The Trust treats each Fund as a separate entity for federal income tax purposes. Each Fund intends to meet the requirements of the Internal Revenue Code of 1986, as amended, applicable to regulated investment companies, and to distribute to its shareholders substantially all of its net investment income and any net realized capital gains at least annually. None of the Funds will be subject to federal or state income taxes to the extent that they qualify as regulated investment companies and substantially all of their income is distributed.
37
| | |
| Baron Funds | | September 30, 2019 |
NOTES TO FINANCIAL STATEMENTS (Continued)
2. SIGNIFICANT ACCOUNTING POLICIES (Continued)
The Funds may be subject to foreign taxes on income and gains on investments that are accrued based upon the Funds’ understanding of the tax rules and regulations that exist in the countries in which the Funds invest. Foreign governments may also impose taxes or other payments on investments with respect to foreign securities. Such taxes are accrued as applicable.
h) Restricted Securities. The Funds may invest in securities that are restricted as to public sale in accordance with the Securities Act of 1933. Such assets are valued by the Adviser pursuant to policies and procedures approved by the Board.
i) Distributions to Shareholders. Income and capital gain distributions to shareholders are determined in accordance with income tax regulations which may differ from GAAP. These differences are primarily due to differing treatments for net investment loss, foreign currency gains and losses, non-deductible interest expense, reclassification of distributions, partnership basis adjustments, income from passive foreign investment companies, late-year loss deferral, post-October loss deferral, and wash sale loss deferral.
j) Commitments and Contingencies. In the normal course of business, the Funds may enter into contracts and agreements that contain a variety of representations and warranties, which provide general indemnification. The maximum exposure to the Funds under these agreements is unknown, as this would involve future claims that may be made against the Funds that have not yet occurred. However, based on experience, the Funds expect the risk of loss to be remote.
k) Cash and Cash Equivalents. The Funds consider all short term liquid investments with a maturity of three months or less when purchased to be cash equivalents.
3. PURCHASES AND SALES OF SECURITIES
Purchases and sales of securities, other than short term securities, for the year ended September 30, 2019 were as follows:
| | | | | | | | |
| | |
| Fund | | Purchases | | | Sales | |
Baron Asset Fund | | $ | 772,956,010 | | | $ | 447,576,594 | |
Baron Growth Fund | | | 125,720,466 | | | | 569,510,971 | |
Baron Small Cap Fund | | | 530,131,600 | | | | 1,180,822,014 | |
Baron Opportunity Fund | | | 158,960,143 | | | | 189,008,951 | |
Baron Fifth Avenue Growth Fund | | | 65,614,448 | | | | 59,745,936 | |
Baron Discovery Fund | | | 422,215,218 | | | | 243,453,977 | |
Baron Durable Advantage Fund | | | 3,282,820 | | | | 548,370 | |
4. INVESTMENT ADVISORY FEES AND OTHER TRANSACTIONS WITH AFFILIATES
a) Investment Advisory Fees. The Adviser, a wholly owned subsidiary of Baron Capital Group, Inc. (“BCG”), serves as investment adviser to the Funds. As compensation for services rendered, the Adviser receives a fee payable monthly from Baron Asset Fund, Baron Growth Fund, Baron Small Cap Fund, Baron Opportunity Fund, and Baron Discovery Fund equal to 1% per annum of the average daily net assets of the respective Funds. The Adviser receives a fee payable monthly equal to 0.70% per annum of Baron Fifth Avenue Growth Fund’s average daily net assets and 0.65% per annum of Baron Durable Advantage Fund’s average daily net assets.
For Baron Opportunity Fund, Baron Fifth Avenue Growth Fund, Baron Discovery Fund, and Baron Durable Advantage Fund, the Adviser has contractually agreed to reduce its fee, to the extent required to limit the net annual operating expense ratio (excluding portfolio transaction costs, interest, dividend and extraordinary expenses), as follows:
| | | | | | | | | | | | |
| |
| | | Annual Operating
Expense Ratio Cap | |
| | | |
| Fund | | Retail
Shares | | | Institutional Shares | | | R6 Shares | |
Baron Opportunity Fund | | | 1.50 | % | | | 1.25 | % | | | 1.24 | % |
Baron Fifth Avenue Growth Fund | | | 1.00 | % | | | 0.75 | % | | | 0.75 | % |
Baron Discovery Fund | | | 1.35 | % | | | 1.10 | % | | | 1.09 | % |
Baron Durable Advantage Fund | | | 0.95 | % | | | 0.70 | % | | | 0.70 | % |
b) Distribution Fees. Baron Capital, Inc. (“BCI”), a wholly owned subsidiary of BCG, is a registered limited purpose broker-dealer and the distributor of the Funds’ shares. The Funds are authorized to pay BCI a distribution fee payable monthly pursuant to a distribution plan under Rule 12b-1 of the 1940 Act equal to 0.25% per annum of the Retail Shares’ average daily net assets of the respective Funds.
c) Trustee Fees. Certain Trustees of the Trust may be deemed to be affiliated with, or interested persons (as defined by the 1940 Act) of the Funds’ Adviser or of BCI. None of the Trustees so affiliated received compensation for his or her services as a Trustee of the Trust. None of the Funds’ officers received compensation from the Funds for their services as an officer.
d) Fund Accounting and Administration Fees. The Funds have entered into an agreement with State Street Bank and Trust Company (“State Street”) to perform accounting and certain administrative services. State Street is compensated for fund accounting services based on a percentage of the Funds’ net assets, subject to certain minimums plus fixed annual fees for the administrative services.
e) Cross Trades. The Funds are permitted to purchase securities from, or sell securities to, other Funds within the Trust, other funds in the Baron Select Funds, and other entities advised or subadvised by the Adviser, pursuant to “Cross-Trading Procedures” adopted by the Board. These procedures have been designed to ensure that any cross-trade of securities by the respective Baron Fund from or to another fund/other entity that is or could be considered an affiliate of a Fund under certain limited
38
| | |
| September 30, 2019 | | Baron Funds |
NOTES TO FINANCIAL STATEMENTS (Continued)
4. INVESTMENT ADVISORY FEES AND OTHER TRANSACTIONS WITH AFFILIATES (Continued)
circumstances by virtue of having a common investment adviser, common officers, or common trustees complies with Rule 17a-7 under the 1940 Act. Further, as defined under these procedures, each cross-trade is effected at the current market price and with no commissions. Pursuant to these procedures, for the year ended September 30, 2019, the Funds engaged in the following cross-trades:
| | | | | | | | | | | | |
| | | |
| | | Purchases | | | Sales | | | Net Realized
Gains (Losses) | |
Baron Opportunity Fund | | $ | 512,329 | | | $ | 488,144 | | | $ | (138,029 | ) |
Baron Discovery Fund | | | 623,064 | | | | 512,329 | | | | 379,378 | |
5. LINE OF CREDIT
The Funds, together with other funds in Baron Select Funds (except Baron Partners Fund), participate in a committed line of credit agreement with State Street to be used for temporary purposes, primarily for financing redemptions. Each fund may borrow up to the lesser of $100 million or the maximum amount each fund may borrow under the 1940 Act, the limitations included in each fund’s prospectus, or any limit or restriction under any law or regulation to which each fund is subject or any agreement to which each fund is a party; provided that the aggregate outstanding principal amount of all loans to any of the funds may not exceed $100 million. Interest is charged to each fund, based on its borrowings, at a rate per annum equal to the higher of the effective federal funds rate or the one month LIBOR rate plus a margin of 1.00%. An upfront fee of 0.05% is incurred on the commitment amount and a commitment fee of 0.20% per annum is incurred on the unused portion of the line of credit. Both fees are allocated to the participating funds based on their relative net assets. During the year ended September 30, 2019, Baron Growth Fund and Baron Opportunity Fund had borrowings under the line of credit and incurred interest expense of $132,849 and $1,139, respectively. For the 65 days during which there were borrowings, Baron Growth Fund had an average daily balance on the line of credit of $21.4 million at a weighted average interest rate of 3.49%. For the one day during which there were borrowings, Baron Opportunity Fund had a balance on the line of credit of $13.6 million at an interest rate of 3.02%.
6. RESTRICTED SECURITIES
At September 30, 2019, investments in securities included securities that are restricted and/or illiquid. Restricted securities are often purchased in private placement transactions, are not registered under the Securities Act of 1933, may have contractual restrictions on resale and are valued pursuant to the policies and procedures for fair value pricing approved by the Board. A security may be considered illiquid if it lacks a readily available market or if its valuation has not changed for a certain period of time. The Funds may receive more or less than this valuation in an actual sale and that difference could be material. At September 30, 2019, the Funds held investments in restricted and/or illiquid securities that were valued pursuant to policies and procedures for fair value pricing as follows:
| | | | | | | | |
| |
| | | Baron Asset Fund | |
| | |
| | | Acquisition Date(s) | | | Value | |
Private Partnerships | | | | | | | | |
Windy City Investments Holdings, L.L.C. | | | 11/13/2007-1/27/2011 | | | $ | 179,228 | |
| | | | | | | | |
(Cost $0) (0.01% of Net Assets) | | | | | | | | |
| |
| | | Baron Growth Fund | |
| | |
| Name of Issuer | | Acquisition Date(s) | | | Value | |
Private Preferred Stocks | | | | | | | | |
Schrodinger, Inc. Series E | | | 11/9/2018 | | | $ | 5,870,118 | |
| | |
Private Partnerships | | | | | | | | |
Windy City Investments Holdings, L.L.C. | | | 11/13/2007-1/27/2011 | | | | 60,329 | |
| | | | | | | | |
| | |
Total Restricted Securities | | | | | | $ | 5,930,447 | |
| | | | | | | | |
(Cost $ 4,999,999)†(0.08% of Net Assets) | | | | | | | | |
| |
| | | Baron Small Cap Fund | |
| | |
| Name of Issuer | | Acquisition Date(s) | | | Value | |
Common Stocks | | | | | | | | |
Repay Holdings Corporation | | | 7/11/2019 | | | $ | 45,535,000 | |
| | |
Warrants | | | | | | | | |
Repay Holdings Corporation Warrants Exp 7/11/2024 | | | 7/11/2019 | | | | 3,010,000 | |
| | | | | | | | |
| | |
Total Restricted Securities | | | | | | $ | 48,545,000 | |
| | | | | | | | |
(Cost $35,000,000)†(1.25% of Net Assets) | | | | | | | | |
| † | See Statements of Net Assets for cost of individual securities. |
39
| | |
| Baron Funds | | September 30, 2019 |
NOTES TO FINANCIAL STATEMENTS (Continued)
7. FAIR VALUE MEASUREMENTS
Fair value is defined by GAAP as the price that the Funds would receive upon selling an investment in a timely transaction to an independent buyer in the principal or most advantageous market for the investment. GAAP provides a three-tier hierarchy to maximize the use of observable market data and minimize the use of unobservable inputs and to establish classification of fair value measurements for disclosure purposes. Inputs refer broadly to the assumptions that market participants would use in pricing the asset or liability. Inputs may be observable or unobservable. Observable inputs are based on market data obtained from sources independent of the Funds. Unobservable inputs are inputs that reflect the Funds’ own assumptions based on the best information available in the circumstances. The three-tier hierarchy of inputs is summarized in the three broad Levels listed below.
| | • | | Level 1 — quoted prices in active markets for identical assets or liabilities; |
| | • | | Level 2 — prices determined using other inputs that are observable either directly or indirectly through corroboration with observable market data (which could include quoted prices for similar assets or liabilities, interest rates, credit risk, etc.); |
| | • | | Level 3 — prices determined using unobservable inputs when quoted prices or observable inputs are unavailable, such as when there is little or no market activity for an asset or liability (unobservable inputs reflect each Fund’s own assumptions in determining the fair value of assets or liabilities and would be based on the best information available). |
The inputs or methodology used for valuing securities are not necessarily an indication of the risk or liquidity associated with investing in those securities. For example, non-U.S. securities, with markets that close hours before the Funds value their holdings, may require revised valuations to more accurately reflect their fair value. Since these values obtained from quoted prices in an active market are adjusted, such securities are reflected as Level 2.
The Funds have procedures to determine the fair value of securities and other financial instruments for which market prices are not readily available or which may not be reliably priced. Under these procedures, the Funds primarily employ a market-based approach that may use related or comparable assets or liabilities, recent transactions, market multiples, book values, and other relevant information for the investment to determine its fair value. The Funds may also use an income-based valuation approach in which the anticipated future cash flows of the investment are discounted to calculate fair value. Discounts may also be applied due to the nature or duration of any restrictions on the disposition of the investments. Due to the inherent uncertainty of valuations of such investments, the fair values may differ significantly from the values that would have been used had an active market existed.
The following is a summary of the inputs used as of September 30, 2019 in valuing the Funds’ investments carried at fair value:
| | | | | | | | | | | | | | | | |
| |
| | | Baron Asset Fund | |
| | | | |
| Description | | Quoted Prices in
Active Markets for Identical Assets (Level 1) | | | Other
Observable
Inputs (Level 2) | | | Unobservable
Inputs (Level 3) | | | Total | |
Common Stocks† | | $ | 4,231,182,659 | | | $ | — | | | $ | — | | | $ | 4,231,182,659 | |
Private Partnerships | | | — | | | | — | | | | 179,228 | | | | 179,228 | |
Short Term Investments | | | — | | | | 85,756,291 | | | | — | | | | 85,756,291 | |
| | | | | | | | | | | | | | | | |
Total Investments | | $ | 4,231,182,659 | | | $ | 85,756,291 | | | $ | 179,228 | | | $ | 4,317,118,178 | |
| | | | | | | | | | | | | | | | |
| |
| | | Baron Growth Fund | |
| | | | |
| Description | | Quoted Prices in
Active Markets for Identical Assets (Level 1) | | | Other
Observable
Inputs (Level 2) | | | Unobservable
Inputs (Level 3) | | | Total | |
Common Stocks† | | $ | 6,745,163,443 | | | $ | 10,211,884 | | | $ | — | | | $ | 6,755,375,327 | |
Private Preferred Stocks | | | — | | | | — | | | | 5,870,118 | | | | 5,870,118 | |
Private Partnerships | | | — | | | | — | | | | 60,329 | | | | 60,329 | |
Warrants | | | — | | | | 550,135 | | | | — | | | | 550,135 | |
Short Term Investments | | | — | | | | 40,856,879 | | | | — | | | | 40,856,879 | |
| | | | | | | | | | | | | | | | |
Total Investments | | $ | 6,745,163,443 | | | $ | 51,618,898 | | | $ | 5,930,447 | | | $ | 6,802,712,788 | |
| | | | | | | | | | | | | | | | |
| † | See Statements of Net Assets for additional detailed categorizations. |
40
| | |
| September 30, 2019 | | Baron Funds |
NOTES TO FINANCIAL STATEMENTS (Continued)
7. FAIR VALUE MEASUREMENTS (Continued)
| | | | | | | | | | | | | | | | |
| |
| | | Baron Small Cap Fund | |
| | | | |
| Description | | Quoted Prices in
Active Markets
for Identical
Assets (Level 1) | | | Other
Observable
Inputs
(Level 2) | | | Unobservable
Inputs
(Level 3) | | | Total | |
Common Stocks† | | $ | 3,656,708,018 | | | $ | 97,189,504 | | | $ | — | | | $ | 3,753,897,522 | |
Warrants† | | | — | | | | 4,496,845 | | | | — | | | | 4,496,845 | |
Short Term Investments | | | — | | | | 127,606,118 | | | | — | | | | 127,606,118 | |
| | | | | | | | | | | | | | | | |
Total Investments | | $ | 3,656,708,018 | | | $ | 229,292,467 | | | $ | — | | | $ | 3,886,000,485 | |
| | | | | | | | | | | | | | | | |
| |
| | | Baron Opportunity Fund | |
| | | | |
| Description | | Quoted Prices in
Active Markets
for Identical
Assets (Level 1) | | | Other
Observable
Inputs
(Level 2) | | | Unobservable
Inputs
(Level 3) | | | Total | |
Common Stocks† | | $ | 427,070,547 | | | $ | — | | | $ | — | | | $ | 427,070,547 | |
| | | | | | | | | | | | | | | | |
Total Investments | | $ | 427,070,547 | | | $ | — | | | $ | — | | | $ | 427,070,547 | |
| | | | | | | | | | | | | | | | |
| |
| | | Baron Fifth Avenue Growth Fund | |
| | | | |
| Description | | Quoted Prices in
Active Markets
for Identical
Assets (Level 1) | | | Other
Observable
Inputs
(Level 2) | | | Unobservable
Inputs
(Level 3) | | | Total | |
Common Stocks† | | $ | 290,168,735 | | | $ | 10,228,684 | | | $ | — | | | $ | 300,397,419 | |
Short Term Investments | | | — | | | | 9,834,253 | | | | — | | | | 9,834,253 | |
| | | | | | | | | | | | | | | | |
Total Investments | | $ | 290,168,735 | | | $ | 20,062,937 | | | $ | — | | | $ | 310,231,672 | |
| | | | | | | | | | | | | | | | |
| |
| | | Baron Discovery Fund | |
| | | | |
| Description | | Quoted Prices in
Active Markets
for Identical
Assets (Level 1) | | | Other
Observable
Inputs
(Level 2) | | | Unobservable
Inputs
(Level 3) | | | Total | |
Common Stocks† | | $ | 476,590,340 | | | $ | 20,600,135 | | | $ | — | | | $ | 497,190,475 | |
Short Term Investments | | | — | | | | 41,673,966 | | | | — | | | | 41,673,966 | |
| | | | | | | | | | | | | | | | |
Total Investments | | $ | 476,590,340 | | | $ | 62,274,101 | | | $ | — | | | $ | 538,864,441 | |
| | | | | | | | | | | | | | | | |
| |
| | | Baron Durable Advantage Fund | |
| | | | |
| Description | | Quoted Prices in
Active Markets
for Identical
Assets (Level 1) | | | Other
Observable
Inputs
(Level 2) | | | Unobservable
Inputs
(Level 3) | | | Total | |
Common Stocks† | | $ | 6,675,900 | | | $ | 151,165 | | | $ | — | | | $ | 6,827,065 | |
Short Term Investments | | | — | | | | 436,141 | | | | — | | | | 436,141 | |
| | | | | | | | | | | | | | | | |
Total Investments | | $ | 6,675,900 | | | $ | 587,306 | | | $ | — | | | $ | 7,263,206 | |
| | | | | | | | | | | | | | | | |
| † | See Statements of Net Assets for additional detailed categorizations. |
41
| | |
| Baron Funds | | September 30, 2019 |
NOTES TO FINANCIAL STATEMENTS (Continued)
7. FAIR VALUE MEASUREMENTS (Continued)
The following is a reconciliation of investments in which unobservable inputs (Level 3) were used in determining fair value:
| | | | | | | | | | | | | | | | | | | | | | | | | | | | | | | | | | | | | | | | |
| |
| | | Baron Asset Fund | |
| | | | | | | | | | |
| Investments in Securities | | Balance as of
September 30,
2018 | | | Accrued
Premiums/
Discounts | | | Net
Realized
Gain (Loss) | | | Change in Net
Unrealized
Appreciation
(Depreciation) | | | Purchases | | | Sales/ Distributions | | | Transfers
Into Level 3 | | | Transfers
Out of
Level 3 | | | Balance as of
September 30,
2019 | | | Change in Net
Unrealized
Appreciation
(Depreciation)
from Investments
still held at
September 30,
2019 | |
Private Partnerships | | | | | | | | | | | | | | | | | | | | | | | | | | | | | |
Financials | | $ | 183,462 | | | $ | — | | | $ | — | | | $ | (4,234 | ) | | $ | — | | | $ | — | | | $ | — | | | $ | — | | | $ | 179,228 | | | $ | (4,234 | ) |
| | | | | | | | | | | | | | | | | | | | | | | | | | | | | | | | | | | | | | | | |
| |
| | | Baron Growth Fund | |
| | | | | | | | | | |
| Investments in Securities | | Balance as of
September 30,
2018 | | | Accrued
Premiums/
Discounts | | | Net
Realized
Gain
(Loss) | | | Change in Net
Unrealized
Appreciation
(Depreciation) | | | Purchases | | | Sales/ Distributions | | | Transfers
Into
Level 3 | | | Transfers
Out of
Level 3 | | | Balance as of
September 30,
2019 | | | Change in Net
Unrealized
Appreciation
(Depreciation)
from Investments
still held at
September 30,
2019 | |
Private Preferred Stocks | | | | | | | | | | | | | | | | | | | | | | | | | | | | | | | | | | | | | | | | |
Health Care | | $ | — | | | $ | — | | | $ | — | | | $ | 870,119 | | | $ | 4,999,999 | | | $ | — | | | $ | — | | | $ | — | | | $ | 5,870,118 | | | $ | 870,119 | |
| | | | | | | | | | |
Private Partnerships | | | | | | | | | | | | | | | | | | | | | | | | | | | | | | | | | | | | | | | | |
Financials | | | 61,755 | | | | — | | | | — | | | | (1,426 | ) | | | — | | | | — | | | | — | | | | — | | | | 60,329 | | | | (1,426 | ) |
| | | | | | | | | | | | | | | | | | | | | | | | | | | | | | | | | | | | | | | | |
Total | | $ | 61,755 | | | $ | — | | | $ | — | | | $ | 868,693 | | | $ | 4,999,999 | | | $ | — | | | $ | — | | | $ | — | | | $ | 5,930,447 | | | $ | 868,693 | |
| | | | | | | | | | | | | | | | | | | | | | | | | | | | | | | | | | | | | | | | |
8. INCOME TAXES AND DISTRIBUTIONS TO SHAREHOLDERS
Federal income tax regulations differ from GAAP. Therefore, distributions determined in accordance with tax regulations may differ in amount or character from net investment income and net realized gain for financial reporting purposes. Net investment income (loss) and net realized and unrealized gain (loss) differ for financial statement and tax purposes due to differing treatments of net investment loss, foreign currency gains and losses, non-deductible interest expense, reclassification of distributions, partnership basis adjustments, income from passive foreign investment companies, late year loss deferral, post-October loss deferral and wash sale loss deferral. Financial reporting records are adjusted for permanent book/tax differences to reflect tax character. Financial records are not adjusted for temporary differences.
For the year ended September 30, 2019, the Funds recorded the following permanent reclassifications to reflect tax character. Reclassifications between income, gains andpaid-in capital relate primarily to the tax treatment of net investment loss, foreign currency gains and losses, passive foreign investment companies, REITs, and partnership basis adjustments. Results of operations and net assets were not affected by these reclassifications.
| | | | | | | | | | | | |
| | | |
| Fund | | Undistributed
(Accumulated)
Net Investment
Income (Loss)* | | | Undistributed
(Accumulated) Net
Realized Gain (Loss)* | | | Paid-In Capital | |
Baron Asset Fund | | $ | 22,045,307 | | | $ | (7,511,445 | ) | | $ | (14,533,862 | ) |
Baron Growth Fund | | | 6,238,483 | | | | (28,408 | ) | | | (6,210,075 | ) |
Baron Small Cap Fund | | | 38,790,132 | | | | (36,144,706 | ) | | | (2,645,426 | ) |
Baron Opportunity Fund | | | 3,998,119 | | | | (2,680,745 | ) | | | (1,317,374 | ) |
Baron Fifth Avenue Growth Fund | | | (13,772 | ) | | | 13,772 | | | | — | |
Baron Discovery Fund | | | 2,399,559 | | | | (2,086,355 | ) | | | (313,204 | ) |
Baron Durable Advantage Fund | | | 108 | | | | (108 | ) | | | — | |
| * | Undistributed (accumulated) net investment income (loss) and undistributed (accumulated) net realized gain (loss) are included in distributable earnings (losses) on the Statements of Assets and Liabilities. |
42
| | |
| September 30, 2019 | | Baron Funds |
NOTES TO FINANCIAL STATEMENTS (Continued)
8. INCOME TAXES AND DISTRIBUTIONS TO SHAREHOLDERS (Continued)
As of September 30, 2019, the components of net assets on a tax basis were as follows:
| | | | | | | | | | | | | | | | | | | | | | | | | | | | |
| | | | | | | |
| | | Baron Asset Fund | | | Baron Growth Fund | | | Baron Small Cap
Fund | | | Baron
Opportunity
Fund | | | Baron Fifth Avenue
Growth
Fund | | | Baron
Discovery
Fund | | | Baron
Durable
Advantage
Fund | |
Cost of investments | | $ | 1,704,941,432 | | | $ | 1,842,871,350 | | | $ | 1,874,886,478 | | | $ | 245,381,990 | | | $ | 161,957,444 | | | $ | 485,371,304 | | | $ | 6,514,834 | |
| | | | | | | | | | | | | | | | | | | | | | | | | | | | |
Gross tax unrealized appreciation | | | 2,619,450,897 | | | | 4,999,543,686 | | | | 2,070,777,951 | | | | 185,027,196 | | | | 150,392,547 | | | | 93,377,035 | | | | 823,449 | |
Gross tax unrealized depreciation | | | (7,274,151 | ) | | | (39,702,248 | ) | | | (59,663,944 | ) | | | (3,338,639 | ) | | | (2,118,319 | ) | | | (39,883,898 | ) | | | (75,077 | ) |
| | | | | | | | | | | | | | | | | | | | | | | | | | | | |
Net tax unrealized appreciation (depreciation) | | | 2,612,176,746 | | | | 4,959,841,438 | | | | 2,011,114,007 | | | | 181,688,557 | | | | 148,274,228 | | | | 53,493,137 | | | | 748,372 | |
Net tax unrealized currency appreciation (depreciation) | | | — | | | | (10 | ) | | | — | | | | — | | | | — | | | | (663 | ) | | | (5 | ) |
Undistributed (accumulated) net investment income (loss) | | | — | | | | — | | | | — | | | | — | | | | 239,510 | | | | — | | | | 17,598 | |
Undistributed (accumulated) net realized gain (loss) | | | 71,350,366 | | | | 244,402,381 | | | | 352,984,284 | | | | 24,023,109 | | | | 9,213,430 | | | | — | | | | — | |
Qualified late year loss deferral | | | (19,686,272 | ) | | | (7,247,509 | ) | | | (18,375,464 | ) | | | (3,388,119 | ) | | | — | | | | (3,603,188 | ) | | | (63,465 | ) |
Capital loss carryforwards | | | — | | | | — | | | | — | | | | — | | | | — | | | | — | | | | (71,640 | ) |
Paid-in capital | | | 1,666,836,861 | | | | 1,592,509,444 | | | | 1,535,414,900 | | | | 209,190,845 | | | | 150,626,427 | | | | 489,018,631 | | | | 6,434,512 | |
| | | | | | | | | | | | | | | | | | | | | | | | | | | | |
Net Assets | | $ | 4,330,677,701 | | | $ | 6,789,505,744 | | | $ | 3,881,137,727 | | | $ | 411,514,392 | | | $ | 308,353,595 | | | $ | 538,907,917 | | | $ | 7,065,372 | |
| | | | | | | | | | | | | | | | | | | | | | | | | | | | |
As of September 30, 2019, the Funds had capital loss carryforwards expiring as follows:
| | | | | | | | | | | | | | | | | | | | | | | | | | | | |
| | | | | | | |
| | | Baron
Asset Fund | | | Baron
Growth Fund | | | Baron Small Cap Fund | | | Baron
Opportunity Fund | | | Baron
Fifth Avenue
Growth Fund | | | Baron
Discovery Fund | | | Baron
Durable
Advantage
Fund | |
Short term capital loss carryforwards: | | | | | | | | | | | | | | | | | | | | | | | | | | | | |
No expiration date | | $ | — | | | $ | — | | | $ | — | | | $ | — | | | $ | — | | | $ | — | | | $ | 71,640 | |
| | | | | | | | | | | | | | | | | | | | | | | | | | | | |
Capital loss carryforward utilized during the year ended September 30, 2019 | | $ | — | | | $ | — | | | $ | — | | | $ | — | | | $ | 1,434,901 | | | $ | — | | | $ | — | |
| | | | | | | | | | | | | | | | | | | | | | | | | | | | |
The tax character of distributions paid during the years ended September 30, 2019 and September 30, 2018 was as follows:
| | | | | | | | | | | | | | | | |
| | |
| | | Year Ended
September 30, 2019 | | | Year Ended
September 30, 2018 | |
| | | | |
| Fund | | Ordinary1 | | | Long Term Capital Gain | | | Ordinary1 | | | Long Term Capital Gain | |
Baron Asset Fund | | $ | — | | | $ | 211,479,374 | | | $ | — | | | $ | 208,739,014 | |
Baron Growth Fund | | | — | | | | 430,003,177 | | | | — | | | | 655,754,440 | |
Baron Small Cap Fund | | | — | | | | 351,005,399 | | | | — | | | | 513,668,207 | |
Baron Opportunity Fund | | | — | | | | 19,401,893 | | | | — | | | | 34,774,256 | |
Baron Fifth Avenue Growth Fund | | | — | | | | — | | | | — | | | | — | |
Baron Discovery Fund | | | 370,619 | | | | 25,930,763 | | | | 301,083 | | | | — | |
Baron Durable Advantage Fund | | | 13,002 | | | | — | | | | — | | | | — | |
| 1 | For tax purposes, short-term capital gains are considered ordinary income distributions. |
The Funds follow the provisions of FASB Codification Section 740 (“ASC Section 740”) “Accounting for Uncertainty in Income Taxes” which clarifies the accounting for uncertainty in tax positions taken or expected to be taken on a tax return. ASC Section 740 sets forth a threshold for financial statement recognition, measurement and disclosure of tax positions taken or expected to be taken on a tax return. The Funds are required to recognize the tax effects of certain tax positions under a “more likely than not” standard, that based on their technical merits, have more than 50 percent likelihood of being sustained upon examination. Management has analyzed the tax positions taken on the Funds’ federal income tax returns for all open years (current and prior three years), and has concluded that no provision for federal income tax is required in the Funds’ financial statements. At September 30, 2019, the Funds did not have any uncertain tax benefits that require recognition, de-recognition or disclosure. The Funds’ federal, state and local income and federal excise tax returns for which the applicable statutes of limitations have not expired (current and prior three years) are subject to examination by the Internal Revenue Service and state departments of revenue.
43
| | |
| Baron Funds | | September 30, 2019 |
NOTES TO FINANCIAL STATEMENTS (Continued)
9. OWNERSHIP CONCENTRATION
As of September 30, 2019, the officers, trustees, and portfolio managers owned, directly or indirectly, 13.94% of Baron Fifth Avenue Growth Fund and 30.65% of Baron Durable Advantage Fund. As a result of their ownership, these investors may be able to materially affect the outcome of matters presented to Baron Fifth Avenue Growth Fund, and Baron Durable Advantage Fund shareholders.
10. TRANSACTIONS IN “AFFILIATED” COMPANIES1
BARON GROWTH FUND
| | | | | | | | | | | | | | | | | | | | | | | | | | | | | | | | | | | | |
| | | | | | | | | |
| Name of Issuer | | Value at
September 30,
2018 | | | Purchase Cost | | | Sales
Proceeds/ Return of
Capital | | | Change in Net
Unrealized
Appreciation
(Depreciation) | | | Realized
Gains/ (Losses) | | | Dividend
Income | | | Shares Held at
September 30,
2019 | | | Value at
September 30,
2019 | | | % of Net
Assets at
September 30,
2019 | |
“Affiliated” Company as of September 30, 2019: | | | | | | | | | |
Benefitfocus, Inc. | | $ | 88,990,000 | | | $ | — | | | $ | — | | | $ | (36,608,000 | ) | | $ | — | | | $ | — | | | | 2,200,000 | | | $ | 52,382,000 | | | | 0.77 | % |
Choice Hotels International, Inc. | | | 249,900,000 | | | | — | | | | — | | | | 16,980,000 | | | | — | | | | 2,580,000 | | | | 3,000,000 | | | | 266,880,000 | | | | 3.93 | % |
Iridium Communications Inc. | | | 168,489,833 | | | | 34,464,372 | | | | 20 | | | | (14,357,902 | ) | | | 15 | | | | — | | | | 8,862,608 | | | | 188,596,298 | | | | 2.78 | % |
Vail Resorts, Inc. | | | 576,282,000 | | | | — | | | | — | | | | (98,406,000 | ) | | | — | | | | 13,566,000 | | | | 2,100,000 | | | | 477,876,000 | | | | 7.04 | % |
| | | | | | | | | | | | | | | | | | | | | | | | | | | | | | | | | | | | |
| | $ | 1,083,661,833 | | | $ | 34,464,372 | | | $ | 20 | | | $ | (132,391,902 | ) | | $ | 15 | | | $ | 16,146,000 | | | | | | | $ | 985,734,298 | | | | | |
| | | | | | | | | | | | | | | | | | | | | | | | | | | | | | | | | | | | |
No longer an “Affiliated” Company as of September 30, 2019: | | | | | |
Iridium Communications Inc., Series B, 6.75%† | | $ | 31,258,957 | | | $ | — | | | $ | 34,464,372 | | | $ | 3,205,415 | | | $ | — | | | $ | 693,124 | | | | — | | | $ | — | | | | 0.00 | % |
| | | | | | | | | | | | | | | | | | | | | | | | | | | | | | | | | | | | |
BARON SMALL CAP FUND
| | | | | | | | | | | | | | | | | | | | | | | | | | | | | | | | | | | | |
| | | | | | | | | |
| Name of Issuer | | Value at
September 30,
2018 | | | Purchase
Cost | | | Sales
Proceeds | | | Change in Net
Unrealized
Appreciation
(Depreciation) | | | Realized
Gains/ (Losses) | | | Dividend
Income | | | Shares Held at
September 30,
2019 | | | Value at
September 30,
2019 | | | % of Net
Assets at
September 30,
2019 | |
“Affiliated” Company as of September 30, 2019: | | | | | | | | | |
Repay Holdings Corporation | | $ | — | | | $ | 35,000,000 | | | $ | — | | | $ | 10,535,000 | | | $ | — | | | $ | — | | | | 3,500,000 | | | $ | 45,535,000 | | | | 1.17 | % |
Repay Holdings Corporation Warrants Exp 7/11/2024 | | | — | | | | — | | | | — | | | | 3,010,000 | | | | — | | | | — | | | | 3,500,000 | | | | 3,010,000 | | | | 0.08 | % |
| | | | | | | | | | | | | | | | | | | | | | | | | | | | | | | | | | | | |
| | $ | — | | | $ | 35,000,000 | | | $ | — | | | $ | 13,545,000 | | | $ | — | | | $ | — | | | | | | | $ | 48,545,000 | | | | | |
| | | | | | | | | | | | | | | | | | | | | | | | | | | | | | | | | | | | |
No longer an “Affiliated” Company as of September 30, 2019: | | | | | |
Installed Building Products, Inc. | | $ | 48,750,000 | | | $ | 9,770,446 | | | $ | — | | | $ | 27,489,554 | | | $ | — | | | $ | — | | | | 1,500,000 | | | $ | 86,010,000 | | | | 2.22 | % |
| | | | | | | | | | | | | | | | | | | | | | | | | | | | | | | | | | | | |
| 1 | An “Affiliated” company (“affiliated person” as defined in the 1940 Act) is a company in which a Fund held 5% or more of the company’s outstanding voting securities at any time during the year ended September 30, 2019. |
11. RECENT ACCOUNTING PRONOUNCEMENTS:
As of November 5, 2018, pursuant to amendments to financial statement requirements adopted by SEC Release No. 33-10532 “Disclosure Update and Simplification,” funds are no longer required to disclose whether the distributions from earnings are either from net investment income or net realized capital gains. We have evaluated the implications of these amendments that are included in the financial statements, which had no effect on the Funds’ net assets or results of operations. The amendments require presentation of the total, rather than the components, of distributable earnings on the Statement of Assets and Liabilities and also require presentation of the total, rather than the components, of distributions to shareholders, except for tax return of capital distributions, if any, on the Statements of Changes in Net Assets. At September 30, 2018, the distributions from net investment income and net realized gain from investments, were as follows:
| | | | | | | | | | | | |
| | | |
| Net Investment Income | | Retail Shares | | | Institutional
Shares | | | R6 Shares | |
Baron Asset Fund | | $ | — | | | $ | — | | | $ | — | |
Baron Growth Fund | | | — | | | | — | | | | — | |
Baron Small Cap Fund | | | — | | | | — | | | | — | |
Baron Opportunity Fund | | | — | | | | — | | | | — | |
Baron Fifth Avenue Growth Fund | | | — | | | | — | | | | — | |
Baron Discovery Fund | | | 48,993 | | | | 244,807 | | | | 7,283 | |
Baron Durable Advantage Fund | | | — | | | | — | | | | — | |
Baron Asset Fund | | | 137,145,474 | | | | 69,986,292 | | | | 1,607,248 | |
Baron Growth Fund | | | 286,221,373 | | | | 368,081,112 | | | | 1,451,955 | |
Baron Small Cap Fund | | | 212,143,374 | | | | 289,023,146 | | | | 12,501,687 | |
44
| | |
| September 30, 2019 | | Baron Funds |
NOTES TO FINANCIAL STATEMENTS (Continued)
11. RECENT ACCOUNTING PRONOUNCEMENTS (Continued):
| | | | | | | | | | | | |
| | | |
| Net Realized Gain on investments | | Retail Shares | | | Institutional
Shares | | | R6
Shares | |
Baron Opportunity Fund | | $ | 27,302,633 | | | $ | 7,324,844 | | | $ | 146,779 | |
Baron Fifth Avenue Growth Fund | | | — | | | | — | | | | — | |
Baron Discovery Fund | | | — | | | | — | | | | — | |
Baron Durable Advantage Fund | | | — | | | | — | | | | — | |
As part of this update, it is no longer required to disclose the undistributed net investment income/(distributions in excess of net investment income) on the Statements of Assets and Liabilities. As of September 30, 2018 the undistributed net investment income/(distributions in excess of net investment income) were as follows:
| | | | |
Baron Asset Fund | | $ | (18,053,692 | ) |
Baron Growth Fund | | | 6,338,005 | |
Baron Small Cap Fund | | | (25,558,176 | ) |
Baron Opportunity Fund | | | (2,928,899 | ) |
Baron Fifth Avenue Growth Fund | | | (985,077 | ) |
Baron Discovery Fund | | | (995,200 | ) |
Baron Durable Advantage Fund | | | 10,248 | |
In August 2018, FASB issued Accounting Standards Update No. 2018-13, “Fair Value Measurement (Topic 820: Disclosure Framework — Changes to the Disclosure Requirements for Fair Value Measurement” (“ASU 2018-13”). ASU 2018-13 eliminates the requirement to disclose the amount of and reasons for transfers between Level 1 and Level 2 of the fair value hierarchy, the timing of transfers between levels of the fair value hierarchy and the valuation processes for Level 3 fair value measurements. ASU 2018-13 does not eliminate the requirement to disclose the range and weighted average used to develop significant unobservable inputs for Level 3 fair value measurements and the changes in unrealized gains and losses for recurring Level 3 fair value measurements. ASU 2018-13 requires that information is provided about the measurement uncertainty of Level 3 fair value measurements as of the reporting date. The guidance is effective for fiscal years, and interim periods within those fiscal years, beginning after December 15, 2019. Management has elected to early adopt this guidance and the amendments are reflected in the current financial statements.
45
| | |
| Baron Investment Funds | | September 30, 2019 |
FINANCIAL HIGHLIGHTS
BARON ASSET FUND
Selected data for a share outstanding throughout each year:
| | | | | | | | | | | | | | | | | | | | | | | | | | | | | | | | | | | | | | | | | | | | | | | | | | | | |
| | | | | | | |
| | | | | | Income (loss) from
investment operations: | | | Less distributions to
shareholders from: | | | | | | | | | Ratios to Average Net Assets: | | | Supplemental
Data: | |
| | | | | | | | | | | | | |
| | | Net asset
value,
beginning
of year
($) | | | Net
investment
income
(loss)
($) | | | Net realized and
unrealized
gain (loss) on
investments
($) | | | Total from
investment
operations
($) | | | Net
investment
income
($) | | | Net realized
gain on
investments
($) | | | Total
distributions
($) | | | Net
asset
value,
end of
year
($) | | | Total
return
(%) | | | Operating
expenses
(%) | | | Net
investment
income (loss)
(%) | | | Net
assets (in
millions),
end of
year
($) | | | Portfolio
turnover
rate
(%) | |
|
RETAIL SHARES | |
|
Year Ended September 30, | |
| | | | | | | | | | | | | |
2019 | | | 81.43 | | | | (0.56 | )1 | | | 6.17 | | | | 5.61 | | | | 0.00 | | | | (4.76 | ) | | | (4.76 | ) | | | 82.28 | | | | 7.82 | | | | 1.30 | | | | (0.73 | ) | | | 2,242.0 | | | | 11.83 | |
| | | | | | | | | | | | | |
2018 | | | 70.87 | | | | (0.59 | )1 | | | 16.09 | | | | 15.50 | | | | 0.00 | | | | (4.94 | ) | | | (4.94 | ) | | | 81.43 | | | | 23.11 | | | | 1.30 | | | | (0.79 | ) | | | 2,259.7 | | | | 9.87 | |
| | | | | | | | | | | | | |
2017 | | | 60.67 | | | | (0.48 | )1 | | | 13.48 | | | | 13.00 | | | | 0.00 | | | | (2.80 | ) | | | (2.80 | ) | | | 70.87 | | | | 22.41 | | | | 1.31 | | | | (0.75 | ) | | | 1,979.1 | | | | 10.35 | |
| | | | | | | | | | | | | |
2016 | | | 60.88 | | | | (0.25 | )1 | | | 6.63 | | | | 6.38 | | | | 0.00 | | | | (6.59 | ) | | | (6.59 | ) | | | 60.67 | | | | 11.14 | | | | 1.31 | | | | (0.43 | ) | | | 1,802.6 | | | | 12.54 | |
| | | | | | | | | | | | | |
2015 | | | 63.75 | | | | (0.41 | )1 | | | 1.71 | | | | 1.30 | | | | 0.00 | | | | (4.17 | ) | | | (4.17 | ) | | | 60.88 | | | | 1.81 | | | | 1.31 | | | | (0.62 | ) | | | 1,804.3 | | | | 13.53 | |
| | | | | | | | | | | | | |
2014 | | | 61.37 | | | | (0.44 | )1 | | | 8.42 | | | | 7.98 | | | | 0.00 | | | | (5.60 | ) | | | (5.60 | ) | | | 63.75 | | | | 13.59 | | | | 1.31 | | | | (0.70 | ) | | | 2,000.5 | | | | 11.26 | |
| | | | | | | | | | | | | |
2013 | | | 52.03 | | | | (0.34 | )1 | | | 13.44 | | | | 13.10 | | | | 0.00 | | | | (3.76 | ) | | | (3.76 | ) | | | 61.37 | | | | 27.17 | | | | 1.32 | | | | (0.62 | ) | | | 2,024.2 | | | | 12.04 | |
| | | | | | | | | | | | | |
2012 | | | 49.00 | | | | (0.14 | )1 | | | 10.94 | | | | 10.80 | | | | 0.00 | | | | (7.77 | ) | | | (7.77 | ) | | | 52.03 | | | | 24.65 | | | | 1.33 | | | | (0.28 | ) | | | 1,845.6 | | | | 13.11 | |
| | | | | | | | | | | | | |
2011 | | | 49.27 | | | | (0.23 | )1 | | | 0.73 | | | | 0.50 | | | | 0.00 | | | | (0.77 | ) | | | (0.77 | ) | | | 49.00 | | | | 0.85 | | | | 1.33 | | | | (0.41 | ) | | | 1,924.9 | | | | 23.89 | |
| | | | | | | | | | | | | |
2010 | | | 43.62 | | | | (0.28 | )1 | | | 5.93 | | | | 5.65 | | | | 0.00 | | | | 0.00 | | | | 0.00 | | | | 49.27 | | | | 12.95 | | | | 1.32 | | | | (0.61 | ) | | | 2,424.2 | | | | 13.04 | |
|
INSTITUTIONAL SHARES | |
|
Year Ended September 30, | |
| | | | | | | | | | | | | |
2019 | | | 84.36 | | | | (0.38 | )1 | | | 6.45 | | | | 6.07 | | | | 0.00 | | | | (4.76 | ) | | | (4.76 | ) | | | 85.67 | | | | 8.11 | | | | 1.05 | | | | (0.48 | ) | | | 1,979.7 | | | | 11.83 | |
| | | | | | | | | | | | | |
2018 | | | 73.07 | | | | (0.41 | )1 | | | 16.64 | | | | 16.23 | | | | 0.00 | | | | (4.94 | ) | | | (4.94 | ) | | | 84.36 | | | | 23.43 | | | | 1.04 | | | | (0.53 | ) | | | 1,315.7 | | | | 9.87 | |
| | | | | | | | | | | | | |
2017 | | | 62.30 | | | | (0.33 | )1 | | | 13.90 | | | | 13.57 | | | | 0.00 | | | | (2.80 | ) | | | (2.80 | ) | | | 73.07 | | | | 22.76 | | | | 1.04 | | | | (0.50 | ) | | | 1,021.0 | | | | 10.35 | |
| | | | | | | | | | | | | |
2016 | | | 62.19 | | | | (0.10 | )1 | | | 6.80 | | | | 6.70 | | | | 0.00 | | | | (6.59 | ) | | | (6.59 | ) | | | 62.30 | | | | 11.44 | | | | 1.04 | | | | (0.17 | ) | | | 723.3 | | | | 12.54 | |
| | | | | | | | | | | | | |
2015 | | | 64.87 | | | | (0.24 | )1 | | | 1.73 | | | | 1.49 | | | | 0.00 | | | | (4.17 | ) | | | (4.17 | ) | | | 62.19 | | | | 2.09 | | | | 1.04 | | | | (0.36 | ) | | | 719.1 | | | | 13.53 | |
| | | | | | | | | | | | | |
2014 | | | 62.20 | | | | (0.28 | )1 | | | 8.55 | | | | 8.27 | | | | 0.00 | | | | (5.60 | ) | | | (5.60 | ) | | | 64.87 | | | | 13.90 | | | | 1.04 | | | | (0.43 | ) | | | 689.8 | | | | 11.26 | |
| | | | | | | | | | | | | |
2013 | | | 52.55 | | | | (0.21 | )1 | | | 13.62 | | | | 13.41 | | | | 0.00 | | | | (3.76 | ) | | | (3.76 | ) | | | 62.20 | | | | 27.51 | | | | 1.05 | | | | (0.38 | ) | | | 506.1 | | | | 12.04 | |
| | | | | | | | | | | | | |
2012 | | | 49.30 | | | | 0.01 | 1 | | | 11.01 | | | | 11.02 | | | | 0.00 | | | | (7.77 | ) | | | (7.77 | ) | | | 52.55 | | | | 24.99 | | | | 1.06 | | | | 0.02 | | | | 386.7 | | | | 13.11 | |
| | | | | | | | | | | | | |
2011 | | | 49.43 | | | | (0.10 | )1 | | | 0.74 | | | | 0.64 | | | | 0.00 | | | | (0.77 | ) | | | (0.77 | ) | | | 49.30 | | | | 1.14 | | | | 1.06 | | | | (0.18 | ) | | | 288.9 | | | | 23.89 | |
| | | | | | | | | | | | | |
2010 | | | 43.65 | | | | (0.15 | )1 | | | 5.93 | | | | 5.78 | | | | 0.00 | | | | 0.00 | | | | 0.00 | | | | 49.43 | | | | 13.24 | | | | 1.06 | | | | (0.33 | ) | | | 242.8 | | | | 13.04 | |
|
R6 SHARES | |
|
Year Ended September 30, | |
| | | | | | | | | | | | | |
2019 | | | 84.35 | | | | (0.38 | )1 | | | 6.44 | | | | 6.06 | | | | 0.00 | | | | (4.76 | ) | | | (4.76 | ) | | | 85.65 | | | | 8.09 | | | | 1.05 | | | | (0.47 | ) | | | 109.0 | | | | 11.83 | |
| | | | | | | | | | | | | |
2018 | | | 73.06 | | | | (0.41 | )1 | | | 16.64 | | | | 16.23 | | | | 0.00 | | | | (4.94 | ) | | | (4.94 | ) | | | 84.35 | | | | 23.43 | | | | 1.04 | | | | (0.54 | ) | | | 73.5 | | | | 9.87 | |
| | | | | | | | | | | | | |
2017 | | | 62.30 | | | | (0.34 | )1 | | | 13.90 | | | | 13.56 | | | | 0.00 | | | | (2.80 | ) | | | (2.80 | ) | | | 73.06 | | | | 22.74 | | | | 1.04 | | | | (0.51 | ) | | | 22.5 | | | | 10.35 | |
| | | | | | | | | | | | | |
20164 | | | 53.85 | | | | (0.21 | )1 | | | 8.68 | | | | 8.47 | | | | 0.00 | | | | (0.02 | ) | | | (0.02 | ) | | | 62.30 | | | | 15.73 | 2 | | | 1.04 | 3 | | | (0.52 | )3 | | | 7.8 | | | | 12.54 | |
| 1 | Based on average shares outstanding. |
| 4 | For the period January 29, 2016 (initial offering of R6 Shares) to September 30, 2016. |
| | |
| 46 | | See Notes to Financial Statements. |
| | |
| September 30, 2019 | | Baron Investment Funds |
FINANCIAL HIGHLIGHTS (Continued)
BARON GROWTH FUND
Selected data for a share outstanding throughout each year:
| | | | | | | | | | | | | | | | | | | | | | | | | | | | | | | | | | | | | | | | | | | | | | | | | | | | |
| | | | | | | |
| | | | | | Income (loss) from
investment operations: | | | Less distributions to
shareholders from: | | | | | | | | | Ratios to Average Net Assets: | | | Supplemental
Data: | |
| | | | | | | | | | | | | |
| | | Net asset
value,
beginning
of year
($) | | | Net
investment
income (loss) ($) | | | Net realized and unrealized gain (loss) on
investments
($) | | | Total from
investment
operations
($) | | | Net
investment
income ($) | | | Net realized
gain on
investments
($) | | | Total
distributions
($) | | | Net
asset
value,
end of
year
($) | | | Total
return
(%) | | | Operating
expenses
(%) | | | Net
investment
income (loss) (%) | | | Net
assets (in
millions),
end of
year ($) | | | Portfolio
turnover
rate (%) | |
|
RETAIL SHARES | |
|
Year Ended September 30, | |
| | | | | | | | | | | | | |
2019 | | | 80.68 | | | | (0.16 | )1 | | | 3.56 | | | | 3.40 | | | | 0.00 | | | | (5.13 | ) | | | (5.13 | ) | | | 78.95 | | | | 5.09 | | | | 1.29 | 2 | | | (0.21 | ) | | | 2,507.0 | | | | 1.93 | |
| | | | | | | | | | | | | |
2018 | | | 71.77 | | | | (0.17 | )1 | | | 16.98 | | | | 16.81 | | | | 0.00 | | | | (7.90 | ) | | | (7.90 | ) | | | 80.68 | | | | 25.55 | | | | 1.29 | 2 | | | (0.24 | ) | | | 2,747.8 | | | | 2.92 | |
| | | | | | | | | | | | | |
2017 | | | 67.13 | | | | (0.16 | )1 | | | 12.44 | | | | 12.28 | | | | 0.00 | | | | (7.64 | ) | | | (7.64 | ) | | | 71.77 | | | | 20.47 | | | | 1.30 | 2 | | | (0.25 | ) | | | 2,666.6 | | | | 3.32 | |
| | | | | | | | | | | | | |
2016 | | | 68.25 | | | | 0.08 | 1 | | | 4.83 | | | | 4.91 | | | | 0.00 | | | | (6.03 | ) | | | (6.03 | ) | | | 67.13 | | | | 7.60 | | | | 1.30 | 2 | | | 0.12 | | | | 2,917.2 | | | | 4.68 | |
| | | | | | | | | | | | | |
2015 | | | 70.46 | | | | (0.27 | )1 | | | 1.28 | | | | 1.01 | | | | 0.00 | | | | (3.22 | ) | | | (3.22 | ) | | | 68.25 | | | | 1.27 | | | | 1.29 | 2 | | | (0.37 | ) | | | 3,511.2 | | | | 6.95 | |
| | | | | | | | | | | | | |
2014 | | | 68.67 | | | | 0.06 | 1 | | | 3.45 | | | | 3.51 | | | | (0.03 | ) | | | (1.69 | ) | | | (1.72 | ) | | | 70.46 | | | | 5.11 | | | | 1.29 | 2 | | | 0.08 | | | | 4,076.1 | | | | 13.15 | |
| | | | | | | | | | | | | |
2013 | | | 58.19 | | | | (0.12 | )1 | | | 16.37 | | | | 16.25 | | | | (0.18 | ) | | | (5.59 | ) | | | (5.77 | ) | | | 68.67 | | | | 30.76 | | | | 1.30 | | | | (0.20 | ) | | | 4,644.2 | | | | 9.63 | |
| | | | | | | | | | | | | |
2012 | | | 46.18 | | | | 0.20 | 1 | | | 12.64 | | | | 12.84 | | | | 0.00 | | | | (0.83 | ) | | | (0.83 | ) | | | 58.19 | | | | 28.12 | | | | 1.32 | | | | 0.38 | | | | 4,073.5 | | | | 13.70 | |
| | | | | | | | | | | | | |
2011 | | | 44.37 | | | | (0.29 | )1 | | | 2.10 | | | | 1.81 | | | | 0.00 | | | | 0.00 | | | | 0.00 | | | | 46.18 | | | | 4.08 | | | | 1.32 | | | | (0.56 | ) | | | 4,110.8 | | | | 13.51 | |
| | | | | | | | | | | | | |
2010 | | | 39.00 | | | | (0.34 | )1 | | | 5.71 | | | | 5.37 | | | | 0.00 | | | | 0.00 | | | | 0.00 | | | | 44.37 | | | | 13.77 | | | | 1.32 | | | | (0.80 | ) | | | 4,842.8 | | | | 16.12 | |
|
INSTITUTIONAL SHARES | |
|
Year Ended September 30, | |
| | | | | | | | | | | | | |
2019 | | | 83.09 | | | | 0.03 | 1 | | | 3.70 | | | | 3.73 | | | | 0.00 | | | | (5.13 | ) | | | (5.13 | ) | | | 81.69 | | | | 5.36 | | | | 1.04 | 2 | | | 0.03 | | | | 4,150.9 | | | | 1.93 | |
| | | | | | | | | | | | | |
2018 | | | 73.52 | | | | 0.01 | 1 | | | 17.46 | | | | 17.47 | | | | 0.00 | | | | (7.90 | ) | | | (7.90 | ) | | | 83.09 | | | | 25.86 | | | | 1.03 | 2 | | | 0.01 | | | | 4,134.2 | | | | 2.92 | |
| | | | | | | | | | | | | |
2017 | | | 68.42 | | | | 0.00 | 1,5 | | | 12.74 | | | | 12.74 | | | | 0.00 | | | | (7.64 | ) | | | (7.64 | ) | | | 73.52 | | | | 20.79 | | | | 1.04 | 2 | | | 0.00 | 6 | | | 3,433.5 | | | | 3.32 | |
| | | | | | | | | | | | | |
2016 | | | 69.28 | | | | 0.24 | 1 | | | 4.93 | | | | 5.17 | | | | 0.00 | | | | (6.03 | ) | | | (6.03 | ) | | | 68.42 | | | | 7.88 | | | | 1.05 | 2 | | | 0.37 | | | | 3,043.3 | | | | 4.68 | |
| | | | | | | | | | | | | |
2015 | | | 71.33 | | | | (0.09 | )1 | | | 1.28 | | | | 1.19 | | | | (0.02 | ) | | | (3.22 | ) | | | (3.24 | ) | | | 69.28 | | | | 1.51 | | | | 1.04 | 2 | | | (0.12 | ) | | | 3,440.4 | | | | 6.95 | |
| | | | | | | | | | | | | |
2014 | | | 69.32 | | | | 0.20 | 1 | | | 3.53 | | | | 3.73 | | | | (0.03 | ) | | | (1.69 | ) | | | (1.72 | ) | | | 71.33 | | | | 5.39 | | | | 1.04 | 2 | | | 0.28 | | | | 3,694.5 | | | | 13.15 | |
| | | | | | | | | | | | | |
2013 | | | 58.70 | | | | 0.02 | 1 | | | 16.52 | | | | 16.54 | | | | (0.33 | ) | | | (5.59 | ) | | | (5.92 | ) | | | 69.32 | | | | 31.10 | | | | 1.05 | | | | 0.04 | | | | 2,976.7 | | | | 9.63 | |
| | | | | | | | | | | | | |
2012 | | | 46.46 | | | | 0.45 | 1 | | | 12.62 | | | | 13.07 | | | | 0.00 | | | | (0.83 | ) | | | (0.83 | ) | | | 58.70 | | | | 28.45 | | | | 1.06 | | | | 0.83 | | | | 1,747.3 | | | | 13.70 | |
| | | | | | | | | | | | | |
2011 | | | 44.52 | | | | (0.17 | )1 | | | 2.11 | | | | 1.94 | | | | 0.00 | | | | 0.00 | | | | 0.00 | | | | 46.46 | | | | 4.36 | | | | 1.06 | | | | (0.33 | ) | | | 1,261.8 | | | | 13.51 | |
| | | | | | | | | | | | | |
2010 | | | 39.03 | | | | (0.22 | )1 | | | 5.71 | | | | 5.49 | | | | 0.00 | | | | 0.00 | | | | 0.00 | | | | 44.52 | | | | 14.07 | | | | 1.06 | | | | (0.53 | ) | | | 728.9 | | | | 16.12 | |
|
R6 SHARES | |
|
Year Ended September 30, | |
| | | | | | | | | | | | | |
2019 | | | 83.10 | | | | 0.00 | 1,5 | | | 3.73 | | | | 3.73 | | | | 0.00 | | | | (5.13 | ) | | | (5.13 | ) | | | 81.70 | | | | 5.36 | | | | 1.04 | 2 | | | 0.00 | 6 | | | 131.6 | | | | 1.93 | |
| | | | | | | | | | | | | |
2018 | | | 73.52 | | | | (0.00 | )1,5 | | | 17.48 | | | | 17.48 | | | | 0.00 | | | | (7.90 | ) | | | (7.90 | ) | | | 83.10 | | | | 25.88 | | | | 1.04 | 2 | | | (0.00 | )6 | | | 107.4 | | | | 2.92 | |
| | | | | | | | | | | | | |
2017 | | | 68.42 | | | | (0.11 | )1 | | | 12.85 | | | | 12.74 | | | | 0.00 | | | | (7.64 | ) | | | (7.64 | ) | | | 73.52 | | | | 20.79 | | | | 1.05 | 2 | | | (0.15 | ) | | | 12.5 | | | | 3.32 | |
| | | | | | | | | | | | | |
20167 | | | 60.02 | | | | (0.15 | )1 | | | 8.55 | | | | 8.40 | | | | 0.00 | | | | 0.00 | | | | 0.00 | | | | 68.42 | | | | 14.00 | 3 | | | 1.05 | 2,4 | | | (0.33 | )4 | | | 2.3 | | | | 4.68 | |
| 1 | Based on average shares outstanding. |
| 2 | Interest expense rounds to less than 0.01%. |
| 5 | Less than $0.01 per share. |
| 7 | For the period January 29, 2016 (initial offering of R6 Shares) to September 30, 2016. |
| | |
| See Notes to Financial Statements. | | 47 |
| | |
| Baron Investment Funds | | September 30, 2019 |
FINANCIAL HIGHLIGHTS (Continued)
BARON SMALL CAP FUND
Selected data for a share outstanding throughout each year:
| | | | | | | | | | | | | | | | | | | | | | | | | | | | | | | | | | | | | | | | | | | | | | | | | | | | |
| | | | | | | |
| | | | | | Income (loss) from
investment operations: | | | Less distributions to
shareholders from: | | | | | | | | | Ratios to Average Net Assets: | | | Supplemental
Data: | |
| | | | | | | | | | | | | |
| | | Net asset
value,
beginning of year
($) | | | Net
investment
income
(loss)
($) | | | Net
realized
and
unrealized
gain (loss) on
Investment
($) | | | Total from
investment
operations
($) | | | Net
investment
income
($) | | | Net realized
gain on
investments
($) | | | Total
distributions
($) | | | Net
asset
value,
end of
year
($) | | | Total
return
(%) | | | Operating
expenses
(%) | | | Net
investment
income (loss)
(%) | | | Net
assets (in
millions),
end of
year
($) | | | Portfolio
turnover
rate
(%) | |
|
RETAIL SHARES | |
|
Year Ended September 30, | |
| | | | | | | | | | | | | |
2019 | | | 33.68 | | | | (0.27 | )1 | | | (1.36 | ) | | | (1.63 | ) | | | 0.00 | | | | (2.61 | ) | | | (2.61 | ) | | | 29.44 | | | | (4.17 | ) | | | 1.31 | | | | (0.95 | ) | | | 1,451.9 | | | | 13.44 | |
| | | | | | | | | | | | | |
2018 | | | 30.64 | | | | (0.32 | )1 | | | 7.21 | | | | 6.89 | | | | 0.00 | | | | (3.85 | ) | | | (3.85 | ) | | | 33.68 | | | | 25.00 | | | | 1.30 | | | | (1.05 | ) | | | 1,831.3 | | | | 14.19 | |
| | | | | | | | | | | | | |
2017 | | | 30.59 | | | | (0.04 | )1 | | | 5.77 | | | | 5.73 | | | | 0.00 | | | | (5.68 | ) | | | (5.68 | ) | | | 30.64 | | | | 22.45 | | | | 1.31 | 5 | | | (0.15 | ) | | | 1,730.3 | | | | 28.95 | |
| | | | | | | | | | | | | |
2016 | | | 30.34 | | | | (0.18 | )1 | | | 3.84 | | | | 3.66 | | | | 0.00 | | | | (3.41 | ) | | | (3.41 | ) | | | 30.59 | | | | 12.89 | | | | 1.32 | 5 | | | (0.64 | ) | | | 1,826.3 | | | | 10.25 | |
| | | | | | | | | | | | | |
2015 | | | 33.68 | | | | (0.21 | )1 | | | (1.10 | ) | | | (1.31 | ) | | | 0.00 | | | | (2.03 | ) | | | (2.03 | ) | | | 30.34 | | | | (4.32 | ) | | | 1.30 | | | | (0.61 | ) | | | 2,601.4 | | | | 14.66 | |
| | | | | | | | | | | | | |
2014 | | | 32.83 | | | | (0.01 | )1 | | | 2.14 | | | | 2.13 | | | | 0.00 | | | | (1.28 | ) | | | (1.28 | ) | | | 33.68 | | | | 6.52 | | | | 1.30 | | | | (0.04 | ) | | | 3,192.8 | | | | 16.41 | |
| | | | | | | | | | | | | |
2013 | | | 26.14 | | | | (0.12 | )1 | | | 7.61 | | | | 7.49 | | | | 0.00 | | | | (0.80 | ) | | | (0.80 | ) | | | 32.83 | | | | 29.51 | | | | 1.31 | | | | (0.42 | ) | | | 3,626.1 | | | | 20.35 | |
| | | | | | | | | | | | | |
2012 | | | 20.84 | | | | (0.19 | )1 | | | 5.96 | | | | 5.77 | | | | 0.00 | | | | (0.47 | ) | | | (0.47 | ) | | | 26.14 | | | | 28.09 | | | | 1.31 | | | | (0.76 | ) | | | 3,081.8 | | | | 28.02 | |
| | | | | | | | | | | | | |
2011 | | | 20.90 | | | | (0.15 | )1 | | | 0.09 | 2 | | | (0.06 | ) | | | 0.00 | | | | 0.00 | | | | 0.00 | | | | 20.84 | | | | (0.29 | ) | | | 1.31 | | | | (0.63 | ) | | | 2,842.0 | | | | 32.81 | |
| | | | | | | | | | | | | |
2010 | | | 17.96 | | | | (0.06 | )1 | | | 3.00 | | | | 2.94 | | | | 0.00 | | | | 0.00 | | | | 0.00 | | | | 20.90 | | | | 16.37 | | | | 1.31 | | | | (0.30 | ) | | | 3,032.0 | | | | 27.22 | |
|
INSTITUTIONAL SHARES | |
|
Year Ended September 30, | |
| | | | | | | | | | | | | |
2019 | | | 34.95 | | | | (0.21 | )1 | | | (1.39 | ) | | | (1.60 | ) | | | 0.00 | | | | (2.61 | ) | | | (2.61 | ) | | | 30.74 | | | | (3.91 | ) | | | 1.05 | | | | (0.69 | ) | | | 2,267.3 | | | | 13.44 | |
| | | | | | | | | | | | | |
2018 | | | 31.58 | | | | (0.25 | )1 | | | 7.47 | | | | 7.22 | | | | 0.00 | | | | (3.85 | ) | | | (3.85 | ) | | | 34.95 | | | | 25.33 | | | | 1.04 | | | | (0.79 | ) | | | 2,696.7 | | | | 14.19 | |
| | | | | | | | | | | | | |
2017 | | | 31.29 | | | | 0.02 | 1 | | | 5.95 | | | | 5.97 | | | | 0.00 | | | | (5.68 | ) | | | (5.68 | ) | | | 31.58 | | | | 22.76 | | | | 1.05 | 5 | | | 0.06 | | | | 2,404.6 | | | | 28.95 | |
| | | | | | | | | | | | | |
2016 | | | 30.88 | | | | (0.12 | )1 | | | 3.94 | | | | 3.82 | | | | 0.00 | | | | (3.41 | ) | | | (3.41 | ) | | | 31.29 | | | | 13.21 | | | | 1.06 | 5 | | | (0.41 | ) | | | 1,680.7 | | | | 10.25 | |
| | | | | | | | | | | | | |
2015 | | | 34.16 | | | | (0.13 | )1 | | | (1.12 | ) | | | (1.25 | ) | | | 0.00 | | | | (2.03 | ) | | | (2.03 | ) | | | 30.88 | | | | (4.08 | ) | | | 1.04 | | | | (0.37 | ) | | | 1,923.2 | | | | 14.66 | |
| | | | | | | | | | | | | |
2014 | | | 33.20 | | | | 0.06 | 1 | | | 2.18 | | | | 2.24 | | | | 0.00 | | | | (1.28 | ) | | | (1.28 | ) | | | 34.16 | | | | 6.79 | | | | 1.04 | | | | 0.18 | | | | 2,057.4 | | | | 16.41 | |
| | | | | | | | | | | | | |
2013 | | | 26.36 | | | | (0.05 | )1 | | | 7.69 | | | | 7.64 | | | | 0.00 | | | | (0.80 | ) | | | (0.80 | ) | | | 33.20 | | | | 29.85 | | | | 1.05 | | | | (0.16 | ) | | | 1,775.7 | | | | 20.35 | |
| | | | | | | | | | | | | |
2012 | | | 20.96 | | | | (0.13 | )1 | | | 6.00 | | | | 5.87 | | | | 0.00 | | | | (0.47 | ) | | | (0.47 | ) | | | 26.36 | | | | 28.41 | | | | 1.05 | | | | (0.53 | ) | | | 1,111.0 | | | | 28.02 | |
| | | | | | | | | | | | | |
2011 | | | 20.97 | | | | (0.10 | )1 | | | 0.09 | 2 | | | (0.01 | ) | | | 0.00 | | | | 0.00 | | | | 0.00 | | | | 20.96 | | | | (0.05 | ) | | | 1.06 | | | | (0.42 | ) | | | 518.6 | | | | 32.81 | |
| | | | | | | | | | | | | |
2010 | | | 17.97 | | | | (0.03 | )1 | | | 3.03 | | | | 3.00 | | | | 0.00 | | | | 0.00 | | | | 0.00 | | | | 20.97 | | | | 16.69 | | | | 1.06 | | | | (0.15 | ) | | | 261.1 | | | | 27.22 | |
| | | |
R6 SHARES | | | | | | | | | | | | | |
|
Year Ended September 30, | |
| | | | | | | | | | | | | |
2019 | | | 34.94 | | | | (0.21 | )1 | | | (1.39 | ) | | | (1.60 | ) | | | 0.00 | | | | (2.61 | ) | | | (2.61 | ) | | | 30.73 | | | | (3.91 | ) | | | 1.05 | | | | (0.70 | ) | | | 161.9 | | | | 13.44 | |
| | | | | | | | | | | | | |
2018 | | | 31.57 | | | | (0.26 | )1 | | | 7.48 | | | | 7.22 | | | | 0.00 | | | | (3.85 | ) | | | (3.85 | ) | | | 34.94 | | | | 25.34 | | | | 1.05 | | | | (0.82 | ) | | | 155.2 | | | | 14.19 | |
| | | | | | | | | | | | | |
2017 | | | 31.29 | | | | (0.08 | )1 | | | 6.04 | | | | 5.96 | | | | 0.00 | | | | (5.68 | ) | | | (5.68 | ) | | | 31.57 | | | | 22.72 | | | | 1.06 | 5 | | | (0.28 | ) | | | 101.8 | | | | 28.95 | |
| | | | | | | | | | | | | |
20166 | | | 26.06 | | | | (0.17 | )1 | | | 5.40 | | | | 5.23 | | | | 0.00 | | | | 0.00 | | | | 0.00 | | | | 31.29 | | | | 20.07 | 3 | | | 1.06 | 4,5 | | | (0.85 | )4 | | | 3.7 | | | | 10.25 | |
| 1 | Based on average shares outstanding. |
| 2 | The amount shown for a share outstanding does not correspond with the aggregate realized and unrealized gain (loss) on investments for the period due to the timing of sales and redemptions of Fund shares in relation to fluctuating market values of investments of the Fund. |
| 5 | Interest expense rounds to less than 0.01%. |
| 6 | For the period January 29, 2016 (initial offering of R6 Shares) to September 30, 2016. |
| | |
| 48 | | See Notes to Financial Statements. |
| | |
| September 30, 2019 | | Baron Investment Funds |
FINANCIAL HIGHLIGHTS (Continued)
BARON OPPORTUNITY FUND
Selected data for a share outstanding throughout each year:
| | | | | | | | | | | | | | | | | | | | | | | | | | | | | | | | | | | | | | | | | | | | | | | | | | | | | | | | |
| | | | | | | | |
| | | | | | Income (loss) from
investment operations: | | | Less distributions to
shareholders from: | | | | | | | | | | | | Ratios to Average Net Assets: | | | Supplemental
Data: | |
| | | | | | | | | | | | | | |
| | | Net asset
value,
beginning
of year
($) | | | Net
investment
income
(loss) ($) | | | Net realized and
unrealized
gain (loss) on
investments
($) | | | Total from
investment
operations
($) | | | Net
investment
income ($) | | | Net realized
gain on
investments
($) | | | Total
distributions
($) | | | Redemption
fee | | | Net
asset
value,
end of
year
($) | | | Total
return
(%) | | | Operating
expenses
(%) | | | Net
investment
income (loss) (%) | | | Net
assets (in
millions),
end of
year ($) | | | Portfolio
turnover
rate (%) | |
| | | | | | | | | | | |
RETAIL SHARES | | | | | | | | | | | | | | | | | | | | | | | | | | | | | | | | | | | | | | | | | | | | | |
| | | | | | | | | | | |
Year Ended September 30, | | | | | | | | | | | | | | | | | | | | | | | | | | | | | | | | | | | | | | | | | | | | | |
| | | | | | | | | | | | | | |
2019 | | | 22.02 | | | | (0.22 | )1 | | | 0.66 | | | | 0.44 | | | | 0.00 | | | | (0.93 | ) | | | (0.93 | ) | | | 0.00 | | | | 21.53 | | | | 2.51 | | | | 1.34 | 4 | | | (1.07 | ) | | | 302.6 | | | | 37.10 | |
| | | | | | | | | | | | | | |
2018 | | | 18.53 | | | | (0.22 | )1 | | | 6.36 | | | | 6.14 | | | | 0.00 | | | | (2.65 | ) | | | (2.65 | ) | | | 0.00 | | | | 22.02 | | | | 37.41 | | | | 1.37 | 4 | | | (1.13 | ) | | | 363.6 | | | | 23.97 | |
| | | | | | | | | | | | | | |
2017 | | | 16.87 | | | | (0.20 | )1 | | | 3.75 | | | | 3.55 | | | | 0.00 | | | | (1.89 | ) | | | (1.89 | ) | | | 0.00 | | | | 18.53 | | | | 24.32 | | | | 1.41 | 4 | | | (1.18 | ) | | | 201.4 | | | | 32.62 | |
| | | | | | | | | | | | | | |
2016 | | | 17.12 | | | | (0.13 | )1 | | | 1.70 | | | | 1.57 | | | | 0.00 | | | | (1.82 | ) | | | (1.82 | ) | | | 0.00 | | | | 16.87 | | | | 9.19 | | | | 1.41 | 4 | | | (0.83 | ) | | | 207.0 | | | | 32.38 | |
| | | | | | | | | | | | | | |
2015 | | | 18.61 | | | | (0.21 | )1 | | | (0.25 | ) | | | (0.46 | ) | | | 0.00 | | | | (1.03 | ) | | | (1.03 | ) | | | 0.00 | | | | 17.12 | | | | (2.70 | ) | | | 1.38 | 4 | | | (1.10 | ) | | | 232.2 | | | | 41.87 | |
| | | | | | | | | | | | | | |
2014 | | | 19.26 | | | | (0.24 | )1 | | | 0.79 | | | | 0.55 | | | | 0.00 | | | | (1.20 | ) | | | (1.20 | ) | | | 0.00 | | | | 18.61 | | | | 2.87 | 3 | | | 1.35 | | | | (1.24 | ) | | | 331.2 | | | | 63.40 | |
| | | | | | | | | | | | | | |
2013 | | | 15.61 | | | | (0.17 | )1 | | | 4.06 | | | | 3.89 | | | | 0.00 | | | | (0.24 | ) | | | (0.24 | ) | | | 0.00 | | | | 19.26 | | | | 25.39 | | | | 1.37 | | | | (1.02 | ) | | | 359.9 | | | | 70.44 | |
| | | | | | | | | | | | | | |
2012 | | | 12.83 | | | | (0.17 | )1 | | | 2.95 | | | | 2.78 | | | | 0.00 | | | | 0.00 | | | | 0.00 | | | | 0.00 | | | | 15.61 | | | | 21.67 | | | | 1.39 | | | | (1.16 | ) | | | 332.4 | | | | 88.56 | |
| | | | | | | | | | | | | | |
2011 | | | 12.76 | | | | (0.16 | )1 | | | 0.23 | | | | 0.07 | | | | 0.00 | | | | 0.00 | | | | 0.00 | | | | 0.00 | | | | 12.83 | | | | 0.55 | | | | 1.41 | | | | (1.11 | ) | | | 240.4 | | | | 65.43 | |
| | | | | | | | | | | | | | |
2010 | | | 10.61 | | | | (0.13 | )1 | | | 2.28 | | | | 2.15 | | | | 0.00 | | | | 0.00 | | | | 0.00 | | | | 0.00 | 2 | | | 12.76 | | | | 20.26 | | | | 1.44 | | | | (1.08 | ) | | | 214.4 | | | | 76.44 | |
| | | | | | | | | | | |
INSTITUTIONAL SHARES | | | | | | | | | | | | | | | | | | | | | | | | | | | | | | | | | | | | | | | | | | | | | |
| | | | | | | | | | | |
Year Ended September 30, | | | | | | | | | | | | | | | | | | | | | | | | | | | | | | | | | | | | | | | | | | | | | |
| | | | | | | | | | | | | | |
2019 | | | 22.83 | | | | (0.18 | )1 | | | 0.70 | | | | 0.52 | | | | 0.00 | | | | (0.93 | ) | | | (0.93 | ) | | | 0.00 | | | | 22.42 | | | | 2.78 | | | | 1.09 | 4 | | | (0.82 | ) | | | 94.4 | | | | 37.10 | |
| | | | | | | | | | | | | | |
2018 | | | 19.08 | | | | (0.18 | )1 | | | 6.58 | | | | 6.40 | | | | 0.00 | | | | (2.65 | ) | | | (2.65 | ) | | | 0.00 | | | | 22.83 | | | | 37.73 | | | | 1.11 | 4 | | | (0.88 | ) | | | 96.4 | | | | 23.97 | |
| | | | | | | | | | | | | | |
2017 | | | 17.27 | | | | (0.16 | )1 | | | 3.86 | | | | 3.70 | | | | 0.00 | | | | (1.89 | ) | | | (1.89 | ) | | | 0.00 | | | | 19.08 | | | | 24.65 | | | | 1.14 | 4 | | | (0.92 | ) | | | 51.7 | | | | 32.62 | |
| | | | | | | | | | | | | | |
2016 | | | 17.45 | | | | (0.08 | )1 | | | 1.72 | | | | 1.64 | | | | 0.00 | | | | (1.82 | ) | | | (1.82 | ) | | | 0.00 | | | | 17.27 | | | | 9.44 | | | | 1.13 | 4 | | | (0.46 | ) | | | 43.3 | | | | 32.38 | |
| | | | | | | | | | | | | | |
2015 | | | 18.89 | | | | (0.16 | )1 | | | (0.25 | ) | | | (0.41 | ) | | | 0.00 | | | | (1.03 | ) | | | (1.03 | ) | | | 0.00 | | | | 17.45 | | | | (2.38 | ) | | | 1.10 | 4 | | | (0.84 | ) | | | 91.7 | | | | 41.87 | |
| | | | | | | | | | | | | | |
2014 | | | 19.49 | | | | (0.19 | )1 | | | 0.79 | | | | 0.60 | | | | 0.00 | | | | (1.20 | ) | | | (1.20 | ) | | | 0.00 | | | | 18.89 | | | | 3.10 | 3 | | | 1.08 | | | | (0.97 | ) | | | 109.4 | | | | 63.40 | |
| | | | | | | | | | | | | | |
2013 | | | 15.75 | | | | (0.13 | )1 | | | 4.11 | | | | 3.98 | | | | 0.00 | | | | (0.24 | ) | | | (0.24 | ) | | | 0.00 | | | | 19.49 | | | | 25.74 | | | | 1.11 | | | | (0.79 | ) | | | 101.3 | | | | 70.44 | |
| | | | | | | | | | | | | | |
2012 | | | 12.91 | | | | (0.13 | )1 | | | 2.97 | | | | 2.84 | | | | 0.00 | | | | 0.00 | | | | 0.00 | | | | 0.00 | | | | 15.75 | | | | 22.00 | | | | 1.13 | | | | (0.90 | ) | | | 62.5 | | | | 88.56 | |
| | | | | | | | | | | | | | |
2011 | | | 12.80 | | | | (0.12 | )1 | | | 0.23 | | | | 0.11 | | | | 0.00 | | | | 0.00 | | | | 0.00 | | | | 0.00 | | | | 12.91 | | | | 0.86 | | | | 1.14 | | | | (0.84 | ) | | | 35.5 | | | | 65.43 | |
| | | | | | | | | | | | | | |
2010 | | | 10.62 | | | | (0.10 | )1 | | | 2.28 | | | | 2.18 | | | | 0.00 | | | | 0.00 | | | | 0.00 | | | | 0.00 | 2 | | | 12.80 | | | | 20.53 | | | | 1.18 | | | | (0.83 | ) | | | 25.5 | | | | 76.44 | |
| | | | | | | | | | | |
R6 SHARES | | | | | | | | | | | | | | | | | | | | | | | | | | | | | | | | | | | | | | | | | | | | | |
| | | | | | | | | | | |
Year Ended September 30, | | | | | | | | | | | | | | | | | | | | | | | | | | | | | | | | | | | | | | | | | | | | | |
| | | | | | | | | | | | | | |
2019 | | | 22.86 | | | | (0.18 | )1 | | | 0.70 | | | | 0.52 | | | | 0.00 | | | | (0.93 | ) | | | (0.93 | ) | | | 0.00 | | | | 22.45 | | | | 2.78 | | | | 1.08 | 4 | | | (0.81 | ) | | | 14.5 | | | | 37.10 | |
| | | | | | | | | | | | | | |
2018 | | | 19.09 | | | | (0.17 | )1 | | | 6.59 | | | | 6.42 | | | | 0.00 | | | | (2.65 | ) | | | (2.65 | ) | | | 0.00 | | | | 22.86 | | | | 37.83 | | | | 1.09 | 4 | | | (0.82 | ) | | | 14.0 | | | | 23.97 | |
| | | | | | | | | | | | | | |
2017 | | | 17.28 | | | | (0.16 | )1 | | | 3.86 | | | | 3.70 | | | | 0.00 | | | | (1.89 | ) | | | (1.89 | ) | | | 0.00 | | | | 19.09 | | | | 24.64 | | | | 1.12 | 4 | | | (0.89 | ) | | | 1.0 | | | | 32.62 | |
| | | | | | | | | | | | | | |
20167 | | | 16.88 | | | | (0.02 | )1 | | | 0.42 | | | | 0.40 | | | | 0.00 | | | | 0.00 | | | | 0.00 | | | | 0.00 | | | | 17.28 | | | | 2.37 | 5 | | | 1.12 | 4,6 | | | (1.25 | )6 | | | 0.5 | | | | 32.38 | |
| 1 | Based on average shares outstanding. |
| 2 | Less than $0.01 per share. |
| 3 | The Adviser made a voluntary payment to the Fund in the amount of $140,762 to compensate the Fund for a loss incurred due to a trade processing error. The impact of this payment increased the Fund’s total return by 0.03%. |
| 4 | Interest expense rounds to less than 0.01%. |
| 7 | For the period August 31, 2016 (initial offering of R6 Shares) to September 30, 2016. |
| | |
| See Notes to Financial Statements. | | 49 |
| | |
| Baron Investment Funds | | September 30, 2019 |
FINANCIAL HIGHLIGHTS (Continued)
BARON FIFTH AVENUE GROWTH FUND
Selected data for a share outstanding throughout each year:
| | | | | | | | | | | | | | | | | | | | | | | | | | | | | | | | | | | | | | | | | | | | | | | | | | | | | | | | | | | | |
| | | | | | | |
| | | | | | Income (loss) from
investment operations: | | | Less distributions to
shareholders from: | | | | | | | | | Ratios to Average Net Assets: | | | Supplemental
Data: | |
| | | | | | | | | | | | | | | |
| | | Net asset
value,
beginning
of year
($) | | | Net
investment
income
(loss) ($) | | | Net realized and
unrealized
gain (loss) on
investments
($) | | | Total from
investment
operations
($) | | | Net
investment
income ($) | | | Net realized
gain on
investments
($) | | | Total
distributions
($) | | | Net
asset
value,
end of
year
($) | | | Total
return
(%) | | | Operating
expenses
(%) | | | Less:
Reimbursement
of expenses
by Adviser (%) | | | Net
operating
expenses
(%) | | | Net
investment
income
(loss) (%) | | | Net
assets (in
millions),
end of
year ($) | | | Portfolio
turnover
rate (%) | |
| | | | | | | | | | | | |
RETAIL SHARES | | | | | | | | | | | | | | | | | | | | | | | | | | | | | | | | | | | | | | | | | | | | | | | | | |
| | | | | | | | | | | |
Year Ended September 30, | | | | | | | | | | | | | | | | | | | | | | | | | | | | | | | | | | | | | | | | | | | | | |
| | | | | | | | | | | | | | | |
2019 | | | 31.02 | | | | 0.07 | 1 | | | 1.01 | | | | 1.08 | | | | 0.00 | | | | 0.00 | | | | 0.00 | | | | 32.10 | | | | 3.48 | 2 | | | 1.06 | | | | (0.06 | ) | | | 1.00 | | | | 0.23 | | | | 115.5 | | | | 21.24 | |
| | | | | | | | | | | | | | | |
2018 | | | 24.04 | | | | (0.17 | )1 | | | 7.15 | | | | 6.98 | | | | 0.00 | | | | 0.00 | | | | 0.00 | | | | 31.02 | | | | 29.03 | 2 | | | 1.09 | | | | (0.08 | ) | | | 1.01 | | | | (0.61 | ) | | | 132.2 | | | | 8.81 | |
| | | | | | | | | | | | | | | |
2017 | | | 19.35 | | | | (0.11 | )1 | | | 4.80 | | | | 4.69 | | | | 0.00 | | | | 0.00 | | | | 0.00 | | | | 24.04 | | | | 24.24 | 2 | | | 1.12 | 3 | | | (0.02 | ) | | | 1.10 | | | | (0.50 | ) | | | 87.5 | | | | 13.94 | |
| | | | | | | | | | | | | | | |
2016 | | | 16.91 | | | | (0.08 | )1 | | | 2.52 | | | | 2.44 | | | | 0.00 | | | | 0.00 | | | | 0.00 | | | | 19.35 | | | | 14.43 | 2 | | | 1.26 | | | | (0.04 | ) | | | 1.22 | | | | (0.43 | ) | | | 73.5 | | | | 19.30 | |
| | | | | | | | | | | | | | | |
2015 | | | 16.83 | | | | (0.09 | )1 | | | 0.17 | 6 | | | 0.08 | | | | 0.00 | | | | 0.00 | | | | 0.00 | | | | 16.91 | | | | 0.48 | 2 | | | 1.32 | | | | (0.02 | ) | | | 1.30 | | | | (0.49 | ) | | | 71.5 | | | | 14.54 | |
| | | | | | | | | | | | | | | |
2014 | | | 14.42 | | | | (0.05 | )1 | | | 2.46 | | | | 2.41 | | | | 0.00 | | | | 0.00 | | | | 0.00 | | | | 16.83 | | | | 16.71 | 2 | | | 1.37 | | | | (0.07 | ) | | | 1.30 | | | | (0.29 | ) | | | 53.2 | | | | 16.84 | |
| | | | | | | | | | | | | | | |
2013 | | | 11.83 | | | | 0.02 | 1 | | | 2.57 | | | | 2.59 | | | | 0.00 | | | | 0.00 | | | | 0.00 | | | | 14.42 | | | | 21.89 | 2 | | | 1.47 | | | | (0.17 | ) | | | 1.30 | | | | 0.14 | | | | 47.8 | | | | 22.91 | |
| | | | | | | | | | | | | | | |
2012 | | | 8.98 | | | | (0.03 | )1 | | | 2.88 | | | | 2.85 | | | | 0.00 | | | | 0.00 | | | | 0.00 | | | | 11.83 | | | | 31.74 | 2 | | | 1.55 | | | | (0.25 | ) | | | 1.30 | | | | (0.30 | ) | | | 34.8 | | | | 79.07 | |
| | | | | | | | | | | | | | | |
2011 | | | 9.21 | | | | (0.06 | )1 | | | (0.17 | ) | | | (0.23 | ) | | | 0.00 | | | | 0.00 | | | | 0.00 | | | | 8.98 | | | | (2.50 | )2 | | | 1.59 | | | | (0.29 | ) | | | 1.30 | | | | (0.55 | ) | | | 23.4 | | | | 75.36 | |
| | | | | | | | | | | | | | | |
2010 | | | 8.60 | | | | (0.03 | )1 | | | 0.66 | | | | 0.63 | | | | (0.02 | ) | | | 0.00 | | | | (0.02 | ) | | | 9.21 | | | | 7.38 | 2 | | | 1.62 | | | | (0.25 | ) | | | 1.37 | | | | (0.32 | ) | | | 29.0 | | | | 57.67 | |
| | | | | | | | | | | | |
INSTITUTIONAL SHARES | | | | | | | | | | | | | | | | | | | | | | | | | | | | | | | | | | | | | | | | | | | | | | | | | |
| | | | | | | | | | | |
Year Ended September 30, | | | | | | | | | | | | | | | | | | | | | | | | | | | | | | | | | | | | | | | | | | | | | |
| | | | | | | | | | | | | | | |
2019 | | | 31.62 | | | | 0.17 | 1 | | | 1.01 | | | | 1.18 | | | | 0.00 | | | | 0.00 | | | | 0.00 | | | | 32.80 | | | | 3.73 | 2 | | | 0.80 | | | | (0.05 | ) | | | 0.75 | | | | 0.56 | | | | 170.4 | | | | 21.24 | |
| | | | | | | | | | | | | | | |
2018 | | | 24.44 | | | | (0.10 | )1 | | | 7.28 | | | | 7.18 | | | | 0.00 | | | | 0.00 | | | | 0.00 | | | | 31.62 | | | | 29.38 | 2 | | | 0.82 | | | | (0.06 | ) | | | 0.76 | | | | (0.36 | ) | | | 152.2 | | | | 8.81 | |
| | | | | | | | | | | | | | | |
2017 | | | 19.62 | | | | (0.05 | )1 | | | 4.87 | | | | 4.82 | | | | 0.00 | | | | 0.00 | | | | 0.00 | | | | 24.44 | | | | 24.57 | | | | 0.84 | 3 | | | 0.00 | | | | 0.84 | | | | (0.24 | ) | | | 89.5 | | | | 13.94 | |
| | | | | | | | | | | | | | | |
2016 | | | 17.10 | | | | (0.03 | )1 | | | 2.55 | | | | 2.52 | | | | 0.00 | | | | 0.00 | | | | 0.00 | | | | 19.62 | | | | 14.74 | 2 | | | 0.98 | | | | (0.01 | ) | | | 0.97 | | | | (0.19 | ) | | | 81.9 | | | | 19.30 | |
| | | | | | | | | | | | | | | |
2015 | | | 17.00 | | | | (0.04 | )1 | | | 0.16 | 6 | | | 0.12 | | | | (0.02 | ) | | | 0.00 | | | | (0.02 | ) | | | 17.10 | | | | 0.72 | | | | 1.04 | | | | 0.00 | | | | 1.04 | | | | (0.23 | ) | | | 74.7 | | | | 14.54 | |
| | | | | | | | | | | | | | | |
2014 | | | 14.53 | | | | (0.01 | )1 | | | 2.48 | | | | 2.47 | | | | 0.00 | | | | 0.00 | | | | 0.00 | | | | 17.00 | | | | 17.00 | 2 | | | 1.08 | | | | (0.03 | ) | | | 1.05 | | | | (0.08 | ) | | | 56.0 | | | | 16.84 | |
| | | | | | | | | | | | | | | |
2013 | | | 11.89 | | | | 0.05 | 1 | | | 2.59 | | | | 2.64 | | | | 0.00 | | | | 0.00 | | | | 0.00 | | | | 14.53 | | | | 22.20 | 2 | | | 1.18 | | | | (0.13 | ) | | | 1.05 | | | | 0.36 | | | | 33.8 | | | | 22.91 | |
| | | | | | | | | | | | | | | |
2012 | | | 9.00 | | | | (0.01 | )1 | | | 2.90 | | | | 2.89 | | | | 0.00 | | | | 0.00 | | | | 0.00 | | | | 11.89 | | | | 32.11 | 2 | | | 1.26 | | | | (0.21 | ) | | | 1.05 | | | | (0.05 | ) | | | 18.9 | | | | 79.07 | |
| | | | | | | | | | | | | | | |
2011 | | | 9.21 | | | | (0.03 | )1 | | | (0.18 | ) | | | (0.21 | ) | | | 0.00 | | | | 0.00 | | | | 0.00 | | | | 9.00 | | | | (2.28 | )2 | | | 1.31 | | | | (0.26 | ) | | | 1.05 | | | | (0.30 | ) | | | 10.2 | | | | 75.36 | |
| | | | | | | | | | | | | | | |
2010 | | | 8.61 | | | | (0.01 | )1 | | | 0.66 | | | | 0.65 | | | | (0.05 | ) | | | 0.00 | | | | (0.05 | ) | | | 9.21 | | | | 7.59 | 2 | | | 1.35 | | | | (0.24 | ) | | | 1.11 | | | | (0.07 | ) | | | 10.4 | | | | 57.67 | |
| | | | | | | | | | | | |
R6 SHARES | | | | | | | | | | | | | | | | | | | | | | | | | | | | | | | | | | | | | | | | | | | | | | | | | |
| | | | | | | | | | | |
Year Ended September 30, | | | | | | | | | | | | | | | | | | | | | | | | | | | | | | | | | | | | | | | | | | | | | |
| | | | | | | | | | | | | | | |
2019 | | | 31.63 | | | | 0.17 | 1 | | | 1.01 | | | | 1.18 | | | | 0.00 | | | | 0.00 | | | | 0.00 | | | | 32.81 | | | | 3.73 | 2 | | | 0.79 | | | | (0.04 | ) | | | 0.75 | | | | 0.54 | | | | 22.5 | | | | 21.24 | |
| | | | | | | | | | | | | | | |
2018 | | | 24.45 | | | | (0.11 | )1 | | | 7.29 | | | | 7.18 | | | | 0.00 | | | | 0.00 | | | | 0.00 | | | | 31.63 | | | | 29.37 | 2 | | | 0.80 | | | | (0.05 | ) | | | 0.75 | | | | (0.37 | ) | | | 21.4 | | | | 8.81 | |
| | | | | | | | | | | | | | | |
2017 | | | 19.63 | | | | (0.06 | )1 | | | 4.88 | | | | 4.82 | | | | 0.00 | | | | 0.00 | | | | 0.00 | | | | 24.45 | | | | 24.55 | | | | 0.84 | 3 | | | 0.00 | | | | 0.84 | | | | (0.27 | ) | | | 4.7 | | | | 13.94 | |
| | | | | | | | | | | | | | | |
20167 | | | 17.03 | | | | (0.05 | )1 | | | 2.65 | | | | 2.60 | | | | 0.00 | | | | 0.00 | | | | 0.00 | | | | 19.63 | | | | 15.27 | 2,4 | | | 0.85 | 5 | | | (0.01 | )5 | | | 0.84 | 5 | | | (0.37 | )5 | | | 1.4 | | | | 19.30 | |
| 1 | Based on average shares outstanding. |
| 2 | The total returns would have been lower had certain expenses not been reduced during the period shown. |
| 3 | Interest expense rounds to less than 0.01%. |
| 6 | The amount shown for a share outstanding does not correspond with the aggregate realized and unrealized gain (loss) on investments for the period due to the timing of sales and redemptions of Fund shares in relation to fluctuating market values of investments of the Fund. |
| 7 | For the period January 29, 2016 (initial offering of R6 Shares) to September 30, 2016. |
| | |
| 50 | | See Notes to Financial Statements. |
| | |
| September 30, 2019 | | Baron Investment Funds |
FINANCIAL HIGHLIGHTS (Continued)
BARON DISCOVERY FUND
Selected data for a share outstanding throughout each year:
| | | | | | | | | | | | | | | | | | | | | | | | | | | | | | | | | | | | | | | | | | | | | | | | | | | | | | | | | | | | |
| | | | | | | |
| | | | | | Income (loss) from
investment operations: | | | Less distributions to
shareholders from: | | | | | | | | | Ratios to Average Net Assets: | | | Supplemental
Data: | |
| | | | | | | | | | | | | | | |
| | | Net asset
value,
beginning
of year
($) | | | Net
investment
income
(loss) ($) | | | Net realized and
unrealized
gain (loss) on
investments
($) | | | Total from
investment
operations
($) | | | Net
investment
income ($) | | | Net realized
gain on
investments
($) | | | Total
distributions
($) | | | Net
asset
value,
end of
year
($) | | | Total
return
(%) | | | Operating
expenses
(%) | | | Less:
Reimbursement
of expenses by Adviser (%) | | | Net
operating
expenses
(%) | | | Net
investment
income
(loss) (%) | | | Net
assets (in
millions),
end of
year ($) | | | Portfolio
turnover
rate (%) | |
| | | | | | | | | | | | |
RETAIL SHARES | | | | | | | | | | | | | | | | | | | | | | | | | | | | | | | | | | | | | | | | | | | | | | | | | |
| | | | | | | | | | | | |
Year Ended September 30, | | | | | | | | | | | | | | | | | | | | | | | | | | | | | | | | | | | | | | | | | | | | | | | | | |
| | | | | | | | | | | | | | | |
2019 | | | 23.77 | | | | (0.22 | )1 | | | (2.64 | ) | | | (2.86 | ) | | | 0.00 | | | | (1.50 | ) | | | (1.50 | ) | | | 19.41 | | | | (11.93 | )3 | | | 1.36 | | | | (0.01 | ) | | | 1.35 | | | | (1.10 | ) | | | 122.7 | | | | 55.94 | |
| | | | | | | | | | | | | | | |
2018 | | | 17.56 | | | | 0.09 | 1 | | | 6.13 | | | | 6.22 | | | | (0.01 | ) | | | 0.00 | | | | (0.01 | ) | | | 23.77 | | | | 35.41 | 3 | | | 1.40 | 8 | | | (0.05 | ) | | | 1.35 | | | | 0.45 | | | | 108.2 | | | | 72.25 | |
| | | | | | | | | | | | | | | |
2017 | | | 13.40 | | | | (0.17 | )1 | | | 4.33 | | | | 4.16 | | | | 0.00 | | | | 0.00 | | | | 0.00 | | | | 17.56 | | | | 31.04 | 3 | | | 1.47 | | | | (0.12 | ) | | | 1.35 | | | | (1.11 | ) | | | 131.2 | | | | 40.97 | |
| | | | | | | | | | | | | | | |
2016 | | | 11.13 | | | | 0.16 | 1 | | | 2.38 | | | | 2.54 | | | | 0.00 | | | | (0.27 | ) | | | (0.27 | ) | | | 13.40 | | | | 23.24 | 3 | | | 1.88 | | | | (0.53 | ) | | | 1.35 | | | | 1.38 | | | | 18.6 | | | | 90.74 | |
| | | | | | | | | | | | | | | |
2015 | | | 11.68 | | | | (0.13 | )1 | | | (0.42 | ) | | | (0.55 | ) | | | 0.00 | | | | 0.00 | | | | 0.00 | | | | 11.13 | | | | (4.71 | )3,4 | | | 1.57 | | | | (0.22 | ) | | | 1.35 | | | | (0.97 | ) | | | 19.9 | | | | 114.82 | |
| | | | | | | | | | | | | | | |
2014 | | | 10.00 | | | | (0.10 | )1 | | | 1.78 | 2 | | | 1.68 | | | | 0.00 | | | | 0.00 | | | | 0.00 | | | | 11.68 | | | | 16.80 | 3 | | | 2.16 | | | | (0.81 | ) | | | 1.35 | | | | (0.85 | ) | | | 16.6 | | | | 109.40 | |
| | | | | | | | | | | | |
INSTITUTIONAL SHARES | | | | | | | | | | | | | | | | | | | | | | | | | | | | | | | | | | | | | | | | | | | | | | | | | |
| | | | | | | | | | | | |
Year Ended September 30, | | | | | | | | | | | | | | | | | | | | | | | | | | | | | | | | | | | | | | | | | | | | | | | | | |
| | | | | | | | | | | | | | | |
2019 | | | 24.03 | | | | (0.18 | )1 | | | (2.67 | ) | | | (2.85 | ) | | | 0.00 | | | | (1.50 | ) | | | (1.50 | ) | | | 19.68 | | | | (11.75 | ) | | | 1.10 | | | | 0.00 | | | | 1.10 | | | | (0.88 | ) | | | 409.4 | | | | 55.94 | |
| | | | | | | | | | | | | | | |
2018 | | | 17.74 | | | | 0.01 | 1 | | | 6.32 | | | | 6.33 | | | | (0.04 | ) | | | 0.00 | | | | (0.04 | ) | | | 24.03 | | | | 35.74 | 3 | | | 1.12 | 8 | | | (0.02 | ) | | | 1.10 | | | | 0.05 | | | | 280.2 | | | | 72.25 | |
| | | | | | | | | | | | | | | |
2017 | | | 13.50 | | | | (0.13 | )1 | | | 4.37 | | | | 4.24 | | | | 0.00 | | | | 0.00 | | | | 0.00 | | | | 17.74 | | | | 31.41 | 3 | | | 1.23 | | | | (0.13 | ) | | | 1.10 | | | | (0.85 | ) | | | 113.6 | | | | 40.97 | |
| | | | | | | | | | | | | | | |
2016 | | | 11.19 | | | | 0.12 | 1 | | | 2.46 | | | | 2.58 | | | | 0.00 | | | | (0.27 | ) | | | (0.27 | ) | | | 13.50 | | | | 23.47 | 3 | | | 1.49 | | | | (0.39 | ) | | | 1.10 | | | | 1.06 | | | | 22.8 | | | | 90.74 | |
| | | | | | | | | | | | | | | |
2015 | | | 11.71 | | | | (0.10 | )1 | | | (0.42 | ) | | | (0.52 | ) | | | 0.00 | | | | 0.00 | | | | 0.00 | | | | 11.19 | | | | (4.44 | )3,4 | | | 1.25 | | | | (0.15 | ) | | | 1.10 | | | | (0.72 | ) | | | 53.9 | | | | 114.82 | |
| | | | | | | | | | | | | | | |
2014 | | | 10.00 | | | | (0.08 | )1 | | | 1.79 | 2 | | | 1.71 | | | | 0.00 | | | | 0.00 | | | | 0.00 | | | | 11.71 | | | | 17.10 | 3 | | | 1.91 | | | | (0.81 | ) | | | 1.10 | | | | (0.64 | ) | | | 48.7 | | | | 109.40 | |
| | | | | | | | | | | | |
R6 SHARES | | | | | | | | | | | | | | | | | | | | | | | | | | | | | | | | | | | | | | | | | | | | | | | | | |
| | | | | | | | | | | | |
Year Ended September 30, | | | | | | | | | | | | | | | | | | | | | | | | | | | | | | | | | | | | | | | | | | | | | | | | | |
| | | | | | | | | | | | | | | |
2019 | | | 24.03 | | | | (0.18 | )1 | | | (2.67 | ) | | | (2.85 | ) | | | 0.00 | | | | (1.50 | ) | | | (1.50 | ) | | | 19.68 | | | | (11.75 | ) | | | 1.09 | | | | 0.00 | | | | 1.09 | | | | (0.88 | ) | | | 6.8 | | | | 55.94 | |
| | | | | | | | | | | | | | | |
2018 | | | 17.74 | | | | 0.03 | 1 | | | 6.30 | | | | 6.33 | | | | (0.04 | ) | | | 0.00 | | | | (0.04 | ) | | | 24.03 | | | | 35.75 | 3 | | | 1.10 | 8 | | | (0.01 | ) | | | 1.09 | | | | 0.15 | | | | 5.6 | | | | 72.25 | |
| | | | | | | | | | | | | | | |
2017 | | | 13.50 | | | | (0.12 | )1 | | | 4.36 | | | | 4.24 | | | | 0.00 | | | | 0.00 | | | | 0.00 | | | | 17.74 | | | | 31.41 | 3 | | | 1.22 | | | | (0.13 | ) | | | 1.09 | | | | (0.79 | ) | | | 3.2 | | | | 40.97 | |
| | | | | | | | | | | | | | | |
20165 | | | 12.89 | | | | (0.01 | )1 | | | 0.62 | | | | 0.61 | | | | 0.00 | | | | 0.00 | | | | 0.00 | | | | 13.50 | | | | 4.73 | 3,6 | | | 1.48 | 7 | | | (0.39 | )7 | | | 1.09 | 7 | | | (0.66 | )7 | | | 2.0 | | | | 90.74 | |
| 1 | Based on average shares outstanding. |
| 2 | The amount shown for a share outstanding does not correspond with the aggregate realized and unrealized gain (loss) on investments for the period due to the timing of sales and redemptions of Fund shares in relation to fluctuating market values of investments of the Fund. |
| 3 | The total returns would have been lower had certain expenses not been reduced during the period shown. |
| 4 | The Adviser made a voluntary payment to the Fund in the amount of $1,000 to compensate the Fund for a loss incurred due to a trade processing error. The impact of this payment increased the Fund’s total return by less than 0.01%. |
| 5 | For the period August 31, 2016 (initial offering of R6 Shares) to September 30, 2016. |
| 8 | Interest expense rounds to less than 0.01%. |
| | |
| See Notes to Financial Statements. | | 51 |
| | |
| Baron Investment Funds | | September 30, 2019 |
FINANCIAL HIGHLIGHTS (Continued)
BARON DURABLE ADVANTAGE FUND
Selected data for a share outstanding throughout each year:
| | | | | | | | | | | | | | | | | | | | | | | | | | | | | | | | | | | | | | | | | | | | | | | | | | | | | | | | | | | | |
| | | | | | | |
| | | | | | Income (loss) from
investment operations: | | | Less distributions to
shareholders from: | | | | | | | | | Ratios to Average Net Assets: | | | Supplemental
Data: | |
| | | | | | | | | | | | | | | |
| | | Net asset value,
beginning of year ($) | | | Net
investment
income ($) | | | Net realized and
unrealized
gain
(loss) on
investments
($) | | | Total from
investment
operations
($) | | | Net
investment
income ($) | | | Net realized
gain on
investments
($) | | | Total
distributions
($) | | | Net
asset
value,
end of
year
($) | | | Total
return
(%) | | | Operating
expenses
(%) | | | Less:
Reimbursement
of expenses
by Adviser (%) | | | Net
operating
expenses
(%) | | | Net
investment
income
(%) | | | Net
assets (in
millions),
end of
year ($) | | | Portfolio
turnover
rate (%) | |
| | | | | | | | | | | | |
RETAIL SHARES | | | | | | | | | | | | | | | | | | | | | | | | | | | | | | | | | | | | | | | | | | | | | | | | | |
| | | | | | | | | | | |
Year Ended September 30, | | | | | | | | | | | | | | | | | | | | | | | | | | | | | | | | | | | | | | | | | | | | | |
| | | | | | | | | | | | | | | |
2019 | | | 10.74 | | | | 0.03 | 1 | | | 1.03 | | | | 1.06 | | | | (0.03 | ) | | | 0.00 | | | | (0.03 | ) | | | 11.77 | | | | 9.97 | 2 | | | 6.22 | | | | (5.27 | ) | | | 0.95 | | | | 0.25 | | | | 1.9 | | | | 13.23 | |
| | | | | | | | | | | |
Period Ended September 30, | | | | | | | | | | | | | | | | | | | | | | | | | | | | | | | | | | | | | | | | | | | | | |
| | | | | | | | | | | | | | | |
20185 | | | 10.00 | | | | 0.01 | 1 | | | 0.73 | | | | 0.74 | | | | 0.00 | | | | 0.00 | | | | 0.00 | | | | 10.74 | | | | 7.40 | 2,3 | | | 7.45 | 4 | | | (6.50 | )4 | | | 0.95 | 4 | | | 0.19 | 4 | | | 0.6 | | | | 5.85 | 3 |
| | | | | | | | | | | | |
INSTITUTIONAL SHARES | | | | | | | | | | | | | | | | | | | | | | | | | | | | | | | | | | | | | | | | | | | | | | | | | |
| | | | | | | | | | | |
Year Ended September 30, | | | | | | | | | | | | | | | | | | | | | | | | | | | | | | | | | | | | | | | | | | | | | |
| | | | | | | | | | | | | | | |
2019 | | | 10.76 | | | | 0.06 | 1 | | | 1.03 | | | | 1.09 | | | | (0.03 | ) | | | 0.00 | | | | (0.03 | ) | | | 11.82 | | | | 10.23 | 2 | | | 4.91 | | | | (4.21 | ) | | | 0.70 | | | | 0.52 | | | | 4.7 | | | | 13.23 | |
| | | | | | | | | | | |
Period Ended September 30, | | | | | | | | | | | | | | | | | | | | | | | | | | | | | | | | | | | | | | | | | | | | | |
| | | | | | | | | | | | | | | |
20185 | | | 10.00 | | | | 0.04 | 1 | | | 0.72 | | | | 0.76 | | | | 0.00 | | | | 0.00 | | | | 0.00 | | | | 10.76 | | | | 7.60 | 2,3 | | | 5.71 | 4 | | | (5.01 | )4 | | | 0.70 | 4 | | | 0.46 | 4 | | | 3.0 | | | | 5.85 | 3 |
| | | | | | | | | | | | |
R6 SHARES | | | | | | | | | | | | | | | | | | | | | | | | | | | | | | | | | | | | | | | | | | | | | | | | | |
| | | | | | | | | | | |
Year Ended September 30, | | | | | | | | | | | | | | | | | | | | | | | | | | | | | | | | | | | | | | | | | | | | | |
| | | | | | | | | | | | | | | |
2019 | | | 10.75 | | | | 0.06 | 1 | | | 1.04 | | | | 1.10 | | | | (0.03 | ) | | | 0.00 | | | | (0.03 | ) | | | 11.82 | | | | 10.34 | 2 | | | 4.65 | | | | (3.95 | ) | | | 0.70 | | | | 0.53 | | | | 0.5 | | | | 13.23 | |
| | | | | | | | | | | |
Period Ended September 30, | | | | | | | | | | | | | | | | | | | | | | | | | | | | | | | | | | | | | | | | | | | | | |
| | | | | | | | | | | | | | | |
20185 | | | 10.00 | | | | 0.04 | 1 | | | 0.71 | | | | 0.75 | | | | 0.00 | | | | 0.00 | | | | 0.00 | | | | 10.75 | | | | 7.50 | 2,3 | | | 5.24 | 4 | | | (4.54 | )4 | | | 0.70 | 4 | | | 0.46 | 4 | | | 0.4 | | | | 5.85 | 3 |
| 1 | Based on average shares outstanding. |
| 2 | The total returns would have been lower had certain expenses not been reduced during the period shown. |
| 5 | For the period January 2, 2018 (commencement of operations) to September 30, 2018. |
| | |
| 52 | | See Notes to Financial Statements. |
| | |
| September 30, 2019 | | Baron Funds |
REPORT OF INDEPENDENT REGISTERED PUBLIC ACCOUNTING FIRM
To the Board of Trustees of Baron Investment Funds Trust and Shareholders of
Baron Asset Fund, Baron Growth Fund, Baron Small Cap Fund, Baron Opportunity Fund, Baron Fifth Avenue Growth Fund, Baron Discovery Fund and Baron Durable Advantage Fund
Opinions on the Financial Statements
We have audited the accompanying statements of assets and liabilities, including the statements of net assets, of each of the Funds indicated in the table below (constituting the Baron Investment Funds Trust, hereafter collectively referred to as the “Funds”) as of September 30, 2019, the related statements of operations and of changes in net assets for each of the periods indicated in the table below, including the related notes, and financial highlights for each of the periods indicated therein (collectively referred to as the “financial statements”). In our opinion, the financial statements present fairly, in all material respects, the financial position of each of the Funds as of September 30, 2019, the results of each of their operations and the changes in each of their net assets for each of the periods indicated in the table below and each of the financial highlights for each of the periods indicated therein in conformity with accounting principles generally accepted in the United States of America.
| | |
Baron Asset Fund Baron Growth Fund Baron Small Cap Fund Baron Opportunity Fund Baron Fifth Avenue Growth Fund Baron Discovery Fund | | Statements of operations for the year ended September 30, 2019 and the statements of changes in net assets for each of the two years in the period ended September 30, 2019 |
Baron Durable Advantage Fund | | Statement of operations for the year ended September 30, 2019 and the statements of changes in net assets for the year ended September 30, 2019 and for the period January 2, 2018 (commencement of operations) through September 30, 2018 |
Basis for Opinions
These financial statements are the responsibility of the Funds’ management. Our responsibility is to express an opinion on the Funds’ financial statements based on our audits. We are a public accounting firm registered with the Public Company Accounting Oversight Board (United States) (PCAOB) and are required to be independent with respect to the Funds in accordance with the U.S. federal securities laws and the applicable rules and regulations of the Securities and Exchange Commission and the PCAOB.
We conducted our audits of these financial statements in accordance with the standards of the PCAOB. Those standards require that we plan and perform the audit to obtain reasonable assurance about whether the financial statements are free of material misstatement, whether due to error or fraud.
Our audits included performing procedures to assess the risks of material misstatement of the financial statements, whether due to error or fraud, and performing procedures that respond to those risks. Such procedures included examining, on a test basis, evidence regarding the amounts and disclosures in the financial statements. Our audits also included evaluating the accounting principles used and significant estimates made by management, as well as evaluating the overall presentation of the financial statements. Our procedures included confirmation of securities owned as of September 30, 2019 by correspondence with the custodian, transfer agent and brokers; when replies were not received from brokers, we performed other auditing procedures. We believe that our audits provide a reasonable basis for our opinions.

PricewaterhouseCoopers LLP
New York, New York
November 25, 2019
We have served as the auditor of one or more investment companies in the Baron group of funds since 1987.
53
| | |
| Baron Funds | | September 30, 2019 |
TAX INFORMATION (Unaudited)
The federal tax status of distributions paid by the Funds during the year ended September 30, 2019 are listed below.
During the fiscal year ended September 30, 2019, the Funds’ distributions to shareholders included:
| | | | | | | | |
| | |
| Fund | | Ordinary
Income1,3 | | | Long-Term
Capital Gains2,3 | |
| | |
Baron Asset Fund | | | — | | | $ | 211,479,374 | |
| | |
Baron Growth Fund | | | — | | | | 430,003,177 | |
| | |
Baron Small Cap Fund | | | — | | | | 351,005,399 | |
| | |
Baron Opportunity Fund | | | — | | | | 19,401,893 | |
| | |
Baron Fifth Avenue Growth Fund | | | — | | | | — | |
| | |
Baron Discovery Fund | | | 370,619 | | | | 25,930,763 | |
| | |
Baron Durable Advantage Fund | | | 13,002 | | | | — | |
| 1 | For tax purposes, short-term capital gains are considered ordinary income distributions. |
| 2 | Long-term capital gains are subject to a maximum allowable rate of 20% for individuals pursuant to The Tax Cuts and Jobs Act of 2017. |
| 3 | Under the Patient Protection and Affordable Care Act, higher income taxpayers must pay a 3.8% additional tax on net investment income. |
Of the total ordinary income distributions paid by Baron Discovery Fund and Baron Durable Advantage Fund, 100.00% and 100.00%, respectively, is qualified dividend income subject to a reduced tax rate and 100.00% and 100.00%, respectively, qualifies for the corporate dividends received deduction.
The information and distributions reported may differ from the information and distributions taxable to the shareholders for the calendar year ending December 31, 2019. The information necessary to complete your income tax return for the calendar year ending December 31, 2019 will be listed on the Form 1099-DIV, which will be mailed to you in January 2020.
54
| | |
| September 30, 2019 | | Baron Funds |
FUND EXPENSES (Unaudited)
As a shareholder of the Funds, you may incur two types of costs: ongoing expenses and transaction costs. Ongoing expenses include advisory fees, distribution and service (12b-1) fees and other Fund expenses. Due to the payment of Rule 12b-1 fees, long-term shareholders may indirectly pay more than the maximum permitted front-end sales charge. The information on this page is intended to help you understand your ongoing costs of investing in the Funds and to compare these costs with the ongoing costs of investing in other mutual funds.
The information in the following table is based on an investment of $1,000 invested on April 1, 2019 and held for the six months ended September 30, 2019.
ACTUAL EXPENSES
The table below titled “Based on Actual Total Return” provides information about actual account values and actual expenses. You may use the information provided in this table, together with the amount you invested, to estimate the expenses that you paid over the period. To estimate the expenses you paid on your account, divide your ending account value by $1,000 (for example, an $8,600 ending account value divided by $1,000 = 8.6), then multiply the result by the number under the heading titled “Expenses Paid During the Period”.
BASED ON ACTUAL TOTAL RETURN FOR THE SIX MONTHS ENDED SEPTEMBER 30, 20191
| | | | | | | | | | | | | | | | | | | | |
| | | | | |
| | | Actual Total Return | | | Beginning Account Value April 1, 2019 | | | Ending Account Value September 30, 2019 | | | Annualized Expense Ratio | | | Expenses Paid During the Period2 | |
Baron Asset Fund — Retail Shares | | | 7.18 | % | | $ | 1,000.00 | | | $ | 1,071.80 | | | | 1.31 | % | | $ | 6.80 | |
Baron Asset Fund — Institutional Shares | | | 7.34 | % | | $ | 1,000.00 | | | $ | 1,073.40 | | | | 1.05 | % | | $ | 5.46 | |
Baron Asset Fund — R6 Shares | | | 7.32 | % | | $ | 1,000.00 | | | $ | 1,073.20 | | | | 1.05 | % | | $ | 5.46 | |
Baron Growth Fund — Retail Shares | | | 6.14 | % | | $ | 1,000.00 | | | $ | 1,061.40 | | | | 1.29 | % | | $ | 6.67 | |
Baron Growth Fund — Institutional Shares | | | 6.28 | % | | $ | 1,000.00 | | | $ | 1,062.80 | | | | 1.03 | % | | $ | 5.33 | |
Baron Growth Fund — R6 Shares | | | 6.28 | % | | $ | 1,000.00 | | | $ | 1,062.80 | | | | 1.04 | % | | $ | 5.38 | |
Baron Small Cap Fund — Retail Shares | | | (0.07 | )% | | $ | 1,000.00 | | | $ | 999.30 | | | | 1.30 | % | | $ | 6.52 | |
Baron Small Cap Fund — Institutional Shares | | | 0.03 | % | | $ | 1,000.00 | | | $ | 1,000.30 | | | | 1.05 | % | | $ | 5.27 | |
Baron Small Cap Fund — R6 Shares | | | 0.03 | % | | $ | 1,000.00 | | | $ | 1,000.30 | | | | 1.05 | % | | $ | 5.27 | |
Baron Opportunity Fund — Retail Shares | | | 1.27 | % | | $ | 1,000.00 | | | $ | 1,012.70 | | | | 1.33 | % | | $ | 6.71 | |
Baron Opportunity Fund — Institutional Shares | | | 1.36 | % | | $ | 1,000.00 | | | $ | 1,013.60 | | | | 1.08 | % | | $ | 5.45 | |
Baron Opportunity Fund — R6 Shares | | | 1.40 | % | | $ | 1,000.00 | | | $ | 1,014.00 | | | | 1.07 | % | | $ | 5.40 | |
Baron Fifth Avenue Growth Fund — Retail Shares | | | 5.04 | % | | $ | 1,000.00 | | | $ | 1,050.40 | 3 | | | 1.00 | %4 | | $ | 5.14 | |
Baron Fifth Avenue Growth Fund — Institutional Shares | | | 5.16 | % | | $ | 1,000.00 | | | $ | 1,051.60 | 3 | | | 0.75 | %4 | | $ | 3.86 | |
Baron Fifth Avenue Growth Fund — R6 Shares | | | 5.16 | % | | $ | 1,000.00 | | | $ | 1,051.60 | 3 | | | 0.75 | %4 | | $ | 3.86 | |
Baron Discovery Fund — Retail Shares | | | (3.91 | )% | | $ | 1,000.00 | | | $ | 960.90 | 3 | | | 1.35 | %4 | | $ | 6.64 | |
Baron Discovery Fund — Institutional Shares | | | (3.81 | )% | | $ | 1,000.00 | | | $ | 961.90 | | | | 1.09 | % | | $ | 5.36 | |
Baron Discovery Fund — R6 Shares | | | (3.81 | )% | | $ | 1,000.00 | | | $ | 961.90 | | | | 1.09 | % | | $ | 5.36 | |
Baron Durable Advantage Fund — Retail Shares | | | 11.25 | % | | $ | 1,000.00 | | | $ | 1,112.50 | 3 | | | 0.95 | %4 | | $ | 5.03 | |
Baron Durable Advantage Fund — Institutional Shares | | | 11.40 | % | | $ | 1,000.00 | | | $ | 1,114.00 | 3 | | | 0.70 | %4 | | $ | 3.71 | |
Baron Durable Advantage Fund — R6 Shares | | | 11.40 | % | | $ | 1,000.00 | | | $ | 1,114.00 | 3 | | | 0.70 | %4 | | $ | 3.71 | |
| 1 | Assumes reinvestment of all dividends and capital gain distributions, if any. |
| 2 | Expenses are equal to each share class’ respective annualized expense ratio multiplied by the average account value over the period, multiplied by the number of days in the most recent fiscal half-year, then divided by 365. |
| 3 | Ending account value assumes the return earned after waiver and would have been lower if a portion of the expenses had not been waived. |
| 4 | Annualized expense ratios are adjusted to reflect fee waiver. |
55
| | |
| Baron Funds | | September 30, 2019 |
FUND EXPENSES (Unaudited) (Continued)
HYPOTHETICAL EXAMPLE FOR COMPARISON PURPOSES
The table below titled “Based on Hypothetical Total Return” provides information about hypothetical account values and hypothetical expenses based on the actual expense ratio and an assumed rate of return of 5% per year before expenses, which is not the Funds’ actual return. The hypothetical account values and expenses may not be used to estimate the actual ending account values and expenses you paid for the period. You may use the information provided in this table to compare the ongoing costs of investing in the Funds and other funds. To do so, compare the 5% hypothetical example relating to the Funds with the 5% hypothetical examples that appear in the shareholder reports of other funds.
Please note that expenses shown in the table below are meant to highlight your ongoing costs and do not reflect any transactional costs, such as redemption fees, if any. Therefore, the table is useful in comparing ongoing costs only and will not help you determine your relative total costs of owning different mutual funds. In addition, if these transactional costs were included, your costs would have been higher.
BASED ON HYPOTHETICAL TOTAL RETURN FOR THE SIX MONTHS ENDED SEPTEMBER 30, 2019
| | | | | | | | | | | | | | | | | | | | |
| | | | | |
| | | Hypothetical Annualized Total Return | | | Beginning Account Value April 1, 2019 | | | Ending Account Value September 30, 2019 | | | Annualized Expense Ratio | | | Expenses Paid During the Period2 | |
Baron Asset Fund — Retail Shares | | | 5.00 | % | | $ | 1,000.00 | | | $ | 1,018.50 | | | | 1.31 | % | | $ | 6.63 | |
Baron Asset Fund — Institutional Shares | | | 5.00 | % | | $ | 1,000.00 | | | $ | 1,019.80 | | | | 1.05 | % | | $ | 5.32 | |
Baron Asset Fund — R6 Shares | | | 5.00 | % | | $ | 1,000.00 | | | $ | 1,019.80 | | | | 1.05 | % | | $ | 5.32 | |
Baron Growth Fund — Retail Shares | | | 5.00 | % | | $ | 1,000.00 | | | $ | 1,018.60 | | | | 1.29 | % | | $ | 6.53 | |
Baron Growth Fund — Institutional Shares | | | 5.00 | % | | $ | 1,000.00 | | | $ | 1,019.90 | | | | 1.03 | % | | $ | 5.22 | |
Baron Growth Fund — R6 Shares | | | 5.00 | % | | $ | 1,000.00 | | | $ | 1,019.85 | | | | 1.04 | % | | $ | 5.27 | |
Baron Small Cap Fund — Retail Shares | | | 5.00 | % | | $ | 1,000.00 | | | $ | 1,018.55 | | | | 1.30 | % | | $ | 6.58 | |
Baron Small Cap Fund — Institutional Shares | | | 5.00 | % | | $ | 1,000.00 | | | $ | 1,019.80 | | | | 1.05 | % | | $ | 5.32 | |
Baron Small Cap Fund — R6 Shares | | | 5.00 | % | | $ | 1,000.00 | | | $ | 1,019.80 | | | | 1.05 | % | | $ | 5.32 | |
Baron Opportunity Fund — Retail Shares | | | 5.00 | % | | $ | 1,000.00 | | | $ | 1,018.40 | | | | 1.33 | % | | $ | 6.73 | |
Baron Opportunity Fund — Institutional Shares | | | 5.00 | % | | $ | 1,000.00 | | | $ | 1,019.65 | | | | 1.08 | % | | $ | 5.47 | |
Baron Opportunity Fund — R6 Shares | | | 5.00 | % | | $ | 1,000.00 | | | $ | 1,019.70 | | | | 1.07 | % | | $ | 5.42 | |
Baron Fifth Avenue Growth Fund — Retail Shares | | | 5.00 | % | | $ | 1,000.00 | | | $ | 1,020.05 | 3 | | | 1.00 | %4 | | $ | 5.06 | |
Baron Fifth Avenue Growth Fund — Institutional Shares | | | 5.00 | % | | $ | 1,000.00 | | | $ | 1,021.31 | 3 | | | 0.75 | %4 | | $ | 3.80 | |
Baron Fifth Avenue Growth Fund — R6 Shares | | | 5.00 | % | | $ | 1,000.00 | | | $ | 1,021.31 | 3 | | | 0.75 | %4 | | $ | 3.80 | |
Baron Discovery Fund — Retail Shares | | | 5.00 | % | | $ | 1,000.00 | | | $ | 1,018.30 | 3 | | | 1.35 | %4 | | $ | 6.83 | |
Baron Discovery Fund — Institutional Shares | | | 5.00 | % | | $ | 1,000.00 | | | $ | 1,019.60 | | | | 1.09 | % | | $ | 5.52 | |
Baron Discovery Fund — R6 Shares | | | 5.00 | % | | $ | 1,000.00 | | | $ | 1,019.60 | | | | 1.09 | % | | $ | 5.52 | |
Baron Durable Advantage Fund — Retail Shares | | | 5.00 | % | | $ | 1,000.00 | | | $ | 1,020.31 | 3 | | | 0.95 | %4 | | $ | 4.81 | |
Baron Durable Advantage Fund — Institutional Shares | | | 5.00 | % | | $ | 1,000.00 | | | $ | 1,021.56 | 3 | | | 0.70 | %4 | | $ | 3.55 | |
Baron Durable Advantage Fund — R6 Shares | | | 5.00 | % | | $ | 1,000.00 | | | $ | 1,021.56 | 3 | | | 0.70 | %4 | | $ | 3.55 | |
| 1 | Assumes reinvestment of all dividends and capital gain distributions, if any. |
| 2 | Expenses are equal to each share class’ respective annualized expense ratio multiplied by the average account value over the period, multiplied by the number of days in the most recent fiscal half-year, then divided by 365. |
| 3 | Ending account value assumes the return earned after waiver and would have been lower if a portion of the expenses had not been waived. |
| 4 | Annualized expense ratios are adjusted to reflect fee waiver. |
56
| | |
| September 30, 2019 | | Baron Funds |
DISCLOSURE REGARDING THE APPROVAL OF THE INVESTMENT ADVISORY AGREEMENTS FOR THE FUNDS BY THE BOARD OF TRUSTEES (Unaudited)
The Board of Trustees (the “Board”) of Baron Investment Funds Trust (the “Trust”) met on May 23, 2019 to discuss the selection of BAMCO, Inc. (the “Adviser”) as the investment adviser and the approval of the investment advisory agreements for Baron Asset Fund, Baron Growth Fund, Baron Small Cap Fund, Baron Opportunity Fund, Baron Fifth Avenue Growth Fund, Baron Discovery Fund, and Baron Durable Advantage Fund (each, a “Fund” and collectively, the “Funds”). The members of the Board who are not “interested persons” (as defined in the Investment Company Act of 1940, as amended) of the Trust (the “Independent Trustees”) met in a separate session to discuss and consider the renewal of the investment advisory agreements for the Funds. Representatives of Broadridge Financial Solutions, Inc. (“Broadridge”), an independent provider of investment company data, provided reports to the Board and attended the Board meeting. The Trustees received a substantial amount of information from the Adviser and from Broadridge, and were advised by independent legal counsel. Based on its evaluation of this and other information, the Board, including a majority of the Independent Trustees, approved the continuation of the investment advisory agreements for the Funds for an additionalone-year period.
In reaching its determination, the Board considered various factors that it deemed relevant, including the factors listed below.
1. NATURE, EXTENT AND QUALITY OF SERVICES
As part of their consideration of the nature, extent and quality of services provided by the Adviser, the Independent Trustees considered the information provided, including their experience and knowledge gained from their service as Trustees and their experience generally, including the following, which they had considered in past years and remained, in their thinking, material to their consideration:
| • | | Their confidence in the senior personnel, portfolio management, the financial condition of the Adviser and its affiliates and the Adviser’s available resources; |
| • | | The nature, extent and quality of the services provided by the Adviser, including: intensive devotion to research, selection of broker/dealers for Fund portfolio transactions, relationships with and supervision of third party service providers, such as the Funds’ custodian and transfer agent, the quality of shareholder reports, the ability to monitor adherence to investment guidelines and restrictions, the legal, accounting and compliance services provided to the Funds and the support services provided to the Board; |
| • | | The Adviser’s investment principles and processes and the historical performance of the Funds as compared to similar funds managed by other advisers and other funds managed by the Adviser over comparable periods; |
| • | | The advisory fees, total expense ratios of the Funds and comparisons to similar funds managed by other advisers over comparable periods. They observed that, for most of the Funds, while the advisory fee was comparatively higher, the net operating expenses paid by the Funds (total expense ratio) were within the range of those of the funds in their respective peer groups; and |
| • | | Additional services provided by the Adviser. |
Based on the considerations as described above, the Board concluded that the nature, extent and quality of the services the Adviser provides to each Fund, including performance consistent with its investing principles as discussed below, supported approval of the investment advisory agreement for each Fund.
2. INVESTMENT PERFORMANCE OF THE FUNDS AND THE ADVISER
As part of its consideration of the investment performance of the Funds and the Adviser, the Board took into account the analyses performed by and discussed with representatives of Broadridge. The Board considered for each Fund, among other information, Broadridge’s comparisons of the expense ratio and contractual advisory fee with those of peer group (comparable) funds selected by Broadridge and Morningstar category medians. The Board also considered, among other performance information, Broadridge’s comparisons of each Fund’s annualized total return and related risk metrics overone-, three- and five-year periods, where applicable, against peer group funds and Morningstar category medians. After considering all the information, the Board concluded that the Adviser continued to invest in accordance with its long-standing principles and that each Fund’s performance remained consistent with expectations for the Adviser’s investment style, in light of recent market conditions.
3. COSTS OF SERVICES PROVIDED AND PROFITS TO BE REALIZED BY THE ADVISER
The Board considered comparisons of the advisory fees charged and services provided by the Adviser and its investment adviser affiliate tosub-advised accounts and separately managed accounts. The Board considered that, while the advisory fees for the other clients are the same as, or lower than, the fees for the Funds, the Adviser or its affiliate performs significantly fewer services for those clients compared with those provided by the Adviser to the Funds. The Board also considered a profitability analysis prepared by the Adviser and discussed with the representatives of the Adviser that the Adviser has continued to invest in quality personnel, systems and facilities, and otherwise continued to invest in its business, irrespective of fund flows.
The Board also considered benefits that accrue to the Adviser and its affiliates from their relationship with the Funds. The Board considered the costs of portfolio management, including the types of investments made for the Funds, the personnel and systems necessary for implementation of investment strategies, and thepre-tax profits realized by the Adviser and its affiliates from their relationship with the Funds.
The Board concluded that the advisory fee for each Fund was supportable in light of the services provided as discussed at this meeting.
4. ECONOMIES OF SCALE AND BENEFITS TO INVESTORS
The Board considered the extent to which each Fund’s advisory fee reflected economies of scale for the benefit of Fund shareholders, appreciating that the economies of scale analysis is predicated on generally predictable increasing assets and noting the small size of certain Funds and the significant fluctuation in assets in recent years. The Board considered that small- andmid-cap investment strategies require more attention by the Adviser than a strategy that involves other types of investing, particularly as asset size increases. The Board considered that the Adviser was continuing to grow and upgrade its staff and invest in its business. The Board members reiterated their intention to continue to consider the extent of economies of scale, asset growth and the Adviser’s plans to invest further to support the Funds.
After due consideration of the above-enumerated factors and other factors it deemed relevant, the Board, including a majority of the Independent Trustees, approved the continuance of each Fund’s investment advisory agreement.
57
| | |
| Baron Funds | | September 30, 2019 |
MANAGEMENT OF THE FUNDS (Unaudited)
Board of Trustees and Officers.
Trustees of the Trust, together with information as to their positions with the Trust, principal occupations and other board memberships and affiliations for the past five years, are shown below. Each Trustee serves as Trustee of the Trust until its termination; until the Trustee’s retirement, resignation or death; or as otherwise specified in the Trust’s organizational documents. Unless otherwise noted, the address of each Officer and Trustee is Baron Investment Funds Trust, 767 Fifth Avenue, 49th Floor, New York, NY 10153. All Trustees listed below, whether Interested or Independent, serve as Trustees for the Trust. Additional information about the Trustees and Officers of the Trust can be found in the Trust’s Statement of Additional Information (the “SAI”) which may be obtained without charge by writing or calling1-800-99BARON. The SAI is also available on the Baron Funds® website, www.BaronFunds.com.
| | | | | | | | | | |
| | | | | |
| Name, Address & Age | | Position(s) Held With the Funds | | Term of
Office and
Length of
Time Served | | Principal Occupation(s)
During the Past Five Years | | Number of
Portfolios
in Fund
Complex
Overseen
by Trustee | | Other Directorships
Held by Trustee |
Interested Trustees | | | | | | |
| | | | | |
Ronald Baron(1),(2) 767 Fifth Avenue New York, NY 10153 Age: 75 | | Chief Executive Officer, Chief Investment Officer, Trustee and Portfolio Manager | | 32 years | | Director, Chairman, CEO and CIO: the Firm* (1982-Present); Trustee: Baron Investment Funds Trust (1987-Present); Trustee: Baron Select Funds (2003-Present); Portfolio Manager: Baron USA Partners Fund, Ltd. (2003-Present). | | 17 | | None |
| | | | | |
Linda S. Martinson(1),(2) 767 Fifth Avenue New York, NY 10153 Age: 63 | | Chairman, President, Chief Operating Officer and Trustee | | 32 years | | Director: the Firm* (2003-Present); Secretary: the Firm* (1997-2008); President: the Firm* (2007-Present); Chief Operating Officer: the Firm (2006-Present); Chairman (2010-Present), President (2007-Present), Trustee (1987-Present): Baron Investment Funds Trust; Chairman (2010-Present), President (2007-Present), Trustee (2003-Present): Baron Select Funds; Director: Baron USA Partners Fund, Ltd. (2006-Present). | | 17 | | None |
Independent Trustees | | | | | | | | | | |
| | | | | |
Norman S. Edelcup(3),(4),(5) 767 Fifth Avenue New York, NY 10153 Age: 83 | | Trustee | | 32 years | | Mayor (2003-2015): Sunny Isles Beach, Florida; Trustee: Baron Investment Funds Trust (1987-Present), Baron Select Funds (2003-Present). | | 17 | | Director: CompX International, Inc. (diversified manufacturer of engineered components) (2006-2016); Director: Valhi, Inc. (diversified company) (1975-2016). |
| | | | | |
Thomas J. Folliard(4),(5) 767 Fifth Avenue New York, NY 10153 Age: 54 | | Trustee | | 1 year | | Non-Executive Chair of the Board: CarMax, Inc. (2016-Present); President and Chief Executive Officer: CarMax, Inc. (2006-2016); Trustee: Baron Investment Funds Trust (2017-Present), Baron Select Funds (2017-Present). | | 17 | | Director: PulteGroup, Inc. (2012-Present) |
| | | | | |
Harold W. Milner(4),(5) 767 Fifth Avenue New York, NY 10153 Age: 84 | | Trustee | | 32 years | | Trustee: Baron Investment Funds Trust (1987-Present), Baron Select Funds (2003-Present). | | 17 | | None |
| | | | | |
Raymond Noveck(3),(4),(5) 767 Fifth Avenue New York, NY 10153 Age: 75 | | Lead Trustee | | 32 years | | Private Investor (1999-Present); Trustee: Baron Investment Funds Trust (1987-Present), Baron Select Funds (2003-Present). | | 17 | | None |
| | | | | |
Anita Rosenberg(4),(5) 767 Fifth Avenue New York, NY 10153 Age: 54 | | Trustee | | 5 years | | Advisory Board Member: Impala Capital Management, LLC (2014-Present); Advisory Board Member: ValueAct Capital, LLC (2014-Present); Senior Advisor: Magnetar Capital (2011-2012); Trustee: Baron Investment Funds Trust, Baron Select Funds (2013-Present). | | 17 | | Director: Golub Capital BDC, Inc. (2011-Present). |
58
| | |
| September 30, 2019 | | Baron Funds |
MANAGEMENT OF THE FUNDS (Unaudited) (Continued)
| | | | | | | | | | |
| | | | | |
| Name, Address & Age | | Position(s) Held With the Funds | | Term of
Office and
Length of
Time Served | | Principal Occupation(s)
During the Past Five Years | | Number of
Portfolios
in Fund
Complex
Overseen
by Trustee | | Other Directorships
Held by Trustee |
Independent Trustees (continued) | | | | | | |
| | | | | |
David A. Silverman, MD(4),(5) 767 Fifth Avenue New York, NY 10153 Age: 68 | | Trustee | | 32 years | | Physician and Faculty: New York University School of Medicine (1976-Present); Trustee: Baron Investment Funds Trust (1987-Present), Baron Select Funds (2003-Present). | | 17 | | None |
| | | | | |
Alex Yemenidjian(4),(5) 767 Fifth Avenue New York, NY 10153 Age: 62 | | Trustee | | 13 years | | Chairman and CEO: Tropicana Las Vegas (gaming) (2009-2015); Chairman and CEO: Armenco Holdings, LLC (investment company) (2005-Present); Managing Partner: Armenco Capital LLC (investment company) (2013-Present); Trustee: Baron Investment Funds Trust (2006-Present), Baron Select Funds (2006-Present). | | 17 | | Director: Guess?, Inc. (2005-Present); Director: Regal Entertainment Group (2005-Present). |
Additional Officers of the Funds | | | | | | |
| | | | | |
Louis Beasley 767 Fifth Avenue New York, NY 10153 Age: 48 | | Vice President and Chief Compliance Officer | | 4 years | | Chief Compliance Officer: Baron Capital Group, Inc., BAMCO, Inc., Baron Capital Management Inc., Baron Investment Funds Trust, Baron Select Funds, Baron USA Partners Fund, Ltd (2014-Present); Vice President: the Firm* (2014-Present); Principal and Director of Investment Management Compliance and Risk Management: Bessemer Trust (2006-2014). | | N/A | | N/A |
| | | | | |
Clifford Greenberg 767 Fifth Avenue New York, NY 10153 Age: 59 | | Senior Vice President | | 22 years | | Director and Senior Vice President: the Firm*; Senior Vice President: Baron Investment Funds Trust, Baron Select Funds; Portfolio Manager: Baron Small Cap Fund. | | N/A | | N/A |
| | | | | |
Patrick M. Patalino 767 Fifth Avenue New York, NY 10153 Age: 50 | | Vice President, General Counsel and Secretary | | 11 years | | Vice President, General Counsel and Secretary: the Firm*, Baron Investment Funds Trust, Baron Select Funds; General Counsel: Baron USA Partners Fund, Ltd. | | N/A | | N/A |
| | | | | |
Andrew Peck 767 Fifth Avenue New York, NY 10153 Age: 49 | | Senior Vice President | | 16 years | | Senior Vice President: the Firm*, Baron Investment Funds Trust, Baron Select Funds; Portfolio Manager: Baron Asset Fund. | | N/A | | N/A |
| | | | | |
Peggy C. Wong 767 Fifth Avenue New York, NY 10153 Age: 57 | | Treasurer and Chief Financial Officer | | 32 years | | Chief Financial Officer and Treasurer: the Firm*, Baron Investment Funds Trust, Baron Select Funds. | | N/A | | N/A |
| * | The “Firm” means BCG along with its subsidiaries BCI, Baron Capital Management, Inc. and BAMCO. |
| (1) | Trustees deemed to be “Interested Trustees” by reason of their employment with the Adviser and BCI. |
| (2) | Members of the Executive Committee, which is empowered to exercise all of the powers, including the power to declare dividends, of the full Board when the full Board is not in session. |
| (3) | Members of the Audit Committee. |
| (4) | Members of the Nominating Committee. |
| (5) | Members of the Independent Committee. |
59
Privacy Notice
The Funds collect nonpublic personal information about you from the following sources:
| ∎ | | Information we receive from you on applications or other forms; |
| ∎ | | Information about your transactions with us, our Adviser or others; and |
| ∎ | | Information we receive from third parties, such as credit reporting agencies. |
“Nonpublic personal information” is private information about you that we obtain in connection with providing a financial product or service to you.
We may share your name and address with other Baron Funds and the Adviser and its affiliates for the purpose of sending you information about our products that we believe may be of interest to you and informing you of our upcoming Baron Investment Conference and for sending required information.
We do not disclose any nonpublic personal information about our customers to anyone, except as permitted or required by law. Examples of permitted disclosures under the law include sharing with companies that work for us to provide you services, such as the Transfer Agent or mailing house. All such companies that act on our behalf are contractually obligated to keep the information that we provide to them confidential and to use the information only to provide the services that we have asked them to perform for you and us.
We restrict access to nonpublic information about you to those employees who need to know that information to provide products or services to you. We maintain physical, electronic and procedural safeguards to guard your nonpublic personal information.
This privacy notice is also available at all times on the Baron Funds® website, www.BaronFunds.com or by calling 1-800-99BARON.
Go Paperless!
It’s fast, simple and a smart way to help the environment.
Enjoy the speed and convenience of receiving Fund documents electronically.
For more information, and to enroll today, go to www.baronfunds.com/edelivery.
767 Fifth Avenue, 49th Fl.
New York, NY 10153
1.800.99.BARON
212-583-2000
www.BaronFunds.com
SEPTEMBER 30
The Registrant has adopted a Code of Ethics for Principal Executive and Senior Financial Officers (the “Code”). Upon request, the Registrant will provide a copy of the Code to any person without charge. To obtain a copy of the Code, please send your request to info@Baronfunds.com or call1-800-99BARON(1-800-992-2766).
| Item 3. | Audit Committee Financial Expert. |
The Registrant’s Board of Trustees has determined that the Registrant has two audit committee financial experts serving on its Audit Committee, Norman S. Edelcup and Raymond Noveck. Both Mr. Edelcup and Mr. Noveck are “independent” for purposes of Item 3(a)(2) of FormN-CSR.
| Item 4. | Principal Accountant Fees and Services. |
The following table shows the fees paid to PricewaterhouseCoopers, LLP, the Registrant’s principal accounting firm during the fiscal years ended September 30, 2019 and September 30, 2018:
| (a) | Audit Fees: for professional services rendered for the audit of the Registrant’s annual financial statements or services that are normally provided in connection with statutory and regulatory filings or engagements: |
| | | | | | | | |
| | | 2019 | | | 2018 | |
Baron Investment Funds Trust | | $ | 312,060 | | | $ | 272,200 | |
| (b) | Audit-Related Fees: for assurance and related services that are reasonably related to the performance of the audit and are not included as Audit Fees: |
| | | | | | | | |
| | | 2019 | | | 2018 | |
Baron Investment Funds Trust | | $ | 0 | | | $ | 0 | |
| (c) | Tax Fees: for professional services rendered for tax compliance, tax advice and tax planning: |
| | | | | | | | |
| | | 2019 | | | 2018 | |
Baron Investment Funds Trust | | $ | 109,973 | | | $ | 110,350 | |
The Tax Fees represent services provided in connection with the preparation of tax returns andyear-end distribution review.
| (d) | All Other Fees: for products and services provided by such accounting firm that are not included in (a), (b) or (c) above: |
| | | | | | | | |
| | | 2019 | | | 2018 | |
Baron Investment Funds Trust | | $ | 0 | | | $ | 0 | |
e) Audit CommitteePre-Approval Policies and Procedures: (i) Pursuant to paragraph (c)(7) of Rule2-01 of RegulationS-X and to its charter, the Audit Committee shallpre-approve all audit andnon-audit services provided by the independent auditors and in connection therewith to review and evaluate the qualifications, independence and performance of the Fund’s independent auditors; (ii) 100% of the services described in each of items 4(b) through 4(d) were approved by the Audit Committee pursuant to paragraph (c)(7)(i)(C) ofRule 2-01 of RegulationS-X.
(f) Not Applicable.
(g) The aggregatenon-audit fees billed by the registrant’s accountant for services rendered to the registrant, and rendered to the registrant’s investment adviser (not including anysub-adviser whose role is primarily portfolio management and is subcontracted with or overseen by another investment adviser), and
any entity controlling, controlled by, or under common control with the adviser that provides ongoing services to the registrant for the last two fiscal years is as follows:
| | | | |
2019: | | $ | 30,500 | |
2018: | | $ | 30,500 | |
| Item 5. | Audit Committee of Listed Registrants. |
The Registrant has a separately-designated standing Audit Committee established in accordance with Section 3(a)(58)(A) of the Securities Exchange Act of 1934. The members of the Audit Committee are Norman S. Edelcup and Raymond Noveck.
| Item 6. | Schedule of Investments. |
Included herein under Item 1.
| Item 7. | Disclosure of Proxy Voting Policies and Procedures forClosed-End Management Investment Companies. |
Not applicable.
| Item 8. | Portfolio Managers ofClosed-End Management Investment Companies. |
Not applicable.
| Item 9. | Purchases of Equity Securities byClosed-End Management Investment Company and Affiliated Purchasers. |
Not applicable.
| Item 10. | Submission of Matters to a Vote of Security Holders. |
Not applicable.
| Item 11. | Controls and Procedures. |
(a) The Registrant’s principal executive officer and principal financial officer have concluded that the Registrant’s disclosure controls and procedures (as defined in Rule30a-3(c) under the Investment Company Act of 1940 (the “1940 Act”)) are effective based on their evaluation of these controls and procedures as of a date within 90 days of the filing date of this report.
(b) There were no changes in the Registrant’s internal control over financial reporting (as defined in Rule30a-3(d) under the 1940 Act) that occurred during the Registrant’s second fiscal quarter of the period covered by this report that have materially affected, or are reasonably likely to materially affect, the Registrant’s internal control over financial reporting.
(a)(1) Not applicable.
(a) (2) Certification of each of the principal executive officers and principal financial officers of the Registrant as required byRule 30a-2 under the Act (17 CFR270.30a-2) is attached hereto as a part ofEX-99.CERT.
(b) Certification of each of the principal executive officers and principal financial officers of the Registrant as required by Section 906 of the Sarbanes-Oxley Act of 2002 is attached hereto as a part ofEX-99.906CERT.
SIGNATURES
Pursuant to the requirements of the Securities Exchange Act of 1934 and the Investment Company Act of 1940, the registrant has duly caused this report to be signed on its behalf by the undersigned, thereunto duly authorized.
| | |
| BARON INVESTMENT FUNDS TRUST |
| |
| By: | | /s/ Ronald Baron |
| | Ronald Baron |
| | Chief Executive Officer |
| |
| Date: | | December 5, 2019 |
Pursuant to the requirements of the Securities Exchange Act of 1934 and the Investment Company Act of 1940, this report has been signed below by the following persons on behalf of the registrant and in the capacities and on the dates indicated.
| | |
| By: | | /s/ Ronald Baron |
| | Ronald Baron |
| | Chief Executive Officer |
| |
| Date: | | December 5, 2019 |
| |
| By: | | /s/ Peggy Wong |
| | Peggy Wong |
| | Treasurer and Chief Financial Officer |
| |
| Date: | | December 5, 2019 |