Table of Contents
OMB APPROVAL | ||||
| OMB Number: | 3235-0570 | |||
| Expires: | August 31, 2020 | |||
| Estimated average burden | ||||
| Hours per response ......... | 20.6 | |||
UNITED STATES
SECURITIES AND EXCHANGE COMMISSION
Washington, DC 20549
FORM N-CSR
CERTIFIED SHAREHOLDER REPORT OF REGISTERED
MANAGEMENT INVESTMENT COMPANIES
Investment Company Act file number: 811-5032
BARON INVESTMENT FUNDS TRUST f/k/a BARON ASSET FUND
(Exact Name of Registrant as Specified in Charter)
767 Fifth Avenue, 49th Floor
New York, NY 10153
(Address of Principal Executive Offices) (Zip Code)
Patrick M. Patalino, General Counsel
c/o Baron Investment Funds Trust
767 Fifth Avenue, 49th Floor
New York, NY 10153
(Name and Address of Agent for Service)
(Registrant’s Telephone Number, including Area Code): 212-583-2000
Date of fiscal year end: September 30
Date of reporting period: September 30, 2017
Form N-CSR is to be used by management investment companies to file reports with the Commission not later than 10 days after the transmission to stockholders of any report that is required to be transmitted to stockholders under Rule 30e-1 under the Investment Company Act of 1940 (17CRF 270.30e-1). The Commission may use the information provided on Form N-CSR in its regulatory, disclosure review, inspection, and policymaking roles.
A registrant is required to disclose the information specified by Form N-CSR, and the Commission will make this information public. A registrant is not required to respond to the collection of information contained in Form N-CSR unless the Form displays a currently valid Office of Management and Budget (“OMB”) control number. Please direct comments concerning the accuracy of the information collection burden estimate and suggestions for reducing the burden to Secretary, Securities and Exchange Commission, 450 5th Street, NW, Washington, D.C. 20549-0609. The OMB has reviewed this collection of information under the clearance requirements of 44 U.S.C. Section 3507.
Persons who are to respond to the collection of information contained in this form are not required to respond unless the form displays a currently valid OMB control number.
SEC 2569 (5-07)
| Item 1. | Report to Stockholders. |
Table of Contents
Baron Asset Fund
Baron Growth Fund
Baron Small Cap Fund
Baron Opportunity Fund
Baron Fifth Avenue Growth Fund
Baron Discovery Fund
September 30, 2017
DEAR BARON FUNDS SHAREHOLDER:
In this report, you will find audited financial statements for Baron Asset Fund, Baron Growth Fund, Baron Small Cap Fund, Baron Opportunity Fund, Baron Fifth Avenue Growth Fund and Baron Discovery Fund (the “Funds”) for the year ended September 30, 2017. The U.S. Securities and Exchange Commission (the “SEC”) requires mutual funds to furnish these statements semi-annually to their shareholders. We hope you find these statements informative and useful.
We thank you for choosing to join us as fellow shareholders in Baron Funds. We will continue to work hard to justify your confidence.
Sincerely,
 |  |  | ||
Ronald Baron Chief Executive Officer and Chief Investment Officer November 27, 2017 | Linda S. Martinson Chairman, President and Chief Operating Officer November 27, 2017 | Peggy Wong Treasurer and Chief Financial Officer November 27, 2017 |
This Annual Financial Report is for the Baron Investment Funds Trust, which currently has six series: Baron Asset Fund, Baron Growth Fund, Baron Small Cap Fund, Baron Opportunity Fund, Baron Fifth Avenue Growth Fund and Baron Discovery Fund. If you are interested in the Baron Select Funds, which contains the Baron Partners Fund, Baron Focused Growth Fund, Baron International Growth Fund, Baron Real Estate Fund, Baron Emerging Markets Fund, Baron Energy and Resources Fund and Baron Global Advantage Fund series, please visit the Funds’ website at www.BaronFunds.com or contact us at 1-800-99BARON.
The Funds’ Proxy Voting Policy is available without charge and can be found on the Funds’ website at www.BaronFunds.com, by clicking on the “Legal Notices” link at the bottom left corner of the homepage or by calling 1-800-99BARON and on the SEC’s website at www.sec.gov. The Funds’ most current proxy voting record, Form N-PX, is also available on the Funds’ website and on the SEC’s website.
The Funds file their complete schedules of portfolio holdings with the SEC for the first and third quarters of each fiscal year on Form N-Q. The Funds’ Forms N-Q are available on the SEC’s website at www.sec.gov. The Funds’ Forms N-Q may also be reviewed and copied at the SEC’s Public Reference Room in Washington, DC; information on the operation of the SEC’s Public Reference Room may be obtained by calling 1-202-551-8090. A copy of the Funds’ Forms N-Q may also be obtained upon request by calling 1-800-99BARON. Schedules of portfolio holdings current to the most recent quarter are also available on the Funds’ website.
Some of the comments contained in this report are based on current management expectations and are considered “forward-looking statements.” Actual future results, however, may prove to be different from our expectations. You can identify forward-looking statements by words such as “estimate,” “may,” “expect,” “should,” “could,” “believe,” “plan” and other similar terms. We cannot promise future returns and our opinions are a reflection of our best judgment at the time this report is compiled.
The views expressed in this report reflect those of BAMCO, Inc. (“BAMCO” or the “Adviser”) only through the end of the period stated in this report. The views are not intended as recommendations or investment advice to any person reading this report and are subject to change at any time without notice based on market and other conditions.
Past performance is no guarantee of future results. The investment return and principal value of an investment will fluctuate; an investor’s shares, when redeemed, may be worth more or less than their original cost. For more complete information about Baron Funds, including charges and expenses, call, write or go to www.BaronFunds.com for a prospectus or summary prospectus. Read them carefully before you invest or send money. This report is not authorized for use as an offer of sale or a solicitation of an offer to buy shares of the Funds, unless accompanied or preceded by the Funds’ current prospectus or summary prospectus.

Table of Contents
| Baron Asset Fund (Unaudited) | September 30, 2017 |
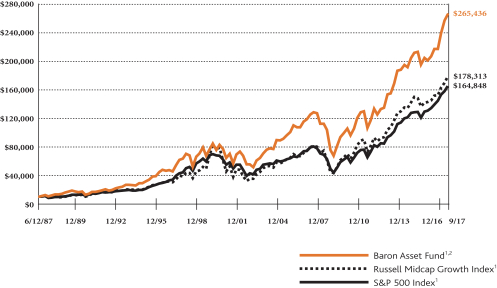
COMPARISONOFTHECHANGEIN VALUEOF $10,000INVESTMENTIN BARON ASSET FUND (RETAIL SHARES)
INRELATIONTOTHE RUSSELL MIDCAP GROWTH INDEXANDTHE S&P 500 INDEX
| AVERAGE ANNUAL TOTAL RETURNSFORTHEPERIODSENDED SEPTEMBER 30, 2017 | ||||||||||
| One Year | Three Years | Five Years | Ten Years | Since Inception (June 12, 1987) | ||||||
Baron Asset Fund — Retail Shares1,2 | 22.41% | 11.48% | 14.88% | 7.55% | 11.43% | |||||
Baron Asset Fund — Institutional Shares1,2,4 | 22.76% | 11.78% | 15.19% | 7.79% | 11.51% | |||||
Baron Asset Fund — R6 Shares1,2,4 | 22.74% | 11.78% | 15.19% | 7.79% | 11.51% | |||||
Russell Midcap Growth Index1 | 17.82% | 9.96% | 14.18% | 8.20% | 9.99%3 | |||||
S&P 500 Index1 | 18.61% | 10.81% | 14.22% | 7.44% | 9.69% | |||||
| 1 | The indexes are unmanaged. The Russell MidcapTM Growth Index measures the performance of medium-sized U.S. companies that are classified as growth and the S&P 500 Index of 500 widely held large cap U.S. companies. The indexes and the Fund are with dividends reinvested, which positively impact the performance results. |
| 2 | Past performance is not predictive of future performance. The performance data does not reflect the deduction of taxes that a shareholder would pay on Fund distributions or redemption of Fund shares. The Fund’s transfer agency expenses may be reduced by expense offsets from an unaffiliated transfer agent, without which performance would have been lower. |
| 3 | For the period June 30, 1987 to September 30, 2017. |
| 4 | Performance for the Institutional Shares prior to May 29, 2009 is based on the performance of the Retail Shares. Performance for the R6 Shares prior to January 29, 2016 is based on the performance of the Institutional Shares, and prior to May 29, 2009 is based on the Retail Shares. The Retail Shares have a distribution fee, but Institutional Shares and R6 Shares do not. If the annual returns for the Institutional Shares and R6 Shares prior to May 29, 2009 did not reflect this fee, the returns would be higher. |
2
Table of Contents
| September 30, 2017 (Unaudited) | Baron Asset Fund |
TOP TEN HOLDINGSASOF SEPTEMBER 30, 2017
| Percent of Net Assets | ||||
Gartner, Inc. | 6.4% | |||
IDEXX Laboratories, Inc. | 5.8% | |||
Vail Resorts, Inc. | 5.5% | |||
Mettler-Toledo International, Inc. | 5.2% | |||
Arch Capital Group Ltd. | 4.2% | |||
Verisk Analytics, Inc. | 3.6% | |||
The Charles Schwab Corp. | 3.5% | |||
Guidewire Software, Inc. | 3.1% | |||
SBA Communications Corp. | 2.8% | |||
FactSet Research Systems, Inc. | 2.6% | |||
| 42.7% | ||||
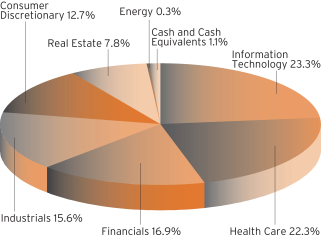
SECTOR BREAKDOWNASOF SEPTEMBER 30, 2017†
(as a percentage of net assets)
MANAGEMENT’S DISCUSSIONOF FUND PERFORMANCE
For the 12-month period ended September 30, 2017, Baron Asset Fund1 increased 22.41%, while the Russell Midcap Growth Index gained 17.82% and the S&P 500 Index gained 18.61%.
Baron Asset Fund invests primarily in medium-sized growth companies for the long term, using a value-oriented purchase discipline. The Fund purchases companies that we believe have sustainable competitive advantages, strong financial characteristics, and exceptional management; and operate in industries with favorable growth characteristics.
After moving mostly sideways in September and October of 2016, equities embarked on a rally that began shortly after the November election. For much of the period, high-quality growth companies trading at attractive prices enjoyed strong demand. As investors came to realize that businesses could not depend on policy-driven stimulus from the new administration, they turned their attention to secular stocks able to generate growth regardless of fiscal or monetary policy, stimulus spending, interest rates, or geopolitical conditions. Gains were fueled by mostly positive economic news, including low unemployment, elevated consumer confidence, and robust corporate earnings growth in the second half of the period.
The Fund’s investments in Health Care, Information Technology, and Financials contributed the most to performance. The Telecommunication Services and Energy sectors were modest detractors in the period.
Veterinary diagnostics leader IDEXX Laboratories, Inc. was the top contributor. Shares rallied throughout much of the period on strong financial results and multiple expansion. Competitive trends are solid and improving, highlighted by instrument revenue growth, domestic lab growth, rising sales productivity, and stability in rapid assays. We think that IDEXX’s direct go-to-market model coupled with meaningful research and development-driven product enhancements will put steady upward pressure on organic revenue and earnings growth over time.
The top detractor was FleetCor Technologies, Inc. Shares of this global payment processing services provider fell early in the period after a large contract loss and intensifying forex market headwinds. Later in the period, shares contracted due to weaker oil prices and an unflattering short seller report. We believe the report contains factual inaccuracies and the negative allegations are exaggerated. We expect short-term headwinds to abate and strong earnings growth to persist.
We continue to believe that mid-sized growth stocks represent an attractive investment opportunity. The U.S. economy remains among the world’s healthiest, its equity market multiples remain within the range of their long-term historic averages, and interest rates continue to be quite low by historic standards. We believe our diversified portfolio of fast growing, well managed, competitively advantaged businesses will continue to perform well in this environment. There is, of course, no guarantee that this will be the case.
| † | Industry sector group levels are provided by the Global Industry Classification Standard (“GICS”), developed and exclusively owned by MSCI, Inc. and Standard & Poor’s Financial Services LLC, unless otherwise stated that they have been classified by the Adviser. All GICS data is provided “as is” with no warranties. |
| 1 | Performance information reflects results of the Retail Shares. |
3
Table of Contents
| Baron Growth Fund (Unaudited) | September 30, 2017 |
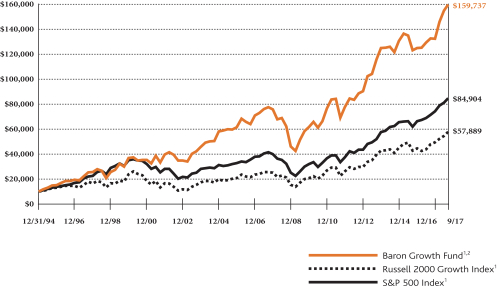
COMPARISONOFTHECHANGEIN VALUEOF $10,000INVESTMENTIN BARON GROWTH FUND (RETAIL SHARES)
INRELATIONTOTHE RUSSELL 2000 GROWTH INDEXANDTHE S&P 500 INDEX
| AVERAGE ANNUAL TOTAL RETURNSFORTHEPERIODSENDED SEPTEMBER 30, 2017 | ||||||||||||||||||
| One Year | Three Years | Five Years | Ten Years | Since Inception (December 31, 1994) | ||||||||||||||
Baron Growth Fund — Retail Shares1,2 | 20.47% | 9.49% | 12.53% | 7.48% | 12.95% | |||||||||||||
Baron Growth Fund — Institutional Shares1,2,3 | 20.79% | 9.77% | 12.82% | 7.71% | 13.06% | |||||||||||||
Baron Growth Fund — R6 Shares1,2,3 | 20.79% | 9.77% | 12.82% | 7.71% | 13.06% | |||||||||||||
Russell 2000 Growth Index1 | 20.98% | 12.17% | 14.28% | 8.47% | 8.02% | |||||||||||||
S&P 500 Index1 | 18.61% | 10.81% | 14.22% | 7.44% | 9.86% | |||||||||||||
| 1 | The indexes are unmanaged. The Russell 2000® Growth Index measures the performance of small-sized U.S. companies that are classified as growth and the S&P 500 Index of 500 widely held large cap U.S. companies. The indexes and the Fund are with dividends reinvested, which positively impact the performance results. |
| 2 | Past performance is not predictive of future performance. The performance data does not reflect the deduction of taxes that a shareholder would pay on Fund distributions or redemption of Fund shares. The Fund’s transfer agency expenses may be reduced by expense offsets from an unaffiliated transfer agent, without which performance would have been lower. |
| 3 | Performance for the Institutional Shares prior to May 29, 2009 is based on the performance of the Retail Shares. Performance for the R6 Shares prior to January 29, 2016 is based on the performance of the Institutional Shares, and prior to May 29, 2009 is based on the Retail Shares. The Retail Shares have a distribution fee, but Institutional Shares and R6 Shares do not. If the annual returns for the Institutional Shares and R6 Shares prior to May 29, 2009 did not reflect this fee, the returns would be higher. |
4
Table of Contents
| September 30, 2017 (Unaudited) | Baron Growth Fund |
TOP TEN HOLDINGSASOF SEPTEMBER 30, 2017
| Percent of Net Assets | ||||
Vail Resorts, Inc. | 8.2 | % | ||
Arch Capital Group Ltd. | 6.0 | % | ||
Gartner, Inc. | 4.8 | % | ||
CoStar Group, Inc. | 4.3 | % | ||
FactSet Research Systems, Inc. | 4.0 | % | ||
MSCI, Inc. | 3.5 | % | ||
IDEXX Laboratories, Inc. | 3.5 | % | ||
Marriott Vacations Worldwide Corp. | 3.3 | % | ||
Gaming and Leisure Properties, Inc. | 3.3 | % | ||
ANSYS, Inc. | 3.2 | % | ||
| 44.1 | % | |||
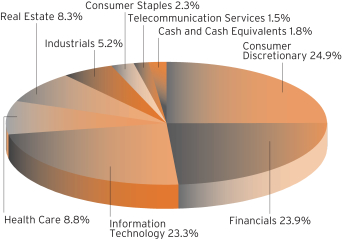
SECTOR BREAKDOWNASOF SEPTEMBER 30, 2017†
(as a percentage of net assets)
MANAGEMENT’S DISCUSSIONOF FUND PERFORMANCE
For the 12-month period ended September 30, 2017, Baron Growth Fund1 gained 20.47%, while the Russell 2000 Growth Index gained 20.98% and the S&P 500 Index gained 18.61%.
Baron Growth Fund invests primarily in small-sized U.S. growth companies for the long term. Through independent research, we utilize an investment approach that we believe allows us to look at a business’s fundamental characteristics and beyond the current market environment. We invest based on the potential profitability of a business at what we believe are attractive valuations.
After moving mostly sideways in September and October of 2016, equities embarked on a rally that began shortly after the November election. For much of the period, high-quality growth companies trading at attractive prices enjoyed strong demand. As investors came to realize that businesses could not depend on policy-driven stimulus from the new administration, they turned their attention to secular stocks able to generate growth regardless of fiscal or monetary policy, stimulus spending, interest rates, or geopolitical conditions. Gains were fueled by mostly positive economic news, including low unemployment, elevated consumer confidence, and robust corporate earnings growth in the second half of the period.
Financials, Consumer Discretionary, and Information Technology were the top contributing sectors in the period. Holdings in the Consumer Staples sector detracted.
Vail Resorts, Inc. was the top contributor in the period. Shares of this operator of ski resorts in the U.S., Canada, and Australia increased on strong earnings growth due to increased visitation and spend levels in a strong ski season. We believe Vail’s recent acquisitions of Whistler Blackcomb in Canada, Park City in Utah, Perisher in Australia, and most recently, Stowe in Vermont, will continue to help drive season pass sales and visitation, which, in turn, will help insulate earnings from poor snowfall seasons and improve cash flow.
The top detractor was Under Armour, Inc. Shares of this athletic apparel company declined as revenue growth rates remained meaningfully below historic growth levels and the company’s outlook remained cautious. Store growth with existing accounts has slowed, mall traffic continues to decline, and competition is taking share. The company is examining costs in order to improve margins over time. We still believe the brand resonates with consumers and growth can return over the long term as product segmentation expands, distribution is replaced, and the marketing campaign is improved. However, we are reevaluating our position in light of current headwinds.
The Fund continues to invest in a portfolio of businesses that have better financial characteristics than the benchmark index against which it is compared. These businesses have higher operating profit margins, net margins, EBITDA margins, return on invested capital, return on equity, return on assets, and lower standard deviations of earnings growth. While we do not try to predict short-term macro developments or current events, we believe conditions remain favorable for the U.S. economy and equity markets.
| † | Industry sector group levels are provided by the Global Industry Classification Standard (“GICS”), developed and exclusively owned by MSCI, Inc. and Standard & Poor’s Financial Services LLC, unless otherwise stated that they have been classified by the Adviser. All GICS data is provided “as is” with no warranties. |
| 1 | Performance information reflects results of the Retail Shares. |
5
Table of Contents
| Baron Small Cap Fund (Unaudited) | September 30, 2017 |
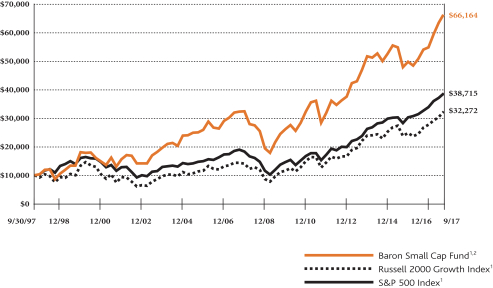
COMPARISONOFTHECHANGEIN VALUEOF $10,000INVESTMENTIN BARON SMALL CAP FUND (RETAIL SHARES)IN RELATIONTOTHE RUSSELL 2000 GROWTH INDEXANDTHE S&P 500 INDEX
| AVERAGE ANNUAL TOTAL RETURNSFORTHEPERIODSENDED SEPTEMBER 30, 2017 | ||||||||||||||||||
| One Year | Three Years | Five Years | Ten Years | Since Inception (September 30, 1997) | ||||||||||||||
Baron Small Cap Fund — Retail Shares1,2 | 22.45% | 9.77% | 12.79% | 7.42% | 9.91% | |||||||||||||
Baron Small Cap Fund — Institutional Shares1,2,3 | 22.76% | 10.06% | 13.07% | 7.65% | 10.03% | |||||||||||||
Baron Small Cap Fund — R6 Shares1,2,3 | 22.72% | 10.05% | 13.07% | 7.65% | 10.02% | |||||||||||||
Russell 2000 Growth Index1 | 20.98% | 12.17% | 14.28% | 8.47% | 6.03% | |||||||||||||
S&P 500 Index1 | 18.61% | 10.81% | 14.22% | 7.44% | 7.00% | |||||||||||||
| 1 | The indexes are unmanaged. The Russell 2000® Growth Index measures the performance of small-sized U.S. companies that are classified as growth and the S&P 500 Index of 500 widely held large cap U.S. companies. The indexes and the Fund are with dividends reinvested, which positively impact the performance results. |
| 2 | Past performance is not predictive of future performance. The performance data does not reflect the deduction of taxes that a shareholder would pay on Fund distributions or redemption of Fund shares. The Fund’s transfer agency expenses may be reduced by expense offsets from an unaffiliated transfer agent, without which performance would have been lower. |
| 3 | Performance for the Institutional Shares prior to May 29, 2009 is based on the performance of the Retail Shares. Performance for the R6 Shares prior to January 29, 2016 is based on the performance of the Institutional Shares, and prior to May 29, 2009 is based on the Retail Shares. The Retail Shares have a distribution fee, but Institutional Shares and R6 Shares do not. If the annual returns for the Institutional Shares and R6 Shares prior to May 29, 2009 did not reflect this fee, the returns would be higher. |
6
Table of Contents
| September 30, 2017 (Unaudited) | Baron Small Cap Fund |
TOP TEN HOLDINGSASOF SEPTEMBER 30, 2017
| Percent of Net Assets | ||||
Gartner, Inc. | 4.1% | |||
Waste Connections, Inc. | 3.3% | |||
Guidewire Software, Inc. | 3.2% | |||
Bright Horizons Family Solutions, Inc. | 3.0% | |||
TransDigm Group, Inc. | 2.9% | |||
IDEXX Laboratories, Inc. | 2.7% | |||
Cognex Corp. | 2.6% | |||
On Assignment, Inc. | 2.3% | |||
SBA Communications Corp. | 2.3% | |||
ICON plc | 2.1% | |||
| 28.5% | ||||
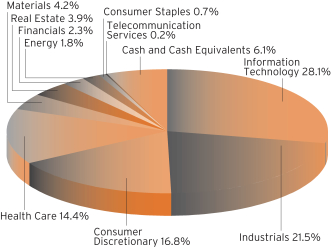
SECTOR BREAKDOWNASOF SEPTEMBER 30, 2017†
(as a percentage of net assets)
MANAGEMENT’S DISCUSSIONOF FUND PERFORMANCE
For the 12-month period ended September 30, 2017, Baron Small Cap Fund1 gained 22.45%, while the Russell 2000 Growth Index increased 20.98% and the S&P 500 Index increased 18.61%.
Baron Small Cap Fund invests primarily in small-cap growth companies for the long term. The Fund invests in what we believe are well-run small-cap growth businesses that can be purchased at prices that represent a significant discount to our assessment of future value.
After moving mostly sideways in September and October of 2016, equities embarked on a rally that began shortly after the November election. For much of the period, high quality growth companies trading at attractive prices enjoyed strong demand. As investors came to realize that businesses could not depend on policy-driven stimulus from the new administration, they turned their attention to secular stocks able to generate growth regardless of fiscal or monetary policy, stimulus spending, interest rates, or geopolitical conditions. Gains were fueled by mostly positive economic news, including low unemployment, elevated consumer confidence, and robust corporate earnings growth in the second half of the period.
Investments in Information Technology, Industrials, and Consumer Discretionary were the top contributors to performance. Holdings in Telecommunication Services detracted modestly.
Cognex Corp., a leading provider of machine vision products for factory automation, was the top contributor. Shares rose steadily throughout the period, driven by financial results that exceeded analyst expectations, thanks to strong sales in consumer electronics, automotive, and logistics markets. We continue to believe Cognex has a special business and will benefit from expanding applications for its products.
Shares of Acuity Brands, Inc., the leading U.S. provider of lighting solutions, detracted the most in the period. The company has seen weakened demand for smaller retrofit projects, and Acuity’s internet-enabled lighting platform Atrius has been slow to take off. We retain conviction in Acuity’s ability to extend its leading share in a growing market, led by LED retrofit opportunities and new construction. Participation in new high-value segments that integrate lighting with controls, connections to other building services, and data collection could also contribute to growth, in our view.
Baron Small Cap Fund invests primarily in classic growth stocks that we believe have significant long-term growth prospects and can be purchased at what we believe are attractive prices because their prospects have not yet been appreciated by investors. We also invest in fallen angels, which are companies that we believe have strong long-term franchises but have disappointed investors with short-term results, creating what we believe is a buying opportunity. A third category of investment is special situations, including spin-offs and recapitalizations, where lack of investor awareness creates opportunities to purchase what we believe are strong businesses at attractive prices.
| † | Industry sector group levels are provided by the Global Industry Classification Standard (“GICS”), developed and exclusively owned by MSCI, Inc. and Standard & Poor’s Financial Services LLC, unless otherwise stated that they have been classified by the Adviser. All GICS data is provided “as is” with no warranties. |
| 1 | Performance information reflects results of the Retail Shares. |
7
Table of Contents
| Baron Opportunity Fund (Unaudited) | September 30, 2017 |
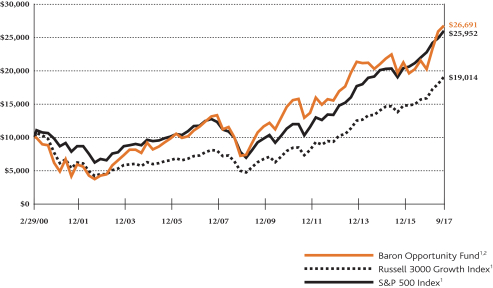
COMPARISONOFTHECHANGEIN VALUEOF $10,000INVESTMENTIN BARON OPPORTUNITY FUND† (RETAIL SHARES)
INRELATIONTOTHE RUSSELL 3000 GROWTH INDEXANDTHE S&P 500 INDEX
| AVERAGE ANNUAL TOTAL RETURNSFORTHEPERIODSENDED SEPTEMBER 30, 2017 | ||||||||||||||||||
| One Year | Three Years | Five Years | Ten Years | Since Inception (February 29, 2000) | ||||||||||||||
Baron Opportunity Fund — Retail Shares1,2 | 24.32% | 9.72% | 11.24% | 7.41% | 5.74% | |||||||||||||
Baron Opportunity Fund — Institutional Shares1,2,3 | 24.65% | 10.02% | 11.54% | 7.65% | 5.88% | |||||||||||||
Baron Opportunity Fund — R6 Shares1,2,3 | 24.64% | 10.04% | 11.55% | 7.66% | 5.88% | |||||||||||||
Russell 3000 Growth Index1 | 21.87% | 12.65% | 15.18% | 9.03% | 3.72% | |||||||||||||
S&P 500 Index1 | 18.61% | 10.81% | 14.22% | 7.44% | 5.57% | |||||||||||||
| † | The Fund’s historical performance was impacted by gains from IPOs and/or secondary offerings. There is no guarantee that these results can be repeated or that the Fund’s level of participation in IPOs and secondary offerings will be the same in the future. |
| 1 | The indexes are unmanaged. The Russell 3000® Growth Index measures the performance of those companies classified as growth among the largest 3,000 U.S. companies, and the S&P 500 Index of 500 widely held large cap U.S. companies. The indexes and the Fund are with dividends reinvested, which positively impact the performance results. |
| 2 | Past performance is not predictive of future performance. The performance data does not reflect the deduction of taxes that a shareholder would pay on Fund distributions or redemption of Fund shares. The Adviser has reimbursed certain Fund expenses and the Fund’s transfer agency expenses may be reduced by expense offsets from an unaffiliated transfer agent, without which performance would have been lower. |
| 3 | Performance for the Institutional Shares prior to May 29, 2009 is based on the performance of the Retail Shares. Performance for the R6 Shares prior to August 31, 2016 is based on the performance of the Institutional Shares, and prior to May 29, 2009 is based on the Retail Shares. The Retail Shares have a distribution fee, but Institutional Shares and R6 Shares do not. If the annual returns for the Institutional Shares and R6 Shares prior to May 29, 2009 did not reflect this fee, the returns would be higher. |
8
Table of Contents
| September 30, 2017 (Unaudited) | Baron Opportunity Fund |
TOP TEN HOLDINGSASOF SEPTEMBER 30, 2017
| Percent of Net Assets | ||||
Amazon.com, Inc. | 6.5% | |||
Guidewire Software, Inc. | 6.0% | |||
Gartner, Inc. | 5.4% | |||
Tesla, Inc. | 5.2% | |||
Alphabet Inc. | 4.7% | |||
CoStar Group, Inc. | 3.7% | |||
Acxiom Corporation | 3.4% | |||
Expedia, Inc. | 2.8% | |||
Visa, Inc. | 2.8% | |||
Benefitfocus, Inc. | 2.6% | |||
| 43.1% | ||||
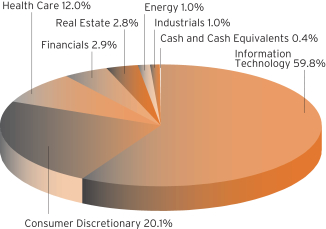
SECTOR BREAKDOWNASOF SEPTEMBER 30, 2017†
(as a percentage of net assets)
MANAGEMENT’S DISCUSSIONOF FUND PERFORMANCE
For the 12-month period ended September 30, 2017, Baron Opportunity Fund1 gained 24.32%, while the Russell 3000 Growth Index gained 21.87% and the S&P 500 Index gained 18.61%.
Baron Opportunity Fund invests primarily in U.S. growth companies that we believe are driving or benefiting from innovation, through development of pioneering, transformative, or technologically advanced products and services. The Fund invests in high growth businesses of any market capitalization, selected for their capital appreciation potential.
After moving mostly sideways in September and October of 2016, equities embarked on a rally that began shortly after the November election. For much of the period, high quality growth companies trading at attractive prices enjoyed strong demand. As investors came to realize that businesses could not depend on policy-driven stimulus from the new administration, they turned their attention to secular stocks able to generate growth regardless of fiscal or monetary policy, stimulus spending, interest rates, or geopolitical conditions. Gains were fueled by mostly positive economic news, including low unemployment, elevated consumer confidence, and robust corporate earnings growth in the second half of the period.
Investments in Information Technology and Consumer Discretionary contributed the most during the period. Telecommunication Services and Energy holdings detracted modestly.
Shares of top contributor Tesla, Inc., maker of fully electric vehicles, solar products and energy storage solutions, rose early in the period following the company’s launch of GigaFactory, one of the world’s largest manufacturing facilities, which we think will potentially drive significant cost reduction. Shares continued to appreciate on an increase in reservations for Tesla’s mass market electric vehicle, the Model 3, before its launch and without marketing. Further, Tesla now offers its solar roof product and has downsized the operations of recent acquisition SolarCity, focusing instead on cash generation that suggests lower merger-related risks.
Benefits software vendor Benefitfocus, Inc. detracted the most from performance as uncertainty around health care reform froze sales cycles with many customers. We believe short-term headwinds, which include longer implementation periods, slower employer signings due to a sales restructuring, and a revenue share of Benefitstore commissions, will abate later this year. We believe Benefitfocus’ addressable opportunity is large and expanding, its competitive position continues to improve, and it is progressing on its margin goals.
We remain focused on finding unique businesses across different segments of the economy that we believe offer long-term secular growth, sustainable competitive advantages, high-quality management teams, and attractive stock prices. We believe that investment returns for stocks are driven by earnings growth, and therefore direct our research towards understanding the drivers of business profit and projecting future profit growth as accurately as we can.
| † | Industry sector group levels are provided by the Global Industry Classification Standard (“GICS”), developed and exclusively owned by MSCI, Inc. and Standard & Poor’s Financial Services LLC, unless otherwise stated that they have been classified by the Adviser. All GICS data is provided “as is” with no warranties. |
| 1 | Performance information reflects results of the Retail Shares. |
9
Table of Contents
| Baron Fifth Avenue Growth Fund (Unaudited) | September 30, 2017 |
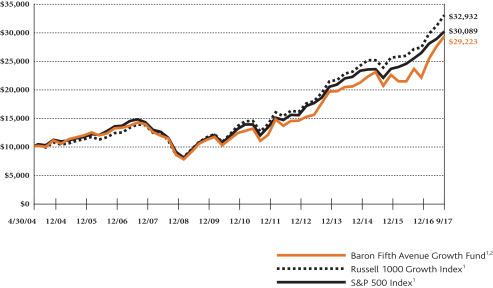
COMPARISONOFTHECHANGEIN VALUEOF $10,000INVESTMENTIN BARON FIFTH AVENUE GROWTH FUND (RETAIL SHARES)INRELATIONTOTHE RUSSELL 1000 GROWTH INDEXANDTHE S&P 500 INDEX
| AVERAGE ANNUAL TOTAL RETURNSFORTHEPERIODSENDED SEPTEMBER 30, 2017 | ||||||||||||||||||
| One Year | Three Years | Five Years | Ten Years | Since Inception (April 30, 2004) | ||||||||||||||
Baron Fifth Avenue Growth Fund — Retail Shares1,2 | 24.24% | 12.62% | 15.24% | 7.54% | 8.32% | |||||||||||||
Baron Fifth Avenue Growth Fund — Institutional Shares1,2,3 | 24.57% | 12.91% | 15.53% | 7.77% | 8.49% | |||||||||||||
Baron Fifth Avenue Growth Fund — R6 Shares1,2,3 | 24.55% | 12.93% | 15.54% | 7.77% | 8.49% | |||||||||||||
Russell 1000 Growth Index1 | 21.94% | 12.69% | 15.26% | 9.08% | 9.29% | |||||||||||||
S&P 500 Index1 | 18.61% | 10.81% | 14.22% | 7.44% | 8.56% | |||||||||||||
| 1 | The indexes are unmanaged. The Russell 1000® Growth Index measures the performance of large-sized U.S. companies that are classified as growth and the S&P 500 Index of 500 widely held large cap U.S. companies. The indexes and the Fund are with dividends reinvested, which positively impact the performance results. |
| 2 | Past performance is not predictive of future performance. The performance data does not reflect the deduction of taxes that a shareholder would pay on Fund distributions or redemption of Fund shares. The Adviser has reimbursed certain Fund expenses and the Fund’s transfer agency expenses may be reduced by expense offsets from an unaffiliated transfer agent, without which performance would have been lower. |
| 3 | Performance for the Institutional Shares prior to May 29, 2009 is based on the performance of the Retail Shares. Performance for the R6 Shares prior to January 29, 2016 is based on the performance of the Institutional Shares, and prior to May 29, 2009 is based on the Retail Shares. The Retail Shares have a distribution fee, but Institutional Shares and R6 Shares do not. If the annual returns for the Institutional Shares and R6 Shares prior to May 29, 2009 did not reflect this fee, the returns would be higher. |
10
Table of Contents
| September 30, 2017 (Unaudited) | Baron Fifth Avenue Growth Fund |
TOP TEN HOLDINGSASOF SEPTEMBER 30, 2017
| Percent of Net Assets | ||||
Amazon.com, Inc. | 14.0% | |||
Alibaba Group Holding Limited | 8.8% | |||
Alphabet Inc. | 6.4% | |||
Facebook, Inc. | 6.1% | |||
Mastercard Incorporated | 5.1% | |||
Visa, Inc. | 4.8% | |||
Equinix, Inc. | 4.8% | |||
The Priceline Group, Inc. | 4.4% | |||
Naspers Limited | 3.5% | |||
Illumina, Inc. | 3.3% | |||
| 61.2% | ||||
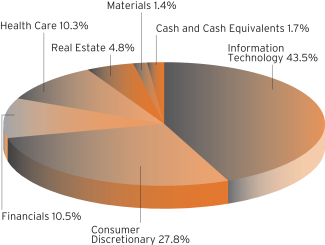
SECTOR BREAKDOWNASOF SEPTEMBER 30, 2017†
(as a percentage of net assets)
MANAGEMENT’S DISCUSSIONOF FUND PERFORMANCE
For the 12-month period ended September 30, 2017, Baron Fifth Avenue Growth Fund1 gained 24.24%, while the Russell 1000 Growth Index gained 21.94% and the S&P 500 Index gained 18.61%.
Baron Fifth Avenue Growth Fund focuses on identifying and investing in what we believe are unique companies with sustainable competitive advantages that have the ability to redeploy capital at high rates of return. The portfolio is constructed on a bottom-up basis, with the quality of ideas and conviction level the most important determinants of the size of each investment. We expect our highest conviction businesses to have meaningful weight in the portfolio. Sector weightings are incidental to portfolio construction, and exposure to any sector is a result of stock selection.
After moving mostly sideways in September and October of 2016, equities embarked on a rally that began shortly after the November election. For much of the period, high quality growth companies trading at attractive prices enjoyed strong demand. As investors came to realize that businesses could not depend on policy-driven stimulus from the new administration, they turned their attention to secular stocks able to generate growth regardless of fiscal or monetary policy, stimulus spending, interest rates, or geopolitical conditions. Gains were fueled by mostly positive economic news, including low unemployment, elevated consumer confidence, and robust corporate earnings growth in the second half of the period.
Information Technology, Consumer Discretionary, and Financials were the top contributing sectors in the period. The Energy and Utilities sectors detracted modestly.
The top contributor to Fund performance was Alibaba Group Holding Ltd., the largest e-commerce company in China. Shares of Alibaba appreciated on financial results that continued to exceed analyst expectations. The company is benefiting from strong mobile and advertising growth, which is driving upside beyond core e-commerce growth. We believe mobile monetization should continue to improve while Alibaba invests in new growth areas such as groceries, logistics, and cloud computing.
The top detractor was athletic apparel company Under Armour, Inc. Shares fell due to several challenges, including increased competition, weak consumer dynamics, and decreased distribution as a result of retailer bankruptcies. The company lowered 2017 earnings guidance as it plans to increase spending to drive sales growth. Although we believe Under Armour still has potential opportunities for growth over the long term, we exited our position in light of current headwinds.
The Fund seeks to manage risk by focusing on business risk (competition, management, regulations), valuation risk (purchase price providing a large enough margin of safety), financial risk (leverage and capital structure), and analysis risk (our assumptions). Our objective is not to predict how markets may perform in a given year. Instead, we aim to create a portfolio of unique companies with different end markets because, in our experience, this is the best way to manage market risk over time.
| † | Industry sector group levels are provided by the Global Industry Classification Standard (“GICS”), developed and exclusively owned by MSCI, Inc. and Standard & Poor’s Financial Services LLC, unless otherwise stated that they have been classified by the Adviser. All GICS data is provided “as is” with no warranties. |
| 1 | Performance information reflects results of the Retail Shares. |
11
Table of Contents
| Baron Discovery Fund (Unaudited) | September 30, 2017 |
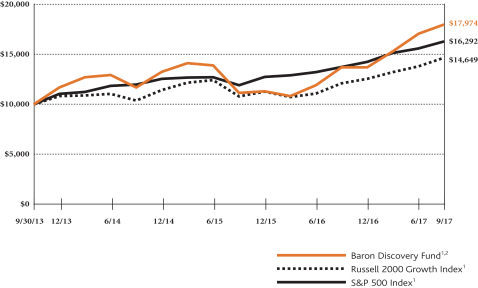
COMPARISONOFTHECHANGEIN VALUEOF $10,000INVESTMENTIN BARON DISCOVERY FUND† (RETAIL SHARES)
INRELATIONTOTHE RUSSELL 2000 GROWTH INDEXANDTHE S&P 500 INDEX
| AVERAGE ANNUAL TOTAL RETURNSFORTHEPERIODSENDED SEPTEMBER 30, 2017 | ||||||
| One Year | Three Years | Since Inception (September 30, 2013) | ||||
Baron Discovery Fund — Retail Shares1,2 | 31.04% | 15.45% | 15.79% | |||
Baron Discovery Fund — Institutional Shares1,2 | 31.41% | 15.74% | 16.08% | |||
Baron Discovery Fund — R6 Shares1,2,3 | 31.41% | 15.74% | 16.08% | |||
Russell 2000 Growth Index1 | 20.98% | 12.17% | 10.01% | |||
S&P 500 Index1 | 18.61% | 10.81% | 12.98% | |||
| † | The Fund’s historical performance was impacted by gains from IPOs and/or secondary offerings. There is no guarantee that these results can be repeated or that the Fund’s level of participation in IPOs and secondary offerings will be the same in the future. |
| 1 | The indexes are unmanaged. The Russell 2000® Growth Index measures the performance of small-sized U.S. companies that are classified as growth and the S&P 500 Index of 500 widely held large cap U.S. companies. The indexes and the Fund are with dividends reinvested, which positively impact the performance results. |
| 2 | Past performance is not predictive of future performance. The performance data does not reflect the deduction of taxes that a shareholder would pay on Fund distributions or redemption of Fund shares. The Adviser has reimbursed certain Fund expenses and the Fund’s transfer agency expenses may be reduced by expense offsets from an unaffiliated transfer agent, without which performance would have been lower. |
| 3 | Performance for the R6 Shares prior to August 31, 2016 is based on the performance of the Institutional Shares. |
12
Table of Contents
| September 30, 2017 (Unaudited) | Baron Discovery Fund |
TOP TEN HOLDINGSASOF SEPTEMBER 30, 2017
| Percent of Net Assets | ||||
Qualys, Inc. | 3.6% | |||
MACOM Technology Solutions Holdings, Inc. | 3.3% | |||
Novanta Inc. | 3.3% | |||
Myriad Genetics, Inc. | 3.1% | |||
Sientra, Inc. | 3.1% | |||
General Communication, Inc. | 3.0% | |||
Teladoc, Inc. | 2.8% | |||
The Trade Desk | 2.7% | |||
Alexander & Baldwin, Inc. | 2.7% | |||
Mercury Systems, Inc. | 2.6% | |||
| 30.2% | ||||
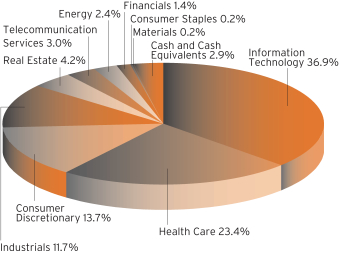
SECTOR BREAKDOWNASOF SEPTEMBER 30, 2017†
(as a percentage of net assets)
MANAGEMENT’S DISCUSSIONOF FUND PERFORMANCE
For the 12-month period ended September 30, 2017, Baron Discovery Fund1 increased 31.04%, while the Russell 2000 Growth Index gained 20.98% and the S&P 500 Index gained 18.61%.
Baron Discovery Fund invests primarily in small-sized U.S. companies with significant growth potential and market capitalizations up to the weighted median market capitalization of the Russell 2000 Growth Index at reconstitution, or companies with market capitalizations up to $1.5 billion, whichever is larger. The Fund invests for the long term at attractive valuations in companies with appropriately capitalized, open-ended growth opportunities, exceptional leadership, and sustainable competitive advantages.
After moving mostly sideways in September and October of 2016, equities embarked on a rally that began shortly after the November election. For much of the period, high quality growth companies trading at attractive prices enjoyed strong demand. As investors came to realize that businesses could not depend on policy-driven stimulus from the new administration, they turned their attention to secular stocks able to generate growth regardless of fiscal or monetary policy, stimulus spending, interest rates, or geopolitical conditions. Gains were fueled by mostly positive economic news, including low unemployment, elevated consumer confidence, and robust corporate earnings growth in the second half of the period.
The Information Technology, Industrials, and Health Care sectors contributed the most in the period. Materials was the only detracting sector.
Mercury Systems, Inc., a provider of complex electronic subsystems to major defense contractors, was the top contributor. Shares increased steadily during the period as Mercury continued to win contract awards and completed a successful secondary offering to provide funding for accretive future acquisitions. We believe defense spending and outsourcing will grow under the current presidential administration, which could benefit Mercury.
Cerus Corporation detracted the most in the period. Cerus is a developer of an FDA- and EU-approved device that deactivates pathogens such as viruses and bacteria in donated blood. Current regulatory approvals cover use of the Cerus device for platelets and plasma from donated blood. Shares fell sharply in May 2017 after the company encountered an unexpected component supply issue. We believe growth prospects for Cerus are significant for 2018 and beyond, as expected approval for usage with red blood cells would introduce an additional $2.5 billion in potential revenue.
We think the long-term fundamentals of our companies remain strong. The companies we own are high quality, innovative and run by excellent management teams. We are optimistic that they will be significantly bigger next year than they are today and that this growth can continue for years after. There is, of course, no guarantee that this will be the case.
| † | Industry sector group levels are provided by the Global Industry Classification Standard (“GICS”), developed and exclusively owned by MSCI, Inc. and Standard & Poor’s Financial Services LLC, unless otherwise stated that they have been classified by the Adviser. All GICS data is provided “as is” with no warranties. |
| 1 | Performance information reflects results of the Retail Shares. |
13
Table of Contents
| Baron Asset Fund | September 30, 2017 |
SEPTEMBER 30, 2017
|
| Shares | Cost | Value | ||||||||||
| Common Stocks (98.75%) | ||||||||||||
| Consumer Discretionary (12.65%) | ||||||||||||
Automotive Retail (0.85%) | ||||||||||||
| 339,000 | CarMax, Inc.1 | $ | 3,852,557 | $ | 25,699,590 | |||||||
Hotels, Resorts & Cruise Lines (2.13%) | ||||||||||||
| 525,400 | Choice Hotels International, Inc. | 2,254,244 | 33,573,060 | |||||||||
| 500,000 | Hyatt Hotels Corp., Cl A1 | 13,523,436 | 30,895,000 | |||||||||
|
|
|
| |||||||||
| 15,777,680 | 64,468,060 | |||||||||||
Internet & Direct Marketing Retail (3.44%) | ||||||||||||
| 315,000 | Expedia, Inc. | 39,652,193 | 45,341,100 | |||||||||
| 32,000 | The Priceline Group, Inc.1 | 5,125,131 | 58,586,240 | |||||||||
|
|
|
| |||||||||
| 44,777,324 | 103,927,340 | |||||||||||
Leisure Facilities (5.47%) | ||||||||||||
| 725,000 | Vail Resorts, Inc. | 14,063,109 | 165,387,000 | |||||||||
Specialty Stores (0.76%) | ||||||||||||
| 250,000 | Tiffany & Co. | 7,708,110 | 22,945,000 | |||||||||
|
|
|
| |||||||||
Total Consumer Discretionary | 86,178,780 | 382,426,990 | ||||||||||
|
|
|
| |||||||||
| Energy (0.33%) | ||||||||||||
Oil & Gas Exploration & Production (0.33%) | ||||||||||||
| 75,500 | Concho Resources, Inc.1 | 3,227,625 | 9,944,860 | |||||||||
|
|
|
| |||||||||
| Financials (16.75%) | ||||||||||||
Asset Management & Custody Banks (0.99%) | ||||||||||||
| 330,000 | T. Rowe Price Group, Inc. | 12,447,797 | 29,914,500 | |||||||||
Financial Exchanges & Data (4.00%) | ||||||||||||
| 435,000 | FactSet Research Systems, Inc. | 23,564,473 | 78,347,850 | |||||||||
| 230,000 | MarketAxess Holdings, Inc. | 25,489,330 | 42,437,300 | |||||||||
|
|
|
| |||||||||
| 49,053,803 | 120,785,150 | |||||||||||
Insurance Brokers (2.42%) | ||||||||||||
| 475,000 | Willis Towers Watson plc2 | 58,514,776 | 73,259,250 | |||||||||
Investment Banking & Brokerage (3.55%) | ||||||||||||
| 2,450,000 | The Charles Schwab Corp. | 2,351,369 | 107,163,000 | |||||||||
Property & Casualty Insurance (4.15%) | ||||||||||||
| 1,275,000 | Arch Capital Group Ltd.1,2 | 13,874,063 | 125,587,500 | |||||||||
Regional Banks (1.64%) | ||||||||||||
| 475,000 | First Republic Bank | 15,197,602 | 49,618,500 | |||||||||
|
|
|
| |||||||||
Total Financials | 151,439,410 | 506,327,900 | ||||||||||
|
|
|
| |||||||||
| Health Care (22.34%) | ||||||||||||
Health Care Distributors (1.69%) | ||||||||||||
| 624,000 | Henry Schein, Inc.1 | 8,296,353 | 51,161,760 | |||||||||
Health Care Equipment (6.81%) | ||||||||||||
| 1,121,000 | IDEXX Laboratories, Inc.1 | 21,172,869 | 174,304,290 | |||||||||
| 130,000 | Teleflex, Inc. | 21,819,589 | 31,456,100 | |||||||||
|
|
|
| |||||||||
| 42,992,458 | 205,760,390 | |||||||||||
| Shares | Cost | Value | ||||||||||
| Common Stocks (continued) | ||||||||||||
| Health Care (continued) | ||||||||||||
Health Care Facilities (0.39%) | ||||||||||||
| 107,000 | Universal Health Services, Inc., Cl B | $ | 6,055,045 | $ | 11,870,580 | |||||||
Health Care Supplies (4.35%) | ||||||||||||
| 85,000 | Align Technology, Inc.1 | 12,923,390 | 15,832,950 | |||||||||
| 240,000 | The Cooper Companies, Inc. | 30,555,224 | 56,906,400 | |||||||||
| 610,000 | West Pharmaceutical Services, Inc. | 26,714,894 | 58,718,600 | |||||||||
|
|
|
| |||||||||
| 70,193,508 | 131,457,950 | |||||||||||
Life Sciences Tools & Services (9.10%) | ||||||||||||
| 400,000 | Bio-Techne Corporation | 39,337,900 | 48,356,000 | |||||||||
| 352,000 | Illumina, Inc.1 | 15,181,108 | 70,118,400 | |||||||||
| 250,000 | Mettler-Toledo International, Inc.1 | 15,496,167 | 156,540,000 | |||||||||
|
|
|
| |||||||||
| 70,015,175 | 275,014,400 | |||||||||||
|
|
|
| |||||||||
Total Health Care | 197,552,539 | 675,265,080 | ||||||||||
|
|
|
| |||||||||
| Industrials (15.58%) | ||||||||||||
Aerospace & Defense (0.84%) | ||||||||||||
| 450,000 | BWX Technologies, Inc. | 21,837,763 | 25,209,000 | |||||||||
Agricultural & Farm Machinery (0.87%) | ||||||||||||
| 425,000 | The Toro Co. | 26,000,375 | 26,375,500 | |||||||||
Building Products (0.98%) | ||||||||||||
| 500,000 | AO Smith Corp. | 25,865,926 | 29,715,000 | |||||||||
Construction Machinery & Heavy Trucks (1.22%) | ||||||||||||
| 95,000 | WABCO Holdings, Inc.1 | 11,150,680 | 14,060,000 | |||||||||
| 300,000 | Westinghouse Air Brake Technologies Corporation | 19,394,146 | 22,725,000 | |||||||||
|
|
|
| |||||||||
| 30,544,826 | 36,785,000 | |||||||||||
Electrical Components & Equipment (0.51%) | ||||||||||||
| 90,000 | Acuity Brands, Inc. | 18,700,047 | 15,415,200 | |||||||||
Environmental & Facilities Services (0.91%) | ||||||||||||
| 596,087 | Rollins, Inc. | 17,339,864 | 27,503,454 | |||||||||
Industrial Conglomerates (1.93%) | ||||||||||||
| 240,000 | Roper Technologies, Inc. | 20,050,484 | 58,416,000 | |||||||||
Industrial Machinery (2.58%) |
| |||||||||||
| 430,000 | IDEX Corporation | 31,397,849 | 52,232,100 | |||||||||
| 200,000 | The Middleby Corp.1 | 9,741,935 | 25,634,000 | |||||||||
|
|
|
| |||||||||
| 41,139,784 | 77,866,100 | |||||||||||
Research & Consulting Services (5.36%) | ||||||||||||
| 365,000 | Nielsen Holdings PLC2 | 8,395,000 | 15,129,250 | |||||||||
| 819,833 | TransUnion1 | 34,532,680 | 38,745,308 | |||||||||
| 1,300,000 | Verisk Analytics, Inc.1 | 33,418,943 | 108,147,000 | |||||||||
|
|
|
| |||||||||
| 76,346,623 | 162,021,558 | |||||||||||
Trading Companies & Distributors (0.38%) | ||||||||||||
| 250,000 | Fastenal Co. | 4,134,515 | 11,395,000 | |||||||||
|
|
|
| |||||||||
Total Industrials | 281,960,207 | 470,701,812 | ||||||||||
|
|
|
| |||||||||
| 14 | See Notes to Financial Statements. |
Table of Contents
| September 30, 2017 | Baron Asset Fund |
STATEMENT OF NET ASSETS (Continued)
SEPTEMBER 30, 2017
|
| Shares | Cost | Value | ||||||||||
| Common Stocks (continued) | ||||||||||||
| Information Technology (23.31%) | ||||||||||||
Application Software (7.29%) | ||||||||||||
| 550,000 | ANSYS, Inc.1 | $ | 14,771,001 | $ | 67,501,500 | |||||||
| 1,220,000 | Guidewire Software, Inc.1 | 58,902,936 | 94,989,200 | |||||||||
| 919,000 | SS&C Technologies Holdings, Inc. | 25,120,157 | 36,897,850 | |||||||||
| 110,000 | The Ultimate Software Group, Inc.1 | 21,304,054 | 20,856,000 | |||||||||
|
|
|
| |||||||||
| 120,098,148 | 220,244,550 | |||||||||||
Data Processing & Outsourced Services (3.63%) | ||||||||||||
| 206,000 | FleetCor Technologies, Inc.1 | 7,476,912 | 31,882,620 | |||||||||
| 400,000 | MAXIMUS, Inc. | 20,233,990 | 25,800,000 | |||||||||
| 740,000 | Vantiv, Inc., Cl A1 | 40,255,109 | 52,147,800 | |||||||||
|
|
|
| |||||||||
| 67,966,011 | 109,830,420 | |||||||||||
Internet Software & Services (5.24%) | ||||||||||||
| 200,000 | CoStar Group, Inc.1 | 34,528,695 | 53,650,000 | |||||||||
| 650,000 | Verisign, Inc.1 | 31,889,164 | 69,153,500 | |||||||||
| 270,872 | Zillow Group, Inc., Cl A1 | 7,666,898 | 10,875,511 | |||||||||
| 614,000 | Zillow Group, Inc., CI C1 | 15,676,412 | 24,688,940 | |||||||||
|
|
|
| |||||||||
| 89,761,169 | 158,367,951 | |||||||||||
IT Consulting & Other Services (6.38%) | ||||||||||||
| 1,550,000 | Gartner, Inc.1 | 33,739,350 | 192,835,500 | |||||||||
Technology Distributors (0.77%) | ||||||||||||
| 350,000 | CDW Corp. | 21,524,055 | 23,100,000 | |||||||||
|
|
|
| |||||||||
Total Information Technology | 333,088,733 | 704,378,421 | ||||||||||
|
|
|
| |||||||||
| Real Estate (7.79%) | ||||||||||||
Office REITs (0.84%) | ||||||||||||
| 60,000 | Alexander’s, Inc.3 | 2,675,243 | 25,445,400 | |||||||||
Real Estate Services (2.00%) | ||||||||||||
| 1,600,000 | CBRE Group, Inc., Cl A1 | 19,628,157 | 60,608,000 | |||||||||
Specialized REITs (4.95%) | ||||||||||||
| 144,505 | Equinix, Inc. | 9,802,123 | 64,492,581 | |||||||||
| 590,000 | SBA Communications Corp.1 | 16,542,706 | 84,989,500 | |||||||||
|
|
|
| |||||||||
| 26,344,829 | 149,482,081 | |||||||||||
|
|
|
| |||||||||
Total Real Estate | 48,648,229 | 235,535,481 | ||||||||||
|
|
|
| |||||||||
Total Common Stocks | 1,102,095,523 | 2,984,580,544 | ||||||||||
|
|
|
| |||||||||
| Private Equity Investments (0.11%) | ||||||||||||
| Financials (0.11%) | ||||||||||||
Asset Management & Custody Banks (0.11%) | ||||||||||||
| 7,056,223 | Windy City Investments Holdings, L.L.C.1,3,4,6 | 0 | 3,330,537 | |||||||||
|
|
|
| |||||||||
| Principal Amount | Cost | Value | ||||||||||
| Short Term Investments (1.35%) | ||||||||||||
| $40,903,556 | Repurchase Agreement with Fixed Income Clearing Corp., dated 9/29/2017, 0.12% due 10/2/2017; Proceeds at maturity - $40,903,965; (Fully collateralized by $41,880,000 U.S. Treasury Inflation-Indexed Note, 0.375% due 7/15/2027; Market value - $41,722,950)5 | $ | 40,903,556 | $ | 40,903,556 | |||||||
|
|
|
| |||||||||
Total Investments (100.21%) | $ | 1,142,999,079 | 3,028,814,637 | |||||||||
|
| |||||||||||
Liabilities Less Cash and Other Assets (-0.21%) | (6,260,390 | ) | ||||||||||
|
| |||||||||||
Net Assets | $ | 3,022,554,247 | ||||||||||
|
| |||||||||||
| | Retail Shares (Equivalent to $70.87 per share | $ | 1,979,082,084 | |||||||||
|
| |||||||||||
| | Institutional Shares (Equivalent to $73.07 per share | $ | 1,020,981,492 | |||||||||
|
| |||||||||||
| | R6 Shares (Equivalent to $73.06 per share | $ | 22,490,671 | |||||||||
|
| |||||||||||
| % | Represents percentage of net assets. |
| 1 | Non-income producing securities. |
| 2 | Foreign corporation. |
| 3 | The Adviser has reclassified/classified certain securities in or out of this sub-industry. Such reclassifications/classifications are not supported by S&P or MSCI. |
| 4 | At September 30, 2017, the market value of restricted and fair valued securities amounted to $3,330,537 or 0.11% of net assets. This security is not deemed liquid. See Note 6 regarding Restricted Securities. |
| 5 | Level 2 security. See Note 7 regarding Fair Value Measurements. |
| 6 | Level 3 security. See Note 7 regarding Fair Value Measurements. |
All securities are Level 1, unless otherwise noted.
| See Notes to Financial Statements. | 15 |
Table of Contents
| Baron Growth Fund | September 30, 2017 |
STATEMENT OF NET ASSETS
SEPTEMBER 30, 2017
|
| Shares | Cost | Value | ||||||||||
| Common Stocks (97.94%) | ||||||||||||
| Consumer Discretionary (24.88%) | ||||||||||||
Apparel, Accessories & Luxury Goods (1.48%) | ||||||||||||
| 3,475,000 | Under Armour, Inc., Cl A1 | $ | 13,912,447 | $ | 57,268,000 | |||||||
| 2,195,254 | Under Armour, Inc., Cl C1 | 7,919,679 | 32,972,715 | |||||||||
|
|
|
| |||||||||
| 21,832,126 | 90,240,715 | |||||||||||
Automotive Retail (0.18%) | ||||||||||||
| 275,000 | Camping World Holdings, Inc., Cl A | 7,734,179 | 11,203,500 | |||||||||
Casinos & Gaming (3.90%) | ||||||||||||
| 725,000 | Boyd Gaming Corp. | 18,479,841 | 18,886,250 | |||||||||
| 4,155,000 | Penn National Gaming, Inc.1 | 36,915,622 | 97,185,450 | |||||||||
| 2,725,000 | Pinnacle Entertainment, Inc.1 | 31,437,493 | 58,069,750 | |||||||||
| 2,770,582 | Red Rock Resorts, Inc., Cl A | 58,186,103 | 64,166,679 | |||||||||
|
|
|
| |||||||||
| 145,019,059 | 238,308,129 | |||||||||||
Education Services (2.72%) | ||||||||||||
| 1,925,000 | Bright Horizons Family Solutions, Inc.1 | 62,442,112 | 165,954,250 | |||||||||
General Merchandise Stores (0.05%) | ||||||||||||
| 60,200 | Ollie’s Bargain Outlet Holdings, Inc.1 | 2,784,461 | 2,793,280 | |||||||||
Hotels, Resorts & Cruise Lines (6.40%) | ||||||||||||
| 3,007,500 | Choice Hotels International, Inc.4 | 73,061,456 | 192,179,250 | |||||||||
| 1,600,000 | Marriott Vacations Worldwide Corp.4 | 87,504,361 | 199,248,000 | |||||||||
|
|
|
| |||||||||
| 160,565,817 | 391,427,250 | |||||||||||
Leisure Facilities (8.20%) | ||||||||||||
| 2,196,993 | Vail Resorts, Inc.4 | 80,228,702 | 501,178,043 | |||||||||
Movies & Entertainment (1.60%) | ||||||||||||
| 5,450,018 | Manchester United plc, Cl A2 | 77,159,985 | 98,100,324 | |||||||||
Specialty Stores (0.35%) | ||||||||||||
| 799,223 | Dick’s Sporting Goods, Inc. | 12,230,119 | 21,587,014 | |||||||||
|
|
|
| |||||||||
Total Consumer Discretionary | 569,996,560 | 1,520,792,505 | ||||||||||
|
|
|
| |||||||||
| Consumer Staples (2.26%) | ||||||||||||
Food Distributors (0.51%) | ||||||||||||
| 1,100,000 | Performance Food Group Co.1 | 20,900,000 | 31,075,000 | |||||||||
Household Products (1.17%) | ||||||||||||
| 1,475,000 | Church & Dwight Co., Inc. | 13,377,300 | 71,463,750 | |||||||||
Packaged Foods & Meats (0.58%) | ||||||||||||
| 525,000 | TreeHouse Foods, Inc.1 | 17,574,452 | 35,558,250 | |||||||||
|
|
|
| |||||||||
Total Consumer Staples | 51,851,752 | 138,097,000 | ||||||||||
|
|
|
| |||||||||
| Financials (23.94%) | ||||||||||||
Asset Management & Custody Banks (4.44%) | ||||||||||||
| 1,950,000 | The Carlyle Group | 42,498,847 | 46,020,000 | |||||||||
| 2,000,000 | Cohen & Steers, Inc. | 49,208,575 | 78,980,000 | |||||||||
| 2,250,000 | Financial Engines, Inc. | 63,928,705 | 78,187,500 | |||||||||
| 1,455,195 | Oaktree Capital Group, LLC | 65,648,565 | 68,466,925 | |||||||||
|
|
|
| |||||||||
| 221,284,692 | 271,654,425 | |||||||||||
| Shares | Cost | Value | ||||||||||
| Common Stocks (continued) | ||||||||||||
| Financials (continued) | ||||||||||||
Financial Exchanges & Data (9.16%) | ||||||||||||
| 1,350,000 | FactSet Research Systems, Inc. | $ | 67,699,227 | $ | 243,148,500 | |||||||
| 1,180,000 | Morningstar, Inc. | 29,712,536 | 100,288,200 | |||||||||
| 1,850,000 | MSCI, Inc. | 35,414,266 | 216,265,000 | |||||||||
|
|
|
| |||||||||
| 132,826,029 | 559,701,700 | |||||||||||
Investment Banking & Brokerage (0.55%) | ||||||||||||
| 775,000 | Moelis & Co., Cl A | 22,607,787 | 33,363,750 | |||||||||
Life & Health Insurance (2.71%) |
| |||||||||||
| 2,030,000 | Primerica, Inc. | 43,907,721 | 165,546,500 | |||||||||
Property & Casualty Insurance (6.73%) | ||||||||||||
| 3,750,000 | Arch Capital Group Ltd.1,2 | 36,285,036 | 369,375,000 | |||||||||
| 978,449 | Kinsale Capital Group, Inc. | 32,761,205 | 42,239,643 | |||||||||
|
|
|
| |||||||||
| 69,046,241 | 411,614,643 | |||||||||||
Thrifts & Mortgage Finance (0.35%) | ||||||||||||
| 525,000 | Essent Group, Ltd.1,2 | 14,507,433 | 21,262,500 | |||||||||
|
|
|
| |||||||||
Total Financials | 504,179,903 | 1,463,143,518 | ||||||||||
|
|
|
| |||||||||
| Health Care (8.77%) | ||||||||||||
Health Care Equipment (3.78%) | ||||||||||||
| 461,246 | Glaukos Corporation1 | 16,470,442 | 15,221,118 | |||||||||
| 1,390,000 | IDEXX Laboratories, Inc.1 | 21,181,421 | 216,131,100 | |||||||||
|
|
|
| |||||||||
| 37,651,863 | 231,352,218 | |||||||||||
Health Care Supplies (1.72%) | ||||||||||||
| 365,038 | Neogen Corp.1 | 8,075,677 | 28,275,844 | |||||||||
| 800,000 | West Pharmaceutical | 27,688,593 | 77,008,000 | |||||||||
|
|
|
| |||||||||
| 35,764,270 | 105,283,844 | |||||||||||
Life Sciences Tools & Services (3.27%) | ||||||||||||
| 875,000 | Bio-Techne Corporation | 46,302,066 | 105,778,750 | |||||||||
| 150,000 | Mettler-Toledo | 6,877,056 | 93,924,000 | |||||||||
|
|
|
| |||||||||
| 53,179,122 | 199,702,750 | |||||||||||
|
|
|
| |||||||||
Total Health Care | 126,595,255 | 536,338,812 | ||||||||||
|
|
|
| |||||||||
| Industrials (5.26%) | ||||||||||||
Building Products (3.15%) | ||||||||||||
| 650,000 | CaesarStone Ltd.1,2 | 7,164,043 | 19,370,000 | |||||||||
| 1,360,000 | Masonite International Corp.1,2 | 75,756,614 | 94,112,000 | |||||||||
| 875,000 | Trex Company, Inc.1 | 31,973,878 | 78,811,250 | |||||||||
|
|
|
| |||||||||
| 114,894,535 | 192,293,250 | |||||||||||
Industrial Machinery (1.41%) | ||||||||||||
| 675,000 | The Middleby Corp.1 | 18,871,502 | 86,514,750 | |||||||||
Trading Companies & Distributors (0.70%) | ||||||||||||
| 1,000,000 | Air Lease Corp. | 23,203,508 | 42,620,000 | |||||||||
|
|
|
| |||||||||
Total Industrials | 156,969,545 | 321,428,000 | ||||||||||
|
|
|
| |||||||||
| 16 | See Notes to Financial Statements. |
Table of Contents
| September 30, 2017 | Baron Growth Fund |
STATEMENT OF NET ASSETS (Continued)
SEPTEMBER 30, 2017
|
| Shares | Cost | Value | ||||||||||
| Common Stocks (continued) | ||||||||||||
| Information Technology (23.30%) | ||||||||||||
Application Software (8.81%) | ||||||||||||
| 1,600,000 | ANSYS, Inc.1 | $ | 37,902,179 | $ | 196,368,000 | |||||||
| 1,190,000 | Guidewire Software, Inc.1 | 38,711,926 | 92,653,400 | |||||||||
| 1,000,000 | Pegasystems, Inc. | 13,997,009 | 57,650,000 | |||||||||
| 4,775,000 | SS&C Technologies Holdings, Inc. | 38,927,132 | 191,716,250 | |||||||||
|
|
|
| |||||||||
| 129,538,246 | 538,387,650 | |||||||||||
Data Processing & Outsourced Services (2.11%) | ||||||||||||
| 2,000,000 | MAXIMUS, Inc. | 37,304,950 | 129,000,000 | |||||||||
Electronic Components (0.90%) | ||||||||||||
| 280,000 | Littelfuse, Inc. | 31,472,950 | 54,846,400 | |||||||||
Internet Software & Services (6.66%) | ||||||||||||
| 660,582 | 2U, Inc.1 | 33,000,791 | 37,019,015 | |||||||||
| 2,324,374 | Benefitfocus, Inc.1,4 | 86,529,482 | 78,215,185 | |||||||||
| 975,000 | CoStar Group, Inc.1 | 42,637,436 | 261,543,750 | |||||||||
| 425,000 | Wix.com Ltd.1,2 | 27,515,281 | 30,536,250 | |||||||||
|
|
|
| |||||||||
| 189,682,990 | 407,314,200 | |||||||||||
IT Consulting & Other Services (4.82%) | ||||||||||||
| 2,370,000 | Gartner, Inc.1 | 36,432,291 | 294,851,700 | |||||||||
|
|
|
| |||||||||
Total Information Technology | 424,431,427 | 1,424,399,950 | ||||||||||
|
|
|
| |||||||||
| Real Estate (8.27%) | ||||||||||||
Diversified REITs (0.30%) | ||||||||||||
| 460,135 | American Assets Trust, Inc. | 8,503,418 | 18,299,569 | |||||||||
Office REITs (3.25%) | ||||||||||||
| 120,000 | Alexander’s, Inc.5 | 22,426,316 | 50,890,800 | |||||||||
| 3,750,000 | Douglas Emmett, Inc. | 48,432,016 | 147,825,000 | |||||||||
|
|
|
| |||||||||
| 70,858,332 | 198,715,800 | |||||||||||
Specialized REITs (4.72%) | ||||||||||||
| 750,000 | Alexandria Real Estate Equities, Inc.5 | 27,037,562 | 89,227,500 | |||||||||
| 5,400,000 | Gaming and Leisure Properties, Inc. | 119,143,510 | 199,206,000 | |||||||||
|
|
|
| |||||||||
| 146,181,072 | 288,433,500 | |||||||||||
|
|
|
| |||||||||
Total Real Estate | 225,542,822 | 505,448,869 | ||||||||||
|
|
|
| |||||||||
| Telecommunication Services (1.26%) | ||||||||||||
Alternative Carriers (1.26%) | ||||||||||||
| 7,493,437 | Iridium Communications, Inc.1,4 | 45,709,971 | 77,182,401 | |||||||||
|
|
|
| |||||||||
Total Common Stocks | 2,105,277,235 | 5,986,831,055 | ||||||||||
|
|
|
| |||||||||
| Preferred Stocks (0.24%) | ||||||||||||
| Telecommunication Services (0.24%) | ||||||||||||
Alternative Carriers (0.24%) | ||||||||||||
| 41,074 | Iridium Communications, Inc., Series B, 6.75%4,6 | 10,268,500 | 14,927,934 | |||||||||
|
|
|
| |||||||||
| Shares | Cost | Value | ||||||||||
| Private Equity Investments (0.02%) | ||||||||||||
| Financials (0.02%) | ||||||||||||
Asset Management & Custody Banks (0.02%) | ||||||||||||
| 2,375,173 | Windy City Investments Holdings, L.L.C.1,3,5,7 | $ | 0 | $ | 1,121,082 | |||||||
|
|
|
| |||||||||
| Principal Amount | ||||||||||||
| Short Term Investments (1.90%) | ||||||||||||
| $115,964,659 | Repurchase Agreement with Fixed Income Clearing Corp., dated 9/29/2017, 0.12% | 115,964,659 | 115,964,659 | |||||||||
|
|
|
| |||||||||
Total Investments (100.10%) | $ | 2,231,510,394 | 6,118,844,730 | |||||||||
|
| |||||||||||
Liabilities Less Cash and Other Assets (-0.10%) | (6,204,680 | ) | ||||||||||
|
| |||||||||||
Net Assets | $ | 6,112,640,050 | ||||||||||
|
| |||||||||||
| | Retail Shares (Equivalent to $71.77 per share | $ | 2,666,621,400 | |||||||||
|
| |||||||||||
| | Institutional Shares (Equivalent to $73.52 per share | $ | 3,433,538,999 | |||||||||
|
| |||||||||||
| | R6 Shares (Equivalent to $73.52 per share | $ | 12,479,651 | |||||||||
|
| |||||||||||
| % | Represents percentage of net assets. |
| 1 | Non-income producing securities. |
| 2 | Foreign corporation. |
| 3 | At September 30, 2017, the market value of restricted and fair valued securities amounted to $1,121,082 or 0.02% of net assets. This security is not deemed liquid. See Note 6 regarding Restricted Securities. |
| 4 | See Note 10 regarding “Affiliated” companies. |
| 5 | The Adviser has reclassified/classified certain securities in or out of this sub-industry. Such reclassifications/classifications are not supported by S&P or MSCI. |
| 6 | Level 2 security. See Note 7 regarding Fair Value Measurements. |
| 7 | Level 3 security. See Note 7 regarding Fair Value Measurements. |
All securities are Level 1, unless otherwise noted.
| See Notes to Financial Statements. | 17 |
Table of Contents
| Baron Small Cap Fund | September 30, 2017 |
STATEMENT OF NET ASSETS
SEPTEMBER 30, 2017
|
| Shares | Cost | Value | ||||||||||
| Common Stocks (93.87%) | ||||||||||||
| Consumer Discretionary (16.77%) | ||||||||||||
Advertising (0.59%) | ||||||||||||
| 1,075,000 | Emerald Expositions Events, Inc. | $ | 19,233,163 | $ | 24,983,000 | |||||||
Automotive Retail (1.85%) | ||||||||||||
| 1,925,000 | Camping World Holdings, Inc., Cl A | 50,348,340 | 78,424,500 | |||||||||
Cable & Satellite (2.36%) | ||||||||||||
| 100,000 | Liberty Broadband Corporation, Cl A1 | 404,823 | 9,418,000 | |||||||||
| 300,000 | Liberty Broadband Corporation, Cl C1 | 1,184,602 | 28,590,000 | |||||||||
| 1,100,000 | Liberty Media Corp. - Liberty SiriusXM, Cl C, (formerly, Liberty SiriusXM Group, Cl C)1 | 2,399,373 | 46,057,000 | |||||||||
| 750,000 | MSG Networks, Inc., Cl A1 | 5,189,393 | 15,900,000 | |||||||||
|
|
|
| |||||||||
| 9,178,191 | 99,965,000 | |||||||||||
Casinos & Gaming (1.31%) | ||||||||||||
| 2,400,000 | Red Rock Resorts, Inc., Cl A | 50,060,152 | 55,584,000 | |||||||||
Education Services (3.05%) | ||||||||||||
| 1,500,000 | Bright Horizons Family | 48,547,800 | 129,315,000 | |||||||||
Home Improvement Retail (0.64%) | ||||||||||||
| 700,000 | Floor & Decor Holdings, Inc., Cl A1 | 24,473,785 | 27,251,000 | |||||||||
Internet & Direct Marketing Retail (2.36%) | ||||||||||||
| 1,200,000 | Liberty Expedia | 54,954,345 | 63,732,000 | |||||||||
| 750,000 | Shutterfly, Inc.1 | 35,725,281 | 36,360,000 | |||||||||
|
|
|
| |||||||||
| 90,679,626 | 100,092,000 | |||||||||||
Movies & Entertainment (1.94%) |
| |||||||||||
| 750,000 | Liberty Media Corporation -Liberty Formula One, Cl C1 | 10,168,679 | 28,567,500 | |||||||||
| 250,000 | The Madison Square Garden Company, Cl A1 | 13,336,231 | 53,525,000 | |||||||||
|
|
|
| |||||||||
| 23,504,910 | 82,092,500 | |||||||||||
Restaurants (1.95%) | ||||||||||||
| 500,000 | BJ’s Restaurants, Inc.1 | 16,384,828 | 15,225,000 | |||||||||
| 925,000 | The Cheesecake Factory, Inc. | 28,124,763 | 38,961,000 | |||||||||
| 850,000 | Wingstop Inc. | 18,883,347 | 28,262,500 | |||||||||
|
|
|
| |||||||||
| 63,392,938 | 82,448,500 | |||||||||||
Specialty Stores (0.72%) | ||||||||||||
| 2,250,000 | Party City Holdco, Inc.1 | 32,984,775 | 30,487,500 | |||||||||
|
|
|
| |||||||||
Total Consumer Discretionary | 412,403,680 | 710,643,000 | ||||||||||
|
|
|
| |||||||||
| Consumer Staples (0.68%) | ||||||||||||
Food Distributors (0.68%) | ||||||||||||
| 1,500,000 | The Chefs’ Warehouse, Inc.1,4 | 22,433,215 | 28,950,000 | |||||||||
|
|
|
| |||||||||
| Energy (1.75%) | ||||||||||||
Oil & Gas Storage & Transportation (1.75%) | ||||||||||||
| 560,000 | Dominion Energy Midstream Partners L.P. | 12,939,755 | 17,920,000 | |||||||||
| 800,000 | PBF Logistics LP | 20,465,744 | 16,800,000 | |||||||||
| 2,000,000 | Scorpio Tankers Inc.2 | 16,600,000 | 6,860,000 | |||||||||
| 745,500 | Valero Energy Partners LP | 20,810,301 | 32,593,260 | |||||||||
|
|
|
| |||||||||
Total Energy | 70,815,800 | 74,173,260 | ||||||||||
|
|
|
| |||||||||
| Shares | Cost | Value | ||||||||||
| Common Stocks (continued) | ||||||||||||
| Financials (2.30%) | ||||||||||||
Asset Management & Custody Banks (1.03%) | ||||||||||||
| 1,250,000 | Financial Engines, Inc. | $ | 23,245,087 | $ | 43,437,500 | |||||||
Financial Exchanges & Data (0.51%) | ||||||||||||
| 200,000 | CBOE Holdings, Inc. | 15,498,427 | 21,526,000 | |||||||||
Investment Banking & Brokerage (0.76%) | ||||||||||||
| 750,000 | Moelis & Co., Cl A | 18,642,401 | 32,287,500 | |||||||||
|
|
|
| |||||||||
Total Financials | 57,385,915 | 97,251,000 | ||||||||||
|
|
|
| |||||||||
| Health Care (14.44%) | ||||||||||||
Biotechnology (0.48%) | ||||||||||||
| 1,500,000 | Abcam plc (United Kingdom)2 | 14,075,553 | 20,501,991 | |||||||||
Health Care Equipment (5.22%) |
| |||||||||||
| 515,000 | Cantel Medical Corp. | 21,972,255 | 48,497,550 | |||||||||
| 300,000 | DexCom, Inc.1 | 3,984,388 | 14,677,500 | |||||||||
| 1,250,000 | Glaukos Corporation.1 | 45,798,340 | 41,250,000 | |||||||||
| 750,000 | IDEXX Laboratories, Inc.1 | 11,724,552 | 116,617,500 | |||||||||
|
|
|
| |||||||||
| 83,479,535 | 221,042,550 | |||||||||||
Health Care Services (0.98%) | ||||||||||||
| 1,250,000 | Teladoc, Inc.1 | 40,822,556 | 41,437,500 | |||||||||
Life Sciences Tools & Services (6.39%) | ||||||||||||
| 775,000 | ICON plc1,2 | 22,033,569 | 88,257,000 | |||||||||
| 500,000 | INC Research Holdings, Inc., Cl A1 | 9,250,000 | 26,150,000 | |||||||||
| 140,000 | Mettler-Toledo International, Inc.1 | 7,249,198 | 87,662,400 | |||||||||
| 900,000 | PRA Health Sciences, Inc.1 | 16,553,917 | 68,553,000 | |||||||||
|
|
|
| |||||||||
| 55,086,684 | 270,622,400 | |||||||||||
Managed Health Care (1.37%) | ||||||||||||
| 1,150,000 | HealthEquity, Inc.1 | 19,890,974 | 58,167,000 | |||||||||
|
|
|
| |||||||||
Total Health Care | 213,355,302 | 611,771,441 | ||||||||||
|
|
|
| |||||||||
| Industrials (21.48%) | ||||||||||||
Aerospace & Defense (4.21%) |
| |||||||||||
| 1,100,000 | Mercury Systems, Inc.1 | 30,895,240 | 57,068,000 | |||||||||
| 475,000 | TransDigm Group, Inc.1 | 2 | 121,433,750 | |||||||||
|
|
|
| |||||||||
| 30,895,242 | 178,501,750 | |||||||||||
Construction Machinery & Heavy Trucks (0.71%) | ||||||||||||
| 1,050,000 | REV Group, Inc. | 24,333,632 | 30,198,000 | |||||||||
Diversified Support Services (0.22%) | ||||||||||||
| 175,000 | Healthcare Services Group, Inc. | 5,146,627 | 9,444,750 | |||||||||
Electrical Components & Equipment (1.82%) | ||||||||||||
| 450,000 | Acuity Brands, Inc. | 22,758,772 | 77,076,000 | |||||||||
Environmental & Facilities Services (3.35%) | ||||||||||||
| 2,025,000 | Waste Connections, Inc.2 | 88,425,000 | 141,669,000 | |||||||||
Human Resource & Employment Services (2.35%) |
| |||||||||||
| 1,850,000 | On Assignment, Inc.1 | 45,881,952 | 99,308,000 | |||||||||
| 18 | See Notes to Financial Statements. |
Table of Contents
| September 30, 2017 | Baron Small Cap Fund |
STATEMENT OF NET ASSETS (Continued)
SEPTEMBER 30, 2017
|
| Shares | Cost | Value | ||||||||||
| Common Stocks (continued) | ||||||||||||
| Industrials (continued) | ||||||||||||
Industrial Machinery (4.32%) | ||||||||||||
| 750,000 | John Bean Technologies Corp. | $ | 65,764,804 | $ | 75,825,000 | |||||||
| 250,000 | Nordson Corp. | 6,938,012 | 29,625,000 | |||||||||
| 325,000 | RBC Bearings, Incorporated1 | 20,780,422 | 40,673,750 | |||||||||
| 1,600,000 | Welbilt, Inc.1 | 27,323,186 | 36,880,000 | |||||||||
|
|
|
| |||||||||
| 120,806,424 | 183,003,750 | |||||||||||
Trading Companies & Distributors (4.50%) | ||||||||||||
| 750,000 | Beacon Roofing Supply, Inc.1 | 35,982,302 | 38,437,500 | |||||||||
| 1,375,000 | SiteOne Landscape Supply, Inc.1 | 41,419,060 | 79,887,500 | |||||||||
| 2,500,000 | Univar, Inc.1 | 56,106,636 | 72,325,000 | |||||||||
|
|
|
| |||||||||
| 133,507,998 | 190,650,000 | |||||||||||
|
|
|
| |||||||||
Total Industrials | 471,755,647 | 909,851,250 | ||||||||||
|
|
|
| |||||||||
| Information Technology (28.12%) | ||||||||||||
Application Software (8.65%) | ||||||||||||
| 1,000,000 | ACI Worldwide, Inc.1 | 11,814,864 | 22,780,000 | |||||||||
| 850,000 | Aspen Technology, Inc.1 | 31,990,281 | 53,388,500 | |||||||||
| 6,000,000 | Cision Ltd.1,2,3 | 64,996,212 | 78,120,000 | |||||||||
| 1,750,000 | Guidewire Software, Inc.1 | 56,545,754 | 136,255,000 | |||||||||
| 400,000 | The Ultimate Software Group, Inc.1 | 15,338,294 | 75,840,000 | |||||||||
|
|
|
| |||||||||
| 180,685,405 | 366,383,500 | |||||||||||
Data Processing & Outsourced Services (2.65%) | ||||||||||||
| 400,000 | FleetCor Technologies, Inc.1 | 9,414,050 | 61,908,000 | |||||||||
| 450,000 | WEX, Inc.1 | 18,982,530 | 50,499,000 | |||||||||
|
|
|
| |||||||||
| 28,396,580 | 112,407,000 | |||||||||||
Electronic Equipment & Instruments (2.60%) | ||||||||||||
| 1,000,000 | Cognex Corp. | 17,347,926 | 110,280,000 | |||||||||
Internet Software & Services (5.99%) | ||||||||||||
| 1,250,000 | 2U, Inc.1 | 60,172,361 | 70,050,000 | |||||||||
| 2,278,200 | GTT Communications, Inc.1,4 | 69,319,522 | 72,105,030 | |||||||||
| 665,000 | The Trade Desk, Inc., Cl A1 | 27,908,140 | 40,904,150 | |||||||||
| 800,000 | Wix.com Ltd.1,2 | 48,128,448 | 57,480,000 | |||||||||
| 1,000,000 | Yext, Inc.1,5 | 13,011,322 | 13,280,000 | |||||||||
|
|
|
| |||||||||
| 218,539,793 | 253,819,180 | |||||||||||
IT Consulting & Other Services (5.42%) | ||||||||||||
| 2,250,000 | Acxiom Corporation1 | 51,976,675 | 55,440,000 | |||||||||
| 1,400,000 | Gartner, Inc.1 | 23,400,287 | 174,174,000 | |||||||||
|
|
|
| |||||||||
| 75,376,962 | 229,614,000 | |||||||||||
Semiconductors (0.79%) | ||||||||||||
| 750,000 | MACOM Technology Solutions Holdings, Inc.1 | 33,241,237 | 33,457,500 | |||||||||
Systems Software (0.81%) | ||||||||||||
| 660,000 | Qualys, Inc.1 | 24,304,793 | 34,188,000 | |||||||||
Technology Hardware, Storage & |
| |||||||||||
| 1,200,000 | Electronics For Imaging, Inc.1 | 49,848,043 | 51,216,000 | |||||||||
|
|
|
| |||||||||
Total Information Technology | 627,740,739 | 1,191,365,180 | ||||||||||
|
|
|
| |||||||||
| Shares | Cost | Value | ||||||||||
| Common Stocks (continued) | ||||||||||||
| Materials (4.16%) | ||||||||||||
Commodity Chemicals (0.19%) | ||||||||||||
| 350,000 | Westlake Chemical Partners LP | $ | 8,402,456 | $ | 7,945,000 | |||||||
Construction Materials (1.89%) |
| |||||||||||
| 2,500,000 | Summit Materials, Inc., Cl A1 | 52,667,129 | 80,075,000 | |||||||||
Metal & Glass Containers (1.07%) |
| |||||||||||
| 800,000 | Berry Global Group, Inc.1 | 12,652,147 | 45,320,000 | |||||||||
Specialty Chemicals (1.01%) | ||||||||||||
| 2,000,000 | Flotek Industries, Inc.1 | 37,558,366 | 9,300,000 | |||||||||
| 1,100,000 | GCP Applied Technologies, Inc.1 | 31,789,126 | 33,770,000 | |||||||||
|
|
|
| |||||||||
| 69,347,492 | 43,070,000 | |||||||||||
|
|
|
| |||||||||
Total Materials | 143,069,224 | 176,410,000 | ||||||||||
|
|
|
| |||||||||
| Real Estate (3.94%) | ||||||||||||
Office REITs (0.24%) | ||||||||||||
| 100,000 | SL Green Realty Corp. | 2,127,325 | 10,132,000 | |||||||||
Real Estate Services (0.45%) | ||||||||||||
| 500,000 | CBRE Group, Inc., Cl A1 | 2,180,507 | 18,940,000 | |||||||||
Specialized REITs (3.25%) | ||||||||||||
| 1,100,000 | Gaming and Leisure Properties, Inc. | 18,408,255 | 40,579,000 | |||||||||
| 675,000 | SBA Communications Corp.1 | 2,720,831 | 97,233,750 | |||||||||
|
|
|
| |||||||||
| 21,129,086 | 137,812,750 | |||||||||||
|
|
|
| |||||||||
Total Real Estate | 25,436,918 | 166,884,750 | ||||||||||
|
|
|
| |||||||||
| Telecommunication Services (0.23%) | ||||||||||||
Wireless Telecommunication Services (0.23%) | ||||||||||||
| 29,276,953 | PT Sarana Menara Nusantara Tbk. (Indonesia)2 | 6,096,559 | 9,716,236 | |||||||||
|
|
|
| |||||||||
Total Common Stocks | 2,050,492,999 | 3,977,016,117 | ||||||||||
|
|
|
| |||||||||
| Principal Amount | ||||||||||||
| Short Term Investments (6.00%) | ||||||||||||
| Repurchase Agreement (5.92%) | ||||||||||||
| $250,910,830 | Repurchase Agreement with Fixed Income Clearing Corp., dated 9/29/2017, 0.12% due 10/2/2017; Proceeds at maturity - $250,913,340; (Fully collateralized by $241,545,000 U.S. Treasury Note, 3.00% due 11/15/2044; Market value - $251,100,279 and by $5,175,000 U.S. Treasury Note, 2.50% due 2/15/2045; Market value - $4,833,036)7 | 250,910,830 | 250,910,830 | |||||||||
| See Notes to Financial Statements. | 19 |
Table of Contents
| Baron Small Cap Fund | September 30, 2017 |
STATEMENT OF NET ASSETS (Continued)
SEPTEMBER 30, 2017
|
| Shares | Cost | Value | ||||||||||
| Securities Lending Collateral (0.08%) | ||||||||||||
| 3,188,808 | State Street Navigator Securities Lending Prime Portfolio6,7 | $ | 3,188,808 | $ | 3,188,808 | |||||||
|
|
|
| |||||||||
Total Short Term Investments | 254,099,638 | 254,099,638 | ||||||||||
|
|
|
| |||||||||
Total Investments (99.87%) | $ | 2,304,592,637 | 4,231,115,755 | |||||||||
|
| |||||||||||
Cash and Other Assets Less Liabilities (0.13%) | 5,581,104 | |||||||||||
|
| |||||||||||
Net Assets | $ | 4,236,696,859 | ||||||||||
|
| |||||||||||
| | Retail Shares (Equivalent to $30.64 per share | $ | 1,730,302,566 | |||||||||
|
| |||||||||||
| | Institutional Shares (Equivalent to $31.58 per share | $ | 2,404,629,535 | |||||||||
|
| |||||||||||
| | R6 Shares (Equivalent to $31.57 per share | $ | 101,764,758 | |||||||||
|
| |||||||||||
| % | Represents percentage of net assets. |
| 1 | Non-income producing securities. |
| 2 | Foreign corporation. |
| 3 | The Adviser has reclassified/classified certain securities in or out of this sub-industry. Such reclassifications/classifications are not supported by S&P or MSCI. |
| 4 | See Note 10 regarding “Affiliated” companies. |
| 5 | The value of all securities loaned at September 30, 2017 amounted to $3,136,842 or 0.07% of net assets. See Note 2d regarding Securities Lending. |
| 6 | Represents investment of cash collateral received from securities lending transactions. See Note 2d regarding Securities Lending. |
| 7 | Level 2 security. See Note 7 regarding Fair Value Measurements. |
All securities are Level 1, unless otherwise noted.
| 20 | See Notes to Financial Statements. |
Table of Contents
| September 30, 2017 | Baron Opportunity Fund |
STATEMENT OF NET ASSETS
SEPTEMBER 30, 2017
|
| Shares | Cost | Value | ||||||||||
| Common Stocks (99.56%) | ||||||||||||
| Consumer Discretionary (20.10%) | ||||||||||||
Automobile Manufacturers (5.23%) | ||||||||||||
| 39,000 | Tesla, Inc.1 | $ | 7,962,336 | $ | 13,302,900 | |||||||
Internet & Direct Marketing Retail (12.91%) | ||||||||||||
| 17,075 | Amazon.com, Inc.1 | 5,474,308 | 16,415,051 | |||||||||
| 48,800 | Expedia, Inc. | 5,484,289 | 7,024,272 | |||||||||
| 27,525 | Netflix, Inc.1 | 965,457 | 4,991,659 | |||||||||
| 2,385 | The Priceline Group, Inc.1 | 377,932 | 4,366,506 | |||||||||
|
|
|
| |||||||||
| 12,301,986 | 32,797,488 | |||||||||||
Movies & Entertainment (1.96%) | ||||||||||||
| 276,014 | Manchester United plc, Cl A2 | 4,459,199 | 4,968,252 | |||||||||
|
|
|
| |||||||||
Total Consumer Discretionary | 24,723,521 | 51,068,640 | ||||||||||
|
|
|
| |||||||||
| Energy (1.05%) | ||||||||||||
Oil & Gas Exploration & Production (1.05%) | ||||||||||||
| 20,315 | Concho Resources, Inc.1 | 1,832,910 | 2,675,892 | |||||||||
|
|
|
| |||||||||
| Financials (2.88%) | ||||||||||||
Financial Exchanges & Data (0.97%) | ||||||||||||
| 13,300 | MarketAxess Holdings, Inc. | 1,322,145 | 2,453,983 | |||||||||
Investment Banking & Brokerage (1.91%) | ||||||||||||
| 111,100 | The Charles Schwab Corp. | 3,231,312 | 4,859,514 | |||||||||
|
|
|
| |||||||||
Total Financials | 4,553,457 | 7,313,497 | ||||||||||
|
|
|
| |||||||||
| Health Care (11.97%) | ||||||||||||
Biotechnology (5.51%) | ||||||||||||
| 40,800 | Acceleron Pharma, Inc.1 | 1,297,591 | 1,522,656 | |||||||||
| 4,700 | Biogen, Inc.1 | 1,307,598 | 1,471,664 | |||||||||
| 27,100 | Clovis Oncology, Inc.1 | 2,367,199 | 2,233,040 | |||||||||
| 55,955 | Gemphire Therapeutics, Inc.1 | 866,787 | 528,215 | |||||||||
| 9,600 | Incyte Corp.1 | 1,282,052 | 1,120,704 | |||||||||
| 52,500 | Sage Therapeutics, Inc.1 | 1,797,595 | 3,270,750 | |||||||||
| 12,000 | TESARO, Inc.1 | 1,603,269 | 1,549,200 | |||||||||
| 15,200 | Vertex Pharmaceuticals, Inc.1 | 2,369,823 | 2,311,008 | |||||||||
|
|
|
| |||||||||
| 12,891,914 | 14,007,237 | |||||||||||
Health Care Equipment (4.32%) | ||||||||||||
| 29,500 | Edwards Lifesciences Corp.1 | 2,603,314 | 3,224,645 | |||||||||
| 119,300 | Glaukos Corporation.1 | 3,997,702 | 3,936,900 | |||||||||
| 3,645 | Intuitive Surgical, Inc.1 | 2,399,505 | 3,812,233 | |||||||||
|
|
|
| |||||||||
| 9,000,521 | 10,973,778 | |||||||||||
Life Sciences Tools & Services (1.19%) | ||||||||||||
| 15,215 | Illumina, Inc.1 | 813,554 | 3,030,828 | |||||||||
Pharmaceuticals (0.95%) | ||||||||||||
| 60,500 | Supernus Pharmaceuticals, Inc.1 | 2,580,932 | 2,420,000 | |||||||||
|
|
|
| |||||||||
Total Health Care | 25,286,921 | 30,431,843 | ||||||||||
|
|
|
| |||||||||
| Industrials (0.99%) | ||||||||||||
Research & Consulting Services (0.99%) | ||||||||||||
| 30,190 | Verisk Analytics, Inc.1 | 1,458,849 | 2,511,506 | |||||||||
|
|
|
| |||||||||
| Shares | Cost | Value | ||||||||||
| Common Stocks (continued) | ||||||||||||
| Information Technology (59.81%) | ||||||||||||
Application Software (11.52%) | ||||||||||||
| 14,675 | ANSYS, Inc.1 | $ | 296,915 | $ | 1,801,063 | |||||||
| 197,200 | Guidewire Software, Inc.1 | 4,992,237 | 15,353,992 | |||||||||
| 40,180 | salesforce.com, Inc.1 | 2,333,650 | 3,753,615 | |||||||||
| 44,500 | Splunk, Inc.1 | 2,478,586 | 2,956,135 | |||||||||
| 135,000 | SS&C Technologies Holdings, Inc. | 4,579,511 | 5,420,250 | |||||||||
|
|
|
| |||||||||
| 14,680,899 | 29,285,055 | |||||||||||
Data Processing & Outsourced Services (5.34%) | ||||||||||||
| 46,400 | MasterCard Incorporated, Cl A | 3,817,397 | 6,551,680 | |||||||||
| 66,700 | Visa, Inc., Cl A | 4,858,895 | 7,019,508 | |||||||||
|
|
|
| |||||||||
| 8,676,292 | 13,571,188 | |||||||||||
Home Entertainment Software (1.14%) | ||||||||||||
| 24,500 | Electronic Arts, Inc.1 | 2,177,214 | 2,892,470 | |||||||||
Internet Software & Services (25.48%) | ||||||||||||
| 41,360 | 2U, Inc.1 | 1,890,847 | 2,317,814 | |||||||||
| 37,900 | Alibaba Group Holding Ltd., ADR1,2 | 2,634,768 | 6,545,709 | |||||||||
| 12,350 | Alphabet, Inc., Cl C1 | 8,249,454 | 11,845,008 | |||||||||
| 197,714 | Benefitfocus, Inc.1 | 7,315,344 | 6,653,076 | |||||||||
| 35,333 | CoStar Group, Inc.1 | 827,629 | 9,478,077 | |||||||||
| 37,050 | Facebook, Inc., Cl A1 | 2,481,532 | 6,330,734 | |||||||||
| 147,800 | Tencent Holdings Ltd. (Hong Kong)2 | 4,488,314 | 6,361,099 | |||||||||
| 77,010 | The Trade Desk, Inc., Cl A1 | 1,483,955 | 4,736,885 | |||||||||
| 62,843 | Wix.com Ltd.1,2 | 3,621,305 | 4,515,270 | |||||||||
| 204,000 | Yext, Inc.1,4 | 2,747,976 | 2,709,120 | |||||||||
| 80,950 | Zillow Group, Inc., Cl C1 | 1,808,633 | 3,255,000 | |||||||||
|
|
|
| |||||||||
| 37,549,757 | 64,747,792 | |||||||||||
IT Consulting & Other Services (8.76%) | ||||||||||||
| 351,700 | Acxiom Corporation1 | 6,008,609 | 8,665,888 | |||||||||
| 109,387 | Gartner, Inc.1 | 2,299,371 | 13,608,837 | |||||||||
|
|
|
| |||||||||
| 8,307,980 | 22,274,725 | |||||||||||
Semiconductors (1.07%) | ||||||||||||
| 57,700 | Mellanox Technologies Ltd.1,2 | 2,387,614 | 2,720,555 | |||||||||
Systems Software (6.50%) | ||||||||||||
| 57,551 | Cloudera, Inc.1,3 | 863,265 | 956,497 | |||||||||
| 29,600 | Proofpoint, Inc.1 | 2,381,481 | 2,581,712 | |||||||||
| 34,200 | Red Hat, Inc.1 | 1,495,140 | 3,791,412 | |||||||||
| 56,300 | ServiceNow, Inc.1 | 3,397,915 | 6,616,939 | |||||||||
| 61,300 | Varonis Systems, Inc.1 | 1,700,991 | 2,568,470 | |||||||||
|
|
|
| |||||||||
| 9,838,792 | 16,515,030 | |||||||||||
|
|
|
| |||||||||
Total Information Technology | 83,618,548 | 152,006,815 | ||||||||||
|
|
|
| |||||||||
| Real Estate (2.76%) | ||||||||||||
Specialized REITs (2.76%) | ||||||||||||
| 9,725 | Equinix, Inc. | 184,085 | 4,340,267 | |||||||||
| 18,500 | SBA Communications Corp.1 | 61,875 | 2,664,925 | |||||||||
|
|
|
| |||||||||
Total Real Estate | 245,960 | 7,005,192 | ||||||||||
|
|
|
| |||||||||
Total Common Stocks | 141,720,166 | 253,013,385 | ||||||||||
|
|
|
| |||||||||
| See Notes to Financial Statements. | 21 |
Table of Contents
| Baron Opportunity Fund | September 30, 2017 |
STATEMENT OF NET ASSETS (Continued)
SEPTEMBER 30, 2017
|
| Principal Amount | Cost | Value | ||||||||||
| Short Term Investments (0.60%) | ||||||||||||
| Repurchase Agreement (0.47%) | ||||||||||||
| $1,187,023 | Repurchase Agreement with Fixed Income Clearing Corp., dated 9/29/2017, 0.12% due 10/2/2017; Proceeds at maturity - $1,187,035; (Fully collateralized by $1,220,000 U.S. Treasury Inflation-Indexed Note, 0.375% due 7/15/2027; Market value - | $ | 1,187,023 | $ | 1,187,023 | |||||||
| Shares | ||||||||||||
| Securities Lending Collateral (0.13%) | ||||||||||||
| 327,227 | State Street Navigator Securities Lending Prime Portfolio5,6 | 327,227 | 327,227 | |||||||||
|
|
|
| |||||||||
Total Short Term Investments | 1,514,250 | 1,514,250 | ||||||||||
|
|
|
| |||||||||
Total Investments (100.16%) | $ | 143,234,416 | 254,527,635 | |||||||||
|
| |||||||||||
Liabilities Less Cash and Other Assets (-0.16%) | (403,900 | ) | ||||||||||
|
| |||||||||||
Net Assets | $ | 254,123,735 | ||||||||||
|
| |||||||||||
| | Retail Shares (Equivalent to $18.53 per share | $ | 201,372,276 | |||||||||
|
| |||||||||||
| | Institutional Shares (Equivalent to $19.08 per share | $ | 51,693,959 | |||||||||
|
| |||||||||||
| | R6 Shares (Equivalent to $19.09 per share | $ | 1,057,500 | |||||||||
|
| |||||||||||
| % | Represents percentage of net assets. |
| 1 | Non-income producing securities. |
| 2 | Foreign corporation. |
| 3 | The Adviser has reclassified/classified certain securities in or out of this sub-industry. Such reclassifications/classifications are not supported by S&P or MSCI. |
| 4 | The value of all securities loaned at September 30, 2017 amounted to $321,894 or 0.13% of net assets. See Note 2d regarding Securities Lending. |
| 5 | Represents investment of cash collateral received from securities lending transactions. See Note 2d regarding Securities Lending. |
| 6 | Level 2 security. See Note 7 regarding Fair Value Measurements. |
| ADR | American Depositary Receipt. |
All securities are Level 1, unless otherwise noted.
| 22 | See Notes to Financial Statements. |
Table of Contents
| September 30, 2017 | Baron Fifth Avenue Growth Fund |
STATEMENT OF NET ASSETS
SEPTEMBER 30, 2017
|
| Shares | Cost | Value | ||||||||||
| Common Stocks (98.26%) | ||||||||||||
| Consumer Discretionary (27.81%) | ||||||||||||
Automobile Manufacturers (0.94%) | ||||||||||||
| 5,036 | Tesla, Inc.1 | $ | 1,272,774 | $ | 1,717,780 | |||||||
Cable & Satellite (3.53%) | ||||||||||||
| 29,750 | Naspers Limited, Cl N (South Africa)2 | 4,770,085 | 6,416,397 | |||||||||
Internet & Direct Marketing |
| |||||||||||
| 26,405 | Amazon.com, Inc.1 | 6,616,510 | 25,384,447 | |||||||||
| 91,960 | Ctrip.com International Ltd., ADR1,2 | 2,980,457 | 4,849,970 | |||||||||
| 29,321 | Expedia, Inc. | 3,507,773 | 4,220,465 | |||||||||
| 4,337 | The Priceline Group, Inc.1 | 2,941,040 | 7,940,266 | |||||||||
|
|
|
| |||||||||
| 16,045,780 | 42,395,148 | |||||||||||
|
|
|
| |||||||||
Total Consumer Discretionary | 22,088,639 | 50,529,325 | ||||||||||
|
|
|
| |||||||||
| Financials (10.53%) | ||||||||||||
Asset Management & Custody Banks (1.93%) |
| |||||||||||
| 84,940 | Brookfield Asset Management, Inc., Cl A2 | 1,716,811 | 3,508,022 | |||||||||
Consumer Finance (1.04%) | ||||||||||||
| 60,667 | Synchrony Financial | 1,985,245 | 1,883,710 | |||||||||
Financial Exchanges & Data (2.66%) | ||||||||||||
| 35,570 | CME Group, Inc. | 2,088,336 | 4,826,138 | |||||||||
Investment Banking & Brokerage (2.80%) |
| |||||||||||
| 116,272 | The Charles Schwab Corp. | 3,623,115 | 5,085,737 | |||||||||
Regional Banks (2.10%) | ||||||||||||
| 36,627 | First Republic Bank | 2,619,742 | 3,826,057 | |||||||||
|
|
|
| |||||||||
Total Financials | 12,033,249 | 19,129,664 | ||||||||||
|
|
|
| |||||||||
| Health Care (10.33%) | ||||||||||||
Biotechnology (3.35%) | ||||||||||||
| 6,459 | Biogen, Inc.1 | 1,734,906 | 2,022,442 | |||||||||
| 5,489 | Regeneron Pharmaceuticals, Inc.1 | 1,763,077 | 2,454,242 | |||||||||
| 10,625 | Vertex Pharmaceuticals, Inc.1 | 1,639,547 | 1,615,425 | |||||||||
|
|
|
| |||||||||
| 5,137,530 | 6,092,109 | |||||||||||
Health Care Equipment (2.63%) | ||||||||||||
| 4,562 | Intuitive Surgical, Inc.1 | 2,885,519 | 4,771,305 | |||||||||
Health Care Technology (1.09%) | ||||||||||||
| 35,230 | Veeva Systems, Inc., Cl A1 | 2,192,610 | 1,987,324 | |||||||||
Life Sciences Tools & Services (3.26%) | ||||||||||||
| 29,701 | Illumina, Inc.1 | 1,055,540 | 5,916,439 | |||||||||
|
|
|
| |||||||||
Total Health Care | 11,271,199 | 18,767,177 | ||||||||||
|
|
|
| |||||||||
| Information Technology (43.45%) | ||||||||||||
Application Software (0.39%) | ||||||||||||
| 48,528 | Snap, Inc., Cl A1 | 835,904 | 705,597 | |||||||||
Data Processing & Outsourced Services (10.73%) |
| |||||||||||
| 65,205 | MasterCard Incorporated, Cl A | 3,418,562 | 9,206,946 | |||||||||
| 21,498 | Vantiv, Inc., Cl A1 | 1,405,653 | 1,514,964 | |||||||||
| 83,299 | Visa, Inc., Cl A | 2,537,808 | 8,766,387 | |||||||||
|
|
|
| |||||||||
| 7,362,023 | 19,488,297 | |||||||||||
Internet Software & Services (22.73%) | ||||||||||||
| 92,830 | Alibaba Group Holding Limited, ADR1,2 | 7,959,441 | 16,032,669 | |||||||||
| 1,948 | Alphabet, Inc., Cl A1 | 280,365 | 1,896,807 | |||||||||
| 10,046 | Alphabet, Inc., Cl C1 | 4,142,964 | 9,635,219 | |||||||||
| 65,002 | Facebook, Inc., Cl A1 | 1,611,511 | 11,106,892 | |||||||||
| 36,504 | Wix.com Ltd.1,2 | 2,661,907 | 2,622,812 | |||||||||
|
|
|
| |||||||||
| 16,656,188 | 41,294,399 | |||||||||||
| Shares | Cost | Value | ||||||||||
| Common Stocks (continued) | ||||||||||||
| Information Technology (continued) | ||||||||||||
IT Consulting & Other Services (1.56%) | ||||||||||||
| 32,126 | EPAM Systems, Inc.1 | $ | 2,264,388 | $ | 2,824,839 | |||||||
Semiconductor Equipment (2.61%) | ||||||||||||
| 27,701 | ASML Holding N.V.2 | 1,817,805 | 4,742,411 | |||||||||
Systems Software (2.32%) | ||||||||||||
| 38,097 | Red Hat, Inc.1 | 1,910,187 | 4,223,433 | |||||||||
Technology Hardware, Storage & Peripherals (3.11%) | ||||||||||||
| 36,662 | Apple, Inc. | 869,664 | 5,650,348 | |||||||||
|
|
|
| |||||||||
Total Information Technology | 31,716,159 | 78,929,324 | ||||||||||
|
|
|
| |||||||||
| Materials (1.34%) | ||||||||||||
Fertilizers & Agricultural Chemicals (1.34%) | ||||||||||||
| 20,242 | Monsanto Co. | 1,479,816 | 2,425,396 | |||||||||
|
|
|
| |||||||||
| Real Estate (4.80%) | ||||||||||||
Specialized REITs (4.80%) | ||||||||||||
| 19,555 | Equinix, Inc. | 3,178,515 | 8,727,397 | |||||||||
|
|
|
| |||||||||
Total Common Stocks | 81,767,577 | 178,508,283 | ||||||||||
|
|
|
| |||||||||
| Principal Amount | ||||||||||||
| Short Term Investments (1.27%) | ||||||||||||
| $2,311,946 | Repurchase Agreement with | 2,311,946 | 2,311,946 | |||||||||
|
|
|
| |||||||||
Total Investments (99.53%) | $ | 84,079,523 | 180,820,229 | |||||||||
|
| |||||||||||
Cash and Other Assets Less Liabilities (0.47%) | 850,692 | |||||||||||
|
| |||||||||||
Net Assets | $ | 181,670,921 | ||||||||||
|
| |||||||||||
| | Retail Shares (Equivalent to $24.04 per share | $ | 87,520,170 | |||||||||
|
| |||||||||||
| | Institutional Shares (Equivalent to $24.44 per share | $ | 89,457,362 | |||||||||
|
| |||||||||||
| | R6 Shares (Equivalent to $24.45 per share | $ | 4,693,389 | |||||||||
|
| |||||||||||
| % | Represents percentage of net assets. |
| 1 | Non-income producing securities. |
| 2 | Foreign corporation. |
| 3 | Level 2 security. See Note 7 regarding Fair Value Measurements. |
| ADR | American Depositary Receipt. |
All securities are Level 1, unless otherwise noted. |
| See Notes to Financial Statements. | 23 |
Table of Contents
| Baron Discovery Fund | September 30, 2017 |
STATEMENT OF NET ASSETS
SEPTEMBER 30, 2017
|
| Shares | Cost | Value | ||||||||||
| Common Stocks (97.05%) | ||||||||||||
| Consumer Discretionary (13.68%) | ||||||||||||
Casinos & Gaming (4.13%) | ||||||||||||
| 220,000 | Pinnacle Entertainment, Inc.1 | $ | 3,768,093 | $ | 4,688,200 | |||||||
| 240,000 | Red Rock Resorts, Inc., Cl A | 5,452,771 | 5,558,400 | |||||||||
|
|
|
| |||||||||
| 9,220,864 | 10,246,600 | |||||||||||
Home Improvement Retail (0.31%) | ||||||||||||
| 60,000 | The Tile Shop Holdings, Inc. | 1,232,485 | 762,000 | |||||||||
Internet & Direct Marketing Retail (2.14%) | ||||||||||||
| 100,000 | Liberty Expedia Holdings, Inc., Cl A1 | 4,602,767 | 5,311,000 | |||||||||
Movies & Entertainment (1.30%) | ||||||||||||
| 88,000 | Liberty Media Corporation - Liberty Formula One, Cl A1 | 2,547,514 | 3,211,120 | |||||||||
Restaurants (4.08%) | ||||||||||||
| 62,000 | Bob Evans Farms, Inc. | 4,167,217 | 4,805,620 | |||||||||
| 160,000 | Wingstop, Inc. | 4,164,606 | 5,320,000 | |||||||||
|
|
|
| |||||||||
| 8,331,823 | 10,125,620 | |||||||||||
Specialty Stores (1.72%) | ||||||||||||
| 315,000 | Party City Holdco, Inc.1 | 4,566,895 | 4,268,250 | |||||||||
|
|
|
| |||||||||
Total Consumer Discretionary | 30,502,348 | 33,924,590 | ||||||||||
|
|
|
| |||||||||
| Consumer Staples (0.21%) | ||||||||||||
Packaged Foods & Meats (0.21%) | ||||||||||||
| 750,000 | Barfresh Food Group, Inc.1 | 417,200 | 525,000 | |||||||||
|
|
|
| |||||||||
| Energy (2.39%) | ||||||||||||
Oil & Gas Storage & Transportation (2.39%) | ||||||||||||
| 185,000 | Dominion Energy Midstream Partners, L.P. | 4,781,483 | 5,920,000 | |||||||||
|
|
|
| |||||||||
| Financials (1.36%) | ||||||||||||
Property & Casualty Insurance (1.36%) | ||||||||||||
| 78,309 | Kinsale Capital Group, Inc. | 1,905,575 | 3,380,600 | |||||||||
|
|
|
| |||||||||
| Health Care (23.38%) | ||||||||||||
Biotechnology (9.48%) |
| |||||||||||
| 103,200 | Adamas Pharmaceuticals, Inc.1 | 1,700,198 | 2,184,744 | |||||||||
| 209,500 | Flexion Therapeutics, Inc.1 | 3,888,860 | 5,065,710 | |||||||||
| 90,900 | Foundation Medicine, Inc.1 | 2,242,316 | 3,654,180 | |||||||||
| 227,359 | Gemphire Therapeutics, Inc.1 | 3,336,701 | 2,146,269 | |||||||||
| 64,800 | MiMedx Group, Inc.1 | 851,414 | 769,824 | |||||||||
| 215,500 | Myriad Genetics, Inc.1 | 4,150,559 | 7,796,790 | |||||||||
| 30,200 | Sage Therapeutics, Inc.1 | 1,834,187 | 1,881,460 | |||||||||
|
|
|
| |||||||||
| 18,004,235 | 23,498,977 | |||||||||||
Health Care Equipment (5.07%) | ||||||||||||
| 177,935 | AxoGen, Inc.1 | 3,156,212 | 3,443,042 | |||||||||
| 152,000 | Glaukos Corporation1 | 5,455,255 | 5,016,000 | |||||||||
| 23,000 | Inogen, Inc.1 | 1,179,820 | 2,187,300 | |||||||||
| 21,300 | Nevro Corp.1 | 1,653,257 | 1,935,744 | |||||||||
|
|
|
| |||||||||
| 11,444,544 | 12,582,086 | |||||||||||
Health Care Services (2.75%) | ||||||||||||
| 205,900 | Teladoc, Inc.1 | 5,637,423 | 6,825,585 | |||||||||
| Shares | Cost | Value | ||||||||||
| Common Stocks (continued) | ||||||||||||
| Health Care (continued) | ||||||||||||
Health Care Supplies (3.73%) | ||||||||||||
| 560,900 | Cerus Corp.1 | $ | 2,711,288 | $ | 1,531,257 | |||||||
| 501,500 | Sientra, Inc.1 | 4,235,126 | 7,723,100 | |||||||||
|
|
|
| |||||||||
| 6,946,414 | 9,254,357 | |||||||||||
Pharmaceuticals (2.35%) | ||||||||||||
| 23,900 | Supernus Pharmaceuticals, Inc.1 | 1,068,277 | 956,000 | |||||||||
| 920,000 | TherapeuticsMD, Inc.1 | 4,986,435 | 4,866,800 | |||||||||
|
|
|
| |||||||||
| 6,054,712 | 5,822,800 | |||||||||||
|
|
|
| |||||||||
Total Health Care | 48,087,328 | 57,983,805 | ||||||||||
|
|
|
| |||||||||
| Industrials (11.69%) | ||||||||||||
Aerospace & Defense (4.63%) | ||||||||||||
| 649,400 | The KEYW Holding Corporation1 | 5,749,644 | 4,941,934 | |||||||||
| 126,000 | Mercury Systems, Inc.1 | 3,022,920 | 6,536,880 | |||||||||
|
|
|
| |||||||||
| 8,772,564 | 11,478,814 | |||||||||||
Heavy Electrical Equipment (2.10%) | ||||||||||||
| 233,500 | TPI Composites, Inc.1 | 4,028,672 | 5,216,390 | |||||||||
Industrial Machinery (3.32%) | ||||||||||||
| 52,300 | ESCO Technologies, Inc. | 2,573,920 | 3,135,385 | |||||||||
| 170,000 | Kornit Digital Ltd.1,2 | 2,614,585 | 2,601,000 | |||||||||
| 46,000 | Sun Hydraulics Corp. | 1,716,970 | 2,484,000 | |||||||||
|
|
|
| |||||||||
| 6,905,475 | 8,220,385 | |||||||||||
Trading Companies & Distributors (1.64%) | ||||||||||||
| 70,000 | SiteOne Landscape Supply, Inc.1 | 2,744,653 | 4,067,000 | |||||||||
|
|
|
| |||||||||
Total Industrials | 22,451,364 | 28,982,589 | ||||||||||
|
|
|
| |||||||||
| Information Technology (36.94%) | ||||||||||||
Application Software (1.05%) | ||||||||||||
| 50,000 | QAD, Inc., Cl A | 1,469,585 | 1,717,500 | |||||||||
| 32,000 | QAD, Inc., Cl B | 646,894 | 876,160 | |||||||||
|
|
|
| |||||||||
| 2,116,479 | 2,593,660 | |||||||||||
Electronic Equipment & Instruments (4.81%) | ||||||||||||
| 16,300 | Coherent, Inc.1 | 2,853,429 | 3,833,271 | |||||||||
| 185,900 | Novanta, Inc.1,2 | 5,795,326 | 8,105,240 | |||||||||
|
|
|
| |||||||||
| 8,648,755 | 11,938,511 | |||||||||||
Internet Software & Services (13.80%) | ||||||||||||
| 50,000 | 2U, Inc.1 | 2,562,807 | 2,802,000 | |||||||||
| 194,200 | Amber Road, Inc.1 | 1,494,499 | 1,491,456 | |||||||||
| 135,000 | CommerceHub, Inc., Series C1 | 2,135,264 | 2,882,250 | |||||||||
| 85,700 | Envestnet, Inc.1 | 3,141,909 | 4,370,700 | |||||||||
| 650,000 | JUST EAT plc (United Kingdom)1,2 | 4,525,679 | 5,822,632 | |||||||||
| 215,000 | Quotient Technology, Inc.1 | 2,382,152 | 3,364,750 | |||||||||
| 110,000 | The Trade Desk, Inc., Cl A1 | 3,342,047 | 6,766,100 | |||||||||
| 220,000 | TrueCar, Inc.1 | 3,256,728 | 3,473,800 | |||||||||
| 245,000 | Yext, Inc.1,5 | 3,325,053 | 3,253,600 | |||||||||
|
|
|
| |||||||||
| 26,166,138 | 34,227,288 | |||||||||||
IT Consulting & Other Services (2.14%) | ||||||||||||
| 215,000 | Acxiom Corp.1 | 5,558,432 | 5,297,600 | |||||||||
Semiconductor Equipment (3.05%) | ||||||||||||
| 187,000 | Ichor Holdings Ltd.1,2 | 2,956,334 | 5,011,600 | |||||||||
| 165,500 | PDF Solutions, Inc.1 | 3,150,647 | 2,563,595 | |||||||||
|
|
|
| |||||||||
| 6,106,981 | 7,575,195 | |||||||||||
| 24 | See Notes to Financial Statements. |
Table of Contents
| September 30, 2017 | Baron Discovery Fund |
STATEMENT OF NET ASSETS (Continued)
SEPTEMBER 30, 2017
|
| Shares | Cost | Value | ||||||||||
| Common Stocks (continued) | ||||||||||||
| Information Technology (continued) | ||||||||||||
Semiconductors (6.36%) | ||||||||||||
| 243,825 | Everspin Technologies, Inc.1 | $ | 2,283,047 | $ | 4,166,969 | |||||||
| 80,000 | Impinj, Inc.1 | 2,192,655 | 3,328,800 | |||||||||
| 185,500 | MACOM Technology Solutions Holdings, Inc.1 | 8,295,200 | 8,275,155 | |||||||||
|
|
|
| |||||||||
| 12,770,902 | 15,770,924 | |||||||||||
Systems Software (5.73%) | ||||||||||||
| 28,132 | Okta, Inc.1,3 | 478,244 | 793,604 | |||||||||
| 171,600 | Qualys, Inc.1 | 5,712,025 | 8,888,880 | |||||||||
| 108,000 | Varonis Systems, Inc.1 | 3,110,092 | 4,525,200 | |||||||||
|
|
|
| |||||||||
| 9,300,361 | 14,207,684 | |||||||||||
|
|
|
| |||||||||
Total Information Technology | 70,668,048 | 91,610,862 | ||||||||||
|
|
|
| |||||||||
| Materials (0.19%) | ||||||||||||
Specialty Chemicals (0.19%) | ||||||||||||
| 100,000 | Flotek Industries, Inc.1 | 1,037,477 | 465,000 | |||||||||
|
|
|
| |||||||||
| Real Estate (4.17%) | ||||||||||||
Diversified REITs (2.71%) | ||||||||||||
| 145,000 | Alexander & Baldwin, Inc. | 6,164,347 | 6,717,850 | |||||||||
Industrial REITs (1.16%) | ||||||||||||
| 100,000 | Rexford Industrial Realty, Inc. | 2,253,563 | 2,862,000 | |||||||||
Real Estate Services (0.30%) | ||||||||||||
| 30,000 | Redfin Corp.1 | 488,570 | 752,700 | |||||||||
|
|
|
| |||||||||
Total Real Estate | 8,906,480 | 10,332,550 | ||||||||||
|
|
|
| |||||||||
| Telecommunication Services (3.04%) | ||||||||||||
Integrated Telecommunication Services (3.04%) | ||||||||||||
| 185,000 | General Communication, Inc., Cl A1 | 6,890,579 | 7,546,150 | |||||||||
|
|
|
| |||||||||
Total Common Stocks | 195,647,882 | 240,671,146 | ||||||||||
|
|
|
| |||||||||
| Warrants (0.02%) | ||||||||||||
| Consumer Staples (0.02%) | ||||||||||||
Packaged Foods & Meats (0.02%) | ||||||||||||
| 300,000 | Barfresh Food Group, Inc. Warrants Exp 3/13/20201,4,7 | 0 | 60,000 | |||||||||
|
|
|
| |||||||||
| Principal Amount | Cost | Value | ||||||||||
| Short Term Investments (3.15%) | ||||||||||||
| Repurchase Agreement (2.99%) | ||||||||||||
| $7,427,395 | Repurchase Agreement with Fixed Income Clearing Corp., dated 9/29/2017, 0.12% due 10/2/2017; Proceeds at maturity - $7,427,470; (Fully collateralized by $7,605,000 U.S. Treasury Inflation-Indexed Note, 0.375% due 7/15/2027; Market value - $7,576,481)7 | $ | 7,427,395 | $ | 7,427,395 | |||||||
| Shares | ||||||||||||
| Securities Lending Collateral (0.16%) | ||||||||||||
| 392,985 | State Street Navigator Securities Lending Prime Portfolio6,7 | 392,985 | 392,985 | |||||||||
|
|
|
| |||||||||
Total Short Term Investments | 7,820,380 | 7,820,380 | ||||||||||
|
|
|
| |||||||||
Total Investments (100.22%) | $ | 203,468,262 | 248,551,526 | |||||||||
|
| |||||||||||
Liabilities Less Cash and Other Assets (-0.22%) | (553,818 | ) | ||||||||||
|
| |||||||||||
Net Assets | $ | 247,997,708 | ||||||||||
|
| |||||||||||
| | Retail Shares (Equivalent to $17.56 per share | $ | 131,189,393 | |||||||||
|
| |||||||||||
| | Institutional Shares (Equivalent to $17.74 per share | $ | 113,615,958 | |||||||||
|
| |||||||||||
| | R6 Shares (Equivalent to $17.74 per share | $ | 3,192,357 | |||||||||
|
| |||||||||||
| % | Represents percentage of net assets. |
| 1 | Non-income producing securities. |
| 2 | Foreign corporation. |
| 3 | The Adviser has reclassified/classified certain securities in or out of this sub-industry. Such reclassifications/classifications are not supported by S&P or MSCI. |
| 4 | At September 30, 2017, the market value of restricted and fair valued securities amounted to $60,000 or 0.02% of net assets. This security is not deemed liquid. See Note 6 regarding Restricted Securities. |
| 5 | The value of all securities loaned at September 30, 2017 amounted to $386,581 or 0.16% of net assets. See Note 2d regarding Securities Lending. |
| 6 | Represents investment of cash collateral received from securities lending transactions. See Note 2d regarding Securities Lending. |
| 7 | Level 2 security. See Note 7 regarding Fair Value Measurements. |
All securities are Level 1, unless otherwise noted.
| See Notes to Financial Statements. | 25 |
Table of Contents
| Baron Funds | September 30, 2017 |
STATEMENTS OF ASSETS AND LIABILITIES
SEPTEMBER 30, 2017
|
| Baron Asset Fund | Baron Growth Fund | Baron Small Cap Fund | Baron Opportunity Fund | Baron Fifth Avenue Growth Fund | Baron Discovery Fund | |||||||||||||||||||
Assets: | ||||||||||||||||||||||||
Investments in securities, at value†* | ||||||||||||||||||||||||
Unaffiliated investments | $ | 3,028,814,637 | $ | 5,055,913,917 | $ | 4,130,060,725 | $ | 254,527,635 | $ | 180,820,229 | $ | 248,551,526 | ||||||||||||
“Affiliated” investments | — | 1,062,930,813 | 101,055,030 | — | — | — | ||||||||||||||||||
|
|
|
|
|
|
|
|
|
|
|
| |||||||||||||
Total investments, at value | 3,028,814,637 | 6,118,844,730 | 4,231,115,755 | 254,527,635 | 180,820,229 | 248,551,526 | ||||||||||||||||||
Cash | — | — | — | — | — | 103,717 | ||||||||||||||||||
Receivable for securities sold | — | 301,574 | 15,785,252 | — | 262,751 | — | ||||||||||||||||||
Receivable for shares sold | 2,476,436 | 6,268,019 | 4,640,495 | 30,358 | 726,455 | 728,338 | ||||||||||||||||||
Dividends and interest receivable | 559,984 | 3,012,386 | 365,598 | 36,175 | 4,714 | 66,385 | ||||||||||||||||||
Prepaid expenses | 14,304 | 32,429 | 18,790 | 874 | 804 | 5,600 | ||||||||||||||||||
|
|
|
|
|
|
|
|
|
|
|
| |||||||||||||
| 3,031,865,361 | 6,128,459,138 | 4,251,925,890 | 254,595,042 | 181,814,953 | 249,455,566 | |||||||||||||||||||
|
|
|
|
|
|
|
|
|
|
|
| |||||||||||||
Liabilities: | ||||||||||||||||||||||||
Payable for shares redeemed | 6,225,604 | 12,321,257 | 4,768,915 | 76,091 | 71,303 | 79,806 | ||||||||||||||||||
Payable for securities purchased | 2,762,531 | 2,784,460 | 6,678,677 | — | 4,699 | 900,380 | ||||||||||||||||||
Trustee fees payable | 32,088 | 68,008 | 39,098 | 2,626 | 1,818 | 1,340 | ||||||||||||||||||
Investment advisory fees payable (Note 4) | 950 | 291 | 252 | 689 | 819 | 670 | ||||||||||||||||||
Distribution fees payable (Note 4) | 846 | 80 | 697 | 971 | 513 | 774 | ||||||||||||||||||
Payable for collateral on loaned securities | — | — | 3,188,808 | 327,227 | — | 392,985 | ||||||||||||||||||
Accrued expenses and other payables | 289,095 | 644,992 | 552,584 | 63,703 | 64,880 | 81,903 | ||||||||||||||||||
|
|
|
|
|
|
|
|
|
|
|
| |||||||||||||
| 9,311,114 | 15,819,088 | 15,229,031 | 471,307 | 144,032 | 1,457,858 | |||||||||||||||||||
|
|
|
|
|
|
|
|
|
|
|
| |||||||||||||
Net Assets | $ | 3,022,554,247 | $ | 6,112,640,050 | $ | 4,236,696,859 | $ | 254,123,735 | $ | 181,670,921 | $ | 247,997,708 | ||||||||||||
|
|
|
|
|
|
|
|
|
|
|
| |||||||||||||
Net Assets consist of: | ||||||||||||||||||||||||
Paid-in capital | $ | 964,537,560 | $ | 1,626,680,505 | $ | 1,820,939,776 | $ | 114,524,645 | $ | 90,786,801 | $ | 208,762,575 | ||||||||||||
Undistributed (accumulated) net investment income (loss) | (14,527,630 | ) | 3,768,344 | (8,732,318 | ) | (1,981,831 | ) | (538,708 | ) | (661,654 | ) | |||||||||||||
Undistributed (accumulated) net realized gain (loss) on investments and foreign currency transactions | 186,728,759 | 594,857,447 | 497,967,264 | 30,287,702 | (5,317,904 | ) | (5,186,477 | ) | ||||||||||||||||
Net unrealized appreciation on investments and foreign currency translations | 1,885,815,558 | 3,887,333,754 | 1,926,522,137 | 111,293,219 | 96,740,732 | 45,083,264 | ||||||||||||||||||
|
|
|
|
|
|
|
|
|
|
|
| |||||||||||||
Net Assets | $ | 3,022,554,247 | $ | 6,112,640,050 | $ | 4,236,696,859 | $ | 254,123,735 | $ | 181,670,921 | $ | 247,997,708 | ||||||||||||
|
|
|
|
|
|
|
|
|
|
|
| |||||||||||||
Retail Shares: | ||||||||||||||||||||||||
Net Assets | $ | 1,979,082,084 | $ | 2,666,621,400 | $ | 1,730,302,566 | $ | 201,372,276 | $ | 87,520,170 | $ | 131,189,393 | ||||||||||||
Shares Outstanding ($0.01 par value; indefinite shares authorized) | 27,925,388 | 37,153,290 | 56,473,393 | 10,870,222 | 3,640,365 | 7,468,951 | ||||||||||||||||||
|
|
|
|
|
|
|
|
|
|
|
| |||||||||||||
Net Asset Value and Offering Price Per Share | $ | 70.87 | $ | 71.77 | $ | 30.64 | $ | 18.53 | $ | 24.04 | $ | 17.56 | ||||||||||||
|
|
|
|
|
|
|
|
|
|
|
| |||||||||||||
Institutional Shares: | ||||||||||||||||||||||||
Net Assets | $ | 1,020,981,492 | $ | 3,433,538,999 | $ | 2,404,629,535 | $ | 51,693,959 | $ | 89,457,362 | $ | 113,615,958 | ||||||||||||
Shares Outstanding ($0.01 par value; indefinite shares authorized) | 13,972,245 | 46,704,116 | 76,143,590 | 2,709,760 | 3,659,714 | 6,405,085 | ||||||||||||||||||
|
|
|
|
|
|
|
|
|
|
|
| |||||||||||||
Net Asset Value and Offering Price Per Share | $ | 73.07 | $ | 73.52 | $ | 31.58 | $ | 19.08 | $ | 24.44 | $ | 17.74 | ||||||||||||
|
|
|
|
|
|
|
|
|
|
|
| |||||||||||||
R6 Shares: | ||||||||||||||||||||||||
Net Assets | $ | 22,490,671 | $ | 12,479,651 | $ | 101,764,758 | $ | 1,057,500 | $ | 4,693,389 | $ | 3,192,357 | ||||||||||||
Shares Outstanding ($0.01 par value; indefinite shares authorized) | 307,831 | 169,736 | 3,223,062 | 55,403 | 191,958 | 179,957 | ||||||||||||||||||
|
|
|
|
|
|
|
|
|
|
|
| |||||||||||||
Net Asset Value and Offering Price Per Share | $ | 73.06 | $ | 73.52 | $ | 31.57 | $ | 19.09 | $ | 24.45 | $ | 17.74 | ||||||||||||
|
|
|
|
|
|
|
|
|
|
|
| |||||||||||||
†Securities on loan, at value: | ||||||||||||||||||||||||
Unaffiliated investments | $ | — | $ | — | $ | 3,136,842 | $ | 321,894 | $ | — | $ | 386,581 | ||||||||||||
|
|
|
|
|
|
|
|
|
|
|
| |||||||||||||
*Investments in securities, at cost: | ||||||||||||||||||||||||
Unaffiliated investments | $ | 1,142,999,079 | $ | 1,848,207,922 | $ | 2,212,839,900 | $ | 143,234,416 | $ | 84,079,523 | $ | 203,468,262 | ||||||||||||
“Affiliated” investments | — | 383,302,472 | 91,752,737 | — | — | — | ||||||||||||||||||
|
|
|
|
|
|
|
|
|
|
|
| |||||||||||||
Total investments, at cost | $ | 1,142,999,079 | $ | 2,231,510,394 | $ | 2,304,592,637 | $ | 143,234,416 | $ | 84,079,523 | $ | 203,468,262 | ||||||||||||
|
|
|
|
|
|
|
|
|
|
|
| |||||||||||||
| 26 | See Notes to Financial Statements. |
Table of Contents
| September 30, 2017 | Baron Funds |
FOR THE YEAR ENDED SEPTEMBER 30, 2017
|
| Baron Asset Fund | Baron Growth Fund | Baron Small Cap Fund | Baron Opportunity Fund | Baron Fifth Avenue Growth Fund | Baron Discovery Fund | |||||||||||||||||||
Investment income: | ||||||||||||||||||||||||
Income: | ||||||||||||||||||||||||
Dividends — Unaffiliated investments | $ | 14,859,646 | $ | 46,871,344 | $ | 39,006,081 | $ | 407,780 | $ | 906,018 | $ | 182,427 | ||||||||||||
Dividends — “Affiliated” investments | — | 14,915,407 | — | — | — | — | ||||||||||||||||||
Interest | 30,052 | 107,598 | 53,002 | 4,160 | 1,633 | 6,862 | ||||||||||||||||||
Securities lending income, net | — | 171,263 | 283,348 | 120,625 | 72,132 | 132,253 | ||||||||||||||||||
Foreign taxes withheld on dividends | — | — | (218,399 | ) | — | (14,321 | ) | — | ||||||||||||||||
|
|
|
|
|
|
|
|
|
|
|
| |||||||||||||
Total income | 14,889,698 | 62,065,612 | 39,124,032 | 532,565 | 965,462 | 321,542 | ||||||||||||||||||
|
|
|
|
|
|
|
|
|
|
|
| |||||||||||||
Expenses: | ||||||||||||||||||||||||
Investment advisory fees (Note 4) | 27,115,994 | 59,137,609 | 34,512,550 | 2,363,199 | 1,122,301 | 1,310,513 | ||||||||||||||||||
Distribution fees — Retail Shares (Note 4) | 4,655,906 | 6,859,794 | 4,293,435 | 477,379 | 187,851 | 158,145 | ||||||||||||||||||
Shareholder servicing agent fees and expenses —Retail Shares | 371,307 | 342,689 | 244,739 | 76,360 | 32,024 | 23,518 | ||||||||||||||||||
Shareholder servicing agent fees and expenses — Institutional Shares | 52,930 | 235,755 | 88,400 | 12,267 | 13,339 | 17,947 | ||||||||||||||||||
Shareholder servicing agent fees and expenses — R6 Shares | 455 | 162 | 2,676 | 26 | 85 | 112 | ||||||||||||||||||
Reports to shareholders | 423,900 | 962,900 | 939,400 | 66,360 | 11,885 | 22,557 | ||||||||||||||||||
Trustee fees and expenses | 129,238 | 282,731 | 162,646 | 10,601 | 7,396 | 4,332 | ||||||||||||||||||
Registration and filing fees | 114,400 | 155,460 | 160,080 | 62,340 | 53,960 | 86,260 | ||||||||||||||||||
Custodian and fund accounting fees | 111,135 | 238,195 | 178,917 | 44,861 | 45,301 | 44,211 | ||||||||||||||||||
Professional fees | 79,370 | 183,395 | 105,780 | 44,415 | 44,663 | 62,400 | ||||||||||||||||||
Insurance expense | 39,354 | 92,117 | 54,550 | 3,847 | 2,372 | 781 | ||||||||||||||||||
Line of credit fees | 39,261 | 85,470 | 48,619 | 3,364 | 2,318 | 2,006 | ||||||||||||||||||
Administration fees | 30,427 | 30,356 | 30,301 | 30,451 | 30,410 | 30,410 | ||||||||||||||||||
Miscellaneous expenses | 1,857 | 8,490 | 1,969 | 1,856 | 1,855 | 1,856 | ||||||||||||||||||
|
|
|
|
|
|
|
|
|
|
|
| |||||||||||||
Total operating expenses | 33,165,534 | 68,615,123 | 40,824,062 | 3,197,326 | 1,555,760 | 1,765,048 | ||||||||||||||||||
|
|
|
|
|
|
|
|
|
|
|
| |||||||||||||
Interest expense on borrowings | — | 109,192 | 2,612 | 5,319 | 6,221 | — | ||||||||||||||||||
|
|
|
|
|
|
|
|
|
|
|
| |||||||||||||
Total expenses | 33,165,534 | 68,724,315 | 40,826,674 | 3,202,645 | 1,561,981 | 1,765,048 | ||||||||||||||||||
Reimbursement of expenses by Adviser —Retail Shares (Note 4) | — | — | — | — | (13,139 | ) | (75,747 | ) | ||||||||||||||||
Reimbursement of expenses by Adviser —Institutional Shares (Note 4) | — | — | — | — | — | (86,561 | ) | |||||||||||||||||
Reimbursement of expenses by Adviser —R6 Shares (Note 4) | — | — | — | — | — | (3,280 | ) | |||||||||||||||||
|
|
|
|
|
|
|
|
|
|
|
| |||||||||||||
Net expenses | 33,165,534 | 68,724,315 | 40,826,674 | 3,202,645 | 1,548,842 | 1,599,460 | ||||||||||||||||||
|
|
|
|
|
|
|
|
|
|
|
| |||||||||||||
Net investment loss | (18,275,836 | ) | (6,658,703 | ) | (1,702,642 | ) | (2,670,080 | ) | (583,380 | ) | (1,277,918 | ) | ||||||||||||
|
|
|
|
|
|
|
|
|
|
|
| |||||||||||||
Realized and unrealized gain (loss) on investments: | ||||||||||||||||||||||||
Net realized gain (loss) on investments sold — Unaffiliated investments | 190,819,440 | 591,127,945 | 531,326,942 | 33,874,617 | (479,221 | ) | 3,801,067 | |||||||||||||||||
Net realized gain (loss) on investments sold — “Affiliated” investments | — | 35,798,387 | (15,149,197 | ) | — | — | — | |||||||||||||||||
Net realized loss on foreign currency transactions | — | (27,764 | ) | (26,521 | ) | (459 | ) | (7,699 | ) | (4,085 | ) | |||||||||||||
Change in net unrealized appreciation (depreciation) of: | ||||||||||||||||||||||||
Investments — Unaffiliated investments | 379,431,766 | 159,206,902 | 165,124,325 | 17,268,086 | 35,920,643 | 37,617,086 | ||||||||||||||||||
Investments — “Affiliated” investments | — | 322,895,841 | 33,145,546 | — | — | — | ||||||||||||||||||
Foreign currency translations | — | (812 | ) | (981 | ) | — | (67 | ) | — | |||||||||||||||
|
|
|
|
|
|
|
|
|
|
|
| |||||||||||||
Net gain on investments | 570,251,206 | 1,109,000,499 | 714,420,114 | 51,142,244 | 35,433,656 | 41,414,068 | ||||||||||||||||||
|
|
|
|
|
|
|
|
|
|
|
| |||||||||||||
Net increase in net assets resulting from operations | $ | 551,975,370 | $ | 1,102,341,796 | $ | 712,717,472 | $ | 48,472,164 | $ | 34,850,276 | $ | 40,136,150 | ||||||||||||
|
|
|
|
|
|
|
|
|
|
|
| |||||||||||||
| See Notes to Financial Statements. | 27 |
Table of Contents
| Baron Funds | September 30, 2017 |
STATEMENTS OF CHANGES IN NET ASSETS
|
| Baron Asset Fund | Baron Growth Fund | Baron Small Cap Fund | ||||||||||||||||||||||
| For the Year Ended September 30, 2017 | For the Year Ended September 30, 2016 | For the Year Ended September 30, 2017 | For the Year Ended September 30, 2016 | For the Year Ended September 30, 2017 | For the Year Ended September 30, 2016 | |||||||||||||||||||
Increase (Decrease) in Net Assets: | ||||||||||||||||||||||||
Operations: | ||||||||||||||||||||||||
Net investment income (loss) | $ | (18,275,836 | ) | $ | (8,914,391 | ) | $ | (6,658,703 | ) | $ | 15,241,504 | $ | (1,702,642 | ) | $ | (20,432,156 | ) | |||||||
Net realized gain | 190,819,440 | 115,016,633 | 626,898,568 | 677,283,345 | 516,151,224 | 611,465,766 | ||||||||||||||||||
Change in net unrealized appreciation (depreciation) | 379,431,766 | 162,597,930 | 482,101,931 | (261,093,859 | ) | 198,268,890 | (127,761,526 | ) | ||||||||||||||||
|
|
|
|
|
|
|
|
|
|
|
| |||||||||||||
Increase in net assets resulting from operations | 551,975,370 | 268,700,172 | 1,102,341,796 | 431,430,990 | 712,717,472 | 463,272,084 | ||||||||||||||||||
|
|
|
|
|
|
|
|
|
|
|
| |||||||||||||
Distributions to shareholders from: | ||||||||||||||||||||||||
Net realized gain on investments — Retail Shares | (81,908,923 | ) | (192,857,983 | ) | (315,911,802 | ) | (300,771,852 | ) | (325,929,736 | ) | (249,256,906 | ) | ||||||||||||
Net realized gain on investments — Institutional Shares | (32,742,122 | ) | (75,706,896 | ) | (335,828,188 | ) | (292,771,461 | ) | (293,355,641 | ) | (200,060,422 | ) | ||||||||||||
Net realized gain on investments — R6 Shares | (351,281 | ) | (2,496 | ) | (261,804 | ) | — | (720,045 | ) | — | ||||||||||||||
|
|
|
|
|
|
|
|
|
|
|
| |||||||||||||
Decrease in net assets from distributions to shareholders | (115,002,326 | ) | (268,567,375 | ) | (652,001,794 | ) | (593,543,313 | ) | (620,005,422 | ) | (449,317,328 | ) | ||||||||||||
|
|
|
|
|
|
|
|
|
|
|
| |||||||||||||
Capital share transactions: | ||||||||||||||||||||||||
Proceeds from the sale of shares — Retail Shares | 115,665,453 | 74,173,128 | 188,519,623 | 209,973,033 | 163,463,589 | 159,998,217 | ||||||||||||||||||
Proceeds from the sale of shares — Institutional Shares | 242,968,632 | 104,274,919 | 714,942,632 | 587,751,924 | 1,007,683,374 | 459,238,081 | ||||||||||||||||||
Proceeds from the sale of shares — R6 Shares | 12,611,555 | 7,361,253 | 9,486,342 | 2,239,695 | 97,048,919 | 3,449,895 | ||||||||||||||||||
Net asset value of shares issued in reinvestment of distributions — Retail Shares | 79,981,714 | 188,688,679 | 308,276,661 | 295,137,151 | 320,323,421 | 245,730,982 | ||||||||||||||||||
Net asset value of shares issued in reinvestment of distributions — Institutional Shares | 31,600,055 | 73,173,688 | 322,216,695 | 276,721,034 | 272,997,394 | 184,345,711 | ||||||||||||||||||
Net asset value of shares issues in reinvestment of distribution — R6 Shares | 351,281 | 2,496 | 261,804 | — | 720,045 | — | ||||||||||||||||||
Cost of shares redeemed — Retail Shares | (314,340,692 | ) | (260,675,946 | ) | (937,016,098 | ) | (1,016,386,109 | ) | (598,528,879 | ) | (1,178,412,830 | ) | ||||||||||||
Cost of shares redeemed — Institutional Shares | (116,860,490 | ) | (176,801,922 | ) | (906,994,433 | ) | (1,182,140,006 | ) | (616,142,227 | ) | (902,239,753 | ) | ||||||||||||
Cost of shares redeemed — R6 Shares | (102,646 | ) | — | (177,853 | ) | (275 | ) | (14,233,874 | ) | — | ||||||||||||||
|
|
|
|
|
|
|
|
|
|
|
| |||||||||||||
Increase (decrease) in net assets derived from capital share transactions | 51,874,862 | 10,196,295 | (300,484,627 | ) | (826,703,553 | ) | 633,331,762 | (1,027,889,697 | ) | |||||||||||||||
|
|
|
|
|
|
|
|
|
|
|
| |||||||||||||
Net increase (decrease) in net assets | 488,847,906 | 10,329,092 | 149,855,375 | (988,815,876 | ) | 726,043,812 | (1,013,934,941 | ) | ||||||||||||||||
|
|
|
|
|
|
|
|
|
|
|
| |||||||||||||
Net Assets: | ||||||||||||||||||||||||
Beginning of year | 2,533,706,341 | 2,523,377,249 | 5,962,784,675 | 6,951,600,551 | 3,510,653,047 | 4,524,587,988 | ||||||||||||||||||
|
|
|
|
|
|
|
|
|
|
|
| |||||||||||||
End of year | $ | 3,022,554,247 | $ | 2,533,706,341 | $ | 6,112,640,050 | $ | 5,962,784,675 | $ | 4,236,696,859 | $ | 3,510,653,047 | ||||||||||||
|
|
|
|
|
|
|
|
|
|
|
| |||||||||||||
Undistributed (accumulated) net investment income (loss) at end of year | $ | (14,527,630 | ) | $ | (12,928,105 | ) | $ | 3,768,344 | $ | 5,881,500 | $ | (8,732,318 | ) | $ | (5,385,237 | ) | ||||||||
|
|
|
|
|
|
|
|
|
|
|
| |||||||||||||
Capital share transactions — Retail Shares | ||||||||||||||||||||||||
Shares sold | 1,767,315 | 1,303,840 | 2,863,571 | 3,267,882 | 5,955,401 | 5,675,541 | ||||||||||||||||||
Shares issued in reinvestment of distributions | 1,367,677 | 3,295,576 | 5,120,028 | 4,600,018 | 12,546,941 | 8,616,093 | ||||||||||||||||||
Shares redeemed | (4,919,411 | ) | (4,527,322 | ) | (14,287,516 | ) | (15,856,841 | ) | (21,728,339 | ) | (40,336,749 | ) | ||||||||||||
|
|
|
|
|
|
|
|
|
|
|
| |||||||||||||
Net increase (decrease) | (1,784,419 | ) | 72,094 | (6,303,917 | ) | (7,988,941 | ) | (3,225,997 | ) | (26,045,115 | ) | |||||||||||||
|
|
|
|
|
|
|
|
|
|
|
| |||||||||||||
Capital share transactions — Institutional Shares | ||||||||||||||||||||||||
Shares sold | 3,614,440 | 1,784,611 | 10,510,393 | 9,007,462 | 33,667,418 | 15,866,935 | ||||||||||||||||||
Shares issued in reinvestment of distributions | 525,354 | 1,247,530 | 5,235,890 | 4,240,286 | 10,395,940 | 6,332,728 | ||||||||||||||||||
Shares redeemed | (1,778,012 | ) | (2,984,894 | ) | (13,523,246 | ) | (18,424,376 | ) | (21,629,733 | ) | (30,763,117 | ) | ||||||||||||
|
|
|
|
|
|
|
|
|
|
|
| |||||||||||||
Net increase (decrease) | 2,361,782 | 47,247 | 2,223,037 | (5,176,628 | ) | 22,433,625 | (8,563,454 | ) | ||||||||||||||||
|
|
|
|
|
|
|
|
|
|
|
| |||||||||||||
Capital share transactions — R6 Shares | ||||||||||||||||||||||||
Shares sold | 178,182 | 125,217 | 133,900 | 34,095 | 3,563,039 | 117,047 | ||||||||||||||||||
Shares issued in reinvestment of distributions | 5,840 | 44 | 4,254 | — | 27,420 | — | ||||||||||||||||||
Shares redeemed | (1,452 | ) | — | (2,509 | ) | (4 | ) | (484,444 | ) | — | ||||||||||||||
|
|
|
|
|
|
|
|
|
|
|
| |||||||||||||
Net increase | 182,570 | 125,261 | 135,645 | 34,091 | 3,106,015 | 117,047 | ||||||||||||||||||
|
|
|
|
|
|
|
|
|
|
|
| |||||||||||||
| 28 | See Notes to Financial Statements. |
Table of Contents
| September 30, 2017 | Baron Funds |
STATEMENTS OF CHANGES IN NET ASSETS (Continued)
|
| Baron Opportunity Fund | Baron Fifth Avenue Growth Fund | Baron Discovery Fund | ||||||||||||||||||||||
| For the Year Ended September 30, 2017 | For the Year Ended September 30, 2016 | For the Year Ended September 30, 2017 | For the Year Ended September 30, 2016 | For the Year Ended September 30, 2017 | For the Year Ended September 30, 2016 | |||||||||||||||||||
Increase (Decrease) in Net Assets: | ||||||||||||||||||||||||
Operations: | ||||||||||||||||||||||||
Net investment income (loss) | $ | (2,670,080 | ) | $ | (2,072,319 | ) | $ | (583,380 | ) | $ | (475,449 | ) | $ | (1,277,918 | ) | $ | 459,288 | |||||||
Net realized gain (loss) | 33,874,158 | 26,739,948 | (486,920 | ) | (4,123,105 | ) | 3,796,982 | (7,492,617 | ) | |||||||||||||||
Change in net unrealized appreciation (depreciation) | 17,268,086 | (1,100,590 | ) | 35,920,576 | 24,216,389 | 37,617,086 | 13,484,335 | |||||||||||||||||
|
|
|
|
|
|
|
|
|
|
|
| |||||||||||||
Increase in net assets resulting from operations | 48,472,164 | 23,567,039 | 34,850,276 | 19,617,835 | 40,136,150 | 6,451,006 | ||||||||||||||||||
|
|
|
|
|
|
|
|
|
|
|
| |||||||||||||
Distributions to shareholders from: | ||||||||||||||||||||||||
Net realized gain on investments — Retail Shares | (22,424,986 | ) | (23,538,224 | ) | — | — | — | (362,976 | ) | |||||||||||||||
Net realized gain on investments — Institutional Shares | (4,531,300 | ) | (9,136,197 | ) | — | — | — | (338,882 | ) | |||||||||||||||
Net realized gain on investments — R6 Shares | (44,520 | ) | — | — | — | — | — | |||||||||||||||||
|
|
|
|
|
|
|
|
|
|
|
| |||||||||||||
Decrease in net assets from distributions to shareholders | (27,000,806 | ) | (32,674,421 | ) | — | — | — | (701,858 | ) | |||||||||||||||
|
|
|
|
|
|
|
|
|
|
|
| |||||||||||||
Capital share transactions: | ||||||||||||||||||||||||
Proceeds from the sale of shares — Retail Shares | 38,997,107 | 20,711,733 | 16,765,682 | 13,334,709 | 114,749,640 | 3,325,323 | ||||||||||||||||||
Proceeds from the sale of shares — Institutional Shares | 11,258,139 | 4,351,441 | 16,442,797 | 21,707,323 | 78,686,663 | 9,434,873 | ||||||||||||||||||
Proceeds from the sale of shares — R6 Shares | 578,045 | 434,469 | 2,878,395 | 1,259,756 | 538,828 | 1,982,543 | ||||||||||||||||||
Net asset value of shares issued in reinvestment of distributions — Retail Shares | 21,793,006 | 22,746,010 | — | — | — | 360,715 | ||||||||||||||||||
Net asset value of shares issued in reinvestment of distributions — Institutional Shares | 4,021,193 | 8,314,026 | — | — | — | 271,096 | ||||||||||||||||||
Net asset value of shares issues in reinvestment of distribution — R6 Shares | 44,520 | — | — | — | — | — | ||||||||||||||||||
Cost of shares redeemed — Retail Shares | (82,686,684 | ) | (63,302,681 | ) | (18,861,614 | ) | (20,733,353 | ) | (21,729,392 | ) | (8,059,970 | ) | ||||||||||||
Cost of shares redeemed — Institutional Shares | (12,064,063 | ) | (57,314,953 | ) | (27,200,861 | ) | (24,613,301 | ) | (7,772,823 | ) | (43,422,332 | ) | ||||||||||||
Cost of shares redeemed — R6 Shares | (58,188 | ) | — | (11,130 | ) | — | (45,031 | ) | — | |||||||||||||||
|
|
|
|
|
|
|
|
|
|
|
| |||||||||||||
Increase (decrease) in net assets derived from capital share transactions | (18,116,925 | ) | (64,059,955 | ) | (9,986,731 | ) | (9,044,866 | ) | 164,427,885 | (36,107,752 | ) | |||||||||||||
|
|
|
|
|
|
|
|
|
|
|
| |||||||||||||
Net increase (decrease) in net assets | 3,354,433 | (73,167,337 | ) | 24,863,545 | 10,572,969 | 204,564,035 | (30,358,604 | ) | ||||||||||||||||
|
|
|
|
|
|
|
|
|
|
|
| |||||||||||||
Net Assets: | ||||||||||||||||||||||||
Beginning of year | 250,769,302 | 323,936,639 | 156,807,376 | 146,234,407 | 43,433,673 | 73,792,277 | ||||||||||||||||||
|
|
|
|
|
|
|
|
|
|
|
| |||||||||||||
End of year | $ | 254,123,735 | $ | 250,769,302 | $ | 181,670,921 | $ | 156,807,376 | $ | 247,997,708 | $ | 43,433,673 | ||||||||||||
|
|
|
|
|
|
|
|
|
|
|
| |||||||||||||
Undistributed (accumulated) net investment income (loss) at end of year | $ | (1,981,831 | ) | $ | (2,093,185 | ) | $ | (538,708 | ) | $ | (564,320 | ) | $ | (661,654 | ) | $ | 4,889 | |||||||
|
|
|
|
|
|
|
|
|
|
|
| |||||||||||||
Capital share transactions — Retail Shares | ||||||||||||||||||||||||
Shares sold | 2,341,809 | 1,289,427 | 771,906 | 751,628 | 7,468,019 | 278,949 | ||||||||||||||||||
Shares issued in reinvestment of distributions | 1,519,736 | 1,353,124 | — | — | — | 32,007 | ||||||||||||||||||
Shares redeemed | (5,265,873 | ) | (3,926,468 | ) | (930,371 | ) | (1,179,010 | ) | (1,386,143 | ) | (712,512 | ) | ||||||||||||
|
|
|
|
|
|
|
|
|
|
|
| |||||||||||||
Net increase (decrease) | (1,404,328 | ) | (1,283,917 | ) | (158,465 | ) | (427,382 | ) | 6,081,876 | (401,556 | ) | |||||||||||||
|
|
|
|
|
|
|
|
|
|
|
| |||||||||||||
Capital share transactions — Institutional Shares | ||||||||||||||||||||||||
Shares sold | 654,610 | 259,249 | 753,708 | 1,180,779 | 5,210,694 | 738,254 | ||||||||||||||||||
Shares issued in reinvestment of distributions | 272,808 | 483,936 | — | — | — | 23,885 | ||||||||||||||||||
Shares redeemed | (725,418 | ) | (3,493,332 | ) | (1,269,553 | ) | (1,376,764 | ) | (498,025 | ) | (3,886,277 | ) | ||||||||||||
|
|
|
|
|
|
|
|
|
|
|
| |||||||||||||
Net increase (decrease) | 202,000 | (2,750,147 | ) | (515,845 | ) | (195,985 | ) | 4,712,669 | (3,124,138 | ) | ||||||||||||||
|
|
|
|
|
|
|
|
|
|
|
| |||||||||||||
Capital share transactions — R6 Shares | ||||||||||||||||||||||||
Shares sold | 30,876 | 25,224 | 122,106 | 70,371 | 35,121 | 147,688 | ||||||||||||||||||
Shares issued in reinvestment of dividends | 3,020 | — | — | — | — | — | ||||||||||||||||||
Shares redeemed | (3,717 | ) | — | (519 | ) | — | (2,852 | ) | — | |||||||||||||||
|
|
|
|
|
|
|
|
|
|
|
| |||||||||||||
Net increase | 30,179 | 25,224 | 121,587 | 70,371 | 32,269 | 147,688 | ||||||||||||||||||
|
|
|
|
|
|
|
|
|
|
|
| |||||||||||||
| See Notes to Financial Statements. | 29 |
Table of Contents
| Baron Funds | September 30, 2017 |
1. ORGANIZATION
Baron Investment Funds Trust (the “Trust”) is registered under the Investment Company Act of 1940, as amended (the “1940 Act”), as an open-end management investment company established as a Massachusetts business trust on February 19, 1987, and accordingly follows the investment company accounting and reporting guidance of the Financial Accounting Standards Board (“FASB”) Accounting Standard Codification Topic 946 Financial Services – Investment Companies. The Trust currently offers six series (individually, a “Fund” and collectively, the “Funds”): Baron Asset Fund, Baron Growth Fund, Baron Small Cap Fund, Baron Opportunity Fund, Baron Fifth Avenue Growth Fund and Baron Discovery Fund.
Each Fund offers Retail Shares, Institutional Shares and R6 Shares. Each class of shares differs only in its ongoing fees, expenses and eligibility requirements. Retail Shares are offered to all investors. Institutional Shares are for investments in the amount of $1 million or more per Fund. Institutional Shares are intended for certain financial intermediaries that offer shares of Baron Funds through fee-based platforms, retirement platforms or other platforms. R6 Shares are for investments in the amount of $5 million or more per Fund. R6 Shares are available only to qualified 401(a) plans (including 401(k) plans, Keogh plans, profit sharing plans, money purchase pension plans, target benefit plans, defined benefit pension plans and Taft-Hartley multi-employer pension plans), endowment funds and foundations, any state, county or city, or its instrumentality, department, authority, or agency, 457 plans, including 457(a) governmental entity plans and tax-exempt plans, accounts registered to insurance companies, trust companies and bank trust departments, investment companies, both affiliated and not affiliated with the adviser, and any entity that is considered a corporation for tax purposes, including corporate non-qualified deferred compensation plans of such corporations. Each class of shares has equal rights to earnings and assets, except that each class bears different expenses for distribution and shareholder servicing. Each Fund’s investment income, realized and unrealized gains or losses on investments and foreign currency, and expenses other than those attributable to a specific class are allocated to each class based on its relative net assets. Each class of shares has exclusive voting rights with respect to matters that affect just that class.
The investment goals of the Funds are as follows:
Baron Asset Fund seeks capital appreciation through long-term investments primarily in securities of medium-sized companies with undervalued assets or favorable growth prospects.
Baron Growth Fund seeks capital appreciation through long-term investments primarily in securities of small-sized growth companies.
Baron Small Cap Fund seeks capital appreciation through investments primarily in securities of small-sized growth companies.
Baron Opportunity Fund seeks capital appreciation through investments primarily in growth companies that benefit from technology advances.
Baron Fifth Avenue Growth Fund seeks capital appreciation through investments primarily in securities of large-sized growth companies.
Baron Discovery Fund seeks capital appreciation through investments primarily in securities of small-sized growth companies.
2. SIGNIFICANT ACCOUNTING POLICIES
The following is a summary of significant accounting policies followed by the Funds. The policies are in conformity with accounting principles generally accepted in the United States of America (“GAAP”). The preparation of financial statements in accordance with GAAP requires management to make estimates and assumptions that affect the reported amounts of assets and liabilities at the date of the financial statements and the amounts of income and expenses during the period. Actual results could differ from those estimates. Events occurring subsequent to the date of the Statements of Assets and Liabilities and through the date of issuance of the financial statements have been evaluated for adjustment to or disclosure in the financial statements.
a) Security Valuation. The Funds’ share prices or net asset values (“NAV”) are calculated as of the scheduled close of the regular trading session (usually 4 p.m. E.T. or such other time as of which the Funds’ NAVs are calculated (the “NAV Calculation Time”)) on the New York Stock Exchange (the “Exchange”) on any day the Exchange is scheduled to be open. Portfolio securities traded on any national stock exchange are valued based on the last sale price on the exchange where such shares are principally traded. For securities traded on NASDAQ, the Funds use the NASDAQ Official Closing Price. If there are no sales on a given day, the value of the security may be the average of the most recent bid and asked quotations on such exchange or the last sale price from a prior day. Where market quotations are not readily available, or, if in BAMCO, Inc.’s (the “Adviser”) judgment, they do not accurately reflect the fair value of a security, or an event occurs after the market close but before the Funds are priced that materially affects the value of a security, the security will be valued by the Adviser using policies and procedures approved by the Board of Trustees (the “Board”). The Adviser has a Fair Valuation Committee (the “Committee”) comprised of senior management representatives and the Committee reports to the Board every quarter. Factors the Committee may consider when valuing a security include whether a current price is stale, there is recent news, the security is thinly traded, transactions are infrequent or quotations are genuine. There can be no guarantee, however, that a fair valuation used by the Funds on any given day will more accurately reflect the market value of an investment than the closing price of such investment in its market. U.S. Government obligations, money market instruments, and other debt instruments held by the Funds with a remaining maturity of 60 days or less are generally valued at amortized cost, which approximates fair value. Debt instruments having a greater remaining maturity will be valued on the basis of prices obtained from a pricing service approved by the Board or at the mean of the bid and ask prices from the dealer maintaining an active market in that security. The value of the Funds’ investments in convertible bonds is determined primarily by obtaining valuations from independent pricing services based on readily available bid quotations or, if quotations are not available, by methods which include various considerations such as yields or prices of securities of comparable quality, coupon, maturity and type; indications as to values from dealers; and general market conditions. Other inputs used by an independent pricing service to value convertible bonds generally include underlying stock data, conversion premiums, listed bond and preferred stock prices and other market information which may include benchmark curves, trade execution data, and sensitivity analysis, when available. Open-end investment companies, including securities lending collateral invested in registered investment company money market funds, are valued at their NAV each day.
30
Table of Contents
| September 30, 2017 | Baron Funds |
NOTES TO FINANCIAL STATEMENTS (Continued)
2. SIGNIFICANT ACCOUNTING POLICIES (Continued)
Non-U.S. equity securities are valued on the basis of their most recent closing market prices and translated into U.S. dollars at the NAV Calculation Time, except under the circumstances described below. Most foreign markets close before the NAV Calculation Time. For securities primarily traded in the Far East, for example, the most recent closing prices may be as much as 15 hours old at the NAV Calculation Time. As a result, the Adviser may use a third-party pricing service to assist in determining fair value of foreign securities. This service utilizes a systematic methodology in making fair value estimates. The Adviser may also fair value securities in other situations, for example, when a particular foreign market is closed but the Funds are open. The Adviser cannot predict how often it will use closing prices or how often it will adjust those prices. As a means of evaluating its fair value process, the Adviser routinely compares closing market prices, the next day’s opening prices in the same markets, and the adjusted prices. Other mutual funds may adjust the prices of their securities by different amounts.
b) Securities Transactions, Investment Income and Expense Allocation. Securities transactions are recorded on a trade date basis. Realized gain and loss from securities transactions are recorded on an identified cost basis for financial reporting and federal income tax purposes. Dividend income is recognized on the ex-dividend date and interest income is recognized on an accrual basis, which includes the accretion of discounts and amortization of premiums. Certain dividends from foreign securities will be recorded as soon as the Funds are informed of the dividend if such information is obtained subsequent to the ex-dividend date. Distributions received from certain investments held by the Funds may be comprised of dividends, realized gains and returns of capital. The Funds originally estimate the expected classification of such payments. The amounts may subsequently be reclassified upon receipt of information from the issuer. The Funds are charged for those expenses of the Trust that are directly attributable to each Fund, such as advisory and custodian fees. Expenses that are not directly attributable to a Fund are typically allocated among the Funds in proportion to their respective net assets.
c) Foreign Currency Translations. Values of assets and liabilities denominated in foreign currencies are translated into U.S. dollars using the price of such currencies at the time the NAV is determined. Purchases and sales of investments and dividend income are converted at the prevailing rate of exchange on the respective dates of such transactions. Net realized gain (loss) on foreign currency transactions includes gain (loss) arising from the fluctuation in the exchange rates between trade and settlement dates on security transactions and currency gain (loss) between the accrual and payment dates on dividends and foreign withholding taxes. The Funds do not isolate that portion of the results of operations resulting from changes in foreign exchange rates on investments from the fluctuations arising from changes in market prices of securities held. Such fluctuations are included with the net realized and unrealized gain or loss from investments and foreign currency transactions on the Statements of Operations. The Funds may invest in foreign securities and foreign currency transactions that may involve risks not associated with domestic investments as a result of the level of governmental supervision and regulation of foreign securities markets and the possibility of political or economic instability, among others.
Pursuant to U.S. federal income tax regulations, gains and losses from certain foreign currency transactions and the foreign currency portion of gains and losses realized on sales and maturities of foreign denominated debt securities are generally treated as ordinary income for U.S. federal income tax purposes.
d) Securities Lending. The Funds may lend securities to certain brokers under the terms of a master netting agreement. Upon such loans, the Funds receive collateral which is maintained by the custodian. The Funds may pay fees to the custodian for administering the securities lending program. The Funds earn interest on such collateral and earn income in the form of negotiated lenders’ fees, both of which are included in securities lending income in the Statements of Operations. Securities loaned are required to be secured at all times by collateral equal to at least 102% of the market value of the securities loaned. Risks may arise upon entering into securities lending to the extent that the value of the collateral is less than the value of the securities loaned due to the changes in the value of collateral or the loaned securities. The collateral is marked-to-market daily and settled on the next business day. The Funds may receive collateral in the form of cash or other eligible securities, such as a letter of credit issued by a U.S. bank or securities issued or guaranteed by the U.S. government. Securities purchased with cash collateral are subject to the risks inherent in investing in these securities.
The information required to be disclosed by FASB Accounting Standards Update No. 2011-11 (“ASU No. 2011-11”), Disclosures about Offsetting Assets and Liabilities for the Funds’ securities lending agreement at September 30, 2017, including the market value of securities on loan and the amount of collateral, can be found in each respective Fund’s Statement of Assets and Liabilities. The Funds did not hold derivatives or participate in securities borrowing activities at September 30, 2017. All securities on loan are classified as common stocks in the Funds’ Statements of Net Assets as of September 30, 2017 with a contractual maturity of overnight and continuous.
At September 30, 2017, Baron Small Cap Fund, Baron Opportunity Fund and Baron Discovery had securities on loan with values of $3,136,842, $321,894 and $386,581, respectively and held $3,188,808, $327,227 and $392,985 of short term investments as collateral for these loans, respectively.
e) Repurchase Agreements. The Funds may invest in repurchase agreements, which are short term investments whereby the Funds acquire ownership of a debt security and the seller agrees to repurchase the security at a future date at a specified price. When entering into repurchase agreements, it is the Funds’ policy that their custodian take possession of the underlying collateral securities, the market value of which, at all times, equals at least 102% of the principal amount of the repurchase transaction. To the extent that any repurchase transaction exceeds one business day, the value of the collateral is marked-to-market to ensure the adequacy of the collateral. If the seller defaults and the market value of the collateral declines or if bankruptcy proceedings are commenced with respect to the seller of the security, realization of the collateral by the Funds may be delayed or limited. The information required to be disclosed by ASU No. 2011-11 for the Funds’ investments in repurchase agreements at September 30, 2017, including the fair value of the repurchase agreement and the amount of collateral, can be found in each respective Fund’s Statement of Net Assets.
f) Master Limited Partnerships. The Funds may invest in master limited partnerships (“MLPs”). MLPs are limited partnerships or limited liability companies, whose partnership units or limited liability interests are listed and traded on a U.S. securities exchange, and are treated as publicly traded partnerships for federal income tax purposes. To qualify to be treated as a partnership for tax purposes, an MLP must receive at least 90% of its income from qualifying sources as set forth in Section 7704(d) of the Internal Revenue Code of 1986, as amended. These qualifying sources include interest, dividend, real property rent, gain from sale or other disposition of real property and income from activities such as the exploration, development, mining, production, processing, refining, transportation, storage and marketing of mineral or natural resources.
31
Table of Contents
| Baron Funds | September 30, 2017 |
NOTES TO FINANCIAL STATEMENTS (Continued)
2. SIGNIFICANT ACCOUNTING POLICIES (Continued)
g) Federal and Foreign Income Taxes. The Trust treats each Fund as a separate entity for federal income tax purposes. Each Fund intends to meet the requirements of the Internal Revenue Code of 1986, as amended, applicable to regulated investment companies, and to distribute to its shareholders substantially all of its net investment income and any net realized capital gains at least annually. None of the Funds will be subject to federal or state income taxes to the extent that they qualify as regulated investment companies and substantially all of their income is distributed.
The Funds may be subject to foreign taxes on income and gains on investments that are accrued based upon the Funds’ understanding of the tax rules and regulations that exist in the countries in which the Funds invest. Foreign governments may also impose taxes or other payments on investments with respect to foreign securities. Such taxes are accrued as applicable.
h) Restricted Securities. The Funds may invest in securities that are restricted as to public sale in accordance with the Securities Act of 1933. Such assets are valued by the Adviser pursuant to policies and procedures approved by the Board.
i) Distributions to Shareholders. Income and capital gain distributions to shareholders are determined in accordance with income tax regulations which may differ from GAAP. These differences are primarily due to differing treatments for net investment loss, foreign currency gains and losses, reclassification of distributions, partnership basis adjustments, income from passive foreign investment companies and wash sale losses deferred.
j) Commitments and Contingencies. In the normal course of business, the Funds may enter into contracts and agreements that contain a variety of representations and warranties, which provide general indemnification. The maximum exposure to the Funds under these agreements is unknown, as this would involve future claims that may be made against the Funds that have not yet occurred. However, based on experience, the Funds expect the risk of loss to be remote.
k) Cash and Cash Equivalents. The Funds consider all short term liquid investments with a maturity of three months or less when purchased to be cash equivalents.
3. PURCHASES AND SALES OF SECURITIES
Purchases and sales of securities, other than short term securities, for the year ended September 30, 2017 were as follows:
| Fund | Purchases | Sales | ||||||
Baron Asset Fund | $ | 277,644,558 | $ | 376,420,741 | ||||
Baron Growth Fund | 193,537,891 | 1,244,240,847 | ||||||
Baron Small Cap Fund | 992,779,532 | 1,202,063,139 | ||||||
Baron Opportunity Fund | 76,032,899 | 124,837,361 | ||||||
Baron Fifth Avenue Growth Fund | 22,120,855 | 35,951,681 | ||||||
Baron Discovery Fund | 208,898,415 | 51,914,249 | ||||||
4. INVESTMENT ADVISORY FEES AND OTHER TRANSACTIONS WITH AFFILIATES
a) Investment Advisory Fees. The Adviser, a wholly owned subsidiary of Baron Capital Group, Inc. (“BCG”), serves as investment adviser to the Funds. As compensation for services rendered, the Adviser receives a fee payable monthly from Baron Asset Fund, Baron Growth Fund, Baron Small Cap Fund, Baron Opportunity Fund and Baron Discovery Fund equal to 1% per annum of the average daily net assets of the respective Funds. The Adviser receives a fee payable monthly from Baron Fifth Avenue Growth Fund equal to 0.70% per annum of the Fund’s average daily net assets.
For Baron Opportunity Fund, Baron Fifth Avenue Growth Fund and Baron Discovery Fund, the Adviser has contractually agreed to reduce its fee, to the extent required to limit the net annual operating expense ratio (excluding portfolio transaction costs, interest, dividend and extraordinary expenses), as follows.
| Annual Operating Expense Ratio Cap | ||||||||||||
| Fund | Retail Shares | Institutional Shares | R6 Shares | |||||||||
Baron Opportunity Fund | 1.50 | % | 1.25 | % | 1.24 | % | ||||||
Baron Fifth Avenue Growth Fund | 1.10 | % | 0.85 | % | 0.84 | % | ||||||
Baron Discovery Fund | 1.35 | % | 1.10 | % | 1.09 | % | ||||||
b) Distribution Fees. Baron Capital, Inc. (“BCI”), a wholly owned subsidiary of BCG, is a registered limited purpose broker-dealer and the distributor of the Funds’ shares. The Funds are authorized to pay BCI a distribution fee payable monthly pursuant to a distribution plan under Rule 12b-1 of the 1940 Act equal to 0.25% per annum of the Retail Shares’ average daily net assets of the respective Funds.
c) Trustee Fees. Certain Trustees of the Trust may be deemed to be affiliated with, or interested persons (as defined by the 1940 Act) of the Funds’ Adviser or of BCI. None of the Trustees so affiliated received compensation for his or her services as a Trustee of the Trust. None of the Funds’ officers received compensation from the Funds for their services as an officer.
d) Fund Accounting and Administration Fees. The Funds have entered into an agreement with State Street Bank and Trust Company (“State Street”) to perform accounting and certain administrative services. State Street is compensated for fund accounting services based on a percentage of the Funds’ net assets, subject to certain minimums plus fixed annual fees for the administrative services.
32
Table of Contents
| September 30, 2017 | Baron Funds |
NOTES TO FINANCIAL STATEMENTS (Continued)
4. INVESTMENT ADVISORY FEES AND OTHER TRANSACTIONS WITH AFFILIATES (Continued)
e) Cross Trades. The Funds are permitted to purchase securities from, or sell securities to, other Funds within the Trust, other funds in the Baron Select Funds and other entities advised or subadvised by the Adviser, pursuant to “Cross-Trading” Procedures adopted by the Board. These procedures have been designed to ensure that any cross-trade of securities by the respective Baron Fund from or to another fund/other entity that is or could be considered an affiliate of a Fund under certain limited circumstances by virtue of having a common investment adviser, common officers, or common trustees complies with Rule 17a-7 under the 1940 Act. Further, as defined under these procedures, each cross-trade is effected at the current market price and with no commissions. Pursuant to these procedures, for the year ended September 30, 2017, the Funds engaged in the following cross-trades:
| Purchases | Sales | Net Realized Gains (Losses) | ||||||||||
Baron Small Cap Fund | $ | 1,135,968 | $ | — | $ | — | ||||||
Baron Discovery Fund | 139,200 | — | — | |||||||||
5. LINE OF CREDIT
The Funds, together with other funds in Baron Select Funds (except Baron Partners Fund), participate in a committed line of credit agreement with State Street to be used for temporary purposes, primarily for financing redemptions. Each fund may borrow up to the lesser of $100 million or the maximum amount each fund may borrow under the 1940 Act, the limitations included in each fund’s prospectus, or any limit or restriction under any law or regulation to which each fund is subject or any agreement to which each fund is a party; provided that the aggregate outstanding principal amount of all loans to any of the funds may not exceed $100 million. Interest is charged to each fund, based on its borrowings, at a rate per annum equal to the higher of the Overnight Federal Funds Rate or the one month LIBOR Rate plus a margin of 1.00%. An upfront fee of 0.05% is incurred on the commitment amount and a commitment fee of 0.20% per annum is incurred on the unused portion of the line of credit. Both fees are allocated to the participating funds based on their relative net assets.
During the year ended September 30, 2017, Baron Growth Fund, Baron Small Cap Fund, Baron Opportunity Fund and Baron Fifth Avenue Growth Fund had borrowings under the line of credit and incurred interest expense of $109,192, $2,612, $5,319 and $6,221, respectively. For the 147 days during which there were borrowings, Baron Growth Fund had an average daily balance on the line of credit of $15.2 million at a weighted average interest rate of 1.78%. For the 10 days during which there were borrowings, Baron Small Cap Fund had an average daily balance on the line of credit of $6.2 million at a weighted average interest rate of 1.55%. For the 60 days during which there were borrowings, Baron Opportunity Fund had an average daily balance on the line of credit of $1.8 million at a weighted average interest rate of 1.81%. For the 84 days during which there were borrowings, Baron Fifth Avenue Growth Fund had an average daily balance on the line of credit of $1.4 million at a weighted average interest rate of 1.89%.
6. RESTRICTED SECURITIES
At September 30, 2017, investments in securities included securities that are restricted and/or illiquid. Restricted securities are often purchased in private placement transactions, are not registered under the Securities Act of 1933, may have contractual restrictions on resale and are valued pursuant to the policies and procedures for fair value pricing approved by the Board. A security may be considered illiquid if it lacks a readily available market or if its valuation has not changed for a certain period of time. The Funds may receive more or less than this valuation in an actual sale and that difference could be material. At September 30, 2017, the Funds held investments in restricted and/or illiquid securities that were valued pursuant to policies and procedures for fair value pricing as follows:
| Baron Asset Fund | ||||||||
| Name of Issuer | Acquisition Date(s) | Value | ||||||
Private Equity Investments | ||||||||
Windy City Investments Holdings, L.L.C. | 11/13/2007-1/27/2011 | $ | 3,330,537 | |||||
|
| |||||||
(Cost $0) (0.11% of Net Assets) | ||||||||
| Baron Growth Fund | ||||||||
| Name of Issuer | Acquisition Date(s) | Value | ||||||
Private Equity Investments | ||||||||
Windy City Investments Holdings, L.L.C. | 11/13/2007-1/27/2011 | $ | 1,121,082 | |||||
|
| |||||||
(Cost $0) (0.02% of Net Assets) | ||||||||
| Baron Discovery Fund | ||||||||
| Name of Issuer | Acquisition Date(s) | Value | ||||||
Warrants | ||||||||
Barfresh Food Group, Inc., Warrants, Exp 3/13/2020 | 2/23/2015 | $ | 60,000 | |||||
|
| |||||||
(Cost $0) (0.02% of Net Assets) | ||||||||
33
Table of Contents
| Baron Funds | September 30, 2017 |
NOTES TO FINANCIAL STATEMENTS (Continued)
7. FAIR VALUE MEASUREMENTS
Fair value is defined by GAAP as the price that the Funds would receive upon selling an investment in a timely transaction to an independent buyer in the principal or most advantageous market for the investment. GAAP provides a three-tier hierarchy to maximize the use of observable market data and minimize the use of unobservable inputs and to establish classification of fair value measurements for disclosure purposes. Inputs refer broadly to the assumptions that market participants would use in pricing the asset or liability. Inputs may be observable or unobservable. Observable inputs are based on market data obtained from sources independent of the Funds. Unobservable inputs are inputs that reflect the Funds’ own assumptions based on the best information available in the circumstances. The three-tier hierarchy of inputs is summarized in the three broad Levels listed below.
| • | Level 1 — quoted prices in active markets for identical assets or liabilities; |
| • | Level 2 — prices determined using other inputs that are observable either directly or indirectly through corroboration with observable market data (which could include quoted prices for similar assets or liabilities, interest rates, credit risk, etc.); |
| • | Level 3 — prices determined using unobservable inputs when quoted prices or observable inputs are unavailable, such as when there is little or no market activity for an asset or liability (unobservable inputs reflect each Fund’s own assumptions in determining the fair value of assets or liabilities and would be based on the best information available). |
The inputs or methodology used for valuing securities are not necessarily an indication of the risk associated with investing in those securities. For example, non-U.S. securities, with markets that close hours before the Funds value their holdings, may require revised valuations due to significant movement in the U.S. markets. Since these values are not obtained from quoted prices in an active market, such securities are reflected as Level 2.
The Funds have procedures to determine the fair value of securities and other financial instruments for which market prices are not readily available or which may not be reliably priced. Under these procedures, the Funds primarily employ a market-based approach that may use related or comparable assets or liabilities, recent transactions, market multiples, book values, and other relevant information for the investment to determine its fair value. The Funds may also use an income-based valuation approach in which the anticipated future cash flows of the investment are discounted to calculate fair value. Discounts may also be applied due to the nature or duration of any restrictions on the disposition of the investments. Due to the inherent uncertainty of valuations of such investments, the fair values may differ significantly from the values that would have been used had an active market existed.
The following is a summary of the inputs used as of September 30, 2017 in valuing the Funds’ investments carried at fair value:
| Baron Asset Fund | ||||||||||||||||
| Description | Quoted Prices in Active Markets for Identical Assets (Level 1) | Other Observable Inputs (Level 2) | Unobservable Inputs (Level 3) | Total | ||||||||||||
Common Stocks† | $ | 2,984,580,544 | $ | — | $ | — | $ | 2,984,580,544 | ||||||||
Private Equity Investments | — | — | 3,330,537 | 3,330,537 | ||||||||||||
Short Term Investments | — | 40,903,556 | — | 40,903,556 | ||||||||||||
|
|
|
|
|
|
|
| |||||||||
Total Investments | $ | 2,984,580,544 | $ | 40,903,556 | $ | 3,330,537 | $ | 3,028,814,637 | ||||||||
|
|
|
|
|
|
|
| |||||||||
Transfers between Levels 1, 2 or 3, if any, are recognized at ending value on September 30, 2017. There have been no transfers in and out of Level 1, 2 or 3 fair value measurements for the Fund for the year ended September 30, 2017.
| † | See Statements of Net Assets for additional detailed categorizations. |
34
Table of Contents
| September 30, 2017 | Baron Funds |
NOTES TO FINANCIAL STATEMENTS (Continued)
7. FAIR VALUE MEASUREMENTS (Continued)
| Baron Growth Fund | ||||||||||||||||
| Description | Quoted Prices in Active Markets for Identical Assets (Level 1) | Other Observable Inputs (Level 2) | Unobservable Inputs (Level 3) | Total | ||||||||||||
Common Stocks† | $ | 5,986,831,055 | $ | — | $ | — | $ | 5,986,831,055 | ||||||||
Preferred Stocks | — | 14,927,934 | — | 14,927,934 | ||||||||||||
Private Equity Investments | — | — | 1,121,082 | 1,121,082 | ||||||||||||
Short Term Investments | — | 115,964,659 | — | 115,964,659 | ||||||||||||
|
|
|
|
|
|
|
| |||||||||
Total Investments | $ | 5,986,831,055 | $ | 130,892,593 | $ | 1,121,082 | $ | 6,118,844,730 | ||||||||
|
|
|
|
|
|
|
| |||||||||
Transfers between Levels 1, 2 or 3, if any, are recognized at ending value on September 30, 2017. There have been no transfers in and out of Level 1, 2 or 3 fair value measurements for the Fund for the year ended September 30, 2017.
| Baron Small Cap Fund | ||||||||||||||||
| Description | Quoted Prices in Active Markets for Identical Assets (Level 1) | Other Observable Inputs (Level 2) | Unobservable Inputs (Level 3) | Total | ||||||||||||
Common Stocks† | $ | 3,977,016,117 | $ | — | $ | — | $ | 3,977,016,117 | ||||||||
Short Term Investments† | — | 254,099,638 | — | 254,099,638 | ||||||||||||
|
|
|
|
|
|
|
| |||||||||
Total Investments | $ | 3,977,016,117 | $ | 254,099,638 | $ | — | $ | 4,231,115,755 | ||||||||
|
|
|
|
|
|
|
| |||||||||
Transfers between Levels 1, 2 or 3, if any, are recognized at ending value on September 30, 2017. There have been no transfers in and out of Level 1, 2 or 3 fair value measurements for the Fund for the year ended September 30, 2017.
| Baron Opportunity Fund | ||||||||||||||||
| Description | Quoted Prices in Active Markets for Identical Assets (Level 1) | Other Observable Inputs (Level 2) | Unobservable Inputs (Level 3) | Total | ||||||||||||
Common Stocks† | $ | 253,013,385 | $ | — | $ | — | $ | 253,013,385 | ||||||||
Short Term Investments† | — | 1,514,250 | — | 1,514,250 | ||||||||||||
|
|
|
|
|
|
|
| |||||||||
Total Investments | $ | 253,013,385 | $ | 1,514,250 | $ | — | $ | 254,527,635 | ||||||||
|
|
|
|
|
|
|
| |||||||||
Transfers between Levels 1, 2 or 3, if any, are recognized at ending value on September 30, 2017. There have been no transfers in and out of Level 1, 2 or 3 fair value measurements for the Fund for the year ended September 30, 2017.
| Baron Fifth Avenue Growth Fund | ||||||||||||||||
| Description | Quoted Prices in Active Markets for Identical Assets (Level 1) | Other Observable Inputs (Level 2) | Unobservable Inputs (Level 3) | Total | ||||||||||||
Common Stocks† | $ | 178,508,283 | $ | — | $ | — | $ | 178,508,283 | ||||||||
Short Term Investments | — | 2,311,946 | — | 2,311,946 | ||||||||||||
|
|
|
|
|
|
|
| |||||||||
Total Investments | $ | 178,508,283 | $ | 2,311,946 | $ | — | $ | 180,820,229 | ||||||||
|
|
|
|
|
|
|
| |||||||||
Transfers between Levels 1, 2 or 3, if any, are recognized at ending value on September 30, 2017. There have been no transfers in and out of Level 1, 2 or 3 fair value measurements for the Fund for the year ended September 30, 2017.
| † | See Statements of Net Assets for additional detailed categorizations. |
35
Table of Contents
| Baron Funds | September 30, 2017 |
NOTES TO FINANCIAL STATEMENTS (Continued)
7. FAIR VALUE MEASUREMENTS (Continued)
| Baron Discovery Fund | ||||||||||||||||
| Description | Quoted Prices in Active Markets for Identical Assets (Level 1) | Other Observable Inputs (Level 2) | Unobservable Inputs (Level 3) | Total | ||||||||||||
Common Stocks† | $ | 240,671,146 | $ | — | $ | — | $ | 240,671,146 | ||||||||
Warrants | — | 60,000 | — | 60,000 | ||||||||||||
Short Term Investments† | — | 7,820,380 | — | 7,820,380 | ||||||||||||
|
|
|
|
|
|
|
| |||||||||
Total Investments | $ | 240,671,146 | $ | 7,880,380 | $ | — | $ | 248,551,526 | ||||||||
|
|
|
|
|
|
|
| |||||||||
Transfers between Levels 1, 2 or 3, if any, are recognized at ending value on September 30, 2017. There have been no transfers in and out of Level 1, 2 or 3 fair value measurements for the Fund for the year ended September 30, 2017.
| † | See Statements of Net Assets for additional detailed categorizations. |
The following is a reconciliation of investments in which unobservable inputs (Level 3) were used in determining fair value:
| Baron Asset Fund | ||||||||||||||||||||||||||||||||||||||||
| Investments in Securities | Balance as of September 30, 2016 | Accrued Premiums/ Discounts | Net Realized Gain (Loss) | Change in Net Unrealized Appreciation (Depreciation) | Purchases | Sales/ Distributions | Transfers Into Level 3 | Transfers Out of Level 3 | Balance as of September 30, 2017 | Change in Net Unrealized Appreciation (Depreciation) from Investments still held at September 30, 2017 | ||||||||||||||||||||||||||||||
Private Equity Investments | ||||||||||||||||||||||||||||||||||||||||
Financials | $ | 3,175,300 | $ | — | $ | — | $ | 155,237 | $ | — | $ | — | $ | — | $ | — | $ | 3,330,537 | $ | 155,237 | ||||||||||||||||||||
|
|
|
|
|
|
|
|
|
|
|
|
|
|
|
|
|
|
|
| |||||||||||||||||||||
Total | $ | 3,175,300 | $ | — | $ | — | $ | 155,237 | $ | — | $ | — | $ | — | $ | — | $ | 3,330,537 | $ | 155,237 | ||||||||||||||||||||
|
|
|
|
|
|
|
|
|
|
|
|
|
|
|
|
|
|
|
| |||||||||||||||||||||
| Baron Growth Fund | ||||||||||||||||||||||||||||||||||||||||
| Investments in Securities | Balance as of September 30, 2016 | Accrued Premiums/ Discounts | Net Realized Gain (Loss) | Change in Net Unrealized Appreciation (Depreciation) | Purchases | Sales/ Distributions | Transfers Into Level 3 | Transfers Out of Level 3 | Balance as of September 30, 2017 | Change in Net Unrealized Appreciation (Depreciation) from Investments still held at September 30, 2017 | ||||||||||||||||||||||||||||||
Private Equity Investments | ||||||||||||||||||||||||||||||||||||||||
Financials | $ | 1,068,828 | $ | — | $ | — | $ | 52,254 | $ | — | $ | — | $ | — | $ | — | $ | 1,121,082 | $ | 52,254 | ||||||||||||||||||||
|
|
|
|
|
|
|
|
|
|
|
|
|
|
|
|
|
|
|
| |||||||||||||||||||||
Total | $ | 1,068,828 | $ | — | $ | — | $ | 52,254 | $ | — | $ | — | $ | — | $ | — | $ | 1,121,082 | $ | 52,254 | ||||||||||||||||||||
|
|
|
|
|
|
|
|
|
|
|
|
|
|
|
|
|
|
|
| |||||||||||||||||||||
36
Table of Contents
| September 30, 2017 | Baron Funds |
NOTES TO FINANCIAL STATEMENTS (Continued)
8. INCOME TAXES AND DISTRIBUTIONS TO SHAREHOLDERS
Federal income tax regulations differ from GAAP. Therefore, distributions determined in accordance with tax regulations may differ in amount or character from net investment income and net realized gain for financial reporting purposes. Net investment income (loss) and net realized and unrealized gain (loss) differ for financial statement and tax purposes due to differing treatments of net investment loss, foreign currency gains and losses, reclassification of distributions, partnership basis adjustments, income from passive foreign investment companies and wash sale losses deferred. Financial reporting records are adjusted for permanent book/tax differences to reflect tax character. Financial records are not adjusted for temporary differences.
For the year ended September 30, 2017, the Funds recorded the following permanent reclassifications to reflect tax character. Reclassifications between income, gains and
paid-in capital relate primarily to the tax treatment of net investment loss, foreign currency gains and losses and partnership basis adjustments. Results of operations and
net assets were not affected by these reclassifications.
| Fund | Undistributed (Accumulated) Net Investment Income ( Loss) | Undistributed (Accumulated) Net Realized Gain ( Loss) | Paid-In Capital | |||||||||
Baron Asset Fund | $ | 16,676,311 | $ | (876,061 | ) | $ | (15,800,250 | ) | ||||
Baron Growth Fund | 4,545,547 | 18,617 | (4,564,164 | ) | ||||||||
Baron Small Cap Fund | (1,644,439 | ) | 1,646,260 | (1,821 | ) | |||||||
Baron Opportunity Fund | 2,781,434 | (2,605,549 | ) | (175,885 | ) | |||||||
Baron Fifth Avenue Growth Fund | 608,992 | (8,149 | ) | (600,843 | ) | |||||||
Baron Discovery Fund | 611,375 | (28,903 | ) | (582,472 | ) | |||||||
As of September 30, 2017, the components of net assets on a tax basis were as follows:
| Baron Asset Fund | Baron Growth Fund | Baron Small Cap Fund | Baron Opportunity Fund | Baron Fifth Avenue Growth Fund | Baron Discovery Fund | |||||||||||||||||||
Cost of investments | $ | 1,146,503,218 | $ | 2,233,029,648 | $ | 2,301,979,089 | $ | 143,808,471 | $ | 84,102,344 | $ | 203,962,913 | ||||||||||||
|
|
|
|
|
|
|
|
|
|
|
| |||||||||||||
Gross tax unrealized appreciation | 1,886,044,319 | 3,895,378,702 | 1,979,462,906 | 112,389,309 | 97,218,229 | 50,816,941 | ||||||||||||||||||
Gross tax unrealized depreciation | (3,732,900 | ) | (9,563,620 | ) | (50,326,240 | ) | (1,670,145 | ) | (500,344 | ) | (6,228,328 | ) | ||||||||||||
|
|
|
|
|
|
|
|
|
|
|
| |||||||||||||
Net tax unrealized appreciation | 1,882,311,419 | 3,885,815,082 | 1,929,136,666 | 110,719,164 | 96,717,885 | 44,588,613 | ||||||||||||||||||
Net tax unrealized currency appreciation (depreciation) | — | (582 | ) | (981 | ) | — | 26 | — | ||||||||||||||||
Undistributed net realized gain | 190,223,883 | 606,325,781 | 506,063,735 | 30,861,757 | — | — | ||||||||||||||||||
Qualified late year loss deferral | (14,518,615 | ) | (6,180,736 | ) | (19,442,337 | ) | (1,981,831 | ) | (610,633 | ) | (755,591 | ) | ||||||||||||
Capital loss carryforwards | — | — | — | — | (5,223,158 | ) | (4,597,889 | ) | ||||||||||||||||
Paid-in capital | 964,537,560 | 1,626,680,505 | 1,820,939,776 | 114,524,645 | 90,786,801 | 208,762,575 | ||||||||||||||||||
|
|
|
|
|
|
|
|
|
|
|
| |||||||||||||
Net Assets | $ | 3,022,554,247 | $ | 6,112,640,050 | $ | 4,236,696,859 | $ | 254,123,735 | $ | 181,670,921 | $ | 247,997,708 | ||||||||||||
|
|
|
|
|
|
|
|
|
|
|
| |||||||||||||
As of September 30, 2017, the Funds had capital loss carryforwards expiring as follows:
| Baron Asset Fund | Baron Growth Fund | Baron Small Cap Fund | Baron Opportunity Fund | Baron Fifth Avenue Growth Fund | Baron Discovery Fund | |||||||||||||||||||
Short term capital loss carryforwards: | ||||||||||||||||||||||||
September 30, 2018 | $ | — | $ | — | $ | — | $ | — | $ | 85,567 | $ | — | ||||||||||||
No expiration date | — | — | — | — | 5,137,591 | 4,597,889 | ||||||||||||||||||
|
|
|
|
|
|
|
|
|
|
|
| |||||||||||||
| $ | — | $ | — | $ | — | $ | — | $ | 5,223,158 | $ | 4,597,889 | |||||||||||||
|
|
|
|
|
|
|
|
|
|
|
| |||||||||||||
Capital loss carryforward utilized during the year ended September 30, 2017 | $ | — | $ | — | $ | — | $ | — | $ | — | $ | — | ||||||||||||
|
|
|
|
|
|
|
|
|
|
|
| |||||||||||||
The tax character of distributions paid during the years ended September 30, 2017 and September 30, 2016 was as follows:
| Year Ended September 30, 2017 | Year Ended September 30, 2016 | |||||||||||||||
| Fund | Ordinary Income1 | Long-Term Capital Gain | Ordinary Income1 | Long-Term Capital Gain | ||||||||||||
Baron Asset Fund | $ | — | $ | 115,002,326 | $ | — | $ | 268,567,375 | ||||||||
Baron Growth Fund | — | 652,001,794 | — | 593,543,313 | ||||||||||||
Baron Small Cap Fund | — | 620,005,422 | — | 449,317,328 | ||||||||||||
Baron Opportunity Fund | — | 27,000,806 | — | 32,674,421 | ||||||||||||
Baron Fifth Avenue Growth Fund | — | — | — | — | ||||||||||||
Baron Discovery Fund | — | — | — | 701,858 | ||||||||||||
| 1 | For tax purposes, short-term capital gains are considered ordinary income distributions. |
37
Table of Contents
| Baron Funds | September 30, 2017 |
NOTES TO FINANCIAL STATEMENTS (Continued)
8. INCOME TAXES AND DISTRIBUTIONS TO SHAREHOLDERS (Continued)
The Funds follow the provisions of FASB Codification Section 740 (“ASC Section 740”) “Accounting for Uncertainty in Income Taxes” which clarifies the accounting for uncertainty in tax positions taken or expected to be taken on a tax return. ASC Section 740 sets forth a threshold for financial statement recognition, measurement and disclosure of tax positions taken or expected to be taken on a tax return. The Funds are required to recognize the tax effects of certain tax positions under a “more likely than not” standard, that based on their technical merits, have more than 50 percent likelihood of being sustained upon examination. Management has analyzed the tax positions taken on the Funds’ federal income tax returns for all open years (current and prior three years), and has concluded that no provision for federal income tax is required in the Funds’ financial statements. At September 30, 2017, the Funds did not have any uncertain tax benefits that require recognition, de-recognition or disclosure. The Funds’ federal, state and local income and federal excise tax returns for which the applicable statutes of limitations have not expired (current and prior three years) are subject to examination by the Internal Revenue Service and state departments of revenue.
9. OWNERSHIP CONCENTRATION
As of September 30, 2017, the officers, trustees, and portfolio managers owned, directly or indirectly, 17.57% of Baron Fifth Avenue Growth Fund. As a result of their ownership, these investors may be able to materially affect the outcome of matters presented to Baron Fifth Avenue Growth Fund shareholders.
10. TRANSACTIONS IN “AFFILIATED” COMPANIES1
BARON GROWTH FUND
| Name of Issuer | Value at September 30, 2016 | Purchase Cost | Sales Proceeds | Change in Net Unrealized Appreciation (Depreciation) | Realized (Losses) | Dividend Income | Shares Held at | Value at September 30, 2017 | % of Net Assets at September 30, 2017 | ||||||||||||||||||||||||||||||||||||
“Affiliated” Company as of September 30, 2017: |
| ||||||||||||||||||||||||||||||||||||||||||||
Benefitfocus, Inc. | $ | 92,789,010 | $ | — | $ | — | $ | (14,573,825 | ) | $ | — | $ | — | 2,324,374 | $ | 78,215,185 | 1.28 | % | |||||||||||||||||||||||||||
Choice Hotels International, Inc. | 135,578,100 | — | — | 56,601,150 | — | 2,586,450 | 3,007,500 | 192,179,250 | 3.14 | % | |||||||||||||||||||||||||||||||||||
Iridium Communications, Inc. | 60,771,774 | — | — | 16,410,627 | — | — | 7,493,437 | 77,182,401 | 1.26 | % | |||||||||||||||||||||||||||||||||||
Iridium Communications, Inc., Series B, 6.75% | 12,353,827 | — | — | 2,574,107 | — | 346,562 | 41,074 | 14,927,934 | 0.24 | % | |||||||||||||||||||||||||||||||||||
Marriott Vacations Worldwide Corp. | 117,312,000 | — | — | 81,936,000 | — | 2,240,000 | 1,600,000 | 199,248,000 | 3.26 | % | |||||||||||||||||||||||||||||||||||
Vail Resorts, Inc. | 323,925,824 | 20,357,722 | — | 156,894,497 | — | 8,078,920 | 2,196,993 | 501,178,043 | 8.20 | % | |||||||||||||||||||||||||||||||||||
|
|
|
|
|
|
|
|
|
|
|
|
|
| ||||||||||||||||||||||||||||||||
| $ | 742,730,535 | $ | 20,357,722 | $ | — | $ | 299,842,556 | — | $ | 13,251,932 | $ | 1,062,930,813 | |||||||||||||||||||||||||||||||||
|
|
|
|
|
|
|
|
|
|
|
|
|
| ||||||||||||||||||||||||||||||||
No Longer an “Affiliated” Company as of September 30, 2017: |
| ||||||||||||||||||||||||||||||||||||||||||||
CaesarStone Ltd. | $ | 78,813,900 | $ | — | $ | 50,438,773 | $ | (23,565,991 | ) | $ | 14,560,864 | $ | — | 650,000 | $ | 19,370,000 | 0.32 | % | |||||||||||||||||||||||||||
Primerica, Inc. | 132,575,000 | — | 34,885,299 | 46,619,276 | 21,237,523 | 1,663,475 | 2,030,000 | 165,546,500 | 2.71 | % | |||||||||||||||||||||||||||||||||||
|
|
|
|
|
|
|
|
|
|
|
|
|
| ||||||||||||||||||||||||||||||||
| $ | 211,388,900 | $ | — | $ | 85,324,072 | $ | 23,053,285 | $ | 35,798,387 | $ | 1,663,475 | $ | 184,916,500 | ||||||||||||||||||||||||||||||||
|
|
|
|
|
|
|
|
|
|
|
|
|
| ||||||||||||||||||||||||||||||||
BARON SMALL CAP FUND
| Name of Issuer | Value at September 30, 2016 | Purchase Cost | Sales Proceeds | Change in Net Unrealized Appreciation (Depreciation) | Realized (Losses) | Dividend Income | Shares Held at | Value at September 30, 2017 | % of Net Assets at September 30, 2017 | ||||||||||||||||||||||||||||||||||||
“Affiliated” Company as of September 30, 2017: |
| ||||||||||||||||||||||||||||||||||||||||||||
The Chefs’ Warehouse, Inc. | $ | 18,721,472 | $ | — | $ | 2,159,866 | $ | 13,339,917 | $ | (951,523 | ) | $ | — | 1,500,000 | $ | 28,950,000 | 0.68 | % | |||||||||||||||||||||||||||
GTT Communications, Inc. | — | 69,319,522 | — | 2,785,508 | — | — | 2,278,200 | 72,105,030 | 1.70 | % | |||||||||||||||||||||||||||||||||||
|
|
|
|
|
|
|
|
|
|
|
|
|
| ||||||||||||||||||||||||||||||||
| $ | 18,721,472 | $ | 69,319,522 | $ | 2,159,866 | $ | 16,125,425 | $ | (951,523 | ) | $ | — | $ | 101,055,030 | |||||||||||||||||||||||||||||||
|
|
|
|
|
|
|
|
|
|
|
|
|
| ||||||||||||||||||||||||||||||||
No Longer an “Affiliated” Company as of September 30, 2017: |
| ||||||||||||||||||||||||||||||||||||||||||||
Cision Ltd. (formerly Capitol Acqusition Corp. III) | $ | — | $ | 64,996,212 | $ | — | $ | 13,123,788 | $ | — | $ | — | 6,000,000 | 78,120,000 | 1.84 | % | |||||||||||||||||||||||||||||
Zoe’s Kitchen, Inc. | 11,095,000 | 15,094,163 | 15,887,822 | 3,896,333 | (14,197,674 | ) | — | — | — | 0.00 | % | ||||||||||||||||||||||||||||||||||
|
|
|
|
|
|
|
|
|
|
|
|
|
| ||||||||||||||||||||||||||||||||
| $ | 11,095,000 | $ | 80,090,375 | $ | 15,887,822 | $ | 17,020,121 | $ | (14,197,674 | ) | $ | — | $ | 78,120,000 | |||||||||||||||||||||||||||||||
|
|
|
|
|
|
|
|
|
|
|
|
|
| ||||||||||||||||||||||||||||||||
| 1 | An “Affiliated” company (“affiliated person�� as defined in the 1940 Act) is a company in which a Fund held 5% or more of the company’s outstanding voting securities at any time during the year ended September 30, 2017. |
11. RECENT ACCOUNTING PRONOUNCEMENTS
In December 2016, FASB issued ASU No. 2016-19, “Technical Corrections and Improvements” (“ASU 2016-19”). The guidance includes an amendment to Topic 820, Fair Value Measurement, which clarifies the difference between a valuation approach and a valuation technique. The amendment also requires an entity to disclose when it has changed either a valuation approach and/or a valuation technique. The guidance is effective for interim and annual reporting periods beginning after December 15, 2016. Management is currently evaluating the impact, if any, of applying this guidance.
38
Table of Contents
| September 30, 2017 | Baron Funds |
BARON ASSET FUND
Selected data for a share outstanding throughout each year:
| RETAIL SHARES | ||||||||||||||||||||||||||||||||||||||||||||||||
| Year Ended September 30, | ||||||||||||||||||||||||||||||||||||||||||||||||
| 2017 | 2016 | 2015 | 2014 | 2013 | 2012 | 2011 | 2010 | 2009 | 2008 | |||||||||||||||||||||||||||||||||||||||
Net asset value, beginning of year | $ | 60.67 | $ | 60.88 | $ | 63.75 | $ | 61.37 | $ | 52.03 | $ | 49.00 | $ | 49.27 | $ | 43.62 | $ | 52.12 | $ | 66.57 | ||||||||||||||||||||||||||||
|
|
|
|
|
|
|
|
|
|
|
|
|
|
|
|
|
|
|
| |||||||||||||||||||||||||||||
Income (loss) from investment operations: |
| |||||||||||||||||||||||||||||||||||||||||||||||
Net investment loss | (0.48 | )1 | (0.25 | )1 | (0.41 | )1 | (0.44 | )1 | (0.34 | )1 | (0.14 | )1 | (0.23 | )1 | (0.28 | )1 | (0.20 | )1 | (0.29 | )1 | ||||||||||||||||||||||||||||
Net realized and unrealized gain (loss) on investments | 13.48 | 6.63 | 1.71 | 8.42 | 13.44 | 10.94 | 0.73 | 5.93 | (5.68 | ) | (12.08 | ) | ||||||||||||||||||||||||||||||||||||
|
|
|
|
|
|
|
|
|
|
|
|
|
|
|
|
|
|
|
| |||||||||||||||||||||||||||||
Total from investment operations | 13.00 | 6.38 | 1.30 | 7.98 | 13.10 | 10.80 | 0.50 | 5.65 | (5.88 | ) | (12.37 | ) | ||||||||||||||||||||||||||||||||||||
|
|
|
|
|
|
|
|
|
|
|
|
|
|
|
|
|
|
|
| |||||||||||||||||||||||||||||
Less distributions to shareholders from: |
| |||||||||||||||||||||||||||||||||||||||||||||||
Net investment income | 0.00 | 0.00 | 0.00 | 0.00 | 0.00 | 0.00 | 0.00 | 0.00 | 0.00 | 0.00 | ||||||||||||||||||||||||||||||||||||||
Net realized gain on investments | (2.80 | ) | (6.59 | ) | (4.17 | ) | (5.60 | ) | (3.76 | ) | (7.77 | ) | (0.77 | ) | 0.00 | (2.62 | ) | (2.08 | ) | |||||||||||||||||||||||||||||
|
|
|
|
|
|
|
|
|
|
|
|
|
|
|
|
|
|
|
| |||||||||||||||||||||||||||||
Total distributions | (2.80 | ) | (6.59 | ) | (4.17 | ) | (5.60 | ) | (3.76 | ) | (7.77 | ) | (0.77 | ) | 0.00 | (2.62 | ) | (2.08 | ) | |||||||||||||||||||||||||||||
|
|
|
|
|
|
|
|
|
|
|
|
|
|
|
|
|
|
|
| |||||||||||||||||||||||||||||
Net asset value, end of year | $ | 70.87 | $ | 60.67 | $ | 60.88 | $ | 63.75 | $ | 61.37 | $ | 52.03 | $ | 49.00 | $ | 49.27 | $ | 43.62 | $ | 52.12 | ||||||||||||||||||||||||||||
|
|
|
|
|
|
|
|
|
|
|
|
|
|
|
|
|
|
|
| |||||||||||||||||||||||||||||
Total return | 22.41 | % | 11.14 | % | 1.81 | % | 13.59 | % | 27.17 | % | 24.65 | % | 0.85 | % | 12.95 | % | (9.88 | )% | (19.14 | )% | ||||||||||||||||||||||||||||
|
|
|
|
|
|
|
|
|
|
|
|
|
|
|
|
|
|
|
| |||||||||||||||||||||||||||||
Ratios/Supplemental data: | ||||||||||||||||||||||||||||||||||||||||||||||||
Net assets (in millions), end of year | $ | 1,979.1 | $ | 1,802.6 | $ | 1,804.3 | $ | 2,000.5 | $ | 2,024.2 | $ | 1,845.6 | $ | 1,924.9 | $ | 2,424.2 | $ | 2,652.6 | $ | 3,311.8 | ||||||||||||||||||||||||||||
|
|
|
|
|
|
|
|
|
|
|
|
|
|
|
|
|
|
|
| |||||||||||||||||||||||||||||
Ratio of operating expenses to average net assets | 1.31 | % | 1.31 | % | 1.31 | % | 1.31 | % | 1.32 | % | 1.33 | % | 1.33 | % | 1.32 | % | 1.36 | %2 | 1.33 | %2 | ||||||||||||||||||||||||||||
|
|
|
|
|
|
|
|
|
|
|
|
|
|
|
|
|
|
|
| |||||||||||||||||||||||||||||
Ratio of net investment loss to average net assets | (0.75 | )% | (0.43 | )% | (0.62 | )% | (0.70 | )% | (0.62 | )% | (0.28 | )% | (0.41 | )% | (0.61 | )% | (0.54 | )% | (0.49 | )% | ||||||||||||||||||||||||||||
|
|
|
|
|
|
|
|
|
|
|
|
|
|
|
|
|
|
|
| |||||||||||||||||||||||||||||
Portfolio turnover rate | 10.35 | % | 12.54 | % | 13.53 | % | 11.26 | % | 12.04 | % | 13.11 | % | 23.89 | % | 13.04 | % | 14.67 | % | 16.02 | % | ||||||||||||||||||||||||||||
|
|
|
|
|
|
|
|
|
|
|
|
|
|
|
|
|
|
|
| |||||||||||||||||||||||||||||
| INSTITUTIONAL SHARES | R6 SHARES | |||||||||||||||||||||||||||||||||||||||||||||||
| Year Ended September 30, | Year Ended September 30, | |||||||||||||||||||||||||||||||||||||||||||||||
| 2017 | 2016 | 2015 | 2014 | 2013 | 2012 | 2011 | 2010 | 20093 | 2017 | 20166 | ||||||||||||||||||||||||||||||||||||||
Net asset value, beginning of year | $ | 62.30 | $ | 62.19 | $ | 64.87 | $ | 62.20 | $ | 52.55 | $ | 49.30 | $ | 49.43 | $ | 43.65 | $ | 37.38 | $ | 62.30 | $ | 53.85 | ||||||||||||||||||||||||||
|
|
|
|
|
|
|
|
|
|
|
|
|
|
|
|
|
|
|
|
|
| |||||||||||||||||||||||||||
Income (loss) from investment operations: |
| |||||||||||||||||||||||||||||||||||||||||||||||
Net investment income (loss) | (0.33 | )1 | (0.10 | )1 | (0.24 | )1 | (0.28 | )1 | (0.21 | )1 | 0.01 | 1 | (0.10 | )1 | (0.15 | )1 | (0.05 | )1 | (0.34 | )1 | (0.21 | )1 | ||||||||||||||||||||||||||
Net realized and unrealized gain on investments | 13.90 | 6.80 | 1.73 | 8.55 | 13.62 | 11.01 | 0.74 | 5.93 | 6.32 | 13.90 | 8.68 | |||||||||||||||||||||||||||||||||||||
|
|
|
|
|
|
|
|
|
|
|
|
|
|
|
|
|
|
|
|
|
| |||||||||||||||||||||||||||
Total from investment operations | 13.57 | 6.70 | 1.49 | 8.27 | 13.41 | 11.02 | 0.64 | 5.78 | 6.27 | 13.56 | 8.47 | |||||||||||||||||||||||||||||||||||||
|
|
|
|
|
|
|
|
|
|
|
|
|
|
|
|
|
|
|
|
|
| |||||||||||||||||||||||||||
Less distributions to shareholders from: |
| |||||||||||||||||||||||||||||||||||||||||||||||
Net investment income | 0.00 | 0.00 | 0.00 | 0.00 | 0.00 | 0.00 | 0.00 | 0.00 | 0.00 | 0.00 | 0.00 | |||||||||||||||||||||||||||||||||||||
Net realized gain on investments | (2.80 | ) | (6.59 | ) | (4.17 | ) | (5.60 | ) | (3.76 | ) | (7.77 | ) | (0.77 | ) | 0.00 | 0.00 | (2.80 | ) | (0.02 | ) | ||||||||||||||||||||||||||||
|
|
|
|
|
|
|
|
|
|
|
|
|
|
|
|
|
|
|
|
|
| |||||||||||||||||||||||||||
Total distributions | (2.80 | ) | (6.59 | ) | (4.17 | ) | (5.60 | ) | (3.76 | ) | (7.77 | ) | (0.77 | ) | 0.00 | 0.00 | (2.80 | ) | (0.02 | ) | ||||||||||||||||||||||||||||
|
|
|
|
|
|
|
|
|
|
|
|
|
|
|
|
|
|
|
|
|
| |||||||||||||||||||||||||||
Net asset value, end of year | $ | 73.07 | $ | 62.30 | $ | 62.19 | $ | 64.87 | $ | 62.20 | $ | 52.55 | $ | 49.30 | $ | 49.43 | $ | 43.65 | $ | 73.06 | $ | 62.30 | ||||||||||||||||||||||||||
|
|
|
|
|
|
|
|
|
|
|
|
|
|
|
|
|
|
|
|
|
| |||||||||||||||||||||||||||
Total return | 22.76 | % | 11.44 | % | 2.09 | % | 13.90 | % | 27.51 | % | 24.99 | % | 1.14 | % | 13.24 | % | 16.77 | %4 | 22.74 | % | 15.73 | %4 | ||||||||||||||||||||||||||
|
|
|
|
|
|
|
|
|
|
|
|
|
|
|
|
|
|
|
|
|
| |||||||||||||||||||||||||||
Ratios/Supplemental data: | ||||||||||||||||||||||||||||||||||||||||||||||||
Net assets (in millions), end of year | $ | 1,021.0 | $ | 723.3 | $ | 719.1 | $ | 689.8 | $ | 506.1 | $ | 386.7 | $ | 288.9 | $ | 242.8 | $ | 82.3 | $ | 22.5 | $ | 7.8 | ||||||||||||||||||||||||||
|
|
|
|
|
|
|
|
|
|
|
|
|
|
|
|
|
|
|
|
|
| |||||||||||||||||||||||||||
Ratio of operating expenses to average net assets | 1.04 | % | 1.04 | % | 1.04 | % | 1.04 | % | 1.05 | % | 1.06 | % | 1.06 | % | 1.06 | % | 1.16 | %5 | 1.04 | % | 1.04 | %5 | ||||||||||||||||||||||||||
|
|
|
|
|
|
|
|
|
|
|
|
|
|
|
|
|
|
|
|
|
| |||||||||||||||||||||||||||
Ratio of net investment income (loss) to average net assets | (0.50 | )% | (0.17 | )% | (0.36 | )% | (0.43 | )% | (0.38 | )% | 0.02 | % | (0.18 | )% | (0.33 | )% | (0.39 | )%5 | (0.51 | )% | (0.52 | )%5 | ||||||||||||||||||||||||||
|
|
|
|
|
|
|
|
|
|
|
|
|
|
|
|
|
|
|
|
|
| |||||||||||||||||||||||||||
Portfolio turnover rate | 10.35 | % | 12.54 | % | 13.53 | % | 11.26 | % | 12.04 | % | 13.11 | % | 23.89 | % | 13.04 | % | 14.67 | % | 10.35 | % | 12.54 | % | ||||||||||||||||||||||||||
|
|
|
|
|
|
|
|
|
|
|
|
|
|
|
|
|
|
|
|
|
| |||||||||||||||||||||||||||
1 Based on average shares outstanding. 2 Benefit of expense reduction rounds to less than 0.01%. 3 For the period May 29, 2009 (initial offering of Institutional Shares) to September 30, 2009. | 4 Not Annualized. 5 Annualized. 6 For the period January 29, 2016 (initial offering of R6 Shares) to September 30, 2016. |
| See Notes to Financial Statements. | 39 |
Table of Contents
| Baron Funds | September 30, 2017 |
FINANCIAL HIGHLIGHTS (Continued)
BARON GROWTH FUND
Selected data for a share outstanding throughout each year:
| RETAIL SHARES | ||||||||||||||||||||||||||||||||||||||||||||||||
| Year Ended September 30, | ||||||||||||||||||||||||||||||||||||||||||||||||
| 2017 | 2016 | 2015 | 2014 | 2013 | 2012 | 2011 | 2010 | 2009 | 2008 | |||||||||||||||||||||||||||||||||||||||
Net asset value, beginning of year | $ | 67.13 | $ | 68.25 | $ | 70.46 | $ | 68.67 | $ | 58.19 | $ | 46.18 | $ | 44.37 | $ | 39.00 | $ | 41.69 | $ | 54.55 | ||||||||||||||||||||||||||||
|
|
|
|
|
|
|
|
|
|
|
|
|
|
|
|
|
|
|
| |||||||||||||||||||||||||||||
Income (loss) from investment operations: |
| |||||||||||||||||||||||||||||||||||||||||||||||
Net investment income (loss) | (0.16 | )1 | 0.08 | 1 | (0.27 | )1 | 0.06 | 1 | (0.12 | )1 | 0.20 | 1 | (0.29 | )1 | (0.34 | )1 | (0.18 | )1 | (0.28 | )1 | ||||||||||||||||||||||||||||
Net realized and unrealized gain (loss) on investments | 12.44 | 4.83 | 1.28 | 3.45 | 16.37 | 12.64 | 2.10 | 5.71 | (2.47 | ) | (10.07 | ) | ||||||||||||||||||||||||||||||||||||
|
|
|
|
|
|
|
|
|
|
|
|
|
|
|
|
|
|
|
| |||||||||||||||||||||||||||||
Total from investment operations | 12.28 | 4.91 | 1.01 | 3.51 | 16.25 | 12.84 | 1.81 | 5.37 | (2.65 | ) | (10.35 | ) | ||||||||||||||||||||||||||||||||||||
|
|
|
|
|
|
|
|
|
|
|
|
|
|
|
|
|
|
|
| |||||||||||||||||||||||||||||
Less distributions to shareholders from: |
| |||||||||||||||||||||||||||||||||||||||||||||||
Net investment income | 0.00 | 0.00 | 0.00 | (0.03 | ) | (0.18 | ) | 0.00 | 0.00 | 0.00 | 0.00 | 0.00 | ||||||||||||||||||||||||||||||||||||
Net realized gain on investments | (7.64 | ) | (6.03 | ) | (3.22 | ) | (1.69 | ) | (5.59 | ) | (0.83 | ) | 0.00 | 0.00 | (0.04 | ) | (2.51 | ) | ||||||||||||||||||||||||||||||
|
|
|
|
|
|
|
|
|
|
|
|
|
|
|
|
|
|
|
| |||||||||||||||||||||||||||||
Total distributions | (7.64 | ) | (6.03 | ) | (3.22 | ) | (1.72 | ) | (5.77 | ) | (0.83 | ) | 0.00 | 0.00 | (0.04 | ) | (2.51 | ) | ||||||||||||||||||||||||||||||
|
|
|
|
|
|
|
|
|
|
|
|
|
|
|
|
|
|
|
| |||||||||||||||||||||||||||||
Net asset value, end of year | $ | 71.77 | $ | 67.13 | $ | 68.25 | $ | 70.46 | $ | 68.67 | $ | 58.19 | $ | 46.18 | $ | 44.37 | $ | 39.00 | $ | 41.69 | ||||||||||||||||||||||||||||
|
|
|
|
|
|
|
|
|
|
|
|
|
|
|
|
|
|
|
| |||||||||||||||||||||||||||||
Total return | 20.47 | % | 7.60 | % | 1.27 | % | 5.11 | % | 30.76 | % | 28.12 | % | 4.08 | % | 13.77 | % | (6.34 | )% | (19.78 | )% | ||||||||||||||||||||||||||||
|
|
|
|
|
|
|
|
|
|
|
|
|
|
|
|
|
|
|
| |||||||||||||||||||||||||||||
Ratios/Supplemental data: | ||||||||||||||||||||||||||||||||||||||||||||||||
Net assets (in millions), end of year | $ | 2,666.6 | $ | 2,917.2 | $ | 3,511.2 | $ | 4,076.1 | $ | 4,644.2 | $ | 4,073.5 | $ | 4,110.8 | $ | 4,842.8 | $ | 5,034.5 | $ | 5,615.0 | ||||||||||||||||||||||||||||
|
|
|
|
|
|
|
|
|
|
|
|
|
|
|
|
|
|
|
| |||||||||||||||||||||||||||||
Ratio of operating expenses to average net assets | 1.30 | %4 | 1.30 | %4 | 1.29 | %4 | 1.29 | %4 | 1.30 | % | 1.32 | % | 1.32 | % | 1.32 | % | 1.35 | %2 | 1.32 | %2 | ||||||||||||||||||||||||||||
|
|
|
|
|
|
|
|
|
|
|
|
|
|
|
|
|
|
|
| |||||||||||||||||||||||||||||
Ratio of net investment income (loss) to average net assets | (0.25 | )% | 0.12 | % | (0.37 | )% | 0.08 | % | (0.20 | )% | 0.38 | % | (0.56 | )% | (0.80 | )% | (0.56 | )% | (0.59 | )% | ||||||||||||||||||||||||||||
|
|
|
|
|
|
|
|
|
|
|
|
|
|
|
|
|
|
|
| |||||||||||||||||||||||||||||
Portfolio turnover rate | 3.32 | % | 4.68 | % | 6.95 | % | 13.15 | % | 9.63 | % | 13.70 | % | 13.51 | % | 16.12 | % | 26.65 | % | 25.97 | % | ||||||||||||||||||||||||||||
|
|
|
|
|
|
|
|
|
|
|
|
|
|
|
|
|
|
|
| |||||||||||||||||||||||||||||
| INSTITUTIONAL SHARES | R6 SHARES | |||||||||||||||||||||||||||||||||||||||||||||||
| Year Ended September 30, | Year Ended September 30, | |||||||||||||||||||||||||||||||||||||||||||||||
| 2017 | 2016 | 2015 | 2014 | 2013 | 2012 | 2011 | 2010 | 20093 | 2017 | 20169 | ||||||||||||||||||||||||||||||||||||||
Net asset value, beginning of year | $ | 68.42 | $ | 69.28 | $ | 71.33 | $ | 69.32 | $ | 58.70 | $ | 46.46 | $ | 44.52 | $ | 39.03 | $ | 33.71 | $ | 68.42 | $ | 60.02 | ||||||||||||||||||||||||||
|
|
|
|
|
|
|
|
|
|
|
|
|
|
|
|
|
|
|
|
|
| |||||||||||||||||||||||||||
Income (loss) from investment operations: |
| |||||||||||||||||||||||||||||||||||||||||||||||
Net investment income (loss) | 0.00 | 1,7 | 0.24 | 1 | (0.09 | )1 | 0.20 | 1 | 0.02 | 1 | 0.45 | 1 | (0.17 | )1 | (0.22 | )1 | (0.04 | )1 | (0.11 | )1 | (0.15 | )1 | ||||||||||||||||||||||||||
Net realized and unrealized gain on investments | 12.74 | 4.93 | 1.28 | 3.53 | 16.52 | 12.62 | 2.11 | 5.71 | 5.36 | 12.85 | 8.55 | |||||||||||||||||||||||||||||||||||||
|
|
|
|
|
|
|
|
|
|
|
|
|
|
|
|
|
|
|
|
|
| |||||||||||||||||||||||||||
Total from investment operations | 12.74 | 5.17 | 1.19 | 3.73 | 16.54 | 13.07 | 1.94 | 5.49 | 5.32 | 12.74 | 8.40 | |||||||||||||||||||||||||||||||||||||
|
|
|
|
|
|
|
|
|
|
|
|
|
|
|
|
|
|
|
|
|
| |||||||||||||||||||||||||||
Less distributions to shareholders from: |
| |||||||||||||||||||||||||||||||||||||||||||||||
Net investment income | 0.00 | 0.00 | (0.02 | ) | (0.03 | ) | (0.33 | ) | 0.00 | 0.00 | 0.00 | 0.00 | 0.00 | 0.00 | ||||||||||||||||||||||||||||||||||
Net realized gain on investments | (7.64 | ) | (6.03 | ) | (3.22 | ) | (1.69 | ) | (5.59 | ) | (0.83 | ) | 0.00 | 0.00 | 0.00 | (7.64 | ) | 0.00 | ||||||||||||||||||||||||||||||
|
|
|
|
|
|
|
|
|
|
|
|
|
|
|
|
|
|
|
|
|
| |||||||||||||||||||||||||||
Total distributions | (7.64 | ) | (6.03 | ) | (3.24 | ) | (1.72 | ) | (5.92 | ) | (0.83 | ) | 0.00 | 0.00 | 0.00 | (7.64 | ) | 0.00 | ||||||||||||||||||||||||||||||
|
|
|
|
|
|
|
|
|
|
|
|
|
|
|
|
|
|
|
| �� |
| |||||||||||||||||||||||||||
Net asset value, end of year | $ | 73.52 | $ | 68.42 | $ | 69.28 | $ | 71.33 | $ | 69.32 | $ | 58.70 | $ | 46.46 | $ | 44.52 | $ | 39.03 | $ | 73.52 | $ | 68.42 | ||||||||||||||||||||||||||
|
|
|
|
|
|
|
|
|
|
|
|
|
|
|
|
|
|
|
|
|
| |||||||||||||||||||||||||||
Total return | 20.79 | % | 7.88 | % | 1.51 | % | 5.39 | % | 31.10 | % | 28.45 | % | 4.36 | % | 14.07 | % | 15.78 | %5 | 20.79 | % | 14.00 | %5 | ||||||||||||||||||||||||||
|
|
|
|
|
|
|
|
|
|
|
|
|
|
|
|
|
|
|
|
|
| |||||||||||||||||||||||||||
Ratios/Supplemental data: | ||||||||||||||||||||||||||||||||||||||||||||||||
Net assets (in millions), end of year | $ | 3,433.5 | $ | 3,043.3 | $ | 3,440.4 | $ | 3,694.5 | $ | 2,976.7 | $ | 1,747.3 | $ | 1,261.8 | $ | 728.9 | $ | 238.7 | $ | 12.5 | $ | 2.3 | ||||||||||||||||||||||||||
|
|
|
|
|
|
|
|
|
|
|
|
|
|
|
|
|
|
|
|
|
| |||||||||||||||||||||||||||
Ratio of operating expenses to average net assets | 1.04 | %4 | 1.05 | %4 | 1.04 | %4 | 1.04 | %4 | 1.05 | % | 1.06 | % | 1.06 | % | 1.06 | % | 1.13 | %6 | 1.05 | %4 | 1.05 | %4,6 | ||||||||||||||||||||||||||
|
|
|
|
|
|
|
|
|
|
|
|
|
|
|
|
|
|
|
|
|
| |||||||||||||||||||||||||||
Ratio of net investment income (loss) to average net assets | 0.00 | %8 | 0.37 | % | (0.12 | )% | 0.28 | % | 0.04 | % | 0.83 | % | (0.33 | )% | (0.53 | )% | (0.29 | )%6 | (0.15 | )% | (0.33 | )%6 | ||||||||||||||||||||||||||
|
|
|
|
|
|
|
|
|
|
|
|
|
|
|
|
|
|
|
|
|
| |||||||||||||||||||||||||||
Portfolio turnover rate | 3.32 | % | 4.68 | % | 6.95 | % | 13.15 | % | 9.63 | % | 13.70 | % | 13.51 | % | 16.12 | % | 26.65 | % | 3.32 | % | 4.68 | % | ||||||||||||||||||||||||||
|
|
|
|
|
|
|
|
|
|
|
|
|
|
|
|
|
|
|
|
|
| |||||||||||||||||||||||||||
1 Based on average shares outstanding. 2 Benefit of expense reduction rounds to less than 0.01%. 3 For the period May 29, 2009 (initial offering of Institutional Shares) to September 30, 2009. 4 Interest expense rounds to less than 0.01%. 5 Not Annualized. | 6 Annualized. 7 Less than $0.01 per share. 8 Less than 0.01%. 9 For the period January 29, 2016 (initial offering of R6 Shares) to September 30, 2016. |
| 40 | See Notes to Financial Statements. |
Table of Contents
| September 30, 2017 | Baron Funds |
FINANCIAL HIGHLIGHTS (Continued)
BARON SMALL CAP FUND
Selected data for a share outstanding throughout each year:
| RETAIL SHARES | ||||||||||||||||||||||||||||||||||||||||||||||||
| Year Ended September 30, | ||||||||||||||||||||||||||||||||||||||||||||||||
| 2017 | 2016 | 2015 | 2014 | 2013 | 2012 | 2011 | 2010 | 2009 | 2008 | |||||||||||||||||||||||||||||||||||||||
Net asset value, beginning of year | $ | 30.59 | $ | 30.34 | $ | 33.68 | $ | 32.83 | $ | 26.14 | $ | 20.84 | $ | 20.90 | $ | 17.96 | $ | 18.70 | $ | 25.47 | ||||||||||||||||||||||||||||
|
|
|
|
|
|
|
|
|
|
|
|
|
|
|
|
|
|
|
| |||||||||||||||||||||||||||||
Income (loss) from investment operations: |
| |||||||||||||||||||||||||||||||||||||||||||||||
Net investment loss | (0.04 | )1 | (0.18 | )1 | (0.21 | )1 | (0.01 | )1 | (0.12 | )1 | (0.19 | )1 | (0.15 | )1 | (0.06 | )1 | (0.13 | )1 | (0.09 | )1 | ||||||||||||||||||||||||||||
Net realized and unrealized gain (loss) on investments | 5.77 | 3.84 | (1.10 | ) | 2.14 | 7.61 | 5.96 | 0.09 | 2 | 3.00 | (0.61 | ) | (5.01 | ) | ||||||||||||||||||||||||||||||||||
|
|
|
|
|
|
|
|
|
|
|
|
|
|
|
|
|
|
|
| |||||||||||||||||||||||||||||
Total from investment operations | 5.73 | 3.66 | (1.31 | ) | 2.13 | 7.49 | 5.77 | (0.06 | ) | 2.94 | (0.74 | ) | (5.10 | ) | ||||||||||||||||||||||||||||||||||
|
|
|
|
|
|
|
|
|
|
|
|
|
|
|
|
|
|
|
| |||||||||||||||||||||||||||||
Less distributions to shareholders from: |
| |||||||||||||||||||||||||||||||||||||||||||||||
Net investment income | 0.00 | 0.00 | 0.00 | 0.00 | 0.00 | 0.00 | 0.00 | 0.00 | 0.00 | 0.00 | ||||||||||||||||||||||||||||||||||||||
Net realized gain on investments | (5.68 | ) | (3.41 | ) | (2.03 | ) | (1.28 | ) | (0.80 | ) | (0.47 | ) | 0.00 | 0.00 | (0.00 | )3 | (1.67 | ) | ||||||||||||||||||||||||||||||
|
|
|
|
|
|
|
|
|
|
|
|
|
|
|
|
|
|
|
| |||||||||||||||||||||||||||||
Total distributions | (5.68 | ) | (3.41 | ) | (2.03 | ) | (1.28 | ) | (0.80 | ) | (0.47 | ) | 0.00 | 0.00 | (0.00 | ) | (1.67 | ) | ||||||||||||||||||||||||||||||
|
|
|
|
|
|
|
|
|
|
|
|
|
|
|
|
|
|
|
| |||||||||||||||||||||||||||||
Net asset value, end of year | $ | 30.64 | $ | 30.59 | $ | 30.34 | $ | 33.68 | $ | 32.83 | $ | 26.14 | $ | 20.84 | $ | 20.90 | $ | 17.96 | $ | 18.70 | ||||||||||||||||||||||||||||
|
|
|
|
|
|
|
|
|
|
|
|
|
|
|
|
|
|
|
| |||||||||||||||||||||||||||||
Total return | 22.45 | % | 12.89 | % | (4.32 | )% | 6.52 | % | 29.51 | % | 28.09 | % | (0.29 | )% | 16.37 | % | (3.95 | )% | (21.44 | )% | ||||||||||||||||||||||||||||
|
|
|
|
|
|
|
|
|
|
|
|
|
|
|
|
|
|
|
| |||||||||||||||||||||||||||||
Ratios/Supplemental data: | ||||||||||||||||||||||||||||||||||||||||||||||||
Net assets (in millions), end of year | $ | 1,730.3 | $ | 1,826.3 | $ | 2,601.4 | $ | 3,192.8 | $ | 3,626.1 | $ | 3,081.8 | $ | 2,842.0 | $ | 3,032.0 | $ | 2,719.4 | $ | 2,871.6 | ||||||||||||||||||||||||||||
|
|
|
|
|
|
|
|
|
|
|
|
|
|
|
|
|
|
|
| |||||||||||||||||||||||||||||
Ratio of operating expenses to average net assets | 1.31 | %8 | 1.32 | %8 | 1.30 | % | 1.30 | % | 1.31 | % | 1.31 | % | 1.31 | % | 1.31 | % | 1.34 | %4 | 1.32 | %4 | ||||||||||||||||||||||||||||
|
|
|
|
|
|
|
|
|
|
|
|
|
|
|
|
|
|
|
| |||||||||||||||||||||||||||||
Ratio of net investment loss to average net assets | (0.15 | )% | (0.64 | )% | (0.61 | )% | (0.04 | )% | (0.42 | )% | (0.76 | )% | (0.63 | )% | (0.30 | )% | (0.86 | )% | (0.42 | )% | ||||||||||||||||||||||||||||
|
|
|
|
|
|
|
|
|
|
|
|
|
|
|
|
|
|
|
| |||||||||||||||||||||||||||||
Portfolio turnover rate | 28.95 | % | 10.25 | % | 14.66 | % | 16.41 | % | 20.35 | % | 28.02 | % | 32.81 | % | 27.22 | % | 35.83 | % | 41.52 | % | ||||||||||||||||||||||||||||
|
|
|
|
|
|
|
|
|
|
|
|
|
|
|
|
|
|
|
| |||||||||||||||||||||||||||||
| INSTITUTIONAL SHARES | R6 SHARES | |||||||||||||||||||||||||||||||||||||||||||||||
| Year Ended September 30, | Year Ended September 30, | |||||||||||||||||||||||||||||||||||||||||||||||
| 2017 | 2016 | 2015 | 2014 | 2013 | 2012 | 2011 | 2010 | 20095 | 2017 | 20169 | ||||||||||||||||||||||||||||||||||||||
Net asset value, beginning of year | $ | 31.29 | $ | 30.88 | $ | 34.16 | $ | 33.20 | $ | 26.36 | $ | 20.96 | $ | 20.97 | $ | 17.97 | $ | 15.52 | $ | 31.29 | $ | 26.06 | ||||||||||||||||||||||||||
|
|
|
|
|
|
|
|
|
|
|
|
|
|
|
|
|
|
|
|
|
| |||||||||||||||||||||||||||
Income (loss) from investment operations: |
| |||||||||||||||||||||||||||||||||||||||||||||||
Net investment income (loss) | 0.02 | 1 | (0.12 | )1 | (0.13 | )1 | 0.06 | 1 | (0.05 | )1 | (0.13 | )1 | (0.10 | )1 | (0.03 | )1 | (0.04 | )1 | (0.08 | )1 | (0.17 | )1 | ||||||||||||||||||||||||||
Net realized and unrealized gain (loss) on investments | 5.95 | 3.94 | (1.12 | ) | 2.18 | 7.69 | 6.00 | 0.09 | 2 | 3.03 | 2.49 | 6.04 | 5.40 | |||||||||||||||||||||||||||||||||||
|
|
|
|
|
|
|
|
|
|
|
|
|
|
|
|
|
|
|
|
|
| |||||||||||||||||||||||||||
Total from investment operations | 5.97 | 3.82 | (1.25 | ) | 2.24 | 7.64 | 5.87 | (0.01 | ) | 3.00 | 2.45 | 5.96 | 5.23 | |||||||||||||||||||||||||||||||||||
|
|
|
|
|
|
|
|
|
|
|
|
|
|
|
|
|
|
|
|
|
| |||||||||||||||||||||||||||
Less distributions to shareholders from: |
| |||||||||||||||||||||||||||||||||||||||||||||||
Net investment income | 0.00 | 0.00 | 0.00 | 0.00 | 0.00 | 0.00 | 0.00 | 0.00 | 0.00 | 0.00 | 0.00 | |||||||||||||||||||||||||||||||||||||
Net realized gain on investments | (5.68 | ) | (3.41 | ) | (2.03 | ) | (1.28 | ) | (0.80 | ) | (0.47 | ) | 0.00 | 0.00 | 0.00 | (5.68 | ) | 0.00 | ||||||||||||||||||||||||||||||
|
|
|
|
|
|
|
|
|
|
|
|
|
|
|
|
|
|
|
|
|
| |||||||||||||||||||||||||||
Total distributions | (5.68 | ) | (3.41 | ) | (2.03 | ) | (1.28 | ) | (0.80 | ) | (0.47 | ) | 0.00 | 0.00 | 0.00 | (5.68 | ) | 0.00 | ||||||||||||||||||||||||||||||
|
|
|
|
|
|
|
|
|
|
|
|
|
|
|
|
|
|
|
|
|
| |||||||||||||||||||||||||||
Net asset value, end of year | $ | 31.58 | $ | 31.29 | $ | 30.88 | $ | 34.16 | $ | 33.20 | $ | 26.36 | $ | 20.96 | $ | 20.97 | $ | 17.97 | $ | 31.57 | $ | 31.29 | ||||||||||||||||||||||||||
|
|
|
|
|
|
|
|
|
|
|
|
|
|
|
|
|
|
|
|
|
| |||||||||||||||||||||||||||
Total return | 22.76 | % | 13.21 | % | (4.08 | )% | 6.79 | % | 29.85 | % | 28.41 | % | (0.05 | )% | 16.69 | % | 15.79 | %6 | 22.72 | % | 20.07 | %6 | ||||||||||||||||||||||||||
|
|
|
|
|
|
|
|
|
|
|
|
|
|
|
|
|
|
|
|
|
| |||||||||||||||||||||||||||
Ratios/Supplemental data: | ||||||||||||||||||||||||||||||||||||||||||||||||
Net assets (in millions), end of year | $ | 2,404.6 | $ | 1,680.7 | $ | 1,923.2 | $ | 2,057.4 | $ | 1,775.7 | $ | 1,111.0 | $ | 518.6 | $ | 261.1 | $ | 89.4 | $ | 101.8 | $ | 3.7 | ||||||||||||||||||||||||||
|
|
|
|
|
|
|
|
|
|
|
|
|
|
|
|
|
|
|
|
|
| |||||||||||||||||||||||||||
Ratio of operating expenses to average net assets | 1.05 | %8 | 1.06 | %8 | 1.04 | % | 1.04 | % | 1.05 | % | 1.05 | % | 1.06 | % | 1.06 | % | 1.16 | %7 | 1.06 | %8 | 1.06 | %7,8 | ||||||||||||||||||||||||||
|
|
|
|
|
|
|
|
|
|
|
|
|
|
|
|
|
|
|
|
|
| |||||||||||||||||||||||||||
Ratio of net investment income (loss) to average net assets | 0.06 | % | (0.41 | )% | (0.37 | )% | 0.18 | % | (0.16 | )% | (0.53 | )% | (0.42 | )% | (0.15 | )% | (0.75 | )%7 | (0.28 | )% | (0.85 | )%7 | ||||||||||||||||||||||||||
|
|
|
|
|
|
|
|
|
|
|
|
|
|
|
|
|
|
|
|
|
| |||||||||||||||||||||||||||
Portfolio turnover rate | 28.95 | % | 10.25 | % | 14.66 | % | 16.41 | % | 20.35 | % | 28.02 | % | 32.81 | % | 27.22 | % | 35.83 | % | 28.95 | % | 10.25 | % | ||||||||||||||||||||||||||
|
|
|
|
|
|
|
|
|
|
|
|
|
|
|
|
|
|
|
|
|
| |||||||||||||||||||||||||||
1 Based on average shares outstanding. 2 The amount shown for a share outstanding does not correspond with the aggregate realized and unrealized gain (loss) on investments for the period due to the timing of sales and redemptions of Fund shares in relation to fluctuating market values of investments of the Fund. 3 Less than $0.01 per share. 4 Benefit of expense reduction rounds to less than 0.01%. | 5 For the period May 29, 2009 (initial offering of Institutional Shares) to September 30, 2009. 6 Not Annualized. 7 Annualized. 8 Interest expense rounds to less than 0.01%. 9 For the period January 29, 2016 (initial offering of R6 Shares) to September 30, 2016. |
| See Notes to Financial Statements. | 41 |
Table of Contents
| Baron Funds | September 30, 2017 |
FINANCIAL HIGHLIGHTS
BARON OPPORTUNITY FUND
Selected data for a share outstanding throughout each year:
| RETAIL SHARES | ||||||||||||||||||||||||||||||||||||||||||||||||
| Year Ended September 30, | ||||||||||||||||||||||||||||||||||||||||||||||||
| 2017 | 2016 | 2015 | 2014 | 2013 | 2012 | 2011 | 2010 | 2009 | 2008 | |||||||||||||||||||||||||||||||||||||||
Net asset value, beginning of year | $ | 16.87 | $ | 17.12 | $ | 18.61 | $ | 19.26 | $ | 15.61 | $ | 12.83 | $ | 12.76 | $ | 10.61 | $ | 9.90 | $ | 13.01 | ||||||||||||||||||||||||||||
|
|
|
|
|
|
|
|
|
|
|
|
|
|
|
|
|
|
|
| |||||||||||||||||||||||||||||
Income (loss) from investment operations: |
| |||||||||||||||||||||||||||||||||||||||||||||||
Net investment loss | (0.20 | )1 | (0.13 | )1 | (0.21 | )1 | (0.24 | )1 | (0.17 | )1 | (0.17 | )1 | (0.16 | )1 | (0.13 | )1 | (0.08 | )1 | (0.09 | )1 | ||||||||||||||||||||||||||||
Net realized and unrealized gain (loss) on investments | 3.75 | 1.70 | (0.25 | ) | 0.79 | 4.06 | 2.95 | 0.23 | 2.28 | 0.79 | (3.02 | ) | ||||||||||||||||||||||||||||||||||||
|
|
|
|
|
|
|
|
|
|
|
|
|
|
|
|
|
|
|
| |||||||||||||||||||||||||||||
Total from investment operations | 3.55 | 1.57 | (0.46 | ) | 0.55 | 3.89 | 2.78 | 0.07 | 2.15 | 0.71 | (3.11 | ) | ||||||||||||||||||||||||||||||||||||
|
|
|
|
|
|
|
|
|
|
|
|
|
|
|
|
|
|
|
| |||||||||||||||||||||||||||||
Less distributions to shareholders from: |
| |||||||||||||||||||||||||||||||||||||||||||||||
Net investment income | 0.00 | 0.00 | 0.00 | 0.00 | 0.00 | 0.00 | 0.00 | 0.00 | 0.00 | 0.00 | ||||||||||||||||||||||||||||||||||||||
Net realized gain on investments | (1.89 | ) | (1.82 | ) | (1.03 | ) | (1.20 | ) | (0.24 | ) | 0.00 | 0.00 | 0.00 | 0.00 | 0.00 | |||||||||||||||||||||||||||||||||
|
|
|
|
|
|
|
|
|
|
|
|
|
|
|
|
|
|
|
| |||||||||||||||||||||||||||||
Total distributions | (1.89 | ) | (1.82 | ) | (1.03 | ) | (1.20 | ) | (0.24 | ) | 0.00 | 0.00 | 0.00 | 0.00 | 0.00 | |||||||||||||||||||||||||||||||||
|
|
|
|
|
|
|
|
|
|
|
|
|
|
|
|
|
|
|
| |||||||||||||||||||||||||||||
Redemption fees added to paid-in capital | 0.00 | 0.00 | 0.00 | 0.00 | 0.00 | 0.00 | 0.00 | 0.00 | 2 | 0.00 | 2 | 0.00 | 2 | |||||||||||||||||||||||||||||||||||
|
|
|
|
|
|
|
|
|
|
|
|
|
|
|
|
|
|
|
| |||||||||||||||||||||||||||||
Net asset value, end of year | $ | 18.53 | $ | 16.87 | $ | 17.12 | $ | 18.61 | $ | 19.26 | $ | 15.61 | $ | 12.83 | $ | 12.76 | $ | 10.61 | $ | 9.90 | ||||||||||||||||||||||||||||
|
|
|
|
|
|
|
|
|
|
|
|
|
|
|
|
|
|
|
| |||||||||||||||||||||||||||||
Total return | 24.32 | % | 9.19 | % | (2.70 | )% | 2.87 | %5 | 25.39 | % | 21.67 | % | 0.55 | % | 20.26 | % | 7.17 | % | (23.90 | )% | ||||||||||||||||||||||||||||
|
|
|
|
|
|
|
|
|
|
|
|
|
|
|
|
|
|
|
| |||||||||||||||||||||||||||||
Ratios/Supplemental data: | ||||||||||||||||||||||||||||||||||||||||||||||||
Net assets (in millions), end of year | $ | 201.4 | $ | 207.0 | $ | 232.2 | $ | 331.2 | $ | 359.9 | $ | 332.4 | $ | 240.4 | $ | 214.4 | $ | 142.7 | $ | 154.4 | ||||||||||||||||||||||||||||
|
|
|
|
|
|
|
|
|
|
|
|
|
|
|
|
|
|
|
| |||||||||||||||||||||||||||||
Ratio of operating expenses to average net assets | 1.41 | %7 | 1.41 | %7 | 1.38 | %7 | 1.35 | % | 1.37 | % | 1.39 | % | 1.41 | % | 1.44 | % | 1.50 | % | 1.42 | % | ||||||||||||||||||||||||||||
Less: Reimbursement of expenses by Adviser and/or offsets | 0.00 | % | 0.00 | % | 0.00 | % | 0.00 | % | 0.00 | % | 0.00 | % | 0.00 | % | 0.00 | % | 0.00 | %4 | 0.00 | %4 | ||||||||||||||||||||||||||||
|
|
|
|
|
|
|
|
|
|
|
|
|
|
|
|
|
|
|
| |||||||||||||||||||||||||||||
Ratio of net operating expenses to average net assets | 1.41 | % | 1.41 | % | 1.38 | % | 1.35 | % | 1.37 | % | 1.39 | % | 1.41 | % | 1.44 | % | 1.50 | % | 1.42 | % | ||||||||||||||||||||||||||||
|
|
|
|
|
|
|
|
|
|
|
|
|
|
|
|
|
|
|
| |||||||||||||||||||||||||||||
Ratio of net investment loss to average net assets | (1.18 | )% | (0.83 | )% | (1.10 | )% | (1.24 | )% | (1.02 | )% | (1.16 | )% | (1.11 | )% | (1.08 | )% | (1.00 | )% | (0.79 | )% | ||||||||||||||||||||||||||||
|
|
|
|
|
|
|
|
|
|
|
|
|
|
|
|
|
|
|
| |||||||||||||||||||||||||||||
Portfolio turnover rate | 32.62 | % | 32.38 | % | 41.87 | % | 63.40 | % | 70.44 | % | 88.56 | % | 65.43 | % | 76.44 | % | 68.09 | % | 61.44 | % | ||||||||||||||||||||||||||||
|
|
|
|
|
|
|
|
|
|
|
|
|
|
|
|
|
|
|
| |||||||||||||||||||||||||||||
| INSTITUTIONAL SHARES | R6 SHARES | |||||||||||||||||||||||||||||||||||||||||||||||
| Year Ended September 30, | Year Ended September 30, | |||||||||||||||||||||||||||||||||||||||||||||||
| 2017 | 2016 | 2015 | 2014 | 2013 | 2012 | 2011 | 2010 | 20096 | 2017 | 201610 | ||||||||||||||||||||||||||||||||||||||
Net asset value, beginning of year | $ | 17.27 | $ | 17.45 | $ | 18.89 | $ | 19.49 | $ | 15.75 | $ | 12.91 | $ | 12.80 | $ | 10.62 | $ | 8.88 | $ | 17.28 | $ | 16.88 | ||||||||||||||||||||||||||
|
|
|
|
|
|
|
|
|
|
|
|
|
|
|
|
|
|
|
|
|
| |||||||||||||||||||||||||||
Income (loss) from investment operations: |
| |||||||||||||||||||||||||||||||||||||||||||||||
Net investment loss | (0.16 | )1 | (0.08 | )1 | (0.16 | )1 | (0.19 | )1 | (0.13 | )1 | (0.13 | )1 | (0.12 | )1 | (0.10 | )1 | (0.02 | )1 | (0.16 | )1 | (0.02 | )1 | ||||||||||||||||||||||||||
Net realized and unrealized gain (loss) on investments | 3.86 | 1.72 | (0.25 | ) | 0.79 | 4.11 | 2.97 | 0.23 | 2.28 | 1.76 | 3.86 | 0.42 | ||||||||||||||||||||||||||||||||||||
|
|
|
|
|
|
|
|
|
|
|
|
|
|
|
|
|
|
|
|
|
| |||||||||||||||||||||||||||
Total from investment operations | 3.70 | 1.64 | (0.41 | ) | 0.60 | 3.98 | 2.84 | 0.11 | 2.18 | 1.74 | 3.70 | 0.40 | ||||||||||||||||||||||||||||||||||||
|
|
|
|
|
|
|
|
|
|
|
|
|
|
|
|
|
|
|
|
|
| |||||||||||||||||||||||||||
Less distributions to shareholders from: |
| |||||||||||||||||||||||||||||||||||||||||||||||
Net investment income | 0.00 | 0.00 | 0.00 | 0.00 | 0.00 | 0.00 | 0.00 | 0.00 | 0.00 | 0.00 | 0.00 | |||||||||||||||||||||||||||||||||||||
Net realized gain on investments | (1.89 | ) | (1.82 | ) | (1.03 | ) | (1.20 | ) | (0.24 | ) | 0.00 | 0.00 | 0.00 | 0.00 | (1.89 | ) | 0.00 | |||||||||||||||||||||||||||||||
|
|
|
|
|
|
|
|
|
|
|
|
|
|
|
|
|
|
|
|
|
| |||||||||||||||||||||||||||
Total distributions | (1.89 | ) | (1.82 | ) | (1.03 | ) | (1.20 | ) | (0.24 | ) | 0.00 | 0.00 | 0.00 | 0.00 | (1.89 | ) | 0.00 | |||||||||||||||||||||||||||||||
|
|
|
|
|
|
|
|
|
|
|
|
|
|
|
|
|
|
|
|
|
| |||||||||||||||||||||||||||
Redemption fees added to paid-in capital | 0.00 | 0.00 | 0.00 | 0.00 | 0.00 | 0.00 | 0.00 | 0.00 | 2 | 0.00 | ||||||||||||||||||||||||||||||||||||||
|
|
|
|
|
|
|
|
|
|
|
|
|
|
|
|
|
| |||||||||||||||||||||||||||||||
Net asset value, end of year | $ | 19.08 | $ | 17.27 | $ | 17.45 | $ | 18.89 | $ | 19.49 | $ | 15.75 | $ | 12.91 | $ | 12.80 | $ | 10.62 | $ | 19.09 | $ | 17.28 | ||||||||||||||||||||||||||
|
|
|
|
|
|
|
|
|
|
|
|
|
|
|
|
|
|
|
|
|
| |||||||||||||||||||||||||||
Total return | 24.65 | % | 9.44 | % | (2.38 | )% | 3.10 | %5 | 25.74 | % | 22.00 | % | 0.86 | % | 20.53 | % | 19.59 | %3,8 | 24.64 | % | 2.37 | %8 | ||||||||||||||||||||||||||
|
|
|
|
|
|
|
|
|
|
|
|
|
|
|
|
|
|
|
|
|
| |||||||||||||||||||||||||||
Ratios/Supplemental data: | ||||||||||||||||||||||||||||||||||||||||||||||||
Net assets (in millions), end of year | $ | 51.7 | $ | 43.3 | $ | 91.7 | $ | 109.4 | $ | 101.3 | $ | 62.5 | $ | 35.5 | $ | 25.5 | $ | 10.9 | $ | 1.0 | $ | 0.5 | ||||||||||||||||||||||||||
|
|
|
|
|
|
|
|
|
|
|
|
|
|
|
|
|
|
|
|
|
| |||||||||||||||||||||||||||
Ratio of operating expenses to average net assets | 1.14 | %7 | 1.13 | %7 | 1.10 | %7 | 1.08 | % | 1.11 | % | 1.13 | % | 1.14 | % | 1.18 | % | 1.37 | %9 | 1.12 | %7 | 1.12 | %7,9 | ||||||||||||||||||||||||||
Less: Reimbursement of expenses by Adviser and/or offsets | 0.00 | % | 0.00 | % | 0.00 | % | 0.00 | % | 0.00 | % | 0.00 | % | 0.00 | % | 0.00 | % | (0.12 | )%9 | 0.00 | % | 0.00 | % | ||||||||||||||||||||||||||
|
|
|
|
|
|
|
|
|
|
|
|
|
|
|
|
|
|
|
|
|
| |||||||||||||||||||||||||||
Ratio of net operating expenses to average net assets | 1.14 | % | 1.13 | % | 1.10 | % | 1.08 | % | 1.11 | % | 1.13 | % | 1.14 | % | 1.18 | % | 1.25 | %9 | 1.12 | % | 1.12 | %9 | ||||||||||||||||||||||||||
|
|
|
|
|
|
|
|
|
|
|
|
|
|
|
|
|
|
|
|
|
| |||||||||||||||||||||||||||
Ratio of net investment loss to average net assets | (0.92 | )% | (0.46 | )% | (0.84 | )% | (0.97 | )% | (0.79 | )% | (0.90 | )% | (0.84 | )% | (0.83 | )% | (0.74 | )%9 | (0.89 | )% | (1.25 | )%9 | ||||||||||||||||||||||||||
|
|
|
|
|
|
|
|
|
|
|
|
|
|
|
|
|
|
|
|
|
| |||||||||||||||||||||||||||
Portfolio turnover rate | 32.62 | % | 32.38 | % | 41.87 | % | 63.40 | % | 70.44 | % | 88.56 | % | 65.43 | % | 76.44 | % | 68.09 | % | 32.62 | % | 32.38 | % | ||||||||||||||||||||||||||
|
|
|
|
|
|
|
|
|
|
|
|
|
|
|
|
|
|
|
|
|
| |||||||||||||||||||||||||||
1 Based on average shares outstanding. 2 Less than $0.01 per share. 3 The total returns would have been lower had certain expenses not been reduced during the period shown. 4 Benefit of expense reduction rounds to less than 0.01%. 5 The Adviser made a voluntary payment to the Fund in the amount of $140,762 to compensate the Fund for a loss incurred due to a trade processing error. The impact of this payment increased the Fund’s total return by 0.03%. | 6 For the period May 29, 2009 (initial offering of Institutional Shares) to September 30, 2009. 7 Interest expense rounds to less than 0.01%. 8 Not Annualized. 10 For the period August 31, 2016 (initial offering of R6 Shares) to September 30, 2016. 9 Annualized. |
| 42 | See Notes to Financial Statements. |
Table of Contents
| September 30, 2017 | Baron Funds |
FINANCIAL HIGHLIGHTS (Continued)
BARON FIFTH AVENUE GROWTH FUND
Selected data for a share outstanding throughout each year:
| RETAIL SHARES | ||||||||||||||||||||||||||||||||||||||||||||||||
| Year Ended September 30, | ||||||||||||||||||||||||||||||||||||||||||||||||
| 2017 | 2016 | 2015 | 2014 | 2013 | 2012 | 2011 | 2010 | 2009 | 2008 | |||||||||||||||||||||||||||||||||||||||
Net asset value, beginning of year | $ | 19.35 | $ | 16.91 | $ | 16.83 | $ | 14.42 | $ | 11.83 | $ | 8.98 | $ | 9.21 | $ | 8.60 | $ | 10.38 | $ | 14.12 | ||||||||||||||||||||||||||||
|
|
|
|
|
|
|
|
|
|
|
|
|
|
|
|
|
|
|
| |||||||||||||||||||||||||||||
Income (loss) from investment operations: |
| |||||||||||||||||||||||||||||||||||||||||||||||
Net investment income (loss) | (0.11 | )1 | (0.08 | )1 | (0.09 | )1 | (0.05 | )1 | 0.02 | 1 | (0.03 | )1 | (0.06 | )1 | (0.03 | )1 | 0.03 | 1 | 0.00 | 1,2 | ||||||||||||||||||||||||||||
Net realized and unrealized gain (loss) on investments | 4.80 | 2.52 | 0.17 | 7 | 2.46 | 2.57 | 2.88 | (0.17 | ) | 0.66 | (1.03 | ) | (2.62 | ) | ||||||||||||||||||||||||||||||||||
|
|
|
|
|
|
|
|
|
|
|
|
|
|
|
|
|
|
|
| |||||||||||||||||||||||||||||
Total from investment operations | 4.69 | 2.44 | 0.08 | 2.41 | 2.59 | 2.85 | (0.23 | ) | 0.63 | (1.00 | ) | (2.62 | ) | |||||||||||||||||||||||||||||||||||
|
|
|
|
|
|
|
|
|
|
|
|
|
|
|
|
|
|
|
| |||||||||||||||||||||||||||||
Less distributions to shareholders from: |
| |||||||||||||||||||||||||||||||||||||||||||||||
Net investment income | 0.00 | 0.00 | 0.00 | 0.00 | 0.00 | 0.00 | 0.00 | (0.02 | ) | (0.01 | ) | 0.00 | ||||||||||||||||||||||||||||||||||||
Net realized gain on investments | 0.00 | 0.00 | 0.00 | 0.00 | 0.00 | 0.00 | 0.00 | 0.00 | (0.77 | ) | (1.12 | ) | ||||||||||||||||||||||||||||||||||||
|
|
|
|
|
|
|
|
|
|
|
|
|
|
|
|
|
|
|
| |||||||||||||||||||||||||||||
Total distributions | 0.00 | 0.00 | 0.00 | 0.00 | 0.00 | 0.00 | 0.00 | (0.02 | ) | (0.78 | ) | (1.12 | ) | |||||||||||||||||||||||||||||||||||
|
|
|
|
|
|
|
|
|
|
|
|
|
|
|
|
|
|
|
| |||||||||||||||||||||||||||||
Net asset value, end of year | $ | 24.04 | $ | 19.35 | $ | 16.91 | $ | 16.83 | $ | 14.42 | $ | 11.83 | $ | 8.98 | $ | 9.21 | $ | 8.60 | $ | 10.38 | ||||||||||||||||||||||||||||
|
|
|
|
|
|
|
|
|
|
|
|
|
|
|
|
|
|
|
| |||||||||||||||||||||||||||||
Total return | 24.24 | %3 | 14.43 | %3 | 0.48 | %3 | 16.71 | %3 | 21.89 | %3 | 31.74 | %3 | (2.50 | )%3 | 7.38 | %3 | (7.75 | )%3 | (19.96 | )%3 | ||||||||||||||||||||||||||||
|
|
|
|
|
|
|
|
|
|
|
|
|
|
|
|
|
|
|
| |||||||||||||||||||||||||||||
Ratios/Supplemental data: | ||||||||||||||||||||||||||||||||||||||||||||||||
Net assets (in millions), end of year | $ | 87.5 | $ | 73.5 | $ | 71.5 | $ | 53.2 | $ | 47.8 | $ | 34.8 | $ | 23.4 | $ | 29.0 | $ | 32.8 | $ | 58.2 | ||||||||||||||||||||||||||||
|
|
|
|
|
|
|
|
|
|
|
|
|
|
|
|
|
|
|
| |||||||||||||||||||||||||||||
Ratio of operating expenses to average net assets | 1.12 | %4 | 1.26 | % | 1.32 | % | 1.37 | % | 1.47 | % | 1.55 | % | 1.59 | % | 1.62 | % | 1.69 | % | 1.47 | % | ||||||||||||||||||||||||||||
Less: Reimbursement of expenses by Adviser and/or offsets | (0.02 | )% | (0.04 | )% | (0.02 | )% | (0.07 | )% | (0.17 | )% | (0.25 | )% | (0.29 | )% | (0.25 | )% | (0.29 | )% | (0.07 | )% | ||||||||||||||||||||||||||||
|
|
|
|
|
|
|
|
|
|
|
|
|
|
|
|
|
|
|
| |||||||||||||||||||||||||||||
Ratio of net operating expenses to average net assets | 1.10 | % | 1.22 | % | 1.30 | % | 1.30 | % | 1.30 | % | 1.30 | % | 1.30 | % | 1.37 | % | 1.40 | % | 1.40 | % | ||||||||||||||||||||||||||||
|
|
|
|
|
|
|
|
|
|
|
|
|
|
|
|
|
|
|
| |||||||||||||||||||||||||||||
Ratio of net investment income (loss) to average net assets | (0.50 | )% | (0.43 | )% | (0.49 | )% | (0.29 | )% | 0.14 | % | (0.30 | )% | (0.55 | )% | (0.32 | )% | 0.40 | % | (0.01 | )% | ||||||||||||||||||||||||||||
|
|
|
|
|
|
|
|
|
|
|
|
|
|
|
|
|
|
|
| |||||||||||||||||||||||||||||
Portfolio turnover rate | 13.94 | % | 19.30 | % | 14.54 | % | 16.84 | % | 22.91 | % | 79.07 | % | 75.36 | % | 57.67 | % | 39.61 | % | 39.59 | % | ||||||||||||||||||||||||||||
|
|
|
|
|
|
|
|
|
|
|
|
|
|
|
|
|
|
|
| |||||||||||||||||||||||||||||
| INSTITUTIONAL SHARES | R6 SHARES | |||||||||||||||||||||||||||||||||||||||||||||||
| Year Ended September 30, | Year Ended September 30, | |||||||||||||||||||||||||||||||||||||||||||||||
| 2017 | 2016 | 2015 | 2014 | 2013 | 2012 | 2011 | 2010 | 20098 | 2017 | 20169 | ||||||||||||||||||||||||||||||||||||||
Net asset value, beginning of year | $ | 19.62 | $ | 17.10 | $ | 17.00 | $ | 14.53 | $ | 11.89 | $ | 9.00 | $ | 9.21 | $ | 8.61 | $ | 7.54 | $ | 19.63 | $ | 17.03 | ||||||||||||||||||||||||||
|
|
|
|
|
|
|
|
|
|
|
|
|
|
|
|
|
|
|
|
|
| |||||||||||||||||||||||||||
Income (loss) from investment operations: |
| |||||||||||||||||||||||||||||||||||||||||||||||
Net investment income (loss) | (0.05 | )1 | (0.03 | )1 | (0.04 | )1 | (0.01 | )1 | 0.05 | 1 | (0.01 | )1 | (0.03 | )1 | (0.01 | )1 | 0.02 | 1 | (0.06 | )1 | (0.05 | )1 | ||||||||||||||||||||||||||
Net realized and unrealized gain (loss) on investments | 4.87 | 2.55 | 0.16 | 7 | 2.48 | 2.59 | 2.90 | (0.18 | ) | 0.66 | 1.05 | 4.88 | 2.65 | |||||||||||||||||||||||||||||||||||
|
|
|
|
|
|
|
|
|
|
|
|
|
|
|
|
|
|
|
|
|
| |||||||||||||||||||||||||||
Total from investment operations | 4.82 | 2.52 | 0.12 | 2.47 | 2.64 | 2.89 | (0.21 | ) | 0.65 | 1.07 | 4.82 | 2.60 | ||||||||||||||||||||||||||||||||||||
|
|
|
|
|
|
|
|
|
|
|
|
|
|
|
|
|
|
|
|
|
| |||||||||||||||||||||||||||
Less distributions to shareholders from: |
| |||||||||||||||||||||||||||||||||||||||||||||||
Net investment income | 0.00 | 0.00 | (0.02 | ) | 0.00 | 0.00 | 0.00 | 0.00 | (0.05 | ) | 0.00 | 0.00 | 0.00 | |||||||||||||||||||||||||||||||||||
Net realized gain on investments | 0.00 | 0.00 | 0.00 | 0.00 | 0.00 | 0.00 | 0.00 | 0.00 | 0.00 | 0.00 | 0.00 | |||||||||||||||||||||||||||||||||||||
|
|
|
|
|
|
|
|
|
|
|
|
|
|
|
|
|
|
|
|
|
| |||||||||||||||||||||||||||
Total distributions | 0.00 | 0.00 | (0.02 | ) | 0.00 | 0.00 | 0.00 | 0.00 | (0.05 | ) | 0.00 | 0.00 | 0.00 | |||||||||||||||||||||||||||||||||||
|
|
|
|
|
|
|
|
|
|
|
|
|
|
|
|
|
|
|
|
|
| |||||||||||||||||||||||||||
Net asset value, end of year | $ | 24.44 | $ | 19.62 | $ | 17.10 | $ | 17.00 | $ | 14.53 | $ | 11.89 | $ | 9.00 | $ | 9.21 | $ | 8.61 | $ | 24.45 | $ | 19.63 | ||||||||||||||||||||||||||
|
|
|
|
|
|
|
|
|
|
|
|
|
|
|
|
|
|
|
|
|
| |||||||||||||||||||||||||||
Total return | 24.57 | %3 | 14.74 | %3 | 0.72 | % | 17.00 | %3 | 22.20 | %3 | 32.11 | %3 | (2.28 | )%3 | 7.59 | %3 | 14.19 | %3,5 | 24.55 | %3 | 15.27 | %3,5 | ||||||||||||||||||||||||||
|
|
|
|
|
|
|
|
|
|
|
|
|
|
|
|
|
|
|
|
|
| |||||||||||||||||||||||||||
Ratios/Supplemental data: | ||||||||||||||||||||||||||||||||||||||||||||||||
Net assets (in millions), end of year | $ | 89.5 | $ | 81.9 | $ | 74.7 | $ | 56.0 | $ | 33.8 | $ | 18.9 | $ | 10.2 | $ | 10.4 | $ | 9.5 | $ | 4.7 | $ | 1.4 | ||||||||||||||||||||||||||
|
|
|
|
|
|
|
|
|
|
|
|
|
|
|
|
|
|
|
|
|
| |||||||||||||||||||||||||||
Ratio of operating expenses to average net assets | 0.84 | %4 | 0.98 | % | 1.04 | % | 1.08 | % | 1.18 | % | 1.26 | % | 1.31 | % | 1.35 | % | 1.61 | %6 | 0.84 | %4 | 0.85 | %6 | ||||||||||||||||||||||||||
Less: Reimbursement of expenses by Adviser and/or offsets | 0.00 | % | (0.01 | )% | 0.00 | % | (0.03 | )% | (0.13 | )% | (0.21 | )% | (0.26 | )% | (0.24 | )% | (0.46 | )%6 | 0.00 | % | (0.01 | )%6 | ||||||||||||||||||||||||||
|
|
|
|
|
|
|
|
|
|
|
|
|
|
|
|
|
|
|
|
|
| |||||||||||||||||||||||||||
Ratio of net operating expenses to average net assets | 0.84 | % | 0.97 | % | 1.04 | % | 1.05 | % | 1.05 | % | 1.05 | % | 1.05 | % | 1.11 | % | 1.15 | %6 | 0.84 | % | 0.84 | %6 | ||||||||||||||||||||||||||
|
|
|
|
|
|
|
|
|
|
|
|
|
|
|
|
|
|
|
|
|
| |||||||||||||||||||||||||||
Ratio of net investment income (loss) to average net assets | (0.24 | )% | (0.19 | )% | (0.23 | )% | (0.08 | )% | 0.36 | % | (0.05 | )% | (0.30 | )% | (0.07 | )% | 0.58 | %6 | (0.27 | )% | (0.37 | )%6 | ||||||||||||||||||||||||||
|
|
|
|
|
|
|
|
|
|
|
|
|
|
|
|
|
|
|
|
|
| |||||||||||||||||||||||||||
Portfolio turnover rate | 13.94 | % | 19.30 | % | 14.54 | % | 16.84 | % | 22.91 | % | 79.07 | % | 75.36 | % | 57.67 | % | 39.61 | % | 13.94 | % | 19.30 | % | ||||||||||||||||||||||||||
|
|
|
|
|
|
|
|
|
|
|
|
|
|
|
|
|
|
|
|
|
| |||||||||||||||||||||||||||
1 Based on average shares outstanding. 2 Less than $0.01 per share. 3 The total returns would have been lower had certain expenses not been reduced during the period shown. 4 Interest expense rounds to less than 0.01%. 5 Not Annualized. 6 Annualized. | 7 The amount shown for a share outstanding does not correspond with the aggregate realized and unrealized gain (loss) on investments for the period due to the timing of sales and redemptions of Fund shares in relation to fluctuating market values of investments of the Fund. 8 For the period May 29, 2009 (initial offering of Institutional Shares) to September 30, 2009. 9 For the period January 29, 2016 (initial offering of R6 Shares) to September 30, 2016. |
| See Notes to Financial Statements. | 43 |
Table of Contents
| Baron Funds | September 30, 2017 |
FINANCIAL HIGHLIGHTS (Continued)
BARON DISCOVERY FUND
Selected data for a share outstanding throughout each year:
| RETAIL SHARES | ||||||||||||||||||||||||||||
| Year Ended September 30, | ||||||||||||||||||||||||||||
| 2017 | 2016 | 2015 | 2014 | |||||||||||||||||||||||||
Net asset value, beginning of year | $ | 13.40 | $ | 11.13 | $ | 11.68 | $ | 10.00 | ||||||||||||||||||||
|
|
|
|
|
|
|
| |||||||||||||||||||||
Income (loss) from investment operations: | ||||||||||||||||||||||||||||
Net investment income (loss) | (0.17 | )1 | 0.16 | 1 | (0.13 | )1 | (0.10 | )1 | ||||||||||||||||||||
Net realized and unrealized gain (loss) on investments | 4.33 | 2.38 | (0.42 | ) | 1.78 | 2 | ||||||||||||||||||||||
|
|
|
|
|
|
|
| |||||||||||||||||||||
Total from investment operations | 4.16 | 2.54 | (0.55 | ) | 1.68 | |||||||||||||||||||||||
|
|
|
|
|
|
|
| |||||||||||||||||||||
Less distributions to shareholders from: | ||||||||||||||||||||||||||||
Net investment income | 0.00 | 0.00 | 0.00 | 0.00 | ||||||||||||||||||||||||
Net realized gain on investments | 0.00 | (0.27 | ) | 0.00 | 0.00 | |||||||||||||||||||||||
|
|
|
|
|
|
|
| |||||||||||||||||||||
Total distributions | 0.00 | (0.27 | ) | 0.00 | 0.00 | |||||||||||||||||||||||
|
|
|
|
|
|
|
| |||||||||||||||||||||
Net asset value, end of year | $ | 17.56 | $ | 13.40 | $ | 11.13 | $ | 11.68 | ||||||||||||||||||||
|
|
|
|
|
|
|
| |||||||||||||||||||||
Total return | 31.04 | %3 | 23.24 | %3 | (4.71 | )%3,4 | 16.80 | %3 | ||||||||||||||||||||
|
|
|
|
|
|
|
| |||||||||||||||||||||
Ratios/Supplemental data: | ||||||||||||||||||||||||||||
Net assets (in millions), end of year | $ | 131.2 | $ | 18.6 | $ | 19.9 | $ | 16.6 | ||||||||||||||||||||
|
|
|
|
|
|
|
| |||||||||||||||||||||
Ratio of operating expenses to average net assets | 1.47 | % | 1.88 | % | 1.57 | % | 2.16 | % | ||||||||||||||||||||
Less: Reimbursement of expenses by Adviser and/or offsets | (0.12 | )% | (0.53 | )% | (0.22 | )% | (0.81 | )% | ||||||||||||||||||||
|
|
|
|
|
|
|
| |||||||||||||||||||||
Ratio of net operating expenses to average net assets | 1.35 | % | 1.35 | % | 1.35 | % | 1.35 | % | ||||||||||||||||||||
|
|
|
|
|
|
|
| |||||||||||||||||||||
Ratio of net investment income (loss) to average net assets | (1.11 | )% | 1.38 | % | (0.97 | )% | (0.85 | )% | ||||||||||||||||||||
|
|
|
|
|
|
|
| |||||||||||||||||||||
Portfolio turnover rate | 40.97 | % | 90.74 | % | 114.82 | % | 109.40 | % | ||||||||||||||||||||
|
|
|
|
|
|
|
| |||||||||||||||||||||
| INSTITUTIONAL SHARES | R6 SHARES | |||||||||||||||||||||||||||
| Year Ended September 30, | Year Ended September 30, | |||||||||||||||||||||||||||
| 2017 | 2016 | 2015 | 2014 | 2017 | 20165 | |||||||||||||||||||||||
Net asset value, beginning of year | $ | 13.50 | $ | 11.19 | $ | 11.71 | $ | 10.00 | $ | 13.50 | $ | 12.89 | ||||||||||||||||
|
|
|
|
|
|
|
|
|
|
|
| |||||||||||||||||
Income (loss) from investment operations: | ||||||||||||||||||||||||||||
Net investment income (loss) | (0.13 | )1 | 0.12 | 1 | (0.10 | )1 | (0.08 | )1 | (0.12 | )1 | (0.01 | )1 | ||||||||||||||||
Net realized and unrealized gain (loss) on investments | 4.37 | 2.46 | (0.42 | ) | 1.79 | 2 | 4.36 | 0.62 | ||||||||||||||||||||
|
|
|
|
|
|
|
|
|
|
|
| |||||||||||||||||
Total from investment operations | 4.24 | 2.58 | (0.52 | ) | 1.71 | 4.24 | 0.61 | |||||||||||||||||||||
|
|
|
|
|
|
|
|
|
|
|
| |||||||||||||||||
Less distributions to shareholders from: | ||||||||||||||||||||||||||||
Net investment income | 0.00 | 0.00 | 0.00 | 0.00 | 0.00 | 0.00 | ||||||||||||||||||||||
Net realized gain on investments | 0.00 | (0.27 | ) | 0.00 | 0.00 | 0.00 | 0.00 | |||||||||||||||||||||
|
|
|
|
|
|
|
|
|
|
|
| |||||||||||||||||
Total distributions | 0.00 | (0.27 | ) | 0.00 | 0.00 | 0.00 | 0.00 | |||||||||||||||||||||
|
|
|
|
|
|
|
|
|
|
|
| |||||||||||||||||
Net asset value, end of year | $ | 17.74 | $ | 13.50 | $ | 11.19 | $ | 11.71 | $ | 17.74 | $ | 13.50 | ||||||||||||||||
|
|
|
|
|
|
|
|
|
|
|
| |||||||||||||||||
Total return | 31.41 | %3 | 23.47 | %3 | (4.44 | )%3,4 | 17.10 | %3 | 31.41 | %3 | 4.73 | %3,6 | ||||||||||||||||
|
|
|
|
|
|
|
|
|
|
|
| |||||||||||||||||
Ratios/Supplemental data: | ||||||||||||||||||||||||||||
Net assets (in millions), end of year | $ | 113.6 | $ | 22.8 | $ | 53.9 | $ | 48.7 | $ | 3.2 | $ | 2.0 | ||||||||||||||||
|
|
|
|
|
|
|
|
|
|
|
| |||||||||||||||||
Ratio of operating expenses to average net assets | 1.23 | % | 1.49 | % | 1.25 | % | 1.91 | % | 1.22 | % | 1.48 | %7 | ||||||||||||||||
Less: Reimbursement of expenses by Adviser and/or offsets | (0.13 | )% | (0.39 | )% | (0.15 | )% | (0.81 | )% | (0.13 | )% | (0.39 | )%7 | ||||||||||||||||
|
|
|
|
|
|
|
|
|
|
|
| |||||||||||||||||
Ratio of net operating expenses to average net assets | 1.10 | % | 1.10 | % | 1.10 | % | 1.10 | % | 1.09 | % | 1.09 | %7 | ||||||||||||||||
|
|
|
|
|
|
|
|
|
|
|
| |||||||||||||||||
Ratio of net investment income (loss) to average net assets | (0.85 | )% | 1.06 | % | (0.72 | )% | (0.64 | )% | (0.79 | )% | (0.66 | )%7 | ||||||||||||||||
|
|
|
|
|
|
|
|
|
|
|
| |||||||||||||||||
Portfolio turnover rate | 40.97 | % | 90.74 | % | 114.82 | % | 109.40 | % | 40.97 | % | 90.74 | % | ||||||||||||||||
|
|
|
|
|
|
|
|
|
|
|
| |||||||||||||||||
1 Based on average shares outstanding. 2 The amount shown for a share outstanding does not correspond with the aggregate realized and unrealized gain (loss) on investments for the period due to the timing of sales and redemptions of fund shares in relation to fluctuating market values of investments of the Fund. 3 The total returns would have been lower had certain expenses not been reduced during the period shown. 4 The Adviser made a voluntary payment to the Fund in the amount of $1,000 to compensate the Fund for a loss incurred due to a trade processing error. The impact of this payment increased the Fund’s total return by less than 0.01%. | 5 For the period August 31, 2016 (initial offering of R6 Shares) to September 30, 2016. 6 Not Annualized. 7 Annualized. |
| 44 | See Notes to Financial Statements. |
Table of Contents
| September 30, 2017 | Baron Funds |
REPORT OF INDEPENDENT REGISTERED PUBLIC ACCOUNTING FIRM
To the Board of Trustees of Baron Investment Funds Trust and Shareholders of
Baron Asset Fund, Baron Growth Fund, Baron Small Cap Fund, Baron Opportunity Fund, Baron Fifth Avenue Growth Fund and Baron Discovery Fund
In our opinion, the accompanying statements of assets and liabilities, including the statements of net assets, and the related statements of operations, and of changes in net assets and the financial highlights present fairly, in all material respects, the financial position of each of Baron Asset Fund, Baron Growth Fund, Baron Small Cap Fund, Baron Opportunity Fund, Baron Fifth Avenue Growth Fund and Baron Discovery Fund (six of the portfolios constituting the Baron Investment Funds Trust, hereafter referred to as the “Funds”) as of September 30, 2017, the results of each of their operations for the year then ended, the changes in each of their net assets for each of the two years in the period then ended, and the financial highlights for each of the periods indicated, in conformity with accounting principles generally accepted in the United States of America. These financial statements and financial highlights (hereafter referred to as “financial statements”) are the responsibility of the Funds’ management. Our responsibility is to express an opinion on these financial statements based on our audits. We conducted our audits of these financial statements in accordance with the standards of the Public Company Accounting Oversight Board (United States). Those standards require that we plan and perform the audit to obtain reasonable assurance about whether the financial statements are free of material misstatement. An audit includes examining, on a test basis, evidence supporting the amounts and disclosures in the financial statements, assessing the accounting principles used and significant estimates made by management, and evaluating the overall financial statement presentation. We believe that our audits, which included confirmation of securities as of September 30, 2017 by correspondence with the custodian, brokers, portfolio companies, and transfer agents provide a reasonable basis for our opinion.

PricewaterhouseCoopers LLP
New York, New York
November 27, 2017
45
Table of Contents
| Baron Funds | September 30, 2017 |
The federal tax status of distributions paid by the Funds during the year ended September 30, 2017 are listed below.
During the fiscal year ended September 30, 2017, the Funds’ distributions to shareholders included:
| Fund | Ordinary Income1,3 | Long-Term Capital Gains2,3 | ||||||
Baron Asset Fund | — | $ | 115,002,326 | |||||
Baron Growth Fund | — | 652,001,794 | ||||||
Baron Small Cap Fund | — | 620,005,422 | ||||||
Baron Opportunity Fund | — | 27,000,806 | ||||||
Baron Fifth Avenue Growth Fund | — | — | ||||||
Baron Discovery Fund | — | — | ||||||
| 1 | For tax purposes, short-term capital gains are considered ordinary income distributions. |
| 2 | Long-term capital gains are subject to a maximum allowable rate of 20% for individuals pursuant to The America Taxpayer Relief Act of 2012. |
| 3 | Under the Patient Protection and Affordable Care Act, higher income taxpayers must pay a 3.8% additional tax on net investment income. |
The information and distributions reported may differ from the information and distributions taxable to the shareholders for the calendar year ending December 31, 2017. The information necessary to complete your income tax return for the calendar year ending December 31, 2017 will be listed on the Form 1099-DIV, which will be mailed to you in January 2018.
46
Table of Contents
| September 30, 2017 | Baron Funds |
As a shareholder of the Funds, you may incur two types of costs: ongoing expenses and transaction costs. Ongoing expenses include advisory fees, distribution and service (12b-1) fees and other Fund expenses. Due to the payment of Rule 12b-1 fees, long-term shareholders may indirectly pay more than the maximum permitted front-end sales charge. The information on this page is intended to help you understand your ongoing costs of investing in the Funds and to compare these costs with the ongoing costs of investing in other mutual funds.
The information in the following table is based on an investment of $1,000 invested on April 1, 2017 and held for the six months ended September 30, 2017.
ACTUAL EXPENSES
The table below titled “Based on Actual Total Return” provides information about actual account values and actual expenses. You may use the information provided in this table, together with the amount you invested, to estimate the expenses that you paid over the period. To estimate the expenses you paid on your account, divide your ending account value by $1,000 (for example, an $8,600 ending account value divided by $1,000 = 8.6), then multiply the result by the number under the heading titled “Expenses Paid During the Period”.
BASED ON ACTUAL TOTAL RETURN FOR THE SIX MONTHS ENDED SEPTEMBER 30, 20171
Actual Total Return | Beginning Account Value April 1, 2017 | Ending Account Value September 30, 2017 | Annualized Expense Ratio | Expenses Paid During the Period2 | ||||||
Baron Asset Fund — Retail Shares | 11.20% | $1,000.00 | $1,112.00 | 1.30% | $6.88 | |||||
Baron Asset Fund — Institutional Shares | 11.35% | $1,000.00 | $1,113.50 | 1.04% | $5.51 | |||||
Baron Asset Fund — R6 Shares | 11.36% | $1,000.00 | $1,113.60 | 1.04% | $5.51 | |||||
Baron Growth Fund — Retail Shares | 9.34% | $1,000.00 | $1,093.40 | 1.29% | $6.77 | |||||
Baron Growth Fund — Institutional Shares | 9.49% | $1,000.00 | $1,094.90 | 1.04% | $5.46 | |||||
Baron Growth Fund — R6 Shares | 9.49% | $1,000.00 | $1,094.90 | 1.05% | $5.51 | |||||
Baron Small Cap Fund — Retail Shares | 11.42% | $1,000.00 | $1,114.20 | 1.31% | $6.94 | |||||
Baron Small Cap Fund — Institutional Shares | 11.55% | $1,000.00 | $1,115.50 | 1.05% | $5.57 | |||||
Baron Small Cap Fund — R6 Shares | 11.52% | $1,000.00 | $1,115.20 | 1.05% | $5.57 | |||||
Baron Opportunity Fund — Retail Shares | 15.16% | $1,000.00 | $1,151.60 | 1.37% | $7.39 | |||||
Baron Opportunity Fund — Institutional Shares | 15.29% | $1,000.00 | $1,152.90 | 1.11% | $5.99 | |||||
Baron Opportunity Fund — R6 Shares | 15.28% | $1,000.00 | $1,152.80 | 1.10% | $5.94 | |||||
Baron Fifth Avenue Growth Fund — Retail Shares | 15.30% | $1,000.00 | $1,153.003 | 1.10%4 | $5.94 | |||||
Baron Fifth Avenue Growth Fund — Institutional Shares | 15.45% | $1,000.00 | $1,154.50 | 0.83% | $4.48 | |||||
Baron Fifth Avenue Growth Fund — R6 Shares | 15.44% | $1,000.00 | $1,154.40 | 0.83% | $4.48 | |||||
Baron Discovery Fund — Retail Shares | 17.46% | $1,000.00 | $1,174.603 | 1.35%4 | $7.36 | |||||
Baron Discovery Fund — Institutional Shares | 17.64% | $1,000.00 | $1,176.403 | 1.10%4 | $6.00 | |||||
Baron Discovery Fund — R6 Shares | 17.64% | $1,000.00 | $1,176.403 | 1.09%4 | $5.95 |
| 1 | Assumes reinvestment of all dividends and capital gain distributions, if any. |
| 2 | Expenses are equal to each share class’ respective annualized expense ratio multiplied by the average account value over the period, multiplied by the number of days in the most recent fiscal half-year, then divided by 365. |
| 3 | Ending account value assumes the return earned after waiver and would have been lower if a portion of the expenses had not been waived. |
| 4 | Annualized expense ratios are adjusted to reflect fee waiver. |
47
Table of Contents
| Baron Funds | September 30, 2017 |
FUND EXPENSES (Unaudited) (Continued)
HYPOTHETICAL EXAMPLE FOR COMPARISON PURPOSES
The table below titled “Based on Hypothetical Total Return” provides information about hypothetical account values and hypothetical expenses based on the actual expense ratio and an assumed rate of return of 5% per year before expenses, which is not the Funds’ actual return. The hypothetical account values and expenses may not be used to estimate the actual ending account values and expenses you paid for the period. You may use the information provided in this table to compare the ongoing costs of investing in the Funds and other funds. To do so, compare the 5% hypothetical example relating to the Funds with the 5% hypothetical examples that appear in the shareholder reports of other funds.
Please note that expenses shown in the table below are meant to highlight your ongoing costs and do not reflect any transactional costs, such as redemption fees, if any. Therefore, the table is useful in comparing ongoing costs only and will not help you determine your relative total costs of owning different mutual funds. In addition, if these transactional costs were included, your costs would have been higher.
BASED ON HYPOTHETICAL TOTAL RETURN FOR THE SIX MONTHS ENDED SEPTEMBER 30, 2017
Hypothetical Annualized Total Return | Beginning Account Value April 1, 2017 | Ending Account Value September 30, 2017 | Annualized Expense Ratio | Expenses Paid During the Period22 | ||||||
Baron Asset Fund — Retail Shares | 5.00% | $1,000.00 | $1,018.55 | 1.30% | $6.58 | |||||
Baron Asset Fund — Institutional Shares | 5.00% | $1,000.00 | $1,019.85 | 1.04% | $5.27 | |||||
Baron Asset Fund — R6 Shares | 5.00% | $1,000.00 | $1,019.85 | 1.04% | $5.27 | |||||
Baron Growth Fund — Retail Shares | 5.00% | $1,000.00 | $1,018.60 | 1.29% | $6.53 | |||||
Baron Growth Fund — Institutional Shares | 5.00% | $1,000.00 | $1,019.85 | 1.04% | $5.27 | |||||
Baron Growth Fund — R6 Shares | 5.00% | $1,000.00 | $1,019.80 | 1.05% | $5.32 | |||||
Baron Small Cap Fund — Retail Shares | 5.00% | $1,000.00 | $1,018.50 | 1.31% | $6.63 | |||||
Baron Small Cap Fund — Institutional Shares | 5.00% | $1,000.00 | $1,019.80 | 1.05% | $5.32 | |||||
Baron Small Cap Fund — R6 Shares | 5.00% | $1,000.00 | $1,019.80 | 1.05% | $5.32 | |||||
Baron Opportunity Fund — Retail Shares | 5.00% | $1,000.00 | $1,018.20 | 1.37% | $6.93 | |||||
Baron Opportunity Fund — Institutional Shares | 5.00% | $1,000.00 | $1,019.50 | 1.11% | $5.62 | |||||
Baron Opportunity Fund — R6 Shares | 5.00% | $1,000.00 | $1,019.55 | 1.10% | $5.57 | |||||
Baron Fifth Avenue Growth Fund — Retail Shares | 5.00% | $1,000.00 | $1,019.553 | 1.10%4 | $5.57 | |||||
Baron Fifth Avenue Growth Fund — Institutional Shares | 5.00% | $1,000.00 | $1,020.91 | 0.83% | $4.20 | |||||
Baron Fifth Avenue Growth Fund — R6 Shares | 5.00% | $1,000.00 | $1,020.91 | 0.83% | $4.20 | |||||
Baron Discovery Fund — Retail Shares | 5.00% | $1,000.00 | $1,018.303 | 1.35%4 | $6.83 | |||||
Baron Discovery Fund — Institutional Shares | 5.00% | $1,000.00 | $1,019.553 | 1.10%4 | $5.57 | |||||
Baron Discovery Fund — R6 Shares | 5.00% | $1,000.00 | $1,019.603 | 1.09%4 | $5.52 |
| 1 | Assumes reinvestment of all dividends and capital gain distributions, if any. |
| 2 | Expenses are equal to each share class’ respective annualized expense ratio multiplied by the average account value over the period, multiplied by the number of days in the most recent fiscal half-year, then divided by 365. |
| 3 | Ending account value assumes the return earned after waiver and would have been lower if a portion of the expenses had not been waived. |
| 4 | Annualized expense ratios are adjusted to reflect fee waiver. |
48
Table of Contents
| September 30, 2017 | Baron Funds |
DISCLOSURE REGARDING THE APPROVAL OF THE INVESTMENT ADVISORY AGREEMENTS FOR THE FUNDS BY THE BOARD OF TRUSTEES (Unaudited)
The Board of Trustees (the “Board”) of Baron Investment Funds Trust (the “Trust”) met on May 4, 2017 to discuss the selection of BAMCO, Inc. (the “Adviser”) as the investment adviser and the approval of the investment advisory agreements for Baron Asset Fund, Baron Growth Fund, Baron Small Cap Fund, Baron Opportunity Fund, Baron Fifth Avenue Growth Fund and Baron Discovery Fund (each, a “Fund” and collectively, the “Funds”). The members of the Board who are not affiliated with the Trust (the “Independent Trustees”) met in a separate session to discuss and consider the renewal of the advisory agreements for the Funds. An independent consultant provided reports to the Board and attended the Board meeting. The Trustees received a substantial amount of information from the Adviser and from the independent consultant, and were advised by independent legal counsel. Based on its evaluation of this and other information, the Board, including a majority of the Independent Trustees, approved the continuation of the advisory agreements for the Funds for an additional one-year period.
In reaching its determination, the Board considered various factors that it deemed relevant, including the factors listed below.
1. NATURE, EXTENT AND QUALITY OF SERVICES
As part of their consideration of the nature, extent and quality of services provided by the Adviser, the Independent Trustees considered the information provided, their experience and knowledge gained from their service as Trustees and their experience generally, including the following, which they had considered in past years and remained, in their thinking, material to their consideration:
| • | Their confidence in the senior personnel, portfolio management, the financial condition of the Adviser and its affiliates and the Adviser’s available resources; |
| • | The nature, quality and the level of long-term performance of the services provided by the Adviser, including: intensive devotion to research, selection of broker/dealers for Fund portfolio transactions, relationships with and supervision of third party service providers, such as the Funds’ custodian and transfer agent, the quality of shareholder reports, the ability to monitor adherence to investment guidelines and restrictions, the legal, accounting and compliance services provided to the Funds and the support services provided to the Board; |
| • | The Adviser’s investment principles and processes and the historical performance of the Funds as compared to similar funds managed by other advisers and other funds managed by the Adviser over comparable periods; |
| • | The total expense ratio of the Funds and comparisons to similar funds managed by other advisers over comparable periods; |
| • | The costs of portfolio management, including the types of investments made for the Funds, the personnel and systems necessary for implementation of investment strategies, and the pre-tax profits realized by the Adviser and its affiliates from their relationship with the Funds; and |
| • | Additional services provided by the Adviser. |
The Board was provided with information from the Adviser and the independent consultant regarding the fees charged by the Adviser as compared to the fees charged by comparable funds. This information compared various fees and expenses, as well as the total expense ratios, of the Funds against the fees, expenses and total expense ratios of other funds of similar size, character and investment strategies (“comparable funds”). The Board observed that, for the retail and/or institutional classes of most of the Funds, while the management fee was comparatively higher, the net operating expenses paid by the Funds generally were comparatively lower, when compared to respective peer groups. They concluded that the Funds’ management fee was justified because of, among other reasons, the nature, extent and quality of the services the Adviser provides. The Board concluded that the nature, extent and quality of the services provided by the Adviser to each Fund were appropriate and that each Fund was likely to continue to benefit from those services provided under the relevant advisory agreement with the Adviser.
2. INVESTMENT PERFORMANCE OF THE FUNDS AND THE ADVISER
As part of its consideration of the investment performance of the Funds and the Adviser, the Board took into account the analyses performed by and discussed with the independent consultant. The Board considered for each Fund, among other information, the independent consultant’s comparisons of the expense ratio and contractual advisory fee with those of the comparable funds selected by the independent consultant, as noted above. The Board also considered the independent consultant’s risk-adjusted performance comparisons with comparable funds. The Board also considered comparisons of each Fund’s annualized total return over one-, three-, five- and ten-year periods, where applicable, against the performance universe averages and relevant securities market indices. After considering all the information, the Board concluded that the Adviser continued to invest in accordance with its long-standing principles and that each Fund’s performance remained consistent with expectations for the Adviser’s investment style, in light of recent market conditions.
3. COSTS OF SERVICES PROVIDED AND PROFITS TO BE REALIZED BY THE ADVISER
The Board considered benefits that accrue to the Adviser and its affiliates from their relationship with the Funds. Representatives of the Adviser said the Board should consider the advisory fee in the context of other fees paid to the Adviser’s affiliates, such as the distribution fee paid to Baron Capital, Inc. and paid out pursuant to the 12b-1 plan.
The Board considered comparisons of the advisory fees charged and services provided by the Adviser and its investment adviser affiliate to sub-advised accounts and separately managed accounts. The Board considered that, while the advisory fees for the other clients are the same as, or lower than, the fees for the Funds, the Adviser or its affiliate performs significantly fewer services for those clients compared with those provided by the Adviser to the Funds. The Board also considered a profitability analysis prepared by the Adviser and discussed with the representatives of the Adviser that the Adviser has continued to invest in quality personnel, systems and facilities, and otherwise continued to invest in its business, even as profits had declined in recent years due to persistent outflows.
49
Table of Contents
| Baron Funds | September 30, 2017 |
DISCLOSURE REGARDING THE APPROVAL OF THE INVESTMENT ADVISORY AGREEMENTS FOR THE FUNDS BY THE BOARD OF TRUSTEES (Unaudited) (Continued)
4. ECONOMIES OF SCALE AND BENEFITS TO INVESTORS
The Board considered the extent to which each Fund’s management fee reflected economies of scale for the benefit of Fund shareholders, appreciating that the economies of scale analysis is predicated on generally predictable increasing assets and noting the small size of certain Funds and the significant fluctuation in assets since 2007. The Board considered that small- and mid-cap investment strategies require more attention by the Adviser than a strategy that involves other types of investing, particularly as asset size increases. The Board considered that the Adviser was continuing to grow and upgrade its staff and invest in its business. The Board members reiterated their intention to continue to scrutinize the extent of economies of scale, asset growth and the Adviser’s plans to invest further to support the Funds. The Board concluded that approval of the management fee for each Fund was supportable in light of the services provided as discussed at the meeting, including the Adviser’s investments in resources to support the Funds.
After due consideration of the above-enumerated factors and other factors it deemed relevant, the Board, including a majority of the Independent Trustees, approved the continuance of each Fund’s investment advisory agreement.
50
Table of Contents
| September 30, 2017 | Baron Funds |
MANAGEMENT OF THE FUNDS (Unaudited)
Board of Trustees and Executive Officers.
Trustees of the Trust, together with information as to their positions with the Trust, principal occupations and other board memberships and affiliations for the past five years, are shown below. Each Trustee serves as Trustee of a Fund until its termination; until the Trustee’s retirement, resignation or death; or as otherwise specified in the Trust’s organizational documents. Unless otherwise noted, the address of each Executive Officer and Trustee is Baron investment Funds Trust, 767 Fifth Avenue, 49th Floor, New York, NY 10153. “Interested Trustees” are considered “interested persons” (as defined in the 1940 Act) of the Trust, and “Independent Trustees” are not considered “interested persons” of the Trust. Additional Information about the Trustees and Executive Officers of the Trust can be found in the Trust’s Statement of Additional Information (the “SAI”) which may be obtained without charge by writing or calling 1-800-99BARON. The SAI is also available on the Baron Funds® website, www.BaronFunds.com.
| Name, Address & Age | Position(s) Held With the Funds | Term of Office and Length of Time Served | Principal Occupation(s) During the Past Five Years | Number of Portfolios in Fund Complex Overseen by Trustee | Other Directorships Held by Trustee | |||||
Interested Trustees | ||||||||||
Ronald Baron(1),(2) 767 Fifth Avenue New York, NY 10153 Age: 74 | Chief Executive Officer, Chief Investment Officer, Trustee and Portfolio Manager | 30 years | Director, Chairman, CEO and CIO: the Firm* (1982-Present); Trustee: Baron Investment Funds Trust (1987-Present); Trustee: Baron Select Funds (2003-Present); Portfolio Manager: Baron USA Partners Fund, Ltd. (2003-Present). | 13 | None | |||||
Linda S. Martinson(1),(2) 767 Fifth Avenue New York, NY 10153 Age: 62 | Chairman, President, Chief Operating Officer and Trustee | 30 years | Director: the Firm* (2003-Present); President: the Firm* (2007-Present); Chief Operating Officer: the Firm (2006-Present); Chairman (2010-Present), President (2007-Present), Trustee (1987-Present): Baron Investment Funds Trust; Chairman (2010-Present), President (2007-Present), Trustee (2003-Present): Baron Select Funds; Director: Baron USA Partners Fund, Ltd. (2006-Present). | 13 | None | |||||
Independent Trustees | ||||||||||
Norman S. Edelcup(3),(4),(5) City of Sunny Isles Beach 18070 Collins Avenue Sunny Isles Beach, FL 33160 Age: 81 | Trustee | 30 years | Mayor (2003-2015): Sunny Isles Beach, Florida; Trustee: Baron Investment Funds Trust (1987-Present), Baron Select Funds (2003-Present). | 13 | Director: CompX International, Inc. (diversified manufacturer of engineered components) (2006-2016); Director: Valhi, Inc. (diversified company) (1975-2016). | |||||
Harold W. Milner(4),(5) 2293 Morningstar Drive Park City, UT 84060 Age: 82 | Trustee | 30 years | Trustee: Baron Investment Funds Trust (1987-Present), Baron Select Funds (2003-Present). | 13 | None | |||||
Raymond Noveck(3),(4),(5) 31 Karen Road Waban, MA 02468 Age: 74 | Lead Trustee | 30 years | Private Investor (1999-Present); Trustee: Baron Investment Funds Trust (1987-Present), Baron Select Funds (2003-Present). | 13 | None | |||||
Anita Rosenberg(4),(5) 1235 N. Astor Street Chicago, Il 60610 Age: 53 | Trustee | 4 years | Advisory Board Member: Impala Capital Management, LLC (2014-Present); Advisory Board Member: ValueAct Capital, LLC (2014-Present); Senior Advisor: Magnetar Capital (2011-2012); Trustee: Baron Investment Funds Trust, Baron Select Funds (2013-Present). | 13 | Director: Golub Capital BDC, Inc. (2011-Present). | |||||
David A. Silverman, MD(4),(5) 146 Central Park West New York, NY 10024 Age: 67 | Trustee | 30 years | Physician and Faculty: New York University School of Medicine (1976-Present); Trustee: Baron Investment Funds Trust (1987-Present), Baron Select Funds (2003-Present). | 13 | None | |||||
51
Table of Contents
| Baron Funds | September 30, 2017 |
MANAGEMENT OF THE FUNDS (Unaudited) (Continued)
| Name, Address & Age | Position(s) Held With the Funds | Term of Office and Length of Time Served | Principal Occupation(s) During the Past Five Years | Number of Portfolios in Fund Complex Overseen by Trustee | Other Directorships Held by Trustee | |||||
Independent Trustees (continued) | ||||||||||
Alex Yemenidjian(4),(5) 3801 Las Vegas Blvd. South Las Vegas, NV 89109 Age: 61 | Trustee | 11 years | Chairman and CEO: Tropicana Las Vegas (gaming) (2009-2015); Chairman and CEO: Armenco Holdings, LLC (investment company) (2005-Present); Managing Partner: Armenco Capital LLC (investment company) (2013-Present); Trustee: Baron Investment Funds Trust (2006-Present), Baron Select Funds (2006-Present). | 13 | Director: Guess?, Inc. (2005-Present); Director: Regal Entertainment Group (2005-Present). | |||||
Thomas J. Folliard(4),(5) 56 Beacon Street Boston, MA 02108 Age: 52 | Trustee | < 1 year | Non-Executive Chair of the Board: CarMax, Inc. (2016-Present); President and Chief Executive Officer: CarMax, Inc. (2006-2016); Trustee: Baron Investment Funds Trust (2017-Present), Baron Select Funds (2017-Present). | 13 | Director: PulteGroup, Inc.; Director: DAVIDsTEA, Inc | |||||
Additional Officers of the Funds | ||||||||||
Clifford Greenberg 767 Fifth Avenue New York, NY 10153 Age: 58 | Senior Vice President | 20 years | Director and Senior Vice President: the Firm*; Senior Vice President: Baron Investment Funds Trust, Baron Select Funds; Portfolio Manager: Baron Small Cap Fund. | N/A | N/A | |||||
Louis Beasley 767 Fifth Avenue New York, NY 10153 Age: 46 | Vice President and Chief Compliance Officer | 2 year | Chief Compliance Officer: Baron Capital Group, Inc., BAMCO, Inc., Baron Capital Management Inc., Baron Investment Funds Trust, Baron Select Funds, Baron USA Partners Fund, Ltd (9/2014-Present); Vice President: the Firm* (9/2014-Present); Principal and Director of Investment Management Compliance and Risk Management: Bessemer Trust (2006-9/2014). | N/A | N/A | |||||
Patrick M. Patalino 767 Fifth Avenue New York, NY 10153 Age: 49 | Vice President, General Counsel and Secretary | 9 years | Vice President, General Counsel and Secretary: the Firm*, Baron Investment Funds Trust, Baron Select Funds; General Counsel: Baron USA Partners Fund, Ltd. | N/A | N/A | |||||
Andrew Peck 767 Fifth Avenue New York, NY 10153 Age: 48 | Senior Vice President | 14 years | Senior Vice President: the Firm*, Baron Investment Funds Trust, Baron Select Funds; Portfolio Manager: Baron Asset Fund. | N/A | N/A | |||||
Susan Robbins 767 Fifth Avenue New York, NY 10153 Age: 63 | Vice President | 23 years | Director and Vice President: the Firm*; Vice President: Baron Investment Funds Trust, Baron Select Funds. | N/A | N/A | |||||
Peggy C. Wong 767 Fifth Avenue New York, NY 10153 Age: 56 | Treasurer and Chief Financial Officer | 30 years | Chief Financial Officer and Treasurer: the Firm*, Baron Investment Funds Trust, Baron Select Funds. | N/A | N/A | |||||
| * | The “Firm” means BCG along with its subsidiaries BCI, Baron Capital Management, Inc. and BAMCO. |
| (1) | Trustees deemed to be “Interested Trustees” by reason of their employment with the Adviser and BCI. |
| (2) | Members of the Executive Committee, which is empowered to exercise all of the powers, including the power to declare dividends, of the full Board when the full Board is not in session. |
| (3) | Members of the Audit Committee. |
| (4) | Members of the Nominating Committee. |
| (5) | Members of the Independent Committee. |
52
Table of Contents
Privacy Notice
The Funds collect nonpublic personal information about you from the following sources:
| ∎ | Information we receive from you on applications or other forms; |
| ∎ | Information about your transactions with us, our Adviser or others; and |
| ∎ | Information we receive from third parties, such as credit reporting agencies. |
“Nonpublic personal information” is private information about you that we obtain in connection with providing a financial product or service to you.
We may share your name and address with other Baron Funds and the Adviser and its affiliates for the purpose of sending you information about our products that we believe may be of interest to you and informing you of our upcoming Baron Investment Conference and for sending required information.
We do not disclose any nonpublic personal information about our customers to anyone, except as permitted or required by law. Examples of permitted disclosures under the law include sharing with companies that work for us to provide you services, such as the Transfer Agent or mailing house. All such companies that act on our behalf are contractually obligated to keep the information that we provide to them confidential and to use the information only to provide the services that we have asked them to perform for you and us.
We restrict access to nonpublic information about you to those employees who need to know that information to provide products or services to you. We maintain physical, electronic and procedural safeguards to guard your nonpublic personal information.
This privacy notice is also available at all times on the Baron Funds® website, www.BaronFunds.com or by calling 1-800-99BARON.
Go Paperless!
It’s fast, simple and a smart way to help the environment.
Enjoy the speed and convenience of receiving Fund documents electronically.
For more information, and to enroll today, go to www.baronfunds.com/edelivery.

767 Fifth Avenue, 49th Fl.
New York, NY 10153
1.800.99.BARON
212-583-2000
www.BaronFunds.com
Table of Contents
SEPTEMBER 17
Table of Contents
| Item 2. | Code of Ethics. |
The Registrant has adopted a Code of Ethics for Principal Executive and Senior Financial Officers (the “Code”). Upon request, the Registrant will provide a copy of the Code to any person without charge. To obtain a copy of the Code, please send your request to info@Baronfunds.com or call 1-800-99BARON (1-800-992-2766).
| Item 3. | Audit Committee Financial Expert. |
The Registrant’s Board of Trustees has determined that the Registrant has two audit committee financial experts serving on its Audit Committee, Norman S. Edelcup and Raymond Noveck. Both Mr. Edelcup and Mr. Noveck are “independent” for purposes of Item 3(a)(2) of Form N-CSR.
| Item 4. | Principal Accountant Fees and Services. |
The following table shows the fees paid to PricewaterhouseCoopers, LLP, the Registrant’s principal accounting firm during the fiscal years ended September 30, 2017 and September 30, 2016:
| (a) | Audit Fees: for professional services rendered for the audit of the Registrant’s annual financial statements or services that are normally provided in connection with statutory and regulatory filings or engagements: |
| 2017 | 2016 | |||||||
Baron Investment Funds Trust | $ | 255,450 | $ | 272,450 | ||||
| (b) | Audit-Related Fees: for assurance and related services that are reasonably related to the performance of the audit and are not included as Audit Fees: |
| 2017 | 2016 | |||||||
Baron Investment Funds Trust | $ | 0 | $ | 0 | ||||
| (c) | Tax Fees: for professional services rendered for tax compliance, tax advice and tax planning: |
| 2017 | 2016 | |||||||
Baron Investment Funds Trust | $ | 106,070 | $ | 114,650 | ||||
The Tax Fees represent services provided in connection with the preparation of tax returns and year-end distribution review.
| (d) | All Other Fees: for products and services provided by such accounting firm that are not included in (a), (b) or (c) above: |
| 2017 | 2016 | |||||||
Baron Investment Funds Trust | $ | 0 | $ | 0 | ||||
(e) Audit Committee Pre-Approval Policies and Procedures: (i) Pursuant to paragraph (c)(7) of Rule 2-01 of Regulation S-X and to its charter, the Audit Committee shall pre-approve all audit and non-audit services provided by the independent auditors and in connection therewith to review and evaluate the qualifications, independence and performance of the Fund’s independent auditors; (ii) 100% of the services described in each of items 4(b) through 4(d) were approved by the Audit Committee pursuant to paragraph (c)(7)(i)(C) of Rule 2-01 of Regulation S-X.
(f) Not Applicable.
(g) The aggregate non-audit fees billed by the registrant’s accountant for services rendered to the registrant, and rendered to the registrant’s investment adviser (not including any sub-adviser whose role is primarily portfolio management and is subcontracted with or overseen by another investment adviser), and any entity controlling, controlled by, or under common control with the adviser that provides ongoing services to the registrant for the last two fiscal years is as follows:
2017: | $ | 29,000 | ||
2016: | $ | 25,000 |
| Item 5. | Audit Committee of Listed Registrants. |
The Registrant has a separately-designated standing Audit Committee established in accordance with Section 3(a)(58)(A) of the Securities Exchange Act of 1934. The members of the Audit Committee are Norman S. Edelcup and Raymond Noveck.
| Item 6. | Schedule of Investments. |
Included herein under Item 1.
| Item 7. | Disclosure of Proxy Voting Policies and Procedures for Closed-End Management Investment Companies. |
Not applicable.
| Item 8. | Portfolio Managers of Closed-End Management Investment Companies. |
Not applicable.
| Item 9. | Purchases of Equity Securities by Closed-End Management Investment Company and Affiliated Purchasers. |
Not applicable.
| Item 10. | Submission of Matters to a Vote of Security Holders. |
Not applicable.
| Item 11. | Controls and Procedures. |
(a) The Registrant’s principal executive officer and principal financial officer have concluded that the Registrant’s disclosure controls and procedures (as defined in Rule 30a-3(c) under the Investment Company Act of 1940 (the “1940 Act”)) are effective based on their evaluation of these controls and procedures as of a date within 90 days of the filing date of this report.
(b) There were no changes in the Registrant’s internal control over financial reporting (as defined in Rule 30a-3(d) under the 1940 Act) that occurred during the Registrant’s second fiscal quarter of the period covered by this report that have materially affected, or are reasonably likely to materially affect, the Registrant’s internal control over financial reporting.
| Item 12. | Exhibits. |
(a)(1) Not applicable.
(a) (2) Certification of each of the principal executive officers and principal financial officers of the Registrant as required by Rule 30a-2 under the Act (17 CFR 270.30a-2) is attached hereto as a part of EX-99.CERT.
(b) Certification of each of the principal executive officers and principal financial officers of the Registrant as required by Section 906 of the Sarbanes-Oxley Act of 2002 is attached hereto as a part of EX-99.906CERT.
Table of Contents
SIGNATURES
Pursuant to the requirements of the Securities Exchange Act of 1934 and the Investment Company Act of 1940, the registrant has duly caused this report to be signed on its behalf by the undersigned, thereunto duly authorized.
| BARON INVESTMENT FUNDS TRUST | ||
| By: | /s/ Ronald Baron | |
| Ronald Baron | ||
| Chief Executive Officer | ||
| Date: December 7, 2017 | ||
Pursuant to the requirements of the Securities Exchange Act of 1934 and the Investment Company Act of 1940, this report has been signed below by the following persons on behalf of the registrant and in the capacities and on the dates indicated.
| By: | /s/ Ronald Baron | |
| Ronald Baron | ||
| Chief Executive Officer | ||
| Date: December 7, 2017 | ||
| By: | /s/ Peggy Wong | |
| Peggy Wong | ||
| Treasurer and Chief Financial Officer | ||
| Date: December 7, 2017 | ||