| OMB APPROVAL |
| OMB Number: 3235-0570 |
| Expires: January 31, 2017 |
Estimated average burden
Hours per response . . . . . . . . . 20.6 |
| UNITED STATES |
| SECURITIES AND EXCHANGE COMMISSION |
| Washington, DC 20549 |
| |
|
| |
| FORM N-CSR |
| |
| CERTIFIED SHAREHOLDER REPORT OF REGISTERED |
| MANAGEMENT INVESTMENT COMPANIES |
| |
| Investment Company Act file number: 811-5032 |
| |
| BARON INVESTMENT FUNDS TRUST f/k/a |
| BARON ASSET FUND |
|
| (Exact Name of Registrant as Specified in Charter) |
| |
| 767 Fifth Avenue, 49th Floor |
| New York, NY 10153 |
| (Address of Principal Executive Offices) (Zip Code) |
| |
|
| |
| Patrick M. Patalino, General Counsel |
| c/o Baron Investment Funds Trust |
| 767 Fifth Avenue, 49th Floor |
| New York, NY 10153 |
| (Name and Address of Agent for Service) |
|
| (Registrant’s Telephone Number, including Area Code): 212-583-2000 |
Date of fiscal year end: September 30
Date of reporting period: September 30, 2014
Form N-CSR is to be used by management investment companies to file reports with the Commission not later than 10 days after the transmission to stockholders of any report that is required to be transmitted to stockholders under Rule 30e-1 under the Investment Company Act of 1940 (17CRF 270.30e-1). The Commission may use the information provided on Form N-CSR in its regulatory, disclosure review, inspection, and policymaking roles.
A registrant is required to disclose the information specified by Form N-CSR, and the Commission will make this information public. A registrant is not required to respond to the collection of information contained in Form N-CSR unless the Form displays a currently valid Office of Management and Budget (“OMB”) control number. Please direct comments concerning the accuracy of the information collection burden estimate and suggestions for reducing the burden to Secretary, Securities and Exchange Commission, 450 5th Street, NW, Washington, D.C. 20549-0609. The OMB has reviewed this collection of information under the clearance requirements of 44 U.S.C. Section 3507.
Persons who are to respond to the collection of information contained in this form are not required to respond unless the form displays a currently valid OMB control number.
SEC 2569 (5-07)
Item 1. Reports to Stockholders.
| | | | | |
| | | | | |
| | Baron Asset Fund | | | Baron Funds® |
| | Baron Growth Fund | | |
| | Baron Small Cap Fund | | |
| | Baron Opportunity Fund | | |
| | Baron Fifth Avenue Growth Fund | | |
| | Baron Discovery Fund | | |
| | | | | |
| | | | | |
| | September 30, 2014 | | | Annual Financial Report |
| | | | | |
| | | | | |
| |
| Baron Asset Fund | | |
| Ticker Symbols: | | |
Retail Shares: BARAX | | |
Institutional Shares: BARIX | | |
| Performance | | 2 |
| Top Ten Holdings | | 3 |
| Sector Breakdown | | 3 |
| Management’s Discussion of Fund Performance | | 3 |
| |
| Baron Growth Fund | | |
| Ticker Symbols: | | |
Retail Shares: BGRFX | | |
Institutional Shares: BGRIX | | |
| Performance | | 4 |
| Top Ten Holdings | | 5 |
| Sector Breakdown | | 5 |
| Management’s Discussion of Fund Performance | | 5 |
| |
| Baron Small Cap Fund | | |
| Ticker Symbols: | | |
Retail Shares: BSCFX | | |
Institutional Shares: BSFIX | | |
| Performance | | 6 |
| Top Ten Holdings | | 7 |
| Sector Breakdown | | 7 |
| Management’s Discussion of Fund Performance | | 7 |
| |
| Baron Opportunity Fund | | |
| Ticker Symbols: | | |
Retail Shares: BIOPX | | |
Institutional Shares: BIOIX | | |
| Performance | | 8 |
| Top Ten Holdings | | 9 |
| Sector Breakdown | | 9 |
| Management’s Discussion of Fund Performance | | 9 |
| |
| Baron Fifth Avenue Growth Fund | | |
| Ticker Symbols: | | |
Retail Shares: BFTHX | | |
Institutional Shares: BFTIX | | |
| Performance | | 10 |
| Top Ten Holdings | | 11 |
| Sector Breakdown | | 11 |
| Management’s Discussion of Fund Performance | | 11 |
| |
| Baron Discovery Fund | | |
| Ticker Symbols: | | |
Retail Shares: BDFFX | | |
Institutional Shares: BDFIX | | |
| Performance | | 12 |
| Top Ten Holdings | | 13 |
| Sector Breakdown | | 13 |
| Management’s Discussion of Fund Performance | | 13 |
| |
| Financial Statements | | |
| |
| Statements of Net Assets | | 14 |
| Statements of Assets and Liabilities | | 28 |
| Statements of Operations | | 29 |
| Statements of Changes in Net Assets | | 30 |
| Notes to Financial Statements | | 32 |
| |
| Financial Highlights | | 41 |
| |
Report of Independent
Registered Public Accounting Firm | | 47 |
| |
| Tax Information | | 47 |
| |
| Fund Expenses | | 48 |
| |
Disclosure Regarding the Approval of the
Investment Advisory Agreements for Baron Asset
Fund, Baron Growth Fund, Baron Small Cap Fund,
Baron Opportunity Fund and Baron Fifth Avenue
Growth Fund by the Board of Trustees | | 49 |
| |
| Management of the Funds | | 51 |
| |
DEAR BARON FUNDS SHAREHOLDER: In this report, you will find audited financial statements for Baron Asset Fund, Baron Growth Fund, Baron Small Cap Fund, Baron Opportunity Fund, Baron Fifth Avenue Growth Fund and Baron Discovery Fund (the “Funds”) for the year ended September 30, 2014. The U.S. Securities and Exchange Commission (the “SEC”) requires mutual funds to furnish these statements semi-annually to their shareholders. We hope you find these statements informative and useful. We thank you for choosing to join us as fellow shareholders in Baron Funds. We will continue to work hard to justify your confidence. Sincerely, |
 | |  | |  |
| | | | | |
| Ronald Baron | | Linda S. Martinson | | Peggy Wong |
| Chief Executive Officer and | | Chairman, President and | | Treasurer and |
| Chief Investment Officer | | Chief Operating Officer | | Chief Financial Officer |
| November 24, 2014 | | November 24, 2014 | | November 24, 2014 |
| | | | | | |
This Annual Financial Report is for the Baron Investment Funds Trust, which currently has six series: Baron Asset Fund, Baron Growth Fund, Baron Small Cap Fund, Baron Opportunity Fund, Baron Fifth Avenue Growth Fund and Baron Discovery Fund. If you are interested in the Baron Select Funds, which contains the Baron --Partners Fund, Baron Focused Growth Fund, Baron International Growth Fund, Baron Real Estate Fund, Baron Emerging Markets Fund, Baron Energy and Resources Fund and Baron Global Advantage Fund series, please visit the Funds’ website at www.BaronFunds.com or contact us at 1-800-99BARON. The Funds’ Proxy Voting Policy is available without charge on the Funds’ website, www.BaronFunds.com or by calling 1-800-99BARON, and on the SEC’s website at www.sec.gov. The Funds’ most current proxy voting record, Form N-PX, is also available on the Funds’ website and on the SEC’s website. The Funds file their complete schedules of portfolio holdings with the SEC for the first and third quarters of each fiscal year on Form N-Q. The Funds’ Forms N-Q are available on the SEC’s website at www.sec.gov. The Funds’ Forms N-Q may also be reviewed and copied at the SEC’s Public Reference Room in Washington, DC; information on the operation of the SEC’s Public Reference Room may be obtained by calling 1-202-551-8090. A copy of the Funds’ Forms N-Q may also be obtained upon request by calling 1-800-99BARON. Schedules of portfolio holdings current to the most recent quarter-end are also available on the Funds’ website. Some of the comments are based on current management expectations and are considered “forward-looking statements.” Actual future results, however, may prove to be different from our expectations. You can identify forward-looking statements by words such as “estimate,” “may,” “expect,” “should,” “could,” “believe,” “plan” and other similar terms. We cannot promise future returns and our opinions are a reflection of our best judgment at the time this report is compiled. |
The views expressed in this report reflect those of BAMCO, Inc. (“BAMCO” or the “Adviser”) only through the end of the period stated in this report. The views are not intended as recommendations or investment advice to any person reading this report and are subject to change at any time without notice based on market and other conditions. Past performance is no guarantee of future results. The investment return and principal value of an investment will fluctuate; an investor’s shares, when redeemed, may be worth more or less than their original cost. For more complete information about Baron Funds, including charges and expenses, call, write or go to www.BaronFunds.com for a prospectus or summary prospectus. Read them carefully before you invest or send money. This report is not authorized for use as an offer of sale or a solicitation of an offer to buy shares of the Funds, unless accompanied or preceded by the Funds’ current prospectus or summary prospectus. | |  |
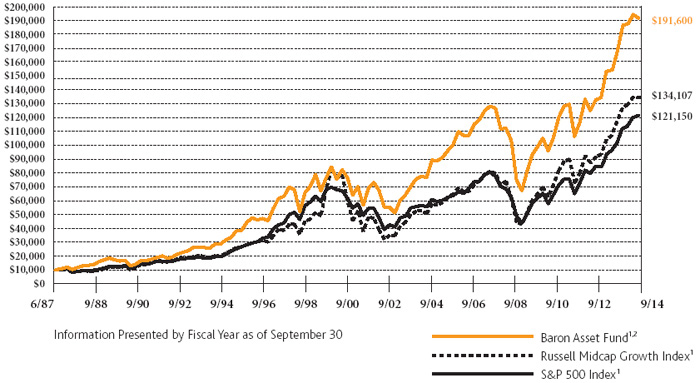
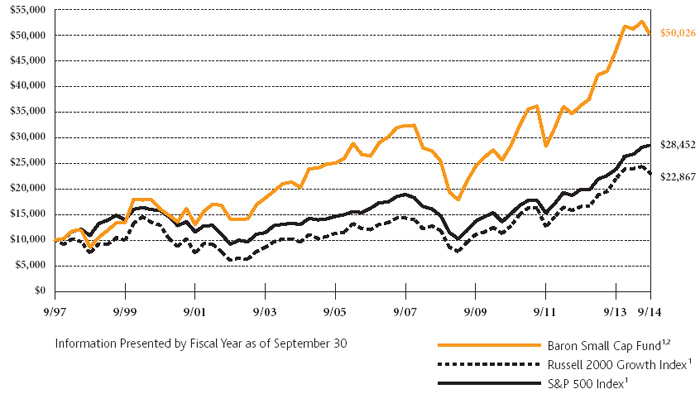
| Baron Asset Fund (Unaudited) | | September 30, 2014 |
| |
| |
COMPARISON OF THE CHANGE IN VALUE OF $10,000 INVESTMENT IN BARON ASSET FUND (RETAIL SHARES)
IN RELATION TO THE RUSSELL MIDCAP GROWTH INDEX AND THE S&P 500 INDEX |
| | | | | | | | | | | | | | | | | | |
 |
| |
AVERAGE ANNUAL TOTAL RETURNS FOR THE PERIODS ENDED SEPTEMBER 30, 2014
| | | | | One
Year | | Three
Years | | Five
Years | | Ten
Years | | Since
Inception
(June 12,
1987) |
| Baron Asset Fund — Retail Shares1, 2 | | | | | | | 13.59 | % | | | 21.65 | % | | | 15.45 | % | | | 9.58 | % | | | 11.42 | % |
| Baron Asset Fund — Institutional Shares1, 2, 4 | | | | | | | 13.90 | % | | | 21.98 | % | | | 15.76 | % | | | 9.73 | % | | | 11.48 | % |
| Russell Midcap Growth Index1 | | | | | | | 14.43 | % | | | 22.74 | % | | | 17.12 | % | | | 10.24 | % | | | 10.00 | %3 |
| S&P 500 Index1 | | | | | | | 19.73 | % | | | 22.99 | % | | | 15.70 | % | | | 8.11 | % | | | 9.57 | % |
| |
| |
| |
| |
| |
| |
| |
| |
| |
| |
| |
| |
|
| 1 | | The indexes are unmanaged. The Russell MidcapTM Growth Index measures the performance of medium-sized U.S. companies that are classified as growth and the S&P 500 Index of 500 widely held large cap U.S. companies. The indexes and the Fund are with dividends, which positively impact the performance results. |
| | | | | | | | | | | | | | | | | | | |
| 2 | | Past performance is not predictive of future performance. The performance data does not reflect the deduction of taxes that a shareholder would pay on Fund distributions or redemption of Fund shares. The Fund’s transfer agency expenses may be reduced by expense offsets from an unaffiliated transfer agent, without which performance would have been lower. |
| | | | | | | | | | | | | | | | | | | |
| 3 | | For the period June 30, 1987 to September 30, 2014. |
| | | | | | | | | | | | | | | | | | | |
| 4 | | Performance for the Institutional Shares prior to May 29, 2009 is based on the performance of the Retail Shares, which have a distribution fee. The Institutional Shares do not have a distribution fee. If the annual returns for the Institutional Shares prior to May 29, 2009 did not reflect this fee, the returns would be higher. |
2
| September 30, 2014 (Unaudited) | Baron Asset Fund |
| TOP TEN HOLDINGS AS OF SEPTEMBER 30, 2014 |
| | | Percent of | |
| | | Net Assets | |
| Gartner, Inc. | | 4.5% | |
| |
| IDEXX Laboratories, Inc. | | 3.6% | |
| |
| Illumina, Inc. | | 3.4% | |
| |
| SBA Communications Corp. | | 3.3% | |
| |
| Vail Resorts, Inc. | | 3.2% | |
| |
| FleetCor Technologies, Inc. | | 3.2% | |
| |
| The Charles Schwab Corp. | | 3.1% | |
| |
| Verisk Analytics, Inc. | | 3.1% | |
| |
| Arch Capital Group Ltd. | | 2.7% | |
| |
| Mettler-Toledo International, Inc. | | 2.6% | |
| | | 32.7% | |
| |
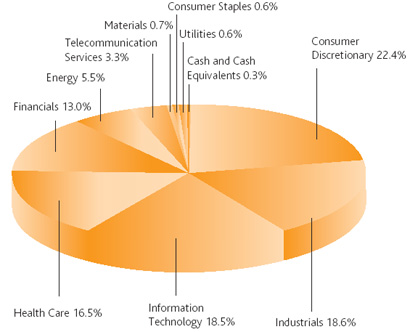
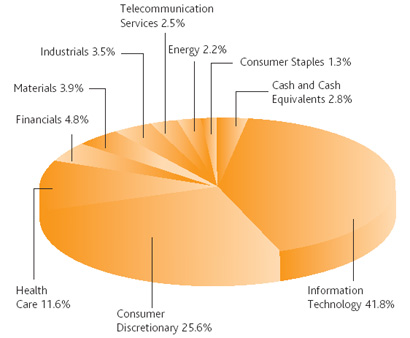
SECTOR BREAKDOWN AS OF SEPTEMBER 30, 2014†
(as a percentage of net assets) |
| |
 |
| |
| MANAGEMENT’S DISCUSSION OF FUND PERFORMANCE |
| |
For the 12-month period ended September 30, 2014, Baron Asset Fund1 (the “Fund”) gained 13.59%, while the Russell Midcap Growth Index gained 14.43% and the S&P 500 Index gained 19.73%. |
| |
The Fund invests primarily in medium-sized growth companies for the long term, using a value-oriented purchase discipline.2 The Fund purchases companies that the Adviser believes have sustainable competitive advantages, strong financial characteristics, and exceptional management; and operate in industries with favorable growth characteristics. |
| |
| 2013 was a stunning year for the market, and performance in the fourth quarter and first two months of 2014 was largely a continuation of the prior run up. However, in March, the market experienced a dramatic shift of assets out of growth areas in which stocks were trading at relatively high multiples. Since then, the market has been relatively volatile, with new highs followed by sharp contractions in both May and September. Investors appear to be taking profits in sectors that “have worked” and redeploying those proceeds in areas that have underperformed. There also appears to be an ongoing “flight to safety” favoring large cap value stocks, driven by concerns over geopolitical unrest, the pace of global economic growth, and interest rates. |
| |
| Even with the volatility during the period, virtually all of the sectors in which the Fund is invested contributed to performance, with the Fund’s investments in Health Care, Consumer Discretionary and Financials contributing the most. Consumer Staples detracted slightly in the period. |
| |
| Illumina, Inc., the leading provider of next generation DNA sequencing instruments and consumables, was the top contributor to Fund performance. Shares appreciated significantly over the period, driven by strong financial results and 2014 guidance, and the announcement of multiple new product introductions, including an ultra-high throughput sequencing platform that will be the first to sequence a full human genome for less than $1,000. |
| |
| Dick’s Sporting Goods, Inc., was the largest detractor during the period. The company reported a sales shortfall that was concentrated in the hunting and golf categories, while other higher margin product segments had sales growth exceeding industry averages. A generally weak consumer outlook and increased competition from e-commerce also fed into investors’ concerns about the strength of the traditional retail sector. We believe the hunting and golf issues are temporary and the company will continue to take market share from its retailer competitors and grow in its online presence. |
| |
| Despite the market volatility since the March/April sell-off, we continue to believe that mid-sized growth stocks represent an attractive investment opportunity. The U.S. economy is among the world’s healthiest, and interest rates remain at historical lows. We believe our diversified portfolio of fast growing, well managed, competitively advantaged businesses will continue to perform better than the broader market. There is, of course, no guarantee that this will be the case. |
| |
|
| † | | Industry sector group levels are provided by the Global Industry Classification Standard (“GICS”), developed and exclusively owned by MSCI, Inc. and Standard & Poor’s Financial Services LLC, unless otherwise stated that they have been classified by the Adviser. All GICS data is provided “as is” with no warranties. |
| |
| 1 | | Performance information reflects results of the Retail Shares. |
| |
| 2 | | Prior to February 15, 2007, the Fund’s strategy was to invest primarily in small- and mid-sized growth companies. |
3
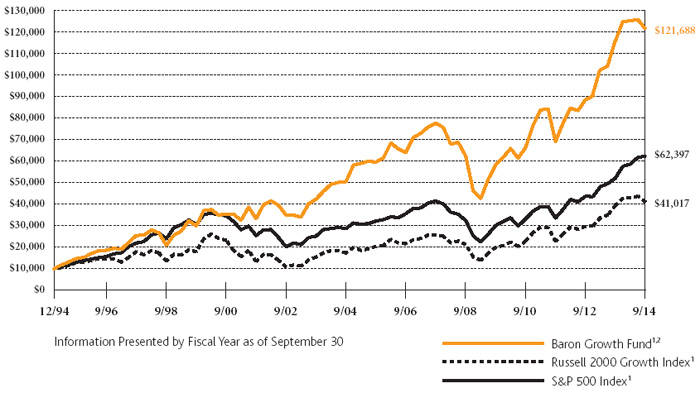
| Baron Growth Fund (Unaudited) | | September 30, 2014 |
| |
| |
COMPARISON OF THE CHANGE IN VALUE OF $10,000 INVESTMENT IN BARON GROWTH FUND (RETAIL SHARES)
IN RELATION TO THE RUSSELL 2000 GROWTH INDEX AND THE S&P 500 INDEX |
| | | | | | | | | | | | | | | | | | |
 |
| |
AVERAGE ANNUAL TOTAL RETURNS FOR THE PERIODS ENDED SEPTEMBER 30, 2014
| | | | | One
Year | | Three
Years | | Five
Years | | Ten
Years | | Since
Inception
(December 31,
1994) |
| Baron Growth Fund — Retail Shares1, 2 | | | | | | | 5.11 | % | | | 20.76 | % | | | 15.83 | % | | | 9.20 | % | | | 13.49 | % |
| Baron Growth Fund — Institutional Shares1, 2, 3 | | | | | | | 5.39 | % | | | 21.07 | % | | | 16.13 | % | | | 9.35 | % | | | 13.57 | % |
| Russell 2000 Growth Index1 | | | | | | | 3.79 | % | | | 21.91 | % | | | 15.51 | % | | | 9.03 | % | | | 7.41 | % |
| S&P 500 Index1 | | | | | | | 19.73 | % | | | 22.99 | % | | | 15.70 | % | | | 8.11 | % | | | 9.71 | % |
| |
| |
| |
| |
| |
| |
| |
| |
| |
| |
| |
| |
|
| 1 | | The indexes are unmanaged. The Russell 2000® Growth Index measures the performance of small-sized U.S. companies that are classified as growth and the S&P 500 Index of 500 widely held large cap U.S. companies. The indexes and the Fund are with dividends, which positively impact the performance results. |
| | | | | | | | | | | | | | | | | | | |
| 2 | | Past performance is not predictive of future performance. The performance data does not reflect the deduction of taxes that a shareholder would pay on Fund distributions or redemption of Fund shares. The Fund’s transfer agency expenses may be reduced by expense offsets from an unaffiliated transfer agent, without which performance would have been lower. |
| | | | | | | | | | | | | | | | | | | |
| 3 | | Performance for the Institutional Shares prior to May 29, 2009 is based on the performance of the Retail Shares, which have a distribution fee. The Institutional Shares do not have a distribution fee. If the annual returns for the Institutional Shares prior to May 29, 2009 did not reflect this fee, the returns would be higher. |
4
| September 30, 2014 (Unaudited) | Baron Growth Fund |
| TOP TEN HOLDINGS AS OF SEPTEMBER 30, 2014 |
| | | Percent of | |
| | | Net Assets | |
| Under Armour, Inc. | | 3.5% | |
| |
| ITC Holdings Corp. | | 3.1% | |
| |
| The Middleby Corp. | | 2.9% | |
| |
| Arch Capital Group Ltd. | | 2.8% | |
| |
| Gartner, Inc. | | 2.7% | |
| |
| FactSet Research Systems, Inc. | | 2.5% | |
| |
| Genesee & Wyoming, Inc. | | 2.5% | |
| |
| Dick’s Sporting Goods, Inc. | | 2.3% | |
| |
| Vail Resorts, Inc. | | 2.3% | |
| |
| Community Health Systems, Inc. | | 2.3% | |
| | | 26.9% | |
| |
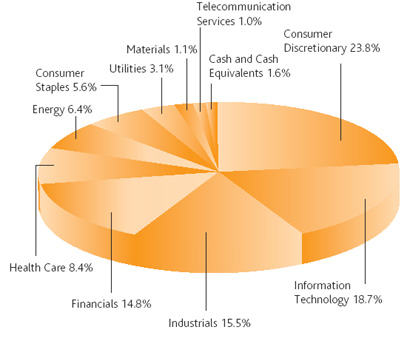
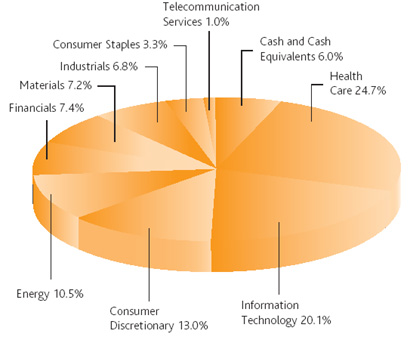
SECTOR BREAKDOWN AS OF SEPTEMBER 30, 2014†
(as a percentage of net assets) |
| |
 |
| |
| MANAGEMENT’S DISCUSSION OF FUND PERFORMANCE |
| |
For the 12-month period ended September 30, 2014, Baron Growth Fund1 (the “Fund”) gained 5.11%, while the Russell 2000 Growth Index gained 3.79% and the S&P 500 Index gained 19.73%. |
| |
| The Fund invests primarily in small-sized U.S. growth companies for the long term. Through independent research, we utilize an investment approach that the Adviser believes allows us to look at a business’s fundamental characteristics and beyond the current market environment. We invest based on the potential profitability of a business at what we believe are attractive valuations. |
| |
| 2013 was a stunning year for the market, and performance in the fourth quarter and January and February of 2014 was largely a continuation of the prior run up. However, the advance of small cap stocks ended in March as concerns over interest rates and geopolitical turmoil sparked a rotation out of faster growing small cap companies into larger companies. Since then, market volatility has continued. We think there are two reasons for this divergence: 1) profit taking by investors moving assets out of small cap stocks that had performed well in 2013 into larger companies whose stocks lagged last year; and 2) a “flight to safety” perceived in larger cap value stocks. |
| |
| Even with the volatility in the period, all sectors in which the Fund is invested contributed to performance, with the Fund’s investments in Health Care, Energy and Financials the top contributors. |
| |
| Athletic apparel company Under Armour, Inc. was the Fund’s top contributor in the 12-month period. Share price increased significantly on the strength of impressive sales gains that continue to exceed expectation. Under Armour is also growing its direct-to-consumer sales through additional outlets, full price stores, and improved e-commerce. The direct business is illustrating the consumer’s desire for higher end items, and we expect retailers to incorporate these products into the wholesale channel. |
| |
| The largest detractor was Lumber Liquidators Holdings, Inc. Shares of the leading specialty retailer of hardwood flooring declined sharply during the period, due to the protracted weather-related impact on demand and supply chain disruptions as a result of the company’s stringent new compliance standards. Despite the pullback, we believe Lumber’s growth opportunity remains intact, in light of several initiatives targeting larger format new stores, sourcing efficiencies, and broader advertising, augmented by a multiyear recovery in housing. |
| |
| The Fund continues to invest in a portfolio of businesses that have significantly better financial characteristics than the benchmark index against which it is compared. These businesses have significantly higher operating profit margins, net margins, EBITDA margins, return on invested capital, return on equity, return on assets, and lower standard deviations of earnings growth. While we do not try to predict short-term macro developments or current events, we believe conditions remain favorable for the U.S. economy and stocks. We invest for the long term, and are optimistic that the pendulum will swing back in favor of the businesses that have produced excellent results for the Fund since its inception. |
| |
|
| † | | Industry sector group levels are provided by the Global Industry Classification Standard (“GICS”), developed and exclusively owned by MSCI, Inc. and Standard & Poor’s Financial Services LLC, unless otherwise stated that they have been classified by the Adviser. All GICS data is provided “as is” with no warranties. |
| |
| 1 | | Performance information reflects results of the Retail Shares. |
5
| Baron Small Cap Fund (Unaudited) | | September 30, 2014 |
| |
| |
COMPARISON OF THE CHANGE IN VALUE OF $10,000 INVESTMENT IN BARON SMALL CAP FUND (RETAIL SHARES)
IN RELATION TO THE RUSSELL 2000 GROWTH INDEX AND THE S&P 500 INDEX |
| | | | | | | | | | | | | | | | | | |
 |
| |
AVERAGE ANNUAL TOTAL RETURNS FOR THE PERIODS ENDED SEPTEMBER 30, 2014
| | | | | One
Year | | Three
Years | | Five
Years | | Ten
Years | | Since
Inception
(September 30,
1997) |
| Baron Small Cap Fund — Retail Shares1,2 | | | | | | | 6.52 | % | | | 20.90 | % | | | 15.44 | % | | | 9.47 | % | | | 9.93 | % |
| Baron Small Cap Fund — Institutional Shares1,2,3 | | | | | | | 6.79 | % | | | 21.20 | % | | | 15.74 | % | | | 9.62 | % | | | 10.02 | % |
| Russell 2000 Growth Index1 | | | | | | | 3.79 | % | | | 21.91 | % | | | 15.51 | % | | | 9.03 | % | | | 4.99 | % |
| S&P 500 Index1 | | | | | | | 19.73 | % | | | 22.99 | % | | | 15.70 | % | | | 8.11 | % | | | 6.34 | % |
| |
| |
| |
| |
| |
| |
| |
| |
| |
| |
| |
| |
|
| 1 | | The indexes are unmanaged. The Russell 2000® Growth Index measures the performance of small-sized U.S. companies that are classified as growth and the S&P 500 Index of 500 widely held large cap U.S. companies. The indexes and the Fund are with dividends, which positively impact the performance results. |
| | | | | | | | | | | | | | | | | | | |
| 2 | | Past performance is not predictive of future performance. The performance data does not reflect the deduction of taxes that a shareholder would pay on Fund distributions or redemption of Fund shares. The Fund’s transfer agency expenses may be reduced by expense offsets from an unaffiliated transfer agent, without which performance would have been lower. |
| | | | | | | | | | | | | | | | | | | |
| 3 | | Performance for the Institutional Shares prior to May 29, 2009 is based on the performance of the Retail Shares, which have a distribution fee. The Institutional Shares do not have a distribution fee. If the annual returns for the Institutional Shares prior to May 29, 2009 did not reflect this fee, the returns would be higher. |
6
| September 30, 2014 (Unaudited) | Baron Small Cap Fund |
| TOP TEN HOLDINGS AS OF SEPTEMBER 30, 2014 |
| | | Percent of | |
| | | Net Assets | |
| SBA Communications Corp. | | 4.2% | |
| |
| TransDigm Group, Inc. | | 3.3% | |
| |
| Gartner, Inc. | | 3.1% | |
| |
| FleetCor Technologies, Inc. | | 2.6% | |
| |
| Waste Connections, Inc. | | 2.3% | |
| |
| Brookdale Senior Living, Inc. | | 2.3% | |
| |
| Berry Plastics Group, Inc. | | 2.2% | |
| |
| Targa Resources Corp. | | 1.9% | |
| |
| The Ultimate Software Group, Inc. | | 1.9% | |
| |
| Bright Horizons Family Solutions, Inc. | | 1.9% | |
| | | 25.7% | |
| |
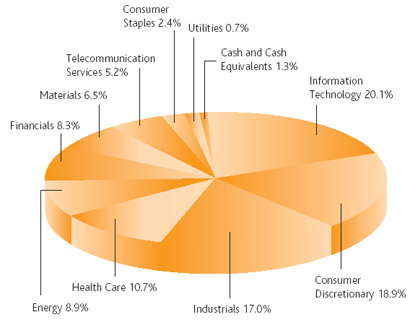
SECTOR BREAKDOWN AS OF SEPTEMBER 30, 2014†
(as a percentage of net assets) |
| |
 |
| |
| MANAGEMENT’S DISCUSSION OF FUND PERFORMANCE |
| |
For the 12-month period ended September 30, 2014, Baron Small Cap Fund1 (the “Fund”) gained 6.52%, while the Russell 2000 Growth Index gained 3.79% and the S&P 500 Index gained 19.73%. |
| |
| The Fund invests primarily in small cap growth companies for the long term. The Fund invests in what the Adviser believes are well-run small cap growth businesses that can be purchased at prices that represent a significant discount to our assessment of future value. |
| |
| 2013 was a tremendous year for the market, and performance in the fourth quarter and first two months of 2014 was largely a continuation of the prior run up. However, the advance of small cap stocks ended in March as concerns over interest rates and geopolitical turmoil sparked a rotation into larger value companies. Since then, the market for small cap stocks has been volatile, with shares weak in July, rallying back almost to their highs in August, and declining again in September. We think this poor performance is because small cap stocks performed well for so long, the gap in valuations between small and large companies has widened, and the March/April sell-off sparked a “flight to safety” which favors stocks, of larger, more secure companies. |
| |
| Even with the volatility that marked the period, virtually all sectors contributed to Fund performance, with Energy, Materials and Telecommunication Services the largest contributors. Consumer Staples detracted. |
| |
| TransDigm Group, Inc., an aircraft parts manufacturer, was the top contributor in the 12-month period, on the strength of impressive earnings numbers and continued successful execution of its strategy. During the period, the company paid a large $25 per share special dividend, and we continue to expect that TransDigm will increase revenues and free cash flow, which will lead to either accretive acquisitions or further shareholder value creation. |
| |
| The largest detractor was Financial Engines, Inc., which offers investment advice and account management to small investors for their 401(k) plans. We think results for the period have been in line, though net new enrollments were weaker in the last quarter. The stock price was affected by the sell-off of high valuation stocks, as well as general pressure on the money management sector in the period. We continue to admire the company’s unique positioning and expect cash flow to increase multi-fold. |
| |
| The Fund invests primarily in classic growth stocks that we believe have significant long-term growth prospects and can be purchased at what we believe are attractive prices because their prospects have not yet been appreciated by investors. We also invest in fallen angels, which are companies that we believe have strong long-term franchises but have disappointed investors with short-term results, creating what we believe is a buying opportunity. A third category of investment is special situations, including spin-offs and recapitalizations, where lack of investor awareness creates opportunities to purchase what we believe are strong businesses at attractive prices. |
| |
|
| † | | Industry sector group levels are provided by the Global Industry Classification Standard (“GICS”), developed and exclusively owned by MSCI, Inc. and Standard & Poor’s Financial Services LLC, unless otherwise stated that they have been classified by the Adviser. All GICS data is provided “as is” with no warranties. |
| |
| 1 | | Performance information reflects results of the Retail Shares. |
7
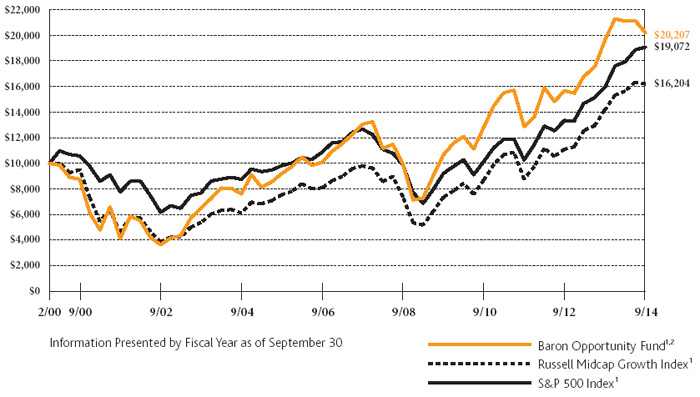
| Baron Opportunity Fund (Unaudited) | | September 30, 2014 |
| |
| |
COMPARISON OF THE CHANGE IN VALUE OF $10,000 INVESTMENT IN BARON OPPORTUNITY FUND† (RETAIL SHARES)
IN RELATION TO THE RUSSELL MIDCAP GROWTH INDEX AND THE S&P 500 INDEX |
| | | | | | | | | | | | | | | | | | |
 |
| |
AVERAGE ANNUAL TOTAL RETURNS FOR THE PERIODS ENDED SEPTEMBER 30, 2014
| | | | | One
Year | | Three
Years | | Five
Years | | Ten
Years | | Since
Inception
(February 29,
2000) |
| Baron Opportunity Fund — Retail Shares1, 2 | | | | | | | 2.87 | % | | | 16.21 | % | | | 13.67 | % | | | 10.26 | % | | | 4.94 | % |
| Baron Opportunity Fund — Institutional Shares1, 2, 3 | | | | | | | 3.10 | % | | | 16.51 | % | | | 13.97 | % | | | 10.42 | % | | | 5.04 | % |
| Russell Midcap Growth Index1 | | | | | | | 14.43 | % | | | 22.74 | % | | | 17.12 | % | | | 10.24 | % | | | 3.37 | % |
| S&P 500 Index1 | | | | | | | 19.73 | % | | | 22.99 | % | | | 15.70 | % | | | 8.11 | % | | | 4.53 | % |
| |
| |
| |
| |
| |
| |
| |
| |
| |
| |
| |
| |
|
| † | | The Fund’s historical performance was impacted by gains from IPOs and/or secondary offerings. There is no guarantee that these results can be repeated or that the Fund’s level of participation in IPOs and secondary offerings will be the same in the future. |
| | | | | | | | | | | | | | | | | | | |
| 1 | | The indexes are unmanaged. The Russell MidcapTM Growth Index measures the performance of medium-sized U.S. companies that are classified as growth and the S&P 500 Index of 500 widely held large cap U.S. companies. The indexes and the Fund are with dividends, which positively impact the performance results. |
| | | | | | | | | | | | | | | | | | | |
| 2 | | Past performance is not predictive of future performance. The performance data does not reflect the deduction of taxes that a shareholder would pay on Fund distributions or redemption of Fund shares. The Adviser has reimbursed certain Fund expenses and the Fund’s transfer agency expenses may be reduced by expense offsets from an unaffiliated transfer agent, without which performance would have been lower. |
| | | | | | | | | | | | | | | | | | | |
| 3 | | Performance for the Institutional Shares prior to May 29, 2009 is based on the performance of the Retail Shares, which have a distribution fee. The Institutional Shares do not have a distribution fee. If the annual returns for the Institutional Shares prior to May 29, 2009 did not reflect this fee, the returns would be higher. |
8
| September 30, 2014 (Unaudited) | Baron Opportunity Fund |
| TOP TEN HOLDINGS AS OF SEPTEMBER 30, 2014 |
| | | Percent of | |
| | | Total Investments | |
| Gartner, Inc. | | 4.8% | |
| |
| Illumina, Inc. | | 4.6% | |
| |
| Guidewire Software, Inc. | | 3.8% | |
| |
| Red Hat, Inc. | | 3.5% | |
| |
| SBA Communications Corp. | | 3.4% | |
| |
| Equinix, Inc. | | 3.1% | |
| |
| Verisk Analytics, Inc. | | 3.0% | |
| |
| Shutterstock, Inc. | | 2.6% | |
| |
| Just Eat plc | | 2.5% | |
| |
| CarMax, Inc. | | 2.4% | |
| | | 33.7% | |
| |
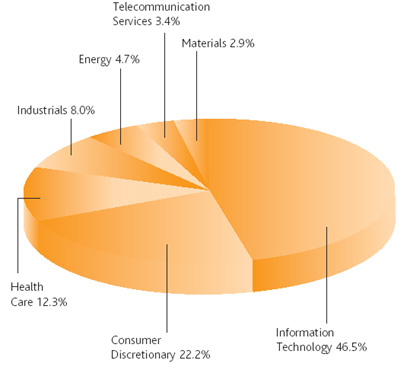
SECTOR BREAKDOWN AS OF SEPTEMBER 30, 2014†
(as a percentage of total investments) |
| |
 |
| |
| MANAGEMENT’S DISCUSSION OF FUND PERFORMANCE |
| |
For the 12-month period ended September 30, 2014, Baron Opportunity Fund1 (the “Fund”) gained 2.87%, while the Russell Midcap Growth Index gained 14.43% and the S&P 500 Index gained 19.73%. |
| |
| The Fund invests primarily in U.S. mid-cap growth companies that the Adviser believes are driving or benefiting from innovation, through development of pioneering, transformative, or technologically advanced products and services. |
| |
| 2013 was a stunning year for the market, and performance in the fourth quarter and January and February of 2014 was largely a continuation of the prior run up. During the period, the Fund performed at or ahead of the benchmark until the last two weeks of March, when it experienced one of the sharpest relative pullbacks in the Fund’s history. In late March and early April, the market experienced a dramatic shift of assets out of certain high growth areas – such as biotechnology, Internet, software-as-a service, social media and cybersecurity – in which many stocks were trading at relatively high multiples. Since then, the market has remained volatile, with high growth and smaller cap stocks significantly trailing their larger cap, value and even GARP (growth at a reasonable price) peers. The volatility appears to be driven by concerns over interest rates, slowing global economic growth and geopolitical events. |
| |
| Health Care, Consumer Discretionary and Telecommunication Services were the top contributors in the period. Top sector detractors included Information Technology, Financials and Industrials. |
| |
| Illumina, Inc., the leading provider of next generation DNA sequencing instruments and consumables, was the top contributor to Fund performance. Shares appreciated significantly over the period, driven by strong financial results and 2014 guidance, and the announcement of multiple new product introductions, including an ultra-high throughput sequencing platform that will be the first to sequence a full human genome for less than $1,000. We believe Illumina has further distanced itself from its competitors and holds an effective monopoly on DNA sequencing at a time when demand is accelerating. |
| |
| The top detractor in the 12-month period was Benefitfocus, Inc. The stock of this cloud-based benefits software sold off sharply in the March/April pullback, as investors weighed higher planned investment spending. Benefitfocus regained some of its losses only to decline again due in part to a secondary offering in July that increased the public float by more than 30%. We think Benefitfocus serves an addressable market more than 100 times larger than its current business, which should allow it to compound revenue at more than 30% annually. |
| |
| We remain focused on finding unique businesses across different segments of the economy that we believe offer long-term secular growth, sustainable competitive advantages, high-quality management teams, and attractive stock prices. We believe that investment returns for stocks are driven by earnings growth, and therefore direct our research towards understanding the drivers of business profit and projecting future profit growth as accurately as we can. |
|
| † | | Industry sector group levels are provided by the Global Industry Classification Standard (“GICS”), developed and exclusively owned by MSCI, Inc. and Standard & Poor’s Financial Services LLC, unless otherwise stated that they have been classified by the Adviser. All GICS data is provided “as is” with no warranties. |
| |
| 1 | | Performance information reflects results of the Retail Shares. |
9
| Baron Fifth Avenue Growth Fund (Unaudited) | | September 30, 2014 |
| |
| |
COMPARISON OF THE CHANGE IN VALUE OF $10,000 INVESTMENT IN BARON FIFTH AVENUE GROWTH FUND (RETAIL SHARES)
IN RELATION TO THE S&P500 INDEX AND THE RUSSELL 1000 GROWTH INDEX |
| | | | | | | | | | | | | | | | | | |
 |
| |
AVERAGE ANNUAL TOTAL RETURNS FOR THE PERIODS ENDED SEPTEMBER 30, 2014
| | | | | One
Year | | Three
Years | | Five
Years | | Ten
Years | | Since
Inception
(April 30,
2004) |
| Baron Fifth Avenue Growth Fund — Retail Shares1, 2 | | | | | | | 16.71 | % | | | 23.29 | % | | | 14.43 | % | | | 7.54 | % | | | 7.11 | % |
| Baron Fifth Avenue Growth Fund — Institutional Shares1, 2, 3 | | | | | | | 17.00 | % | | | 23.61 | % | | | 14.71 | % | | | 7.68 | % | | | 7.25 | % |
| S&P 500 Index1 | | | | | | | 19.73 | % | | | 22.99 | % | | | 15.70 | % | | | 8.11 | % | | | 7.92 | % |
| Russell 1000 Growth Index1 | | | | | | | 19.15 | % | | | 22.45 | % | | | 16.50 | % | | | 8.94 | % | | | 8.33 | % |
| |
| |
| |
| |
| |
| |
| |
| |
| |
| |
| |
| |
|
| 1 | | The indexes are unmanaged. The S&P 500 Index measures the performance of 500 widely held large cap U.S. companies and the Russell 1000® Growth Index of large-sized U.S. companies that are classified as growth. The indexes and the Fund are with dividends, which positively impact the performance results. |
| | | | | | | | | | | | | | | | | | | |
| 2 | | Past performance is not predictive of future performance. The performance data does not reflect the deduction of taxes that a shareholder would pay on Fund distributions or redemption of Fund shares. The Adviser has reimbursed certain Fund expenses and the Fund’s transfer agency expenses may be reduced by expense offsets from an unaffiliated transfer agent, without which performance would have been lower. |
| | | | | | | | | | | | | | | | | | | |
| 3 | | Performance for the Institutional Shares prior to May 29, 2009 is based on the performance of the Retail Shares, which have a distribution fee. The Institutional Shares do not have a distribution fee. If the annual returns for the Institutional Shares prior to May 29, 2009 did not reflect this fee, the returns would be higher. |
10
| September 30, 2014 (Unaudited) | Baron Fifth Avenue Growth Fund |
| TOP TEN HOLDINGS AS OF SEPTEMBER 30, 2014 |
| | | Percent of | |
| | | Net Assets | |
| Facebook Inc. | | 6.6% | |
| |
| Illumina, Inc. | | 6.4% | |
| |
| Google, Inc. | | 5.9% | |
| |
| Apple, Inc. | | 5.1% | |
| |
| Amazon.com, Inc. | | 4.9% | |
| |
| The Priceline Group, Inc. | | 4.4% | |
| |
| Wynn Resorts Ltd. | | 4.0% | |
| |
| Monsanto Co. | | 3.9% | |
| |
| Alibaba Group Holding Ltd. | | 3.6% | |
| |
| Starbucks Corp. | | 3.6% | |
| | | 48.4% | |
| |
SECTOR BREAKDOWN AS OF SEPTEMBER 30, 2014†
(as a percentage of net assets) |
| |
 |
| |
| MANAGEMENT’S DISCUSSION OF FUND PERFORMANCE |
| |
For the 12-month period ended September 30, 2014, Baron Fifth Avenue Growth Fund1 (the “Fund”) gained 16.71%, while the S&P 500 Index gained 19.73% and the Russell 1000 Growth Index gained 19.15%. |
| |
| The Fund focuses on identifying and investing in what the Adviser believes are unique companies with sustainable competitive advantages that it believes have the ability to redeploy capital at high rates of return. The portfolio is constructed on a bottom-up basis, with the quality of ideas and conviction level the most important determinants of the size of each investment. We expect our highest conviction businesses to have meaningful weight in the portfolio, with our top ten holdings comprising 35-45% of the Fund. The Fund’s sector weightings are incidental to portfolio construction, and exposure to any sector is a result of stock selection. |
| |
| 2013 was an excellent year for the market, and performance in the fourth quarter and first two months of 2014 was largely a continuation of the prior run up. During this period, the Fund benefited from the market’s preference for growth. However, in March, the market experienced a dramatic shift of assets out of growth stocks that had been trading at relatively high multiples. Since then, the market has been volatile, with new highs followed by sharp contractions in both May and September. Investors appear to be taking profits in sectors that “have worked” and redeploying those proceeds in areas that have underperformed. There also appears to be an ongoing “flight to safety,” driven by concerns over geopolitical unrest, the pace of global economic growth, and interest rates. |
| |
| Information Technology, Health Care and Consumer Discretionary were the top contributors in the 12-month period. Industrials, Telecommunication Services, and Energy were moderate detractors. |
| |
| Illumina, Inc., the leading provider of next generation DNA sequencing instruments and consumables, was the top individual contributor to performance. Shares appreciated significantly over the period, driven by strong financial results and 2014 guidance, and the announcement of multiple new product introductions, including an ultra-high throughput sequencing platform that will be the first to sequence a full human genome for less than $1,000. |
| |
| Citrix Systems, Inc., a designer of products that allow users to connect with applications on any device, network or location, was the largest detractor. Citrix shares fell as the company experienced a management transition and issues with product cycle transition. We exited our investment in the company. |
| |
| The Fund seeks to manage risk by focusing on business risk (competition, management, regulations), valuation risk (purchase price providing a large enough margin of safety), financial risk (leverage and capital structure), and analysis risk (our assumptions). Our objective is not to predict how markets may perform in a given year. Instead, we aim to create a portfolio of unique companies with different end markets because, in our experience, this is the best way to manage market risk over time. |
|
| † | | Industry sector group levels are provided by the Global Industry Classification Standard (“GICS”), developed and exclusively owned by MSCI, Inc. and Standard & Poor’s Financial Services LLC, unless otherwise stated that they have been classified by the Adviser. All GICS data is provided “as is” with no warranties. |
| |
| 1 | | Performance information reflects results of the Retail Shares. |
11
| Baron Discovery Fund (Unaudited) | | September 30, 2014 |
| |
| |
COMPARISON OF THE CHANGE IN VALUE OF $10,000 INVESTMENT IN BARON DISCOVERY FUND† (RETAIL SHARES)
IN RELATION TO THE RUSSELL 2000 GROWTH INDEX AND THE S&P500 INDEX |
| | | | | | | | | | | | | | | | | | |
 |
| |
AVERAGE ANNUAL TOTAL RETURNS FOR THE PERIOD ENDED SEPTEMBER 30, 2014
| | | | | | | | | | | | | | | | | | | | | One Year
and Since
Inception
(September 30,
2013) |
| Baron Discovery Fund — Retail Shares1, 2 | | | | | | | | | | | | | | | | | | | | | | | 16.80 | % |
| Baron Discovery Fund — Institutional Shares1, 2 | | | | | | | | | | | | | | | | | | | | | | | 17.10 | % |
| Russell 2000 Growth Index1 | | | | | | | | | | | | | | | | | | | | | | | 3.79 | % |
| S&P 500 Index1 | | | | | | | | | | | | | | | | | | | | | | | 19.73 | % |
| |
| |
| |
| |
| |
| |
| |
| |
| |
| |
| |
| |
|
| † | | The Fund’s historical performance was impacted by gains from IPOs and/or secondary offerings. There is no guarantee that these results can be repeated or that the Fund’s level of participation in IPOs and secondary offerings will be the same in the future. |
| | | | | | | | | | | | | | | | | | | |
| 1 | | The indexes are unmanaged. The Russell 2000® Growth Index measures the performance of small-sized U.S. companies that are classified as growth and the S&P 500 Index of 500 widely held large cap U.S. companies. The indexes and the Fund are with dividends, which positively impact the performance results. |
| | | | | | | | | | | | | | | | | | | |
| 2 | | Past performance is not predictive of future performance. The performance data does not reflect the deduction of taxes that a shareholder would pay on Fund distributions or redemption of Fund shares. The Adviser has reimbursed certain Fund expenses and the Fund’s transfer agency expenses may be reduced by expense offsets from an unaffiliated transfer agent, without which performance would have been lower. |
12
| September 30, 2014 (Unaudited) | Baron Discovery Fund |
| TOP TEN HOLDINGS AS OF SEPTEMBER 30, 2014 |
| | | Percent of | |
| | | Net Assets | |
| The Spectranetics Corporation | | 4.7% | |
| |
| Flotek Industries, Inc. | | 4.0% | |
| |
| BioScrip, Inc. | | 3.0% | |
| |
| Tallgrass Energy Partners, LP | | 2.8% | |
| |
| Foundation Medicine, Inc. | | 2.7% | |
| |
| Fiesta Restaurant Group, Inc. | | 2.6% | |
| |
| Strategic Hotels & Resorts, Inc. | | 2.3% | |
| |
| Rose Rock Midstream, L.P. | | 2.3% | |
| |
| Qualys, Inc. | | 2.2% | |
| |
| ExamWorks Group, Inc. | | 2.2% | |
| | | 28.8% | |
| |
SECTOR BREAKDOWN AS OF SEPTEMBER 30, 2014†
(as a percentage of net assets) |
| |
 |
| |
| MANAGEMENT’S DISCUSSION OF FUND PERFORMANCE |
| |
For the 12-month period ended September 30, 2014, Baron Discovery Fund1 (the “Fund”) gained 16.80%, while the Russell 2000 Growth Index gained 3.79% and the S&P 500 Index gained 19.73%. |
| |
| The Fund invests primarily in small-sized U.S. companies with significant growth potential and market capitalizations at or below $1.5 billion. The Fund invests for the long term at attractive valuations in companies with, in our view, appropriately capitalized, open-ended growth opportunities, exceptional leadership, and sustainable competitive advantages. |
| |
| We launched the Fund a year ago. In its first five months, high growth, small cap companies generally did well. In March and April, however, momentum stocks, high growth stocks and new IPOs all performed worse than both the overall market and the more moderate growth stocks in the Fund’s portfolio. Since then, the market has been relatively volatile, with new highs followed by sharp contractions in both May and September. Investors appear to be taking profits in sectors that “have worked” and redeploying those proceeds in areas that have underperformed. There also appears to be an ongoing “flight to safety” favoring large cap value stocks, driven by concerns over geopolitical unrest, the pace of global economic growth, and interest rates. |
| |
| The outperformance that the Fund had in the first five months more than made up for the more challenging period that followed. All the sectors in which the Fund is invested contributed to performance, with the Fund’s investments in Energy, Health Care, and Industrials contributing the most. |
| |
| voxeljet AG, a manufacturer of 3D printing equipment and provider of printing services, contributed the most in the 12-month period. We participated in voxeljet’s IPO, but after the stock ran up 267%, we could no longer justify the valuation even while factoring in what we believe is a large market opportunity and exited the position. We continue to follow the company closely and may re-invest at more reasonable valuations. |
| |
| The biggest detractor in the 12-month period was E2open, Inc., a provider of cloud-based software that helps some of the world’s largest companies manage their complex manufacturing supply chains. The company has been a casualty of the general rotation out of high-growth stocks. The stock price was also affected in September after E2open took down full year guidance due to the loss of three customers who were acquired (and in two cases, shut down operations). We continue to believe that E2open’s solution is sticky, valuable to customers, and difficult to replicate. |
| |
| While the stock market has been volatile in recent months, we think the long-term fundamentals of our companies remain strong. The companies we own are high quality, innovative and run by excellent management teams. We are optimistic that they will be significantly bigger next year than they are today and that this growth can continue for years after. |
|
| † | | Industry sector group levels are provided by the Global Industry Classification Standard (“GICS”), developed and exclusively owned by MSCI, Inc. and Standard & Poor’s Financial Services LLC, unless otherwise stated that they have been classified by the Adviser. All GICS data is provided “as is” with no warranties. |
| |
| 1 | | Performance information reflects results of the Retail Shares. |
13
| Baron Asset Fund | September 30, 2014 |
| STATEMENT OF NET ASSETS |
| |
| |
| SEPTEMBER 30, 2014 |
| |
| Shares | | | | | Cost | | | Value | |
| |
| Common Stocks (98.08%) | | | | | | | |
| |
| Consumer Discretionary (22.42%) | | | | | | | |
| | | Apparel, Accessories & Luxury Goods (2.08%) | | | | | | | |
| 175,000 | | Fossil Group, Inc.1 | | $ | 13,482,048 | | $ | 16,432,500 | |
| 240,000 | | Ralph Lauren Corp. | | | 4,311,799 | | | 39,535,200 | |
| | | | | | | | |
| | | | | | 17,793,847 | | | 55,967,700 | |
| | | Automotive Retail (1.30%) | | | | | | | |
| 750,000 | | CarMax, Inc.1 | | | 14,772,082 | | | 34,837,500 | |
| |
| | | Broadcasting (1.11%) | | | | | | | |
| 375,000 | | Discovery Communications, Inc., Cl A1 | | | 4,026,159 | | | 14,175,000 | |
| 422,000 | | Discovery Communications, Inc., Series C1 | | | 4,476,524 | | | 15,732,160 | |
| | | | | | | | |
| | | | | | 8,502,683 | | | 29,907,160 | |
| | | Casinos & Gaming (2.61%) | | | | | | | |
| 375,000 | | Wynn Resorts Ltd. | | | 0 | | | 70,155,000 | |
| |
| | | Education Services (0.52%) | | | | | | | |
| 325,000 | | DeVry Education Group, Inc. | | | 546,016 | | | 13,913,250 | |
| |
| | | Hotels, Resorts & Cruise Lines (3.85%) | | | | | | | |
| 800,000 | | Choice Hotels International, Inc. | | | 3,577,372 | | | 41,600,000 | |
| 1,025,000 | | Hyatt Hotels Corp., Cl A1 | | | 30,808,659 | | | 62,033,000 | |
| | | | | | | | |
| | | | | | 34,386,031 | | | 103,633,000 | |
| | | Internet Retail (3.88%) | | | | | | | |
| 500,000 | | AO World plc (United Kingdom)1,2 | | | 2,372,126 | | | 1,523,881 | |
| 1,100,000 | | HomeAway, Inc.1 | | | 29,291,514 | | | 39,050,000 | |
| 55,000 | | The Priceline Group, Inc.1 | | | 8,865,734 | | | 63,721,900 | |
| | | | | | | | |
| | | | | | 40,529,374 | | | 104,295,781 | |
| | | Leisure Facilities (3.22%) | | | | | | | |
| 1,000,000 | | Vail Resorts, Inc. | | | 19,491,424 | | | 86,760,000 | |
| |
| | | Specialty Stores (3.85%) | | | | | | | |
| 825,000 | | Dick’s Sporting Goods, Inc. | | | 25,648,808 | | | 36,201,000 | |
| 365,000 | | Tiffany & Co. | | | 11,296,007 | | | 35,153,150 | |
| 525,000 | | Tractor Supply Co. | | | 17,256,750 | | | 32,292,750 | |
| | | | | | | | |
| | | | | | 54,201,565 | | | 103,646,900 | |
| | | | | | | | |
| Total Consumer Discretionary | | | 190,223,022 | | | 603,116,291 | |
| | | | | | | | |
| | | | | | | | | | |
| Consumer Staples (0.63%) | | | | | | | |
| | | Food Distributors (0.63%) | | | | | | | |
| 275,000 | | United Natural Foods, Inc.1 | | | 14,611,785 | | | 16,901,500 | |
| | | | | | | | |
| | | | | | | | | | |
| Energy (5.45%) | | | | | | | |
| | | Oil & Gas Drilling (1.31%) | | | | | | | |
| 360,000 | | Helmerich & Payne, Inc. | | | 10,192,188 | | | 35,233,200 | |
| |
| | | Oil & Gas Equipment & Services (1.35%) | | | | | | | |
| 185,000 | | Core Laboratories N.V.2 | | | 12,671,507 | | | 27,074,750 | |
| 150,000 | | Oil States International, Inc.1 | | | 5,850,283 | | | 9,285,000 | |
| | | | | | | | |
| | | | | | 18,521,790 | | | 36,359,750 | |
| | | Oil & Gas Exploration & Production (1.28%) | | | | | | | |
| 274,500 | | Concho Resources, Inc.1 | | | 12,981,350 | | | 34,419,555 | |
| |
| | | Oil & Gas Storage & Transportation (1.51%) | | | | | | | |
| 450,000 | | Phillips 66 Partners LP | | | 12,772,374 | | | 30,037,500 | |
| 174,934 | | Western Gas Equity Partners LP | | | 3,848,548 | | | 10,660,478 | |
| | | | | | | | |
| | | | | | 16,620,922 | | | 40,697,978 | |
| | | | | | | | |
| Total Energy | | | 58,316,250 | | | 146,710,483 | |
| | | | | | | | |
| Shares | | | | | Cost | | | Value | |
| |
| Common Stocks (continued) | | | | | | | |
| |
| Financials (11.37%) | | | | | | | |
| | | Asset Management & Custody Banks (1.43%) | | | | | | | |
| 250,000 | | Artisan Partners Asset Management, Inc., Cl A | | $ | 15,500,000 | | $ | 13,012,500 | |
| 325,000 | | T. Rowe Price Group, Inc. | | | 7,848,785 | | | 25,480,000 | |
| | | | | | | | |
| | | | | | 23,348,785 | | | 38,492,500 | |
| | | Investment Banking & Brokerage (3.06%) | | | | | | | |
| 2,800,000 | | The Charles Schwab Corp. | | | 3,023,977 | | | 82,292,000 | |
| |
| | | Office REITs (1.24%) | | | | | | | |
| 89,500 | | Alexander’s, Inc.4 | | | 4,271,765 | | | 33,464,945 | |
| |
| | | Property & Casualty Insurance (2.70%) | | | | | | | |
| 1,325,000 | | Arch Capital Group Ltd.1,2 | | | 14,427,862 | | | 72,504,000 | |
| |
| | | Real Estate Services (2.21%) | | | | | | | |
| 2,000,000 | | CBRE Group, Inc., Cl A1 | | | 26,527,399 | | | 59,480,000 | |
| |
| | | Regional Banks (0.73%) | | | | | | | |
| 400,000 | | First Republic Bank | | | 10,477,932 | | | 19,752,000 | |
| | | | | | | | |
| Total Financials | | | 82,077,720 | | | 305,985,445 | |
| | | | | | | | |
| | | | | | | | | | |
| Health Care (16.53%) | | | | | | | |
| | | Health Care Distributors (1.51%) | | | | | | | |
| 350,000 | | Henry Schein, Inc.1 | | | 9,382,832 | | | 40,764,500 | |
| |
| | | Health Care Equipment (3.61%) | | | | | | | |
| 825,000 | | IDEXX Laboratories, Inc.1 | | | 33,055,763 | | | 97,209,750 | |
| |
| | | Health Care Facilities (1.46%) | | | | | | | |
| 375,000 | | Universal Health Services, Inc., Cl B | | | 23,304,910 | | | 39,187,500 | |
| |
| | | Health Care Supplies (2.53%) | | | | | | | |
| 265,000 | | The Cooper Companies, Inc. | | | 34,262,522 | | | 41,273,750 | |
| 600,000 | | West Pharmaceutical Services, Inc. | | | 26,179,186 | | | 26,856,000 | |
| | | | | | | | |
| | | | | | 60,441,708 | | | 68,129,750 | |
| | | Health Care Technology (0.59%) | | | | | | | |
| 265,000 | | Cerner Corp.1 | | | 5,777,893 | | | 15,786,050 | |
| |
| | | Life Sciences Tools & Services (6.83%) | | | | | | | |
| 555,000 | | Illumina, Inc.1 | | | 24,225,443 | | | 90,975,600 | |
| 275,000 | | Mettler-Toledo International, Inc.1 | | | 17,214,470 | | | 70,435,750 | |
| 400,000 | | Quintiles Transnational Holdings, Inc.1 | | | 18,309,703 | | | 22,312,000 | |
| | | | | | | | |
| | | | | | 59,749,616 | | | 183,723,350 | |
| | | | | | | | |
| Total Health Care | | | 191,712,722 | | | 444,800,900 | |
| | | | | | | | |
| | | | | | | | | | |
| Industrials (18.62%) | | | | | | | |
| | | Construction Machinery & Heavy Trucks (1.28%) | | | | | | | |
| 425,000 | | Westinghouse Air Brake Technologies Corporation | | | 28,502,302 | | | 34,442,000 | |
| |
| | | Environmental & Facilities Services (1.08%) | | | | | | | |
| 250,000 | | Stericycle, Inc.1 | | | 7,016,768 | | | 29,140,000 | |
| |
| | | Human Resource & Employment Services (1.20%) | | | | | | | |
| 325,000 | | Towers Watson & Co., Cl A | | | 35,475,007 | | | 32,337,500 | |
| |
| | | Industrial Conglomerates (1.47%) | | | | | | | |
| 270,000 | | Roper Industries, Inc. | | | 22,869,631 | | | 39,498,300 | |
| 14 | | See Notes to Financial Statements. |
| September 30, 2014 | | Baron Asset Funds |
| STATEMENT OF NET ASSETS (Continued) |
| |
| |
| SEPTEMBER 30, 2014 |
| |
| Shares | | | | | Cost | | | Value | |
| |
| Common Stocks (continued) | | | | | | | |
| |
| Industrials (continued) | | | | | | | |
| | | Industrial Machinery (5.27%) | | | | | | | |
| 950,000 | | Colfax Corp.1 | | $ | 30,771,922 | | $ | 54,121,500 | |
| 112,000 | | IDEX Corporation | | | 8,263,616 | | | 8,105,440 | |
| 450,000 | | The Middleby Corp.1 | | | 23,539,575 | | | 39,658,500 | |
| 475,000 | | Pall Corp. | | | 31,354,374 | | | 39,757,500 | |
| | | | | | | | |
| | | | | | 93,929,487 | | | 141,642,940 | |
| | | Research & Consulting Services (5.32%) | | | | | | | |
| 1,375,000 | | Nielsen N.V.2 | | | 33,985,885 | | | 60,953,750 | |
| 1,350,000 | | Verisk Analytics, Inc., Cl A1 | | | 34,838,769 | | | 82,201,500 | |
| | | | | | | | |
| | | | | | 68,824,654 | | | 143,155,250 | |
| | | Trading Companies & Distributors (3.00%) | | | | | | | |
| 1,175,000 | | Fastenal Co. | | | 21,409,223 | | | 52,757,500 | |
| 1,200,000 | | MRC Global, Inc.1 | | | 28,777,893 | | | 27,984,000 | |
| | | | | | | | |
| | | | | | 50,187,116 | | | 80,741,500 | |
| | | | | | | | |
| Total Industrials | | | 306,804,965 | | | 500,957,490 | |
| | | | | | | | |
| | | | | | | | | | |
| Information Technology (18.50%) | | | | | | | |
| | | Application Software (6.31%) | | | | | | | |
| 550,000 | | ANSYS, Inc.1 | | | 14,771,000 | | | 41,618,500 | |
| 525,000 | | FactSet Research Systems, Inc. | | | 28,837,256 | | | 63,803,250 | |
| 935,000 | | Guidewire Software, Inc.1 | | | 43,250,976 | | | 41,457,900 | |
| 426,812 | | Mobileye N.V.1,2 | | | 10,670,300 | | | 22,872,855 | |
| | | | | | | | |
| | | | | | 97,529,532 | | | 169,752,505 | |
| | | Data Processing & Outsourced Services (3.17%) | | | | | | | |
| 600,000 | | FleetCor Technologies, Inc.1 | | | 21,892,482 | | | 85,272,000 | |
| |
| | | Internet Software & Services (3.29%) | | | | | | | |
| 175,000 | | LinkedIn Corp., Cl A1 | | | 9,912,287 | | | 36,363,250 | |
| 267,500 | | Shutterstock, Inc.1 | | | 17,386,686 | | | 19,094,150 | |
| 600,000 | | Verisign, Inc.1 | | | 27,498,021 | | | 33,072,000 | |
| | | | | | | | |
| | | | | | 54,796,994 | | | 88,529,400 | |
| | | IT Consulting & Other Services (5.73%) | | | | | | | |
| 155,000 | | Equinix, Inc.1,4 | | | 10,768,505 | | | 32,934,400 | |
| 1,650,000 | | Gartner, Inc.1 | | | 36,183,876 | | | 121,225,500 | |
| | | | | | | | |
| | | | | | 46,952,381 | | | 154,159,900 | |
| | | | | | | | |
| Total Information Technology | | | 221,171,389 | | | 497,713,805 | |
| | | | | | | | |
| | | | | | | | | | |
| Materials (0.72%) | | | | | | | |
| | | Industrial Gases (0.72%) | | | | | | | |
| 175,000 | | Airgas, Inc. | | | 11,449,835 | | | 19,363,750 | |
| | | | | | | | |
| | | | | | | | | | |
| Telecommunication Services (3.30%) | | | | | | | |
| | | Wireless Telecommunication Services (3.30%) | | | | | | | |
| 800,000 | | SBA Communications Corp., Cl A1 | | | 23,758,066 | | | 88,720,000 | |
| | | | | | | | |
| | | | | | | | | | |
| Utilities (0.54%) | | | | | | | |
| | | Renewable Electricity (0.54%) | | | | | | | |
| 501,980 | | TerraForm Power, Inc., Cl A1 | | | 14,078,326 | | | 14,487,143 | |
| | | | | | | | |
| Total Common Stocks | | | 1,114,204,080 | | | 2,638,756,807 | |
| | | | | | | | |
| Shares | | | | | Cost | | | | Value | |
| | |
| Private Equity Investments (1.59%) | | | | | | | | |
| | |
| Financials (1.59%) | | | | | | | | |
| | | Asset Management & Custody Banks (1.59%) | | | | | | | | |
| 7,056,223 | | Windy City Investments | | | | | | | | |
| | | Holdings, L.L.C.1,3,4,6 | | $ | 34,581,904 | | | $ | 42,901,834 | |
| | | | | | | | | |
| | | | | | | | | | | |
| | |
| Principal | | | | | | | | |
| Amount | | | | | | | | |
| | |
| Short Term Investments (0.18%) | | | | | | | | |
| | |
| $4,724,574 | | Repurchase Agreement with Fixed Income Clearing Corp., dated 9/30/2014, 0.00% due 10/1/2014; Proceeds at maturity - $4,724,574; (Fully collateralized by $4,820,000 U.S. Treasury Note, 2.125% due 6/30/2021; Market value - $4,820,000)5 | | | 4,724,574 | | | | 4,724,574 | |
| | | | | | | | | |
Total Investments (99.85%) | | $ | 1,153,510,558 | | | | 2,686,383,215 | |
| | | | | | | | | | |
Cash and Other Assets Less Liabilities (0.15%) | | | | | | | 3,911,154 | |
| | | | | | | | | | |
Net Assets | | | | | | $ | 2,690,294,369 | |
| | | | | | | | | | |
Retail Shares (Equivalent to $63.75 per share based on 31,381,751 shares outstanding) | | | | | | $ | 2,000,486,489 | |
| | | | | | | | | | |
Institutional Shares (Equivalent to $64.87 per share based on 10,634,393 shares outstanding) | | | | | | $ | 689,807,880 | |
| | | | | | | | | | |
| % | | Represents percentage of net assets. |
| 1 | | Non-income producing securities. |
| 2 | | Foreign corporation. |
| 3 | | At September 30, 2014, the market value of restricted and fair valued securities amounted to $42,901,834 or 1.59% of net assets. This security is not deemed liquid. See Note 6 regarding Restricted Securities. |
| 4 | | The Adviser has reclassified/classified certain securities in or out of this sub-industry. Such reclassifications/classifications are not supported by S&P or MSCI. |
| 5 | | Level 2 security. See Note 7 regarding Fair Value Measurements. |
| 6 | | Level 3 security. See Note 7 regarding Fair Value Measurements. |
| | | |
| | | All securities are Level 1, unless otherwise noted. |
| See Notes to Financial Statements. | | 15 |
| Baron Growth Fund | September 30, 2014 |
| STATEMENT OF NET ASSETS |
| |
| |
| SEPTEMBER 30, 2014 |
| |
| Shares | | | | | Cost | | | Value | |
| |
| Common Stocks (98.06%) | | | | | | | |
| |
| Consumer Discretionary (23.79%) | | | | | | | |
| | | Apparel, Accessories & Luxury Goods (3.51%) | | | | | | | |
| 3,950,000 | | Under Armour, Inc., Cl A1 | | $ | 31,205,806 | | $ | 272,945,000 | |
| |
| | | Automotive Retail (0.39%) | | | | | | | |
| 750,000 | | Penske Automotive Group, Inc. | | | 13,032,059 | | | 30,442,500 | |
| |
| | | Casinos & Gaming (1.50%) | | | | | | | |
| 3,870,620 | | Penn National Gaming, Inc.1 | | | 33,038,240 | | | 43,389,650 | |
| 2,900,000 | | Pinnacle Entertainment, Inc.1 | | | 47,133,881 | | | 72,761,000 | |
| | | | | | | | |
| | | | | | 80,172,121 | | | 116,150,650 | |
| | | Distributors (1.08%) | | | | | | | |
| 3,150,000 | | LKQ Corp. 1 | | | 18,206,418 | | | 83,758,500 | |
| |
| | | Education Services (2.67%) | | | | | | | |
| 2,257,170 | | Bright Horizons Family Solutions, Inc.1 | | | 74,787,601 | | | 94,936,570 | |
| 1,700,000 | | DeVry Education Group, Inc. | | | 24,625,717 | | | 72,777,000 | |
| 2,346,098 | | Nord Anglia Education Inc.1,2 | | | 44,911,032 | | | 39,883,666 | |
| | | | | | | | |
| | | | | | 144,324,350 | | | 207,597,236 | |
| | | Home Improvement Retail (0.87%) | | | | | | | |
| 1,180,000 | | Lumber Liquidators Holdings, Inc.1 | | | 27,982,185 | | | 67,708,400 | |
| |
| | | Hotels, Resorts & Cruise Lines (3.92%) | | | | | | | |
| 3,007,500 | | Choice Hotels International, Inc.4 | | | 73,061,456 | | | 156,390,000 | |
| 271,739 | | Diamond Resorts International, Inc.1 | | | 3,804,346 | | | 6,184,780 | |
| 2,638,652 | | Interval Leisure Group, Inc. | | | 49,668,667 | | | 50,266,320 | |
| 1,450,000 | | Marriott Vacations Worldwide Corp.1 | | | 78,402,844 | | | 91,944,500 | |
| | | | | | | | |
| | | | | | 204,937,313 | | | 304,785,600 | |
| | | Internet Retail (0.61%) | | | | | | | |
| 15,425,000 | | AO World plc (United Kingdom)1,2 | | | 75,665,968 | | | 47,011,734 | |
| |
| | | Leisure Facilities (2.69%) | | | | | | | |
| 386,111 | | ClubCorp Holdings, Inc. | | | 6,820,605 | | | 7,656,581 | |
| 2,064,800 | | Vail Resorts, Inc.4 | | | 59,870,980 | | | 179,142,048 | |
| 1,358,700 | | Whistler Blackcomb Holdings, Inc. (Canada)2 | | | 15,542,103 | | | 22,322,497 | |
| | | | | | | | |
| | | | | | 82,233,688 | | | 209,121,126 | |
| | | Leisure Products (0.08%) | | | | | | | |
| 300,000 | | BRP, Inc. (Canada)1,2 | | | 6,242,137 | | | 6,479,754 | |
| |
| | | Movies & Entertainment (1.96%) | | | | | | | |
| 2,300,000 | | DreamWorks Animation SKG, Inc., Cl A1 | | | 62,895,758 | | | 62,721,000 | |
| 5,422,299 | | Manchester United plc, Cl A1,2 | | | 76,721,822 | | | 89,359,487 | |
| | | | | | | | |
| | | | | | 139,617,580 | | | 152,080,487 | |
| | | Publishing (1.03%) | | | | | | | |
| 1,175,000 | | Morningstar, Inc. | | | 25,213,450 | | | 79,782,500 | |
| |
| | | Restaurants (0.94%) | | | | | | | |
| 450,000 | | Panera Bread Co., Cl A1 | | | 15,602,751 | | | 73,224,000 | |
| |
| | | Specialty Stores (2.54%) | | | | | | | |
| 800,000 | | The Container Store Group, Inc.1 | | | 26,176,648 | | | 17,416,000 | |
| 4,100,000 | | Dick’s Sporting Goods, Inc. | | | 69,383,822 | | | 179,908,000 | |
| | | | | | | | |
| | | | | | 95,560,470 | | | 197,324,000 | |
| | | | | | | | |
| Total Consumer Discretionary | | | 959,996,296 | | | 1,848,411,487 | |
| | | | | | | | |
| Shares | | | | | Cost | | | Value | |
| |
| Common Stocks (continued) | | | | | | | |
| |
| Consumer Staples (5.60%) | | | | | | | |
| | | Brewers (0.58%) | | | | | | | |
| 201,400 | | The Boston Beer Co., Inc., Cl A1 | | $ | 29,104,380 | | $ | 44,662,464 | |
| |
| | | Food Distributors (1.81%) | | | | | | | |
| 2,290,237 | | United Natural Foods, Inc.1 | | | 98,857,949 | | | 140,757,966 | |
| |
| | | Household Products (1.35%) | | | | | | | |
| 1,500,000 | | Church & Dwight Co., Inc. | | | 27,340,827 | | | 105,240,000 | |
| |
| | | Packaged Foods & Meats (1.86%) | | | | | | | |
| 1,800,000 | | TreeHouse Foods, Inc.1 | | | 85,049,691 | | | 144,900,000 | |
| | | | | | | | |
| Total Consumer Staples | | | 240,352,847 | | | 435,560,430 | |
| | | | | | | | |
| | | | | | | | | | |
| Energy (6.42%) | | | | | | | |
| | | Oil & Gas Drilling (0.94%) | | | | | | | |
| 750,000 | | Helmerich & Payne, Inc. | | | 16,760,895 | | | 73,402,500 | |
| |
| | | Oil & Gas Equipment & Services (1.46%) | | | | | | | |
| 575,000 | | Core Laboratories N.V.2 | | | 13,267,301 | | | 84,151,250 | |
| 390,625 | | SEACOR Holdings, Inc.1 | | | 11,947,768 | | | 29,218,750 | |
| | | | | | | | |
| | | | | | 25,215,069 | | | 113,370,000 | |
| | | Oil & Gas Exploration & Production (0.98%) | | | | | | | |
| 247,191 | | Oasis Petroleum, Inc.1 | | | 3,460,674 | | | 10,335,056 | |
| 1,350,000 | | RSP Permian, Inc.1 | | | 28,134,457 | | | 34,506,000 | |
| 400,000 | | SM Energy Co. | | | 13,315,693 | | | 31,200,000 | |
| | | | | | | | |
| | | | | | 44,910,824 | | | 76,041,056 | |
| | | Oil & Gas Storage & Transportation (3.04%) | | | | | | | |
| 1,562,103 | | Atlas Energy, L.P. | | | 68,036,843 | | | 68,732,532 | |
| 70,000 | | MPLX LP | | | 1,540,000 | | | 4,125,800 | |
| 1,200,000 | | Targa Resources Corp. | | | 36,086,844 | | | 163,404,000 | |
| | | | | | | | |
| | | | | | 105,663,687 | | | 236,262,332 | |
| | | | | | | | |
| Total Energy | | | 192,550,475 | | | 499,075,888 | |
| | | | | | | | |
| | | | | | | | | | |
| Financials (14.62%) | | | | | | | |
| | | Asset Management & Custody Banks (3.64%) | | | | | | | |
| 1,994,899 | | The Carlyle Group | | | 43,767,989 | | | 60,764,624 | |
| 2,175,000 | | Cohen & Steers, Inc. | | | 57,433,262 | | | 83,607,000 | |
| 2,204,712 | | Financial Engines, Inc. | | | 63,157,081 | | | 75,434,221 | |
| 1,230,195 | | Oaktree Capital Group, LLC | | | 53,958,848 | | | 62,862,964 | |
| | | | | | | | |
| | | | | | 218,317,180 | | | 282,668,809 | |
| | | Diversified REITs (0.30%) | | | | | | | |
| 712,000 | | American Assets Trust, Inc. | | | 13,782,555 | | | 23,474,640 | |
| |
| | | Hotel & Resort REITs (0.73%) | | | | | | | |
| 1,650,000 | | LaSalle Hotel Properties | | | 38,657,293 | | | 56,496,000 | |
| |
| | | Life & Health Insurance (1.68%) | | | | | | | |
| 2,700,000 | | Primerica, Inc. | | | 65,591,464 | | | 130,194,000 | |
| |
| | | Office REITs (1.77%) | | | | | | | |
| 135,000 | | Alexander’s, Inc.5 | | | 28,435,048 | | | 50,477,850 | |
| 3,400,000 | | Douglas Emmett, Inc. | | | 42,596,064 | | | 87,278,000 | |
| | | | | | | | |
| | | | | | 71,031,112 | | | 137,755,850 | |
| | | Property & Casualty Insurance (2.78%) | | | | | | | |
| 3,950,000 | | Arch Capital Group Ltd.1,2 | | | 38,581,866 | | | 216,144,000 | |
| |
| | | Residential REITs (0.29%) | | | | | | | |
| 625,000 | | American Campus Communities, Inc. | | | 15,885,634 | | | 22,781,250 | |
| 16 | | See Notes to Financial Statements. |
| September 30, 2014 | | Baron Growth Fund |
| STATEMENT OF NET ASSETS (Continued) |
| |
| |
| SEPTEMBER 30, 2014 |
| |
| Shares | | | | | Cost | | | Value | |
| |
| Common Stocks (continued) | | | | | | | |
| Financials (continued) | | | | | | | |
| | | Specialized Finance (1.30%) | | | | | | | |
| 2,150,000 | | MSCI, Inc.1 | | $ | 42,521,078 | | $ | 101,093,000 | |
| |
| | | Specialized REITs (2.13%) | | | | | | | |
| 775,000 | | Alexandria Real Estate Equities, Inc.5 | | | 29,095,131 | | | 57,156,250 | |
| 3,496,074 | | Gaming and Leisure Properties, Inc. | | | 89,454,329 | | | 108,028,687 | |
| | | | | | | | |
| | | | | | 118,549,460 | | | 165,184,937 | |
| | | | | | | | |
| Total Financials | | | 622,917,642 | | | 1,135,792,486 | |
| | | | | | | | |
| Health Care (8.37%) | | | | | | | |
| | | Biotechnology (0.14%) | | | | | | | |
| 450,000 | | Acadia Pharmaceuticals, Inc.1 | | | 10,327,523 | | | 11,142,000 | |
| |
| | | Health Care Equipment (1.89%) | | | | | | | |
| 400,000 | | Edwards Lifesciences Corp.1 | | | 5,349,910 | | | 40,860,000 | |
| 900,000 | | IDEXX Laboratories, Inc.1 | | | 28,558,026 | | | 106,047,000 | |
| | | | | | | | |
| | | | | | 33,907,936 | | | 146,907,000 | |
| | | Health Care Facilities (2.43%) | | | | | | | |
| 275,000 | | Brookdale Senior Living, Inc.1 | | | 5,469,421 | | | 8,860,500 | |
| 3,250,000 | | Community Health Systems, Inc.1 | | | 59,187,483 | | | 178,067,500 | |
| 50,000 | | VCA, Inc.1 | | | 894,350 | | | 1,966,500 | |
| | | | | | | | |
| | | | | | 65,551,254 | | | 188,894,500 | |
| | | Health Care Services (0.09%) | | | | | | | |
| 150,000 | | IPC The Hospitalist Co., Inc.1 | | | 3,121,418 | | | 6,718,500 | |
| |
| | | Health Care Supplies (0.81%) | | | | | | | |
| 365,038 | | Neogen Corp.1 | | | 8,075,677 | | | 14,419,001 | |
| 1,077,686 | | West Pharmaceutical Services, Inc. | | | 37,684,652 | | | 48,237,225 | |
| | | | | | | | |
| | | | | | 45,760,329 | | | 62,656,226 | |
| | | Health Care Technology (0.14%) | | | | | | | |
| 828,286 | | Castlight Health Inc., Cl B1 | | | 4,999,998 | | | 10,718,021 | |
| |
| | | Life Sciences Tools & Services (2.87%) | | | | | | | |
| 550,000 | | Mettler-Toledo International, Inc.1 | | | 27,486,940 | | | 140,871,500 | |
| 880,943 | | TECHNE Corp. | | | 46,631,249 | | | 82,412,218 | |
| | | | | | | | |
| | | | | | 74,118,189 | | | 223,283,718 | |
| | | | | | | | |
| Total Health Care | | | 237,786,647 | | | 650,319,965 | |
| | | | | | | | |
| Industrials (15.51%) | | | | | | | |
| | | Building Products (1.74%) | | | | | | | |
| 1,398,500 | | Masonite International Corp.1,2 | | | 78,148,438 | | | 77,448,930 | |
| 1,670,000 | | Trex Co., Inc.1,4 | | | 62,696,594 | | | 57,731,900 | |
| | | | | | | | |
| | | | | | 140,845,032 | | | 135,180,830 | |
| | | Construction & Engineering (0.68%) | | | | | | | |
| 2,125,000 | | Badger Daylighting Ltd. (Canada)2,4 | | | 74,719,832 | | | 52,975,579 | |
| |
| | | Diversified Support Services (1.14%) | | | | | | | |
| 2,825,000 | | Copart Inc.1 | | | 33,749,595 | | | 88,464,875 | |
| |
| | | Electrical Components & Equipment (1.46%) | | | | | | | |
| 2,800,000 | | Generac Holdings, Inc.1 | | | 13,836,546 | | | 113,512,000 | |
| Shares | | | | | Cost | | | Value | |
| |
| Common Stocks (continued) | | | | | | | |
| Industrials (continued) | | | | | | | |
| | | Industrial Machinery (5.28%) | | | | | | | |
| 2,315,480 | | Colfax Corp.1 | | $ | 53,608,386 | | $ | 131,912,895 | |
| 2,550,000 | | The Middleby Corp.1 | | | 74,456,718 | | | 224,731,500 | |
| 400,000 | | Valmont Industries, Inc. | | | 32,589,034 | | | 53,972,000 | |
| | | | | | | | |
| | | | | | 160,654,138 | | | 410,616,395 | |
| | | Railroads (2.45%) | | | | | | | |
| 2,000,000 | | Genesee & Wyoming, Inc., Cl A1 | | | 32,221,169 | | | 190,620,000 | |
| |
| | | Research & Consulting Services (0.95%) | | | | | | | |
| 434,047 | | The Advisory Board Company1 | | | 22,334,765 | | | 20,222,250 | |
| 375,000 | | IHS, Inc., Cl A1 | | | 15,320,116 | | | 46,946,250 | |
| 315,000 | | Mistras Group, Inc.1 | | | 3,927,500 | | | 6,426,000 | |
| | | | | | | | |
| | | | | | 41,582,381 | | | 73,594,500 | |
| | | Trading Companies & Distributors (1.37%) | | | | | | | |
| 2,000,000 | | Air Lease Corp. | | | 47,523,424 | | | 65,000,000 | |
| 485,000 | | MSC Industrial Direct Co., Inc., Cl A | | | 17,282,737 | | | 41,448,100 | |
| | | | | | | | |
| | | | | | 64,806,161 | | | 106,448,100 | |
| | | Trucking (0.44%) | | | | | | | |
| 475,000 | | Landstar System, Inc. | | | 11,073,375 | | | 34,290,250 | |
| | | | | | | | |
| Total Industrials | | | 573,488,229 | | | 1,205,702,529 | |
| | | | | | | | |
| Information Technology (18.69%) | | | | | | | |
| | | Application Software (9.93%) | | | | | | | |
| 2,109,430 | | Advent Software, Inc. | | | 30,369,321 | | | 66,573,611 | |
| 1,850,000 | | ANSYS, Inc.1 | | | 44,326,673 | | | 139,989,500 | |
| 1,000,000 | | Bottomline Technologies (de), Inc.1 | | | 27,500,934 | | | 27,590,000 | |
| 825,000 | | Concur Technologies, Inc.1 | | | 18,214,873 | | | 104,626,500 | |
| 1,600,000 | | FactSet Research Systems, Inc. | | | 80,624,740 | | | 194,448,000 | |
| 1,173,796 | | Guidewire Software, Inc.1 | | | 37,834,851 | | | 52,046,115 | |
| 2,639,211 | | Pegasystems, Inc. | | | 40,047,948 | | | 50,435,322 | |
| 3,087,713 | | SS&C Technologies Holdings, Inc.1 | | | 52,369,848 | | | 135,519,723 | |
| | | | | | | | |
| | | | | | 331,289,188 | | | 771,228,771 | |
| | | Data Processing & Outsourced Services (1.55%) | | | | | | | |
| 3,000,000 | | MAXIMUS, Inc. | | | 57,528,621 | | | 120,390,000 | |
| |
| | | Electronic Equipment & Instruments (0.63%) | | | | | | | |
| 650,000 | | FEI Company | | | 24,367,636 | | | 49,023,000 | |
| |
| | | Internet Software & Services (2.76%) | | | | | | | |
| 1,260,965 | | Benefitfocus, Inc.1 | | | 57,123,279 | | | 33,970,397 | |
| 999,653 | | CoStar Group, Inc.1 | | | 44,116,616 | | | 155,486,028 | |
| 350,000 | | Shutterstock, Inc.1 | | | 23,390,762 | | | 24,983,000 | |
| | | | | | | | |
| | | | | | 124,630,657 | | | 214,439,425 | |
| | | IT Consulting & Other Services (3.82%) | | | | | | | |
| 3,825,000 | | Booz Allen Hamilton Holding Corp. | | | 48,391,210 | | | 89,505,000 | |
| 2,825,000 | | Gartner, Inc.1 | | | 45,240,023 | | | 207,552,750 | |
| | | | | | | | |
| | | | | | 93,631,233 | | | 297,057,750 | |
| | | | | | | | |
| Total Information Technology | | | 631,447,335 | | | 1,452,138,946 | |
| | | | | | | | |
| | | | | | | | | | |
| Materials (1.15%) | | | | | | | |
| | | Construction Materials (1.15%) | | | | | | | |
| 1,725,000 | | CaesarStone Sdot Yam Ltd.1,2 | | | 31,551,799 | | | 89,148,000 | |
| | | | | | | | |
| See Notes to Financial Statements. | | 17 |
| Baron Growth Fund | September 30, 2014 |
| STATEMENT OF NET ASSETS (Continued) |
| |
| |
| SEPTEMBER 30, 2014 |
| |
| Shares | | | | | Cost | | | | Value | |
| |
| Common Stocks (continued) | | | | | | | | |
| |
| Telecommunication Services (0.85%) | | | | | | | | |
| | | Alternative Carriers (0.85%) | | | | | | | | |
| 7,493,437 | | Iridium Communications Inc.1,4 | | $ | 45,709,971 | | | $ | 66,316,917 | |
| | | | | | | | | |
| | | | | | | | | | | |
| Utilities (3.06%) | | | | | | | | |
| | | Electric Utilities (3.06%) | | | | | | | | |
| 6,675,000 | | ITC Holdings Corp. | | | 68,680,650 | | | | 237,830,250 | |
| | | | | | | | | |
| Total Common Stocks | | | 3,604,481,891 | | | | 7,620,296,898 | |
| | | | | | | | | |
| | | | | | | | | | | |
| |
| Preferred Stocks (0.18%) | | | | | | | | |
| |
| Telecommunication Services (0.18%) | | | | | | | | |
| | | Alternative Carriers (0.18%) | | | | | | | | |
| 41,074 | | Iridium Communications Inc., Series B, 6.75%4 | | | 10,268,500 | | | | 13,989,394 | |
| | | | | | | | | |
| | | | | | | | | | | |
| |
| Private Equity Investments (0.19%) | | | | | | | | |
| |
| Financials (0.19%) | | | | | | | | |
| | | Asset Management & Custody Banks (0.19%) | | | | | | | | |
| 2,375,173 | | Windy City Investments Holdings, L.L.C.1,3,5,7 | | | 8,630,998 | | | | 14,441,055 | |
| | | | | | | | | |
| | | | | | | | | | | |
| |
| Rights (0.00%) | | | | | | | | |
| |
| Materials (0.00%) | | | | | | | | |
| | | Fertilizers & Agricultural Chemicals (0.00%) | | | | | | | | |
| 393,349 | | Agrinos AS (Mexico) Exp 7/15/20151,2,3,6 | | | 0 | | | | 9,184 | |
| | | | | | | | | |
| Principal | | | | | | | | |
| Amount | | | Cost | | | | Value | |
| |
| Short Term Investments (1.48%) | | | | | | | | |
| |
| $114,786,433 | | Repurchase Agreement with Fixed Income Clearing Corp., dated 9/30/2014, 0.00% due 10/1/2014; Proceeds at maturity - $114,786,433; (Fully collateralized by $118,870,000 U.S. Treasury Note, 0.625% due 9/30/2017; Market value - $117,086,950)6 | | $ | 114,786,433 | | | $ | 114,786,433 | |
| | | | | | | | | |
| Total Investments (99.91%) | | $ | 3,738,167,822 | | | | 7,763,522,964 | |
| | | | | | | | | | |
| Cash and Other Assets Less Liabilities (0.09%) | | | | | | | 7,113,673 | |
| | | | | | | | | | |
| Net Assets | | | | | | $ | 7,770,636,637 | |
| | | | | | | | | | |
Retail Shares (Equivalent to $70.46 per share based on 57,847,669 shares outstanding) | | | | | | $ | 4,076,139,936 | |
| | | | | | | | | | |
Institutional Shares (Equivalent to $71.33 per share based on 51,795,804 shares outstanding) | | | | | | $ | 3,694,496,701 | |
| | | | | | | | | | |
| | | | | | | | | | |
| % | | Represents percentage of net assets. |
| 1 | | Non-income producing securities. |
| 2 | | Foreign corporation. |
| 3 | | At September 30, 2014, the market value of restricted and fair valued securities amounted to $14,450,239 or 0.19% of net assets. None of these securities are deemed liquid. See Note 6 regarding Restricted Securities. |
| 4 | | See Note10 regarding “Affiliated” companies. |
| 5 | | The Adviser has reclassified/classified certain securities in or out of this sub-industry. Such reclassifications/classifications are not supported by S&P or MSCI. |
| 6 | | Level 2 security. See Note 7 regarding Fair Value Measurements. |
| 7 | | Level 3 security. See Note 7 regarding Fair Value Measurements. |
| | | |
| | | All securities are Level 1, unless otherwise noted. |
| 18 | | See Notes to Financial Statements. |
| September 30, 2014 | Baron Small Cap Fund |
| STATEMENT OF NET ASSETS |
| |
| |
| SEPTEMBER 30, 2014 |
| |
| Shares | | | | | Cost | | | | Value | |
| |
| Common Stocks (98.66%) | | | | | | | | |
| |
| Consumer Discretionary (18.94%) | | | | | | | | |
| | | Advertising (0.21%) | | | | | | | | |
| 750,000 | | National CineMedia, Inc. | | $ | 7,580,159 | | | $ | 10,882,500 | |
| |
| | | Apparel, Accessories & Luxury Goods (3.45%) | | | | | | | | |
| 650,000 | | Fossil Group, Inc.1 | | | 15,294,653 | | | | 61,035,000 | |
| 2,000,000 | | Iconix Brand Group, Inc.1 | | | 29,279,689 | | | | 73,880,000 | |
| 2,000,000 | | Tumi Holdings, Inc.1 | | | 40,068,737 | | | | 40,700,000 | |
| 175,000 | | Vince Holding Corp.1 | | | 3,500,000 | | | | 5,295,500 | |
| | | | | | | | | |
| | | | | | 88,143,079 | | | | 180,910,500 | |
| | | Broadcasting (1.61%) | | | | | | | | |
| 600,000 | | Liberty Media Corp., Cl A1 | | | 2,409,940 | | | | 28,308,000 | |
| 1,200,000 | | Liberty Media Corp., Cl C1 | | | 4,728,063 | | | | 56,388,000 | |
| | | | | | | | | |
| | | | | | 7,138,003 | | | | 84,696,000 | |
| | | Casinos & Gaming (1.53%) | | | | | | | | |
| 3,000,000 | | Penn National Gaming, Inc.1 | | | 17,926,778 | | | | 33,630,000 | |
| 250,000 | | Wynn Resorts Ltd. | | | 635,920 | | | | 46,770,000 | |
| | | | | | | | | |
| | | | | | 18,562,698 | | | | 80,400,000 | |
| | | Education Services (2.69%) | | | | | | | | |
| 2,347,847 | | Bright Horizons Family Solutions, Inc.1 | | | 80,059,684 | | | | 98,750,445 | |
| 2,500,000 | | Nord Anglia Education Inc.1,2 | | | 43,906,142 | | | | 42,500,000 | |
| | | | | | | | | |
| | | | | | 123,965,826 | | | | 141,250,445 | |
| | | Home Improvement Retail (0.88%) | | | | | | | | |
| 800,000 | | Lumber Liquidators Holdings, Inc.1 | | | 16,184,259 | | | | 45,904,000 | |
| |
| | | Homefurnishing Retail (1.60%) | | | | | | | | |
| 1,400,000 | | Mattress Firm Holding Corp.1 | | | 35,360,733 | | | | 84,084,000 | |
| |
| | | Internet Retail (1.52%) | | | | | | | | |
| 2,250,000 | | HomeAway, Inc.1 | | | 54,558,103 | | | | 79,875,000 | |
| |
| | | Movies & Entertainment (1.93%) | | | | | | | | |
| 1,250,000 | | The Madison Square Garden Co., Cl A1 | | | 31,872,245 | | | | 82,650,000 | |
| 3,750,000 | | SFX Entertainment, Inc.1 | | | 26,066,093 | | | | 18,825,000 | |
| | | | | | | | | |
| | | | | | 57,938,338 | | | | 101,475,000 | |
| | | Restaurants (2.75%) | | | | | | | | |
| 950,000 | | BJ’s Restaurants, Inc.1 | | | 34,185,457 | | | | 34,190,500 | |
| 1,500,000 | | The Cheesecake Factory, Inc. | | | 34,778,285 | | | | 68,250,000 | |
| 2,200,000 | | Del Frisco’s Restaurant Group, Inc.1,4 | | | 45,703,147 | | | | 42,108,000 | |
| | | | | | | | | |
| | | | | | 114,666,889 | | | | 144,548,500 | |
| | | Specialty Stores (0.77%) | | | | | | | | |
| 1,850,000 | | The Container Store Group, Inc.1 | | | 60,559,626 | | | | 40,274,500 | |
| | | | | | | | | |
| Total Consumer Discretionary | | | 584,657,713 | | | | 994,300,445 | |
| | | | | | | | | |
| | | | | | | | | | | |
| Consumer Staples (2.39%) | | | | | | | | |
| | | Food Distributors (2.32%) | | | | | | | | |
| 2,000,000 | | The Chefs’ Warehouse, Inc.1,4 | | | 32,011,792 | | | | 32,520,000 | |
| 1,450,000 | | United Natural Foods, Inc.1 | | | 62,683,145 | | | | 89,117,000 | |
| | | | | | | | | |
| | | | | | 94,694,937 | | | | 121,637,000 | |
| | | Food Retail (0.07%) | | | | | | | | |
| 1,000,000 | | Fairway Group Holdings Corp.1 | | | 15,538,462 | | | | 3,740,000 | |
| | | | | | | | | |
| Total Consumer Staples | | | 110,233,399 | | | | 125,377,000 | |
| | | | | | | | | |
| Shares | | | | | Cost | | | | Value | |
| |
| Common Stocks (continued) | | | | | | | | |
| |
| Energy (8.93%) | | | | | | | | |
| | | Oil & Gas Equipment & Services (1.99%) | | | | | | | | |
| 400,000 | | Core Laboratories N.V.2 | | $ | 15,025,706 | | | $ | 58,540,000 | |
| 1,500,000 | | Forum Energy Technologies, Inc.1 | | | 30,924,862 | | | | 45,915,000 | |
| | | | | | | | | |
| | | | | | 45,950,568 | | | | 104,455,000 | |
| | | Oil & Gas Exploration & Production (1.30%) | | | | | | | | |
| 250,000 | | Athlon Energy Inc.1 | | | 5,065,711 | | | | 14,557,500 | |
| 650,000 | | Bonanza Creek Energy, Inc.1 | | | 21,498,889 | | | | 36,985,000 | |
| 400,000 | | Oasis Petroleum, Inc.1 | | | 5,600,000 | | | | 16,724,000 | |
| | | | | | | | | |
| | | | | | 32,164,600 | | | | 68,266,500 | |
| | | Oil & Gas Storage & Transportation (5.64%) | | | | | | | | |
| 800,000 | | PBF Logistics LP4 | | | 20,465,744 | | | | 20,256,000 | |
| 750,000 | | Phillips 66 Partners LP | | | 20,967,947 | | | | 50,062,500 | |
| 5,000,000 | | Scorpio Tankers Inc.2 | | | 42,287,905 | | | | 41,550,000 | |
| 750,000 | | Targa Resources Corp. | | | 17,965,719 | | | | 102,127,500 | |
| 225,000 | | Tesoro Logistics LP | | | 9,382,500 | | | | 15,923,250 | |
| 700,000 | | Valero Energy Partners LP | | | 18,277,032 | | | | 31,241,000 | |
| 1,000,000 | | Western Refining Logistics, LP | | | 23,110,967 | | | | 34,820,000 | |
| | | | | | | | | |
| | | | | | 152,457,814 | | | | 295,980,250 | |
| | | | | | | | | |
| Total Energy | | | 230,572,982 | | | | 468,701,750 | |
| | | | | | | | | |
| | | | | | | | | | | |
Financials (8.27%) | | | | | | | | |
| | | Asset Management & Custody Banks (2.14%) | | | | | | | | |
| 750,000 | | Artisan Partners Asset Management, Inc., Cl A | | | 28,955,338 | | | | 39,037,500 | |
| 2,150,000 | | Financial Engines, Inc. | | | 48,440,910 | | | | 73,562,250 | |
| | | | | | | | | |
| | | | | | 77,396,248 | | | | 112,599,750 | |
| | | Hotel & Resort REITs (1.81%) | | | | | | | | |
| 1,500,000 | | Chesapeake Lodging Trust | | | 25,744,737 | | | | 43,725,000 | |
| 1,500,000 | | LaSalle Hotel Properties | | | 34,882,419 | | | | 51,360,000 | |
| | | | | | | | | |
| | | | | | 60,627,156 | | | | 95,085,000 | |
| | | Investment Banking & Brokerage (0.46%) | | | | | | | | |
| 700,000 | | Moelis & Co., Cl A | | | 17,573,577 | | | | 23,905,000 | |
| | | | | | | | | | | |
| | | Office REITs (0.68%) | | | | | | | | |
| 350,000 | | SL Green Realty Corp. | | | 7,505,834 | | | | 35,462,000 | |
| | | | | | | | | | | |
| | | Real Estate Services (0.85%) | | | | | | | | |
| 1,500,000 | | CBRE Group, Inc., Cl A1 | | | 7,261,912 | | | | 44,610,000 | |
| | | | | | | | | | | |
| | | Specialized REITs (1.62%) | | | | | | | | |
| 2,750,000 | | Gaming and Leisure Properties, Inc. | | | 54,474,530 | | | | 84,975,000 | |
| | | | | | | | | | | |
| | | Thrifts & Mortgage Finance (0.71%) | | | | | | | | |
| 1,750,000 | | Essent Group, Ltd.1,2 | | | 36,314,929 | | | | 37,467,500 | |
| | | | | | | | | |
Total Financials | | | 261,154,186 | | | | 434,104,250 | |
| | | | | | | | | |
| See Notes to Financial Statements. | | 19 |
| Baron Small Cap Fund | September 30, 2014 |
| STATEMENT OF NET ASSETS (Continued) |
| |
| |
| SEPTEMBER 30, 2014 |
| |
| Shares | | | | | Cost | | | | Value | |
| |
| Common Stocks (continued) | | | | | | | | |
| |
| Health Care (10.68%) | | | | | | | | |
| | | Biotechnology (0.63%) | | | | | | | | |
| 750,000 | | Cepheid1 | | $ | 24,504,439 | | | $ | 33,022,500 | |
| |
| | | Health Care Distributors (0.82%) | | | | | | | | |
| 288,997 | | MWI Veterinary Supply, Inc.1 | | | 40,722,450 | | | | 42,887,155 | |
| |
| | | Health Care Equipment (2.92%) | | | | | | | | |
| 1,250,000 | | DexCom, Inc.1 | | | 17,100,777 | | | | 49,987,500 | |
| 314,672 | | HeartWare International, Inc.1 | | | 30,953,155 | | | | 24,427,987 | |
| 670,922 | | IDEXX Laboratories, Inc.1 | | | 21,699,129 | | | | 79,054,739 | |
| | | | | | | | | |
| | | | | | 69,753,061 | | | | 153,470,226 | |
| | | Health Care Facilities (2.27%) | | | | | | | | |
| 3,697,500 | | Brookdale Senior Living, Inc.1 | | | 72,282,888 | | | | 119,133,450 | |
| |
| | | Life Sciences Tools & Services (3.14%) | | | | | | | | |
| 300,000 | | Covance, Inc.1 | | | 10,515,514 | | | | 23,610,000 | |
| 1,350,000 | | ICON plc1,2 | | | 43,388,030 | | | | 77,260,500 | |
| 250,000 | | Mettler-Toledo International, Inc.1 | | | 14,245,819 | | | | 64,032,500 | |
| | | | | | | | | |
| | | | | | 68,149,363 | | | | 164,903,000 | |
| | | Managed Health Care (0.42%) | | | | | | | | |
| 1,214,887 | | HealthEquity, Inc.1 | | | 21,337,494 | | | | 22,244,581 | |
| |
| | | Pharmaceuticals (0.48%) | | | | | | | | |
| 1,000,000 | | Catalent, Inc.1 | | | 20,462,087 | | | | 25,030,000 | |
| | | | | | | | | |
| Total Health Care | | | 317,211,782 | | | | 560,690,912 | |
| | | | | | | | | |
| | | | | | | | | | | |
| Industrials (17.03%) | | | | | | | | |
| | | Aerospace & Defense (4.97%) | | | | | | | | |
| 2,250,000 | | DigitalGlobe, Inc.1 | | | 66,689,631 | | | | 64,125,000 | |
| 1,950,000 | | The KEYW Holding Corp.1,4 | | | 20,680,495 | | | | 21,586,500 | |
| 950,000 | | TransDigm Group, Inc.1 | | | 0 | | | | 175,113,500 | |
| | | | | | | | | |
| | | | | | 87,370,126 | | | | 260,825,000 | |
| | | Electrical Components & Equipment (2.08%) | | | | | | | | |
| 825,000 | | Acuity Brands, Inc. | | | 44,094,137 | | | | 97,110,750 | |
| 350,000 | | Franklin Electric Co., Inc. | | | 13,080,427 | | | | 12,159,000 | |
| | | | | | | | | |
| | | | | | 57,174,564 | | | | 109,269,750 | |
| | | Environmental & Facilities Services (3.39%) | | | | | | | | |
| 1,050,000 | | Clean Harbors, Inc.1 | | | 26,906,827 | | | | 56,616,000 | |
| 2,500,000 | | Waste Connections, Inc. | | | 44,418,371 | | | | 121,300,000 | |
| | | | | | | | | |
| | | | | | 71,325,198 | | | | 177,916,000 | |
| | | Human Resource & Employment Services (1.12%) | | | | | | | | |
| 2,200,000 | | On Assignment, Inc.1 | | | 57,561,580 | | | | 59,070,000 | |
| |
| | | Industrial Machinery (2.93%) | | | | | | | | |
| 350,000 | | Graco, Inc. | | | 7,828,497 | | | | 25,543,000 | |
| 750,000 | | Nordson Corp. | | | 22,985,460 | | | | 57,052,500 | |
| 2,500,000 | | Rexnord Corp.1 | | | 47,210,825 | | | | 71,125,000 | |
| | | | | | | | | |
| | | | | | 78,024,782 | | | | 153,720,500 | |
| | | Office Services & Supplies (0.45%) | | | | | | | | |
| 1,451,700 | | Interface, Inc. | | | 19,551,250 | | | | 23,430,438 | |
| |
| | | Railroads (1.45%) | | | | | | | | |
| 800,000 | | Genesee & Wyoming, Inc., Cl A1 | | | 21,723,581 | | | | 76,248,000 | |
| |
| | | Research & Consulting Services (0.64%) | | | | | | | | |
| 725,000 | | The Advisory Board Company1 | | | 37,252,738 | | | | 33,777,750 | |
| | | | | | | | | |
| Total Industrials | | | 429,983,819 | | | | 894,257,438 | |
| | | | | | | | | |
| Shares | | | | | Cost | | | | Value | |
| |
| Common Stocks (continued) | | | | | | | | |
| |
| Information Technology (20.04%) | | | | | | | | |
| | | Application Software (5.88%) | | | | | | | | |
| 4,000,000 | | ACI Worldwide, Inc.1 | | $ | 49,698,528 | | | $ | 75,040,000 | |
| 2,150,000 | | Advent Software, Inc. | | | 32,757,573 | | | | 67,854,000 | |
| 1,500,000 | | Guidewire Software, Inc.1 | | | 40,880,643 | | | | 66,510,000 | |
| 700,000 | | The Ultimate Software Group, Inc.1 | | | 17,611,027 | | | | 99,057,000 | |
| | | | | | | | | |
| | | | | | 140,947,771 | | | | 308,461,000 | |
| | | Data Processing & Outsourced Services (3.94%) | | | | | | | | |
| 950,000 | | FleetCor Technologies, Inc.1 | | | 23,597,570 | | | | 135,014,000 | |
| 650,000 | | WEX Inc.1 | | | 30,423,456 | | | | 71,708,000 | |
| | | | | | | | | |
| | | | | | 54,021,026 | | | | 206,722,000 | |
| | | Electronic Components (0.63%) | | | | | | | | |
| 1,250,000 | | Knowles Corp.1 | | | 36,529,755 | | | | 33,125,000 | |
| | | | | | | | | | | |
| | | Electronic Equipment & Instruments (3.12%) | | | | | | | | |
| 1,400,000 | | Cognex Corp.1 | | | 22,631,628 | | | | 56,378,000 | |
| 708,767 | | Coherent, Inc.1 | | | 34,030,133 | | | | 43,497,031 | |
| 850,000 | | FEI Company | | | 33,259,652 | | | | 64,107,000 | |
| | | | | | | | | |
| | | | | | 89,921,413 | | | | 163,982,031 | |
| | | Internet Software & Services (0.78%) | | | | | | | | |
| 850,000 | | comScore, Inc.1 | | | 27,834,214 | | | | 30,948,500 | |
| 300,000 | | GrubHub, Inc.1 | | | 7,800,000 | | | | 10,272,000 | |
| | | | | | | | | |
| | | | | | 35,634,214 | | | | 41,220,500 | |
| | | IT Consulting & Other Services (5.16%) | | | | | | | | |
| 1,250,000 | | Acxiom Corp.1 | | | 28,143,704 | | | | 20,687,500 | |
| 400,000 | | Equinix, Inc.1,5 | | | 23,435,720 | | | | 84,992,000 | |
| 2,250,000 | | Gartner, Inc.1 | | | 41,942,703 | | | | 165,307,500 | |
| | | | | | | | | |
| | | | | | 93,522,127 | | | | 270,987,000 | |
| | | Systems Software (0.53%) | | | | | | | | |
| 2,300,000 | | Rally Software Development Corp.1,4 | | | 51,687,216 | | | | 27,623,000 | |
| | | | | | | | | |
| Total Information Technology | | | 502,263,522 | | | | 1,052,120,531 | |
| | | | | | | | | |
| | | | | | | | | | | |
| Materials (6.48%) | | | | | | | | |
| | | Commodity Chemicals (0.41%) | | | | | | | | |
| 750,000 | | Westlake Chemical Partners LP1 | | | 20,498,030 | | | | 21,750,000 | |
| |
| | | Diversified Metals & Mining (1.38%) | | | | | | | | |
| 4,000,000 | | Globe Specialty Metals, Inc.4 | | | 46,608,066 | | | | 72,760,000 | |
| | | | | | | | | | | |
| | | Metal & Glass Containers (2.16%) | | | | | | | | |
| 4,500,000 | | Berry Plastics Group, Inc.1 | | | 75,853,854 | | | | 113,580,000 | |
| | | | | | | | | | | |
| | | Specialty Chemicals (1.72%) | | | | | | | | |
| 1,536,702 | | Flotek Industries, Inc.1 | | | 31,308,937 | | | | 40,061,821 | |
| 2,000,000 | | Platform Specialty Products Corp.1 | | | 32,710,834 | | | | 50,040,000 | |
| | | | | | | | | |
| | | | | | 64,019,771 | | | | 90,101,821 | |
| | | Steel (0.81%) | | | | | | | | |
| 1,000,000 | | SunCoke Energy, Inc.1 | | | 16,688,469 | | | | 22,450,000 | |
| 675,000 | | SunCoke Energy Partners LP | | | 16,008,489 | | | | 19,865,250 | |
| | | | | | | | | |
| | | | | | 32,696,958 | | | | 42,315,250 | |
| | | | | | | | | |
| Total Materials | | | 239,676,679 | | | | 340,507,071 | |
| | | | | | | | | |
| 20 | | See Notes to Financial Statements. |
| September 30, 2014 | Baron Small Cap Fund |
| STATEMENT OF NET ASSETS (Continued) |
| |
| |
| SEPTEMBER 30, 2014 |
| |
| Shares | | | | | Cost | | | | Value | |
| |
| Common Stocks (continued) | | | | | | | | |
| |
| Telecommunication Services (5.20%) | | | | | | | | |
| | | Wireless Telecommunication Services (5.20%) | | | | | | | | |
| 148,323,290 | | Sarana Menara Nusantara Tbk PT (Indonesia)1,2 | | $ | 30,976,387 | | | $ | 51,124,975 | |
| 2,000,000 | | SBA Communications Corp., Cl A1 | | | 10,934,506 | | | | 221,800,000 | |
| | | | | | | | | |
Total Telecommunication Services | | | 41,910,893 | | | | 272,924,975 | |
| | | | | | | | | |
| | | | | | | | | | | |
| Utilities (0.70%) | | | | | | | | |
| | | Electric Utilities (0.46%) | | | | | | | | |
| 675,000 | | ITC Holdings Corp. | | | 9,427,959 | | | | 24,050,250 | |
| |
| | | Renewable Electricity (0.24%) | | | | | | | | |
| 363,937 | | Abengoa Yield plc1,2 | | | 10,554,173 | | | | 12,948,879 | |
| | | | | | | | | |
| Total Utilities | | | 19,982,132 | | | | 36,999,129 | |
| | | | | | | | | |
| Total Common Stocks | | | 2,737,647,107 | | | | 5,179,983,501 | |
| | | | | | | | | |
| | | | | | | | | | | |
| |
| Warrants (0.00%) | | | | | | | | |
| |
| Information Technology (0.00%) | | | | | | | | |
| | | Internet Software & Services (0.00%) | | | | | | | | |
| 6,818 | | Viggle, Inc. Warrants, Non-Callable Exp 4/27/20151,3,6 | | | 0 | | | | 0 | |
| | | | | | | | | |
| Principal | | | | | | | | | | |
| Amount | | | | | Cost | | | | Value | |
| |
| Short Term Investments (1.27%) | | | | | | | | |
| |
| $66,444,603 | | Repurchase Agreement with Fixed Income Clearing Corp., dated 9/30/2014, 0.00% due 10/1/2014; Proceeds at maturity - $66,444,603; (Fully collateralized by $67,775,000 U.S. Treasury Note, 2.125% due 6/30/2021; Market value - $67,775,000)6 | | $ | 66,444,603 | | | $ | 66,444,603 | |
| | | | | | | | | |
| Total Investments (99.93%) | | $ | 2,804,091,710 | | | | 5,246,428,104 | |
| | | | | | | | | | |
Cash and Other Assets Less Liabilities (0.07%) | | | | | | | 3,792,265 | |
| | | | | | | | | | |
| Net Assets | | | | | | $ | 5,250,220,369 | |
| | | | | | | | | | |
Retail Shares (Equivalent to $33.68 per share based on 94,809,283 shares outstanding) | | | | | | $ | 3,192,830,733 | |
| | | | | | | | | | |
Institutional Shares (Equivalent to $34.16 per share based on 60,224,681 shares outstanding) | | | | | | $ | 2,057,389,636 | |
| | | | | | | | | | |
| % | | Represents percentage of net assets. |
| 1 | | Non-income producing securities. |
| 2 | | Foreign corporation. |
| 3 | | At September 30, 2014, the market value of restricted and fair valued securities amounted to $0 or 0.00% of net assets. This security is not deemed liquid. See Note 6 regarding Restricted Securities. |
| 4 | | See Note 10 regarding “Affiliated” companies. |
| 5 | | The Adviser has reclassified/classified certain securities in or out of this sub-industry. Such reclassifications/classifications are not supported by S&P or MSCI. |
| 6 | | Level 2 security. See Note 7 regarding Fair Value Measurements. |
| | | |
| | | All securities are Level 1, unless otherwise noted. |
| See Notes to Financial Statements. | | 21 |
| Baron Opportunity Fund | September 30, 2014 |
| STATEMENT OF NET ASSETS |
| |
| |
| SEPTEMBER 30, 2014 |
| |
| Shares | | | | | Cost | | | | Value | |
| |
| Common Stocks (101.08%) | | | | | | | | |
| |
| Consumer Discretionary (22.43%) | | | | | | | | |
| | | Apparel, Accessories & Luxury Goods (2.12%) | | | | | | | | |
| 49,000 | | Fossil Group, Inc.1 | | $ | 3,881,007 | | | $ | 4,601,100 | |
| 68,500 | | Under Armour, Inc., Cl A1 | | | 1,729,304 | | | | 4,733,350 | |
| | | | | | | | | |
| | | | | | 5,610,311 | | | | 9,334,450 | |
| | | Automobile Manufacturers (2.04%) | | | | | | | | |
| 37,000 | | Tesla Motors Inc.1 | | | 7,579,282 | | | | 8,979,160 | |
| |
| | | Automotive Retail (2.41%) | | | | | | | | |
| 228,370 | | CarMax, Inc.1 | | | 6,926,825 | | | | 10,607,787 | |
| |
| | | Broadcasting (3.63%) | | | | | | | | |
| 161,000 | | Discovery Communications, Inc., Series C1 | | | 2,928,767 | | | | 6,002,080 | |
| 71,000 | | Liberty Media Corp., Cl A1 | | | 1,624,557 | | | | 3,349,780 | |
| 142,000 | | Liberty Media Corp., Cl C1 | | | 3,187,220 | | | | 6,672,580 | |
| | | | | | | | | |
| | | | | | 7,740,544 | | | | 16,024,440 | |
| | | Homefurnishing Retail (1.41%) | | | | | | | | |
| 78,000 | | Restoration Hardware Holdings, Inc.1 | | | 4,697,026 | | | | 6,204,900 | |
| |
| | | Internet Retail (8.93%) | | | | | | | | |
| 1,475,000 | | AO World plc (United Kingdom)1,2 | | | 6,997,726 | | | | 4,495,449 | |
| 218,222 | | HomeAway, Inc.1 | | | 5,909,118 | | | | 7,746,881 | |
| 164,500 | | Liberty TripAdvisor Holdings, Inc., Cl A1 | | | 5,109,549 | | | | 5,576,550 | |
| 164,500 | | Liberty Ventures Group, Series A1 | | | 5,065,775 | | | | 6,244,420 | |
| 16,000 | | Netflix, Inc.1 | | | 4,093,783 | | | | 7,218,880 | |
| 6,950 | | The Priceline Group, Inc.1 | | | 1,120,974 | | | | 8,052,131 | |
| | | | | | | | | |
| | | | | | 28,296,925 | | | | 39,334,311 | |
| | | Movies & Entertainment (1.89%) | | | | | | | | |
| 504,740 | | Manchester United plc, Cl A1,2 | | | 8,493,720 | | | | 8,318,115 | |
| | | | | | | | | | | |
| | | | | | | | | |
| Total Consumer Discretionary | | | 69,344,633 | | | | 98,803,163 | |
| | | | | | | | | |
| | | | | | | | | | | |
| Energy (4.72%) | | | | | | | | |
| | | Oil & Gas Exploration & Production (3.43%) | | | | | | | | |
| 71,000 | | Concho Resources, Inc.1 | | | 7,054,056 | | | | 8,902,690 | |
| 148,881 | | Oasis Petroleum, Inc.1 | | | 3,555,959 | | | | 6,224,715 | |
| | | | | | | | | |
| | | | | | 10,610,015 | | | | 15,127,405 | |
| | | Oil & Gas Storage & Transportation (1.29%) | | | | | | | | |
| 85,700 | | Golar LNG Ltd.2 | | | 2,888,582 | | | | 5,690,480 | |
| | | | | | | | | |
| Total Energy | | | 13,498,597 | | | | 20,817,885 | |
| | | | | | | | | |
| | | | | | | | | | | |
| Health Care (12.41%) | | | | | | | | |
| | | Biotechnology (1.38%) | | | | | | | | |
| 138,500 | | Cepheid1 | | | 4,763,108 | | | | 6,098,155 | |
| | | | | | | | | | | |
| | | Health Care Supplies (1.01%) | | | | | | | | |
| 167,500 | | The Spectranetics Corporation1 | | | 4,807,065 | | | | 4,450,475 | |
| |
| | | Health Care Technology (3.80%) | | | | | | | | |
| 50,500 | | Athenahealth, Inc.1 | | | 7,058,357 | | | | 6,650,345 | |
| 248,486 | | Castlight Health Inc., Cl B1 | | | 1,500,001 | | | | 3,215,409 | |
| 155,500 | | Medidata Solutions, Inc.1 | | | 7,993,260 | | | | 6,887,095 | |
| | | | | | | | | |
| | | | | | 16,551,618 | | | | 16,752,849 | |
| | | Life Sciences Tools & Services (4.66%) | | | | | | | | |
| 125,115 | | Illumina, Inc.1 | | | 5,960,026 | | | | 20,508,851 | |
| Shares | | | | | Cost | | | | Value | |
| |
| Common Stocks (continued) | | | | | | | | |
| |
| Health Care (continued) | | | | | | | | |
| | | Managed Health Care (0.54%) | | | | | | | | |
| 129,454 | | HealthEquity, Inc.1 | | $ | 2,314,994 | | | $ | 2,370,302 | |
| |
| | | Pharmaceuticals (1.02%) | | | | | | | | |
| 46,500 | | Pacira Pharmaceuticals, Inc.1 | | | 2,917,501 | | | | 4,506,780 | |
| | | | | | | | | |
| Total Health Care | | | 37,314,312 | | | | 54,687,412 | |
| | | | | | | | | |
| | | | | | | | | | | |
| Industrials (8.08%) | | | | | | | | |
| | | Aerospace & Defense (1.78%) | | | | | | | | |
| 275,046 | | DigitalGlobe, Inc.1 | | | 7,908,913 | | | | 7,838,811 | |
| |
| | | Industrial Machinery (1.79%) | | | | | | | | |
| 89,500 | | The Middleby Corp.1 | | | 5,152,328 | | | | 7,887,635 | |
| |
| | | Research & Consulting Services (4.51%) | | | | | | | | |
| 50,700 | | IHS, Inc., Cl A1 | | | 4,746,027 | | | | 6,347,133 | |
| 222,000 | | Verisk Analytics, Inc., Cl A1 | | | 11,277,858 | | | | 13,517,580 | |
| | | | | | | | | |
| | | | | | 16,023,885 | | | | 19,864,713 | |
| | | | | | | | | |
| Total Industrials | | | 29,085,126 | | | | 35,591,159 | |
| | | | | | | | | |
| | | | | | | | | | | |
| Information Technology (47.02%) | | | | | | | | |
| | | Application Software (10.11%) | | | | | | | | |
| 127,150 | | ANSYS, Inc.1 | | | 4,076,156 | | | | 9,621,440 | |
| 65,500 | | Concur Technologies, Inc.1 | | | 5,779,935 | | | | 8,306,710 | |
| 378,500 | | Guidewire Software, Inc.1 | | | 11,655,881 | | | | 16,782,690 | |
| 72,905 | | Mobileye N.V.1,2 | | | 1,822,625 | | | | 3,906,979 | |
| 71,500 | | Workday, Inc., Cl A1 | | | 5,872,396 | | | | 5,898,750 | |
| | | | | | | | | |
| | | | | | 29,206,993 | | | | 44,516,569 | |
| | | Internet Software & Services (20.99%) | | | | | | | | |
| 80,956 | | Alibaba Group Holding Ltd., ADR1,2 | | | 6,826,113 | | | | 7,192,941 | |
| 286,714 | | Benefitfocus, Inc.1 | | | 13,376,296 | | | | 7,724,075 | |
| 185,000 | | comScore, Inc.1 | | | 5,863,111 | | | | 6,735,850 | |
| 63,000 | | Cornerstone OnDemand, Inc.1 | | | 2,325,087 | | | | 2,167,830 | |
| 61,000 | | CoStar Group, Inc.1 | | | 3,170,159 | | | | 9,487,940 | |
| 116,500 | | Facebook Inc., Cl A1 | | | 7,914,777 | | | | 9,208,160 | |
| 2,366,182 | | Just Eat plc (United Kingdom)1,2 | | | 10,174,849 | | | | 11,316,012 | |
| 29,000 | | LinkedIn Corp., Cl A1 | | | 5,372,914 | | | | 6,025,910 | |
| 201,500 | | Pandora Media, Inc.1 | | | 4,870,305 | | | | 4,868,240 | |
| 164,492 | | Shutterstock, Inc.1 | | | 7,396,725 | | | | 11,741,439 | |
| 139,000 | | Twitter, Inc.1 | | | 5,486,404 | | | | 7,169,620 | |
| 201,000 | | Xoom Corp.1 | | | 5,039,480 | | | | 4,411,950 | |
| 38,000 | | Zillow, Inc., Cl A1 | | | 2,693,395 | | | | 4,407,620 | |
| | | | | | | | | |
| | | | | | 80,509,615 | | | | 92,457,587 | |
| | | IT Consulting & Other Services (9.46%) | | | | | | | | |
| 400,575 | | Acxiom Corp.1 | | | 6,628,095 | | | | 6,629,516 | |
| 65,000 | | Equinix, Inc.1,3 | | | 4,215,661 | | | | 13,811,200 | |
| 289,144 | | Gartner, Inc.1 | | | 7,006,185 | | | | 21,243,410 | |
| | | | | | | | | |
| | | | | | 17,849,941 | | | | 41,684,126 | |
| | | Semiconductors (1.54%) | | | | | | | | |
| 151,500 | | Mellanox Technologies Ltd.1,2 | | | 6,416,650 | | | | 6,797,805 | |
| |
| | | Systems Software (4.92%) | | | | | | | | |
| 229,000 | | Qualys, Inc.1 | | | 4,782,892 | | | | 6,091,400 | |
| 277,500 | | Red Hat, Inc.1 | | | 14,461,717 | | | | 15,581,625 | |
| | | | | | | | | |
| | | | | | 19,244,609 | | | | 21,673,025 | |
| | | | | | | | | |
| Total Information Technology | | | 153,227,808 | | | | 207,129,112 | |
| | | | | | | | | |
| 22 | | See Notes to Financial Statements. |
| September 30, 2014 | | Baron Opportunity Fund |
| STATEMENT OF NET ASSETS (Continued) |
| |
| |
| SEPTEMBER 30, 2014 |
| |
| Shares | | | Cost | | | | Value | |
| |
| Common Stocks (continued) | | | | | | | | |
| |
| Materials (2.97%) | | | | | | | | |
| | | Construction Materials (1.71%) | | | | | | | | |
| 145,569 | | CaesarStone Sdot-Yam Ltd.1,2 | | $ | 4,814,479 | | | $ | 7,523,006 | |
| |
| | | Specialty Chemicals (1.26%) | | | | | | | | |
| 214,000 | | Flotek Industries, Inc.1 | | | 6,032,088 | | | | 5,578,980 | |
| | | | | | | | | |
| Total Materials | | | 10,846,567 | | | | 13,101,986 | |
| | | | | | | | | |
| | | | | | | | | |
| Telecommunication Services (3.45%) | | | | | | | | |
| | | Wireless Telecommunication Services (3.45%) | | | | | | | | |
| 137,000 | | SBA Communications Corp., Cl A1 | | | 1,706,613 | | | | 15,193,300 | |
| | | | | | | | | |
| Total Investments (101.08%) | | $ | 315,023,656 | | | | 445,324,017 | |
| | | | | | | | | | |
| Liabilities Less Cash and Other Assets (-1.08%) | | | | | | | (4,768,512 | ) |
| | | | | | | | | | |
| Net Assets | | | | | | $ | 440,555,505 | |
| | | | | | | | | | |
Retail Shares (Equivalent to $18.61 per share
based on 17,801,842 shares outstanding) | | | | | | $ | 331,220,990 | |
| | | | | | | | | | |
Institutional Shares (Equivalent to $18.89 per share
based on 5,787,882 shares outstanding) | | | | | | $ | 109,334,515 | |
| | | | | | | | | | |
| % | | Represents percentage of net assets. |
| 1 | | Non-income producing securities. |
| 2 | | Foreign corporation. |
| 3 | | The Adviser has reclassified/classified certain securities in or out of this sub-industry. Such reclassifications/classifications are not supported by S&P or MSCI. |
| ADR | | American Depositary Receipt. |
| | | | |
| | | All securities are Level 1, unless otherwise noted. |
| See Notes to Financial Statements. | | 23 |
| Baron Fifth Avenue Growth Fund | | September 30, 2014 |
| STATEMENT OF NET ASSETS |
| |
| |
| SEPTEMBER 30, 2014 |
| |
| Shares | | | | | Cost | | | | Value | |
| |
| Common Stocks (97.21%) | | | | | | | | |
| Consumer Discretionary (25.64%) | | | | | | | | |
| | | Apparel, Accessories & Luxury Goods (2.20%) | | | | | | | | |
| 14,613 | | Ralph Lauren Corp. | | $ | 2,327,673 | | | $ | 2,407,199 | |
| |
| | | Broadcasting (2.00%) | | | | | | | | |
| 15,441 | | Liberty Media Corp., Cl A1 | | | 284,347 | | | | 728,506 | |
| 30,882 | | Liberty Media Corp., Cl C1 | | | 557,861 | | | | 1,451,145 | |
| | | | | | | | | |
| | | | | | 842,208 | | | | 2,179,651 | |
| | | Casinos & Gaming (6.51%) | | | | | | | | |
| 44,622 | | Las Vegas Sands Corp. | | | 2,424,979 | | | | 2,775,935 | |
| 23,175 | | Wynn Resorts Ltd. | | | 2,745,410 | | | | 4,335,579 | |
| | | | | | | | | |
| | | | | | 5,170,389 | | | | 7,111,514 | |
| | | Internet Retail (9.34%) | | | | | | | | |
| 16,660 | | Amazon.com, Inc.1 | | | 3,731,084 | | | | 5,371,850 | |
| 4,168 | | The Priceline Group, Inc.1 | | | 2,747,754 | | | | 4,828,962 | |
| | | | | | | | | |
| | | | | | 6,478,838 | | | | 10,200,812 | |
| | | Restaurants (5.59%) | | | | | | | | |
| 51,782 | | Starbucks Corp. | | | 3,152,385 | | | | 3,907,470 | |
| 30,502 | | YUM! Brands, Inc. | | | 1,761,594 | | | | 2,195,534 | |
| | | | | | | | | |
| | | | | | 4,913,979 | | | | 6,103,004 | |
| | | | | | | | | |
| Total Consumer Discretionary | | | 19,733,087 | | | | 28,002,180 | |
| | | | | | | | | |
| | | | | | | | | | | |
| Consumer Staples (1.34%) | | | | | | | | |
| | | Hypermarkets & Super Centers (1.34%) | | | | | | | | |
| 11,648 | | Costco Wholesale Corp. | | | 835,362 | | | | 1,459,727 | |
| | | | | | | | | |
| | | | | | | | | | | |
| Energy (2.14%) | | | | | | | | |
| | | Oil & Gas Exploration & Production (2.14%) | | | | | | | | |
| 18,648 | | Concho Resources, Inc.1 | | | 2,077,154 | | | | 2,338,273 | |
| | | | | | | | | |
| | | | | | | | | | | |
| Financials (4.80%) | | | | | | | | |
| | | Diversified Real Estate Activities (2.73%) | | | | | | | | |
| 66,252 | | Brookfield Asset Management, Inc., Cl A2 | | | 2,102,678 | | | | 2,978,690 | |
| |
| | | Specialized Finance (2.07%) | | | | | | | | |
| 28,350 | | CME Group, Inc. | | | 1,414,435 | | | | 2,266,724 | |
| | | | | | | | | |
| Total Financials | | | 3,517,113 | | | | 5,245,414 | |
| | | | | | | | | |
| | | | | | | | | | | |
| Health Care (11.60%) | | | | | | | | |
| | | Biotechnology (5.19%) | | | | | | | | |
| 9,967 | | Alexion Pharmaceuticals, Inc.1 | | | 1,448,767 | | | | 1,652,728 | |
| 6,454 | | Biogen Idec, Inc.1 | | | 1,936,104 | | | | 2,135,048 | |
| 5,235 | | Regeneron Pharmaceuticals, Inc.1 | | | 1,551,542 | | | | 1,887,322 | |
| | | | | | | | | |
| | | | | | 4,936,413 | | | | 5,675,098 | |
| | | Life Sciences Tools & Services (6.41%) | | | | | | | | |
| 42,692 | | Illumina, Inc.1 | | | 1,663,348 | | | | 6,998,073 | |
| | | | | | | | | |
| Total Health Care | | | 6,599,761 | | | | 12,673,171 | |
| | | | | | | | | |
| Shares | | | | | Cost | | | | Value | |
| |
| Common Stocks (continued) | | | | | | | | |
| Industrials (3.52%) | | | | | | | | |
| | | Research & Consulting Services (1.87%) | | | | | | | | |
| 33,526 | | Verisk Analytics, Inc., Cl A1 | | $ | 1,392,842 | | | $ | 2,041,398 | |
| |
| | | Trading Companies & Distributors (1.65%) | | | | | | | | |
| 40,286 | | Fastenal Co. | | | 1,188,272 | | | | 1,808,842 | |
| | | | | | | | | |
| Total Industrials | | | 2,581,114 | | | | 3,850,240 | |
| | | | | | | | | |
| | | | | | | | | | | |
| Information Technology (41.79%) | | | | | | | | |
| | | Application Software (0.80%) | | | | | | | | |
| 16,306 | | Mobileye N.V.1,2 | | | 407,650 | | | | 873,838 | |
| |
| | | Data Processing & Outsourced Services (6.70%) | | | | | | | | |
| 46,400 | | MasterCard, Inc., Cl A | | | 1,803,993 | | | | 3,429,888 | |
| 18,230 | | Visa, Inc., Cl A | | | 1,816,915 | | | | 3,889,735 | |
| | | | | | | | | |
| | | | | | 3,620,908 | | | | 7,319,623 | |
| | | Internet Software & Services (19.57%) | | | | | | | | |
| 44,636 | | Alibaba Group Holding Ltd., ADR1,2 | | | 3,880,563 | | | | 3,965,909 | |
| 91,363 | | Facebook Inc., Cl A1 | | | 2,333,912 | | | | 7,221,331 | |
| 5,019 | | Google, Inc., Cl A1 | | | 1,256,798 | | | | 2,953,230 | |
| 6,118 | | Google, Inc., Cl C1 | | | 1,865,800 | | | | 3,532,288 | |
| 6,126 | | LinkedIn Corp., Cl A1 | | | 507,226 | | | | 1,272,922 | |
| 47,123 | | Twitter, Inc.1 | | | 1,481,695 | | | | 2,430,604 | |
| | | | | | | | | |
| | | | | | 11,325,994 | | | | 21,376,284 | |
| | | IT Consulting & Other Services (2.70%) | | | | | | | | |
| 13,883 | | Equinix, Inc.1,3 | | | 1,591,750 | | | | 2,949,860 | |
| |
| | | Semiconductor Equipment (2.64%) | | | | | | | | |
| 29,187 | | ASML Holding N.V.2 | | | 1,960,743 | | | | 2,884,259 | |
| |
| | | Systems Software (4.25%) | | | | | | | | |
| 3,460 | | FireEye, Inc.1 | | | 69,200 | | | | 105,738 | |
| 42,692 | | Red Hat, Inc.1 | | | 2,166,568 | | | | 2,397,156 | |
| 22,749 | | VMware, Inc., Cl A1 | | | 2,184,136 | | | | 2,134,766 | |
| | | | | | | | | |
| | | | | | 4,419,904 | | | | 4,637,660 | |
| | | Technology Hardware, Storage & Peripherals (5.13%) | | | | | | | | |
| 55,573 | | Apple, Inc. | | | 2,186,665 | | | | 5,598,980 | |
| | | | | | | | | |
| Total Information Technology | | | 25,513,614 | | | | 45,640,504 | |
| | | | | | | | | |
| | | | | | | | | | | |
| Materials (3.94%) | | | | | | | | |
| | | Fertilizers & Agricultural Chemicals (3.94%) | | | | | | | | |
| 38,220 | | Monsanto Co. | | | 3,345,354 | | | | 4,300,132 | |
| | | | | | | | | |
| | | | | | | | | | | |
Telecommunication Services (2.44%) | | | | | | | | |
| | | Wireless Telecommunication Services (2.44%) | | | | | | | | |
| 38,000 | | SoftBank Corp. (Japan)2 | | | 2,955,676 | | | | 2,664,071 | |
| | | | | | | | | |
| Total Common Stocks | | | 67,158,235 | | | | 106,173,712 | |
| | | | | | | | | |
| 24 | | See Notes to Financial Statements. |
| September 30, 2014 | | Baron Fifth Avenue Growth Fund |
| STATEMENT OF NET ASSETS (Continued) |
| |
| |
| SEPTEMBER 30, 2014 |
| |
| Principal | | | | | | | | |
| Amount | | | Cost | | | | Value | |
| |
| Short Term Investments (2.75%) | | | | | | | | |
| $3,007,365 | | Repurchase Agreement with Fixed Income Clearing Corp., dated 9/30/2014, 0.00% due 10/1/2014; Proceeds at maturity - $3,007,365; (Fully collateralized by $3,070,000 U.S. Treasury Note, 2.125% due 6/30/2021 Market value - $3,070,000)4 | | $ | 3,007,365 | | | $ | 3,007,365 | |
| | | | | | | | | |
Total Investments (99.96%) | | $ | 70,165,600 | | | | 109,181,077 | |
| | | | | | | | | | |
Cash and Other Assets Less Liabilities (0.04%) | | | | | | | 42,821 | |
| | | | | | | | | | |
| | | | | | | | | | |
Net Assets | | | | | | $ | 109,223,898 | |
| | | | | | | | | | |
Retail Shares (Equivalent to $16.83 per share
based on 3,161,956 shares outstanding) | | | | | | $ | 53,222,589 | |
| | | | | | | | | | |
Institutional Shares (Equivalent to $17.00 per share
based on 3,293,800 shares outstanding) | | | | | | $ | 56,001,309 | |
| | | | | | | | | | |
| % | | Represents percentage of net assets. |
| 1 | | Non-income producing securities. |
| 2 | | Foreign corporation. |
| 3 | | The Adviser has reclassified/classified certain securities in or out of this sub-industry. Such reclassifications/classifications are not supported by S&P or MSCI. |
| 4 | | Level 2 security. See Note 7 regarding Fair Value Measurements. |
| ADR | | American Depositary Receipt. |
| | | | |
| | | All securities are Level 1, unless otherwise noted. |
| See Notes to Financial Statements. | | 25 |
| Baron Discovery Fund | | September 30, 2014 |
| STATEMENT OF NET ASSETS |
| |
| |
| SEPTEMBER 30, 2014 |
| |
| Shares | | | | | Cost | | | | Value | |
| |
| Common Stocks (93.98%) | | | | | | | | |
| Consumer Discretionary (12.99%) | | | | | | | | |
| | | Apparel, Accessories & Luxury Goods (1.72%) | | | | | | | | |
| 55,000 | | Tumi Holdings, Inc.1 | | $ | 1,140,807 | | | $ | 1,119,250 | |
| |
| | | Casinos & Gaming (1.79%) | | | | | | | | |
| 12,000 | | Churchill Downs, Inc. | | | 1,109,865 | | | | 1,170,000 | |
| |
| | | Homefurnishing Retail (1.10%) | | | | | | | | |
| 12,000 | | Mattress Firm Holding Corp.1 | | | 761,162 | | | | 720,720 | |
| |
| | | Internet Retail (1.00%) | | | | | | | | |
| 215,000 | | AO World plc (United Kingdom)1,2 | | | 879,978 | | | | 655,269 | |
| |
| | | Restaurants (4.42%) | | | | | | | | |
| 45,000 | | Del Frisco’s Restaurant Group, Inc.1 | | | 902,452 | | | | 861,300 | |
| 34,000 | | Fiesta Restaurant Group, Inc.1 | | | 1,525,430 | | | | 1,689,120 | |
| 11,000 | | Zoe’s Kitchen, Inc.1 | | | 178,852 | | | | 338,360 | |
| | | | | | | | | |
| | | | | | 2,606,734 | | | | 2,888,780 | |
| | | Specialized Consumer Services (1.96%) | | | | | | | | |
| 21,300 | | Ascent Capital Group, Inc., Cl A1 | | | 1,446,831 | | | | 1,282,260 | |
| |
| | | Specialty Stores (1.00%) | | | | | | | | |
| 30,000 | | The Container Store Group, Inc.1 | | | 785,067 | | | | 653,100 | |
| | | | | | | | | |
| Total Consumer Discretionary | | | 8,730,444 | | | | 8,489,379 | |
| | | | | | | | | |
| | | | | | | | | | | |
| Consumer Staples (3.33%) | | | | | | | | |
| | | Packaged Foods & Meats (3.33%) | | | | | | | | |
| 37,000 | | Farmer Bros Co.1 | | | 804,243 | | | | 1,071,150 | |
| 85,000 | | Inventure Foods, Inc.1 | | | 1,099,902 | | | | 1,101,600 | |
| | | | | | | | | |
| Total Consumer Staples | | | 1,904,145 | | | | 2,172,750 | |
| | | | | | | | | |
| | | | | | | | | | | |
| Energy (10.48%) | | | | | | | | |
| | | Oil & Gas Equipment & Services (1.49%) | | | | | | | | |
| 24,000 | | RigNet, Inc.1 | | | 1,060,461 | | | | 970,800 | |
| |
| | | Oil & Gas Exploration & Production (1.06%) | | | | | | | | |
| 17,000 | | Parsley Energy, Inc., Cl A1 | | | 314,500 | | | | 362,610 | |
| 13,000 | | RSP Permian, Inc.1 | | | 280,291 | | | | 332,280 | |
| | | | | | | | | |
| | | | | | 594,791 | | | | 694,890 | |
| | | Oil & Gas Storage & Transportation (7.93%) | | | | | | | | |
| 50,000 | | PBF Logistics LP | | | 1,233,900 | | | | 1,266,000 | |
| 25,000 | | Rose Rock Midstream, L.P. | | | 1,127,770 | | | | 1,478,750 | |
| 40,000 | | Tallgrass Energy Partners, LP | | | 1,518,634 | | | | 1,812,400 | |
| 18,000 | | Western Refining Logistics, LP | | | 507,578 | | | | 626,760 | |
| | | | | | | | | |
| | | | | | 4,387,882 | | | | 5,183,910 | |
| | | | | | | | | |
| Total Energy | | | 6,043,134 | | | | 6,849,600 | |
| | | | | | | | | |
| | | | | | | | | | | |
| Financials (7.42%) | | | | | | | | |
| | | Consumer Finance (1.03%) | | | | | | | | |
| 37,400 | | Regional Management Corp.1 | | | 611,714 | | | | 671,330 | |
| |
| | | Diversified REITs (2.12%) | | | | | | | | |
| 42,000 | | American Assets Trust, Inc. | | | 1,452,853 | | | | 1,384,740 | |
| |
| | | Hotel & Resort REITs (4.27%) | | | | | | | | |
| 45,000 | | Chesapeake Lodging Trust | | | 1,263,094 | | | | 1,311,750 | |
| 127,000 | | Strategic Hotels & Resorts, Inc.1 | | | 1,381,982 | | | | 1,479,550 | |
| | | | | | | | | |
| | | | | | 2,645,076 | | | | 2,791,300 | |
| | | | | | | | | |
| Total Financials | | | 4,709,643 | | | | 4,847,370 | |
| | | | | | | | | |
| Shares | | | | | Cost | | | | Value | |
| |
| Common Stocks (continued) | | | | | | | | |
| Health Care (24.69%) | | | | | | | | |
| | | Biotechnology (3.62%) | | | | | | | | |
| 24,000 | | Esperion Therapeutics, Inc.1 | | $ | 466,461 | | | $ | 587,040 | |
| 93,600 | | Foundation Medicine, Inc.1 | | | 2,257,898 | | | | 1,774,656 | |
| | | | | | | | | |
| | | | | | 2,724,359 | | | | 2,361,696 | |
| | | Health Care Equipment (3.04%) | | | | | | | | |
| 50,000 | | Inogen, Inc.1 | | | 927,716 | | | | 1,030,500 | |
| 16,760 | | Masimo Corporation1 | | | 447,537 | | | | 356,653 | |
| 47,400 | | Novadaq Technologies, Inc. | | | | | | | | |
| | | (Canada)1,2 | | | 623,196 | | | | 601,506 | |
| | | | | | | | | |
| | | | | | 1,998,449 | | | | 1,988,659 | |
| | | Health Care Facilities (0.46%) | | | | | | | | |
| 14,200 | | Capital Senior Living Corp. Inc. | | | 332,496 | | | | 301,466 | |
| |
| | | Health Care Services (5.14%) | | | | | | | | |
| 281,300 | | BioScrip, Inc.1 | | | 2,146,822 | | | | 1,943,783 | |
| 43,100 | | ExamWorks Group, Inc.1 | | | 1,441,930 | | | | 1,411,525 | |
| | | | | | | | | |
| | | | | | 3,588,752 | | | | 3,355,308 | |
| | | Health Care Supplies (4.67%) | | | | | | | | |
| 114,900 | | The Spectranetics Corporation1 | | | 3,049,675 | | | | 3,052,893 | |
| |
| | | Managed Health Care (1.09%) | | | | | | | | |
| 38,800 | | HealthEquity, Inc.1 | | | 721,369 | | | | 710,428 | |
| |
| | | Pharmaceuticals (6.67%) | | | | | | | | |
| 15,000 | | Aerie Pharmaceuticals, Inc.1 | | | 285,976 | | | | 310,350 | |
| 77,528 | | Intersect ENT, Inc.1 | | | 1,009,154 | | | | 1,201,684 | |
| 6,960 | | Pacira Pharmaceuticals, Inc.1 | | | 357,312 | | | | 674,563 | |
| 43,000 | | Revance Therapeutics, Inc.1 | | | 1,015,542 | | | | 831,190 | |
| 288,700 | | TherapeuticsMD, Inc.1 | | | 1,569,589 | | | | 1,339,568 | |
| | | | | | | | | |
| | | | | | 4,237,573 | | | | 4,357,355 | |
| | | | | | | | | |
| Total Health Care | | | 16,652,673 | | | | 16,127,805 | |
| | | | | | | | | |
| | | | | | | | | | | |
| Industrials (6.78%) | | | | | | | | |
| | | Aerospace & Defense (1.41%) | | | | | | | | |
| 83,019 | | The KEYW Holding Corp.1 | | | 1,064,156 | | | | 919,020 | |
| |
| | | Air Freight & Logistics (0.80%) | | | | | | | | |
| 11,000 | | Park-Ohio Holdings Corp. | | | 577,517 | | | | 526,460 | |
| |
| | | Construction & Engineering (2.05%) | | | | | | | | |
| 50,000 | | Primoris Services Corp. | | | 1,430,961 | | | | 1,342,000 | |
| |
| | | Electrical Components & Equipment (1.92%) | | | | | | | | |
| 32,200 | | Polypore International, Inc.1 | | | 1,289,477 | | | | 1,252,902 | |
| |
| | | Industrial Machinery (0.60%) | | | | | | | | |
| 25,000 | | ARC Group Worldwide, Inc.1 | | | 414,629 | | | | 390,500 | |
| | | | | | | | | |
| Total Industrials | | | 4,776,740 | | | | 4,430,882 | |
| | | | | | | | | |
| | | | | | | | | | | |
| Information Technology (20.06%) | | | | | | | | |
| | | Application Software (0.49%) | | | | | | | | |
| 23,400 | | The Descartes Systems Group Inc.1,2 | | | 327,877 | | | | 323,154 | |
| |
| | | Electronic Equipment & Instruments (1.84%) | | | | | | | | |
| 19,560 | | Coherent, Inc.1 | | | 1,262,533 | | | | 1,200,397 | |
| |
| | | Internet Software & Services (8.62%) | | | | | | | | |
| 66,900 | | Amber Road, Inc.1 | | | 897,266 | | | | 1,160,046 | |
| 37,000 | | Benefitfocus, Inc.1 | | | 1,242,438 | | | | 996,780 | |
| 30,000 | | comScore, Inc.1 | | | 1,066,644 | | | | 1,092,300 | |
| 125,000 | | E2open, Inc.1 | | | 1,907,844 | | | | 1,163,750 | |
| 27,138 | | Envestnet, Inc.1 | | | 1,162,587 | | | | 1,221,210 | |
| | | | | | | | | |
| | | | | | 6,276,779 | | | | 5,634,086 | |
| 26 | | See Notes to Financial Statements. |
| September 30, 2014 | | Baron Discovery Fund |
| STATEMENT OF NET ASSETS (Continued) |
| |
| |
| SEPTEMBER 30, 2014 |
| |
| Shares | | | | | Cost | | | | Value | |
| |
| Common Stocks (continued) | | | | | | | | |
| Information Technology (continued) | | | | | | | | |
| | | Semiconductor Equipment (1.21%) | | | | | | | | |
| 62,500 | | PDF Solutions, Inc.1 | | $ | 1,259,807 | | | $ | 788,125 | |
| |
| | | Semiconductors (1.75%) | | | | | | | | |
| 21,200 | | Power Integrations, Inc. | | | 1,154,948 | | | | 1,142,892 | |
| |
| | | Systems Software (6.15%) | | | | | | | | |
| 50,600 | | Barracuda Networks, Inc.1 | | | 1,349,153 | | | | 1,297,890 | |
| 55,200 | | Qualys, Inc.1 | | | 1,294,492 | | | | 1,468,320 | |
| 59,200 | | Varonis Systems, Inc.1 | | | 1,402,848 | | | | 1,249,120 | |
| | | | | | | | | |
| | | | | | 4,046,493 | | | | 4,015,330 | |
| | | | | | | | | |
| Total Information Technology | | | 14,328,437 | | | | 13,103,984 | |
| | | | | | | | | |
| | | | | | | | | | | |
| Materials (7.18%) | | | | | | | | |
| | | Commodity Chemicals (1.64%) | | | | | | | | |
| 37,000 | | Westlake Chemical Partners LP1 | | | 1,088,408 | | | | 1,073,000 | |
| |
| | | Construction Materials (1.55%) | | | | | | | | |
| 19,500 | | CaesarStone Sdot Yam Ltd.1,2 | | | 972,793 | | | | 1,007,760 | |
| |
| | | Specialty Chemicals (3.99%) | | | | | | | | |
| 100,000 | | Flotek Industries, Inc.1 | | | 2,578,629 | | | | 2,607,000 | |
| | | | | | | | | |
| Total Materials | | | 4,639,830 | | | | 4,687,760 | |
| | | | | | | | | |
| | | | | | | | | | | |
| Telecommunication Services (1.05%) | | | | | | | | |
| | | Alternative Carriers (1.05%) | | | | | | | | |
| 77,339 | | Iridium Communications Inc.1 | | | 638,870 | | | | 684,450 | |
| | | | | | | | | |
| Total Common Stocks | | | 62,423,916 | | | | 61,393,980 | |
| | | | | | | | | |
| Principal | | | | | | | | |
| Amount | | | Cost | | | | Value | |
| |
| Short Term Investments (9.24%) | | | | | | | | |
| $6,037,051 | | Repurchase Agreement with Fixed Income Clearing Corp., dated 9/30/2014, 0.00% due 10/1/2014; Proceeds at maturity - $6,037,051; (Fully collateralized by $6,160,000 U.S. Treasury Note, 2.125% due 6/30/2021; Market value - $6,160,000)3 | | $ | 6,037,051 | | | $ | 6,037,051 | |
| | | | | | | | | |
| Total Investments (103.22%) | | $ | 68,460,967 | | | | 67,431,031 | |
| | | | | | | | | | |
| Liabilities Less Cash and Other Assets (-3.22%) | | | | | | | (2,100,418 | ) |
| | | | | | | | | | |
| Net Assets | | | | | | $ | 65,330,613 | |
| | | | | | | | | | |
Retail Shares (Equivalent to $11.68 per share
based on 1,422,580 shares outstanding) | | | | | | $ | 16,617,285 | |
| | | | | | | | | | |
Institutional Shares (Equivalent to $11.71 per share
based on 4,160,839 shares outstanding) | | | | | | $ | 48,713,328 | |
| | | | | | | | | | |
| | |
| % | | Represents percentage of net assets. |
| 1 | | Non-income producing securities. |
| 2 | | Foreign corporation. |
| 3 | | Level 2 security. See Note 7 regarding Fair Value Measurements. |
| | | | |
| | | All securities are Level 1, unless otherwise noted. |
| See Notes to Financial Statements. | | 27 |
| Baron Funds | | September 30, 2014 |
| STATEMENTS OF ASSETS AND LIABILITIES |
| | | | | | | | | | | | | | | | | | Baron | | Baron Fifth | | Baron |
| | | Baron Asset | | Baron Growth | | Baron Small | | Opportunity | | Avenue Growth | | Discovery |
| | | Fund | | Fund | | Cap Fund | | Fund | | Fund | | Fund |
| | | | | | | | | | | | | |
Assets: | | | | | | | | | | | | | | | | | | | | | | | | | | | | | | |
Investments in securities, at value* | | | | | | | | | | | | | | | | | | | | | | | | | | | | | | |
Unaffiliated investments | | | $ | 2,686,383,215 | | | | $ | 7,236,977,126 | | | | $ | 5,029,574,604 | | | | $ | 445,324,017 | | | | $ | 109,181,077 | | | | $ | 67,431,031 | |
“Affiliated” investments | | | | — | | | | | 526,545,838 | | | | | 216,853,500 | | | | | — | | | | | — | | | | | — | |
| | | | | | | | | | | | | | | | | | | | | | | | | |
Total investments, at value | | | | 2,686,383,215 | | | | | 7,763,522,964 | | | | | 5,246,428,104 | | | | | 445,324,017 | | | | | 109,181,077 | | | | | 67,431,031 | |
Foreign currency, at value† | | | | — | | | | | 24 | | | | | — | | | | | 28 | | | | | — | | | | | — | |
Cash | | | | — | | | | | — | | | | | — | | | | | — | | | | | — | | | | | 144,344 | |
Receivable for securities sold | | | | 11,357,808 | | | | | 18,720,365 | | | | | 12,954,281 | | | | | 3,071,095 | | | | | — | | | | | 149,975 | |
Receivable for shares sold | | | | 1,391,661 | | | | | 4,011,119 | | | | | 4,428,732 | | | | | 423,515 | | | | | 96,794 | | | | | 25,335 | |
Dividends and interest receivable | | | | 295,450 | | | | | 2,601,693 | | | | | 1,596,000 | | | | | — | | | | | 13,123 | | | | | 15,500 | |
Prepaid expenses | | | | 14,548 | | | | | 43,917 | | | | | 30,716 | | | | | 2,611 | | | | | 493 | | | | | 61 | |
| | | | | | | | | | | | | | | | | | | | | | | | | |
| | | | | 2,699,442,682 | | | | | 7,788,900,082 | | | | | 5,265,437,833 | | | | | 448,821,266 | | | | | 109,291,487 | | | | | 67,766,246 | |
| | | | | | | | | | | | | | | | | | | | | | | | | |
Liabilities: | | | | | | | | | | | | | | | | | | | | | | | | | | | | | | |
Payable for shares redeemed | | | | 5,222,262 | | | | | 6,018,113 | | | | | 14,667,434 | | | | | 7,313,537 | | | | | 13,771 | | | | | 30,024 | |
Payable for securities purchased | | | | 3,652,512 | | | | | 11,567,343 | | | | | — | | | | | 511,361 | | | | | — | | | | | 2,347,023 | |
Trustee fees payable | | | | 17,981 | | | | | 51,964 | | | | | 34,936 | | | | | 3,009 | | | | | 610 | | | | | 250 | |
Distribution fees payable (Note 4) | | | | 681 | | | | | 120 | | | | | 137 | | | | | 561 | | | | | 317 | | | | | 924 | |
Investment advisory fees payable (Note 4) | | | | 277 | | | | | 431 | | | | | 447 | | | | | 53 | | | | | 373 | | | | | 944 | |
Due to custodian bank | | | | — | | | | | — | | | | | — | | | | | 338,420 | | | | | — | | | | | — | |
Accrued expenses and other payables | | | | 254,600 | | | | | 625,474 | | | | | 514,510 | | | | | 98,820 | | | | | 52,518 | | | | | 56,468 | |
| | | | | | | | | | | | | | | | | | | | | | | | | |
| | | | | 9,148,313 | | | | | 18,263,445 | | | | | 15,217,464 | | | | | 8,265,761 | | | | | 67,589 | | | | | 2,435,633 | |
| | | | | | | | | | | | | | | | | | | | | | | | | |
Net Assets | | | $ | 2,690,294,369 | | | | $ | 7,770,636,637 | | | | $ | 5,250,220,369 | | | | $ | 440,555,505 | | | | $ | 109,223,898 | | | | $ | 65,330,613 | |
| | | | | | | | | | | | | | | | | | | | | | | | | |
Net Assets consist of: | | | | | | | | | | | | | | | | | | | | | | | | | | | | | | |
Paid-in capital | | | $ | 1,004,382,380 | | | | $ | 3,412,147,661 | | | | $ | 2,496,716,026 | | | | $ | 288,852,000 | | | | $ | 71,629,978 | | | | $ | 67,561,639 | |
Undistributed (accumulated) net investment income (loss) | | | | (14,002,691 | ) | | | | 9,650,508 | | | | | 8,399,655 | | | | | (258,478 | ) | | | | (188,877 | ) | | | | (171,944 | ) |
Undistributed (accumulated) net realized gain (loss) on investments and foreign currency transactions | | | | 167,045,957 | | | | | 323,483,769 | | | | | 302,768,294 | | | | | 21,661,668 | | | | | (1,232,637 | ) | | | | (1,029,146 | ) |
Net unrealized appreciation (depreciation) on investments and foreign currency translations | | | | 1,532,868,723 | | | | | 4,025,354,699 | | | | | 2,442,336,394 | | | | | 130,300,315 | | | | | 39,015,434 | | | | | (1,029,936 | ) |
| | | | | | | | | | | | | | | | | | | | | | | | | |
Net Assets | | | $ | 2,690,294,369 | | | | $ | 7,770,636,637 | | | | $ | 5,250,220,369 | | | | $ | 440,555,505 | | | | $ | 109,223,898 | | | | $ | 65,330,613 | |
| | | | | | | | | | | | | | | | | | | | | | | | | |
Retail Shares: | | | | | | | | | | | | | | | | | | | | | | | | | | | | | | |
Net Assets | | | $ | 2,000,486,489 | | | | $ | 4,076,139,936 | | | | $ | 3,192,830,733 | | | | $ | 331,220,990 | | | | $ | 53,222,589 | | | | $ | 16,617,285 | |
Shares Outstanding ($0.01 par value; indefinite shares authorized) | | | | 31,381,751 | | | | | 57,847,669 | | | | | 94,809,283 | | | | | 17,801,842 | | | | | 3,161,956 | | | | | 1,422,580 | |
| | | | | | | | | | | | | | | | | | | | | | | | | |
Net Asset Value and Offering Price Per Share | | | $ | 63.75 | | | | $ | 70.46 | | | | $ | 33.68 | | | | $ | 18.61 | | | | $ | 16.83 | | | | $ | 11.68 | |
| | | | | | | | | | | | | | | | | | | | | | | | | |
Institutional Shares: | | | | | | | | | | | | | | | | | | | | | | | | | | | | | | |
Net Assets | | | $ | 689,807,880 | | | | $ | 3,694,496,701 | | | | $ | 2,057,389,636 | | | | $ | 109,334,515 | | | | $ | 56,001,309 | | | | $ | 48,713,328 | |
Shares Outstanding ($0.01 par value; indefinite shares authorized) | | | | 10,634,393 | | | | | 51,795,804 | | | | | 60,224,681 | | | | | 5,787,882 | | | | | 3,293,800 | | | | | 4,160,839 | |
| | | | | | | | | | | | | | | | | | | | | | | | | |
Net Asset Value and Offering Price Per Share | | | $ | 64.87 | | | | $ | 71.33 | | | | $ | 34.16 | | | | $ | 18.89 | | | | $ | 17.00 | | | | $ | 11.71 | |
| | | | | | | | | | | | | | | | | | | | | | | | | |
*Investments in securities, at cost: | | | | | | | | | | | | | | | | | | | | | | | | | | | | | | |
Unaffiliated investments | | | $ | 1,153,510,558 | | | | $ | 3,411,840,489 | | | | $ | 2,586,935,250 | | | | $ | 315,023,656 | | | | $ | 70,165,600 | | | | $ | 68,460,967 | |
“Affiliated” investments | | | | — | | | | | 326,327,333 | | | | | 217,156,460 | | | | | — | | | | | — | | | | | — | |
| | | | | | | | | | | | | | | | | | | | | | | | | |
Total investments, at cost | | | $ | 1,153,510,558 | | | | $ | 3,738,167,822 | | | | $ | 2,804,091,710 | | | | $ | 315,023,656 | | | | $ | 70,165,600 | | | | $ | 68,460,967 | |
| | | | | | | | | | | | | | | | | | | | | | | | | |
| |
†Foreign currency, at cost: | | | $ | — | | | | $ | 25 | | | | $ | — | | | | $ | 30 | | | | $ | — | | | | $ | — | |
| | | | | | | | | | | | | | | | | | | | | | | | | |
| 28 | | See Notes to Financial Statements. |
| September 30, 2014 | | Baron Funds |
| |
| FOR THE YEAR ENDED SEPTEMBER 30, 2014 |
| |
| | | | | | | | | | | | | | | | | | Baron | | Baron Fifth | | Baron |
| | | Baron Asset | | Baron Growth | | Baron Small | | Opportunity | | Avenue Growth | | Discovery |
| | | Fund | | Fund | | Cap Fund | | Fund | | Fund | | Fund |
| | | | | | | | | | | | | |
Investment income: | | | | | | | | | | | | | | | | | | | | | | | | | | | | | | |
Income: | | | | | | | | | | | | | | | | | | | | | | | | | | | | | | |
Dividends — unaffiliated investments | | | $ | 16,849,900 | | | | $ | 104,900,543 | | | | $ | 66,922,492 | | | | $ | 524,161 | | | | $ | 943,190 | | | | $ | 123,928 | |
Dividends — “Affiliated” investments | | | | — | | | | | 5,290,327 | | | | | 2,429,015 | | | | | — | | | | | — | | | | | — | |
Interest | | | | — | | | | | 98,217 | | | | | — | | | | | — | | | | | — | | | | | — | |
Securities lending income | | | | — | | | | | 476,944 | | | | | 231,323 | | | | | 15,139 | | | | | 30,446 | | | | | 715 | |
Miscellaneous Income | | | | — | | | | | 12,579 | | | | | 48,193 | | | | | — | | | | | — | | | | | — | |
Foreign taxes withheld on dividends | | | | (254,955 | ) | | | | (1,046,350 | ) | | | | (119,100 | ) | | | | (13,839 | ) | | | | (12,023 | ) | | | | (795 | ) |
| | | | | | | | | | | | | | | | | | | | | | | | | |
Total income | | | | 16,594,945 | | | | | 109,732,260 | | | | | 69,511,923 | | | | | 525,461 | | | | | 961,613 | | | | | 123,848 | |
| | | | | | | | | | | | | | | | | | | | | | | | | |
Expenses: | | | | | | | | | | | | | | | | | | | | | | | | | | | | | | |
Investment advisory fees (Note 4) | | | | 27,189,694 | | | | | 81,279,862 | | | | | 55,875,456 | | | | | 4,814,991 | | | | | 875,731 | | | | | 257,434 | |
Distribution fees — Retail Shares (Note 4) | | | | 5,273,573 | | | | | 11,617,222 | | | | | 9,077,334 | | | | | 936,141 | | | | | 132,721 | | | | | 32,924 | |
Shareholder servicing agent fees and expenses — Retail Shares | | | | 503,625 | | | | | 454,275 | | | | | 388,795 | | | | | 121,780 | | | | | 33,798 | | | | | 16,465 | |
Shareholder servicing agent fees and expenses — Institutional Shares | | | | 33,988 | | | | | 223,985 | | | | | 89,255 | | | | | 18,573 | | | | | 11,767 | | | | | 10,255 | |
Reports to shareholders | | | | 502,800 | | | | | 1,451,600 | | | | | 1,317,950 | | | | | 126,025 | | | | | 14,147 | | | | | 5,937 | |
Custodian and fund accounting fees | | | | 108,180 | | | | | 380,338 | | | | | 292,522 | | | | | 41,936 | | | | | 29,100 | | | | | 37,754 | |
Registration and filing fees | | | | 94,390 | | | | | 203,070 | | | | | 130,610 | | | | | 47,735 | | | | | 39,276 | | | | | 89,200 | |
Trustee fees and expenses | | | | 77,493 | | | | | 237,683 | | | | | 161,653 | | | | | 13,918 | | | | | 2,719 | | | | | 662 | |
Professional fees | | | | 57,716 | | | | | 182,100 | | | | | 110,140 | | | | | 41,737 | | | | | 37,531 | | | | | 44,455 | |
Insurance expense | | | | 38,955 | | | | | 113,932 | | | | | 81,456 | | | | | 7,103 | | | | | 1,304 | | | | | 103 | |
Administration fees | | | | 26,412 | | | | | 26,435 | | | | | 26,344 | | | | | 26,373 | | | | | 26,493 | | | | | 26,528 | |
Line of credit fees | | | | 19,152 | | | | | 62,047 | | | | | 39,760 | | | | | 3,465 | | | | | 714 | | | | | 208 | |
Miscellaneous expenses | | | | 1,419 | | | | | 1,421 | | | | | 1,421 | | | | | 1,411 | | | | | 1,418 | | | | | 2,579 | |
| | | | | | | | | | | | | | | | | | | | | | | | | |
Total operating expenses | | | | 33,927,397 | | | | | 96,233,970 | | | | | 67,592,696 | | | | | 6,201,188 | | | | | 1,206,719 | | | | | 524,504 | |
Interest expense on borrowings | | | | — | | | | | 6,105 | | | | | — | | | | | — | | | | | — | | | | | — | |
| | | | | | | | | | | | | | | | | | | | | | | | | |
Total expenses | | | | 33,927,397 | | | | | 96,240,075 | | | | | 67,592,696 | | | | | 6,201,188 | | | | | 1,206,719 | | | | | 524,504 | |
Reimbursement of expenses by Adviser — Retail Shares (Note 4) | | | | — | | | | | — | | | | | — | | | | | — | | | | | (37,478 | ) | | | | (107,026 | ) |
Reimbursement of expenses by Adviser — Institutional Shares (Note 4) | | | | — | | | | | — | | | | | — | | | | | — | | | | | (14,835 | ) | | | | (101,377 | ) |
| | | | | | | | | | | | | | | | | | | | | | | | | |
Net expenses | | | | 33,927,397 | | | | | 96,240,075 | | | | | 67,592,696 | | | | | 6,201,188 | | | | | 1,154,406 | | | | | 316,101 | |
| | | | | | | | | | | | | | | | | | | | | | | | | |
Net investment income (loss) | | | | (17,332,452 | ) | | | | 13,492,185 | | | | | 1,919,227 | | | | | (5,675,727 | ) | | | | (192,793 | ) | | | | (192,253 | ) |
| | | | | | | | | | | | | | | | | | | | | | | | | |
Realized and unrealized gain (loss) on investments: | | | | | | | | | | | | | | | | | | | | | | | | | | | | | | |
Net realized gain (loss) on investments sold — unaffiliated investments | | | | 177,698,106 | | | | | 337,431,083 | | | | | 316,423,389 | | | | | 30,323,514 | | | | | 1,066,111 | | | | | (1,013,467 | ) |
Net realized loss on investments sold — “affiliated” investments | | | | — | | | | | (327,891 | ) | | | | (4,734,335 | ) | | | | — | | | | | — | | | | | — | |
Net realized gain (loss) on foreign currency transactions | | | | (34,582 | ) | | | | (284,894 | ) | | | | — | | | | | (31,620 | ) | | | | (16,993 | ) | | | | 1,525 | |
Net change in unrealized appreciation (depreciation) of: | | | | | | | | | | | | | | | | | | | | | | | | | | | | | | |
Investments — unaffiliated investments | | | | 181,636,179 | | | | | (10,993,230 | ) | | | | 65,411,572 | | | | | (12,775,543 | ) | | | | 12,852,631 | | | | | (1,029,936 | ) |
Investments — “Affiliated” investments | | | | — | | | | | 60,001,192 | | | | | (16,571,281 | ) | | | | — | | | | | — | | | | | — | |
Foreign currency translations | | | | (3,934 | ) | | | | (443 | ) | | | | — | | | | | (46 | ) | | | | (355 | ) | | | | — | |
| | | | | | | | | | | | | | | | | | | | | | | | | |
Net gain (loss) on investments | | | | 359,295,769 | | | | | 385,825,817 | | | | | 360,529,345 | | | | | 17,516,305 | | | | | 13,901,394 | | | | | (2,041,878 | ) |
| | | | | | | | | | | | | | | | | | | | | | | | | |
Voluntary payment from Adviser (Note 4) | | | | — | | | | | — | | | | | — | | | | | 140,762 | | | | | — | | | | | — | |
| | | | | | | | | | | | | | | | | | | | | | | | | |
Net increase (decrease) in net assets resulting from operations | | | $ | 341,963,317 | | | | $ | 399,318,002 | | | | $ | 362,448,572 | | | | $ | 11,981,340 | | | | $ | 13,708,601 | | | | $ | (2,234,131 | ) |
| | | | | | | | | | | | | | | | | | | | | | | | | |
| See Notes to Financial Statements. | | 29 |
| Baron Funds | | September 30, 2014 |
| STATEMENTS OF CHANGES IN NET ASSETS |
| | | Baron Asset Fund | | Baron Growth Fund | | Baron Small Cap Fund |
| | | | | | | |
| | | For the | | | | For the | | | | | For the | | | | | For the | | | | | For the | | | | | For the | |
| | | Year Ended | | | | Year Ended | | | | | Year Ended | | | | | Year Ended | | | | | Year Ended | | | | | Year Ended | |
| | | September 30, | | | | September 30, | | | | | September 30, | | | | | September 30, | | | | | September 30, | | | | | September 30, | |
| | | 2014 | | | | 2013 | | | | | 2014 | | | | | 2013 | | | | | 2014 | | | | | 2013 | |
| | | | | | | | | | | | | |
Increase (Decrease) in Net Assets: | | | | | | | | | | | | | | | | | | | | | | | | | | | | | | |
Operations: | | | | | | | | | | | | | | | | | | | | | | | | | | | | | | |
Net investment income (loss) | | | $ | (17,332,452 | ) | | | $ | (13,217,951 | ) | | | $ | 13,492,185 | | | | $ | (7,481,141 | ) | | | $ | 1,919,227 | | | | $ | (16,158,862 | ) |
Net realized gain | | | | 177,663,524 | | | | | 227,229,894 | | | | | 336,818,298 | | | | | 232,458,845 | | | | | 311,689,054 | | | | | 232,291,521 | |
Net change in unrealized appreciation | | | | 181,632,245 | | | | | 339,079,430 | | | | | 49,007,519 | | | | | 1,537,646,955 | | | | | 48,840,291 | | | | | 1,011,748,374 | |
| | | | | | | | | | | | | | | | | | | | | | | | | |
Increase in net assets resulting from operations | | | | 341,963,317 | | | | | 553,091,373 | | | | | 399,318,002 | | | | | 1,762,624,659 | | | | | 362,448,572 | | | | | 1,227,881,033 | |
| | | | | | | | | | | | | | | | | | | | | | | | | |
Distributions to shareholders from: | | | | | | | | | | | | | | | | | | | | | | | | | | | | | | |
Net investment income — Retail Shares | | | | — | | | | | — | | | | | — | | | | | (12,533,076 | ) | | | | — | | | | | — | |
Net investment income — Institutional Shares | | | | — | | | | | — | | | | | — | | | | | (11,933,611 | ) | | | | — | | | | | — | |
Net realized gain on investments — Retail Shares | | | | (183,214,276 | ) | | | | (129,310,772 | ) | | | | (115,588,985 | ) | | | | (375,799,461 | ) | | | | (138,997,972 | ) | | | | (92,464,987 | ) |
Net realized gain on investments — Institutional Shares | | | | (46,121,408 | ) | | | | (25,794,972 | ) | | | | (76,667,813 | ) | | | | (169,259,302 | ) | | | | (69,574,277 | ) | | | | (34,510,450 | ) |
| | | | | | | | | | | | | | | | | | | | | | | | | |
Decrease in net assets from distributions to shareholders | | | | (229,335,684 | ) | | | | (155,105,744 | ) | | | | (192,256,798 | ) | | | | (569,525,450 | ) | | | | (208,572,249 | ) | | | | (126,975,437 | ) |
| | | | | | | | | | | | | | | | | | | | | | | | | |
Capital share transactions: | | | | | | | | | | | | | | | | | | | | | | | | | | | | | | |
Proceeds from the sale of shares — Retail Shares | | | | 134,877,634 | | | | | 131,045,461 | | | | | 564,936,613 | | | | | 654,636,671 | | | | | 466,982,041 | | | | | 614,930,372 | |
Proceeds from the sale of shares — Institutional Shares | | | | 232,326,449 | | | | | 133,712,633 | | | | | 1,383,261,836 | | | | | 853,401,704 | | | | | 612,992,165 | | | | | 582,343,790 | |
Net asset value of shares issued in reinvestment of distributions — Retail Shares | | | | 179,798,184 | | | | | 126,783,536 | | | | | 111,771,521 | | | | | 373,656,477 | | | | | 136,928,058 | | | | | 90,937,921 | |
Net asset value of shares issued in reinvestment of distributions — Institutional Shares | | | | 44,171,266 | | | | | 24,440,596 | | | | | 71,443,752 | | | | | 171,740,557 | | | | | 63,830,849 | | | | | 31,050,332 | |
Cost of shares redeemed — Retail Shares | | | | (424,191,305 | ) | | | | (403,180,358 | ) | | | | (1,373,978,953 | ) | | | | (1,193,785,340 | ) | | | | (1,142,246,527 | ) | | | | (927,333,800 | ) |
Cost of shares redeemed — Institutional Shares | | | | (119,611,299 | ) | | | | (112,821,144 | ) | | | | (814,745,770 | ) | | | | (252,634,937 | ) | | | | (443,968,703 | ) | | | | (283,831,422 | ) |
| | | | | | | | | | | | | | | | | | | | | | | | | |
Increase (decrease) in net assets derived from capital
share transactions | | | | 47,370,929 | | | | | (100,019,276 | ) | | | | (57,311,001 | ) | | | | 607,015,132 | | | | | (305,482,117 | ) | | | | 108,097,193 | |
| | | | | | | | | | | | | | | | | | | | | | | | | |
Net increase (decrease) in net assets | | | | 159,998,562 | | | | | 297,966,353 | | | | | 149,750,203 | | | | | 1,800,114,341 | | | | | (151,605,794 | ) | | | | 1,209,002,789 | |
| | | | | | | | | | | | | | | | | | | | | | | | | |
Net Assets: | | | | | | | | | | | | | | | | | | | | | | | | | | | | | | |
Beginning of year | | | | 2,530,295,807 | | | | | 2,232,329,454 | | | | | 7,620,886,434 | | | | | 5,820,772,093 | | | | | 5,401,826,163 | | | | | 4,192,823,374 | |
| | | | | | | | | | | | | | | | | | | | | | | | | |
End of year | | | $ | 2,690,294,369 | | | | $ | 2,530,295,807 | | | | $ | 7,770,636,637 | | | | $ | 7,620,886,434 | | | | $ | 5,250,220,369 | | | | $ | 5,401,826,163 | |
| | | | | | | | | | | | | | | | | | | | | | | | | |
Undistributed (accumulated) net investment
income (loss) at end of year | | | $ | (14,002,691 | ) | | | $ | (12,883,037 | ) | | | $ | 9,650,508 | | | | $ | 2,556,793 | | | | $ | 8,399,655 | | | | $ | (13,618,537 | ) |
| | | | | | | | | | | | | | | | | | | | | | | | | |
Capital share transactions — Retail Shares | | | | | | | | | | | | | | | | | | | | | | | | | | | | | | |
Shares sold | | | | 2,155,570 | | | | | 2,396,022 | | | | | 7,942,734 | | | | | 10,844,281 | | | | | 13,680,269 | | | | | 21,478,055 | |
Shares issued in reinvestment of distributions | | | | 3,002,140 | | | | | 2,636,380 | | | | | 1,583,839 | | | | | 6,974,547 | | | | | 4,088,625 | | | | | 3,545,338 | |
Shares redeemed | | | | (6,761,301 | ) | | | | (7,517,071 | ) | | | | (19,314,699 | ) | | | | (20,185,602 | ) | | | | (33,420,807 | ) | | | | (32,481,534 | ) |
| | | | | | | | | | | | | | | | | | | | | | | | | |
Net decrease | | | | (1,603,591 | ) | | | | (2,484,669 | ) | | | | (9,788,126 | ) | | | | (2,366,774 | ) | | | | (15,651,913 | ) | | | | (7,458,141 | ) |
| | | | | | | | | | | | | | | | | | | | | | | | | |
Capital share transactions — Institutional Shares | | | | | | | | | | | | | | | | | | | | | | | | | | | | | | |
Shares sold | | | | 3,646,344 | | | | | 2,394,977 | | | | | 19,222,974 | | | | | 14,149,569 | | | | | 17,707,594 | | | | | 19,856,997 | |
Shares issued in reinvestment of distributions | | | | 726,382 | | | | | 502,583 | | | | | 1,002,298 | | | | | 3,172,890 | | | | | 1,882,916 | | | | | 1,199,781 | |
Shares redeemed | | | | (1,874,586 | ) | | | | (2,119,149 | ) | | | | (11,373,462 | ) | | | | (4,143,374 | ) | | | | (12,850,030 | ) | | | | (9,723,456 | ) |
| | | | | | | | | | | | | | | | | | | | | | | | | |
Net increase | | | | 2,498,140 | | | | | 778,411 | | | | | 8,851,810 | | | | | 13,179,085 | | | | | 6,740,480 | | | | | 11,333,322 | |
| | | | | | | | | | | | | | | | | | | | | | | | | |
| 30 | | See Notes to Financial Statements. |
| September 30, 2014 | | Baron Funds |
| STATEMENTS OF CHANGES IN NET ASSETS (Continued) |
| | | Baron Opportunity Fund | | Baron Fifth Avenue Growth Fund | | Baron Discovery Fund |
| | | | | | | |
| | | For the | | For the | | For the | | For the | | For the |
| | | Year Ended | | Year Ended | | Year Ended | | Year Ended | | Year Ended |
| | | September 30, | | September 30, | | September 30, | | September 30, | | September 30, |
| | | 2014 | | 2013 | | 2014 | | 2013 | | 2014 |
| | | | | | | | | | | |
Increase (Decrease) in Net Assets: | | | | | | | | | | | | | | | | | | | | | | | | | |
Operations: | | | | | | | | | | | | | | | | | | | | | | | | | |
Net investment income (loss) | | | $ | (5,675,727 | ) | | | $ | (3,897,361 | ) | | | $ | (192,793 | ) | | | $ | 153,990 | | | | $ | (192,253 | ) |
Net realized gain (loss) | | | | 30,291,894 | | | | | 37,266,911 | | | | | 1,049,118 | | | | | 683,644 | | | | | (1,011,942 | ) |
Net change in unrealized appreciation (depreciation) | | | | (12,775,589 | ) | | | | 59,557,866 | | | | | 12,852,276 | | | | | 13,352,550 | | | | | (1,029,936 | ) |
Voluntary payment from Adviser | | | | 140,762 | | | | | — | | | | | — | | | | | — | | | | | — | |
| | | | | | | | | | | | | | | | | | | | | |
Increase (decrease) in net assets resulting from operations | | | | 11,981,340 | | | | | 92,927,416 | | | | | 13,708,601 | | | | | 14,190,184 | | | | | (2,234,131 | ) |
| | | | | | | | | | | | | | | | | | | | | |
Distributions to shareholders from: | | | | | | | | | | | | | | | | | | | | | | | | | |
Net realized gain on investments — Retail Shares | | | | (22,565,145 | ) | | | | (5,021,225 | ) | | | | — | | | | | — | | | | | — | |
Net realized gain on investments — Institutional Shares | | | | (6,207,861 | ) | | | | (900,337 | ) | | | | — | | | | | — | | | | | — | |
| | | | | | | | | | | | | | | | | | | | | |
Decrease in net assets from distributions to shareholders | | | | (28,773,006 | ) | | | | (5,921,562 | ) | | | | — | | | | | — | | | | | — | |
| | | | | | | | | | | | | | | | | | | | | |
Capital share transactions: | | | | | | | | | | | | | | | | | | | | | | | | | |
Proceeds from the sale of shares — Retail Shares | | | | 72,205,415 | | | | | 69,855,251 | | | | | 12,422,621 | | | | | 13,574,483 | | | | | 27,253,657 | |
Proceeds from the sale of shares — Institutional Shares | | | | 37,338,359 | | | | | 41,958,614 | | | | | 18,375,636 | | | | | 13,686,963 | | | | | 51,316,916 | |
Net asset value of shares issued in reinvestment of distributions — Retail Shares | | | | 22,168,599 | | | | | 4,934,553 | | | | | — | | | | | — | | | | | — | |
Net asset value of shares issued in reinvestment of distributions — Institutional Shares | | | | 5,394,387 | | | | | 752,126 | | | | | — | | | | | — | | | | | — | |
Cost of shares redeemed — Retail Shares | | | | (109,857,469 | ) | | | | (114,757,426 | ) | | | | (14,496,745 | ) | | | | (8,997,195 | ) | | | | (10,674,047 | ) |
Cost of shares redeemed — Institutional Shares | | | | (31,147,829 | ) | | | | (23,368,614 | ) | | | | (2,360,527 | ) | | | | (4,630,037 | ) | | | | (331,782 | ) |
| | | | | | | | | | | | | | | | | | | | | |
Increase (decrease) in net assets derived from capital share transactions | | | | (3,898,538 | ) | | | | (20,625,496 | ) | | | | 13,940,985 | | | | | 13,634,214 | | | | | 67,564,744 | |
| | | | | | | | | | | | | | | | | | | | | |
Increase (decrease) in net assets | | | | (20,690,204 | ) | | | | 66,380,358 | | | | | 27,649,586 | | | | | 27,824,398 | | | | | 65,330,613 | |
| | | | | | | | | | | | | | | | | | | | | |
Net Assets: | | | | | | | | | | | | | | | | | | | | | | | | | |
Beginning of year | | | | 461,245,709 | | | | | 394,865,351 | | | | | 81,574,312 | | | | | 53,749,914 | | | | | — | |
| | | | | | | | | | | | | | | | | | | | | |
End of year | | | $ | 440,555,505 | | | | $ | 461,245,709 | | | | $ | 109,223,898 | | | | $ | 81,574,312 | | | | $ | 65,330,613 | |
| | | | | | | | | | | | | | | | | | | | | |
Undistributed (accumulated) net investment income (loss) at end of year | | | $ | (258,478 | ) | | | $ | — | | | | $ | (188,877 | ) | | | $ | 1,499 | | | | $ | (171,944 | ) |
| | | | | | | | | | | | | | | | | | | | | |
Capital share transactions — Retail Shares | | | | | | | | | | | | | | | | | | | | | | | | | |
Shares sold | | | | 3,740,884 | | | | | 4,201,895 | | | | | 764,838 | | | | | 1,090,066 | | | | | 2,287,767 | |
Shares issued in reinvestment of distributions | | | | 1,191,220 | | | | | 333,867 | | | | | — | | | | | — | | | | | — | |
Shares redeemed | | | | (5,817,406 | ) | | | | (7,141,887 | ) | | | | (914,422 | ) | | | | (723,933 | ) | | | | (865,187 | ) |
| | | | | | | | | | | | | | | | | | | | | |
Net increase (decrease) | | | | (885,302 | ) | | | | (2,606,125 | ) | | | | (149,584 | ) | | | | 366,133 | | | | | 1,422,580 | |
| | | | | | | | | | | | | | | | | | | | | |
Capital share transactions — Institutional Shares | | | | | | | | | | | | | | | | | | | | | | | | | |
Shares sold | | | | 1,919,468 | | | | | 2,630,913 | | | | | 1,110,731 | | | | | 1,101,728 | | | | | 4,187,992 | |
Shares issued in reinvestment of distributions | | | | 286,174 | | | | | 50,411 | | | | | — | | | | | — | | | | | — | |
Shares redeemed | | | | (1,618,130 | ) | | | | (1,445,085 | ) | | | | (145,591 | ) | | | | (362,188 | ) | | | | (27,153 | ) |
| | | | | | | | | | | | | | | | | | | | | |
Net increase | | | | 587,512 | | | | | 1,236,239 | | | | | 965,140 | | | | | 739,540 | | | | | 4,160,839 | |
| | | | | | | | | | | | | | | | | | | | | |
| See Notes to Financial Statements. | | 31 |
| Baron Funds | | September 30, 2014 |
| NOTES TO FINANCIAL STATEMENTS |
1. ORGANIZATION
Baron Investment Funds Trust (the “Trust”) is registered under the Investment Company Act of 1940, as amended (the “1940 Act”), as an open-end management investment company established as a Massachusetts business trust on February 19, 1987, and accordingly, follows the investment company accounting and reporting guidance of the Financial Accounting Standards Board (“FASB”) Accounting Standard Codification Topic 946 Financial Services – Investment Companies. The Trust currently offers six series (individually, a “Fund” and collectively, the “Funds”): Baron Asset Fund, Baron Growth Fund, Baron Small Cap Fund, Baron Opportunity Fund, Baron Fifth Avenue Growth Fund and Baron Discovery Fund.
Each Fund offers two classes of shares, Retail Shares and Institutional Shares, which differ only in their ongoing fees, expenses and eligibility requirements. Retail Shares are offered to all investors. Institutional Shares are for investments in the amount of $1 million or more per Fund. Institutional Shares are intended for certain financial intermediaries that offer shares of Baron Funds through fee-based platforms, retirement platforms or other platforms. Each class of shares has equal rights to earnings and assets, except that each class bears different expenses for distribution and shareholder servicing. Each Fund’s investment income, realized and unrealized gains or losses on investments and foreign currency, and expenses other than those attributable to a specific class are allocated to each class based on its relative net assets. Each class of shares has exclusive voting rights with respect to matters that affect just that class.
The investment goals of the Funds are as follows:
Baron Asset Fund seeks capital appreciation through long-term investments primarily in securities of medium-sized companies with undervalued assets or favorable growth prospects.
Baron Growth Fund seeks capital appreciation through long-term investments primarily in securities of small-sized growth companies.
Baron Small Cap Fund seeks capital appreciation through investments primarily in securities of small-sized growth companies.
Baron Opportunity Fund seeks capital appreciation through investments primarily in growth companies that benefit from technology advances.
Baron Fifth Avenue Growth Fund seeks capital appreciation through investments primarily in securities of large-sized growth companies.
Baron Discovery Fund seeks capital appreciation through investments primarily in securities of small-sized growth companies.
Baron Discovery Fund commenced investment operations on October 1, 2013.
2. SIGNIFICANT ACCOUNTING POLICIES
The following is a summary of significant accounting policies followed by the Funds. The policies are in conformity with accounting principles generally accepted in the United States of America (“GAAP”). The preparation of financial statements in accordance with GAAP requires management to make estimates and assumptions that affect the reported amounts of assets and liabilities at the date of the financial statements and the amounts of income and expenses during the period. Actual results could differ from those estimates. Events occurring subsequent to the date of the Statements of Assets and Liabilities and through the date of issuance of the financial statements have been evaluated for adjustment to or disclosure in the financial statements.
a) Security Valuation. The Funds’ share prices or net asset values are calculated as of the close of the regular trading session (usually 4 p.m. E.T.) on the New York Stock Exchange (“NYSE”) on any day the NYSE is open. Portfolio securities traded on any national stock exchange are valued based on the last sale price on the exchange where such shares are principally traded. For securities traded on NASDAQ, the Funds use the NASDAQ Official Closing Price. If there are no sales on a given day, the value of the security may be the average of the most recent bid and asked quotations on such exchange or the last sale price from a prior day. Where market quotations are not readily available, or, if in BAMCO, Inc.’s (the “Adviser”) judgment, they do not accurately reflect the fair value of a security, or an event occurs after the market close but before the Funds are priced that materially affects the value of a security, the security will be valued by the Adviser using policies and procedures approved by the Board of Trustees (the “Board”). The Adviser has a Fair Valuation Committee (the “Committee”) comprised of senior executives, and the Committee reports to the Board every quarter. Factors the Committee may consider when valuing a security include whether a current price is stale, there is recent news, the security is thinly traded, transactions are infrequent or quotations are genuine. There can be no guarantee, however, that a fair valuation used by the Funds on any given day will more accurately reflect the market value of an investment than the closing price of such investment in its market. Debt instruments having a remaining maturity greater than 60 days will be valued on the basis of prices obtained from a pricing service approved by the Board or at the mean of the bid and ask prices from the dealer maintaining an active market in that security. Money market instruments held by the Funds with a remaining maturity of 60 days or less are valued at amortized cost, which approximates fair value.
Non-U.S. equity securities are valued on the basis of their most recent closing market prices and translated into U.S. dollars at 4 p.m. E.T., except under the circumstances described below. Most foreign markets close before 4 p.m. E.T. For securities primarily traded in the Far East, for example, the most recent closing prices may be as much as fifteen hours old at 4 p.m. E.T. If the Adviser determines that developments between the close of the foreign markets and 4 p.m. E.T. will, in its judgment, materially affect the value of some or all of the Funds’ non-U.S. securities, the Adviser will adjust the previous closing prices to reflect what it believes to be the fair value of the securities as of 4 p.m. E.T. In deciding whether to make these adjustments, the Adviser may review a variety of factors, including developments in foreign markets, the performance of U.S. securities markets, and the performance of instruments trading in U.S. markets that represent non-U.S. securities and baskets of non-U.S. securities. The Adviser may also fair value securities in other situations, for example, when a particular foreign market is closed but the Funds are open. The Adviser uses an outside pricing service that utilizes a systematic methodology to provide the Adviser with closing market prices and information used for adjusting those prices. The Adviser cannot predict how often it will use closing prices or how often it will adjust those prices. As a means of evaluating its fair value process, the Adviser routinely compares closing market prices, the next day’s opening prices in the same markets, and the adjusted prices. Other mutual funds may adjust the prices of their securities by different amounts.
b) Securities Transactions, Investment Income and Expense Allocation. Securities transactions are recorded on a trade date basis. Realized gain and loss from securities transactions are recorded on an identified cost basis for financial reporting and federal income tax purposes. Dividend income is recognized on the ex-dividend date and interest income is recognized on an accrual basis, which includes the accretion of discounts and amortization of premiums. Certain dividends from foreign securities will be recorded as soon as the Funds are informed of the dividend if such information is obtained subsequent to the ex-dividend date. Distributions received from certain investments held by the Funds may be comprised of dividends, realized gains and returns of capital. The Funds originally estimate the expected classification of such payments. The amounts may subsequently be reclassified upon receipt of information from the issuer. The Funds are charged for those expenses of the Trust that are directly attributable to each Fund, such as advisory and custodian fees. Expenses that are not directly attributable to a Fund are typically allocated among the Funds in proportion to their respective net assets.
c) Foreign Currency Translations. Values of assets and liabilities denominated in foreign currencies are translated into U.S. dollars using the price of such currencies at the time the net asset value is determined. Purchases and sales of investments and dividend income are converted at the prevailing rate of exchange on the respective dates of such transactions. Net realized gain (loss) on foreign currency transactions includes gain (loss) arising from the fluctuation in the exchange rates between trade and settlement dates
32
| September 30, 2014 | | Baron Funds |
| NOTES TO FINANCIAL STATEMENTS (Continued) |
2. SIGNIFICANT ACCOUNTING POLICIES (Continued)
on security transactions and currency gain (loss) between the accrual and payment dates on dividends and foreign withholding taxes. The Funds do not isolate that portion of the results of operations resulting from changes in foreign exchange rates on investments from the fluctuations arising from changes in market prices of securities held. Such fluctuations are included with the net realized and unrealized gain or loss from investments and foreign currency transactions. The Funds may invest in foreign securities and foreign currency transactions that may involve risks not associated with domestic investments as a result of the level of governmental supervision and regulation of foreign securities markets and the possibility of political or economic instability, among others.
Pursuant to U.S. federal income tax regulations, gains and losses from certain foreign currency transactions, and the foreign currency portion of gains and losses realized on sales and maturities of foreign denominated debt securities, are generally treated as ordinary income for U.S. federal income tax purposes.
d) Securities Lending. The Funds may lend securities to certain brokers under the terms of a master netting agreement. Upon such loans, the Funds receive collateral which is maintained by the custodian. The Funds earn interest on such collateral and earn income in the form of negotiated lenders’ fees, both of which are included in securities lending income in the Statements of Operations. Securities loaned are required to be secured at all times by collateral equal to at least 102% of the market value of the securities loaned. Risks may arise upon entering into securities lending to the extent that the value of the collateral is less than the value of the securities loaned due to the changes in the value of collateral or the loaned securities. The Funds may receive collateral in the form of cash or other eligible securities, such as a letter of credit issued by a U.S. bank or securities issued or guaranteed by the U.S. government. Securities purchased with cash collateral are subject to the risks inherent in investing in these securities.
At September 30, 2014, the Funds did not have any securities on loan.
e) Repurchase Agreements. The Funds may invest in repurchase agreements, which are short-term investments whereby the Funds acquire ownership of a debt security and the seller agrees to repurchase the security at a future date at a specified price. When entering into repurchase agreements, it is the Funds’ policy that their custodian take possession of the underlying collateral securities, the market value of which, at all times, equals at least 102% of the principal amount of the repurchase transaction. To the extent that any repurchase transaction exceeds one business day, the value of the collateral is marked-to-market to ensure the adequacy of the collateral. If the seller defaults and the market value of the collateral declines or if bankruptcy proceedings are commenced with respect to the seller of the security, realization of the collateral by the Funds may be delayed or limited.
f) Federal and Foreign Income Taxes. The Trust treats each Fund as a separate entity for federal income tax purposes. Each Fund intends to meet the requirements of the Internal Revenue Code of 1986, as amended, applicable to regulated investment companies, and to distribute to its shareholders substantially all of its net investment income and any net realized capital gains at least annually. None of the Funds will be subject to federal or state income taxes to the extent that they qualify as regulated investment companies and substantially all of their income is distributed.
The Funds may be subject to foreign taxes on income and gains on investments that are accrued based upon the Funds’ understanding of the tax rules and regulations that exist in the countries in which the Funds invest. Foreign governments may also impose taxes or other payments on investments with respect to foreign securities. Such taxes are accrued as applicable.
g) Restricted Securities. The Funds may invest in securities that are restricted as to public sale in accordance with the Securities Act of 1933. Such assets are valued by the Adviser pursuant to policies and procedures approved by the Board.
h) Distributions to Shareholders. Income and capital gain distributions to shareholders are determined in accordance with income tax regulations which may differ from GAAP. These differences are primarily due to differing treatments for net investment loss, foreign currency gains and losses, reclassification of distributions, partnership basis adjustments, income from passive foreign investment corporations and wash sale losses deferred.
i) Commitments and Contingencies. In the normal course of business, the Funds may enter into contracts and agreements that contain a variety of representations and warranties, which provide general indemnification. The maximum exposure to the Funds under these agreements is unknown, as this would involve future claims that may be made against the Funds that have not yet occurred. However, based on experience, the Funds expect the risk of loss to be remote.
j) Cash and Cash Equivalents. The Funds consider all short term liquid investments with a maturity of three months or less when purchased to be cash equivalents.
3. PURCHASES AND SALES OF SECURITIES
Purchases and sales of securities, other than short term securities, for the year ended September 30, 2014 were as follows:
| Fund | Purchases | | Sales | |
| Baron Asset Fund | $ | 302,632,317 | | $ | 494,414,853 | |
| Baron Growth Fund | | 1,040,378,654 | | | 1,117,235,035 | |
| Baron Small Cap Fund | | 895,599,060 | | | 1,293,556,503 | |
| Baron Opportunity Fund | | 301,870,822 | | | 329,272,600 | |
| Baron Fifth Avenue Growth Fund | | 29,588,679 | | | 15,927,784 | |
| Baron Discovery Fund | | 91,863,621 | | | 28,426,237 | |
4. INVESTMENT ADVISORY FEES AND OTHER TRANSACTIONS WITH AFFILIATES
a) Investment Advisory Fees. The Adviser, a wholly owned subsidiary of Baron Capital Group, Inc. (“BCG”), serves as investment adviser to the Funds. As compensation for services rendered, the Adviser receives a fee payable monthly from Baron Asset Fund, Baron Growth Fund, Baron Small Cap Fund, Baron Opportunity Fund and Baron Discovery Fund equal to 1% per annum of the average daily net assets of the respective Funds. The Adviser receives a fee payable monthly from Baron Fifth Avenue Growth Fund equal to 0.90% per annum for daily net assets under $1 billion, 0.85% per annum for daily net assets greater than $1 billion but less than $2 billion and 0.80% per annum for daily net assets greater than $2 billion. For Baron Opportunity Fund, Baron Fifth Avenue Growth Fund and Baron Discovery Fund, the Adviser has contractually agreed to reduce its fee, to the extent required to limit the net operating expense ratio (excluding portfolio transaction costs, interest, dividend and extraordinary expenses) to 1.50%, 1.30% and 1.35% of average daily net assets of the Retail Shares, and 1.25%, 1.05% and 1.10% of average daily net assets of the Institutional Shares, respectively.
b) Distribution Fees. Baron Capital, Inc. (“BCI”), a wholly owned subsidiary of BCG, is a registered limited purpose broker-dealer and the distributor of the Funds’ shares. The Funds are authorized to pay BCI a distribution fee payable monthly pursuant to a distribution plan under Rule 12b-1 of the 1940 Act equal to 0.25% per annum of the Retail Shares’ average daily net assets of the respective Funds.
33
| Baron Funds | | September 30, 2014 |
| NOTES TO FINANCIAL STATEMENTS (Continued) |
4. INVESTMENT ADVISORY FEES AND OTHER TRANSACTIONS WITH AFFILIATES (Continued)
c) Trustee Fees. Certain Trustees of the Trust may be deemed to be affiliated with, or interested persons (as defined by the 1940 Act) of the Funds’ Adviser or of BCI. None of the Trustees so affiliated received compensation for his or her services as a Trustee of the Trust. None of the Funds’ officers received compensation from the Funds for their services as an officer.
d) Fund Accounting and Administration Fees. The Funds have entered into an agreement with State Street Bank and Trust Company (“State Street”) to perform accounting and certain administrative services. State Street is compensated for fund accounting services based on a percentage of the Funds’ net assets, subject to certain minimums plus fixed annual fees for the administrative services.
e) Voluntary Payment. The Adviser made a voluntary payment to Baron Opportunity Fund in the amount of $140,762 to compensate the Fund for a loss incurred due to a trade processing error. The impact of this payment increased the Fund’s total return by 0.03%.
5. LINE OF CREDIT
The Funds participate in a committed line of credit agreement with State Street to be used for temporary purposes, primarily for financing redemptions. Each Fund may borrow up to the lesser of $100 million or the maximum amount each Fund may borrow under the 1940 Act, the limitations included in each Fund’s prospectus, or any limit or restriction under any law or regulation to which each Fund is subject or any agreement to which each Fund is a party; provided that the aggregate outstanding principal amount of all loans to any of the Funds may not exceed $100 million. Interest is charged to each Fund, based on its borrowings, at a rate per annum equal to the higher of the Overnight Federal Funds Rate or the Overnight LIBOR Rate plus a margin of 1.00%. A commitment fee of 0.12% per annum is incurred on the unused portion of the line of credit and is allocated to the participating Funds.
During the year ended September 30, 2014, Baron Growth Fund had borrowings under the line of credit and incurred interest expense of $6,105. For the period in which there were borrowings from September 17, 2014 to September 29, 2014, the Fund had an average daily balance on the line of credit of $15.4 million at a weighted average interest rate of 1.12%. At September 30, 2014, there were no loans outstanding under the line of credit.
6. RESTRICTED SECURITIES
At September 30, 2014, investments in securities included securities that are restricted and/or illiquid. Restricted securities are often purchased in private placement transactions, are not registered under the Securities Act of 1933, may have contractual restrictions on resale and are valued pursuant to the policies and procedures for fair value pricing approved by the Board. A security may be considered illiquid if it lacks a readily available market or if its valuation has not changed for a certain period of time. The Funds may receive more or less than this valuation in an actual sale and that difference could be material. At September 30, 2014, the Funds held investments in restricted and/or illiquid securities that were valued pursuant to policies and procedures for fair value pricing as follows:
| | | Baron Asset Fund |
| | | Acquisition | | | |
| Name of Issuer | | Date(s) | | Value |
| Private Equity Investments | | | | | | | |
Windy City Investments Holdings, L.L.C. | | | | | | | |
(Cost $34,581,904) (1.59% of Net Assets) | | | 11/13/2007-1/27/2011 | | | $ | 42,901,834 |
| | | | | | | |
| | | | | | | | |
| | | Baron Growth Fund |
| | | Acquisition | | | |
| Name of Issuer | | Date(s) | | Value |
| Private Equity Investments | | | | | | | |
Windy City Investments Holdings, L.L.C. | | | 11/13/2007-1/27/2011 | | | $ | 14,441,055 |
| | | | | | | | |
| Rights | | | | | | | |
Agrinos AS Exp 7/15/2015 (Mexico) | | | 12/23/2013 | | | | 9,184 |
| | | | | | | |
| | | | | | | | |
| Total Restricted Securities: | | | | | | | |
(Cost $8,630,998)† (0.19% of Net Assets) | | | | | | $ | 14,450,239 |
| | | | | | | |
| | | | | | | | |
| | | Baron Small Cap Fund |
| | | Acquisition | | | |
| Name of Issuer | | Date(s) | | Value |
| Warrants | | | | | | | |
Viggle, Inc. Warrants, Non-Callable, Exp 4/27/2015 | | | | | | | |
(Cost $0) (0.00% of Net Assets) | | | 4/27/2012 | | | $ | 0 |
| | | | | | | |
| | | | | | | | |
† See Statements of Net Assets for cost of individual securities.
34
| September 30, 2014 | | Baron Funds |
| NOTES TO FINANCIAL STATEMENTS (Continued) |
7. FAIR VALUE MEASUREMENTS
Fair value is defined by GAAP as the price that the Funds would receive upon selling an investment in a timely transaction to an independent buyer in the principal or most advantageous market for the investment. GAAP provides a three-tier hierarchy to maximize the use of observable market data and minimize the use of unobservable inputs and to establish classification of fair value measurements for disclosure purposes. Inputs refer broadly to the assumptions that market participants would use in pricing the asset or liability. Inputs may be observable or unobservable. Observable inputs are based on market data obtained from sources independent of the Funds. Unobservable inputs are inputs that reflect the Funds’ own assumptions based on the best information available in the circumstances. The three-tier hierarchy of inputs is summarized in the three broad Levels listed below.
| • | | Level 1 – quoted prices in active markets for identical assets or liabilities; |
| | | |
| • | | Level 2 – prices determined using other inputs that are observable either directly or indirectly through corroboration with observable market data (which could include quoted prices for similar assets or liabilities, interest rates, credit risk, etc.); |
| | | |
| • | | Level 3 – prices determined using unobservable inputs when quoted prices or observable inputs are unavailable, such as when there is little or no market activity for an asset or liability (unobservable inputs reflect each Fund’s own assumptions in determining the fair value of assets or liabilities and would be based on the best information available). |
The inputs or methodology used for valuing securities are not necessarily an indication of the risk associated with investing in those securities. For example, non-U.S. securities, with markets that close hours before the Funds value their holdings, may require revised valuations due to significant movement in the U.S. markets. Since these values are not obtained from quoted prices in an active market, such securities are reflected as Level 2.
The Funds have procedures to determine the fair value of securities and other financial instruments for which market prices are not readily available or which may not be reliably priced. Under these procedures, the Funds primarily employ a market-based approach that may use related or comparable assets or liabilities, recent transactions, market multiples, book values, and other relevant information for the investment to determine its fair value. The Funds may also use an income-based valuation approach in which the anticipated future cash flows of the investment are discounted to calculate fair value. Discounts may also be applied due to the nature or duration of any restrictions on the disposition of the investments. Due to the inherent uncertainty of valuations of such investments, the fair values may differ significantly from the values that would have been used had an active market existed.
The following is a summary of the inputs used as of September 30, 2014 in valuing the Funds’ investments carried at fair value:
| | | Baron Asset Fund |
| | | Quoted Prices in | | | | | | | | | |
| | | Active Markets | | Other | | | | | |
| | | for Identical | | Observable | | Unobservable | | | |
| | | Assets | | Inputs | | Inputs | | | |
| Description | | (Level 1) | | (Level 2) | | (Level 3) | | Total |
| Common Stocks† | | $ | 2,638,756,807 | | | $ | — | | | $ | — | | | $ | 2,638,756,807 |
| Private Equity Investments | | | — | | | | — | | | | 42,901,834 | | | | 42,901,834 |
| Short Term Investments | | | — | | | | 4,724,574 | | | | — | | | | 4,724,574 |
| | | | | | | | | | | | |
| Total Investments | | $ | 2,638,756,807 | | | $ | 4,724,574 | | | $ | 42,901,834 | | | $ | 2,686,383,215 |
| | | | | | | | | | | | |
Transfers between Levels 1, 2 or 3, if any, are recognized at ending value on September 30, 2014. There have been no transfers in and out of Level 1, 2 or 3 fair value measurements for the Fund for the year ended September 30, 2014.
| | | Baron Growth Fund |
| | | Quoted Prices in | | | | | | | | | |
| | | Active Markets | | Other | | | | | |
| | | for Identical | | Observable | | Unobservable | | | |
| | | Assets | | Inputs | | Inputs | | | |
| Description | | (Level 1) | | (Level 2) | | (Level 3) | | Total |
| Common Stocks† | | $ | 7,620,296,898 | | | $ | — | | | $ | — | | | $ | 7,620,296,898 |
| Preferred Stocks | | | 13,989,394 | | | | — | | | | — | | | | 13,989,394 |
| Private Equity Investments | | | — | | | | — | | | | 14,441,055 | | | | 14,441,055 |
| Rights | | | — | | | | 9,184 | | | | — | | | | 9,184 |
| Short Term Investments | | | — | | | | 114,786,433 | | | | — | | | | 114,786,433 |
| | | | | | | | | | | | |
| Total Investments | | $ | 7,634,286,292 | | | $ | 114,795,617 | | | $ | 14,441,055 | | | $ | 7,763,522,964 |
| | | | | | | | | | | | |
$10,718,021 was transferred out of Level 3 into Level 1 at September 30, 2014 due to a restricted investment that became listed on a national exchange. It is the Fund’s policy to recognize transfers-in and transfers-out at the fair value as of the end of the period.
† See Statements of Net Assets for additional detailed categorizations.
35
| Baron Funds | | September 30, 2014 |
| NOTES TO FINANCIAL STATEMENTS (Continued) |
7. FAIR VALUE MEASUREMENTS (Continued)
| | | Baron Small Cap Fund |
| | | Quoted Prices in | | | | | | | | | |
| | | Active Markets | | Other | | | | | |
| | | for Identical | | Observable | | Unobservable | | | |
| | | Assets | | Inputs | | Inputs | | | |
| Description | | (Level 1) | | (Level 2) | | (Level 3) | | Total |
| Common Stocks† | | $ | 5,179,983,501 | | | $ | — | | | $ | — | | | $ | 5,179,983,501 |
| Warrants | | | — | | | | 0 | | | | — | | | | 0 |
| Short Term Investments | | | — | | | | 66,444,603 | | | | — | | | | 66,444,603 |
| | | | | | | | | | | | |
| Total Investments | | $ | 5,179,983,501 | | | $ | 66,444,603 | | | $ | — | | | $ | 5,246,428,104 |
| | | | | | | | | | | | |
$12,550,000 was transferred out of Level 3 into Level 1 at September 30, 2014 due to a restricted investment that became listed on a national exchange. It is the Fund’s policy to recognize transfers-in and transfers-out at the fair value as of the end of the period.
| | | Baron Opportunity Fund |
| | | Quoted Prices in | | | | | | | | | |
| | | Active Markets | | Other | | | | | |
| | | for Identical | | Observable | | Unobservable | | | |
| | | Assets | | Inputs | | Inputs | | | |
| Description | | (Level 1) | | (Level 2) | | (Level 3) | | Total |
| Common Stocks† | | $ | 445,324,017 | | | $ | — | | | $ | — | | | $ | 445,324,017 |
| | | | | | | | | | | | |
| Total Investments | | $ | 445,324,017 | | | $ | — | | | $ | — | | | $ | 445,324,017 |
| | | | | | | | | | | | |
$3,215,409 was transferred out of Level 3 into Level 1 at September 30, 2014 due to a restricted investment that became listed on a national exchange. It is the Fund’s policy to recognize transfers-in and transfers-out at the fair value as of the end of the period.
| | | Baron Fifth Avenue Growth Fund |
| | | Quoted Prices in | | | | | | | | | |
| | | Active Markets | | Other | | | | | |
| | | for Identical | | Observable | | Unobservable | | | |
| | | Assets | | Inputs | | Inputs | | | |
| Description | | (Level 1) | | (Level 2) | | (Level 3) | | Total |
| Common Stocks† | | $ | 106,173,712 | | | $ | — | | | $ | — | | | $ | 106,173,712 |
| Short Term Investments | | | — | | | | 3,007,365 | | | | — | | | | 3,007,365 |
| | | | | | | | | | | | |
| Total Investments | | $ | 106,173,712 | | | $ | 3,007,365 | | | $ | — | | | $ | 109,181,077 |
| | | | | | | | | | | | |
Transfers between Levels 1, 2 or 3, if any, are recognized at ending value on September 30, 2014. There have been no transfers in and out of Level 1, 2 or 3 fair value measurements for the Fund for the year ended September 30, 2014.
| | | Baron Discovery Fund |
| | | Quoted Prices in | | | | | | | | | |
| | | Active Markets | | Other | | | | | |
| | | for Identical | | Observable | | Unobservable | | | |
| | | Assets | | Inputs | | Inputs | | | |
| Description | | (Level 1) | | (Level 2) | | (Level 3) | | Total |
| Common Stocks† | | $ | 61,393,980 | | | $ | — | | | $ | — | | | $ | 61,393,980 |
| Short Term Investments | | | — | | | | 6,037,051 | | | | — | | | | 6,037,051 |
| | | | | | | | | | | | |
| Total Investments | | $ | 61,393,980 | | | $ | 6,037,051 | | | $ | — | | | $ | 67,431,031 |
| | | | | | | | | | | | |
Transfers between Levels 1, 2 or 3, if any, are recognized at ending value on September 30, 2014. There have been no transfers in and out of Level 1, 2 or 3 fair value measurements for the Fund for the year ended September 30, 2014.
† See Statements of Net Assets for additional detailed categorizations.
36
| September 30, 2014 | | Baron Funds |
| NOTES TO FINANCIAL STATEMENTS (Continued) |
7. FAIR VALUE MEASUREMENTS (Continued)
The following is a reconciliation of investments in which unobservable inputs (Level 3) were used in determining fair value:
| | | | Baron Asset Fund |
| | | | | | | | | | | | | | | | | | | | | | | | | | | | | | | | | | | | | | | Change in Net |
| | | | | | | | | | | | | | | | | | | | | | | | | | | | | | | | | | | | | | | Unrealized |
| | | | | | | | | | | | | | | | | | | | | | | | | | | | | | | | | | | | | | | Appreciation |
| | | | | | | | | | | | | | | | | | | | | | | | | | | | | | | | | | | | | | | (Depreciation) |
| | | | | | | | | | | | Net | | | Net Change in | | | | | | | | | | | | | | | | | | | | | | from Investments |
| | | | Balance as of | | | Accrued | | | Realized | | | Unrealized | | | | | | | | | | | Transfers | | | Transfers | | | Balance as of | | still held at |
| Investments in | | | September 30, | | | Premiums/ | | | Gain | | | Appreciation | | | | | | | | | | | Into | | | Out of | | | September 30, | | September 30, |
| Securities | | | 2013 | | | Discounts | | | (Loss) | | | (Depreciation) | | | Purchases | | | Sales | | | Level 3 | | | Level 3 | | | 2014 | | 2014 |
| Private Equity Investments |
Consumer | | | | | | | | | | | | | | | | | | | | | | | | | | | | | | | | | | | | | | | | | |
Discretionary | | | $ | 11,752,000 | | | $ | — | | | $ | (31,200,000 | ) | | $ | 40,248,000 | | | $ | — | | | $ | (20,800,000 | ) | | $ | — | | | $ | — | | | $ | — | | | $ | — | |
Financials | | | | 21,168,668 | | | | — | | | | — | | | | 21,733,166 | | | | — | | | | — | | | | — | | | | — | | | | 42,901,834 | | | | 21,733,166 | |
| | | | | | | | | | | | | | | | | | | | | | | | | | | | | | | | |
| Total | | | $ | 32,920,668 | | | $ | — | | | $ | (31,200,000 | ) | | $ | 61,981,166 | | | $ | — | | | $ | (20,800,000 | ) | | $ | — | | | $ | — | | | $ | 42,901,834 | | | $ | 21,733,166 | |
| | | | | | | | | | | | | | | | | | | | | | | | | | | | | | | | |
| | | | Baron Growth Fund |
| | | | | | | | | | | | | | | | | | | | | | | | | | | | | | | | | | | | | | | Change in Net |
| | | | | | | | | | | | | | | | | | | | | | | | | | | | | | | | | | | | | | | Unrealized |
| | | | | | | | | | | | | | | | | | | | | | | | | | | | | | | | | | | | | | | Appreciation |
| | | | | | | | | | | | | | | | | | | | | | | | | | | | | | | | | | | | | | | (Depreciation) |
| | | | | | | | | | | | Net | | | Net Change in | | | | | | | | | | | | | | | | | | | | | | from Investments |
| | | | Balance as of | | | Accrued | | | Realized | | | Unrealized | | | | | | | | | | | Transfers | | | Transfers | | | Balance as of | | still held at |
| Investments in | | | September 30, | | | Premiums/ | | | Gain | | | Appreciation | | | | | | | | | | | Into | | | Out of | | | September 30, | | September 30, |
| Securities | | | 2013 | | | Discounts | | | (Loss) | | | (Depreciation) | | | Purchases | | | Sales | | | Level 3 | | | Level 3 | | | 2014 | | 2014 |
| Private Equity Investments |
Consumer | | | | | | | | | | | | | | | | | | | | | | | | | | | | | | | | | | | | | | | | | |
Discretionary | | | $ | 16,724,000 | | | $ | — | | | $ | (44,400,000 | ) | | $ | 57,276,000 | | | $ | — | | | $ | (29,600,000 | ) | | $ | — | | | $ | — | | | $ | — | | | $ | — | |
Financials | | | | 7,125,521 | | | | — | | | | — | | | | 7,315,534 | | | | — | | | | — | | | | — | | | | — | | | | 14,441,055 | | | | 7,315,534 | |
Health Care | | | | 4,999,998 | | | | — | | | | — | | | | 5,718,023 | | | | — | | | | — | | | | — | | | | (10,718,021 | ) | | | — | | | | — | |
| | | | | | | | | | | | | | | | | | | | | | | | | | | | | | | | |
| Total | | | $ | 28,849,519 | | | $ | — | | | $ | (44,400,000 | ) | | $ | 70,309,557 | | | $ | — | | | $ | (29,600,000 | ) | | $ | — | | | $ | (10,718,021 | ) | | $ | 14,441,055 | | | $ | 7,315,534 | |
| | | | | | | | | | | | | | | | | | | | | | | | | | | | | | | | |
| | | | Baron Small Cap Fund |
| | | | | | | | | | | | | | | | | | | | | | | | | | | | | | | | | | | | | | | Change in Net |
| | | | | | | | | | | | | | | | | | | | | | | | | | | | | | | | | | | | | | | Unrealized |
| | | | | | | | | | | | | | | | | | | | | | | | | | | | | | | | | | | | | | | Appreciation |
| | | | | | | | | | | | | | | | | | | | | | | | | | | | | | | | | | | | | | | (Depreciation) |
| | | | | | | | | | | | Net | | | Net Change in | | | | | | | | | | | | | | | | | | | | | | from Investments |
| | | | Balance as of | | | Accrued | | | Realized | | | Unrealized | | | | | | | Sales/ | | | Transfers | | | Transfers | | | Balance as of | | still held at |
| Investments in | | | September 30, | | | Premiums/ | | | Gain | | | Appreciation | | | | | | | Exercise | | | Into | | | Out of | | | September 30, | | September 30, |
| Securities | | | 2013 | | | Discounts | | | (Loss) | | | (Depreciation) | | | Purchases | | | of Warrants | | | Level 3 | | | Level 3 | | | 2014 | | 2014 |
| Private Equity Investments |
Consumer | | | | | | | | | | | | | | | | | | | | | | | | | | | | | | | | | | | | | | | | | |
Discretionary | | | $ | 20,410,000 | | | $ | — | | | $ | (21,000,000 | ) | | $ | 27,140,000 | | | $ | — | | | $ | (14,000,000 | ) | | $ | — | | | $ | (12,550,000 | ) | | $ | — | | | $ | — | |
| Warrants | | | | | | | | | | | | | | | | | | | | | | | | | | | | | | | | | | | | | | | | | |
Unclassified | | | | 0 | | | | — | | | | 2,075,003 | | | | — | | | | — | | | | (2,075,003 | ) | | | — | | | | — | | | | — | | | | — | |
| | | | | | | | | | | | | | | | | | | | | | | | | | | | | | | | |
| Total | | | $ | 20,410,000 | | | $ | — | | | $ | (18,924,997 | ) | | $ | 27,140,000 | | | $ | — | | | $ | (16,075,003 | ) | | $ | — | | | $ | (12,550,000 | ) | | $ | — | | | $ | — | |
| | | | | | | | | | | | | | | | | | | | | | | | | | | | | | | | |
| | | | Baron Opportunity Fund |
| | | | | | | | | | | | | | | | | | | | | | | | | | | | | | | | | | | | | | | Change in Net |
| | | | | | | | | | | | | | | | | | | | | | | | | | | | | | | | | | | | | | | Unrealized |
| | | | | | | | | | | | | | | | | | | | | | | | | | | | | | | | | | | | | | | Appreciation |
| | | | | | | | | | | | | | | | | | | | | | | | | | | | | | | | | | | | | | | (Depreciation) |
| | | | | | | | | | | | Net | | | Net Change in | | | | | | | | | | | | | | | | | | | | | | from Investments |
| | | | Balance as of | | | Accrued | | | Realized | | | Unrealized | | | | | | | | | | | Transfers | | | Transfers | | | Balance as of | | still held at |
| Investments in | | | September 30, | | | Premiums/ | | | Gain | | | Appreciation | | | | | | | | | | | Into | | | Out of | | | September 30, | | September 30, |
| Securities | | | 2013 | | | Discounts | | | (Loss) | | | (Depreciation) | | | Purchases | | | Sales | | | Level 3 | | | Level 3 | | | 2014 | | 2014 |
| Private Equity Investments |
Health Care | | | $ | 1,500,001 | | | $ | — | | | $ | — | | | $ | 1,715,408 | | | $ | — | | | $ | — | | | $ | — | | | $ | (3,2015,409 | ) | | $ | — | | | $ | — | |
| | | | | | | | | | | | | | | | | | | | | | | | | | | | | | | | |
37
| Baron Funds | | September 30, 2014 |
| NOTES TO FINANCIAL STATEMENTS (Continued) |
7. FAIR VALUE MEASUREMENTS (Continued)
Unobservable valuation inputs developed by the Adviser for significant (greater than 1% of net assets) Level 3 investments as of September 30, 2014 were as follows:
Baron Asset Fund
| |
| | | | | | | | | | | Weighted Average | | Range |
| | | | | Fair Value as of | | | | | | used on | | used on |
| Sector | | Company | | September 30, 2014 | | Valuation Technique | | Unobservable Input | | September 30, 2014 | | September 30, 2014 |
| |
| | | | | | | | | Probability of IPO scenario | | | 1% | | | | 1% | |
| | | | | | | | | |
| | | | | | | | | Probability of acquisition | | | | | | | | |
| | | | | | | | | Scenario | | | 99% | | | | 99% | |
| | | | | | | | | |
| | | | | | | | | Discount for lack of | | | | | | | | |
| | | | | | | | | marketability under IPO | | | | | | | | |
| | | | | | | | | Scenario | | | 2.84% | | | | 2.84% | |
| | | | | | | | | |
| | | | | | | | | Discount for lack of | | | | | | | | |
| | | | | | | | | marketability under | | | | | | | | |
| | | | | | | | | Acquisition scenario | | | 0.21% | | | | 0.21% | |
| | | | | | | | | |
| | | | | | | Combination of | | Estimated volatility of the | | | | | | | | |
| Private Equity | | Windy City Investments | | | | scenario analysis, | | returns of the | | | | | | | | |
| Investments: | | Holdings, L.L.C. | | $42,901,834 | | market comparables and | | enterprise value(1) | | | 5.12% | | | | 5.12% | |
| | | | | | | | | |
| Financials | | | | | | option pricing methods | | EV/Run Rate EBITDA | | | | | | | | |
| | | | | | | | | Multiple(2) | | | 10.44X | | | | 8.11x to 13.93x | |
| | | | | | | | | |
| | | | | | | | | Adjustment to the | | | | | | | | |
| | | | | | | | | EBITDA Multiple due | | | | | | | | |
| | | ` | | | | | | to leverage(2) | | | 2.65% | | | | 2.65% | |
| | | | | | | | | |
| | | | | | | | | Change in the composite | | | | | | | | |
| | | | | | | | | equity index of | | | | | | | | |
| | | | | | | | | comparable companies | | | -0.41% | | | | -1.62% to -0.15% | |
| | | | | | | | | |
| | | | | | | | | Estimated price per share | | | | | | | | |
| | | | | | | | | at acquisition closing | | | $6.12 | | | | $6.12 | |
| |
| (1) | | The volatility was derived using the historical returns of the publicly traded debt of Nuveen Investments, Inc., historical returns of the SMI 100 Index and the historical returns of the equity of comparable public companies. |
| (2) | | The multiple was derived as a simple average of the multiples of comparable companies. The derived EBITDA multiple was increased by 2.65% to 10.72x. This increase adjusts for leverage, as Nuveen Investments, Inc. is more levered than its comparable companies. |
A significant change in the EV/EBITDA multiple ratio may result in a directionally similar significant change in the fair value measurement, while a significant change in the discount for lack of marketability and equity index of comparable companies may not result in a materially higher or lower fair value measurement.
8. INCOME TAXES AND DISTRIBUTIONS TO SHAREHOLDERS
Federal income tax regulations differ from GAAP. Therefore, distributions determined in accordance with tax regulations may differ in amount or character from net investment income and net realized gain for financial reporting purposes. Net investment income (loss) and net realized and unrealized gain (loss) differ for financial statement and tax purposes due to differing treatments of net investment loss, foreign currency gains and losses, reclassification of distributions, partnership basis adjustments, income from passive foreign investment corporations and wash sale losses deferred. Financial reporting records are adjusted for permanent book/tax differences to reflect tax character. Financial records are not adjusted for temporary differences.
For the year ended September 30, 2014, the Funds recorded the following permanent reclassifications to reflect tax character. Reclassifications between income, gains and paid-in capital relate primarily to the tax treatment of net investment loss, foreign currency gains and losses and partnership basis adjustments. Results of operations and net assets were not affected by these reclassifications.
| | | Undistributed | | Undistributed | | | | |
| | | (Accumulated) | | (Accumulated) | | | | |
| | | Net Investment | | Net Realized | | Paid-In | | |
| Fund | | Income (Loss) | | Gain (Loss) | | Capital | | |
| Baron Asset Fund | | $16,212,798 | | | $(3,504,035 | ) | | $(12,708,763 | ) | |
| Baron Growth Fund | | (6,398,470 | ) | | 6,398,470 | | | — | | |
| Baron Small Cap Fund | | 20,098,965 | | | (1,102,845 | ) | | (18,996,120 | ) | |
| Baron Opportunity Fund | | 5,417,249 | | | (5,417,114 | ) | | (135 | ) | |
| Baron Fifth Avenue Growth Fund | | 2,417 | | | 20,541 | | | (22,958 | ) | |
| Baron Discovery Fund | | 20,309 | | | (17,204 | ) | | (3,105 | ) | |
38
| September 30, 2014 | | Baron Funds |
| NOTES TO FINANCIAL STATEMENTS (Continued) |
8. INCOME TAXES AND DISTRIBUTIONS TO SHAREHOLDERS (Continued)
As of September 30, 2014, the components of net assets on a tax basis were as follows:
| | | | | | | | | Baron | | | Baron | | | Baron Fifth | | | Baron | | |
| | | Baron Asset | | | Baron Growth | | | Small Cap | | | Opportunity | | | Avenue Growth | | | Discovery | | |
| | | Fund | | | Fund | | | Fund | | | Fund | | | Fund | | | Fund | | |
| Cost of investments | | $1,153,124,987 | | | $3,742,265,479 | | | $2,800,362,421 | | | $315,729,063 | | | $ 70,195,992 | | | $68,778,965 | | |
| | | | | | | | | | | | | | | | | | | | |
| Gross tax unrealized appreciation | | 1,542,476,625 | | | 4,116,548,341 | | | 2,539,750,691 | | | 141,105,885 | | | 39,326,061 | | | 3,144,445 | | |
| Gross tax unrealized depreciation | | (9,218,397 | ) | | (95,290,856 | ) | | (93,685,008 | ) | | (11,510,931 | ) | | (340,976 | ) | | (4,492,379 | ) | |
| | | | | | | | | | | | | | | | | | | | |
| Net tax unrealized appreciation (depreciation) | | 1,533,258,228 | | | 4,021,257,485 | | | 2,446,065,683 | | | 129,594,954 | | | 38,985,085 | | | (1,347,934 | ) | |
| Net tax unrealized currency depreciation | | (3,934 | ) | | (443 | ) | | — | | | (46 | ) | | (43 | ) | | — | | |
| Undistributed net investment income | | — | | | 3,838,615 | | | — | | | — | | | 79,005 | | | — | | |
| Undistributed net realized gain | | 167,232,346 | | | 333,393,319 | | | 307,438,660 | | | 22,367,075 | | | — | | | — | | |
| Qualified late year loss deferral | | (14,574,651 | ) | | — | | | — | | | (258,478 | ) | | (267,882 | ) | | (883,092 | ) | |
| Capital loss carryforwards | | — | | | — | | | — | | | — | | | (1,202,245 | ) | | — | | |
| Paid-in capital | | 1,004,382,380 | | | 3,412,147,661 | | | 2,496,716,026 | | | 288,852,000 | | | 71,629,978 | | | 67,561,639 | | |
| | | | | | | | | | | | | | | | | | | | |
| Net Assets | | $2,690,294,369 | | | $7,770,636,637 | | | $5,250,220,369 | | | $440,555,505 | | | $109,223,898 | | | $65,330,613 | | |
| | | | | | | | | | | | | | | | | | | | |
As of September30, 2014, the Funds had capital loss carryforwards expiring as follows:
| | | | | | | | | Baron | | Baron | | Baron Fifth | | | Baron |
| | | Baron Asset | | Baron Growth | | Small Cap | | Opportunity | | Avenue Growth | | | Discovery |
| | | Fund | | Fund | | Fund | | Fund | | Fund | | | Fund |
| Short term capital loss carryforwards: | | | | | | | | | | | | | | | | | | |
| September 30, 2018 | | $ | — | | $ | — | | $ | — | | $ | — | | $ | 1,202,245 | | $ | — |
| | | | | | | | | | | | | |
| Capital loss carryforward utilized during the | | | | | | | | | | | | | | | | | | |
year ended September 30, 2014 | | $ | — | | $ | — | | $ | — | | $ | — | | $ | 1,058,282 | | $ | — |
| | | | | | | | | | | | | |
The tax character of distributions paid during the years ended September 30, 2014 and September 30, 2013 was as follows:
| | | Year Ended | Year Ended |
| | | September 30, 2014 | September 30, 2013 |
| | | | | |
| | | | Ordinary | | | Long Term | | | Ordinary | | | Long Term | |
| Fund | | | Income1 | | | Capital Gain | | | Income1 | | | Capital Gain | |
| Baron Asset Fund | | $ | — | | $ | 229,335,684 | | $ | — | | $ | 155,105,744 | |
| Baron Growth Fund | | | 14,691,238 | | | 177,565,560 | | | 24,466,687 | | | 545,058,763 | |
| Baron Small Cap Fund | | | — | | | 208,572,249 | | | — | | | 126,975,437 | |
| Baron Opportunity Fund | | | 14,059,154 | | | 14,713,852 | | | — | | | 5,921,562 | |
| Baron Fifth Avenue Growth Fund | | | — | | | — | | | — | | | — | |
| Baron Discovery Fund | | | — | | | — | | | — | | | — | |
1 For tax purposes, short-term capital gains are considered ordinary income distributions.
The Funds follow the provisions of Financial Accounting Standards Board (“FASB”) Codification Section 740 (“ASC Section 740”) “Accounting for Uncertainty in Income Taxes” which clarifies the accounting for uncertainty in tax positions taken or expected to be taken on a tax return. ASC Section 740 sets forth a threshold for financial statement recognition, measurement and disclosure of tax positions taken or expected to be taken on a tax return. The Funds are required to recognize the tax effects of certain tax positions under a “more likely than not” standard, that based on their technical merits, have more than 50 percent likelihood of being sustained upon examination. Management has analyzed the tax positions taken on the Funds’ federal income tax returns for all open years (current and prior three years), and has concluded that no provision for federal income tax is required in the Funds’ financial statements. At September 30, 2014, the Funds did not have any uncertain tax benefits that require recognition, de-recognition or disclosure. The Funds’ federal, state and local income and federal excise tax returns for which the applicable statutes of limitations have not expired (current and prior three years) are subject to examination by the Internal Revenue Service and state departments of revenue.
9. OWNERSHIP CONCENTRATION
As of September 30, 2014, the officers, trustees, and portfolio managers owned, directly or indirectly, 16.15% of Baron Fifth Avenue Growth Fund. As a result of their ownership, these investors may be able to materially affect the outcome of matters presented to Baron Fifth Avenue Growth Fund shareholders.
39
| Baron Funds | | September 30, 2014 |
| NOTES TO FINANCIAL STATEMENTS (Continued) |
| |
10. TRANSACTIONS IN “AFFILIATED” COMPANIES1
BARON GROWTH FUND
| | | | | | | | | | | Net Change in | | | | | | | | | | | | | |
| | | Value at | | | | | | | Unrealized | | | | | | | | Shares Held at | | Value at |
| | | September 30, | | Purchase | | Sales | | Appreciation | | Realized | | Dividend | | September 30, | | September 30, |
| Name of Issuer | | 2013 | | Cost | | Proceeds | | (Depreciation) | | Gains/(Losses) | | Income | | 2014 | | 2014 |
| “Affiliated” Company as of September 30, 2014: |
Badger Daylighting Ltd. | | $ | — | | $ | 75,685,715 | | $ | 637,992 | | $ | (21,744,253 | ) | | $ | (327,891 | ) | $ | 259,209 | | | 2,125,000 | | | $ | 52,975,579 | |
| Choice Hotels International, Inc. | | | 129,893,925 | | | — | | | — | | | 26,496,075 | | | | — | | | 2,225,550 | | | 3,007,500 | | | | 156,390,000 | |
| Iridium Communications, Inc. | | | — | | | 45,709,971 | | | — | | | 20,606,946 | | | | — | | | — | | | 7,493,437 | | | | 66,316,917 | |
| Iridium Communications, Inc., |
Series B, 6.75% | | | — | | | 10,268,500 | | | — | | | 3,720,894 | | | | — | | | 234,892 | | | 41,074 | | | | 13,989,394 | |
Trex Co., Inc.2 | | | — | | | 62,696,594 | | | — | | | (4,964,694 | ) | | | — | | | — | | | 1,670,000 | | | | 57,731,900 | |
Vail Resorts, Inc. | | | 143,255,824 | | | — | | | — | | | 35,886,224 | | | | — | | | 2,570,676 | | | 2,064,800 | | | | 179,142,048 | |
| | | | | | | | | | | | | | | | | | | | | |
| | | $ | 273,149,749 | | $ | 194,360,780 | | $ | 637,992 | | $ | 60,001,192 | | | $ | (327,891 | ) | $ | 5,290,327 | | | | | | $ | 526,545,838 | |
| | | | | | | | | | | | | | | | | | | | | |
BARON SMALL CAP FUND
| | | | | | | | | | | Net Change in | | | | | | | | | | | | | | | |
| | | Value at | | | | | | | Unrealized | | | | | | | | | Shares Held at | | Value at |
| | | September 30, | | Purchase | | Sales | | Appreciation | | Realized | | Dividend | | September 30, | | September 30, |
| Name of Issuer | | 2013 | | Cost | | Proceeds | | (Depreciation) | | Gains/(Losses) | | Income | | 2014 | | 2014 |
| “Affiliated” Company as of September 30, 2014: |
The Chefs’ Warehouse, Inc. | | $ | 48,510,000 | | $ | — | | $ | 1,805,928 | | $ | (13,853,375 | ) | | $ | (330,697 | ) | | $ | — | | | 2,000,000 | | | $ | 32,520,000 | |
Del Frisco’s Restaurant Group, Inc | | | 32,272,000 | | | 11,969,926 | | | — | | | (2,133,926 | ) | | | — | | | | — | | | 2,200,000 | | | | 42,108,000 | |
Globe Specialty Metals, Inc. | | | 61,640,000 | | | — | | | — | | | 11,120,000 | | | | — | | | | 1,175,000 | | | 4,000,000 | | | | 72,760,000 | |
The KEYW Holding Corp. | | | 30,262,500 | | | — | | | 3,882,062 | | | (5,041,313 | ) | | | 247,375 | | | | — | | | 1,950,000 | | | | 21,586,500 | |
PBF Logistics LP | | | — | | | 20,465,744 | | | — | | | (209,744 | ) | | | — | | | | 128,000 | | | 800,000 | | | | 20,256,000 | |
| Rally Software Development Corp. | | | — | | | 51,687,216 | | | — | | | (24,064,216 | ) | | | — | | | | — | | | 2,300,000 | | | | 27,623,000 | |
| | | | | | | | | | | | | | | | | | | | | | |
| | | $ | 172,684,500 | | $ | 84,122,886 | | $ | 5,687,990 | | $ | (34,182,574 | ) | | $ | (83,322 | ) | | $ | 1,303,000 | | | | | | $ | 216,853,500 | |
| | | | | | | | | | | | | | | | | | | | | | |
| | | | | | | | | | | | | | | | | | | | | | | | | | | | | | |
| No Longer an “Affiliated” Company as of September 30, 2014: |
BJ’s Restaurants, Inc. | | $ | 43,080,000 | | $ | — | | $ | 16,372,716 | | $ | 12,913,668 | | | $ | (5,430,452 | ) | | $ | — | | | 950,000 | | | $ | 34,190,500 | |
| Bravo Brio Restaurant Group, Inc. | | | 18,875,000 | | | — | | | 19,334,912 | | | (326,596 | ) | | | 786,508 | | | | — | | | — | | | | — | |
| Susser Petroleum Partners LP | | | 34,638,000 | | | — | | | 49,563,116 | | | (8,499,009 | ) | | | 23,424,125 | | | | 1,126,015 | | | — | | | | — | |
| Viggle, Inc.3 | | | 1,654,546 | | | — | | | 239,685 | | | 11,345,454 | | | | (12,760,315 | ) | | | — | | | — | | | | — | |
Viggle, Inc., Warrants, Callable,
Exp 8/22/20143 | | | 0 | | | — | | | — | | | — | | | | — | | | | — | | | — | | | | — | |
Viggle, Inc., Warrants, Non-Callable,
Exp 4/27/2015 | | | 38,182 | | | — | | | — | | | (38,182 | ) | | | — | | | | — | | | 6,818 | | | | — | |
Vitacost.com, Inc. | | | 25,500,000 | | | — | | | 17,328,908 | | | 2,702,438 | | | | (10,873,530 | ) | | | — | | | — | | | | — | |
| Vitacost.com, Inc. Warrants, Exp 2/15/2016 | | | 516,714 | | | — | | | 232,885 | | | (486,480 | ) | | | 202,651 | | | | — | | | — | | | | — | |
| | | | | | | | | | | | | | | | | | | | | | |
| | | $ | 124,302,442 | | $ | — | | $ | 103,072,222 | | $ | 17,611,293 | | | $ | (4,651,013 | ) | | $ | 1,126,015 | | | | | | $ | 34,190,500 | |
| | | | | | | | | | | | | | | | | | | | | | |
| 1 | An “Affiliated” Company, as defined in the 1940 Act, is a company in which a Fund held 5% or more of the company’s outstanding voting securities at any time during the year ended September 30, 2014. |
| 2 | Adjusted for 2 for 1 stock split. |
| 3 | Adjusted for reverse 1 for 80 stock split. |
11. DISCLOSURES REGARDING OFFSETTING ASSETS AND LIABILITIES
In December 2011, the FASB issued an Accounting Standards Update (“ASU”) related to disclosures about offsetting assets and liabilities in financial statements. This ASU requires an entity to disclose both gross and net information for derivatives, repurchase agreements and reverse repurchase agreements, and securities borrowing and securities lending transactions that are either offset in the statement of assets and liabilities or subject to an enforceable master netting arrangement or similar agreement. In January 2013, the FASB issued an ASU to clarify the scope of disclosures about offsetting assets and liabilities. The ASU is effective for reporting periods beginning on or after January 1, 2013. The information required to be disclosed by the ASU for the Funds’ investments in repurchase agreements at September 30, 2014, including the fair value of the repurchase agreement and the amount of collateral, can be found in each respective Fund’s Statement of Net Assets. The information required to be disclosed by the ASU for the Funds’ securities lending agreement at September 30, 2014 can be found in each respective Fund’s Statement of Assets and Liabilities. The Funds did not hold derivatives or participate in borrowing activities at September 30, 2014.
12. RECENT ACCOUNTING PRONOUNCEMENT
In June 2014, The FASB issued “ASU 2014-11 Transfers & Servicing (Topic 860): Repurchase-to-Maturity Transactions, Repurchase Financings, and Disclosures” to improve the financial reporting of repurchase agreements and other similar transactions. The guidance includes expanded disclosure requirements for entities that enter into repurchase agreements or securities lending transactions. The guidance is effective for financial statements with fiscal years beginning on or after December 15, 2014, and interim periods within those fiscal years. The Adviser is evaluating the impact, if any, of this guidance on the Funds’ financial statement disclosures.
40
| September 30, 2014 | Baron Funds |
| BARON ASSET FUND |
| Selected data for a share outstanding throughout each year: |
| | | | | | | | | | | | | | | | | | | | | | | | | | | | | | | | | | | | | | | | | |
| RETAIL SHARES | | Year Ended September 30, |
| | | |
| | | | 2014 | | | 2013 | | | 2012 | | | 2011 | | | 2010 | | | 2009 | | | 2008 | | | 2007 | | | 2006 | | | 2005 |
Net asset value, beginning of year | | $ | 61.37 | | | $ | 52.03 | | | $ | 49.00 | | | $ | 49.27 | | | $ | 43.62 | | | $ | 52.12 | | | $ | 66.57 | | | $ | 60.08 | | | $ | 56.52 | | | $ | 47.89 | |
| | | | | | | | | | | | | | | | | | | | | | | | | | | | | | | |
Income (loss) from investment operations: | | | | | | | | | | | | | | | | | | | | | | | | | | | | | | | | | | | | | | | | |
Net investment loss | | | (0.44 | )1 | | | (0.34 | )1 | | | (0.14 | )1 | | | (0.23 | )1 | | | (0.28 | )1 | | | (0.20 | )1 | | | (0.29 | )1 | | | (0.10 | )1 | | | (0.27 | ) | | | (0.46 | ) |
Net realized and unrealized gain (loss) on investments | | | 8.42 | | | | 13.44 | | | | 10.94 | | | | 0.73 | | | | 5.93 | | | | (5.68 | ) | | | (12.08 | ) | | | 11.27 | | | | 6.64 | | | | 12.08 | |
| | | | | | | | | | | | | | | | | | | | | | | | | | | | | | | |
Total from investment operations | | | 7.98 | | | | 13.10 | | | | 10.80 | | | | 0.50 | | | | 5.65 | | | | (5.88 | ) | | | (12.37 | ) | | | 11.17 | | | | 6.37 | | | | 11.62 | |
| | | | | | | | | | | | | | | | | | | | | | | | | | | | | | | |
Less distributions to shareholders from: | | | | | | | | | | | | | | | | | | | | | | | | | | | | | | | | | | | | | | | | |
Net investment income | | | 0.00 | | | | 0.00 | | | | 0.00 | | | | 0.00 | | | | 0.00 | | | | 0.00 | | | | 0.00 | | | | 0.00 | | | | 0.00 | | | | 0.00 | |
Net realized gain on investments | | | (5.60 | ) | | | (3.76 | ) | | | (7.77 | ) | | | (0.77 | ) | | | 0.00 | | | | (2.62 | ) | | | (2.08 | ) | | | (4.68 | ) | | | (2.81 | ) | | | (2.99 | ) |
| | | | | | | | | | | | | | | | | | | | | | | | | | | | | | | |
Total distributions | | | (5.60 | ) | | | (3.76 | ) | | | (7.77 | ) | | | (0.77 | ) | | | 0.00 | | | | (2.62 | ) | | | (2.08 | ) | | | (4.68 | ) | | | (2.81 | ) | | | (2.99 | ) |
| | | | | | | | | | | | | | | | | | | | | | | | | | | | | | | |
Net asset value, end of year | | $ | 63.75 | | | $ | 61.37 | | | $ | 52.03 | | | $ | 49.00 | | | $ | 49.27 | | | $ | 43.62 | | | $ | 52.12 | | | $ | 66.57 | | | $ | 60.08 | | | $ | 56.52 | |
| | | | | | | | | | | | | | | | | | | | | | | | | | | | | | | |
Total return | | | 13.59 | % | | | 27.17 | % | | | 24.65 | % | | | 0.85 | % | | | 12.95 | % | | | (9.88 | )% | | | (19.14 | )% | | | 19.56 | % | | | 11.54 | % | | | 25.21 | % |
| | | | | | | | | | | | | | | | | | | | | | | | | | | | | | | |
Ratios/Supplemental data: | | | | | | | | | | | | | | | | | | | | | | | | | | | | | | | | | | | | | | | | |
Net assets (in millions), end of year | | $ | 2,000.5 | | | $ | 2,024.2 | | | $ | 1,845.6 | | | $ | 1,924.9 | | | $ | 2,424.2 | | | $ | 2,652.6 | | | $ | 3,311.8 | | | $ | 4,468.0 | | | $ | 3,365.6 | | | $ | 2,687.4 | |
| | | | | | | | | | | | | | | | | | | | | | | | | | | | | | | |
Ratio of operating expenses to average net assets | | | 1.31 | % | | | 1.32 | % | | | 1.33 | % | | | 1.33 | % | | | 1.32 | % | | | 1.36 | %2 | | | 1.33 | %2 | | | 1.34 | %2 | | | 1.33 | % | | | 1.34 | % |
| | | | | | | | | | | | | | | | | | | | | | | | | | | | | | | |
Ratio of net investment loss to average net assets | | | (0.70 | )% | | | (0.62 | )% | | | (0.28 | )% | | | (0.41 | )% | | | (0.61 | )% | | | (0.54 | )% | | | (0.49 | )% | | | (0.17 | )% | | | (0.49 | )% | | | (0.91 | )% |
| | | | | | | | | | | | | | | | | | | | | | | | | | | | | | | |
Portfolio turnover rate | | | 11.26 | % | | | 12.04 | % | | | 13.11 | % | | | 23.89 | % | | | 13.04 | % | | | 14.67 | % | | | 16.02 | % | | | 13.39 | % | | | 21.87 | % | | | 11.47 | % |
| | | | | | | | | | | | | | | | | | | | | | | | | | | | | | | |
| INSTITUTIONAL SHARES | | Year Ended September 30, | |
| | | | |
| | | 2014 | | | 2013 | | | 2012 | | | 2011 | | | 2010 | | | 20093 | | |
Net asset value, beginning of year | | $ | 62.20 | | | $ | 52.55 | | | $ | 49.30 | | | $ | 49.43 | | | $ | 43.65 | | | $ | 37.38 | | |
| | | | | | | | | | | | | | | | | | | | |
Income (loss) from investment operations: | | | | | | | | | | | | | | | | | | | | | | | | | |
Net investment income (loss) | | | (0.28 | )1 | | | (0.21 | )1 | | | 0.01 | 1 | | | (0.10 | )1 | | | (0.15 | )1 | | | (0.05 | )1 | |
Net realized and unrealized gain on investments | | | 8.55 | | | | 13.62 | | | | 11.01 | | | | 0.74 | | | | 5.93 | | | | 6.32 | | |
| | | | | | | | | | | | | | | | | | | | |
Total from investment operations | | | 8.27 | | | | 13.41 | | | | 11.02 | | | | 0.64 | | | | 5.78 | | | | 6.27 | | |
| | | | | | | | | | | | | | | | | | | | |
Less distributions to shareholders from: | | | | | | | | | | | | | | | | | | | | | | | | | |
Net investment income | | | 0.00 | | | | 0.00 | | | | 0.00 | | | | 0.00 | | | | 0.00 | | | | 0.00 | | |
Net realized gain on investments | | | (5.60 | ) | | | (3.76 | ) | | | (7.77 | ) | | | (0.77 | ) | | | 0.00 | | | | 0.00 | | |
| | | | | | | | | | | | | | | | | | | | |
Total distributions | | | (5.60 | ) | | | (3.76 | ) | | | (7.77 | ) | | | (0.77 | ) | | | 0.00 | | | | 0.00 | | |
| | | | | | | | | | | | | | | | | | | | |
Net asset value, end of year | | $ | 64.87 | | | $ | 62.20 | | | $ | 52.55 | | | $ | 49.30 | | | $ | 49.43 | | | $ | 43.65 | | |
| | | | | | | | | | | | | | | | | | | | |
Total return | | | 13.90 | % | | | 27.51 | % | | | 24.99 | % | | | 1.14 | % | | | 13.24 | % | | | 16.77 | %4 | |
| | | | | | | | | | | | | | | | | | | | |
Ratios/Supplemental data: | | | | | | | | | | | | | | | | | | | | | | | | | |
Net assets (in millions), end of year | | $ | 689.8 | | | $ | 506.1 | | | $ | 386.7 | | | $ | 288.9 | | | $ | 242.8 | | | $ | 82.3 | | |
| | | | | | | | | | | | | | | | | | | | |
Ratio of operating expenses to average net assets | | | 1.04 | % | | | 1.05 | % | | | 1.06 | % | | | 1.06 | % | | | 1.06 | % | | | 1.16 | %5 | |
| | | | | | | | | | | | | | | | | | | | |
Ratio of net investment income (loss) to average net assets | | | (0.43 | )% | | | (0.38 | )% | | | 0.02 | % | | | (0.18 | )% | | | (0.33 | )% | | | (0.39 | )%5 | |
| | | | | | | | | | | | | | | | | | | | |
Portfolio turnover rate | | | 11.26 | % | | | 12.04 | % | | | 13.11 | % | | | 23.89 | % | | | 13.04 | % | | | 14.67 | % | |
| | | | | | | | | | | | | | | | | | | | |
| 1 | | Based on average shares outstanding. |
| 2 | | Benefit of expense reduction rounds to less than 0.01%. |
| 3 | | For the period May 29, 2009 (initial offering of Institutional Shares) to September 30, 2009. |
| 4 | | Not Annualized. |
| 5 | | Annualized. |
| See Notes to Financial Statements. | | 41 |
| Baron Funds | September 30, 2014 |
| BARON GROWTH FUND |
| Selected data for a share outstanding throughout each year: |
| | | | | | | | | | | | | | | | | | | | | | | | | | | | | | | | | | | | | | | | | |
| RETAIL SHARES | | Year Ended September 30, |
| | | |
| | | 2014 | | | 2013 | | | 2012 | | | 2011 | | | 2010 | | | 2009 | | | 2008 | | | 2007 | | | 2006 | | | 2005 | |
Net asset value, beginning of year | | $ | 68.67 | | | $ | 58.19 | | | $ | 46.18 | | | $ | 44.37 | | | $ | 39.00 | | | $ | 41.69 | | | $ | 54.55 | | | $ | 47.23 | | | $ | 45.96 | | | $ | 38.92 | |
| | | | | | | | | | | | | | | | | | | | | | | | | | | | | | | |
Income (loss) from investment operations: | | | | | | | | | | | | | | | | | | | | | | | | | | | | | | | | | | | | | | | | |
Net investment income (loss) | | | 0.061 | 1 | | | (0.12 | )1 | | | 0.20 | 1 | | | (0.29 | )1 | | | (0.34 | )1 | | | (0.18 | )1 | | | (0.28 | )1 | | | (0.25 | )1 | | | (0.29 | ) | | | (0.29 | ) |
Net realized and unrealized gain (loss) on investments | | | 3.45 | | | | 16.37 | | | | 12.64 | | | | 2.10 | | | | 5.71 | | | | (2.47 | ) | | | (10.07 | ) | | | 10.11 | | | | 3.61 | | | | 7.33 | |
| | | | | | | | | | | | | | | | | | | | | | | | | | | | | | | |
Total from investment operations | | | 3.51 | | | | 16.25 | | | | 12.84 | | | | 1.81 | | | | 5.37 | | | | (2.65 | ) | | | (10.35 | ) | | | 9.86 | | | | 3.32 | | | | 7.04 | |
| | | | | | | | | | | | | | | | | | | | | | | | | | | | | | | |
Less distributions to shareholders from: | | | | | | | | | | | | | | | | | | | | | | | | | | | | | | | | | | | | | | | | |
Net investment income | | | (0.03 | ) | | | (0.18 | ) | | | 0.00 | | | | 0.00 | | | | 0.00 | | | | 0.00 | | | | 0.00 | | | | 0.00 | | | | 0.00 | | | | 0.00 | |
Net realized gain on investments | | | (1.69 | ) | | | (5.59 | ) | | | (0.83 | ) | | | 0.00 | | | | 0.00 | | | | (0.04 | ) | | | (2.51 | ) | | | (2.54 | ) | | | (2.05 | ) | | | 0.00 | |
| | | | | | | | | | | | | | | | | | | | | | | | | | | | | | | |
Total distributions | | | (1.72 | ) | | | (5.77 | ) | | | (0.83 | ) | | | 0.00 | | | | 0.00 | | | | (0.04 | ) | | | (2.51 | ) | | | (2.54 | ) | | | (2.05 | ) | | | 0.00 | |
| | | | | | | | | | | | | | | | | | | | | | | | | | | | | | | |
Net asset value, end of year | | $ | 70.46 | | | $ | 68.67 | | | $ | 58.19 | | | $ | 46.18 | | | $ | 44.37 | | | $ | 39.00 | | | $ | 41.69 | | | $ | 54.55 | | | $ | 47.23 | | | $ | 45.96 | |
| | | | | | | | | | | | | | | | | | | | | | | | | | | | | | | |
Total return | | | 5.11 | % | | | 30.76 | % | | | 28.12 | % | | | 4.08 | % | | | 13.77 | % | | | (6.34 | )% | | | (19.78 | )% | | | 21.41 | % | | | 7.36 | % | | | 18.09 | % |
| | | | | | | | | | | | | | | | | | | | | | | | | | | | | | | |
Ratios/Supplemental data: | | | | | | | | | | | | | | | | | | | | | | | | | | | | | | | | | | | | | | | | |
Net assets (in millions), end of year | | $ | 4,076.1 | | | $ | 4,644.2 | | | $ | 4,073.5 | | | $ | 4,110.8 | | | $ | 4,842.8 | | | $ | 5,034.5 | | | $ | 5,615.0 | | | $ | 7,075.9 | | | $ | 5,315.8 | | | $ | 5,005.1 | |
| | | | | | | | | | | | | | | | | | | | | | | | | | | | | | | |
Ratio of operating expenses to average net assets | | | 1.29 | %4 | | | 1.30 | % | | | 1.32 | % | | | 1.32 | % | | | 1.32 | % | | | 1.35 | %2 | | | 1.32 | %2 | | | 1.31 | %2 | | | 1.31 | % | | | 1.31 | % |
| | | | | | | | | | | | | | | | | | | | | | | | | | | | | | | |
Ratio of net investment income (loss) to average net assets | | | 0.08 | % | | | (0.20 | )% | | | 0.38 | % | | | (0.56 | )% | | | (0.80 | )% | | | (0.56 | )% | | | (0.59 | )% | | | (0.49 | )% | | | (0.61 | )% | | | (0.73 | )% |
| | | | | | | | | | | | | | | | | | | | | | | | | | | | | | | |
Portfolio turnover rate | | | 13.15 | % | | | 9.63 | % | | | 13.70 | % | | | 13.51 | % | | | 16.12 | % | | | 26.65 | % | | | 25.97 | % | | | 21.37 | % | | | 21.27 | % | | | 15.50 | % |
| | | | | | | | | | | | | | | | | | | | | | | | | | | | | | | |
| INSTITUTIONAL SHARES | | Year Ended September 30, | |
| | | | |
| | | 2014 | | | 2013 | | | 2012 | | | 2011 | | | 2010 | | | 20093 | | |
Net asset value, beginning of year | | $ | 69.32 | | | $ | 58.70 | | | $ | 46.46 | | | $ | 44.52 | | | $ | 39.03 | | | $ | 33.71 | | |
| | | | | | | | | | | | | | | | | | | | |
Income (loss) from investment operations: | | | | | | | | | | | | | | | | | | | | | |
Net investment income (loss) | | | 0.20 | 1 | | | 0.02 | 1 | | | 0.45 | 1 | | | (0.17 | )1 | | | (0.22 | )1 | | | (0.04 | )1 | |
Net realized and unrealized gain on investments | | | 3.53 | | | | 16.52 | | | | 12.62 | | | | 2.11 | | | | 5.71 | | | | 5.36 | | |
| | | | | | | | | | | | | | | | | | | | |
Total from investment operations | | | 3.73 | | | | 16.54 | | | | 13.07 | | | | 1.94 | | | | 5.49 | | | | 5.32 | | |
| | | | | | | | | | | | | | | | | | | | |
Less distributions to shareholders from: | | | | | | | | | | | | | | | | | | | | | |
Net investment income | | | (0.03 | ) | | | (0.33 | ) | | | 0.00 | | | | 0.00 | | | | 0.00 | | | | 0.00 | | |
Net realized gain on investments | | | (1.69 | ) | | | (5.59 | ) | | | (0.83 | ) | | | 0.00 | | | | 0.00 | | | | 0.00 | | |
| | | | | | | | | | | | | | | | | | | | |
Total distributions | | | (1.72 | ) | | | (5.92 | ) | | | (0.83 | ) | | | 0.00 | | | | 0.00 | | | | 0.00 | | |
| | | | | | | | | | | | | | | | | | | | |
Net asset value, end of year | | $ | 71.33 | | | $ | 69.32 | | | $ | 58.70 | | | $ | 46.46 | | | $ | 44.52 | | | $ | 39.03 | | |
| | | | | | | | | | | | | | | | | | | | |
Total return | | | 5.39 | % | | | 31.10 | % | | | 28.45 | % | | | 4.36 | % | | | 14.07 | % | | | 15.78 | %5 | |
| | | | | | | | | | | | | | | | | | | | |
Ratios/Supplemental data: | | | | | | | | | | | | | | | | | | | | | |
Net assets (in millions), end of year | | $ | 3,694.5 | | | $ | 2,976.7 | | | $ | 1,747.3 | | | $ | 1,261.8 | | | $ | 728.9 | | | $ | 238.7 | | |
| | | | | | | | | | | | | | | | | | | | |
Ratio of operating expenses to average net assets | | | 1.04 | %4 | | | 1.05 | % | | | 1.06 | % | | | 1.06 | % | | | 1.06 | % | | | 1.13 | %6 | |
| | | | | | | | | | | | | | | | | | | | |
Ratio of net investment income (loss) to average net assets | | | 0.28 | % | | | 0.04 | % | | | 0.83 | % | | | (0.33 | )% | | | (0.53 | )% | | | (0.29 | )%6 | |
| | | | | | | | | | | | | | | | | | | | |
Portfolio turnover rate | | | 13.15 | % | | | 9.63 | % | | | 13.70 | % | | | 13.51 | % | | | 16.12 | % | | | 26.65 | % | |
| | | | | | | | | | | | | | | | | | | | |
| 1 | | Based on average shares outstanding. |
| 2 | | Benefit of expense reduction rounds to less than 0.01%. |
| 3 | | For the period May 29, 2009 (initial offering of Institutional Shares) to September 30, 2009. |
| 4 | | Interest expense rounds to less than 0.01%. |
| 5 | | Not Annualized. |
| 6 | | Annualized. |
| 42 | | See Notes to Financial Statements. |
| September 30, 2014 | Baron Funds |
| BARON SMALL CAP FUND |
| Selected data for a share outstanding throughout each year: |
| | | | | | | | | | | | | | | | | | | | | | | | | | | | | | | | | | | | | | | | | |
| RETAIL SHARES | | Year Ended September 30, |
| | | |
| | | 2014 | | | 2013 | | | 2012 | �� | | 2011 | | | 2010 | | | 2009 | | | 2008 | | | 2007 | | | 2006 | | | 2005 | |
Net asset value, beginning of year | | $ | 32.83 | | | $ | 26.14 | | | $ | 20.84 | | | $ | 20.90 | | | $ | 17.96 | | | $ | 18.70 | | | $ | 25.47 | | | $ | 23.59 | | | $ | 23.08 | | | $ | 19.18 | |
| | | | | | | | | | | | | | | | | | | | | | | | | | | | | | | |
Income (loss) from investment operations: | | | | | | | | | | | | | | | | | | | | | | | | | | | | | | | | | | | | | | | | |
Net investment loss | | | (0.01 | )1 | | | (0.12 | )1 | | | (0.19 | )1 | | | (0.15 | )1 | | | (0.06 | )1 | | | (0.13 | )1 | | | (0.09 | )1 | | | (0.02 | )1 | | | (0.18 | ) | | | (0.10 | ) |
Net realized and unrealized gain (loss) on investments | | | 2.14 | | | | 7.61 | | | | 5.96 | | | | 0.09 | 2 | | | 3.00 | | | | (0.61 | ) | | | (5.01 | ) | | | 4.96 | | | | 1.43 | | | | 4.55 | |
| | | | | | | | | | | | | | | | | | | | | | | | | | | | | | | |
Total from investment operations | | | 2.13 | | | | 7.49 | | | | 5.77 | | | | (0.06 | ) | | | 2.94 | | | | (0.74 | ) | | | (5.10 | ) | | | 4.94 | | | | 1.25 | | | | 4.45 | |
| | | | | | | | | | | | | | | | | | | | | | | | | | | | | | | |
Less distributions to shareholders from: | | | | | | | | | | | | | | | | | | | | | | | | | | | | | | | | | | | | | | | | |
Net investment income | | | 0.00 | | | | 0.00 | | | | 0.00 | | | | 0.00 | | | | 0.00 | | | | 0.00 | | | | 0.00 | | | | 0.00 | | | | 0.00 | | | | 0.00 | |
Net realized gain on investments | | | (1.28 | ) | | | (0.80 | ) | | | (0.47 | ) | | | 0.00 | | | | 0.00 | | | | (0.00 | )3 | | | (1.67 | ) | | | (3.06 | ) | | | (0.74 | ) | | | (0.55 | ) |
| | | | | | | | | | | | | | | | | | | | | | | | | | | | | | | |
Total distributions | | | (1.28 | ) | | | (0.80 | ) | | | (0.47 | ) | | | 0.00 | | | | 0.00 | | | | (0.00 | ) | | | (1.67 | ) | | | (3.06 | ) | | | (0.74 | ) | | | (0.55 | ) |
| | | | | | | | | | | | | | | | | | | | | | | | | | | | | | | |
Net asset value, end of year | | $ | 33.68 | | | $ | 32.83 | | | $ | 26.14 | | | $ | 20.84 | | | $ | 20.90 | | | $ | 17.96 | | | $ | 18.70 | | | $ | 25.47 | | | $ | 23.59 | | | $ | 23.08 |
| | | | | | | | | | | | | | | | | | | | | | | | | | | | | | | |
Total return | | | 6.52 | % | | | 29.51 | % | | | 28.09 | % | | | (0.29 | )% | | | 16.37 | % | | | (3.95 | )% | | | (21.44 | )% | | | 22.54 | % | | | 5.52 | % | | | 23.56 | % |
| | | | | | | | | | | | | | | | | | | | | | | | | | | | | | | |
Ratios/Supplemental data: | | | | | | | | | | | | | | | | | | | | | | | | | | | | | | | | | | | | | | | | |
Net assets (in millions), end of year | | $ | 3,192.8 | | | $ | 3,626.1 | | | $ | 3,081.8 | | | $ | 2,842.0 | | | $ | 3,032.0 | | | $ | 2,719.4 | | | $ | 2,871.6 | | | $ | 3,522.4 | | | $ | 2,921.7 | | | $ | 2,828.6 | |
| | | | | | | | | | | | | | | | | | | | | | | | | | | | | | | |
Ratio of operating expenses to average net assets | | | 1.30 | % | | | 1.31 | % | | | 1.31 | % | | | 1.31 | % | | | 1.31 | % | | | 1.34 | %4 | | | 1.32 | %4 | | | 1.31 | %4 | | | 1.33 | % | | | 1.33 | % |
| | | | | | | | | | | | | | | | | | | | | | | | | | | | | | | |
Ratio of net investment loss to average net assets | | | (0.04 | )% | | | (0.42 | )% | | | (0.76 | )% | | | (0.63 | )% | | | (0.30 | )% | | | (0.86 | )% | | | (0.42 | )% | | | (0.09 | )% | | | (0.73 | )% | | | (0.48 | )% |
| | | | | | | | | | | | | | | | | | | | | | | | | | | | | | | |
Portfolio turnover rate | | | 16.41 | % | | | 20.35 | % | | | 28.02 | % | | | 32.81 | % | | | 27.22 | % | | | 35.83 | % | | | 41.52 | % | | | 36.51 | % | | | 39.99 | % | | | 24.68 | % |
| | | | | | | | | | | | | | | | | | | | | | | | | | | | | | | |
| INSTITUTIONAL SHARES | | Year Ended September 30, | |
| | | | |
| | | 2014 | | | | 2013 | | | 2012 | | | 2011 | | | 2010 | | | 20095 | | |
Net asset value, beginning of year | | $ | 33.20 | | | $ | 26.36 | | | $ | 20.96 | | | $ | 20.97 | | | $ | 17.97 | | | $ | 15.52 | | |
| | | | | | | | | | | | | | | | | | | | |
Income (loss) from investment operations: | | | | | | | | | | | | | | | | | | | | | |
Net investment income (loss) | | | 0.06 | 1 | | | (0.05 | )1 | | | (0.13 | )1 | | | (0.10 | )1 | | | (0.03 | )1 | | | (0.04 | )1 | |
Net realized and unrealized gain on investments | | | 2.18 | | | | 7.69 | | | | 6.00 | | | | 0.09 | 2 | | | 3.03 | | | | 2.49 | | |
| | | | | | | | | | | | | | | | | | | | |
Total from investment operations | | | 2.24 | | | | 7.64 | | | | 5.87 | | | | (0.01 | ) | | | 3.00 | | | | 2.45 | | |
| | | | | | | | | | | | | | | | | | | | |
Less distributions to shareholders from: | | | | | | | | | | | | | | | | | | | | | |
Net investment income | | | 0.00 | | | | 0.00 | | | | 0.00 | | | | 0.00 | | | | 0.00 | | | | 0.00 | | |
Net realized gain on investments | | | (1.28 | ) | | | (0.80 | ) | | | (0.47 | ) | | | 0.00 | | | | 0.00 | | | | 0.00 | | |
| | | | | | | | | | | | | | | | | | | | |
Total distributions | | | (1.28 | ) | | | (0.80 | ) | | | (0.47 | ) | | | 0.00 | | | | 0.00 | | | | 0.00 | | |
| | | | | | | | | | | | | | | | | | | | |
Net asset value, end of year | | $ | 34.16 | | | $ | 33.20 | | | $ | 26.36 | | | $ | 20.96 | | | $ | 20.97 | | | $ | 17.97 | | |
| | | | | | | | | | | | | | | | | | | | |
Total return | | | 6.79 | % | | | 29.85 | % | | | 28.41 | % | | | (0.05 | )% | | | 16.69 | % | | | 15.79 | %6 | |
| | | | | | | | | | | | | | | | | | | | |
Ratios/Supplemental data: | | | | | | | | | | | | | | | | | | | | | |
Net assets (in millions), end of year | | $ | 2,057.4 | | | $ | 1,775.7 | | | $ | 1,111.0 | | | $ | 518.6 | | | $ | 261.1 | | | $ | 89.4 | | |
| | | | | | | | | | | | | | | | | | | | |
Ratio of operating expenses to average net assets | | | 1.04 | % | | | 1.05 | % | | | 1.05 | % | | | 1.06 | % | | | 1.06 | % | | | 1.16 | %7 | |
| | | | | | | | | | | | | | | | | | | | |
Ratio of net investment income (loss) to average net assets | | | 0.18 | % | | | (0.16 | )% | | | (0.53 | )% | | | (0.42 | )% | | | (0.15 | )% | | | (0.75 | )%7 | |
| | | | | | | | | | | | | | | | | | | | |
Portfolio turnover rate | | | 16.41 | % | | | 20.35 | % | | | 28.02 | % | | | 32.81 | % | | | 27.22 | % | | | 35.83 | % | |
| | | | | | | | | | | | | | | | | | | | |
| 1 | | Based on average shares outstanding. |
| 2 | | The amount shown for a share outstanding does not correspond with the aggregate realized and unrealized gain (loss) on investments for the period due to the timing of sales and redemptions of fund shares in relation to fluctuating market values of investments of the Fund. |
| 3 | | Less than $0.01 per share. |
| 4 | | Benefit of expense reduction rounds to less than 0.01%. |
| 5 | | For the period May 29, 2009 (initial offering of Institutional Shares) to September 30, 2009. |
| 6 | | Not Annualized. |
| 7 | | Annualized. |
| See Notes to Financial Statements. | | 43 |
| Baron Funds | September 30, 2014 |
| BARON OPPORTUNITY FUND |
| Selected data for a share outstanding throughout each year: |
| | | | | | | | | | | | | | | | | | | | | | | | | | | | | | | | | | | | | | | | | |
| RETAIL SHARES | | Year Ended September 30, |
| | | |
| | | 2014 | | | 2013 | | | 2012 | | | 2011 | | | 2010 | | | 2009 | | | 2008 | | | 2007 | | | 2006 | | | 2005 | |
Net asset value, beginning of year | | $ | 19.26 | | | $ | 15.61 | | | $ | 12.83 | | | $ | 12.76 | | | $ | 10.61 | | | $ | 9.90 | | | $ | 13.01 | | | $ | 10.05 | | | $ | 9.16 | | | $ | 7.58 | |
| | | | | | | | | | | | | | | | | | | | | | | | | | | | | | | |
Income (loss) from investment operations: | | | | | | | | | | | | | | | | | | | | | | | | | | | | | | | | | | | | | | | | |
Net investment loss | | | (0.24 | )1 | | | (0.17 | )1 | | | (0.17 | )1 | | | (0.16 | )1 | | | (0.13 | )1 | | | (0.08 | )1 | | | (0.09 | )1 | | | (0.07 | )1 | | | (0.03 | ) | | | (0.09 | ) |
Net realized and unrealized gain (loss) on investments | | | 0.79 | | | | 4.06 | | | | 2.95 | | | | 0.23 | | | | 2.28 | | | | 0.79 | | | | (3.02 | ) | | | 3.03 | | | | 0.92 | | | | 1.66 | |
| | | | | | | | | | | | | | | | | | | | | | | | | | | | | | | |
Total from investment operations | | | 0.55 | | | | 3.89 | | | | 2.78 | | | | 0.07 | | | | 2.15 | | | | 0.71 | | | | (3.11 | ) | | | 2.96 | | | | 0.89 | | | | 1.57 | |
| | | | | | | | | | | | | | | | | | | | | | | | | | | | | | | |
Less distributions to shareholders from: | | | | | | | | | | | | | | | | | | | | | | | | | | | | | | | | | | | | | | | | |
Net investment income | | | 0.00 | | | | 0.00 | | | | 0.00 | | | | 0.00 | | | | 0.00 | | | | 0.00 | | | | 0.00 | | | | 0.00 | | | | 0.00 | | | | 0.00 | |
Net realized gain on investments | | | (1.20 | ) | | | (0.24 | ) | | | 0.00 | | | | 0.00 | | | | 0.00 | | | | 0.00 | | | | 0.00 | | | | 0.00 | | | | 0.00 | | | | 0.00 | |
| | | | | | | | | | | | | | | | | | | | | | | | | | | | | | | |
Total distributions | | | (1.20 | ) | | | (0.24 | ) | | | 0.00 | | | | 0.00 | | | | 0.00 | | | | 0.00 | | | | 0.00 | | | | 0.00 | | | | 0.00 | | | | 0.00 | |
| | | | | | | | | | | | | | | | | | | | | | | | | | | | | | | |
Redemption fees added to paid-in capital | | | 0.00 | | | | 0.00 | | | | 0.00 | | | | 0.00 | | | | 0.00 | 2 | | | 0.00 | 2 | | | 0.00 | 2 | | | 0.00 | 2 | | | 0.00 | 2 | | | 0.01 | |
| | | | | | | | | | | | | | | | | | | | | | | | | | | | | | | |
Net asset value, end of year | | $ | 18.61 | | | $ | 19.26 | | | $ | 15.61 | | | $ | 12.83 | | | $ | 12.76 | | | $ | 10.61 | | | $ | 9.90 | | | $ | 13.01 | | | $ | 10.05 | | | $ | 9.16 | |
| | | | | | | | | | | | | | | | | | | | | | | | | | | | | | | |
Total return | | | 2.87 | %5 | | | 25.39 | % | | | 21.67 | % | | | 0.55 | % | | | 20.26 | % | | | 7.17 | % | | | (23.90 | )% | | | 29.45 | %3 | | | 9.72 | % | | | 20.84 | %3 |
| | | | | | | | | | | | | | | | | | | | | | | | | | | | | | | |
Ratios/Supplemental data: | | | | | | | | | | | | | | | | | | | | | | | | | | | | | | | | | | | | | | | | |
Net assets (in millions), end of year | | $ | 331.2 | | | $ | 359.9 | | | $ | 332.4 | | | $ | 240.4 | | | $ | 214.4 | | | $ | 142.7 | | | $ | 154.4 | | | $ | 198.0 | | | $ | 145.4 | | | $ | 145.7 | |
| | | | | | | | | | | | | | | | | | | | | | | | | | | | | | | |
Ratio of operating expenses to average net assets | | | 1.35 | % | | | 1.37 | % | | | 1.39 | % | | | 1.41 | % | | | 1.44 | % | | | 1.50 | % | | | 1.42 | % | | | 1.43 | % | | | 1.45 | % | | | 1.52 | % |
Less: Reimbursement of expenses by Adviser and/or offsets | | | 0.00 | % | | | 0.00 | % | | | 0.00 | % | | | 0.00 | % | | | 0.00 | % | | | 0.00 | %4 | | | 0.00 | %4 | | | (0.01 | )% | | | 0.00 | % | | | (0.02 | )% |
| | | | | | | | | | | | | | | | | | | | | | | | | | | | | | | |
Ratio of net operating expenses to average net assets | | | 1.35 | % | | | 1.37 | % | | | 1.39 | % | | | 1.41 | % | | | 1.44 | % | | | 1.50 | % | | | 1.42 | % | | | 1.42 | % | | | 1.45 | % | | | 1.50 | % |
| | | | | | | | | | | | | | | | | | | | | | | | | | | | | | | |
Ratio of net investment loss to average net assets | | | (1.24 | )% | | | (1.02 | )% | | | (1.16 | )% | | | (1.11 | )% | | | (1.08 | )% | | | (1.00 | )% | | | (0.79 | )% | | | (0.61 | )% | | | (0.26 | )% | | | (1.01 | )% |
| | | | | | | | | | | | | | | | | | | | | | | | | | | | | | | |
Portfolio turnover rate | | | 63.40 | % | | | 70.44 | % | | | 88.56 | % | | | 65.43 | % | | | 76.44 | % | | | 68.09 | % | | | 61.44 | % | | | 46.20 | % | | | 67.25 | % | | | 83.64 | % |
| | | | | | | | | | | | | | | | | | | | | | | | | | | | | | | |
| INSTITUTIONAL SHARES | | Year Ended September 30, | |
| | | | |
| | | 2014 | | | 2013 | | | 2012 | | | 2011 | | | 2010 | | | 20096 | | |
Net asset value, beginning of year | | $ | 19.49 | | | $ | 15.75 | | | $ | 12.91 | | | $ | 12.80 | | | $ | 10.62 | | | $ | 8.88 | | |
| | | | | | | | | | | | | | | | | | | | |
Income (loss) from investment operations: | | | | | | | | | | | | | | | | | | | | | |
Net investment loss | | | (0.19 | )1 | | | (0.13 | )1 | | | (0.13 | )1 | | | (0.12 | )1 | | | (0.10 | )1 | | | (0.02 | )1 | |
Net realized and unrealized gain on investments | | | 0.79 | | | | 4.11 | | | | 2.97 | | | | 0.23 | | | | 2.28 | | | | 1.76 | | |
| | | | | | | | | | | | | | | | | | | | |
Total from investment operations | | | 0.60 | | | | 3.98 | | | | 2.84 | | | | 0.11 | | | | 2.18 | | | | 1.74 | | |
| | | | | | | | | | | | | | | | | | | | |
Less distributions to shareholders from: | | | | | | | | | | | | | | | | | | | | | |
Net investment income | | | 0.00 | | | | 0.00 | | | | 0.00 | | | | 0.00 | | | | 0.00 | | | | 0.00 | | |
Net realized gain on investments | | | (1.20 | ) | | | (0.24 | ) | | | 0.00 | | | | 0.00 | | | | 0.00 | | | | 0.00 | | |
| | | | | | | | | | | | | | | | | | | | |
Total distributions | | | (1.20 | ) | | | (0.24 | ) | | | 0.00 | | | | 0.00 | | | | 0.00 | | | | 0.00 | | |
| | | | | | | | | | | | | | | | | | | | |
Redemption fees added to paid-in capital | | | 0.00 | | | | 0.00 | | | | 0.00 | | | | 0.00 | | | | 0.00 | 2 | | | 0.00 | | |
| | | | | | | | | | | | | | | | | | | | |
Net asset value, end of year | | $ | 18.89 | | | $ | 19.49 | | | $ | 15.75 | | | $ | 12.91 | | | $ | 12.80 | | | $ | 10.62 | | |
| | | | | | | | | | | | | | | | | | | | |
Total return | | | 3.10 | %5 | | | 25.74 | % | | | 22.00 | % | | | 0.86 | % | | | 20.53 | % | | | 19.59 | %3,7 | |
| | | | | | | | | | | | | | | | | | | | |
Ratios/Supplemental data: | | | | | | | | | | | | | | | | | | | | | |
Net assets (in millions), end of year | | $ | 109.4 | | | $ | 101.3 | | | $ | 62.5 | | | $ | 35.5 | | | $ | 25.5 | | | $ | 10.9 | | |
| | | | | | | | | | | | | | | | | | | | |
Ratio of operating expenses to average net assets | | | 1.08 | % | | | 1.11 | % | | | 1.13 | % | | | 1.14 | % | | | 1.18 | % | | | 1.37 | %8 | |
Less: Reimbursement of expenses by Adviser and/or offsets | | | 0.00 | % | | | 0.00 | % | | | 0.00 | % | | | 0.00 | % | | | 0.00 | % | | | (0.12 | )%8 | |
| | | | | | | | | | | | | | | | | | | | |
Ratio of net operating expenses to average net assets | | | 1.08 | % | | | 1.11 | % | | | 1.13 | % | | | 1.14 | % | | | 1.18 | % | | | 1.25 | %8 | |
| | | | | | | | | | | | | | | | | | | | |
Ratio of net investment loss to average net assets | | | (0.97 | )% | | | (0.79 | )% | | | (0.90 | )% | | | (0.84 | )% | | | (0.83 | )% | | | (0.74 | )%8 | |
| | | | | | | | | | | | | | | | | | | | |
Portfolio turnover rate | | | 63.40 | % | | | 70.44 | % | | | 88.56 | % | | | 65.43 | % | | | 76.44 | % | | | 68.09 | % | |
| | | | | | | | | | | | | | | | | | | | |
| 1 | | Based on average shares outstanding. |
| 2 | | Less than $0.01 per share. |
| 3 | | The total returns would have been lower had certain expenses not been reduced during the period shown. |
| 4 | | Benefit of expense reduction rounds to less than 0.01%. |
| 5 | | The Adviser made a voluntary payment to the Fund in the amount of $140,762 to compensate the Fund for a loss incurred due to a trade processing error. The impact of this payment increased the Fund’s total return by 0.03%. |
| 6 | | For the period May 29, 2009 (initial offering of Institutional Shares) to September 30, 2009. |
| 7 | | Not Annualized. |
| 8 | | Annualized. |
| 44 | | See Notes to Financial Statements. |
| September 30, 2014 | Baron Funds |
| BARON FIFTH AVENUE GROWTH FUND |
| Selected data for a share outstanding throughout each year: |
| | | | | | | | | | | | | | | | | | | | | | | | | | | | | | | | | | | | | | | | | |
| RETAIL SHARES | | Year Ended September 30, |
| | | |
| | | 2014 | | | 2013 | | | 2012 | | | 2011 | | | 2010 | | | 2009 | | | 2008 | | | 2007 | | | 2006 | | | 2005 | |
Net asset value, beginning of year | | $ | 14.42 | | | $ | 11.83 | | | $ | 8.98 | | | $ | 9.21 | | | $ | 8.60 | | | $ | 10.38 | | | $ | 14.12 | | | $ | 12.22 | | | $ | 11.56 | | | $ | 9.89 | |
| | | | | | | | | | | | | | | | | | | | | | | | | | | | | | | |
Income (loss) from investment operations: | | | | | | | | | | | | | | | | | | | | | | | | | | | | | | | | | | | | | | | | |
Net investment income (loss) | | | (0.05 | )1 | | | 0.02 | 1 | | | (0.03 | )1 | | | (0.06 | )1 | | | (0.03 | )1 | | | 0.03 | 1 | | | 0.00 | 1,2 | | | (0.01 | )1 | | | (0.02 | ) | | | (0.05 | ) |
Net realized and unrealized gain (loss) on investments | | | 2.46 | | | | 2.57 | | | | 2.88 | | | | (0.17 | ) | | | 0.66 | | | | (1.03 | ) | | | (2.62 | ) | | | 1.91 | | | | 0.68 | | | | 1.72 | |
| | | | | | | | | | | | | | | | | | | | | | | | | | | | | | | |
Total from investment operations | | | 2.41 | | | | 2.59 | | | | 2.85 | | | | (0.23 | ) | | | 0.63 | | | | (1.00 | ) | | | (2.62 | ) | | | 1.90 | | | | 0.66 | | | | 1.67 | |
| | | | | | | | | | | | | | | | | | | | | | | | | | | | | | | |
Less distributions to shareholders from: | | | | | | | | | | | | | | | | | | | | | | | | | | | | | | | | | | | | | | | | |
Net investment income | | | 0.00 | | | | 0.00 | | | | 0.00 | | | | 0.00 | | | | (0.02 | ) | | | (0.01 | ) | | | 0.00 | | | | 0.00 | | | | 0.00 | | | | 0.00 | |
Net realized gain on investments | | | 0.00 | | | | 0.00 | | | | 0.00 | | | | 0.00 | | | | 0.00 | | | | (0.77 | ) | | | (1.12 | ) | | | 0.00 | | | | 0.00 | | | | 0.00 | |
| | | | | | | | | | | | | | | | | | | | | | | | | | | | | | | |
Total distributions | | | 0.00 | | | | 0.00 | | | | 0.00 | | | | 0.00 | | | | (0.02 | ) | | | (0.78 | ) | | | (1.12 | ) | | | 0.00 | | | | 0.00 | | | | 0.00 | |
| | | | | | | | | | | | | | | | | | | | | | | | | | | | | | | |
Net asset value, end of year | | $ | 16.83 | | | $ | 14.42 | | | $ | 11.83 | | | $ | 8.98 | | | $ | 9.21 | | | $ | 8.60 | | | $ | 10.38 | | | $ | 14.12 | | | $ | 12.22 | | | $ | 11.56 | |
| | | | | | | | | | | | | | | | | | | | | | | | | | | | | | | |
Total return | | | 16.71 | %3 | | | 21.89 | %3 | | | 31.74 | %3 | | | (2.50 | )%3 | | | 7.38 | %3 | | | (7.75 | )%3 | | | (19.96 | )%3 | | | 15.55 | % | | | 5.71 | % | | | 16.89 | %3 |
| | | | | | | | | | | | | | | | | | | | | | | | | | | | | | | |
Ratios/Supplemental data: | | | | | | | | | | | | | | | | | | | | | | | | | | | | | | | | | | | | | | | | |
Net assets (in millions), end of year | | $ | 53.2 | | | $ | 47.8 | | | $ | 34.8 | | | $ | 23.4 | | | $ | 29.0 | | | $ | 32.8 | | | $ | 58.2 | | | $ | 110.2 | | | $ | 123.3 | | | $ | 96.5 | |
| | | | | | | | | | | | | | | | | | | | | | | | | | | | | | | |
Ratio of operating expenses to average net assets | | | 1.37 | % | | | 1.47 | % | | | 1.55 | % | | | 1.59 | % | | | 1.62 | % | | | 1.69 | % | | | 1.47 | % | | | 1.36 | % | | | 1.39 | % | | | 1.49 | % |
Less: Reimbursement of expenses by Adviser and/or offsets | | | (0.07 | )% | | | (0.17 | )% | | | (0.25 | )% | | | (0.29 | )% | | | (0.25 | )% | | | (0.29 | )% | | | (0.07 | )% | | | 0.00 | %4 | | | 0.00 | % | | | (0.09 | )% |
| | | | | | | | | | | | | | | | | | | | | | | | | | | | | | | |
Ratio of net operating expenses to average net assets | | | 1.30 | % | | | 1.30 | % | | | 1.30 | % | | | 1.30 | % | | | 1.37 | % | | | 1.40 | % | | | 1.40 | % | | | 1.36 | % | | | 1.39 | % | | | 1.40 | % |
| | | | | | | | | | | | | | | | | | | | | | | | | | | | | | | |
Ratio of net investment income (loss) to average net assets | | | (0.29 | )% | | | 0.14 | % | | | (0.30 | )% | | | (0.55 | )% | | | (0.32 | )% | | | 0.40 | % | | | (0.01 | )% | | | (0.08 | )% | | | (0.16 | )% | | | (0.58 | )% |
| | | | | | | | | | | | | | | | | | | | | | | | | | | | | | | |
Portfolio turnover rate | | | 16.84 | % | | | 22.91 | % | | | 79.07 | % | | | 75.36 | % | | | 57.67 | % | | | 39.61 | % | | | 39.59 | % | | | 28.75 | % | | | 105.77 | % | | | 46.71 | % |
| | | | | | | | | | | | | | | | | | | | | | | | | | | | | | | |
| INSTITUTIONAL SHARES | | Year Ended September 30, | |
| | | | |
| | | 2014 | | | | 2013 | | | 2012 | | | 2011 | | | 2010 | | | 20095 | | |
Net asset value, beginning of year | | $ | 14.53 | | | $ | 11.89 | | | $ | 9.00 | | | $ | 9.21 | | | $ | 8.61 | | | $ | 7.54 | | |
| | | | | | | | | | | | | | | | | | | | |
Income (loss) from investment operations: | | | | | | | | | | | | | | | | | | | | | |
Net investment income (loss) | | | (0.01 | )1 | | | 0.05 | 1 | | | (0.01 | )1 | | | (0.03 | )1 | | | (0.01 | )1 | | | 0.02 | 1 | |
Net realized and unrealized gain (loss) on investments | | | 2.48 | | | | 2.59 | | | | 2.90 | | | | (0.18 | ) | | | 0.66 | | | | 1.05 | | |
| | | | | | | | | | | | | | | | | | | | |
Total from investment operations | | | 2.47 | | | | 2.64 | | | | 2.89 | | | | (0.21 | ) | | | 0.65 | | | | 1.07 | | |
| | | | | | | | | | | | | | | | | | | | |
Less distributions to shareholders from: | | | | | | | | | | | | | | | | | | | | | |
Net investment income | | | 0.00 | | | | 0.00 | | | | 0.00 | | | | 0.00 | | | | (0.05 | ) | | | 0.00 | | |
Net realized gain on investments | | | 0.00 | | | | 0.00 | | | | 0.00 | | | | 0.00 | | | | 0.00 | | | | 0.00 | | |
| | | | | | | | | | | | | | | | | | | | |
Total distributions | | | 0.00 | | | | 0.00 | | | | 0.00 | | | | 0.00 | | | | (0.05 | ) | | | 0.00 | | |
| | | | | | | | | | | | | | | | | | | | |
Net asset value, end of year | | $ | 17.00 | | | $ | 14.53 | | | $ | 11.89 | | | $ | 9.00 | | | $ | 9.21 | | | $ | 8.61 | | |
| | | | | | | | | | | | | | | | | | | | |
Total return | | | 17.00 | %3 | | | 22.20 | %3 | | | 32.11 | %3 | | | (2.28 | )%3 | | | 7.59 | %3 | | | 14.19 | %3,6 | |
| | | | | | | | | | | | | | | | | | | | |
Ratios/Supplemental data: | | | | | | | | | | | | | | | | | | | | | |
Net assets (in millions), end of year | | $ | 56.0 | | | $ | 33.8 | | | $ | 18.9 | | | $ | 10.2 | | | $ | 10.4 | | | $ | 9.5 | | |
| | | | | | | | | | | | | | | | | | | | |
Ratio of operating expenses to average net assets | | | 1.08 | % | | | 1.18 | % | | | 1.26 | % | | | 1.31 | % | | | 1.35 | % | | | 1.61 | %7 | |
Less: Reimbursement of expenses by Adviser and/or offsets | | | (0.03 | )% | | | (0.13 | )% | | | (0.21 | )% | | | (0.26 | )% | | | (0.24 | )% | | | (0.46 | )%7 | |
| | | | | | | | | | | | | | | | | | | | |
Ratio of net operating expenses to average net assets | | | 1.05 | % | | | 1.05 | % | | | 1.05 | % | | | 1.05 | % | | | 1.11 | % | | | 1.15 | %7 | |
| | | | | | | | | | | | | | | | | | | | |
Ratio of net investment income (loss) to average net assets | | | (0.08 | )% | | | 0.36 | % | | | (0.05 | )% | | | (0.30 | )% | | | (0.07 | )% | | | 0.58 | %7 | |
| | | | | | | | | | | | | | | | | | | | |
Portfolio turnover rate | | | 16.84 | % | | | 22.91 | % | | | 79.07 | % | | | 75.36 | % | | | 57.67 | % | | | 39.61 | % | |
| | | | | | | | | | | | | | | | | | | | |
| 1 | | Based on average shares outstanding. |
| 2 | | Less than $0.01 per share. |
| 3 | | The total returns would have been lower had certain expenses not been reduced during the period shown. |
| 4 | | Benefit of expense reduction rounds to less than 0.01%. |
| 5 | | For the period May 29, 2009 (initial offering of Institutional Shares) to September 30, 2009. |
| 6 | | Not Annualized. |
| 7 | | Annualized. |
| See Notes to Financial Statements. | | 45 |
| Baron Funds | | September 30, 2014 |
BARON DISCOVERY FUND
Selected data for a share outstanding throughout the year:
| | | RETAIL SHARES | | INSTITUTIONAL SHARES |
| | | | | |
| | | Year Ended | | Year Ended |
| | | September 30, | | September 30, |
| | | 2014 | | 2014 |
| Net asset value, beginning of year | | $ | 10.00 | | | $ | 10.00 | |
| | | | | | | |
| Income (loss) from investment operations: | | | | | | | | |
| Net investment loss | | | (0.10 | )1 | | | (0.08 | )1 |
| Net realized and unrealized gain on investments | | | 1.78 | 2 | | | 1.79 | 2 |
| | | | | | | |
Total from investment operations | | | 1.68 | | | | 1.71 | |
| | | | | | | |
| Less distributions to shareholders from: | | | | | | | | |
| Net investment income | | | 0.00 | | | | 0.00 | |
| Net realized gain on investments | | | 0.00 | | | | 0.00 | |
| | | | | | | |
Total distributions | | | 0.00 | | | | 0.00 | |
| | | | | | | |
| Net asset value, end of year | | $ | 11.68 | | | $ | 11.71 | |
| | | | | | | |
| Total return | | | 16.80 | %3 | | | 17.10 | %3 |
| | | | | | | |
| Ratios/Supplemental data: | | | | | | | | |
| Net assets (in millions), end of year | | $ | 16.6 | | | $ | 48.7 | |
| | | | | | | |
| Ratio of operating expenses to average net assets | | | 2.16 | % | | | 1.91 | % |
| Less: Reimbursement of expenses by Adviser and/or offsets | | | (0.81 | )% | | | (0.81 | )% |
| | | | | | | |
| Ratio of net operating expenses to average net assets | | | 1.35 | % | | | 1.10 | % |
| | | | | | | |
| Ratio of net investment loss to average net assets | | | (0.85 | )% | | | (0.64 | )% |
| | | | | | | |
| Portfolio turnover rate | | | 109.40 | % | | | 109.40 | % |
| | | | | | | |
| 1 | | Based on average shares outstanding. |
| 2 | | The amount shown for a share outstanding does not correspond with the aggregate realized and unrealized gain (loss) on investments for the period due to the timing of sales and redemptions of fund shares in relation to fluctuating market values of investments of the Fund. |
| 3 | | The total returns would have been lower had certain expenses not been reduced during the period shown. |
| 46 | | See Notes to Financial Statements. |
| September 30, 2014 | | Baron Funds |
| REPORT OF INDEPENDENT REGISTERED PUBLIC ACCOUNTING FIRM |
| |
To the Shareholders and Board of Trustees of
Baron Investment Funds Trust
In our opinion, the accompanying statements of assets and liabilities, including the statements of net assets, and the related statements of operations and of changes in net assets and the financial highlights present fairly, in all material respects, the financial position of each of Baron Asset Fund, Baron Growth Fund, Baron Small Cap Fund, Baron Opportunity Fund, Baron Fifth Avenue Growth Fund and Baron Discovery Fund (six of the portfolios constituting Baron Investment Funds Trust, hereafter referred to as the “Funds”) at September 30, 2014, the results of each of their operations for the year ended, the changes in each of their net assets and the financial highlights for each of the periods presented, in conformity with accounting principles generally accepted in the United States of America. These financial statements and financial highlights (hereafter referred to as “financial statements”) are the responsibility of the Funds’ management. Our responsibility is to express an opinion on these financial statements based on our audits. We conducted our audits of these financial statements in accordance with the standards of the Public Company Accounting Oversight Board (United States). Those standards require that we plan and perform the audit to obtain reasonable assurance about whether the financial statements are free of material misstatement. An audit includes examining, on a test basis, evidence supporting the amounts and disclosures in the financial statements, assessing the accounting principles used and significant estimates made by management, and evaluating the overall financial statement presentation. We believe that our audits, which included confirmation of securities at September 30, 2014 by correspondence with the custodian, brokers, and portfolio companies, provide a reasonable basis for our opinion.

PricewaterhouseCoopers LLP
New York, New York
November 24, 2014
| TAX INFORMATION (Unaudited) |
| |
| |
| The federal tax status of distributions paid by the Funds during the year ended September 30, 2014 are listed below. |
| |
During the fiscal year ended September 30, 2014, the Funds’ distributions to shareholders included:
| Fund | Ordinary
Income1,3 | | Long-Term
Capital Gains2,3 |
| Baron Asset Fund | $ | — | | $ | 229,335,684 |
| Baron Growth Fund | | 14,691,238 | | | 177,565,560 |
| Baron Small Cap Fund | | — | | | 208,572,249 |
| Baron Opportunity Fund | | 14,059,154 | | | 14,713,852 |
| Baron Fifth Avenue Growth Fund | | — | | | — |
| Baron Discovery Fund | | — | | | — |
| 1 | | For tax purposes, short-term capital gains are considered ordinary income distributions. |
| 2 | | Long-term capital gains are subject to a maximum allowable rate of 20% for individuals pursuant to The American Taxpayer Relief Act of 2012. |
| 3 | | Under the Patient Protection and Affordable Care Act, higher income taxpayers must pay a 3.8% additional tax on net investment income. |
Of the total ordinary income distributions paid by Baron Growth Fund and Baron Opportunity Fund, 100.00% and 5.54%, respectively, is qualified dividend income subject to a reduced tax rate. Of the total ordinary income distributions paid by Baron Growth Fund and Baron Opportunity Fund, 100.00% and 5.56%, respectively, qualifies for the corporate dividends received deduction.
The information and distributions reported may differ from the information and distributions taxable to the shareholders for the calendar year ended December 31, 2014. The information necessary to complete your income tax return for the calendar year ended December 31, 2014 will be listed on the Form 1099-DIV, which will be mailed to you in January 2015.
47
| Baron Funds | | September 30, 2014 |
| FUND EXPENSES (Unaudited) |
| |
As a shareholder of the Funds, you may incur two types of costs: ongoing expenses and transaction costs. Ongoing expenses include advisory fees, distribution and service (12b-1) fees and other Fund expenses. Due to the payment of Rule 12b-1 fees, long-term shareholders may indirectly pay more than the maximum permitted front-end sales charge. The information on this page is intended to help you understand your ongoing costs of investing in the Funds and to compare these costs with the ongoing costs of investing in other mutual funds.
The information in the following table is based on an investment of $1,000 invested on April 1, 2014 and held for the six months ended September 30, 2014.
ACTUAL EXPENSES
The table below titled “Based on Actual Total Return” provides information about actual account values and actual expenses. You may use the information provided in this table, together with the amount you invested, to estimate the expenses that you paid over the period. To estimate the expenses you paid on your account, divide your ending account value by $1,000 (for example, an $8,600 ending account value divided by $1,000 = 8.6), then multiply the result by the number under the heading titled “Expenses Paid During the Period”.
BASED ON ACTUAL TOTAL RETURN FOR THE YEAR ENDED SEPTEMBER 30, 20141
| | | Actual
Total
Return | | Beginning
Account Value
April 1, 2014 | | Ending
Account Value
September 30, 2014 | | Annualized
Expense
Ratio | | Expenses
Paid During
the Period2 |
| | | | | | | | | | | | | | | | | | | | | |
| Baron Asset Fund- Retail Shares | | | 2.08 | % | | $ | 1,000.00 | | | $ | 1,020.80 | | | | 1.31 | % | | $ | 6.64 | |
| Baron Asset Fund- Institutional Shares | | | 2.22 | % | | $ | 1,000.00 | | | $ | 1,022.20 | | | | 1.04 | % | | $ | 5.27 | |
| Baron Growth Fund- Retail Shares | | | (2.84 | )% | | $ | 1,000.00 | | | $ | 971.60 | | | | 1.29 | % | | $ | 6.38 | |
| Baron Growth Fund- Institutional Shares | | | (2.70 | )% | | $ | 1,000.00 | | | $ | 973.00 | | | | 1.04 | % | | $ | 5.14 | |
| Baron Small Cap Fund- Retail Shares | | | (2.24 | )% | | $ | 1,000.00 | | | $ | 977.60 | | | | 1.30 | % | | $ | 6.44 | |
| Baron Small Cap Fund- Institutional Shares | | | (2.12 | )% | | $ | 1,000.00 | | | $ | 978.80 | | | | 1.05 | % | | $ | 5.21 | |
| Baron Opportunity Fund- Retail Shares | | | (4.22 | )% | | $ | 1,000.00 | | | $ | 957.80 | | | | 1.35 | % | | $ | 6.63 | |
| Baron Opportunity Fund- Institutional Shares | | | (4.11 | )% | | $ | 1,000.00 | | | $ | 958.90 | | | | 1.09 | % | | $ | 5.35 | |
| Baron Fifth Avenue Growth Fund- Retail Shares | | | 4.34 | % | | $ | 1,000.00 | | | $ | 1,043.40 | 3 | | | 1.30 | %4 | | $ | 6.66 | |
| Baron Fifth Avenue Growth Fund- Institutional Shares | | | 4.49 | % | | $ | 1,000.00 | | | $ | 1,044.90 | 3 | | | 1.05 | %4 | | $ | 5.38 | |
| Baron Discovery Fund- Retail Shares | | | (8.10 | )% | | $ | 1,000.00 | | | $ | 919.00 | 3 | | | 1.35 | %4 | | $ | 6.49 | |
| Baron Discovery Fund- Institutional Shares | | | (8.01 | )% | | $ | 1,000.00 | | | $ | 919.90 | 3 | | | 1.10 | %4 | | $ | 5.29 | |
HYPOTHETICAL EXAMPLE FOR COMPARISON PURPOSES
The table below titled “Based on Hypothetical Total Return” provides information about hypothetical account values and hypothetical expenses based on the actual expense ratio and an assumed rate of return of 5% per year before expenses, which is not the Funds’ actual return. The hypothetical account values and expenses may not be used to estimate the actual ending account values and expenses you paid for the period. You may use the information provided in this table to compare the ongoing costs of investing in the Funds and other funds. To do so, compare the 5% hypothetical example relating to the Funds with the 5% hypothetical examples that appear in the shareholder reports of other funds.
Please note that expenses shown in the table below are meant to highlight your ongoing costs and do not reflect any transactional costs, such as redemption fees, if any. Therefore, the table is useful in comparing ongoing costs only and will not help you determine your relative total costs of owning different mutual funds. In addition, if these transactional costs were included, your costs would have been higher.
BASED ON HYPOTHETICAL TOTAL RETURN FOR THE YEAR ENDED SEPTEMBER 31, 2014
| | | Hypothetical
Annualized
Total Return | | Beginning
Account Value
April 1, 2014 | | Ending
Account Value
September 30, 2014 | | Annualized
Expense
Ratio | | Expenses
Paid During
the Period2 |
| | | | | | | | | | | | | | | | | | | | | |
| Baron Asset Fund- Retail Shares | | | 5.00 | % | | $ | 1,000.00 | | | $ | 1,018.50 | | | | 1.31 | % | | $ | 6.63 | |
| Baron Asset Fund- Institutional Shares | | | 5.00 | % | | $ | 1,000.00 | | | $ | 1,019.85 | | | | 1.04 | % | | $ | 5.27 | |
| Baron Growth Fund- Retail Shares | | | 5.00 | % | | $ | 1,000.00 | | | $ | 1,018.60 | | | | 1.29 | % | | $ | 6.53 | |
| Baron Growth Fund- Institutional Shares | | | 5.00 | % | | $ | 1,000.00 | | | $ | 1,019.85 | | | | 1.04 | % | | $ | 5.27 | |
| Baron Small Cap Fund- Retail Shares | | | 5.00 | % | | $ | 1,000.00 | | | $ | 1,018.55 | | | | 1.30 | % | | $ | 6.58 | |
| Baron Small Cap Fund- Institutional Shares | | | 5.00 | % | | $ | 1,000.00 | | | $ | 1,019.80 | | | | 1.05 | % | | $ | 5.32 | |
| Baron Opportunity Fund- Retail Shares | | | 5.00 | % | | $ | 1,000.00 | | | $ | 1,018.30 | | | | 1.35 | % | | $ | 6.83 | |
| Baron Opportunity Fund- Institutional Shares | | | 5.00 | % | | $ | 1,000.00 | | | $ | 1,019.60 | | | | 1.09 | % | | $ | 5.52 | |
| Baron Fifth Avenue Growth Fund- Retail Shares | | | 5.00 | % | | $ | 1,000.00 | | | $ | 1,018.55 | 3 | | | 1.30 | %4 | | $ | 6.58 | |
| Baron Fifth Avenue Growth Fund- Institutional Shares | | | 5.00 | % | | $ | 1,000.00 | | | $ | 1,019.80 | 3 | | | 1.05 | %4 | | $ | 5.32 | |
| Baron Discovery Fund- Retail Shares | | | 5.00 | % | | $ | 1,000.00 | | | $ | 1,018.30 | 3 | | | 1.35 | %4 | | $ | 6.83 | |
| Baron Discovery Fund- Institutional Shares | | | 5.00 | % | | $ | 1,000.00 | | | $ | 1,019.55 | 3 | | | 1.10 | %4 | | $ | 5.57 | |
| 1 | | Assumes reinvestment of all dividends and capital gain distributions, if any. |
| 2 | | Expenses are equal to each Share Class’ respective annualized expense ratio multiplied by the average account value over the period, multiplied by the number of days in the most recent fiscal half-year, then divided by 365. |
| 3 | | Ending account value assumes the return earned after waiver and would have been lower if a portion of the expenses had not been waived. |
| 4 | | Annualized expense ratios are adjusted to reflect fee waiver. |
48
| September 30, 2014 | | Baron Funds |
DISCLOSURE REGARDING THE APPROVAL OF THE INVESTMENT ADVISORY AGREEMENTS FOR BARON ASSET FUND, BARON GROWTH FUND, BARON SMALL CAP FUND, BARON OPPORTUNITY FUND AND BARON FIFTH AVENUE GROWTH FUND BY THE BOARD OF TRUSTEES (Unaudited) |
The Board of Trustees (the “Board”) of Baron Investment Funds Trust (the “Trust”) met on May 6, 2014 to discuss the selection of BAMCO, Inc. (the “Adviser”) as the investment adviser and the approval of the investment advisory agreements for Baron Asset Fund, Baron Growth Fund, Baron Small Cap Fund, Baron Opportunity Fund and Baron Fifth Avenue Growth Fund, (each a “Fund” and collectively, the “Funds”). The members of the Board who are not affiliated with the Trust (the “Independent Trustees”) met in a separate session to discuss and consider the renewal of the advisory agreement for the Funds. An independent consultant provided reports to the Board and attended the Board meeting. The Trustees received a substantial amount of information from the Adviser and from the consultant, and were advised by independent counsel. Based on its evaluation of this and other information, the Board, including a majority of the Independent Trustees, approved the continuation of the advisory agreements for the Funds for an additional one-year period.
In reaching its determination, the Board considered various factors that it deemed relevant, including the factors listed below.
1. NATURE, EXTENT AND QUALITY OF SERVICES
As part of their consideration of the nature, extent and quality of services provided by the Adviser, the Independent Trustees relied on the information they received at or prior to the Board meeting, their experience and knowledge gained from their service as Trustees and their experience generally and information they had considered in past years and remained, in their thinking, material to their consideration. In particular, the Board considered the following:
| • | | Its confidence in the Adviser’s senior personnel and portfolio management, the financial condition of the Adviser and its affiliates and the Adviser’s available resources; |
| | | |
| • | | The nature, quality and the level of long-term performance of the services provided by the Adviser, including: intensive devotion to research, selection of broker/dealers for Fund portfolio transactions, relationships with and supervision of third party service providers, such as the Funds’ custodian and transfer agent, the quality of shareholder reports, the ability to monitor adherence to investment guidelines and restrictions, the legal, accounting and compliance services provided to the Funds and the support services provided to the Board; |
| | | |
| • | | The Adviser’s investment principles and processes and the historical performance of the Funds as compared to similar funds managed by other advisers and other funds managed by the Adviser over comparable periods; |
| | | |
| • | | The total expense ratio of the Funds and comparisons to similar funds managed by other advisers over comparable periods; |
| | | |
| • | | The costs of portfolio management, including the types of investments made for the Funds, the personnel and systems necessary for implementation of investment strategies, and the pre-tax profits realized by the Adviser and its affiliates from their relationship with the Funds; and |
| | | |
| • | | Additional services provided by the Adviser. |
The Board concluded that the nature, extent and quality of the services provided by the Adviser to each Fund were appropriate and that each Fund was likely to continue to benefit from those services provided under the relevant advisory agreement with the Adviser.
2. INVESTMENT PERFORMANCE OF THE FUNDS AND THE ADVISER
As part of its consideration of the investment performance of the Funds and the Adviser, the Board took into account the analyses performed by and discussed with the independent consultant. The Board considered for each Fund, among other information, the independent consultant’s comparisons of the expense ratio and contractual advisory fee with those of peer funds selected by the independent consultant, as noted below. The Board noted that long-term performance for the Funds was generally good compared to their peers. The Board noted that each Fund with performance data covering at least ten years was ranked in the first or second quintile for the ten-year period and in the first or second quintile for at least one of the shorter-term performance periods. For the Funds that underperformed relative to their peers during certain periods, representatives of the Adviser described the reasons for the lower relative performance and, as applicable, the steps the Adviser had taken to improve performance. The Board also considered the independent consultant’s risk-adjusted performance comparisons with comparable funds for Funds that have been in existence for more than three years. The Board also considered comparisons of each Fund’s annualized total return over one-, three-, five- and ten-year periods, where applicable, against expense group and performance universe averages and relevant securities market indices. After considering all the information, the Board concluded that the Adviser continued to invest in accordance with its long-standing principles and that each Fund’s more recent relative performance was consistent with expectations for the Adviser’s investment style under recent market conditions.
3. COSTS OF SERVICES PROVIDED AND PROFITS TO BE REALIZED BY THE ADVISER
The Board considered benefits that accrue to the Adviser and its affiliates from their relationship with the Funds. Representatives of the Adviser said the Board should consider the advisory fee in the context of other fees paid to the Adviser’s affiliates, such as the distribution fee paid pursuant to the 12b-1 plan. The Board was provided with information from the Adviser and the independent consultant regarding the fees charged by the Adviser as compared to the fees charged by comparable funds. This information compared various fees and expenses, as well as the total expense ratios, of the Funds against the same fees, expenses and total expense ratios of other funds of similar size, character and investment strategies. The Board observed that, for most of the Funds, while the management fee was relatively high, the other expenses paid by the Funds generally were relatively low, when compared to their peers. They concluded that the Funds’ higher management fee was justified given the Adviser’s highly research intensive process and highly disciplined adherence to its process.
The Board considered comparisons of the advisory fees charged and services provided by the Adviser and its investment adviser affiliate to sub-advised accounts and separately managed accounts and a profitability analysis prepared by the Adviser. The Board considered that, while the advisory fees for the other clients are the same as, or lower than, the fees for the Funds, the Adviser or its affiliate performs significantly fewer services for those clients compared with those provided by the Adviser to the Funds.
49
| Baron Funds | | September 30, 2014 |
DISCLOSURE REGARDING THE APPROVAL OF THE INVESTMENT ADVISORY AGREEMENTS FOR BARON ASSET FUND, BARON GROWTH FUND, BARON SMALL CAP FUND, BARON OPPORTUNITY FUND AND BARON FIFTH AVENUE GROWTH FUND BY THE BOARD OF TRUSTEES (Unaudited) (Continued) |
4. ECONOMIES OF SCALE AND BENEFITS TO INVESTORS
The Board considered the extent to which each Fund’s management fee reflected economies of scale for the benefit of Fund shareholders, noting the sharp decline in assets from their highs in 2007 and, then, a recovery and appreciating that the economies of scale analysis is predicated on generally predictable increasing assets. The Board considered that, except for Baron Fifth Avenue Growth Fund, the Funds’ fee schedules do not have break points. The Board considered that small- and mid-cap investment strategies require more attention by the Adviser than a strategy that involves other types of investing, particularly as asset size increases. The Board considered that the Adviser was continuing to grow and upgrade its staff and invest in its business even during this recent period of declining assets and reduced revenues. The Board members reiterated their intention to continue to scrutinize the extent of economies of scale, asset growth and the Adviser’s plans to invest further to support the Funds. The Board concluded that approval of the management fee for each Fund was supportable in light of the services provided as discussed at the meeting, including the Adviser’s investments in resources to support the Funds.
After due consideration of the above-enumerated factors and other factors in deemed relevant, the Board, including a majority of the Independent Trustees, approved the continuance of each Fund’s investment advisory agreement.
50
| September 30, 2014 | | Baron Funds |
| MANAGEMENT OF THE FUNDS (Unaudited) |
| |
| |
| Board of Trustees and Officers. |
| |
Trustees of the Trust, together with information as to their positions with the Trust, principal occupations and other board memberships and affiliations for the past five years, are shown below. Each Trustee serves as Trustee of a Fund until its termination; until the Trustee’s retirement, resignation or death; or as otherwise specified in the Trust’s organizational documents. Unless otherwise noted, the address of each Executive Officer and Trustee is Baron Investment Funds Trust, 767 Fifth Avenue, 49th Floor, New York, NY 10153. All Trustees listed below, whether Interested or Independent, serve as Trustees for the Trust. Additional information about the Trustees and Officers of the Trust can be found in the Trust’s Statement of Additional Information (the “SAI”) which may be obtained without charge by writing or calling 1-800-99BARON. The SAI is also available on the Baron Funds® website, www.BaronFunds.com.
| Name, Address & Age | | Position(s) Held
With the Funds | | Term of
Office and
Length of
Time Served | | Principal Occupation(s)
During the Past Five Years | | Number of
Portfolios
in Fund
Complex
Overseen
by Trustee | | Other
Trustee/Directorships
Held by Trustee |
| | | | | | | | | | | |
| Interested Trustees | | | | | |
| | | | | | | | | | | |
Ronald Baron(1),(2)
767 Fifth Avenue
New York, NY 10153
Age: 71 | | Chief Executive Officer, Chief Investment Officer, Trustee and Portfolio Manager | | 27 years | | Director, Chairman, CEO and CIO: the Firm* (1982-Present); Trustee: Baron Investment Funds Trust (1987-Present); Trustee: Baron Select Funds (2003-Present); Portfolio Manager: Baron USA Partners Fund, Ltd. (2003-Present); Portfolio Manager: Baron Managed Funds plc (2005-2009). | | 13 | | None |
| | | | | | | | | | | |
Linda S. Martinson(1),(2)
767 Fifth Avenue
New York, NY 10153
Age: 59 | | Chairman, President, Chief Operating Officer and Trustee | | 27 years | | Director: the Firm* (2003-Present); Secretary: the Firm* (1997-2008); President: the Firm* (2007- Present); Chief Operating Officer: the Firm (2006- present); Chairman (2010-Present), President (2007-Present), Trustee (1987-Present), Secretary (2003-2008): Baron Investment Funds Trust; Chairman (2010-Present), President (2007-Present), Trustee (2003-Present): Baron Select Funds; Director: Baron USA Partners Fund, Ltd. (2006-Present); Director: Baron Managed Funds plc (2005-2009). | | 13 | | None |
| Baron Funds | | September 30, 2014 |
| MANAGEMENT OF THE FUNDS (Unaudited) (Continued) |
| |
| Name, Address & Age | | Position(s) Held
With the Funds | | Term of
Office and
Length of
Time Served | | Principal Occupation(s)
During the Past Five Years | | Number of
Portfolios
in Fund
Complex
Overseen
by Trustee | | Other
Trustee/Directorships
Held by Trustee |
| | | | | | | | | | | |
| Independent Trustees | | | | | |
| | | | | | | | | | | |
Norman S. Edelcup(3),(4),(5)
City of Sunny Isles Beach
18070 Collins Avenue
Sunny Isles Beach, FL 33160
Age: 79 | | Trustee | | 27 years | | Mayor (2003-Present): Sunny Isles Beach, Florida; Trustee: Baron Investment Funds Trust (1987-Present), Baron Select Funds (2003-Present). | | 13 | | Director: CompX International, Inc. (diversified manufacturer of engineered components) (2006-Present); Director: Valhi, Inc. (diversified company) (1975-Present). |
| | | | | | | | | | | |
Harold W. Milner(4),(5)
2293 Morningstar Drive
Park City, UT 84060
Age: 79 | | Trustee | | 27 years | | Trustee: Baron Investment Funds Trust (1987-Present), Baron Select Funds (2003-Present). | | 13 | | None |
| | | | | | | | | | | |
Raymond Noveck(3),(4),(5)
31 Karen Road
Waban, MA 02468
Age: 71 | | Lead Trustee | | 27 years | | Private Investor (1999-Present); Trustee: Baron Investment Funds Trust (1987-Present), Baron Select Funds (2003-Present). | | 13 | | None |
| | | | | | | | | | | |
Anita Rosenberg(4),(5)
1235 N. Astor Street
Chicago, Il 60610
Age: 50 | | Trustee | | 1 year | | Senior Advisor: Magnetar Capital (2011-2012); Trustee: Baron Investment Funds Trust, Baron Select Funds (2013-Present). | | 13 | | Director: Golub Capital BDC, Inc. (2011-Present). |
| | | | | | | | | | | |
David A. Silverman, MD(4),(5)
146 Central Park West
New York, NY 10024
Age: 64 | | Trustee | | 27 years | | Physician and Faculty: New York University School of Medicine (1976-Present); Trustee: Baron Investment Funds Trust (1987-Present), Baron Select Funds (2003-Present). | | 13 | | None |
| | | | | | | | | | | |
Alex Yemenidjian(4),(5)
3801 Las Vegas Blvd. South
Las Vegas, NV 89109
Age: 58 | | Trustee | | 8 years | | Chairman and CEO: Tropicana Las Vegas (gaming) (2009-Present); Chairman and CEO: Armenco Holdings, LLC (investment company) (2005-Present); Trustee: Baron Investment Funds Trust (2006-Present), Baron Select Funds (2006-Present). | | 13 | | Director: Guess?, Inc. (2005-Present); Director: Regal Entertainment Group (2005-Present). |
52
| September 30, 2014 | | Baron Funds |
| MANAGEMENT OF THE FUNDS (Unaudited) (Continued) |
| |
| Name, Address & Age | | Position(s) Held
With the Funds | | Term of
Office and
Length of
Time Served | | Principal Occupation(s)
During the Past Five Years | | Number of
Portfolios
in Fund
Complex
Overseen
by Trustee | | Other
Trustee/Directorships
Held by Trustee |
| | | | | | | | | | | |
| Additional Officers of the Funds | | | | | |
| | | | | | | | | | | |
Clifford Greenberg
767 Fifth Avenue
New York, NY 10153
Age: 55 | | Senior Vice
President | | 17 years | | Director and Senior Vice President: the Firm*; Senior Vice President: Baron Investment Funds Trust, Baron Select Funds; Portfolio Manager: Baron Small Cap Fund. | | N/A | | N/A |
| | | | | | | | | | | |
Louis Beasley
767 Fifth Avenue
New York, NY 10153
Age: 43 | | Vice President and
Chief Compliance
Officer | | 1 year (appointed 9/2014) | | Chief Compliance Officer: Baron Capital Group, Inc., BAMCO, Inc., Baron Capital Management Inc., Baron Investment Funds Trust, Baron Select Funds, Baron USA Partners Fund, Ltd (9/2014-Present); Vice President: the Firm* (9/2014-Present); Principal and Director of Investment Management Compliance and Risk Management: Bessemer Trust (2006-9/2014). | | N/A | | N/A |
| | | | | | | | | | | |
Patrick M. Patalino
767 Fifth Avenue
New York, NY 10153
Age: 46 | | Vice President,
General Counsel
and Secretary | | 7 years | | Vice President, General Counsel and Secretary: the Firm*, Baron Investment Funds Trust, Baron Select Funds; General Counsel: Baron USA Partners Fund, Ltd. | | N/A | | N/A |
| | | | | | | | | | | |
Andrew Peck
767 Fifth Avenue
New York, NY 10153
Age: 45 | | Senior Vice
President | | 11 years | | Senior Vice President: the Firm*, Baron Investment Funds Trust, Baron Select Funds; Portfolio Manager: Baron Asset Fund. | | N/A | | N/A |
| | | | | | | | | | | |
Susan Robbins
767 Fifth Avenue
New York, NY 10153
Age: 60 | | Vice President | | 20 years | | Director and Vice President: the Firm*; Vice President: Baron Investment Funds Trust, Baron Select Funds. | | N/A | | N/A |
| | | | | | | | | | | |
Peggy C. Wong
767 Fifth Avenue
New York, NY 10153
Age: 53 | | Treasurer and
Chief Financial
Officer | | 27 years | | Chief Financial Officer and Treasurer: the Firm*, Baron Investment Funds Trust, Baron Select Funds. | | N/A | | N/A |
| * | The Firm (Baron Capital Group, Inc. (“BCG”) with its subsidiaries BCI, Baron Capital Management, Inc. (“BCM”) and BAMCO). |
| (1) | Trustees deemed to be “Interested Trustees” of the Funds, as that term is defined in the 1940 Act, by reason of their employment with the Funds’ Adviser and Distributor. |
| (2) | Members of the Executive Committee, which is empowered to exercise all of the powers, including the power to declare dividends, of the full Board when the full Board is not in session. |
| (3) | Members of the Audit Committee. |
| (4) | Members of the Nominating Committee. |
| (5) | Members of the Independent Committee. |
Go Paperless!
It’s fast, simple and a smart way to help the environment.
Enjoy the speed and convenience of receiving Fund documents electronically.
For more information, and to enroll today, go to www.baronfunds.com/edelivery.
767 Fifth Avenue, 49th Fl.
New York, NY 10153
1.800.99.BARON
212-583-2000
www.BaronFunds.com
Item 2. Code of Ethics.
The Registrant has adopted a Code of Ethics for Principal Executive and Senior Financial Officers (the “Code”). Upon request, the Registrant will provide a copy of the Code to any person without charge. To obtain a copy of the Code, please send your request to info@Baronfunds.com or call 1-800-99BARON (1-800-992-2766).
Item 3. Audit Committee Financial Expert.
The Registrant’s Board of Trustees has determined that the Registrant has two audit committee financial experts serving on its Audit Committee, Norman S. Edelcup and Raymond Noveck. Both Mr. Edelcup and Mr. Noveck are “independent” for purposes of Item 3(a)(2) of Form N-CSR.
Item 4. Principal Accountant Fees and Services.
The following table shows the fees paid to PricewaterhouseCoopers, LLP, the Registrant’s principal accounting firm during the fiscal years ended September 30, 2014 and September 30, 2013:
| (a) | Audit Fees: for professional services rendered for the audit of the Registrant’s annual financial statements or services that are normally provided in connection with statutory and regulatory filings or engagements: |
| | | 2014 | 2013 |
| | Baron Investment Funds Trust | $244,370 | $220,100 |
| | | | |
| (b) | Audit-Related Fees: for assurance and related services that are reasonably related to the performance of the audit and are not included as Audit Fees: |
| | | 2014 | 2013 |
| | Baron Investment Funds Trust | $0 | $0 |
| | | | |
| (c) | Tax Fees: for professional services rendered for tax compliance, tax advice and tax planning: |
| | | 2014 | 2013 |
| | Baron Investment Funds Trust | $60,240 | $51,150 |
The Tax Fees represent services provided in connection with the preparation of tax returns and year-end distribution review.
| (d) | All Other Fees: for products and services provided by such accounting firm that are not included in (a), (b) or (c) above: |
| | | 2014 | 2013 |
| | Baron Investment Funds Trust | $0 | $0 |
e) Audit Committee Pre-Approval Policies and Procedures: (i) Pursuant to paragraph (c)(7) of Rule 2-01 of Regulation S-X and to its charter, the Audit Committee shall pre-approve all audit and non-audit services provided by the independent auditors and in connection therewith to review and evaluate the qualifications, independence and performance of the Fund’s independent auditors; (ii) 100% of the services described in each of items 4(b) through 4(d) were approved by the Audit Committee pursuant to paragraph (c)(7)(i)(C) of Rule 2-01 of Regulation S-X.
(f) Not Applicable.
(g) The aggregate non-audit fees billed by the registrant’s accountant for services rendered to the registrant, and rendered to the registrant’s investment adviser (not including any sub-adviser whose role is primarily portfolio management and is subcontracted with or overseen by another investment adviser), and any entity controlling, controlled by, or under common control with the adviser that provides ongoing services to the registrant for the last two fiscal years is as follows:
| 2014: | | $65,000 |
| | | |
| 2013: | | $49,035 |
Item 5. Audit Committee of Listed Registrants.
The Registrant has a separately-designated standing Audit Committee established in accordance with Section 3(a)(58)(A) of the Securities Exchange Act of 1934. The members of the Audit Committee are Norman S. Edelcup and Raymond Noveck.
Item 6. Schedule of Investments.
Included herein under Item 1.
Item 7. Disclosure of Proxy Voting Policies and Procedures for Closed-End Management Investment Companies.
Not applicable.
Item 8. Portfolio Managers of Closed-End Management Investment Companies.
Not applicable.
Item 9. Purchases of Equity Securities by Closed-End Management Investment Company and Affiliated Purchasers.
Not applicable.
Item 10. Submission of Matters to a Vote of Security Holders.
Not applicable.
Item 11. Controls and Procedures.
| | (a) The Registrant’s principal executive officer and principal financial officer have concluded that the Registrant’s disclosure controls and procedures (as defined in Rule 30a-3(c) under the Investment Company Act of 1940 (the “1940 Act”)) are effective based on their evaluation of these controls and procedures as of a date within 90 days of the filing date of this report. |
| | (b) There were no changes in the Registrant’s internal control over financial reporting (as defined in Rule 30a-3(d) under the 1940 Act) that occurred during the Registrant’s second fiscal quarter of the period covered by this report that have materially affected, or are reasonably likely to materially affect, the Registrant’s internal control over financial reporting. |
Item 12. Exhibits.
| | (a)(1) Not applicable.
(a) (2) Certification of each of the principal executive officers and principal financial officers of the Registrant as required by Rule 30a-2 under the Act (17 CFR 270.30a-2) is attached hereto as a part of EX-99.CERT.
(b) Certification of each of the principal executive officers and principal financial officers of the Registrant as required by Section 906 of the Sarbanes-Oxley Act of 2002 is attached hereto as a part of EX-99.906CERT. |
SIGNATURES
Pursuant to the requirements of the Securities Exchange Act of 1934 and the Investment Company Act of 1940, the registrant has duly caused this report to be signed on its behalf by the undersigned, thereunto duly authorized.
| | BARON INVESTMENT FUNDS TRUST |
| | | |
| | By: | /s/ Ronald Baron |
| | | Ronald Baron |
| | | Chief Executive Officer |
| | | |
| | Date: | December 5, 2014 |
Pursuant to the requirements of the Securities Exchange Act of 1934 and the Investment Company Act of 1940, this report has been signed below by the following persons on behalf of the registrant and in the capacities and on the dates indicated.
| | By: | /s/ Ronald Baron |
| | | Ronald Baron |
| | | Chief Executive Officer |
| | | |
| | Date: | December 5, 2014 |
| | | |
| | By: | /s/ Peggy Wong |
| | | Peggy Wong |
| | | Treasurer and Chief Financial Officer |
| | | |
| | Date: | December 5, 2014 |